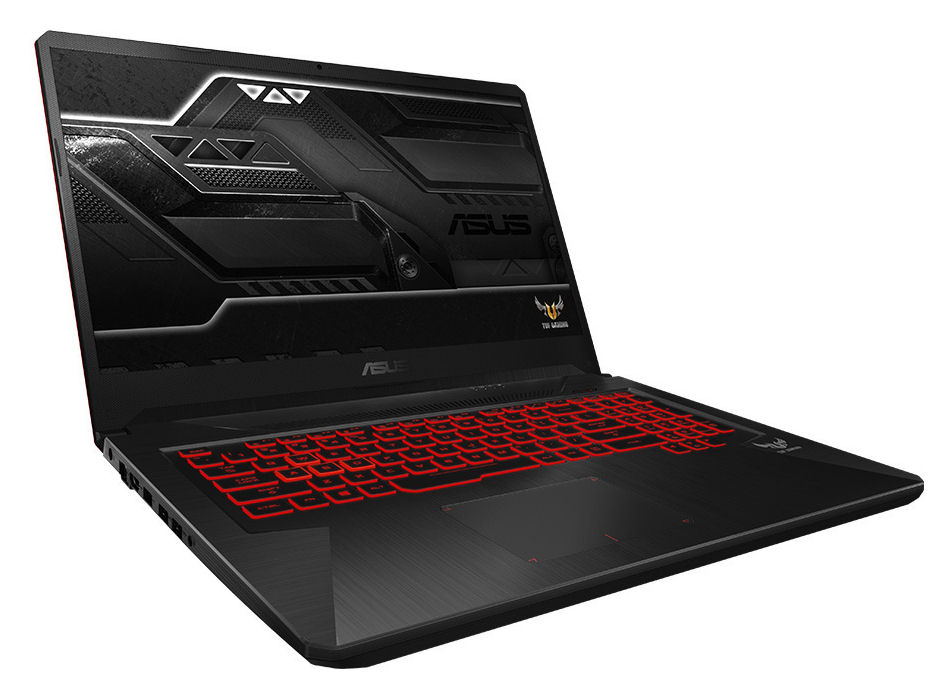
ASUS TUF Gaming FX705DY (Ryzen 5 3550H, Radeon RX 560X, SSD, FHD) Laptop Review

The FX705DY forms part of ASUS’ The Ultimate Force (TUF) series, which is the Taiwanese company’s affordable range of gaming laptops. We have recently reviewed two models, the FX705GM and the FX705GE, which are both powered by Intel Core i7-8750H processors. Our current review unit, the FX705DY-AU072, is the cheapest model in the series at almost 800 Euros (~$900) and comes with an AMD Ryzen 5 3550H APU along with an AMD Radeon RX 560X GPU.
Our review unit’s closest competitor is the Dell G3 17 3779, which also costs around 800 Euros (~$900). We have also chosen to compare the FX705DY against the Acer Predator Helios 300 and Lenovo Legion Y730-17ICH, although both are more expensive than ASUS’ budget gaming laptop.
We should also point out early on that the FX705DY shares many of its components and design with its FX705 siblings. Hence, we shall skip straight to the display and forgo discussing the case, connectivity, software, accessories, warranty and input devices. We shall not cover our review unit’s display or speakers in great depth either because we have already covered them in our FX705GM and FX705GE reviews.


Display

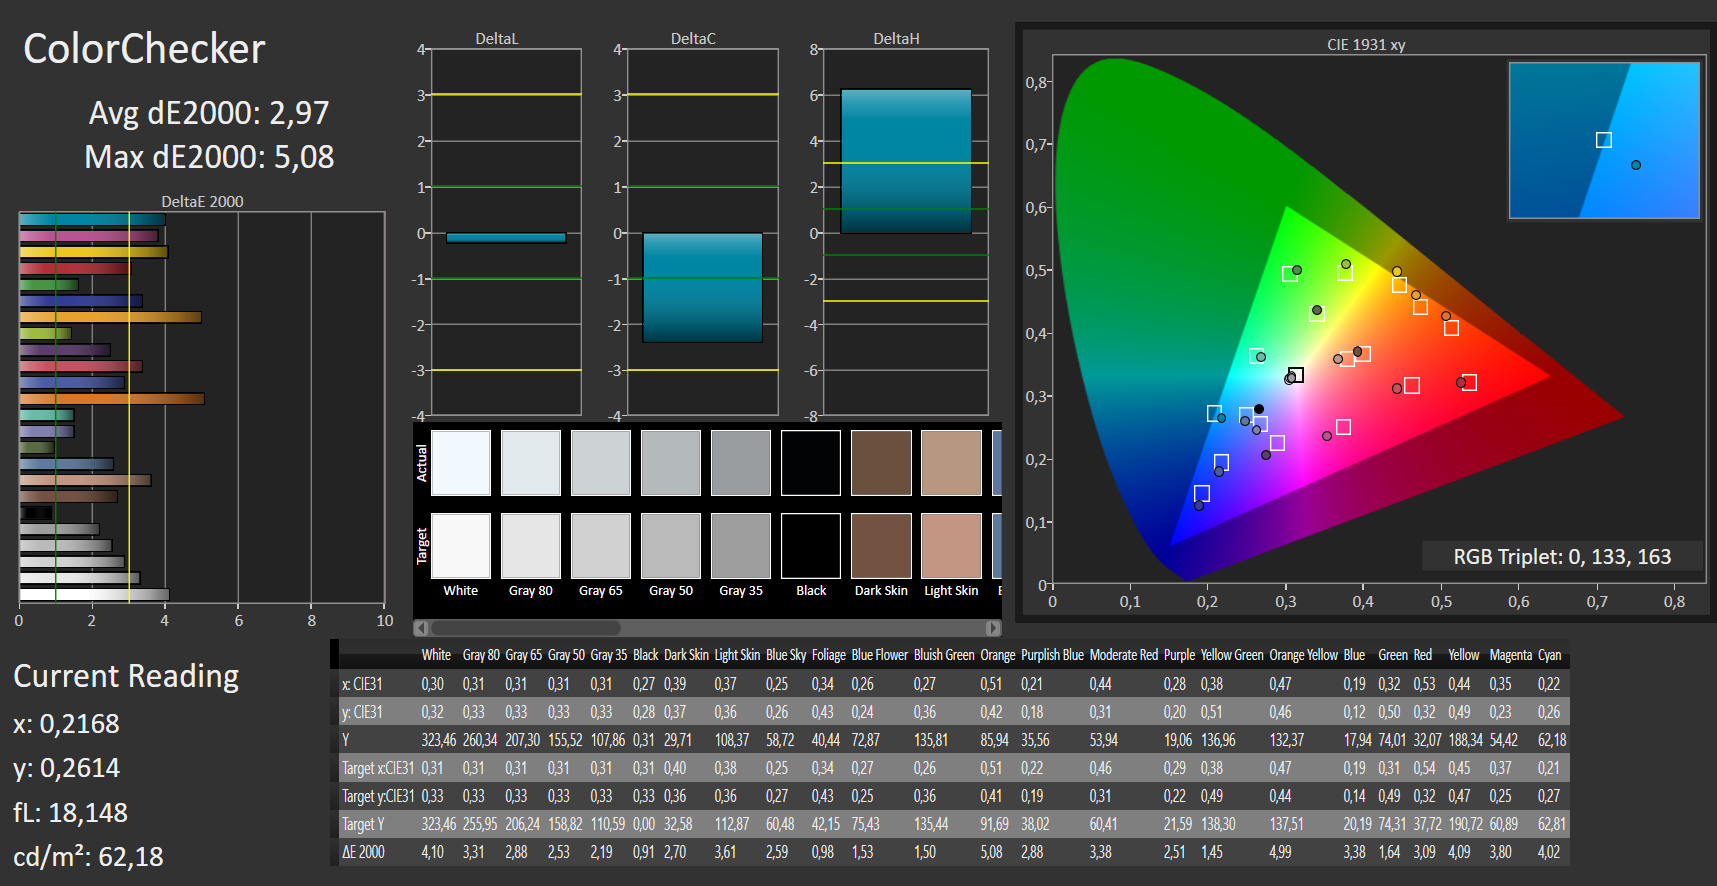
The FX705DY has a matte, 17.3-inch IPS display that operates natively at 1920x1080. Our review unit achieved an average maximum brightness of 303.4 cd/m² in our tests and a contrast ratio of 1,006:1, which are acceptable and on par with its competitors. The FX705DY does not use pulse-width modulation (PWM) to adjust screen brightness, so you should not have any ill effects from looking at the display for prolonged periods.
ASUS equips the FX705DY with the same panel as it uses in the FX705GE. The two devices achieve different results in our tests, but this is to be expected as every panel has slight variances even if they are from the same batch and manufacturer.
| |||||||||||||||||||||||||
Brightness Distribution: 84 %
Center on Battery: 322 cd/m²
Contrast: 1006:1 (Black: 0.32 cd/m²)
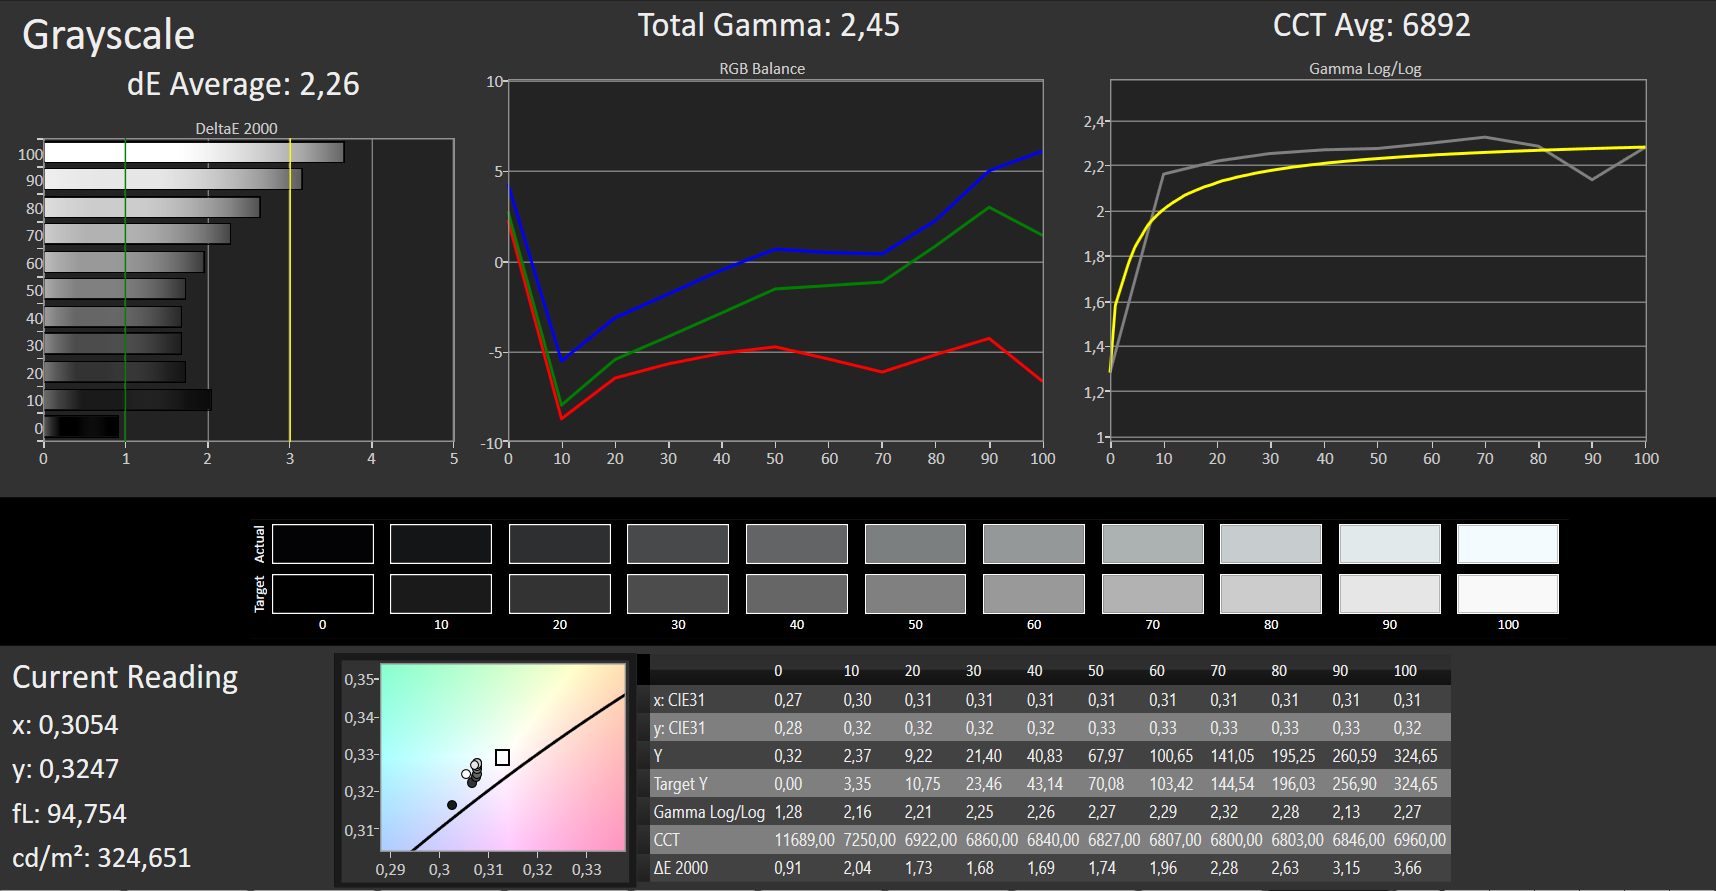
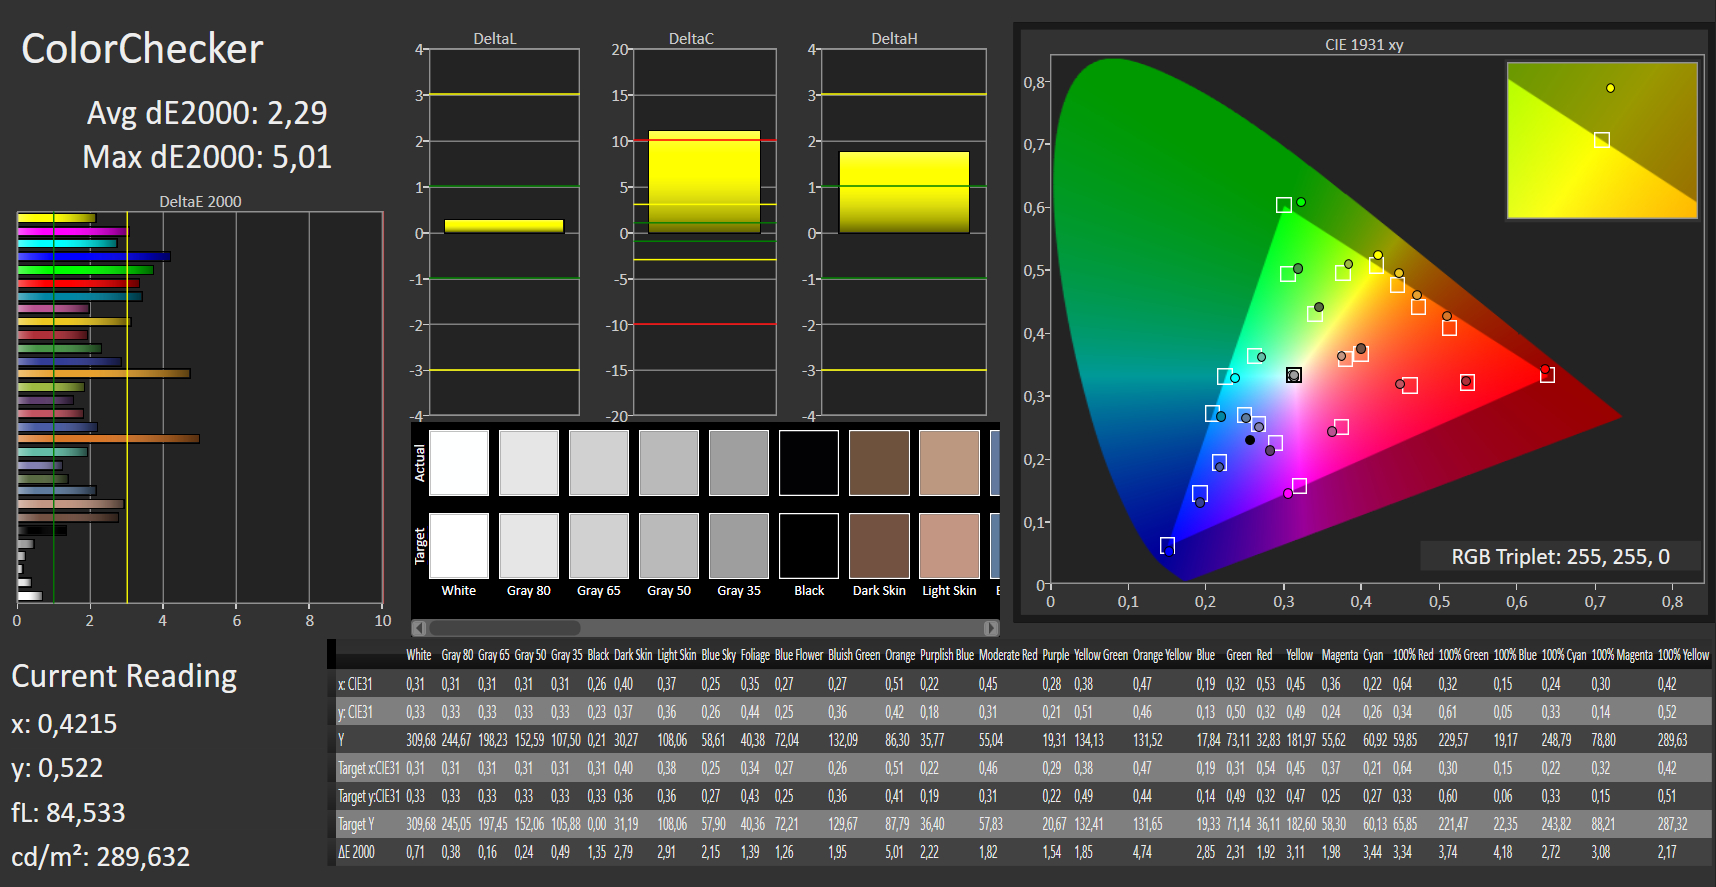
ΔE ColorChecker Calman: 2.97 | ∀{0.5-29.43 Ø4.73}
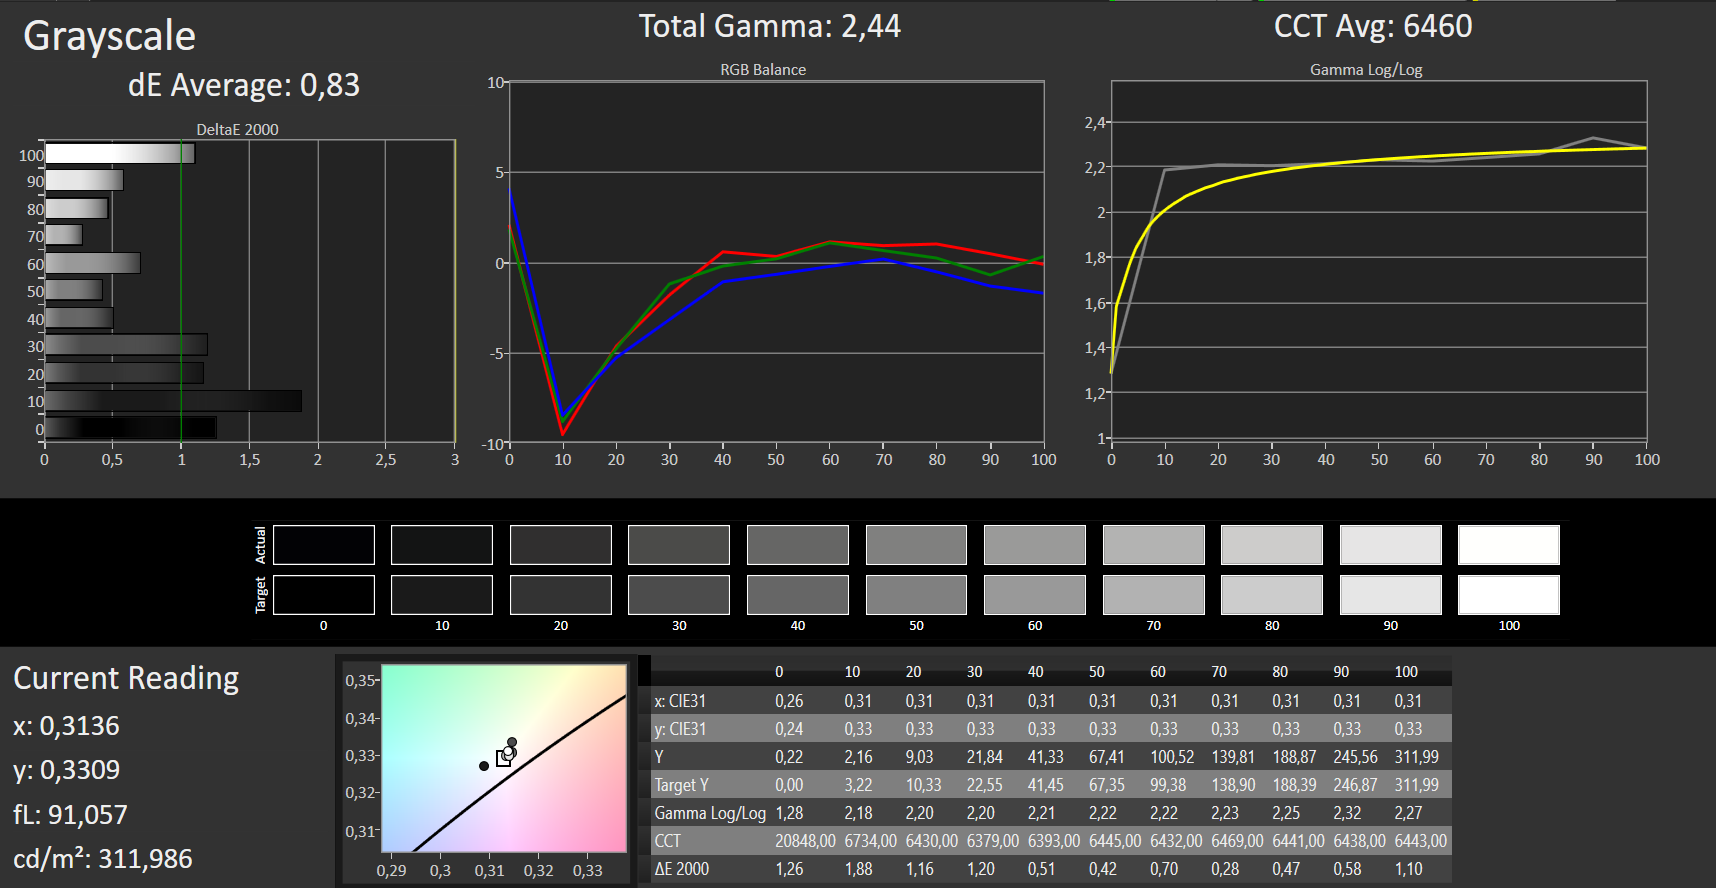
calibrated: 2.29
ΔE Greyscale Calman: 2.26 | ∀{0.09-98 Ø4.97}
87% sRGB (Argyll 1.6.3 3D)
57% AdobeRGB 1998 (Argyll 1.6.3 3D)
Gamma: 2.45
CCT: 6892 K
| Asus TUF FX705DY-AU072 IPS, 1920x1080, 17.3" | Asus TUF FX705GE-EW096T IPS, 1920x1080, 17.3" | Dell G3 17 3779 IPS, 1920x1080, 17.3" | Lenovo Legion Y730-17ICH, i7-8750H IPS, 1920x1080, 17.3" | Acer Predator Helios 300 PH317-52-51M6 IPS, 1920x1080, 17.3" | Asus TUF FX705GM IPS, 1920x1080, 17.3" | |
|---|---|---|---|---|---|---|
| Display | ||||||
| Display P3 Coverage (%) | 63.1 | 63.9 | 66.4 | 67.1 | 62.4 | |
| sRGB Coverage (%) | 86.8 | 89.8 | 84.9 | 86.1 | 88.8 | |
| AdobeRGB 1998 Coverage (%) | 63.5 | 64.9 | 62.1 | 63 | 63.8 | |
| Response Times | -1% | 5% | 10% | 15% | 72% | |
| Response Time Grey 50% / Grey 80% * (ms) | 40 ? | 39 ? 2% | 38 ? 5% | 36.8 ? 8% | 36 ? 10% | 7.4 ? 81% |
| Response Time Black / White * (ms) | 27 ? | 28 ? -4% | 26 ? 4% | 24 ? 11% | 22 ? 19% | 10 ? 63% |
| PWM Frequency (Hz) | 122000 ? | |||||
| Screen | -1% | -26% | -37% | -44% | 8% | |
| Brightness middle (cd/m²) | 322 | 299 -7% | 323 0% | 328.7 2% | 365 13% | 234 -27% |
| Brightness (cd/m²) | 303 | 291 -4% | 306 1% | 318 5% | 341 13% | 228 -25% |
| Brightness Distribution (%) | 84 | 90 7% | 89 6% | 91 8% | 89 6% | 85 1% |
| Black Level * (cd/m²) | 0.32 | 0.28 12% | 0.31 3% | 0.51 -59% | 0.32 -0% | 0.2 37% |
| Contrast (:1) | 1006 | 1068 6% | 1042 4% | 645 -36% | 1141 13% | 1170 16% |
| Colorchecker dE 2000 * | 2.97 | 3.02 -2% | 4.96 -67% | 4.91 -65% | 6.51 -119% | 2.16 27% |
| Colorchecker dE 2000 max. * | 5.08 | 5.27 -4% | 8.25 -62% | 10.15 -100% | 12.32 -143% | 3.39 33% |
| Colorchecker dE 2000 calibrated * | 2.29 | 2.76 -21% | 4.27 -86% | 2.9 -27% | 2.02 12% | |
| Greyscale dE 2000 * | 2.26 | 2.18 4% | 5.65 -150% | 3.9 -73% | 7.65 -238% | 2 12% |
| Gamma | 2.45 90% | 2.48 89% | 2.24 98% | 2.13 103% | 2.64 83% | 2.46 89% |
| CCT | 6892 94% | 6392 102% | 7441 87% | 6911 94% | 8066 81% | 6394 102% |
| Color Space (Percent of AdobeRGB 1998) (%) | 57 | 57 0% | 58 2% | 55.6 -2% | 56 -2% | 58 2% |
| Color Space (Percent of sRGB) (%) | 87 | 87 0% | 90 3% | 84.7 -3% | 86 -1% | 89 2% |
| Total Average (Program / Settings) | -1% /
-1% | -11% /
-21% | -14% /
-30% | -15% /
-35% | 40% /
18% |
* ... smaller is better


Display Response Times
| ↔ Response Time Black to White | ||
|---|---|---|
| 27 ms ... rise ↗ and fall ↘ combined | ↗ 16 ms rise | 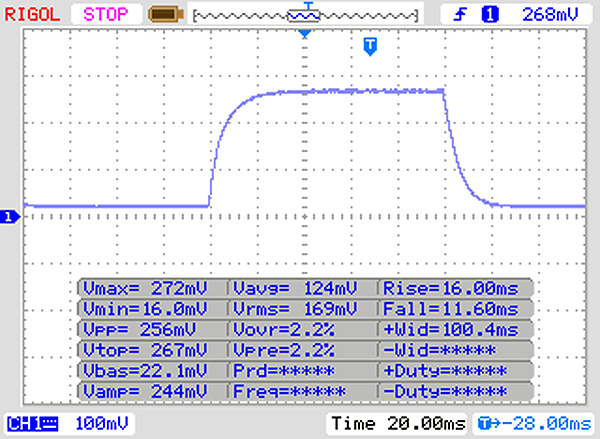 |
| ↘ 11 ms fall | ||
| The screen shows relatively slow response rates in our tests and may be too slow for gamers. In comparison, all tested devices range from 0.1 (minimum) to 240 (maximum) ms. » 67 % of all devices are better. This means that the measured response time is worse than the average of all tested devices (19.9 ms). | ||
| ↔ Response Time 50% Grey to 80% Grey | ||
| 40 ms ... rise ↗ and fall ↘ combined | ↗ 20 ms rise |  |
| ↘ 20 ms fall | ||
| The screen shows slow response rates in our tests and will be unsatisfactory for gamers. In comparison, all tested devices range from 0.165 (minimum) to 636 (maximum) ms. » 61 % of all devices are better. This means that the measured response time is worse than the average of all tested devices (31.1 ms). | ||
Screen Flickering / PWM (Pulse-Width Modulation)
| Screen flickering / PWM not detected |  | ||
In comparison: 52 % of all tested devices do not use PWM to dim the display. If PWM was detected, an average of 7798 (minimum: 5 - maximum: 343500) Hz was measured. | |||
Performance
The FX705DY is powerful enough to handle all modern triple-A games smoothly thanks to its AMD Ryzen 5 3550H APU and AMD Radeon RX 560X GPU. ASUS sells other variants, like the FX705GM and FX705GE that we recently reviewed. These cost considerably more than the 800 Euros (~$900) that the Taiwanese manufacturer charges for the FX705DY though.


Test Conditions
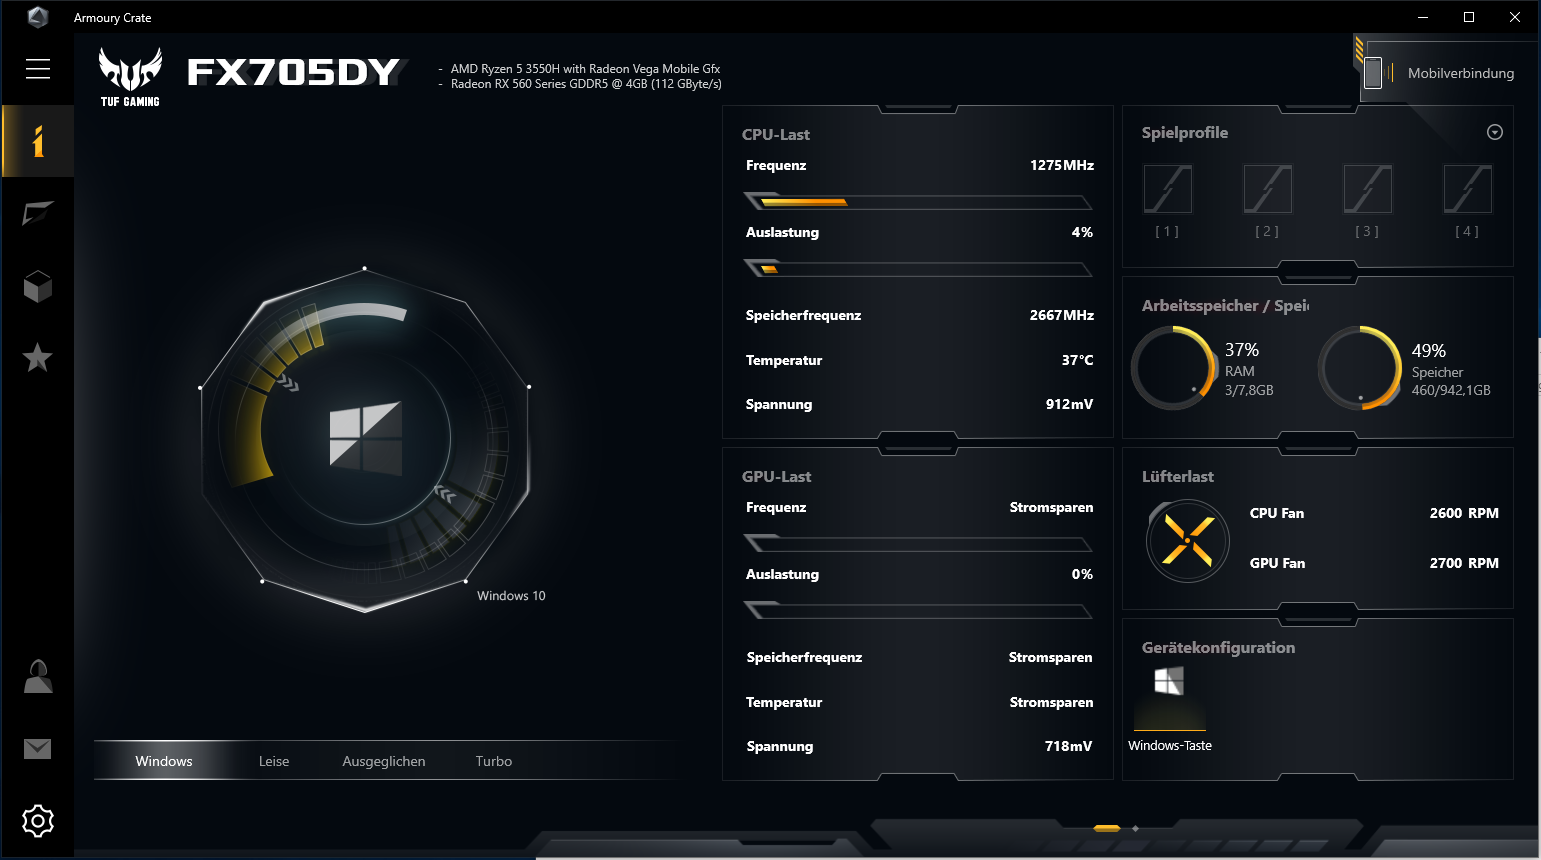
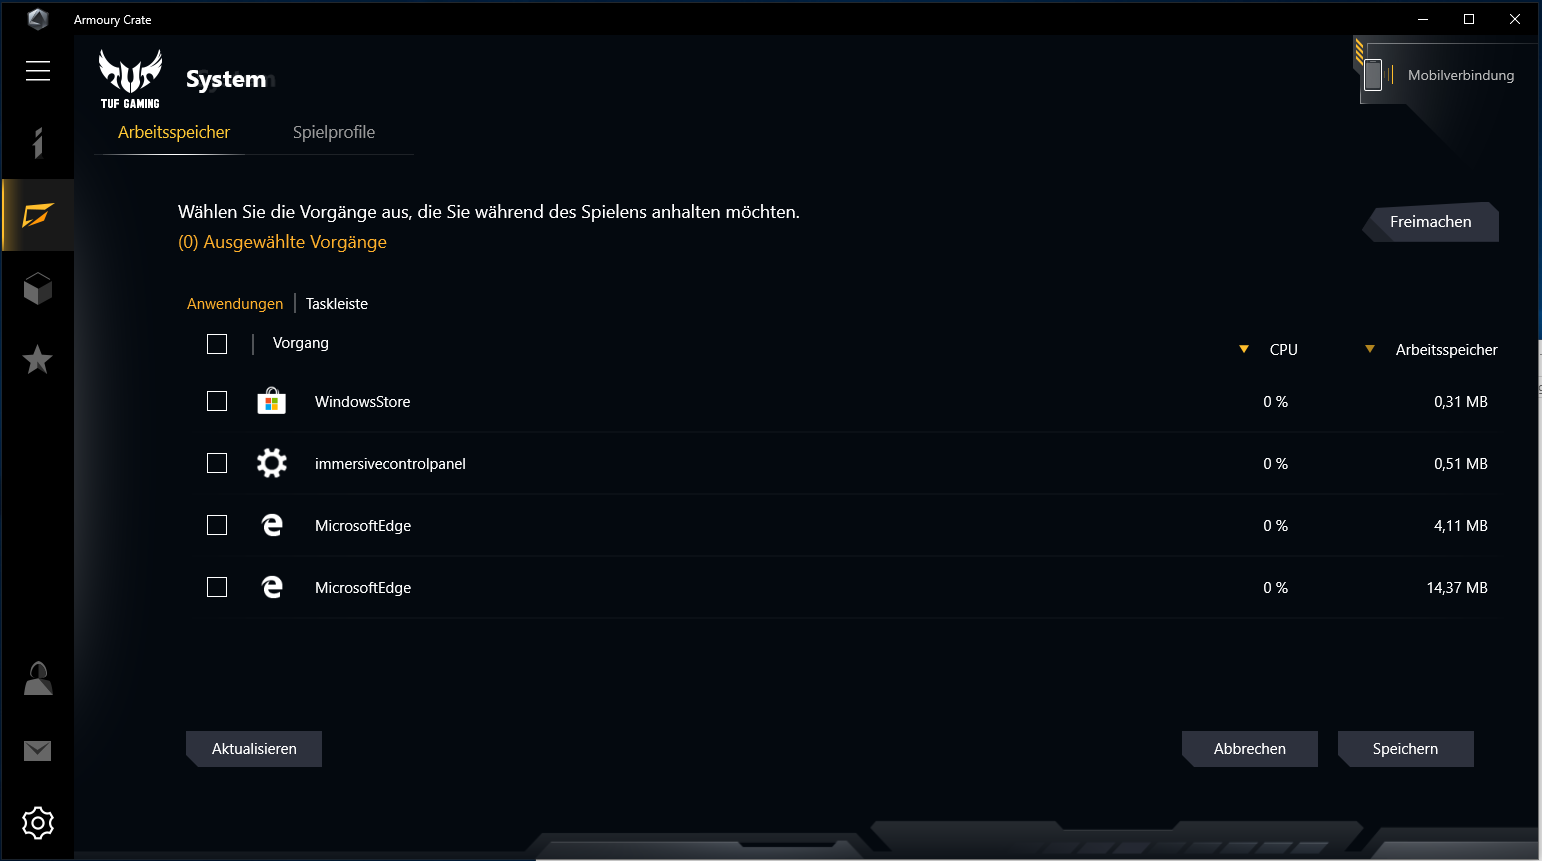
The FX705DY does not come with an OS, so we installed Windows 10 Pro to conduct our tests. We also installed ASUS’ Armory Crate Control Center, which allows you to monitor system performance and adjust fan speeds among other settings. The software also includes three preset power modes that ASUS calls “Quiet", "Balanced", and "Turbo”. There is an option labelled "Windows" too, which cedes control to Windows Power Management. We used the latter in our tests to compare the power of the FX705DY’s components and how it utilises them against our comparison devices without a custom power mode muddying our results.
We also ran some benchmarks with our review unit running in turbo and silent mode to demonstrate what difference they make if any. We have included the results throughout our charts and tables below.
Processor
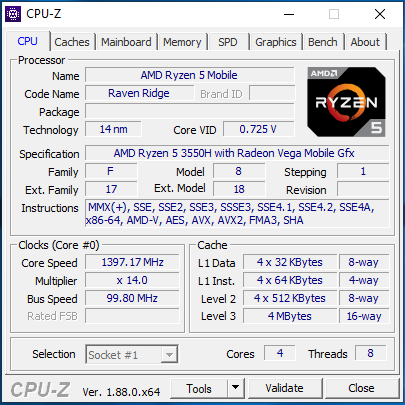
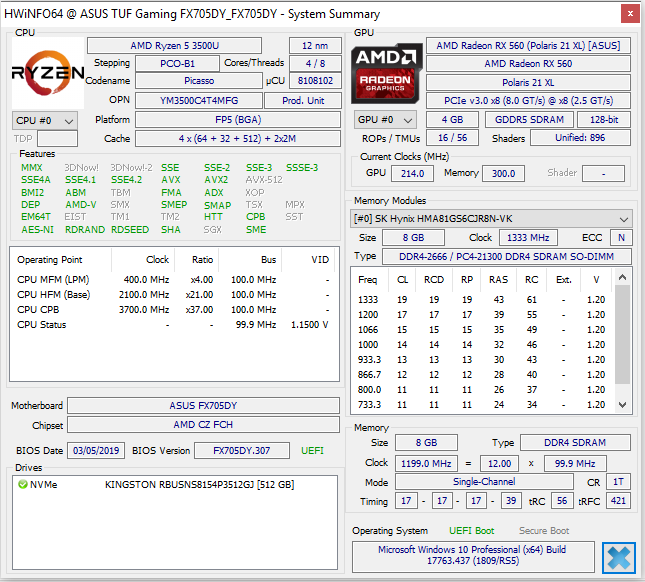
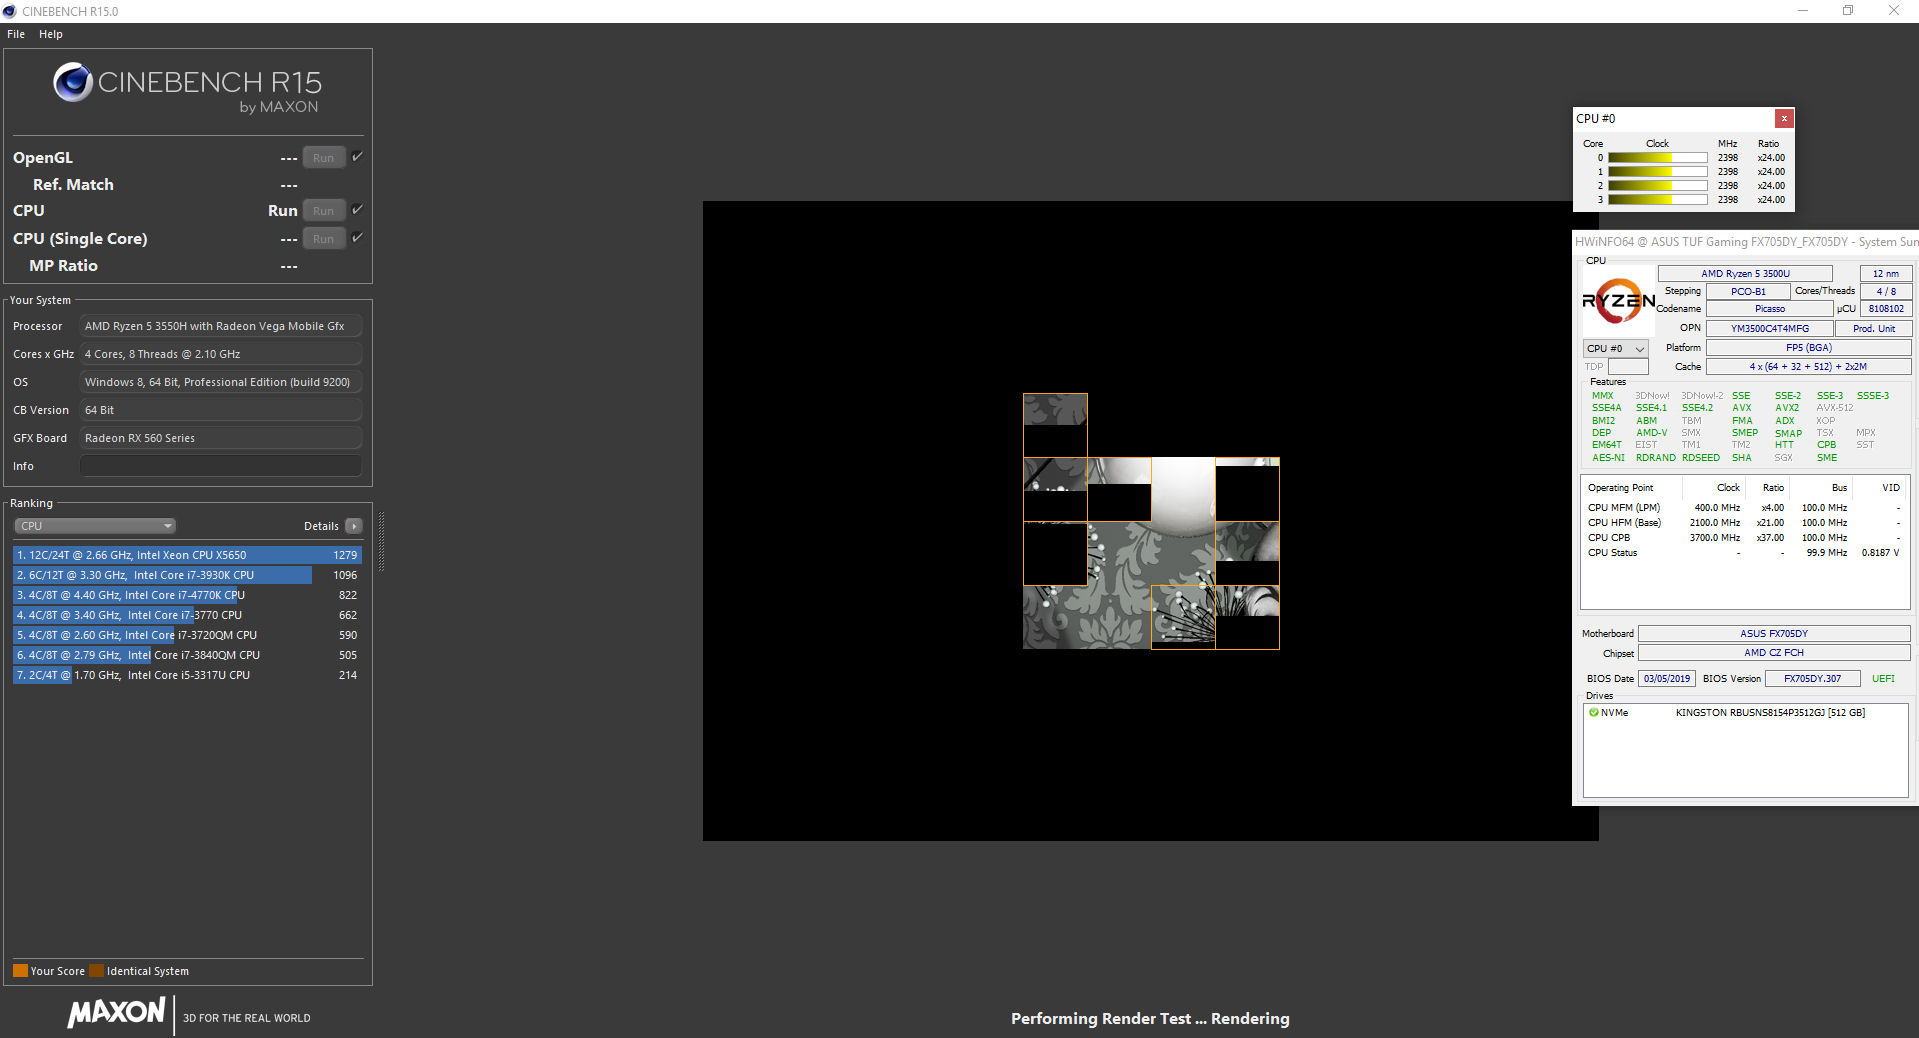
The FX705DY is powered by a Ryzen 5 3550H APU that AMD manufacturers on its Zen+ microarchitecture. The Picasso-generation chip has a 35 W thermal design power (TDP) and a 2.1 GHz base clock speed across its four cores. The APU uses AMD Turbo Core to achieve up to 3.7 GHz on all cores and Simultaneous Multithreading (SMT) to execute up to eight threads, or two on each core.
The Ryzen 5 3550H is AMD's answer to the Intel Core i5-8300H, although the APU cannot quite match the Intel chip on performance. The Core i5-8300H has a 10 W higher TDP, which allows it to achieve markedly better single-core performance while still edging the Ryzen 5 3550H in multi-core applications too.
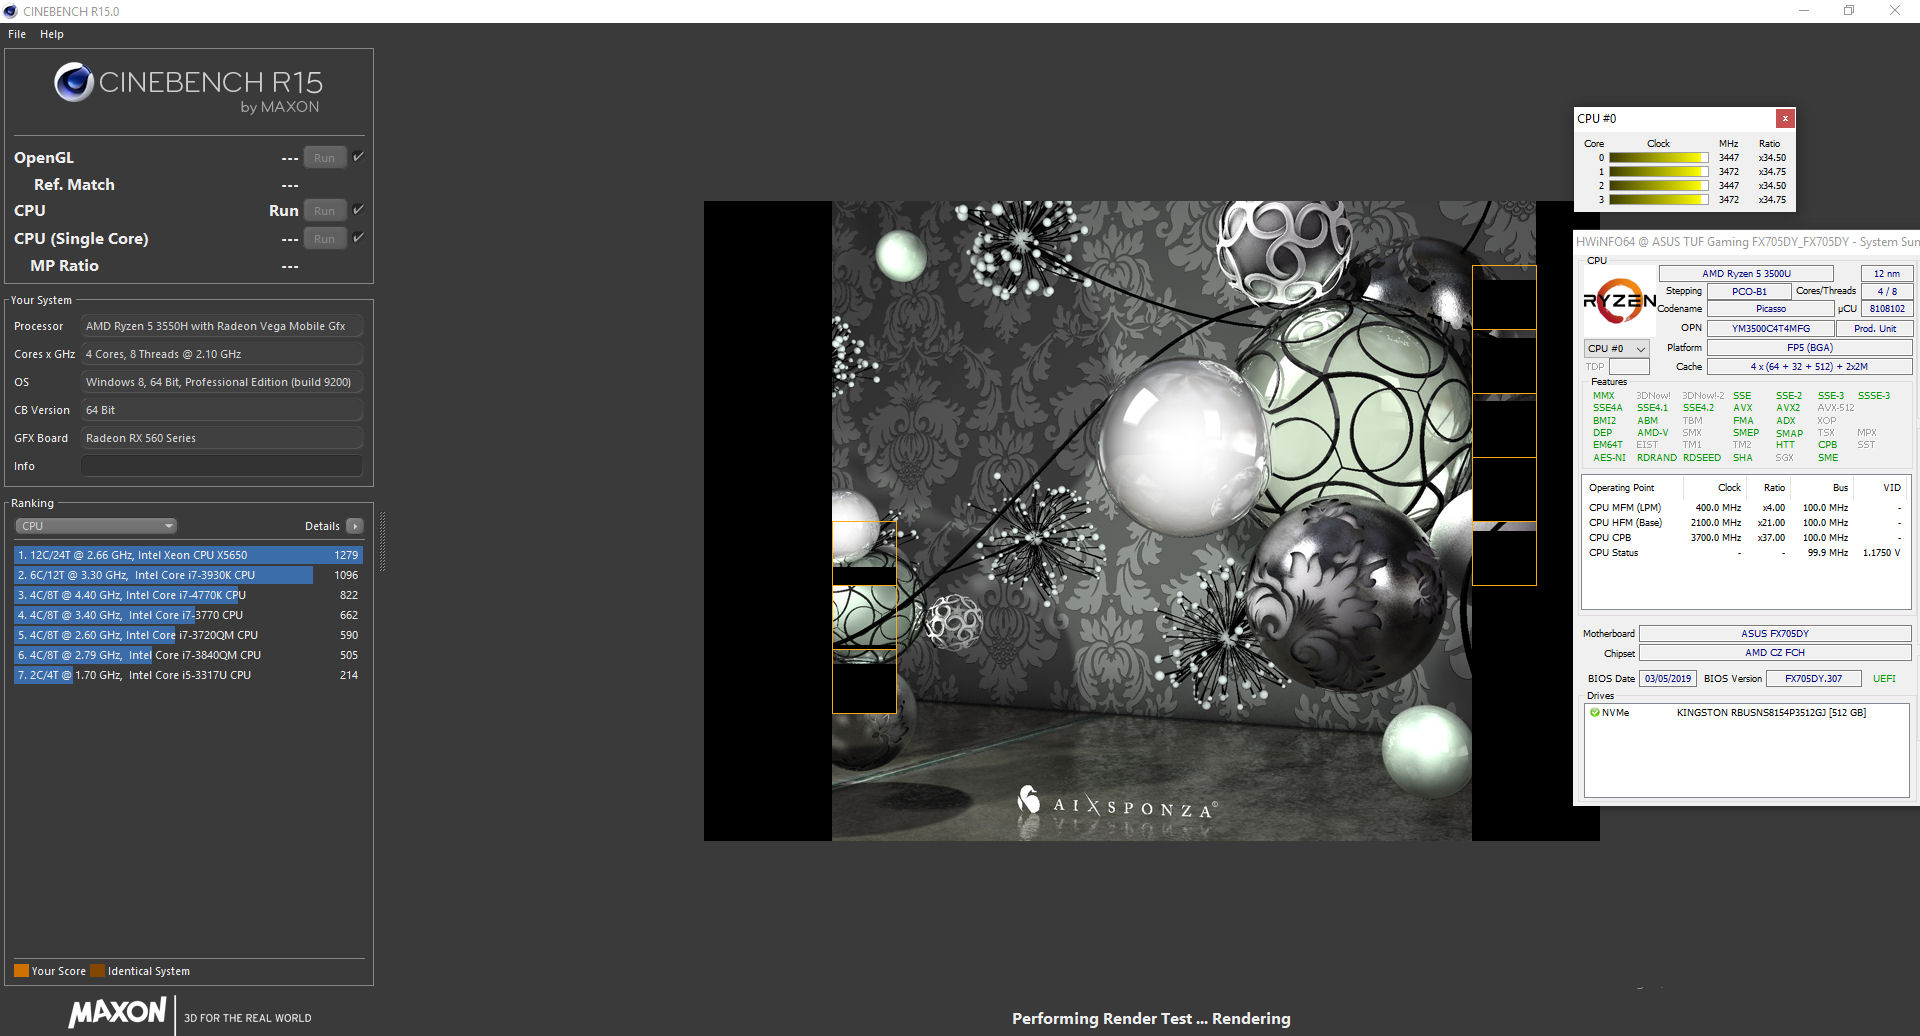
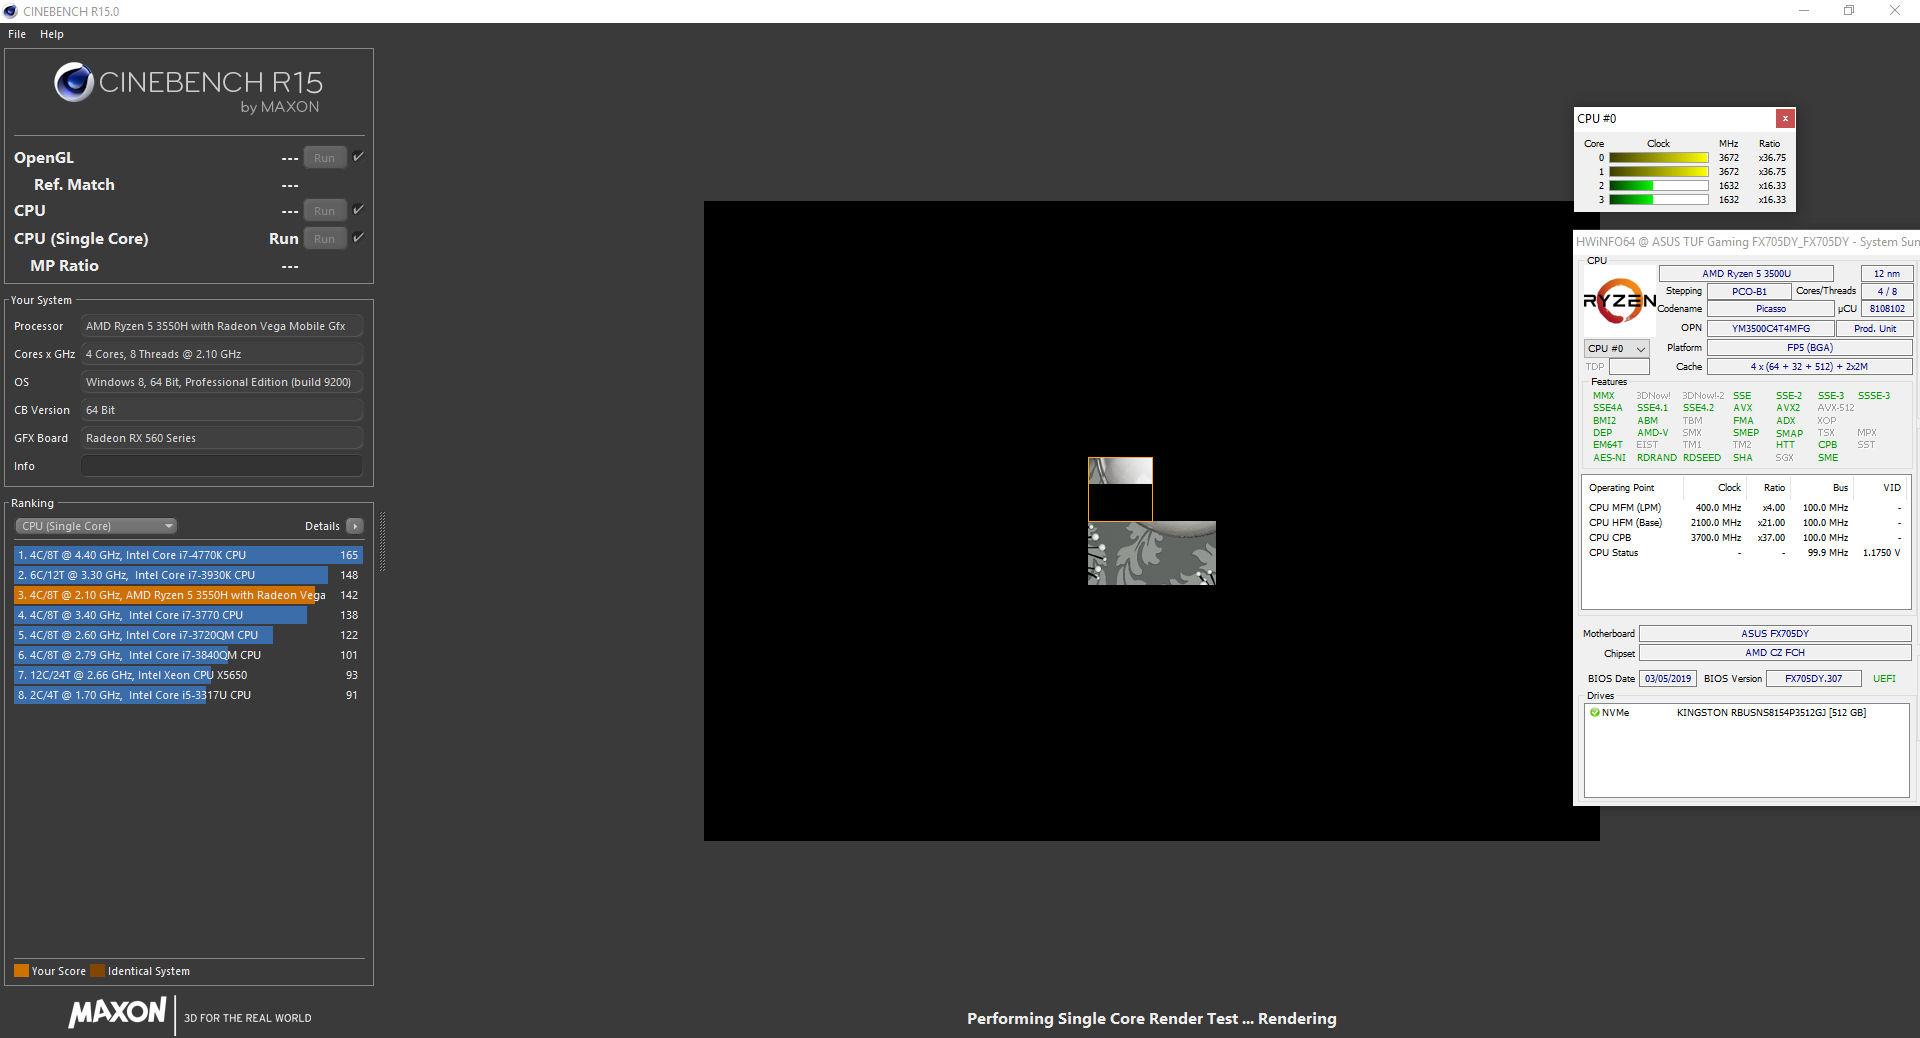
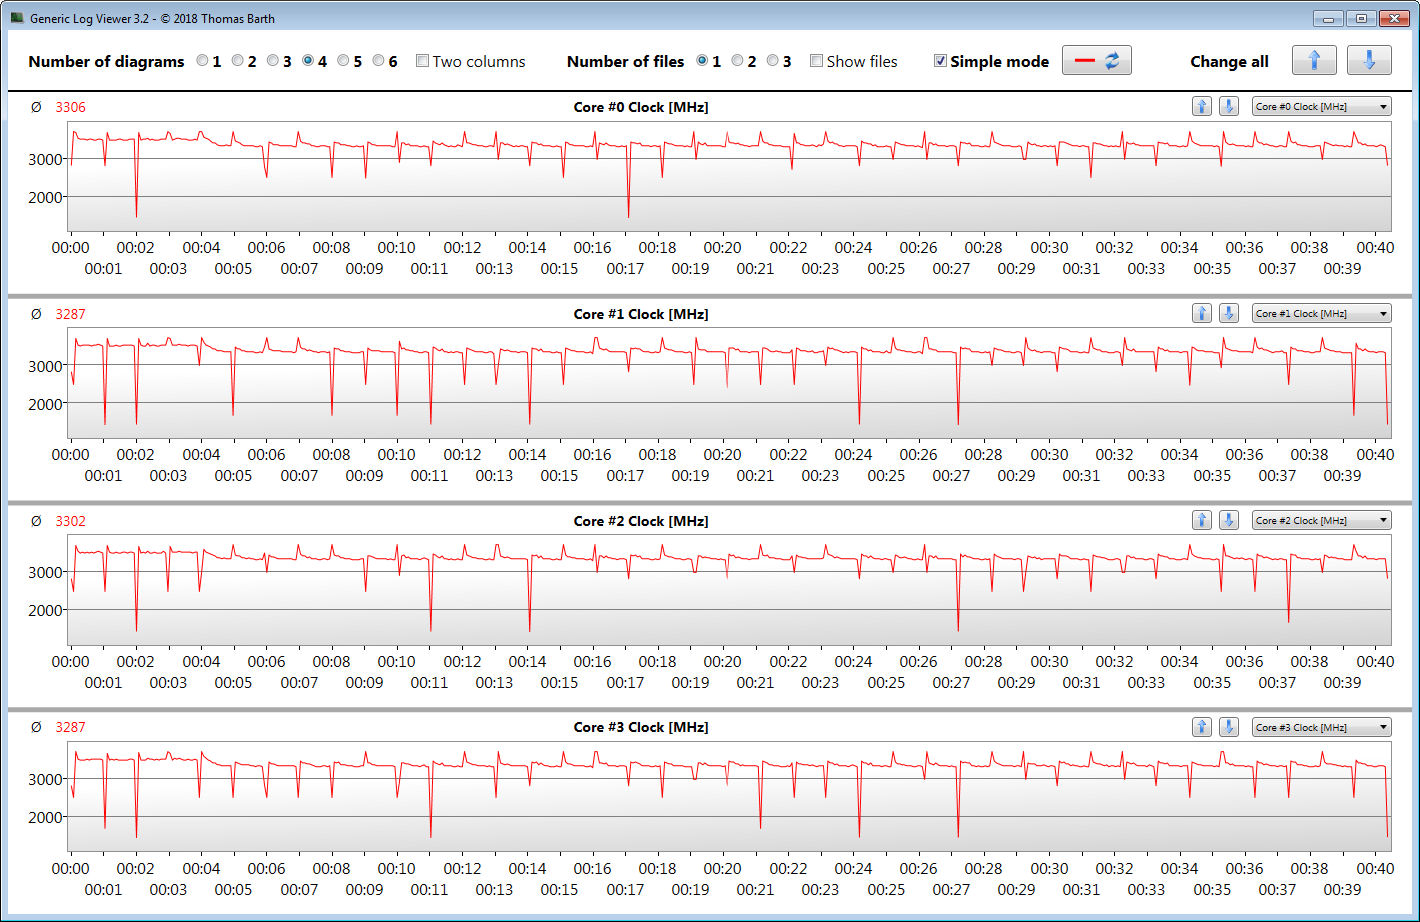
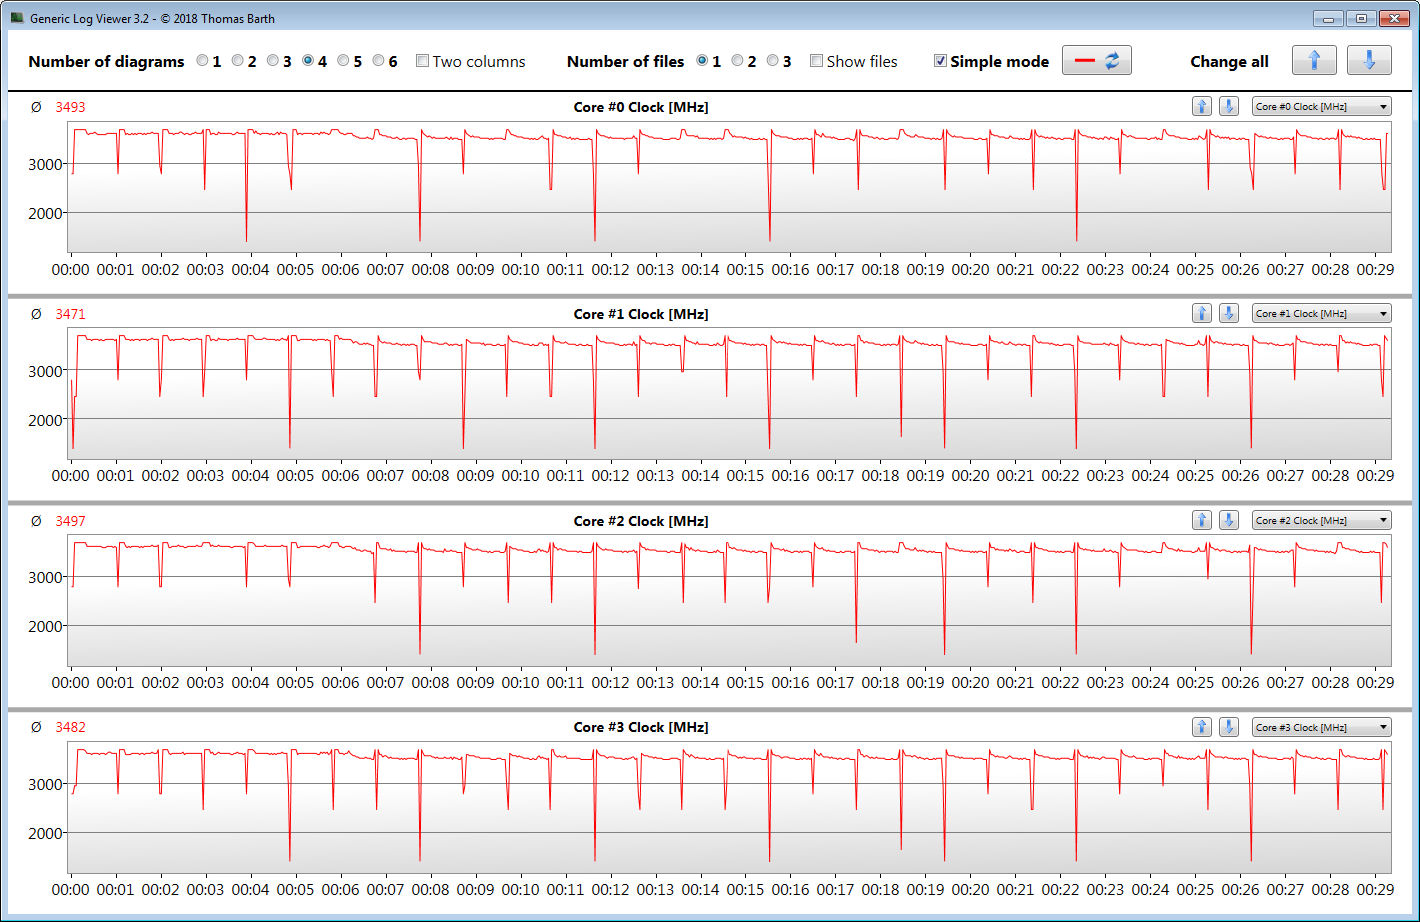
The APU in our review unit initially operates at 3.7 GHz in multithreaded benchmarks like Cinebench R15, but it quickly drops to 3.5 GHz and hovers around there for the remainder of the benchmark. However, the chip fluctuates between 1.6 and 3.7 GHz during single-threaded benchmarks, although it can only manage between 1.4 and 2.4 GHz when running on battery. Likewise, the APU begins multithreaded benchmarks at 2.4 GHz on battery but soon increases to around 3.3 or 3.4 GHz.

We also subjected our review unit to a looped CB R15 Multi 64Bit benchmark that we run for at least 30 minutes. We do this to see how devices manage their performance under prolonged load. The FX705DY scored 742 points in the first benchmarks but dropped to around 735 points for the next four pass-throughs. Scores had decreased to 705 points by the seventh pass, which the system maintained for the remainder of our loop.
Enabling turbo mode boosts performance by around 2% and closes the gap to the Dell G3 17 3779, but the FX705DY still generally scores around 3% less than its Core i5-8300H-powered counterpart. As expected, quiet mode reduces performance and results in around 10% lower CB R15 Multi 64Bit scores.
| Cinebench R15 | |
| CPU Single 64Bit | |
| Average of class Gaming (188.8 - 343, n=111, last 2 years) | |
| Asus TUF FX705GM | |
| Acer Predator Helios 300 PH317-52-51M6 | |
| Lenovo Legion Y730-17ICH, i7-8750H | |
| Asus TUF FX705GE-EW096T | |
| Dell G3 17 3779 | |
| Acer Nitro 5 AN515-52 | |
| Lenovo IdeaPad 330-17IKB 81DM | |
| HP Envy 17-ae143ng | |
| Asus TUF FX705DY-AU072 | |
| Asus TUF FX705DY-AU072 (Turbo-Modus) | |
| Average AMD Ryzen 5 3550H (77 - 146, n=11) | |
| HP 17-ca0013ng | |
| Asus TUF FX705DY-AU072 (Leise-Modus) | |
| CPU Multi 64Bit | |
| Average of class Gaming (1578 - 6271, n=111, last 2 years) | |
| Lenovo Legion Y730-17ICH, i7-8750H | |
| Asus TUF FX705GM | |
| Asus TUF FX705GE-EW096T | |
| Acer Predator Helios 300 PH317-52-51M6 | |
| Acer Nitro 5 AN515-52 | |
| Dell G3 17 3779 | |
| Asus TUF FX705DY-AU072 (Turbo-Modus) | |
| Asus TUF FX705DY-AU072 | |
| Average AMD Ryzen 5 3550H (635 - 769, n=11) | |
| Asus TUF FX705DY-AU072 (Leise-Modus) | |
| HP Envy 17-ae143ng | |
| HP 17-ca0013ng | |
| Lenovo IdeaPad 330-17IKB 81DM | |
| Cinebench R20 | |
| CPU (Single Core) | |
| Average of class Gaming (442 - 895, n=111, last 2 years) | |
| Asus TUF FX705DY-AU072 | |
| Average AMD Ryzen 5 3550H (331 - 370, n=8) | |
| CPU (Multi Core) | |
| Average of class Gaming (4029 - 16108, n=111, last 2 years) | |
| Asus TUF FX705DY-AU072 | |
| Average AMD Ryzen 5 3550H (1421 - 1728, n=8) | |
| Geekbench 3 | |
| 32 Bit Multi-Core Score | |
| Asus TUF FX705GE-EW096T | |
| Acer Nitro 5 AN515-52 | |
| Asus TUF FX705DY-AU072 | |
| Average AMD Ryzen 5 3550H (13474 - 15114, n=3) | |
| HP Envy 17-ae143ng | |
| 32 Bit Single-Core Score | |
| Acer Nitro 5 AN515-52 | |
| Asus TUF FX705GE-EW096T | |
| HP Envy 17-ae143ng | |
| Average AMD Ryzen 5 3550H (3348 - 3558, n=3) | |
| Asus TUF FX705DY-AU072 | |
| Geekbench 4.4 | |
| 64 Bit Multi-Core Score | |
| Average of class Gaming (89200 - 97490, n=2, last 2 years) | |
| Asus TUF FX705GE-EW096T | |
| Acer Nitro 5 AN515-52 | |
| HP Envy 17-ae143ng | |
| Average AMD Ryzen 5 3550H (11183 - 13441, n=7) | |
| Asus TUF FX705DY-AU072 | |
| 64 Bit Single-Core Score | |
| Average of class Gaming (9335 - 9492, n=2, last 2 years) | |
| Acer Nitro 5 AN515-52 | |
| Asus TUF FX705GE-EW096T | |
| HP Envy 17-ae143ng | |
| Average AMD Ryzen 5 3550H (3623 - 3938, n=7) | |
| Asus TUF FX705DY-AU072 | |
| Mozilla Kraken 1.1 - Total | |
| Asus TUF FX705DY-AU072 (Edge 44) | |
| Dell G3 17 3779 (Edge 42.17134.1.0) | |
| Average AMD Ryzen 5 3550H (1042 - 1229, n=8) | |
| Average of class Gaming (391 - 590, n=105, last 2 years) | |
| Octane V2 - Total Score | |
| Average of class Gaming (87588 - 139447, n=30, last 2 years) | |
| Dell G3 17 3779 (Edge 42.17134.1.0) | |
| Asus TUF FX705DY-AU072 (Edge 44) | |
| Average AMD Ryzen 5 3550H (28324 - 29361, n=4) | |
| WebXPRT 3 - Overall | |
| Average of class Gaming (242 - 532, n=100, last 2 years) | |
| Asus TUF FX705DY-AU072 (Edge 44) | |
| Average AMD Ryzen 5 3550H (151.3 - 174, n=5) | |
| Speedometer 2.0 - Result 2.0 | |
| Average of class Gaming (29 - 686, n=29, last 2 years) | |
| Asus TUF FX705DY-AU072 (Edge 44) | |
| Average AMD Ryzen 5 3550H (42.1 - 43.5, n=2) | |
* ... smaller is better
System Performance
The FX705DY scored well in PCMark benchmarks, but it falls short of most of our comparison devices here. Regardless, our review unit worked smoothly throughout our tests, and we encountered no problems like crashes or stutters while multitasking.
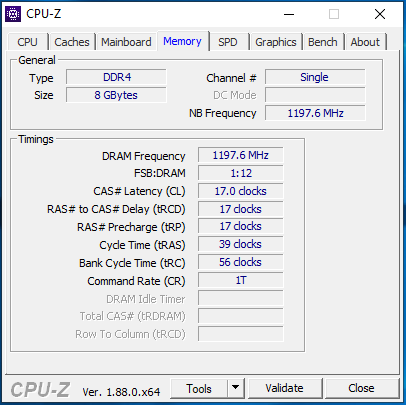
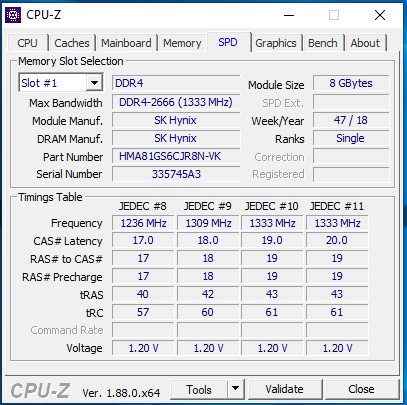
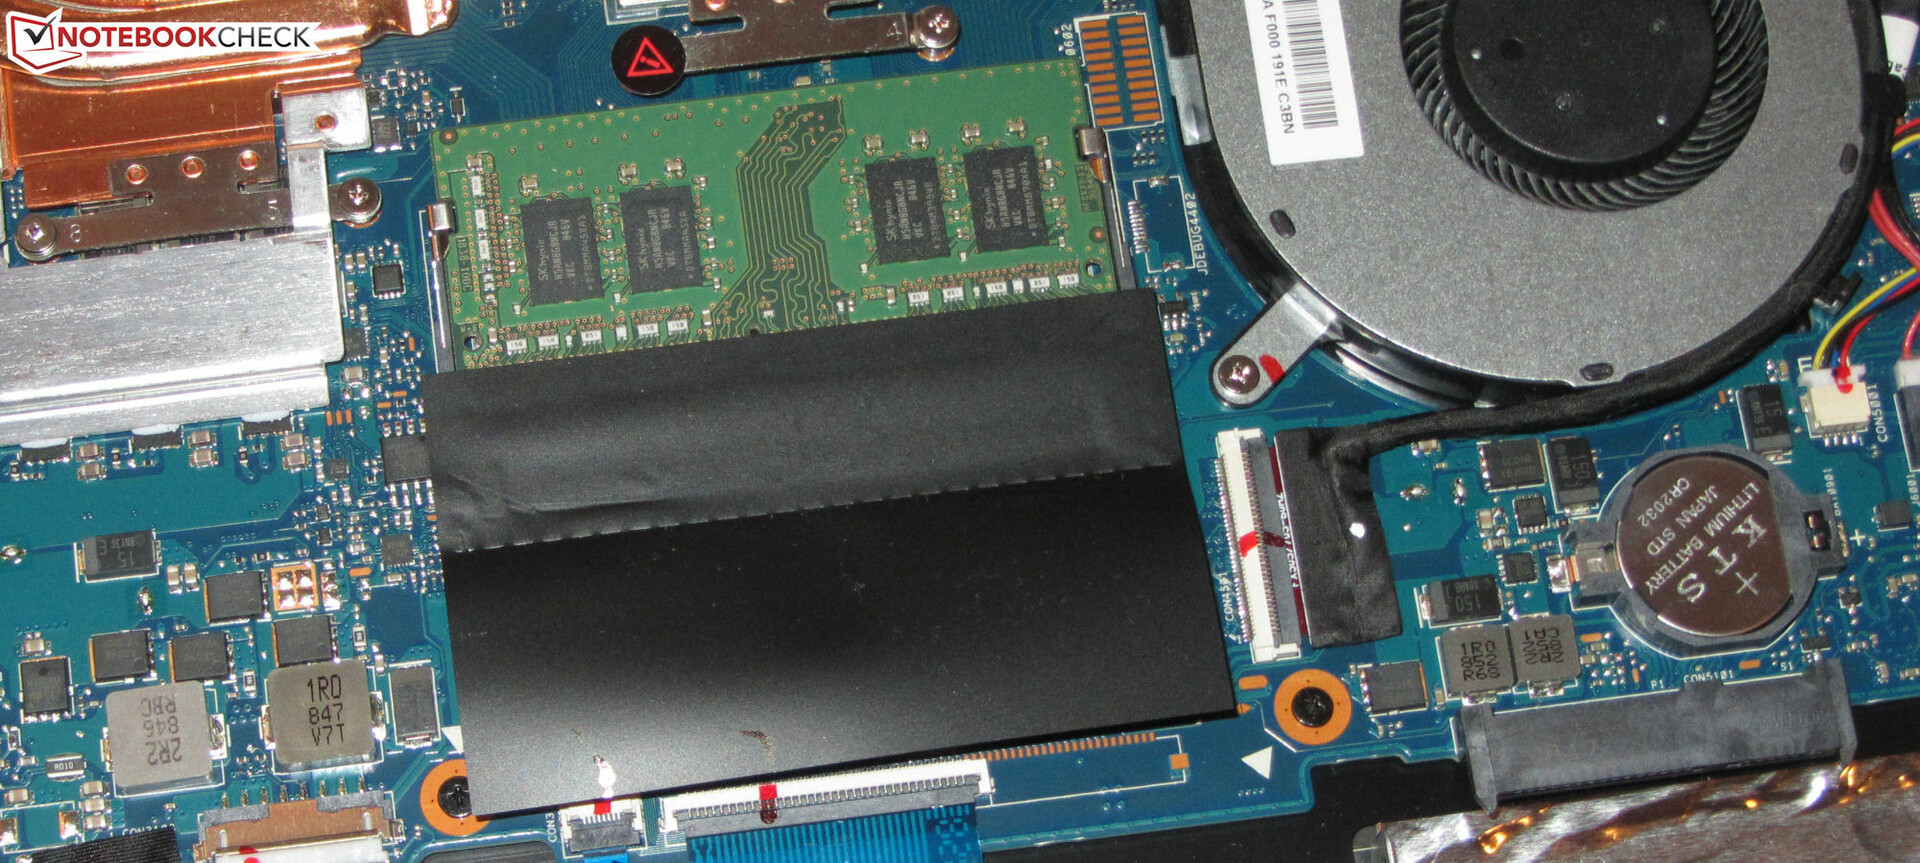
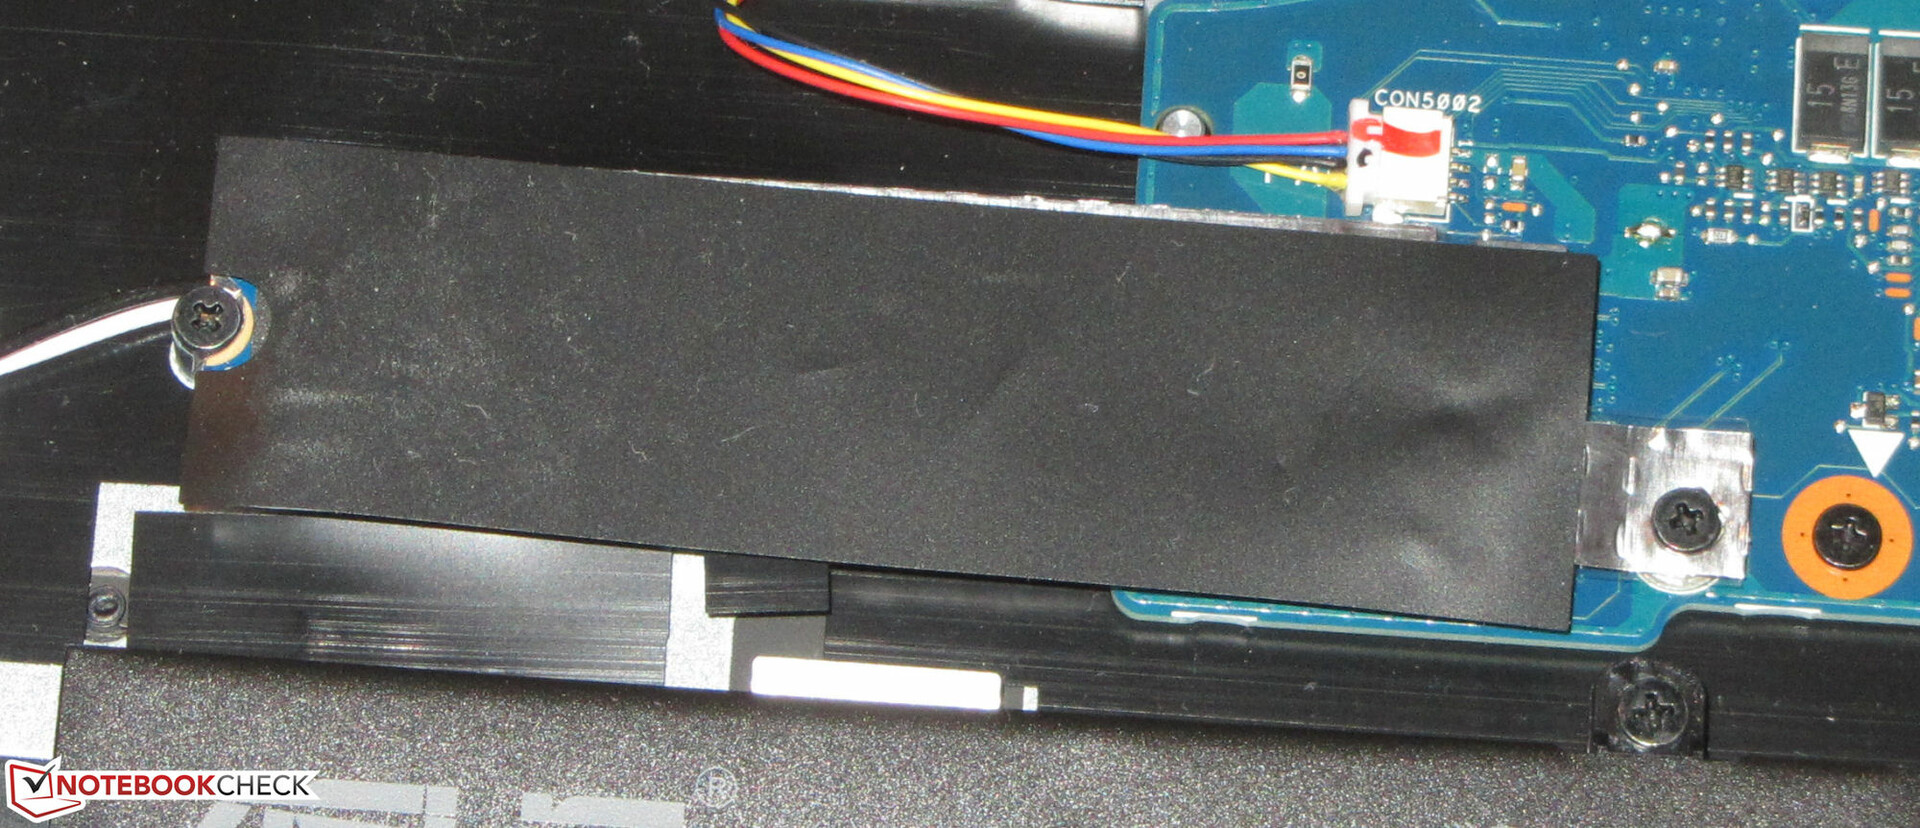
It would be possible to improve though by adding a second RAM module, which would enable dual-channel mode. Our review unit runs in single channel mode out of the box, which prevents the system from getting the most out of its GPU.
| PCMark 7 Score | 7154 points | |
| PCMark 8 Home Score Accelerated v2 | 4041 points | |
| PCMark 8 Creative Score Accelerated v2 | 4142 points | |
| PCMark 8 Work Score Accelerated v2 | 4877 points | |
| PCMark 10 Score | 4237 points | |
Help | ||
Storage Devices
ASUS equips the FX705DY with a 512 GB Kingston NVMe SSD. The drive in our review unit delivers decent transfer speeds as demonstrated in our CrystalDiskMark comparison table below. The SSD has better transfer speeds than all the drives in our comparison devices apart from the one in the FX705GM, although it is not one of the fastest SSDs currently on the market. The Samsung 970 EVO Plus is significantly faster, for example. However, NVMe SSDs have much higher transfer speeds than their SATA III counterparts, which are limited to around 600 MB/s, so the Kingston has that going for it too.
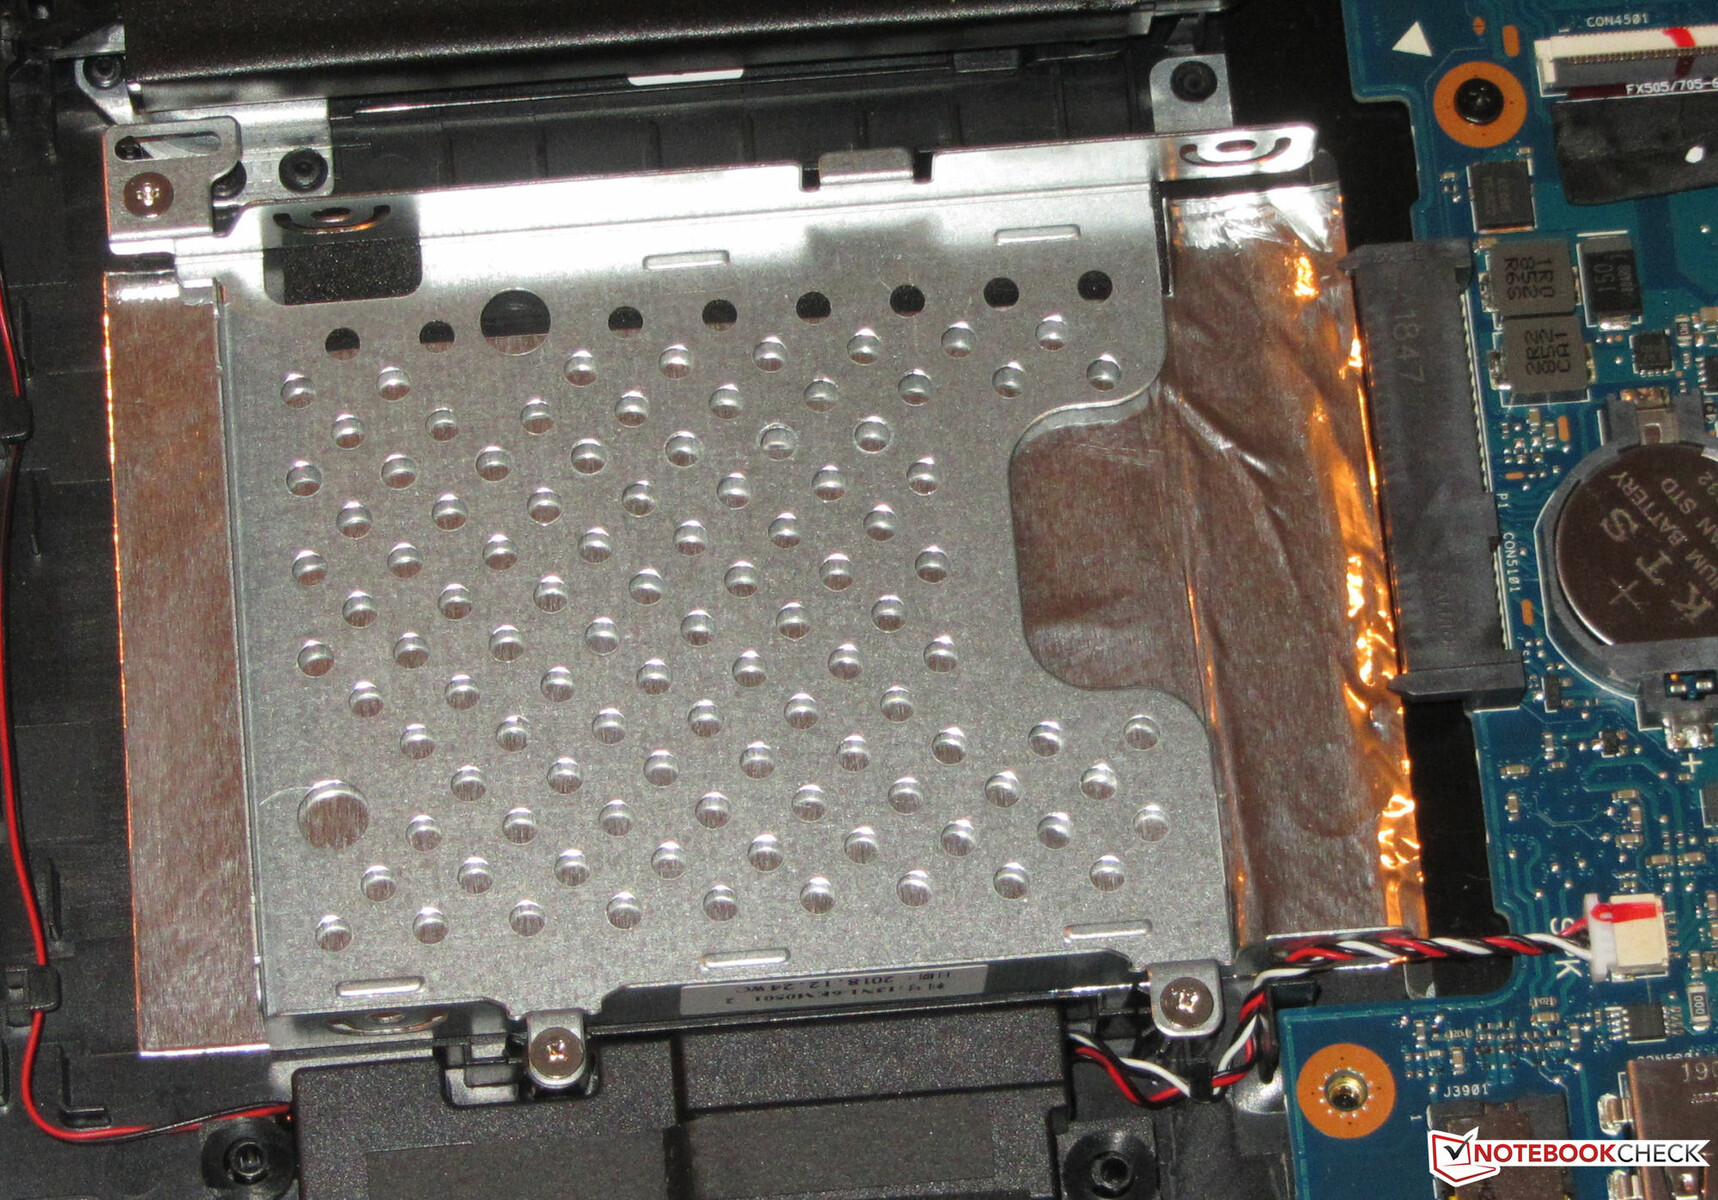
The FX705DY also has space to be retrofitted with a 2.5-inch HDD. ASUS includes the appropriate drive mount and screws in the box should you wish to add additional storage.

| Asus TUF FX705DY-AU072 Kingston RBUSNS8154P3512GJ | Asus TUF FX705GE-EW096T SK hynix BC501 HFM128GDJTNG-831 | Dell G3 17 3779 SK hynix SC311 SATA | Lenovo Legion Y730-17ICH, i7-8750H Toshiba KBG30ZMT128G | Acer Predator Helios 300 PH317-52-51M6 Hynix HFS128G39TND | Asus TUF FX705GM WDC PC SN520 SDAPNUW-256G | Average Kingston RBUSNS8154P3512GJ | |
|---|---|---|---|---|---|---|---|
| CrystalDiskMark 5.2 / 6 | -29% | -56% | -51% | -60% | 9% | -5% | |
| Write 4K (MB/s) | 107.7 | 90.3 -16% | 62.8 -42% | 71.4 -34% | 61.9 -43% | 104.2 -3% | 87.8 ? -18% |
| Read 4K (MB/s) | 36.5 | 37.03 1% | 24.63 -33% | 29.98 -18% | 22.78 -38% | 41.46 14% | 33.7 ? -8% |
| Write Seq (MB/s) | 988 | 320.3 -68% | 203.9 -79% | 129.6 -87% | 136.1 -86% | 1295 31% | 878 ? -11% |
| Read Seq (MB/s) | 1115 | 1012 -9% | 550 -51% | 843 -24% | 490.1 -56% | 1325 19% | 949 ? -15% |
| Write 4K Q32T1 (MB/s) | 334.9 | 196.8 -41% | 160.1 -52% | 88.9 -73% | 136.2 -59% | 282.8 -16% | 355 ? 6% |
| Read 4K Q32T1 (MB/s) | 360.8 | 271.5 -25% | 184.3 -49% | 196.4 -46% | 208.4 -42% | 321.3 -11% | 402 ? 11% |
| Write Seq Q32T1 (MB/s) | 1008 | 268.8 -73% | 235 -77% | 130.5 -87% | 136 -87% | 1301 29% | 977 ? -3% |
| Read Seq Q32T1 (MB/s) | 1609 | 1595 -1% | 554 -66% | 1037 -36% | 553 -66% | 1704 6% | 1597 ? -1% |
Graphics Card
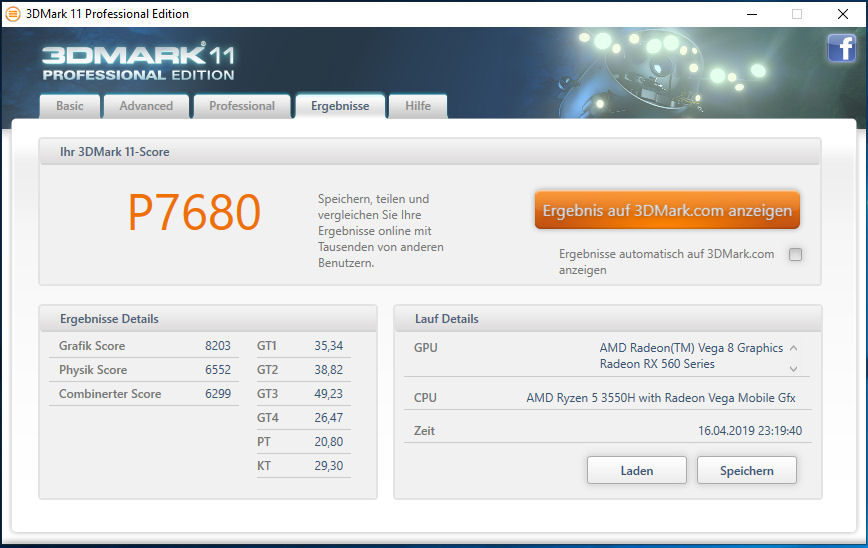
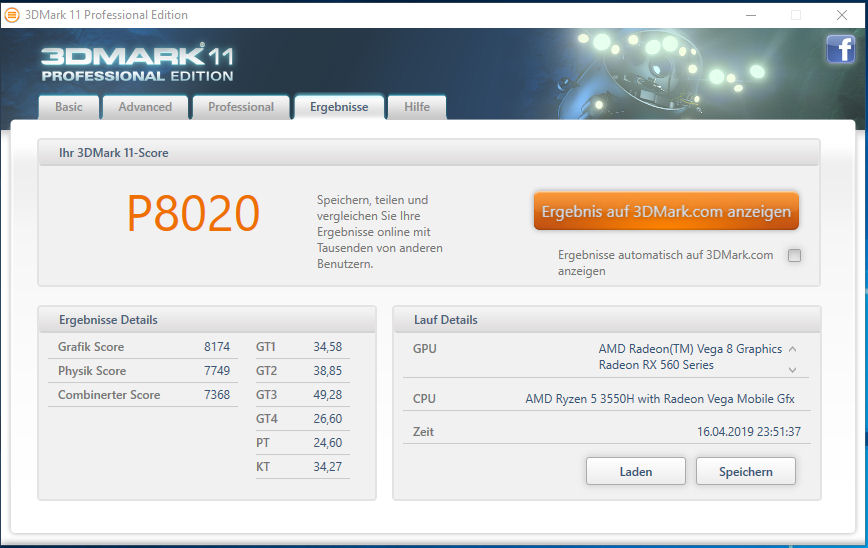
The Radeon RX 560X GPU is based on AMD’s Polaris generation and supports DirectX 12. The chip can operate at up 1,223 MHz, which AMD complements with 4 GB of GDDR5 VRAM. Our review unit performed as expected for an RX 560X-powered device, which puts its graphics performance between laptops equipped with either an Nvidia GeForce GTX 1050 or a GeForce GTX 1050 Ti.
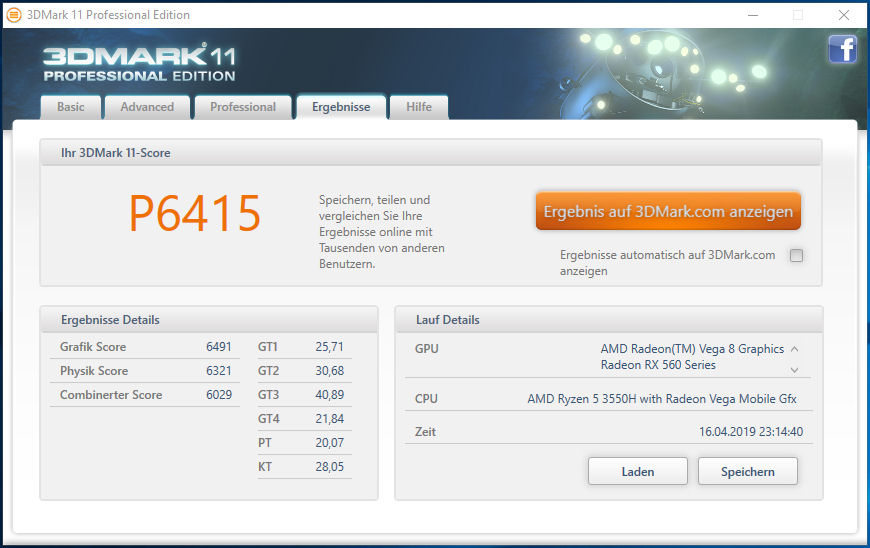
Interestingly, activating turbo mode did not improve 3DMark results. Quiet mode does reduce performance slightly though but not by the same degree as it affects CPU performance. Incidentally, adding a second RAM module improves the physics performance in synthetic benchmarks, although not by much.
| 3DMark 06 Standard Score | 25527 points | |
| 3DMark 11 Performance | 7725 points | |
| 3DMark Ice Storm Standard Score | 60240 points | |
| 3DMark Cloud Gate Standard Score | 10106 points | |
| 3DMark Fire Strike Score | 5513 points | |
| 3DMark Time Spy Score | 1909 points | |
Help | ||
Gaming Performance
The FX705DY is a competent gaming laptop. Our review unit can play most modern games in 1080p at medium to high graphics settings, although we would recommend turning the graphics down to low or reducing the resolution in some triple-A titles like Metro Exodus. The GPU is also not powerful enough to play games smoothly at higher than 1080p on an external monitor.
| low | med. | high | ultra | |
|---|---|---|---|---|
| StarCraft 2 (2010) | 256.3 | 116.3 | 113.6 | 81.6 |
| Diablo III (2012) | 150.2 | 133.5 | 130.8 | 105.7 |
| Counter-Strike: GO (2012) | 209.3 | 188.2 | 162 | 121.7 |
| BioShock Infinite (2013) | 188 | 158.2 | 140.9 | 53 |
| Sims 4 (2014) | 145.4 | 114.8 | 73.2 | 64.8 |
| GTA V (2015) | 89.3 | 83 | 48.3 | 21.2 |
| The Witcher 3 (2015) | 105.5 | 67.6 | 35.9 | 21.7 |
| Batman: Arkham Knight (2015) | 90 | 84 | 47 | |
| Dota 2 Reborn (2015) | 80 | 73.1 | 65.6 | 60.7 |
| World of Warships (2015) | 125.7 | 105.9 | 83.6 | 71.4 |
| Ashes of the Singularity (2016) | 44.5 | 31.7 | 24.2 | |
| Mafia 3 (2016) | 44.9 | 34.4 | 22.7 | |
| Civilization 6 (2016) | 107.6 | 76.4 | 39.3 | 33.9 |
| Warhammer 40.000: Dawn of War III (2017) | 90.8 | 50 | 45 | 39.4 |
| Team Fortress 2 (2017) | 95.3 | 93.8 | 84.1 | 80.5 |
| Ark Survival Evolved (2017) | 64.3 | 18.9 | 14 | 9.7 |
| Destiny 2 (2017) | 77.8 | 50.8 | 46.7 | 37.3 |
| X-Plane 11.11 (2018) | 37 | 30 | 26.6 | |
| Far Cry 5 (2018) | 63 | 39 | 36 | 33 |
| Call of Duty Black Ops 4 (2018) | 89.3 | 48.4 | 45.2 | 37.3 |
| Battlefield V (2018) | 81.2 | 53.9 | 45.8 | 41.9 |
| Darksiders III (2018) | 96.8 | 40.3 | 31.8 | 27.6 |
| Just Cause 4 (2018) | 65.8 | 41.8 | 29.6 | 26.8 |
| Apex Legends (2019) | 106.8 | 45.4 | 37.5 | 34.9 |
| Far Cry New Dawn (2019) | 56 | 39 | 36 | 33 |
| Metro Exodus (2019) | 55.1 | 27.8 | 18.3 | 15.3 |
| Anthem (2019) | 47.2 | 36.6 | 33.1 | 30.2 |
| Dirt Rally 2.0 (2019) | 151.9 | 65.7 | 53.1 | 28.3 |
| The Division 2 (2019) | 69 | 42 | 31 | 23 |
| BioShock Infinite - 1920x1080 Ultra Preset, DX11 (DDOF) | |
| Lenovo Legion Y730-17ICH, i7-8750H | |
| Asus TUF FX705GE-EW096T | |
| Dell G3 17 3779 | |
| Asus TUF FX505DY | |
| Average AMD Radeon RX 560X (Laptop) (53 - 53.1, n=2) | |
| Asus TUF FX705DY-AU072 | |
| HP Envy 17-ae143ng | |
| HP 17-ca0013ng | |
| The Witcher 3 - 1366x768 Medium Graphics & Postprocessing | |
| Average of class Gaming (295 - 517, n=3, last 2 years) | |
| Lenovo Legion Y730-17ICH, i7-8750H | |
| Asus TUF FX705GE-EW096T | |
| Dell G3 17 3779 | |
| Asus TUF FX505DY | |
| Average AMD Radeon RX 560X (Laptop) (67.6 - 70.3, n=3) | |
| Asus TUF FX705DY-AU072 | |
| Lenovo IdeaPad 330-17IKB 81DM | |
| Far Cry 5 - 1920x1080 Medium Preset AA:T | |
| Average of class Gaming (84 - 173, n=10, last 2 years) | |
| Asus TUF FX705GE-EW096T | |
| Dell G3 17 3779 | |
| Asus TUF FX705DY-AU072 | |
| Average AMD Radeon RX 560X (Laptop) (38 - 39, n=2) | |
| Darksiders III - 1920x1080 Medium | |
| Asus TUF FX705GE-EW096T | |
| Asus TUF FX705DY-AU072 | |
| Average AMD Radeon RX 560X (Laptop) (n=1) | |
| Diablo III - 1920x1080 High AA:on | |
| Asus TUF FX705GE-EW096T | |
| Asus TUF FX705DY-AU072 | |
| Average AMD Radeon RX 560X (Laptop) (n=1) | |
| HP Envy 17-ae143ng | |
| StarCraft 2 - 1920x1080 ultra | |
| Asus TUF FX705GE-EW096T | |
| Asus TUF FX705DY-AU072 | |
| Average AMD Radeon RX 560X (Laptop) (n=1) | |
| HP Envy 17-ae143ng | |
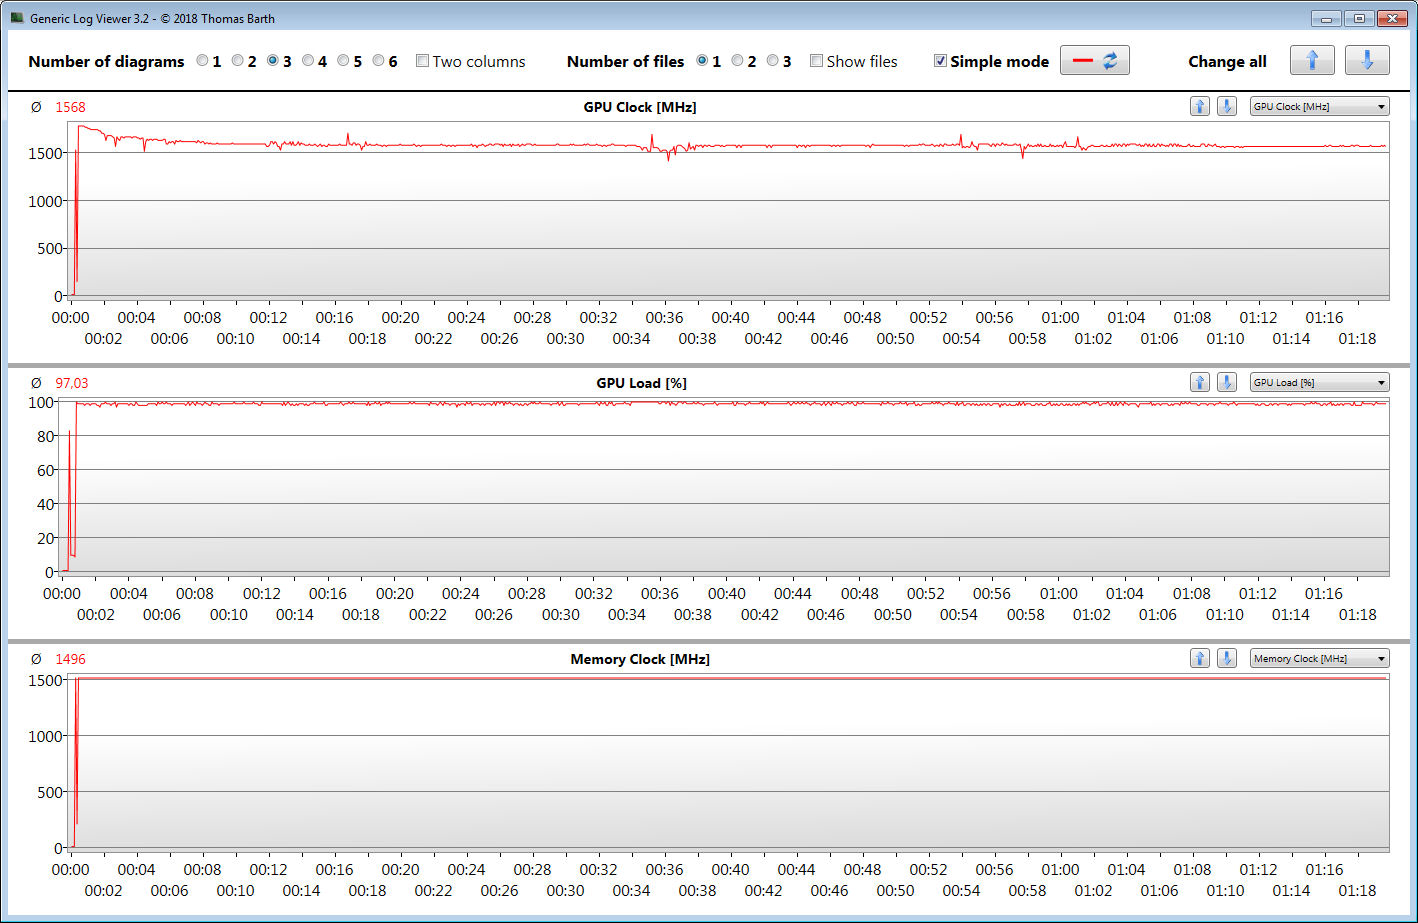
We also subjected our review unit to an hour-long run-through of The Witcher 3 that we set to 1080p and maximum graphics. We do not move the game's main character, Geralt of Rivia, during this test, for reference.
The FX705DY maintained between 20 FPS and 24 FPS throughout this test, so the device should not throttle during prolonged gaming sessions. We would not recommend playing at these frame rates though.
Emissions
Fan Noise
The fans in our review unit run constantly even at idle with Windows managing fan speeds. The resulting background noise is bearable but may become irritating in a quiet room.
Predictably, the fans get louder under sustained load and reached a maximum of 45 dB(A) during our tests. Typically, the fans tend to operate at around 38.7 dB(A) while gaming, but they will get louder and spin up more aggressively with turbo mode activated.
Correspondingly, enabling quiet mode noticeably reduces fan noise. This does come at a cost to CPU performance though.
Noise level
| Idle |
| 32.5 / 32.6 / 33.3 dB(A) |
| Load |
| 38.7 / 45 dB(A) |
 | ||
30 dB silent 40 dB(A) audible 50 dB(A) loud |
||
min: | ||
| Asus TUF FX705DY-AU072 R5 3550H, Radeon RX 560X (Laptop) | Dell G3 17 3779 i5-8300H, GeForce GTX 1050 Mobile | Asus TUF FX705GE-EW096T i7-8750H, GeForce GTX 1050 Ti Mobile | Lenovo Legion Y730-17ICH, i7-8750H i7-8750H, GeForce GTX 1050 Ti Mobile | Acer Predator Helios 300 PH317-52-51M6 i5-8300H, GeForce GTX 1050 Ti Mobile | Asus TUF FX705GM i7-8750H, GeForce GTX 1060 Mobile | Average AMD Radeon RX 560X (Laptop) | Average of class Gaming | |
|---|---|---|---|---|---|---|---|---|
| Noise | 3% | -2% | 9% | -1% | -9% | 3% | 6% | |
| off / environment * (dB) | 30.7 | 30.5 1% | 30.5 1% | 28 9% | 29 6% | 29 6% | 29.3 ? 5% | 24.1 ? 21% |
| Idle Minimum * (dB) | 32.5 | 30.5 6% | 31.2 4% | 28 14% | 29 11% | 32 2% | 29.9 ? 8% | 25.8 ? 21% |
| Idle Average * (dB) | 32.6 | 31.1 5% | 32.4 1% | 28 14% | 31 5% | 33 -1% | 30.6 ? 6% | 27.4 ? 16% |
| Idle Maximum * (dB) | 33.3 | 32.1 4% | 32.8 2% | 31.3 6% | 33 1% | 44 -32% | 31.2 ? 6% | 30 ? 10% |
| Load Average * (dB) | 38.7 | 43.4 -12% | 43 -11% | 33.4 14% | 45 -16% | 46 -19% | 39.5 ? -2% | 43 ? -11% |
| Load Maximum * (dB) | 45 | 39.2 13% | 48.1 -7% | 46.2 -3% | 51 -13% | 50 -11% | 47.2 ? -5% | 54 ? -20% |
| Witcher 3 ultra * (dB) | 42.8 | 45 | 48 |
* ... smaller is better
Temperature
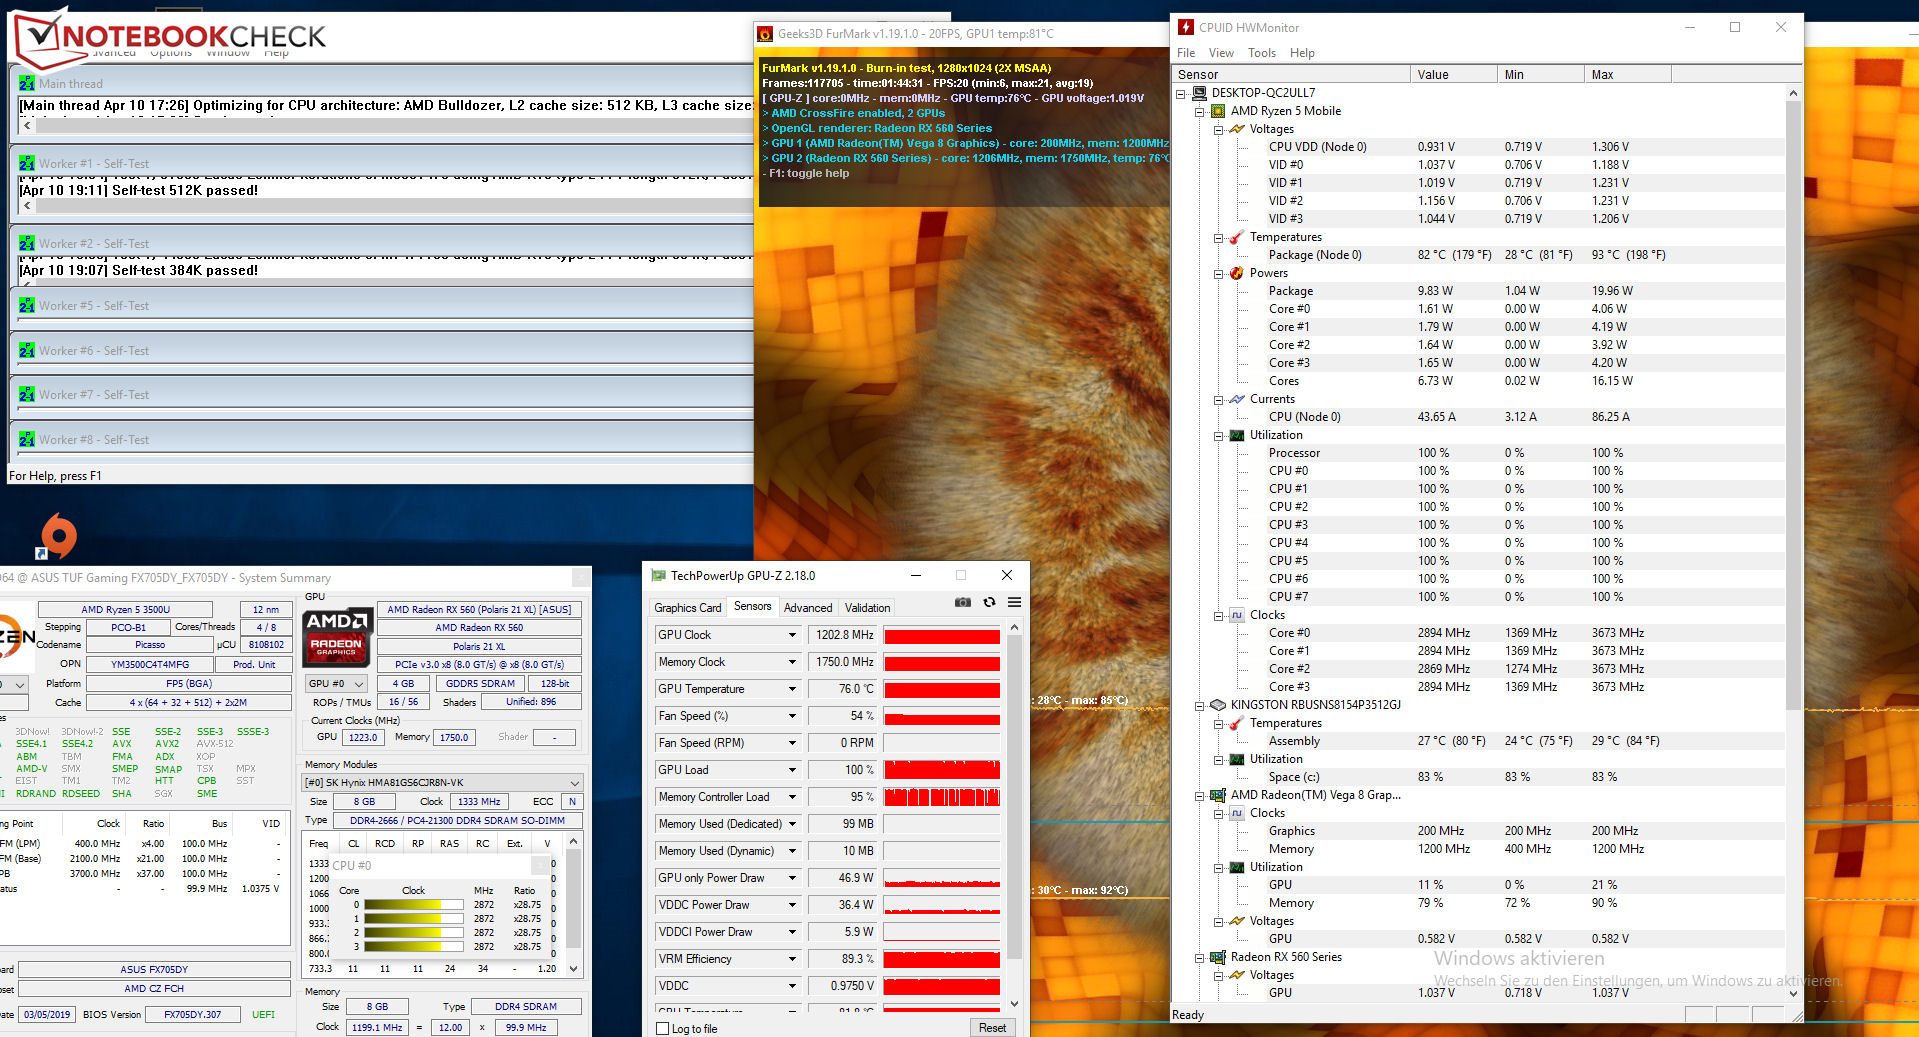
We also subjected our review device to a combined FurMark and Prime95 stress test that we ran for at least an hour to see how the system managed its performance in extreme conditions. Interestingly, the FX705DY performed slightly differently when running on battery than on mains power. The APU operates at between 3.3 and 3.5 GHz for a few minutes before lowering back to between 2.7 and 2.9 GHz in both scenarios. However, the processor repeatedly accelerated to beyond 3 GHz when running on mains power but did not replicate this behaviour on battery power. The system also throttled the GPU to between 250 and 350 MHz on battery but maintained its peak clock speed when running on mains power.
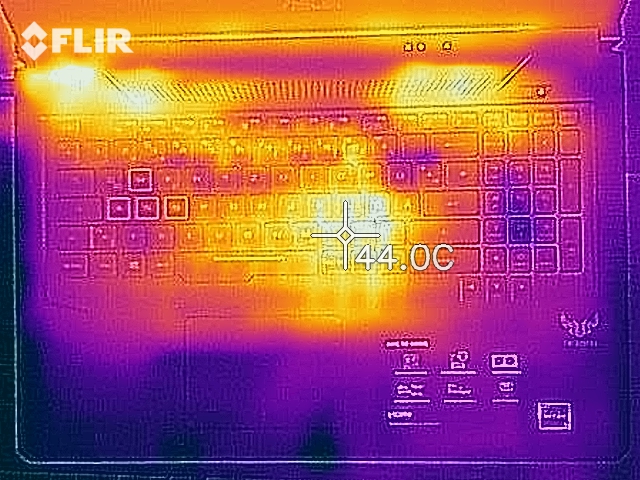
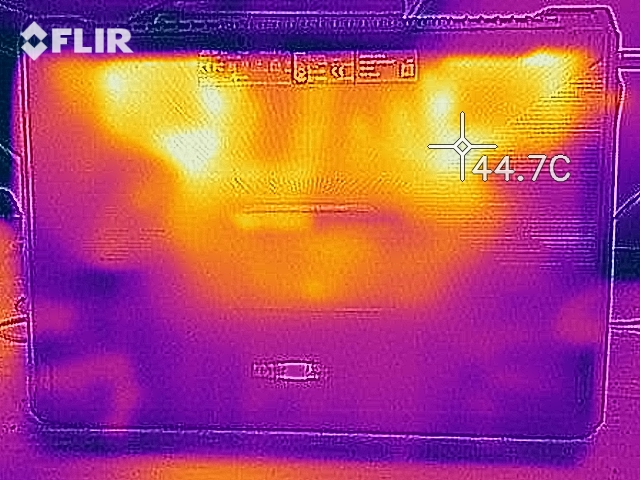
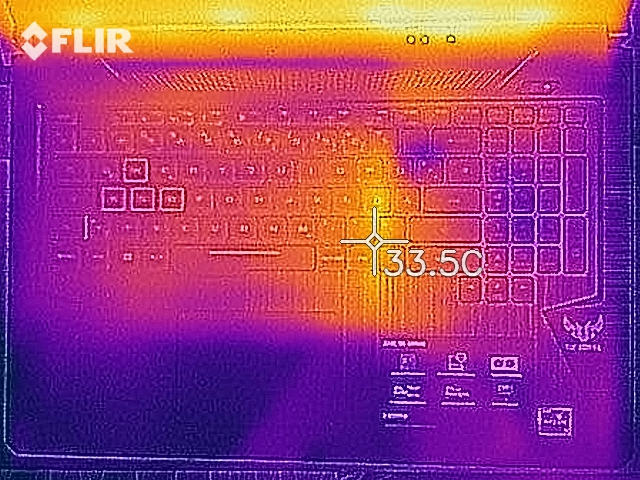
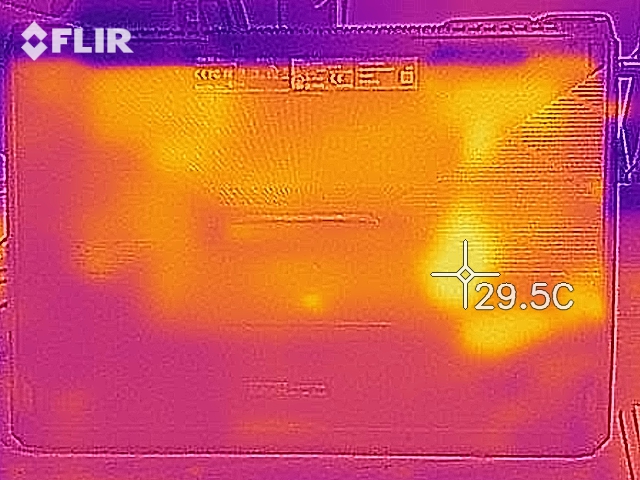
The FX705DY also does not get that hot for a gaming laptop. Surface temperatures on our review unit do not exceed 26 °C at idle and only reached a maximum of 41.5 °C in one area during our stress test. The palm rest remains a pleasant 22 to 23 °C too even when the machine is being pushed to its limits.
In short, the FX705DY should never feel hot to the touch even when gaming. We should also point out that our stress test represents an extreme scenario that puts the system under more stress than even gaming would.
(±) The maximum temperature on the upper side is 41.5 °C / 107 F, compared to the average of 40.4 °C / 105 F, ranging from 21.2 to 68.8 °C for the class Gaming.
(+) The bottom heats up to a maximum of 39.6 °C / 103 F, compared to the average of 43.2 °C / 110 F
(+) In idle usage, the average temperature for the upper side is 23.7 °C / 75 F, compared to the device average of 33.9 °C / 93 F.
(+) The palmrests and touchpad are cooler than skin temperature with a maximum of 22.9 °C / 73.2 F and are therefore cool to the touch.
(+) The average temperature of the palmrest area of similar devices was 28.8 °C / 83.8 F (+5.9 °C / 10.6 F).
| Asus TUF FX705DY-AU072 R5 3550H, Radeon RX 560X (Laptop) | Dell G3 17 3779 i5-8300H, GeForce GTX 1050 Mobile | Asus TUF FX705GE-EW096T i7-8750H, GeForce GTX 1050 Ti Mobile | Lenovo Legion Y730-17ICH, i7-8750H i7-8750H, GeForce GTX 1050 Ti Mobile | Acer Predator Helios 300 PH317-52-51M6 i5-8300H, GeForce GTX 1050 Ti Mobile | Asus TUF FX705GM i7-8750H, GeForce GTX 1060 Mobile | Average AMD Radeon RX 560X (Laptop) | Average of class Gaming | |
|---|---|---|---|---|---|---|---|---|
| Heat | -33% | -17% | -25% | -26% | -26% | -10% | -23% | |
| Maximum Upper Side * (°C) | 41.5 | 53 -28% | 53.3 -28% | 42 -1% | 50 -20% | 54 -30% | 44.2 ? -7% | 45.2 ? -9% |
| Maximum Bottom * (°C) | 39.6 | 60.5 -53% | 44.7 -13% | 51.2 -29% | 52 -31% | 53 -34% | 44.3 ? -12% | 48 ? -21% |
| Idle Upper Side * (°C) | 25.7 | 30.3 -18% | 29.5 -15% | 31.8 -24% | 33 -28% | 30 -17% | 27.2 ? -6% | 31.1 ? -21% |
| Idle Bottom * (°C) | 24.2 | 32 -32% | 27 -12% | 35.4 -46% | 30 -24% | 30 -24% | 27.7 ? -14% | 34.2 ? -41% |
* ... smaller is better
Speakers
Asus TUF FX705DY-AU072 audio analysis
(-) | not very loud speakers (66.8 dB)
Bass 100 - 315 Hz
(-) | nearly no bass - on average 19.2% lower than median
(±) | linearity of bass is average (10.6% delta to prev. frequency)
Mids 400 - 2000 Hz
(+) | balanced mids - only 3.3% away from median
(±) | linearity of mids is average (9.5% delta to prev. frequency)
Highs 2 - 16 kHz
(±) | higher highs - on average 8% higher than median
(±) | linearity of highs is average (9.4% delta to prev. frequency)
Overall 100 - 16.000 Hz
(±) | linearity of overall sound is average (29.1% difference to median)
Compared to same class
» 94% of all tested devices in this class were better, 2% similar, 4% worse
» The best had a delta of 6%, average was 18%, worst was 132%
Compared to all devices tested
» 87% of all tested devices were better, 2% similar, 11% worse
» The best had a delta of 4%, average was 24%, worst was 134%
Power Management
Power Consumption
There are no surprises with power consumption. The FX705DY consumes a minimum of 5.5 W at idle, which is significantly higher than its Core i7-8750H-powered sibling, the FX705GE. Power consumption peaked at 123 W during our stress test, but the machine generally consumes approximately 77 W under load, which is more economic than its sibling. ASUS includes a 120 W power supply in the box, which is powerful enough to keep the device charging even when it is being pushed hard. Our review unit only briefly exceeded 120 W during our stress test, so you should have no problems in daily use or when gaming.
| Off / Standby | |
| Idle | |
| Load |
|
Key:
min: | |
| Asus TUF FX705DY-AU072 R5 3550H, Radeon RX 560X (Laptop) | Dell G3 17 3779 i5-8300H, GeForce GTX 1050 Mobile | Asus TUF FX705GE-EW096T i7-8750H, GeForce GTX 1050 Ti Mobile | Lenovo Legion Y730-17ICH, i7-8750H i7-8750H, GeForce GTX 1050 Ti Mobile | Acer Predator Helios 300 PH317-52-51M6 i5-8300H, GeForce GTX 1050 Ti Mobile | Asus TUF FX705GM i7-8750H, GeForce GTX 1060 Mobile | Average AMD Radeon RX 560X (Laptop) | Average of class Gaming | |
|---|---|---|---|---|---|---|---|---|
| Power Consumption | -21% | 6% | -7% | -6% | -75% | -0% | -92% | |
| Idle Minimum * (Watt) | 5.5 | 7.7 -40% | 3.8 31% | 6.3 -15% | 6 -9% | 13 -136% | 5.9 ? -7% | 13.2 ? -140% |
| Idle Average * (Watt) | 10.9 | 14 -28% | 9 17% | 11 -1% | 9 17% | 17 -56% | 9.47 ? 13% | 18.9 ? -73% |
| Idle Maximum * (Watt) | 12.2 | 15.5 -27% | 11.2 8% | 11.5 6% | 13 -7% | 24 -97% | 13.2 ? -8% | 24.3 ? -99% |
| Load Average * (Watt) | 77 | 95 -23% | 101 -31% | 89.8 -17% | 95 -23% | 106 -38% | 76.3 ? 1% | 108 ? -40% |
| Load Maximum * (Watt) | 123 | 106 14% | 119.7 3% | 130.7 -6% | 134 -9% | 179 -46% | 123.9 ? -1% | 254 ? -107% |
| Witcher 3 ultra * (Watt) | 102 | 102 | 151 |
* ... smaller is better
Battery Life
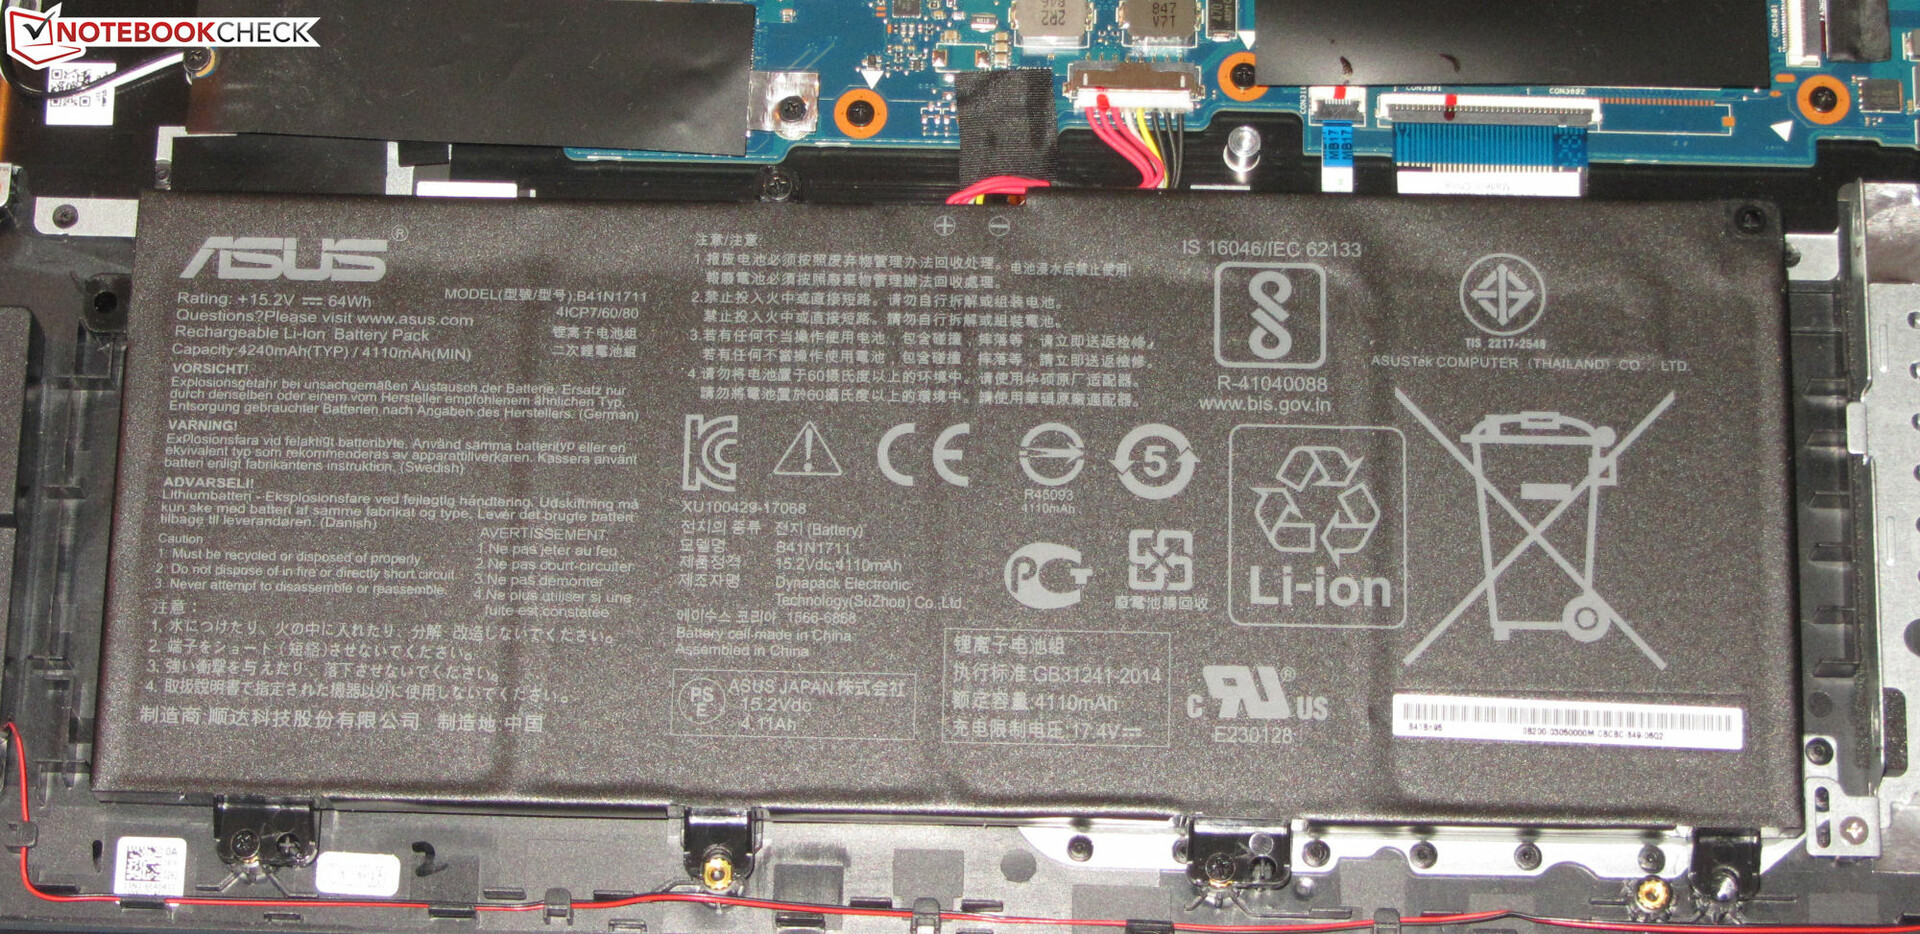
ASUS equips the FX705DY with a 64 Wh battery, which lasted for 7:10 hours in our practical WLAN test. We conduct this test by running a script that simulates the load required to render websites, for reference. We also adjust the display to approximately 150 cd/m², set the Windows power plan to Balanced and disable any power-saving features. Our review unit performed comparatively well here and outlasted all but the FX705GE of our comparison devices. The FX705DY also leads the way in our looped H.264 video test with its runtime of 6:39 hours. Here, we run the short film Big Buck Bunny at 1080p on a continuous loop. We set the power mode to power-saving but deactivate the radio modules and any other energy-saving features. We also adjust the brightness to 150 cd/m².
Overall, the FX705DY has surprisingly good battery life. You should be able to last a workday between charges, but only if you do not push the machine too hard.
| Asus TUF FX705DY-AU072 R5 3550H, Radeon RX 560X (Laptop), 64 Wh | Dell G3 17 3779 i5-8300H, GeForce GTX 1050 Mobile, 56 Wh | Lenovo Legion Y730-17ICH, i7-8750H i7-8750H, GeForce GTX 1050 Ti Mobile, 76 Wh | Acer Predator Helios 300 PH317-52-51M6 i5-8300H, GeForce GTX 1050 Ti Mobile, 48 Wh | Asus TUF FX705GE-EW096T i7-8750H, GeForce GTX 1050 Ti Mobile, 64 Wh | Asus TUF FX705GM i7-8750H, GeForce GTX 1060 Mobile, 64 Wh | Average of class Gaming | |
|---|---|---|---|---|---|---|---|
| Battery runtime | -10% | -19% | -13% | 19% | -36% | -9% | |
| Reader / Idle (h) | 12.6 | 12.2 -3% | 13.2 5% | 11.8 -6% | 6.3 -50% | 8.71 ? -31% | |
| H.264 (h) | 6.7 | 5.3 -21% | 4.3 -36% | 8.26 ? 23% | |||
| WiFi v1.3 (h) | 7.2 | 5.8 -19% | 6.7 -7% | 5.9 -18% | 8.6 19% | 4.5 -37% | 7.02 ? -3% |
| Load (h) | 2 | 2.1 5% | 0.9 -55% | 1.7 -15% | 1.6 -20% | 1.47 ? -26% |
Pros
Cons
Verdict
The ASUS TUF Gaming FX705DY is a well-equipped device considering its price. Its AMD APU and GPU combine well to deliver decent system performance and are powerful enough to handle all modern games at enjoyable frame rates and graphics settings.
Moreover, the machine does not always run loudly as many gaming laptops do, but you must first enable quiet mode, which does sacrifice processor performance. The machine is still capable of ploughing through office and Internet-based tasks in this mode though.
The ASUS TUF Gaming FX705DY is great value for money and delivers a decent gaming experience with only a few minor compromises.
The 512 GB NVMe SSD should be enough storage for most people, but you can always add a 2.5-inch HDD should you run out of space. Unfortunately, you must remove the bottom case to access the drive bay, but this is often the case with modern laptops.
We also like the matte IPS display too. It is bright, has good contrast, stable viewing angles and it reproduces colours accurately. Likewise, the device has a decent RGB backlit keyboard, and the battery should last you through the day, although the FX705GE will last a few hours longer.
It is a shame that ASUS decided against including a USB Type-C port or a card reader of some sort. Moreover, the choice to equip the device with just a single video output seems like a misstep. These quibbles aside, the ASUS TUF Gaming FX705DY is a bargain at 800 Euros (~$900) if you are looking for a 17.3-inch gaming laptop. It should tick most people’s boxes even if it falls short to its competitors in some areas.
Asus TUF FX705DY-AU072
- 04/17/2019 v6 (old)
Sascha Mölck
Price comparison

