Lenovo IdeaPad 330-17IKB (i7-8550U, GeForce MX150) Laptop Review
Take one step down from the flagship Lenovo Yoga series and you have the mainstream Lenovo IdeaPad series. The IdeaPad series itself is further divided into the budget 300 series, mid-range 500 series, and the mid-upper-range 700 series. Our test unit today is the bottom-of-the-barrel IdeaPad 330 17 aimed at users who want to spend as little as possible on a no-frills reliable laptop.
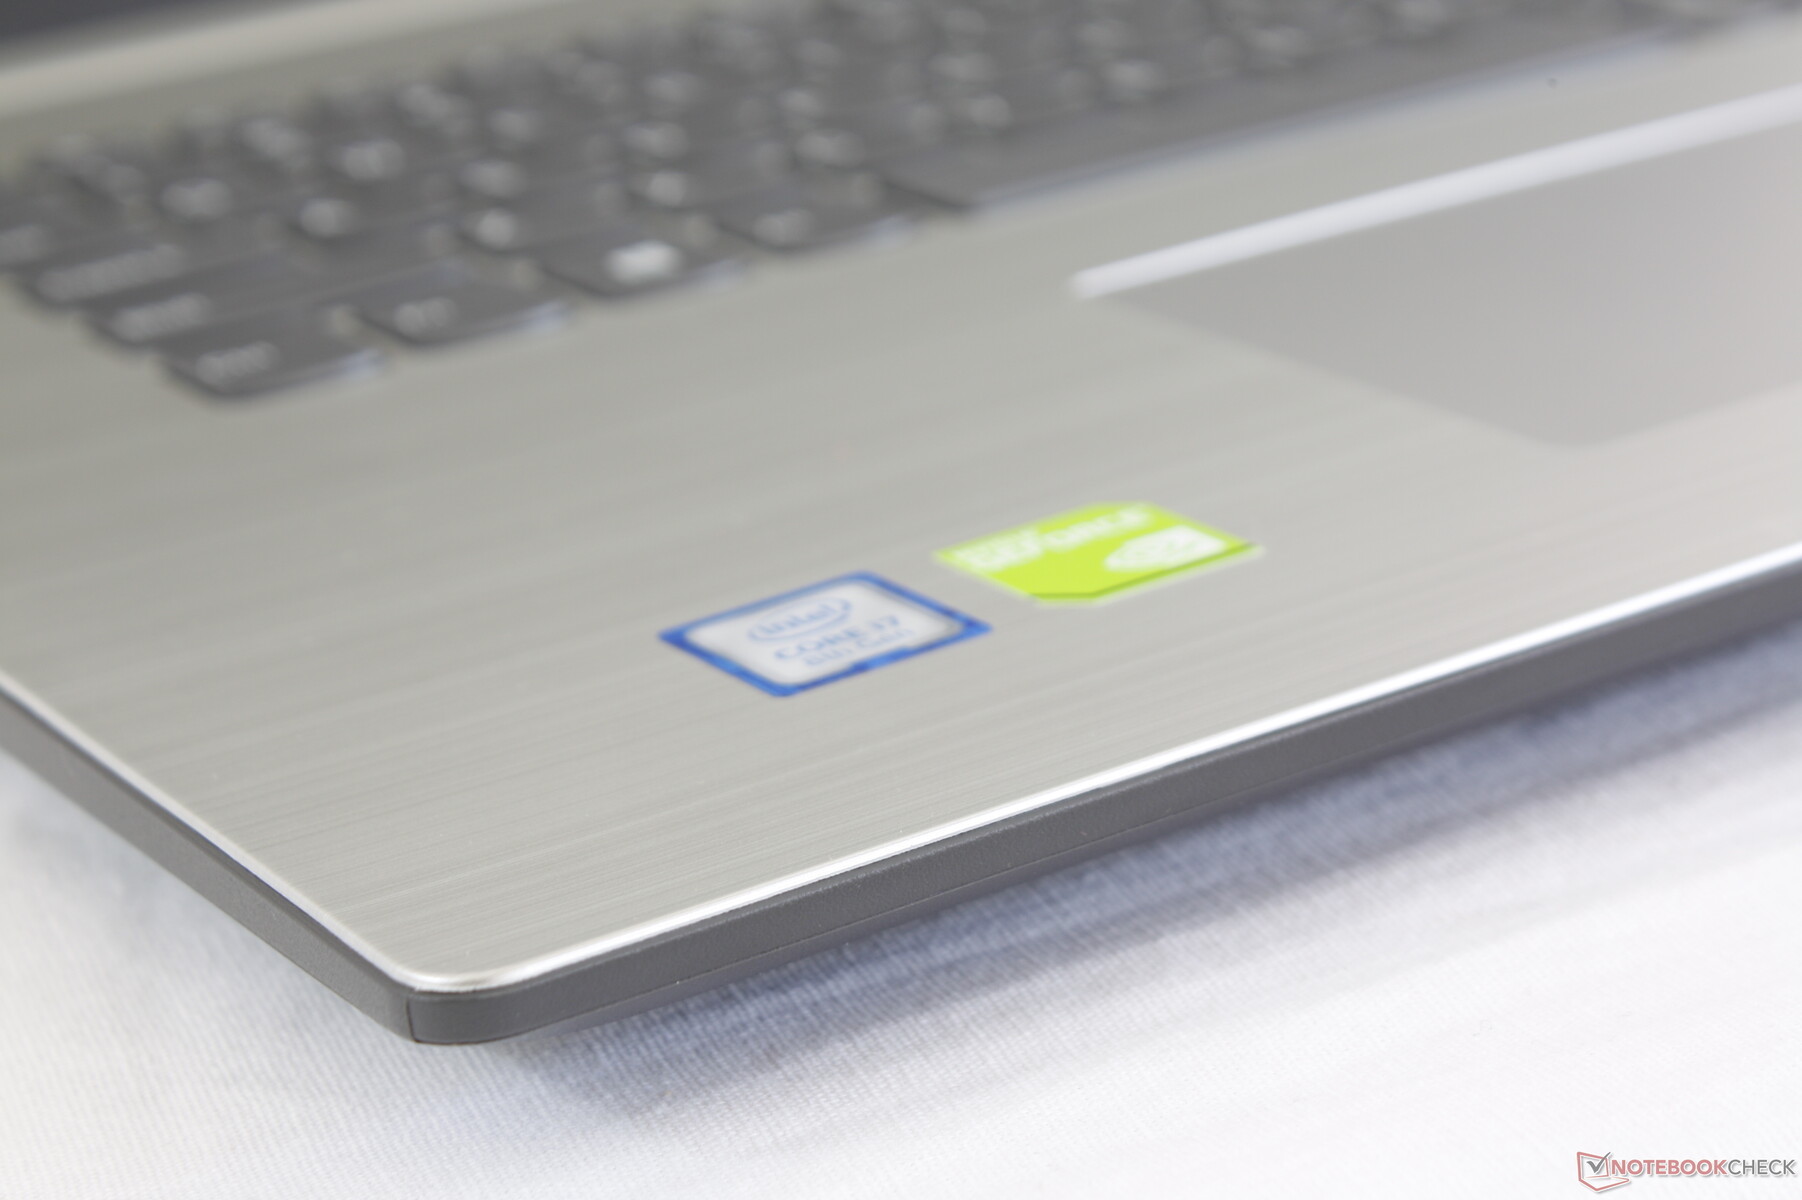
The specific configuration we have is equipped with a Core i7-8550U CPU, 16 GB of RAM, and dedicated GeForce MX150 GPU for $800 to $900 USD. Cheaper configurations can be found with a Core i3 CPU and integrated UHD Graphics 620 GPU while pricier configurations with a Core i7-8750H CPU and GeForce GTX 1050 GPU are also available. Even at its best, however, our review will show why the system still manages to fall short when compared to the competition.
The Lenovo IdeaPad 330-17 is the direct successor to the IdeaPad 320-17 and it competes directly with other budget 17.3-inch multimedia laptops like the Acer Aspire ES1-732, Asus VivoBook 17, Dell Inspiron series, and the HP Pavilion 17.
More Lenovo IdeaPad reviews:
Case
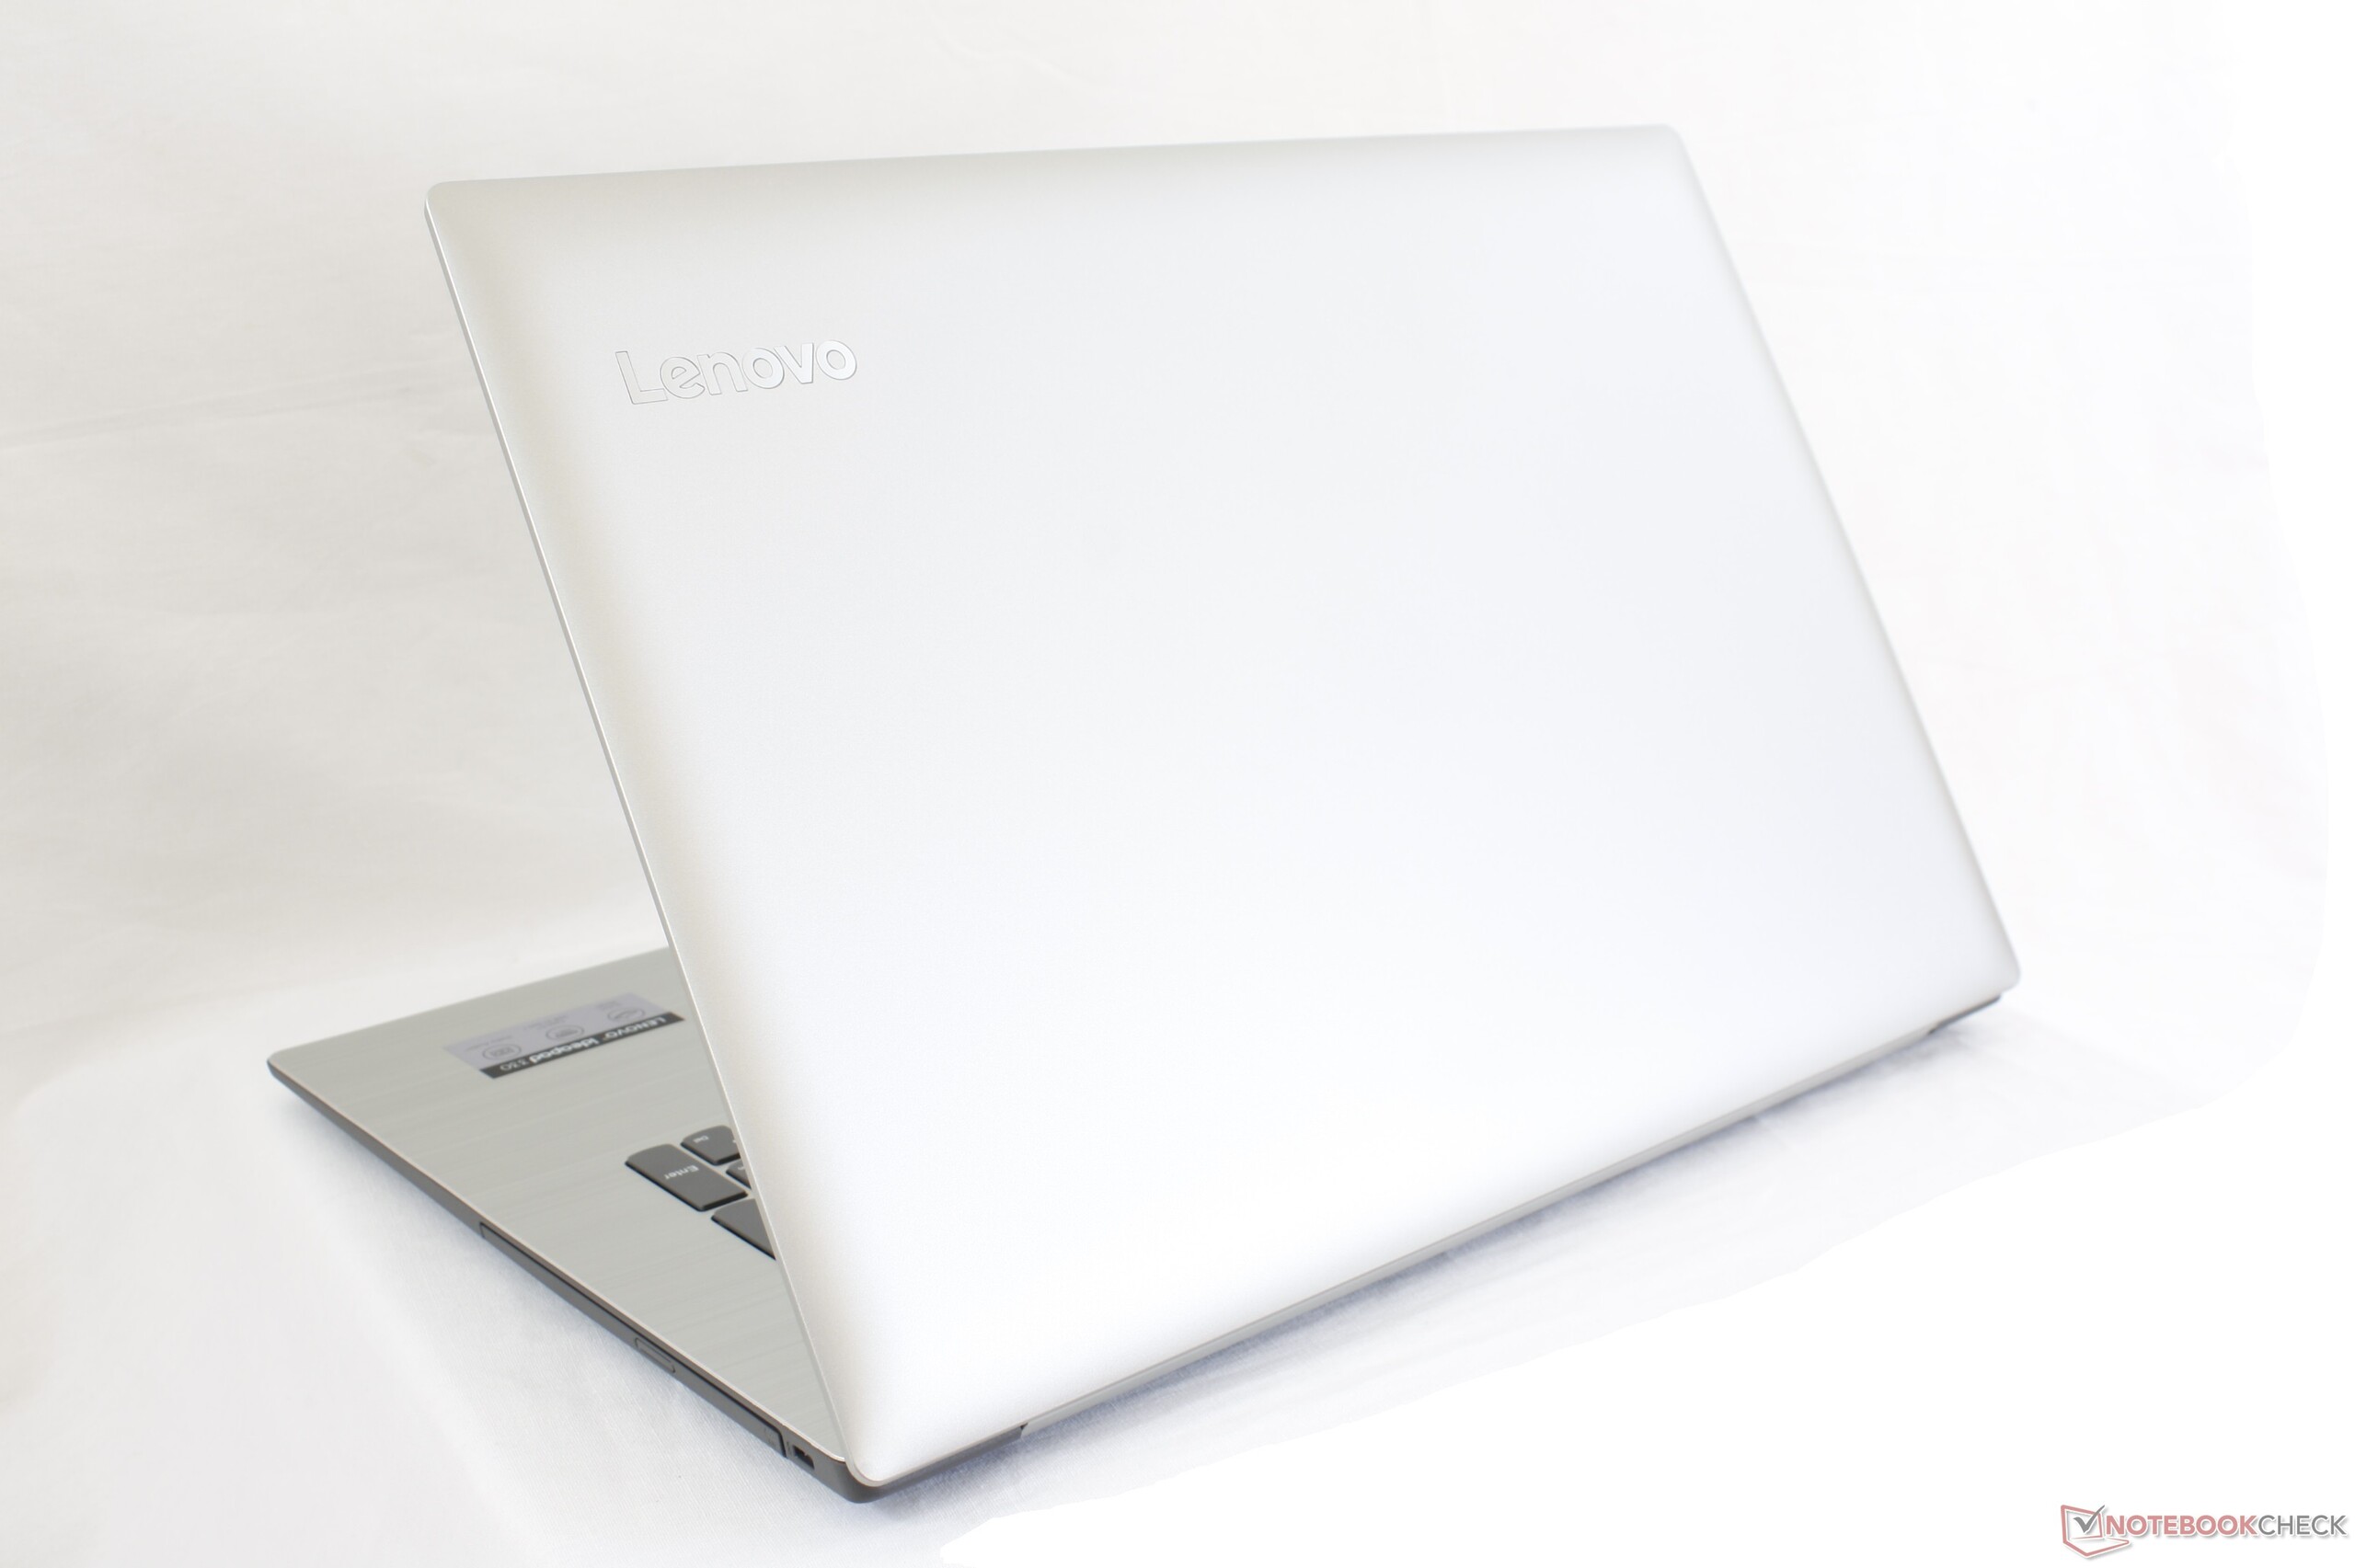
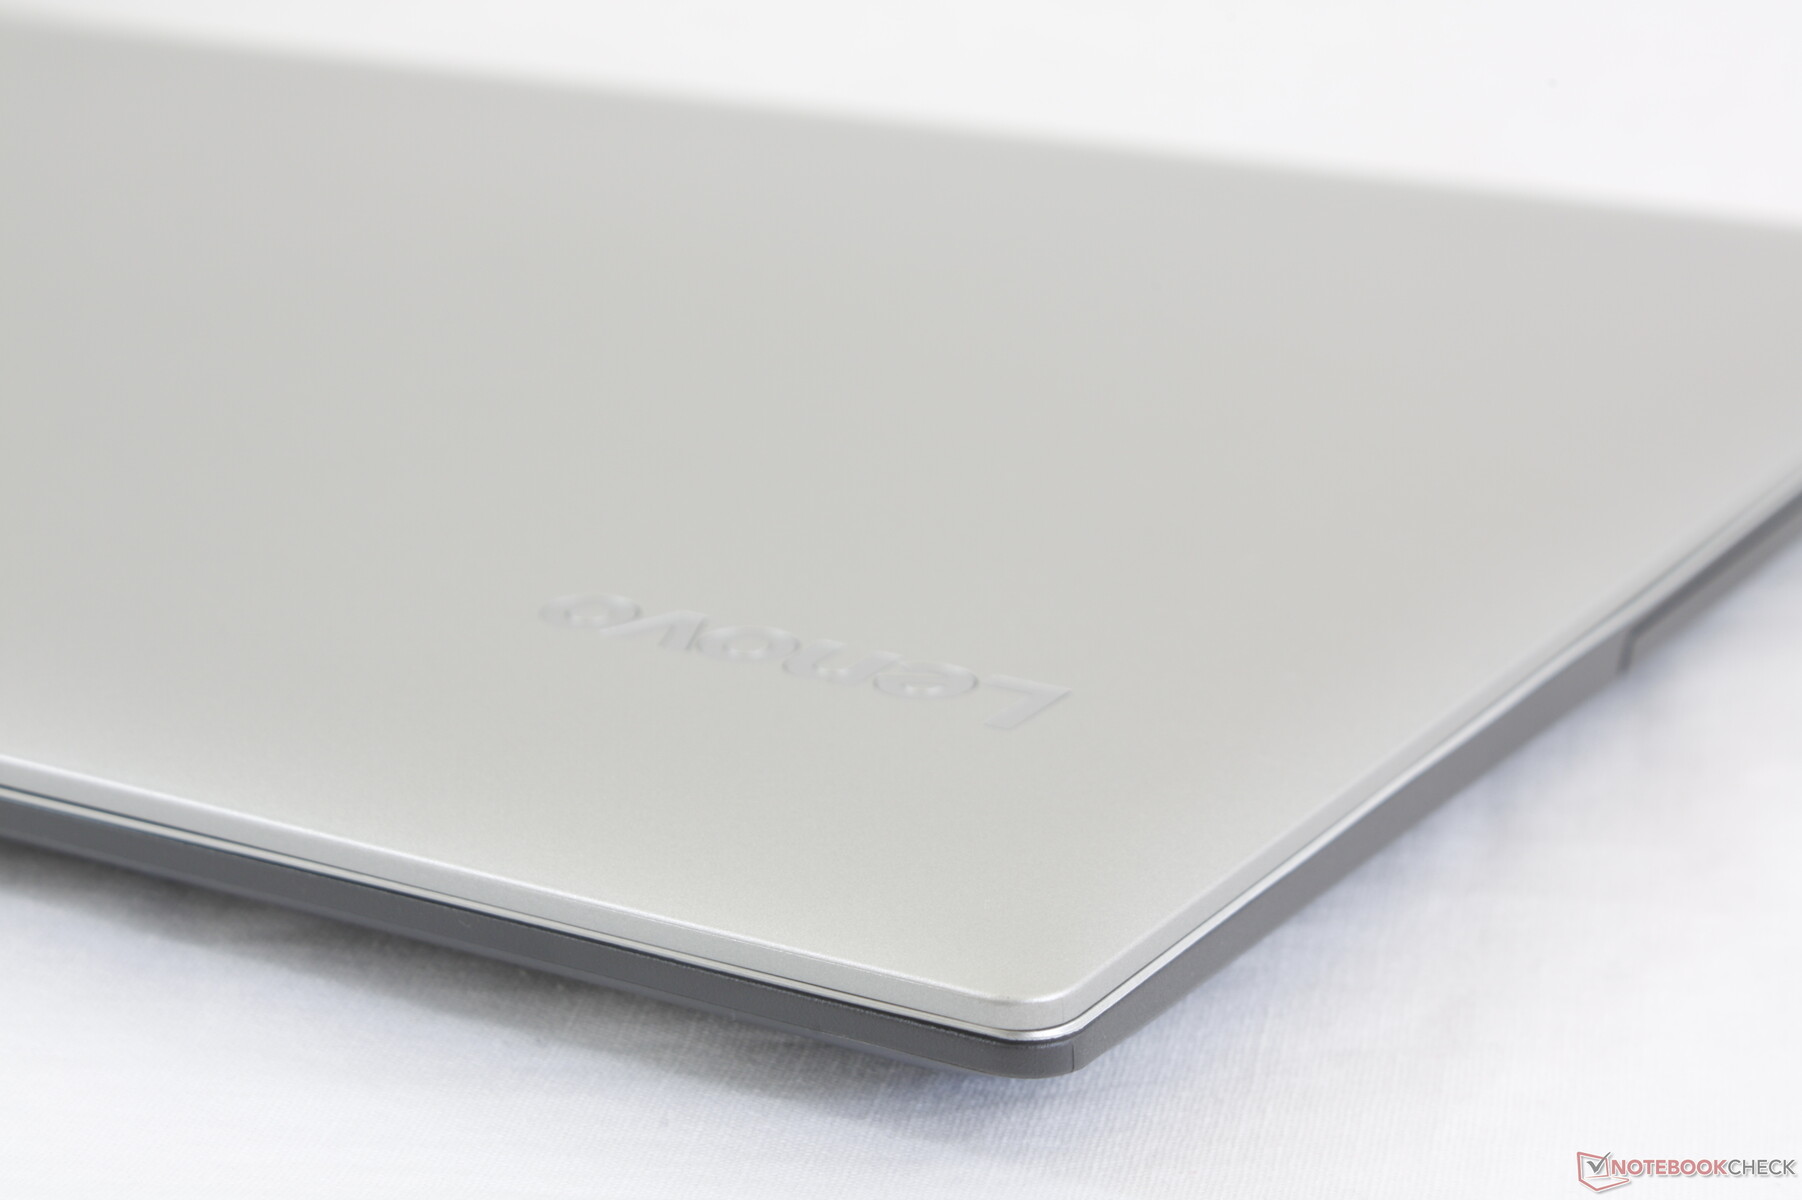
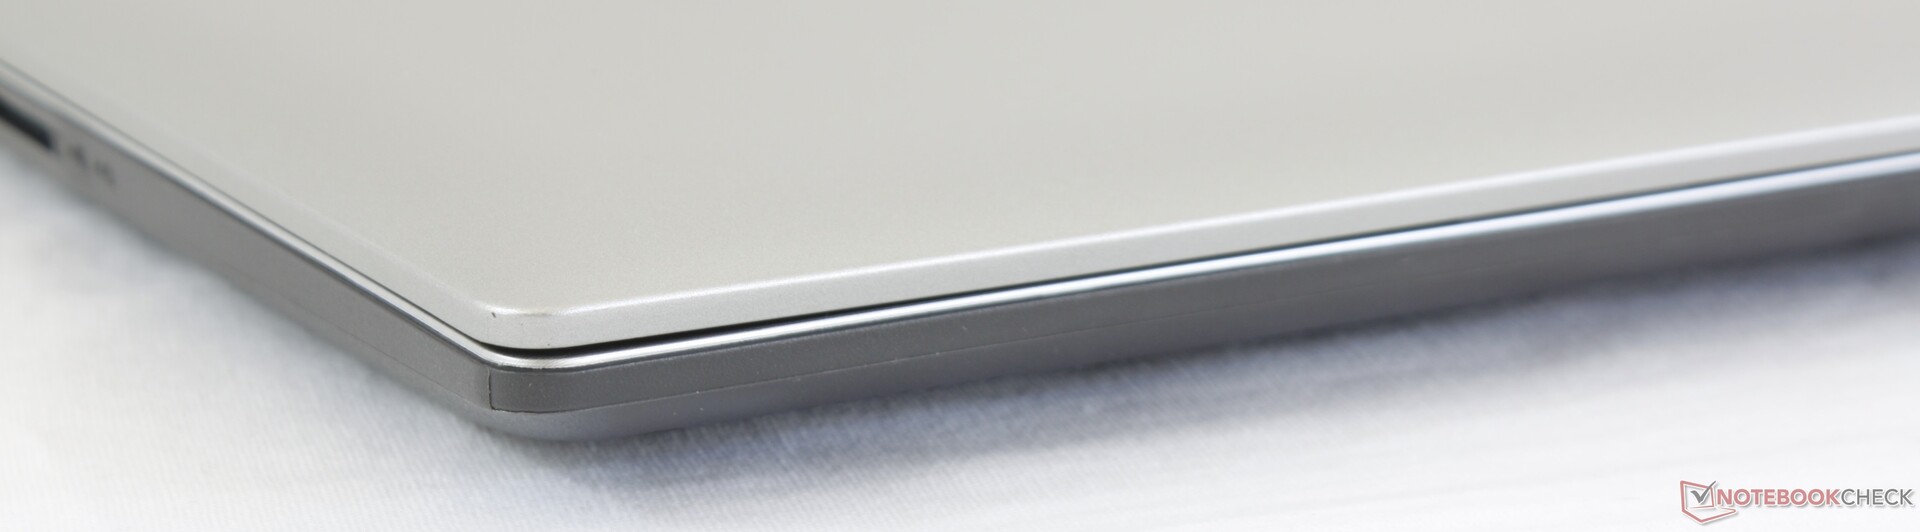
The chassis is plastic from top to bottom in stark contrast to the carbon fiber or aluminum alloy materials of higher-end models. The lid exhibits moderate flexing, the base creaks slightly when twisting its edges, and the hinge teeters more than we would like. This all contributes to the overall budget impression of the laptop. To Lenovo's defense, these characteristics are common on inexpensive laptops and so the IdeaPad 330 17 isn't trying to break any new ground here. On the other hand, we're disappointed to not see any notable gen-to-gen improvements in terms of rigidity or quality. We find the system to feel just slightly better than the Pavilion 17.
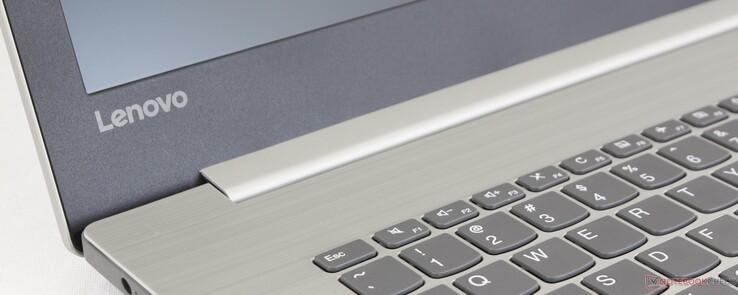
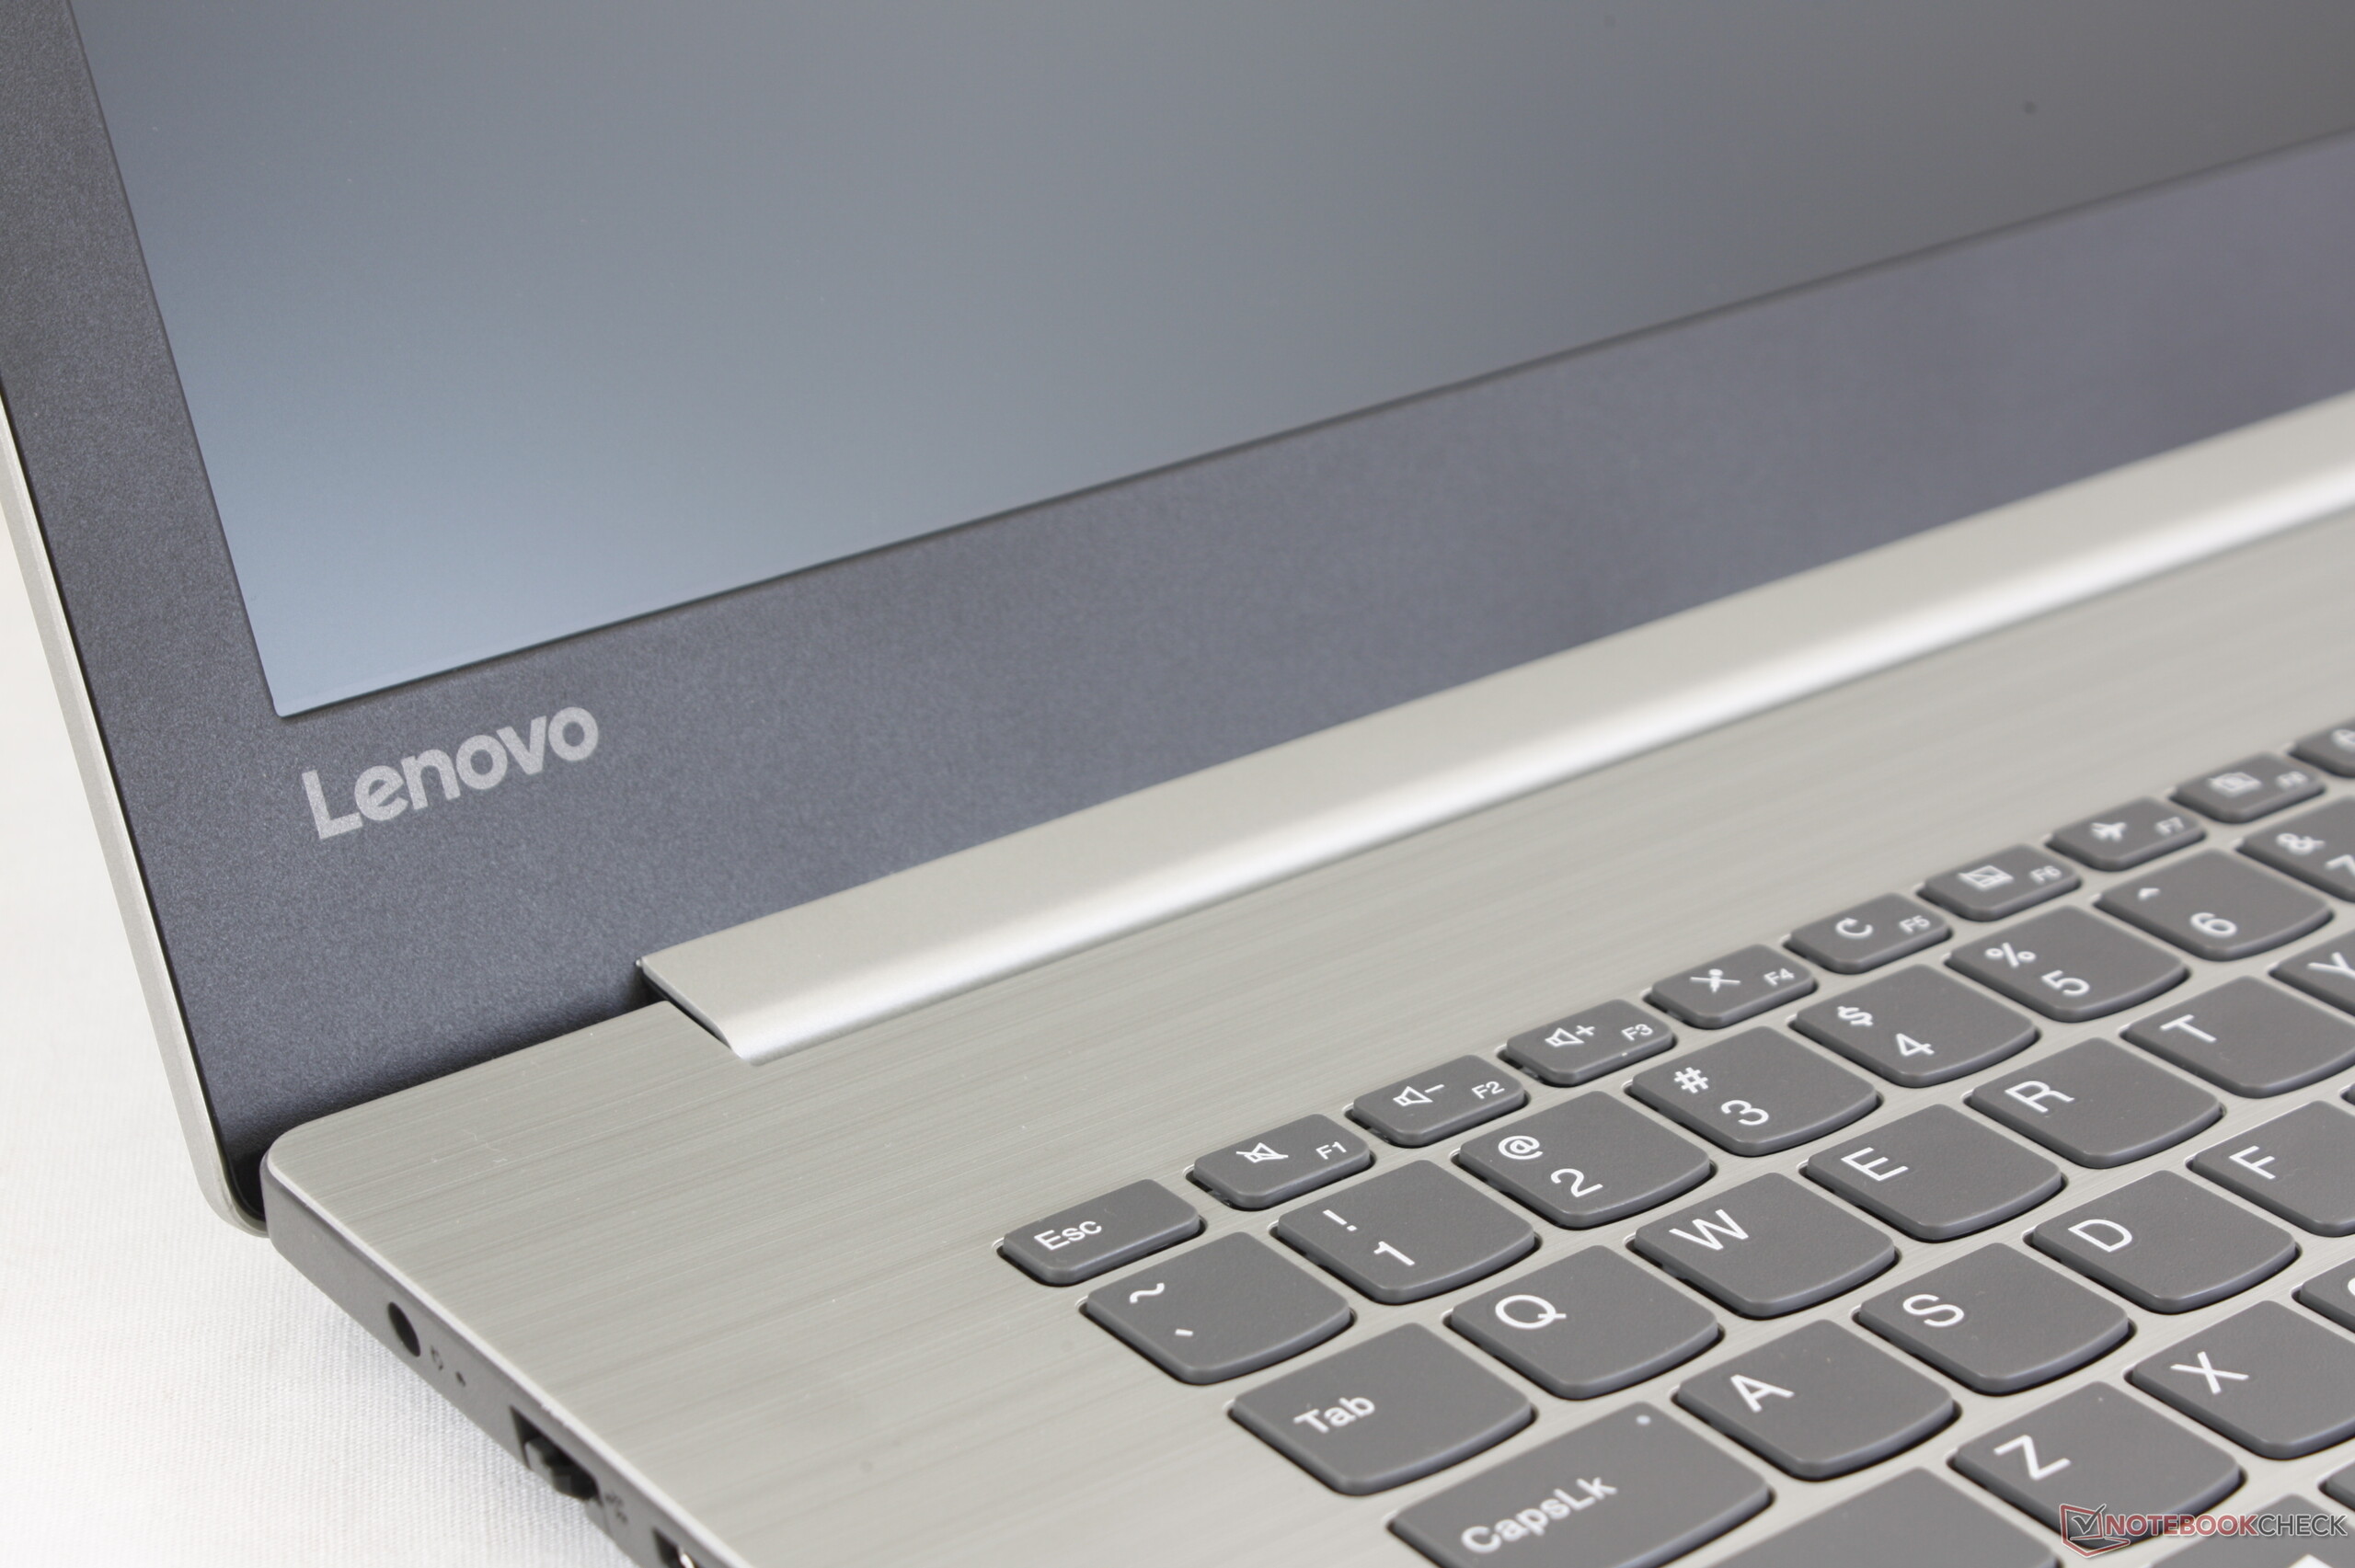
One particular aspect we can appreciate is that the matte silver surfaces are great at hiding fingerprints. The palm rests and keyboard center are also relatively rigid and resistant to flexing in contrast to the lid.
Build quality is otherwise excellent on our unit with no unintended gaps or crevices between materials.
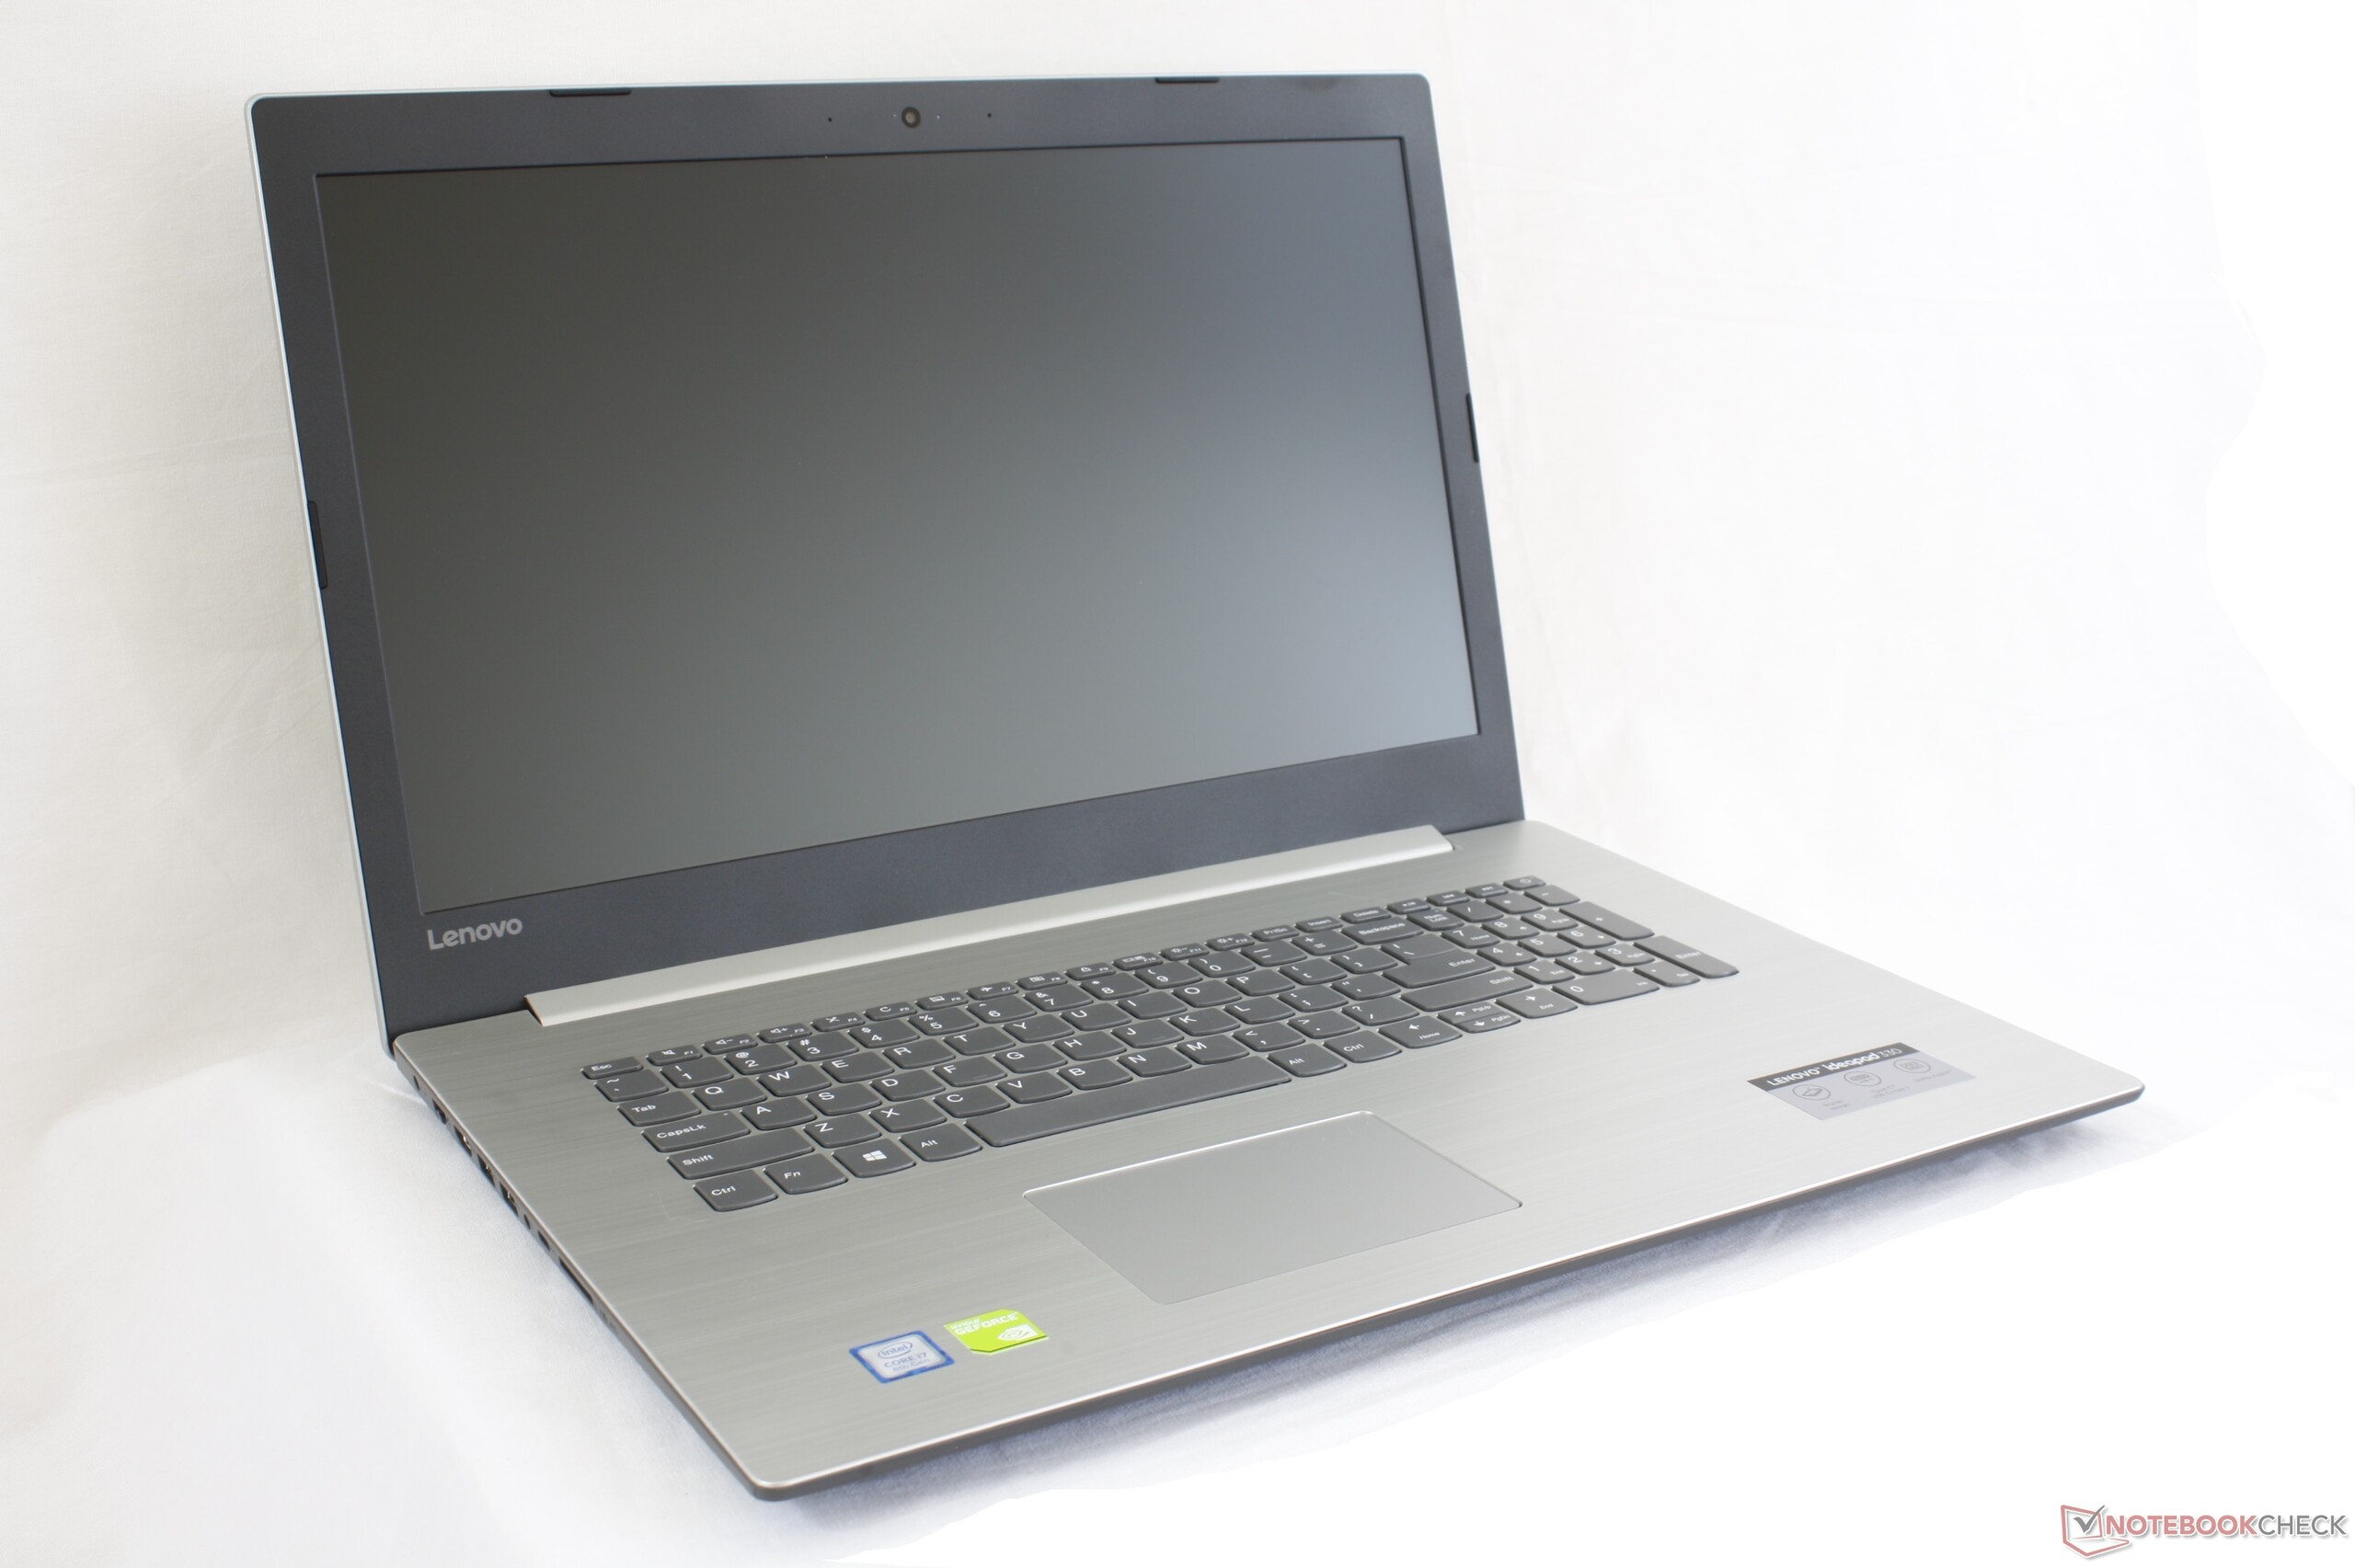
The Lenovo system is larger, thicker, and heavier than both the competing Asus VivoBook Pro 17 and HP Pavilion 17. We attribute this to the thick bezels of the system that appear to be even wider than other inexpensive 17.3-inch laptops. We're surprised by how heavy the system is considering the ample amount of unused empty space inside.
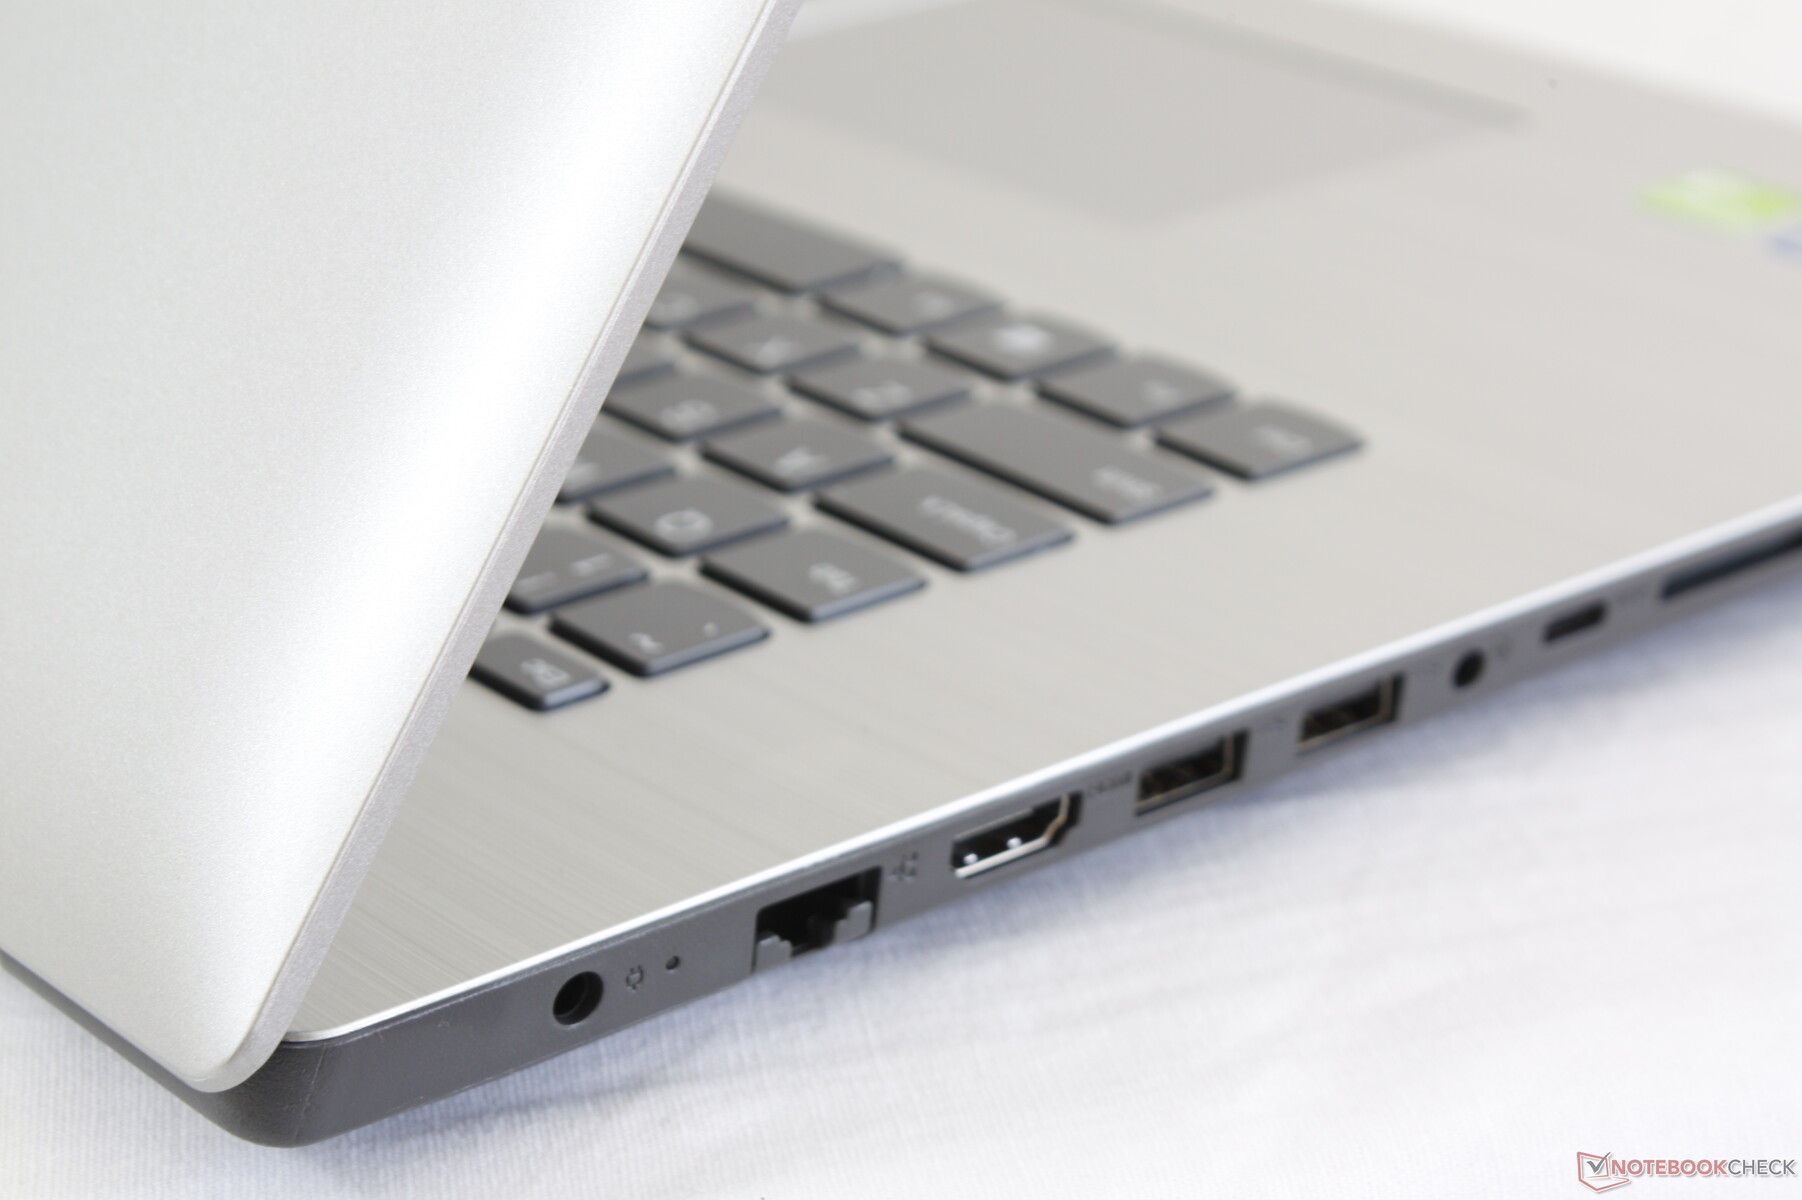
Connectivity
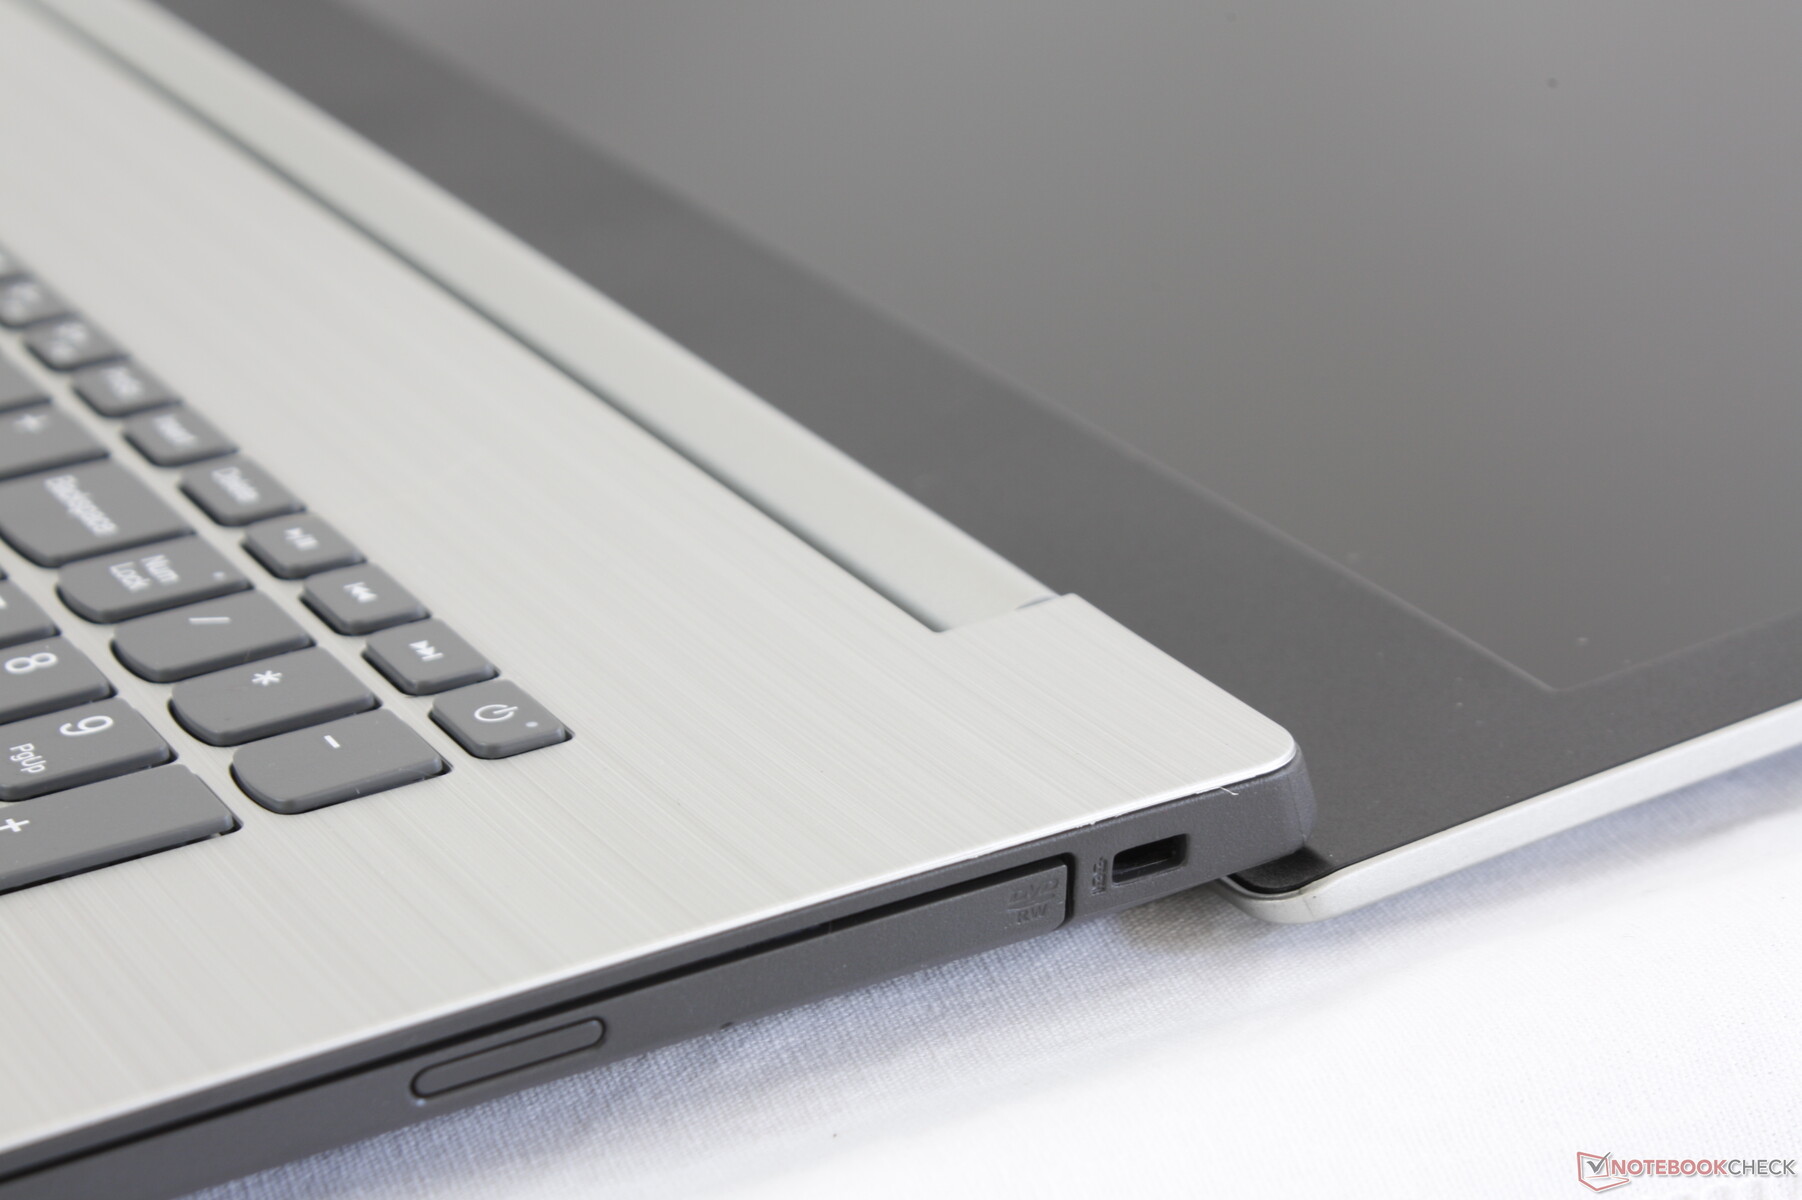
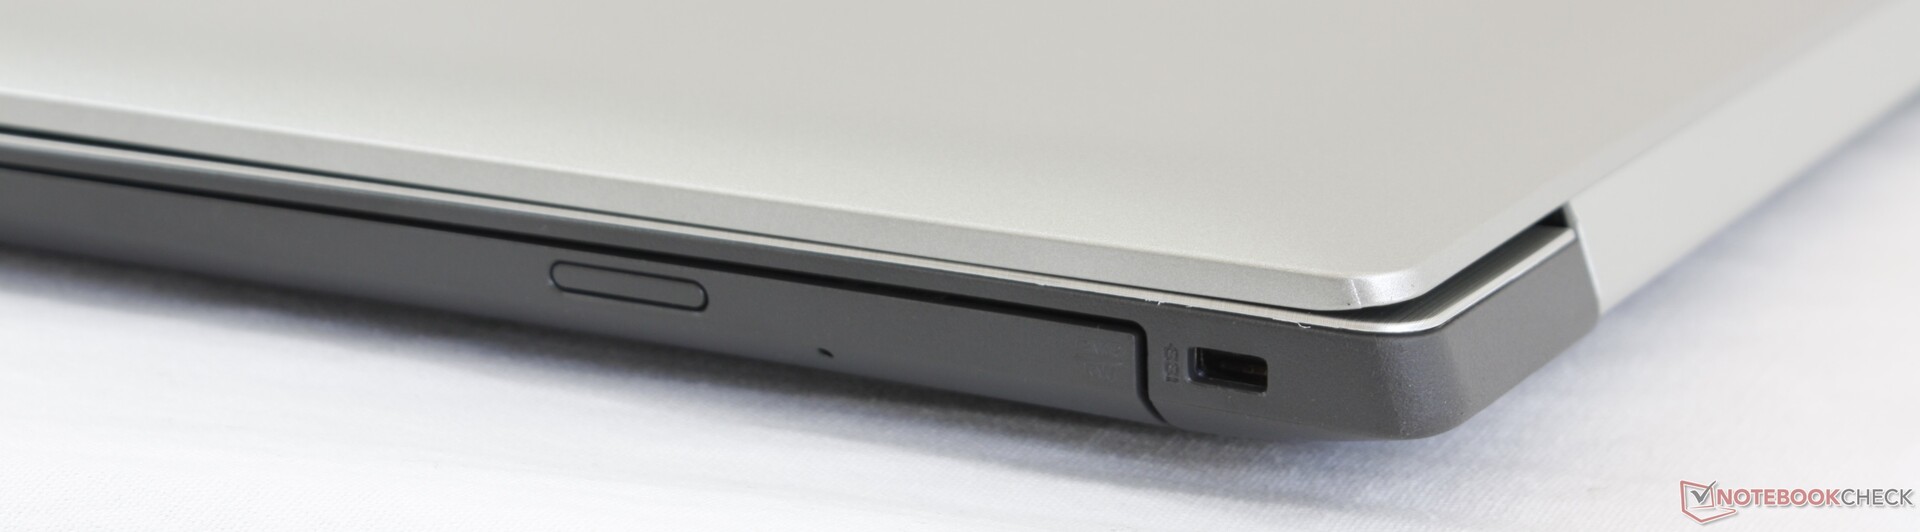
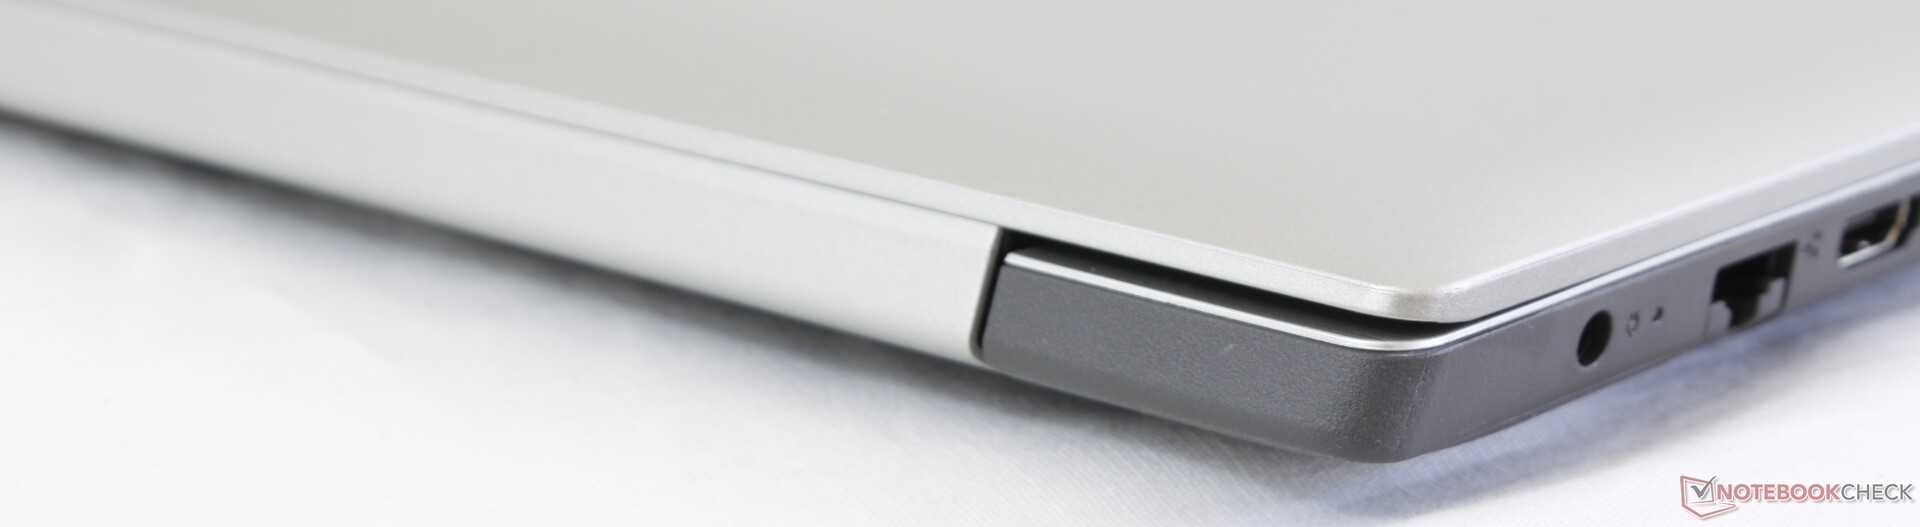
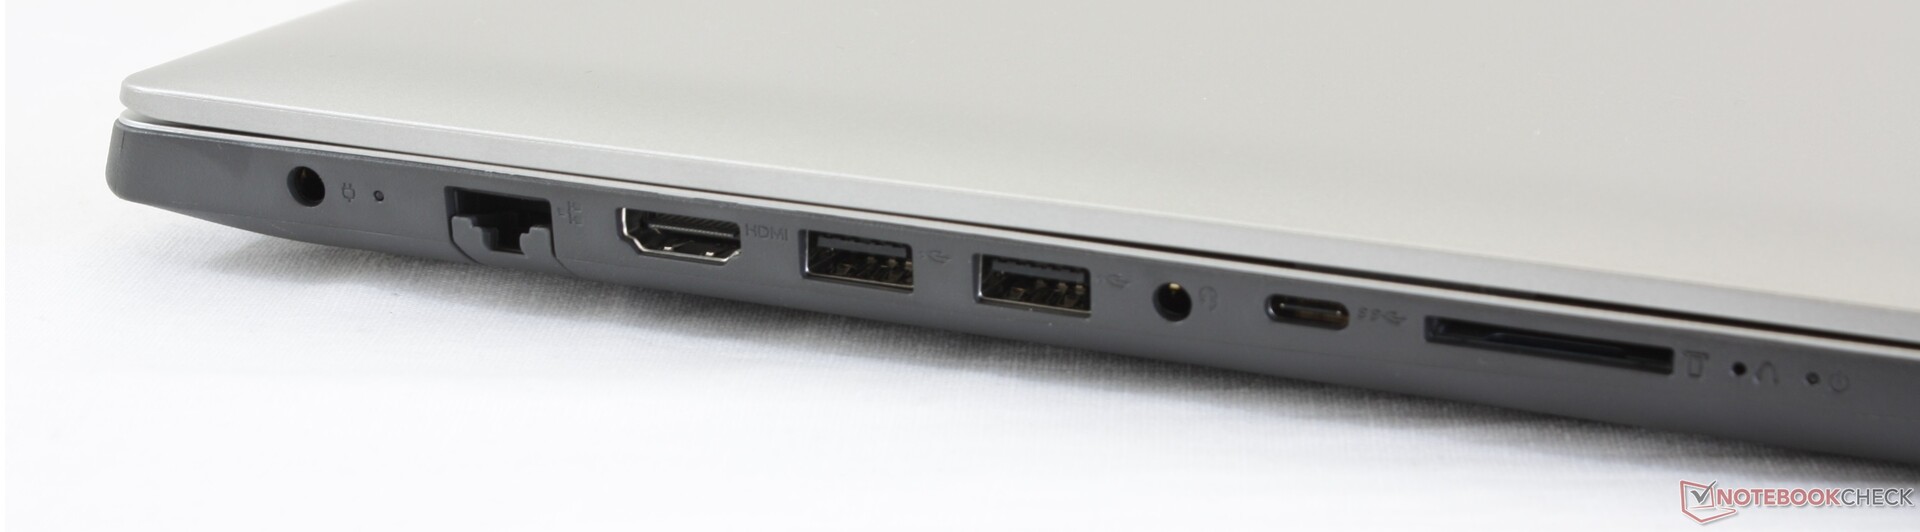
All the ports we expect to be on a budget laptop can be found here including HDMI, USB Type-C, and an SD card reader. Port positioning, however, is a mixed bag because all ports are positioned along the left edge. DisplayPort over USB does not appear to be supported.
The DVD drive on the right edge can be easily removed with a screwdriver. While convenient, it's too bad that there is no quick and official way to swap in a secondary 2.5-inch SATA III drive for users who have no need for an optical drive.
SD Card Reader

The integrated SD card reader is slow at just under 30 MB/s. Transferring 1 GB worth of pictures from our UHS-II test card to desktop takes 36 seconds compared to only 6 or 7 seconds on the Dell XPS 15.
A fully inserted SD card still protrudes by over half its length. We recommend removing the card before transporting the laptop.
| SD Card Reader | |
| average JPG Copy Test (av. of 3 runs) | |
| Asus VivoBook Pro 17 N705UD-EH76 (Toshiba Exceria Pro SDXC 64 GB UHS-II) | |
| HP Pavilion 17z 1EX13AV | |
| Lenovo IdeaPad 330-17IKB 81DM (Toshiba Exceria Pro SDXC 64 GB UHS-II) | |
| Dell Inspiron 17-7786 (Toshiba Exceria Pro SDXC 64 GB UHS-II) | |
| Acer Aspire ES1-732-P7YA (Toshiba Exceria Pro SDXC 64 GB UHS-II) | |
| maximum AS SSD Seq Read Test (1GB) | |
| HP Pavilion 17z 1EX13AV | |
| Asus VivoBook Pro 17 N705UD-EH76 (Toshiba Exceria Pro SDXC 64 GB UHS-II) | |
| Dell Inspiron 17-7786 (Toshiba Exceria Pro SDXC 64 GB UHS-II) | |
| Lenovo IdeaPad 330-17IKB 81DM (Toshiba Exceria Pro SDXC 64 GB UHS-II) | |
| Acer Aspire ES1-732-P7YA (Toshiba Exceria Pro SDXC 64 GB UHS-II) | |
Communication
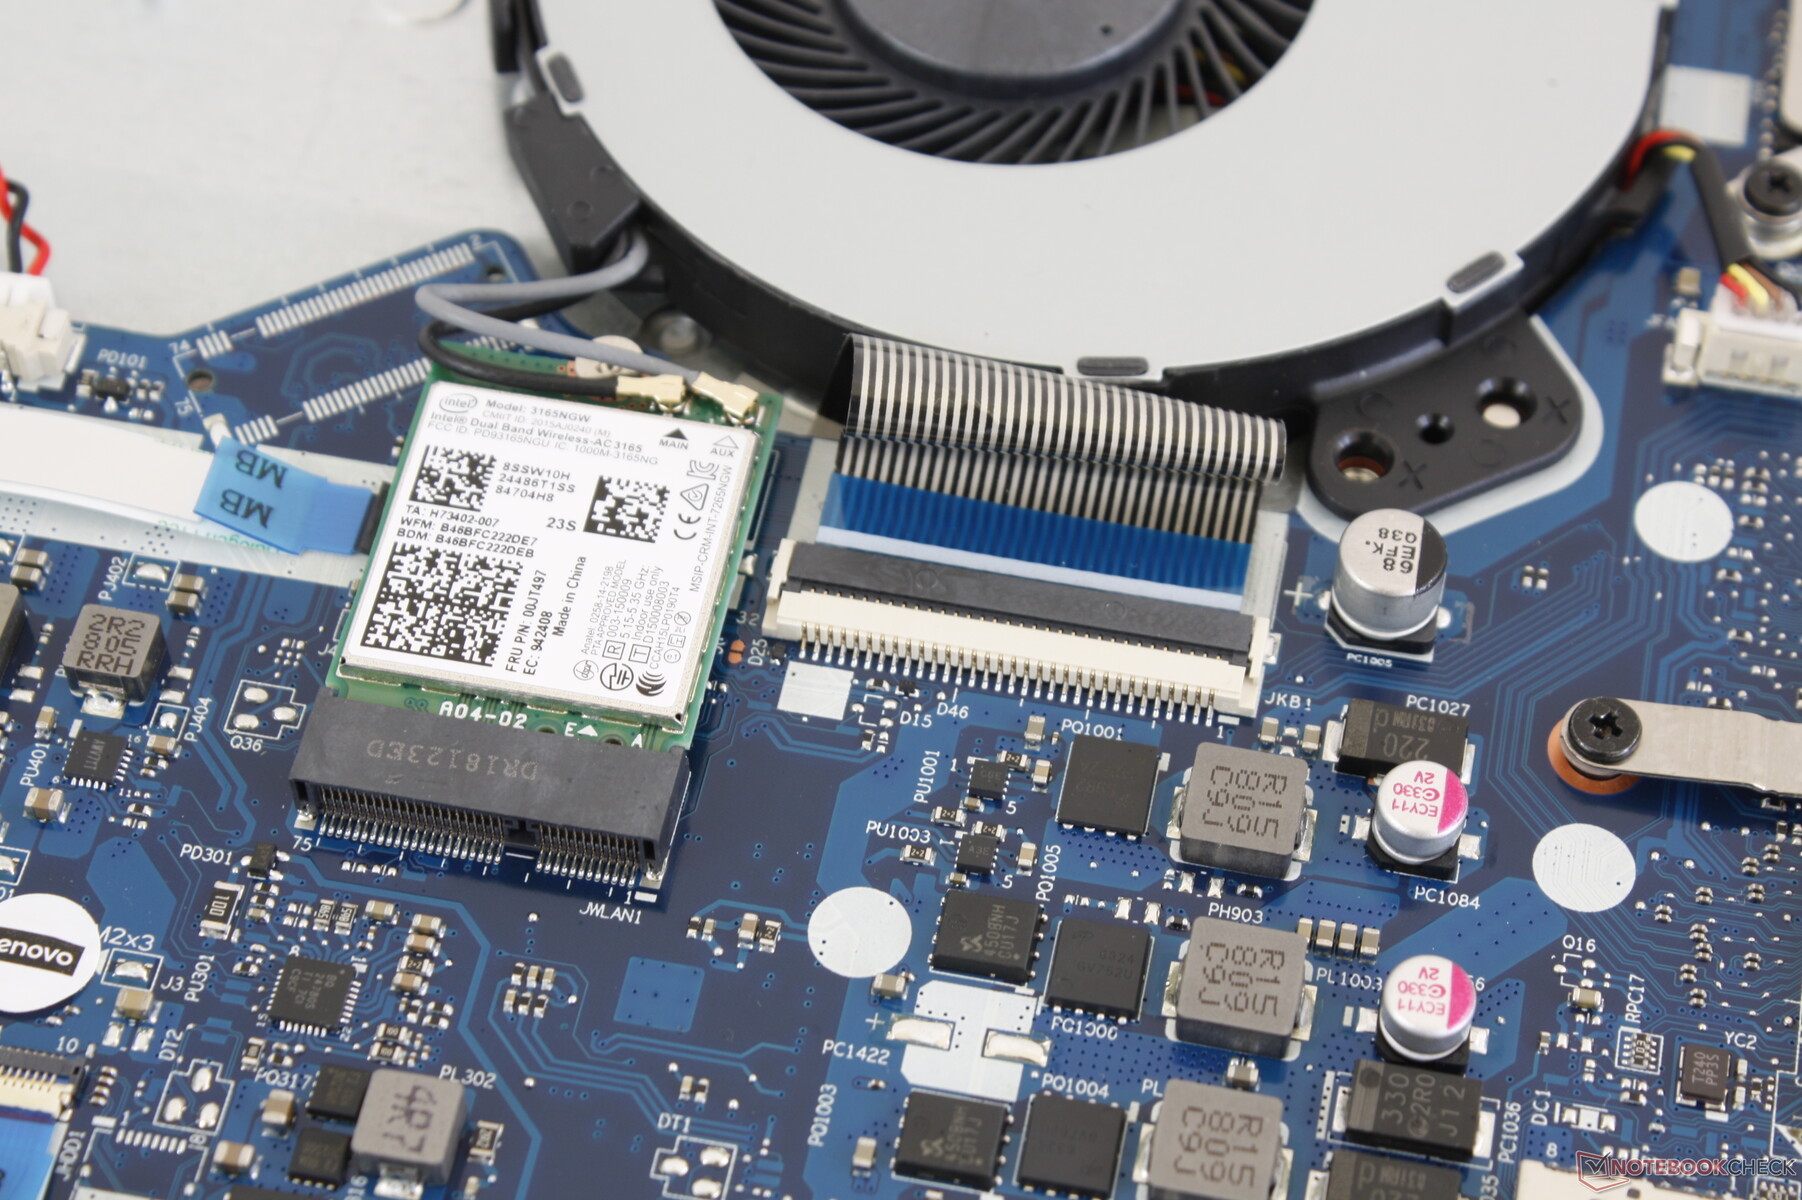
Our test unit comes equipped with an Intel 3165 WLAN module for 802.11ac and Bluetooth 4.2 connectivity. Unlike the 2x2 Intel 9560 on newer Ultrabooks, this 1x1 module offers just one-fourth the maximum transfer rate (433 Mbps vs. 1.73 Gbps). This thankfully does not impact day-to-day web browsing or streaming and we didn't experience any connectivity issues during our time with the unit.
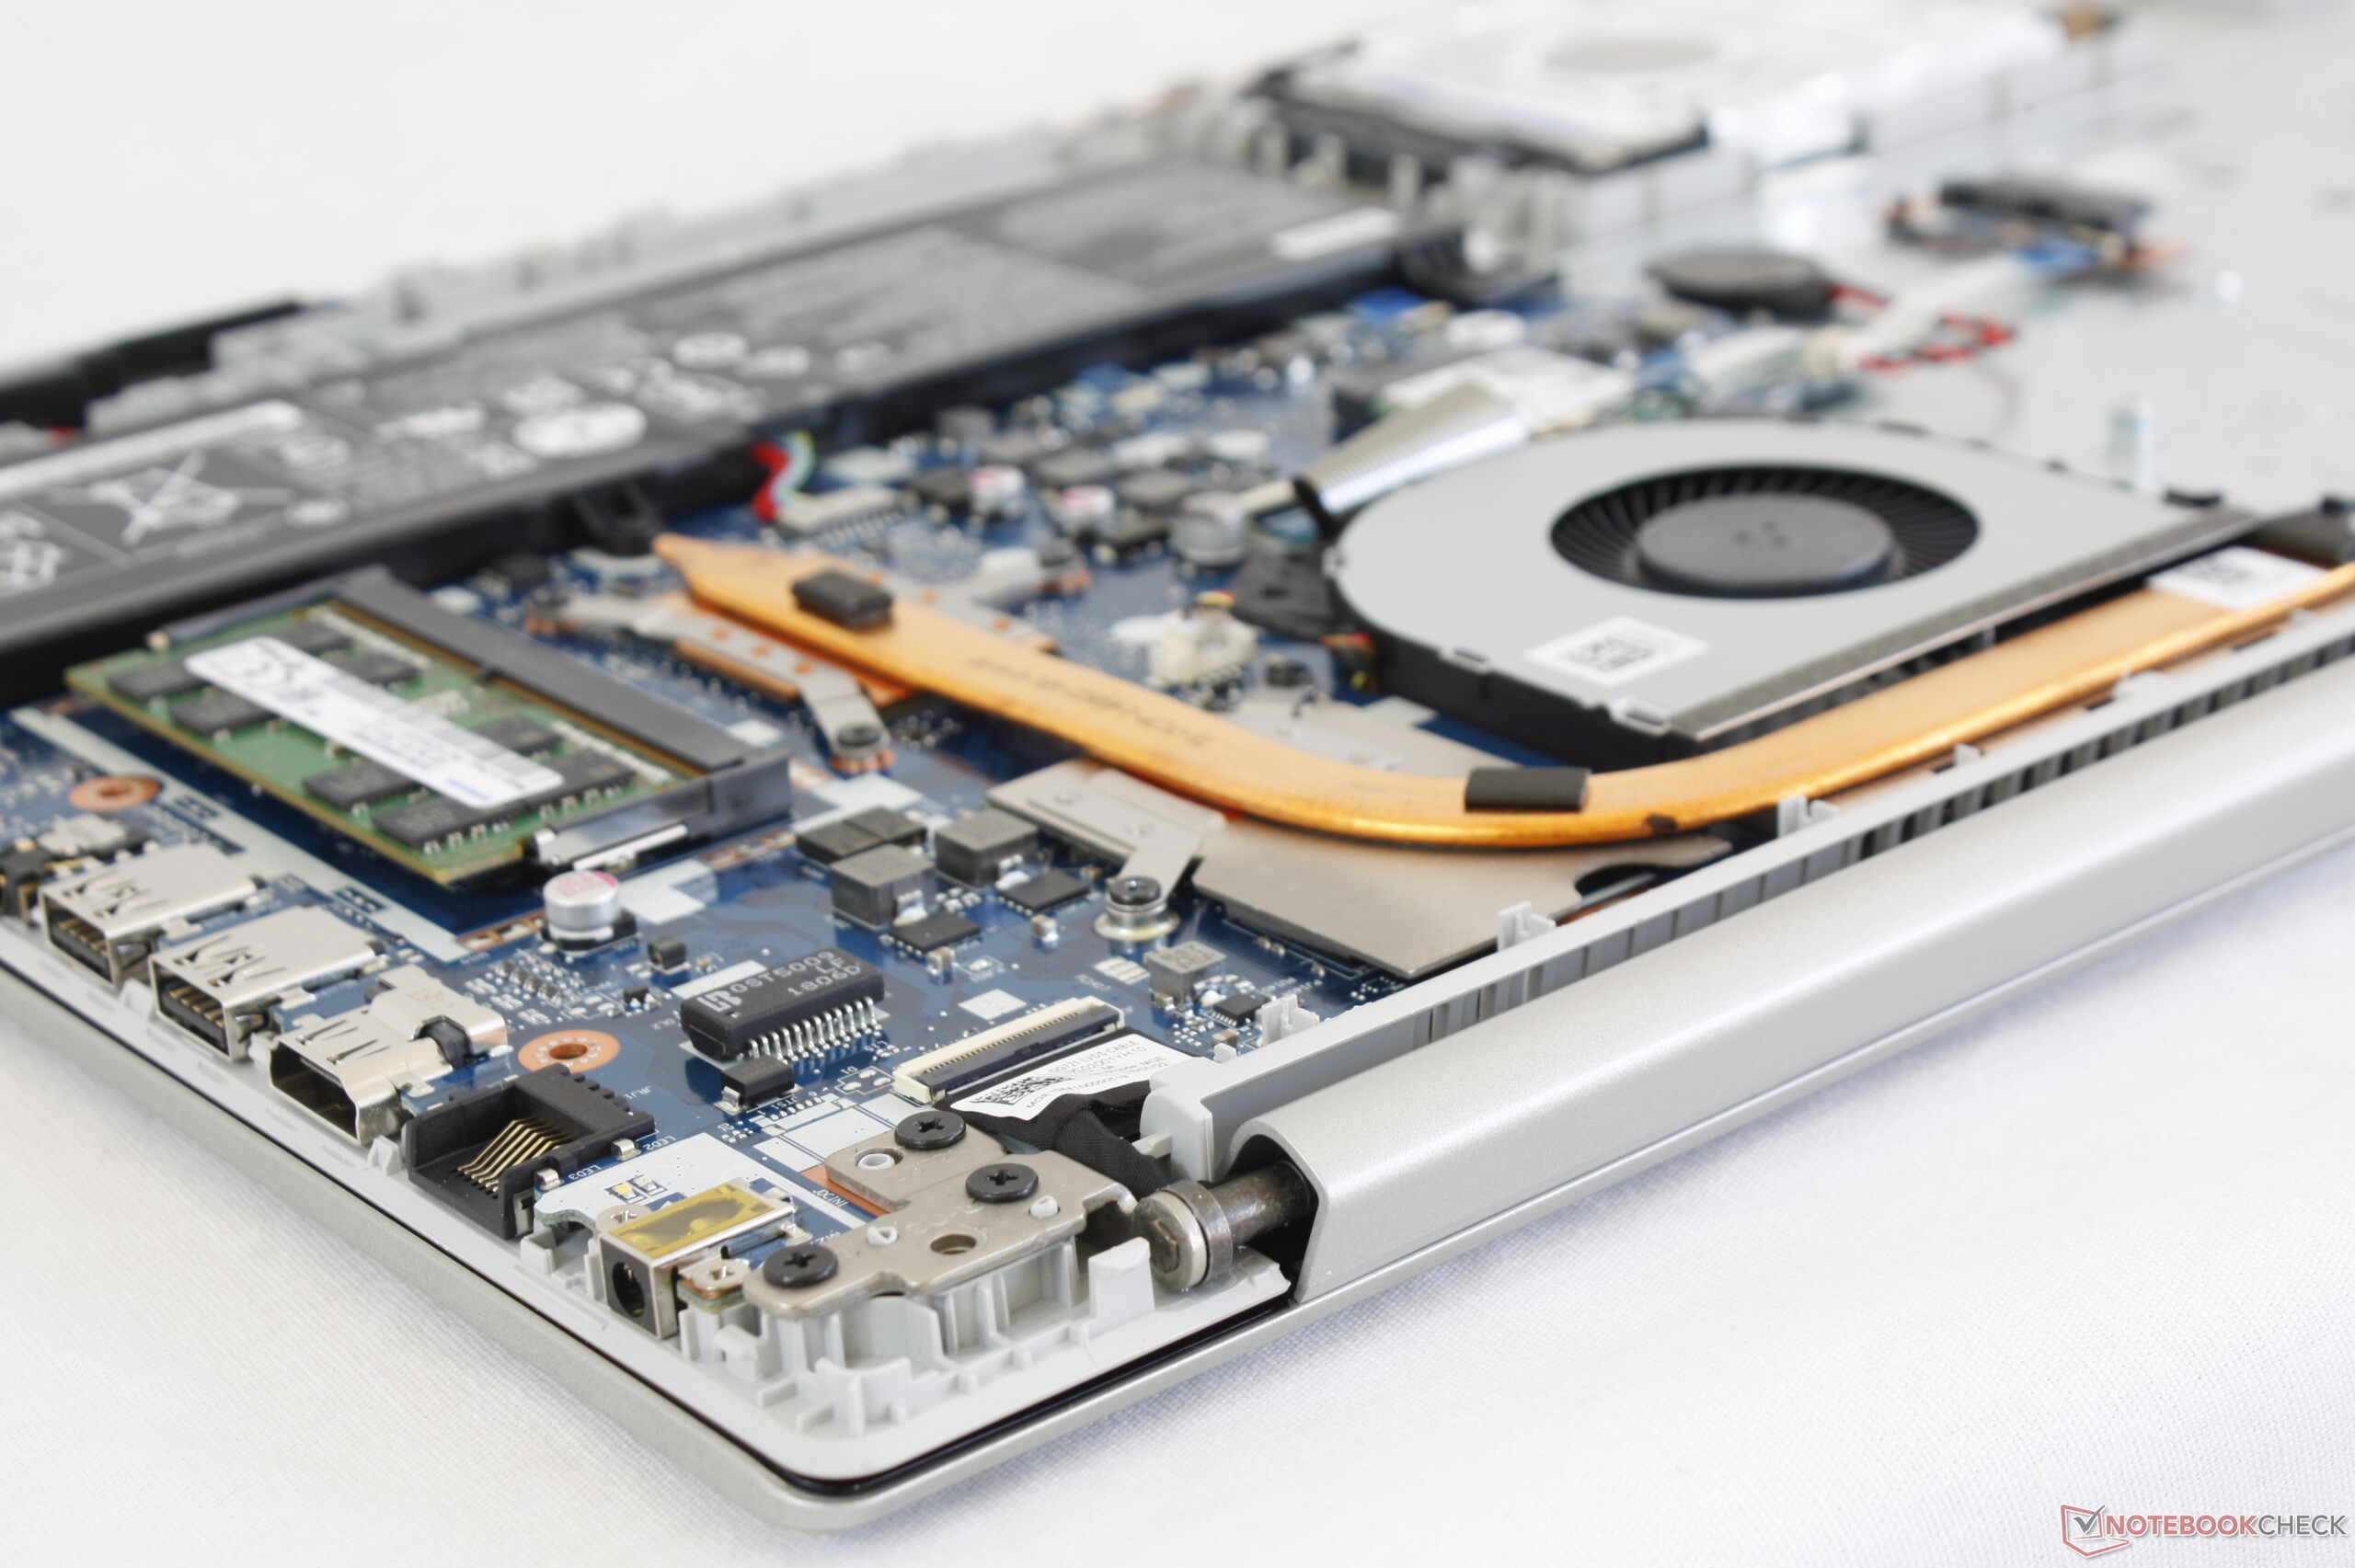
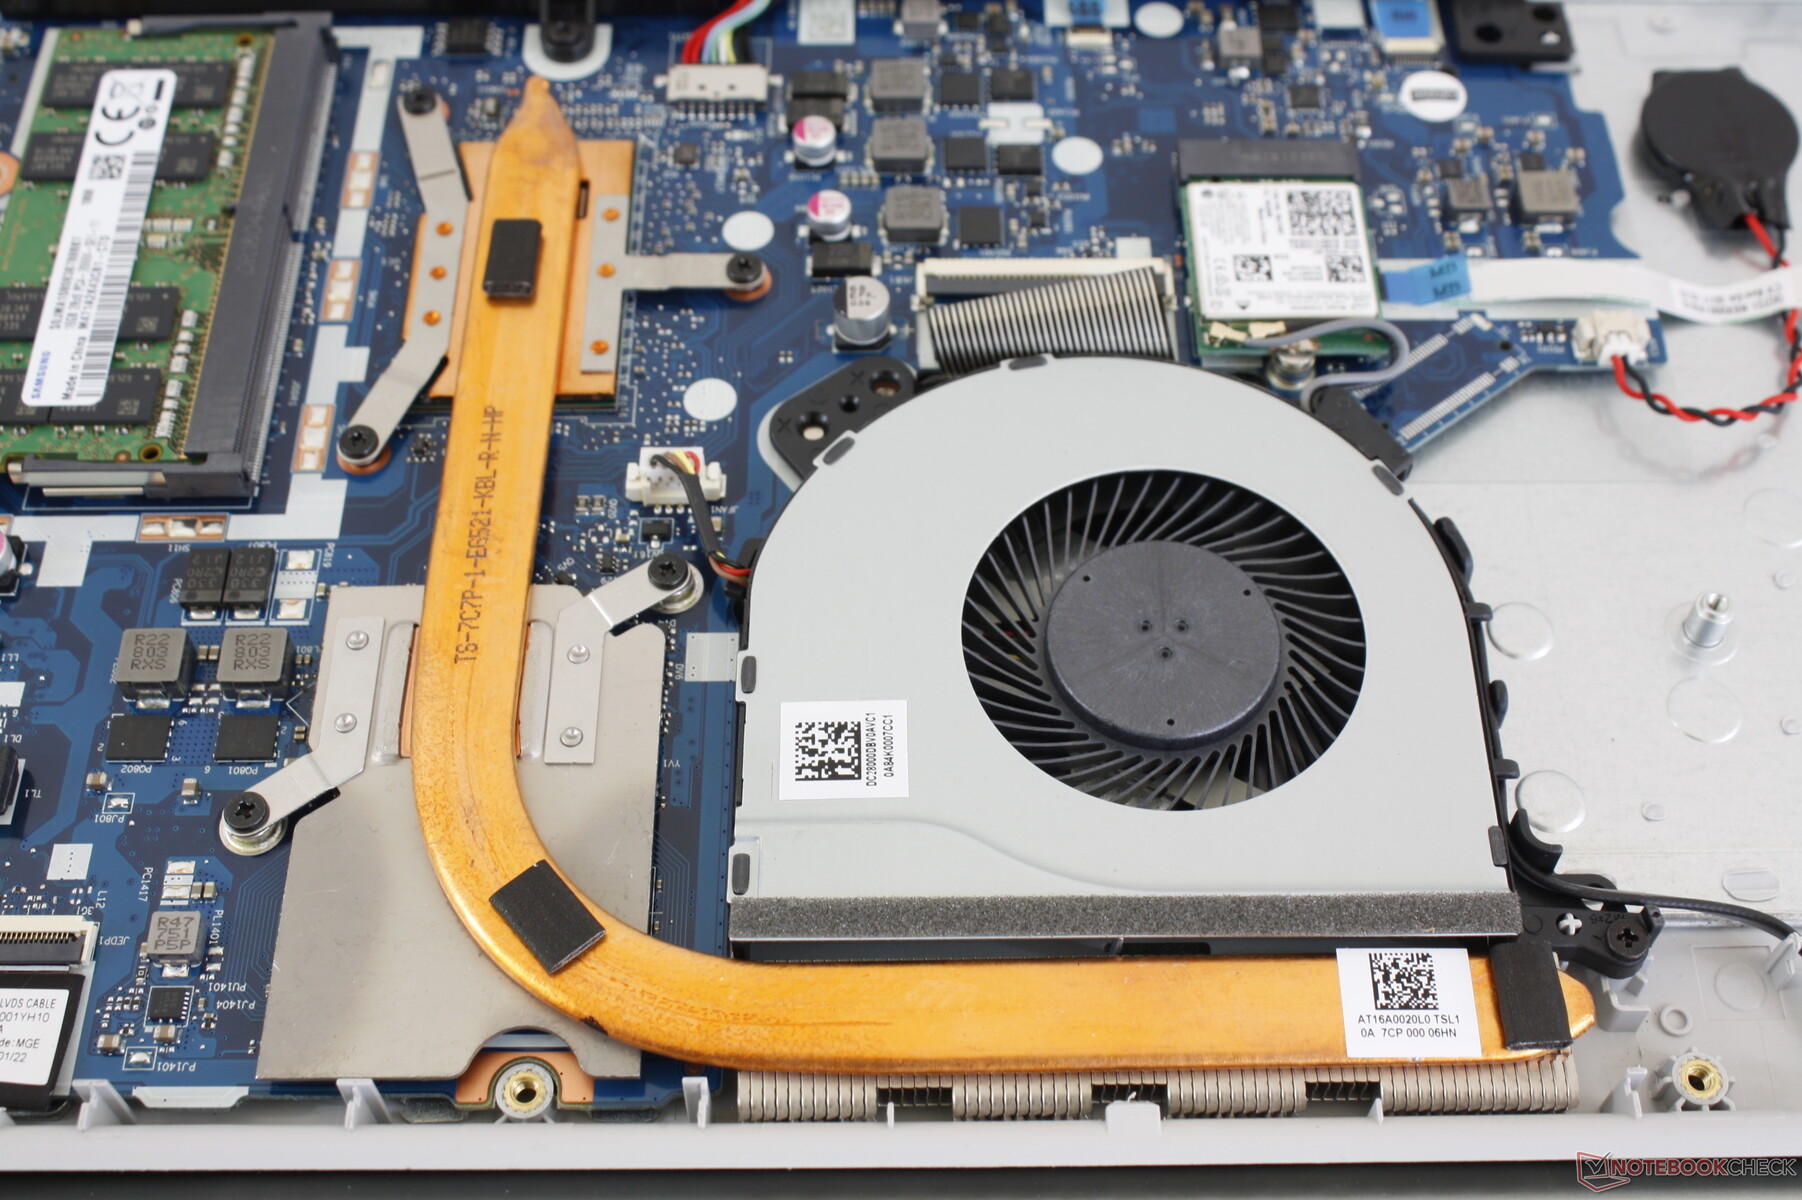
Maintenance
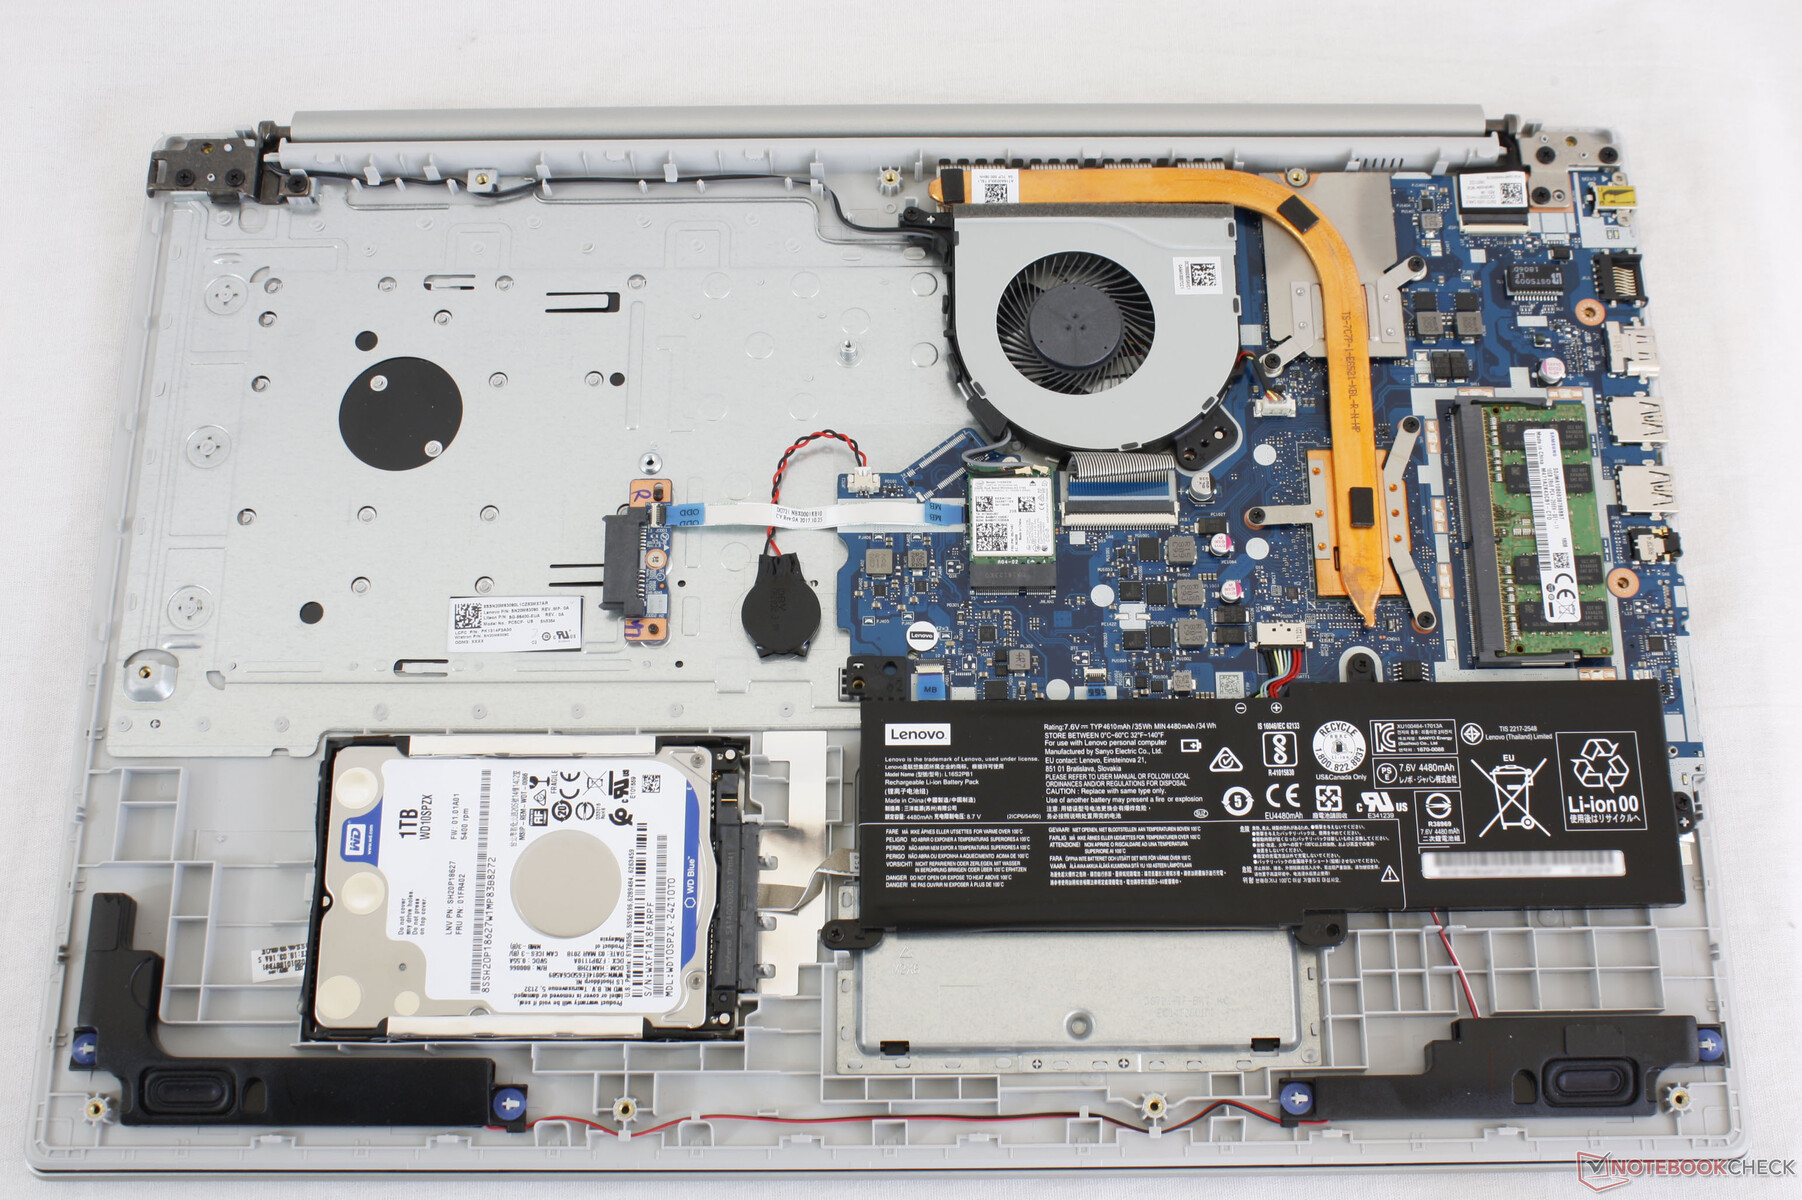
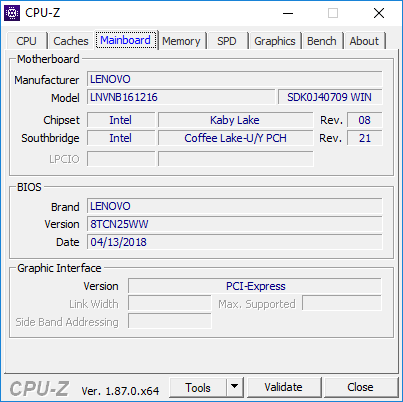
The bottom panel requires a Philips screwdriver and a sharp edge to remove. It's latched tightly around the edges and corners to make end-user servicing more difficult than it should be. Once opened, users have access to just 1x DDR4 SODIMM slot and 1x storage bay. Note the vast amount of space dedicated to the optical drive and the unused space surrounding the small battery.
Accessories and Warranty
There are no included extras in the retail box other than the usual AC adapter and small start guide.
The standard one-year limited warranty applies. Lenovo typically offers a wider range of optional protection packages than smaller OEMs like Asus or Acer.
Input Devices
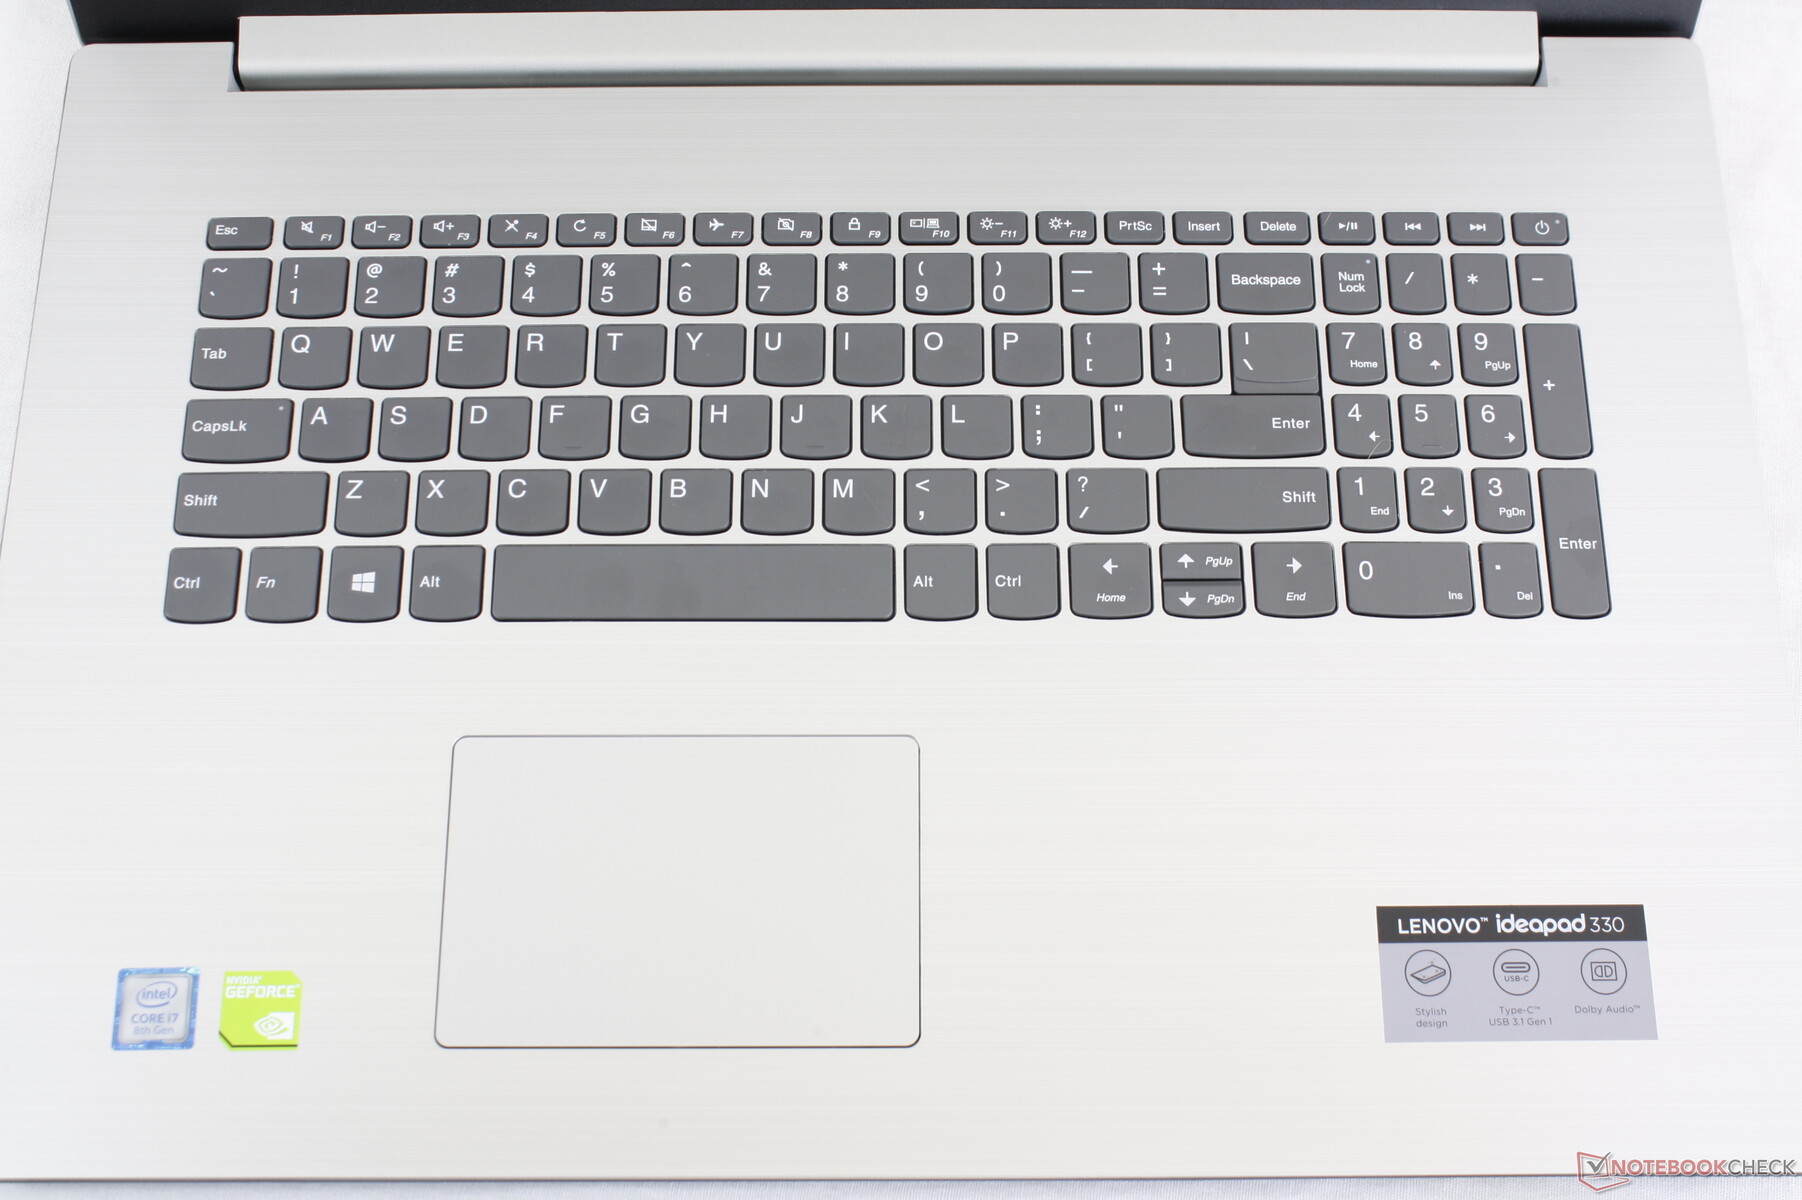
Keyboard
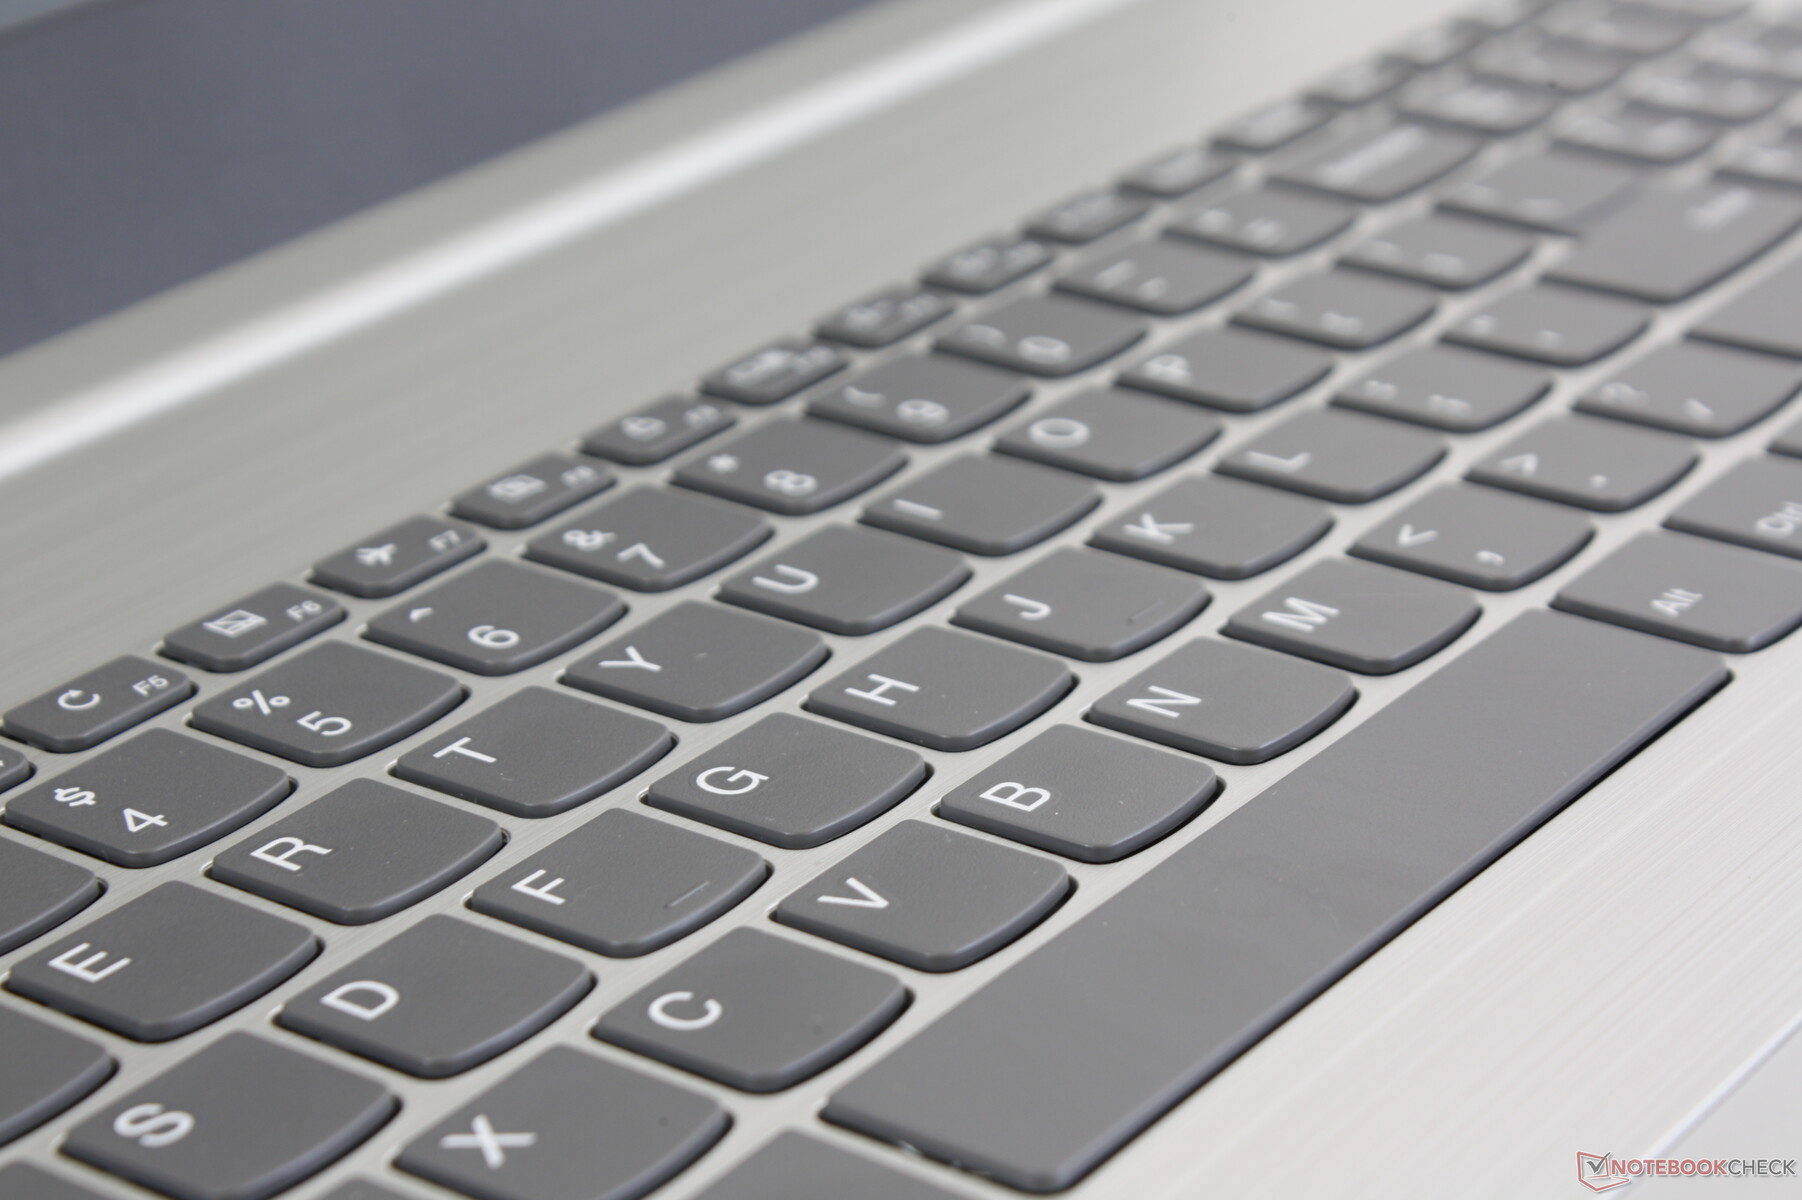
The keyboard keys offer good feedback when pressed including the smaller NumPad keys. Actuation force feels lighter than usual, however, so the keys don't feel as firm or as deep as they could have been unlike on the Lenovo ThinkPad series. Clatter is relatively quiet save for the noticeably louder Enter and Space keys. As for as budget laptops go, the IdeaPad 330 17 keyboard is better than most in its category.
There is no keyboard backlight option.
Touchpad
The multi-touch trackpad (~10.6 x 7 cm) is relatively small considering the large screen size. The trackpad on the 15.6-inch Dell XPS 15, for example, is larger at 10.5 x 8.5 cm. Its surface is smooth with no cursor jumping when gliding slowly or quickly. There appears to be no Microsoft Precision support.
Whereas the trackpad is decent for cursor movement, the integrated mouse keys are poor and representative of the budget laptop category. Feedback is soft, spongy, and rather difficult to press. The auditory click in particular feels hollow for a cheap impression.
Display

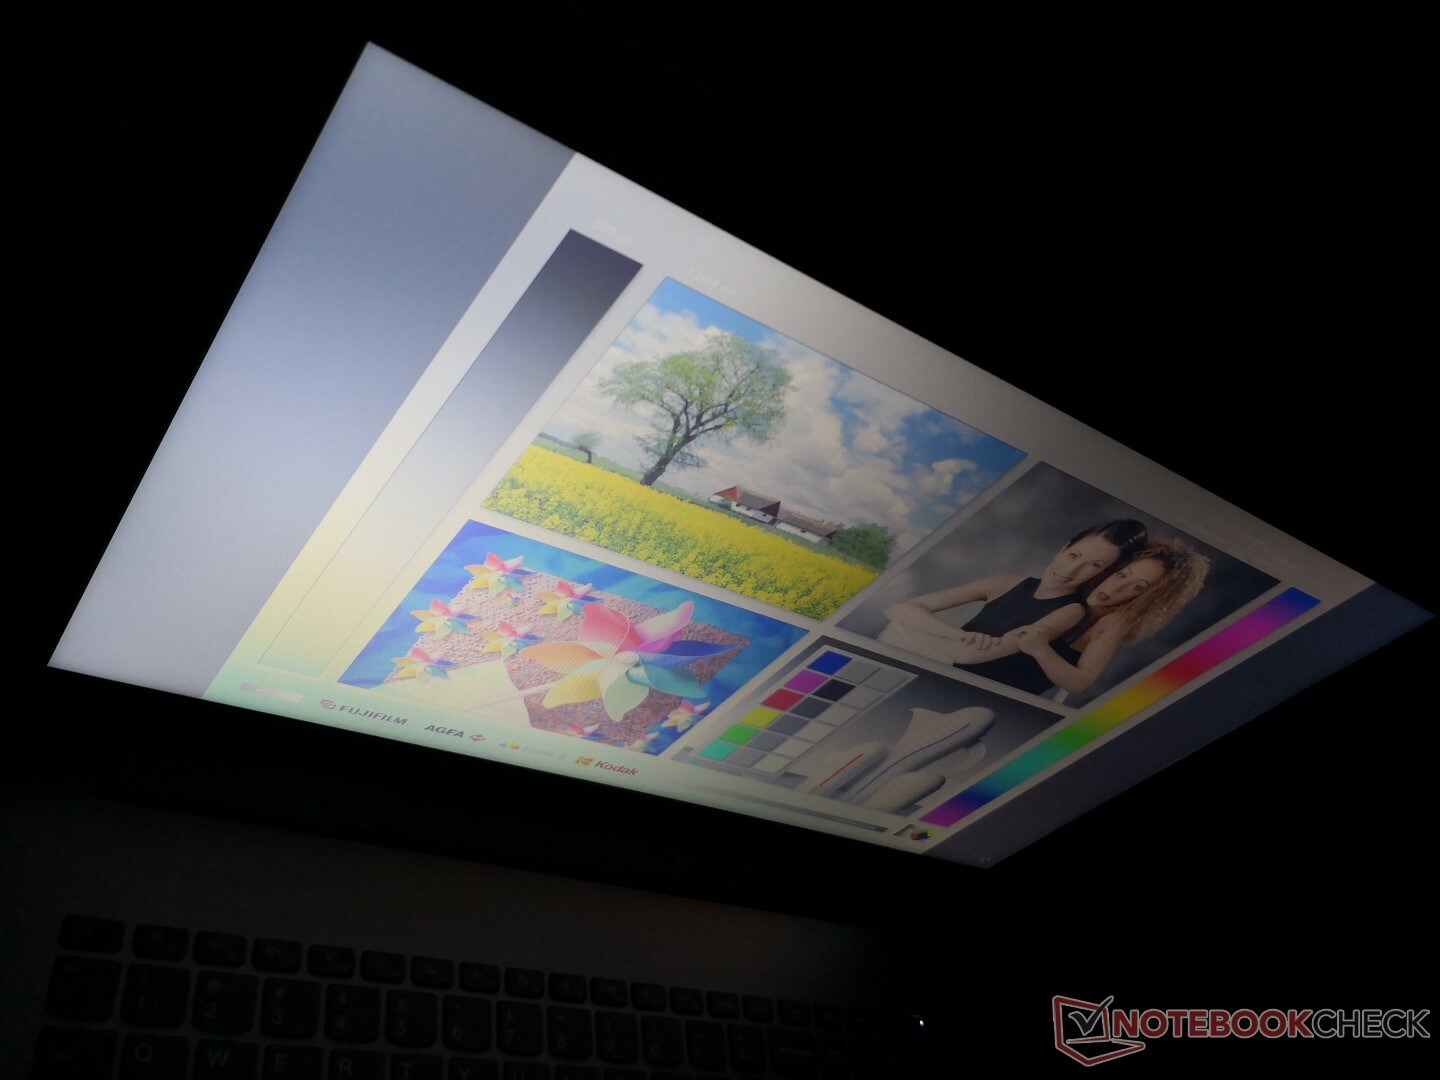
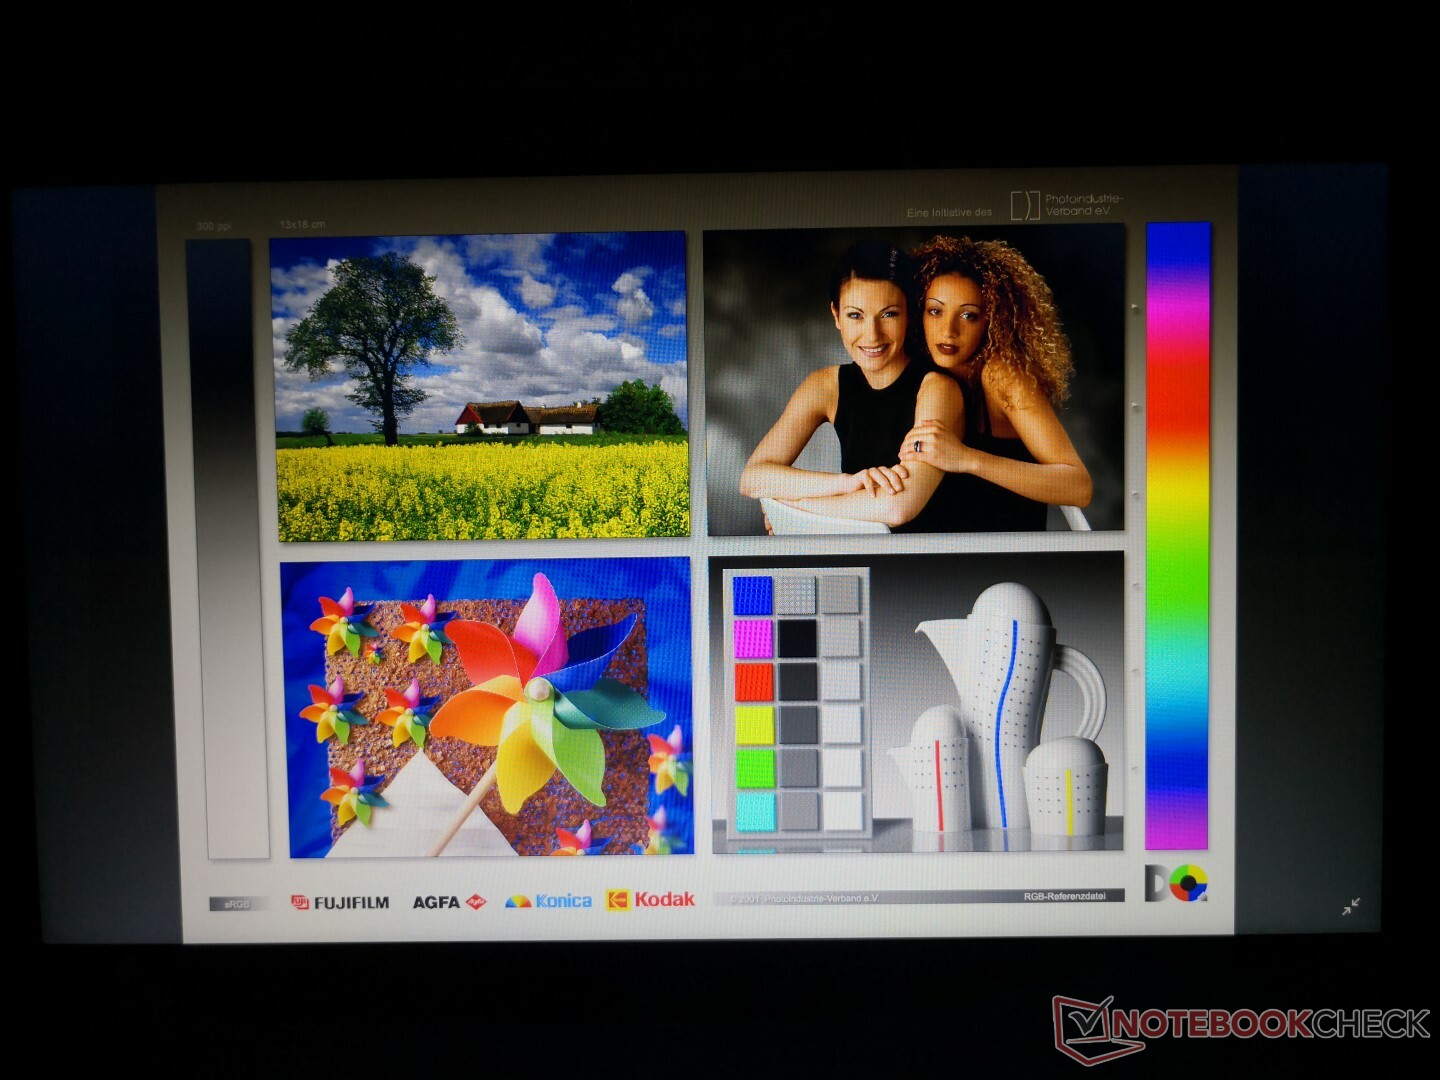
Lenovo IdeaPad laptops are traditionally equipped with cheap displays and the IdeaPad 330 17 is no exception. The matte HD+ panel here offers low PPI for blocky texts and images, low contrast ratio for poor colors and blacks, and low brightness for poor outdoor visibility. Perhaps the one saving grace is its relatively fast black-white and gray-gray response times for fewer ghosting issues when compared to traditional IPS panels on competing systems. Even so, we don't think this makes up for the generally poor visual experience.
The BOE0685 TN panel on our unit can be found on no other laptop in our database.
Moderate-to-heavy graininess is apparent on our test unit to reduce sharpness even further. We're disappointed to not see any significant improvements over the 2016 IdeaPad V110-17IKB in terms of display quality.
| |||||||||||||||||||||||||
Brightness Distribution: 94 %
Center on Battery: 210.5 cd/m²
Contrast: 334:1 (Black: 0.63 cd/m²)
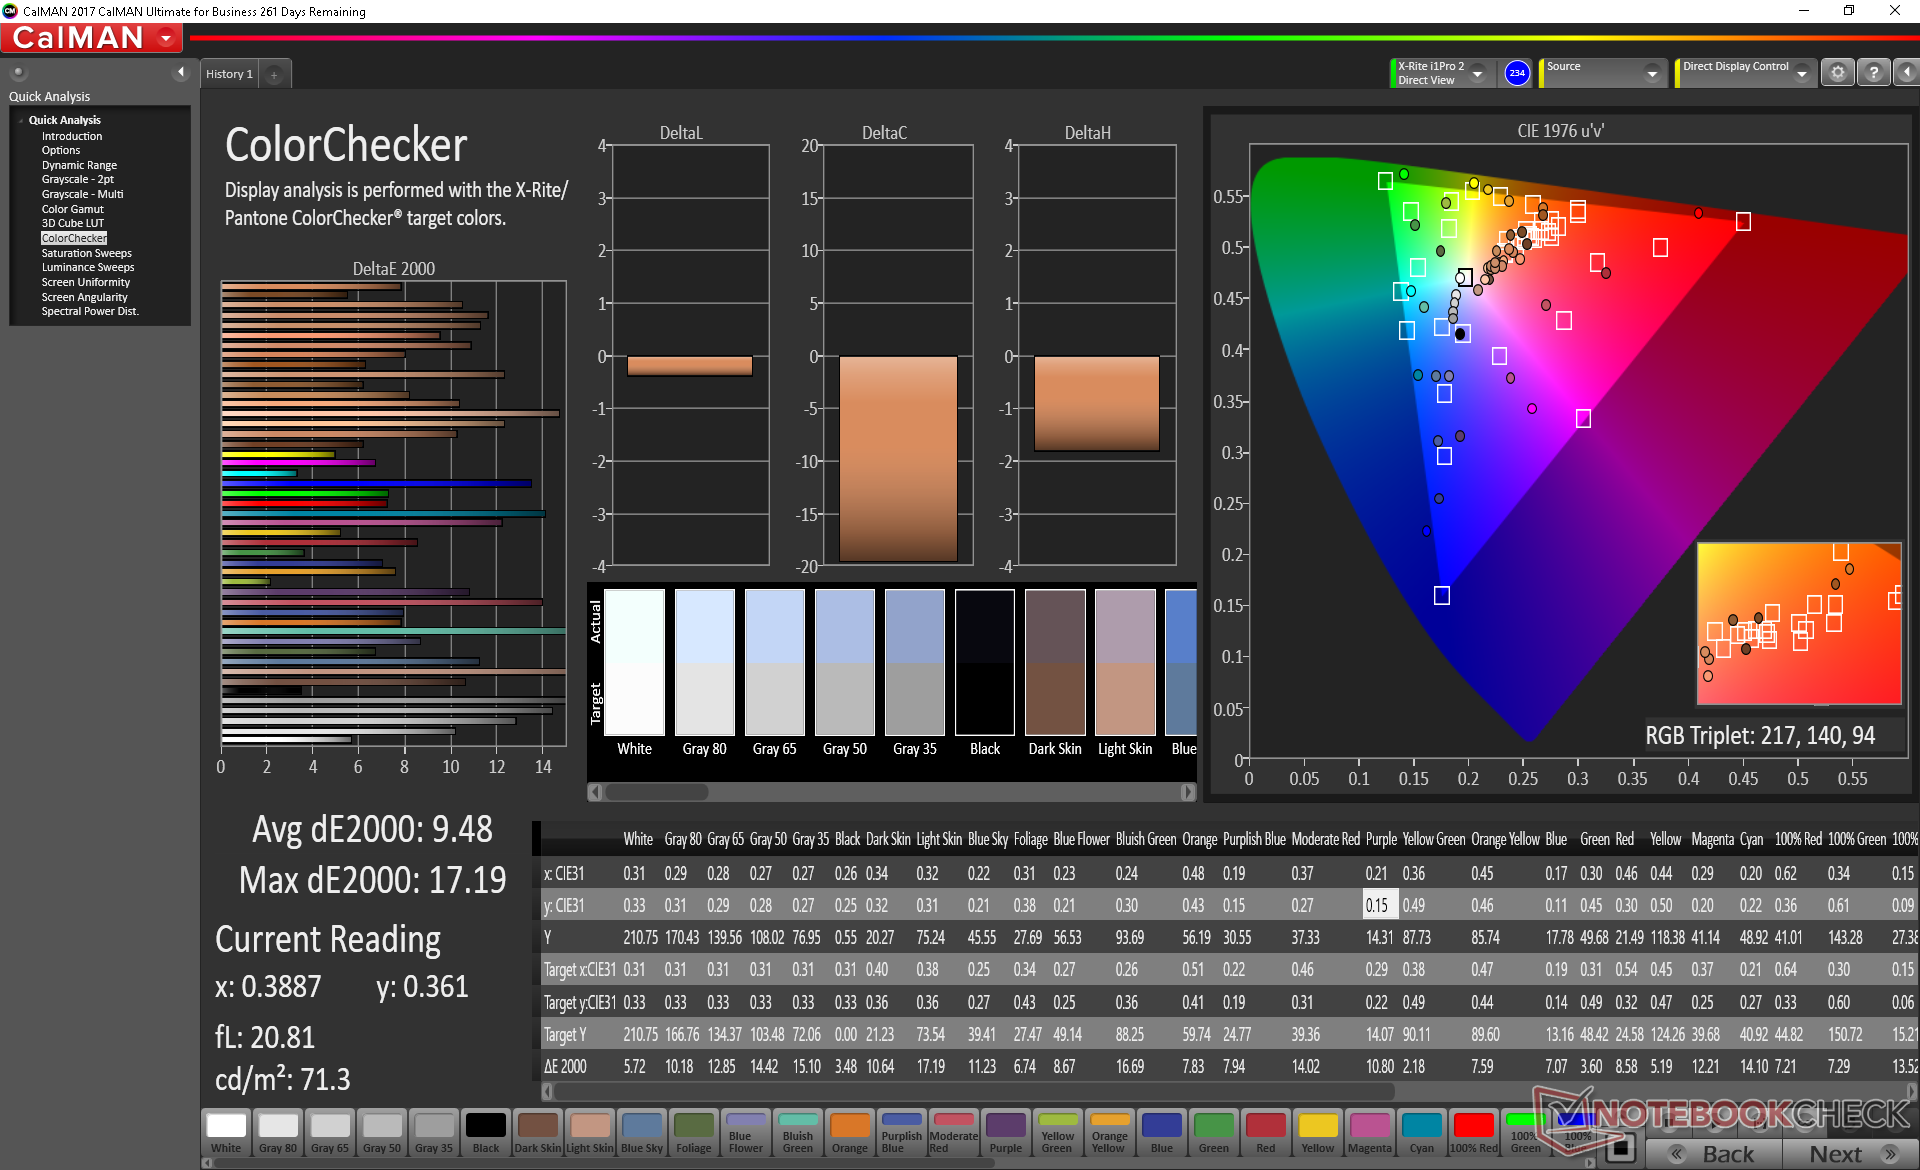
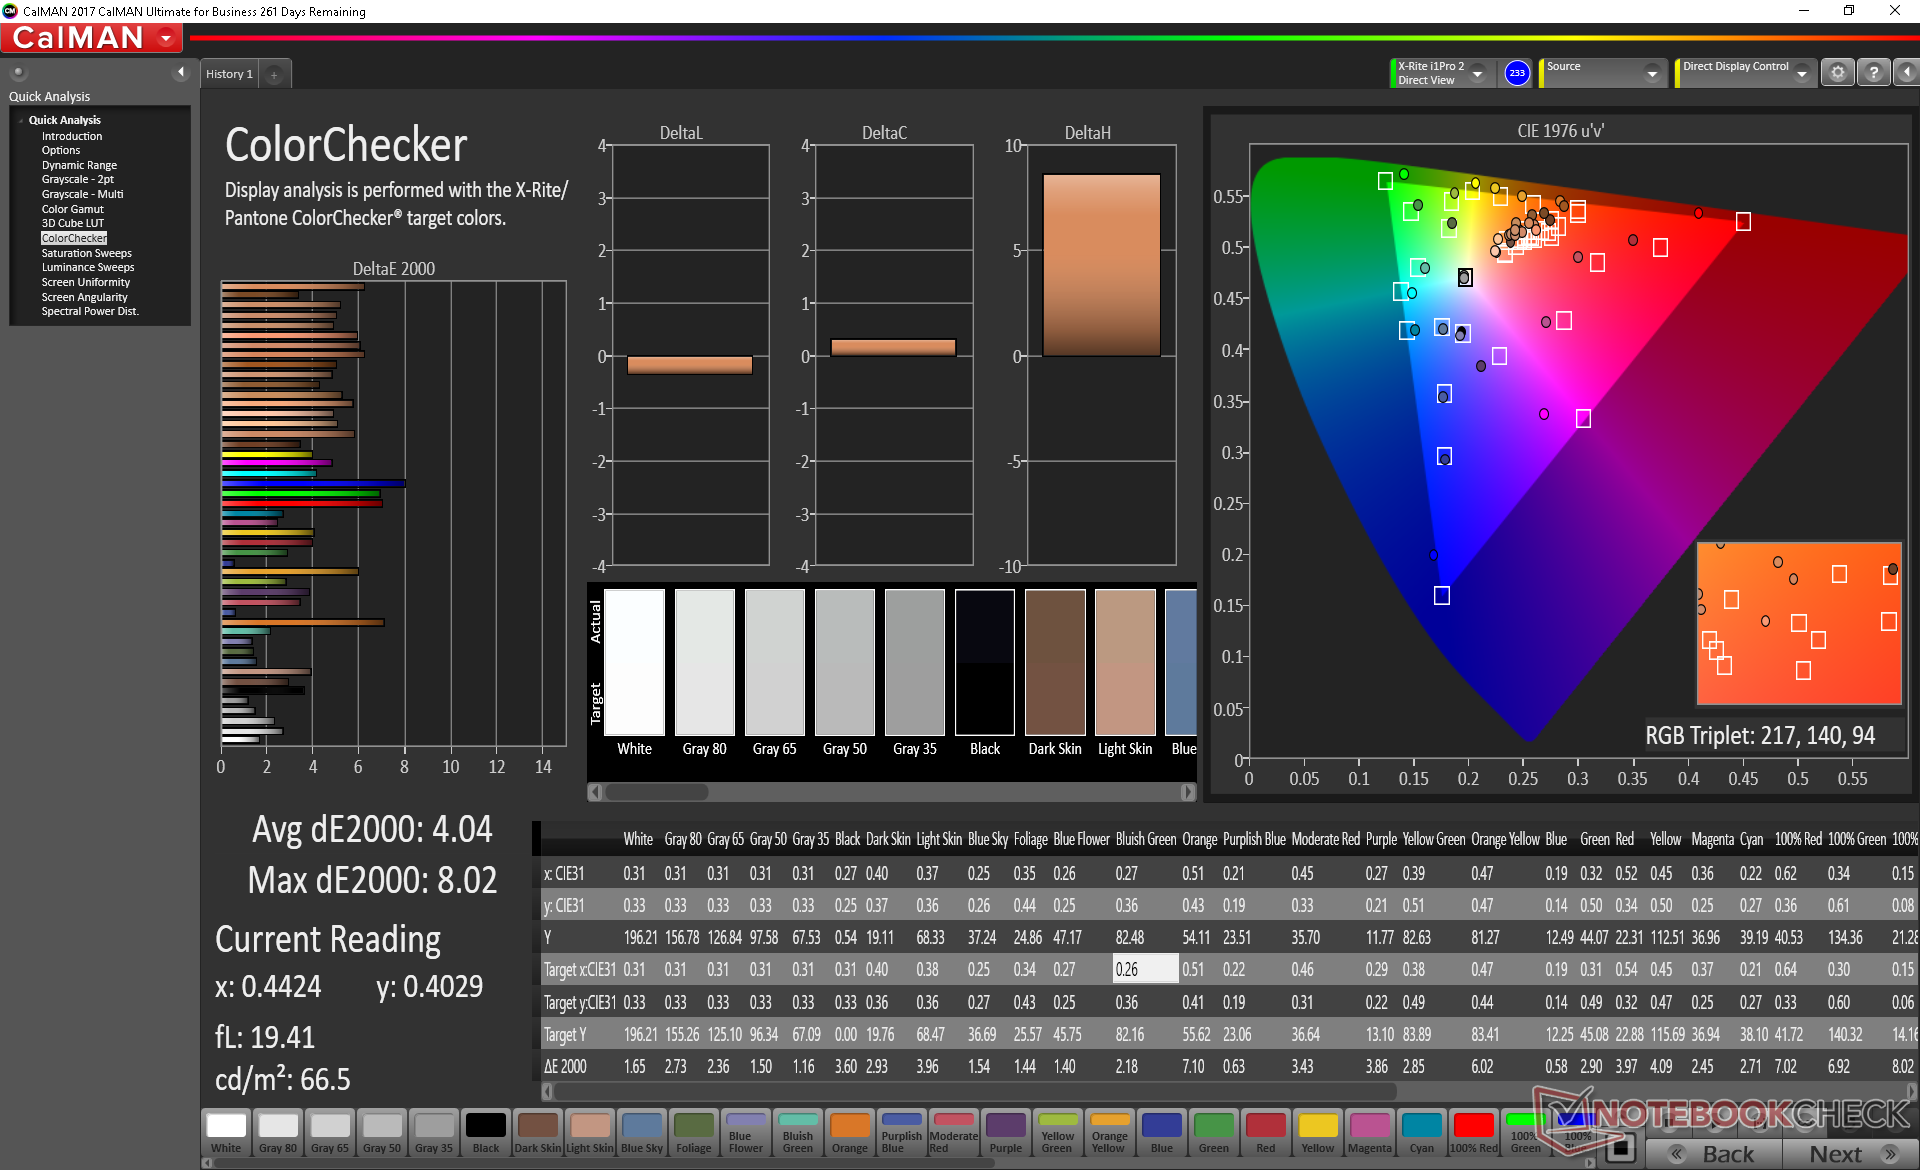
ΔE ColorChecker Calman: 9.48 | ∀{0.5-29.43 Ø4.71}
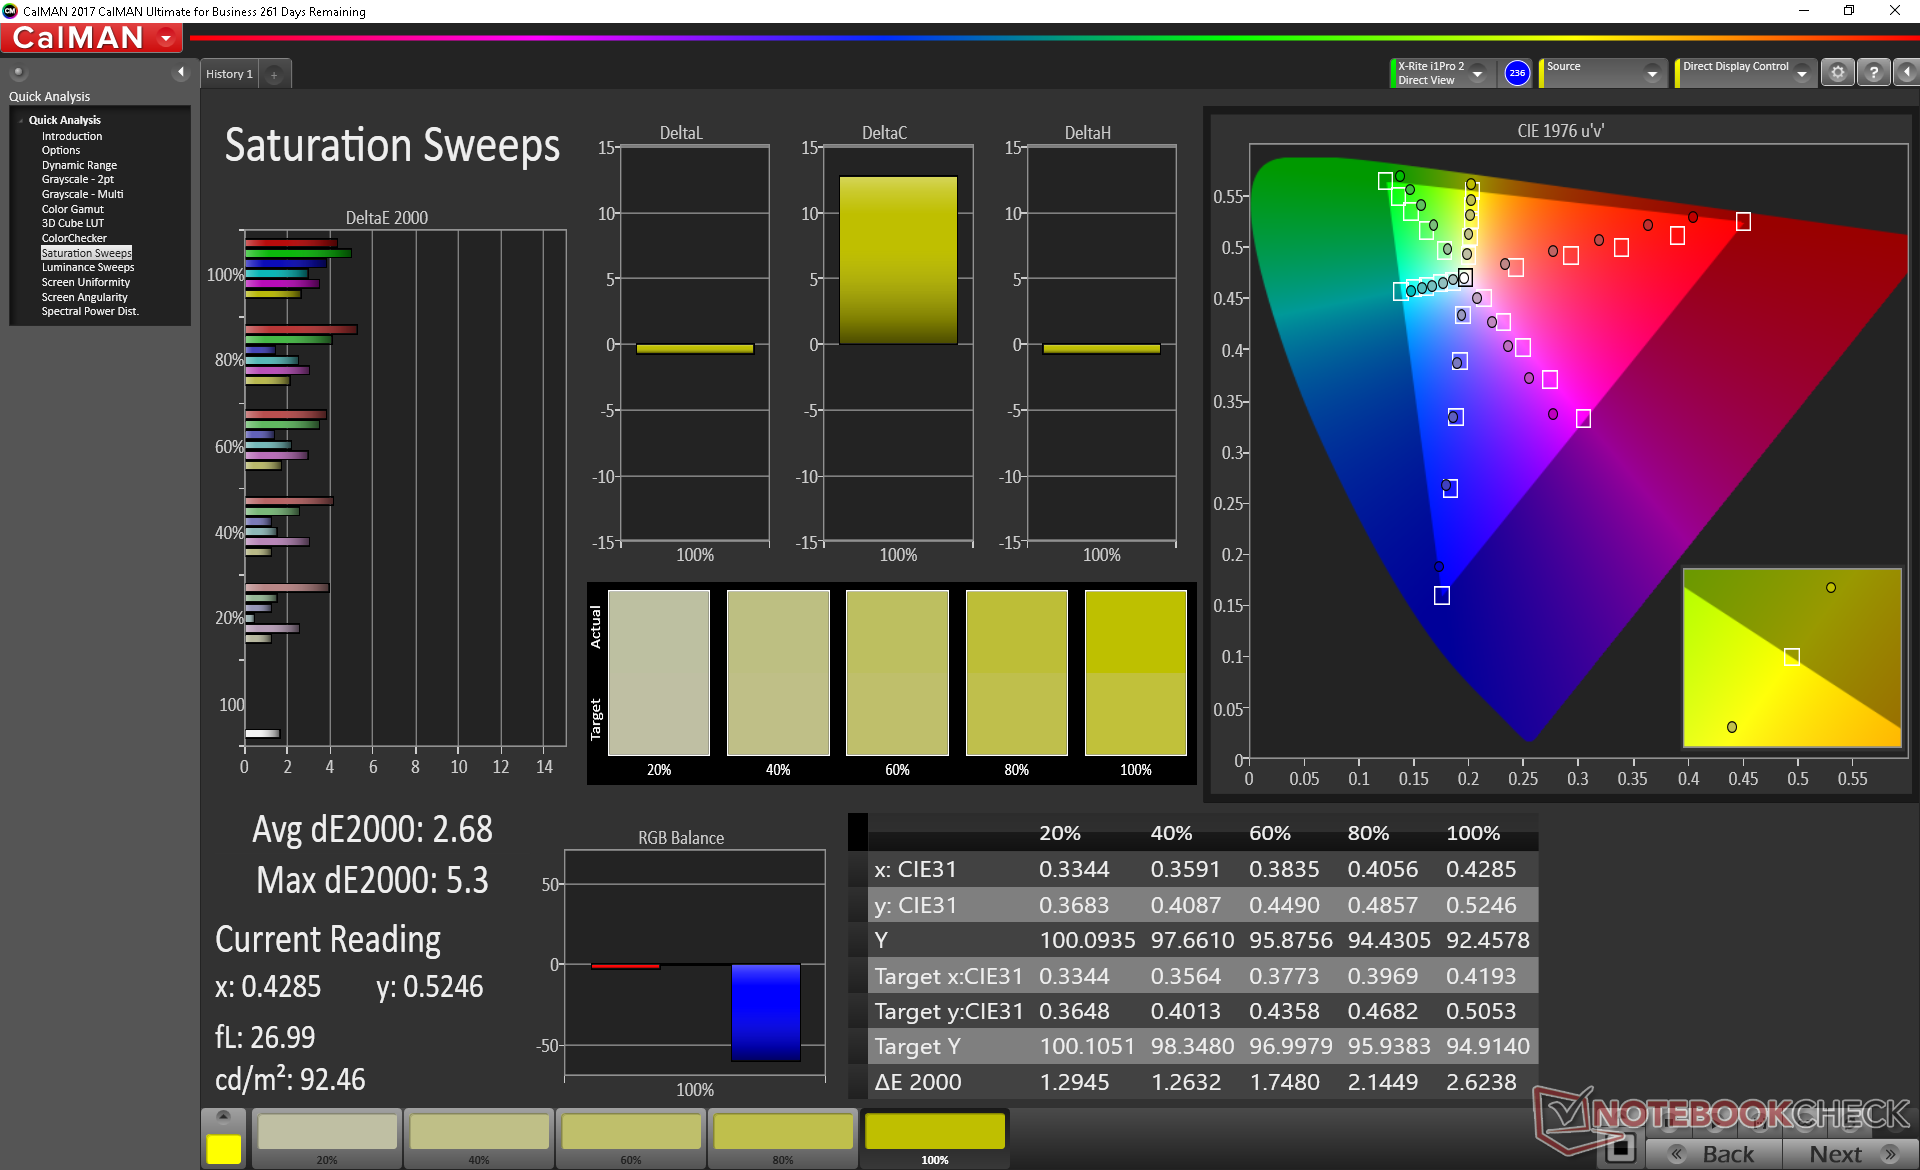
calibrated: 4.04
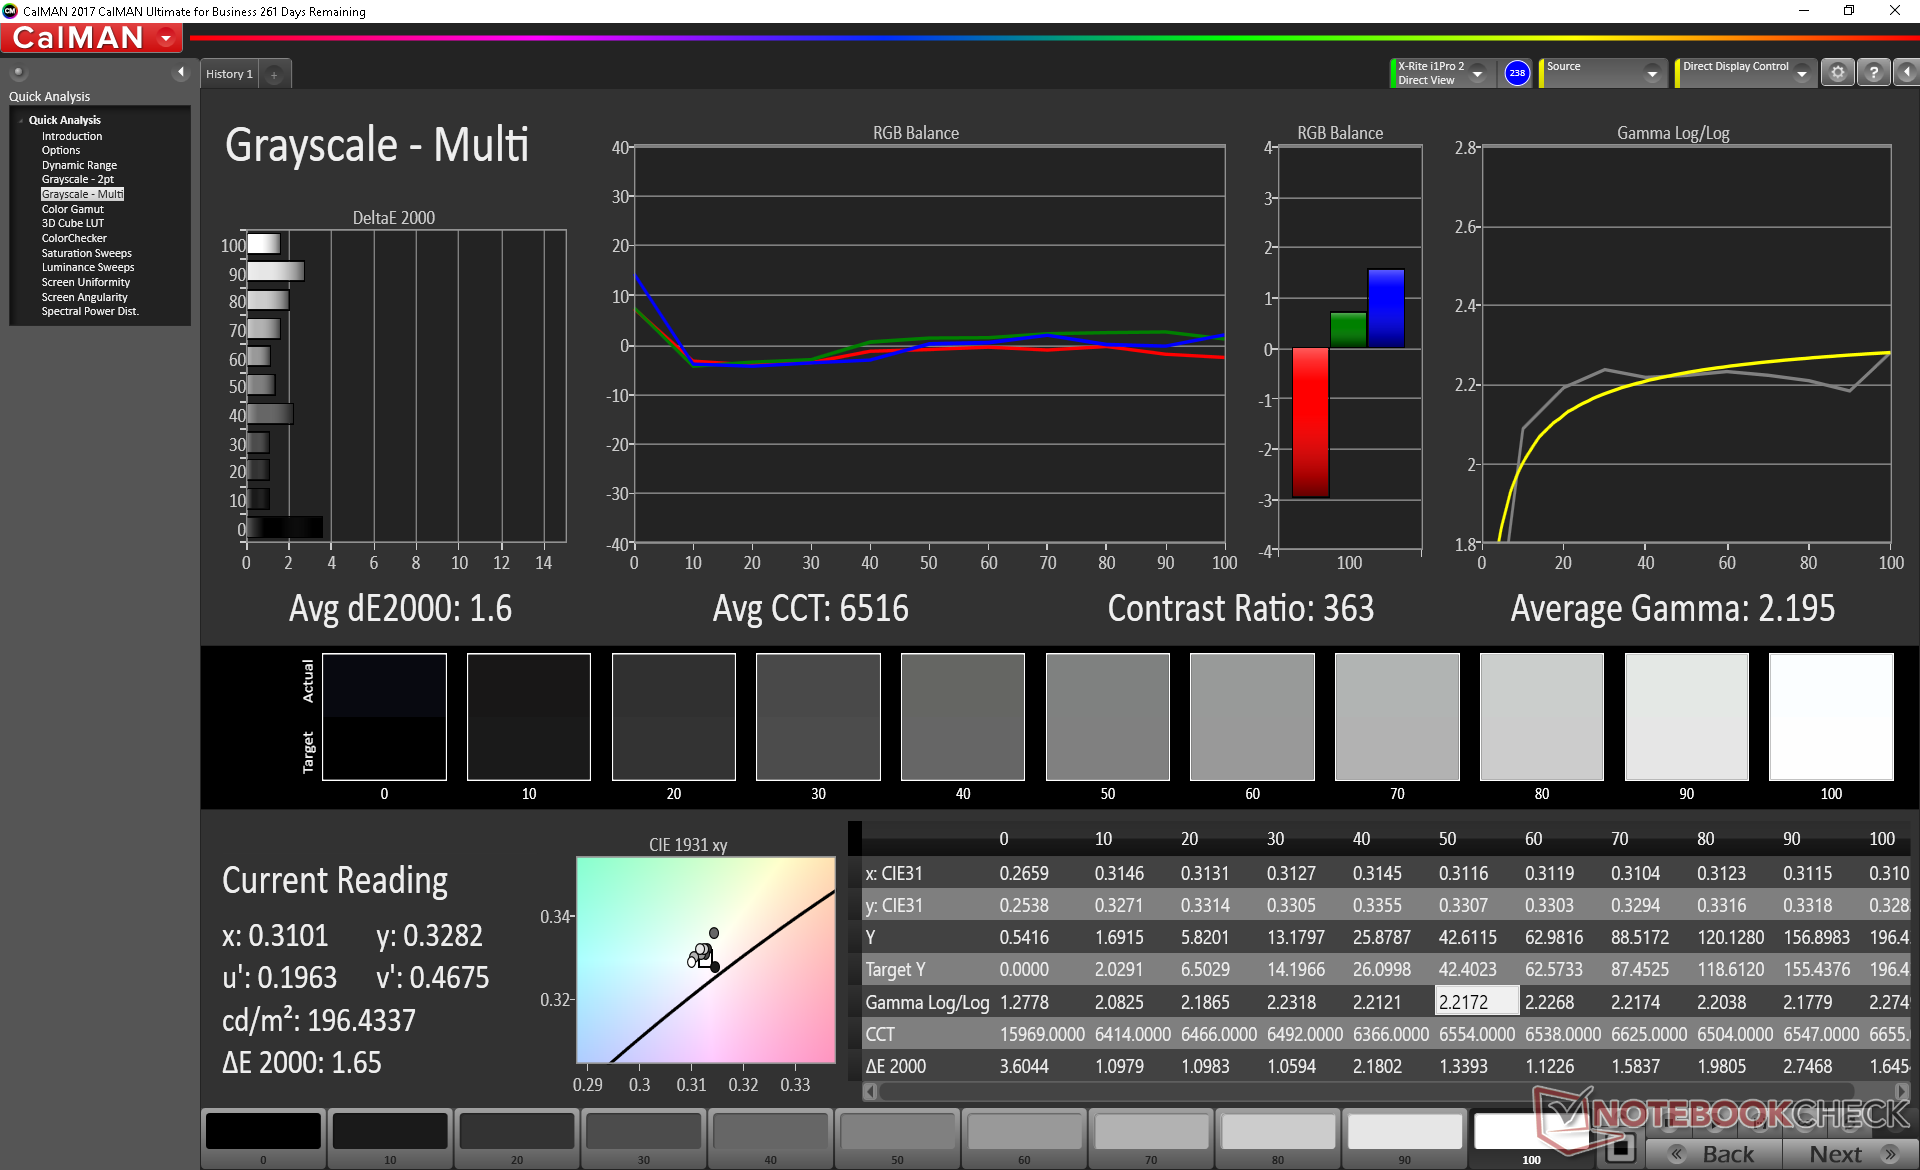
ΔE Greyscale Calman: 12 | ∀{0.09-98 Ø4.96}
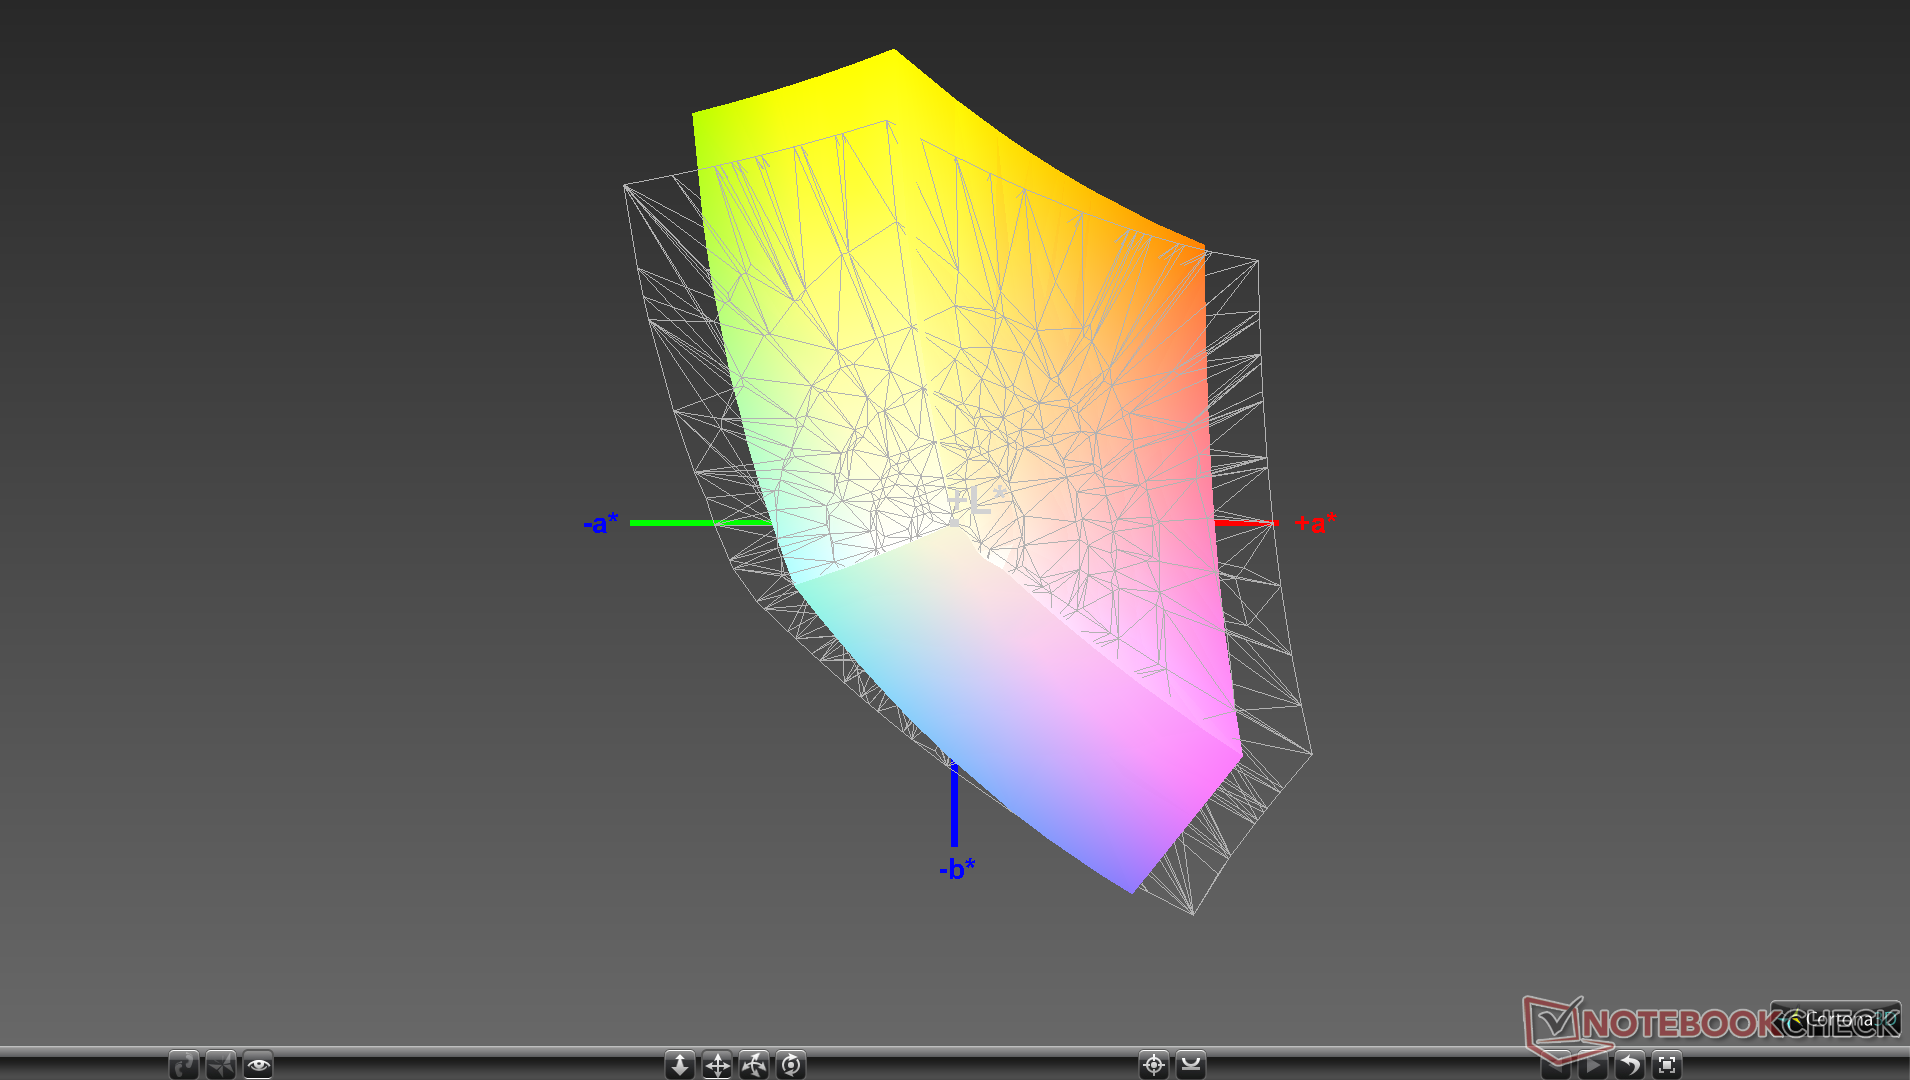
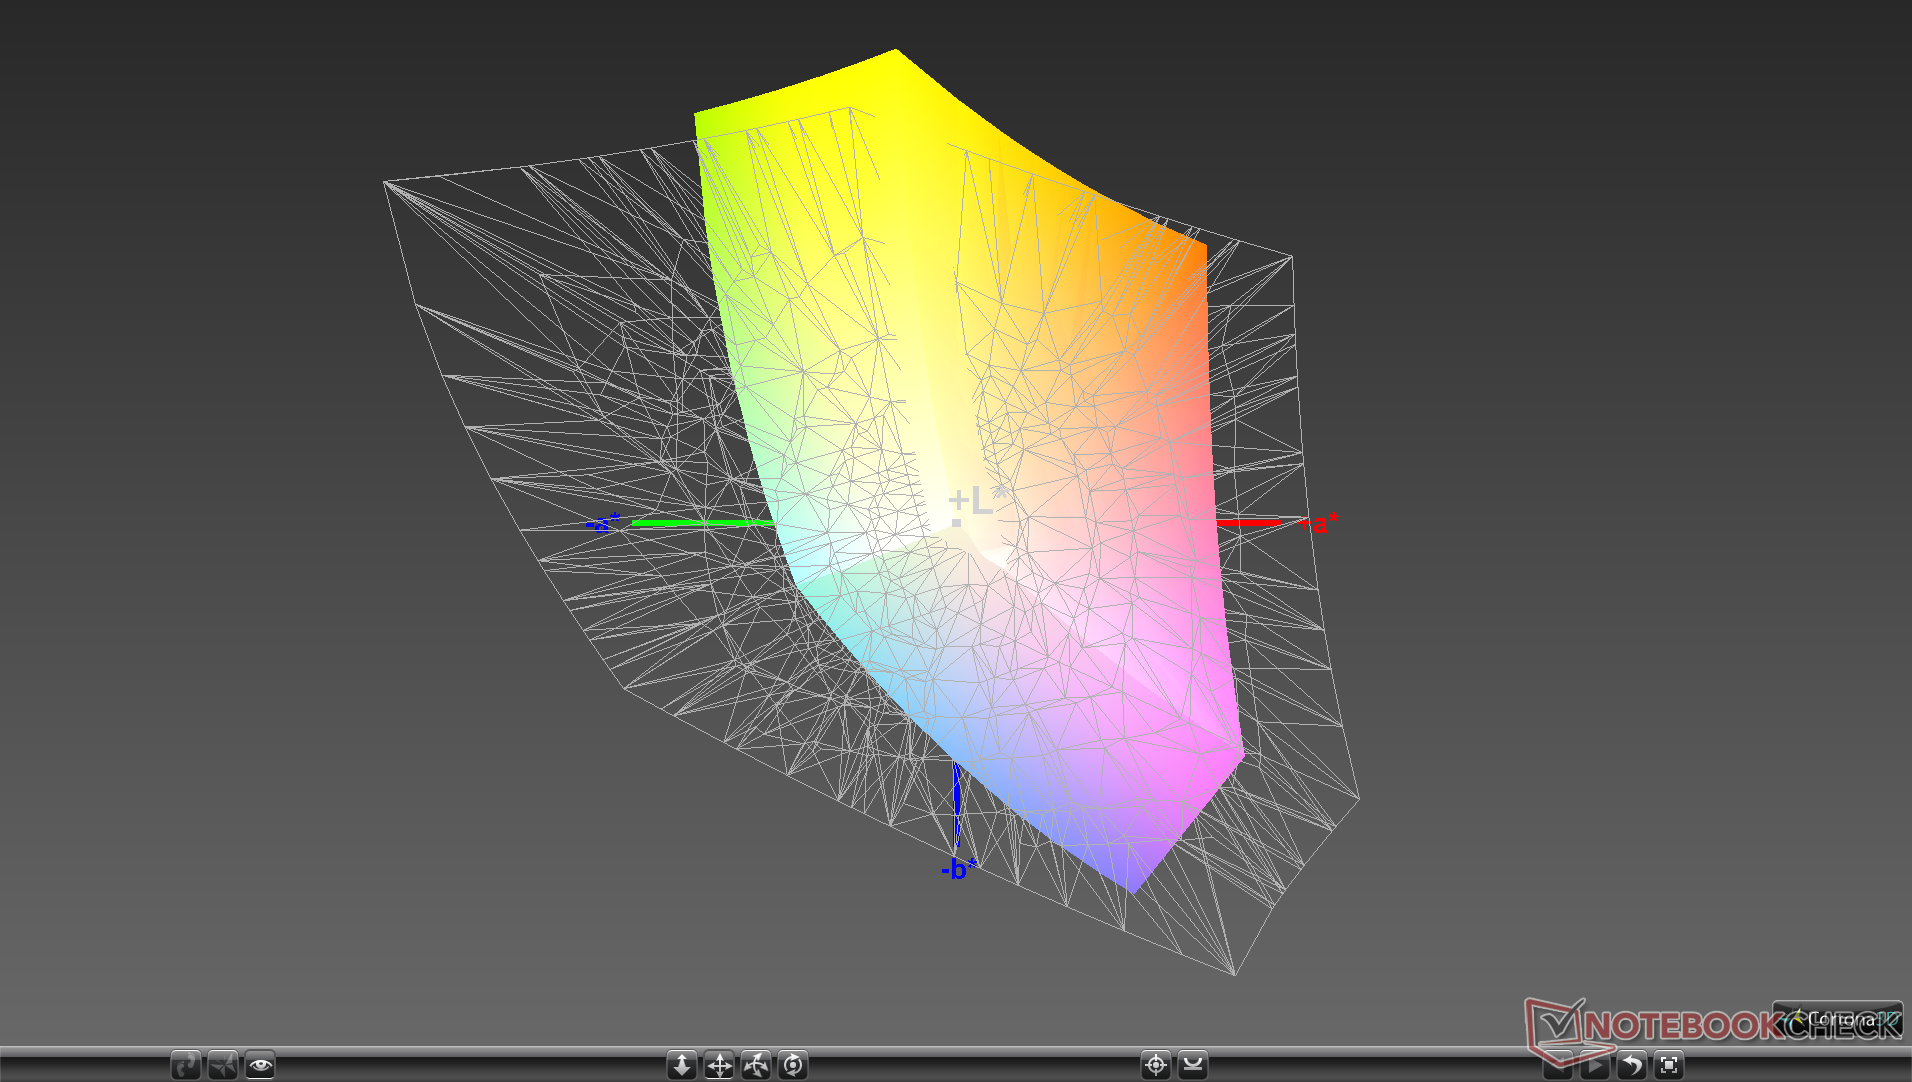
75.8% sRGB (Argyll 1.6.3 3D)
49.4% AdobeRGB 1998 (Argyll 1.6.3 3D)
55.9% AdobeRGB 1998 (Argyll 3D)
76.3% sRGB (Argyll 3D)
56.9% Display P3 (Argyll 3D)
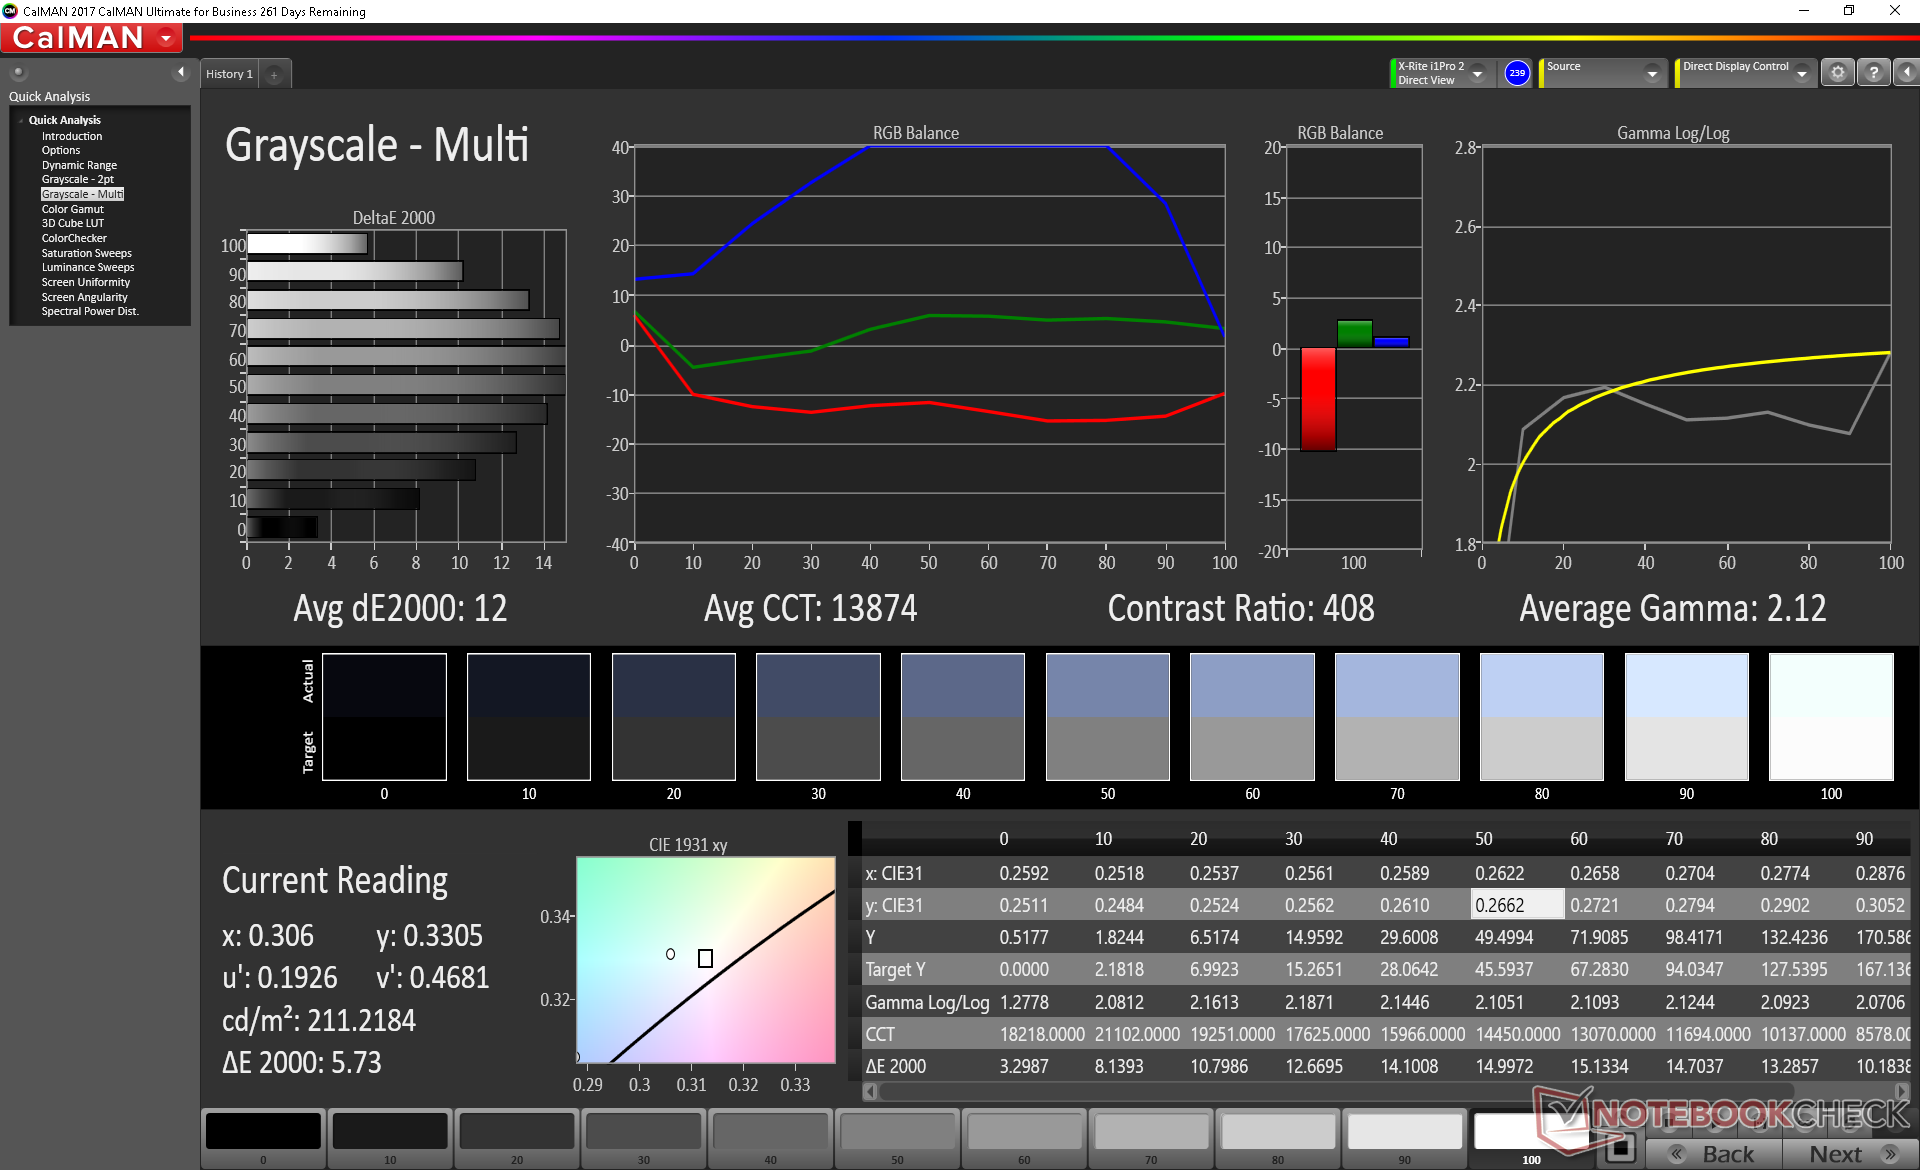
Gamma: 2.12
CCT: 13874 K
| Lenovo IdeaPad 330-17IKB 81DM BOE0685, TN LED, 17.3", 1600x900 | Dell Inspiron 17-7786 LG Philips, 173W4F, IPS, 17.3", 1920x1080 | Acer Aspire ES1-732-P7YA Chi Mei N173FGE-E23, TN LED, 17.3", 1600x900 | Asus VivoBook Pro 17 N705UD-EH76 LP173WF4-SPF5, IPS, 17.3", 1920x1080 | HP Pavilion 17z 1EX13AV ID: AUO109D, Name: AU Optronics B173HW01 V0, IPS, 17.3", 1920x1080 | Lenovo IdeaPad V110-17IKB 80V20006GE BOE, TN LED, 17.3", 1600x900 | |
|---|---|---|---|---|---|---|
| Display | 9% | -1% | 16% | 14% | 0% | |
| Display P3 Coverage (%) | 56.9 | 64.8 14% | 53.5 -6% | 67.9 19% | 64.8 14% | 56.6 -1% |
| sRGB Coverage (%) | 76.3 | 81.6 7% | 80.1 5% | 86.8 14% | 87.5 15% | 77.2 1% |
| AdobeRGB 1998 Coverage (%) | 55.9 | 59.7 7% | 54.9 -2% | 63.5 14% | 64 14% | 56.5 1% |
| Response Times | -49% | -18% | -25% | -44% | -49% | |
| Response Time Grey 50% / Grey 80% * (ms) | 38.8 ? | 38 ? 2% | 49 ? -26% | 30.8 ? 21% | 34 ? 12% | 44 ? -13% |
| Response Time Black / White * (ms) | 13.6 ? | 27 ? -99% | 15 ? -10% | 23.2 ? -71% | 27.2 ? -100% | 25 ? -84% |
| PWM Frequency (Hz) | 961 | 119000 ? | 50 ? | |||
| Screen | 50% | 35% | 49% | 51% | -9% | |
| Brightness middle (cd/m²) | 210.5 | 343 63% | 227 8% | 376.2 79% | 363.6 73% | 213 1% |
| Brightness (cd/m²) | 204 | 313 53% | 209 2% | 355 74% | 349 71% | 203 0% |
| Brightness Distribution (%) | 94 | 82 -13% | 80 -15% | 89 -5% | 90 -4% | 86 -9% |
| Black Level * (cd/m²) | 0.63 | 0.37 41% | 0.15 76% | 0.42 33% | 0.37 41% | 0.67 -6% |
| Contrast (:1) | 334 | 927 178% | 1513 353% | 896 168% | 983 194% | 318 -5% |
| Colorchecker dE 2000 * | 9.48 | 4.8 49% | 12.93 -36% | 4.21 56% | 5.8 39% | 12.3 -30% |
| Colorchecker dE 2000 max. * | 17.19 | 10.35 40% | 20.92 -22% | 8.31 52% | 10 42% | 21.48 -25% |
| Colorchecker dE 2000 calibrated * | 4.04 | 3.95 2% | ||||
| Greyscale dE 2000 * | 12 | 3.51 71% | 14.69 -22% | 5.5 54% | 8.8 27% | 14.13 -18% |
| Gamma | 2.12 104% | 2.19 100% | 2.38 92% | 2.335 94% | 2.16 102% | 2.11 104% |
| CCT | 13874 47% | 6188 105% | 19863 33% | 7056 92% | 5900 110% | 17705 37% |
| Color Space (Percent of AdobeRGB 1998) (%) | 49.4 | 54 9% | 51 3% | 57 15% | 57.2 16% | 50 1% |
| Color Space (Percent of sRGB) (%) | 75.8 | 81 7% | 80 6% | 87 15% | 87.3 15% | 77 2% |
| Total Average (Program / Settings) | 3% /
29% | 5% /
21% | 13% /
34% | 7% /
31% | -19% /
-12% |
* ... smaller is better
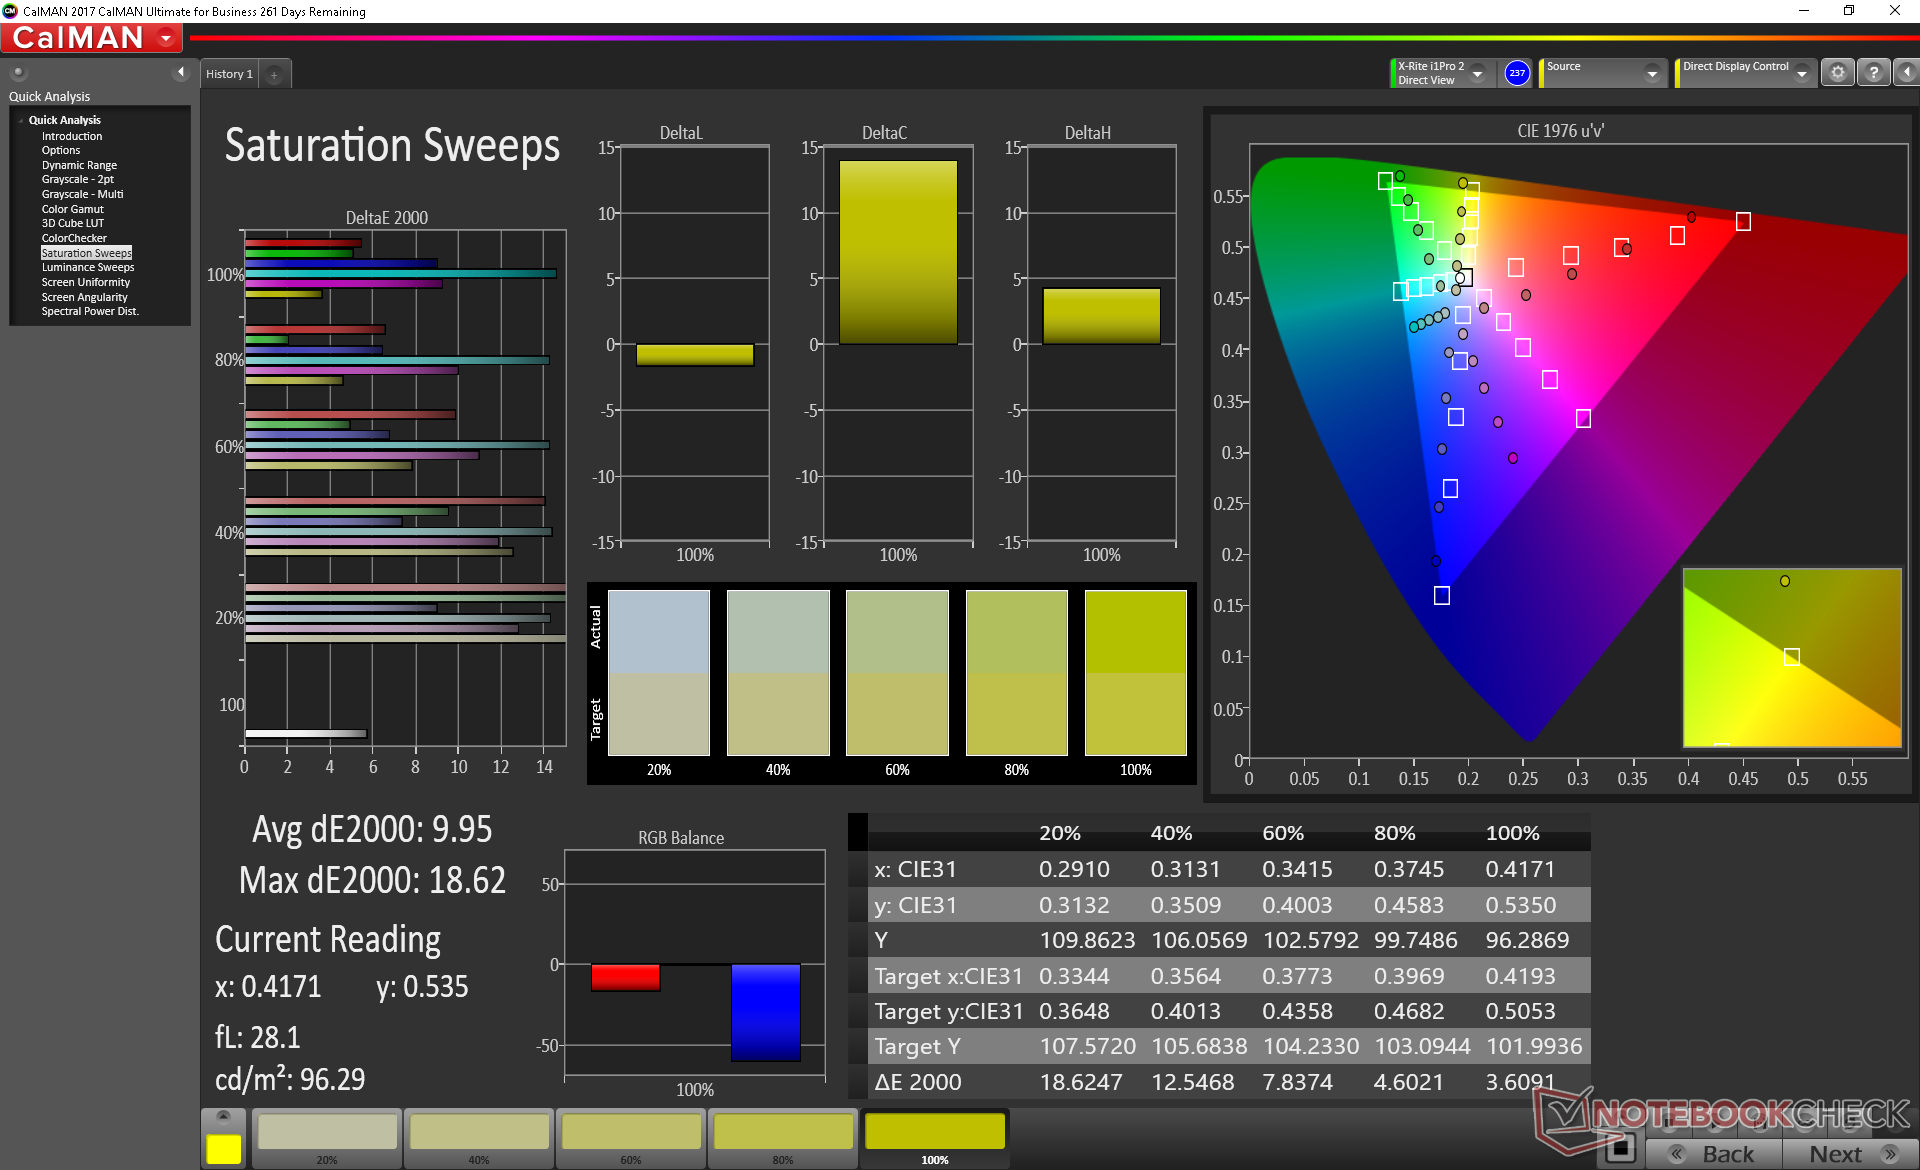
Color space is narrow at just 76 percent of sRGB to suggest a budget panel. This helps explain the generally shallow and washed out colors of the display. Digital artists should avoid working on this system.
Further measurements with an X-Rite colorimeter reveal very inaccurate colors and grayscale. Color temperature in particular is much too cool which is not uncommon on cheap laptops with low resolution TN displays. Once calibrated, however, display quality improves immensely as shown by our CalMAN measurements below. We recommend applying our color profile to make the most out of the display.
Display Response Times
| ↔ Response Time Black to White | ||
|---|---|---|
| 13.6 ms ... rise ↗ and fall ↘ combined | ↗ 8.4 ms rise | 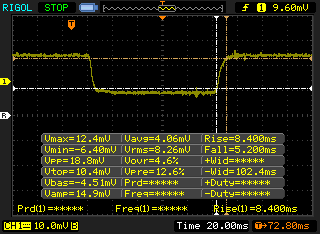 |
| ↘ 5.2 ms fall | ||
| The screen shows good response rates in our tests, but may be too slow for competitive gamers. In comparison, all tested devices range from 0.1 (minimum) to 240 (maximum) ms. » 34 % of all devices are better. This means that the measured response time is better than the average of all tested devices (19.8 ms). | ||
| ↔ Response Time 50% Grey to 80% Grey | ||
| 38.8 ms ... rise ↗ and fall ↘ combined | ↗ 20 ms rise | 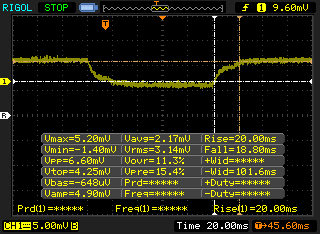 |
| ↘ 18.8 ms fall | ||
| The screen shows slow response rates in our tests and will be unsatisfactory for gamers. In comparison, all tested devices range from 0.165 (minimum) to 636 (maximum) ms. » 58 % of all devices are better. This means that the measured response time is worse than the average of all tested devices (30.9 ms). | ||
Screen Flickering / PWM (Pulse-Width Modulation)
| Screen flickering / PWM not detected | 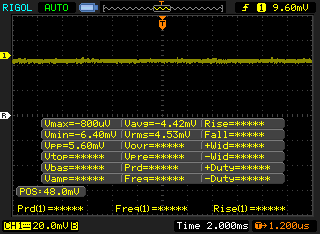 | ||
In comparison: 52 % of all tested devices do not use PWM to dim the display. If PWM was detected, an average of 7748 (minimum: 5 - maximum: 343500) Hz was measured. | |||
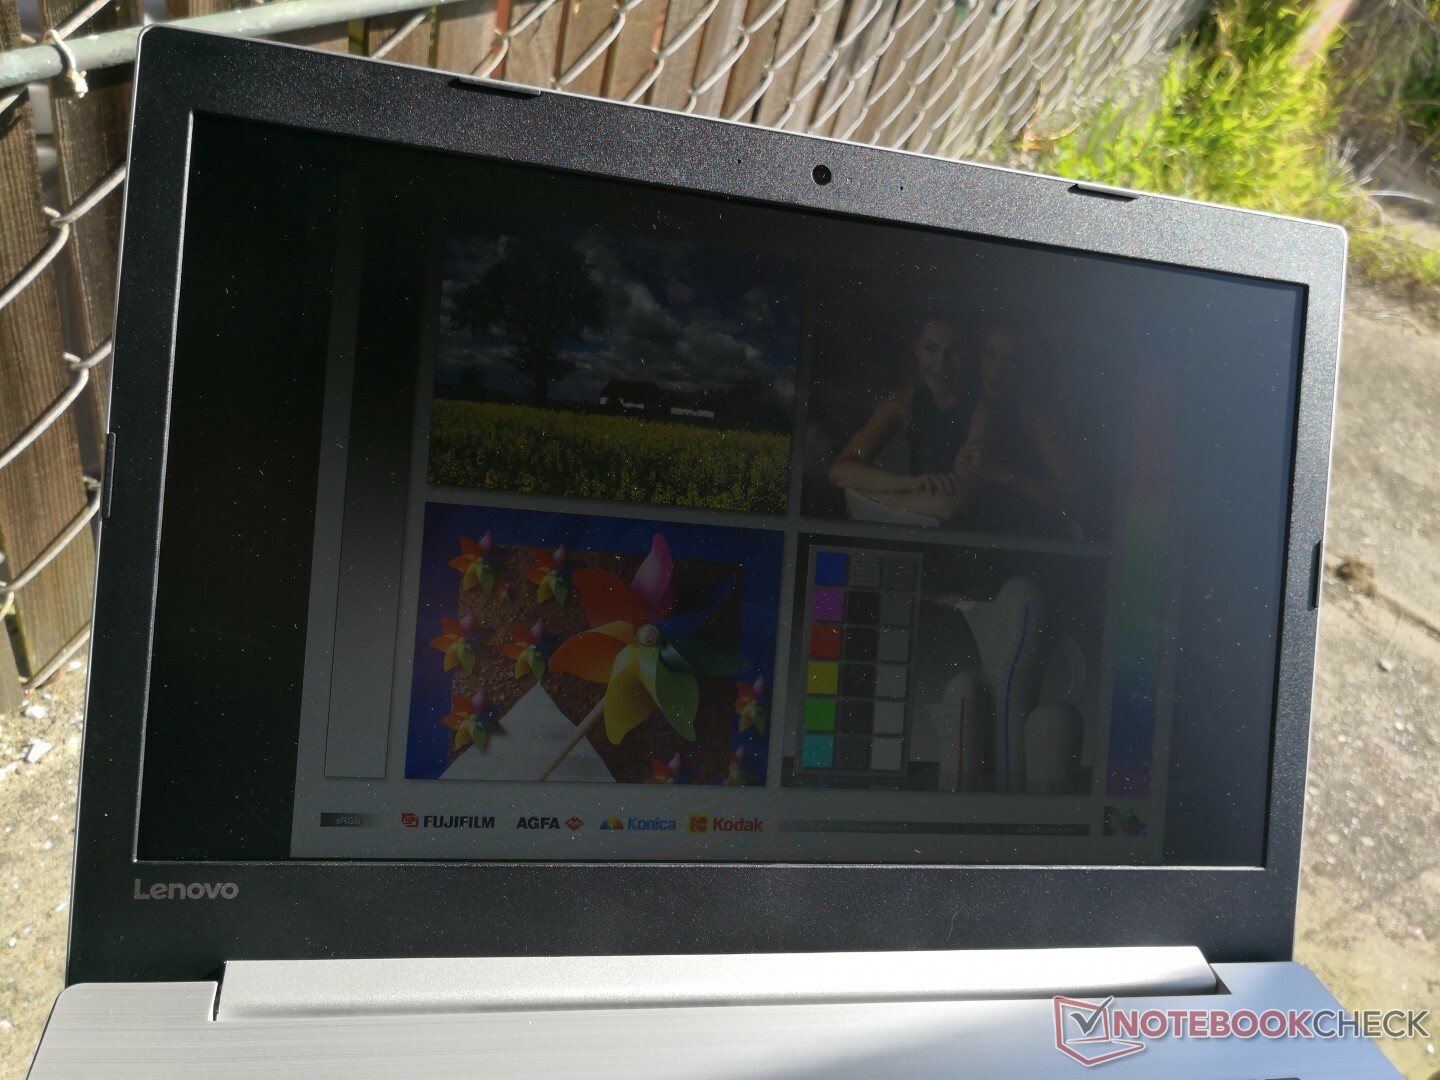
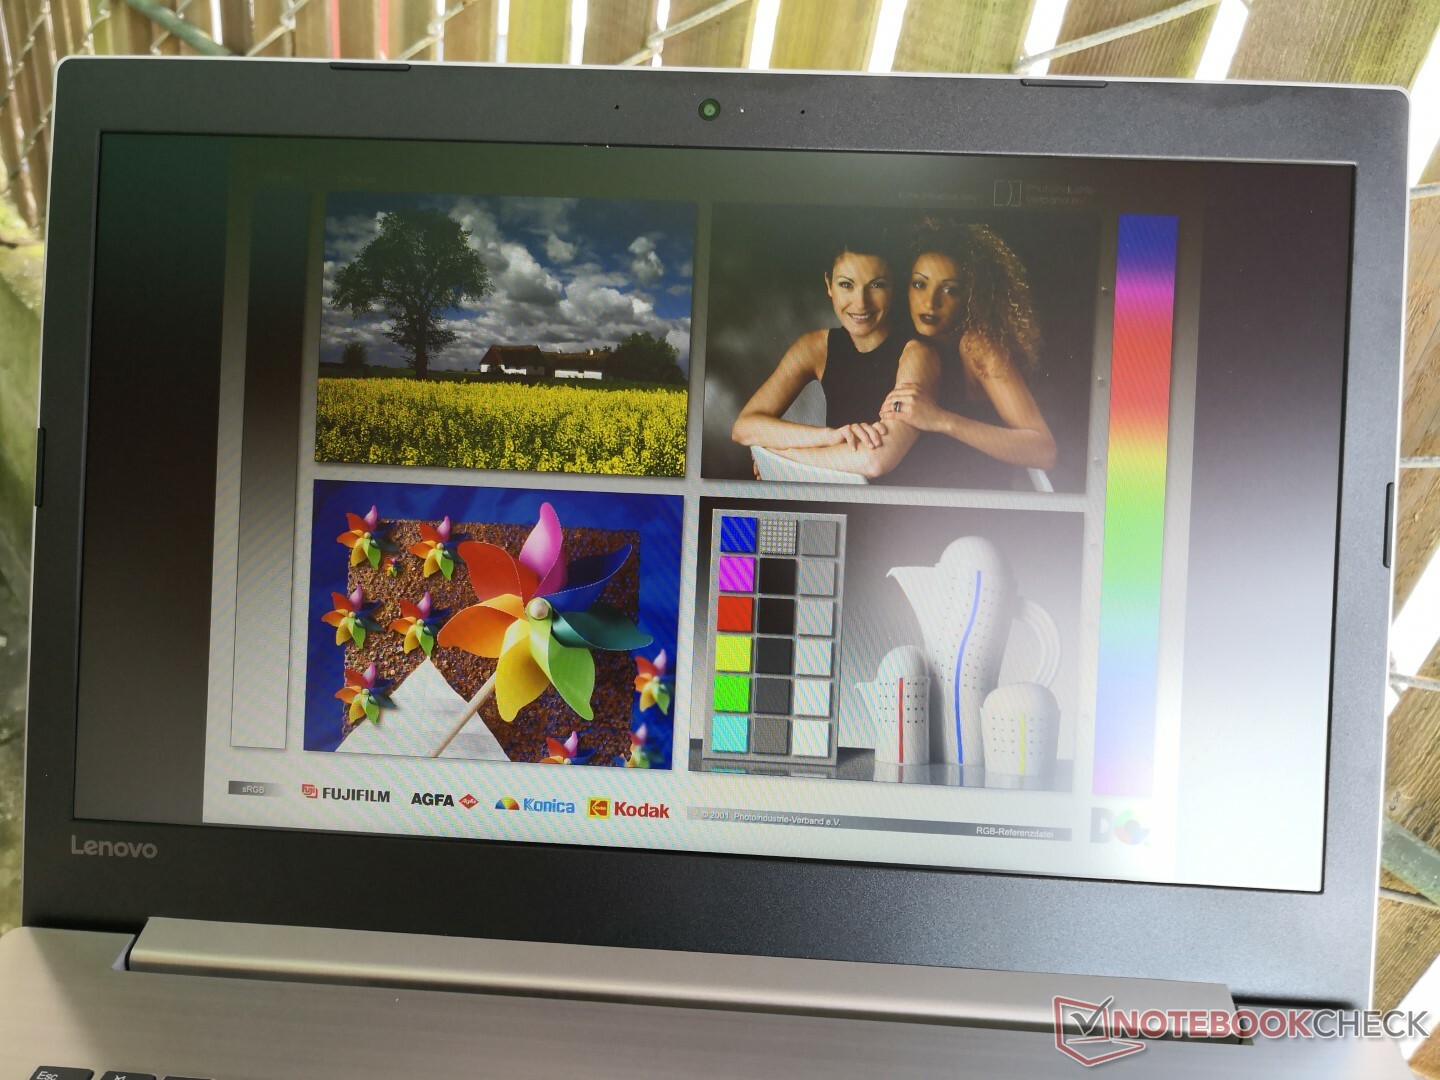
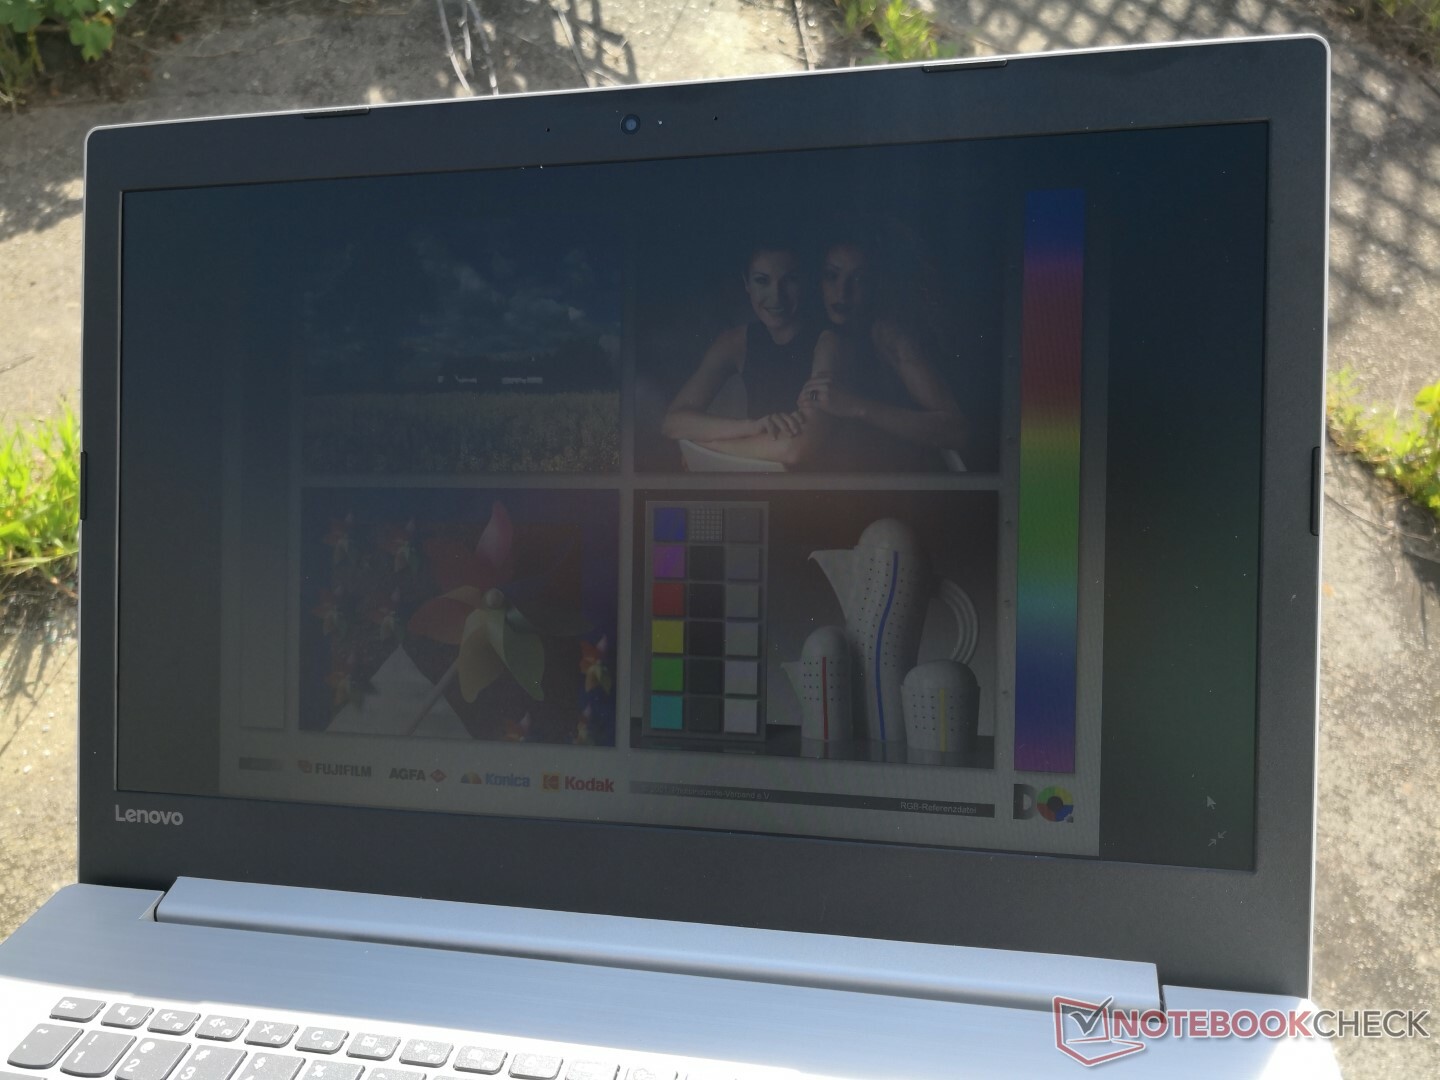
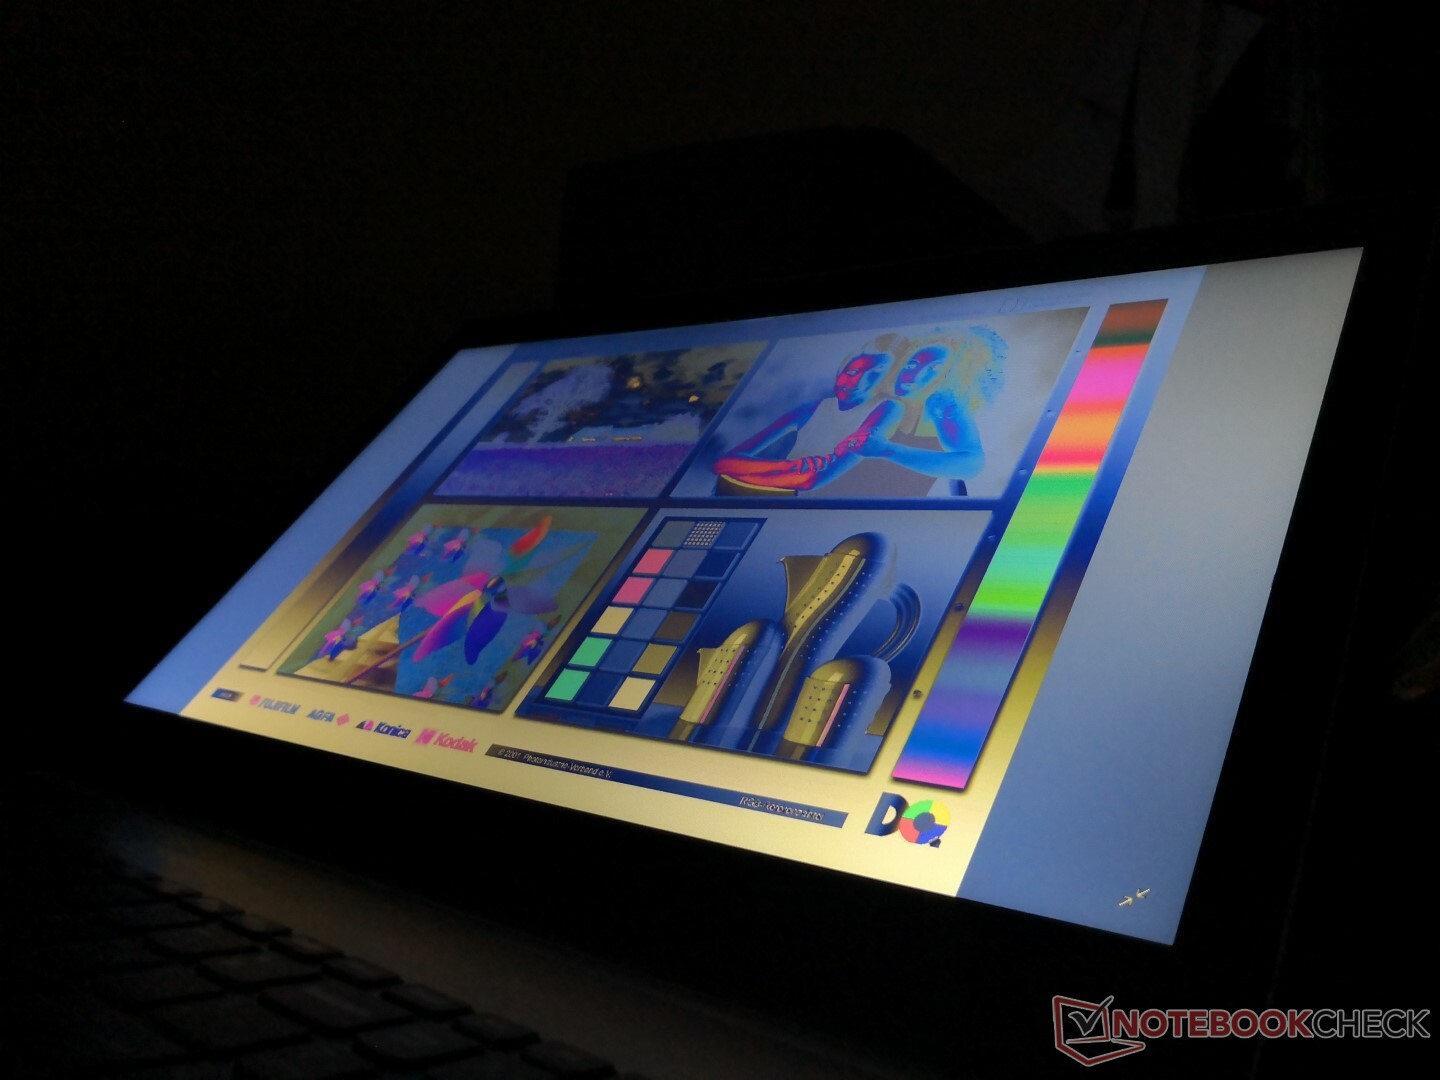
Outdoor visibility is extremely poor. Not only is the backlight dim, but the narrow TN viewing angles severely limit the laptop's ability to minimize glare without impacting color quality. This is most certainly not a laptop to be used outdoors on a frequent basis.
Performance
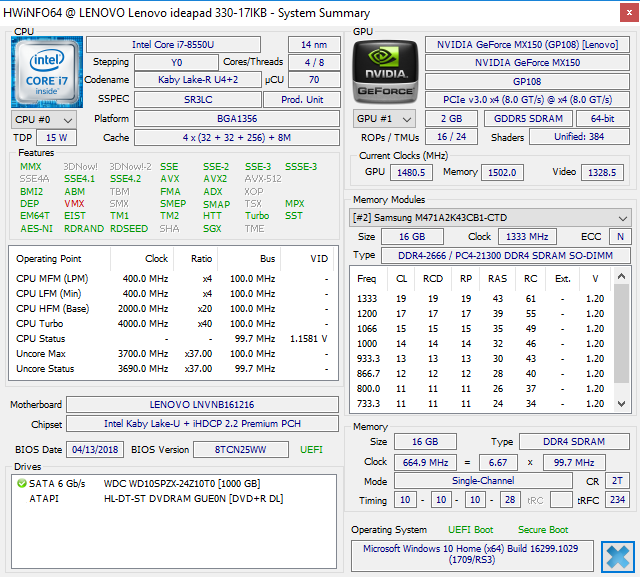
The 15 W Core i7-8550U is a common CPU found on most flagship Ultrabooks including the Dell XPS 13 and Lenovo's own Yoga C930. The IdeaPad 330 17 is unique in that the chassis also carries 45 W quad-core Core i5-8300H and hexa-core i7-8750H options as well for much faster performance.
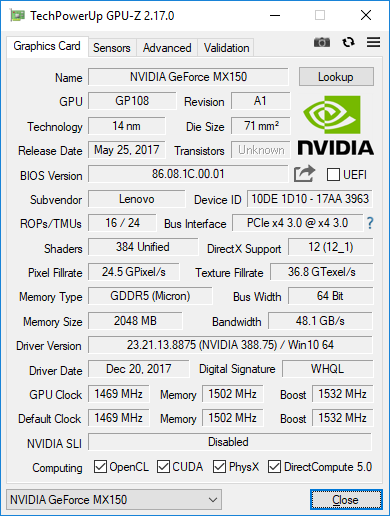
As for the GPU, the 25 W GeForce MX150 GPU on our test unit is relatively powerful for a budget laptop. It allows the IdeaPad 330 17 to play even the latest PC titles at the native 900p resolution with most settings reduced.
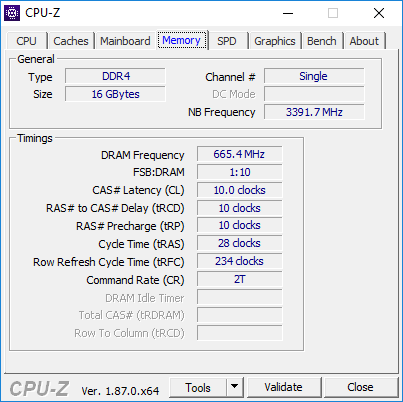
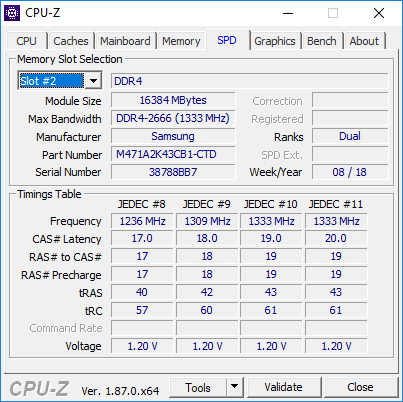
System RAM is limited to one SODIMM slot for single-channel memory only. The pricier SKUs with GTX 1050 graphics have 4 GB of soldered RAM to supplement the single SODIMM slot. Nvidia Optimus is included to increase battery life.
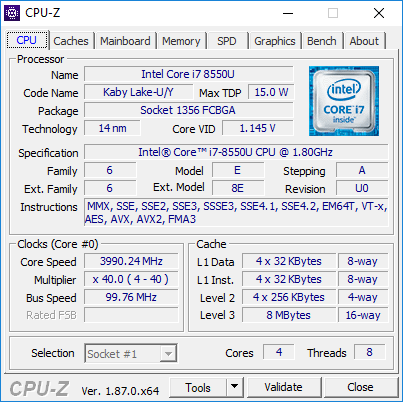
Processor
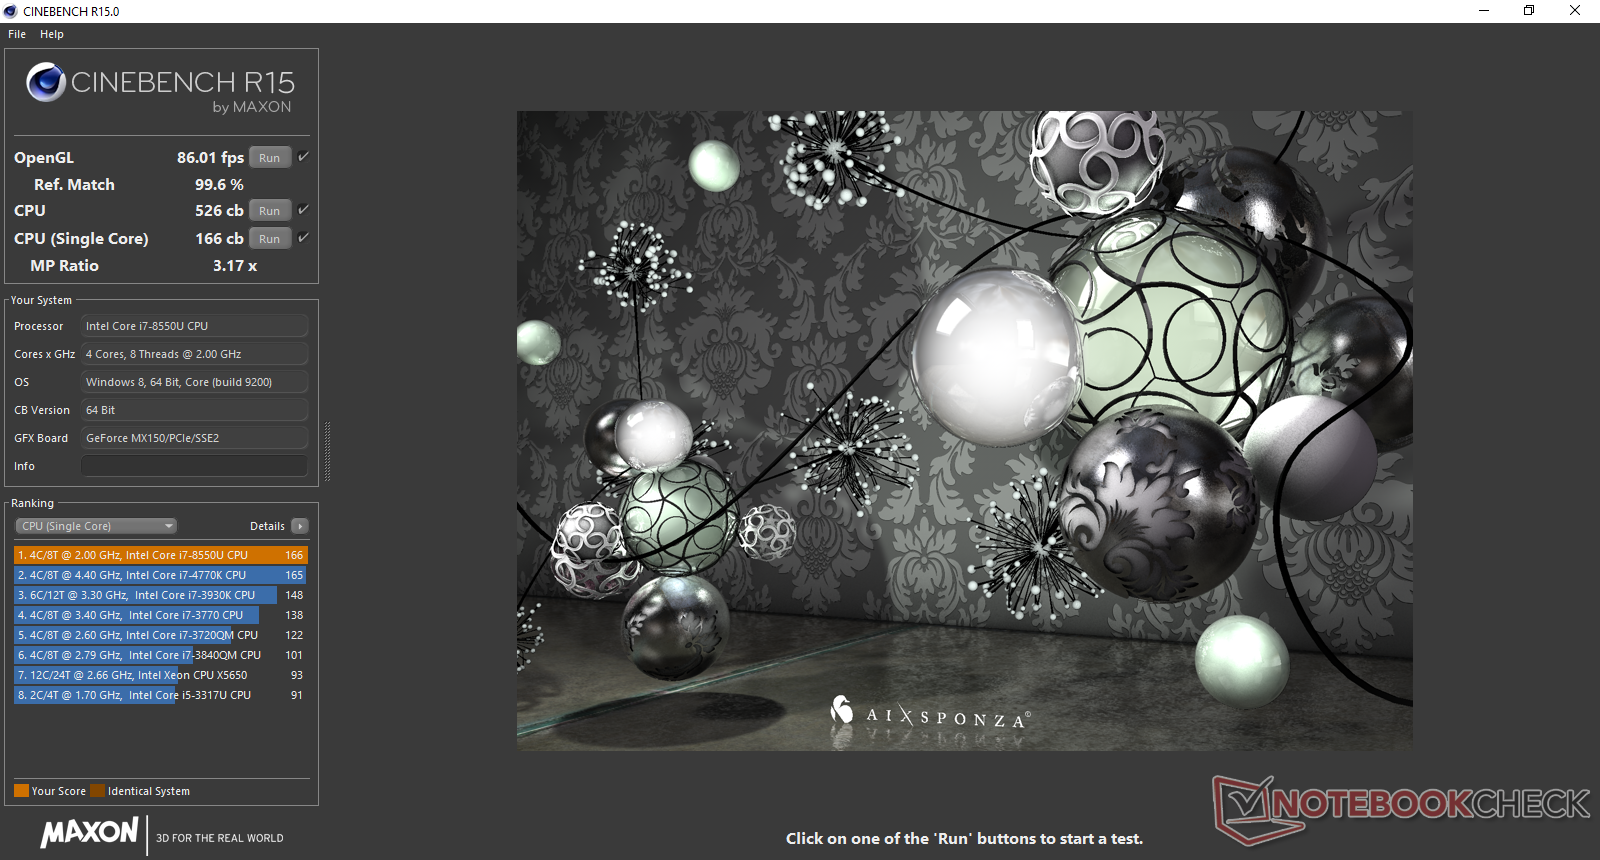
CPU performance is about where we expect it to be if not a bit slower than the average Core i7-8550U in our database. The pricier ThinkPad T480, for example, is 25 percent faster than our IdeaPad 330 according CineBench R15 Multi-Thread despite both systems having the same Core i7 CPU.
Running CineBench R15 Multi-Thread in a loop shows a very short-lived Turbo Boost during the initial loop. The ThinkPad T480 and Yoga C930 are both able to maintain faster clock rates than our inexpensive IdeaPad throughout the entirety of the stress test.
See our dedicated page on the Core i7-8550U for more technical information and benchmark comparisons.
System Performance
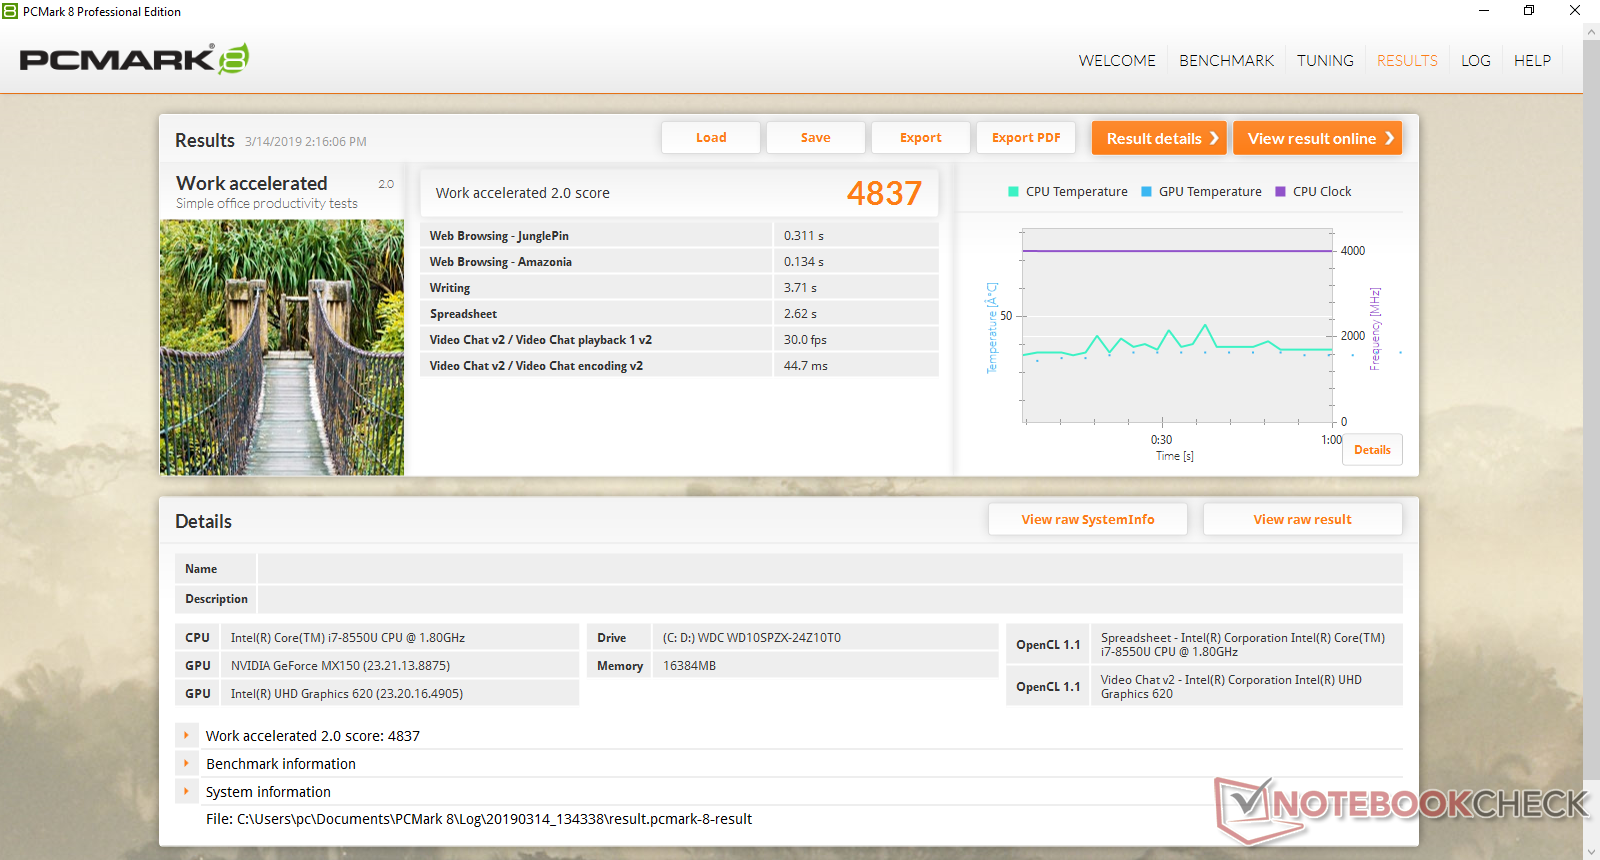
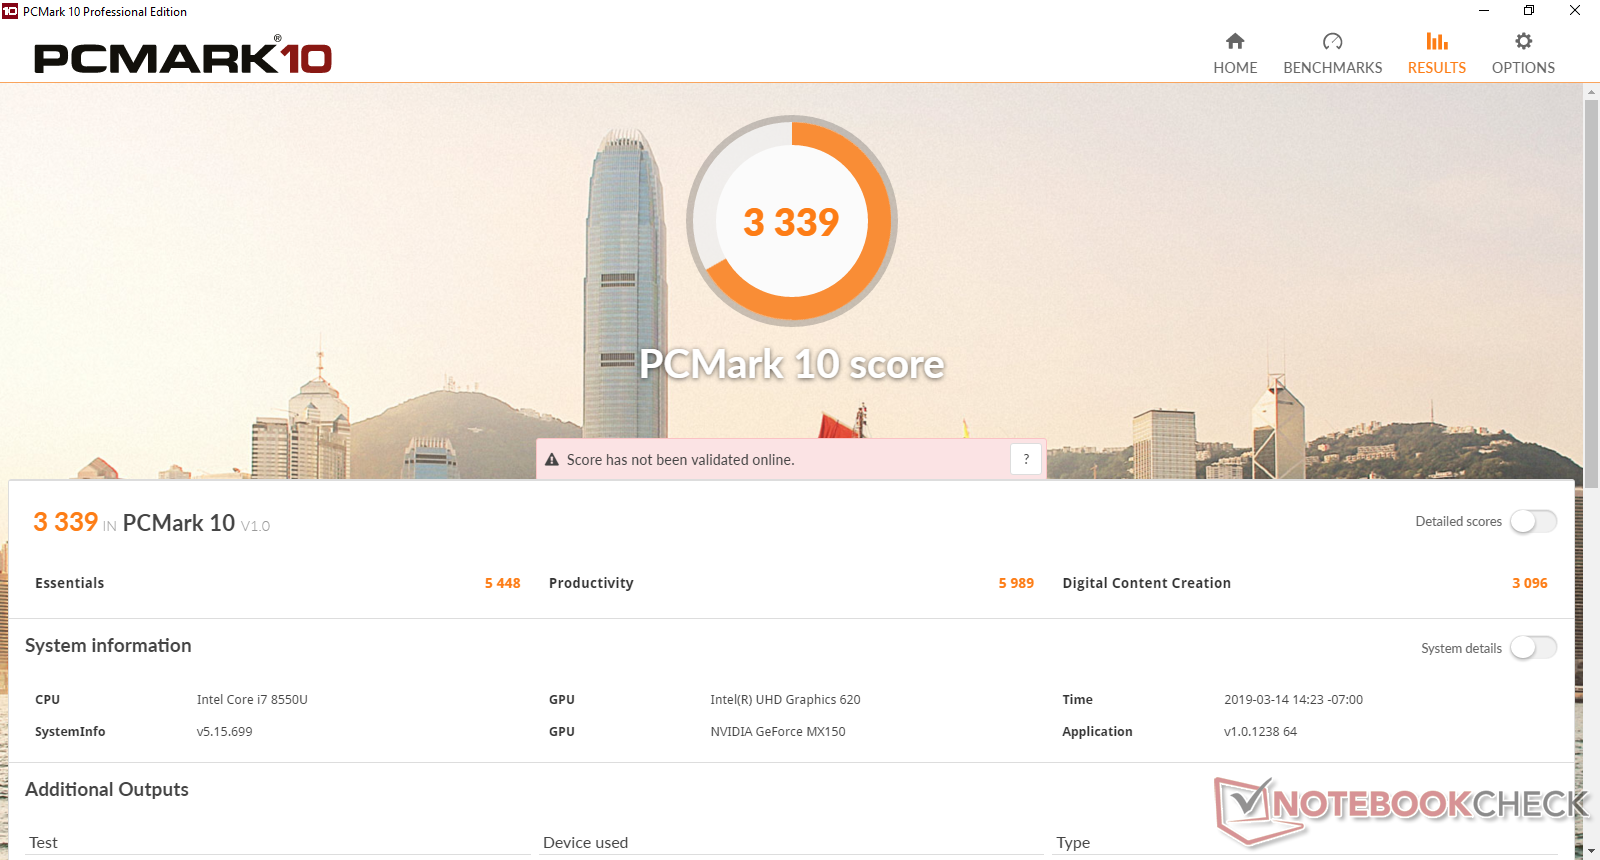
PCMark results are consistently behind the Asus VivoBook S15 even though both systems are equipped with the same CPU and GPU. We suspect that the slow HDD and single-channel RAM on our Lenovo are responsible for the lower scores. Subjectively, the IdeaPad 330 feels sluggish with its long boot up time and constant loading when launching applications.
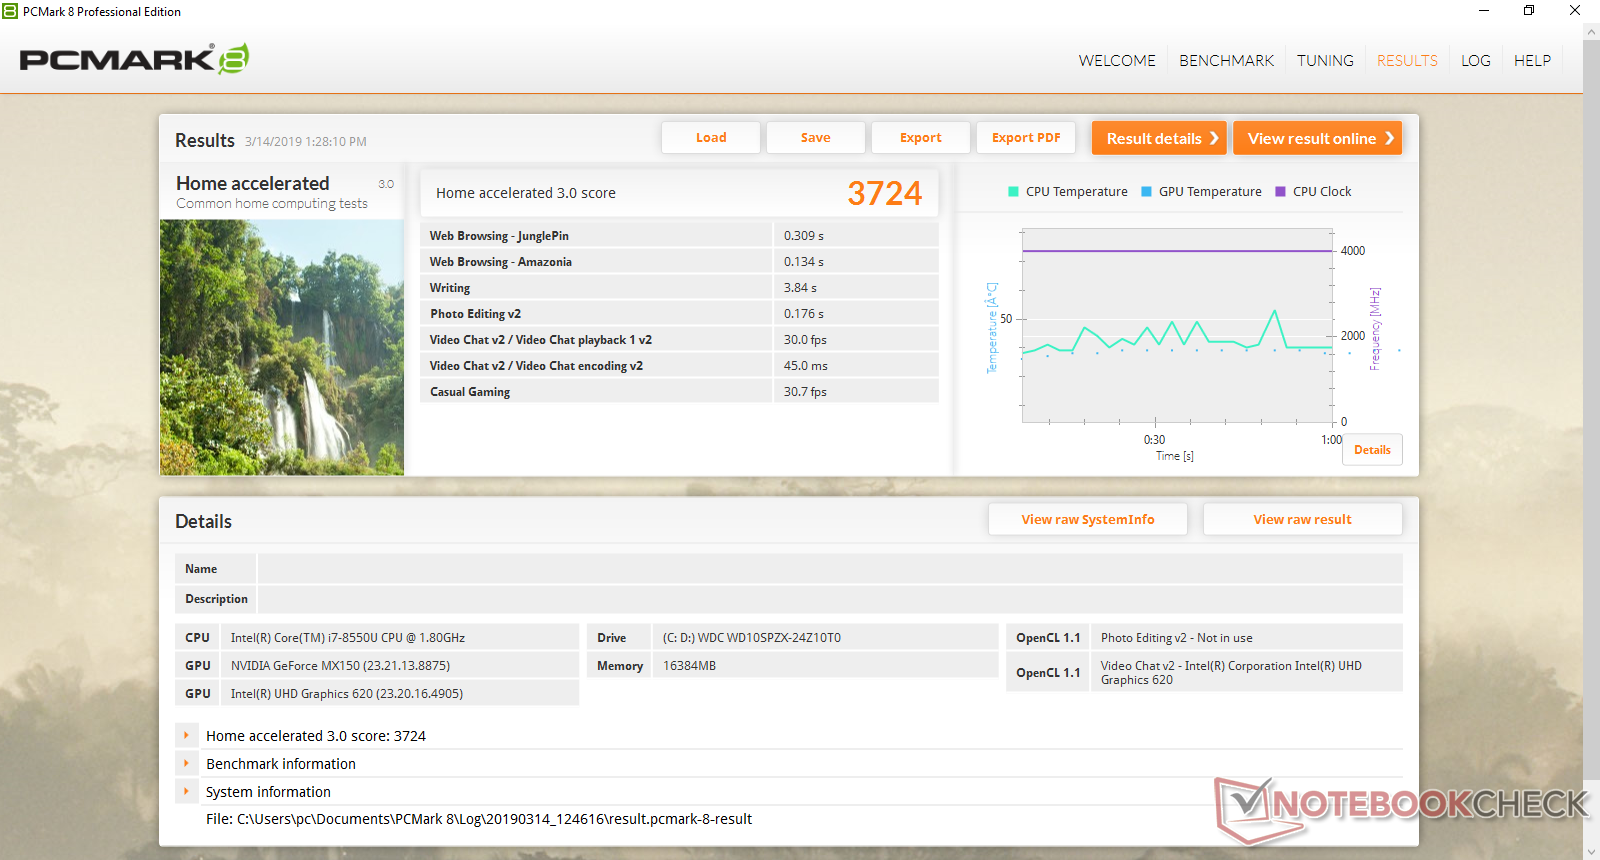
| PCMark 8 Home Score Accelerated v2 | 3724 points | |
| PCMark 8 Work Score Accelerated v2 | 4837 points | |
| PCMark 10 Score | 3339 points | |
Help | ||
Storage Devices
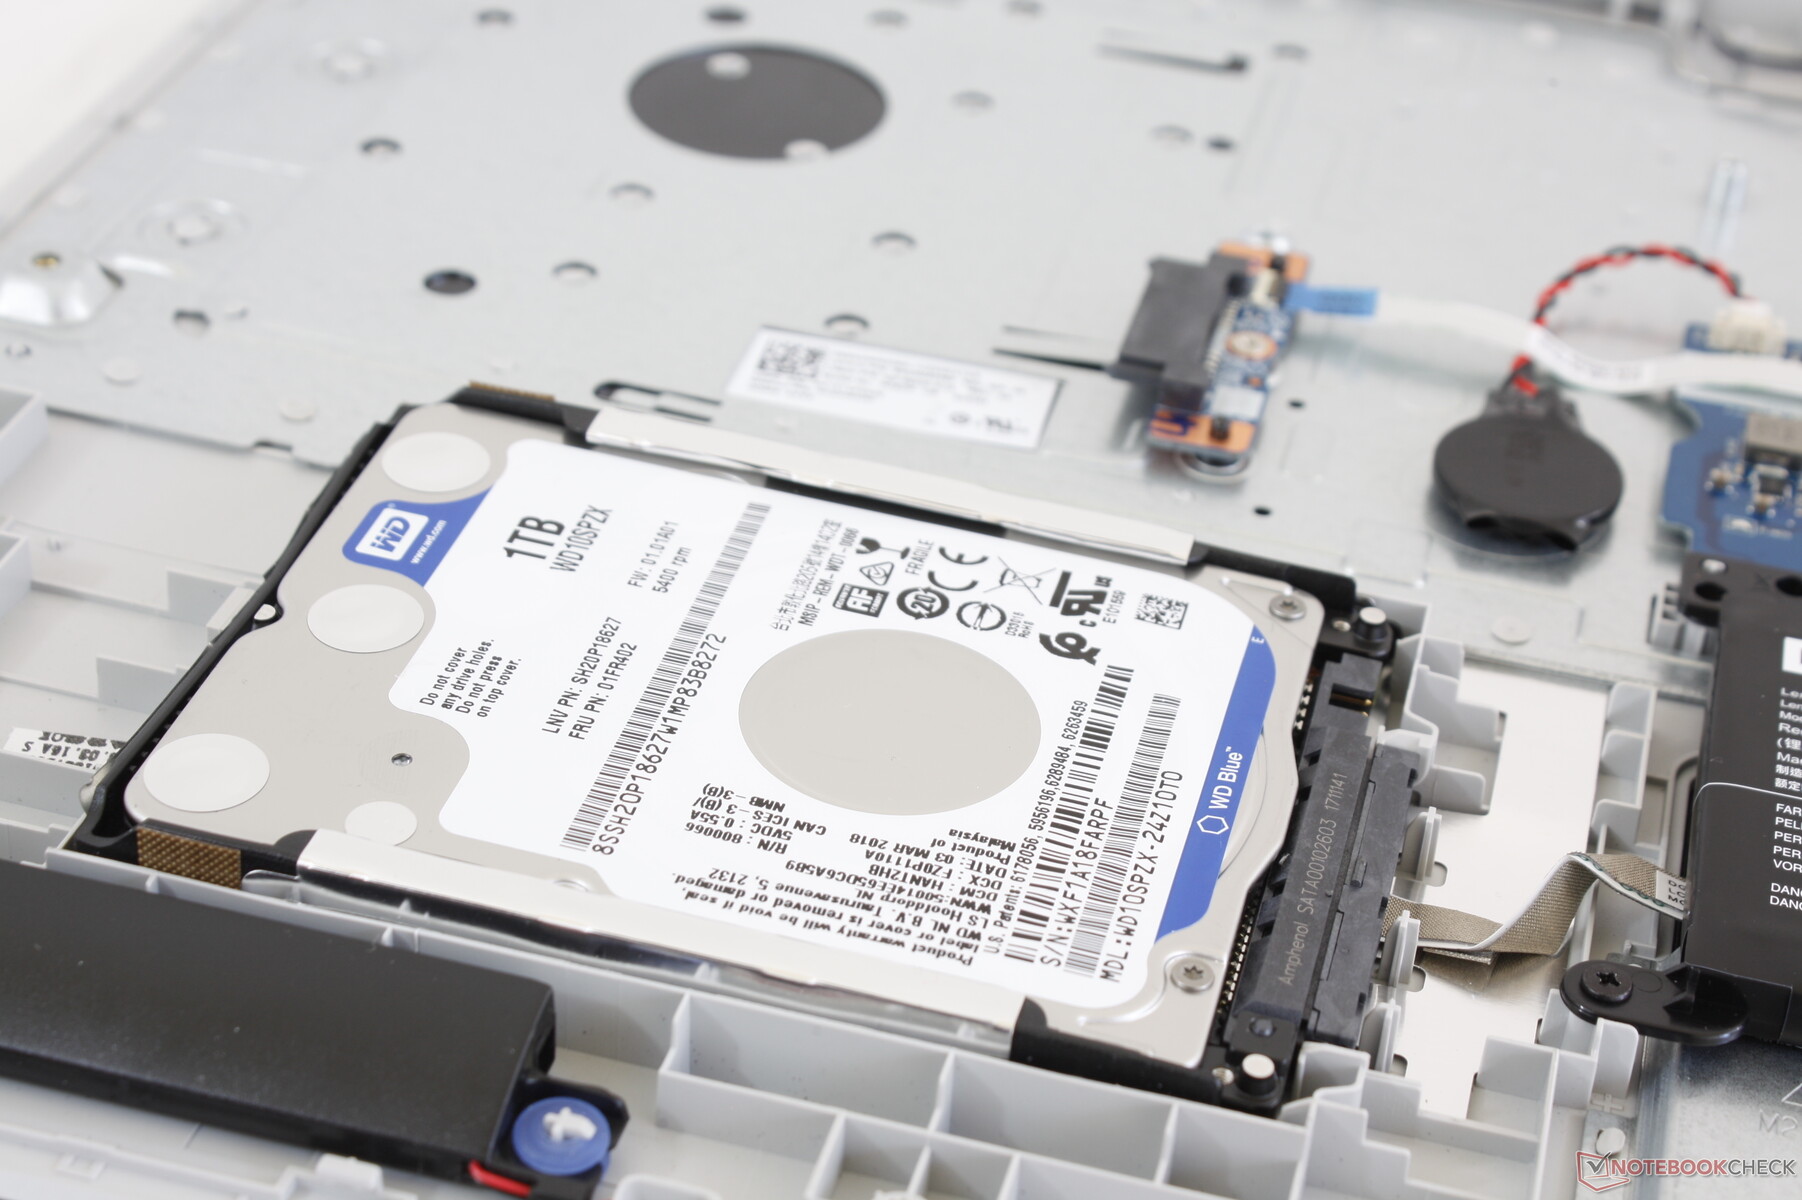
The system has just one 2.5-inch SATA III bay with no secondary options. Our specific test unit utilizes a standard 1 TB WD Blue WD10SPZX HDD with no Optane or dedicated SSD cache.
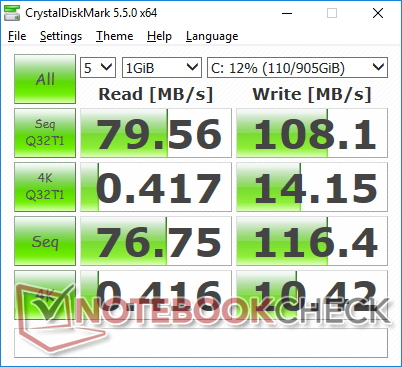
Transfer rates are very slow. Average sequential read rate is just 77 MB/s according to CrystalDiskMark which is slow even for a 5400 RPM drive. We recommend configuring with an SSD if possible to boost system performance and responsiveness.
See our table of HDDs and SSDs for more benchmark comparisons.
| Lenovo IdeaPad 330-17IKB 81DM WDC Blue WD10SPZX-24Z10T0 | Dell Inspiron 17-7786 KBG30ZMS128G | Acer Aspire ES1-732-P7YA Toshiba MQ01ABD100 | Asus VivoBook Pro 17 N705UD-EH76 Samsung PM961 NVMe MZVLW512HMJP | HP Pavilion 17z 1EX13AV Avolusion MD1TBLSSHD | |
|---|---|---|---|---|---|
| CrystalDiskMark 5.2 / 6 | 7306% | 9% | 19592% | 14% | |
| Write 4K (MB/s) | 10.42 | 71.3 584% | 1.167 -89% | 151.3 1352% | 1.322 -87% |
| Read 4K (MB/s) | 0.416 | 33.43 7936% | 0.443 6% | 46.62 11107% | 0.545 31% |
| Write Seq (MB/s) | 116.4 | 127.3 9% | 123.3 6% | 1020 776% | 89.1 -23% |
| Read Seq (MB/s) | 76.8 | 816 963% | 123.9 61% | 935 1117% | 91.4 19% |
| Write 4K Q32T1 (MB/s) | 14.15 | 94.6 569% | 1.163 -92% | 452.3 3096% | 1.239 -91% |
| Read 4K Q32T1 (MB/s) | 0.417 | 196.7 47070% | 0.885 112% | 559 133953% | 1.548 271% |
| Write Seq Q32T1 (MB/s) | 108.1 | 130.6 21% | 121.9 13% | 1614 1393% | 90.3 -16% |
| Read Seq Q32T1 (MB/s) | 79.6 | 1110 1294% | 124.3 56% | 3220 3945% | 88.3 11% |
| Write 4K Q8T8 (MB/s) | 98 | ||||
| Read 4K Q8T8 (MB/s) | 209.4 |

GPU Performance
Surprisingly, the IdeaPad 330 ships with a full-fledged 25 W GeForce MX150 '1D10' GPU instead of the slower 10 W '1D12' variant. Users upgrading from the UHD Graphics 620-only SKU will see a raw GPU performance boost of 100 to 200 percent.
Popular titles like League of Legends, Overwatch, DOTA 2, or Fortnite run well on this system especially because of the low native resolution of 1600 x 900. Running Witcher 3 shows stable frame rates with no recurring dips to suggest no interrupting background activity or throttling when gaming. We experienced one small dip to 22 FPS as shown by our graph below, though this appears to be an odd exception rather than a rule.
See our dedicated page on the GeForce MX150 GPU for more technical information and benchmark comparisons.
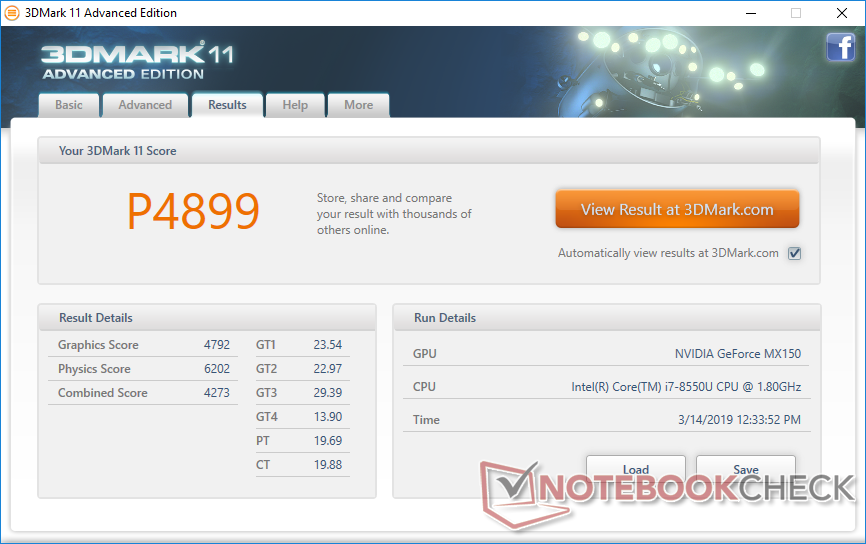
| 3DMark 11 Performance | 4899 points | |
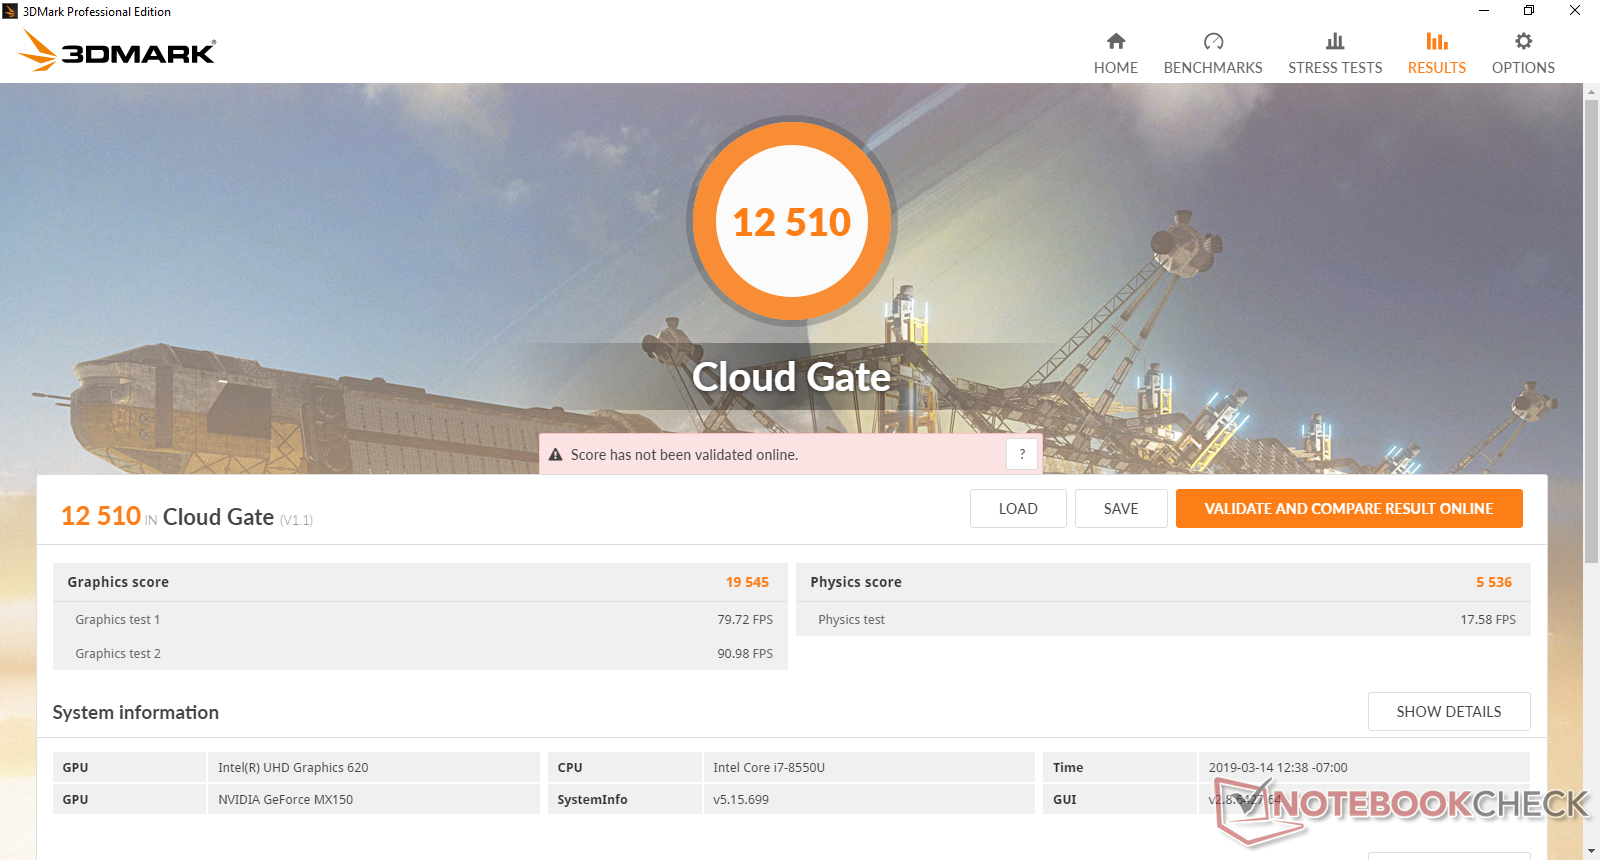
| 3DMark Cloud Gate Standard Score | 12510 points | |
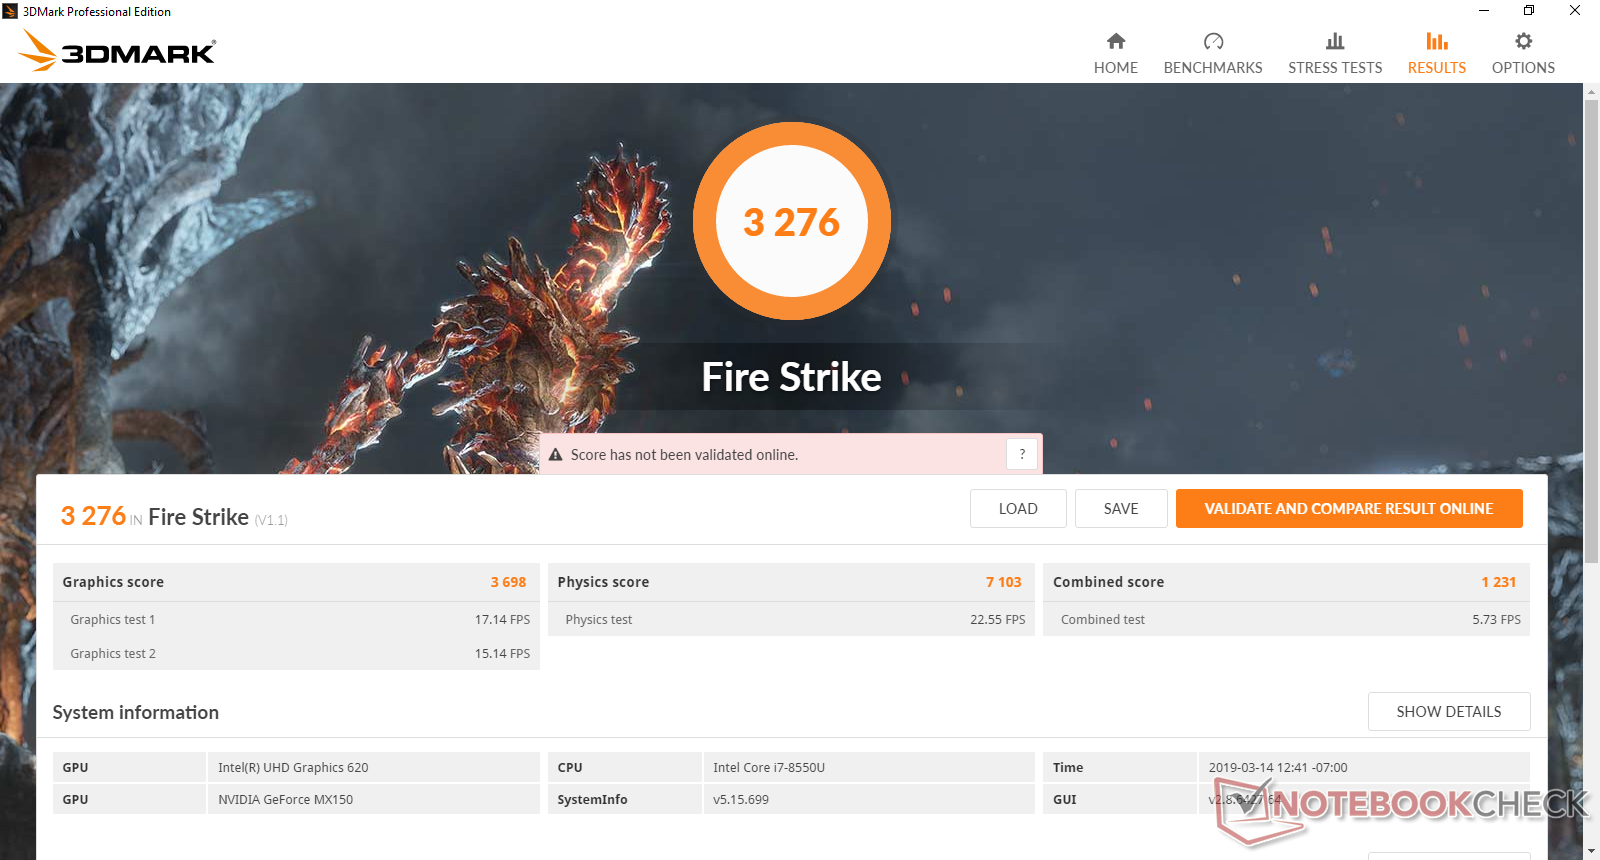
| 3DMark Fire Strike Score | 3276 points | |
Help | ||
| The Witcher 3 - 1366x768 Medium Graphics & Postprocessing | |
| Asus GL552VW-DK725T | |
| Razer Blade Stealth i7-8565U | |
| Asus ZenBook UX530UX-FY070T | |
| Average NVIDIA GeForce MX150 (24.4 - 43.2, n=26) | |
| Lenovo IdeaPad 330-17IKB 81DM | |
| Asus VivoBook S410UQ-NH74 | |
| HP ProBook 450 G6-5TJ93EA | |
| low | med. | high | ultra | |
|---|---|---|---|---|
| BioShock Infinite (2013) | 162.8 | 96.8 | 82.8 | |
| The Witcher 3 (2015) | 59.7 | 30.4 | ||
| Rise of the Tomb Raider (2016) | 74.8 | 40.7 |
Emissions
System Noise
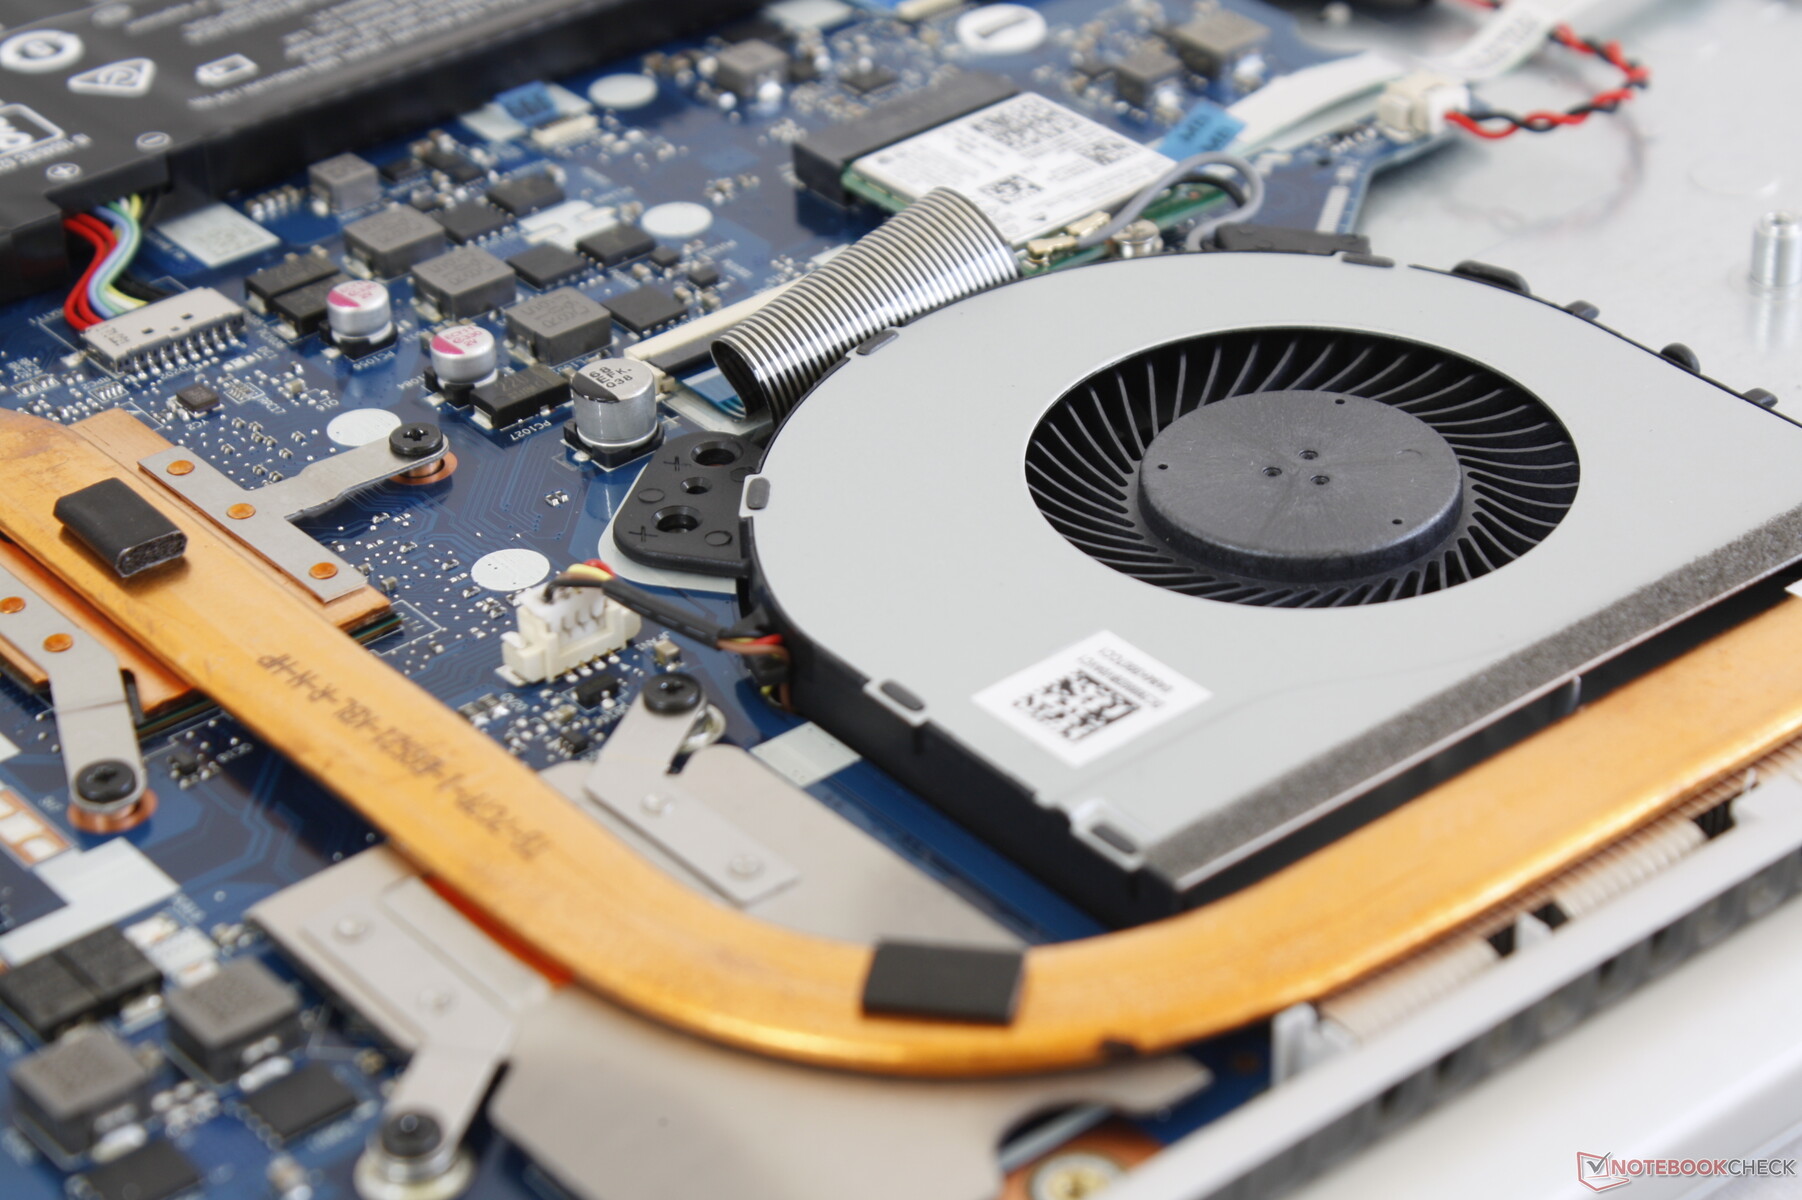
The cooling solution consists of a single fan and a short heat pipe shared between the CPU and GPU. The fan will idle when not running any applications, but it will rev almost immediately when heavier loads are introduced. Expect the fan to hover between 31.8 dB(A) and 34 dB(A) when browsing or video streaming to be louder than most Ultrabooks under similar loads. For a cheap multimedia laptop, however, this is rather typical.
Running Witcher 3 will induce a fan noise of 39.9 dB(A) to be slightly quieter than a full-fledged gaming laptop with more powerful GTX graphics. While noticeable, we certainly don't find it deafening unlike on some ultra-thin gaming laptops.
Our test unit suffers from no audible coil whine.
| Lenovo IdeaPad 330-17IKB 81DM GeForce MX150, i5-8550U, WDC Blue WD10SPZX-24Z10T0 | Dell Inspiron 17-7786 GeForce MX150, i7-8565U, KBG30ZMS128G | Acer Aspire ES1-732-P7YA HD Graphics 505, Pentium N4200, Toshiba MQ01ABD100 | Asus VivoBook Pro 17 N705UD-EH76 GeForce GTX 1050 Mobile, i5-8550U, Samsung PM961 NVMe MZVLW512HMJP | HP Pavilion 17z 1EX13AV Radeon 530, A9-9420, Avolusion MD1TBLSSHD | Lenovo IdeaPad V110-17IKB 80V20006GE HD Graphics 620, i5-7200U, WDC Scorpio Blue WD10JPCX-24UE4T0 | |
|---|---|---|---|---|---|---|
| Noise | -1% | -1% | -1% | -9% | 1% | |
| off / environment * (dB) | 28.6 | 30.3 -6% | 30.2 -6% | 28.3 1% | 28 2% | 30.5 -7% |
| Idle Minimum * (dB) | 29 | 30.7 -6% | 31 -7% | 28.3 2% | 30.5 -5% | 31.2 -8% |
| Idle Average * (dB) | 29 | 30.7 -6% | 31 -7% | 29 -0% | 30.6 -6% | 31.2 -8% |
| Idle Maximum * (dB) | 31.8 | 30.7 3% | 31 3% | 29 9% | 30.6 4% | 31.2 2% |
| Load Average * (dB) | 34.8 | 33.4 4% | 35.1 -1% | 36.7 -5% | 41.6 -20% | 32.6 6% |
| Witcher 3 ultra * (dB) | 39.9 | 44.7 -12% | 48 -20% | |||
| Load Maximum * (dB) | 40.8 | 38.7 5% | 35.1 14% | 42.8 -5% | 48 -18% | 32.6 20% |
* ... smaller is better
Noise level
| Idle |
| 29 / 29 / 31.8 dB(A) |
| Load |
| 34.8 / 40.8 dB(A) |
 | ||
30 dB silent 40 dB(A) audible 50 dB(A) loud |
||
min: | ||
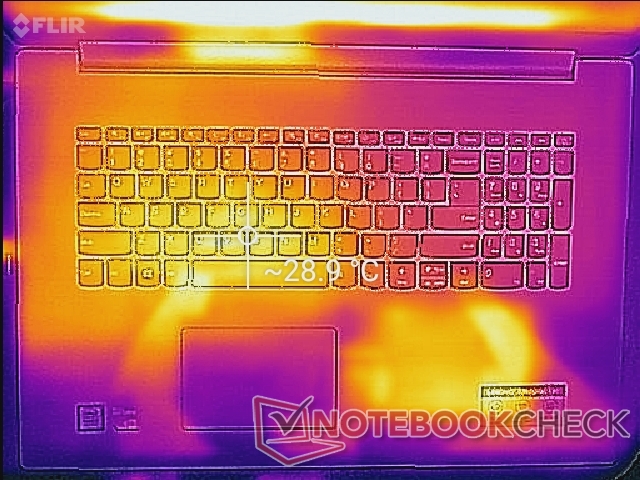
Temperature
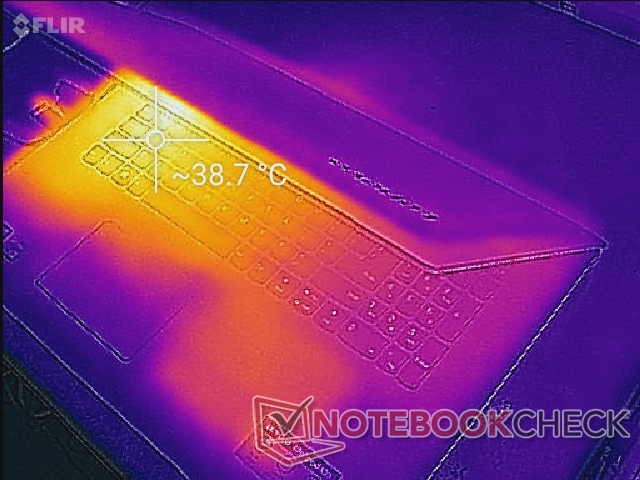
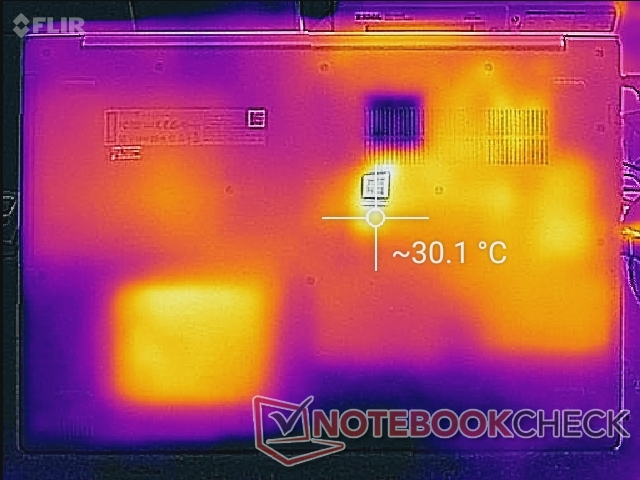
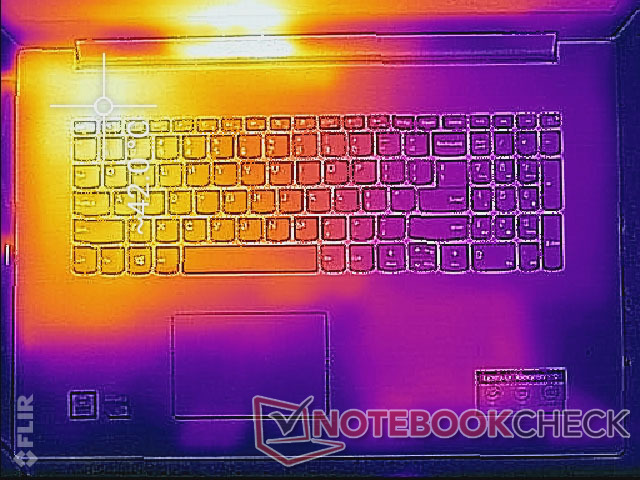
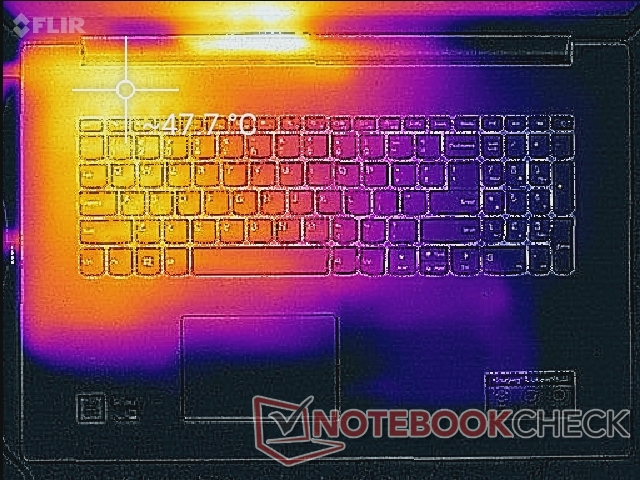
Surface temperatures are flat across the board when idling on desktop. Even so, the left half of the notebook will generally always be warmer than the right half because of how the motherboard and heat sink are positioned. Note that the right palm rest can be warmer than the left since the HDD is directly underneath as shown by our temperature maps below.
When under higher stress like gaming, the top left quadrant of the system can become as warm as 42 C to 47 C. Meanwhile, the other half of the notebook will barely warm up and remain at just 25 C for a wide temperature difference between both sides. Since the CPU and GPU are so close to the commonly used WASD keys and 1-4 number keys, however, be prepared for sweaty fingers when gaming.

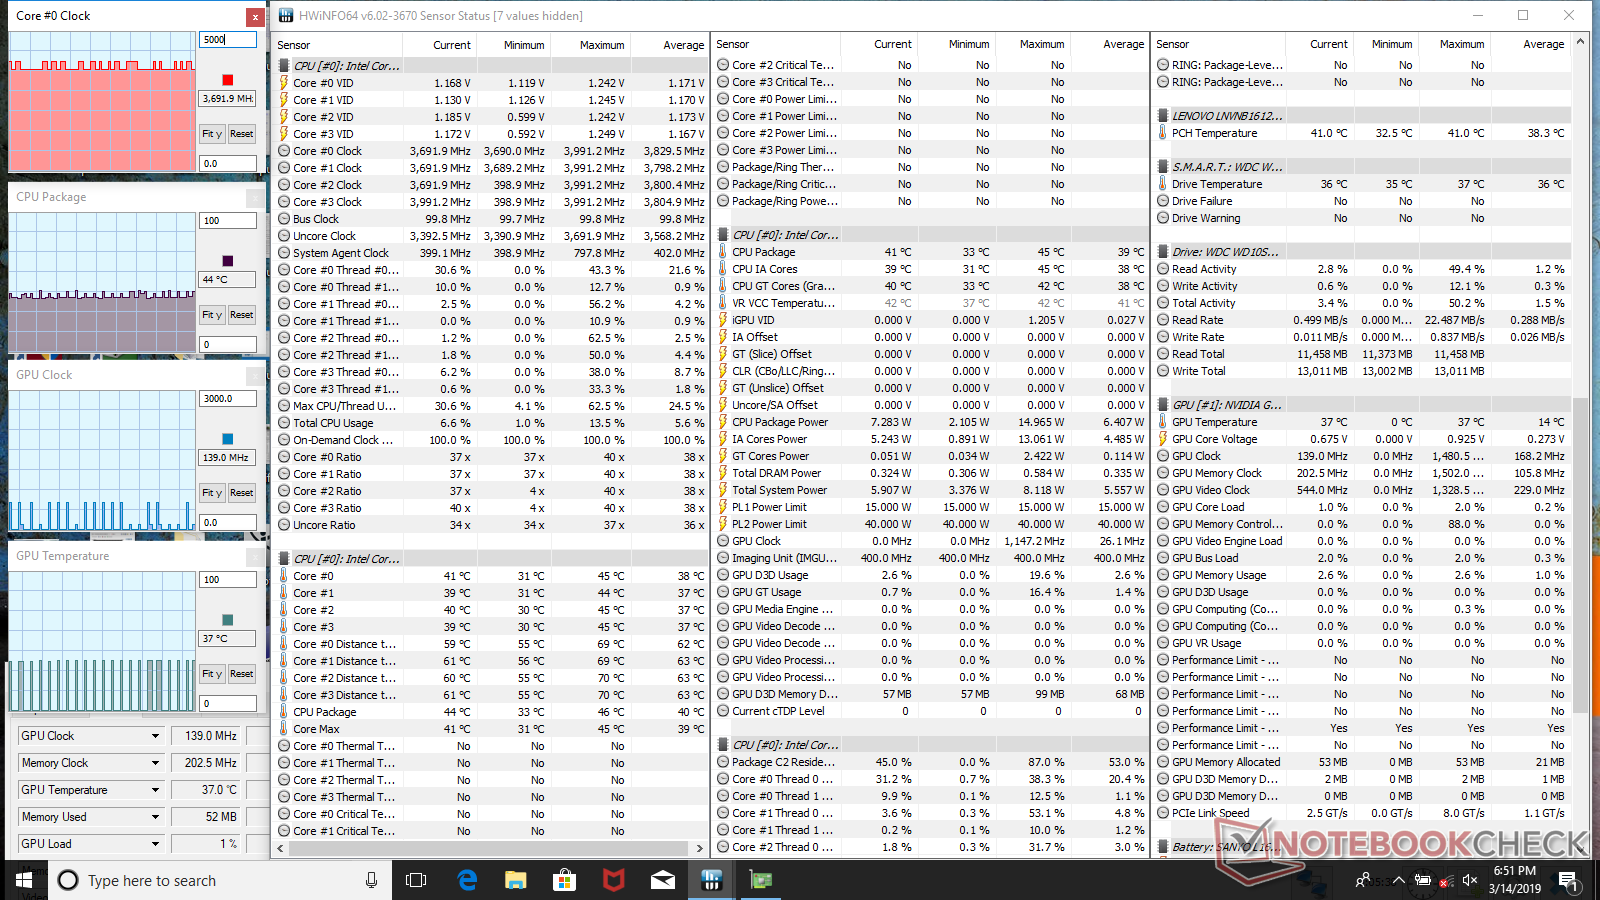
Stress Test
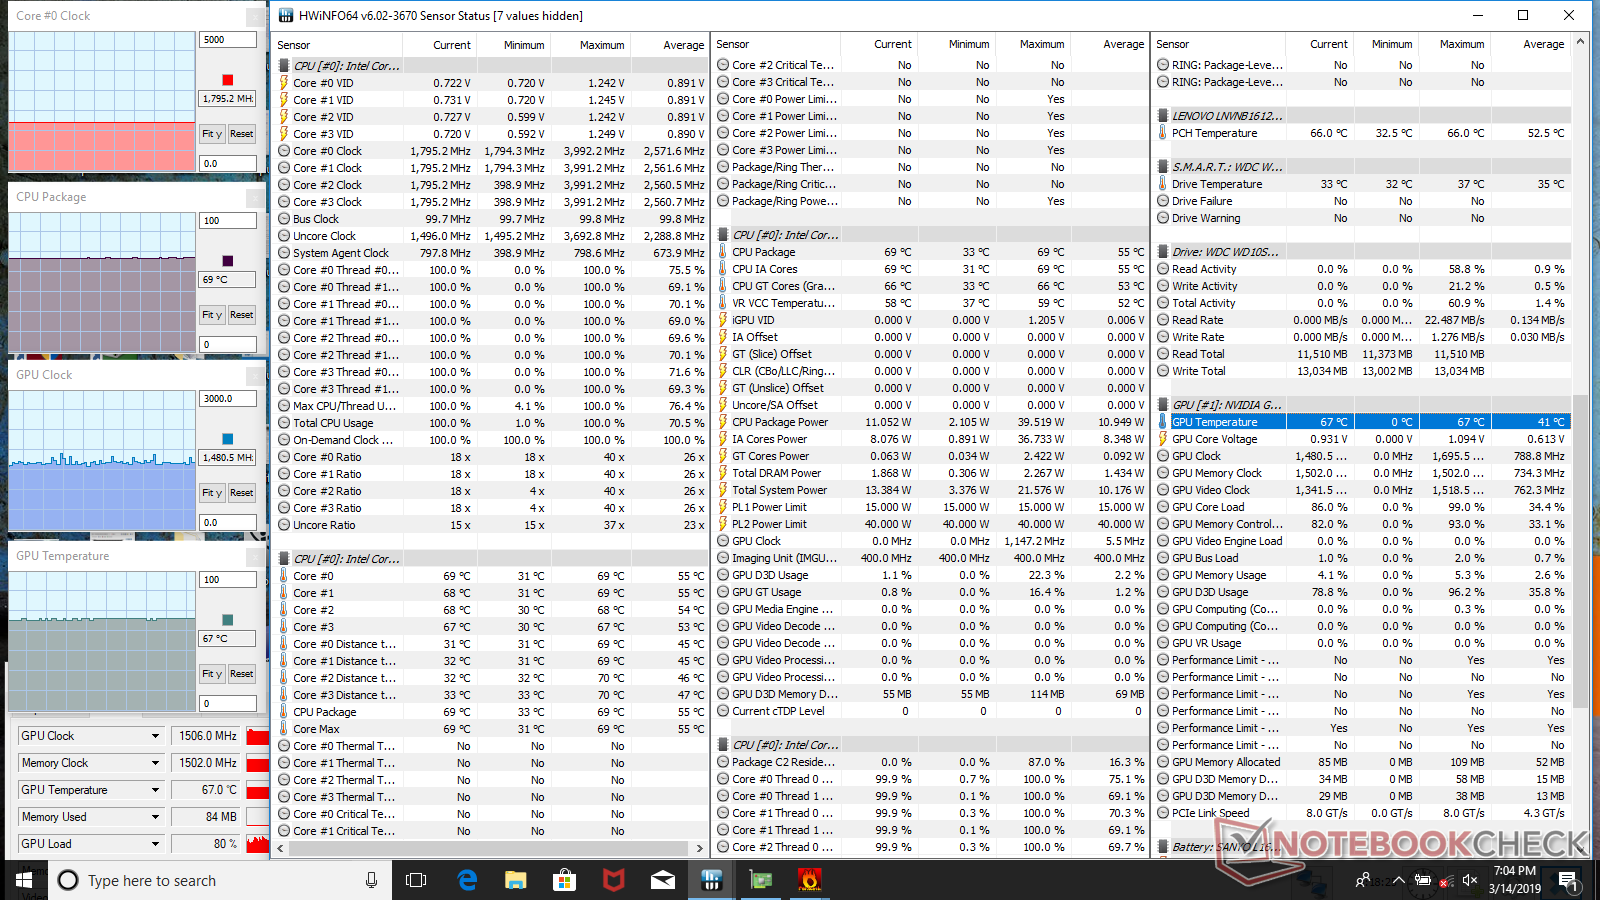
We stress the system with synthetic loads to identify for any potential throttling or stability issues. When running Prime95, the CPU can be observed running at 3.7 GHz for the first few seconds before reaching a core temperature of 67 C. Thereafter, clock rate drops to 2.2 to 2.3 GHz in order to maintain a cooler core temperature of 58 C. If running both Prime95 and FurMark loads, the CPU and GPU each stabilize at just under 70 C.
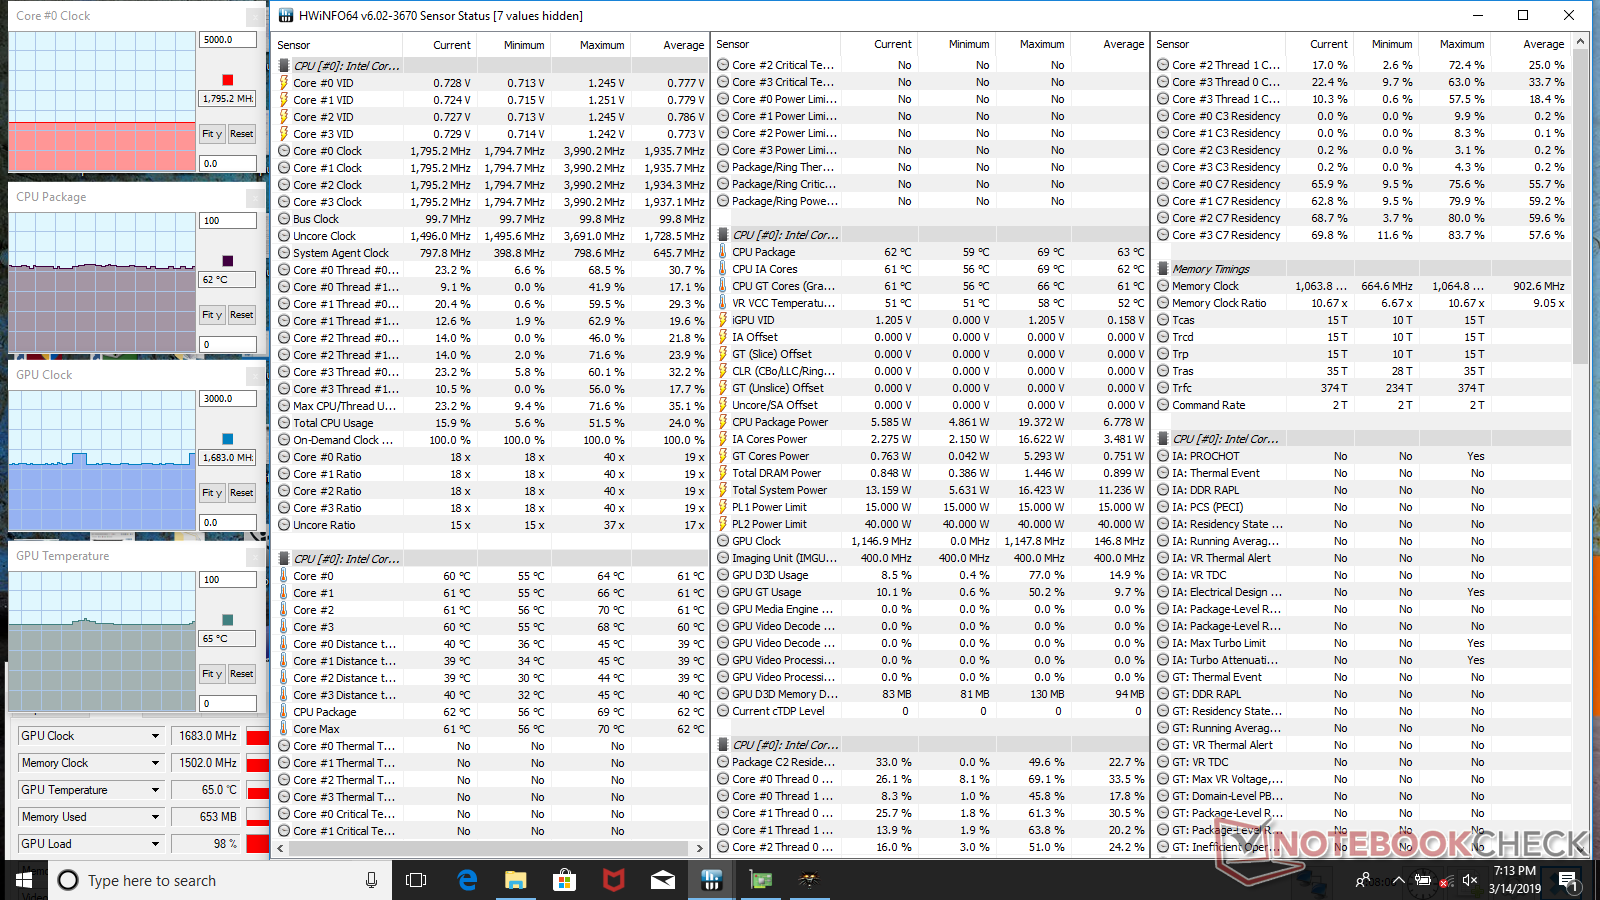
Witcher 3 is a more accurate representation of real-world gaming stress. The CPU and GPU become stable at 62 C and 65 C, respectively, to be relatively cool for an Ultrabook with a discrete GPU.
Running on battery power will limit performance even when on the High Performance profile. A 3DMark Cloud Gate test on batteries returns Physics and Graphics scores of 4069 and 17396 points, respectively. compared to 5536 and 19545 points when on mains.
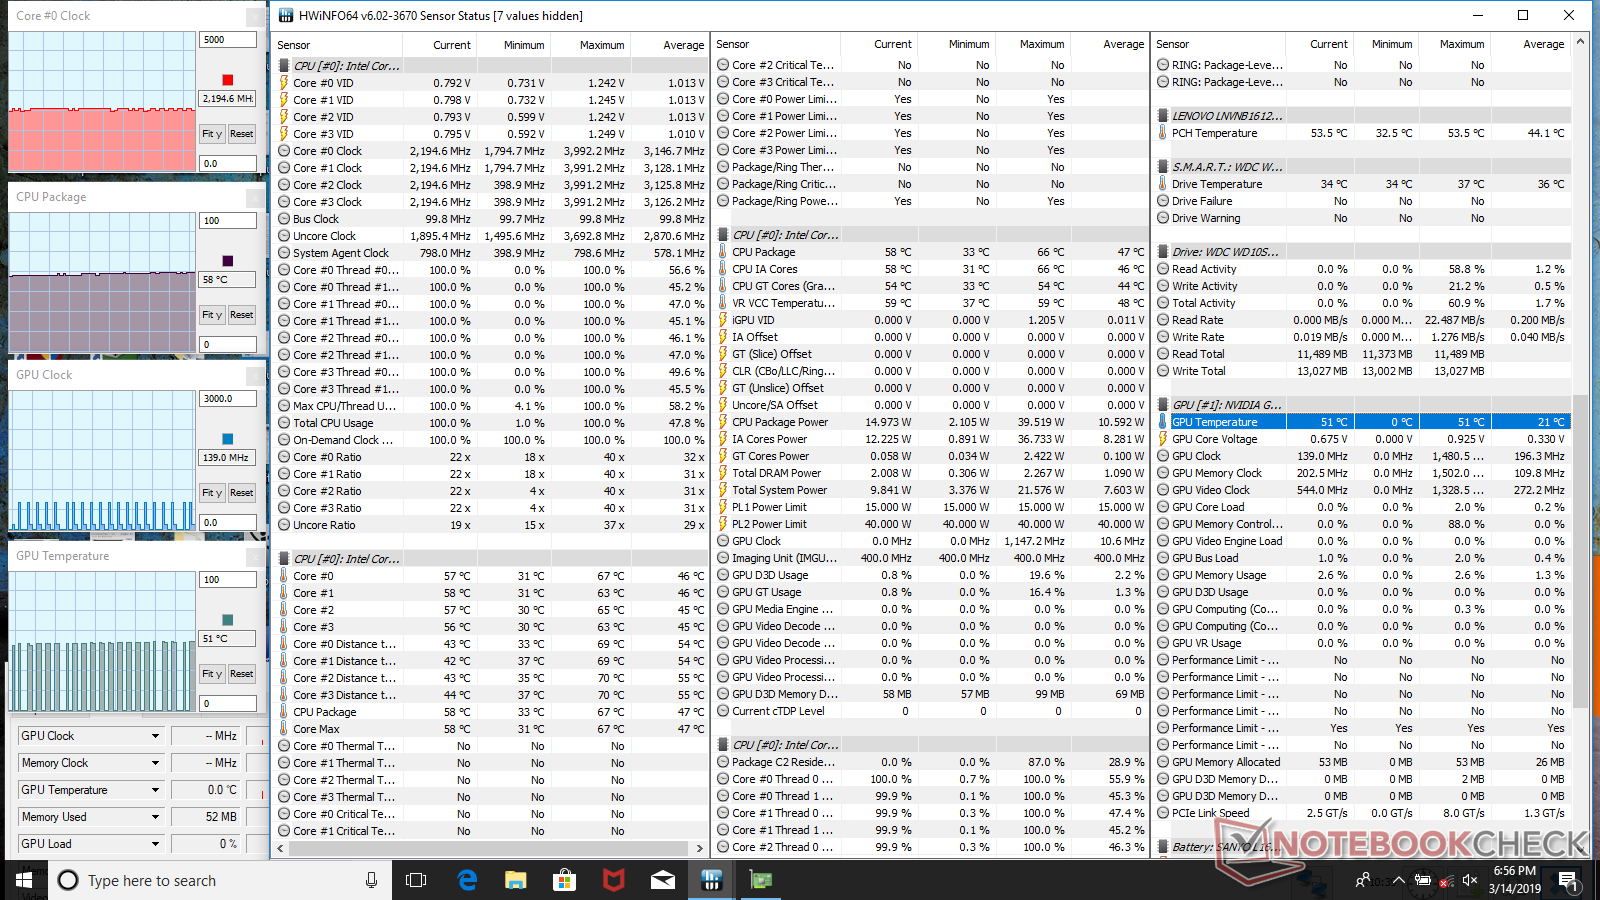
| CPU Clock (GHz) | GPU Clock (MHz) | Average CPU Temperature (°C) | Average GPU Temperature (°C) | |
| System Idle | -- | -- | 44 | 37 |
| Prime95 Stress | 2.2-2.3 | -- | 58 | -- |
| Prime95 + FurMark Stress | 1.8 | 1506 | 69 | 67 |
| Witcher 3 Stress | 1.8 | 1683 | 62 | 65 |
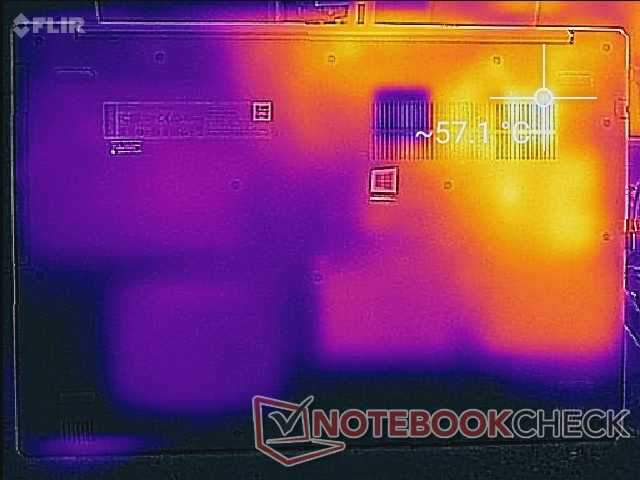
(-) The maximum temperature on the upper side is 47.4 °C / 117 F, compared to the average of 36.8 °C / 98 F, ranging from 21 to 71 °C for the class Multimedia.
(-) The bottom heats up to a maximum of 51 °C / 124 F, compared to the average of 39.1 °C / 102 F
(+) In idle usage, the average temperature for the upper side is 26.7 °C / 80 F, compared to the device average of 31.3 °C / 88 F.
(+) Playing The Witcher 3, the average temperature for the upper side is 30.4 °C / 87 F, compared to the device average of 31.3 °C / 88 F.
(+) The palmrests and touchpad are cooler than skin temperature with a maximum of 30 °C / 86 F and are therefore cool to the touch.
(±) The average temperature of the palmrest area of similar devices was 28.7 °C / 83.7 F (-1.3 °C / -2.3 F).
Speakers
Sound quality is good for a budget laptop. Maximum volume is loud enough to fill a small room with no static or clatter from vibrations. Higher frequencies are accentuated more than usual and bass is poor as one would expect.


Lenovo IdeaPad 330-17IKB 81DM audio analysis
(±) | speaker loudness is average but good (75.6 dB)
Bass 100 - 315 Hz
(-) | nearly no bass - on average 17.5% lower than median
(±) | linearity of bass is average (13.2% delta to prev. frequency)
Mids 400 - 2000 Hz
(+) | balanced mids - only 2.5% away from median
(±) | linearity of mids is average (9.4% delta to prev. frequency)
Highs 2 - 16 kHz
(±) | higher highs - on average 5.4% higher than median
(±) | linearity of highs is average (8.5% delta to prev. frequency)
Overall 100 - 16.000 Hz
(±) | linearity of overall sound is average (22.8% difference to median)
Compared to same class
» 81% of all tested devices in this class were better, 5% similar, 15% worse
» The best had a delta of 5%, average was 17%, worst was 45%
Compared to all devices tested
» 68% of all tested devices were better, 5% similar, 27% worse
» The best had a delta of 4%, average was 23%, worst was 134%
Apple MacBook 12 (Early 2016) 1.1 GHz audio analysis
(+) | speakers can play relatively loud (83.6 dB)
Bass 100 - 315 Hz
(±) | reduced bass - on average 11.3% lower than median
(±) | linearity of bass is average (14.2% delta to prev. frequency)
Mids 400 - 2000 Hz
(+) | balanced mids - only 2.4% away from median
(+) | mids are linear (5.5% delta to prev. frequency)
Highs 2 - 16 kHz
(+) | balanced highs - only 2% away from median
(+) | highs are linear (4.5% delta to prev. frequency)
Overall 100 - 16.000 Hz
(+) | overall sound is linear (10.2% difference to median)
Compared to same class
» 7% of all tested devices in this class were better, 2% similar, 90% worse
» The best had a delta of 5%, average was 18%, worst was 53%
Compared to all devices tested
» 5% of all tested devices were better, 1% similar, 94% worse
» The best had a delta of 4%, average was 23%, worst was 134%
Energy Management
Power Consumption
Idling on desktop demands anywhere between 4 W and 11 W depending on the brightness setting and power profile. When gaming, consumption jumps to about 56 W not unlike on the Dell Inspiron 17-7786 since both laptops share the same GeForce MX150 GPU and 15 W Intel U-class CPU.
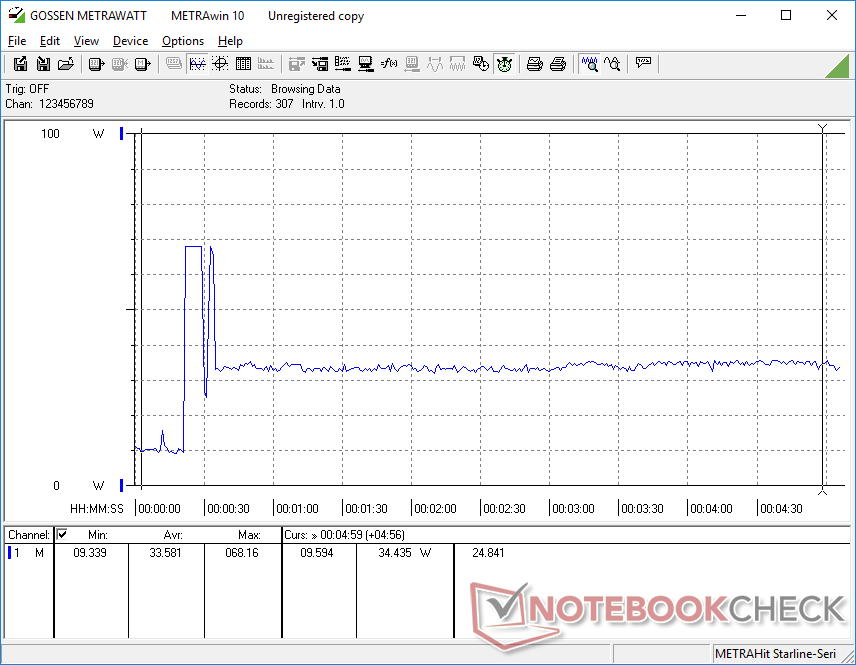
The highest consumption we can record is 75 W from the small (~7.5 x 7.5 x 2.7 cm) 65 W AC adapter. The system eventually throttles when under such high loads to stabilize at a lower consumption rate. When running Prime95, for example, consumption jumps to 68 W for the first few seconds before dropping and stabilizing at 34 W to match our observations during the Prime95 stress test above.
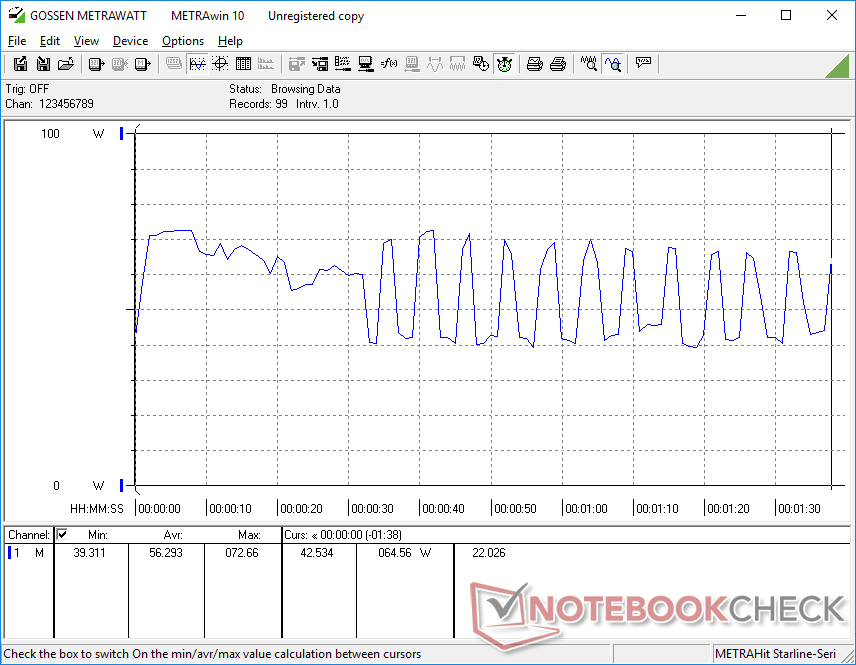
Interestingly, power consumption is not constant when running 3DMark 06 as shown by the graph below. The dynamic frame rates and demands of the benchmark scene could be responsible for the unexpected results.
| Off / Standby | |
| Idle | |
| Load |
|
Key:
min: | |
| Lenovo IdeaPad 330-17IKB 81DM i5-8550U, GeForce MX150, WDC Blue WD10SPZX-24Z10T0, TN LED, 1600x900, 17.3" | Dell Inspiron 17-7786 i7-8565U, GeForce MX150, KBG30ZMS128G, IPS, 1920x1080, 17.3" | Acer Aspire ES1-732-P7YA Pentium N4200, HD Graphics 505, Toshiba MQ01ABD100, TN LED, 1600x900, 17.3" | Asus VivoBook Pro 17 N705UD-EH76 i5-8550U, GeForce GTX 1050 Mobile, Samsung PM961 NVMe MZVLW512HMJP, IPS, 1920x1080, 17.3" | HP Pavilion 17z 1EX13AV A9-9420, Radeon 530, Avolusion MD1TBLSSHD, IPS, 1920x1080, 17.3" | Lenovo IdeaPad V110-17IKB 80V20006GE i5-7200U, HD Graphics 620, WDC Scorpio Blue WD10JPCX-24UE4T0, TN LED, 1600x900, 17.3" | |
|---|---|---|---|---|---|---|
| Power Consumption | 1% | 19% | -28% | -35% | 26% | |
| Idle Minimum * (Watt) | 4.7 | 4.2 11% | 6 -28% | 5.06 -8% | 8.4 -79% | 4.2 11% |
| Idle Average * (Watt) | 9.2 | 9.4 -2% | 9.6 -4% | 10.3 -12% | 11.7 -27% | 8.4 9% |
| Idle Maximum * (Watt) | 10.6 | 12.9 -22% | 10.7 -1% | 10.7 -1% | 24.1 -127% | 9 15% |
| Load Average * (Watt) | 56.3 | 56 1% | 21.2 62% | 83 -47% | 50.4 10% | 36.7 35% |
| Witcher 3 ultra * (Watt) | 55 | 92.4 -68% | 58 -5% | |||
| Load Maximum * (Watt) | 75.3 | 63.4 16% | 26 65% | 99.9 -33% | 62.8 17% | 29.7 61% |
* ... smaller is better
Battery Life
The internal 34 Wh battery is smaller than the batteries of the competing Acer Aspire ES1 (37 Wh) or HP Pavilion 17 (42 Wh). Consequently, runtimes are shorter on the Lenovo. The system lasts just under 4 hours when subjected to our WLAN test whereas the aforementioned Acer and HP laptops can each last around 5 hours.
Recharging the laptop from empty to full with the included AC adapter is very slow. Expect to wait about 3 hours for a full charge compared to 1.5 hours on most Ultrabooks.
| Lenovo IdeaPad 330-17IKB 81DM i5-8550U, GeForce MX150, 34 Wh | Dell Inspiron 17-7786 i7-8565U, GeForce MX150, 56 Wh | Acer Aspire ES1-732-P7YA Pentium N4200, HD Graphics 505, 37 Wh | Asus VivoBook Pro 17 N705UD-EH76 i5-8550U, GeForce GTX 1050 Mobile, 42 Wh | HP Pavilion 17z 1EX13AV A9-9420, Radeon 530, 41.6 Wh | Lenovo IdeaPad V110-17IKB 80V20006GE i5-7200U, HD Graphics 620, 32 Wh | |
|---|---|---|---|---|---|---|
| Battery runtime | 98% | 31% | -14% | 3% | 0% | |
| Reader / Idle (h) | 8.5 | 16.6 95% | 7.8 -8% | |||
| WiFi v1.3 (h) | 3.9 | 9 131% | 5.1 31% | 4.4 13% | 4.6 18% | 3.9 0% |
| Load (h) | 1.5 | 2.5 67% | 0.9 -40% | 1.5 0% |
Pros
Cons
Verdict
The IdeaPad 330 17 is not the laptop to get in 2019. While its Kaby Lake-R CPU and Pascal GPU are comparable or even better than on many Ultrabooks, its display is a tremendous eyesore. Contrast is incredibly poor, resolution is low, brightness is dim, and colors are washed out and grainy. Such a panel would have been acceptable on a budget laptop 5 years ago, but it has no place here even on a cheap multimedia offering.
Look past the horrendous display and there are still a fair number of deep faults. The short battery life, teetering lid, spongy trackpad, thick bezel chassis, single-channel memory, and slow HDD performance are heavy prices to pay.
Speaking of price, our particular configuration can be found for around $800 at retail. This is overpriced for a model belonging to Lenovo's bottom-of-the-barrel IdeaPad 300 family. Significantly more powerful laptops with the Core i5-8300H CPU, GTX 1050 GPU, and 1080p display can be found for around the same price including the MSI GV72, Asus Vivobook F510, Asus TUF FX504, or the HP Pavilion Gaming 15.
Keep away from this configuration. Its retail price is far too high considering the terrible display and teetering lid. If you have $800 to spend, then we recommend the many GTX 1050 laptops in the market that offer significantly faster performance and more features than what we have here.
Lenovo IdeaPad 330-17IKB 81DM
- 03/19/2019 v6 (old)
Allen Ngo
Price comparison
