HP Pavilion 17z-ak000 (A9-9420, Radeon 530) Laptop Review
Our look into AMD's current lineup of 7th generation APUs continues with the A9-9420 processor and Radeon 530 GPU in the Pavilion 17z. Unlike the quad-core Bristol Ridge A12-9720P SKU we reviewed just a week prior, this dual-core Stoney Ridge configuration does not come with Dual Graphics support and is even less expensive for those on a tighter budget. Other than the CPU and GPU differences, this is the exact same Pavilion 17z chassis that we are already familiar with. Prices start for as low as $430 USD with integrated Radeon R5 graphics and 900p display or as high as $600 USD with our dedicated Radeon 530 graphics and 1080p display.
See our existing reviews on the Pavilion 17 series for more information on what to expect in terms of features and design. Everything we have to say about the keyboard, connectivity options, and quality of the Pavilion can be found through the links below. We'll be jumping straight to performance in order to see if the A9-9420 can be a worthy alternative to Intel's budget Core i3 range.
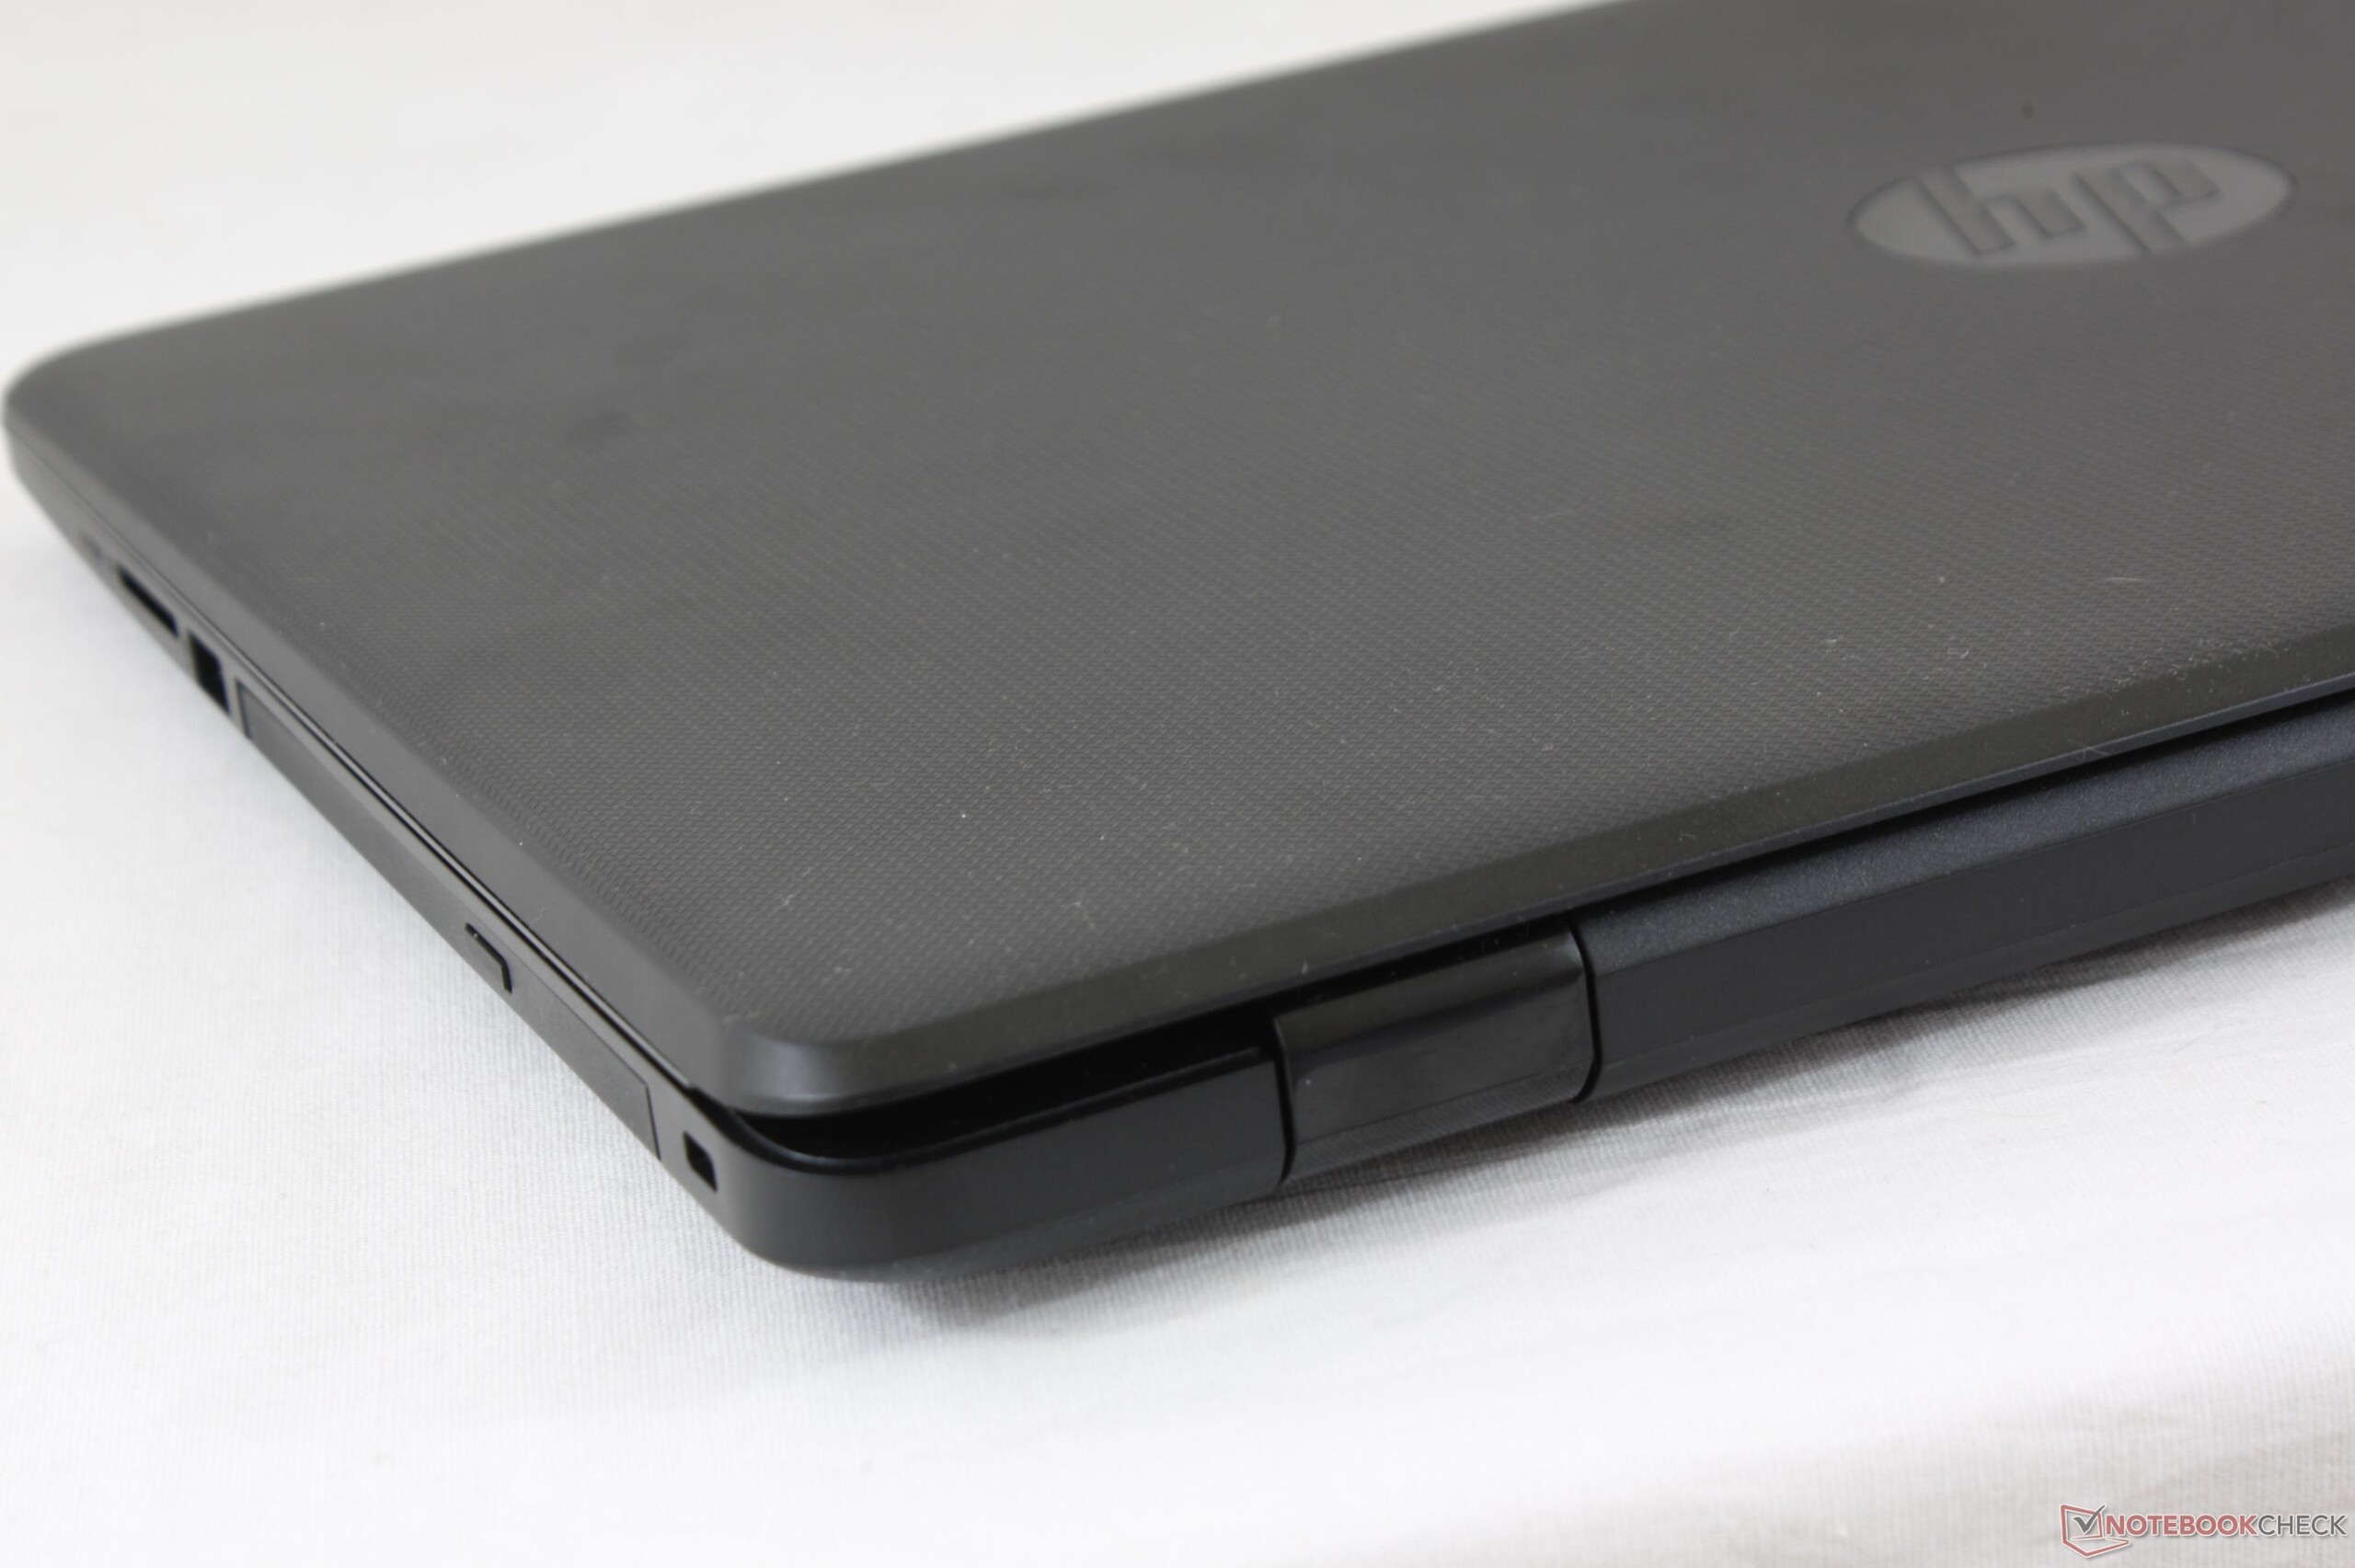
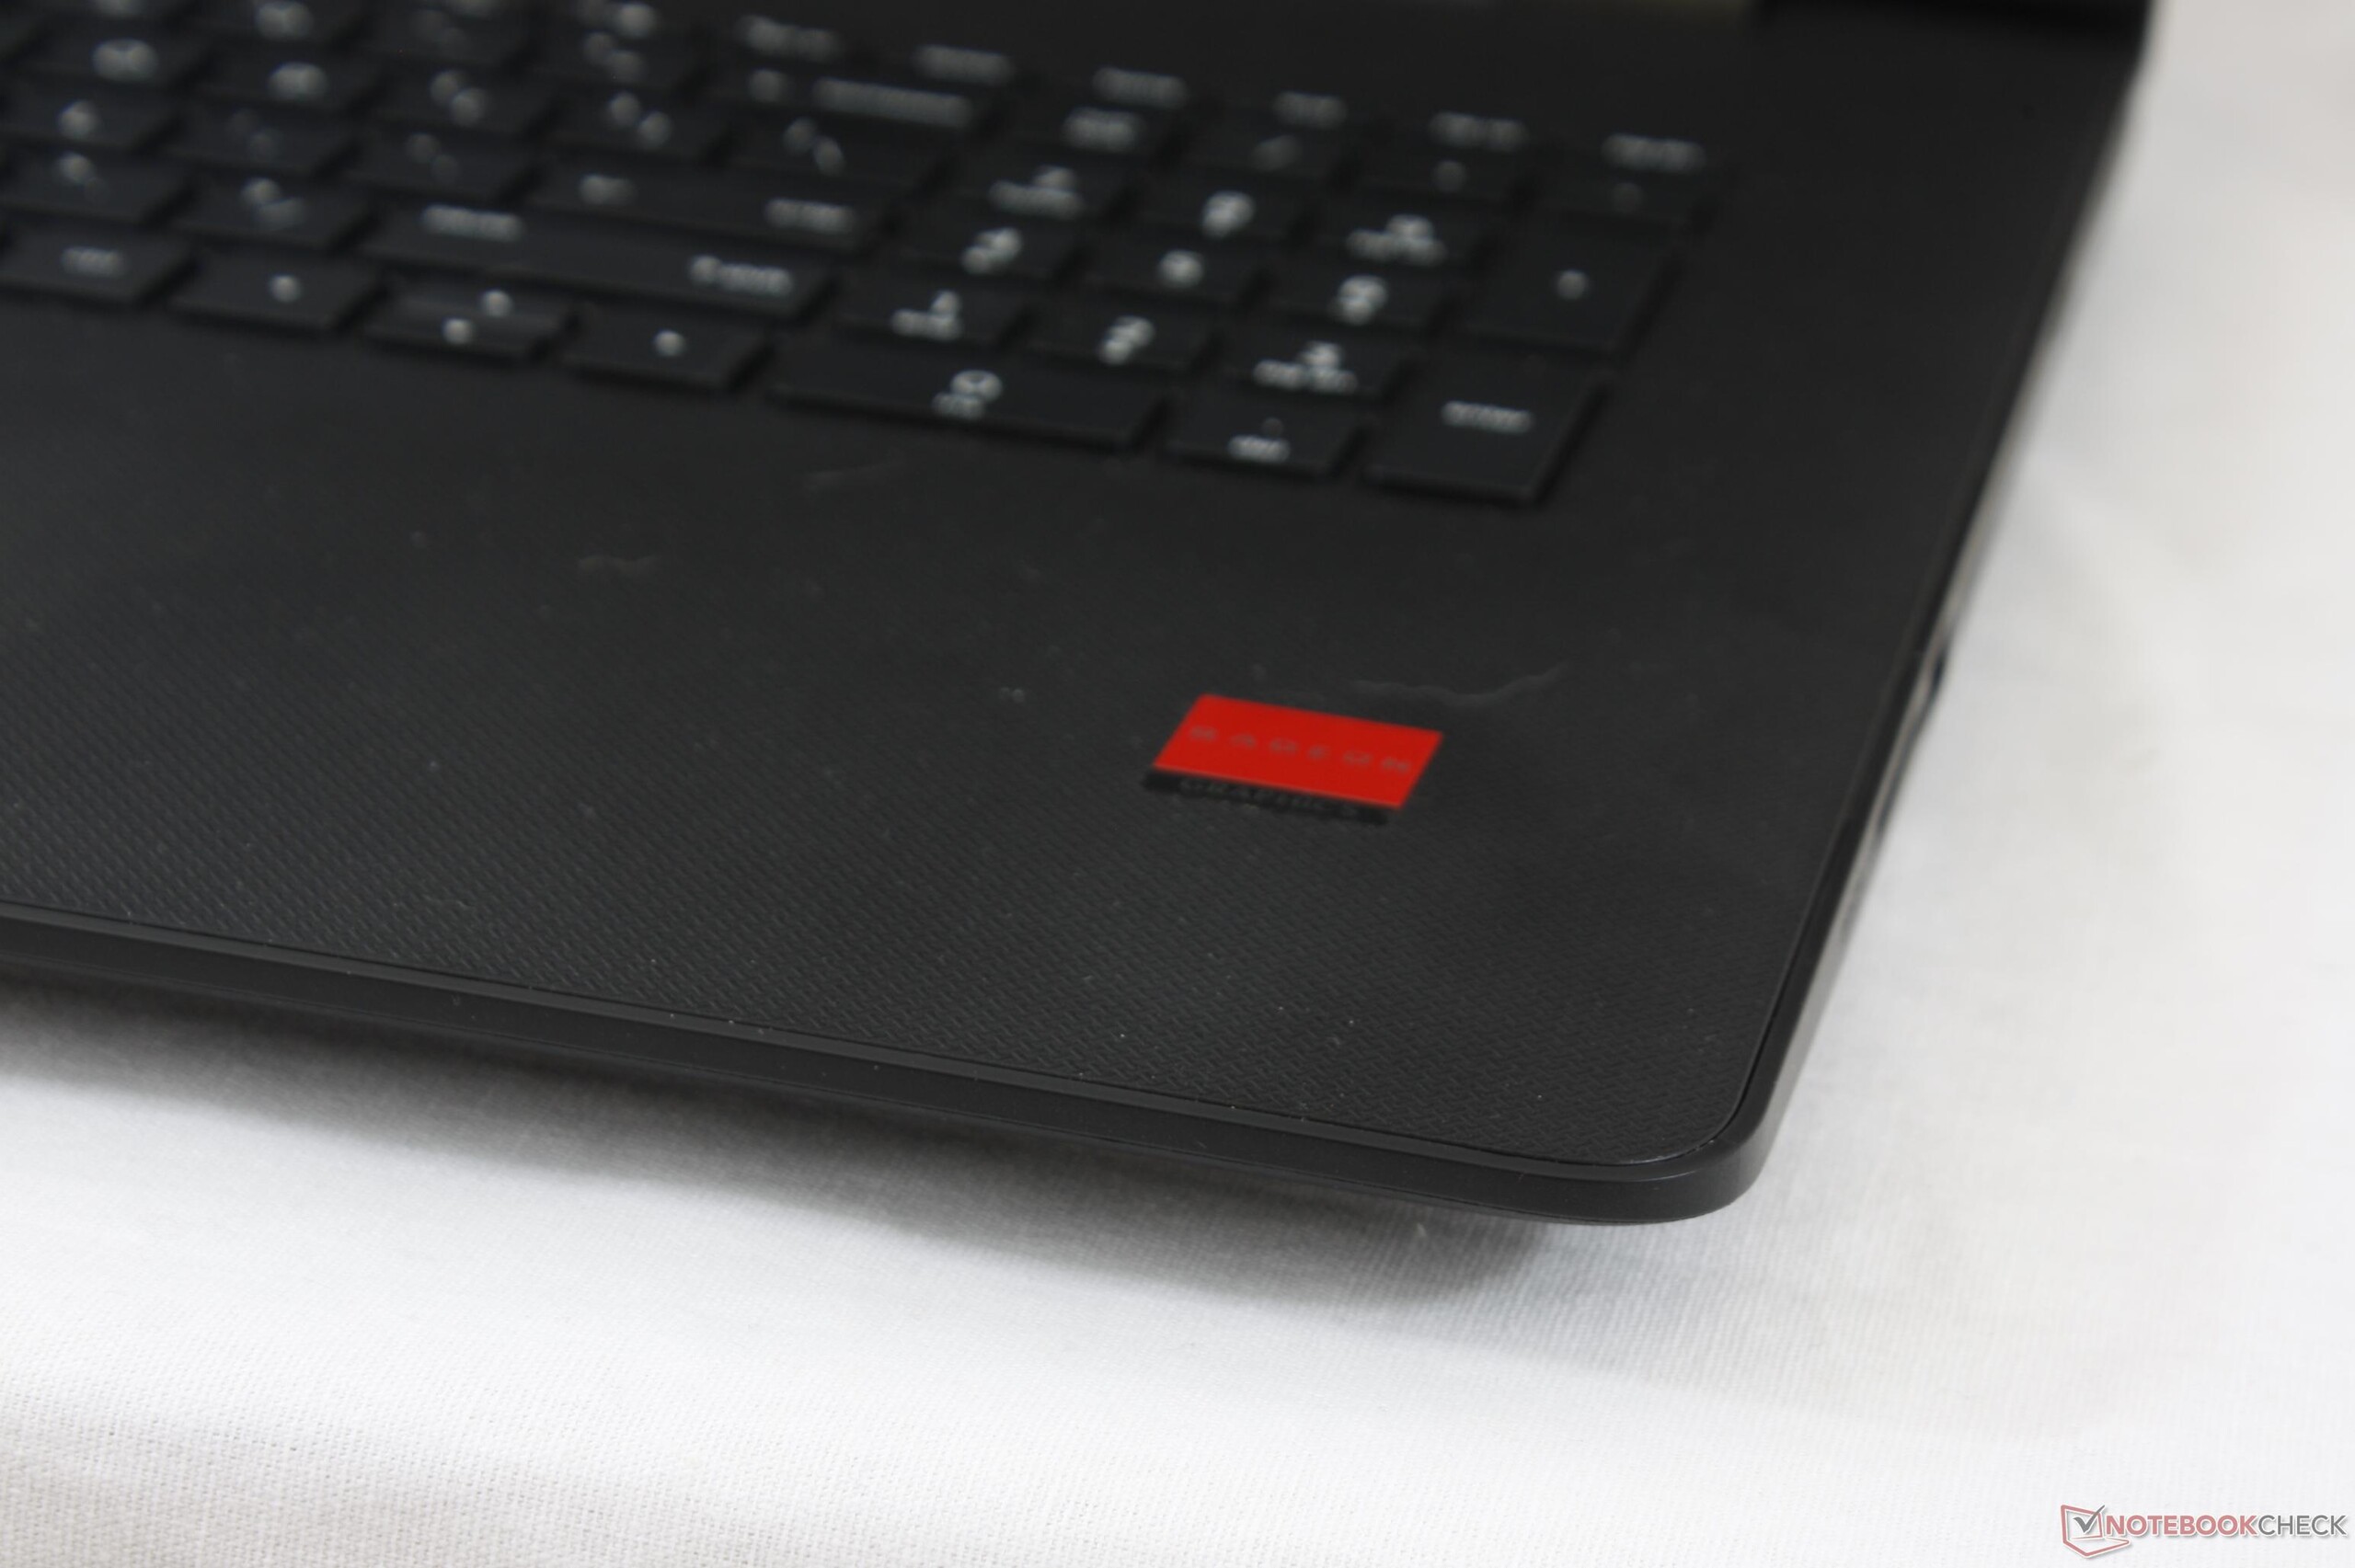
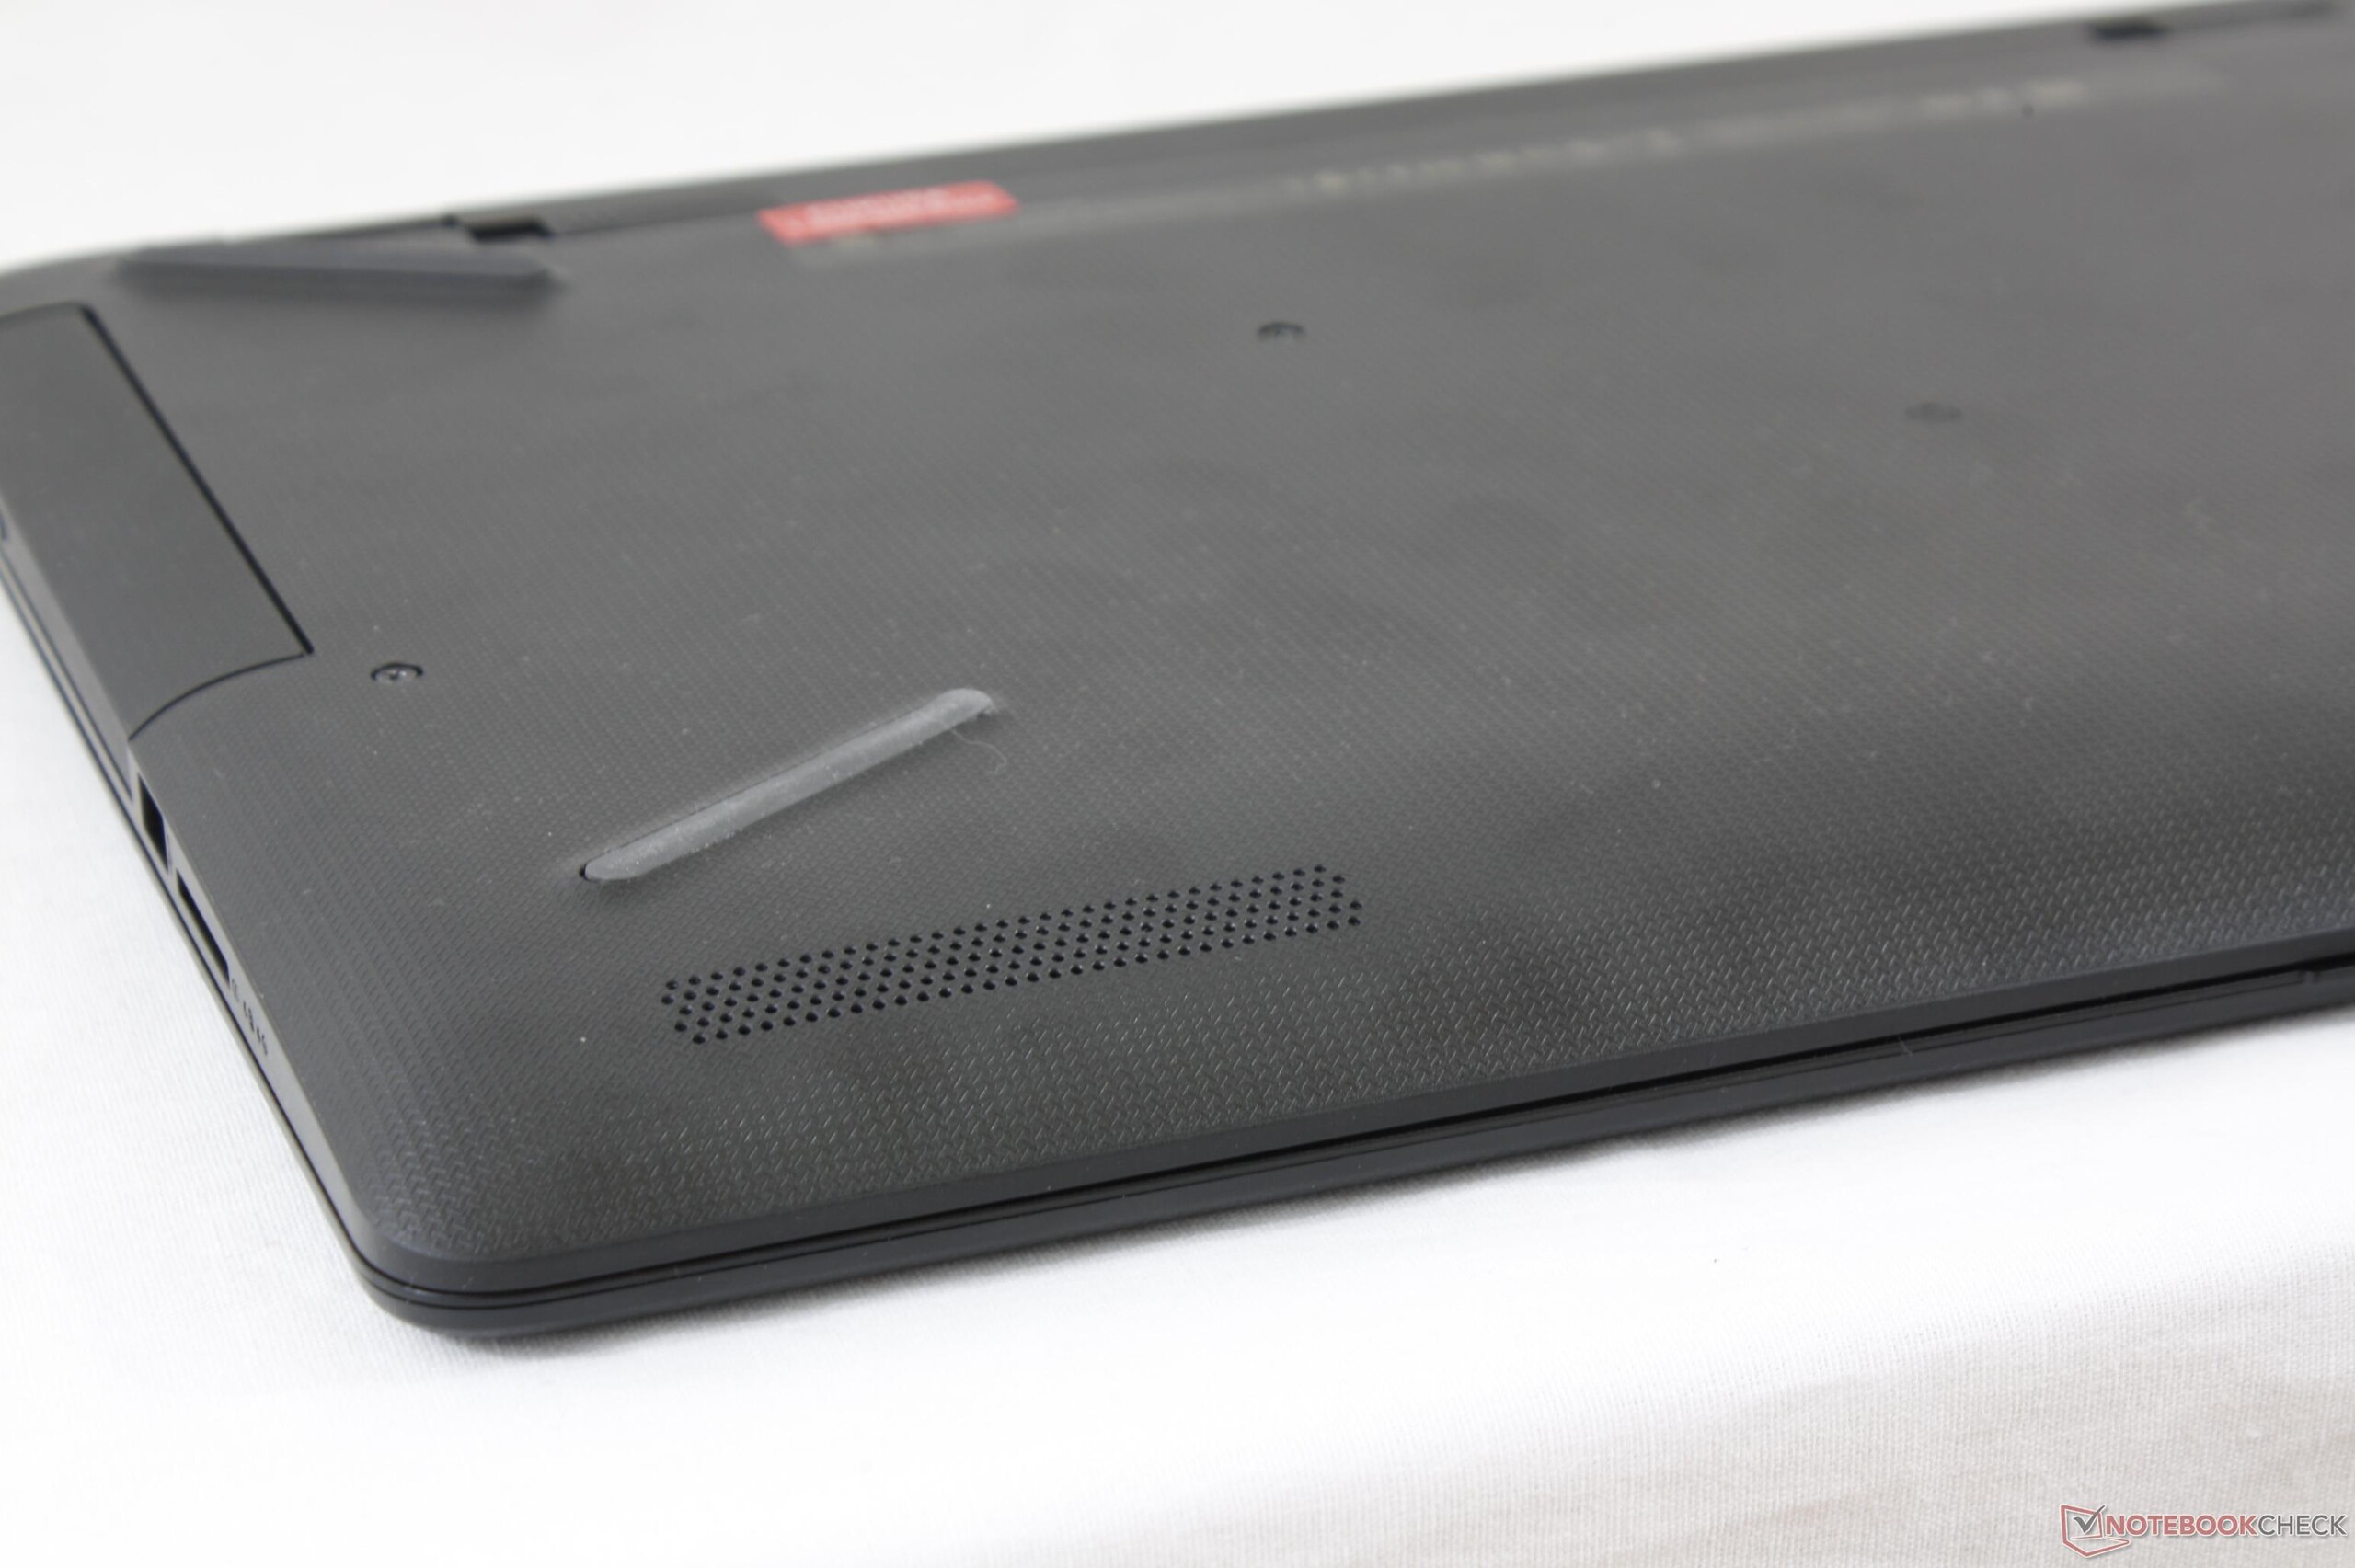
Case
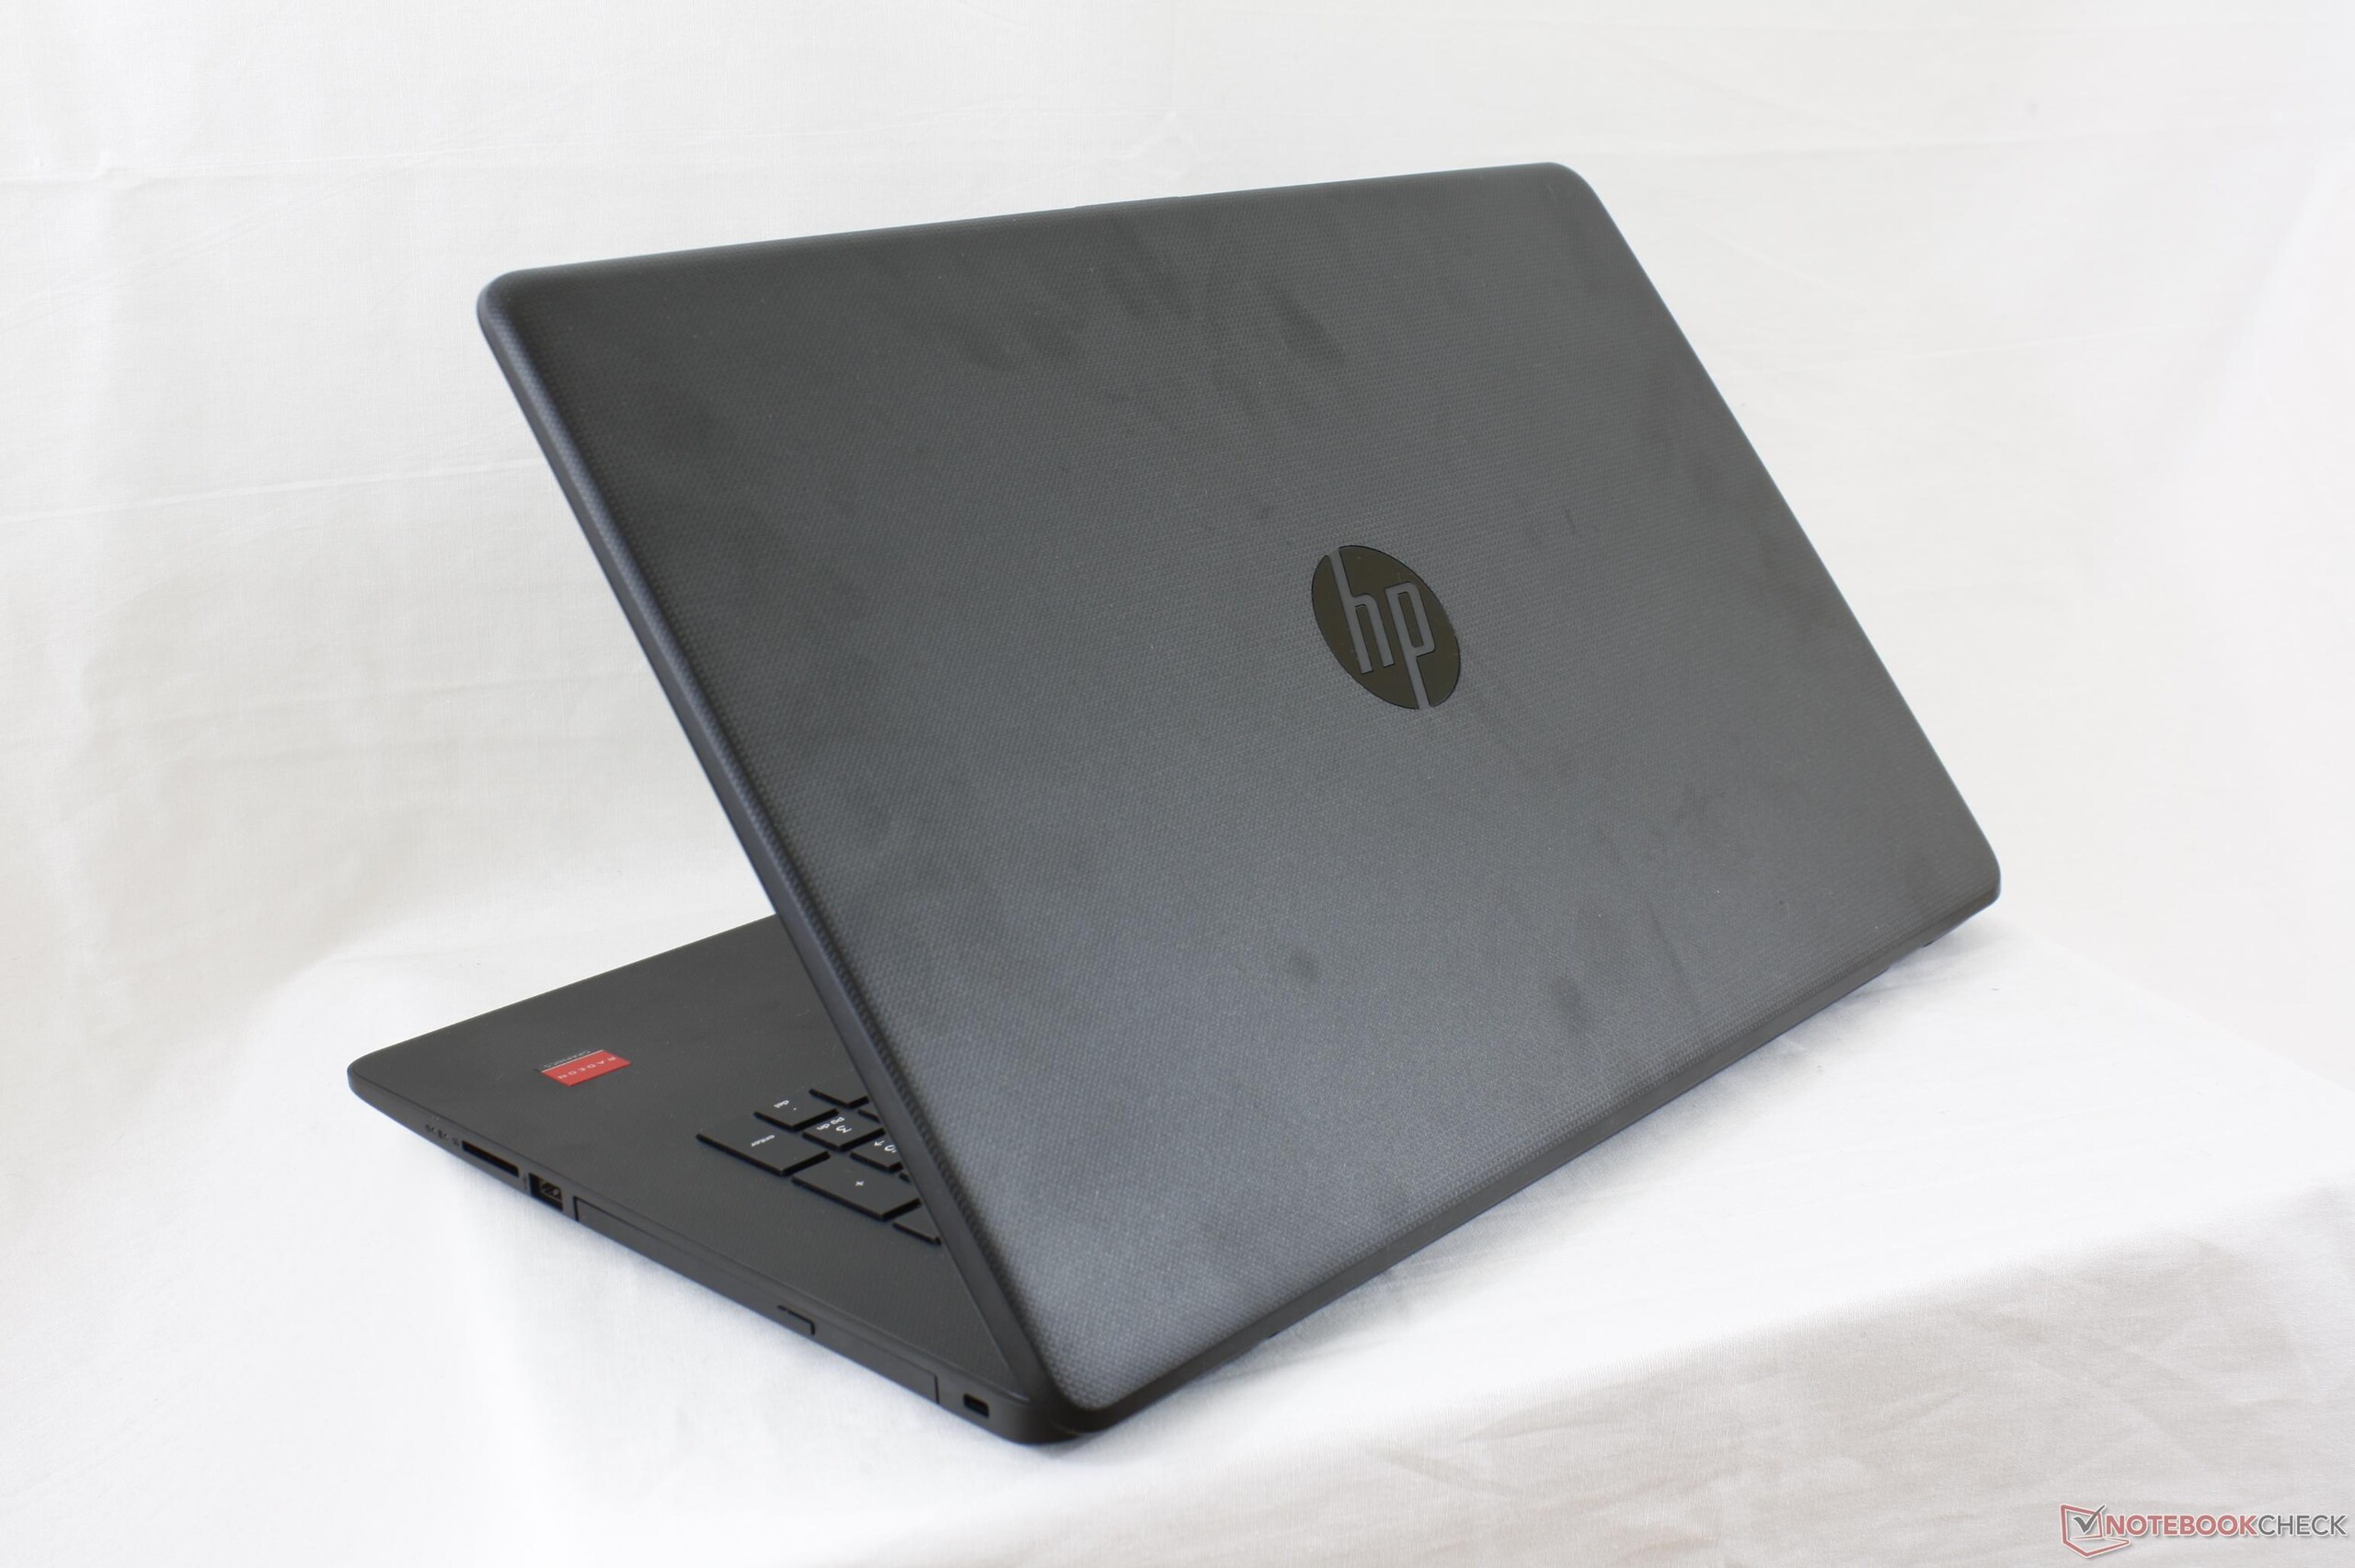
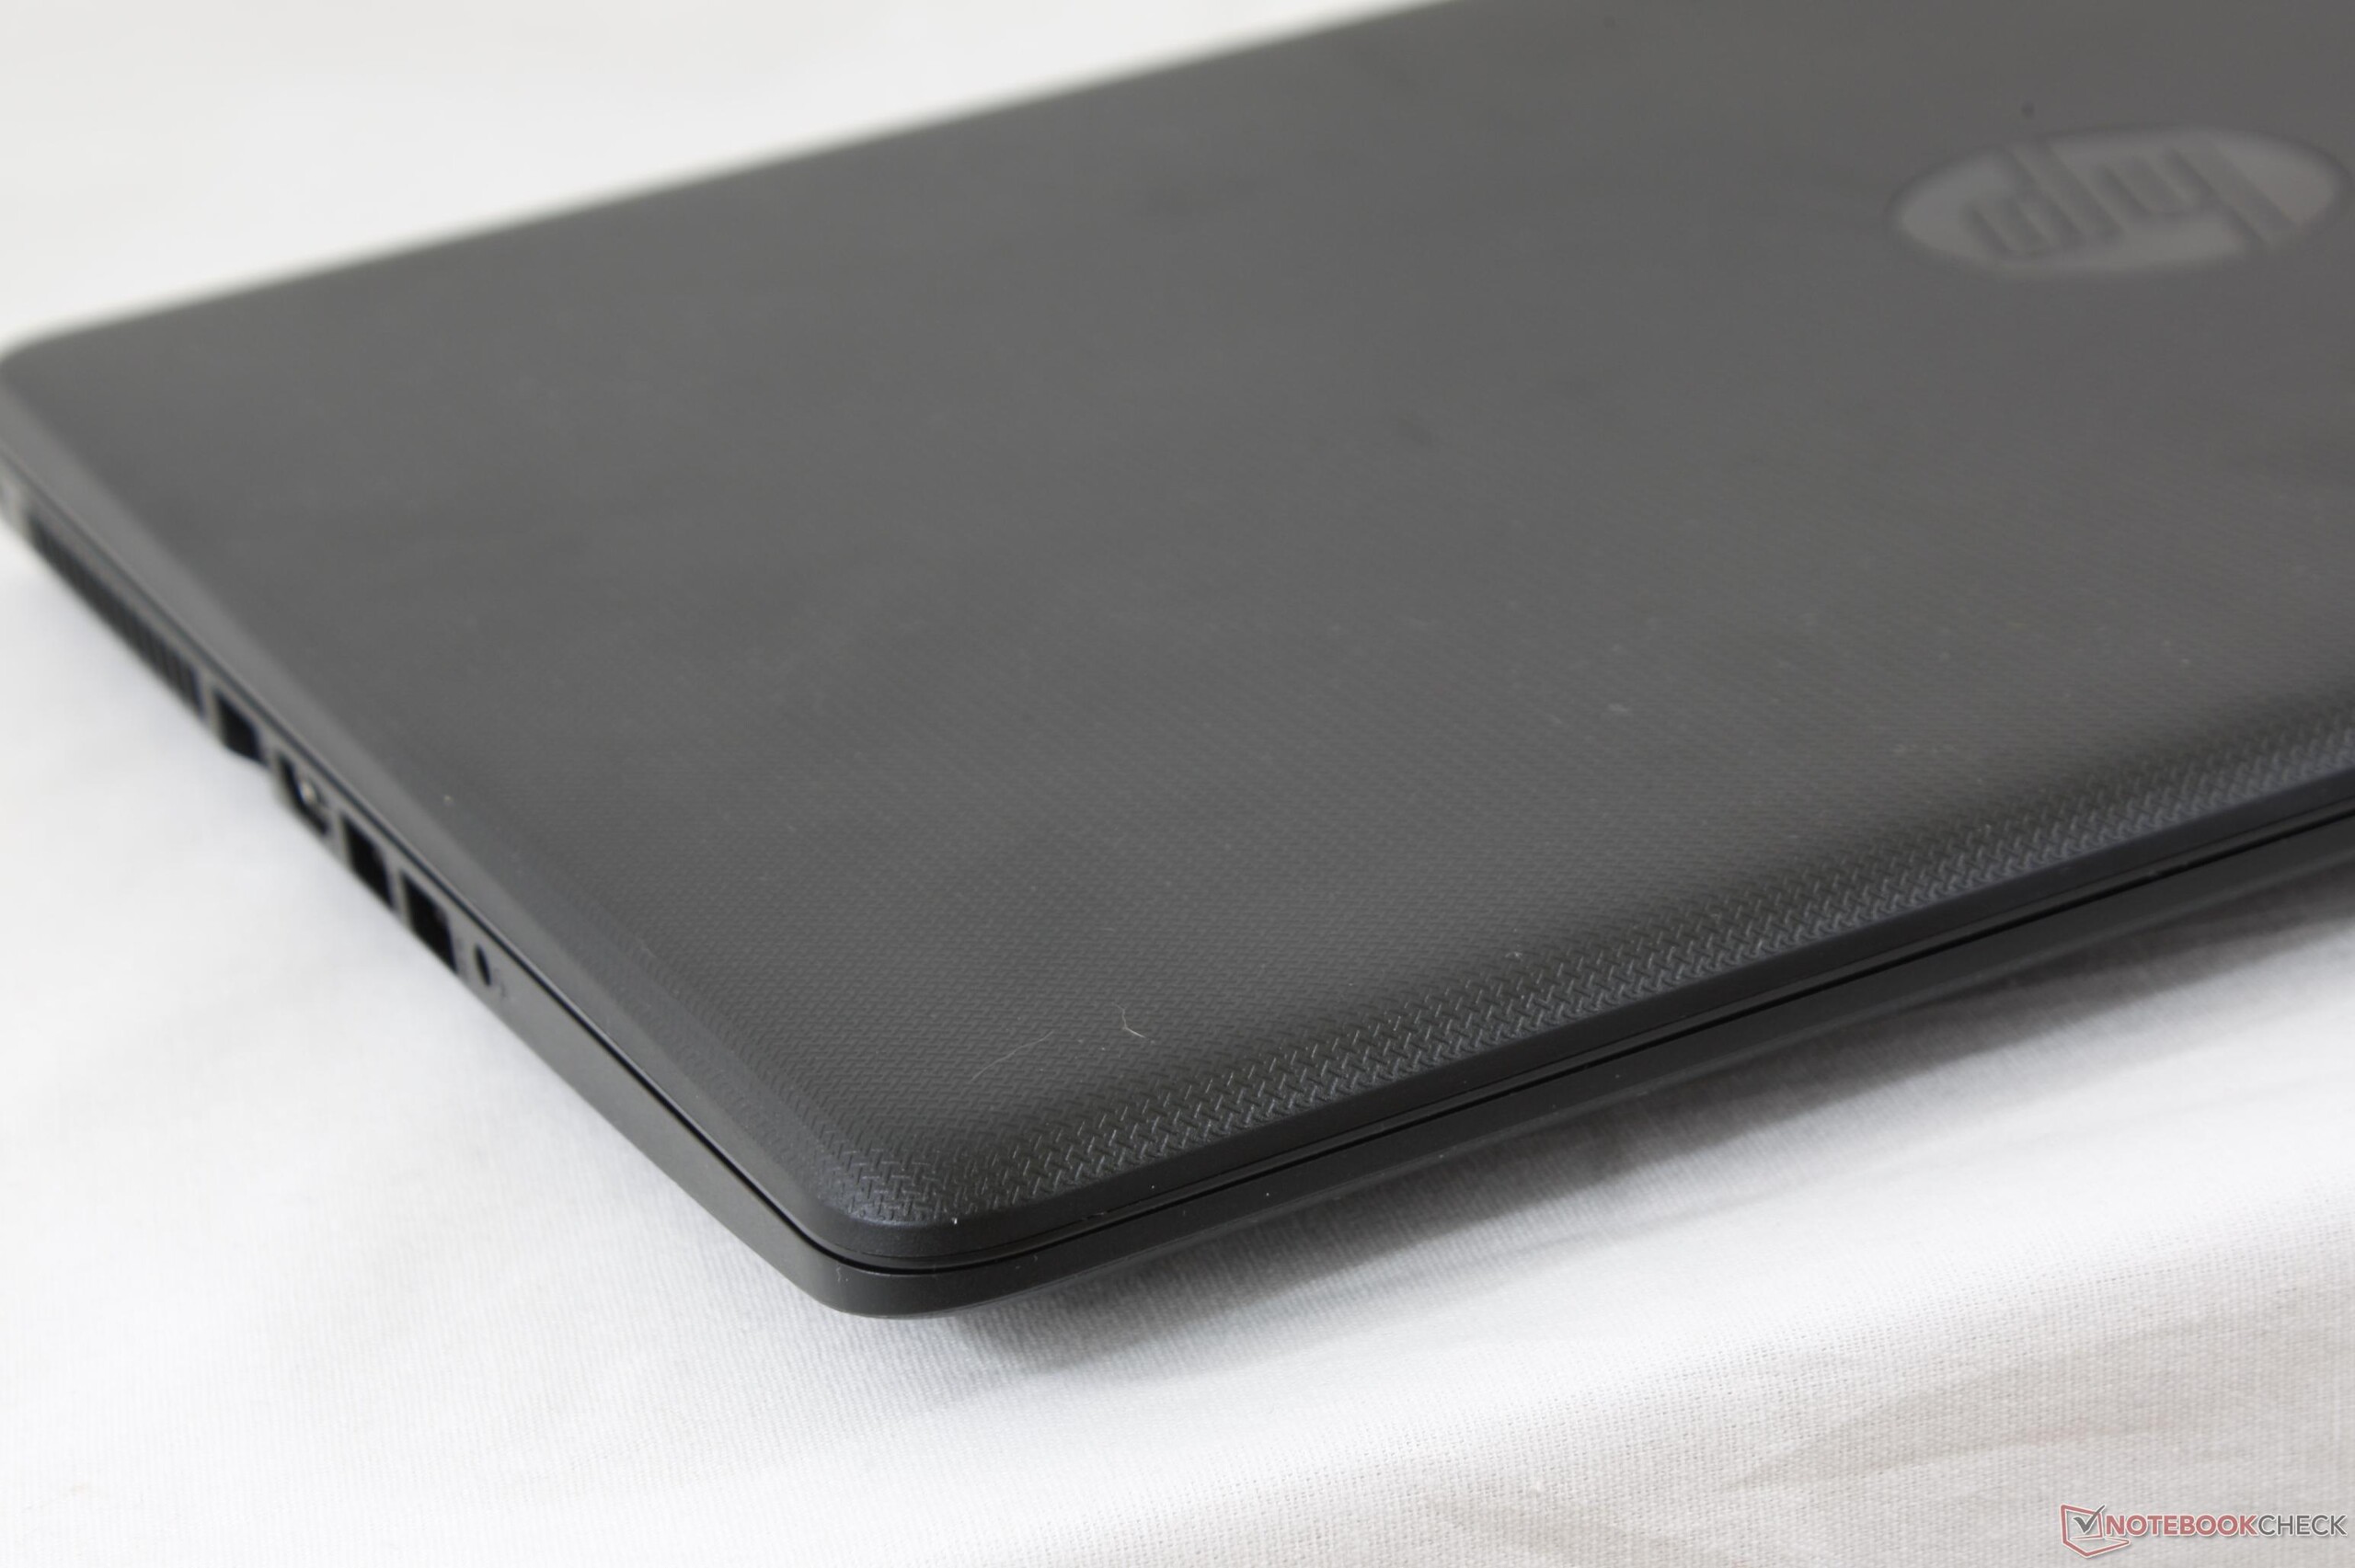
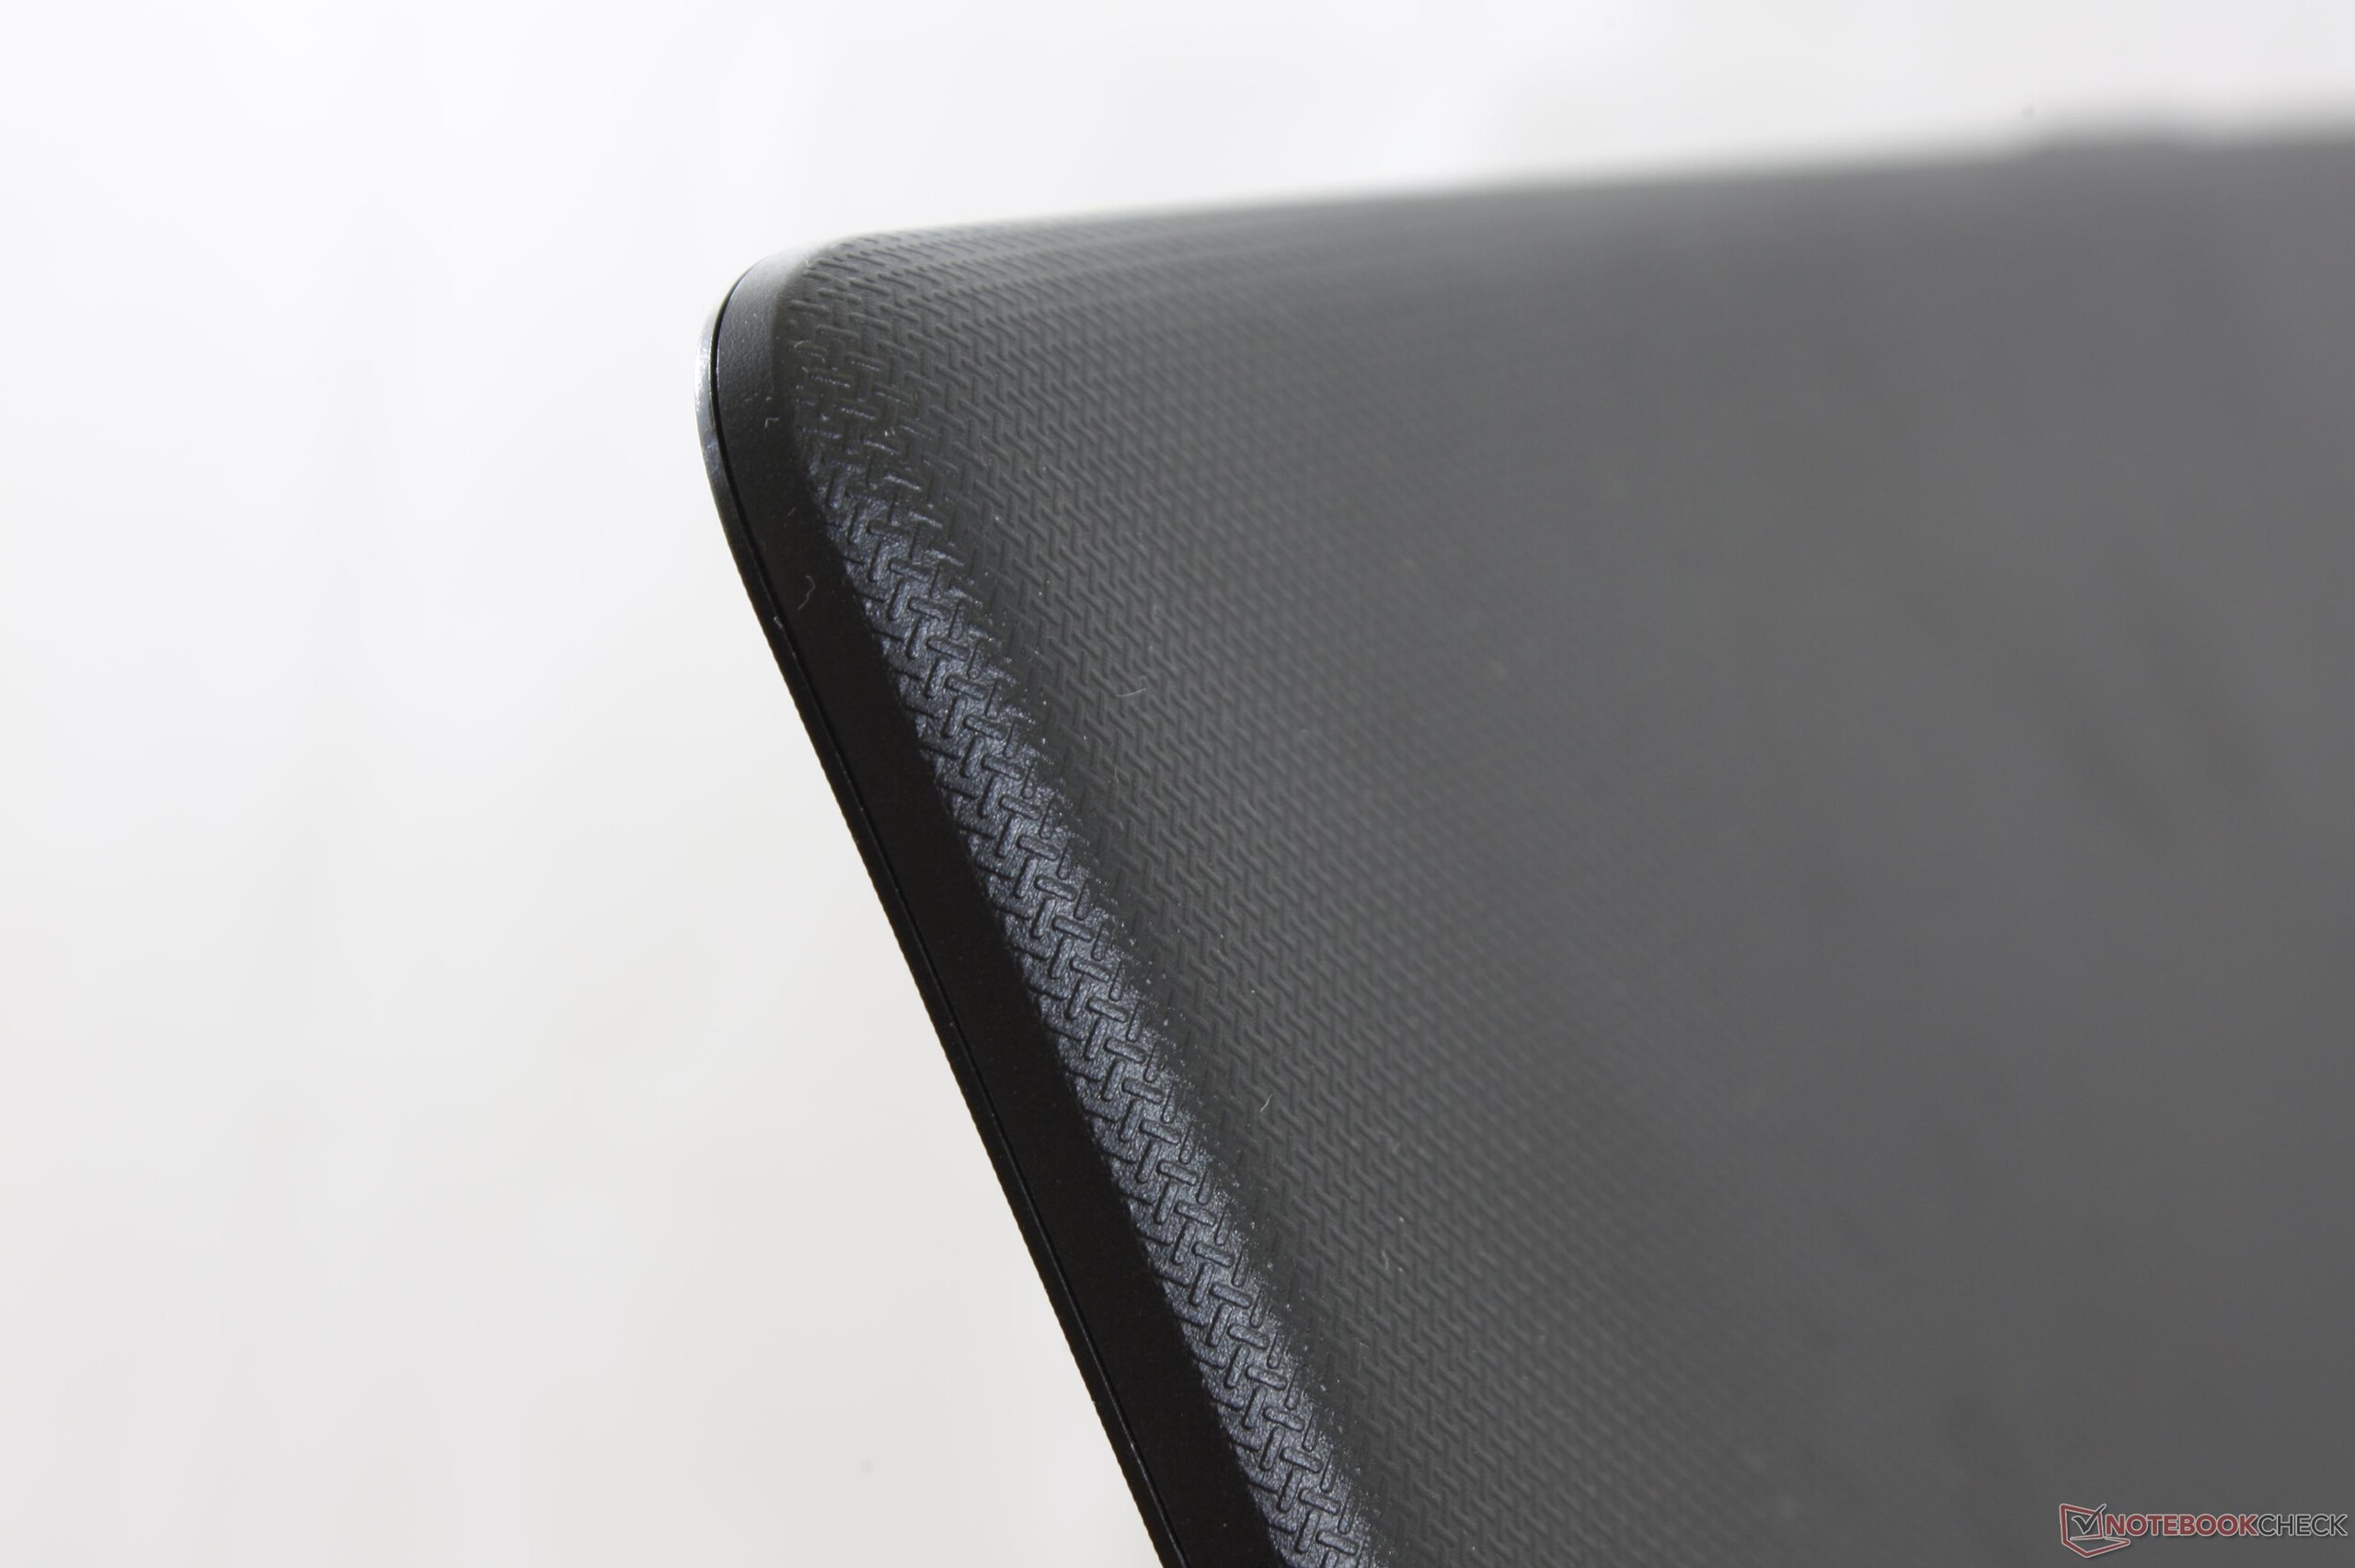
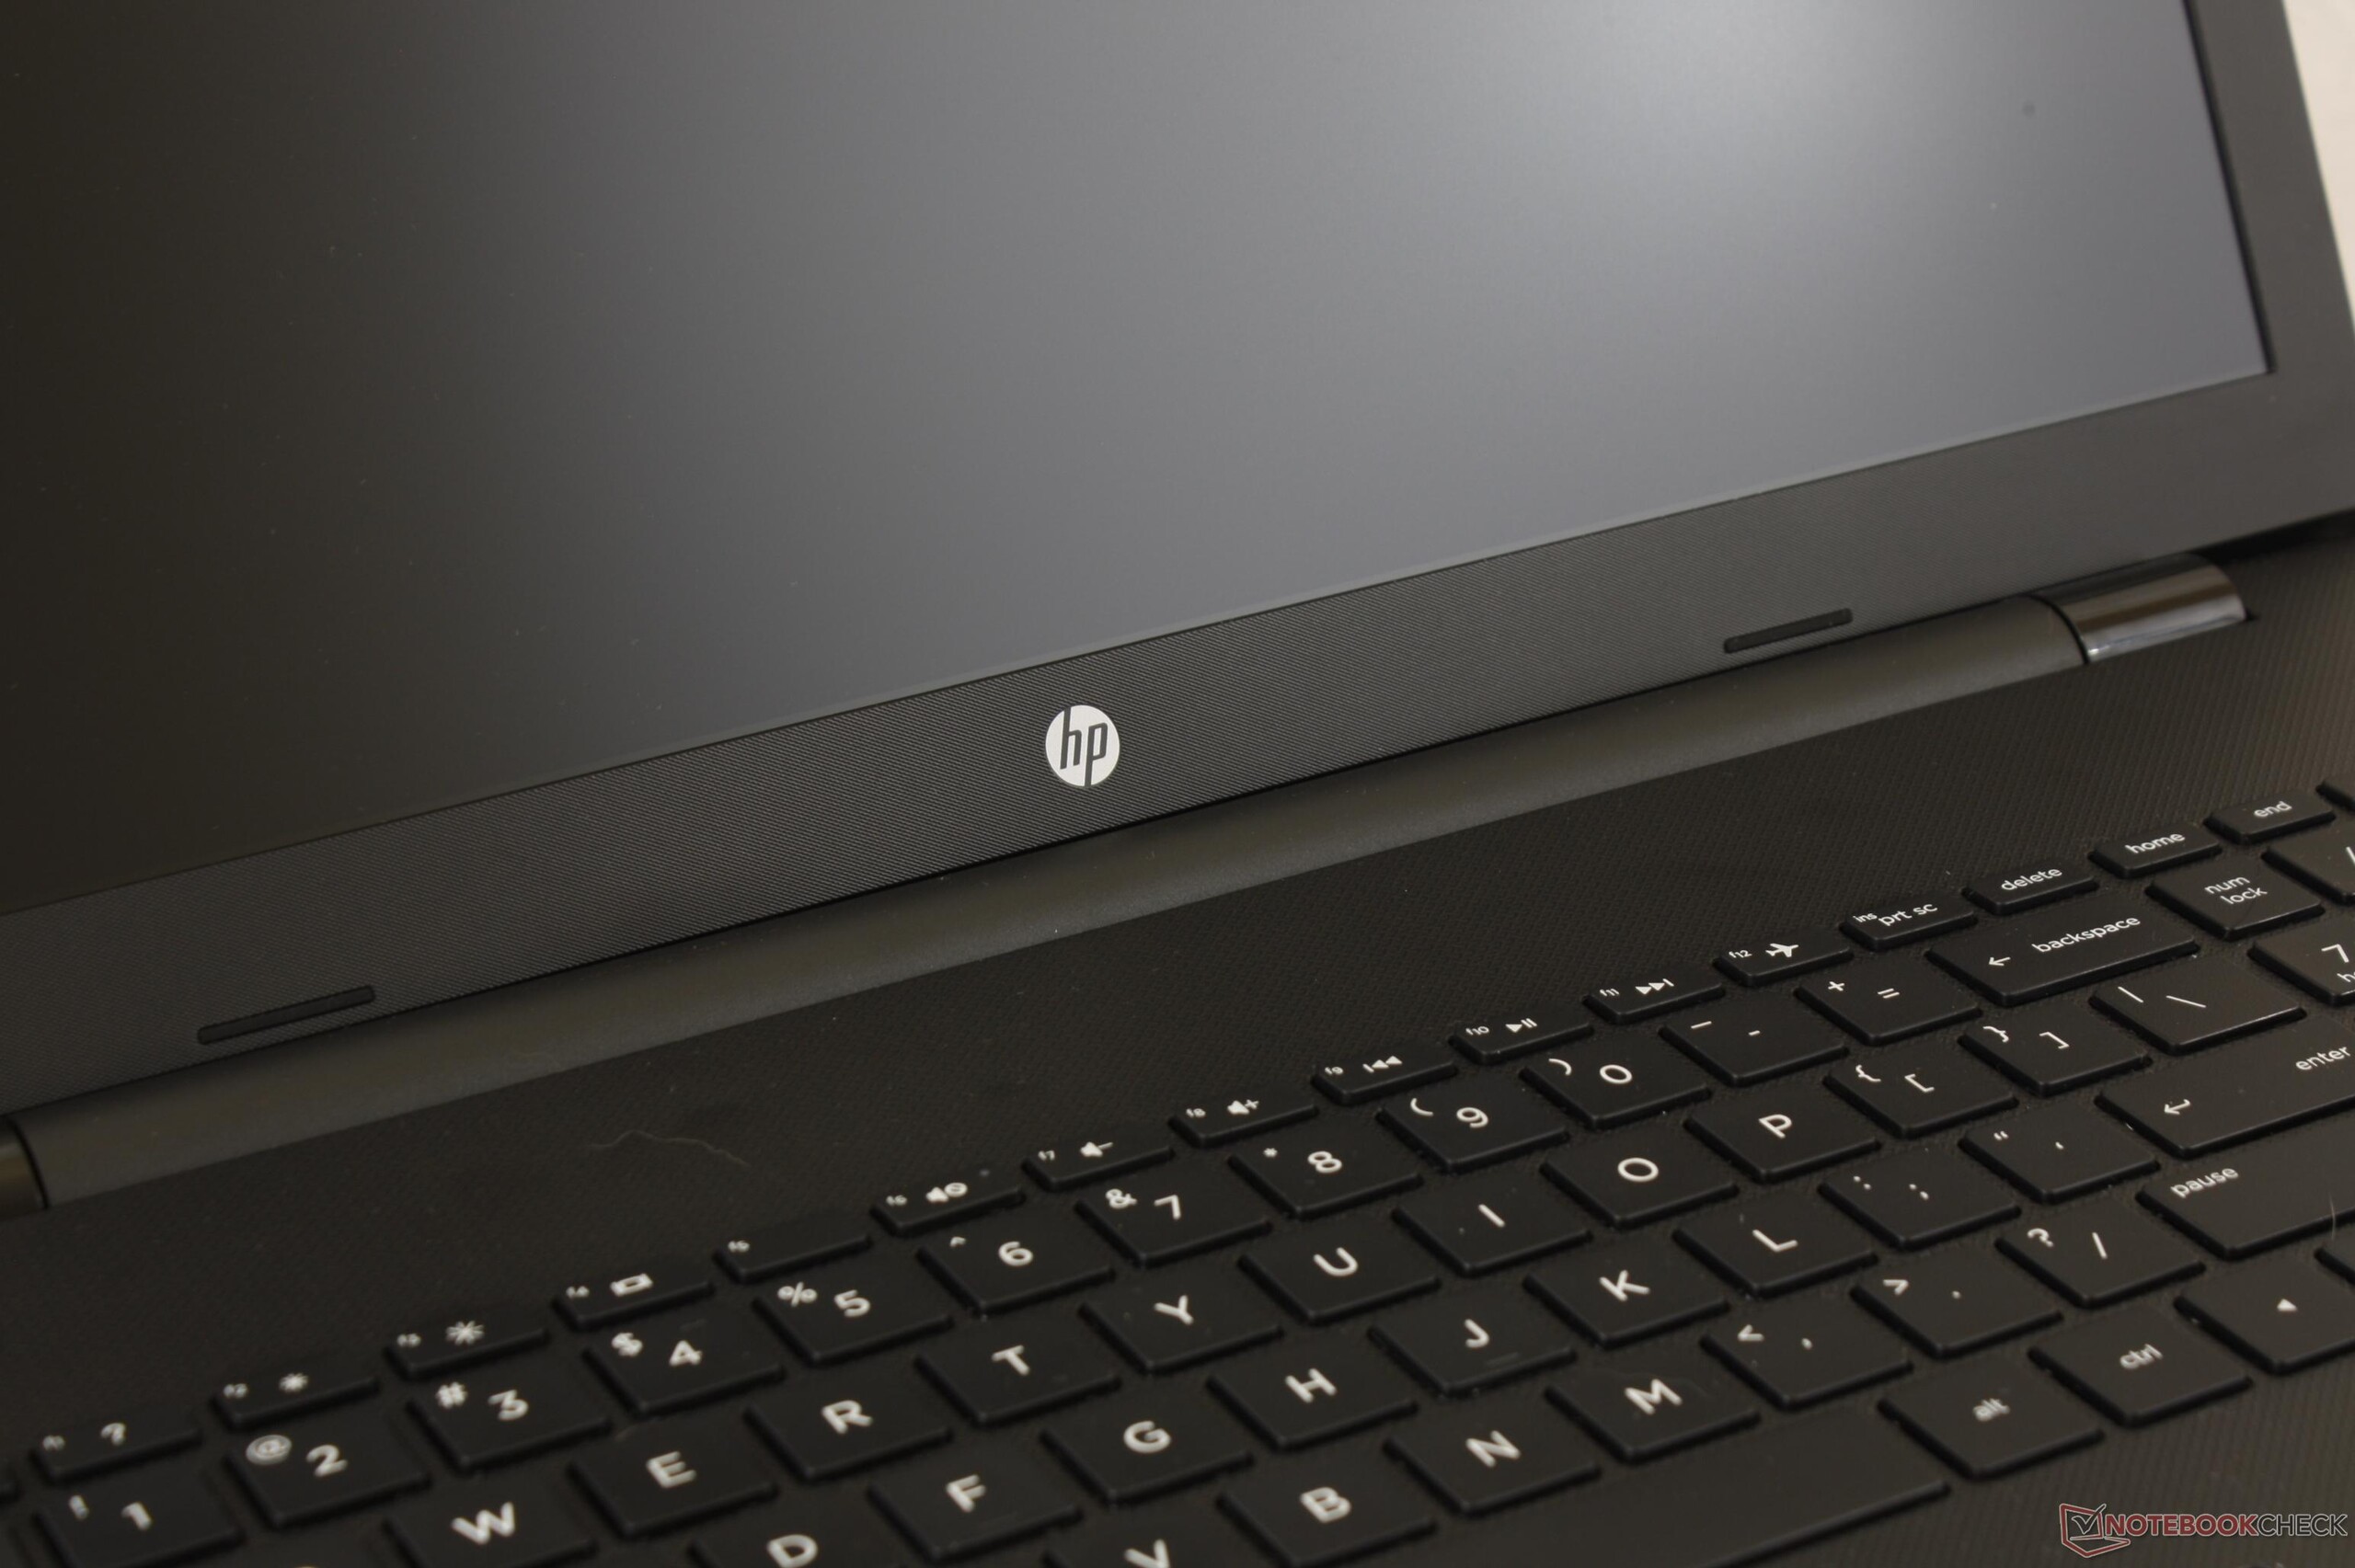
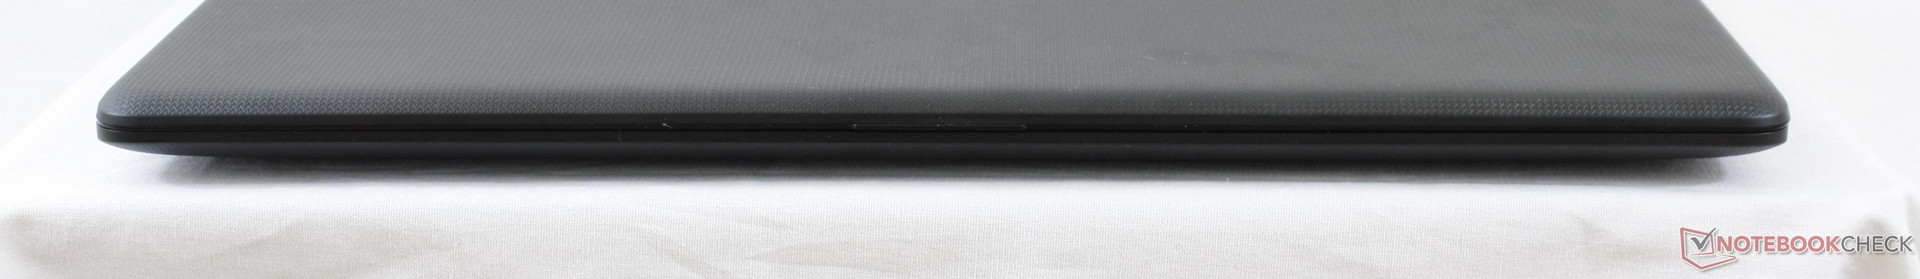
The all-plastic chassis is ordinary in every sense of the word. It brings nothing new or special in order to keep prices low and does nothing to hide the fact that this is a no-frills budget system. The base creaks when attempting to twist it and the lid is very susceptible to warping once again. Pushing down on the center of the keyboard or outer lid will result in slight depressions since the surfaces are not entirely rigid. The bumpy matte texture can at least hide fingerprints quite well compared to the smooth glossy surfaces on most other notebooks if grease build up is a concern.
Construction quality is otherwise excellent on our particular unit. Unlike our last Pavilion 17z, we can find no unintended gaps or crevices between the chassis materials.
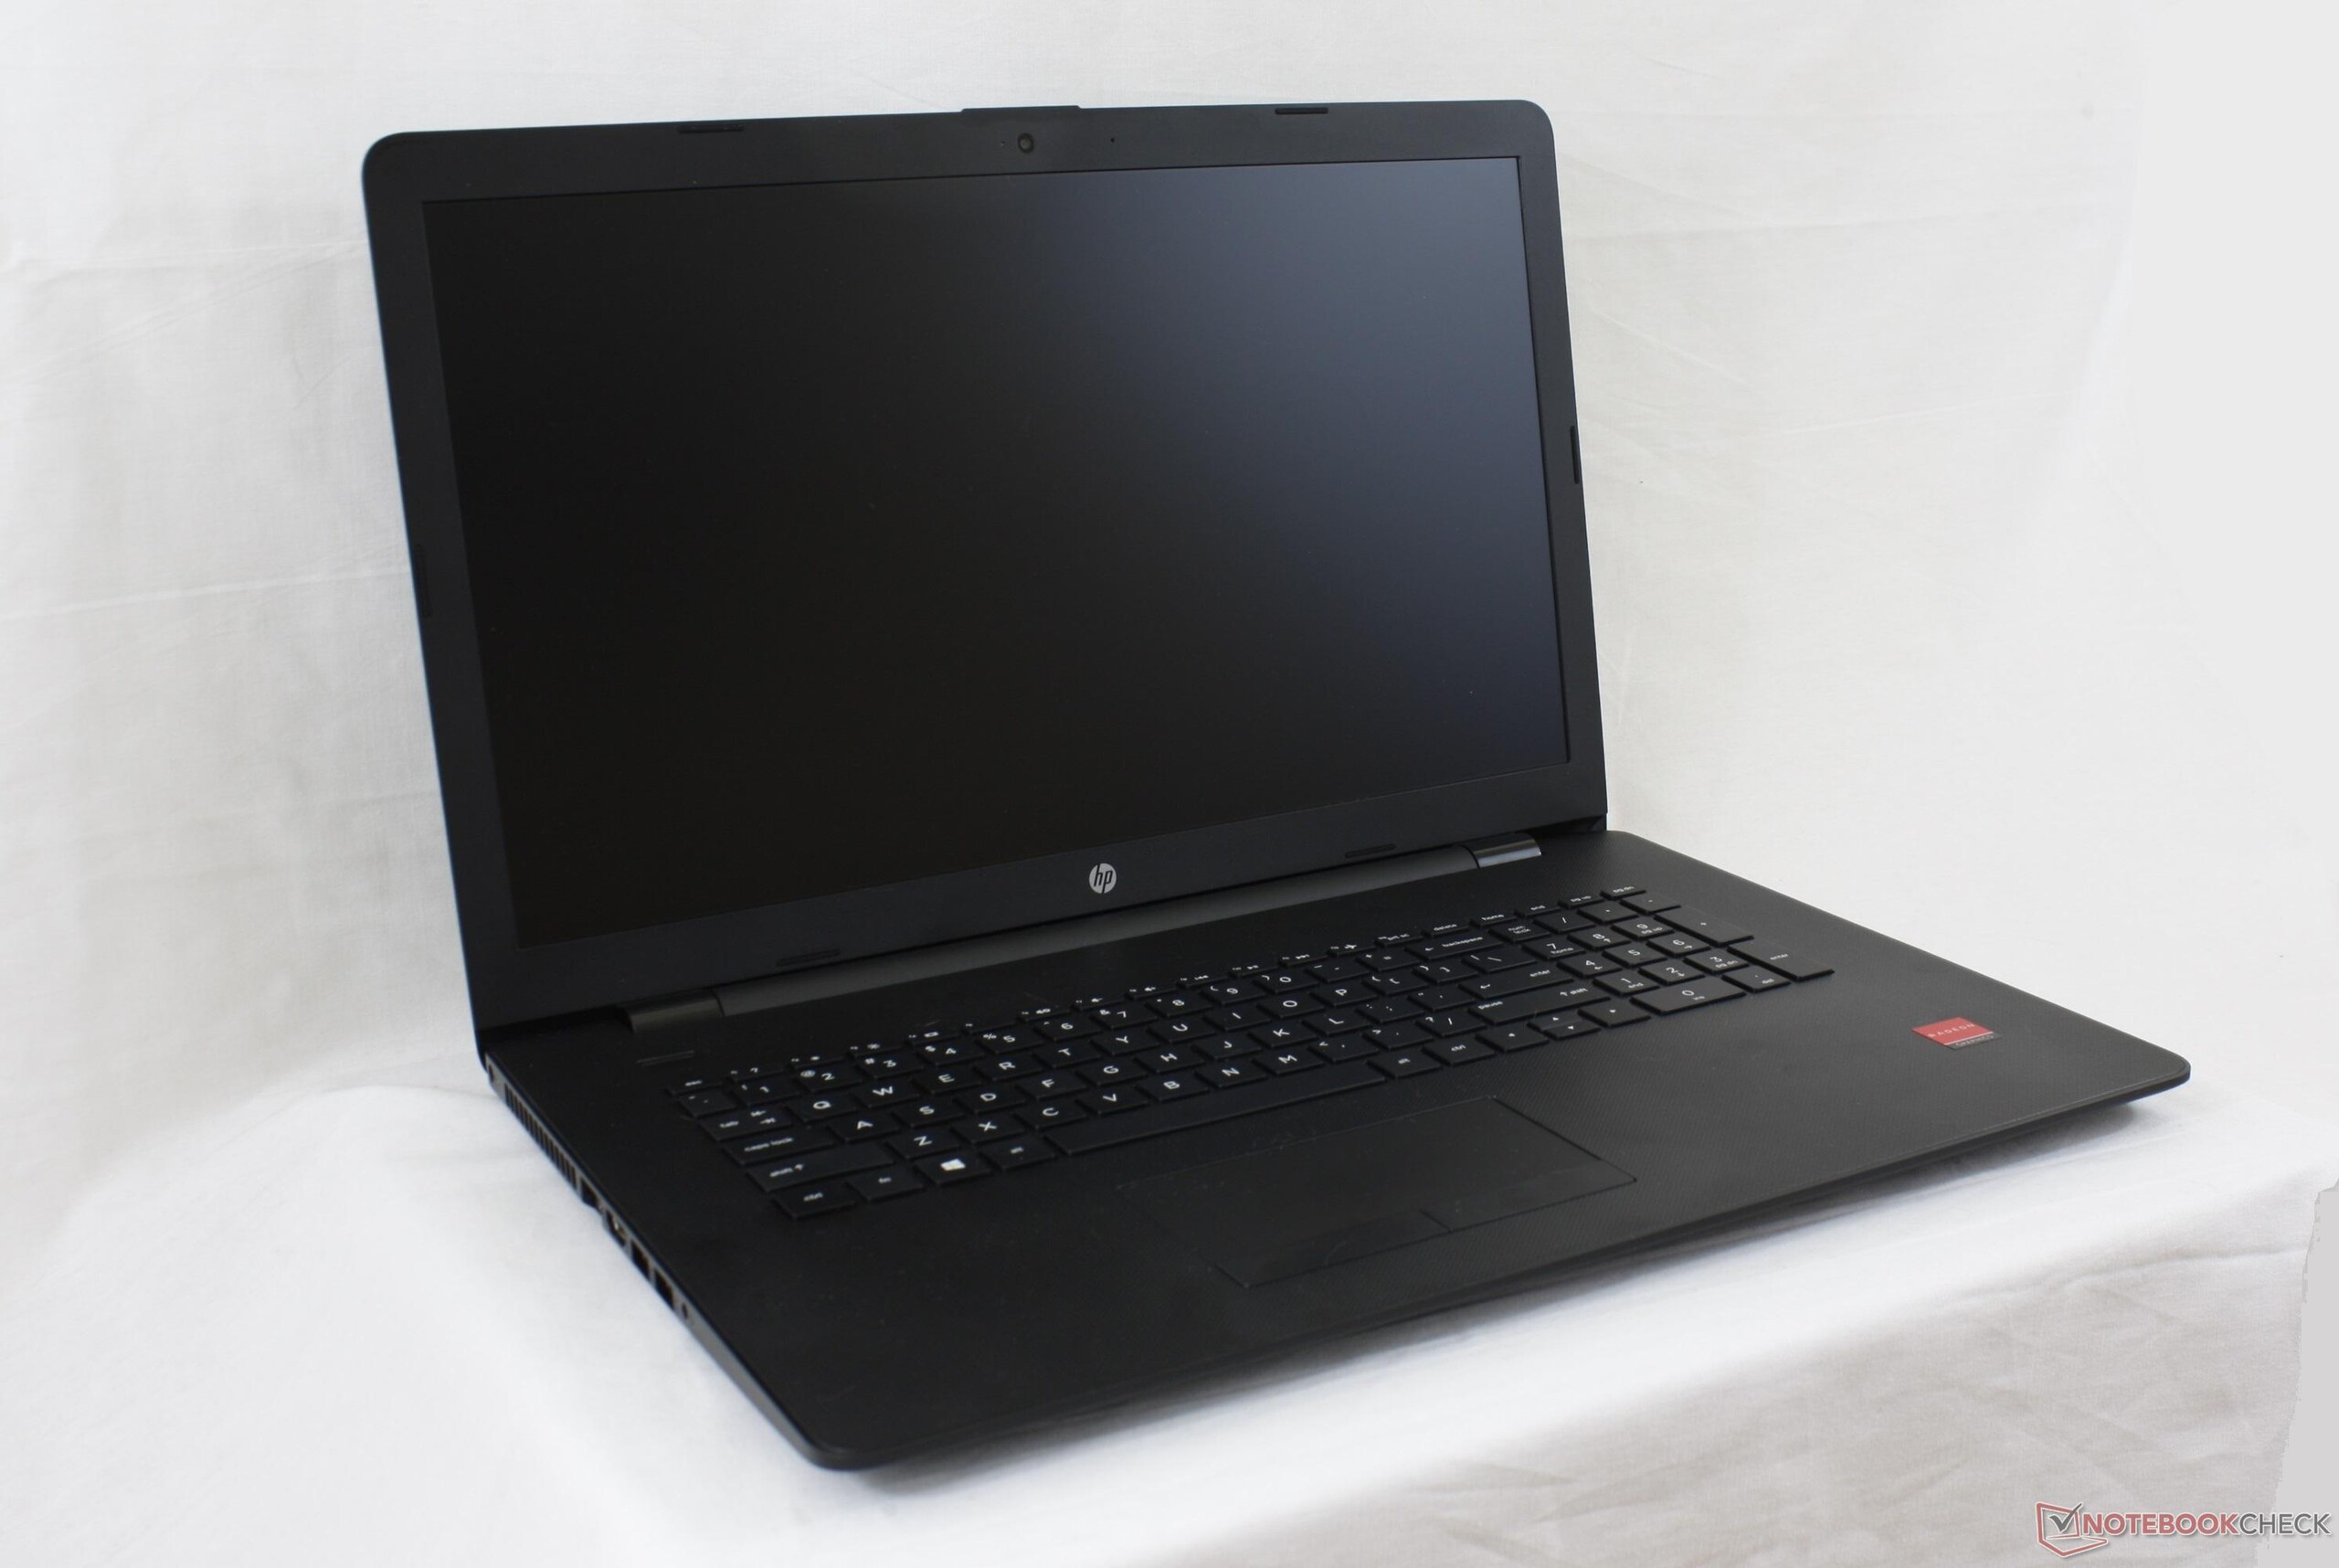

At about 2.6 kg, the Pavilion 17z is slightly lighter and smaller than many other inexpensive offerings.
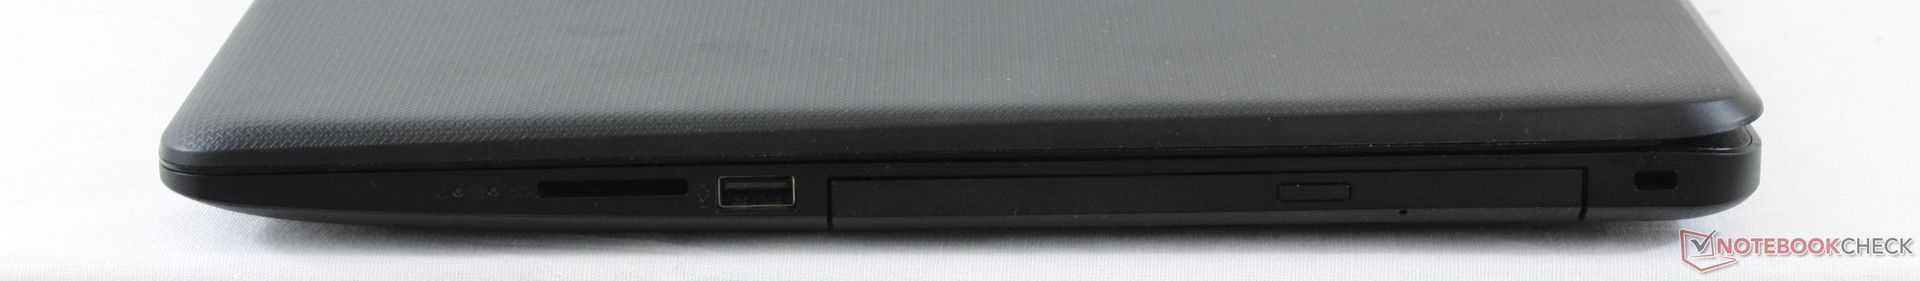
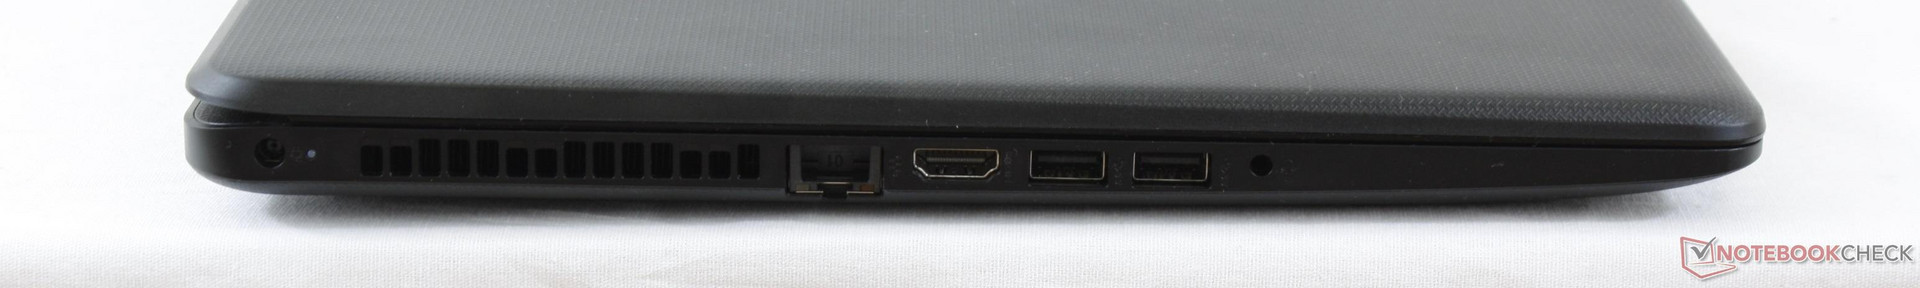
Connectivity
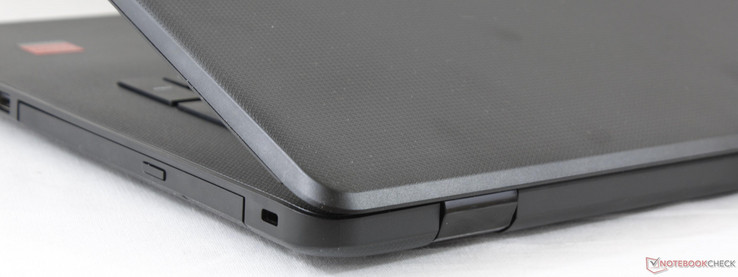
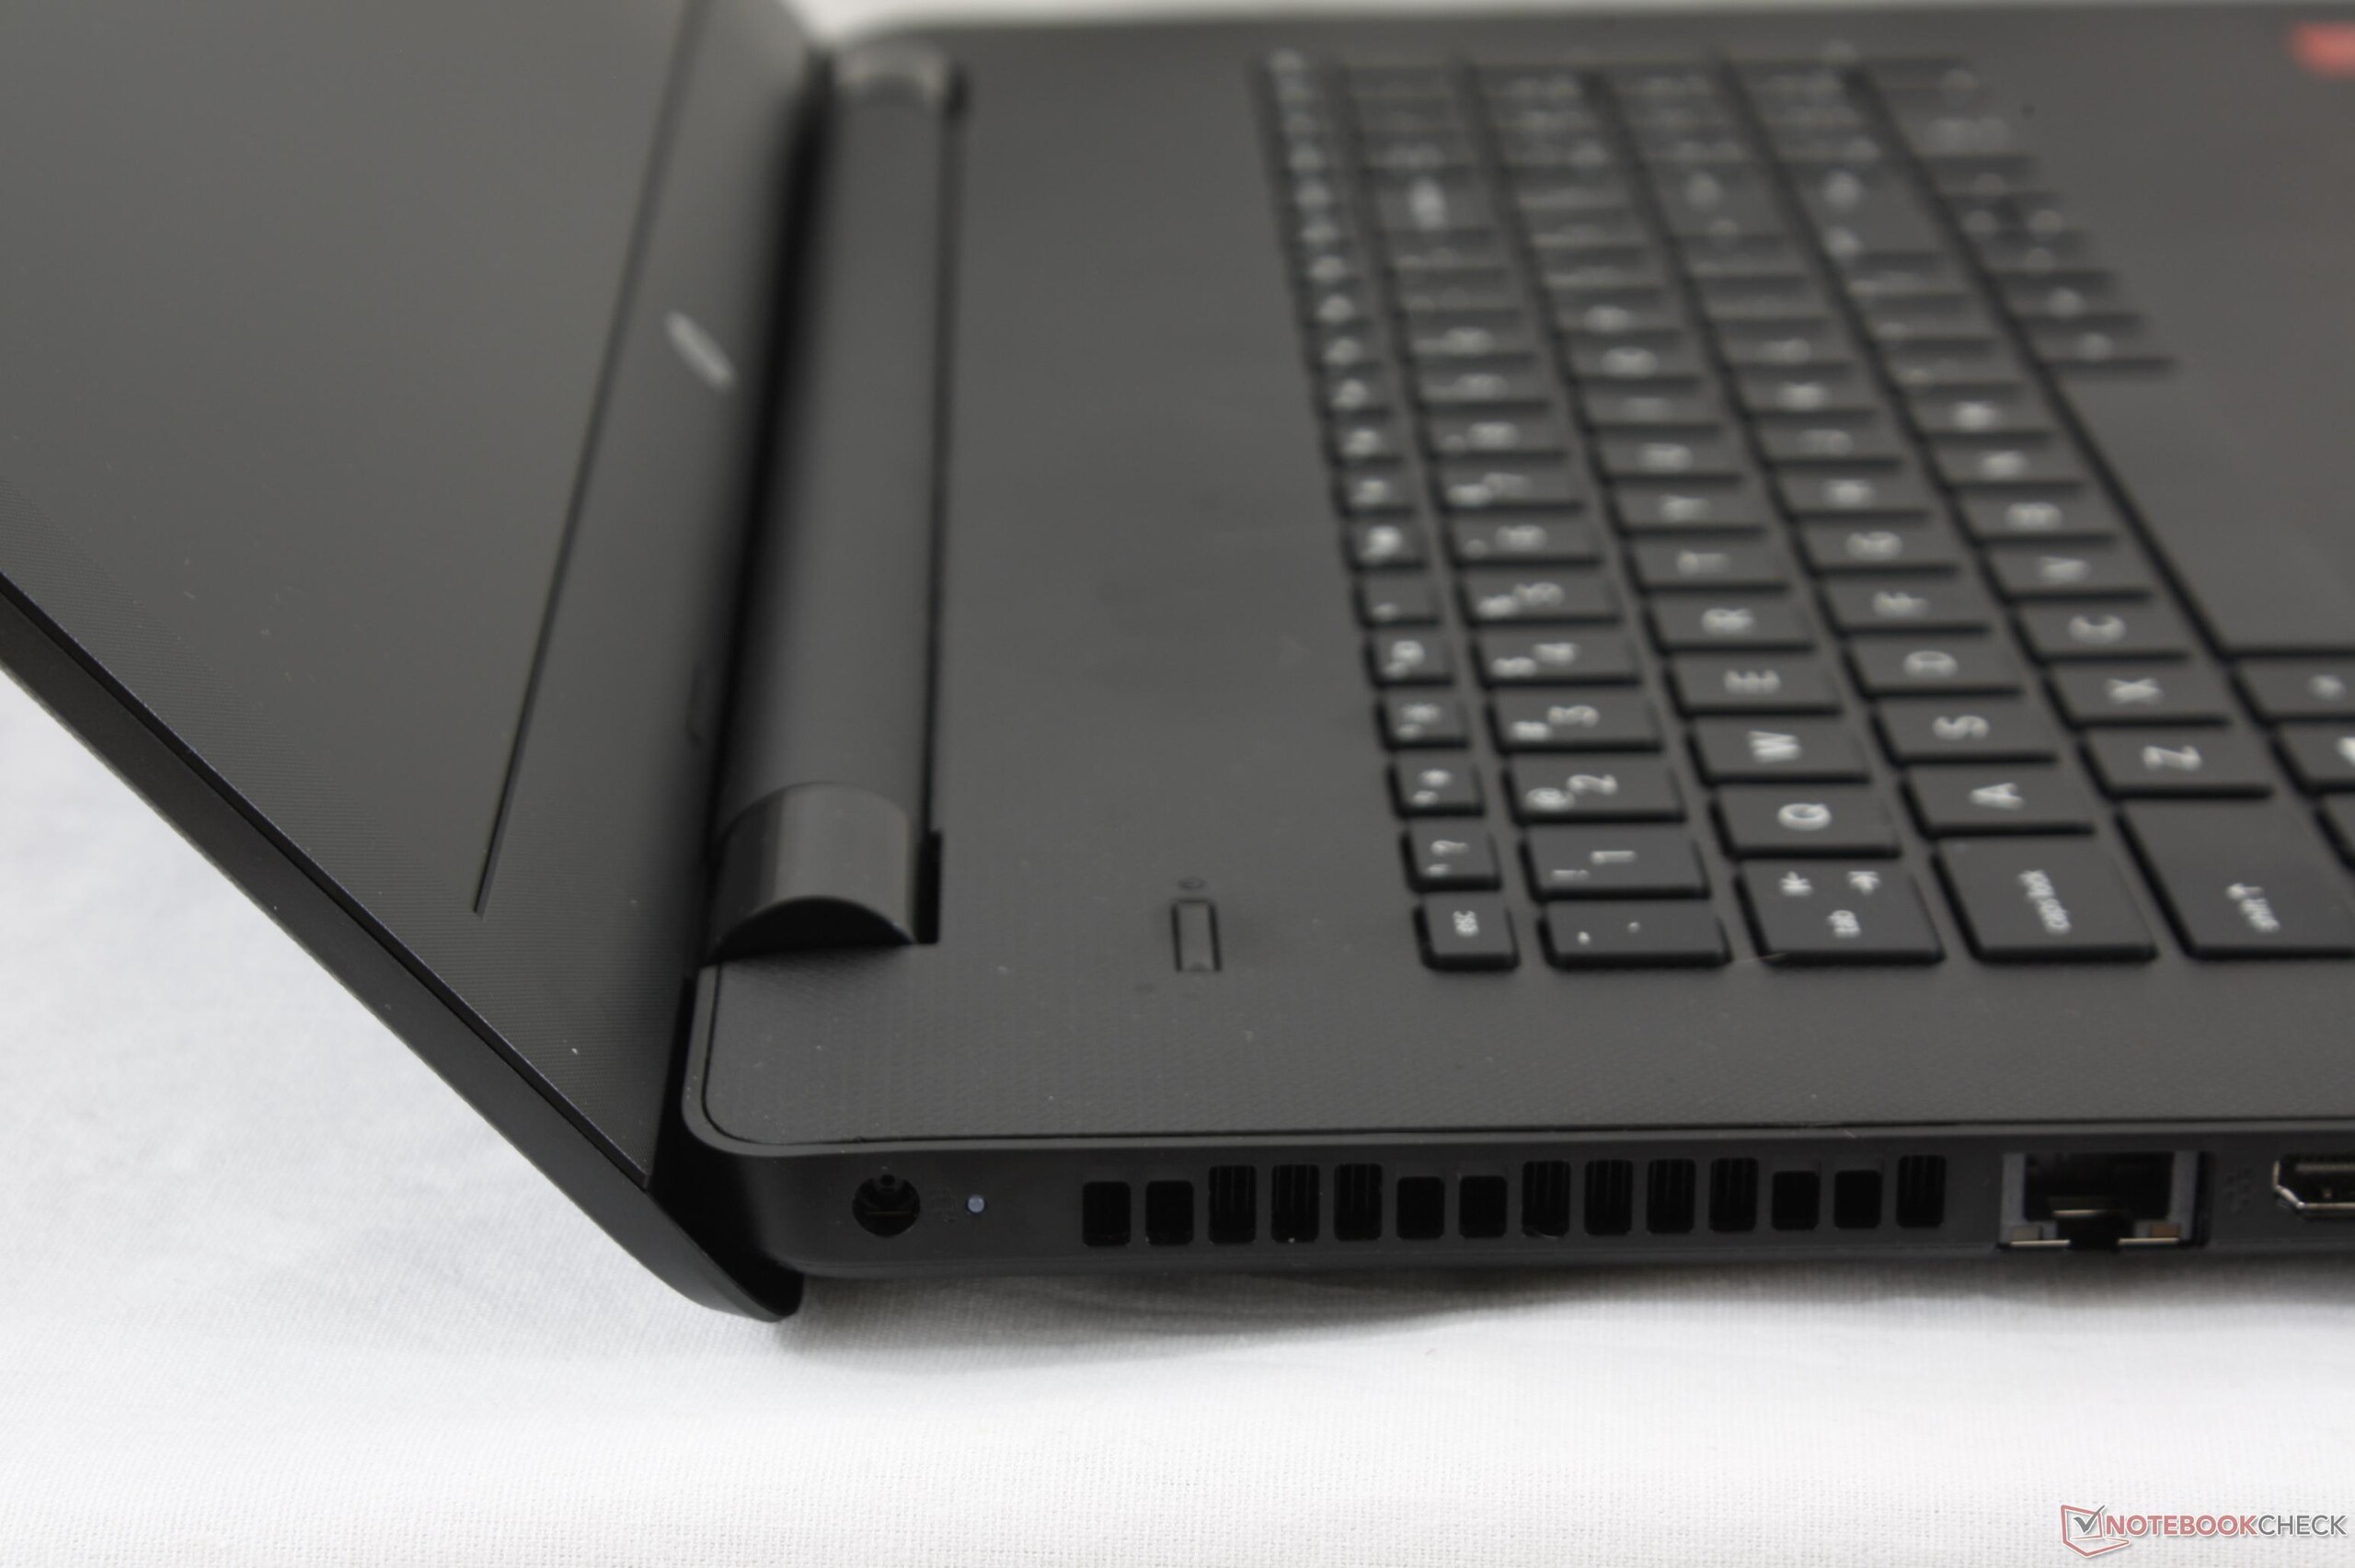
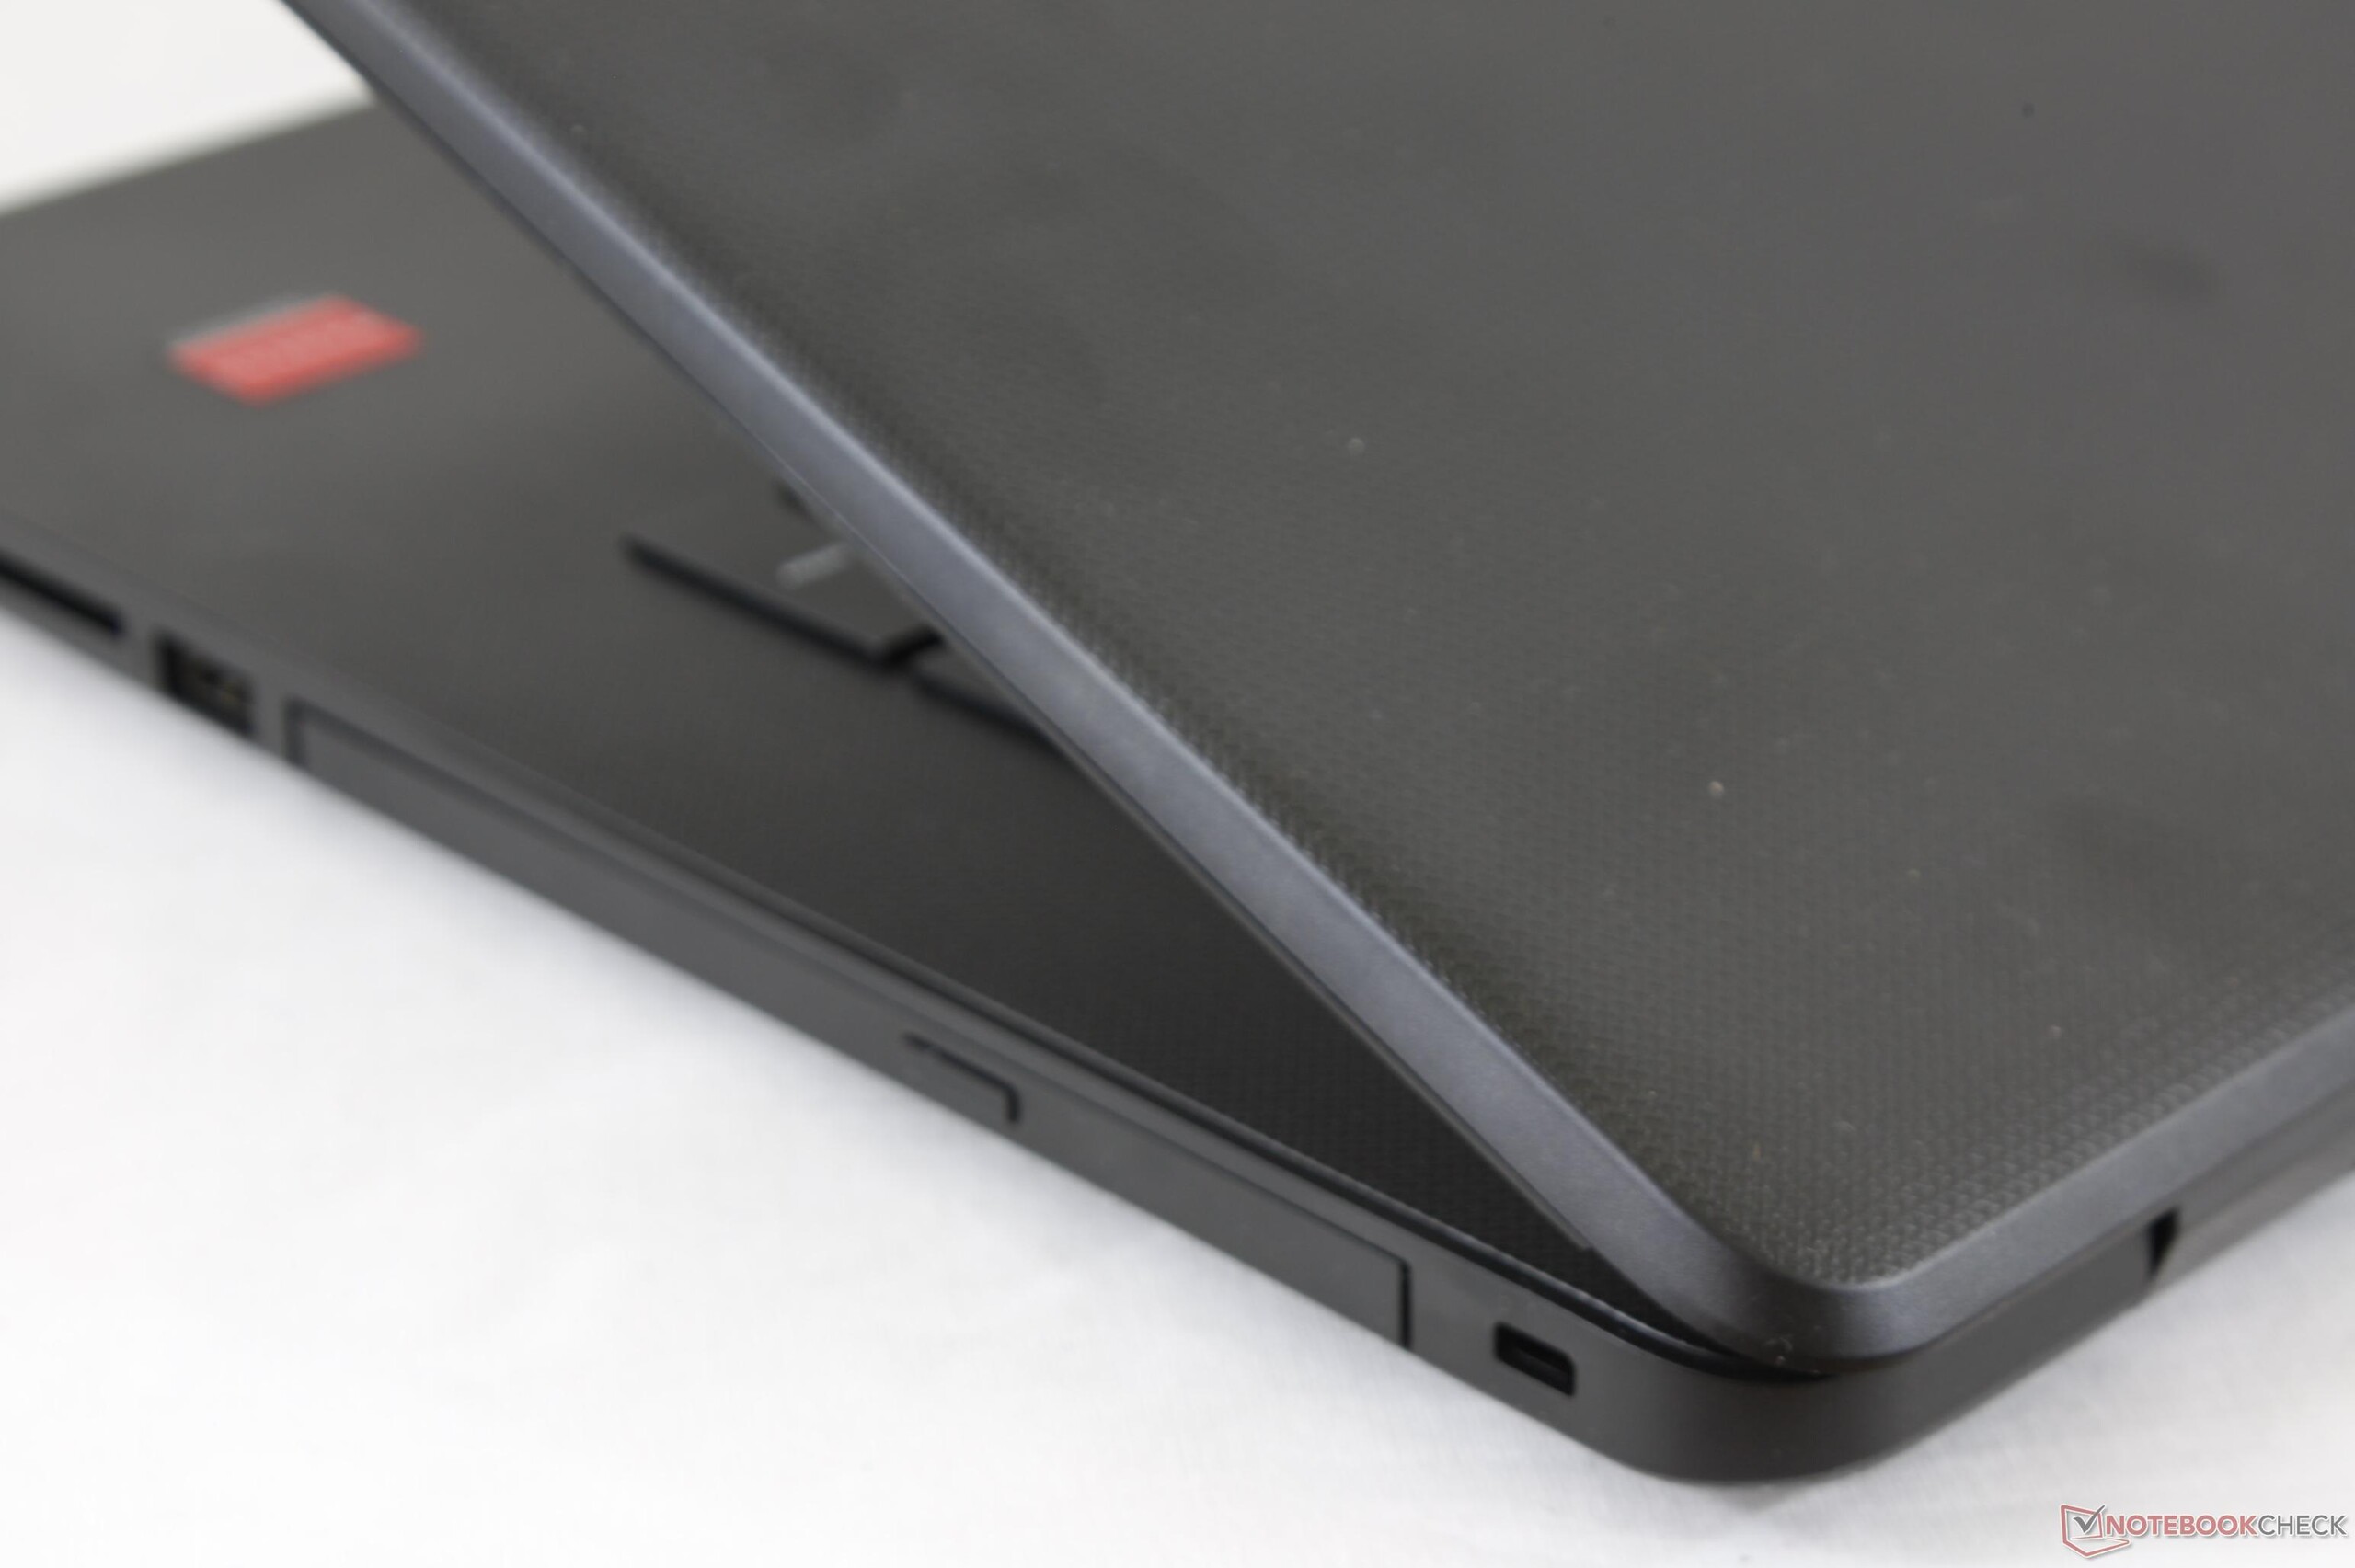
Available ports include the basic USB 3.0, HDMI, and headphone jack. The optical drive takes up a large portion of the right edge and there is still no USB Type-C, mDP, or legacy VGA.
SD Card Reader
Transfer rates from the SD reader are slow at just 37 MB/s with our Toshiba SDXC UHS-II test card. The Pavilion 15 Power and XPS 15 series have SD readers that are many times faster than our HP unit. Removing an inserted SD card is difficult since the reader is not spring-loaded and the card sits almost flushed against the edge.
| SD Card Reader | |
| average JPG Copy Test (av. of 3 runs) | |
| HP Pavilion Power 15t-cb2000 | |
| HP Pavilion 17z 1EX13AV | |
| Lenovo Thinkpad 13-20J1001BUS | |
| maximum AS SSD Seq Read Test (1GB) | |
| HP Pavilion Power 15t-cb2000 | |
| HP Pavilion 17z 1EX13AV | |
| Lenovo Thinkpad 13-20J1001BUS | |
Communication
WLAN is provided by the same Realtek RTL8188E module as our previous Pavilion 17z unit for 802.11n connectivity. A real-world test standing one meter away from our Linksys EA8500 router returns an average transfer rate of just 46 Mbps compared to over ten times that speed with newer 802.11ac-compatible WLAN options.
Bluetooth is not included on our particular configuration.
| Networking | |
| iperf3 transmit AX12 | |
| Lenovo Thinkpad 13-20J1001BUS | |
| HP Pavilion Power 15t-cb2000 | |
| HP Pavilion 17z 1EX13AV | |
| iperf3 receive AX12 | |
| Lenovo Thinkpad 13-20J1001BUS | |
| HP Pavilion Power 15t-cb2000 | |
| HP Pavilion 17z 1EX13AV | |
Accessories
There are no included extras outside of the Quick Start guide and AC adapter.
Maintenance
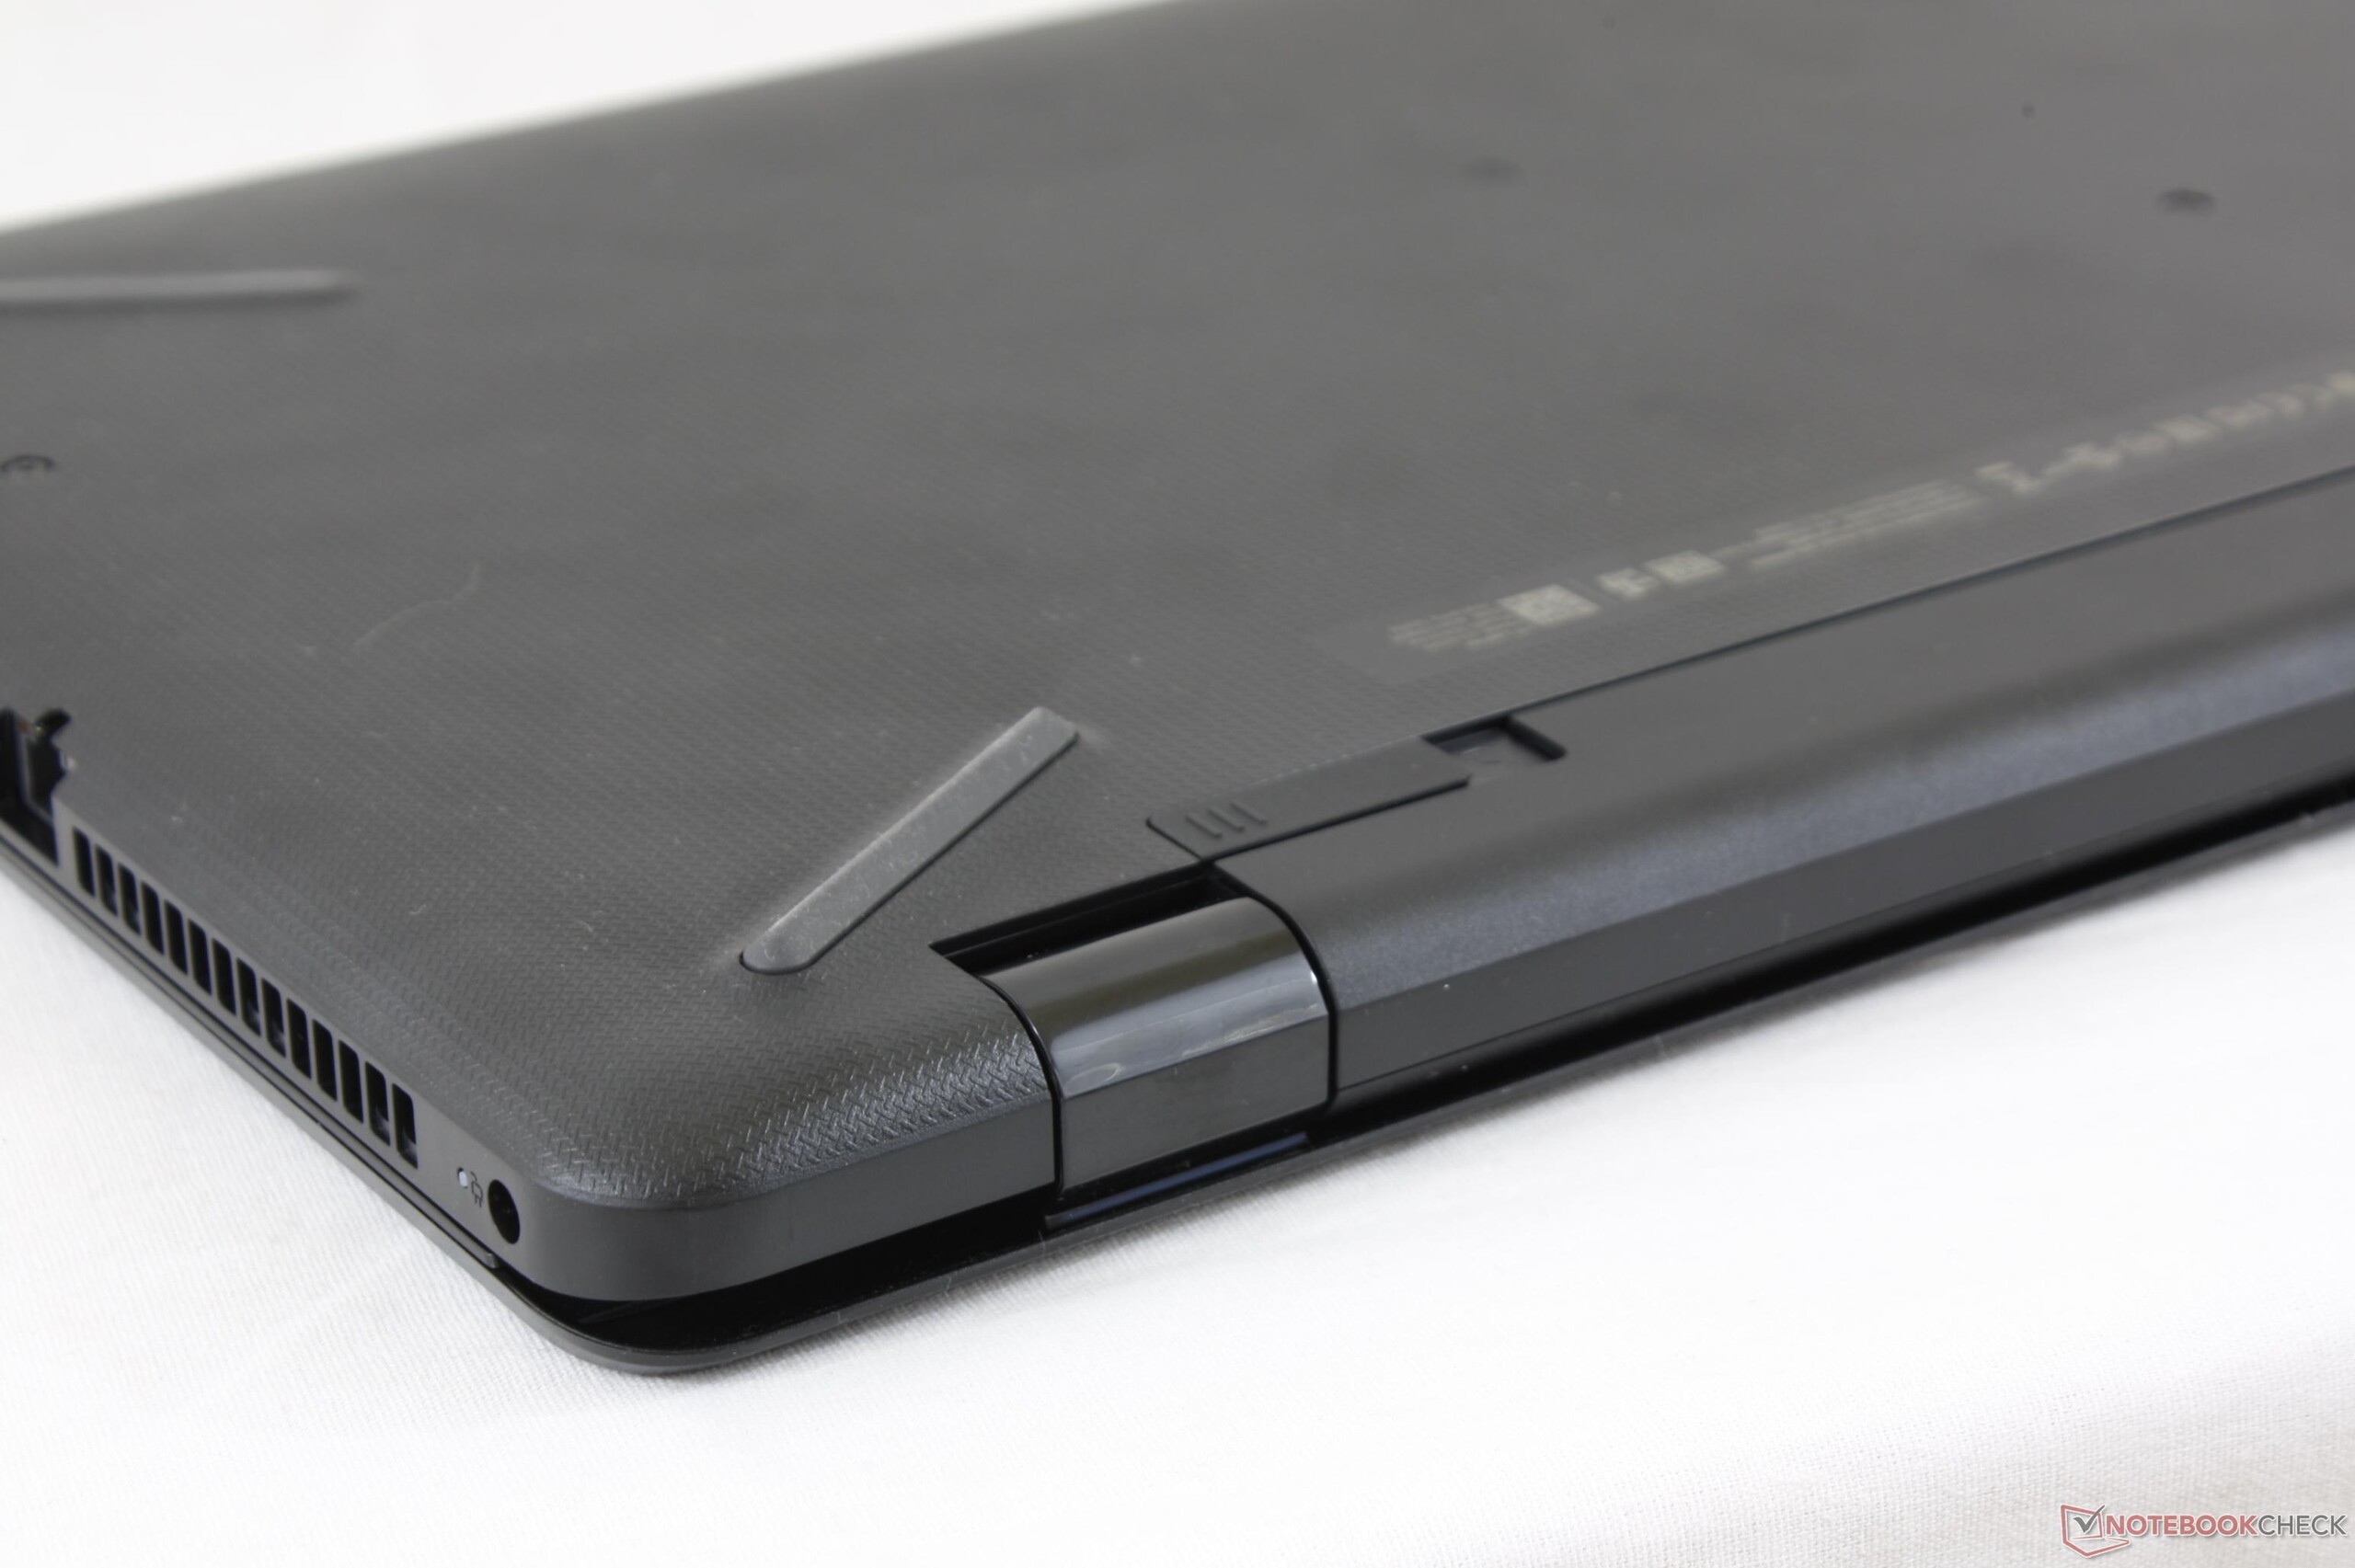
Serviceability is tricky because the bottom panel is very tightly latched around its edges and corners. Both a Philips screwdriver and sharp edge are required for upgrades or changes.
Warranty
The standard one-year limited warranty applies with optional HP Care Pack and pickup services if needed.
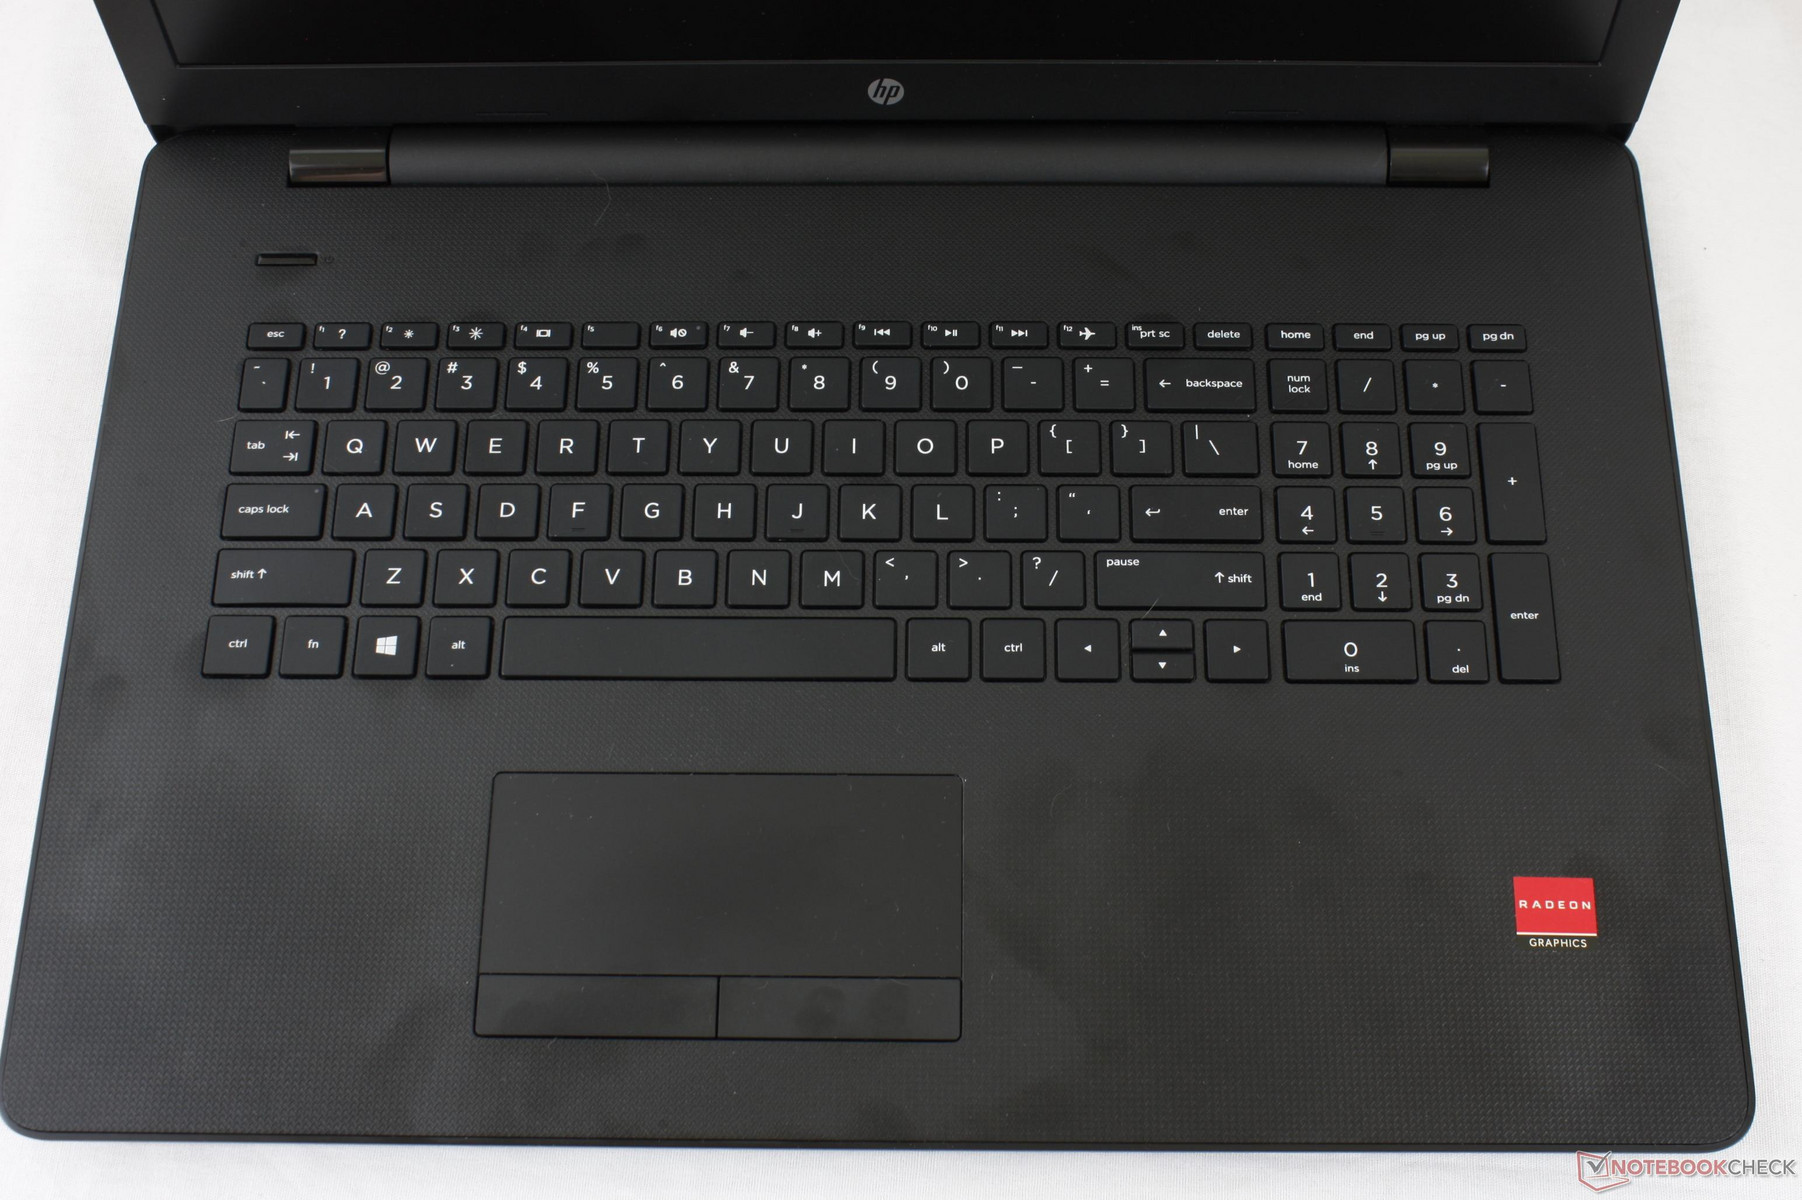
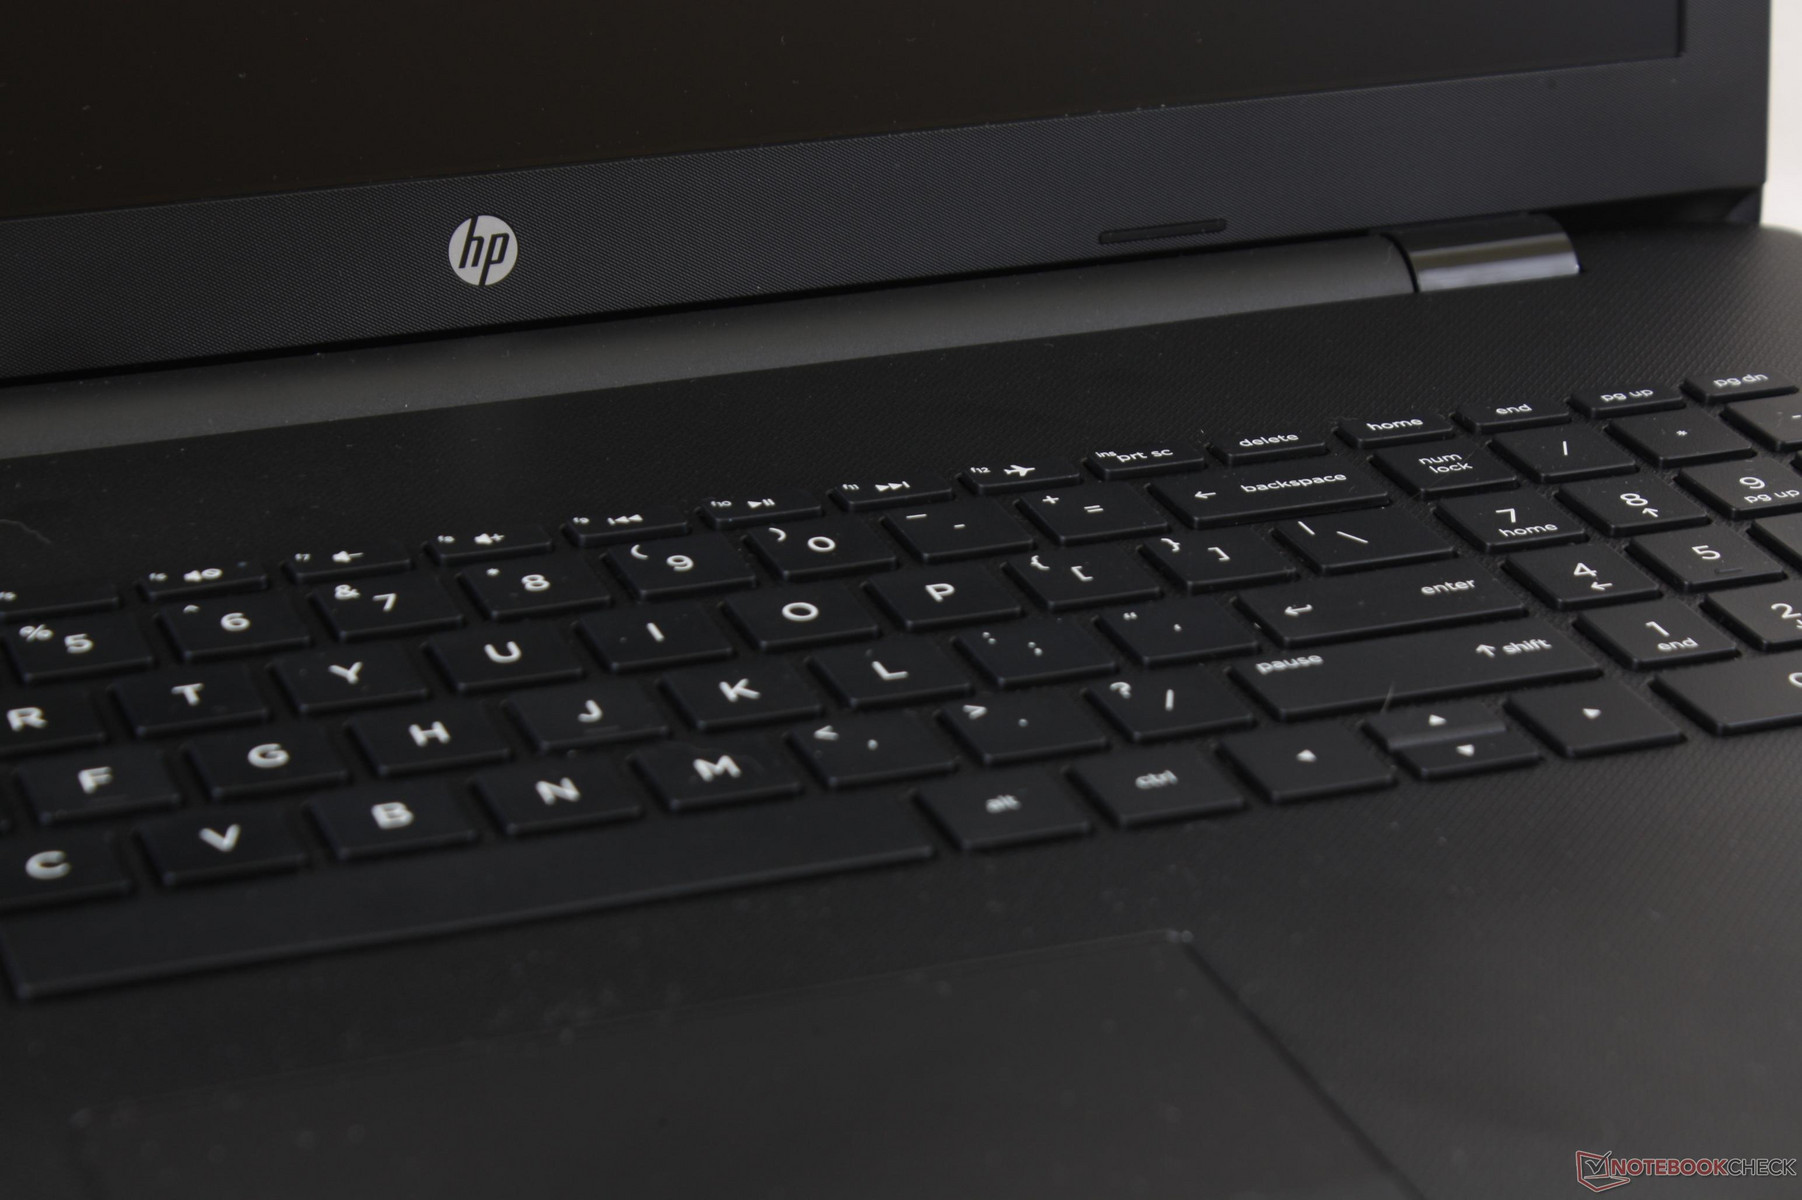
Input Devices
Keyboard and Touchpad
Key travel is still very shallow with light feedback and loud clatter while the narrow trackpad (11.5 x 5.0 cm) could have benefited from a wider surface area. Typing is not as firm or as quiet as on pricier notebooks like the XPS 15 or Spectre x360 series.
Display
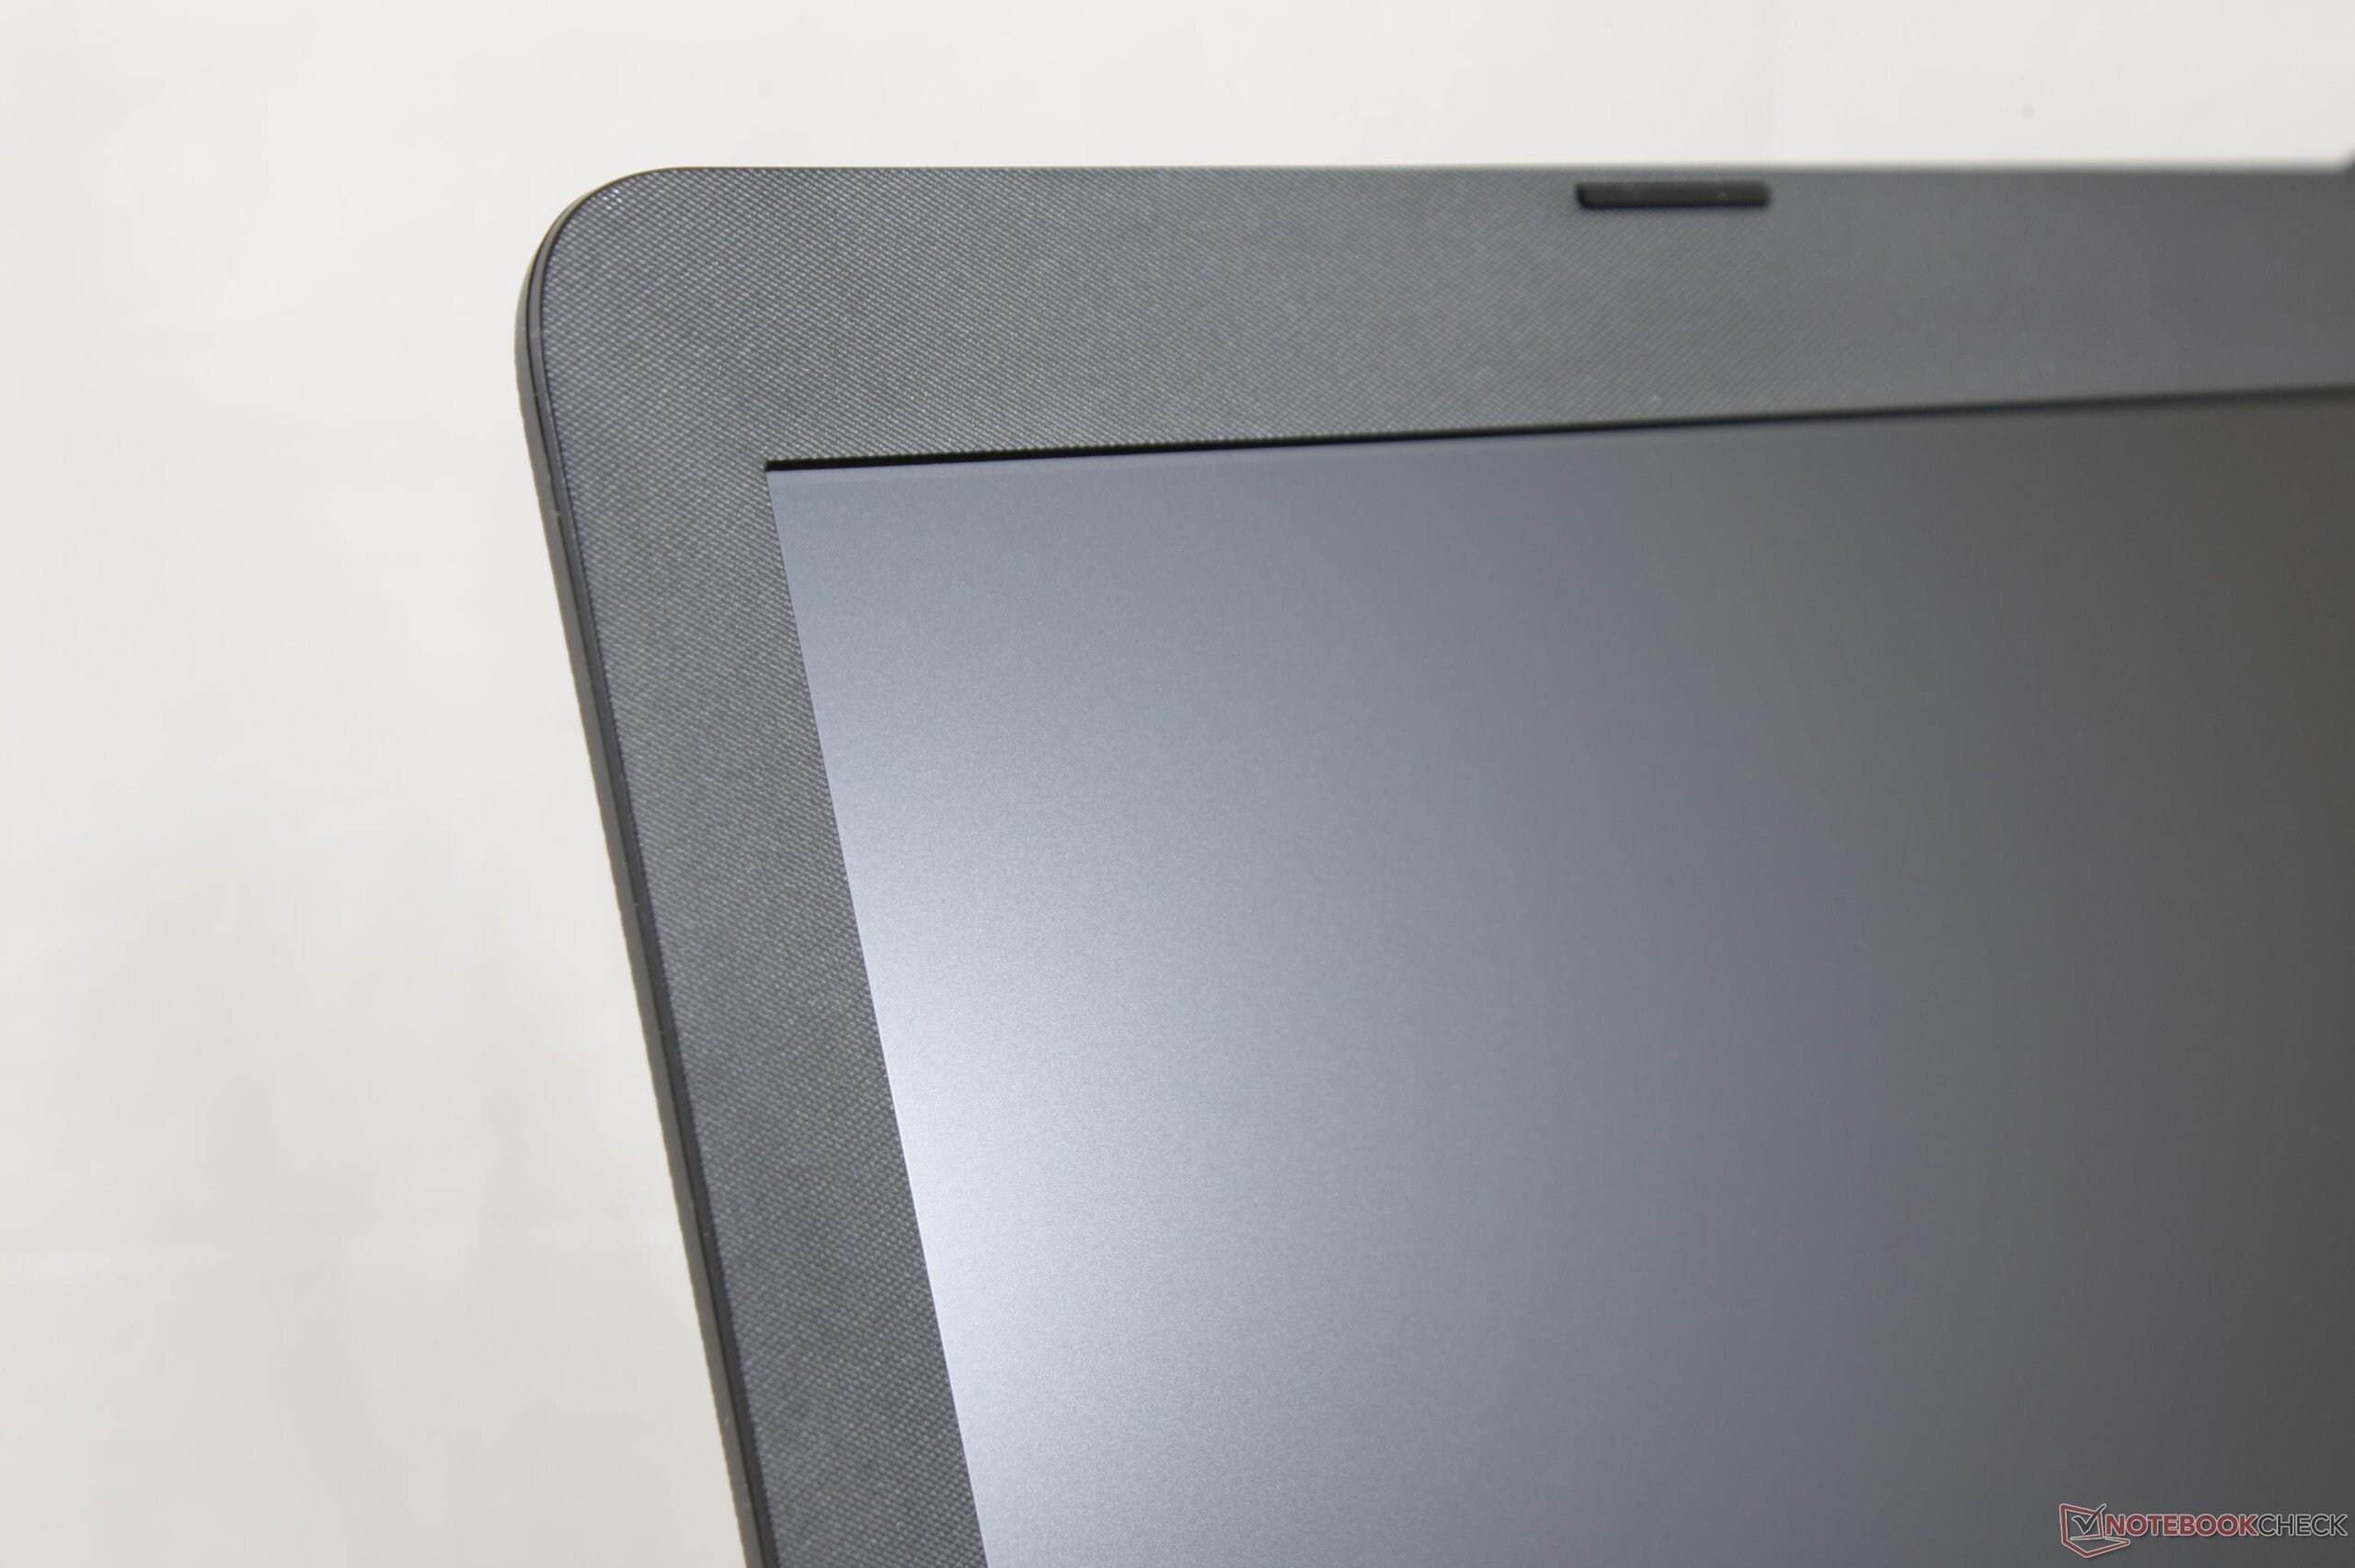
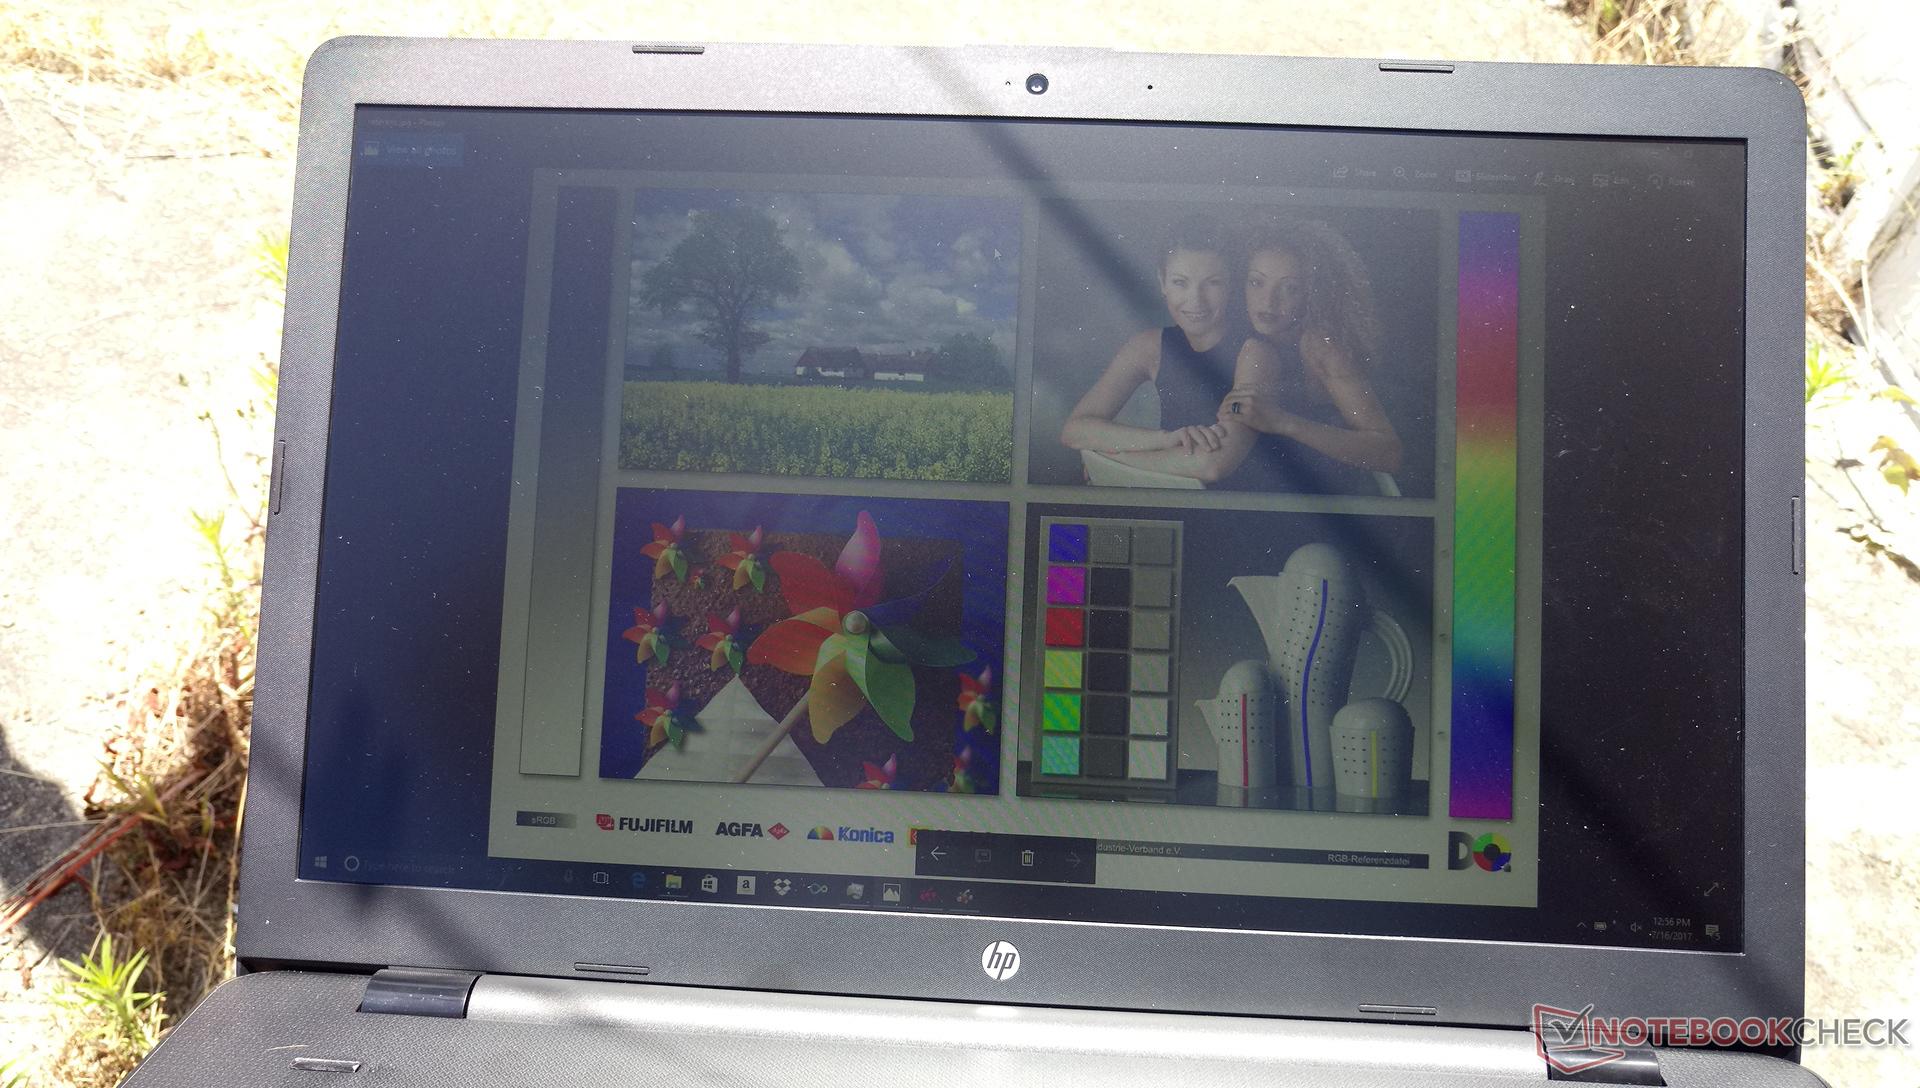
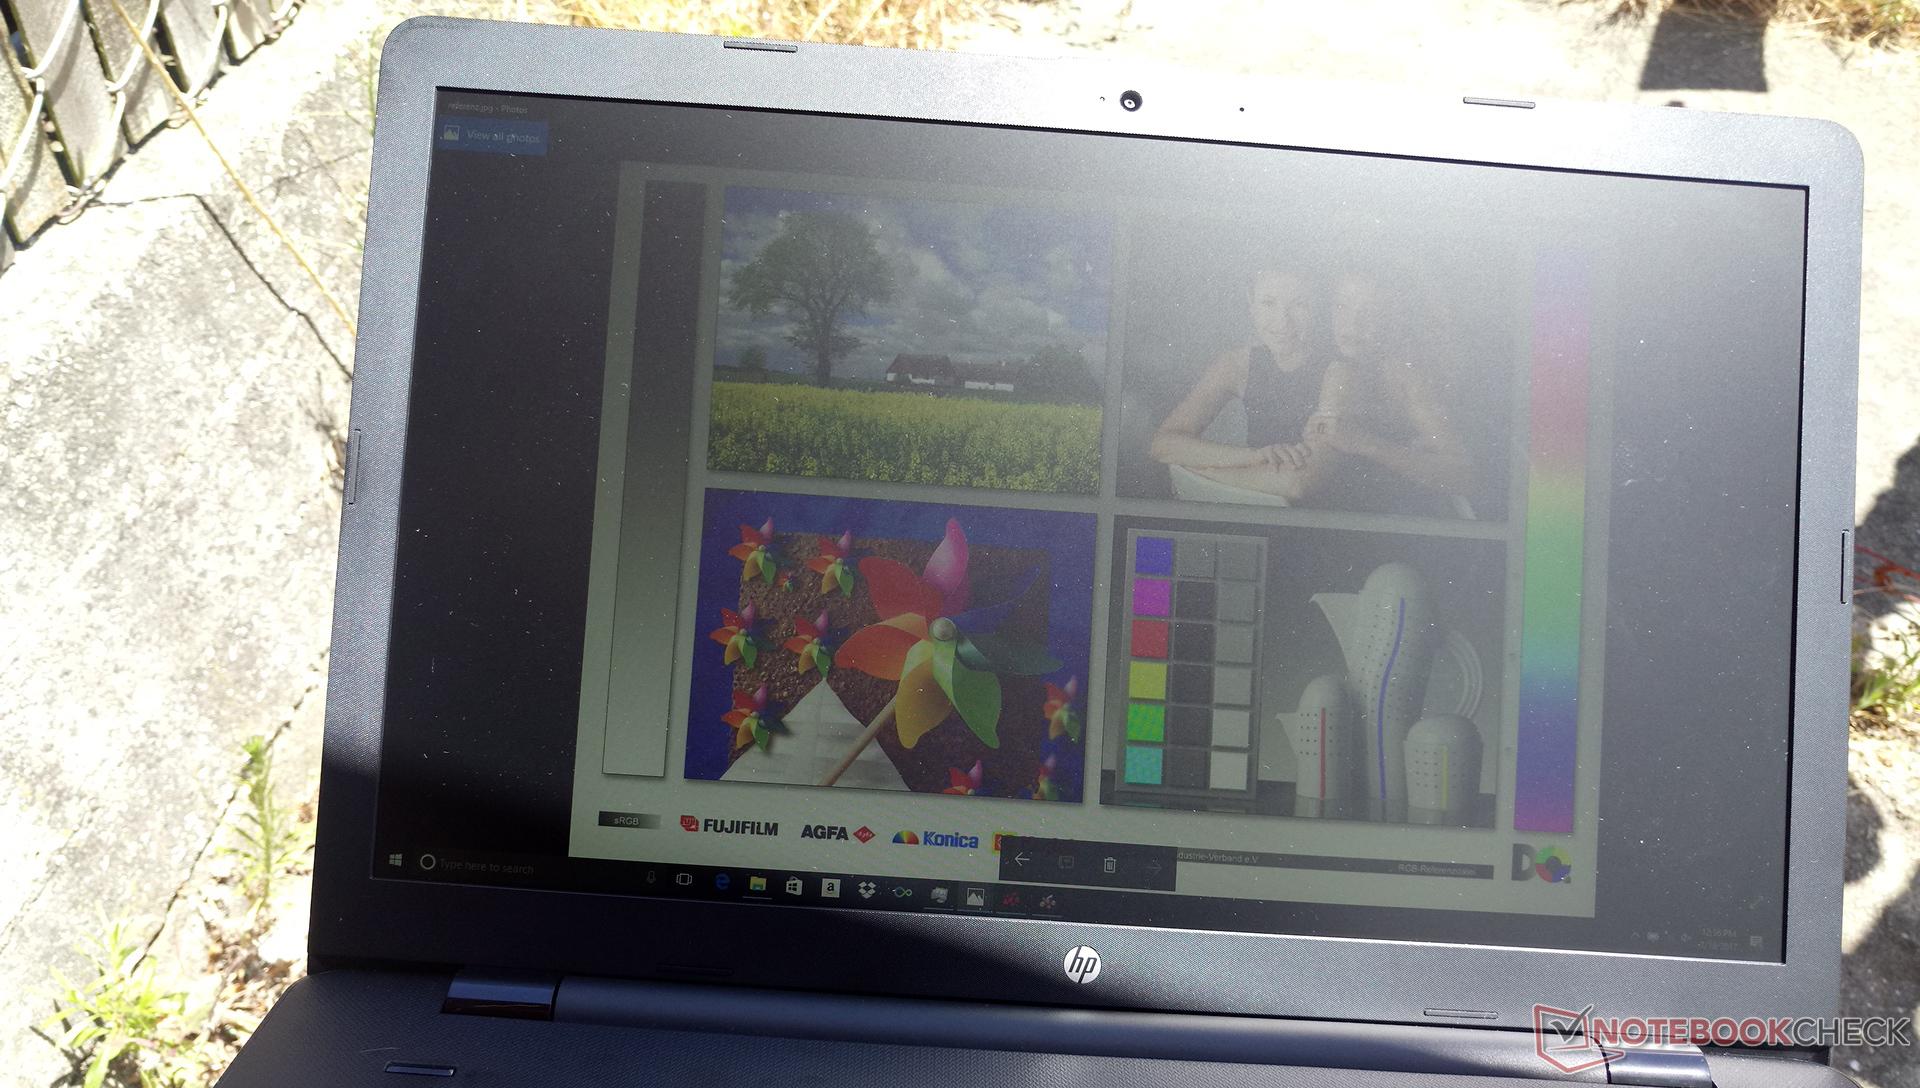
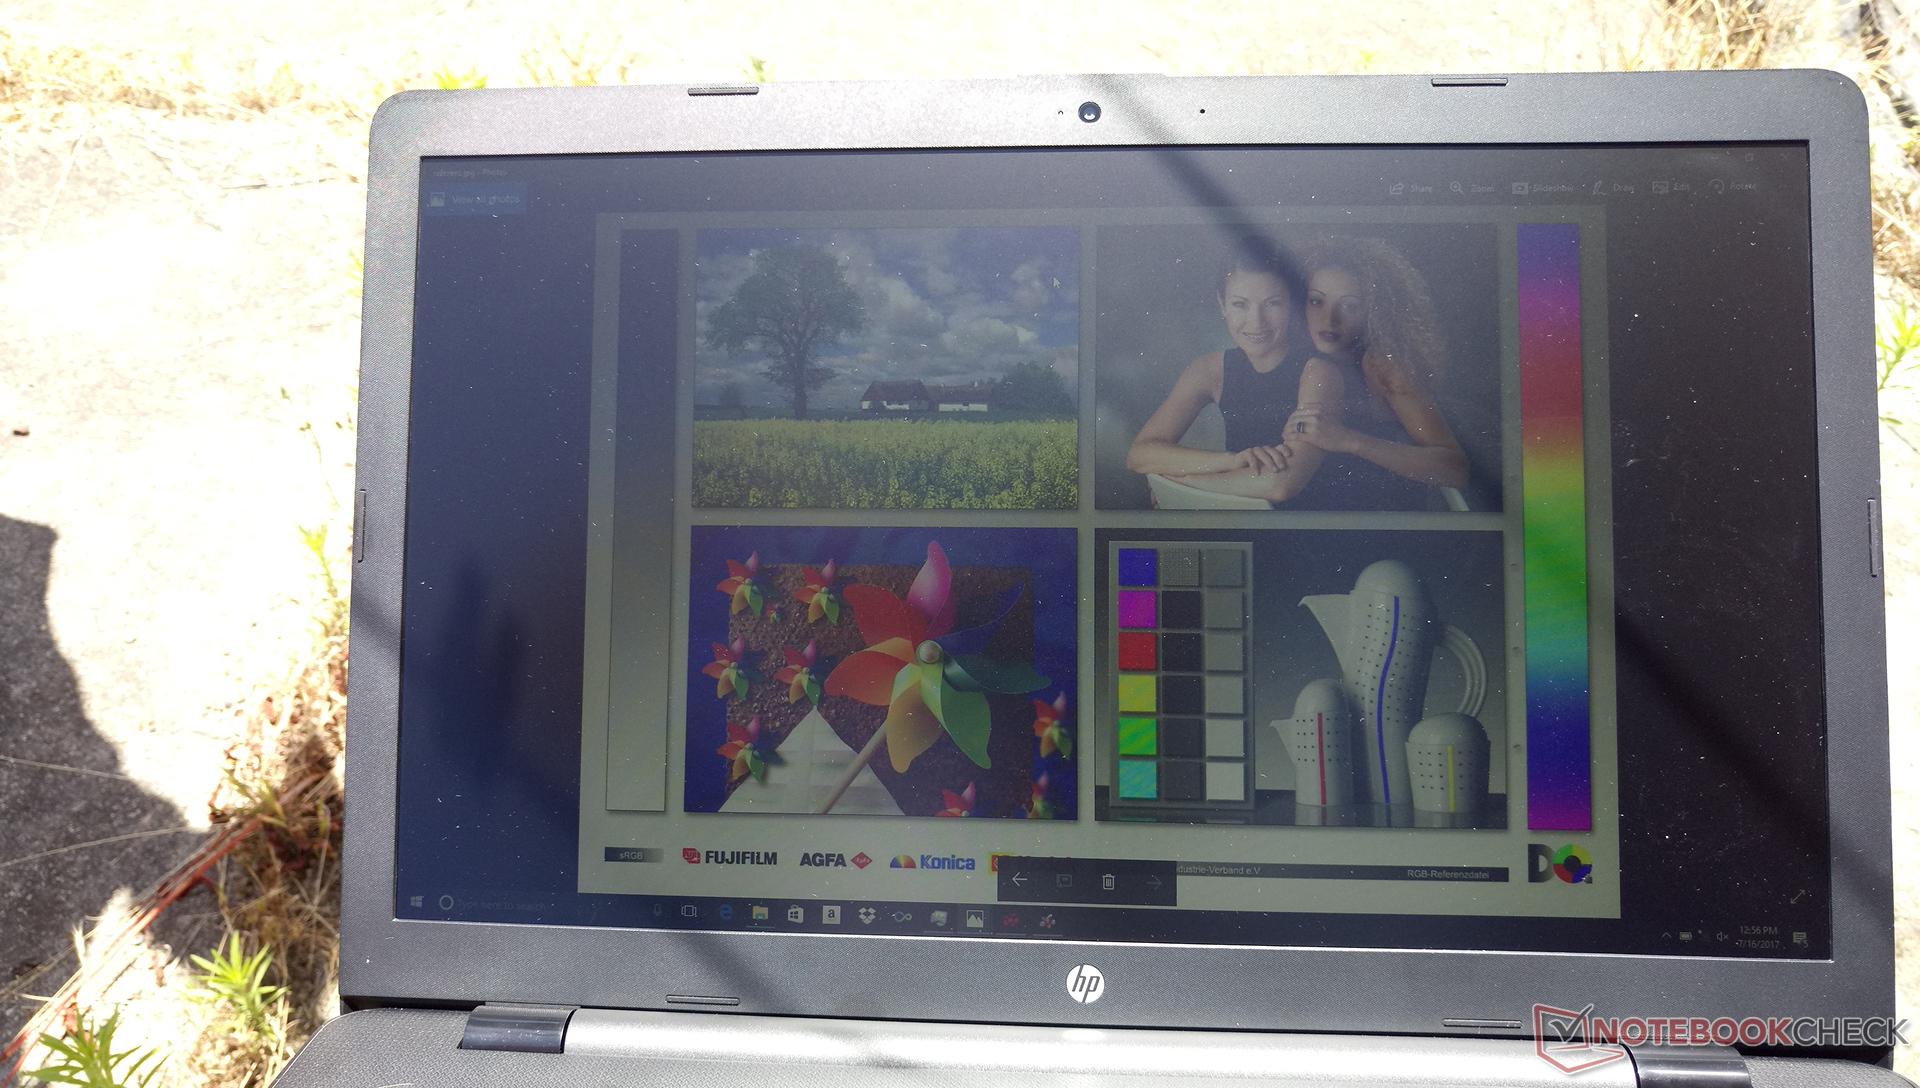
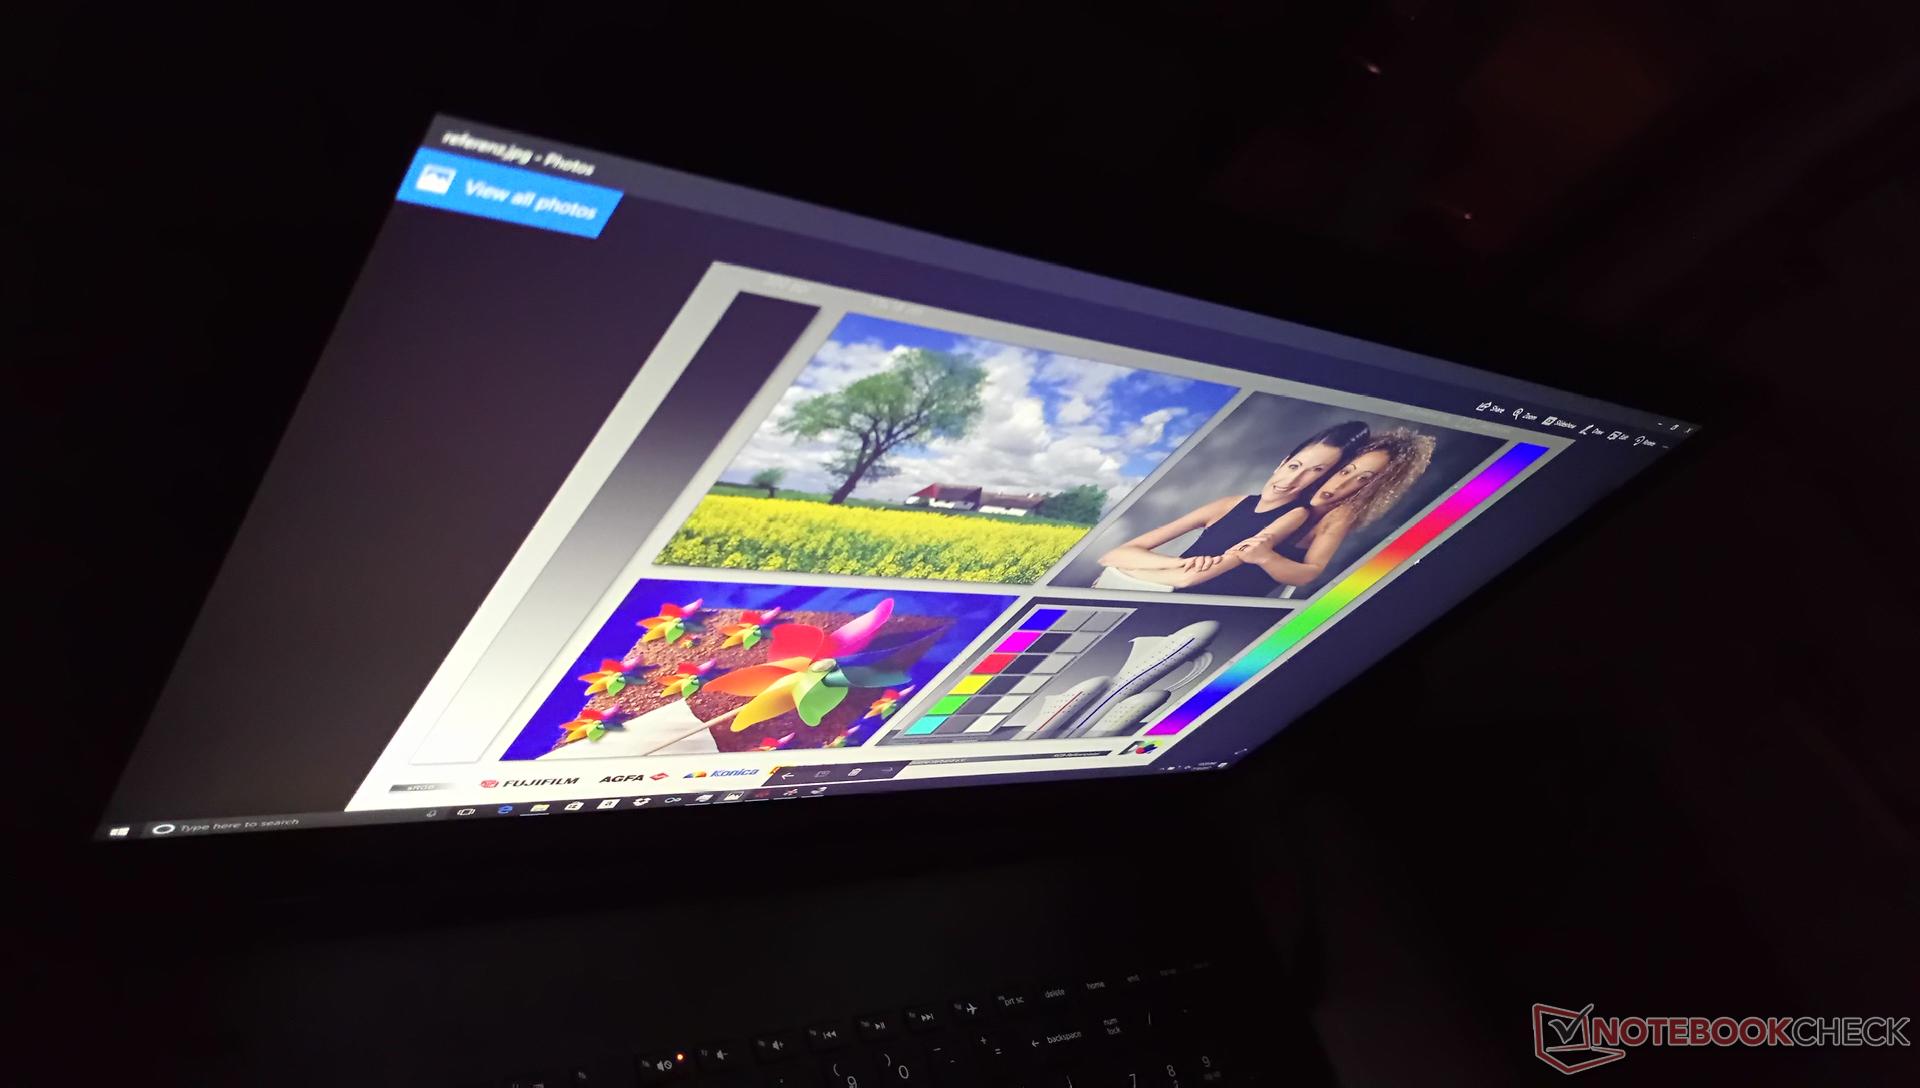
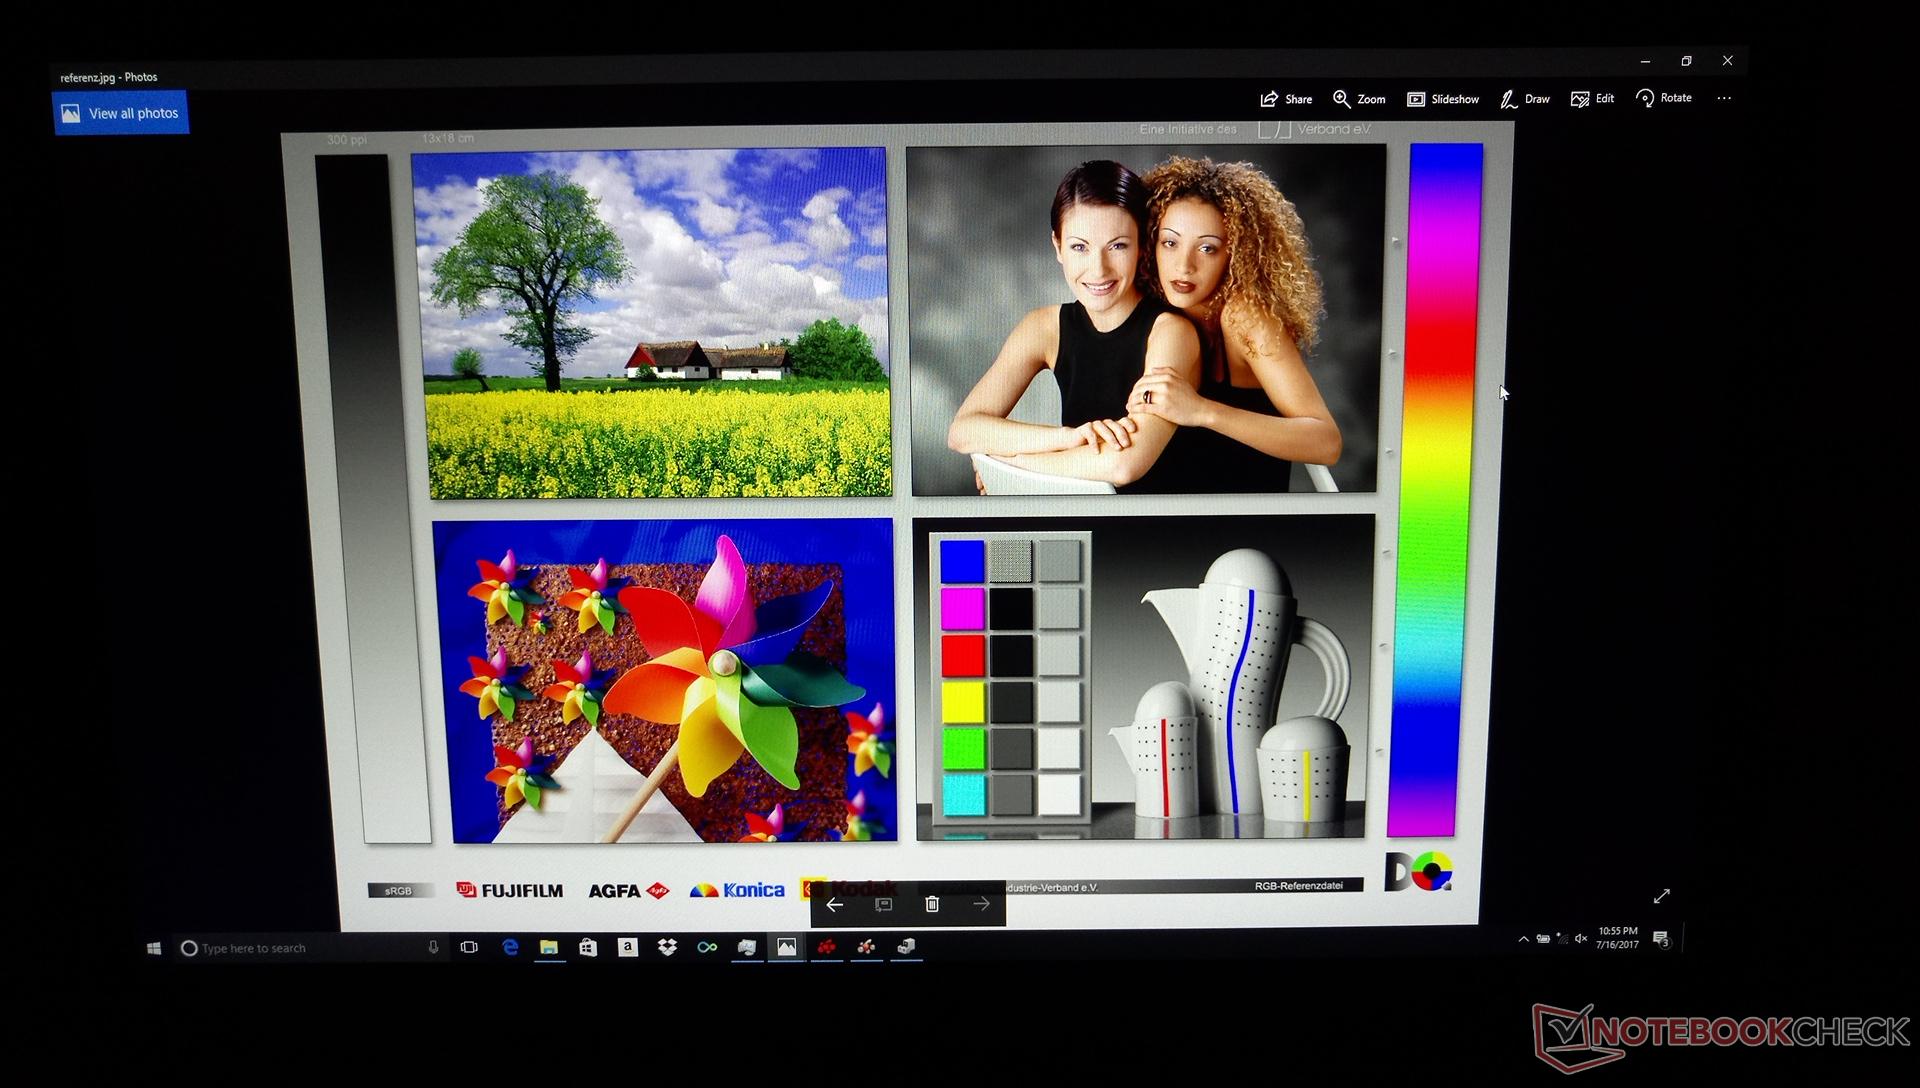
Our configuration uses the exact same AU Optronics B173HW01 V0 IPS panel as our previous Pavilion 17z with the A12-9720P APU. As such, both of our units share very similar display characteristics including brightness, black levels, black-white response times, and color coverage.
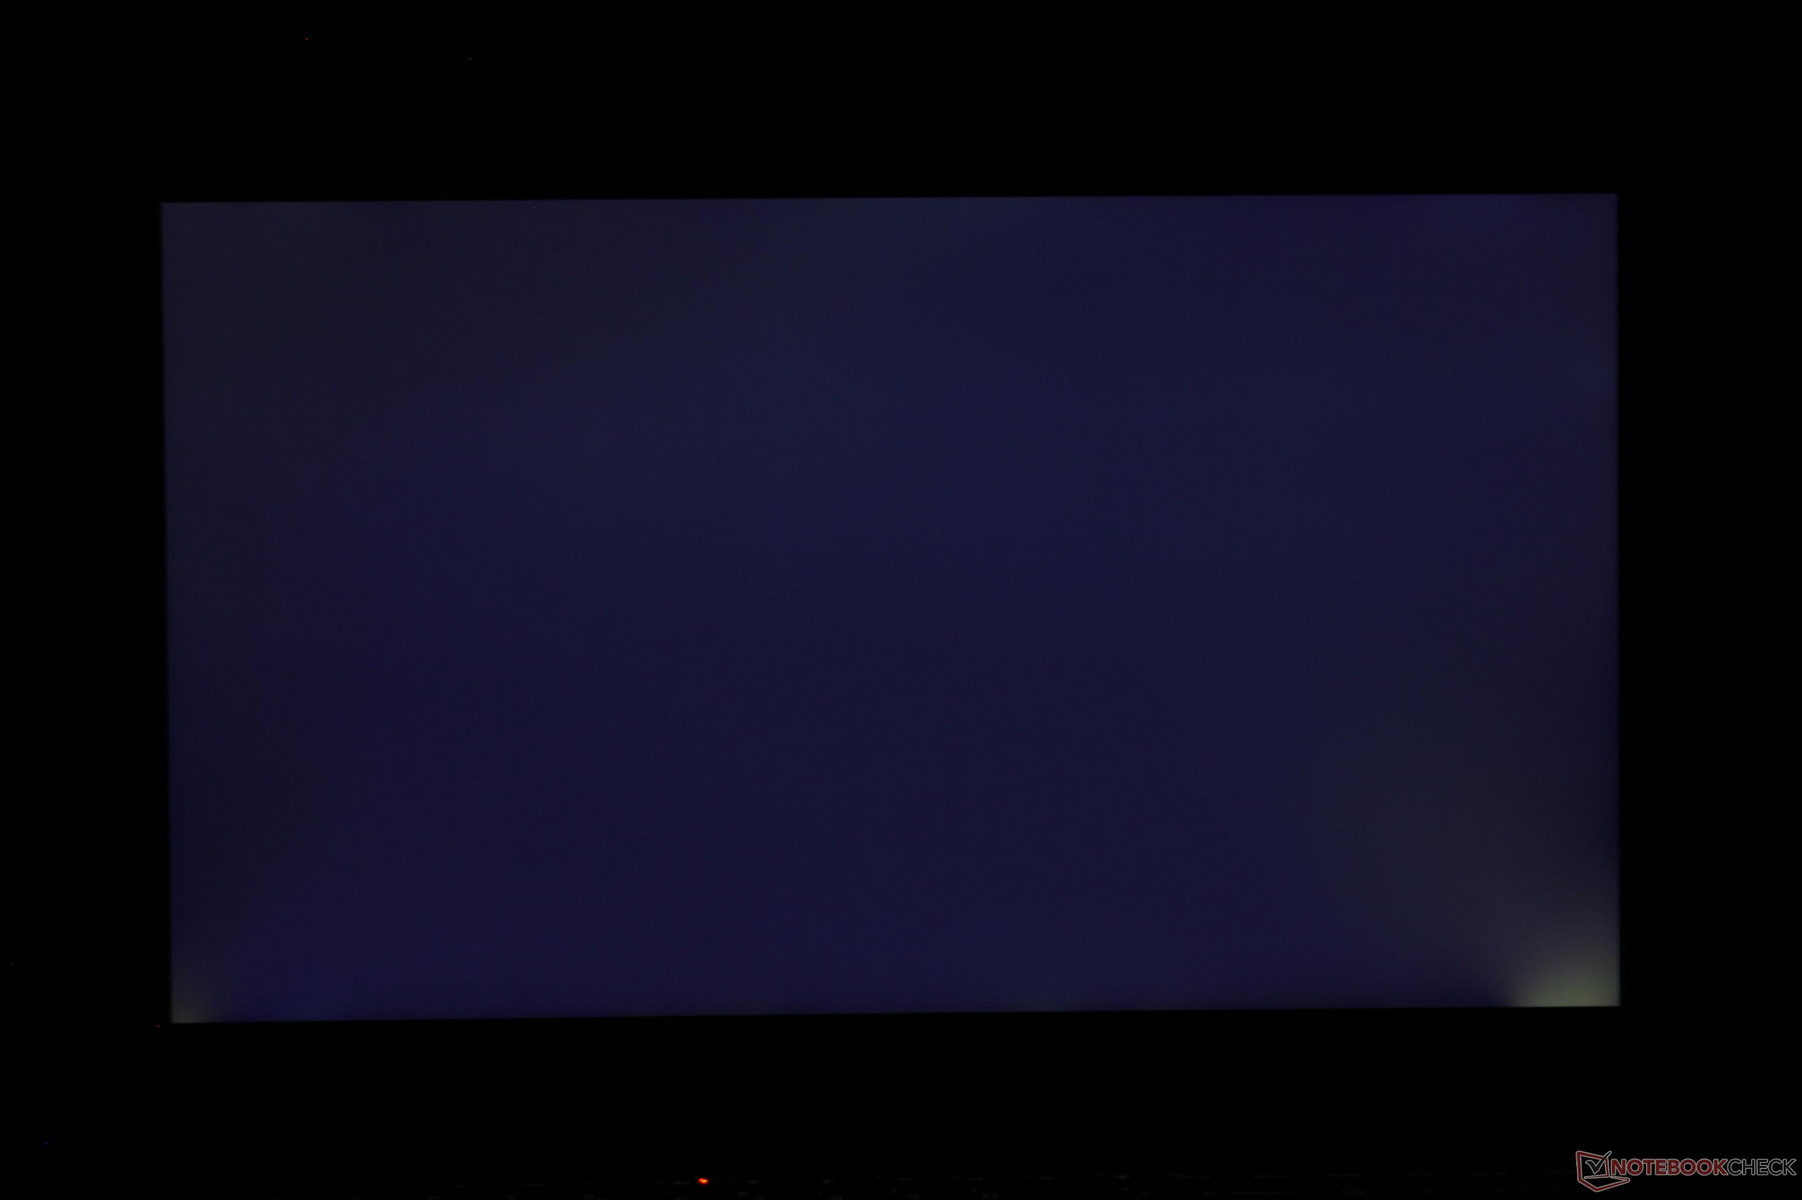
Unfortunately, some unfavorable attributes have also carried over from previous Pavilion 17z. For one, backlight bleeding is even more noticeable around the bottom two corners especially when playing movies with black borders. The overlying matte panel is grainier than on other notebooks and so images and texts aren't as "clean" as they could have been.
| |||||||||||||||||||||||||
Brightness Distribution: 90 %
Center on Battery: 363.6 cd/m²
Contrast: 983:1 (Black: 0.37 cd/m²)
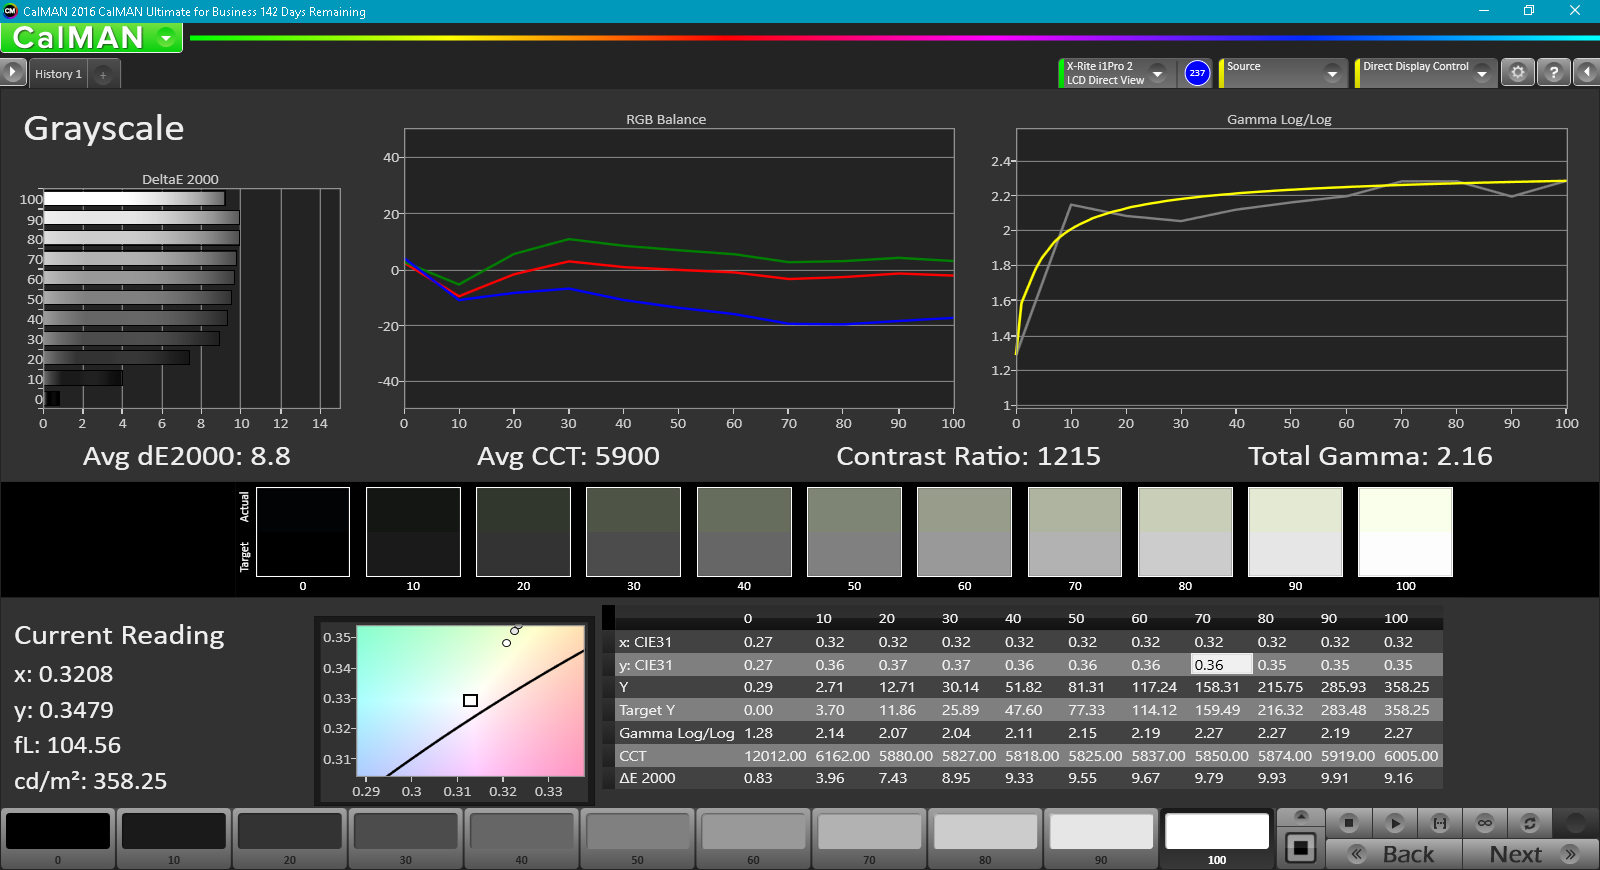
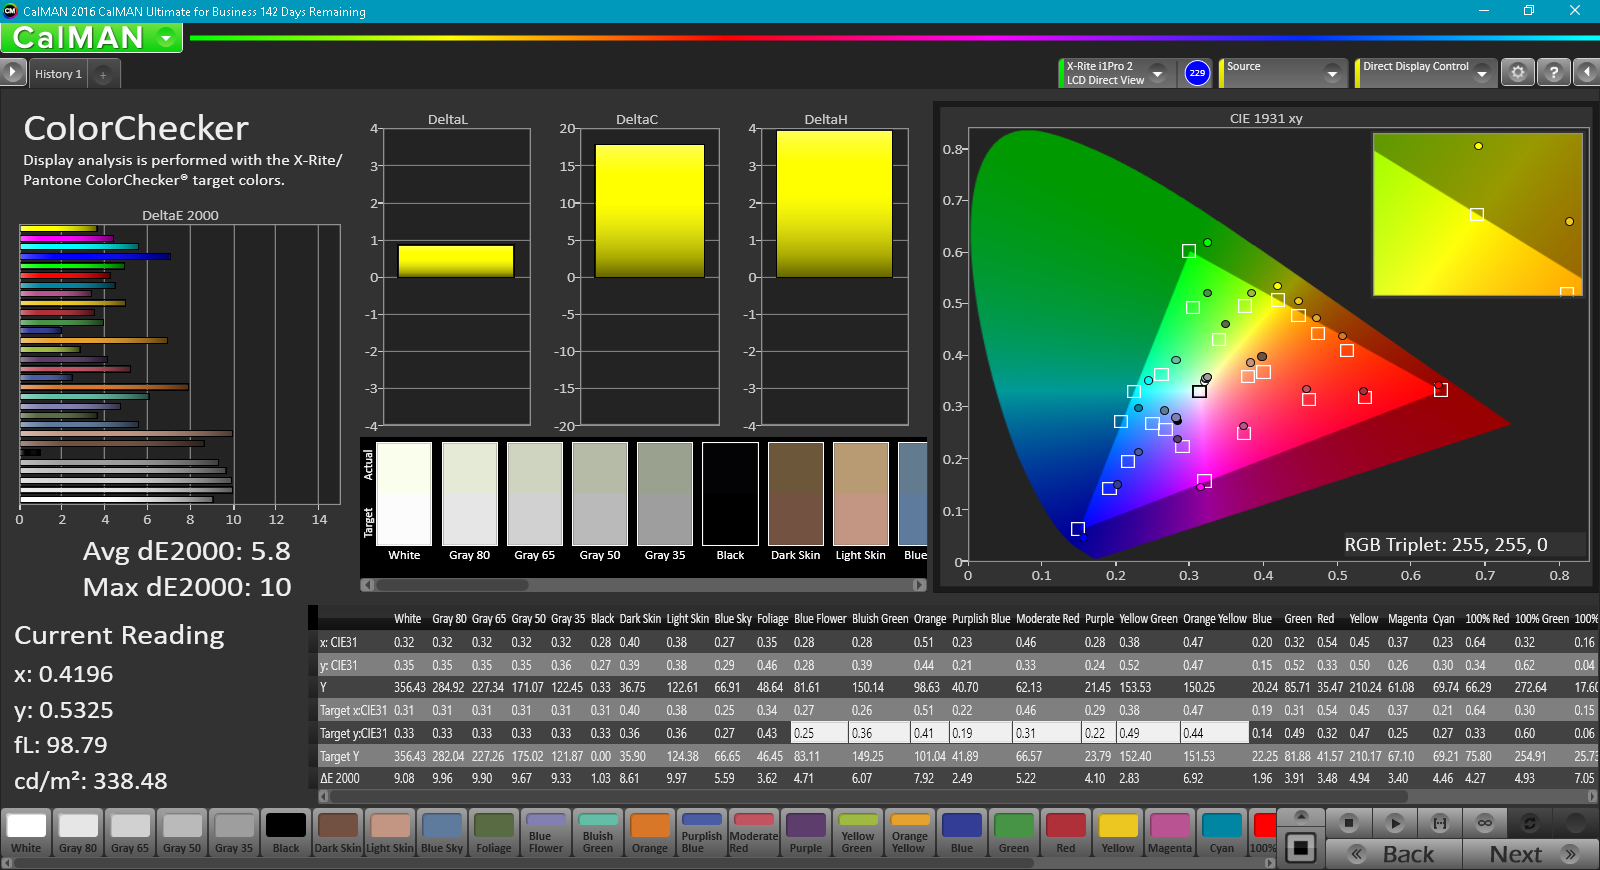
ΔE ColorChecker Calman: 5.8 | ∀{0.5-29.43 Ø4.71}
ΔE Greyscale Calman: 8.8 | ∀{0.09-98 Ø4.96}
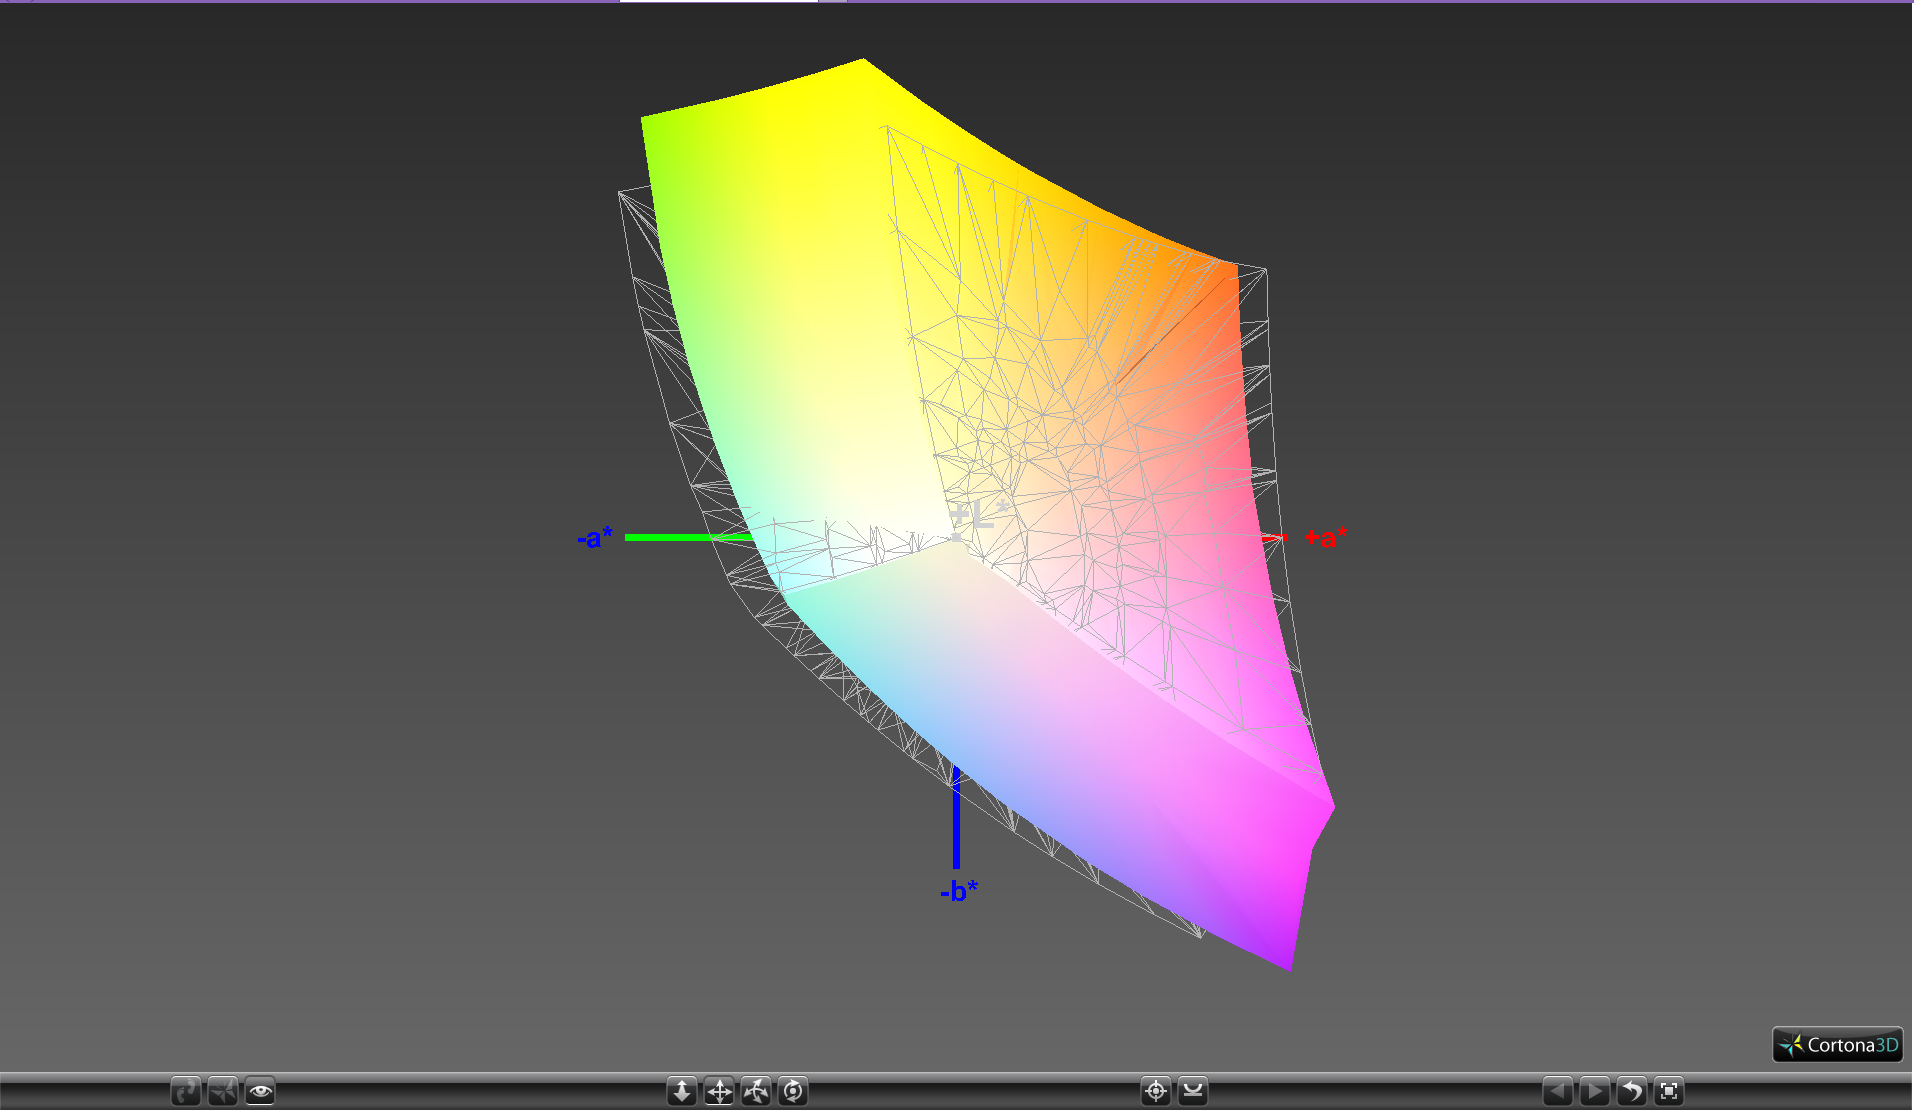
87.3% sRGB (Argyll 1.6.3 3D)
57.2% AdobeRGB 1998 (Argyll 1.6.3 3D)
64% AdobeRGB 1998 (Argyll 3D)
87.5% sRGB (Argyll 3D)
64.8% Display P3 (Argyll 3D)
Gamma: 2.16
CCT: 5900 K
| HP Pavilion 17z 1EX13AV ID: AUO109D, Name: AU Optronics B173HW01 V0, IPS, 17.3", 1920x1080 | HP Pavilion 17z 1EX13AV ID: AUO109D, Name: AU Optronics B173HW01 V0, IPS, 17.3", 1920x1080 | HP Pavilion Power 15t-cb2000 AUO41ED , IPS, 15.6", 1920x1080 | Lenovo V510-15IKB 80WQ0002GE LG Philips LP156WF6-SPK3, IPS, 15.6", 1920x1080 | Asus X555DA-BB11 TN LED, 15.6", 1920x1080 | |
|---|---|---|---|---|---|
| Display | 0% | -36% | -37% | -43% | |
| Display P3 Coverage (%) | 64.8 | 64.3 -1% | 39.28 -39% | 38.8 -40% | 35.12 -46% |
| sRGB Coverage (%) | 87.5 | 88.5 1% | 58.9 -33% | 58.1 -34% | 52.7 -40% |
| AdobeRGB 1998 Coverage (%) | 64 | 64.6 1% | 40.59 -37% | 40.12 -37% | 36.29 -43% |
| Response Times | -9% | -30% | -13% | -3% | |
| Response Time Grey 50% / Grey 80% * (ms) | 34 ? | 40.8 ? -20% | 51.6 ? -52% | 39 ? -15% | 42 ? -24% |
| Response Time Black / White * (ms) | 27.2 ? | 26.4 ? 3% | 29.2 ? -7% | 30 ? -10% | 22.4 ? 18% |
| PWM Frequency (Hz) | 20000 ? | ||||
| Screen | 12% | -9% | -7% | -26% | |
| Brightness middle (cd/m²) | 363.6 | 333.5 -8% | 256 -30% | 256 -30% | 242.7 -33% |
| Brightness (cd/m²) | 349 | 323 -7% | 241 -31% | 252 -28% | 232 -34% |
| Brightness Distribution (%) | 90 | 91 1% | 88 -2% | 87 -3% | 88 -2% |
| Black Level * (cd/m²) | 0.37 | 0.32 14% | 0.21 43% | 0.3 19% | 0.52 -41% |
| Contrast (:1) | 983 | 1042 6% | 1219 24% | 853 -13% | 467 -52% |
| Colorchecker dE 2000 * | 5.8 | 4 31% | 5.2 10% | 5.4 7% | 4.9 16% |
| Colorchecker dE 2000 max. * | 10 | 6.9 31% | 19.3 -93% | 9.36 6% | 20.3 -103% |
| Greyscale dE 2000 * | 8.8 | 4.5 49% | 3.5 60% | 5.37 39% | 2.7 69% |
| Gamma | 2.16 102% | 2.19 100% | 2.35 94% | 2.58 85% | 2.34 94% |
| CCT | 5900 110% | 6386 102% | 6576 99% | 6795 96% | 6876 95% |
| Color Space (Percent of AdobeRGB 1998) (%) | 57.2 | 57.5 1% | 37 -35% | 37 -35% | 33.5 -41% |
| Color Space (Percent of sRGB) (%) | 87.3 | 88.1 1% | 59 -32% | 58 -34% | 52.5 -40% |
| Total Average (Program / Settings) | 1% /
7% | -25% /
-17% | -19% /
-14% | -24% /
-26% |
* ... smaller is better
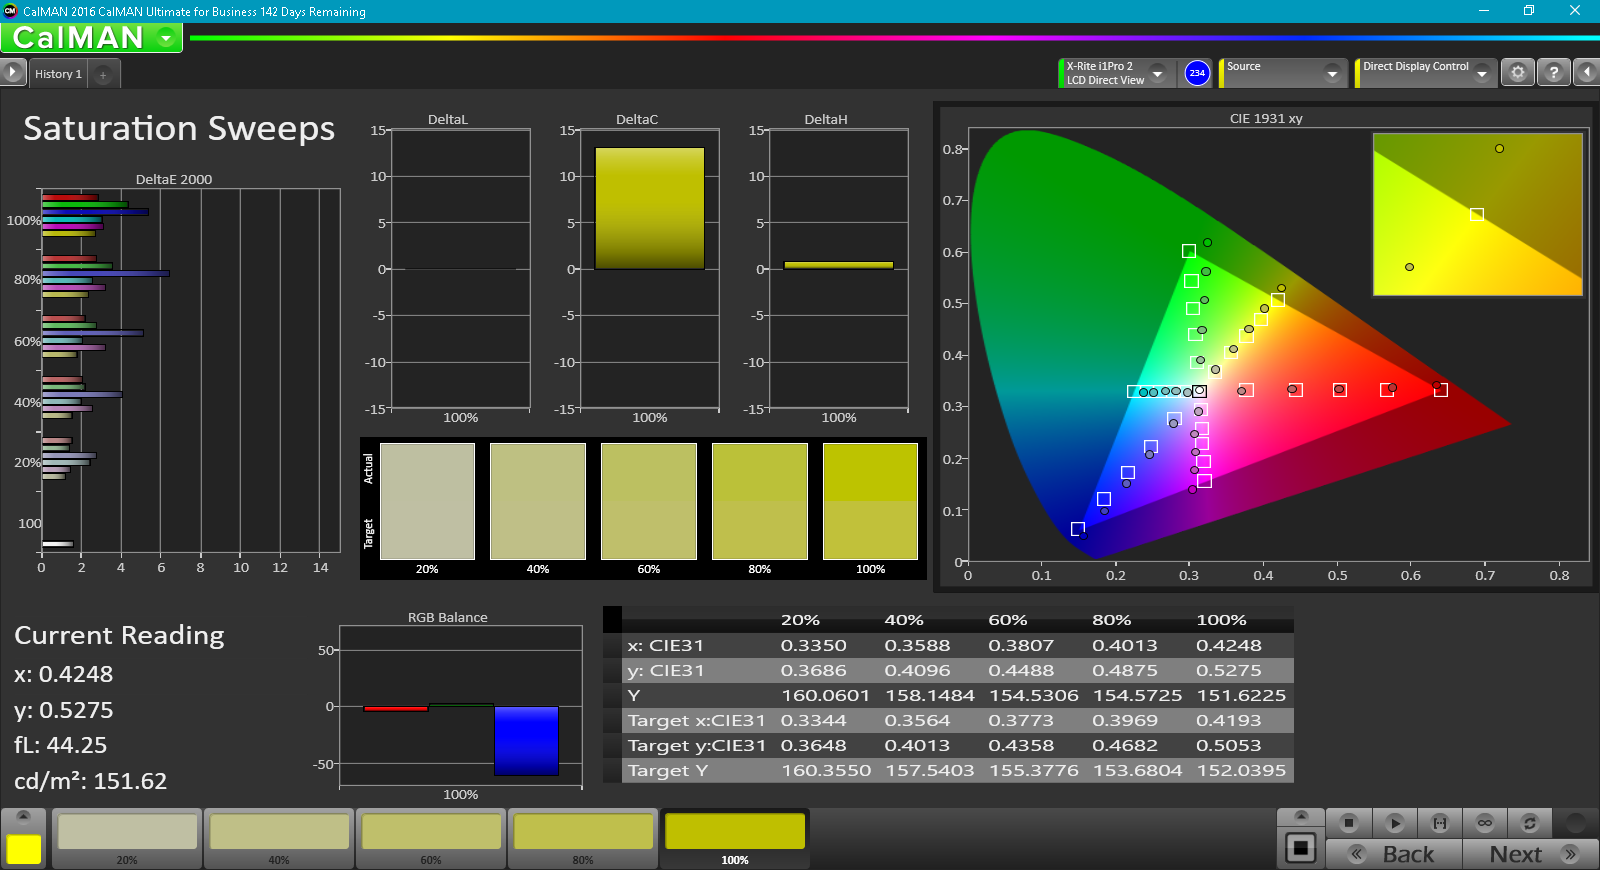
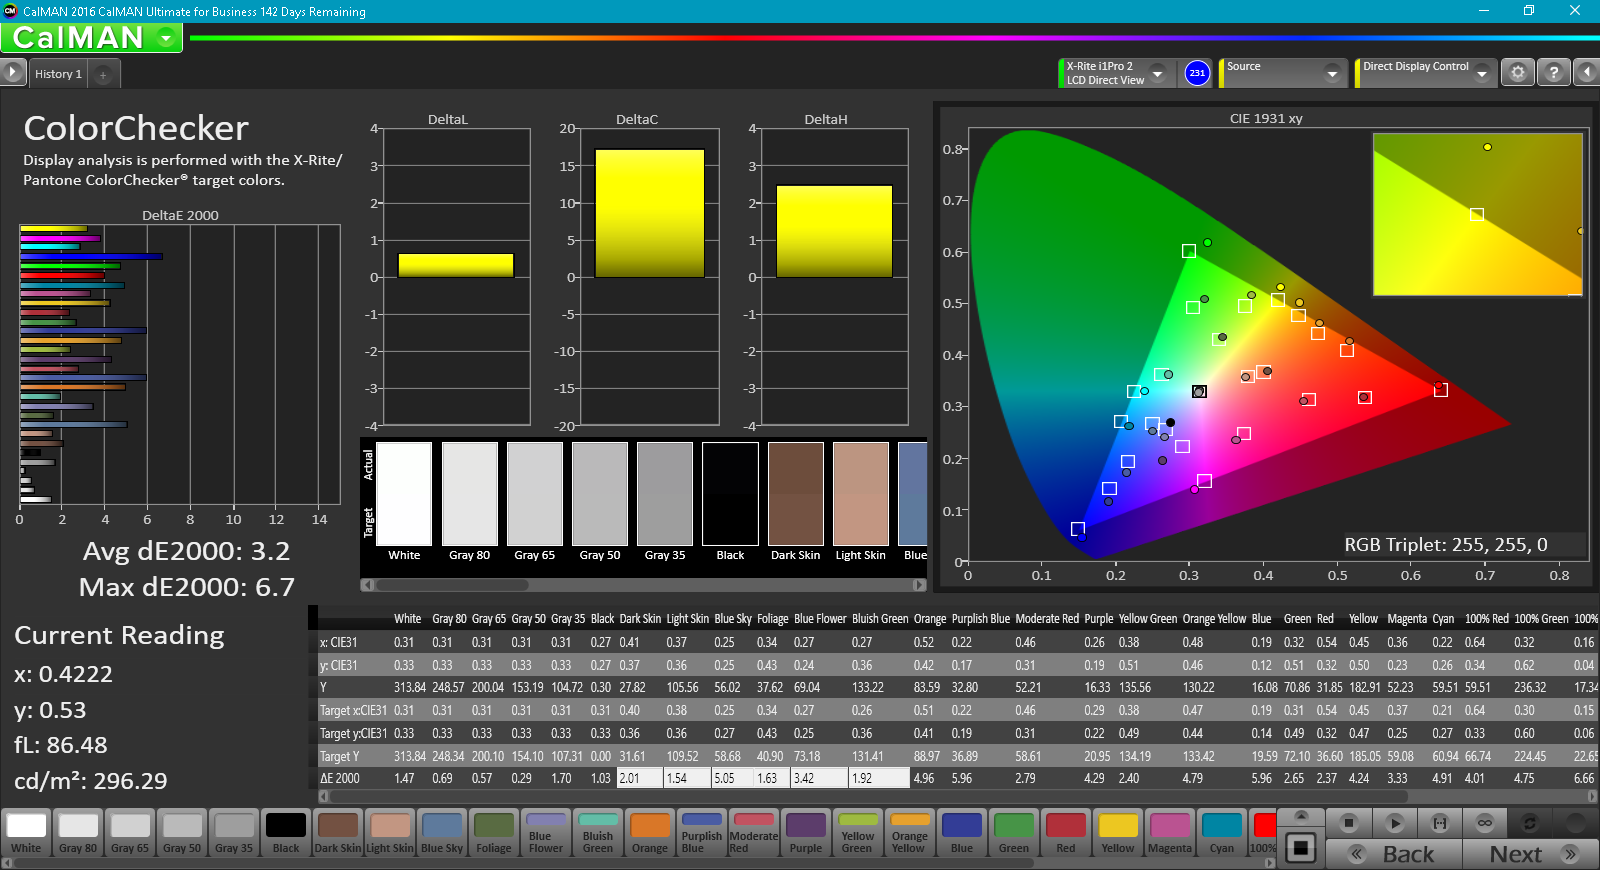
Color coverage is very wide for a Pavilion-class notebook at approximately 57 percent and 87 percent of the AdobeRGB and sRGB standards, respectively. Cheaper panels on budget alternatives typically cover about 60 percent of sRGB for shallower colors overall.
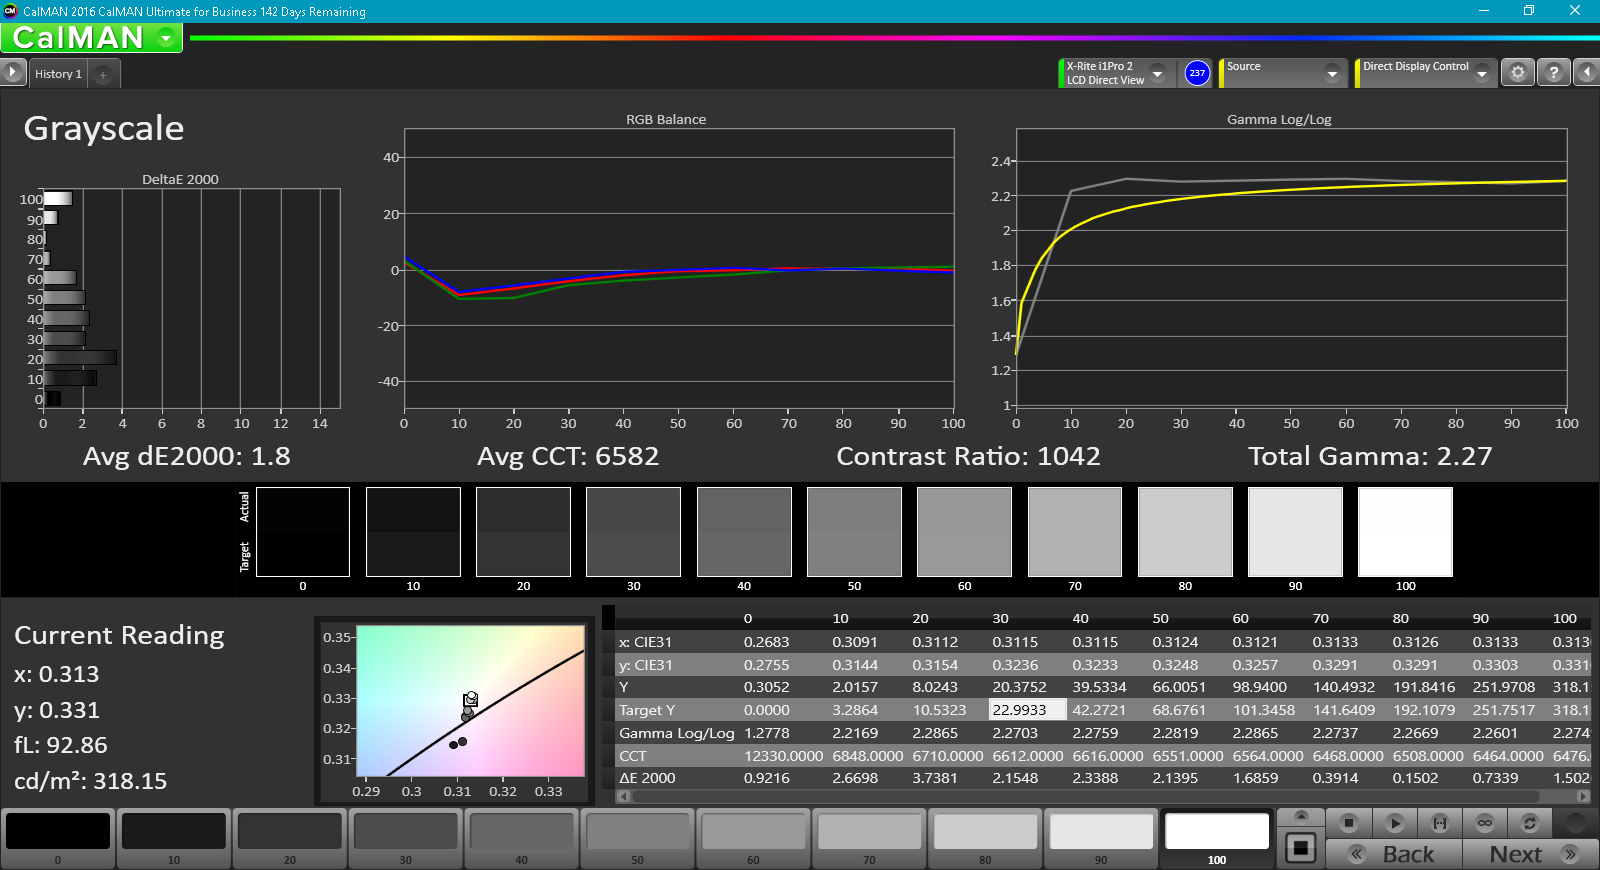
Further measurements with an X-Rite spectrophotometer reveal an inaccurate grayscale and a warm color temperature out of the box. A calibration improves grayscale and colors dramatically and brings the average deltaE down to just 1.8. We recommend a display calibration in order to get the most out of the notebook.
Display Response Times
| ↔ Response Time Black to White | ||
|---|---|---|
| 27.2 ms ... rise ↗ and fall ↘ combined | ↗ 16.4 ms rise | 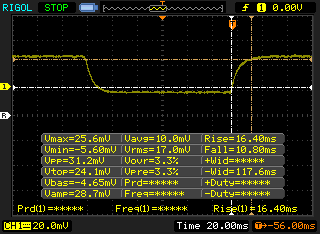 |
| ↘ 10.8 ms fall | ||
| The screen shows relatively slow response rates in our tests and may be too slow for gamers. In comparison, all tested devices range from 0.1 (minimum) to 240 (maximum) ms. » 69 % of all devices are better. This means that the measured response time is worse than the average of all tested devices (19.8 ms). | ||
| ↔ Response Time 50% Grey to 80% Grey | ||
| 34 ms ... rise ↗ and fall ↘ combined | ↗ 15.6 ms rise | 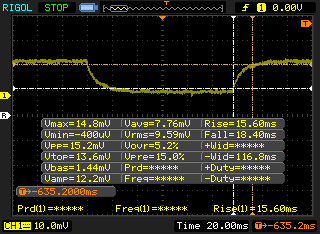 |
| ↘ 18.4 ms fall | ||
| The screen shows slow response rates in our tests and will be unsatisfactory for gamers. In comparison, all tested devices range from 0.165 (minimum) to 636 (maximum) ms. » 47 % of all devices are better. This means that the measured response time is similar to the average of all tested devices (31 ms). | ||
Screen Flickering / PWM (Pulse-Width Modulation)
| Screen flickering / PWM not detected | 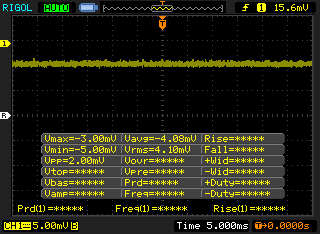 | ||
In comparison: 52 % of all tested devices do not use PWM to dim the display. If PWM was detected, an average of 7747 (minimum: 5 - maximum: 343500) Hz was measured. | |||
Outdoor visibility is average when under shade owing to the matte panel and relatively bright backlight for this price range. It's important to note that Radeon Vari-Bright must be disabled through the Radeon Settings menu or else the maximum brightness will be limited to just 198 nits when not connected to an outlet. Users will want the maximum brightness allowable when working outdoors especially if under direct sunlight. Viewing angles are wide to make avoiding glare easier if necessary.
Performance
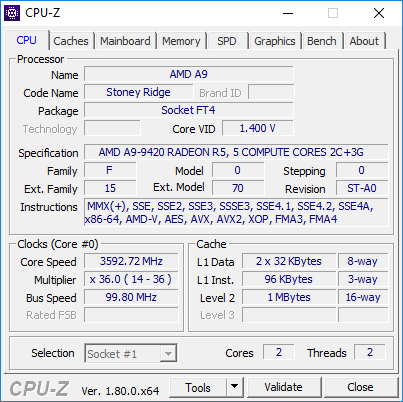
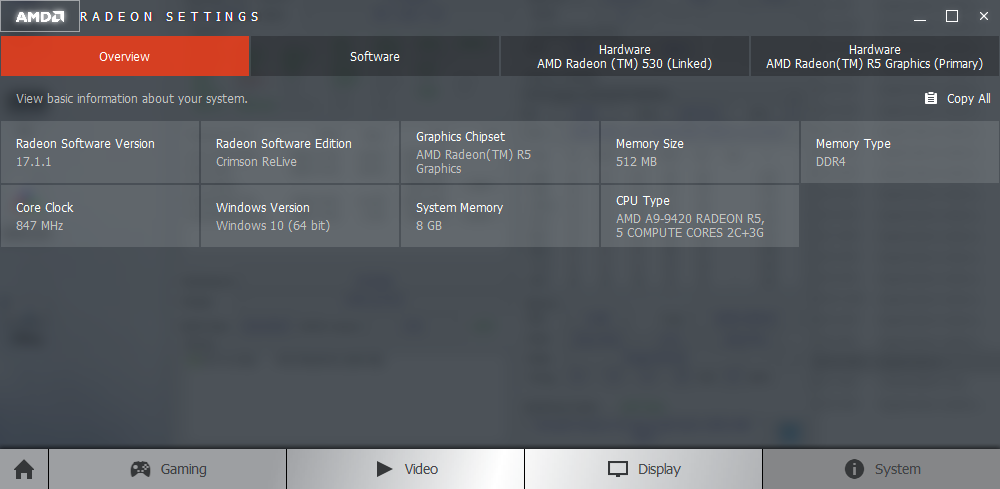
The A9-9420 SoC is capable of Burst (or Boost) frequencies of up to 3.6 GHz similar to the quad-core A12-9720P. Unlike the A12, however, its base clock rate is 200 to 300 MHz faster while integrating a slower Radeon R5 GPU instead of the Radeon R7. Overall performance is still slower than Intel's budget Core i3 series since AMD lacks Hyper-Threading for its dual-core Stoney Ridge and quad-core Bristol Ridge series.
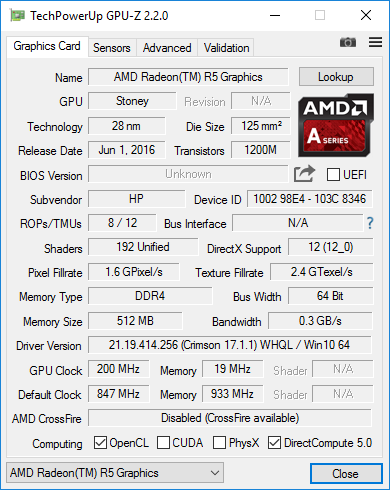
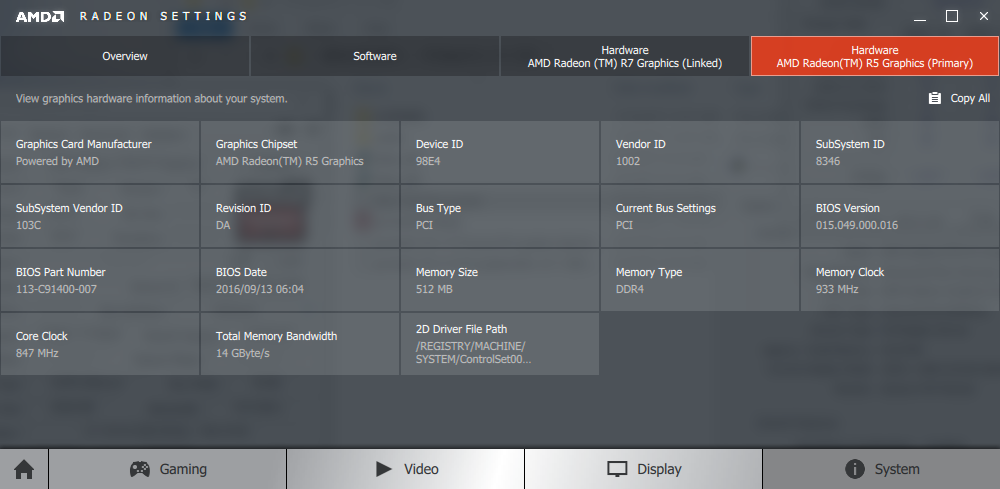
Graphics power is provided by the discrete Radeon 530 with 2 GB of DDR3 VRAM. While the Radeon 530 should be slightly faster than the R7 M340 on paper (384 vs. 320 shaders), our results below show it to be slower since the A9 series is lacking the Dual Graphics support found on our A12 Pavilion 17z configuration.
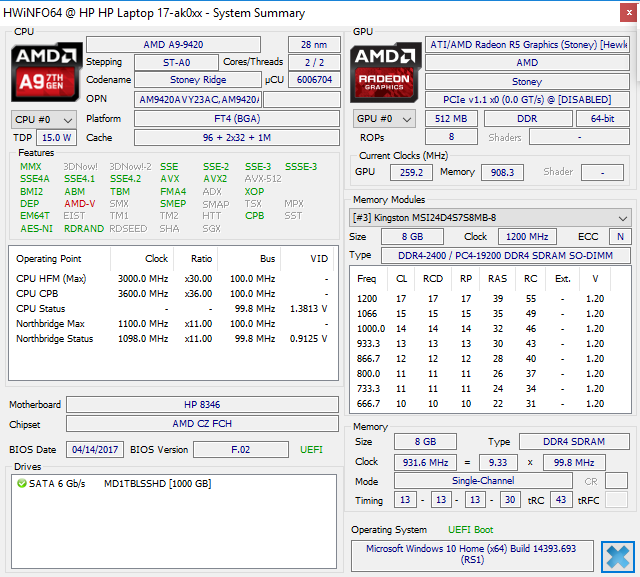
Processor
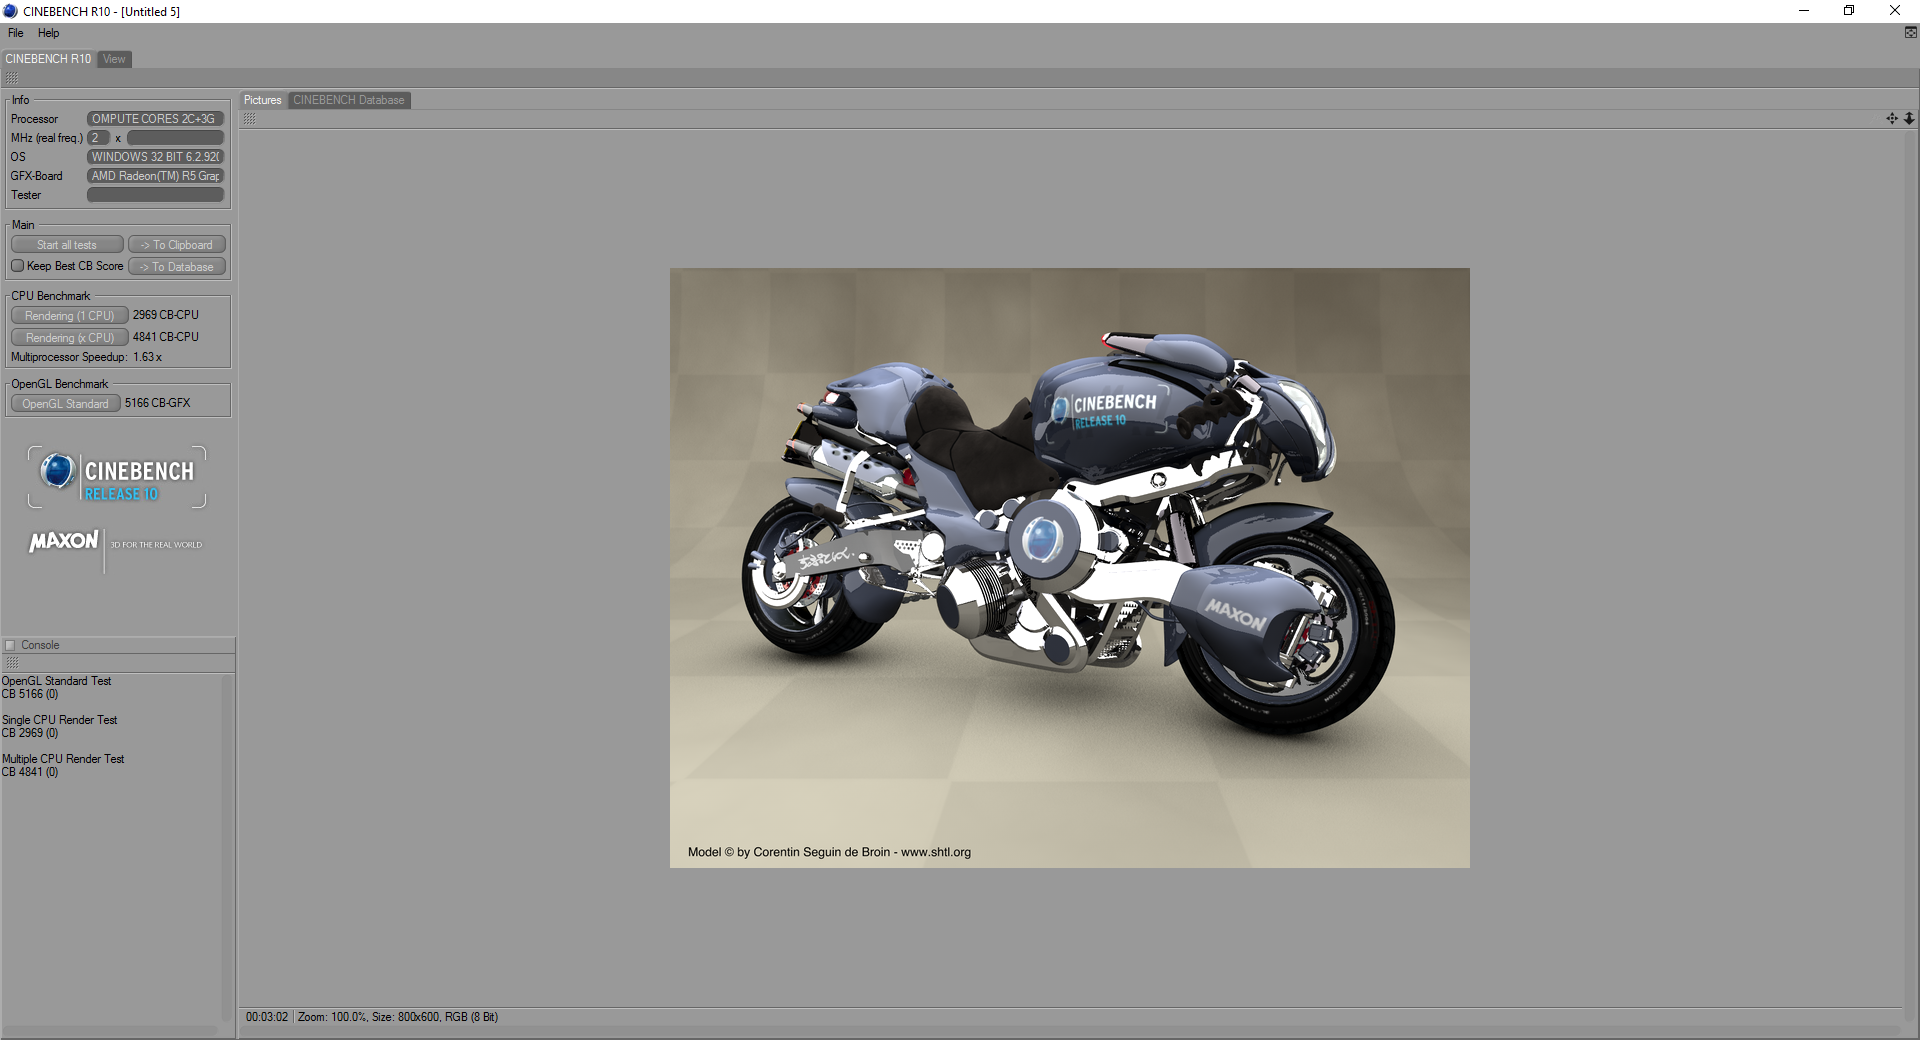
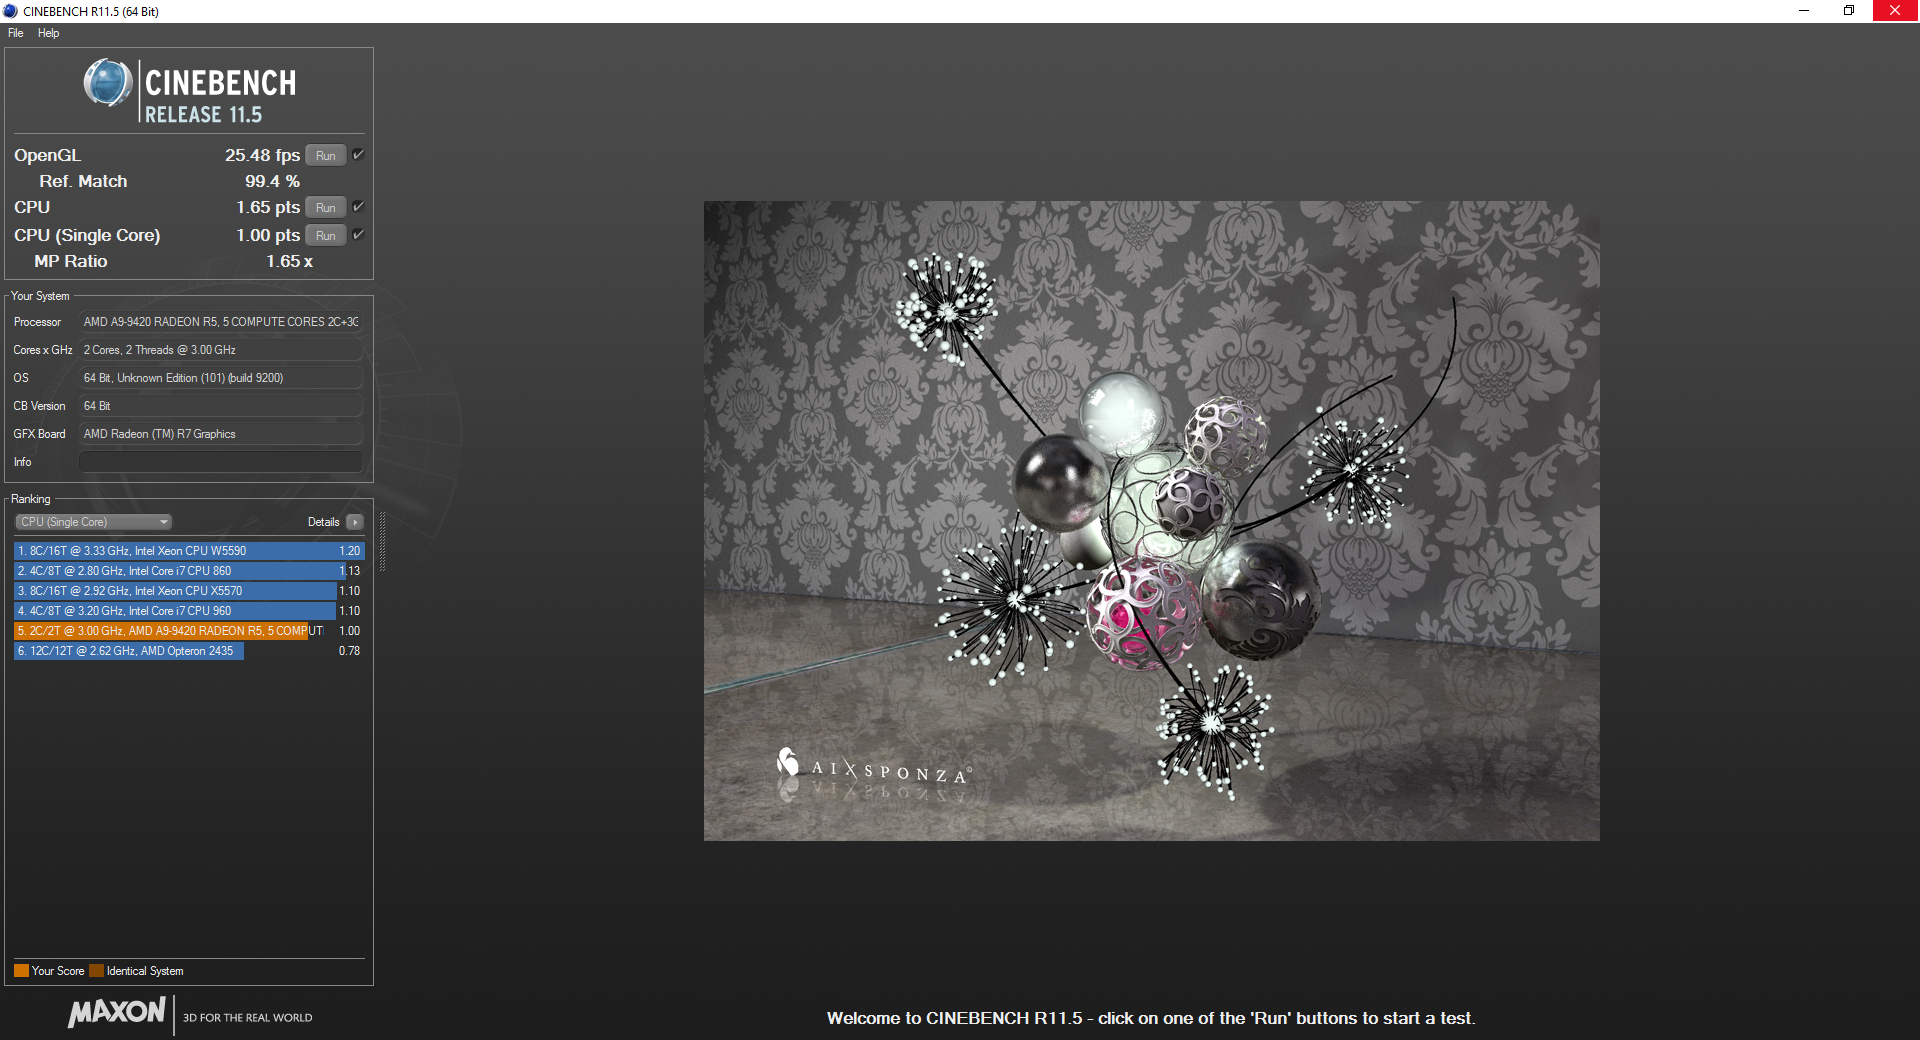
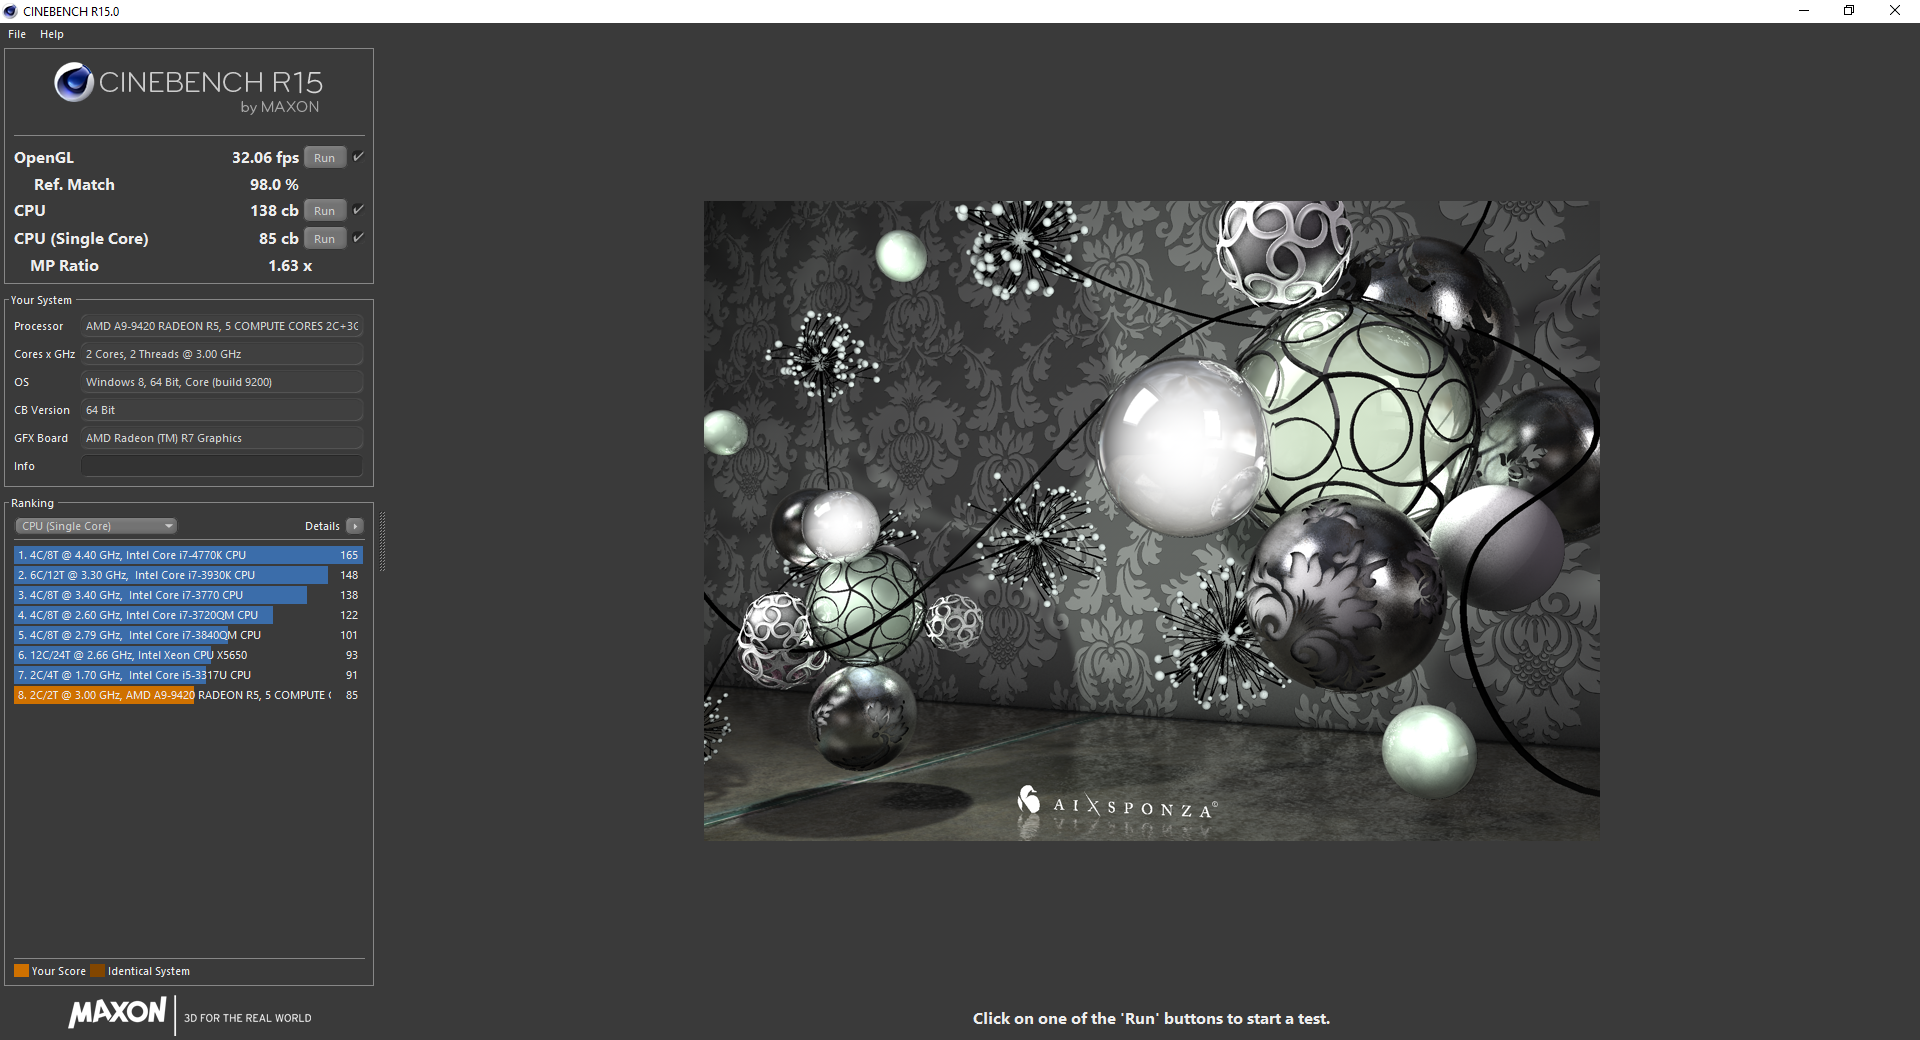
CineBench benchmarks reveal the A9-9420 to be on par with the i3-5010U and i3-4010U in multi-threaded and single-threaded workloads, respectively. Single-thread performance is surprisingly good with a respectable Super Pi completion time ahead of even the A12-9720P to indicate better performance sustainability at higher clock rates. In contrast, multi-thread performance is much weaker due to the lower thread count per core when compared to Intel alternatives. Running CineBench Multi-Thread in a loop results in very steady scores throughout with no statistically significant performance dips.
See our dedicated page on the A9-9420 APU for more technical information and benchmark comparisons on the processor.
| wPrime 2.10 - 1024m | |
| HP 15-bw077ax | |
| HP Pavilion 14t-ab000 K9E07AV | |
| HP Pavilion 17z 1EX13AV | |
| Lenovo Thinkpad 13-20J1001BUS | |
| HP EliteBook 725 G4 | |
| HP Pavilion 15z-bw000 | |
| HP Pavilion 17z 1EX13AV | |
* ... smaller is better
System Performance
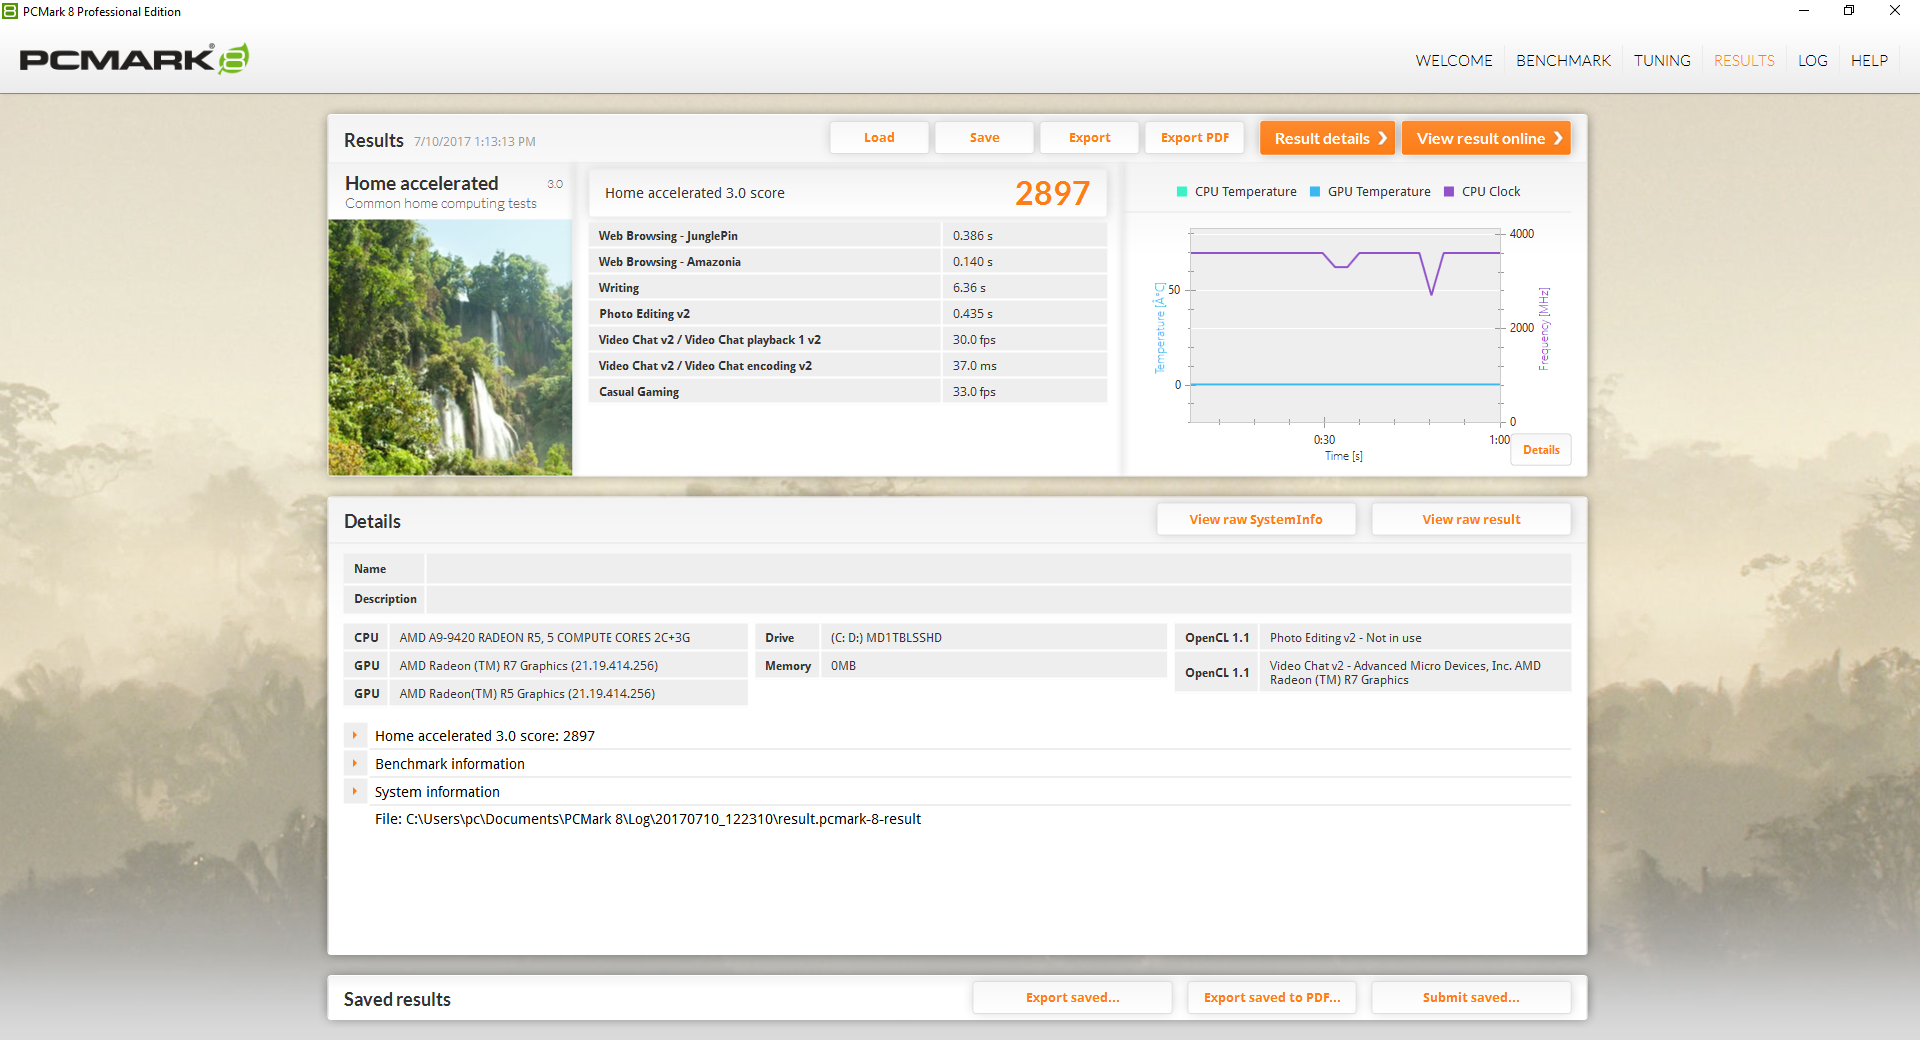
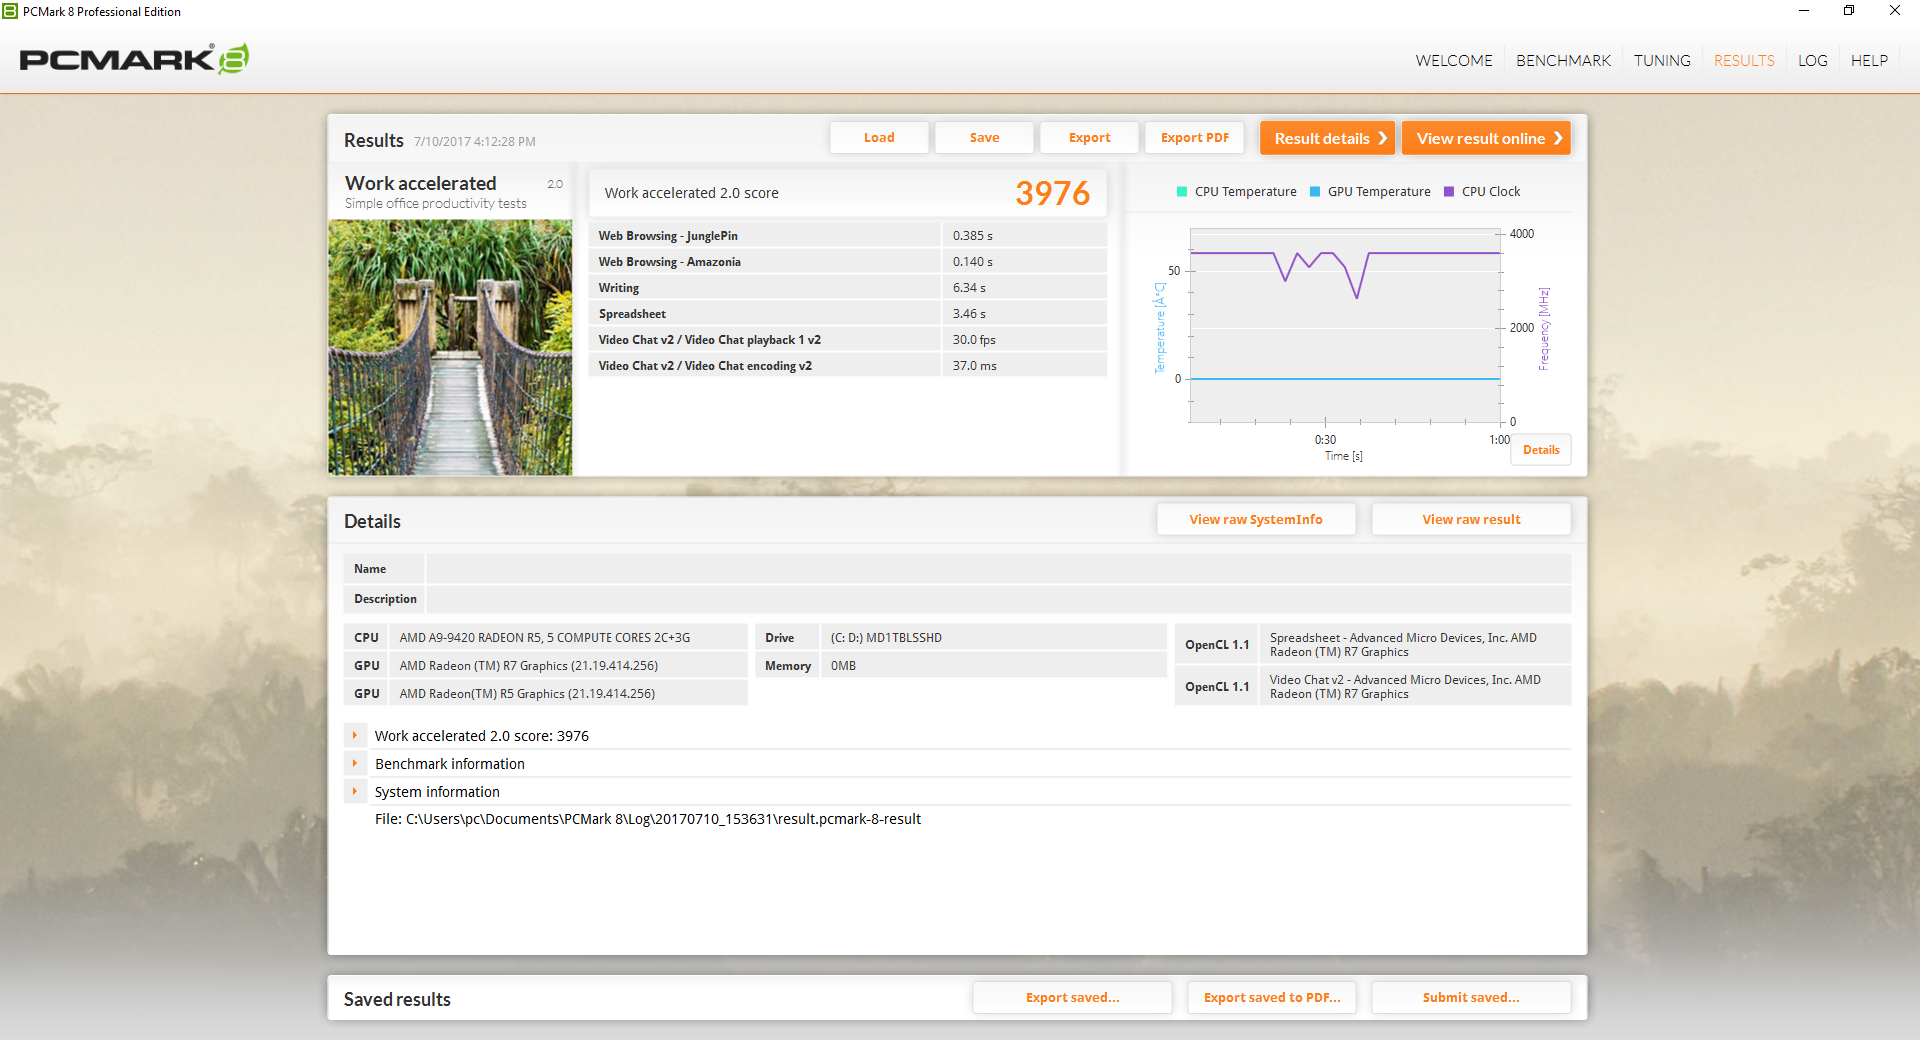
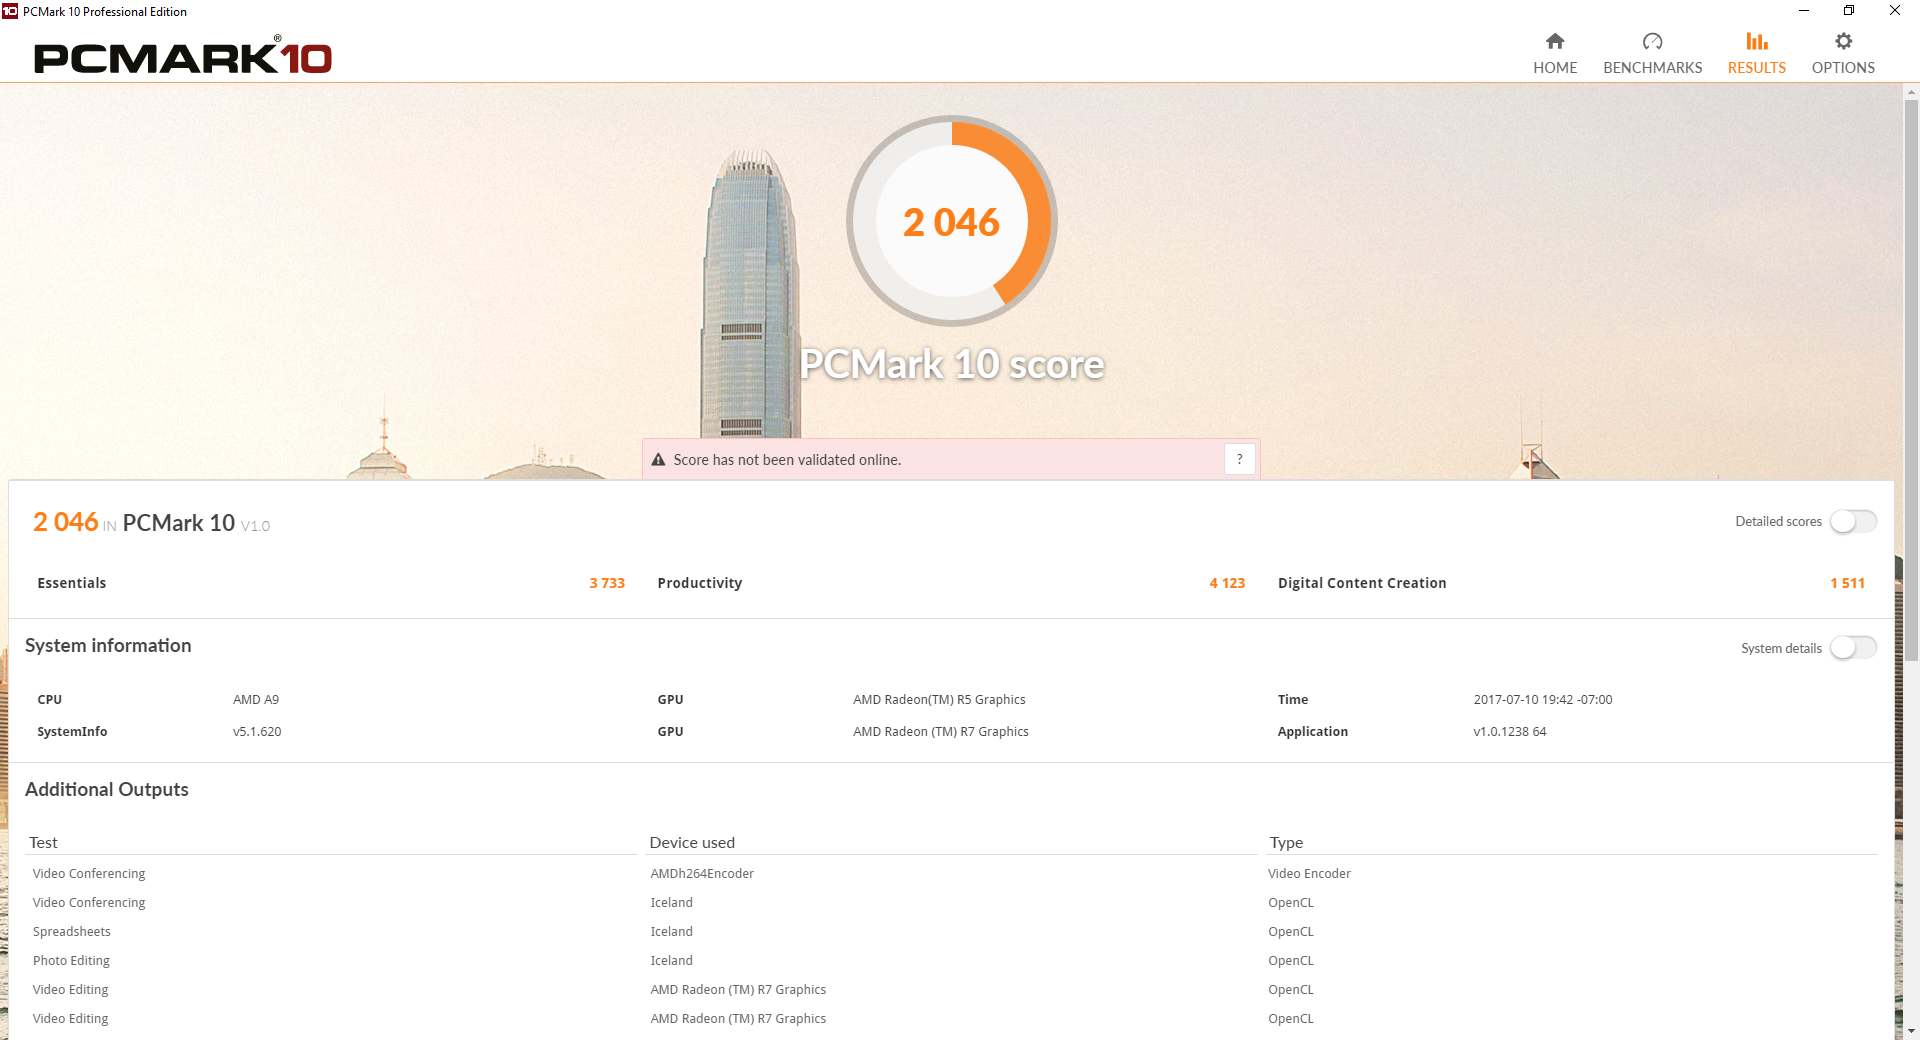
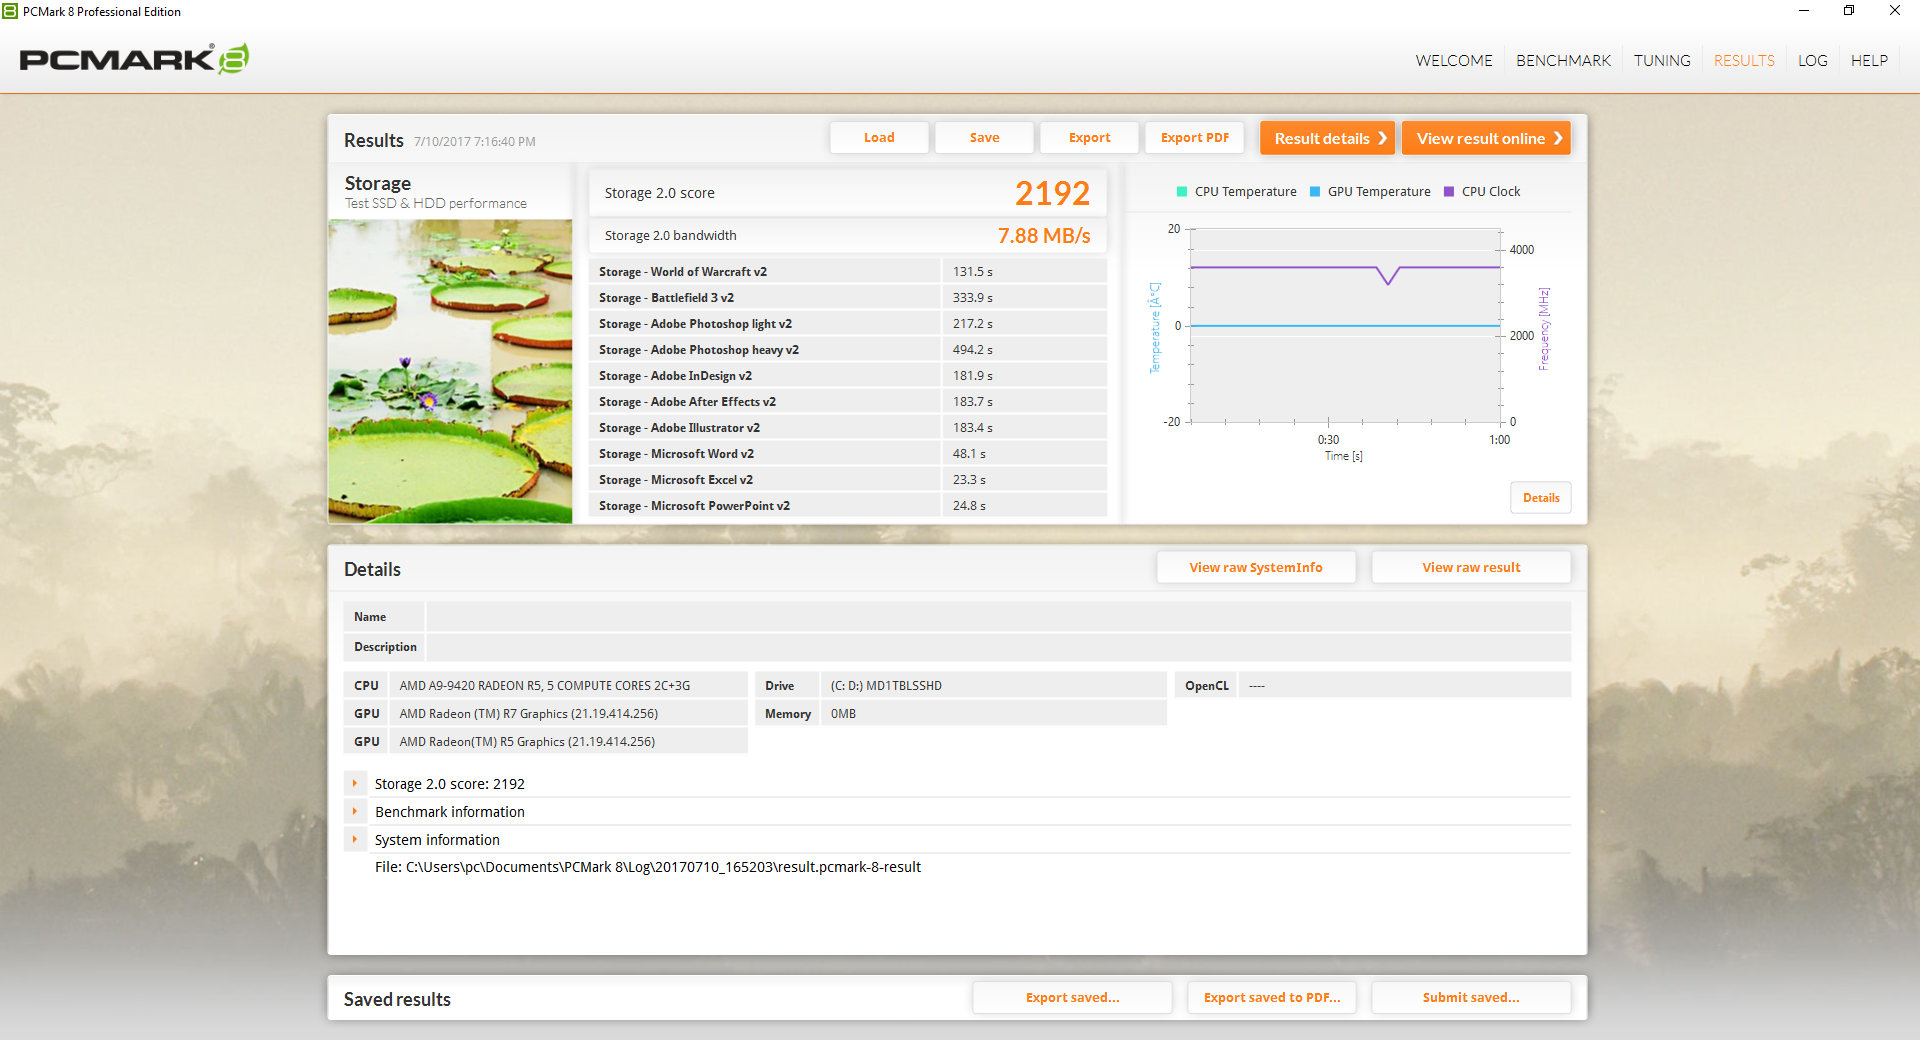
PCmark benchmarks rank our Pavilion within single-digit percentages from the budget Intel-Powered Satellite Pro R50-C. In practice, however, the HP is extremely slow. Launching applications will take seconds longer than usual and overall system responsiveness is even worse than on other notebooks with primary HDDs. Despite the molasses-like chug, we never experienced any actual crashes.
| PCMark 8 | |
| Home Score Accelerated v2 | |
| HP Pavilion Power 15t-cb2000 | |
| Toshiba Satellite Pro R50-C-16V | |
| HP Pavilion 17z 1EX13AV | |
| Asus X555DA-BB11 | |
| Work Score Accelerated v2 | |
| HP Pavilion Power 15t-cb2000 | |
| HP Pavilion 17z 1EX13AV | |
| Toshiba Satellite Pro R50-C-16V | |
| Asus X555DA-BB11 | |
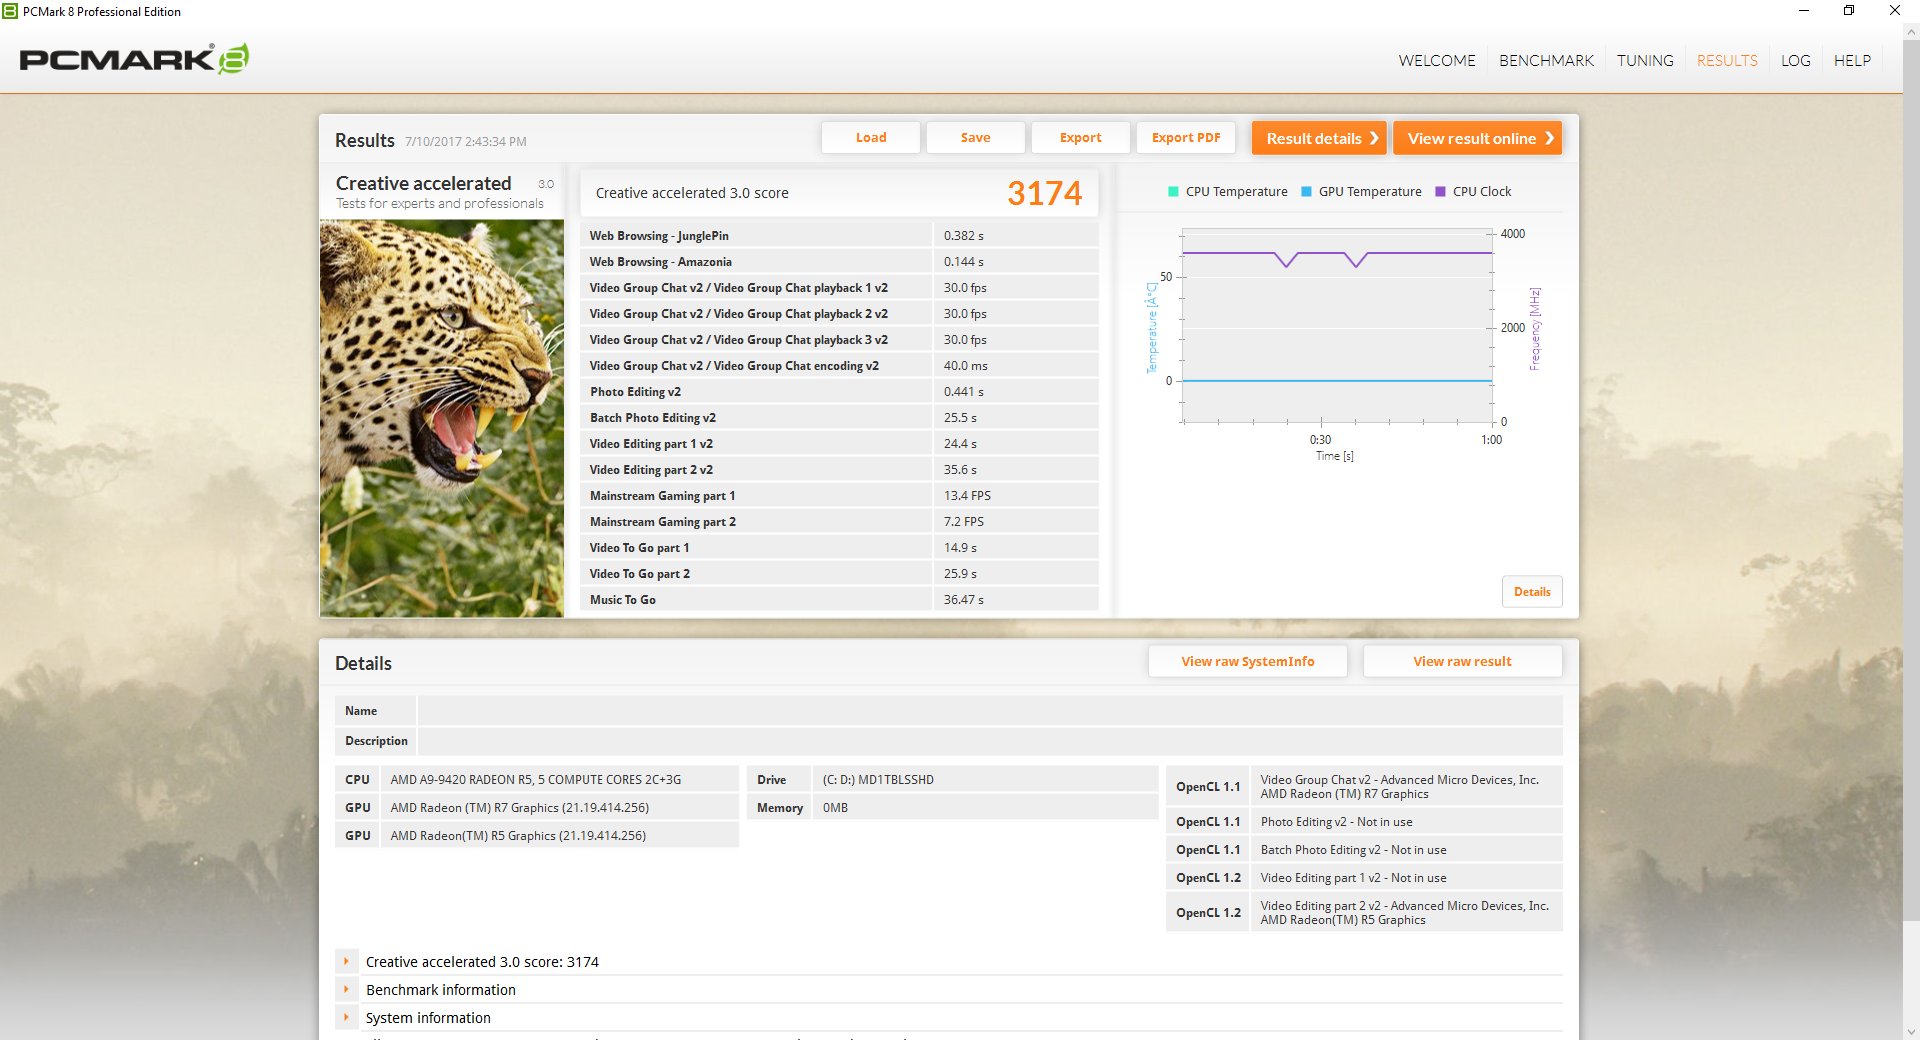
| Creative Score Accelerated v2 | |
| HP Pavilion Power 15t-cb2000 | |
| Toshiba Satellite Pro R50-C-16V | |
| HP Pavilion 17z 1EX13AV | |
| Asus X555DA-BB11 | |
| PCMark 8 Home Score Accelerated v2 | 2897 points | |
| PCMark 8 Creative Score Accelerated v2 | 3174 points | |
| PCMark 8 Work Score Accelerated v2 | 3976 points | |
| PCMark 10 Score | 2046 points | |
Help | ||
Storage Devices
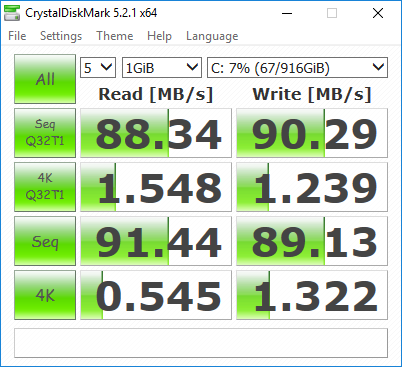
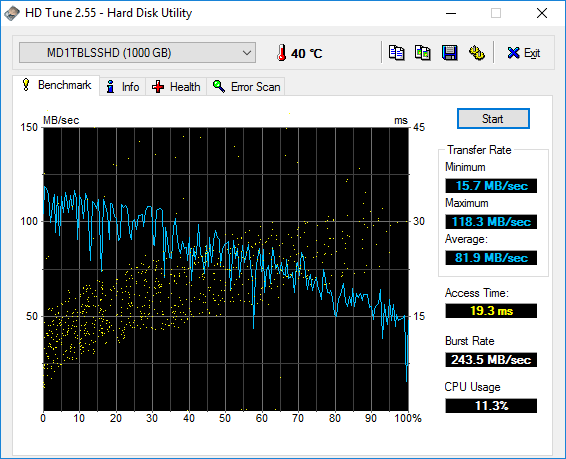
The same 1 TB Avolusion SHDD as found on some of our previous AMD-powered Pavilion units is back. Average transfer rate from the 5400 drive is slow at just 82 MB/s according to HD Tune compared to over 100 MB/s from many 7200 RPM options. We recommend investing in a lower capacity primary SSD especially if the large 1 TB storage space will not be necessary for everyday use.
See our table of SSDs and HDDs for more benchmarks and comparisons.
July 26, 2017 update: We can confirm that the Avolusion SHDD was installed by the reseller CUKUSA and is not the original drive as shipped by HP. Users who purchase the Pavilion 17z directly from HP.com will not receive the same drive as we have on our tested unit.
| HP Pavilion 17z 1EX13AV Avolusion MD1TBLSSHD | Asus X555DA-BB11 Seagate Momentus SpinPoint M8 ST1000LM024 HN-M101MBB | Toshiba Satellite Pro R50-C-16V TOSHIBA MQ01ABD075 | Lenovo V510-15IKB 80WQ0002GE Samsung CM871a MZNTY256HDHP | HP Pavilion 17z 1EX13AV WDC Scorpio Blue WD10JPVX-60JC3T1 | |
|---|---|---|---|---|---|
| CrystalDiskMark 3.0 | -2% | -15% | 13527% | 2% | |
| Read Seq (MB/s) | 90 | 106.9 19% | 96.5 7% | 532 491% | 90 0% |
| Write Seq (MB/s) | 93.4 | 97.5 4% | 77.9 -17% | 511 447% | 90.3 -3% |
| Read 512 (MB/s) | 28.71 | 32.28 12% | 20.82 -27% | 414.8 1345% | 28.47 -1% |
| Write 512 (MB/s) | 44.35 | 35.39 -20% | 19.83 -55% | 307.7 594% | 47.07 6% |
| Read 4k (MB/s) | 0.316 | 0.373 18% | 0.342 8% | 39.51 12403% | 0.31 -2% |
| Write 4k (MB/s) | 0.813 | 0.636 -22% | 0.836 3% | 108.1 13196% | 0.3997 -51% |
| Read 4k QD32 (MB/s) | 0.711 | 0.694 -2% | 0.595 -16% | 361.6 50758% | 1.021 44% |
| Write 4k QD32 (MB/s) | 0.87 | 0.682 -22% | 0.706 -19% | 253 28980% | 1.076 24% |

GPU Performance
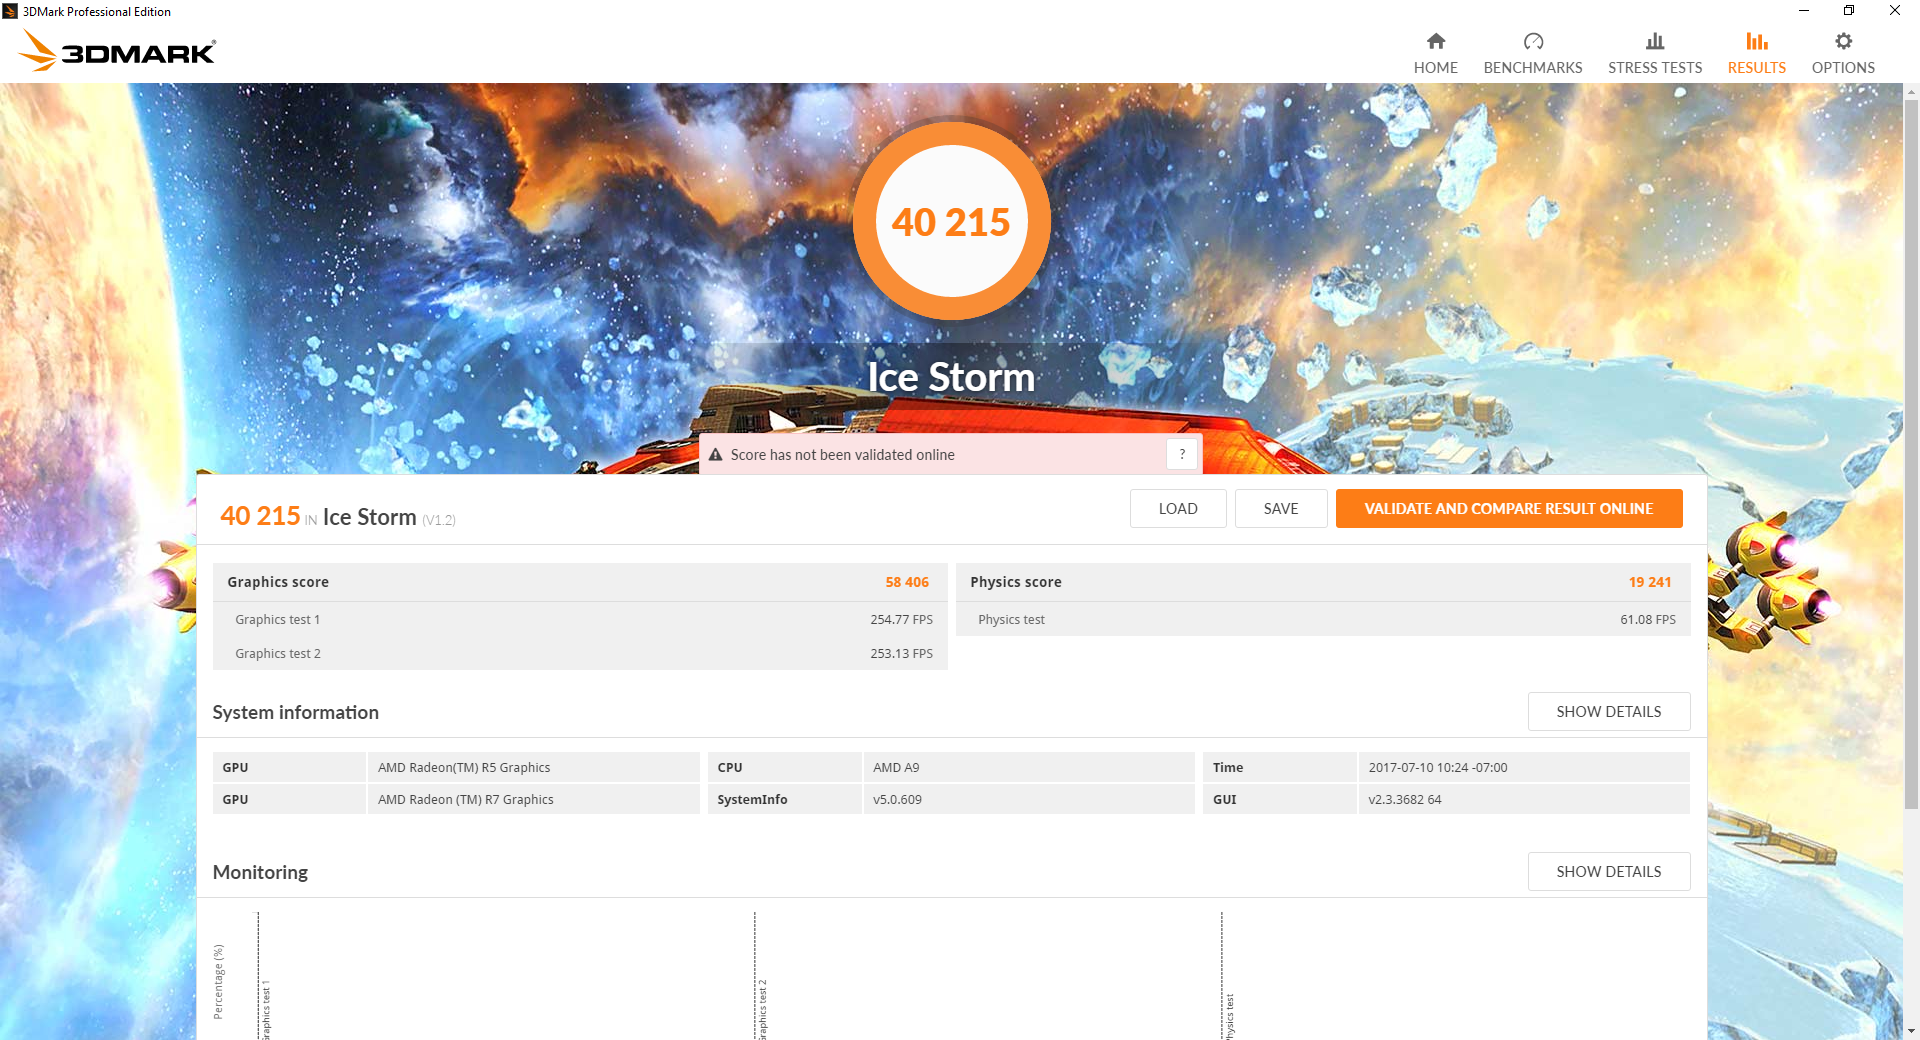
The raw graphics power of the discrete Radeon 530 is in line with the GeForce 940MX and Iris Graphics 640 in the latest Surface Pro 2017 according to 3DMark 11. 3DMark Cloud Gate and Fire Strike, however, are more physics-heavy benchmarks that rank the Radeon 530 much lower alongside the GeForce 920M and HD Graphics 620. The discrepancy can be attributed to the very poor CPU performance from the A9-9420 as the GPU can only be as fast as its weakest link. Note that the Pavilion 17z with the A12-9720P processor and slower Radeon R7 M340 GPU can outperform our A9-9420 configuration by about 50 to 60 percent due to a combination of Dual Graphics and faster multi-core performance.
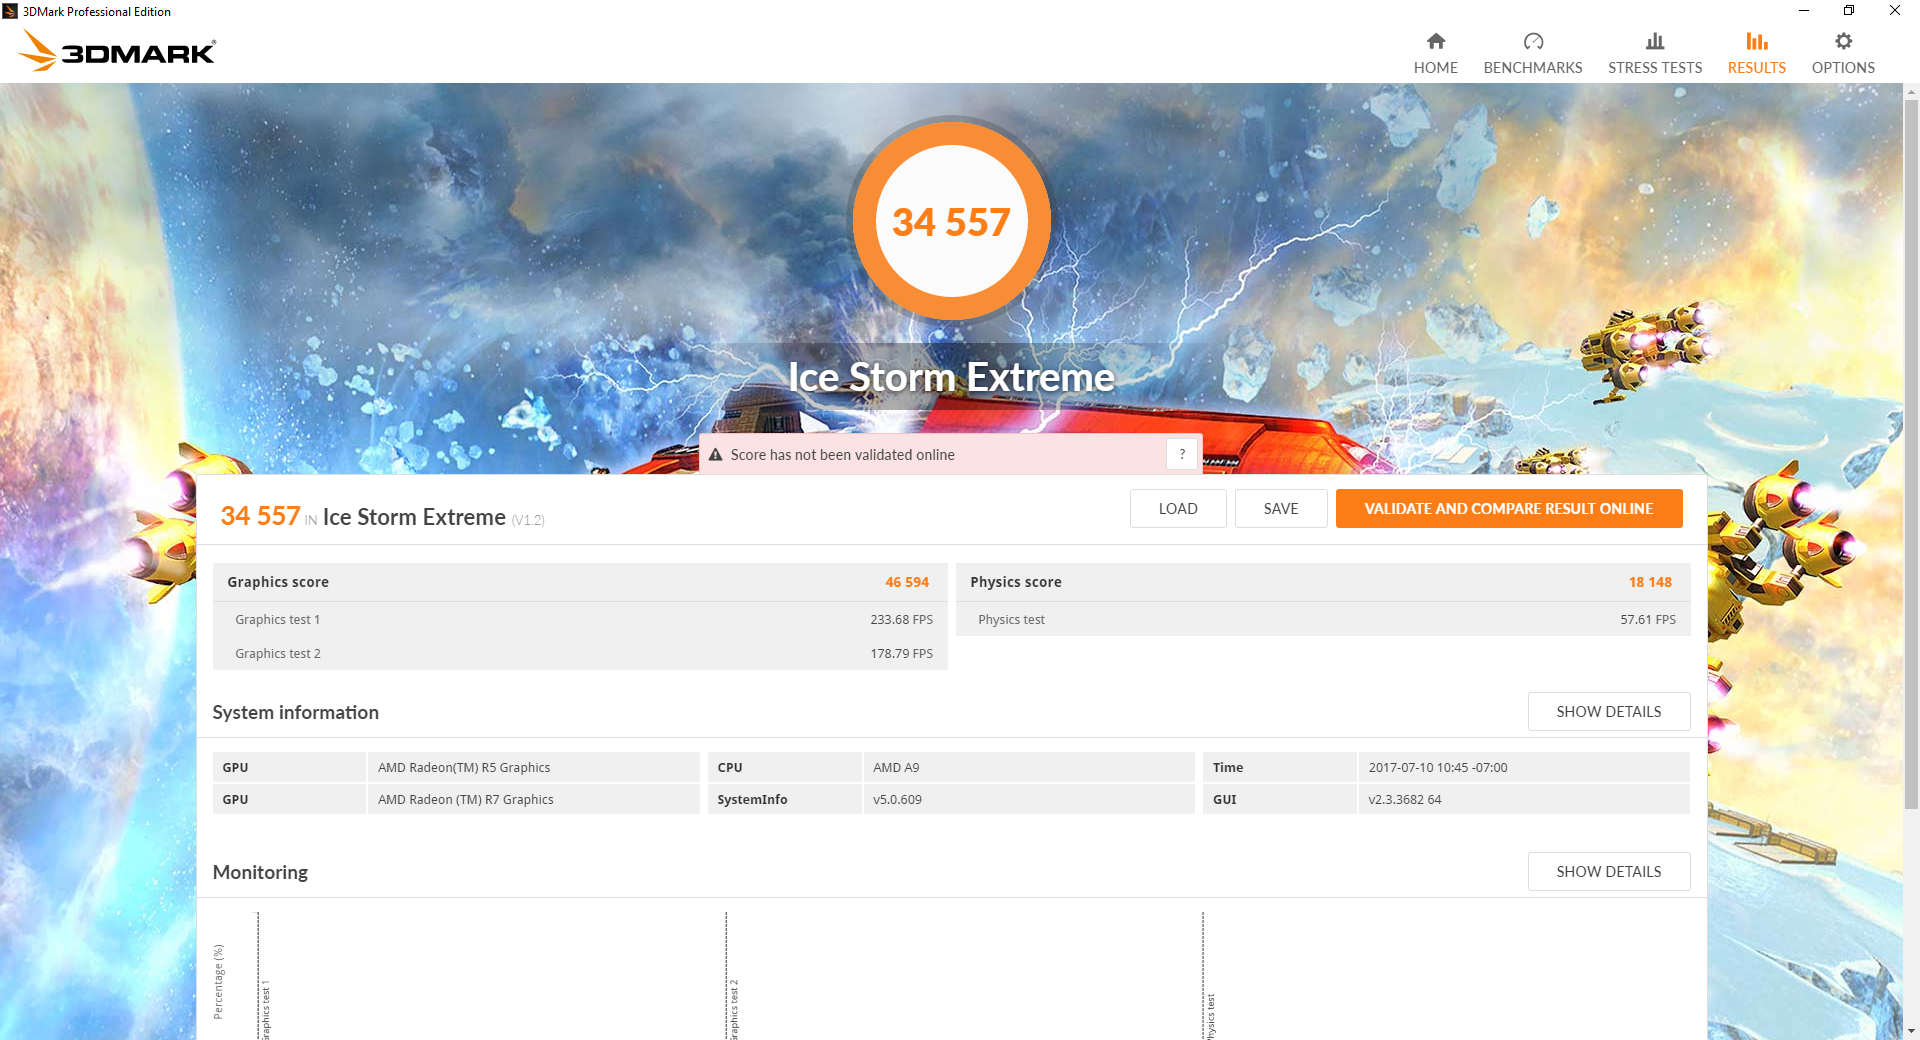
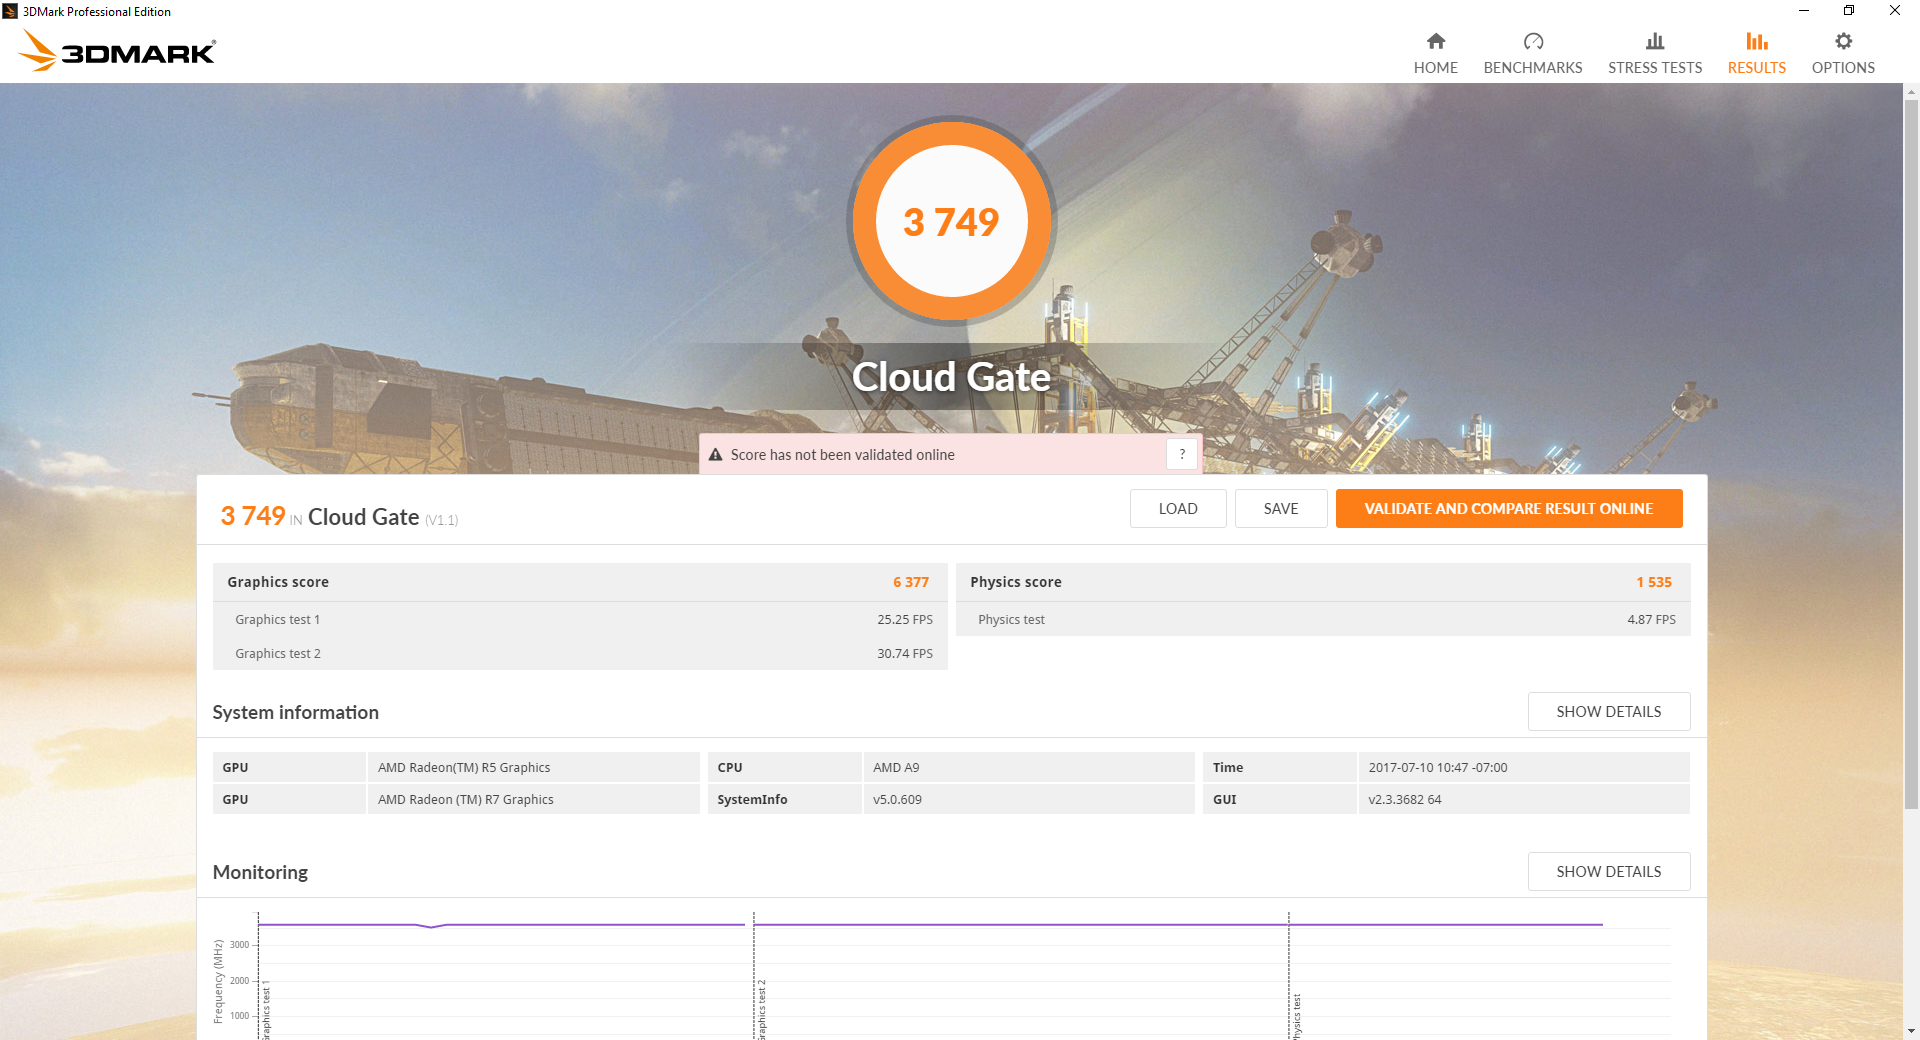
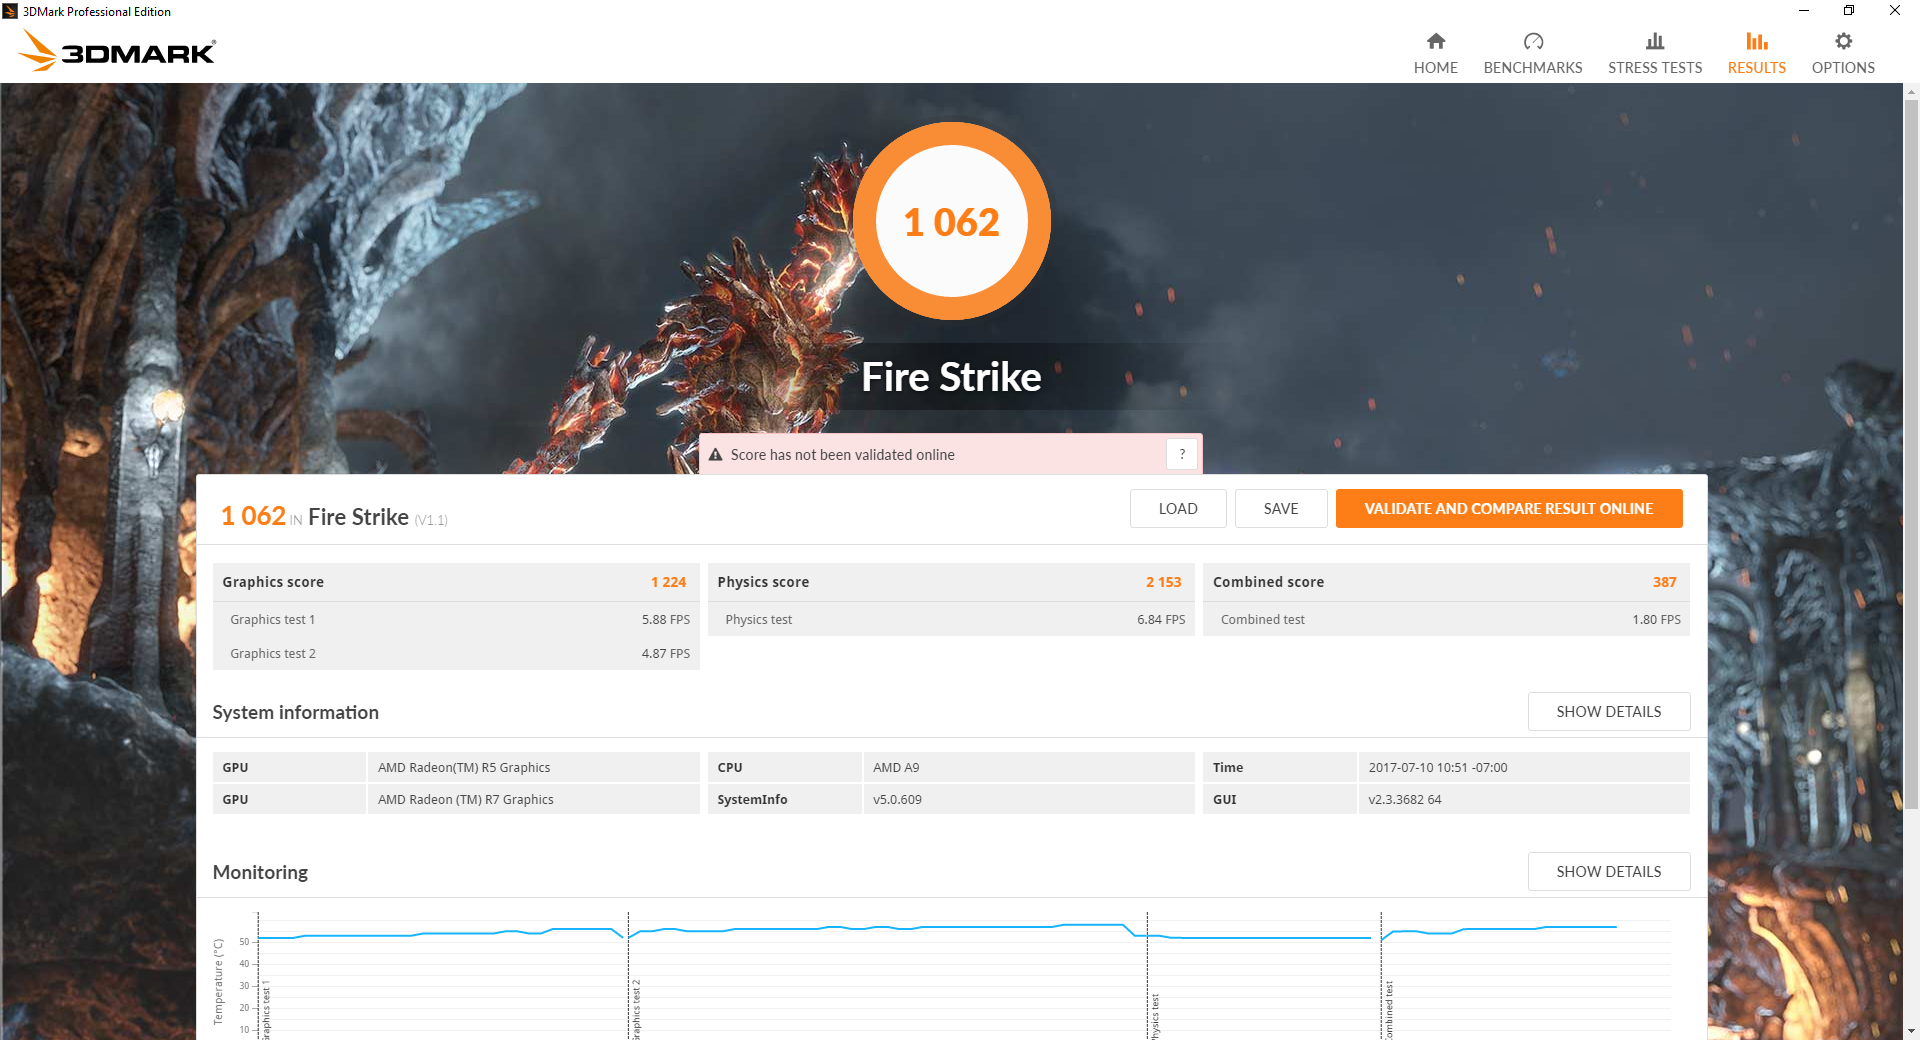
| 3DMark 11 Performance | 2121 points | |
| 3DMark Ice Storm Standard Score | 40215 points | |
| 3DMark Cloud Gate Standard Score | 3749 points | |
| 3DMark Fire Strike Score | 1062 points | |
Help | ||
Gaming Performance
Real-world performance on certain titles is in line with the Radeon R7 M340 and Iris Graphics 540 as found on the MacBook Pro 13 2016 despite what the synthetic 3DMark benchmarks show above. Other titles like Doom and Overwatch, however, show the Radeon 530 to be behind by as much as 80 percent against the MacBook even when on the lowest settings possible. Actual performance is a mixed bag and appears to be highly dependent on the title in question.
See our dedicated page on the Radeon 530 for more technical information and benchmark comparisons.
| Doom - 1280x720 Low Preset | |
| Apple MacBook Pro 13 2016 | |
| HP Pavilion 17z 1EX13AV | |
| HP Pavilion 17z 1EX13AV | |
| Overwatch - 1280x720 Low (Render Scale 100 %) AA:FX AF:1x | |
| Acer Aspire E5-575G-549D | |
| Apple MacBook Pro 13 2016 | |
| Samsung Notebook 9 NP900X5N-X01US | |
| Microsoft Surface Pro (2017) i7 | |
| HP Pavilion 17z 1EX13AV | |
| HP Pavilion 17z 1EX13AV | |
| low | med. | high | ultra | |
|---|---|---|---|---|
| StarCraft II: Heart of the Swarm (2013) | 71.5 | 43.4 | 35.2 | 21.9 |
| BioShock Infinite (2013) | 61.7 | 41.7 | 33.8 | 11.9 |
| The Witcher 3 (2015) | 24 | |||
| Batman: Arkham Knight (2015) | 13 | |||
| Rise of the Tomb Raider (2016) | 26.1 | 14.7 | ||
| Doom (2016) | 16.8 | |||
| Overwatch (2016) | 35.8 | 30.4 |
Stress Test
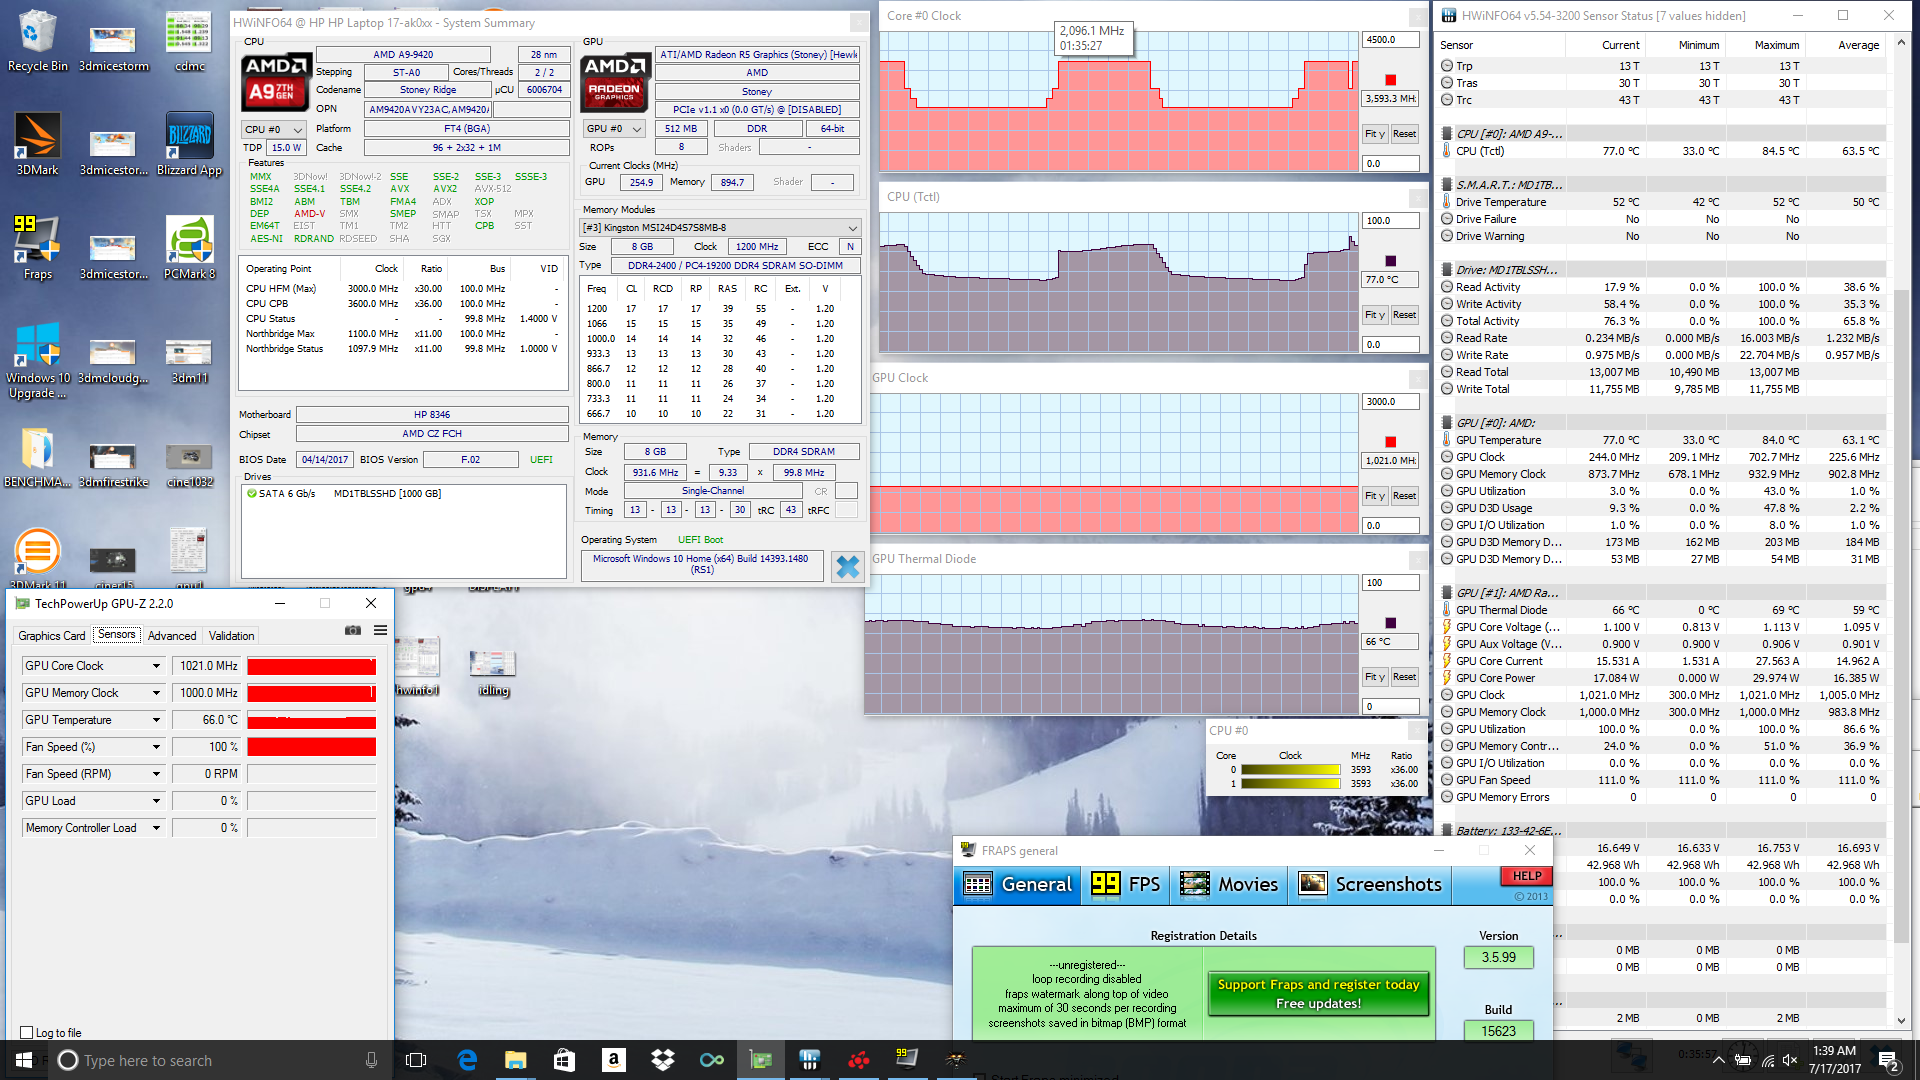
The A9-9420 APU never falls below its base 2.9 to 3.0 GHz clock rate when under extreme Prime95 stress. While great, we're still disappointed to see no sustainable Burst clock rates at all especially when considering that core temperature flattens at a relatively cool 51 C. Running both Prime95 and FurMark simultaneously will bump APU and GPU temperatures close to the 70 C mark each with steady clock rates and no hints of throttling. This temperature range is typical of Intel ULV U-class processors under stress as well, so it's a relief to see the AMD APU run similarly.
CPU behavior changes when under Witcher 3 stress. The CPU can cycle anywhere between 2.1 GHz and 3.6 GHz with fluctuating temperature ranging from 53 C up to 83 C, which is strangely significantly warmer than if running Prime95 alone. Fortunately, both GPU clock rate and fan noise remain constant while the unsteady CPU performance appears to have no effect on frame rates over time.
Running on batteries will not throttle CPU or GPU power. A 3DMark 11 run on batteries returns Physics and Graphics scores of 1723 and 2338 points, respectively, compared to 1776 and 2327 points when on mains.
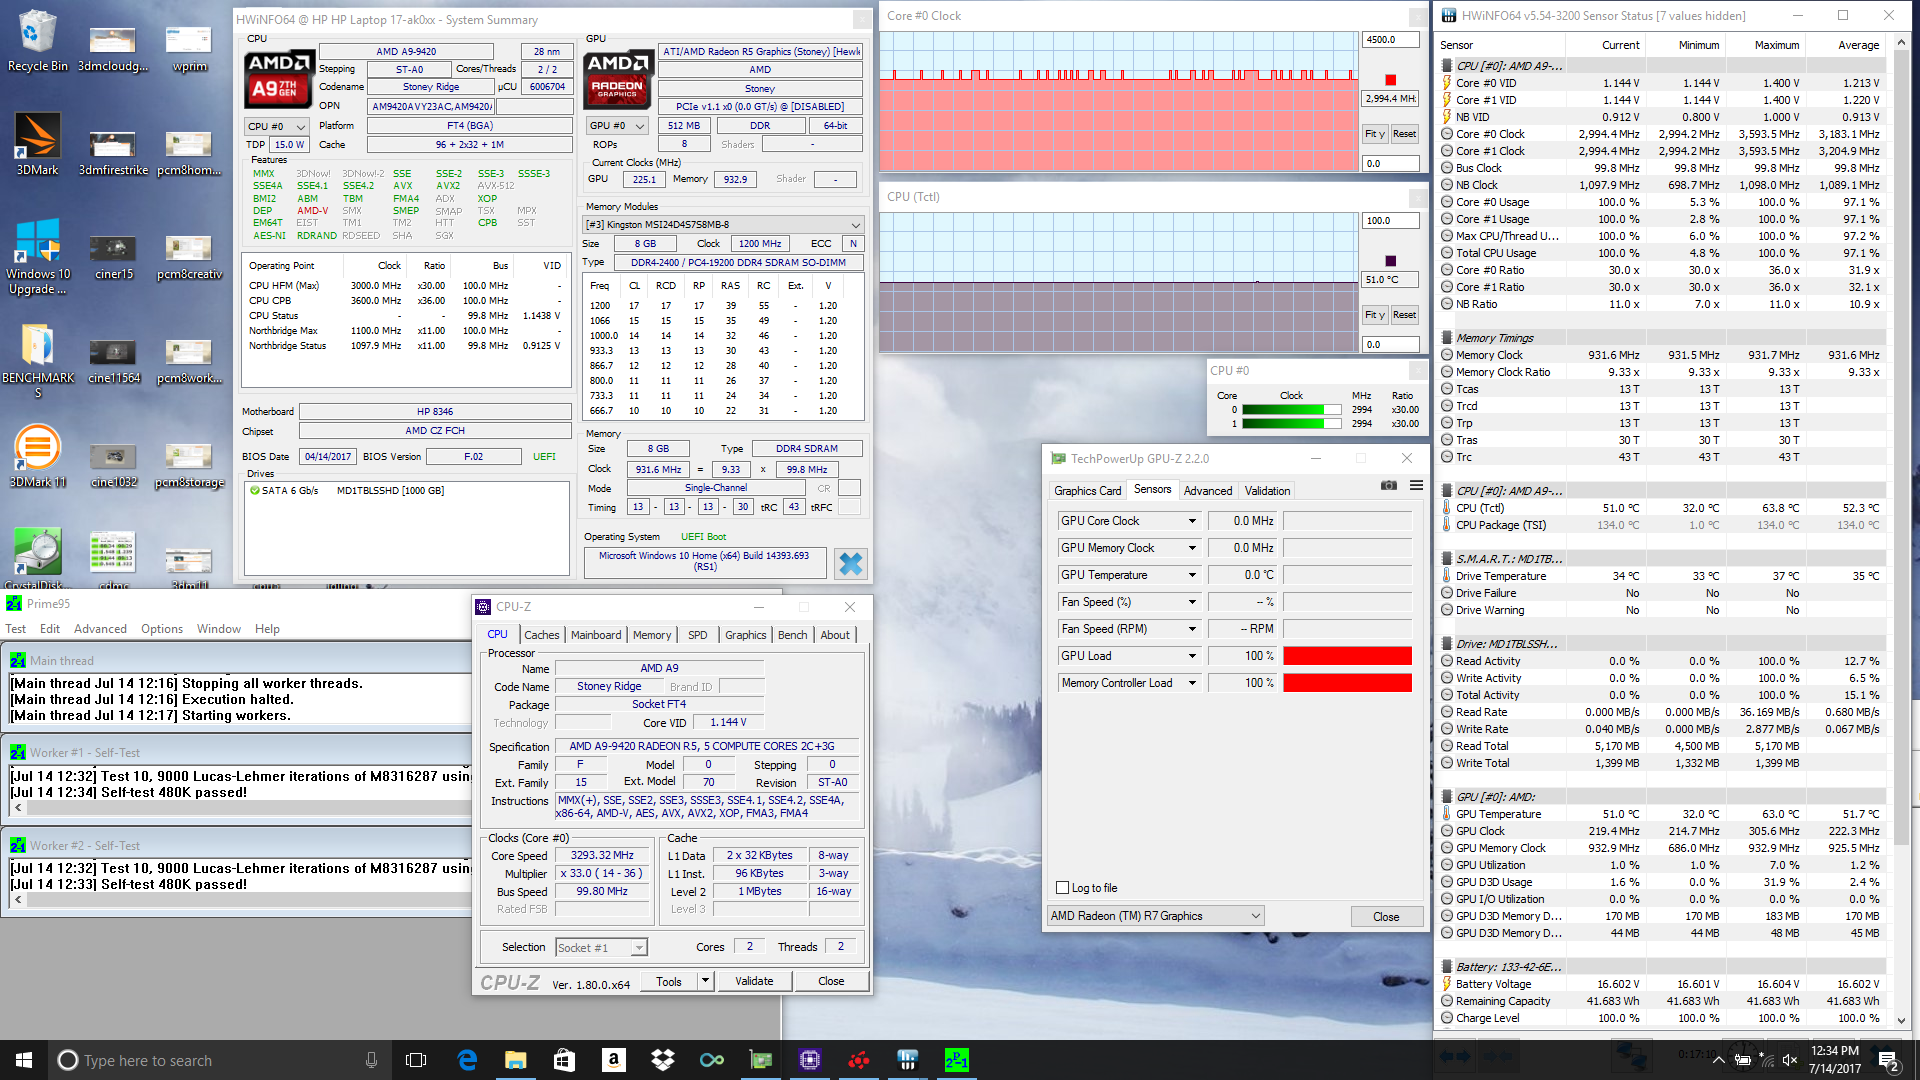
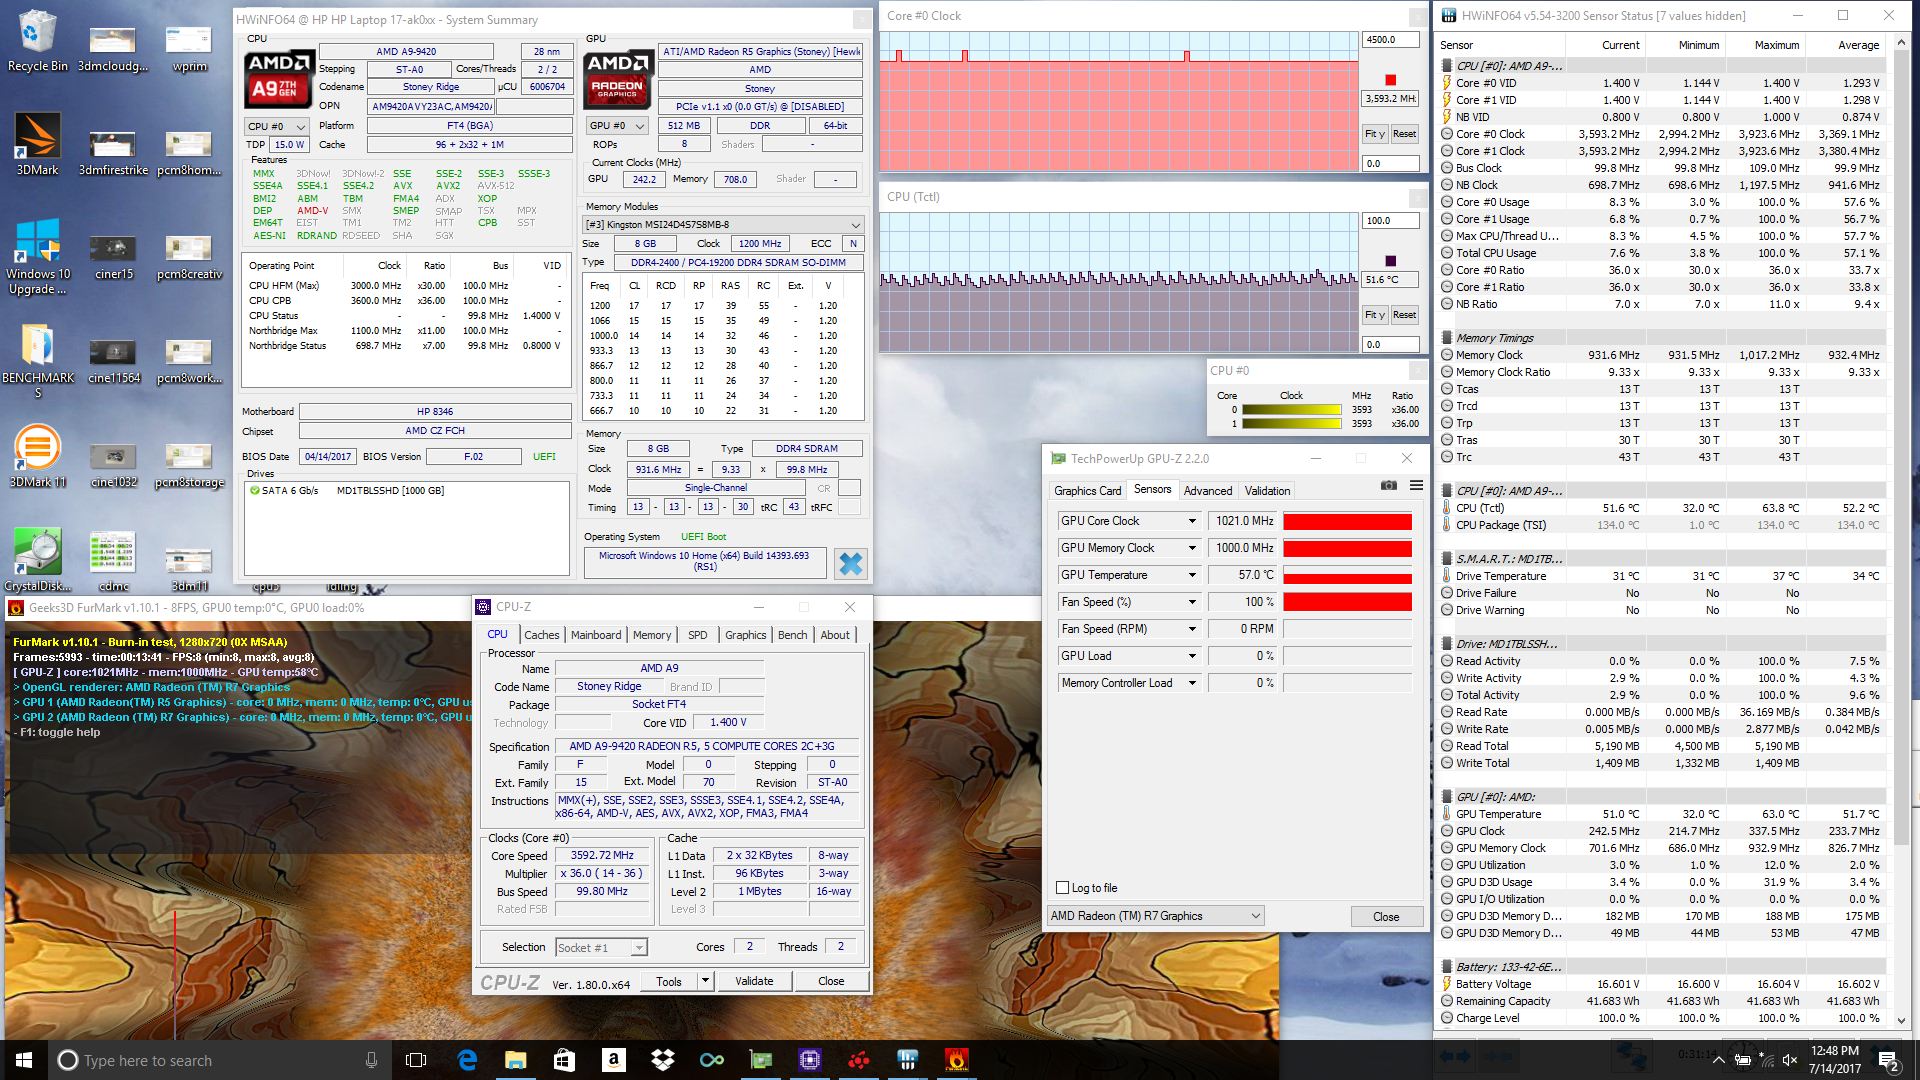
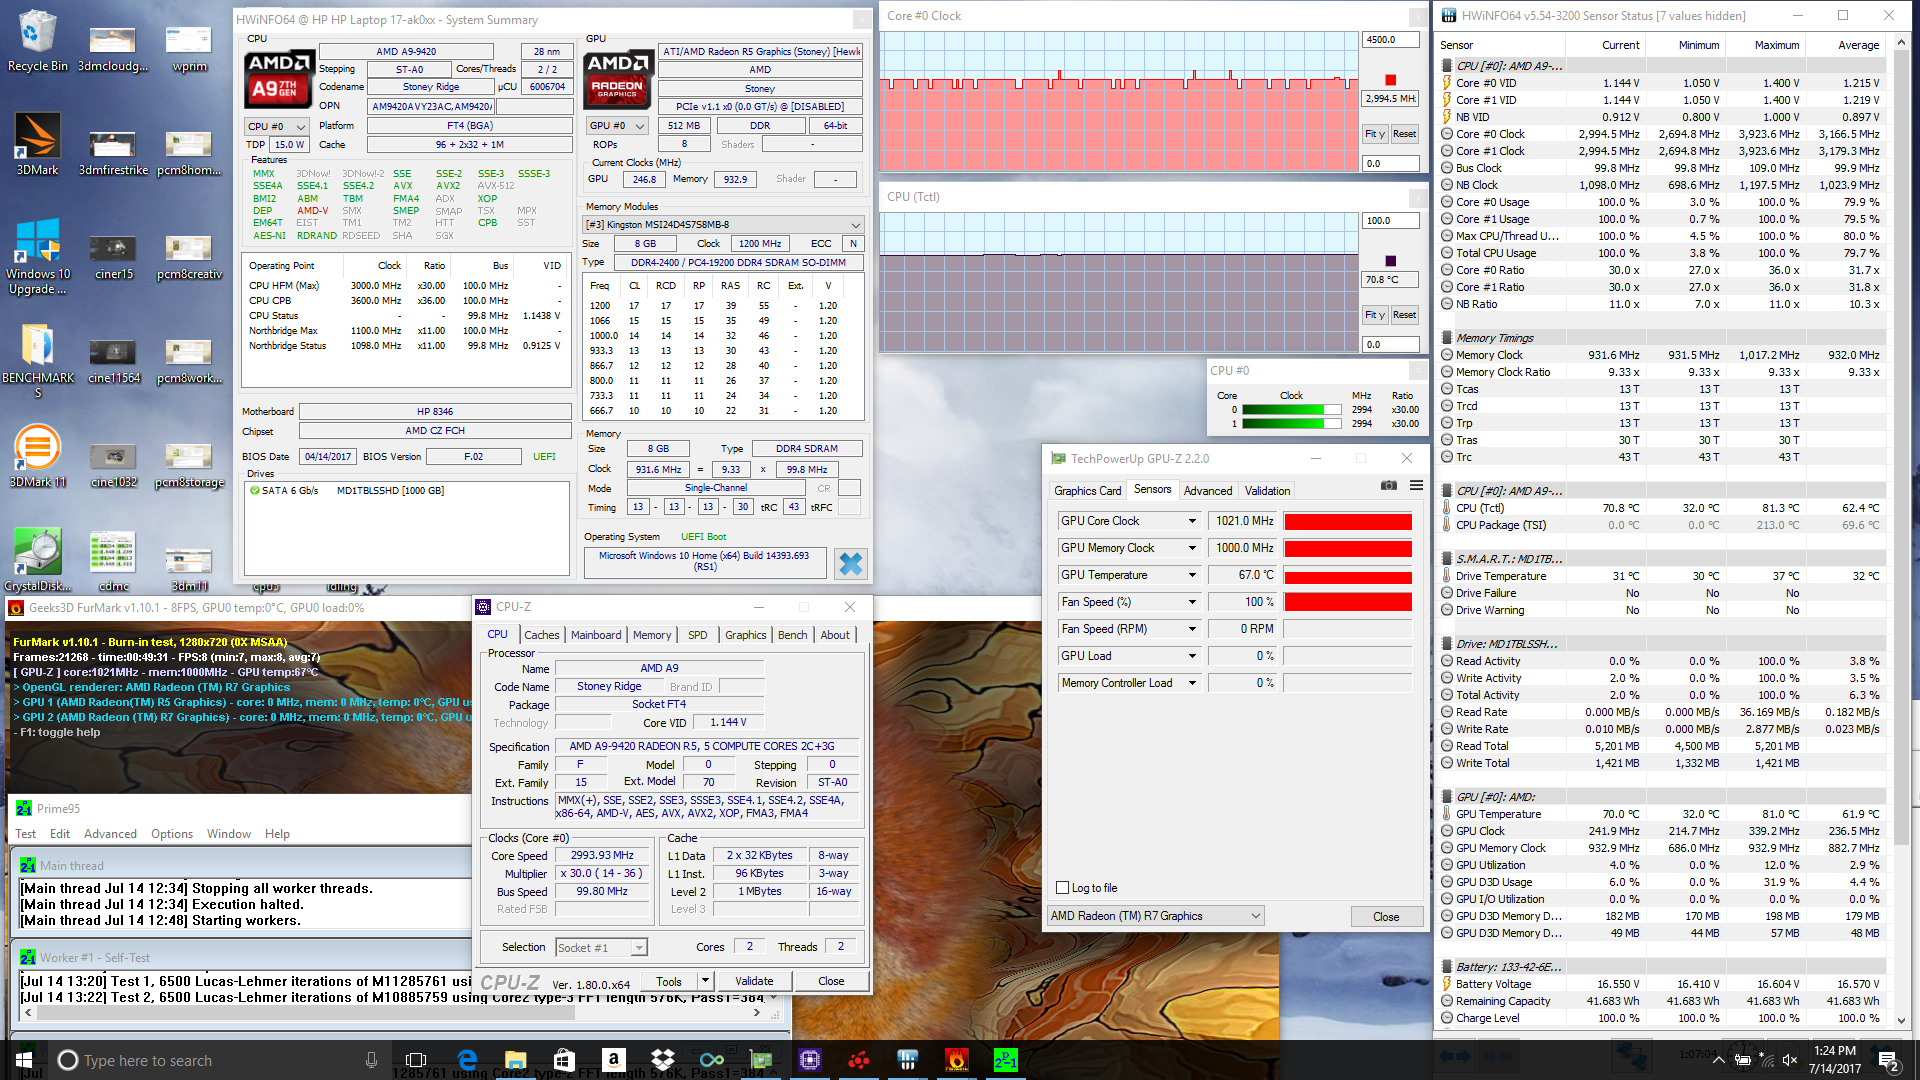
| CPU Clock (GHz) | GPU Clock (MHz) | Average CPU Temperature (°C) | Average GPU Temperature (°C) | |
| Prime95 Stress | 3.0 - 3.1 | -- | 51 | -- |
| FurMark Stress | -- | 1021 | -- | 57 |
| Prime95 + FurMark Stress | 2.9 - 3.0 | 1021 | 71 | 67 |
| Witcher 3 Stress | 2.1 - 3.6 | 1021 | 53 - 83 | 65 - 69 |
Emissions
System Noise
Fan noise is essentially identical to our previous Pavilion 17z with the A12-9720P. Users can expect the fans to always be active at a relatively quiet 30.5 dB(A) when browsing or streaming content. Medium loads as represented by 3DMark06 will bump the fans to a steady 41.6 dB(A) while even higher loads with Prime95 and FurMark will drive the fans up to the maximum of 48 dB(A). It's also worth noting that running Witcher 3 will already cause the fans to operate at maximum. Fan noise under medium load is louder than on the Acer Aspire E5 with Iris 550 graphics despite the AMD solution being slower in both CPU and graphics performance.
We can otherwise notice no electronic noise from our test unit.
Noise level
| Idle |
| 30.5 / 30.6 / 30.6 dB(A) |
| Load |
| 41.6 / 48 dB(A) |
 | ||
30 dB silent 40 dB(A) audible 50 dB(A) loud |
||
min: | ||
| HP Pavilion 17z 1EX13AV Radeon 530, A9-9420, Avolusion MD1TBLSSHD | HP Pavilion 17z 1EX13AV Radeon R7 M340, A12-9720P, WDC Scorpio Blue WD10JPVX-60JC3T1 | Asus X555DA-BB11 Radeon R6 (Carrizo), A10-8700P, Seagate Momentus SpinPoint M8 ST1000LM024 HN-M101MBB | Toshiba Satellite Pro R50-C-16V HD Graphics 520, 6006U, TOSHIBA MQ01ABD075 | Lenovo V510-15IKB 80WQ0002GE HD Graphics 620, i5-7200U, Samsung CM871a MZNTY256HDHP | Acer Aspire E5-574-53YZ Iris Graphics 550, 6267U, Toshiba MQ02ABD100H | |
|---|---|---|---|---|---|---|
| Noise | 2% | 5% | 6% | 6% | 2% | |
| off / environment * (dB) | 28 | 28 -0% | 28.9 -3% | 30.4 -9% | 30.2 -8% | 28.8 -3% |
| Idle Minimum * (dB) | 30.5 | 30.4 -0% | 31.6 -4% | 31.8 -4% | 30.2 1% | 31 -2% |
| Idle Average * (dB) | 30.6 | 30.5 -0% | 32 -5% | 31.8 -4% | 30.2 1% | 31 -1% |
| Idle Maximum * (dB) | 30.6 | 30.5 -0% | 32.4 -6% | 31.8 -4% | 32 -5% | 31 -1% |
| Load Average * (dB) | 41.6 | 41.5 -0% | 33.3 20% | 31.9 23% | 34.7 17% | 39.1 6% |
| Witcher 3 ultra * (dB) | 48 | 41.8 13% | ||||
| Load Maximum * (dB) | 48 | 48.2 -0% | 35.5 26% | 31.8 34% | 33.9 29% | 41 15% |
* ... smaller is better
Temperature
Surface temperatures are flat on both sides when idling except for the warmer right palm rest due to the storage drive directly underneath. Extreme stress with Prime95 and FurMark will warm the left side of the notebook much more than the right - again because of how the processors and hollow optical drive are positioned. The main QWERTY keys can become relatively warm at the upper 30 C range, but we never find them to be uncomfortable for typing or gaming. Nonetheless, the Intel Core i3 version of this same Pavilion 17z chassis will run much cooler in the low to mid 30 C range at most.
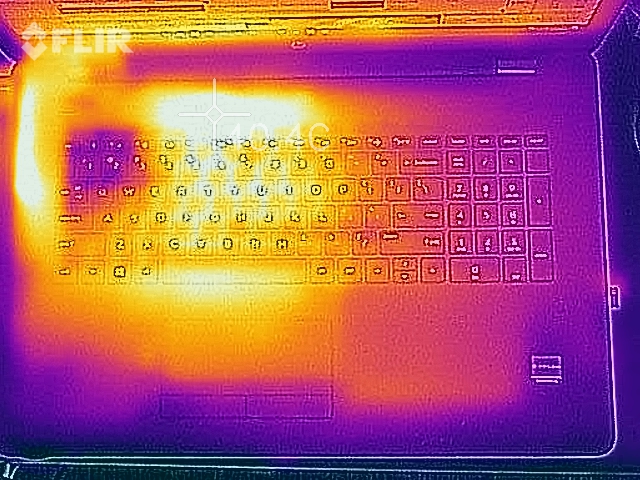
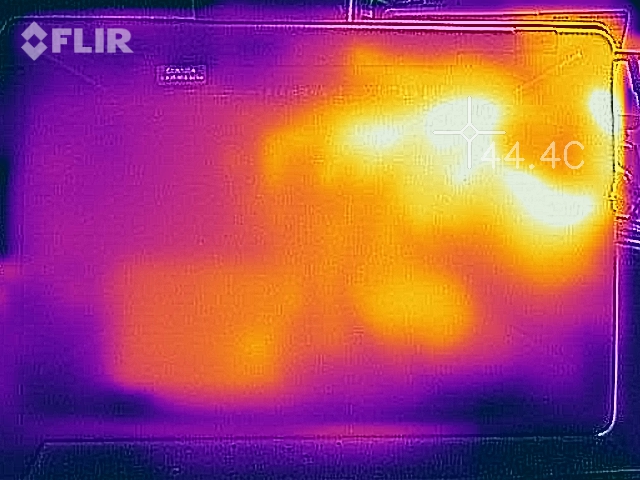
(±) The maximum temperature on the upper side is 40.4 °C / 105 F, compared to the average of 36.8 °C / 98 F, ranging from 21 to 71 °C for the class Multimedia.
(±) The bottom heats up to a maximum of 45 °C / 113 F, compared to the average of 39.1 °C / 102 F
(+) In idle usage, the average temperature for the upper side is 25.3 °C / 78 F, compared to the device average of 31.3 °C / 88 F.
(+) The palmrests and touchpad are cooler than skin temperature with a maximum of 30.8 °C / 87.4 F and are therefore cool to the touch.
(-) The average temperature of the palmrest area of similar devices was 28.7 °C / 83.7 F (-2.1 °C / -3.7 F).
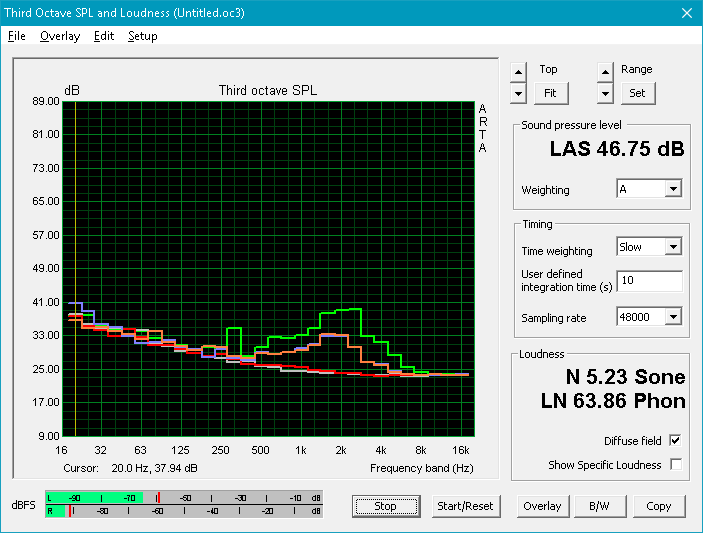
Speakers
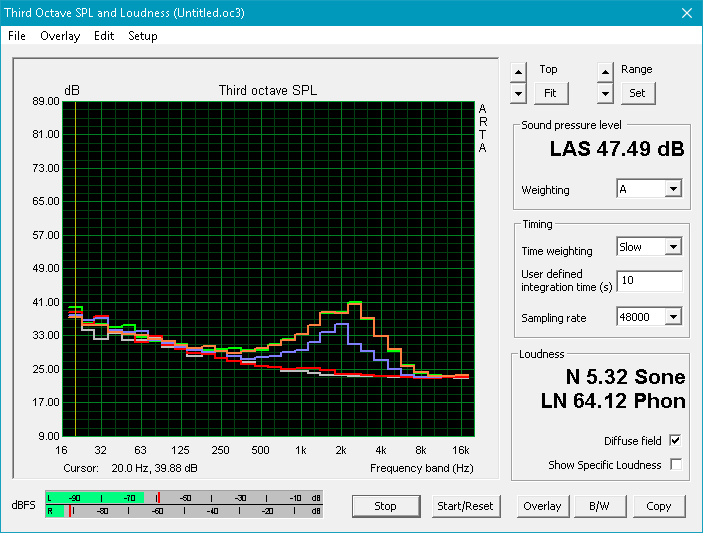
Sound quality is good considering the low price of the system. Louder volume settings do not favor higher frequencies or cause static or chassis reverberations. Maximum volume could be a little stronger and our pink measurements below show bass reproduction to be slightly worse than the pricier Spectre x360 15.


HP Pavilion 17z 1EX13AV audio analysis
(-) | not very loud speakers (61.5 dB)
Bass 100 - 315 Hz
(±) | reduced bass - on average 14.7% lower than median
(-) | bass is not linear (15.8% delta to prev. frequency)
Mids 400 - 2000 Hz
(+) | balanced mids - only 2.5% away from median
(±) | linearity of mids is average (10.6% delta to prev. frequency)
Highs 2 - 16 kHz
(+) | balanced highs - only 4.5% away from median
(-) | highs are not linear (15.2% delta to prev. frequency)
Overall 100 - 16.000 Hz
(±) | linearity of overall sound is average (24.7% difference to median)
Compared to same class
» 87% of all tested devices in this class were better, 5% similar, 8% worse
» The best had a delta of 5%, average was 17%, worst was 45%
Compared to all devices tested
» 75% of all tested devices were better, 5% similar, 19% worse
» The best had a delta of 4%, average was 23%, worst was 134%
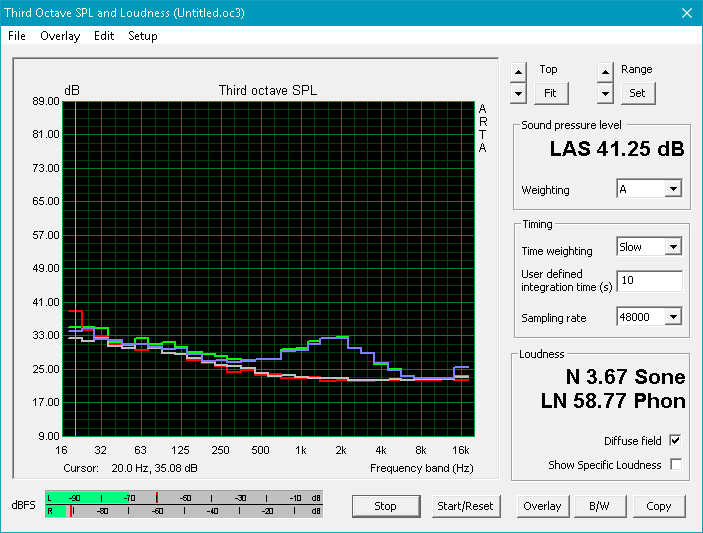
Apple MacBook 12 (Early 2016) 1.1 GHz audio analysis
(+) | speakers can play relatively loud (83.6 dB)
Bass 100 - 315 Hz
(±) | reduced bass - on average 11.3% lower than median
(±) | linearity of bass is average (14.2% delta to prev. frequency)
Mids 400 - 2000 Hz
(+) | balanced mids - only 2.4% away from median
(+) | mids are linear (5.5% delta to prev. frequency)
Highs 2 - 16 kHz
(+) | balanced highs - only 2% away from median
(+) | highs are linear (4.5% delta to prev. frequency)
Overall 100 - 16.000 Hz
(+) | overall sound is linear (10.2% difference to median)
Compared to same class
» 7% of all tested devices in this class were better, 2% similar, 90% worse
» The best had a delta of 5%, average was 18%, worst was 53%
Compared to all devices tested
» 5% of all tested devices were better, 1% similar, 94% worse
» The best had a delta of 4%, average was 23%, worst was 134%
Frequency Comparison (Checkbox selectable!)
Graph 1: Pink Noise 100% Vol.; Graph 2: Audio off
Energy Management
Power Consumption
AMD notebooks are generally less efficient than the latest Intel offerings due to the larger 28 nm fabrication process and more demanding GPU. Idling on desktop will draw anywhere from 8 W to 24 W depending on the Windows Power settings and brightness level compared to <10 W on the Intel-powered Toshiba Satellite Pro and Lenovo V510. Medium loads as represented by 3DMark06 will demand 50 W to be almost twice as much as the aforementioned Lenovo under similar loads. Of course, a lot of that extra energy is going towards powering the Radeon 530 GPU. Even so, our HP is still less efficient than the more powerful Aspire F5-771G with GTX 950M graphics.
Maximum load with both Prime95 and FurMark will draw as much as 63 W from the small AC adapter (11.0 x 4.5 x 3.0 cm) rated for up to 65 W. A higher capacity adapter would have been better suited to reduce the chances of reaching any power delivery issues. A 10 to 20 percent overhead is more common amongst most other notebooks.
| Off / Standby | |
| Idle | |
| Load |
|
Key:
min: | |
| HP Pavilion 17z 1EX13AV A9-9420, Radeon 530, Avolusion MD1TBLSSHD, IPS, 1920x1080, 17.3" | HP 17-x066ng 6006U, HD Graphics 520, WDC WD10JPVX-08JC3T5, IPS, 1920x1080, 17.3" | Asus X555DA-BB11 A10-8700P, Radeon R6 (Carrizo), Seagate Momentus SpinPoint M8 ST1000LM024 HN-M101MBB, TN LED, 1920x1080, 15.6" | Lenovo V510-15IKB 80WQ0002GE i5-7200U, HD Graphics 620, Samsung CM871a MZNTY256HDHP, IPS, 1920x1080, 15.6" | Acer Aspire F5-771G-50RD i5-7200U, GeForce GTX 950M, Toshiba MQ01ABD100, TN, 1920x1080, 17.3" | |
|---|---|---|---|---|---|
| Power Consumption | 39% | 28% | 43% | 14% | |
| Idle Minimum * (Watt) | 8.4 | 5.5 35% | 8.3 1% | 4 52% | 6.9 18% |
| Idle Average * (Watt) | 11.7 | 9.9 15% | 8.6 26% | 9.6 18% | 13.6 -16% |
| Idle Maximum * (Watt) | 24.1 | 14.6 39% | 13.1 46% | 9.7 60% | 14.8 39% |
| Load Average * (Watt) | 50.4 | 28 44% | 31.2 38% | 27.7 45% | 41 19% |
| Witcher 3 ultra * (Watt) | 58 | 33 43% | |||
| Load Maximum * (Watt) | 62.8 | 24.6 61% | 43.9 30% | 38.4 39% | 75 -19% |
* ... smaller is better
Battery Life
Runtimes from the small 31 Wh battery are mediocre at just 4.5 hours during real-world WLAN use compared to about 6 hours on the Toshiba Satellite Pro with the ULV Core i3-6006U. The removable battery makes it easier to swap and replace as needed.
Charging from near empty to full capacity will take just 1.5 hours with the included AC adapter.
| HP Pavilion 17z 1EX13AV A9-9420, Radeon 530, 41.6 Wh | HP Pavilion Power 15t-cb2000 i7-7700HQ, Radeon RX 550 (Laptop), 70 Wh | Asus X555DA-BB11 A10-8700P, Radeon R6 (Carrizo), 37 Wh | Toshiba Satellite Pro R50-C-16V 6006U, HD Graphics 520, 44 Wh | Lenovo V510-15IKB 80WQ0002GE i5-7200U, HD Graphics 620, 32 Wh | HP Omen 15-ax213ng i7-7700HQ, GeForce GTX 1050 Ti Mobile, 63.3 Wh | |
|---|---|---|---|---|---|---|
| Battery runtime | 29% | -21% | 28% | -17% | 42% | |
| Reader / Idle (h) | 7.8 | 10.5 35% | 7.3 -6% | 12.8 64% | ||
| WiFi v1.3 (h) | 4.6 | 5.7 24% | 2.9 -37% | 5.9 28% | 3.8 -17% | 7.1 54% |
| Load (h) | 1.5 | 1.9 27% | 1.2 -20% | 1.6 7% |
Pros
Cons
Verdict

The AMD-powered Pavilion notebooks have all been a test of patience. Not only is performance slow, but applications take far too long to launch each and every time. No one wants to wait 6+ seconds to launch a Word document only to wait another 6+ seconds to open File Explorer and even longer for Microsoft Edge and iTunes. This aspect alone is enough for us to not recommend any AMD Pavilion equipped with standard HDDs regardless of chassis quality or display characteristics.
With that out of the way, the Stoney Ridge A9 APU and Radeon 530 GPU are an imbalanced pair. Like our previous A12-9720P Pavilion 17z SKU, the graphics capabilities of our A9 configuration are held back by the slow processing power of the SoC. Frames rates can be as high as 80 percent over the HD Graphics 620 or as low as 20 percent depending on the game at the severe costs of higher power consumption, shorter battery life, and significantly louder fan noise under load. A GPU that can be as power hungry as the GeForce GTX 950M but with the performance level of an older Intel Iris or HD Graphics series is a headscratcher on its own.
The Pavilion 17z chassis is the standard budget fare with a couple of surprises. The internal speakers are decent and the display backlight is bright for its class with a wider-than-expected color gamut. Other than these few upsides, we're hoping that future hardware revisions will address the grainy matte panel, moderate backlight bleeding, and difficult servicing especially for those who want to invest in SSDs down the line.
The AMD-powered Pavilion can't seem to decide if it wants to be a cheap low-end gaming notebook or a very affordable office workhorse. In either case, it falls flat on both fronts.
HP Pavilion 17z 1EX13AV
- 07/18/2017 v6 (old)
Allen Ngo
Price comparison
