HP 15-bw075ax (A12-9720P, Radeon R7) Laptop Review
We recently reviewed the HP 15-bw077ax, a budget-level notebook powered by AMD's latest Bristol Ridge line of APUs. The 15-bw077ax has a slow dual-core A9-9420 which resulted in sluggish and frustrating performance. Today, we will look at the the HP 15-bw075ax, a more powerful variant in the updated HP 15 line . The bigger brother sports the latest high-tier APU from AMD, the A12-9720P. Following AMD's nomenclature, the APU packs in 12 compute cores: four on the CPU and eight GPU cores on the embedded Radeon R7 GPU. So what advantages will the quad-core CPU and improved graphics chipset bring compared to the lower cost 15-bw077ax? Let's dive in and see.
The HP 15-bw075ax, which we will refer to as the HP 15 (A12) henceforth, is beginning to roll onto the store shelves for multiple big box retailers. Pricing data is difficult to find for our specific model as stores seem to price the device independently of each other. We could not find a reliable source for the MSRP but have seen the device priced anywhere from $399 to about $530, depending on the retailer. Our specific configuration has, in addition to the A12 APU, 4 GB of DDR4 RAM and a 1 TB 5400 RPM HDD. Most retail models bump the RAM up to 8 GB.
Other than the change in APU and a different finish on the plastic case, the HP 15 (A12) is essentially the same device as the HP 15 (A9). As such, we will focus on the changes in performance and will not discuss the input devices, maintenance, or exterior chassis. For information on these aspects of the notebook, please check our review of the HP 15 (A9).
Case
The only difference in the chassis is the black color and textured finish. Compared to the HP 15 (A9), which had a smooth silver plastic shell, the case of the HP 15 (A12) feels cheap and looks cheaper. The cross-hatch pattern on the chassis is not pleasing, and the device feels chintzy overall. The case is still rigid, much like its little brother, but this is not a handsome device.
SD Card Reader
The performance of the SD card reader is very similar to the HP 15 (A9), which is disappointing. Using our Toshiba Exceria Pro SDXC 64 GB UHS-II reference card, we measure transfer speeds around 30 MB/s, which is very slow, even for a budget device.
| SD Card Reader | |
| average JPG Copy Test (av. of 3 runs) | |
| Lenovo Yoga 510-14AST | |
| HP Pavilion 15-aw004ng W8Y60EA | |
| Lenovo B50-10 80QR0013GE | |
| HP 15-bw075ax | |
| HP 15-bw077ax | |
| Asus X555DA-BB11 | |
| maximum AS SSD Seq Read Test (1GB) | |
| Lenovo B50-10 80QR0013GE | |
| Lenovo Yoga 510-14AST | |
| HP Pavilion 15-aw004ng W8Y60EA | |
| HP 15-bw077ax | |
| HP 15-bw075ax | |
| Asus X555DA-BB11 | |
Communication
Wireless speeds, on the other hand, are a noticeable improvement over the lower-tiered HP 15. Transmit and receive speeds sit around 447 MBit/s and 482 MBit/s, respectively. Connections are just as rock solid as with the A9 variant; during our testing period, we have yet to experience a dropped connection.
| Networking | |
| iperf3 transmit AX12 | |
| HP 15-bw075ax | |
| HP 15-bw077ax | |
| Lenovo Yoga 510-14AST | |
| Asus X555DA-BB11 | |
| iperf3 receive AX12 | |
| HP 15-bw075ax | |
| HP 15-bw077ax | |
| Asus X555DA-BB11 | |
| Lenovo Yoga 510-14AST | |
Display
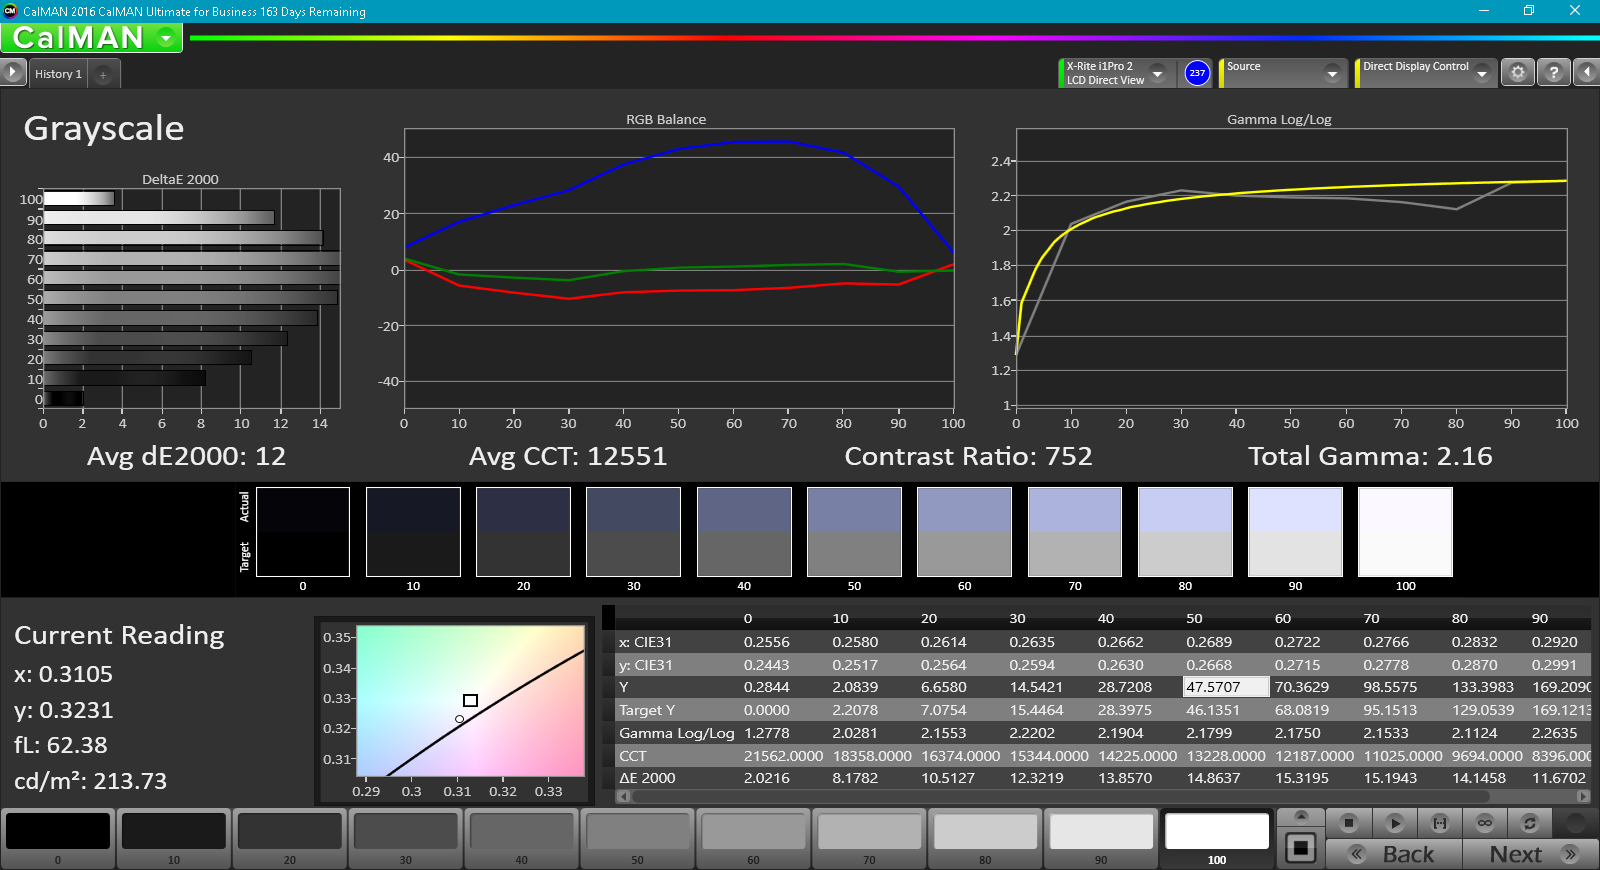
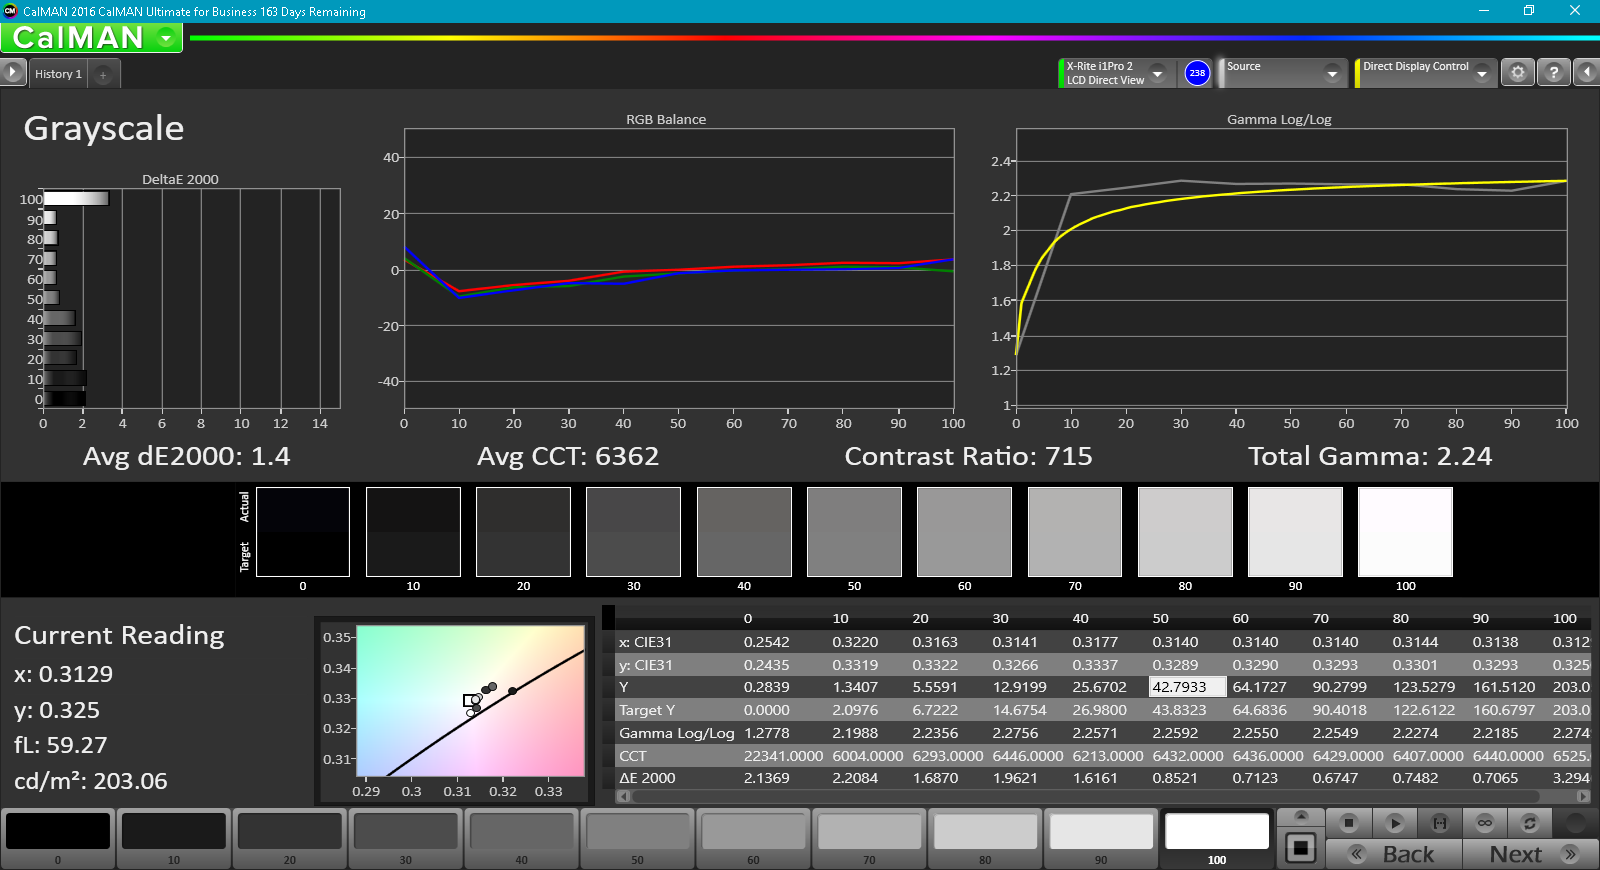
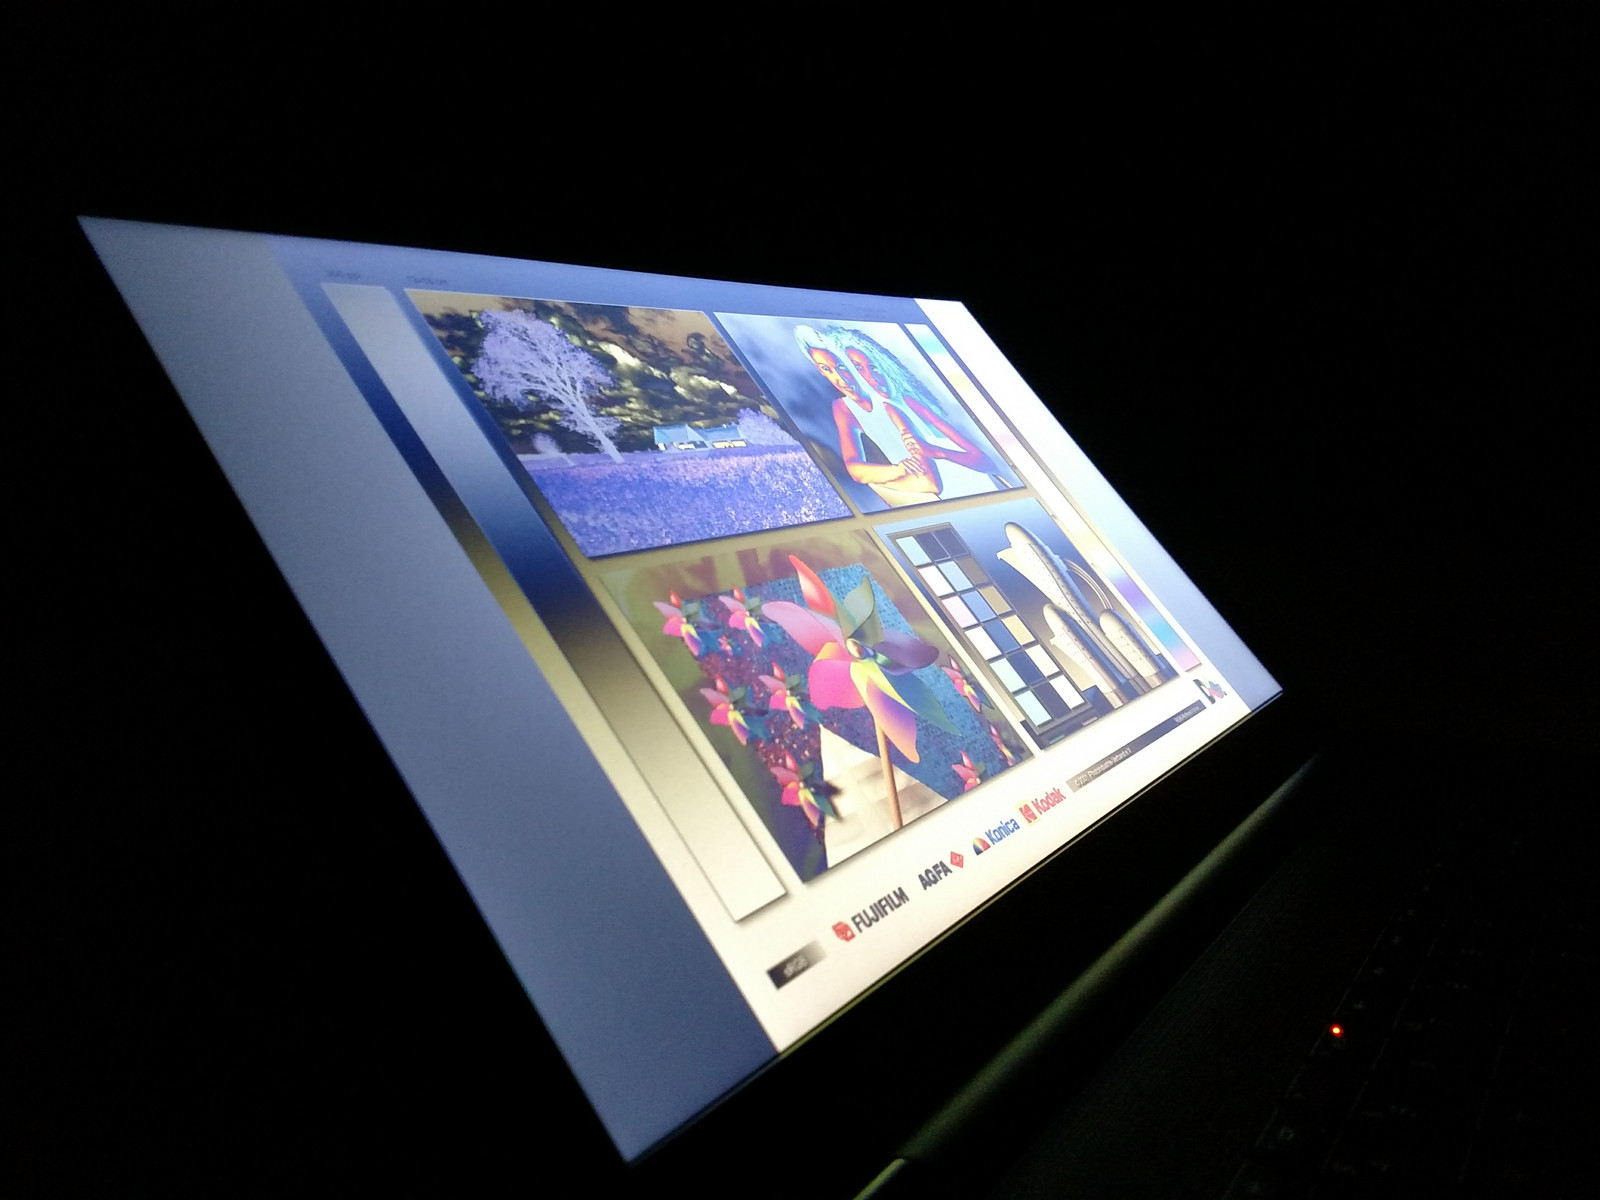
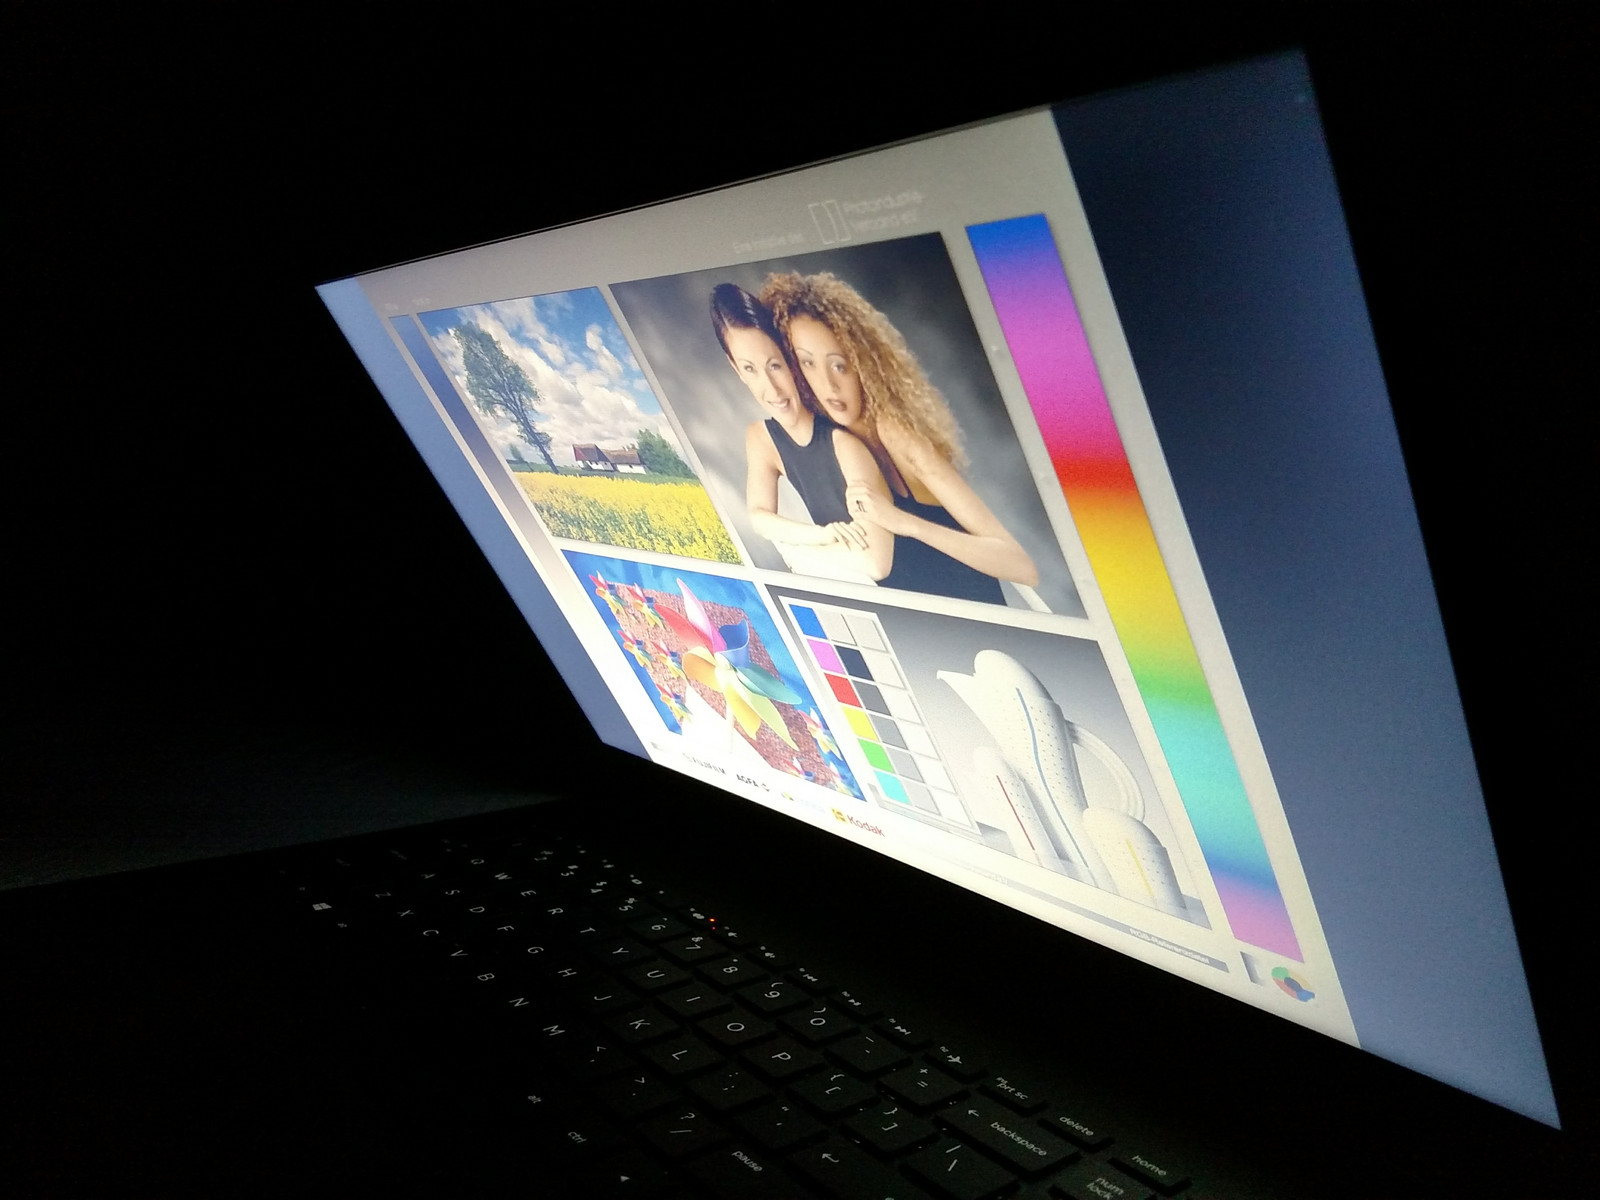
The display is very similar to the HP 15 (A9). It experiences the same problems with color accuracy, color reproduction, and PWM frequency. On the plus side, the panel has a relatively good contrast ratio of 752:1, which is significantly better than other budget options. The screen also has decent response times that are, again, very similar to the display on the HP 15 (A9). These similarities are not a surprise, as both models use the same 15.6-inch BOE06A4 TN LED panel with a resolution of 1366x768.
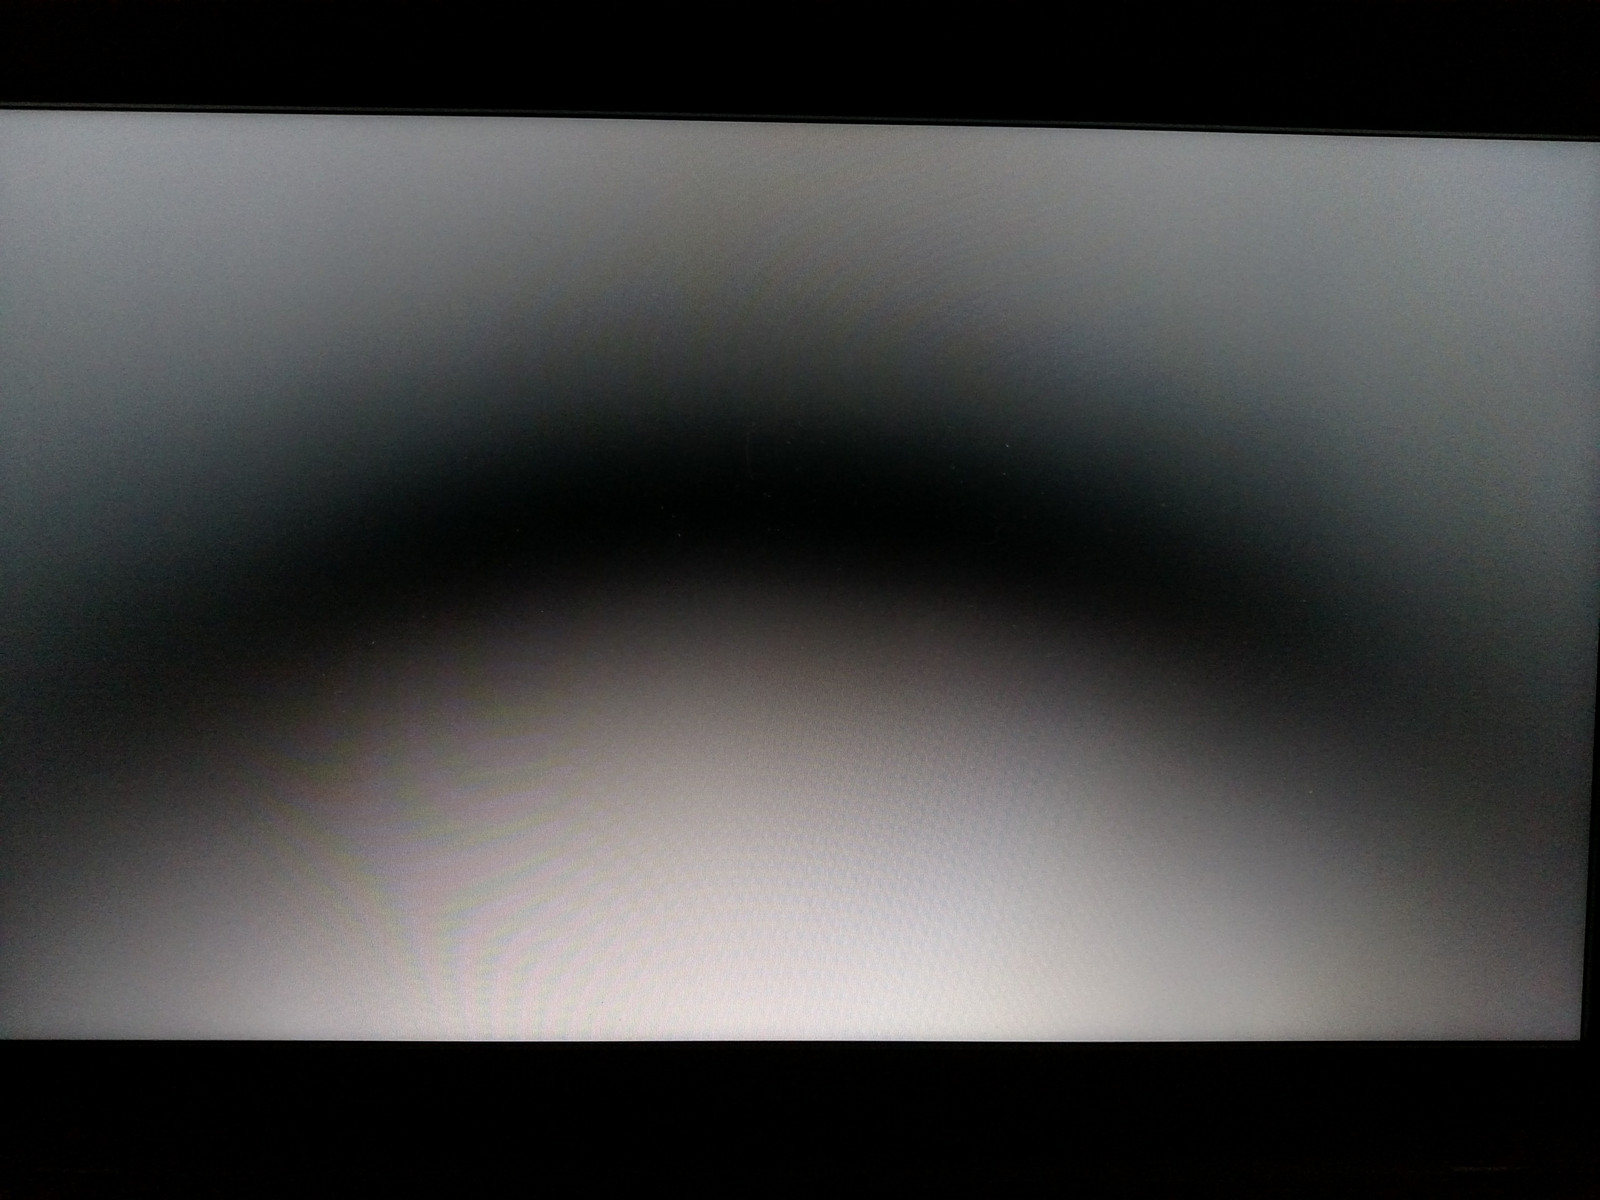
The dim screen does not get very bright, making it very difficult to use in well-lit areas and impossible to see outdoors. The glossy finish on the display adds to this problem, making reflections highly visible even at maximum brightness. PWM frequencies are also very low at 198.4 and are noticeable at all brightness levels up to 99%, so PWM-sensitive users will want to avoid this notebook.

| |||||||||||||||||||||||||
Brightness Distribution: 81 %
Center on Battery: 212.9 cd/m²
Contrast: 760:1 (Black: 0.28 cd/m²)
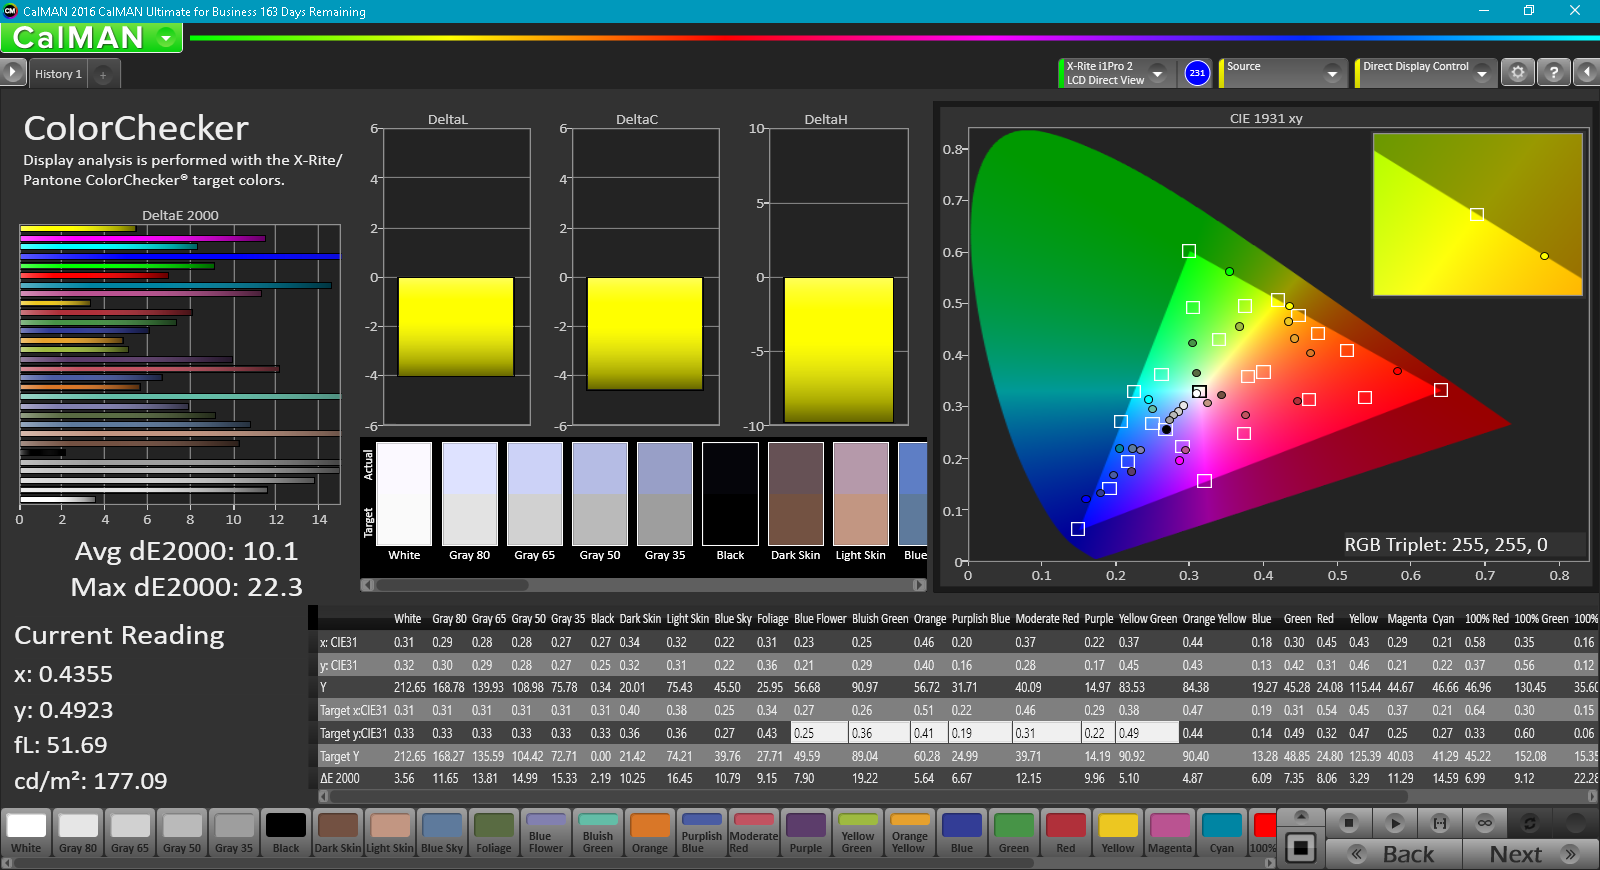
ΔE ColorChecker Calman: 10.1 | ∀{0.5-29.43 Ø4.73}
ΔE Greyscale Calman: 12 | ∀{0.09-98 Ø4.97}
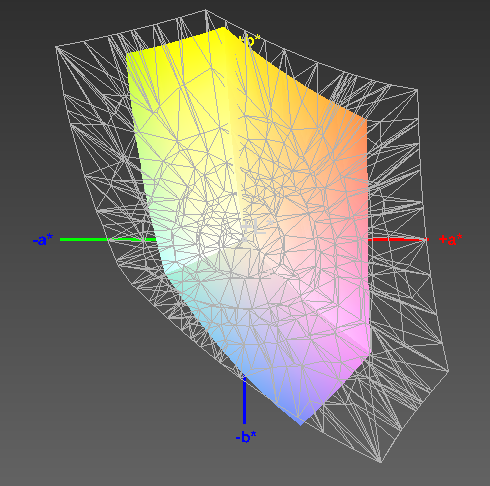
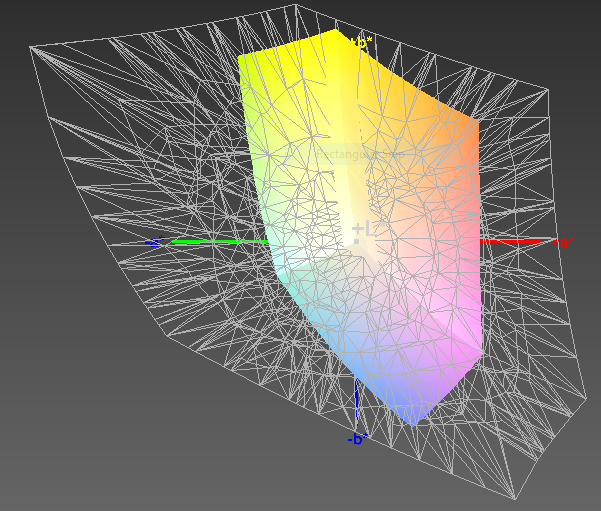
58% sRGB (Argyll 1.6.3 3D)
37% AdobeRGB 1998 (Argyll 1.6.3 3D)
39.34% AdobeRGB 1998 (Argyll 3D)
57.3% sRGB (Argyll 3D)
38.07% Display P3 (Argyll 3D)
Gamma: 2.16
CCT: 12551 K
| HP 15-bw075ax BOE06A4, TN LED, 15.6", 1366x768 | HP 15-bw077ax BOE BOE06A4, TN LED, 15.6", 1366x768 | Asus X555DA-BB11 TN LED, 15.6", 1920x1080 | Lenovo B50-10 80QR0013GE Chi Mei N156BGE-EA2, TN LED, 15.6", 1366x768 | Lenovo Yoga 510-14AST AU Optronics B140XTN02.E, TN LED, 14", 1366x768 | HP Pavilion 15-aw004ng W8Y60EA Chi Mei, TN LED, 15.6", 1920x1080 | |
|---|---|---|---|---|---|---|
| Display | -8% | 6% | -10% | 6% | ||
| Display P3 Coverage (%) | 38.07 | 35.12 -8% | 40.21 6% | 34.15 -10% | 40.35 6% | |
| sRGB Coverage (%) | 57.3 | 52.7 -8% | 60.1 5% | 51.4 -10% | 60.3 5% | |
| AdobeRGB 1998 Coverage (%) | 39.34 | 36.29 -8% | 41.56 6% | 35.28 -10% | 41.71 6% | |
| Response Times | 9% | 9% | 30% | -37% | 9% | |
| Response Time Grey 50% / Grey 80% * (ms) | 42 ? | 42.4 ? -1% | 42 ? -0% | 28 ? 33% | 70 ? -67% | 41 ? 2% |
| Response Time Black / White * (ms) | 27.2 ? | 22.4 ? 18% | 22.4 ? 18% | 20 ? 26% | 29 ? -7% | 23 ? 15% |
| PWM Frequency (Hz) | 198.4 ? | 198.4 ? | 200 ? | |||
| Screen | -3% | 3% | 2% | -19% | -6% | |
| Brightness middle (cd/m²) | 212.9 | 194.1 -9% | 242.7 14% | 245 15% | 242 14% | 240 13% |
| Brightness (cd/m²) | 206 | 192 -7% | 232 13% | 230 12% | 224 9% | 228 11% |
| Brightness Distribution (%) | 81 | 73 -10% | 88 9% | 84 4% | 88 9% | 89 10% |
| Black Level * (cd/m²) | 0.28 | 0.27 4% | 0.52 -86% | 0.46 -64% | 0.62 -121% | 0.49 -75% |
| Contrast (:1) | 760 | 719 -5% | 467 -39% | 533 -30% | 390 -49% | 490 -36% |
| Colorchecker dE 2000 * | 10.1 | 9.9 2% | 4.9 51% | 8.34 17% | 13.03 -29% | 10.96 -9% |
| Colorchecker dE 2000 max. * | 22.3 | 23.4 -5% | 20.3 9% | 12.31 45% | 18.79 16% | 18.36 18% |
| Greyscale dE 2000 * | 12 | 11.6 3% | 2.7 77% | 9.48 21% | 14.6 -22% | 11.34 5% |
| Gamma | 2.16 102% | 2.16 102% | 2.34 94% | 2.38 92% | 2.22 99% | 2.27 97% |
| CCT | 12551 52% | 11981 54% | 6876 95% | 10624 61% | 18869 34% | 12292 53% |
| Color Space (Percent of AdobeRGB 1998) (%) | 37 | 37 0% | 33.5 -9% | 38 3% | 33 -11% | 39 5% |
| Color Space (Percent of sRGB) (%) | 58 | 58 0% | 52.5 -9% | 57 -2% | 52 -10% | 60 3% |
| Total Average (Program / Settings) | 3% /
-1% | 1% /
2% | 13% /
6% | -22% /
-20% | 3% /
-1% |
* ... smaller is better
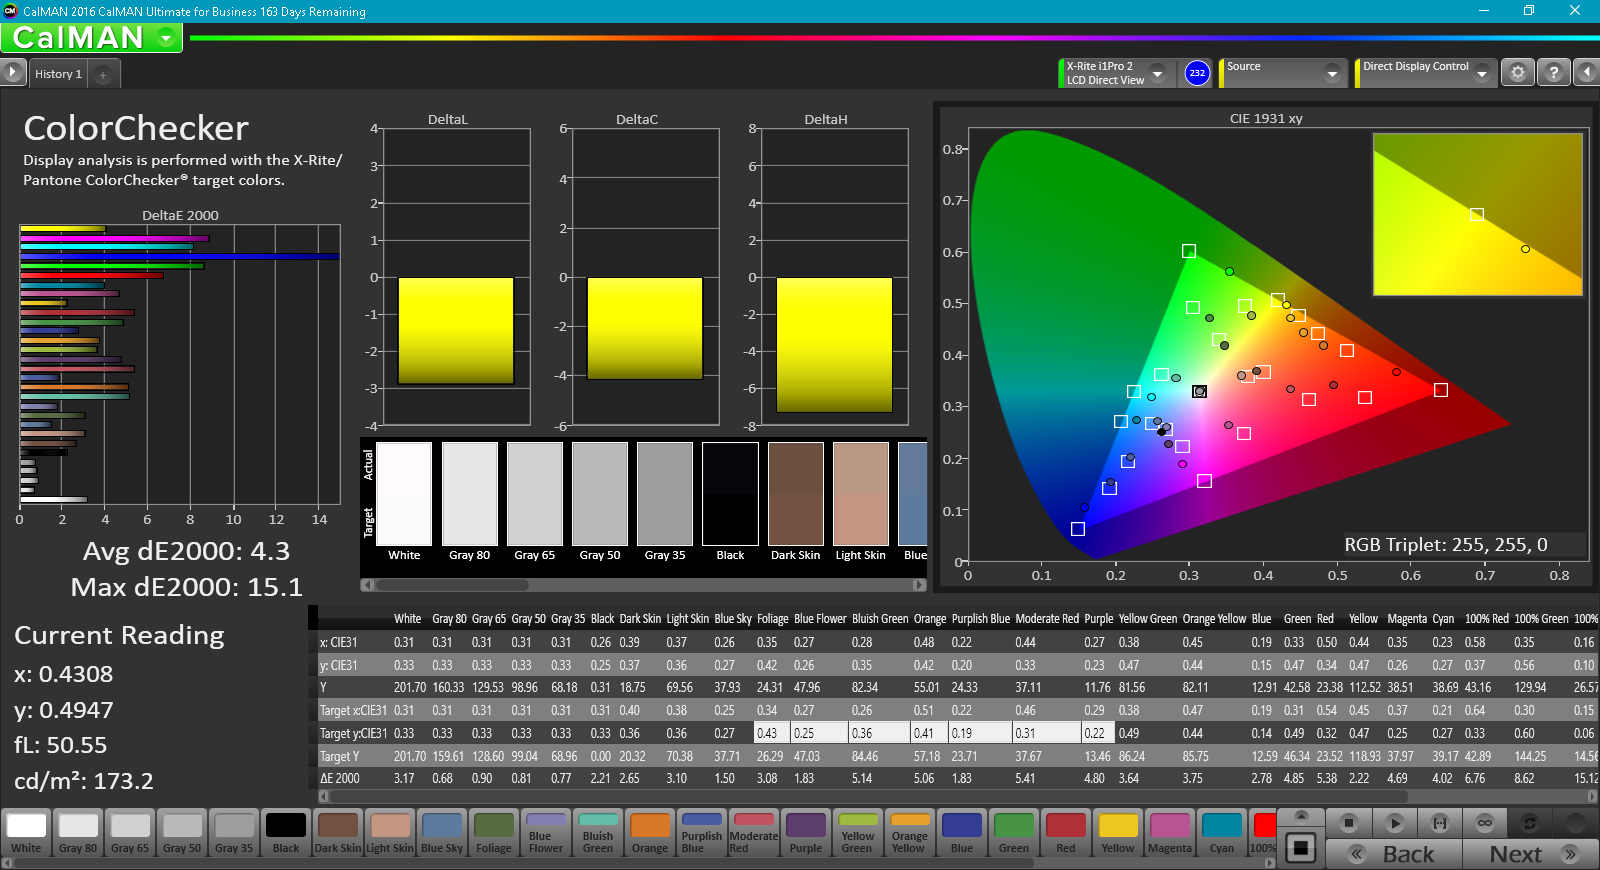
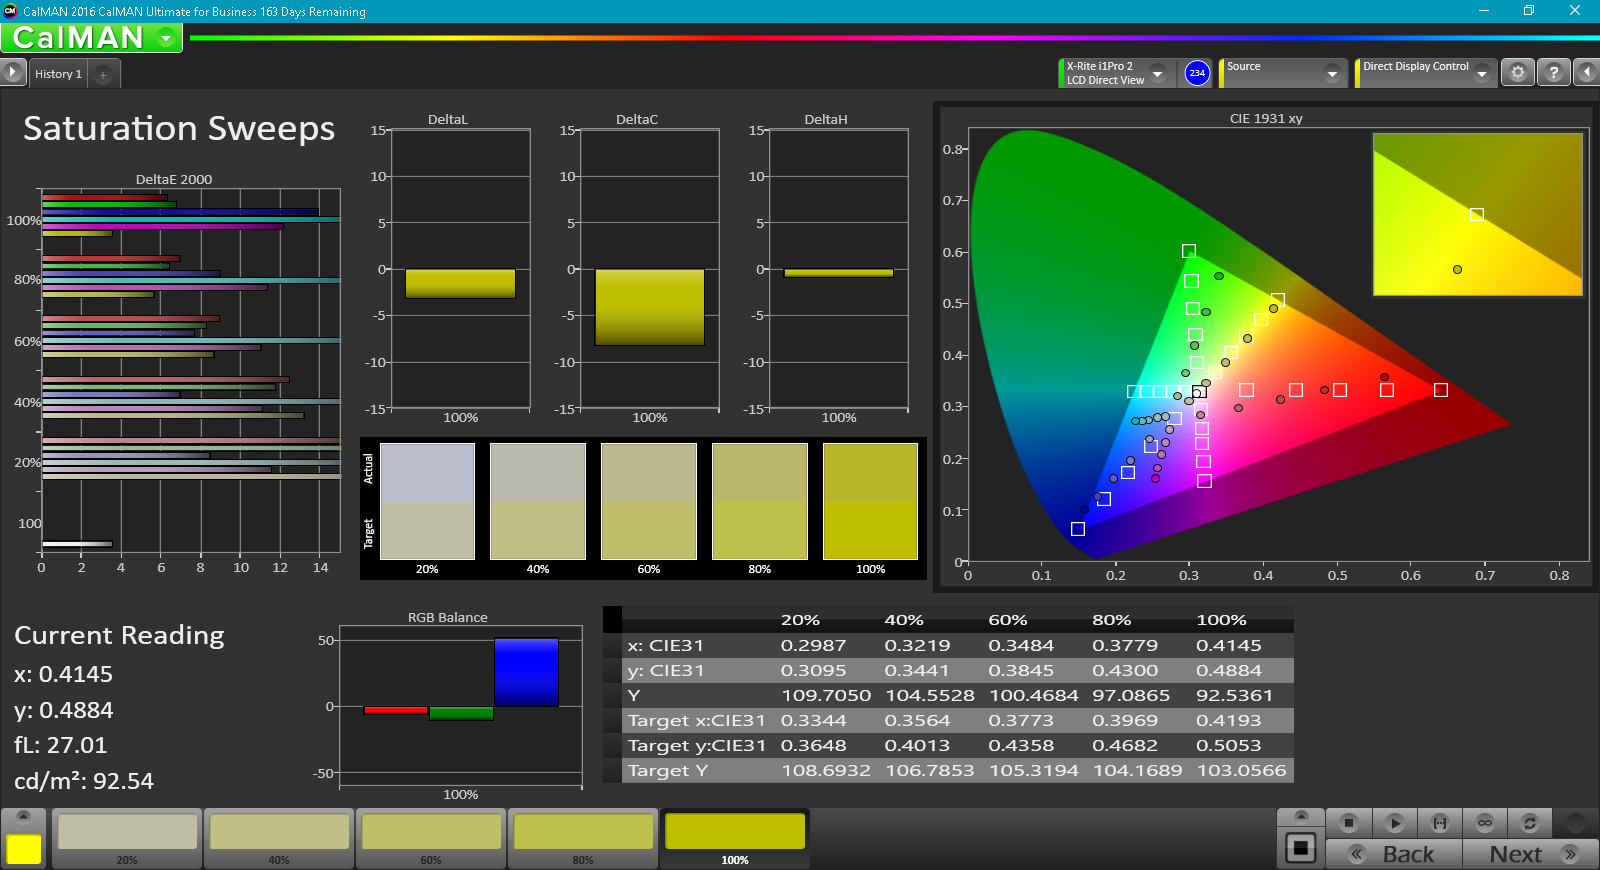
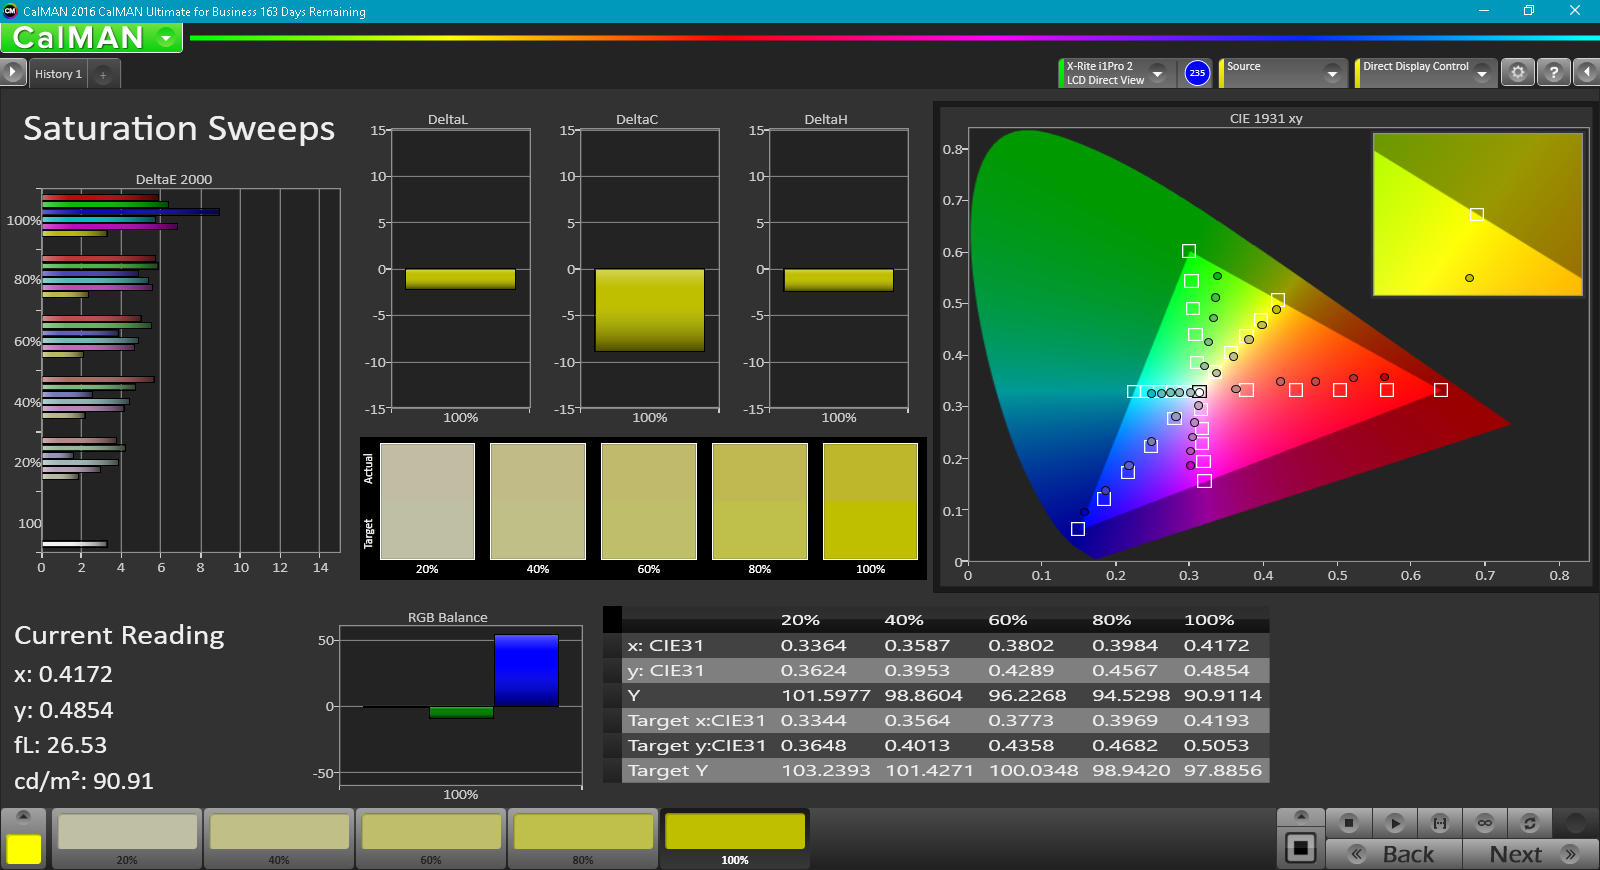
Color reproduction has not improved over the HP 15 (A9). The DeltaEs for color and greyscale averages at 10.1 and 12, respectively, which are a far cry from what is generally considered acceptable for professional color work (DeltaE at or under 3). The color space is almost exactly the same as the HP 15 (A9). The panel on the HP 15 (A12) covers the same 37% of the AdobeRGB and 58% of the sRGB color spaces. Overall, the display brings the same disappointments as our previous review unit.
Viewing angles are also shallow due to the TN panel. Contrast fades as viewing angles increase, and colors invert at angles greater than 45º on the vertical plane. The overall viewing experience is much the same as the HP 15-bw077ax, which is unfortunate.

Display Response Times
| ↔ Response Time Black to White | ||
|---|---|---|
| 27.2 ms ... rise ↗ and fall ↘ combined | ↗ 22 ms rise | 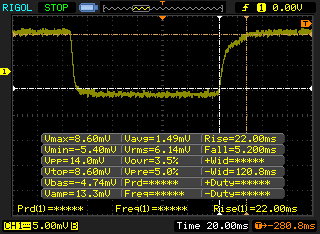 |
| ↘ 5.2 ms fall | ||
| The screen shows relatively slow response rates in our tests and may be too slow for gamers. In comparison, all tested devices range from 0.1 (minimum) to 240 (maximum) ms. » 69 % of all devices are better. This means that the measured response time is worse than the average of all tested devices (19.9 ms). | ||
| ↔ Response Time 50% Grey to 80% Grey | ||
| 42 ms ... rise ↗ and fall ↘ combined | ↗ 20.8 ms rise | 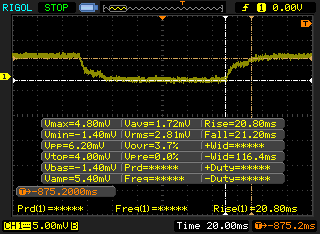 |
| ↘ 21.2 ms fall | ||
| The screen shows slow response rates in our tests and will be unsatisfactory for gamers. In comparison, all tested devices range from 0.165 (minimum) to 636 (maximum) ms. » 67 % of all devices are better. This means that the measured response time is worse than the average of all tested devices (31.1 ms). | ||
Screen Flickering / PWM (Pulse-Width Modulation)
| Screen flickering / PWM detected | 198.4 Hz | ≤ 99 % brightness setting | 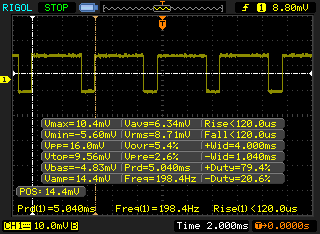 |
The display backlight flickers at 198.4 Hz (worst case, e.g., utilizing PWM) Flickering detected at a brightness setting of 99 % and below. There should be no flickering or PWM above this brightness setting. The frequency of 198.4 Hz is relatively low, so sensitive users will likely notice flickering and experience eyestrain at the stated brightness setting and below. In comparison: 52 % of all tested devices do not use PWM to dim the display. If PWM was detected, an average of 7798 (minimum: 5 - maximum: 343500) Hz was measured. | |||
Performance
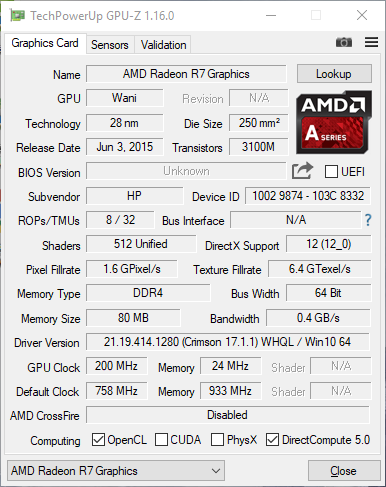
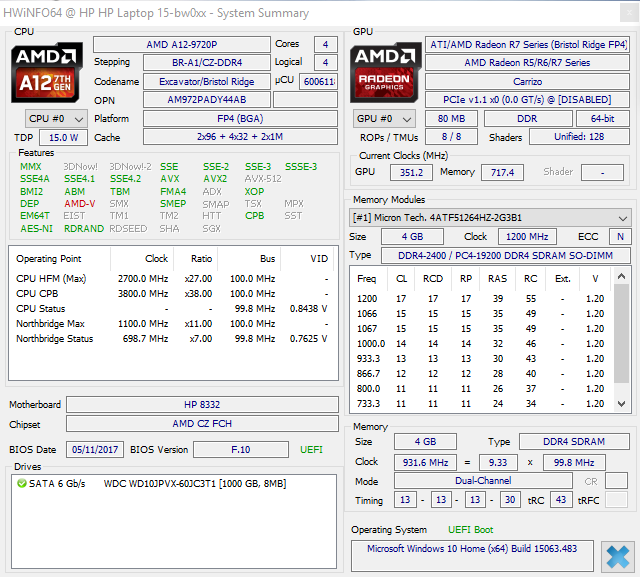
Our review unit features the latest APU from AMD, the A12-9720P. Like other APUs from AMD, the A12 features a CPU and Radeon GPU on the same die. Here, the quad-core A12 is paired with Radeon R7 graphics based on AMD's Bristol Ridge architecture. The inclusion of this Radeon GPU should give the A12 a noticeable advantage over the integrated HD Graphics GPUs from Intel. In theory, this should be the most powerful APU currently available from AMD; in practice, however, this is not the case. Let's take a look.
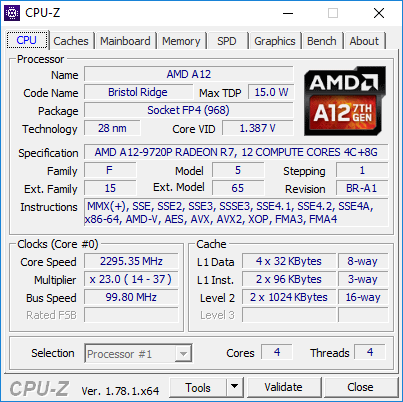
Processor
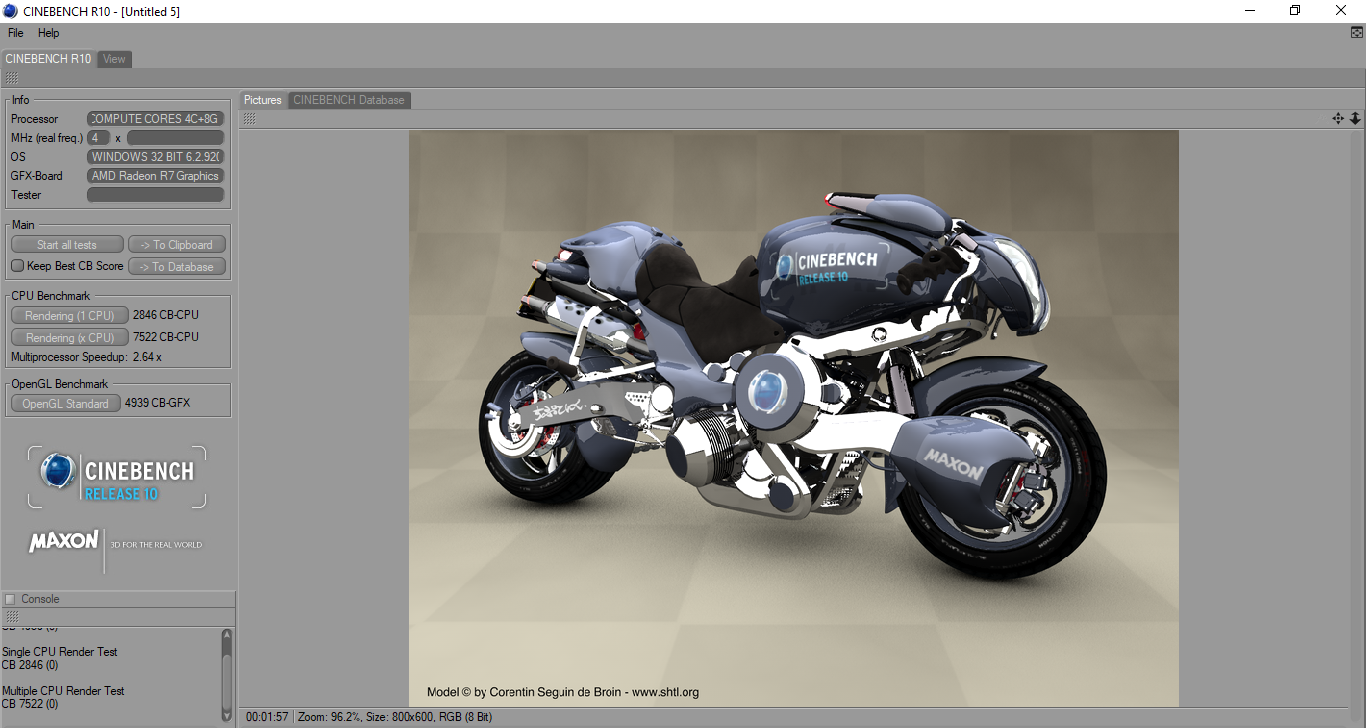
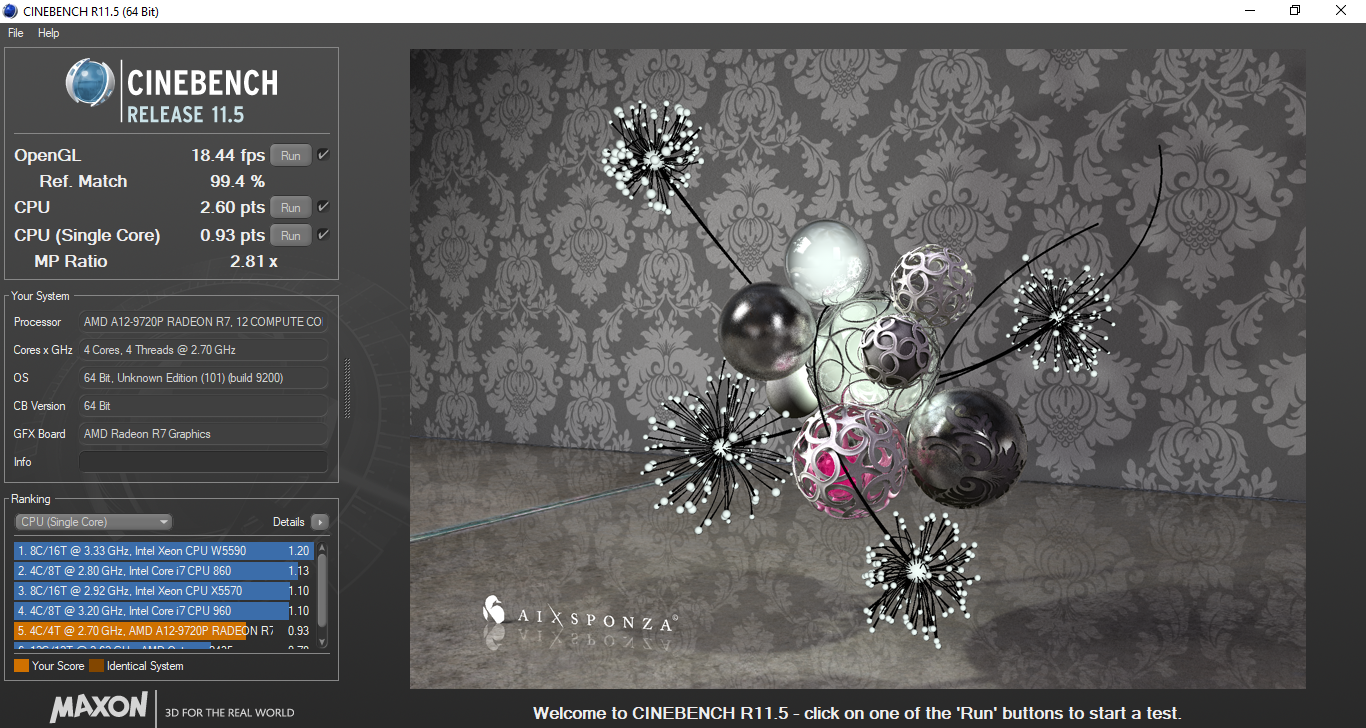
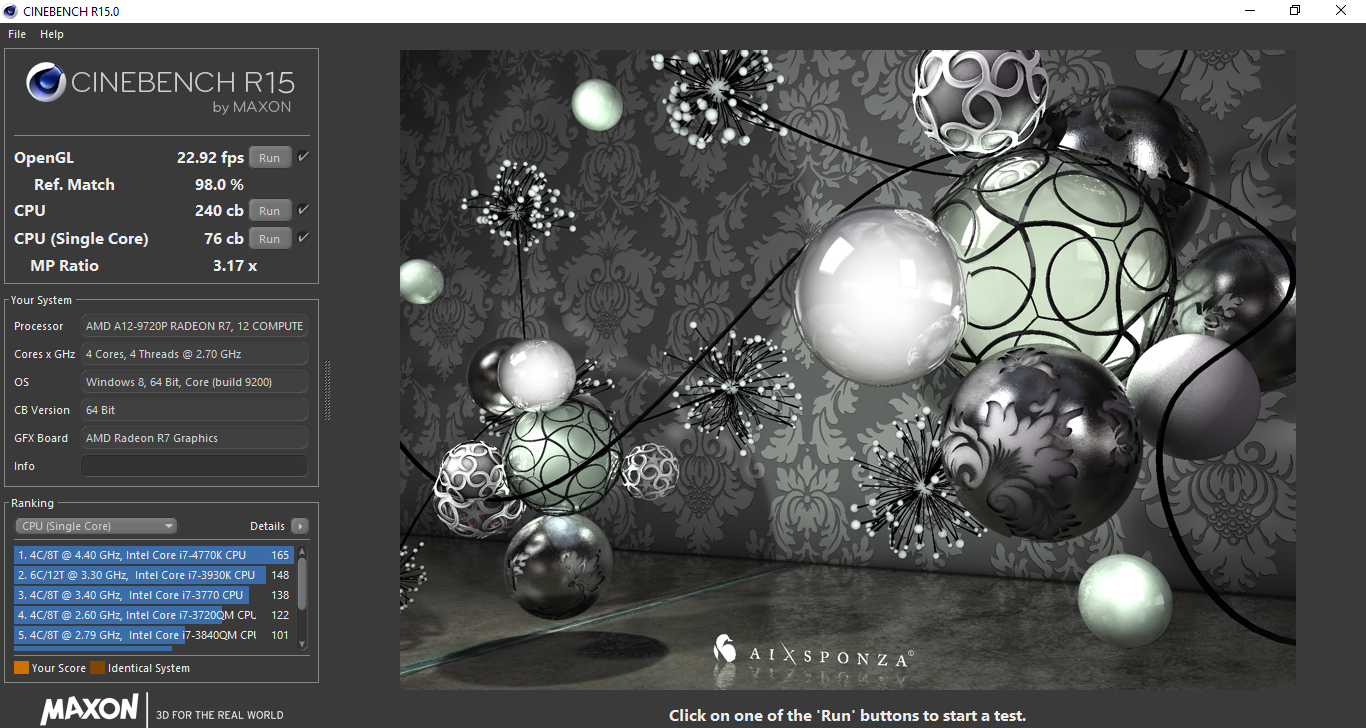
The AMD A12-9720P is the latest and greatest quad-core CPU built on AMD's Bristol Ridge platform. With a base clock speed of 2.7 GHz and a boost clock up to 3.8 GHz, the A12-9720P promises improved performance over the older Stoney Ridge APUs and slower dual-core A9-9420 featured in our review unit's little brother. This is indeed the case; in Cinebench R15, the HP 15 (A12) sits atop other AMD-powered machines, especially in multi-threaded workloads.
Keep in mind that while the A12 puts up quite a show compared to other budget devices, it is still sits below Intel's Core i3 and Core i5 processors. These would be much better options for users that need a boost in CPU performance.
Using our Cinebench R15 loop to test the stability of the processor, we see that the A12 is fairly consistent. Interestingly, the scores we measure over the long term are about 8% lower than a single run.
| Cinebench R15 | |
| CPU Single 64Bit | |
| Dell Latitude 5580 | |
| Lenovo ThinkPad L570 20J80020PB | |
| Acer TravelMate P249-M-5452 | |
| Acer Spin 5 SP513-51 | |
| Lenovo Thinkpad 13-20J1001BUS | |
| HP 15-bw075ax | |
| HP Pavilion 15-aw004ng W8Y60EA | |
| HP 15-bw077ax | |
| Asus X555DA-BB11 | |
| Lenovo Yoga 510-14AST | |
| Lenovo B50-10 80QR0013GE | |
| CPU Multi 64Bit | |
| Dell Latitude 5580 | |
| Lenovo ThinkPad L570 20J80020PB | |
| Acer TravelMate P249-M-5452 | |
| Lenovo Thinkpad 13-20J1001BUS | |
| Acer Spin 5 SP513-51 | |
| HP 15-bw075ax | |
| HP Pavilion 15-aw004ng W8Y60EA | |
| Asus X555DA-BB11 | |
| Lenovo B50-10 80QR0013GE | |
| Lenovo Yoga 510-14AST | |
| HP 15-bw077ax | |
| wPrime 2.10 - 1024m | |
| Lenovo Yoga 510-14AST | |
| HP 15-bw077ax | |
| Lenovo Thinkpad 13-20J1001BUS | |
| Lenovo ThinkPad L570 20J80020PB | |
| Asus X555DA-BB11 | |
* ... smaller is better
System Performance
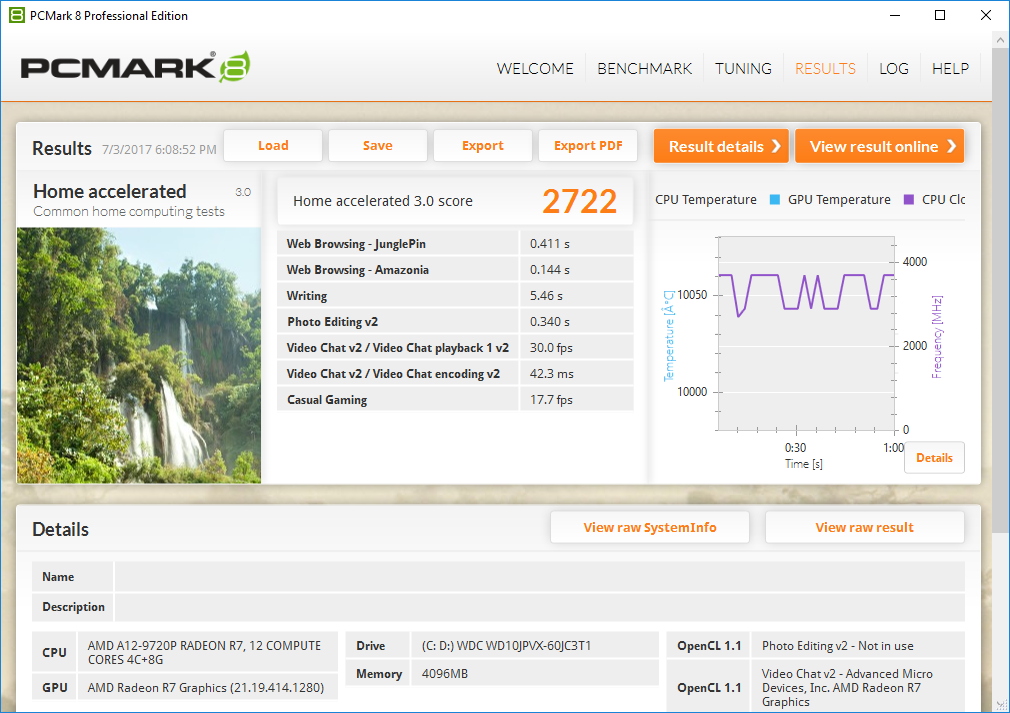
Interestingly, while CPU performance is top-tier in its family, overall system performance is rather disappointing. This is likely due to the limited amount of RAM and sluggish HDD. The HP Pavilion 15, which is equipped with a SATA SSD, sits in first place here. Due to the 5400 RPM drive in our test unit, apps take time to load and users will need to exercise patience during their workflow, no matter how light. Once things get going, however, the device is responsive and very usable.
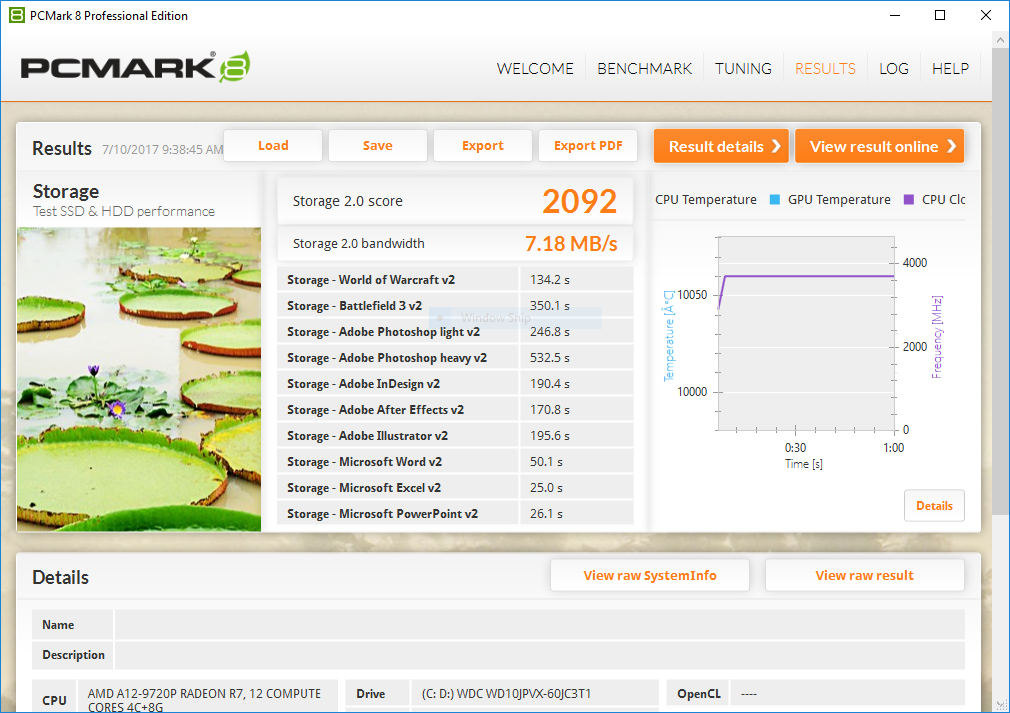
However, it must be said that we experienced a significant number of crashes during our testing period during both benchmarking and regular use. When we say significant, we are not over exaggerating; the system freezes and reboots in about 30% of tasks we start. Some apps (like The Witcher 3) flat out refuse to run without crashing, while others will force a reboot within minutes of running. Still others require a stroke of luck to complete, such as the PCMark 8 benchmark suite. There may be an issue with driver support, but whatever the problem, it completely breaks the experience. There were several times when we lost significant amounts of work due to an unexpected system crash. We hope these issues will be ironed out with a future update.
| PCMark 8 | |
| Home Score Accelerated v2 | |
| HP Pavilion 15-aw004ng W8Y60EA | |
| HP 15-bw075ax | |
| Lenovo Yoga 510-14AST | |
| Asus X555DA-BB11 | |
| HP 15-bw077ax | |
| Lenovo B50-10 80QR0013GE | |
| Work Score Accelerated v2 | |
| HP Pavilion 15-aw004ng W8Y60EA | |
| Lenovo Yoga 510-14AST | |
| Asus X555DA-BB11 | |
| HP 15-bw077ax | |
| HP 15-bw075ax | |
| Lenovo B50-10 80QR0013GE | |
| Creative Score Accelerated v2 | |
| HP Pavilion 15-aw004ng W8Y60EA | |
| HP 15-bw075ax | |
| Lenovo Yoga 510-14AST | |
| Asus X555DA-BB11 | |
| HP 15-bw077ax | |
| Lenovo B50-10 80QR0013GE | |
| PCMark 8 Home Score Accelerated v2 | 2722 points | |
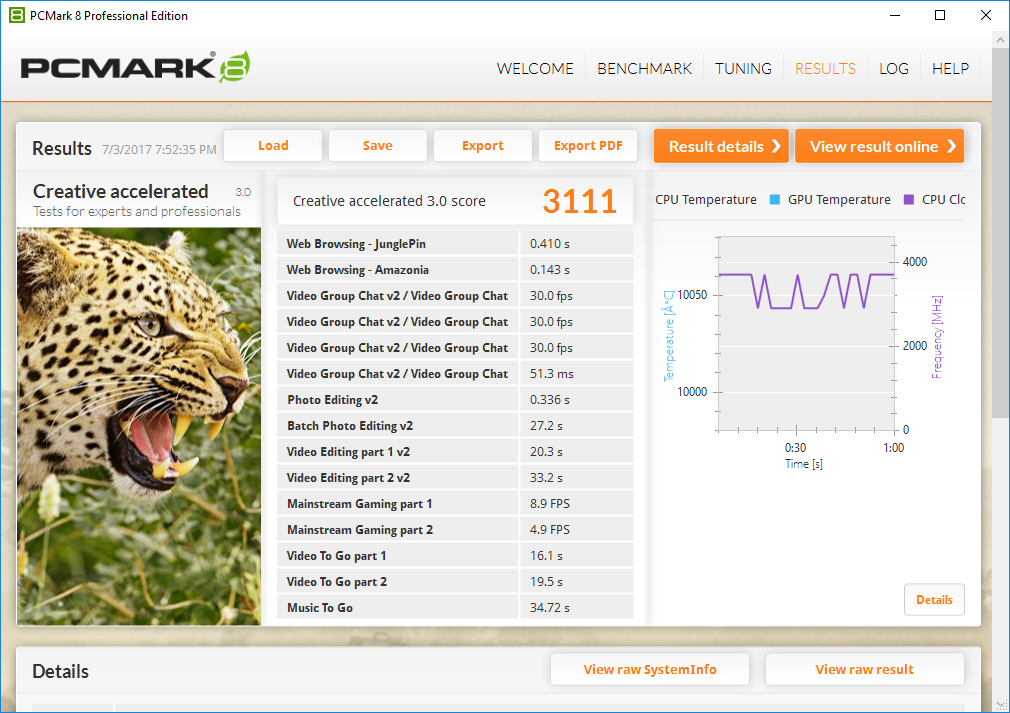
| PCMark 8 Creative Score Accelerated v2 | 3111 points | |
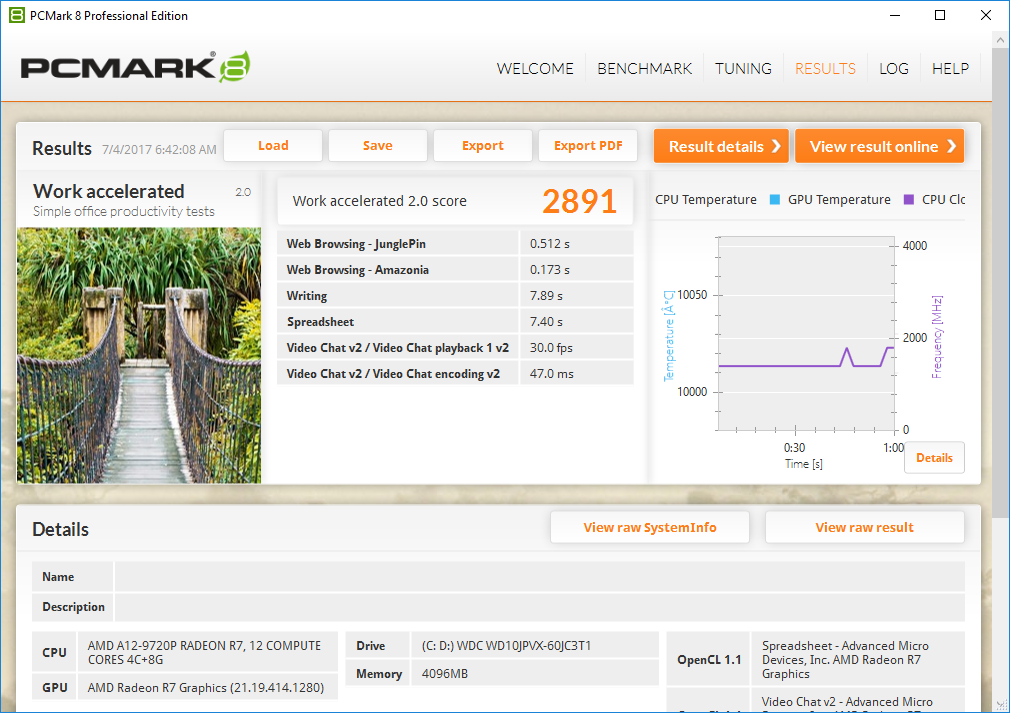
| PCMark 8 Work Score Accelerated v2 | 2891 points | |
Help | ||
Storage Devices
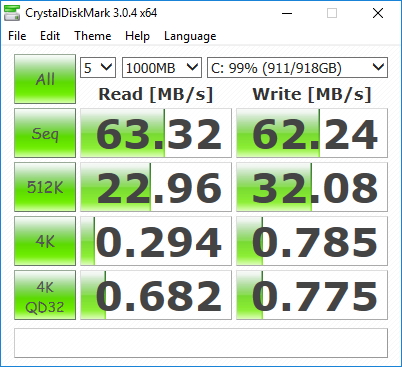
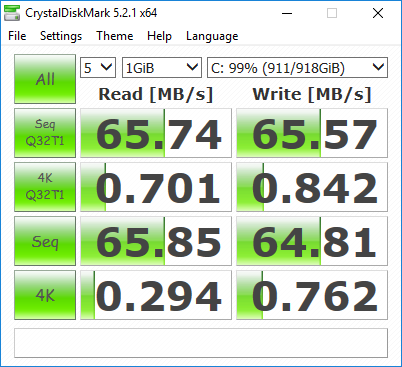
Drive speeds are slow, even for a 5400 RPM mechanical hard drive. Read and write speeds sit around 63 MB/s in CrystalDiskMark 3. This is the case even after multiple runs, which is very disappointing. Other budget options have slow drives as well, but those are still about 50-70% faster than the HDD in our review device.
HD Tune paints a better picture and pegs average drive speeds at 83 MB/s. While a better result than CrystalDiskMark, it is nonetheless sluggish.

| HP 15-bw075ax WDC Scorpio Blue WD10JPVX-60JC3T1 | HP 15-bw077ax WDC Scorpio Blue WD10JPVX-60JC3T1 | Asus X555DA-BB11 Seagate Momentus SpinPoint M8 ST1000LM024 HN-M101MBB | Lenovo B50-10 80QR0013GE Seagate Momentus Thin ST500LT012-1DG142 | Lenovo Yoga 510-14AST | HP Pavilion 15-aw004ng W8Y60EA | |
|---|---|---|---|---|---|---|
| CrystalDiskMark 3.0 | 27% | 22% | 24% | 8206% | 6190% | |
| Read Seq (MB/s) | 63.3 | 91.3 44% | 106.9 69% | 103.5 64% | 434.6 587% | 503 695% |
| Write Seq (MB/s) | 62.2 | 90.2 45% | 97.5 57% | 91.1 46% | 207.7 234% | 316.6 409% |
| Read 512 (MB/s) | 22.96 | 29.02 26% | 32.28 41% | 33.74 47% | 356.3 1452% | 261.9 1041% |
| Write 512 (MB/s) | 32.08 | 39.51 23% | 35.39 10% | 38.77 21% | 195.6 510% | 281.2 777% |
| Read 4k (MB/s) | 0.29 | 0.34 17% | 0.373 29% | 0.374 29% | 26.71 9110% | 17.04 5776% |
| Write 4k (MB/s) | 0.79 | 0.94 19% | 0.636 -19% | 0.649 -18% | 56.8 7090% | 46.55 5792% |
| Read 4k QD32 (MB/s) | 0.68 | 0.83 22% | 0.694 2% | 0.818 20% | 176.3 25826% | 125 18282% |
| Write 4k QD32 (MB/s) | 0.78 | 0.96 23% | 0.682 -13% | 0.648 -17% | 163.3 20836% | 131.4 16746% |

GPU Performance
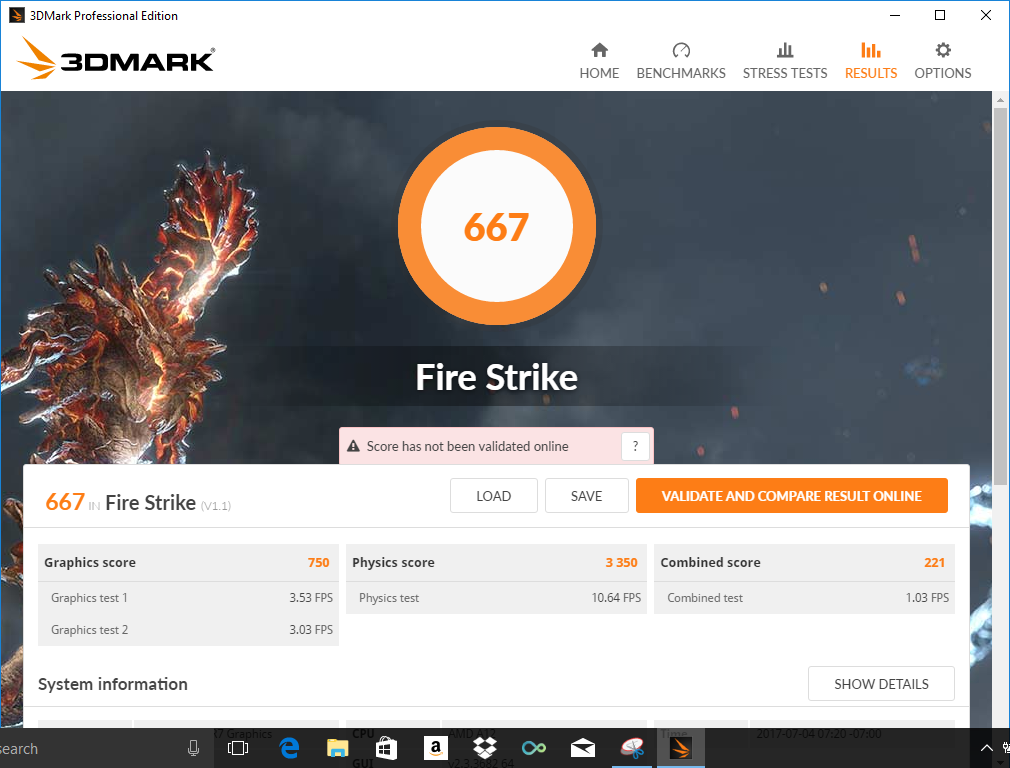
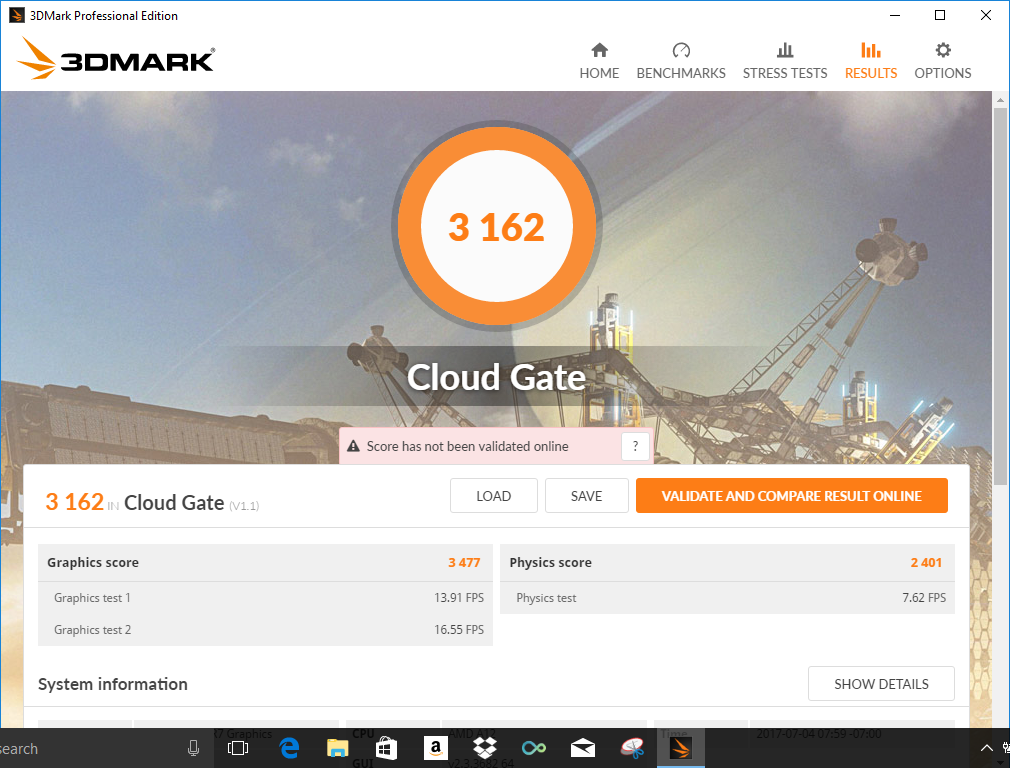
GPU performance is inconsistent. Although the Radeon R7 integrated GPU is a more powerful than the lower-tiered R5 and R6 graphics cores on paper, our benchmarking shows otherwise. 3DMark's Fire Strike pegs the R7 well behind the dedicated Radeon R8 GPU found in the HP Pavilion 15, which is to be expected. Surprisingly, the R7 falls behind even the Stoney Ridge R5 in the Lenovo Yoga 510. This may have something to do with the instability issues we discussed previously, or poor software optimization for the relatively new hardware in our device.

| 3DMark | |
| 1280x720 Cloud Gate Standard Graphics | |
| HP Pavilion 15-aw004ng W8Y60EA | |
| Lenovo Yoga 510-14AST | |
| Asus X555DA-BB11 | |
| HP 15-bw077ax | |
| HP 15-bw075ax | |
| Lenovo B50-10 80QR0013GE | |
| 1920x1080 Fire Strike Graphics | |
| HP Pavilion 15-aw004ng W8Y60EA | |
| Lenovo Yoga 510-14AST | |
| Asus X555DA-BB11 | |
| HP 15-bw075ax | |
| HP 15-bw077ax | |
| 1920x1080 Ice Storm Extreme Graphics | |
| HP Pavilion 15-aw004ng W8Y60EA | |
| Lenovo Yoga 510-14AST | |
| Asus X555DA-BB11 | |
| 3DMark Cloud Gate Standard Score | 3162 points | |
| 3DMark Fire Strike Score | 667 points | |
Help | ||
Gaming Performance
Gaming performance is reasonably good. Older titles are playable at low to medium details and and a 1366x768 resolution. More demanding title, such as Deus Ex: Mankind Divided, are rendered unplayable with frame rates dipping into the single digits. Even Metro: Last Light, a somewhat graphically intensive game from 2013, posts unfavorable results. Lighter and older titles run well, provided settings are turned down.
Compared to Intel's own integrated graphics solutions, the R7 sits about on level with a slight edge over the HD Graphics 520 and 620. Integrated graphics have made great strides over the past few years but are still not suitable for gaming.
| BioShock Infinite | |
| 1280x720 Very Low Preset (sort by value) | |
| HP 15-bw075ax | |
| HP 15-bw077ax | |
| Asus X555DA-BB11 | |
| Lenovo B50-10 80QR0013GE | |
| Lenovo Yoga 510-14AST | |
| HP Pavilion 15-aw004ng W8Y60EA | |
| Lenovo ThinkPad L570 20J80020PB | |
| Dell Latitude 5580 | |
| Lenovo Thinkpad 13-20J1001BUS | |
| Acer Spin 5 SP513-51 | |
| Acer TravelMate P249-M-5452 | |
| 1366x768 Medium Preset (sort by value) | |
| HP 15-bw075ax | |
| HP 15-bw077ax | |
| Lenovo B50-10 80QR0013GE | |
| Lenovo Yoga 510-14AST | |
| HP Pavilion 15-aw004ng W8Y60EA | |
| Lenovo ThinkPad L570 20J80020PB | |
| Dell Latitude 5580 | |
| Lenovo Thinkpad 13-20J1001BUS | |
| Acer Spin 5 SP513-51 | |
| Acer TravelMate P249-M-5452 | |
| Alien: Isolation | |
| 1024x768 (Very) Low, Off, Shadow Map 512 AF:1x (sort by value) | |
| HP 15-bw075ax | |
| HP 15-bw077ax | |
| HP Pavilion 15-aw004ng W8Y60EA | |
| 1366x768 Medium, On (AA & SSAO Off), Shadow Map 1024 AF:4x (sort by value) | |
| HP 15-bw075ax | |
| HP 15-bw077ax | |
| HP Pavilion 15-aw004ng W8Y60EA | |
| Metro: Last Light | |
| 1024x768 Low (DX10) AF:4x (sort by value) | |
| HP 15-bw075ax | |
| HP 15-bw077ax | |
| 1366x768 Medium (DX10) AF:4x (sort by value) | |
| HP 15-bw075ax | |
| HP 15-bw077ax | |
| Deus Ex Mankind Divided | |
| 1280x720 Low Preset AF:1x (sort by value) | |
| HP 15-bw075ax | |
| HP Pavilion 15-aw004ng W8Y60EA | |
| 1366x768 Medium Preset AF:2x (sort by value) | |
| HP 15-bw075ax | |
| HP Pavilion 15-aw004ng W8Y60EA | |
| Rise of the Tomb Raider | |
| 1024x768 Lowest Preset (sort by value) | |
| HP 15-bw075ax | |
| HP 15-bw077ax | |
| Asus X555DA-BB11 | |
| Lenovo Yoga 510-14AST | |
| HP Pavilion 15-aw004ng W8Y60EA | |
| Acer Spin 5 SP513-51 | |
| 1366x768 Medium Preset AF:2x (sort by value) | |
| HP 15-bw075ax | |
| HP 15-bw077ax | |
| Lenovo Yoga 510-14AST | |
| HP Pavilion 15-aw004ng W8Y60EA | |
| low | med. | high | ultra | |
|---|---|---|---|---|
| Batman: Arkham City (2011) | 36 | 29 | 15 | |
| The Elder Scrolls V: Skyrim (2011) | 28 | 19 | 13 | |
| BioShock Infinite (2013) | 43 | 26 | ||
| Metro: Last Light (2013) | 16 | 12 | ||
| Company of Heroes 2 (2013) | 11 | 11 | 6 | |
| Batman: Arkham Origins (2013) | 48 | 29 | 15 | |
| Thief (2014) | 13 | 10 | 8 | |
| Alien: Isolation (2014) | 32 | 20 | ||
| Call of Duty: Advanced Warfare (2014) | 16 | |||
| Batman: Arkham Knight (2015) | 9 | 3 | ||
| Rise of the Tomb Raider (2016) | 18 | 11 | ||
| Ashes of the Singularity (2016) | 8 | |||
| Deus Ex Mankind Divided (2016) | 10 | 7 |
Stress Test
Our stress testing places the notebook under extreme computational and graphical loads that test how the device operates under the worst conditions. Straining the CPU with Prime95, we see that the A12-9720P is able to intermittently boost up to 3.7 GHz. However, overall CPU performance is lackluster and the processor throttles down to an average of 2.4 GHz, slightly below its base clock of 2.7 GHz. Temperatures are excellent, but restrained; the CPU never eclipses 65º C and averages about 56º C.
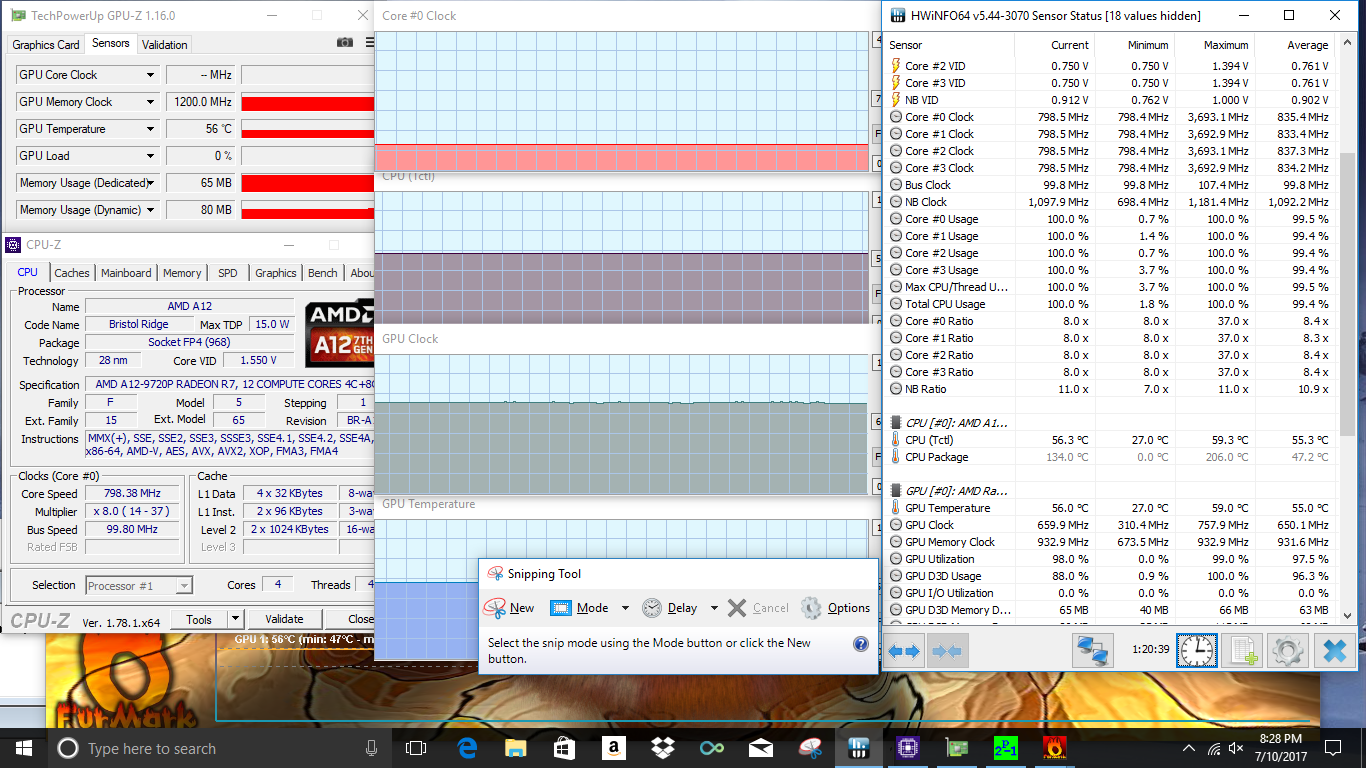
FurMark completely cripples the device. The GPU hits a clock speed of 750 MHz before settling in slightly lower at 637 MHz. However, the CPU is completely crushed, quickly retreating to a mere 800 MHz. Temperatures are even more conservative here; both the CPU and GPU cores average about 55º C, which leaves a lot of untapped headroom. Running FurMark and Prime95 tells much the same story.
The system refuses to run The Witcher 3 for more than about 5 minutes and typically crashes upon reaching the title menu. As such, we are unable to perform our Witcher 3 real world stress testing at this time. Again, system instability is a major problem with this notebook.

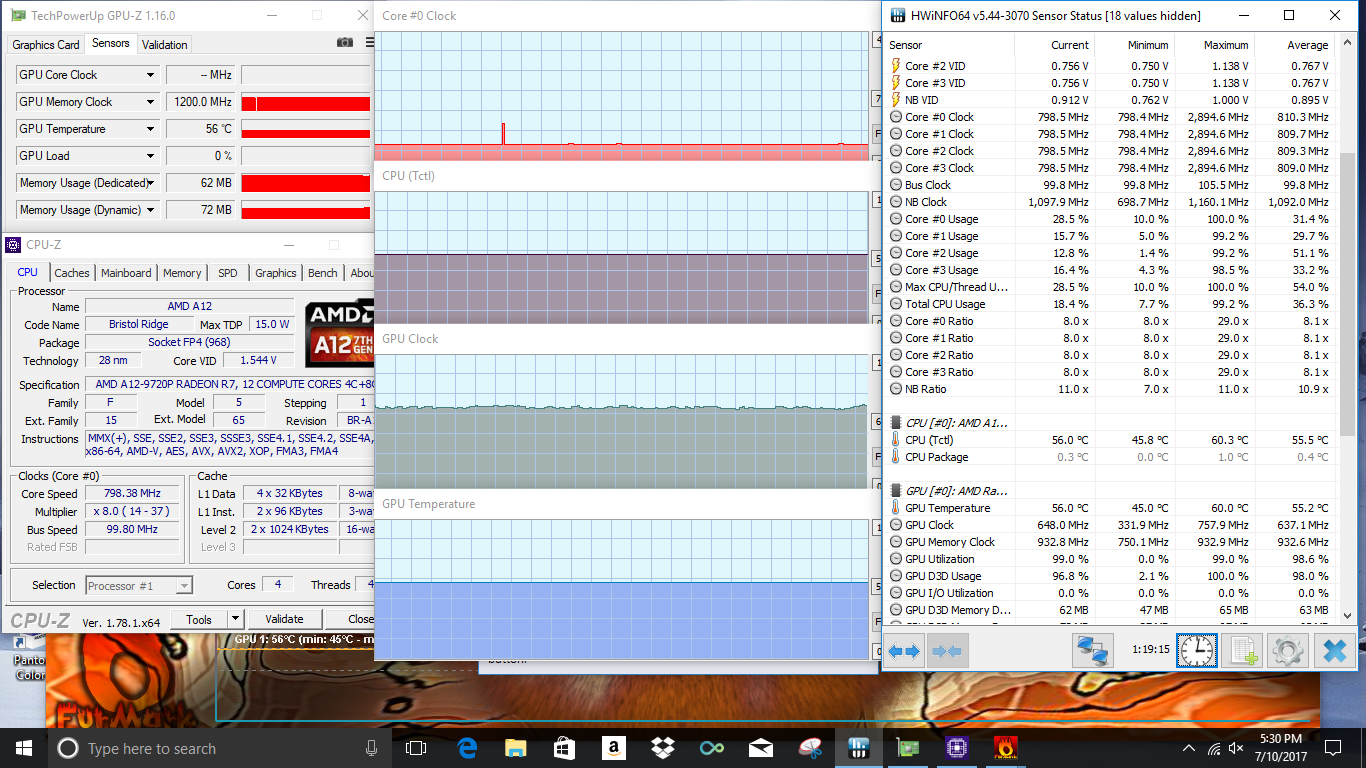
| CPU Clock (GHz) | GPU Clock (MHz) | Average CPU Temperature (°C) | Average GPU Temperature (°C) | |
| Prime95 Stress | 2.4 | - | 56.4 | - |
| FurMark Stress | 0.8 | 637 | 55.5 | 55.2 |
| Prime95 + FurMark Stress | 0.8 | 650 | 55.3 | 55 |
Emissions
System Noise
On the positive side, the fan is very quiet. System noise tops out at 36 dB(A), which is very quiet. On top of that, the fan emits a low pitched whir when active; as such, the fan blends into background noise quickly and likely won't be noticed by users. What will be noticed is the hard drive. In a silent room, the hard drive constantly makes small high-pitched noises, which can grow annoying. Under normal sound conditions, however, the HDD cannot be heard.
Noise level
| Idle |
| 30.9 / 31.2 / 32 dB(A) |
| Load |
| 35 / 36.4 dB(A) |
 | ||
30 dB silent 40 dB(A) audible 50 dB(A) loud |
||
min: | ||
| HP 15-bw075ax Radeon R7 (Bristol Ridge), A12-9720P, WDC Scorpio Blue WD10JPVX-60JC3T1 | HP 15-bw077ax Radeon R5 (Stoney Ridge), A9-9420, WDC Scorpio Blue WD10JPVX-60JC3T1 | Asus X555DA-BB11 Radeon R6 (Carrizo), A10-8700P, Seagate Momentus SpinPoint M8 ST1000LM024 HN-M101MBB | Lenovo B50-10 80QR0013GE HD Graphics (Bay Trail), N3540, Seagate Momentus Thin ST500LT012-1DG142 | Lenovo Yoga 510-14AST Radeon R5 (Stoney Ridge), A9-9410 | HP Pavilion 15-aw004ng W8Y60EA Radeon R8 M445DX, A10-9600P | |
|---|---|---|---|---|---|---|
| Noise | -2% | -1% | -3% | 4% | -9% | |
| off / environment * (dB) | 27.8 | 27.8 -0% | 28.9 -4% | 31.2 -12% | 30.4 -9% | 31.2 -12% |
| Idle Minimum * (dB) | 30.9 | 31.8 -3% | 31.6 -2% | 33.5 -8% | 30.4 2% | 31.7 -3% |
| Idle Average * (dB) | 31.2 | 33.2 -6% | 32 -3% | 33.5 -7% | 30.4 3% | 31.9 -2% |
| Idle Maximum * (dB) | 32 | 34 -6% | 32.4 -1% | 33.5 -5% | 30.4 5% | 31.9 -0% |
| Load Average * (dB) | 35 | 33.3 5% | 33.3 5% | 33.5 4% | 31.3 11% | 41 -17% |
| Load Maximum * (dB) | 36.4 | 36.4 -0% | 35.5 2% | 33.5 8% | 33.3 9% | 42.7 -17% |
* ... smaller is better
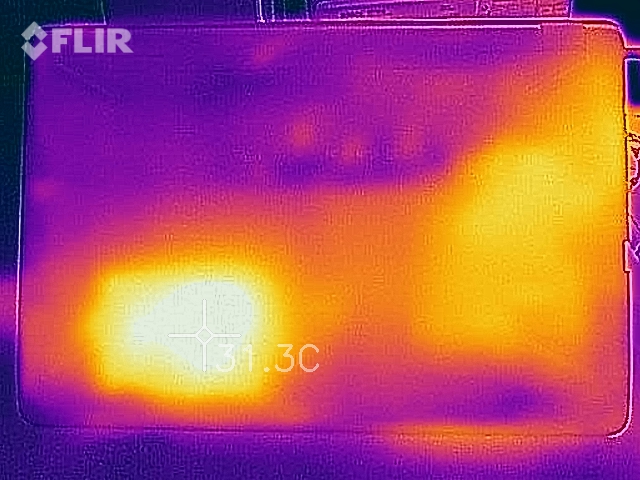
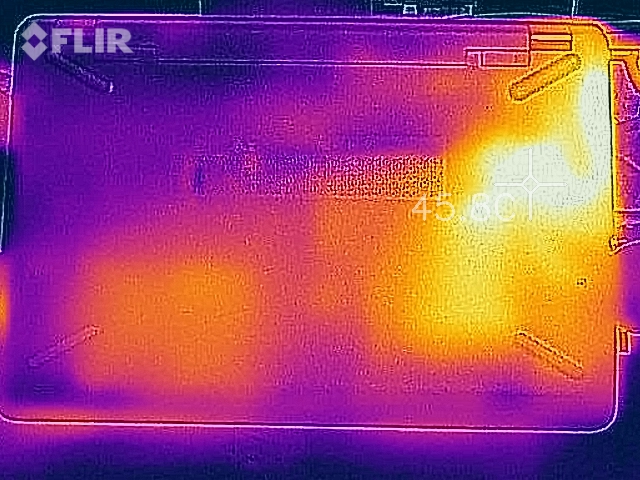
Temperature
Temperatures are well-managed. There is a hot spot located at the single exhaust vent on the left-hand side, but this spot only reaches about 45º C. The wrist rest and keyboard deck stays very cool and remains comfortable to use, even under load.
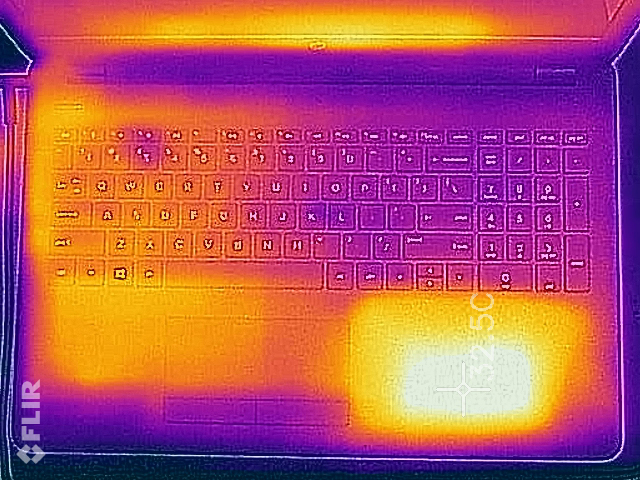
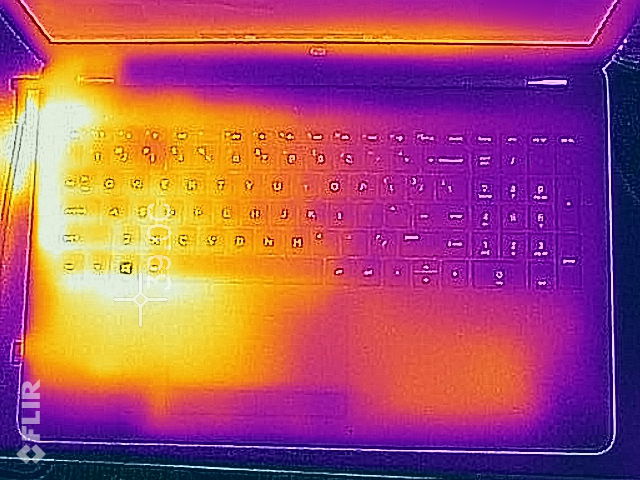
(±) The maximum temperature on the upper side is 40.8 °C / 105 F, compared to the average of 36.8 °C / 98 F, ranging from 21 to 71 °C for the class Multimedia.
(±) The bottom heats up to a maximum of 44.4 °C / 112 F, compared to the average of 39.1 °C / 102 F
(+) In idle usage, the average temperature for the upper side is 29.6 °C / 85 F, compared to the device average of 31.3 °C / 88 F.
(±) The palmrests and touchpad can get very hot to the touch with a maximum of 36.8 °C / 98.2 F.
(-) The average temperature of the palmrest area of similar devices was 28.7 °C / 83.7 F (-8.1 °C / -14.5 F).
Speakers

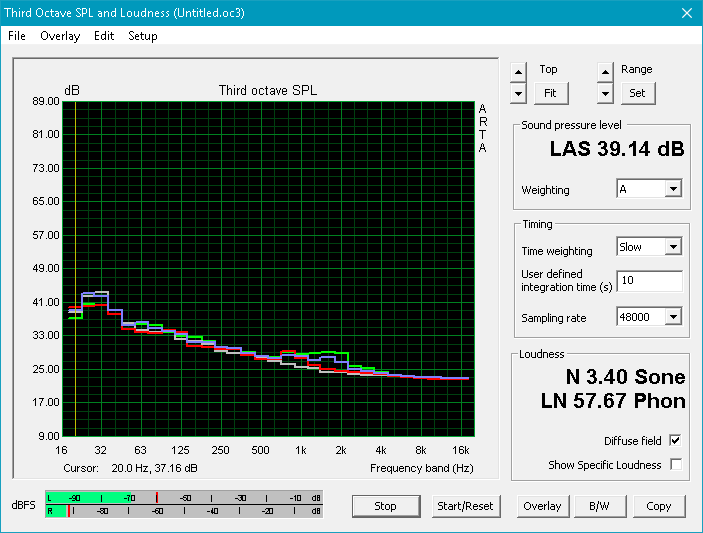
Like the lower-tiered HP 15 (A9), the speakers on the HP 15 (A12) are excellent given the price point. Bass is present, and the overall sound stage is well-balanced. Highs are clear and mids have a full body. The chassis also doesn't rattle when the speakers are at full volume, which is another plus.
HP 15-bw075ax audio analysis
(±) | speaker loudness is average but good (75 dB)
Bass 100 - 315 Hz
(±) | reduced bass - on average 8.2% lower than median
(±) | linearity of bass is average (9.4% delta to prev. frequency)
Mids 400 - 2000 Hz
(+) | balanced mids - only 2.5% away from median
(±) | linearity of mids is average (8.1% delta to prev. frequency)
Highs 2 - 16 kHz
(+) | balanced highs - only 2.7% away from median
(±) | linearity of highs is average (7.5% delta to prev. frequency)
Overall 100 - 16.000 Hz
(+) | overall sound is linear (14.8% difference to median)
Compared to same class
» 35% of all tested devices in this class were better, 4% similar, 61% worse
» The best had a delta of 5%, average was 17%, worst was 45%
Compared to all devices tested
» 20% of all tested devices were better, 4% similar, 76% worse
» The best had a delta of 4%, average was 24%, worst was 134%
Asus X555DA-BB11 audio analysis
(±) | speaker loudness is average but good (76.4 dB)
Bass 100 - 315 Hz
(-) | nearly no bass - on average 21.4% lower than median
(±) | linearity of bass is average (13.5% delta to prev. frequency)
Mids 400 - 2000 Hz
(±) | reduced mids - on average 5.1% lower than median
(±) | linearity of mids is average (14.6% delta to prev. frequency)
Highs 2 - 16 kHz
(±) | higher highs - on average 7.2% higher than median
(±) | linearity of highs is average (14.6% delta to prev. frequency)
Overall 100 - 16.000 Hz
(±) | linearity of overall sound is average (29% difference to median)
Compared to same class
» 95% of all tested devices in this class were better, 1% similar, 4% worse
» The best had a delta of 5%, average was 17%, worst was 45%
Compared to all devices tested
» 87% of all tested devices were better, 2% similar, 11% worse
» The best had a delta of 4%, average was 24%, worst was 134%
Frequency Comparison (Checkbox selectable!)
Graph 1: Pink Noise 100% Vol.; Graph 2: Audio off
Energy Management
Power Consumption
The HP 15 (A12) understandably consumers more power than its less powerful counterpart under load, although idle consumption is surprisingly low. We measure a maximum power draw of 37.6 Watts, well under the 45 Watt rating of the included power supply. Interestingly, our test unit consumes about 11% less power under load than the Asus X555DA, but this could be due to the higher resolution screen in the Asus (among other factors).
| Off / Standby | |
| Idle | |
| Load |
|
Key:
min: | |
| HP 15-bw075ax A12-9720P, Radeon R7 (Bristol Ridge), WDC Scorpio Blue WD10JPVX-60JC3T1, TN LED, 1366x768, 15.6" | HP 15-bw077ax A9-9420, Radeon R5 (Stoney Ridge), WDC Scorpio Blue WD10JPVX-60JC3T1, TN LED, 1366x768, 15.6" | Asus X555DA-BB11 A10-8700P, Radeon R6 (Carrizo), Seagate Momentus SpinPoint M8 ST1000LM024 HN-M101MBB, TN LED, 1920x1080, 15.6" | Lenovo B50-10 80QR0013GE N3540, HD Graphics (Bay Trail), Seagate Momentus Thin ST500LT012-1DG142, TN LED, 1366x768, 15.6" | Lenovo Yoga 510-14AST A9-9410, Radeon R5 (Stoney Ridge), , TN LED, 1366x768, 14" | HP Pavilion 15-aw004ng W8Y60EA A10-9600P, Radeon R8 M445DX, , TN LED, 1920x1080, 15.6" | |
|---|---|---|---|---|---|---|
| Power Consumption | -19% | -36% | 17% | 15% | -32% | |
| Idle Minimum * (Watt) | 4.2 | 8 -90% | 8.3 -98% | 4.8 -14% | 3.9 7% | 5.5 -31% |
| Idle Average * (Watt) | 6.6 | 9.4 -42% | 8.6 -30% | 7.5 -14% | 7.4 -12% | 8.2 -24% |
| Idle Maximum * (Watt) | 10.4 | 13.9 -34% | 13.1 -26% | 9.2 12% | 9.4 10% | 9.5 9% |
| Load Average * (Watt) | 28.2 | 18.5 34% | 31.2 -11% | 16 43% | 19.2 32% | 44.5 -58% |
| Load Maximum * (Watt) | 37.6 | 23 39% | 43.9 -17% | 15.4 59% | 22.5 40% | 58 -54% |
* ... smaller is better
Battery Life
The small 3-cell 31 Wh battery posts similar runtimes to the HP 15 (A9). With brightness at the lowest setting and all radios turned off, the HP 15 (A12) is able to run for just shy of 8 hours. Under more normal conditions (screen set to 150 nits, loading a new web page every 30-40 seconds, Balanced power profile), the battery lasts about 3 hours 40 minutes before calling it quits. This is to be expected, given the small battery size, but won't get users through a day of work away from the wall.
| HP 15-bw075ax A12-9720P, Radeon R7 (Bristol Ridge), 31 Wh | HP 15-bw077ax A9-9420, Radeon R5 (Stoney Ridge), 31 Wh | Asus X555DA-BB11 A10-8700P, Radeon R6 (Carrizo), 37 Wh | Lenovo B50-10 80QR0013GE N3540, HD Graphics (Bay Trail), 24 Wh | Lenovo Yoga 510-14AST A9-9410, Radeon R5 (Stoney Ridge), 35 Wh | HP Pavilion 15-aw004ng W8Y60EA A10-9600P, Radeon R8 M445DX, 41 Wh | |
|---|---|---|---|---|---|---|
| Battery runtime | 6% | -3% | -5% | 72% | 32% | |
| Reader / Idle (h) | 7.8 | 9 15% | 7.3 -6% | 14.1 81% | 9.3 19% | |
| WiFi v1.3 (h) | 3.7 | 3.4 -8% | 2.9 -22% | 3.5 -5% | 5.4 46% | 4.3 16% |
| Load (h) | 1 | 1.1 10% | 1.2 20% | 1.9 90% | 1.6 60% |
Pros
Cons
Verdict


While the HP 15 (A9) we reviewed recently was an exercise in patience due to its slow components and sluggish operation, the HP 15 (A12) is a trial due to its instability. The processor is much faster than the dual-core A9 in our previous unit, but due to either poor driver support, lackluster software optimization, or some other unseen factor, the system is almost unusable due to the unfathomably high chance of a system crash. As it stands, we cannot recommend the HP 15 (A12) until system stability improves.
That's unfortunate, as the HP 15 (A12) is an improvement over the A9 variant in every performance test. While we still find complaint with the poor screen and mushy keyboard, the internals are much improved (when they can actually work). We do, however, see some intense throttling under stress despite ample headroom for the APU to flex its muscle.
Even without taking system crashes into consideration, the HP 15 (A12) is still a forgettable budget notebook that doesn't bring anything compelling to store shelves. As we mentioned with the HP 15 (A9), there are much better options at this price point.
HP 15-bw075ax
- 07/15/2017 v6 (old)
Sam Medley
Price comparison
