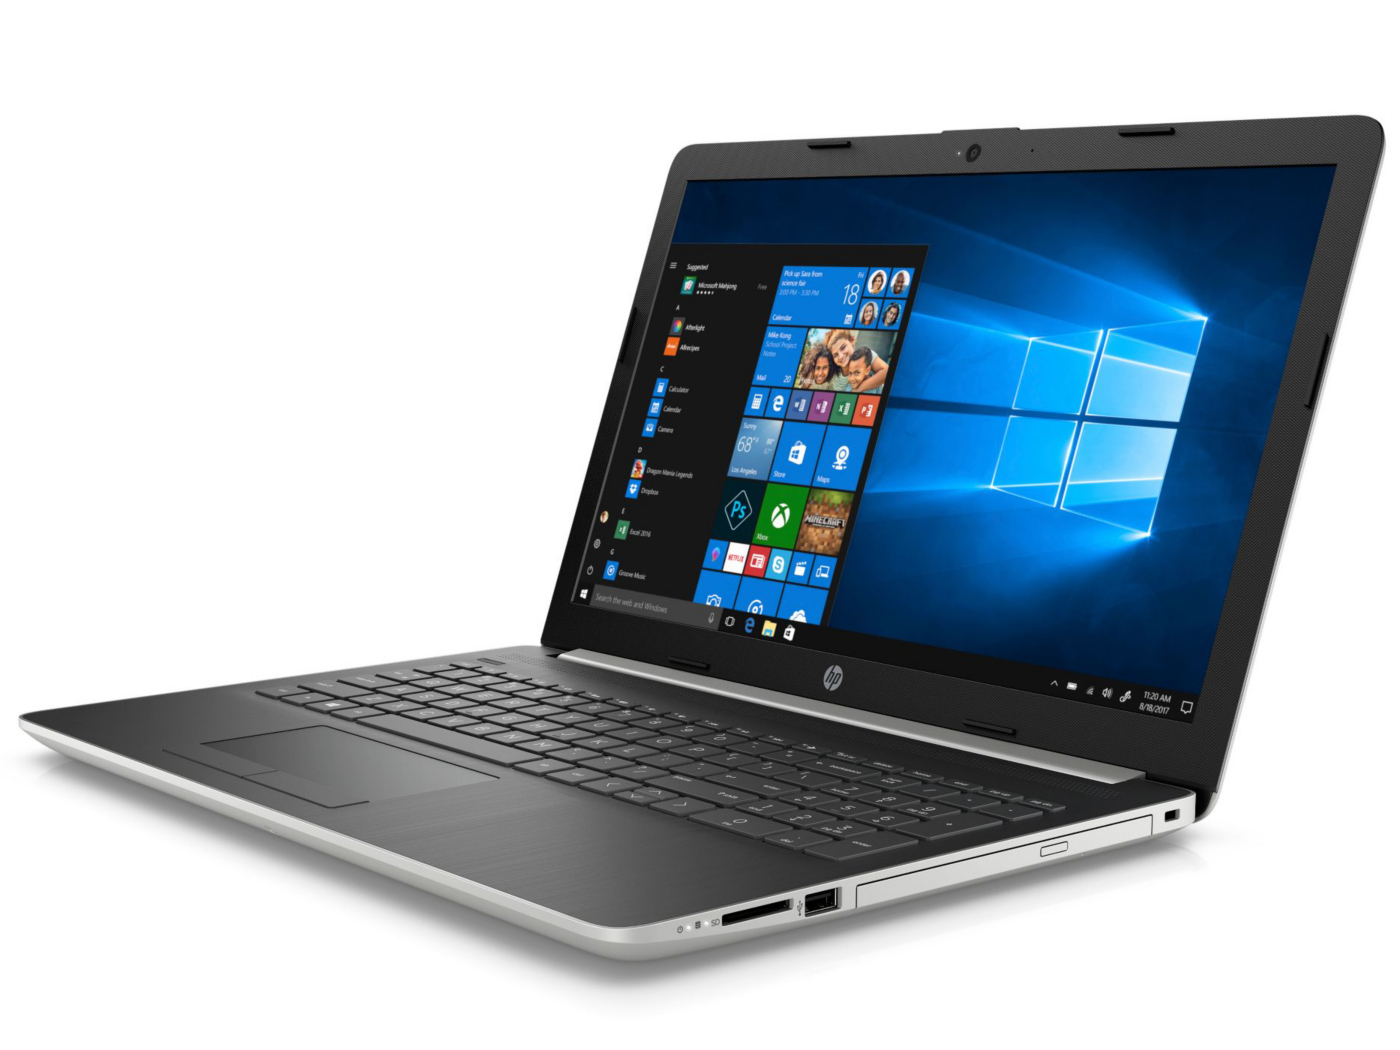
HP 15 (i5-8250U, GeForce MX110, SSD, FHD) Laptop Review

Hewlett Packard’s HP 15-da0405ng is a 15.6-inch office notebook powered by a ULV quad-core made by Intel and a GeForce MX110 GPU. Its competitors are the Acer Aspire 3 A315-41, the Lenovo IdeaPad 320-15IKBRN, and the Asus VivoBook 15 X542UF.
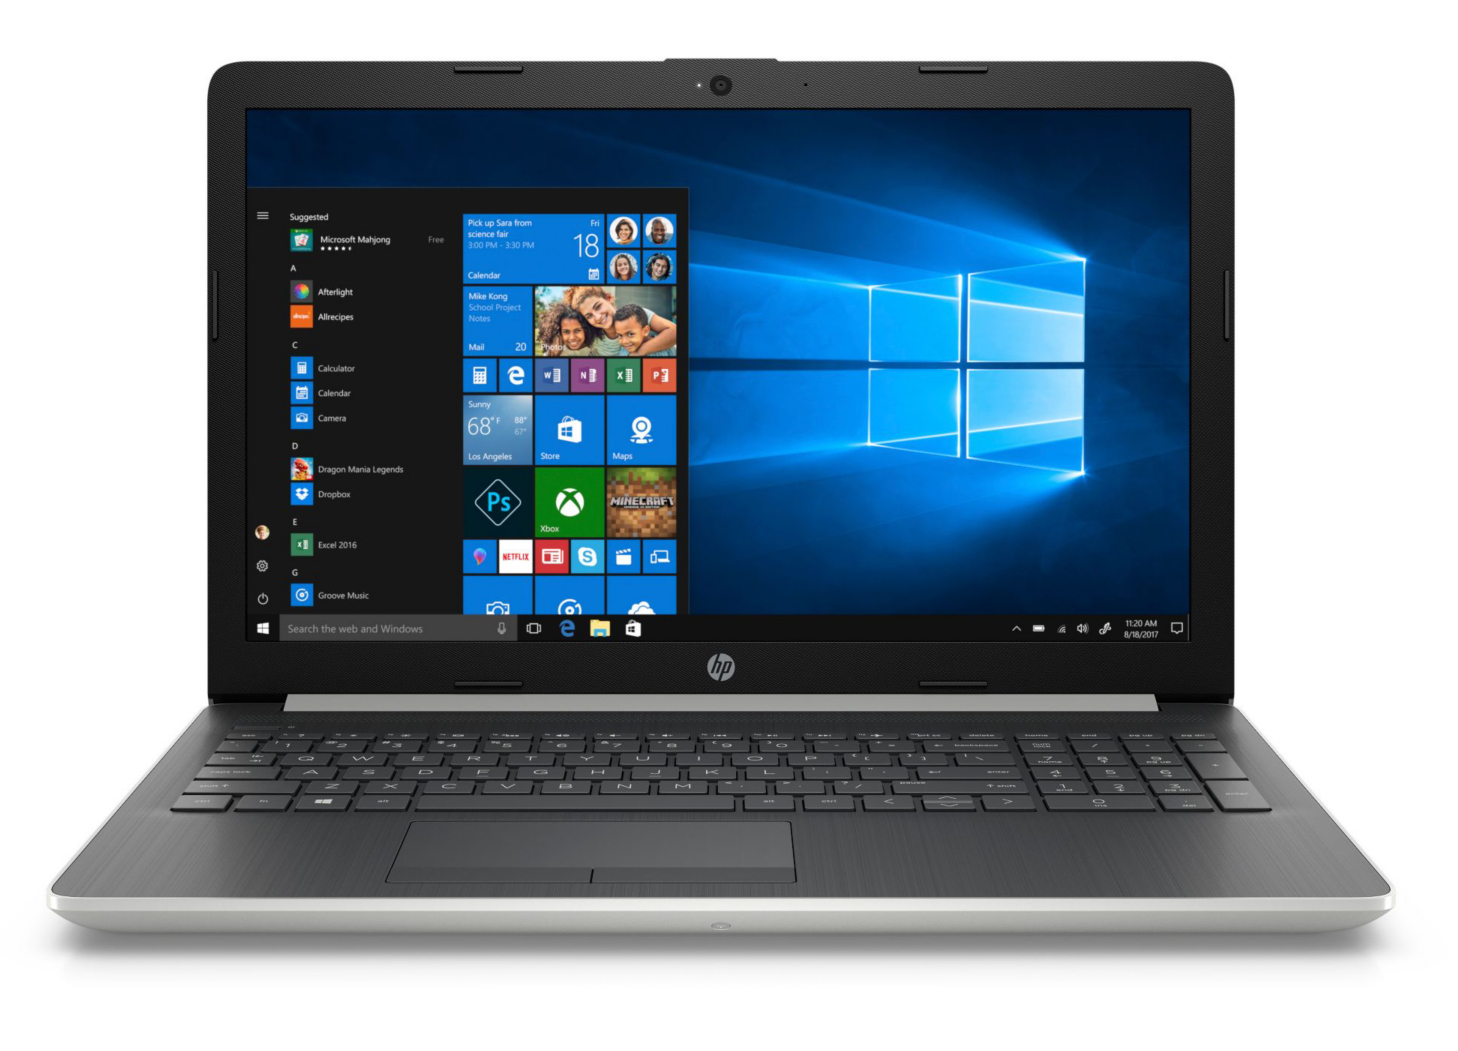
Case
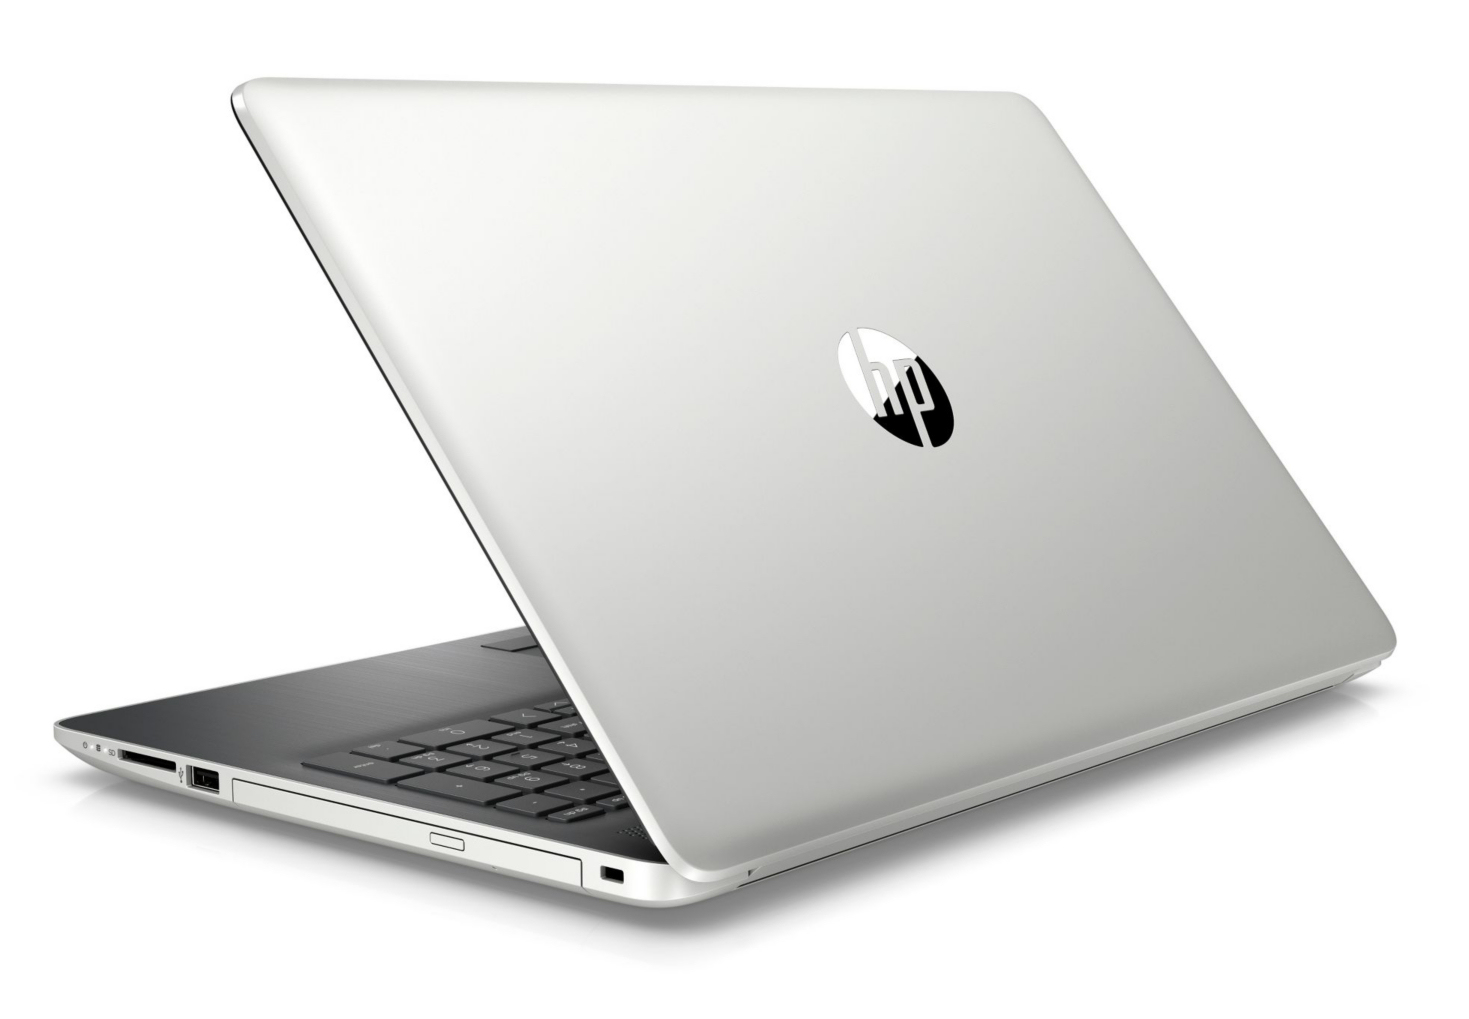
The HP 15’s case is made entirely of plastic. The display bezels and the top of the base are black and the bottom of the base and the display lid are silver. In addition, the top of the base features a faux brushed metal imprint. Build quality was decent overall and so was rigidity. The battery is not user-replaceable.
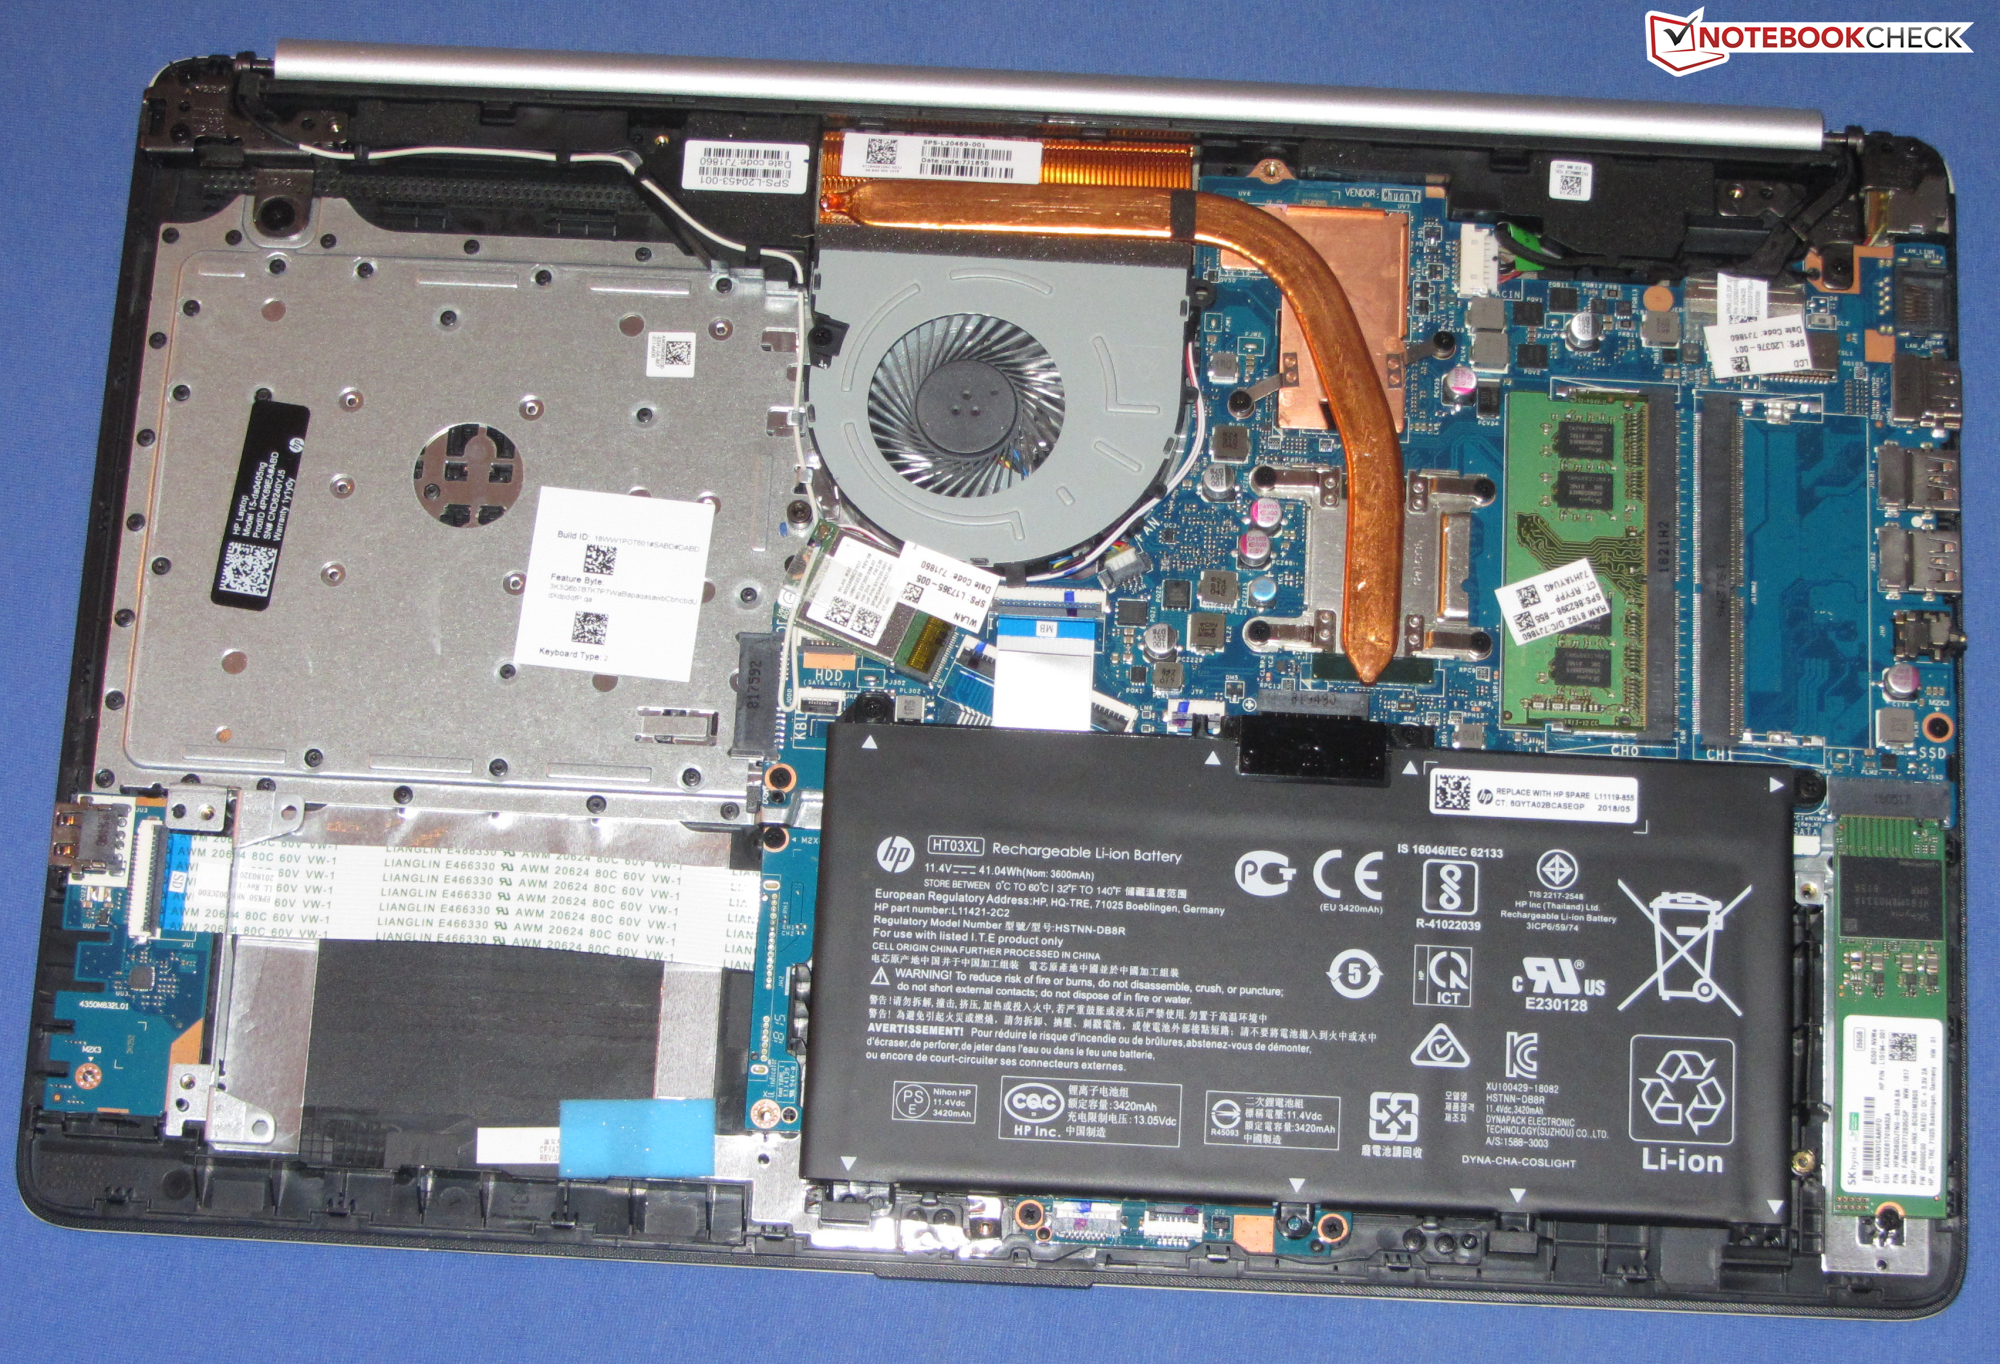
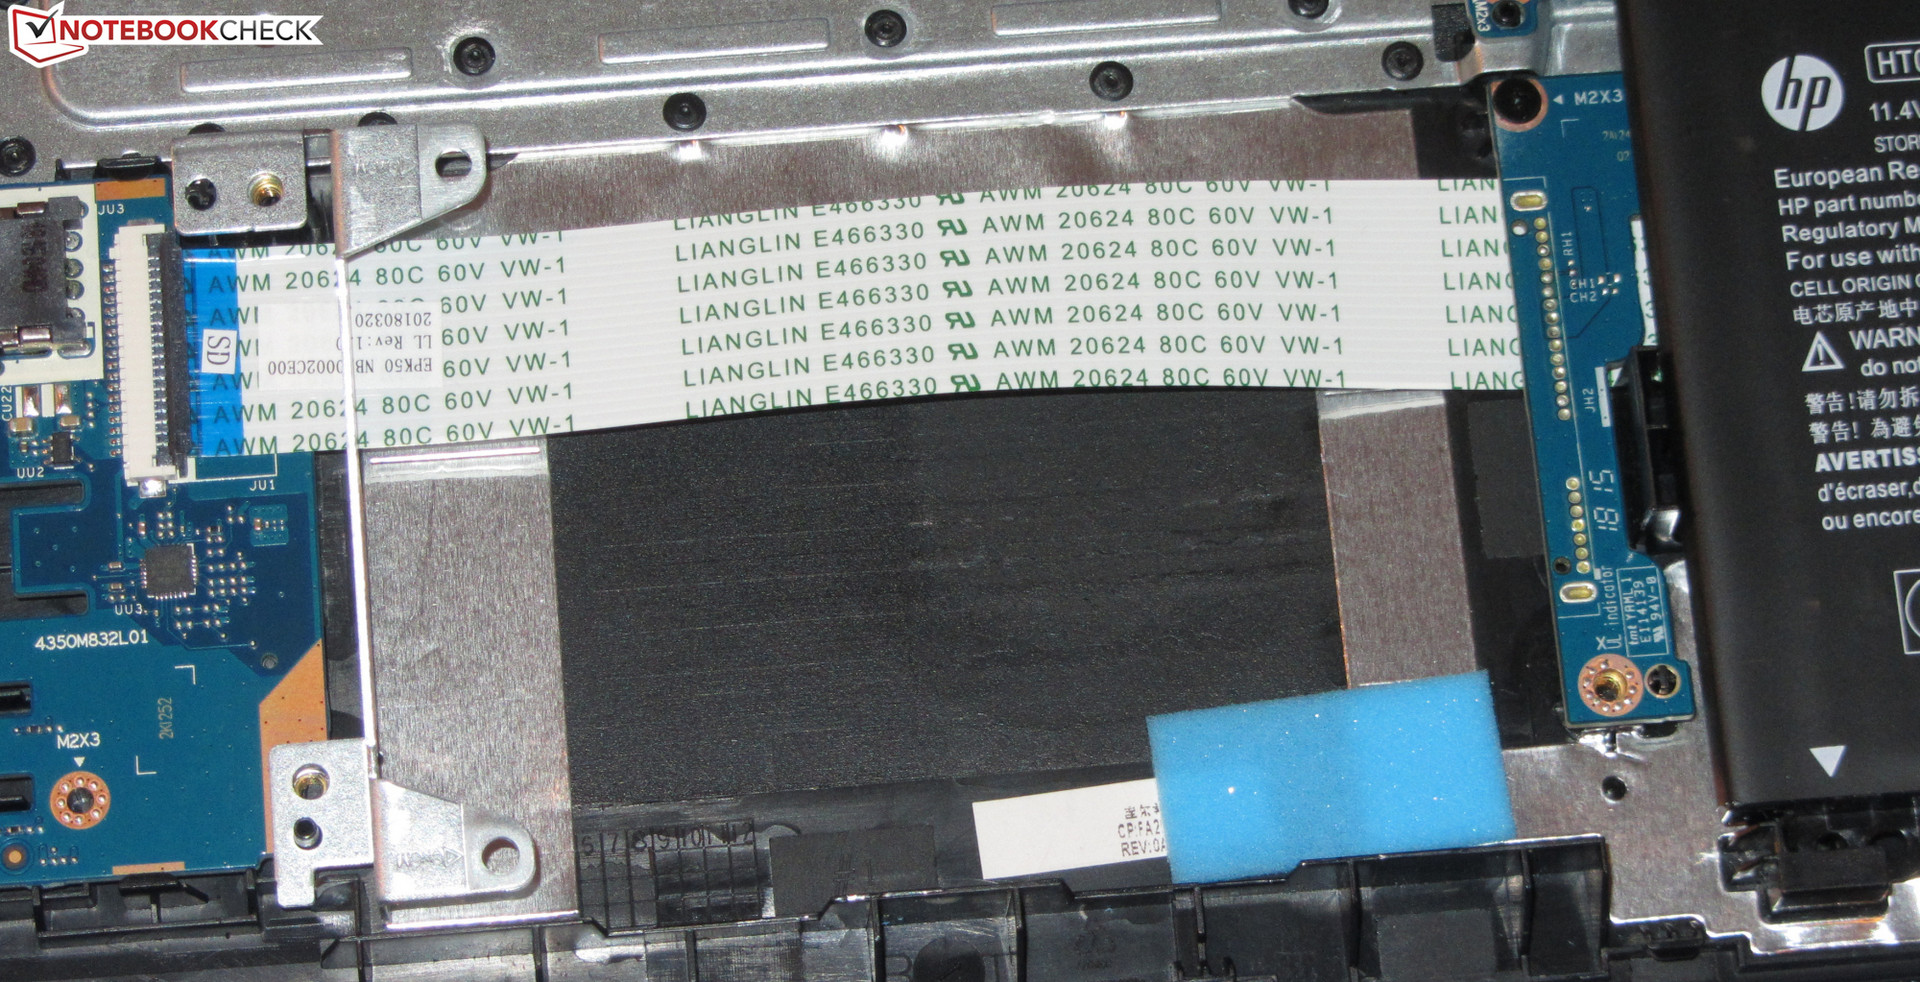
The case lacks a dedicated maintenance opening and consequently requires removal of the entire bottom shell cover in order to access the internal hardware. Unfortunately, this process turned out to be overly complicated. First, you have to remove the optical drive, after which you need to remove the two rubber strips at the bottom as there are screws hidden behind them. You need to be very careful in order to not damage these rubber strips. After undoing all the screws at the bottom the cover can be popped open with a spudger tool, and you need to be very careful once again. Otherwise you might end up scratching the case. In addition, the bottom cover sits very tight.
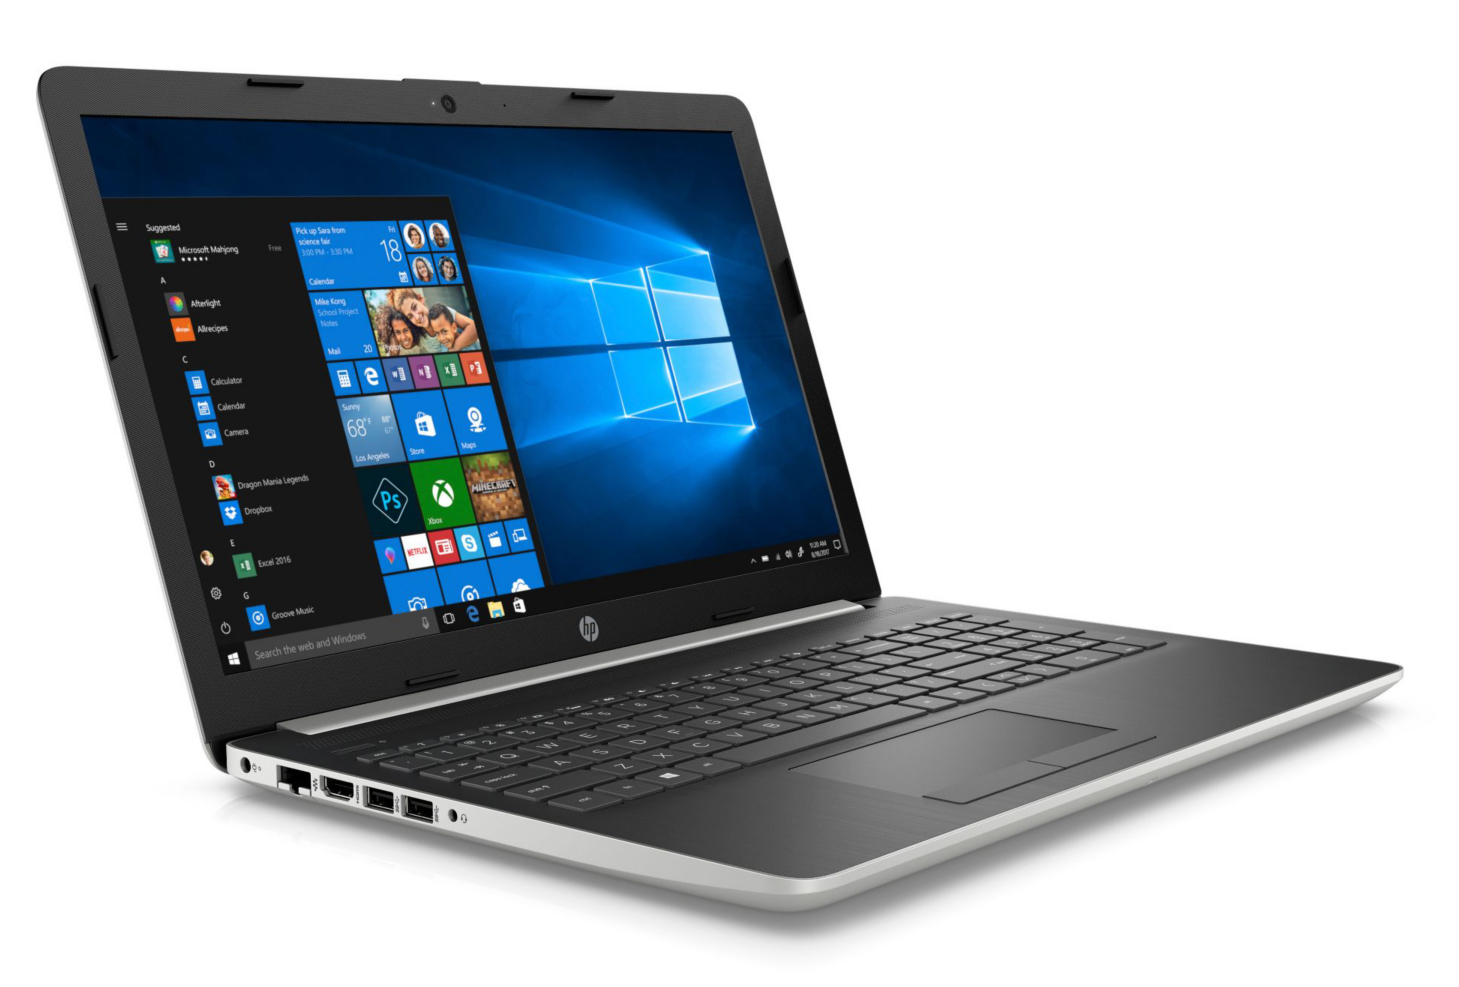
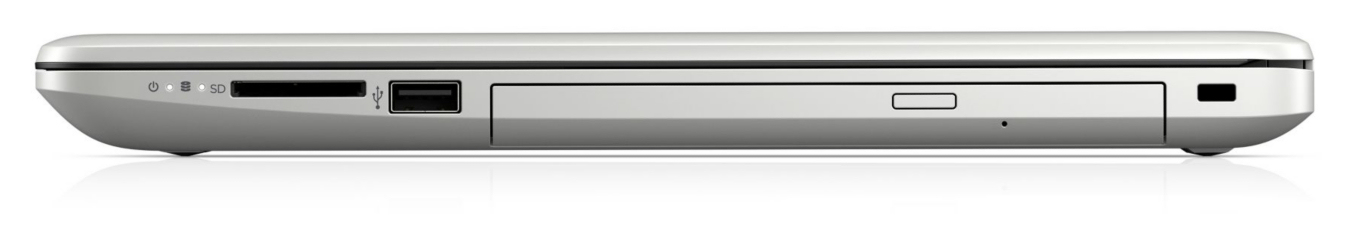
Connectivity
| SD Card Reader | |
| average JPG Copy Test (av. of 3 runs) | |
| Acer Aspire 3 A315-41-R7BM (Toshiba Exceria Pro SDXC 64 GB UHS-II) | |
| Average of class Office (22.4 - 198.5, n=21, last 2 years) | |
| Asus VivoBook 15 X542UF-DM143T (Toshiba Exceria Pro SDXC 64 GB UHS-II) | |
| HP 15-da0405ng (Toshiba Exceria Pro SDXC 64 GB UHS-II) | |
| Lenovo IdeaPad 320-15IKBRN 81BG001KGE (Toshiba Exceria Pro SDXC 64 GB UHS-II) | |
| HP 15-bs103ng (Toshiba Exceria Pro SDXC 64 GB UHS-II) | |
| maximum AS SSD Seq Read Test (1GB) | |
| Acer Aspire 3 A315-41-R7BM (Toshiba Exceria Pro SDXC 64 GB UHS-II) | |
| Average of class Office (27.4 - 249, n=20, last 2 years) | |
| Asus VivoBook 15 X542UF-DM143T (Toshiba Exceria Pro SDXC 64 GB UHS-II) | |
| Lenovo IdeaPad 320-15IKBRN 81BG001KGE (Toshiba Exceria Pro SDXC 64 GB UHS-II) | |
| HP 15-bs103ng (Toshiba Exceria Pro SDXC 64 GB UHS-II) | |
| Networking | |
| iperf3 transmit AX12 | |
| HP 15-bs103ng | |
| Acer Aspire 3 A315-41-R7BM | |
| Lenovo IdeaPad 320-15IKBRN 81BG001KGE | |
| Asus VivoBook 15 X542UF-DM143T | |
| HP 15-da0405ng | |
| iperf3 receive AX12 | |
| Acer Aspire 3 A315-41-R7BM | |
| Asus VivoBook 15 X542UF-DM143T | |
| HP 15-bs103ng | |
| Lenovo IdeaPad 320-15IKBRN 81BG001KGE | |
| HP 15-da0405ng | |
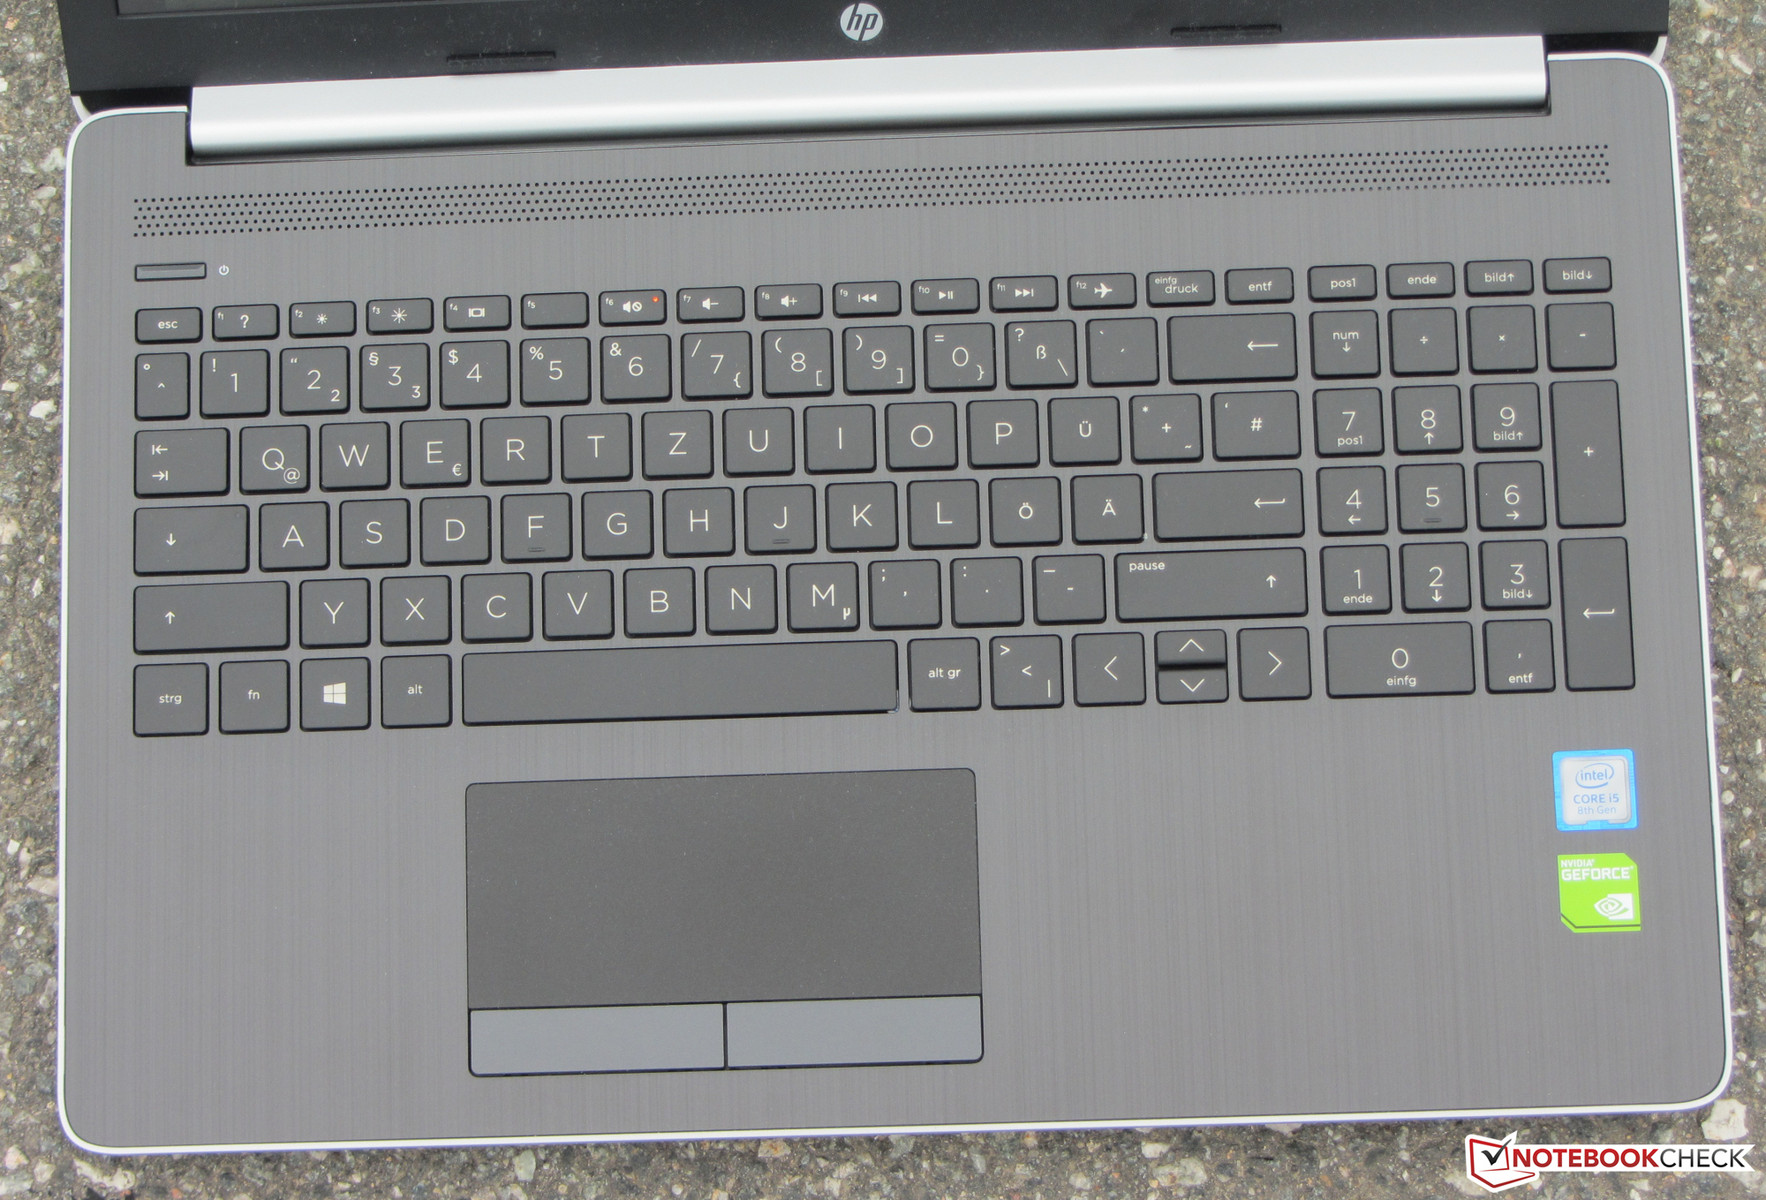
Input Devices
The chiclet keyboard is not backlit but features a numpad in return. The short shallow slightly roughened keys’ travel is rather short but offset by the very well-defined and firm feedback. However, we would have preferred more accentuation resistance as the keys tend to trigger very easily. The keyboard flexed a little bit while typing, which was not particularly bothersome. All things considered, the keyboard was decent and usable for regular long typing sessions.
The multitouch-capable touchpad measures 11.6 x 5.1 cm (4.6 x 2 inches) and is adequately sized for gesture input. Its smooth surface was a pleasure to use and the two dedicated mouse buttons had a short travel but a very well-pronounced and firm accentuation point.
Display
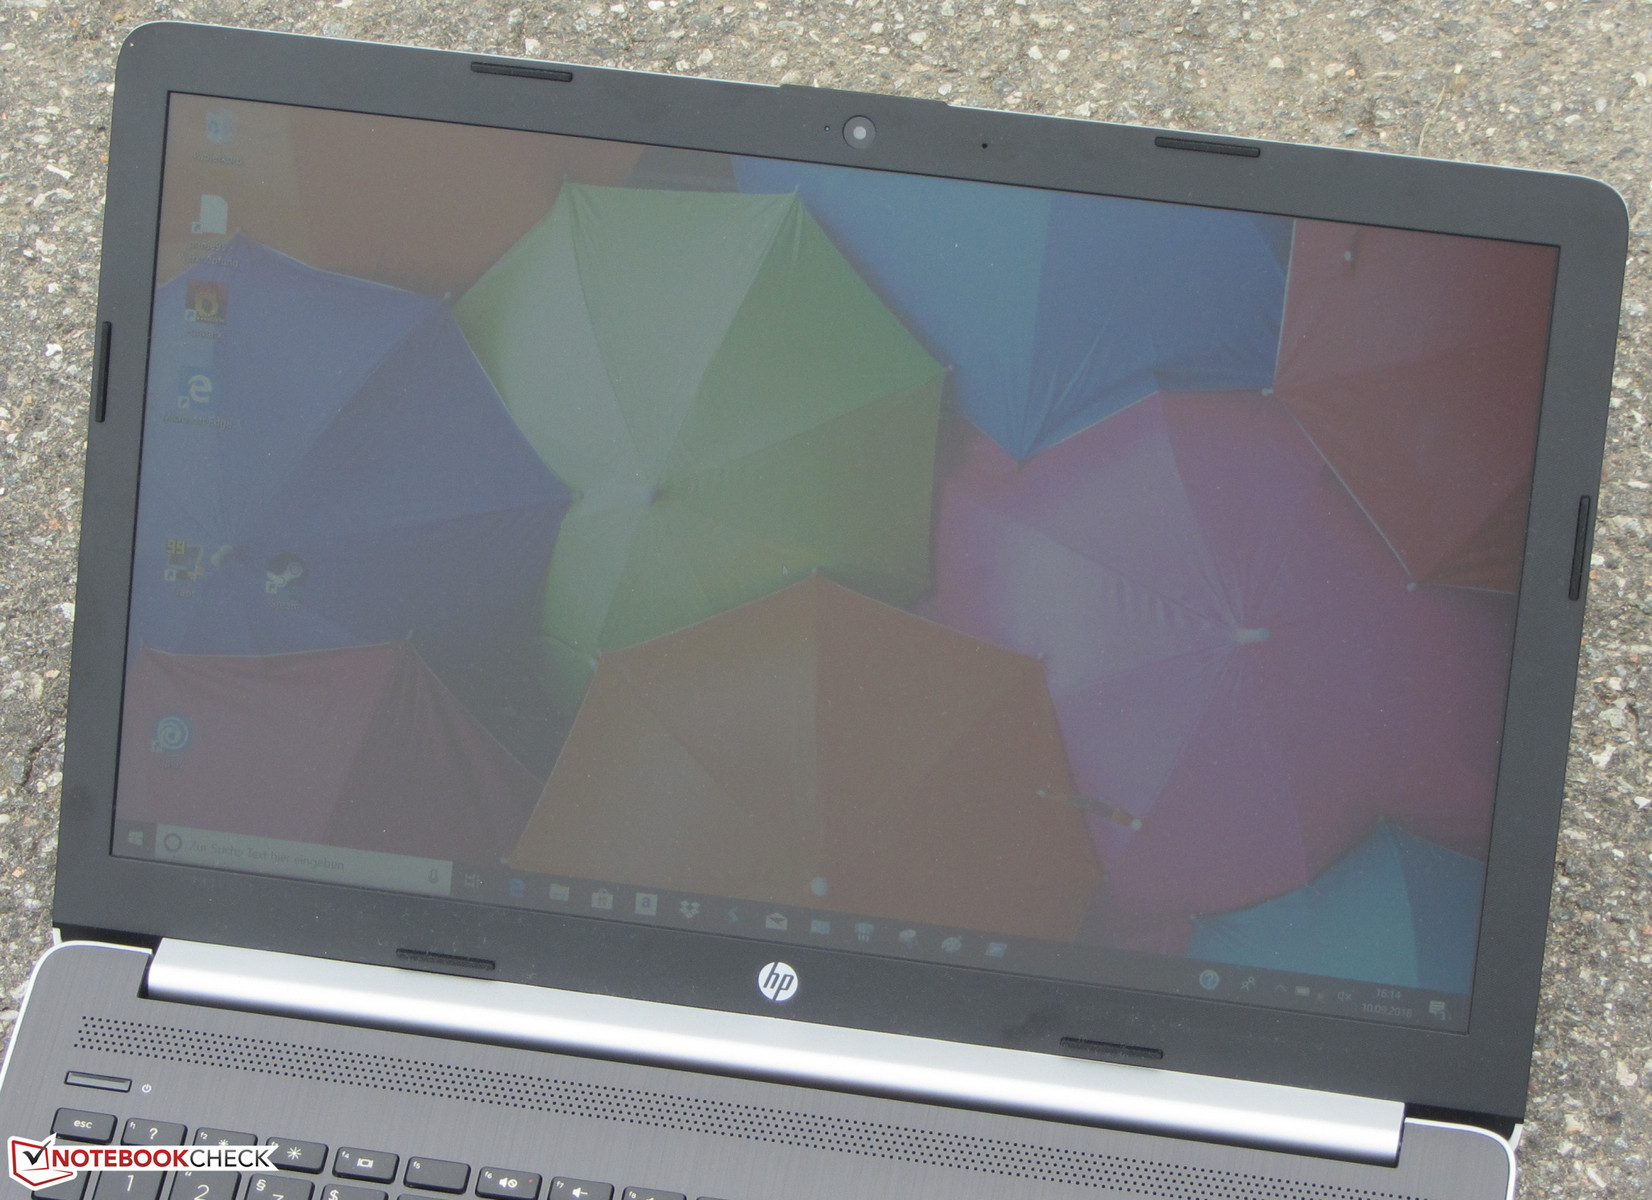
The matte 15.6-inch display features a native FHD resolution of 1920x1080. However, both brightness (163.8 nits) and contrast ratio (568:1) were abysmal and easily outperformed by the entire competition. That being said, not one of the overall pretty dim displays in our comparison group managed to cross the 300 nits threshold.
At brightness levels of 90% and below the display showed PWM flickering at 29,000 Hz. This frequency was high enough to not cause any issues such as headaches or sore eyes even for the more sensitive of our readers.
| |||||||||||||||||||||||||
Brightness Distribution: 69 %
Center on Battery: 176 cd/m²
Contrast: 568:1 (Black: 0.31 cd/m²)
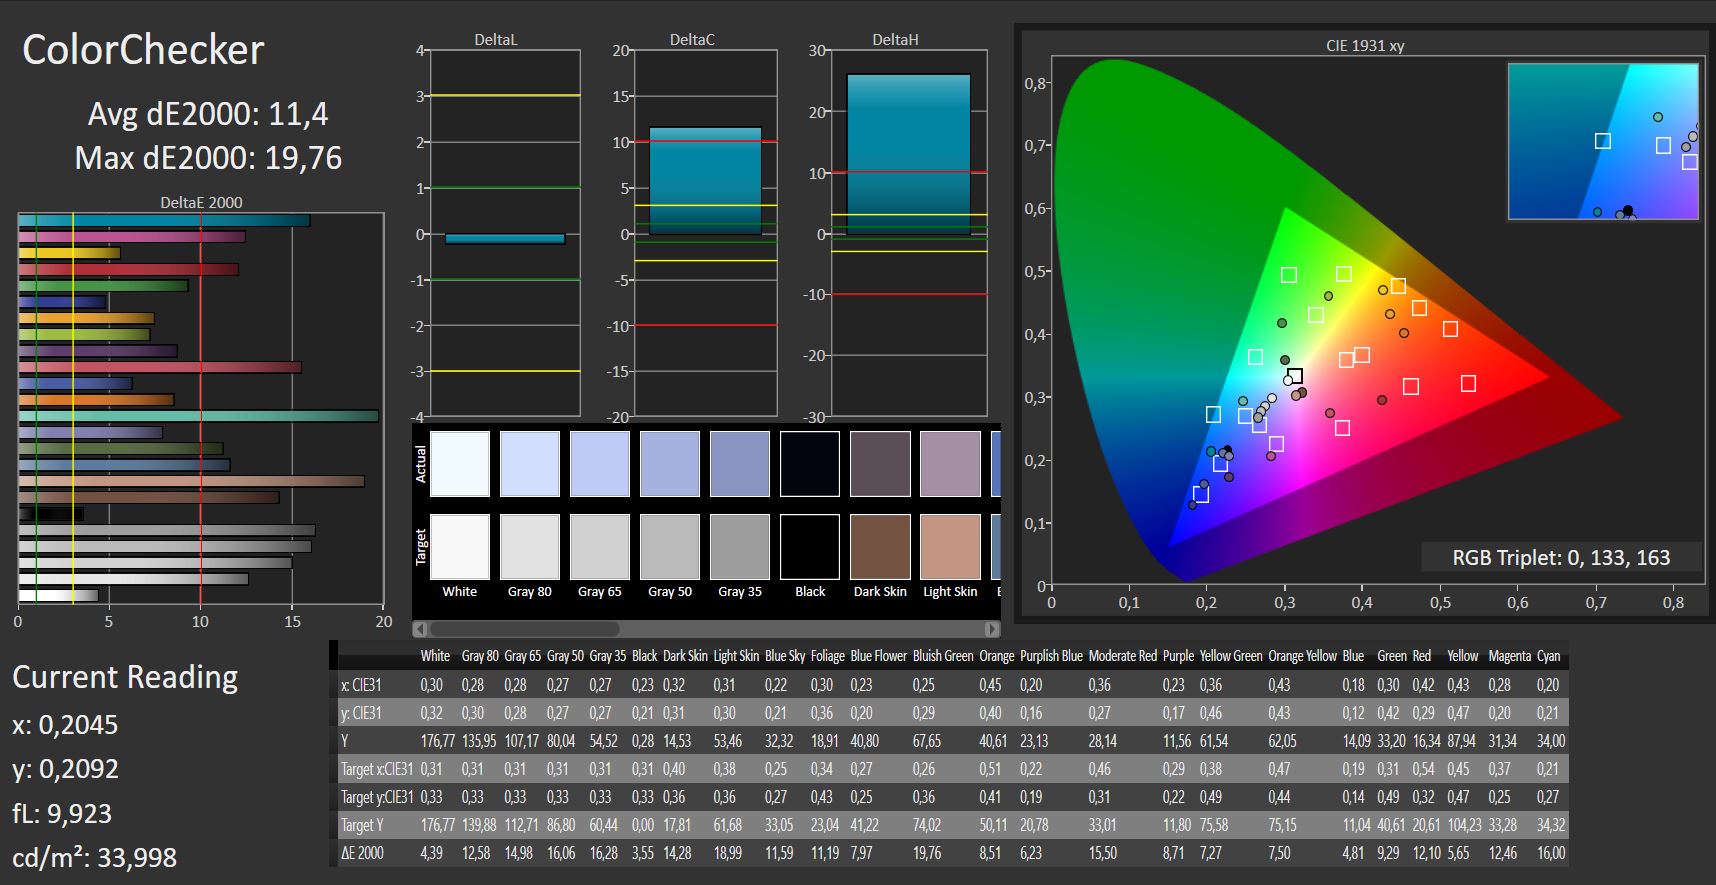
ΔE ColorChecker Calman: 11.4 | ∀{0.5-29.43 Ø4.73}
calibrated: 2.99
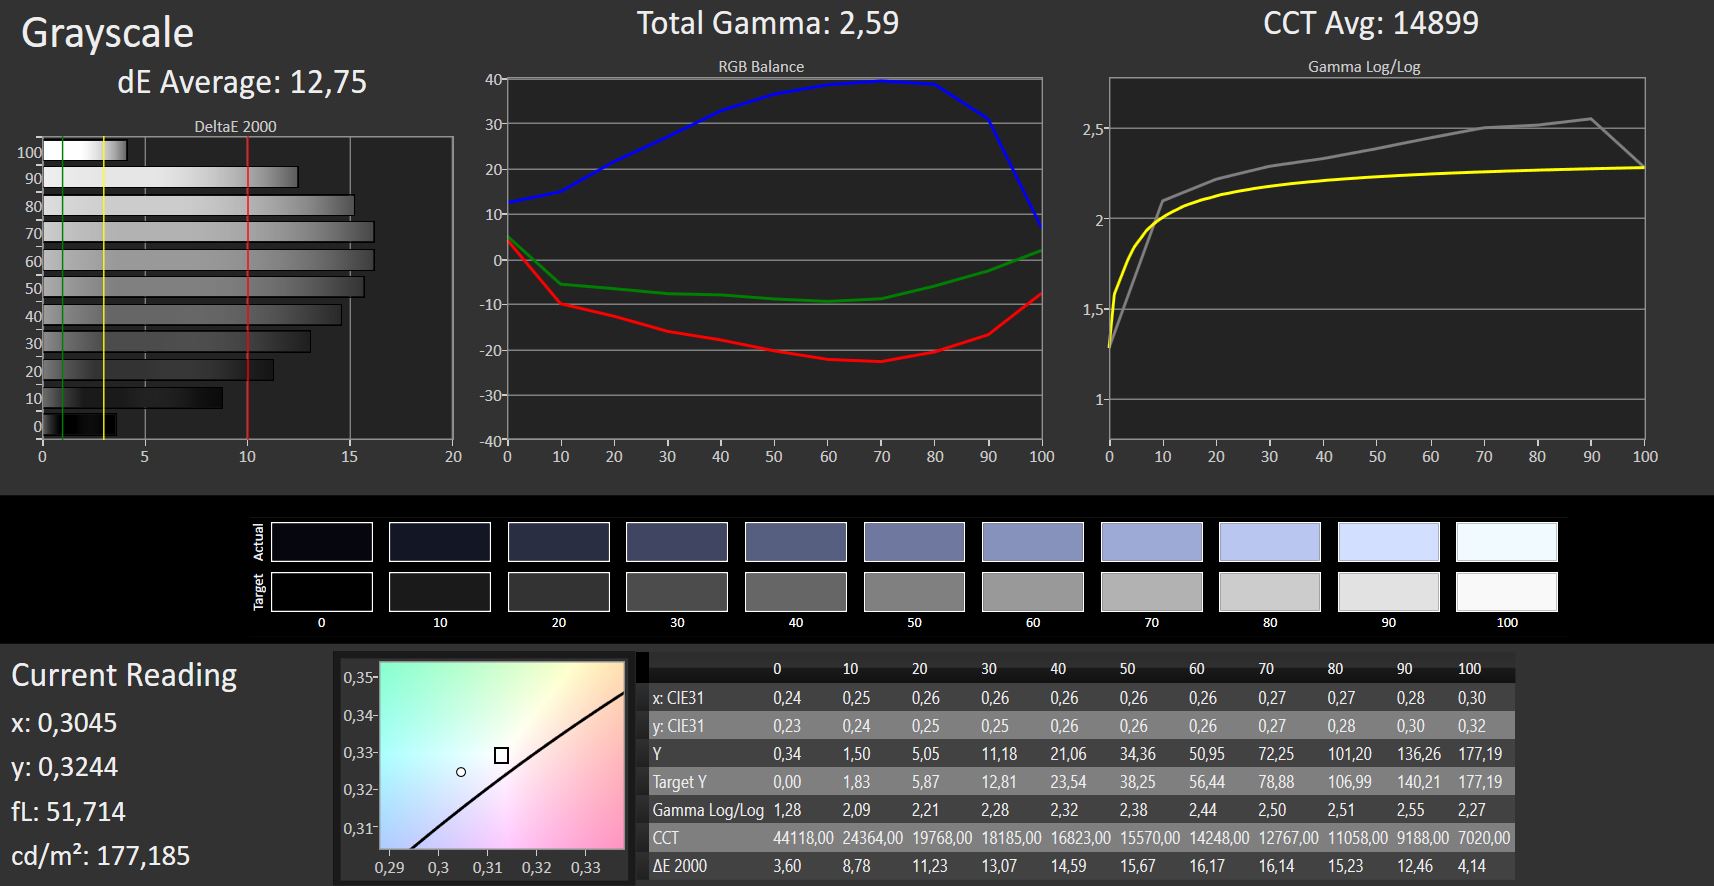
ΔE Greyscale Calman: 12.75 | ∀{0.09-98 Ø4.97}
59% sRGB (Argyll 1.6.3 3D)
38% AdobeRGB 1998 (Argyll 1.6.3 3D)
40.83% AdobeRGB 1998 (Argyll 3D)
59.4% sRGB (Argyll 3D)
39.52% Display P3 (Argyll 3D)
Gamma: 2.59
CCT: 14899 K
| HP 15-da0405ng TN LED, 1920x1080, 15.6" | Acer Aspire 3 A315-41-R7BM TN LED, 1920x1080, 15.6" | Asus VivoBook 15 X542UF-DM143T TN LED, 1920x1080, 15.6" | Lenovo IdeaPad 320-15IKBRN 81BG001KGE TN LED, 1920x1080, 15.6" | HP 15-bs103ng TN LED, 1920x1080, 15.6" | |
|---|---|---|---|---|---|
| Display | 1% | -5% | 6% | -8% | |
| Display P3 Coverage (%) | 39.52 | 40.09 1% | 37.47 -5% | 42.04 6% | 36.55 -8% |
| sRGB Coverage (%) | 59.4 | 59.7 1% | 56.4 -5% | 62.8 6% | 55 -7% |
| AdobeRGB 1998 Coverage (%) | 40.83 | 41.47 2% | 38.71 -5% | 43.44 6% | 37.76 -8% |
| Response Times | -8% | -23% | -17% | -38% | |
| Response Time Grey 50% / Grey 80% * (ms) | 41 ? | 44 ? -7% | 41 ? -0% | 45.6 ? -11% | 44 ? -7% |
| Response Time Black / White * (ms) | 13 ? | 14 ? -8% | 19 ? -46% | 16 ? -23% | 22 ? -69% |
| PWM Frequency (Hz) | 29000 ? | 25000 ? | 7000 ? | 25770 ? | |
| Screen | 6% | 25% | 2% | -1% | |
| Brightness middle (cd/m²) | 176 | 234 33% | 230 31% | 220 25% | 241 37% |
| Brightness (cd/m²) | 164 | 211 29% | 221 35% | 194 18% | 235 43% |
| Brightness Distribution (%) | 69 | 83 20% | 91 32% | 84 22% | 84 22% |
| Black Level * (cd/m²) | 0.31 | 0.43 -39% | 0.45 -45% | 0.43 -39% | 0.43 -39% |
| Contrast (:1) | 568 | 544 -4% | 511 -10% | 512 -10% | 560 -1% |
| Colorchecker dE 2000 * | 11.4 | 11.27 1% | 3.6 68% | 11.8 -4% | 13.62 -19% |
| Colorchecker dE 2000 max. * | 19.76 | 18.03 9% | 5.59 72% | 20.6 -4% | 22.81 -15% |
| Colorchecker dE 2000 calibrated * | 2.99 | ||||
| Greyscale dE 2000 * | 12.75 | 11.54 9% | 3.13 75% | 12.5 2% | 15.19 -19% |
| Gamma | 2.59 85% | 2.09 105% | 2.45 90% | 2.07 106% | 2.13 103% |
| CCT | 14899 44% | 11607 56% | 7244 90% | 14346 45% | 17407 37% |
| Color Space (Percent of AdobeRGB 1998) (%) | 38 | 38 0% | 36 -5% | 40.1 6% | 35 -8% |
| Color Space (Percent of sRGB) (%) | 59 | 60 2% | 56 -5% | 62.7 6% | 55 -7% |
| Total Average (Program / Settings) | -0% /
3% | -1% /
12% | -3% /
0% | -16% /
-7% |
* ... smaller is better
Screen Flickering / PWM (Pulse-Width Modulation)
| Screen flickering / PWM detected | 29000 Hz | ≤ 90 % brightness setting | 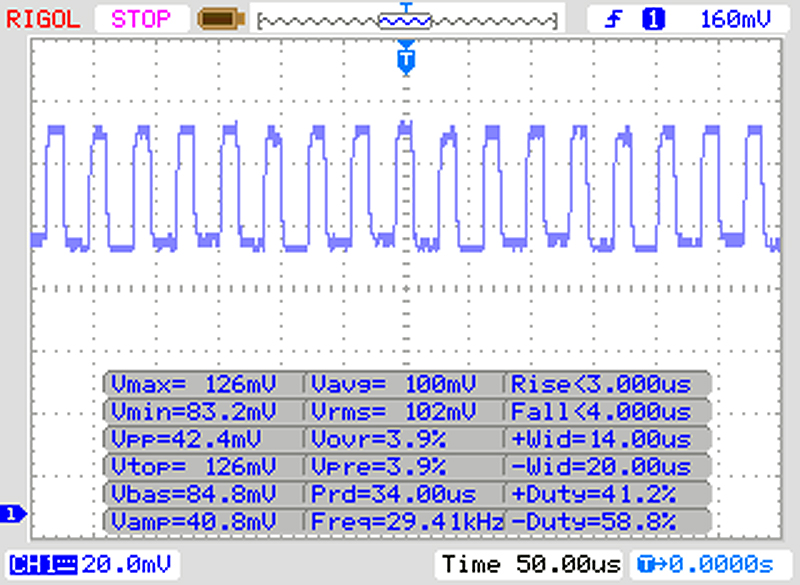 |
The display backlight flickers at 29000 Hz (worst case, e.g., utilizing PWM) Flickering detected at a brightness setting of 90 % and below. There should be no flickering or PWM above this brightness setting. The frequency of 29000 Hz is quite high, so most users sensitive to PWM should not notice any flickering. In comparison: 52 % of all tested devices do not use PWM to dim the display. If PWM was detected, an average of 7794 (minimum: 5 - maximum: 343500) Hz was measured. | |||
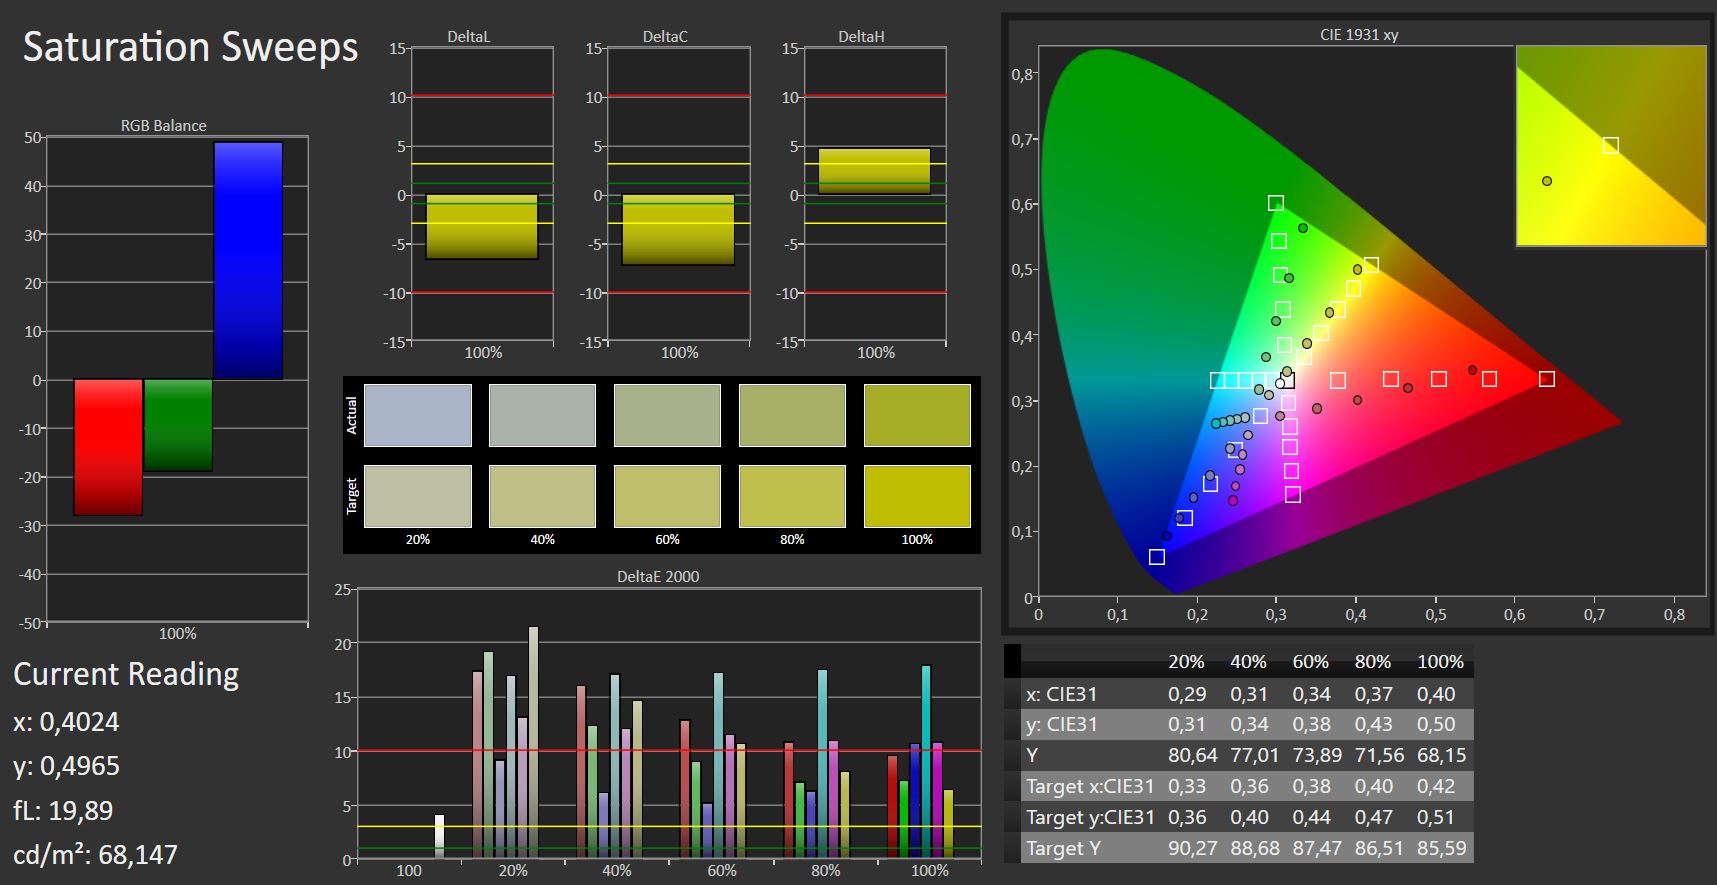
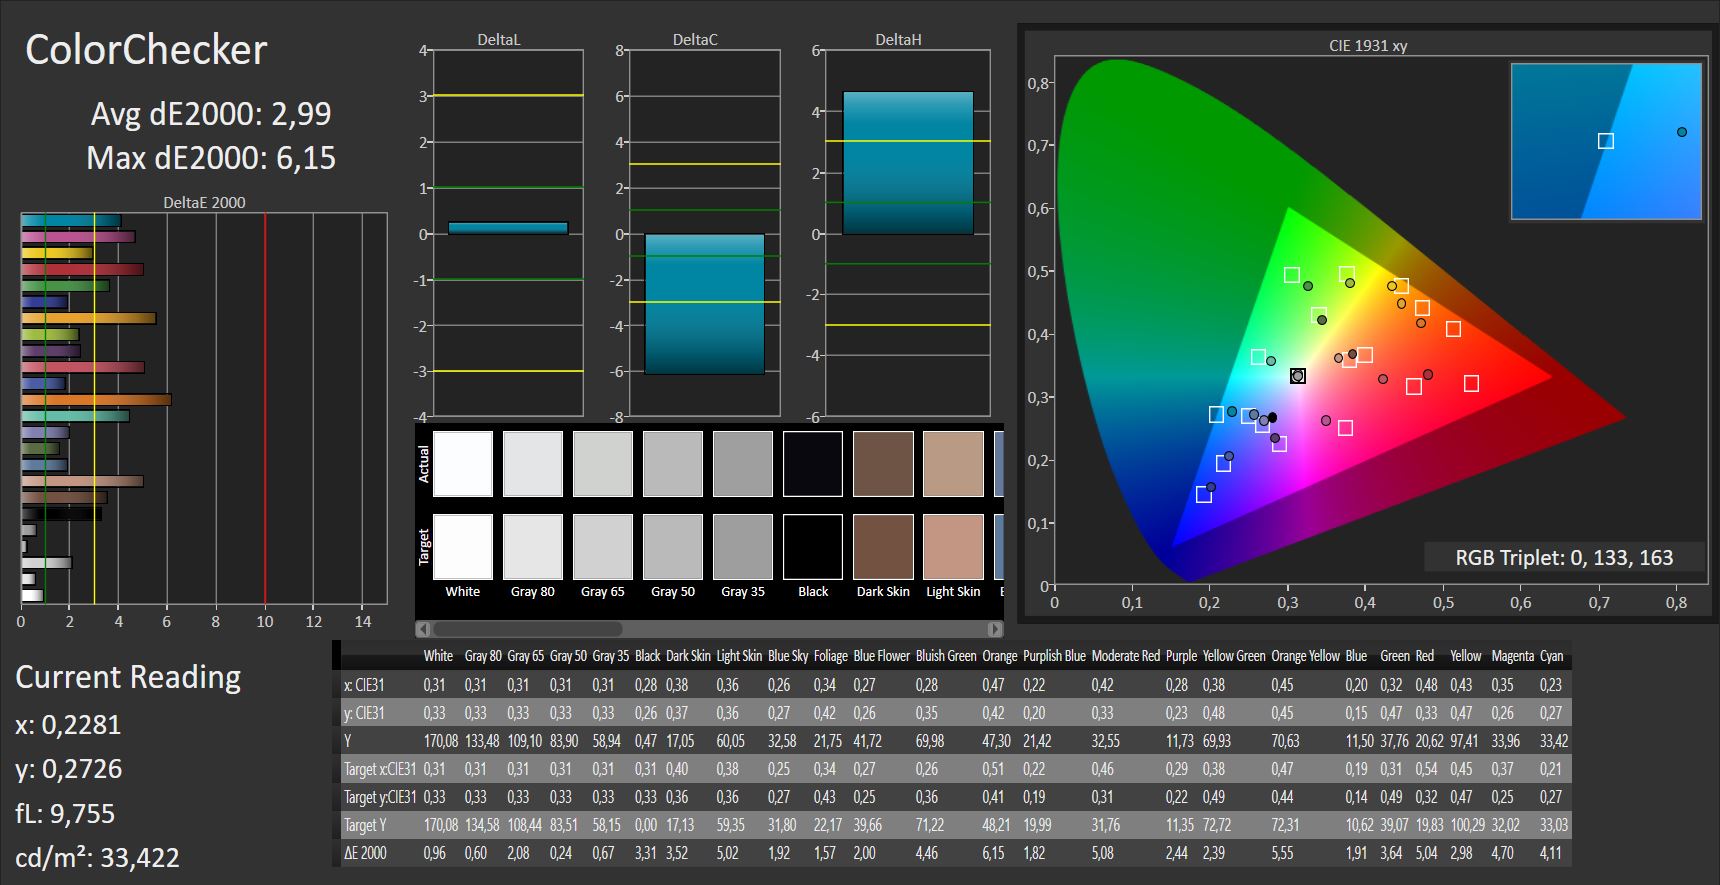
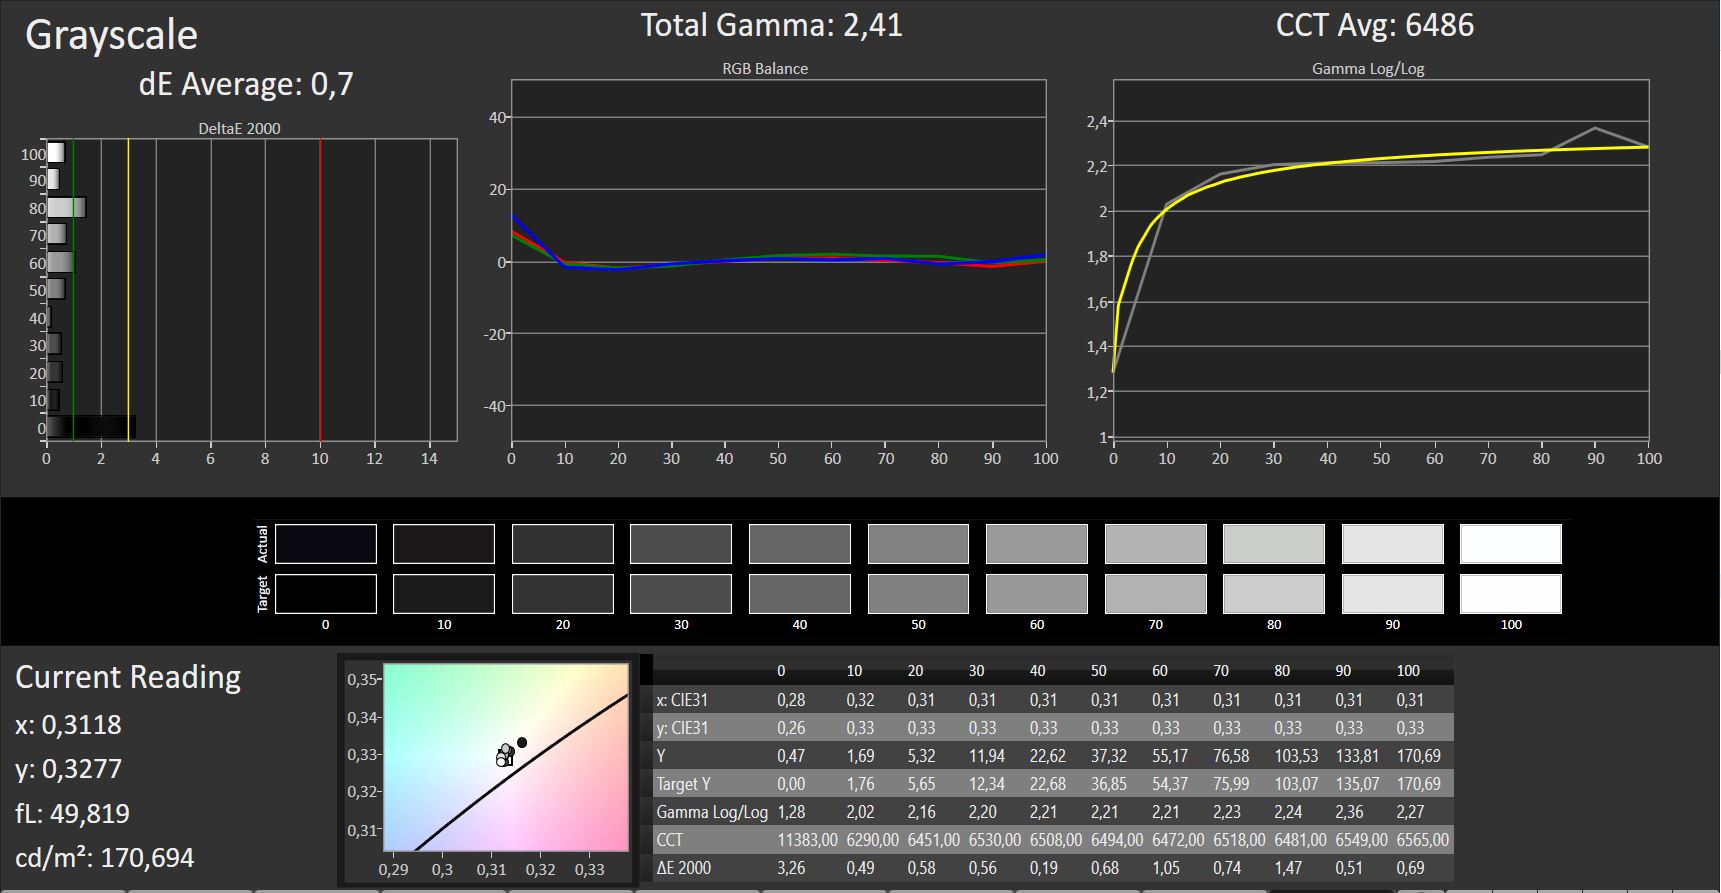
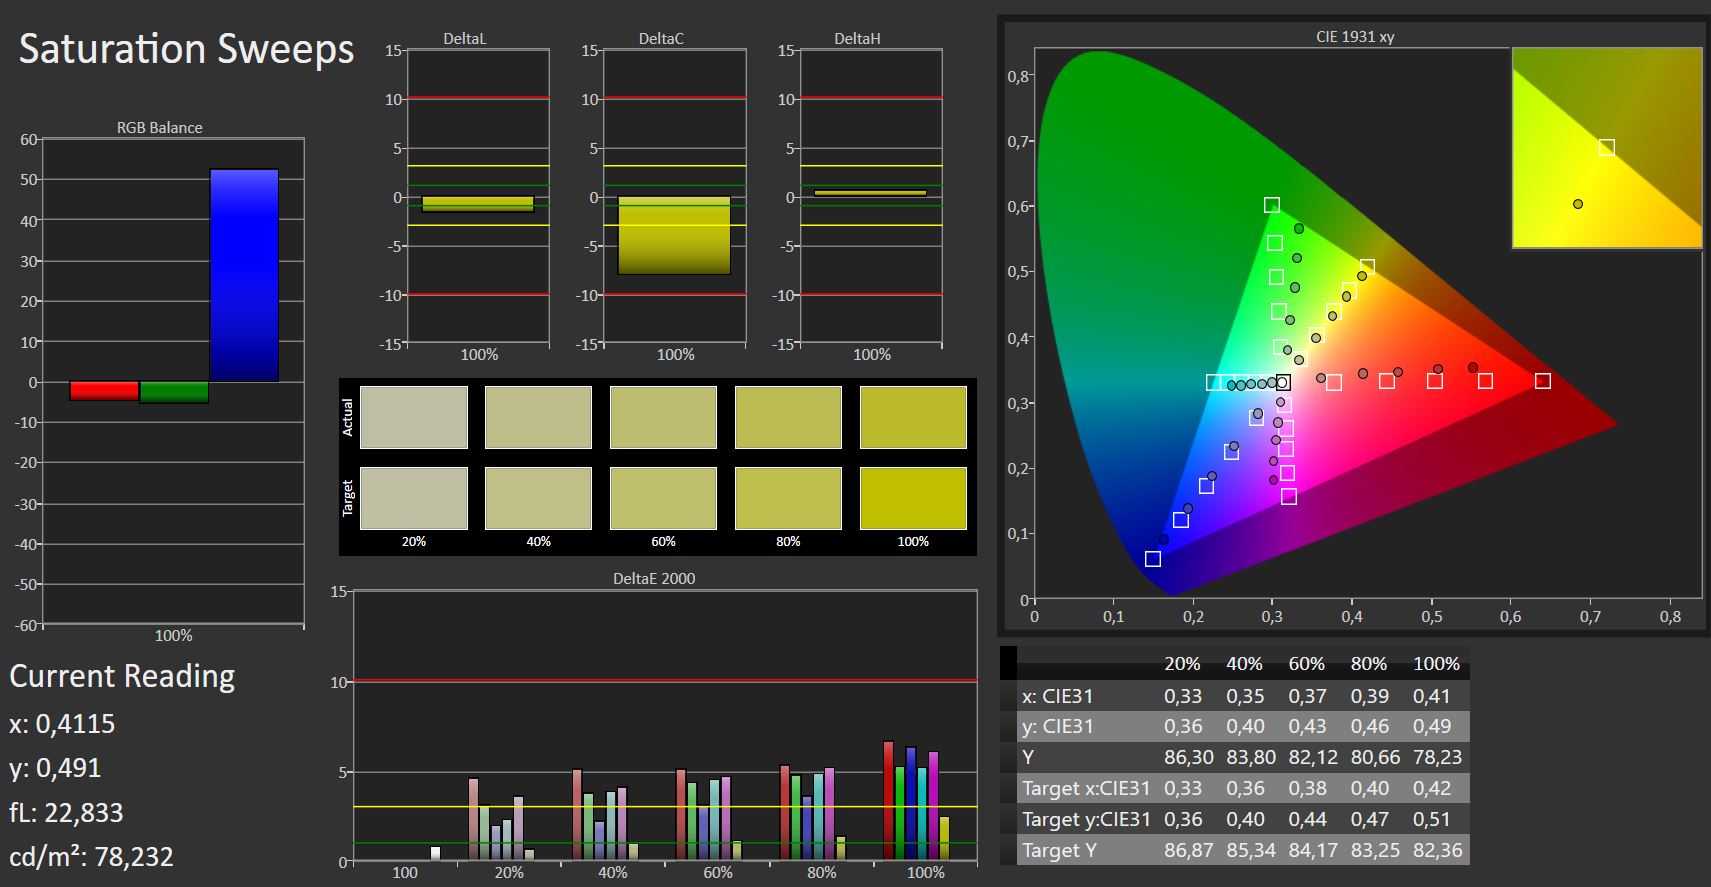
With a DeltaE 2000 deviation for colors of 11.4, accuracy out of the box was rather poor. Ideally, one should be aiming for values of less than 3. In addition, the display suffered from a very visible blue tint. We were able to improve accuracy significantly through calibration. DeltaE for colors was lowered to 2.99 and grays were much more balanced and devoid of the previously visible blue tint.
As usual, the resulting ICC profile can be found for download in the box above. Please remember to make sure you have the exact same display (make and model) as we did, otherwise using the profile might actually impair color accuracy and balance instead of improving it. Many manufacturers use various different displays within one series.
Display Response Times
| ↔ Response Time Black to White | ||
|---|---|---|
| 13 ms ... rise ↗ and fall ↘ combined | ↗ 8 ms rise | 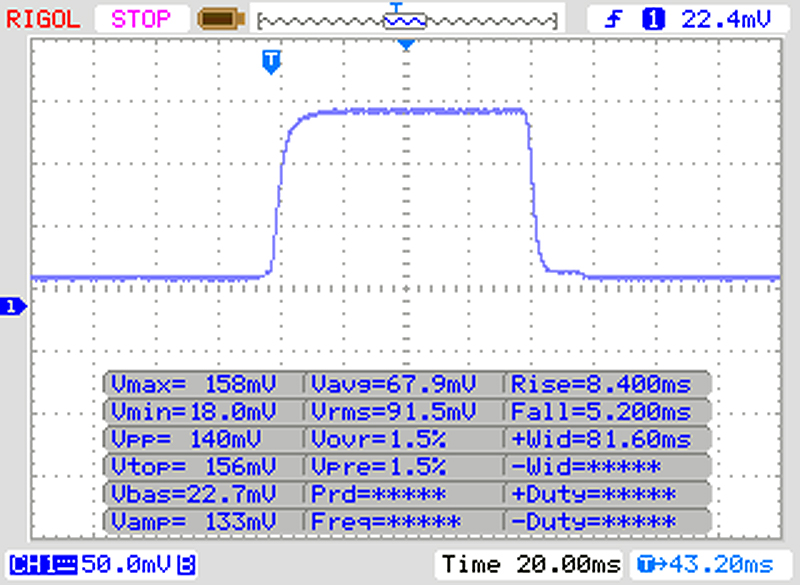 |
| ↘ 5 ms fall | ||
| The screen shows good response rates in our tests, but may be too slow for competitive gamers. In comparison, all tested devices range from 0.1 (minimum) to 240 (maximum) ms. » 33 % of all devices are better. This means that the measured response time is better than the average of all tested devices (19.9 ms). | ||
| ↔ Response Time 50% Grey to 80% Grey | ||
| 41 ms ... rise ↗ and fall ↘ combined | ↗ 22 ms rise | 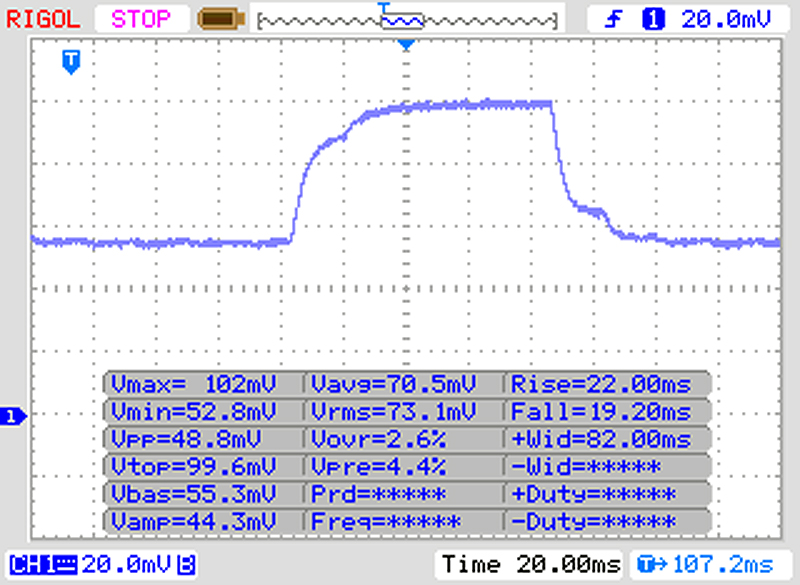 |
| ↘ 19 ms fall | ||
| The screen shows slow response rates in our tests and will be unsatisfactory for gamers. In comparison, all tested devices range from 0.165 (minimum) to 636 (maximum) ms. » 65 % of all devices are better. This means that the measured response time is worse than the average of all tested devices (31.1 ms). | ||
The panel is based on TN technology and as such it features rather poor viewing angles. Accordingly, it cannot be viewed equally well from all angles. Outdoors, it can only be used on overcast days or in the shade due to its abysmally low brightness.
Performance
The HP 15-da0405ng is a 15.6-inch office notebook with plenty of computing prowess for the most common office and Internet applications. Thanks to its dedicated GPU it is even somewhat usable for light gaming. At the time of writing, our review unit sold for around $700. Other SKUs are also available.
Processor
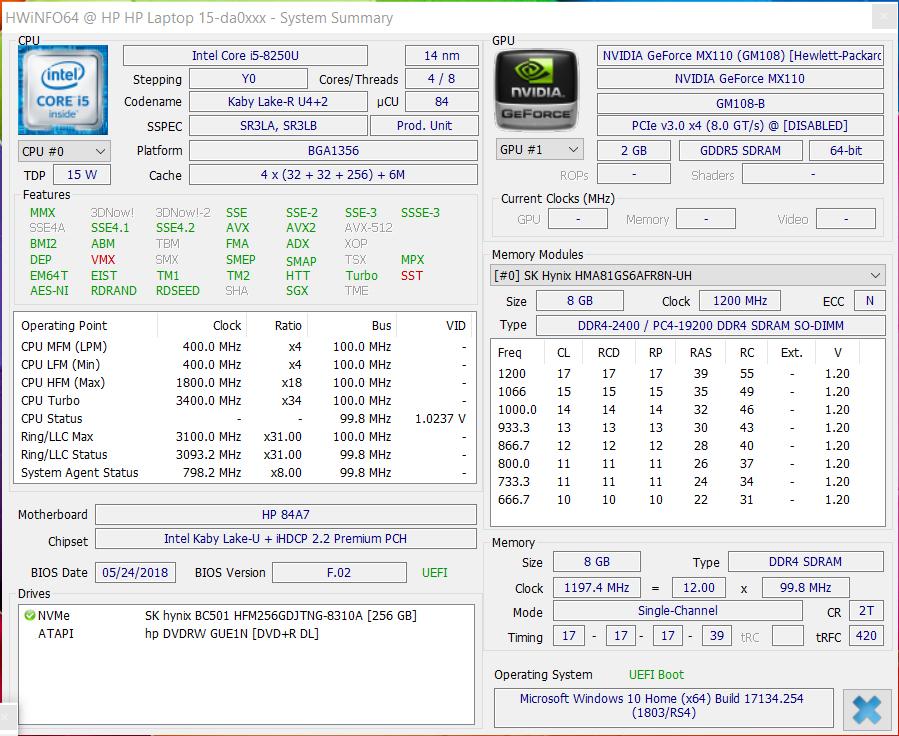
Our review unit came equipped with Intel’s Core i5-8250U ULV quad-core (Kaby Lake Refresh) with a TDP of 15 W. It runs at a base clock speed of 1.6 GHz and can turbo boost up to 3.4 GHz.
During our Cinebench multithread test the CPU ran at 2.9 to 3.1 GHz for a few seconds, after which it dropped to 2.4-2.5 GHz. Single-thread benchmarks were performed at its full turbo boost of 3.4 GHz. The behavior was identical on battery and on mains.
We test every candidate’s long-term load capabilities by running the Cinebench multithread test in a 30-minute loop. The scores dropped between the first and third iteration and remained on that level thereafter. Turbo boost was applied throughout the entire test, and the CPU ran at 2.4-2.5 GHz.
| Cinebench R10 | |
| Rendering Single 32Bit | |
| Average of class Office (4212 - 10817, n=15, last 2 years) | |
| Average Intel Core i5-8250U (5349 - 8356, n=42) | |
| Lenovo IdeaPad 320-15IKBRN 81BG001KGE | |
| Asus VivoBook 15 X542UF-DM143T | |
| HP 15-da0405ng | |
| HP 15-bs103ng | |
| Acer Aspire 3 A315-41-R7BM | |
| Rendering Multiple CPUs 32Bit | |
| Average of class Office (7657 - 60850, n=15, last 2 years) | |
| Asus VivoBook 15 X542UF-DM143T | |
| Average Intel Core i5-8250U (14148 - 22097, n=42) | |
| Lenovo IdeaPad 320-15IKBRN 81BG001KGE | |
| HP 15-bs103ng | |
| HP 15-da0405ng | |
| Acer Aspire 3 A315-41-R7BM | |
| Geekbench 3 | |
| 32 Bit Multi-Core Score | |
| Asus VivoBook 15 X542UF-DM143T | |
| HP 15-bs103ng | |
| Average Intel Core i5-8250U (10893 - 13553, n=18) | |
| HP 15-da0405ng | |
| Acer Aspire 3 A315-41-R7BM | |
| 32 Bit Single-Core Score | |
| Average Intel Core i5-8250U (3148 - 3503, n=18) | |
| Asus VivoBook 15 X542UF-DM143T | |
| HP 15-bs103ng | |
| HP 15-da0405ng | |
| Acer Aspire 3 A315-41-R7BM | |
| Geekbench 4.0 | |
| 64 Bit Multi-Core Score | |
| Average of class Office (15873 - 41046, n=4, last 2 years) | |
| Asus VivoBook 15 X542UF-DM143T | |
| Average Intel Core i5-8250U (10751 - 13486, n=19) | |
| HP 15-bs103ng | |
| HP 15-da0405ng | |
| Acer Aspire 3 A315-41-R7BM | |
| 64 Bit Single-Core Score | |
| Average of class Office (4598 - 7721, n=4, last 2 years) | |
| Average Intel Core i5-8250U (3924 - 4243, n=19) | |
| Asus VivoBook 15 X542UF-DM143T | |
| HP 15-bs103ng | |
| HP 15-da0405ng | |
| Acer Aspire 3 A315-41-R7BM | |
| Geekbench 4.4 | |
| 64 Bit Multi-Core Score | |
| Average of class Office (23754 - 41544, n=9, last 2 years) | |
| Average Intel Core i5-8250U (11269 - 14228, n=25) | |
| Asus VivoBook 15 X542UF-DM143T | |
| HP 15-bs103ng | |
| HP 15-da0405ng | |
| Acer Aspire 3 A315-41-R7BM | |
| 64 Bit Single-Core Score | |
| Average of class Office (4564 - 8042, n=9, last 2 years) | |
| Average Intel Core i5-8250U (3453 - 4330, n=25) | |
| Asus VivoBook 15 X542UF-DM143T | |
| HP 15-bs103ng | |
| HP 15-da0405ng | |
| Acer Aspire 3 A315-41-R7BM | |
| JetStream 1.1 - 1.1 Total | |
| HP 15-bs103ng (Edge 41) | |
| Lenovo IdeaPad 320-15IKBRN 81BG001KGE (Edge 41.16299.15.0) | |
| Asus VivoBook 15 X542UF-DM143T (Edge 41) | |
| Average Intel Core i5-8250U (151.5 - 256, n=78) | |
| HP 15-da0405ng (Edge 42) | |
| Acer Aspire 3 A315-41-R7BM (Edge 42) | |
System Performance
The HP 15 offers enough performance for the most common office and Internet applications. Thanks to its dedicated GPU it is even somewhat usable for light gaming. Overall system performance was fast and smooth, as can be seen in the more than decent PCMark benchmark scores. Adding a second RAM module and thereby enabling dual-channel mode could improve performance ever so slightly.
| PCMark 8 Home Score Accelerated v2 | 3478 points | |
| PCMark 8 Creative Score Accelerated v2 | 4505 points | |
| PCMark 8 Work Score Accelerated v2 | 4728 points | |
| PCMark 10 Score | 3260 points | |
Help | ||
| PCMark 8 - Home Score Accelerated v2 | |
| Average of class Office (n=1last 2 years) | |
| Asus VivoBook 15 X542UF-DM143T | |
| HP 15-bs103ng | |
| HP 15-da0405ng | |
| Acer Aspire 3 A315-41-R7BM | |
| Average Intel Core i5-8250U, NVIDIA GeForce MX110 (3153 - 3478, n=2) | |
| Lenovo IdeaPad 320-15IKBRN 81BG001KGE | |
Storage Devices
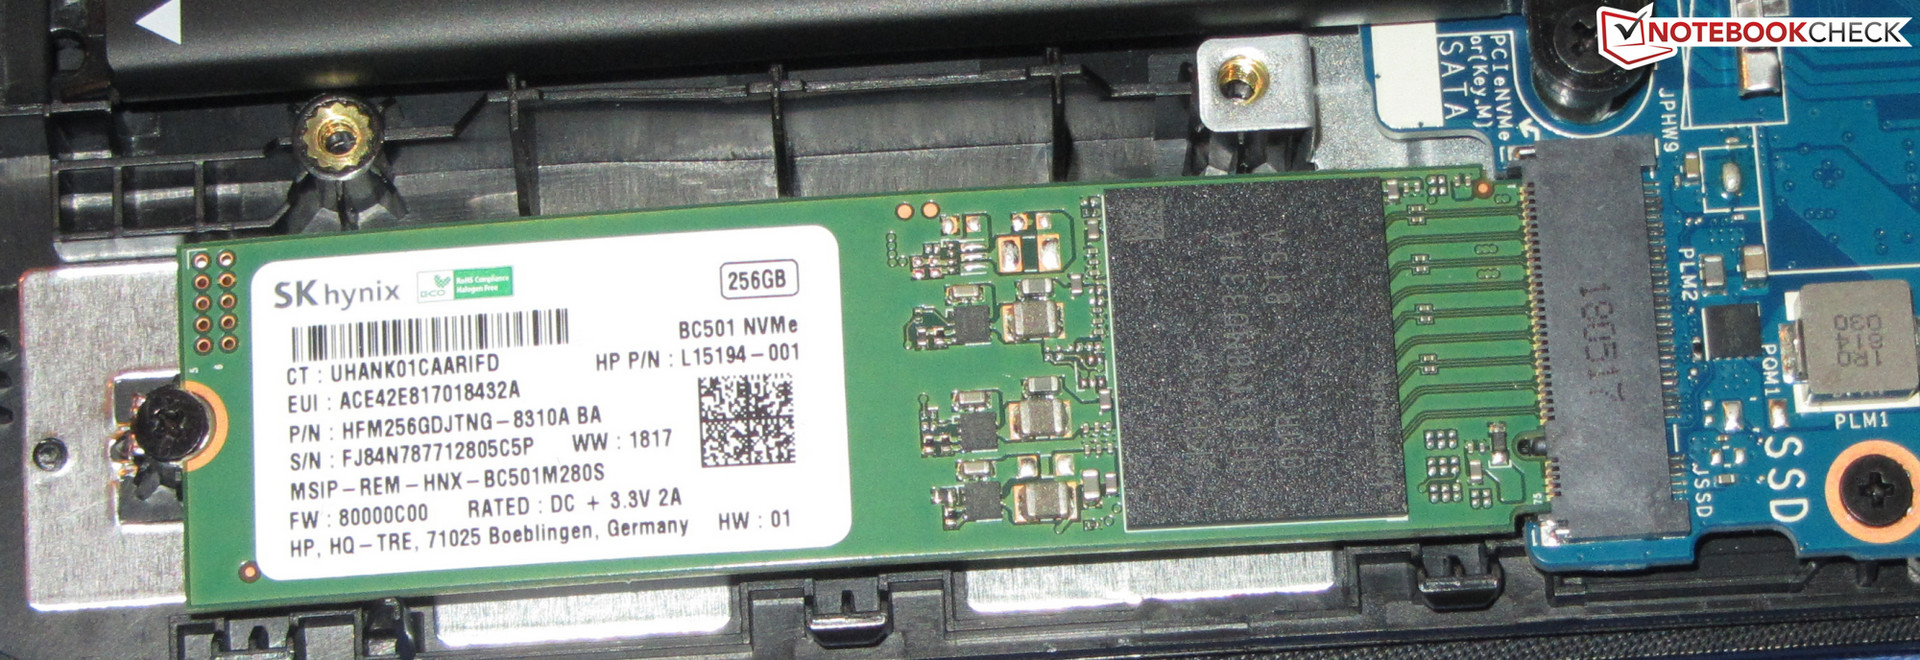
The installed M.2-2280 256 GB NVMe SSD is made by SK Hynix. Roughly 188 GB is user accessible out of the box; the rest is used by the Windows OS and the recovery partition. Transfer rates were very good. Generally speaking, NVMe SSDs are much faster than SATA III SSDs due to the fact that they are connected to the CPU via PCIe 3.0 x4.
The case does have a 2.5-inch slot for a second hard drive. However, the motherboard lacked a SATA connector, which means the wasted slot could not be used.

| HP 15-da0405ng SK Hynix BC501 NVMe 256 GB | Acer Aspire 3 A315-41-R7BM SK Hynix HFS256G39TND-N210A | Asus VivoBook 15 X542UF-DM143T Micron 1100 MTFDDAV256TBN | Lenovo IdeaPad 320-15IKBRN 81BG001KGE Ramaxel RTNTE256PCA8EADL | Average SK Hynix BC501 NVMe 256 GB | Average of class Office | |
|---|---|---|---|---|---|---|
| CrystalDiskMark 5.2 / 6 | -48% | -31% | -27% | 11% | 183% | |
| Write 4K (MB/s) | 97.6 | 64.5 -34% | 94.9 -3% | 85.7 -12% | 110 ? 13% | 151.4 ? 55% |
| Read 4K (MB/s) | 39.08 | 25.1 -36% | 27.3 -30% | 32.89 -16% | 36.6 ? -6% | 72.8 ? 86% |
| Write Seq (MB/s) | 571 | 260.2 -54% | 410.4 -28% | 422.6 -26% | 699 ? 22% | 2558 ? 348% |
| Read Seq (MB/s) | 1110 | 505 -55% | 464 -58% | 537 -52% | 1057 ? -5% | 3237 ? 192% |
| Write 4K Q32T1 (MB/s) | 235.7 | 164 -30% | 246.5 5% | 250.1 6% | 359 ? 52% | 424 ? 80% |
| Read 4K Q32T1 (MB/s) | 297 | 200.7 -32% | 246.4 -17% | 286.1 -4% | 339 ? 14% | 509 ? 71% |
| Write Seq Q32T1 (MB/s) | 812 | 258.5 -68% | 451.4 -44% | 444.1 -45% | 813 ? 0% | 3999 ? 392% |
| Read Seq Q32T1 (MB/s) | 1742 | 513 -71% | 532 -69% | 563 -68% | 1670 ? -4% | 5962 ? 242% |
GPU Performance
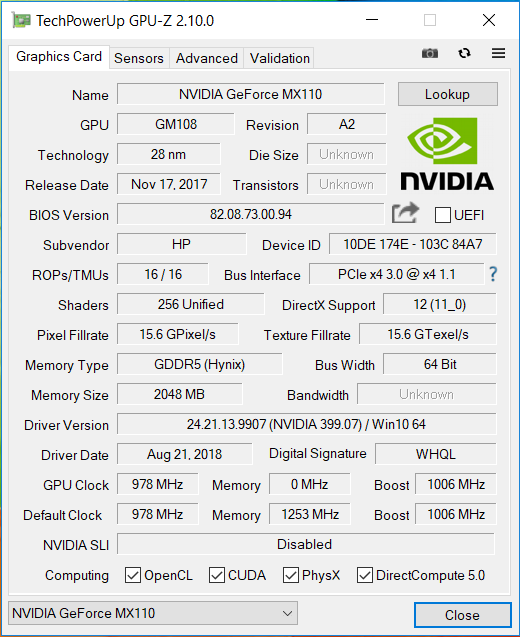
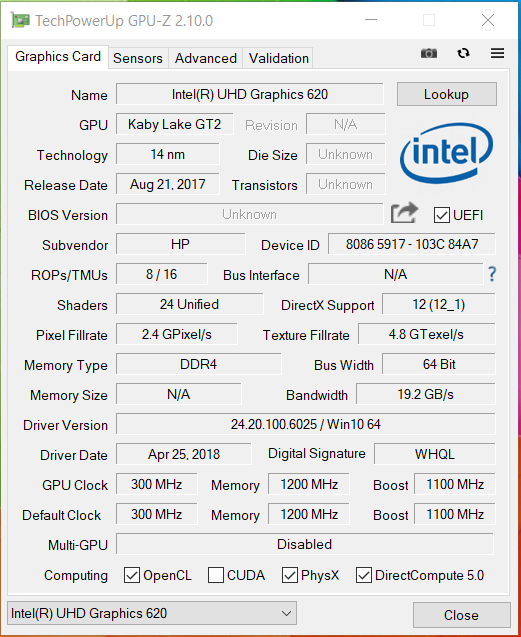
The HP 15 is equipped with a dedicated GeForce MX110 GPU. Unlike its namesake, the GeForce MX150, the MX110 is not based on Nvidia’s Pascal architecture but is based on the older Maxwell generation instead. The GPU supports DirectX 12, runs at up to 1,006 MHz, and it has access to 2 GB of GDDR5 VRAM.
Basically, the MX110 is nothing but a rebranded GeForce 920MX running at slightly higher clock speeds (1,006 vs. 980 MHz). Accordingly, both GPUs performed largely identical in our benchmarks.
| 3DMark 03 Standard | 30463 points | |
| 3DMark 05 Standard | 22463 points | |
| 3DMark 06 Standard Score | 14612 points | |
| 3DMark Vantage P Result | 9124 points | |
| 3DMark 11 Performance | 2378 points | |
| 3DMark Ice Storm Standard Score | 49919 points | |
| 3DMark Cloud Gate Standard Score | 9593 points | |
| 3DMark Fire Strike Score | 1641 points | |
| 3DMark Fire Strike Extreme Score | 782 points | |
| 3DMark Time Spy Score | 530 points | |
Help | ||
| 3DMark 06 - 1280x1024 Standard Score AA:0x AF:0x | |
| Average of class Office (12007 - 35258, n=12, last 2 years) | |
| Asus VivoBook 15 X542UF-DM143T | |
| HP 15-da0405ng | |
| Average NVIDIA GeForce MX110 (n=1) | |
| Lenovo IdeaPad 320s-14IKB | |
| HP ProBook 470 G5 | |
| Asus X302UV-FN016T | |
| Acer Aspire 3 A315-41-R7BM | |
| HP 15-bs103ng | |
| ComputeMark v2.1 - 1024x600 Normal, Score | |
| Average of class Office (2568 - 6397, n=5, last 2 years) | |
| Asus VivoBook 15 X542UF-DM143T | |
| HP 15-da0405ng | |
| Average NVIDIA GeForce MX110 (n=1) | |
| Lenovo IdeaPad 320s-14IKB | |
| Acer Aspire 3 A315-41-R7BM | |
| Asus X302UV-FN016T | |
| HP 15-bs103ng | |
| Unigine Heaven 2.1 - 1280x1024 high, Tesselation (normal), DirectX11 AA:off AF:1x | |
| Asus VivoBook 15 X542UF-DM143T | |
| Lenovo IdeaPad 320s-14IKB | |
| HP 15-da0405ng | |
| Average NVIDIA GeForce MX110 (n=1) | |
| Asus X302UV-FN016T | |
| Acer Aspire 3 A315-41-R7BM | |
| HP 15-bs103ng | |
| Unigine Heaven 3.0 | |
| 1920x1080 OpenGL, Normal Tessellation, High Shaders AA:Off AF:Off | |
| Asus VivoBook 15 X542UF-DM143T | |
| HP 15-da0405ng | |
| Average NVIDIA GeForce MX110 (n=1) | |
| Lenovo IdeaPad 320s-14IKB | |
| HP 15-bs103ng | |
| Acer Aspire 3 A315-41-R7BM | |
| 1920x1080 DX 11, Normal Tessellation, High Shaders AA:Off AF:Off | |
| Asus VivoBook 15 X542UF-DM143T | |
| HP 15-da0405ng | |
| Average NVIDIA GeForce MX110 (n=1) | |
| Lenovo IdeaPad 320s-14IKB | |
| Acer Aspire 3 A315-41-R7BM | |
| HP 15-bs103ng | |
| Unigine Heaven 4.0 | |
| Extreme Preset OpenGL | |
| Average of class Office (8.8 - 23.7, n=5, last 2 years) | |
| Asus VivoBook 15 X542UF-DM143T | |
| HP 15-da0405ng | |
| Average NVIDIA GeForce MX110 (n=1) | |
| Lenovo IdeaPad 320s-14IKB | |
| Acer Aspire 3 A315-41-R7BM | |
| HP 15-bs103ng | |
| Extreme Preset DX11 | |
| Average of class Office (10.8 - 23, n=6, last 2 years) | |
| Asus VivoBook 15 X542UF-DM143T | |
| HP 15-da0405ng | |
| Average NVIDIA GeForce MX110 (n=1) | |
| Lenovo IdeaPad 320s-14IKB | |
| Acer Aspire 3 A315-41-R7BM | |
| HP 15-bs103ng | |
| Unigine Valley 1.0 | |
| 1920x1080 Extreme HD DirectX AA:x8 | |
| Average of class Office (14.3 - 14.5, n=2, last 2 years) | |
| Asus VivoBook 15 X542UF-DM143T | |
| HP 15-da0405ng | |
| Average NVIDIA GeForce MX110 (n=1) | |
| Lenovo IdeaPad 320s-14IKB | |
| Acer Aspire 3 A315-41-R7BM | |
| HP 15-bs103ng | |
| 1920x1080 Extreme HD Preset OpenGL AA:x8 | |
| Average of class Office (15.1 - 15.1, n=2, last 2 years) | |
| Asus VivoBook 15 X542UF-DM143T | |
| HP 15-da0405ng | |
| Average NVIDIA GeForce MX110 (n=1) | |
| Lenovo IdeaPad 320s-14IKB | |
| HP 15-bs103ng | |
| Acer Aspire 3 A315-41-R7BM | |
| Geekbench 4.0 - Compute OpenCL Score | |
| Asus VivoBook 15 X542UF-DM143T | |
| HP ProBook 470 G5 | |
| HP 15-da0405ng | |
| Average NVIDIA GeForce MX110 (n=1) | |
| Lenovo IdeaPad 320s-14IKB | |
| HP 15-bs103ng | |
| Acer Aspire 3 A315-41-R7BM | |
| Geekbench 4.4 - Compute OpenCL Score | |
| Average of class Office (34371 - 127517, n=9, last 2 years) | |
| Asus VivoBook 15 X542UF-DM143T | |
| HP ProBook 470 G5 | |
| HP 15-da0405ng | |
| Average NVIDIA GeForce MX110 (n=1) | |
| Lenovo IdeaPad 320s-14IKB | |
| HP 15-bs103ng | |
| Acer Aspire 3 A315-41-R7BM | |
| GFXBench (DX / GLBenchmark) 2.7 | |
| T-Rex Onscreen | |
| Average of class Office (60 - 453, n=11, last 2 years) | |
| Asus VivoBook 15 X542UF-DM143T | |
| Lenovo IdeaPad 320s-14IKB | |
| HP 15-bs103ng | |
| Acer Aspire 3 A315-41-R7BM | |
| HP 15-da0405ng | |
| Average NVIDIA GeForce MX110 (n=1) | |
| Asus X302UV-FN016T | |
| 1920x1080 T-Rex Offscreen | |
| Average of class Office (60 - 620, n=12, last 2 years) | |
| Asus VivoBook 15 X542UF-DM143T | |
| HP 15-da0405ng | |
| Average NVIDIA GeForce MX110 (n=1) | |
| Lenovo IdeaPad 320s-14IKB | |
| HP 15-bs103ng | |
| Asus X302UV-FN016T | |
| Acer Aspire 3 A315-41-R7BM | |
| GFXBench 3.0 | |
| on screen Manhattan Onscreen OGL | |
| Average of class Office (60 - 260, n=10, last 2 years) | |
| Asus VivoBook 15 X542UF-DM143T | |
| Lenovo IdeaPad 320s-14IKB | |
| Asus X302UV-FN016T | |
| HP 15-da0405ng | |
| Average NVIDIA GeForce MX110 (n=1) | |
| HP 15-bs103ng | |
| Acer Aspire 3 A315-41-R7BM | |
| 1920x1080 1080p Manhattan Offscreen | |
| Average of class Office (138 - 304, n=11, last 2 years) | |
| Asus VivoBook 15 X542UF-DM143T | |
| HP 15-da0405ng | |
| Average NVIDIA GeForce MX110 (n=1) | |
| Lenovo IdeaPad 320s-14IKB | |
| Asus X302UV-FN016T | |
| HP 15-bs103ng | |
| Acer Aspire 3 A315-41-R7BM | |
| GFXBench 3.1 | |
| on screen Manhattan ES 3.1 Onscreen | |
| Average of class Office (60 - 221, n=10, last 2 years) | |
| Asus VivoBook 15 X542UF-DM143T | |
| Asus X302UV-FN016T | |
| Lenovo IdeaPad 320s-14IKB | |
| HP 15-da0405ng | |
| Average NVIDIA GeForce MX110 (n=1) | |
| HP 15-bs103ng | |
| Acer Aspire 3 A315-41-R7BM | |
| 1920x1080 Manhattan ES 3.1 Offscreen | |
| Average of class Office (22 - 237, n=12, last 2 years) | |
| Asus VivoBook 15 X542UF-DM143T | |
| HP 15-da0405ng | |
| Average NVIDIA GeForce MX110 (n=1) | |
| Lenovo IdeaPad 320s-14IKB | |
| Asus X302UV-FN016T | |
| HP 15-bs103ng | |
| Acer Aspire 3 A315-41-R7BM | |
Gaming Performance
Most games ran smoothly in HD (1280x720) and low to medium details. Some less-demanding games will even allow for higher resolutions and/or details. Current 2017/2018 games will not be performing all too well unfortunately.
| low | med. | high | ultra | |
|---|---|---|---|---|
| StarCraft 2 (2010) | 284.2 | 87.5 | 55.8 | 27.3 |
| Diablo III (2012) | 111.5 | 73.5 | 67.5 | 40.4 |
| Tomb Raider (2013) | 123.3 | 68.3 | 47.1 | 21.3 |
| BioShock Infinite (2013) | 100.2 | 54.2 | 48 | 17.9 |
| The Witcher 3 (2015) | 27.2 | 16.7 | 9 | 5.3 |
| Dota 2 Reborn (2015) | 90.5 | 74.9 | 36.6 | 33.5 |
| World of Warships (2015) | 89.2 | 70.4 | 37.5 | 25.3 |
| Rainbow Six Siege (2015) | 65.7 | 43.7 | 24.1 | 20.7 |
| Rise of the Tomb Raider (2016) | 29.3 | 19 | 10.9 | 9.1 |
| The Division (2016) | 33.4 | 21.4 | 9.5 | 7.3 |
| Ashes of the Singularity (2016) | 17.7 | 10.5 | 9.2 | |
| Overwatch (2016) | 87 | 60.4 | 27.9 | 15.8 |
| Battlefield 1 (2016) | 46.5 | 27.8 | 13.3 | 12.1 |
| Farming Simulator 17 (2016) | 121.7 | 77.6 | 35.4 | 24 |
| For Honor (2017) | 47.8 | 17 | 16.2 | 12.1 |
| Ghost Recon Wildlands (2017) | 27.1 | 11.2 | 9.7 | 3 |
| Prey (2017) | 57.8 | 22.1 | 17.1 | 14.2 |
| Rocket League (2017) | 99.8 | 40.8 | 27.4 | |
| Dirt 4 (2017) | 65.3 | 24.6 | 13.6 | 8.1 |
| Team Fortress 2 (2017) | 105.1 | 97.4 | 72.5 | 51 |
| Playerunknown's Battlegrounds (PUBG) (2017) | 41.2 | 17.9 | 16.9 | 11.5 |
| FIFA 18 (2017) | 100.1 | 56.2 | 49.2 | 43.5 |
| Middle-earth: Shadow of War (2017) | 33 | 14 | 10 | 7 |
| Destiny 2 (2017) | 34.3 | 17.7 | 16.2 | 13.2 |
| Assassin´s Creed Origins (2017) | 22 | 10 | 8 | |
| Call of Duty WWII (2017) | 54.8 | 33.1 | 16.6 | 10.6 |
| Need for Speed Payback (2017) | 30.1 | 15.3 | 12.3 | 11.9 |
| Star Wars Battlefront 2 (2017) | 44.3 | 12.3 | 10.5 | 9.1 |
| Fortnite (2018) | 66.1 | 19.9 | 14.1 | 11.5 |
| Final Fantasy XV Benchmark (2018) | 18.3 | 8.7 | 4.9 | |
| Kingdom Come: Deliverance (2018) | 24.5 | 10.2 | 7.8 | 5.9 |
| X-Plane 11.11 (2018) | 41.5 | 24.9 | 23.2 | |
| Far Cry 5 (2018) | 22 | 10 | 9 | 8 |
| The Crew 2 (2018) | 28.8 | 12.7 | 11.4 | 10.4 |
| F1 2018 (2018) | 30 | 16 | 13 | 12 |
| BioShock Infinite - 1366x768 Medium Preset | |
| Lenovo IdeaPad 320-15IKBRN 81BG001KGE | |
| Asus VivoBook 15 X542UF-DM143T | |
| Lenovo IdeaPad 320s-14IKB | |
| HP 15-da0405ng | |
| HP ProBook 470 G5 | |
| Acer Aspire 3 A315-41-R7BM | |
| Asus X302UV-FN016T | |
| Lenovo Ideapad 310-15ISK | |
| HP 15-bs103ng | |
| Dota 2 Reborn - 1366x768 med (1/3) | |
| Asus VivoBook 15 X542UF-DM143T | |
| HP 15-da0405ng | |
| HP ProBook 470 G5 | |
| Lenovo IdeaPad 320s-14IKB | |
| HP 15-bs103ng | |
| Acer Aspire 3 A315-41-R7BM | |
| Team Fortress 2 - 1920x1080 maximum AA:8x MS AF:16x | |
| Asus VivoBook 15 X542UF-DM143T | |
| Lenovo IdeaPad 320s-14IKB | |
| HP 15-da0405ng | |
| HP ProBook 470 G5 | |
| Acer Aspire 3 A315-41-R7BM | |
| HP 15-bs103ng | |
| Overwatch - 1366x768 Medium (Render Scale 100 %) AA:FX AF:2x | |
| Asus VivoBook 15 X542UF-DM143T | |
| HP 15-da0405ng | |
| Lenovo IdeaPad 320s-14IKB | |
| HP ProBook 470 G5 | |
| HP 15-bs103ng | |
| Acer Aspire 3 A315-41-R7BM | |
| Fortnite - 1280x720 Low Preset | |
| Asus VivoBook 15 X542UF-DM143T | |
| Lenovo IdeaPad 320s-14IKB | |
| HP 15-da0405ng | |
| Acer Aspire 3 A315-41-R7BM | |
Emissions and Energy
System noise
The HP 15’s fan was constantly spinning, even when the device was completely idle. Once again the culprit could be found in the unit’s BIOS setup: the “fan always on” setting was enabled by default. Disabling it rendered the fan silent in idle and low load scenarios most of the time, and it only revved up under load. While running our stress test we were exposed to a sound pressure level of 39 dB(A).
Noise level
| Idle |
| 30.9 / 30.9 / 30.9 dB(A) |
| DVD |
| 36.8 / dB(A) |
| Load |
| 36.8 / 39 dB(A) |
 | ||
30 dB silent 40 dB(A) audible 50 dB(A) loud |
||
min: | ||
Temperature
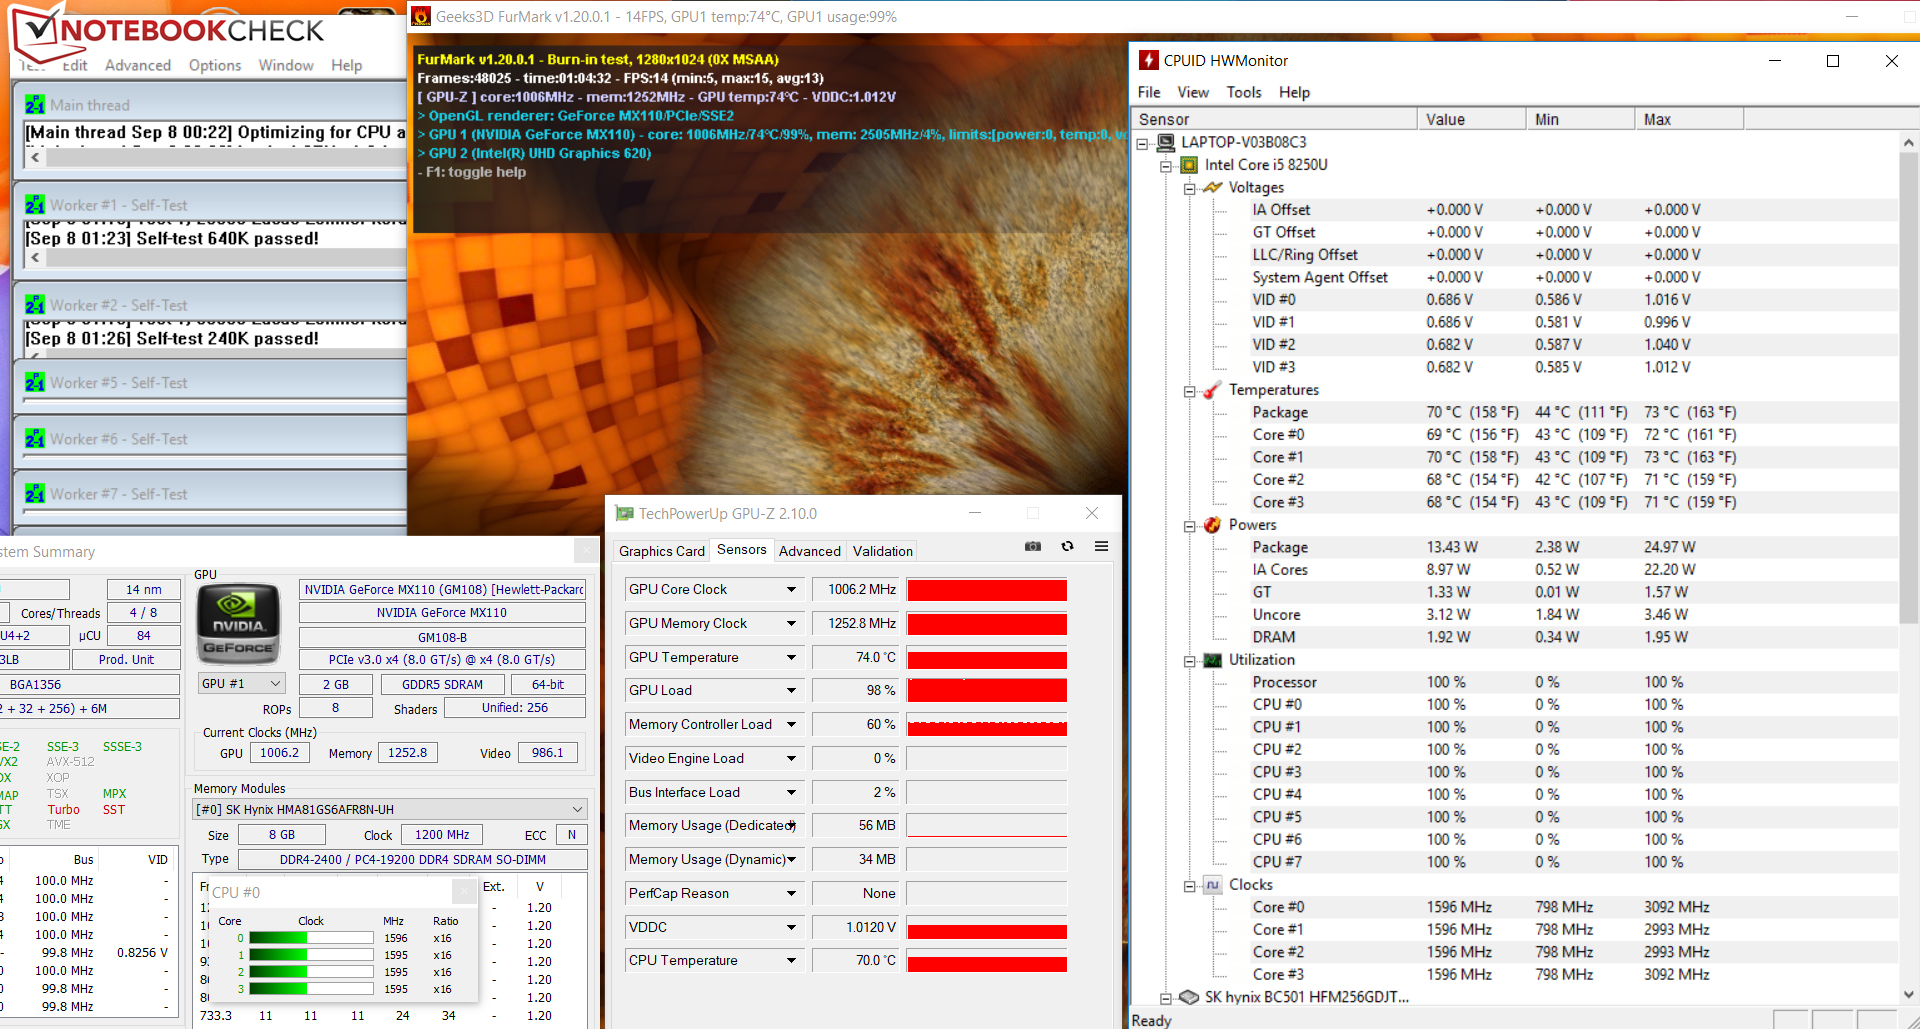
Speaking of which, the stress test (Prime95 and FurMark for at least a full hour) was performed differently on battery and on mains. On mains, the CPU ran at 1.6 GHz all the time while the GPU managed to run at its full speed of 1,006 MHz. On battery, both components were throttled significantly: 1 GHz for the CPU and 550-650 MHz for the GPU.
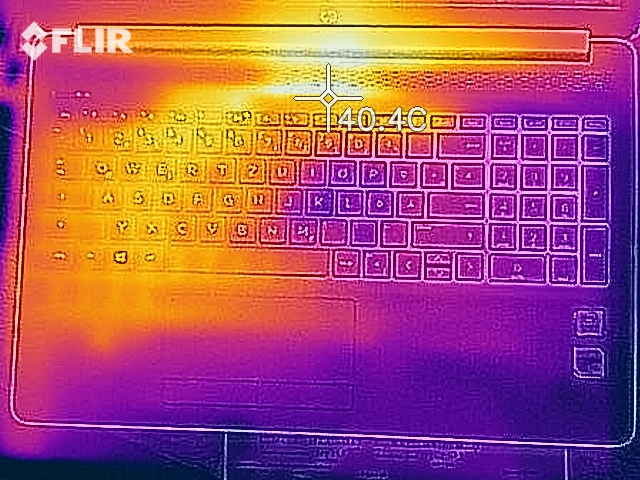
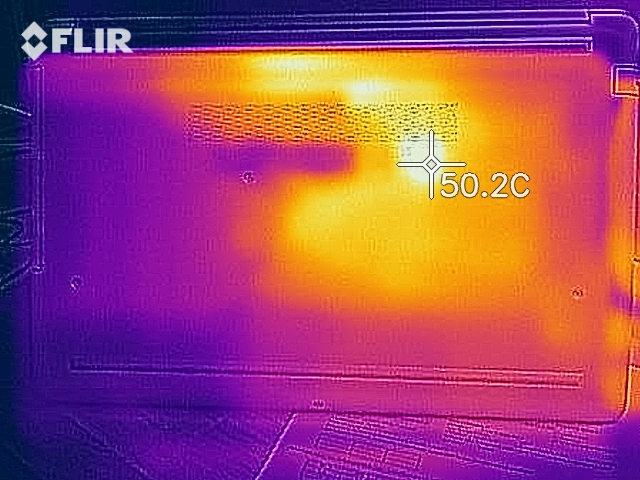
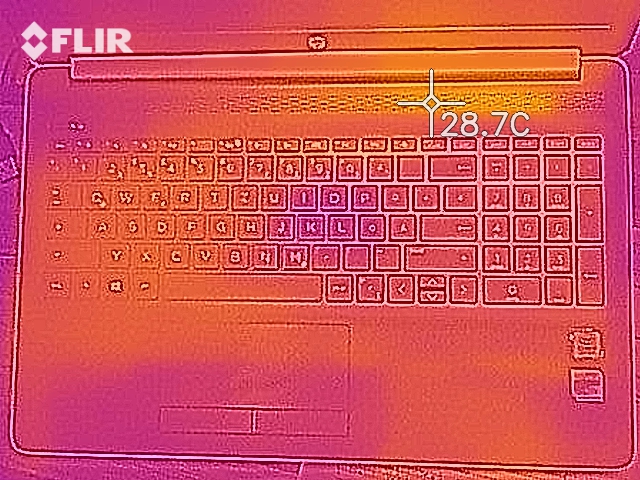
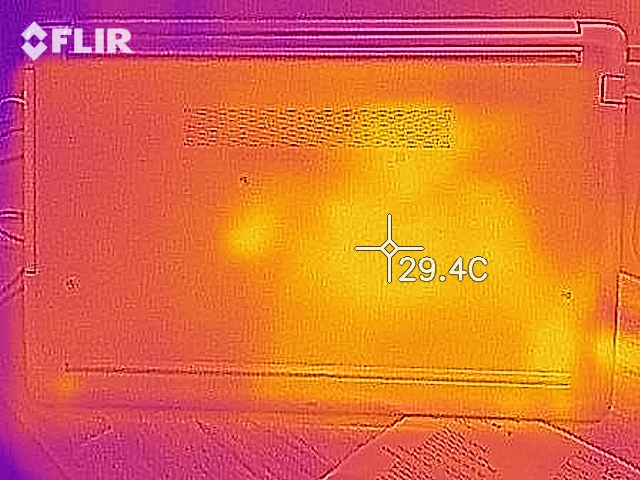
The notebook remained fairly cool by and large with just a single hotspot of more than 40 °C while running our stress test. Keep in mind that this stress test is an unrealistic load scenario that practically never occurs in everyday use. We use it to detect stability and thermal issues.
(+) The maximum temperature on the upper side is 37.3 °C / 99 F, compared to the average of 34.3 °C / 94 F, ranging from 21.2 to 62.5 °C for the class Office.
(±) The bottom heats up to a maximum of 41 °C / 106 F, compared to the average of 36.8 °C / 98 F
(+) In idle usage, the average temperature for the upper side is 21.9 °C / 71 F, compared to the device average of 29.5 °C / 85 F.
(+) The palmrests and touchpad are cooler than skin temperature with a maximum of 27.1 °C / 80.8 F and are therefore cool to the touch.
(±) The average temperature of the palmrest area of similar devices was 27.5 °C / 81.5 F (+0.4 °C / 0.7 F).
Speaker
The stereo speakers are located above the keyboard behind a perforated cover. Sound quality was decent but lacked bass. Headphones or external speakers will be required for improved sound performance.
HP 15-da0405ng audio analysis
(±) | speaker loudness is average but good (72.1 dB)
Bass 100 - 315 Hz
(-) | nearly no bass - on average 25.4% lower than median
(±) | linearity of bass is average (11.6% delta to prev. frequency)
Mids 400 - 2000 Hz
(+) | balanced mids - only 3% away from median
(±) | linearity of mids is average (7.7% delta to prev. frequency)
Highs 2 - 16 kHz
(+) | balanced highs - only 2.3% away from median
(+) | highs are linear (4% delta to prev. frequency)
Overall 100 - 16.000 Hz
(±) | linearity of overall sound is average (19.9% difference to median)
Compared to same class
» 42% of all tested devices in this class were better, 9% similar, 50% worse
» The best had a delta of 7%, average was 21%, worst was 53%
Compared to all devices tested
» 51% of all tested devices were better, 7% similar, 42% worse
» The best had a delta of 4%, average was 24%, worst was 134%
Apple MacBook 12 (Early 2016) 1.1 GHz audio analysis
(+) | speakers can play relatively loud (83.6 dB)
Bass 100 - 315 Hz
(±) | reduced bass - on average 11.3% lower than median
(±) | linearity of bass is average (14.2% delta to prev. frequency)
Mids 400 - 2000 Hz
(+) | balanced mids - only 2.4% away from median
(+) | mids are linear (5.5% delta to prev. frequency)
Highs 2 - 16 kHz
(+) | balanced highs - only 2% away from median
(+) | highs are linear (4.5% delta to prev. frequency)
Overall 100 - 16.000 Hz
(+) | overall sound is linear (10.2% difference to median)
Compared to same class
» 7% of all tested devices in this class were better, 2% similar, 91% worse
» The best had a delta of 5%, average was 18%, worst was 53%
Compared to all devices tested
» 5% of all tested devices were better, 1% similar, 94% worse
» The best had a delta of 4%, average was 24%, worst was 134%
Power Consumption
Power consumption was inconspicuous. Maximum power consumption when idle was determined to be 6.7 W and shot up to 65.2 W during our stress test for a few seconds. The power supply is rated at 65 W.
| Off / Standby | |
| Idle | |
| Load |
|
Key:
min: | |
Battery Life
Our real-life Wi-Fi test simulates browsing the web by running a script. The energy profile is set to “Balanced”, display brightness is normalized to 150 nits, and all energy-saving features are disabled. The HP 15 lasted for 5:55 hours in this test.
| Battery Runtime - WiFi Websurfing | |
| Average of class Office (3.83 - 31.5, n=74, last 2 years) | |
| HP 15-bs103ng | |
| Asus VivoBook 15 X542UF-DM143T | |
| HP 15-da0405ng | |
| Acer Aspire 3 A315-41-R7BM | |
| Lenovo IdeaPad 320-15IKBRN 81BG001KGE | |
Pros
Cons
Verdict
The HP 15-da0405ng is a 15.6-inch office notebook powered by a Kaby Lake Refresh ULV quad-core CPU and a dedicated GeForce MX110 GPU that is not going to stand in the way of occasional light gaming.
The system can be completely silent in low load and idle workloads. However, you will have to manually disable the “fan always on” BIOS setting. The device remained comparatively cool nonetheless.
It is sufficiently fast thanks to the NVMe SSD, which can be replaced by opening the case. The keyboard was decent and very usable overall even though it lacks a backlight. Battery life was mediocre at best.
The display was an utter disappointment.
If only it wasn’t for the abysmal display with its low brightness (163.8 nits), low contrast ratio, and narrow viewing angles. HP also limits the warranty to just one year, which is uncommon for 2018 (at least in Europe). To add insult to injury the device also lacks USB-C, which should be present on any modern-day notebook.
HP 15-da0405ng
- 09/13/2018 v6 (old)
Sascha Mölck
Price comparison

