Dell Latitude 5580 (Full HD, i5-7300U) Laptop Review
For the original German review, click here.
We reviewed the Dell Latitude 5580 not too long ago. Then, the entry-level business device proved its suitability for the office. Its stamina and good input devices gave us a good impression. Nonetheless, the 768p TN panel laid a shadow over the entire device. So we are excited to review a different configuration with Full HD IPS panel and a slightly stronger Intel Core i5-7300U CPU. The office partner is available for $970. If you look at the device on the official Dell website, the price is quite a bit higher: $1040.
As we will mainly focus on the main differences to the version we already reviewed, we suggest that you take a look at the detailed review of the Dell Latitude 5580 for further information.
As in our last review, we have chosen various devices for our comparison field. Apart from the economically configured Latitude 5580 we have also chosen the Lenovo ThinkPad T470s. The ThinkPad's configuration is almost equivalent to our Dell Latitude 5580. However, the Lenovo laptop is equipped with a faster 256-GB SSD.
Security
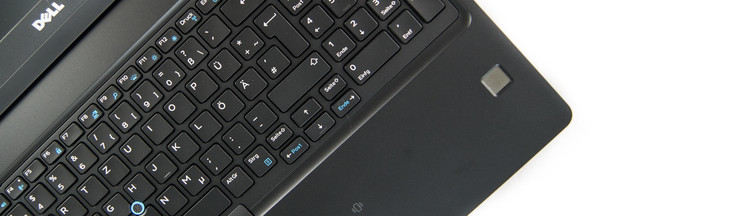
The device has a fingerprint scanner, which can be used for logging in to Windows. This happens very quickly. Our test unit also has a smart-card reader next to the touchpad.
Display
In our last review, we were bothered by the low resolution and meager brightness of the TN panel. The differences to this model are all due to the use of a high-quality IPS panel with higher resolution. The display comes from BOE and now has Full-HD resolution. However, the meager brightness of the matte display remains the same. We measured 223.6 cd/m². The Lenovo ThinkPad T470s has a slightly better value at 264 cd/m².
An improvement that will be noticeable for some users is the reduced screen-flickering (PWM). The higher frequency should not be a problem even for sensitive people.
| |||||||||||||||||||||||||
Brightness Distribution: 84 %
Center on Battery: 234 cd/m²
Contrast: 1300:1 (Black: 0.18 cd/m²)
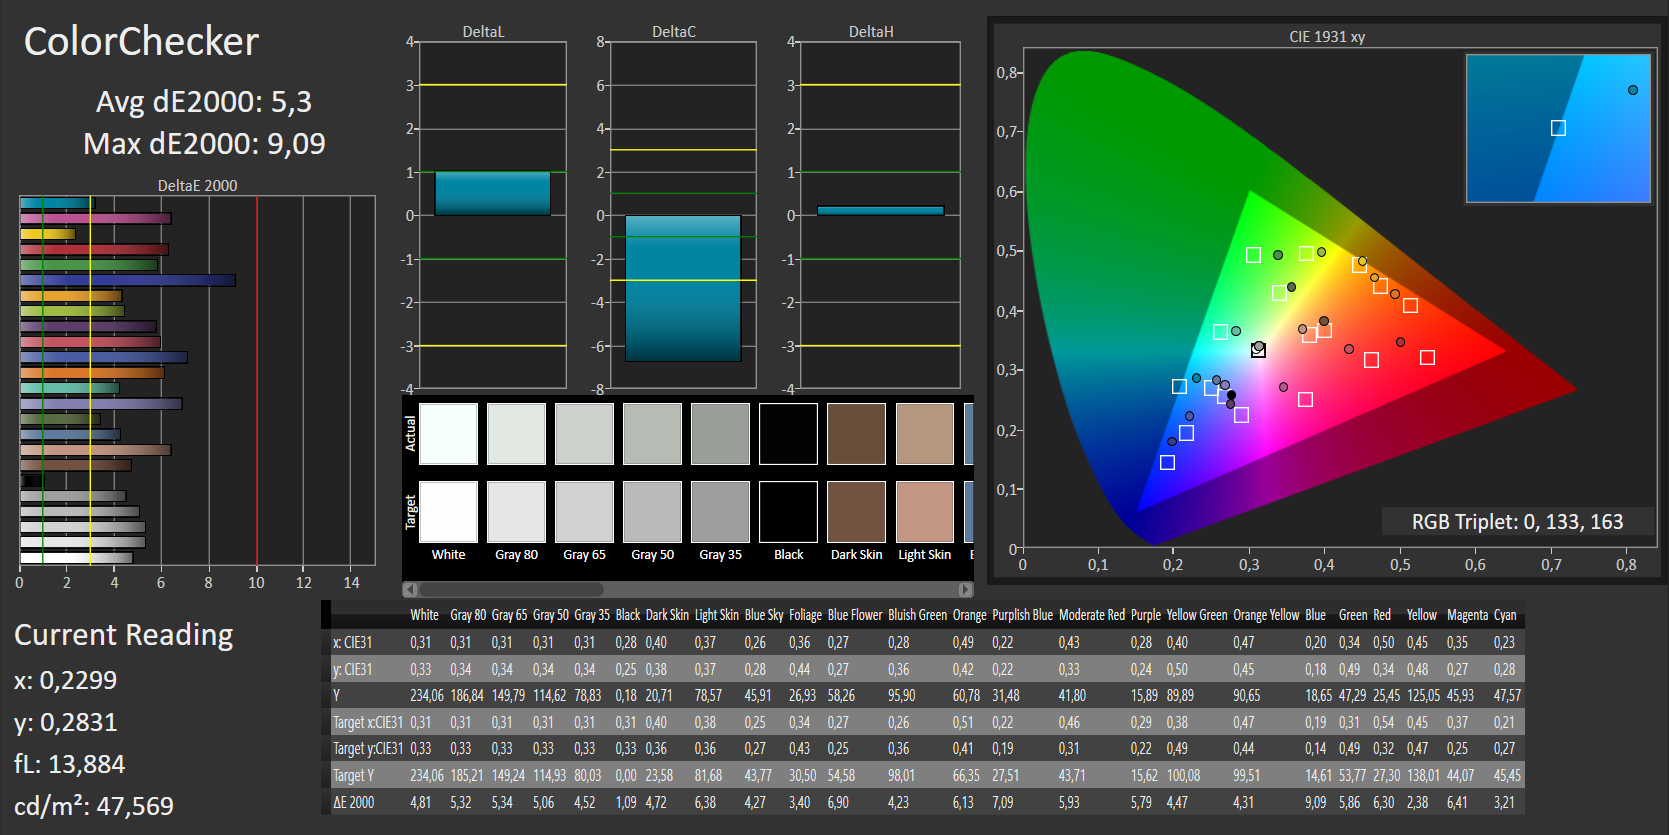
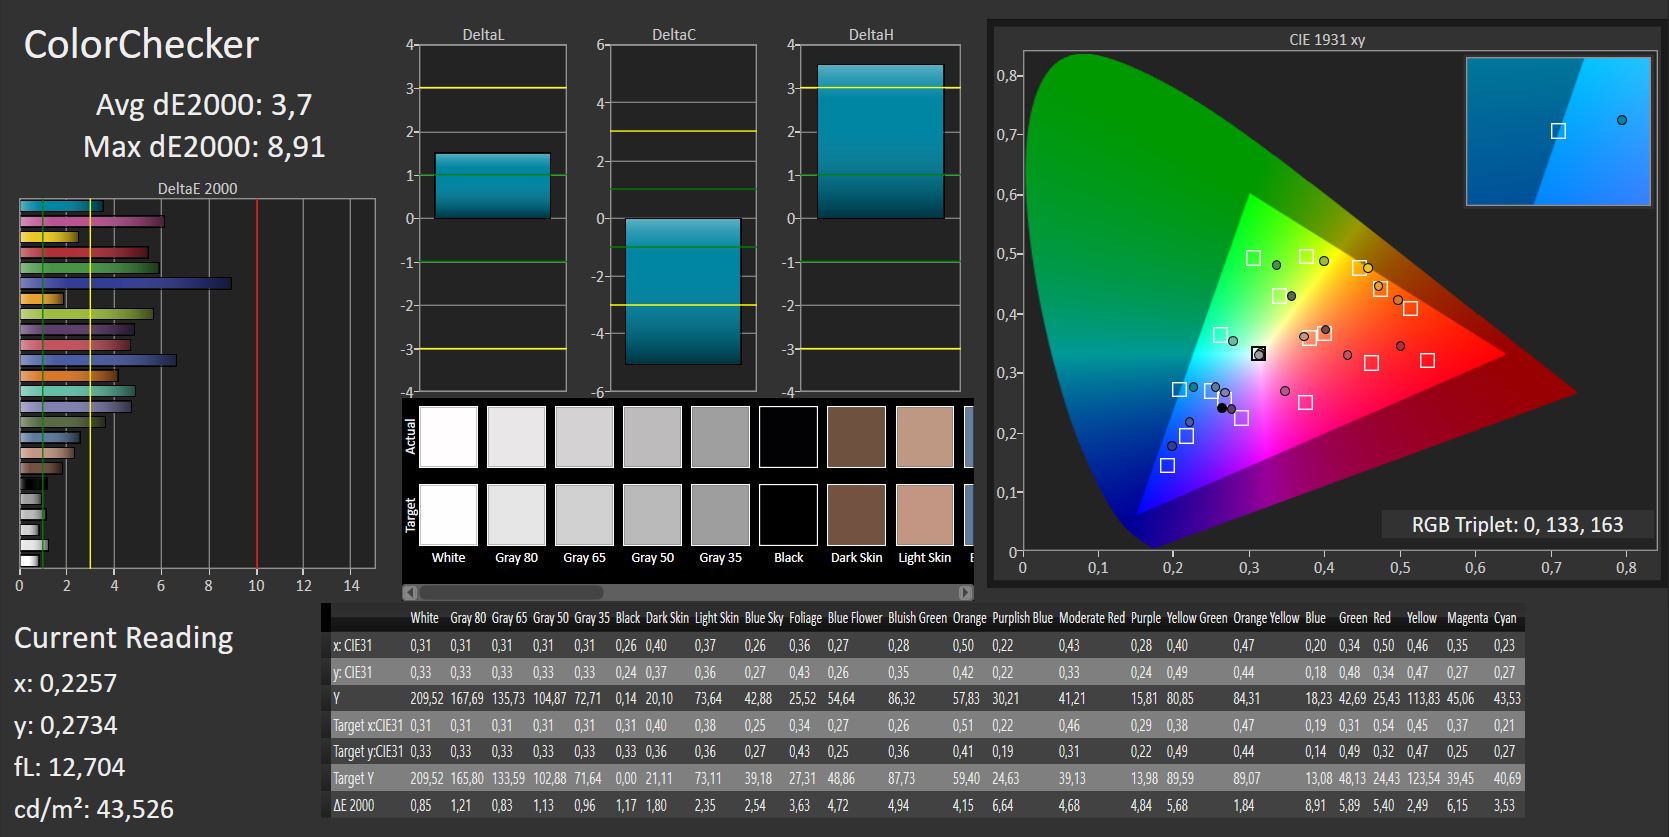
ΔE ColorChecker Calman: 5.3 | ∀{0.5-29.43 Ø4.73}
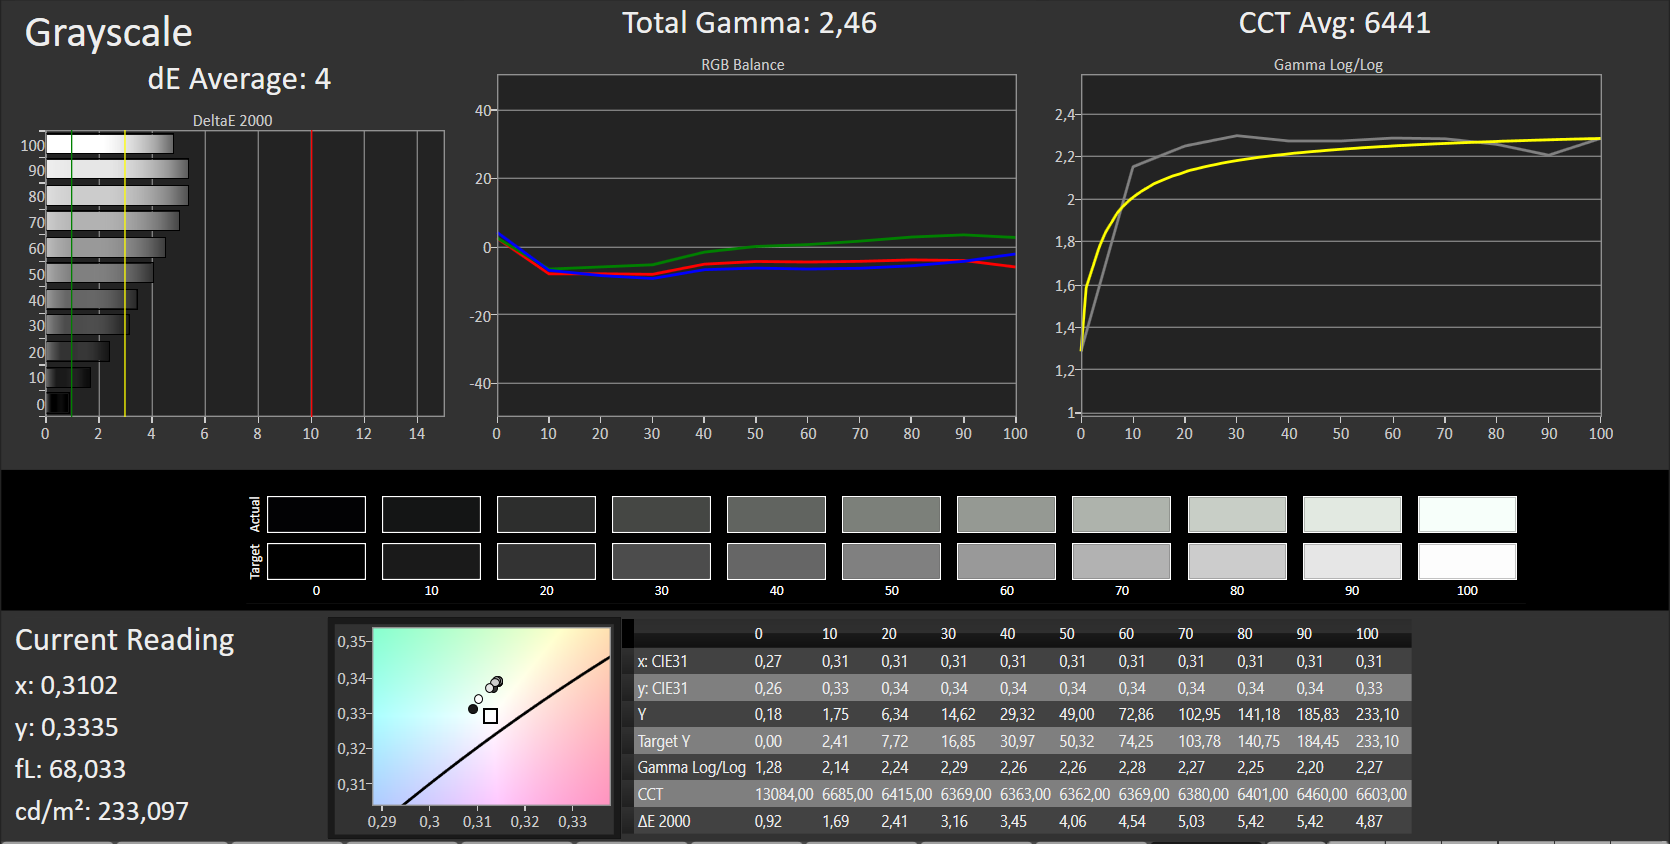
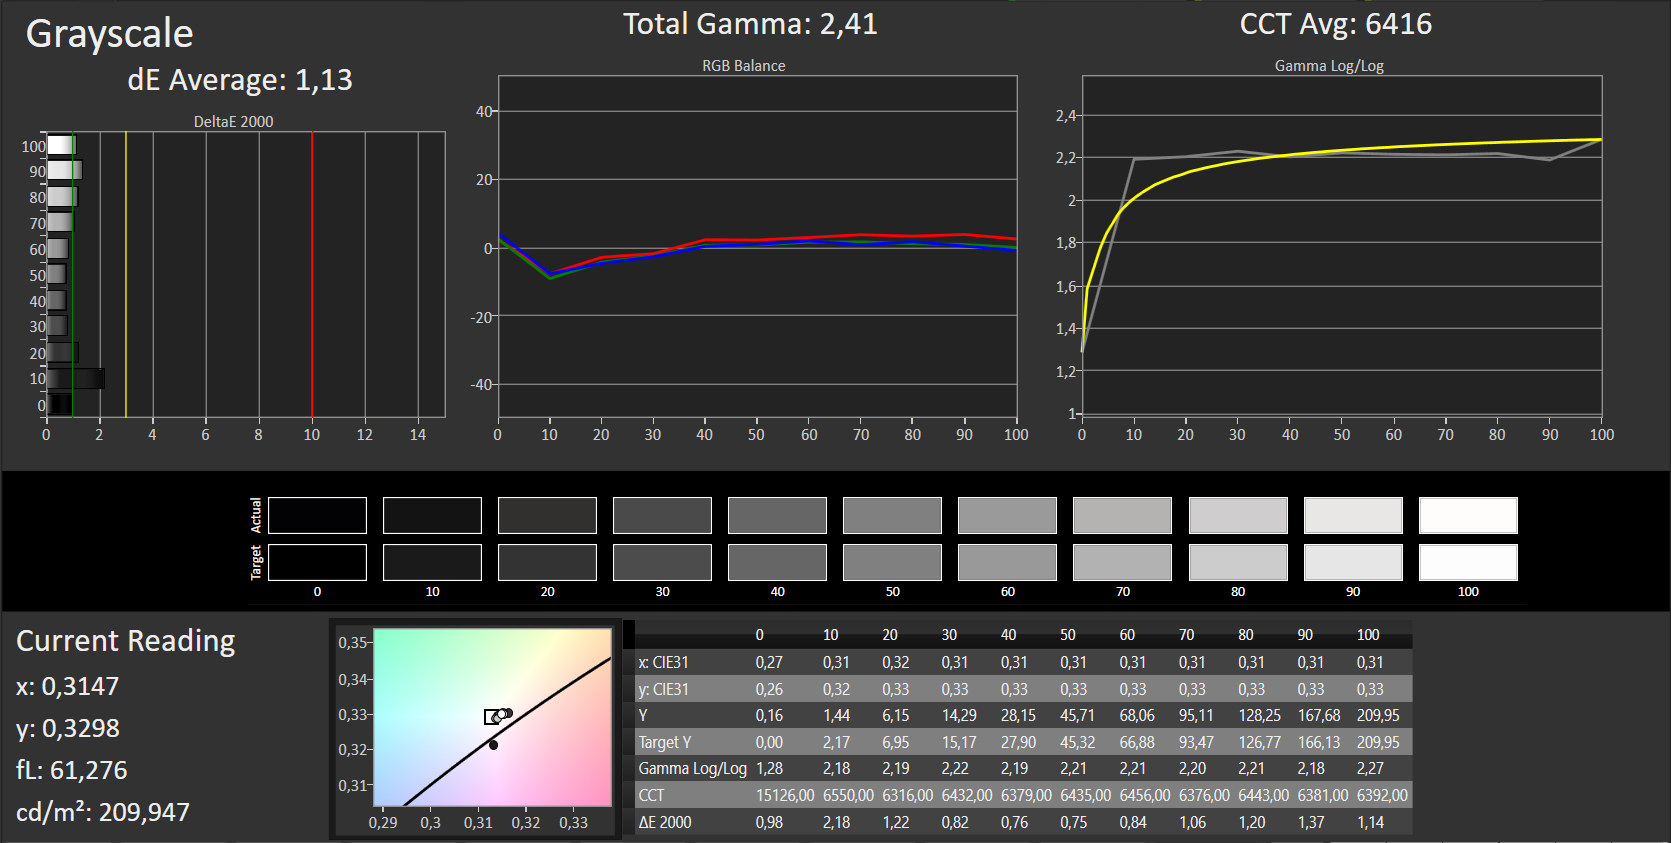
ΔE Greyscale Calman: 4 | ∀{0.09-98 Ø4.97}
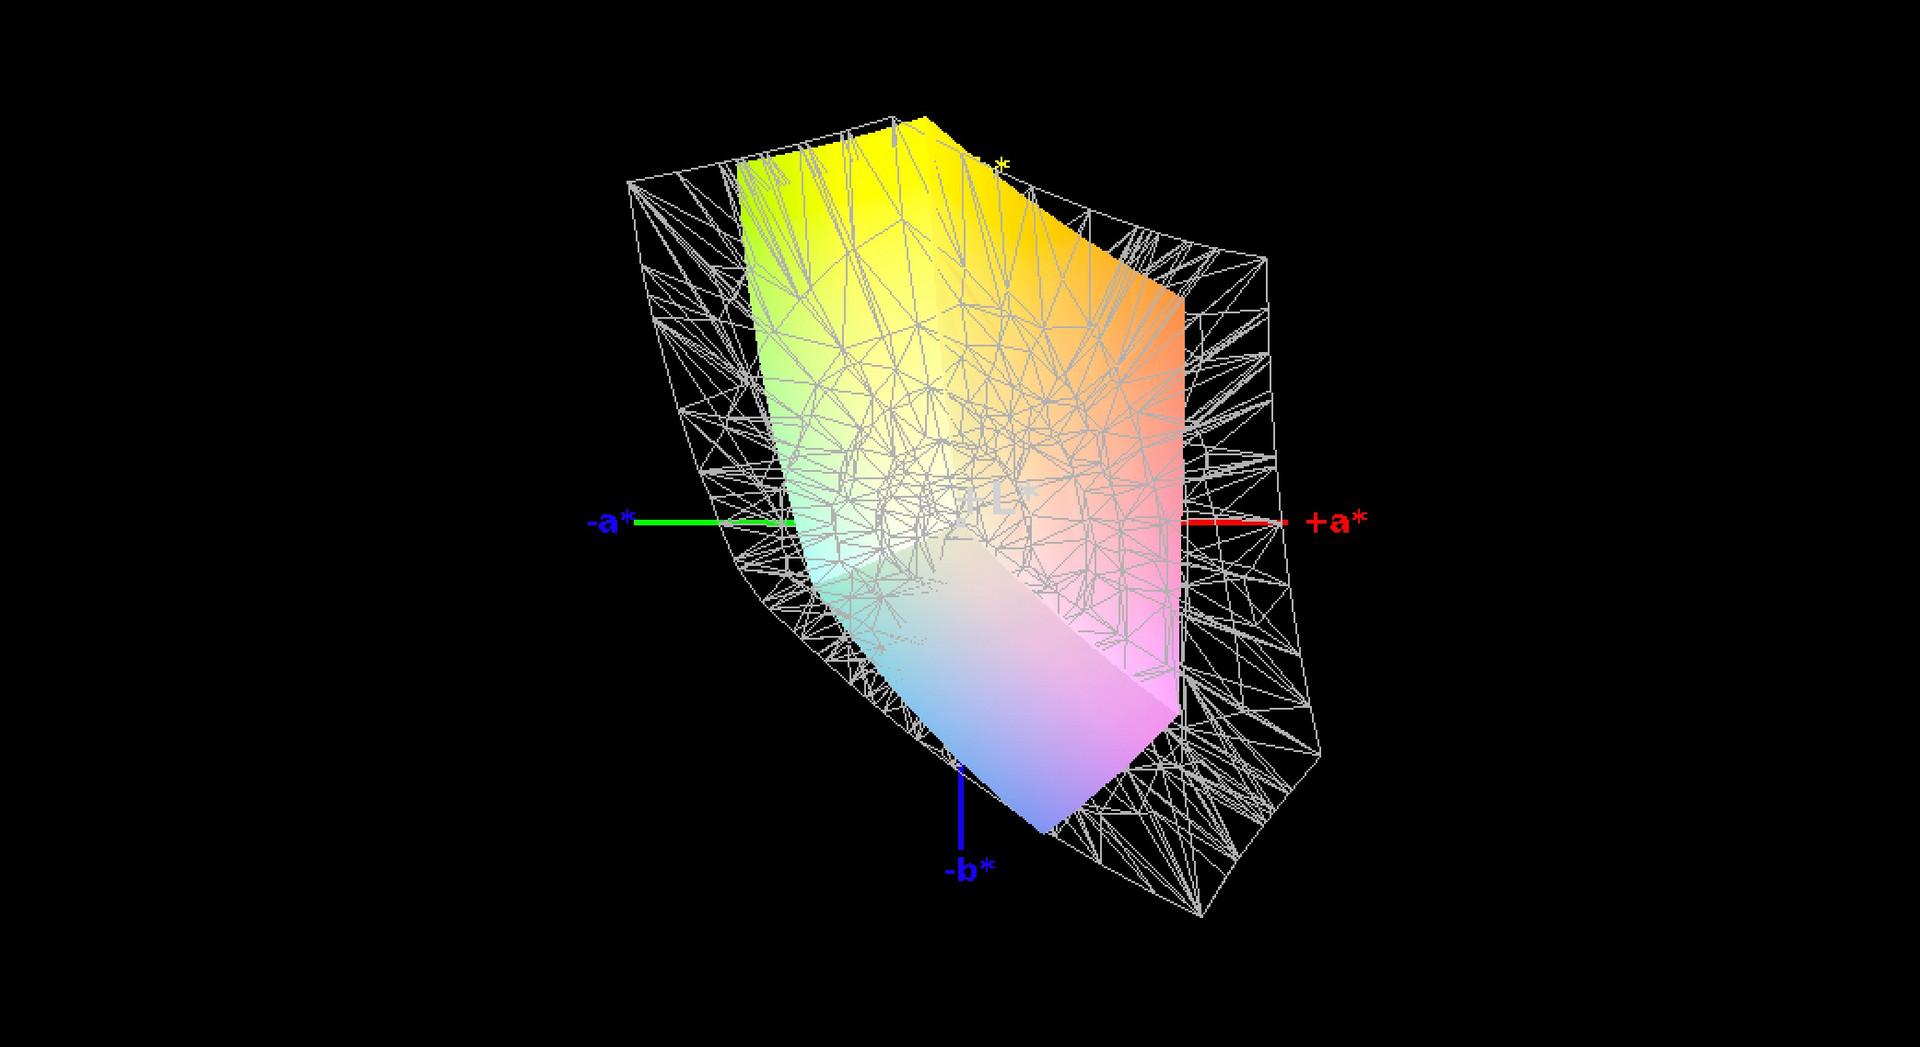
60% sRGB (Argyll 1.6.3 3D)
39% AdobeRGB 1998 (Argyll 1.6.3 3D)
42.94% AdobeRGB 1998 (Argyll 3D)
60.7% sRGB (Argyll 3D)
41.57% Display P3 (Argyll 3D)
Gamma: 2.46
CCT: 6441 K
| Dell Latitude 5580 BOE NV15N42, , 1920x1080, 15.6" | Dell Latitude 5580 1366x768, 15.6" | Lenovo ThinkPad T470s-20HGS00V00 B140QAN01.5, , 2560x1440, 14" | |
|---|---|---|---|
| Display | -2% | 62% | |
| Display P3 Coverage (%) | 41.57 | 40.13 -3% | 69 66% |
| sRGB Coverage (%) | 60.7 | 60 -1% | 95.1 57% |
| AdobeRGB 1998 Coverage (%) | 42.94 | 41.5 -3% | 69.6 62% |
| Response Times | 20% | 3% | |
| Response Time Grey 50% / Grey 80% * (ms) | 43 ? | 30 ? 30% | 46.4 ? -8% |
| Response Time Black / White * (ms) | 33 ? | 29.6 ? 10% | 28.8 ? 13% |
| PWM Frequency (Hz) | 1020 ? | 201.6 ? | |
| Screen | -79% | -1% | |
| Brightness middle (cd/m²) | 234 | 238 2% | 327 40% |
| Brightness (cd/m²) | 224 | 216 -4% | 311 39% |
| Brightness Distribution (%) | 84 | 83 -1% | 88 5% |
| Black Level * (cd/m²) | 0.18 | 0.53 -194% | 0.25 -39% |
| Contrast (:1) | 1300 | 449 -65% | 1308 1% |
| Colorchecker dE 2000 * | 5.3 | 10.8 -104% | 6.1 -15% |
| Colorchecker dE 2000 max. * | 9.09 | 29.3 -222% | 12.2 -34% |
| Greyscale dE 2000 * | 4 | 12.1 -203% | 8.8 -120% |
| Gamma | 2.46 89% | 2.25 98% | 2.18 101% |
| CCT | 6441 101% | 14344 45% | 6172 105% |
| Color Space (Percent of AdobeRGB 1998) (%) | 39 | 38.3 -2% | 61.56 58% |
| Color Space (Percent of sRGB) (%) | 60 | 59.9 0% | 94.88 58% |
| Total Average (Program / Settings) | -20% /
-51% | 21% /
12% |
* ... smaller is better
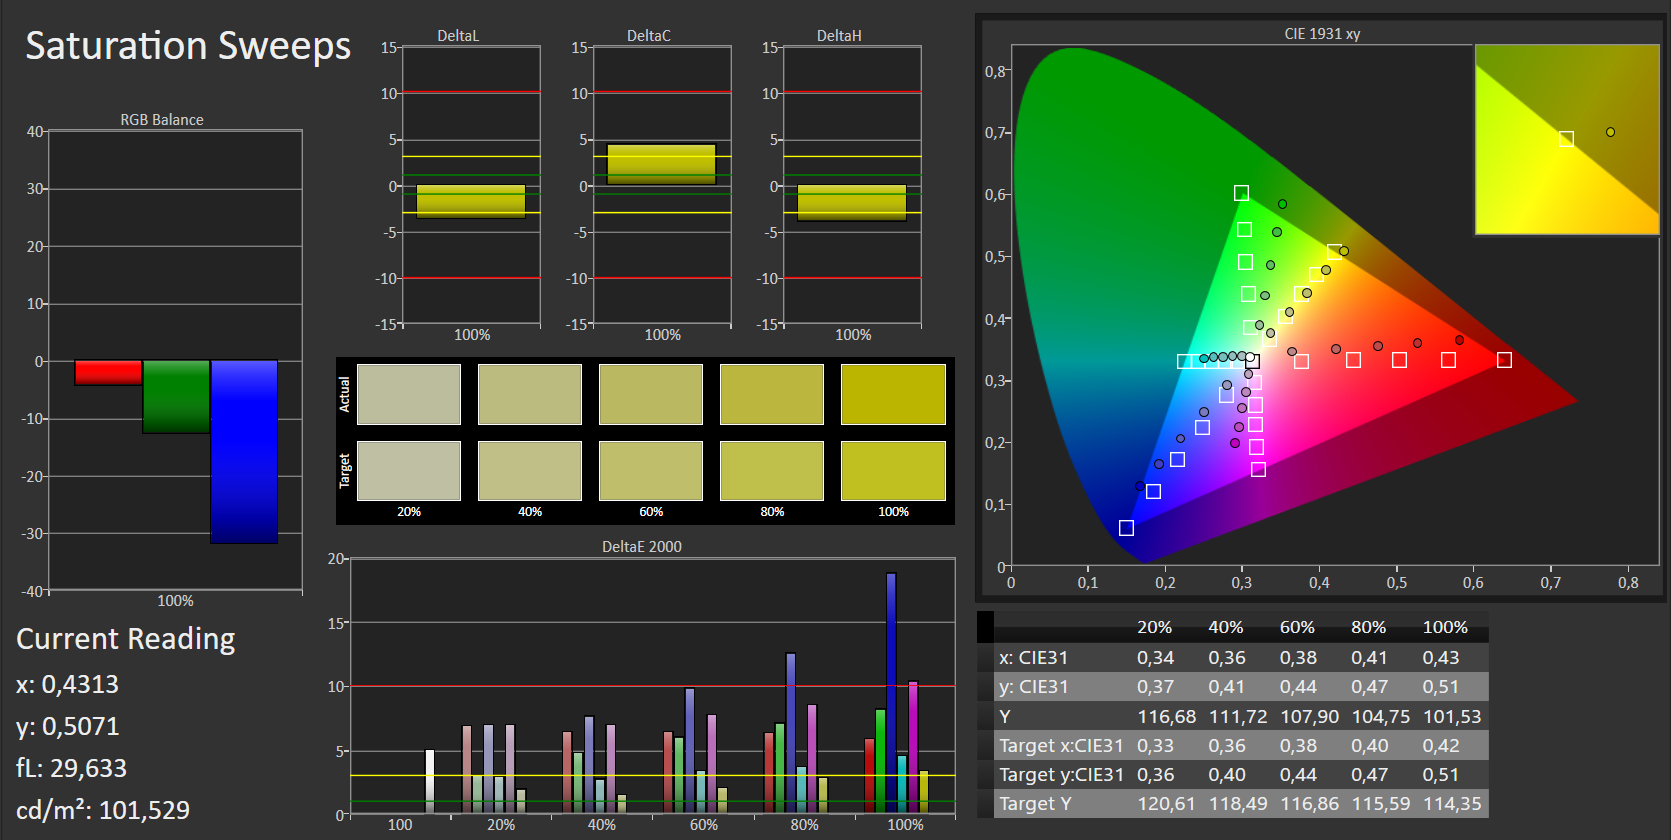
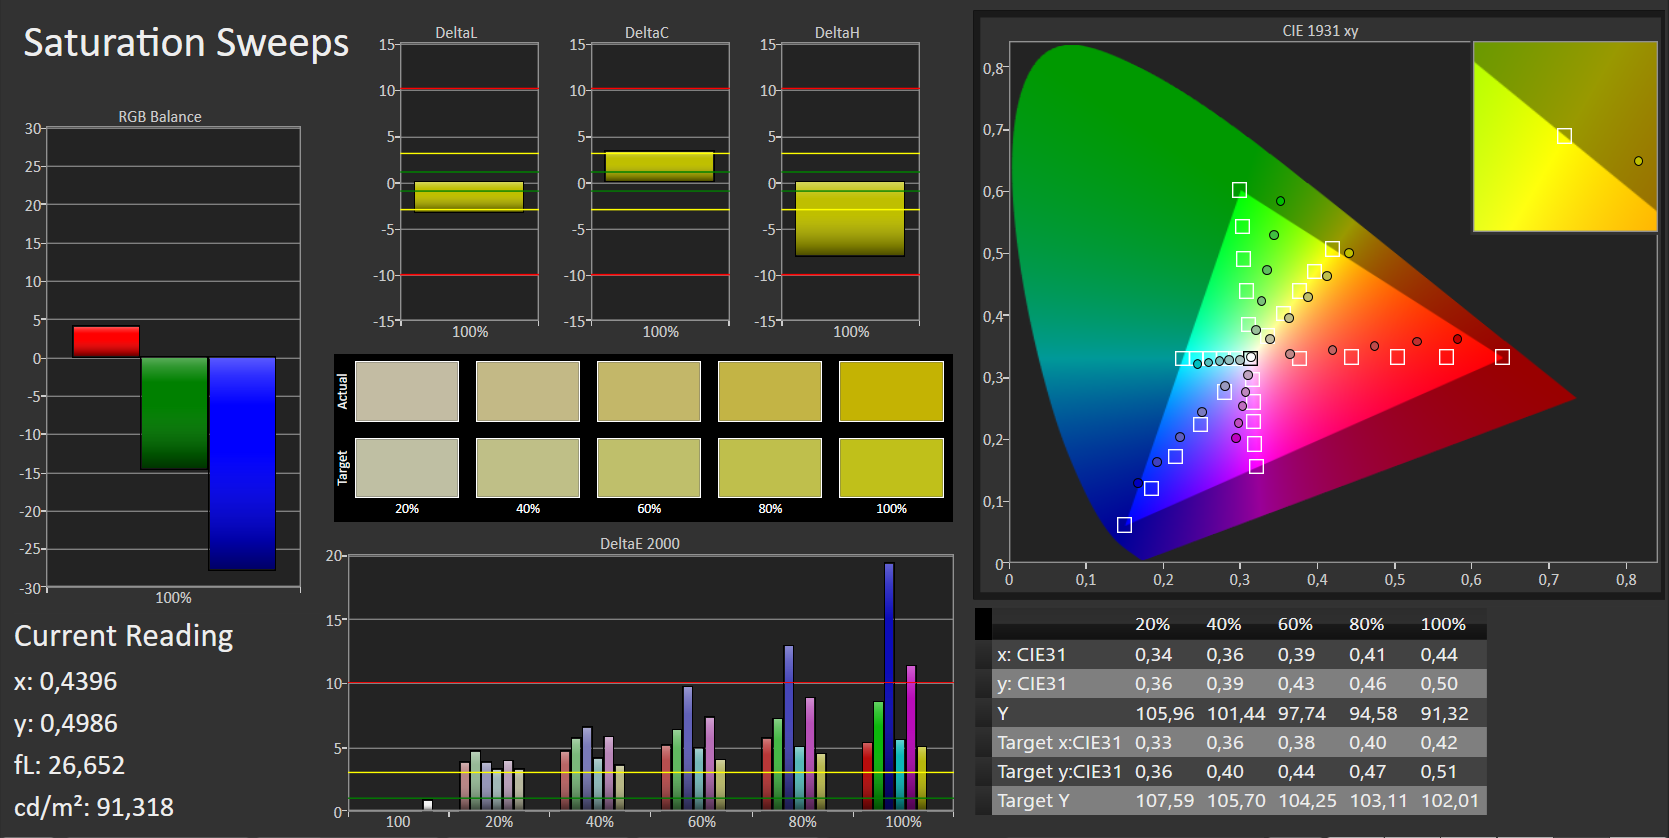
Another advantage is the low black value of 0.18 cd/m² that produces a deep black. We measured the typical good values for an IPS panel with the CalMAN analysis. The DeltaE deviation is at 5.3 for colors, which is a little better than the Lenovo ThinkPad T470s and twice as good as the other configuration of the Latitude 5580.
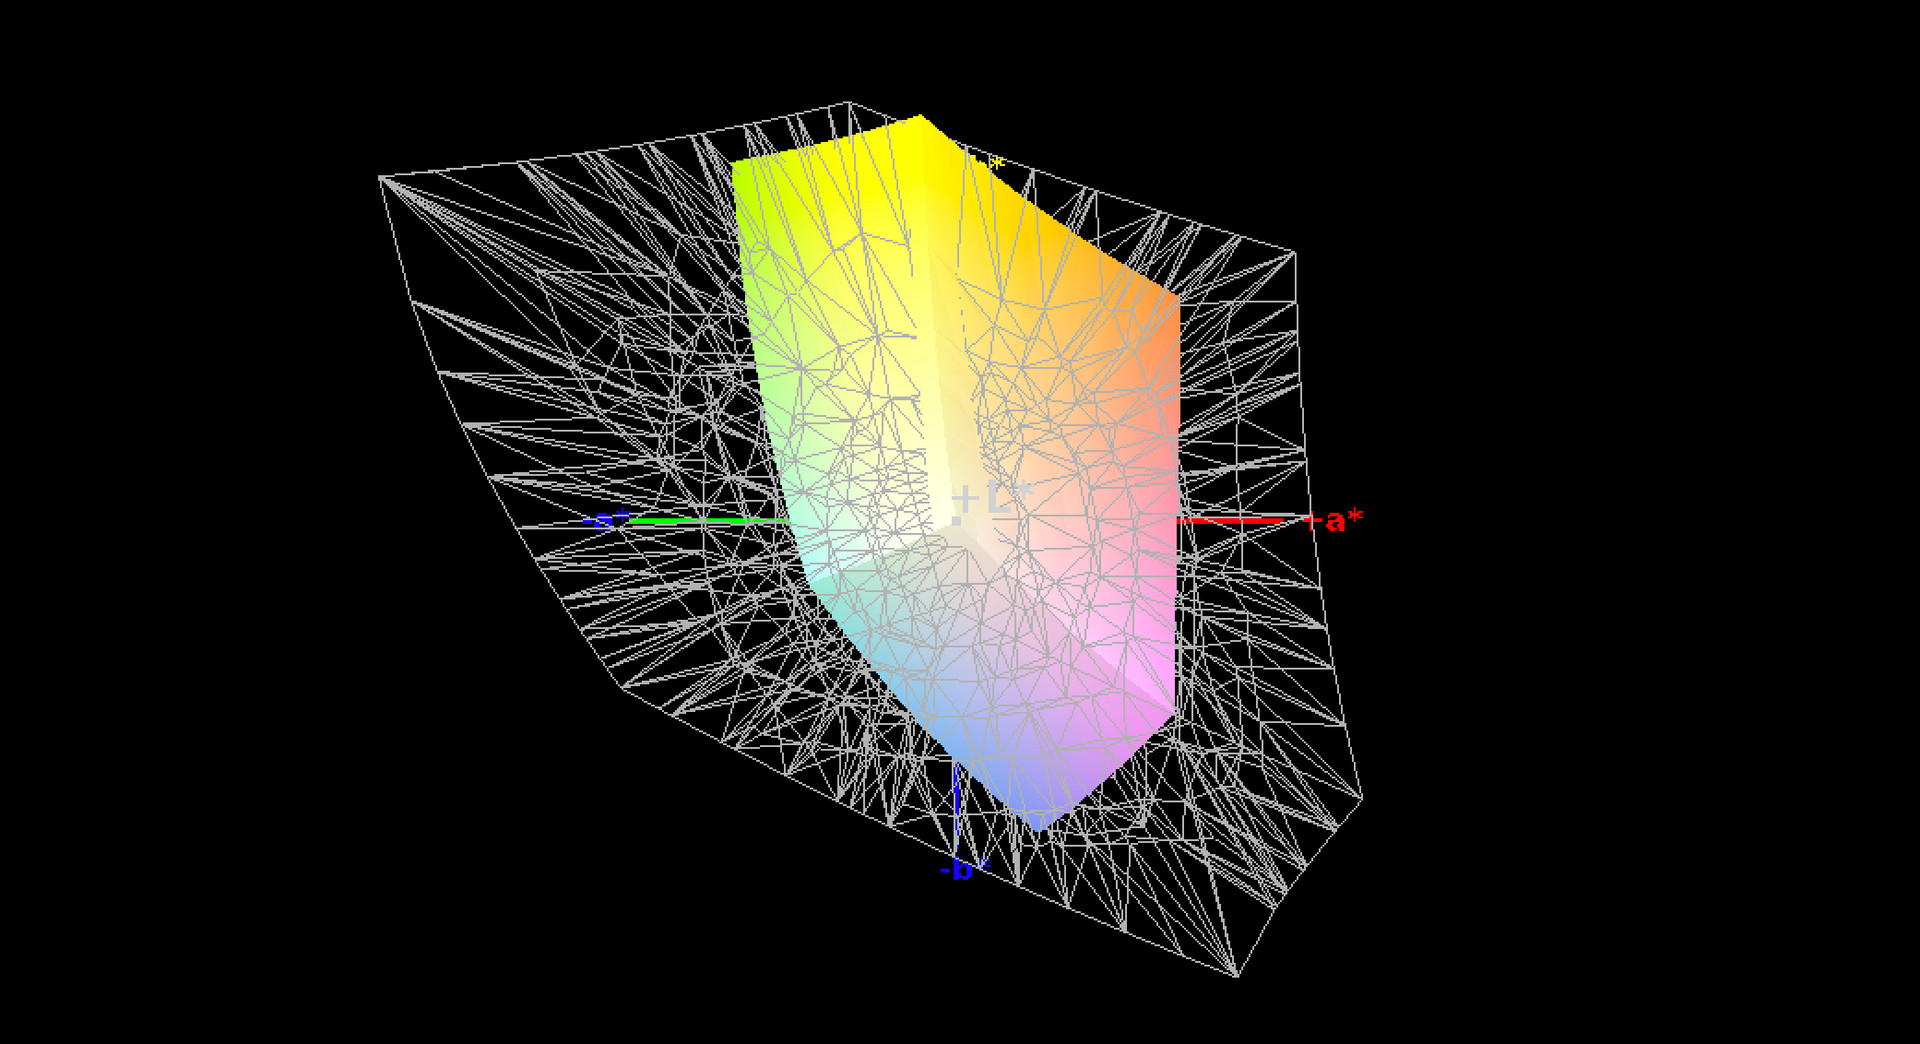
Grayscales have a deviation of 4, which is a lot better as well. Good news: The screen has no blue cast even without calibration. That was a big problem with the TN-panel Latitude. Color-space coverage is low both for the sRGB color space (60%) and the AdobeRGB color space (39%).
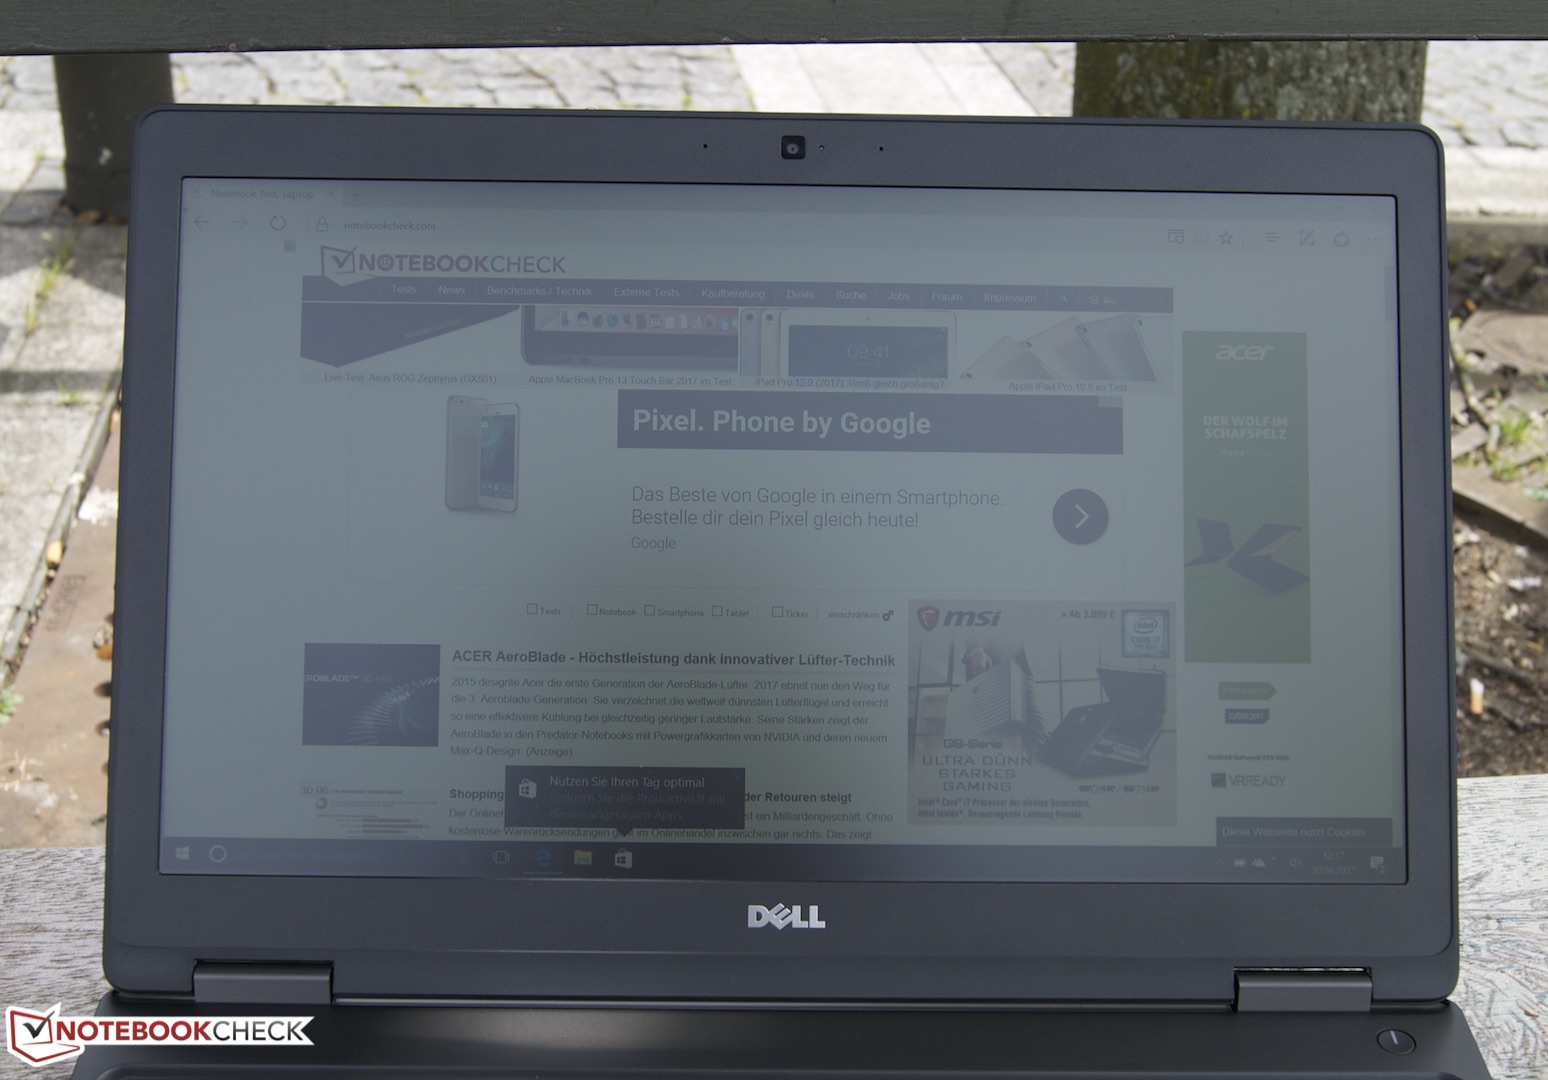
Provided you keep out of direct sunlight and find a shady spot to work in outside, then the matte display should work fine outdoors.
Display Response Times
| ↔ Response Time Black to White | ||
|---|---|---|
| 33 ms ... rise ↗ and fall ↘ combined | ↗ 19 ms rise | 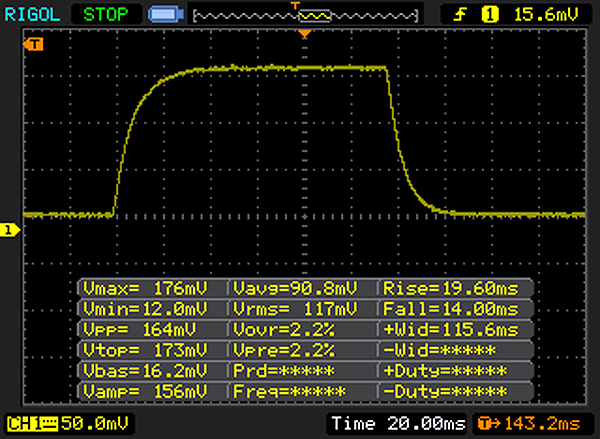 |
| ↘ 14 ms fall | ||
| The screen shows slow response rates in our tests and will be unsatisfactory for gamers. In comparison, all tested devices range from 0.1 (minimum) to 240 (maximum) ms. » 89 % of all devices are better. This means that the measured response time is worse than the average of all tested devices (19.9 ms). | ||
| ↔ Response Time 50% Grey to 80% Grey | ||
| 43 ms ... rise ↗ and fall ↘ combined | ↗ 23 ms rise | 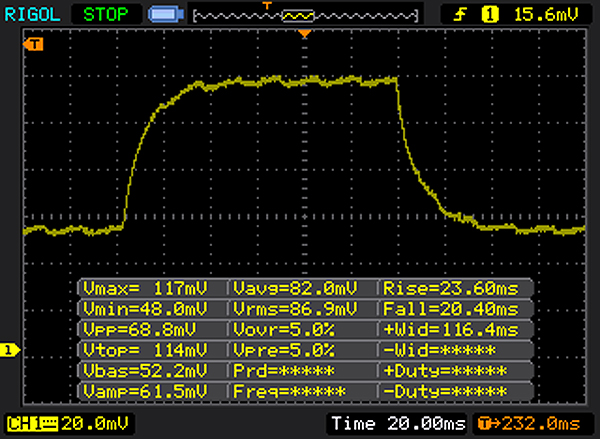 |
| ↘ 20 ms fall | ||
| The screen shows slow response rates in our tests and will be unsatisfactory for gamers. In comparison, all tested devices range from 0.165 (minimum) to 636 (maximum) ms. » 71 % of all devices are better. This means that the measured response time is worse than the average of all tested devices (31.1 ms). | ||
Screen Flickering / PWM (Pulse-Width Modulation)
| Screen flickering / PWM detected | 1020 Hz | 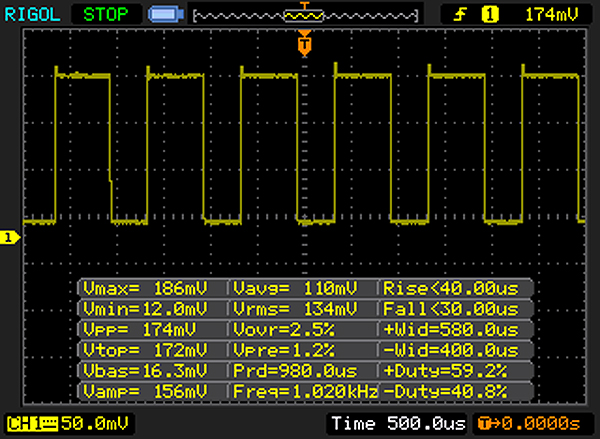 | |
| ≤ 90 cd/m² brightness | |||
The display backlight flickers at 1020 Hz (worst case, e.g., utilizing PWM) Flickering detected at a brightness setting of 90 cd/m² and below. There should be no flickering or PWM above this brightness setting. The frequency of 1020 Hz is quite high, so most users sensitive to PWM should not notice any flickering. Flickering occurs at relatively low brightness settings, so extended use at this brightness setting or lower can cause eyestrain. In comparison: 52 % of all tested devices do not use PWM to dim the display. If PWM was detected, an average of 7794 (minimum: 5 - maximum: 343500) Hz was measured. | |||
As our test unit is equipped with an IPS panel, colors and brightness do not change from various viewing angles.
Performance
As we are accustomed to from this manufacturer, various configurations are available for each model suitable for different budgets. Our test unit is the top-of-the-range model. The Latitude 5580 series aims to cover both professional and private everyday needs. In our case this aim is met with an Intel Core i5 CPU, 8 GB of RAM and a 500 GB hard drive. Our model is available for $970.
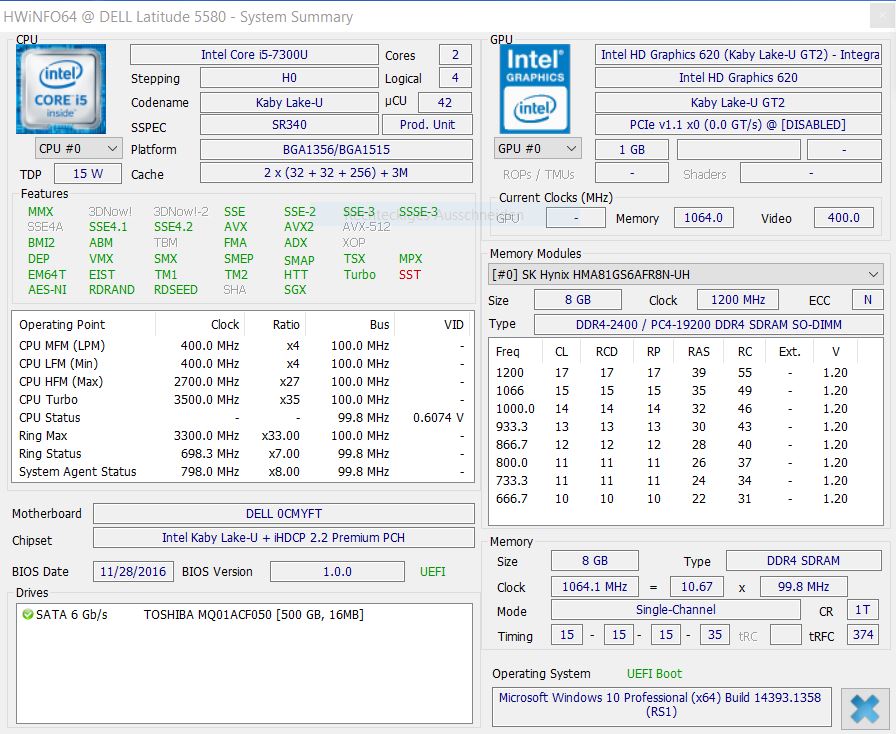
Processor
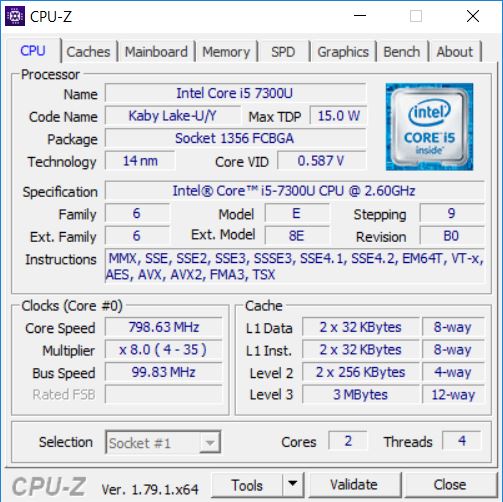
The second change in our current configuration of the Latitude is an Intel Core i5-7300U. The difference to the Intel Core i5-7200 is limited to its higher clock rate. Instead of having to work with a bandwidth of 2500-3100 MHz, our CPU reaches 2600 - 3500 MHz.
We wanted to measure the performance difference with the help of Cinebench R15. The results of the multi-core test surprised us: no increase in performance. Both the previous and current version reached 330 points. The reason behind this lies in the clock rates: as soon as the Cinebench benchmark was started the clock rate of the processor fell to a steady 3100 MHz. The Lenovo ThinkPad T470s proves that this is not usual behavior. It managed 370 points in the same test.
Next, we wanted to find out whether the disappointing addition had any impact on system performance. At least performance remains the same on battery. Results do not vary even after a series of Cinebench runs.
To find out more about the tested processors, take a look at our mobile processors benchmark list.
System Performance
We had no problems with system performance during testing. Occasionally we would have liked faster SSD storage, but that can be added later on if necessary. We used the system benchmark PCMark 8 to find out whether the changed CPU has any implications on system performance. Unfortunately, the results were not that great. Our test unit scored 3300 points, which is just the same as the other model with lower configuration.
| PCMark 8 Home Score Accelerated v2 | 3300 points | |
Help | ||
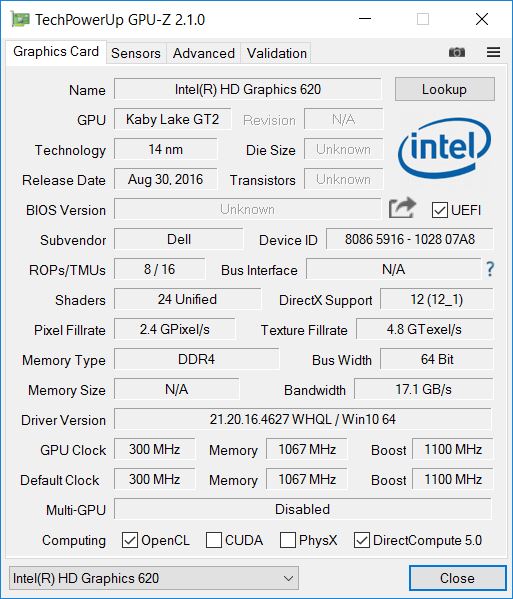
Graphics
Like in our last test, the device is equipped with an internal Intel HD Graphics 620. This manages a surprising 200 points more in 3DMark 11 (total 1540 points) compared to the last test unit. There is no change when the device runs on battery. You can expect full performance while working away from the power supply.
To find out more about various graphics cards, take a look at our mobile graphics cards benchmark list.
| 3DMark 11 - 1280x720 Performance GPU | |
| Lenovo ThinkPad T470s-20HGS00V00 | |
| Dell Latitude 5289 | |
| Lenovo ThinkPad T470s-20HF0012US | |
| HP EliteBook x360 1030 G2 | |
| Dell Latitude 5580 | |
| Dell Latitude 5580 | |
Gaming Performance
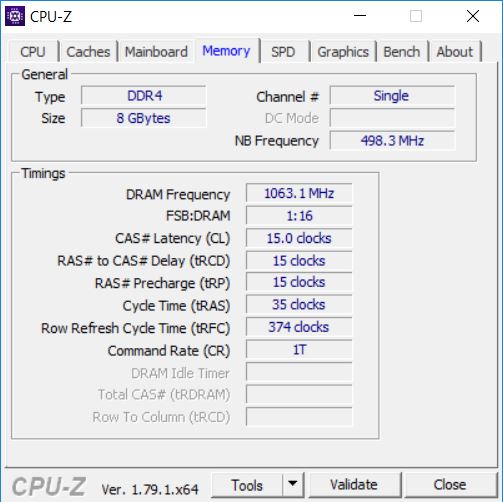
If you like to have a go at older, more classic games and have no high expectations of the display, you will be quite happy with the Intel HD Graphics 620. BioShock Infinite from 2013 is displayed more or less smoothly, with 40 fps at minimum setting. You might be surprised by the comparison to the other Latitude 5580 test unit. The version with lower configuration managed 52 fps and did noticeably better in the gaming benchmark. The reason: Our current test unit works in single-channel mode.
| BioShock Infinite | |
| 1280x720 Very Low Preset | |
| Lenovo ThinkPad T470s-20HF0012US | |
| Dell Latitude 5580 | |
| Dell Latitude 5580 | |
| 1366x768 Medium Preset | |
| Lenovo ThinkPad T470s-20HF0012US | |
| Dell Latitude 5580 | |
| Dell Latitude 5580 | |
| low | med. | high | ultra | |
|---|---|---|---|---|
| BioShock Infinite (2013) | 39.7 | 23.6 | 19.6 |
Emissions
System Noise
We hardly noticed any differences in system noise between the two Latitude 5880s. The only thing is that the HDD is quieter than the cooling fan. You can only hear a little HDD noise occasionally.
The cooling fan remains active most of the time. If you set Windows to high performance, the device produces noise constantly.
We measured a noise increase of up to 37.6 dB(A) under load. That's about 3 dB(A) more than in the previous test. The frequency of the cooling fan is at a good level and has no bothersome high frequency noise.
Noise level
| Idle |
| 32.8 / 32.8 / 33.6 dB(A) |
| Load |
| 37.6 / 37.6 dB(A) |
 | ||
30 dB silent 40 dB(A) audible 50 dB(A) loud |
||
min: | ||
Temperature
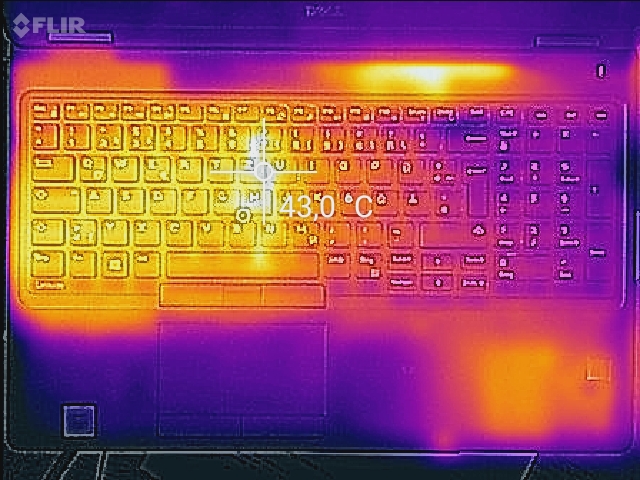
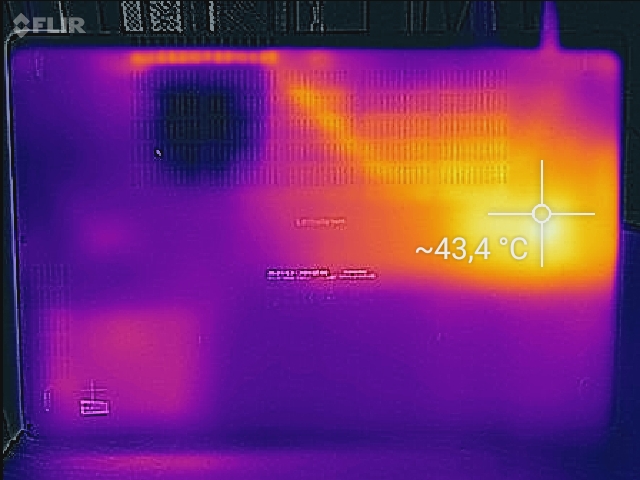
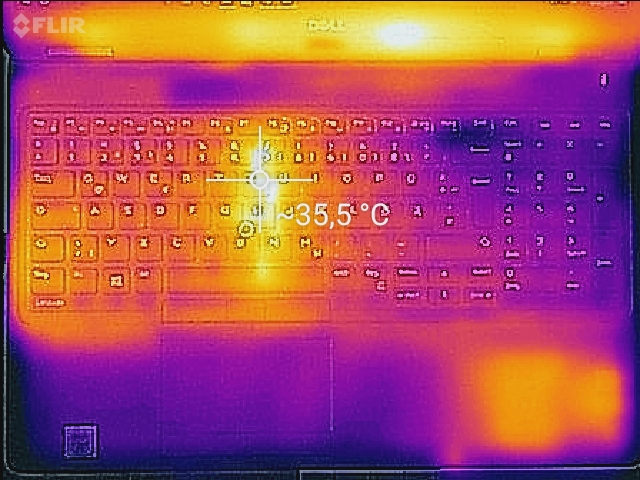
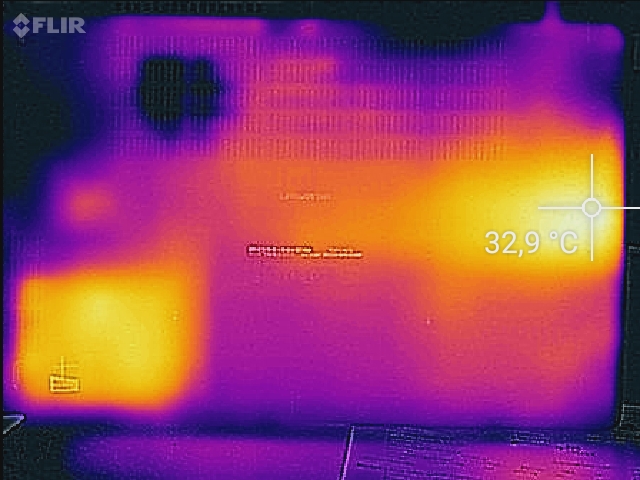
While temperatures remain below 30 °C (~86 °F) while idling, they increase up to 42 °C (~108 °F) under load. The Latitude with a TN panel and lower-clocking CPU was 3.5 °C (~38 °F) warmer. In total, heat distribution has remained the same. The hotspot is on the bottom of the base unit. You can easily use the device on your lap for everyday actions such as surfing the web.
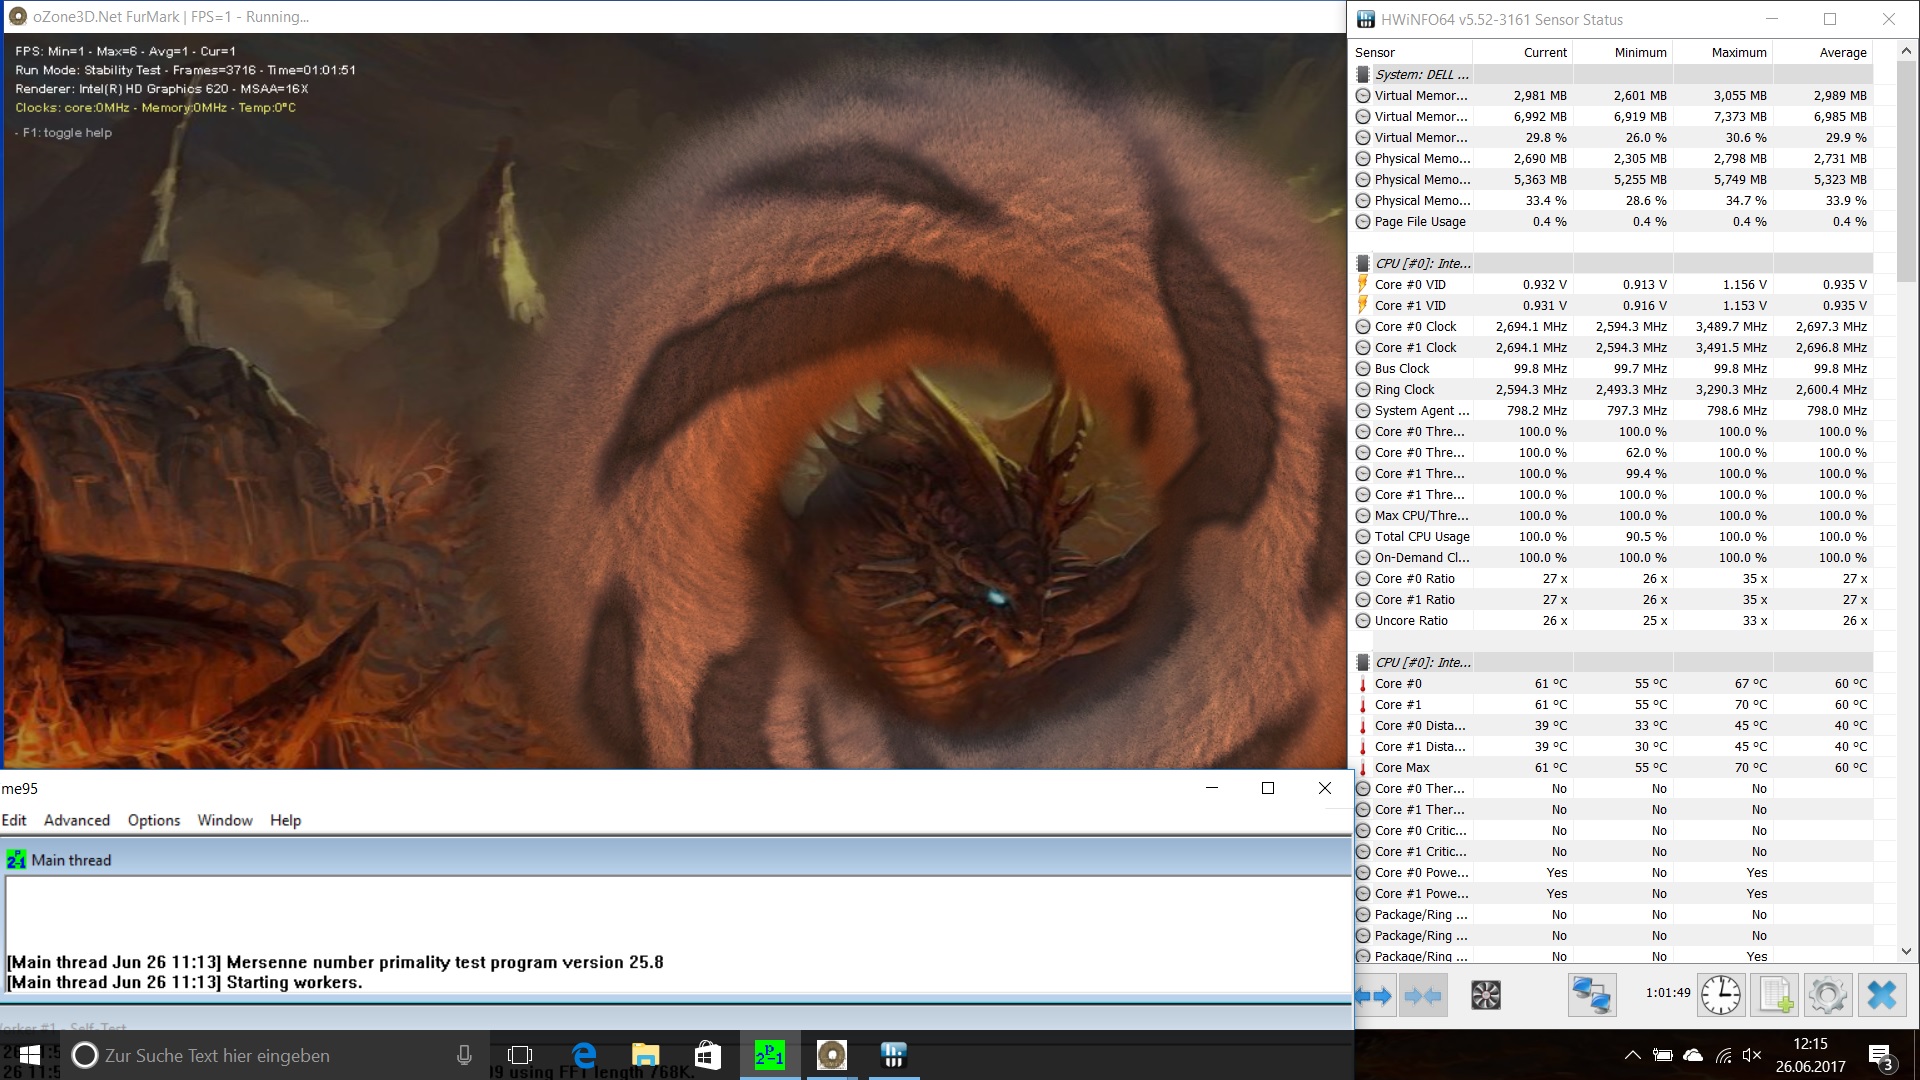
Next, we took a look at head development on the inside. We put the test unit under load with the help of Prime95 and FurMark. After running for an hour, the average clock frequency of the CPU was 2700 MHz. This is 100 MHz more than its actual base clock rate. While running, the processor's temperature did not exceed 70 °C (~158 °F). Afterwards we ran 3DMark 11 to check if the Latitude 5580 could offer its usual performance, which we assume it can as the 3DMark 11 results were the same as before.
(+) The maximum temperature on the upper side is 35.4 °C / 96 F, compared to the average of 34.3 °C / 94 F, ranging from 21.2 to 62.5 °C for the class Office.
(±) The bottom heats up to a maximum of 41.8 °C / 107 F, compared to the average of 36.8 °C / 98 F
(+) In idle usage, the average temperature for the upper side is 27.2 °C / 81 F, compared to the device average of 29.5 °C / 85 F.
(+) The palmrests and touchpad are cooler than skin temperature with a maximum of 28.1 °C / 82.6 F and are therefore cool to the touch.
(±) The average temperature of the palmrest area of similar devices was 27.5 °C / 81.5 F (-0.6 °C / -1.1 F).
Energy Management
Power Consumption
It is interesting that the device seems to require more power while idling. In the last review of the Latitude we measured a power consumption of 3.5-7.3 W. Our current test unit requires 4.3-11.8 W. Under load, power consumption increases to up to 29 W; when we put on Prime95 only, we measured 45 W. The reason behind this difference is that Prime95 is only aimed at CPU performance. Therefore, it can require a higher clock rate and higher CPU performance.
| Off / Standby | |
| Idle | |
| Load |
|
Key:
min: | |
| Dell Latitude 5580 i5-7300U, HD Graphics 620, Toshiba MQ01ACF050, IPS, 1920x1080, 15.6" | Lenovo ThinkPad T470s-20HF0012US i5-7300U, HD Graphics 620, Samsung PM961 MZVLW256HEHP, IPS, 1920x1080, 14" | Dell Latitude 5580 i5-7200U, HD Graphics 620, Seagate ST500LM021-1KJ15, TN LED, 1366x768, 15.6" | HP Probook 650 G3 Z2W44ET i5-7200U, HD Graphics 620, Hitachi Travelstar Z7K500 HTS725050A7E630, TN LED, 1920x1080, 15.6" | |
|---|---|---|---|---|
| Power Consumption | -3% | 19% | 17% | |
| Idle Minimum * (Watt) | 4.3 | 4.8 -12% | 3.5 19% | 4 7% |
| Idle Average * (Watt) | 10.1 | 6.6 35% | 6 41% | 6.9 32% |
| Idle Maximum * (Watt) | 11.8 | 7 41% | 7.3 38% | 7.6 36% |
| Load Average * (Watt) | 32 | 39.2 -23% | 30.8 4% | 29 9% |
| Load Maximum * (Watt) | 29 | 44.8 -54% | 31 -7% | 28.7 1% |
* ... smaller is better
Battery Runtime
Dell has topped up the capacity of the Latitude E series with a battery capacity of 68 W. In order to get realistic results, we simulated surfing the web. The Latitude 5580 lasted over 10 hours. This means that our test unit can even survive long workdays. However, the Latitude with the alternative configuration had an even better battery runtime with 11.5 hours.
| Dell Latitude 5580 i5-7300U, HD Graphics 620, 68 Wh | Lenovo ThinkPad T470s-20HF0012US i5-7300U, HD Graphics 620, 51 Wh | Dell Latitude 5580 i5-7200U, HD Graphics 620, 68 Wh | HP Probook 650 G3 Z2W44ET i5-7200U, HD Graphics 620, 48 Wh | |
|---|---|---|---|---|
| Battery runtime | -21% | 14% | -24% | |
| WiFi v1.3 (h) | 10.2 | 8.1 -21% | 11.6 14% | 7.8 -24% |
| Reader / Idle (h) | 17.7 | 18.4 | 12.8 | |
| Load (h) | 2.9 | 2.2 | 3 | |
| H.264 (h) | 6.7 |
Verdict
Pros
Cons
The difference to the Latitude 5580 model we already tested may not seem big at first glance. But particularly the Full HD screen makes a difference and completes the package. We already admired the device's good input devices in the last review, which are suited to long typing sessions at work or at home. Particularly for the business sector, the Dell Latitude 5580 offers some important security standards.
The processor update in this configuration was unsuccessful. Our benchmarks found no noticeable performance improvement. It even lags an hour behind in battery runtime.
The Dell Latitude proves to be a steady companion, be it as an entry-level business notebook or an office partner for everyday use.
However, it might also be worth taking a look at the Lenovo ThinkPad T470s, which has faster SSD storage and performed better in our benchmarks.
Dell Latitude 5580
- 07/02/2017 v6 (old)
Nino Ricchizzi
Price comparison
