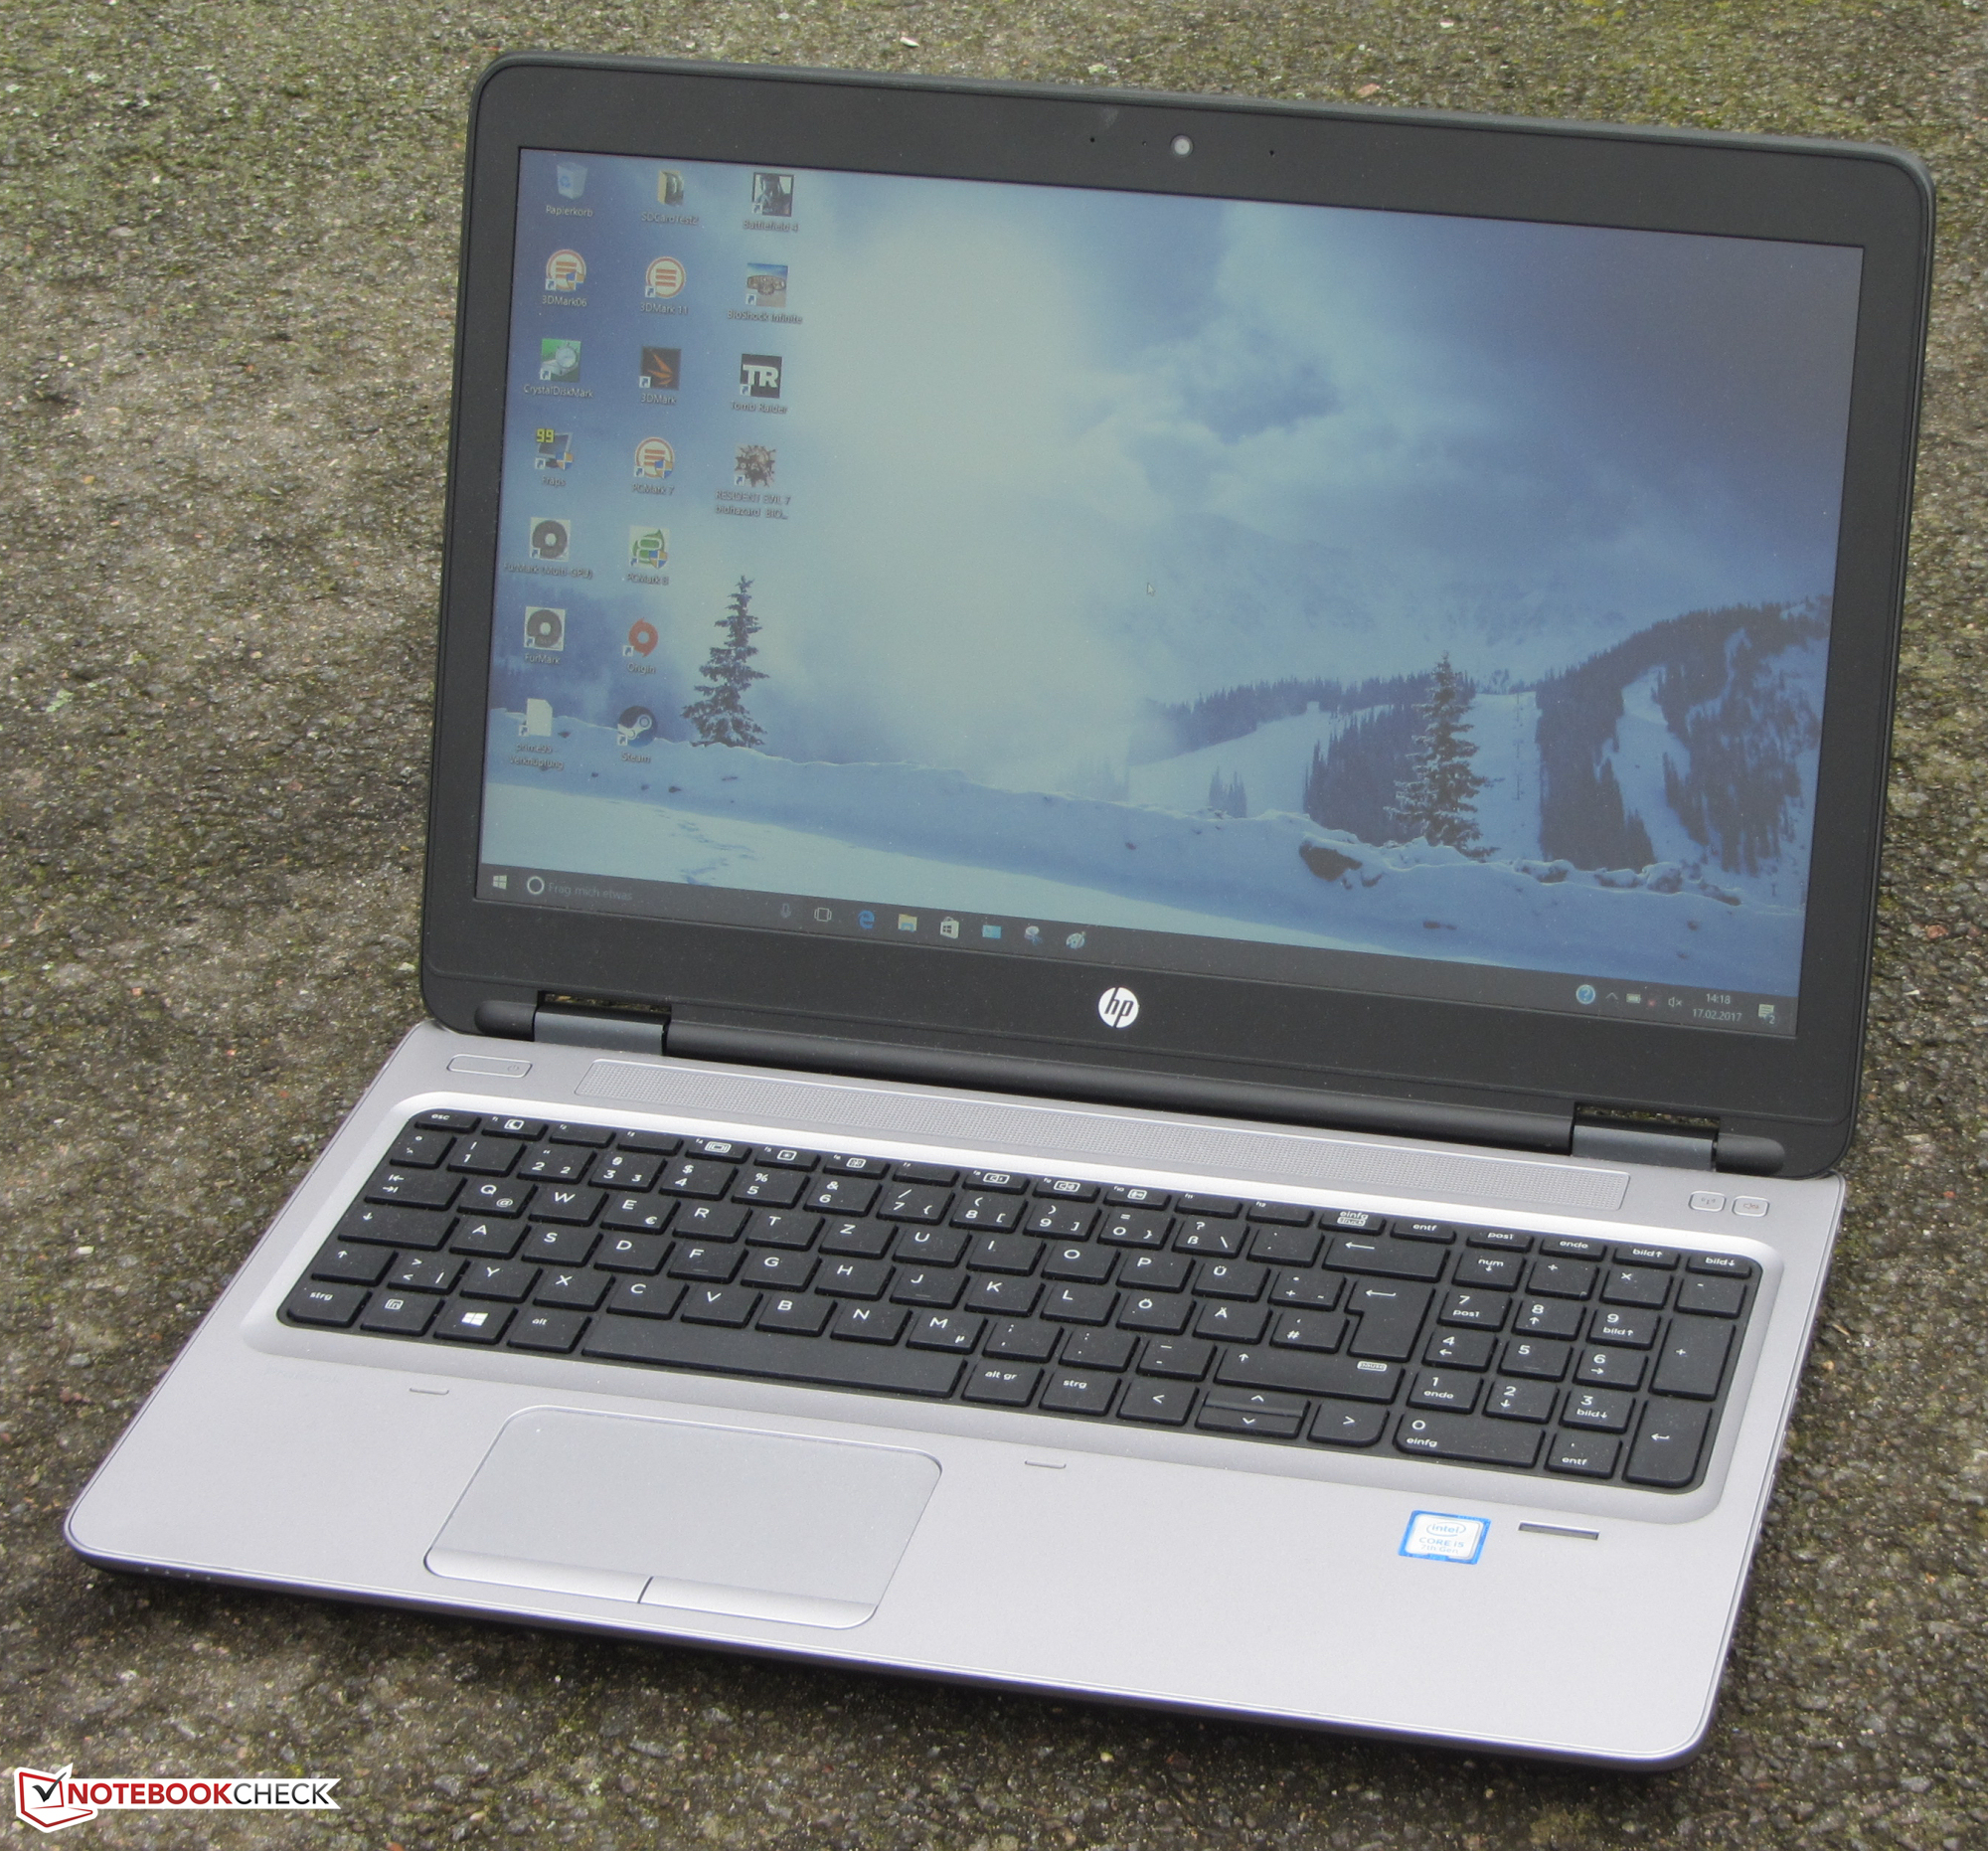
HP ProBook 650 G3 Z2W44ET Notebook Review
For the original German review, see here.
With the HP ProBook 650 G3, we have a new representative of HP's business notebook series under review. Changes can only be found inside: The new models come with Kaby Lake processors. The outside remained unchanged compared to its ProBook 650 G2 predecessor. Competitors include computers such as the Lenovo ThinkPad L560, the Dell Latitude 15 E5570, and the Acer TravelMate P658-M.
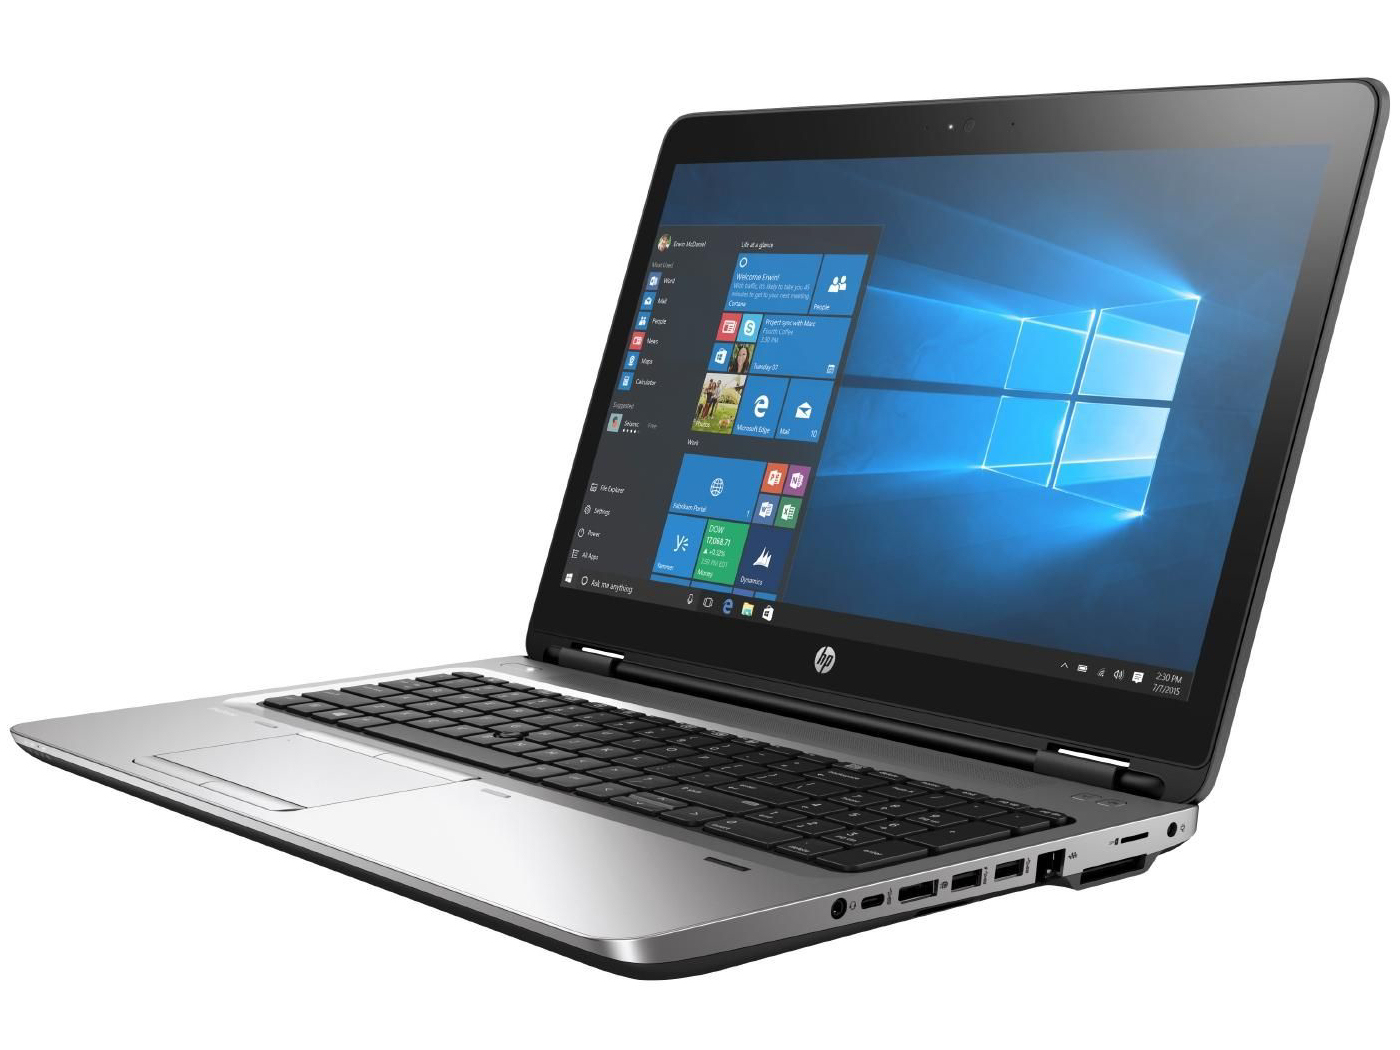
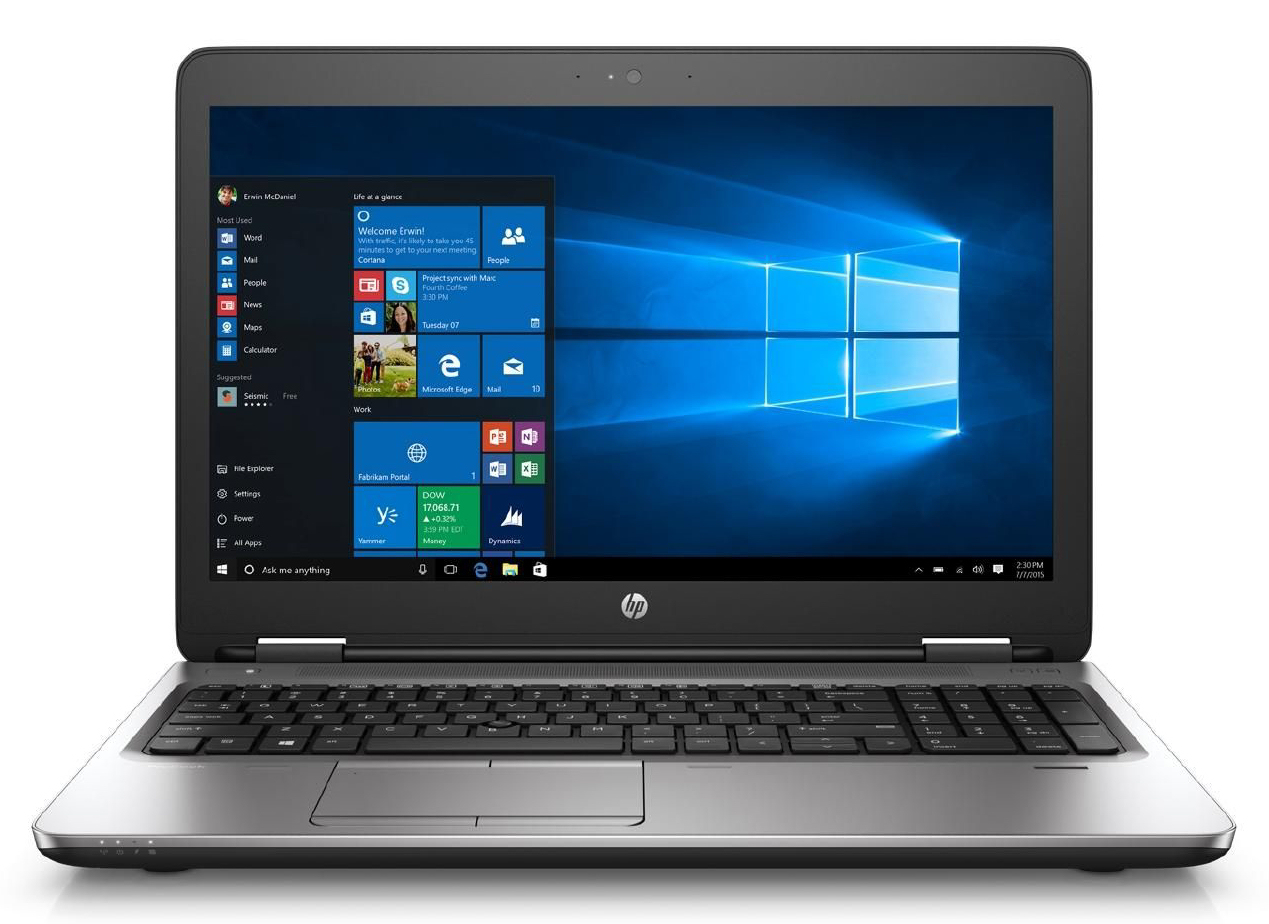
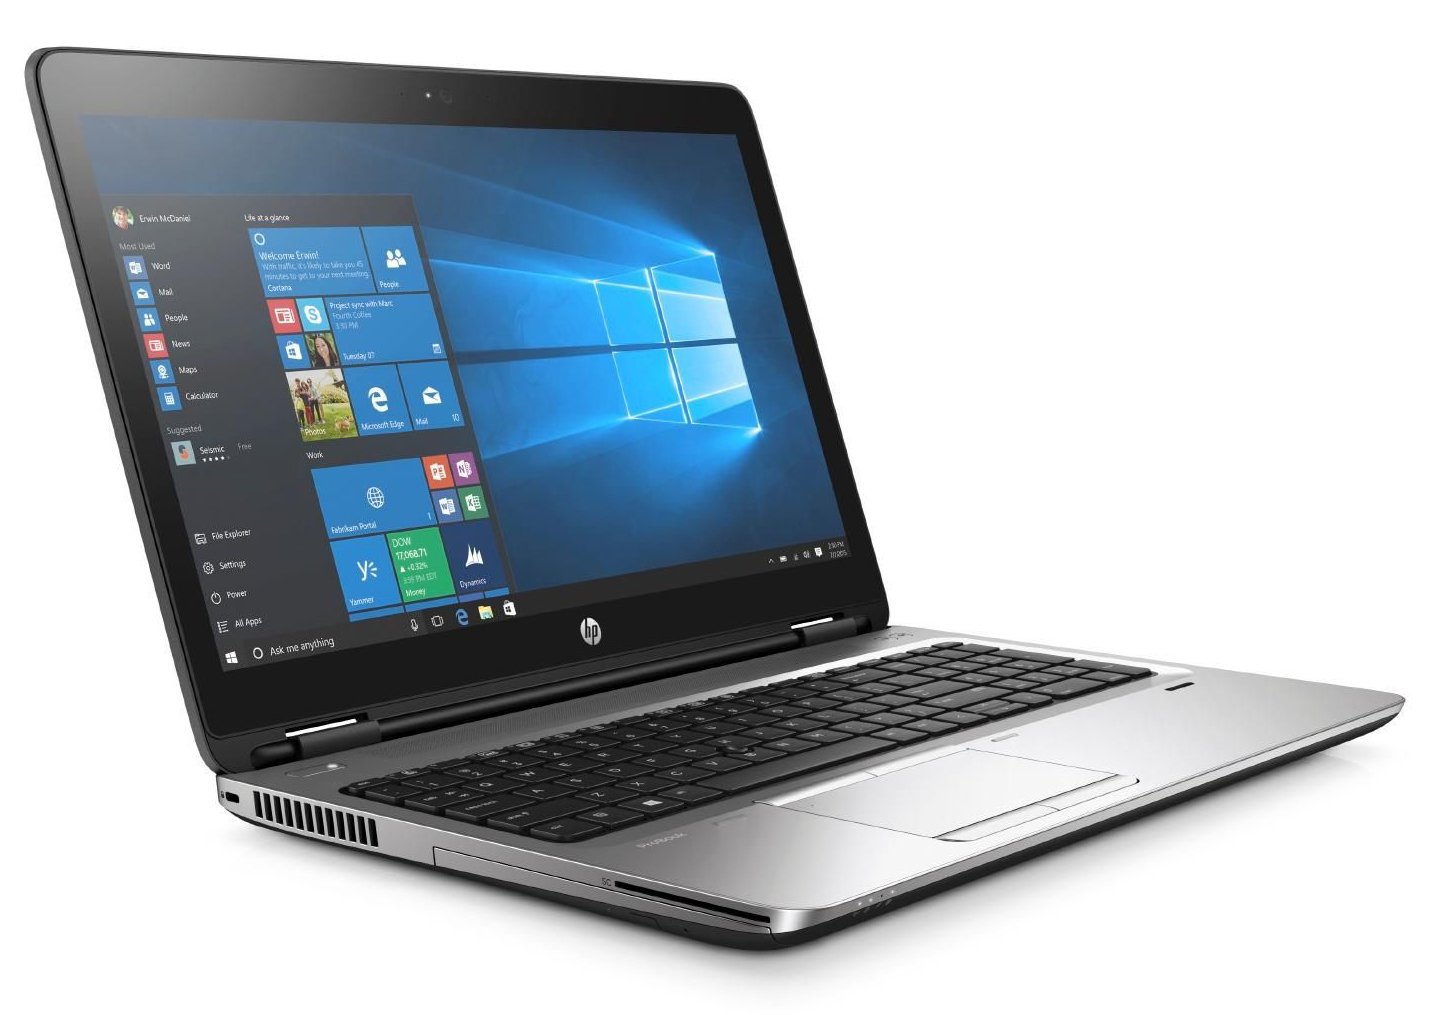
Since the ProBook 650 G2 and the ProBook 650 G3 share the same design, we will not cover case, connectivity, input devices, and speakers in detail here. Information about these is available in our ProBook 650 G2 T9X61ET Review.
| SD Card Reader | |
| average JPG Copy Test (av. of 3 runs) | |
| Dell Latitude 15 E5570 | |
| Lenovo ThinkPad L560-20F10026GE | |
| Acer TravelMate P658-M-537B | |
| HP Probook 650 G3 Z2W44ET | |
| HP ProBook 650 G2 V1A44ET | |
| HP ProBook 655 G2 T9X09ET | |
| maximum AS SSD Seq Read Test (1GB) | |
| HP Probook 650 G3 Z2W44ET | |
| Lenovo ThinkPad L560-20F10026GE | |
| Networking | |
| iperf3 transmit AX12 | |
| Apple MacBook Pro 15 2016 (2.6 GHz, 450) (Klaus I211) | |
| HP Probook 650 G3 Z2W44ET (jseb) | |
| iperf3 receive AX12 | |
| Apple MacBook Pro 15 2016 (2.6 GHz, 450) (Klaus I211) | |
| HP Probook 650 G3 Z2W44ET (jseb) | |
| iperf Client (transmit) TCP 1 m | |
| HP ProBook 650 G2 V1A44ET (jseb) | |
| Dell Latitude 15 E5570 | |
| HP ProBook 655 G2 T9X09ET (jseb) | |
| iperf Server (receive) TCP 1 m | |
| HP ProBook 650 G2 V1A44ET (jseb) | |
| HP ProBook 655 G2 T9X09ET (jseb) | |
| Dell Latitude 15 E5570 | |
Display

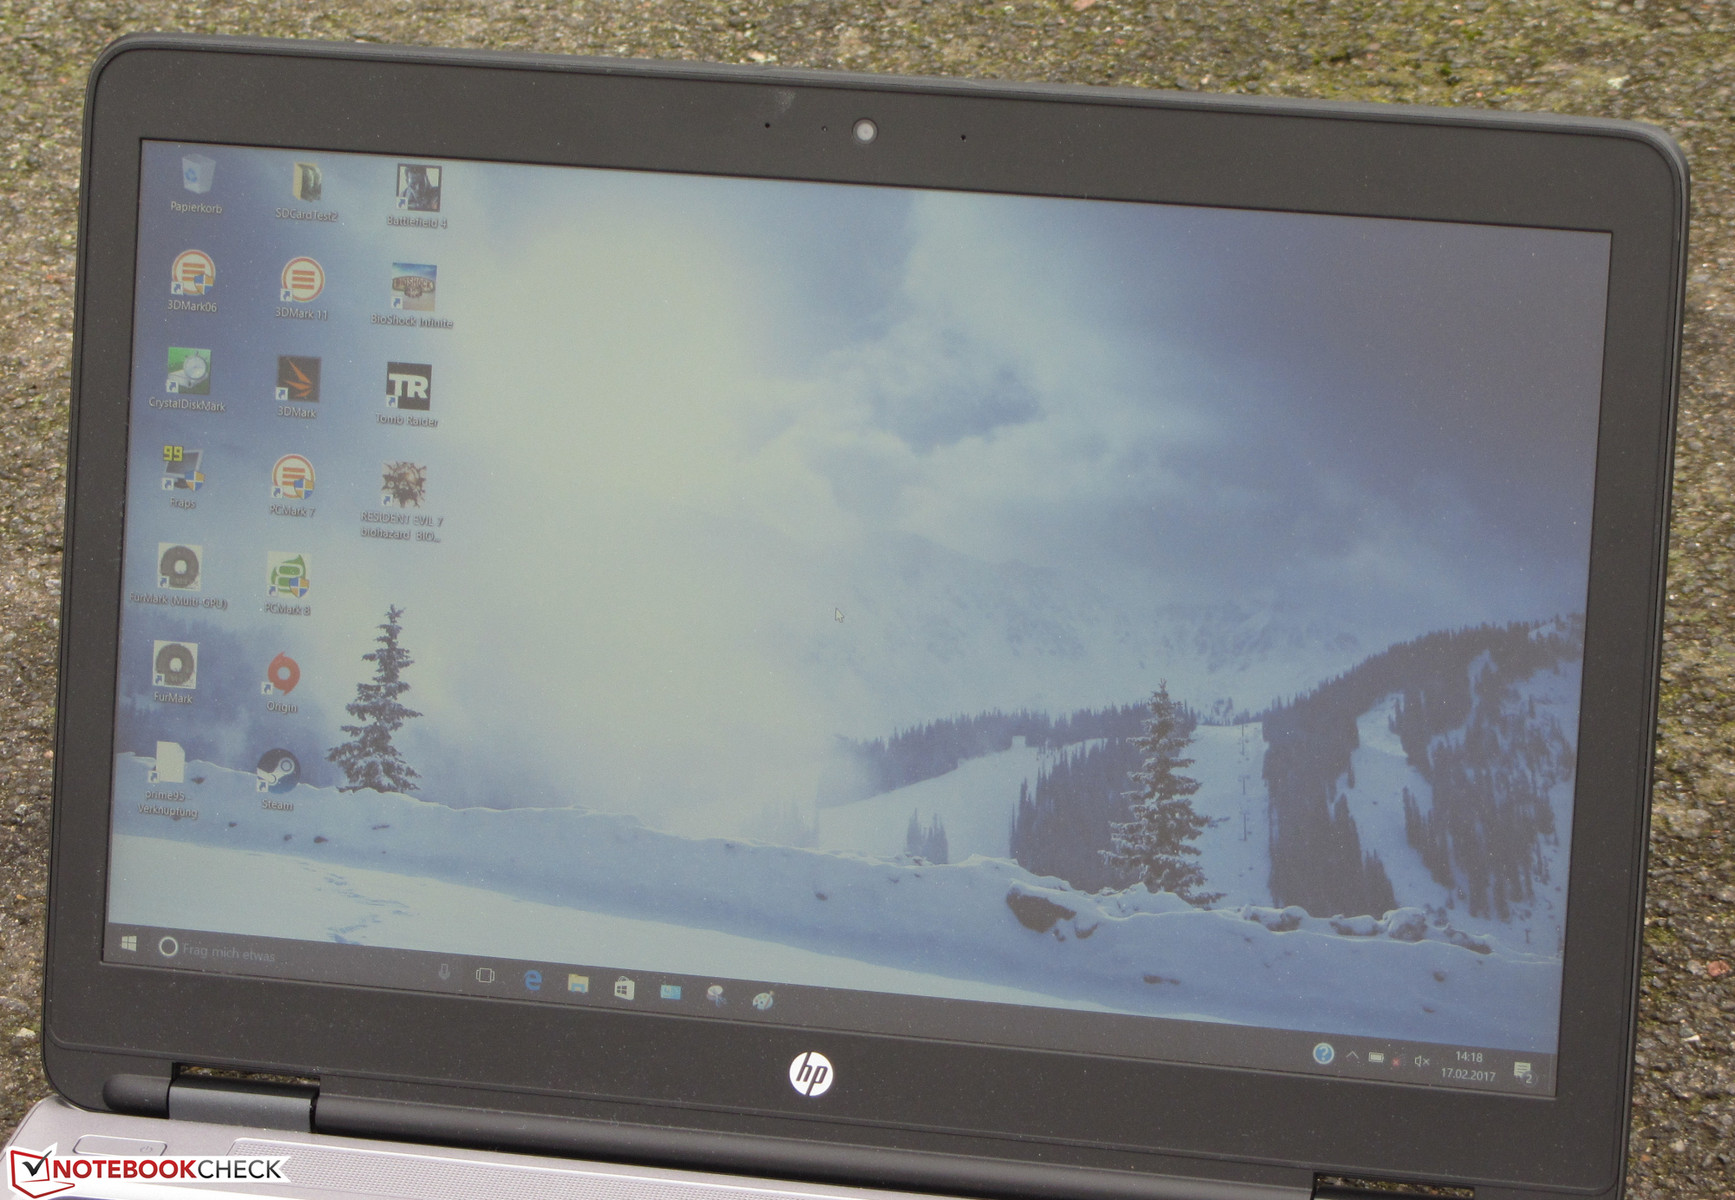
The ProBook comes with a matte 15.6-inch display with a native resolution of 1920x1080 pixels. As an alternative, the computer is also available with HD display (1366x768 pixels). The incorporated display delivers a good brightness (344.8 cd/m²) but performs poorly in contrast (540:1). We expect at least 1000:1 from a notebook of this price category. Unfortunately, the display shows PWM-flickering at a frequency of 200 Hz at brightness levels of 50% and lower. This might cause headaches and/or eye problems in sensitive people.
| |||||||||||||||||||||||||
Brightness Distribution: 95 %
Center on Battery: 355 cd/m²
Contrast: 540:1 (Black: 0.65 cd/m²)
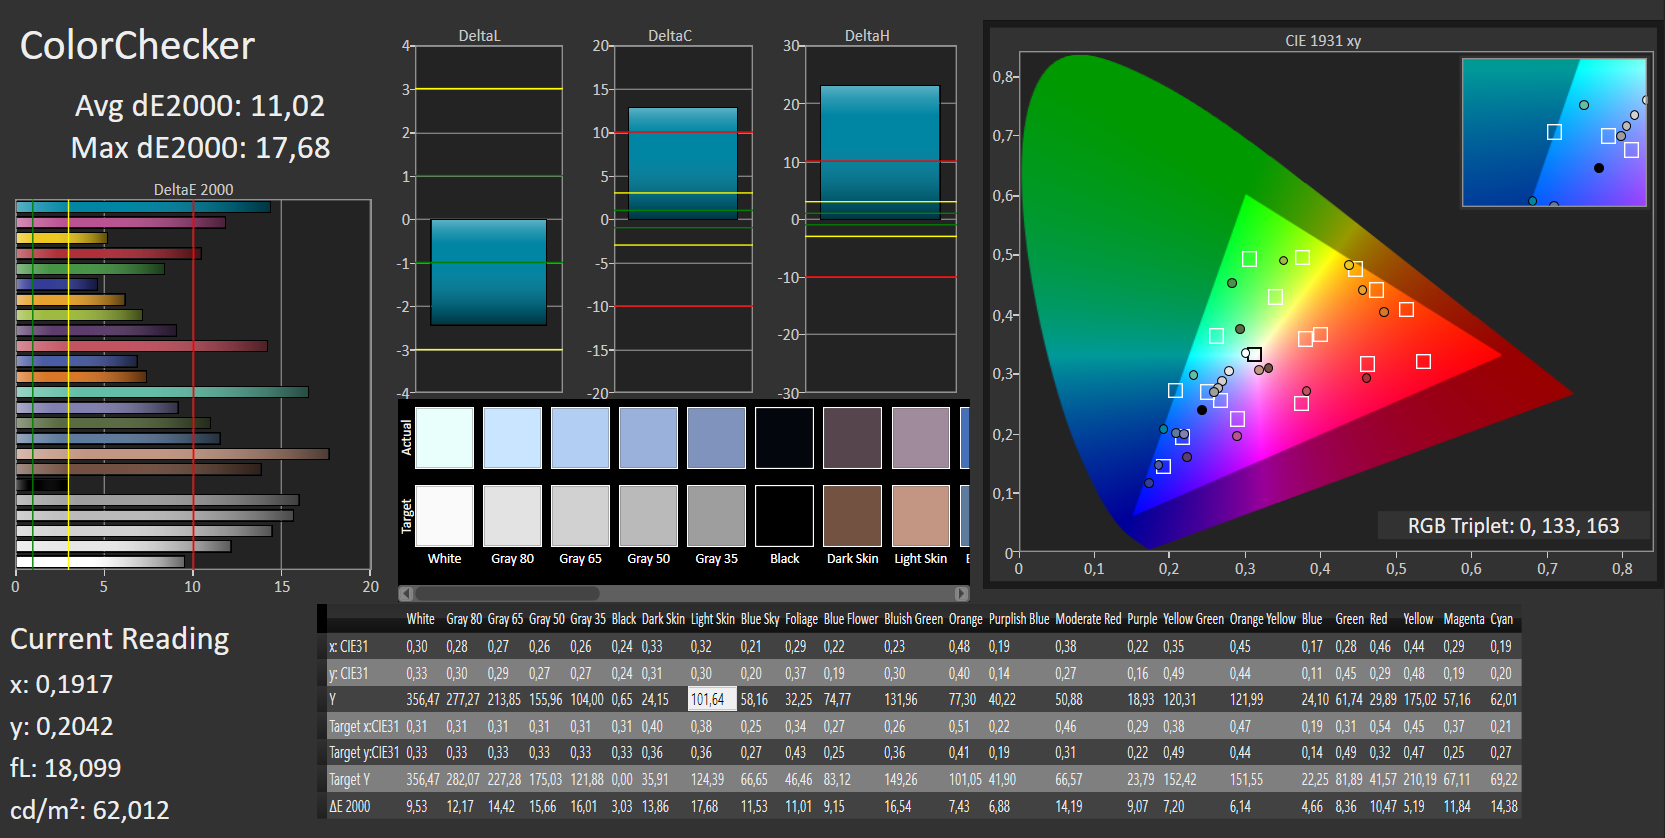
ΔE ColorChecker Calman: 11.02 | ∀{0.5-29.43 Ø4.72}
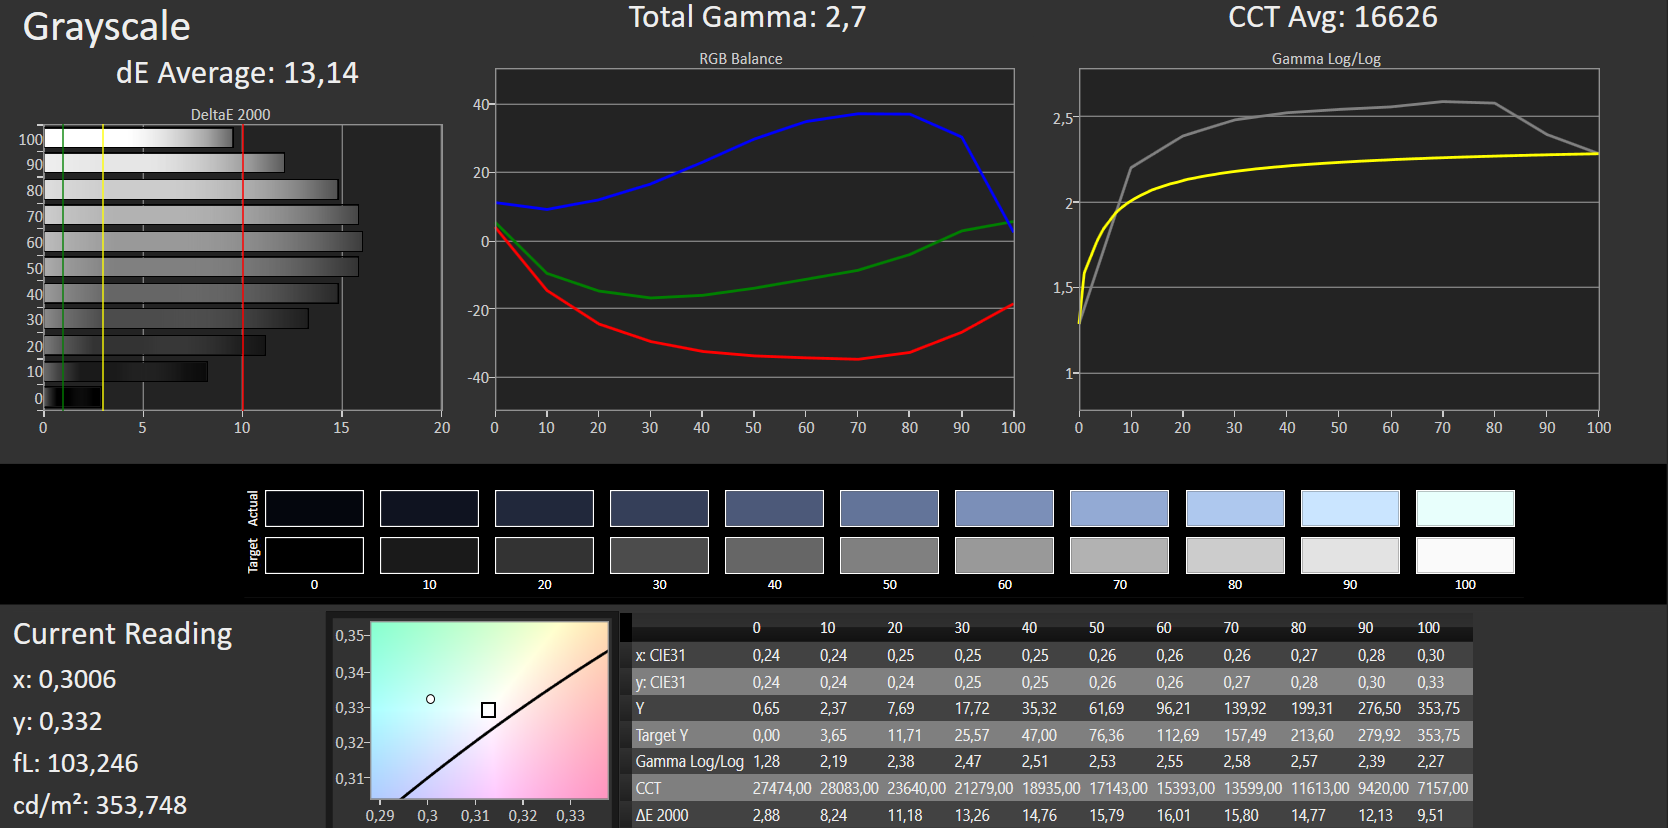
ΔE Greyscale Calman: 13.14 | ∀{0.09-98 Ø4.97}
81% sRGB (Argyll 1.6.3 3D)
52% AdobeRGB 1998 (Argyll 1.6.3 3D)
57% AdobeRGB 1998 (Argyll 3D)
81.1% sRGB (Argyll 3D)
55.2% Display P3 (Argyll 3D)
Gamma: 2.7
CCT: 16626 K
| HP Probook 650 G3 Z2W44ET TN LED, 1920x1080, 15.6" | HP ProBook 650 G2 V1A44ET TN LED, 1920x1080, 15.6" | HP ProBook 655 G2 T9X09ET TN LED, 1366x768, 15.6" | Acer TravelMate P658-M-537B IPS, 1920x1080, 15.6" | Dell Latitude 15 E5570 TN LED, 1366x768, 15.6" | Lenovo ThinkPad L560-20F10026GE AH-IPS, 1920x1080, 15.6" | Apple MacBook Pro 15 2016 (2.6 GHz, 450) IPS, 2880x1800, 15.4" | |
|---|---|---|---|---|---|---|---|
| Display | -5% | -19% | 12% | -26% | -29% | ||
| Display P3 Coverage (%) | 55.2 | 52.1 -6% | 44.49 -19% | 66.6 21% | 40.48 -27% | 39 -29% | |
| sRGB Coverage (%) | 81.1 | 78.3 -3% | 66.9 -18% | 85.7 6% | 60.9 -25% | 58.3 -28% | |
| AdobeRGB 1998 Coverage (%) | 57 | 53.7 -6% | 45.97 -19% | 62.8 10% | 41.82 -27% | 40.33 -29% | |
| Response Times | -4% | -12% | 4% | -12% | -4% | -20% | |
| Response Time Grey 50% / Grey 80% * (ms) | 38 ? | 41 ? -8% | 44 ? -16% | 38 ? -0% | 47 ? -24% | 39.2 ? -3% | 47.3 ? -24% |
| Response Time Black / White * (ms) | 27 ? | 27 ? -0% | 29 ? -7% | 25 ? 7% | 27 ? -0% | 28 ? -4% | 31.2 ? -16% |
| PWM Frequency (Hz) | 200 ? | 200 ? | 200 ? | 117000 ? | |||
| Screen | -6% | -6% | 15% | -10% | 7% | 69% | |
| Brightness middle (cd/m²) | 351 | 313 -11% | 248 -29% | 308 -12% | 228 -35% | 262 -25% | 483 38% |
| Brightness (cd/m²) | 345 | 296 -14% | 230 -33% | 319 -8% | 236 -32% | 250 -28% | 465 35% |
| Brightness Distribution (%) | 95 | 90 -5% | 88 -7% | 71 -25% | 90 -5% | 92 -3% | 92 -3% |
| Black Level * (cd/m²) | 0.65 | 0.59 9% | 0.56 14% | 0.61 6% | 0.56 14% | 0.29 55% | 0.33 49% |
| Contrast (:1) | 540 | 531 -2% | 443 -18% | 505 -6% | 407 -25% | 903 67% | 1464 171% |
| Colorchecker dE 2000 * | 11.02 | 11.89 -8% | 8.7 21% | 4.51 59% | 10.02 9% | 8.49 23% | 1.4 87% |
| Colorchecker dE 2000 max. * | 17.68 | 20.81 -18% | 14.96 15% | 10.19 42% | 15.93 10% | 17.99 -2% | 3 83% |
| Greyscale dE 2000 * | 13.14 | 12.95 1% | 11.48 13% | 2.91 78% | 10.66 19% | 8.11 38% | 1.5 89% |
| Gamma | 2.7 81% | 2.4 92% | 2.38 92% | 2.4 92% | 2.48 89% | 2.37 93% | 2.34 94% |
| CCT | 16626 39% | 15063 43% | 11179 58% | 6740 96% | 11800 55% | 6300 103% | 6650 98% |
| Color Space (Percent of AdobeRGB 1998) (%) | 52 | 50 -4% | 42 -19% | 56 8% | 39 -25% | 37.07 -29% | |
| Color Space (Percent of sRGB) (%) | 81 | 78 -4% | 67 -17% | 86 6% | 61 -25% | 57.94 -28% | |
| Total Average (Program / Settings) | -5% /
-5% | -12% /
-9% | 10% /
13% | -16% /
-13% | -9% /
-2% | 25% /
51% |
* ... smaller is better
Screen Flickering / PWM (Pulse-Width Modulation)
| Screen flickering / PWM detected | 200 Hz | ≤ 50 % brightness setting | 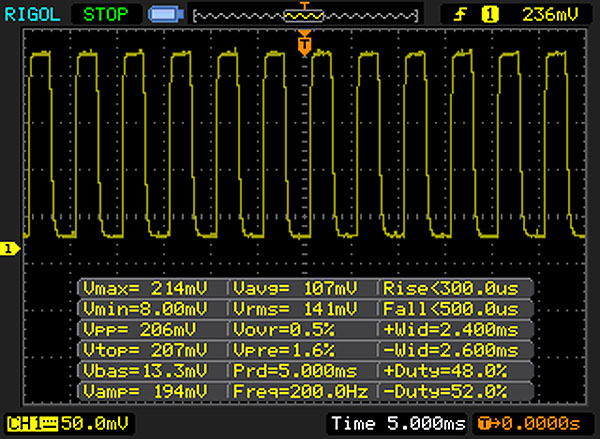 |
The display backlight flickers at 200 Hz (worst case, e.g., utilizing PWM) Flickering detected at a brightness setting of 50 % and below. There should be no flickering or PWM above this brightness setting. The frequency of 200 Hz is relatively low, so sensitive users will likely notice flickering and experience eyestrain at the stated brightness setting and below. In comparison: 52 % of all tested devices do not use PWM to dim the display. If PWM was detected, an average of 7747 (minimum: 5 - maximum: 343500) Hz was measured. | |||
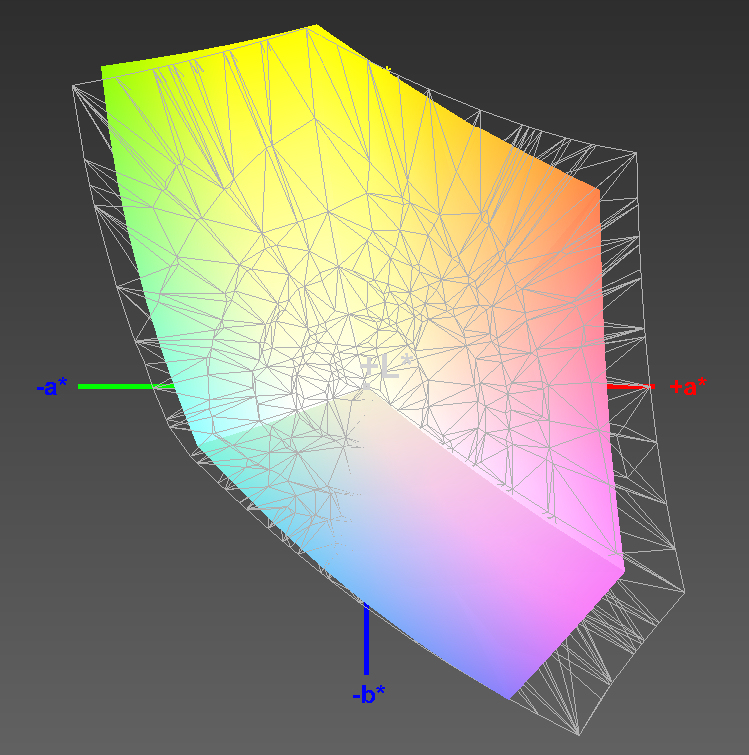
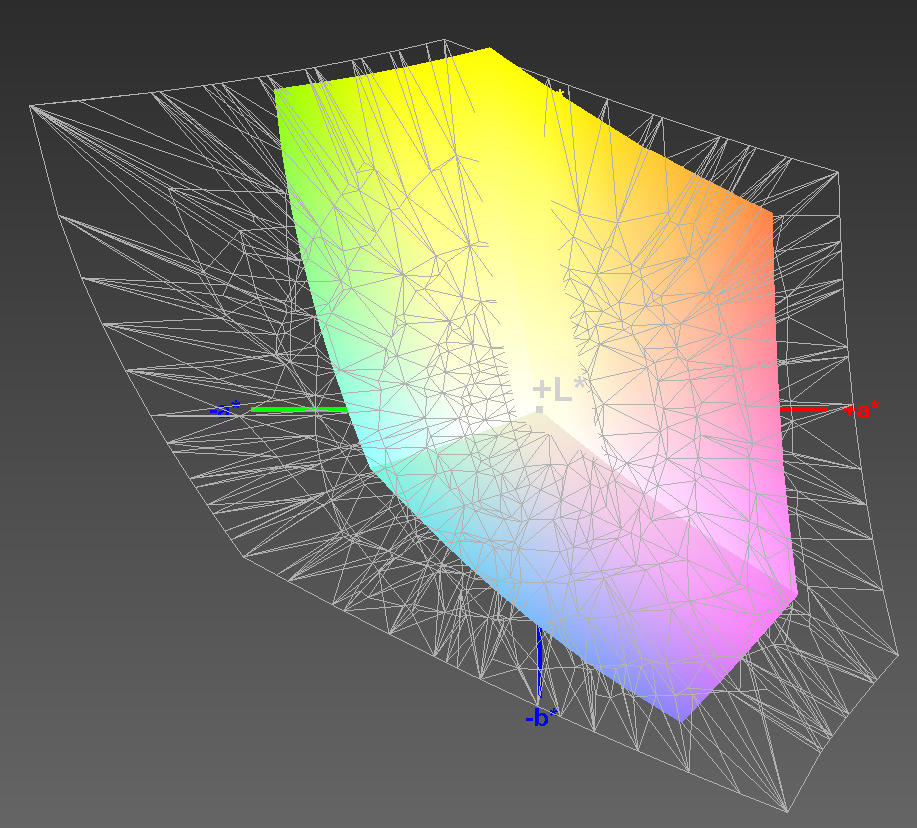
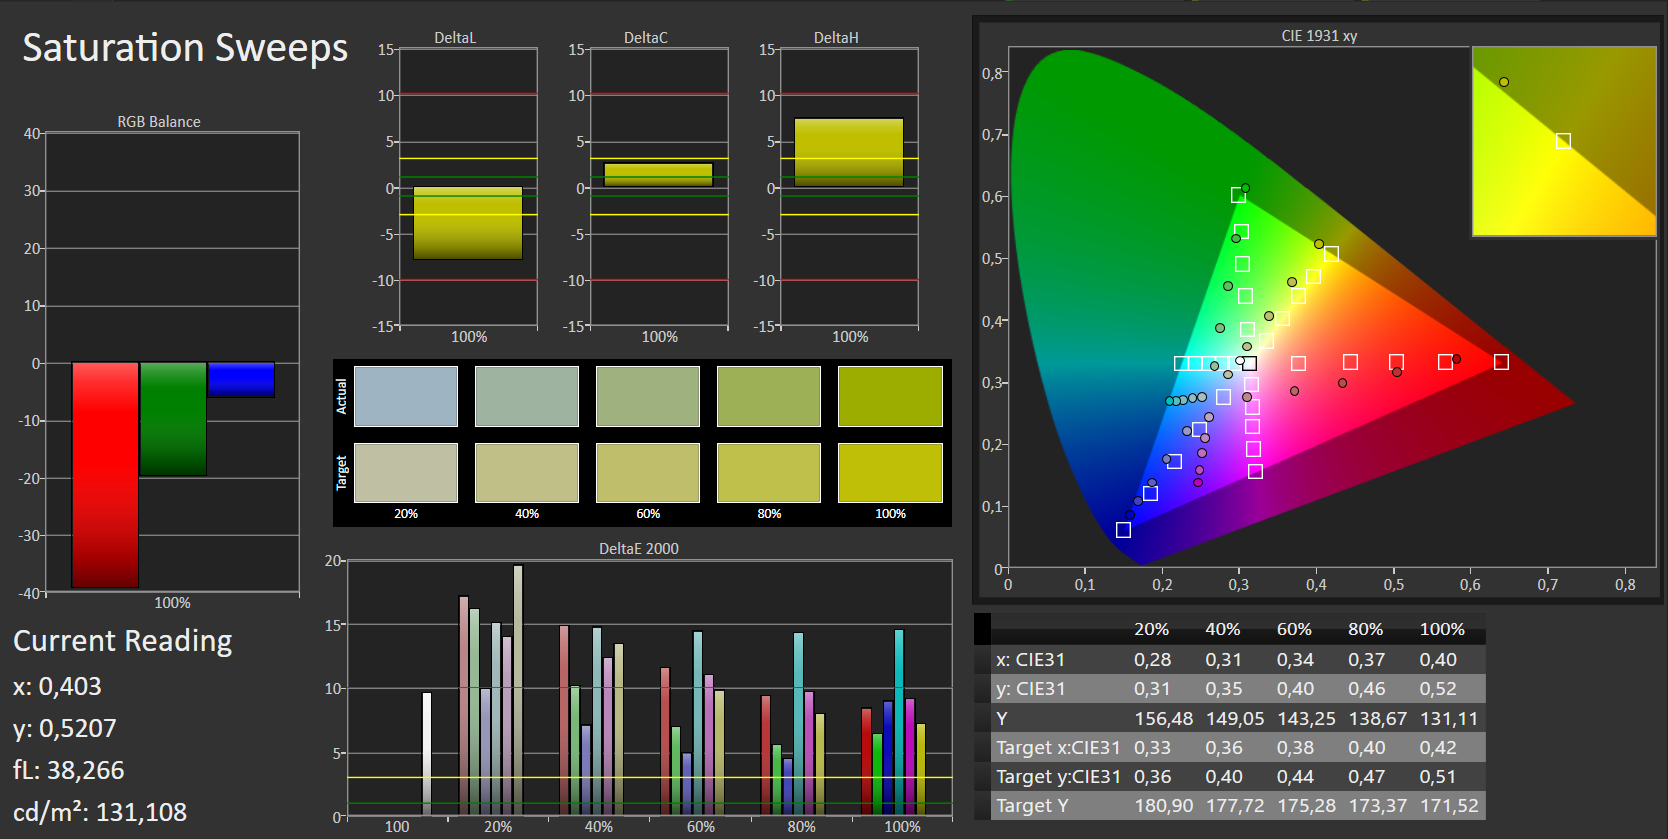
The display cannot shine in color representation, either. The DeltaE 2000 shift is 11.02 out-of-the box. This is an average value. A value smaller than 3 would be desirable. In addition, the display is bluish. The AdobeRGB and sRGB color spaces cannot be covered. It covers 81% for sRGB and 52% of AdobeRGB.
Display Response Times
| ↔ Response Time Black to White | ||
|---|---|---|
| 27 ms ... rise ↗ and fall ↘ combined | ↗ 9 ms rise | 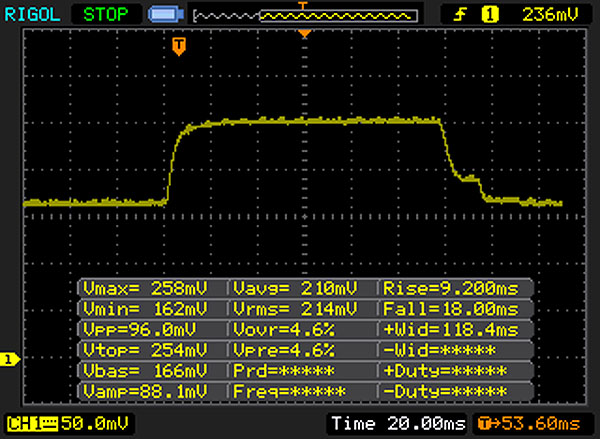 |
| ↘ 18 ms fall | ||
| The screen shows relatively slow response rates in our tests and may be too slow for gamers. In comparison, all tested devices range from 0.1 (minimum) to 240 (maximum) ms. » 67 % of all devices are better. This means that the measured response time is worse than the average of all tested devices (19.8 ms). | ||
| ↔ Response Time 50% Grey to 80% Grey | ||
| 38 ms ... rise ↗ and fall ↘ combined | ↗ 16 ms rise | 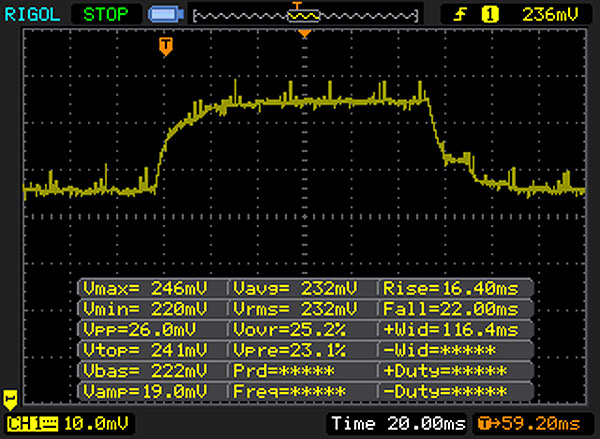 |
| ↘ 22 ms fall | ||
| The screen shows slow response rates in our tests and will be unsatisfactory for gamers. In comparison, all tested devices range from 0.165 (minimum) to 636 (maximum) ms. » 55 % of all devices are better. This means that the measured response time is worse than the average of all tested devices (31 ms). | ||
HP equipped the computer with a viewing-angle unstable TN panel. Hence, it is not possible to read from the display from all positions. The matte display surface and the relatively high brightness allow outdoor use. However, the sun should not be shining too brightly.

Performance
The ProBook 650 G3 is a 15.6-inch mid-range business notebook. It delivers sufficient performance for all usual application scenarios. The computer brings features which are typical for business devices such as a docking port and TPM. An LTE modem is optionally available. Our test model cost about 1,050 Euros (~$1111). Only a second configuration was offered at the time of testing.
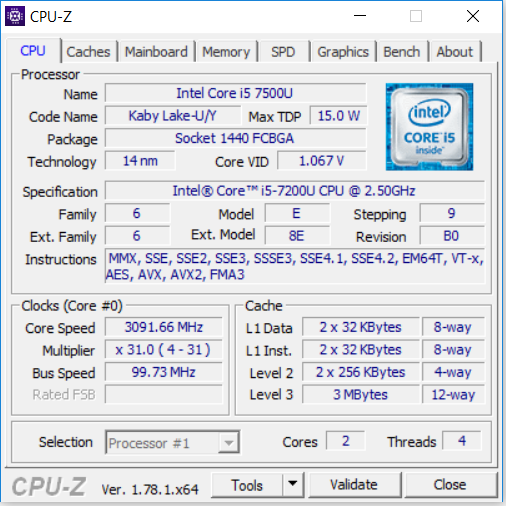

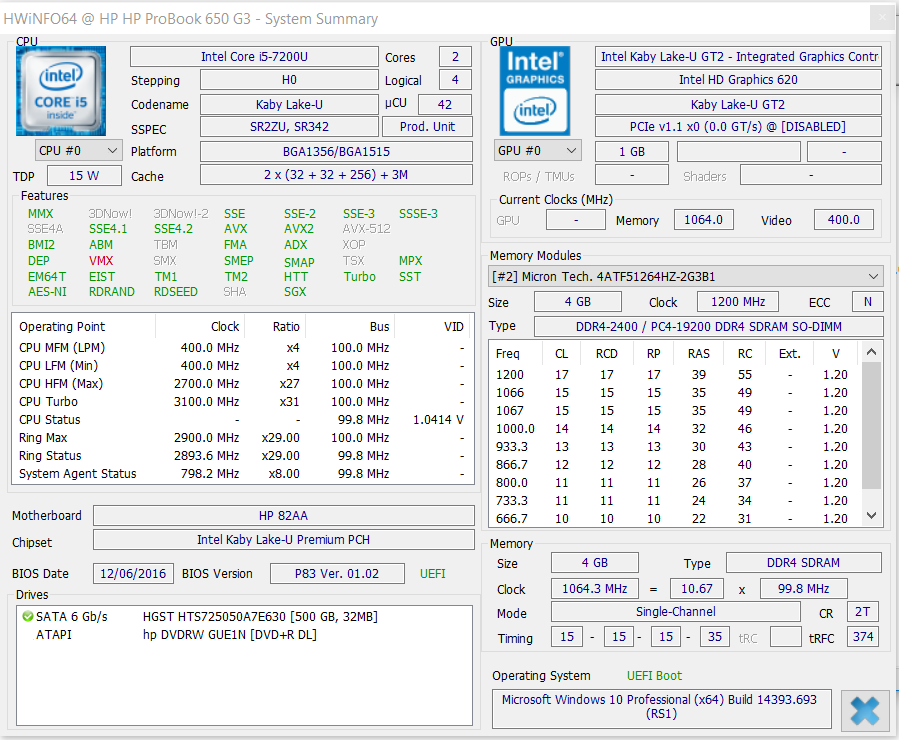
Processor
The ProBook is also equipped with the latest CPU generation now. With the Core i5-7200U (Kaby Lake) dual-core processor, it uses a CPU which can be found in most Kaby Lake notebooks. It is the current ULV mid-range model, which should meet the requirements of most users. The extra costs for a ProBook model with Core i7-7500U processor hardly pays off in most cases. The slightly higher maximum performance would bring a significantly higher price. The used Core i5 processor works at a base clock of 2.5 GHz. Thanks to Turbo, the clock rate can increase to up to 3.1 GHz (both cores). The Turbo is actually used in mains operation. In order to have it available on battery, you have to set the option "Enable Turbo Boost on DC" to "on" in the BIOS.
According to the maintenance guide, the ProBook is also available with more powerful quad-core processors (Core i5-7440HQ, Core i7-7820HQ). We cannot say whether such models will be available in Germany or Austria or will be offered by shops at all.
| Cinebench R10 | |
| Rendering Multiple CPUs 32Bit | |
| HP Probook 650 G3 Z2W44ET | |
| Dell Latitude 15 E5570 | |
| Lenovo ThinkPad L560-20F10026GE | |
| HP ProBook 650 G2 V1A44ET | |
| HP ProBook 655 G2 T9X09ET | |
| Rendering Single 32Bit | |
| HP Probook 650 G3 Z2W44ET | |
| Dell Latitude 15 E5570 | |
| Lenovo ThinkPad L560-20F10026GE | |
| HP ProBook 650 G2 V1A44ET | |
| HP ProBook 655 G2 T9X09ET | |
| Geekbench 3 | |
| 32 Bit Single-Core Score | |
| Dell Latitude 15 E5570 | |
| HP Probook 650 G3 Z2W44ET | |
| HP ProBook 650 G2 V1A44ET | |
| HP ProBook 655 G2 T9X09ET | |
| 32 Bit Multi-Core Score | |
| HP Probook 650 G3 Z2W44ET | |
| Dell Latitude 15 E5570 | |
| HP ProBook 650 G2 V1A44ET | |
| HP ProBook 655 G2 T9X09ET | |
| Geekbench 4.0 | |
| 64 Bit Single-Core Score | |
| Apple MacBook Pro 15 2016 (2.6 GHz, 450) | |
| HP Probook 650 G3 Z2W44ET | |
| HP ProBook 655 G2 T9X09ET | |
| 64 Bit Multi-Core Score | |
| Apple MacBook Pro 15 2016 (2.6 GHz, 450) | |
| HP Probook 650 G3 Z2W44ET | |
| HP ProBook 655 G2 T9X09ET | |
| JetStream 1.1 - 1.1 Total | |
| Apple MacBook Pro 15 2016 (2.6 GHz, 450) | |
| HP Probook 650 G3 Z2W44ET | |
| Dell Latitude 15 E5570 | |
| HP ProBook 650 G2 V1A44ET | |
| Lenovo ThinkPad L560-20F10026GE | |
| HP ProBook 655 G2 T9X09ET | |
System Performance
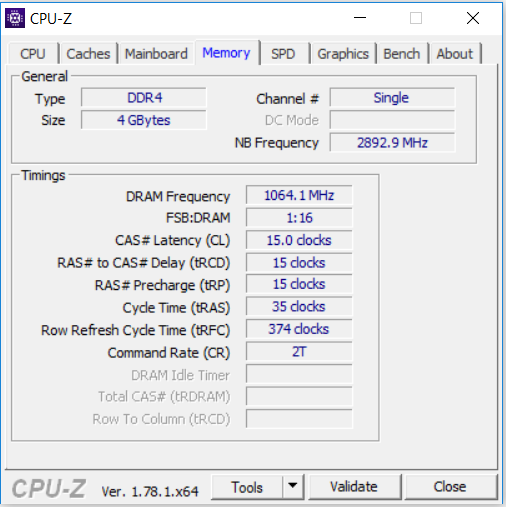
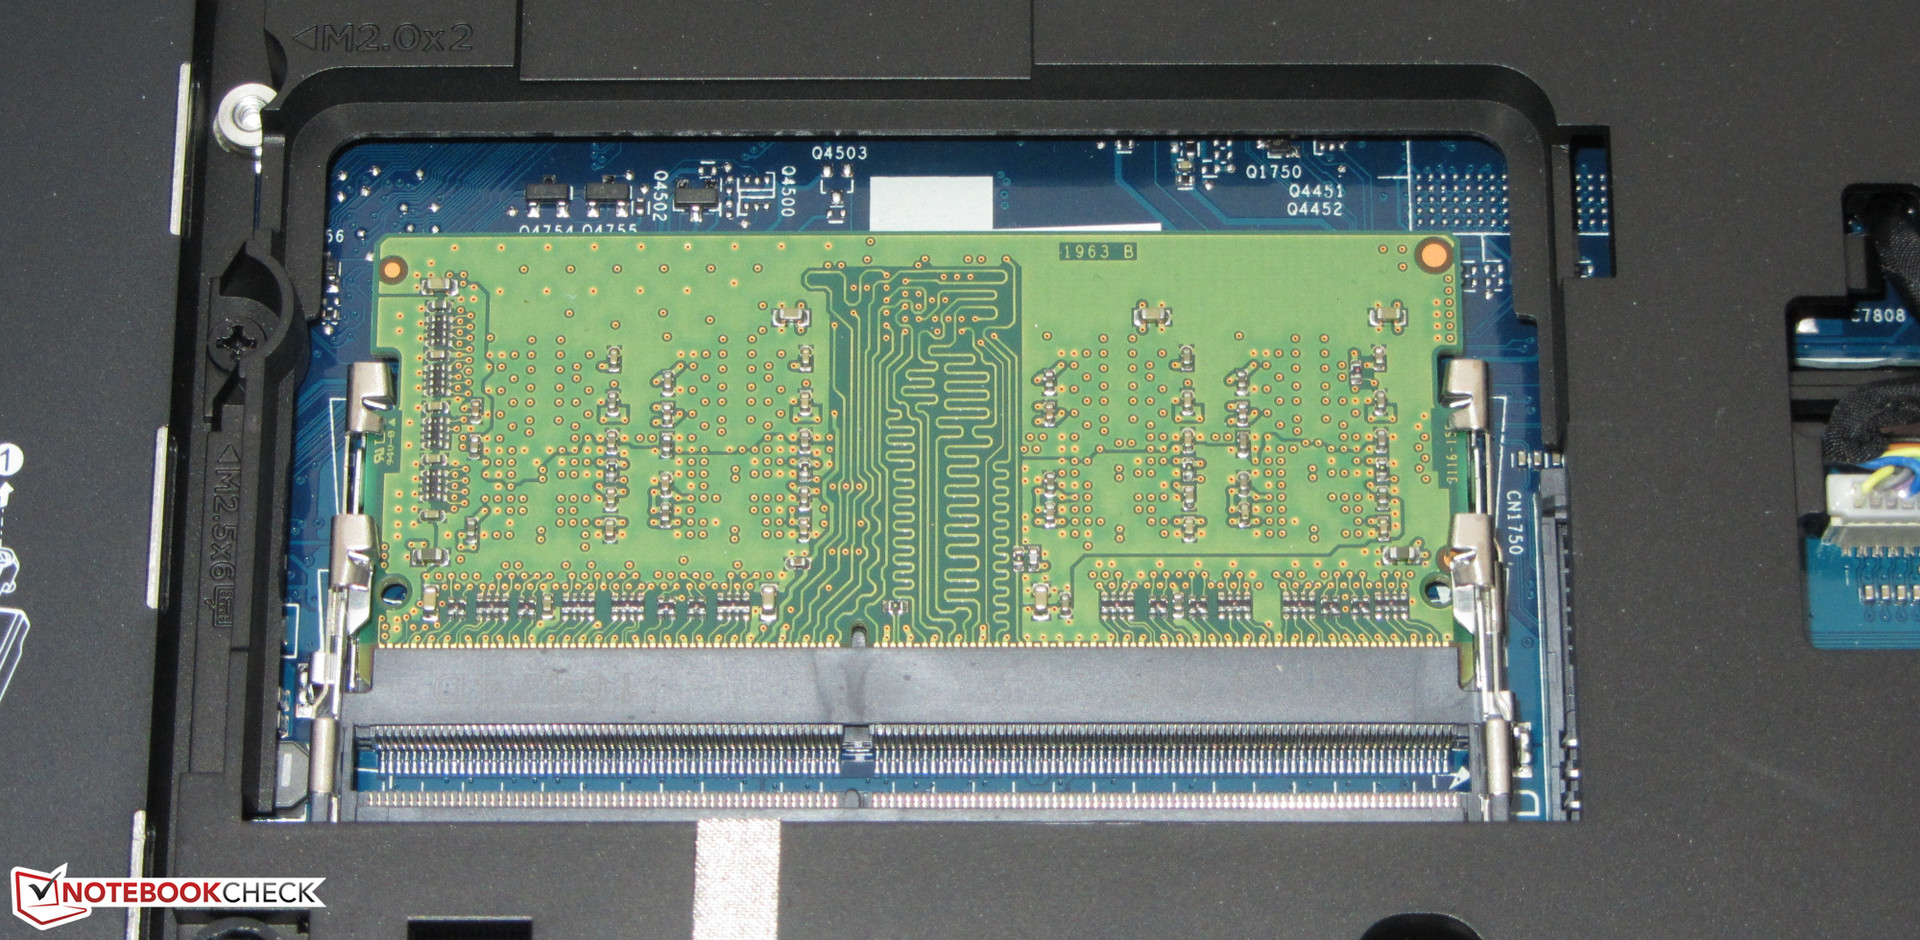
The system runs smoothly without problems. The performance is sufficient for office and Internet applications. Good results in the PCMark benchmarks emphasize this impression. However, you still cannot be satisfied with the system performance, since HP does not use the full potential, although it is fair to expect this in view of a price of 1000 Euros (~$1058). In order to use the full potential of the computer, owners have to spend extra money. First of all, the HDD should be replaced by an SSD. This would make the system more responsive and loading would take less time. In addition, you can add a second RAM module in order to activate dual-channel mode.
| PCMark 7 Score | 3124 points | |
| PCMark 8 Home Score Accelerated v2 | 3149 points | |
| PCMark 8 Creative Score Accelerated v2 | 3741 points | |
| PCMark 8 Work Score Accelerated v2 | 4118 points | |
Help | ||
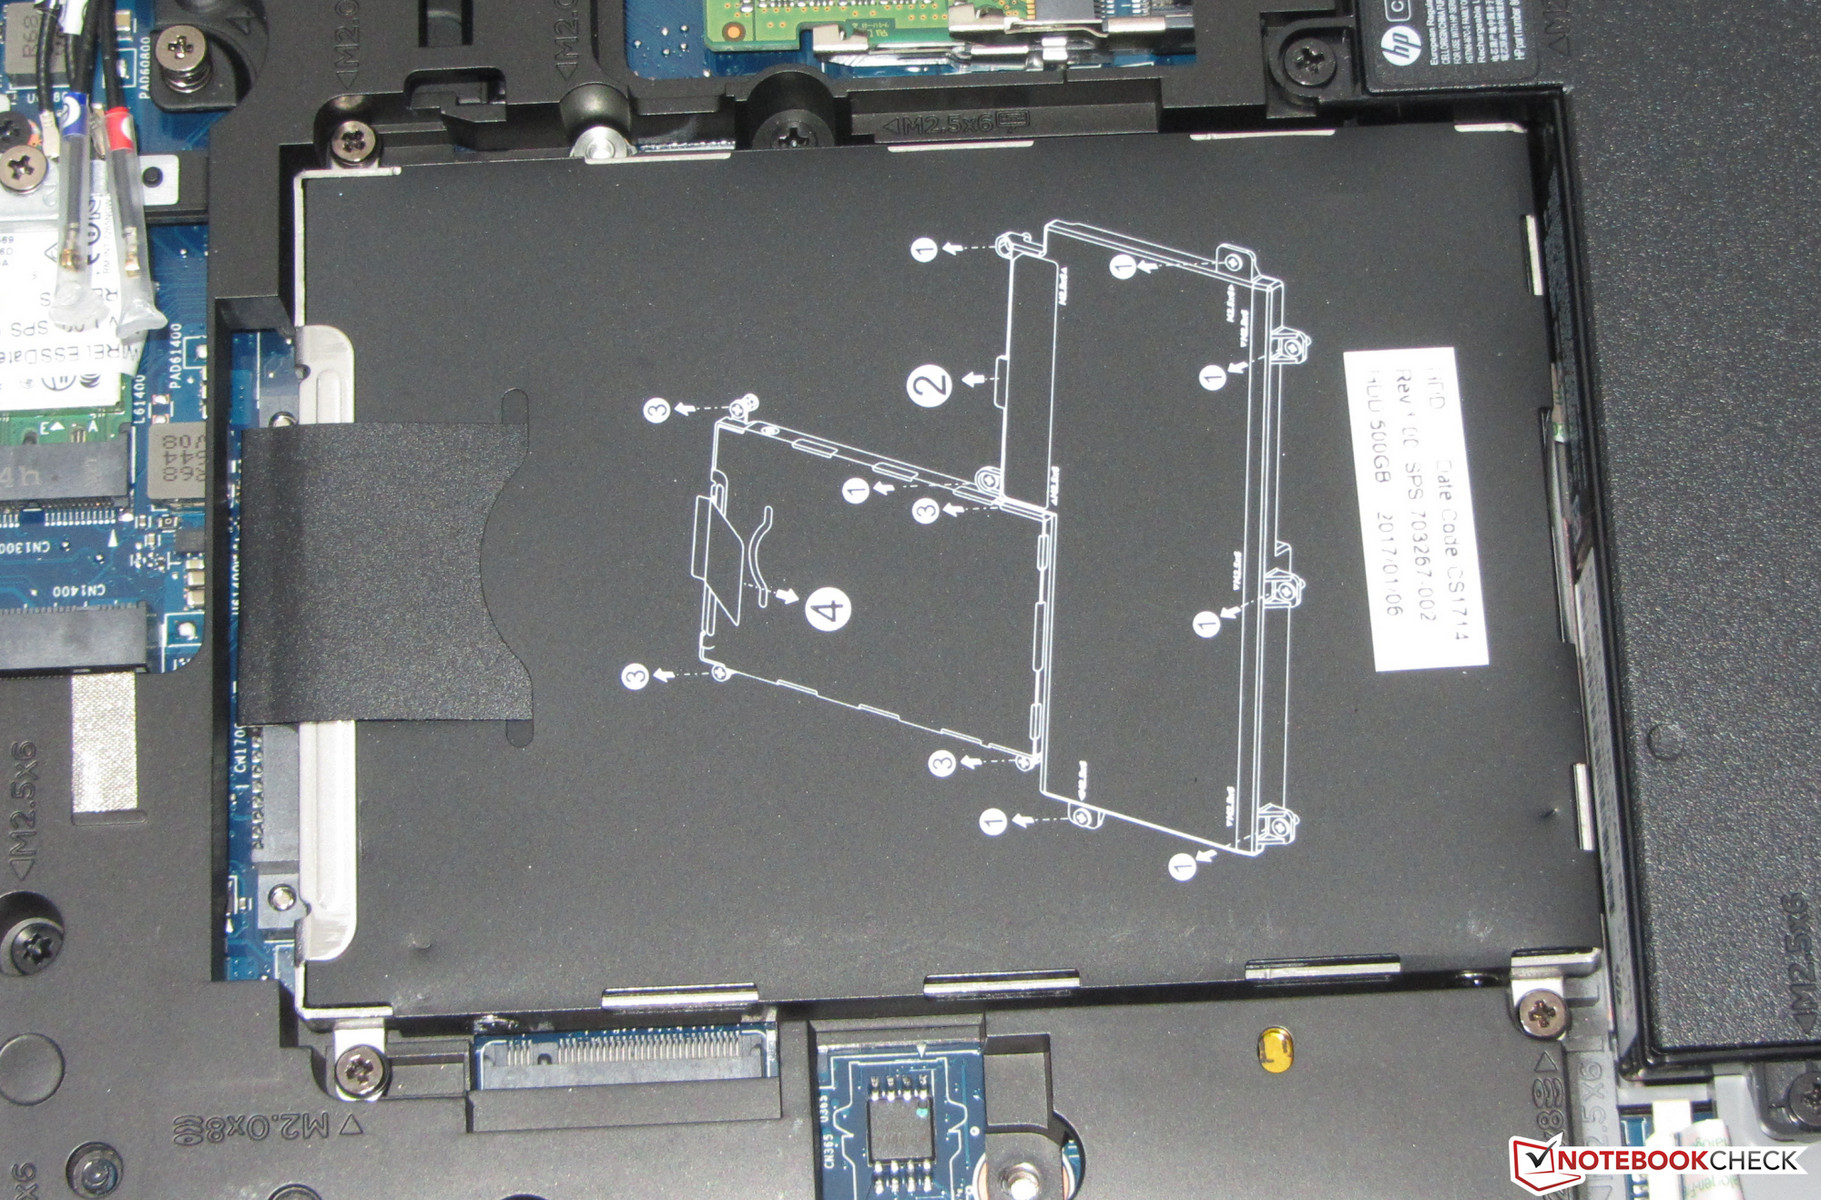
Storage Devices
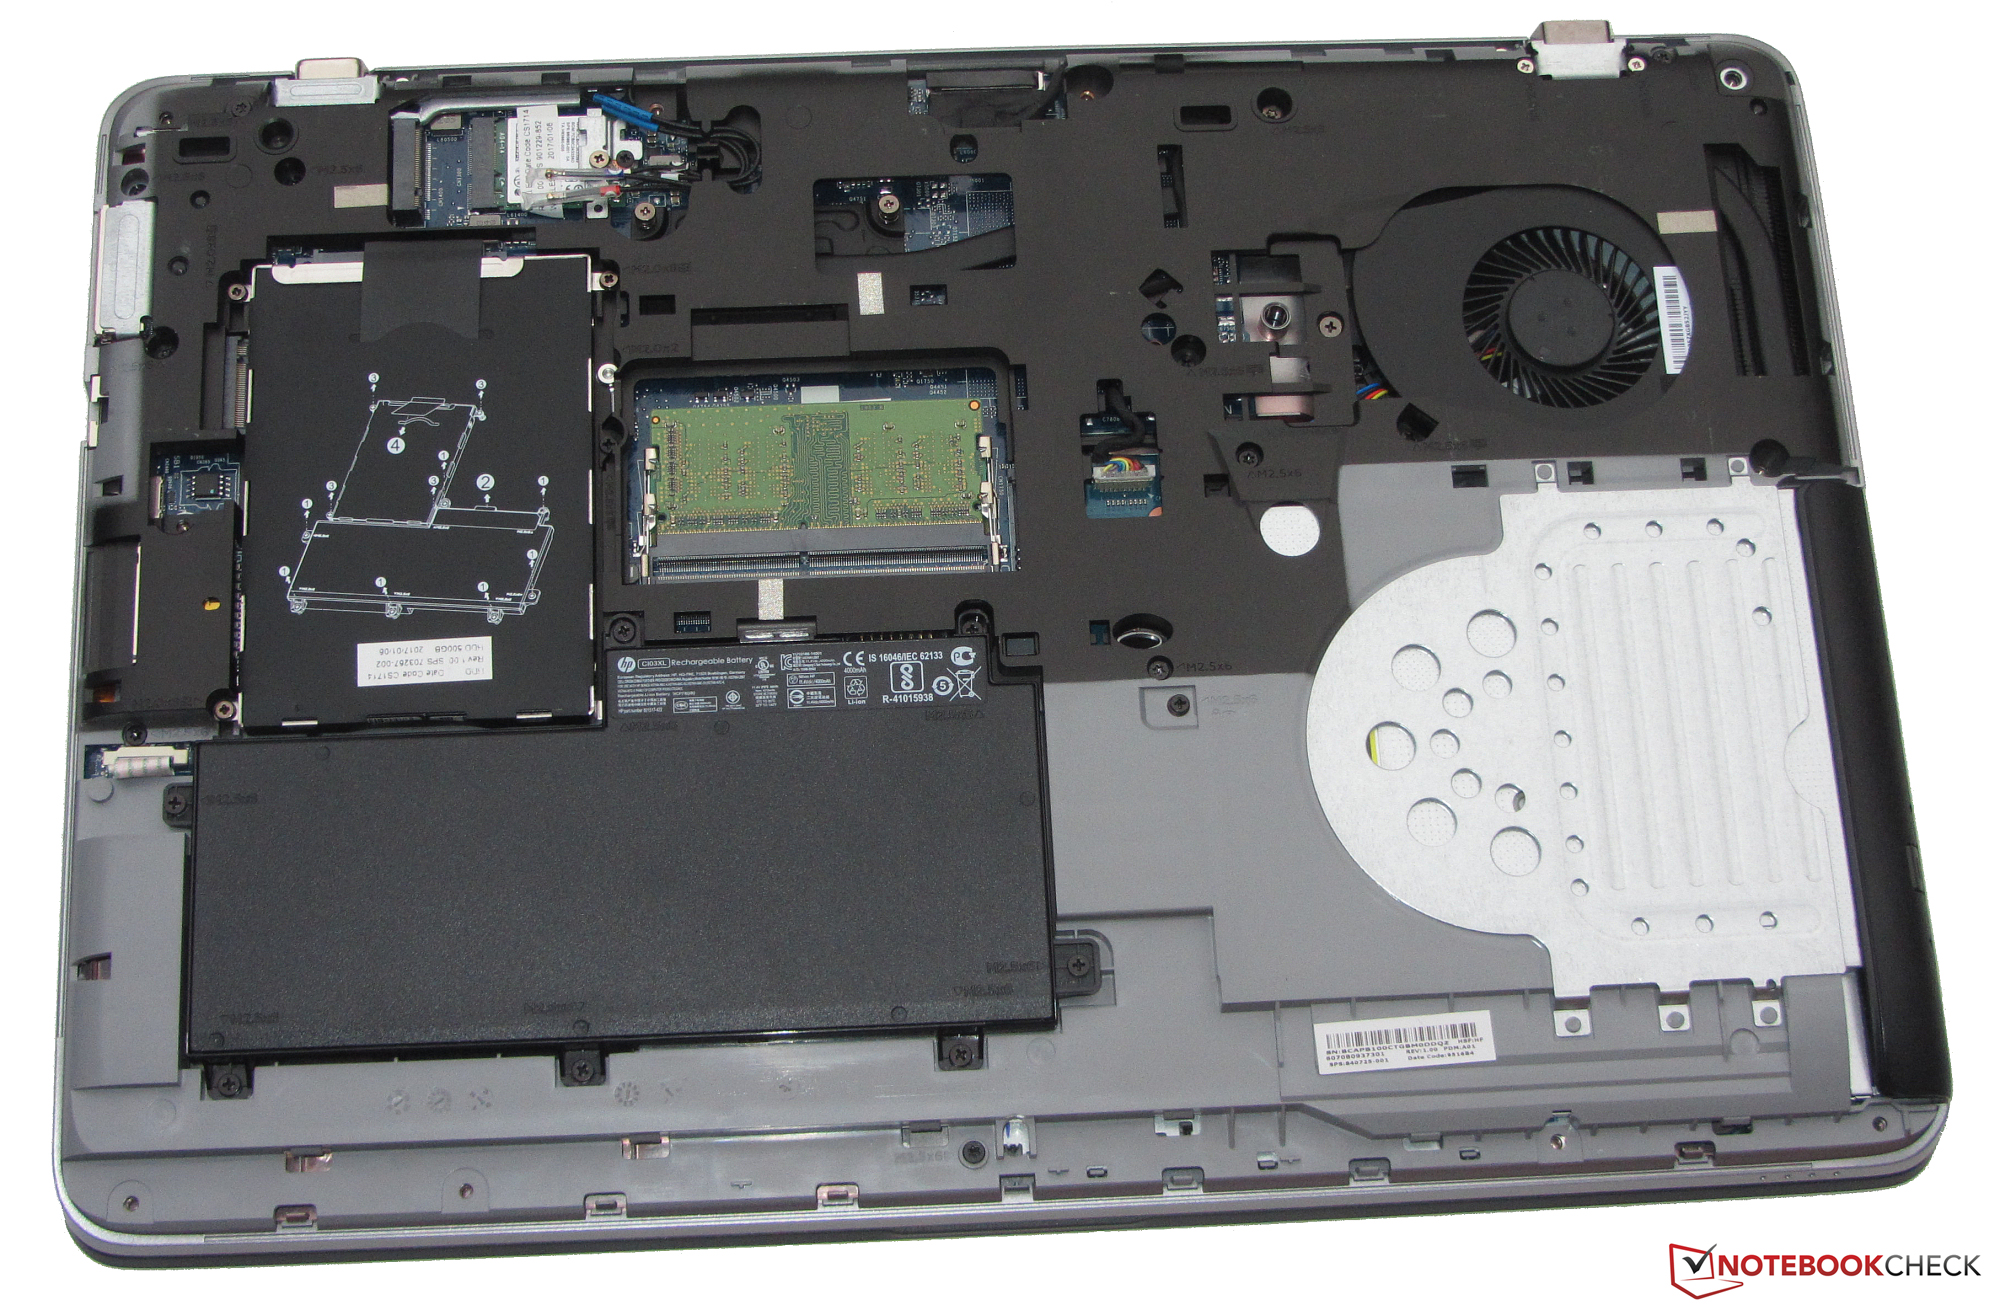
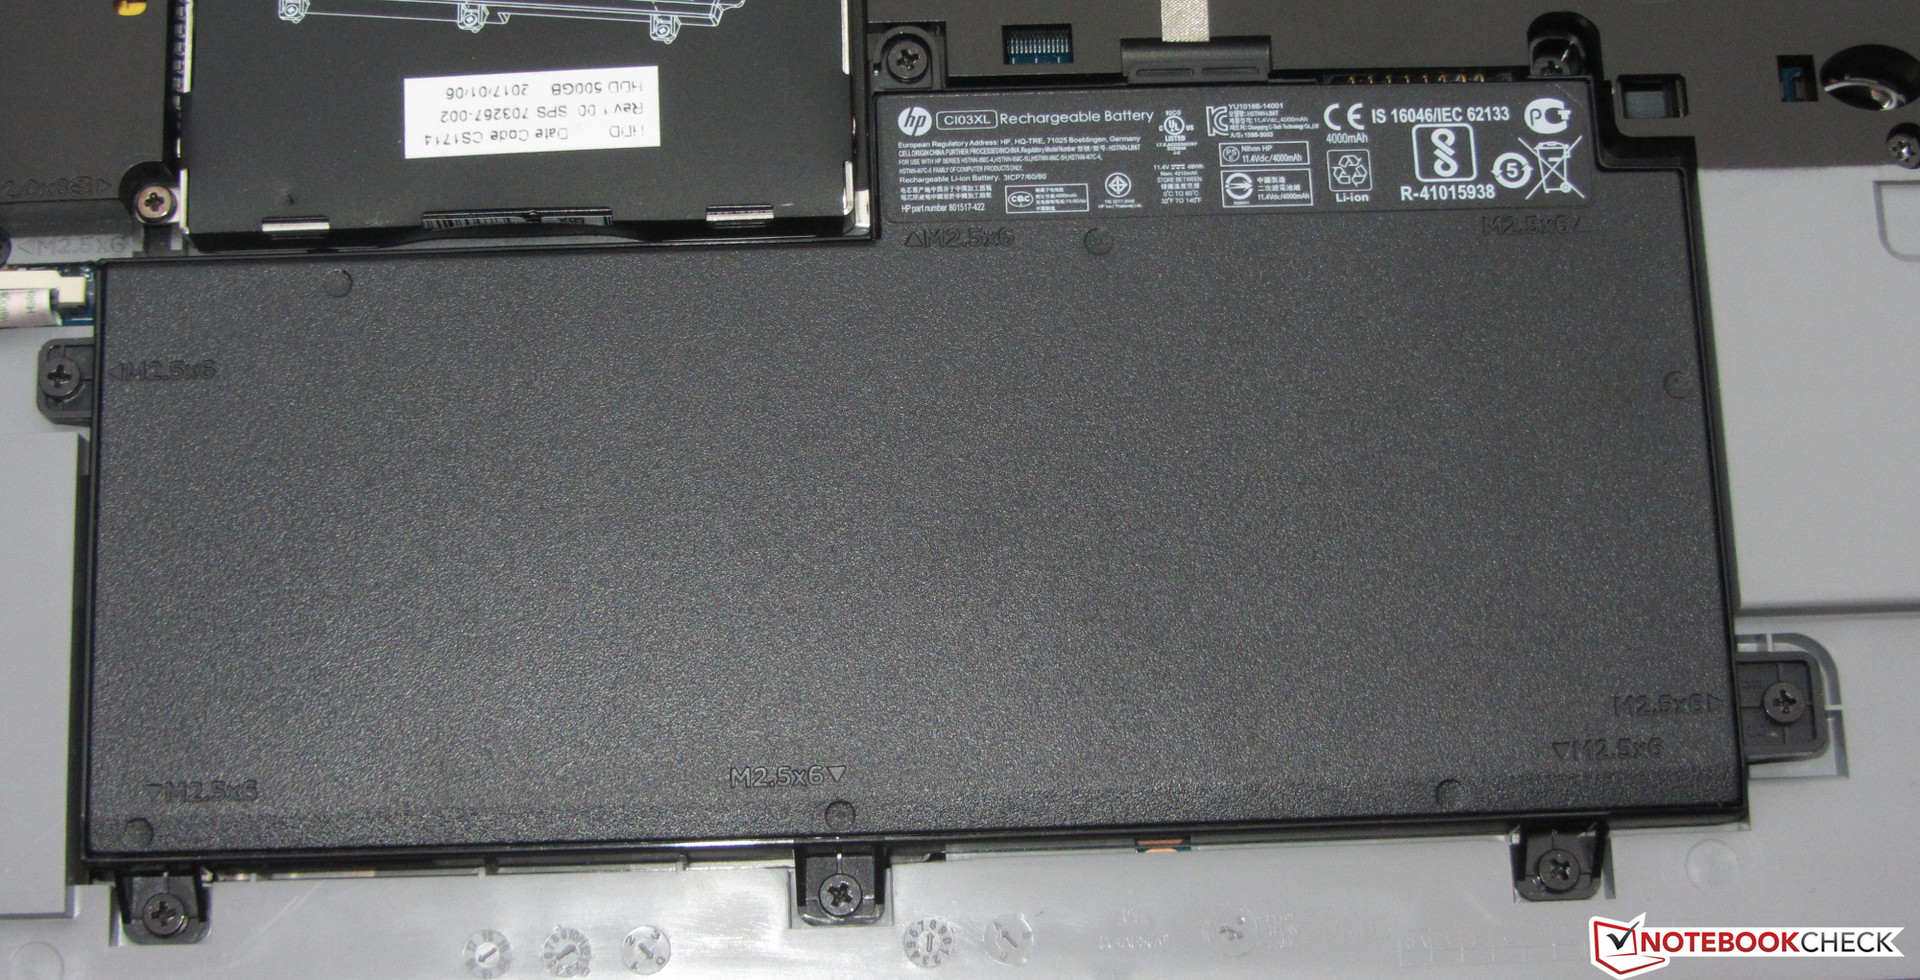
A 2.5-inch hard drive from HGST is used as system drive. It features a capacity of 500 GB and works at 7200 RPM. The transfer rates of the HDD are normal for a 7200-RPM model. In addition, the ProBook comes with an M.2 slot. However, it can only be used after removing the 2.5-inch drive. It is not possible to use a 2.5-inch HDD and an M.2 SSD at the same time.
Apart from SATA SSDs, PCIe models can be connected to the M.2 slot. According to the maintenance guide, HP offers SSDs for the ProBook, which are connected via PCI Express 3.0 x4 (NVMe support available). Such SSDs achieve significantly higher transfer rates than SATA models.

| HP Probook 650 G3 Z2W44ET Hitachi Travelstar Z7K500 HTS725050A7E630 | HP ProBook 655 G2 T9X09ET Seagate ST500LM021-1KJ15 | Acer TravelMate P658-M-537B Kingston RBU-SNS8152S3256GG2 | Dell Latitude 15 E5570 Samsung SSD PM871 MZ7LN128HCHP | Lenovo ThinkPad L560-20F10026GE WDC Slim WD10SPCX-21KHST0 | |
|---|---|---|---|---|---|
| CrystalDiskMark 3.0 | 12% | 8793% | 10223% | 42% | |
| Read Seq (MB/s) | 109.4 | 122.1 12% | 479.1 338% | 474.7 334% | 113.6 4% |
| Write Seq (MB/s) | 99.9 | 110.7 11% | 333.1 233% | 155 55% | 111.7 12% |
| Read 512 (MB/s) | 16.34 | 33.53 105% | 418 2458% | 393.6 2309% | 39.65 143% |
| Write 512 (MB/s) | 43.45 | 51.3 18% | 320.5 638% | 119.7 175% | 55.3 27% |
| Read 4k (MB/s) | 0.337 | 0.357 6% | 25.66 7514% | 34 9989% | 0.488 45% |
| Write 4k (MB/s) | 0.866 | 0.641 -26% | 64.7 7371% | 96.6 11055% | 1.022 18% |
| Read 4k QD32 (MB/s) | 0.826 | 0.778 -6% | 226.2 27285% | 383.3 46304% | 1.367 65% |
| Write 4k QD32 (MB/s) | 0.859 | 0.672 -22% | 211.4 24510% | 100.2 11565% | 1.036 21% |
Graphics Card
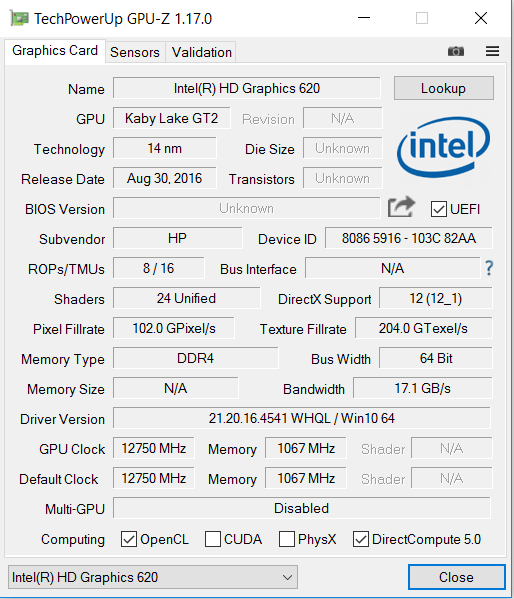
Our test model does not use a dedicated graphics card. However, models with dedicated graphics cards are available. HP uses a Radeon R7 M465X graphics card from AMD in these. However, our current test model only comes with Intel's integrated HD Graphics 620 GPU, which supports DirectX 12 and works at up to 1,000 MHz. The results of the 3DMark benchmarks are normal for this GPU. Adding a second RAM module (activates dual-channel mode) will increase the graphics performance.
| 3DMark 06 Standard Score | 6656 points | |
| 3DMark 11 Performance | 1359 points | |
| 3DMark Ice Storm Standard Score | 46690 points | |
| 3DMark Cloud Gate Standard Score | 5064 points | |
| 3DMark Fire Strike Score | 600 points | |
Help | ||
| 3DMark | |
| 1280x720 Cloud Gate Standard Graphics | |
| Apple MacBook Pro 15 2016 (2.6 GHz, 450) | |
| Acer TravelMate P658-M-537B | |
| Dell Latitude 15 E5570 | |
| Lenovo ThinkPad L560-20F10026GE | |
| HP Probook 650 G3 Z2W44ET | |
| 1920x1080 Fire Strike Graphics | |
| Apple MacBook Pro 15 2016 (2.6 GHz, 450) | |
| Dell Latitude 15 E5570 | |
| Lenovo ThinkPad L560-20F10026GE | |
| HP Probook 650 G3 Z2W44ET | |
Gaming Performance
The hardware of the ProBook can run many games smoothly. Primarily this is true for not too demanding titles. However, you also have to accept low resolutions and low quality settings here. Adding a second RAM module (activates dual-channel mode) will increase the frame rates. However, demanding games such as Mafia 3 will still remain unplayable.
| low | med. | high | ultra | |
|---|---|---|---|---|
| Tomb Raider (2013) | 52.1 | 26.2 | 14.4 | 9.6 |
| BioShock Infinite (2013) | 32.9 | 20.1 | 16.1 | 6.9 |
| Battlefield 4 (2013) | 24.4 | 19.3 | 12.2 | 6.1 |
Emissions
System Noise
A work device such as the ProBook should produce as little noise as possible. The ProBook meets this requirement. In idle mode, the fan usually stands still. Although it occasionally runs at low speed, you will not be able to hear it since the hard drive is louder. Even when the HDD stands still, the fan is hardly noticeable. You can make the device quieter by replacing the HDD by an SSD. The fan only gets slightly louder under load. The noise level increases to 33.3 dB during the stress test.
Noise level
| Idle |
| 31.5 / 31.5 / 31.5 dB(A) |
| HDD |
| 32 dB(A) |
| DVD |
| 36.7 / dB(A) |
| Load |
| 34.6 / 33.3 dB(A) |
 | ||
30 dB silent 40 dB(A) audible 50 dB(A) loud |
||
min: | ||
| HP Probook 650 G3 Z2W44ET i5-7200U, HD Graphics 620 | HP ProBook 650 G2 V1A44ET 6200U, HD Graphics 520 | HP ProBook 655 G2 T9X09ET Pro A8-8600B, Radeon R6 (Carrizo) | Acer TravelMate P658-M-537B 6200U, HD Graphics 520 | Dell Latitude 15 E5570 6300U, HD Graphics 520 | Lenovo ThinkPad L560-20F10026GE 6200U, HD Graphics 520 | Apple MacBook Pro 15 2016 (2.6 GHz, 450) 6700HQ, Radeon Pro 450 | |
|---|---|---|---|---|---|---|---|
| Noise | -0% | -0% | -9% | -4% | 3% | -5% | |
| off / environment * (dB) | 30.7 | 30.5 1% | 31.5 -3% | 31.2 -2% | 31.2 -2% | 29.4 4% | 30.4 1% |
| Idle Minimum * (dB) | 31.5 | 30.5 3% | 31.6 -0% | 32.5 -3% | 31.2 1% | 30.1 4% | 30.6 3% |
| Idle Average * (dB) | 31.5 | 31.6 -0% | 31.6 -0% | 32.5 -3% | 33.2 -5% | 30.1 4% | 30.6 3% |
| Idle Maximum * (dB) | 31.5 | 31.9 -1% | 31.6 -0% | 35 -11% | 34.3 -9% | 30.1 4% | 30.6 3% |
| Load Average * (dB) | 34.6 | 34.7 -0% | 33.5 3% | 42 -21% | 36.6 -6% | 33.4 3% | 34.7 -0% |
| Load Maximum * (dB) | 33.3 | 34.5 -4% | 33.5 -1% | 37.5 -13% | 34.7 -4% | 34.7 -4% | 46.3 -39% |
* ... smaller is better
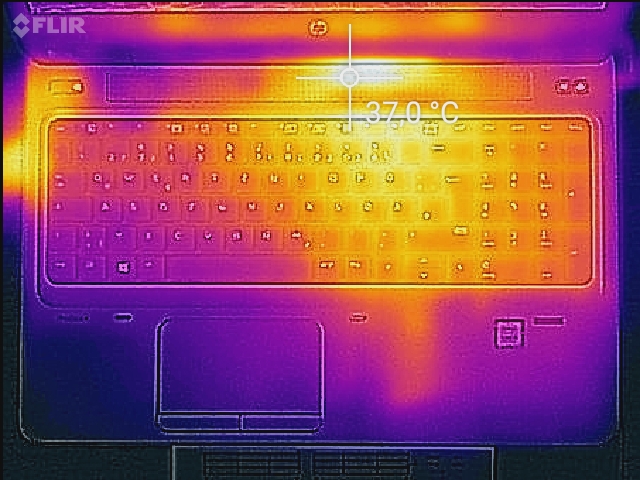
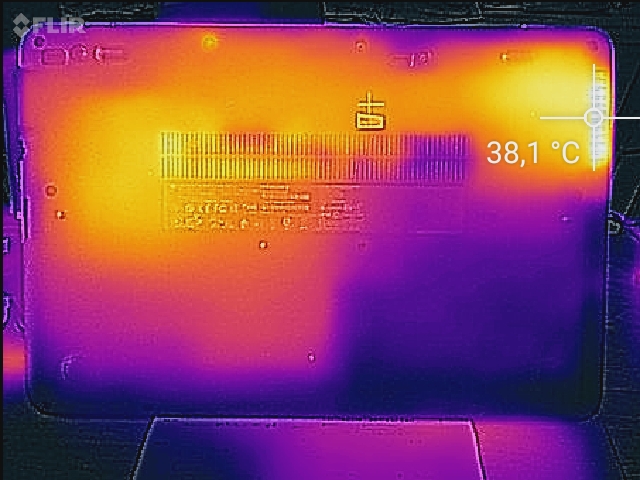
Temperature
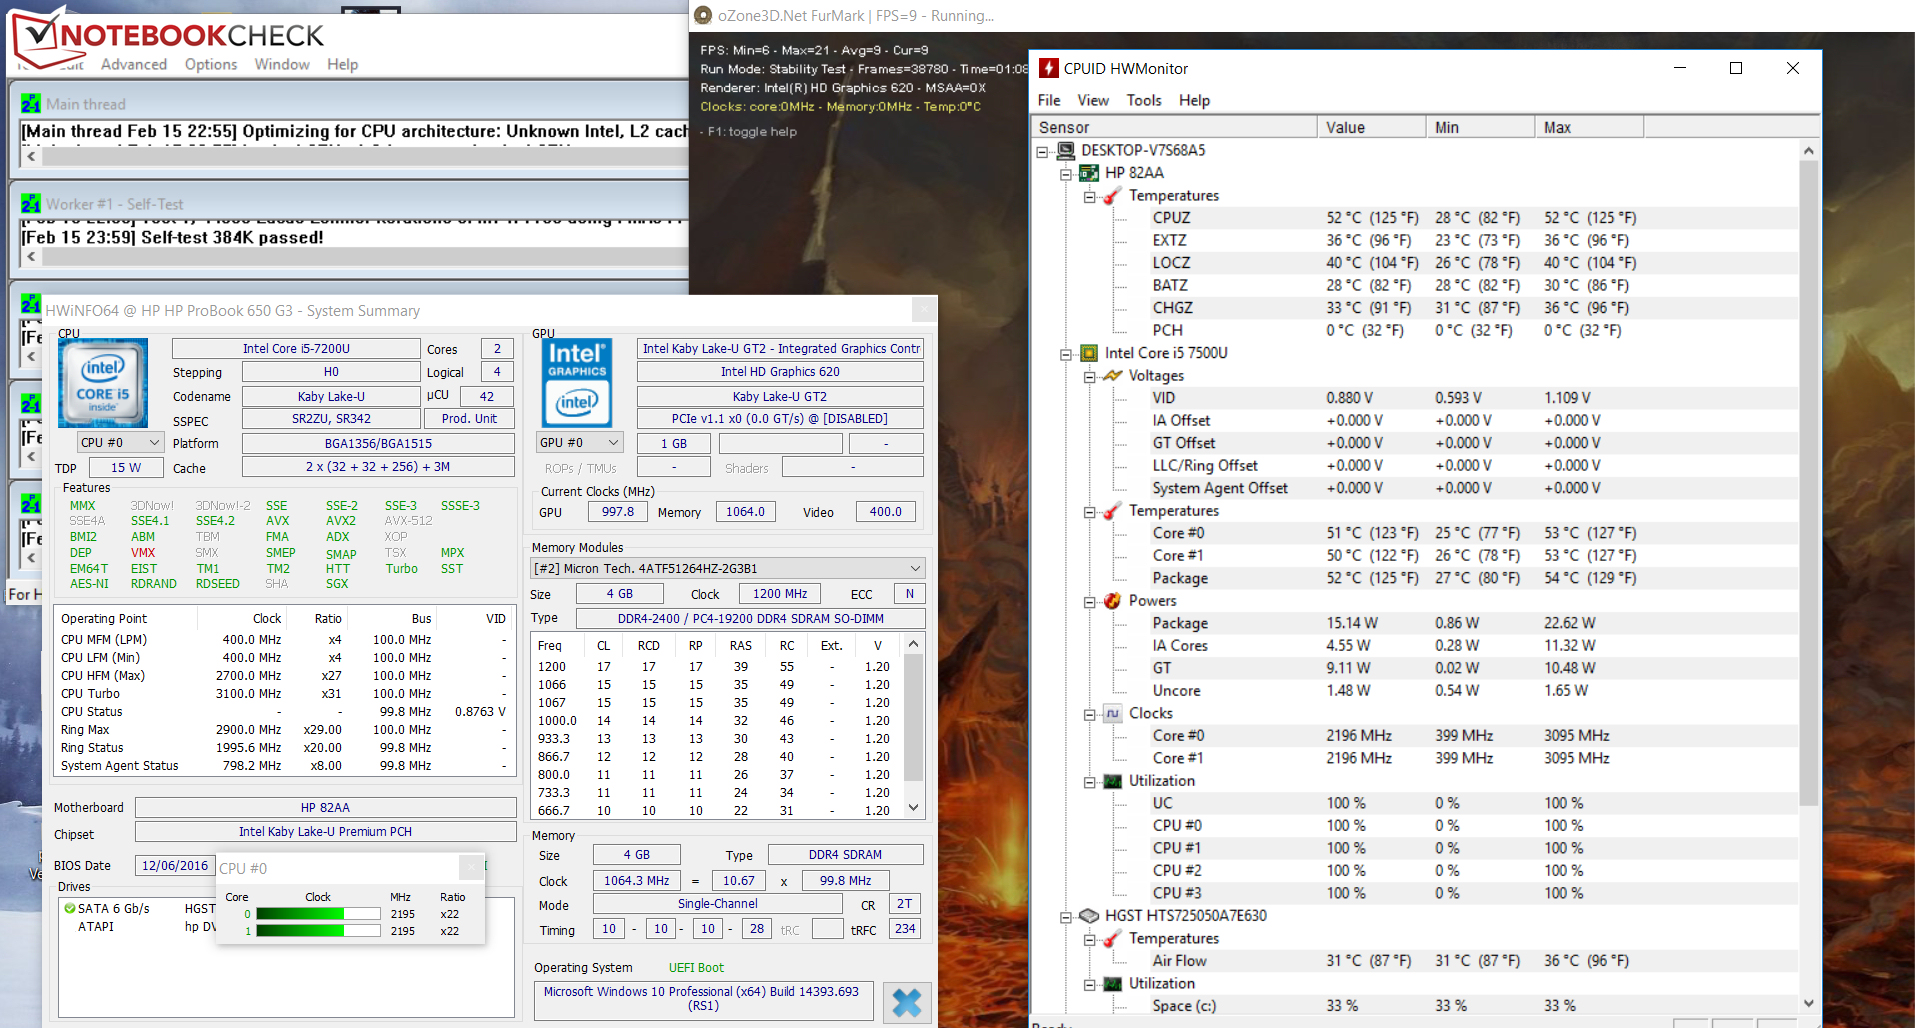
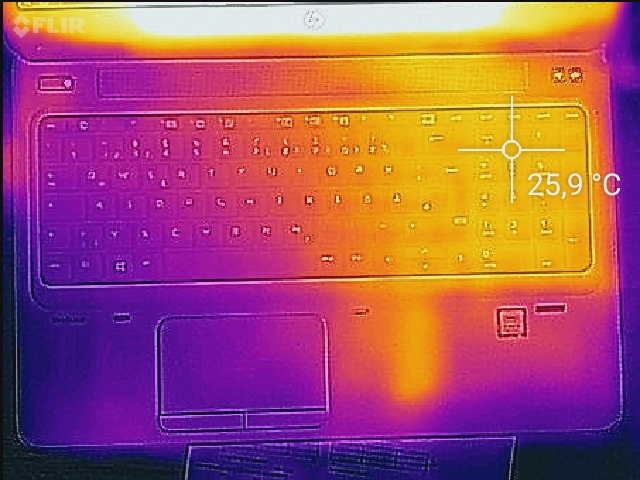
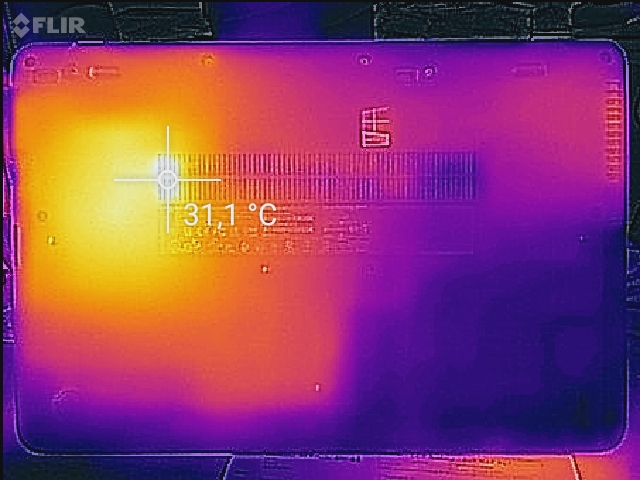
Our test model behaves differently in our stress test (Prime95 and Furmark run for at least one hour) in mains operation and on battery. In mains operation, the CPU clock permanently fluctuates between 1.6 and 2.2 GHz. The graphics core works at full speed (1,000 MHz). On battery, the processor works at 1.4 to 1.6 GHz and the GPU clocks at 450 MHz. Even though the CPU clocks at lower rates in our stress test, you do not have to worry. The CPU uses the full Turbo potential during everyday tasks. Our benchmark results confirm this. It can't be said that the ProBook really gets warmer. During the stress test, it only slightly exceeds the 30 °C level in a few spots.
(+) The maximum temperature on the upper side is 31.9 °C / 89 F, compared to the average of 34.3 °C / 94 F, ranging from 21.2 to 62.5 °C for the class Office.
(+) The bottom heats up to a maximum of 32.1 °C / 90 F, compared to the average of 36.8 °C / 98 F
(+) In idle usage, the average temperature for the upper side is 22.1 °C / 72 F, compared to the device average of 29.5 °C / 85 F.
(+) The palmrests and touchpad are cooler than skin temperature with a maximum of 25.6 °C / 78.1 F and are therefore cool to the touch.
(±) The average temperature of the palmrest area of similar devices was 27.5 °C / 81.5 F (+1.9 °C / 3.4 F).
| HP Probook 650 G3 Z2W44ET i5-7200U, HD Graphics 620 | HP ProBook 650 G2 V1A44ET 6200U, HD Graphics 520 | HP ProBook 655 G2 T9X09ET Pro A8-8600B, Radeon R6 (Carrizo) | Acer TravelMate P658-M-537B 6200U, HD Graphics 520 | Dell Latitude 15 E5570 6300U, HD Graphics 520 | Lenovo ThinkPad L560-20F10026GE 6200U, HD Graphics 520 | Apple MacBook Pro 15 2016 (2.6 GHz, 450) 6700HQ, Radeon Pro 450 | |
|---|---|---|---|---|---|---|---|
| Heat | -26% | -26% | -17% | -36% | -23% | -18% | |
| Maximum Upper Side * (°C) | 31.9 | 39.6 -24% | 35.8 -12% | 35.2 -10% | 37.3 -17% | 37.2 -17% | 43 -35% |
| Maximum Bottom * (°C) | 32.1 | 41.8 -30% | 37.6 -17% | 38 -18% | 41.5 -29% | 36 -12% | 40 -25% |
| Idle Upper Side * (°C) | 23.5 | 31.6 -34% | 33.4 -42% | 29.5 -26% | 34.2 -46% | 30.7 -31% | 26 -11% |
| Idle Bottom * (°C) | 25.3 | 29.7 -17% | 33.2 -31% | 29 -15% | 38.8 -53% | 32.8 -30% | 25 1% |
* ... smaller is better
HP Probook 650 G3 Z2W44ET audio analysis
(-) | not very loud speakers (68 dB)
Bass 100 - 315 Hz
(±) | reduced bass - on average 14.6% lower than median
(±) | linearity of bass is average (7.3% delta to prev. frequency)
Mids 400 - 2000 Hz
(+) | balanced mids - only 3% away from median
(+) | mids are linear (4.5% delta to prev. frequency)
Highs 2 - 16 kHz
(±) | higher highs - on average 8.5% higher than median
(±) | linearity of highs is average (7.6% delta to prev. frequency)
Overall 100 - 16.000 Hz
(±) | linearity of overall sound is average (21% difference to median)
Compared to same class
» 49% of all tested devices in this class were better, 10% similar, 41% worse
» The best had a delta of 7%, average was 21%, worst was 53%
Compared to all devices tested
» 58% of all tested devices were better, 7% similar, 35% worse
» The best had a delta of 4%, average was 23%, worst was 134%
Apple MacBook 12 (Early 2016) 1.1 GHz audio analysis
(+) | speakers can play relatively loud (83.6 dB)
Bass 100 - 315 Hz
(±) | reduced bass - on average 11.3% lower than median
(±) | linearity of bass is average (14.2% delta to prev. frequency)
Mids 400 - 2000 Hz
(+) | balanced mids - only 2.4% away from median
(+) | mids are linear (5.5% delta to prev. frequency)
Highs 2 - 16 kHz
(+) | balanced highs - only 2% away from median
(+) | highs are linear (4.5% delta to prev. frequency)
Overall 100 - 16.000 Hz
(+) | overall sound is linear (10.2% difference to median)
Compared to same class
» 7% of all tested devices in this class were better, 2% similar, 90% worse
» The best had a delta of 5%, average was 18%, worst was 53%
Compared to all devices tested
» 5% of all tested devices were better, 1% similar, 94% worse
» The best had a delta of 4%, average was 23%, worst was 134%
Frequency comparison (checkboxes select/deselectable!)
Energy Management
Power Consumption
In idle mode, we recorded a maximum power consumption of 7.6 Watt - a good value. During the stress test, it increased to 28.7 Watt. It becomes apparent here that the CPU does not use its Turbo during the stress test. If it did, the value would be higher. The power adapter is rated at 45 Watt.
| Off / Standby | |
| Idle | |
| Load |
|
Key:
min: | |
| HP Probook 650 G3 Z2W44ET i5-7200U, HD Graphics 620 | HP ProBook 650 G2 V1A44ET 6200U, HD Graphics 520 | HP ProBook 655 G2 T9X09ET Pro A8-8600B, Radeon R6 (Carrizo) | Acer TravelMate P658-M-537B 6200U, HD Graphics 520 | Dell Latitude 15 E5570 6300U, HD Graphics 520 | Lenovo ThinkPad L560-20F10026GE 6200U, HD Graphics 520 | Apple MacBook Pro 15 2016 (2.6 GHz, 450) 6700HQ, Radeon Pro 450 | |
|---|---|---|---|---|---|---|---|
| Power Consumption | 2% | -16% | -46% | -7% | -13% | -77% | |
| Idle Minimum * (Watt) | 4 | 3.4 15% | 5.8 -45% | 6.6 -65% | 4.5 -13% | 5 -25% | 2.9 27% |
| Idle Average * (Watt) | 6.9 | 7.5 -9% | 7.5 -9% | 10.4 -51% | 7.6 -10% | 7.9 -14% | 9.7 -41% |
| Idle Maximum * (Watt) | 7.6 | 7.6 -0% | 8.6 -13% | 12.7 -67% | 8.7 -14% | 8.6 -13% | 10.1 -33% |
| Load Average * (Watt) | 29 | 28.4 2% | 31 -7% | 36 -24% | 28.5 2% | 27.5 5% | 65 -124% |
| Load Maximum * (Watt) | 28.7 | 28.4 1% | 30.5 -6% | 35 -22% | 29.2 -2% | 33.7 -17% | 89.5 -212% |
* ... smaller is better
Battery Life
Our real-world Wi-Fi test simulates the load needed for opening websites. The "balanced" profile is enabled, energy-saving options are disabled, and the brightness is decreased to about 150 cd/m². The ProBook achieves 7:47 h. The HP computer lasts 6:42 h in our video test. For this test, the short file Big Buck Bunny (H.264 codec, 1920x1080 pixels) runs in a loop. All wireless modules are deactivated and the screen is once again set to about 150 cd/m².
The ProBook 650 G3 delivers very good battery runtimes overall. It outperforms its Skylake predecessors despite the same battery capacity.
| HP Probook 650 G3 Z2W44ET i5-7200U, HD Graphics 620, 48 Wh | HP ProBook 650 G2-T9X61ET 6200U, HD Graphics 520, 48 Wh | HP ProBook 650 G2 V1A44ET 6200U, HD Graphics 520, 48 Wh | HP ProBook 655 G2 T9X09ET Pro A8-8600B, Radeon R6 (Carrizo), 48 Wh | Acer TravelMate P658-M-537B 6200U, HD Graphics 520, 55 Wh | Dell Latitude 15 E5570 6300U, HD Graphics 520, 62 Wh | Lenovo ThinkPad L560-20F10026GE 6200U, HD Graphics 520, 48 Wh | Apple MacBook Pro 15 2016 (2.6 GHz, 450) 6700HQ, Radeon Pro 450, 76 Wh | |
|---|---|---|---|---|---|---|---|---|
| Battery runtime | -9% | -9% | -53% | -4% | 30% | -23% | -5% | |
| Reader / Idle (h) | 12.8 | 11.5 -10% | 14 9% | 20.5 60% | 11.6 -9% | |||
| H.264 (h) | 6.7 | 6.4 -4% | 9.5 42% | 4.6 -31% | 8.6 28% | |||
| WiFi v1.3 (h) | 7.8 | 6.8 -13% | 7.1 -9% | 3.7 -53% | 8.5 9% | 10.5 35% | 6.8 -13% | 10 28% |
| Load (h) | 3 | 2.7 -10% | 2.1 -30% | 2.5 -17% | 1.8 -40% | 0.9 -70% |
Pros
Cons
Verdict
HP's mid-range business notebook achieves a slightly better performance thanks to the new Kaby Lake processors. However, this will hardly be noticeable during everyday tasks. The new processors improve the battery runtimes. The laptop can exceed the already good results of the predecessors. The computer works quietly and hardly gets warmer regardless of the load. Thanks to a 500 GB hard drive, you will not run out of storage space quickly. It is possible to replace the HDD by an SSD. This would require removing the underside - which is done quite easily.
In general, HP delivers a solid business notebook with the ProBook 650 G3. However, the test model is less attractive than it could be since the price is too high for the included features.
Speaking of the SSD: HP actually offers a 1,050-Euro (~$1111) notebook with an HDD instead of an SSD. This is certainly a significant con. The used keyboard appears good and is made for prolific typists. However, it lacks a backlight. This should be a standard feature in view of the computer's price. Moreover, the display is really disappointing. The company incorporated a low-contrast TN model with narrow viewing angles. This display should be absolutely out of the question in a notebook of this price class. We expect an IPS model.
HP Probook 650 G3 Z2W44ET
- 02/21/2017 v6 (old)
Sascha Mölck
Price comparison
