Microsoft Surface Laptop (i5-7200U) Review
The first Surface tablet launched in 2013 and it wasn't until four years later that Microsoft was able to finally add a proper notebook to the family. Simply called the Surface Laptop, the notebook is distinguished by both its 3:2 screen ratio (not unlike the Chromebook Pixel) and rare Core i7-7660U CPU option with integrated Iris Plus 640 graphics. This combination of features can be found on no other Ultrabook currently in the market and Microsoft is banking on this as a key selling point for its premier Surface Laptop series.
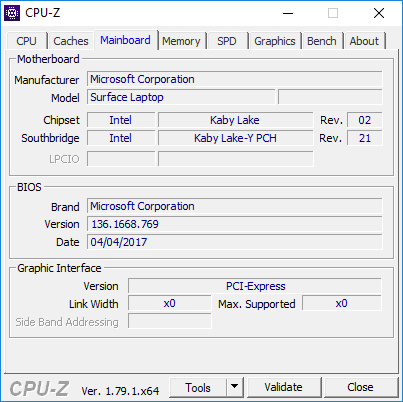
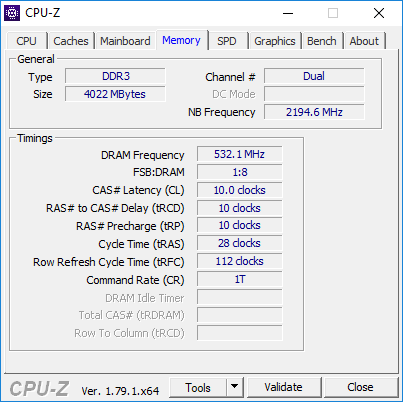
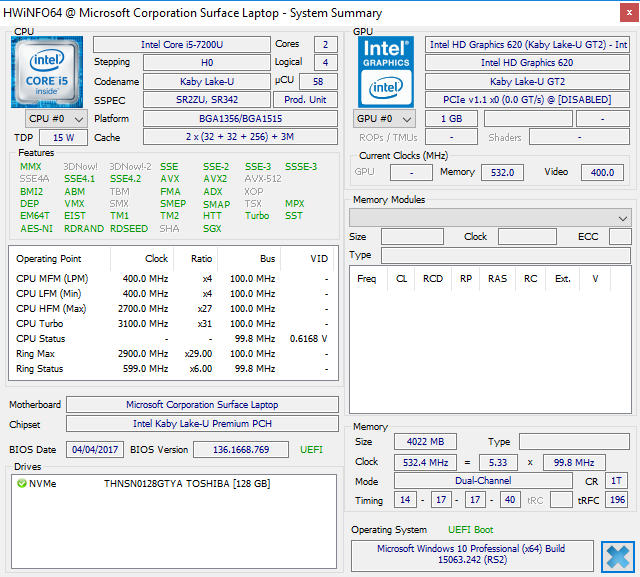
Aside from the various color choices, current SKUs offer just two processor options (i5-7200U and i7-7660U) and a range of RAM and SSD sizes. Our entry-level SKU in review is equipped with an i5-7200U CPU, just 4 GB of DDR3 RAM, and a 128 GB SSD for $1000 USD. Users must pay an additional $600 USD premium if they want the i7-7600U CPU with double the RAM and storage space. Otherwise, there are disappointingly no display or connectivity differences between the configuration levels.
The Surface Laptop is almost a niche product due to its squarer display and design. Microsoft is not explicitly marketing it as an Ultrabook, but the comparisons will be inevitable as the target student demographic will likely want to weigh the pros and cons between the Surface Laptop, Surface Pro 4, Macbook Pro 13/15, and other popular alternatives that we will discuss in detail.
For the purposes of this review, our test system was upgraded from Windows 10 S to Windows 10 Pro 64-bit prior to running any tests or benchmarks.
Case
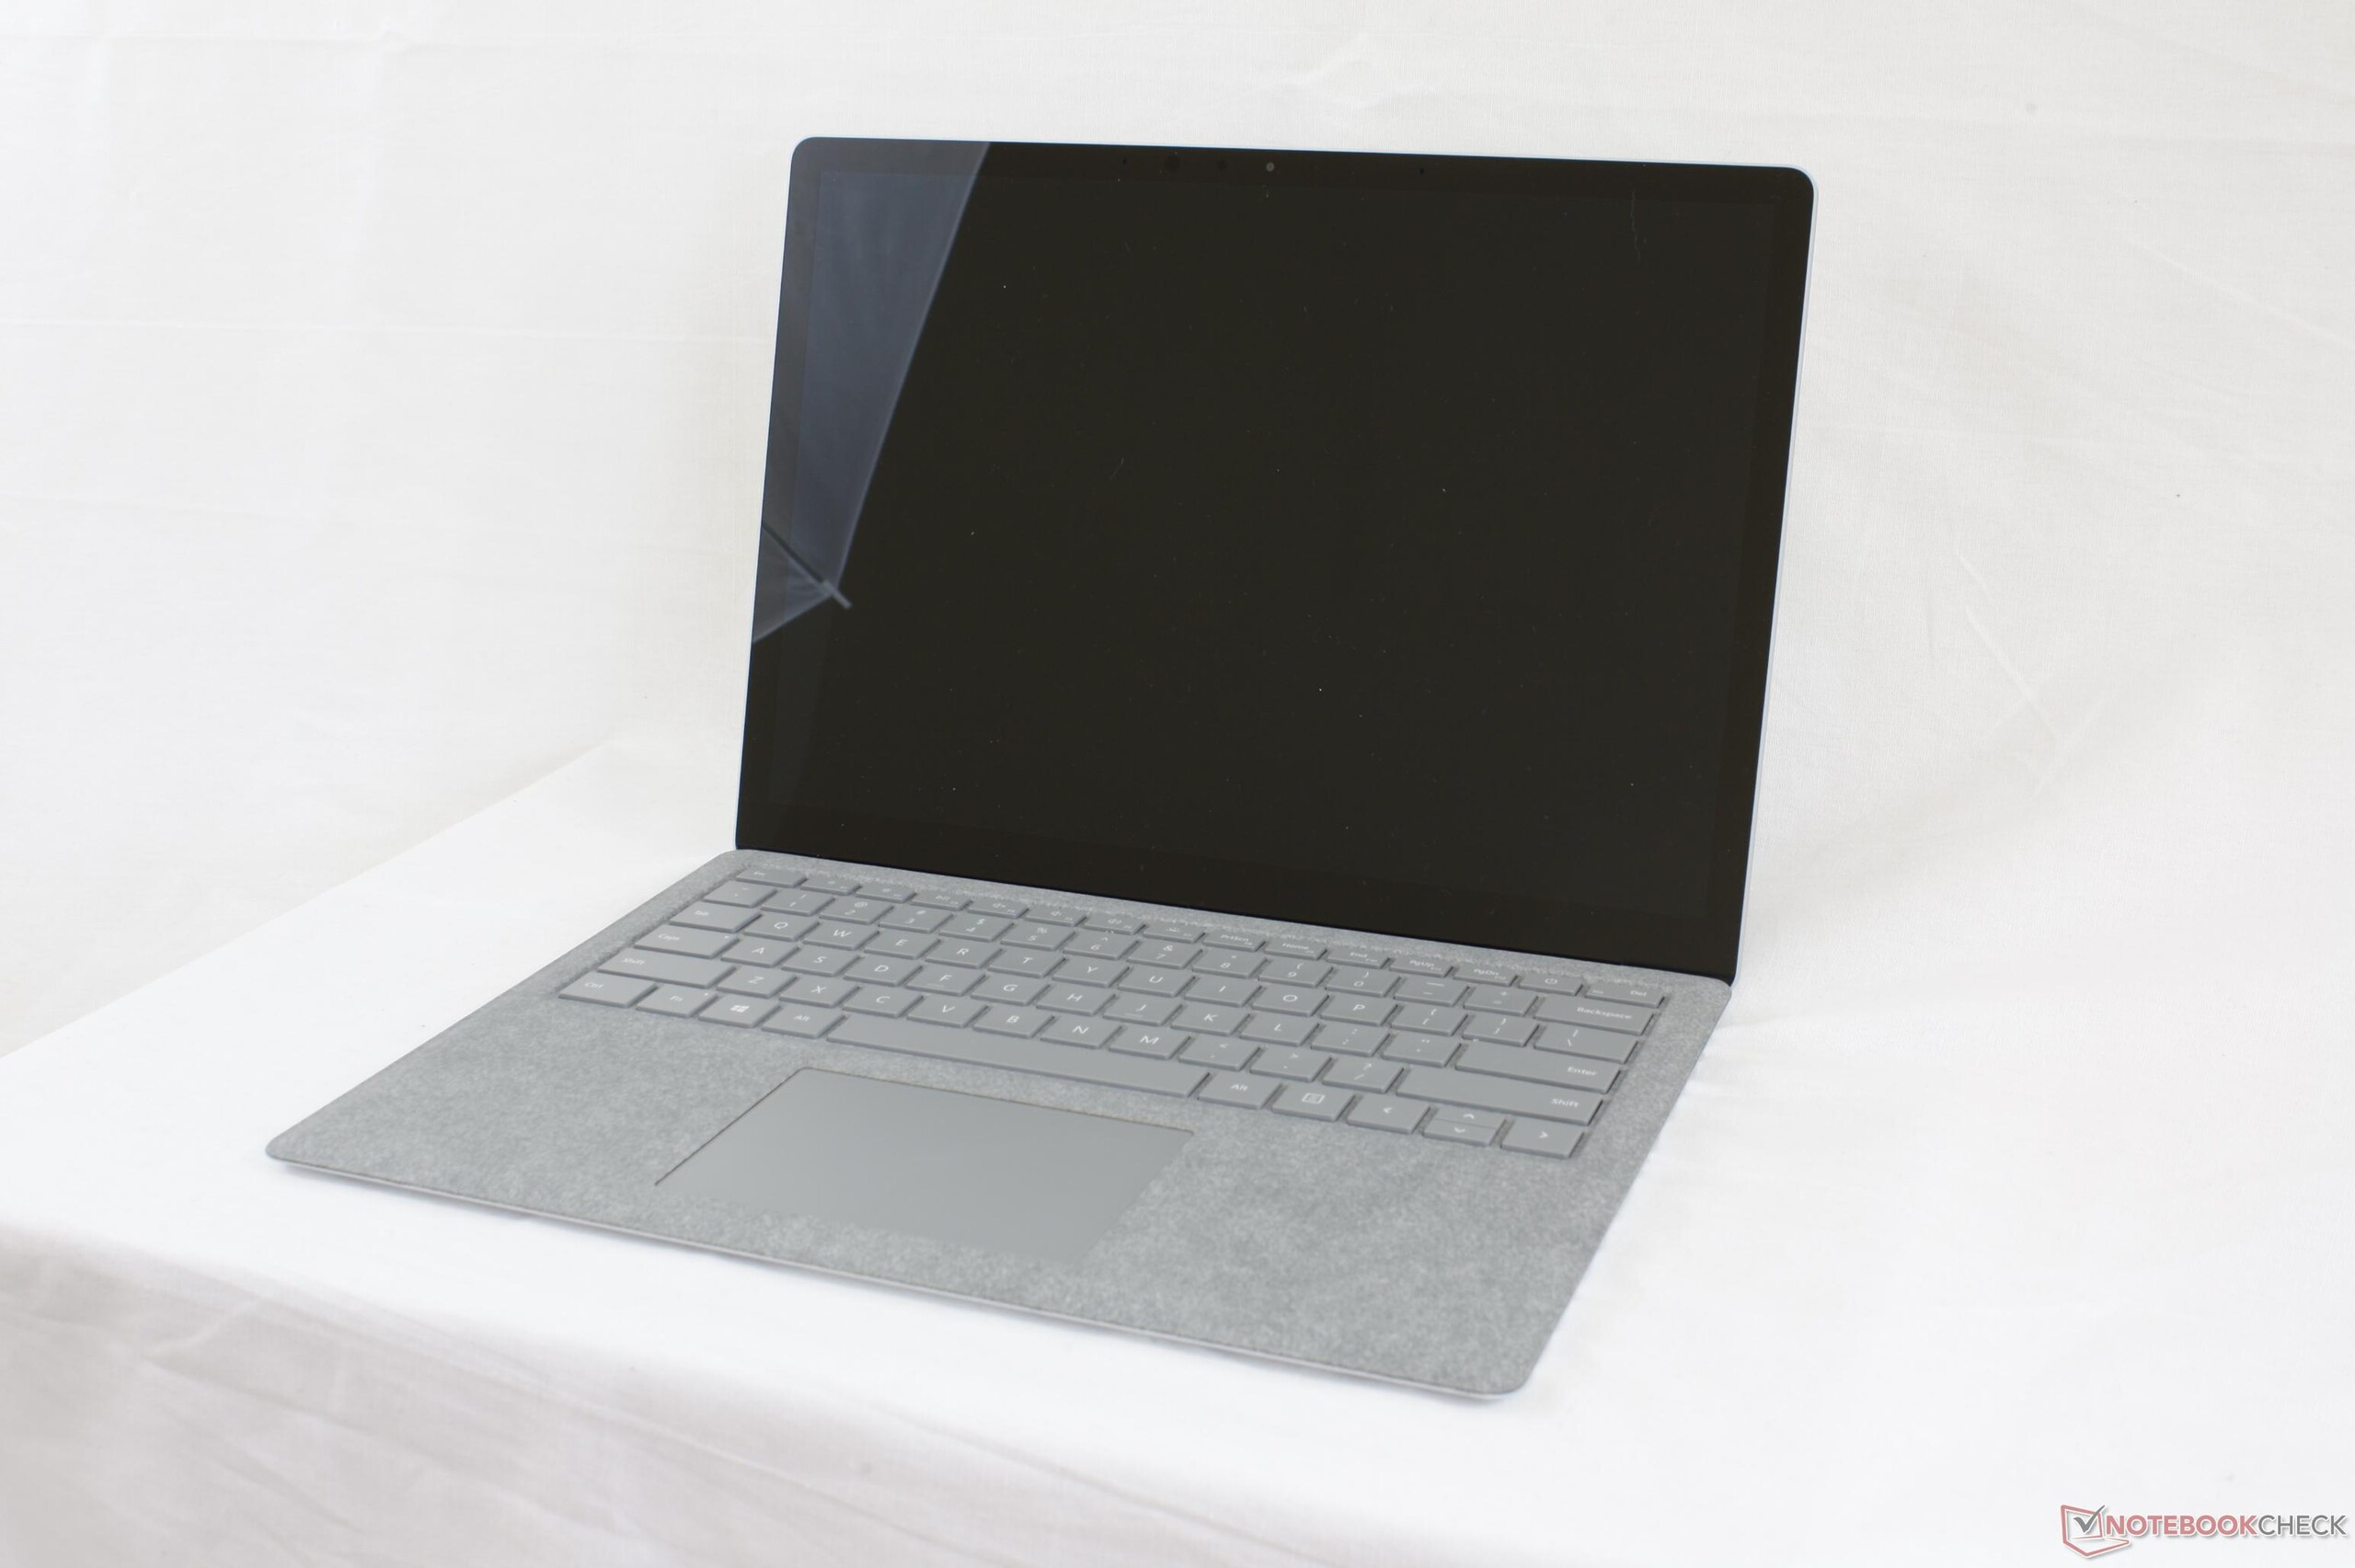
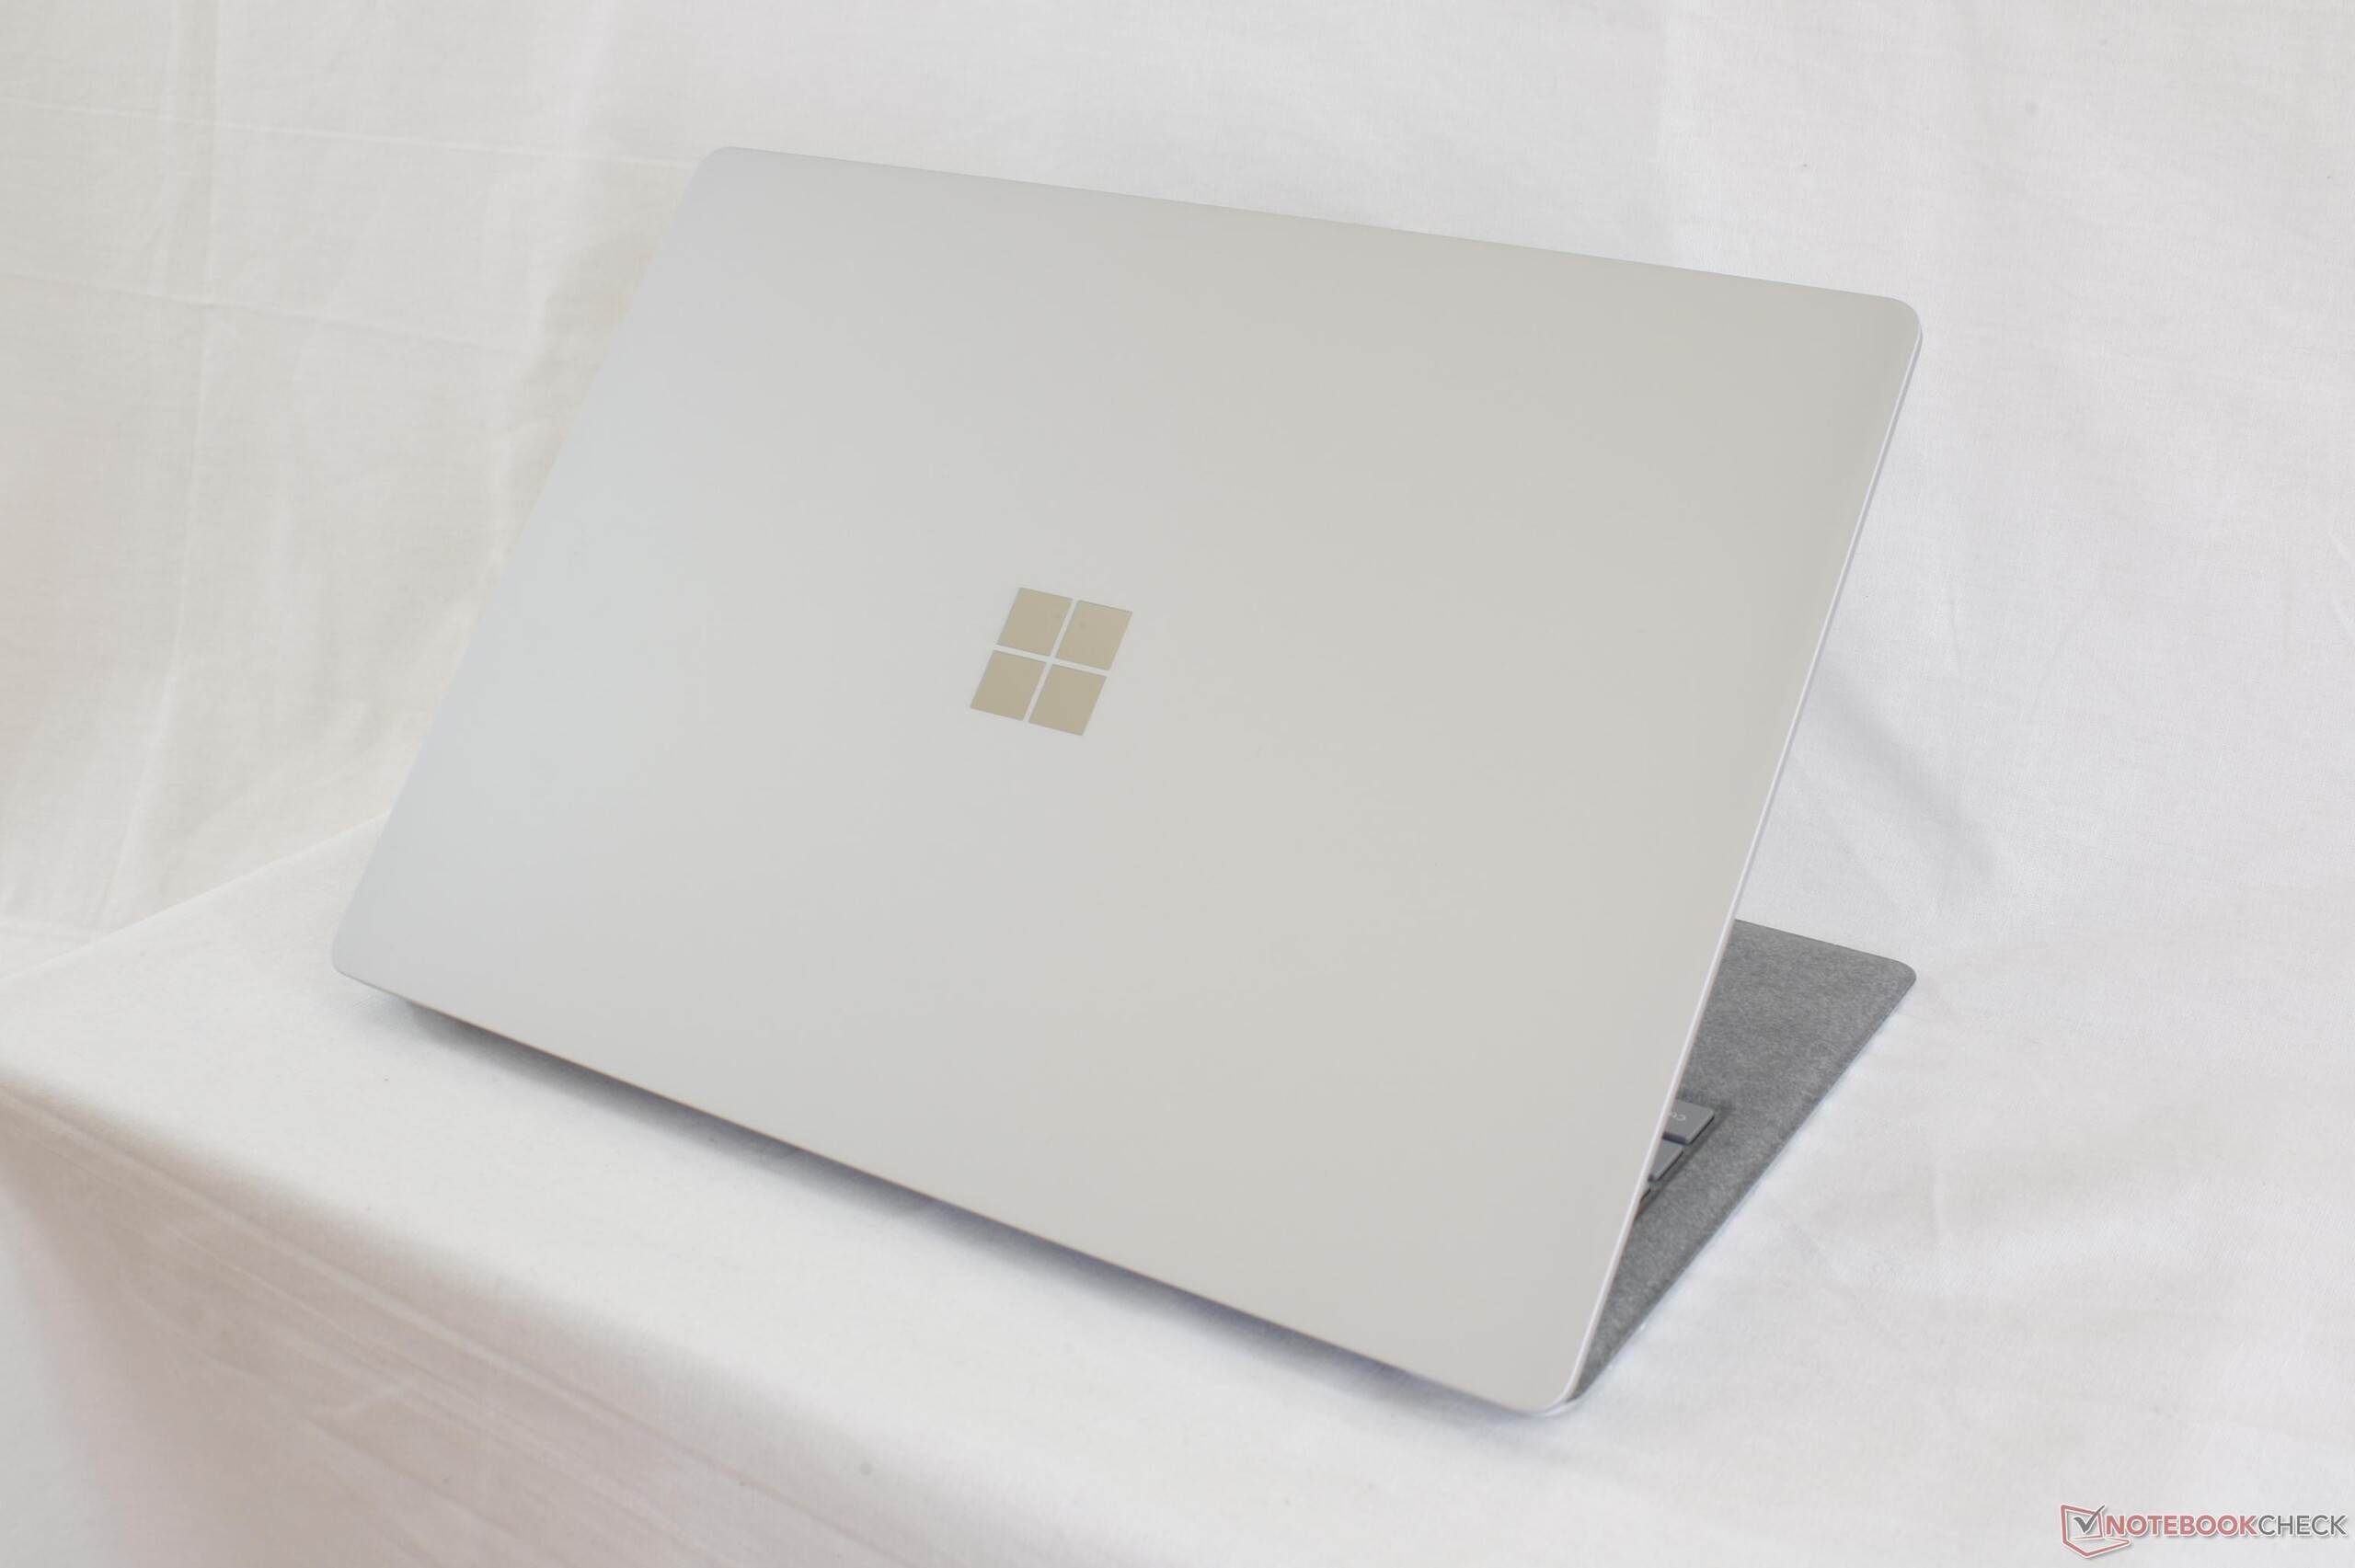
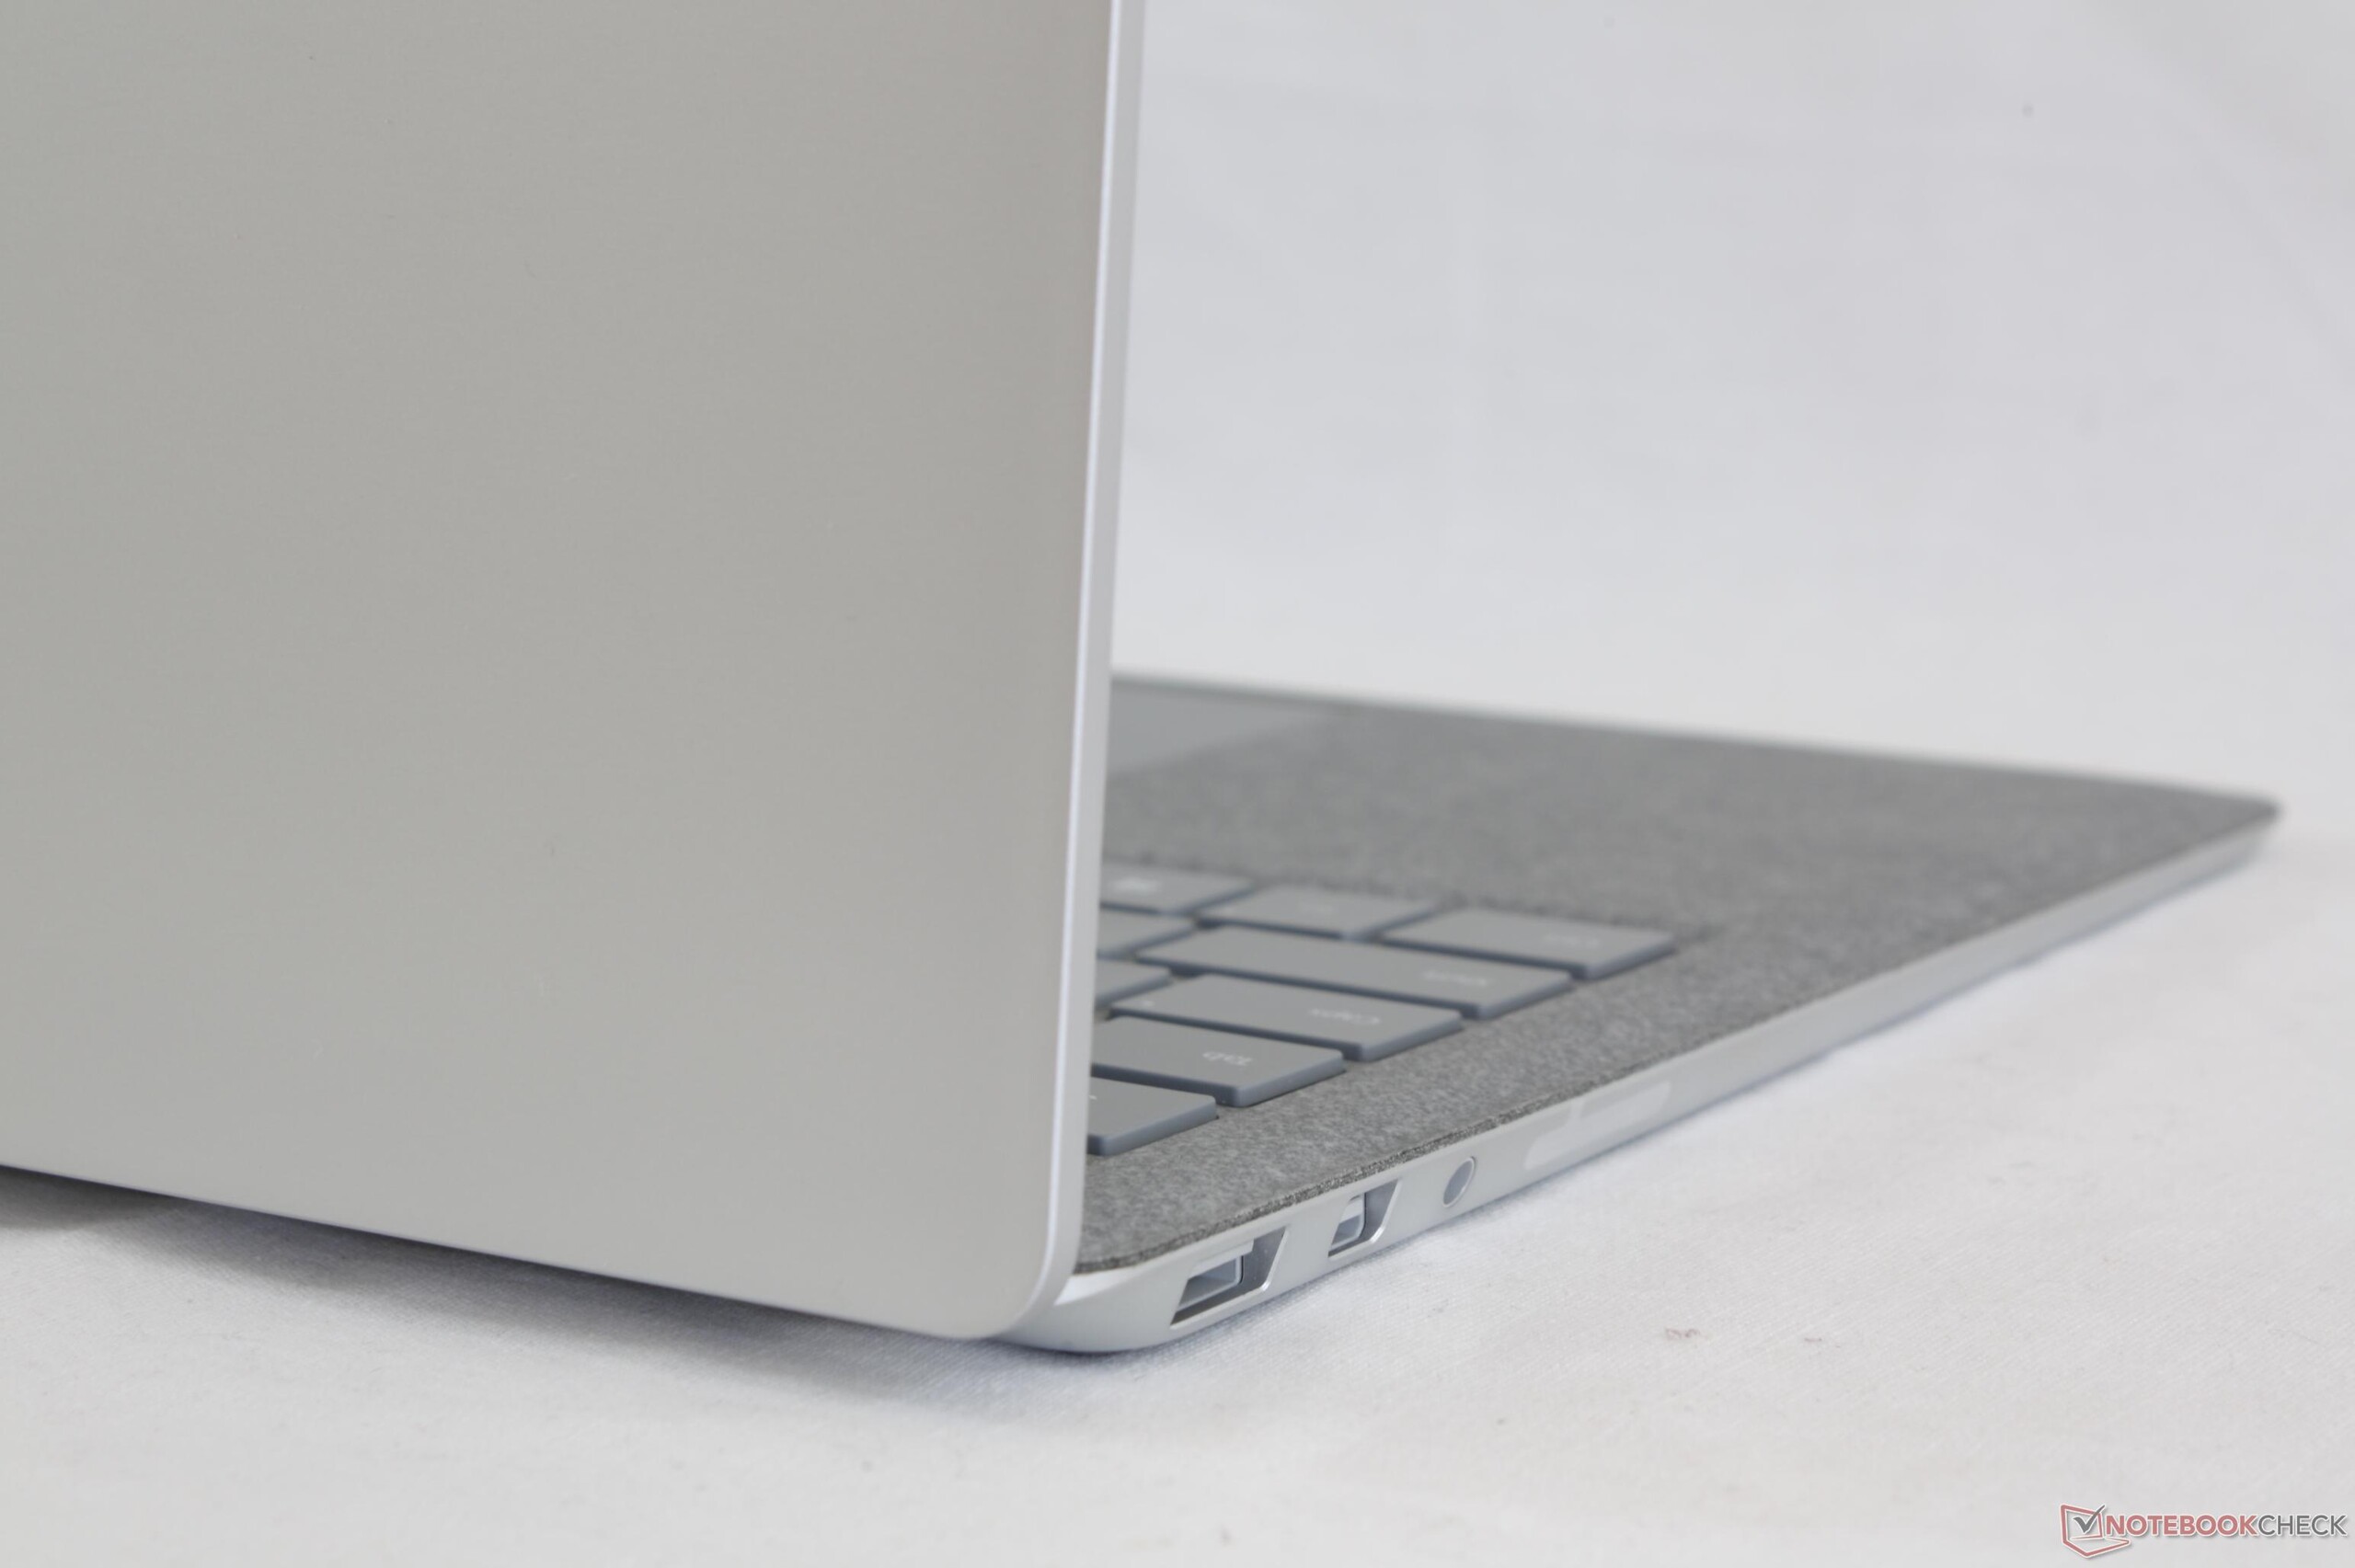
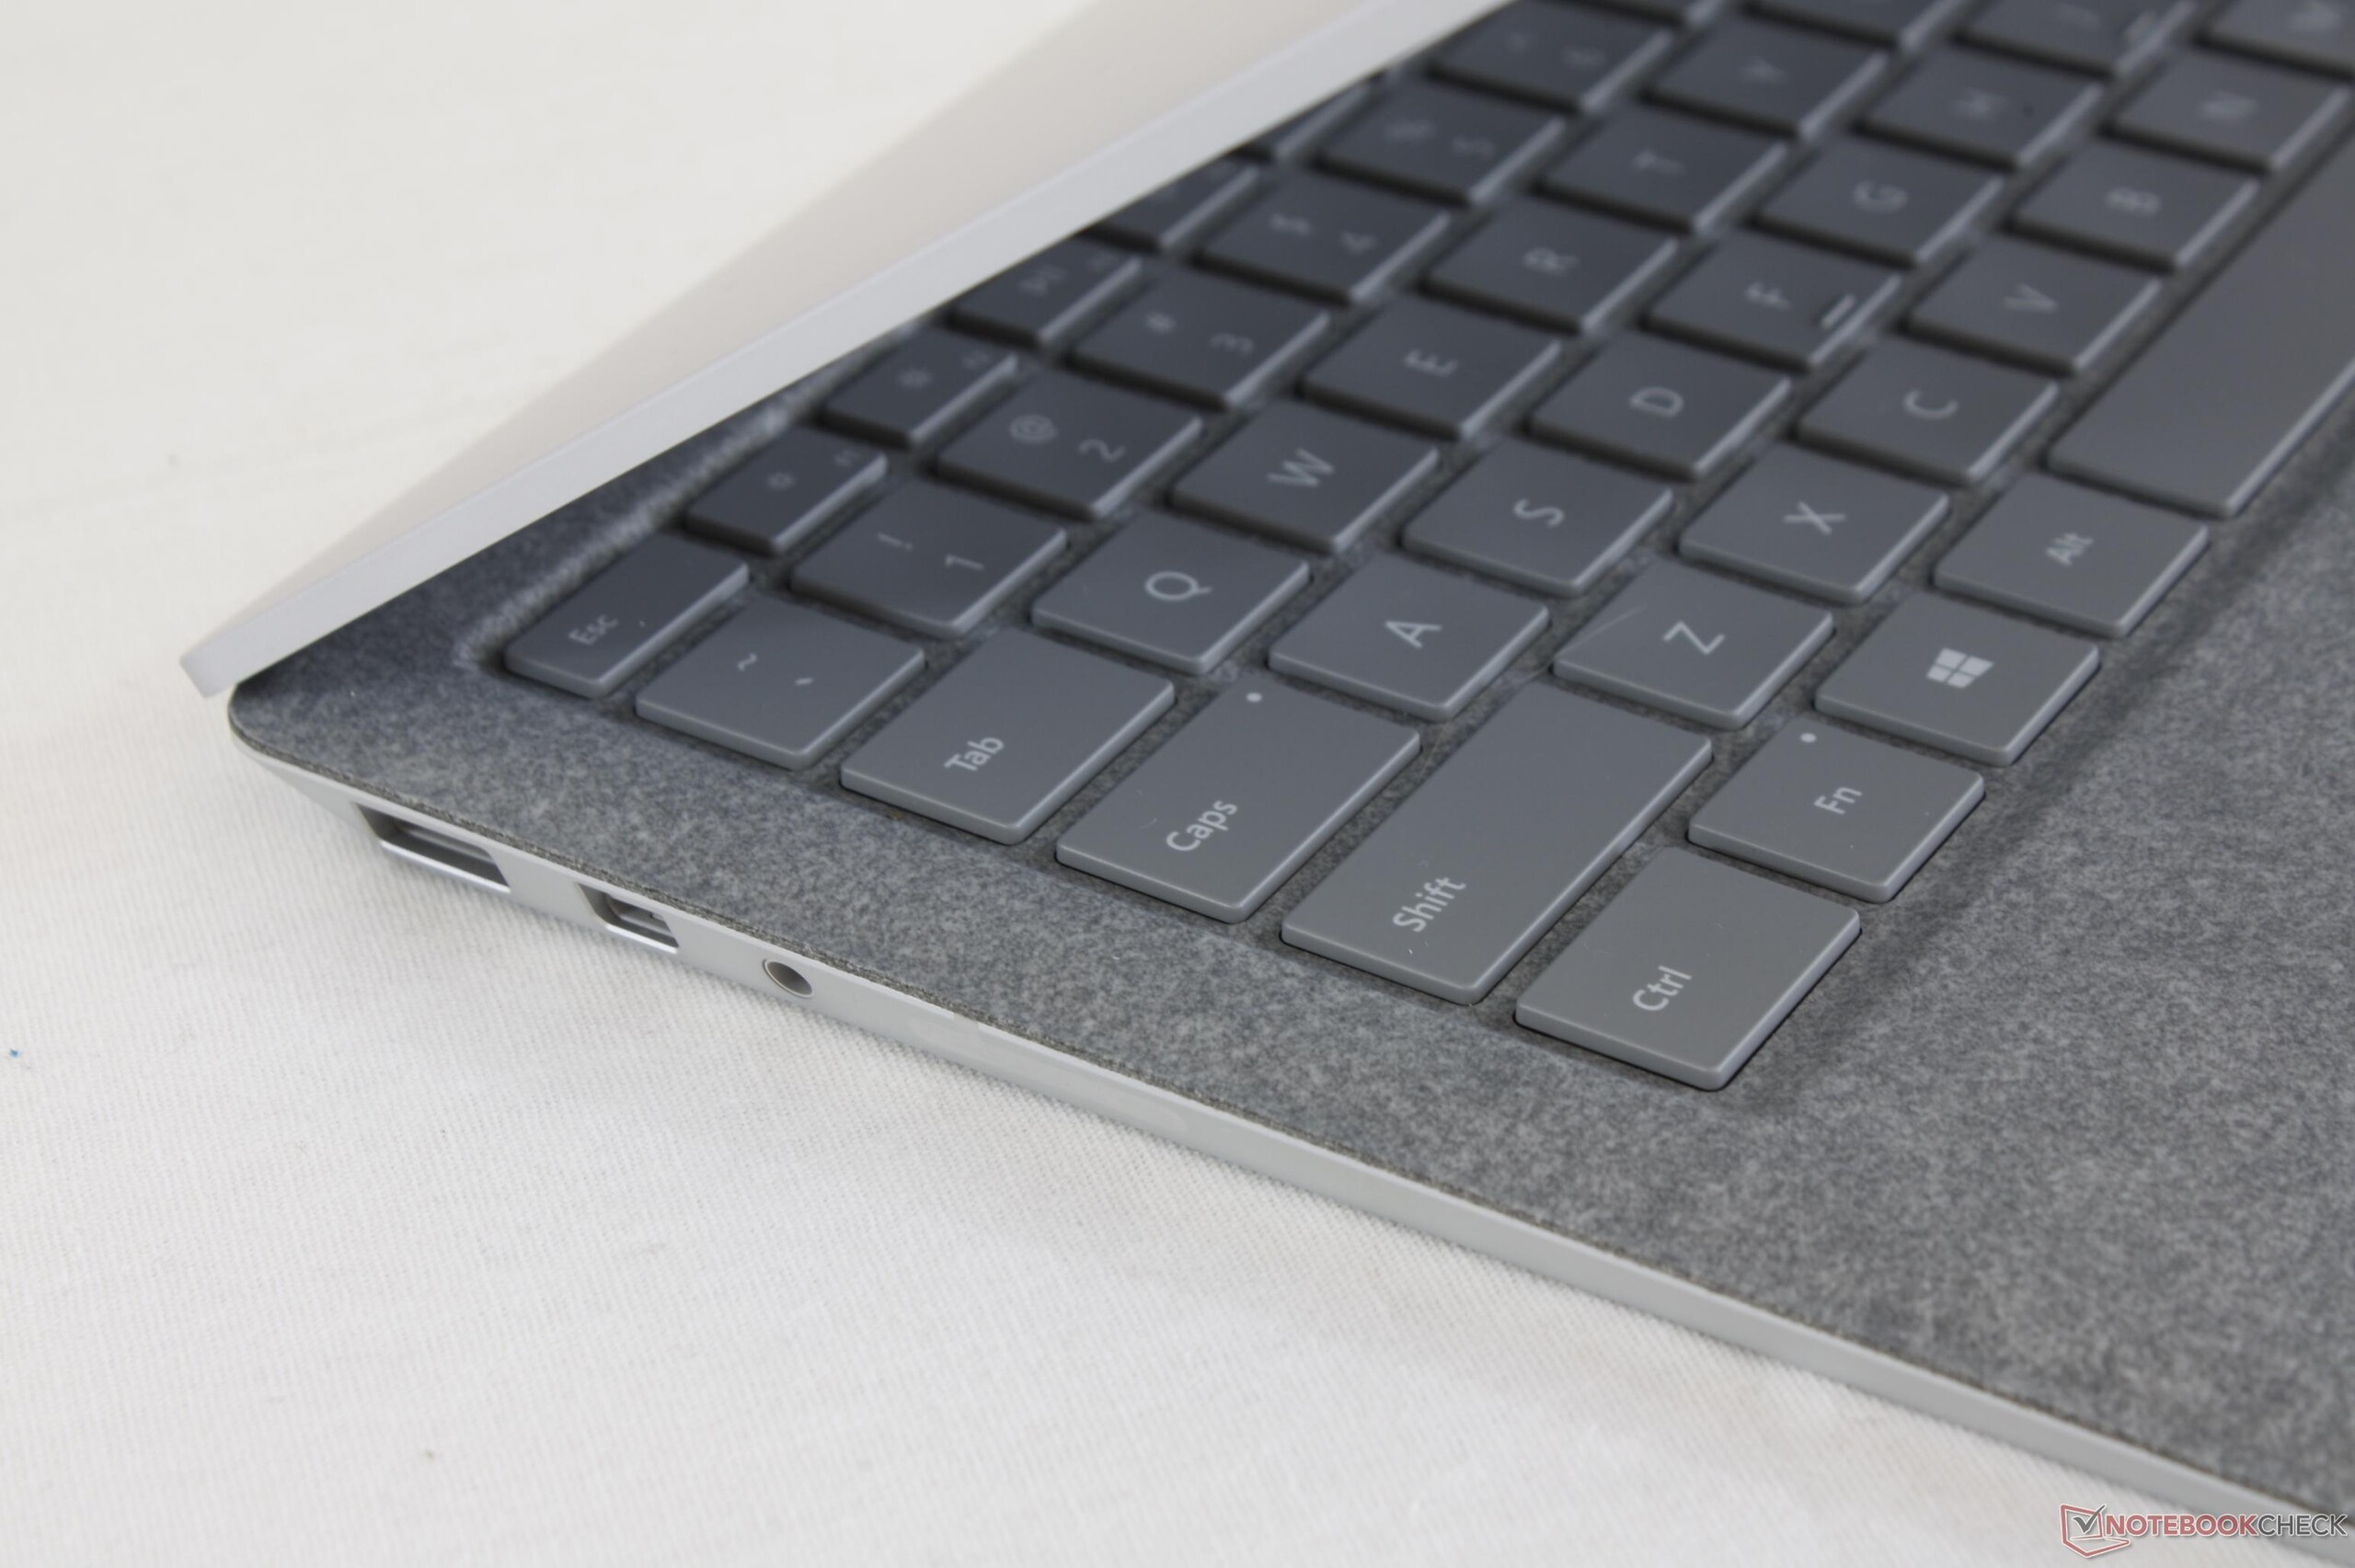
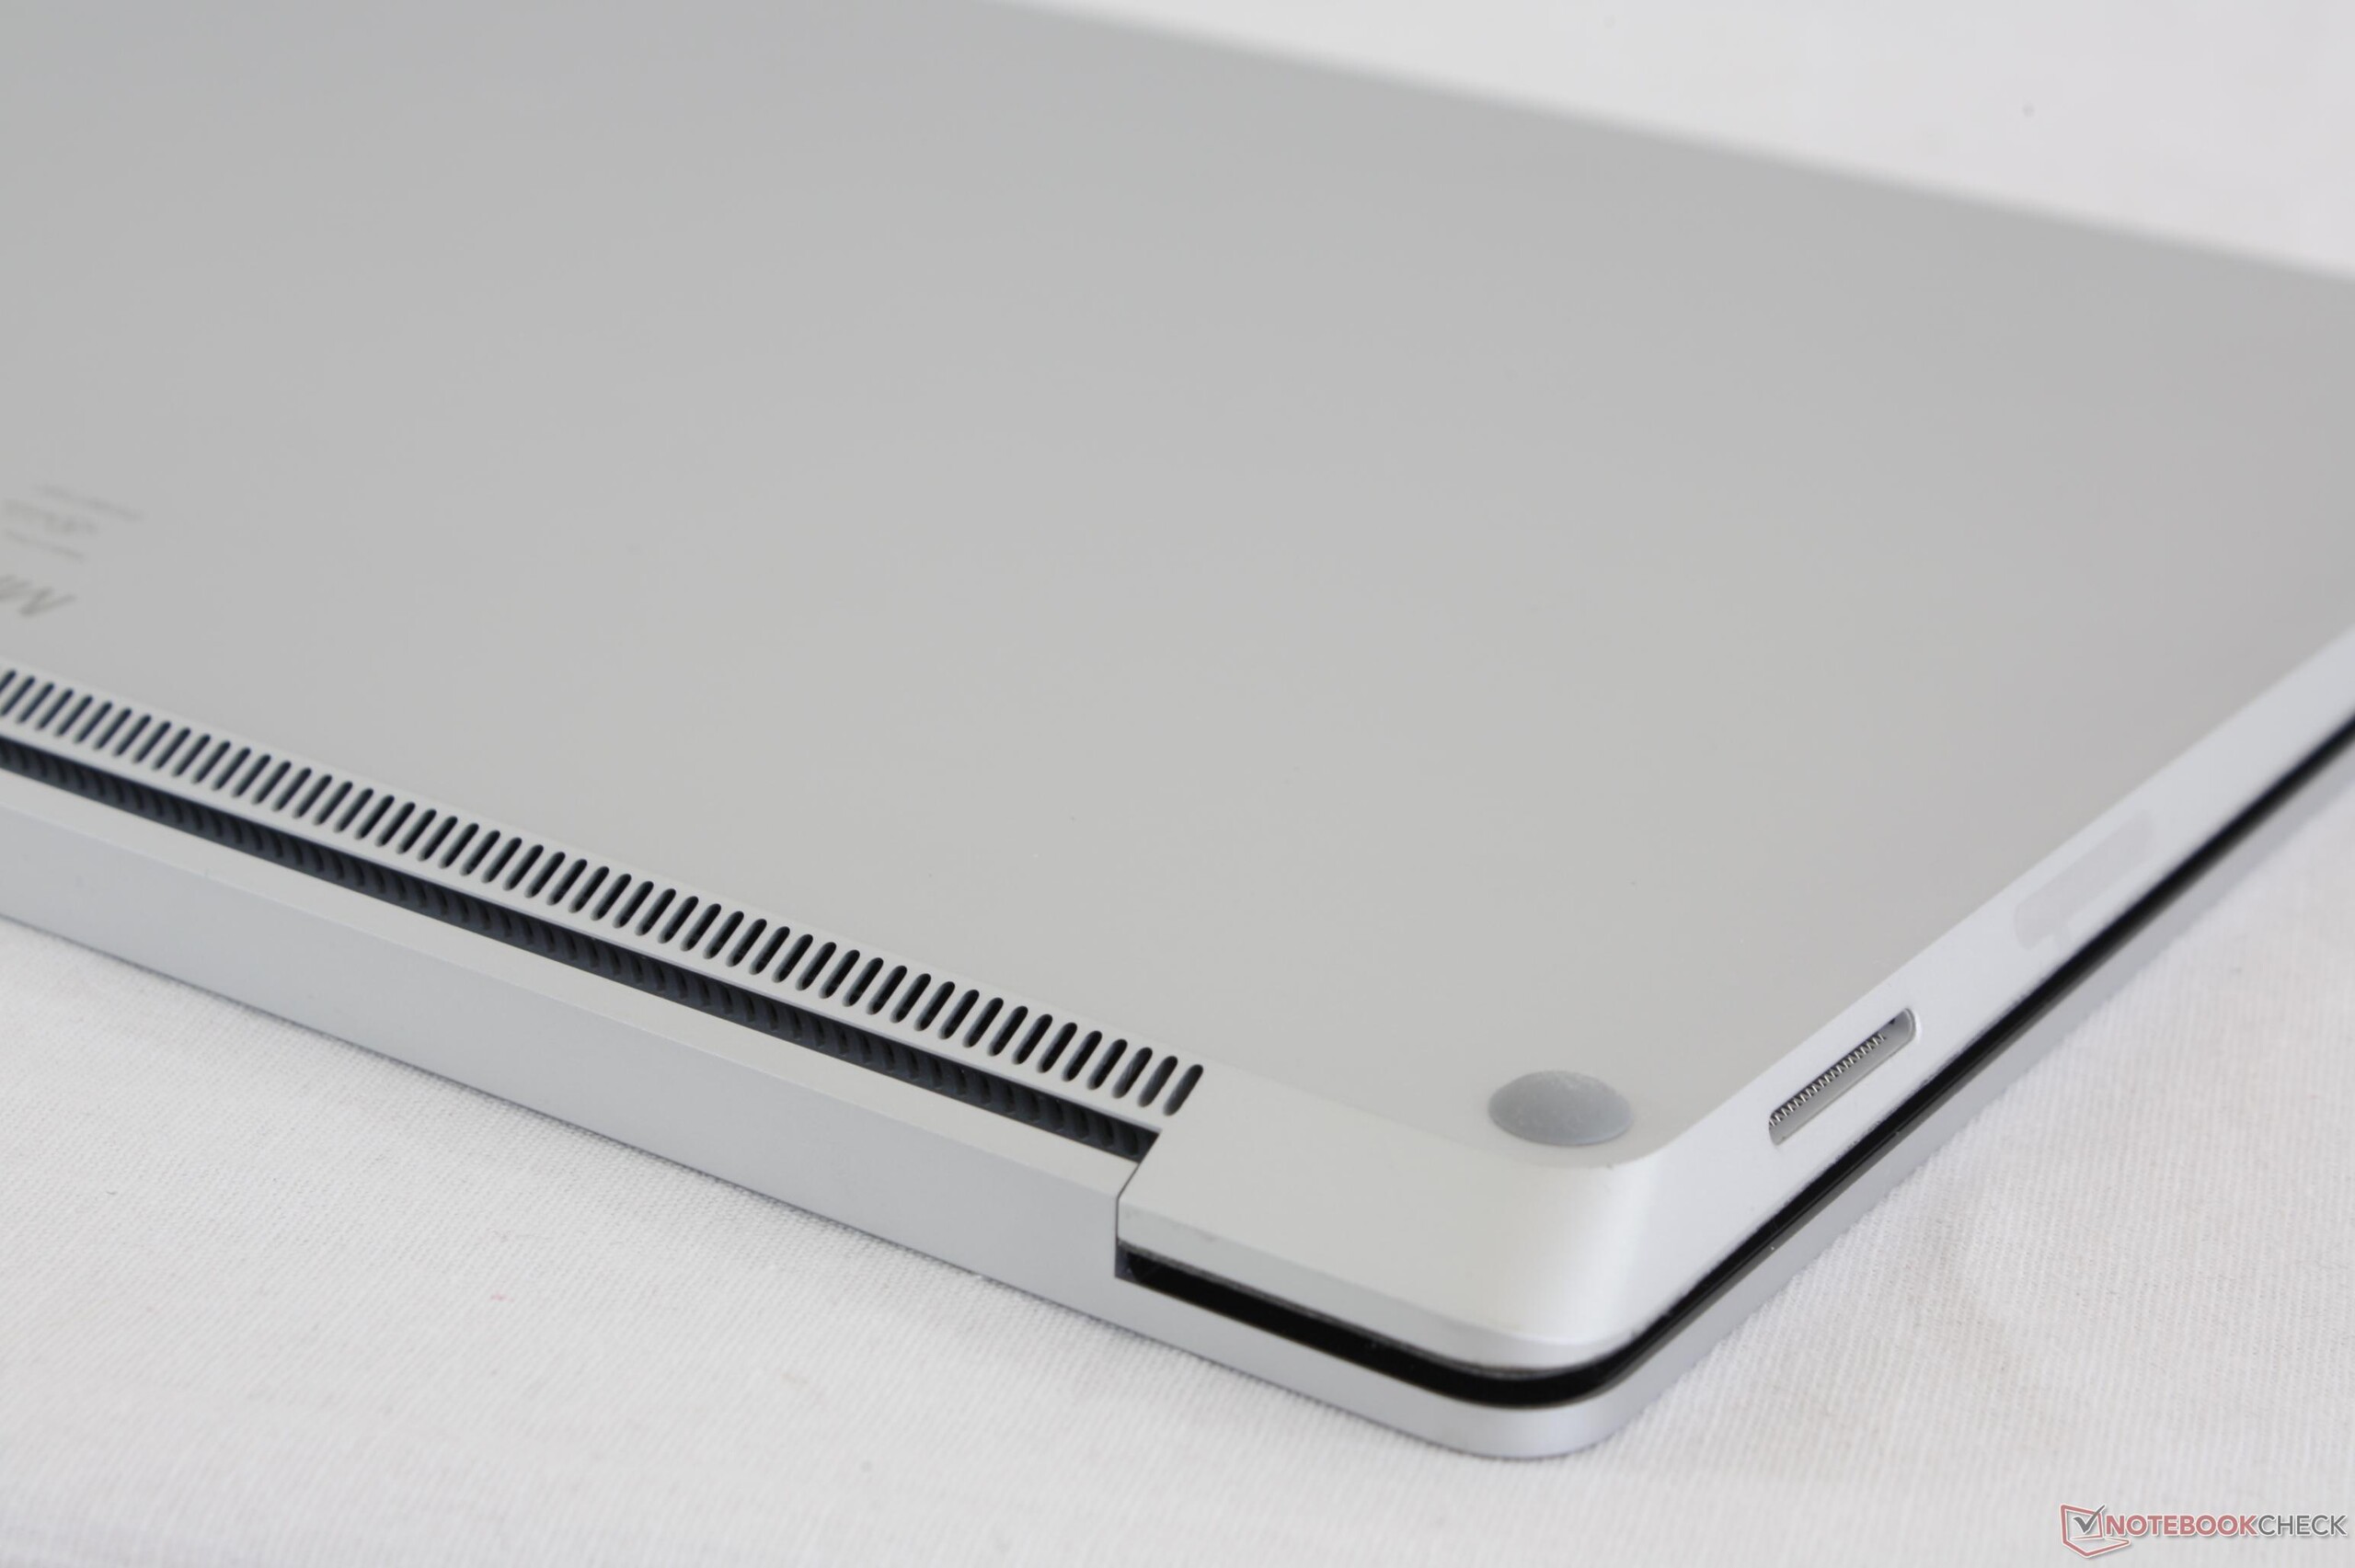
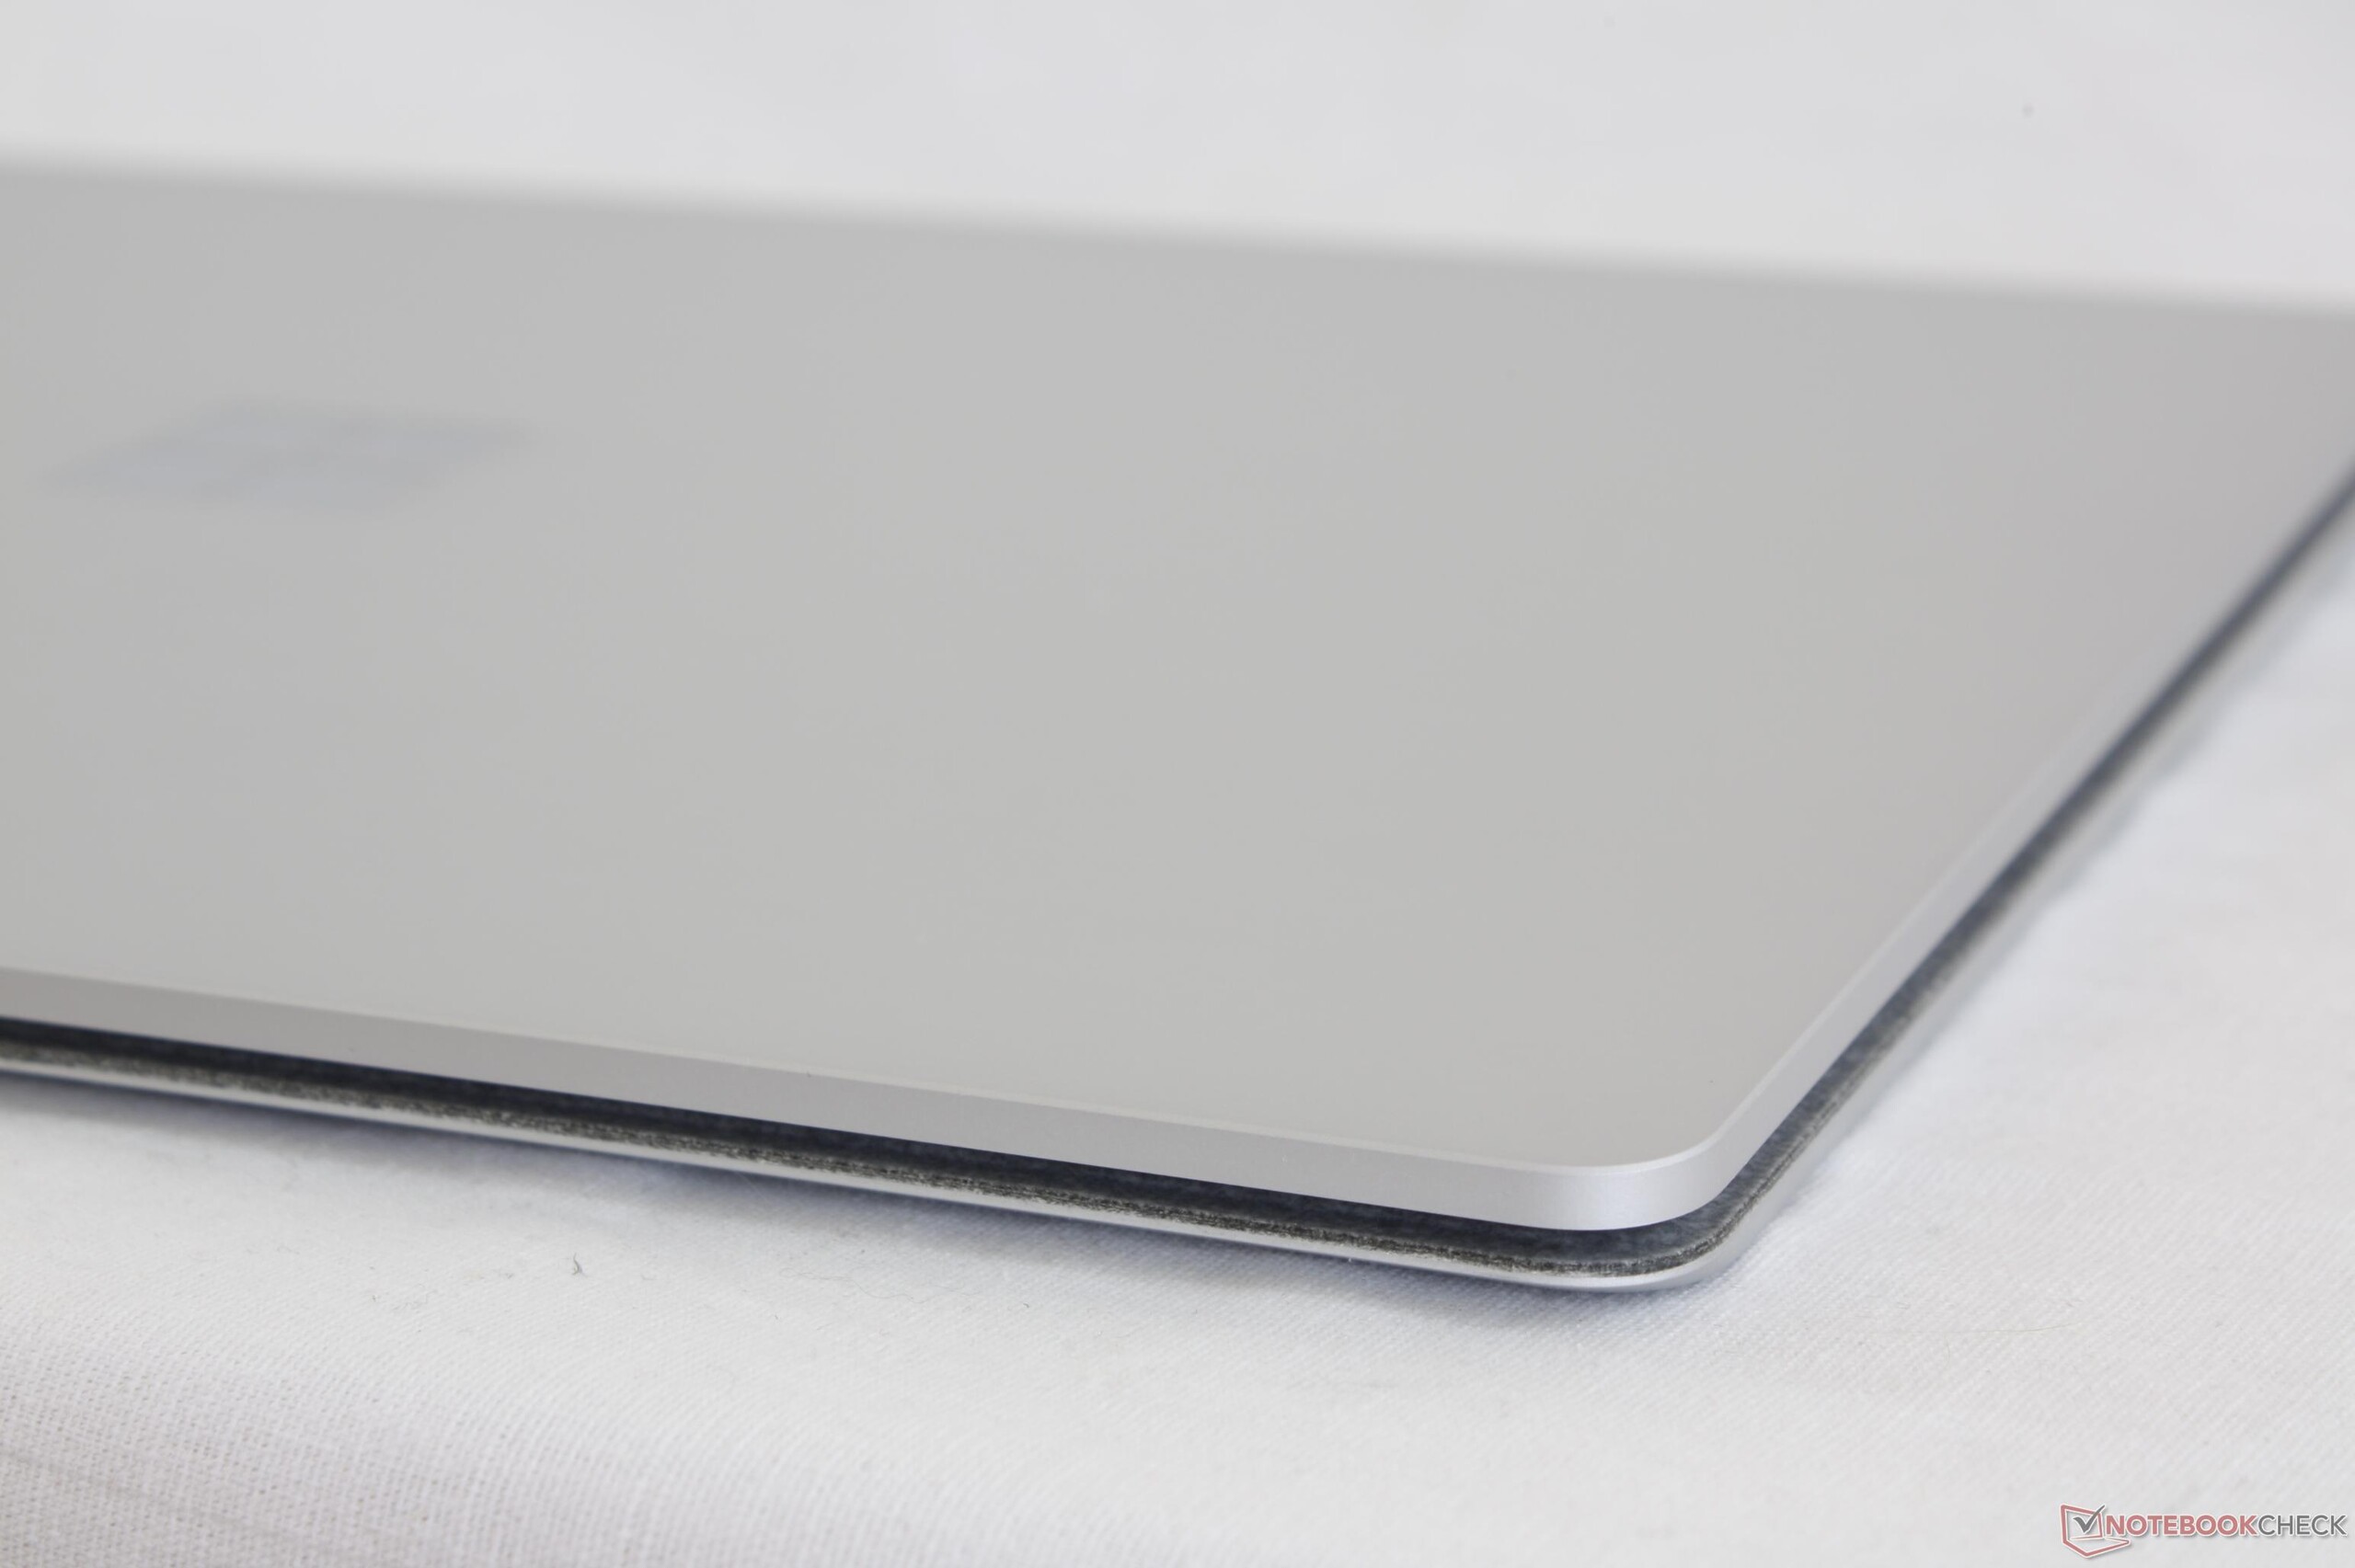
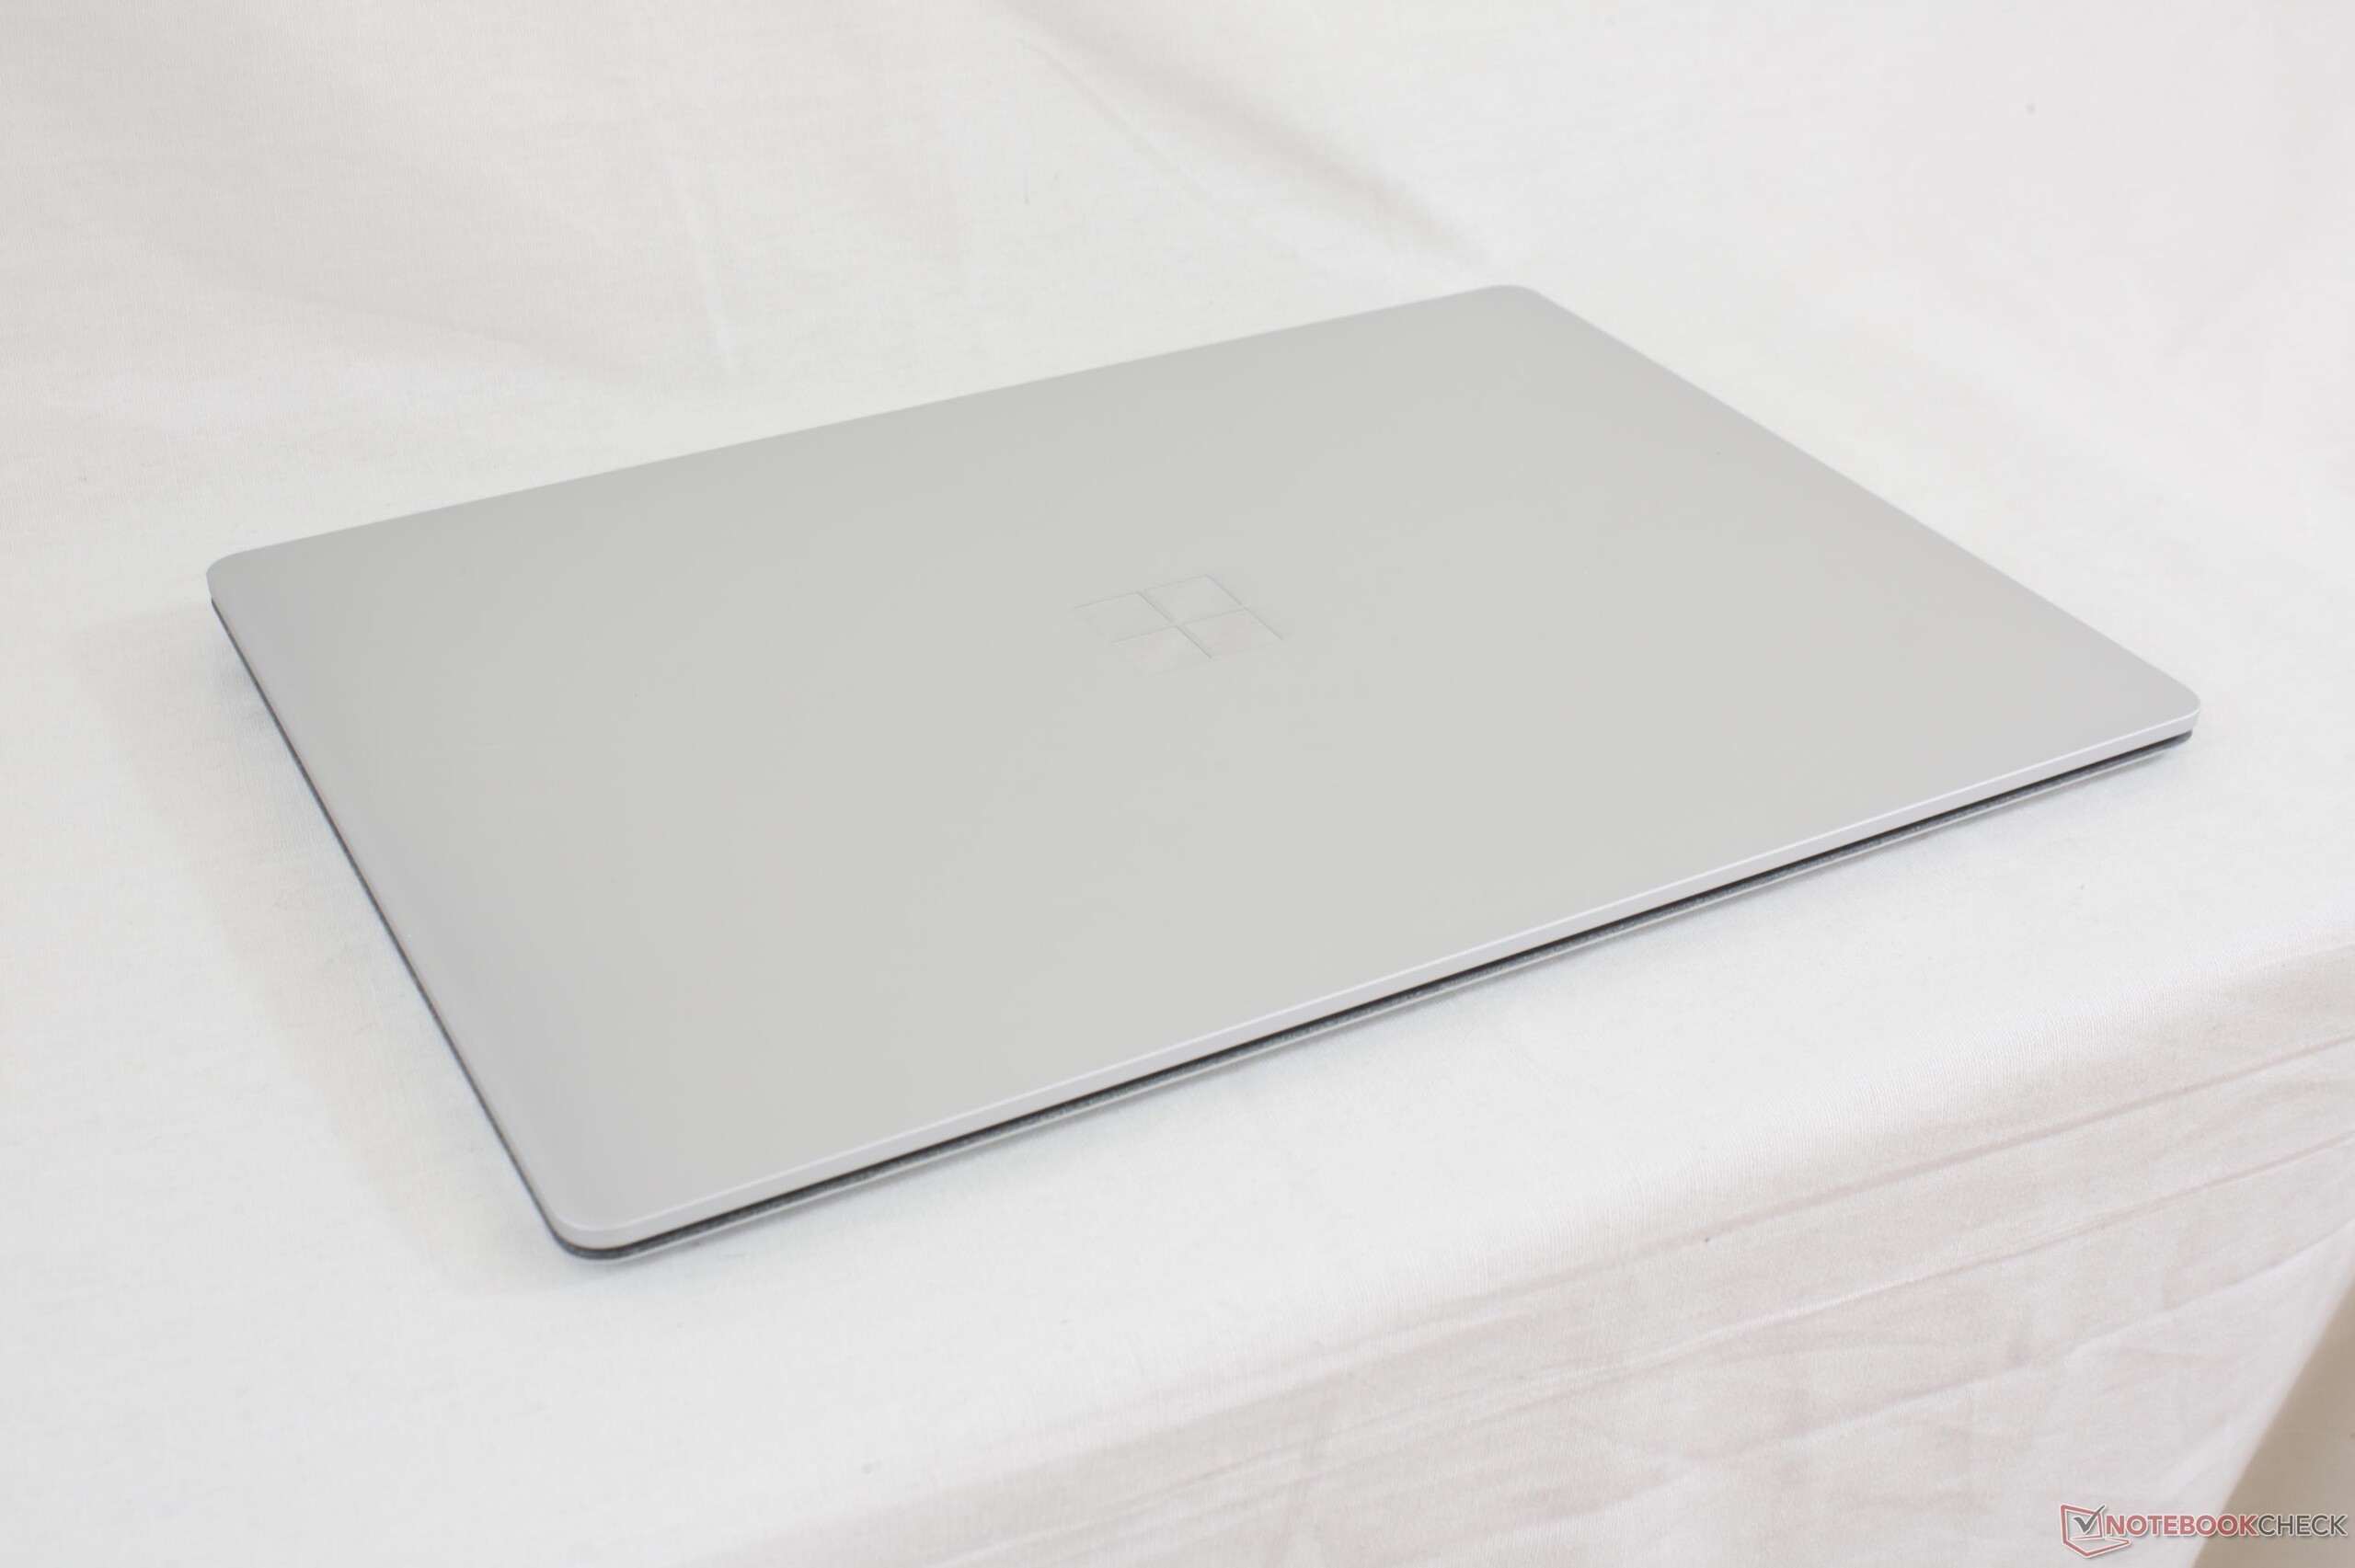
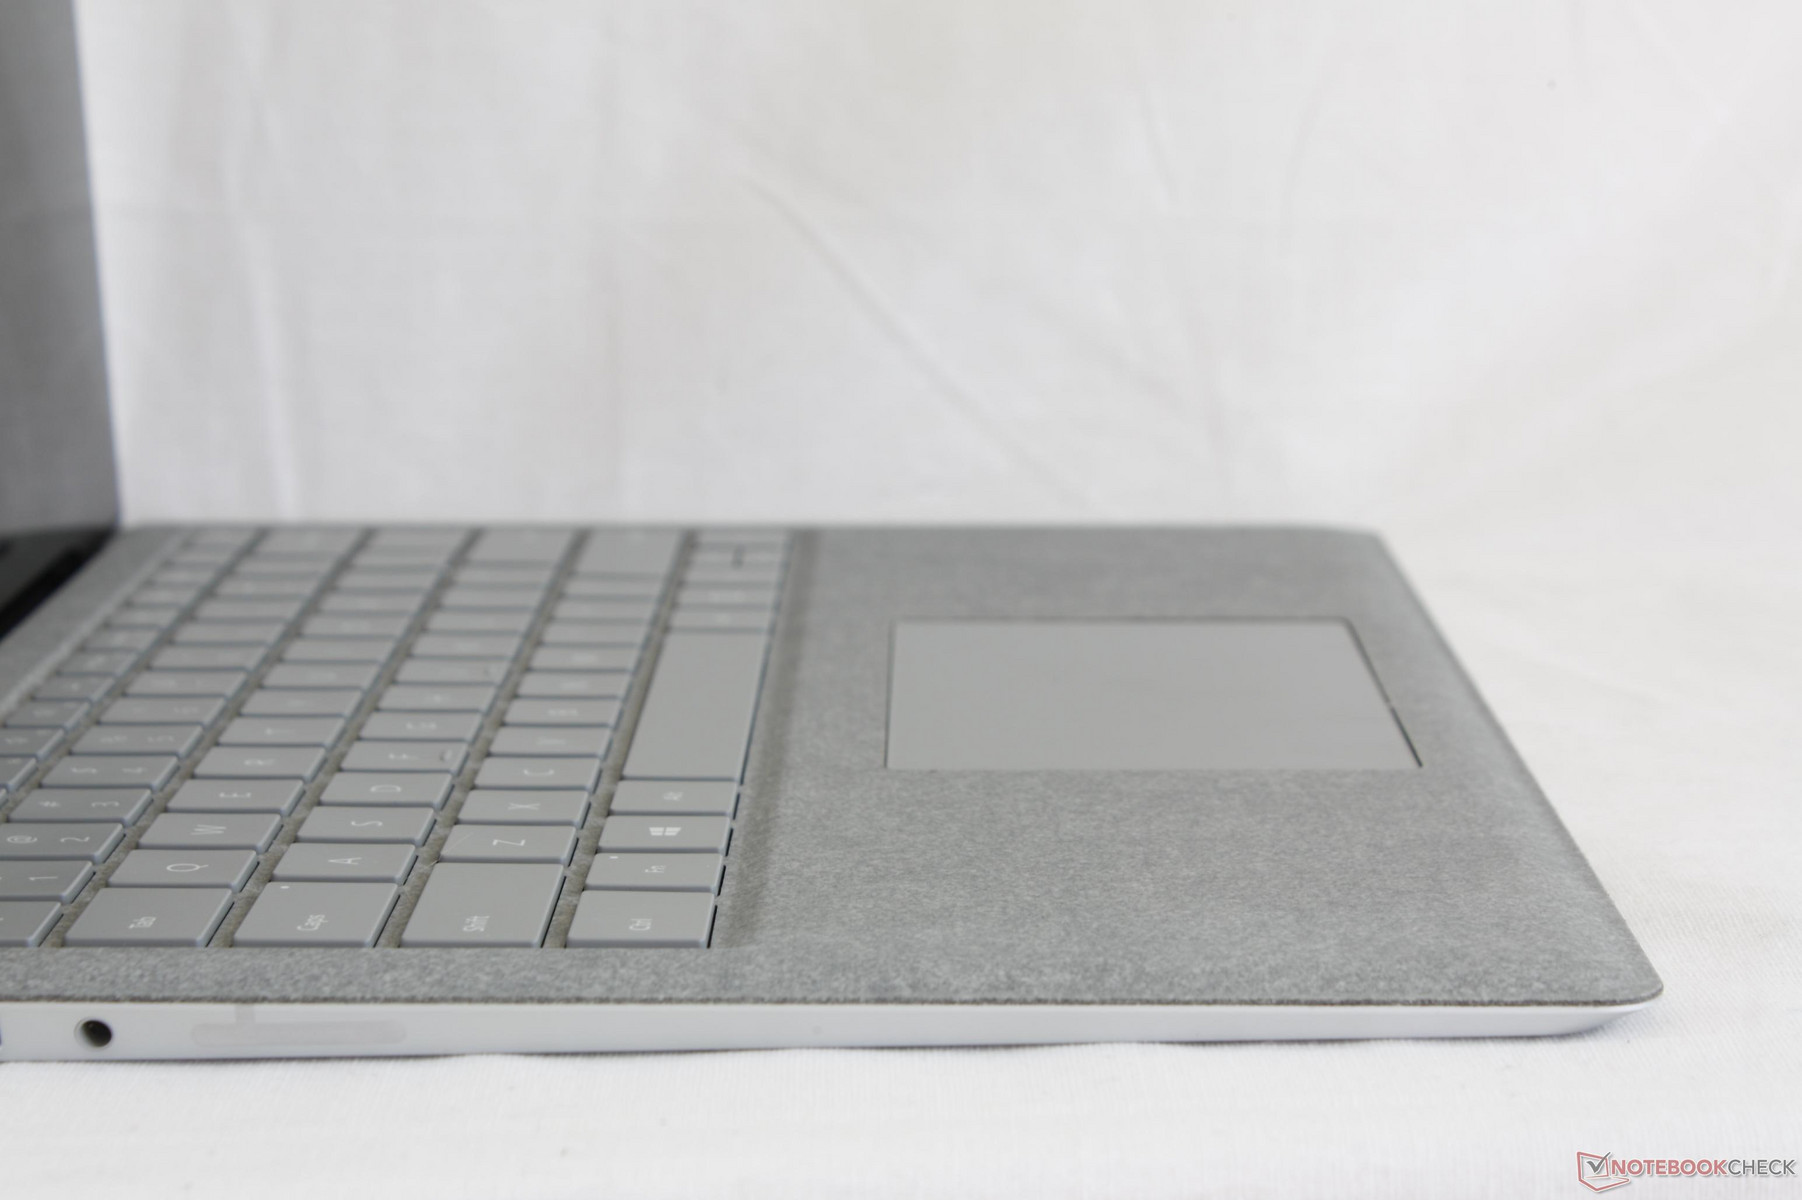
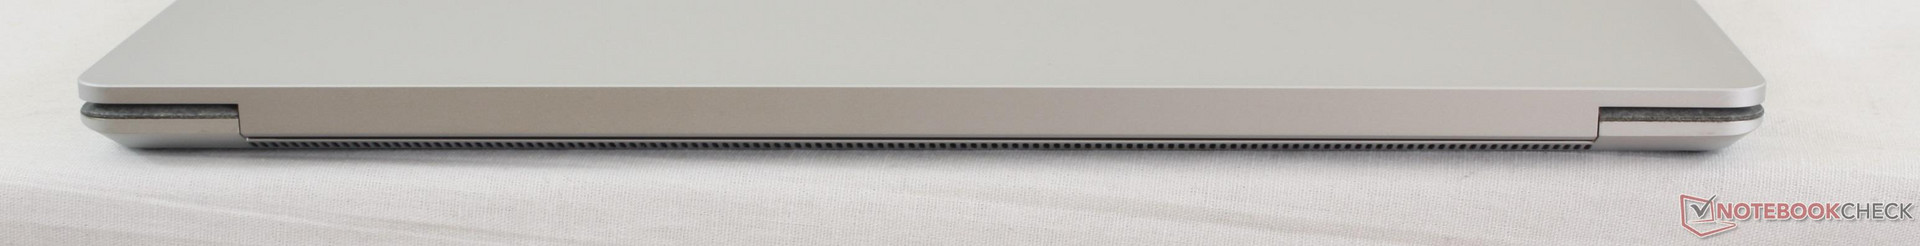
After the design guffaw of the awkward-looking Surface Book, the return to a more traditional style is welcoming. The same dark gray aluminum material from the Surface Pro and Surface Book series makes its return for the lid and bottom of the base. Meanwhile, the Alcantara palm rests from the Surface Pro Signature Type Cover has become standard to visually distinguish the Surface Laptop from competitors. This unique pairing of matte metal and soft synthetic looks luxurious and makes fingerprint build-up almost impossible, though we wouldn't be surprised to see the microfiber alcantara palm rests grow dark and unsightly over time due to the inevitable accumulation of greasy hand sweat.
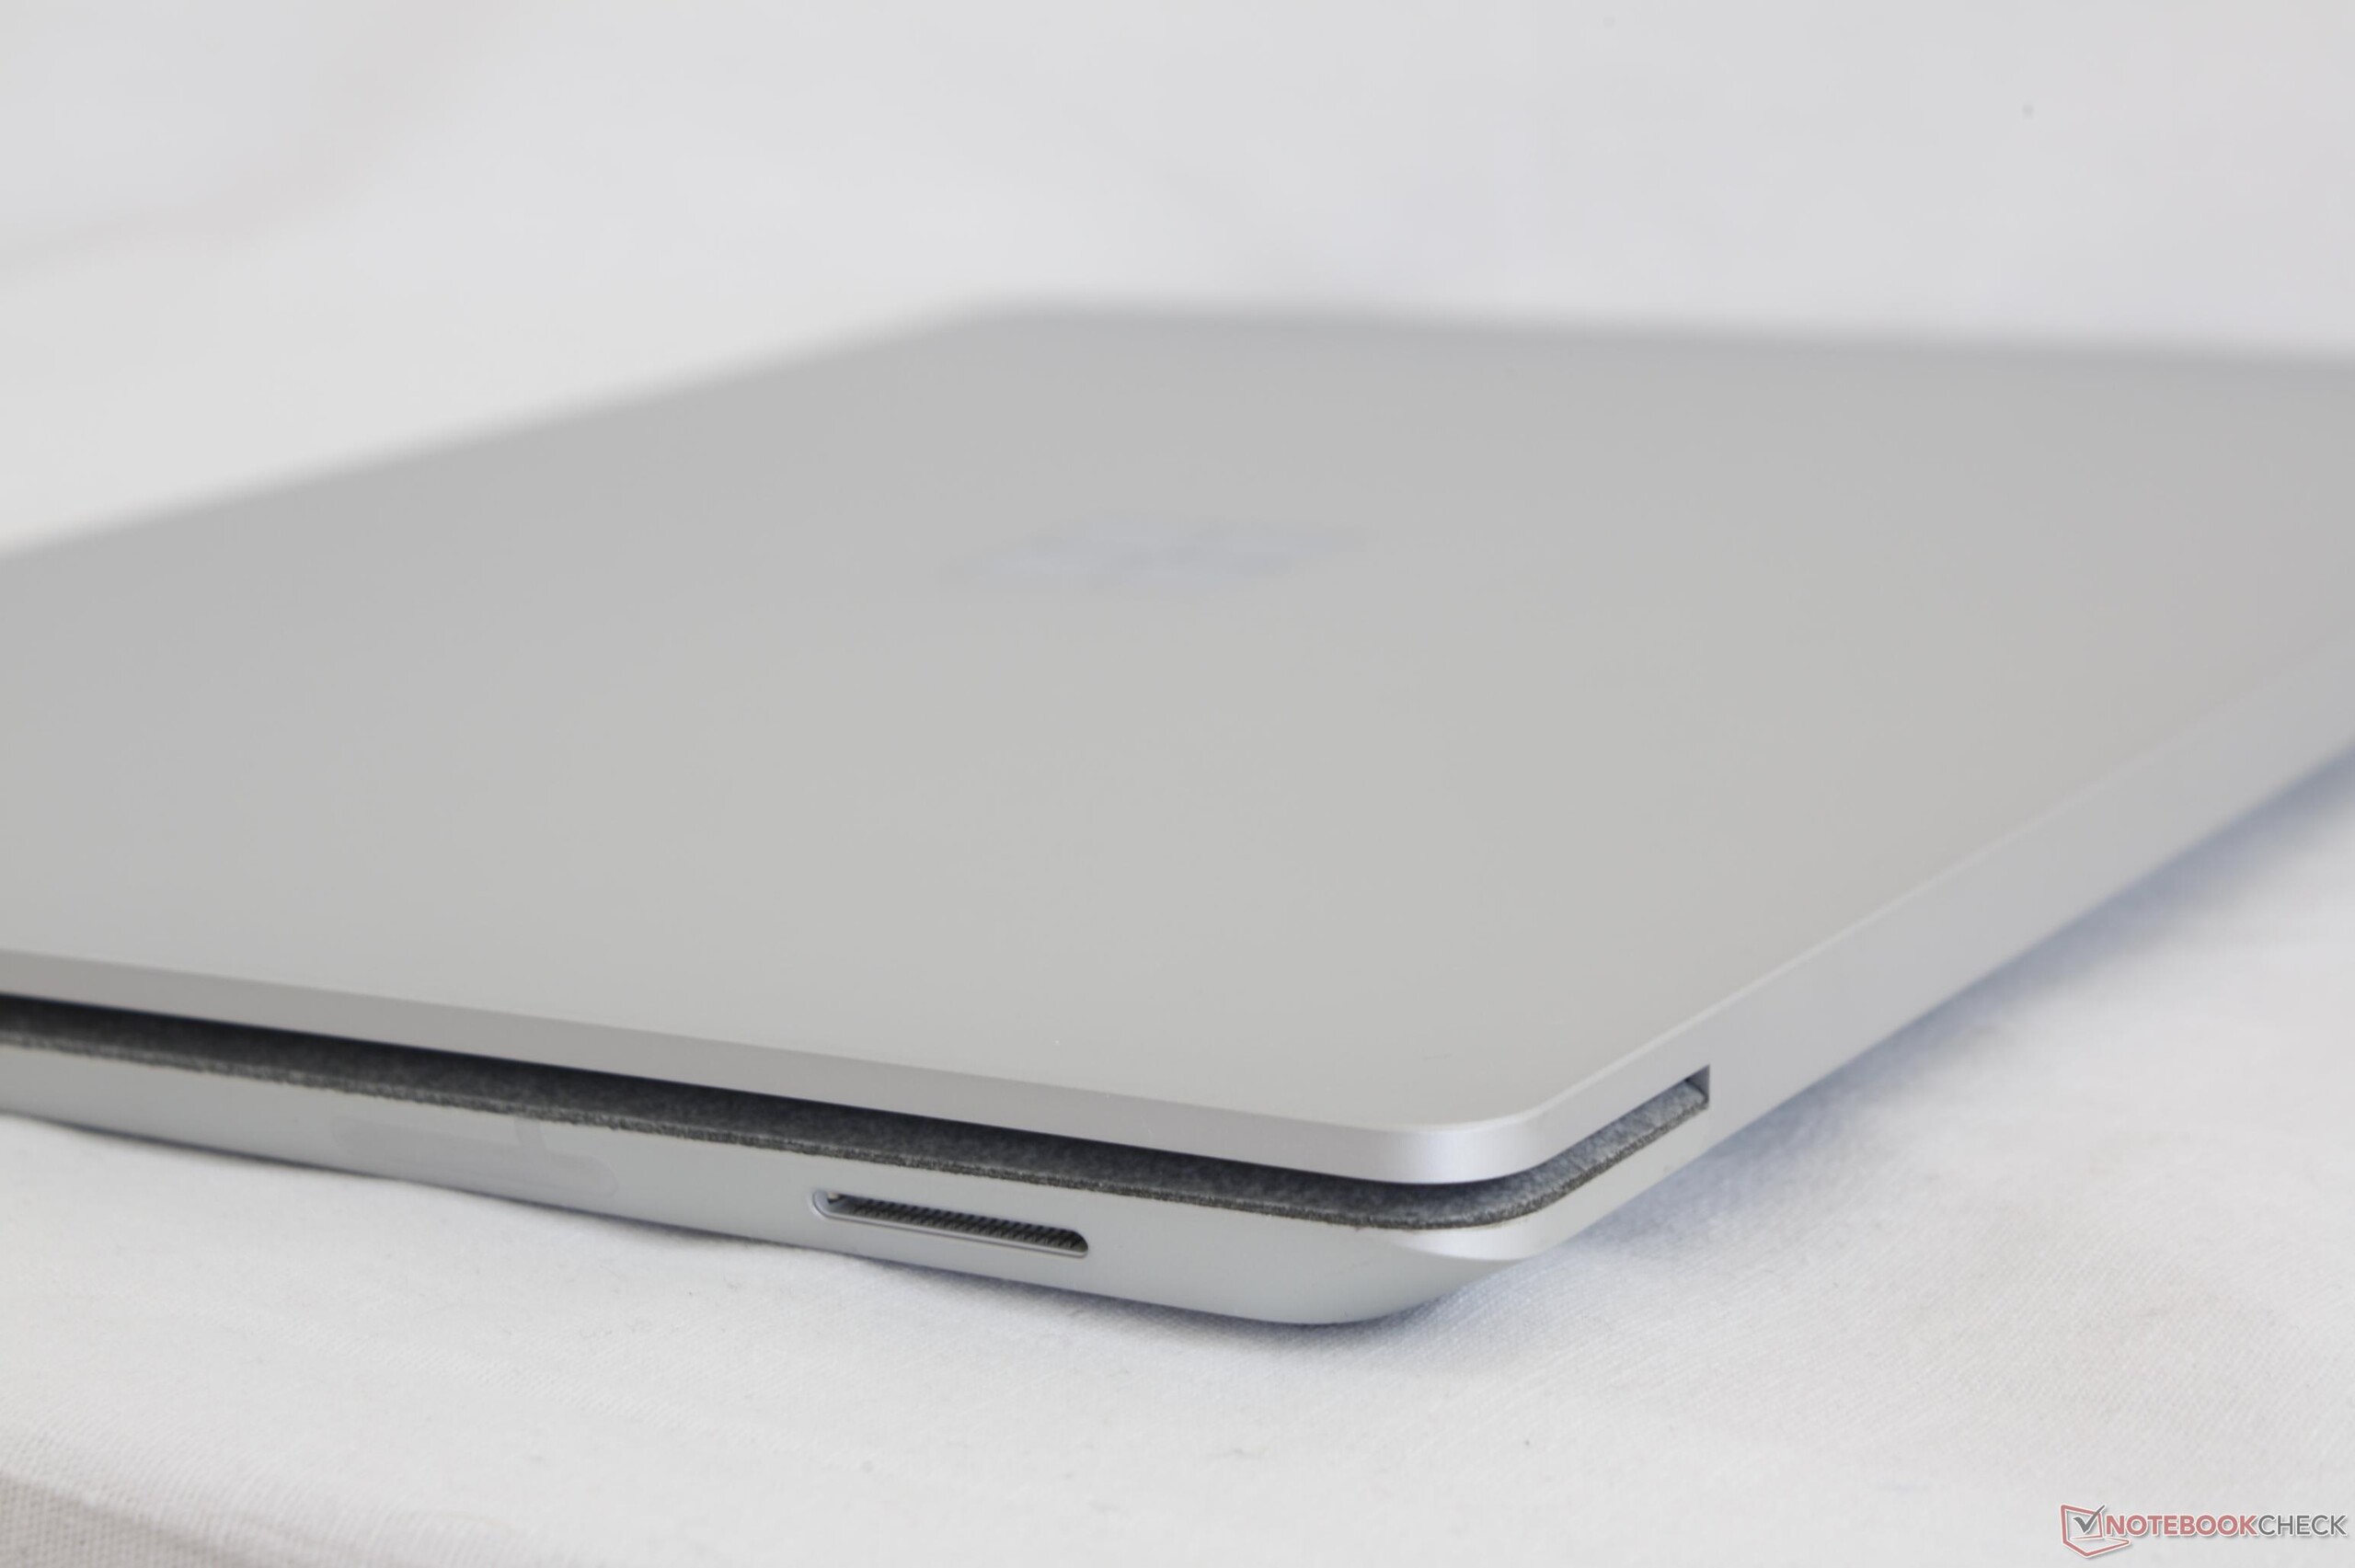
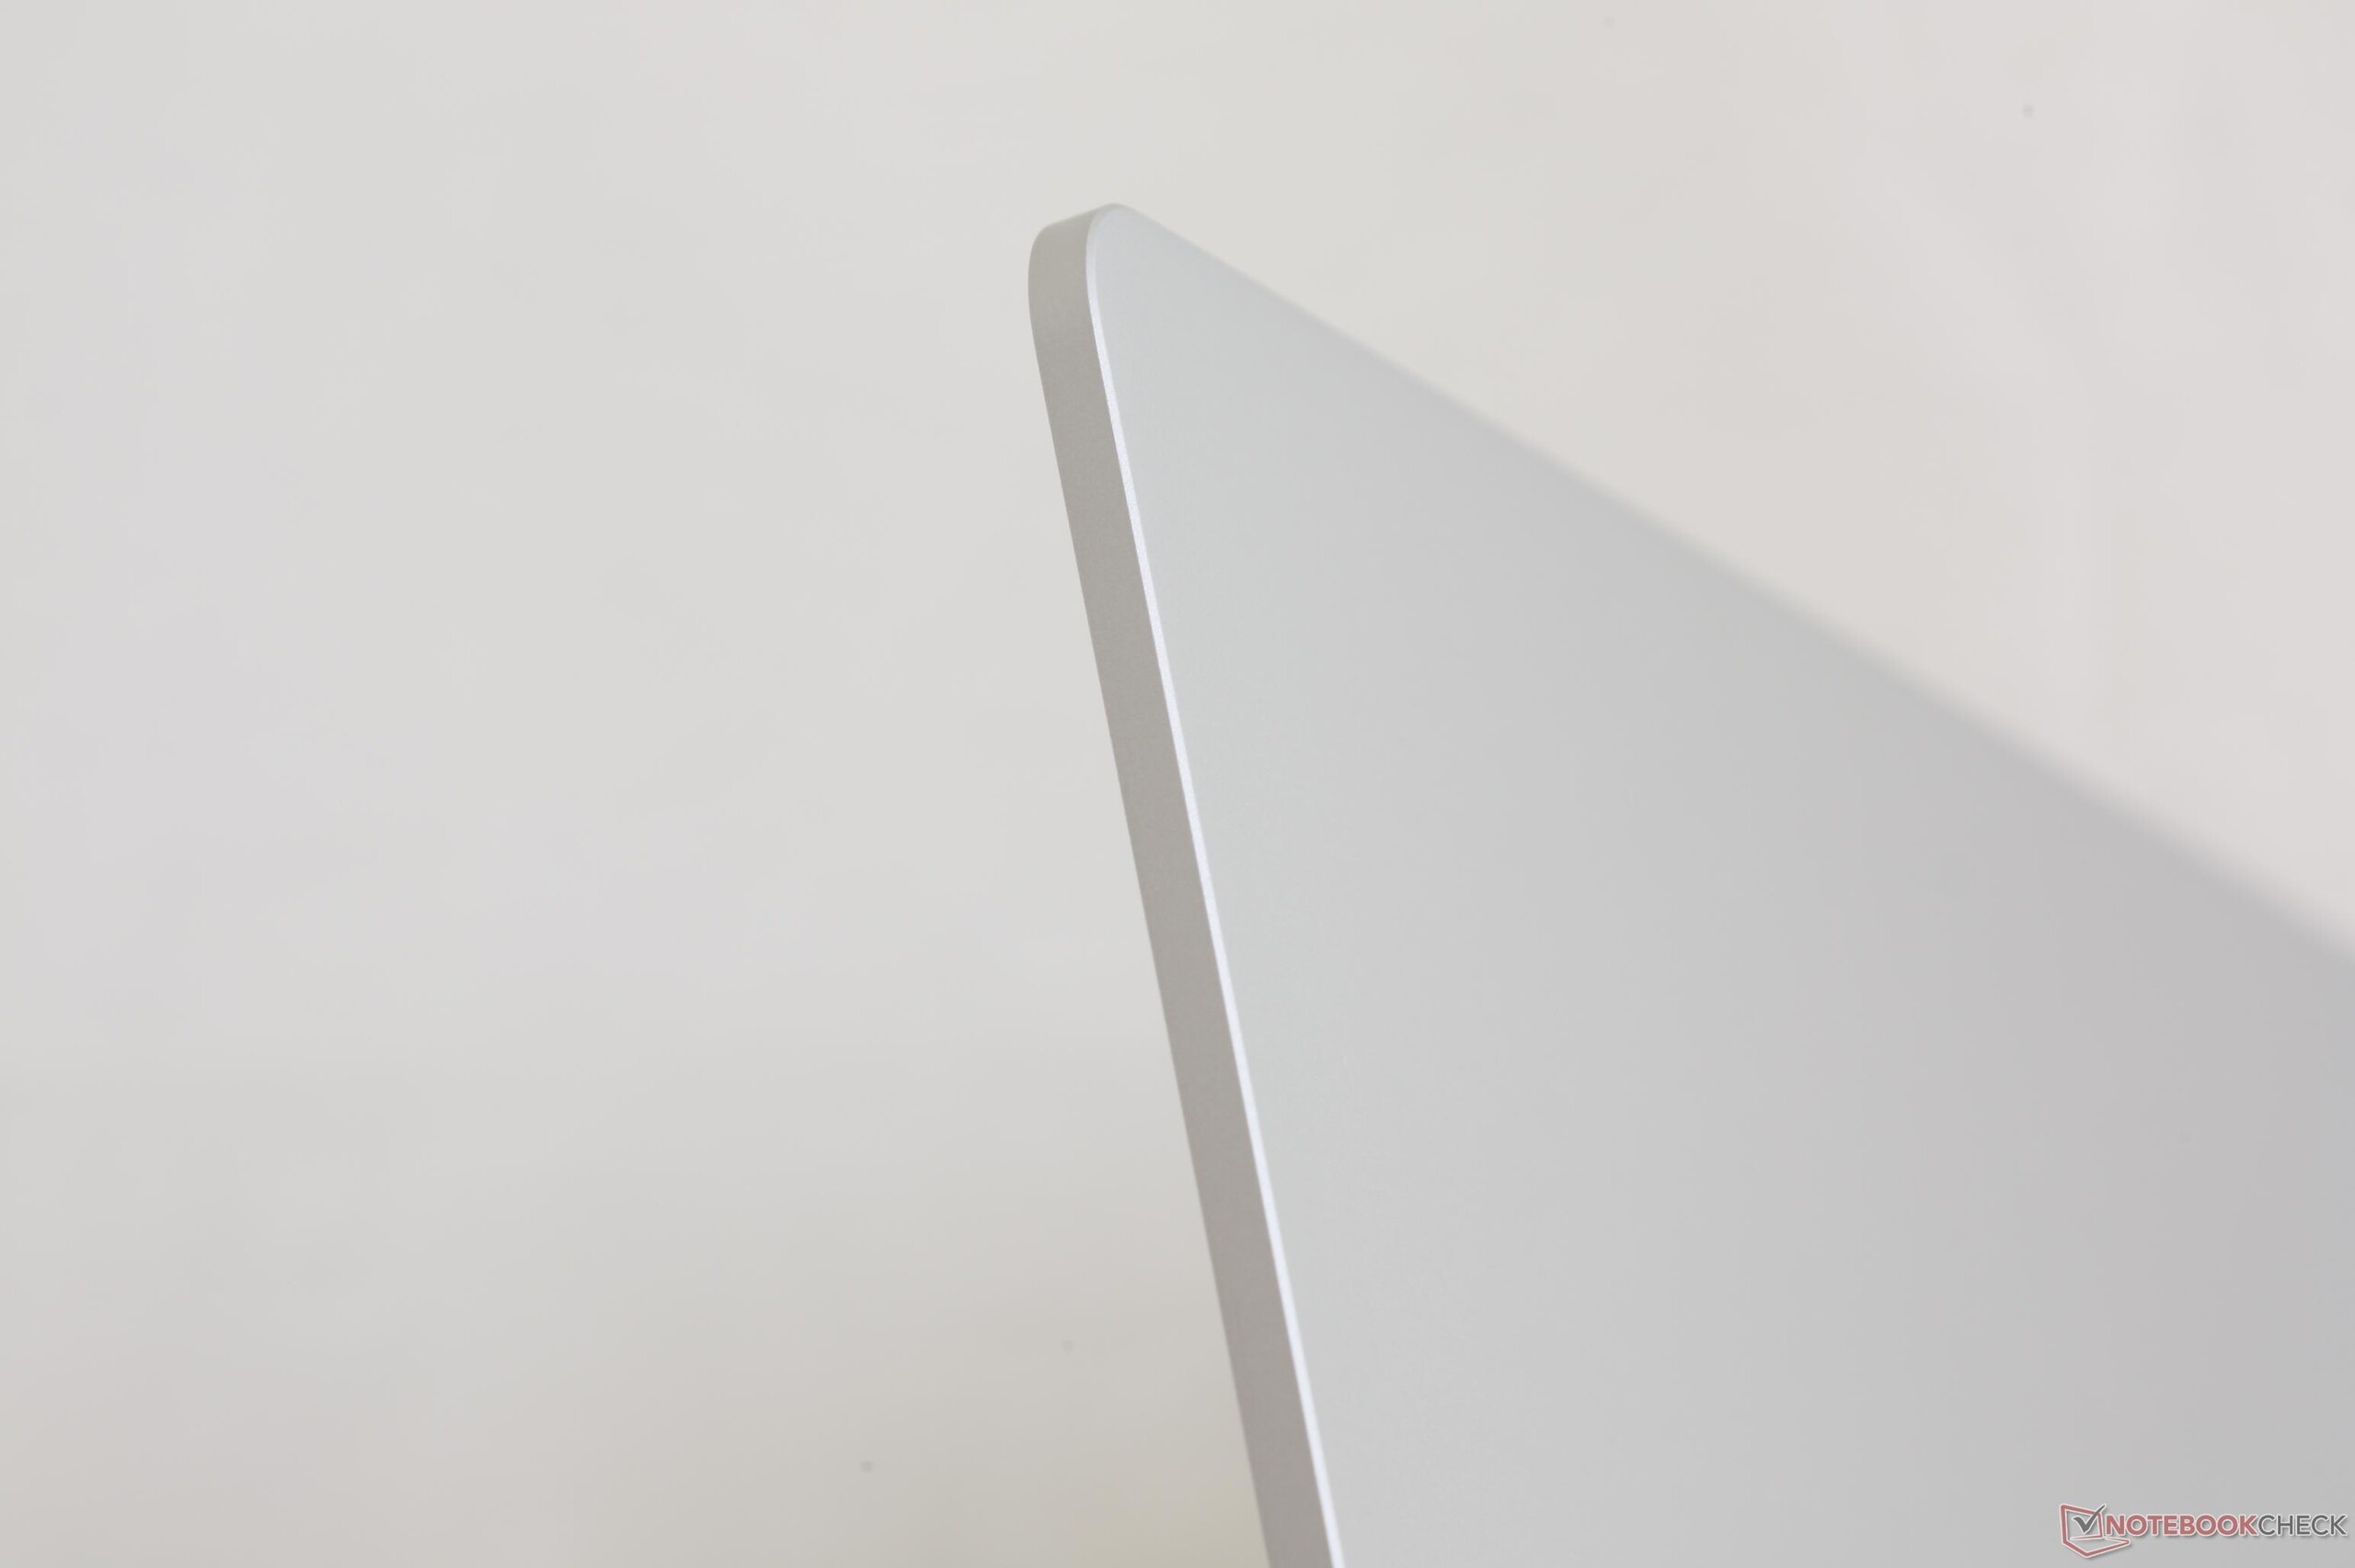
Rigidity is above average for both the base and lid. The lid in particular is reinforced with edge-to-edge Gorilla Glass 3, is thicker than on most Ultrabooks, and doesn't taper from tip to tip for better resistance to bending when compared to something more fragile like the Notebook 9 or Yoga 910. The base is also fairly strong and exhibits almost no creaking when attempting to twist its sides. It's not perfect, however, as the center of the keyboard will still visibly depress if applying pressure with a finger. Overall build quality is nonetheless excellent and reflective of the high standards that the Surface family represents. If we are to have one superficial complaint, it's that the dark strips on the left and right edges for wireless reception deter slightly from the smooth metal surfaces.
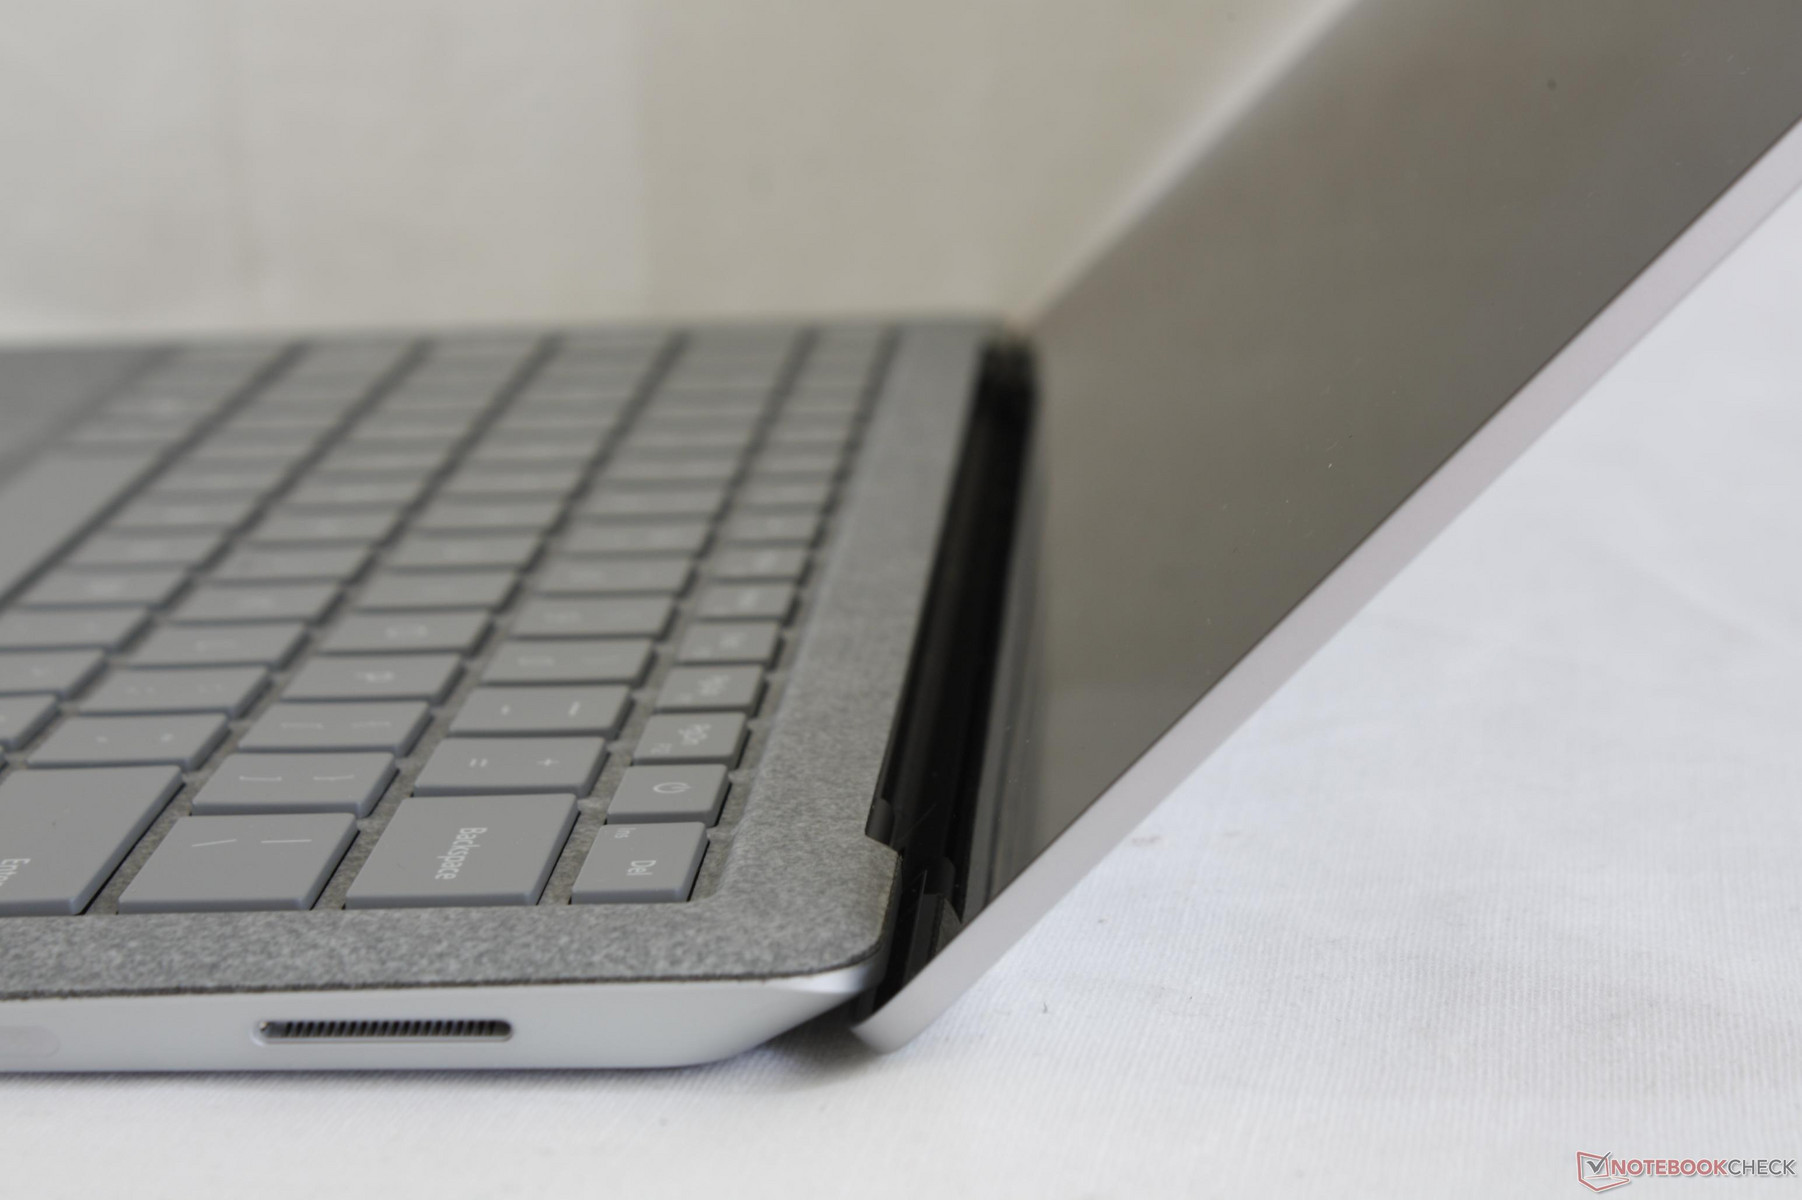
The small hinges are sufficiently taut for minimal wobbling when typing. The maximum angle of 140 degrees is a bit on the low side and tautness starts to weaken once the hinges move pass 120 degrees. Despite this, the system is definitely more balanced and ergonomic than the top-heavy Surface Book or docked Surface Pro 4.
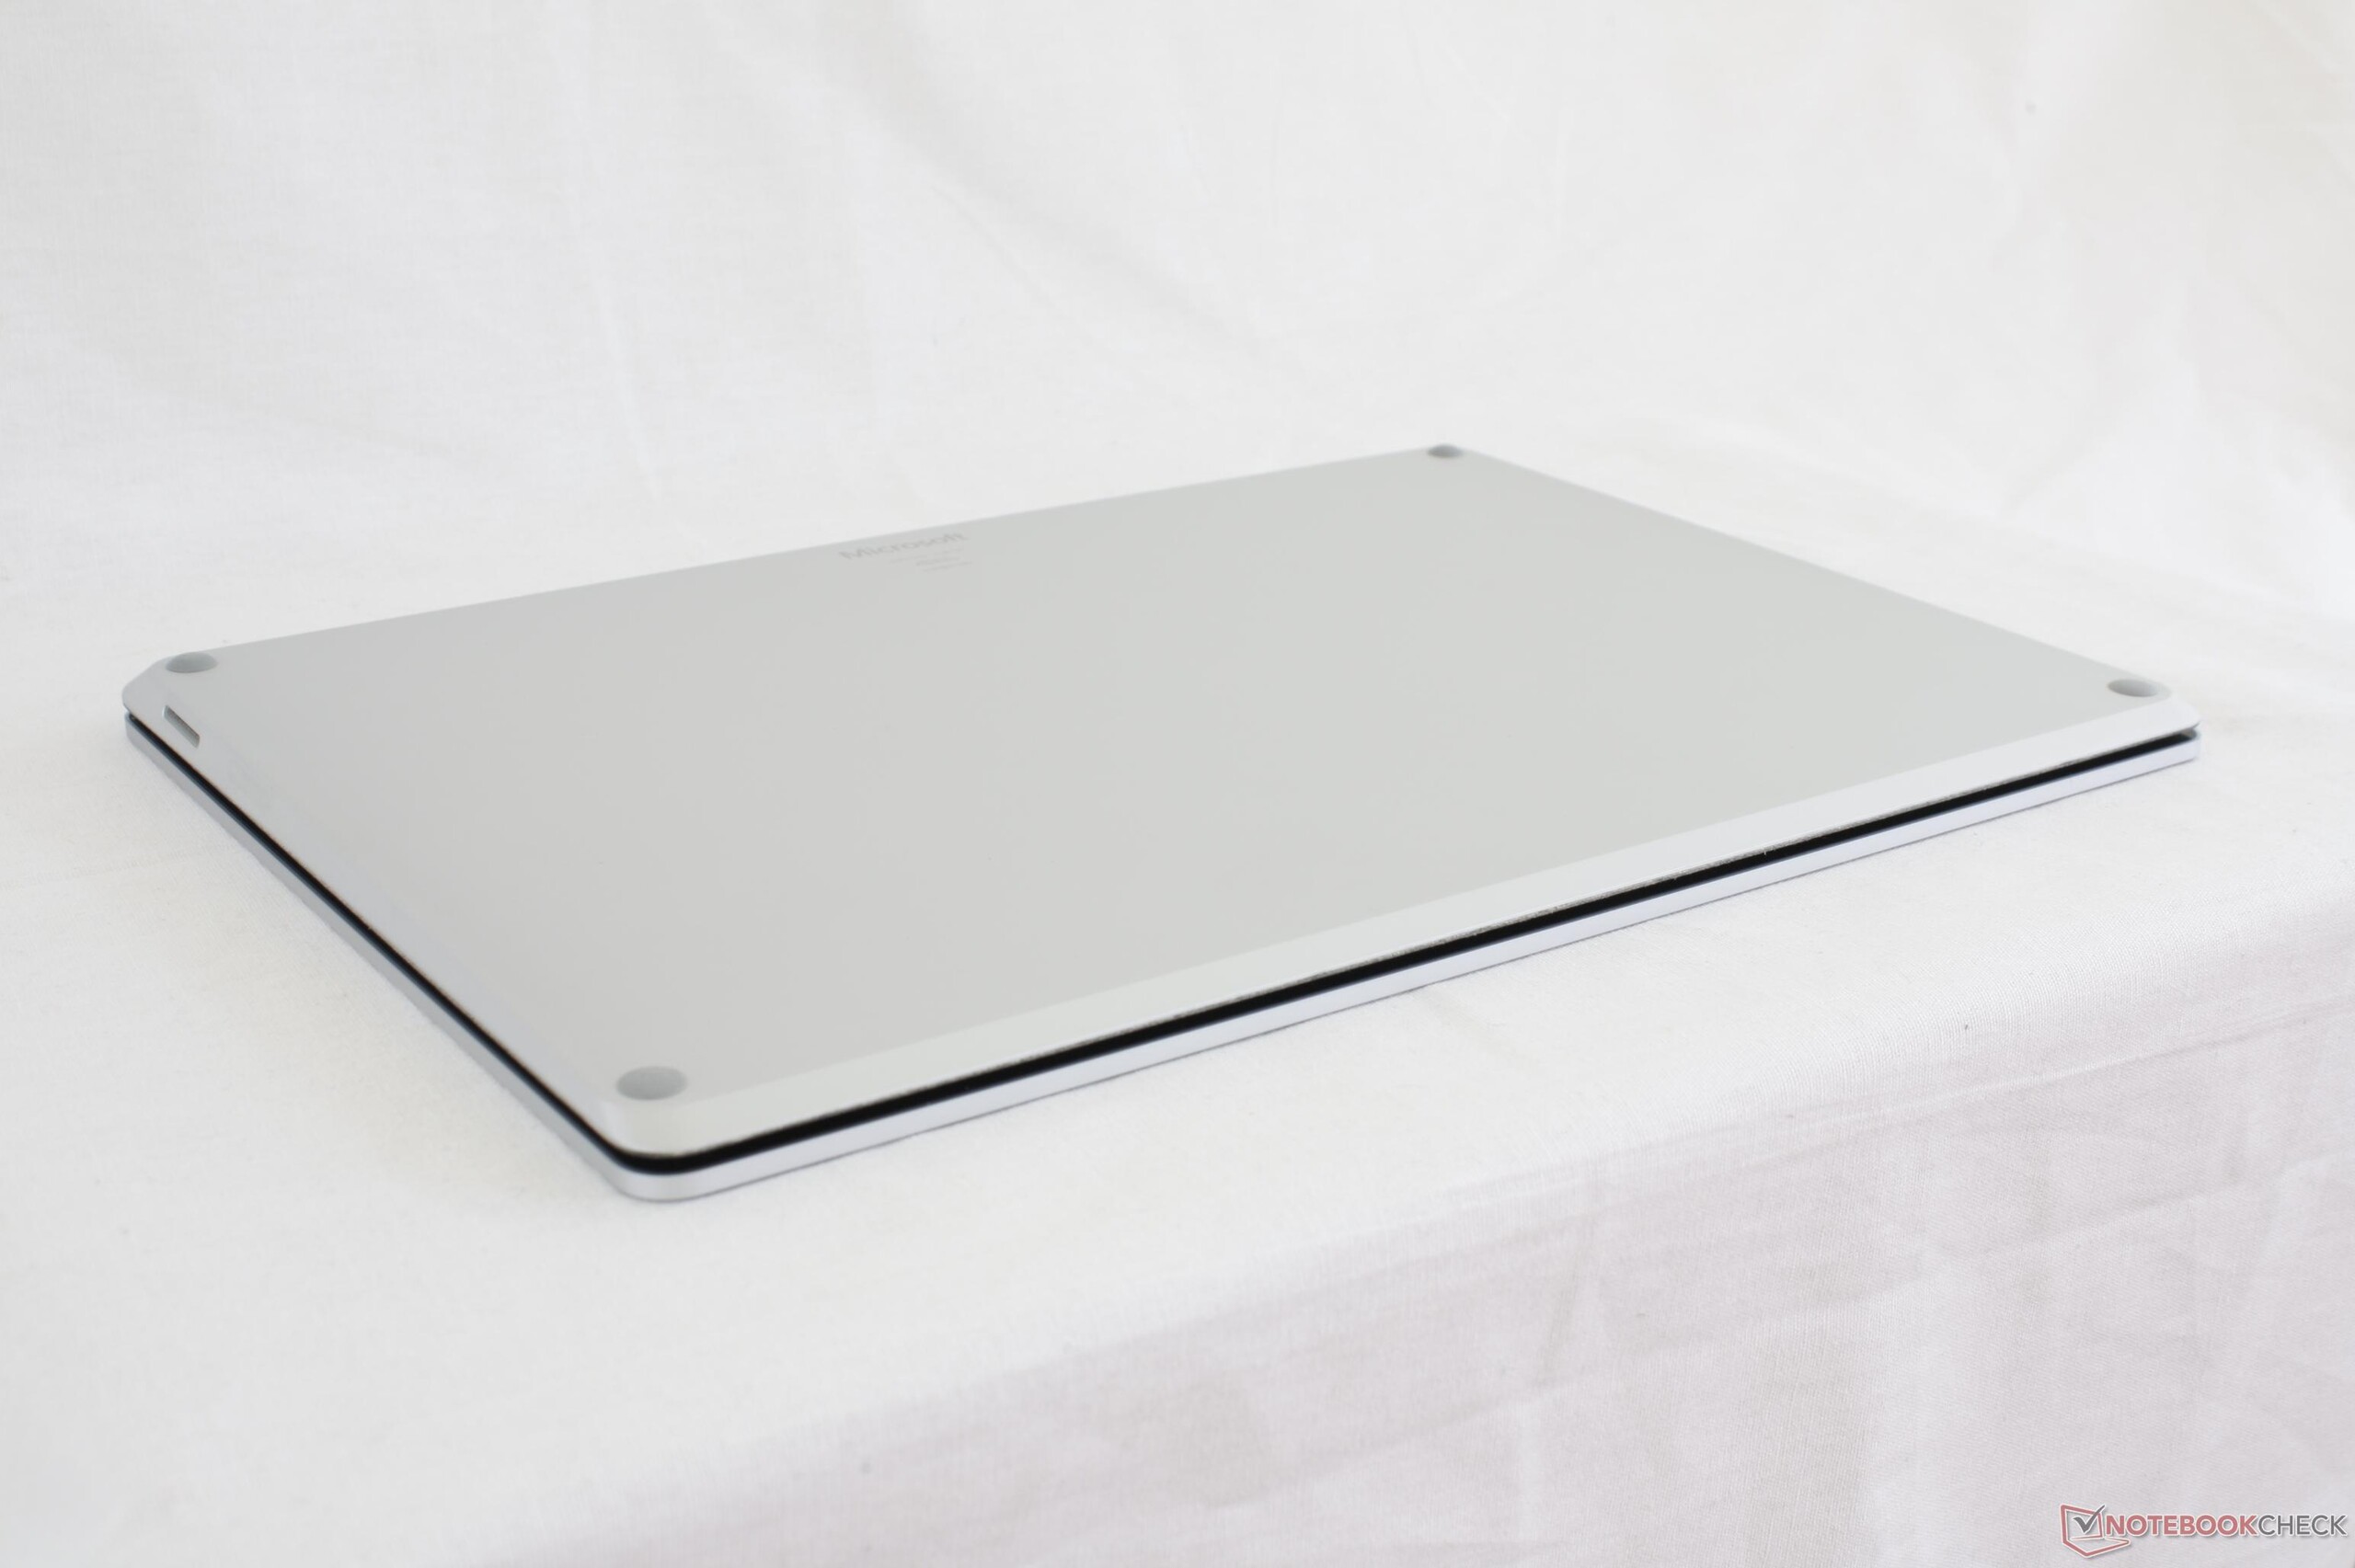


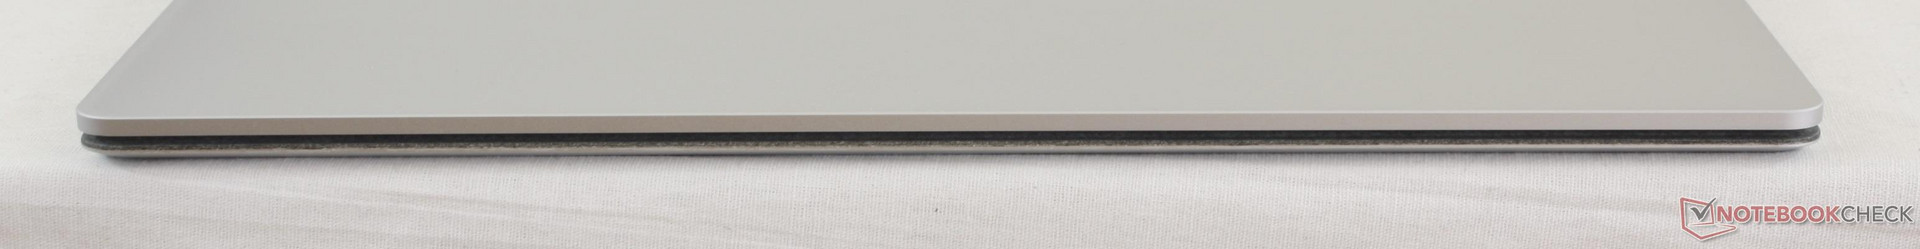
The chassis is relatively dense and lightweight being only about 100 g heavier than the Core i5/i7 Surface Pro 4 and 100 g lighter than the MacBook Pro 13 2017. While its footprint is nearly the same as the Surface Book, the Surface Laptop is significantly thinner since it ditches the unsightly gap. Most 14-inch Ultrabooks are slightly heavier than the Microsoft notebook with the super-light AsusPro B9440 being the notable exception.
It's worth noting that the Core i7 SKU actually weighs 30 g more than the Core i5 configuration likely due to some internal changes to better accommodate the faster processor.

Connectivity
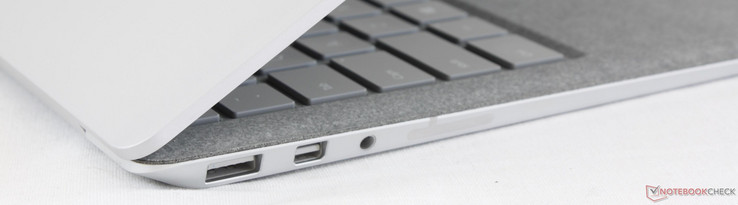
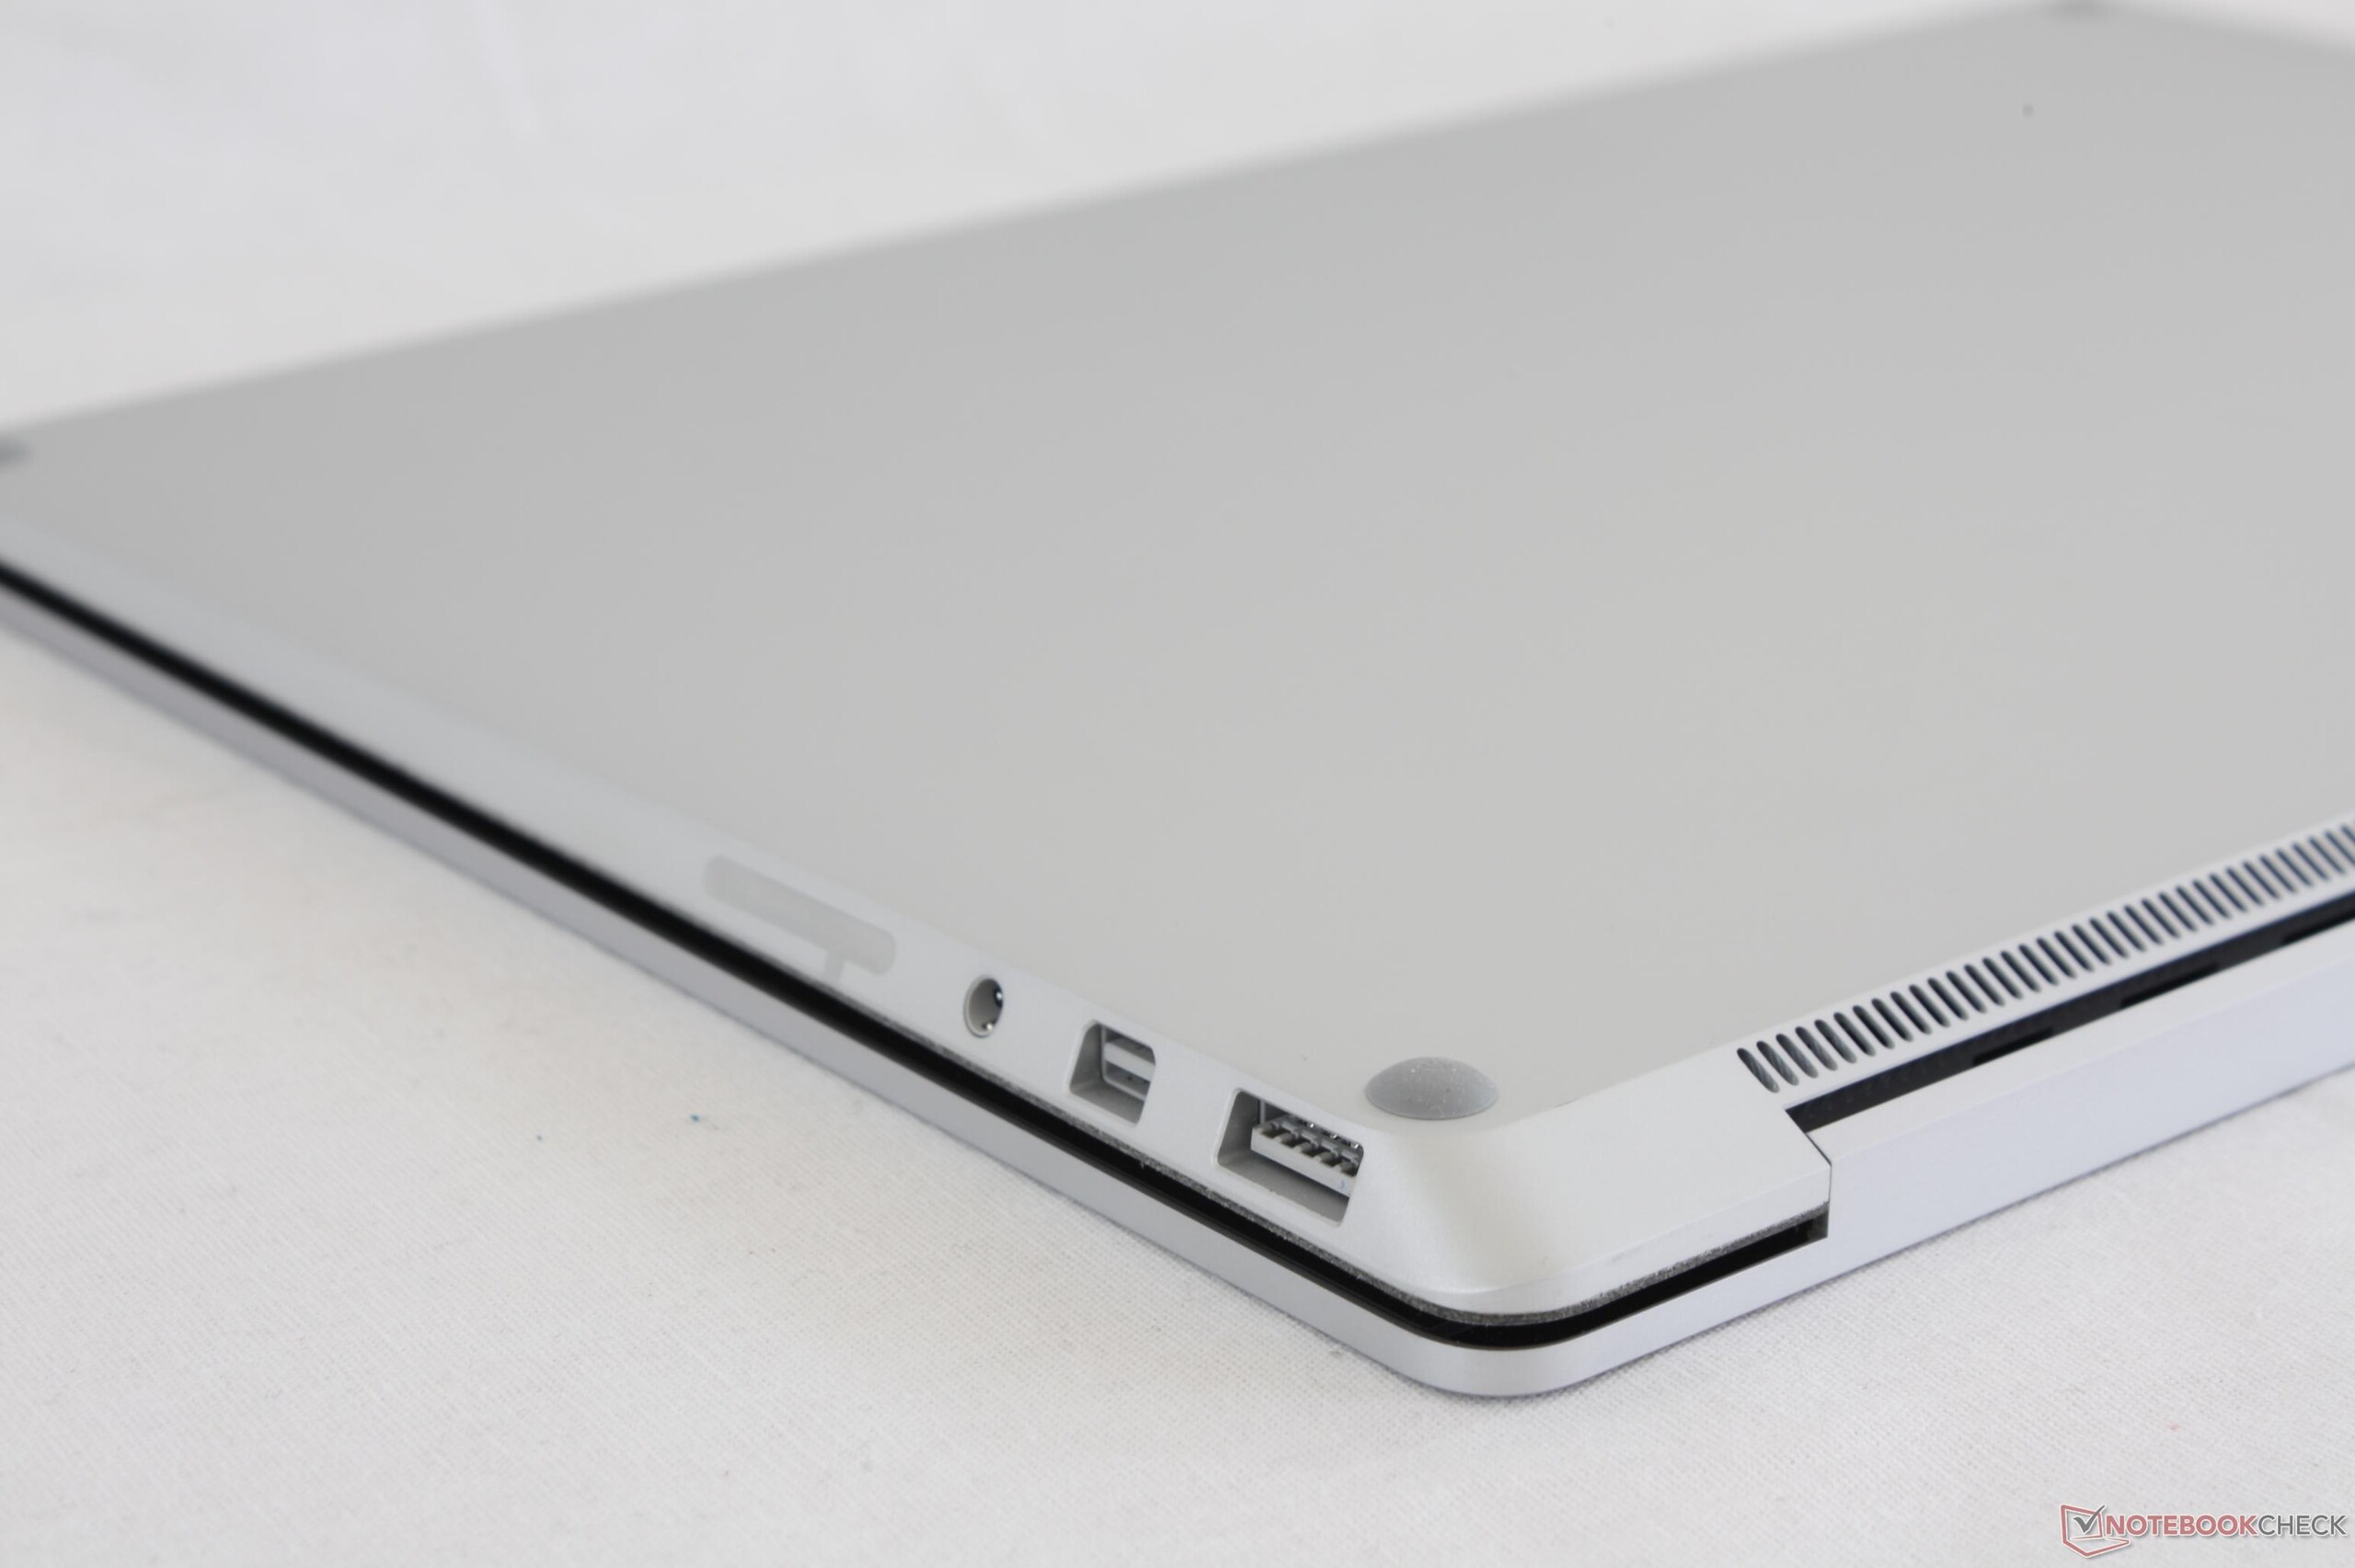
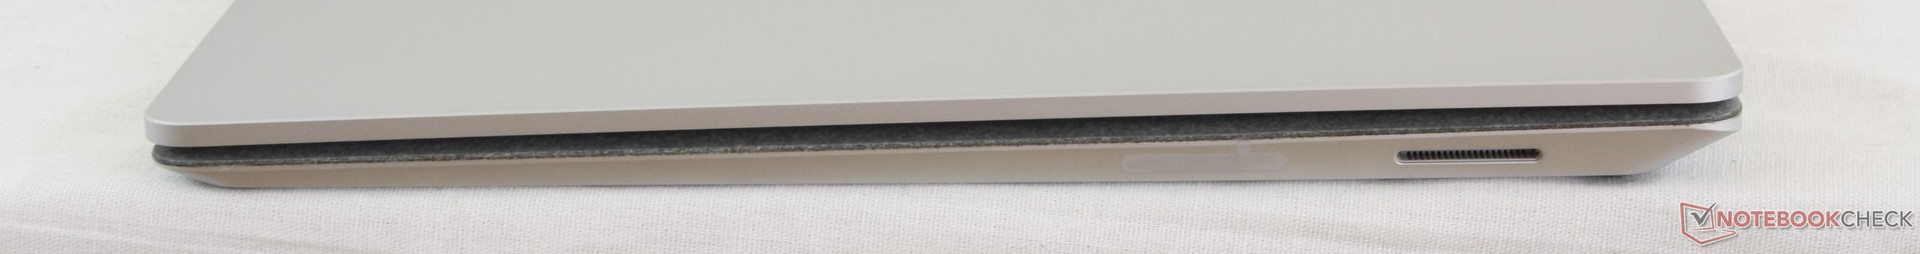
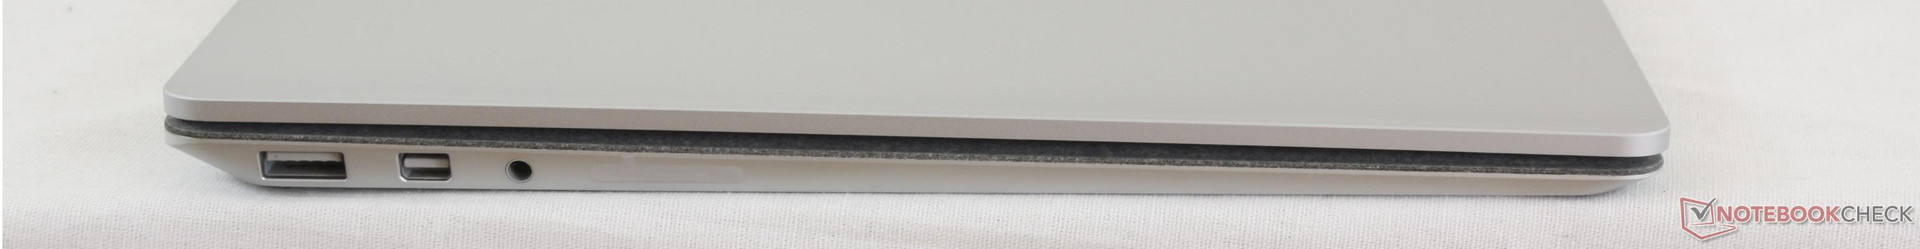
The selection of ports is downright embarrassing for a Windows notebook. There is no Thunderbolt 3 or even a basic USB Type-C port that most newer tablets and Ultrabooks now carry as standard. The lack of a proper SD reader is also disheartening as systems like the ThinkPad X1 Tablet 2, Samsung Notebook 9, and Microsoft's own Surface Pro 4 have managed to at least integrate a MicroSD slot. Even most smartphones come equipped with SIM slots, MicroSD readers, and USB Type-C ports - none of which are present on the Surface Laptop. To Microsoft's credit, the ports here are at least easy to reach and not poorly positioned like the irksome audio port on the top of the lid of the Surface Book.
The same SurfaceConnect port from the Surface Pro 4 and Surface Book series is back for compatibility with the Surface Dock. Whether or not this makes up for the lack of Thunderbolt 3 will depend on the demands of the user.
Communication
Microsoft is sourcing Marvell once again for its Avastar WLAN and Bluetooth 4.0 module. We experienced no connectivity or dropout issues when connected to an 802.11ac network. A real-world test standing one meter away from a Linksys EA8500 test router returns an average transfer rate of 556 Mbps.
No WAN or GPS options are available yet on this series.
| Networking | |
| iperf3 transmit AX12 | |
| Microsoft Surface Book with Performance Base | |
| Dell XPS 13 9360 FHD i5 | |
| Microsoft Surface Laptop i5 | |
| iperf3 receive AX12 | |
| Microsoft Surface Laptop i5 | |
| Dell XPS 13 9360 FHD i5 | |
| Microsoft Surface Book with Performance Base | |
Accessories
There are sadly no included extras in the box outside of the standard safety and Quick Start cards. Adapters such as mDP-to-HDMI or USB-to-Ethernet or even a cleaning cloth would have been appreciated additions. The Surface Pro 4, for example, ships with the useful Surface Pen. Optional Surface-specific accessories include the Arc Mouse, the aforementioned Surface Dock, and the Surface Dial for artists.
Maintenance
The Surface family is notorious for its user-unfriendly serviceability. Consumer electronics repair site iFixit has been rating Surface devices with extremely low repairability scores due to the overuse of glues instead of screws and the Surface Laptop is no different.
Warranty
The standard one-year limited warranty applies if purchased directly from Microsoft.com. Best Buy is an official partner with Microsoft and offers extended warranty options if purchased through the store instead. Please see our Guarantees, Return policies and Warranties FAQ for country-specific information.
Input Devices
Keyboard
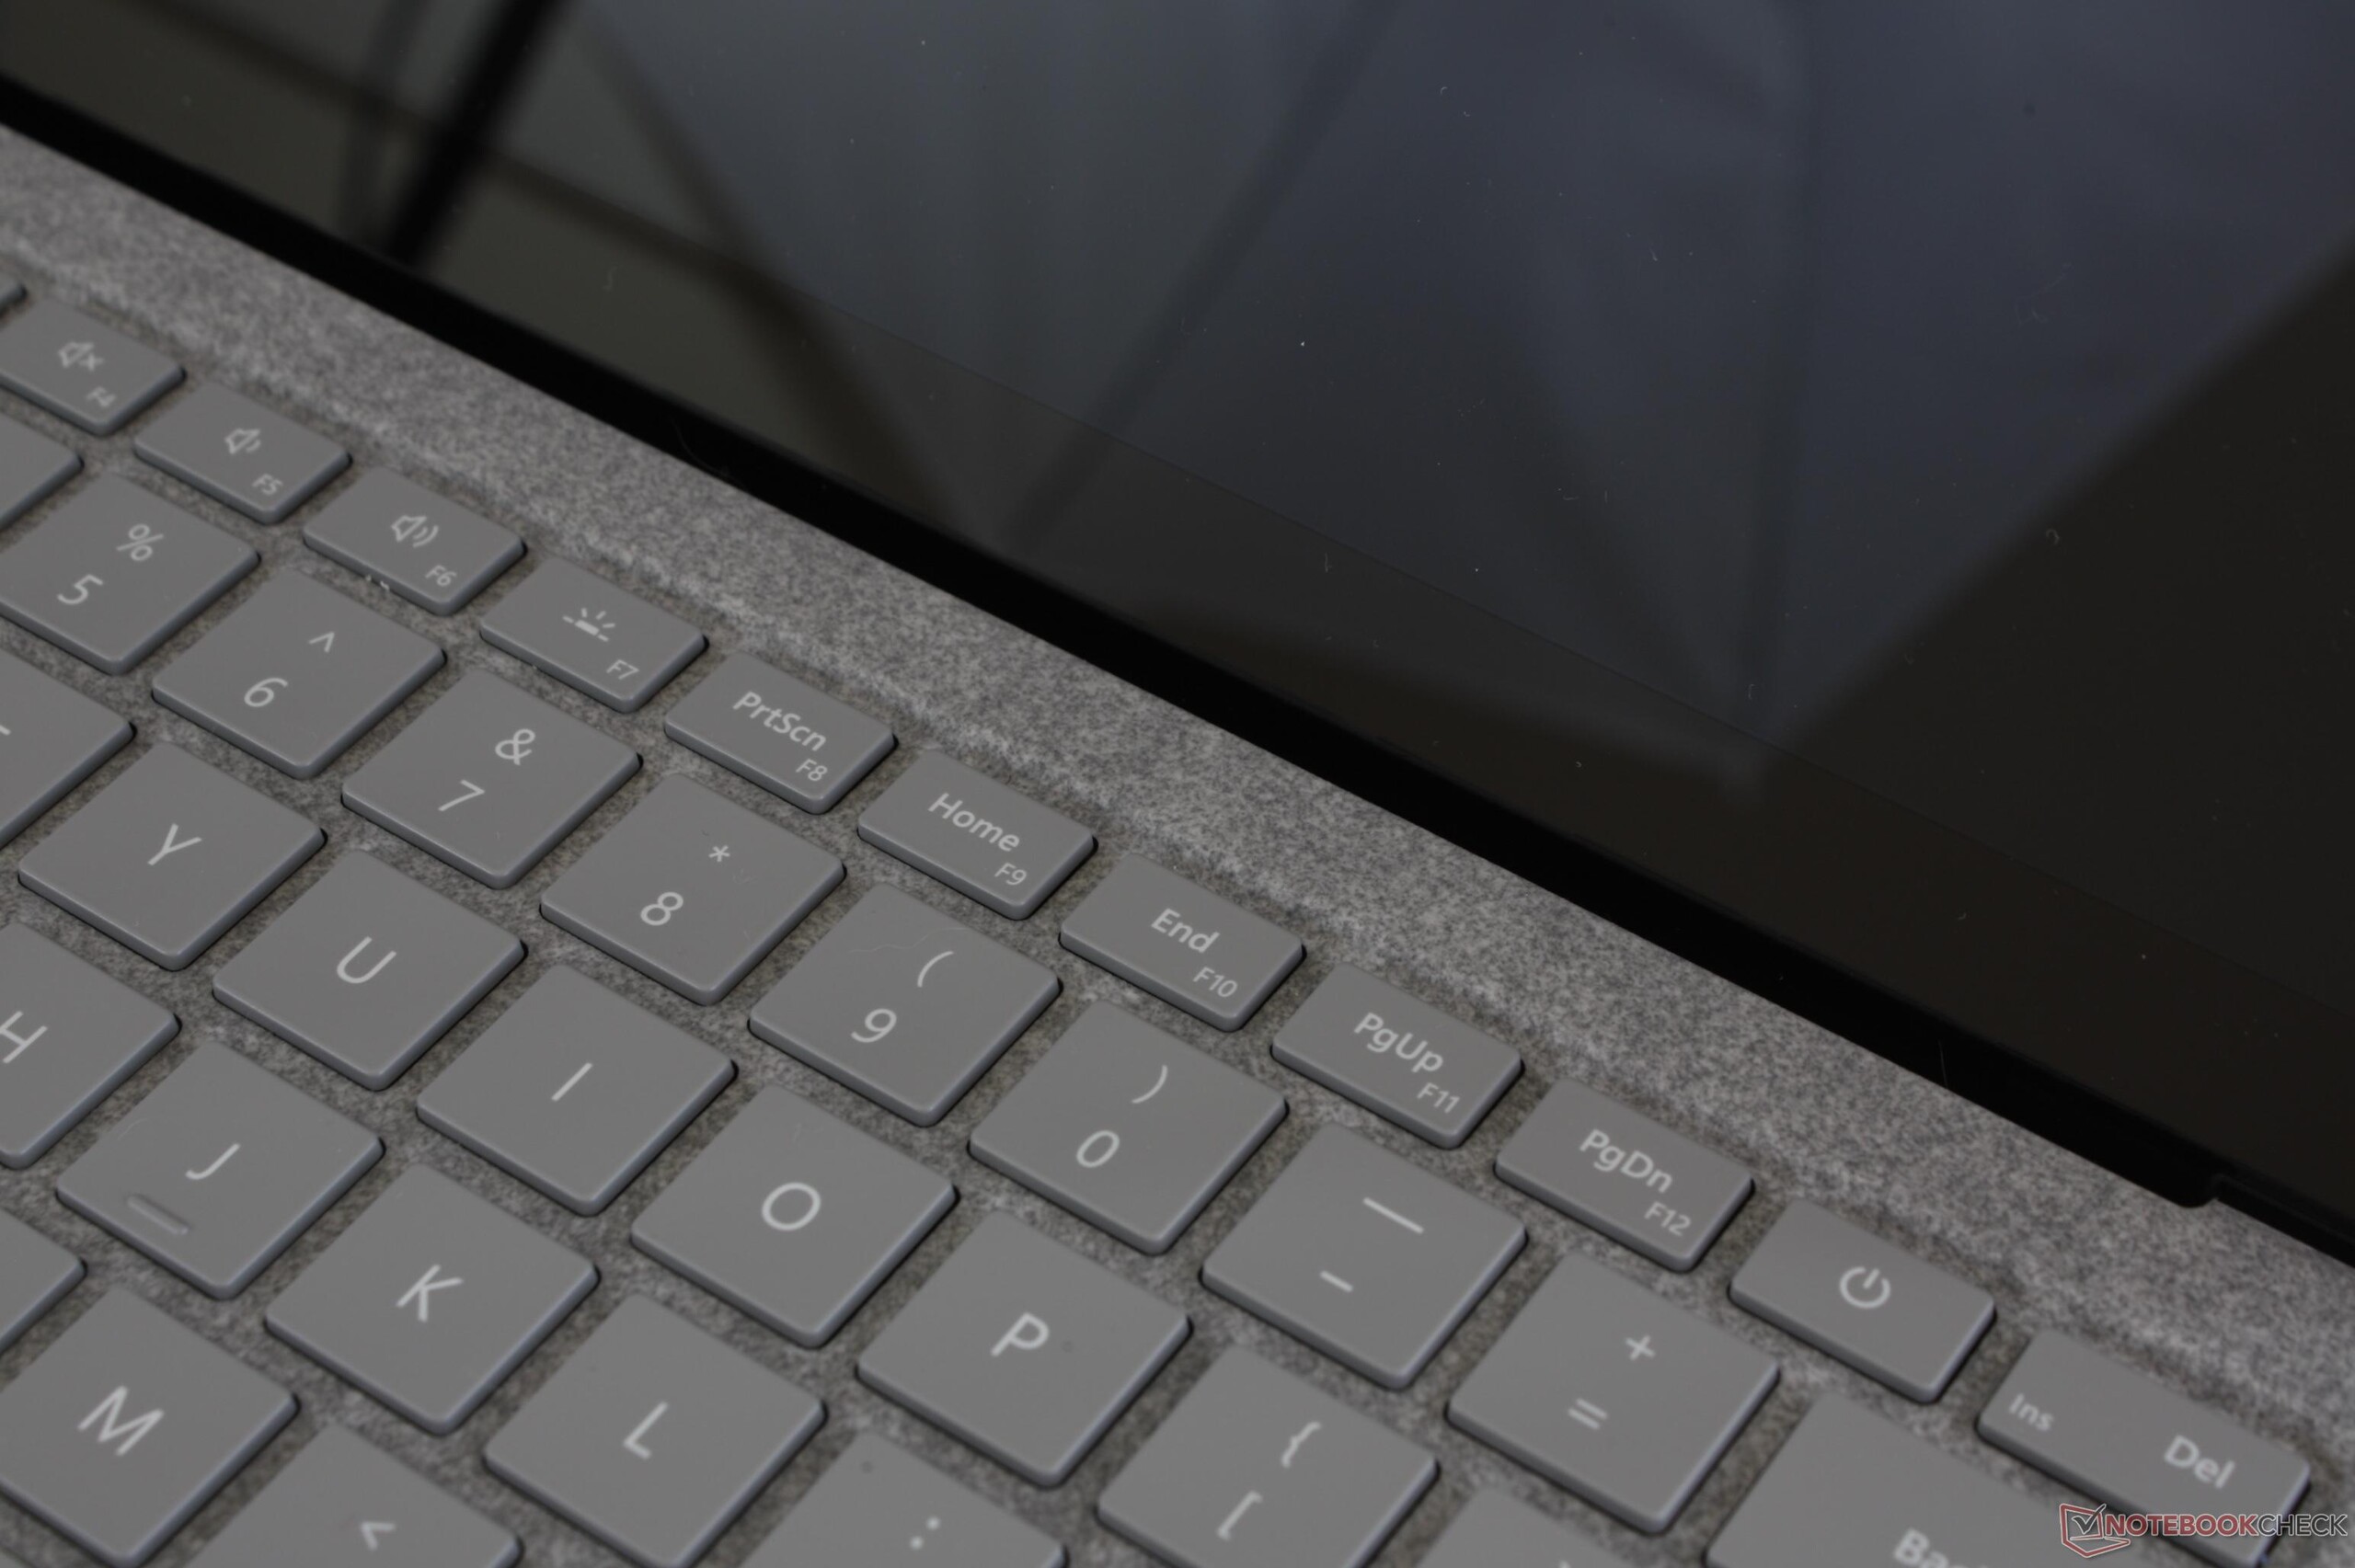
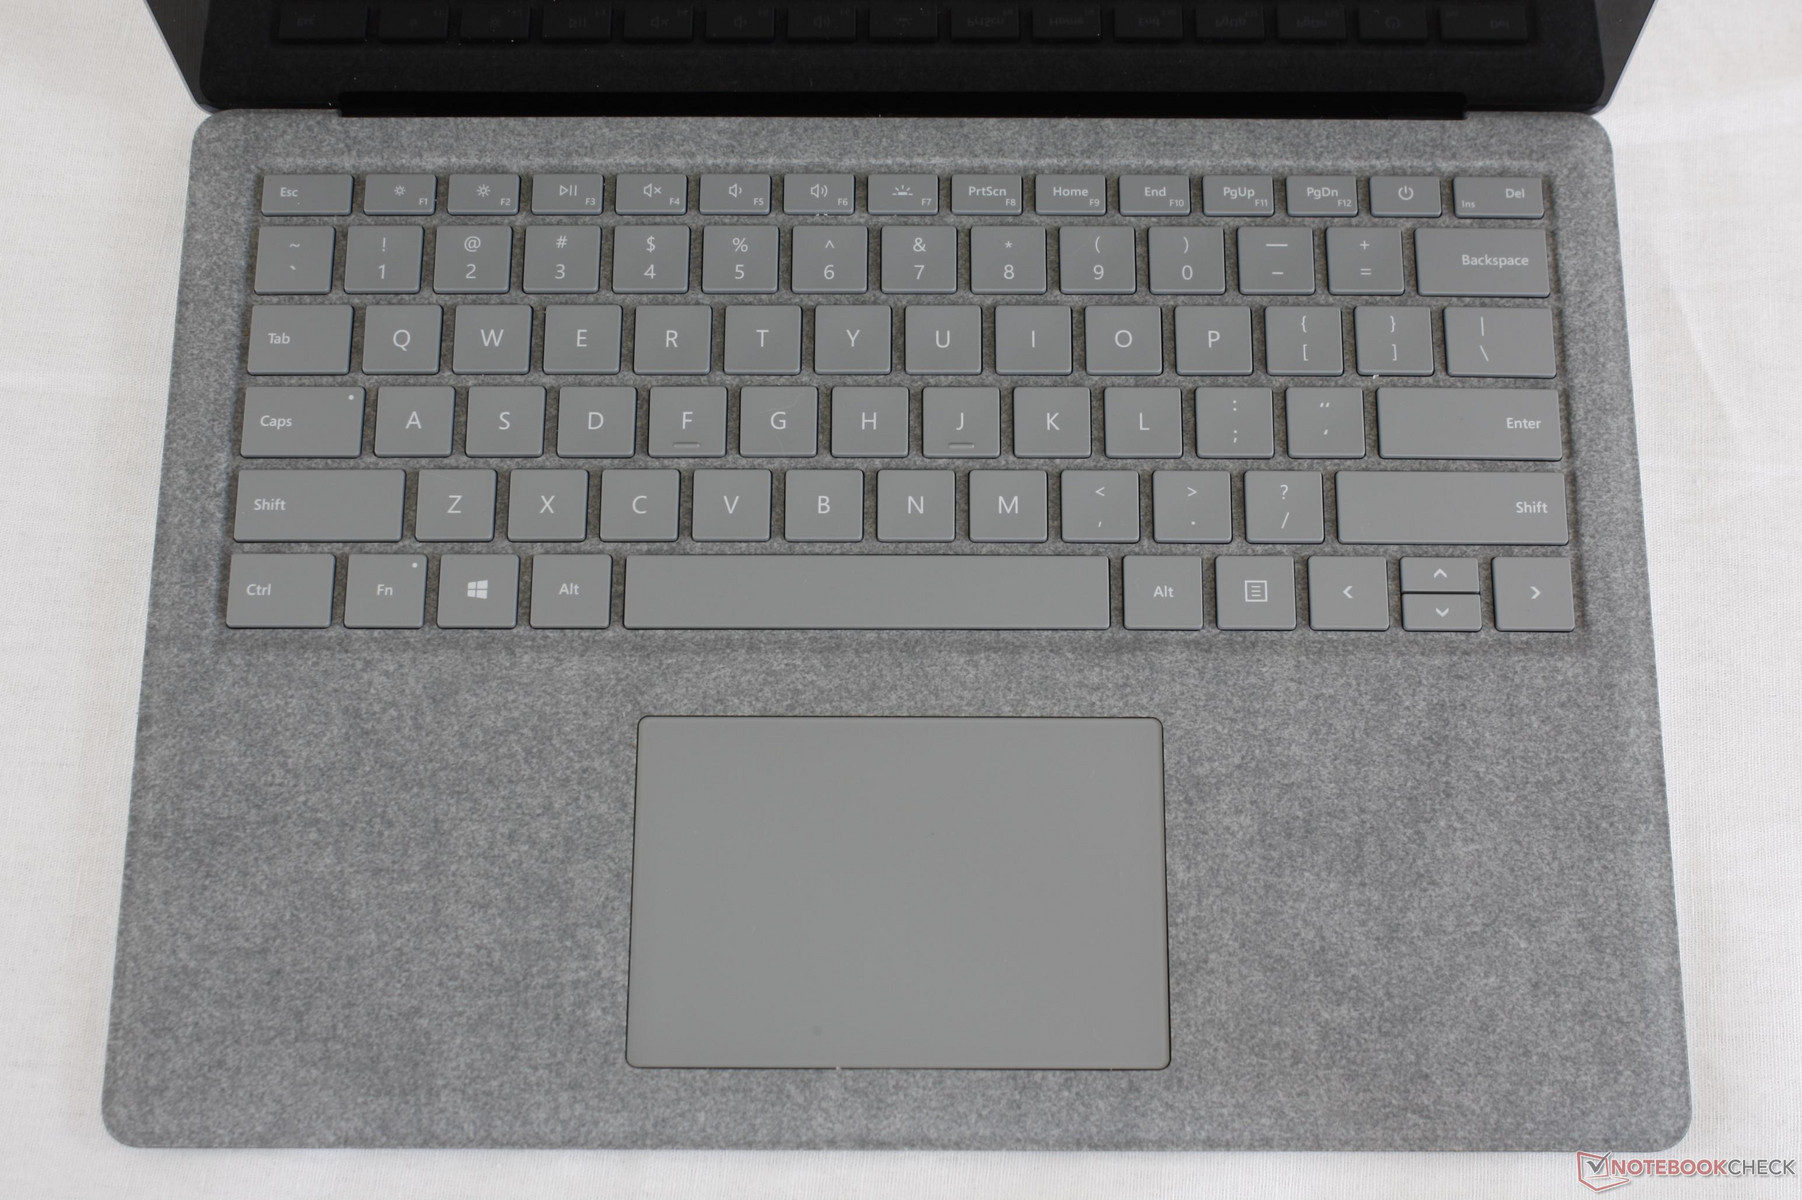
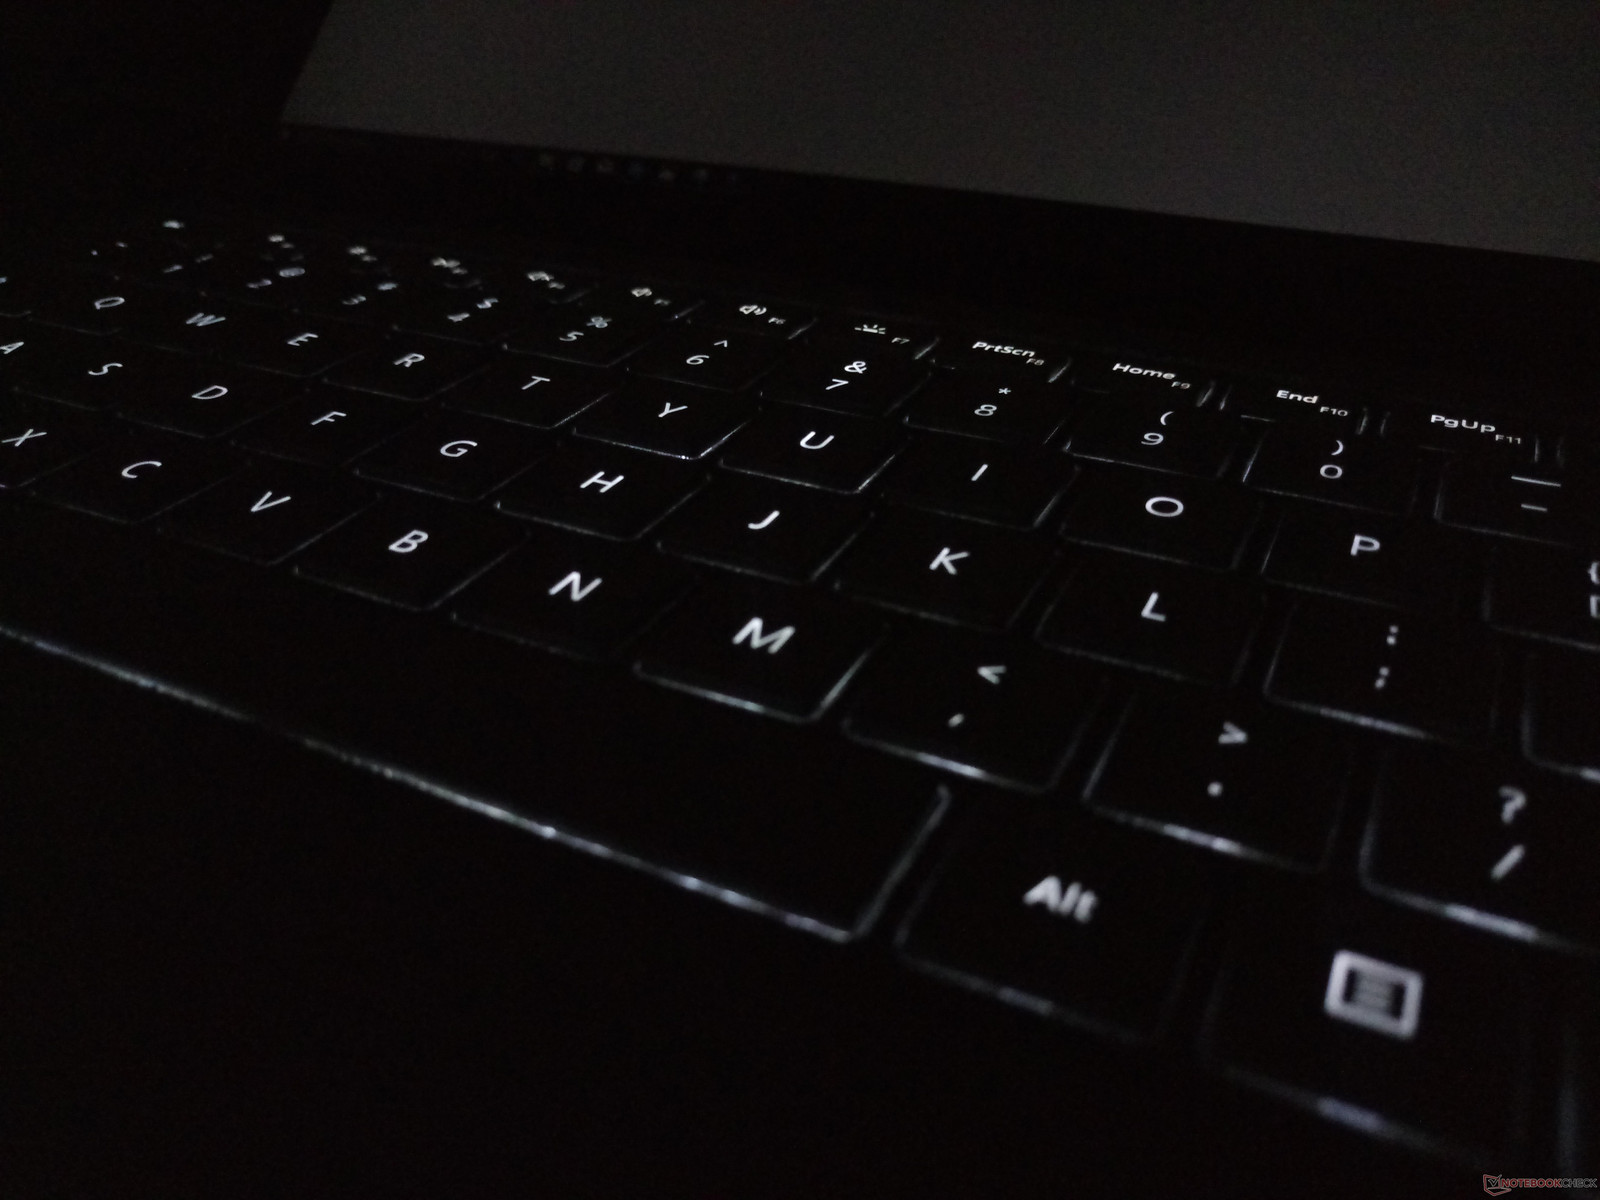
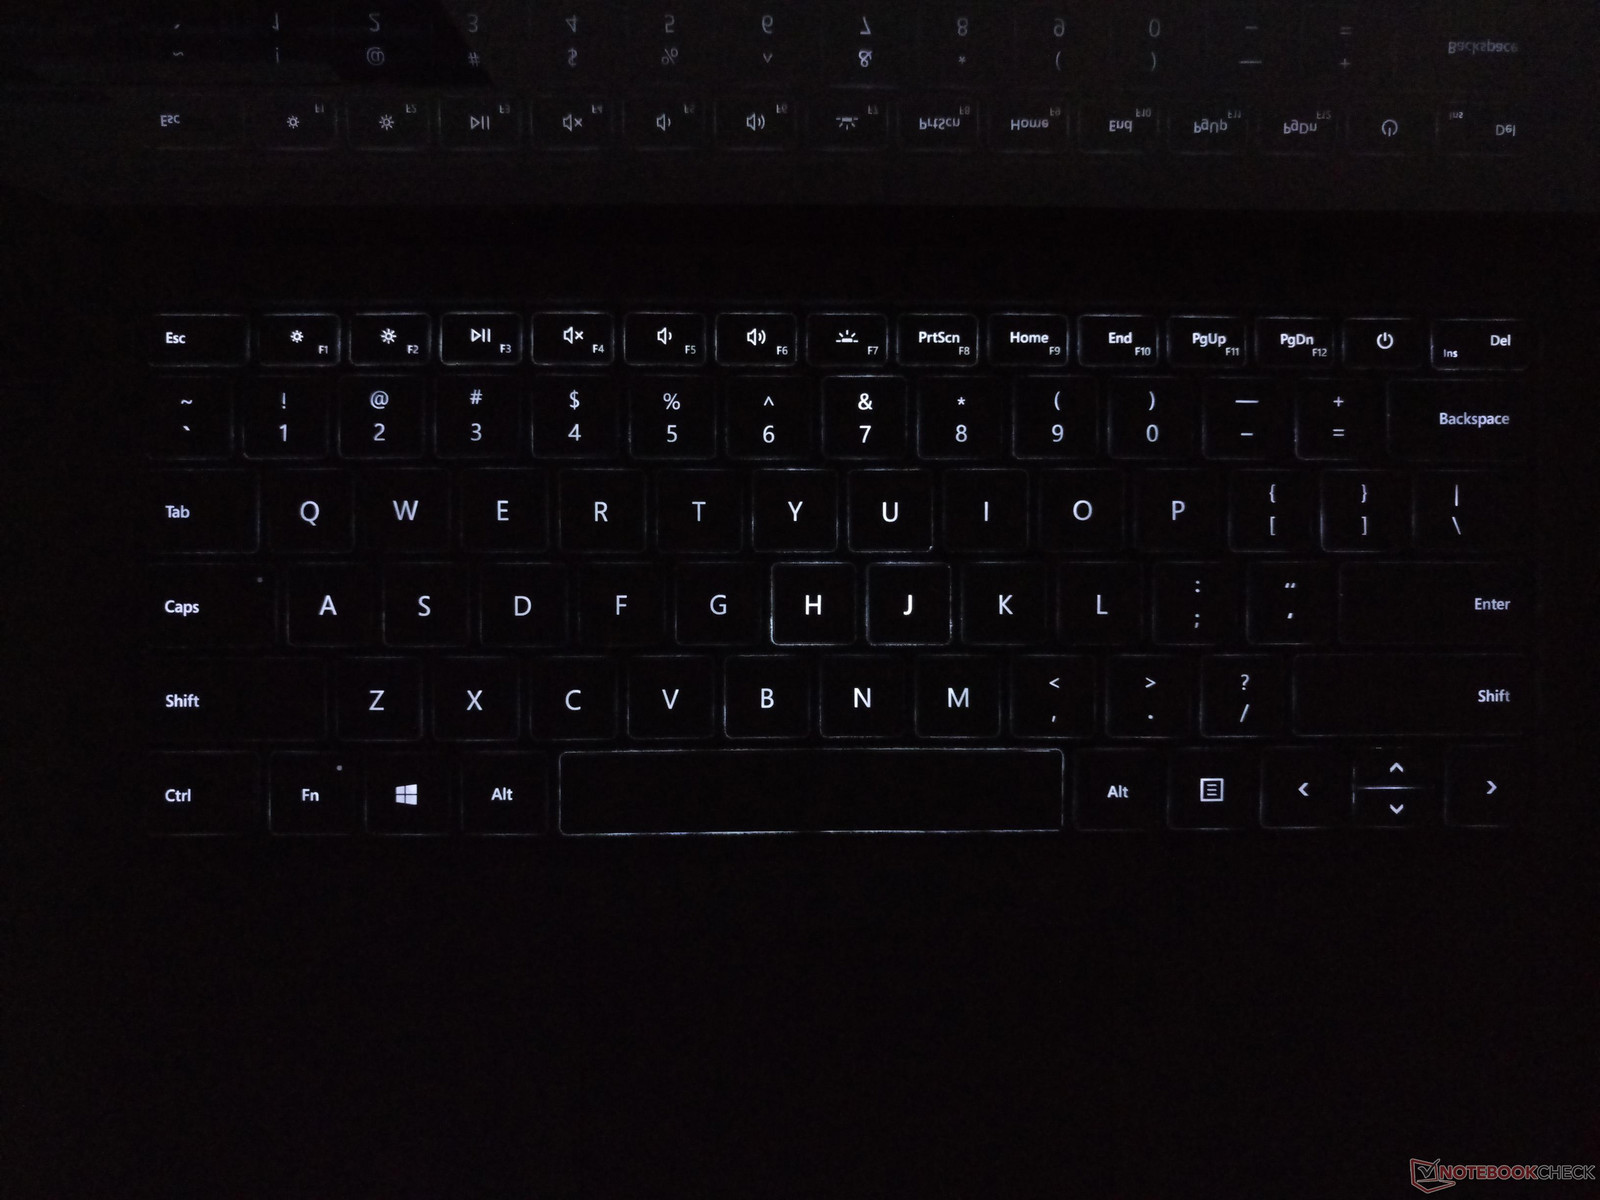
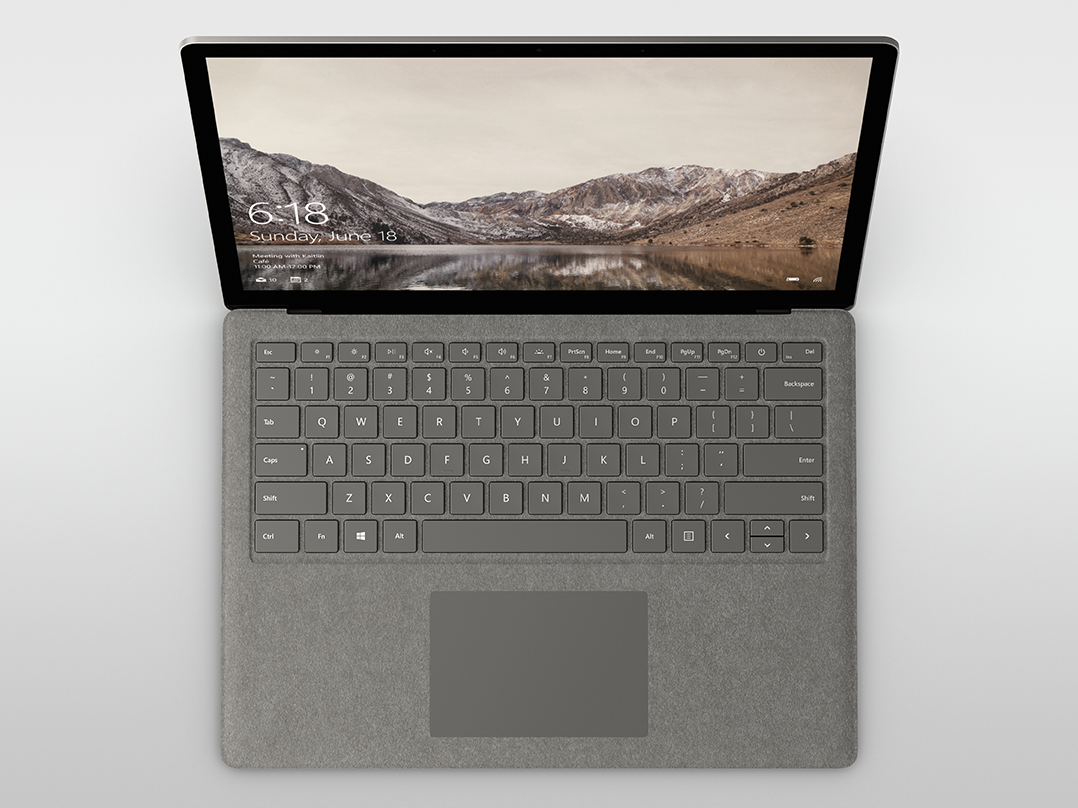
The chiclet keyboard (27.5 x 10 cm) comes standard with a three-level white backlight and offers a generally comfortable typing experience. Key travel is at 1.5 mm (compared to 1.3 mm and 1.4 mm on the XPS 13 and VivoBook S510, respectively) with feedback slightly on the softer side. The Enter and Space keys in particular could have been stronger in feedback, but they will eventually feel adequate after just a few days of typing on the notebook. Clatter is fairly quiet with almost no wiggling on each individual key. We still prefer the AccuType keyboard on most newer ThinkPads for the firmer and more uniform feedback between keys.
The positioning of the Power button is a strange design decision worth mentioning. Expect some accidental presses since the button is adjacent to some commonly used keys including Backspace, Delete, PgDn, and +/=. In other words, there's a good reason why most other notebook manufacturers place the Power button away from the main keyboard keys.
Touchpad
The glass trackpad (10.5 x 7 cm) is slightly larger than the trackpad on the XPS 13 (10.5 x 6 cm) and performs without any significant issues with up to five-finger gestures. The onscreen cursor will not inexplicably jump or jitter during regular use. Annoyingly, there is a split-second delay before finger motion is registered if tapping around the edges and corners of the trackpad whereas there is no such delay if tapping nearer its center. Furthermore, glide can be rough if the finger is even just a little bit moist when compared to most plastic trackpads on other notebooks and so the experience can very quickly go from smooth to bumpy after prolonged use.
The integrated mouse keys are firm in feedback and quite loud when pressed. Travel is shallow, but the sturdy feel of the trackpad surface makes up for this shortcoming. Applying strong pressure on the center of the trackpad with a finger will not warp it in any significant way.

Display
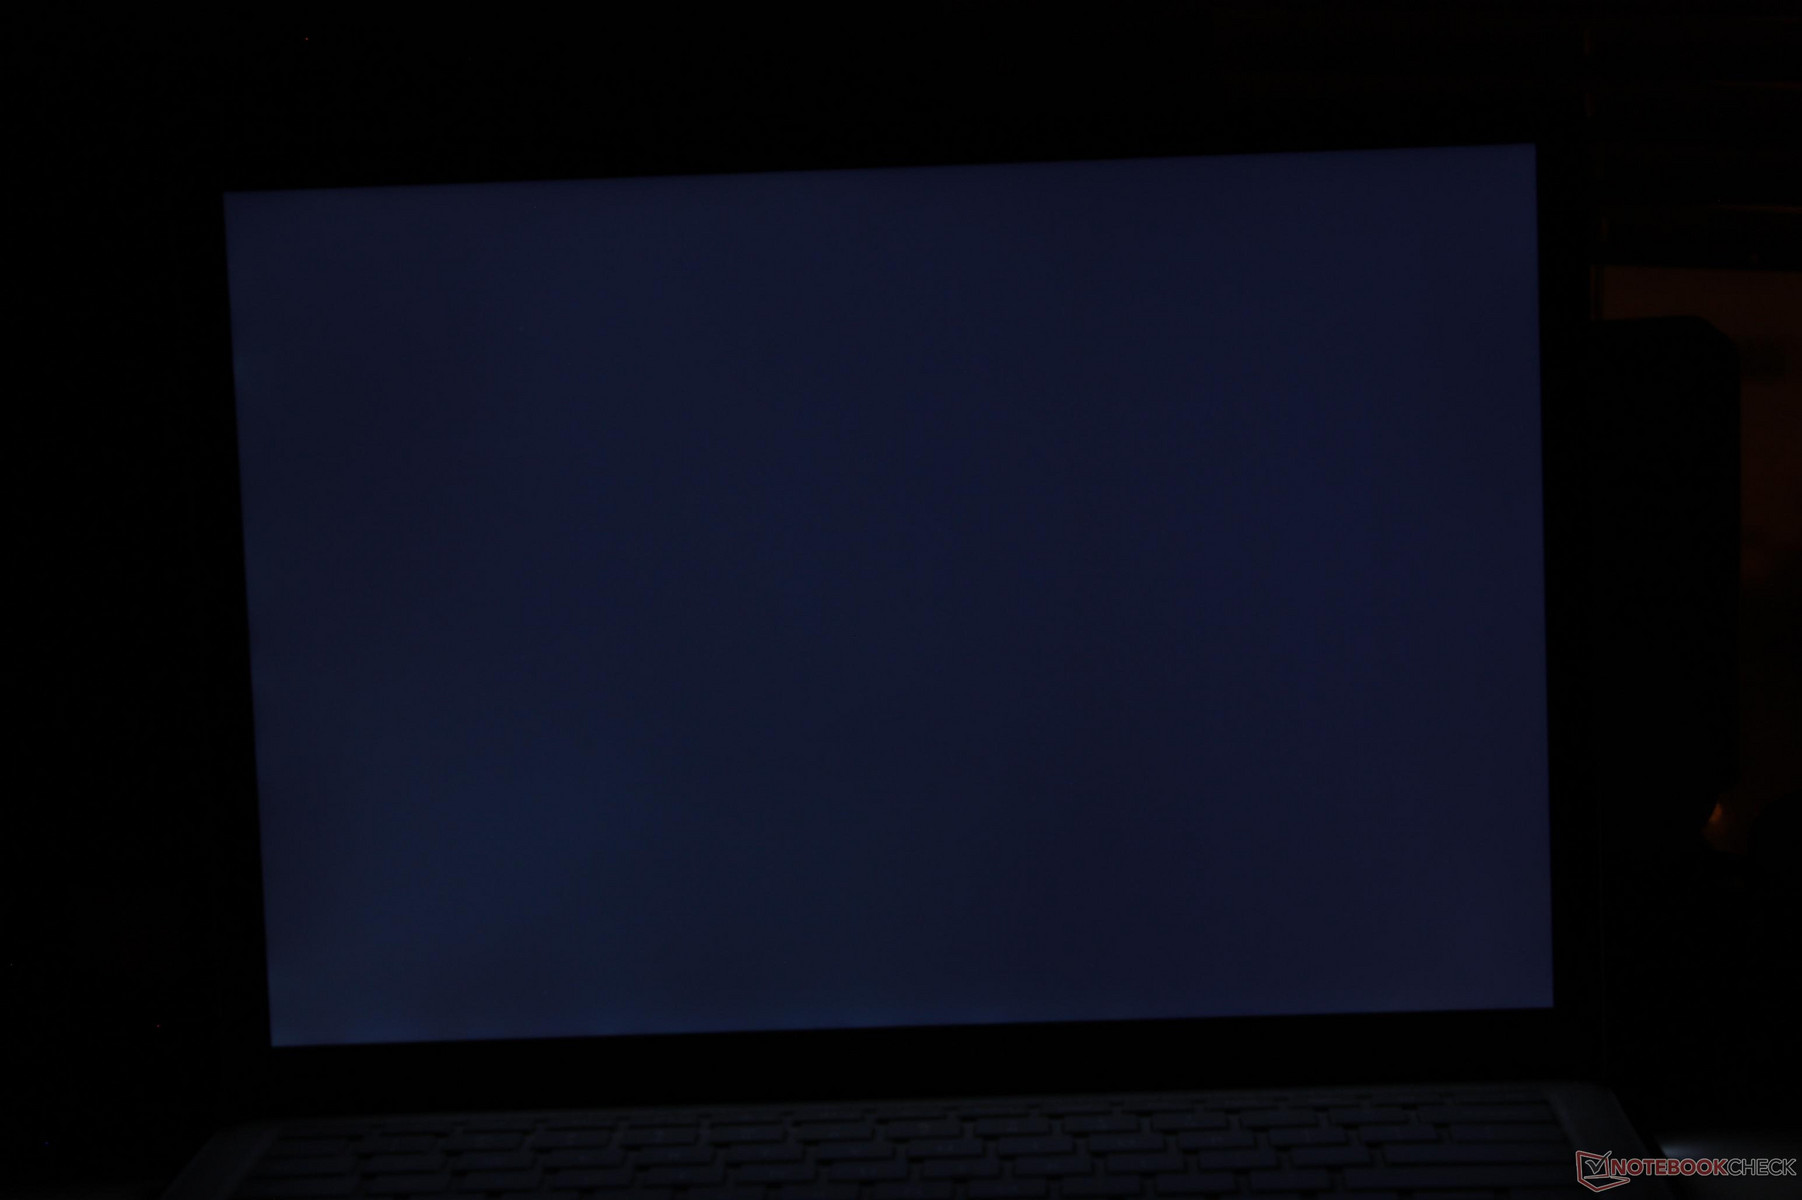
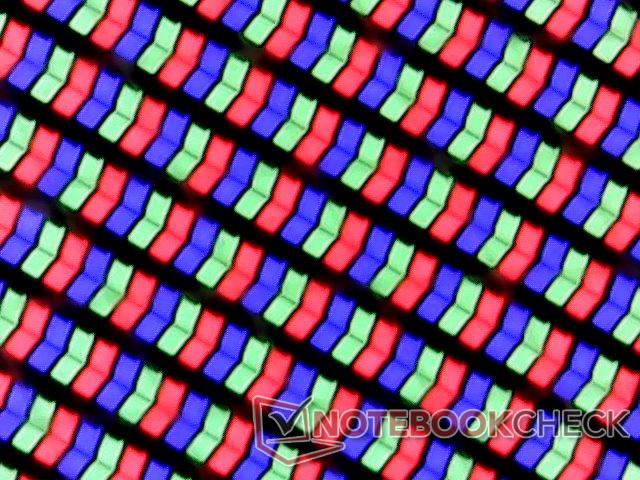
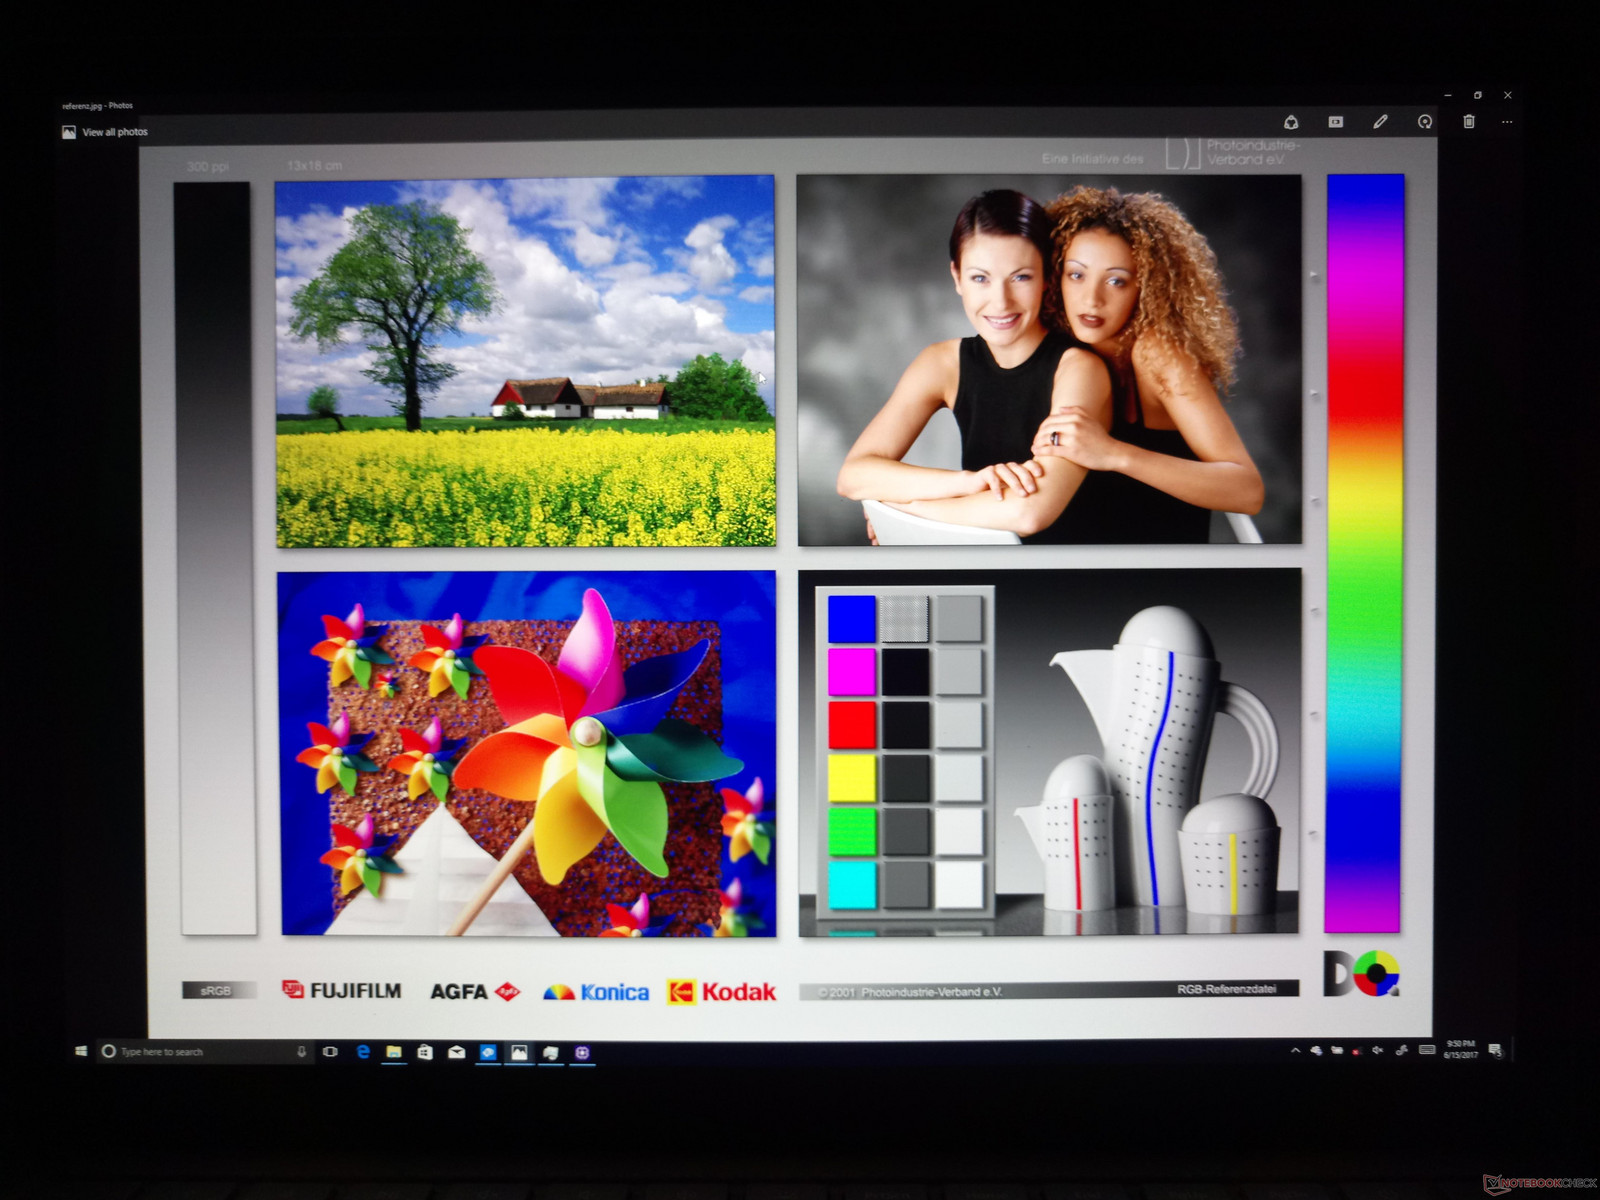
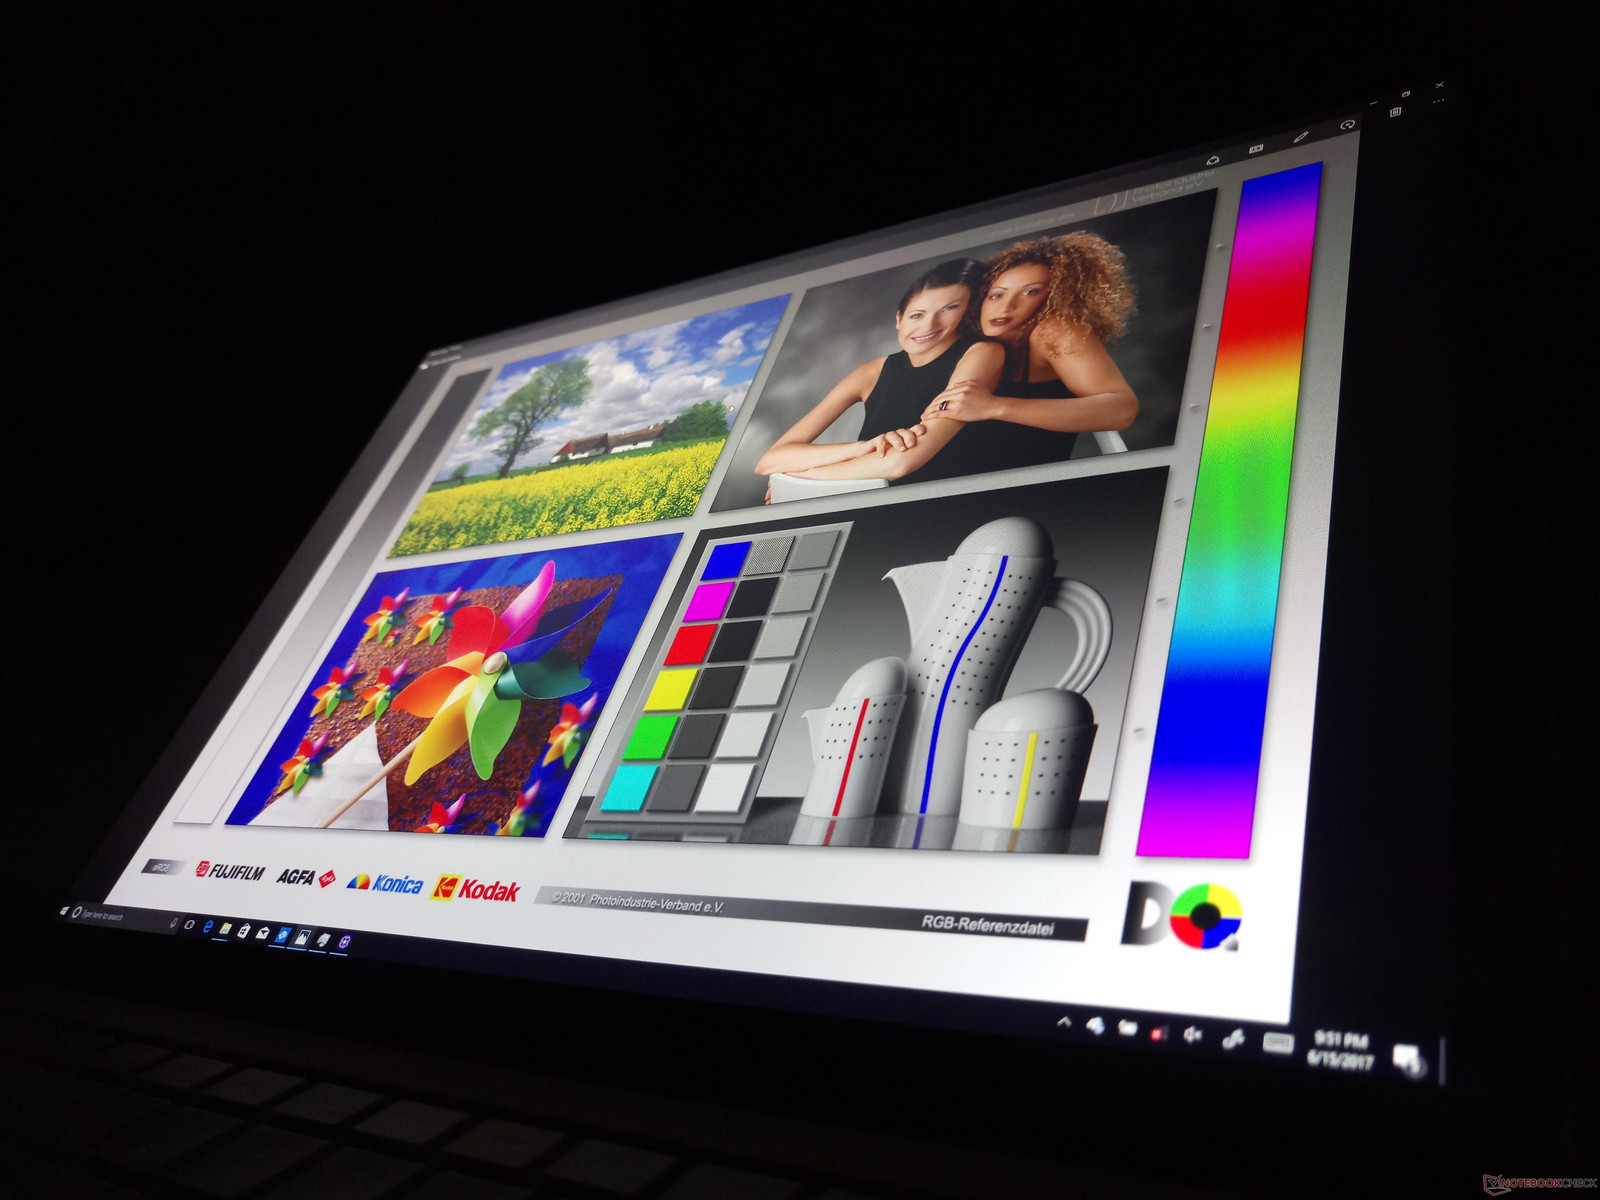
The Gorilla Glass touchscreen is the one aspect that always impresses on the Surface series. Its unconventional 13.5-inch 3:2 screen ratio is designed for presentations and full-frame images rather than multimedia playback and the unique Panasonic VVX14T092N00 IPS panel in use can be found on no other notebook or tablet currently in our database. Colors pop and texts are crisp as one would expect from a glossy panel, but we can still notice some slight - albeit unobtrusive - graininess when looking up close at the display. Backlight brightness is about the same as the Surface Pro 4 and just slightly dimmer than the Surface Book while maintaining the excellent contrast ratio of just over 1000:1. In comparison, most Ultrabooks top out at about 300 nits while a few can go over 500 nits such as the MacBook Pro 13 and Samsung Notebook 9.
Backlight bleeding is a non-issue during day-to-day use with only the slightest of clouding around the edges. Black-White and Gray-Gray response times are on the slow side and we can notice some ghosting as a result especially when jumping back and forth between our gaming laptop with a 120 Hz/5 ms display.
| |||||||||||||||||||||||||
Brightness Distribution: 90 %
Center on Battery: 384.1 cd/m²
Contrast: 1067:1 (Black: 0.36 cd/m²)
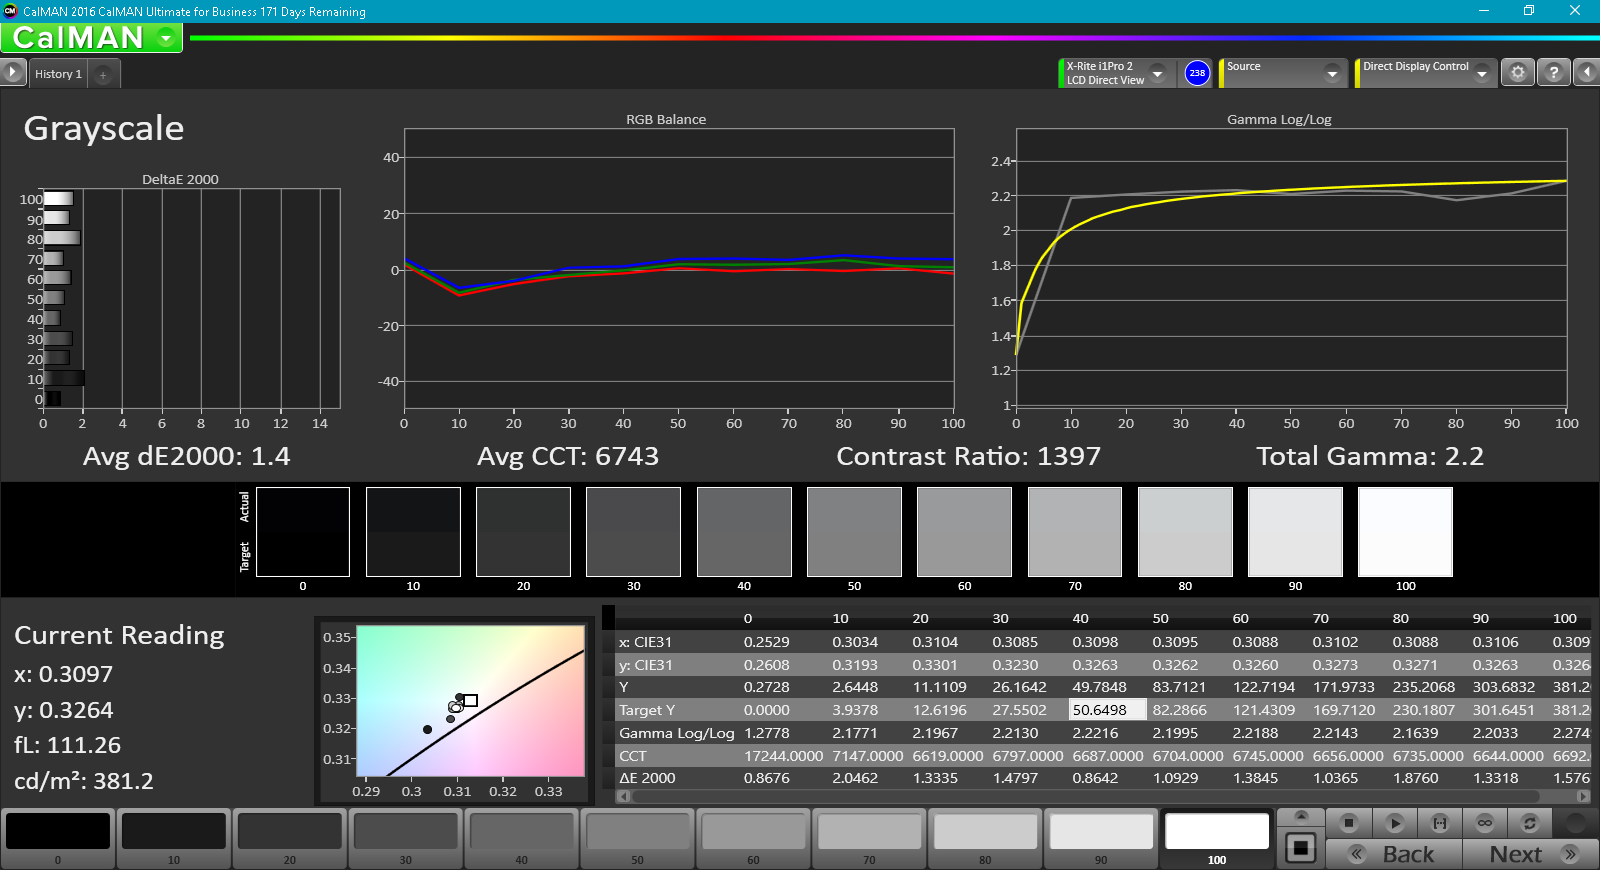
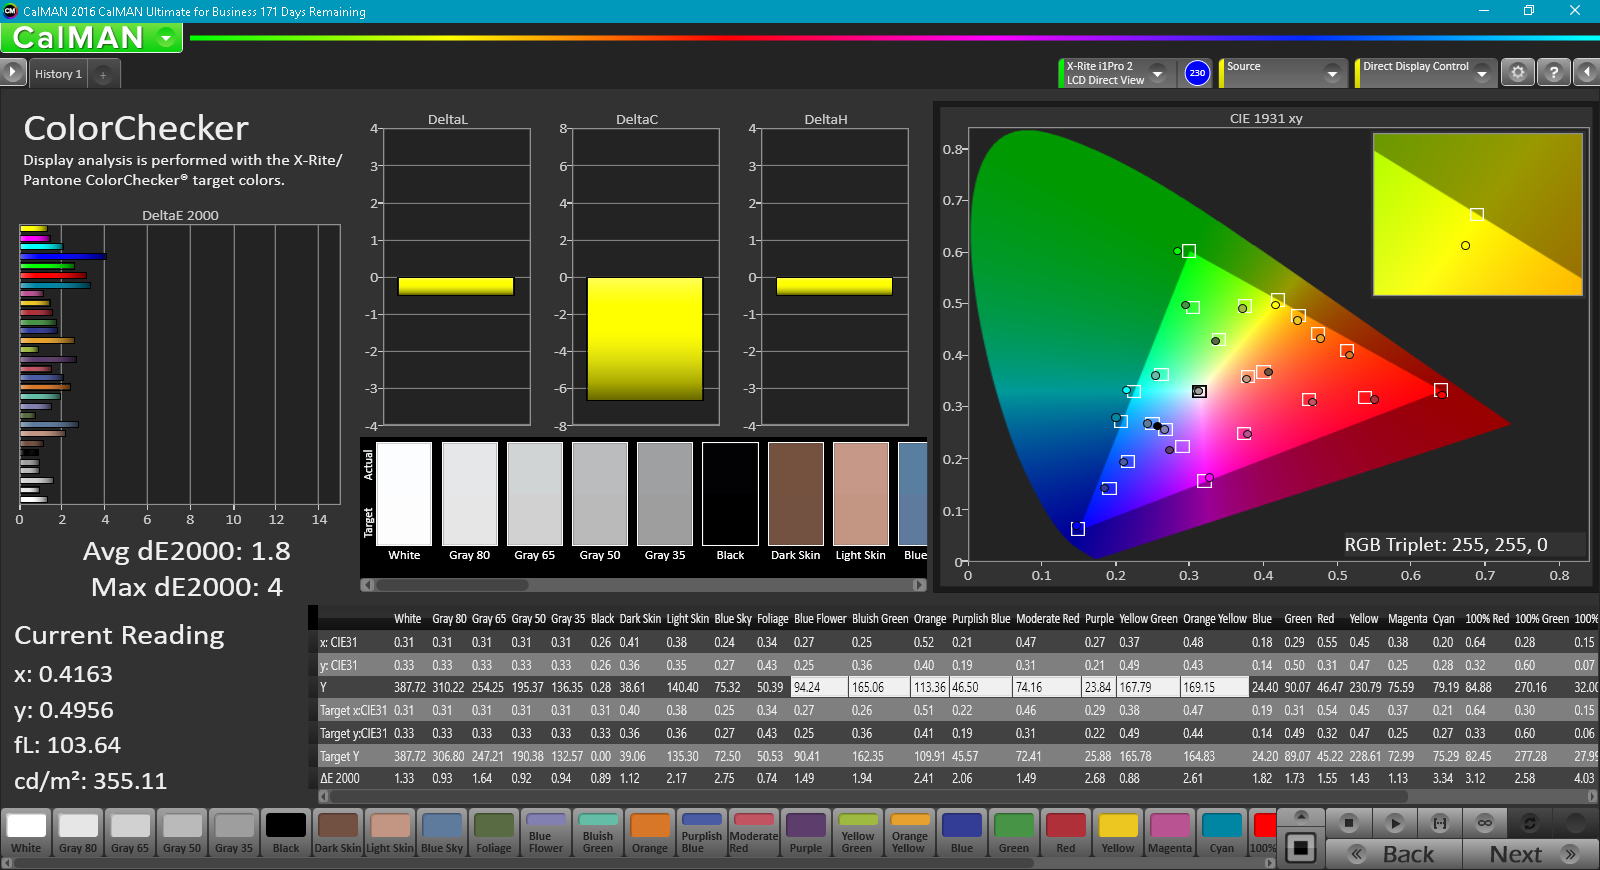
ΔE ColorChecker Calman: 1.8 | ∀{0.5-29.43 Ø4.73}
ΔE Greyscale Calman: 1.2 | ∀{0.09-98 Ø4.97}
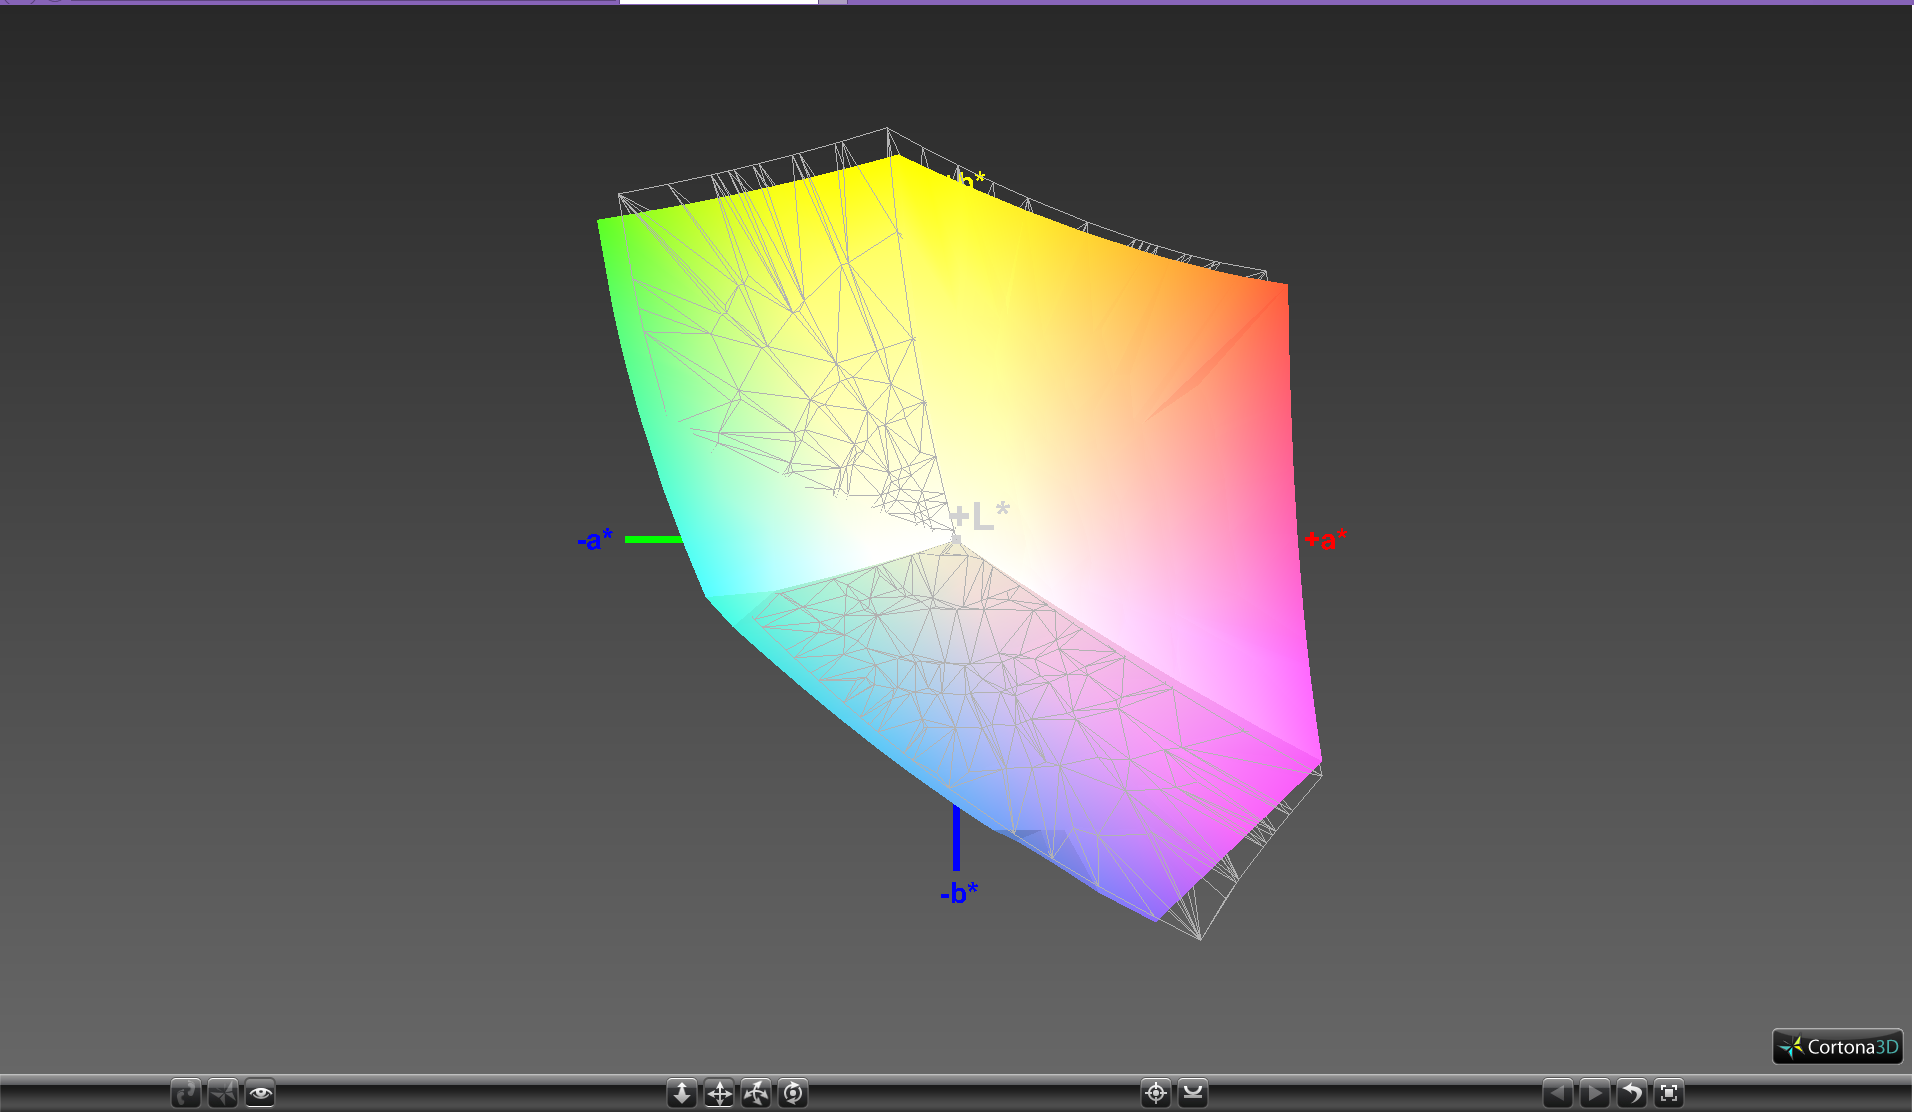
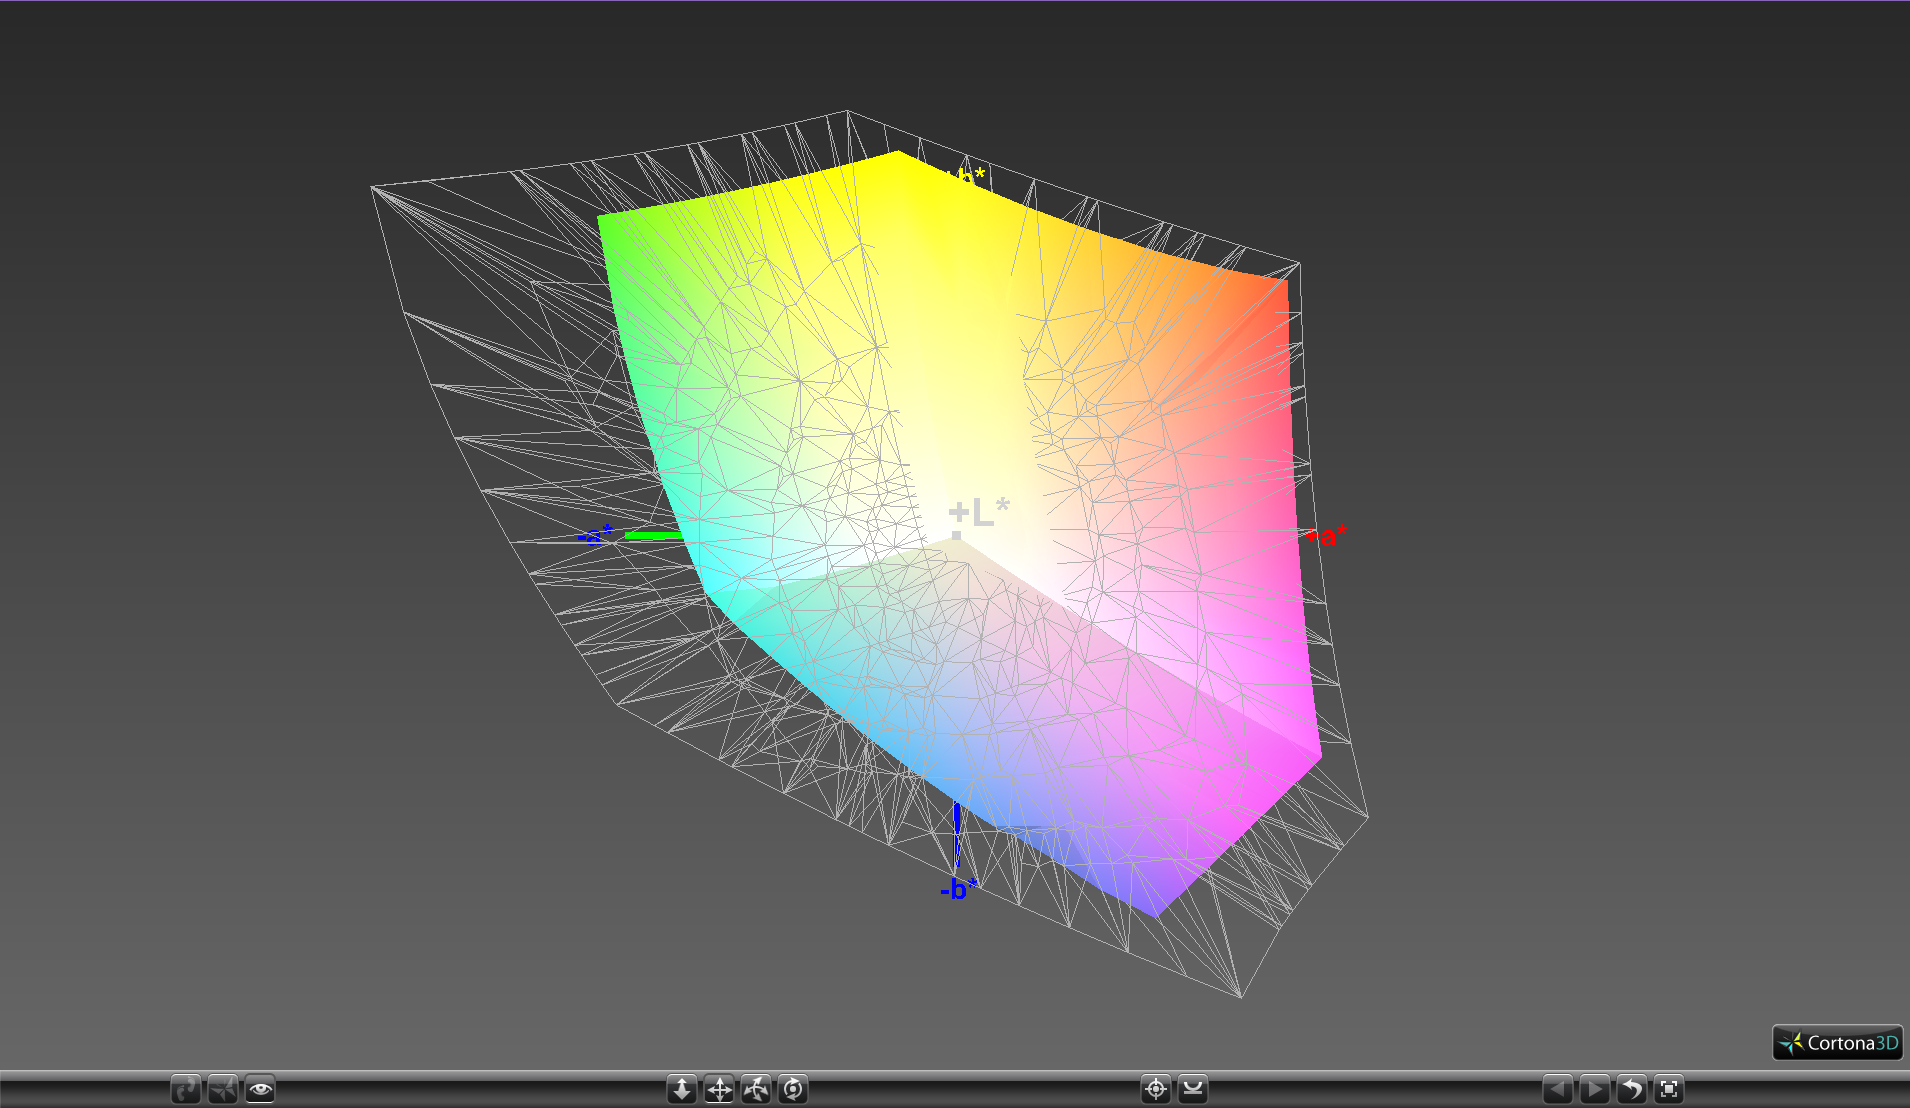
94.2% sRGB (Argyll 1.6.3 3D)
63.7% AdobeRGB 1998 (Argyll 1.6.3 3D)
69.5% AdobeRGB 1998 (Argyll 3D)
94.3% sRGB (Argyll 3D)
67.8% Display P3 (Argyll 3D)
Gamma: 2.21
CCT: 6708 K
| Microsoft Surface Laptop i5 ID: MEI96A2, Name: Panasonic VVX14T092N00, IPS, 13.5", 2256x1504 | Microsoft Surface Book with Performance Base Panasonic MEI96A2, IPS, 13.5", 3000x2000 | Microsoft Surface Pro 4, Core i5, 128GB Samsung 123YL01-001 ID: SDC3853, IPS, 12.3", 2736x1824 | Apple MacBook Pro 13 2016 (2.9 GHz) APPA033, , 13.3", 2560x1600 | Dell XPS 13 9360 FHD i5 Sharp SHP1449 LQ133M1, IPS, 13.3", 1920x1080 | |
|---|---|---|---|---|---|
| Display | -1% | -2% | 26% | -26% | |
| Display P3 Coverage (%) | 67.8 | 66.4 -2% | 65 -4% | 99.2 46% | 48.94 -28% |
| sRGB Coverage (%) | 94.3 | 95.4 1% | 96.5 2% | 99.9 6% | 73.3 -22% |
| AdobeRGB 1998 Coverage (%) | 69.5 | 67.6 -3% | 67 -4% | 87.6 26% | 50.5 -27% |
| Response Times | -10% | 13% | -18% | 23% | |
| Response Time Grey 50% / Grey 80% * (ms) | 50.8 ? | 61 ? -20% | 46 ? 9% | 47.2 ? 7% | 32.8 ? 35% |
| Response Time Black / White * (ms) | 37.2 ? | 37 ? 1% | 31.2 ? 16% | 53 ? -42% | 33.2 ? 11% |
| PWM Frequency (Hz) | 50 ? | ||||
| Screen | -8% | -32% | 6% | -84% | |
| Brightness middle (cd/m²) | 384.2 | 459 19% | 413 7% | 569 48% | 351.2 -9% |
| Brightness (cd/m²) | 378 | 423 12% | 396 5% | 542 43% | 325 -14% |
| Brightness Distribution (%) | 90 | 86 -4% | 87 -3% | 90 0% | 89 -1% |
| Black Level * (cd/m²) | 0.36 | 0.37 -3% | 0.36 -0% | 0.56 -56% | 0.195 46% |
| Contrast (:1) | 1067 | 1241 16% | 1147 7% | 1016 -5% | 1801 69% |
| Colorchecker dE 2000 * | 1.8 | 2.28 -27% | 3.09 -72% | 1.4 22% | 7.4 -311% |
| Colorchecker dE 2000 max. * | 4.2 | 3.61 14% | 2.9 31% | 9.08 -116% | |
| Greyscale dE 2000 * | 1.2 | 2.48 -107% | 3.92 -227% | 1.8 -50% | 6.71 -459% |
| Gamma | 2.21 100% | 2.5 88% | 2.3 96% | 2.16 102% | 2.74 80% |
| CCT | 6708 97% | 8602 76% | 7333 89% | 6877 95% | 7222 90% |
| Color Space (Percent of AdobeRGB 1998) (%) | 63.7 | 62 -3% | 61 -4% | 78.4 23% | 50.48 -21% |
| Color Space (Percent of sRGB) (%) | 94.2 | 96 2% | 97 3% | 99.3 5% | 73.31 -22% |
| Total Average (Program / Settings) | -6% /
-7% | -7% /
-19% | 5% /
7% | -29% /
-58% |
* ... smaller is better
Microsoft is claiming 100 percent sRGB color coverage while our own measurements show 94 percent and 64 percent of sRGB and AdobeRGB, respectively. This is nearly identical to the displays of the Surface Book and Surface Pro 4 and should be sufficient for student editing work, but users demanding an even wider gamut can get full sRGB coverage and 78 percent AdobeRGB from the MacBook Pro 13. Thus, users who have tinkered with the Surface Book or Surface Pro 4 will know exactly what to expect from a color accuracy perspective out of the Surface Laptop.

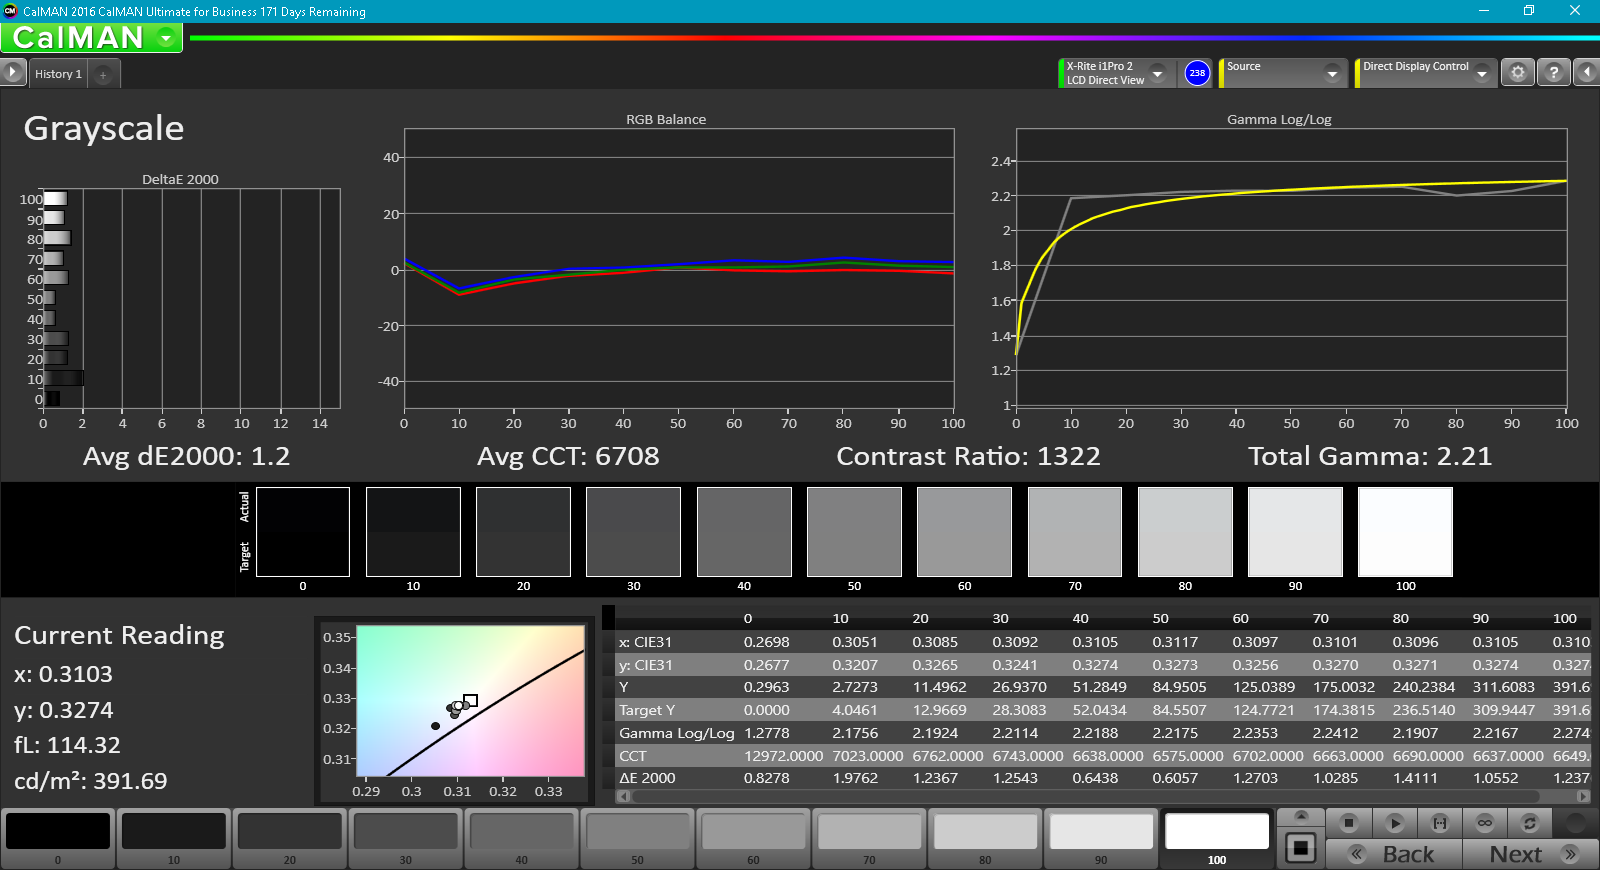
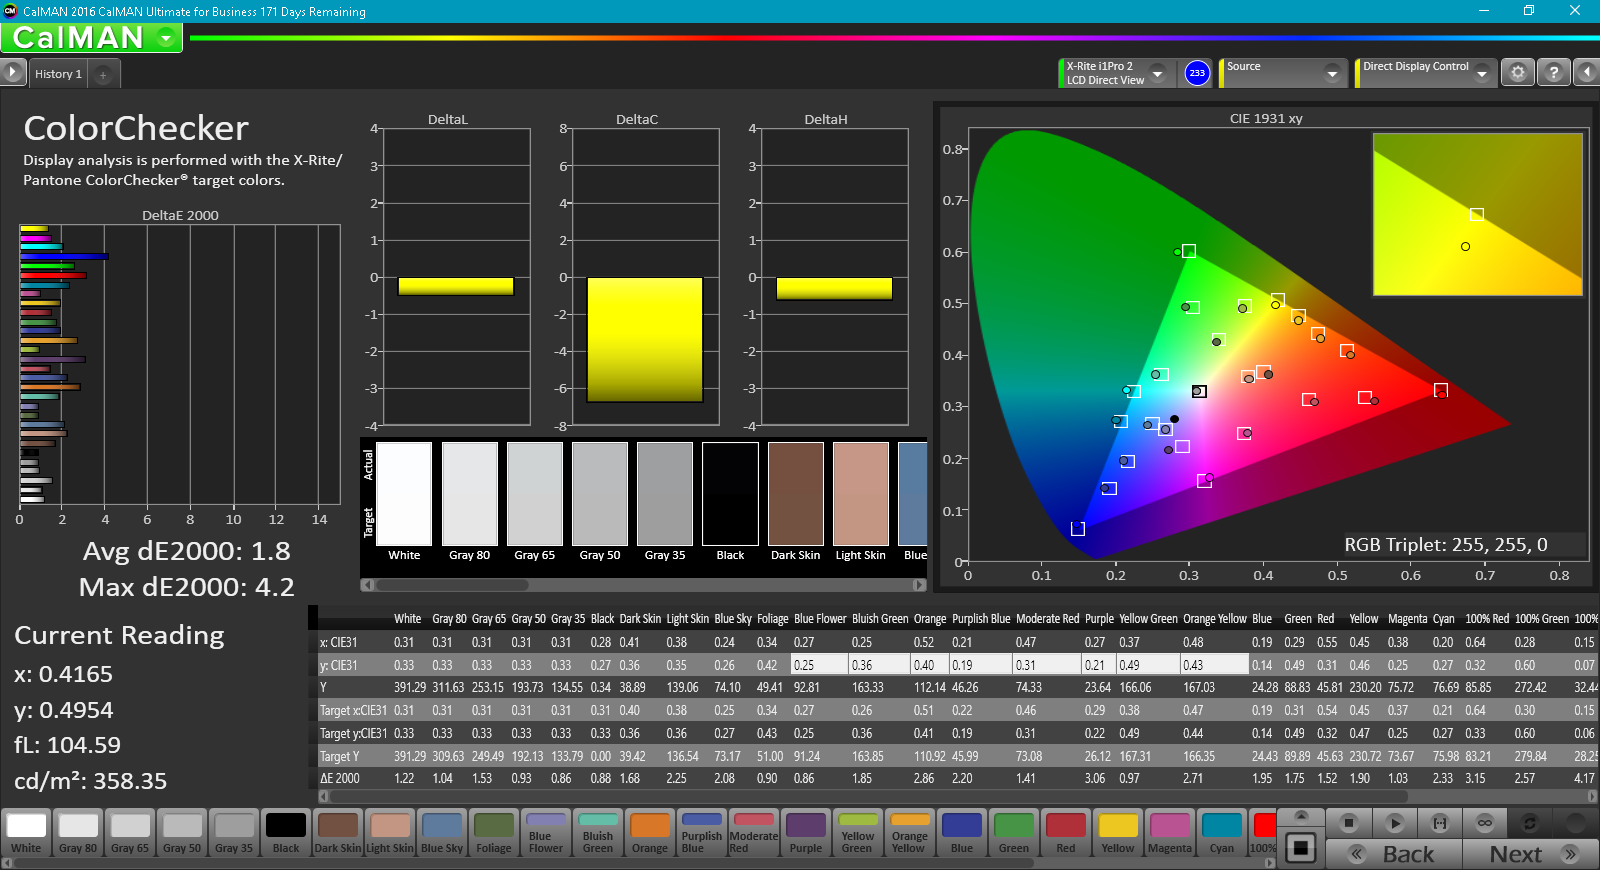
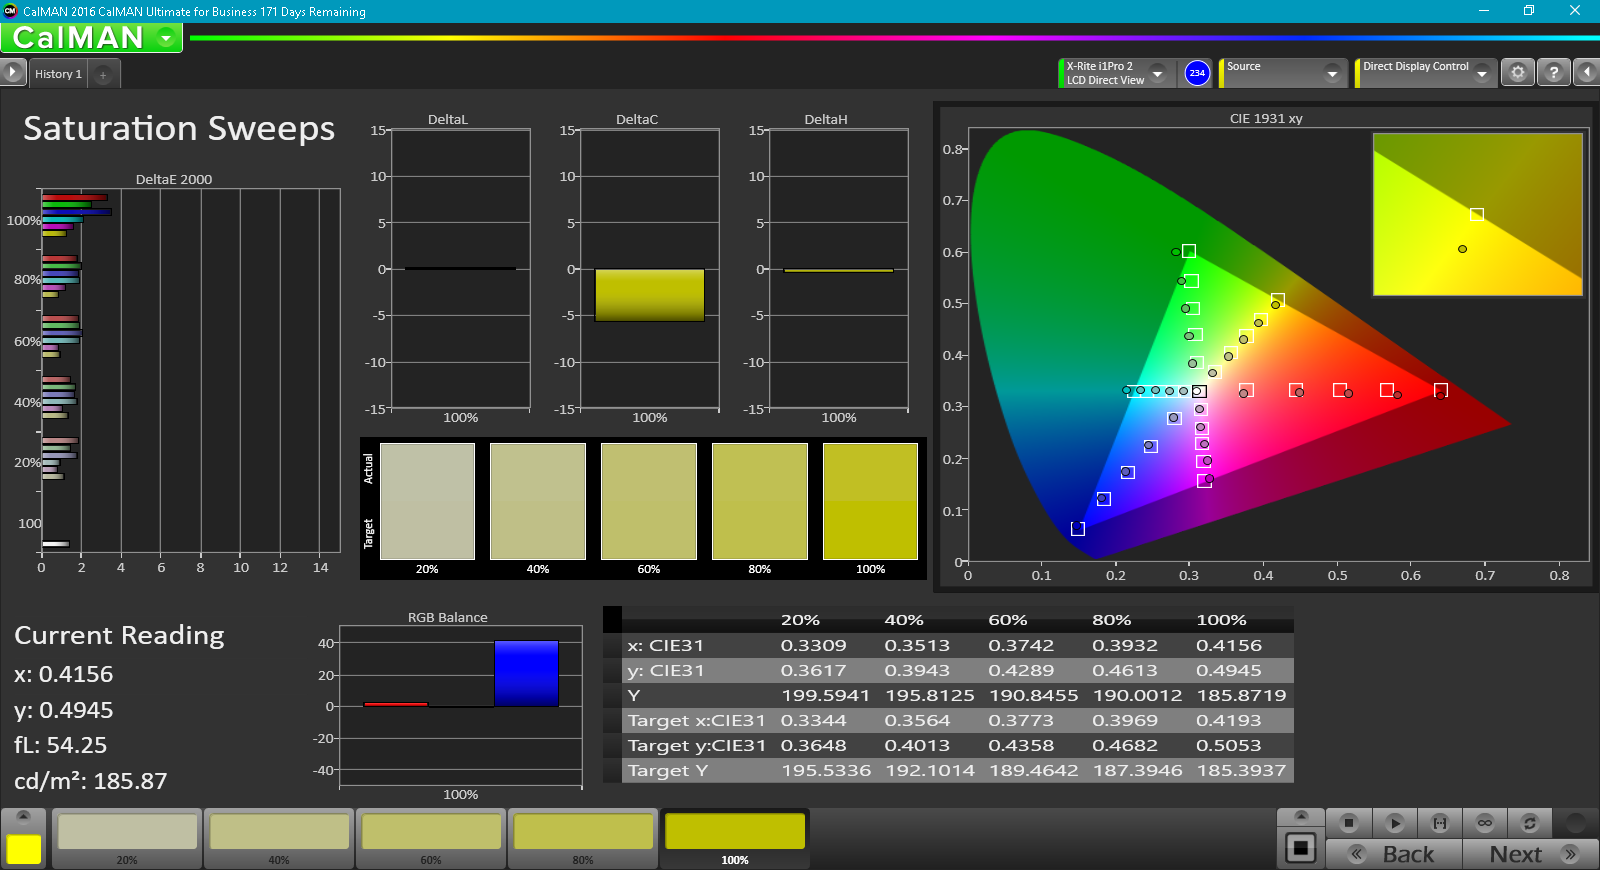
Further measurements with an X-Rite spectrophotometer reveal a very accurate grayscale and an impressive color reproduction with DeltaE averaging less than 2. Microsoft claims it custom-color calibrates all Surface Laptops and this has led to one of the most accurate displays we've tested. Our own calibration attempts against the sRGB standard result in no real gains as shown by our CalMan results below. Note that color accuracy steadily drops the higher the saturation level as is common on most notebooks that do not fully cover sRGB or AdobeRGB.

Display Response Times
| ↔ Response Time Black to White | ||
|---|---|---|
| 37.2 ms ... rise ↗ and fall ↘ combined | ↗ 20 ms rise |  |
| ↘ 17.2 ms fall | ||
| The screen shows slow response rates in our tests and will be unsatisfactory for gamers. In comparison, all tested devices range from 0.1 (minimum) to 240 (maximum) ms. » 95 % of all devices are better. This means that the measured response time is worse than the average of all tested devices (19.9 ms). | ||
| ↔ Response Time 50% Grey to 80% Grey | ||
| 50.8 ms ... rise ↗ and fall ↘ combined | ↗ 25.6 ms rise | 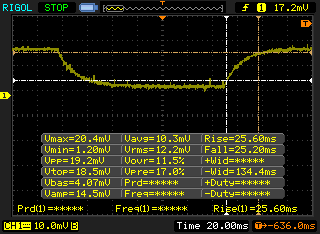 |
| ↘ 25.2 ms fall | ||
| The screen shows slow response rates in our tests and will be unsatisfactory for gamers. In comparison, all tested devices range from 0.165 (minimum) to 636 (maximum) ms. » 87 % of all devices are better. This means that the measured response time is worse than the average of all tested devices (31.1 ms). | ||
Screen Flickering / PWM (Pulse-Width Modulation)
| Screen flickering / PWM not detected | 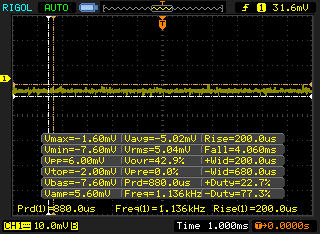 | ||
In comparison: 52 % of all tested devices do not use PWM to dim the display. If PWM was detected, an average of 7794 (minimum: 5 - maximum: 343500) Hz was measured. | |||
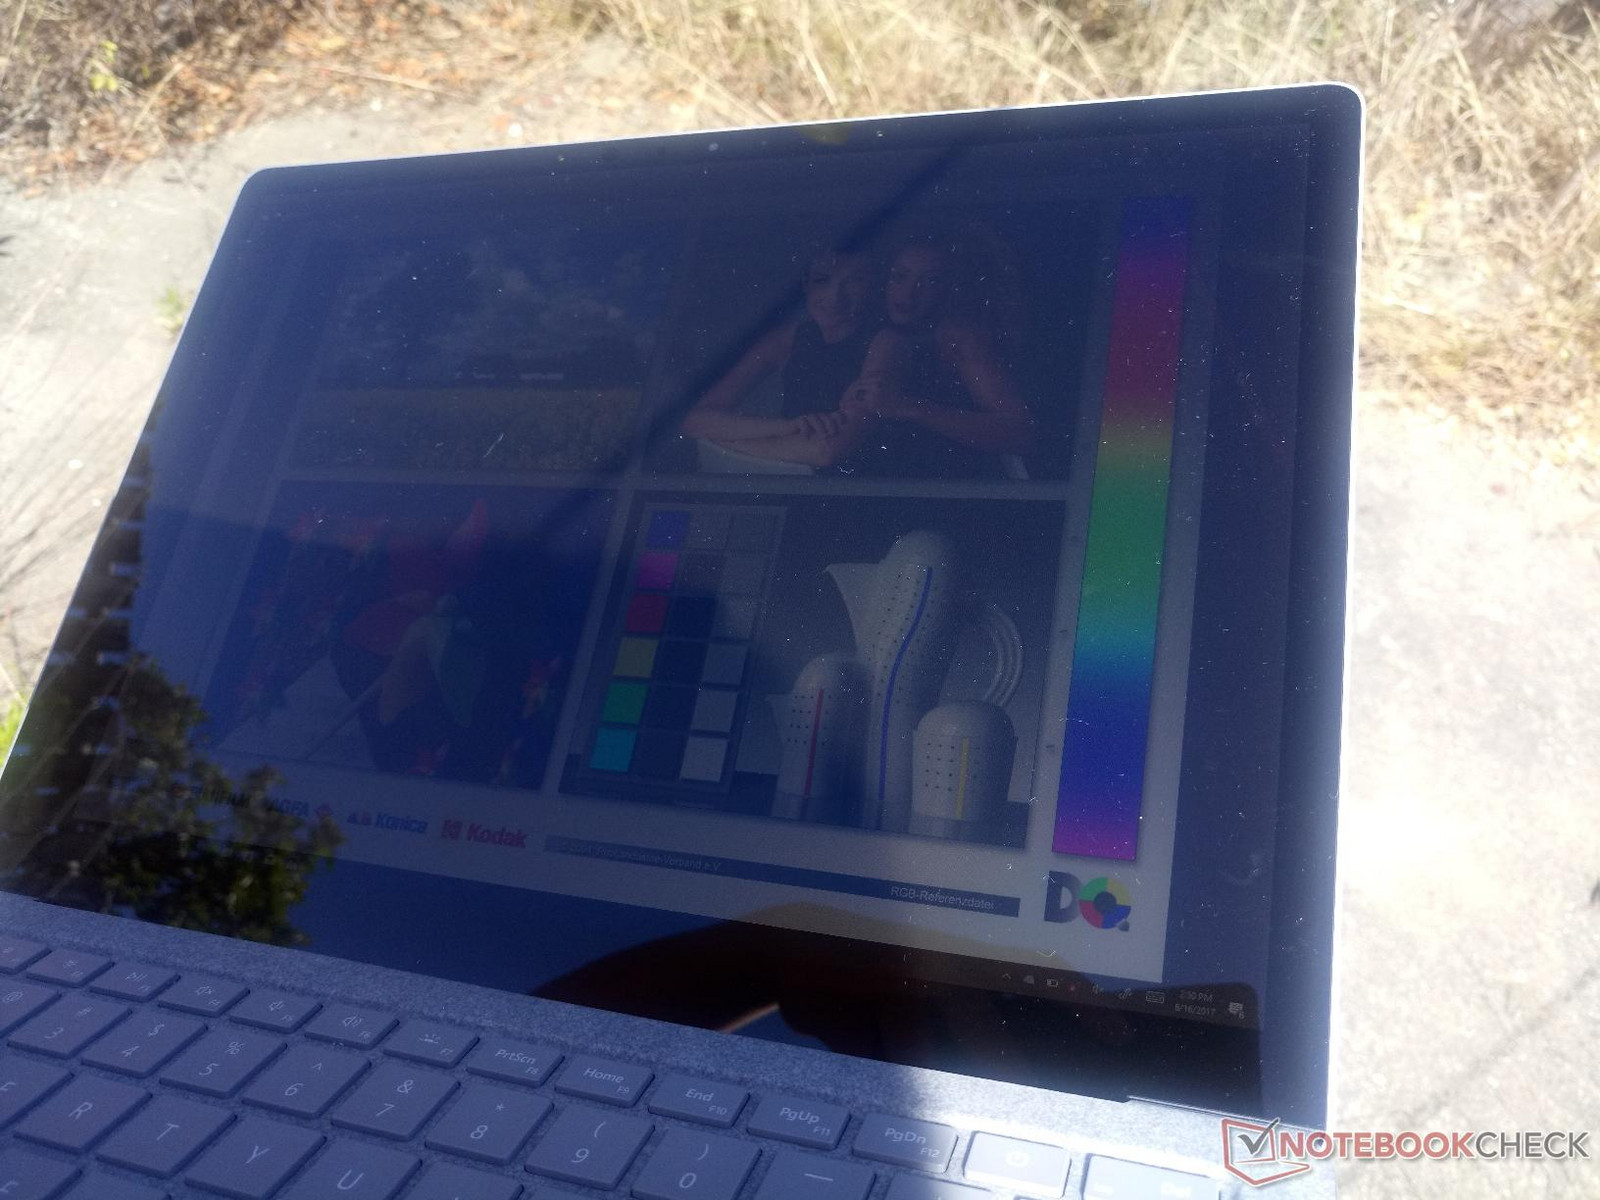
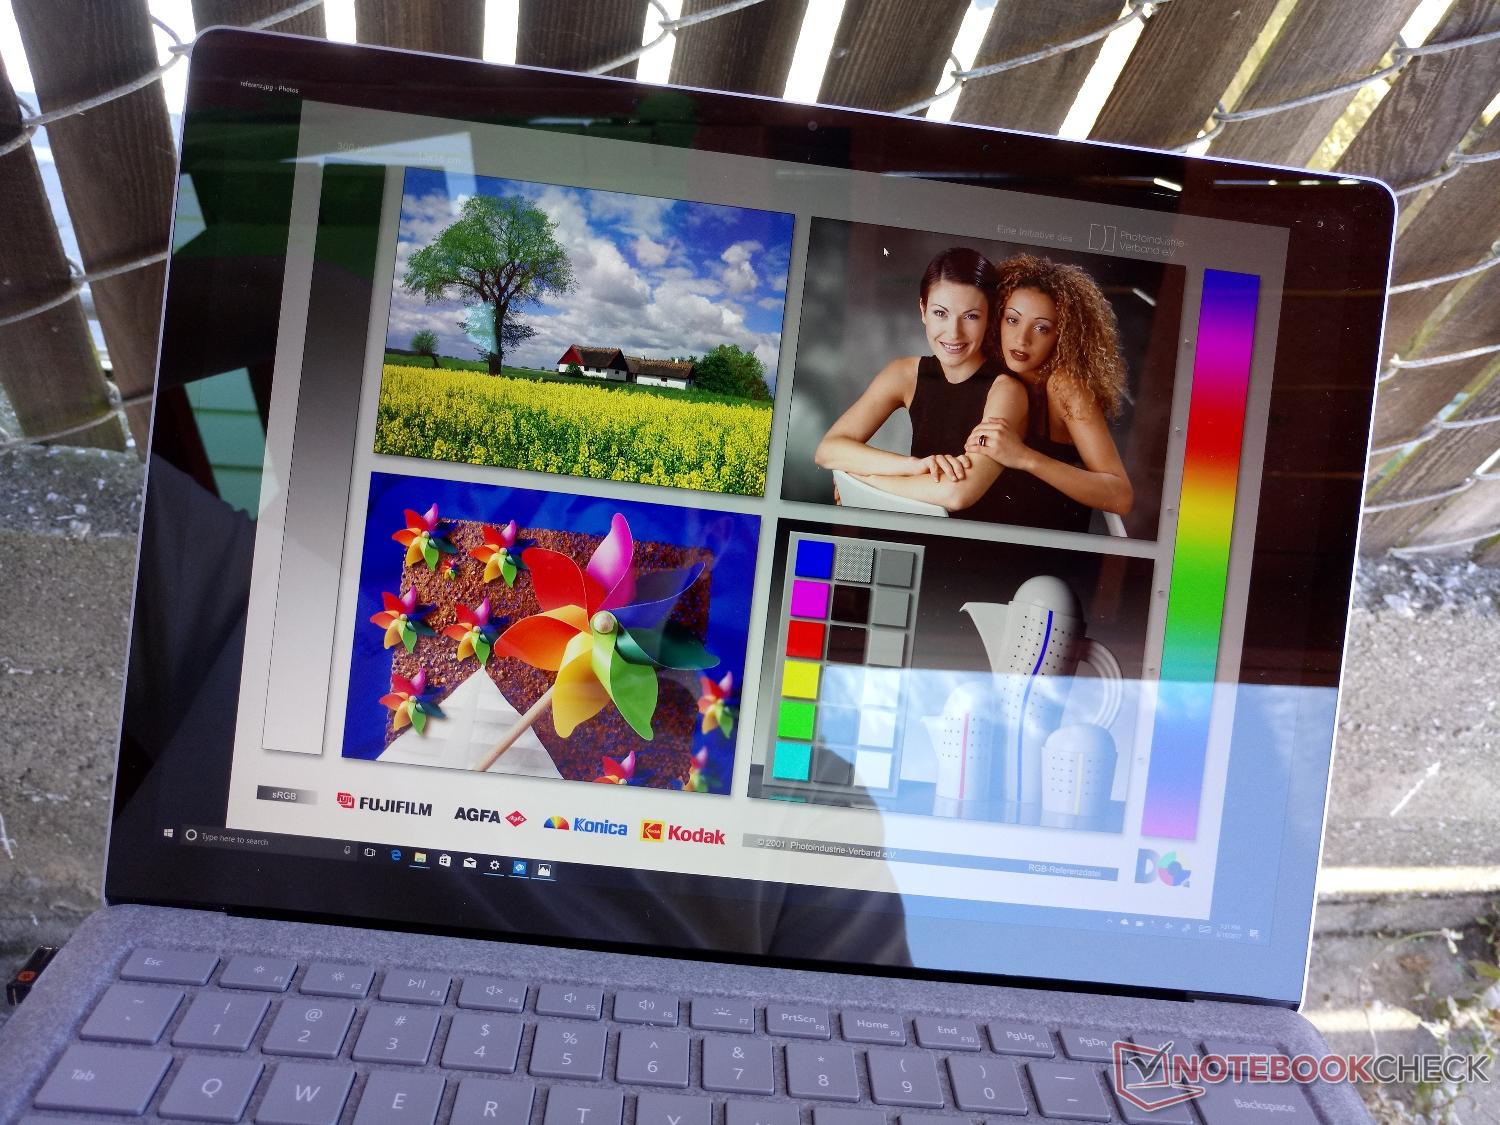
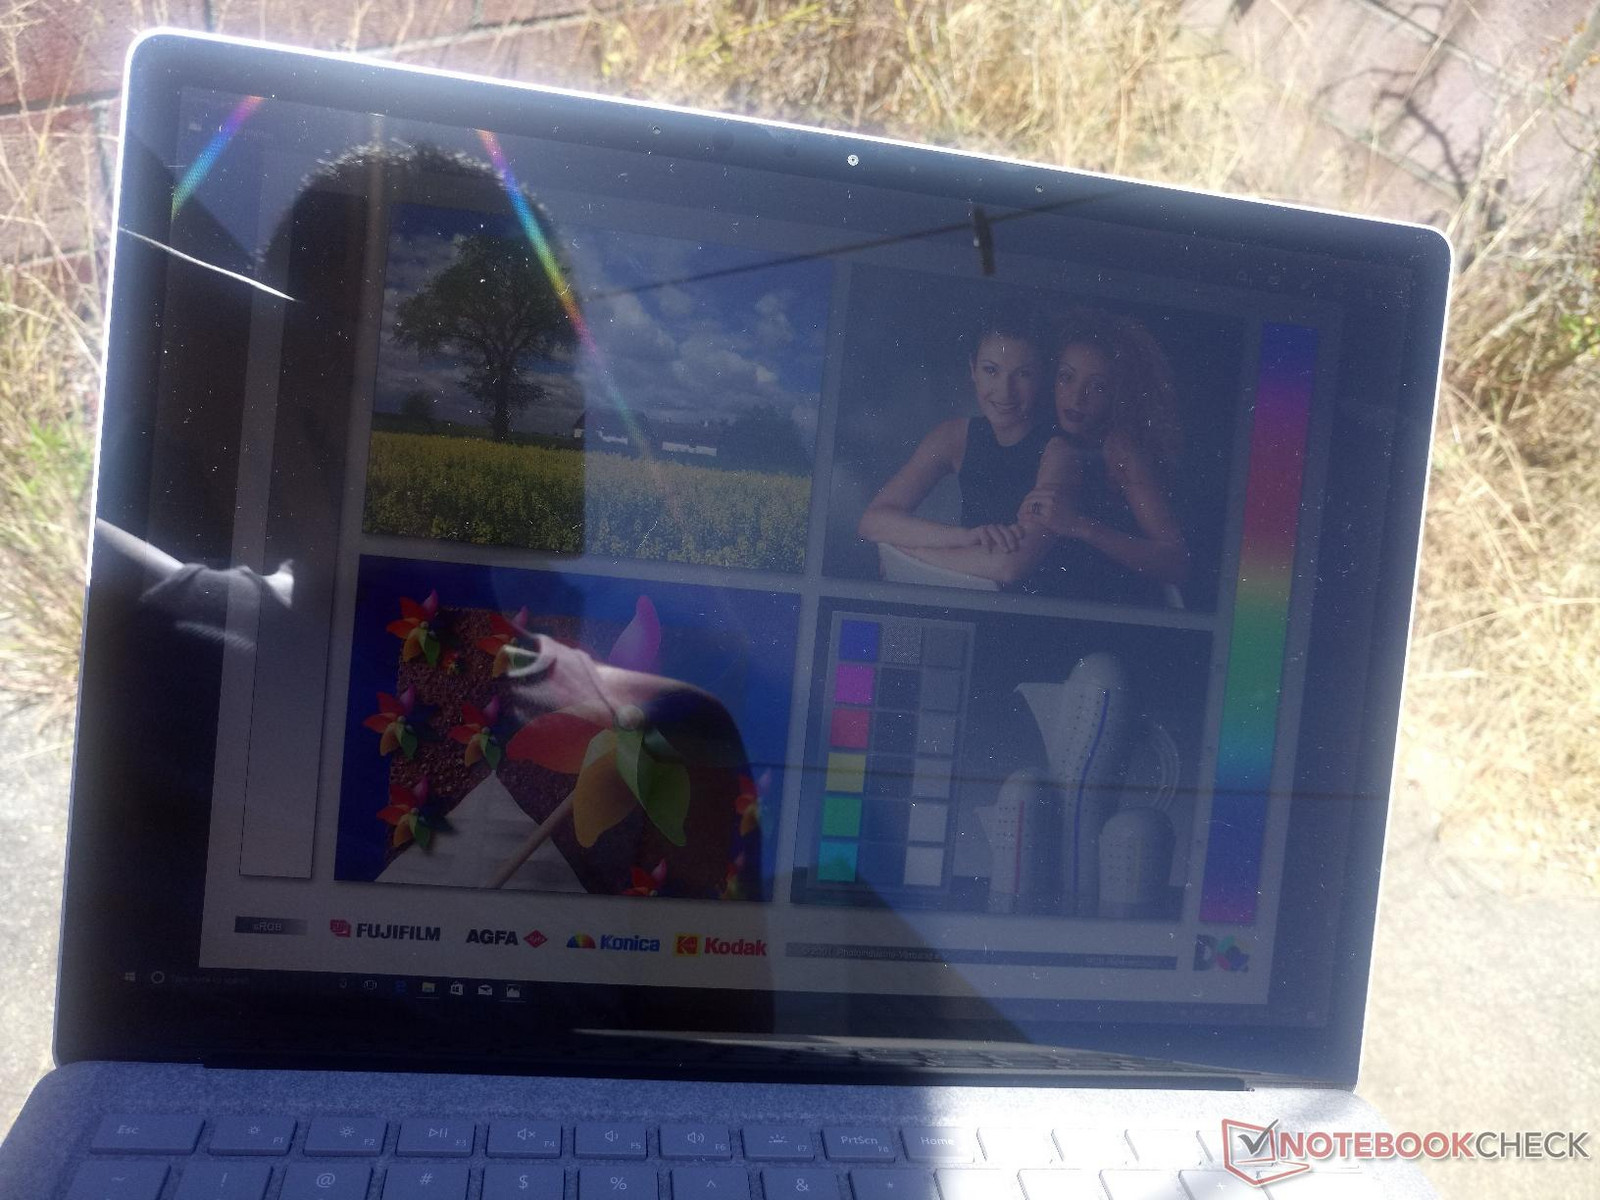
Outdoor visibility is adequate if under shade. Brighter ambient lighting from direct sunlight or an overcast day will produce too much glare on the glossy screen since the backlight is not powerful enough to overcome the surrounding light. Potential owners who intend to use the notebook outdoors more frequently might be better off with the lighter Surface Pro 4 or the Surface Pro 2017. Viewing angles are still excellent with no color degradation and only slight apparent contrast changes from extreme angles.

Performance
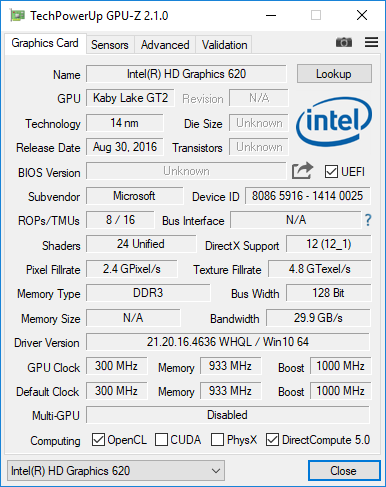
Current SKUs include either a Core i5 or Core i7 CPU with 4 GB to 16 GB of DDR3 RAM and up to 512 GB of internal storage space. It's particularly interesting to see Microsoft skip the more familiar i7-7600U found on most other Ultrabooks for the less common but graphically more adept i7-7660U. No discrete graphics options are available in order to avoid overlap with the current Surface Book lineup, but the Iris Plus Graphics 640 in the i7-7660U SKU should provide a healthy boost in GPU power over the HD Graphics 620 in our test model.
Processor
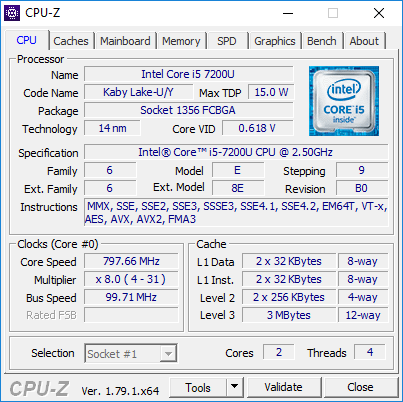
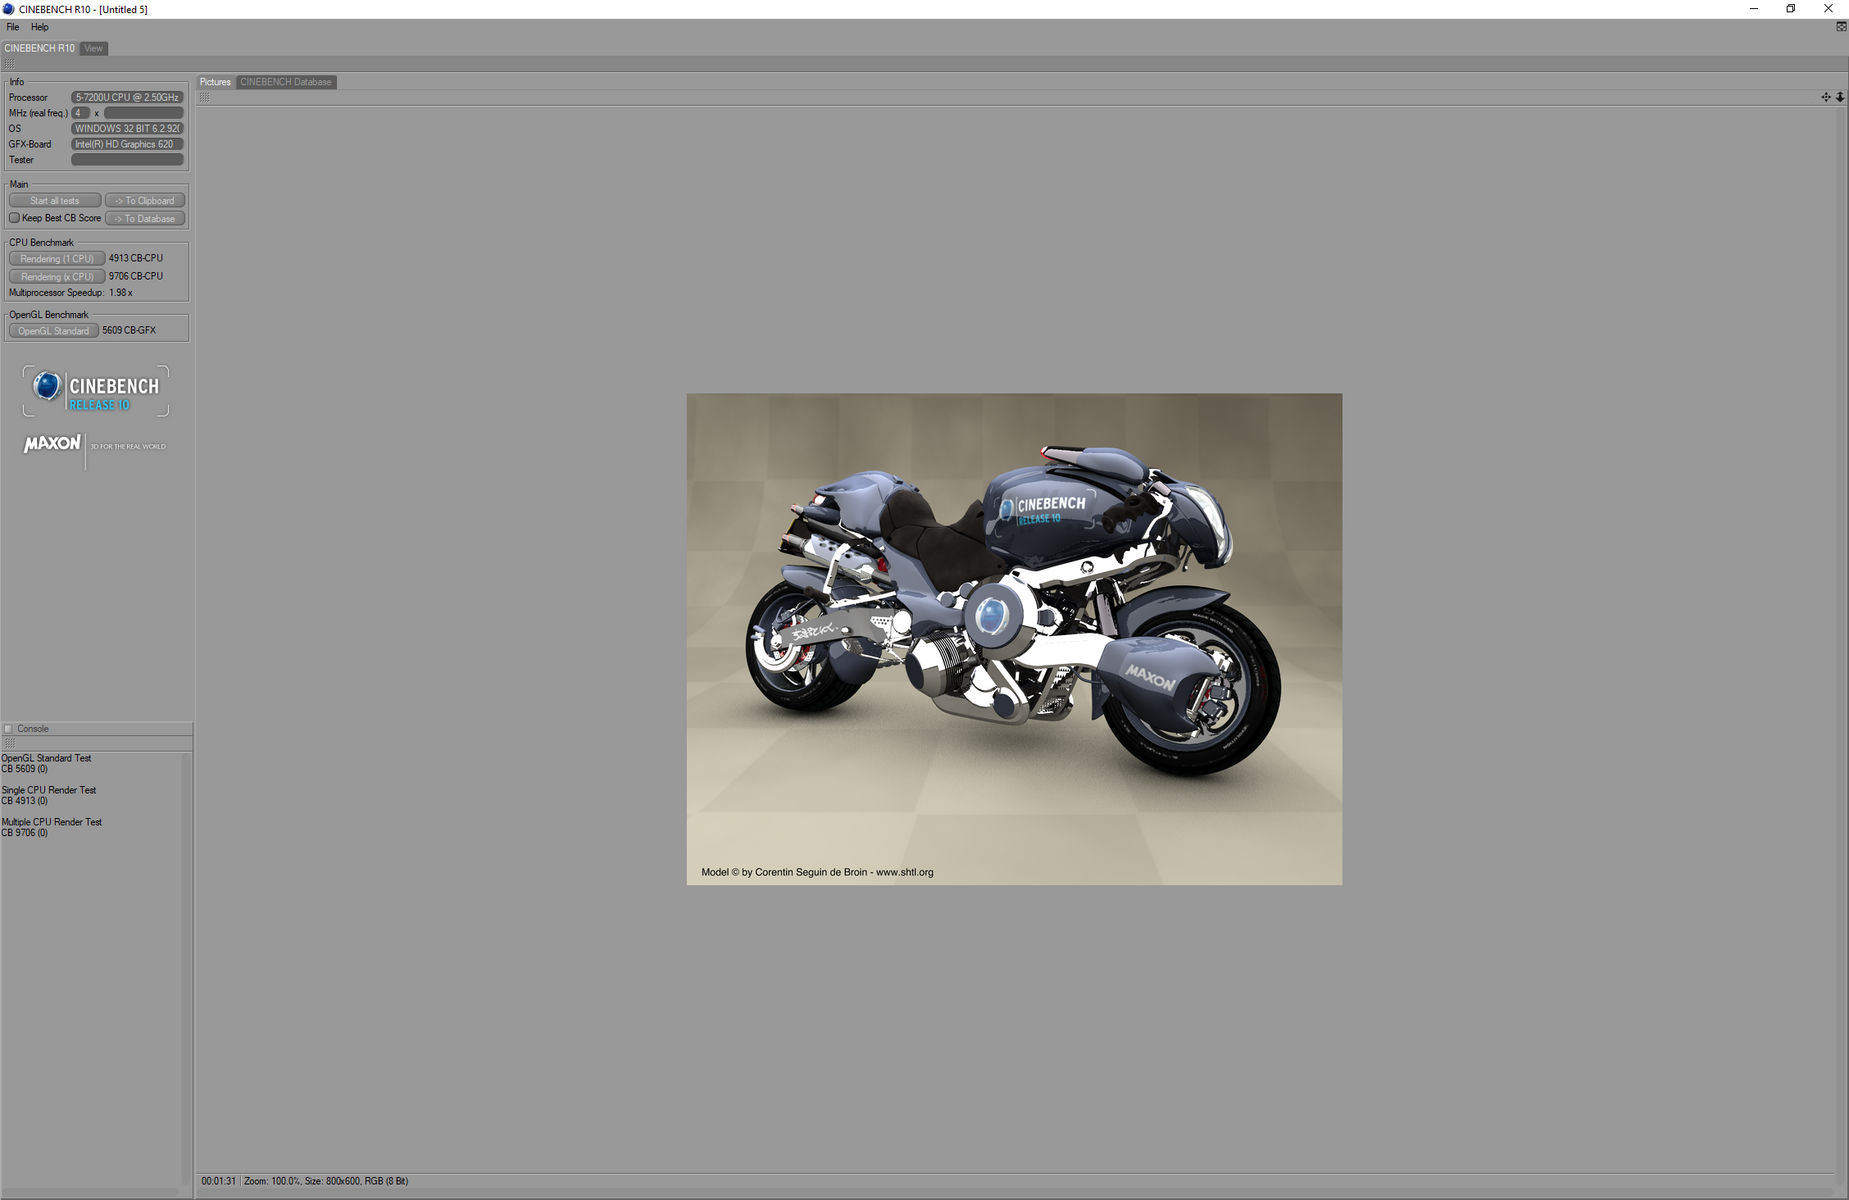
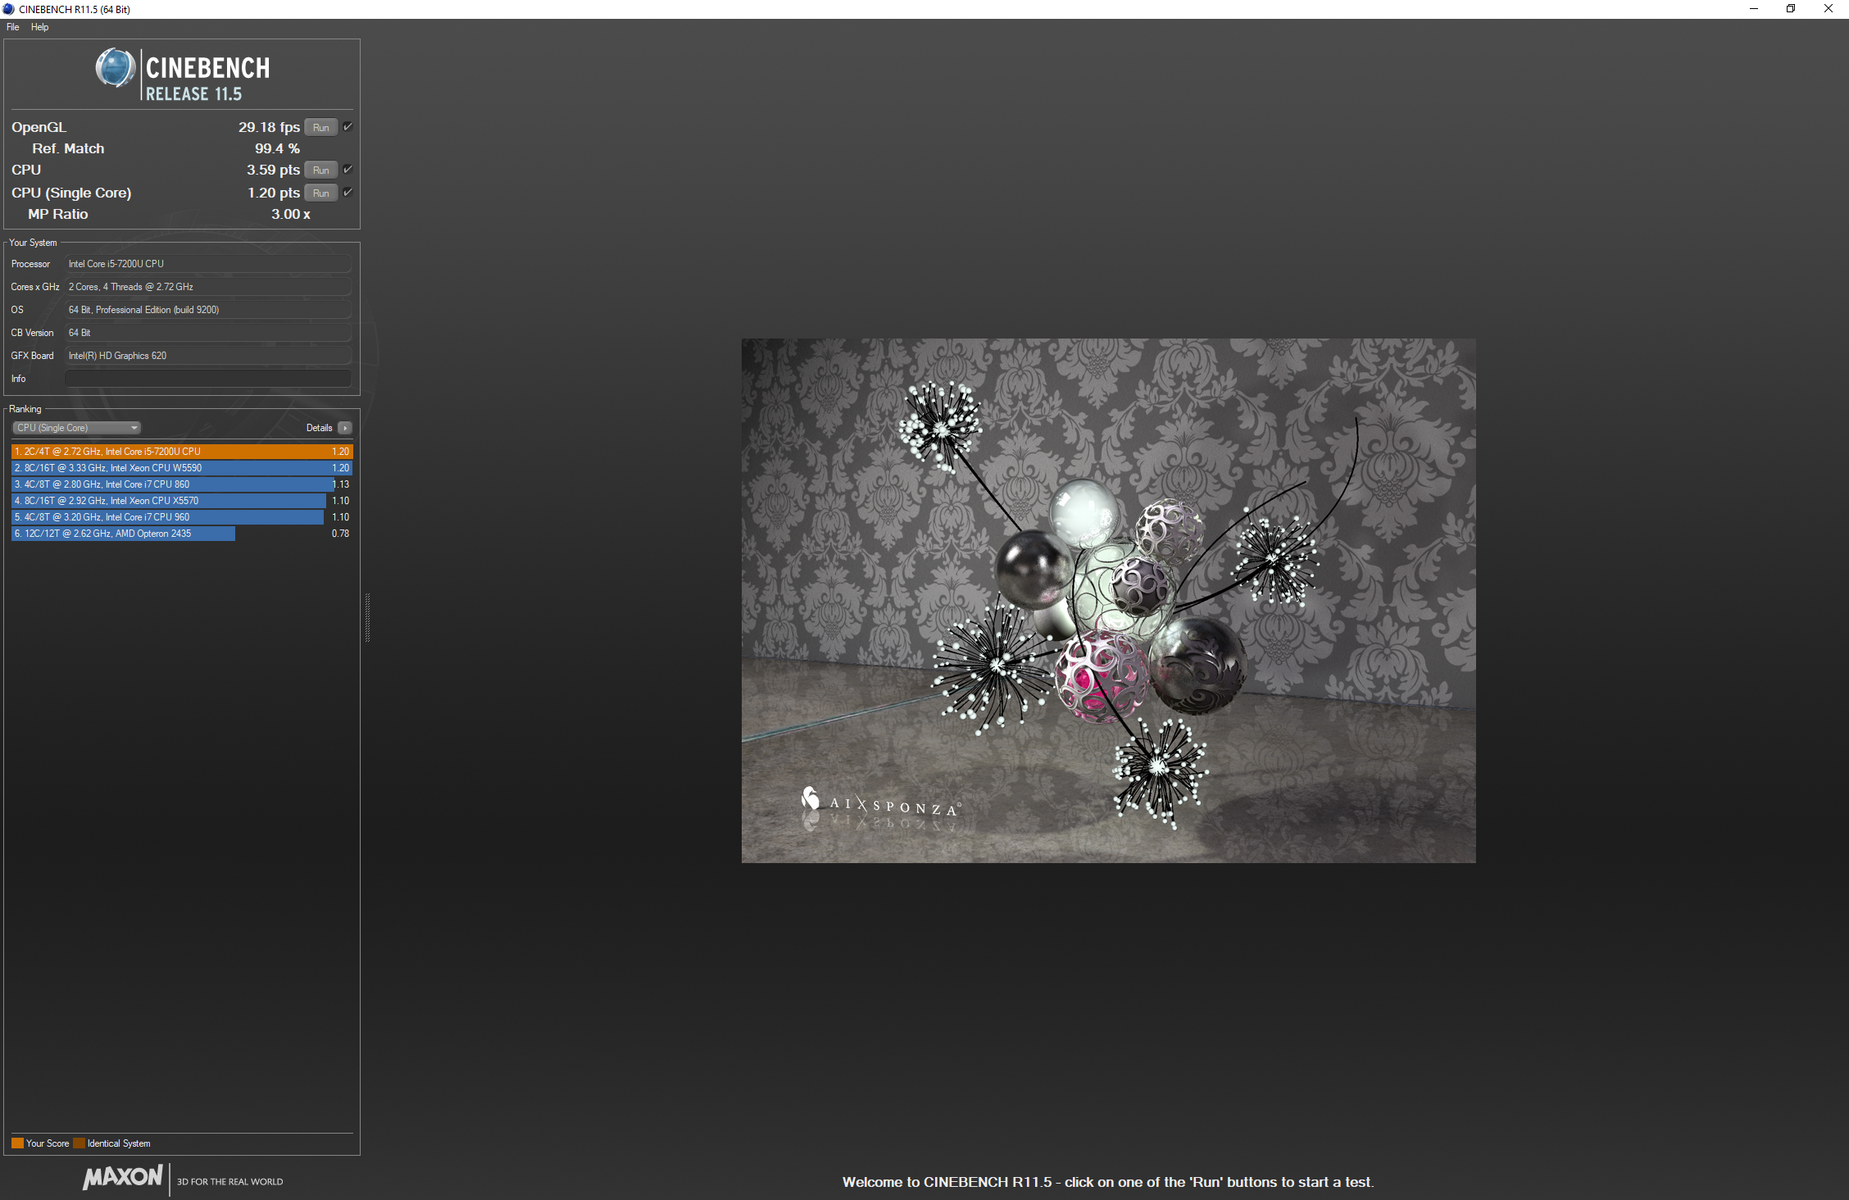
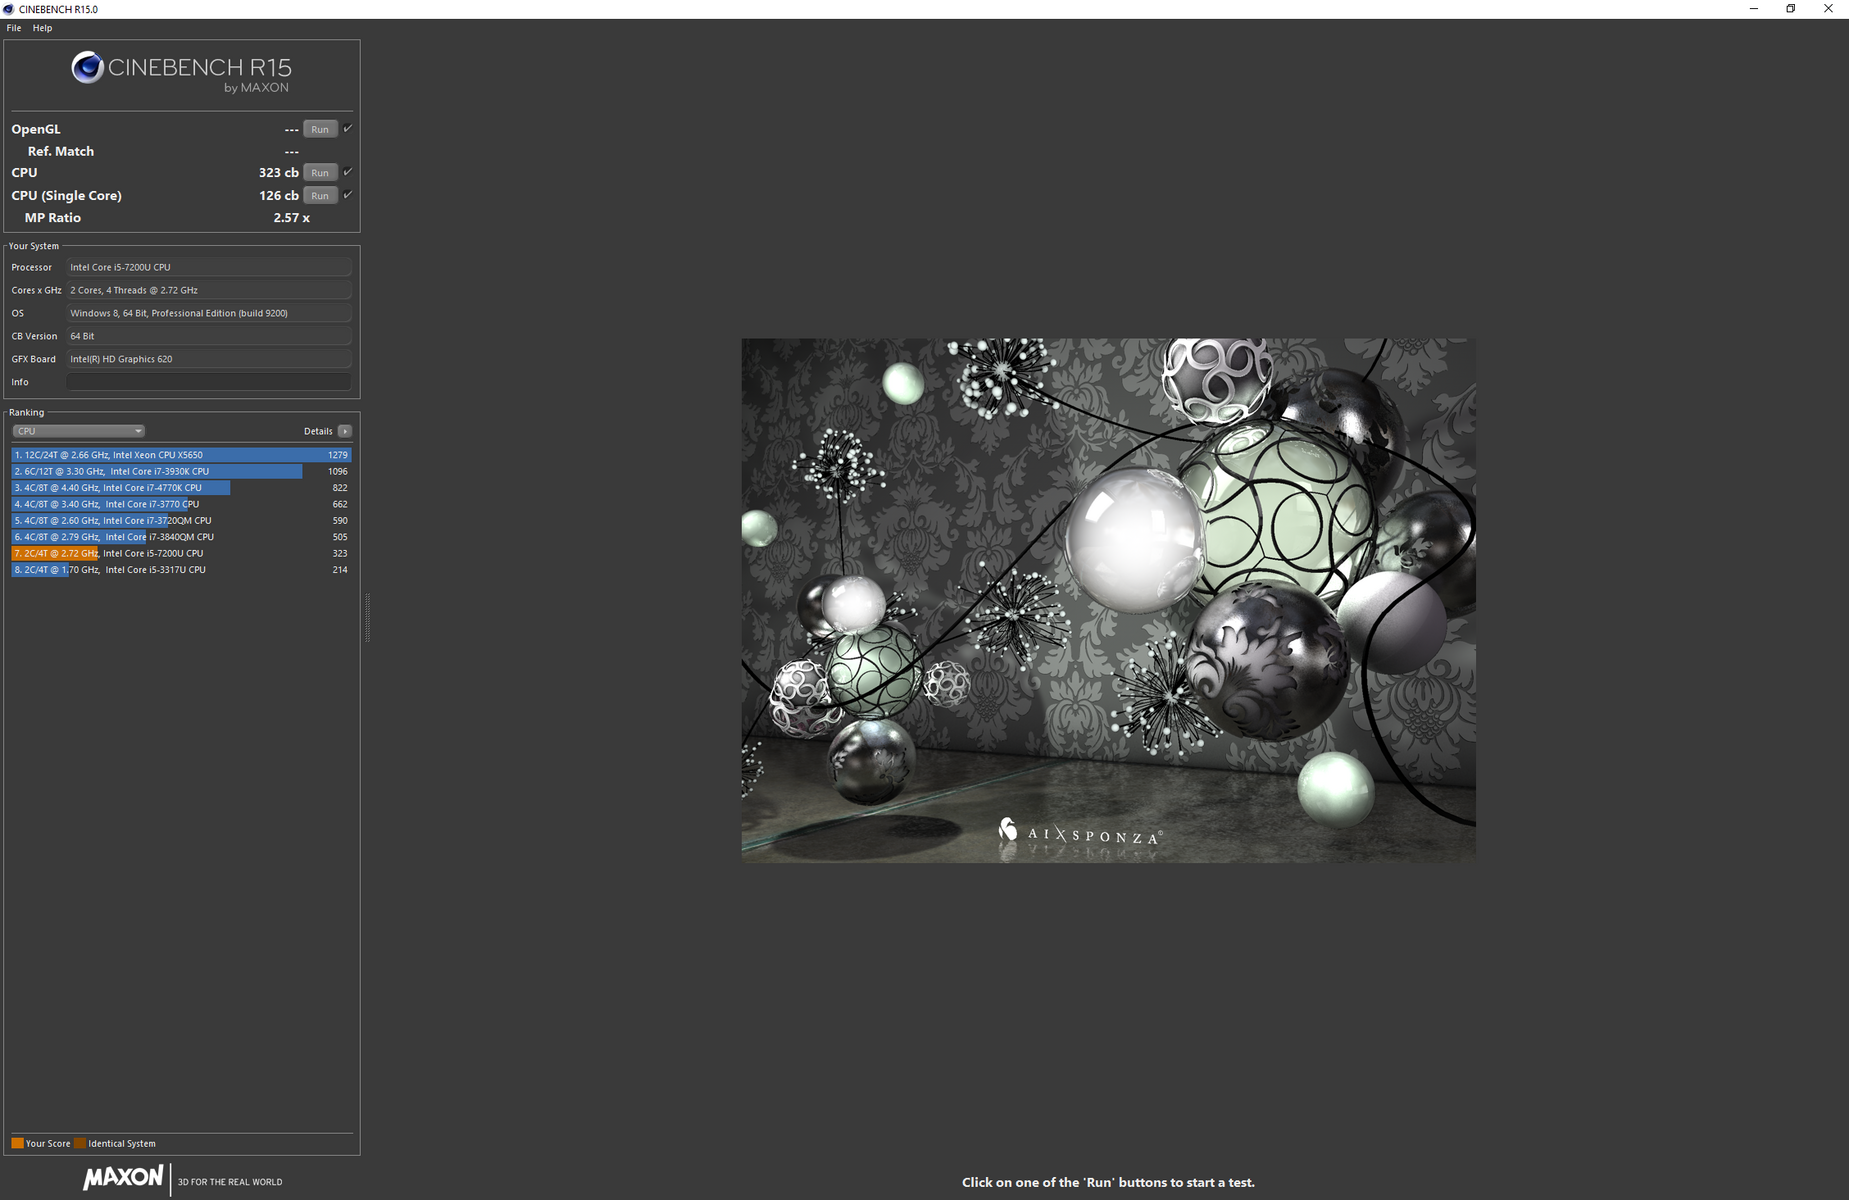
The i5-7200U in the base Surface Laptop SKU is a common Kaby Lake processor option found on competitors like the Spectre 13, Yoga 910, and Samsung Notebook 9. Performance is in line with where we expect the 7200U to be as CineBench scores are nearly identical to the similarly equipped Latitude 5280. Initially, our CineBench R15 Single-Thread score was too low at just 93 points, but scores returned to normal after allowing Windows Update to finish and reboot. Upgrading to the i7-7660U SKU should bring a performance boost of about 20 percent in both single- and multi-thread loads based on what we can extrapolate from the similar i7-7600U. Note that the minimum price difference between the i5 and i7 SKUs is $600 USD, so this meager 20 percent boost comes at a high cost.
Running CineBench Multi-Thread in a loop shows a ~7 percent performance drop over time from 320 points to 300 points. The drop is quite minor and it doesn't kick in until at least a handful of loops later, so most users will not likely notice. Nonetheless, this certainly has us concerned about how the higher-end i7-7660U SKU can perform when subjected to similar conditions.
See our dedicated page on the i5-7200U CPU for more technical information and benchmarks.
| wPrime 2.10 - 1024m | |
| Microsoft Surface Pro 4, Core m3 | |
| Lenovo Thinkpad 13-20J1001BUS | |
| Apple MacBook Pro 13 2016 | |
| Dell Latitude 5280 | |
| Microsoft Surface Laptop i5 | |
| Samsung Notebook 9 NP900X5N-X01US | |
* ... smaller is better
System Performance
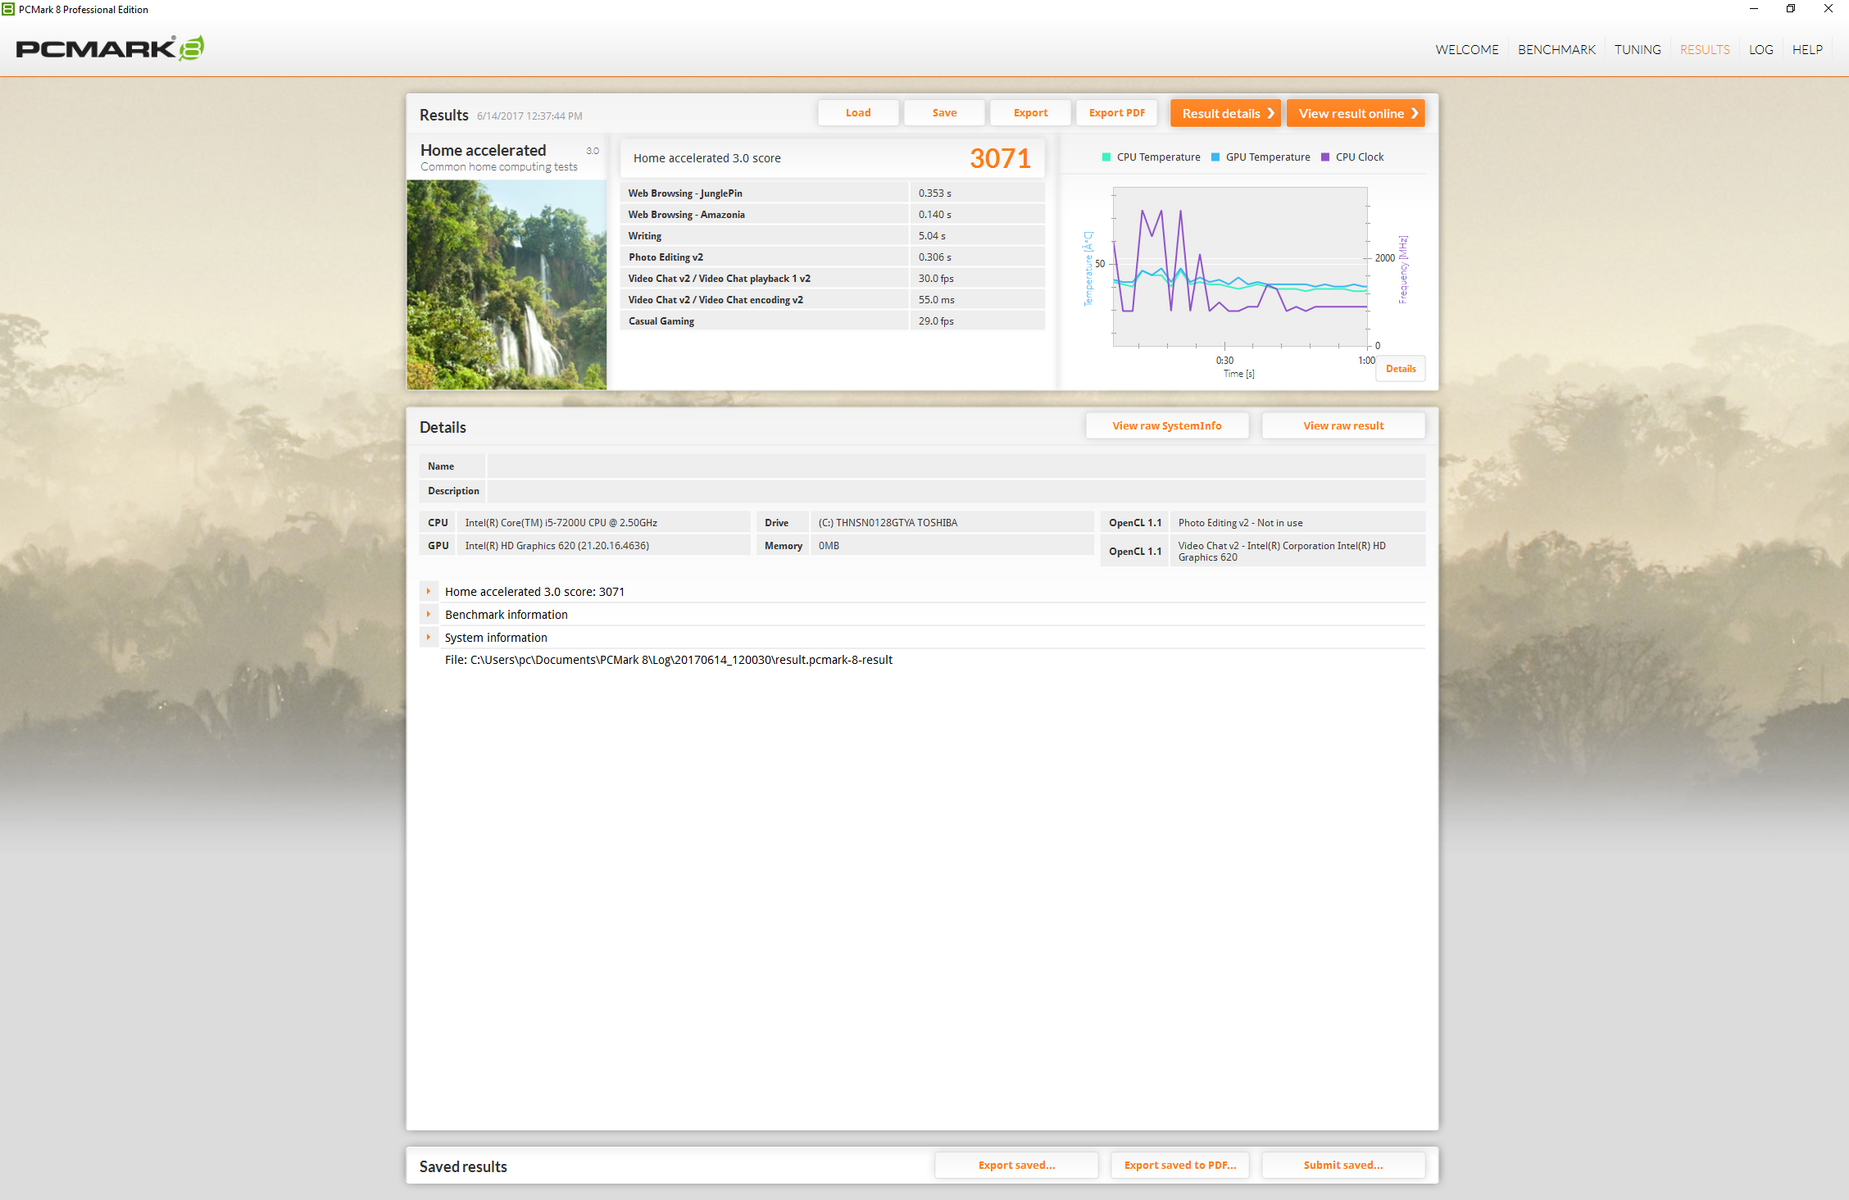
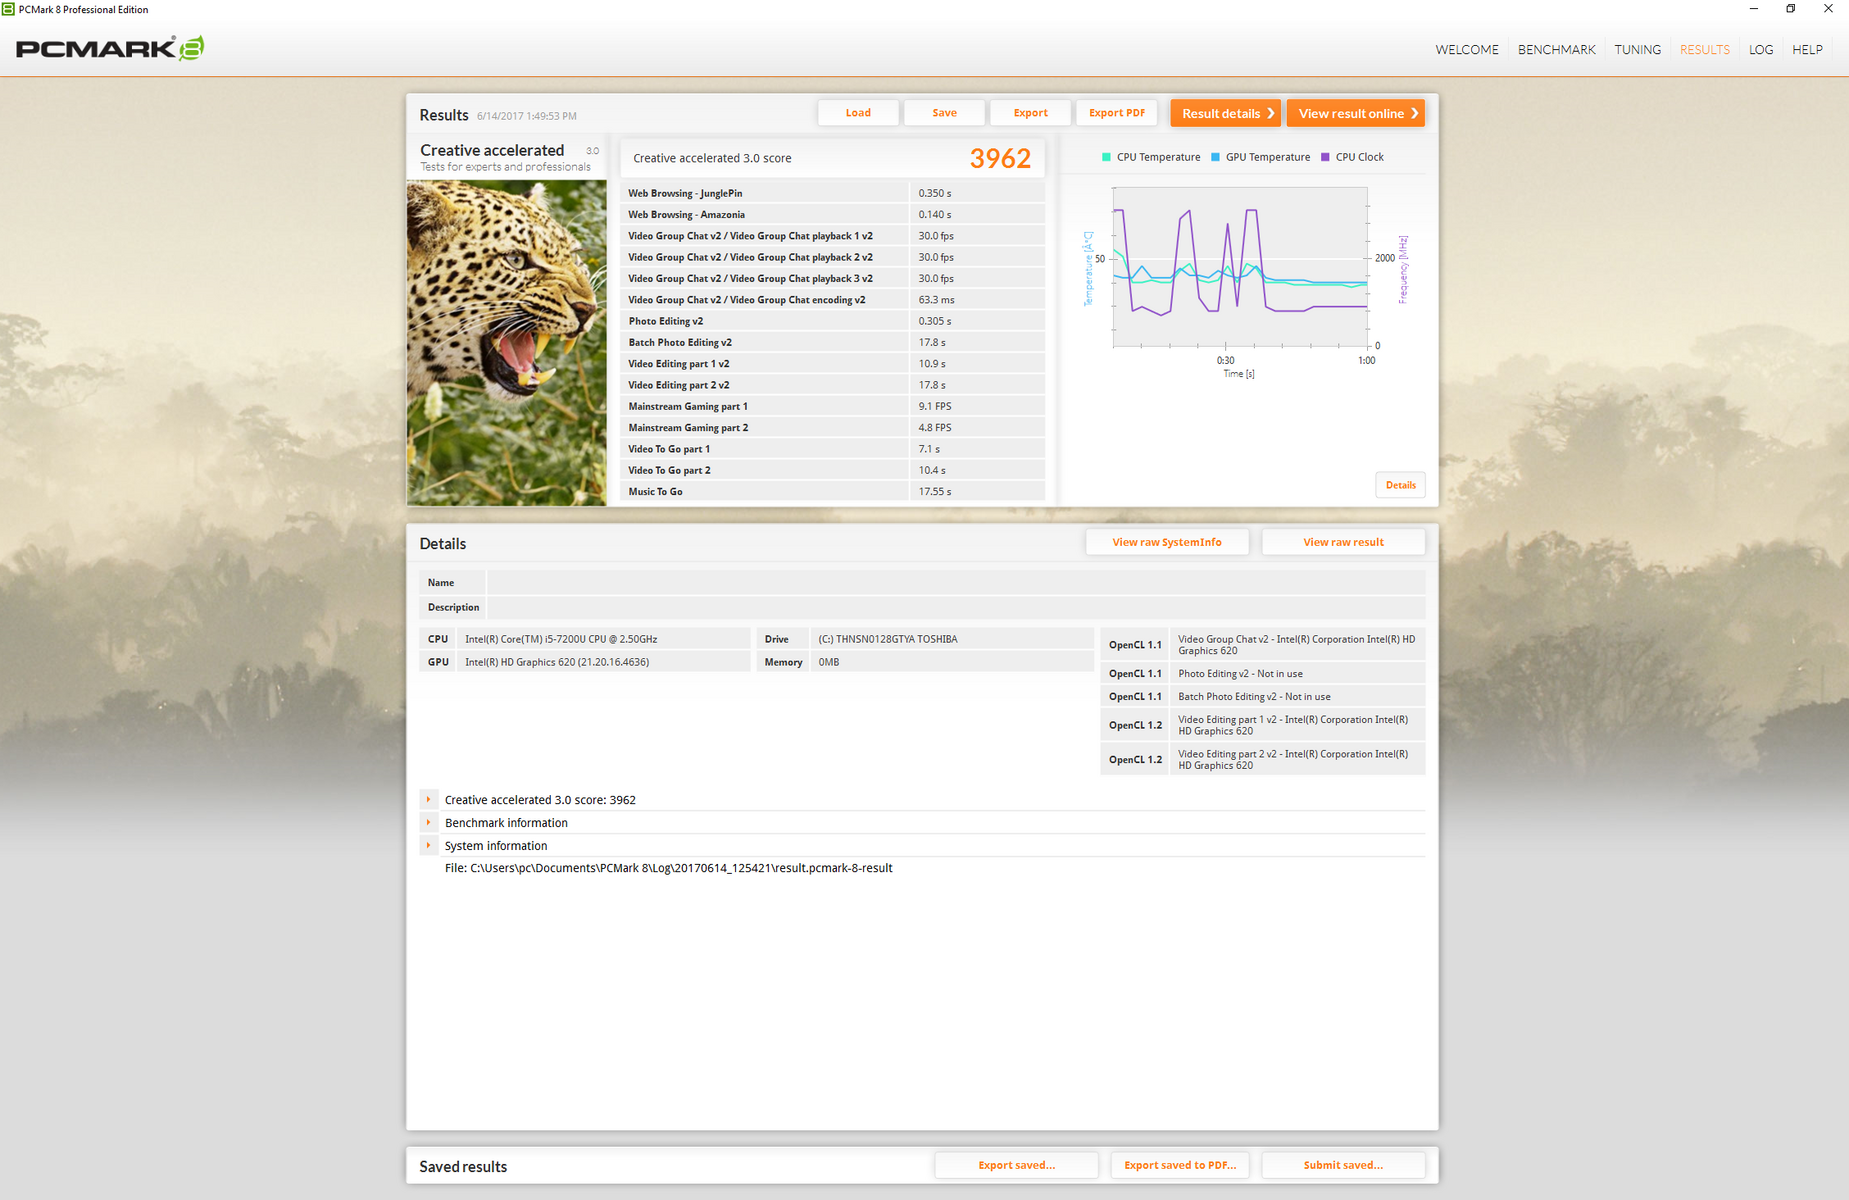
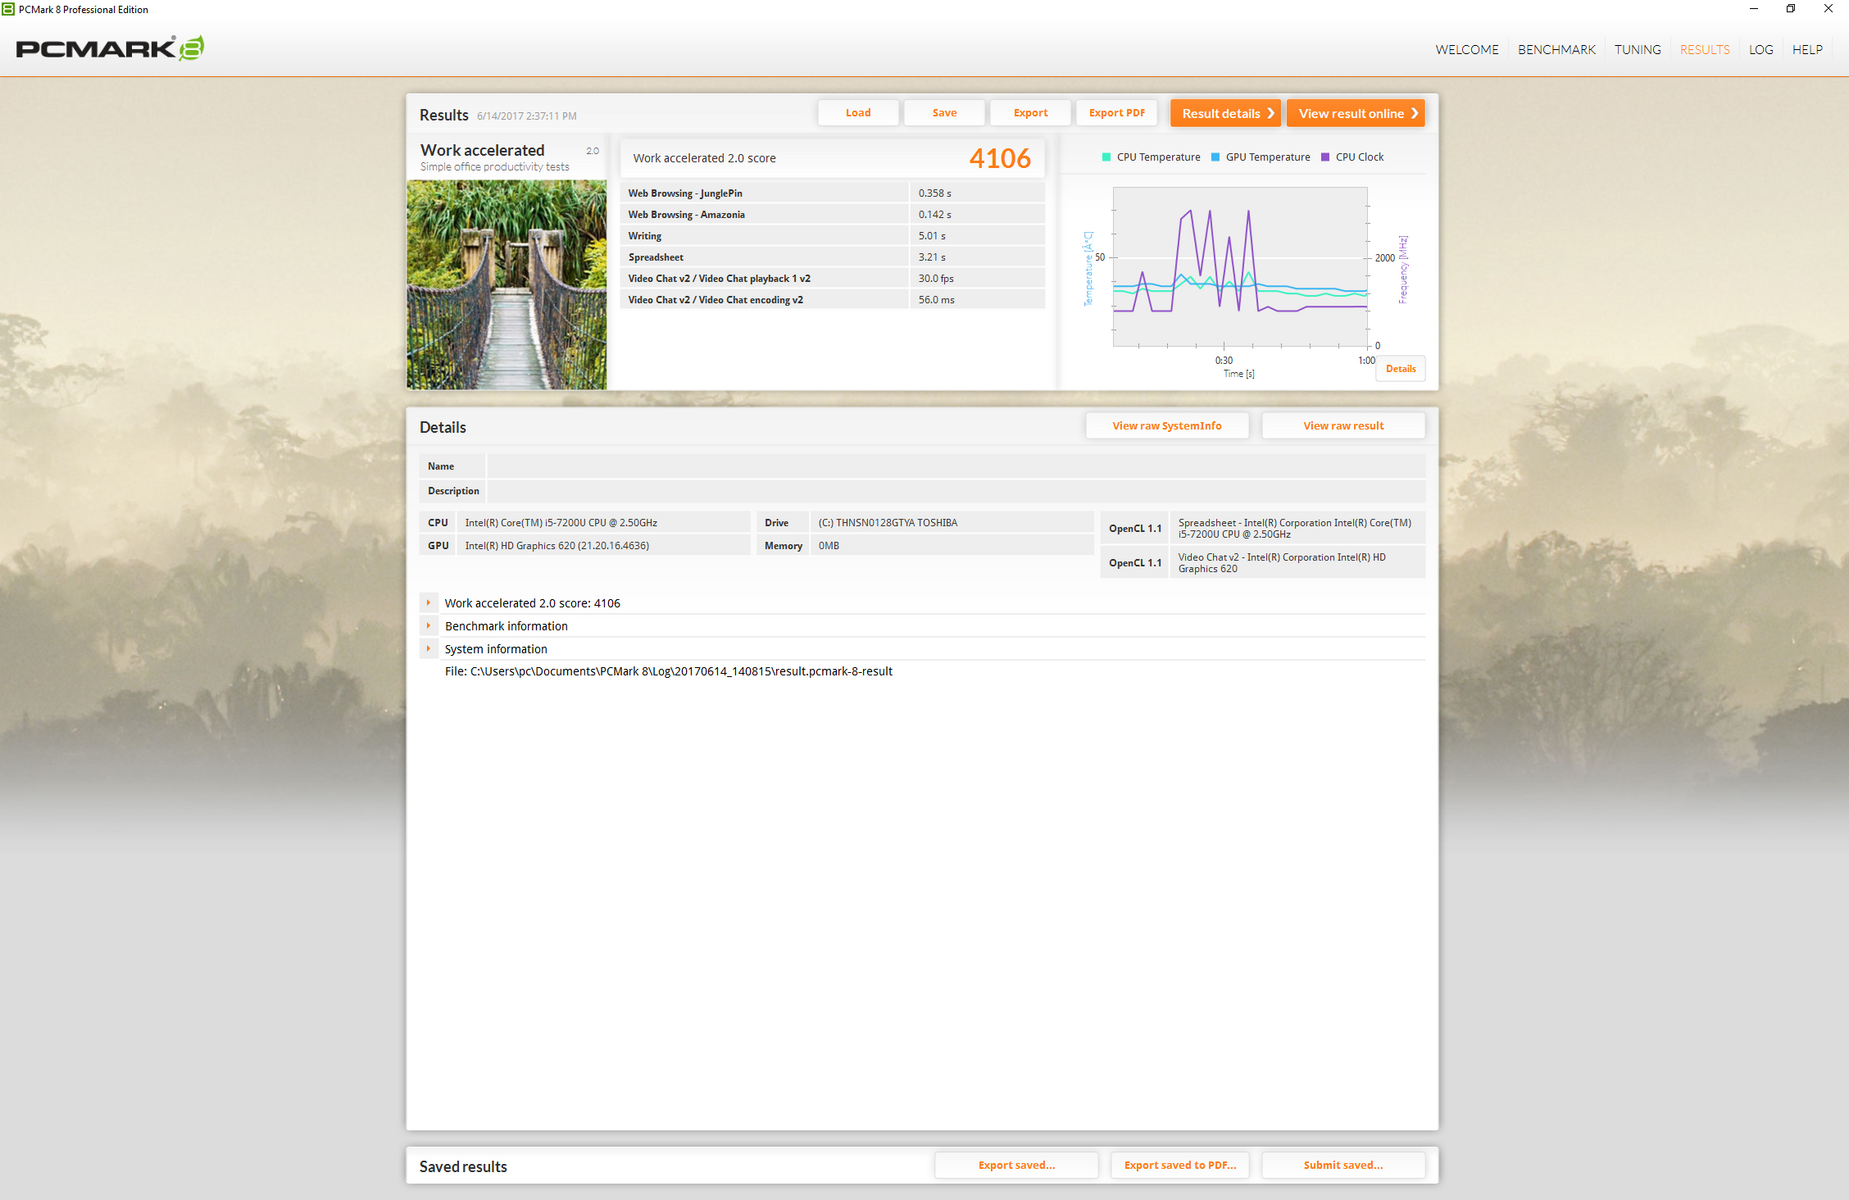
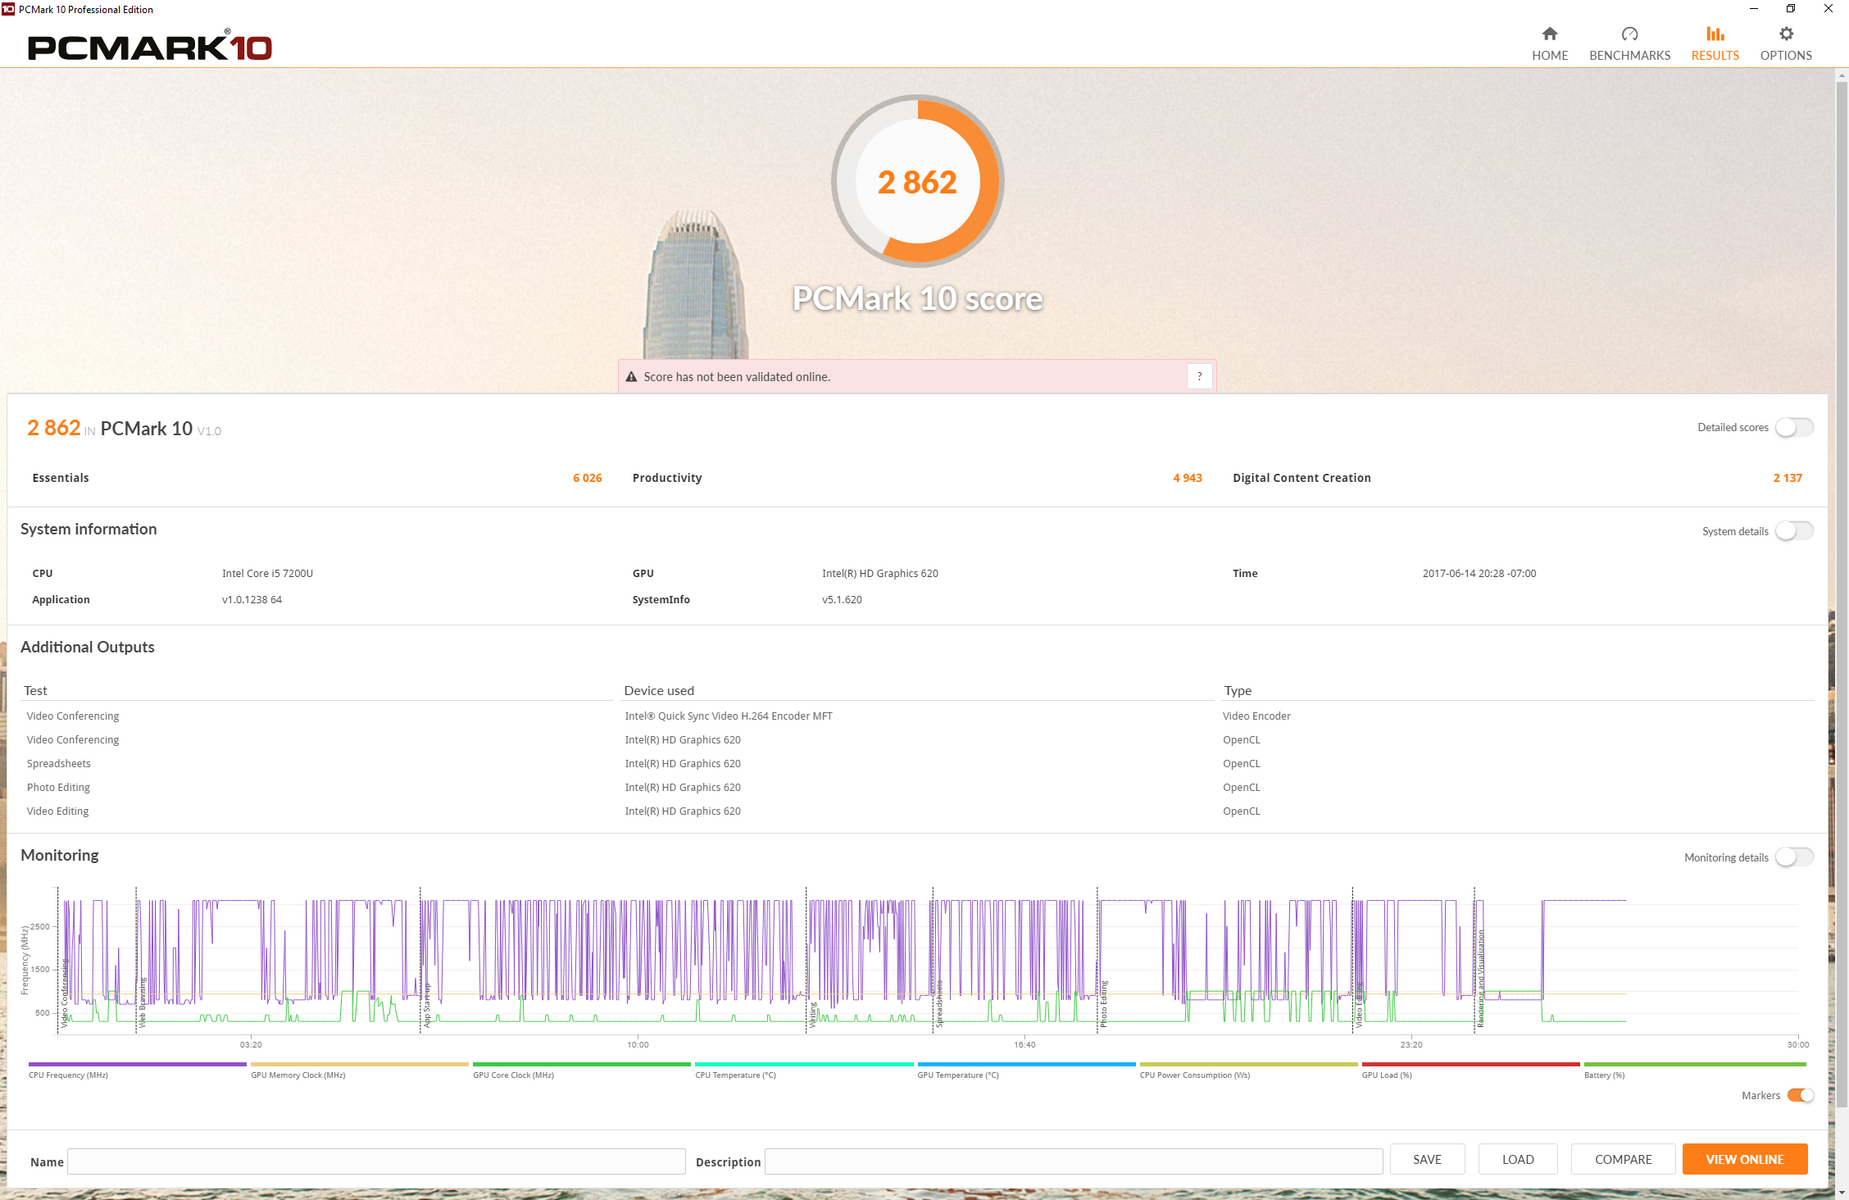
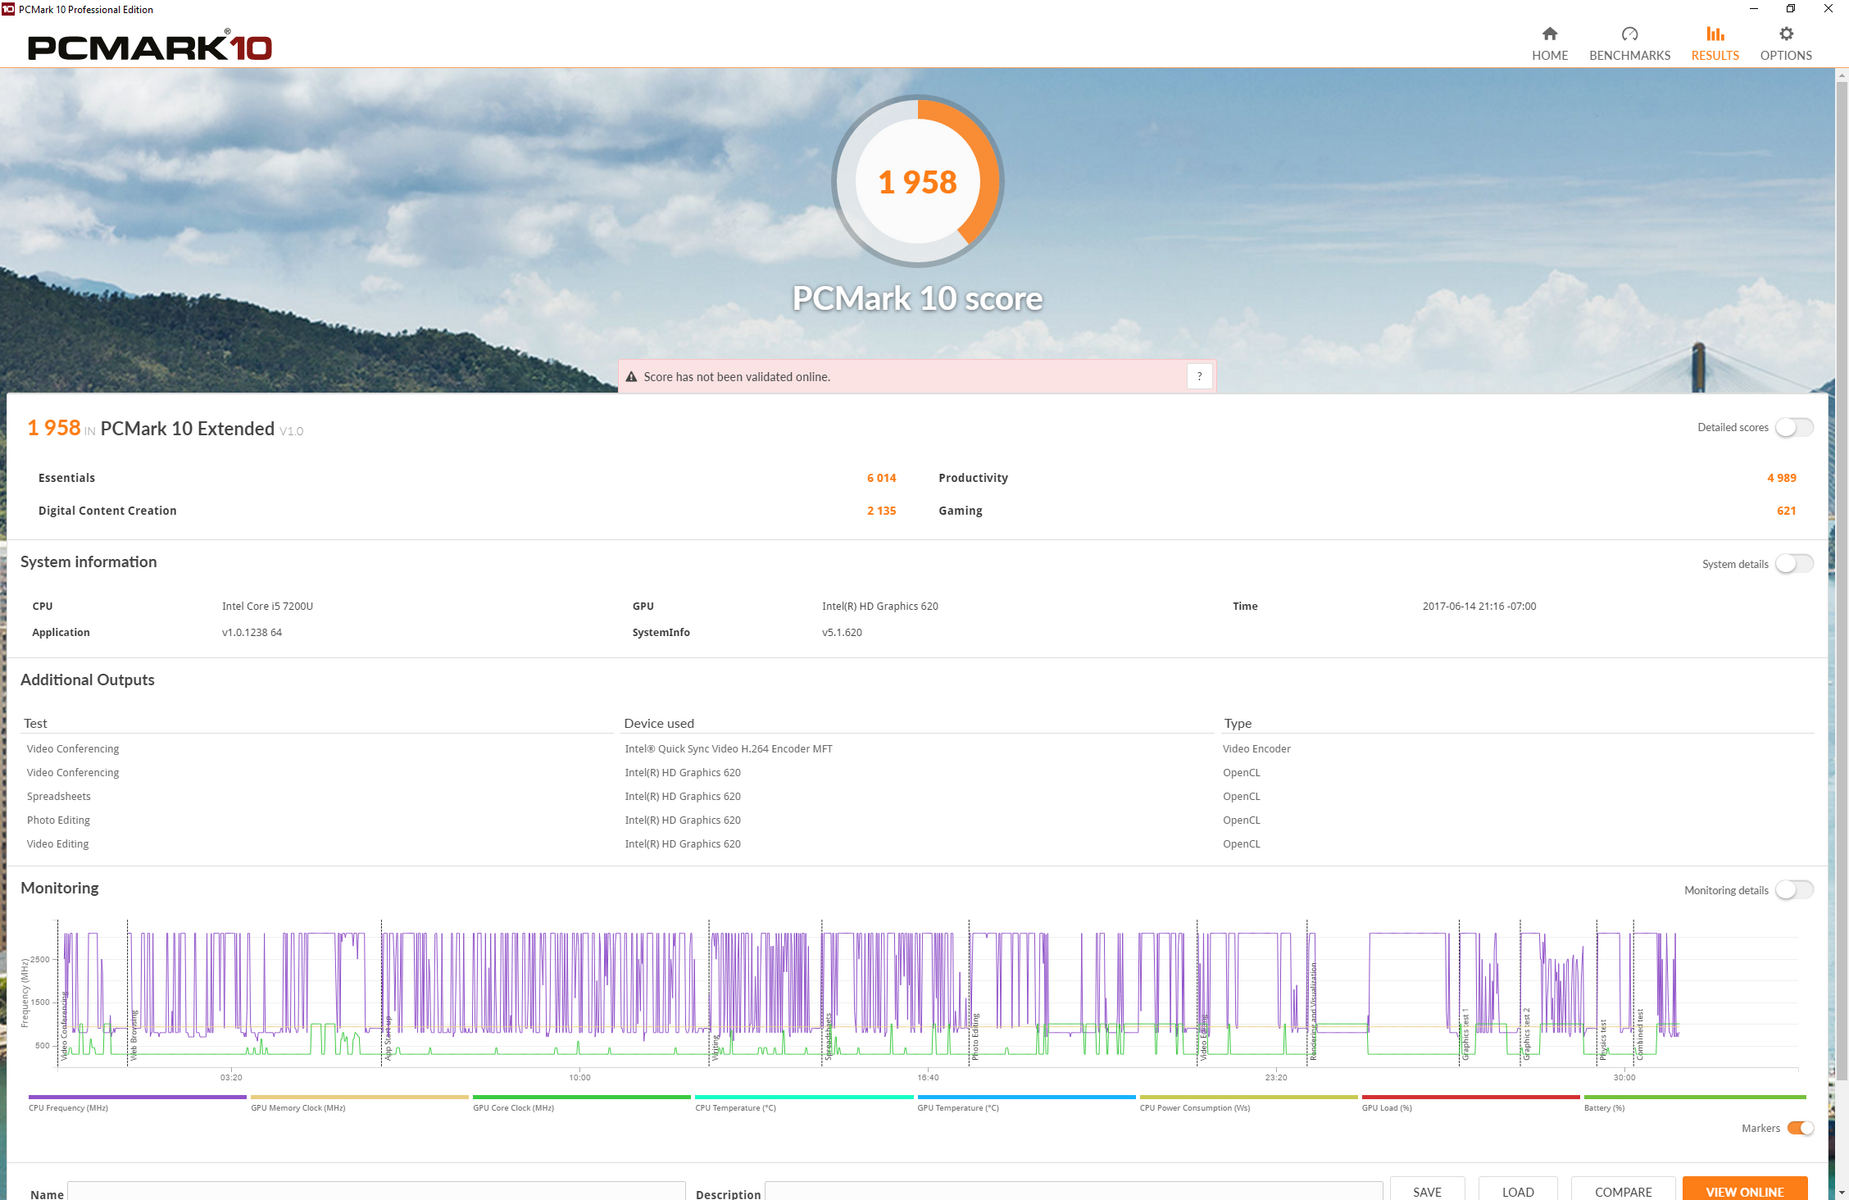
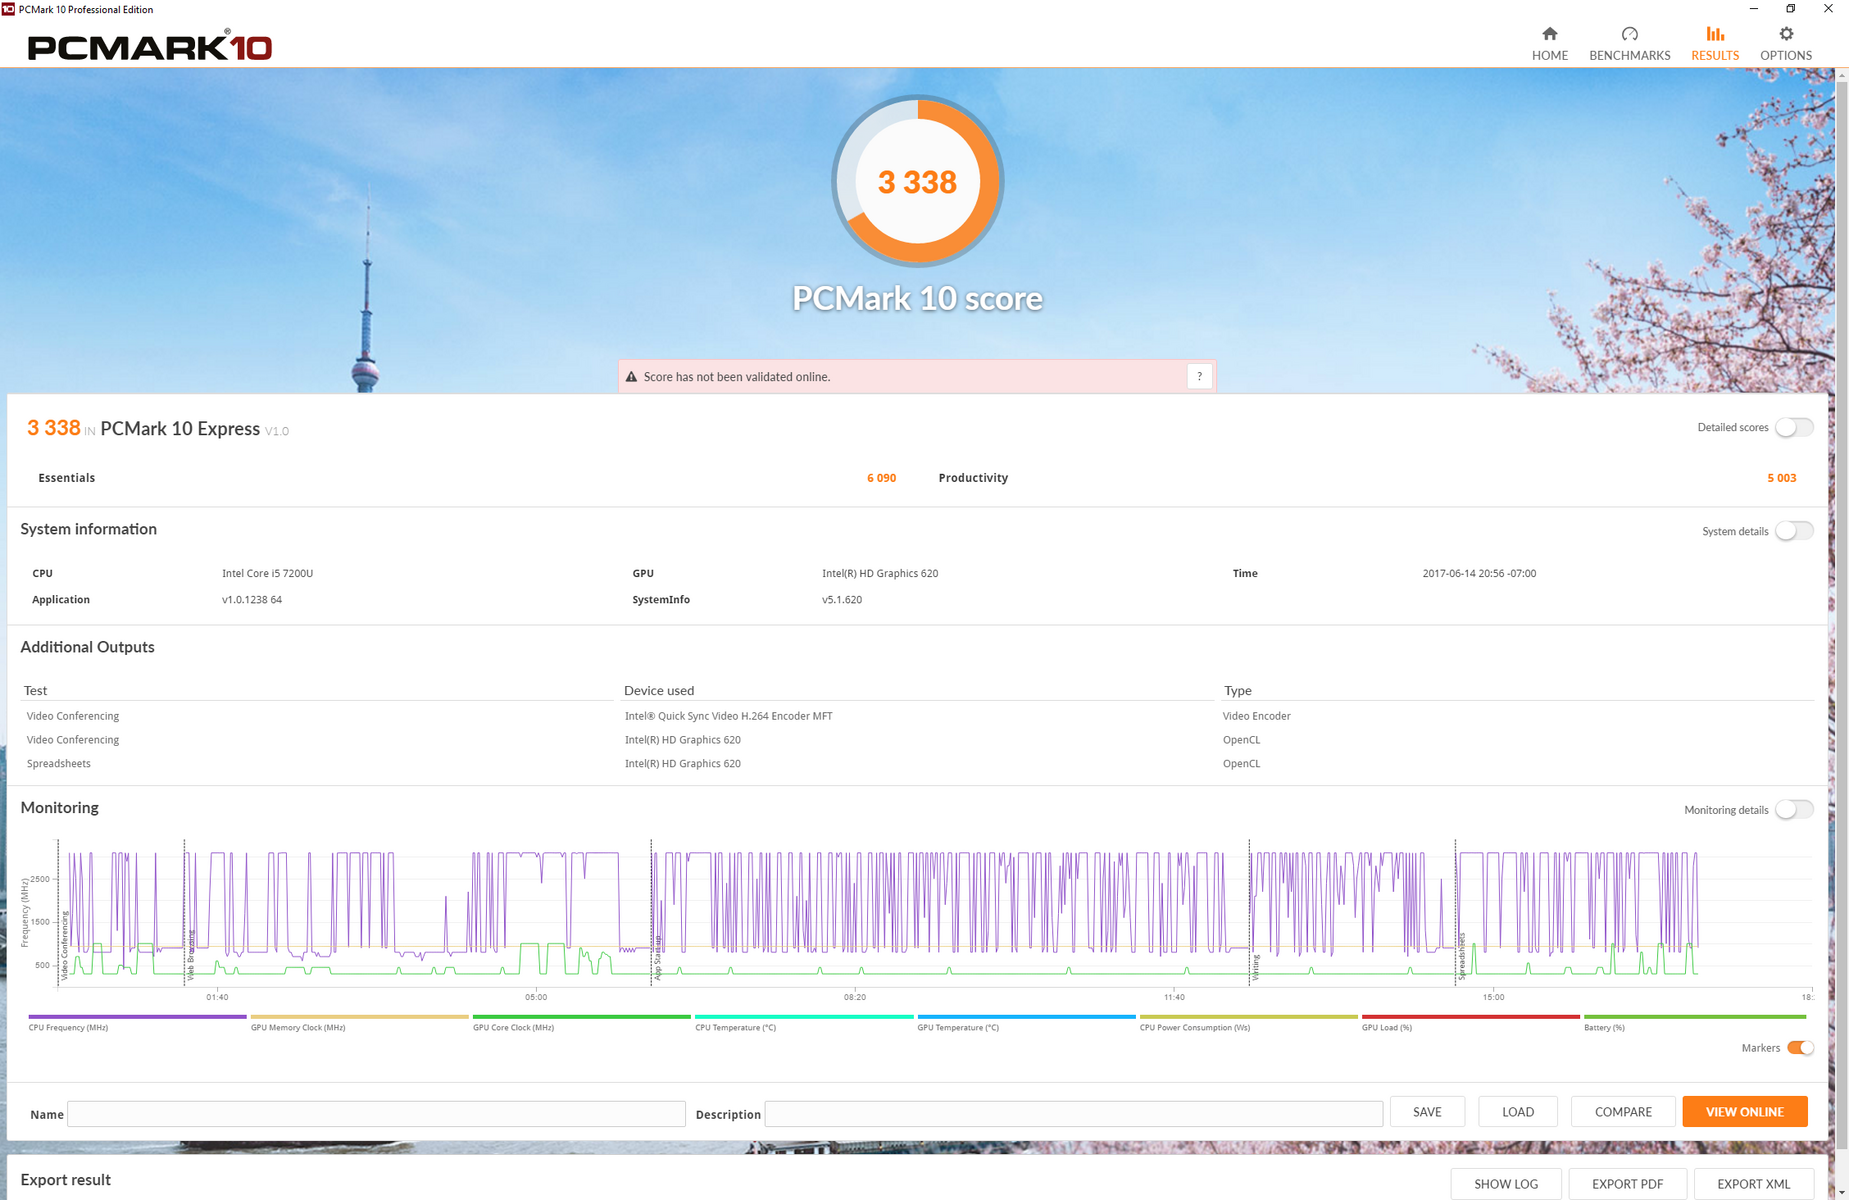
PCMark 8 scores essentially match that of the Surface Book and MacBook Pro 13. Thus, users need not worry about a dumbed-down experience if switching over to the Surface Laptop. We've also included PCMark 10 screenshots as shown below without any direct comparisons since the new benchmark is only a few weeks old. Owners wanting to upgrade from Windows 10 S to Windows 10 Pro may do so for free on the Surface Laptop until the end of the 2017. The switch is a permanent change as Microsoft wants to discourage users from jumping back and forth between the two operating systems. To our surprise, the upgrade process to Windows 10 Pro takes just mere minutes.
| PCMark 8 | |
| Home Score Accelerated v2 | |
| Apple MacBook Pro 13 2016 | |
| Microsoft Surface Laptop i5 | |
| Microsoft Surface Book with Performance Base | |
| Work Score Accelerated v2 | |
| Microsoft Surface Laptop i5 | |
| Microsoft Surface Book with Performance Base | |
| Apple MacBook Pro 13 2016 | |
| Creative Score Accelerated v2 | |
| Apple MacBook Pro 13 2016 | |
| Microsoft Surface Book with Performance Base | |
| Microsoft Surface Laptop i5 | |
| PCMark 8 Home Score Accelerated v2 | 3071 points | |
| PCMark 8 Creative Score Accelerated v2 | 3962 points | |
| PCMark 8 Work Score Accelerated v2 | 4106 points | |
Help | ||
Storage Devices
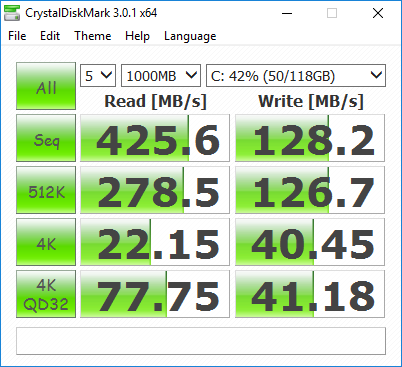
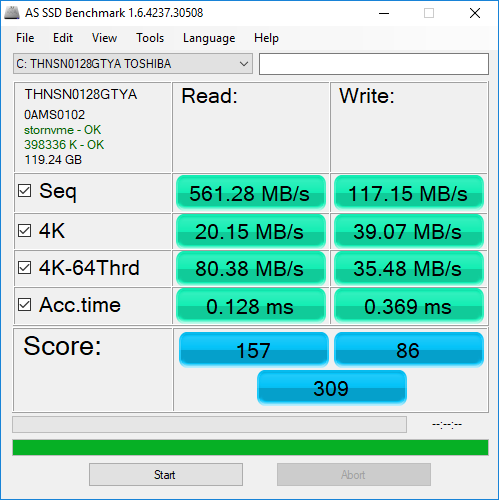
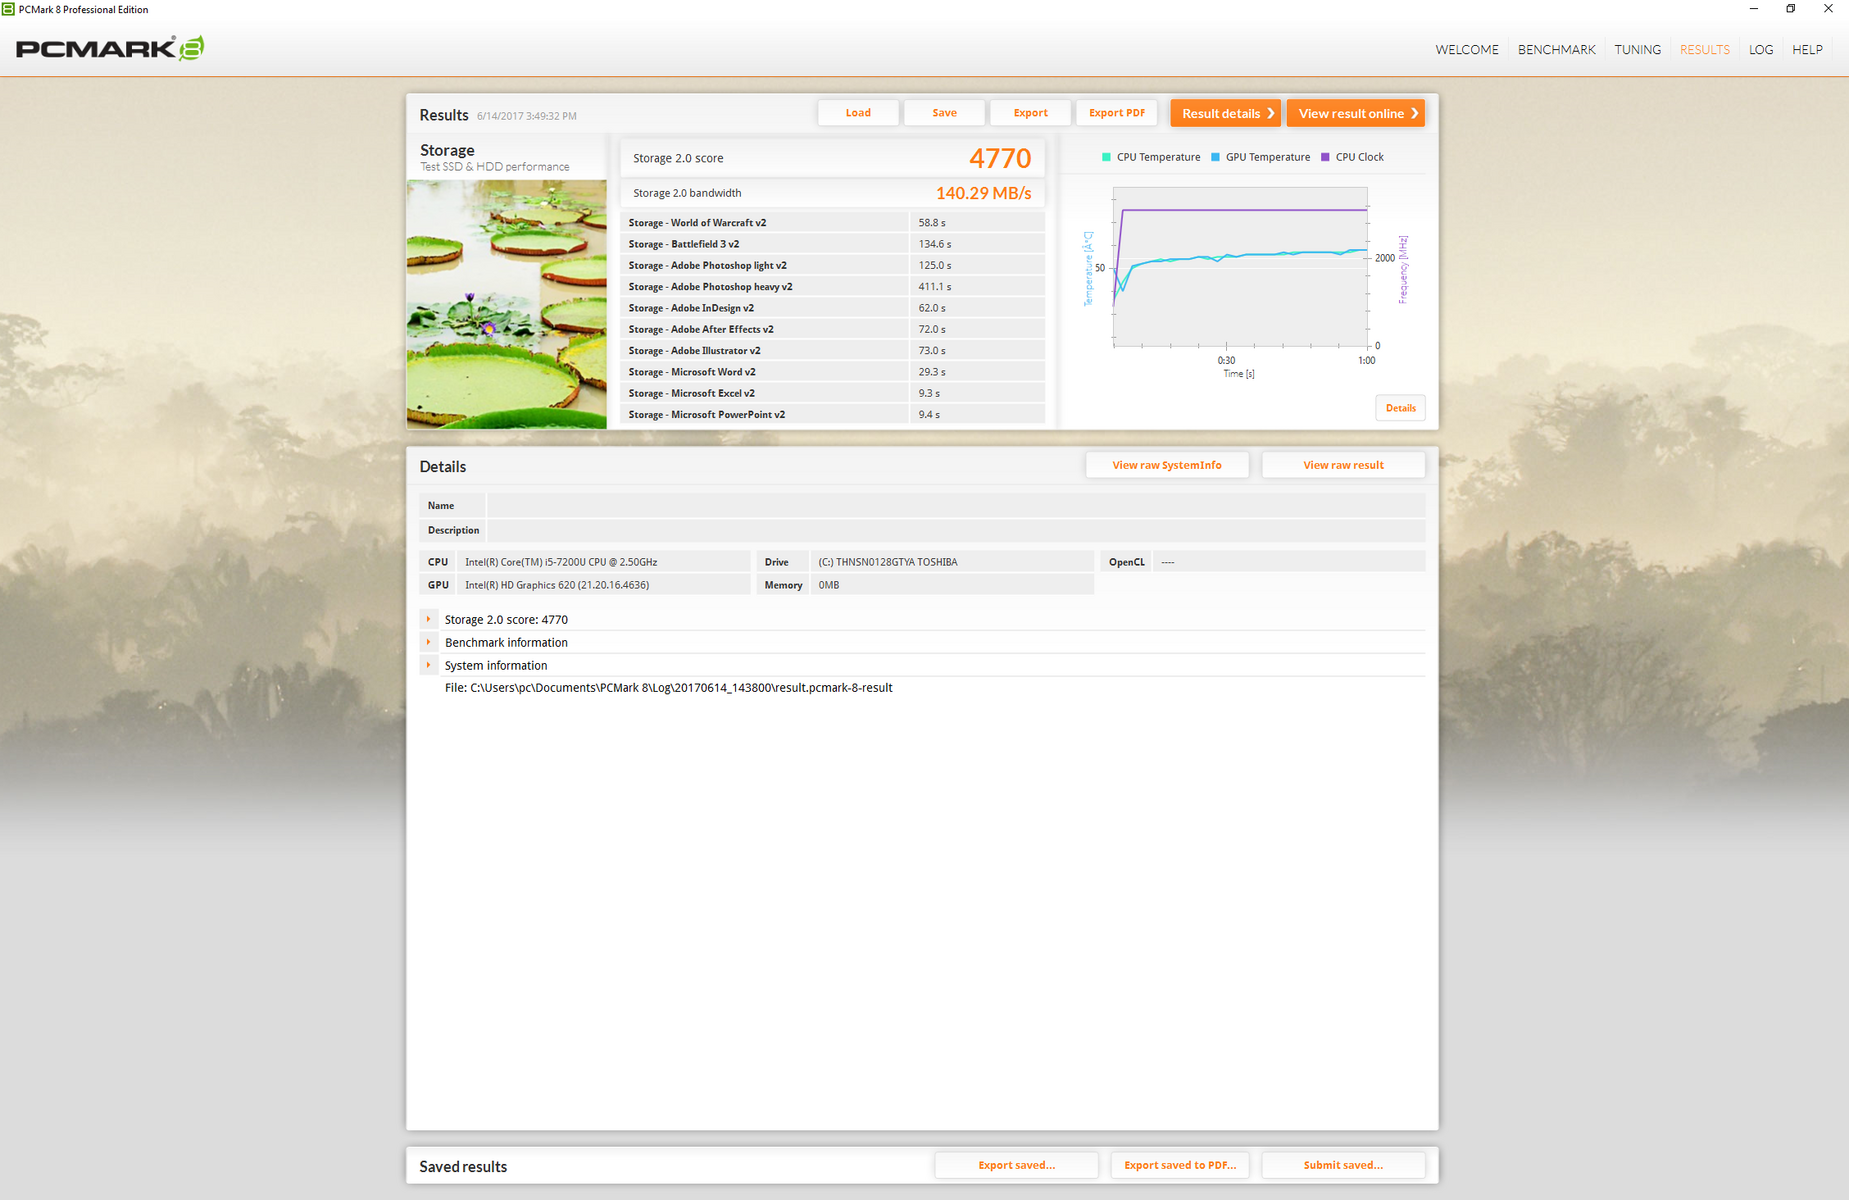
It's disappointing to see such a slow internal SSD as sequential read and write rates lag behind the already under-performing 128 GB Samsung in the Surface Pro 4. Essentially every modern Ultrabook can outclass our Surface Laptop especially those with NVMe support. Digging deeper into the 128 GB Toshiba THNSN0128GTYA M.2 1620 SSD reveals that it is officially rated for sequential read and write speeds of just 700 MiB/s and 130 MiB/s, respectively. Microsoft currently offers larger 256 GB and 512 GB drives that will likely carry different performance ratings, but we can't imagine video editors or graphic artists being too happy with the poor results of this 128 GB SKU.
See our growing table of SSDs and HDDs for more benchmark comparisons.
| Microsoft Surface Laptop i5 Toshiba THNSN0128GTYA | Microsoft Surface Book with Performance Base Toshiba NVMe THNSN5256GPU7 | Microsoft Surface Pro 4, Core i5, 128GB Samsung MZFLV128 NVMe | Apple MacBook Pro 13 2016 (2.9 GHz) Apple SSD AP0256 | Dell XPS 13 9360 FHD i5 Toshiba NVMe THNSN5256GPUK | |
|---|---|---|---|---|---|
| CrystalDiskMark 3.0 | 328% | 115% | 527% | 294% | |
| Read Seq (MB/s) | 425.6 | 1017 139% | 666 56% | 1662 291% | 1233 190% |
| Write Seq (MB/s) | 128.2 | 861 572% | 154.2 20% | 1336 942% | 733 472% |
| Read 512 (MB/s) | 278.5 | 687 147% | 266.3 -4% | 1183 325% | 1036 272% |
| Write 512 (MB/s) | 126.7 | 698 451% | 154.2 22% | 1481 1069% | 439.9 247% |
| Read 4k (MB/s) | 22.15 | 40.91 85% | 28.51 29% | 16.1 -27% | 29.31 32% |
| Write 4k (MB/s) | 40.45 | 108.6 168% | 101.5 151% | 23.5 -42% | 116.9 189% |
| Read 4k QD32 (MB/s) | 77.8 | 326.9 320% | 368.3 373% | 657 744% | 479.2 516% |
| Write 4k QD32 (MB/s) | 41.18 | 347.1 743% | 153.6 273% | 419 917% | 218.3 430% |

GPU Performance
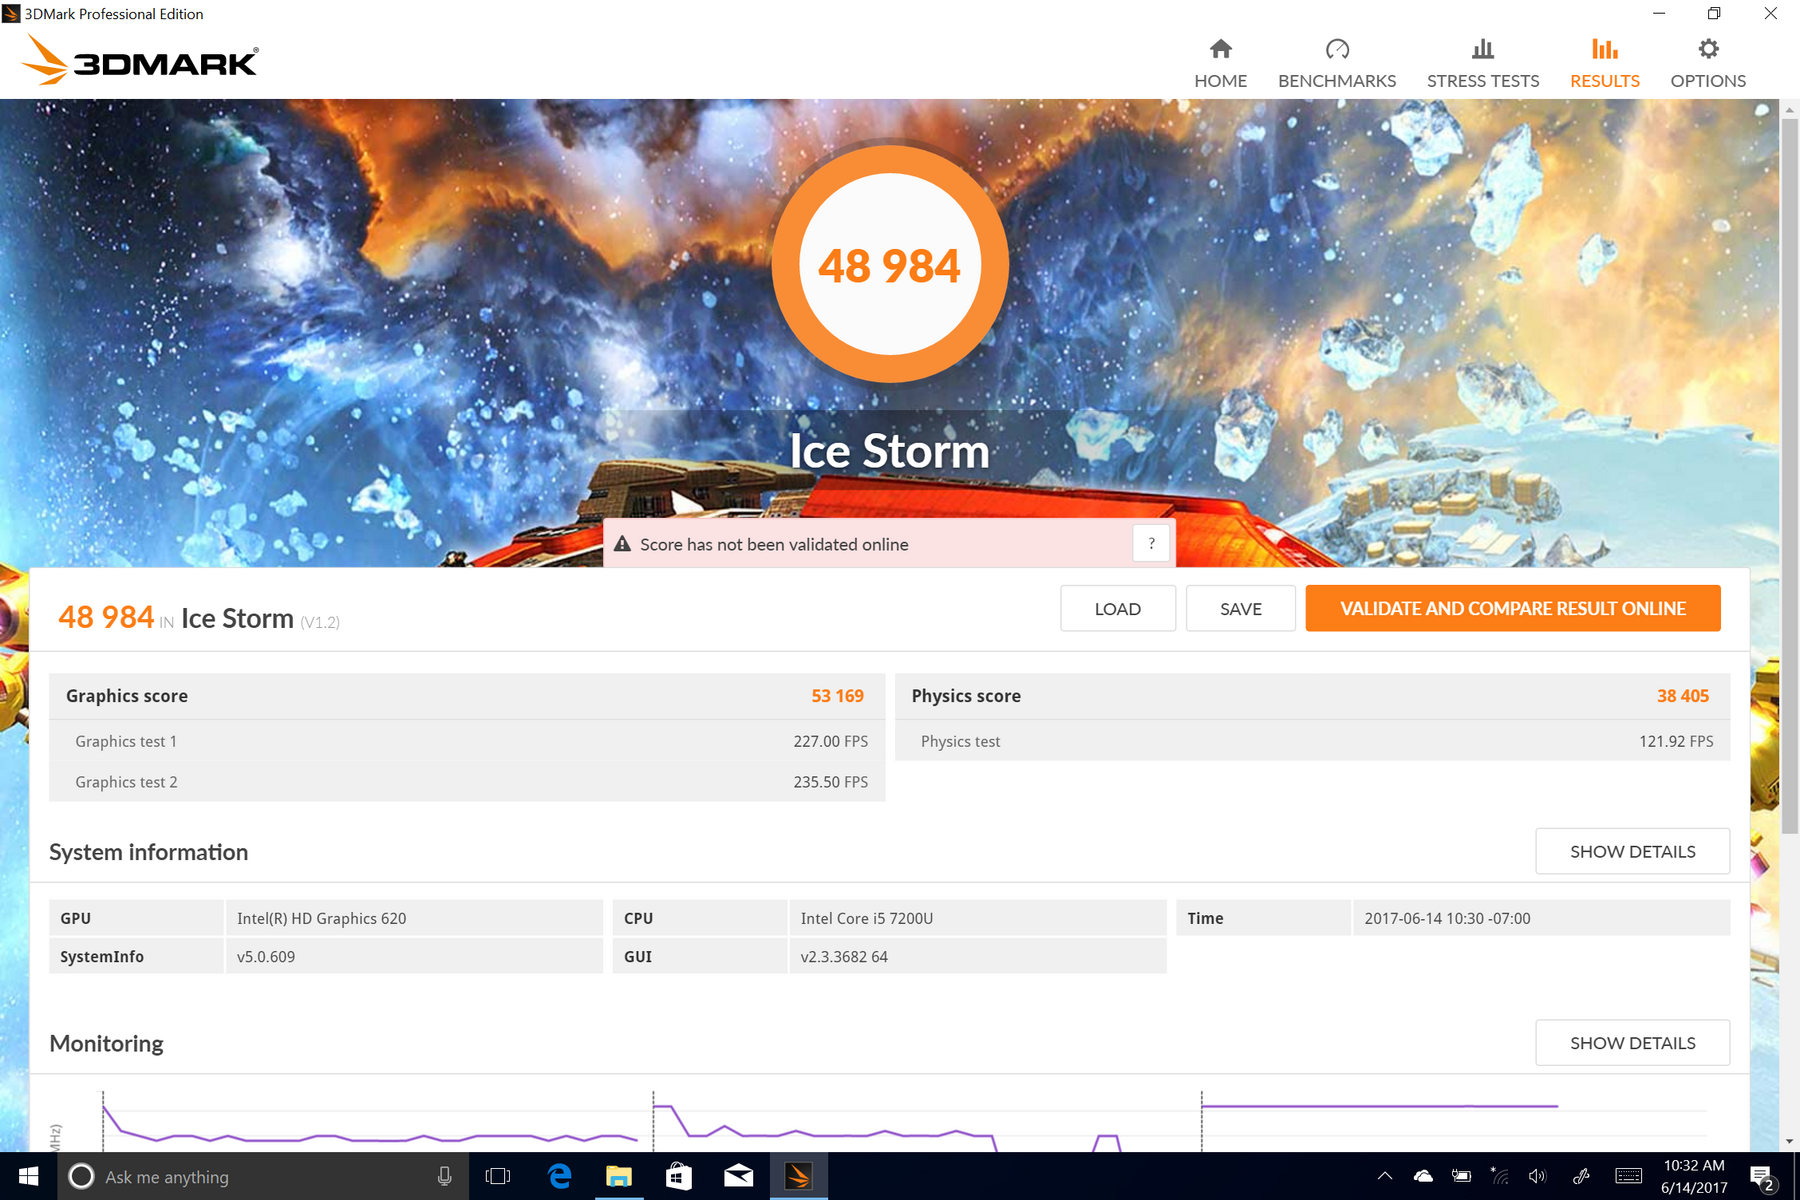
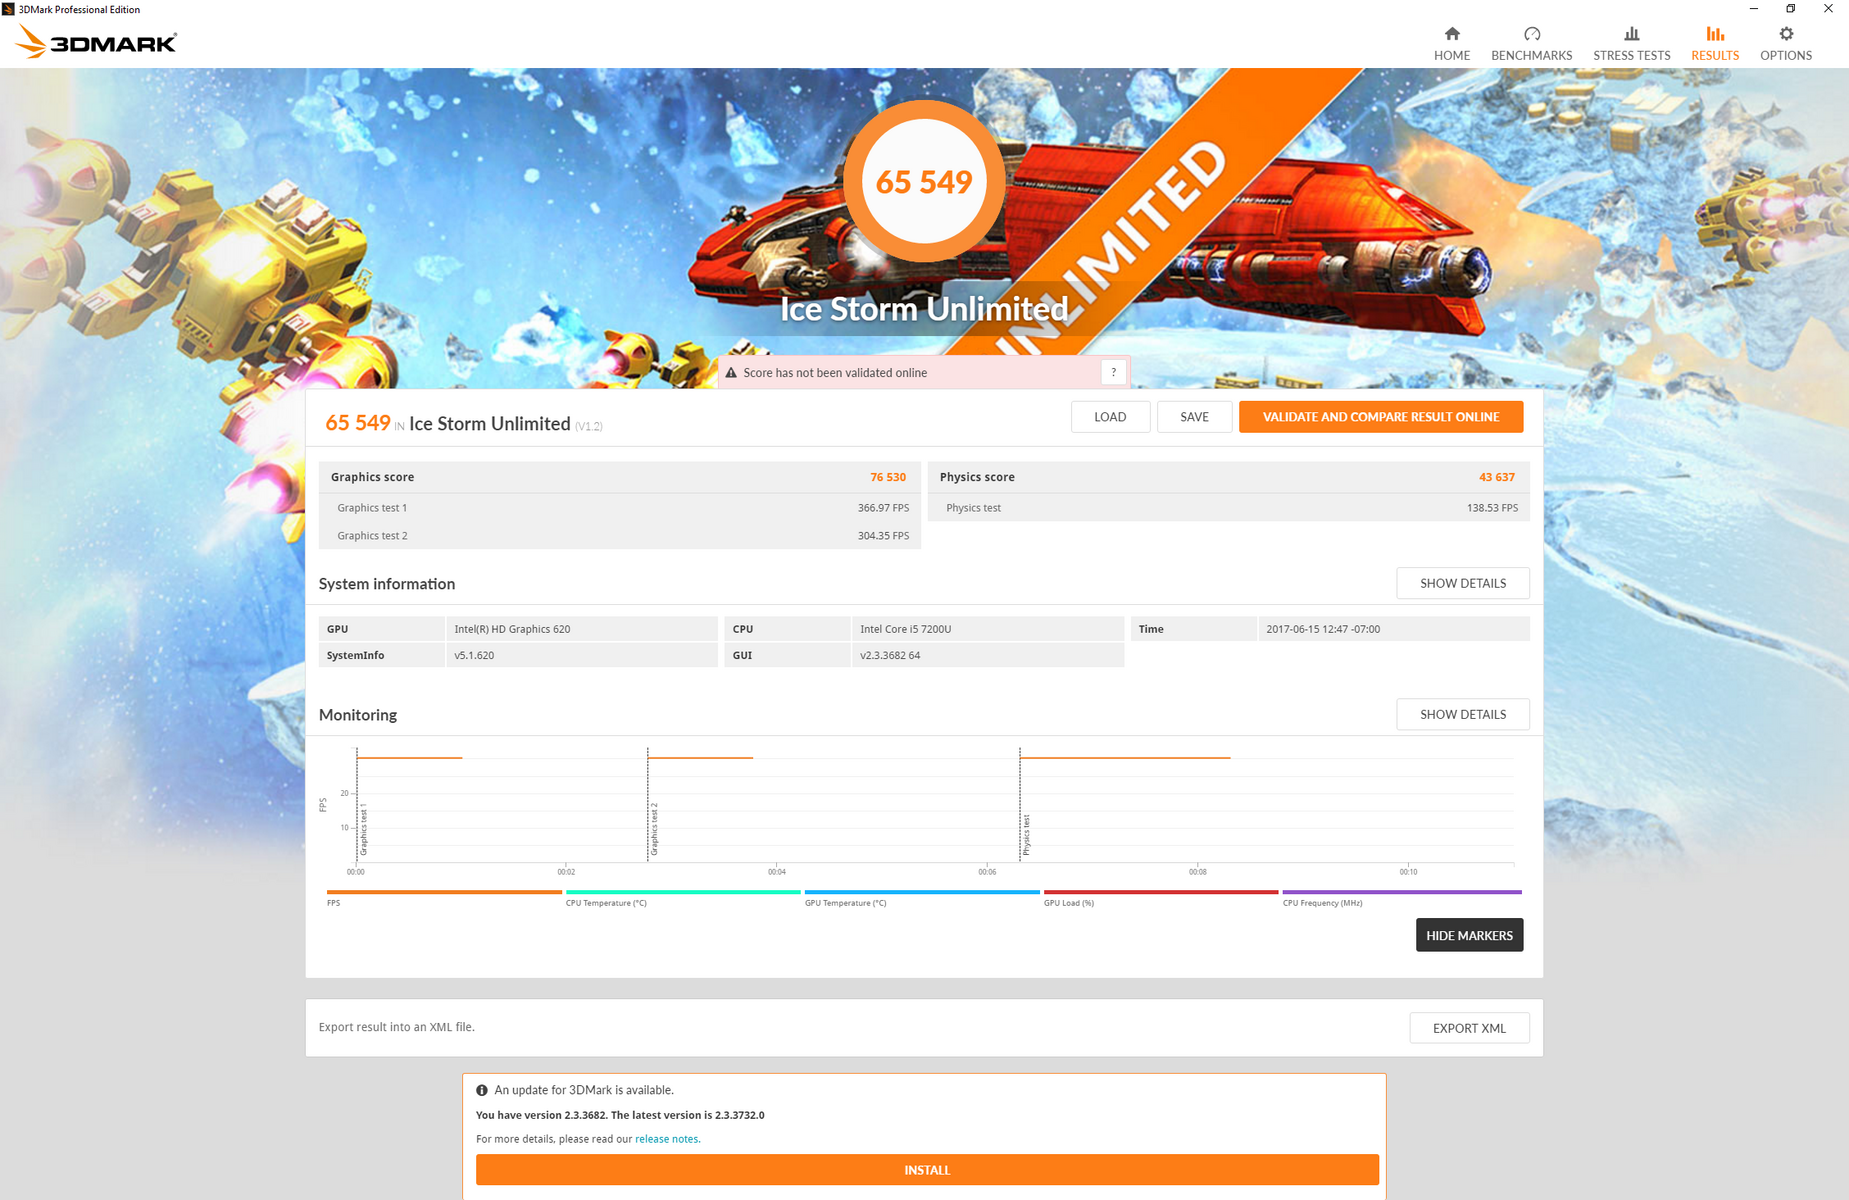
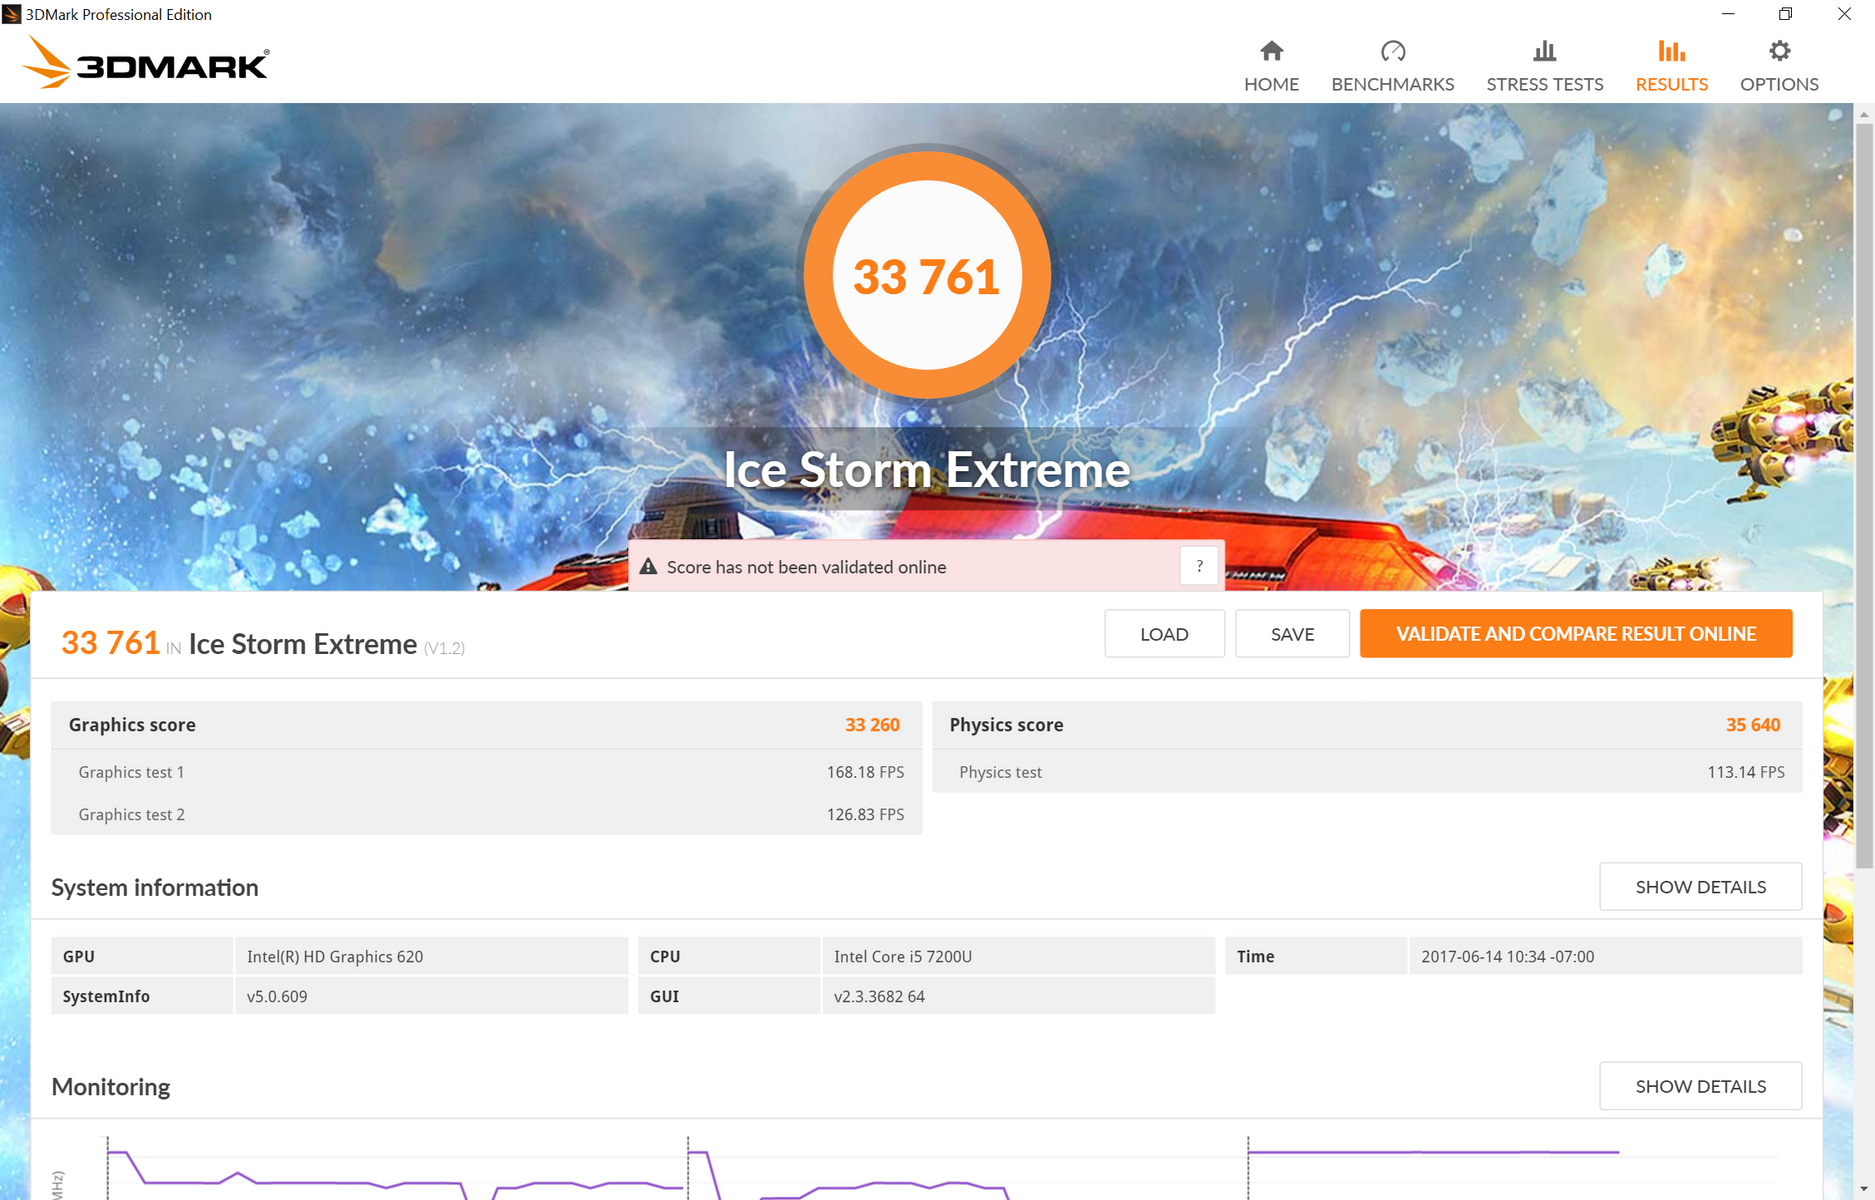
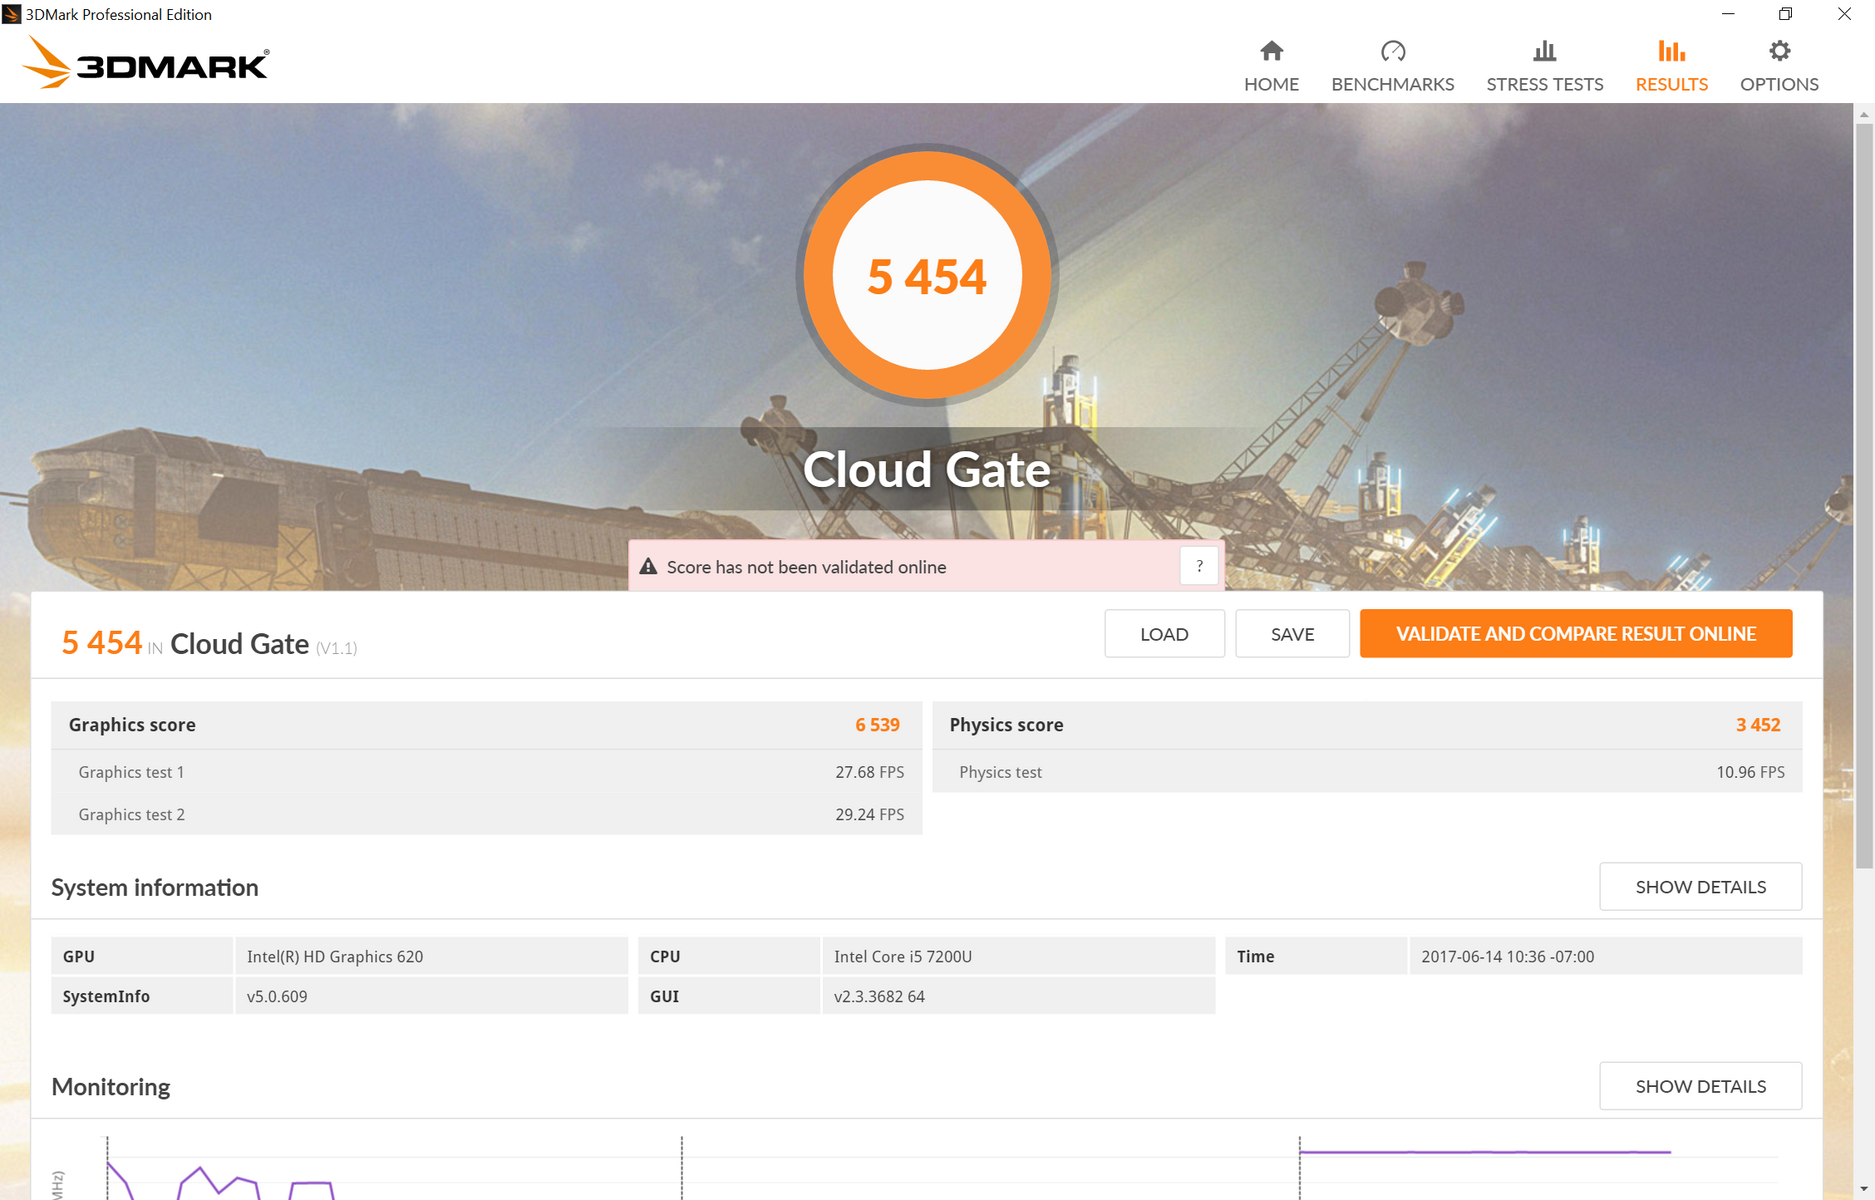
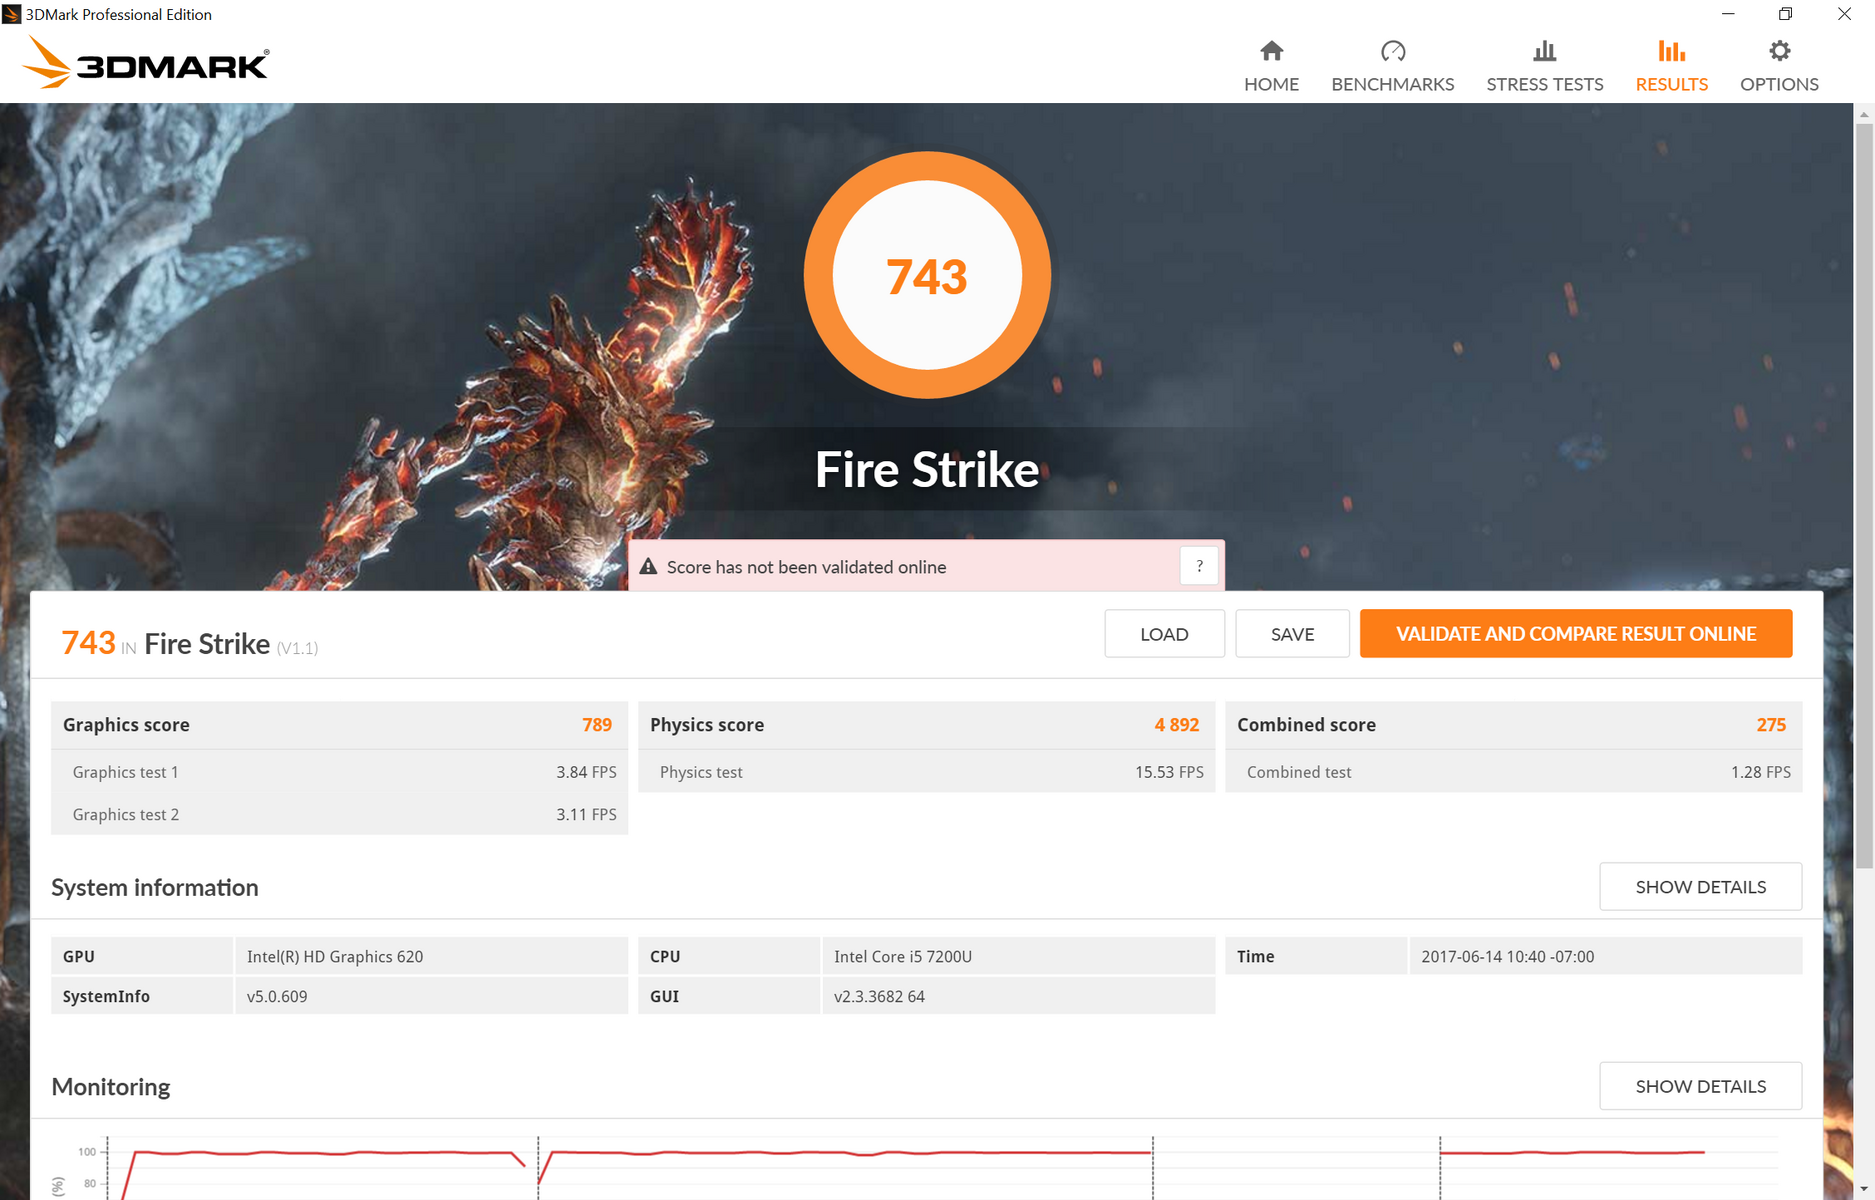
The integrated HD Graphics 620 in the Surface Laptop scores noticeably lower in 3DMark benchmarks than the same GPU in the VivoBook S510UA. Cloud Gate and Fire Strike Graphics, for example, are each about 35 percent higher for the Asus compared to the Microsoft laptop. This may simply be due to both the higher native resolution display of the Microsoft and its use of DDR3 RAM instead of DDR4. Integrated graphics solutions in particular are more sensitive to slower RAM since they share memory with the system and this has us especially concerned about how the Iris Plus Graphics 640 will perform in the i7-7660U SKU.
Gaming performance is poor as expected since the HD Graphics and Iris Pro series aren't tailored for demanding 3D games. Jumping from the HD Graphics 620 to the Iris Graphics 550 will boost frame rates noticeably, but overall performance is still nowhere near powerful enough to run most titles at the atypical native 2256 x 1504 resolution.
See our dedicated GPU page on the HD Graphics 620 for more technical information and benchmark comparisons.
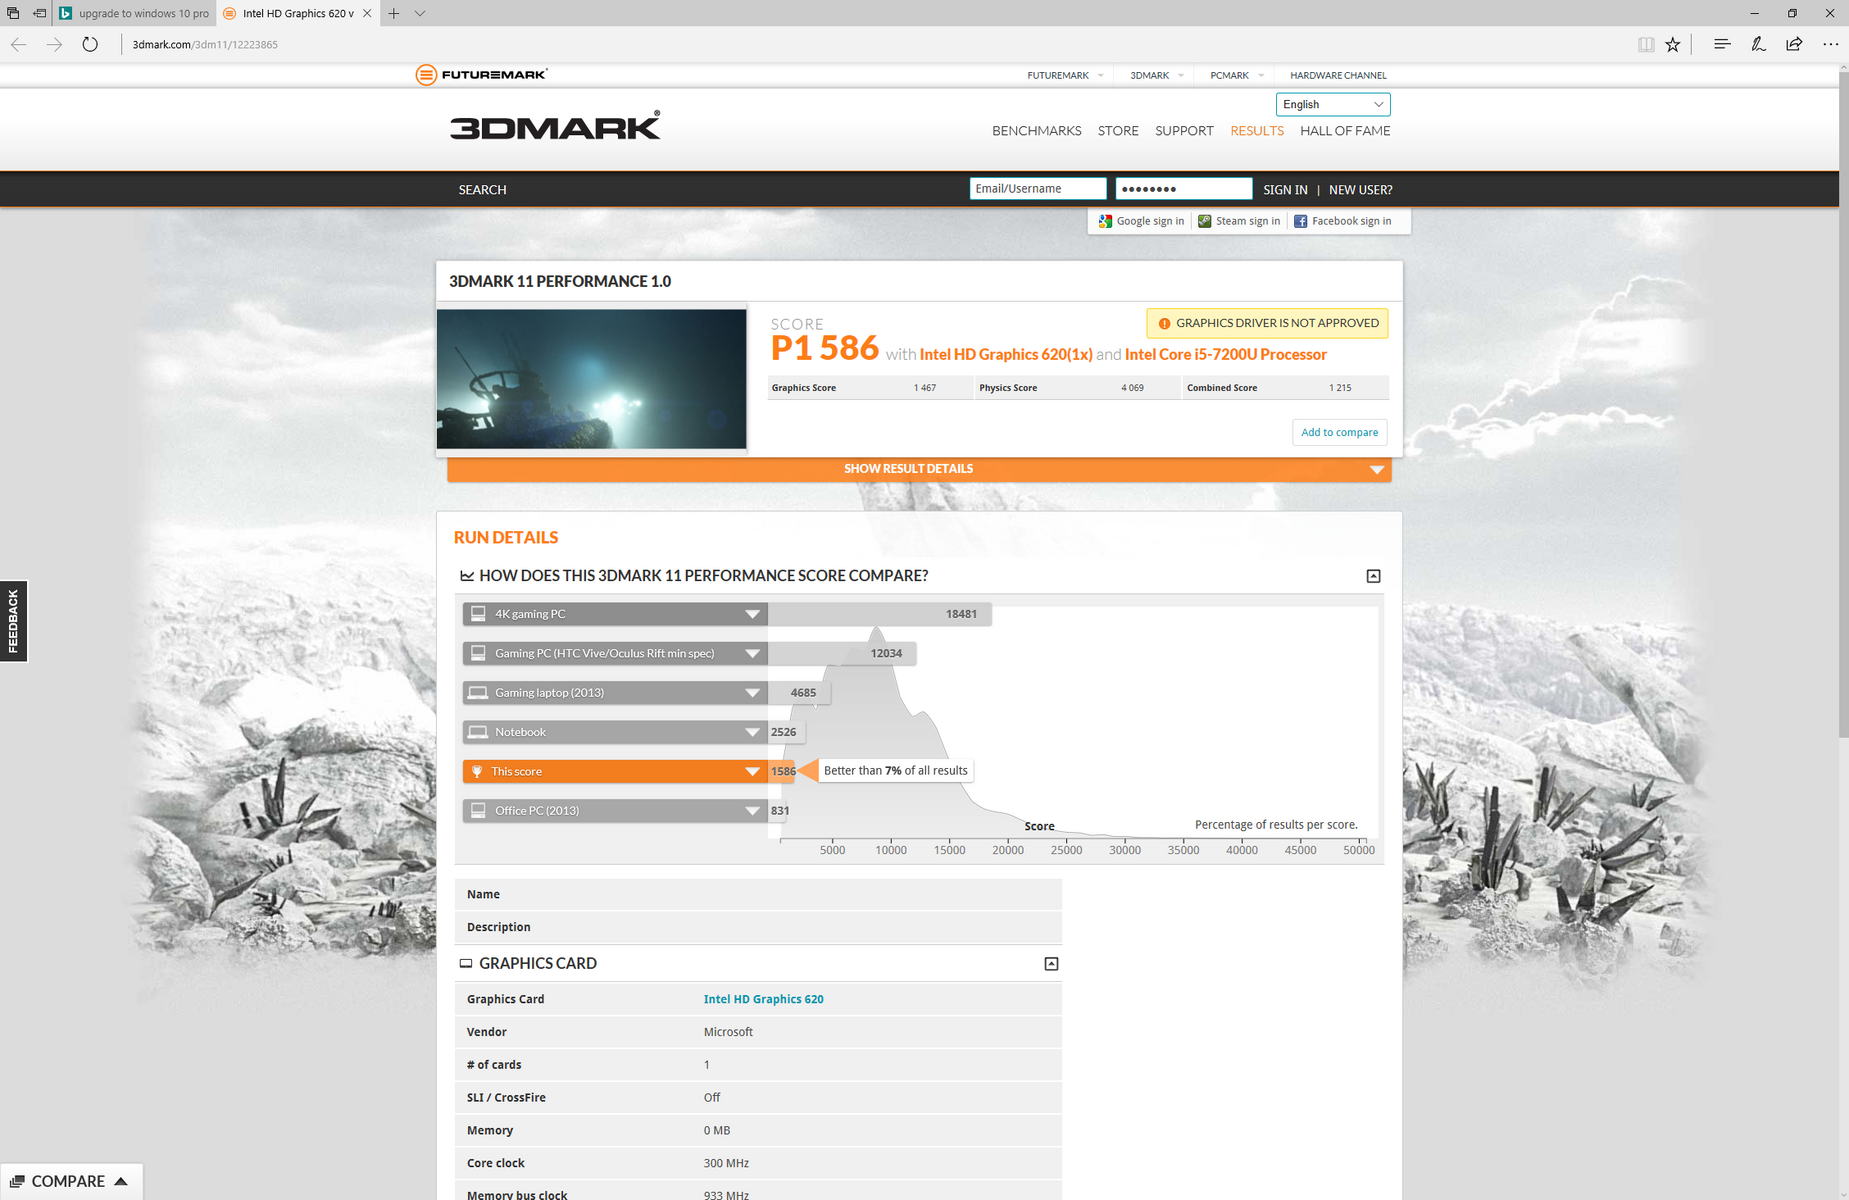
| 3DMark 11 Performance | 1586 points | |
| 3DMark Ice Storm Standard Score | 48984 points | |
| 3DMark Cloud Gate Standard Score | 5454 points | |
| 3DMark Fire Strike Score | 743 points | |
Help | ||
| low | med. | high | ultra | |
|---|---|---|---|---|
| BioShock Infinite (2013) | 45.8 | 27.4 | 22.7 | 7 |
| Rise of the Tomb Raider (2016) | 18.5 |
Stress Test
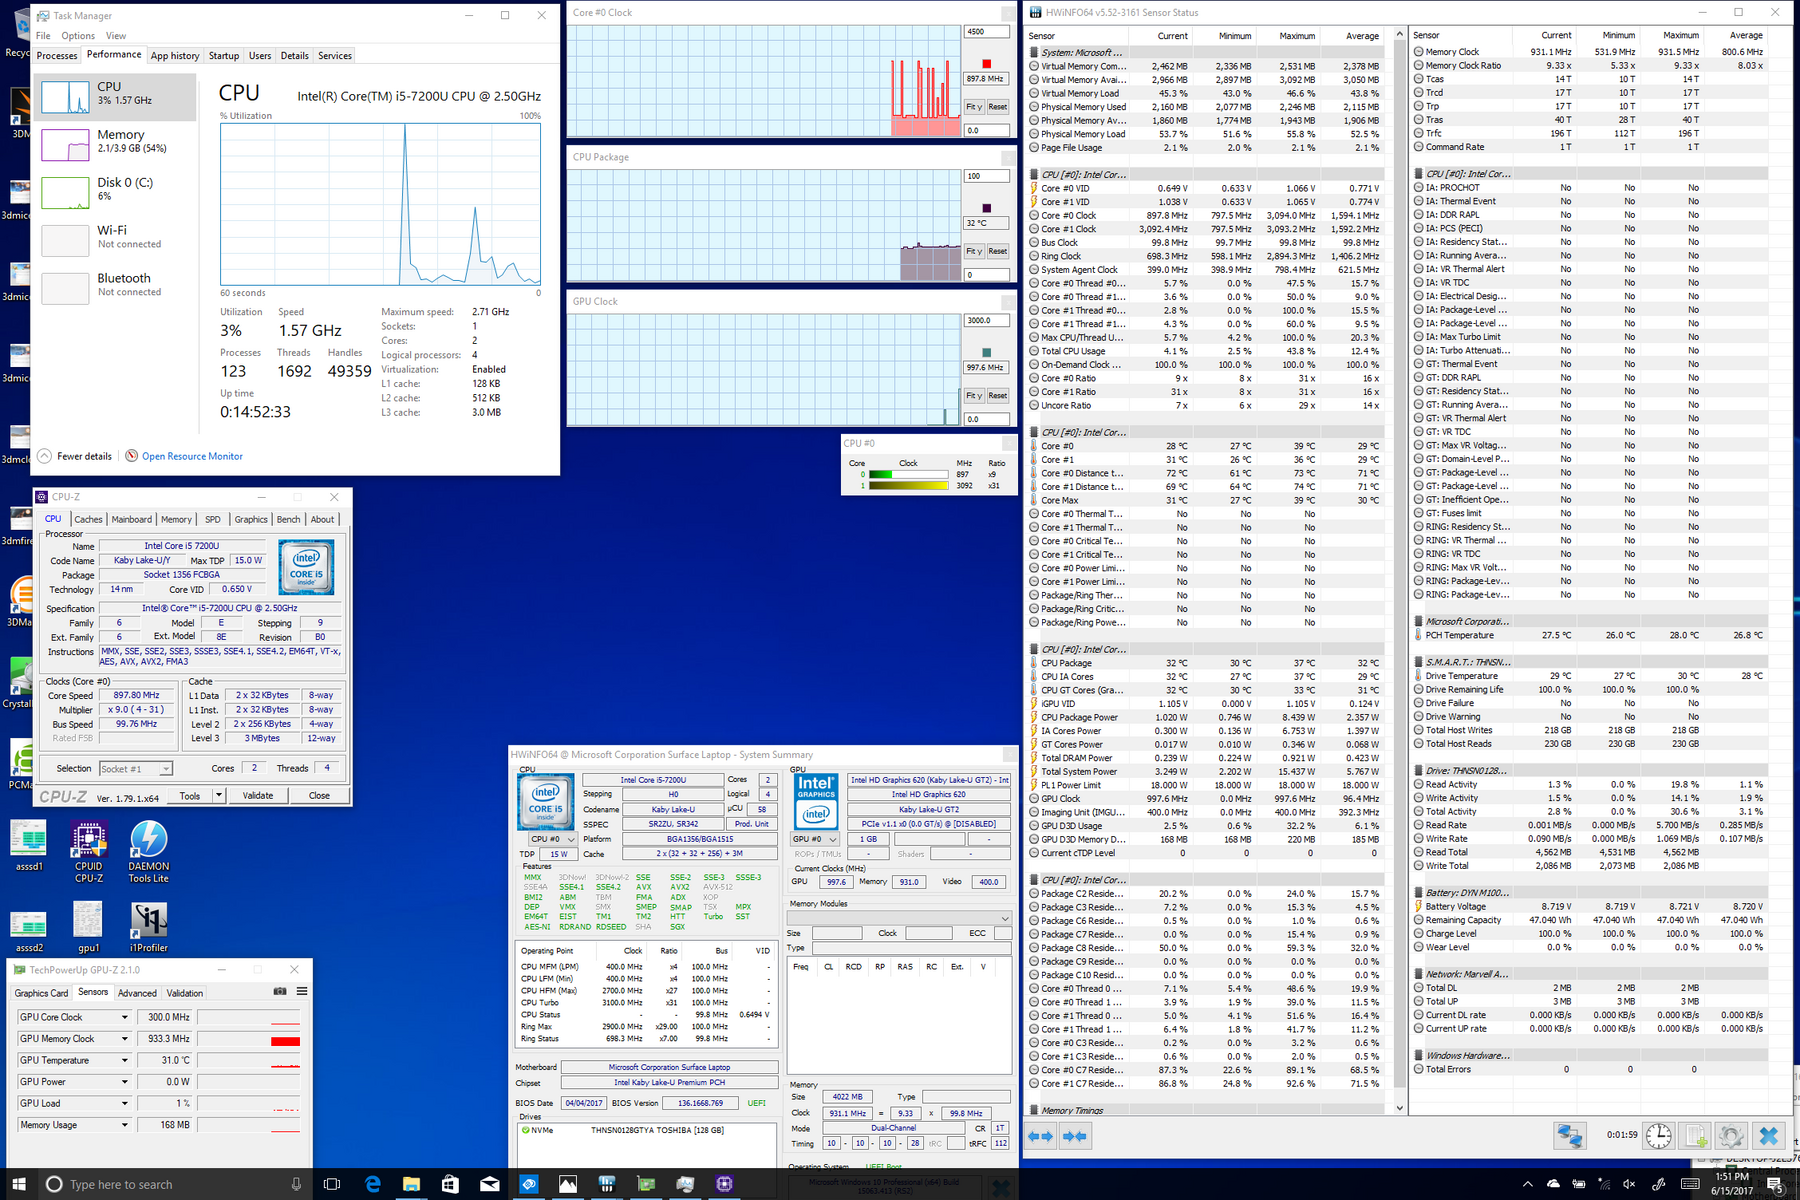
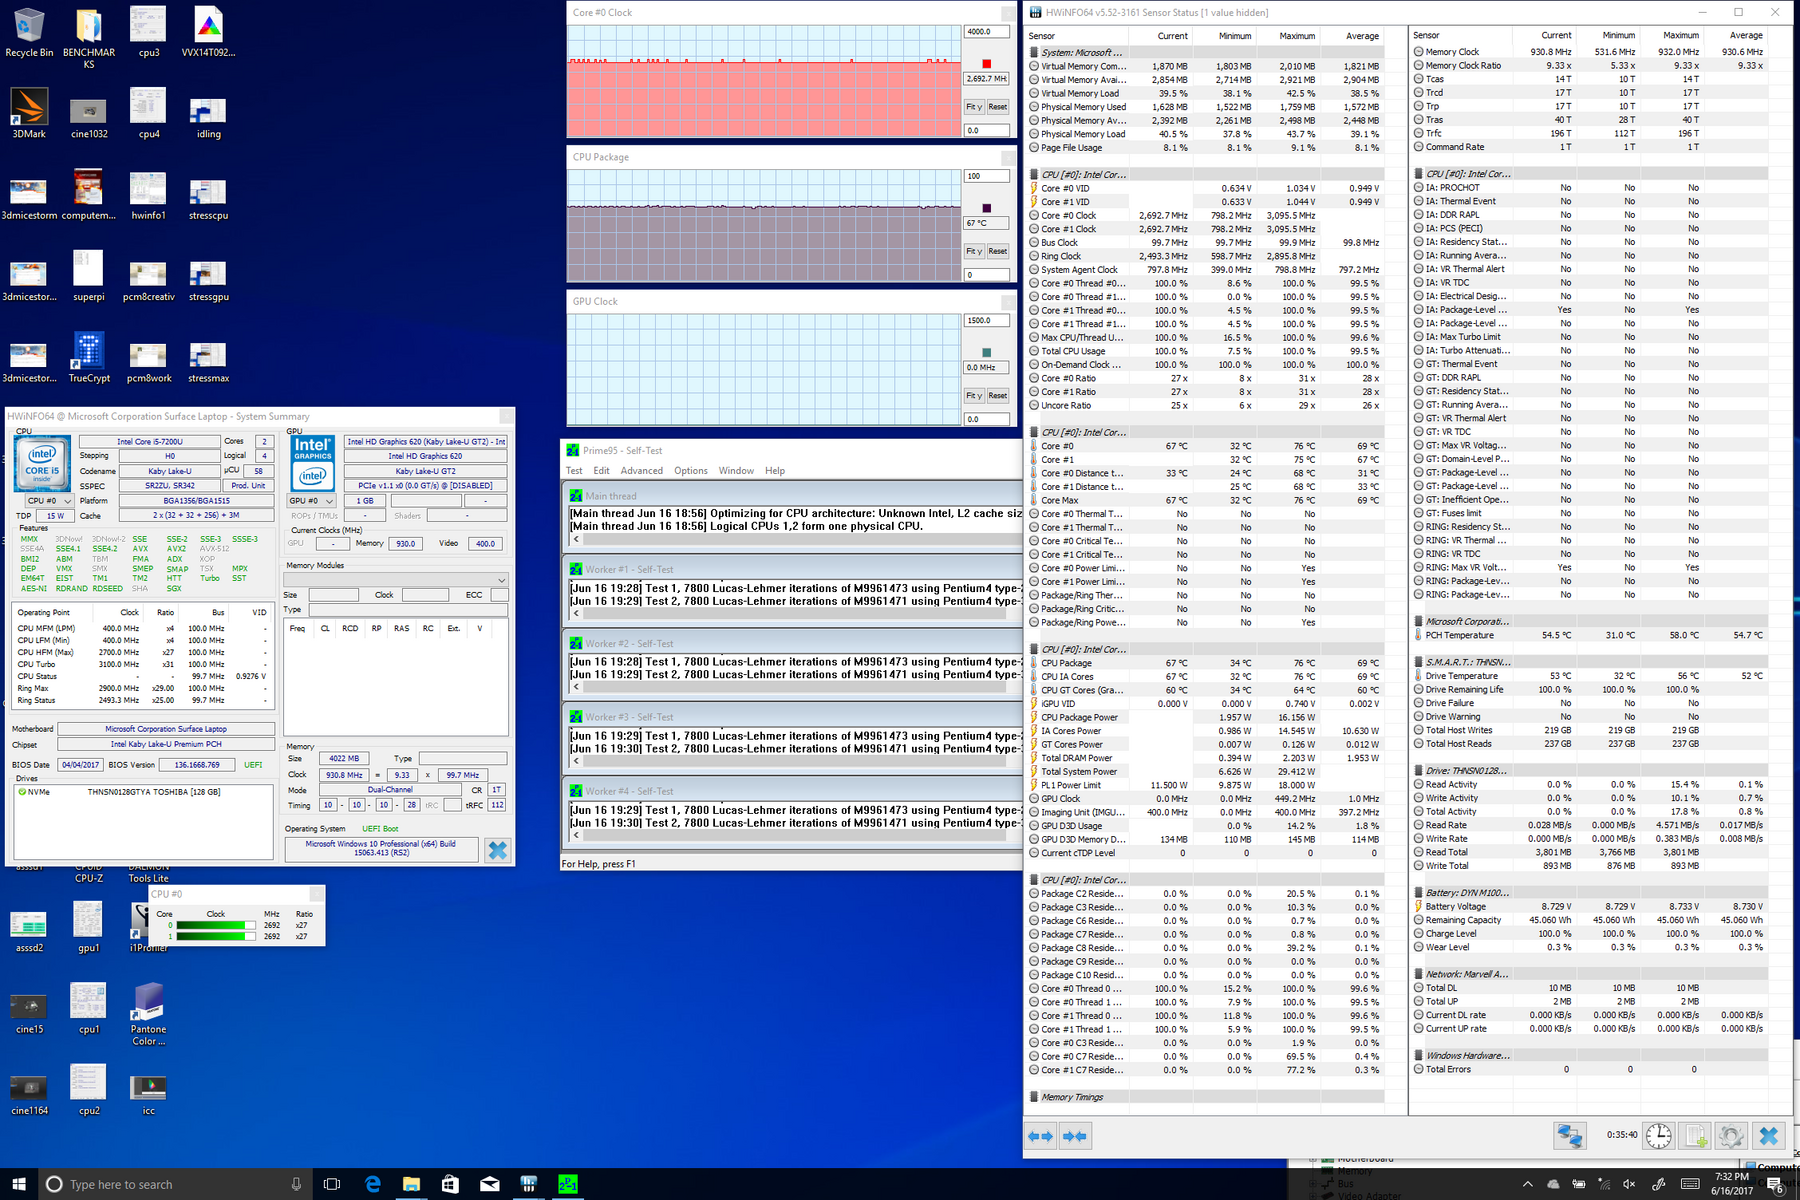
We stress the notebook with synthetic benchmarks in order to identify for any throttling or stability issues. With Prime95 active, the CPU can be observed running at 3.0 GHz for the first few minutes before steadily falling to its stable base clock rate of 2.5 GHz to reflect our steadily decreasing CineBench loop test scores from above. Setting the Power Profile to "Best Performance" will bump up fan noise in an attempt to maintain higher clock rates in the 2.7 to 2.8 GHz range. While a slight improvement, it's disappointing to see that the system cannot maintain the maximum 3.1 GHz Turbo Boost clock rate of the i5-7200U. In contrast, the VivoBook S510UA runs stably at 3.1 GHz and in the low 70 C range when under similar conditions.
Maximum stress with both Prime95 and FurMark will throttle the CPU down to just 1.4 GHz while the GPU stabilizes at 848 MHz. Core temperature stabilizes at a lower value compared to the Prime95 stress test above since the CPU is now operating at half the speed.
Running on batteries will not throttle performance. The system returns 3DMark 11 Physics and Graphics scores of 3912 and 1479 points, respectively, when on battery power compared to 4069 and 1467 points when on mains.
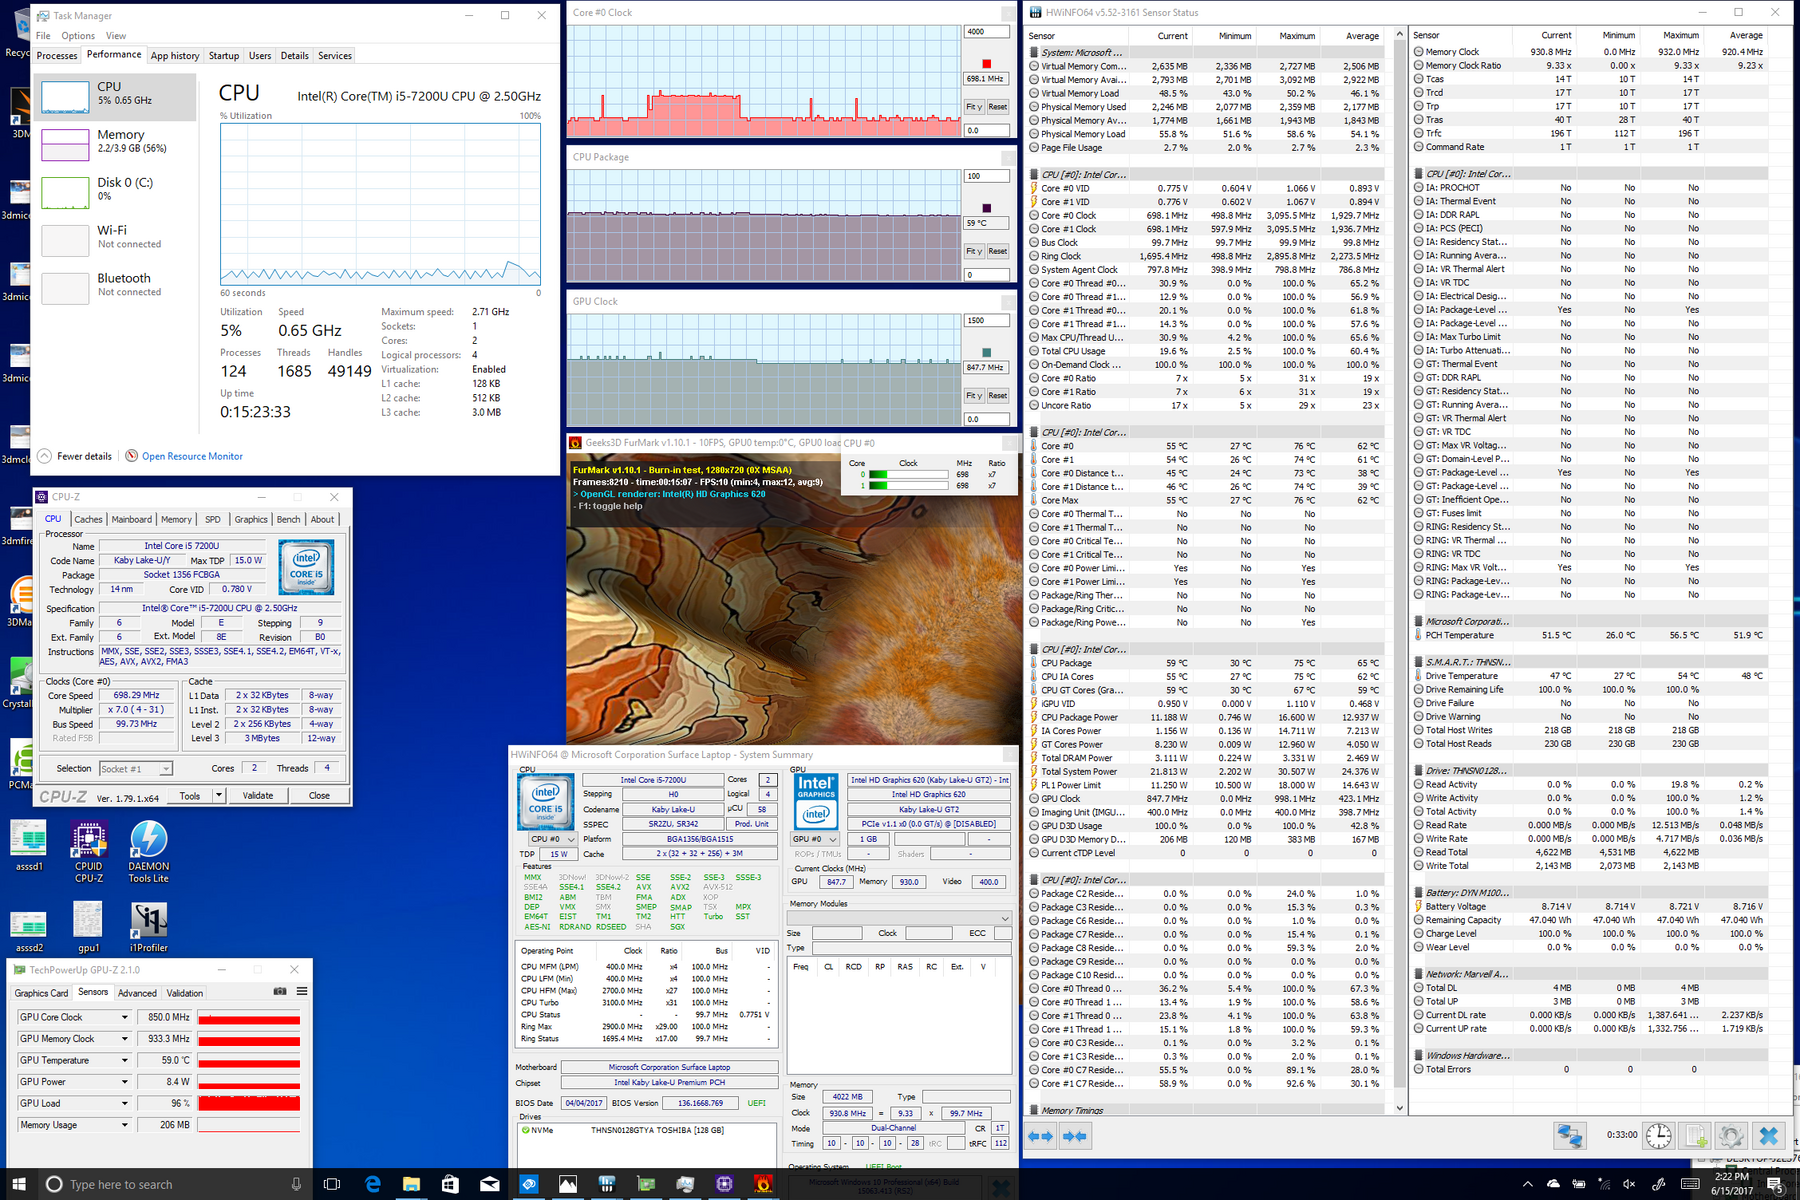

| CPU Clock (GHz) | GPU Clock (MHz) | Average CPU Temperature (°C) | |
| Prime95 Stress | 2.7 - 2.8 | -- | 72 |
| FurMark Stress | -- | 848 | 59 |
| Prime95 + FurMark Stress | 1.4 | 848 | 61 |
Emissions
System Noise
The system fan will idle during low loads for a truly silent experience for tasks like word processing or checking email. Prolonged video playback or browsing will bump the fan to just 29 dB(A) which is still essentially inaudible in a home or office setting. In fact, the fan is so lethargic that we had to run the first benchmark scene of 3DMark06 twice in a row in order to get the fan to a steady 30.3 dB(A). This particular configuration of the Surface Laptop is subsequently one of the quieter Ultrabooks we've tested when under typical day-to-day loads.
Extreme loads with Prime95 and FurMark will have bump fan noise to 34.7 dB(A) if on the "Recommended" power profile. The "Best performance" profile will push up the fan noise ceiling to a higher maximum of 39.3 dB(A), which is similar to the maximums of most other Ultrabooks.
Although the Microsoft notebook is generally very quiet, the fan is higher pitched than expected. Our microphone measurements show a peak at about 6k Hz compared to 4k Hz and 3k Hz on the Spectre x360 13 and VivoBook S510UA, respectively, when under extreme processing loads. As a result, fan noise is more distinct on the Surface Laptop once it starts reaching higher RPMs. There is a very small hint of electronic noise as well if placing an ear next to the keyboard base, but it is otherwise unnoticeable during regular use.
Noise level
| Idle |
| 28.2 / 28.2 / 29 dB(A) |
| Load |
| 30.3 / 39.3 dB(A) |
 | ||
30 dB silent 40 dB(A) audible 50 dB(A) loud |
||
min: | ||
| Microsoft Surface Laptop i5 HD Graphics 620, i5-7200U, Toshiba THNSN0128GTYA | Microsoft Surface Book with Performance Base GeForce GTX 965M, 6600U, Toshiba NVMe THNSN5256GPU7 | Microsoft Surface Pro 4, Core i5, 128GB HD Graphics 520, 6300U, Samsung MZFLV128 NVMe | Apple MacBook Pro 13 2016 (2.9 GHz) Iris Graphics 550, 6267U, Apple SSD AP0256 | Dell XPS 13 9360 FHD i5 HD Graphics 620, i5-7200U, Toshiba NVMe THNSN5256GPUK | |
|---|---|---|---|---|---|
| Noise | -8% | -14% | -4% | 2% | |
| off / environment * (dB) | 28.2 | 29.4 -4% | 30.2 -7% | ||
| Idle Minimum * (dB) | 28.2 | 29.4 -4% | 31.5 -12% | 30.2 -7% | 28.9 -2% |
| Idle Average * (dB) | 28.2 | 29.4 -4% | 31.5 -12% | 30.2 -7% | 28.9 -2% |
| Idle Maximum * (dB) | 29 | 29.7 -2% | 31.5 -9% | 30.2 -4% | 28.9 -0% |
| Load Average * (dB) | 30.3 | 39 -29% | 40.5 -34% | 33 -9% | 30.9 -2% |
| Load Maximum * (dB) | 39.3 | 40.2 -2% | 40.7 -4% | 36.2 8% | 33.5 15% |
| Witcher 3 ultra * (dB) | 39.5 |
* ... smaller is better
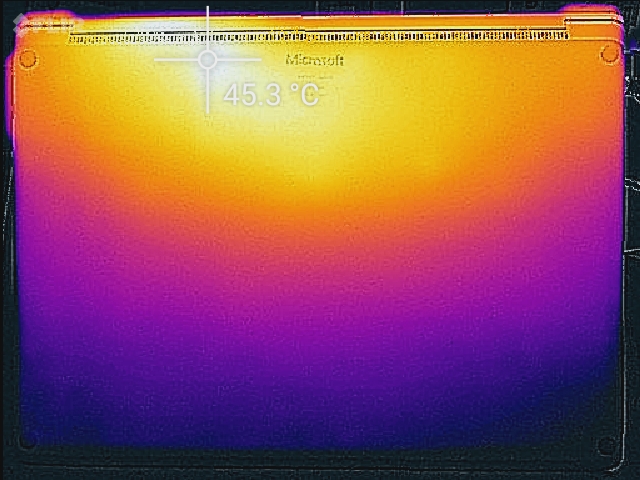
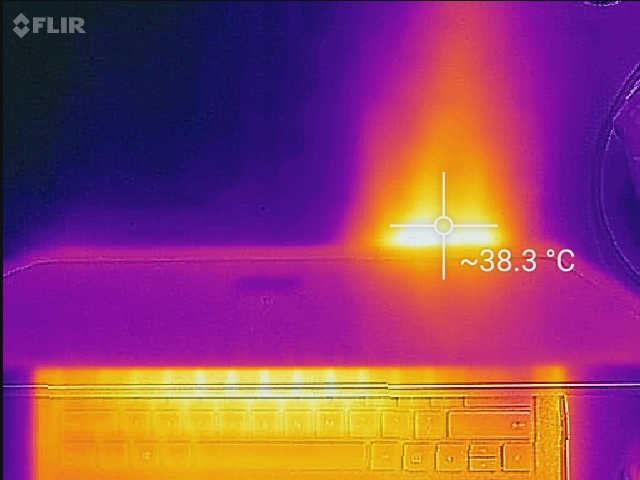
Temperature
Surface temperatures are flat on both sides when the system is idling. When under heavier loads, however, the bottom surface becomes much warmer than the top by about 10 degrees C on average. This is rather uncommon as most Ultrabooks have significantly smaller temperature deltas between the top and bottom surfaces and we can only assume that this is due to the less conductive Alcantara fabric. The more unibody MacBook Pro 13, for example, averages about 36 C on both its top and bottom with much less of a temperature bias towards any given side. While this makes for more comfortable hands when typing on the Surface Laptop, it also means a much warmer bottom if typing on the lap.
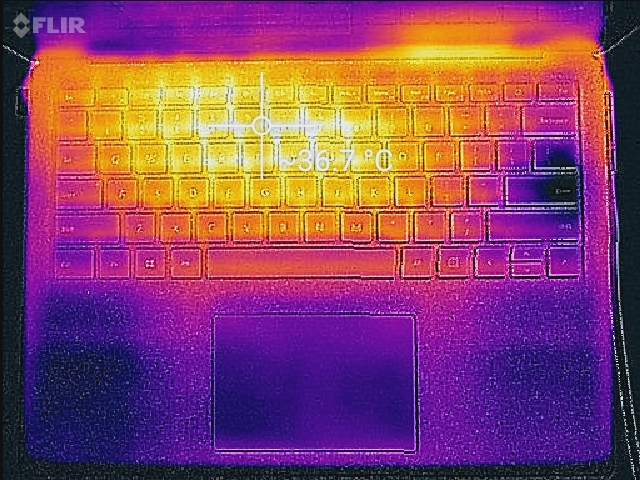
(+) The maximum temperature on the upper side is 36.4 °C / 98 F, compared to the average of 35.9 °C / 97 F, ranging from 21.4 to 59 °C for the class Subnotebook.
(-) The bottom heats up to a maximum of 45.2 °C / 113 F, compared to the average of 39.2 °C / 103 F
(+) In idle usage, the average temperature for the upper side is 26.7 °C / 80 F, compared to the device average of 30.8 °C / 87 F.
(+) The palmrests and touchpad are cooler than skin temperature with a maximum of 26.4 °C / 79.5 F and are therefore cool to the touch.
(±) The average temperature of the palmrest area of similar devices was 28.2 °C / 82.8 F (+1.8 °C / 3.3 F).
Speakers
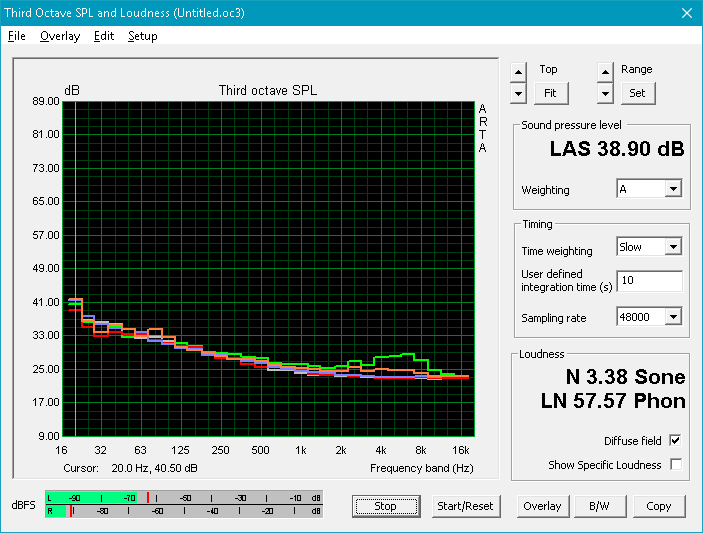
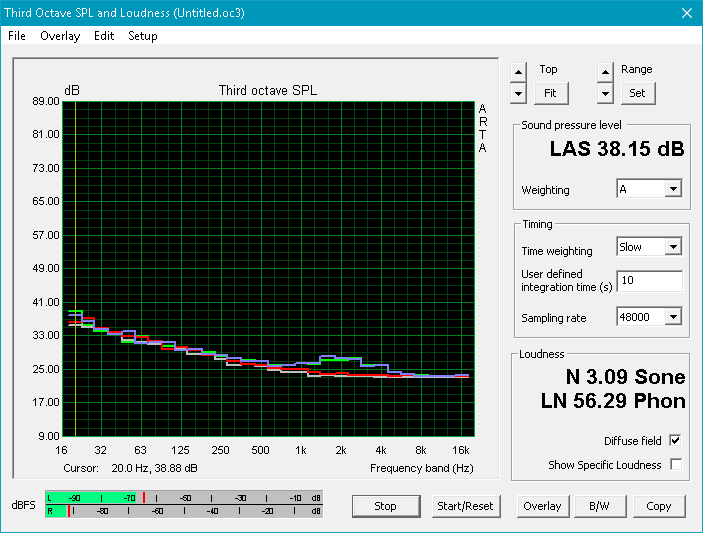
The 2 W stereo speakers are below average in both maximum volume and bass. Our pink noise measurements below show poorer reproduction of lower frequencies when compared to the larger Sky X7E2 likely due to the lack of a dedicated subwoofer. Fortunately, higher volume settings will not introduce static or reverberate the palm rests since the speakers are located towards the rear edge of the notebook instead of the front.
Studio-grade headphones are supported since the system is equipped with the same ESS Sabre HiFi DAC as on some MSI GS and GT notebooks. Mainstream users will not likely take notice, but streamers and and audiophiles will appreciate the higher SNR and wider impedance support.
")


Microsoft Surface Laptop i5 audio analysis
(-) | not very loud speakers (64.6 dB)
Bass 100 - 315 Hz
(±) | reduced bass - on average 7.1% lower than median
(±) | linearity of bass is average (11.8% delta to prev. frequency)
Mids 400 - 2000 Hz
(+) | balanced mids - only 4.1% away from median
(+) | mids are linear (5.6% delta to prev. frequency)
Highs 2 - 16 kHz
(+) | balanced highs - only 1.2% away from median
(+) | highs are linear (4.7% delta to prev. frequency)
Overall 100 - 16.000 Hz
(±) | linearity of overall sound is average (15.6% difference to median)
Compared to same class
» 36% of all tested devices in this class were better, 5% similar, 59% worse
» The best had a delta of 5%, average was 18%, worst was 53%
Compared to all devices tested
» 23% of all tested devices were better, 5% similar, 72% worse
» The best had a delta of 4%, average was 24%, worst was 134%
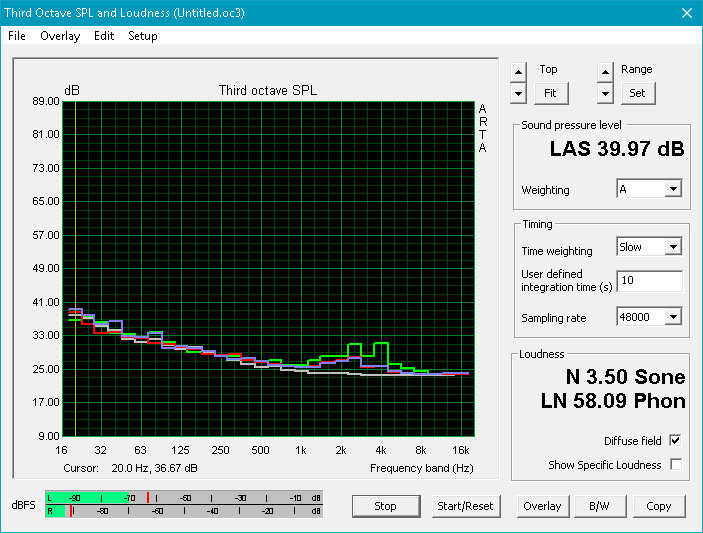
Apple MacBook 12 (Early 2016) 1.1 GHz audio analysis
(+) | speakers can play relatively loud (83.6 dB)
Bass 100 - 315 Hz
(±) | reduced bass - on average 11.3% lower than median
(±) | linearity of bass is average (14.2% delta to prev. frequency)
Mids 400 - 2000 Hz
(+) | balanced mids - only 2.4% away from median
(+) | mids are linear (5.5% delta to prev. frequency)
Highs 2 - 16 kHz
(+) | balanced highs - only 2% away from median
(+) | highs are linear (4.5% delta to prev. frequency)
Overall 100 - 16.000 Hz
(+) | overall sound is linear (10.2% difference to median)
Compared to same class
» 7% of all tested devices in this class were better, 2% similar, 91% worse
» The best had a delta of 5%, average was 18%, worst was 53%
Compared to all devices tested
» 5% of all tested devices were better, 1% similar, 94% worse
» The best had a delta of 4%, average was 24%, worst was 134%
Frequency Comparison (Checkbox selectable!)
Graph 1: Pink Noise 100% Vol.; Graph 2: Audio off
Energy Management
Power Consumption
Our Surface Laptop configuration draws about 3 W to 7 W when idling on desktop depending on the brightness and Power Profile setting to be surprisingly more efficient than the Core i5 version of the smaller Surface Pro 4. Medium load as represented by 3DMark06 demands about 28 W, which is significantly less than the Surface Book and MacBook Pro 13 as these carry more powerful GPUs.
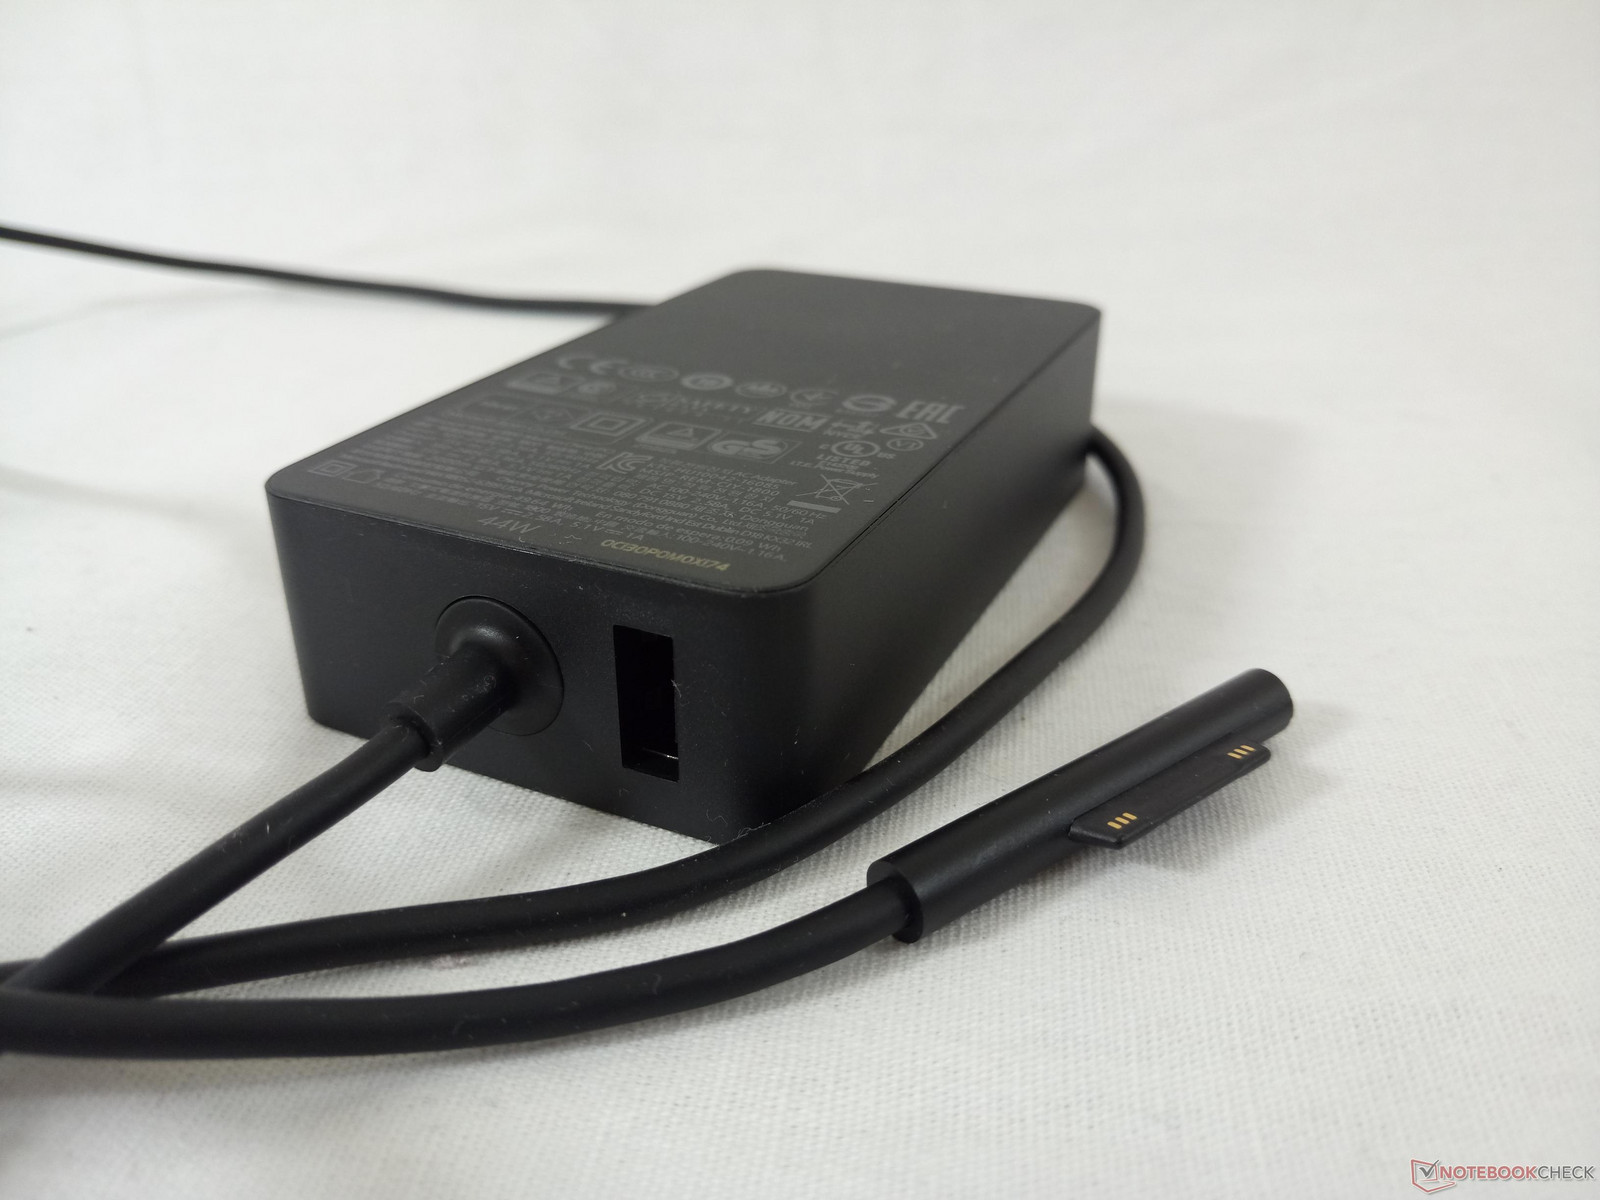
The highest we can record when running both Prime95 and FurMark is about 36 W from the included 44 W AC adapter (9.0 x 5.0 x 2.2 cm). The Iris Plus Graphics 640 version of the Surface Laptop will indubitably demand more power than our HD Graphics 620 SKU and will likely push closer to the 44 W power delivery ceiling. Existing AC chargers from the Surface Pro 4 series should be compatible here as long as the output (5.1 V, 1 A) remains identical. The magnetic SurfaceConnect plug can be difficult to actually connect since it is so shallow, narrow and awkward to grip.
| Off / Standby | |
| Idle | |
| Load |
|
Key:
min: | |
| Microsoft Surface Laptop i5 i5-7200U, HD Graphics 620, Toshiba THNSN0128GTYA, IPS, 2256x1504, 13.5" | Microsoft Surface Book with Performance Base 6600U, GeForce GTX 965M, Toshiba NVMe THNSN5256GPU7, IPS, 3000x2000, 13.5" | Microsoft Surface Pro 4, Core i5, 128GB 6300U, HD Graphics 520, Samsung MZFLV128 NVMe, IPS, 2736x1824, 12.3" | Apple MacBook Pro 13 2016 (2.9 GHz) 6267U, Iris Graphics 550, Apple SSD AP0256, , 2560x1600, 13.3" | Dell XPS 13 9360 FHD i5 i5-7200U, HD Graphics 620, Toshiba NVMe THNSN5256GPUK, IPS, 1920x1080, 13.3" | |
|---|---|---|---|---|---|
| Power Consumption | -75% | -12% | -34% | 14% | |
| Idle Minimum * (Watt) | 3.2 | 4.15 -30% | 4.4 -38% | 2.1 34% | 4.1 -28% |
| Idle Average * (Watt) | 6.5 | 8 -23% | 9 -38% | 7.6 -17% | 4.2 35% |
| Idle Maximum * (Watt) | 6.8 | 11.9 -75% | 10.7 -57% | 8.2 -21% | 5.1 25% |
| Load Average * (Watt) | 28.2 | 67 -138% | 19.6 30% | 56.4 -100% | 22.1 22% |
| Load Maximum * (Watt) | 36 | 76 -111% | 19.9 45% | 59.8 -66% | 29.4 18% |
| Witcher 3 ultra * (Watt) | 58 |
* ... smaller is better
Battery Life
Expect a runtime of 10 hours under real-world WLAN conditions to be just slightly longer than the Surface Book and MacBook Pro 13. Though the similarly configured XPS 13 can last for about an hour longer, its battery capacity is also 33 percent larger than on the Microsoft. Idling on desktop at the lowest brightness setting will last for over 22 hours for very long standby times if needed. The Core i7 SKU will likely have shorter runtimes since the integrated Iris Plus Graphics 640 will be more demanding.
Charging from near empty to full capacity will take about 2.5 hours.
| Microsoft Surface Laptop i5 i5-7200U, HD Graphics 620, 45 Wh | Microsoft Surface Book with Performance Base 6600U, GeForce GTX 965M, 78 Wh | Microsoft Surface Pro 4, Core i5, 128GB 6300U, HD Graphics 520, 38 Wh | Apple MacBook Pro 13 2016 (2.9 GHz) 6267U, Iris Graphics 550, 49.2 Wh | Dell XPS 13 9360 FHD i5 i5-7200U, HD Graphics 620, 60 Wh | Asus Zenbook UX3410UQ-GV077T i7-7500U, GeForce 940MX, 48 Wh | |
|---|---|---|---|---|---|---|
| Battery runtime | -7% | -24% | -27% | 11% | -15% | |
| Reader / Idle (h) | 22.5 | 25.5 13% | 15 -33% | 21.6 -4% | ||
| WiFi v1.3 (h) | 10 | 9.6 -4% | 7.1 -29% | 9.4 -6% | 11.3 13% | 8.5 -15% |
| Load (h) | 2.1 | 1.5 -29% | 1.9 -10% | 1.1 -48% | 2.6 24% |
Pros
Cons
Verdict
Microsoft advertises the Surface Laptop as "more than a traditional laptop", but our experience has been the opposite. If features like USB Type-C, SD card readers, and NVMe are important, then current flagship Ultrabooks from Lenovo, HP, and Dell pack more than what Microsoft's latest Surface device can offer. The Alcantara base is certainly different and makes for another unique marketing bullet point, but its inclusion feels superficial with no significant practical advantages for end users.
The biggest reason to own a Surface Laptop is its 13.5-inch display as everything else about the notebook is fairly underwhelming. If the 3:2 panel or Iris Graphics SKU are not must-haves for any reason, then the notebook becomes that much less compelling compared to the plethora of 13-inch and 14-inch alternatives now available. The long battery life, low fan noise, and wide color gamut of the Microsoft notebook can also be found on competitors like the XPS 13 9360 QHD or Notebook 9.
How the Core i7 SKU will perform under stress will be interesting to see in a future review. If our Core i5 configuration can barely maintain Turbo Boost clock rates in the 2.7 to 2.8 GHz range, then we question how the more demanding Core i7 SKU can maintain its maximum rated Turbo Boost of 4.0 GHz. We're also concerned if the DDR3 RAM will hold back the full potential of the Iris Plus Graphics 640 GPU similar to how our HD Graphics 620 GPU is under-performing for our Core i5 configuration.
Microsoft is marketing its notebook to students and so we can appreciate that the quality of the device suffers from no apparent cut corners. With that said, its long laundry list of missing features severely limits the versatility of the Surface Laptop and makes it tough for us to recommend for both students and general users.
Too little, too late. The Surface Laptop is a solidly built no-frills notebook with a beautiful display. Unfortunately, it doesn't offer much else and is nowhere near as versatile as the Surface Pro 4 or most Ultrabooks currently in the market.
Microsoft Surface Laptop i5
- 06/18/2017 v6 (old)
Allen Ngo
Price comparison
