Lenovo ThinkPad P51s (Core i7, 4K) Workstation Review
For the original German review, see here.
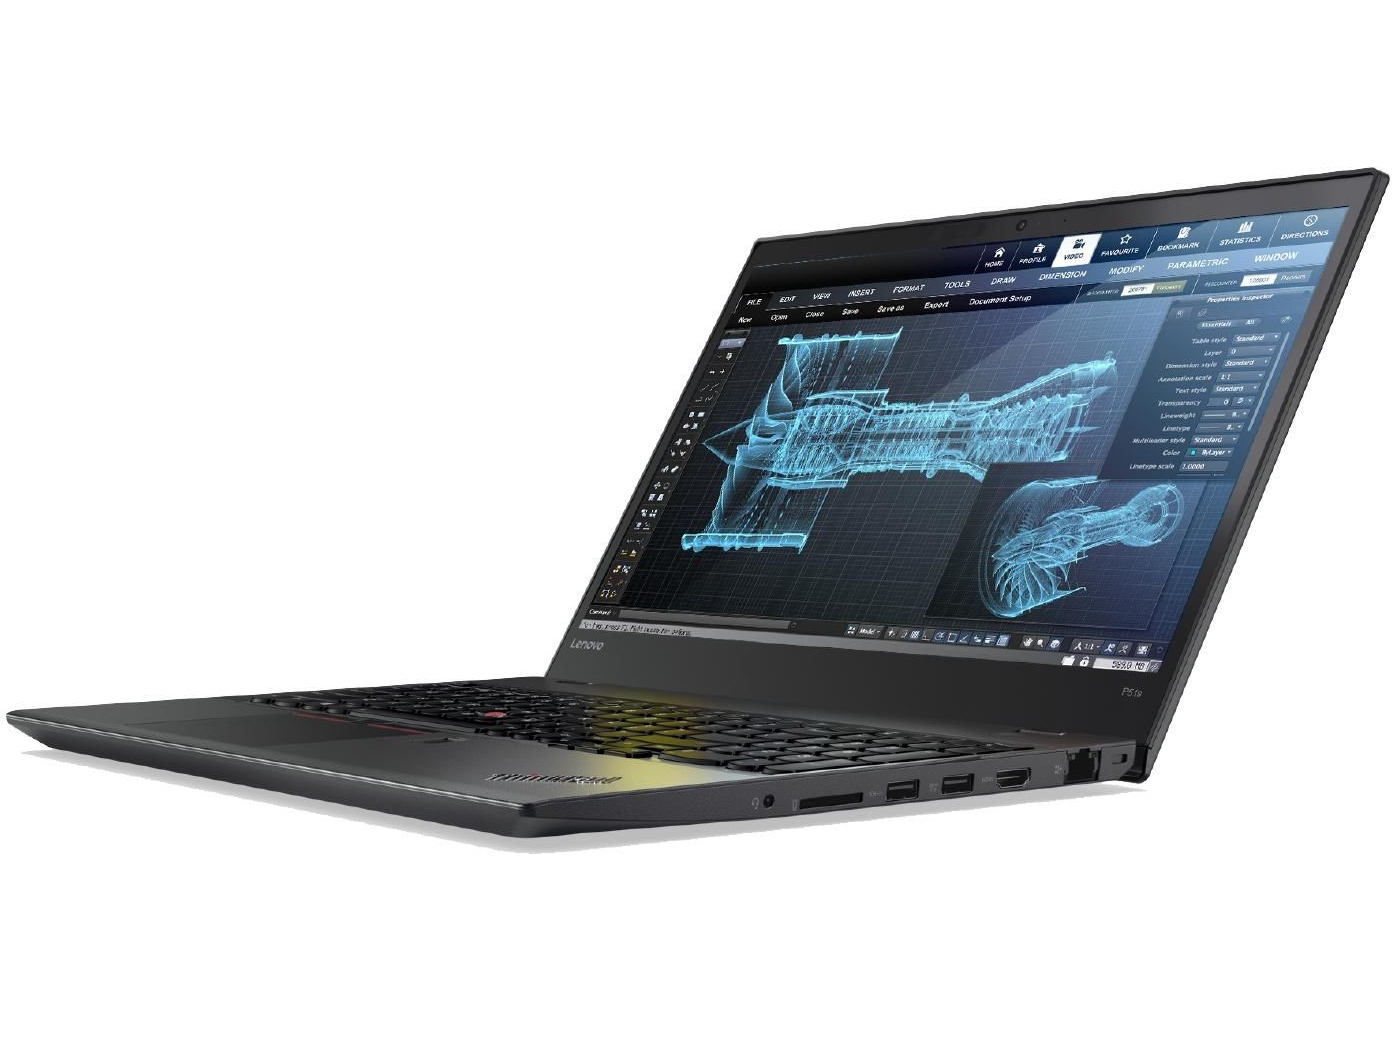
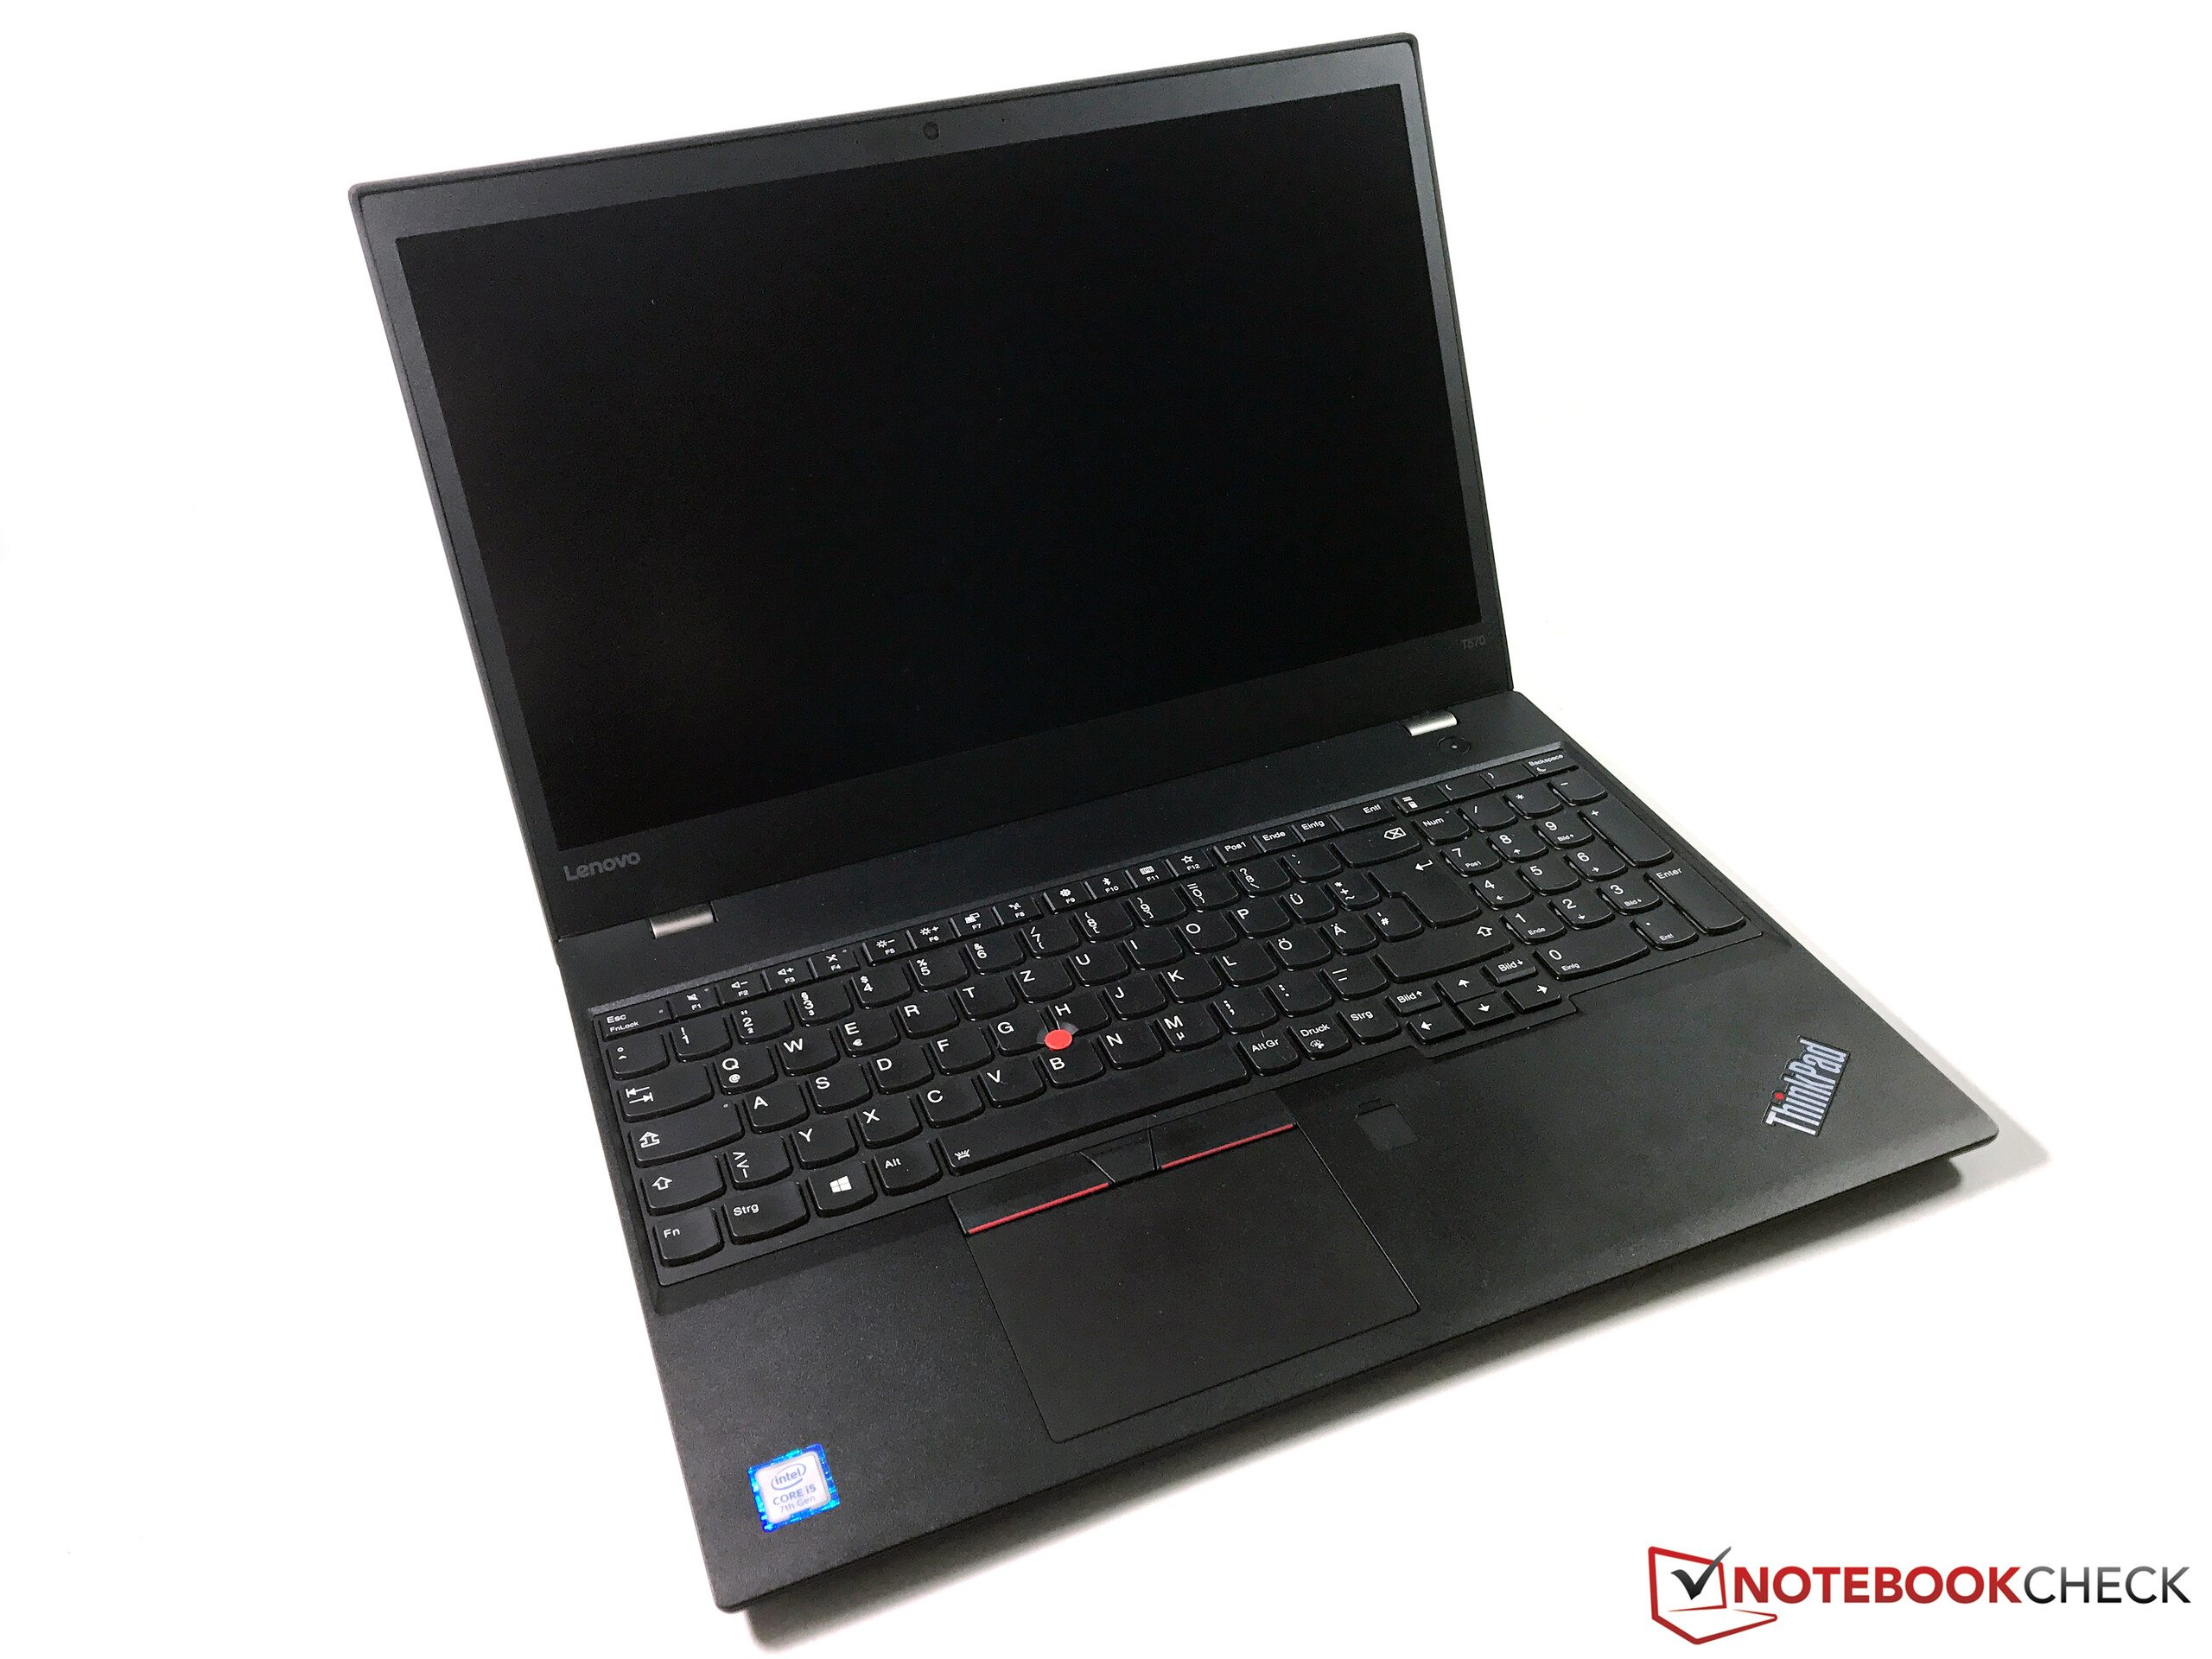
We are looking at the ThinkPad P51s, which is the successor of the ThinkPad P50s. Both devices are mobile, 15.6-inch entry-level workstations. The devices are not identical. While the P50s is based on the ThinkPad W550, the P51s is an identically built sibling of the ThinkPad T570. We have already tested the latter several times, among them a model with a 4K screen and GeForce 940MX graphics core. Our P51s review model is based on this version. Devices like HP's ZBook Studio G3 and Dell's Precision 5520 UHD are rivals of the laptop.
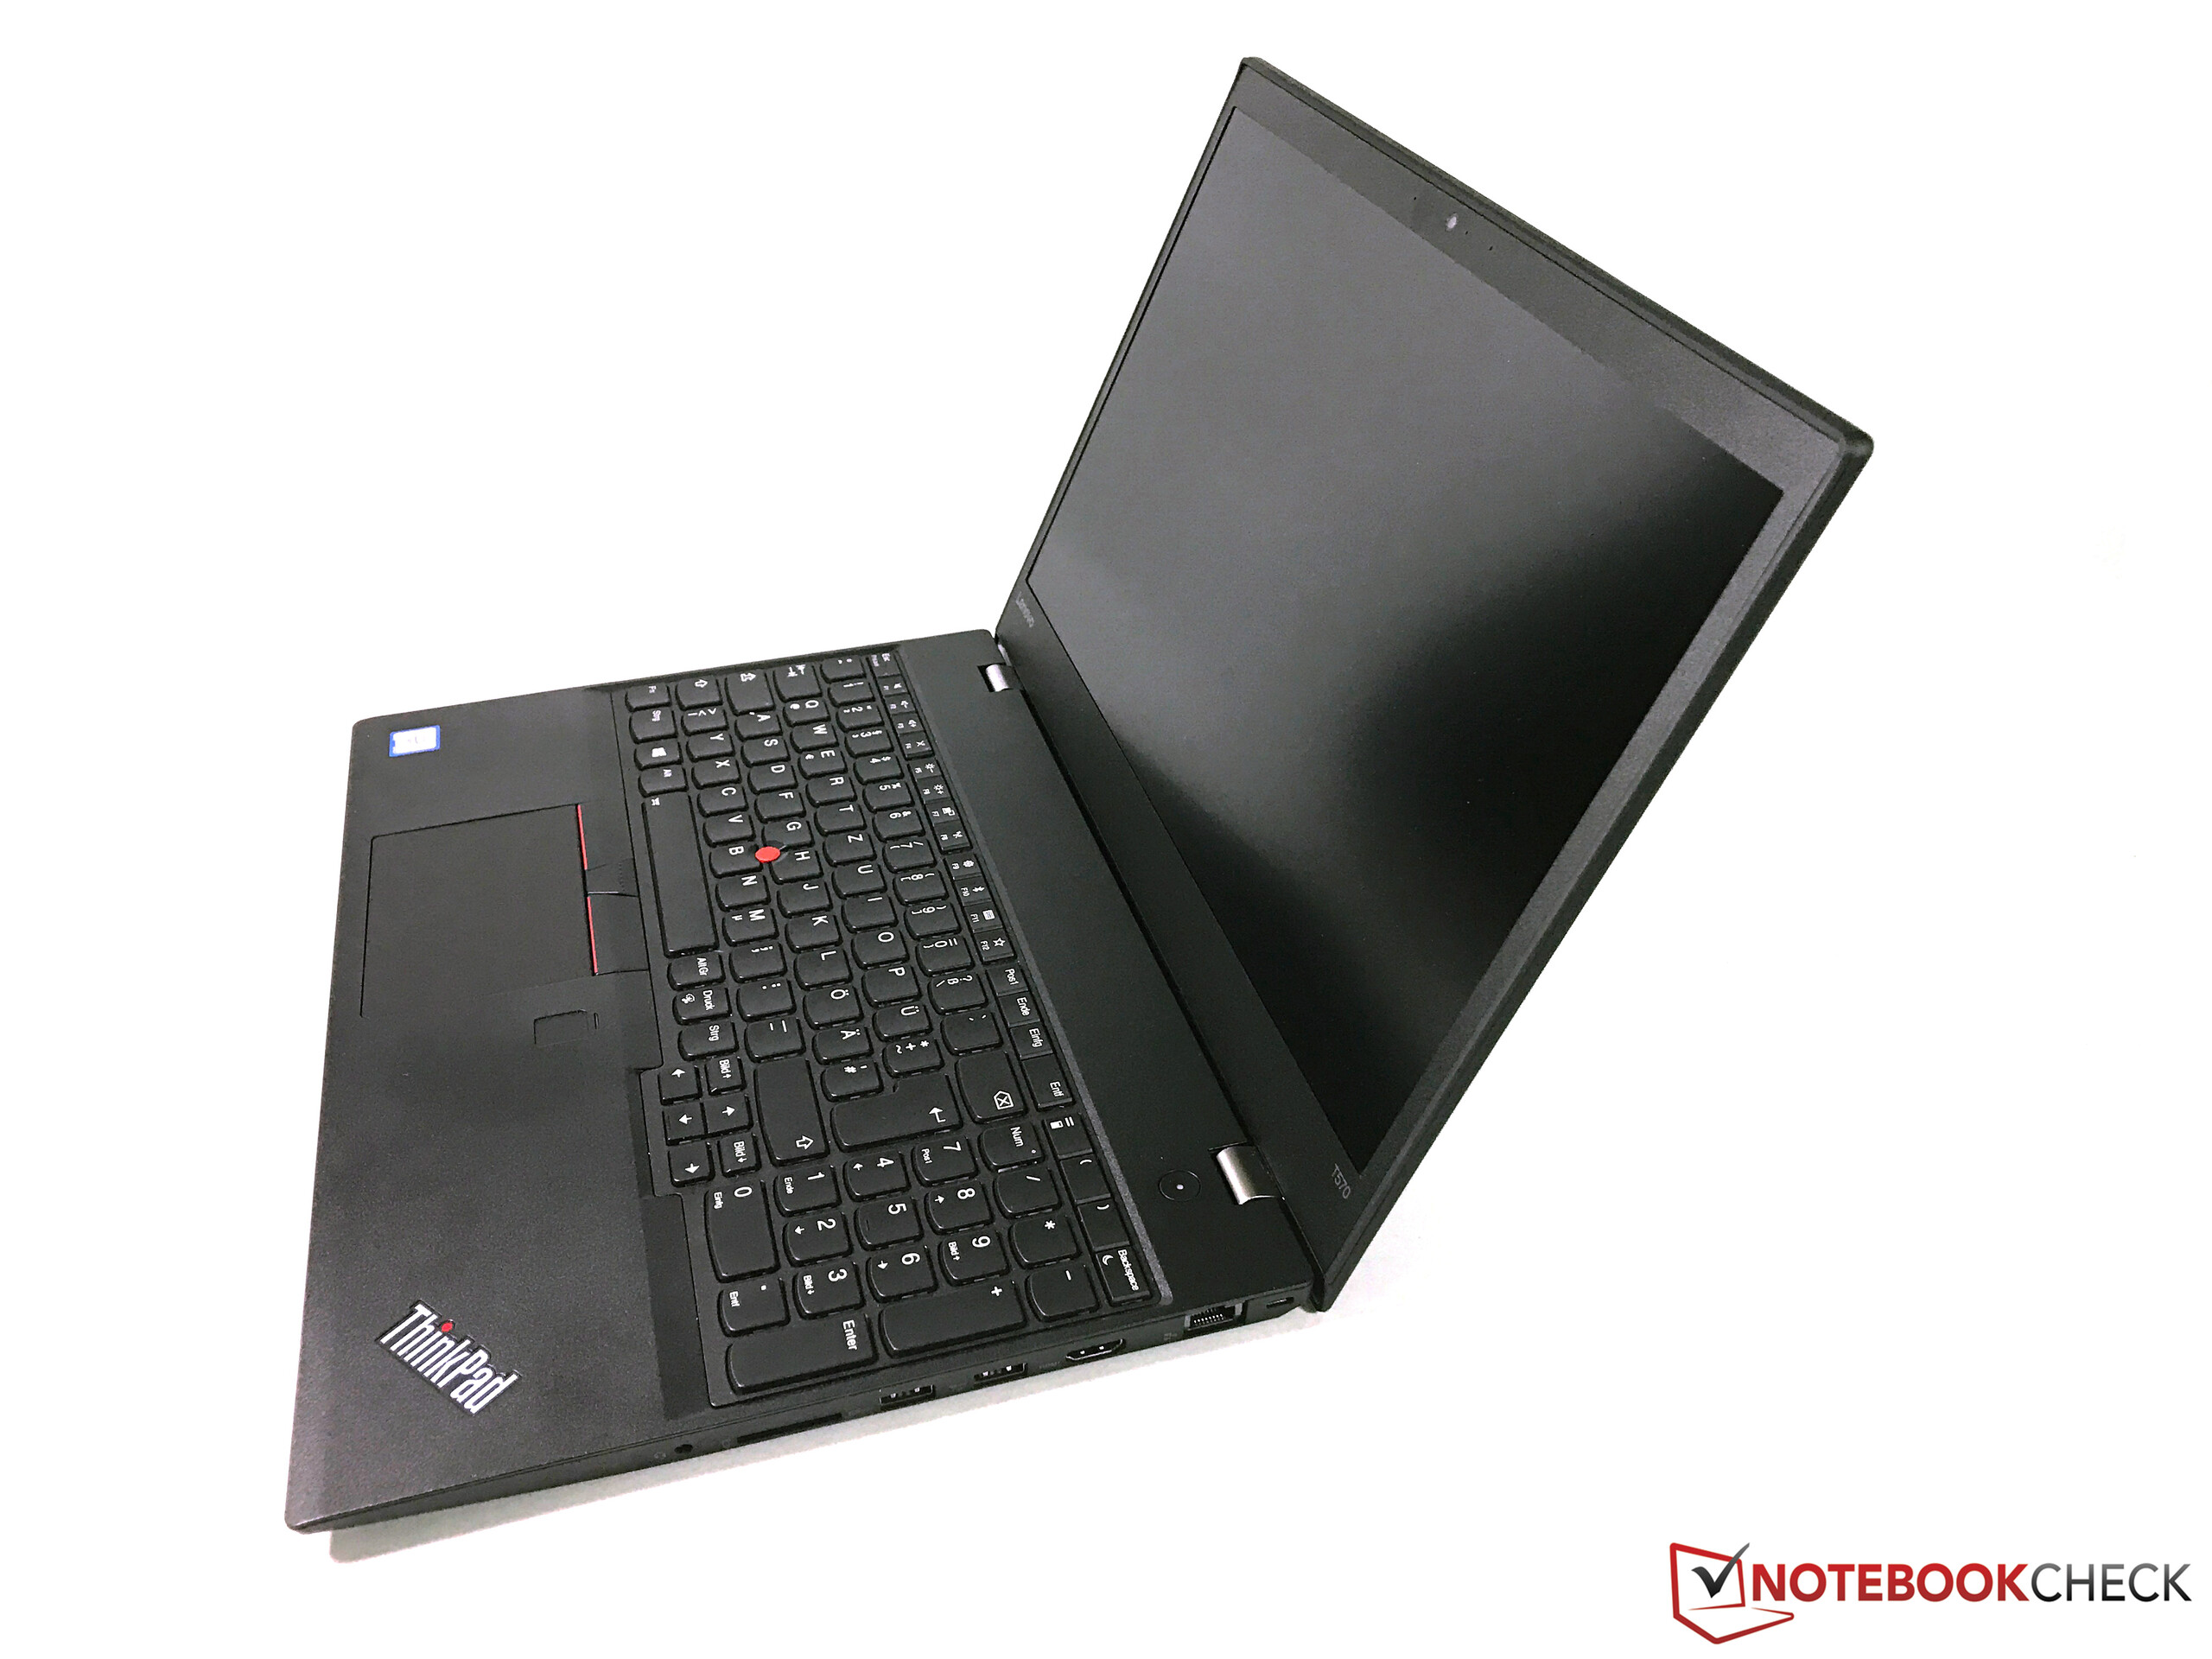
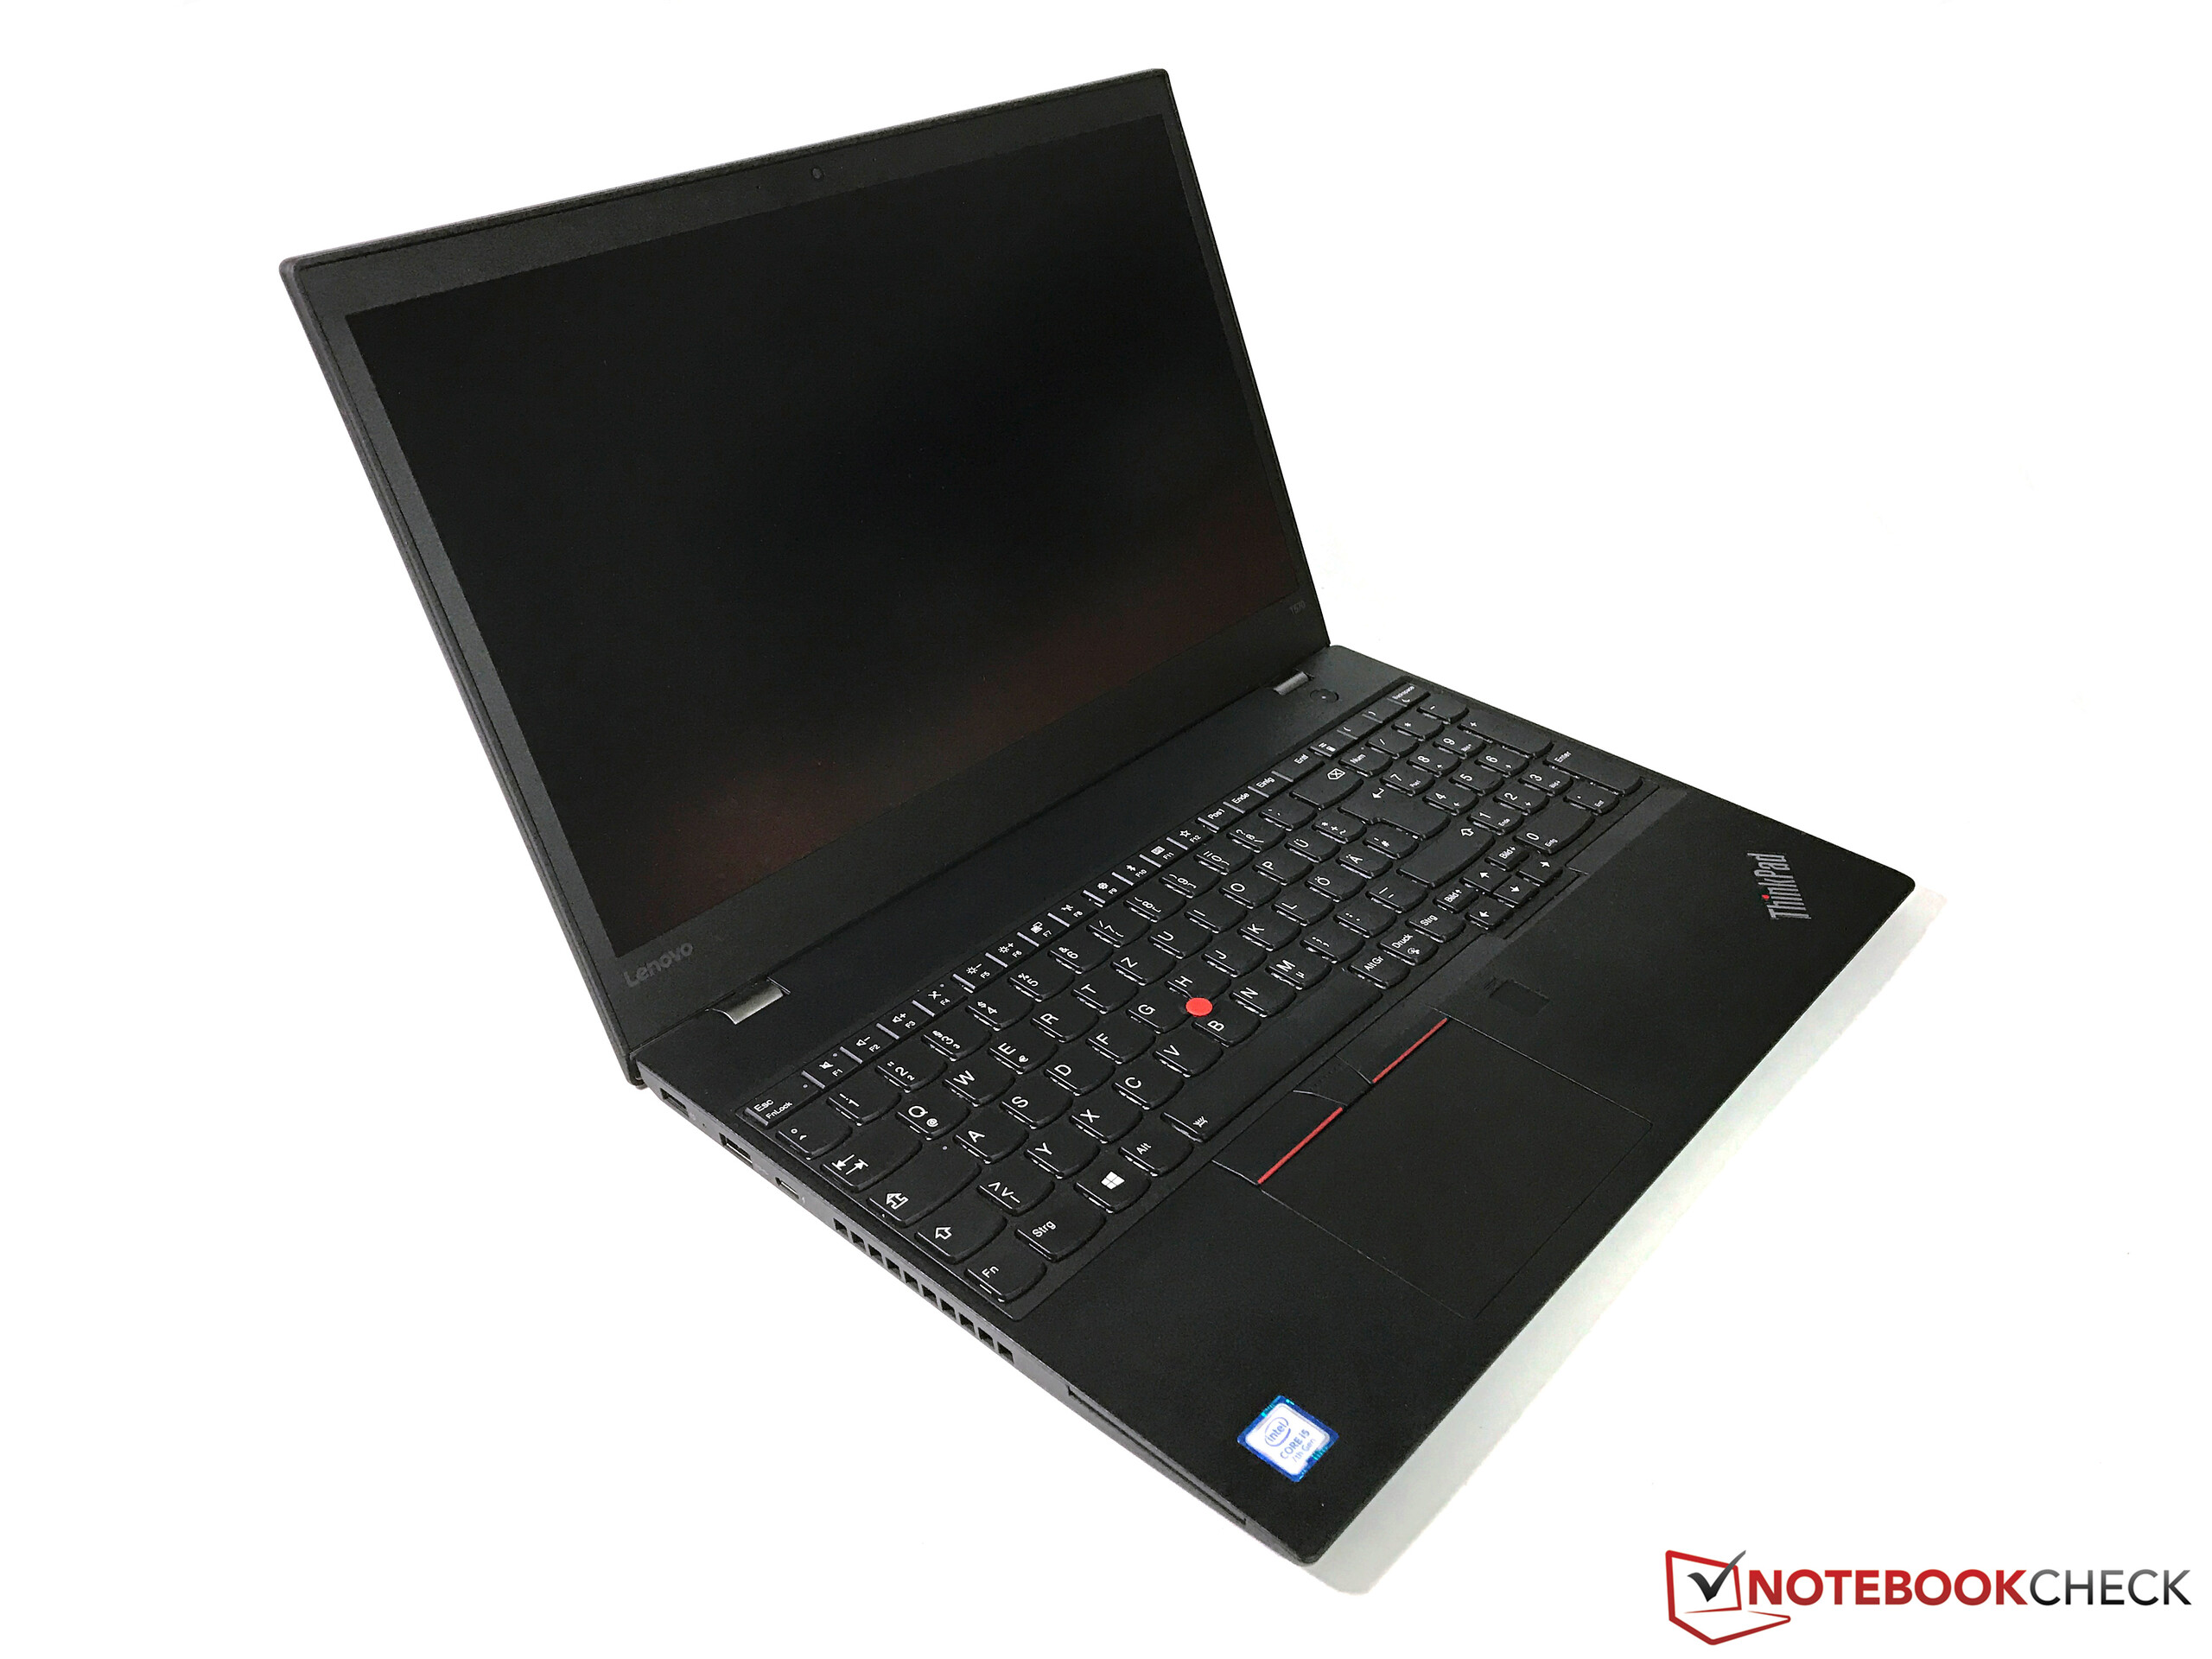
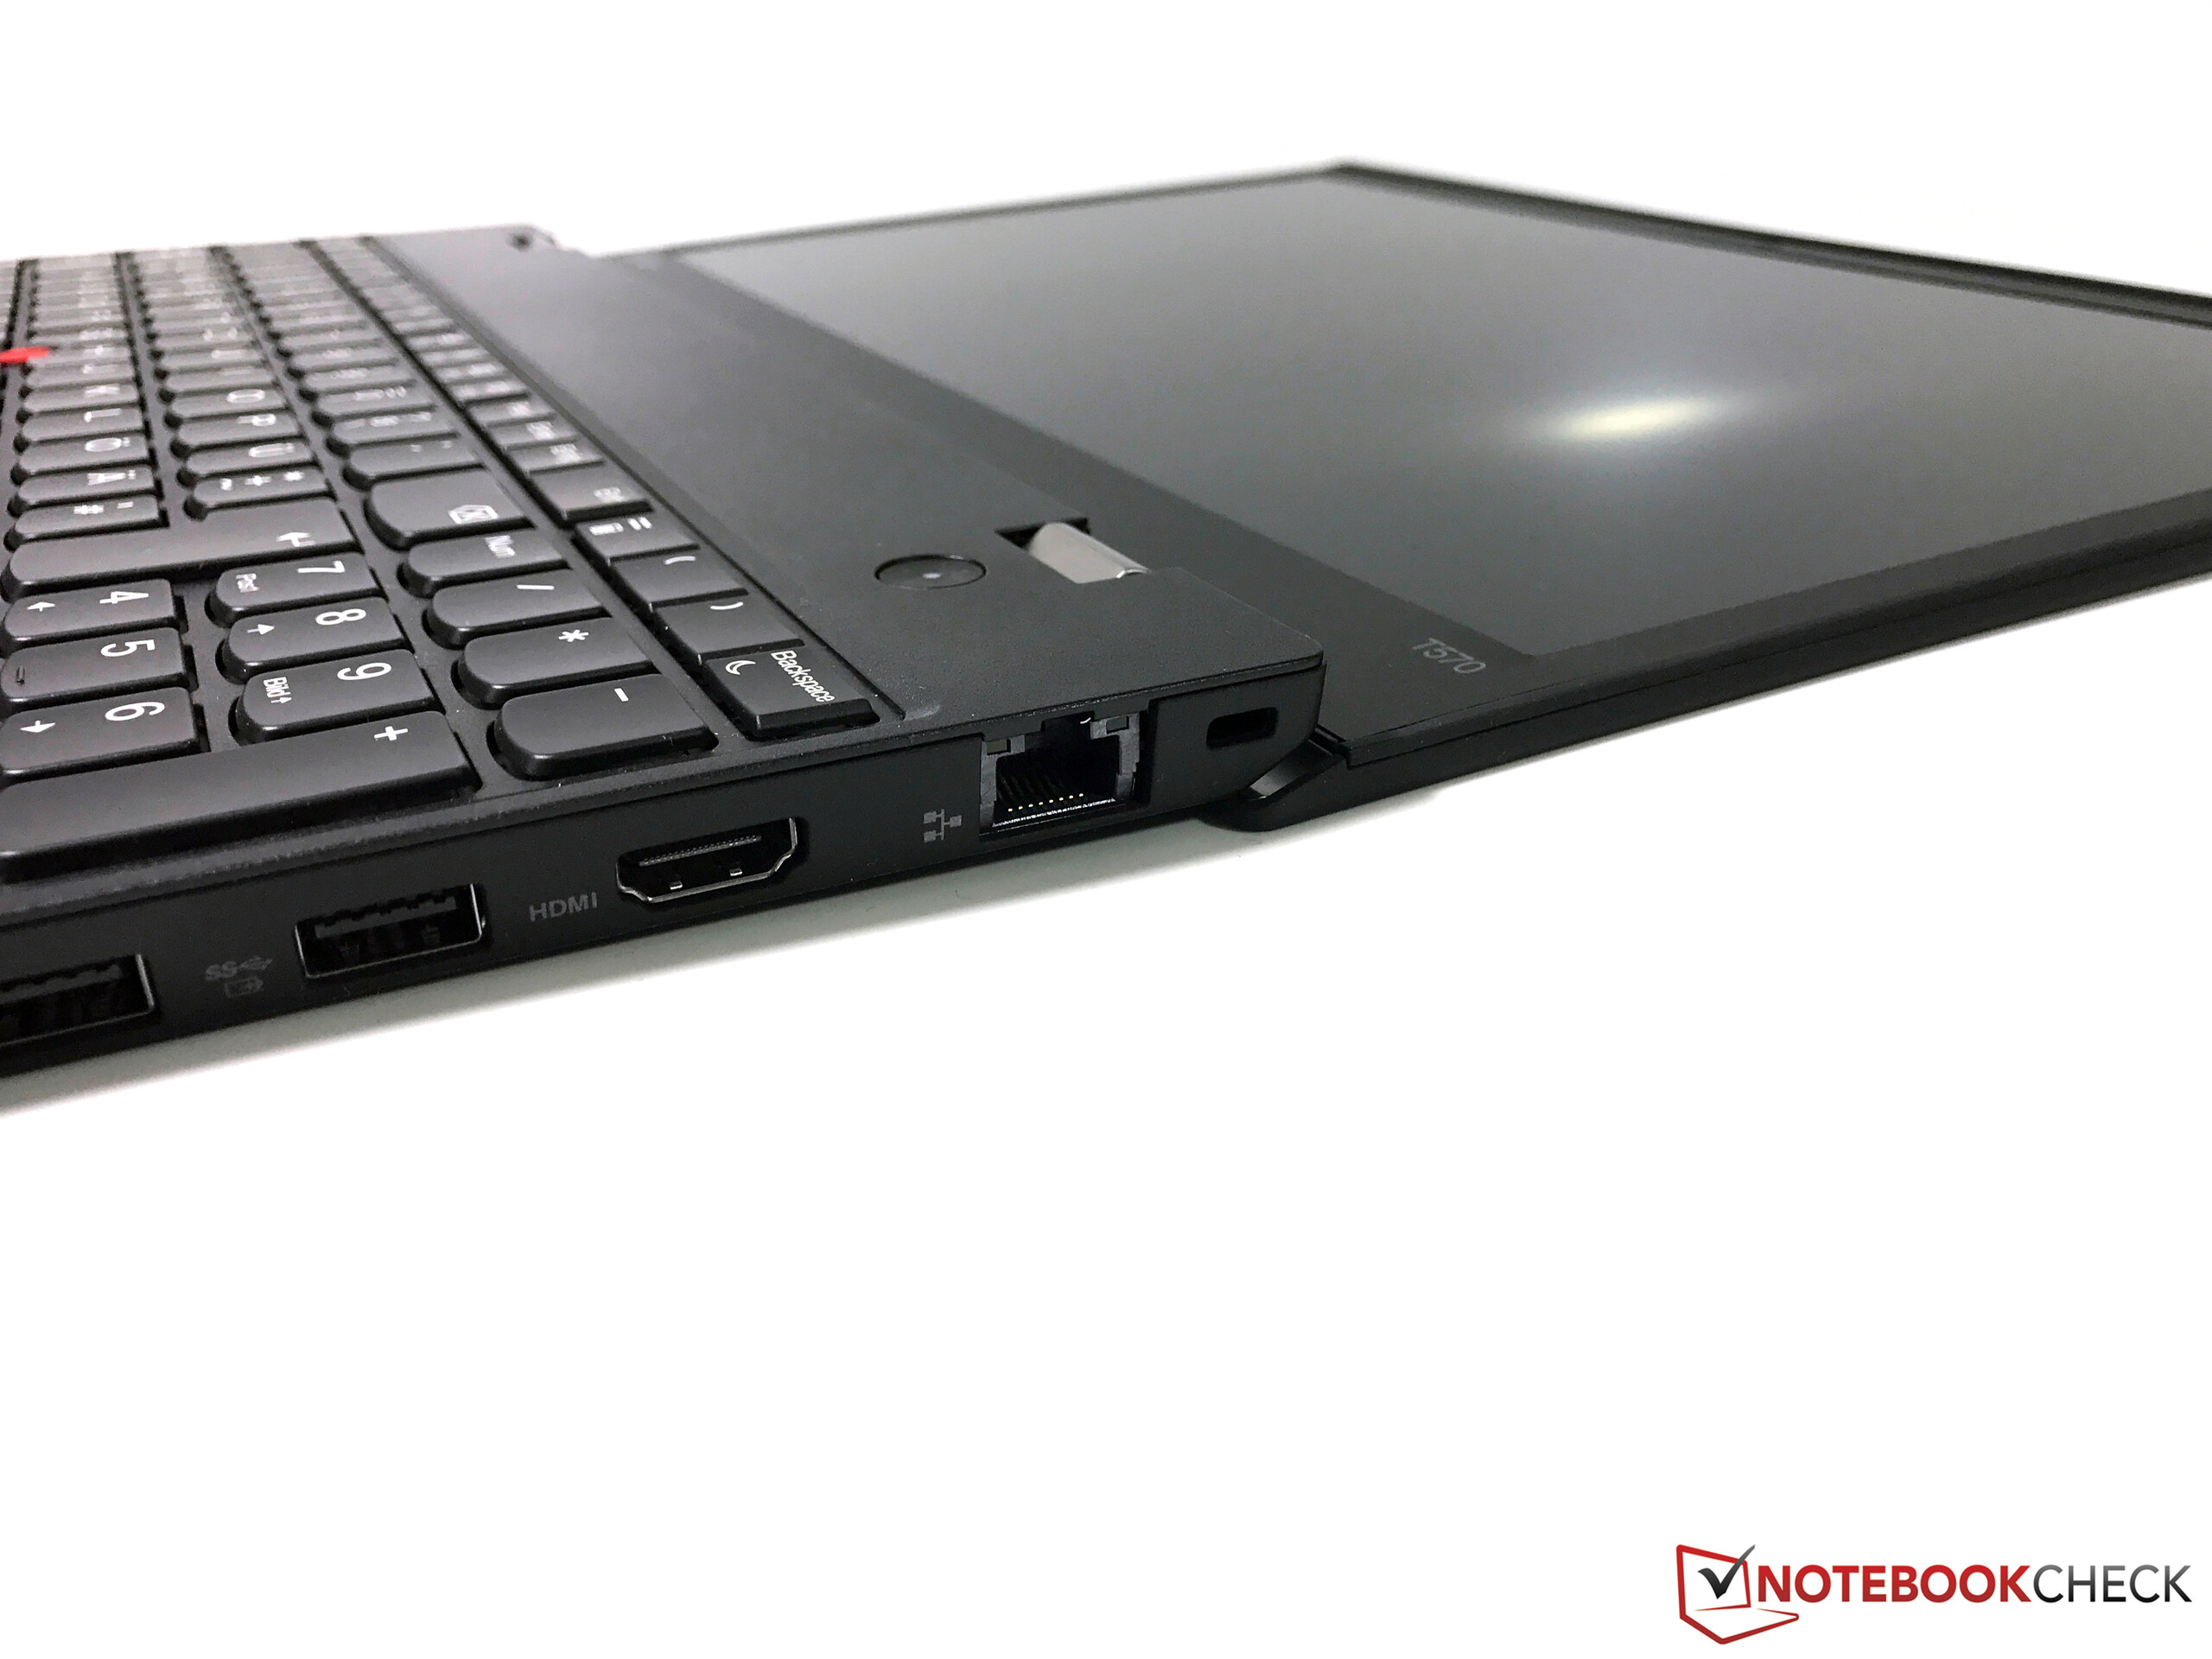
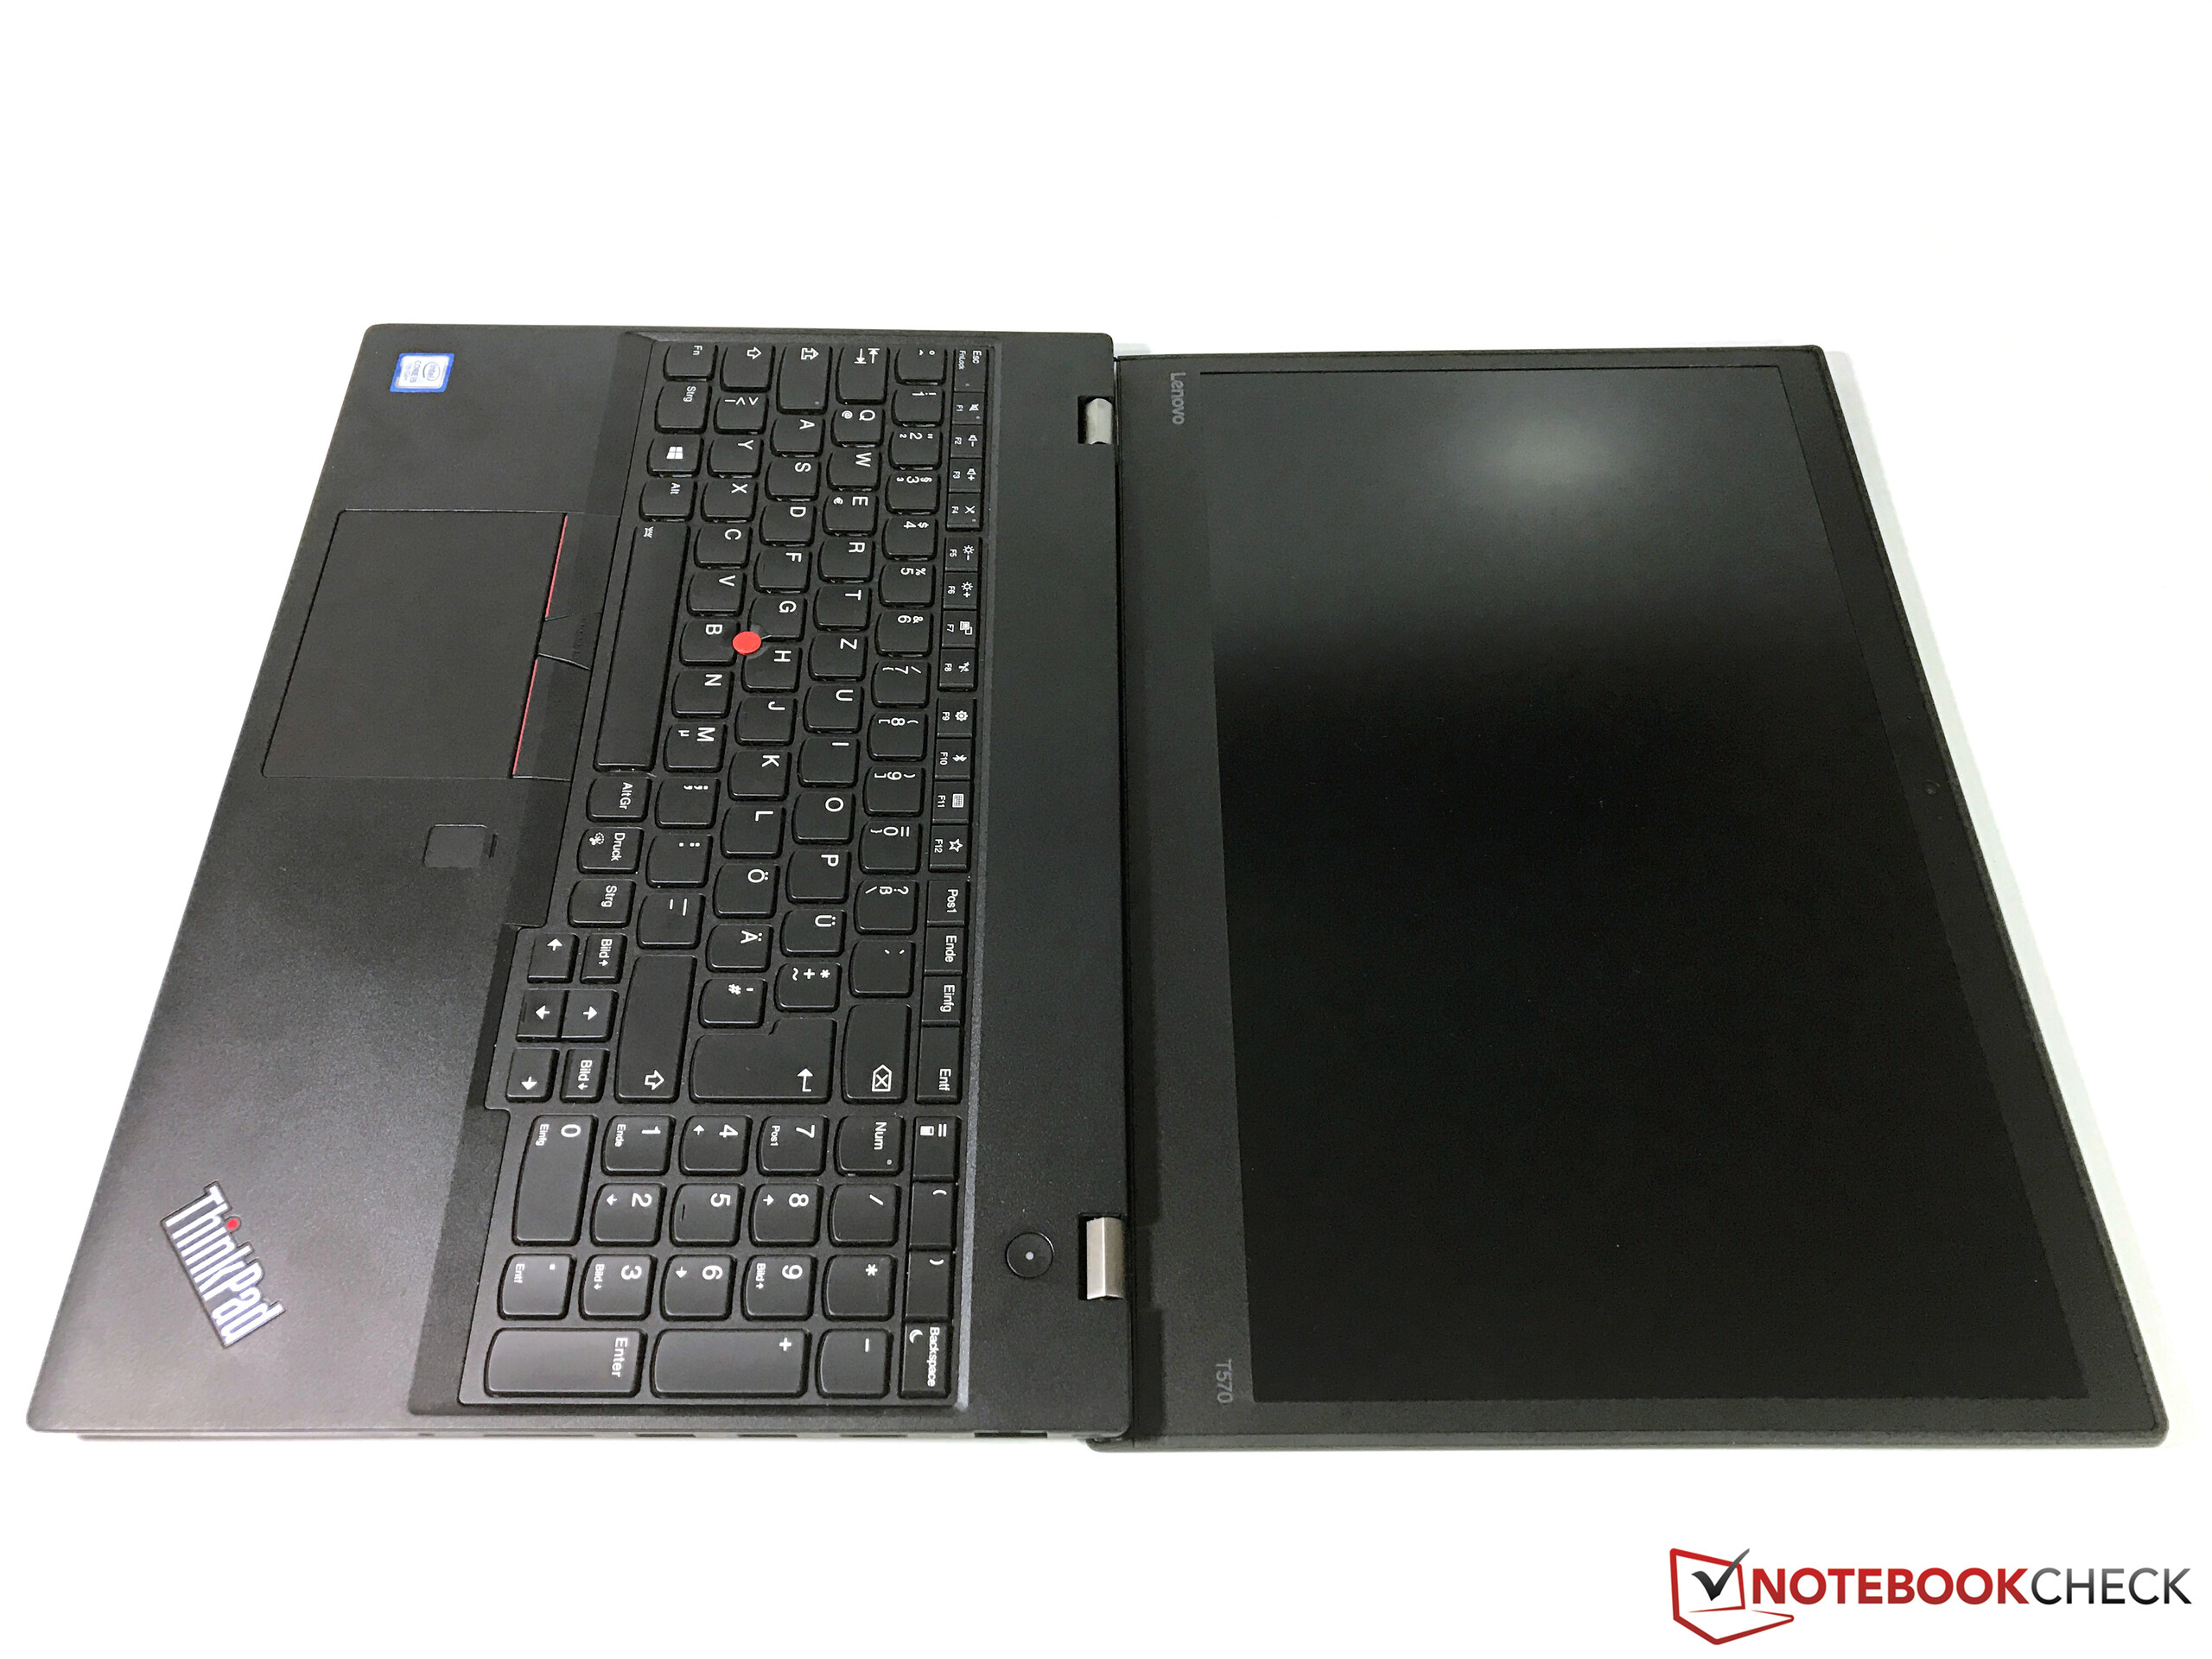
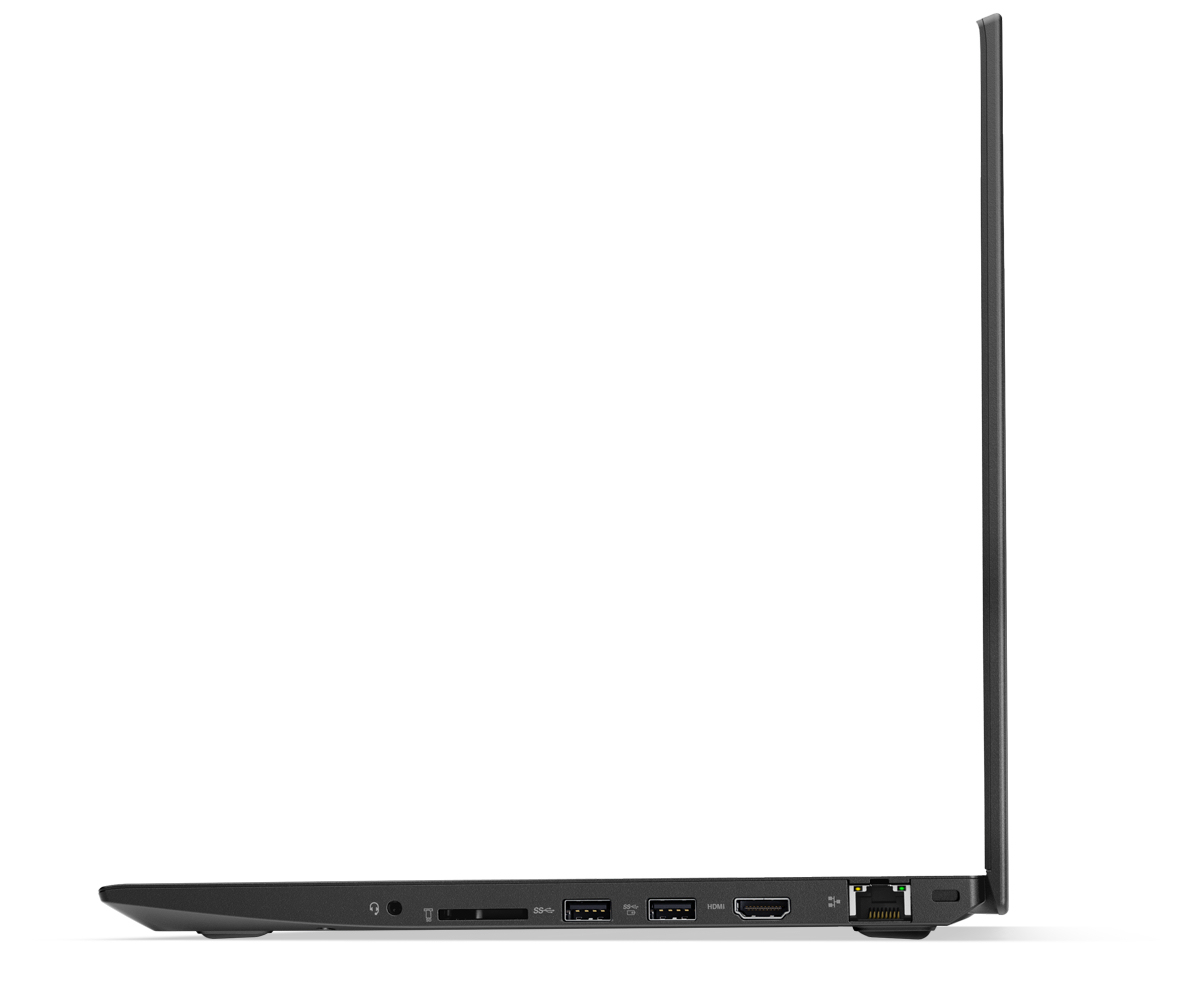
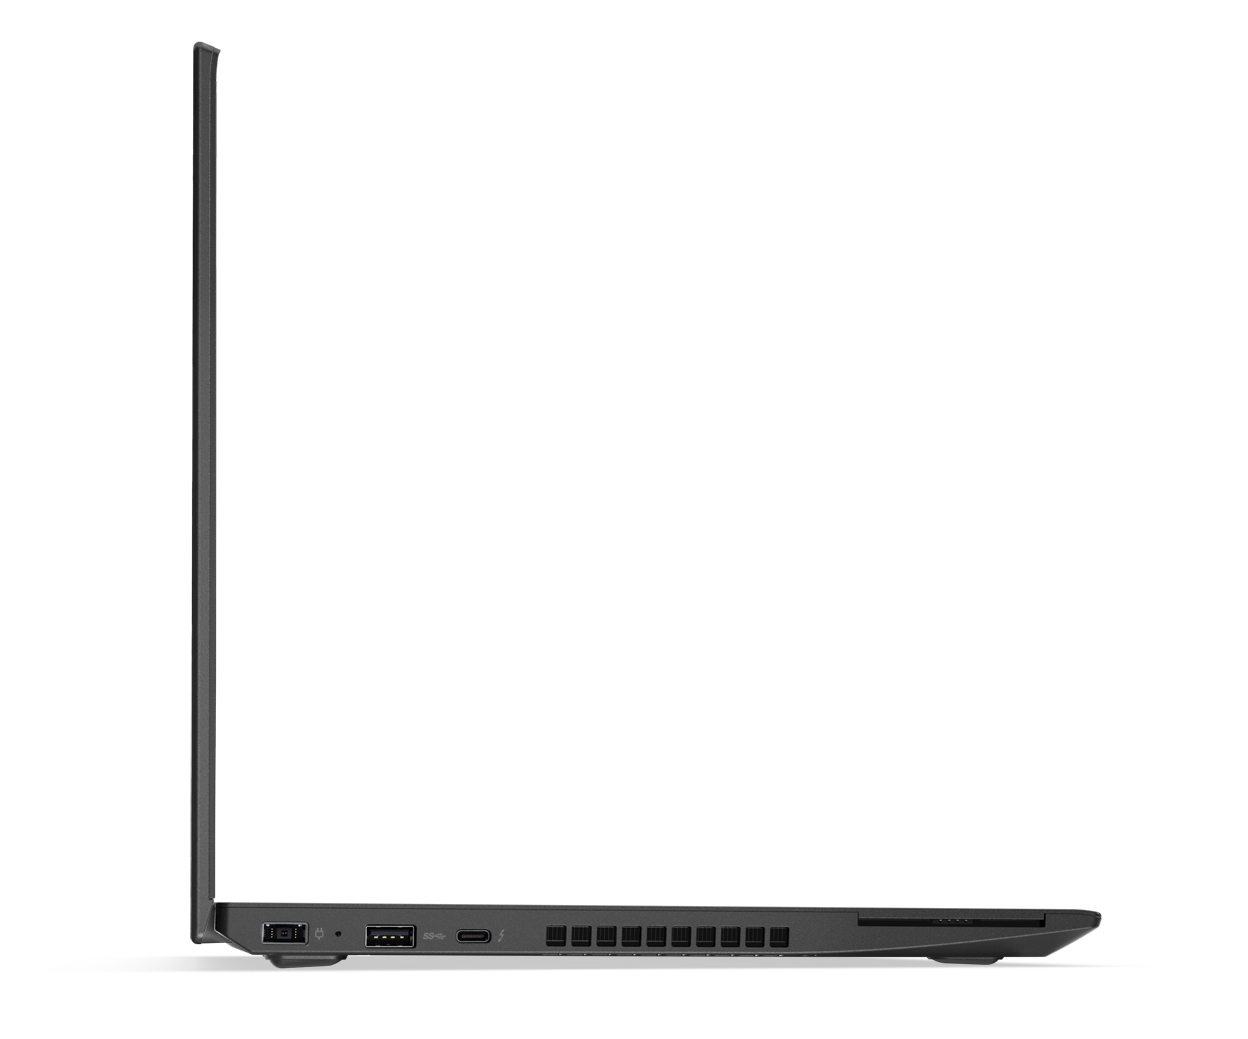
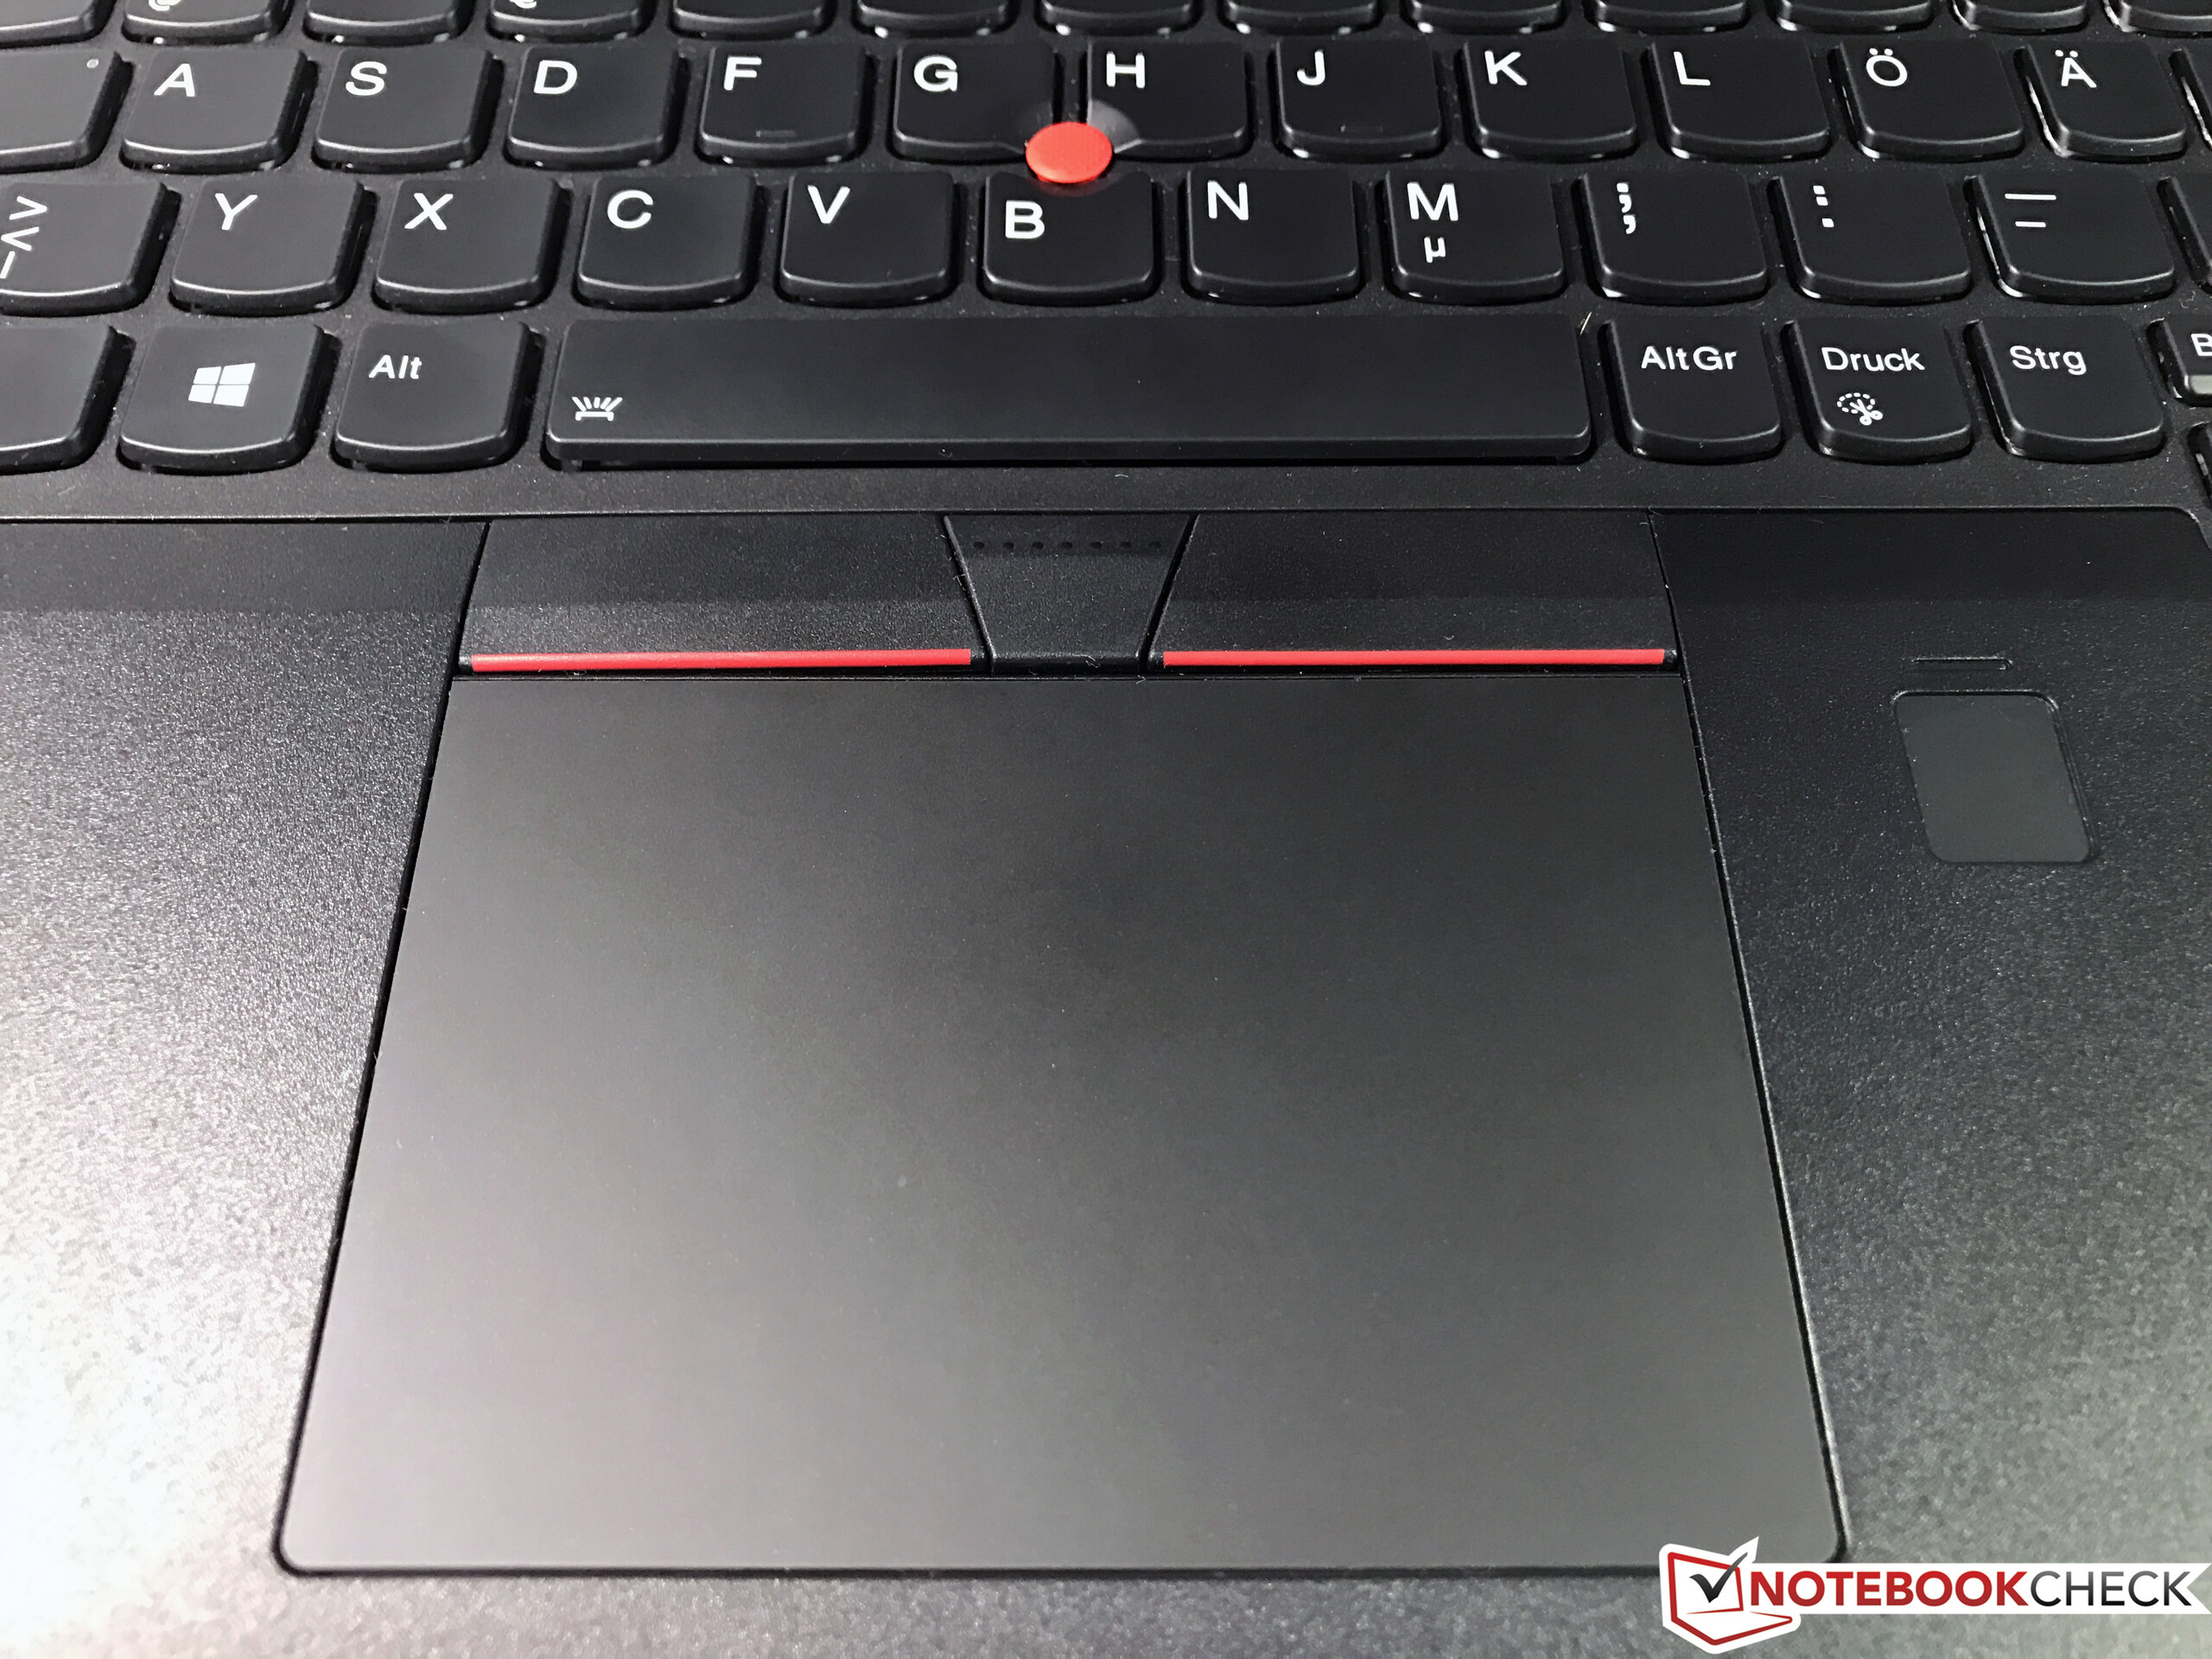
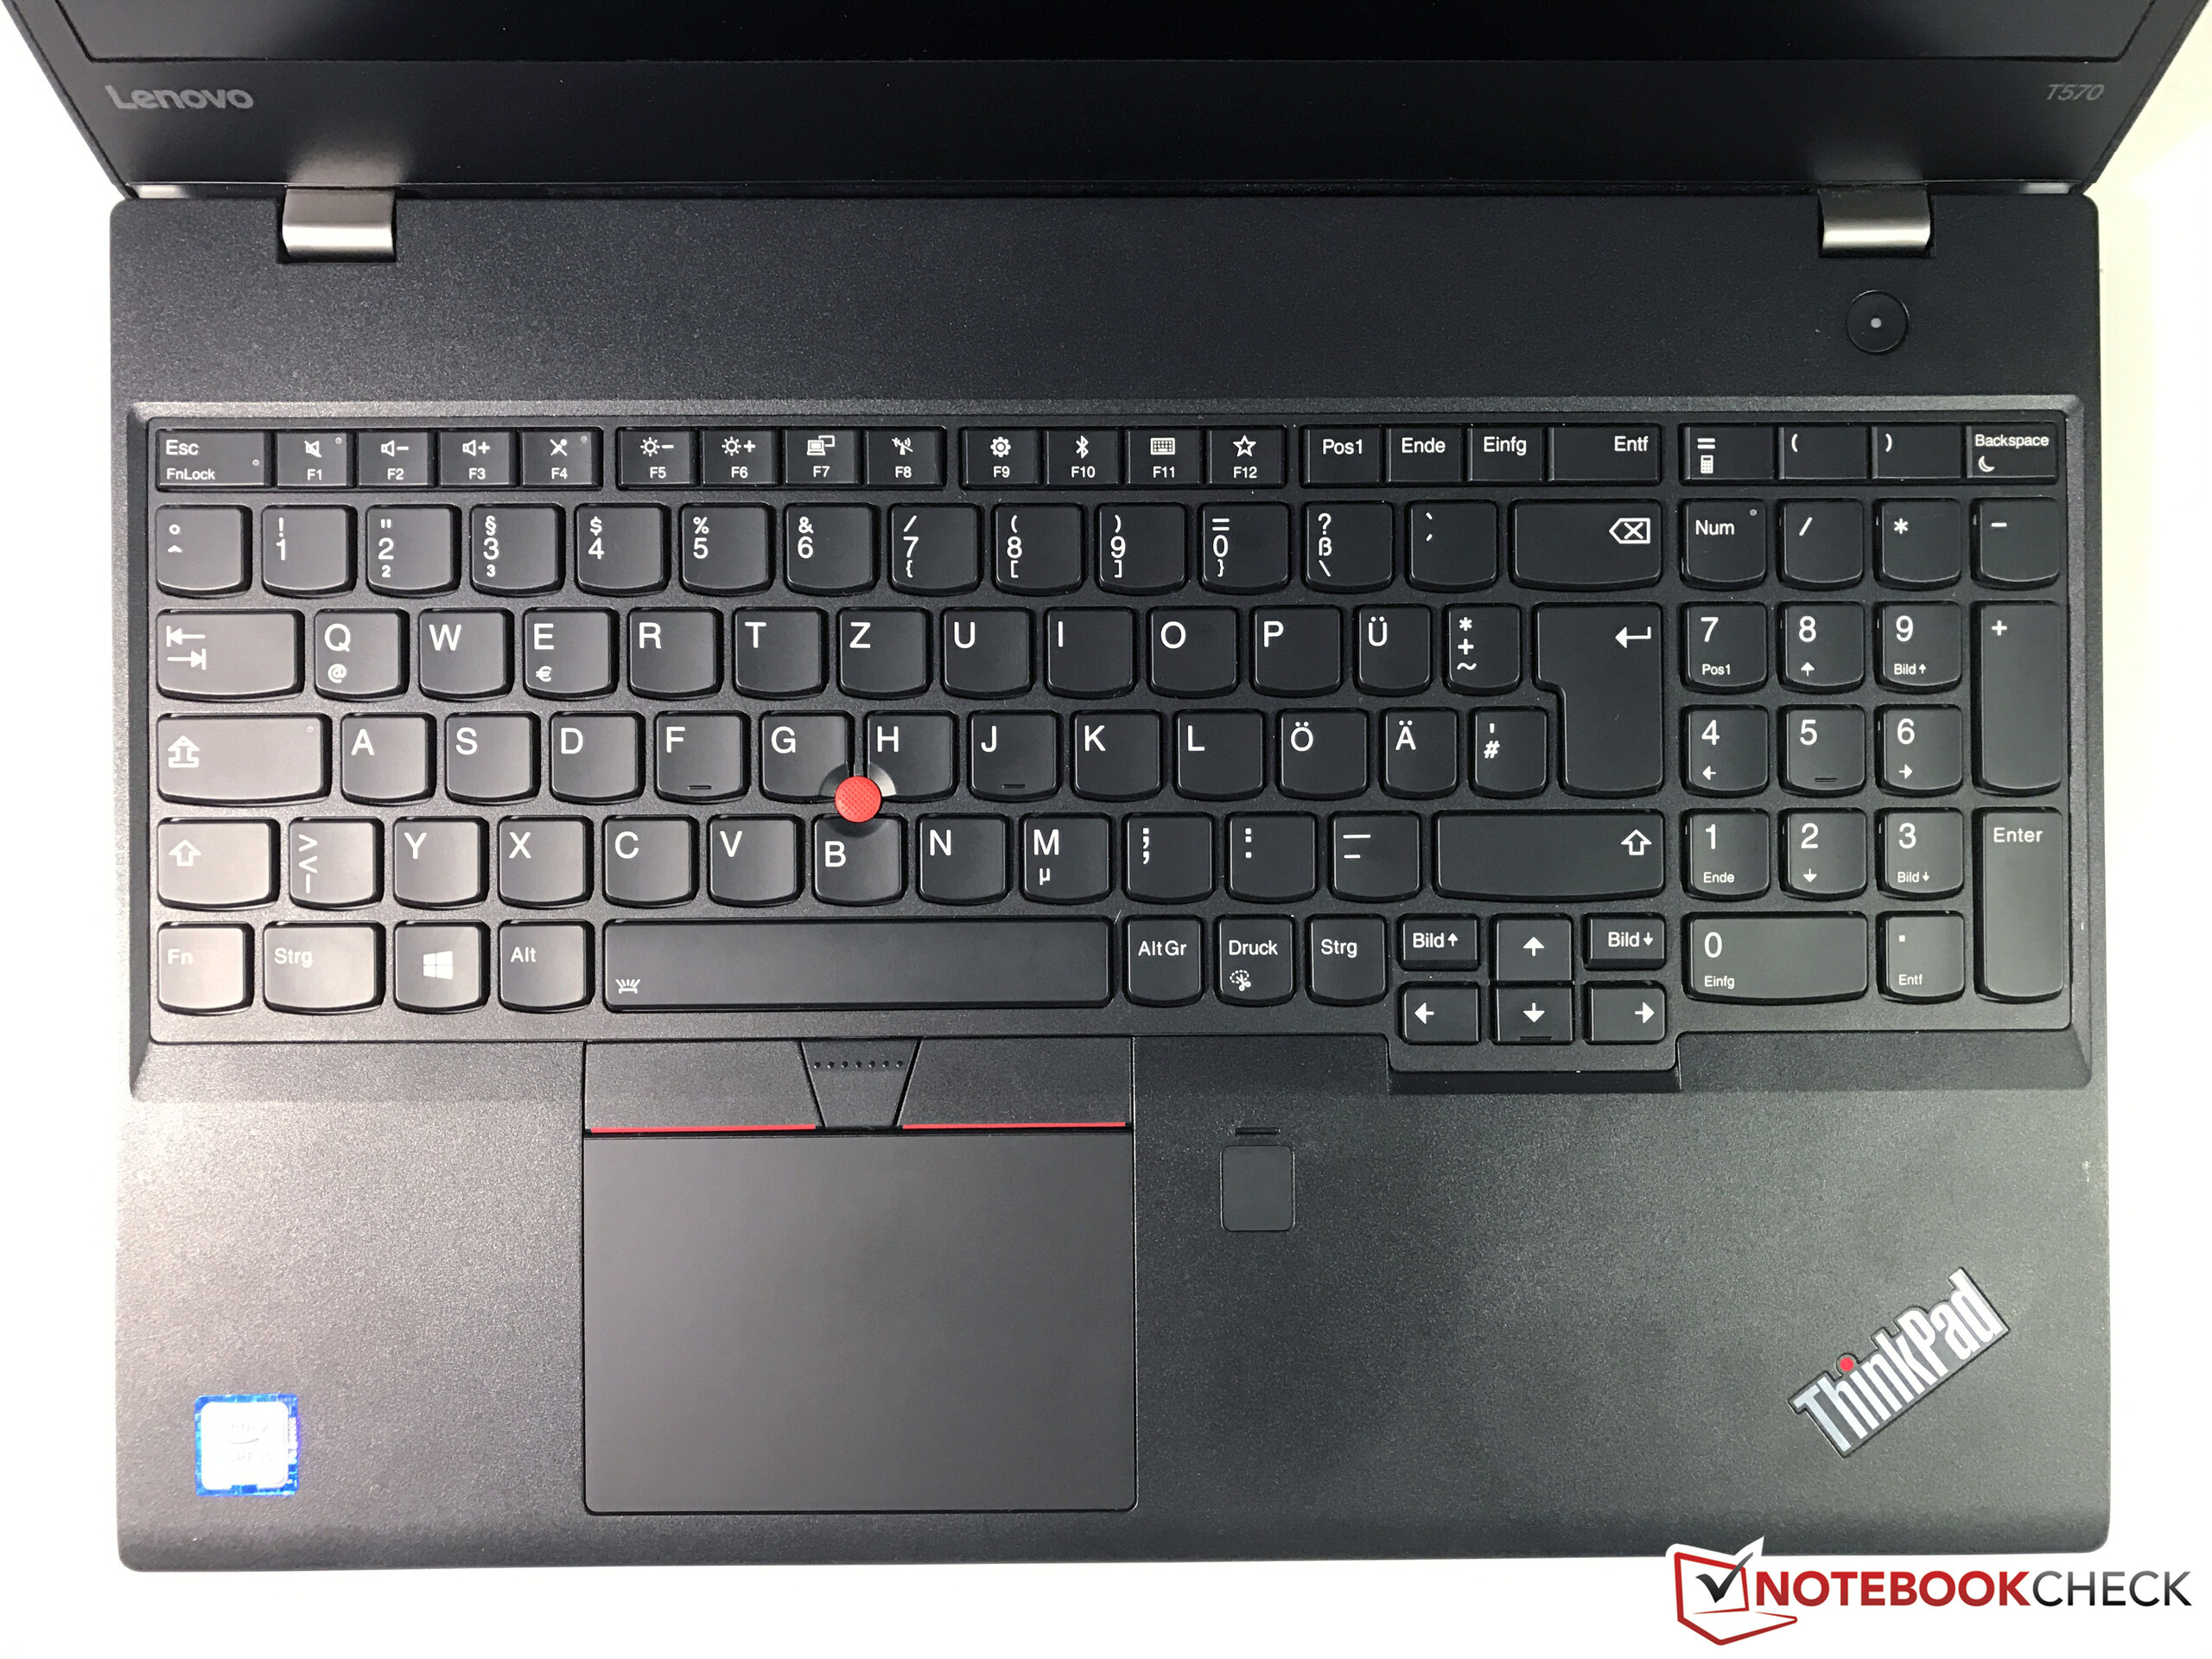
Since the ThinkPad P51s and ThinkPad T570 are identical, we will not go in-depth about the casing, connectivity, input devices or speakers. The corresponding information can be found in the reviews of the ThinkPad T570-20HAS01E00 (Core i7, 4K) and ThinkPad T570-20H90002GE (Core i5, Full HD).
| SD Card Reader | |
| average JPG Copy Test (av. of 3 runs) | |
| Dell Precision 5520 UHD | |
| HP ZBook Studio G3 | |
| Lenovo ThinkPad P51s 20HB000SGE | |
| Lenovo ThinkPad T570-20HAS01E00 | |
| Lenovo ThinkPad P50s-20FKS00400 | |
| maximum AS SSD Seq Read Test (1GB) | |
| Dell Precision 5520 UHD | |
| HP ZBook Studio G3 | |
| Lenovo ThinkPad T570-20HAS01E00 | |
| Lenovo ThinkPad P50s-20FKS00400 | |
| Lenovo ThinkPad P51s 20HB000SGE | |
| Networking | |
| iperf3 transmit AX12 | |
| Lenovo ThinkPad P51s 20HB000SGE | |
| Dell Precision 5520 UHD | |
| Lenovo ThinkPad T570-20HAS01E00 | |
| iperf3 receive AX12 | |
| Lenovo ThinkPad P51s 20HB000SGE | |
| Lenovo ThinkPad T570-20HAS01E00 | |
| Dell Precision 5520 UHD | |
Display

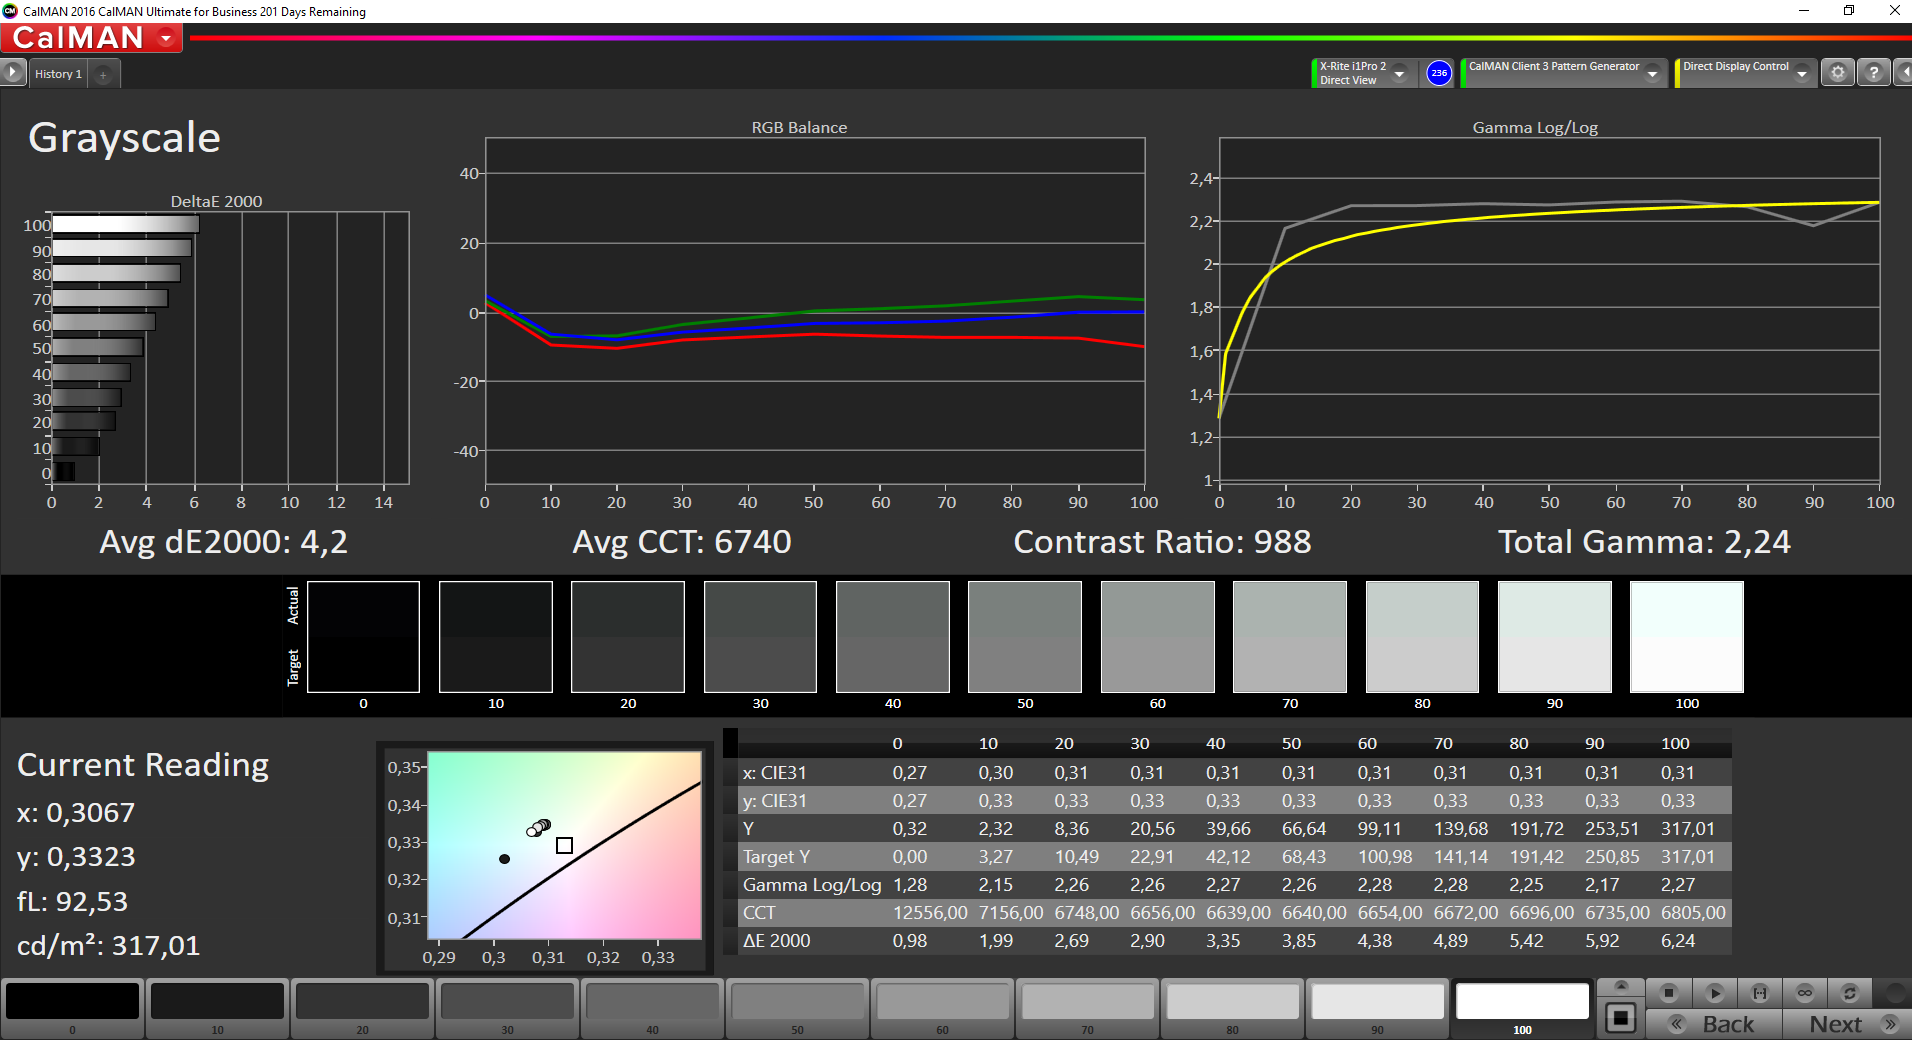
The ThinkPad P51s is furnished with the same matte 4K panel (3840x2160 pixels) as the ThinkPad T570 that we have previously tested. It is a viewing-angle stable IPS screen that offers a good contrast (991:1) and a very decent brightness value (289.9 cd/m²). Nevertheless, better rates could be expected from a device in this price range. A contrast beyond 1000:1 (and brightness rate much higher than 300 cd/m²) would not be too much to ask.
Unfortunately, the screen exhibits PWM-flickering at a frequency of 980.4 Hz at brightness levels of 90% and lower. The high frequency should not cause headaches and/or eye problems in sensitive users, though.
| |||||||||||||||||||||||||
Brightness Distribution: 85 %
Center on Battery: 318 cd/m²
Contrast: 991:1 (Black: 0.32 cd/m²)
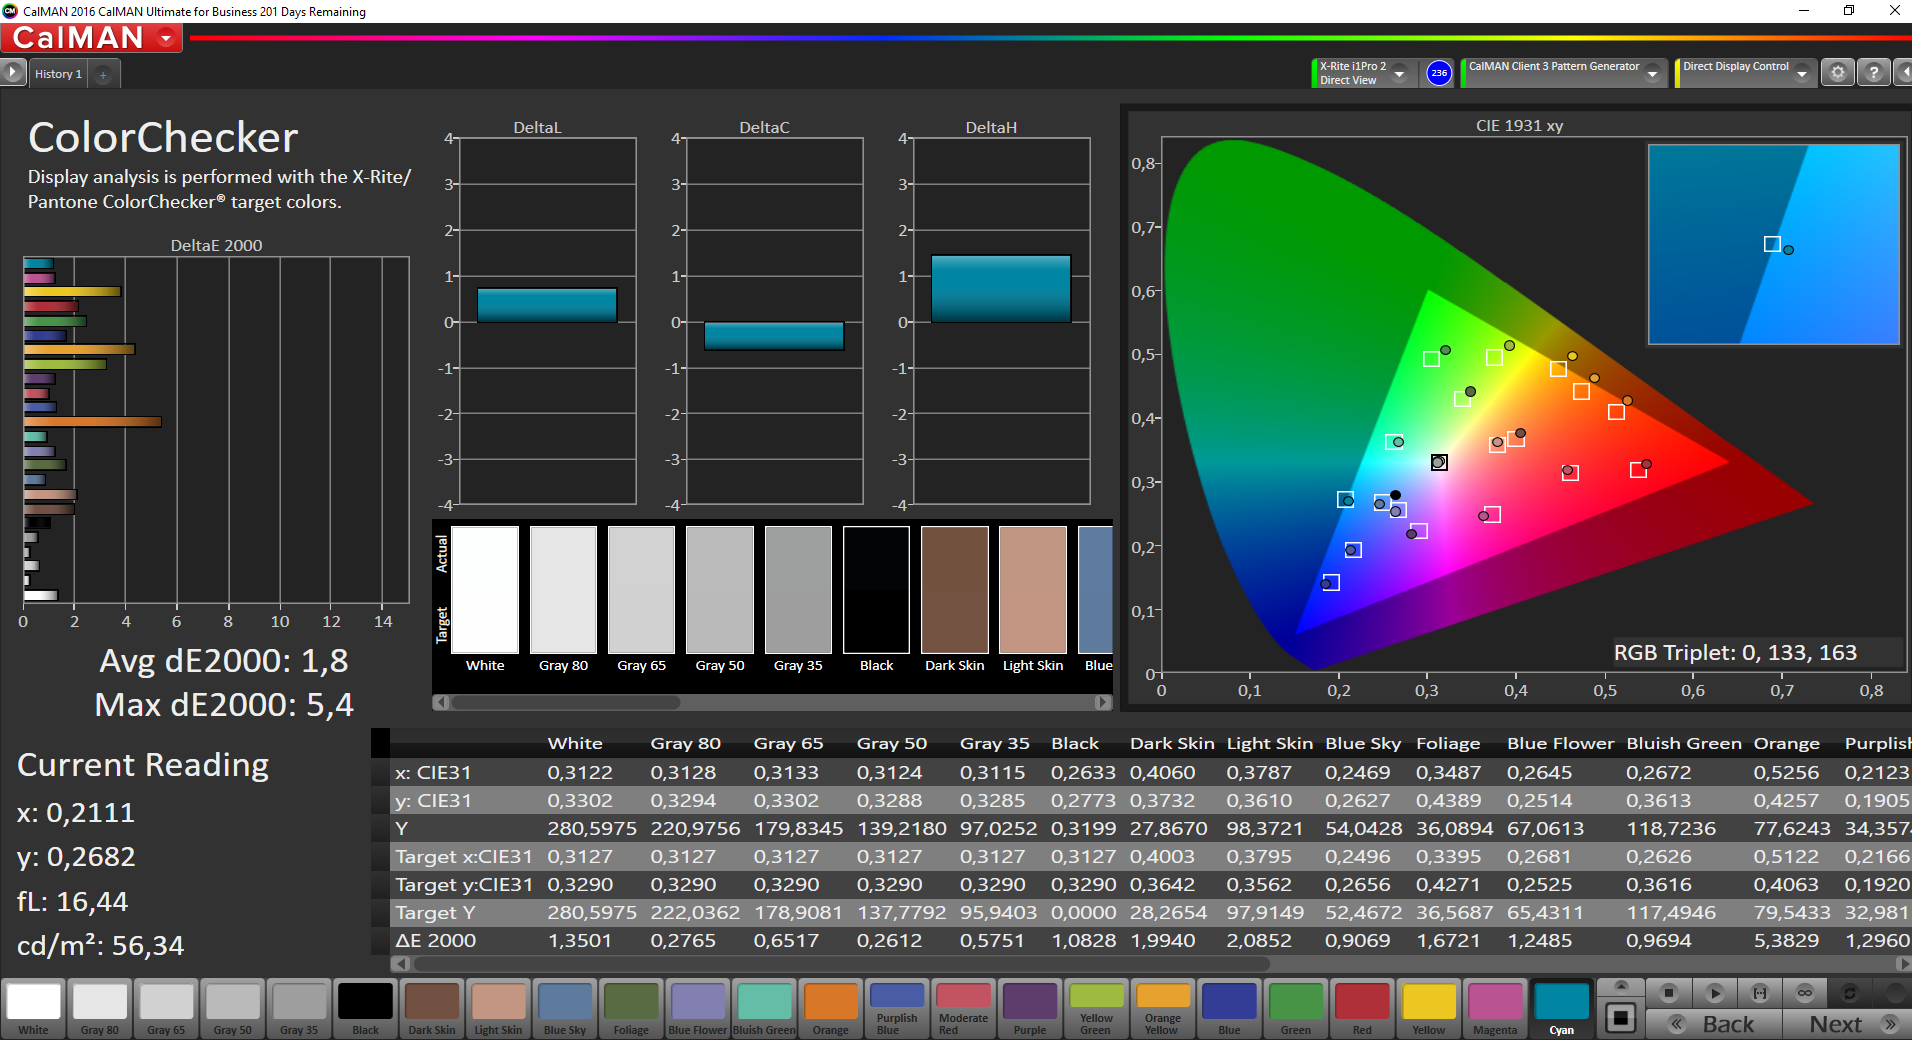
ΔE ColorChecker Calman: 3.6 | ∀{0.5-29.43 Ø4.72}
ΔE Greyscale Calman: 4.2 | ∀{0.09-98 Ø4.97}
91.1% sRGB (Argyll 1.6.3 3D)
59.5% AdobeRGB 1998 (Argyll 1.6.3 3D)
66.8% AdobeRGB 1998 (Argyll 3D)
91.2% sRGB (Argyll 3D)
69.7% Display P3 (Argyll 3D)
Gamma: 2.24
CCT: 6740 K
| Lenovo ThinkPad P51s 20HB000SGE IPS, 3840x2160, 15.6", BOE NV156QUM-N44 | Lenovo ThinkPad P50s-20FKS00400 IPS, 2880x1620, 15.5", WX16T028J00, LEN40B5 | Lenovo ThinkPad T570-20HAS01E00 IPS, 3840x2160, 15.6", BOE NV156QUM-N44 | Dell Precision 5520 UHD IPS, 3840x2160, 15.6", SHP1476 | HP ZBook Studio G3 IPS, 3840x2160, 15.6", Sharp SPH1445 | |
|---|---|---|---|---|---|
| Display | -6% | 0% | 3% | 26% | |
| Display P3 Coverage (%) | 69.7 | 63.7 -9% | 70 0% | 67.4 -3% | 86 23% |
| sRGB Coverage (%) | 91.2 | 87.6 -4% | 91.1 0% | 98.5 8% | 98.9 8% |
| AdobeRGB 1998 Coverage (%) | 66.8 | 63.8 -4% | 66.7 0% | 68.9 3% | 98 47% |
| Response Times | -8% | 16% | -61% | -5% | |
| Response Time Grey 50% / Grey 80% * (ms) | 38.4 ? | 38 ? 1% | 41.6 ? -8% | 59.2 ? -54% | 44 ? -15% |
| Response Time Black / White * (ms) | 24.8 ? | 28.8 ? -16% | 15.2 ? 39% | 41.6 ? -68% | 23.2 ? 6% |
| PWM Frequency (Hz) | 980 ? | 219 ? | 926 ? | 200 ? | |
| Screen | -9% | -5% | 5% | -9% | |
| Brightness middle (cd/m²) | 317 | 319 1% | 339 7% | 372.4 17% | 310 -2% |
| Brightness (cd/m²) | 290 | 290 0% | 314 8% | 368 27% | 299 3% |
| Brightness Distribution (%) | 85 | 82 -4% | 89 5% | 90 6% | 86 1% |
| Black Level * (cd/m²) | 0.32 | 0.31 3% | 0.36 -13% | 0.48 -50% | 0.29 9% |
| Contrast (:1) | 991 | 1029 4% | 942 -5% | 776 -22% | 1069 8% |
| Colorchecker dE 2000 * | 3.6 | 4.8 -33% | 4.2 -17% | 2.6 28% | 5.9 -64% |
| Colorchecker dE 2000 max. * | 6.6 | 7.8 -18% | 7.8 -18% | 5.6 15% | 10.7 -62% |
| Greyscale dE 2000 * | 4.2 | 5.7 -36% | 5.1 -21% | 3.7 12% | 5.5 -31% |
| Gamma | 2.24 98% | 2.07 106% | 2.16 102% | 2.14 103% | 2.09 105% |
| CCT | 6740 96% | 6260 104% | 6569 99% | 7096 92% | 5980 109% |
| Color Space (Percent of AdobeRGB 1998) (%) | 59.5 | 56.9 -4% | 59.4 0% | 63 6% | 85 43% |
| Color Space (Percent of sRGB) (%) | 91.1 | 87.4 -4% | 91 0% | 99 9% | 99 9% |
| Total Average (Program / Settings) | -8% /
-8% | 4% /
-2% | -18% /
-4% | 4% /
-1% |
* ... smaller is better
Screen Flickering / PWM (Pulse-Width Modulation)
| Screen flickering / PWM detected | 980 Hz | ≤ 90 % brightness setting | 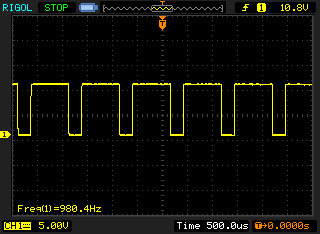 |
The display backlight flickers at 980 Hz (worst case, e.g., utilizing PWM) Flickering detected at a brightness setting of 90 % and below. There should be no flickering or PWM above this brightness setting. The frequency of 980 Hz is quite high, so most users sensitive to PWM should not notice any flickering. In comparison: 52 % of all tested devices do not use PWM to dim the display. If PWM was detected, an average of 7750 (minimum: 5 - maximum: 343500) Hz was measured. | |||
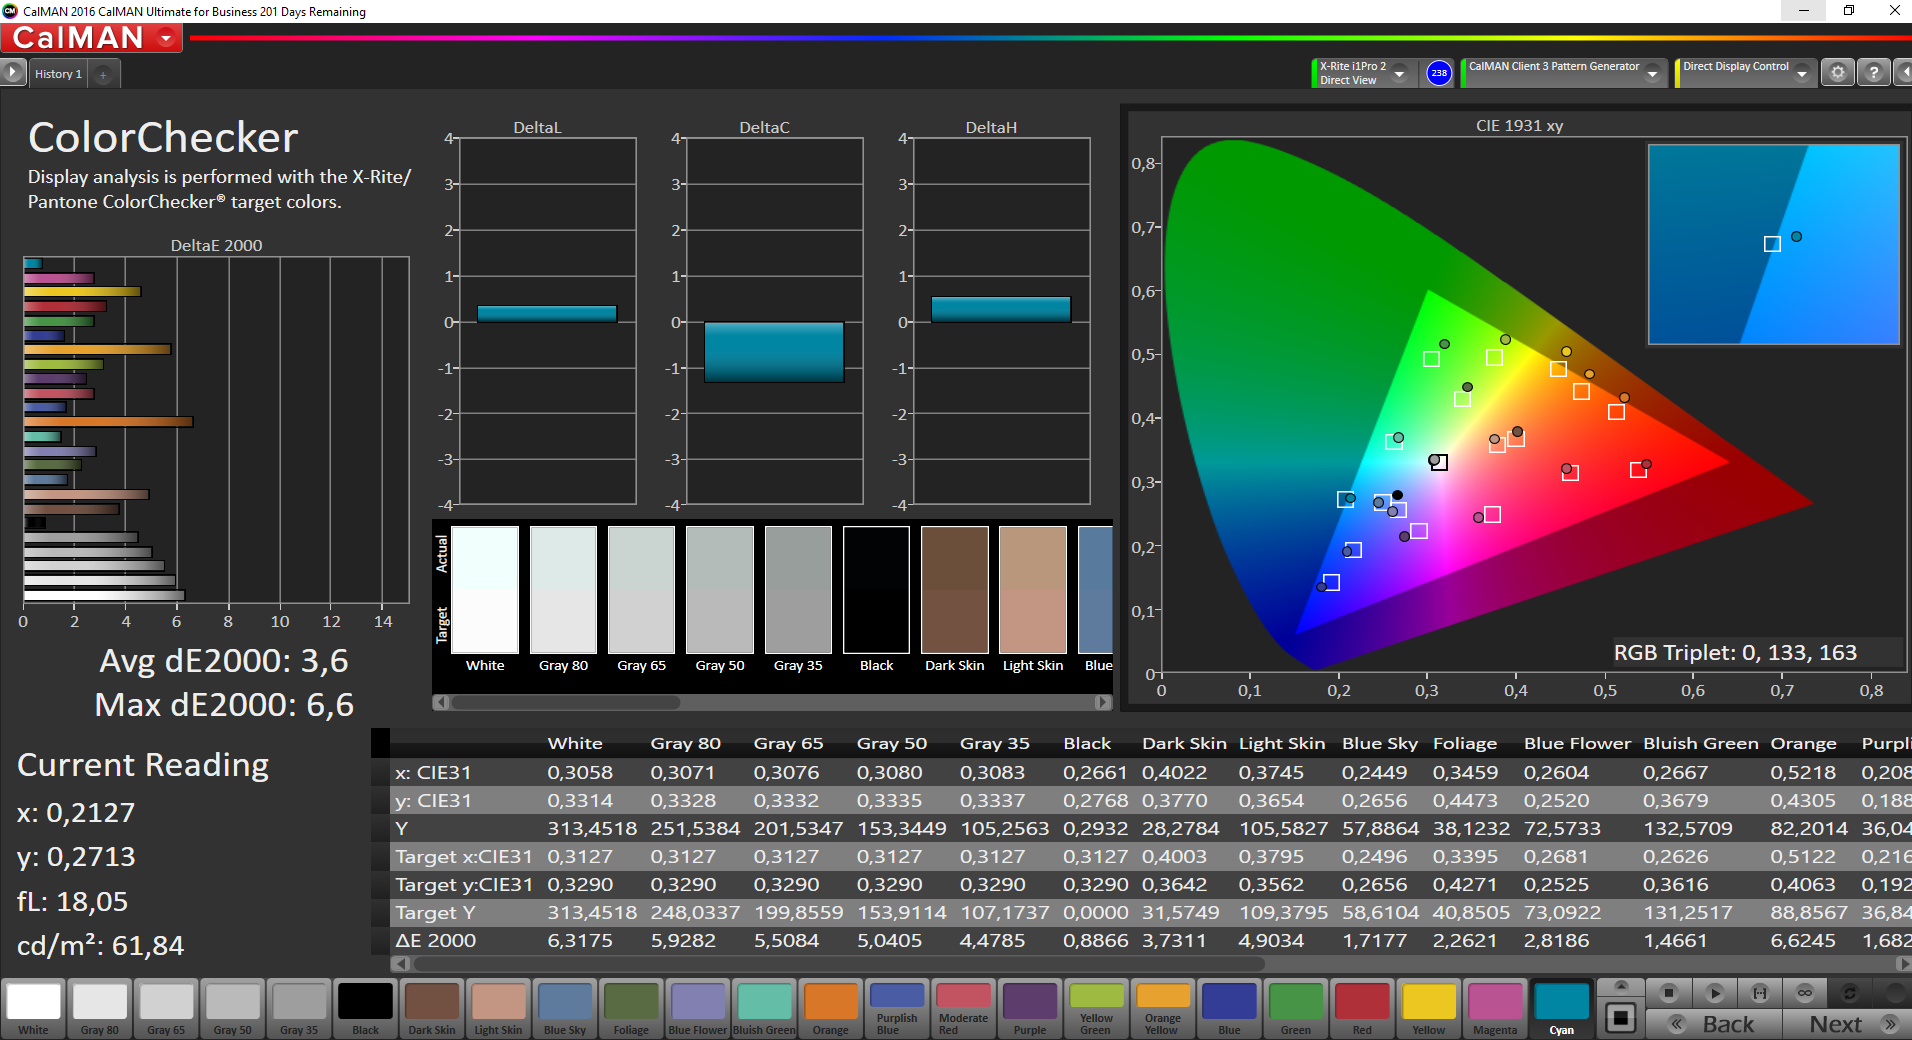
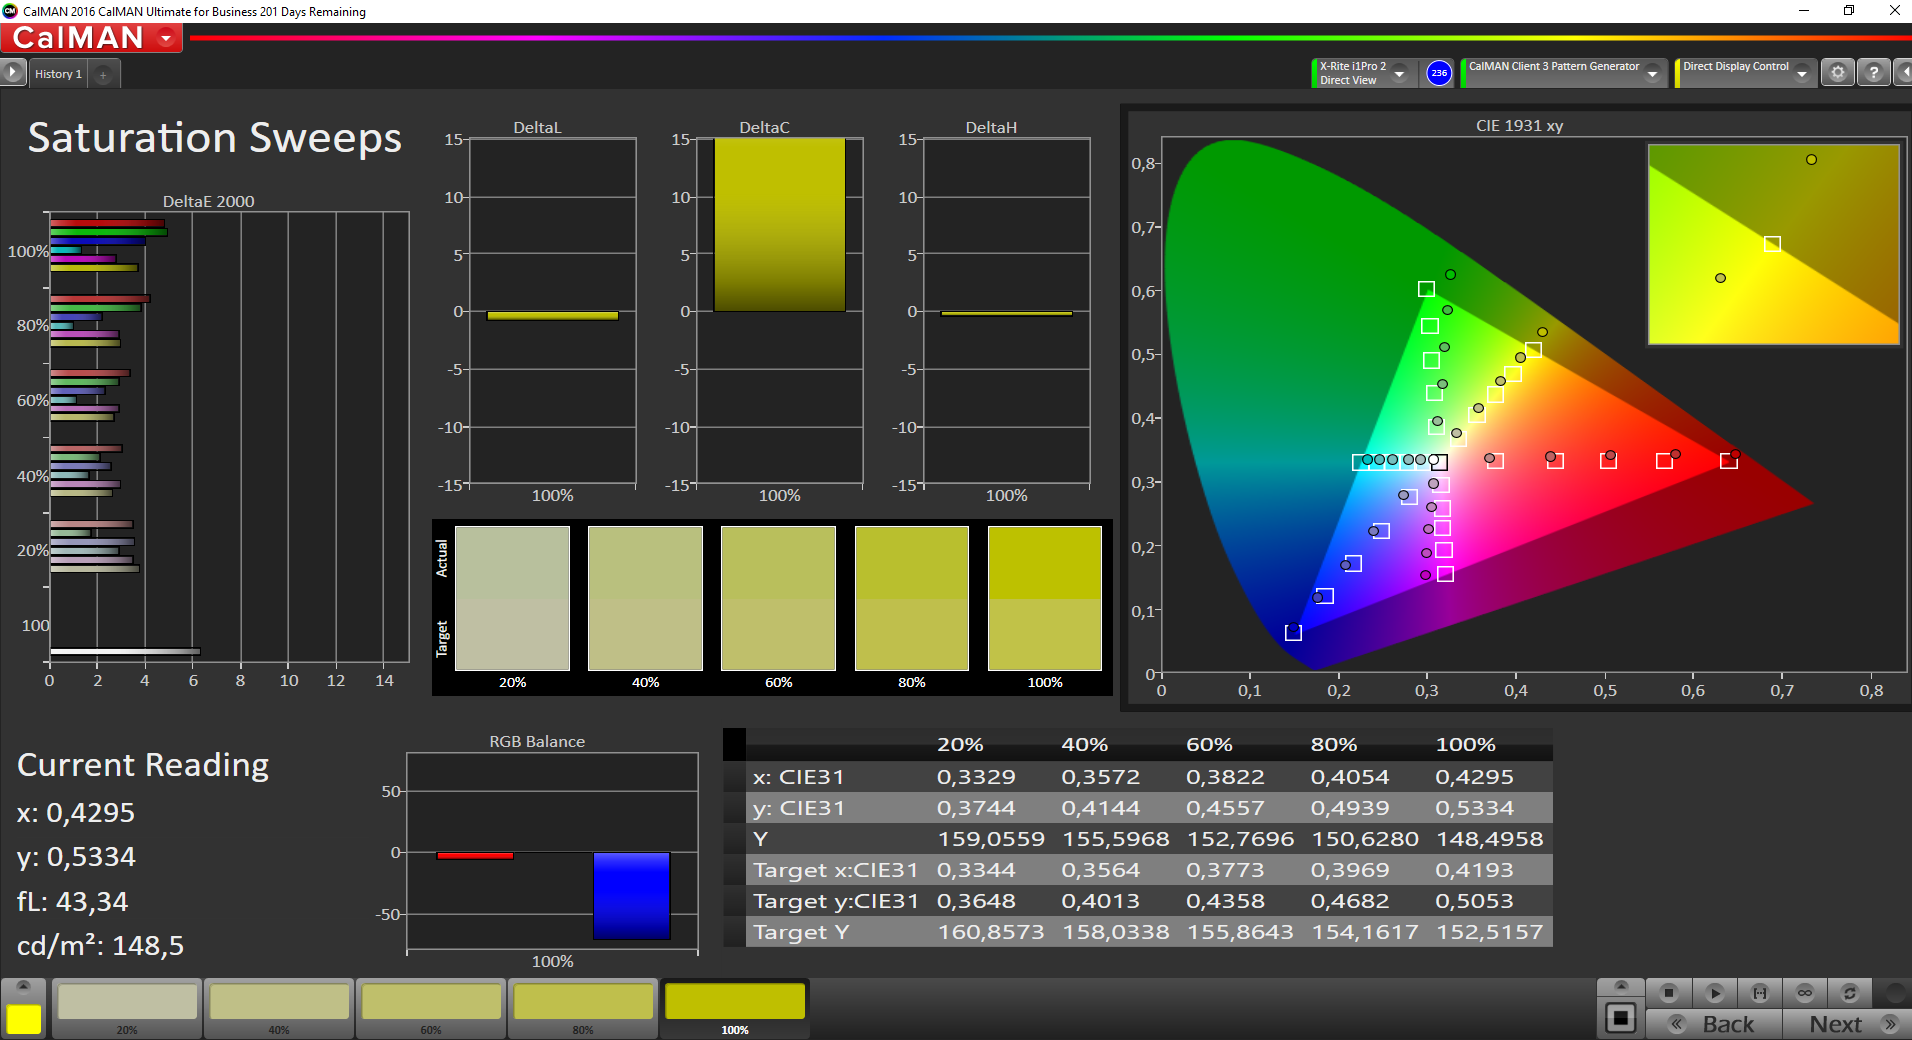
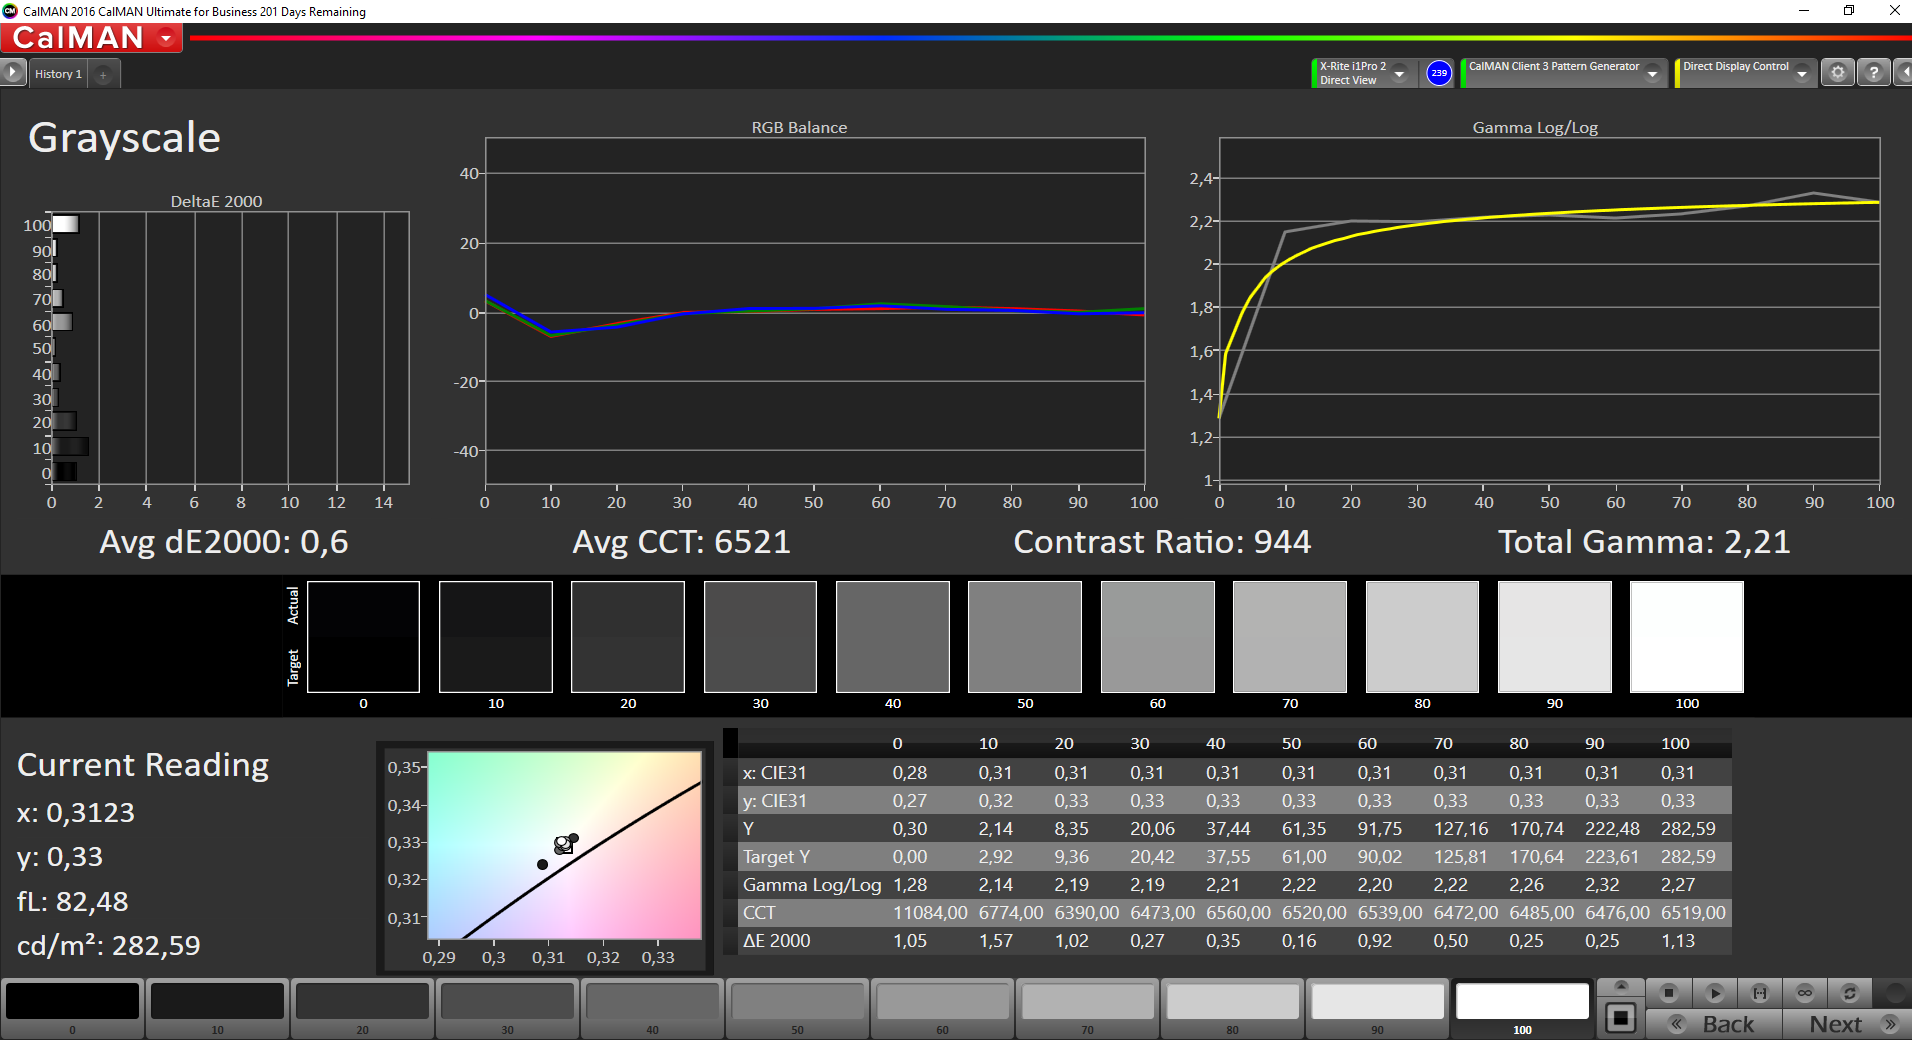
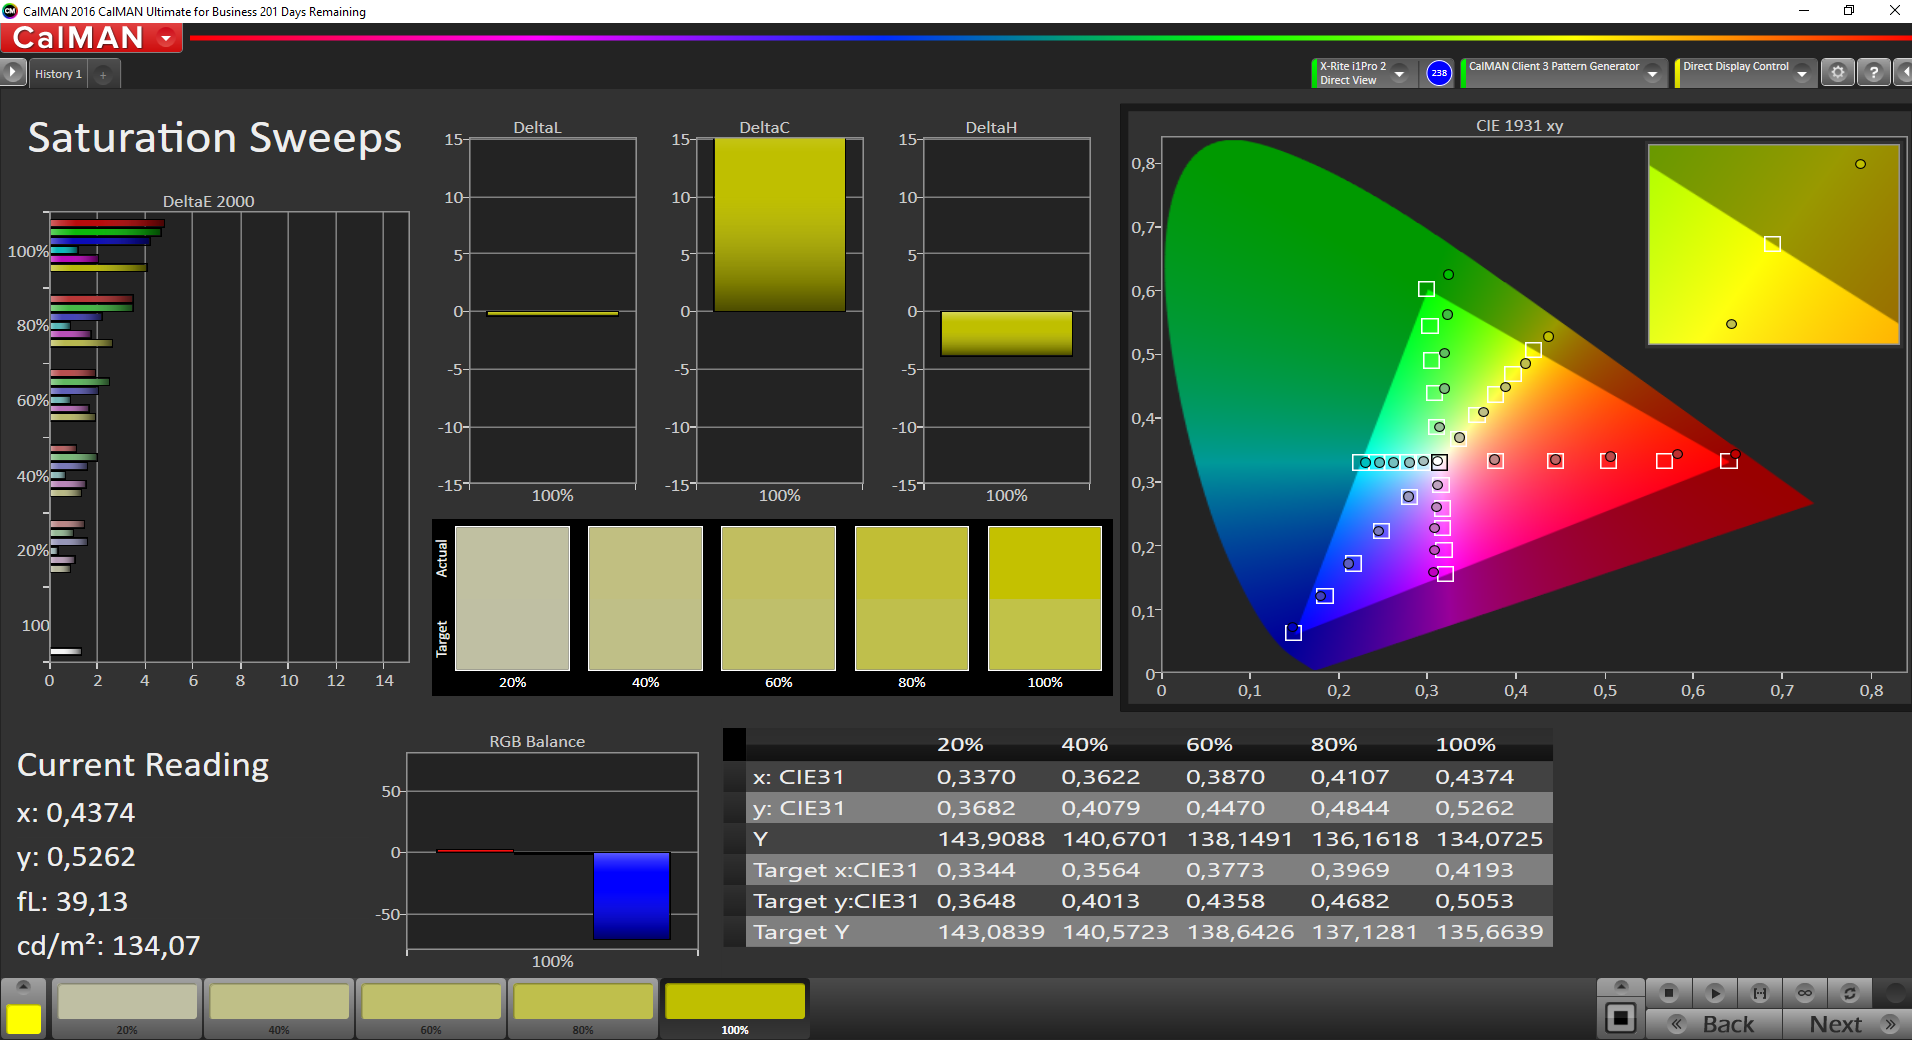
The screen can boast with a relatively decent color reproduction in delivery state. The DeltaE 2000 color shift is 3.6. A rate less than three would be desirable. The screen does not have a bluish tint, but it displays a very light greenish tint. It can be eliminated via calibration. Calibrating also reduces the color shift (to 1.7) and offers a clearly more balanced grayscale reproduction.
The color profile that we provide can be used to improve the screen's color reproduction according to our calibration. However, it should be checked that the same screen model (manufacturer + model number) is installed as in our review sample. Otherwise, the color reproduction could deteriorate even more. Screens from different manufacturers are often used within a laptop model lineup.
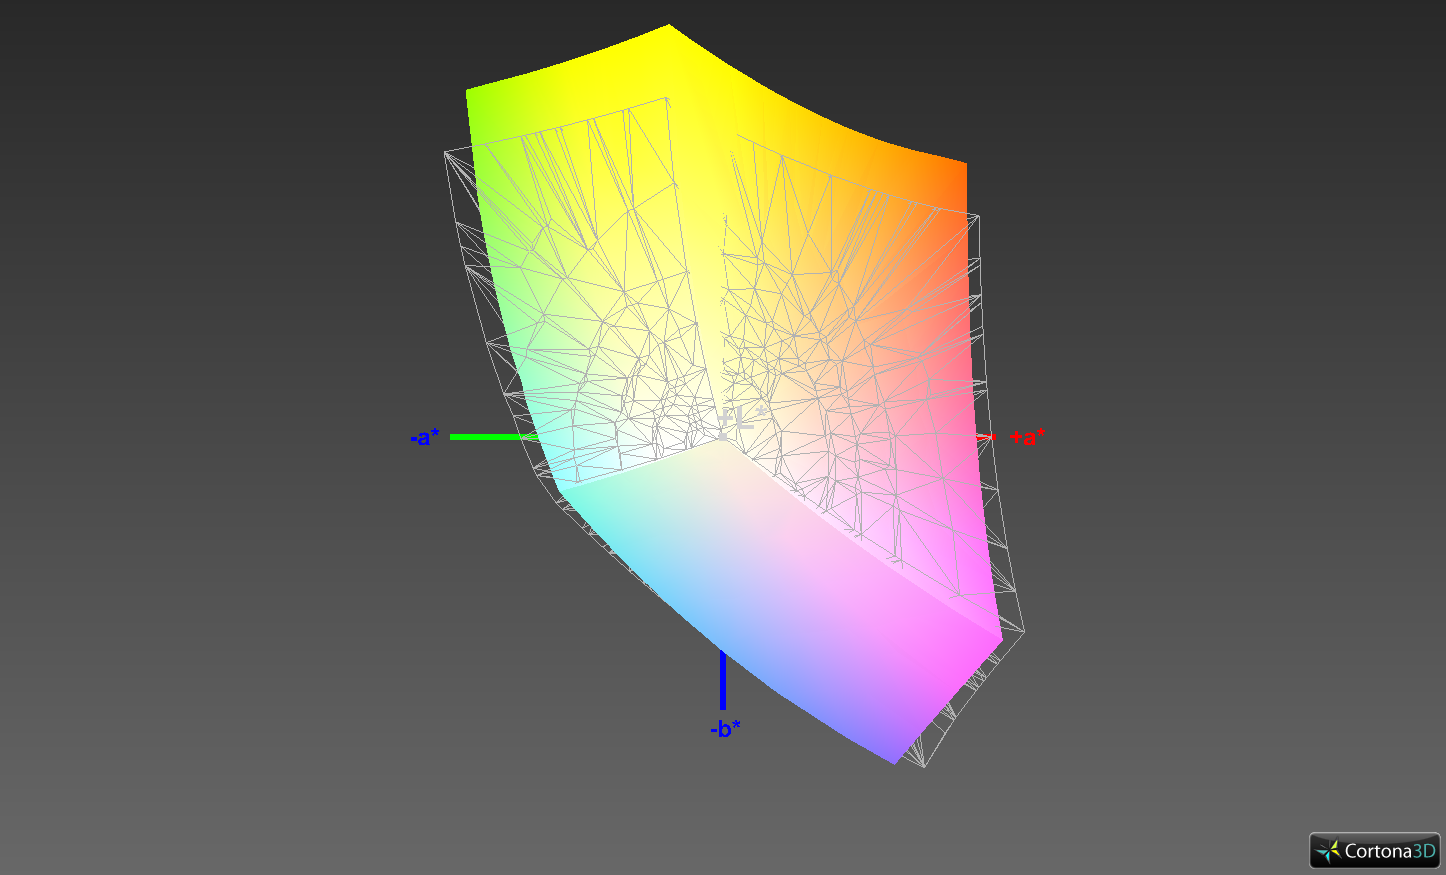
The screen cannot display the AdobeRGB and sRGB color spaces completely. The coverage rates are 91% (sRGB) and 59% (AdobeRGB). Users who rely on high color-space coverage should look at the 4K model of the ThinkPad P51. Lenovo promises 100% NTSC color-space coverage. The review of the device that will be published shortly will show whether this promise is kept.

Display Response Times
| ↔ Response Time Black to White | ||
|---|---|---|
| 24.8 ms ... rise ↗ and fall ↘ combined | ↗ 13.6 ms rise | 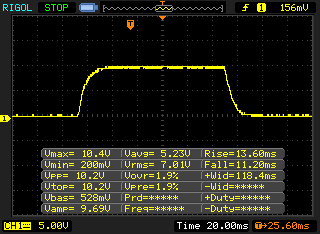 |
| ↘ 11.2 ms fall | ||
| The screen shows good response rates in our tests, but may be too slow for competitive gamers. In comparison, all tested devices range from 0.1 (minimum) to 240 (maximum) ms. » 58 % of all devices are better. This means that the measured response time is worse than the average of all tested devices (19.8 ms). | ||
| ↔ Response Time 50% Grey to 80% Grey | ||
| 38.4 ms ... rise ↗ and fall ↘ combined | ↗ 20.4 ms rise | 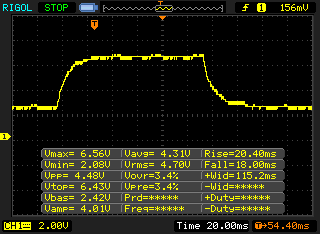 |
| ↘ 18 ms fall | ||
| The screen shows slow response rates in our tests and will be unsatisfactory for gamers. In comparison, all tested devices range from 0.165 (minimum) to 636 (maximum) ms. » 57 % of all devices are better. This means that the measured response time is worse than the average of all tested devices (31 ms). | ||
Performance
Lenovo offers a series of mobile entry-level workstations in a 15.6-inch format with the ThinkPad P51s lineup. Our review sample is sold for approximately 2300 Euros (~$2574). The presently cheapest model costs about 1730 Euros (~$1936).

Processor
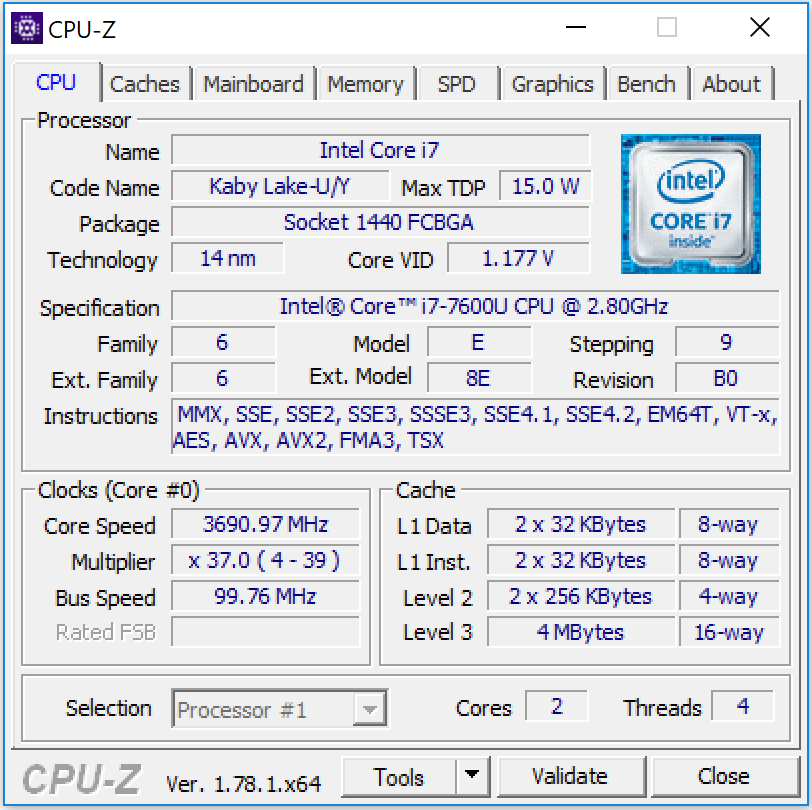
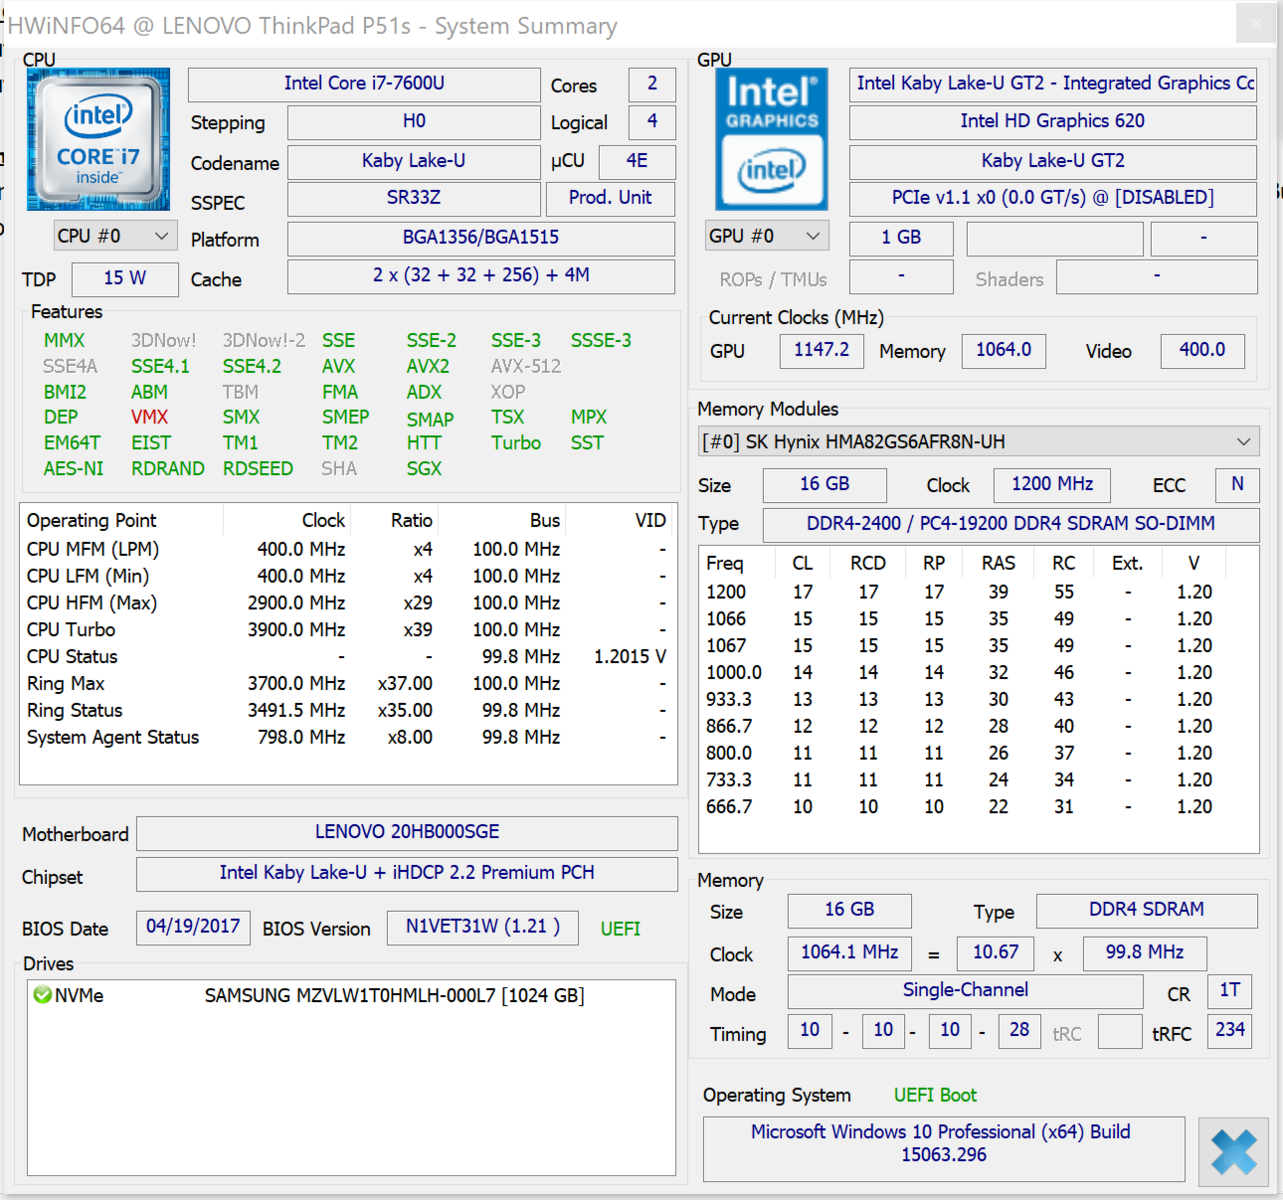
One of the strongest ULV CPUs (TDP: 15 watts) that Intel presently has to offer is inside the ThinkPad - the Core i7-7600U (Kaby Lake) dual-core processor. The CPU looks good in all application fields. Users who need higher multithread computing power will opt for a ThinkPad P51 model. These models are available with quad-core processors. The 7600U processor in the P51s clocks at a base speed of 2.9 GHz, which can be boosted up to 3.9 GHz (both cores) via Turbo.
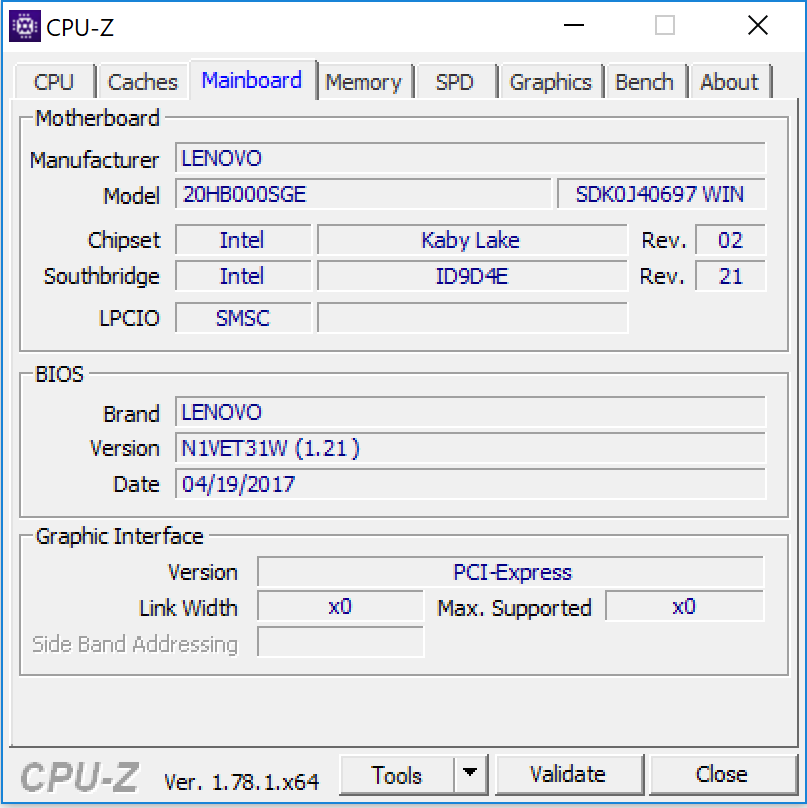
The processor performed our CPU tests at 3.5 to 3.9 GHz (multithread) and 3.7 to 3.9 GHz (single-thread) - but this is only true for AC mode. The clock rates dropped to 1.8 to 2.4 (single- and multithread) in battery mode. The reason for this: While the TDP can be extended up to 25 watts in AC mode, Lenovo limits it to 8 to 9 watts in battery mode. Consequently, the CPU cannot operate at full speed. Changing the energy settings in the BIOS does not lead to a different behavior. Our review sample is furnished with the newest BIOS version (1.21 from April 2017).
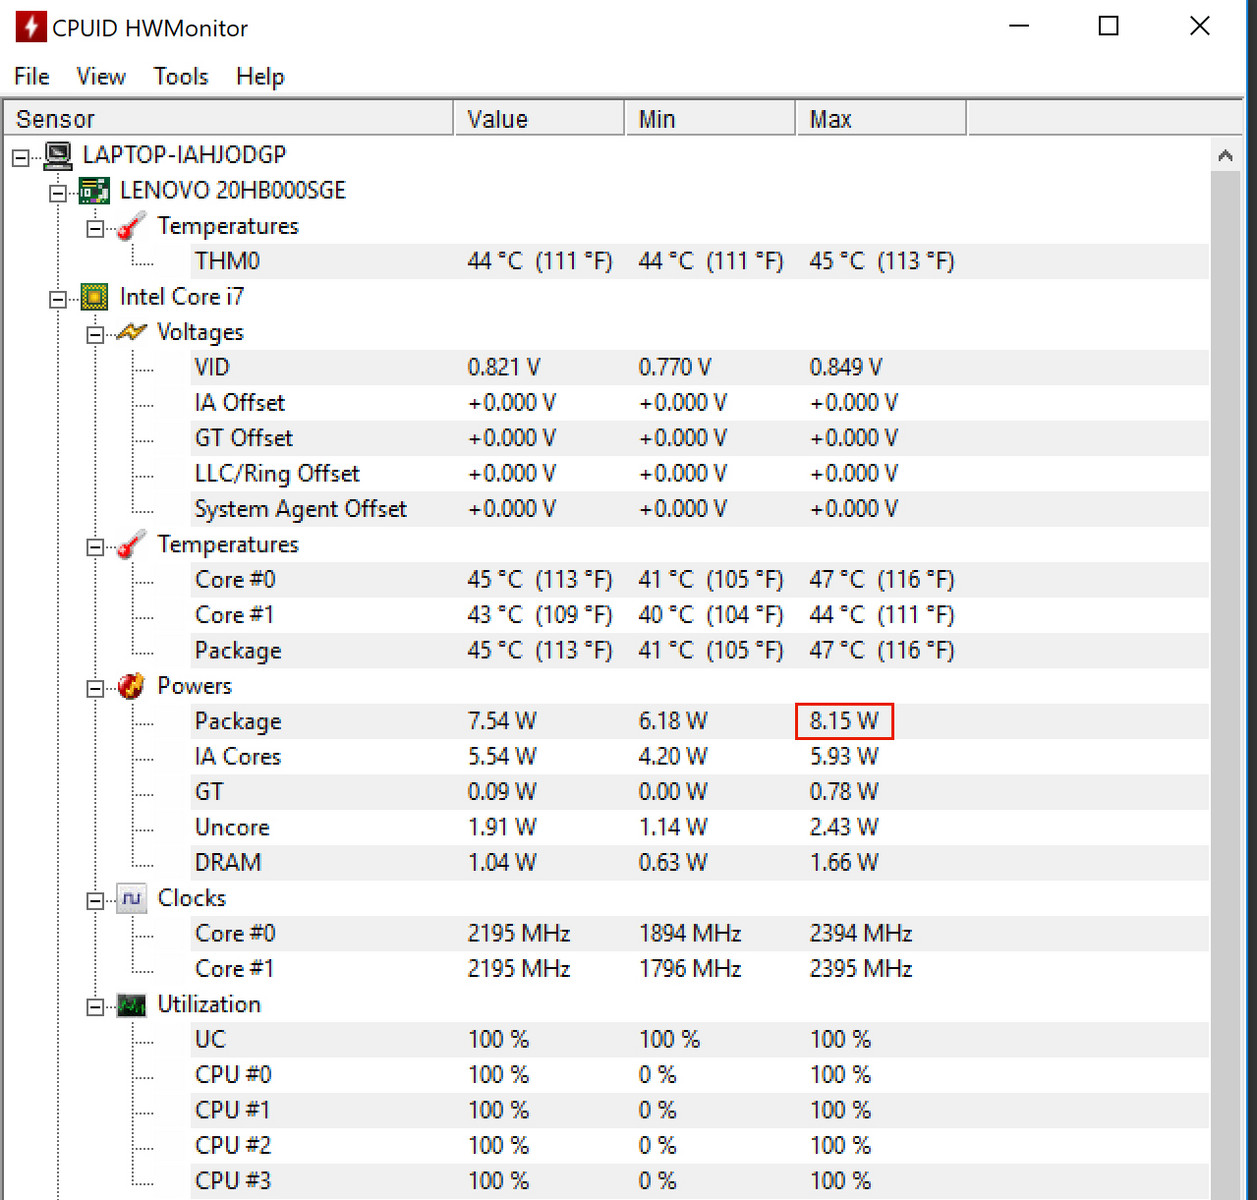
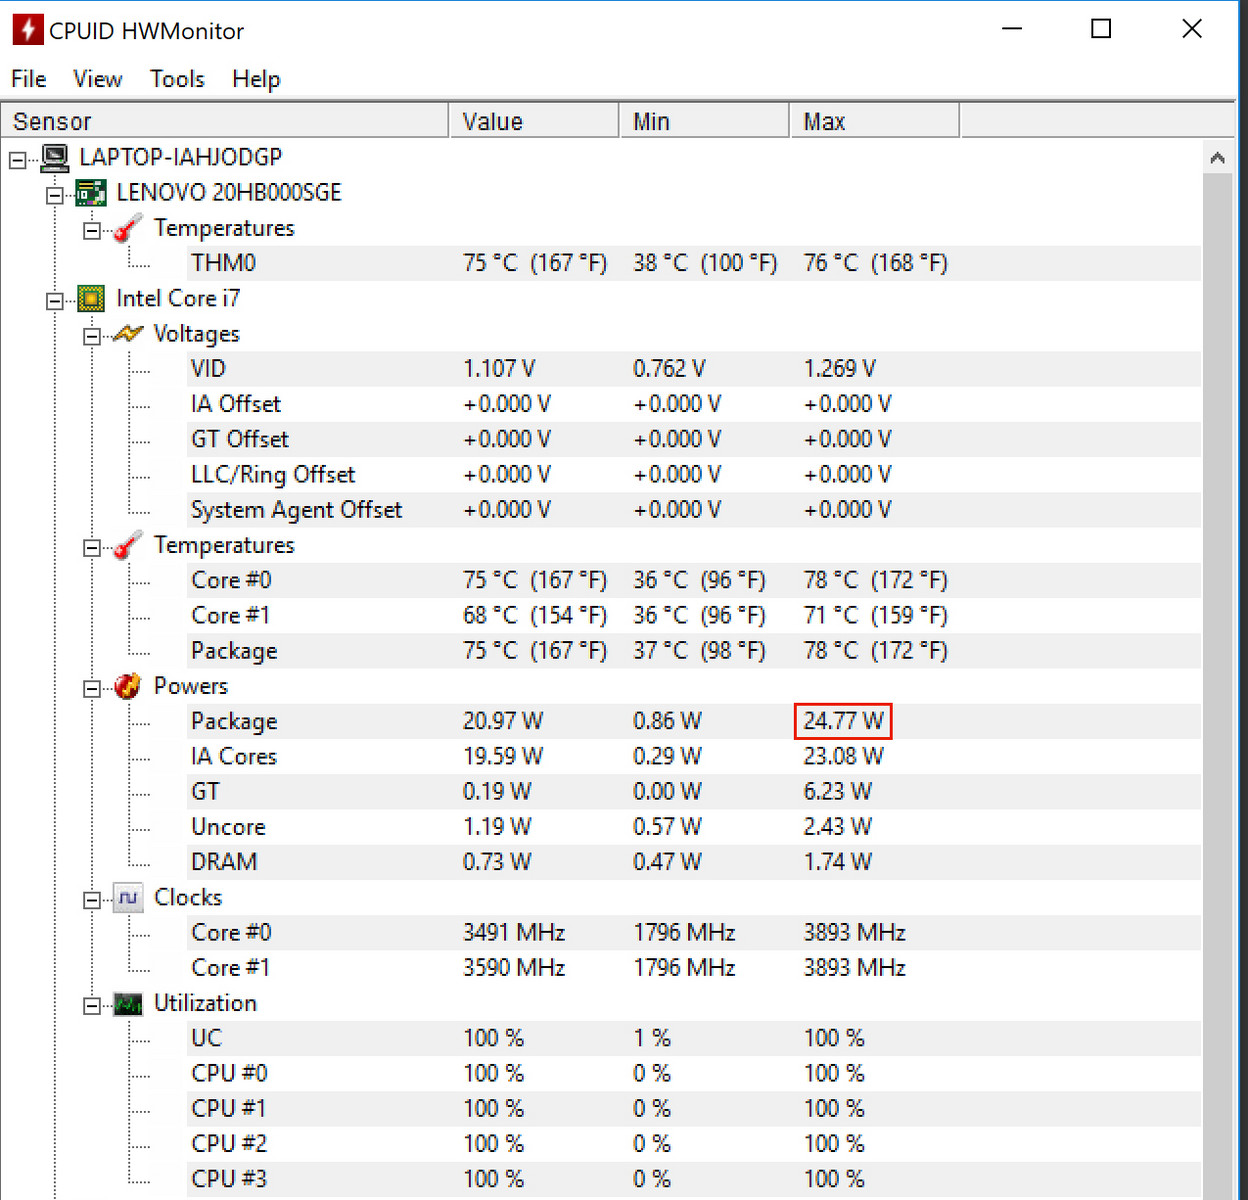
We checked whether Turbo is utilized permanently in AC mode by looping the Cinebench R15 multithread test for approximately 30 minutes. The result drops a few percentage points in the first to the sixth run and then remains stable. Thus, the performance is reduced slightly because Lenovo limits the CPU temperature to 75 °C.
| Cinebench R10 | |
| Rendering Single 32Bit | |
| Lenovo ThinkPad P51 20HH0016GE | |
| Lenovo ThinkPad P51s 20HB000SGE | |
| HP ZBook Studio G3 | |
| Lenovo ThinkPad P50s-20FKS00400 | |
| Rendering Multiple CPUs 32Bit | |
| Lenovo ThinkPad P51 20HH0016GE | |
| HP ZBook Studio G3 | |
| Lenovo ThinkPad P51s 20HB000SGE | |
| Lenovo ThinkPad P50s-20FKS00400 | |
| Geekbench 3 | |
| 32 Bit Multi-Core Score | |
| Lenovo ThinkPad P51 20HH0016GE | |
| Lenovo ThinkPad P51s 20HB000SGE | |
| 32 Bit Single-Core Score | |
| Lenovo ThinkPad P51 20HH0016GE | |
| Lenovo ThinkPad P51s 20HB000SGE | |
| Geekbench 4.0 | |
| 64 Bit Multi-Core Score | |
| Lenovo ThinkPad P51s 20HB000SGE | |
| 64 Bit Single-Core Score | |
| Lenovo ThinkPad P51s 20HB000SGE | |
| Geekbench 4.4 | |
| 64 Bit Multi-Core Score | |
| Lenovo ThinkPad P51s 20HB000SGE | |
| 64 Bit Single-Core Score | |
| Lenovo ThinkPad P51s 20HB000SGE | |
| JetStream 1.1 - 1.1 Total | |
| Lenovo ThinkPad P51 20HH0016GE | |
| Dell Precision 5520 UHD | |
| Lenovo ThinkPad P51s 20HB000SGE | |
System Performance
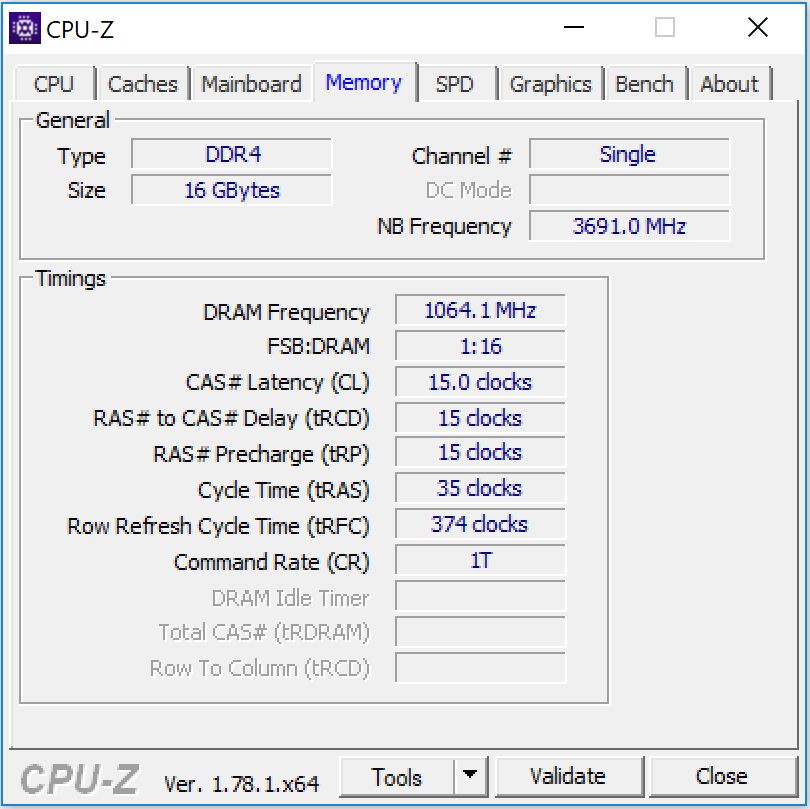
A fast SSD and strong processor ensure a fast system. We did not encounter any problems. The PCMark benchmark scores are very good. The laptop's total performance can be increased a bit. A second working memory bar would have to be installed into the ThinkPad for this.
| PCMark 7 Score | 5568 points | |
| PCMark 8 Home Score Accelerated v2 | 3232 points | |
| PCMark 8 Creative Score Accelerated v2 | 4640 points | |
| PCMark 8 Work Score Accelerated v2 | 4193 points | |
Help | ||
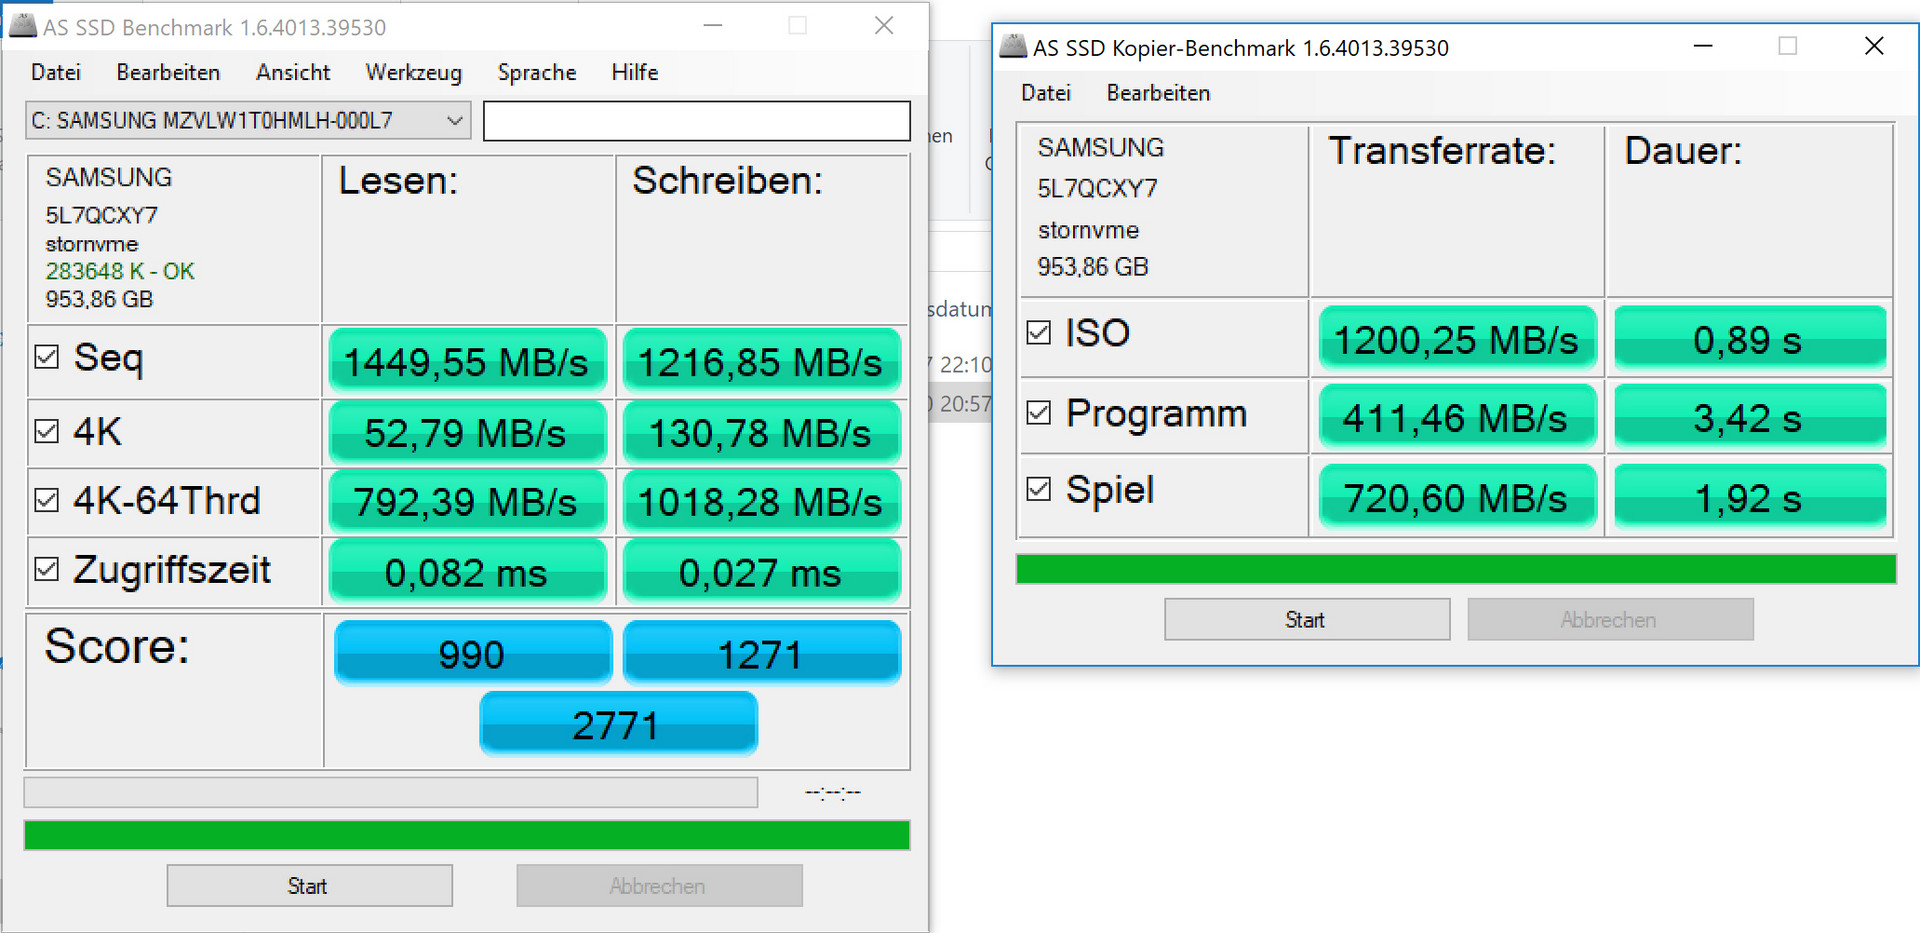
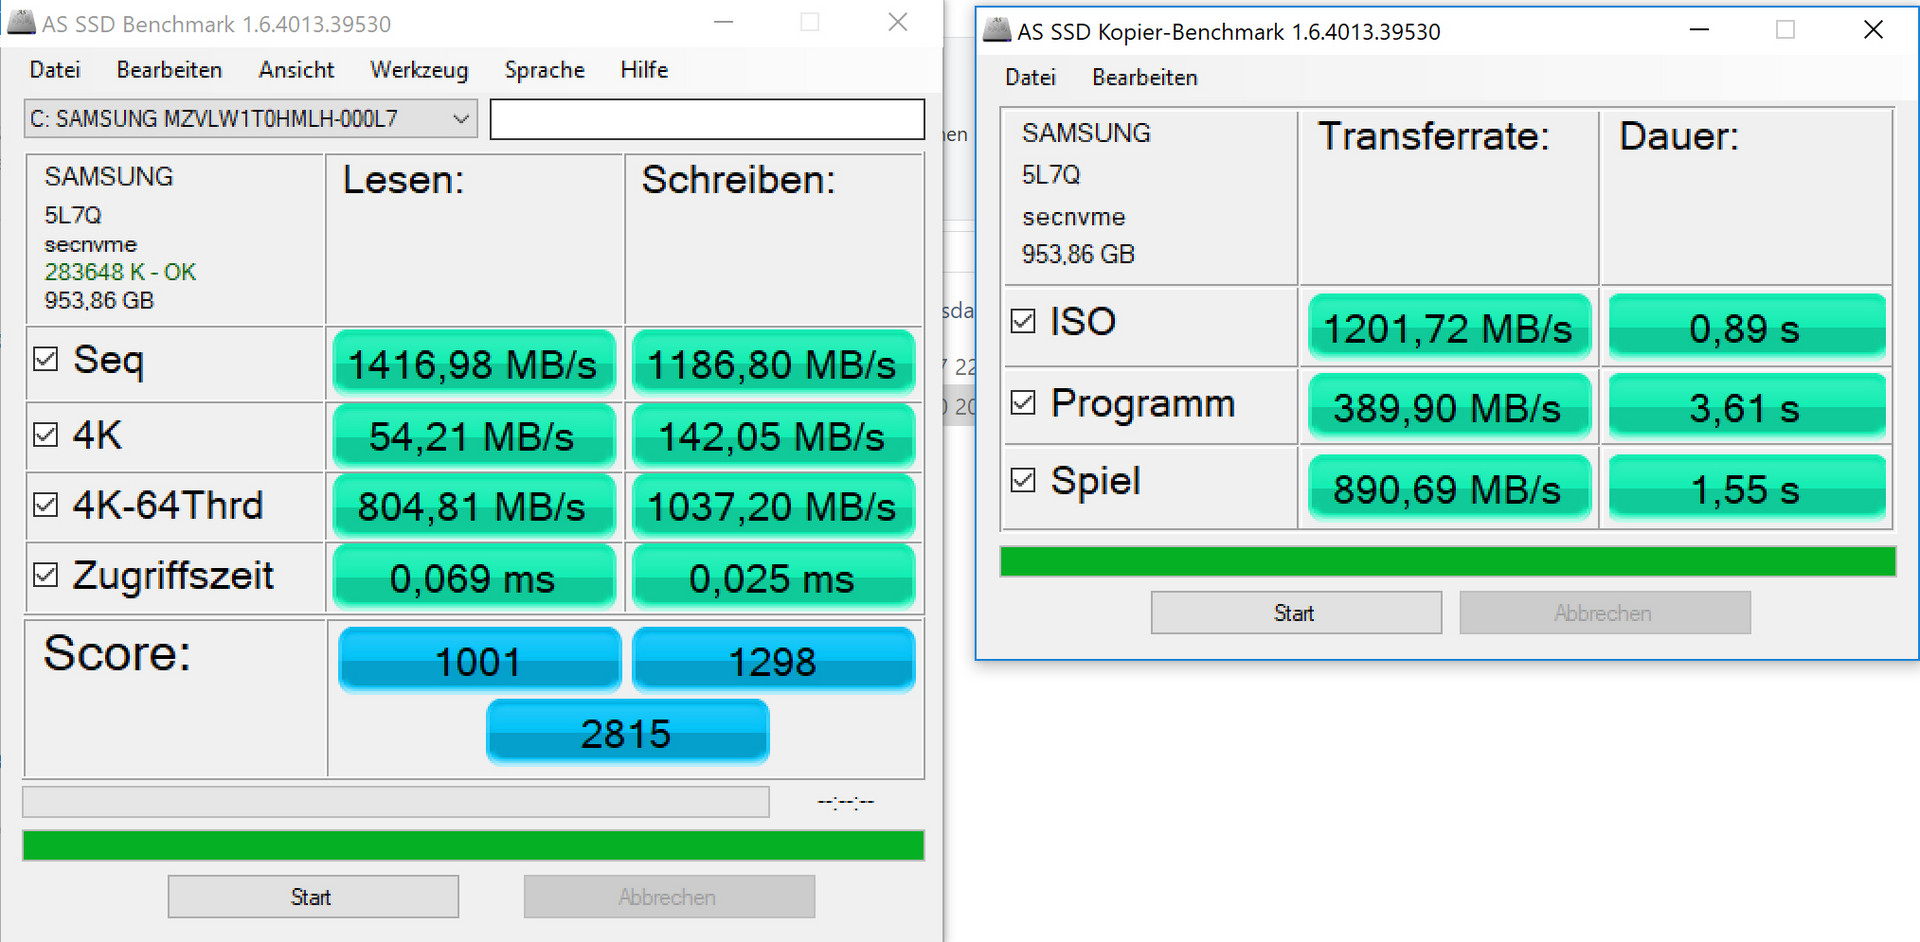
Storage Device
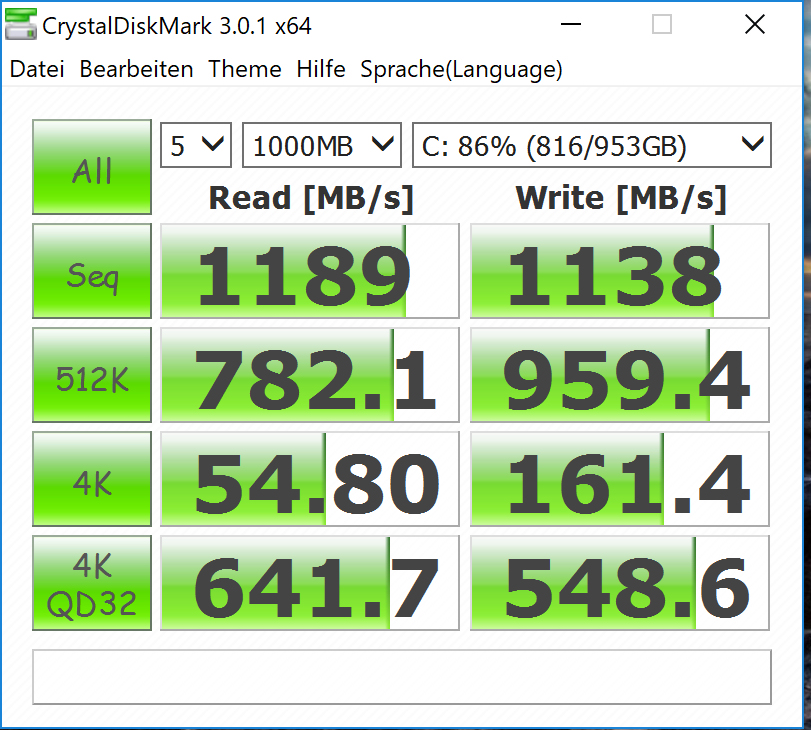
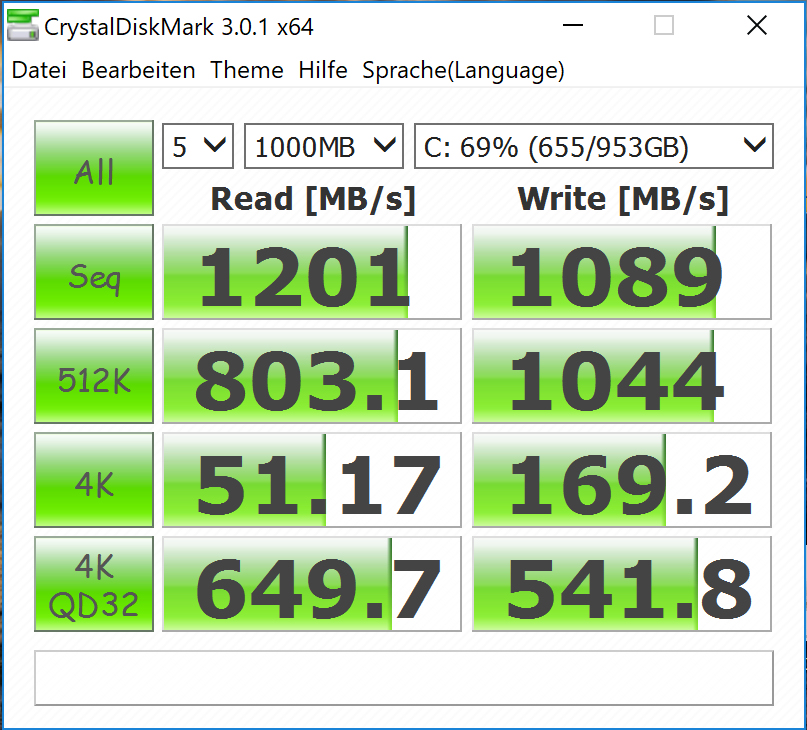
An NVMe SSD by Samsung is installed as the system drive. It is an M.2 2280 model with a total capacity of 1 TB. However, the SSD is not inserted into an M.2 slot but is connected to a SATA Express slot via an adapter. The latter is the successor of SATA III. SATA Express combines SATA and PCI Express 3.0, i.e. not only NVMe SSDs can be connected to this interface but also conventional 2.5-inch SATA hard drives. Data is transmitted via PCI Express here. Up to four PCIe 3.0 lanes can be used. Two lanes are utilized in the ThinkPad. Consequently, the SSD's transfer rates remain behind its potential. However, the rates are still very good. Installing Samsung's NVMe driver does not have an impact on the transfer rates.

| Lenovo ThinkPad P51s 20HB000SGE Samsung SSD PM961 1TB M.2 PCIe 3.0 x4 NVMe (MZVLW1T0) | Lenovo ThinkPad P50s-20FKS00400 Samsung PM871 MZYLN256HCHP | Dell Precision 5520 UHD Samsung SM961 MZVKW512HMJP m.2 PCI-e | HP ZBook Studio G3 Samsung SM951 MZVPV512HDGL m.2 PCI-e | Lenovo ThinkPad T570-20HAS01E00 Samsung PM961 NVMe MZVLW512HMJP | Lenovo ThinkPad P51 20HH0016GE Samsung PM961 NVMe MZVLW512HMJP | |
|---|---|---|---|---|---|---|
| CrystalDiskMark 3.0 | -54% | 20% | 29% | -4% | 20% | |
| Read Seq (MB/s) | 1189 | 475.5 -60% | 2253 89% | 1578 33% | 1210 2% | 1705 43% |
| Write Seq (MB/s) | 1138 | 304.7 -73% | 1662 46% | 1557 37% | 1134 0% | 1541 35% |
| Read 512 (MB/s) | 782 | 379.3 -51% | 459.1 -41% | 1234 58% | 789 1% | 1038 33% |
| Write 512 (MB/s) | 959 | 303.4 -68% | 1611 68% | 1391 45% | 903 -6% | 1157 21% |
| Read 4k (MB/s) | 54.8 | 34.31 -37% | 56.1 2% | 59.9 9% | 58.4 7% | 61.3 12% |
| Write 4k (MB/s) | 161.4 | 89.4 -45% | 169.4 5% | 225.6 40% | 144.1 -11% | 176 9% |
| Read 4k QD32 (MB/s) | 642 | 319.9 -50% | 633 -1% | 946 47% | 559 -13% | 664 3% |
| Write 4k QD32 (MB/s) | 549 | 279.4 -49% | 506 -8% | 359 -35% | 474.4 -14% | 560 2% |
Graphics Card
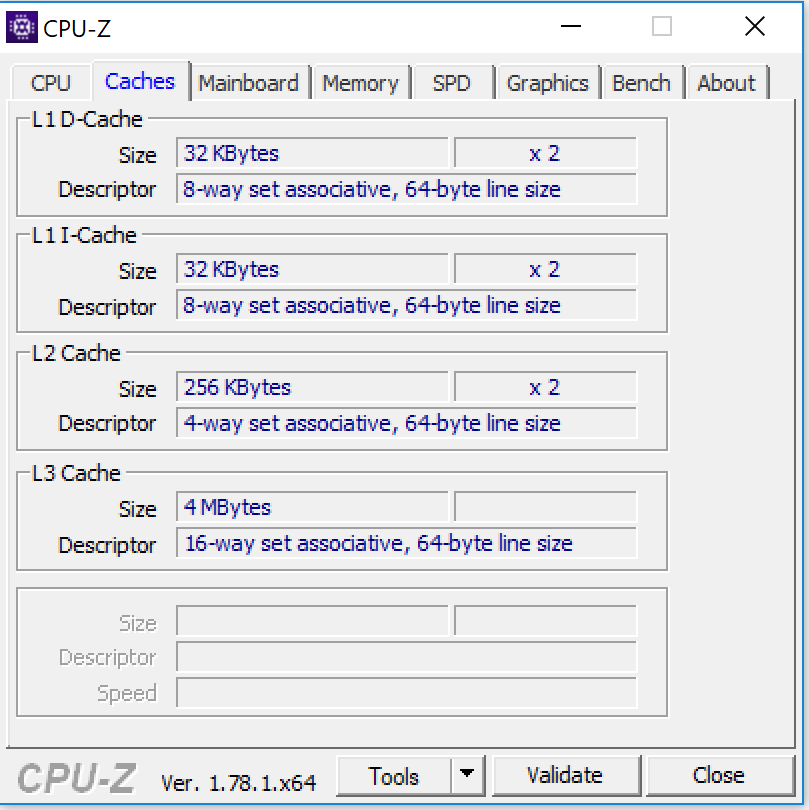
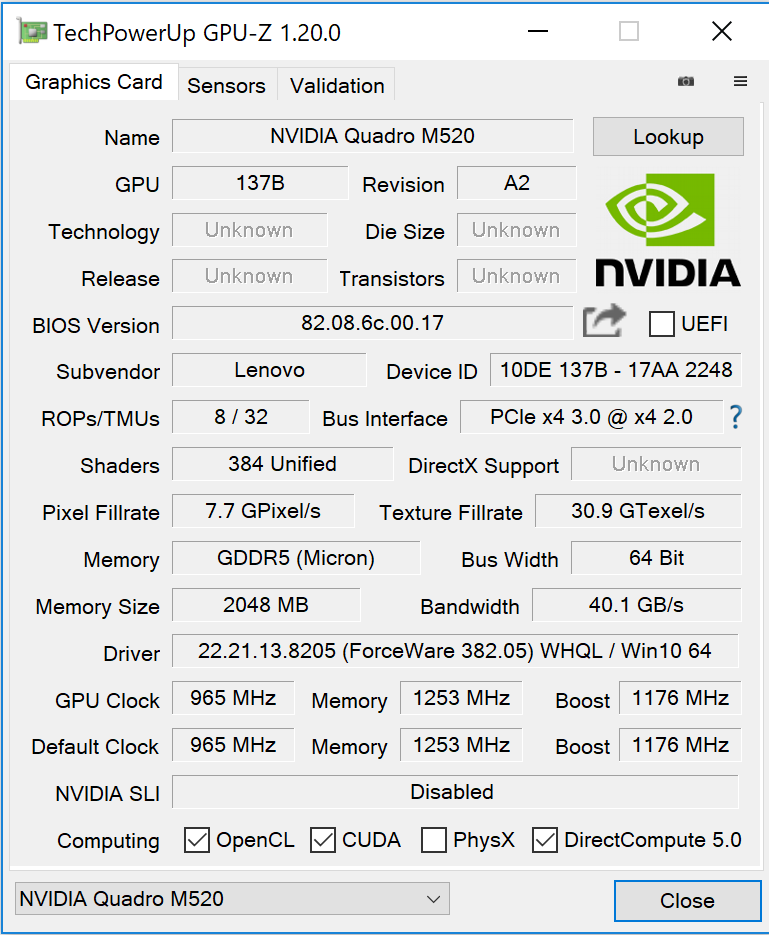
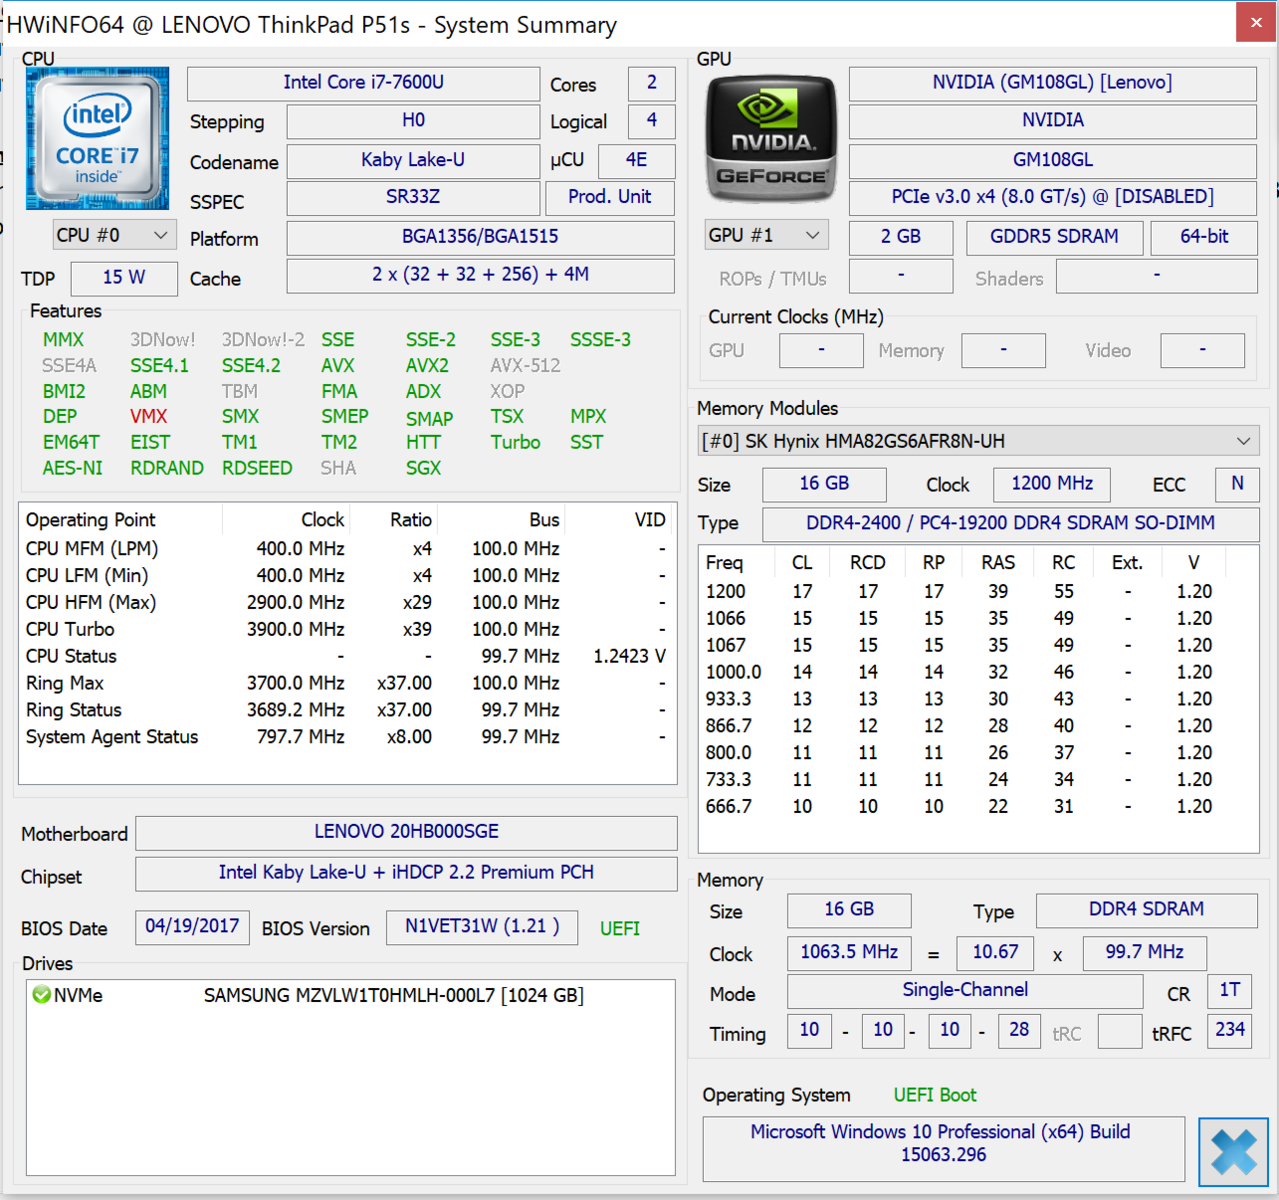
The ThinkPad is furnished with Nvidia's Quadro M520 GPU. It is, so to say, the professional variant of the known GeForce 940MX graphics unit installed in many laptops. The latter is also found in the 4K model of the ThinkPad T570, for example. Differences between the Quadro and GeForce are primarily found in software. Nvidia publishes certified drivers for Quadro GPU that are optimized for professional applications (e.g. CAD, visualizations). Consequently, the Quadro GPUs do a much better job in these applications than their consumer counterparts.
The Quadro M520 core supports DirectX 12 and OpenGL 4.5. It clocks at a base speed of 965 MHz. Up to 1176 MHz is possible via Turbo. The GPU can fall back on a fast 2048 MB GDRR5 graphics memory. The memory is the biggest reason that the M520 scores much better in our GPU tests than the former Quadro M500 model. Both GPUs are based on Nvidia's Maxwell architecture.
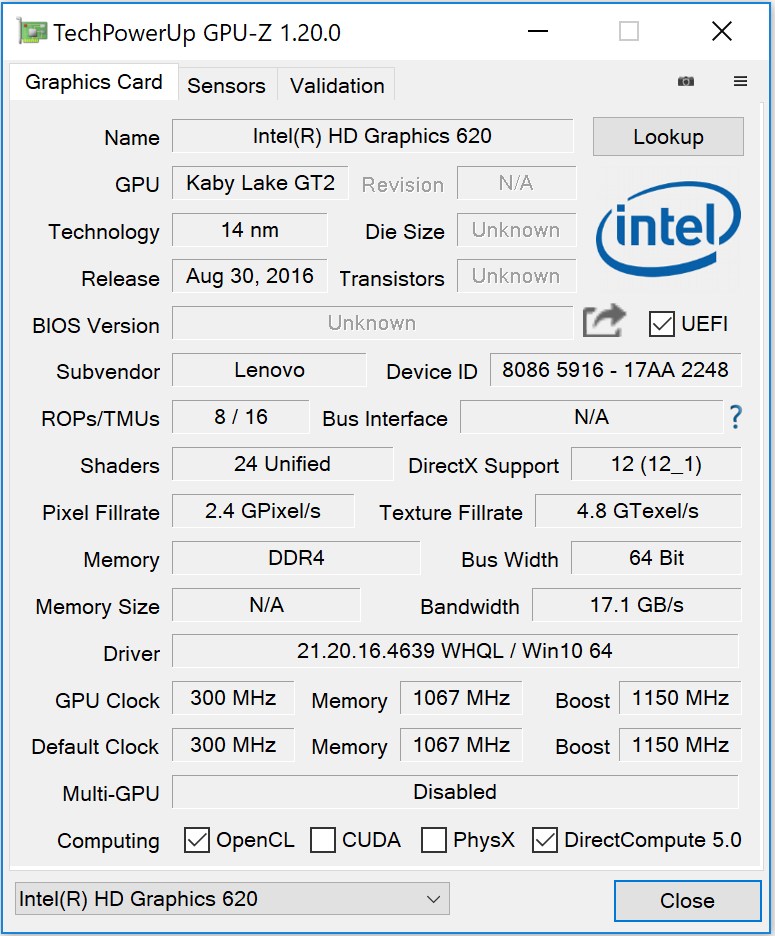
The ThinkPad also provides a graphics-switching solution (Optimus). Intel's HD Graphics 620 graphics core is enabled.
| 3DMark 06 Standard Score | 17305 points | |
| 3DMark Vantage P Result | 11278 points | |
| 3DMark 11 Performance | 2884 points | |
| 3DMark Ice Storm Standard Score | 32374 points | |
| 3DMark Cloud Gate Standard Score | 8544 points | |
| 3DMark Fire Strike Score | 2139 points | |
| 3DMark Fire Strike Extreme Score | 1058 points | |
| 3DMark Time Spy Score | 684 points | |
Help | ||
| Geekbench 4.0 - Compute OpenCL Score | |
| Lenovo ThinkPad P51s 20HB000SGE | |
| Geekbench 4.4 - Compute OpenCL Score | |
| Lenovo ThinkPad P51s 20HB000SGE | |
| GFXBench (DX / GLBenchmark) 2.7 | |
| 1920x1080 T-Rex Offscreen | |
| Lenovo ThinkPad P51s 20HB000SGE | |
| Lenovo ThinkPad P50s-20FKS00400 | |
| T-Rex Onscreen | |
| Lenovo ThinkPad P51s 20HB000SGE | |
| Lenovo ThinkPad P50s-20FKS00400 | |
| GFXBench 3.0 | |
| 1920x1080 1080p Manhattan Offscreen | |
| Lenovo ThinkPad P51s 20HB000SGE | |
| Lenovo ThinkPad P50s-20FKS00400 | |
| on screen Manhattan Onscreen OGL | |
| Lenovo ThinkPad P50s-20FKS00400 | |
| Lenovo ThinkPad P51s 20HB000SGE | |
| GFXBench 3.1 | |
| 1920x1080 Manhattan ES 3.1 Offscreen | |
| Lenovo ThinkPad P51s 20HB000SGE | |
| Lenovo ThinkPad P50s-20FKS00400 | |
| on screen Manhattan ES 3.1 Onscreen | |
| Lenovo ThinkPad P50s-20FKS00400 | |
| Lenovo ThinkPad P51s 20HB000SGE | |
| GFXBench | |
| 1920x1080 Car Chase Offscreen | |
| Lenovo ThinkPad P51s 20HB000SGE | |
| Lenovo ThinkPad P50s-20FKS00400 | |
| on screen Car Chase Onscreen | |
| Lenovo ThinkPad P50s-20FKS00400 | |
| Lenovo ThinkPad P51s 20HB000SGE | |
| ComputeMark v2.1 - 1024x600 Normal, Score | |
| Lenovo ThinkPad P51s 20HB000SGE | |
| Lenovo ThinkPad P50s-20FKS00400 | |
| Dell Precision 5520 UHD | |
| Unigine Heaven 2.1 - 1280x1024 high, Tesselation (normal), DirectX11 AA:off AF:1x | |
| HP ZBook Studio G3 | |
| Lenovo ThinkPad P51s 20HB000SGE | |
| Lenovo ThinkPad P50s-20FKS00400 | |
| Unigine Heaven 3.0 | |
| 1920x1080 OpenGL, Normal Tessellation, High Shaders AA:Off AF:Off | |
| HP ZBook Studio G3 | |
| Lenovo ThinkPad P51s 20HB000SGE | |
| Lenovo ThinkPad P50s-20FKS00400 | |
| 1920x1080 DX 11, Normal Tessellation, High Shaders AA:Off AF:Off | |
| HP ZBook Studio G3 | |
| Lenovo ThinkPad P51s 20HB000SGE | |
| Lenovo ThinkPad P50s-20FKS00400 | |
| Unigine Heaven 4.0 | |
| Extreme Preset OpenGL | |
| Lenovo ThinkPad P51 20HH0016GE | |
| Lenovo ThinkPad P51s 20HB000SGE | |
| Extreme Preset DX11 | |
| Lenovo ThinkPad P51 20HH0016GE | |
| Lenovo ThinkPad P51s 20HB000SGE | |
| Unigine Valley 1.0 | |
| 1920x1080 Extreme HD DirectX AA:x8 | |
| Lenovo ThinkPad P51 20HH0016GE | |
| HP ZBook Studio G3 | |
| Lenovo ThinkPad P51s 20HB000SGE | |
| Lenovo ThinkPad P50s-20FKS00400 | |
| 1920x1080 Extreme HD Preset OpenGL AA:x8 | |
| Lenovo ThinkPad P51 20HH0016GE | |
| HP ZBook Studio G3 | |
| Lenovo ThinkPad P51s 20HB000SGE | |
| Lenovo ThinkPad P50s-20FKS00400 | |
| SiSoft Sandra 2016 | |
| GP Financial Analysis (FP High/Double Precision) | |
| Lenovo ThinkPad P51 20HH0016GE | |
| HP ZBook Studio G3 | |
| Lenovo ThinkPad P51s 20HB000SGE | |
| Lenovo ThinkPad P50s-20FKS00400 | |
| GP Cryptography (Higher Security AES256+SHA2-512) | |
| Lenovo ThinkPad P51 20HH0016GE | |
| HP ZBook Studio G3 | |
| Lenovo ThinkPad P50s-20FKS00400 | |
| Lenovo ThinkPad P51s 20HB000SGE | |
| Image Processing | |
| Lenovo ThinkPad P51 20HH0016GE | |
| HP ZBook Studio G3 | |
| Lenovo ThinkPad P51s 20HB000SGE | |
| Lenovo ThinkPad P50s-20FKS00400 | |
Gaming Performance
The ThinkPad is not a gaming laptop. Nevertheless, the installed hardware allows playing many games. High resolutions - and even the screen's maximum resolution - are only rarely up to not at all possible. Most games achieve smooth frame rates in the HD resolution (1366x768 pixels) and low to medium quality settings. This is primarily true for games that do not have very high hardware requirements. Performance-driven games, such as Mass Effect Andromeda, require reducing the resolution and/or quality settings.
| low | med. | high | ultra | 4K | |
|---|---|---|---|---|---|
| Tomb Raider (2013) | 188.1 | 97.9 | 59.5 | 28.8 | |
| BioShock Infinite (2013) | 138.2 | 76.9 | 64.1 | 24.2 | |
| Middle-earth: Shadow of Mordor (2014) | 54.6 | 32.9 | 22.8 | 16.2 | |
| Dragon Age: Inquisition (2014) | 68.2 | 51.7 | 18.3 | 12.2 | |
| Battlefield Hardline (2015) | 81.1 | 74.2 | 30.4 | 19.6 | |
| Dirt Rally (2015) | 145.6 | 75.1 | 40.5 | 18.7 | 14.7 |
| World of Warships (2015) | 135.6 | 108.1 | 54 | 36.7 | 11 |
| Anno 2205 (2015) | 60.1 | 36.2 | 17.7 | 7.4 | |
| Star Wars Battlefront (2015) | 78.2 | 48.9 | 22.3 | 19.1 | |
| Rainbow Six Siege (2015) | 94.5 | 60.1 | 31.8 | 22.8 | 8.1 |
| Rise of the Tomb Raider (2016) | 30 | 21.5 | 13.3 | 11.7 | |
| Far Cry Primal (2016) | 46 | 20 | 18 | 12 | |
| The Division (2016) | 52.2 | 31.8 | 14.8 | 11.2 | |
| Ashes of the Singularity (2016) | 23.6 | 14.3 | 12 | ||
| Deus Ex Mankind Divided (2016) | 27.2 | 21 | 11.6 | 5.3 | |
| Battlefield 1 (2016) | 56.4 | 43.9 | 33 | 28.2 | |
| Civilization 6 (2016) | 50.8 | 30.4 | 15.2 | 11.7 | |
| Farming Simulator 17 (2016) | 183.1 | 120.6 | 49.8 | 32.1 | 13.7 |
| Titanfall 2 (2016) | 72.2 | 52.5 | 21.3 | 17.3 | |
| Resident Evil 7 (2017) | 84 | 40 | 22.1 | 6.6 | |
| For Honor (2017) | 64.6 | 23 | 21.9 | 15.9 | |
| Ghost Recon Wildlands (2017) | 38.1 | 14.3 | 12 | 3.6 | |
| Prey (2017) | 85.4 | 32.8 | 26.7 | 22 |
| BioShock Infinite - 1366x768 High Preset | |
| Dell Precision 5520 UHD | |
| HP ZBook Studio G3 | |
| Lenovo ThinkPad T570-20HAS01E00 | |
| Lenovo ThinkPad P51s 20HB000SGE | |
| Lenovo ThinkPad P50s-20FKS00400 | |
Emissions
System Noise
The ThinkPad does not produce an excessive amount of noise. The fan is often inactive during idle mode and silence then prevails. The fan speeds up during load. We measured a noise level of 39.4 dB in the stress test. A quiet electronic sizzling can be heard from inside the laptop when holding an ear to it. It is not audible at a normal sitting distance. Nevertheless, this should not occur in a device from this price range.
Noise level
| Idle |
| 29.2 / 29.2 / 31.1 dB(A) |
| Load |
| 36.7 / 39.4 dB(A) |
 | ||
30 dB silent 40 dB(A) audible 50 dB(A) loud |
||
min: | ||
| Lenovo ThinkPad P51s 20HB000SGE i7-7600U, Quadro M520 | Lenovo ThinkPad P50s-20FKS00400 6500U, Quadro M500M | Dell Precision 5520 UHD E3-1505M v6, Quadro M1200 | HP ZBook Studio G3 6820HQ, Quadro M1000M | Lenovo ThinkPad T570-20HAS01E00 i7-7500U, GeForce 940MX | |
|---|---|---|---|---|---|
| Noise | 0% | -6% | -13% | -0% | |
| off / environment * (dB) | 29.2 | 28.7 2% | 30 -3% | 29.3 -0% | |
| Idle Minimum * (dB) | 29.2 | 30 -3% | 28.7 2% | 30 -3% | 29.3 -0% |
| Idle Average * (dB) | 29.2 | 30 -3% | 32.1 -10% | 30 -3% | 29.3 -0% |
| Idle Maximum * (dB) | 31.1 | 30 4% | 32.1 -3% | 30 4% | 31.1 -0% |
| Load Average * (dB) | 36.7 | 33.5 9% | 41.3 -13% | 51 -39% | 35.2 4% |
| Load Maximum * (dB) | 39.4 | 41.9 -6% | 45.5 -15% | 52.8 -34% | 41.3 -5% |
| Witcher 3 ultra * (dB) | 45.5 |
* ... smaller is better
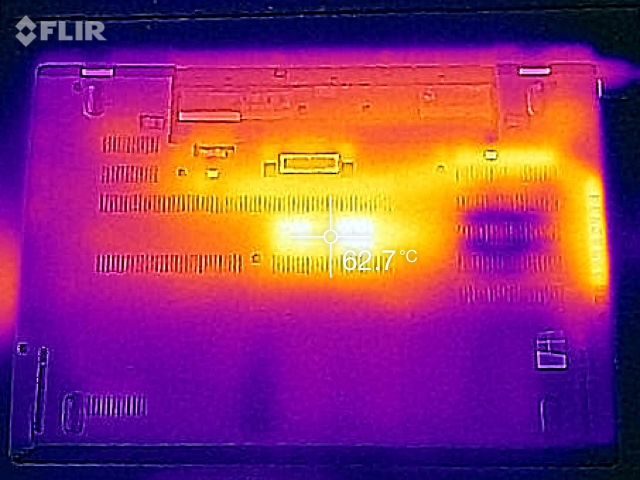
Temperature
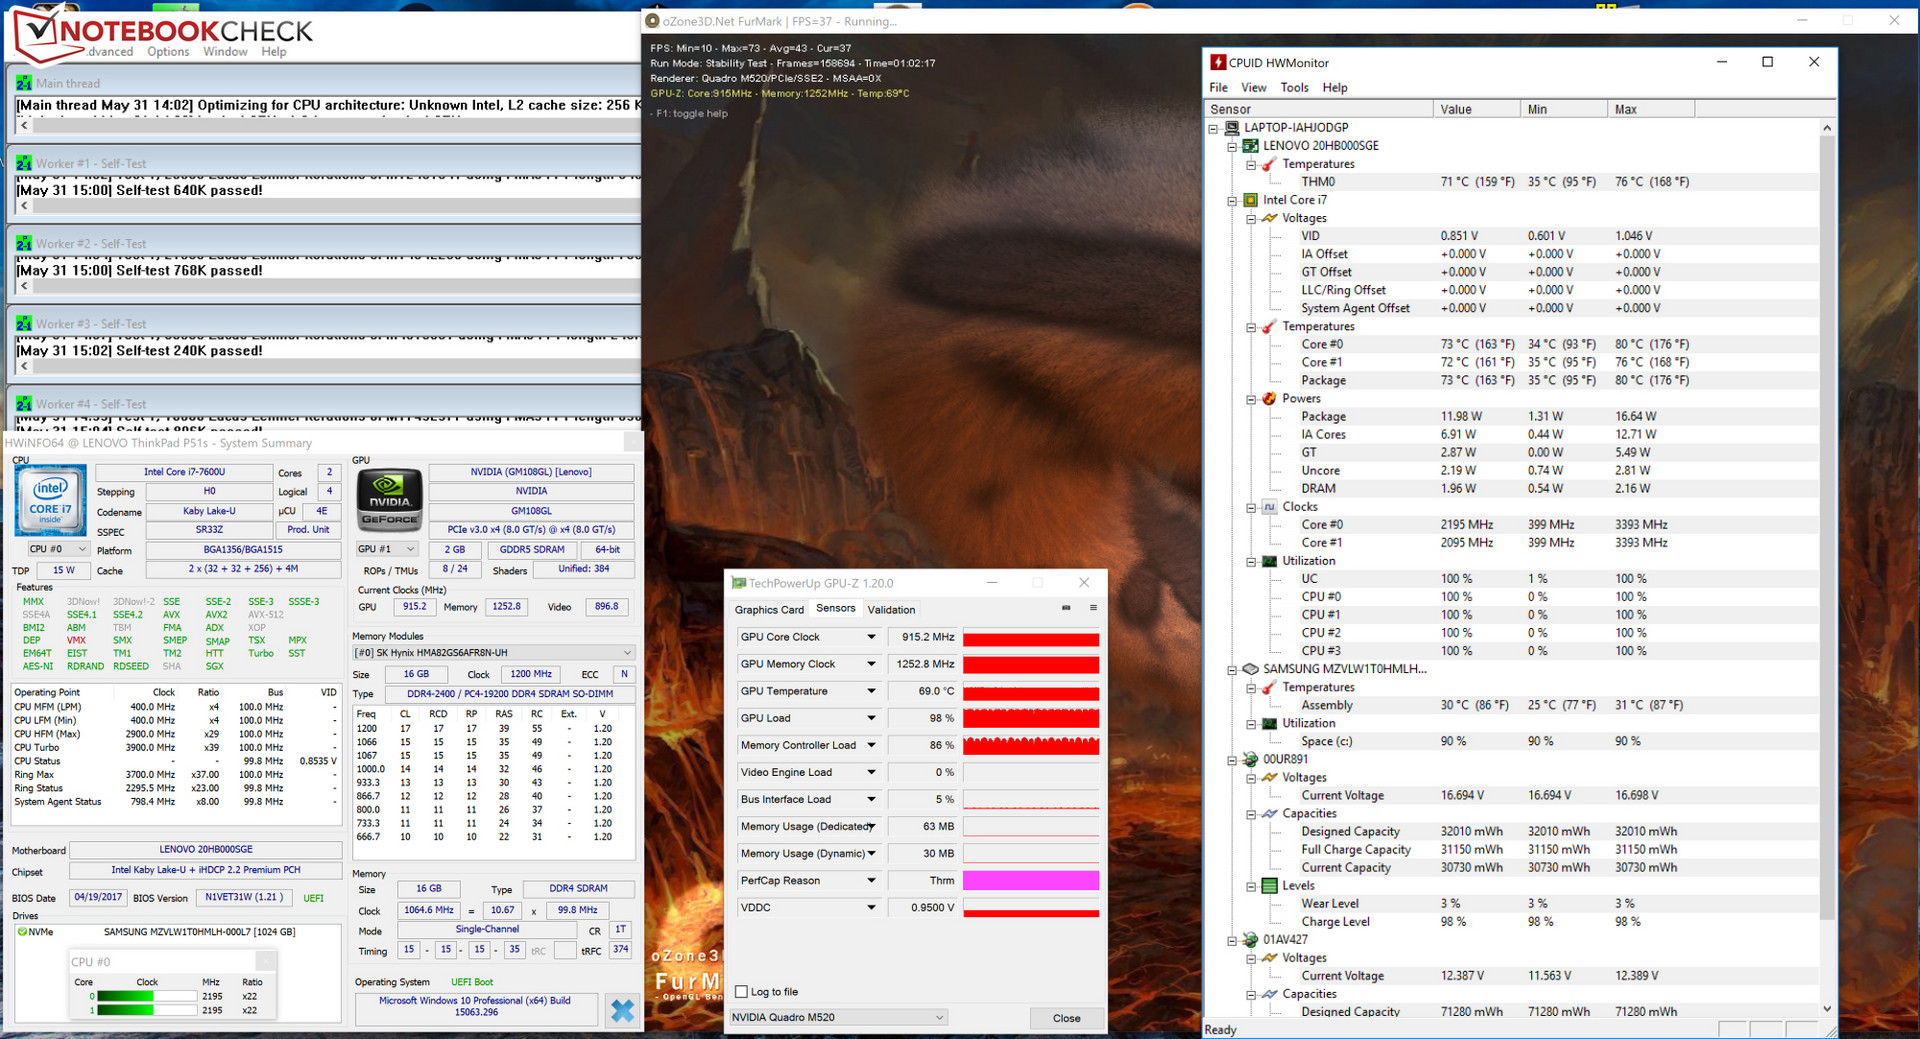
Lenovo's laptop performed our stress test (Prime95 and Furmark run for at least one hour) differently in AC and battery modes. The GPU clocks at full speed (1176 MHz) in battery mode. The CPU throttles to 400 MHz. When running the stress test in AC mode, the CPU and GPU clock at full speed for a few seconds. The CPU then throttles to speeds clearly below 1.5 GHz while the graphics unit still clocks at full speed (1176 MHz). The graphics core's speeds drops gradually and consistently in the course of the test. The CPU's speed climbs proportionally to that. The clock rates settle to about 915 MHz (GPU) and 2 to 2.5 GHz (CPU). The aforementioned CPU temperature limit of 75 °C is also noticed in the stress test.
We reran the 3D Mark 2011 benchmark directly after the stress test. The score is on par with the outcome that we recorded after a cold start run of the benchmark. Thus, the user will not have to deal with performance throttling in routine use.
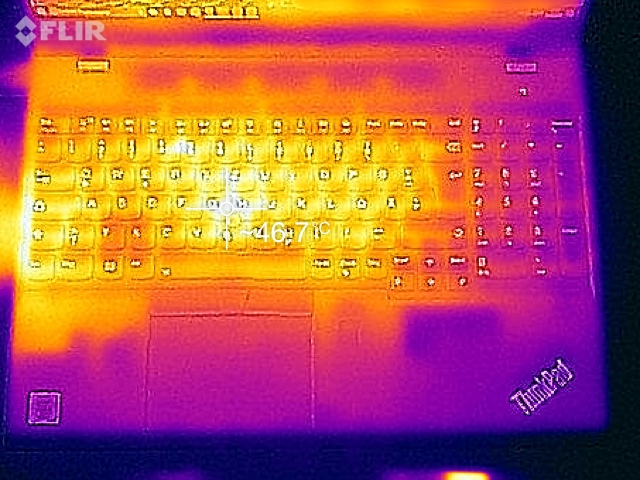
The ThinkPad heated up quite palpably during our stress test - too palpably for a ULV laptop. However, this should not be disconcerting. Our stress test is an extreme scenario that will not occur in daily use. Thus, the temperature increase will usually be much lower in routine use.
(±) The maximum temperature on the upper side is 43.6 °C / 110 F, compared to the average of 38.2 °C / 101 F, ranging from 22.2 to 69.8 °C for the class Workstation.
(-) The bottom heats up to a maximum of 60.8 °C / 141 F, compared to the average of 41.1 °C / 106 F
(+) In idle usage, the average temperature for the upper side is 26.5 °C / 80 F, compared to the device average of 32 °C / 90 F.
(±) The palmrests and touchpad can get very hot to the touch with a maximum of 39 °C / 102.2 F.
(-) The average temperature of the palmrest area of similar devices was 27.8 °C / 82 F (-11.2 °C / -20.2 F).
| Lenovo ThinkPad P51s 20HB000SGE i7-7600U, Quadro M520 | Lenovo ThinkPad P50s-20FKS00400 6500U, Quadro M500M | Dell Precision 5520 UHD E3-1505M v6, Quadro M1200 | HP ZBook Studio G3 6820HQ, Quadro M1000M | Lenovo ThinkPad T570-20HAS01E00 i7-7500U, GeForce 940MX | |
|---|---|---|---|---|---|
| Heat | 3% | 6% | -33% | 9% | |
| Maximum Upper Side * (°C) | 43.6 | 44.2 -1% | 51.6 -18% | 69.8 -60% | 43.1 1% |
| Maximum Bottom * (°C) | 60.8 | 57.8 5% | 43.6 28% | 77.3 -27% | 55.4 9% |
| Idle Upper Side * (°C) | 27.3 | 26.4 3% | 26.6 3% | 37.8 -38% | 24.3 11% |
| Idle Bottom * (°C) | 29 | 28.1 3% | 26.2 10% | 31.4 -8% | 25 14% |
* ... smaller is better
Speakers
Lenovo ThinkPad P51s 20HB000SGE audio analysis
(±) | speaker loudness is average but good (75.2 dB)
Bass 100 - 315 Hz
(±) | reduced bass - on average 10.7% lower than median
(±) | linearity of bass is average (11% delta to prev. frequency)
Mids 400 - 2000 Hz
(+) | balanced mids - only 3.9% away from median
(±) | linearity of mids is average (10.5% delta to prev. frequency)
Highs 2 - 16 kHz
(+) | balanced highs - only 3.1% away from median
(±) | linearity of highs is average (7.1% delta to prev. frequency)
Overall 100 - 16.000 Hz
(±) | linearity of overall sound is average (15.6% difference to median)
Compared to same class
» 35% of all tested devices in this class were better, 11% similar, 54% worse
» The best had a delta of 7%, average was 17%, worst was 35%
Compared to all devices tested
» 23% of all tested devices were better, 5% similar, 72% worse
» The best had a delta of 4%, average was 23%, worst was 134%
Dell Precision 5520 UHD audio analysis
(±) | speaker loudness is average but good (79.6 dB)
Bass 100 - 315 Hz
(±) | reduced bass - on average 12.8% lower than median
(±) | linearity of bass is average (14.2% delta to prev. frequency)
Mids 400 - 2000 Hz
(+) | balanced mids - only 4% away from median
(±) | linearity of mids is average (9.9% delta to prev. frequency)
Highs 2 - 16 kHz
(+) | balanced highs - only 3.3% away from median
(±) | linearity of highs is average (12% delta to prev. frequency)
Overall 100 - 16.000 Hz
(±) | linearity of overall sound is average (16.7% difference to median)
Compared to same class
» 46% of all tested devices in this class were better, 9% similar, 45% worse
» The best had a delta of 7%, average was 17%, worst was 35%
Compared to all devices tested
» 29% of all tested devices were better, 7% similar, 64% worse
» The best had a delta of 4%, average was 23%, worst was 134%
Frequency diagram comparison (checkboxes above can be turned on/off!)
Energy Management
Power Consumption
We measured a maximum idle power consumption of 13.5 watts - a very high rate for a ULV laptop. The 4K screen is responsible for this. At the beginning of the stress test, the rate climbed to 73.1 watts. The 65-watt power supply is overloaded with this. However, the rate drops since the CPU and GPU throttle. The power consumption was 51 watts at the end of the stress test.
| Off / Standby | |
| Idle | |
| Load |
|
Key:
min: | |
| Lenovo ThinkPad P51s 20HB000SGE i7-7600U, Quadro M520 | Lenovo ThinkPad P50s-20FKS00400 6500U, Quadro M500M | Dell Precision 5520 UHD E3-1505M v6, Quadro M1200 | HP ZBook Studio G3 6820HQ, Quadro M1000M | Lenovo ThinkPad T570-20HAS01E00 i7-7500U, GeForce 940MX | |
|---|---|---|---|---|---|
| Power Consumption | 22% | -44% | -42% | 10% | |
| Idle Minimum * (Watt) | 5.8 | 4.3 26% | 8.9 -53% | 8.7 -50% | 4.7 19% |
| Idle Average * (Watt) | 10.4 | 9.7 7% | 13.6 -31% | 14.2 -37% | 9.9 5% |
| Idle Maximum * (Watt) | 13.5 | 10.2 24% | 14.1 -4% | 14.4 -7% | 10.9 19% |
| Load Average * (Watt) | 62.4 | 45.7 27% | 100.3 -61% | 85.6 -37% | 56.1 10% |
| Load Maximum * (Watt) | 73.1 | 55.8 24% | 126.3 -73% | 129.7 -77% | 75 -3% |
| Witcher 3 ultra * (Watt) | 100.2 |
* ... smaller is better
Battery Runtime
The ThinkPad achieves a runtime of 11:52 hours in our practical Wi-Fi test. We simulate the load needed for opening websites via a script here. The "Balanced" profile is enabled, the energy-saving features are disabled, and the screen's brightness is set to approximately 150 cd/m². The P51s finished the video test after 11:40 hours. We loop the short video Big Buck Bunny (H.264 encoding, 1920x1080 pixels) for this. The "Energy Saving" profile is enabled, the wireless modules and energy-saving features are disabled, and the screen's brightness is dimmed to 150 cd/m².
We performed an additional load test. We looped the SpecviewPerf 12 benchmark using the "High Performance" profile. The ThinkPad achieved a runtime of almost 3 hours here.
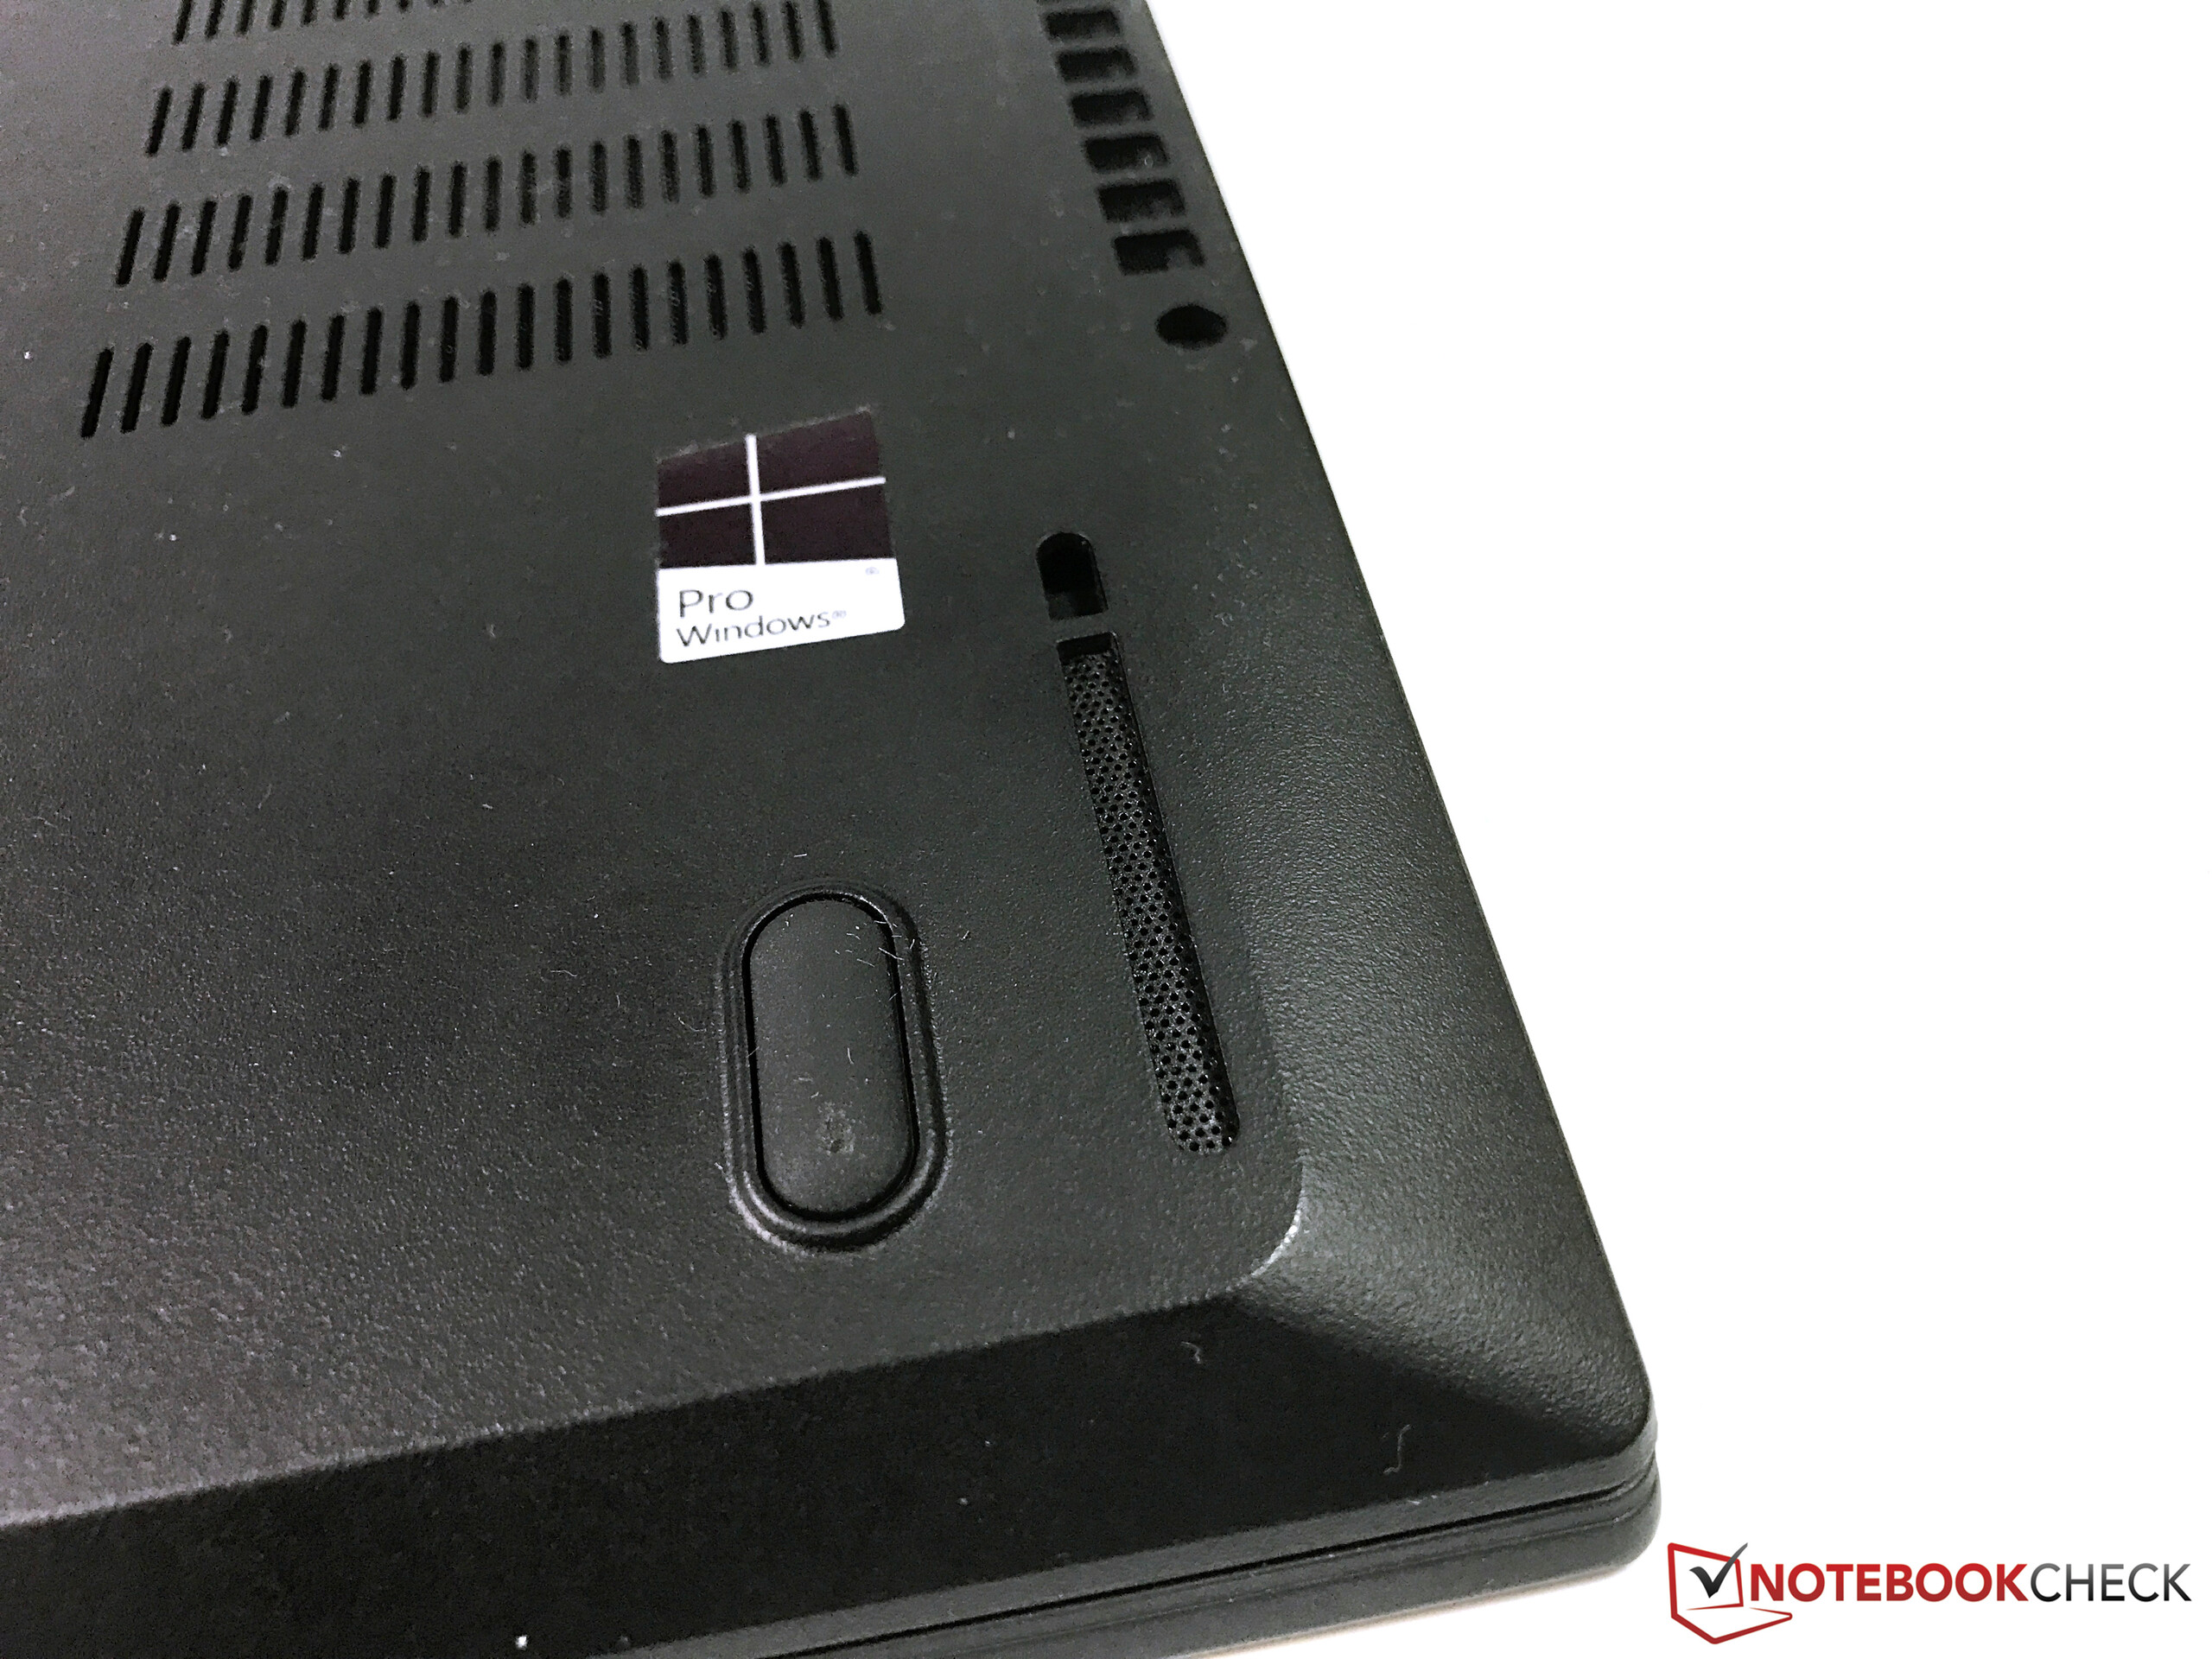
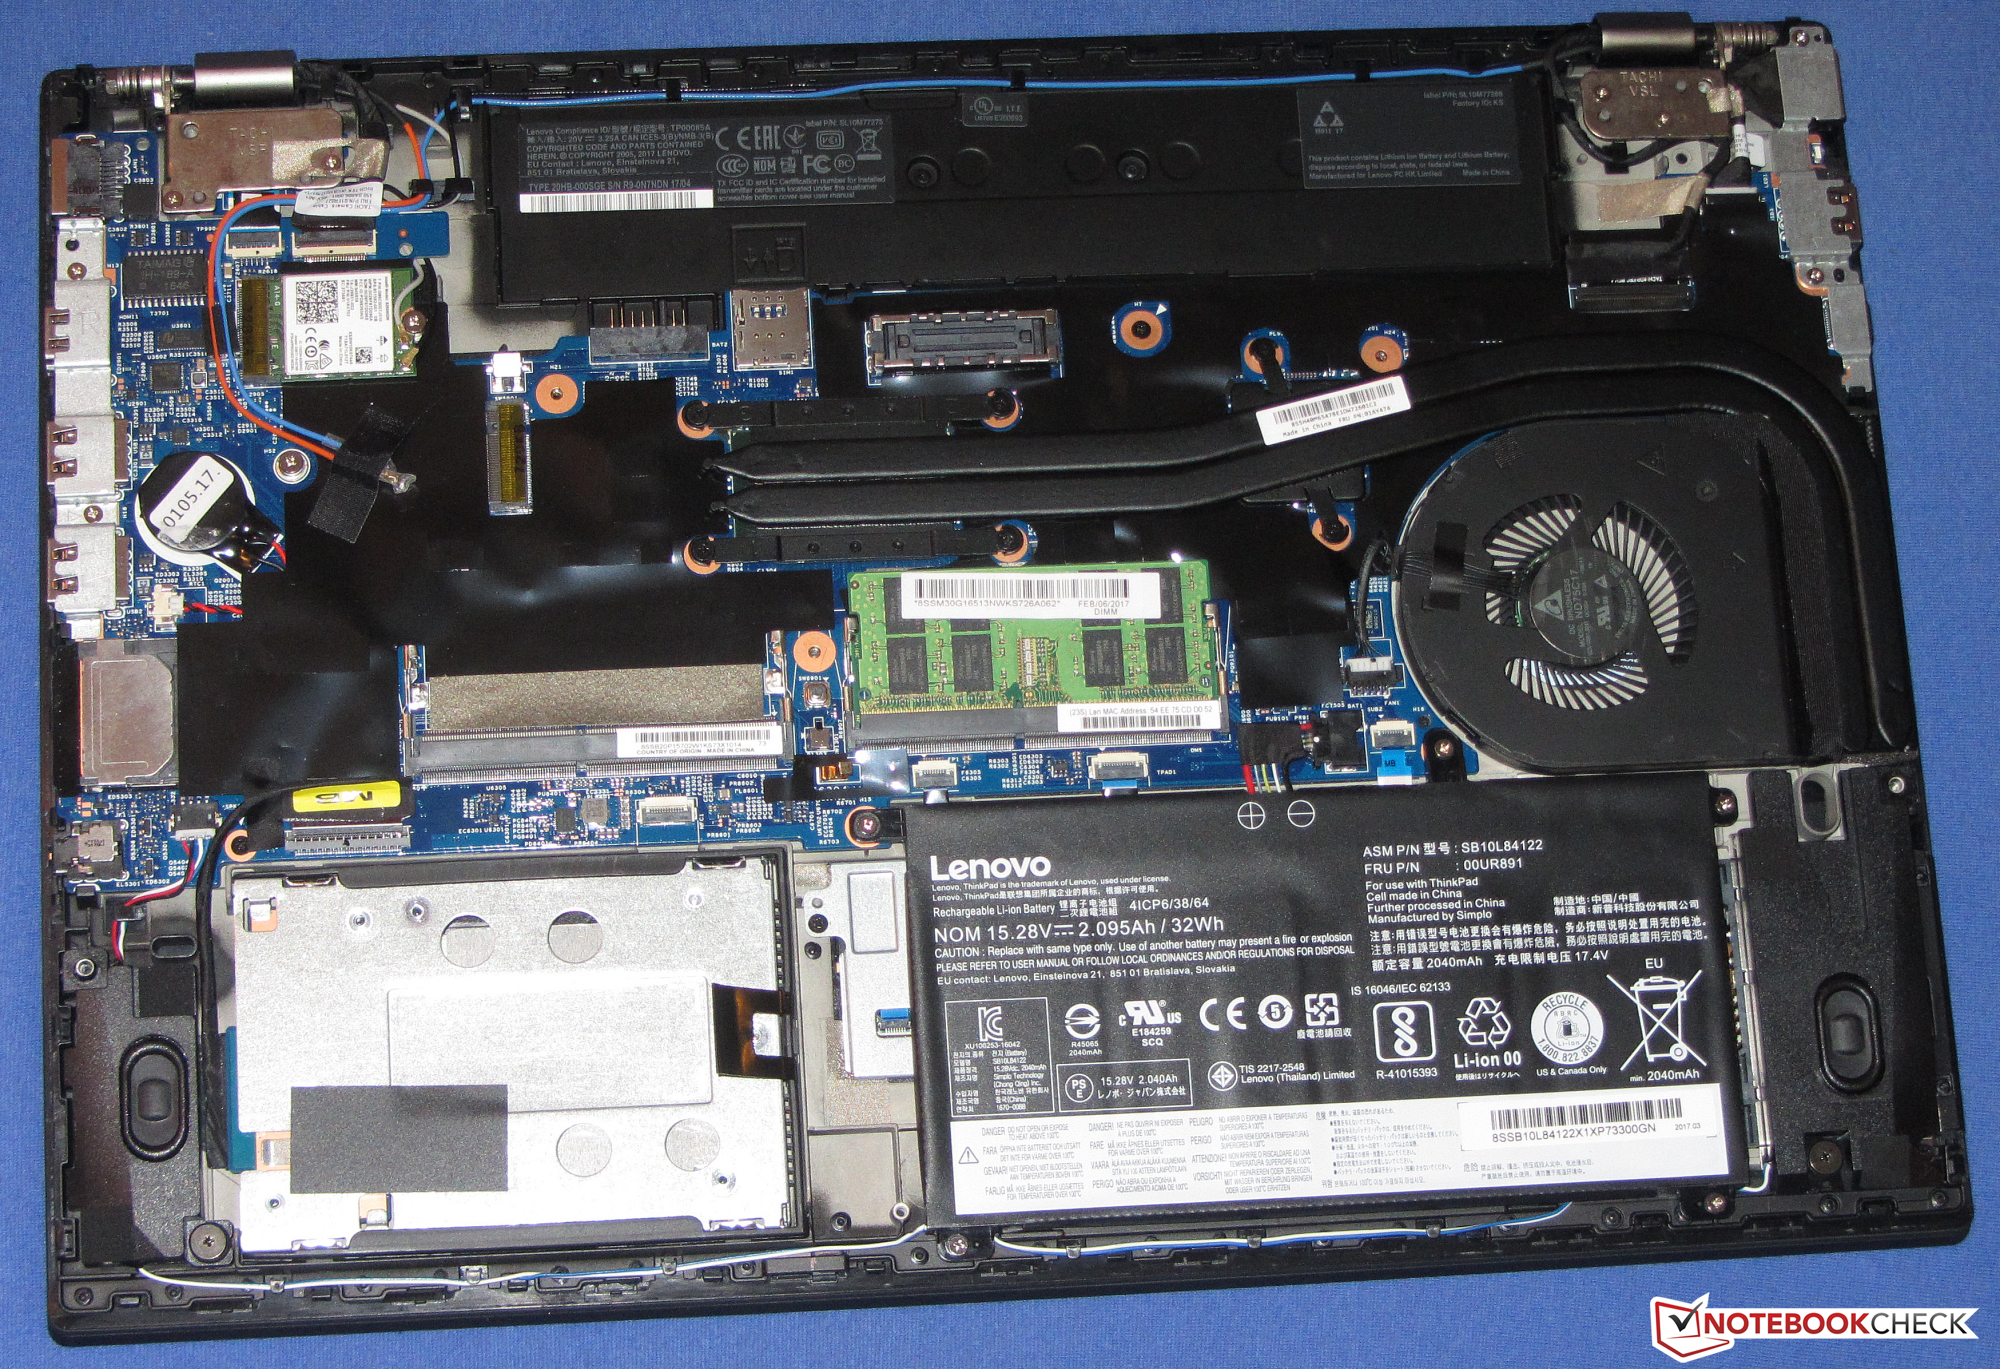
Like the ThinkPad T570, the ThinkPad P51s has an internal battery (32 Wh) and an external battery. Our review sample comes with the highest capacity battery (72 Wh) that Lenovo offers. Consequently, the laptop delivers outstanding battery runtimes. The 72 Wh battery protrudes visibly toward the bottom. Thus, the ThinkPad does not lie evenly on a surface but is tilted toward the user.
| Lenovo ThinkPad P51s 20HB000SGE i7-7600U, Quadro M520, 104 Wh | Lenovo ThinkPad P50s-20FKS00400 6500U, Quadro M500M, 67 Wh | Dell Precision 5520 UHD E3-1505M v6, Quadro M1200, 97 Wh | HP ZBook Studio G3 6820HQ, Quadro M1000M, 64 Wh | Lenovo ThinkPad T570-20HAS01E00 i7-7500U, GeForce 940MX, 56 Wh | |
|---|---|---|---|---|---|
| Battery runtime | -39% | -67% | -72% | -42% | |
| Reader / Idle (h) | 26.4 | 18.5 -30% | 12.1 -54% | 8.5 -68% | 13.3 -50% |
| H.264 (h) | 11.7 | 9 -23% | 3.8 -68% | 8.1 -31% | |
| WiFi v1.3 (h) | 11.9 | 6.8 -43% | 4.2 -65% | 3.5 -71% | 6.9 -42% |
| Load (h) | 5.4 | 2.2 -59% | 1 -81% | 1.1 -80% | 2.9 -46% |
Verdict
Pros
Cons
Lenovo provides a compact, 15.6-inch, mobile workstation with its ThinkPad P51s. However, buyers should be aware that the workstation's performance is limited due to the ULV processor. A workstation with a quad-core processor will be needed for much higher performance - for example, the ThinkPad P51.
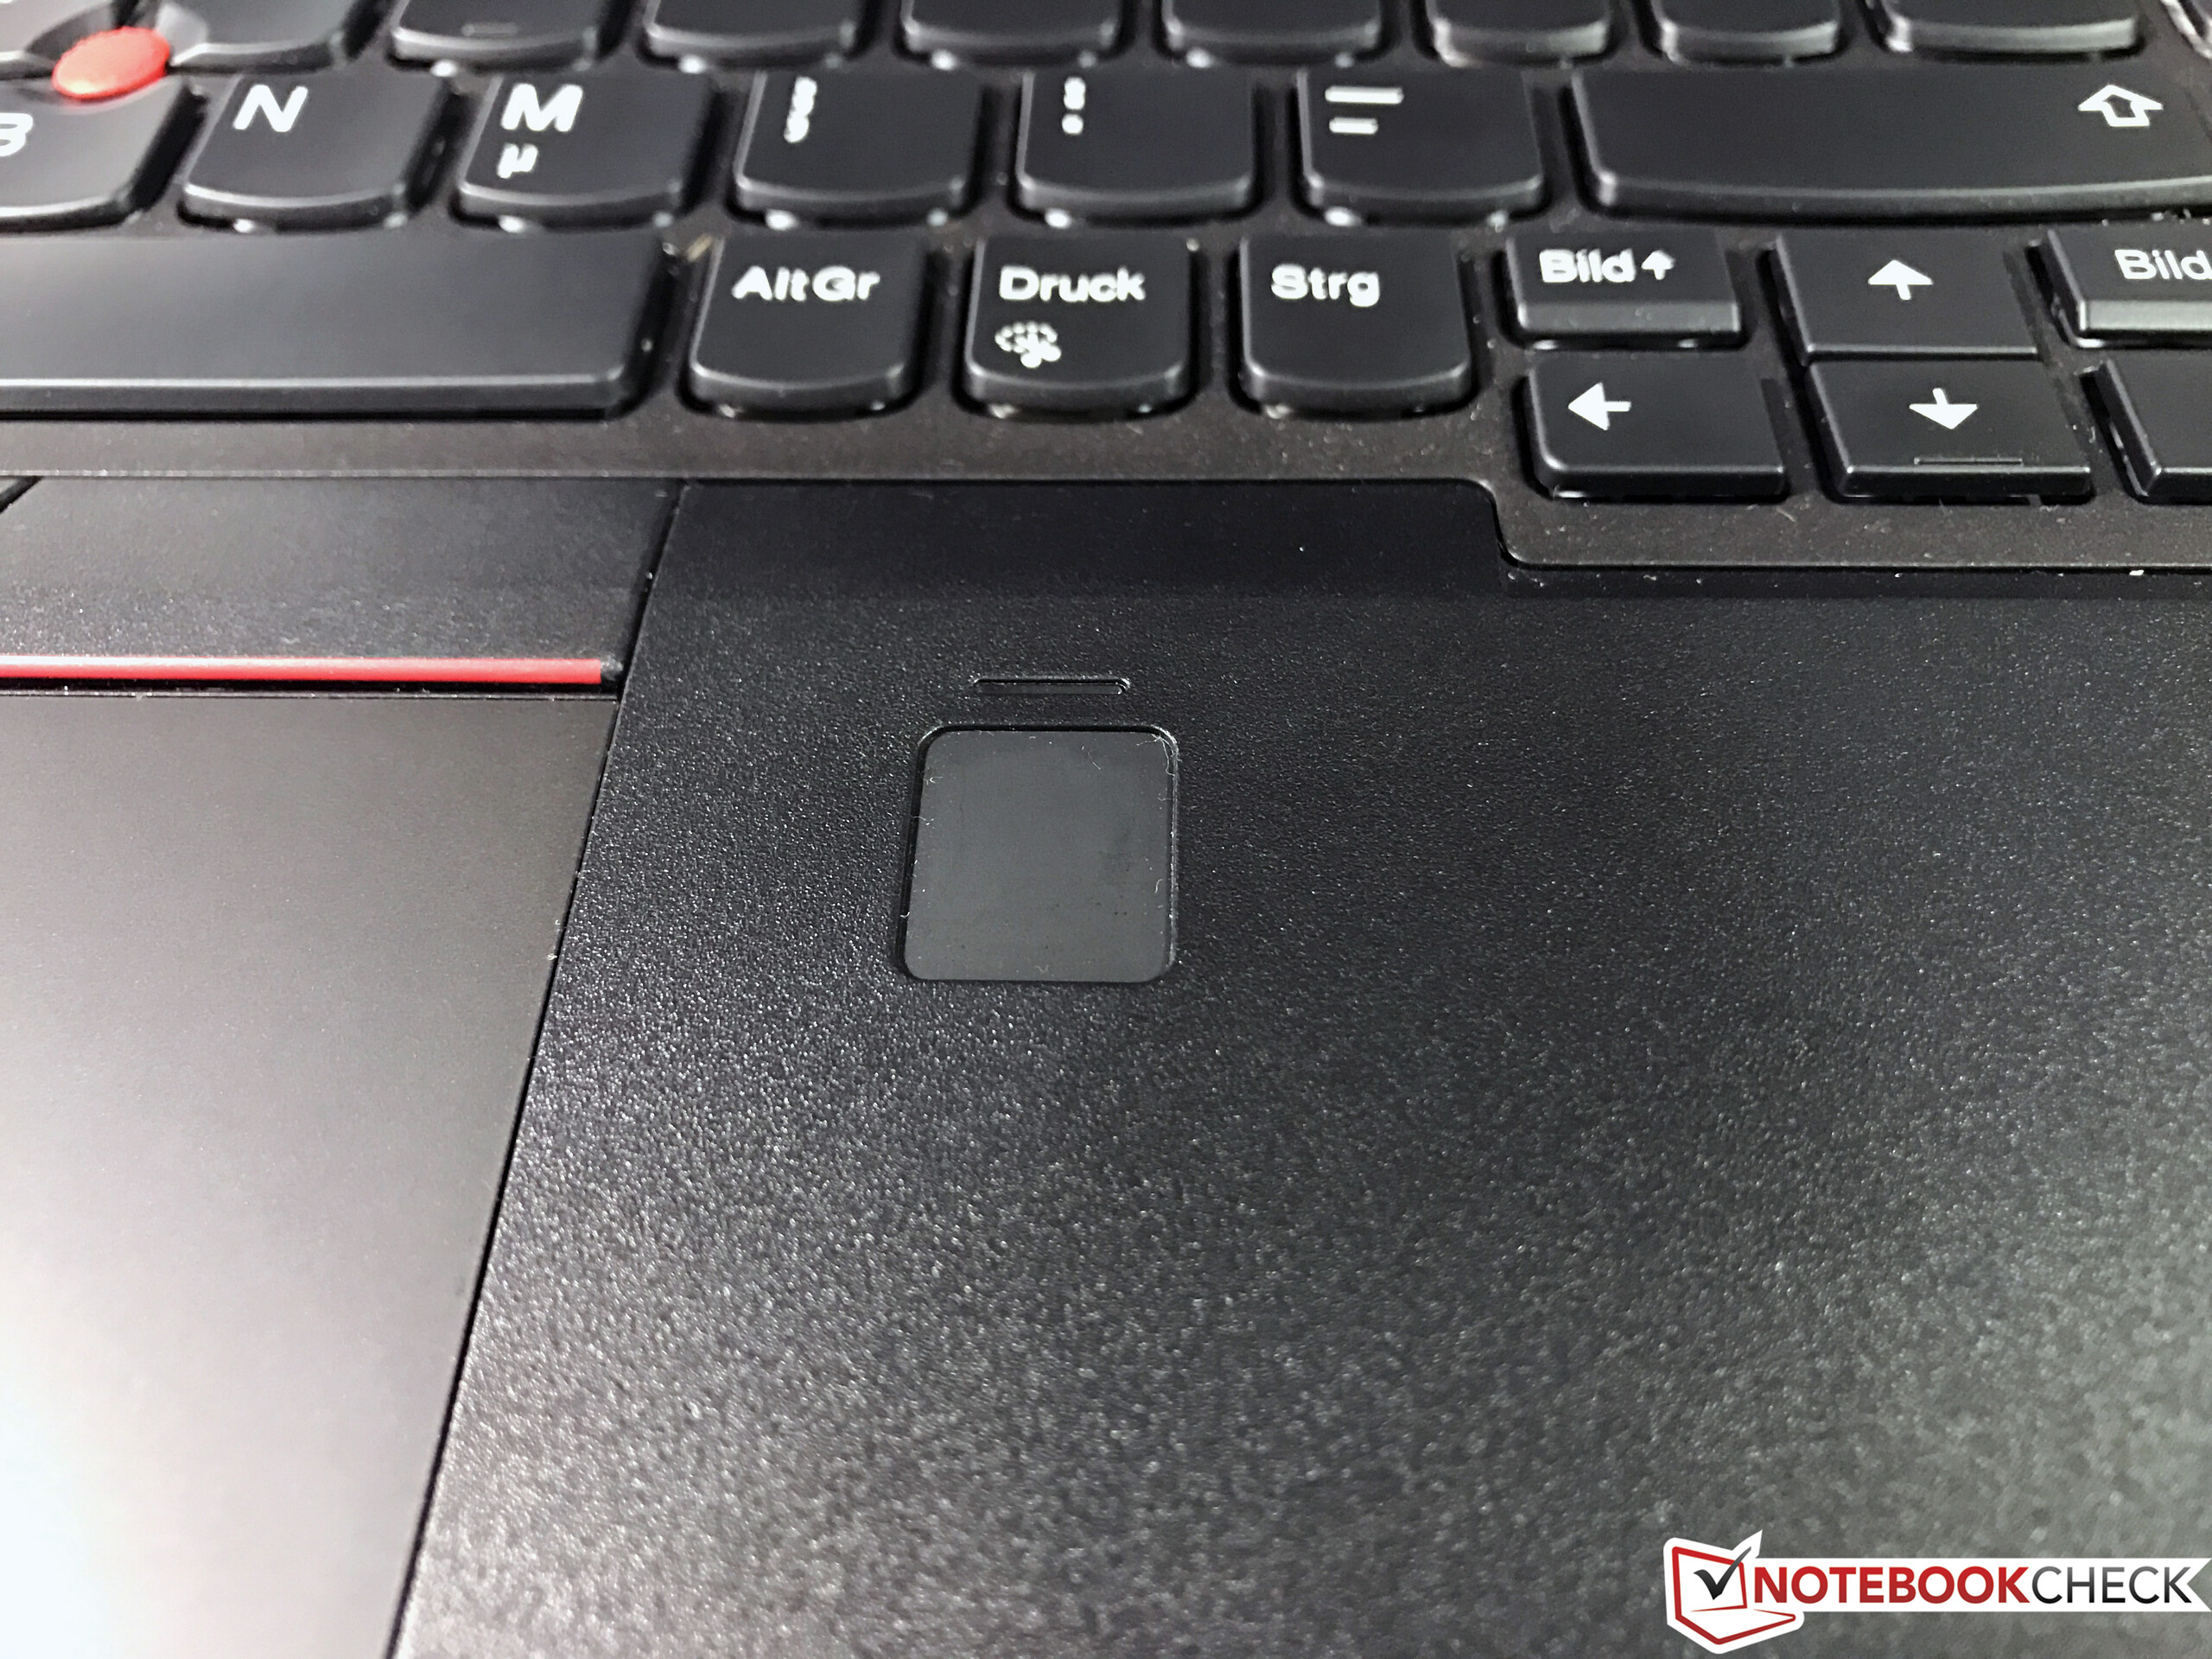
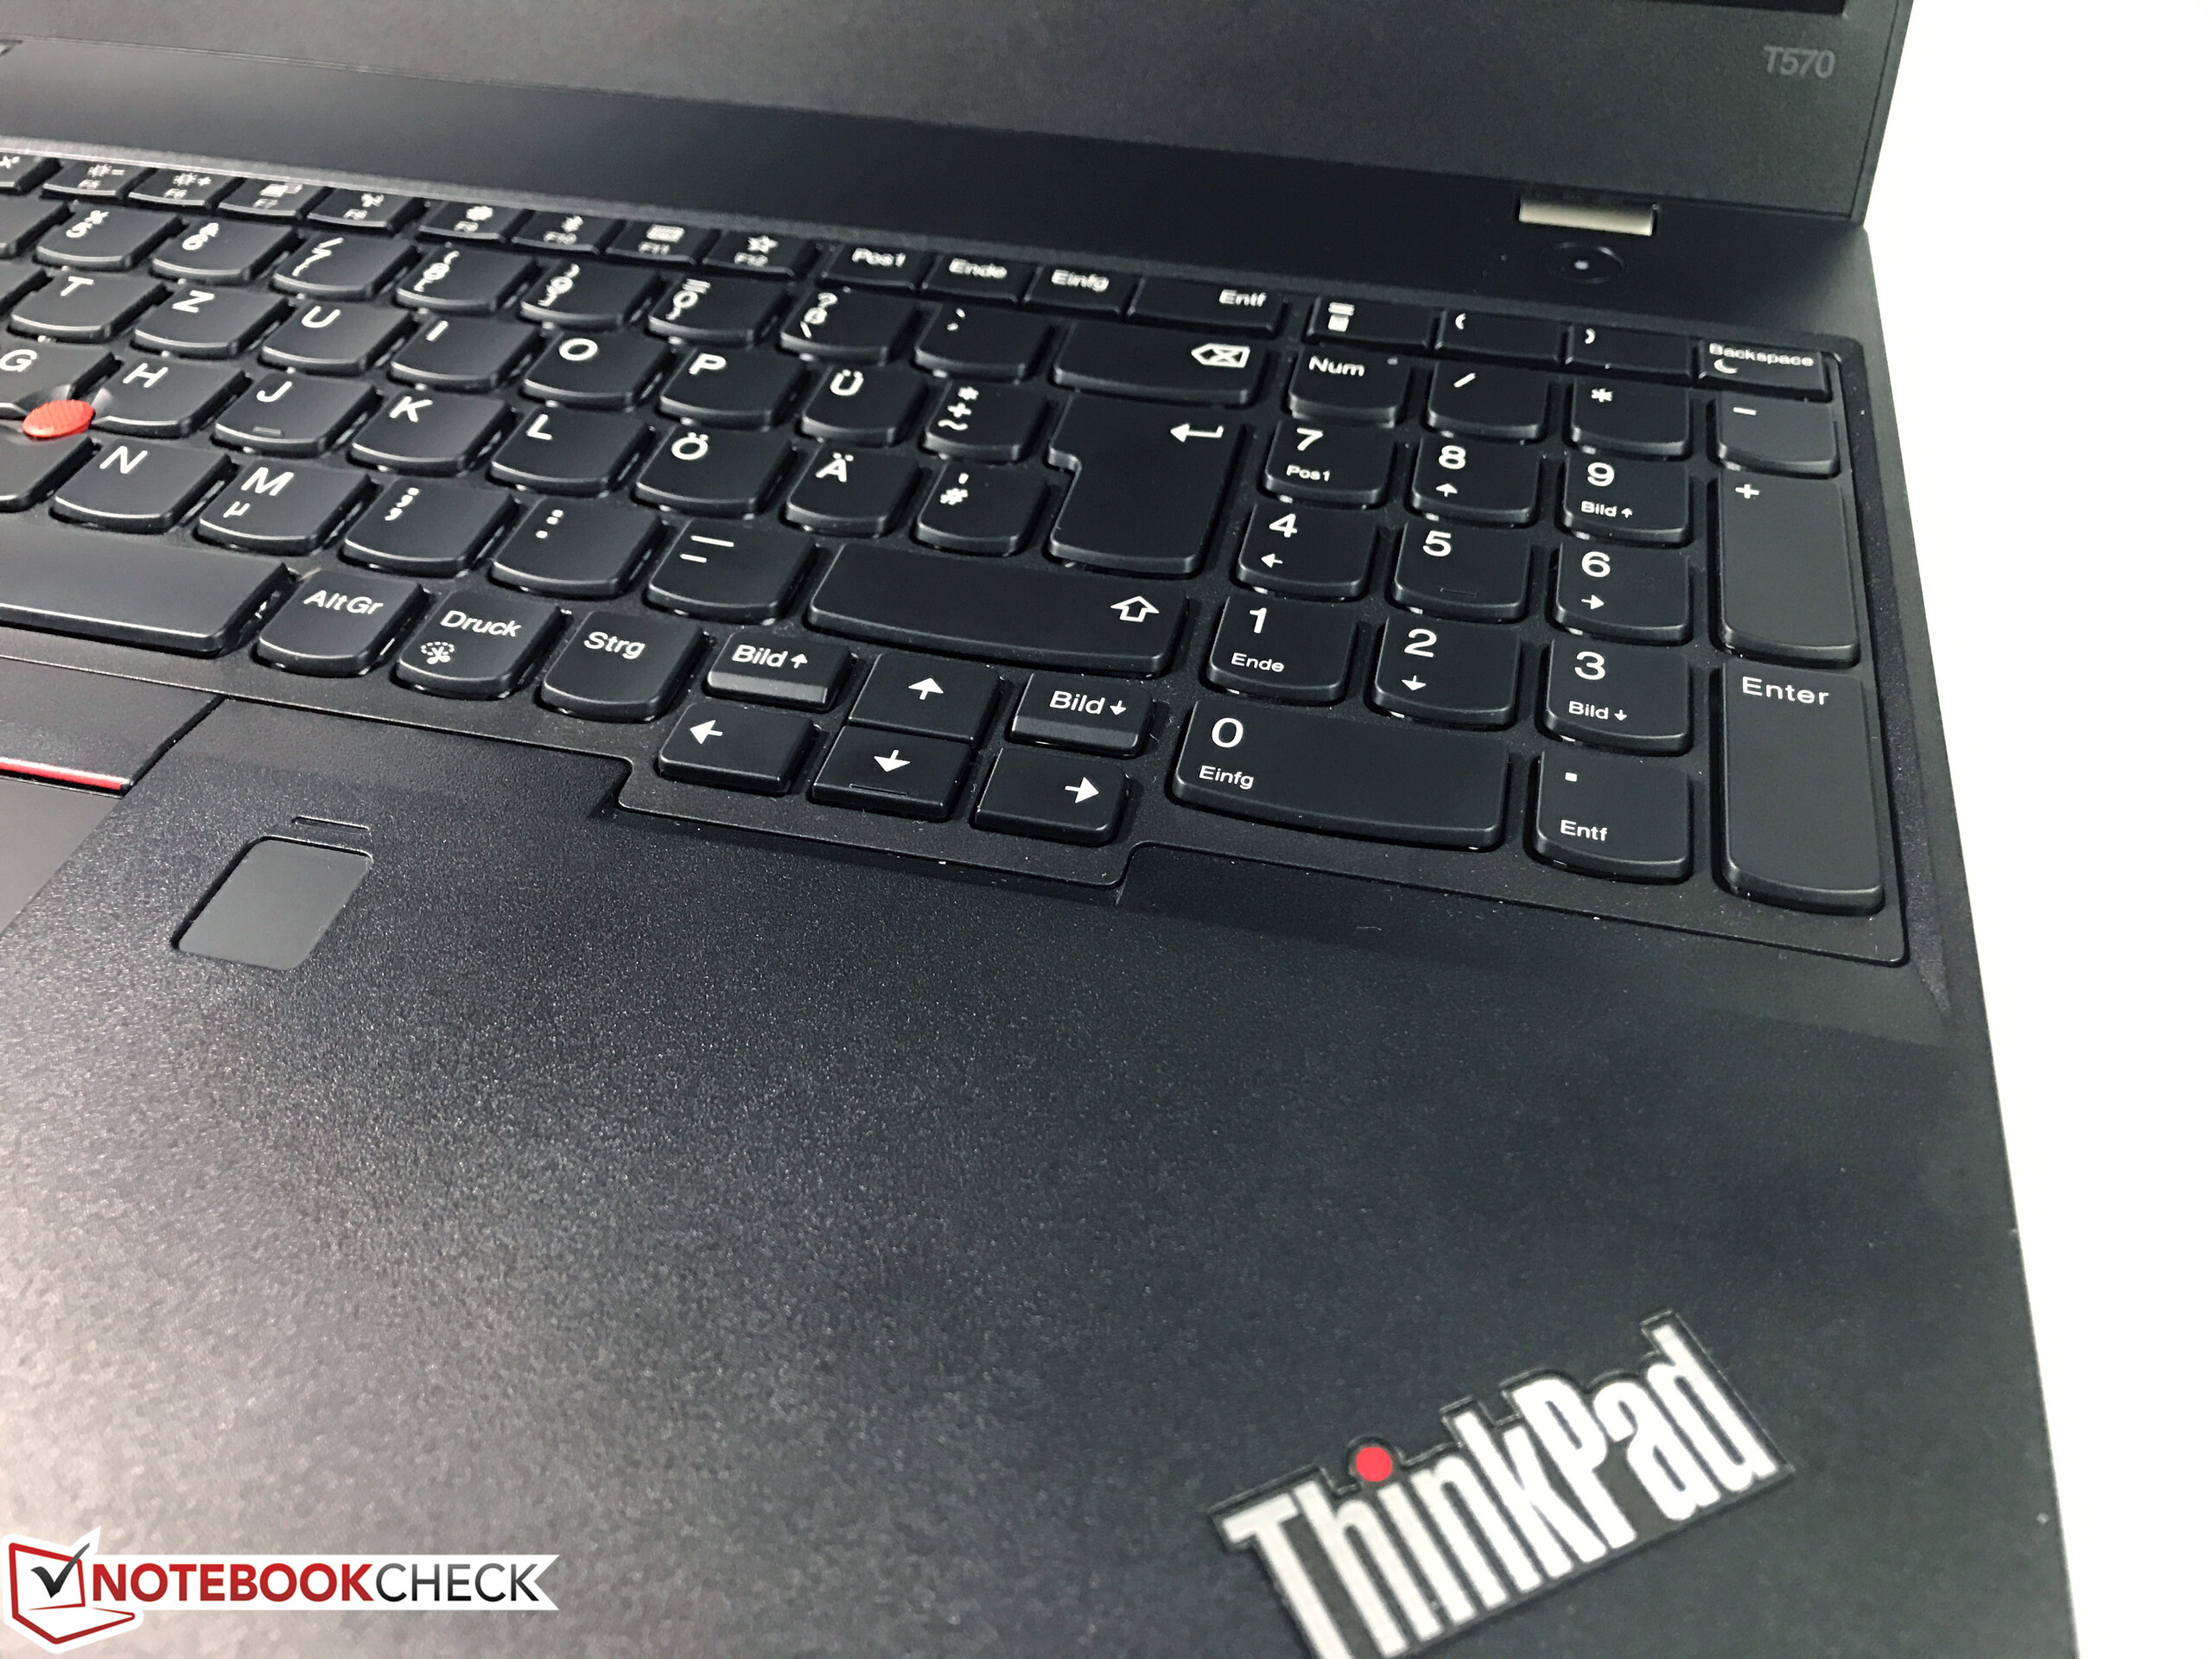
The ThinkPad is the identically built sibling of the ThinkPad T570. Thus, the P51s features the same solid casing, the good input devices, and the diverse connectivity of the T570. The infrared camera is also installed.
Unfortunately, the P51s also inherits the shortcomings of the T570. For example, the CPU throttles in battery mode. We measured clock rates of approximately 1.8 to 2.4 GHz. This throttling results in a deduction. Furthermore, the laptop heated up too strongly in our stress test. We recorded a temperature of 60.8 °C on one measuring point - too high for a ULV laptop. Noise development looks better; the ThinkPad is on a normal level here.
The outstanding battery life is a highlight of the laptop.
In total, the P51s has a battery capacity of 104 Wh (internal: 32 Wh, external: 72 Wh). That is enough to keep even a 4K laptop running for a long time. A fast NVMe SSD ensures a quick system. The laptop could also be equipped with a 2.5-inch hard drive instead of an M.2 NVMe SSD. An LTE modem could also be retrofitted; our review sample has an empty slot and the corresponding antennas.
The matte 4K screen in the P51s is known from the ThinkPad T570. Both laptops are furnished with the same panel. The IPS screen pleases with stable viewing angles and a good contrast. The brightness is satisfactory although it could be higher. Unfortunately, the screen exhibits PWM-flickering at brightness levels of 90% and lower.
Lenovo ThinkPad P51s 20HB000SGE
- 06/03/2017 v6 (old)
Sascha Mölck
Price comparison
