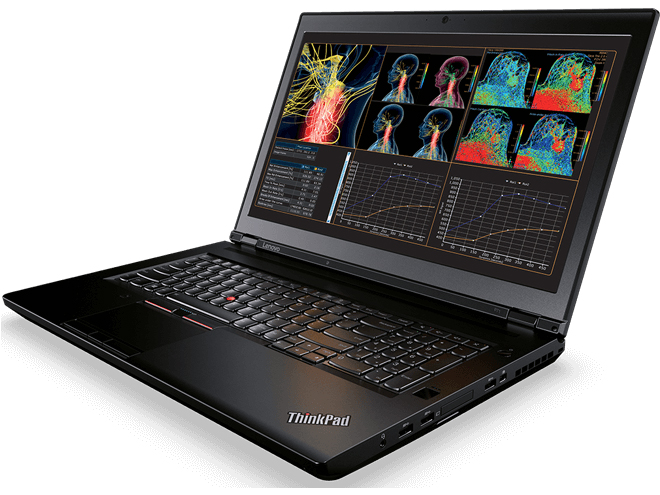
Lenovo ThinkPad P71 (i7, P3000, 4K) Workstation Review
For the original German review, see here.
Last year's ThinkPad P70 was Lenovo's first 17-inch mobile workstation for some time, and it was an instant success. There were some issues (such as the LTE connectivity), but we were impressed by the high performance combined with the low emissions.
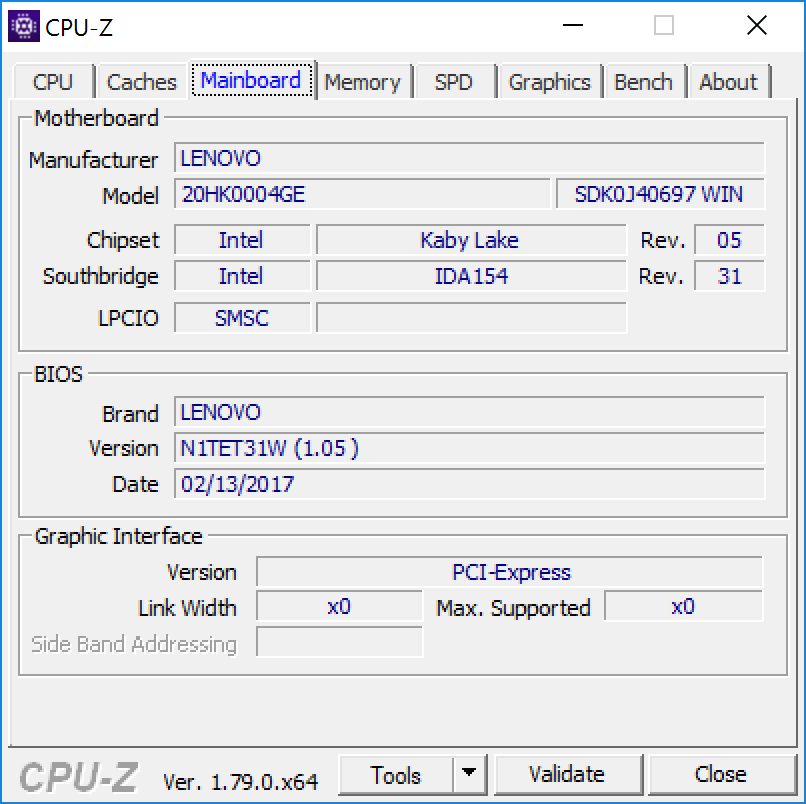
Now we get the new ThinkPad P71, which is still based on the same chassis. The components were updated to current Kaby Lake processors from Intel (Core i7 & Xeon) as well as new GPUs based on Nvidia's Pascal architecture. Our test model carries the designation ThinkPad P71-20HK0004GE and represents a rather mainstream SKU for about 3300 Euros (~$3912). It is shipped with a Core i7 processor, 16 GB of RAM, a 512 GB NVMe-SSD as well as Nvidia's Quadro P3000 GPU. The 17.3-inch panel features the 4K UHD resolution with an integrated colorimeter to calibrate the panel. You can easily raise the price of the P71 by selecting more powerful GPUs (especially the Nvidia Quadro P5000) and additional SSD storage. A fully specced model in Lenovo's online shop costs more than 7500 Euros (~$8894).
We have reviewed two current 17.3-inch workstations: Fujitsu's Celsius H970 and the MSI WE72 JR. Other rivals include the Dell Precision 7720 and the HP ZBook 17 G4. The basic construction has not changed compared to the previous ThinkPad P70, so we recommend checking our previous review for more information.
Note: We updated our rating system to v7 recently (see here) and the rating of the ThinkPad P71 drops from 90 % to 86 %.
Case
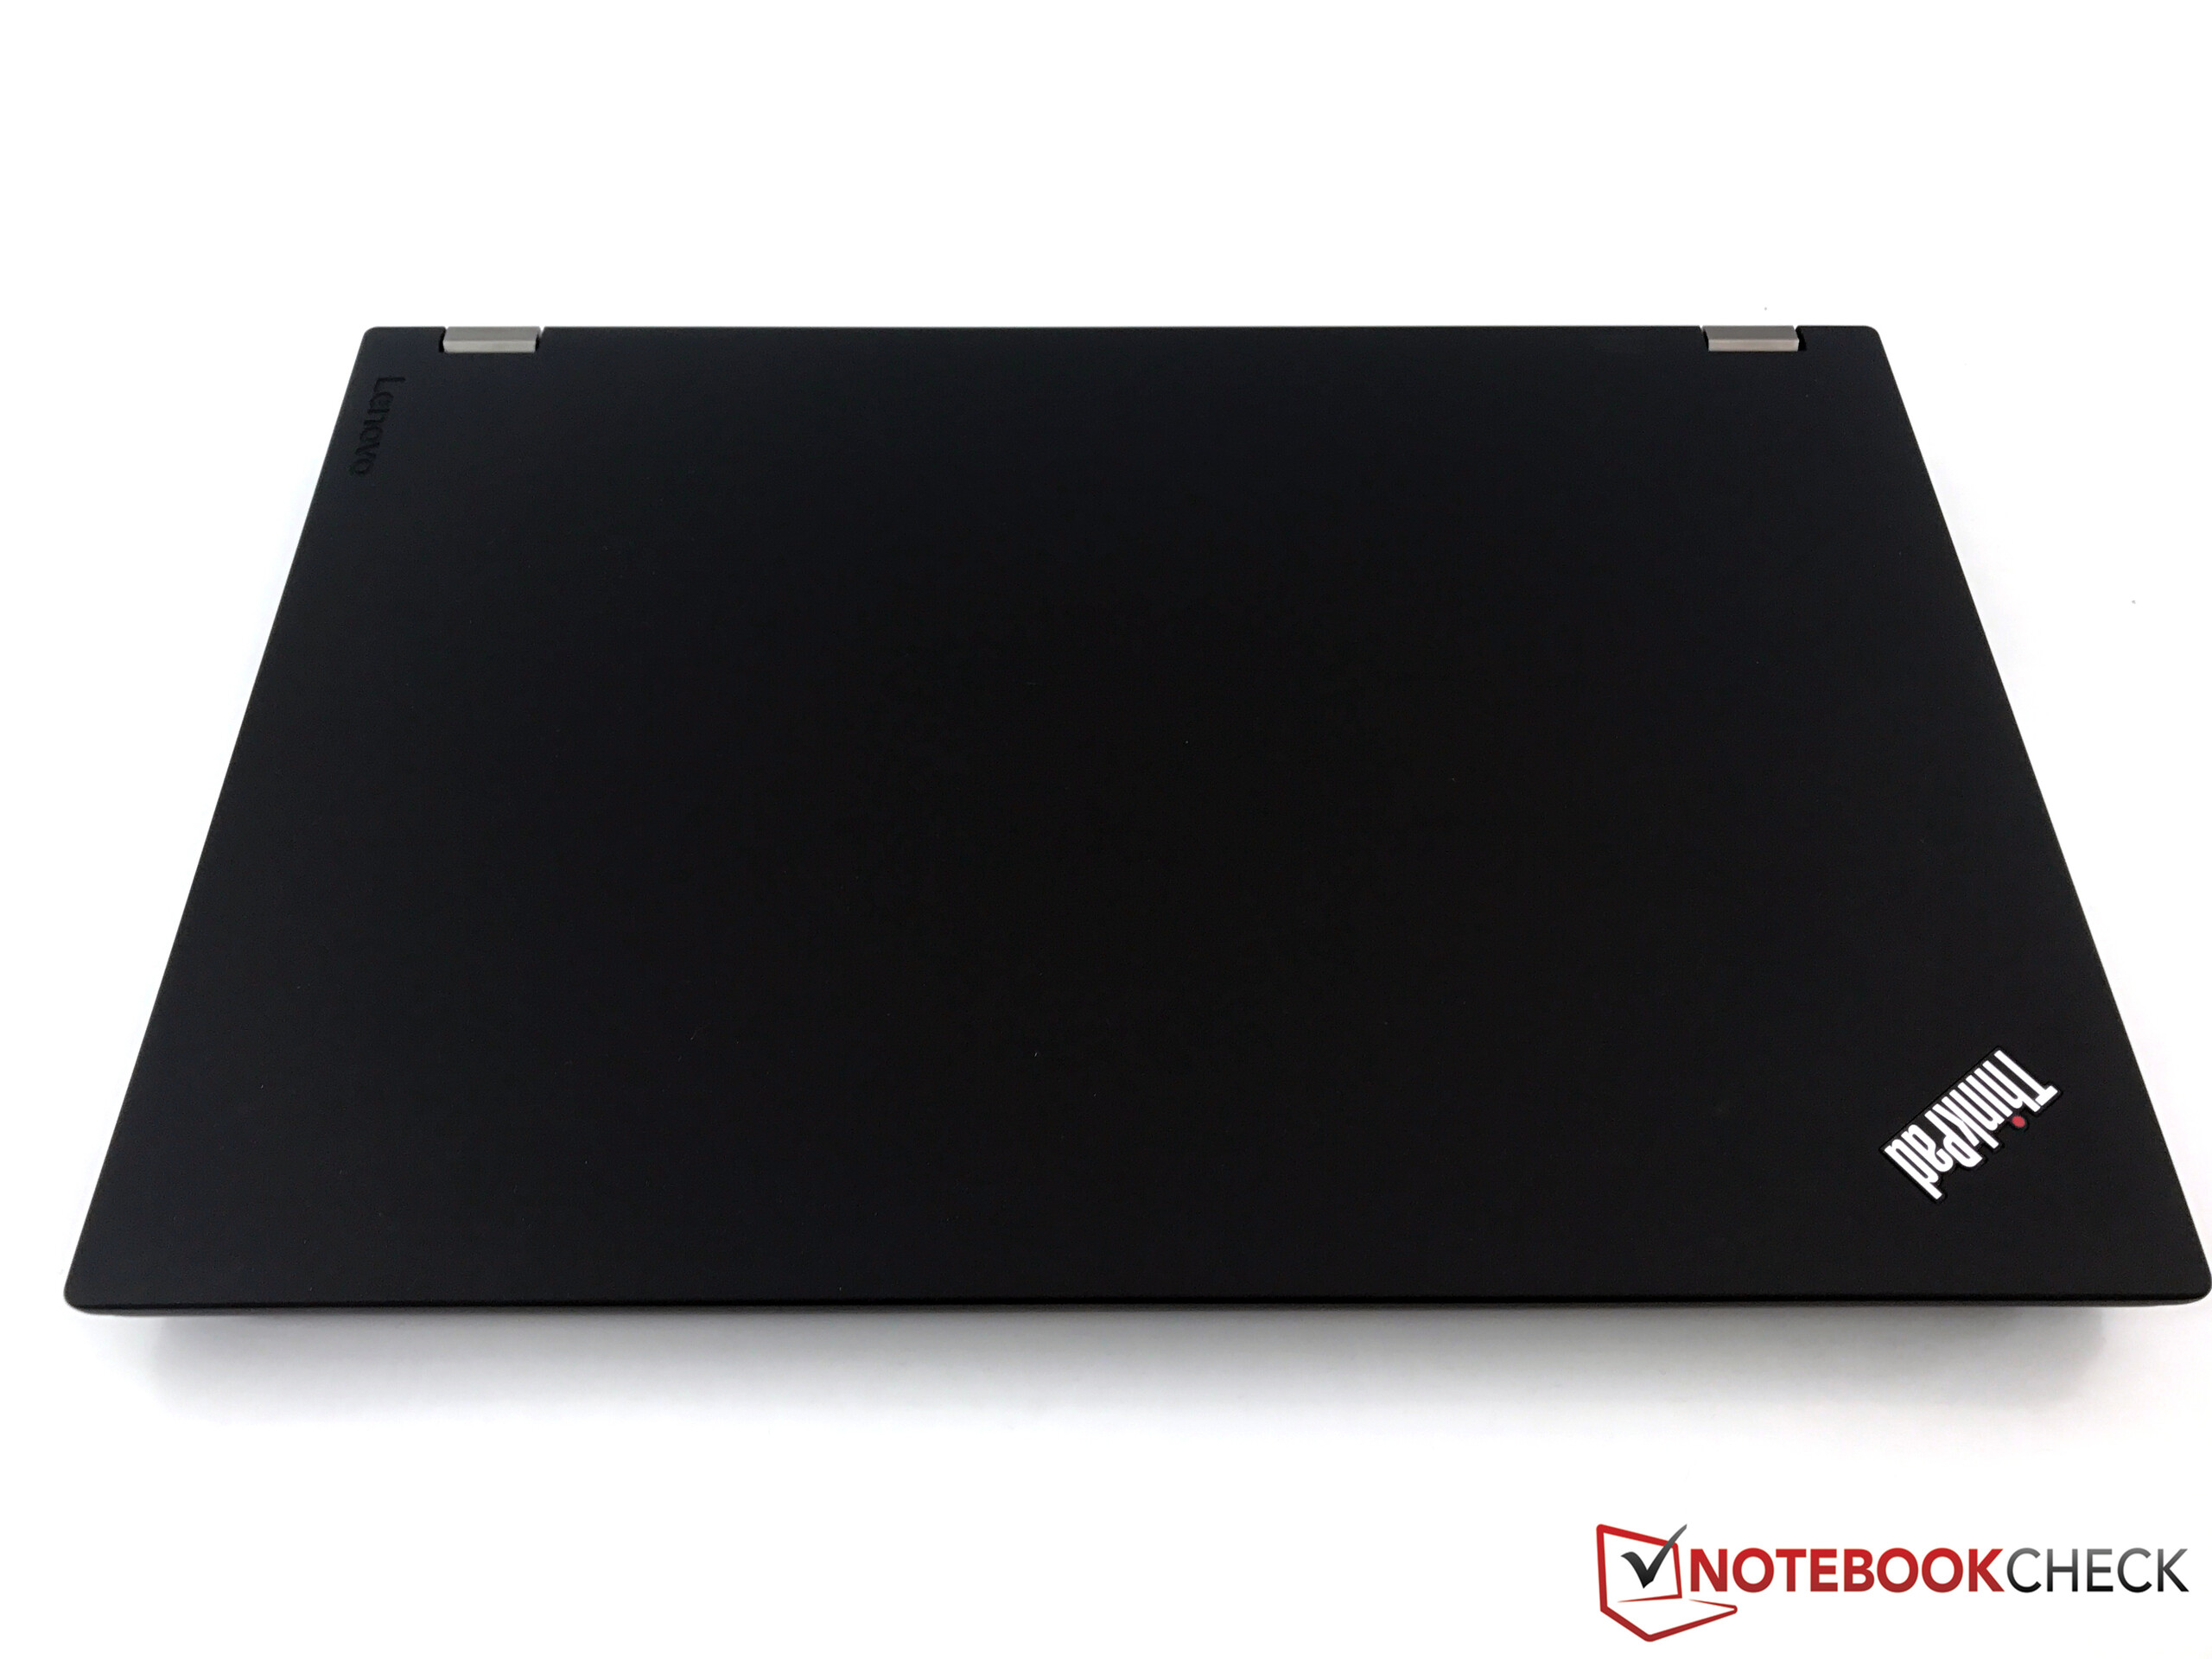
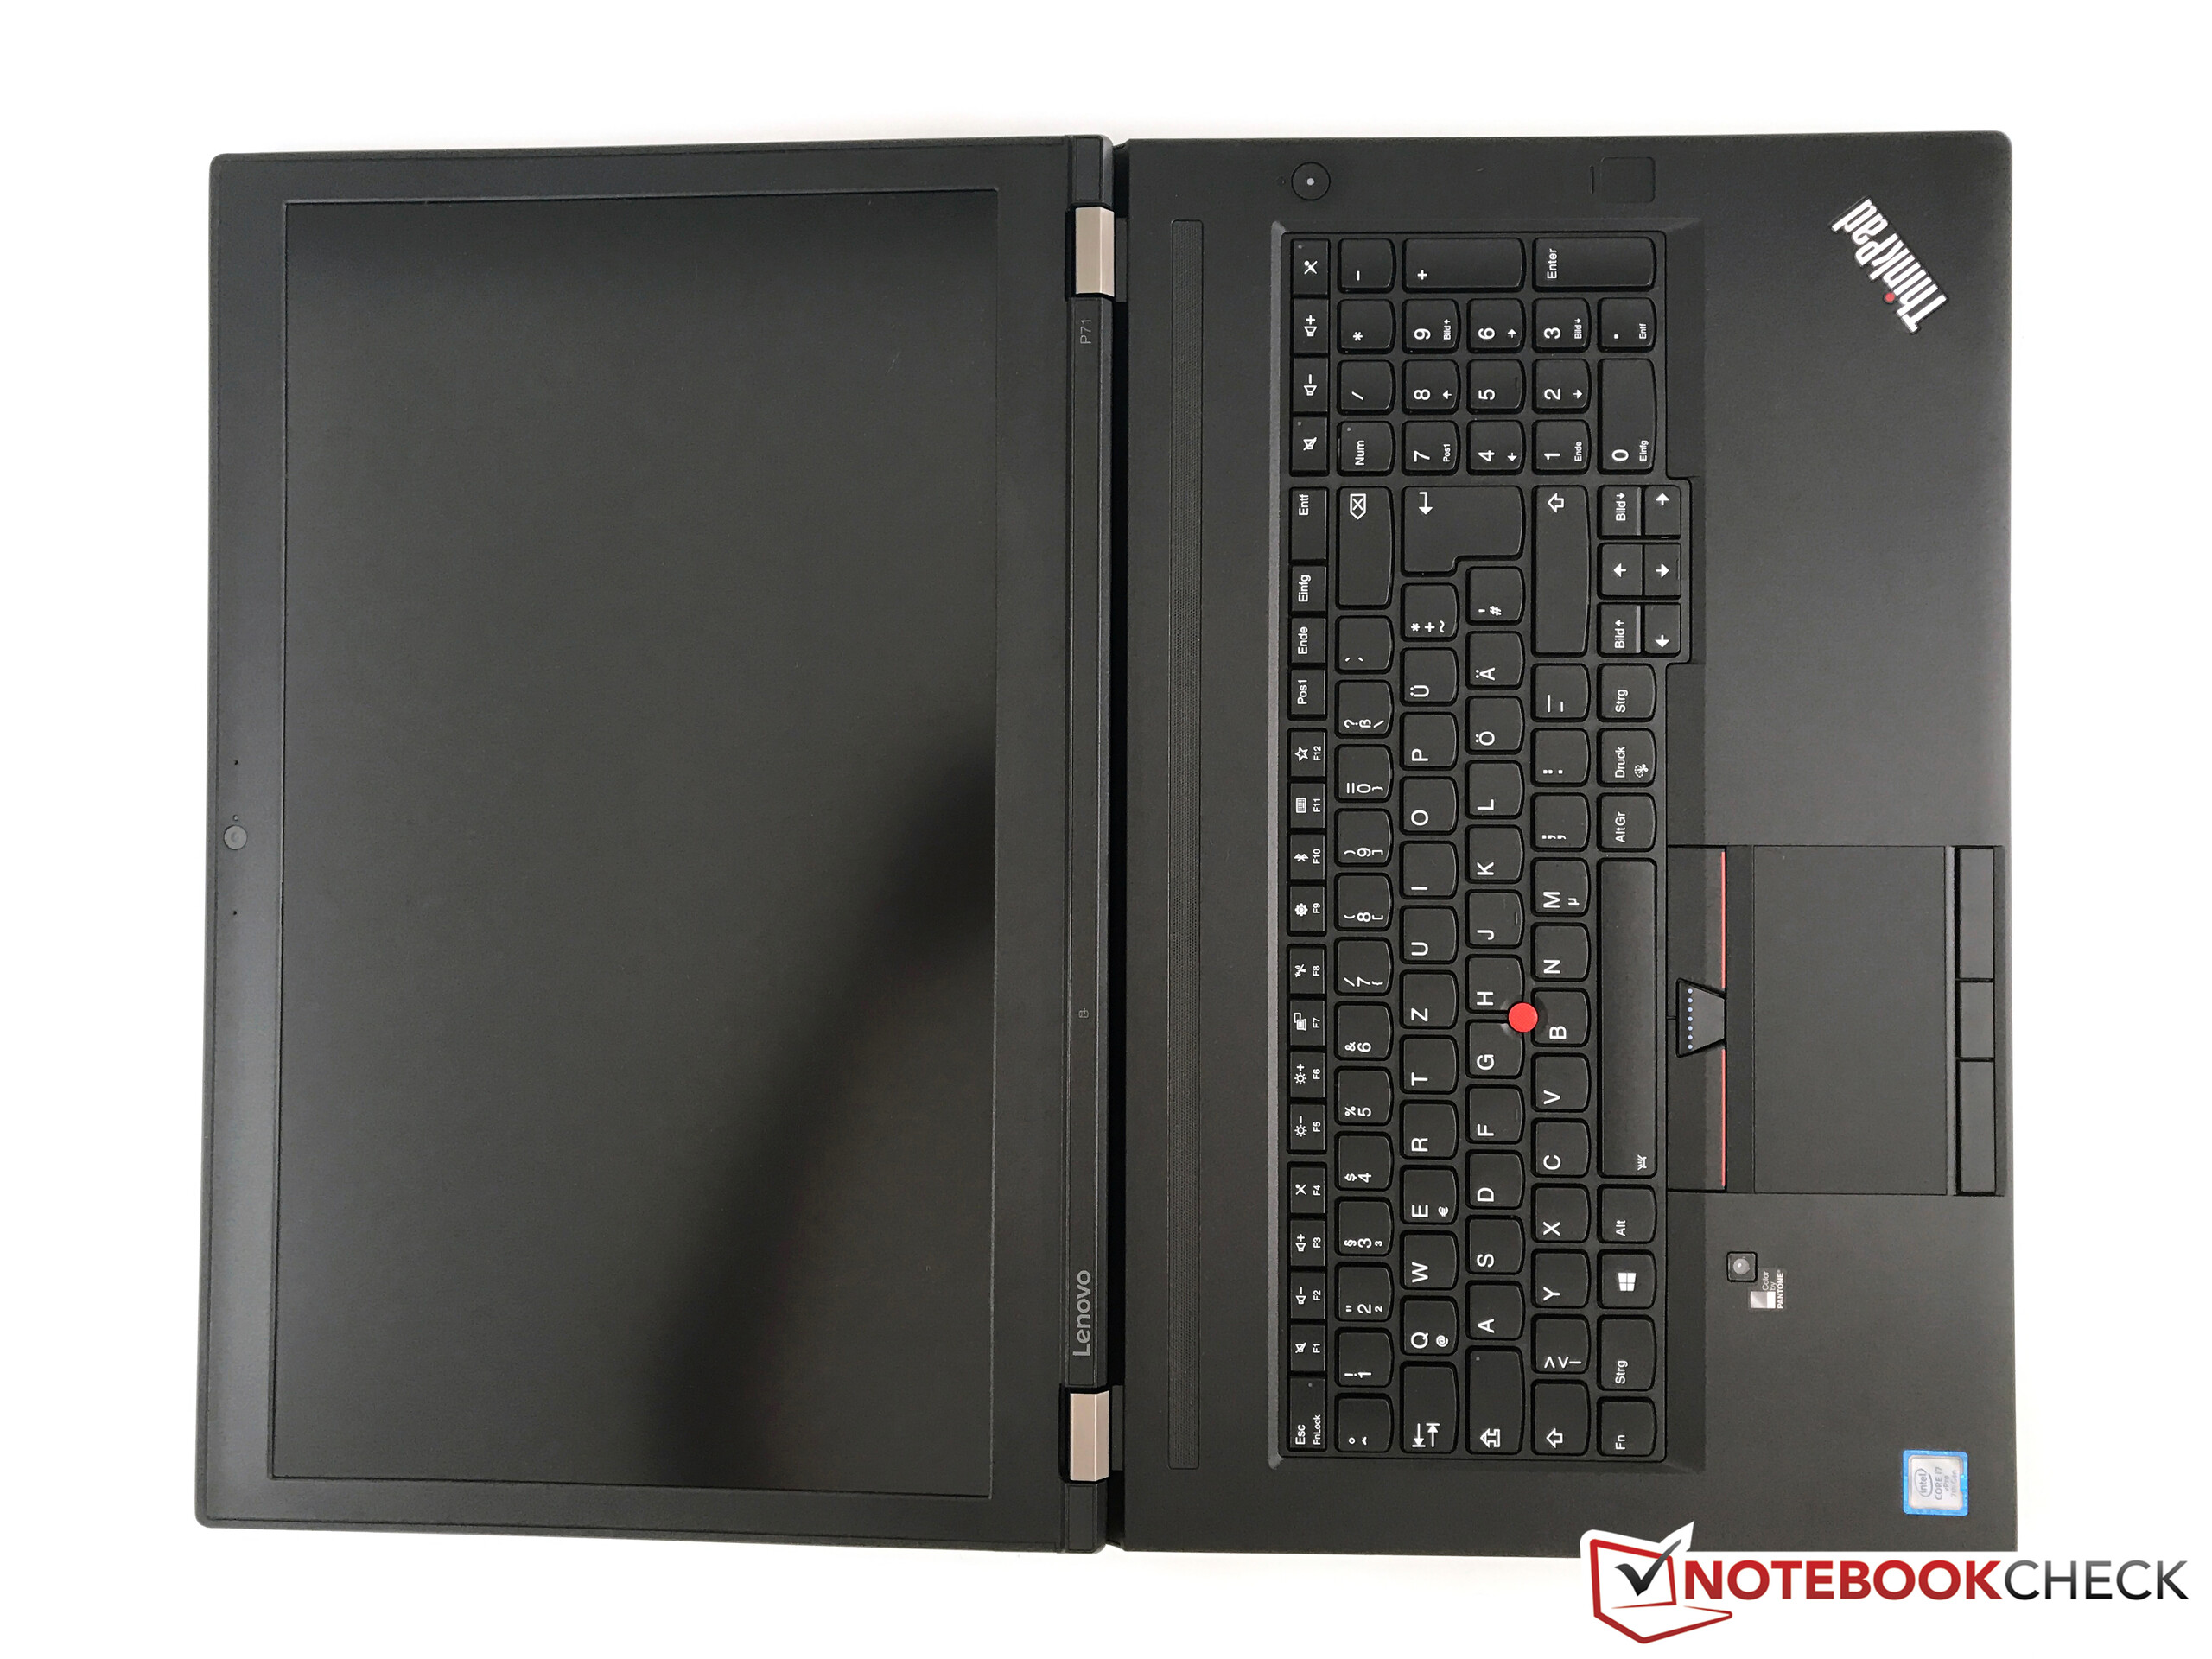
Lenovo introduced the 17.3-inch case with the ThinkPad P70 just last year, so there are no changes for the ThinkPad P71. However, this is not a big problem since we are still impressed by the stability of the black case. The base unit in particular is extremely sturdy thanks to the aluminum/magnesium alloy underneath the plastic surfaces. The tactile feel of the surfaces is similar to the smaller T-series models such as the ThinkPad T570. They are slightly roughened, but the surfaces of the ThinkPad X1 Carbon or other aluminum cases still leave a better impression.
The stability of the large lid is also decent, but still not quite on par with the base unit. You can twist it with some pressure, even though there are no creaking sounds and we cannot provoke picture distortions under pressure from behind either. The two metal hinges allow a maximum opening angle of 180 degrees, but they could be tighter for the heavy lid.
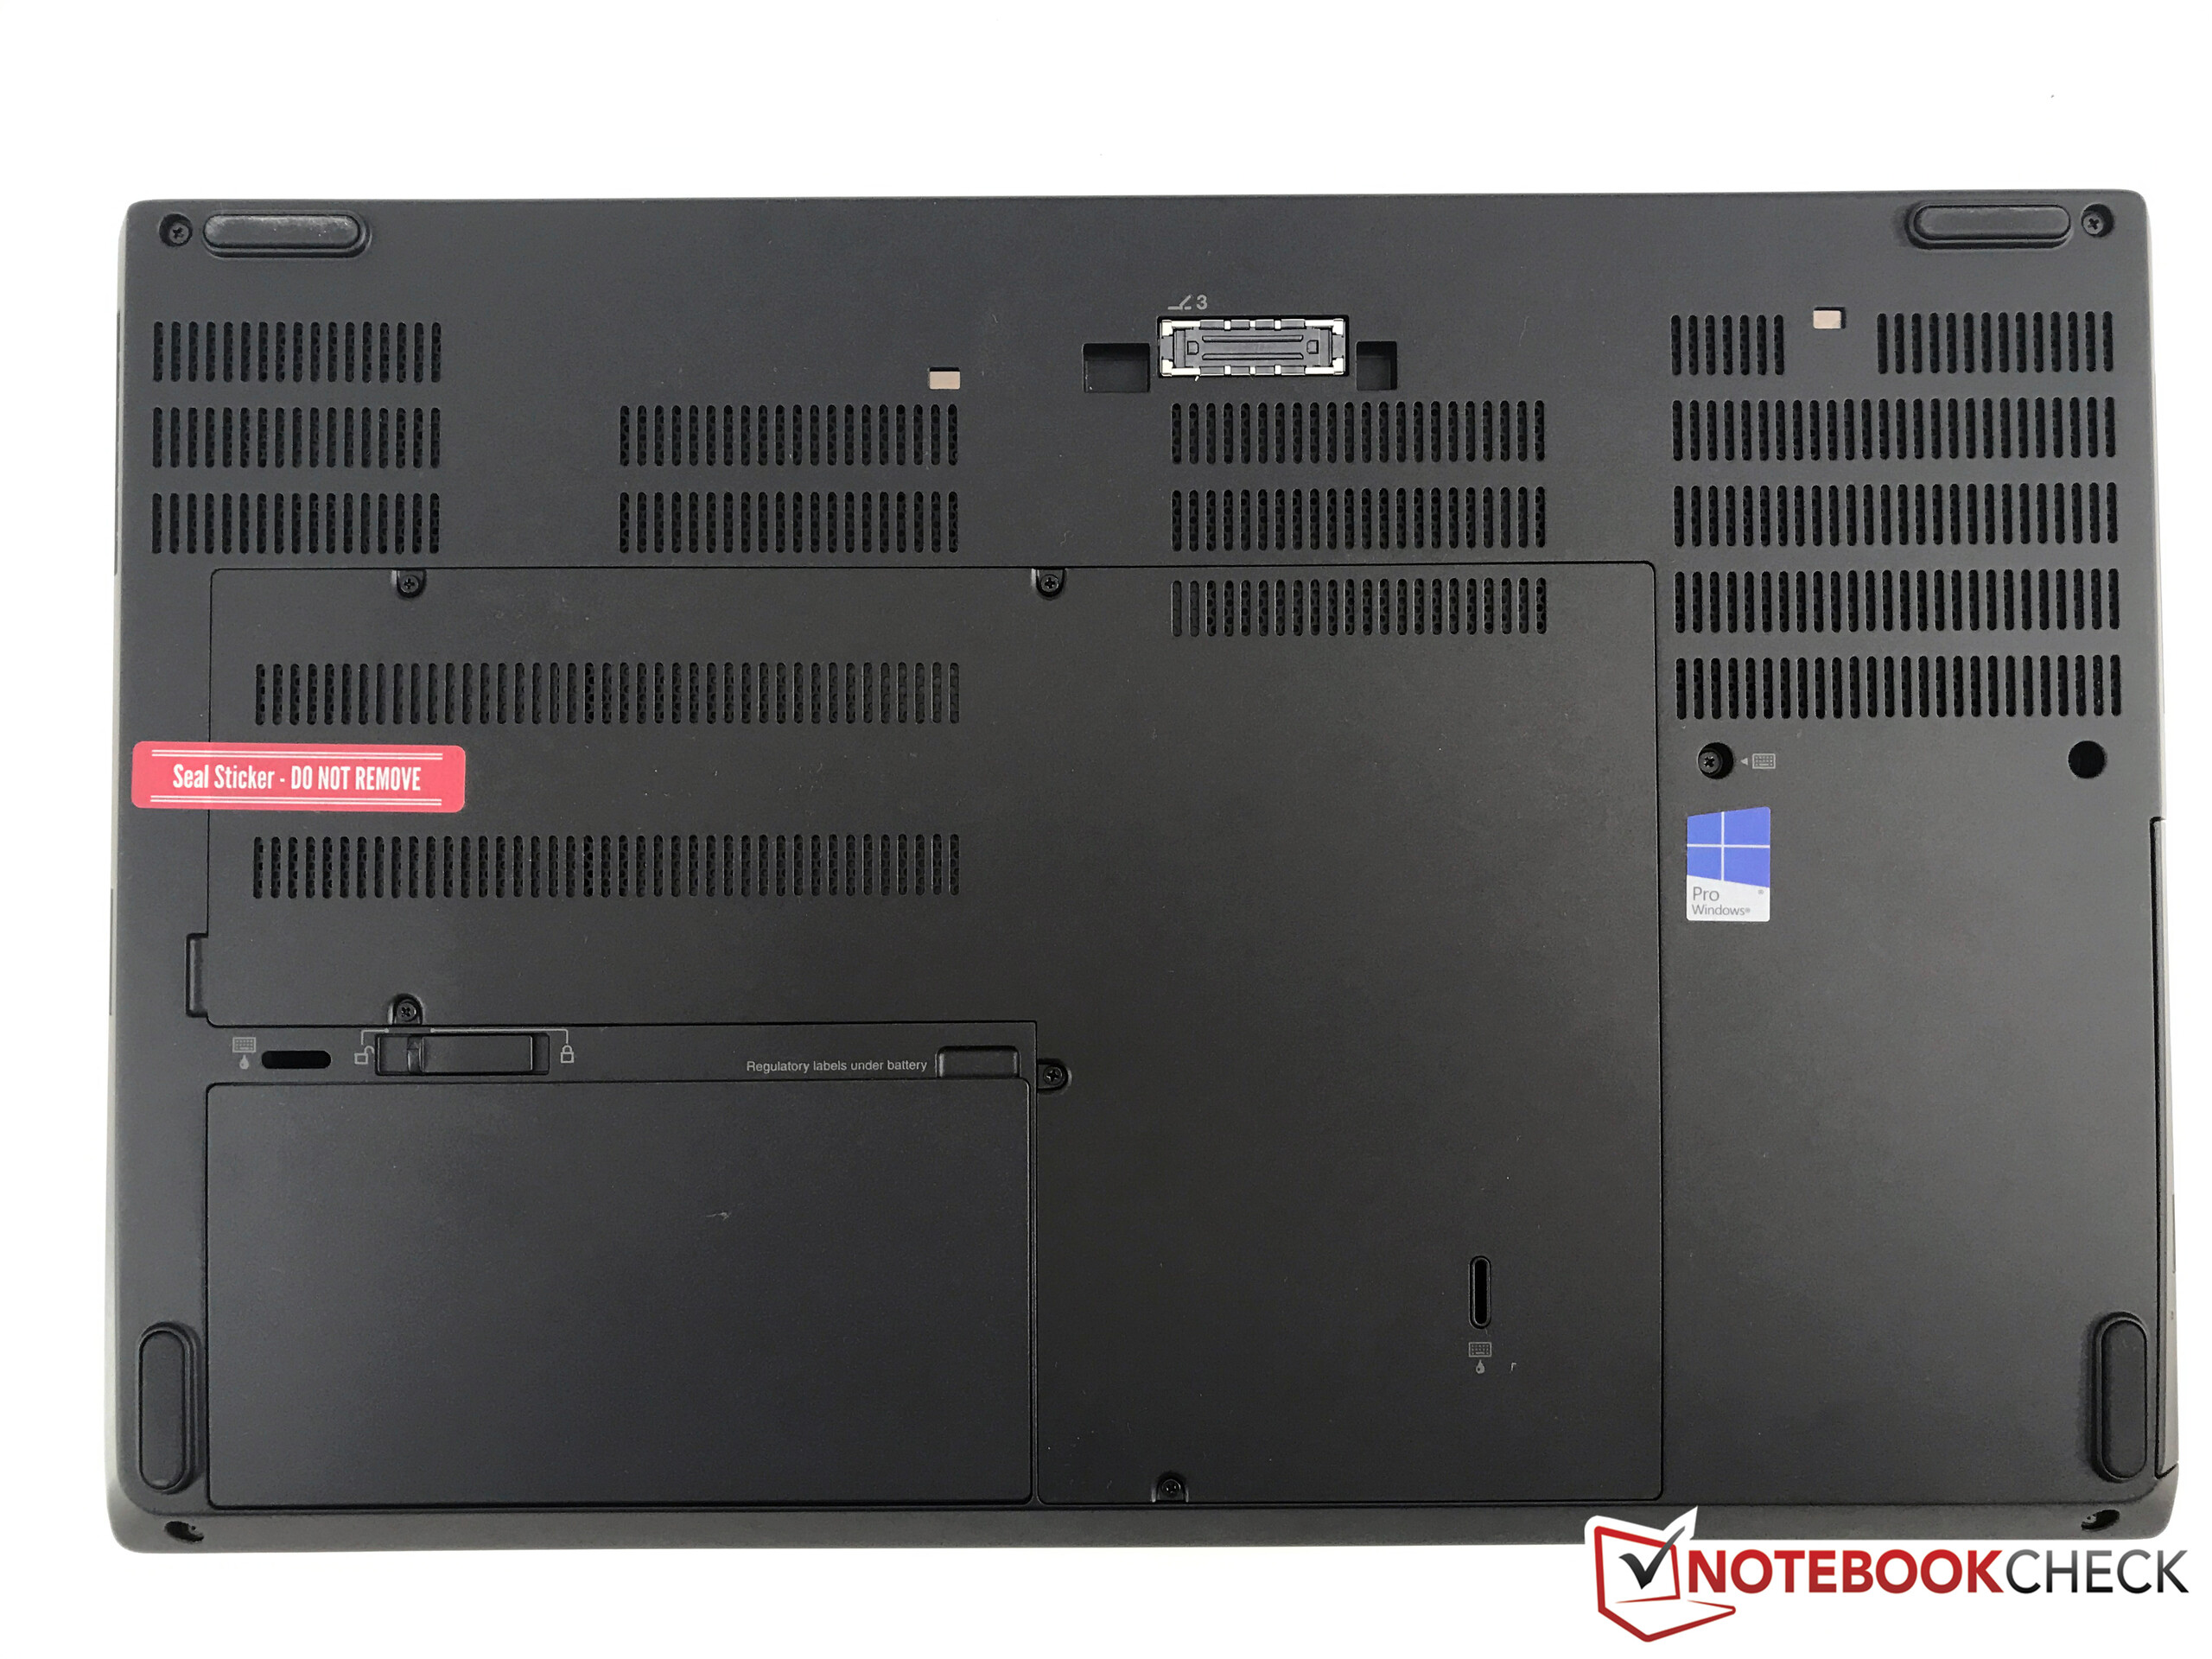
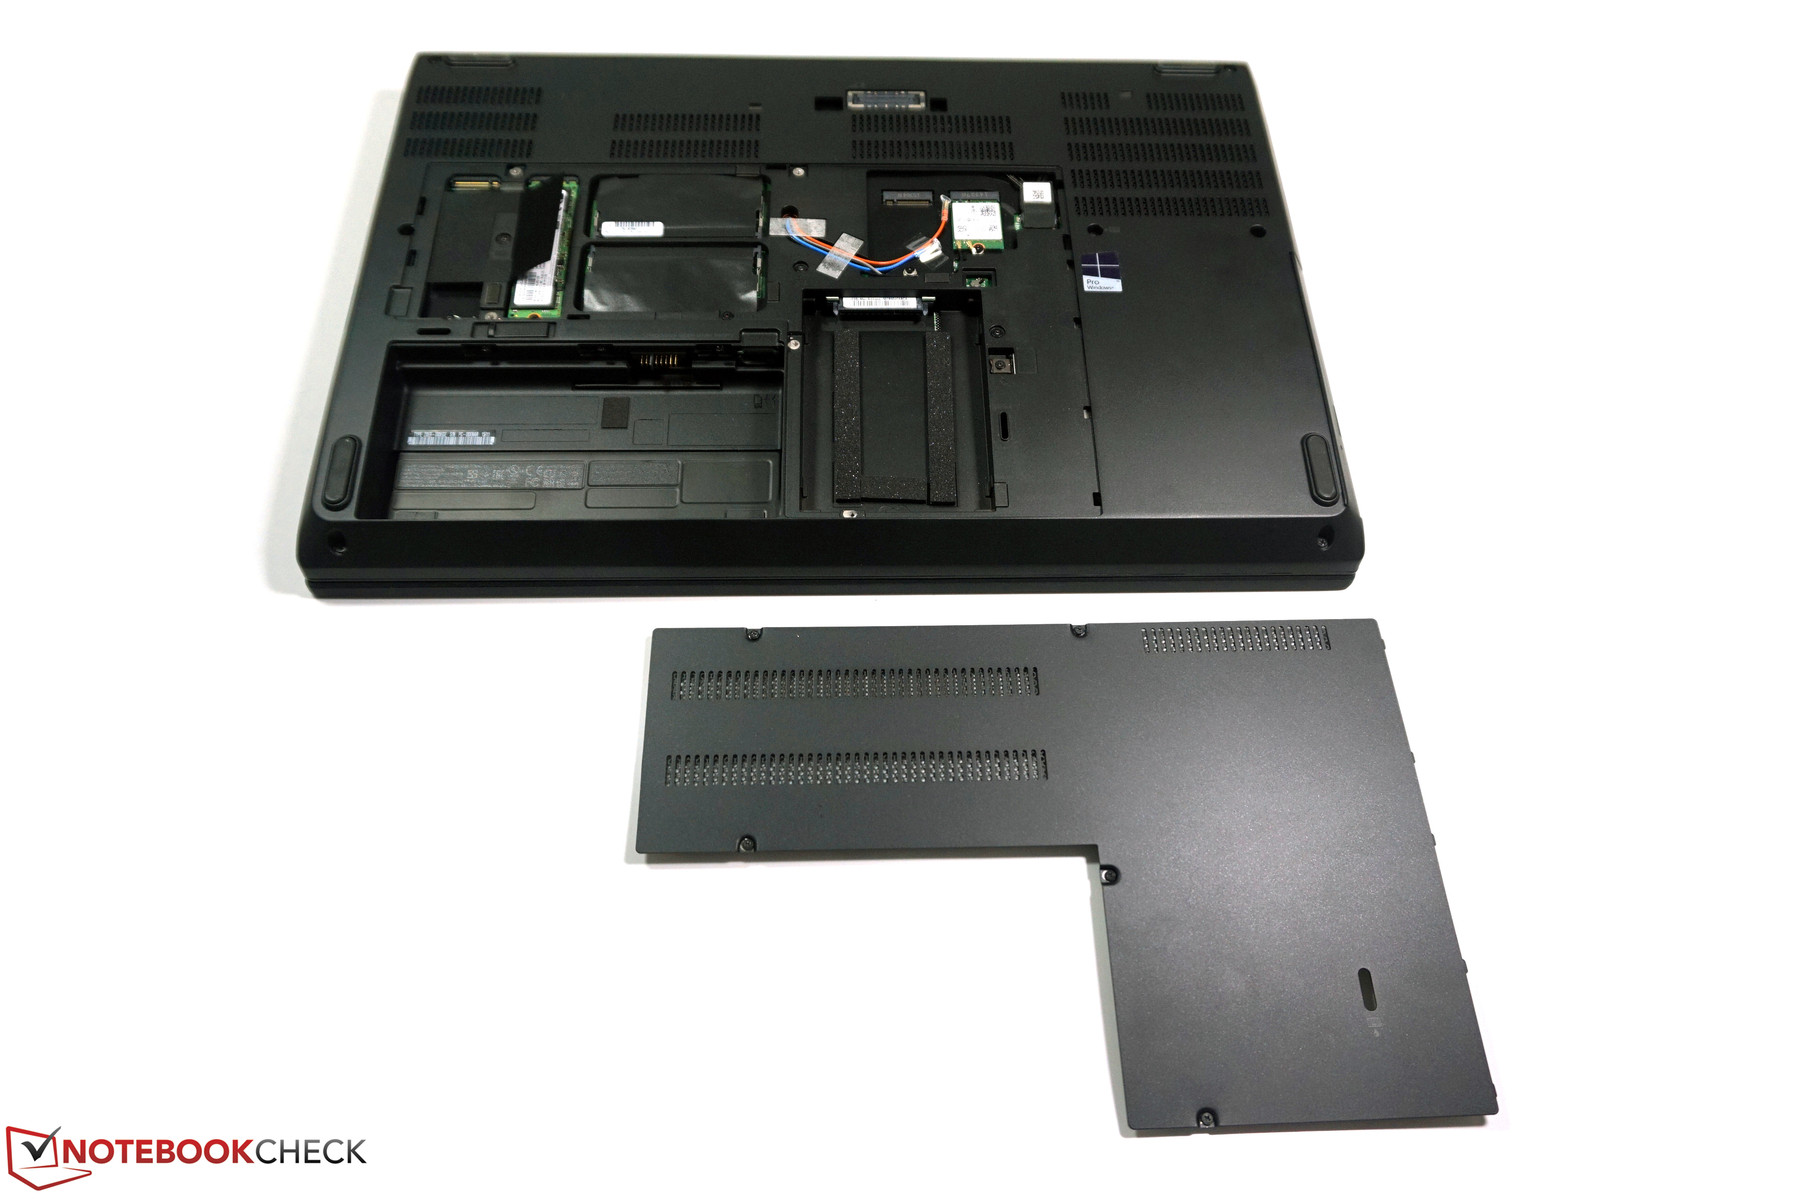
The big case has one advantage over many modern systems with slim constructions: You can easily access the components. The battery is replaceable at the bottom and does not have its own support foot, so the operation without the battery is no problem. There is also a large maintenance hatch at the bottom, which reveals components such as the RAM, for example. According to Lenovo, the notebook also meets the requirements for the military standard MIL-STD-810G, but the manufacturer does not list any specific tests. The keyboard of the ThinkPad P71 is spill-waterproof.
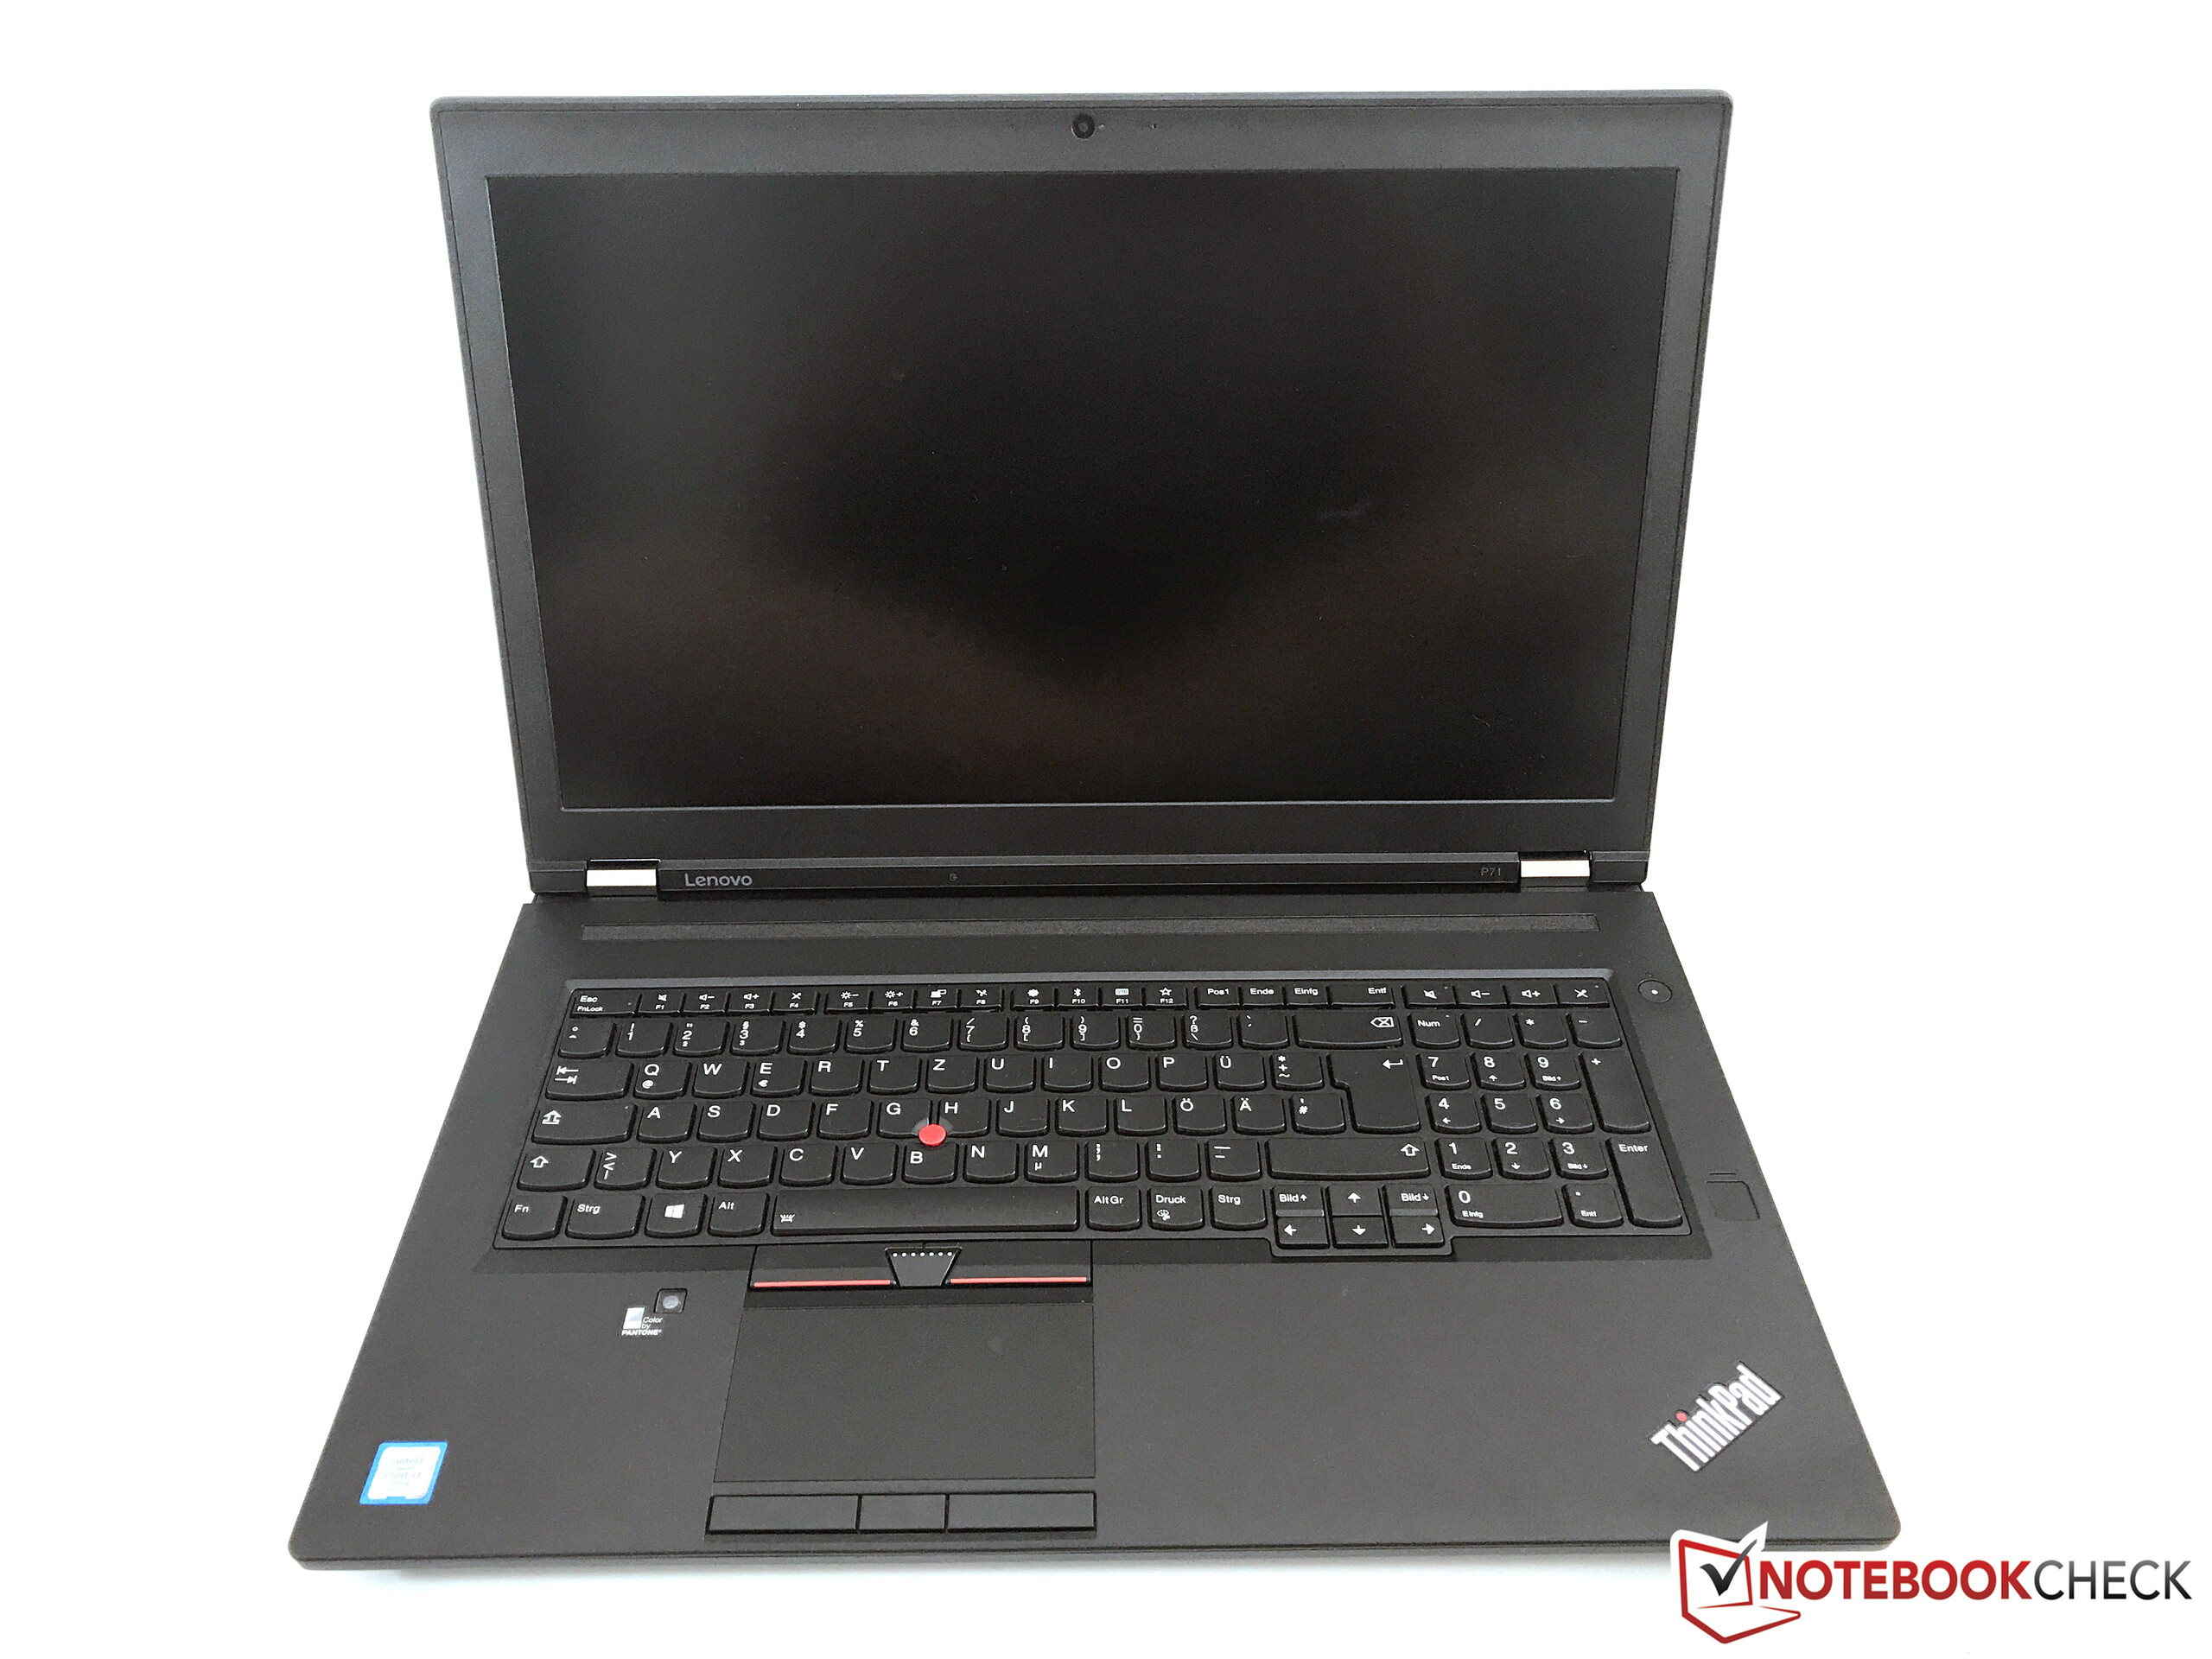
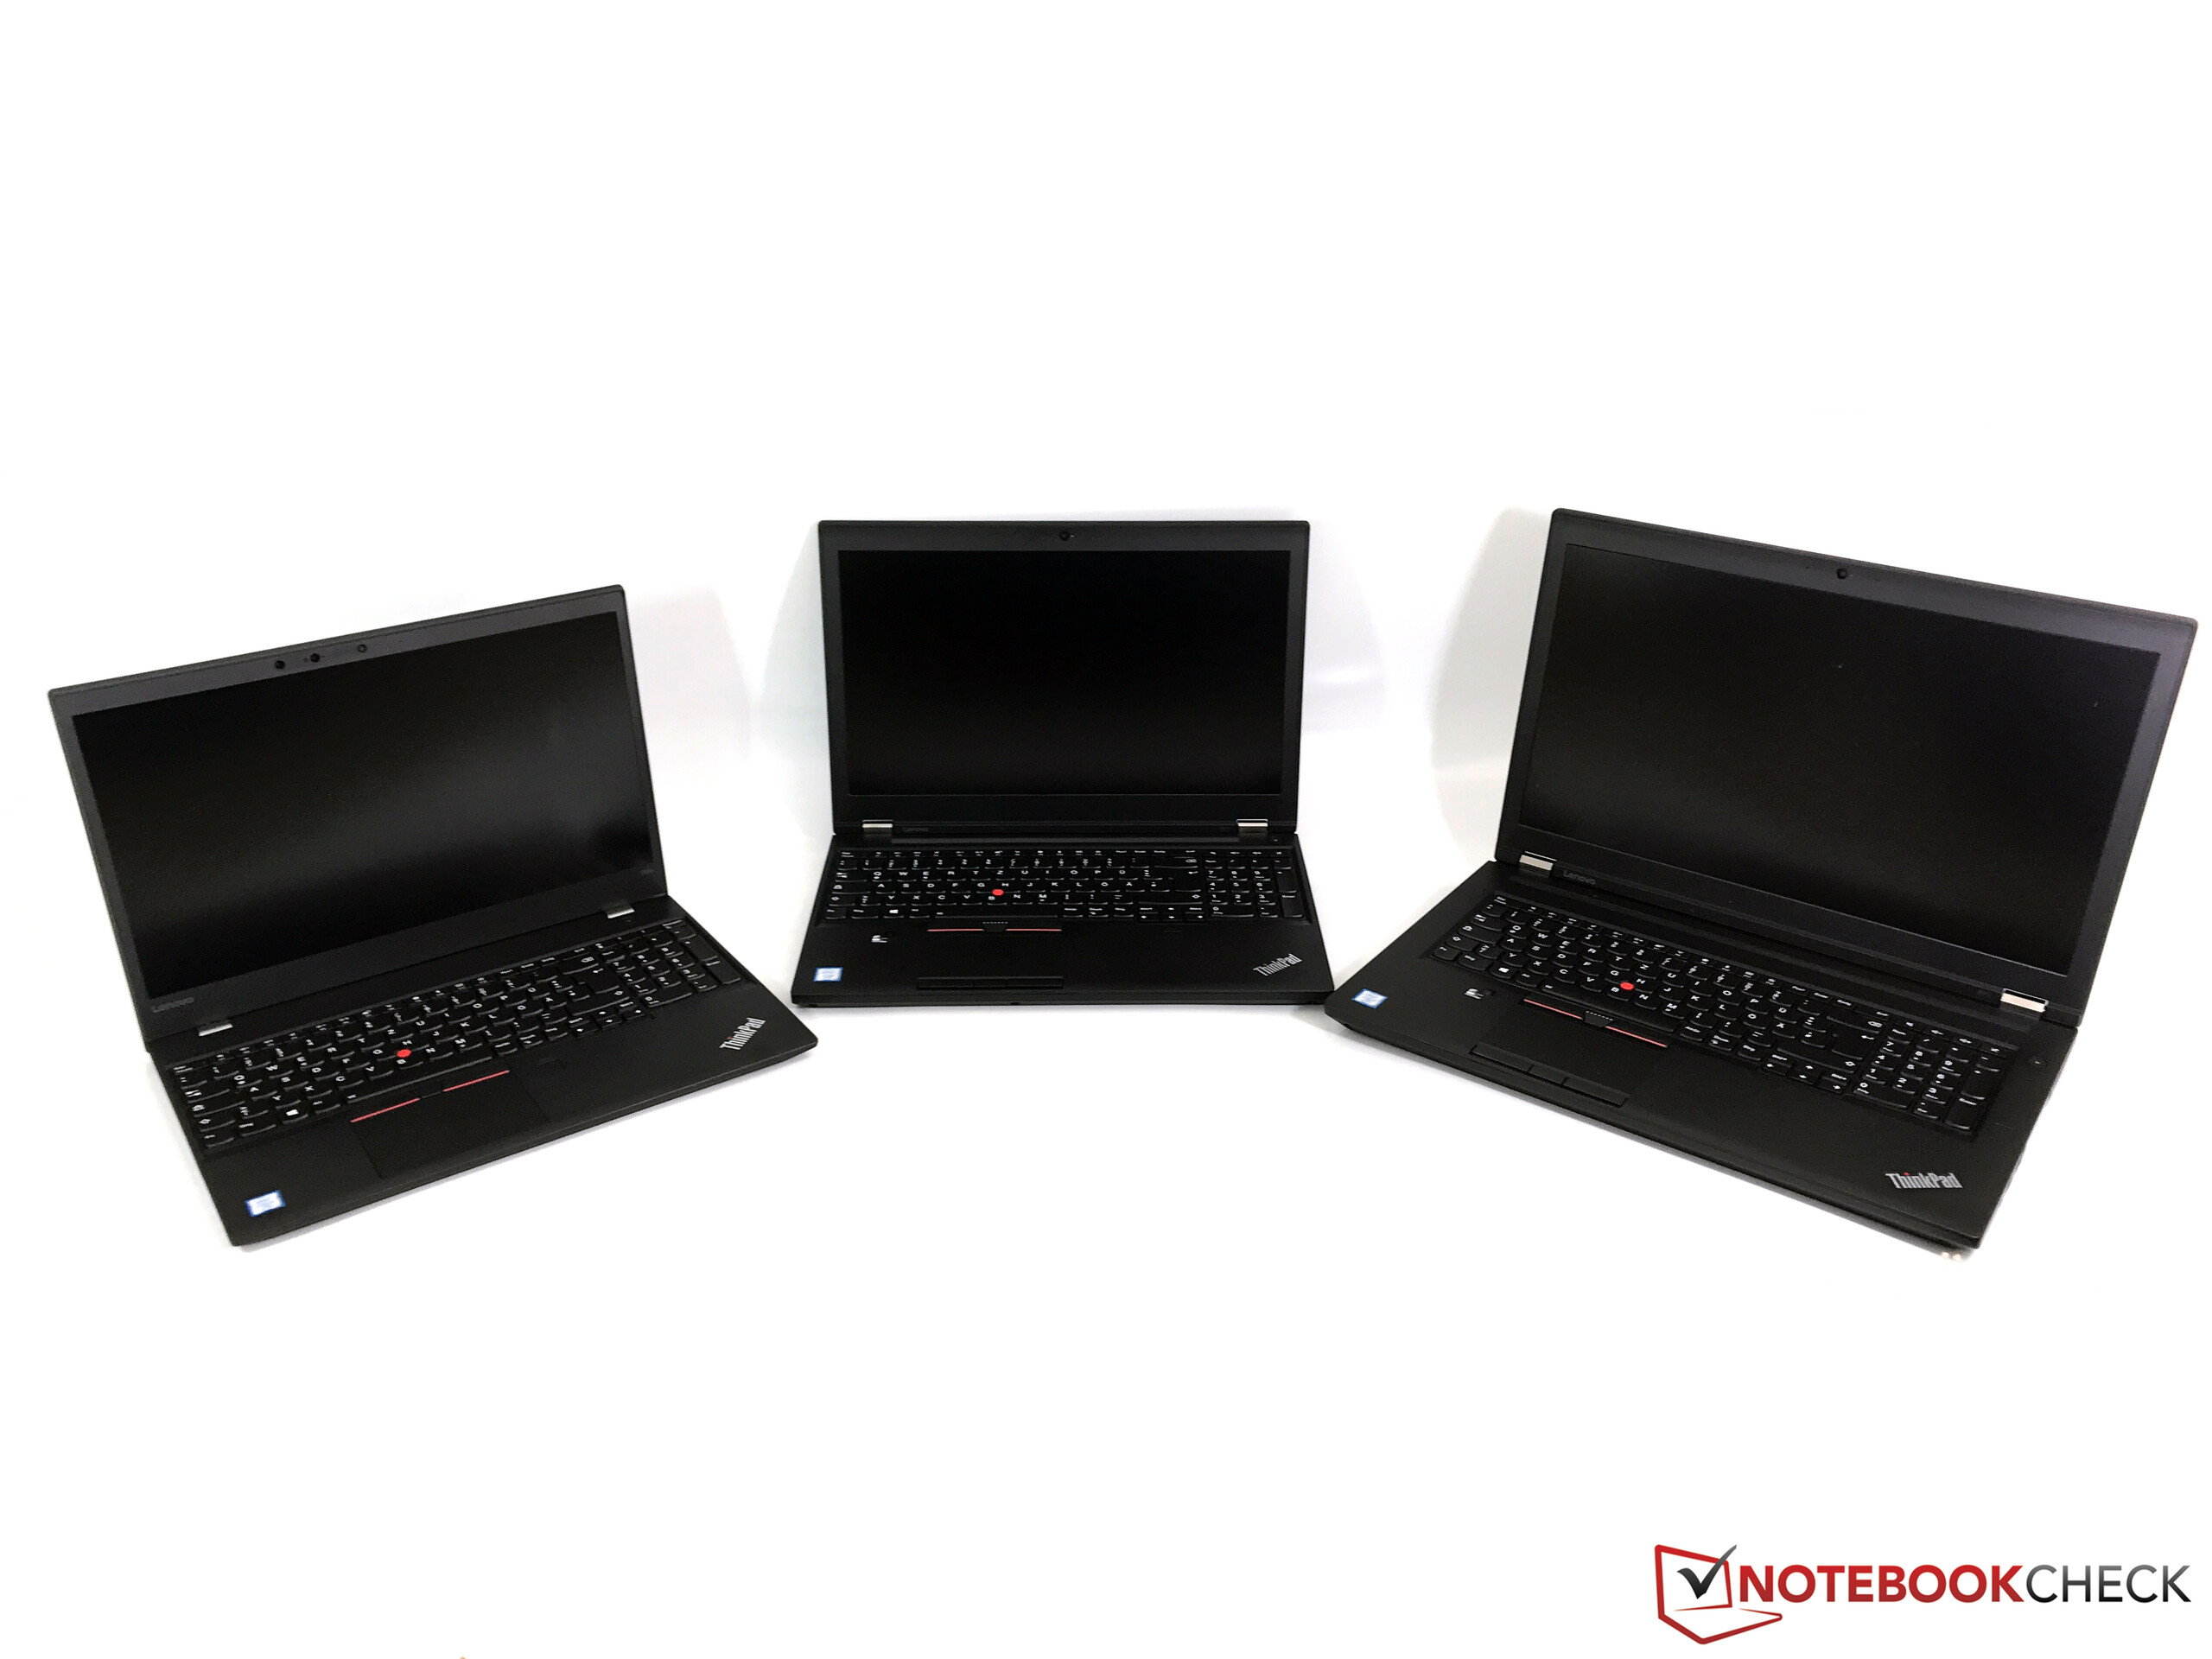
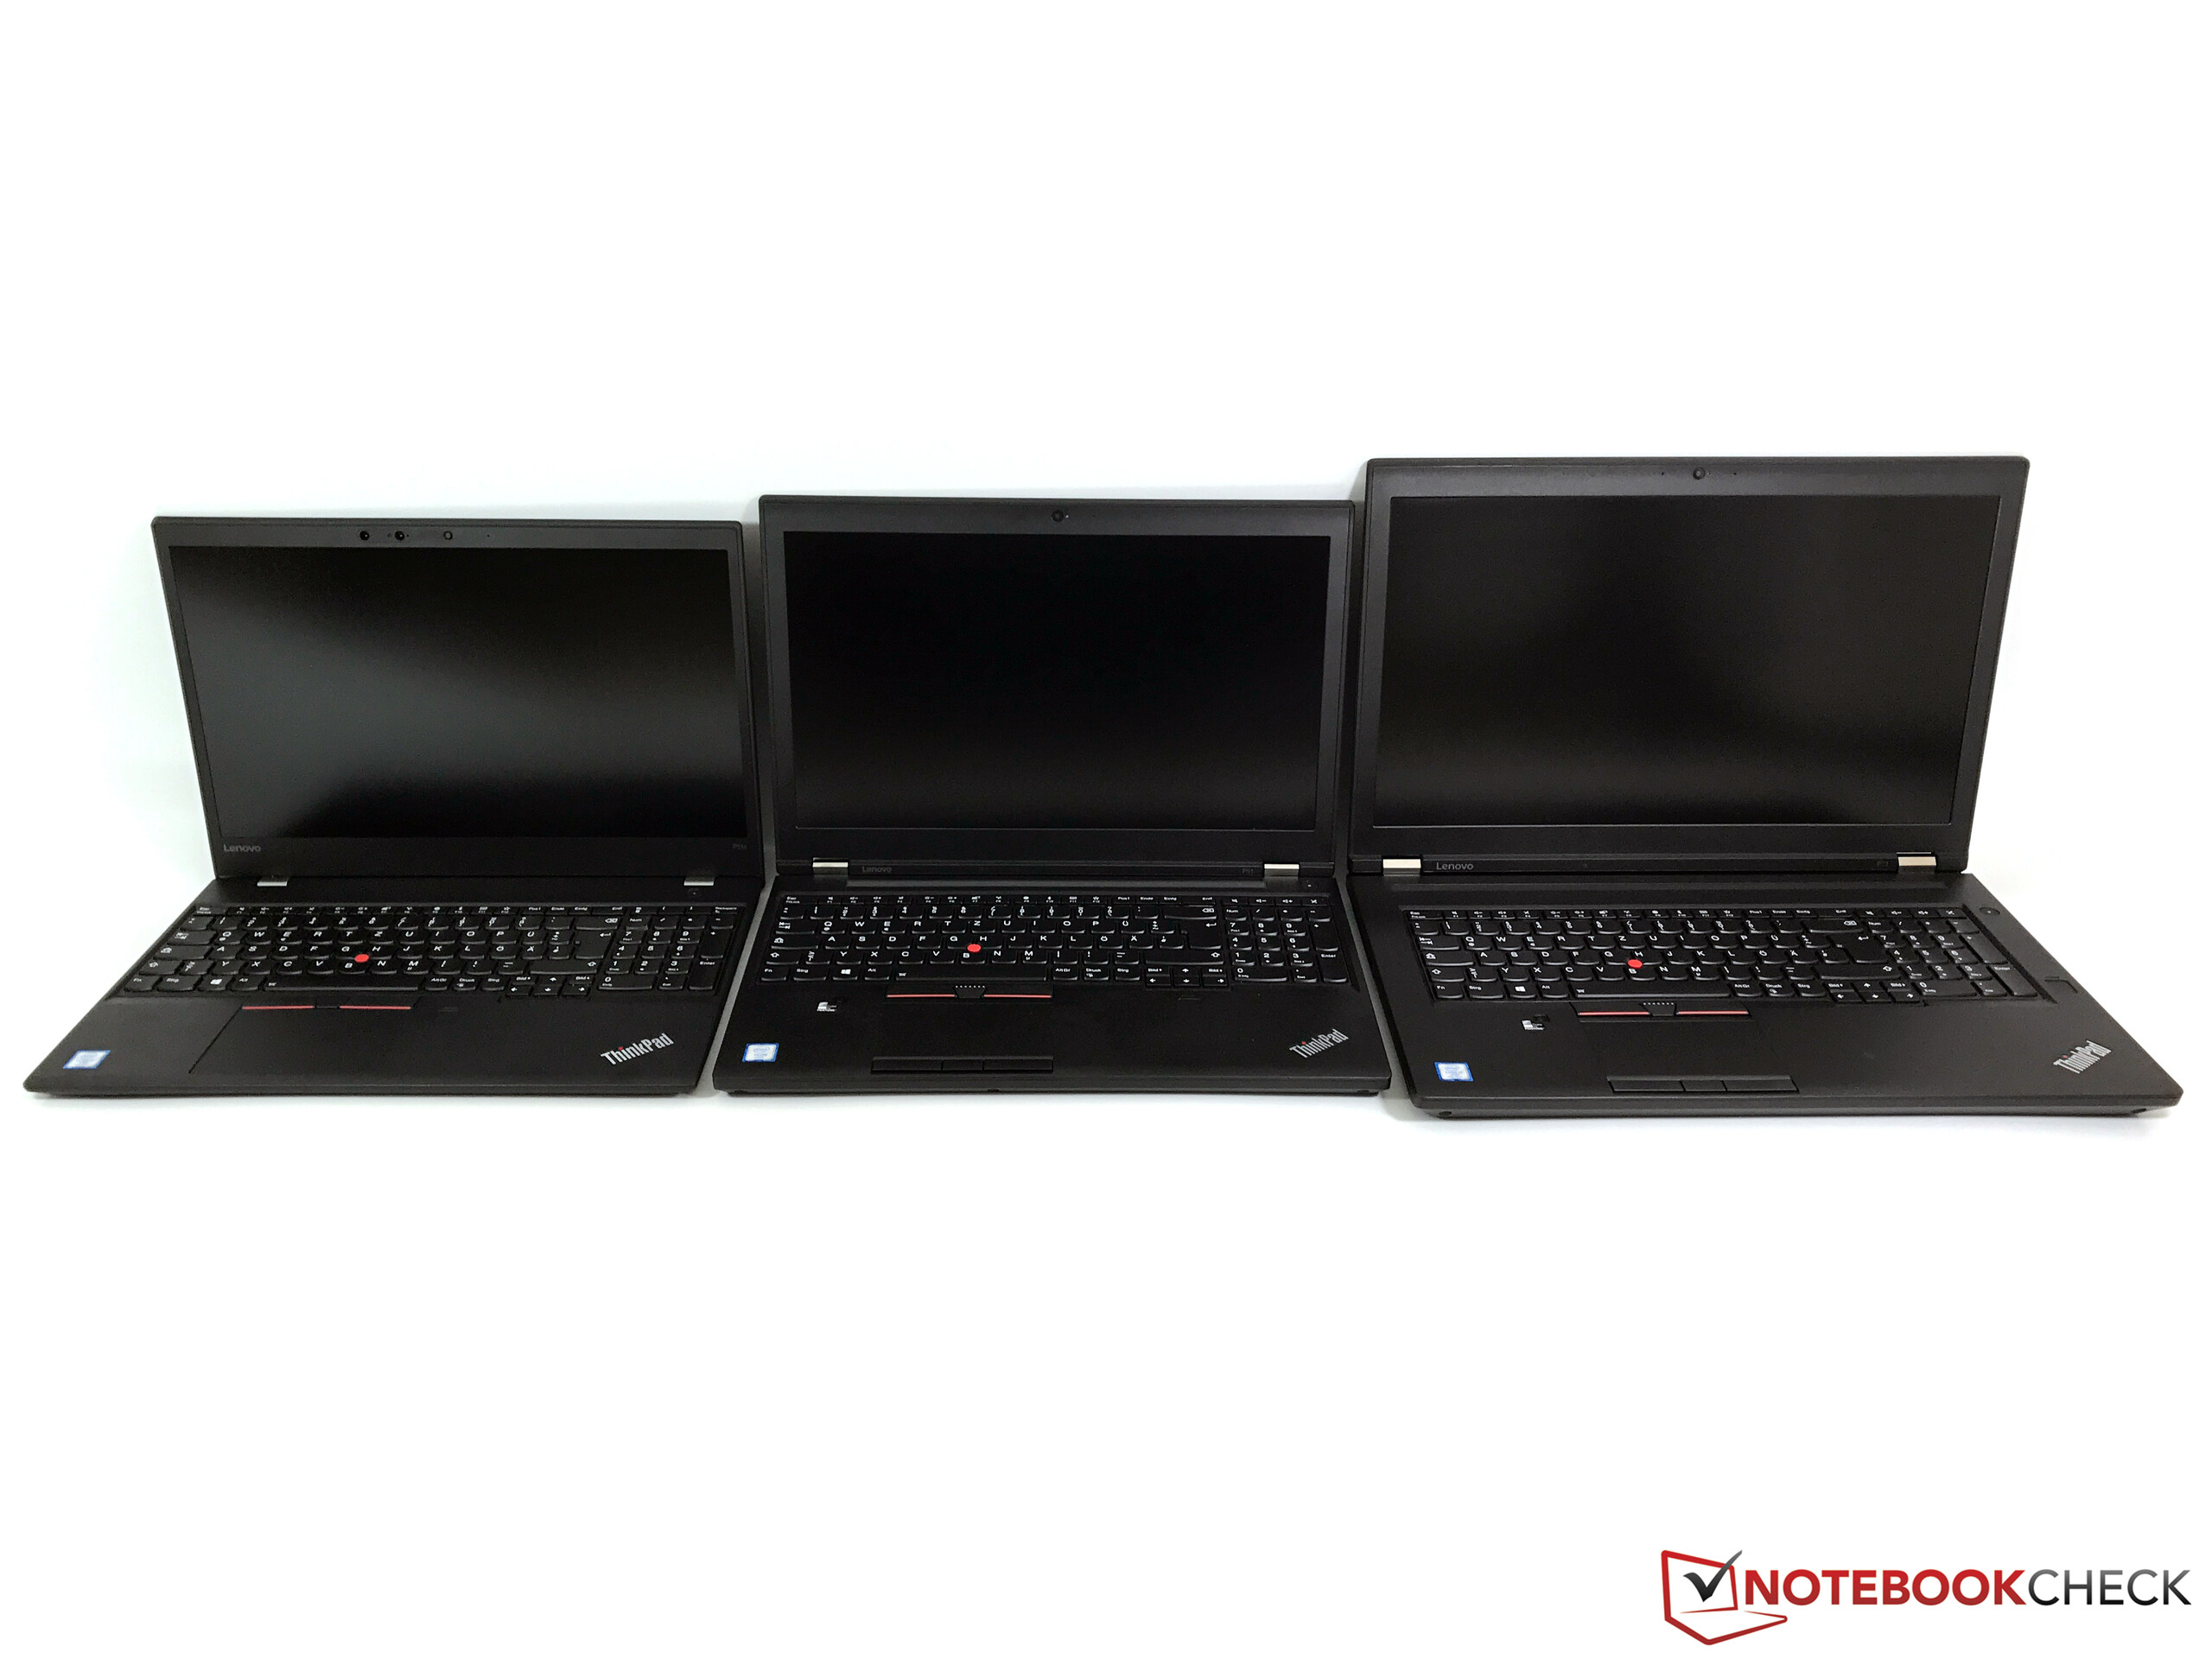
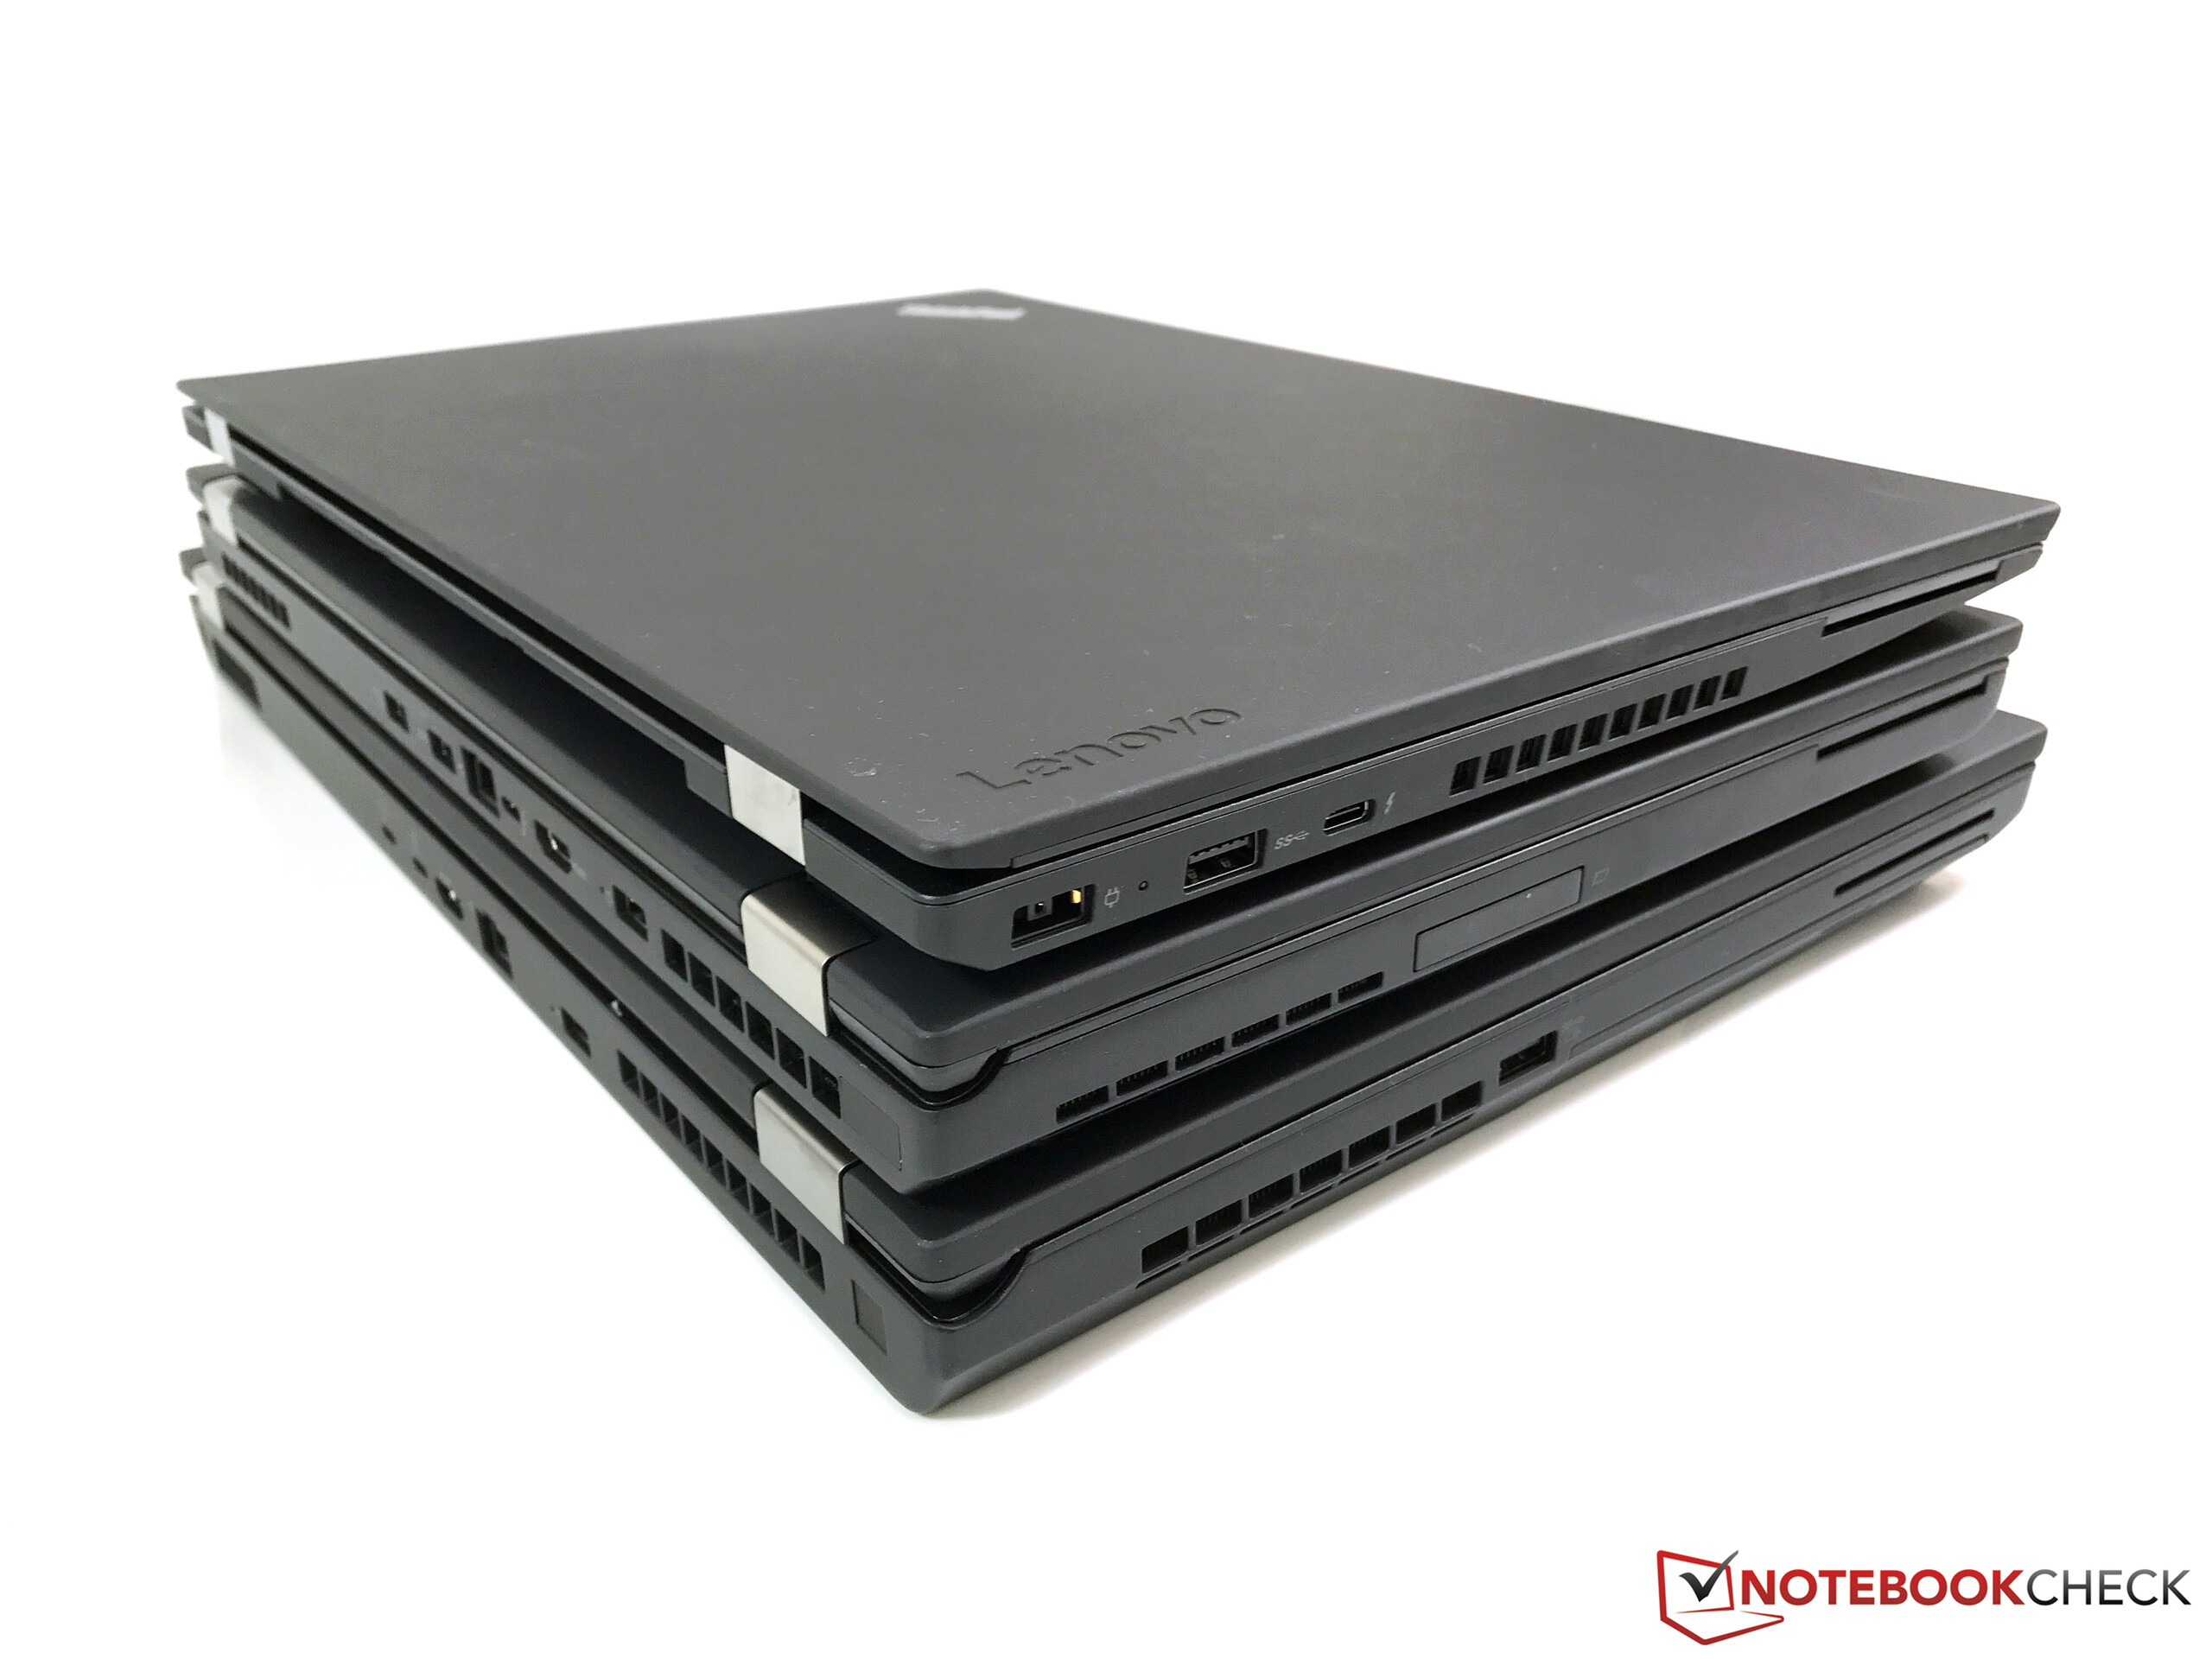
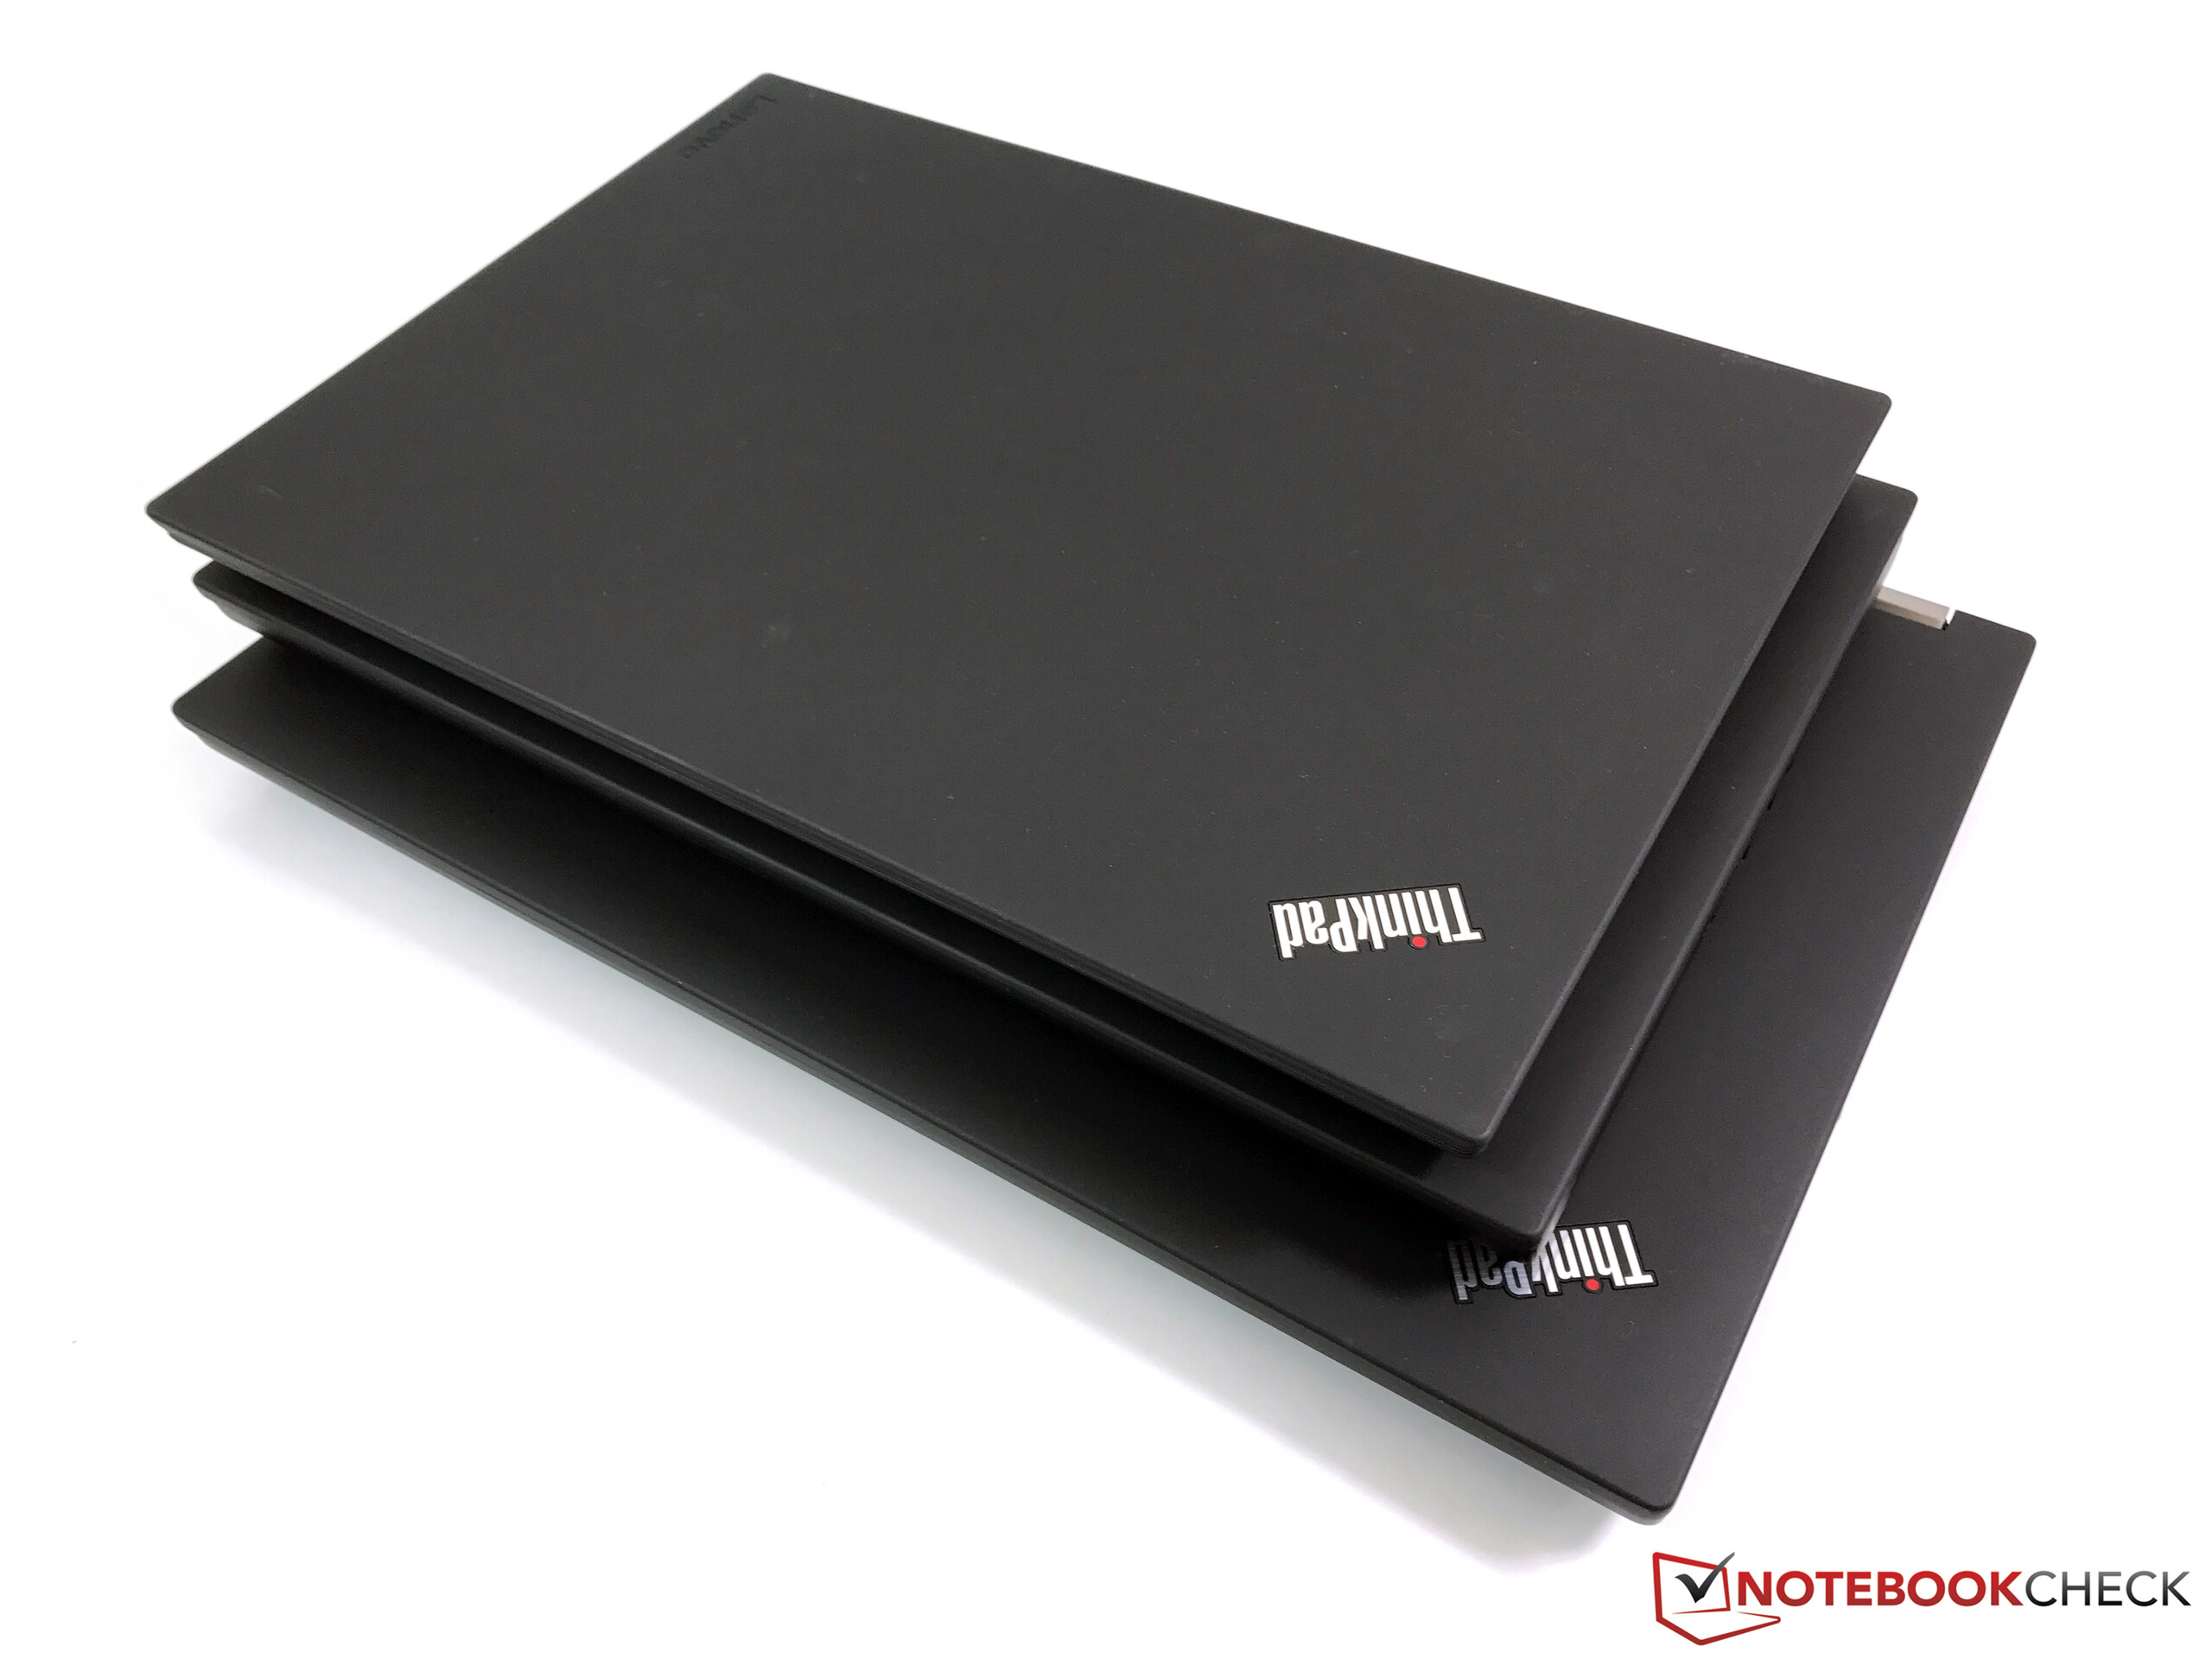
The ThinkPad P71 is a very bulky system, especially compared to 15.6-inch laptops. Compared to its direct rivals, however, there are basically no differences. They are not good choices when you need a portable machine and the workstations really feel at home on the desk.
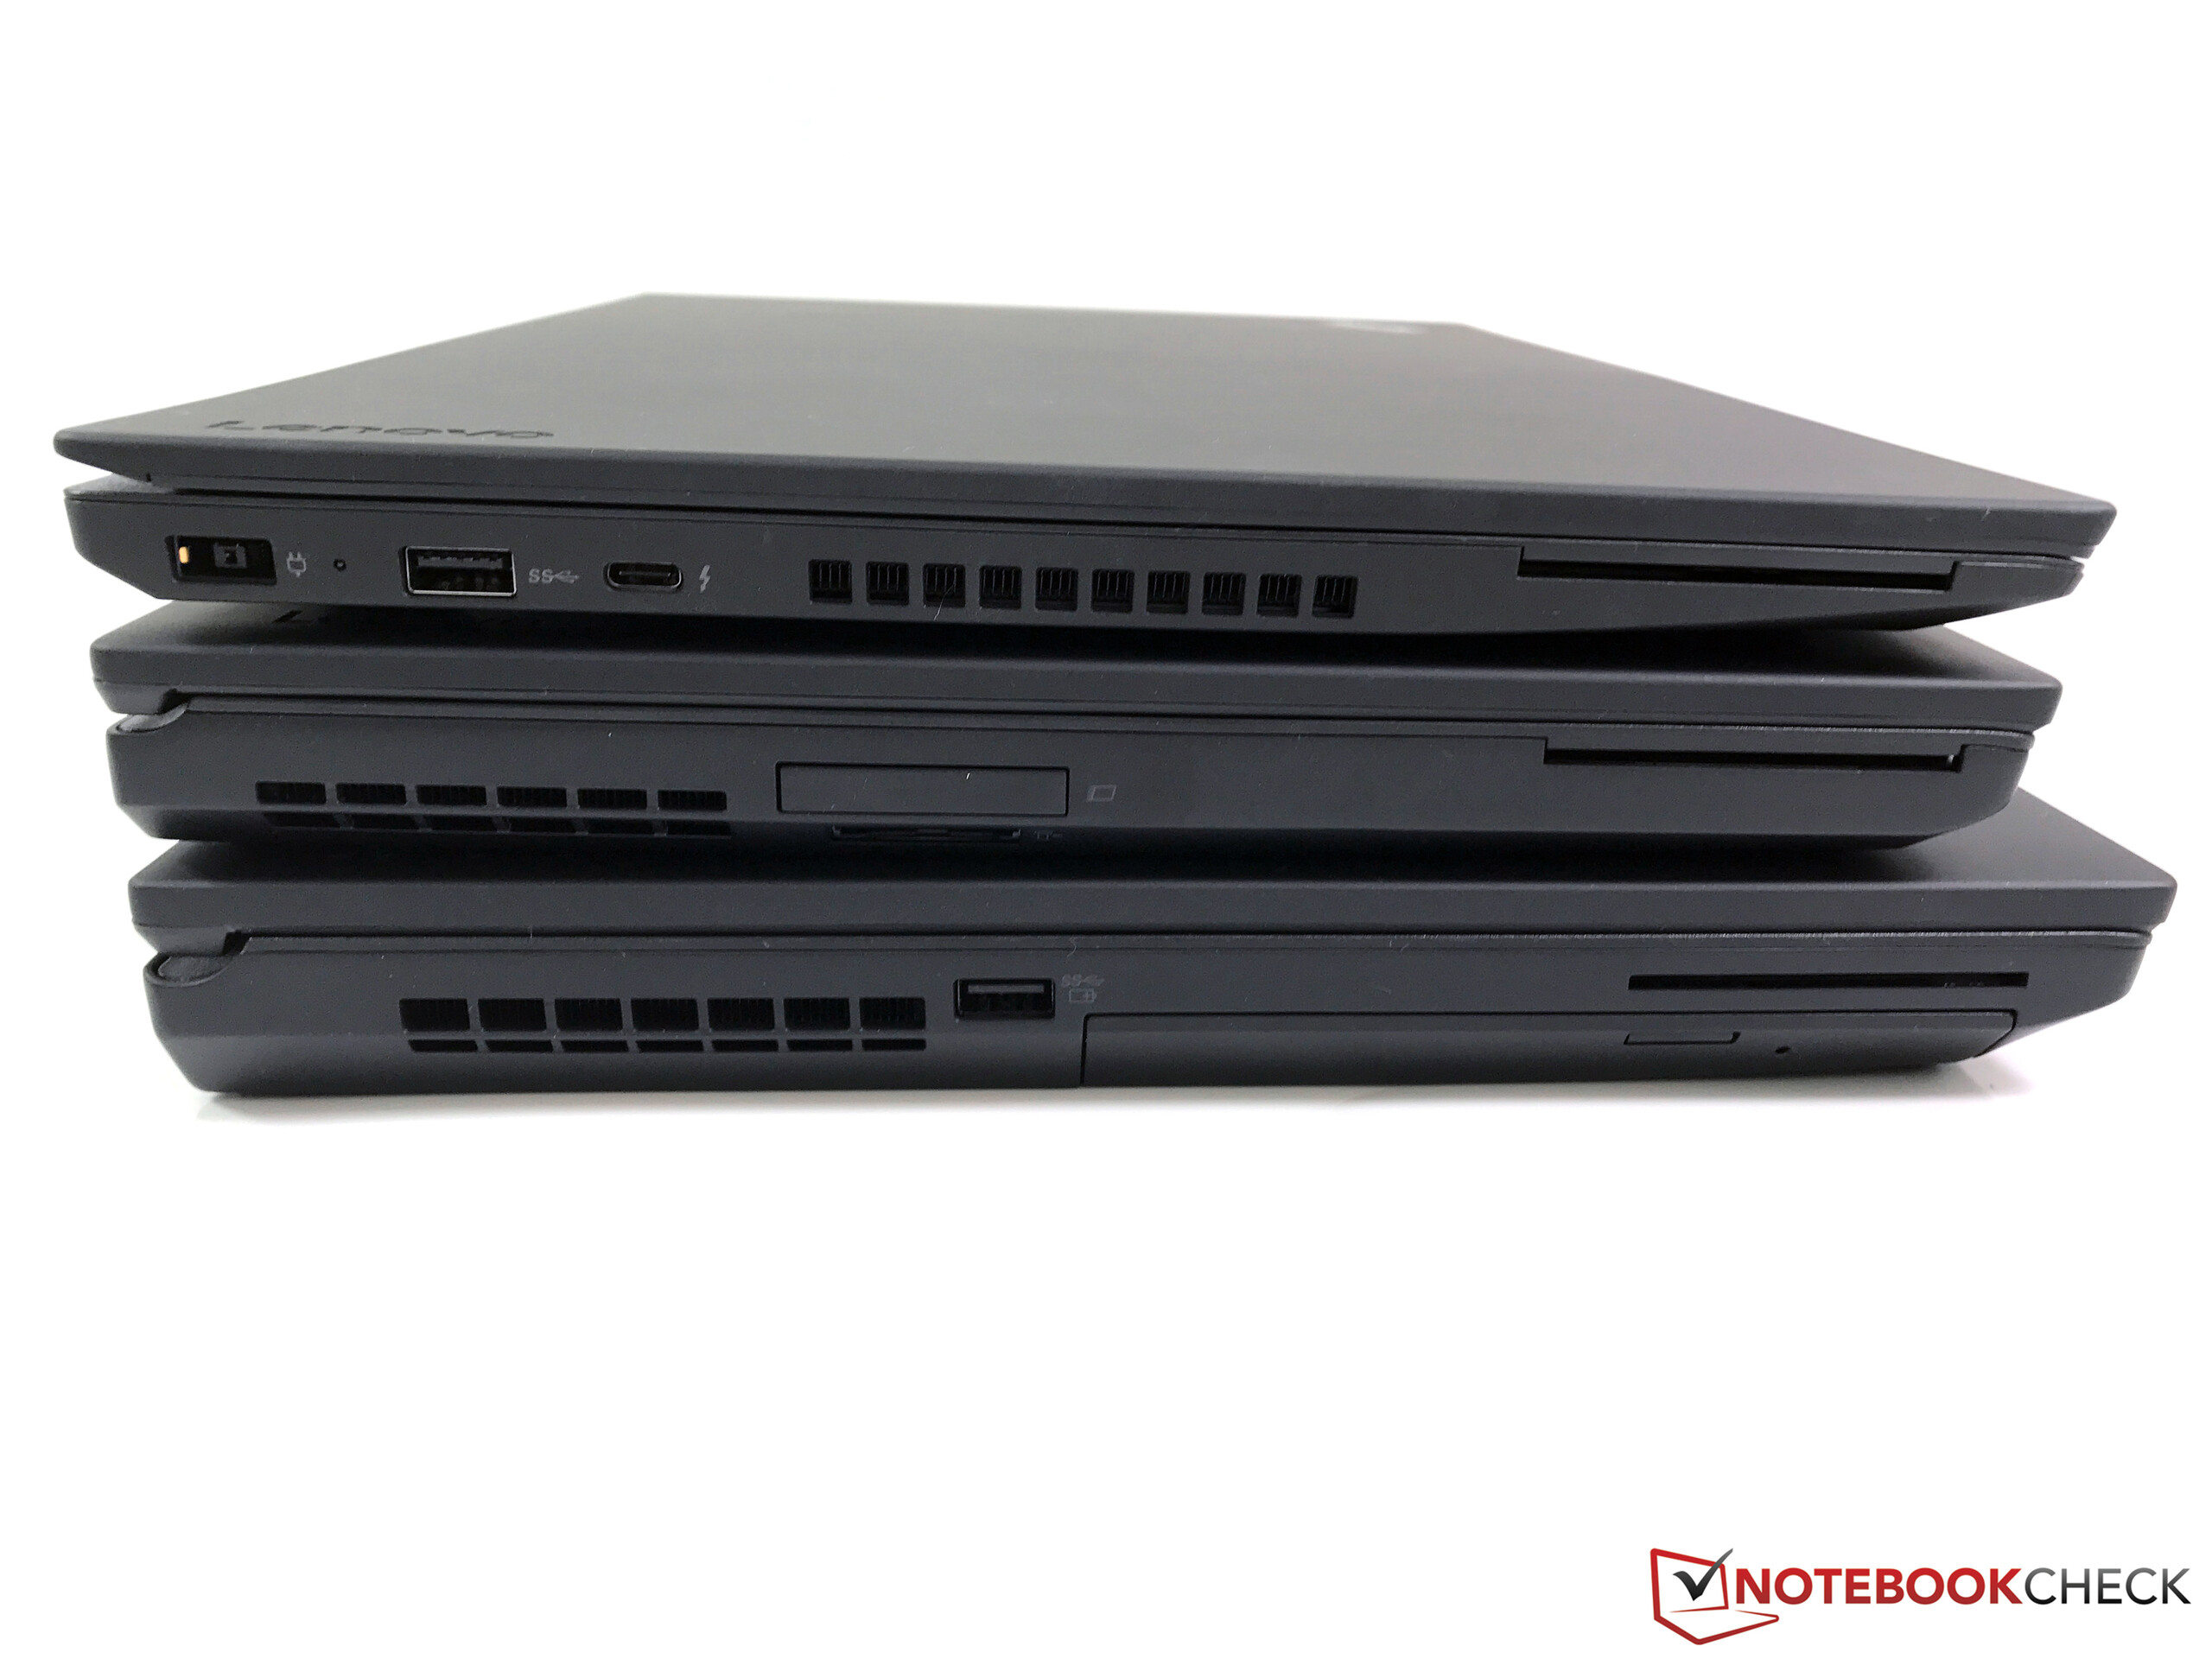
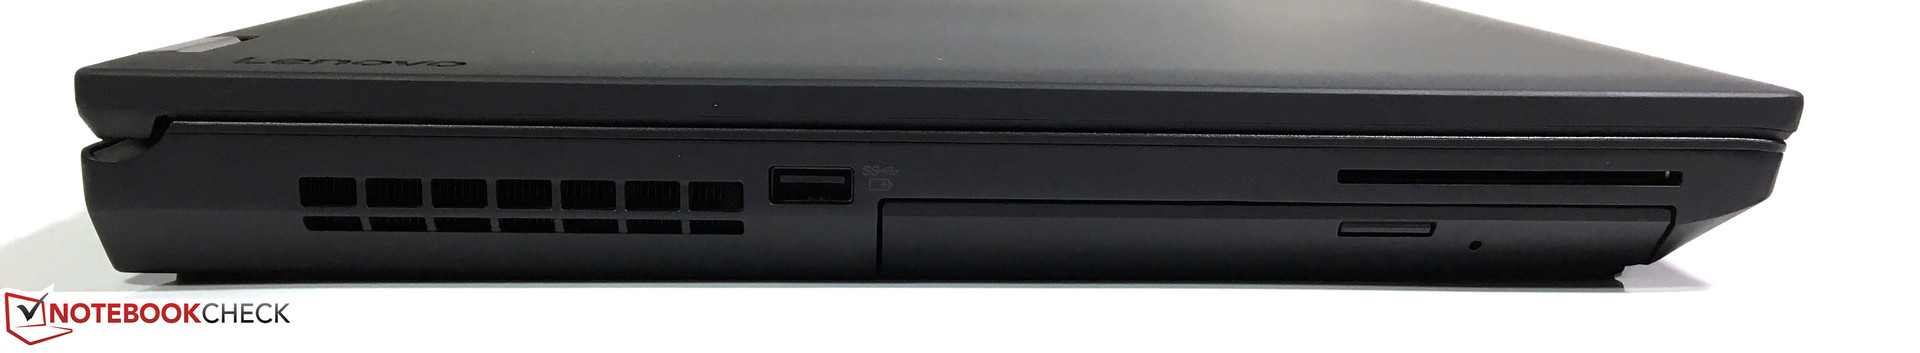
Connectivity
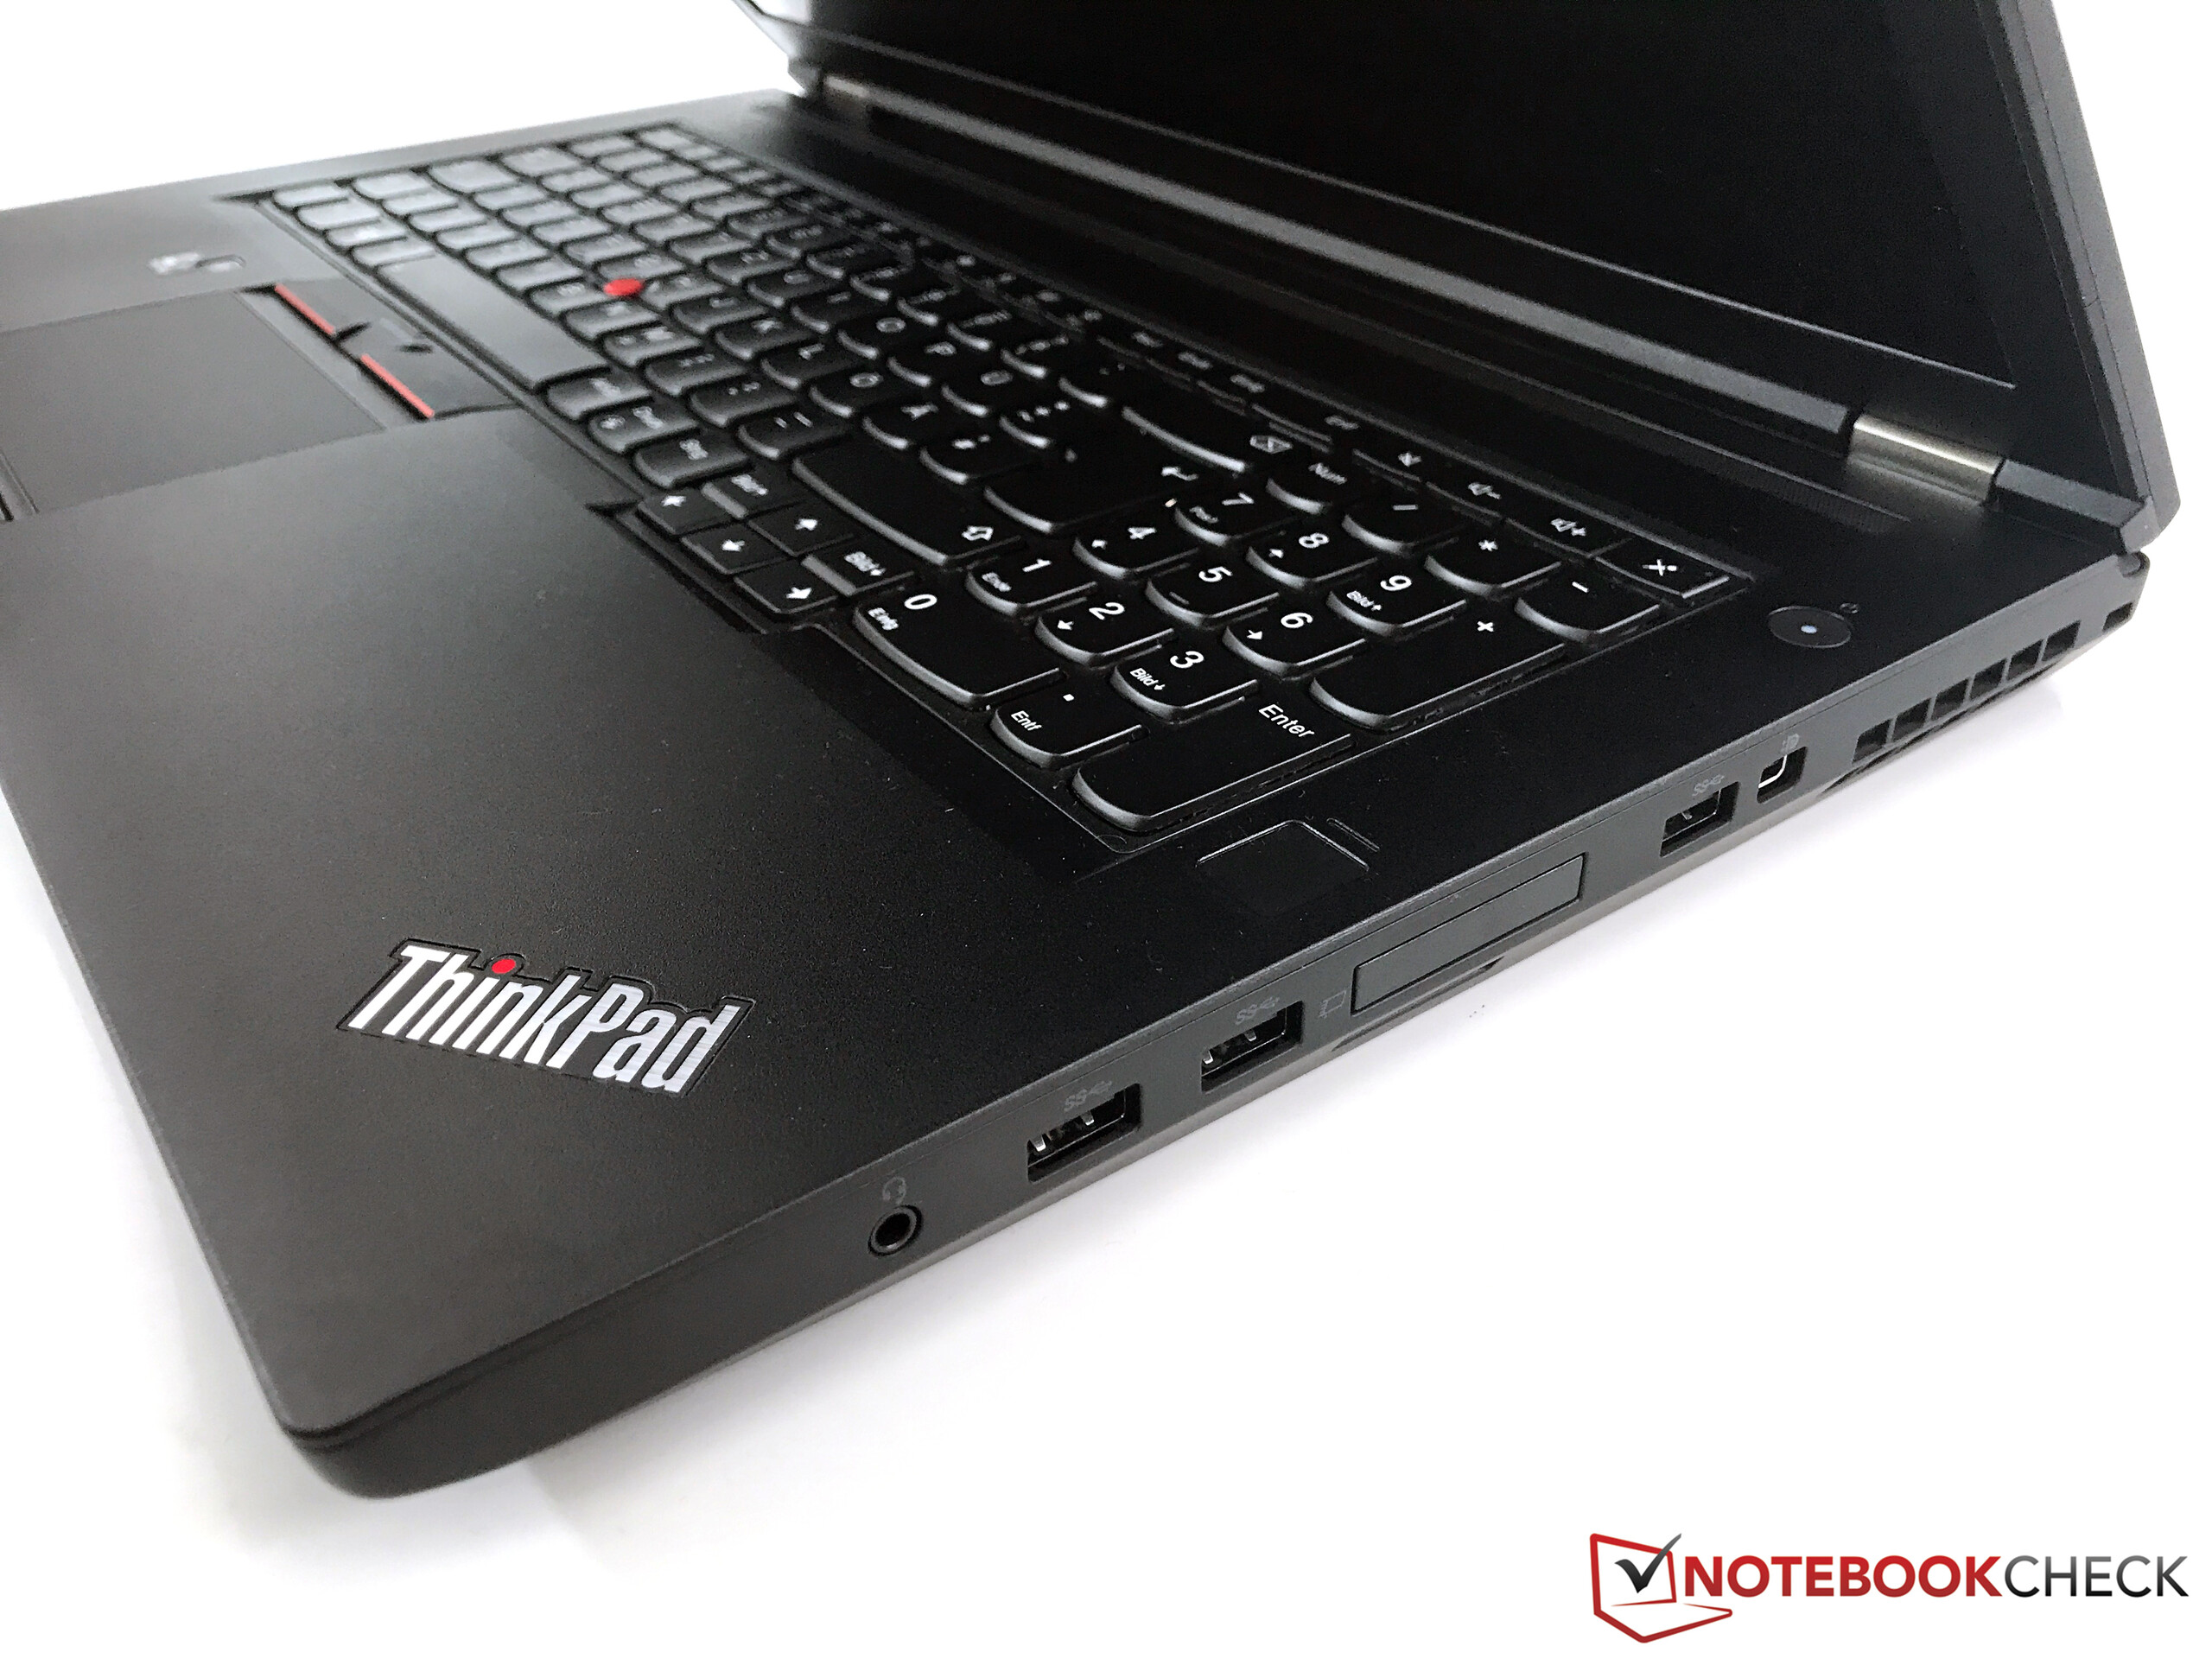
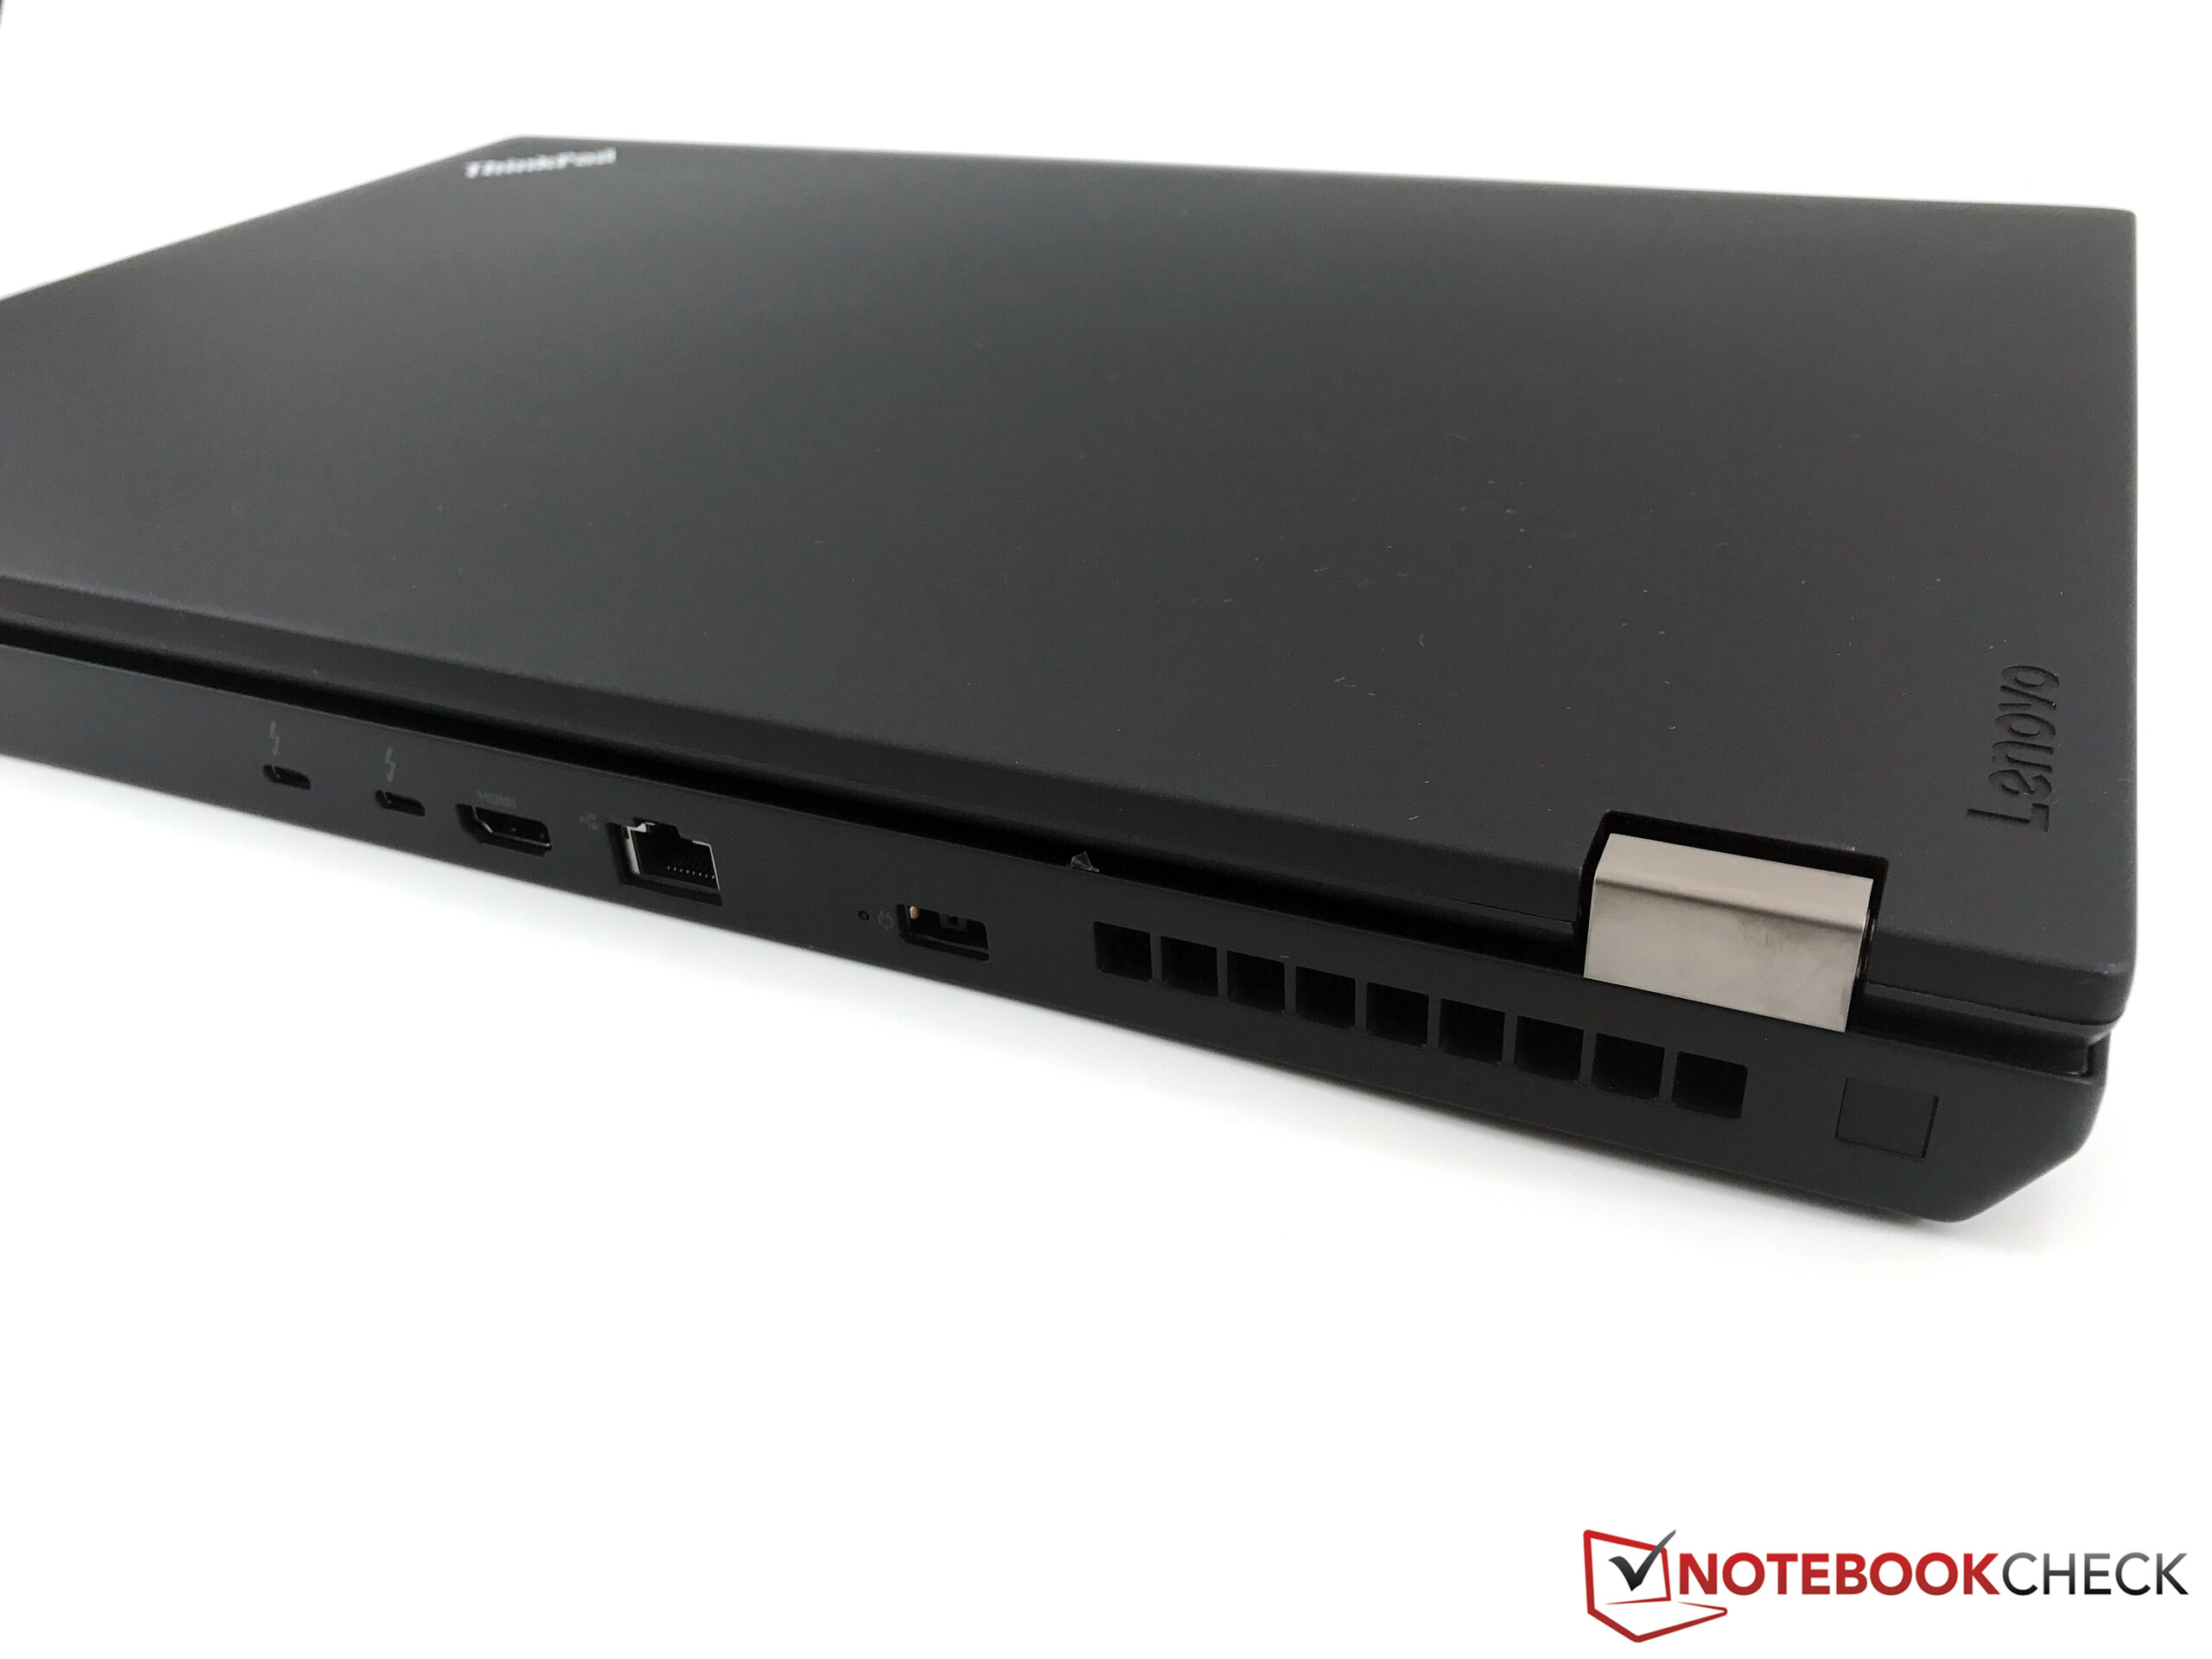
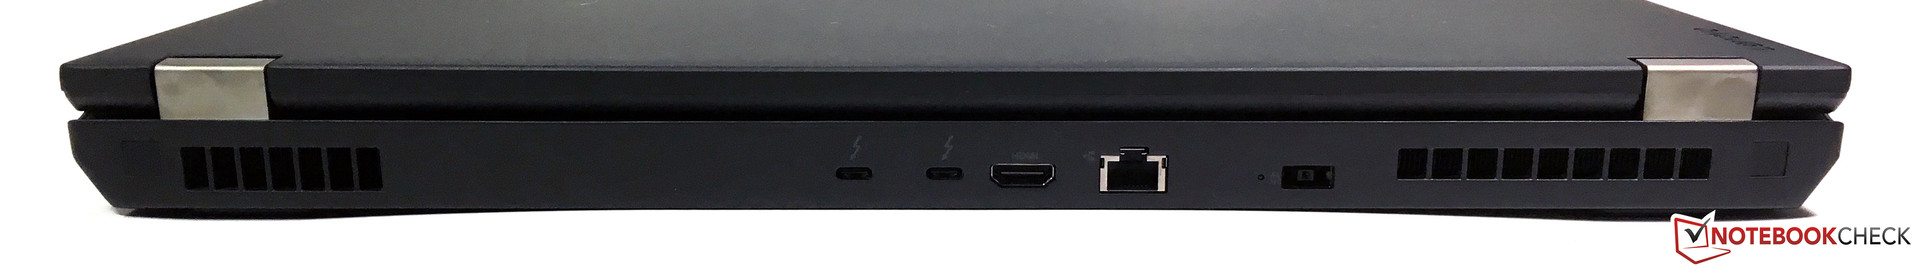
Lenovo has not changed the connectivity, so customers still get plenty of ports, including two modern Thunderbolt 3 ports. According to the specification sheet however, the new ThinkPad P71 can only drive four displays simultaneously (five on the old P70). The 4K output of the HDMI port is limited to 30 Hz, but 60 Hz is possible via mini DisplayPort or Thunderbolt 3. A DVD burner, which is very rare these days, can be found on the left side. Whether it makes much sense, obviously depends on your requirements.
This year we have not had any problems with the performance of the USB ports. We determined good transfer rates of ~380 MB/s in combination with our Samsung SSD T3 and drives were always recognized as USB 3.0 models, which was not the case on the previous unit.
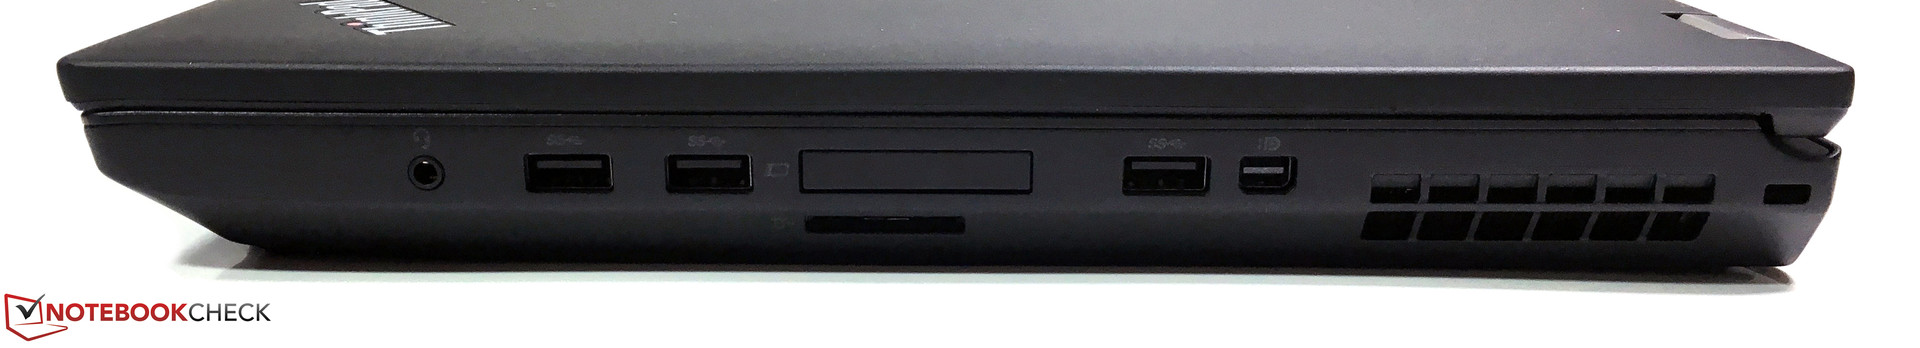
SD Card Reader
The SD card reader is one of the faster modules. We determine a maximum transfer rate of 216 MB/s with our reference card from Toshiba (Exceria Pro UHS-II 64 GB), while pictures are transferred at 156 MB/s on average. An external card reader is not necessary here (if you do not need other formats).
| SD Card Reader | |
| average JPG Copy Test (av. of 3 runs) | |
| HP ZBook 17 G4-Y3J82AV | |
| Lenovo ThinkPad P71-20HK0004GE | |
| Fujitsu Celsius H970 | |
| MSI WE72 7RJ | |
| maximum AS SSD Seq Read Test (1GB) | |
| Lenovo ThinkPad P71-20HK0004GE | |
| HP ZBook 17 G4-Y3J82AV | |
| Fujitsu Celsius H970 | |
| MSI WE72 7RJ | |
Communication
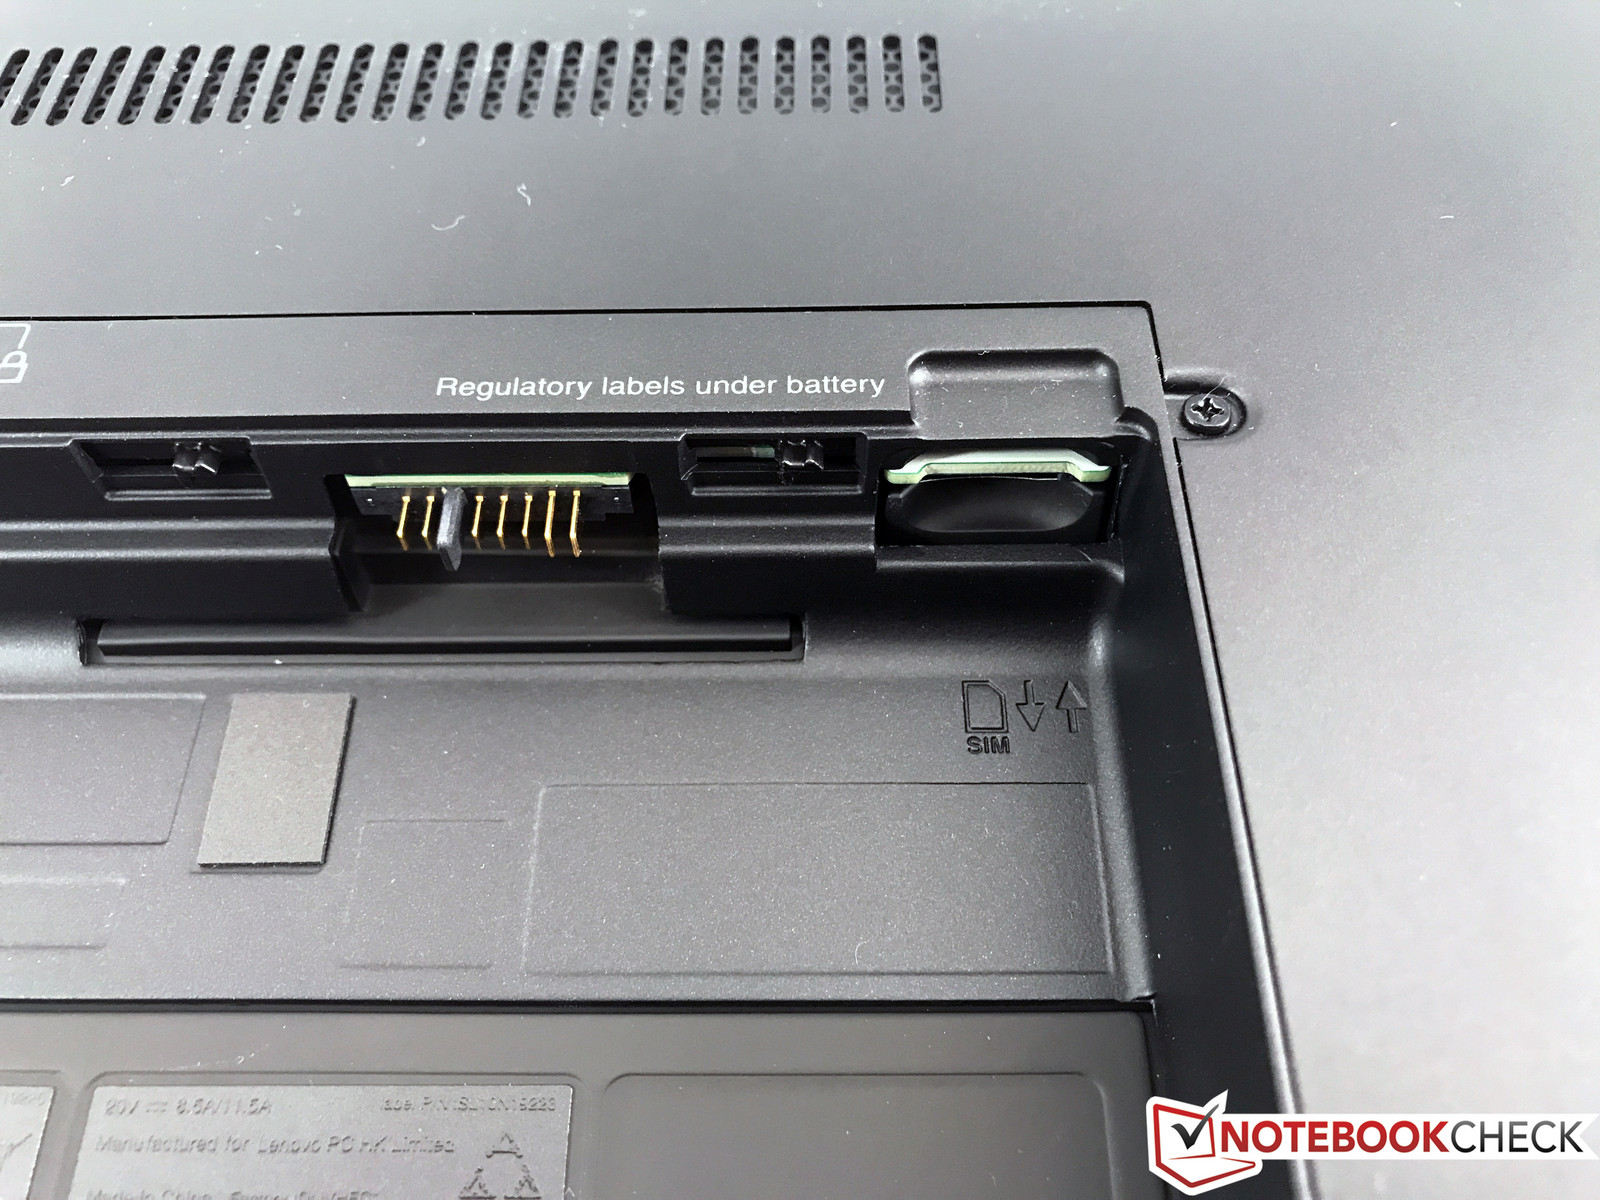
One of the biggest issues of early ThinkPad P70 models was the missing support for LTE modules, and they could not be added later. Lenovo only started shipping "WWAN ready" models a few months after the launch. This is no problem for the ThinkPad P71 since all models are either "WWAN-ready" with pre-installed antennas or shipped with LTE modules. The corresponding micro-SIM slot is located inside the battery tray.
The wireless module is the familiar 8265 card from Intel (dual-band), which supports all modern standards including fast 802.11ac connections. We did not experience any issues with the Wi-Fi signal during our review period and the performance is on the expected level as well.
Security & Accessories
The security equipment has also got a small update. Lenovo has now implemented a TPM 2.0 chip instead of the 1.2 module that was in the old P70. Many laptops are equipped with fingerprint scanners nowadays, but the P71 offers options to increase the security level for more accurate scans. It is easy to implement in business environments thanks to the SmartCard reader, and you can obviously set numerous passwords (power on, hard disk, BIOS).
Lenovo offers multiple accessories that were already compatible with the predecessors P50 & P70. The docking stations are especially interesting if you want to use the P71 within your productive environment. We had a closer look at different models in the review of the P70.
Maintenance
Our test model is a demo unit where we could not open the maintenance hatch. The following picture was taken from the predecessor, the ThinkPad P70, which uses the same chassis. The hatch is secured by a few screws and is easy to remove. You get access to three storage slots (2x M.2-2280 with PCIe-x4 support, 1x 2.5" SATA 3, 7mm), the wireless modules and two out of four SODIMM slots (up to 64 GB RAM). Unfortunately, Lenovo does not include the necessary 2.5-inch adapter if you get an SKU without 2.5-inch drive.
Warranty
The ThinkPad P71 is shipped with a 3-year on-site service in Germany and Austria by default, which is standard in this segment. There is also a 3-year international warranty (bring-in). You can upgrade the service to five years with accidental protection. Please see our Guarantees, Return Policies and Warranties FAQ for country-specific information.
Input Devices
Keyboard
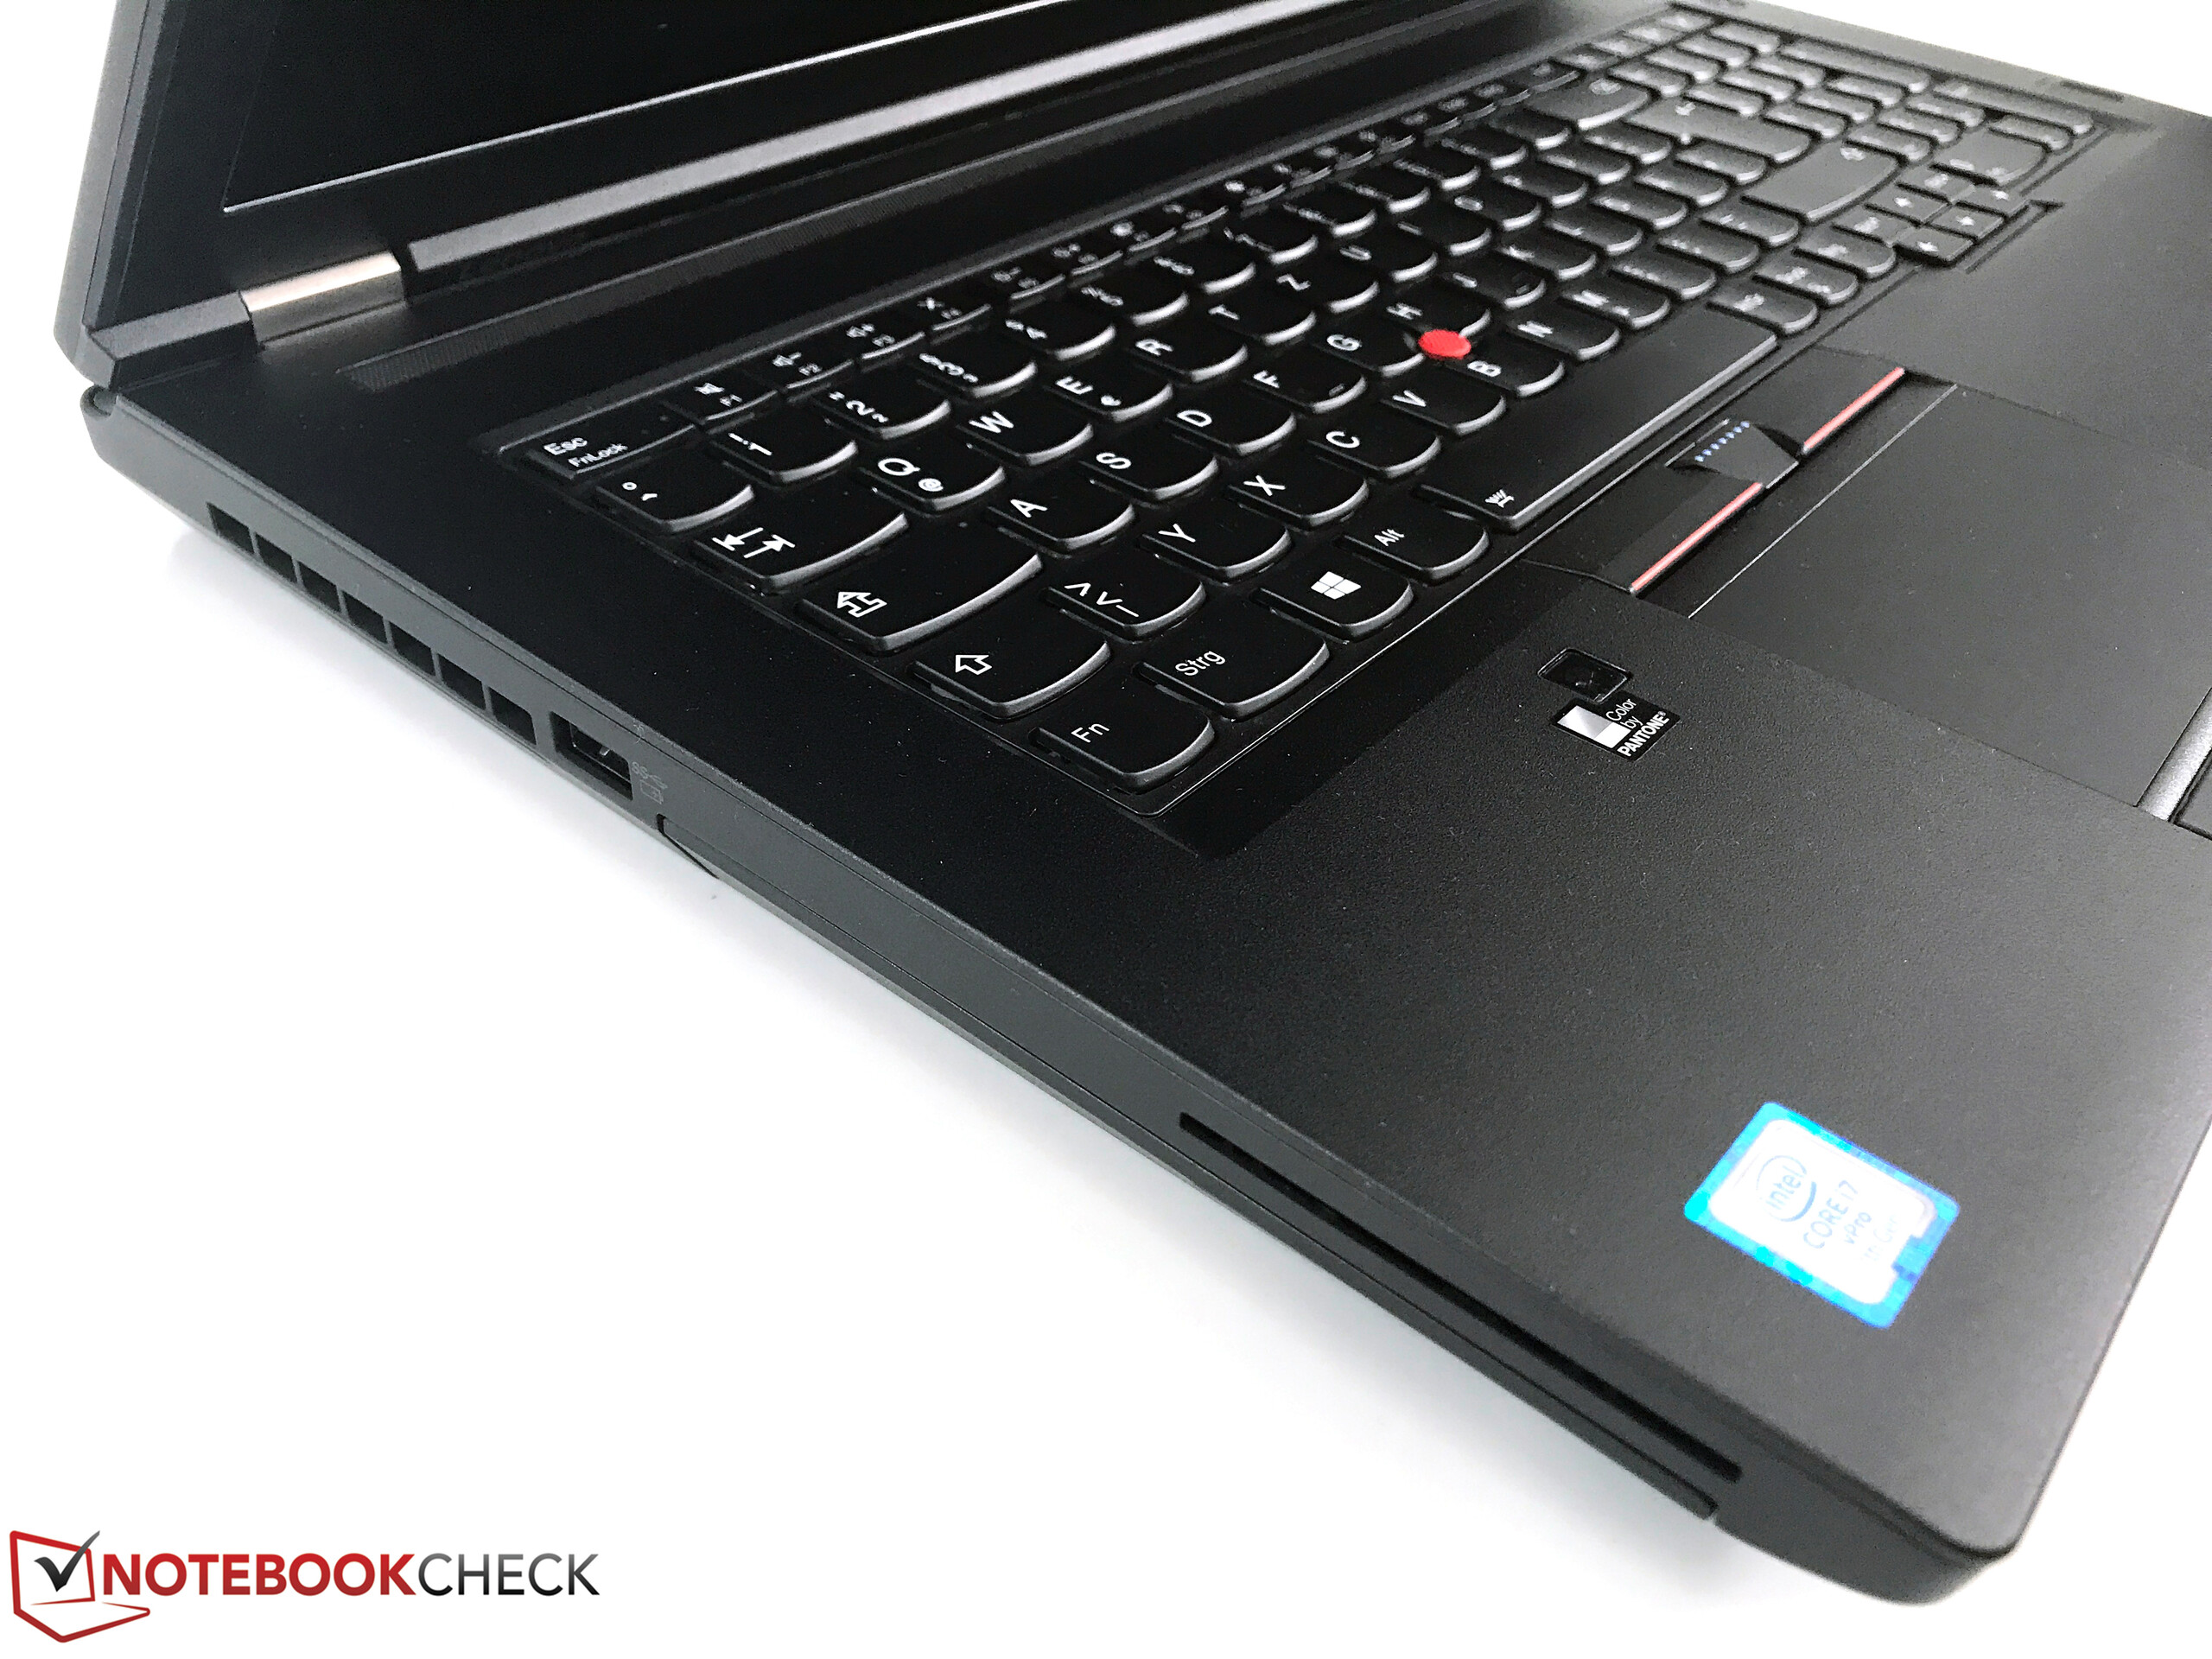
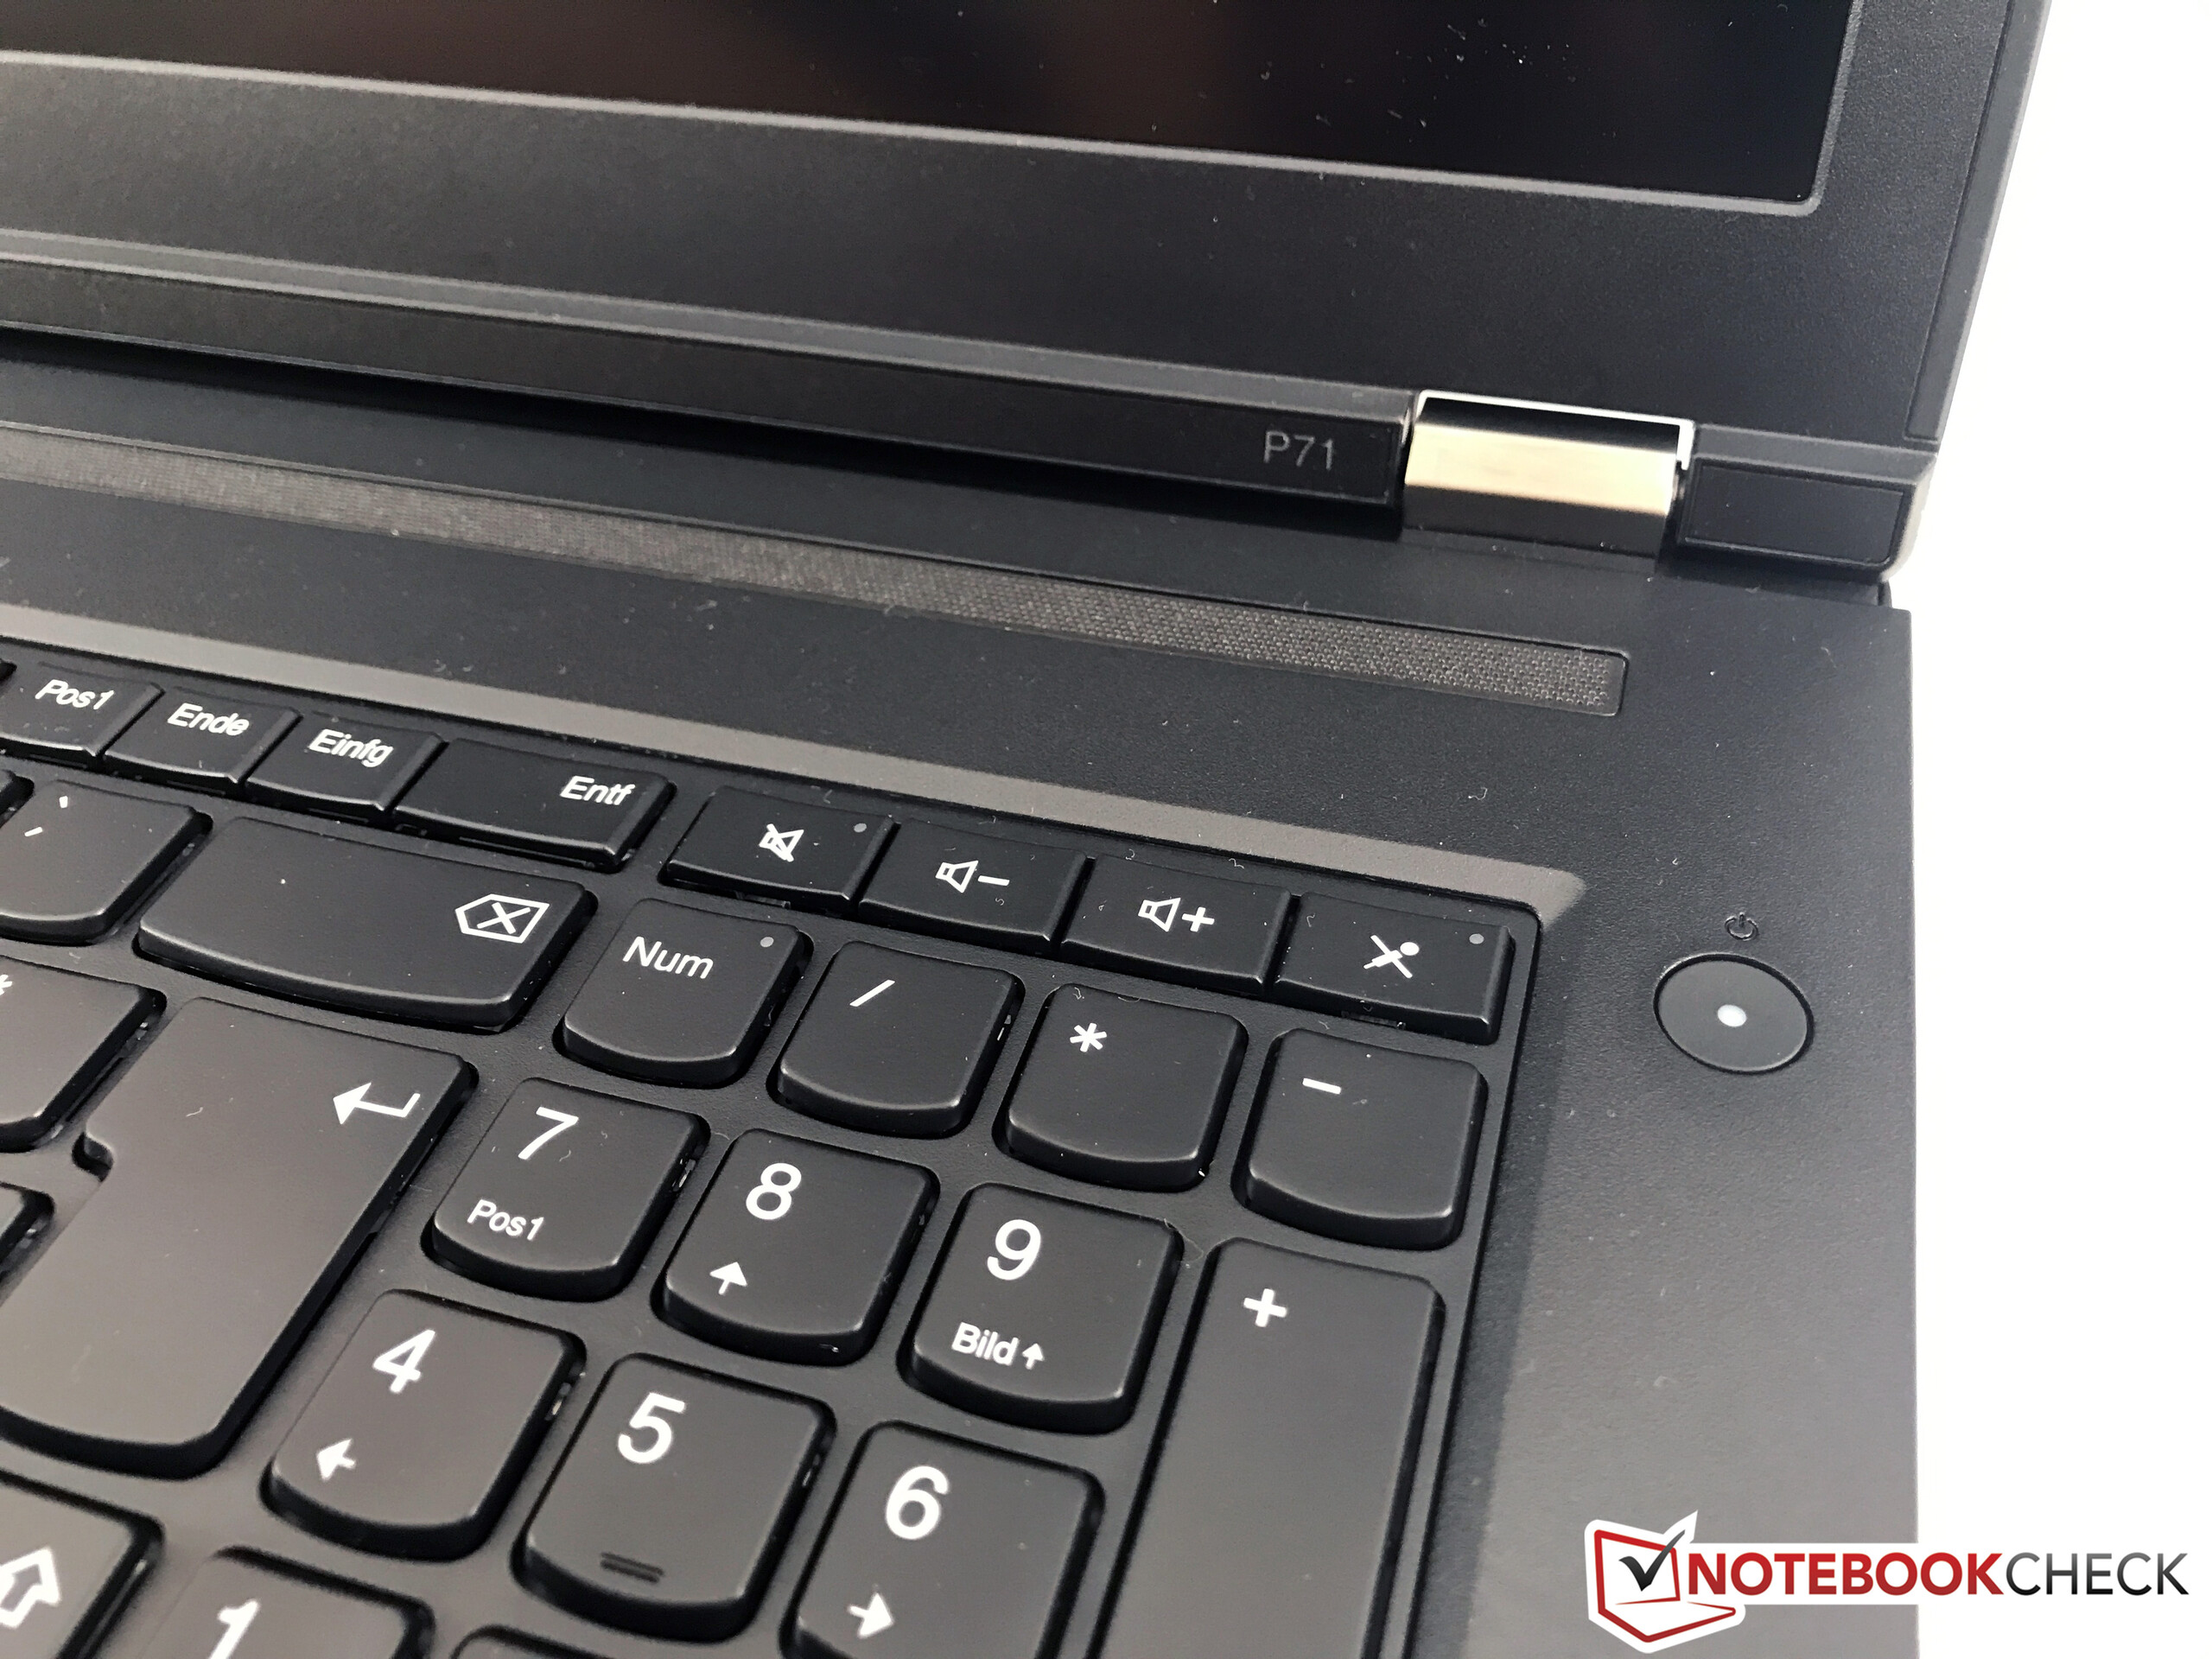
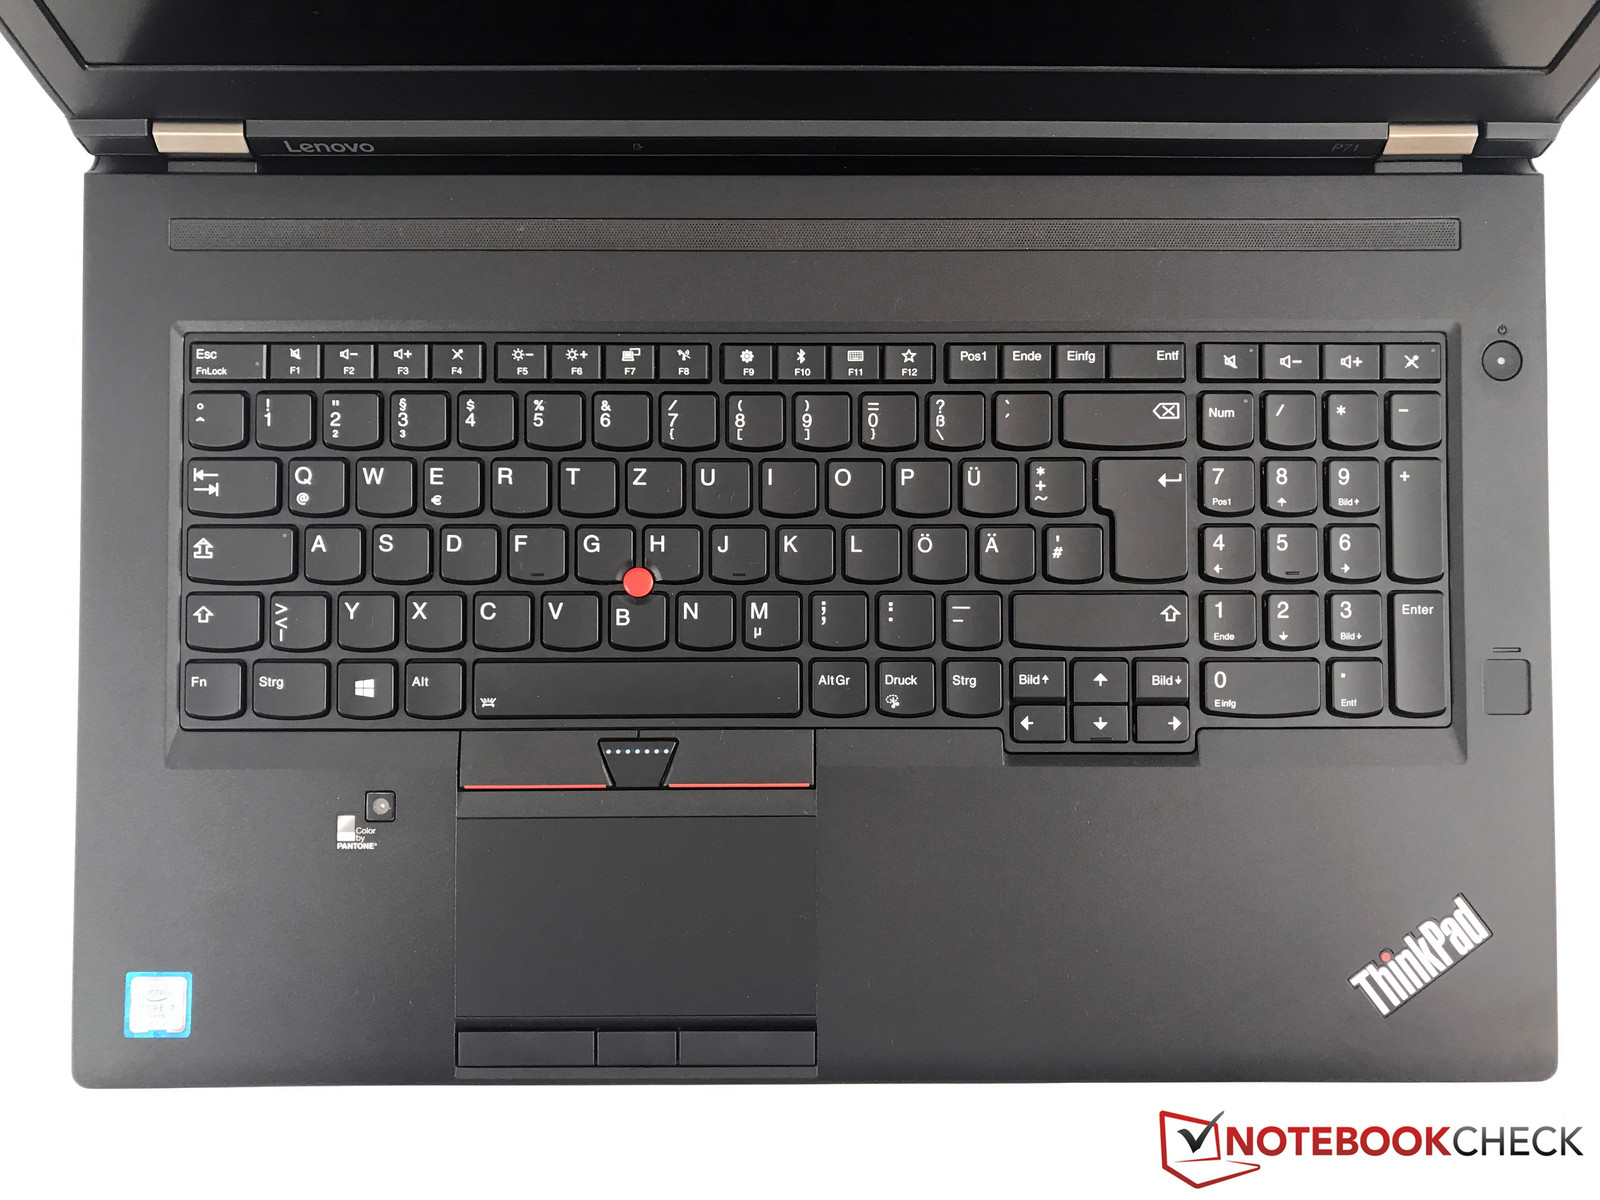
Lenovo has not changed the chiclet keyboard with its three-stage white background illumination for the P71. As with last year’s model, it can dazzle a bit depending on your seating position and we would also like a brighter level. Fortunately, the rich feedback in combination with the very high stability has not changed either, so you can enjoy a very comfortable typing experience.
There is also a numeric keypad with slightly narrower keys on the right side. The arrow keys are sitting a bit lower, but they have a decent size in return. It takes some time getting used to if you do not know the typical ThinkPad layout, but then it works well. It is possible to switch the allocation of the Fn and the Ctrl key.
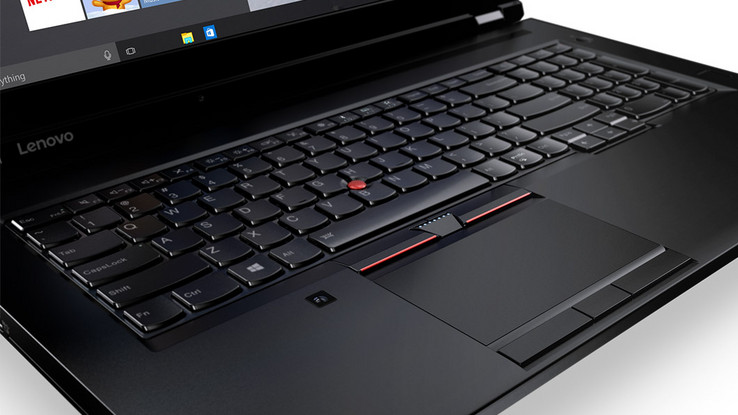
Touchpad & TrackPoint
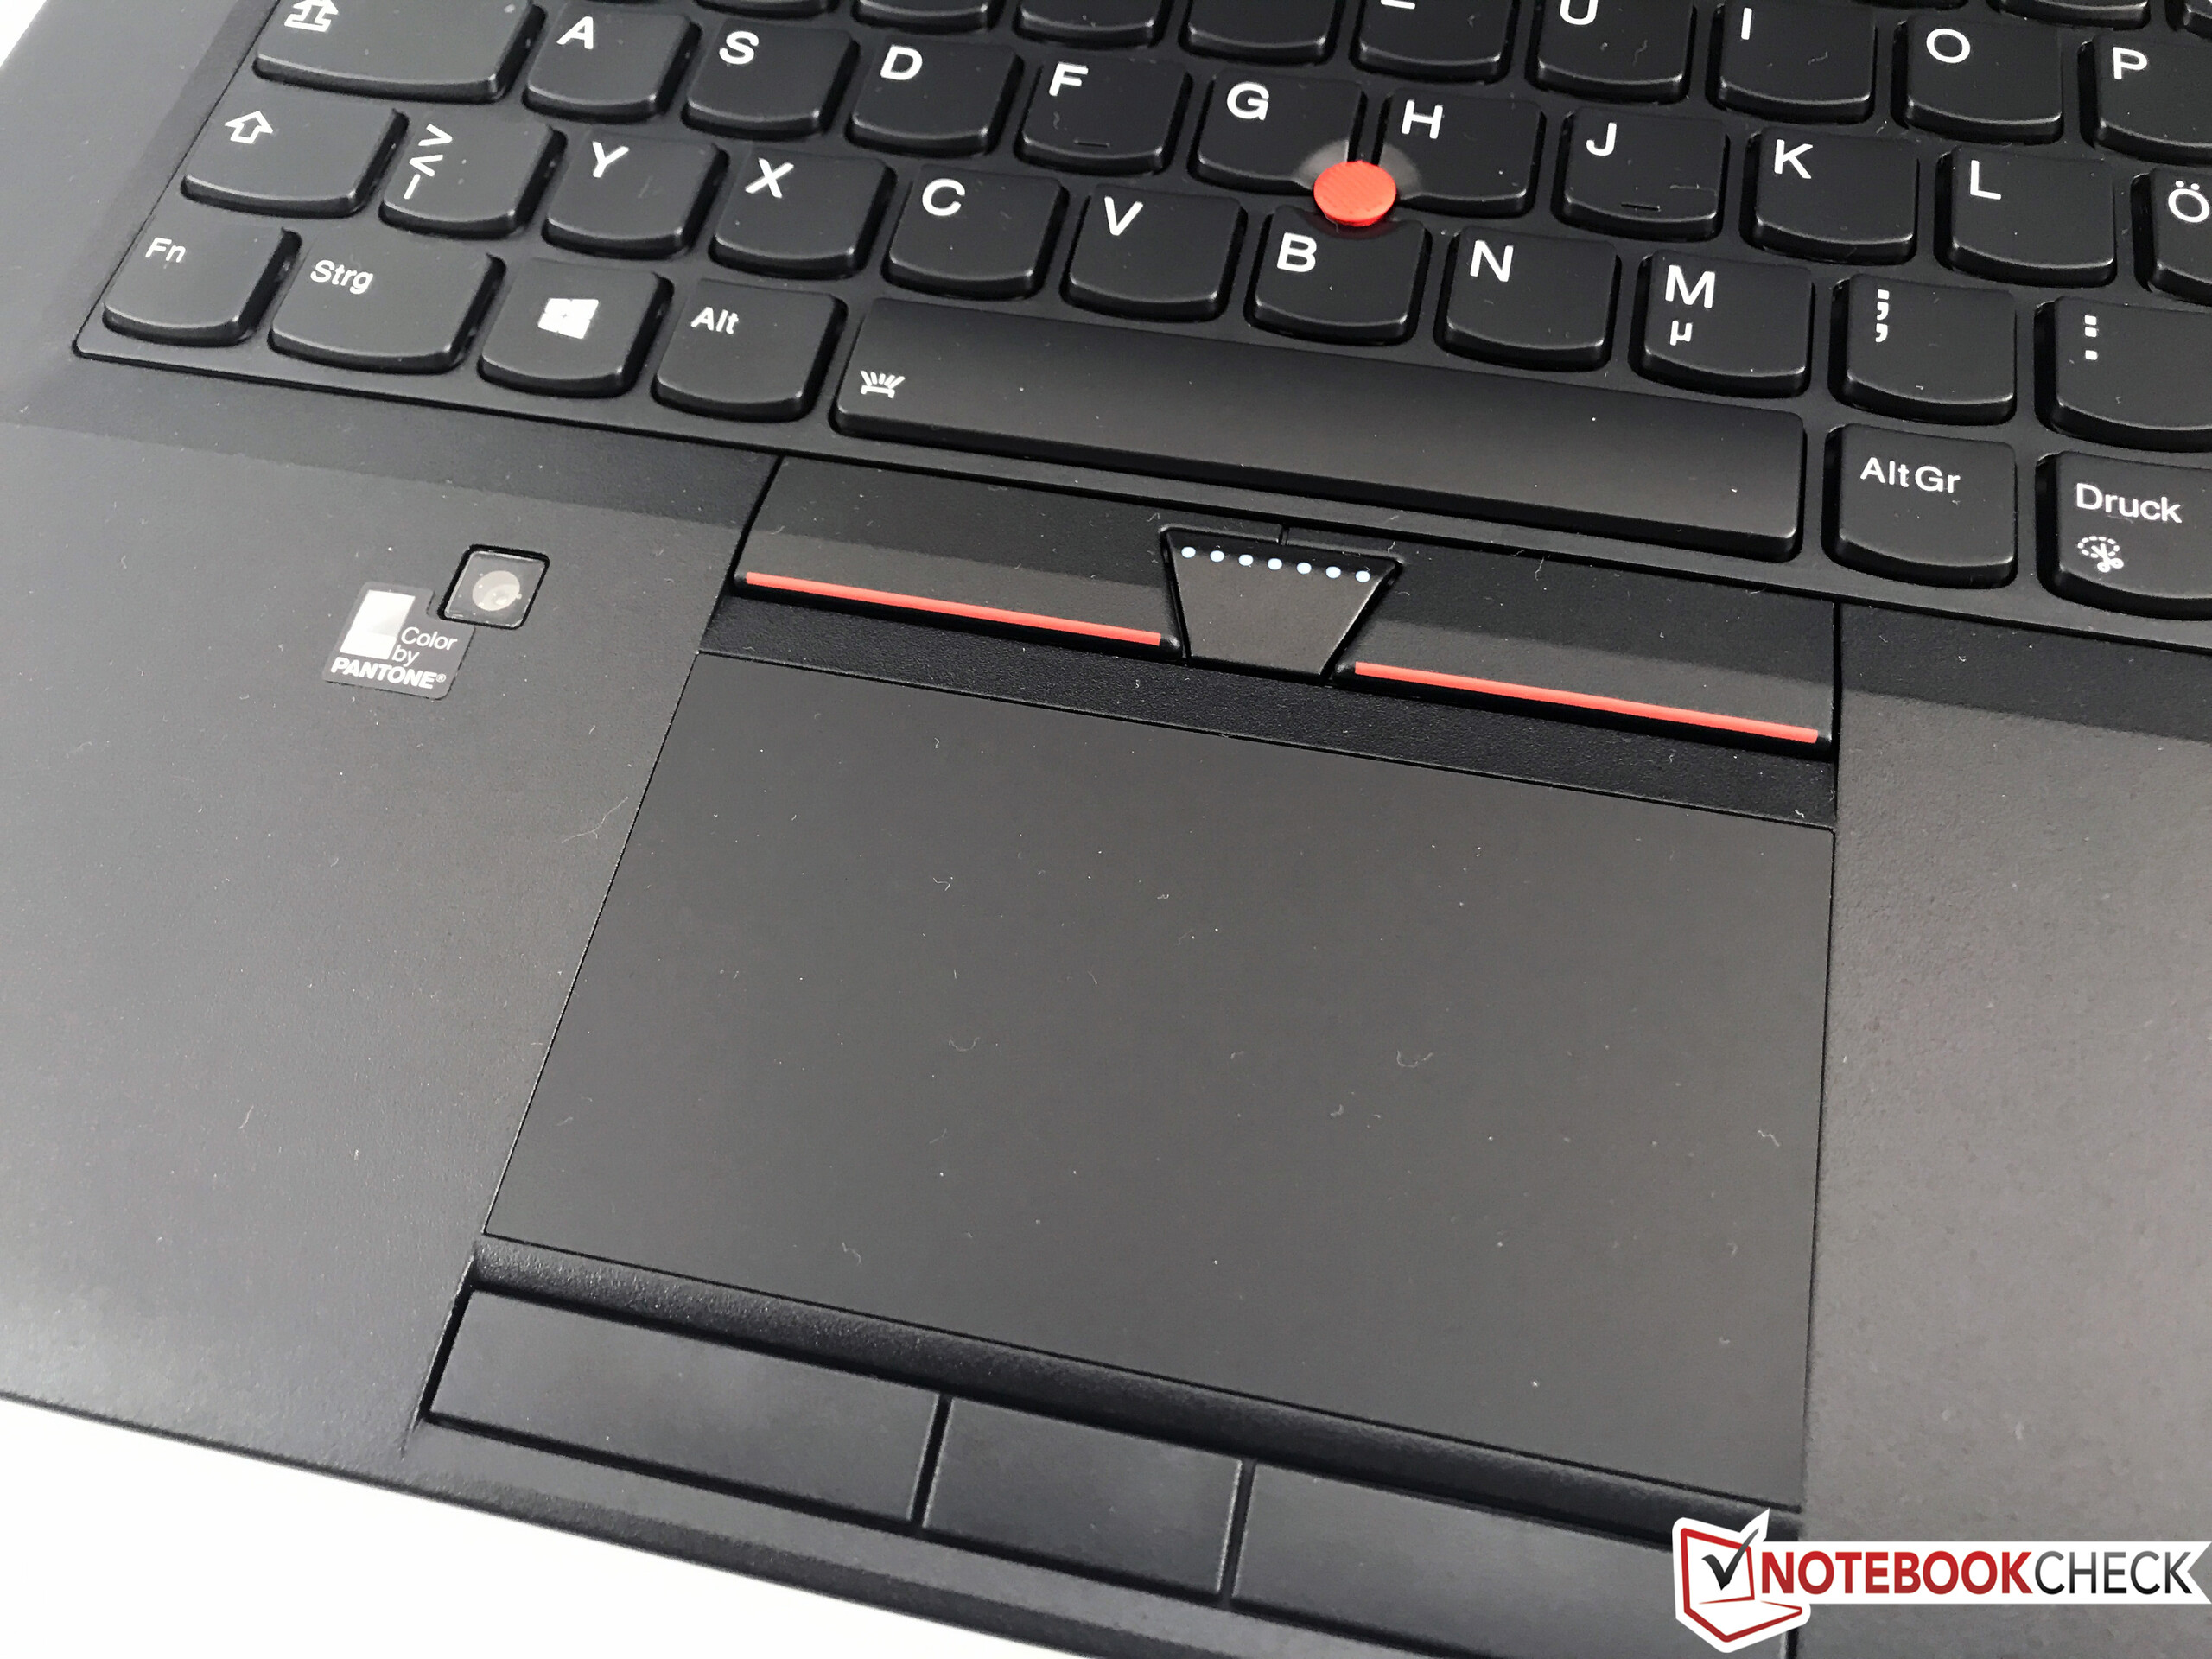
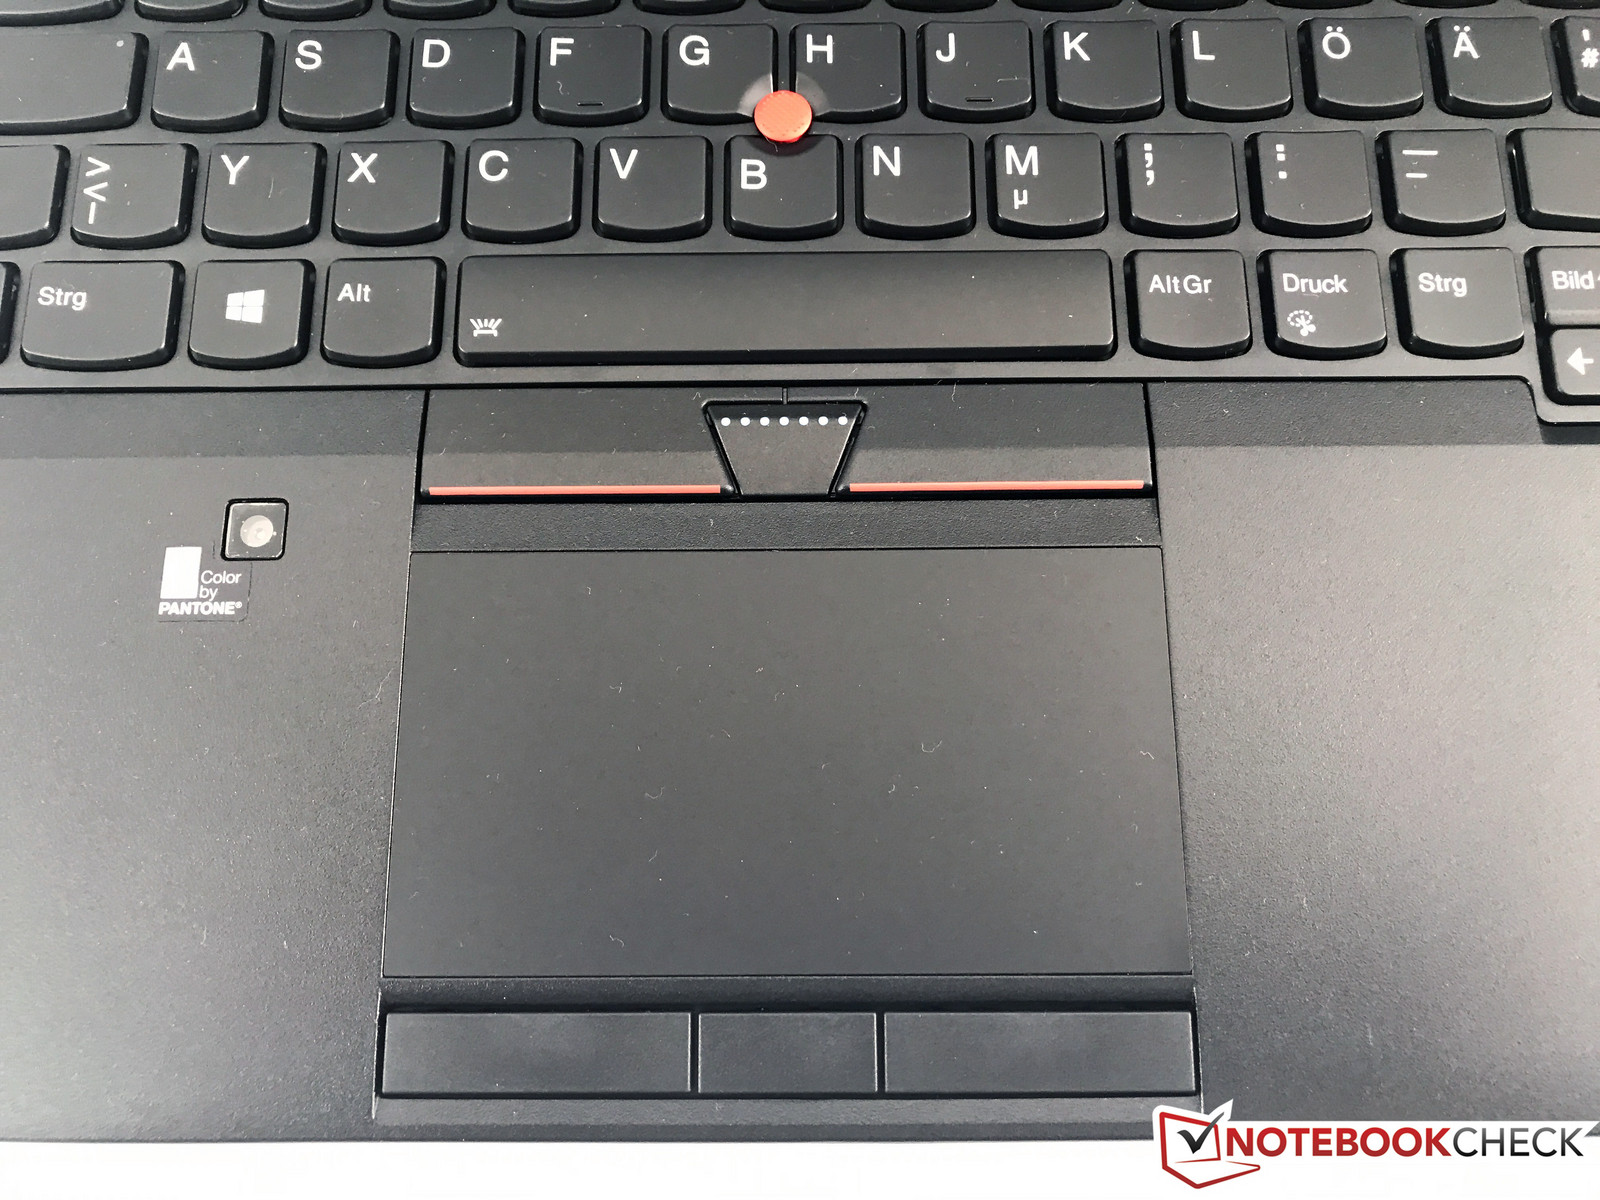
In addition to the traditional touchpad, you can also control the cursor via red TrackPoint. Both mouse replacements have three dedicated mouse buttons each. As a result, the touchpad surface itself is smaller compared to some devices, but still sufficient and we prefer the version with dedicated buttons. There is no criticism for the functionality and you do not really need an external mouse.
Display
Lenovo offers two different matte panels for the P71, one 1080p and one 4K UHD screen. Lenovo lists similar specifications for both IPS panels (300 nits, 800:1 contrast); only the resolution as well as the color gamut differ. Contrary to the previous generation you cannot get a touchscreen anymore.
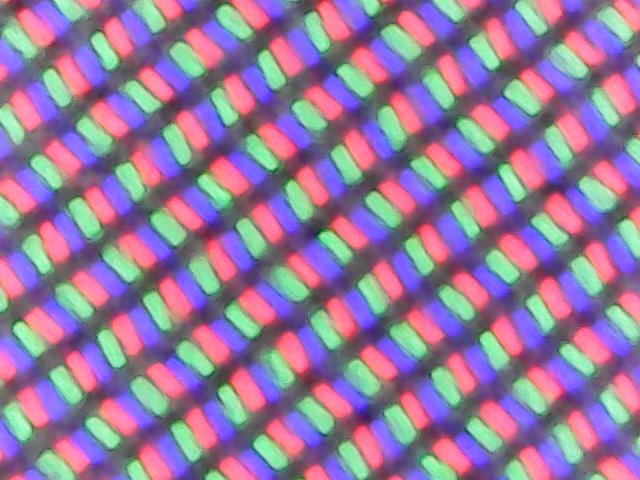
Our test unit features the high-resolution screen from Panasonic (VVX17P051J00), which is already familiar from the ThinkPad P70. As with the smaller ThinkPad P51, you also get an integrated colorimeter from Pantone to calibrate the screen. This worked well on our P71 unit, so we use these results in our database.
The subjective picture impression is very good and backlight bleeding is not a big problem (unlike the P70). The PWM flickering at brightness levels of 90% or lower should not have a big effect, thanks to the high frequency of more than 1.4 kHz.
| |||||||||||||||||||||||||
Brightness Distribution: 83 %
Center on Battery: 363 cd/m²
Contrast: 1155:1 (Black: 0.31 cd/m²)
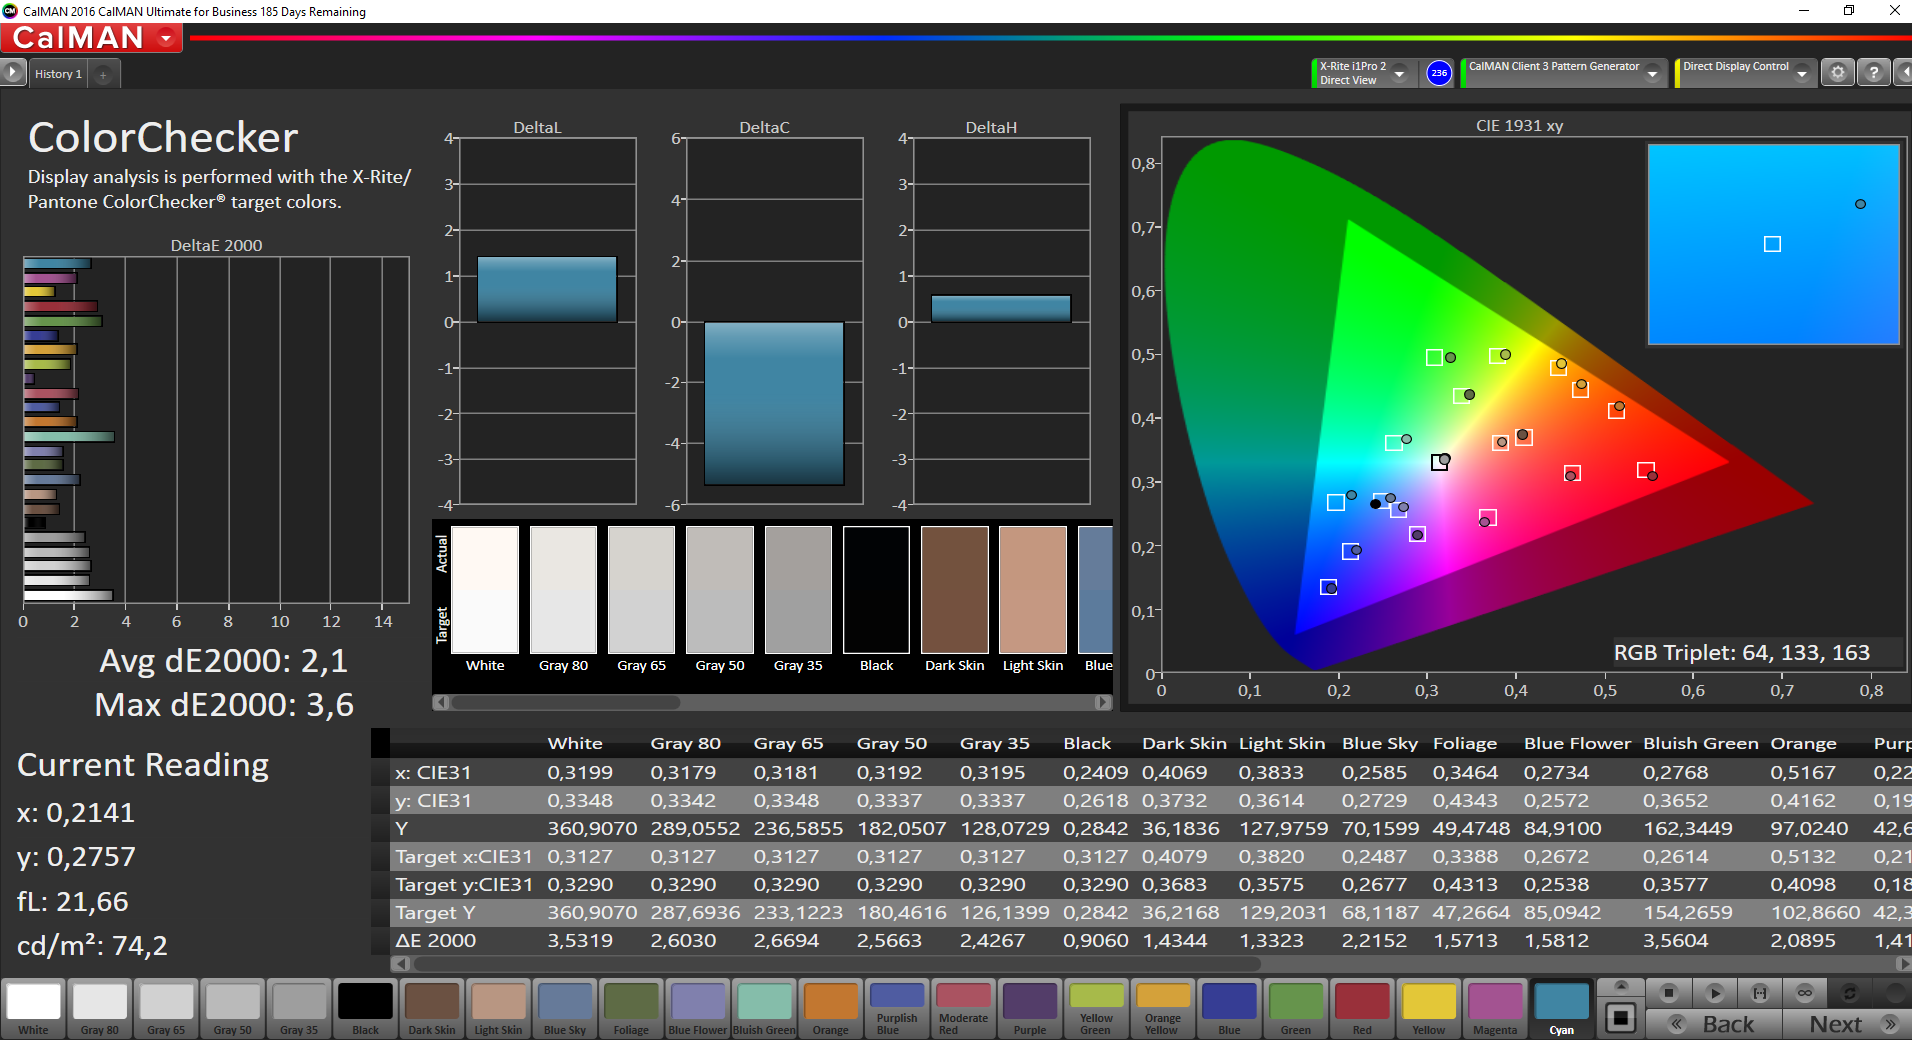
ΔE ColorChecker Calman: 2.1 | ∀{0.5-29.43 Ø4.71}
ΔE Greyscale Calman: 2 | ∀{0.09-98 Ø4.96}
99.97% sRGB (Argyll 1.6.3 3D)
77% AdobeRGB 1998 (Argyll 1.6.3 3D)
Gamma: 2.16
CCT: 6216 K
| Lenovo ThinkPad P71-20HK0004GE LEN4123, VVX17P051J00, , 3840x2160, 17.3" | Lenovo ThinkPad P70-20ER000XUS Panasonic VVX17P051J00 / LEN4123, , 3840x2160, 17.3" | MSI WE72 7RJ LP173WF4-SPF1, , 1920x1080, 17.3" | Fujitsu Celsius H970 LP173WF4-SPF3, , 1920x1080, 17.3" | HP ZBook 17 G4-Y3J82AV Sharp SHP144C, , 3840x2160, 17.3" | Dell Precision 7720 SHP1446 (LQ173D1), , 3840x2160, 17.3" | |
|---|---|---|---|---|---|---|
| Display | ||||||
| Display P3 Coverage (%) | 67.4 | 66.8 | 88 | 87.6 | ||
| sRGB Coverage (%) | 85.3 | 84.6 | 100 | 100 | ||
| AdobeRGB 1998 Coverage (%) | 62.4 | 61.8 | 99.6 | 99.2 | ||
| Response Times | -3% | -15% | 2% | -56% | -77% | |
| Response Time Grey 50% / Grey 80% * (ms) | 39.2 ? | 34.8 ? 11% | 45.2 ? -15% | 32 ? 18% | 56.8 ? -45% | 60 ? -53% |
| Response Time Black / White * (ms) | 23.2 ? | 26.8 ? -16% | 26.4 ? -14% | 26.4 ? -14% | 38.4 ? -66% | 46.4 ? -100% |
| PWM Frequency (Hz) | 1412 ? | 219.3 ? | 1020 ? | 1020 ? | ||
| Screen | -26% | -73% | -66% | 10% | -21% | |
| Brightness middle (cd/m²) | 358 | 332 -7% | 302 -16% | 368 3% | 391 9% | 464 30% |
| Brightness (cd/m²) | 338 | 317 -6% | 306 -9% | 360 7% | 360 7% | 441 30% |
| Brightness Distribution (%) | 83 | 86 4% | 93 12% | 91 10% | 87 5% | 89 7% |
| Black Level * (cd/m²) | 0.31 | 0.397 -28% | 0.31 -0% | 0.3 3% | 0.35 -13% | 0.45 -45% |
| Contrast (:1) | 1155 | 836 -28% | 974 -16% | 1227 6% | 1117 -3% | 1031 -11% |
| Colorchecker dE 2000 * | 2.1 | 3.15 -50% | 6.2 -195% | 6.4 -205% | 1.3 38% | 3.2 -52% |
| Colorchecker dE 2000 max. * | 3.6 | 5.55 -54% | 10.6 -194% | 10.1 -181% | 2.5 31% | 6.1 -69% |
| Greyscale dE 2000 * | 2 | 3.72 -86% | 7.3 -265% | 7.2 -260% | 1.8 10% | 4.2 -110% |
| Gamma | 2.16 102% | 1.86 118% | 2.08 106% | 2.02 109% | 2.11 104% | 2.01 109% |
| CCT | 6216 105% | 6103 107% | 7020 93% | 6882 94% | 6461 101% | 6736 96% |
| Color Space (Percent of AdobeRGB 1998) (%) | 77 | 74.3 -4% | 56 -27% | 55.5 -28% | 87.9 14% | 88.1 14% |
| Color Space (Percent of sRGB) (%) | 99.97 | 100 0% | 85.2 -15% | 84.4 -16% | 100 0% | 100 0% |
| Total Average (Program / Settings) | -15% /
-22% | -44% /
-63% | -32% /
-55% | -23% /
-1% | -49% /
-30% |
* ... smaller is better
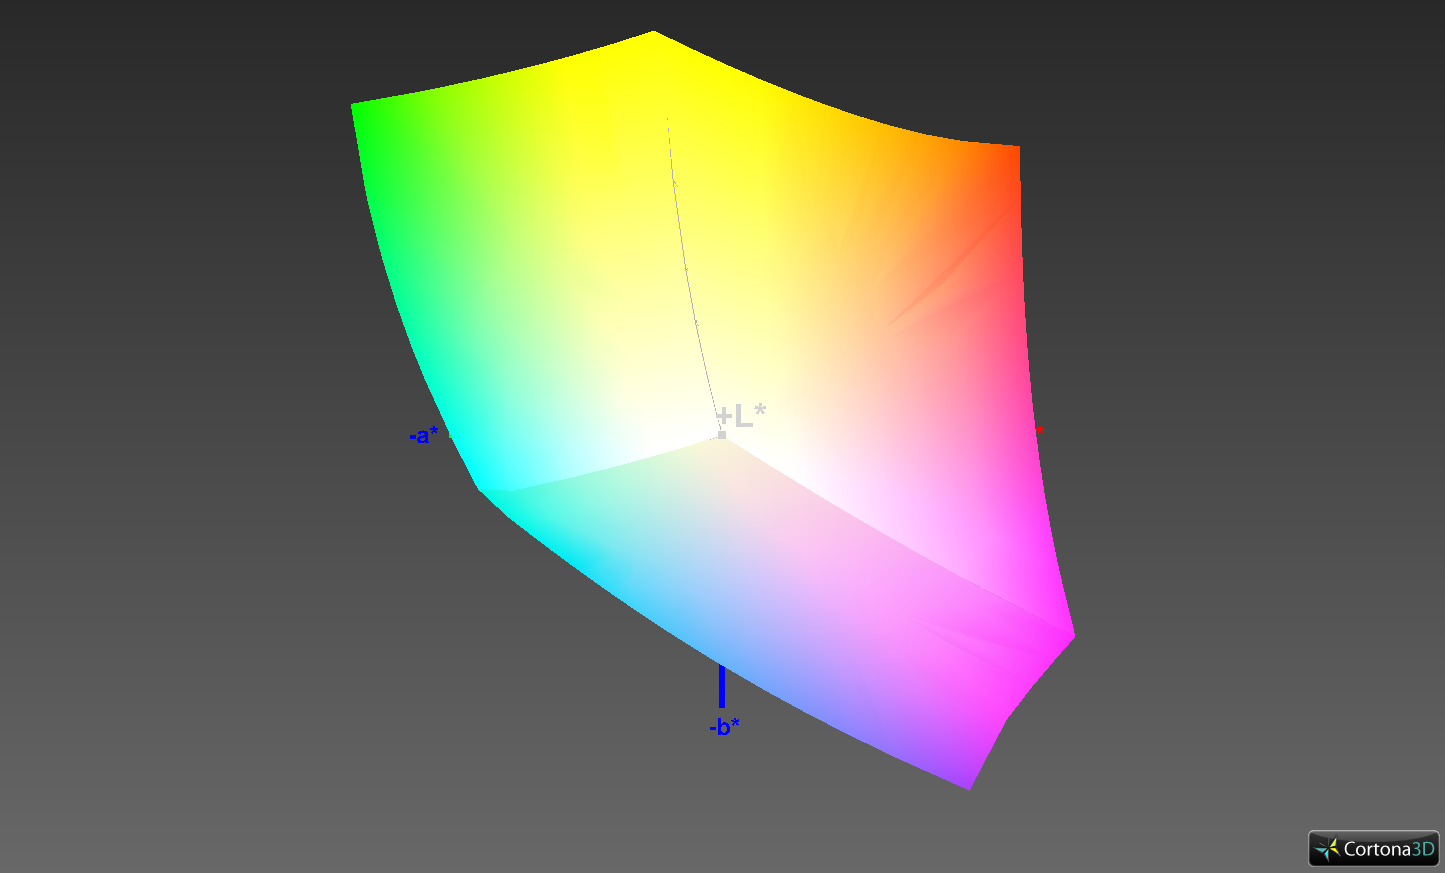
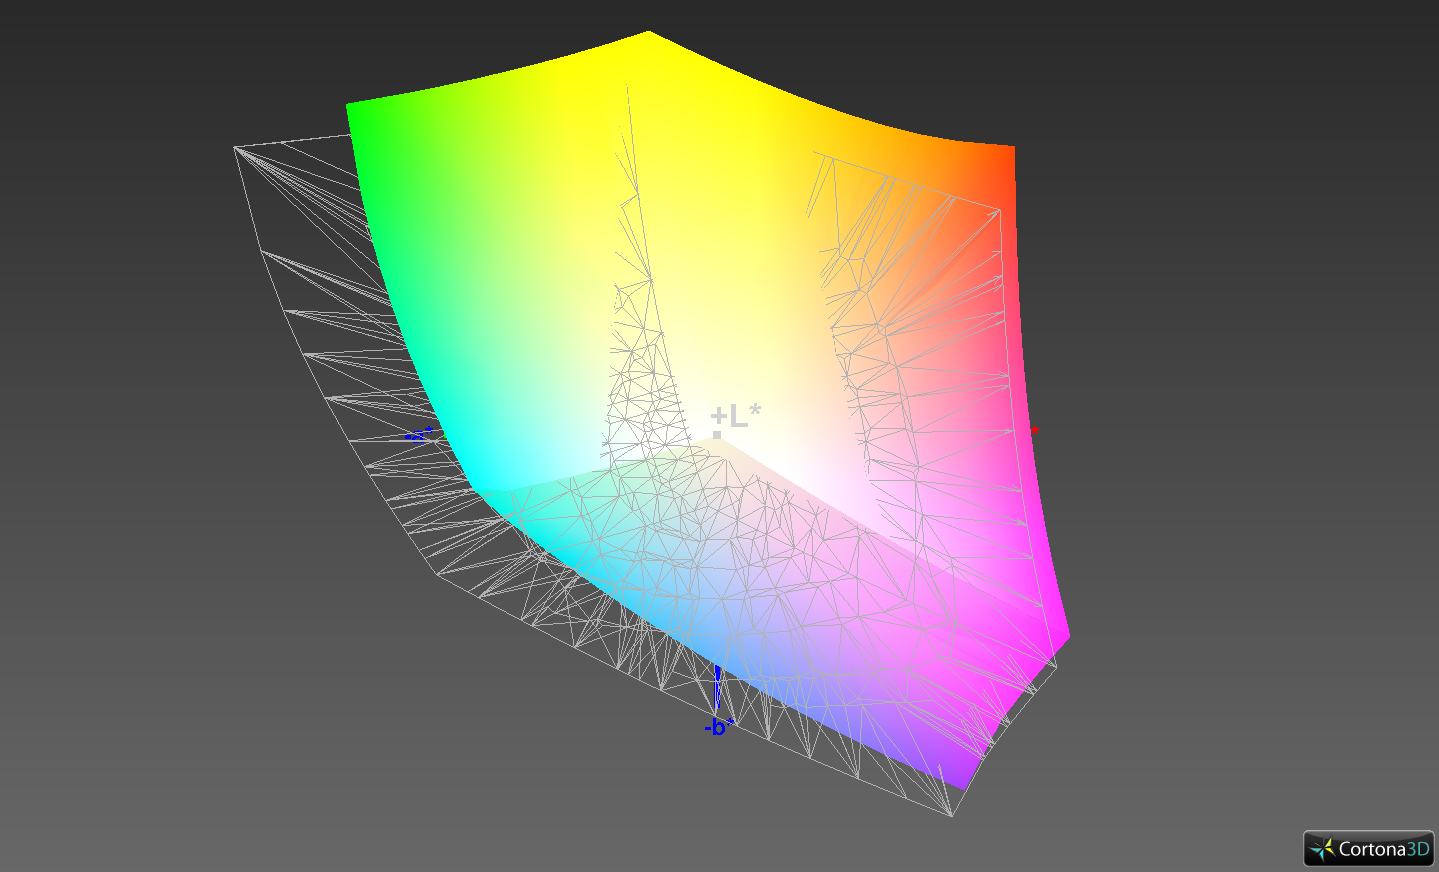
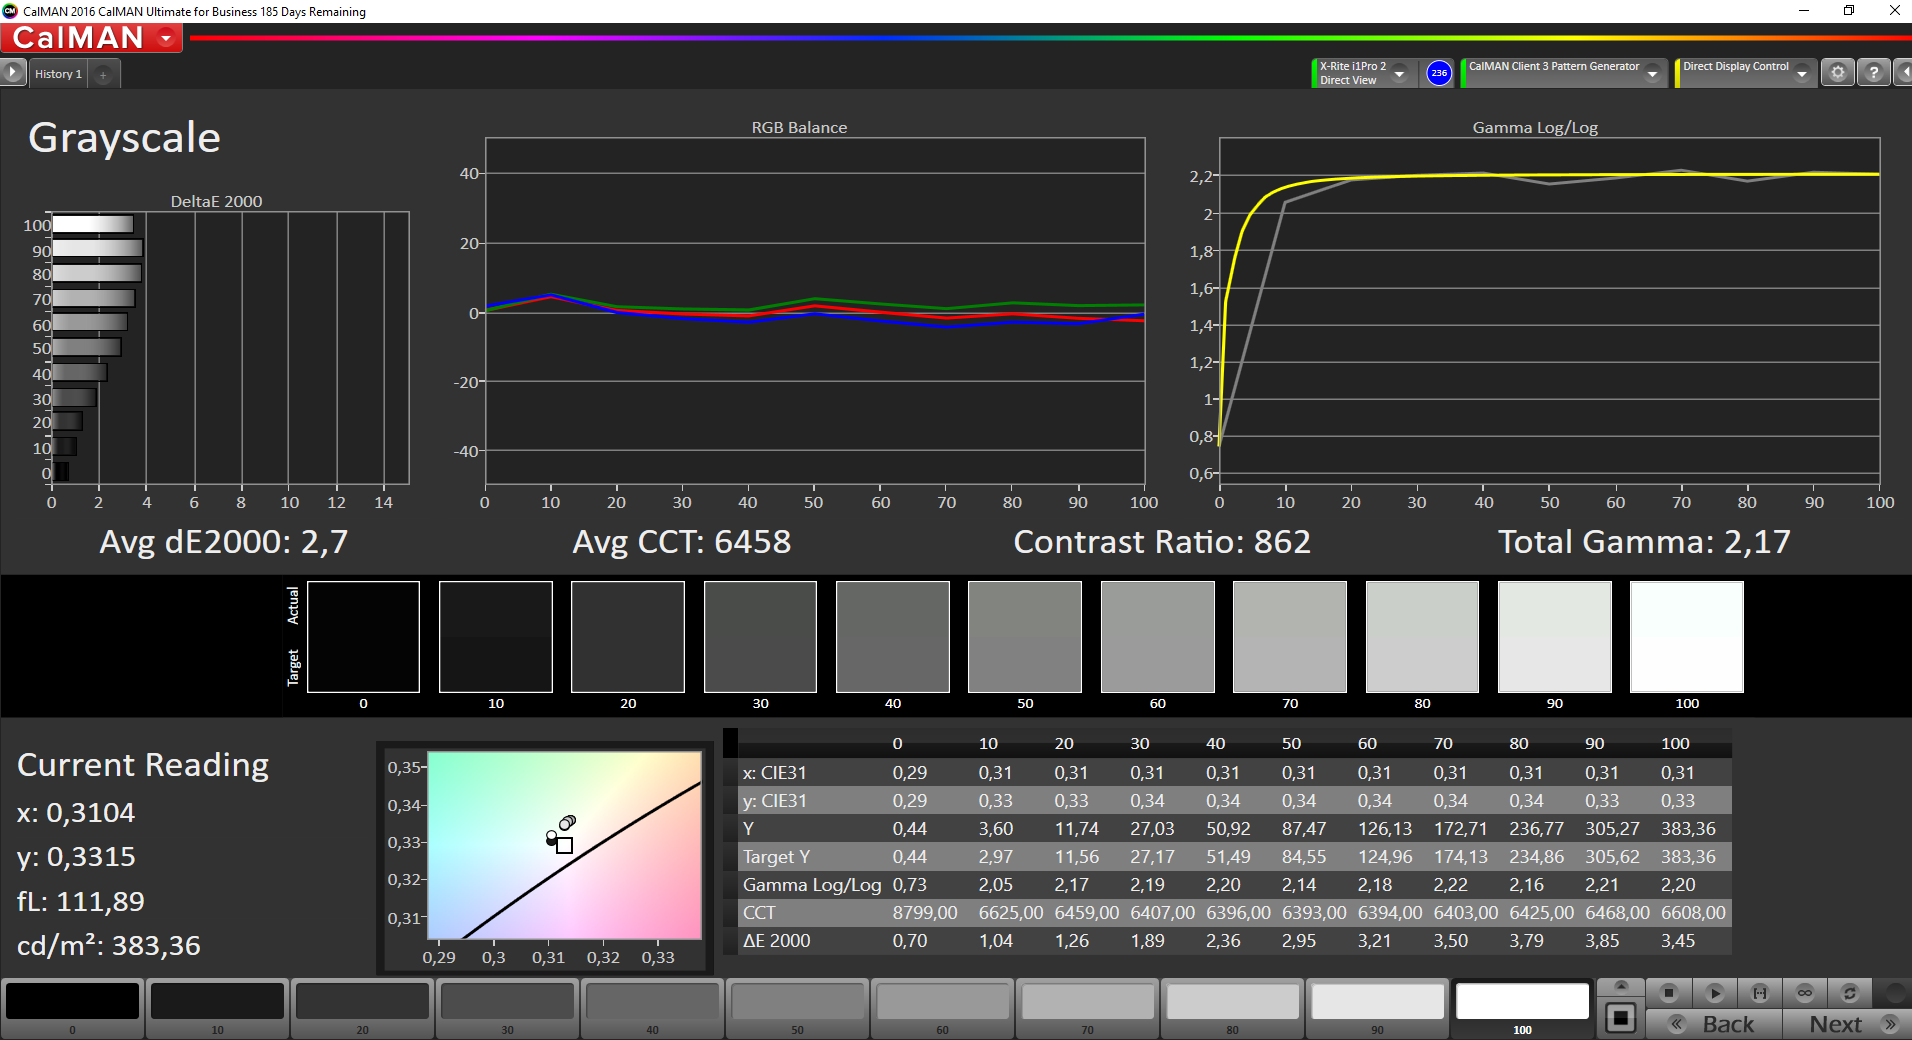
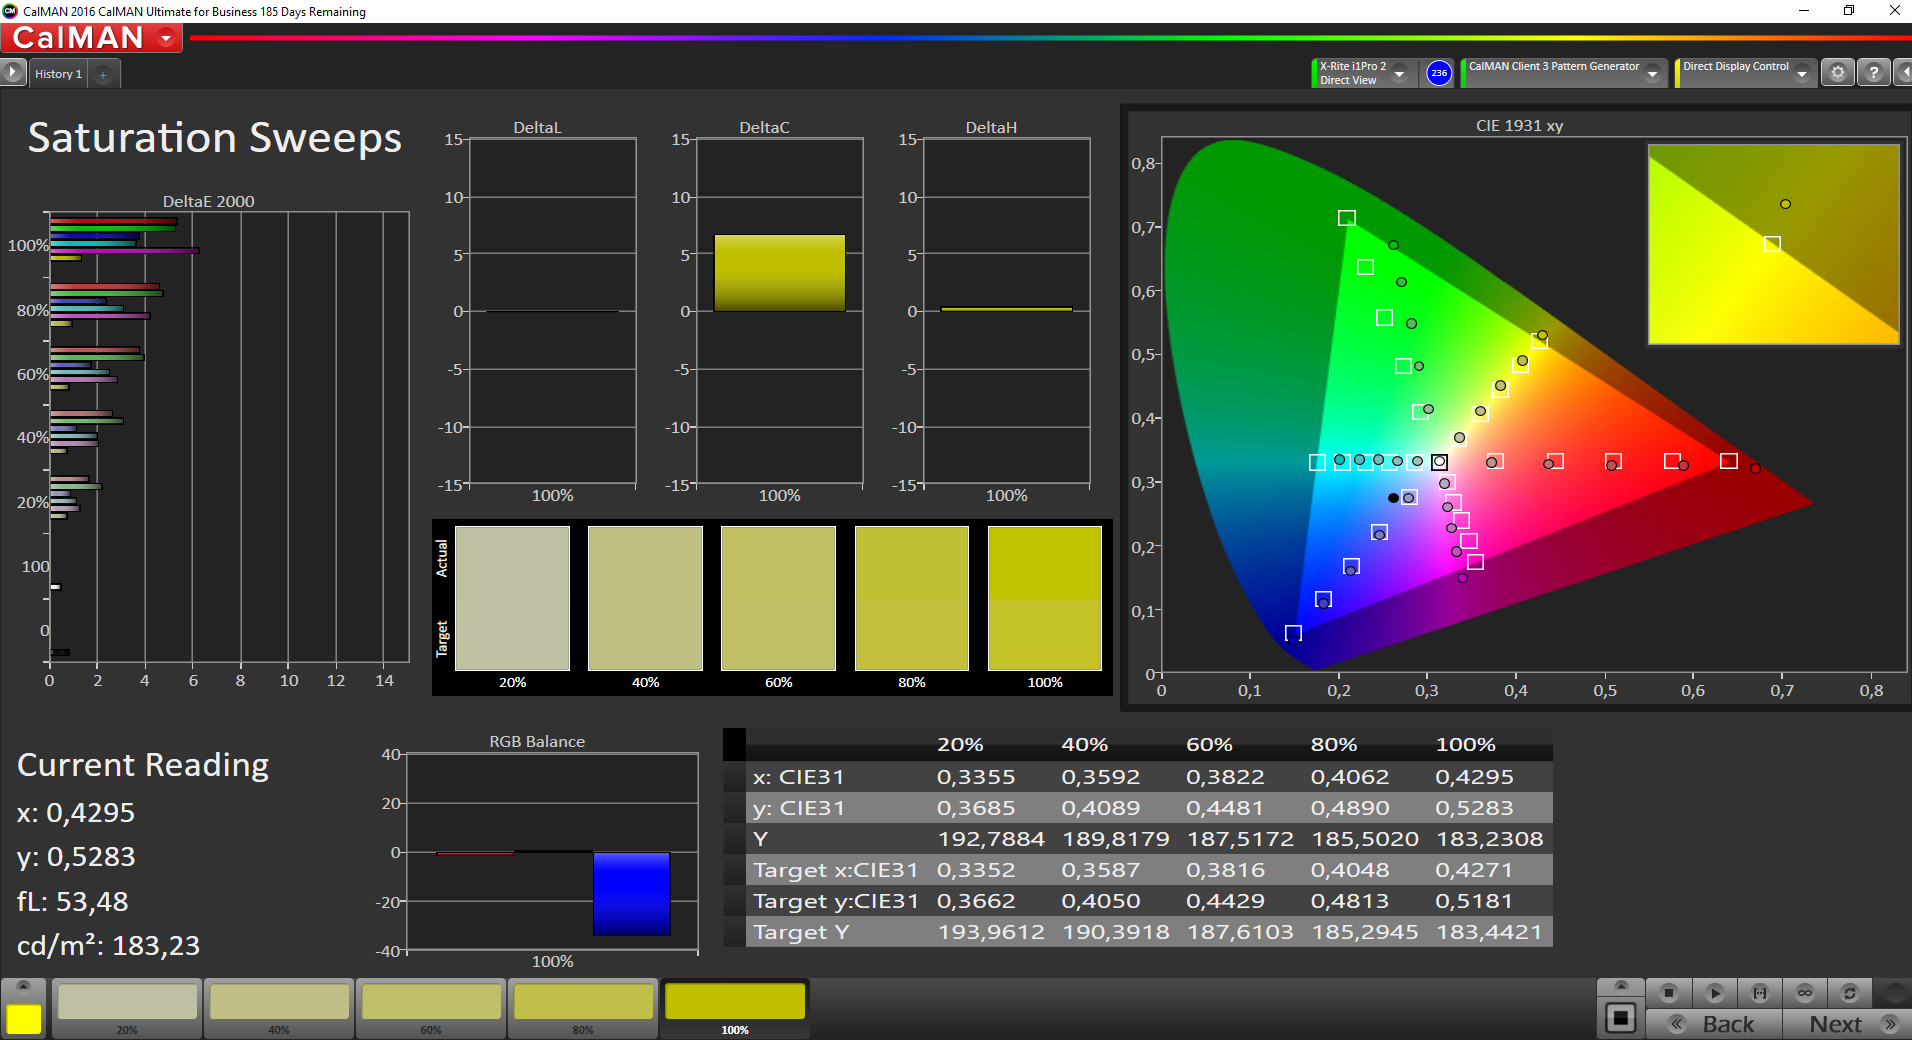
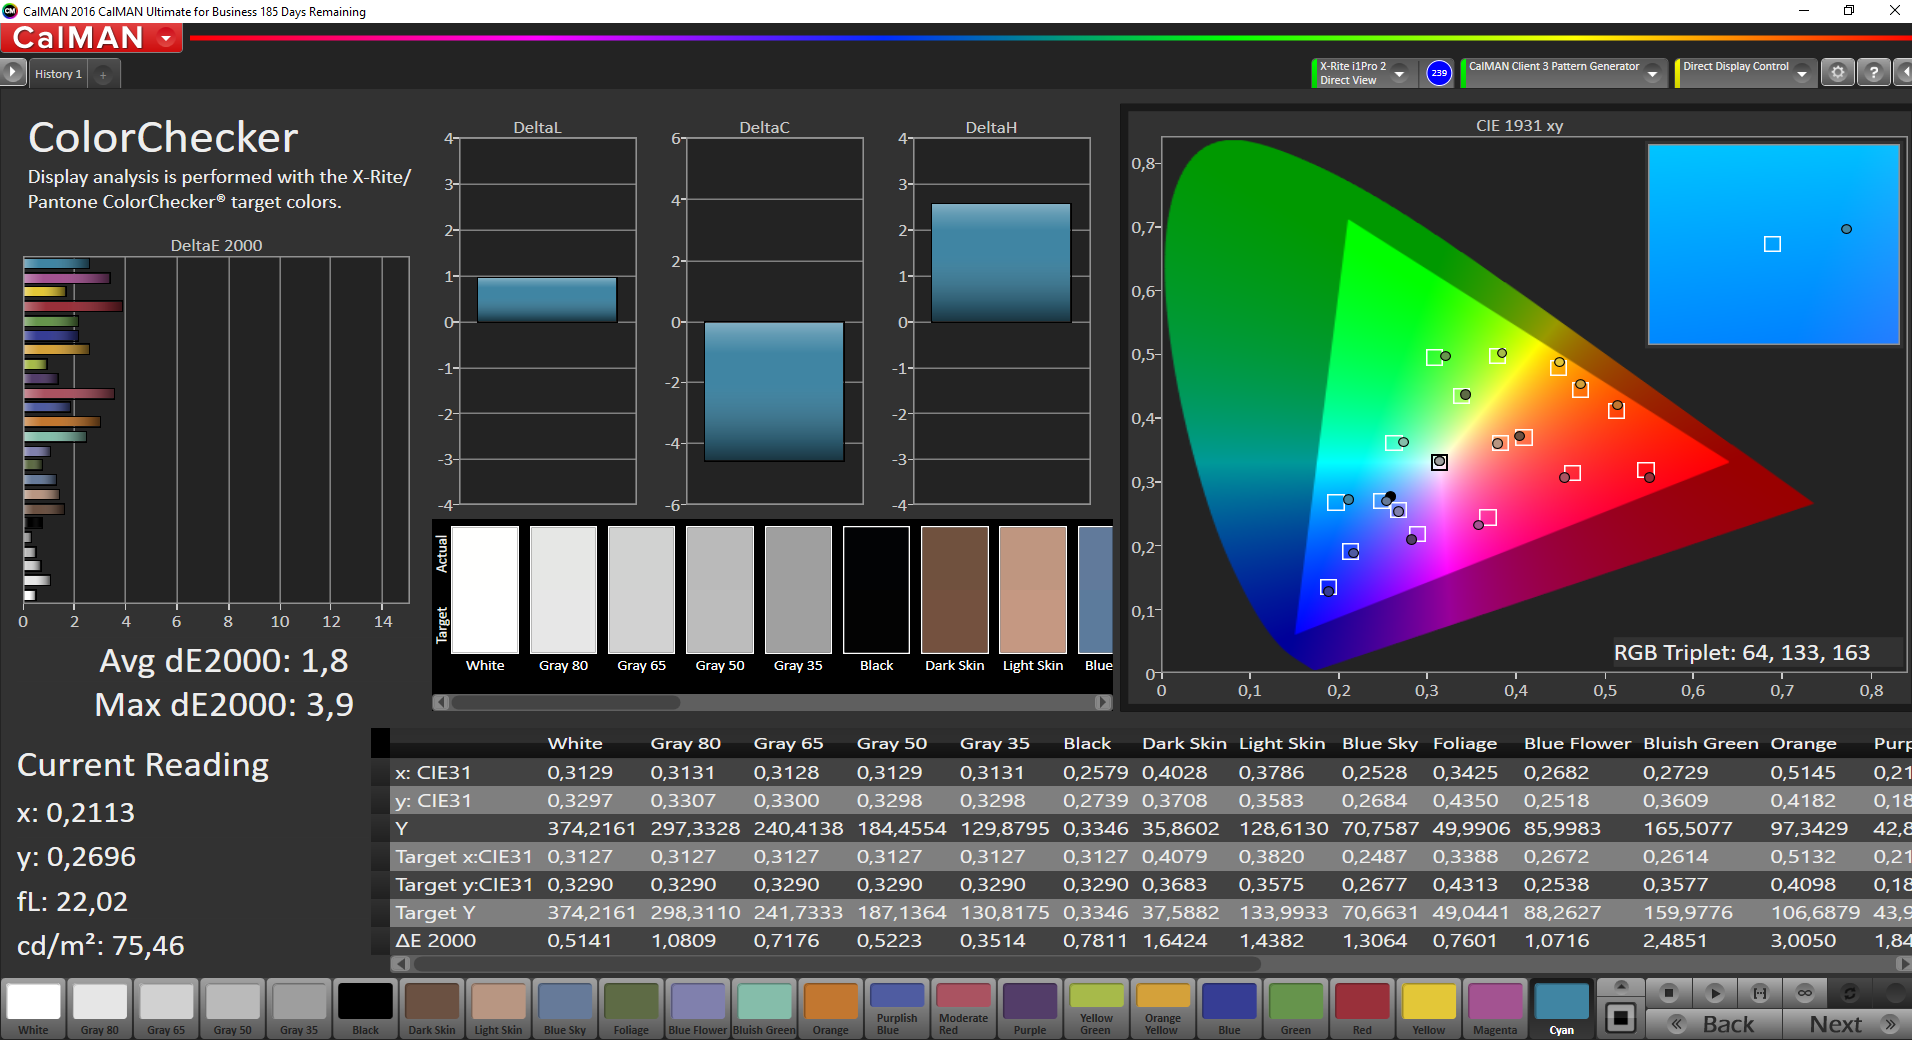
The 4K panel in the ThinkPad P71 covers the smaller sRGB reference completely, and the wider AdobeRGB color space by 77%. This is on par with last year's model, but the two rivals from Dell and HP perform a little bit better, while the two models from MSI and Fujitsu fall behind. Unlike some of the rivals, Lenovo does not offer any settings for the color space. This can be useful if you want to create graphics for the sRGB color space, for example. We therefore checked the performance compared to both references.

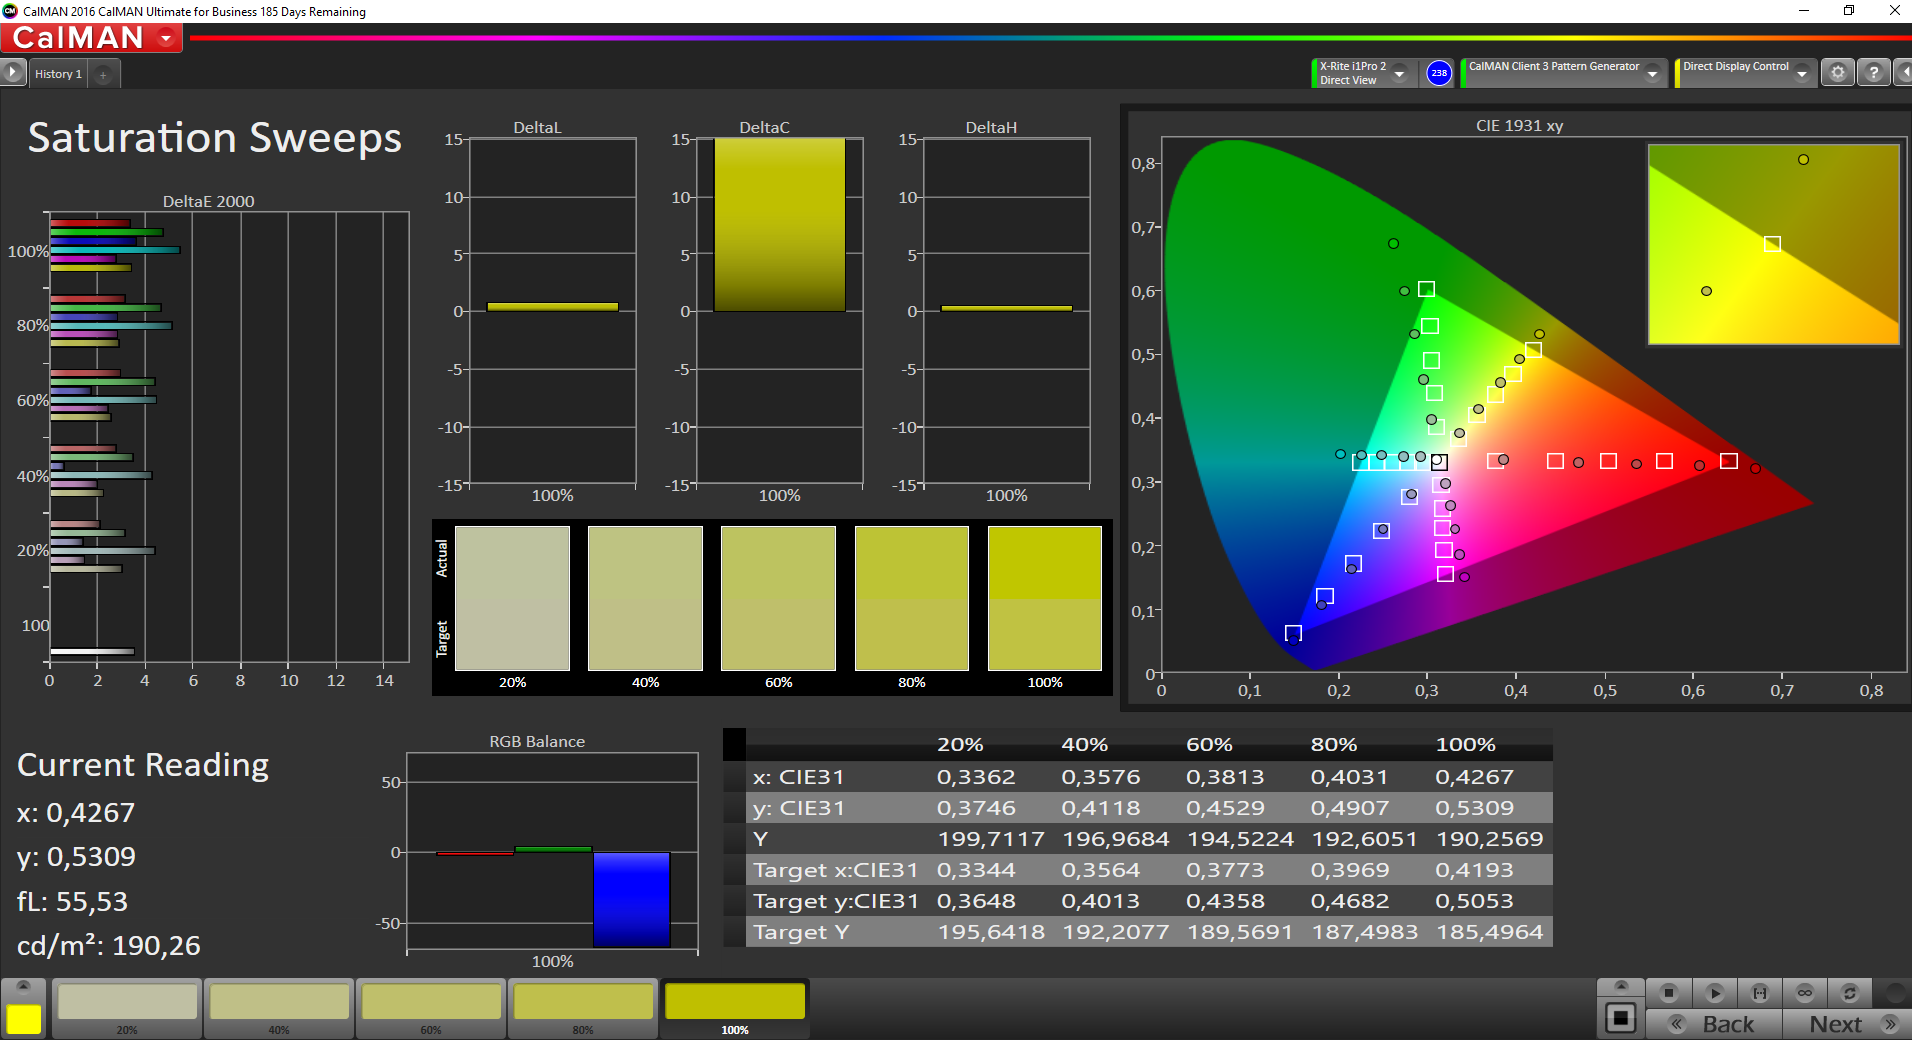

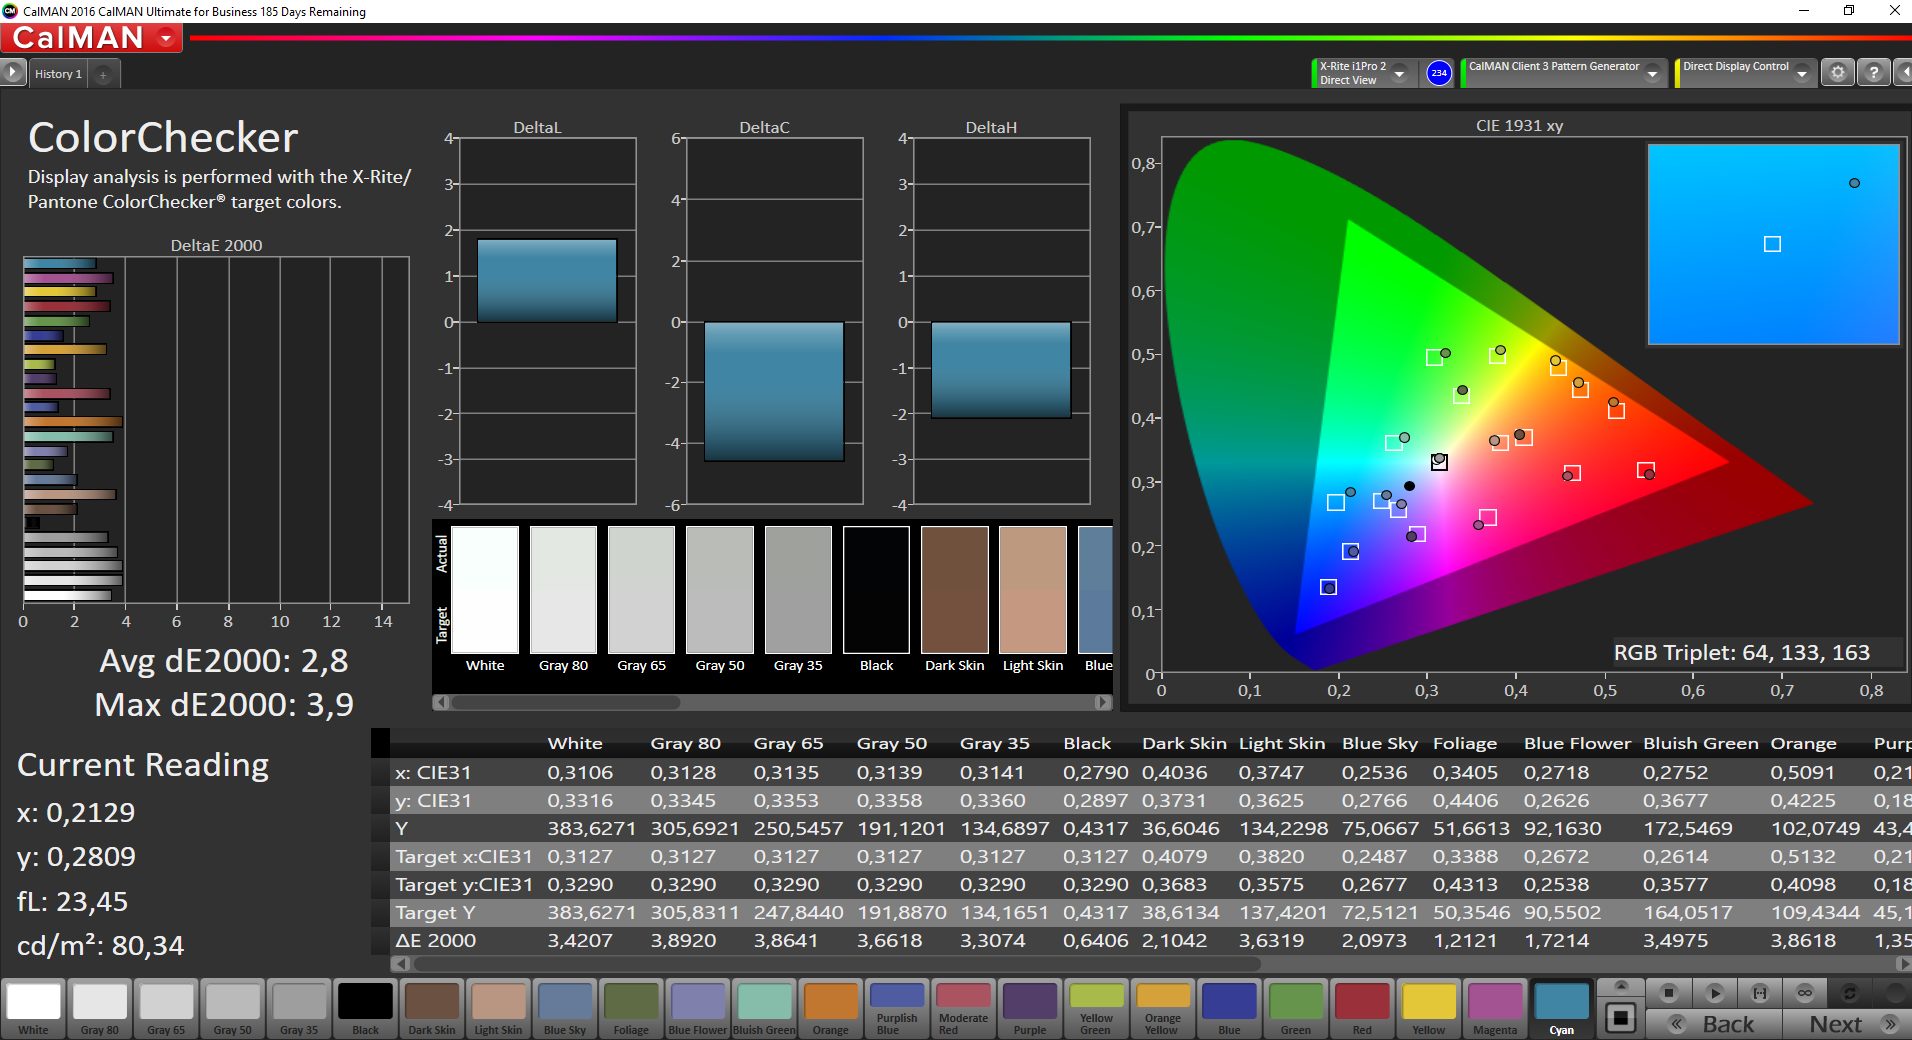
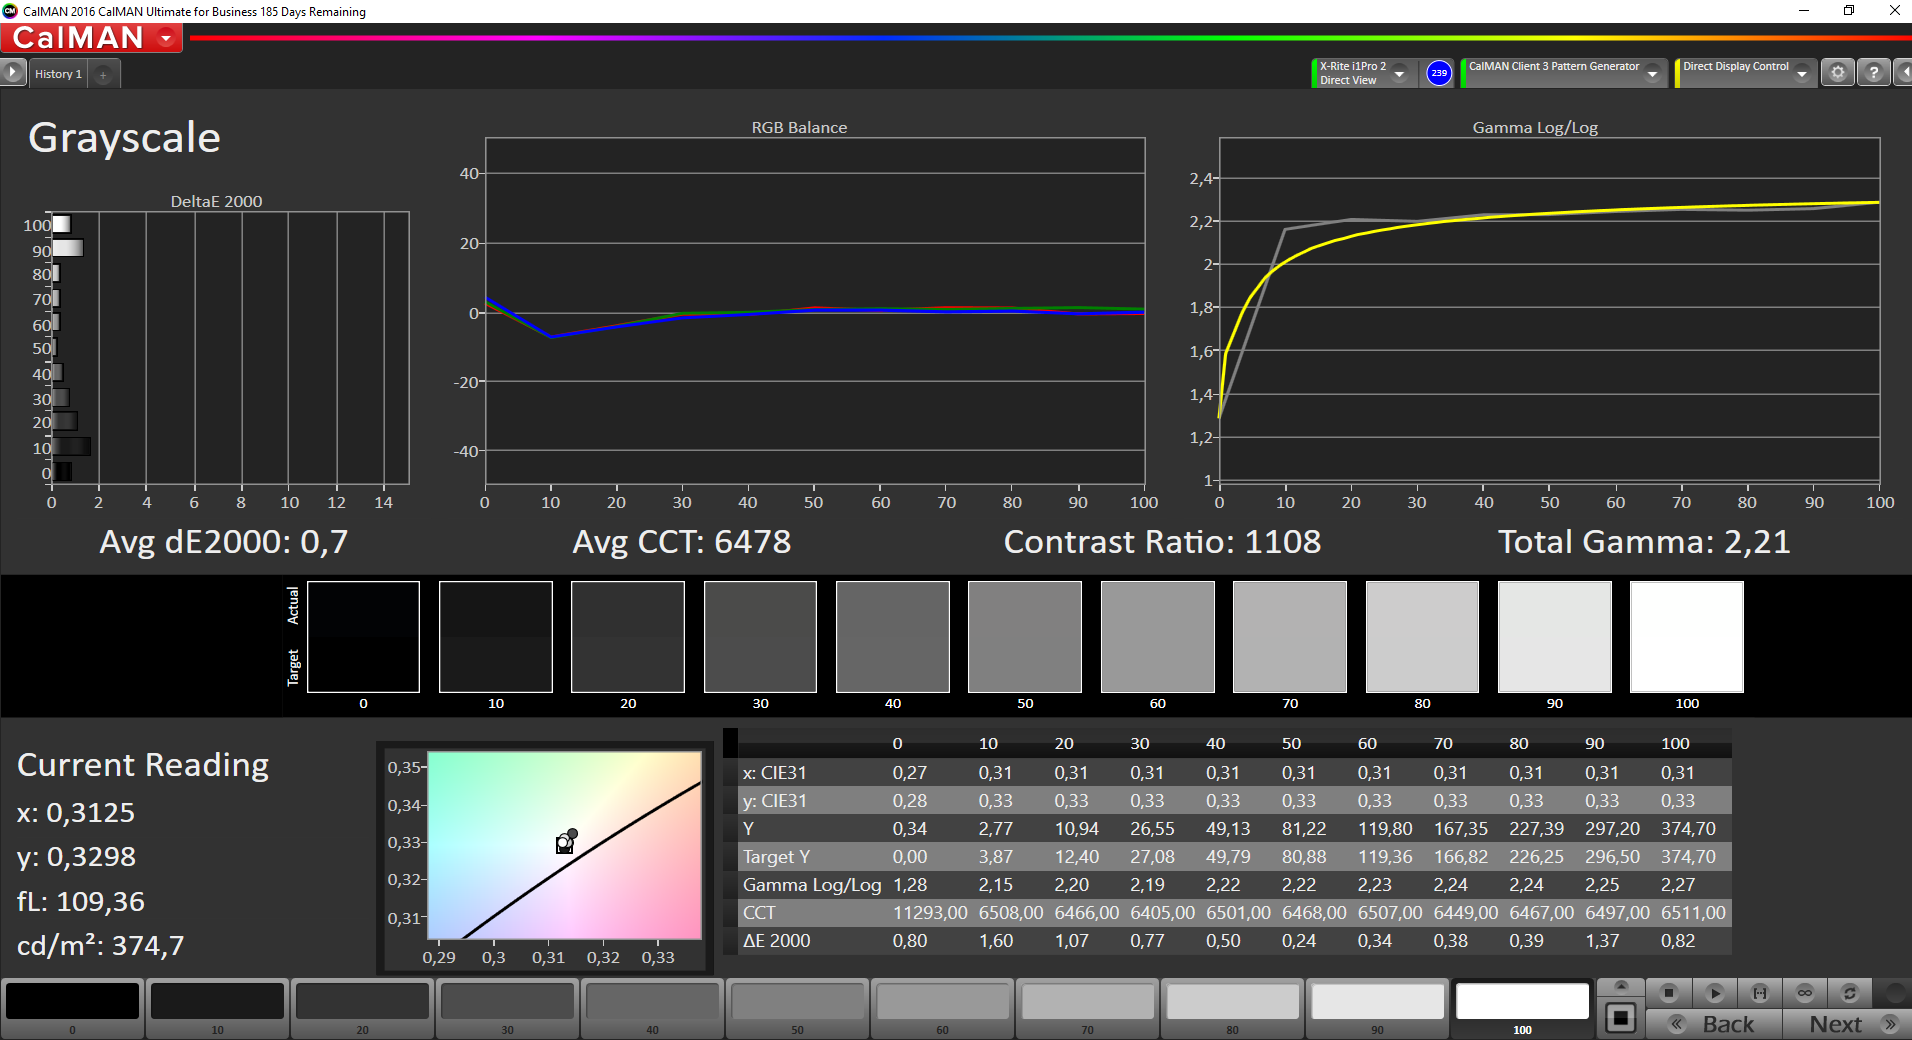
Our measurements determine slightly better results compared to the ThinkPad P70 with an average luminance of about 340 nits, but the brightness distribution is no highlight at just 83%. The black value is decent at 0.31 cd/m² (contrast 1155:1) and the average DeltaE-2000 deviations compared to the sRGB reference are already under the important value of 3. The comparison with the two premium rivals Dell Precision 7720 and HP ZBook 17 G4, both equipped with the best display options (PremierColor and DreamColor, respectively) is also interesting. They are even brighter, but the accuracy is not much better compared to the 4K panel of the ThinkPad P71.

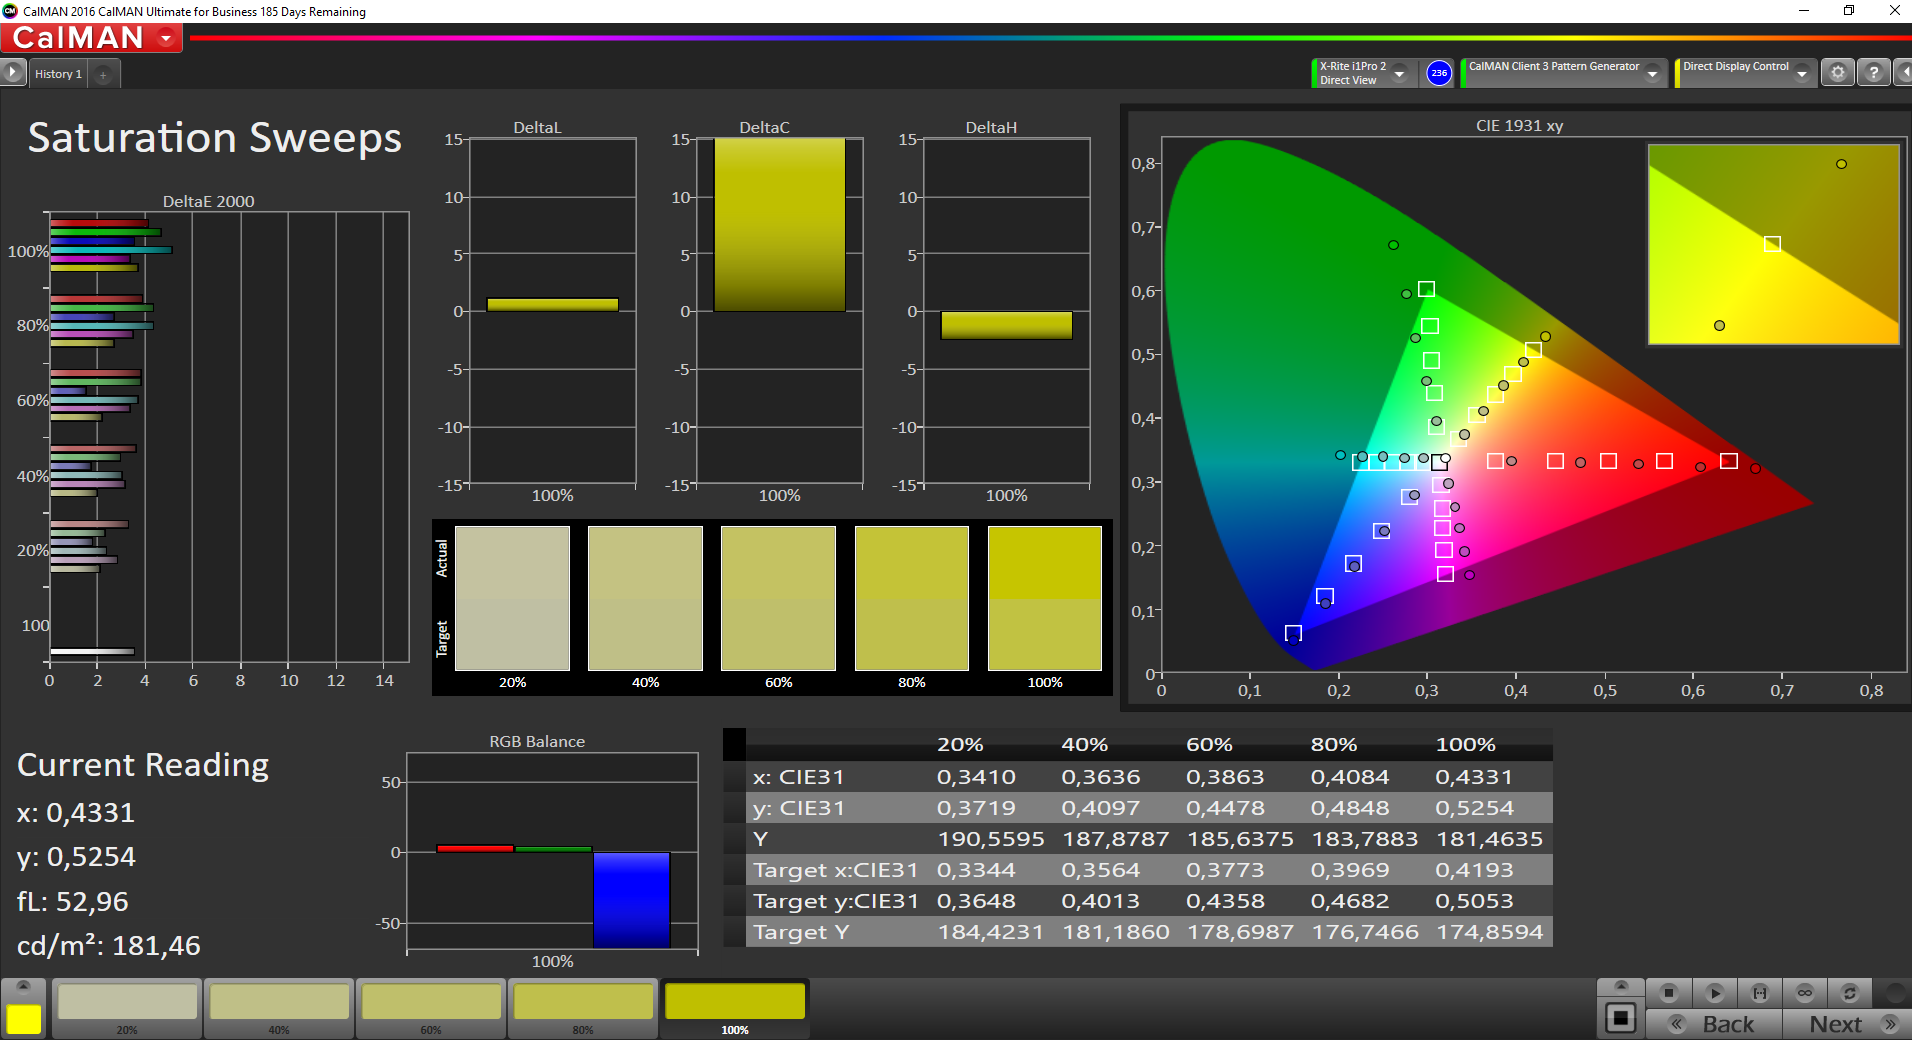
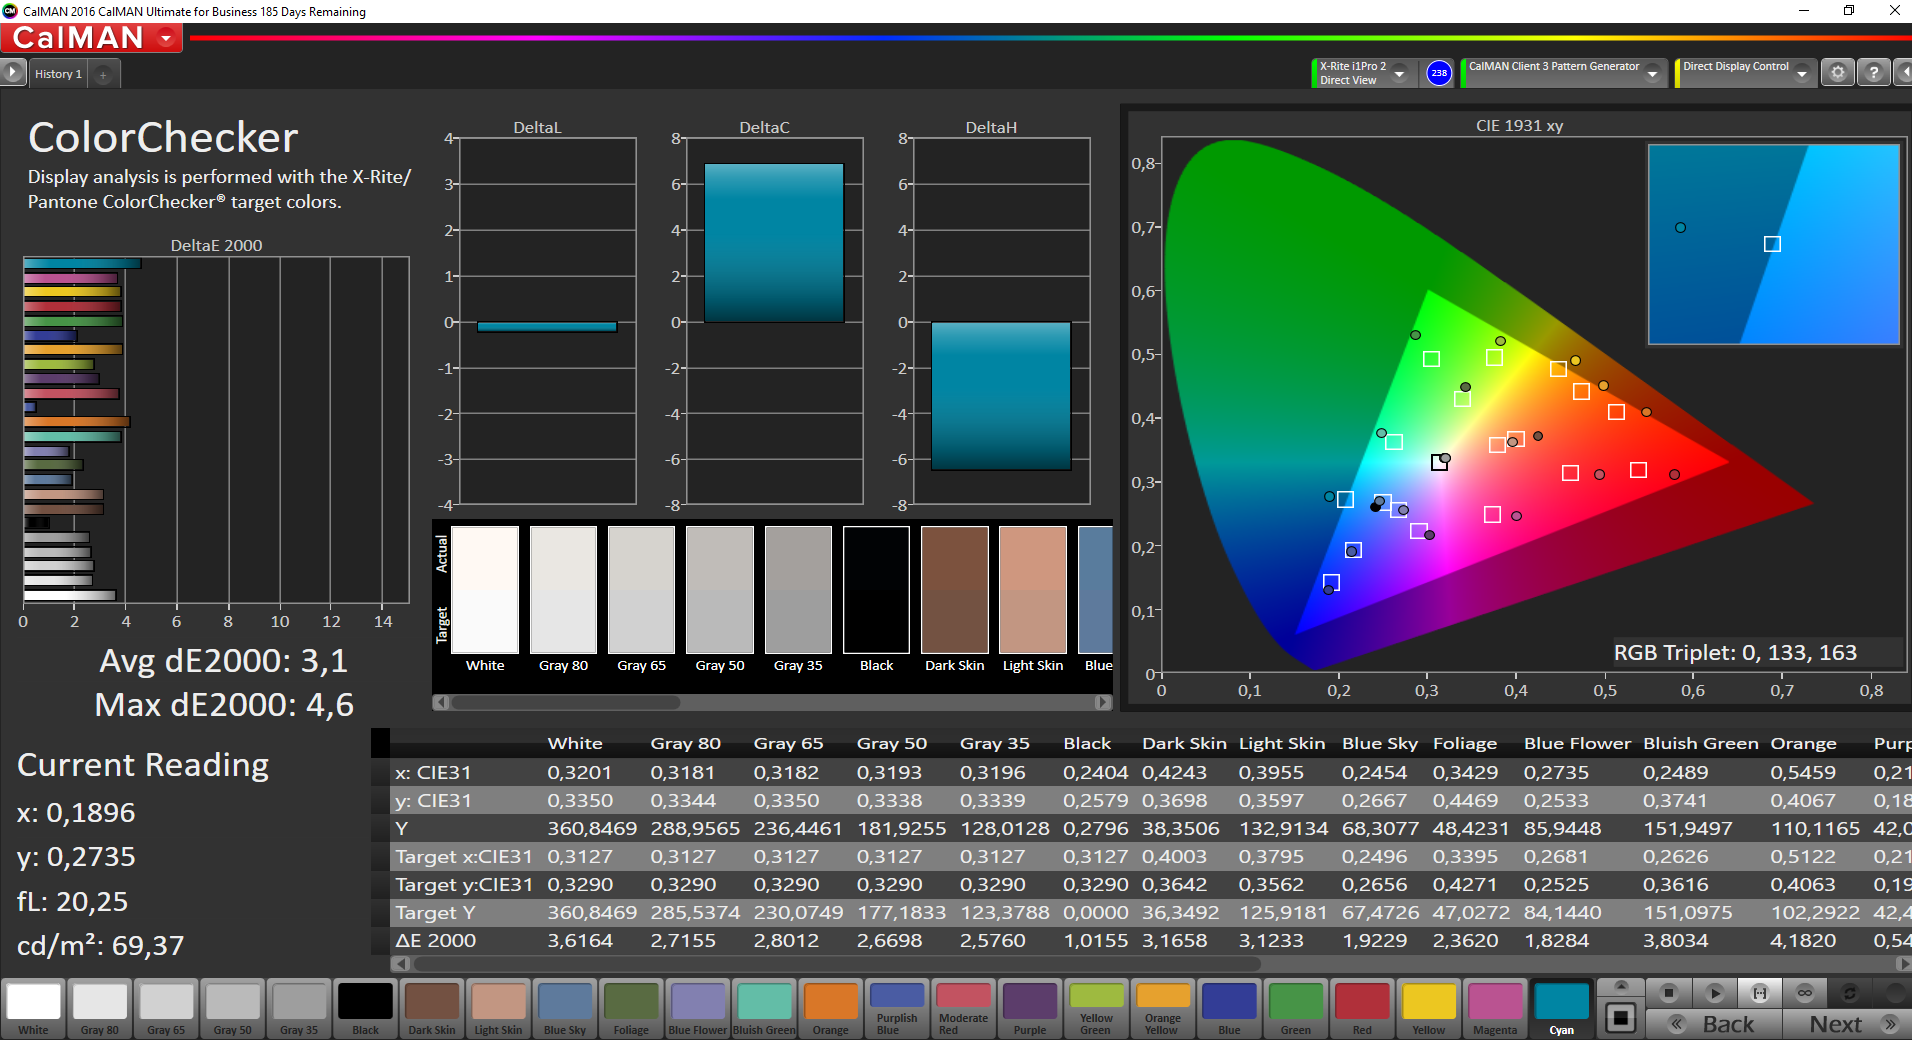
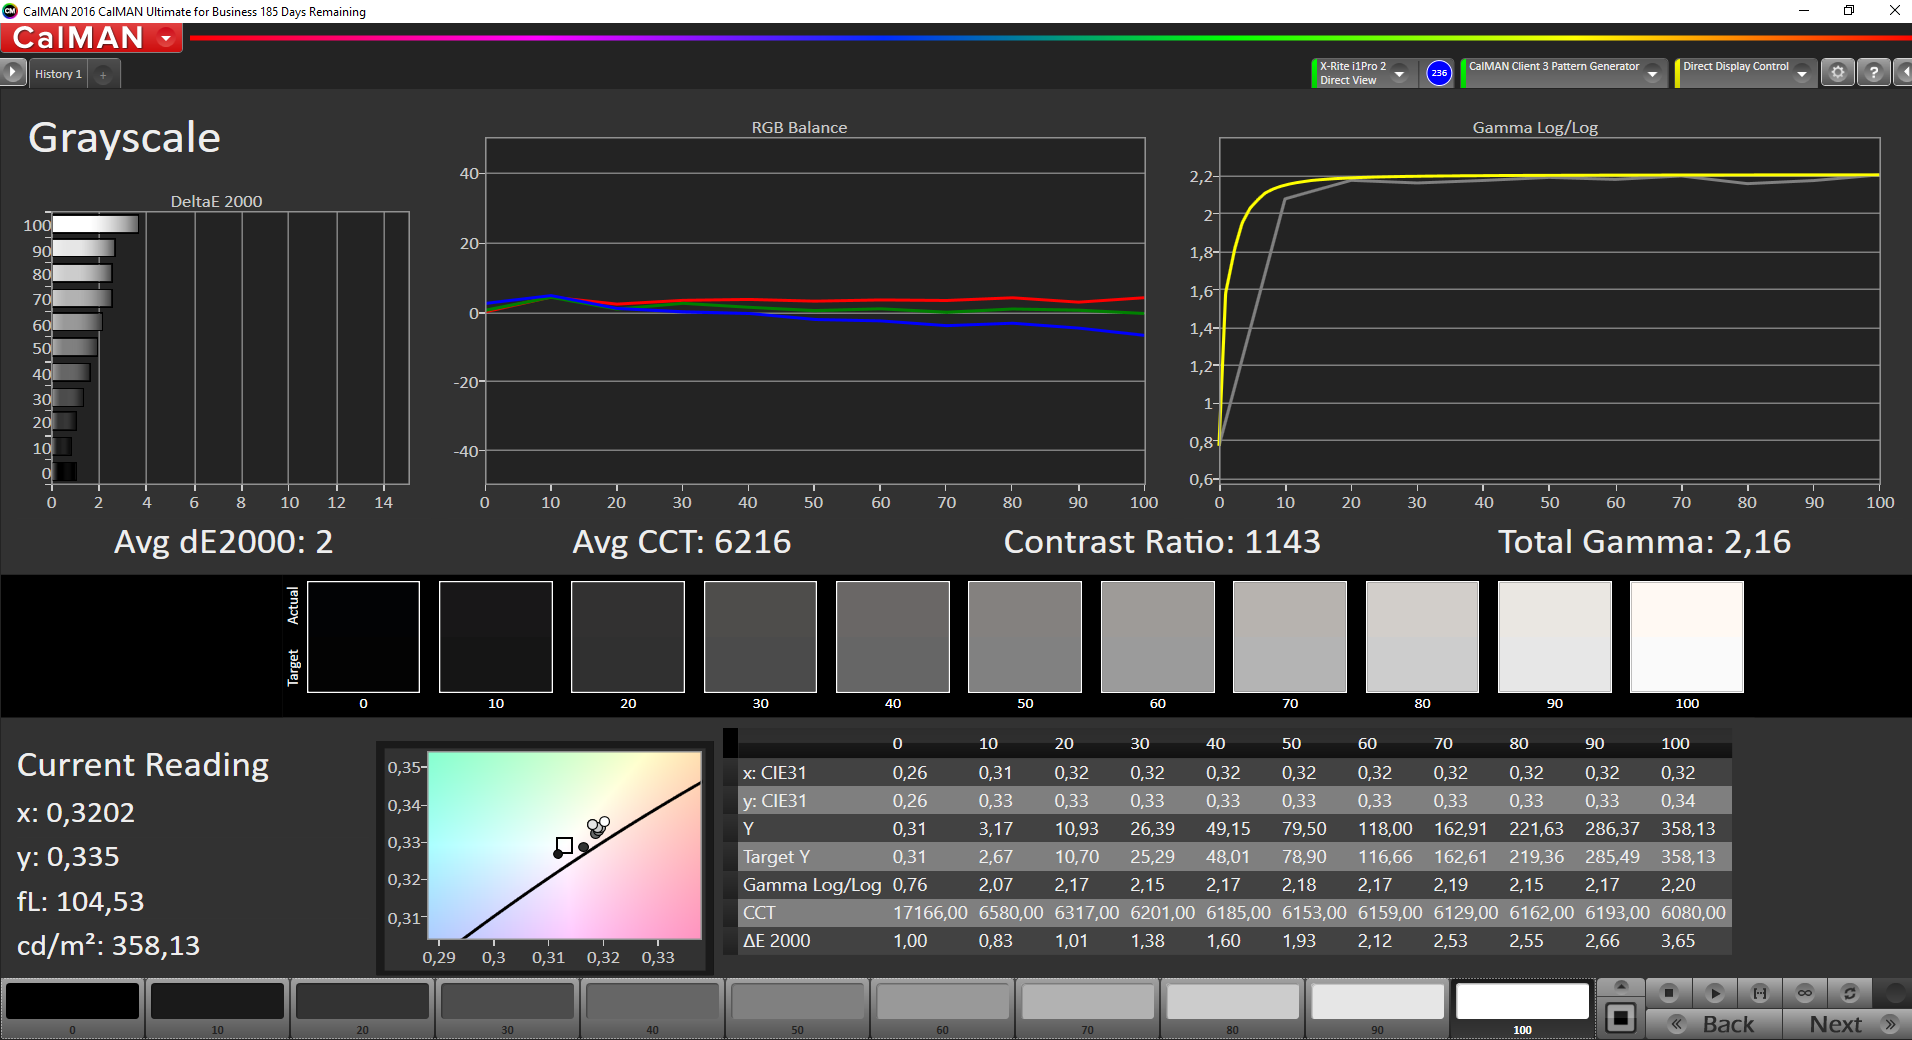
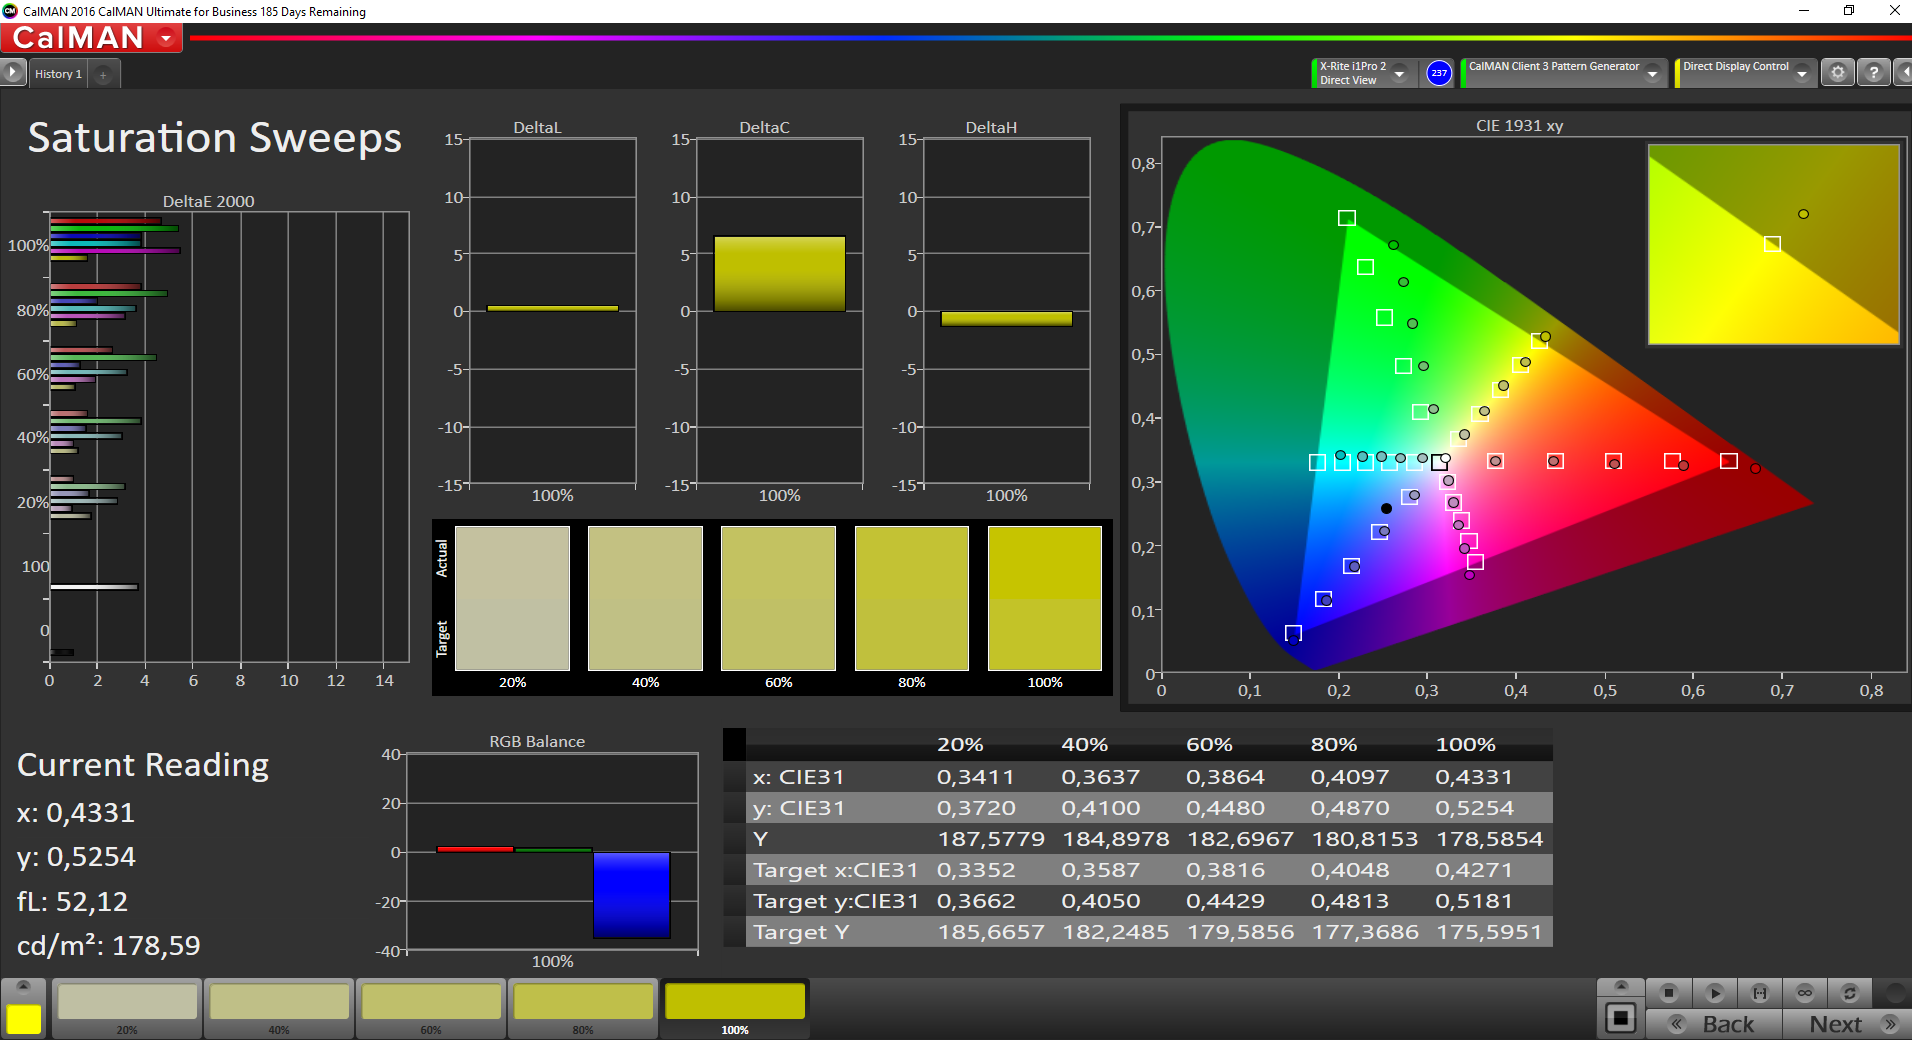
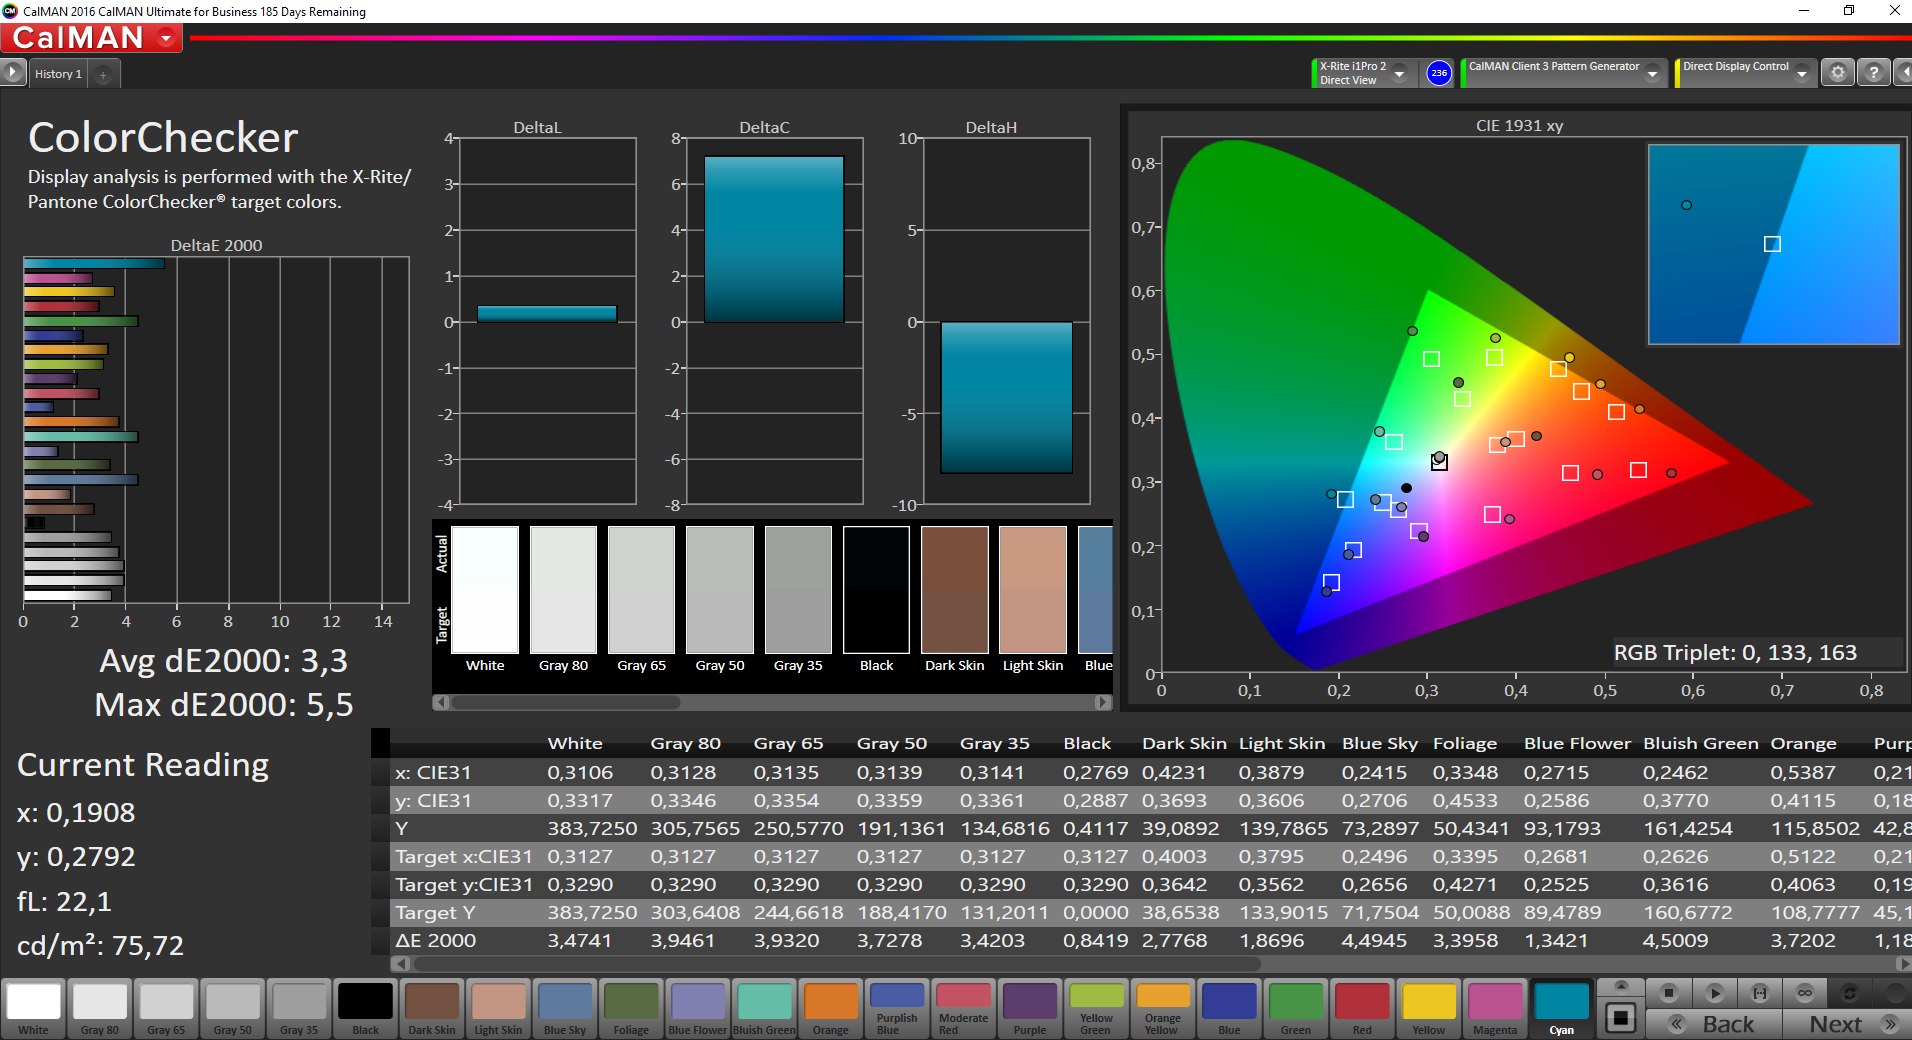
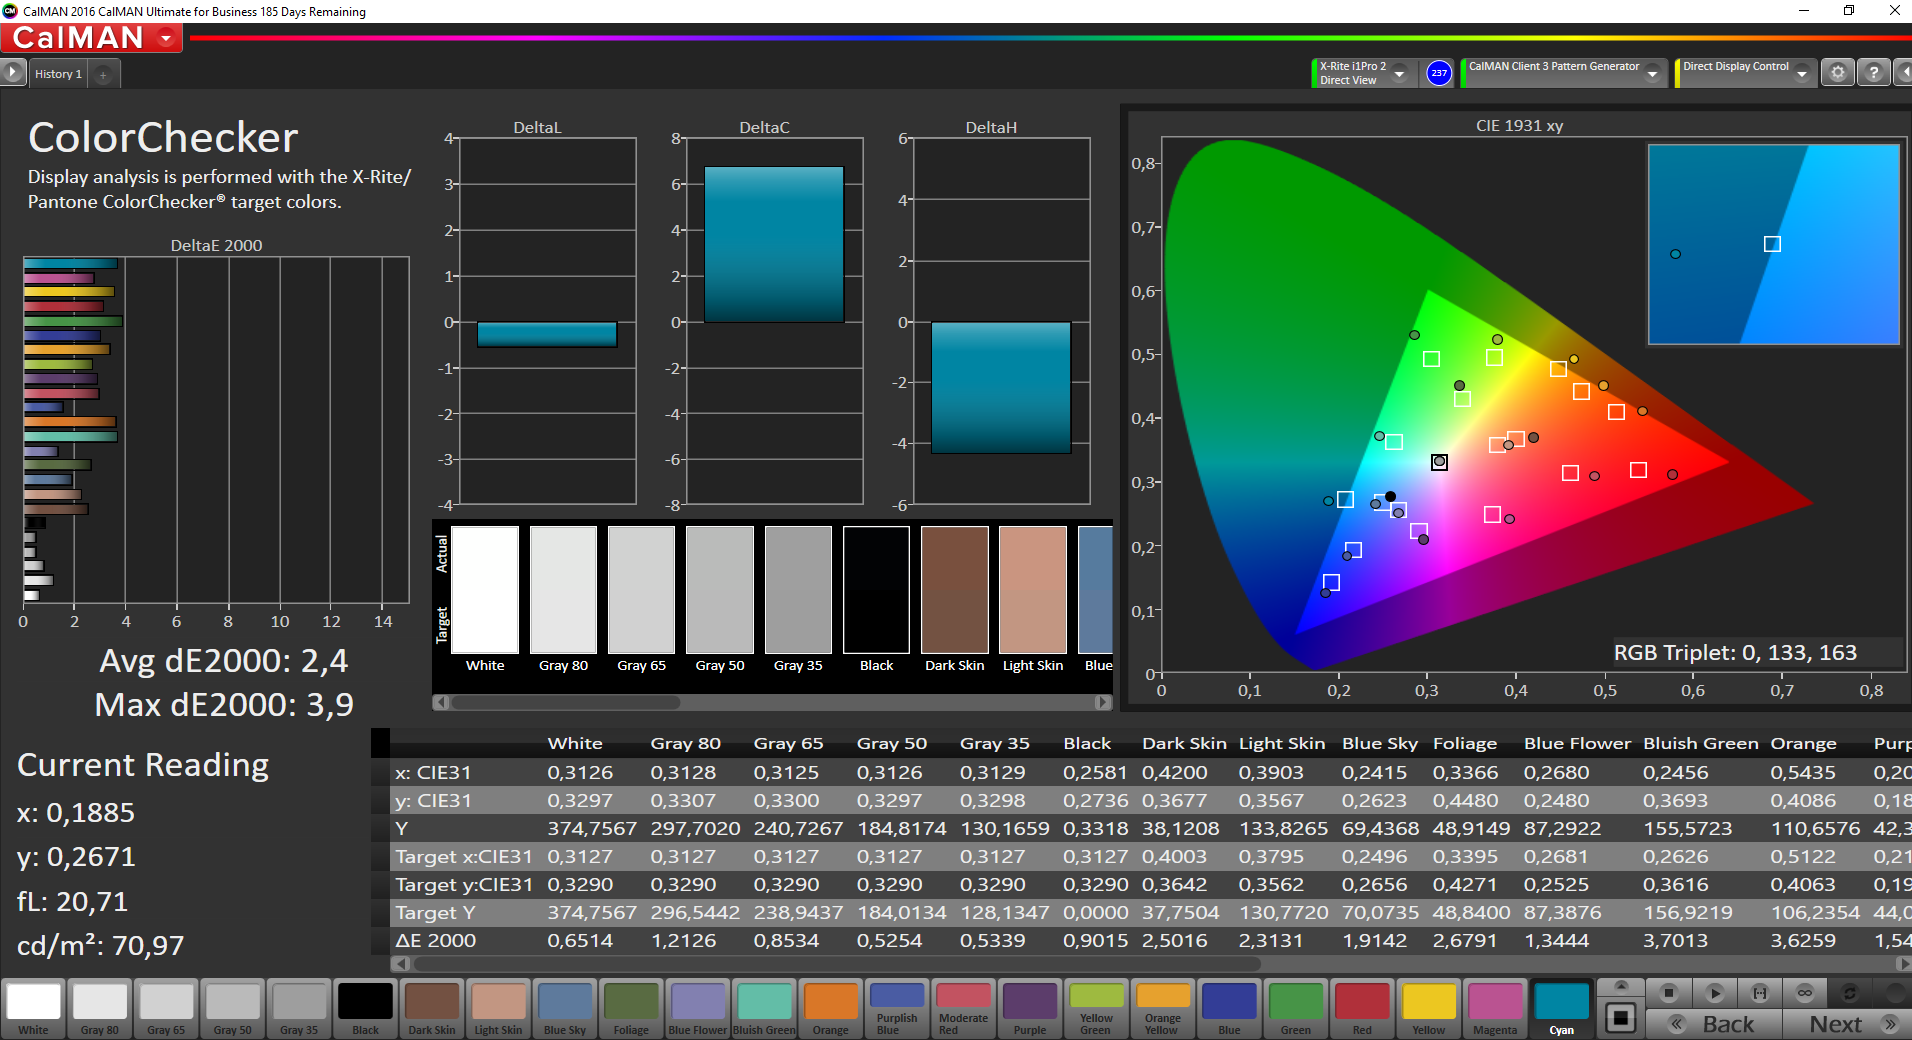
Our own calibration (X-Rite i1Pro 2) improves the grayscale performance in particular. The DeltaE-2000 deviations (colors) are also lower, but there are still some outliers (especially vs. sRGB).
All in all, the integrated calibration is decent on our particular test model and a comprehensive calibration is not always necessary. However, we have had mixed results from the integrated calibration in the past, and it is not successful on every device.


Display Response Times
| ↔ Response Time Black to White | ||
|---|---|---|
| 23.2 ms ... rise ↗ and fall ↘ combined | ↗ 11.6 ms rise | 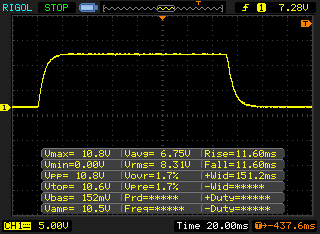 |
| ↘ 11.6 ms fall | ||
| The screen shows good response rates in our tests, but may be too slow for competitive gamers. In comparison, all tested devices range from 0.1 (minimum) to 240 (maximum) ms. » 53 % of all devices are better. This means that the measured response time is worse than the average of all tested devices (19.8 ms). | ||
| ↔ Response Time 50% Grey to 80% Grey | ||
| 39.2 ms ... rise ↗ and fall ↘ combined | ↗ 20.4 ms rise | 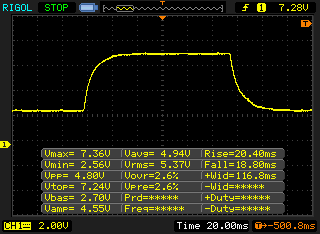 |
| ↘ 18.8 ms fall | ||
| The screen shows slow response rates in our tests and will be unsatisfactory for gamers. In comparison, all tested devices range from 0.165 (minimum) to 636 (maximum) ms. » 60 % of all devices are better. This means that the measured response time is worse than the average of all tested devices (30.9 ms). | ||
Screen Flickering / PWM (Pulse-Width Modulation)
| Screen flickering / PWM detected | 1412 Hz | ≤ 90 % brightness setting | 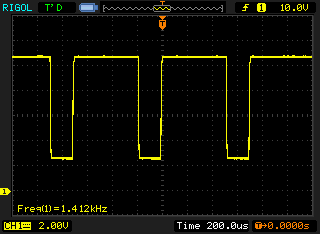 |
The display backlight flickers at 1412 Hz (worst case, e.g., utilizing PWM) Flickering detected at a brightness setting of 90 % and below. There should be no flickering or PWM above this brightness setting. The frequency of 1412 Hz is quite high, so most users sensitive to PWM should not notice any flickering. In comparison: 52 % of all tested devices do not use PWM to dim the display. If PWM was detected, an average of 7741 (minimum: 5 - maximum: 343500) Hz was measured. | |||
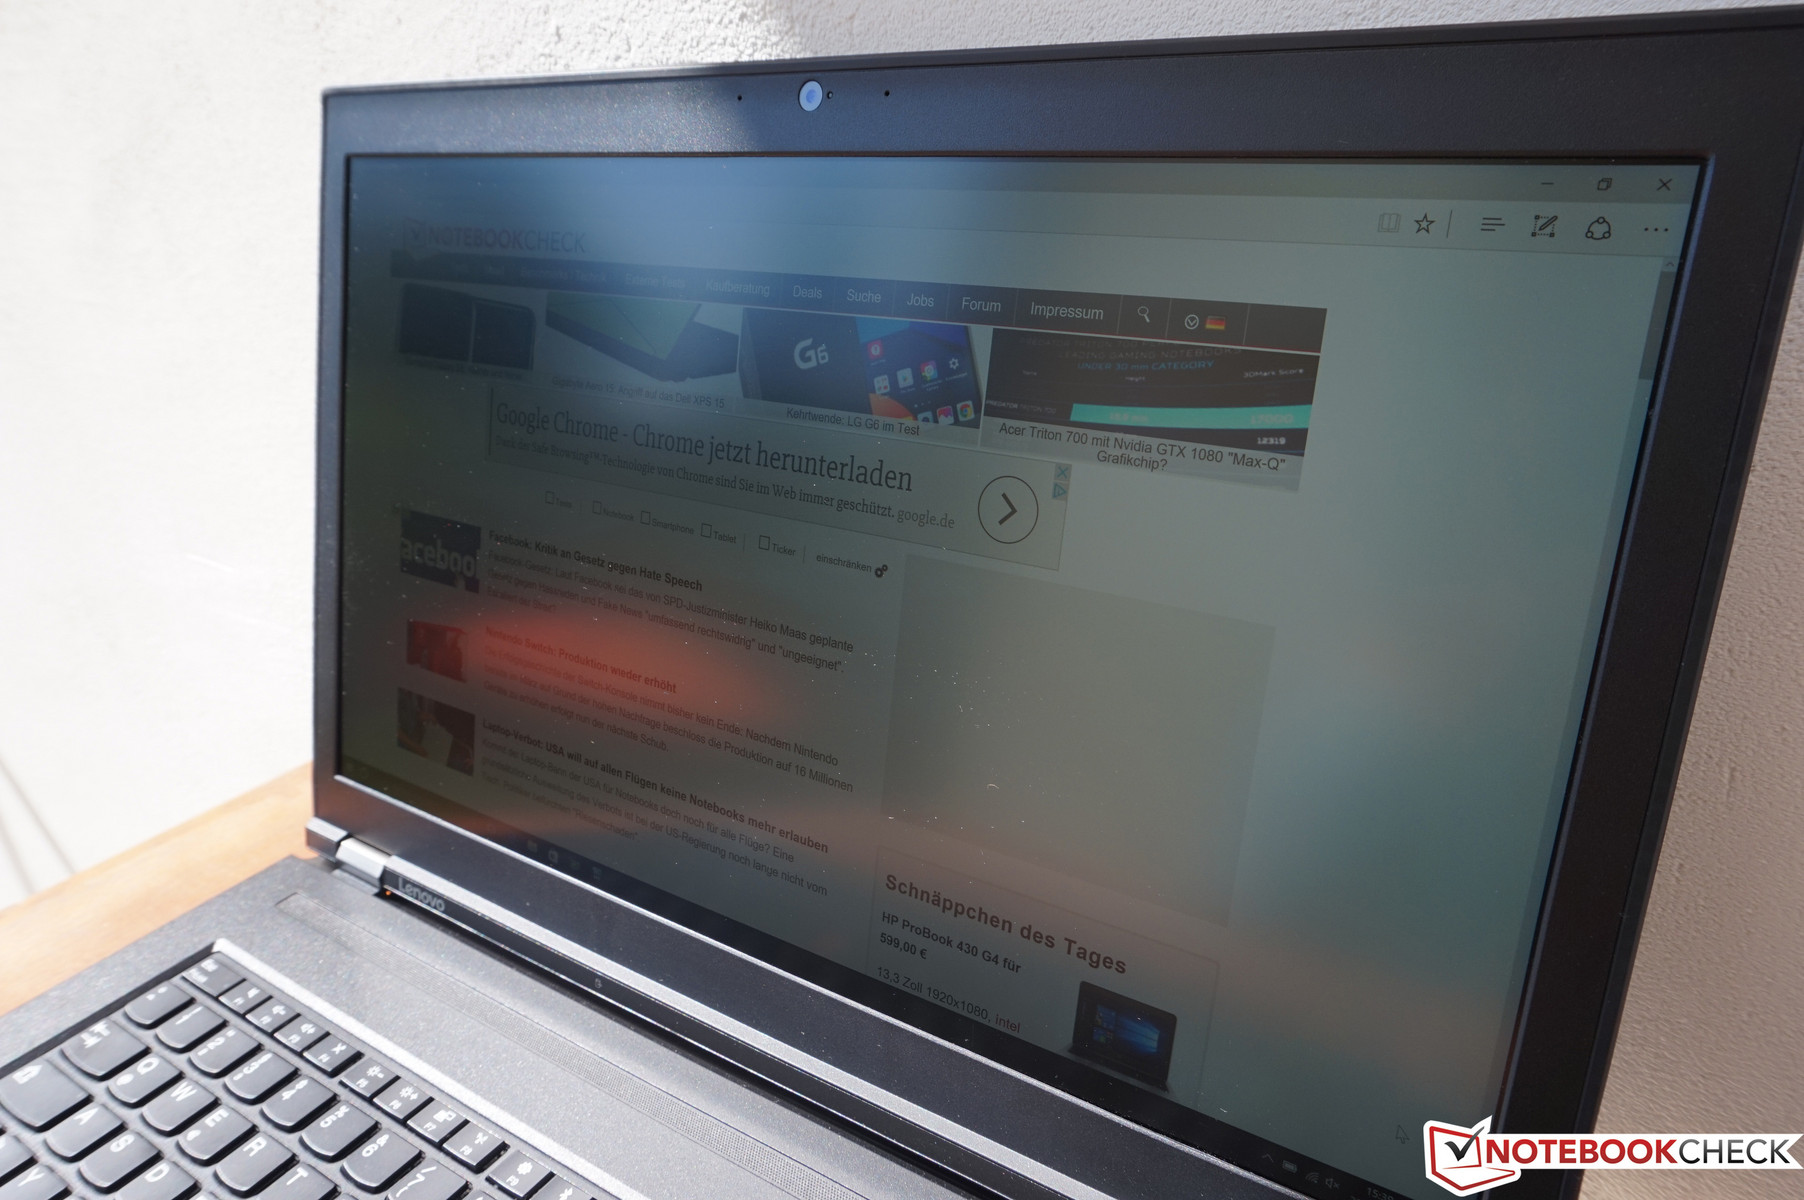
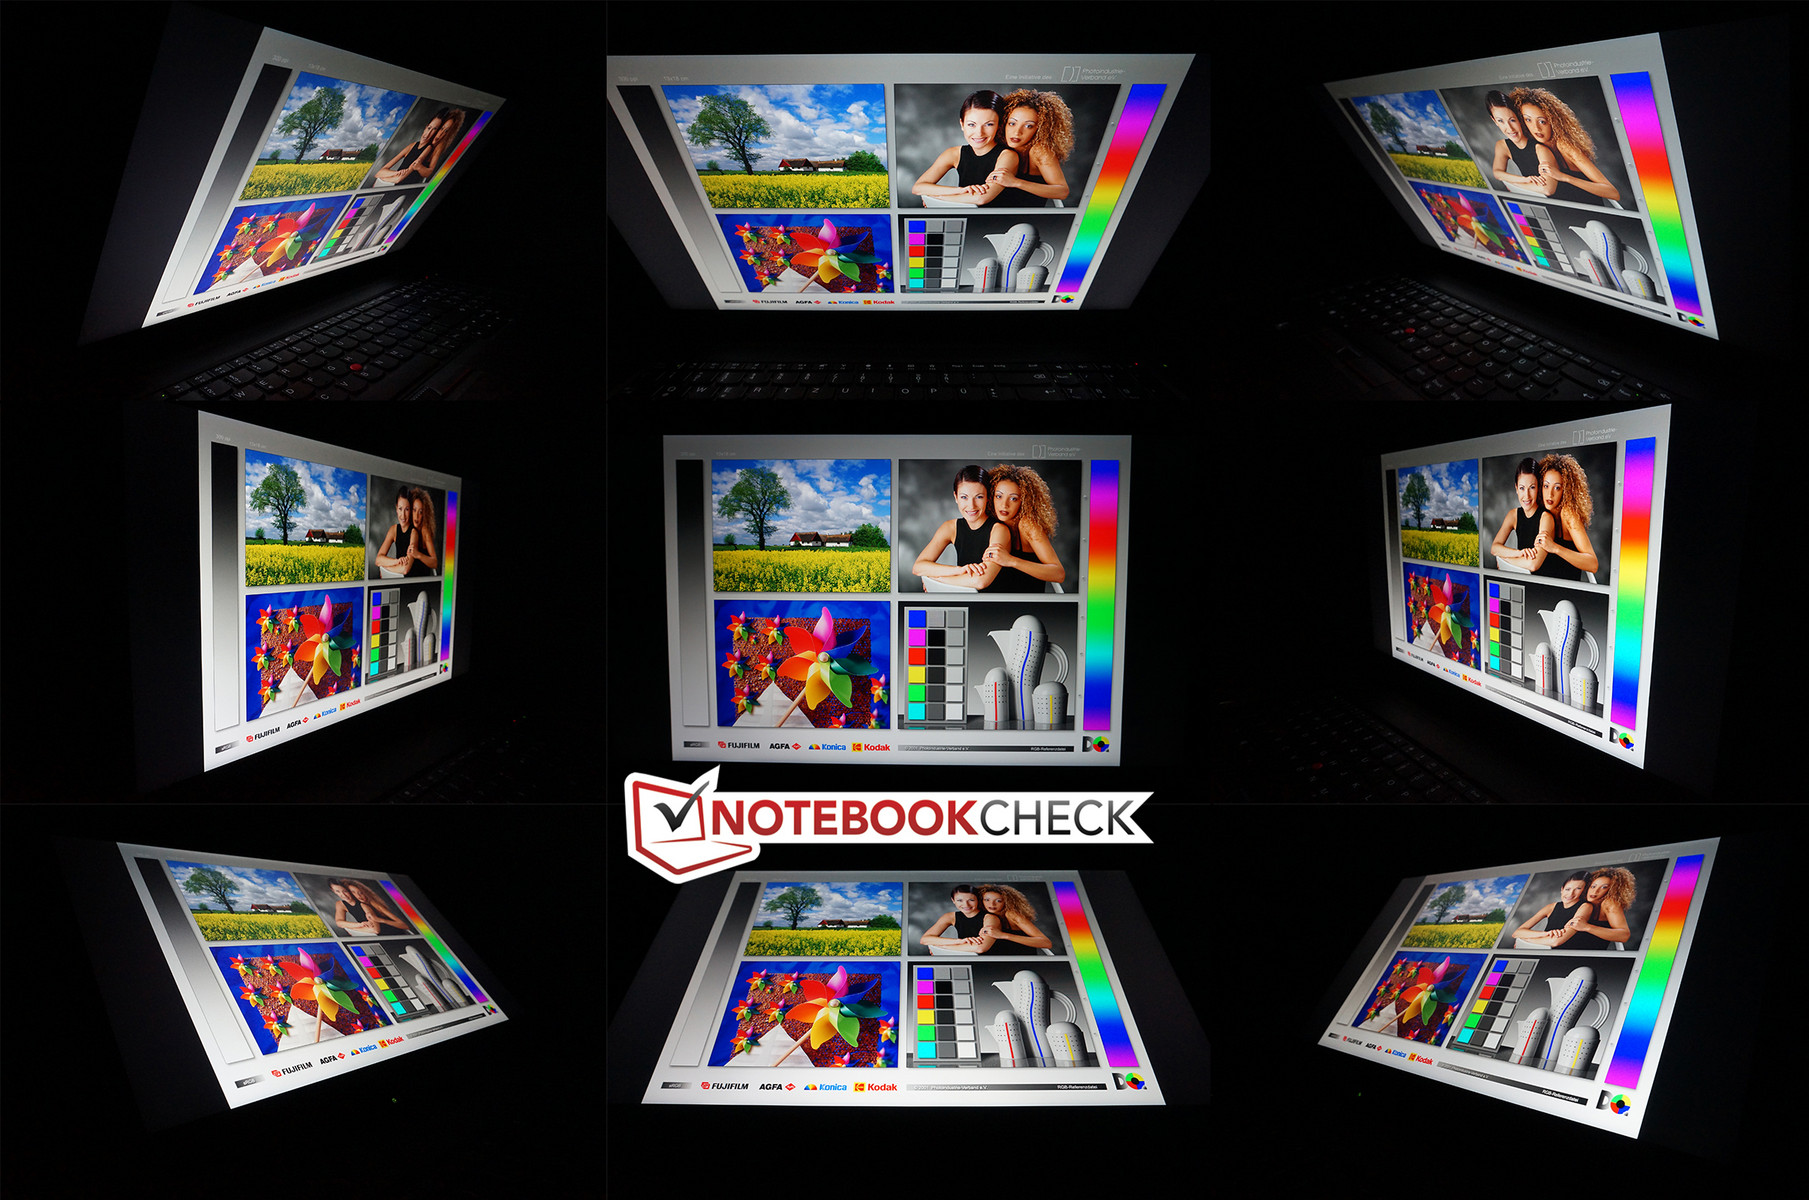
The matte screen surface is obviously an advantage outdoors, but the big display would benefit from an even higher luminance. Still, the ThinkPad P71 is hardly a portable travel companion, and there are no problems indoors. This is also the case for the viewing angles of the IPS screen, because you can see the content from every perspective.
Performance
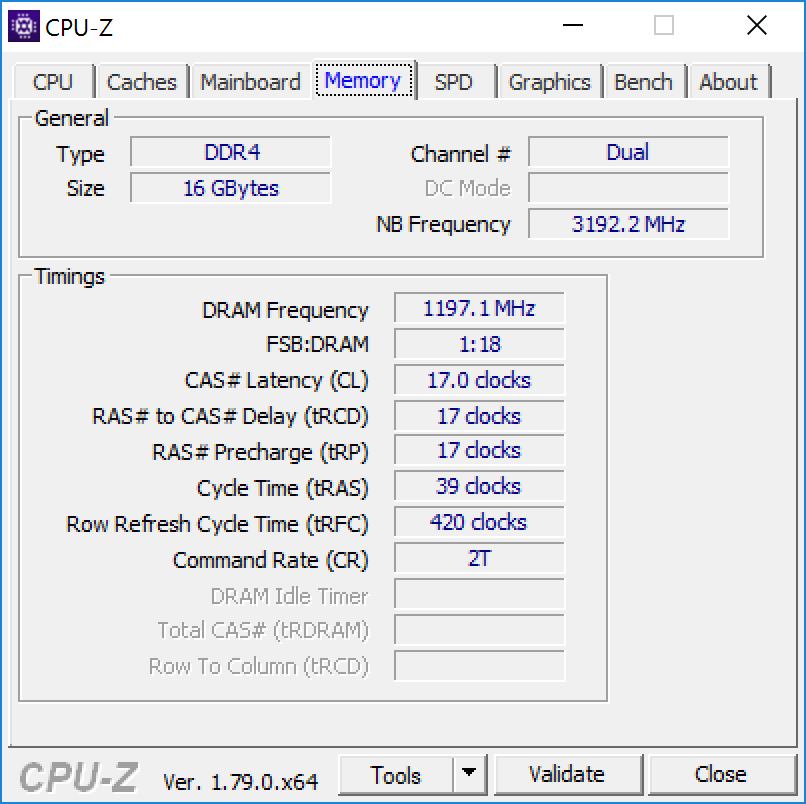
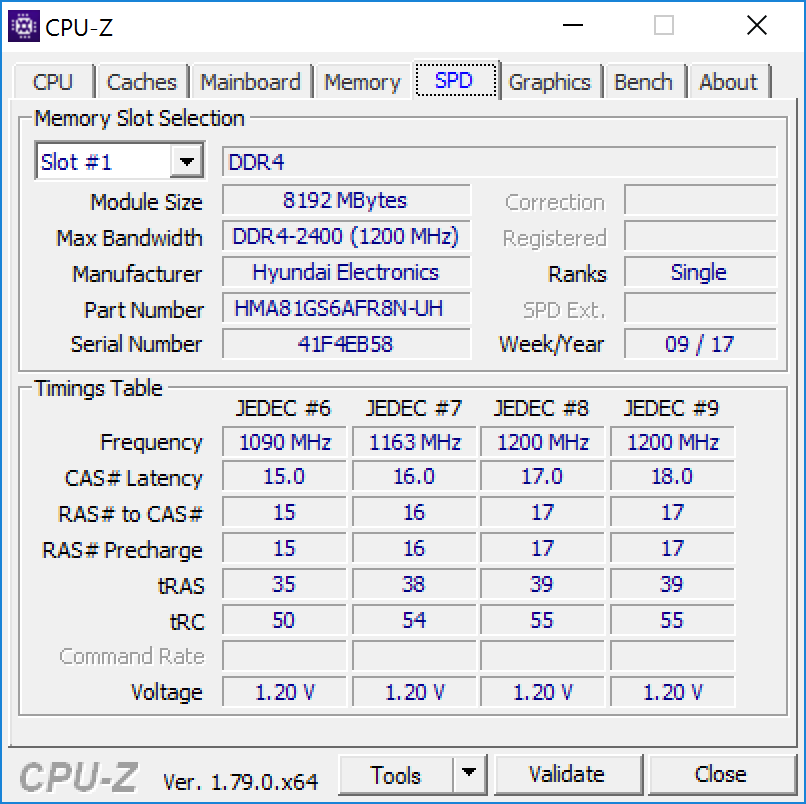
The ThinkPad P71 is Lenovo's most powerful mobile workstation, which is also reflected in the specification sheet. You can choose between four different mobile quad-core CPUs from Intel (2x Core i7, 2x Xeon), which can be combined with up to 64 GB of DDR4-RAM (optional ECC with the Xeons). The list of GPUs includes four dedicated chips from Nvidia, starting with the small M620M, which is still based on the old Maxwell architecture, all the way up to the new Pascal models (P3000, P4000 & P5000).
Processor
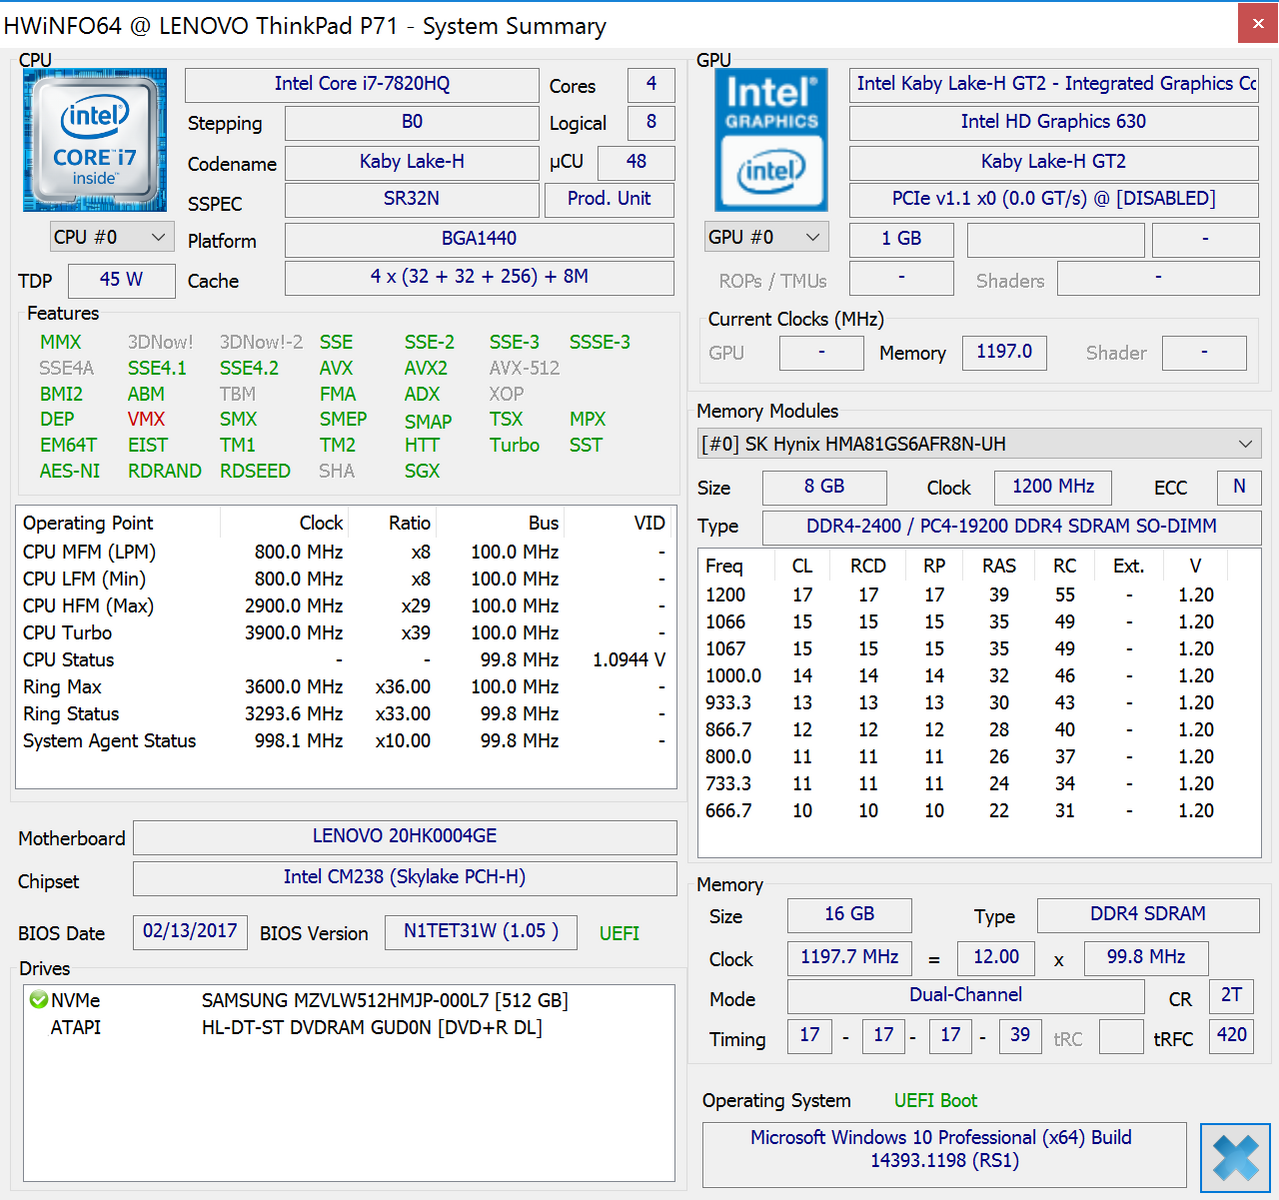
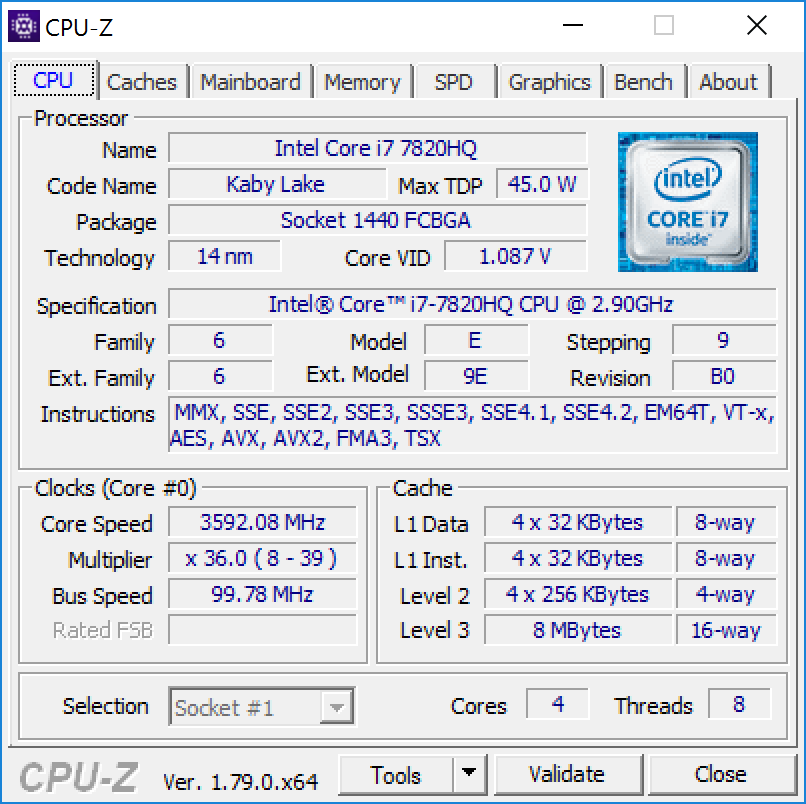
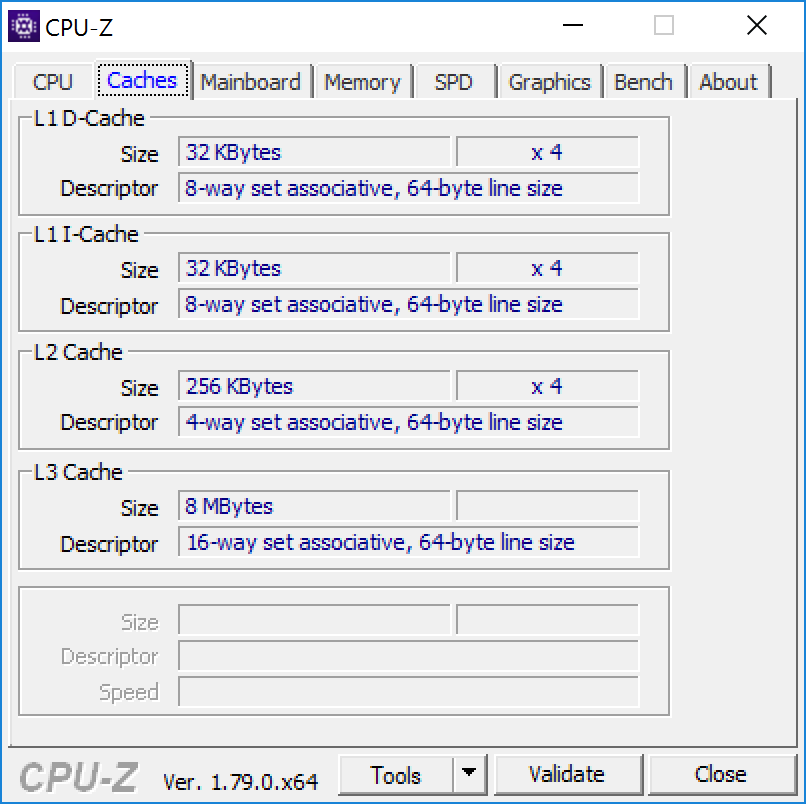
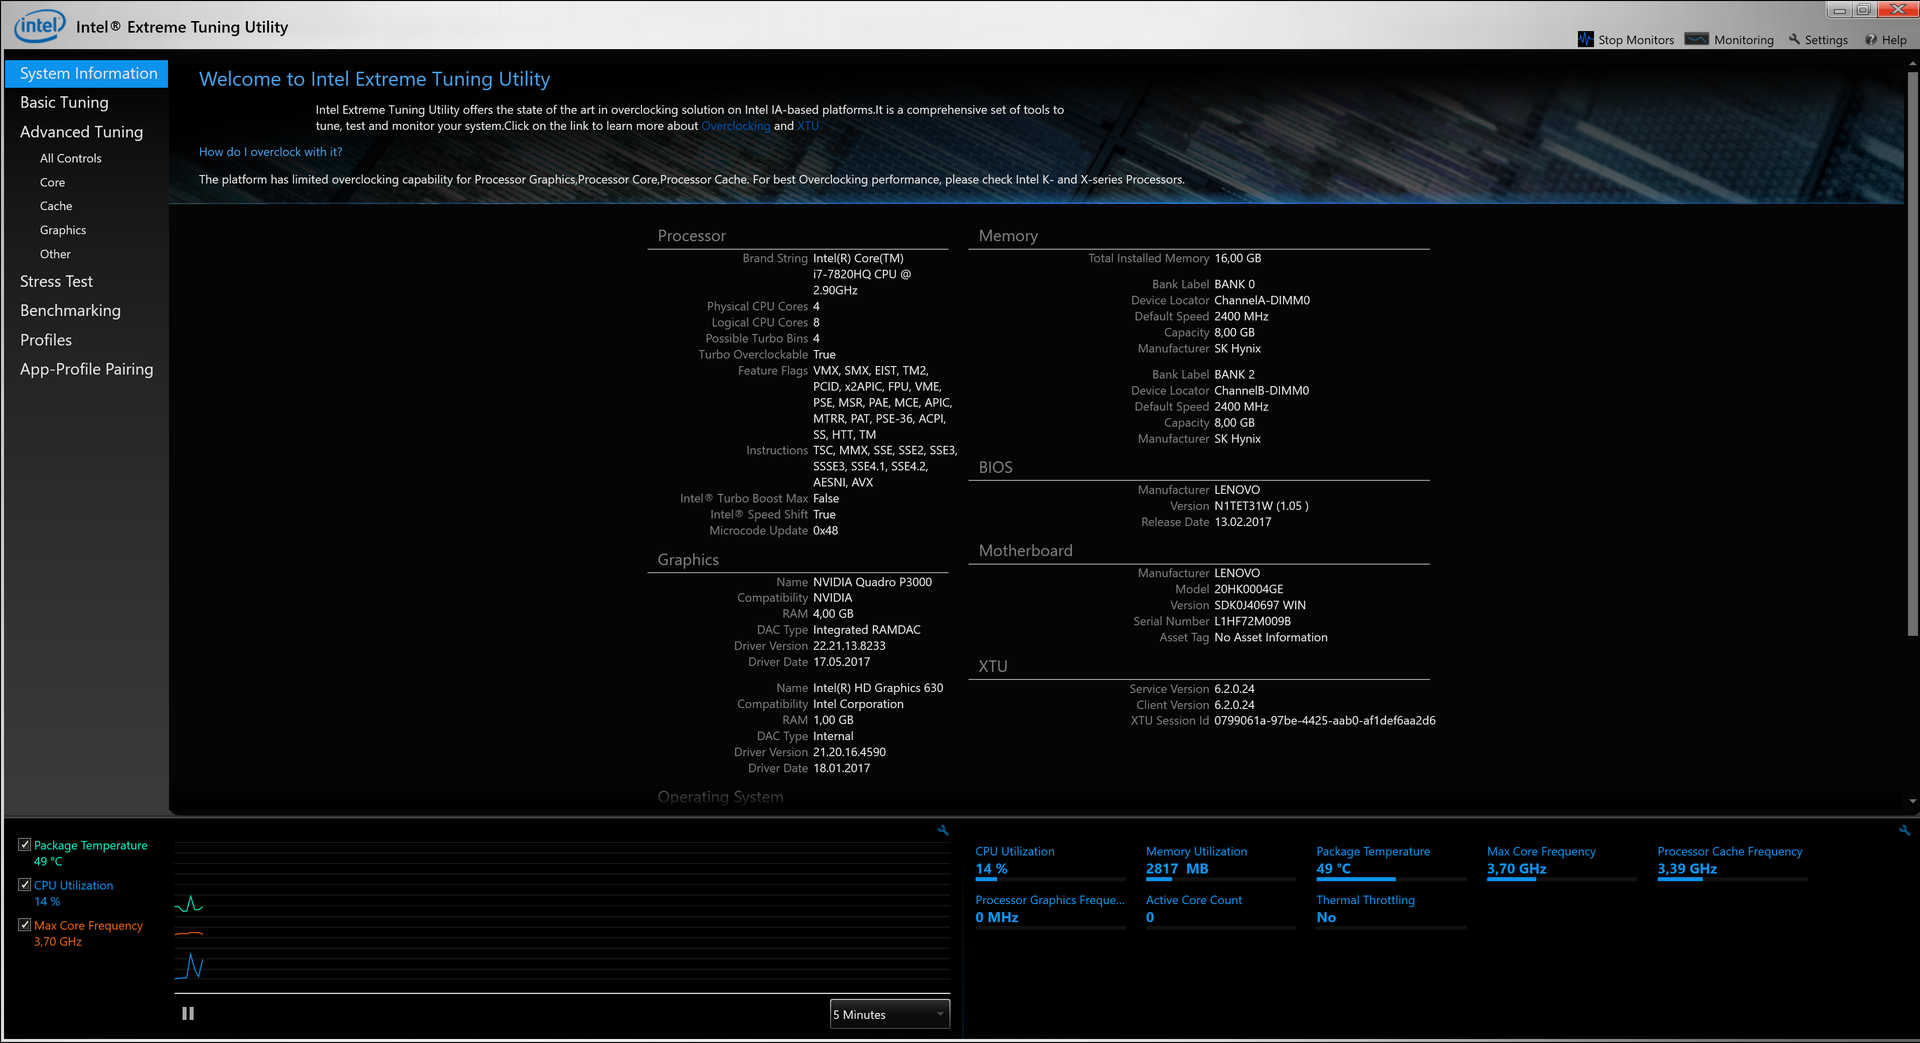
Our ThinkPad P71 is equipped with the Kaby Lake processor Core i7-7820HQ. It can reach up to 3.9 GHz and is just ahead of the very popular Core i7-7700HQ, which can also be found in many modern gaming and multimedia laptops. More specifications are available in our CPU section.
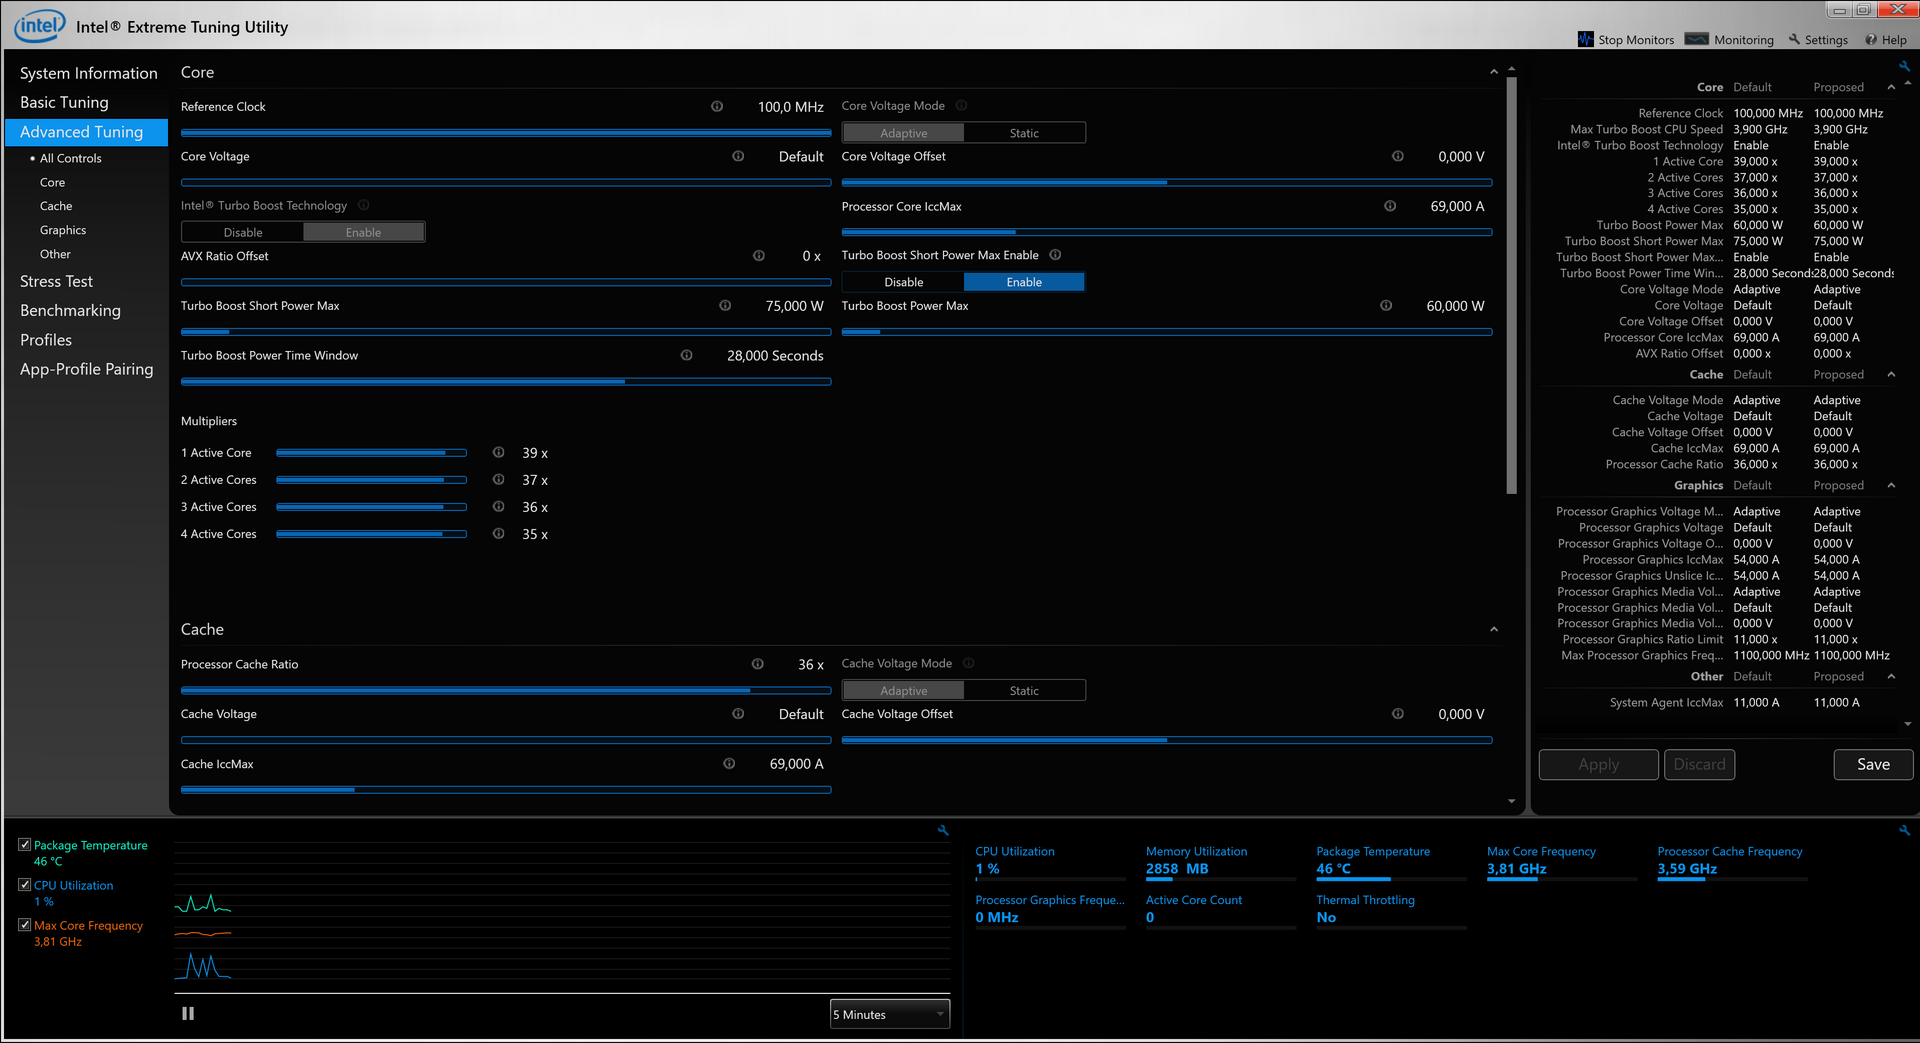
A quick look at Intel's Extreme Tuning Utility shows that Lenovo hardly limits the processor at all. Instead of the default 45-W limit, which usually sets in after ~30 seconds on most devices, the CPU in the P71 can consume 60W for sustained periods and even up to 75W for short periods of time. This should pay off when you select one of the two Xeons. The i7-7820HQ does not really benefit from the raised limit; 4x 3.5 GHz in the Cinebench Multi test only results in 44W. Only extremely high workloads such as Prime95 can result in up to 64W before the Power Limit 2 at 60-W sets in (and is maintained).
The steady performance in our Cinebench Multi loop without any signs of throttling is therefore no surprise. The Xeon chips are obviously a bit faster (see comparison chart below), but the ThinkPad P71 can also be configured with them.
Lenovo limits the performance on battery to 60W, but this is still very generous and does not affect the Cinebench score, for example.
System Performance
Neither the PCMark 8 Work test nor the modern PCMark 10 worked on the test model, which is a bit strange. We suspect an issue with the drivers, because the results are not particularly good in the other two PCMark 8 sub tests (Home/Creative) considering the powerful components.
However, we did not experience any other limitations during our time with the unit and all other benchmarks/applications worked just fine. The subjective performance impression is also great.
| PCMark 8 | |
| Creative Score Accelerated v2 | |
| HP ZBook 17 G4-Y3J82AV | |
| Fujitsu Celsius H970 | |
| Lenovo ThinkPad P71-20HK0004GE | |
| Dell Precision 7720 | |
| Home Score Accelerated v2 | |
| HP ZBook 17 G4-Y3J82AV | |
| MSI WE72 7RJ | |
| Dell Precision 7720 | |
| Lenovo ThinkPad P71-20HK0004GE | |
| PCMark 8 Home Score Accelerated v2 | 3578 points | |
| PCMark 8 Creative Score Accelerated v2 | 6402 points | |
Help | ||
Storage Devices
You can equip the ThinkPad P71 with a total of four storage drives. In addition to both M.2 slots (with PCIe support) and the regular 2.5-inch tray, you can also install another HDD instead of the optical drive. Our test model is shipped with a fast NVMe-SSD from Samsung, which is also the case for most rivals (only Dell's Precision 7720 uses a Toshiba NVMe-SSD), so they are all very close in this section. More benchmarks for many other SSDs & HDDs are listed in our Tech section.
| Lenovo ThinkPad P71-20HK0004GE Samsung PM961 NVMe MZVLW512HMJP | MSI WE72 7RJ Samsung SM961 MZVPW256 m.2 PCI-e | Fujitsu Celsius H970 Samsung SM961 MZVKW512HMJP m.2 PCI-e | HP ZBook 17 G4-Y3J82AV Samsung SSD SM961 1TB M.2 MZVKW1T0HMLH | Dell Precision 7720 Toshiba NVMe THNSN5512GPU7 | |
|---|---|---|---|---|---|
| CrystalDiskMark 3.0 | -5% | -17% | -8% | -7% | |
| Read Seq (MB/s) | 1628 | 1492 -8% | 1821 12% | 1767 9% | 1532 -6% |
| Write Seq (MB/s) | 1512 | 1512 0% | 1622 7% | 1662 10% | 1187 -21% |
| Read 512 (MB/s) | 880 | 312.6 -64% | 395.5 -55% | 406.7 -54% | 1227 39% |
| Write 512 (MB/s) | 1197 | 1483 24% | 1258 5% | 1197 0% | 1287 8% |
| Read 4k (MB/s) | 61.2 | 59.9 -2% | 42.86 -30% | 54.9 -10% | 45.33 -26% |
| Write 4k (MB/s) | 177 | 184.2 4% | 87.4 -51% | 159.3 -10% | 145 -18% |
| Read 4k QD32 (MB/s) | 667 | 681 2% | 590 -12% | 660 -1% | 590 -12% |
| Write 4k QD32 (MB/s) | 574 | 590 3% | 522 -9% | 549 -4% | 467 -19% |

GPU Performance
The current situation for Nvidia's professional GPUs is a bit complicated right now. Similar to the consumer models (GeForce), Nvidia launched the high-end Pascal chips first, while smaller chips are still based on the older Maxwell architecture. The Quadro P3000 in our test model is currently the slowest Pascal model. It is equipped with 1280 shaders as well as 6 GB of GDDR5-VRAM, which is similar to the standard GTX 1060 (Laptop), but the clock is much lower. While the core of the GTX 1060 can run at more than 1600 MHz, the frequency on the P3000 is capped at 1240 MHz.
This is also noticeable in the benchmarks that depend on the raw GPU performance (like 3DMarks), where the P3000 is much closer to the GeForce GTX 1050 Ti than the GTX 1060. The direct predecessor, Quadro M3000M is still easily beaten, and even the old Quadro M4000M falls behind the new Pascal GPU.
The new P3000 also performs well in OpenGL and OpenCL test, because the old M3000M is often beaten. The GPU performance is not restricted on battery power.
| Unigine Heaven 4.0 | |
| Extreme Preset OpenGL | |
| Dell Precision 7720 | |
| HP ZBook 17 G4-Y3J82AV | |
| Lenovo ThinkPad P71-20HK0004GE | |
| MSI WE72 7RJ | |
| Extreme Preset DX11 | |
| Dell Precision 7720 | |
| HP ZBook 17 G4-Y3J82AV | |
| Lenovo ThinkPad P71-20HK0004GE | |
| MSI WE72 7RJ | |
| Unigine Valley 1.0 | |
| 1920x1080 Extreme HD DirectX AA:x8 | |
| HP ZBook 17 G4-Y3J82AV | |
| Dell Precision 7720 | |
| Lenovo ThinkPad P71-20HK0004GE | |
| HP ZBook 17 G3 TZV66eA | |
| Dell Precision 7710 | |
| MSI WE72 7RJ | |
| 1920x1080 Extreme HD Preset OpenGL AA:x8 | |
| HP ZBook 17 G4-Y3J82AV | |
| Dell Precision 7720 | |
| Lenovo ThinkPad P71-20HK0004GE | |
| HP ZBook 17 G3 TZV66eA | |
| Dell Precision 7710 | |
| MSI WE72 7RJ | |
| SiSoft Sandra 2016 | |
| Image Processing | |
| Dell Precision 7720 | |
| HP ZBook 17 G4-Y3J82AV | |
| Dell Precision 7710 | |
| Lenovo ThinkPad P71-20HK0004GE | |
| HP ZBook 17 G3 TZV66eA | |
| GP Cryptography (Higher Security AES256+SHA2-512) | |
| HP ZBook 17 G4-Y3J82AV | |
| Dell Precision 7720 | |
| Lenovo ThinkPad P71-20HK0004GE | |
| HP ZBook 17 G3 TZV66eA | |
| Dell Precision 7710 | |
| GP Financial Analysis (FP High/Double Precision) | |
| Dell Precision 7720 | |
| HP ZBook 17 G4-Y3J82AV | |
| Dell Precision 7710 | |
| Lenovo ThinkPad P71-20HK0004GE | |
| HP ZBook 17 G3 TZV66eA | |
| 3DMark 06 1024x768 Score | 29440 points | |
| 3DMark Vantage P Result | 33390 points | |
| 3DMark 11 Performance | 10738 points | |
| 3DMark Cloud Gate Standard Score | 24854 points | |
| 3DMark Fire Strike Score | 8003 points | |
| 3DMark Fire Strike Extreme Score | 4175 points | |
| 3DMark Time Spy Score | 2999 points | |
Help | ||
Gaming Performance
The Quadro P3000 can obviously not keep up with the gaming performance of the consumer GeForce GTX 1060 thanks to the lower clock, but is still ahead of the GTX 1050 Ti. This is sufficient for smooth gameplay in modern titles (high or even max. details), but only in 1080p. The native 4K UHD resolution is just too challenging. The modern Quadro drivers are usually no problem for games, only brand-new titles sometimes require more modern drivers (you can use the regular GeForce drivers in these cases). More gaming benchmarks are listed here.
| low | med. | high | ultra | 4K | |
|---|---|---|---|---|---|
| BioShock Infinite (2013) | 231.9 | 203.7 | 184.7 | 89.8 | |
| Dirt Rally (2015) | 233.9 | 129.8 | 80.7 | 71.6 | 61.8 |
| The Witcher 3 (2015) | 167.2 | 103.6 | 59.1 | 31.2 | 21.8 |
| Star Wars Battlefront (2015) | 180.9 | 156.4 | 82.5 | 70.3 | 27.4 |
| Rainbow Six Siege (2015) | 278.2 | 189.5 | 107.3 | 78.8 | 34.9 |
| Rise of the Tomb Raider (2016) | 176.4 | 107 | 59.4 | 50.3 | 21 |
| Deus Ex Mankind Divided (2016) | 103.7 | 77.6 | 43.3 | 22.9 | 14.5 |
| Battlefield 1 (2016) | 165.8 | 139.5 | 68.7 | 60.6 | 25.1 |
| Titanfall 2 (2016) | 143.8 | 136.8 | 66.3 | 53.9 | 21.1 |
| Call of Duty Infinite Warfare (2016) | 120.8 | 114.2 | 79.9 | 68.7 | 30.9 |
| For Honor (2017) | 199.7 | 87.1 | 81.6 | 57.3 | 24.8 |
| Ghost Recon Wildlands (2017) | 107.7 | 53.7 | 48.4 | 26 | 19.5 |
| Warhammer 40.000: Dawn of War III (2017) | 84 | 41.2 | 28.7 | 25.4 | 9.6 |
Emissions
System Noise
The powerful and at yet quiet cooling solution is once again an advantage of the ThinkPad P71. The two fans are often deactivated in practice and hardly disturbing at 32 to 34 dB(A) during more challenging tasks. The noise can be described as a pleasant murmur without any annoying frequencies. The noise level of the cooling mainly depends on the CPU load. The maximum value is 39.1 dB(A), but we only recorded 34.7 dB(A) in the “Witcher 3”. This is pretty much on par with the old ThinkPad P71, which was equipped with the Quadro M3000M. The SKU with the more powerful Quadro M4000M on the other hand was noticeably louder (up to 45 dB(A)), so you can expect higher results for configurations with the more powerful Quadro P4000 or even P5000 as well.
There is unfortunately some occasional coil whine at about 30 dB(A), which slightly affects the good overall impression.
Noise level
| Idle |
| 29.2 / 29.2 / 32.2 dB(A) |
| Load |
| 34.7 / 39.1 dB(A) |
 | ||
30 dB silent 40 dB(A) audible 50 dB(A) loud |
||
min: | ||
| Lenovo ThinkPad P71-20HK0004GE Quadro P3000, i7-7820HQ, Samsung PM961 NVMe MZVLW512HMJP | MSI WE72 7RJ Quadro M2200, i7-7700HQ, Samsung SM961 MZVPW256 m.2 PCI-e | Fujitsu Celsius H970 Quadro P4000, E3-1535M v6, Samsung SM961 MZVKW512HMJP m.2 PCI-e | HP ZBook 17 G4-Y3J82AV Quadro P5000, E3-1535M v6, Samsung SSD SM961 1TB M.2 MZVKW1T0HMLH | Dell Precision 7720 Quadro P5000, E3-1535M v6, Toshiba NVMe THNSN5512GPU7 | |
|---|---|---|---|---|---|
| Noise | -16% | -13% | -9% | -3% | |
| off / environment * (dB) | 29.2 | 29.3 -0% | 30.2 -3% | 29.6 -1% | 29.5 -1% |
| Idle Minimum * (dB) | 29.2 | 36.3 -24% | 30.2 -3% | 29.6 -1% | 29.5 -1% |
| Idle Average * (dB) | 29.2 | 36.3 -24% | 32.8 -12% | 31.7 -9% | 29.5 -1% |
| Idle Maximum * (dB) | 32.2 | 36.6 -14% | 32.8 -2% | 34.4 -7% | 29.5 8% |
| Load Average * (dB) | 34.7 | 40.4 -16% | 47.3 -36% | 41.3 -19% | 35 -1% |
| Load Maximum * (dB) | 39.1 | 46.6 -19% | 47.3 -21% | 45.6 -17% | 47.8 -22% |
| Witcher 3 ultra * (dB) | 45.6 | 41 |
* ... smaller is better
Temperature
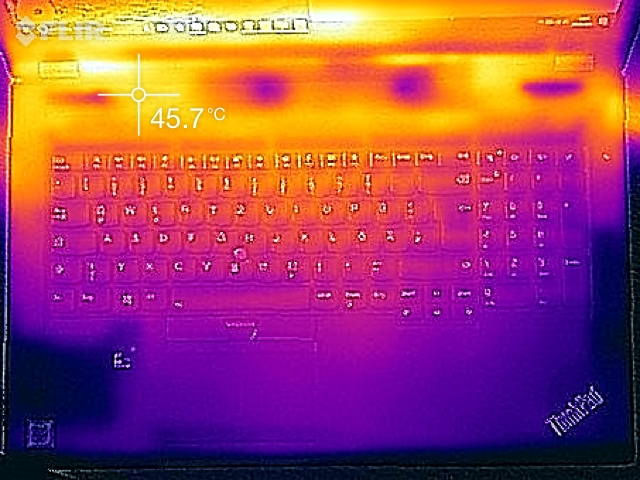
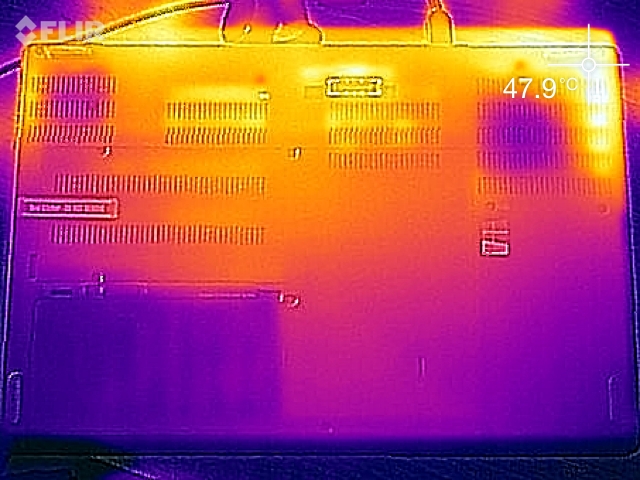
The temperature development of the ThinkPad P71 (at least on our SKU) is exemplary. Only the rear gets warm under load, but a maximum of 44 °C (~111 °F) is anything but critical. The palm rests and large parts of the keyboard stay much cooler and there are no restrictions. As with the noise development, the temperatures will most probably be higher when you get more powerful components.
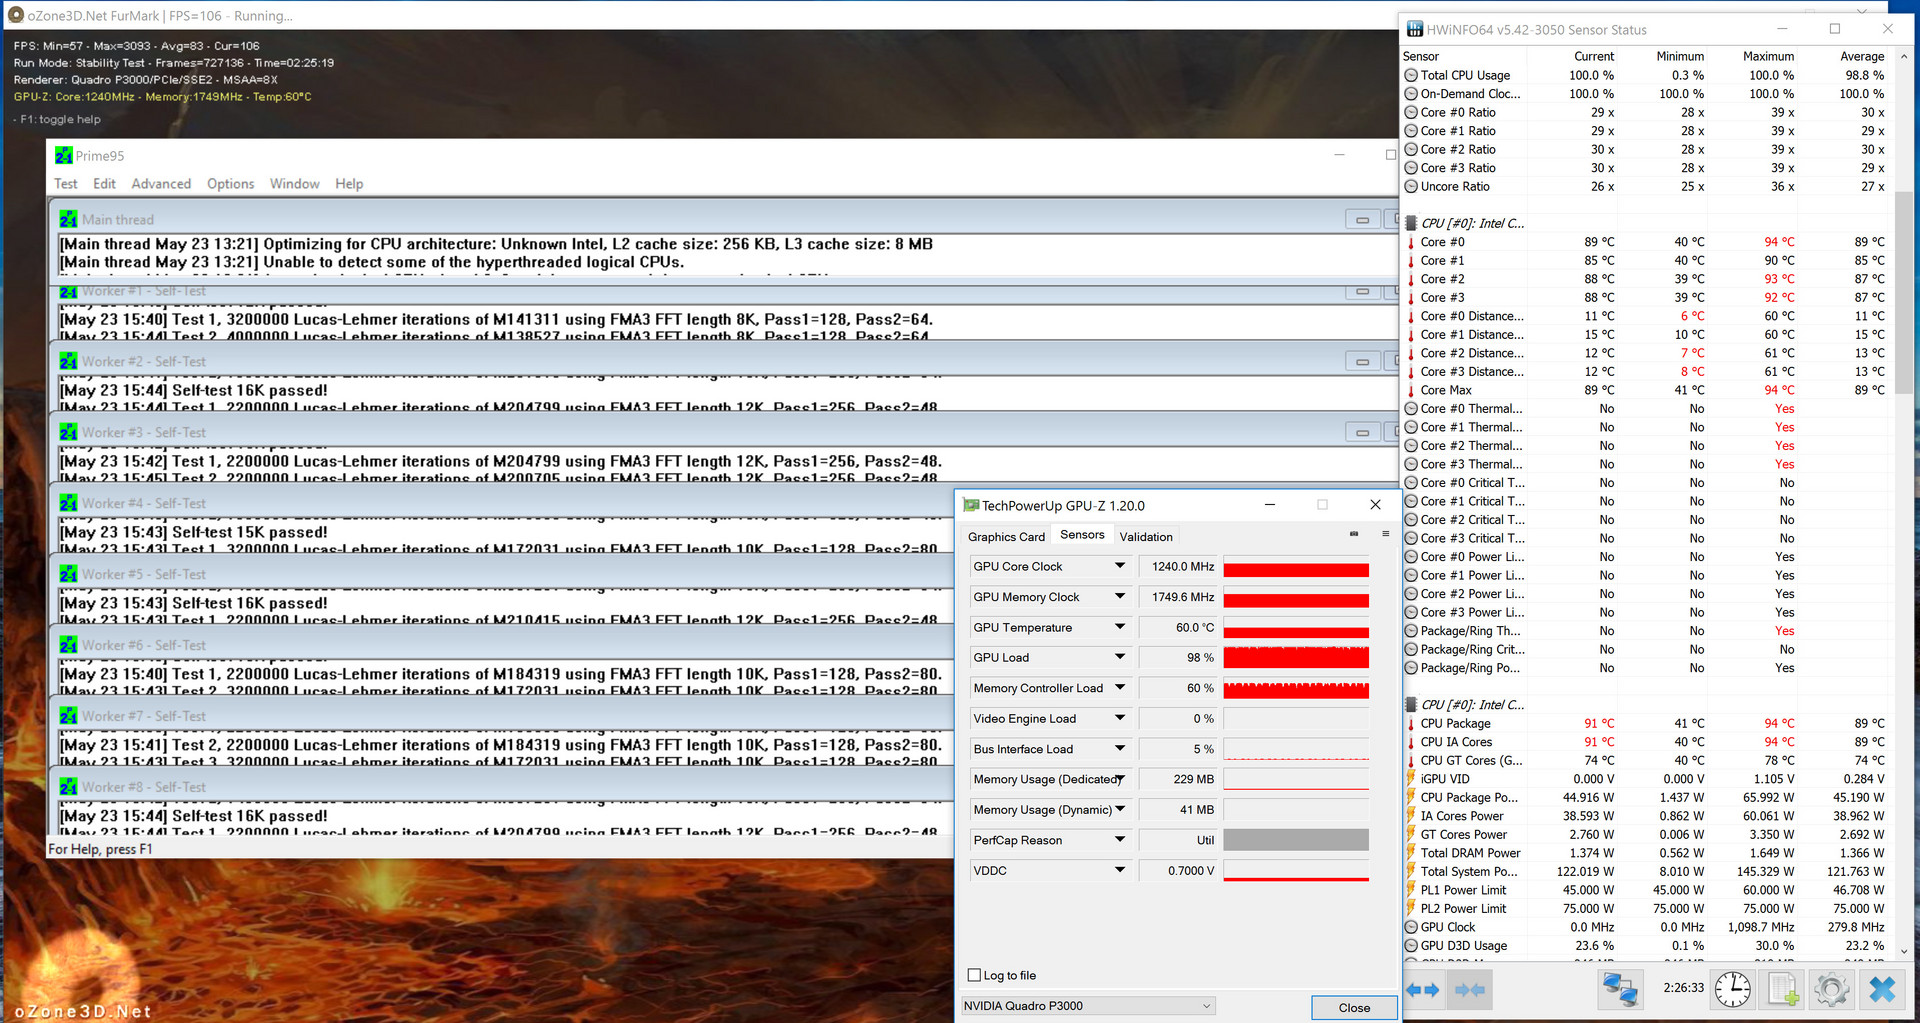
Our stress test with the synthetic tools Prime95 & FurMark is not a big challenge for Lenovo's cooling solution. The processor starts at 4x 3.5 GHz in Prime95 and then fluctuates between 3.4 and 3.5 GHz as soon as the 60-W limit sets in, while the GPU clock is steady at 1240 MHz in FurMark. Combined load for the components is a bigger challenge for the CPU cooling. The CPU cores almost hit 100 °C (~212 °F) after ~15 minutes, which results in a 45-W limitation (4x 2.9 to 3.0 GHz). The GPU is not affected and still runs at 1240 MHz and just 60 °C (~140 °F).
(±) The maximum temperature on the upper side is 44 °C / 111 F, compared to the average of 38.2 °C / 101 F, ranging from 22.2 to 69.8 °C for the class Workstation.
(±) The bottom heats up to a maximum of 43.9 °C / 111 F, compared to the average of 41.1 °C / 106 F
(+) In idle usage, the average temperature for the upper side is 27.1 °C / 81 F, compared to the device average of 32 °C / 90 F.
(+) The palmrests and touchpad are cooler than skin temperature with a maximum of 30 °C / 86 F and are therefore cool to the touch.
(-) The average temperature of the palmrest area of similar devices was 27.8 °C / 82 F (-2.2 °C / -4 F).
Speakers
The two mediocre stereo speakers (2x 2W) have not changed. We determine a maximum volume of just ~70 dB(A) and there is no dedicated subwoofer, so you do not get much bass either. The modules are certainly sufficient for voice transmissions (like conferences), but that is about it. We noticed some weird cracking noises on the ThinkPad P70, but this was not the case here.
You should definitely use external speakers for music playback or movie sessions on the 4K panel. This works well via a stereo jack or Bluetooth.
Lenovo ThinkPad P71-20HK0004GE audio analysis
(-) | not very loud speakers (70.9 dB)
Bass 100 - 315 Hz
(±) | reduced bass - on average 12.4% lower than median
(±) | linearity of bass is average (10.5% delta to prev. frequency)
Mids 400 - 2000 Hz
(±) | higher mids - on average 5.9% higher than median
(+) | mids are linear (6.4% delta to prev. frequency)
Highs 2 - 16 kHz
(±) | reduced highs - on average 5% lower than median
(±) | linearity of highs is average (13.6% delta to prev. frequency)
Overall 100 - 16.000 Hz
(±) | linearity of overall sound is average (26.6% difference to median)
Compared to same class
» 90% of all tested devices in this class were better, 4% similar, 6% worse
» The best had a delta of 7%, average was 17%, worst was 35%
Compared to all devices tested
» 82% of all tested devices were better, 3% similar, 15% worse
» The best had a delta of 4%, average was 23%, worst was 134%
Fujitsu Celsius H970 audio analysis
(±) | speaker loudness is average but good (73.8 dB)
Bass 100 - 315 Hz
(-) | nearly no bass - on average 26.7% lower than median
(+) | bass is linear (5.1% delta to prev. frequency)
Mids 400 - 2000 Hz
(±) | reduced mids - on average 5.4% lower than median
(±) | linearity of mids is average (8.3% delta to prev. frequency)
Highs 2 - 16 kHz
(+) | balanced highs - only 4.1% away from median
(+) | highs are linear (6.2% delta to prev. frequency)
Overall 100 - 16.000 Hz
(±) | linearity of overall sound is average (29.1% difference to median)
Compared to same class
» 96% of all tested devices in this class were better, 1% similar, 3% worse
» The best had a delta of 7%, average was 17%, worst was 35%
Compared to all devices tested
» 87% of all tested devices were better, 2% similar, 11% worse
» The best had a delta of 4%, average was 23%, worst was 134%
Frequency Comparison (Checkboxes select/deselectable!)
Energy Management
Power Consumption
SKUs with the Quadro P3000 are also shipped with the bulky 230-W power adapter, even though the smaller 170-W model would have been sufficient. A direct comparison with the predecessor shows two things: The minimum consumption is now much lower, and the system is more efficient under medium workloads (3DMark 06). Here we can notice the influence of the more efficient Pascal GPU, which consumes less power despite the higher performance. The maximum consumption of the ThinkPad P71 is actually a bit higher, but other factors such as the higher CPU consumption have to be considered as well. The test model also performs well within our comparison group, only the Fujitsu Celsius H970 has an advantage, thanks to the lower display resolution.
| Off / Standby | |
| Idle | |
| Load |
|
Key:
min: | |
| Lenovo ThinkPad P71-20HK0004GE i7-7820HQ, Quadro P3000, Samsung PM961 NVMe MZVLW512HMJP, IPS, 3840x2160, 17.3" | Lenovo ThinkPad P70 6820HQ, Quadro M3000M, Samsung SSD PM871 MZNLN512HCJH, IPS, 3840x2160, 17.3" | HP ZBook 17 G4-Y3J82AV E3-1535M v6, Quadro P5000, Samsung SSD SM961 1TB M.2 MZVKW1T0HMLH, IPS, 3840x2160, 17.3" | Dell Precision 7720 E3-1535M v6, Quadro P5000, Toshiba NVMe THNSN5512GPU7, IGZO, 3840x2160, 17.3" | MSI WE72 7RJ i7-7700HQ, Quadro M2200, Samsung SM961 MZVPW256 m.2 PCI-e, IPS, 1920x1080, 17.3" | Fujitsu Celsius H970 E3-1535M v6, Quadro P4000, Samsung SM961 MZVKW512HMJP m.2 PCI-e, IPS LED, 1920x1080, 17.3" | |
|---|---|---|---|---|---|---|
| Power Consumption | -16% | -27% | -22% | -24% | -5% | |
| Idle Minimum * (Watt) | 7.44 | 12.1 -63% | 12.9 -73% | 9.6 -29% | 15 -102% | 10.7 -44% |
| Idle Average * (Watt) | 18 | 19.7 -9% | 19.6 -9% | 20.5 -14% | 20.1 -12% | 15.8 12% |
| Idle Maximum * (Watt) | 21.8 | 20.5 6% | 23.6 -8% | 22.9 -5% | 23.8 -9% | 17.8 18% |
| Load Average * (Watt) | 77.1 | 94.3 -22% | 92.8 -20% | 96.8 -26% | 85.6 -11% | 92 -19% |
| Load Maximum * (Watt) | 150.5 | 139.6 7% | 190 -26% | 202.1 -34% | 128 15% | 137 9% |
| Witcher 3 ultra * (Watt) | 148.5 |
* ... smaller is better
Battery Runtime
The battery capacity is unchanged at 96 Wh (8 cells), and most of the rivals are on par. MSI's mobile workstation is the only exception with its small 51-Wh module. Our battery tests reflect the consumption measurements pretty well, because the maximum runtime is almost twice as long as on the P70. The battery only lasts for about one hour under load, which is also supported by the SPECviewperf 12 benchmark. Some of the competitors last longer thanks to reduced performance on battery. However, the difference is not huge (92 minutes @HP ZBook 17 G4).
Both ThinkPads are very similar in the tests at an adjusted luminance (150 nits) and the results are decent within our comparison group. This luminance is used in the WLAN test (~6 hours) as well as the video loop (~8.5 hours). The Fujitsu Celsius with its 1080p panel has a small advantage.
The battery is quickly charged, despite the generous capacity. A full recharge takes 2.5 hours, but you get 50% after just 30 minutes when the device is turned on. You can also set charging limits to improve the battery health.
| Lenovo ThinkPad P71-20HK0004GE i7-7820HQ, Quadro P3000, 96 Wh | Lenovo ThinkPad P70 6820HQ, Quadro M3000M, 96 Wh | HP ZBook 17 G4-Y3J82AV E3-1535M v6, Quadro P5000, 95 Wh | Dell Precision 7720 E3-1535M v6, Quadro P5000, 91 Wh | MSI WE72 7RJ i7-7700HQ, Quadro M2200, 51 Wh | Fujitsu Celsius H970 E3-1535M v6, Quadro P4000, 96 Wh | |
|---|---|---|---|---|---|---|
| Battery runtime | -15% | -17% | -7% | -55% | 22% | |
| Reader / Idle (h) | 14.5 | 7.7 -47% | 7.8 -46% | 11.4 -21% | 4.5 -69% | 16.7 15% |
| H.264 (h) | 8.6 | 7.5 -13% | 5.3 -38% | 6.8 -21% | 3 -65% | 9.6 12% |
| WiFi v1.3 (h) | 6 | 6 0% | 4.9 -18% | 6.3 5% | 3 -50% | 9 50% |
| Load (h) | 1.1 | 1.1 0% | 1.5 36% | 1.2 9% | 0.7 -36% | 1.2 9% |
Verdict
Pros
Cons
If it is not broken, do not fix it – this might have been Lenovo's approach for the ThinkPad P71. The previous P70 was the first 17-inch workstation for quite a while, but there were no major issues.
Some aspects are even better this year, like the improved scaling in Windows 10 (even though this is hardly Lenovo's accomplishment). Nothing has changed in terms of the very good 4K panel, but the integrated calibration works much better this time. You still get a sturdy chassis, excellent input devices, and a good cooling solution, which enables an almost perfect performance utilization on our test model.
This brings us to the changes: the components. The new Kaby Lake processor is just a minor upgrade compared to the old Skylake model, but the Quadro P3000 GPU is much faster and at the same time more efficient than the previous Quadro M3000M. The fans stay quiet most of the time and the temperatures are not critical either, so you can enjoy a very comfortable work environment, even under load. We have already mentioned that this will probably change a bit when you opt for one of the more powerful graphics cards (P4000 & P5000).
The highlight of the ThinkPad P71 is the new GPU generation. Thanks to the good cooling solution, the very good display, and great input devices, you get one if the best mobile workstation on the market.
We cannot find any major flaws this year. The webcam could finally get an upgrade and we expect better speakers on such a big mobile workstation. The occasional coil whine is more annoying since the fans are often deactivated during light workloads, so you easily hear any additional sounds in quiet environments.
Lenovo ThinkPad P71-20HK0004GE
- 10/22/2019 v7 (old)
Andreas Osthoff
Price comparison
