MSI WE72 7RJ (7700HQ, FHD, M2200) Workstation Review
For the original German article, see here.
For a couple of years now, instead of developing individual mobile workstations, MSI has equipped its successful gaming cases with professional graphics cards. There were two series so far, the big and bulky WT models (17-inch, based on GT-series) as well as the slim WS-series (15.6-inch, based on GS-series).
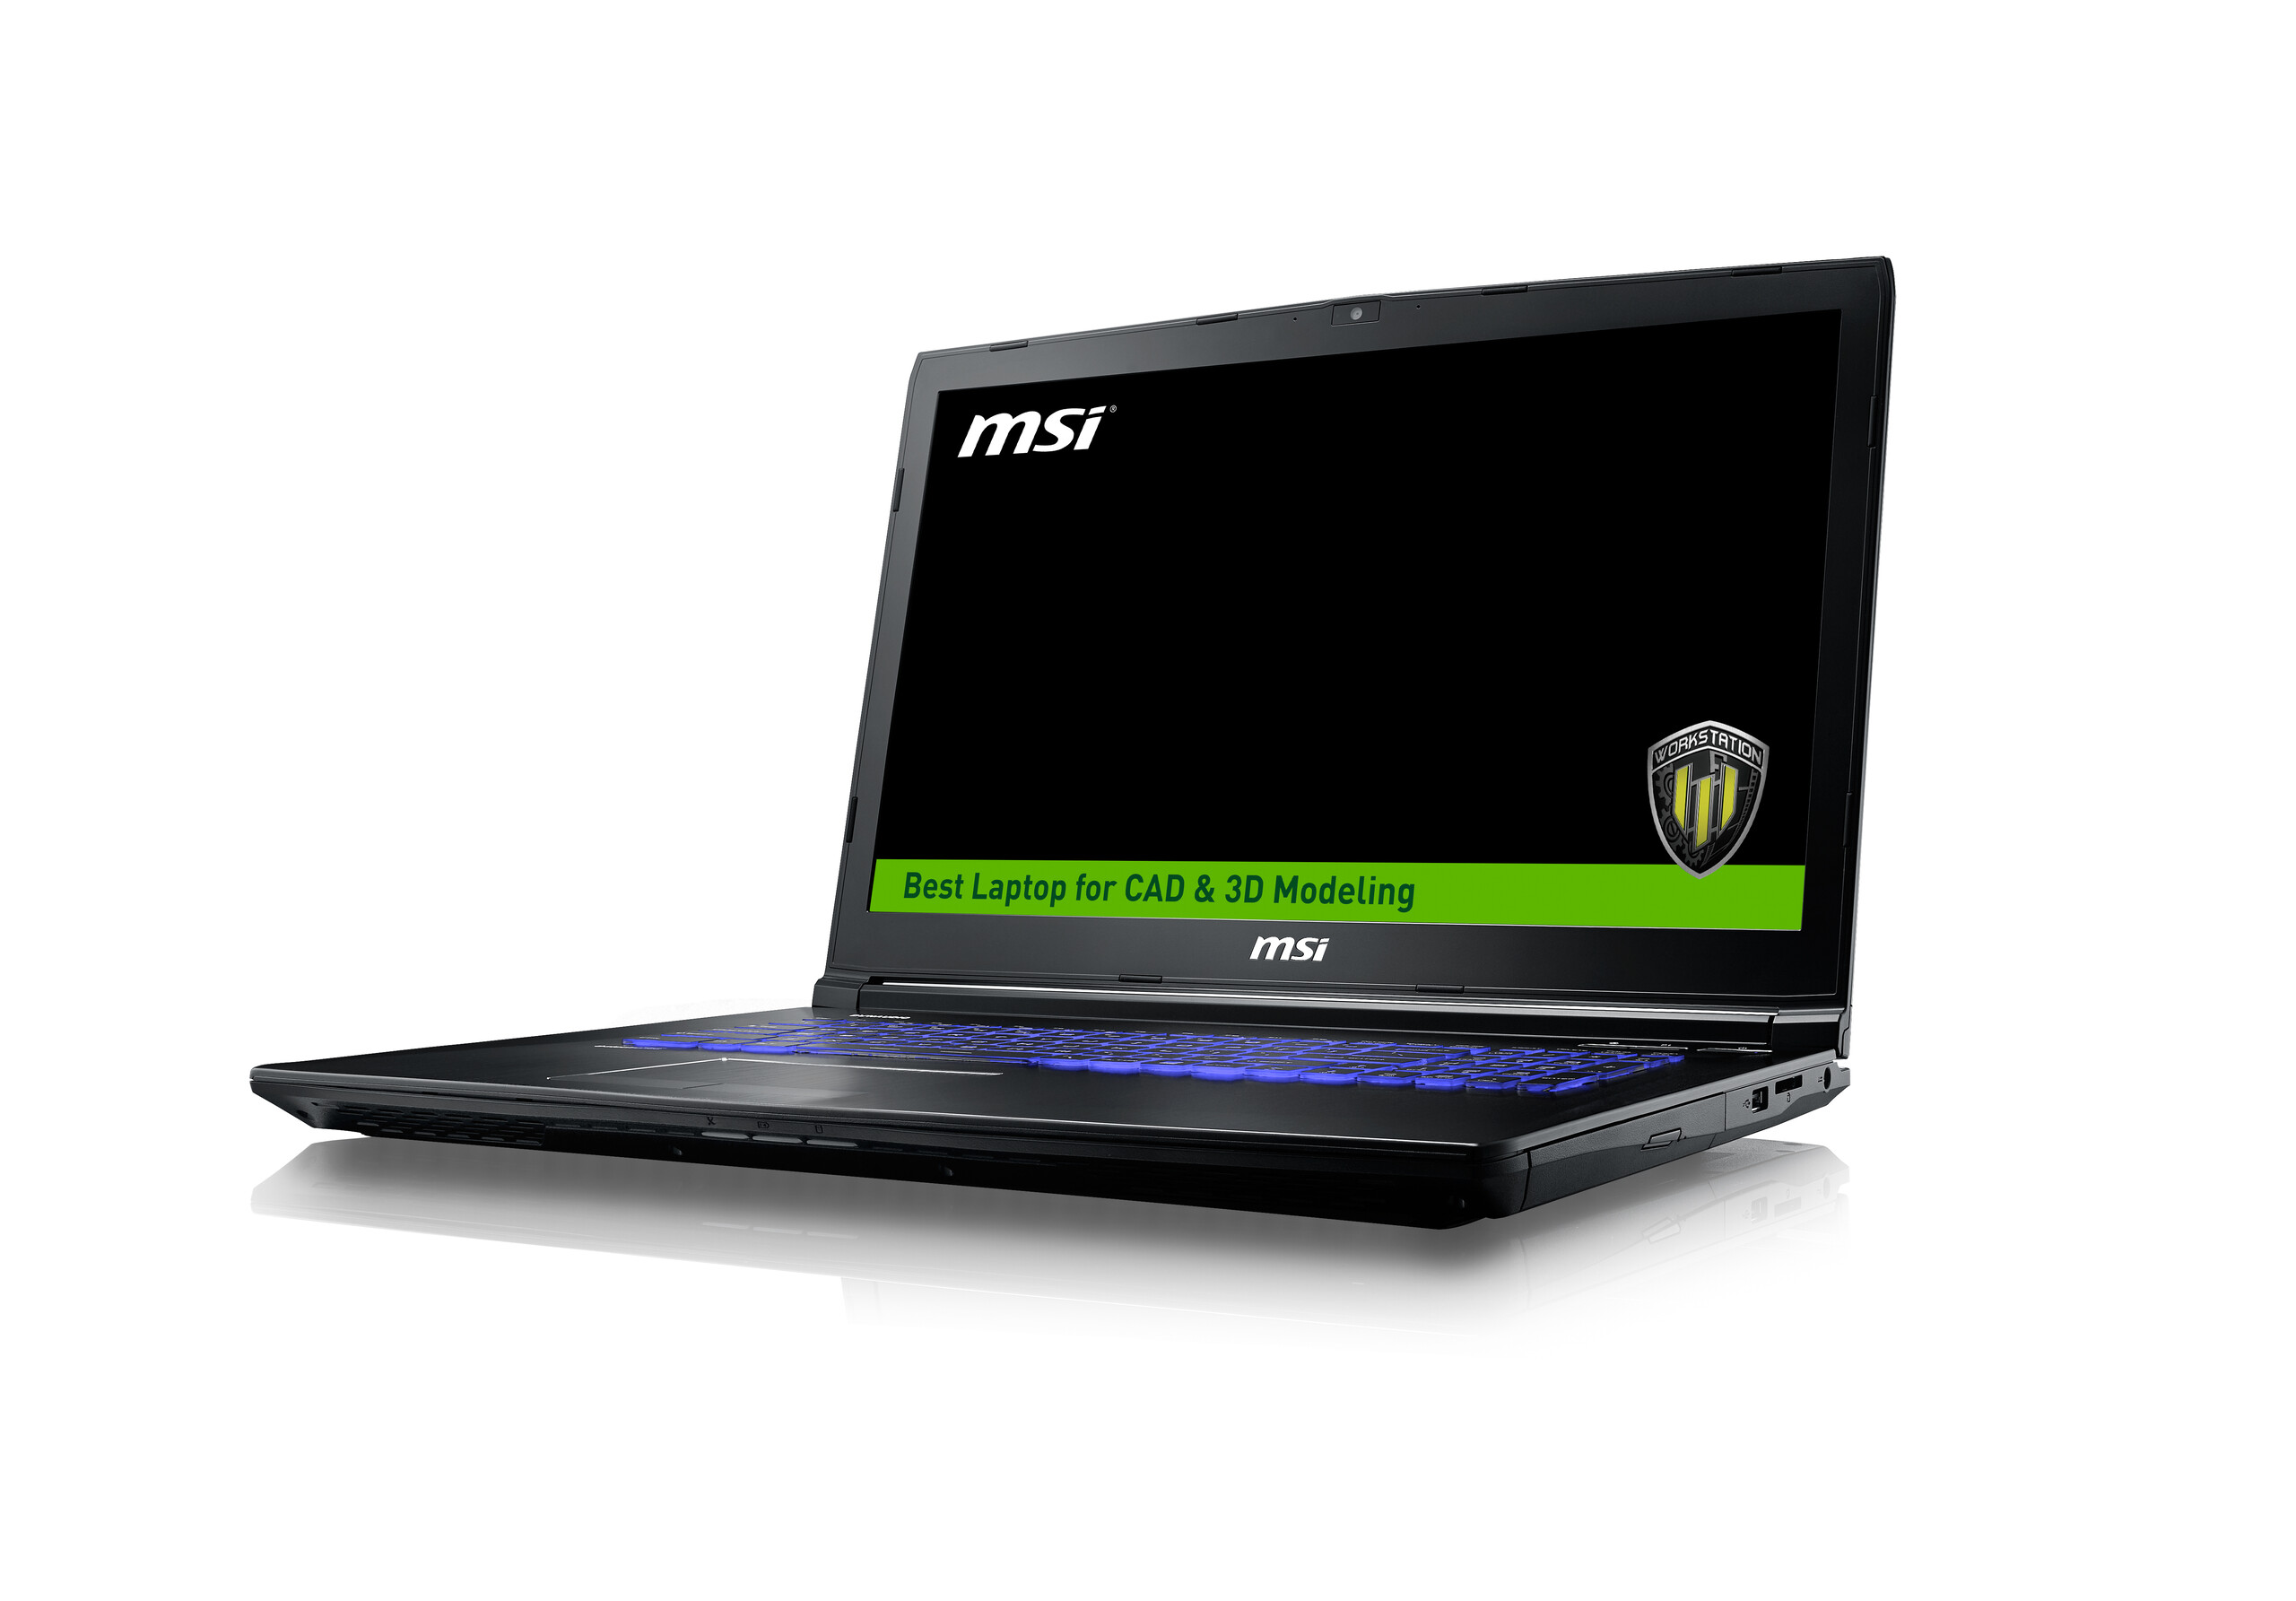
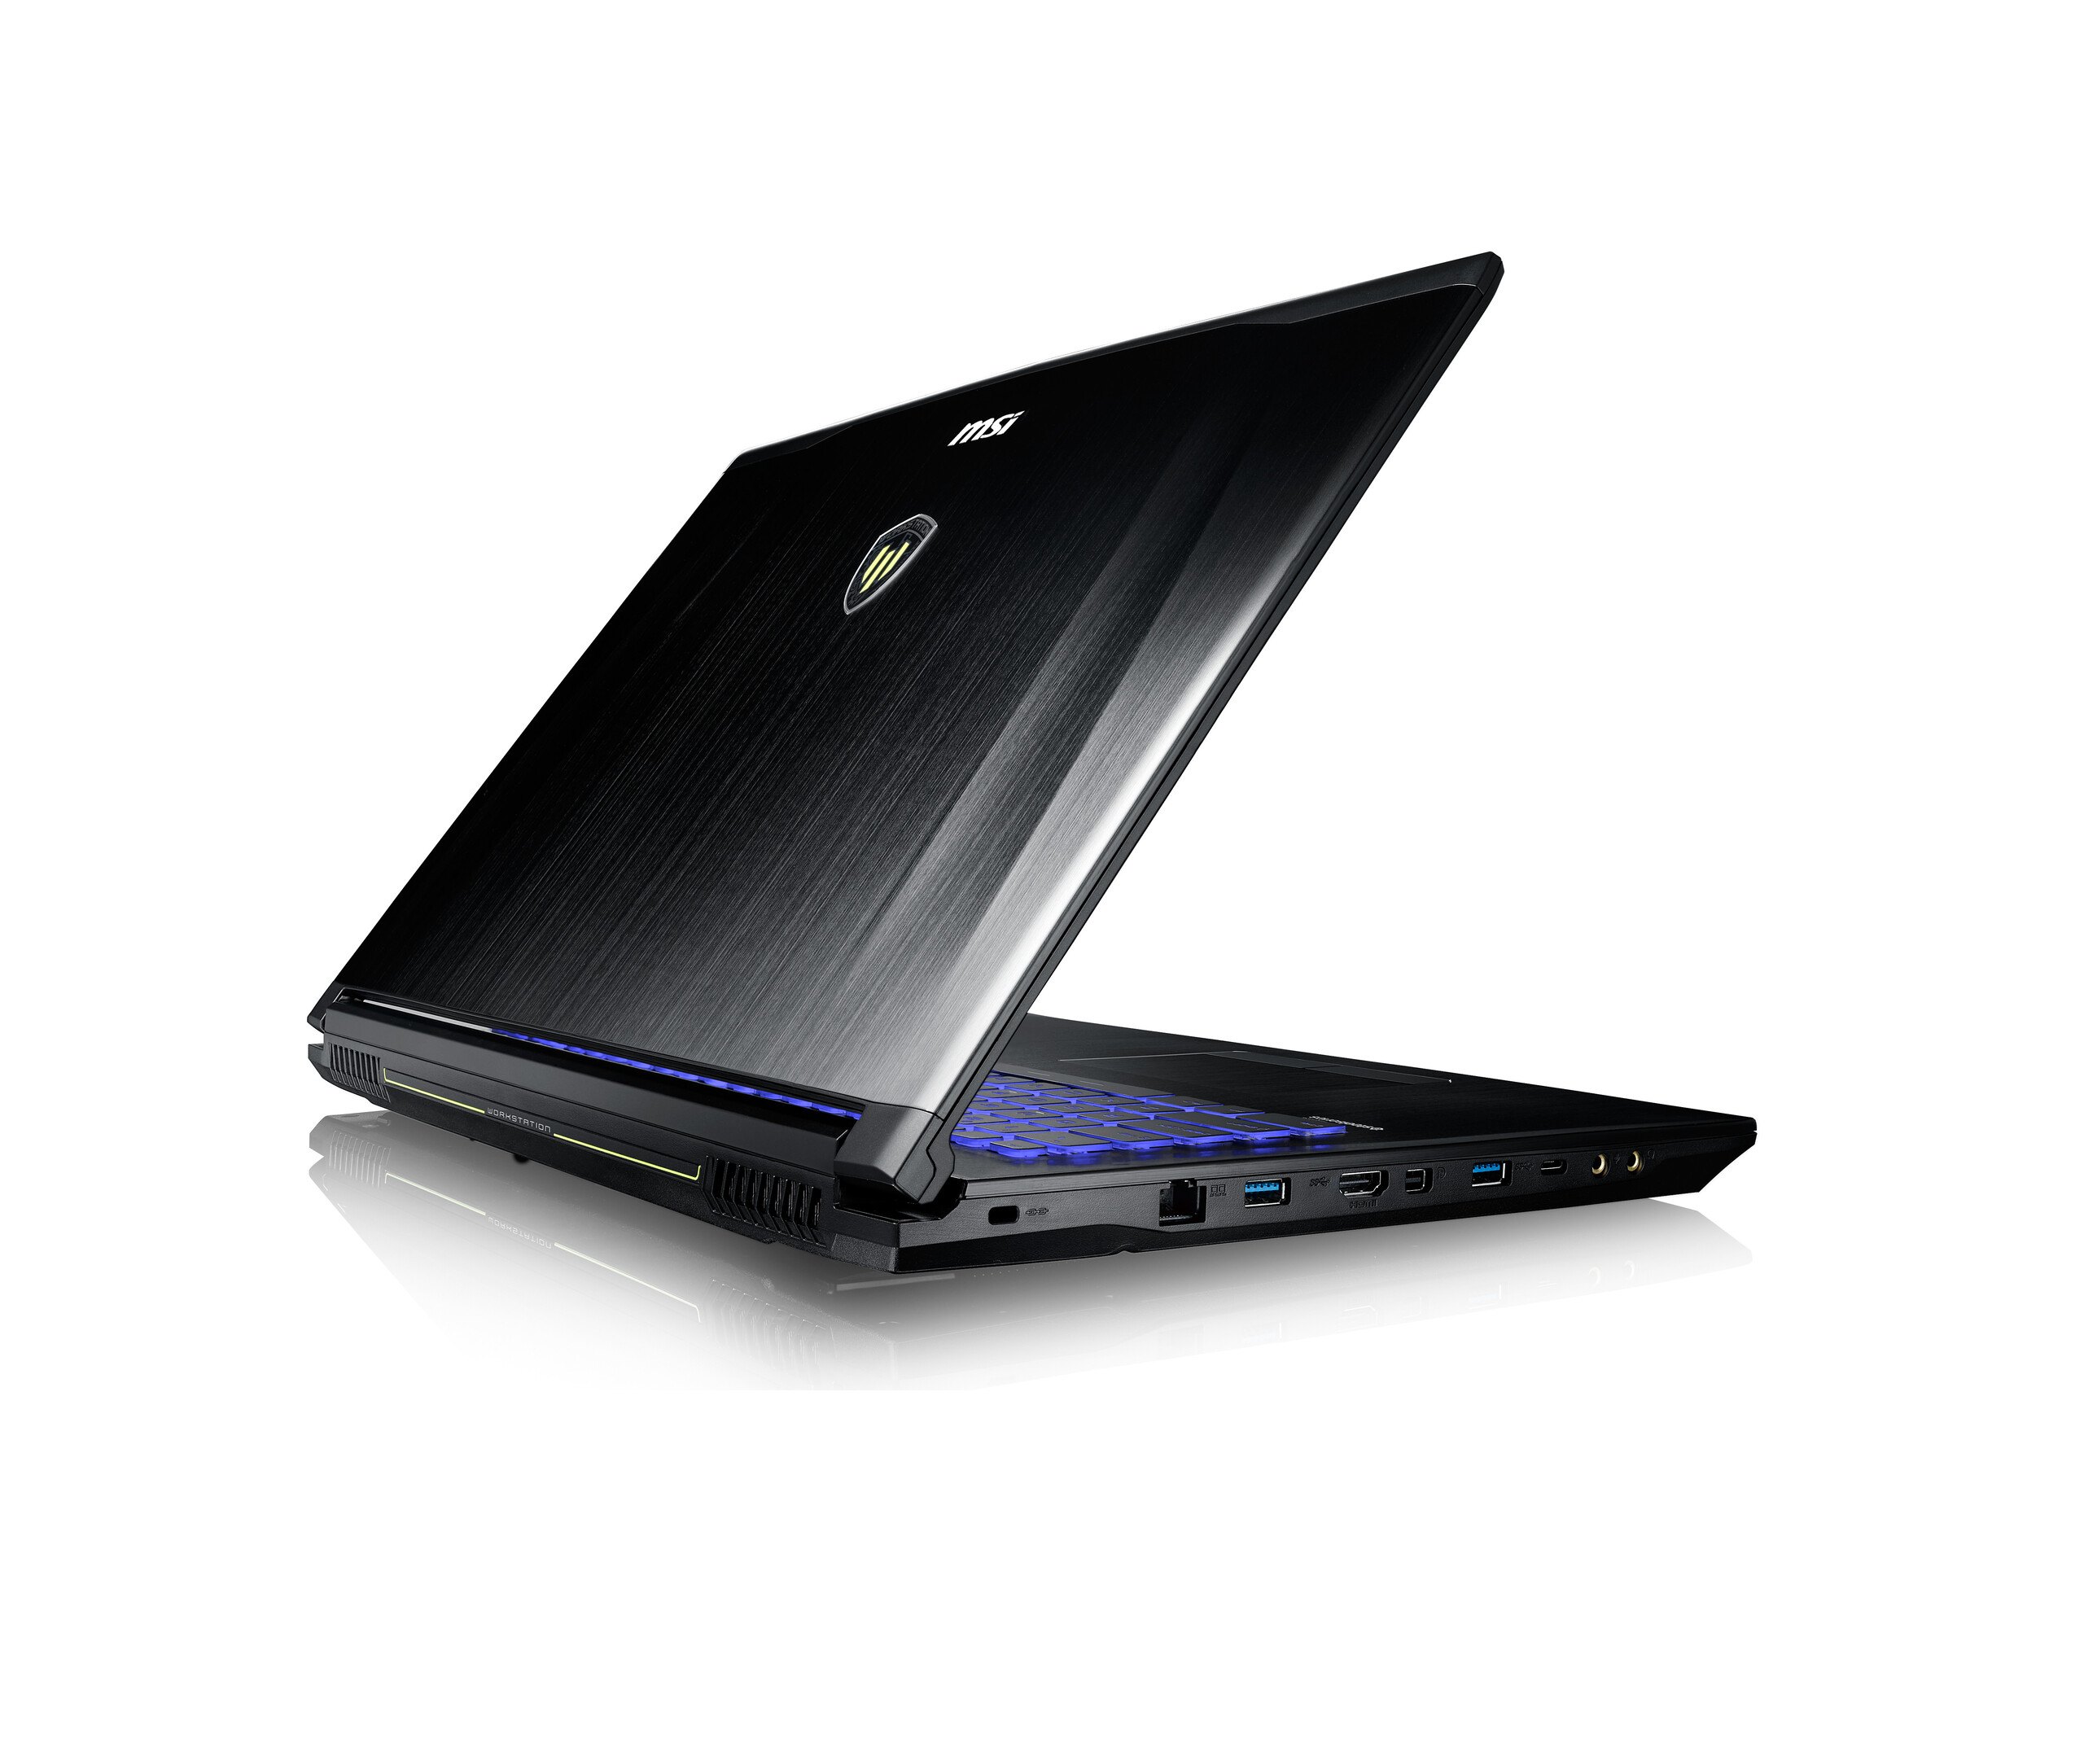
MSI now launches the third model, the WE72, which fills the gap. It is based on the 17.3-inch GE72 gamer and is more compact than the larger WT72. Our test model carries the designation WE72 7RJ and is equipped with a modern Kaby Lake quad-core processor as well as the new Nvidia Quadro M2200. The graphics card is the only big difference compared to the gaming model except for the different color scheme (yellow instead of red lines). But is this enough to compete with full-fledged mobile workstations from established manufacturers like Dell, Lenovo, or HP?
The MSI WE72 is the first new mobile workstation we review this year, so we will use comparison devices from last year. The list includes the Dell Precision 7710, the HP ZBook 17 G3, and the Lenovo ThinkPad P70.
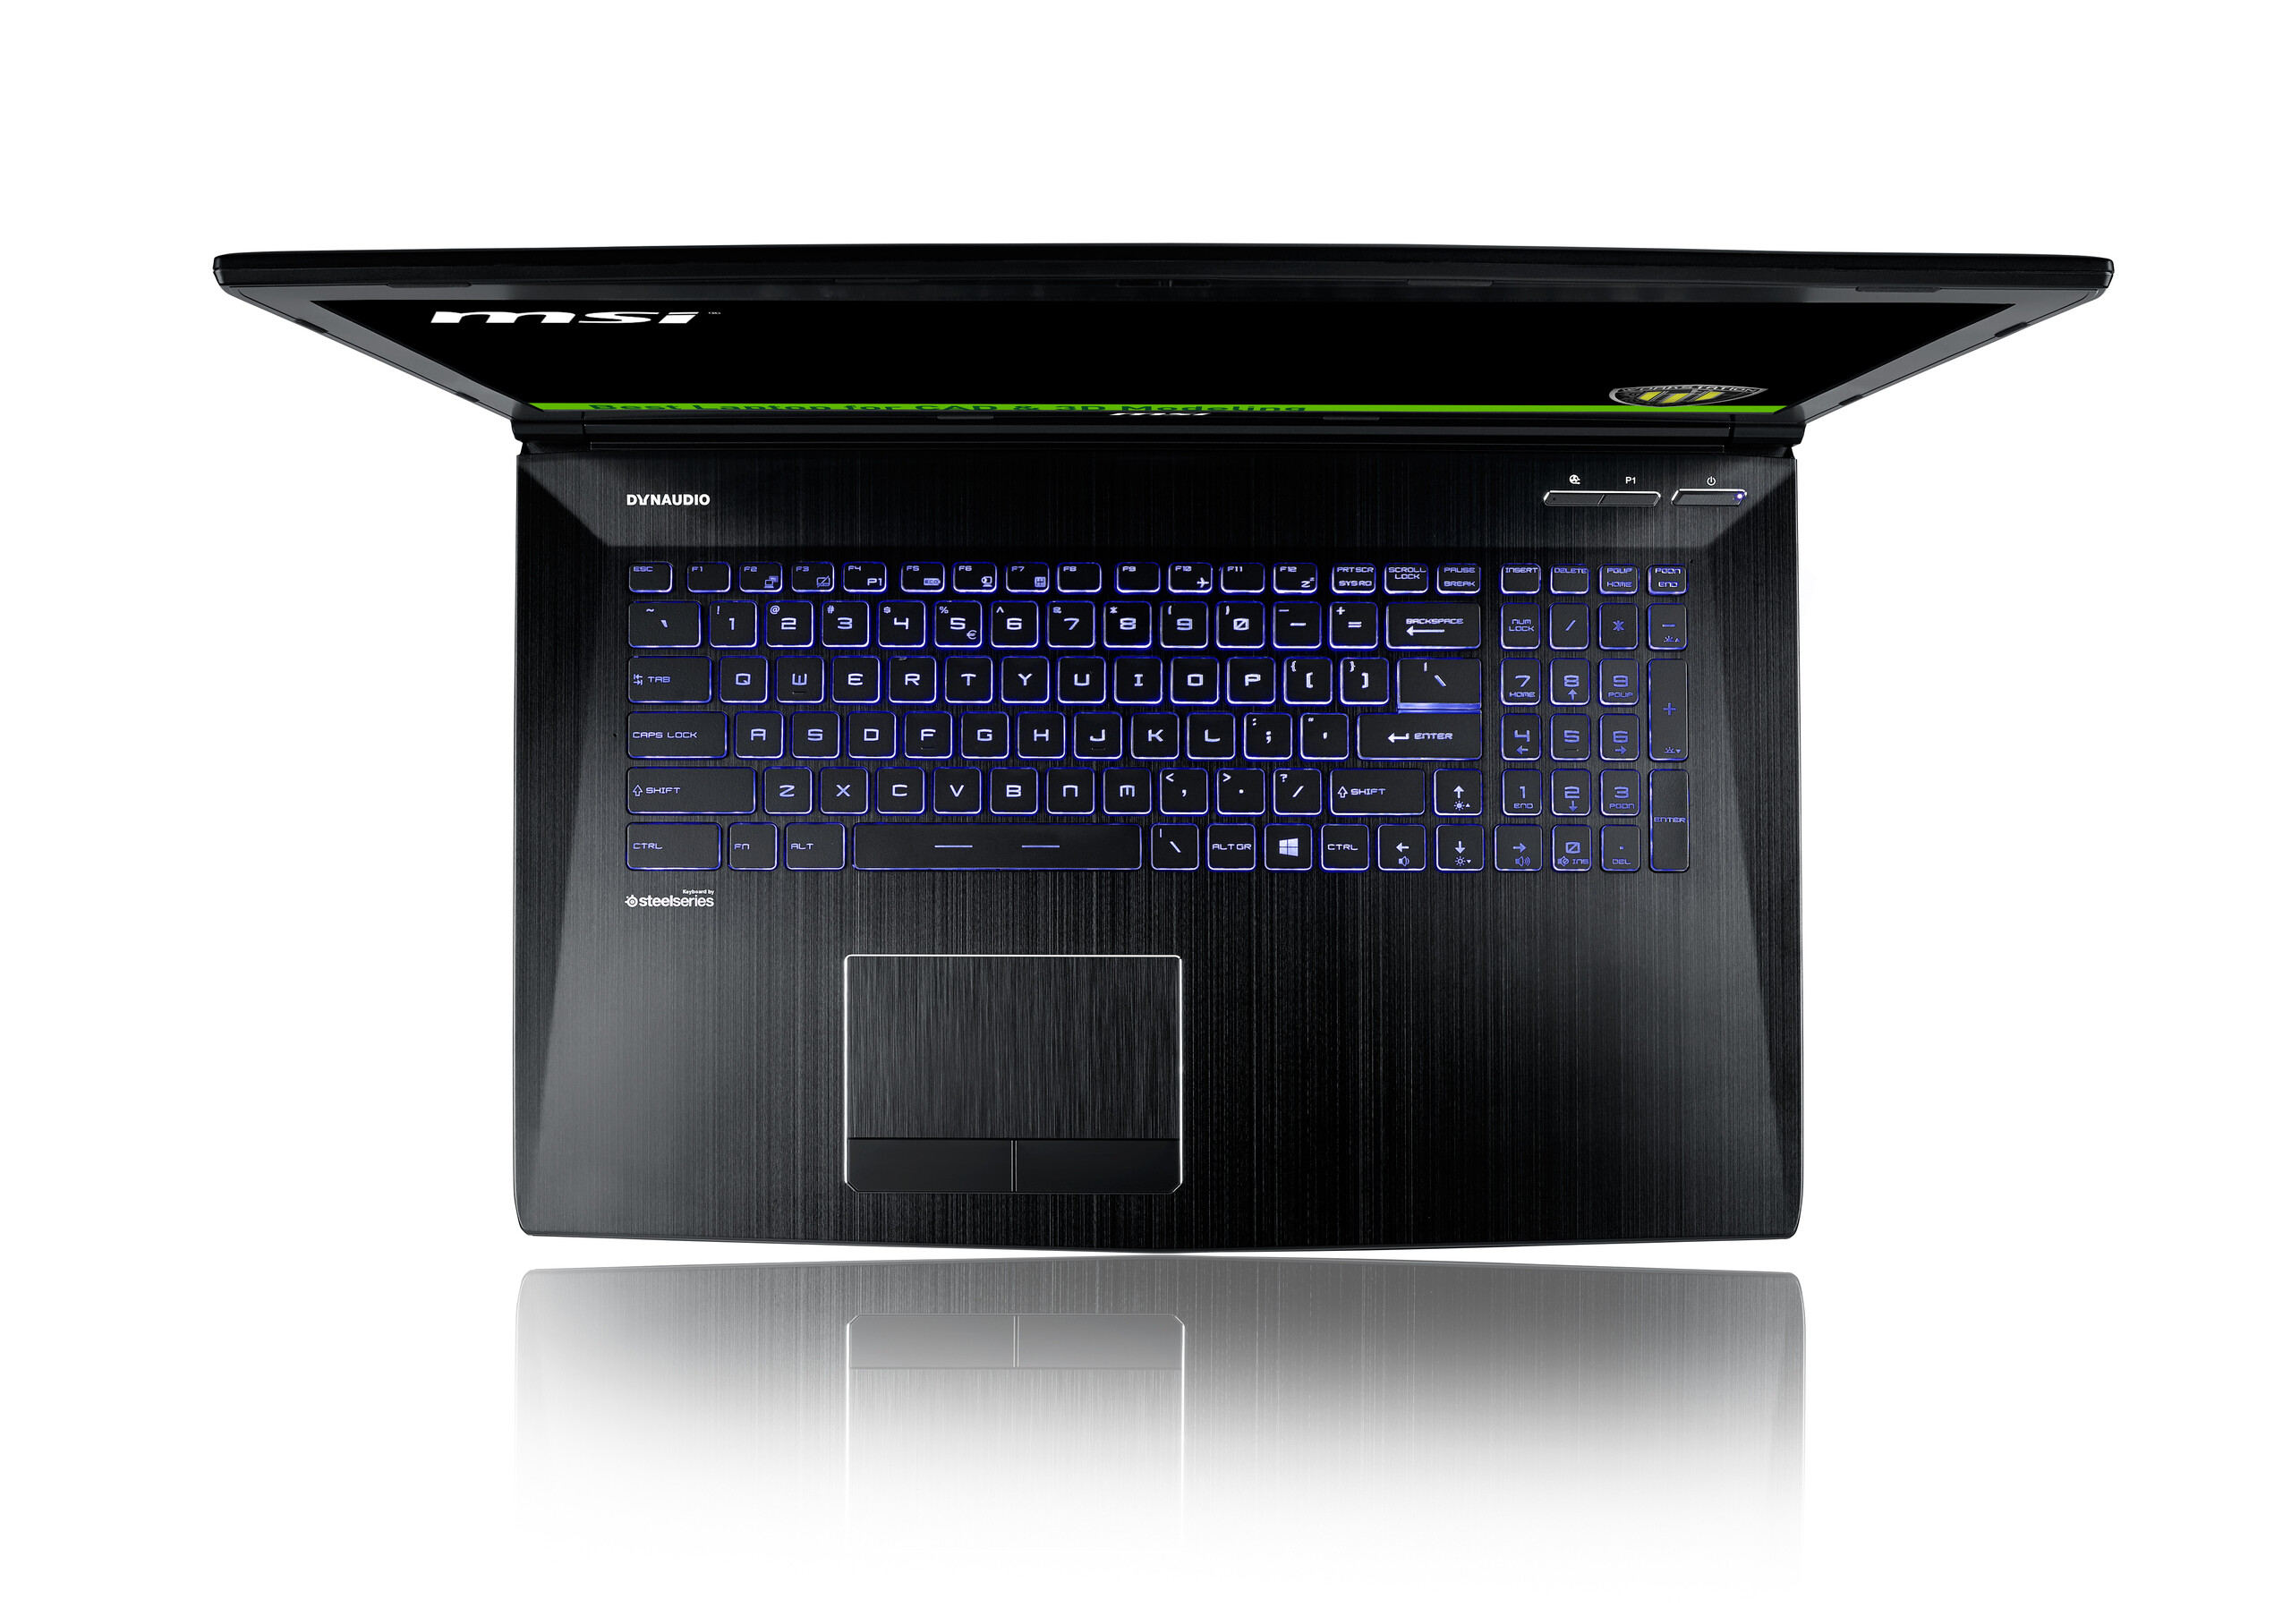
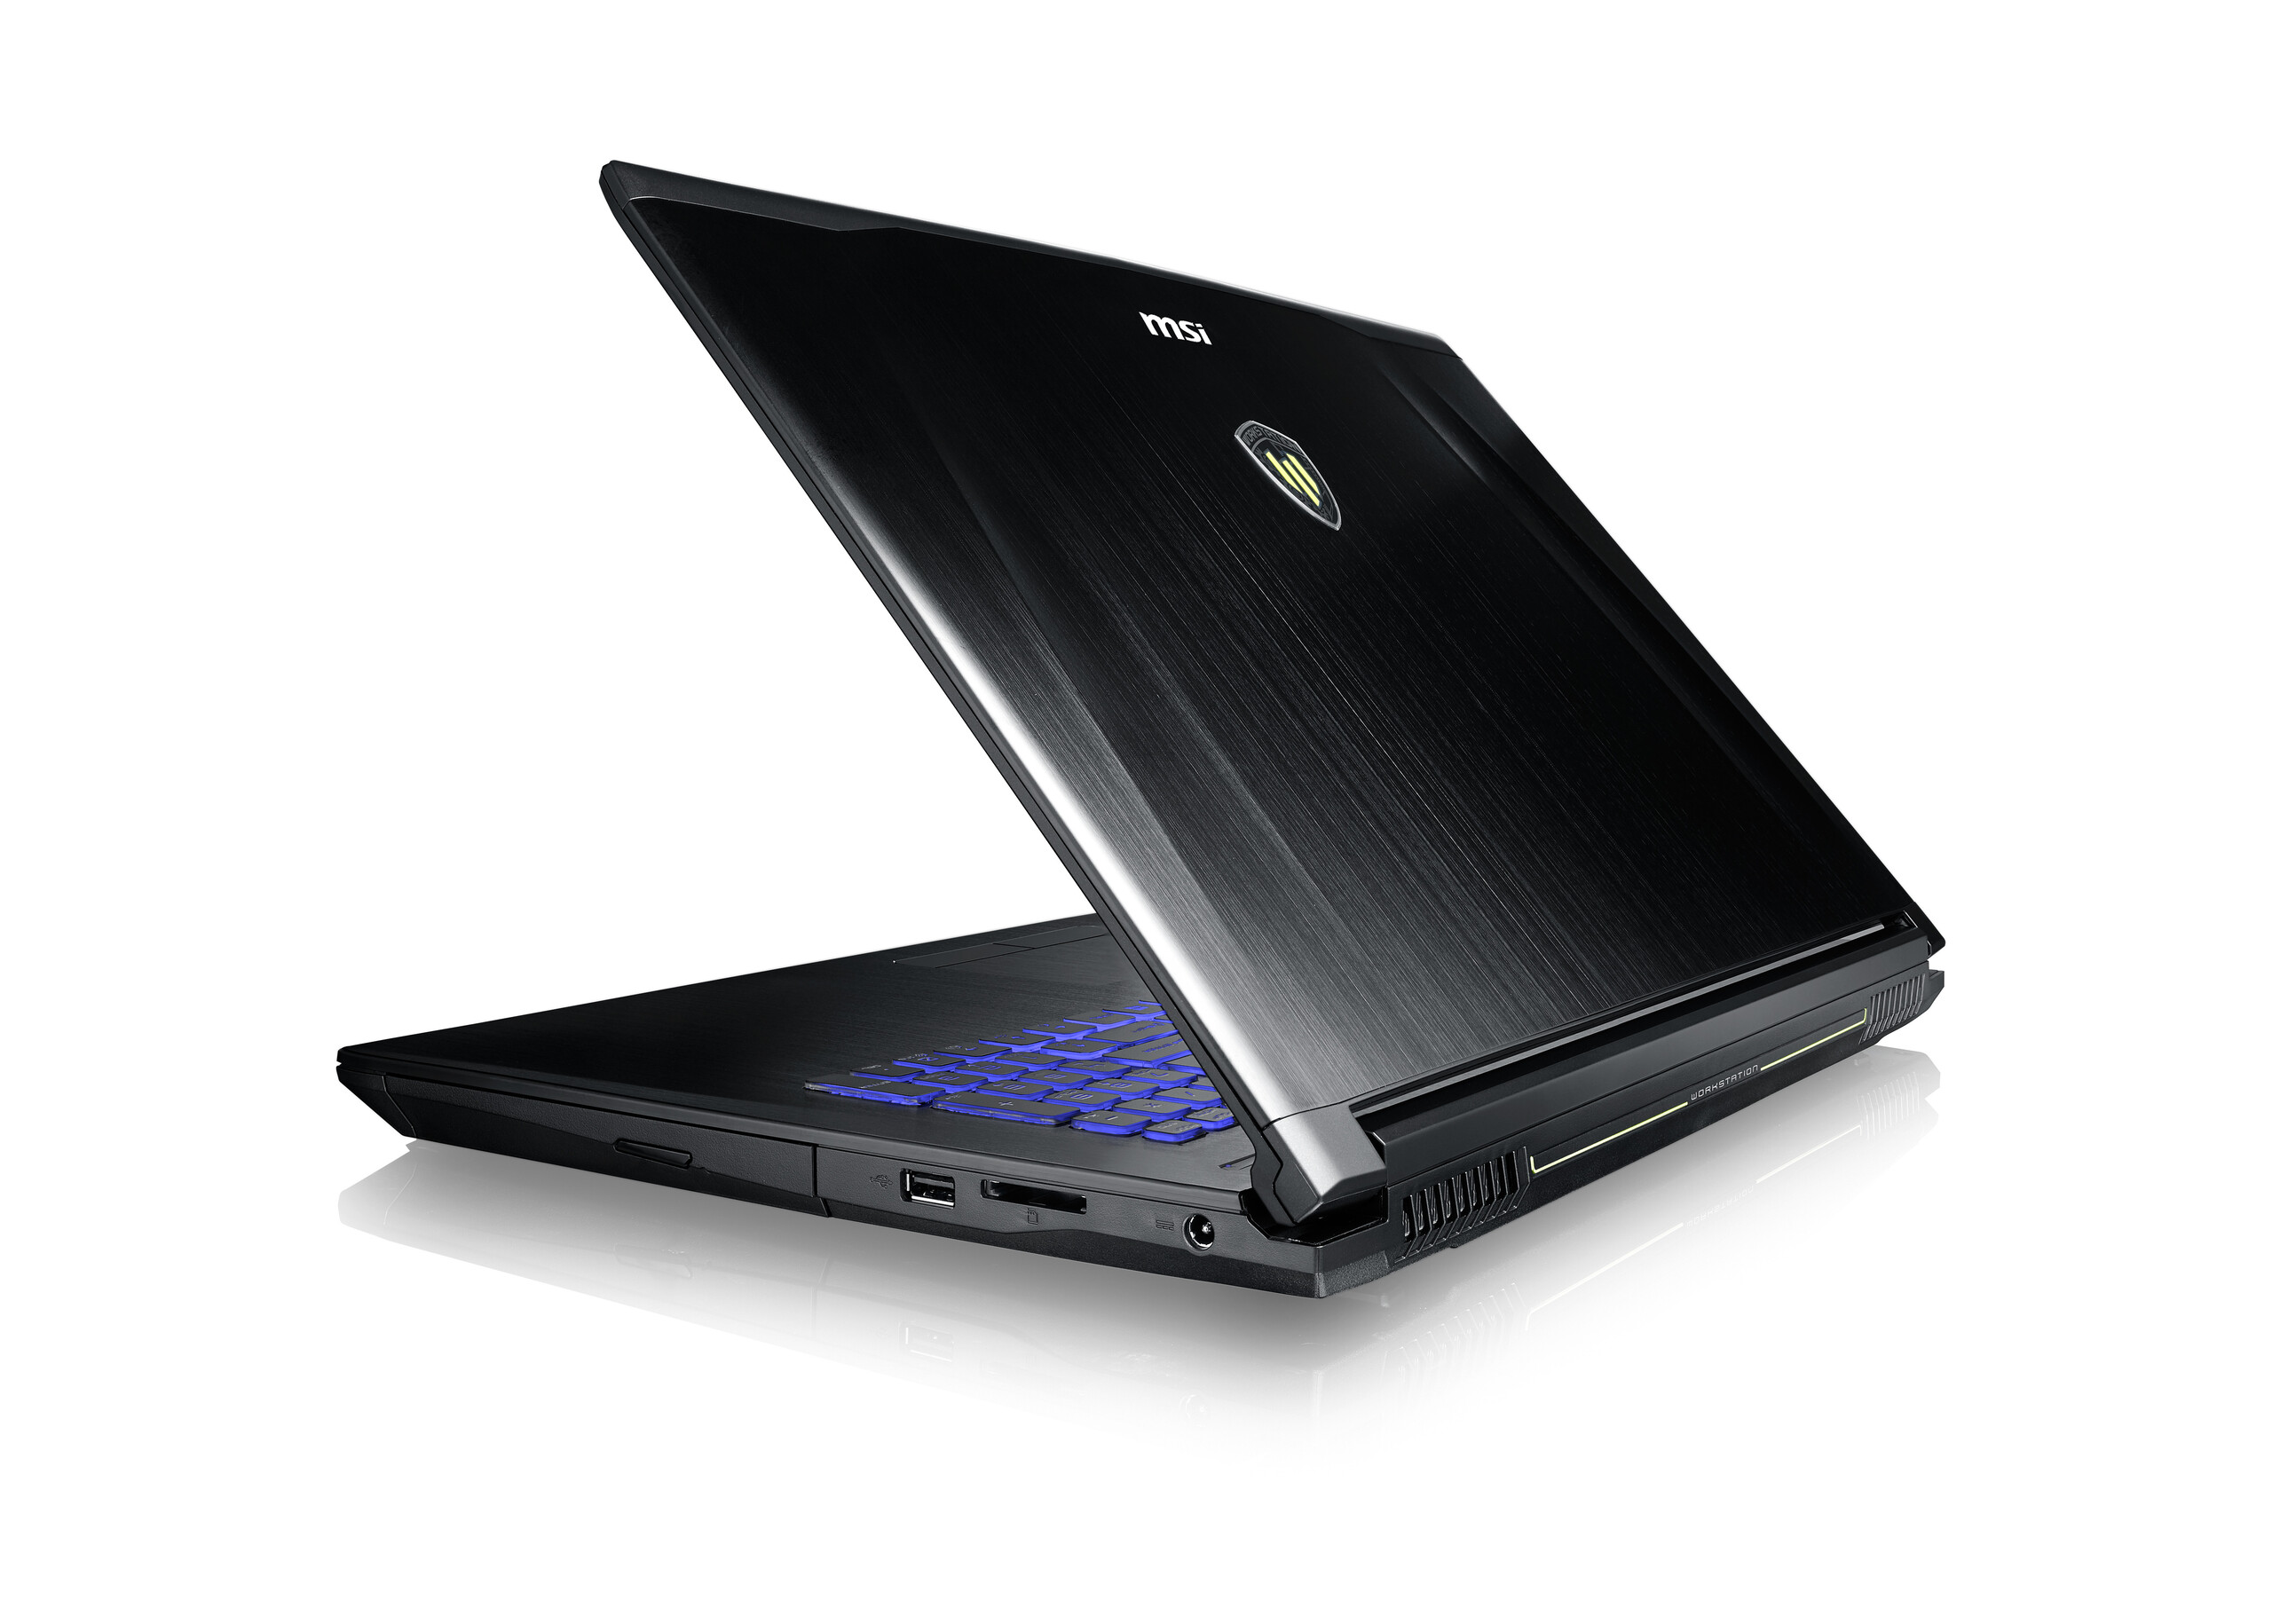
The case construction is identical to the MSI GE72 we have already reviewed in two different configurations. We therefore refer to the review articles of the GE72 7RE Apache Pro and GE72VR 6RF Apache Pro for more information about the connectivity, maintenance, input devices as well as speakers.
Differences compared to the GE72
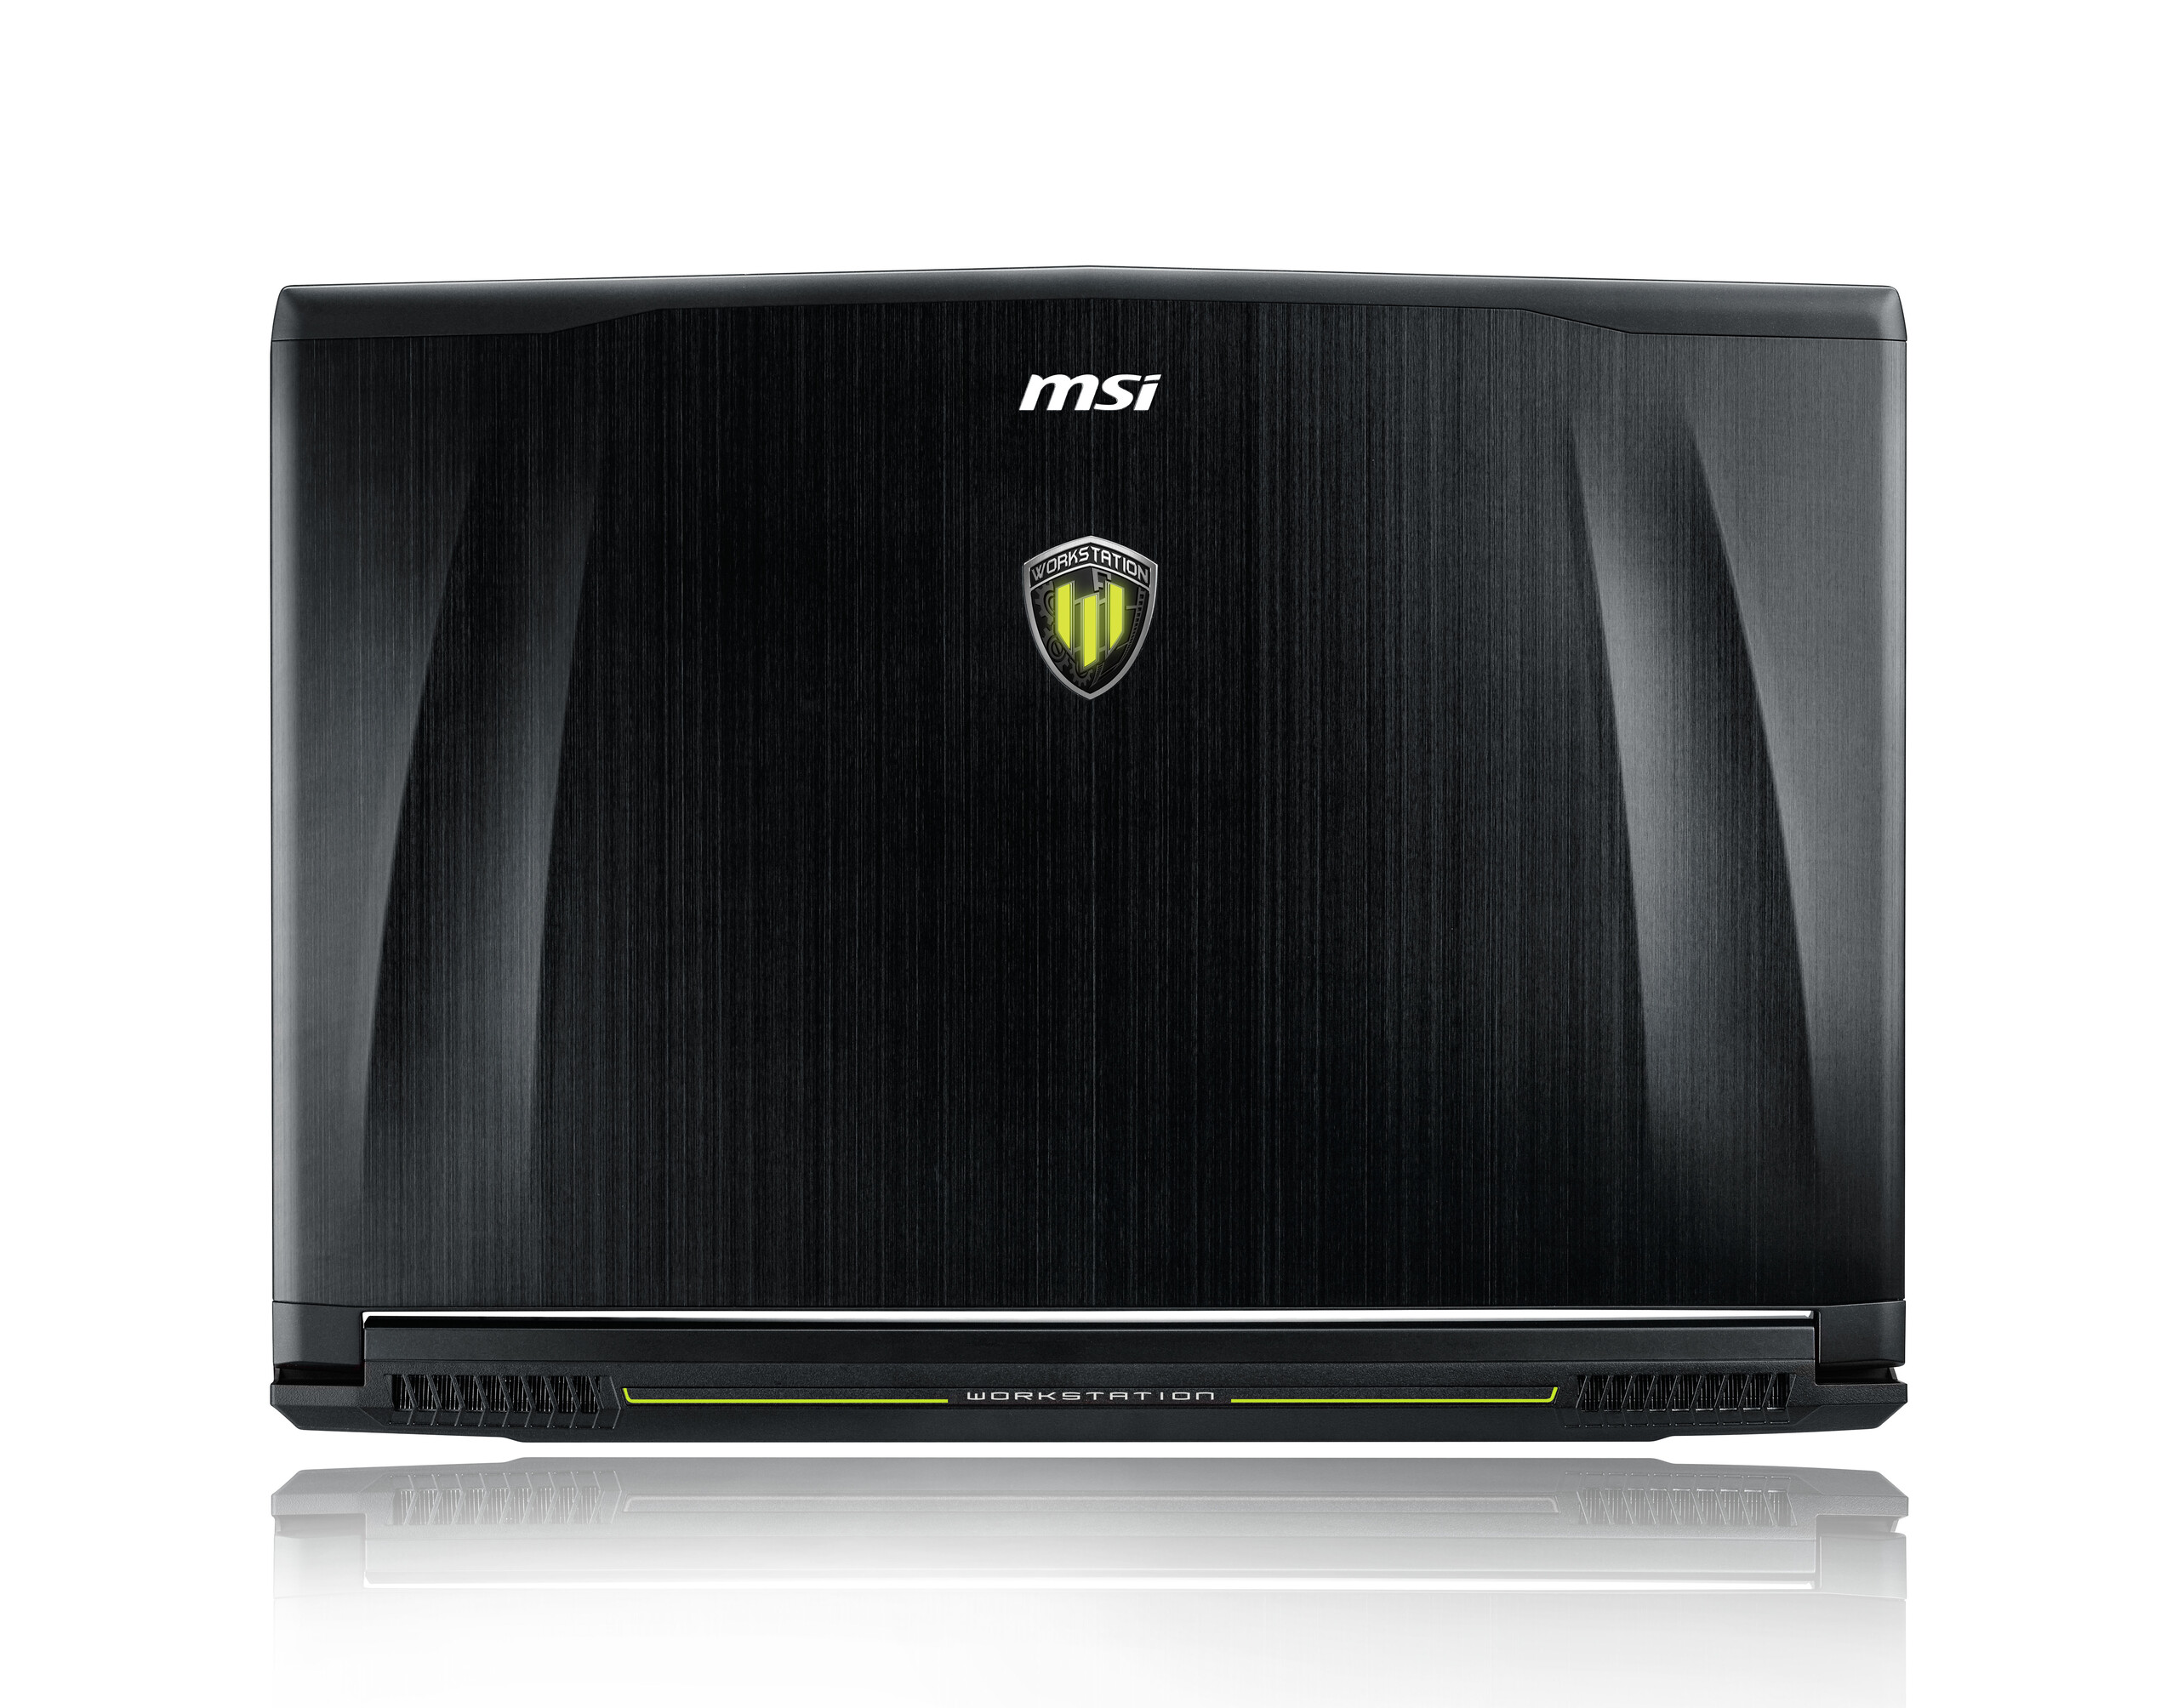
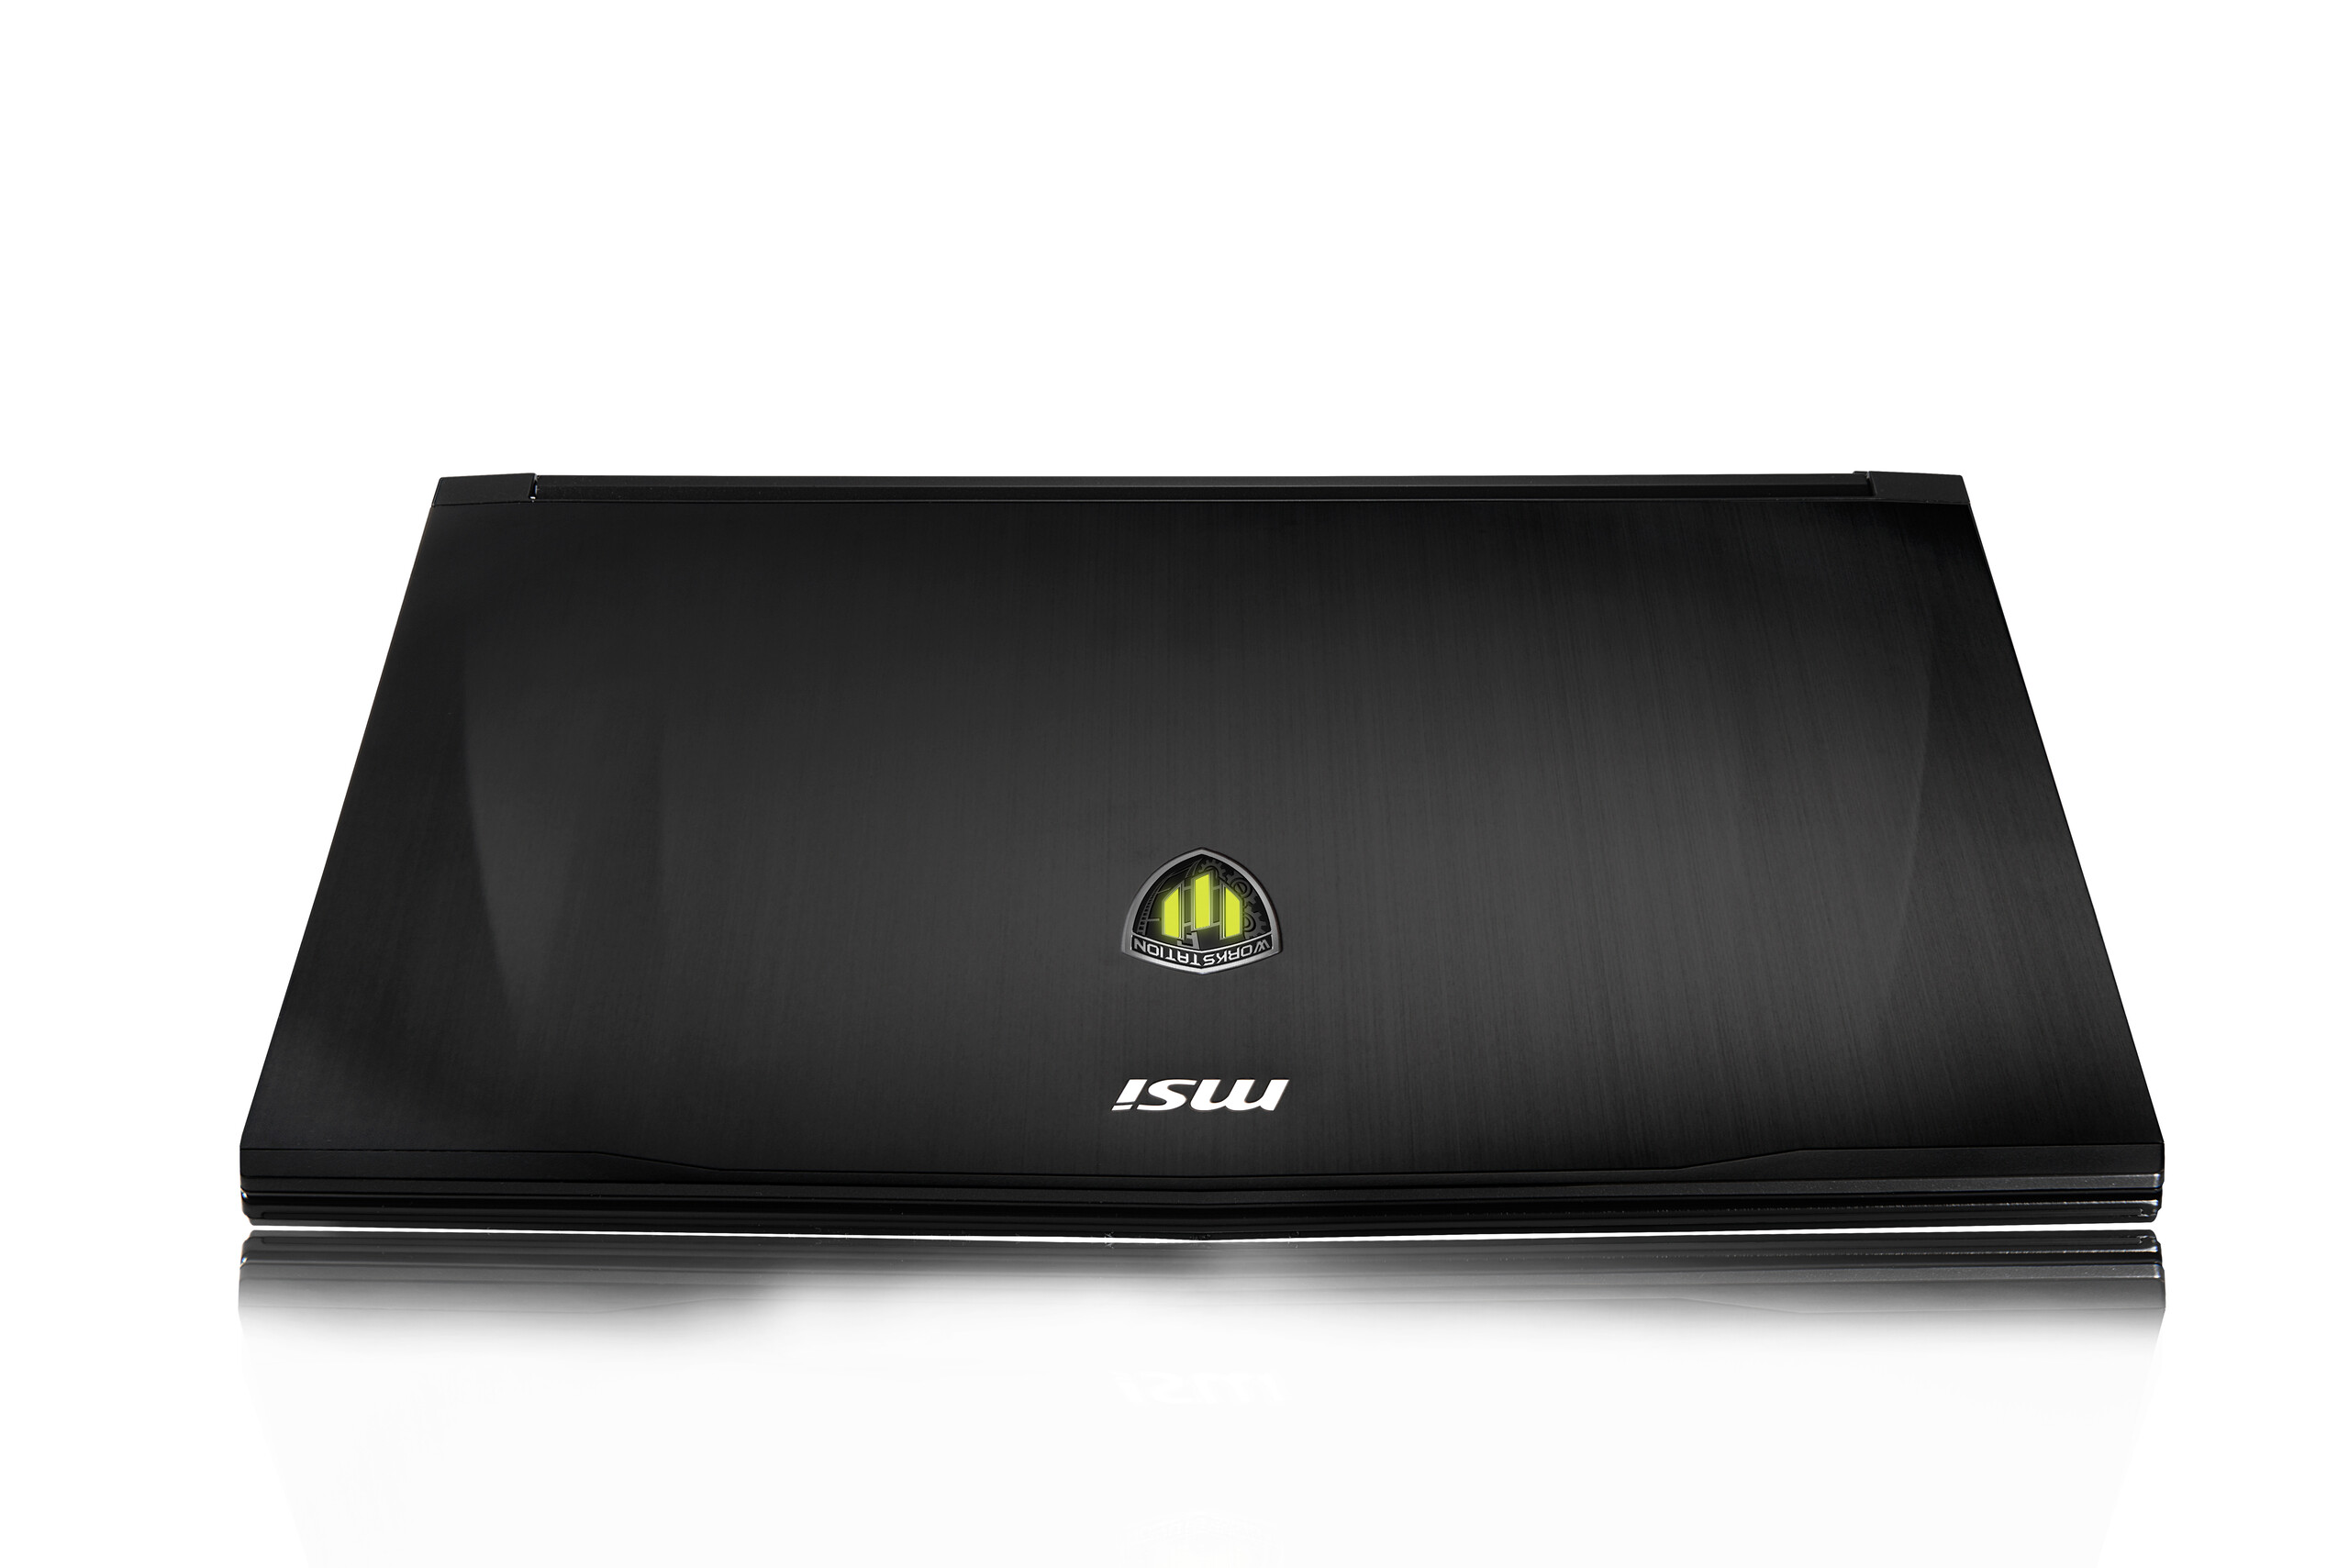
There are no major changes compared to the case of the MSI GE72. Only the red accent stripes as well as the red gaming logo were replaced by yellow variations. The black case actually works pretty well in professional environments, but you should waive the multi-colored keyboard illumination to avoid too much attention.
Size Comparison
Our size comparison shows that all four rivals have a similar footprint, but the MSI WE72 is the lightest and slimmest system. These are certainly not the most important aspects for mobile workstations, but the lower weight in particular does not hurt.
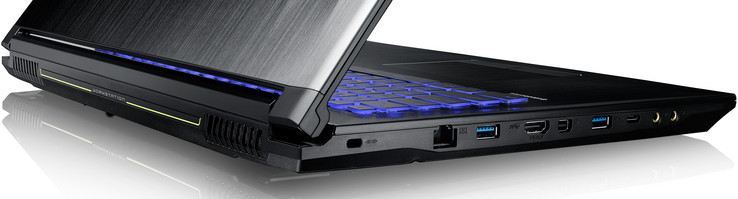
Connectivity
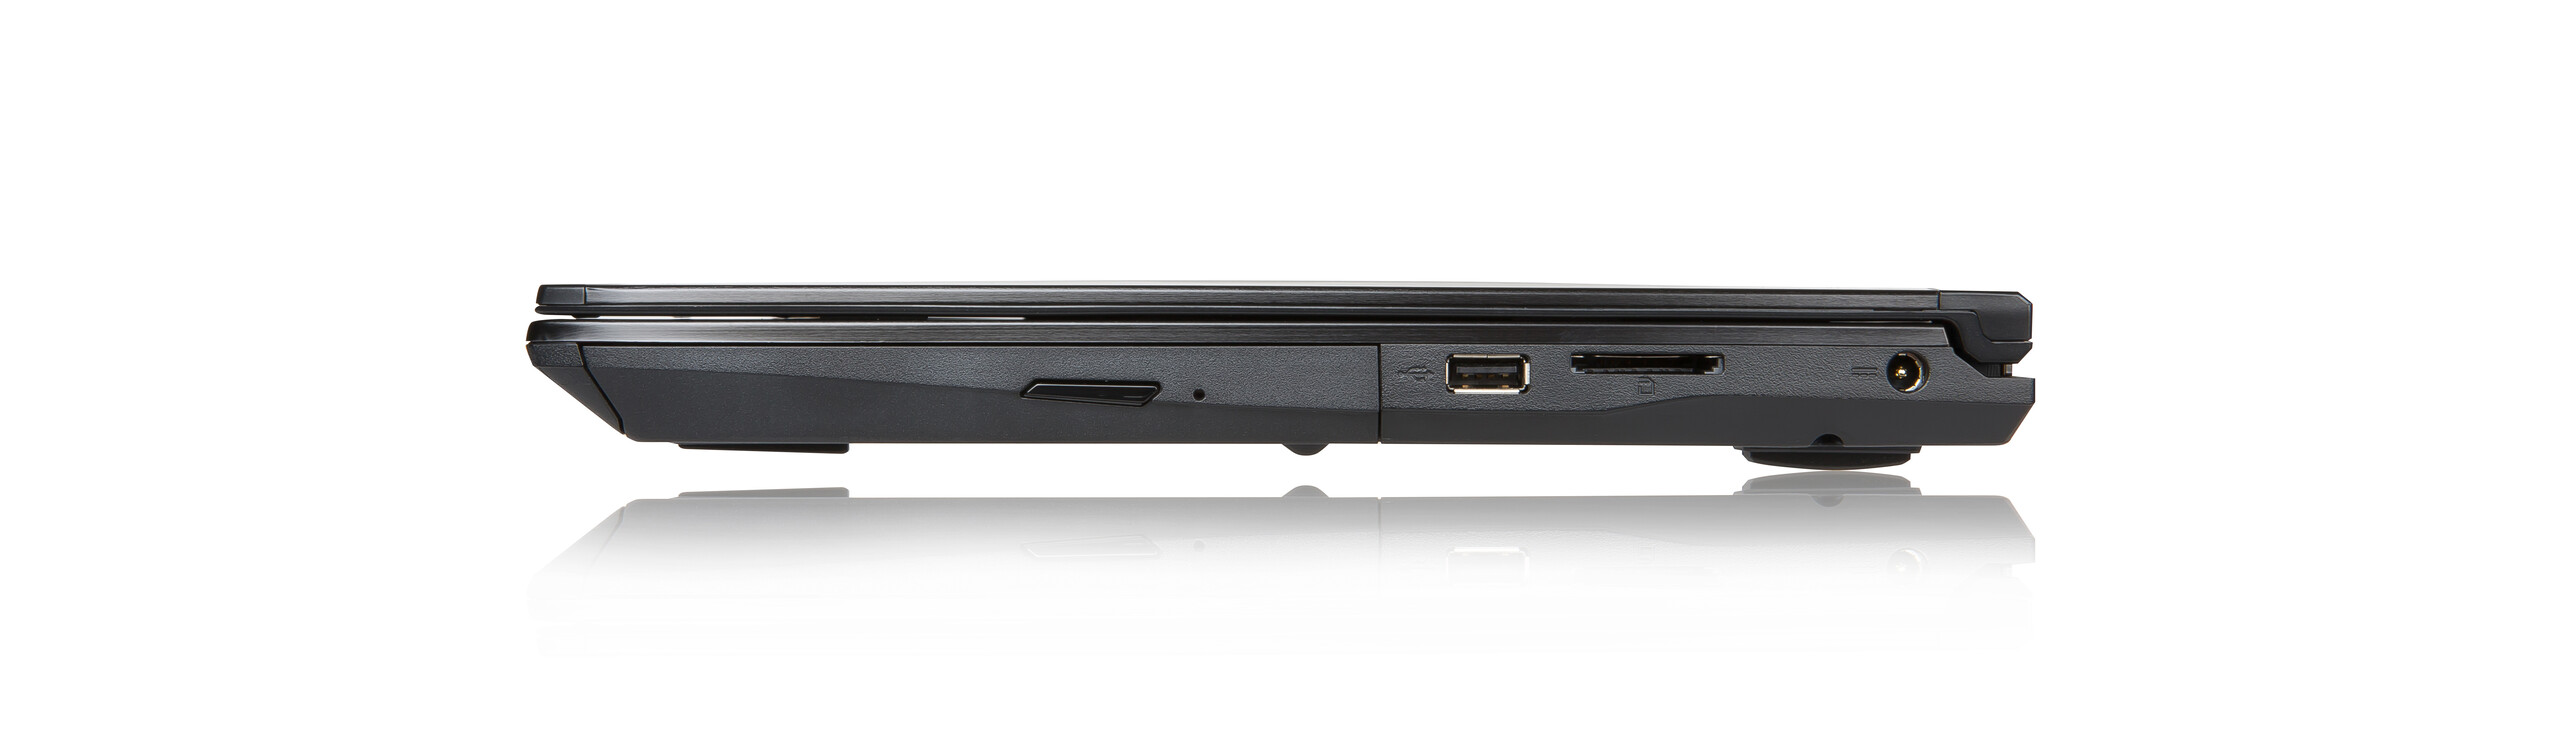
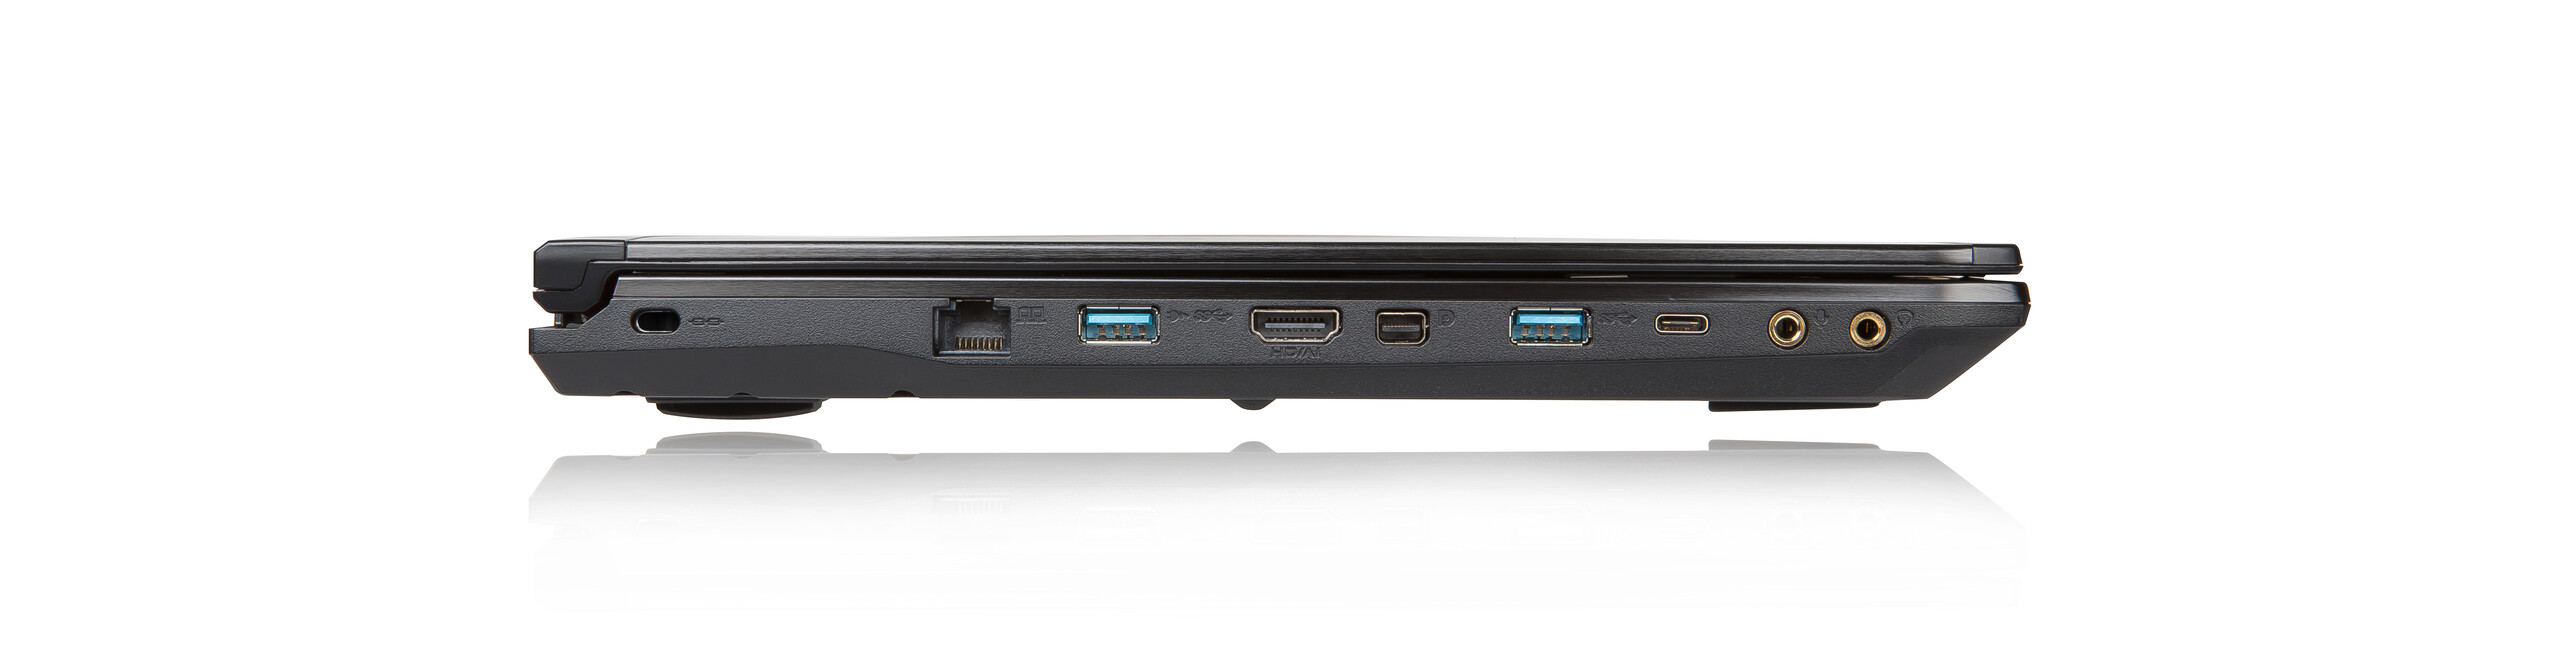
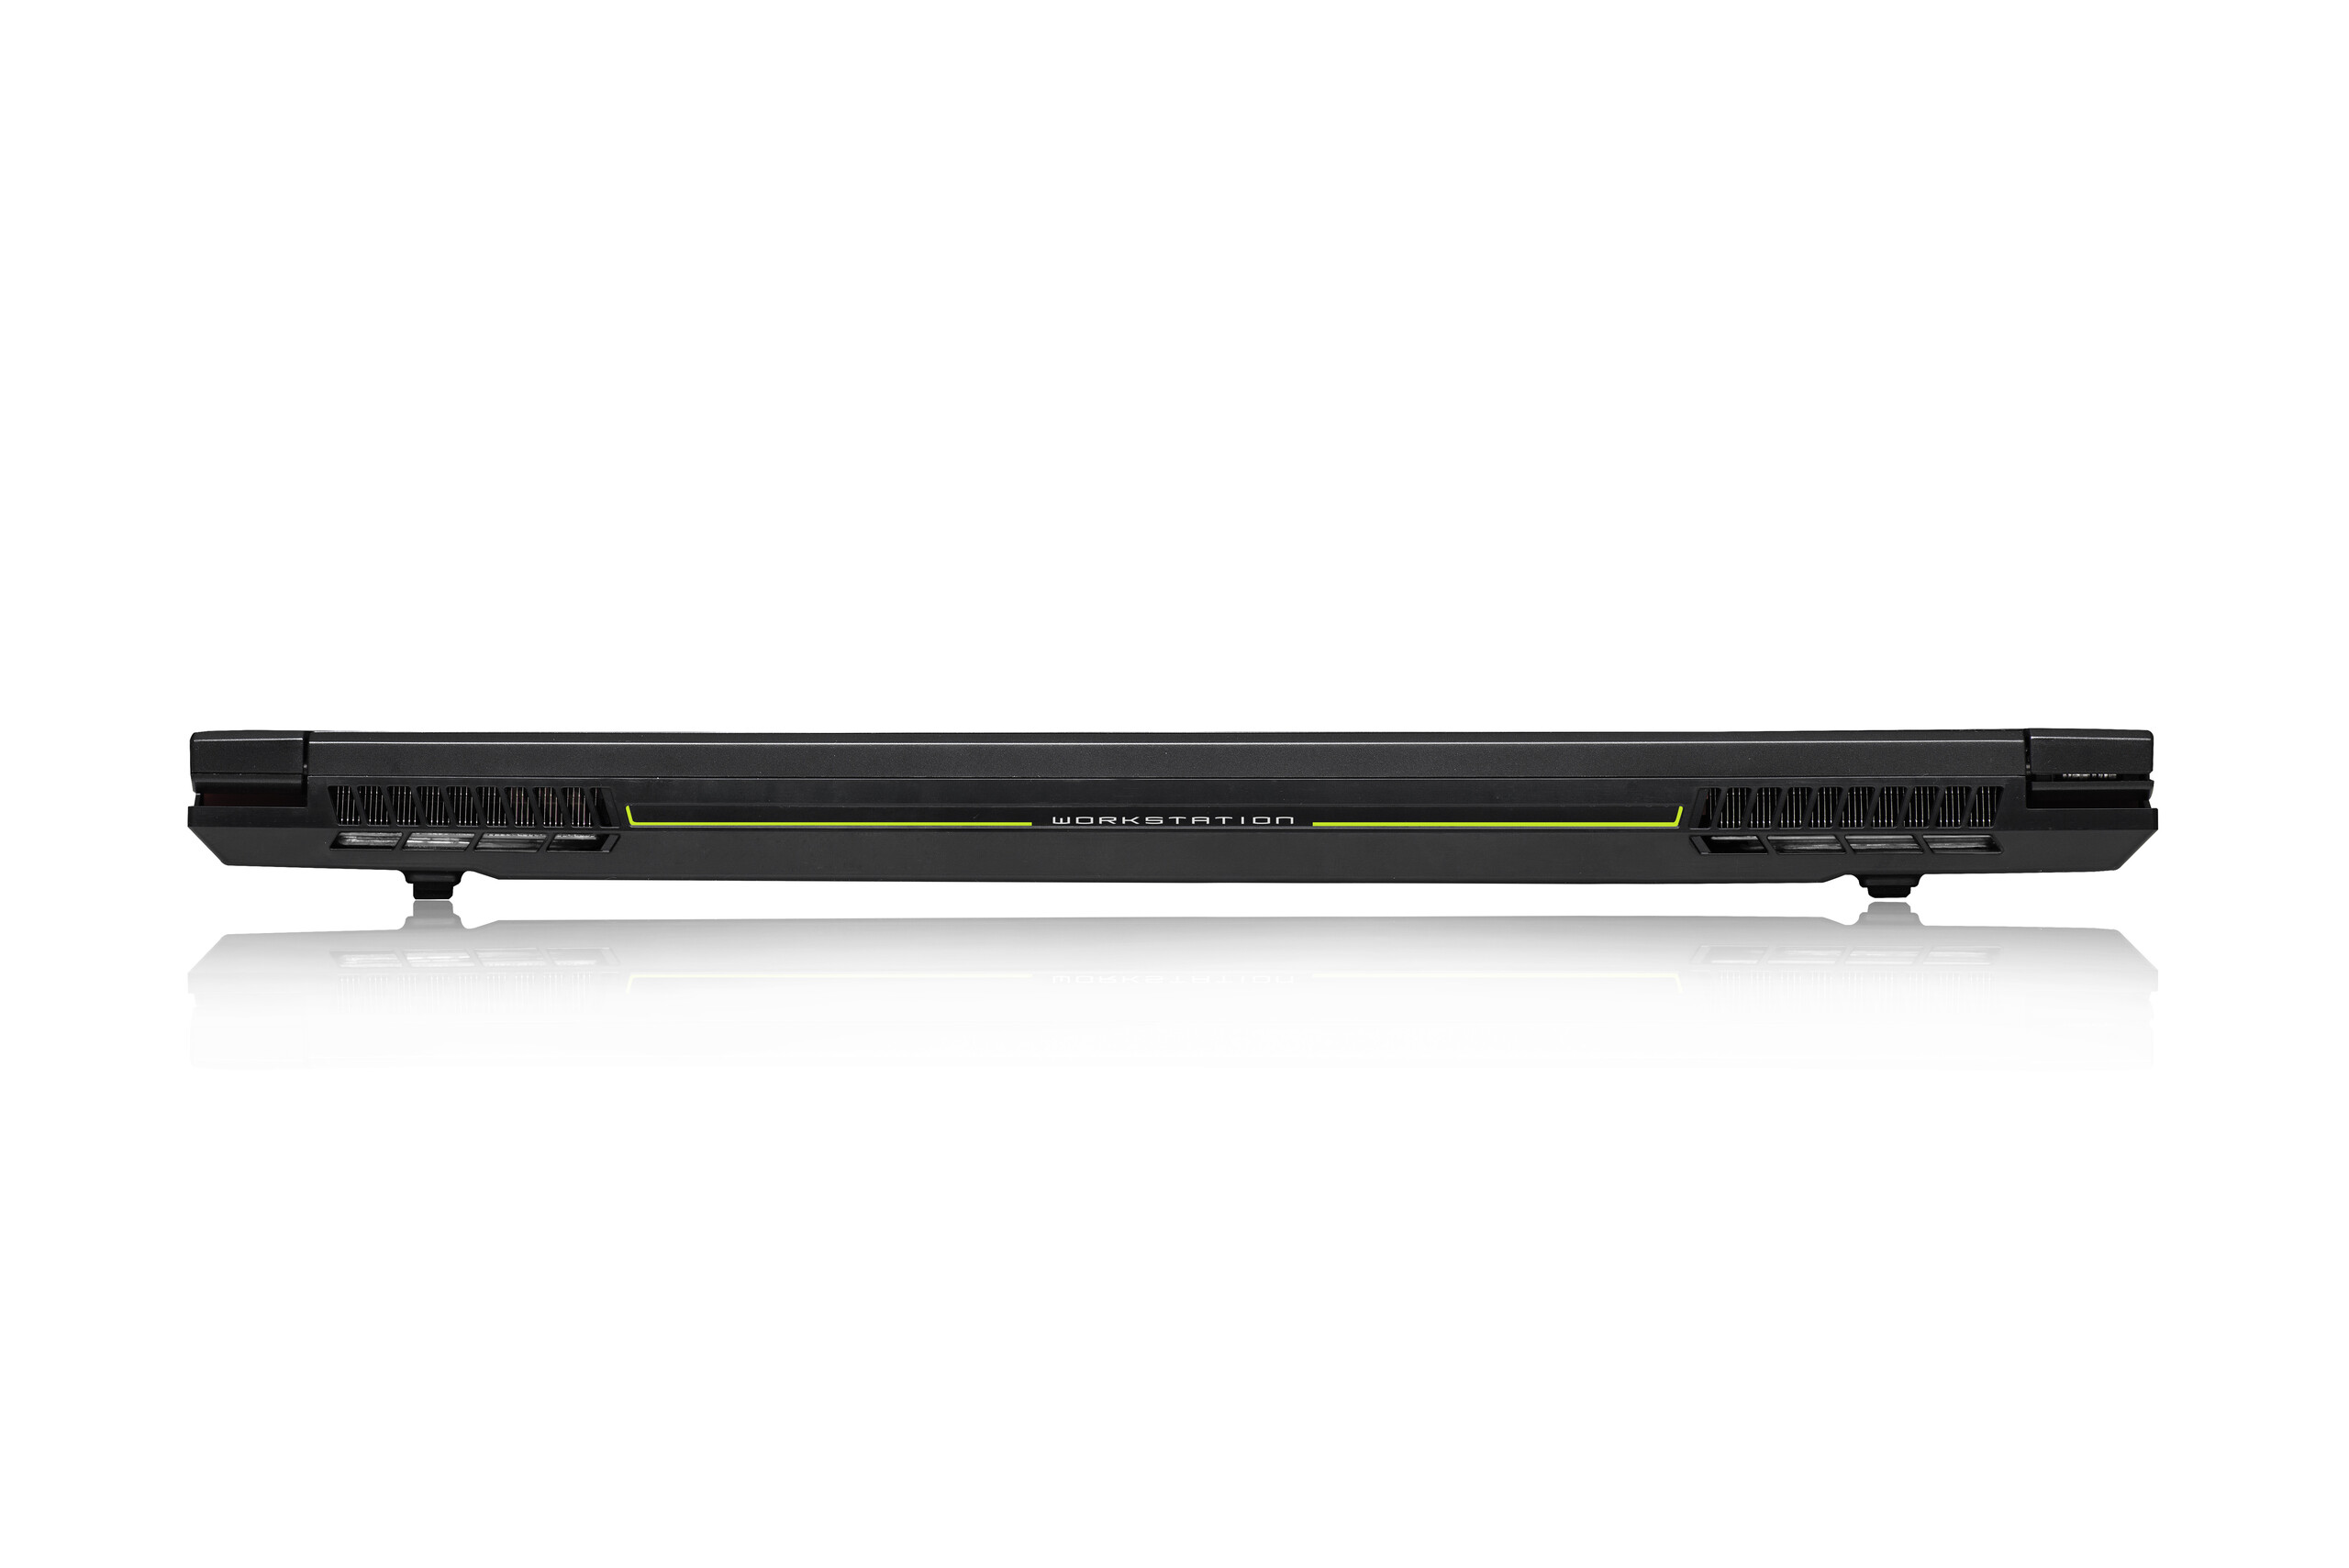
Nothing changed in terms of port or security features, either. The MSI WE72 offers a fast USB-C port (Gen.2), but without Thunderbolt 3 support. There is no proprietary docking port, either, so you are limited to conventional USB solutions. Another problem is the security equipment. MSI includes a Trusted Platform Module (2.0), but no access protection like a fingerprint scanner or a slot for SmartCards.
You can attach two external displays via both video outputs (HDMI, Mini-DisplayPort 1.2). The maximum resolution is 3840x2160 pixels (4K), but the HDMI output is limited to 30 Hz in this case.
The SD-card reader on the right side is one of the slowest models we have tested so far. It does not even manage 20 MB/s, neither in the synthetic test with AS SSD, nor in the transfer of pictures. Overall, you will have to use some USB adapters with the WE72.
| SD Card Reader | |
| average JPG Copy Test (av. of 3 runs) | |
| Dell Precision 7710 | |
| HP ZBook 17 G3 TZV66eA | |
| Lenovo ThinkPad P70 | |
| MSI WE72 7RJ | |
| maximum AS SSD Seq Read Test (1GB) | |
| HP ZBook 17 G3 TZV66eA | |
| Lenovo ThinkPad P70 | |
| Dell Precision 7710 | |
| MSI WE72 7RJ | |
Communication
MSI equips our test model of the WE72 with Intel's 3168 Wi-Fi module. It supports all modern standards including 802.11ac (2.4 & 5 GHz), but it is only a 1x1 adapter with a maximum transfer rate of 433 Mbps. The results in our standardized WLAN test with the router Linksys EA8500 are therefore okay. The connection was always reliable during our review period, but we would still like to see a faster 2x2 module in an expensive workstation. Bluetooth 4.2 is supported as well.
| Networking | |
| iperf3 transmit AX12 | |
| Lenovo ThinkPad T570-20HAS01E00 | |
| MSI GE72 7RE-046 | |
| MSI WE72 7RJ | |
| iperf3 receive AX12 | |
| Lenovo ThinkPad T570-20HAS01E00 | |
| MSI WE72 7RJ | |
| MSI GE72 7RE-046 | |
Display

You can also see the gaming roots of the MSI WE72 when you look at the display options, because one of them is a TN panel (FHD) with 120 Hz/5 ms. Our test model is also equipped with an FHD panel, but it is based on the IPS technology. High-resolution screens are currently not available for the mobile workstation.
The 17.3-inch display features the Full HD resolution (1920x1080 pixels), which results in a pixel density of 127 PPI. This is not much, especially compared to high-resolution screens, but there are at least no scaling issues with Windows or older applications. The panel from LG Philips (LP173WF4-SPF1) does not show any backlight bleeding and we can measure a decent average luminance of 306 nits. Both the brightness distribution (93%) and the contrast (~1000:1, black value 0.31) are good as well.
| |||||||||||||||||||||||||
Brightness Distribution: 93 %
Center on Battery: 301 cd/m²
Contrast: 974:1 (Black: 0.31 cd/m²)
ΔE ColorChecker Calman: 6.2 | ∀{0.5-29.43 Ø4.71}
ΔE Greyscale Calman: 7.3 | ∀{0.09-98 Ø4.96}
85.2% sRGB (Argyll 1.6.3 3D)
56% AdobeRGB 1998 (Argyll 1.6.3 3D)
62.4% AdobeRGB 1998 (Argyll 3D)
85.3% sRGB (Argyll 3D)
67.4% Display P3 (Argyll 3D)
Gamma: 2.08
CCT: 7020 K
| MSI WE72 7RJ LP173WF4-SPF1, , 1920x1080, 17.3" | Dell Precision 7710 SDC8151, VHN17_173HL, , 1920x1080, 17.3" | Lenovo ThinkPad P70 LEN4123, , 3840x2160, 17.3" | HP ZBook 17 G3 TZV66eA SDC3854, , 1920x1080, 17.3" | |
|---|---|---|---|---|
| Display | 8% | 30% | 8% | |
| Display P3 Coverage (%) | 67.4 | 66.6 -1% | 90.8 35% | 67.3 0% |
| sRGB Coverage (%) | 85.3 | 96.9 14% | 100 17% | 95.9 12% |
| AdobeRGB 1998 Coverage (%) | 62.4 | 68.6 10% | 85.4 37% | 69 11% |
| Response Times | -24% | -1% | -10% | |
| Response Time Grey 50% / Grey 80% * (ms) | 45.2 ? | 50 ? -11% | 44 ? 3% | 50.4 ? -12% |
| Response Time Black / White * (ms) | 26.4 ? | 36 ? -36% | 27.6 ? -5% | 28.4 ? -8% |
| PWM Frequency (Hz) | 198 ? | 228 ? | 200 ? | |
| Screen | 13% | 11% | 23% | |
| Brightness middle (cd/m²) | 302 | 332 10% | 365 21% | 252 -17% |
| Brightness (cd/m²) | 306 | 307 0% | 341 11% | 243 -21% |
| Brightness Distribution (%) | 93 | 83 -11% | 85 -9% | 86 -8% |
| Black Level * (cd/m²) | 0.31 | 0.33 -6% | 0.4 -29% | 0.21 32% |
| Contrast (:1) | 974 | 1006 3% | 913 -6% | 1200 23% |
| Colorchecker dE 2000 * | 6.2 | 3 52% | 3.8 39% | 2.2 65% |
| Colorchecker dE 2000 max. * | 10.6 | 3.8 64% | ||
| Greyscale dE 2000 * | 7.3 | 4 45% | 6.09 17% | 2.7 63% |
| Gamma | 2.08 106% | 2 110% | 2.3 96% | 2.28 96% |
| CCT | 7020 93% | 7089 92% | 6332 103% | 6686 97% |
| Color Space (Percent of AdobeRGB 1998) (%) | 56 | 62 11% | 76.01 36% | 62 11% |
| Color Space (Percent of sRGB) (%) | 85.2 | 97 14% | 99.97 17% | 96 13% |
| Total Average (Program / Settings) | -1% /
7% | 13% /
13% | 7% /
15% |
* ... smaller is better
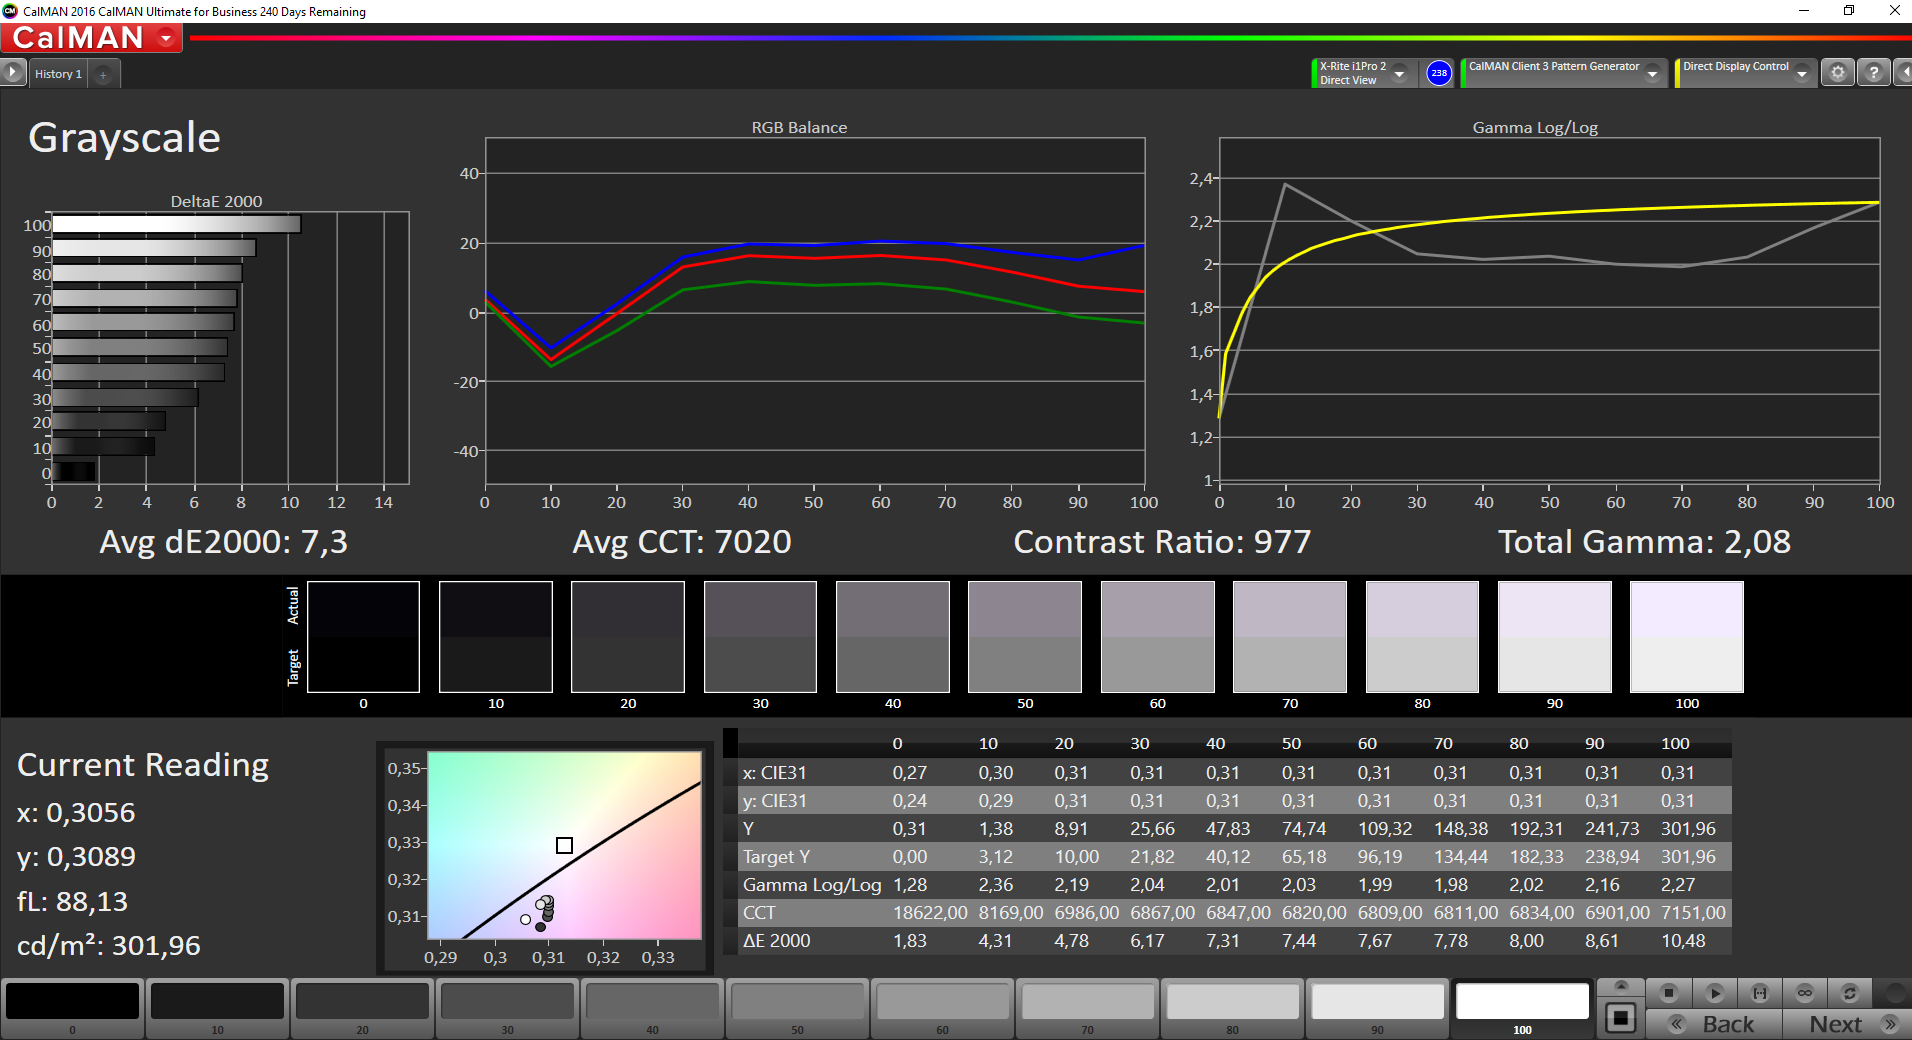
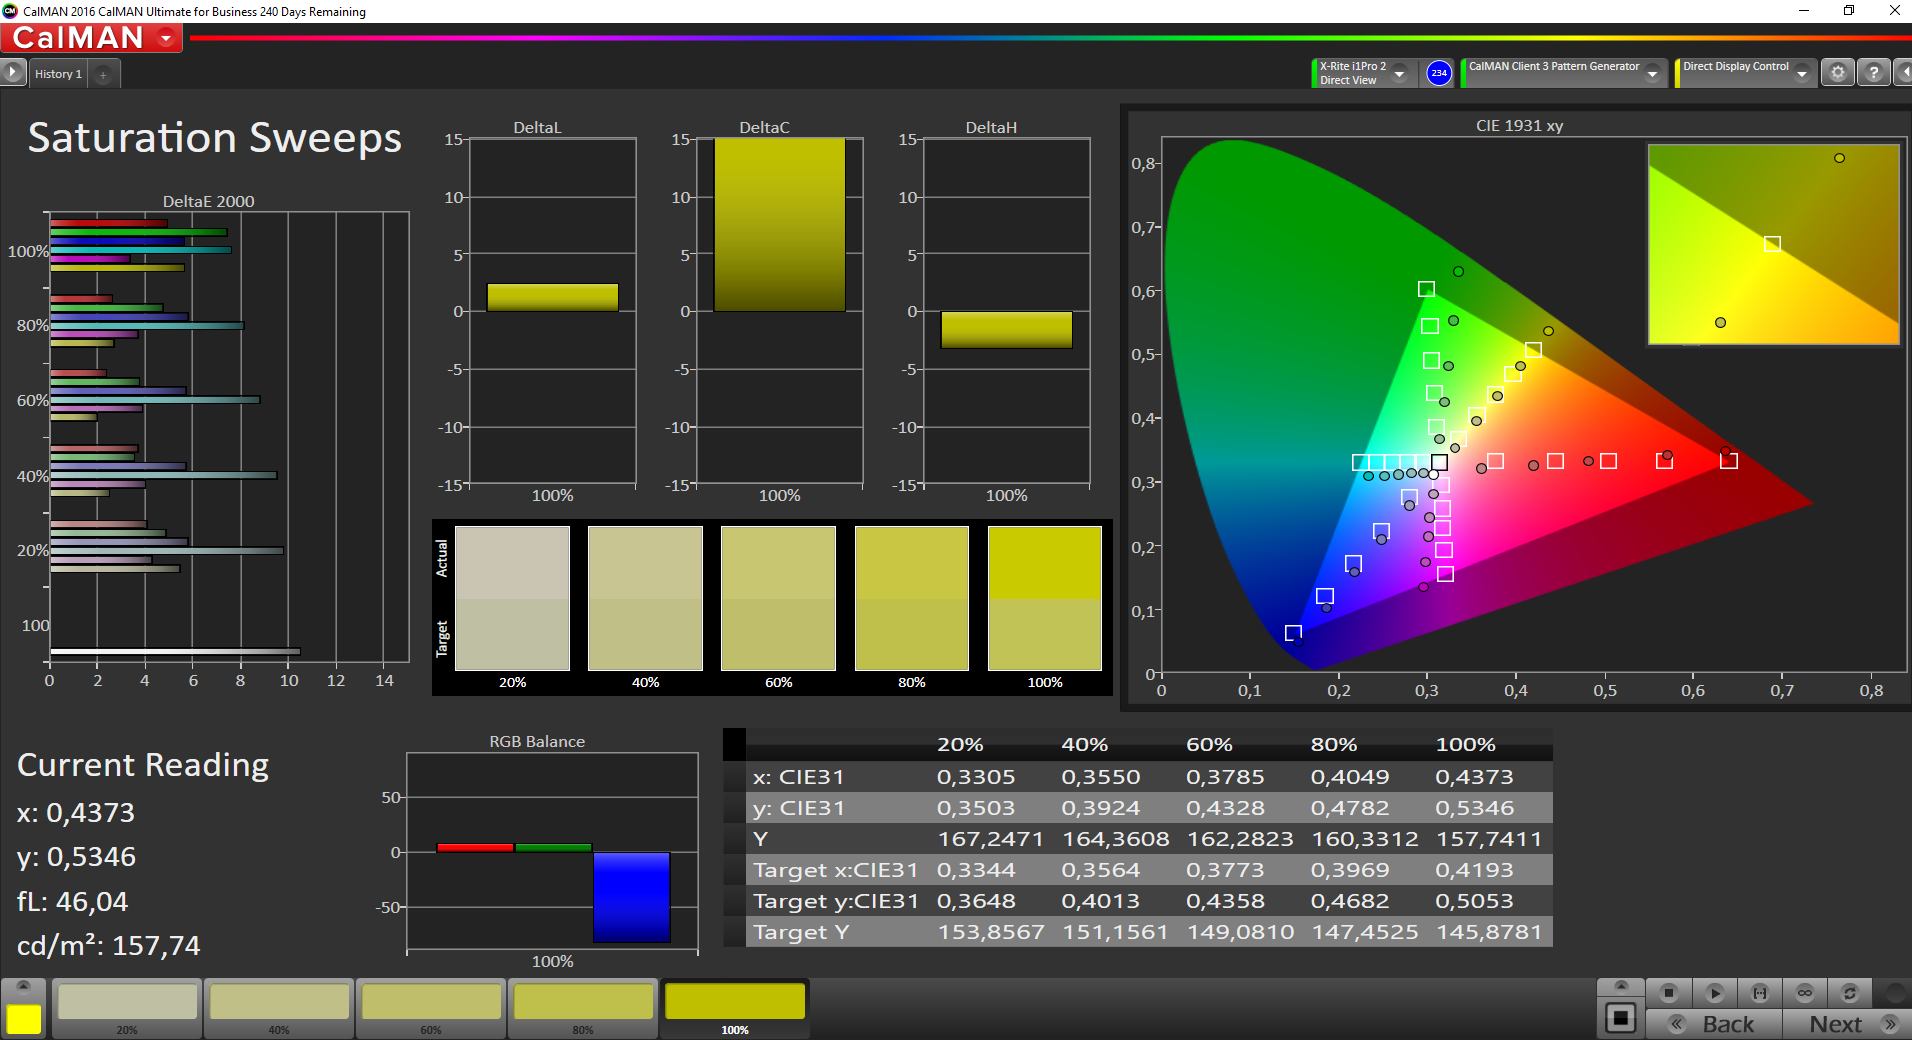
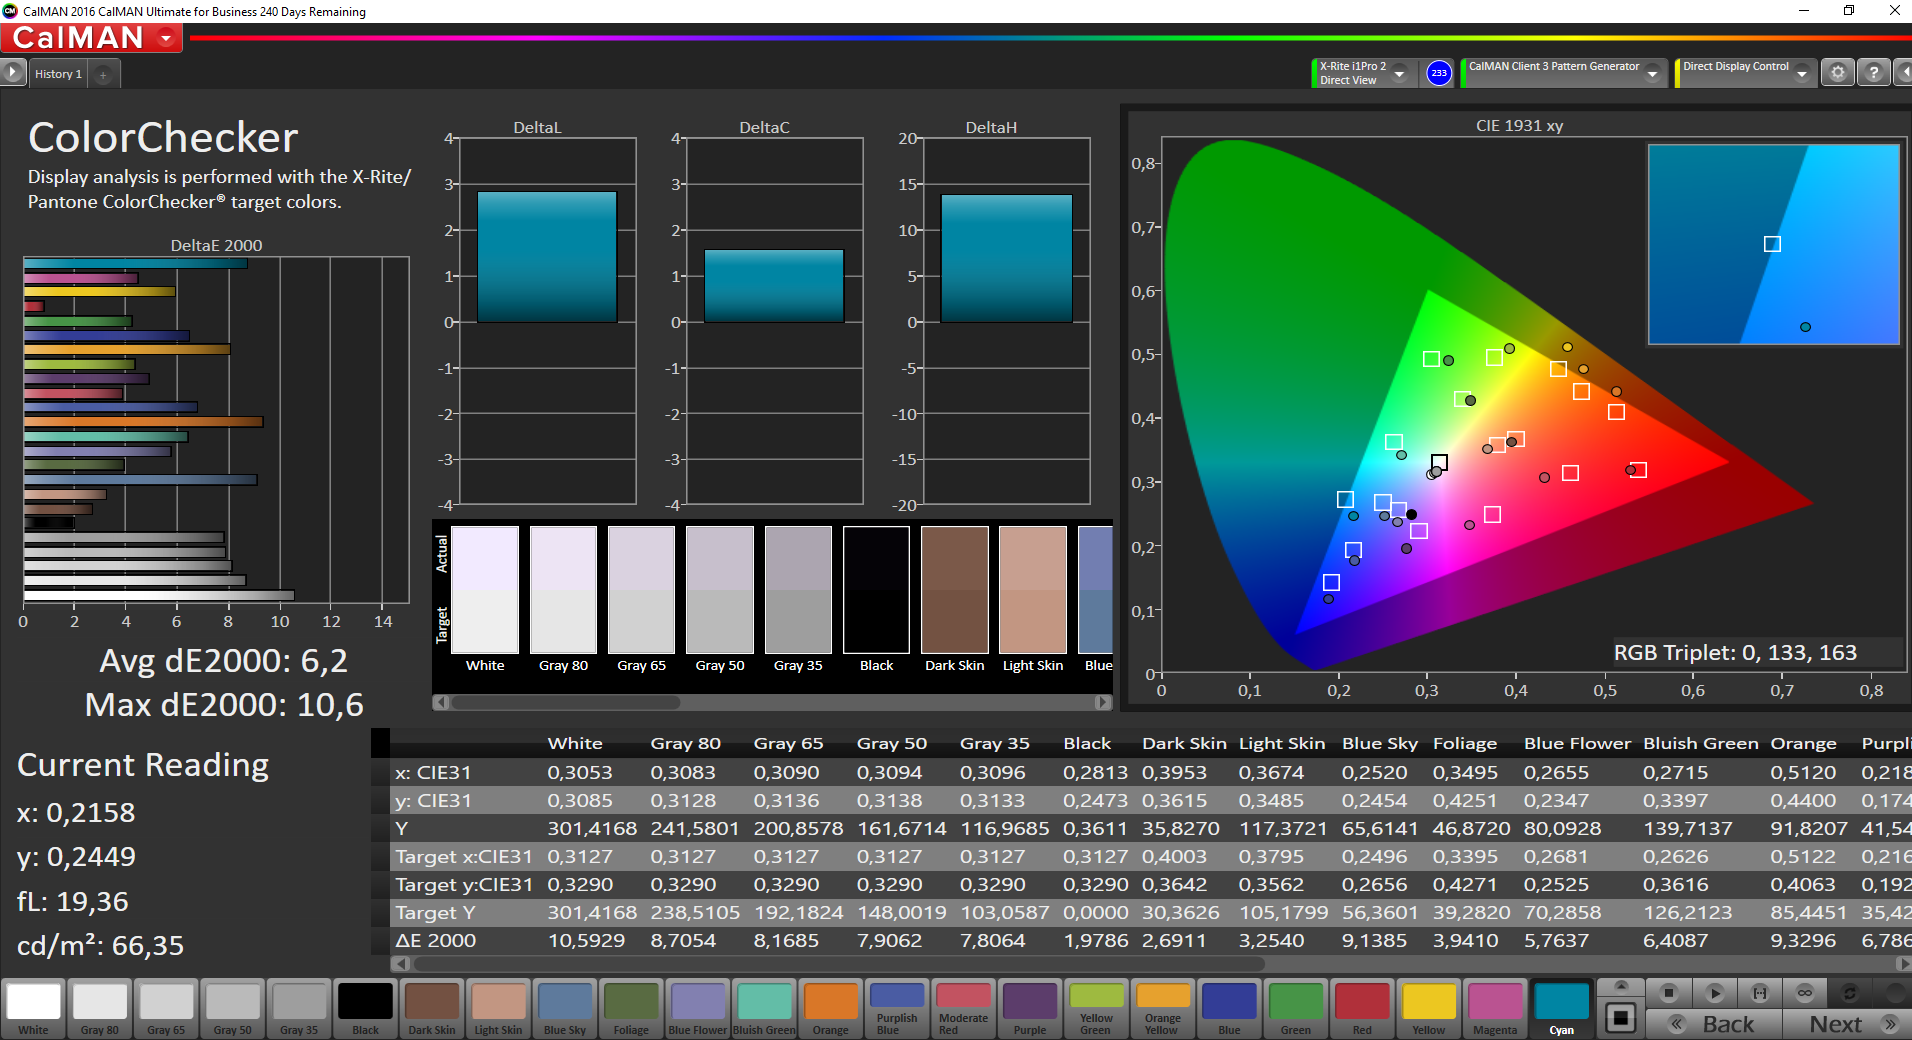
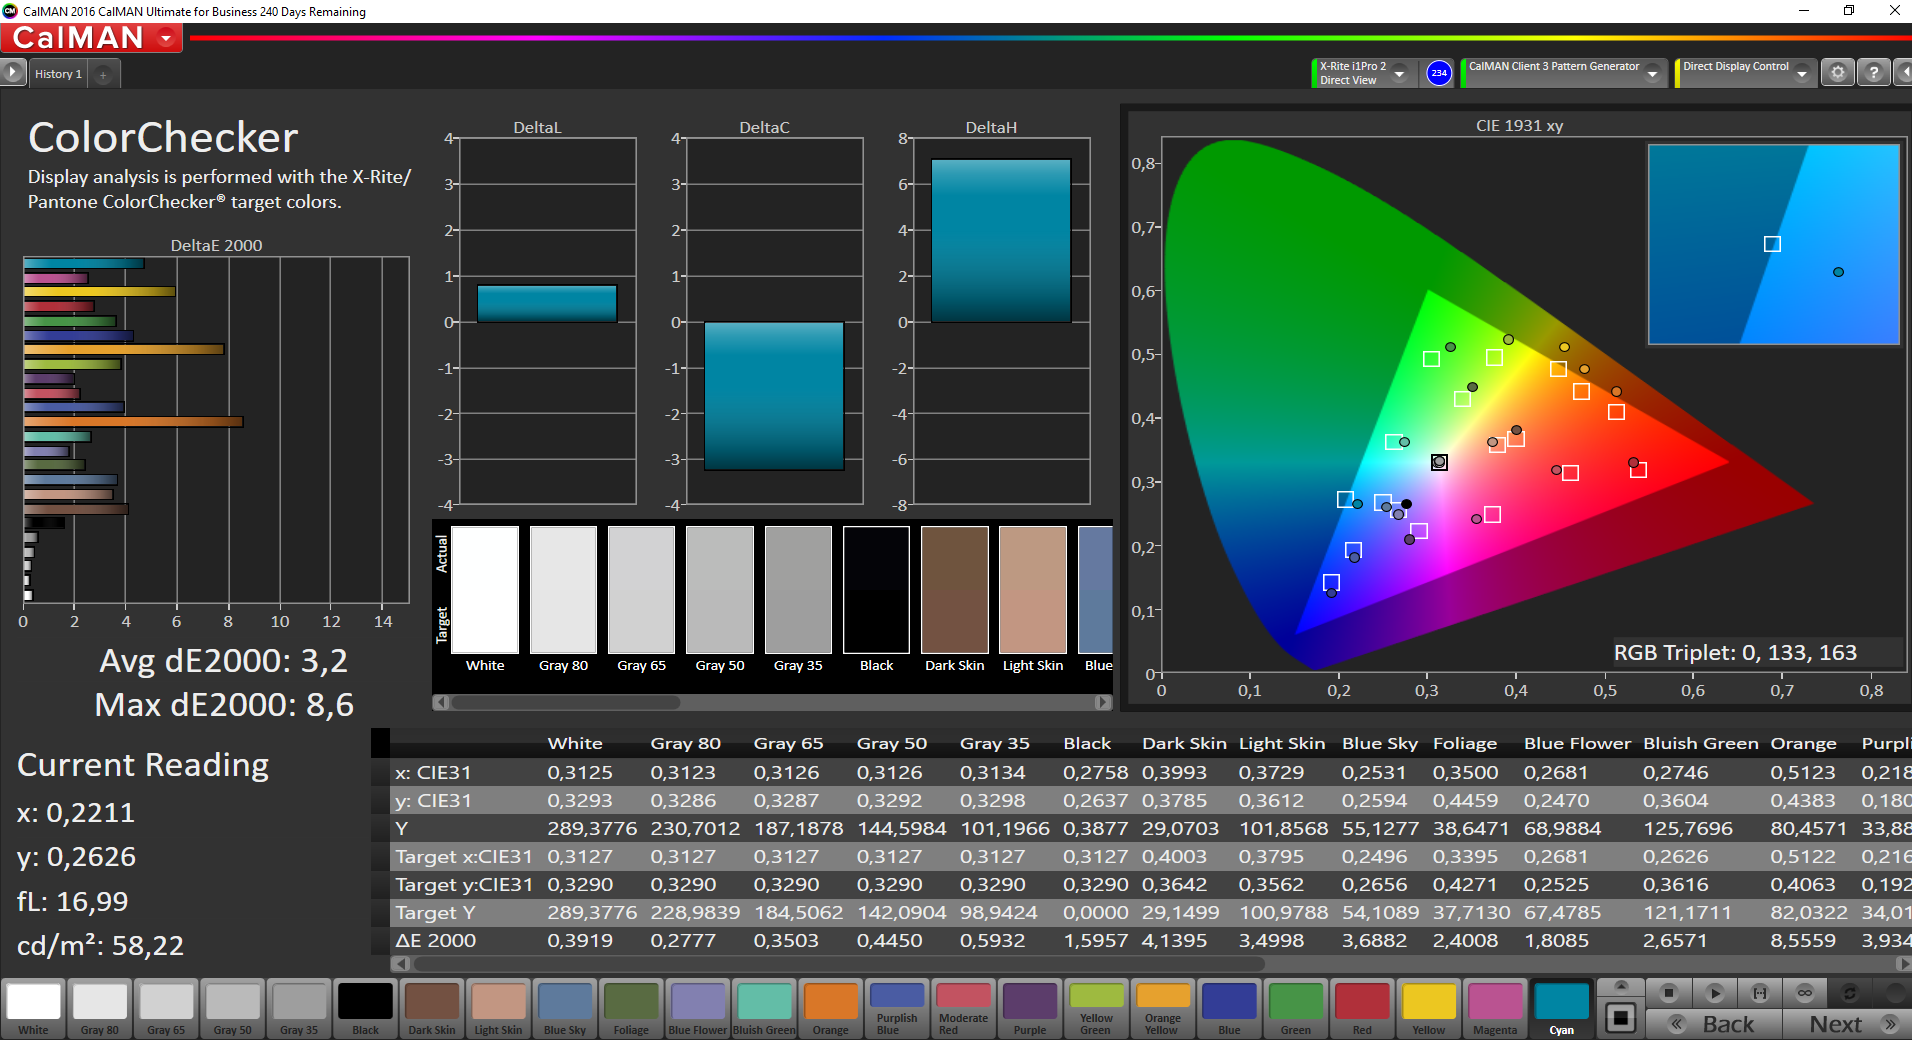
MSI also uses its own True Color technology for the WE72. Users can choose between different color profiles, but the default sRGB setting unfortunately suffers from a severe red cast. Similar to the gaming notebooks from MSI, we found the mode "Gamer" to provide the best results ex-works. However, the results are still not very convincing in general. We determine average DeltaE-2000 deviations of 7.3 (grayscale) and 6.2 (ColorChecker) compared to the sRGB reference, and we can notice a slight blue cast.
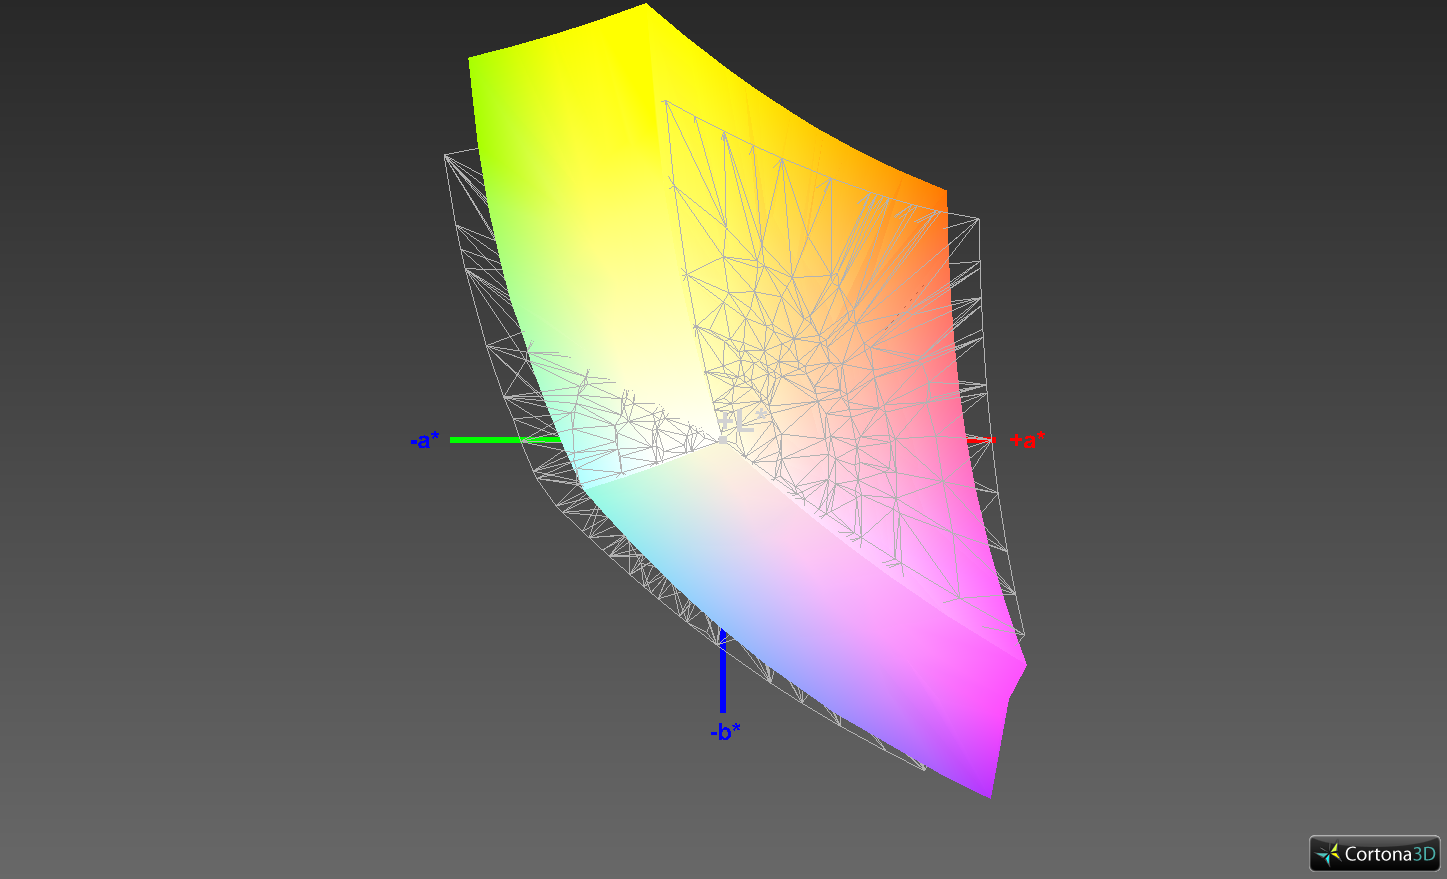
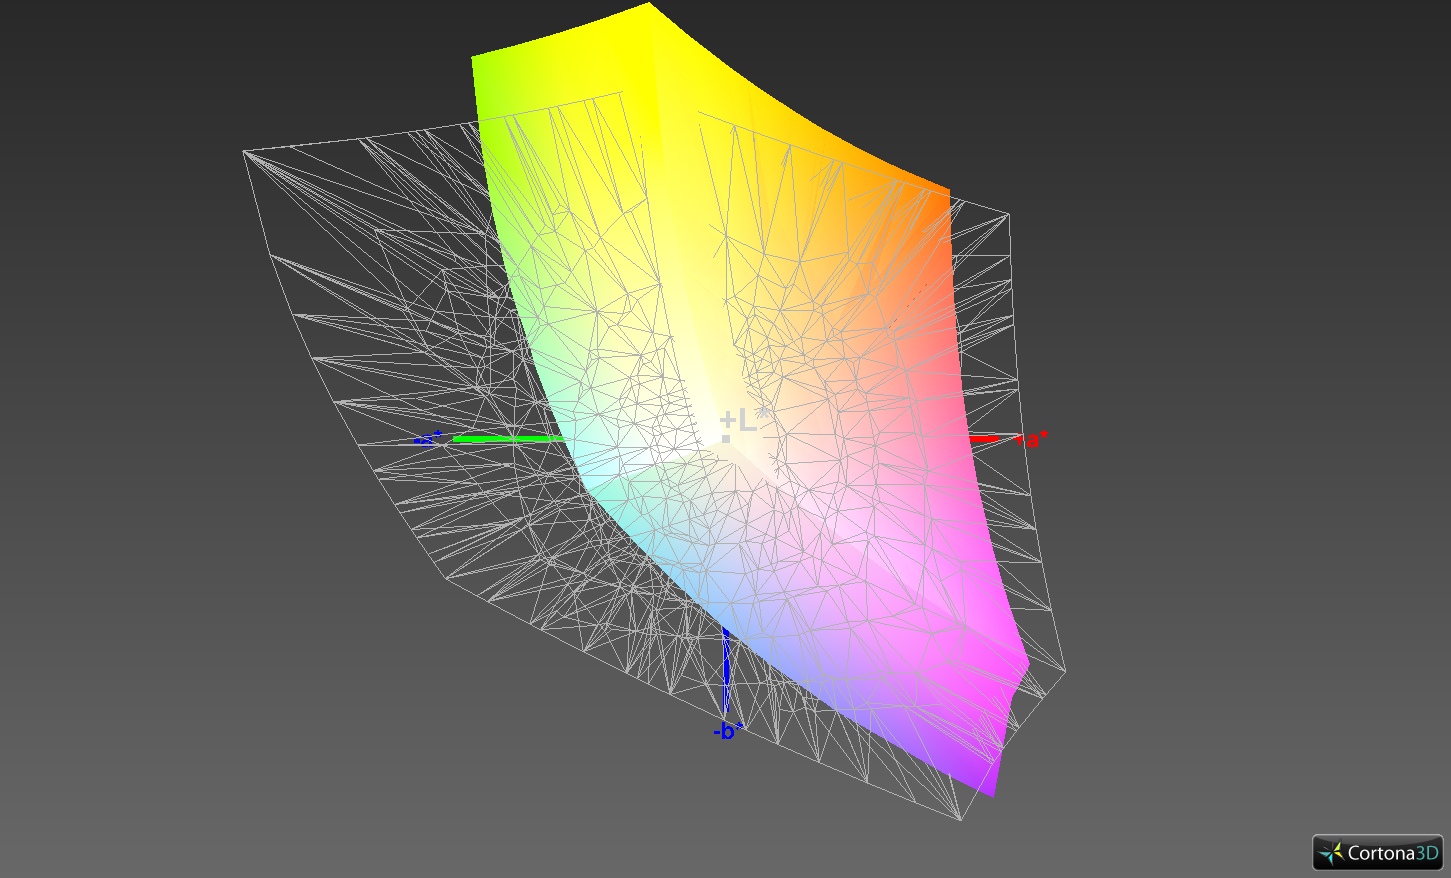
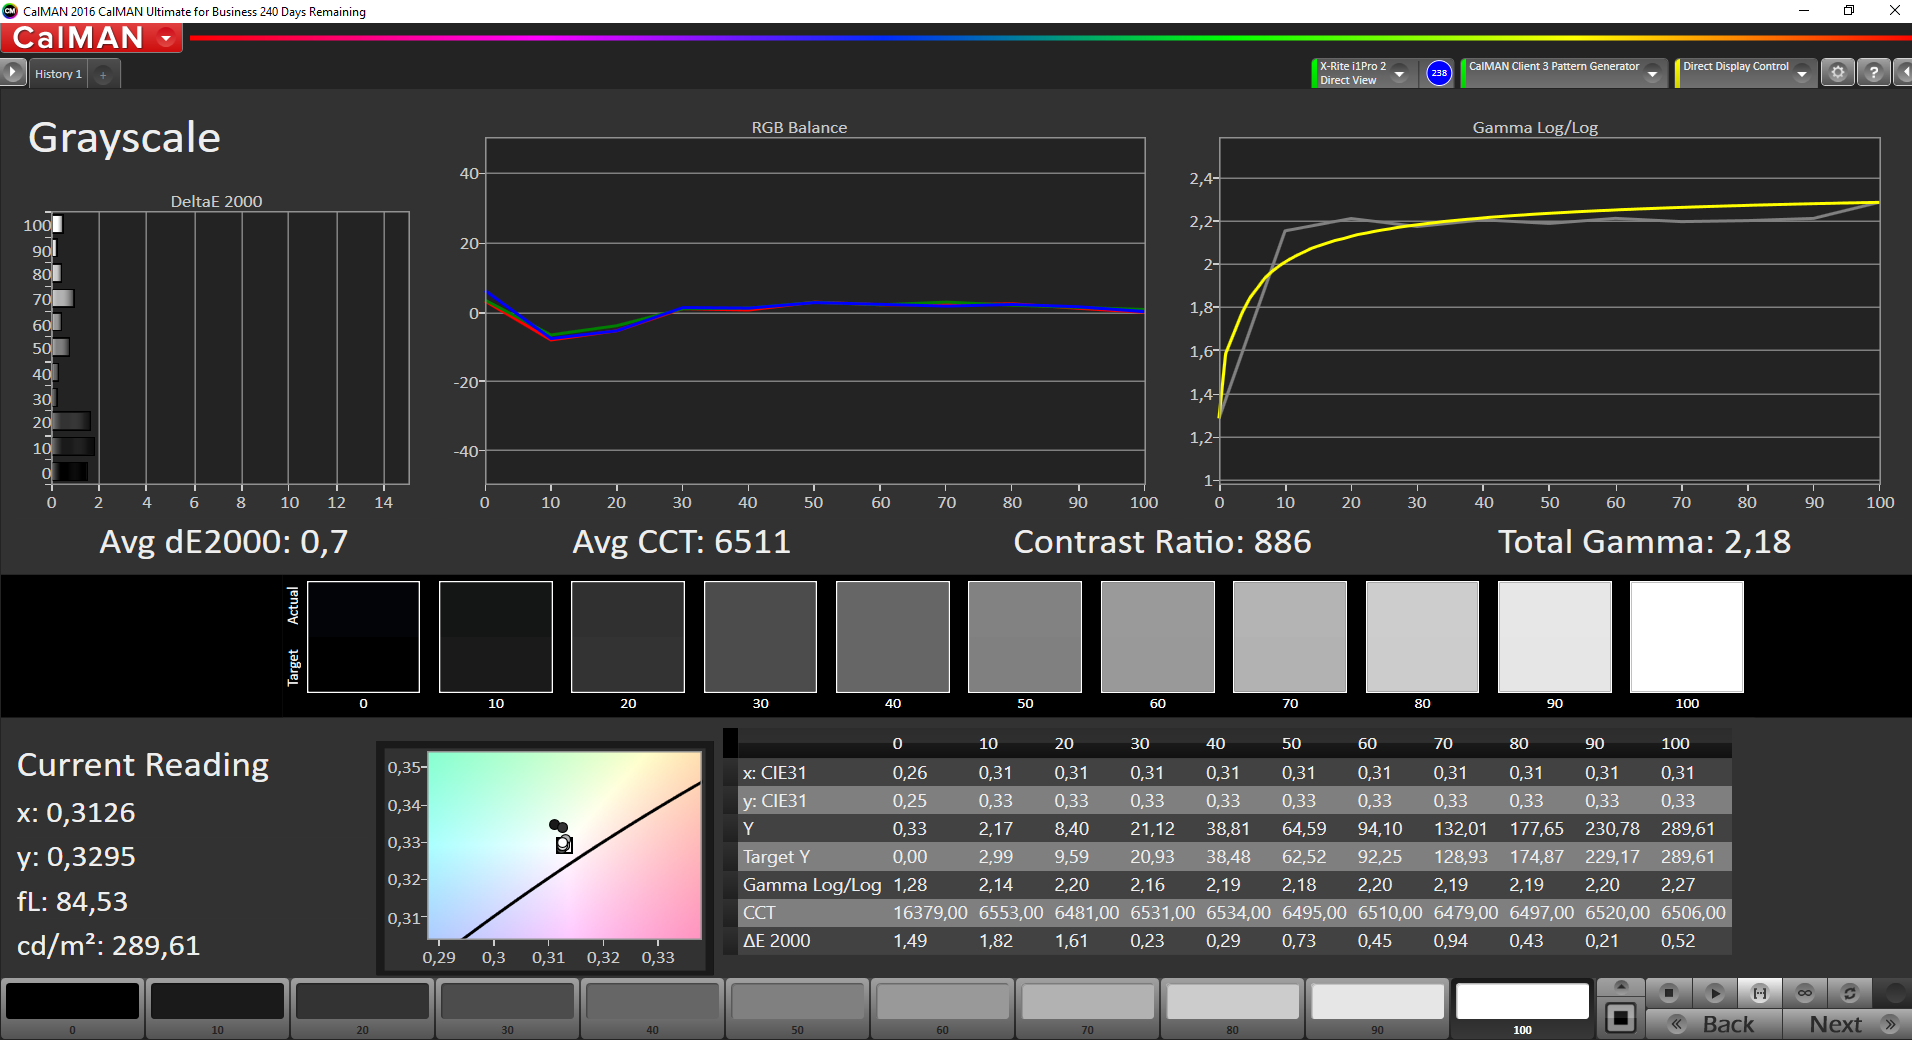
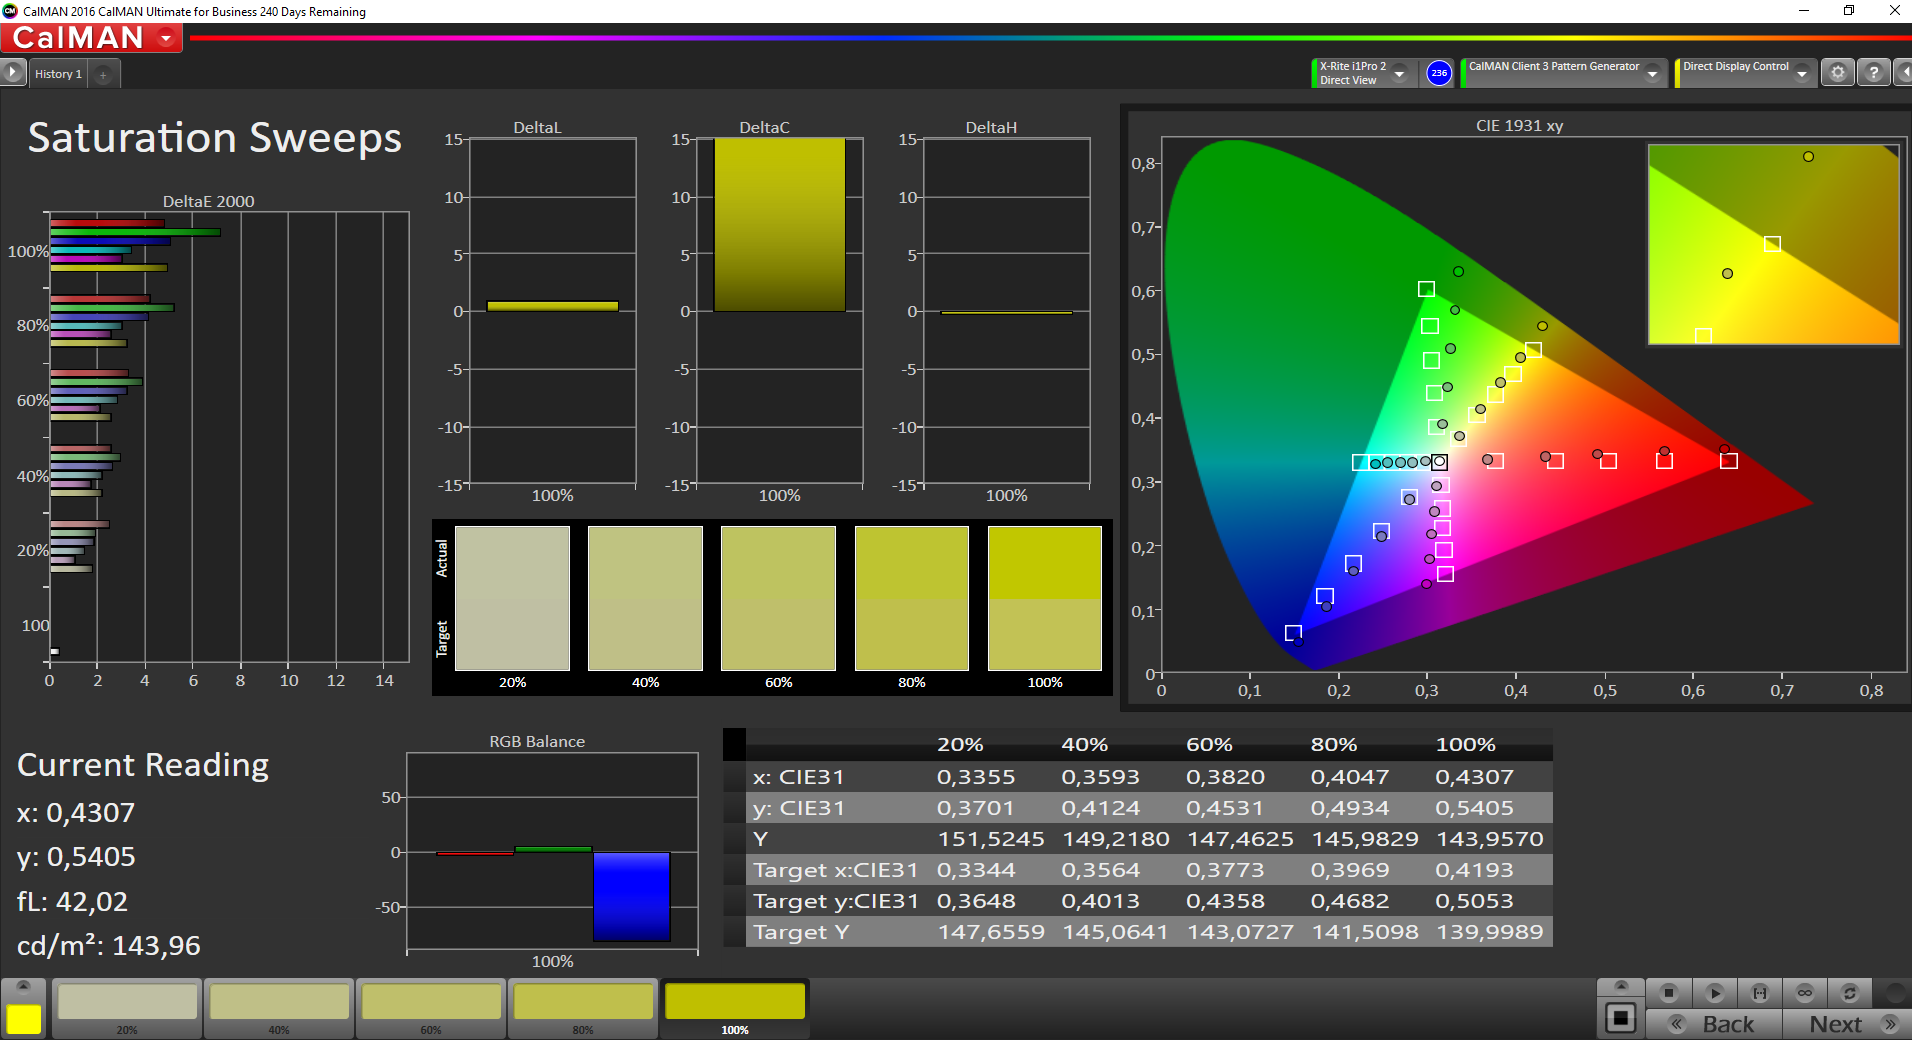
The calibration improves the grayscale performance in particular, and the blue cast is also gone. We definitely recommend using our calibrated profile (linked in the box above). The average color deviation drops as well, but orange/yellow still shows a high deviation of up to 8. That the display is not perfect for professional picture editing is also a result of the color gamut. The panel can only display 85% of the smaller sRGB and 56% of the AdobeRGB reference, respectively.
Display Response Times
| ↔ Response Time Black to White | ||
|---|---|---|
| 26.4 ms ... rise ↗ and fall ↘ combined | ↗ 14.8 ms rise | 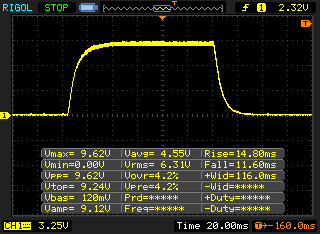 |
| ↘ 11.6 ms fall | ||
| The screen shows relatively slow response rates in our tests and may be too slow for gamers. In comparison, all tested devices range from 0.1 (minimum) to 240 (maximum) ms. » 66 % of all devices are better. This means that the measured response time is worse than the average of all tested devices (19.8 ms). | ||
| ↔ Response Time 50% Grey to 80% Grey | ||
| 45.2 ms ... rise ↗ and fall ↘ combined | ↗ 27.2 ms rise | 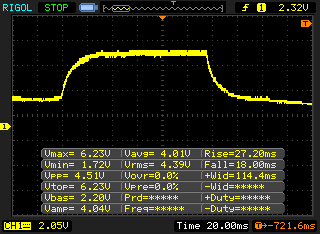 |
| ↘ 18 ms fall | ||
| The screen shows slow response rates in our tests and will be unsatisfactory for gamers. In comparison, all tested devices range from 0.165 (minimum) to 636 (maximum) ms. » 78 % of all devices are better. This means that the measured response time is worse than the average of all tested devices (31 ms). | ||
Screen Flickering / PWM (Pulse-Width Modulation)
| Screen flickering / PWM not detected | 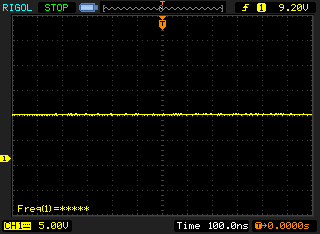 | ||
In comparison: 52 % of all tested devices do not use PWM to dim the display. If PWM was detected, an average of 7757 (minimum: 5 - maximum: 343500) Hz was measured. | |||
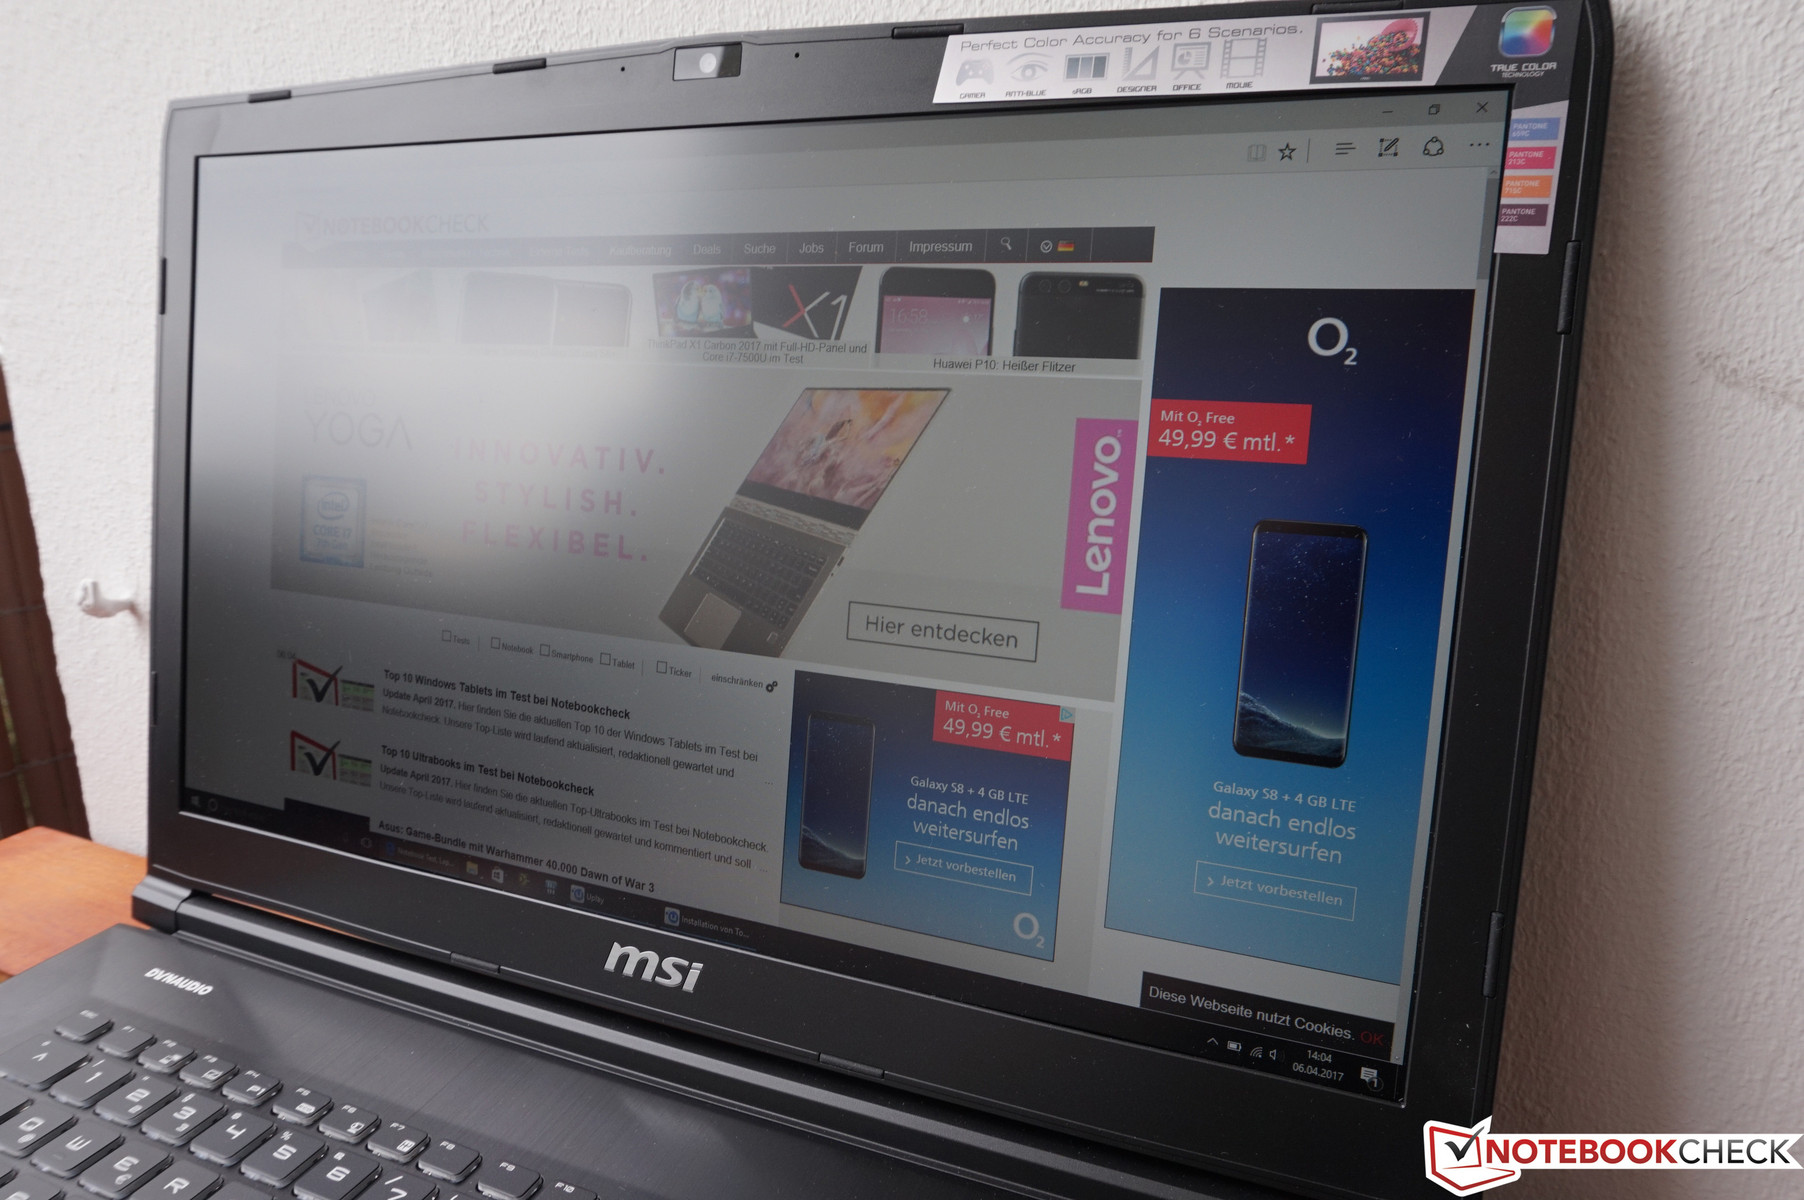
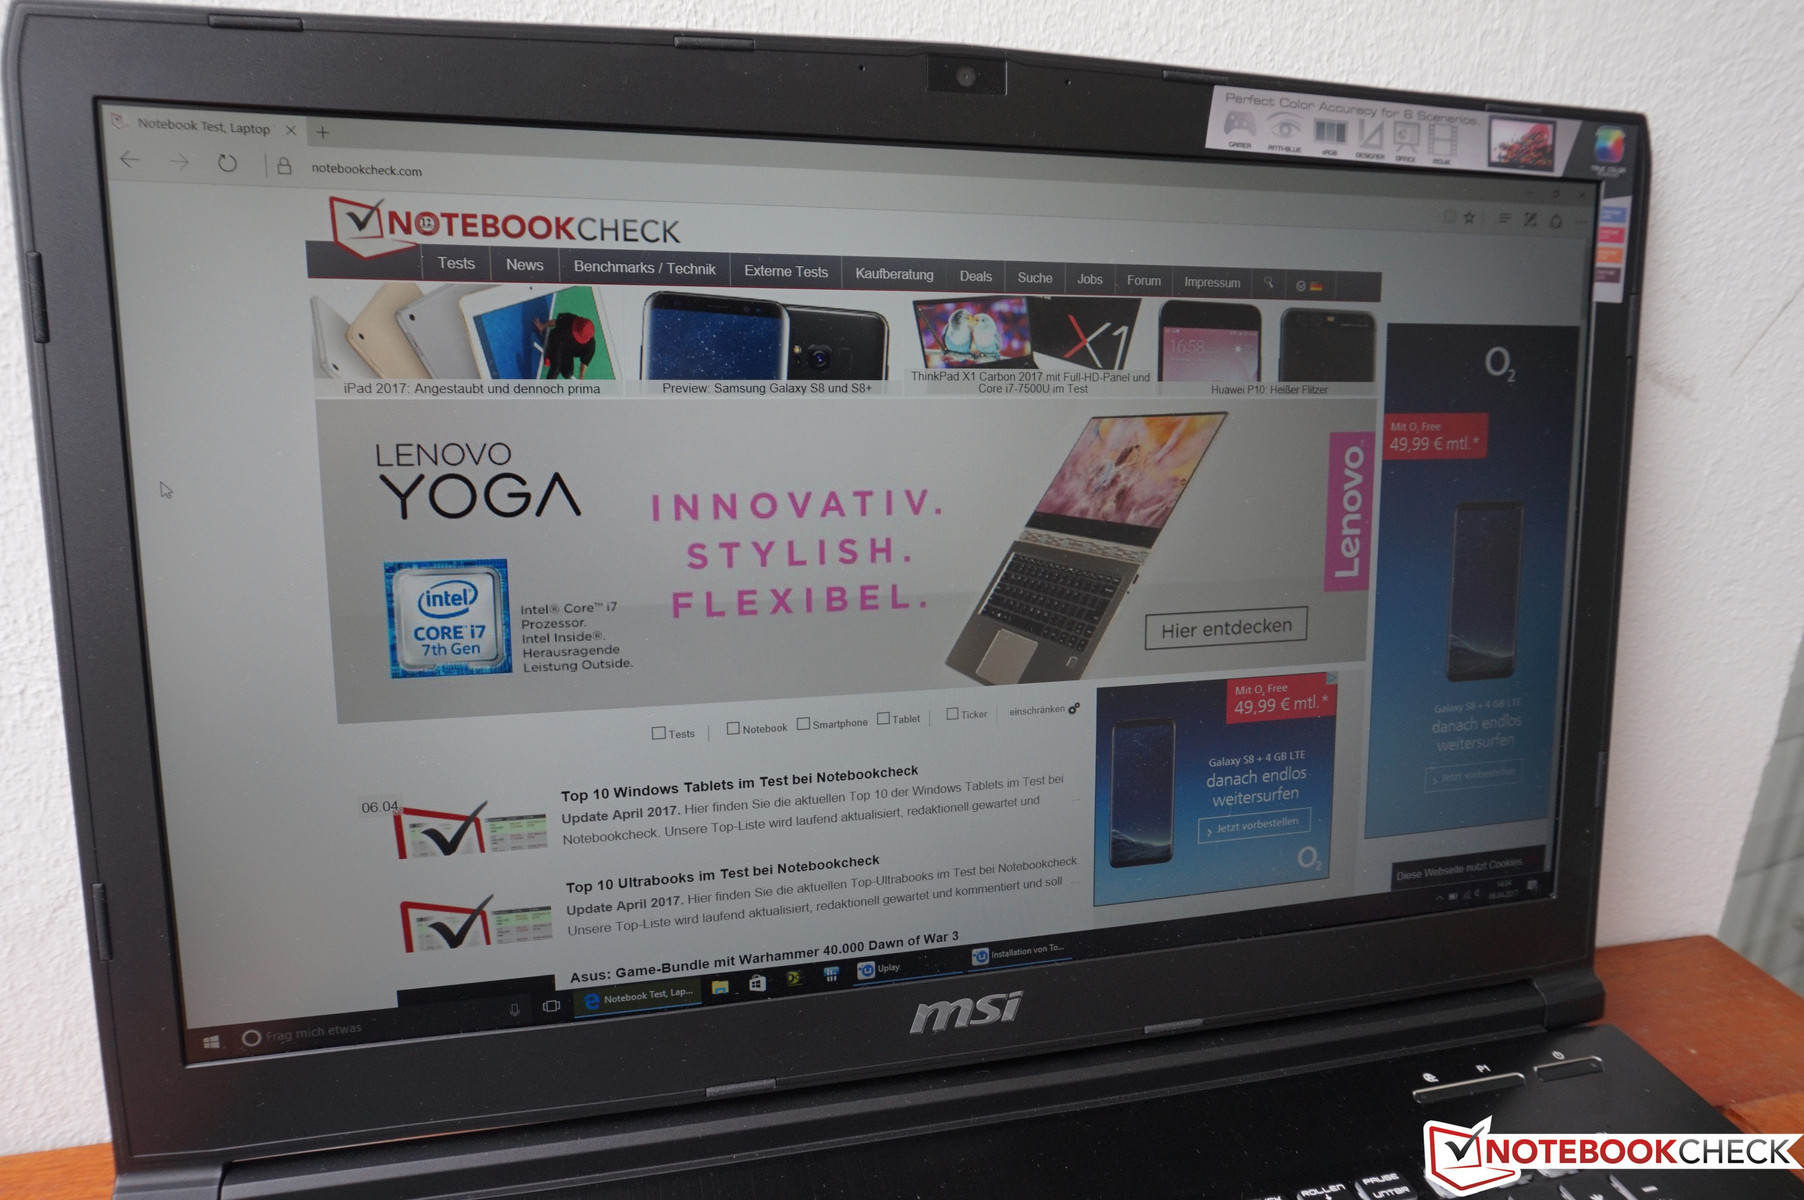
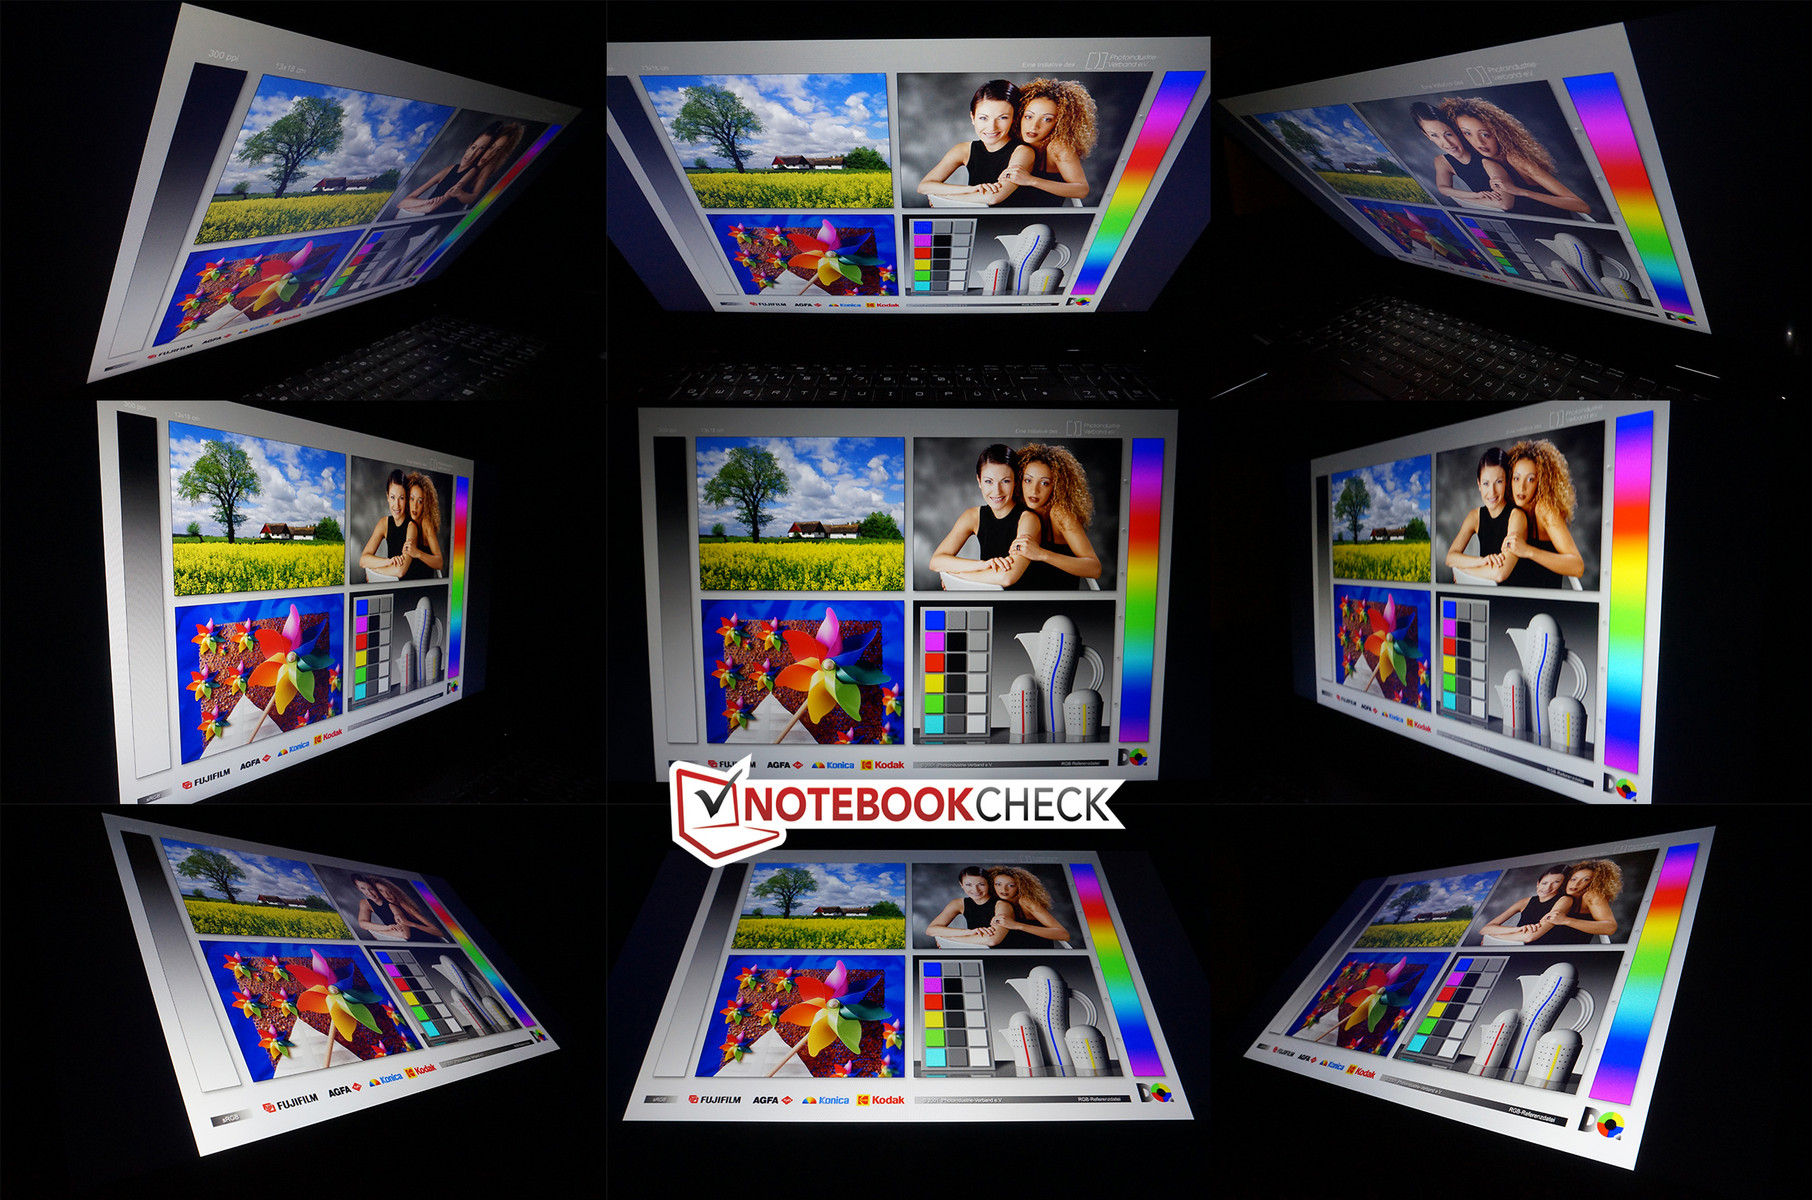
The sheer size and weight alone limit the mobility of the MSI WE72, but you can still use it comfortably in bright environments thanks to the matte panel surface and the decent luminance. Only direct light sources will quickly result in a washed-out picture. The viewing angle stability of the IPS display is very good and there are no color deviations even from wide angles.
Performance
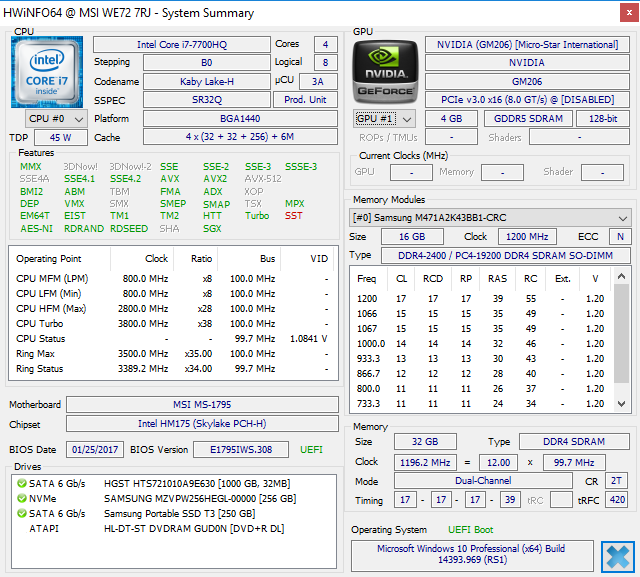
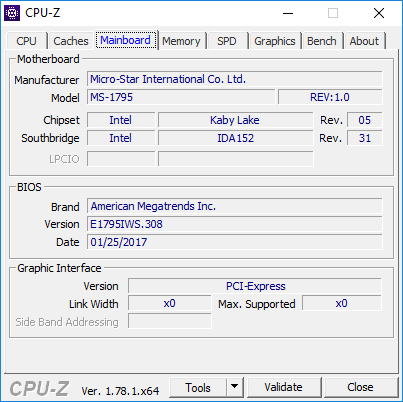
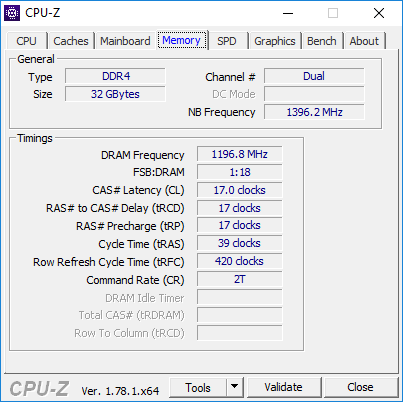
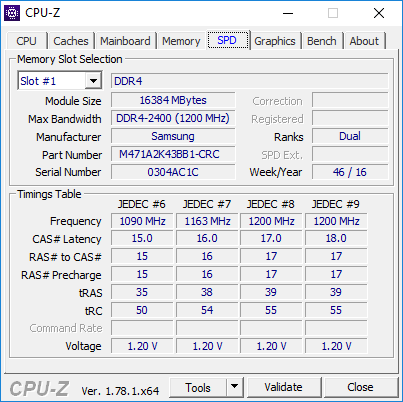
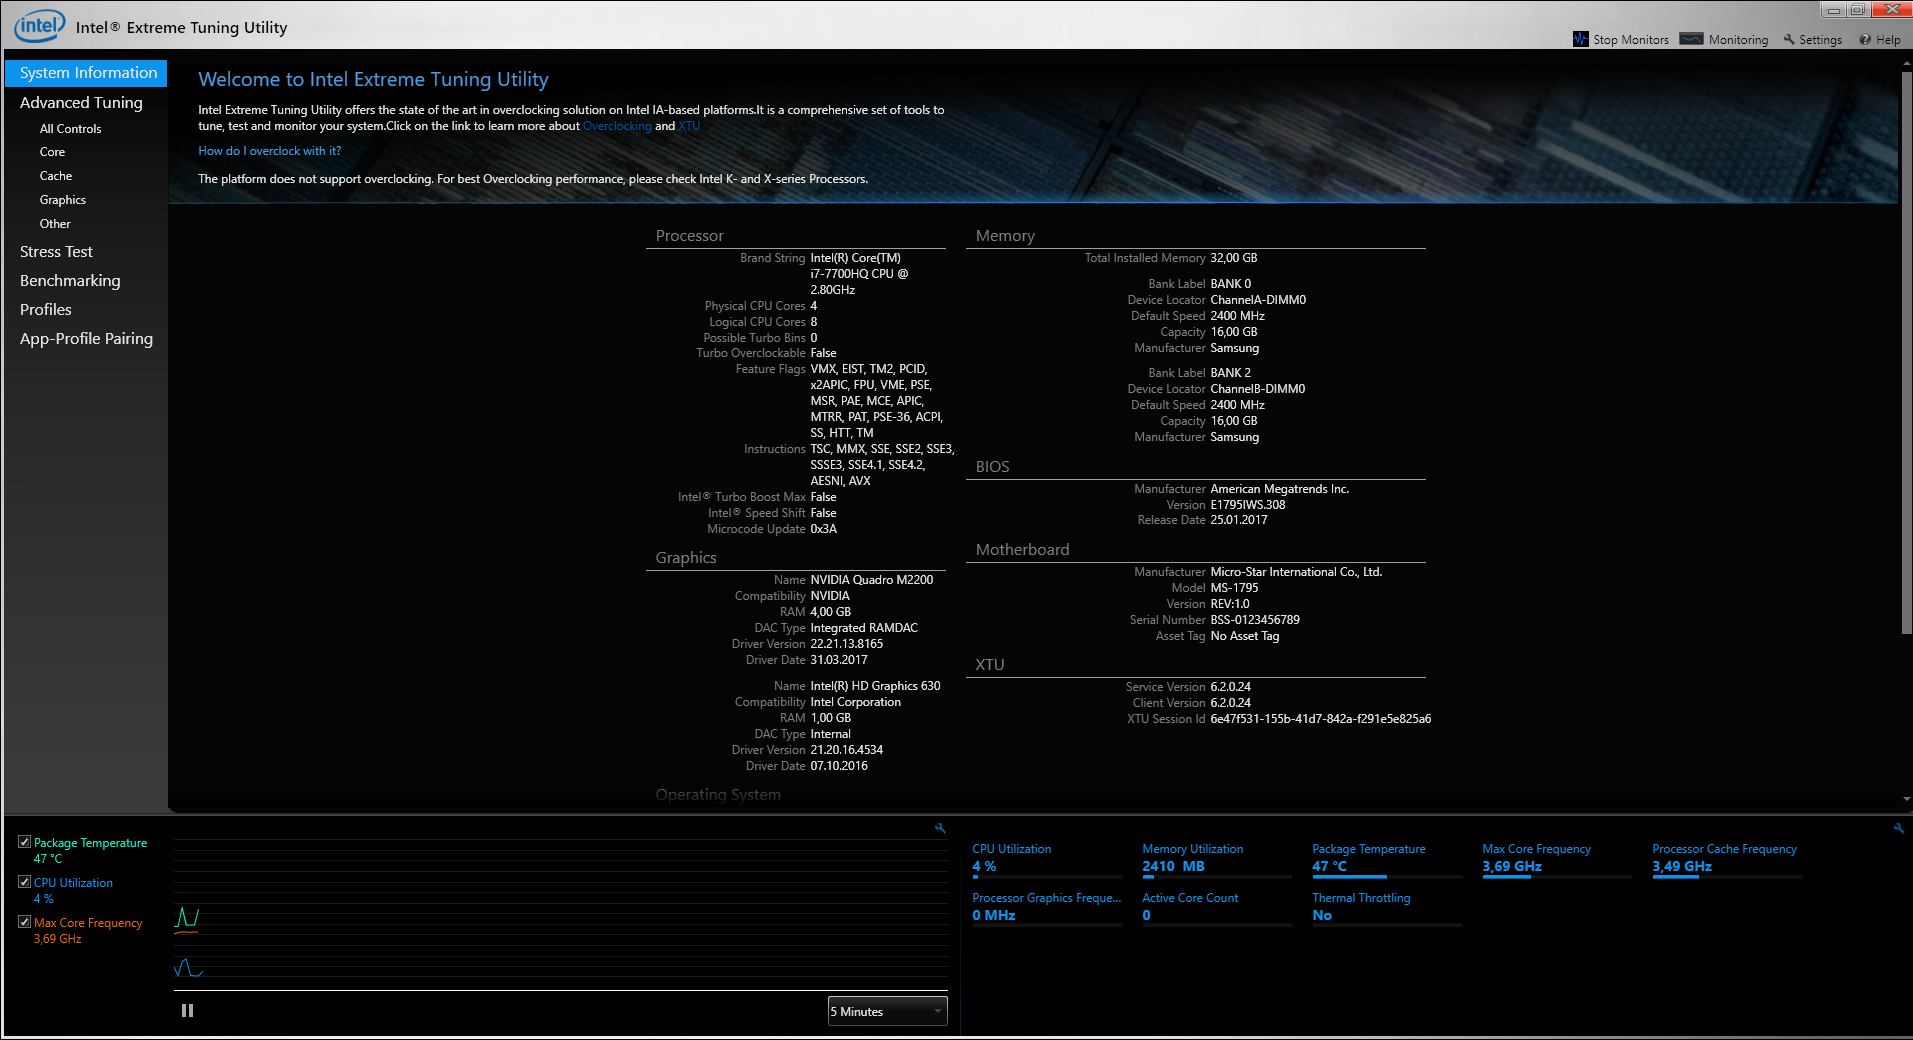
The MSI WE72 is equipped with a modern Kaby Lake quad-core processor from Intel as well as 32 GB DDR4-RAM (maximum), so it is powerful enough even for complex projects. The professional graphics card Nvidia Quadro M2200 is also interesting since it is still based on the old Maxwell architecture. The new GPUs based on the modern Pascal architecture start with the Quadro P3000 (one performance level higher).
MSI offers different profiles to adjust the performance. We performed our benchmarks and emission measurements with the setting "Power Options", so the system uses the regular Windows power profiles (e.g. "High Performance"). We did not determine different performance scores with the Sport mode.
Processor
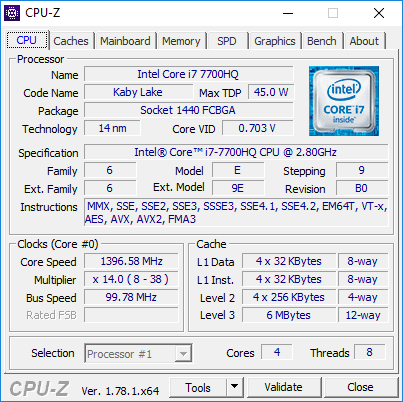
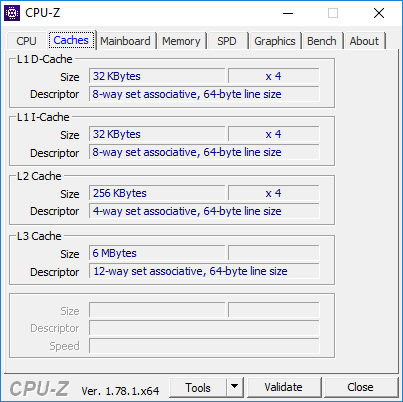
Intel's Core i7-7700HQ is a very popular mobile quad-core processor based on the Kaby Lake architecture we already reviewed a couple of times. We only want to summarize the most important specs at this point, so we refer to our Tech section for more information.
The four native cores of the i7-7700HQ have a base clock of 2.8 GHz, which can reach up to 3.8 GHz (3.4 for four active cores) via Turbo Boost. Hyperthreading is supported as well, so the chip can execute up to eight threads simultaneously.
The benchmark results are basically okay and the i7-7700HQ can compete with the old Intel Xeon E1535M v5 we tested in the Dell Precision 7710 as well as the HP ZBook 17 G3 in the Cinebench Multi test. However, this level of performance cannot be maintained. We can see the usual TDP limitation of 45 watts (~51 watts @4x3.4 GHz) after about 30 seconds, but we can see another drop after a couple of minutes, which is caused by the temperature (>90 °C/194 °F). The chip will level off at 2.7 GHz and a consumption of 34 watts.
This means the chip cannot maintain its base frequency (throttling) when we only stress the CPU; the cooling is just not sufficient. The performance is limited to 45 watts right away on battery power and the Cinebench Multi score is only 3% lower.
More benchmarks with the Intel Core i7-7700HQ are available here.
System Performance
We did not encounter any software or hardware issues with the WE72 during our review period. The primary SSD ensures a responsive system and the test model also performs well in the benchmarks, but it cannot secure the top position within the comparison group.
| PCMark 8 | |
| Home Score Accelerated v2 | |
| Dell Precision 7710 | |
| MSI WE72 7RJ | |
| HP ZBook 17 G3 TZV66eA | |
| Lenovo ThinkPad P70 | |
| Work Score Accelerated v2 | |
| Dell Precision 7710 | |
| HP ZBook 17 G3 TZV66eA | |
| MSI WE72 7RJ | |
| Lenovo ThinkPad P70 | |
| PCMark 8 Home Score Accelerated v2 | 4295 points | |
| PCMark 8 Work Score Accelerated v2 | 5150 points | |
Help | ||
Storage Devices
Inside the MSI WE72 is an M.2 SSD (2281) as well as a 2.5-inch hard drive. This is sufficient in general, but still a bit disappointing considering the size of the case. The M.2 slot supports fast PCIe NVMe SSDs and our test model is equipped with a corresponding drive. Samsung's SM961 has a capacity of 256 GB, and you can use around 190 GB after the initial set-up. The performance of the SSD is very good and is a major factor for the good subjective performance impression. A replacement only makes sense if you want to implement a drive with a higher storage capacity.
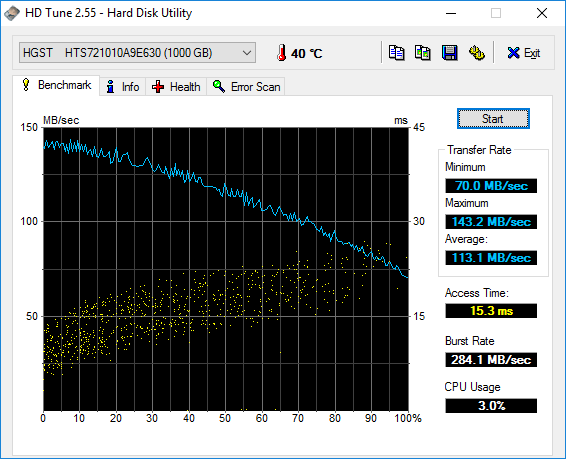
Sufficient space is provided by a 1 TB HDD from HGST spinning at 7200 rpm. The drive manages an average transfer rate of 113 MB/S according to HD Tune – a decent result. Please see our comprehensive HDD/SSD list for more comparisons and benchmarks.
| MSI WE72 7RJ Samsung SM961 MZVPW256 m.2 PCI-e | Lenovo ThinkPad P70 Samsung SSD PM871 MZNLN512HCJH | HP ZBook 17 G3 TZV66eA Samsung SM951 MZVPV256HDGL m.2 PCI-e | MSI GE72 7RE-046 Toshiba HG6 THNSNJ256G8NY | Dell Precision 5520 UHD Samsung SM961 MZVKW512HMJP m.2 PCI-e | MSI GS63VR 7RF-228US Samsung SM961 MZVKW512HMJP m.2 PCI-e | |
|---|---|---|---|---|---|---|
| CrystalDiskMark 3.0 | -44% | 30% | -45% | 10% | 9% | |
| Read Seq (MB/s) | 1492 | 509 -66% | 1481 -1% | 540 -64% | 2253 51% | 2141 43% |
| Write Seq (MB/s) | 1512 | 457.8 -70% | 1243 -18% | 495.7 -67% | 1662 10% | 1621 7% |
| Read 512 (MB/s) | 312.6 | 420.3 34% | 1202 285% | 455.1 46% | 459.1 47% | 499.7 60% |
| Write 512 (MB/s) | 1483 | 420.5 -72% | 1163 -22% | 481.4 -68% | 1611 9% | 1531 3% |
| Read 4k (MB/s) | 59.9 | 29.88 -50% | 58.7 -2% | 22.7 -62% | 56.1 -6% | 54.2 -10% |
| Write 4k (MB/s) | 184.2 | 104.1 -43% | 207.4 13% | 112.9 -39% | 169.4 -8% | 158.2 -14% |
| Read 4k QD32 (MB/s) | 681 | 391.8 -42% | 832 22% | 372.5 -45% | 633 -7% | 632 -7% |
| Write 4k QD32 (MB/s) | 590 | 350.4 -41% | 377.9 -36% | 212.9 -64% | 506 -14% | 527 -11% |

GPU Performance
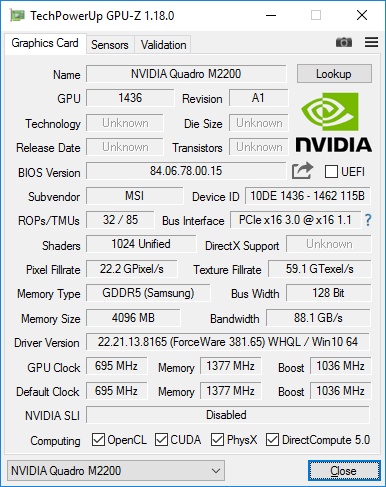
The designation already suggests it: The Nvidia Quadro M2200 is once again based on the Maxwell architecture. The new Pascal models (e.g. Quadro P3000) start one performance level above that. The M2200 is based on the GM206 chip, which was already used for the renewed consumer GeForce GTX 965M (previously GTX 965M Ti). The core reaches a maximum clock of 1039 MHz and 4 GB GDDR5-RAM is attached via a 128-bit interface. More information on the Nvidia Quadro M2200 is available here.
The professional chip differs from the consumer GeForce cards in terms of a modified BIOS as well as special drivers, which are designed for stability. Comprehensive certifications also ensure a trouble-free operation between hardware and software. The drivers can result in a significant performance advantage in OpenGL-optimized applications in particular. We use the benchmark SPECviewperf 12 for professional purposes. It covers the areas CAD, CAM, geology and medical MRI. The results can differ based on the test, but the new M2200 is usually between the old Quadro M2000M and the M3000M, and it is sometimes even on par with the latter. This is also the case for LuxMark 2.0 (OpenCL). However, the two benchmarks also show consumer cards closed the gap significantly. Even a GeForce GTX 1070 does not stand a chance in some tests (like Siemens NX), but leads the comparison in others in return.
The raw performance of the hardware is important for DirectX applications, which include games. The Quadro M2200 is once again between the old Quadro M2000M and M3000M in the 3DMark tests. The equivalent consumer graphics card is the old GeForce GTX 965M, which is not surprising. It is not far behind the current GeForce GTX 1050, either.
You can compare the DirectX and OpenGL performance (without optimizations) with the two benchmarks Unigine Heaven 4.0 and Unigine Valley 1.0, and the DirectX results are higher.
The graphics performance drops by around 25% on battery (3DMark 11 GPU: 7319 points on mains vs. 5588 points on battery). More benchmarks with the Quadro M2200 and many more GPUs are available in our Tech section.
| Unigine Heaven 4.0 | |
| Extreme Preset DX11 | |
| MSI GE72VR-6RF16H21 | |
| MSI GE72 7RE-046 | |
| MSI WE72 7RJ | |
| MSI GE72 965M Ti | |
| HP Omen 17-w010ng | |
| Extreme Preset OpenGL | |
| MSI WE72 7RJ | |
| Unigine Valley 1.0 | |
| 1920x1080 Extreme HD DirectX AA:x8 | |
| MSI GE72VR-6RF16H21 | |
| HP ZBook 17 G3 TZV66eA | |
| Lenovo ThinkPad P70 | |
| Dell Precision 7710 | |
| MSI WE72 7RJ | |
| MSI GE72 965M Ti | |
| Lenovo ThinkPad P50 | |
| 1920x1080 Extreme HD Preset OpenGL AA:x8 | |
| HP ZBook 17 G3 TZV66eA | |
| Dell Precision 7710 | |
| MSI WE72 7RJ | |
| Lenovo ThinkPad P70 | |
| Lenovo ThinkPad P50 | |
| 3DMark 06 Standard Score | 26834 points | |
| 3DMark Vantage P Result | 24622 points | |
| 3DMark 11 Performance | 7453 points | |
| 3DMark Ice Storm Standard Score | 93770 points | |
| 3DMark Cloud Gate Standard Score | 20388 points | |
| 3DMark Fire Strike Score | 5252 points | |
| 3DMark Fire Strike Extreme Score | 2627 points | |
| 3DMark Time Spy Score | 1845 points | |
Help | ||
Gaming Performance
You can obviously use the Quadro M2200 for gaming and we did not experience any issues with crashes or graphics errors during our benchmarks. Only Battlefield 1 required a newer driver version. We just installed the regular GeForce driver, which was no problem. The results are roughly on par with the GeForce GTX 1050 & GeForce GTX 965M. The performance is sufficient to play modern titles at the native FHD resolution in combination with high details. More gaming benchmarks are available in our gaming list.
| Ghost Recon Wildlands - 1920x1080 High Preset AA:T AF:4x | |
| Gigabyte Aero 15 | |
| Acer Aspire VX5-591G-75C4 VX15 | |
| MSI WE72 7RJ | |
| MSI GL62M 7RD-077 | |
| Apple MacBook Pro 15 2016 (2.6 GHz, 450) | |
| For Honor - 1920x1080 High Preset AA:T AF:8x | |
| Gigabyte Aero 15 | |
| Razer Blade (2017) | |
| MSI WE72 7RJ | |
| MSI GE72 965M Ti | |
| Acer Aspire VX5-591G-75C4 VX15 | |
| Apple MacBook Pro 15 2016 (2.6 GHz, 450) | |
| low | med. | high | ultra | |
|---|---|---|---|---|
| Tomb Raider (2013) | 381.4 | 238.8 | 149.3 | 70.2 |
| BioShock Infinite (2013) | 229.4 | 177.2 | 155.5 | 58.6 |
| Battlefield 4 (2013) | 171.5 | 148.3 | 115.9 | 47.8 |
| Thief (2014) | 108.8 | 88.6 | 74.8 | 39.6 |
| The Witcher 3 (2015) | 116.6 | 68.4 | 37.8 | 20.3 |
| Star Wars Battlefront (2015) | 148.8 | 119 | 56.4 | 48.2 |
| Rainbow Six Siege (2015) | 214.2 | 131.2 | 70.4 | 52.4 |
| Rise of the Tomb Raider (2016) | 128.7 | 72.8 | 40.7 | 34.4 |
| Battlefield 1 (2016) | 139.4 | 105.3 | 47.1 | 42 |
| For Honor (2017) | 78 | 52.3 | 50.5 | 36.2 |
| Ghost Recon Wildlands (2017) | 83.4 | 37.1 | 33.7 | 17.6 |
Emissions
System Noise
The system noise is definitely one drawback of the MSI WE72. The two fans are controlled independently. The fan at the left side takes care of the processor and runs all the time, but unfortunately not at a steady speed. The speed already fluctuates between 3300-3400 RPM while idling, which is clearly audible at 36.3-36.6 dB(A). The fan is also sensitive to RPM changes when you install applications and it will quickly reach 3800-4000 RPM. The pulsating behavior is still audible.
The GPU fan at the right side is only active when you stress the dedicated graphics card. However, we can notice a slight grinding sound at low speeds. We measure 40.4 dB(A) under medium workloads and a loud 46.6 dB(A) in the stress test. You can also set the maximum fan speed manually via Fan Boost, which results in 52.7 dB(A).
The preloaded software also includes a fan control, and you can definitely tweak the settings a bit. The default CPU fan speed, for example, is set to 47 percent. There is room for optimizations for light workloads, but you should keep an eye on the temperatures. We will soon see that the processor in particular reaches very high temperatures, so the settings should not be too conservative.
Noise level
| Idle |
| 36.3 / 36.3 / 36.6 dB(A) |
| Load |
| 40.4 / 46.6 dB(A) |
 | ||
30 dB silent 40 dB(A) audible 50 dB(A) loud |
||
min: | ||
Temperature
Some areas of the device warm up to more than 30 °C (86 °F) while idling. This is obviously no problem, but still a bit surprising considering the big case. The rear left on the top in particular gets warm under load. We can measure up to 45 °C (113 °F) and the keyboard warms up as well. Another issue is the power adapter at almost 50 °C (122 °F), so you should not hide it under blankets or the like.
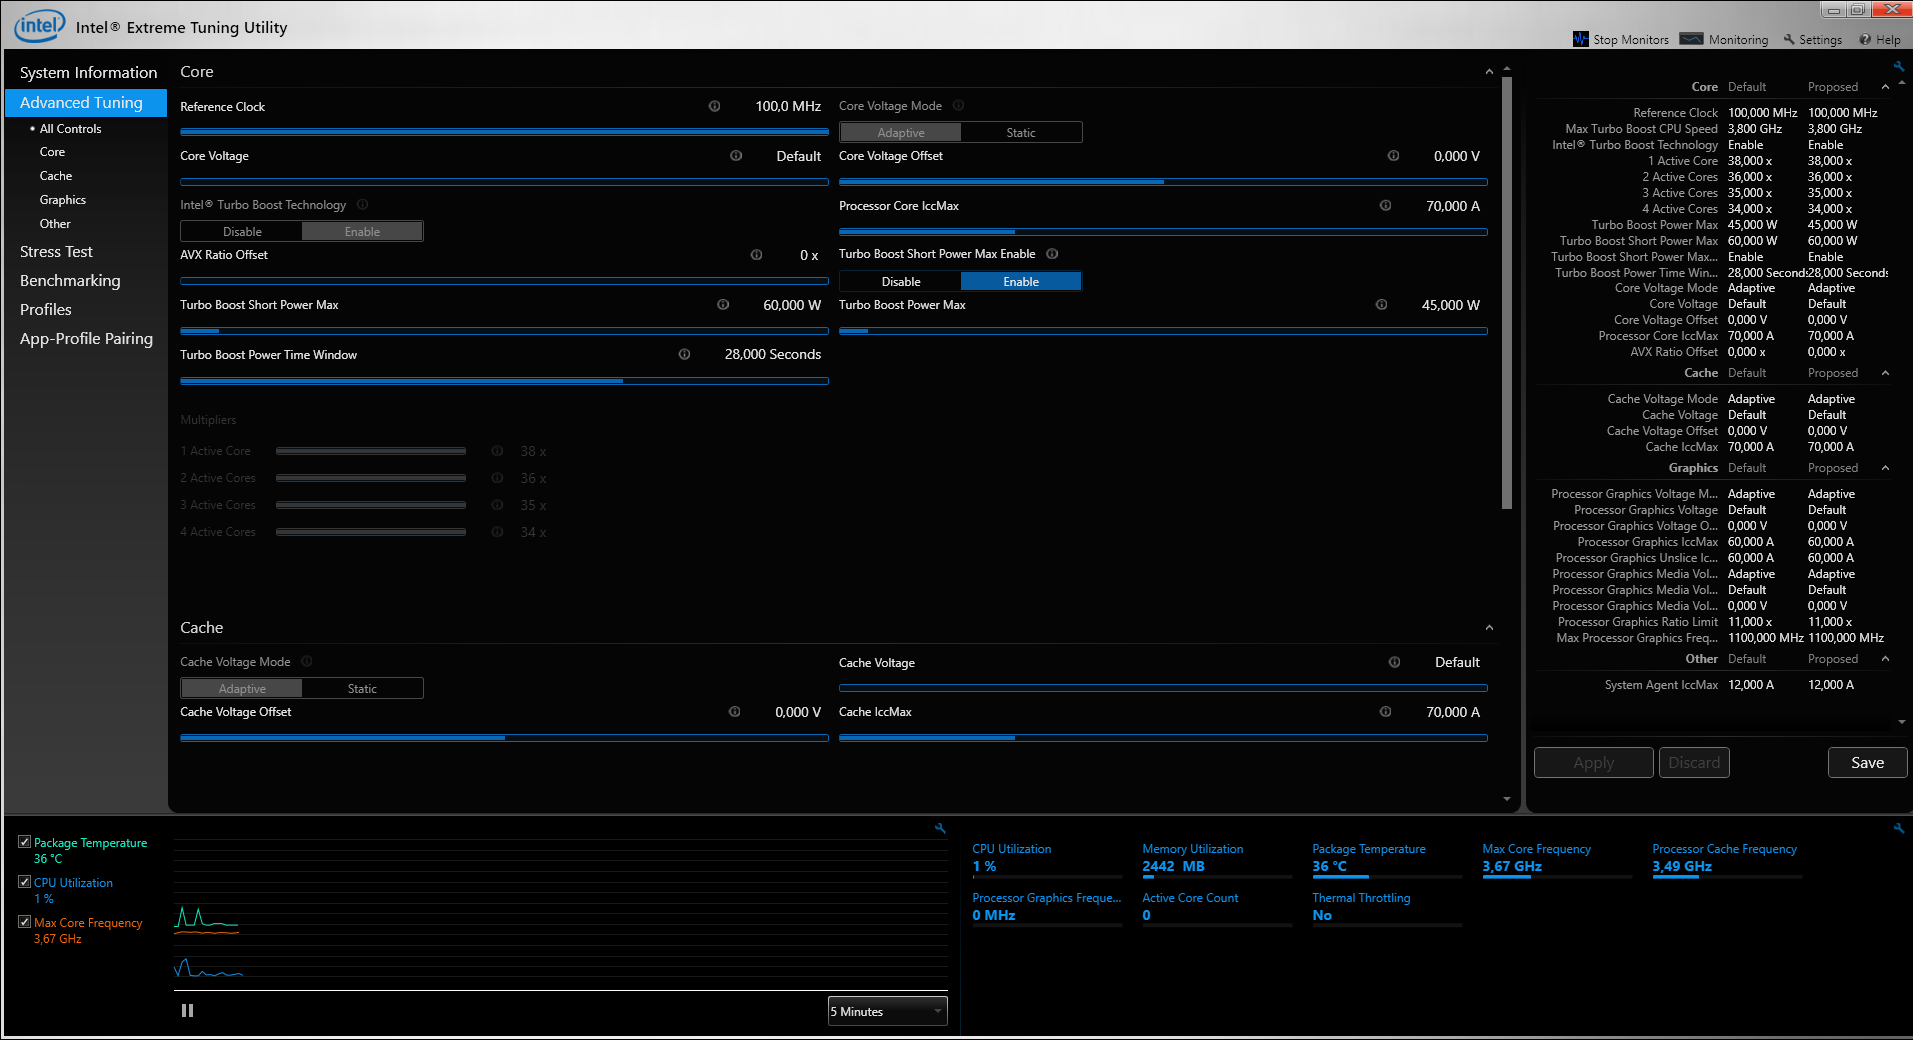
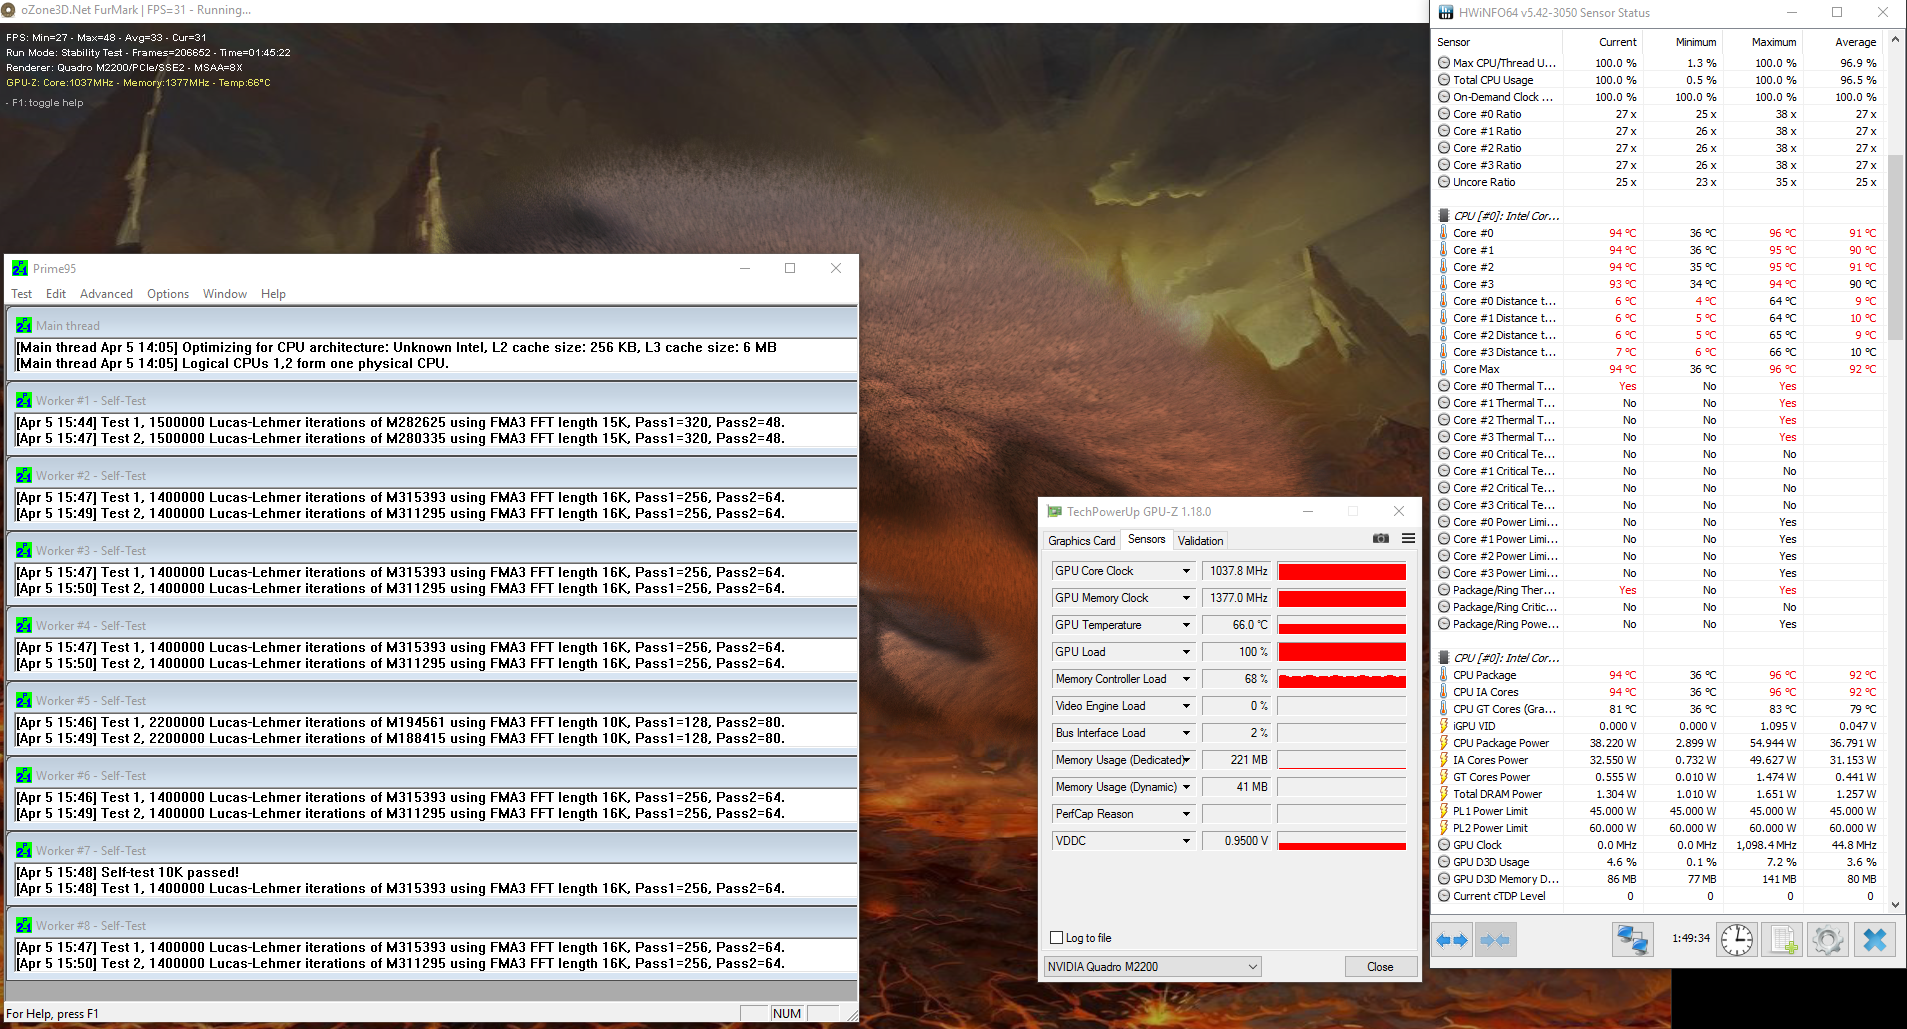
We use the stress test to check the internal temperatures under load. Both the processor and the GPU are stressed by 100%. The CPU reaches very high temperatures, even though it cannot utilize its Turbo Boost. The maximum 3.4 GHz (55 watts) is only available for a short time before the consumption is reduced to 37 watts and a clock of 2.7 GHz. This is below the base frequency of 2.8 GHz and therefore slight throttling. The temperature is still in the mid 90s, despite the low clock, so there is not much headroom.
The situation is much more relaxed for the graphics card. It can maintain the maximum core clock of 1037 MHz and only warms up to 51 °C (123.8 °F). A 3DMark 11 run immediately after the stress test did not determine a lower score. Whether you will notice limitations in practice depends on the scenario. You cannot utilize the full potential when you really stress the processor.
(-) The maximum temperature on the upper side is 45.7 °C / 114 F, compared to the average of 38.2 °C / 101 F, ranging from 22.2 to 69.8 °C for the class Workstation.
(-) The bottom heats up to a maximum of 48.4 °C / 119 F, compared to the average of 41.1 °C / 106 F
(+) In idle usage, the average temperature for the upper side is 26.7 °C / 80 F, compared to the device average of 32 °C / 90 F.
(-) The palmrests and touchpad can get very hot to the touch with a maximum of 40.4 °C / 104.7 F.
(-) The average temperature of the palmrest area of similar devices was 27.8 °C / 82 F (-12.6 °C / -22.7 F).
Energy Management
Power Consumption
The MSI WE72 consumes quite a lot of power, especially while idling and with light workloads. Our measuring device shows at least 15 watts and almost 24 watts at the highest luminance. The results are better under load at around 86 watts in the first scene of 3DMark 06 and 128 watts under maximum load.
The problem is the power adapter, which is only specified at 120 watts. It is therefore insufficient, and the battery capacity drops by 3% during our two-hour stress test. You cannot use the CPU Turbo when you stress the GPU either (not even for a short time) and the TDP is limited to ~37 watts – which results in a processor clock of just 2.7 GHz.
| Off / Standby | |
| Idle | |
| Load |
|
Key:
min: | |
| MSI WE72 7RJ i7-7700HQ, Quadro M2200, Samsung SM961 MZVPW256 m.2 PCI-e, IPS, 1920x1080, 17.3" | Dell Precision 7710 E3-1535M v5, FirePro W7170M, Samsung SM951 MZVPV256HDGL m.2 PCI-e, IPS LED, 1920x1080, 17.3" | Lenovo ThinkPad P70 6820HQ, Quadro M3000M, Samsung SSD PM871 MZNLN512HCJH, IPS, 3840x2160, 17.3" | HP ZBook 17 G3 TZV66eA E3-1535M v5, Quadro M3000M, Samsung SM951 MZVPV256HDGL m.2 PCI-e, IPS, 1920x1080, 17.3" | MSI GE72 7RE-046 i7-7700HQ, GeForce GTX 1050 Ti Mobile, Toshiba HG6 THNSNJ256G8NY, TN LED, 1920x1080, 17.3" | |
|---|---|---|---|---|---|
| Power Consumption | -14% | 3% | 13% | 0% | |
| Idle Minimum * (Watt) | 15 | 6.04 60% | 12.1 19% | 6.7 55% | 14 7% |
| Idle Average * (Watt) | 20.1 | 15.2 24% | 19.7 2% | 12.5 38% | 20 -0% |
| Idle Maximum * (Watt) | 23.8 | 42.3 -78% | 20.5 14% | 13.2 45% | 25 -5% |
| Load Average * (Watt) | 85.6 | 112.8 -32% | 94.3 -10% | 128.2 -50% | 82 4% |
| Load Maximum * (Watt) | 128 | 182.2 -42% | 139.6 -9% | 158.9 -24% | 135 -5% |
* ... smaller is better
Battery Runtime
MSI's mobile workstation is not a compact device, but the battery capacity could also be from a slim Ultrabook. The module only has a capacity of 51 Wh, while some of the comparison devices offer almost twice that. In combination with the rather high consumption values, this is not a good indicator for long battery runtimes.
You can expect around three hours in practice when you browse the web or watch videos (how we test). The comparison devices manage much longer runtimes thanks to their larger batteries alone. The performance is reduced on battery, but maximum load will result in just 42 minutes – both with the Battery Eater Classic and a loop of the SPECviewperf 12 benchmark.
A full recharge of the battery takes about 2.5 hours; 80% are available after little more than 70 minutes.
| MSI WE72 7RJ i7-7700HQ, Quadro M2200, 51 Wh | Dell Precision 7710 E3-1535M v5, FirePro W7170M, 72 Wh | Lenovo ThinkPad P70 6820HQ, Quadro M3000M, 96 Wh | HP ZBook 17 G3 TZV66eA E3-1535M v5, Quadro M3000M, 96 Wh | MSI GE72 7RE-046 i7-7700HQ, GeForce GTX 1050 Ti Mobile, 51.4 Wh | |
|---|---|---|---|---|---|
| Battery runtime | 112% | 95% | 134% | 7% | |
| Reader / Idle (h) | 4.5 | 12.9 187% | 7.7 71% | 15.9 253% | |
| H.264 (h) | 3 | 4.7 57% | 7.5 150% | 5 67% | 3.3 10% |
| WiFi v1.3 (h) | 3 | 6.1 103% | 6 100% | 4.8 60% | 3.1 3% |
| Load (h) | 0.7 | 1.4 100% | 1.1 57% | 1.8 157% |
Verdict
Pros
Cons

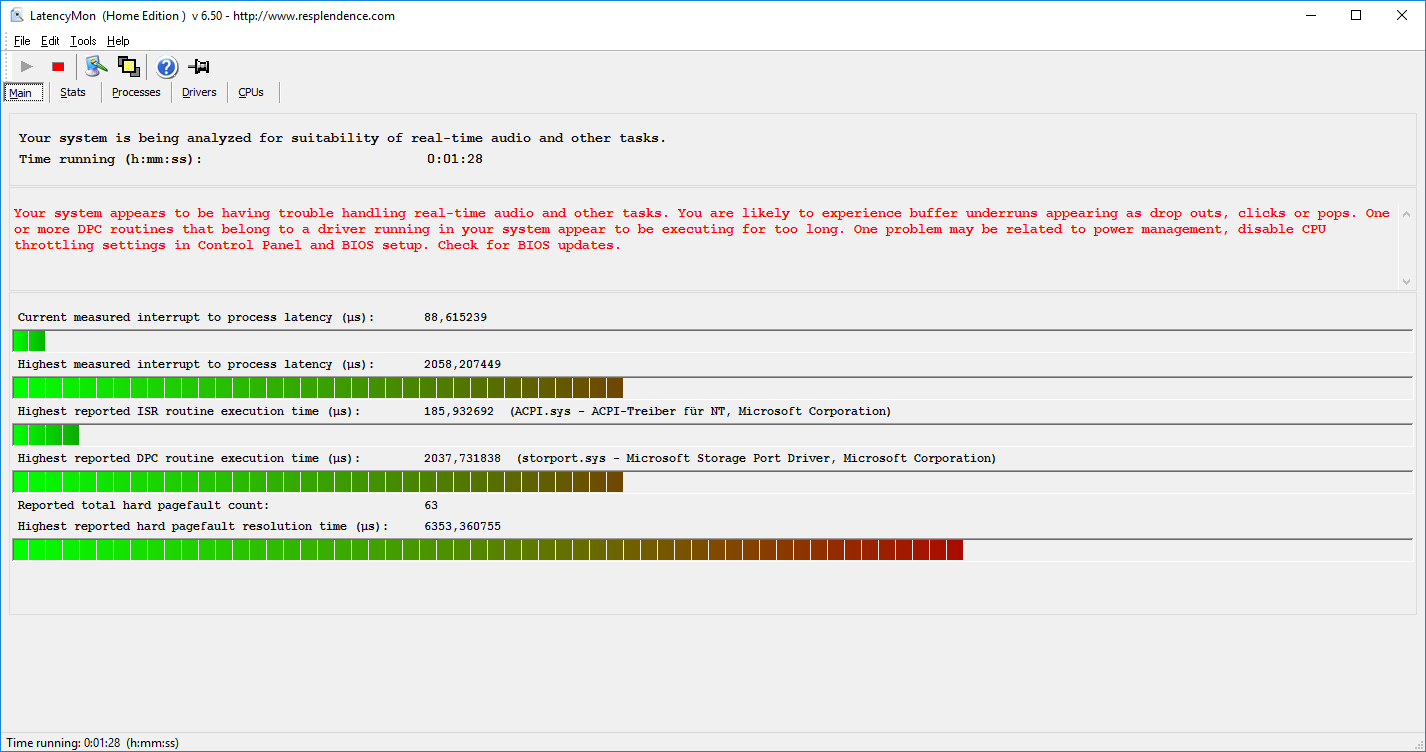
The MSI GE72 is a good gaming laptop, but is the implementation of a professional graphics card enough to create a good mobile workstation? We are not convinced after the review, and the MSI WE72 has a hard time against the established rivals. You are often reminded of the gaming roots. There is neither a docking port, nor Thunderbolt 3, so you cannot use decent docking stations.
This might not be a huge issue depending on your usage scenario, but there are also limitations in terms of performance as well as emissions. The cooling has problems with the heat from the processor, because the clock will drop under the base frequency (throttling) even when we only stress the CPU with Cinebench. The 120-watt power adapter is another limiting factor when you stress both components. The fans can be optimized as well, which is possible thanks to the preinstalled fan control. However, there is not much headroom thanks to the high temperatures.
Limited business features and weak cooling: The impression of MSI's new mobile workstation is not particularly convincing. The WE72 can still make sense depending on the workload, especially when you consider the attractive pricing.
One advantage of the MSI WE72 is the competitive pricing ($1799), because the familiar competition from Dell's Precision series or the ThinkPad P models easily costs more than $3000. If you mainly use the MSI WE72 for CAD applications and can live with the mentioned limitations, you should definitely have it on your shortlist.
MSI WE72 7RJ
- 05/09/2017 v6 (old)
Andreas Osthoff
Price comparison
