HP ZBook 17 G3 Workstation Review
For the original German review, see here.
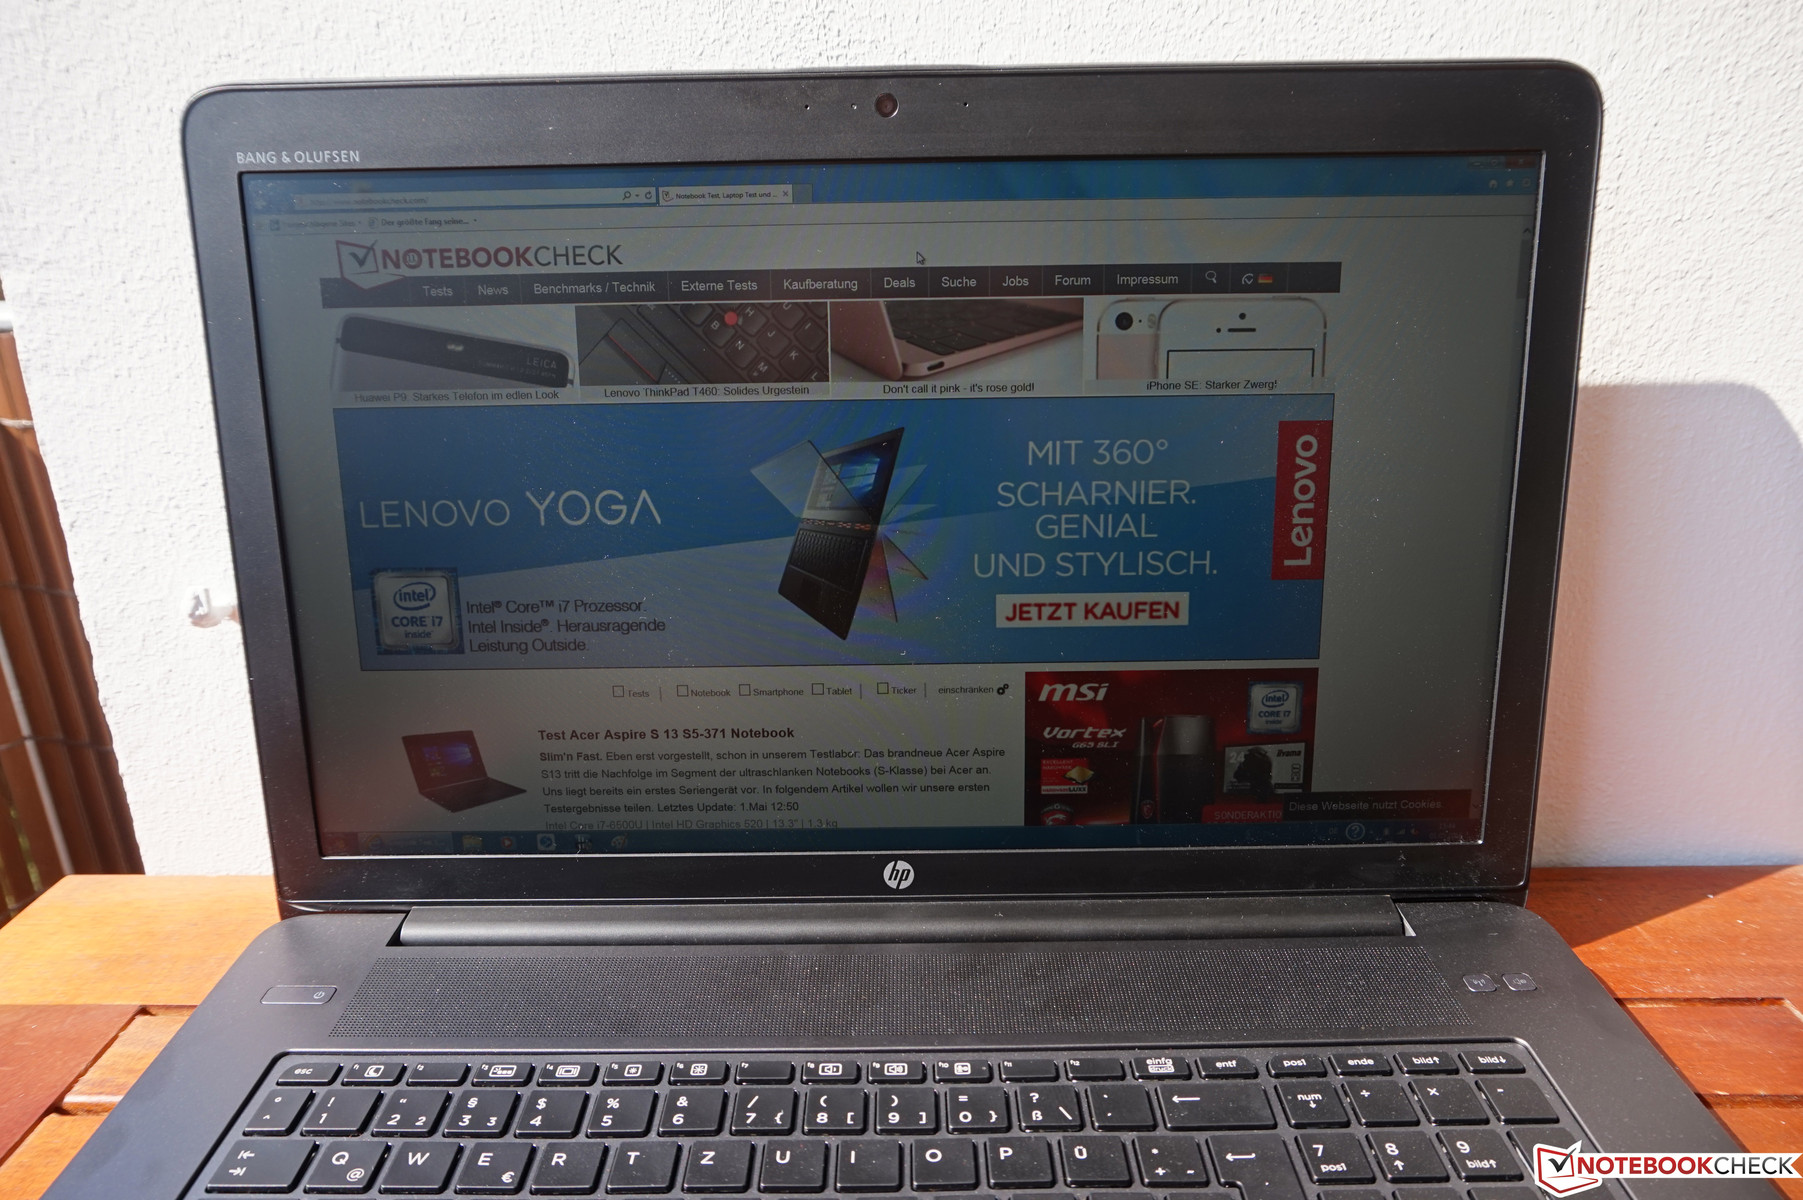
After we have already reviewed three modern ZBooks from HP (15u G3, 15 G3 and Studio G3), we now have a closer look at the biggest model of the series, the ZBook 17 G3. You do not have to worry about the performance of this workstation, because the manufacturer has a clear focus on the performance and not the thinnest construction. This orientation is supported by the most powerful components you can currently get for a mobile device. The ZBook 17 G3, however, also convinces with individual configurations since HP offers a wide variety of components.
Our review model carries the designation TZV66EA and is currently one of the most expensive configurations at 4,500 Euros (~$5014). This is an extremely high price, especially when you look at the specs. They are not bad with a mobile Xeon processor, Nvidia Quadro M3000M GPU and 32 GB DDR4-RAM, but only one 256 GB PCIe-SSD seems a bit stingy. There is also a lot of headroom, particularly in terms of GPU with the optional Quadro M4000M (+730 Euros, ~$813) or M5000M (+1,750 Euros, ~$1950). This is also the case for the optional 4K DreamColor display (not yet available), because our model sports an FHD-IPS screen.
The biggest rivals for the HP ZBook 17 G3 are the Dell Precision 7710 and this year also a device from Lenovo, the ThinkPad P70. Another interesting contender is the MSI WT72, which does lack some business ports but still left a good impression in our review. If you need even more performance, you will have to get a system with a desktop processor. One example would be the Bullman E-Klasse Xeon 17. We will also compare the ZBook 17 G3 with its predecessor ZBook 17 G2 and see if an upgrade to the new model makes sense.
Case
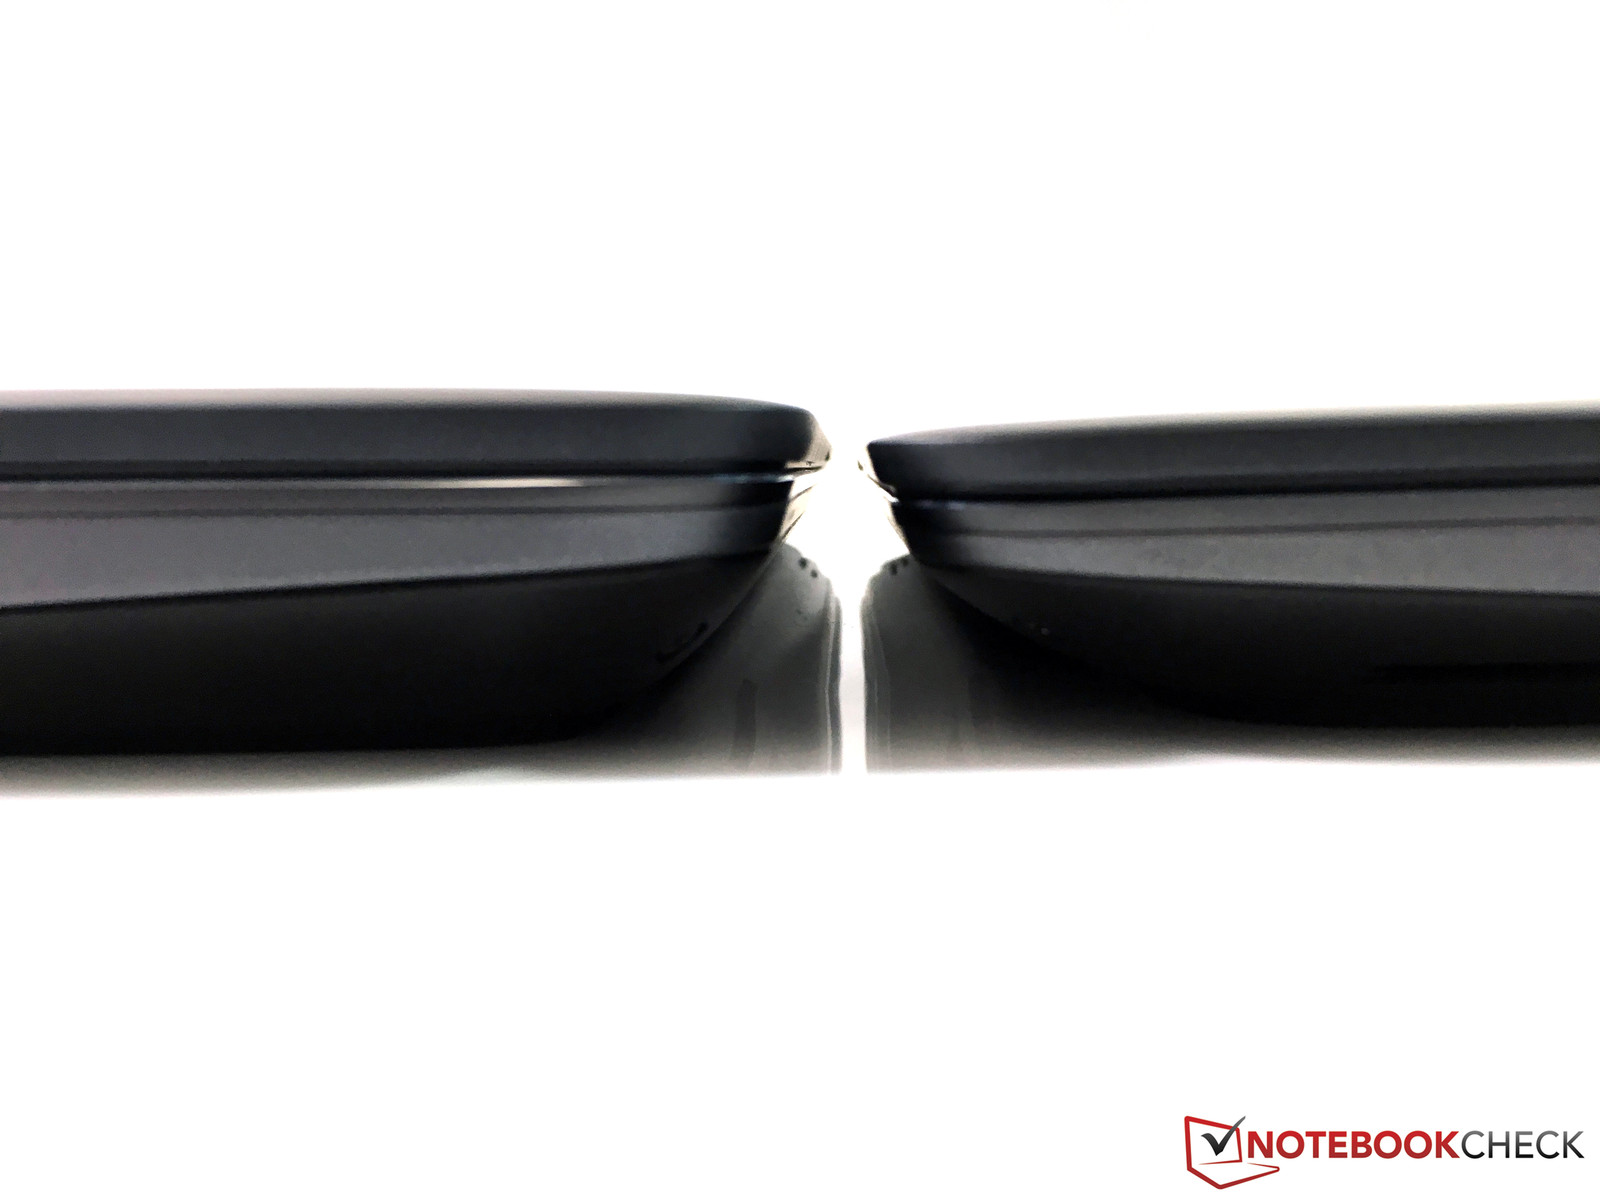
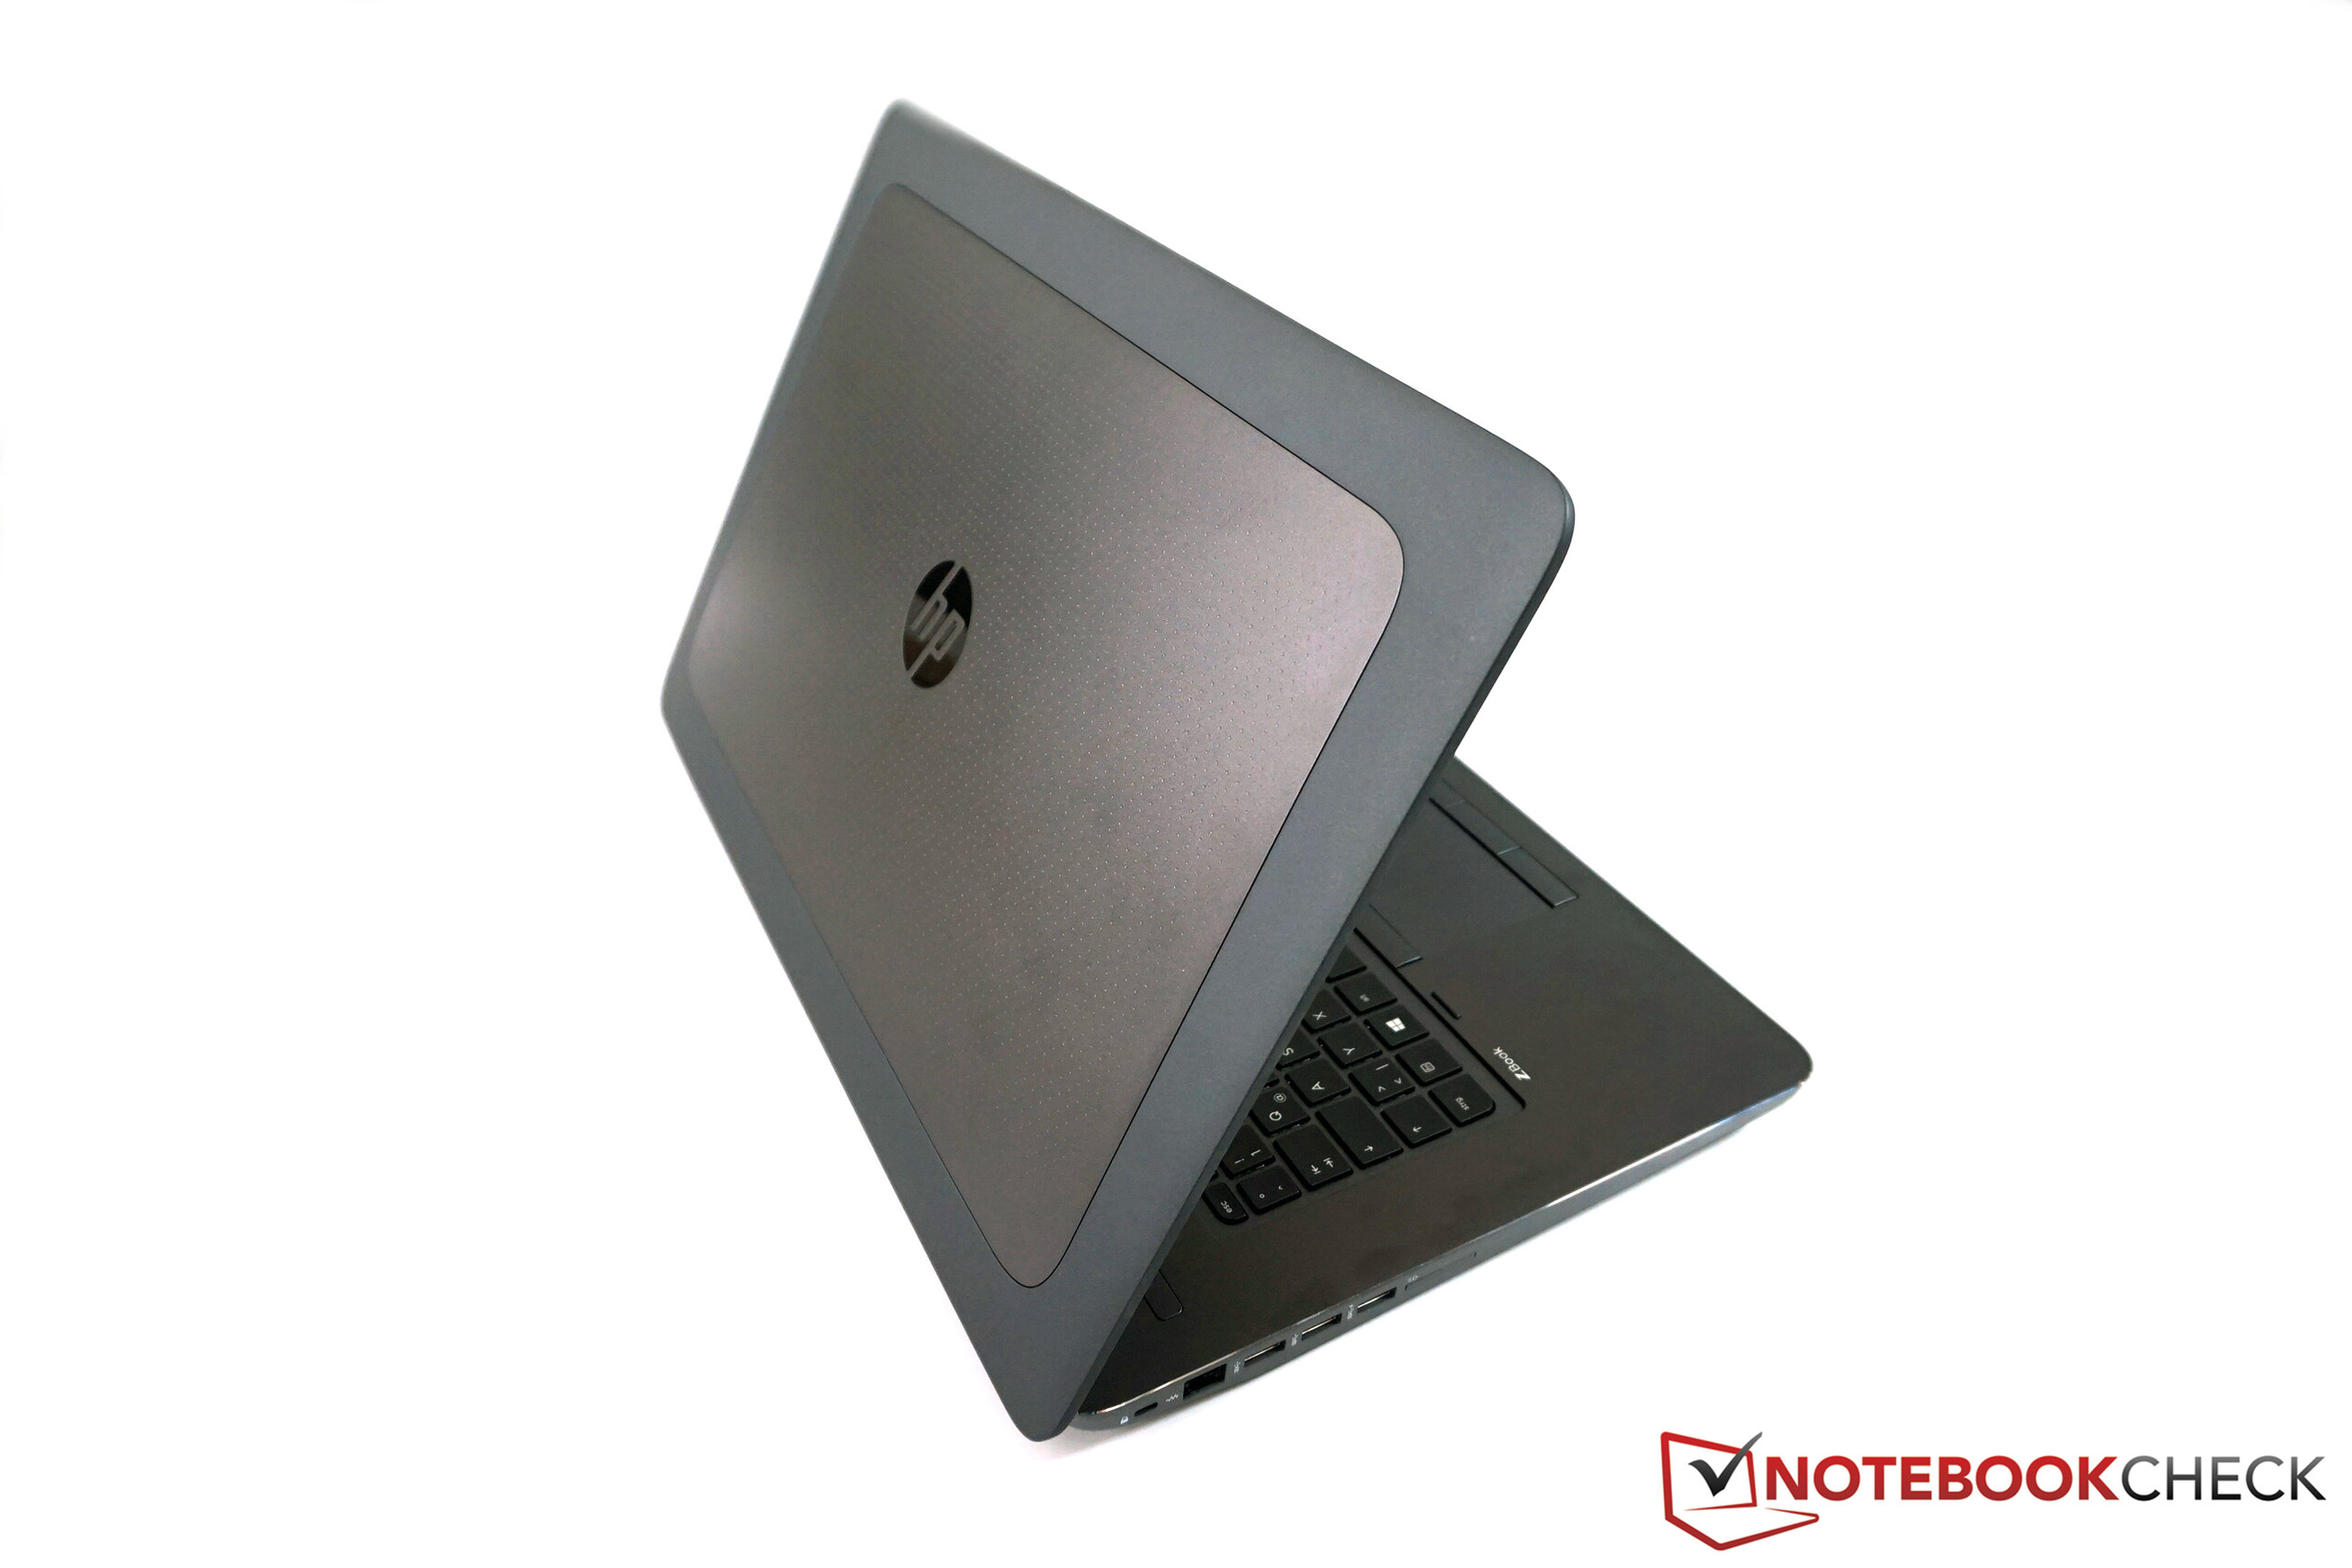
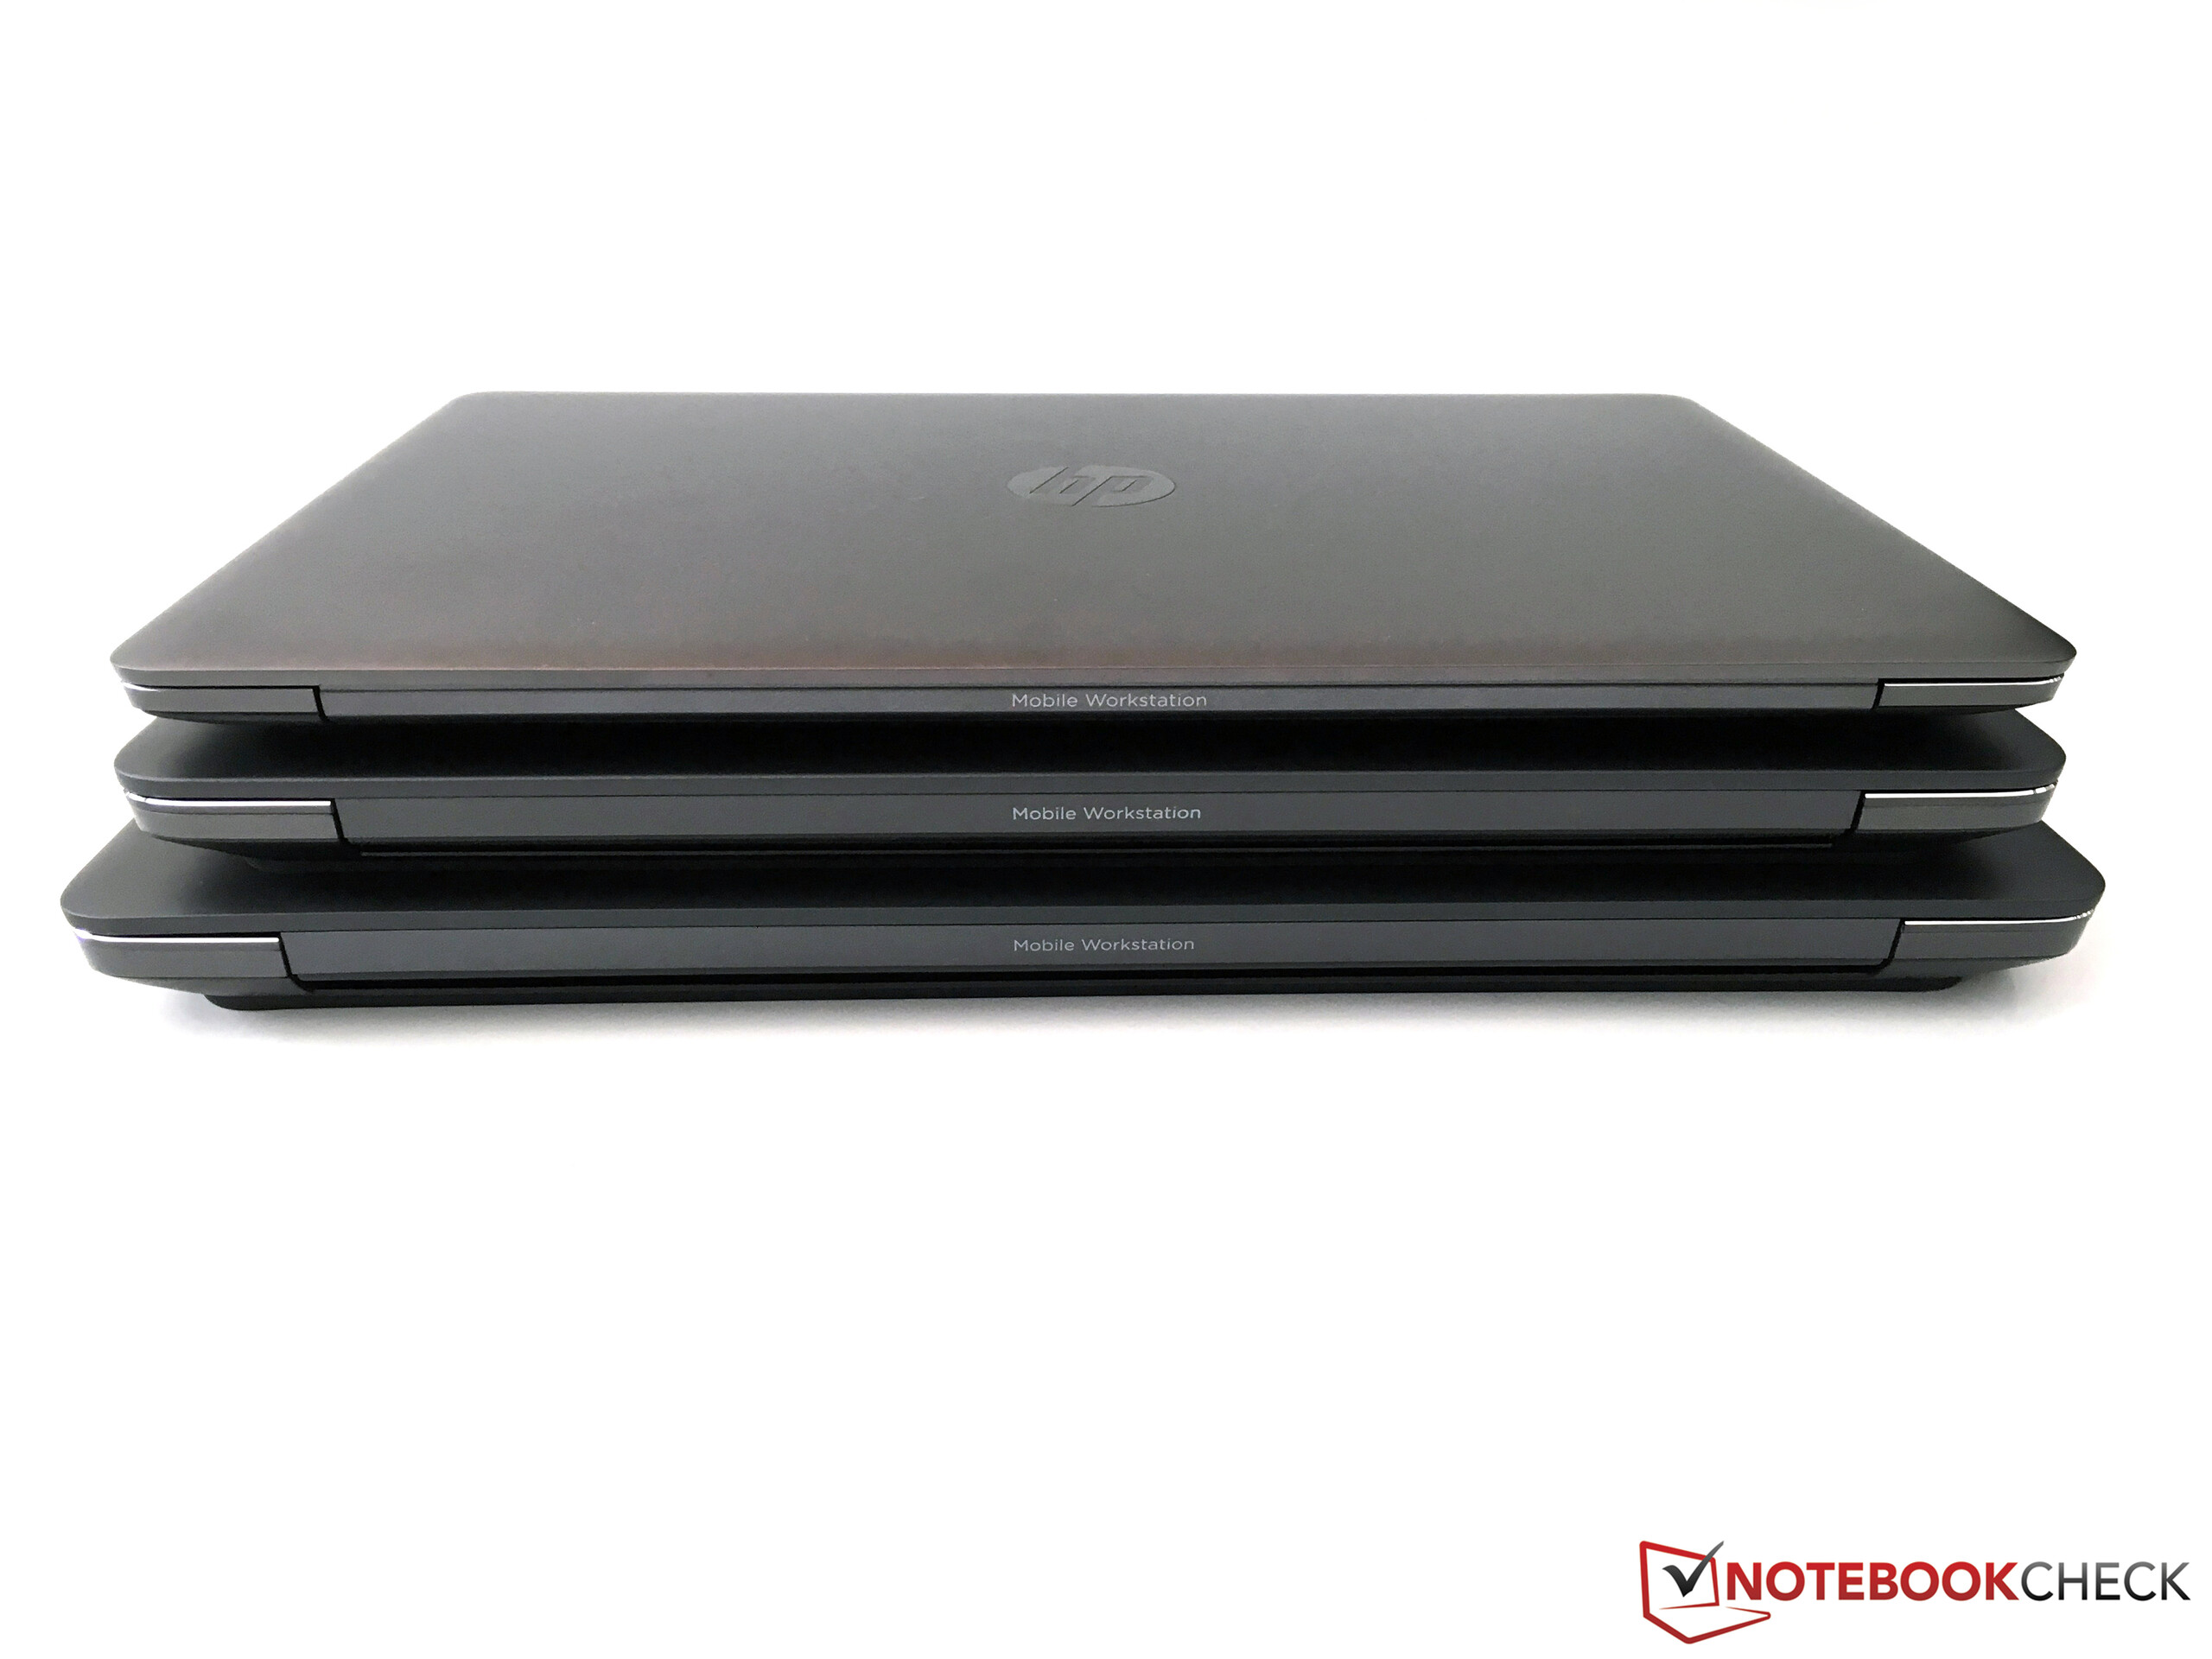
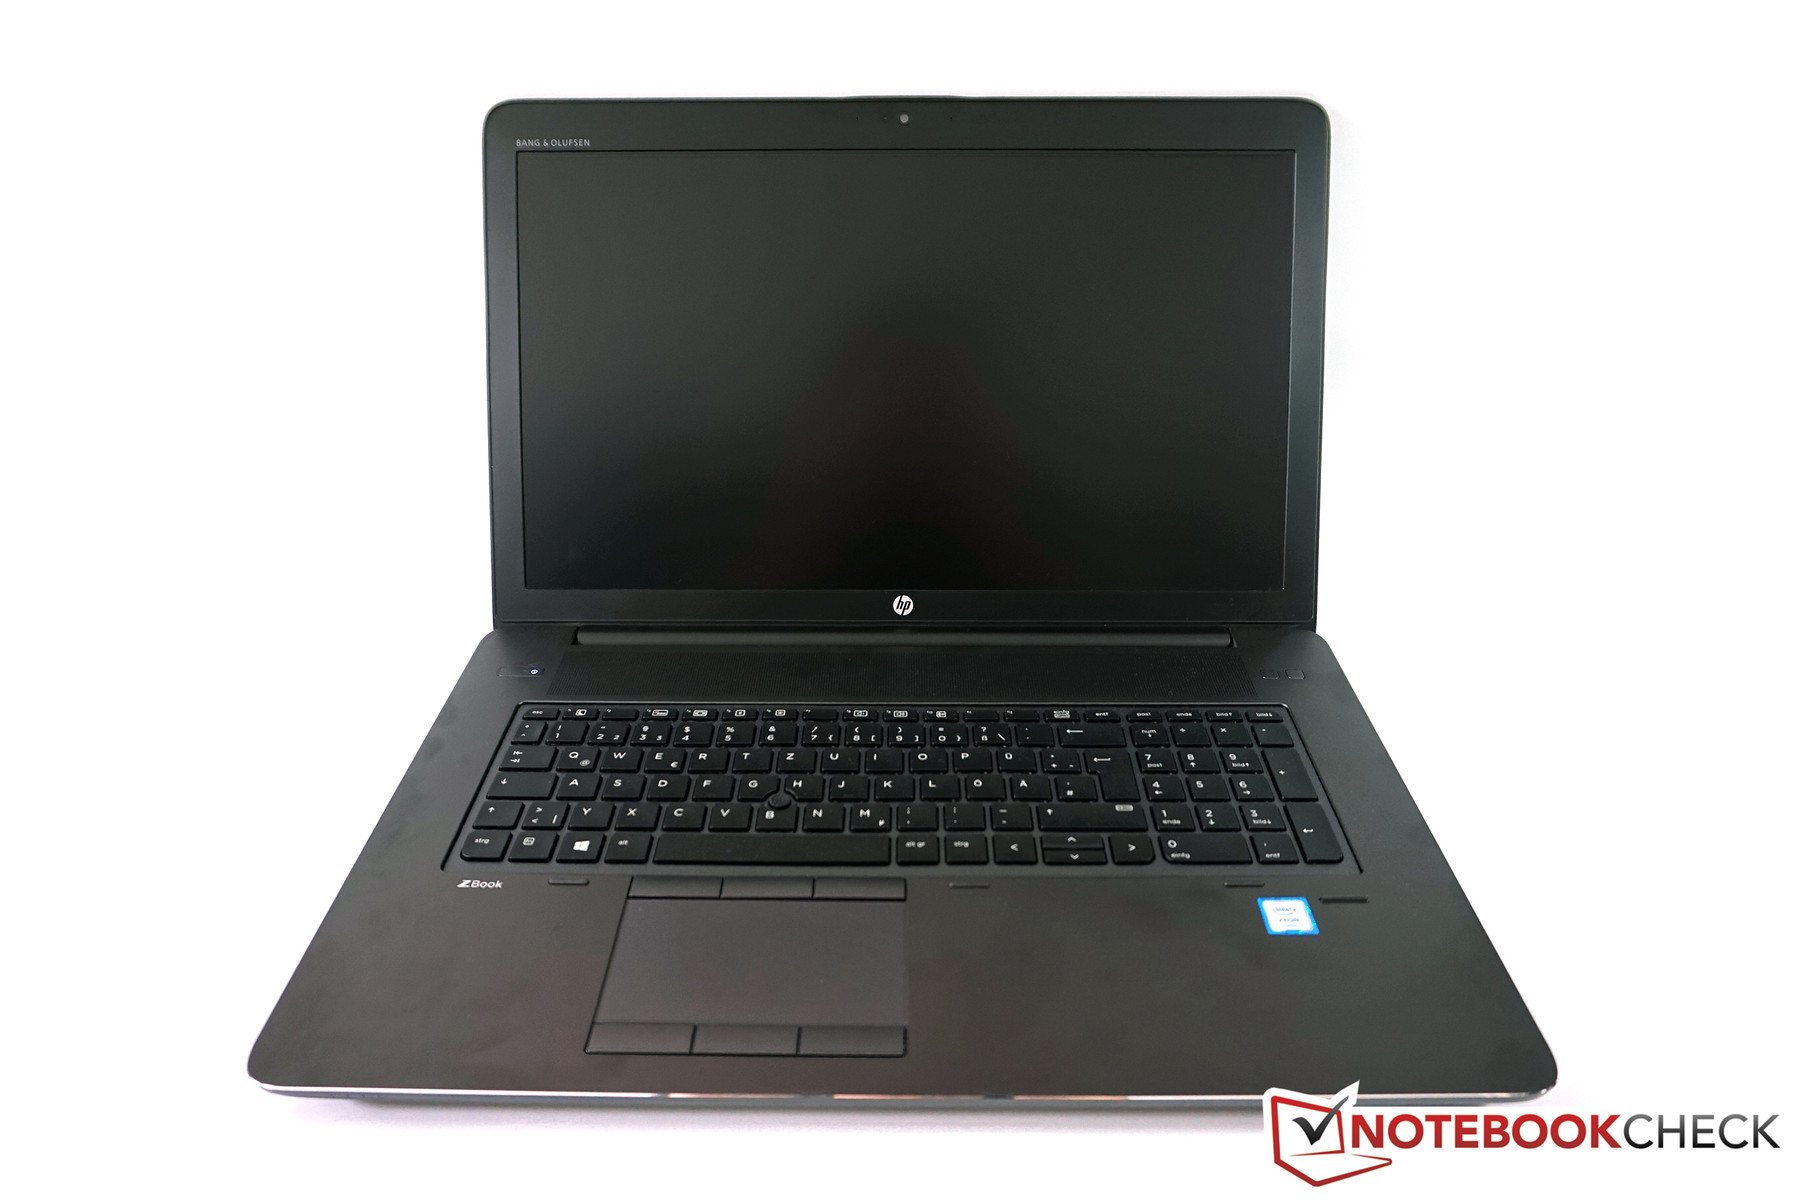
At a first and also second look, the HP ZBook 17 G3 is a bigger version of the recently reviewed ZBook 15 G3. Both devices actually got completely new cases compared to their predecessors but use the identical design. Our review unit is a pretty big machine compared to many slim notebooks with a height of three centimeters, but it actually lost 400 grams compared to the old model and is also 0.4 cm thinner. At 3.2 kg, the HP is also the lightest and at the same time the thinnest device within our comparison group but can occupy a bit more space on the desk due to the footprint (420 x 280 mm).
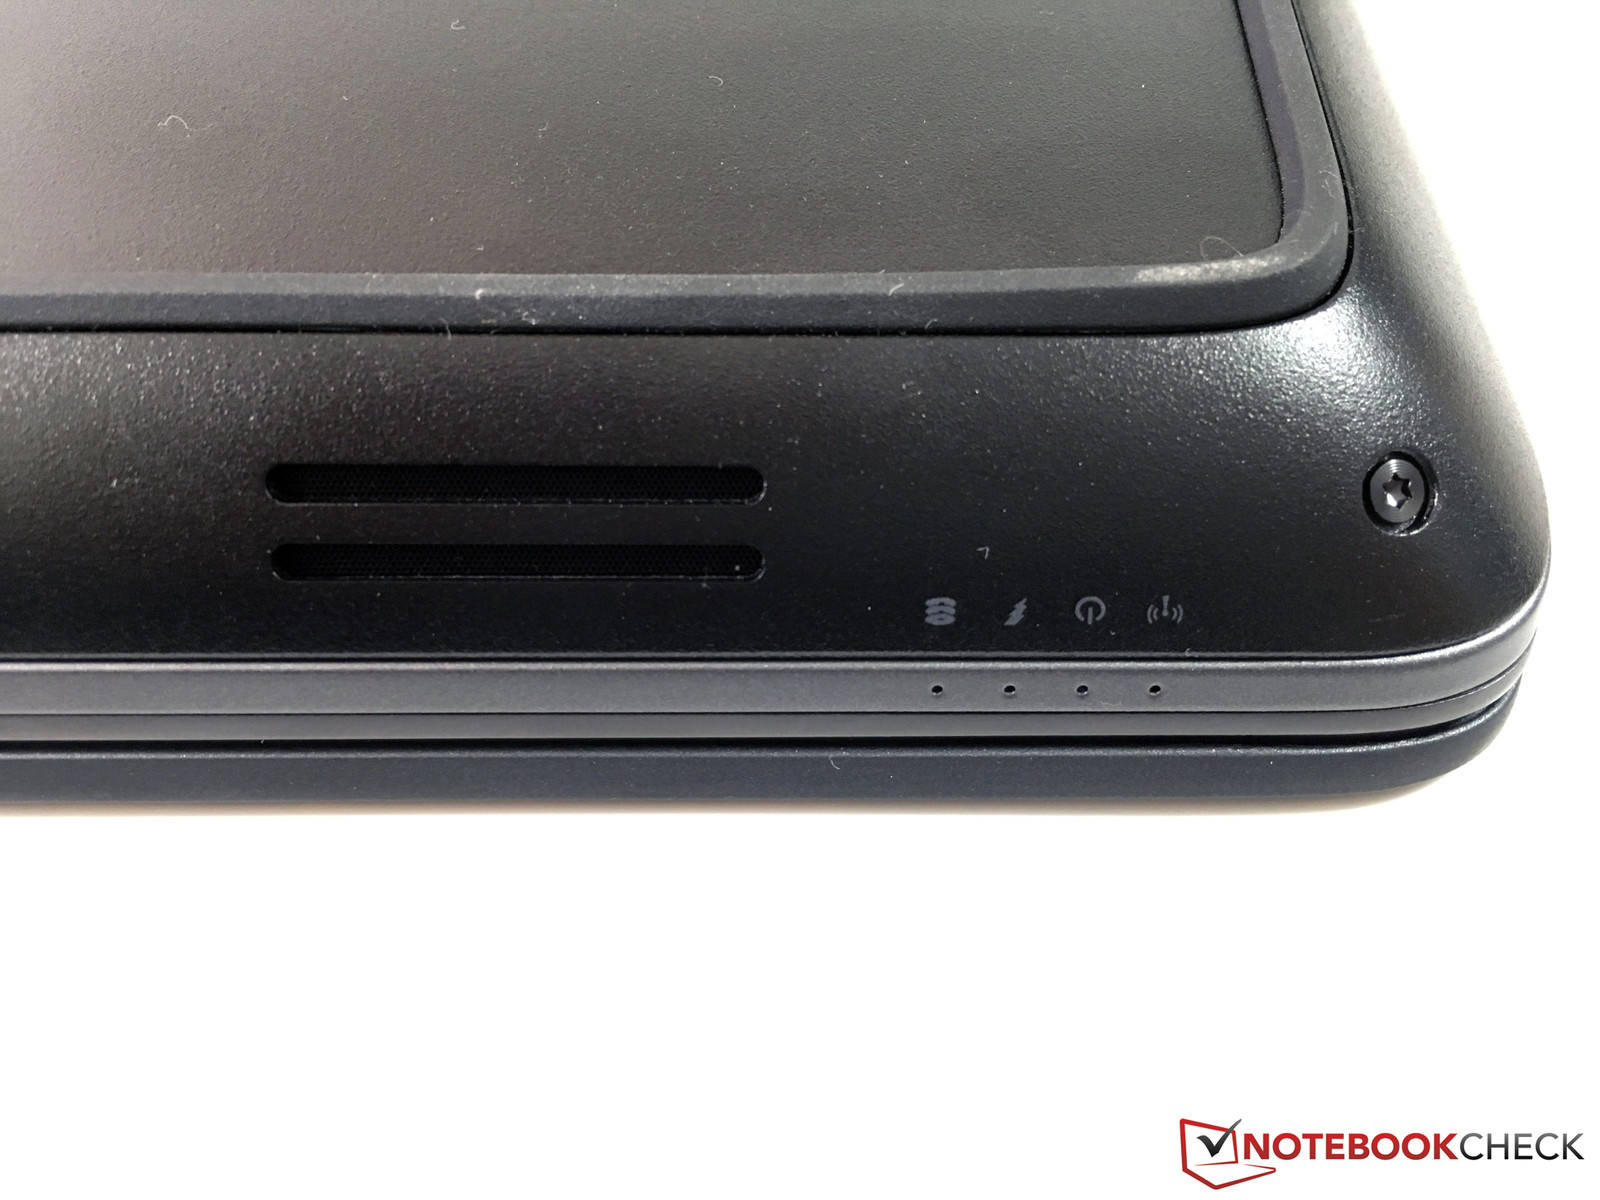
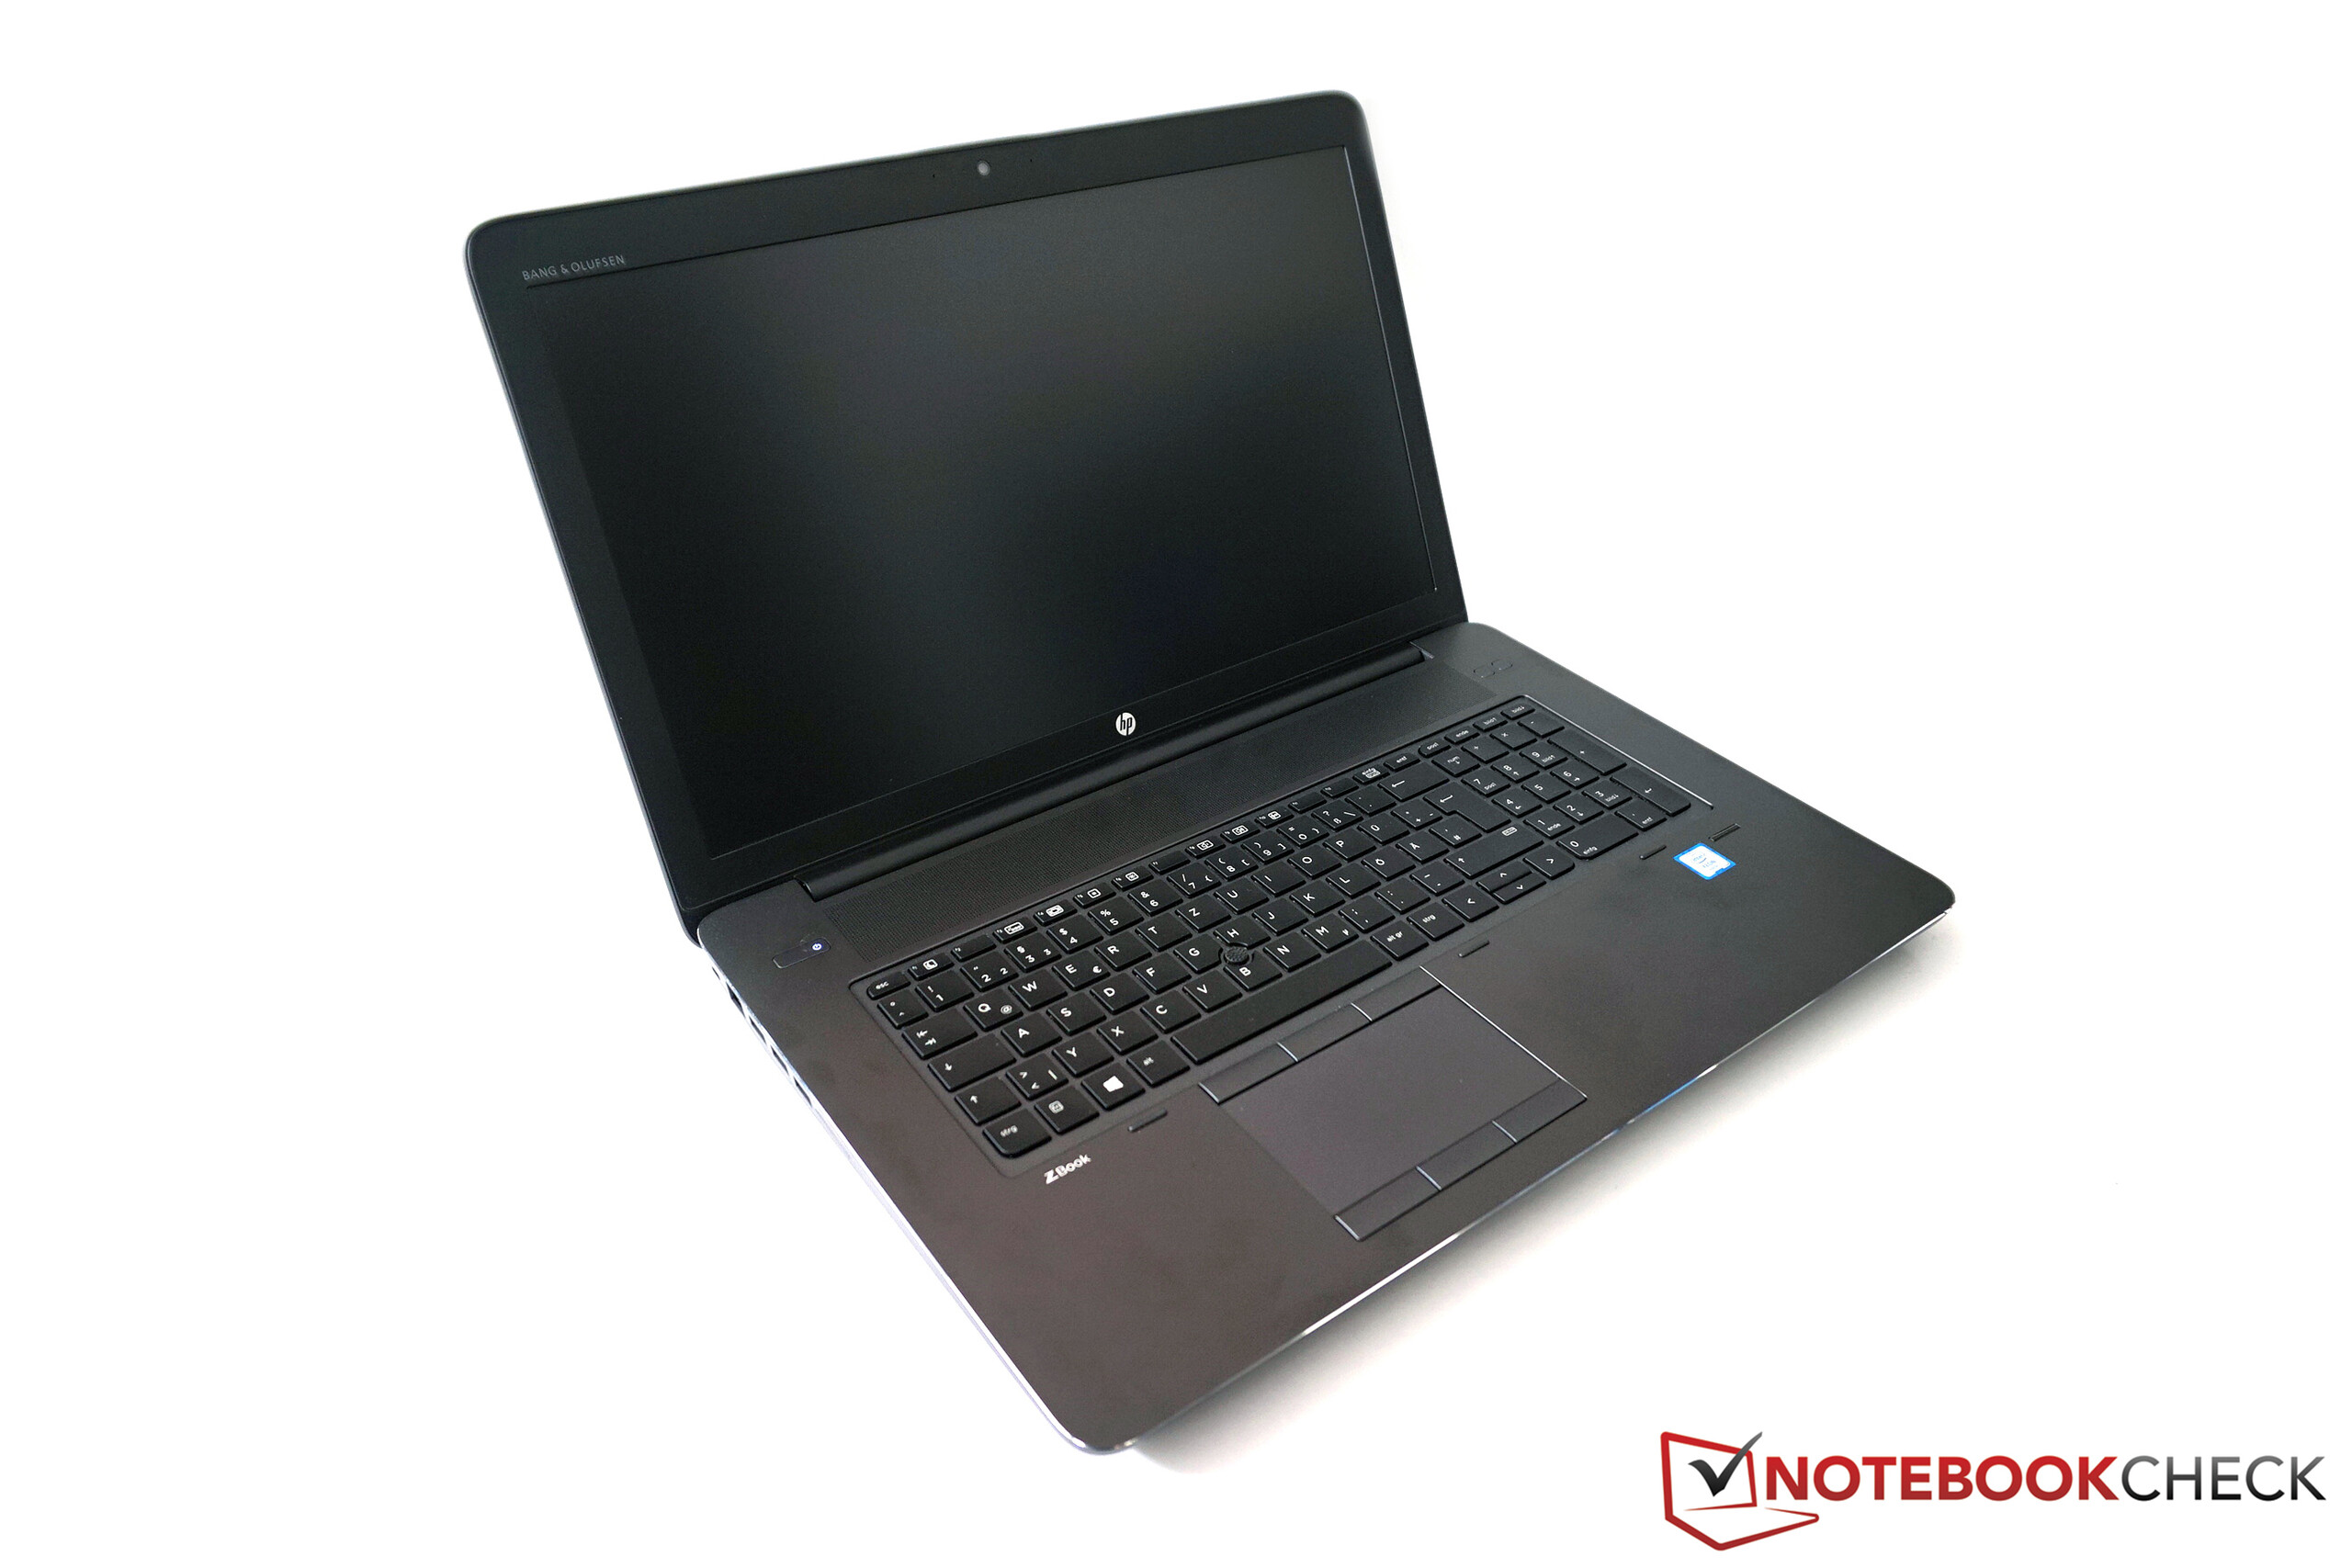
Thanks to the rounded edges at the bottom, the device appears to be much thinner than it really is. HP, similar to the smaller ZBook 15 G3, uses a combination of materials with different shades of gray, which create a very noble appearance in combination with the surrounding polished edge on top of the base unit. The material around the palm rest and the keyboard is matte and does not really attract fingerprints. The whole base unit is made of a magnesium-aluminum alloy, which provides excellent stability. Only the right side of the keyboard can be slightly pushed in, but you have to apply a lot force. The black plastic bottom panel once again falls slightly behind in terms of tactile feel but is also well-integrated. The keyboard of the big ZBook 17 G3 is also spill-water resistant and the notebook is tested according to the military standard MIL-STD-810 (humidity, temperatures, dust etc.).
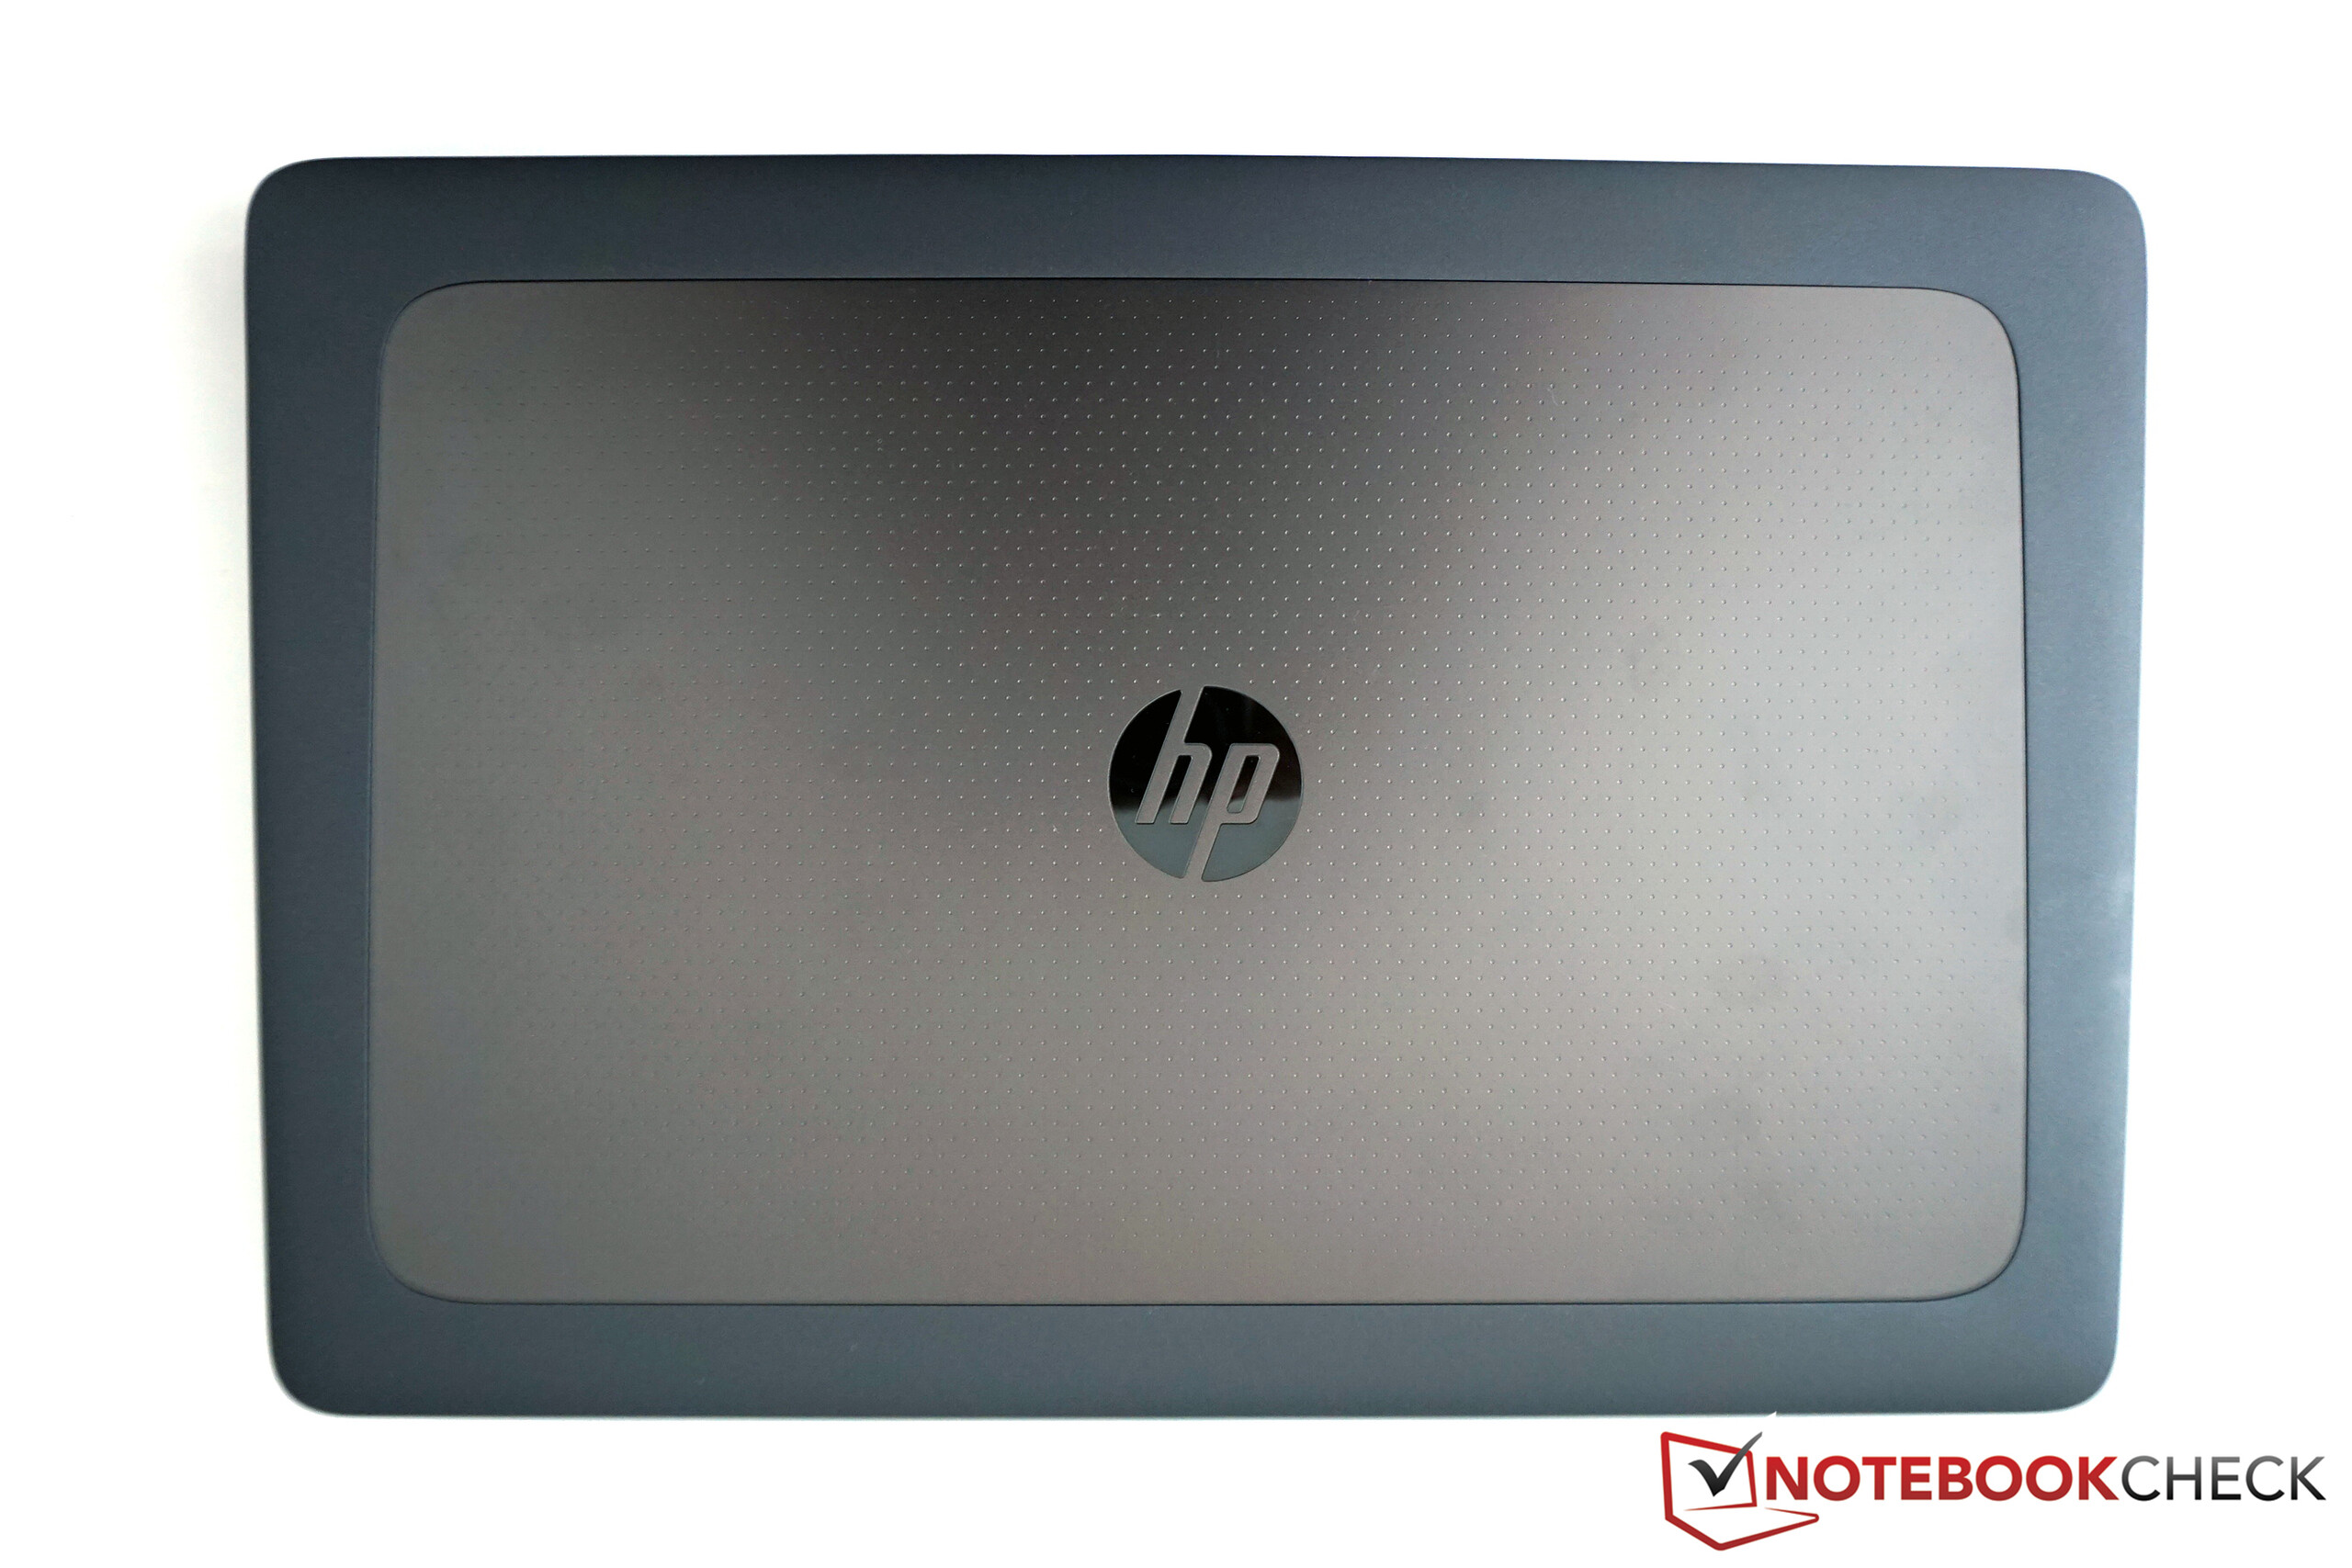
The surface of the display cover has a dotted structure and is surrounded by a rubberized section, which improves the grip but is also susceptible to fingerprints. The stability, as expected, cannot quite keep up with the base unit but is still very good. You can twist the lid a bit, but we could not provoke picture distortions and the same applies for pressure on the back. Our review unit does, however, have a problem with the hinge, because it produces loud squeaking and creaking sounds when we open the lid or adjust the opening angle. We could not notice this issue with the other devices from the ZBook series, so this should be an isolated incident. The build quality is otherwise on a very high level – you will have a hard time finding a workstation with a better chassis right now.
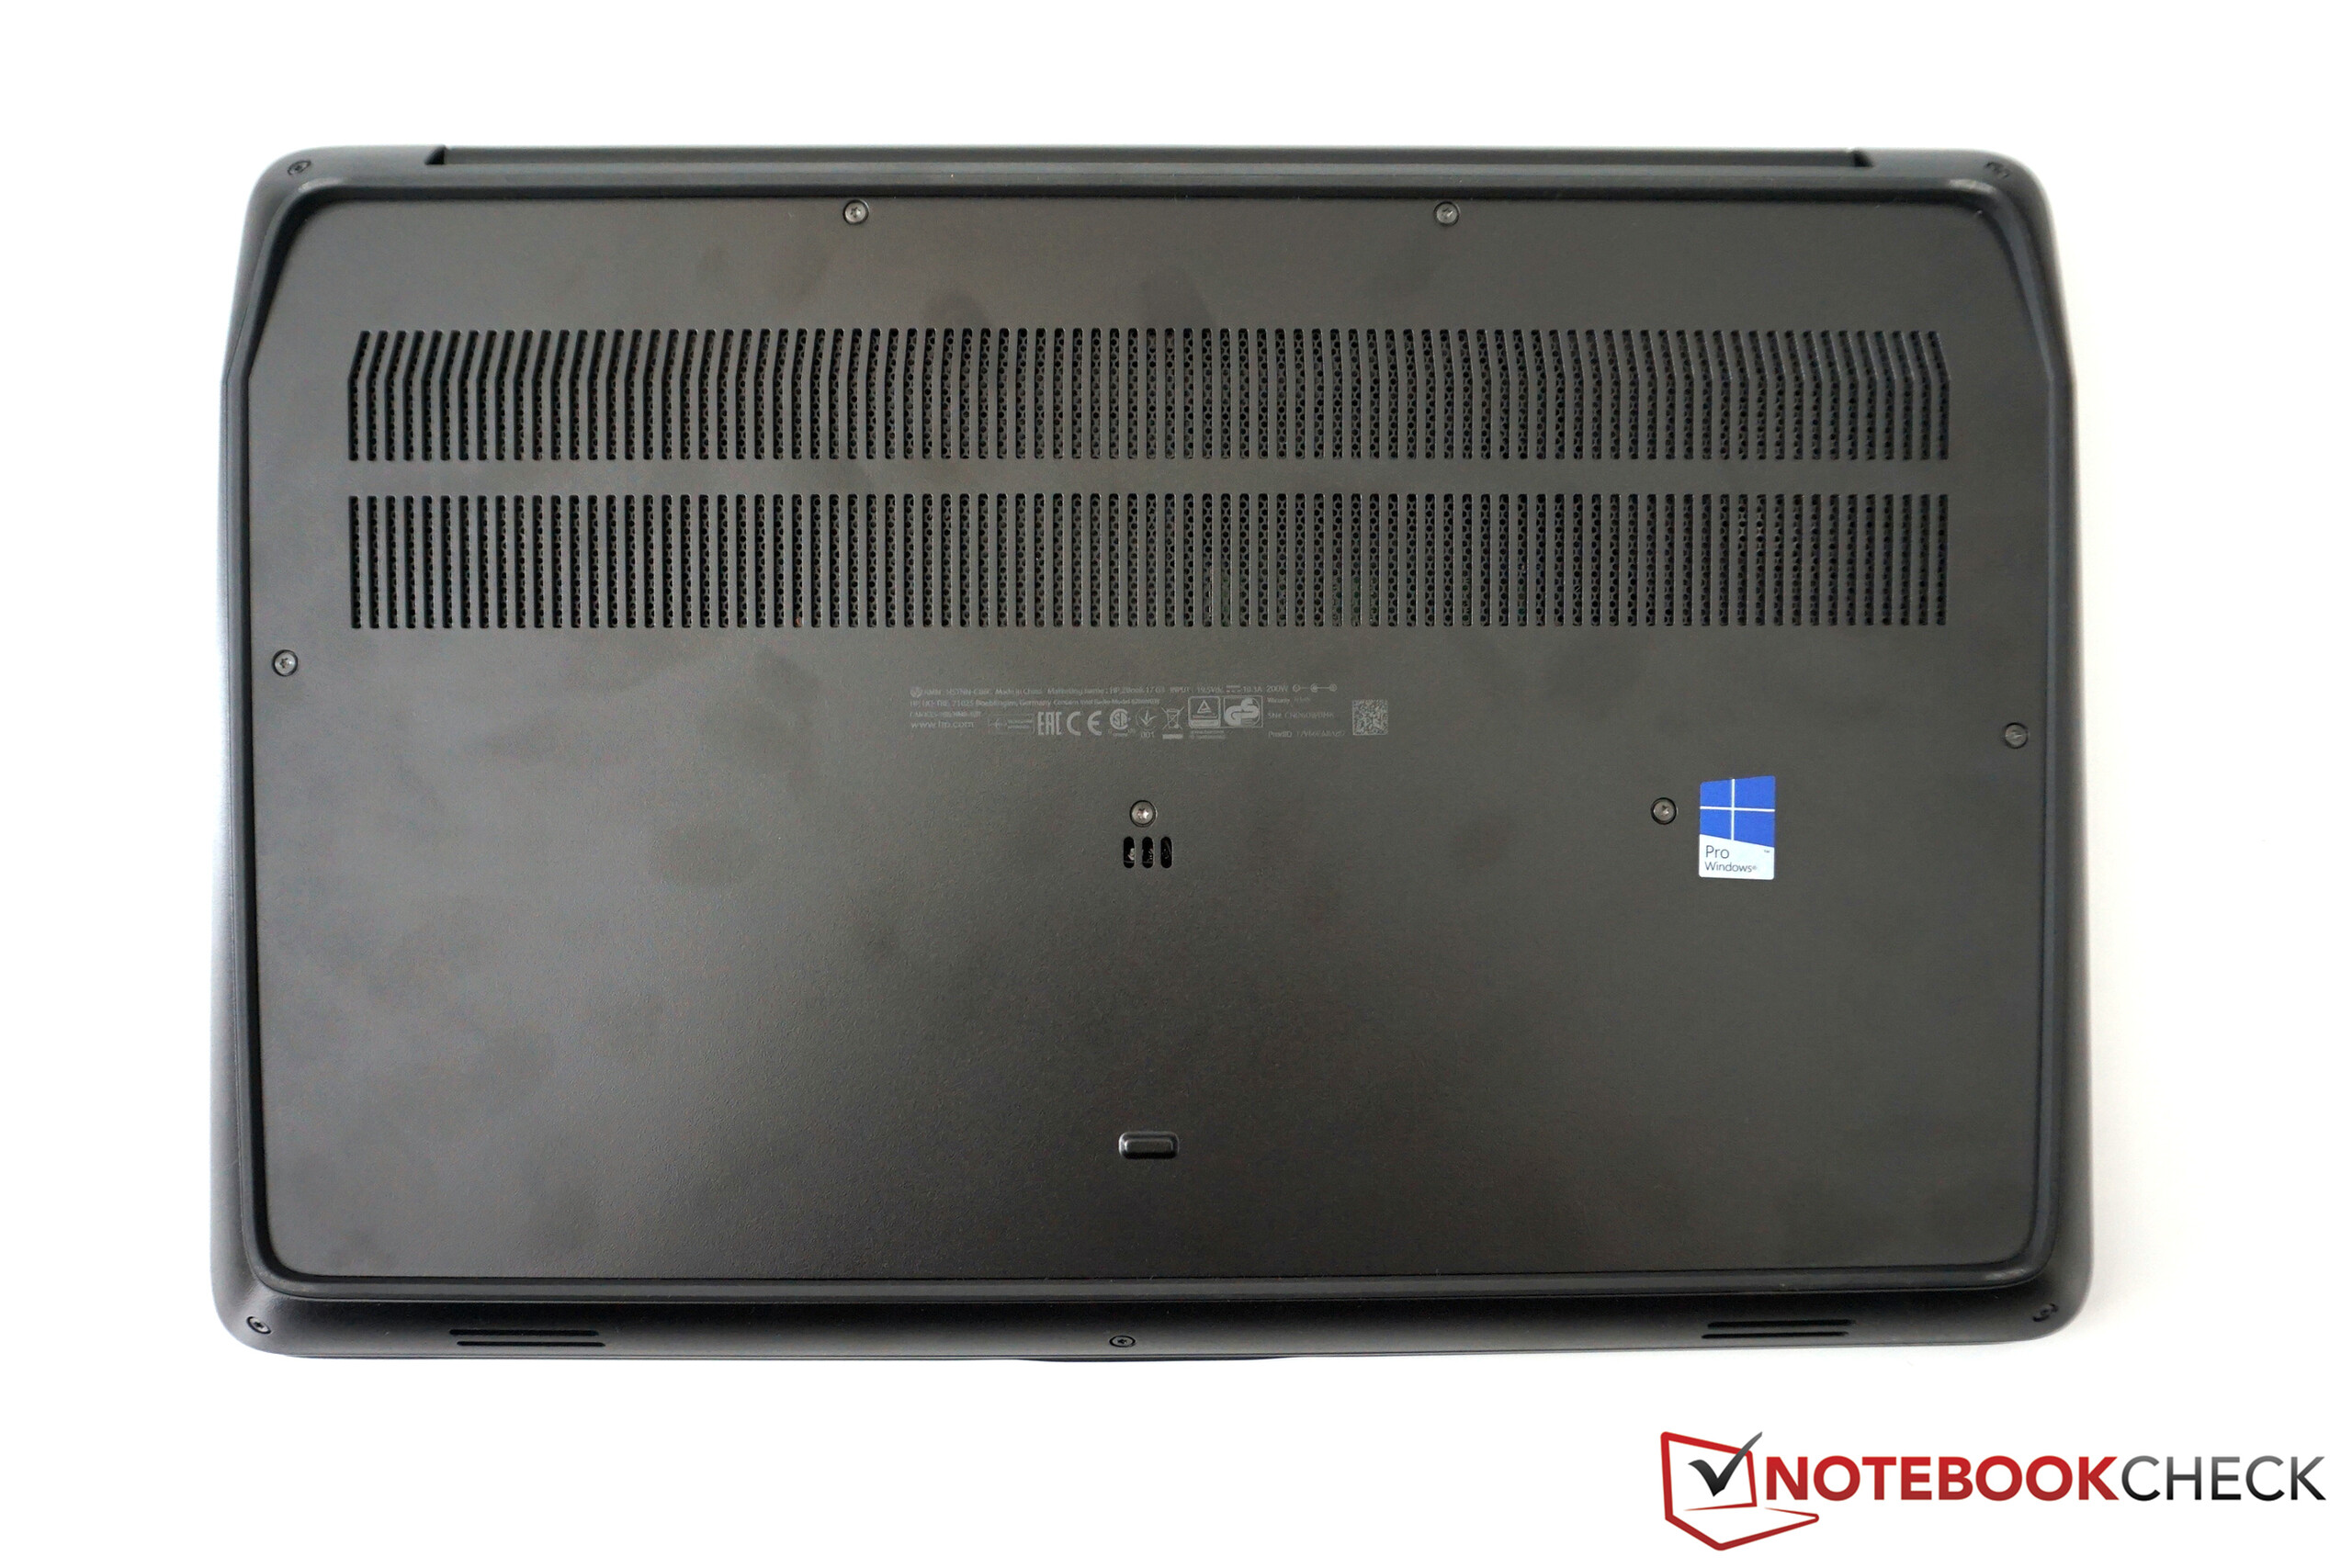
The battery of the HP ZBook 17 G3 is screwed inside the case and therefore cannot be replaced on the go. There is no maintenance hatch, either, but you can remove the whole bottom panel with a few steps in return. More on that later.
Connectivity
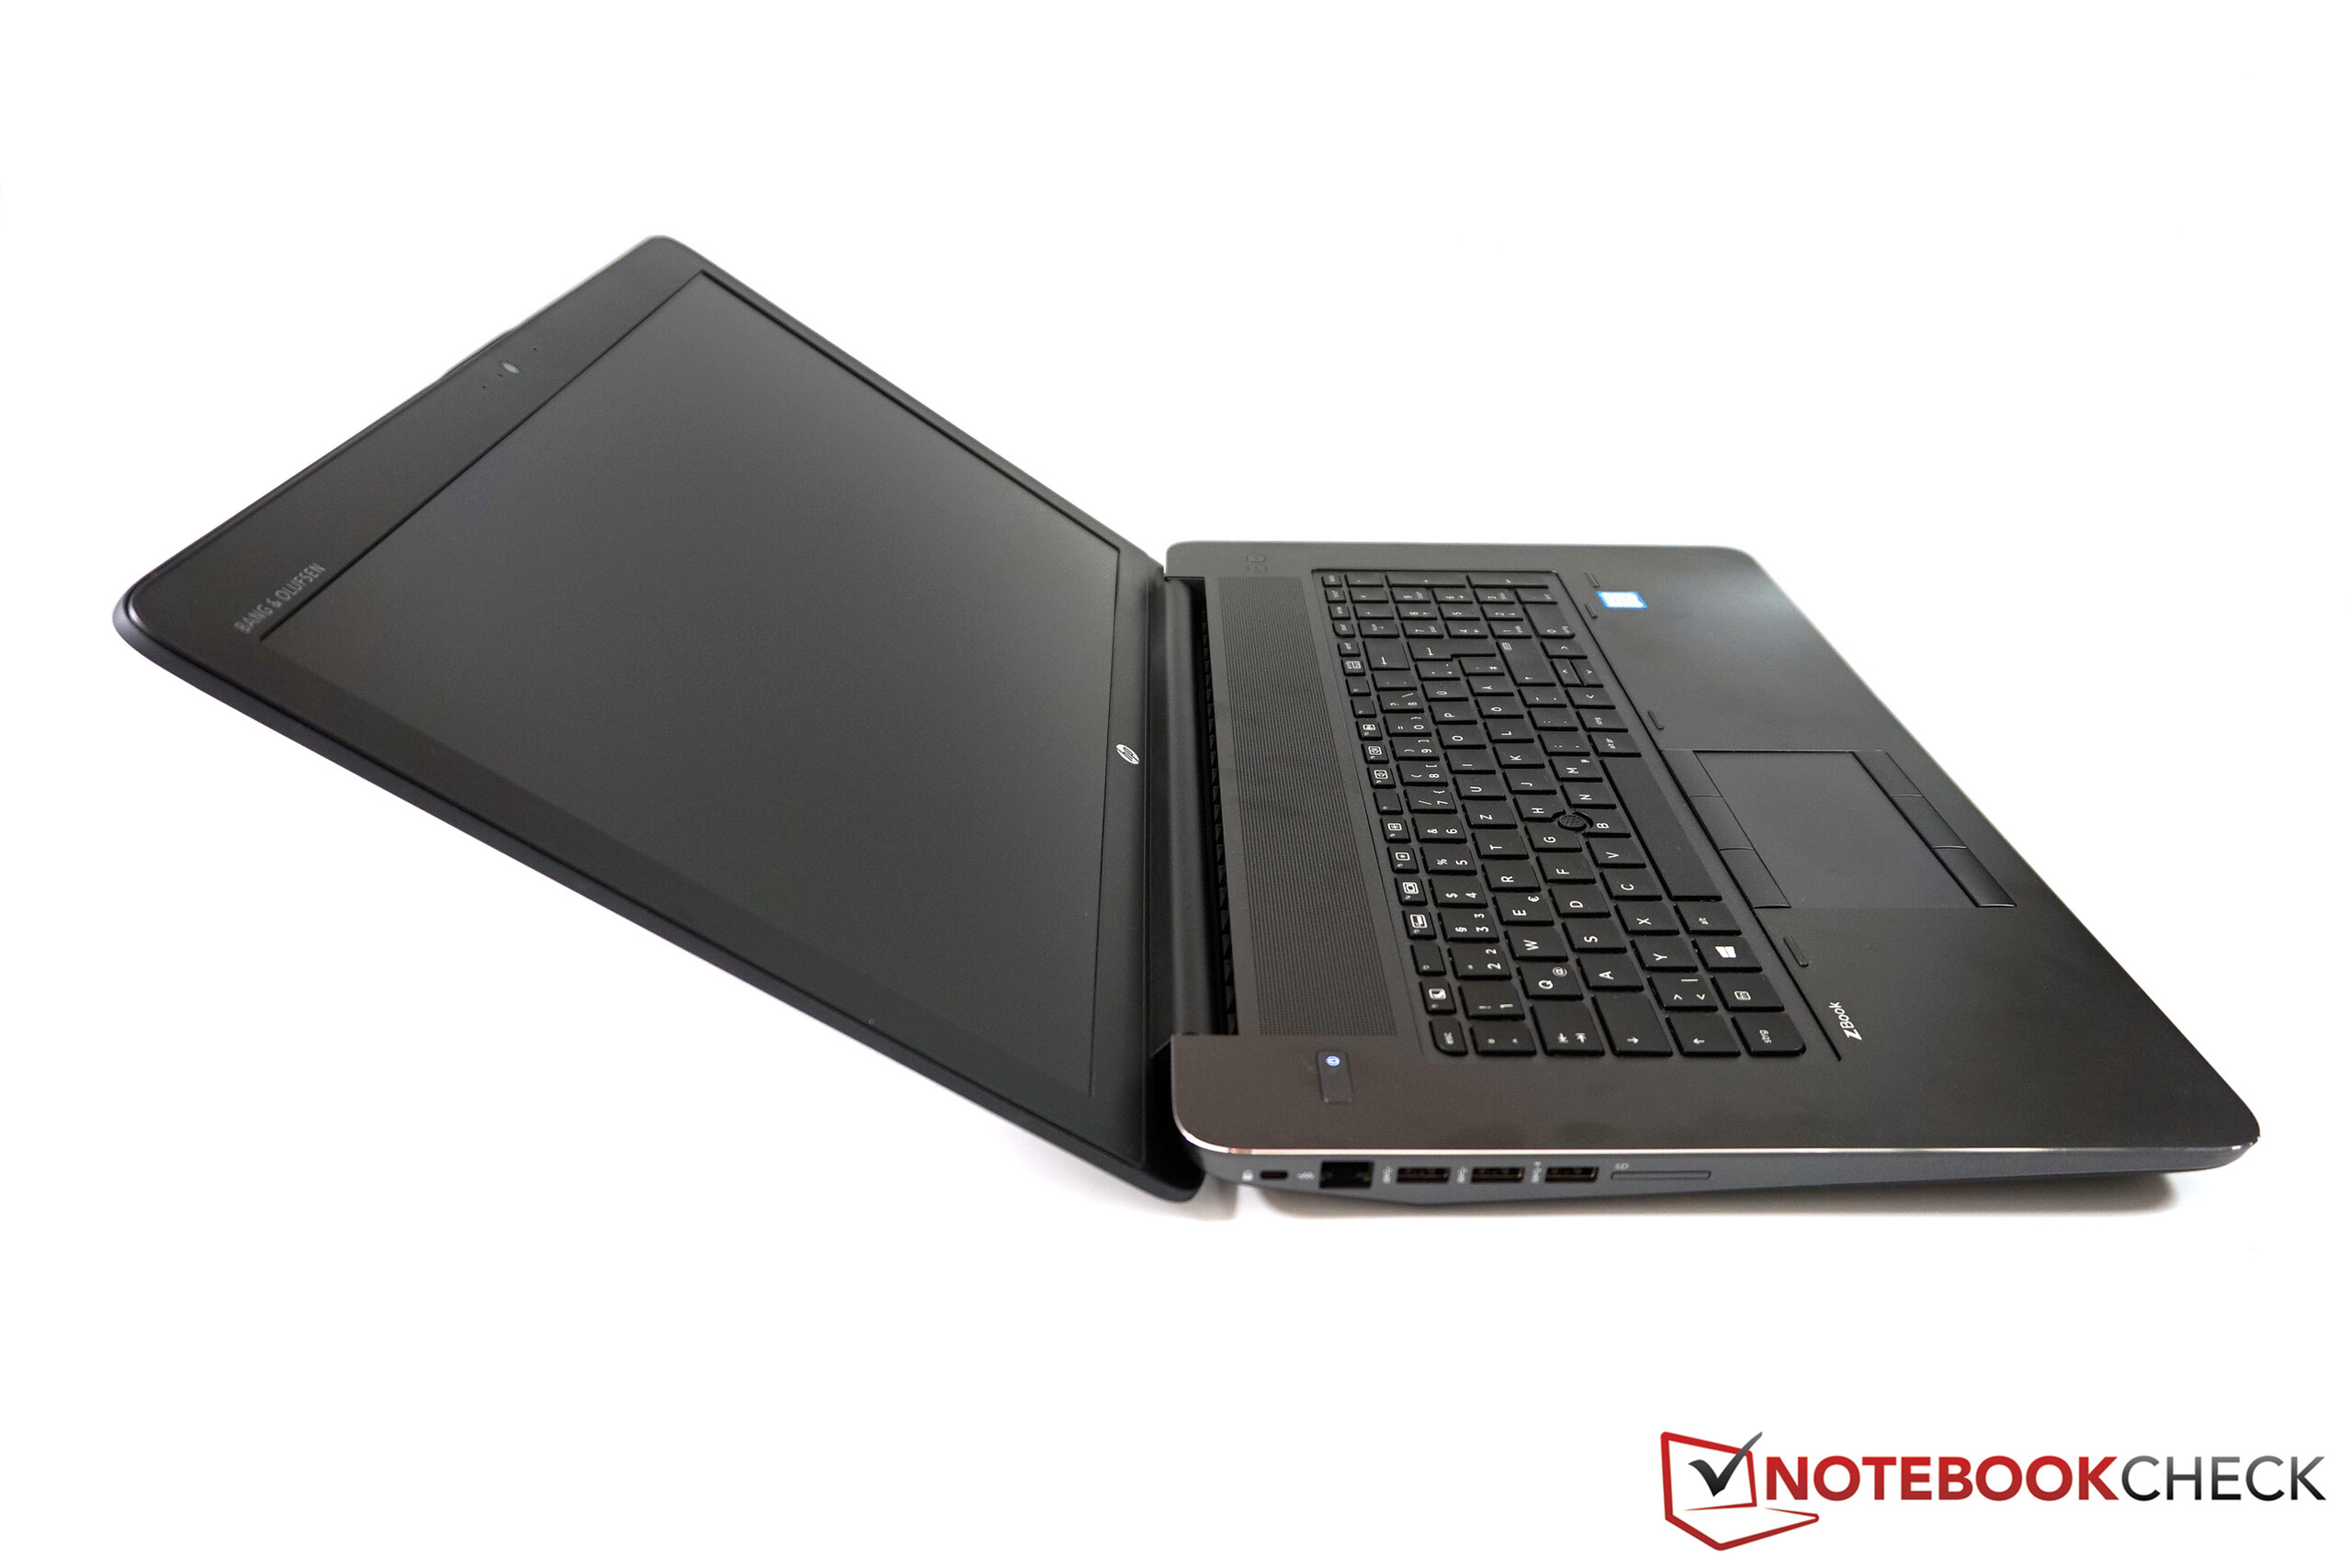
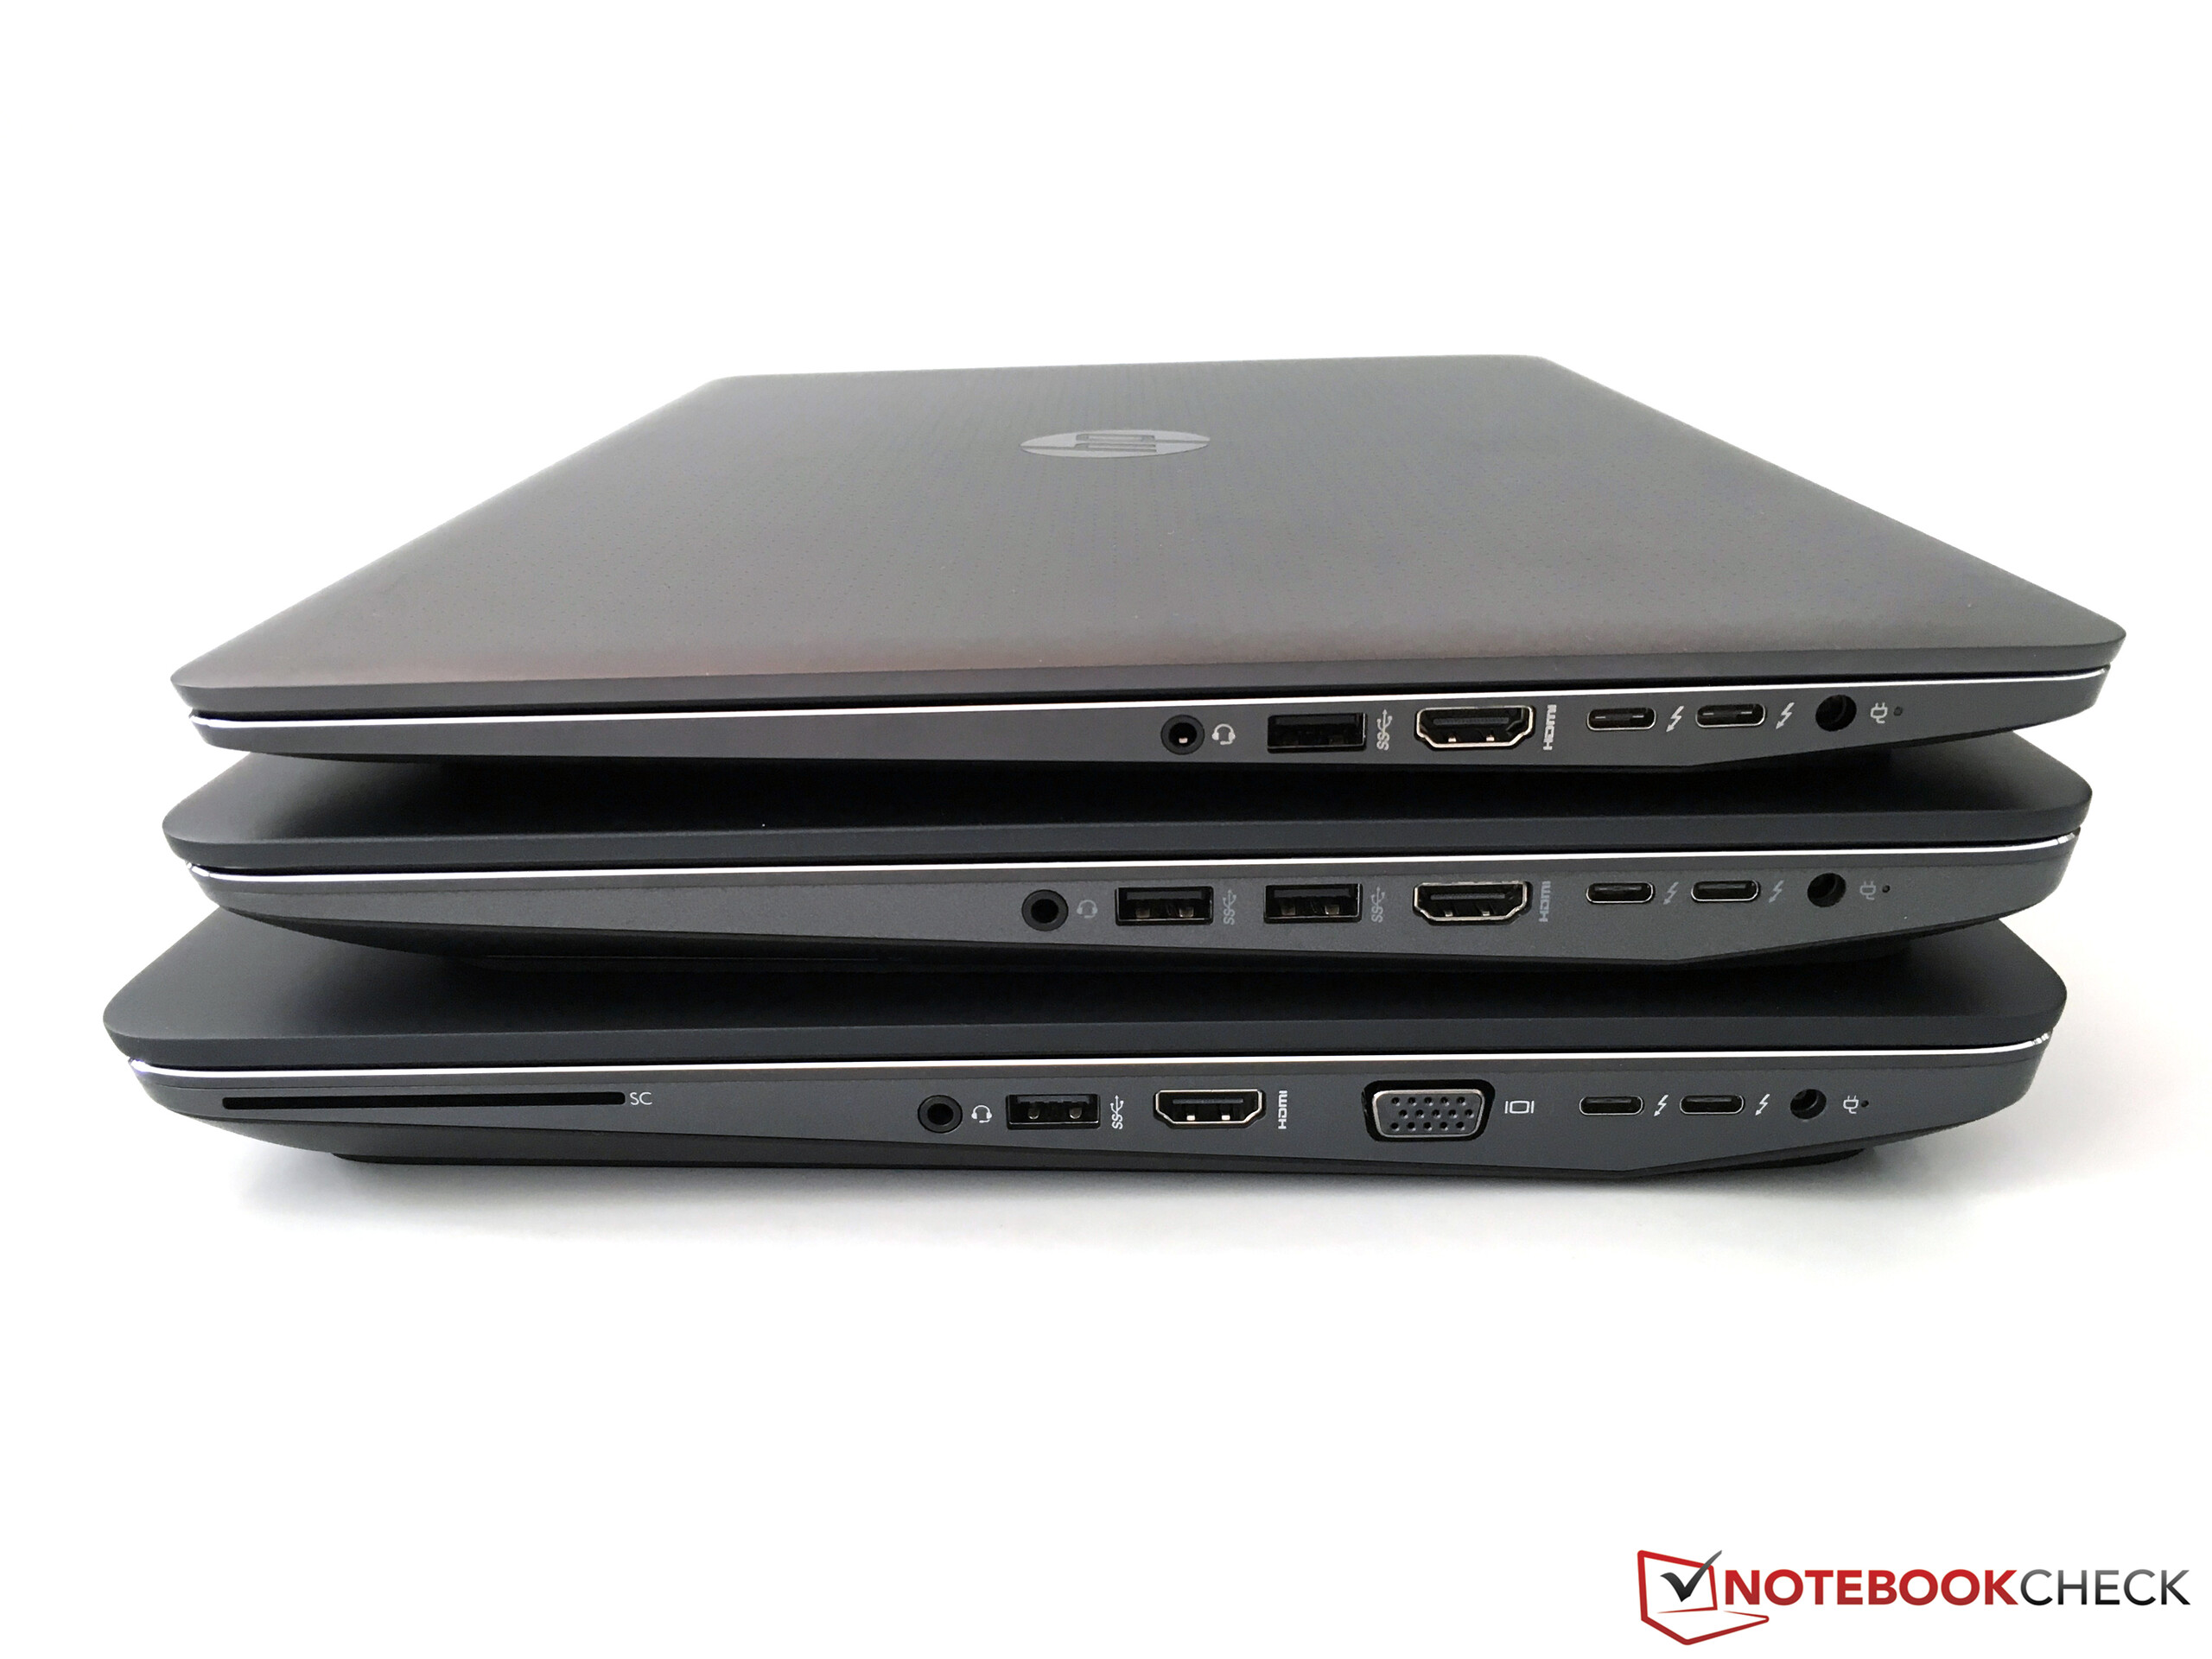
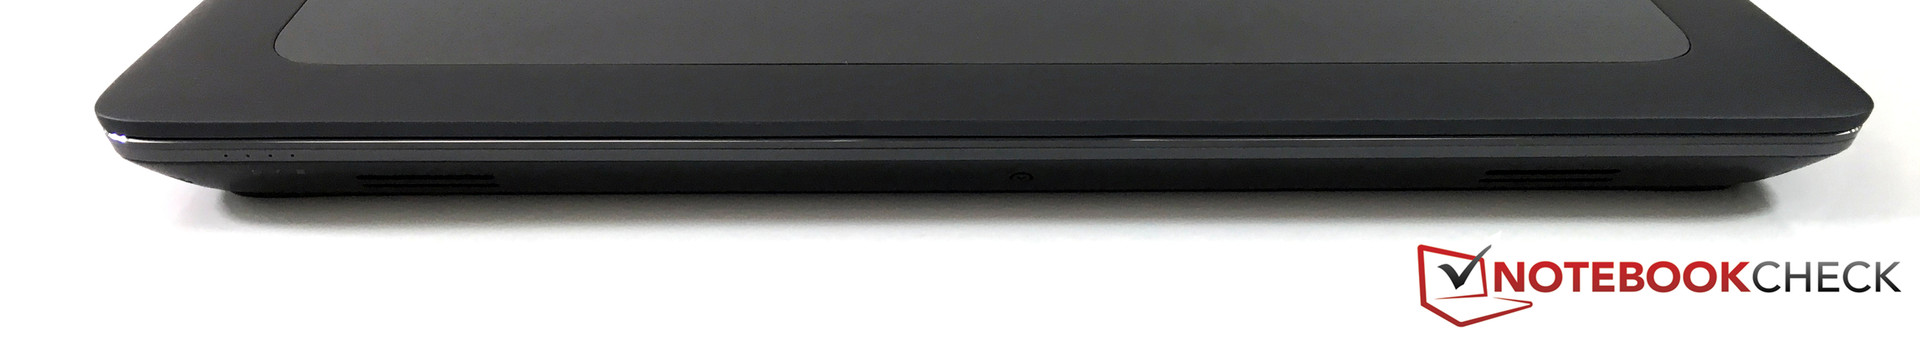
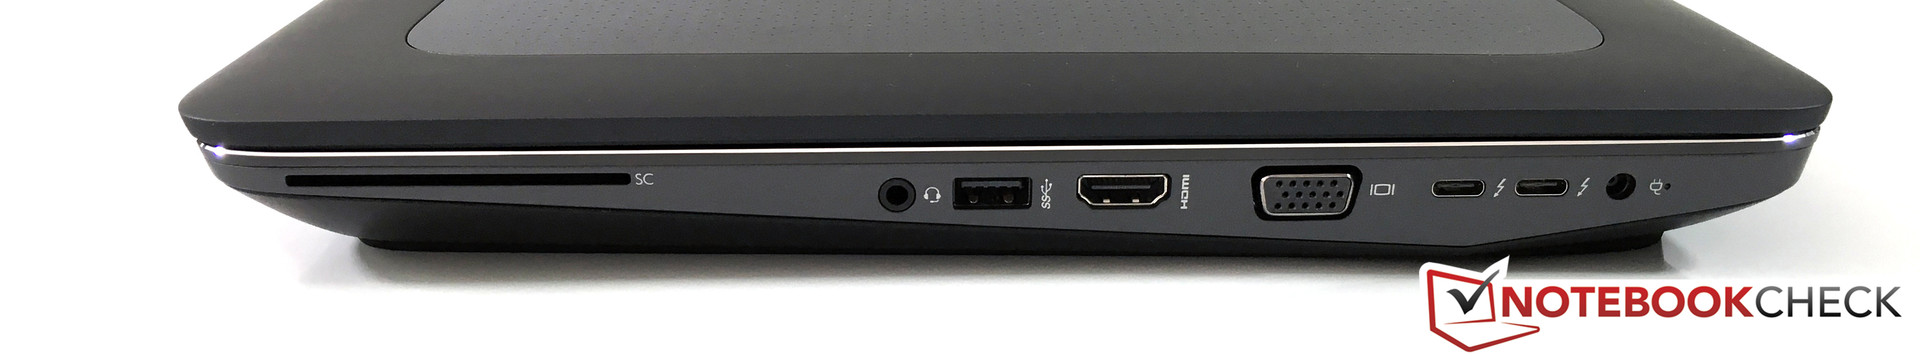
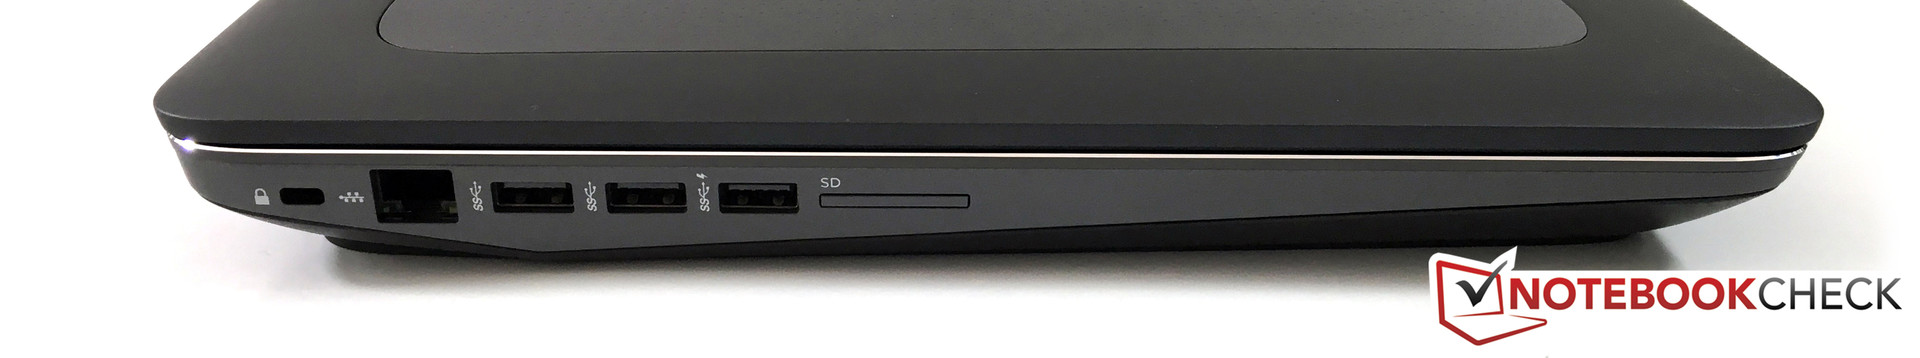
The ZBook 17 G3 does not make any compromises in terms of the connectivity and provides all modern ports. Compared to the predecessor, all the ports are now distributed across both sides. The USB ports on the left side in particular are a bit crowded though and the spacing could be more generous. The highlights are the two Thunderbolt 3 ports (40 Gbps, DisplayPort 1.2, USB 3.1 Gen 2, PCIe Gen 3) with the new USB-C connector. The lack of a proprietary docking port is therefore no problem, either. We listed corresponding solutions in the section Accessories. You can drive up to four individual displays: internal, VGA, and two out of three digital ports (HDMI or 2x Thunderbolt 3). If you use suitable monitors, you can connect two monitors (daisy chain) thanks to the MultiStream technology, which will increase the number of active panels to six. You can even drive six individual monitors with the optional docking stations.
The performance of the ports is on the good level of the smaller sibling ZBook 15 G3. We determined 310/317 MB/s (read/write) with our external Samsung SSDT1 and AS SSD shows 210/124 MB/s (read/write) for our reference SD-card from Toshiba (Exceria Pro UHS-II, 64 GB, up to 260 MB/s). Typical JPG pictures (~5 MB) are transferred at 114/99.8 MB/s (read/write) on average.
Communication
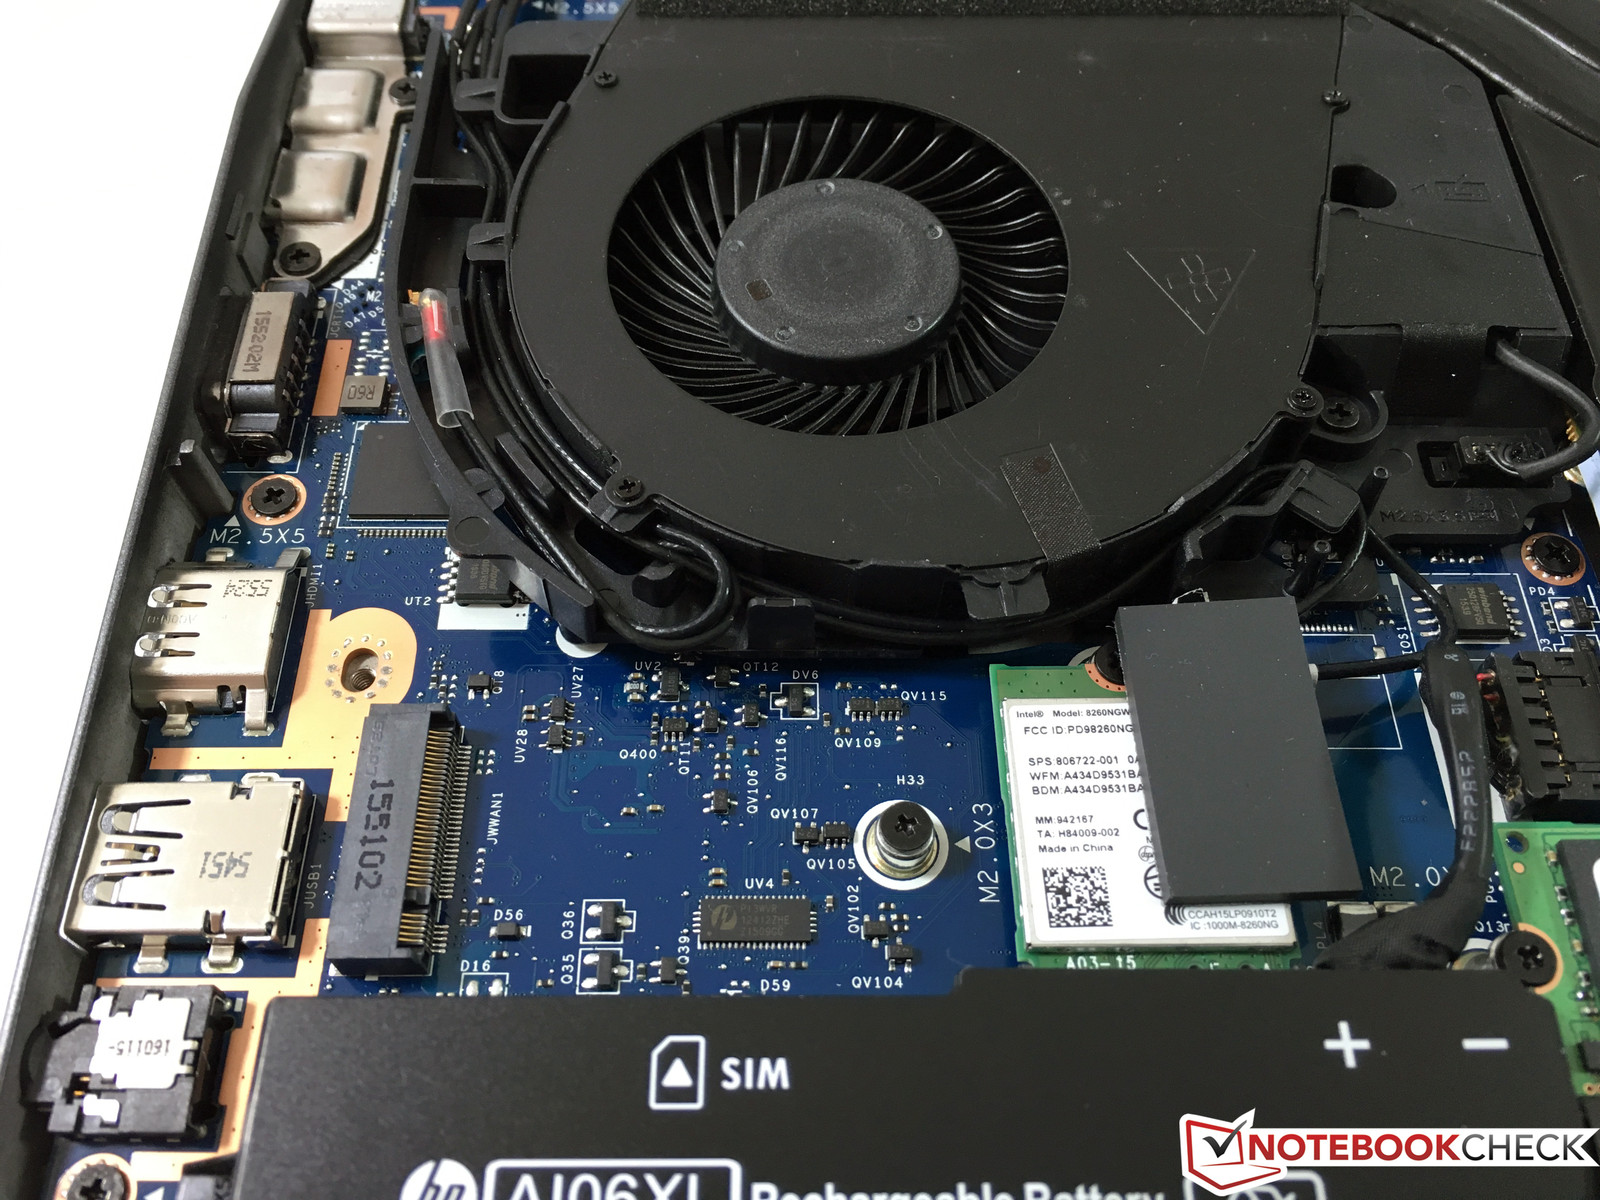
The ZBook 17 G3 supports both wired (Gigabit Ethernet, Intel I219-LM) as well as wireless network connections. The very popular and powerful WLAN module Intel Dual-Band Wireless-AC 8260 supports all common standards including the fast 802.11ac in 2.4 and 5 GHz networks as well as Bluetooth 4.2. The theoretical transfer rate is 867 Mbps, and we can measure a very good 83-85 MB/s (802.11n: ~9 MB/s) under perfect conditions (1 meter to the router ASUS RT-AC56U). We did not notice any problems with the signal quality during our review.
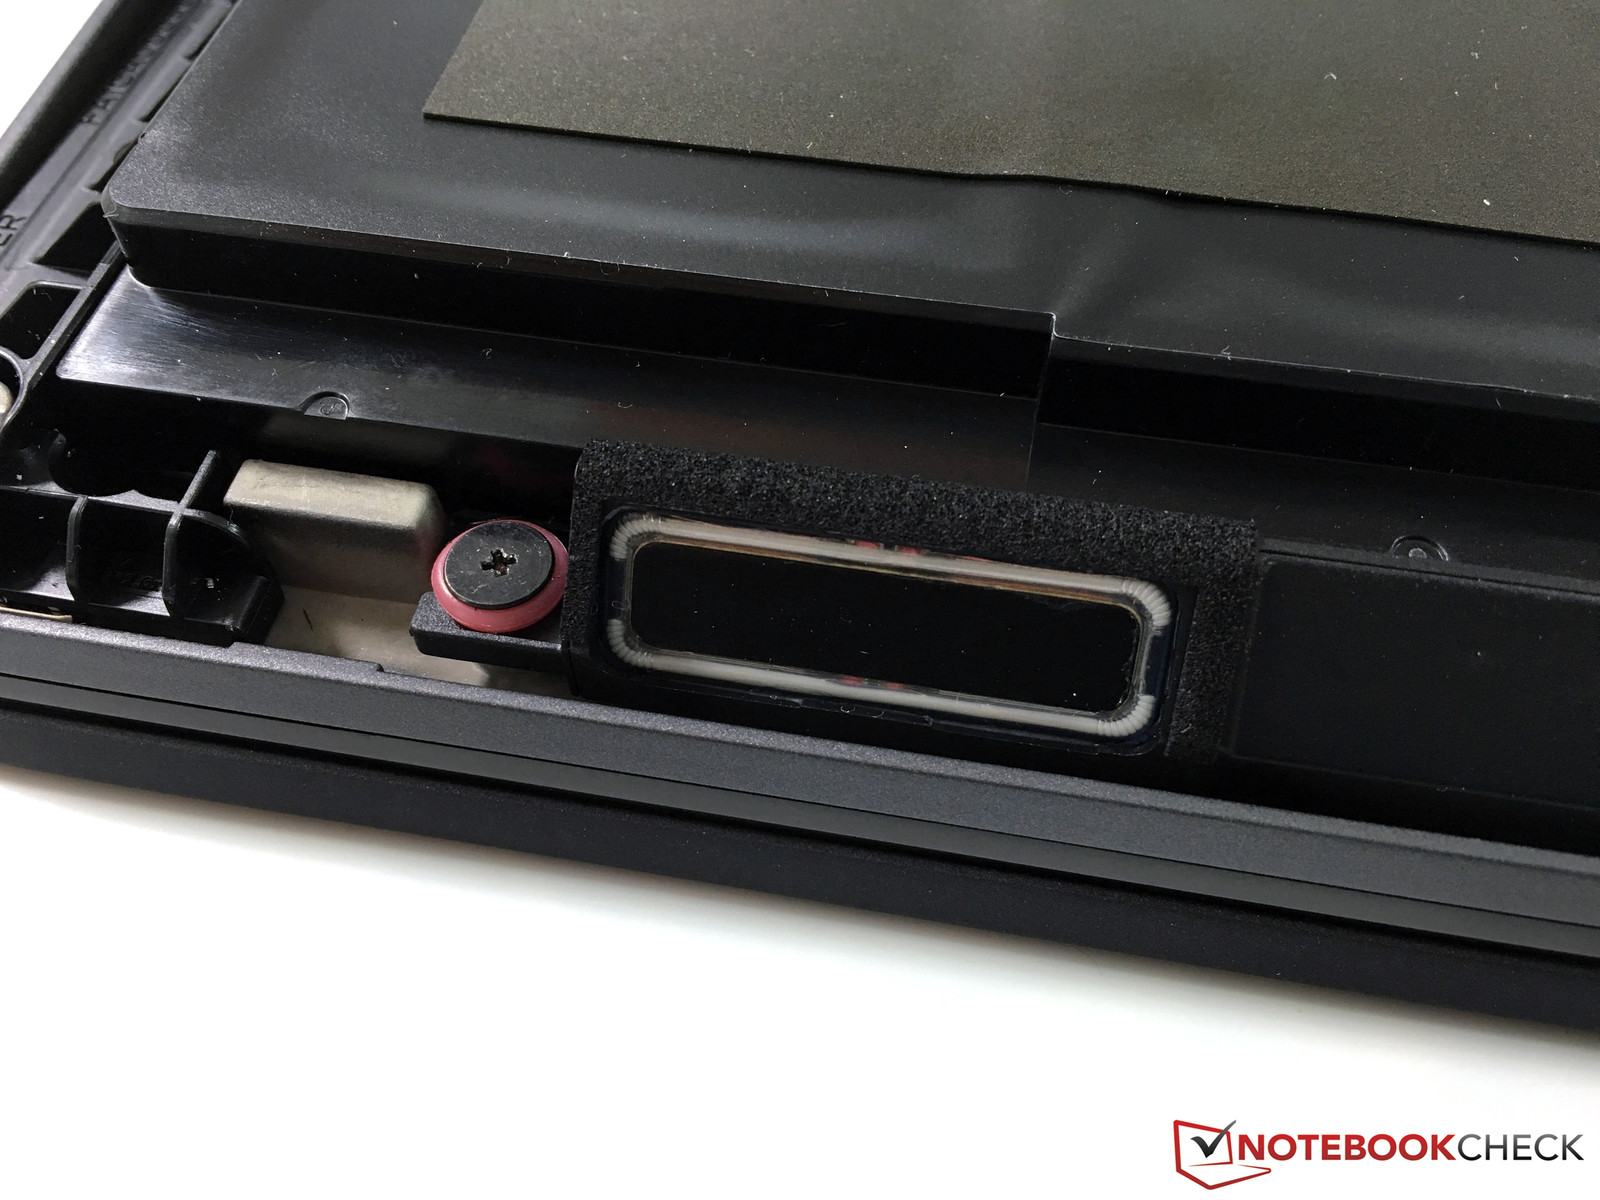
The notebook is WWAN-ready, so there is an additional slot for a corresponding M.2-2242 module (HP lt4120 Qualcomm Snapdragon X5 LTE or HP hs3110 HSPA+ Intel), and the necessary antennas are already integrated. The according SIM slot is underneath the battery and therefore pretty tricky to access.
The HD webcam and the two microphones are located above the display. The sensor with 1280x720 pixels does its job, but that is pretty much it. We liked voice recording much better, where an external headset is not always necessary.
Security
The security features of the ZBook 17 G3 are very comprehensive and do not leave anything to be desired. Access to the notebook can be secured via SmartCard or fingerprint scanner, where you have to swipe your finger across the sensor. HP also implements a TPM 1.2/2.0 module (EAL4+), and you can setup several passwords for the system start and the access to the BIOS. It is also possible to disable individual ports. HP includes many software features in its Client Security software. Here, you can register fingerprints or encrypt the hard drive, for example. Some configurations are also shipped with self-encrypting hard drives.
Accessories
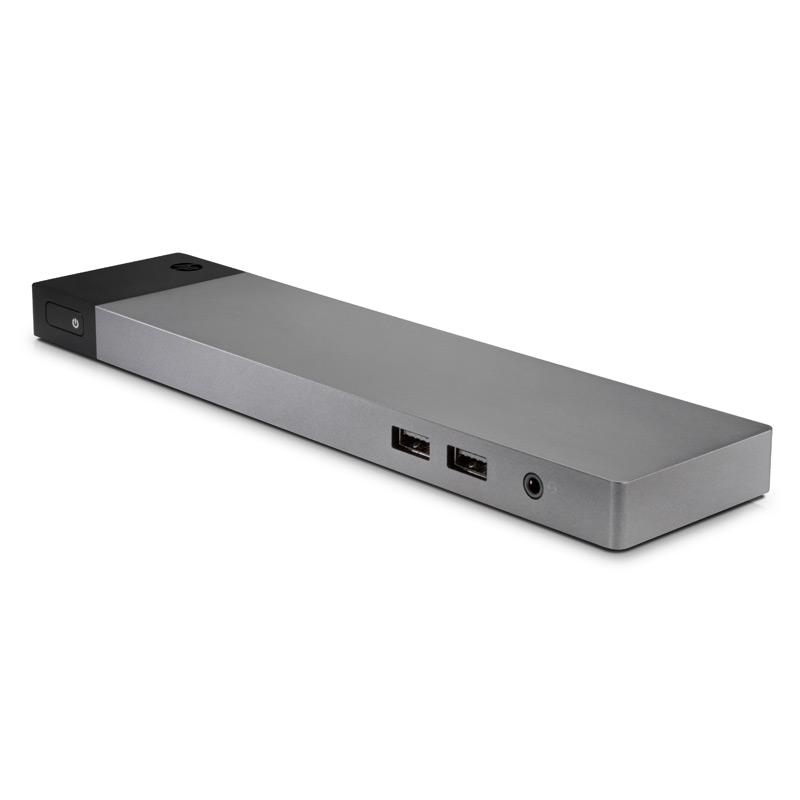
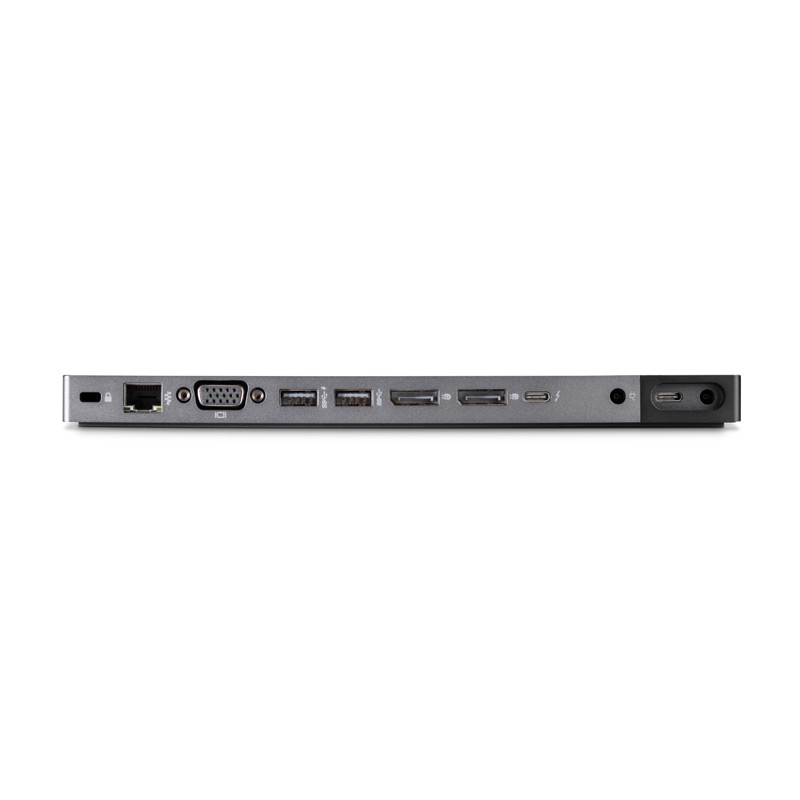
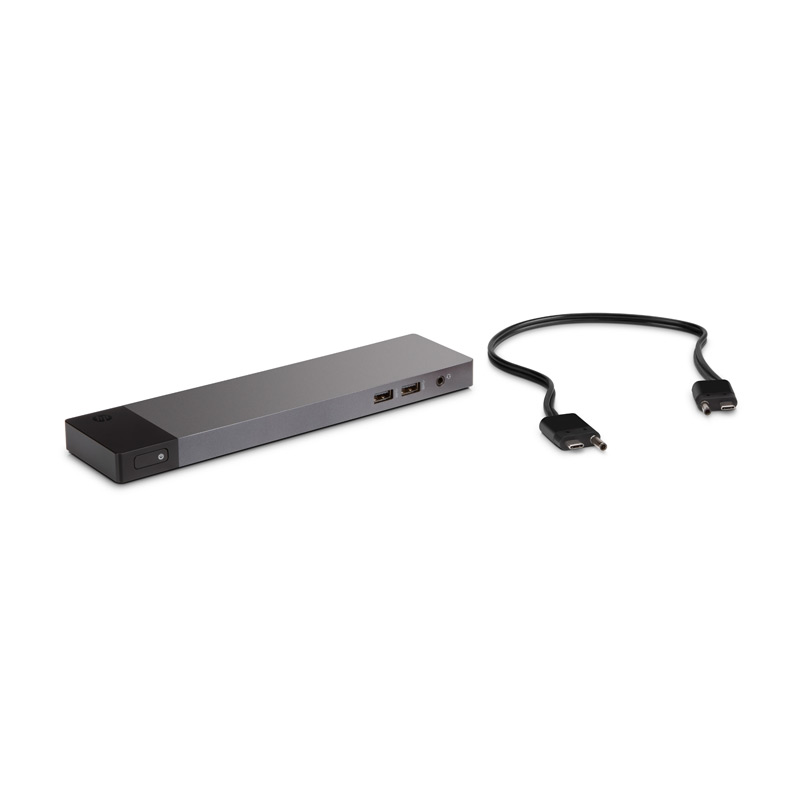
Besides the usual accessories like the power adapter (200 Watts), the quick-start guide and warranty information, the HP ZBook Studio G3 is also shipped with two 2.5-inch brackets as well as the corresponding connector cables. The optional docking station, the HP ZBook TB3 Dock, is very interesting. You only need one cable for the connection, which will also charge the notebook. HP offers three different models that only differ in terms of the power adapter (65, 150 and 200 watts) and can be used with all modern ZBook models. You can expand the port variety with the following ports: 4x USB 3.0, Ethernet, 1x Thunderbolt 3, 2x DisplayPort 1.2, 3.5 mm headset and a Kensington lock. Prices range between about 220 and 250 Euros (~$245 and ~$279) depending on the model.
Maintenance
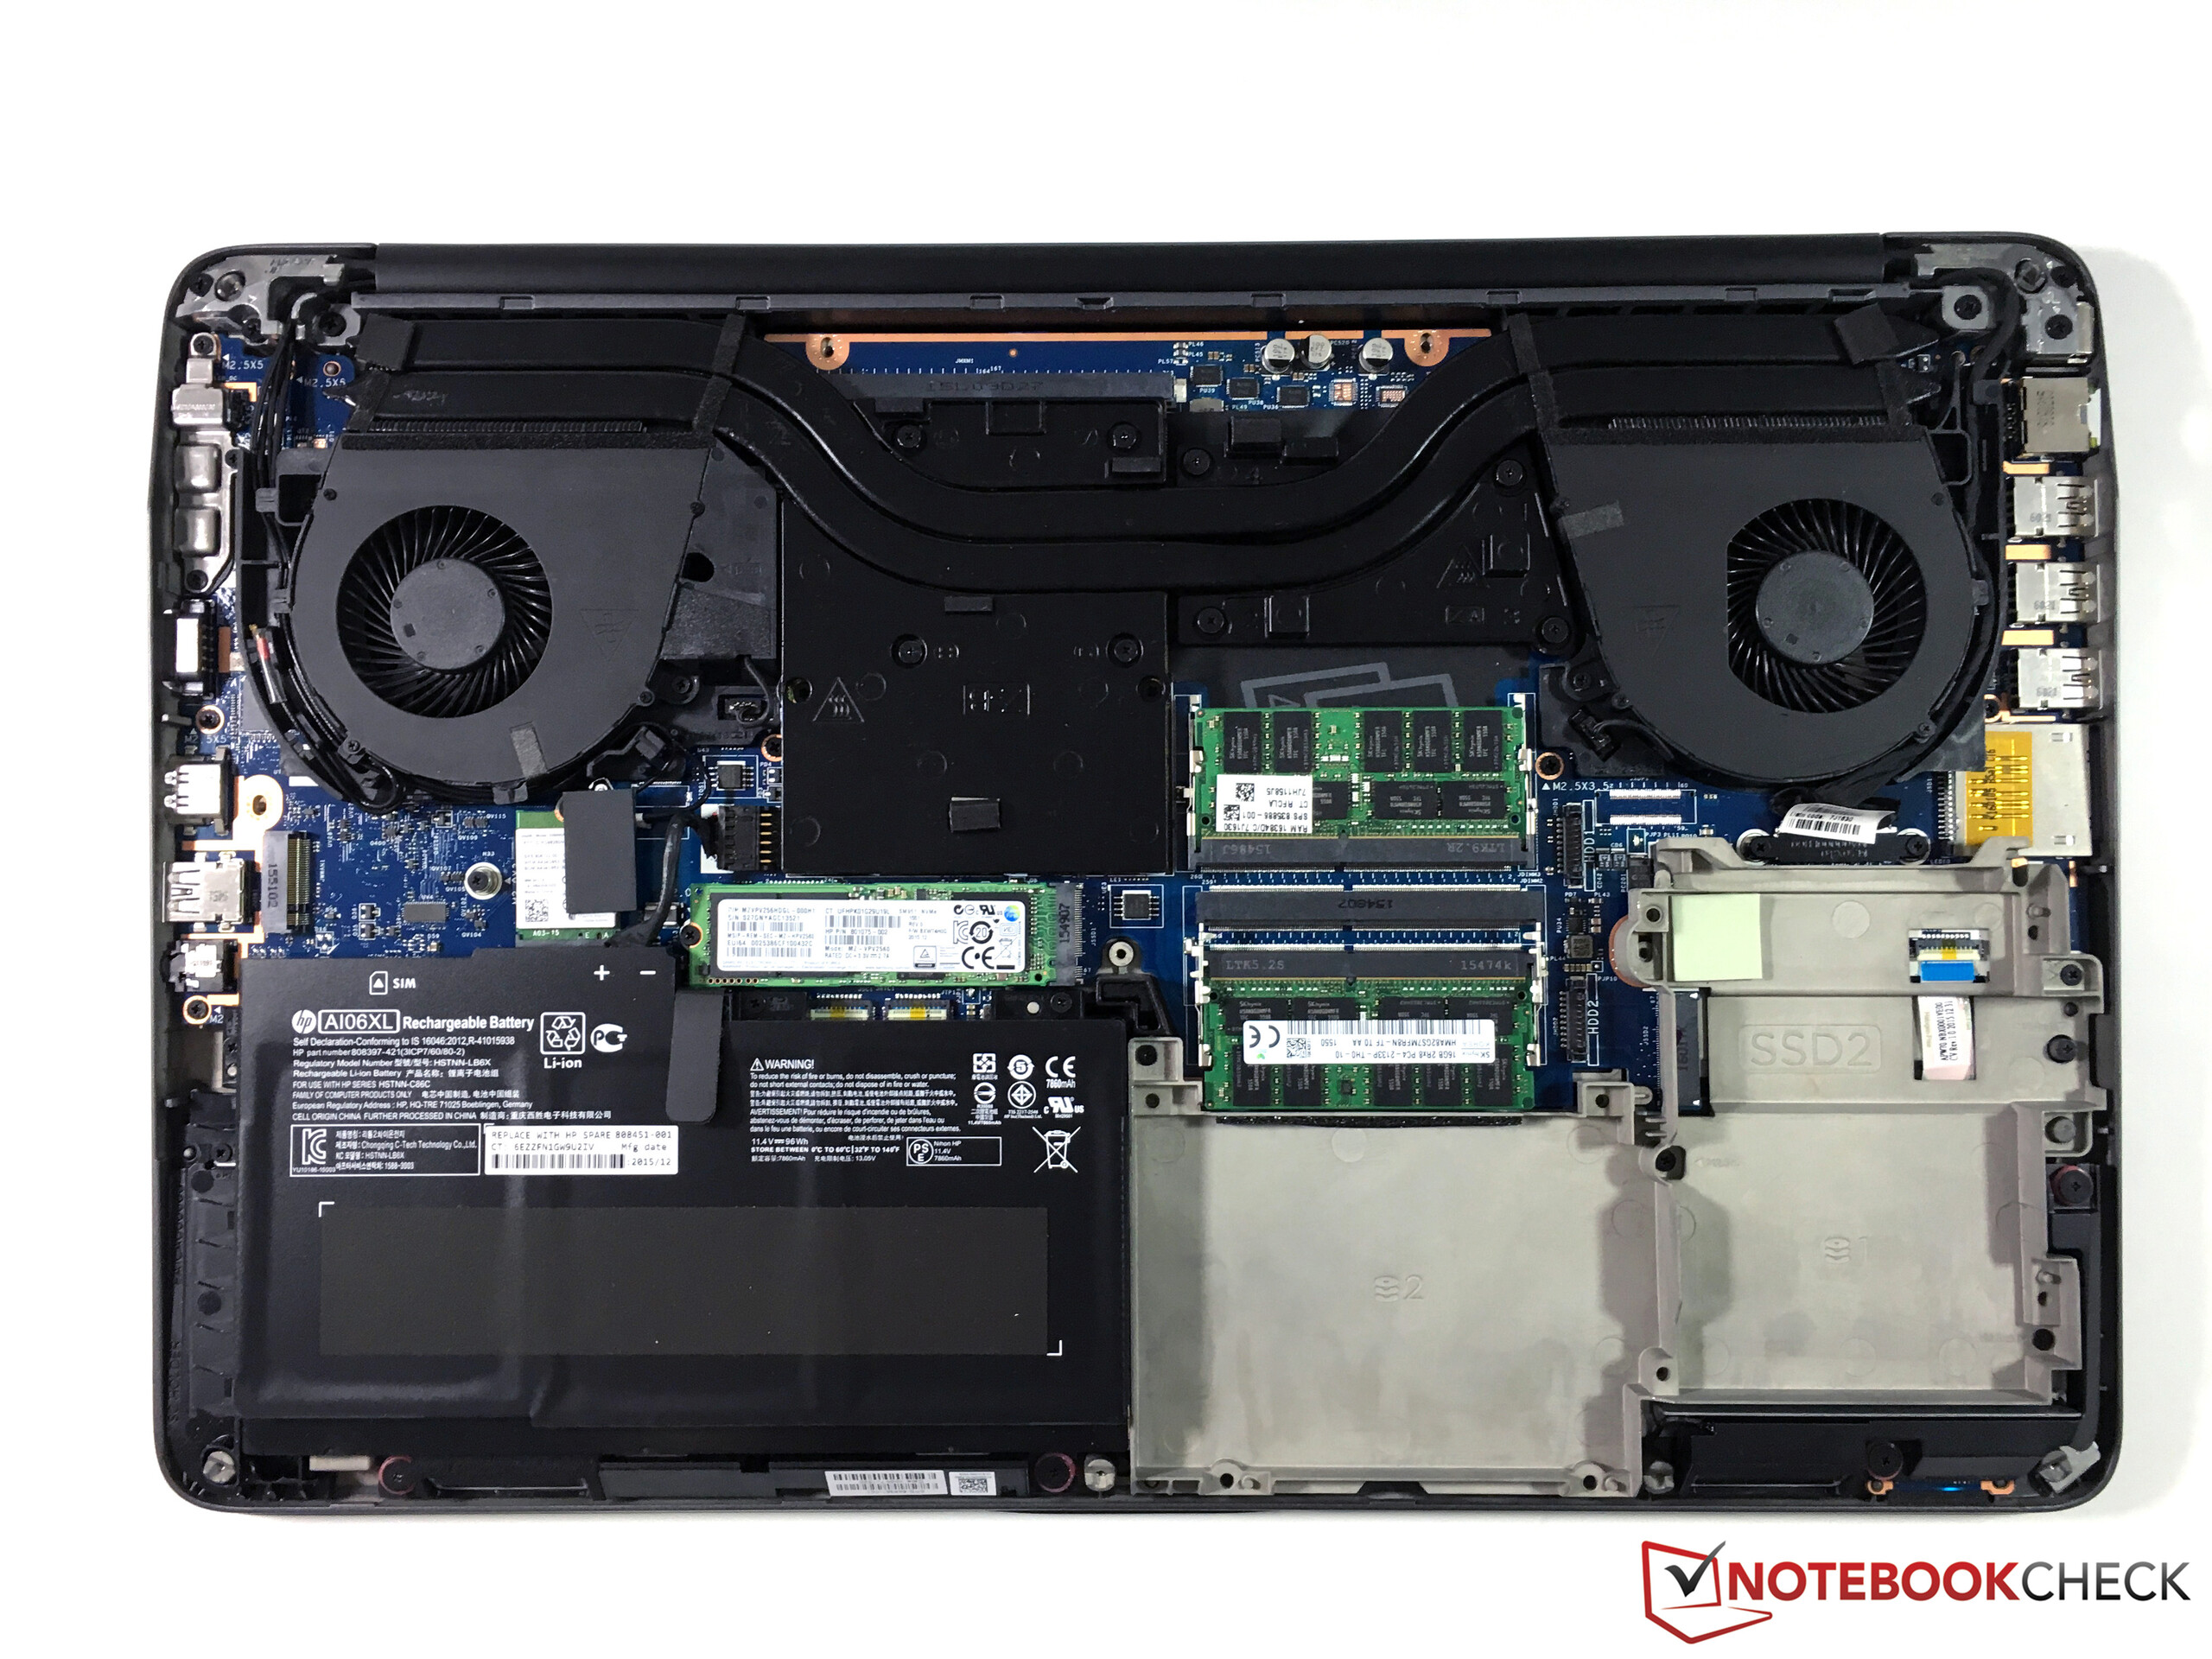
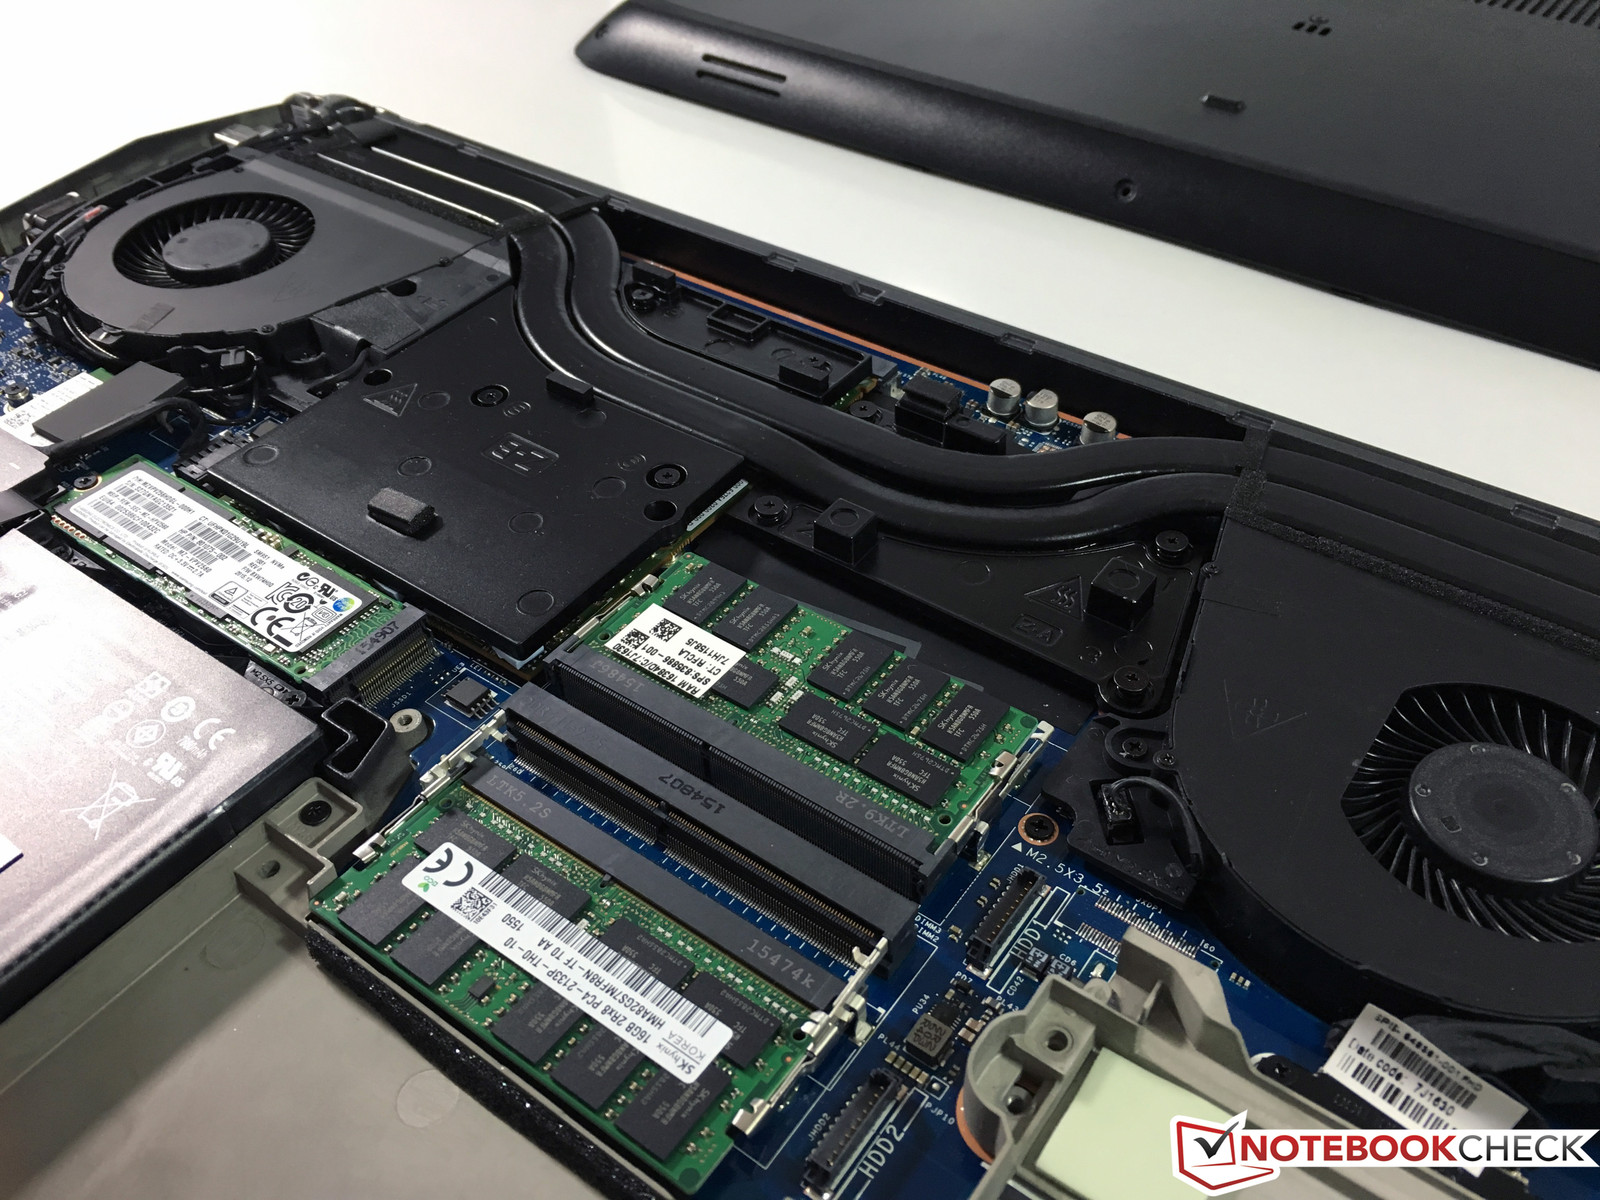
The bottom panel of the ZBook 17 G3 is secured by Torx screws (T9) and can be removed very easily. After that you get access to all important components. Similar to the smaller ZBook 15 G3, the GPU is an MXM module and can be replaced. Four RAM slots (DDR4-SODIMM) can be equipped with up to 64 GB; our test model still has two free slots. The screwed battery indicates the position of the SIM slot underneath the battery. You can still access it, but the process is not particularly comfortable. It is also not possible to change the SIM cards quickly when you travel into another country, for instance. The necessary antennas for the WWAN module are already integrated.
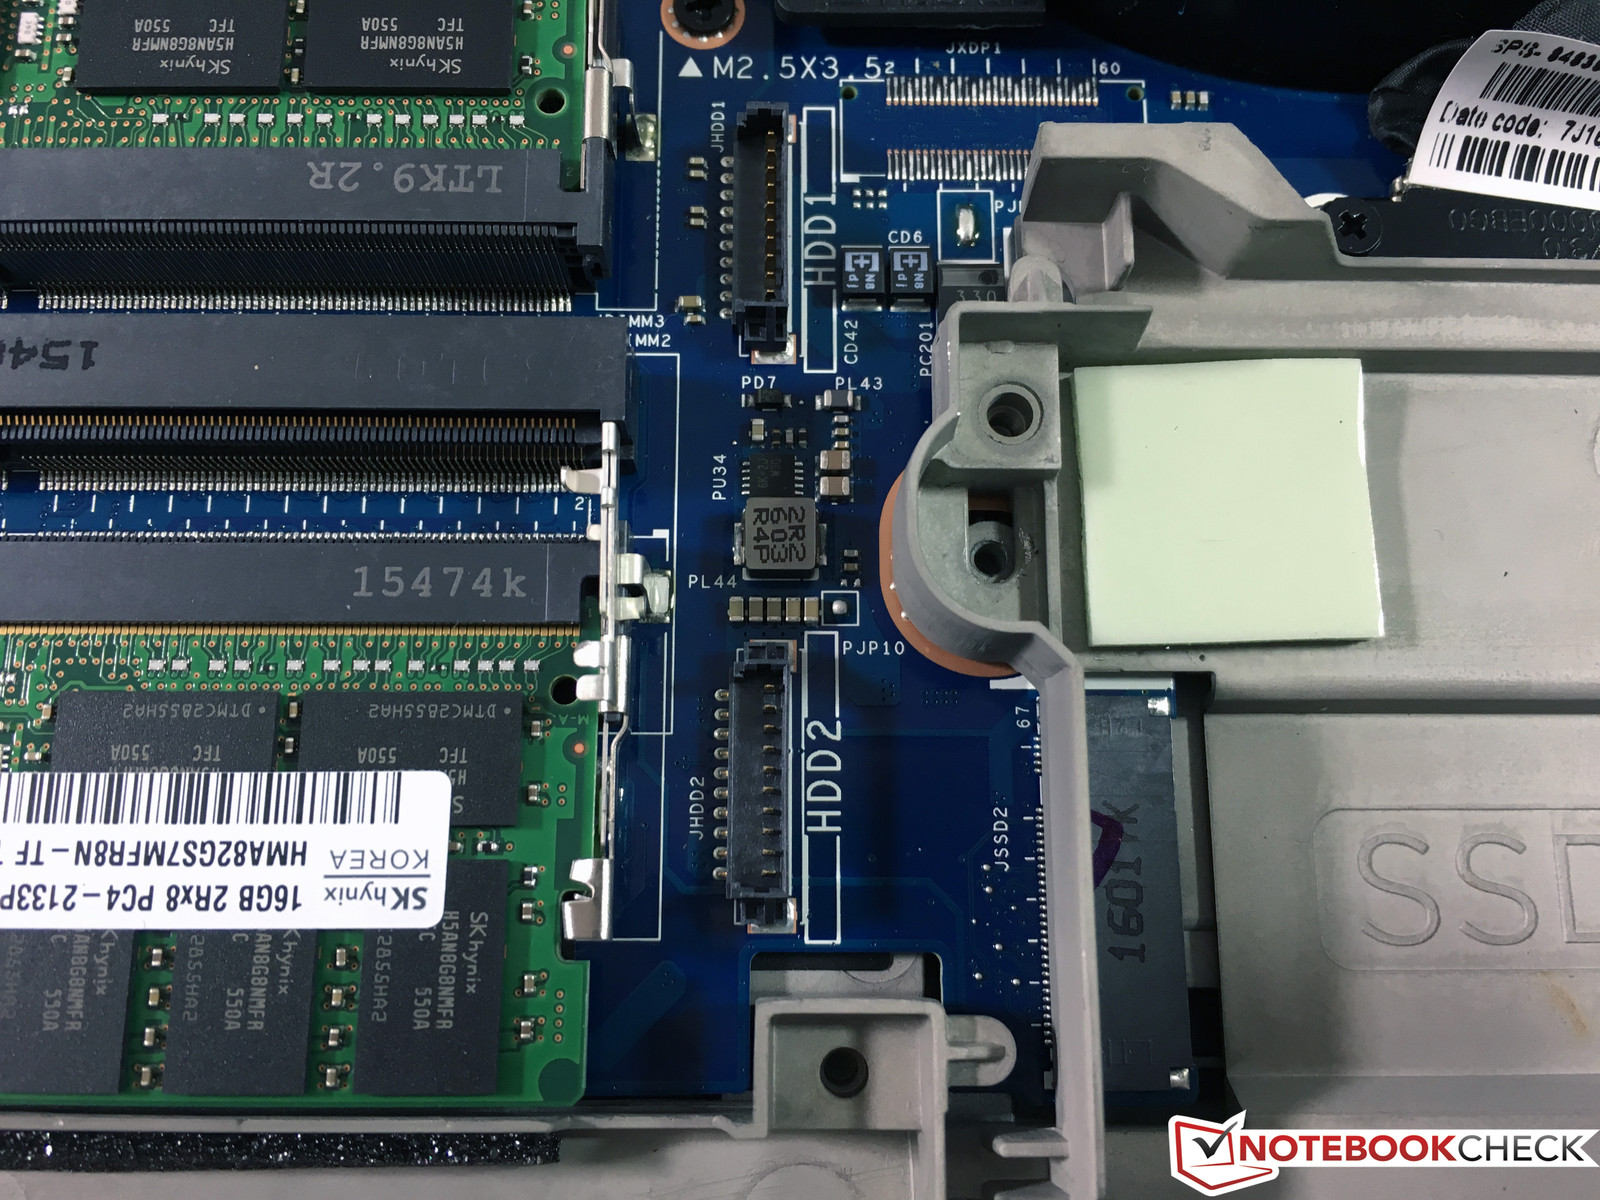
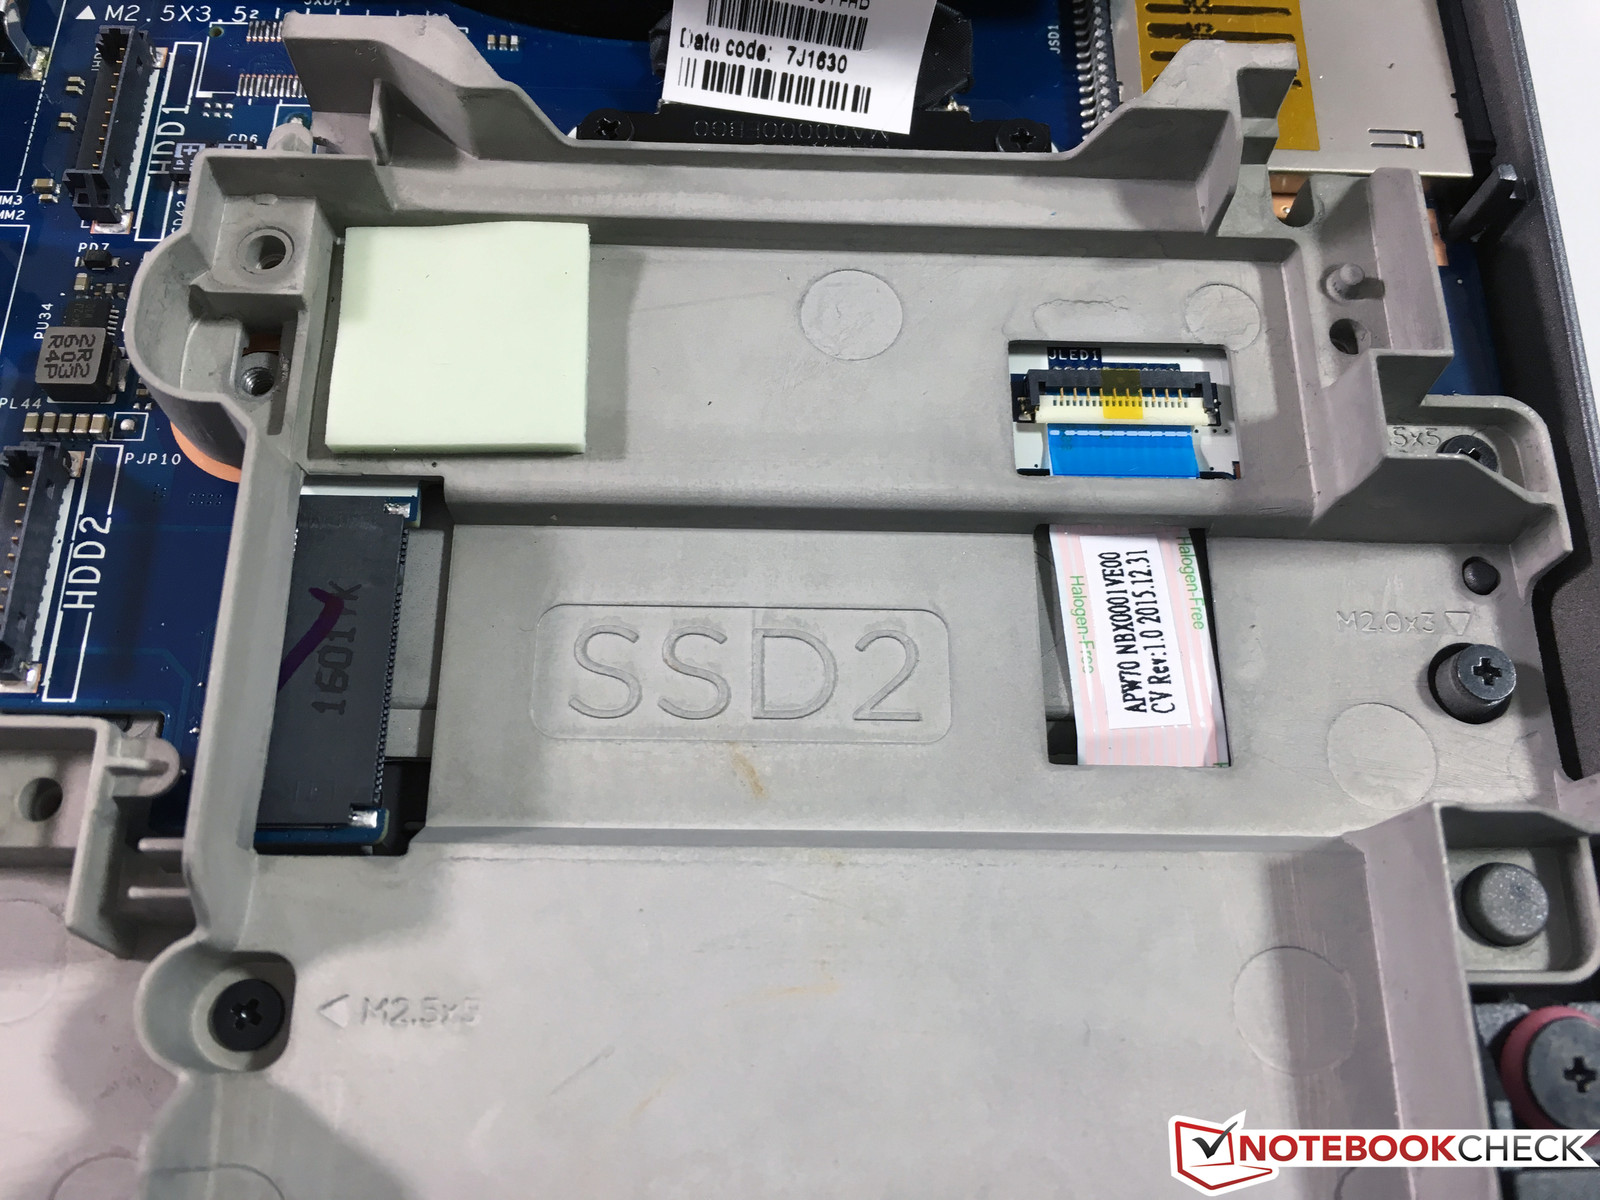
HP uses the available space very well and you can install up to four storage devices. You get one individual M.2 as well as 2.5-inch slot each, and also a combined bay. HP definitely put some thought into the latter, because you can use both slots simultaneously. The M.2-SSD sits in a small depression and the 2.5-inch bracket can just be mounted on top.
Warranty
The warranty period of the HP ZBook 17 G3 is three years and includes a Pickup & Return service. There are also optional CarePacks to expand the duration as well as the scope of the service. An upgrade to three years On-Site service (product number: U4414E) is around 140 Euros (~$156), while 5 years On-Site service (U7861E) costs around 380 Euros (~$424).
Input Devices
Keyboard
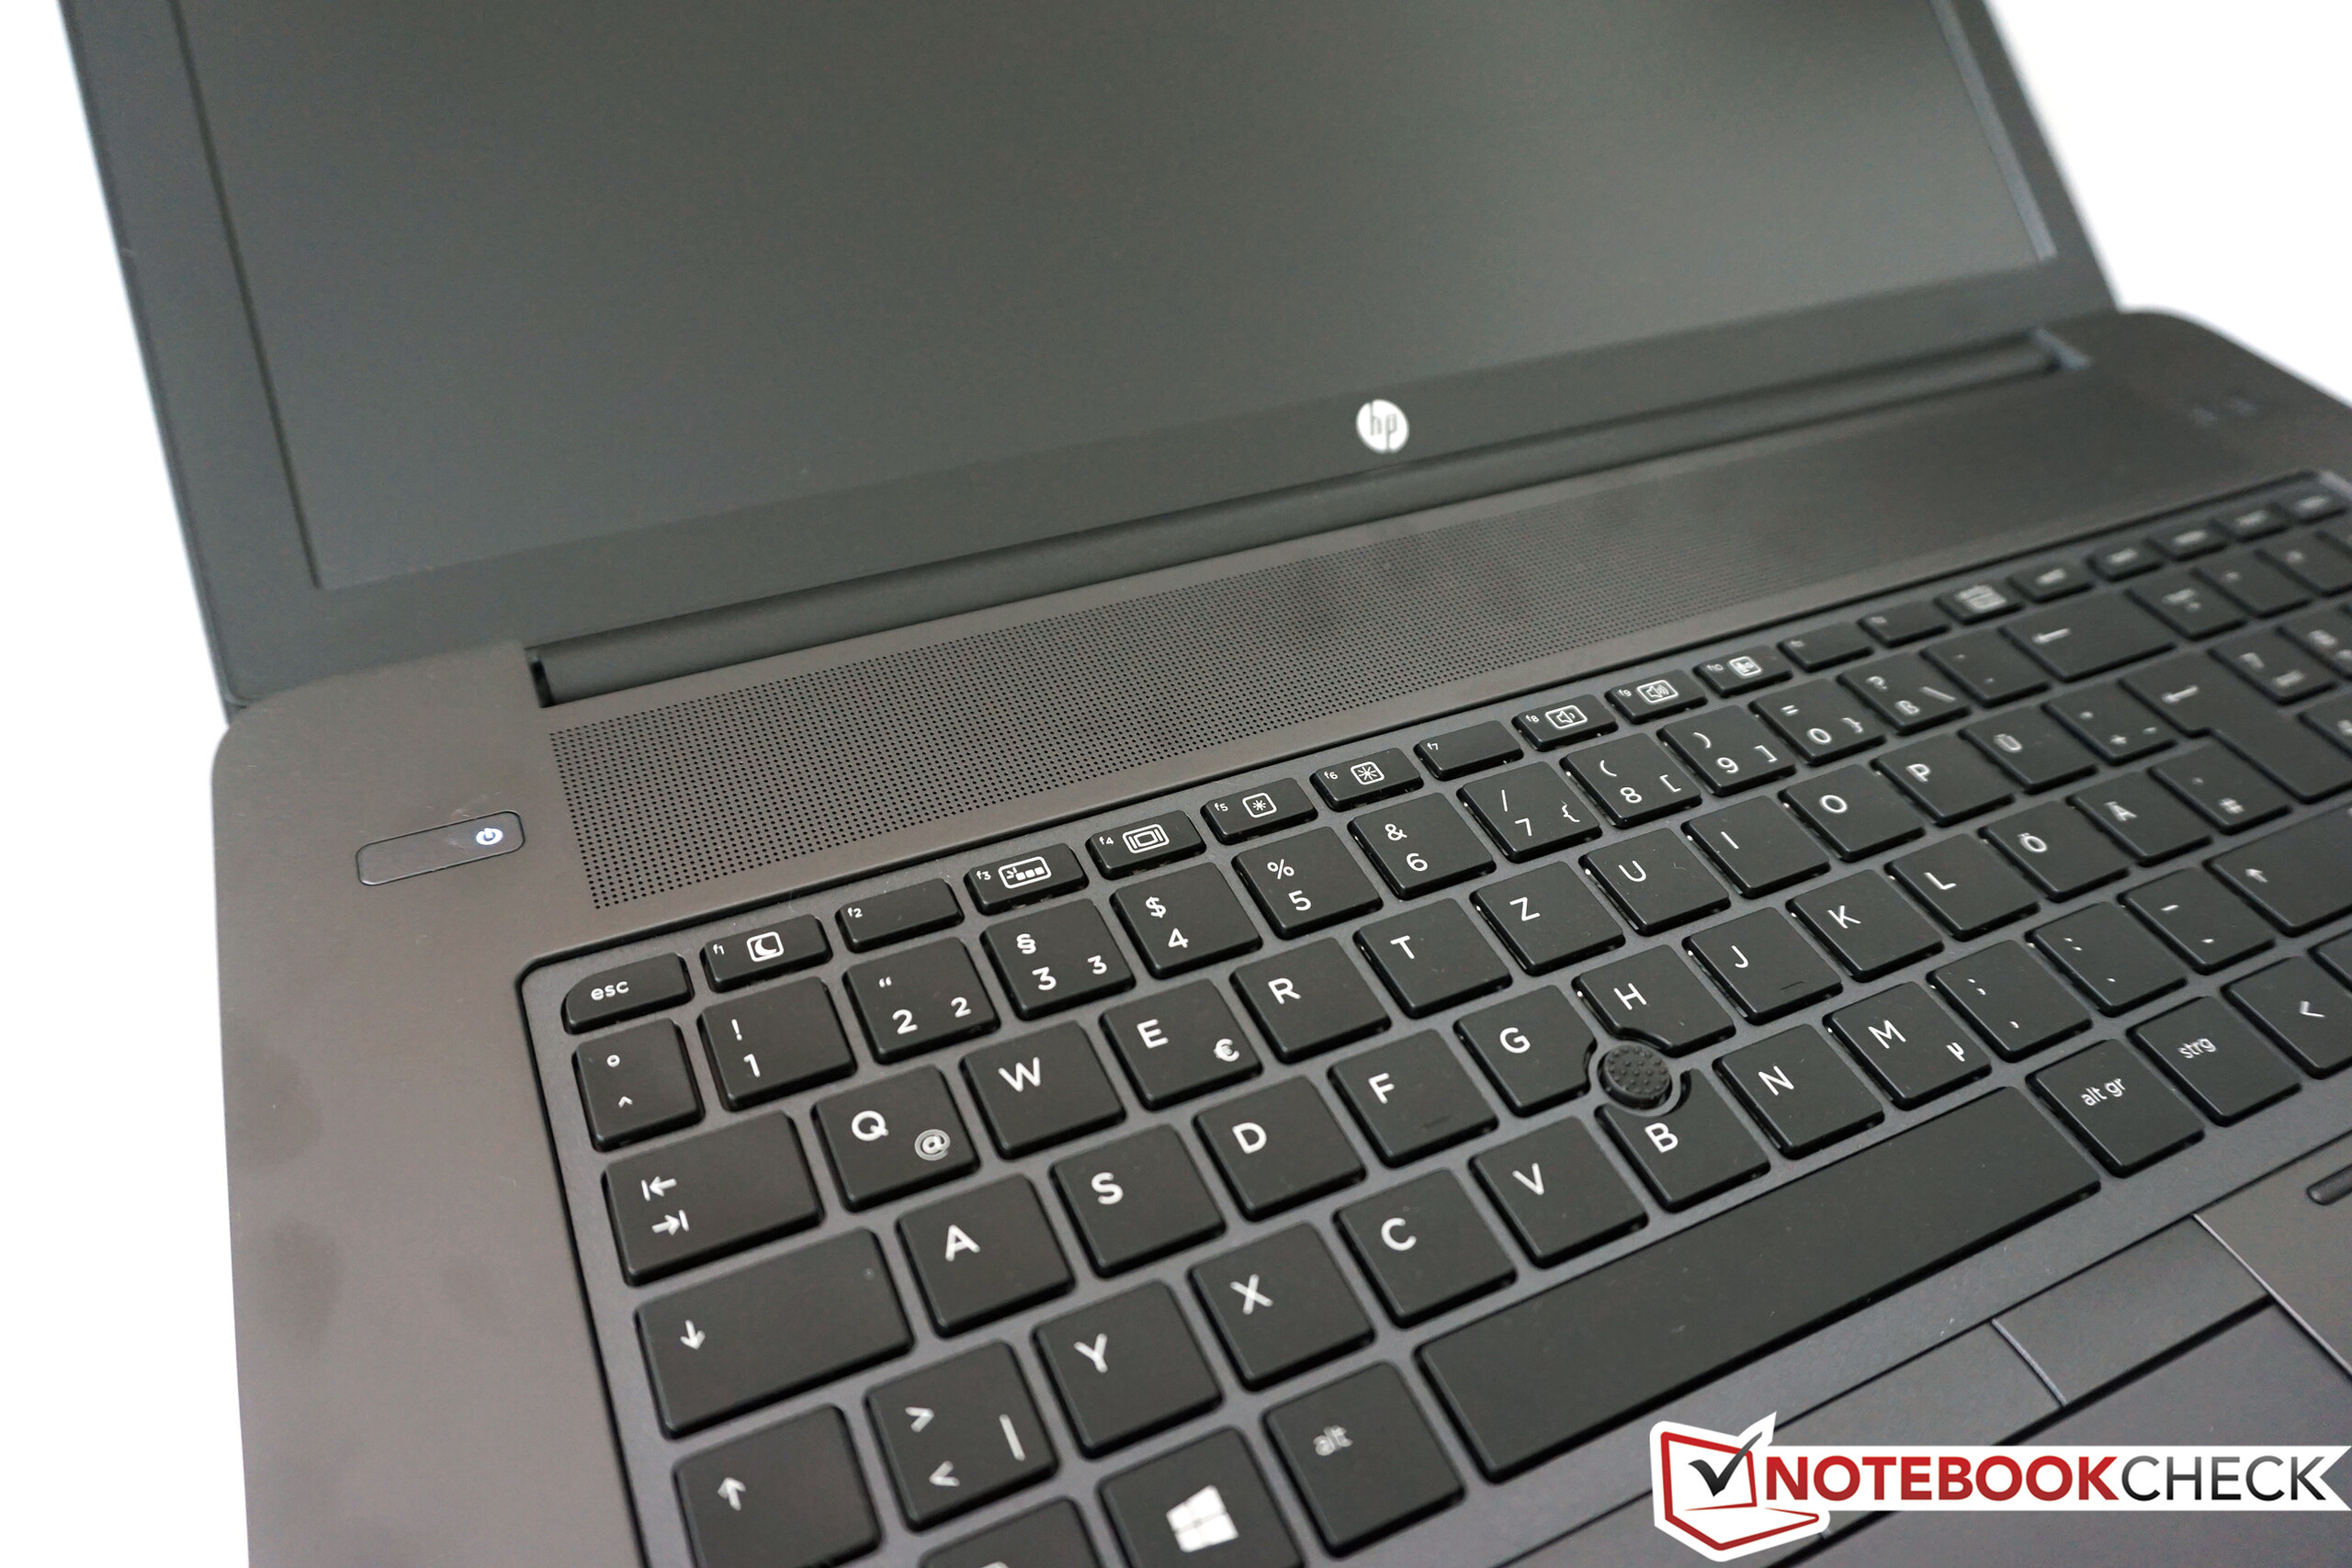
Neither the size nor the functionality of the keyboard differs from the smaller sibling HP ZBook 15 G3, and you just get more unused space next to the input device. We cannot notice any differences during typing, either, so we can once again say that HP implements a very good chiclet keyboard, but it does waste some potential in terms of key travel and in the case of the 17-inch model also in terms of the layout. That a manufacturer uses identical parts to reduce cost is understandable, but the sometimes pretty small keys (arrow keys in particular) are not really necessary when you consider the available space.
The two-stage white illumination is by default deactivated 15 seconds after the last input, but this can be changed in the BIOS (longer time or always on). You can also swap the function of the Ctrl and Fn key in the BIOS, but not the allocation of the function keys F1-F12 (Fn Lock). There is no key combination for it, either. On the top right of the keyboard there are two additional buttons for the wireless modules as well as the speakers, and the status is indicated by different colors (white: active; orange: deactivated and mute, respectively).
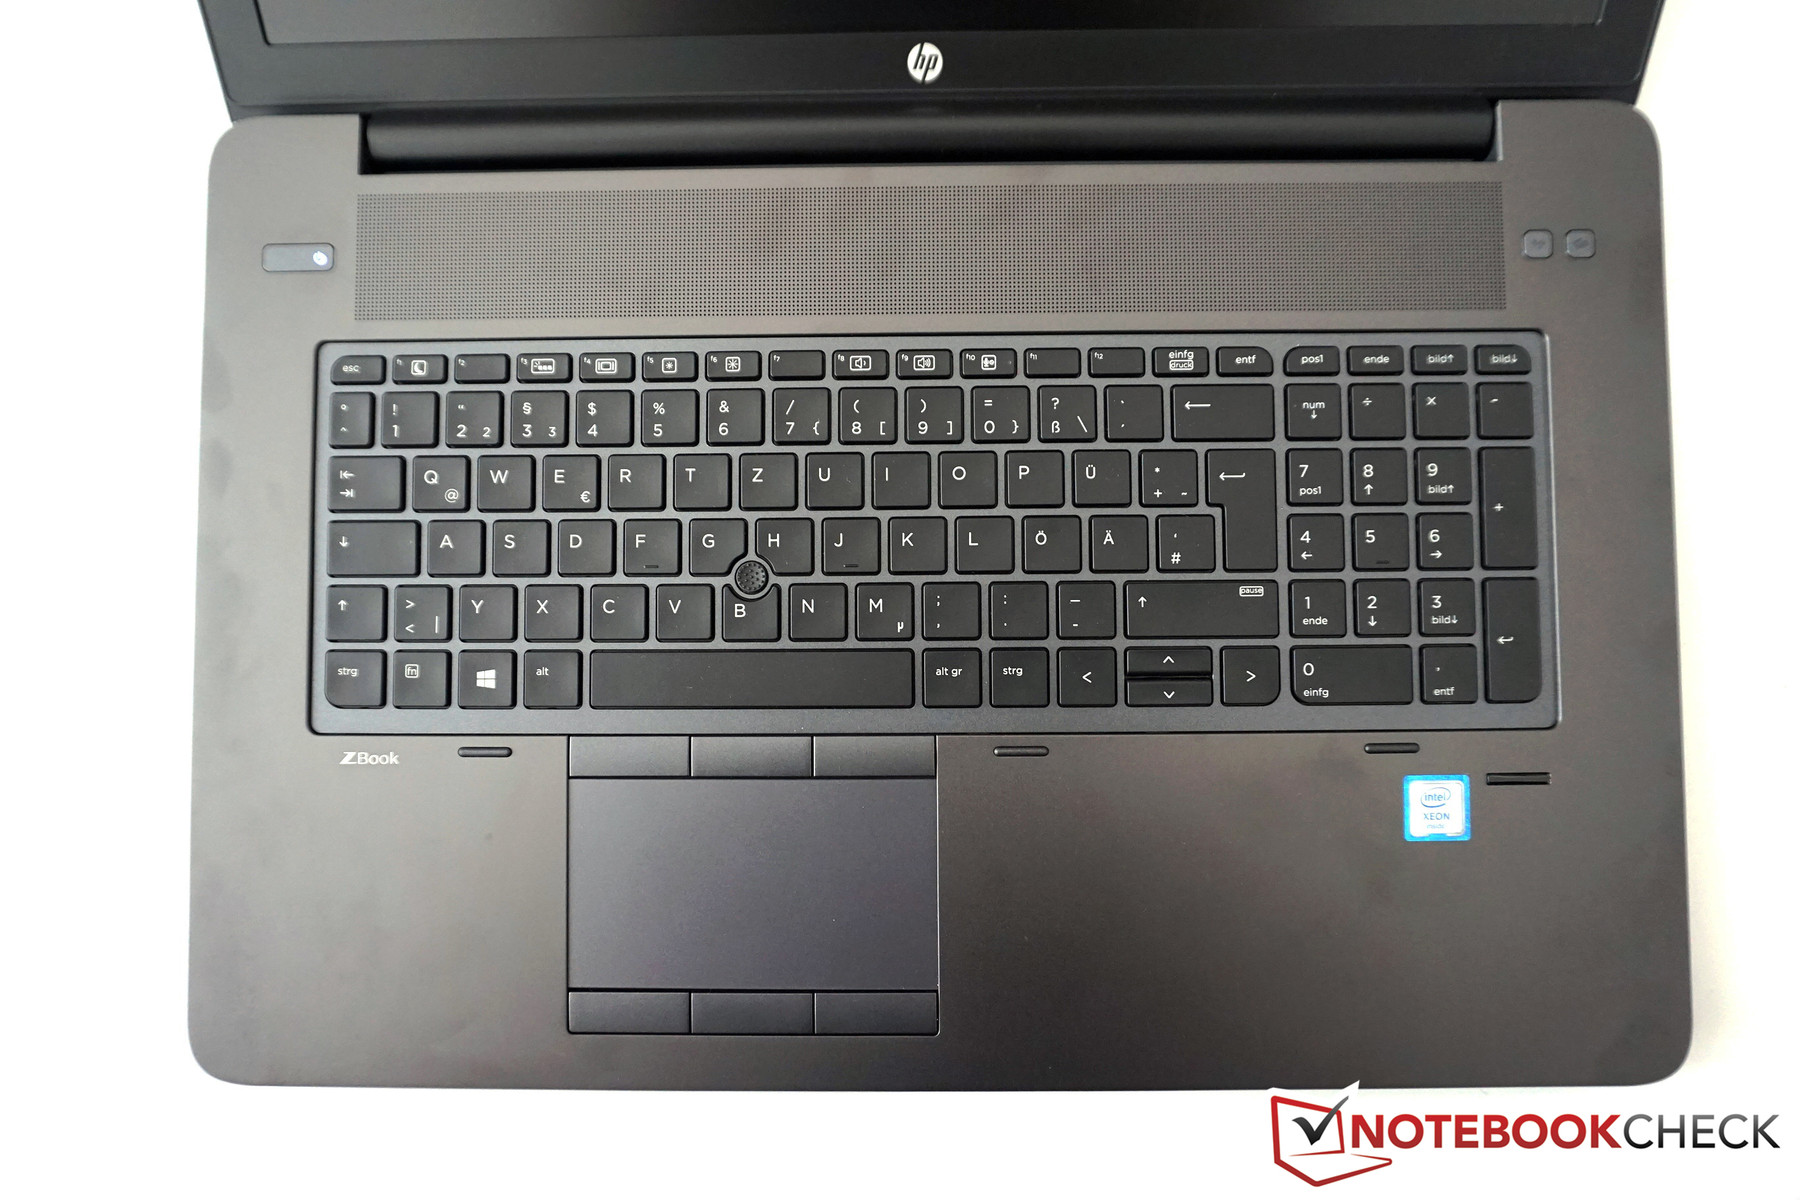
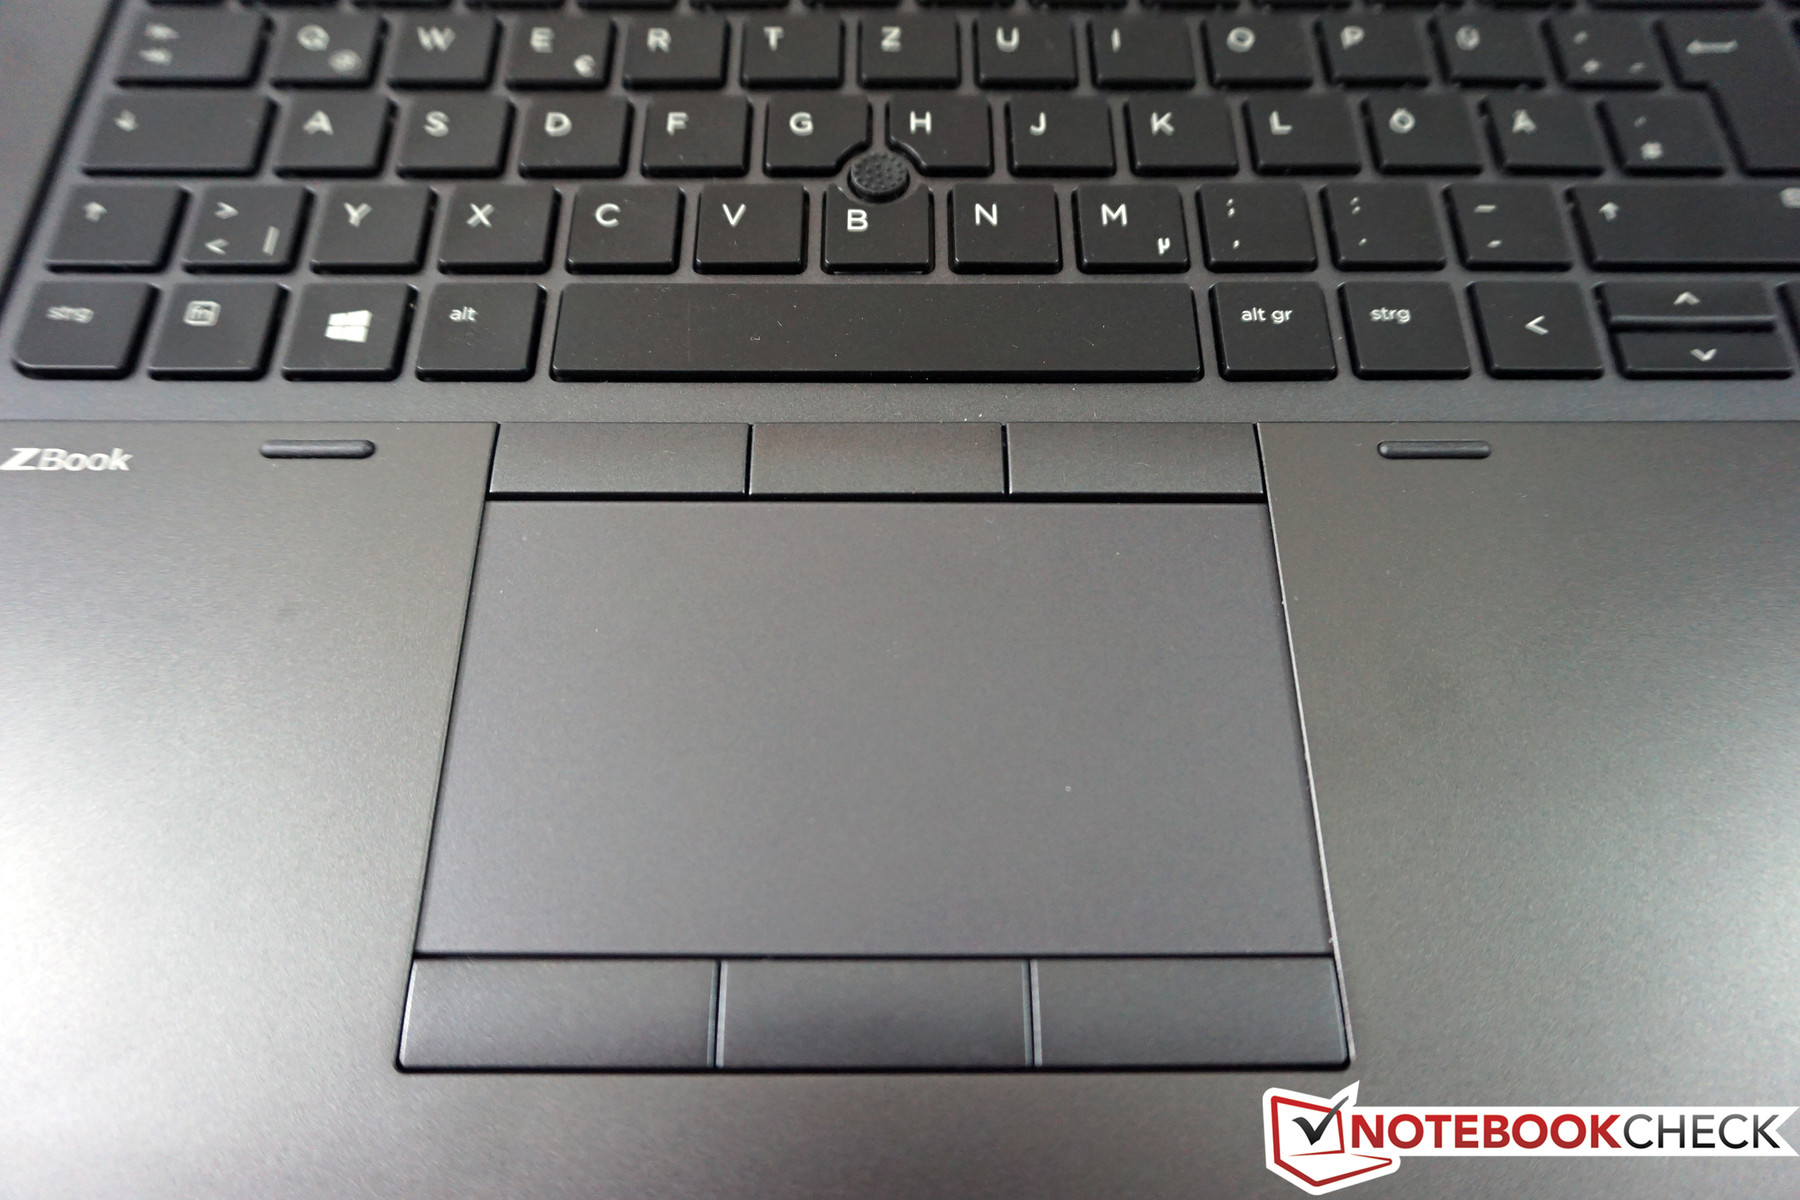
Touchpad and PointStick
HP also waives a ClickPad for the big ZBook 17 G3 and implements a conventional touchpad with three dedicated buttons. The surface is conveniently sized at 10.3 x 5.9 cm and provides good gliding capabilities. The buttons have a pretty rich pressure point and create a comfortably quiet clicking sound. This is also the case for the three buttons above the touchpad, which can be used with the PointStick. It is also a good mouse replacement, even though the precision is not quite as good compared to the counterpart from Lenovo. We also noticed some unwanted movements from time to time, where the cursor would just follow one direction for a couple of seconds.
Display
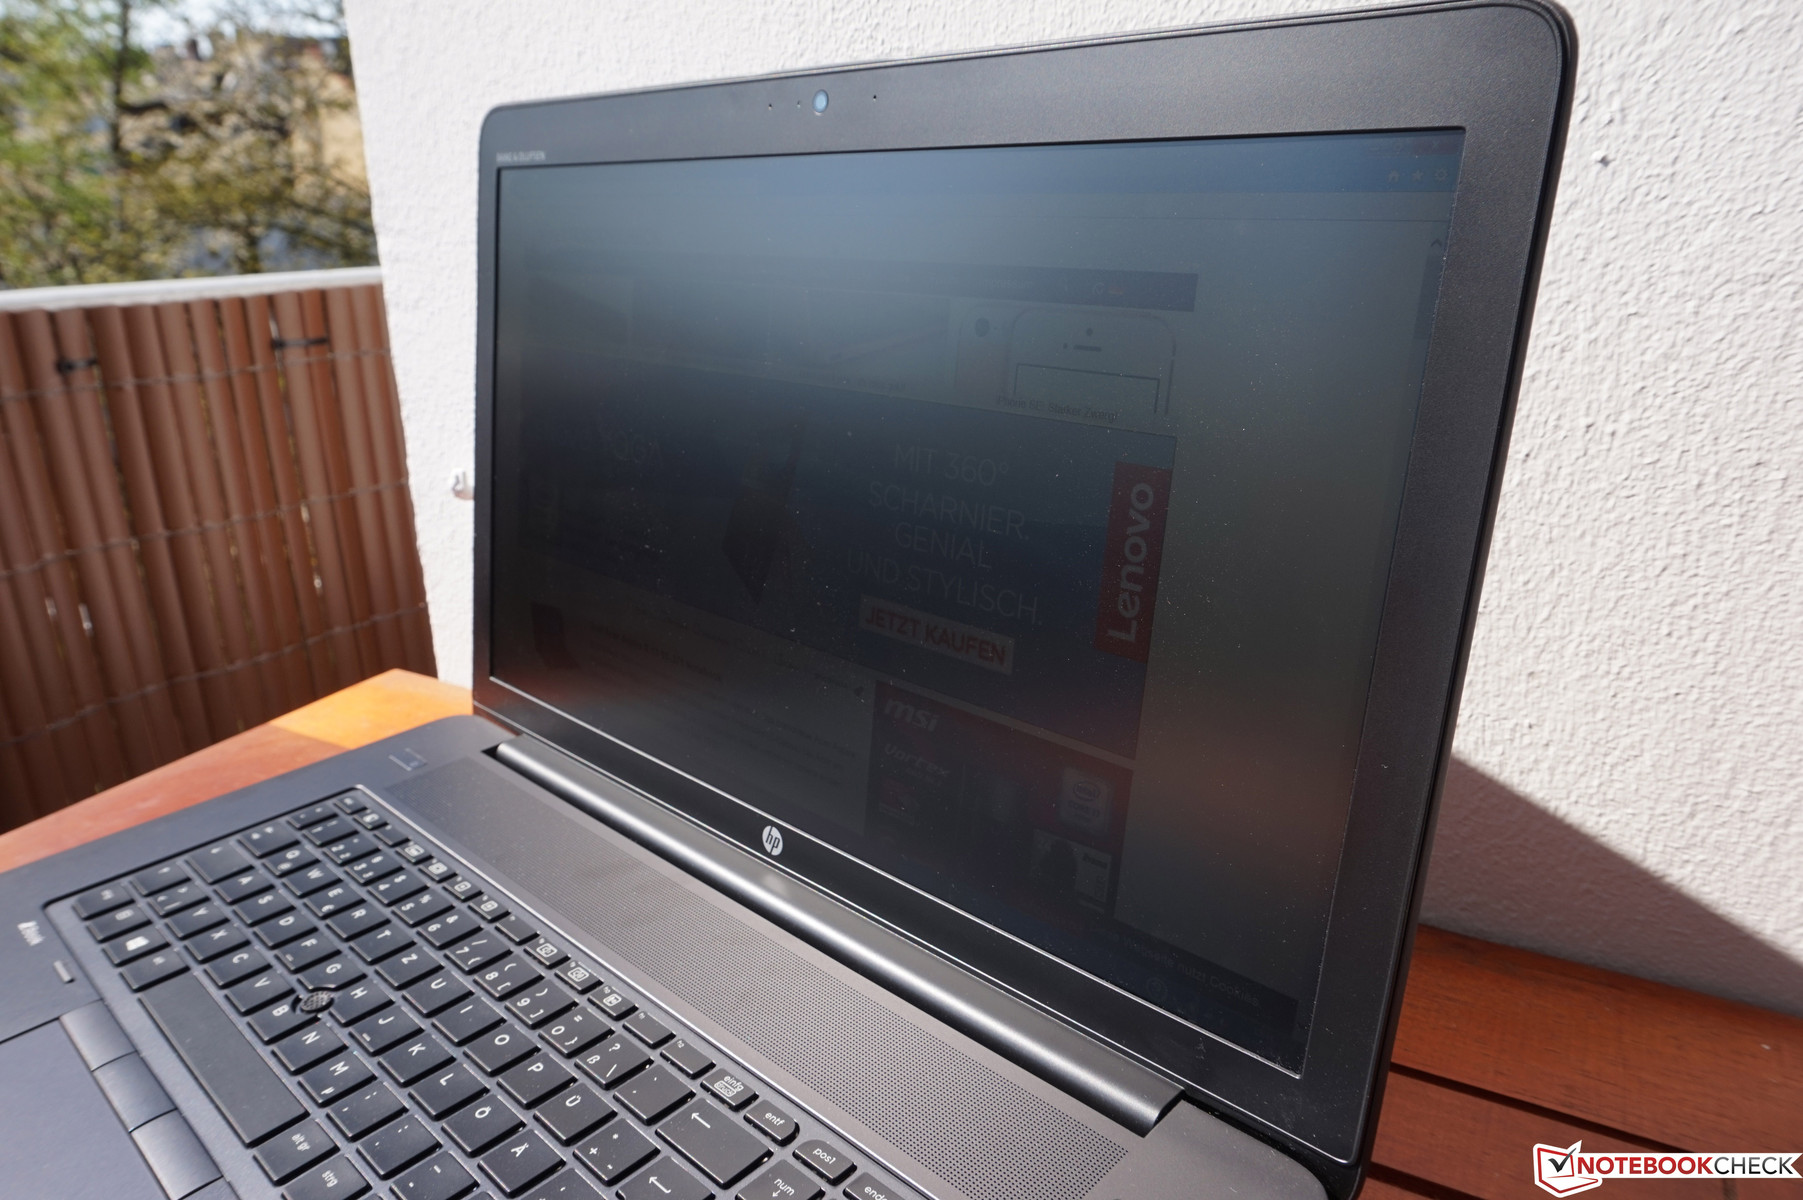
HP is a bit conservative in respect of the display at the moment, because the very interesting 4K DreamColor display is not yet available. This means you have to live with one of the three following displays: a matte HD+ TN panel (1600x900), a matte FHD-IPS display (1920x1080) and a glossy FHD-IPS touchscreen (1920x1080). We are a bit surprised about the TN panel and you can also find corresponding configurations on the Internet. Our review unit is equipped with a matte FHD-IPS panel from Samsung (SDC3854), which only results in a pixel density of 127 PPI with the 17.3-inch screen. All the symbols and fonts are therefore pretty big and you can work comfortably without scaling (advantage with Windows 7), but high-res screens obviously provide a sharper image.
Subjectively, there is still not a lot to criticize. The sharpness is okay, the colors leave a good impression and you cannot see a blue cast. PWM is used to control the display brightness for stage 8/20 and lower. Because of the low frequency of just 200 Hz, there can be limitations in darker environments in particular (see box). You can only see some backlight bleeding with a dark picture and the highest luminance, but it was no problem in practice.
Screen Flickering / PWM (Pulse-Width Modulation)
| Screen flickering / PWM detected | 200 Hz | ≤ 40 % brightness setting | 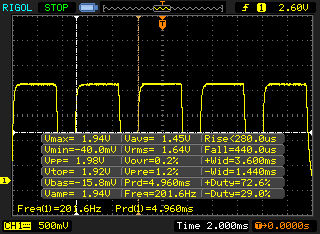 |
The display backlight flickers at 200 Hz (worst case, e.g., utilizing PWM) Flickering detected at a brightness setting of 40 % and below. There should be no flickering or PWM above this brightness setting. The frequency of 200 Hz is relatively low, so sensitive users will likely notice flickering and experience eyestrain at the stated brightness setting and below. In comparison: 52 % of all tested devices do not use PWM to dim the display. If PWM was detected, an average of 7784 (minimum: 5 - maximum: 343500) Hz was measured. | |||
| |||||||||||||||||||||||||
Brightness Distribution: 86 %
Center on Battery: 252 cd/m²
Contrast: 1200:1 (Black: 0.21 cd/m²)
ΔE ColorChecker Calman: 2.2 | ∀{0.5-29.43 Ø4.73}
ΔE Greyscale Calman: 2.7 | ∀{0.09-98 Ø4.97}
97% sRGB (Calman 2D)
96% sRGB (Argyll 1.6.3 3D)
62% AdobeRGB 1998 (Argyll 1.6.3 3D)
69% AdobeRGB 1998 (Argyll 3D)
95.9% sRGB (Argyll 3D)
67.3% Display P3 (Argyll 3D)
Gamma: 2.28
CCT: 6686 K
| HP ZBook 17 G3 TZV66eA IPS, 1920x1080 | Dell Precision 7710 IPS LED, 1920x1080 | Lenovo ThinkPad P70 IPS, 3840x2160 | MSI WT72-6QM IPS, 1920x1080 | Bullman E-Klasse 5 AH-IPS WLED, 1920x1080 | HP ZBook 17 E9X11AA-ABA LED IPS, 1920x1080 | |
|---|---|---|---|---|---|---|
| Display | -0% | 21% | -7% | -8% | 25% | |
| Display P3 Coverage (%) | 67.3 | 66.6 -1% | 90.8 35% | 67.3 0% | 66.5 -1% | 85.7 27% |
| sRGB Coverage (%) | 95.9 | 96.9 1% | 100 4% | 85.4 -11% | 84.5 -12% | 100 4% |
| AdobeRGB 1998 Coverage (%) | 69 | 68.6 -1% | 85.4 24% | 62.5 -9% | 61.8 -10% | 99.2 44% |
| Response Times | -13% | 8% | 13% | |||
| Response Time Grey 50% / Grey 80% * (ms) | 50.4 ? | 50 ? 1% | 44 ? 13% | 42 ? 17% | ||
| Response Time Black / White * (ms) | 28.4 ? | 36 ? -27% | 27.6 ? 3% | 26 ? 8% | ||
| PWM Frequency (Hz) | 200 ? | 198 ? | 228 ? | 86 ? | ||
| Screen | -11% | -22% | -42% | -18% | 3% | |
| Brightness middle (cd/m²) | 252 | 332 32% | 365 45% | 303 20% | 355 41% | 320 27% |
| Brightness (cd/m²) | 243 | 307 26% | 341 40% | 298 23% | 335 38% | 311 28% |
| Brightness Distribution (%) | 86 | 83 -3% | 85 -1% | 94 9% | 89 3% | 88 2% |
| Black Level * (cd/m²) | 0.21 | 0.33 -57% | 0.4 -90% | 0.46 -119% | 0.44 -110% | 0.359 -71% |
| Contrast (:1) | 1200 | 1006 -16% | 913 -24% | 659 -45% | 807 -33% | 891 -26% |
| Colorchecker dE 2000 * | 2.2 | 3 -36% | 3.8 -73% | 5.77 -162% | 3.73 -70% | 2.04 7% |
| Colorchecker dE 2000 max. * | 3.8 | |||||
| Greyscale dE 2000 * | 2.7 | 4 -48% | 6.09 -126% | 4.87 -80% | 2.84 -5% | 2.45 9% |
| Gamma | 2.28 96% | 2 110% | 2.3 96% | 1.99 111% | 2.12 104% | 2.28 96% |
| CCT | 6686 97% | 7089 92% | 6332 103% | 7363 88% | 6457 101% | 6518 100% |
| Color Space (Percent of AdobeRGB 1998) (%) | 62 | 62 0% | 76.01 23% | 56.04 -10% | 55.45 -11% | 93 50% |
| Color Space (Percent of sRGB) (%) | 96 | 97 1% | 99.97 4% | 85.27 -11% | 84.39 -12% | 100 4% |
| Total Average (Program / Settings) | -8% /
-9% | 2% /
-9% | -12% /
-26% | -13% /
-15% | 14% /
9% |
* ... smaller is better
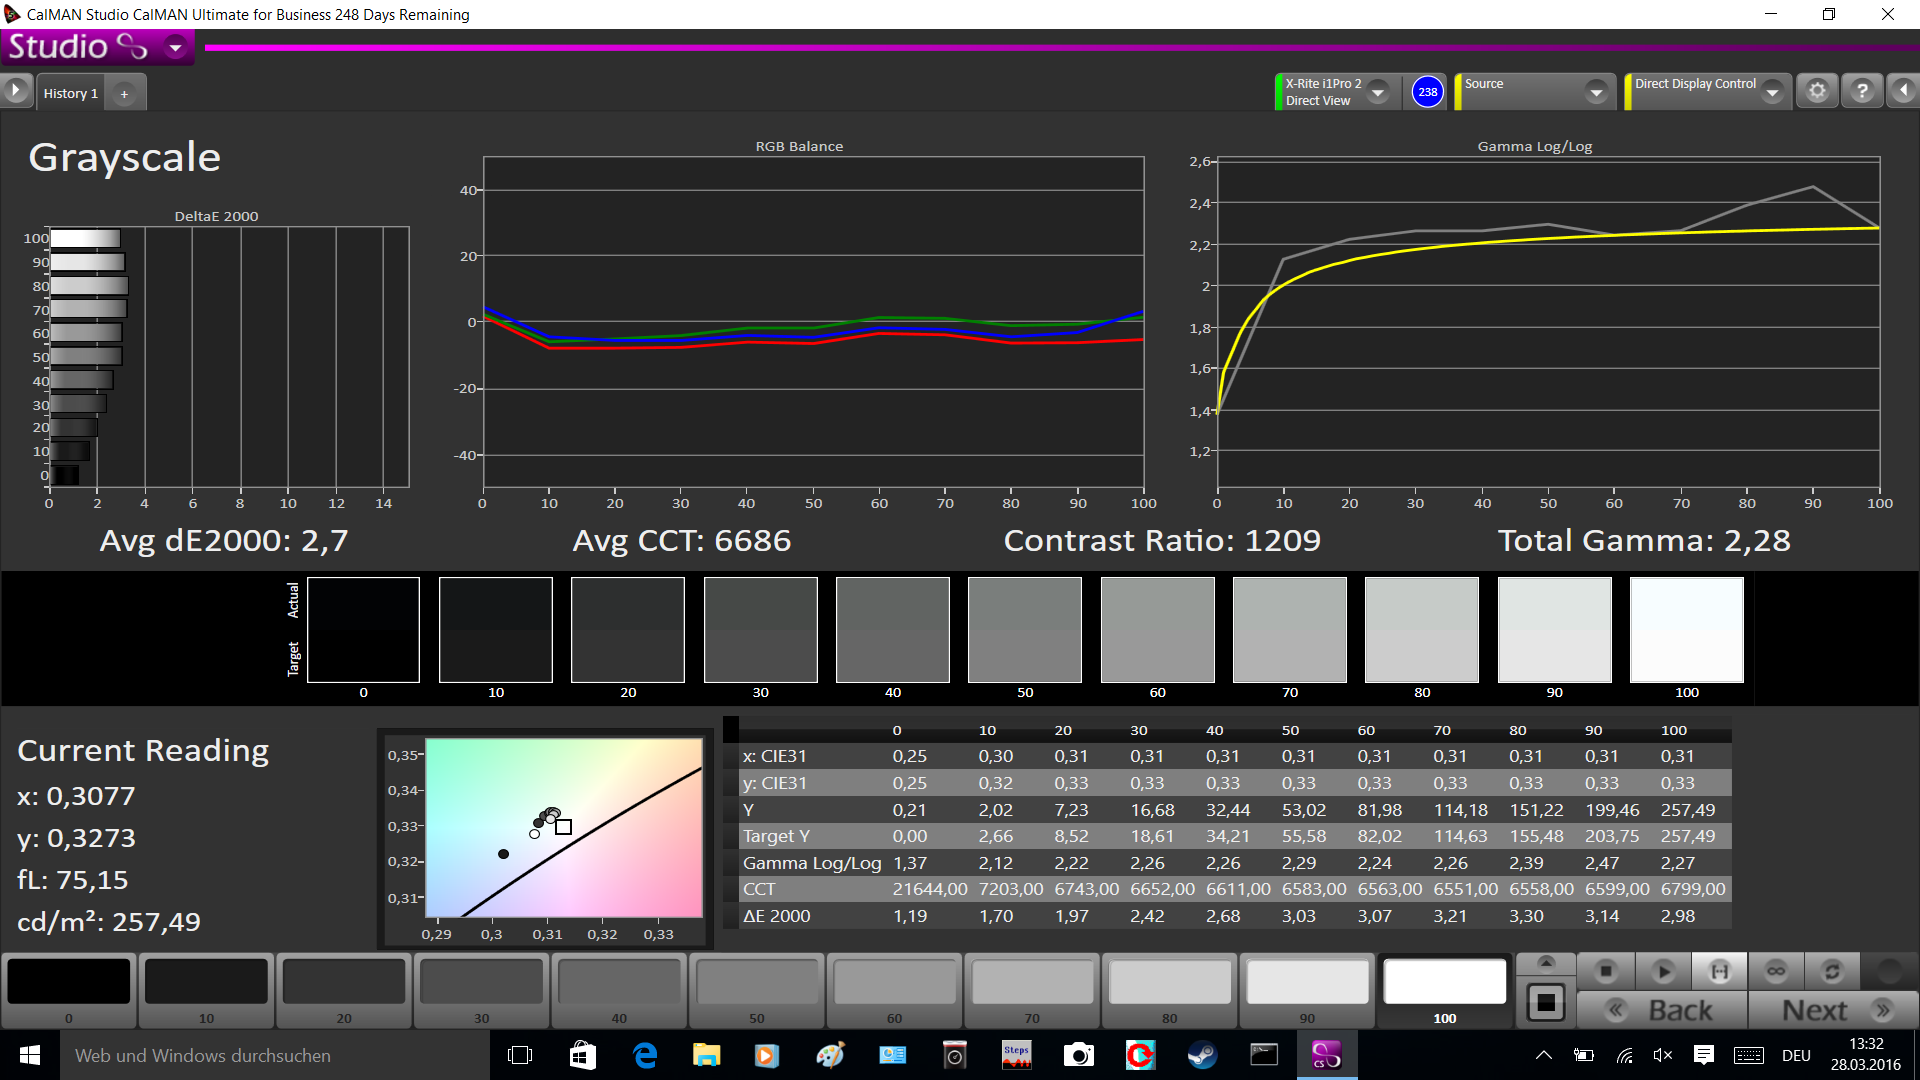
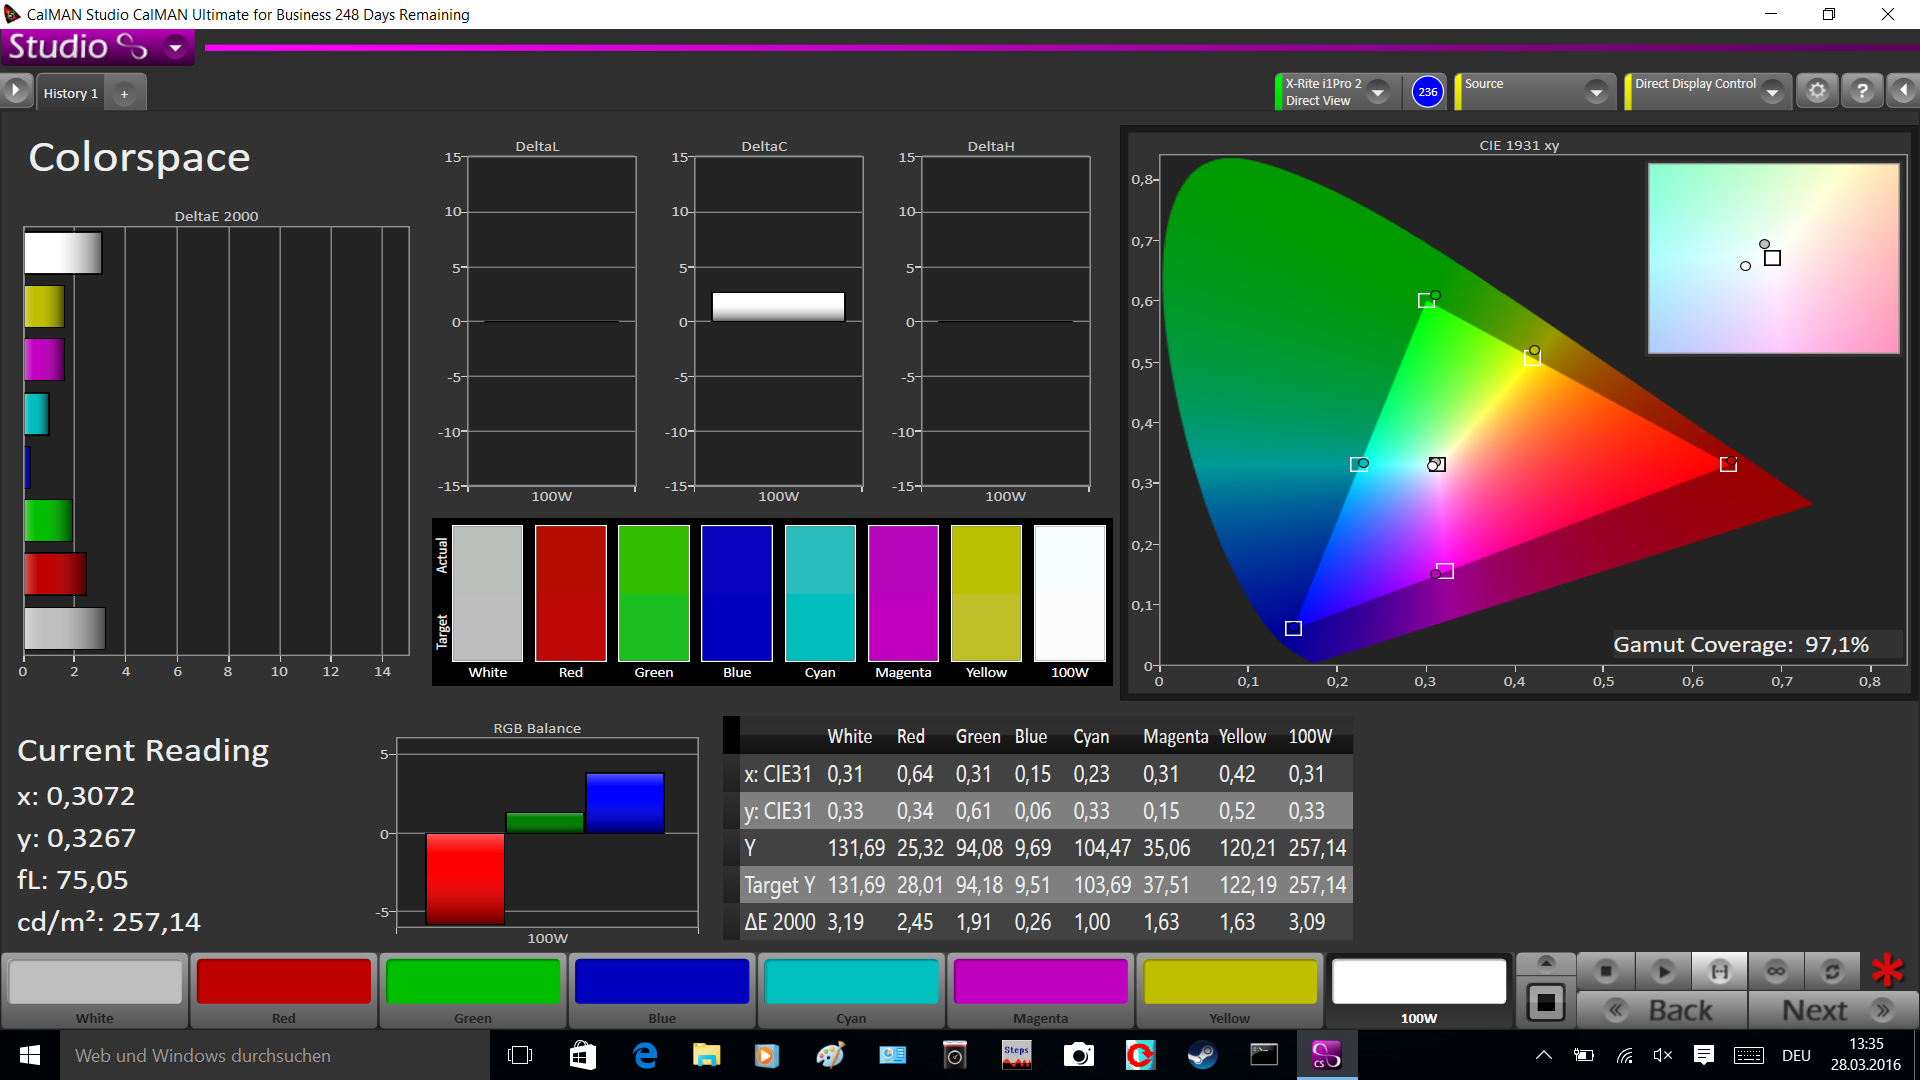
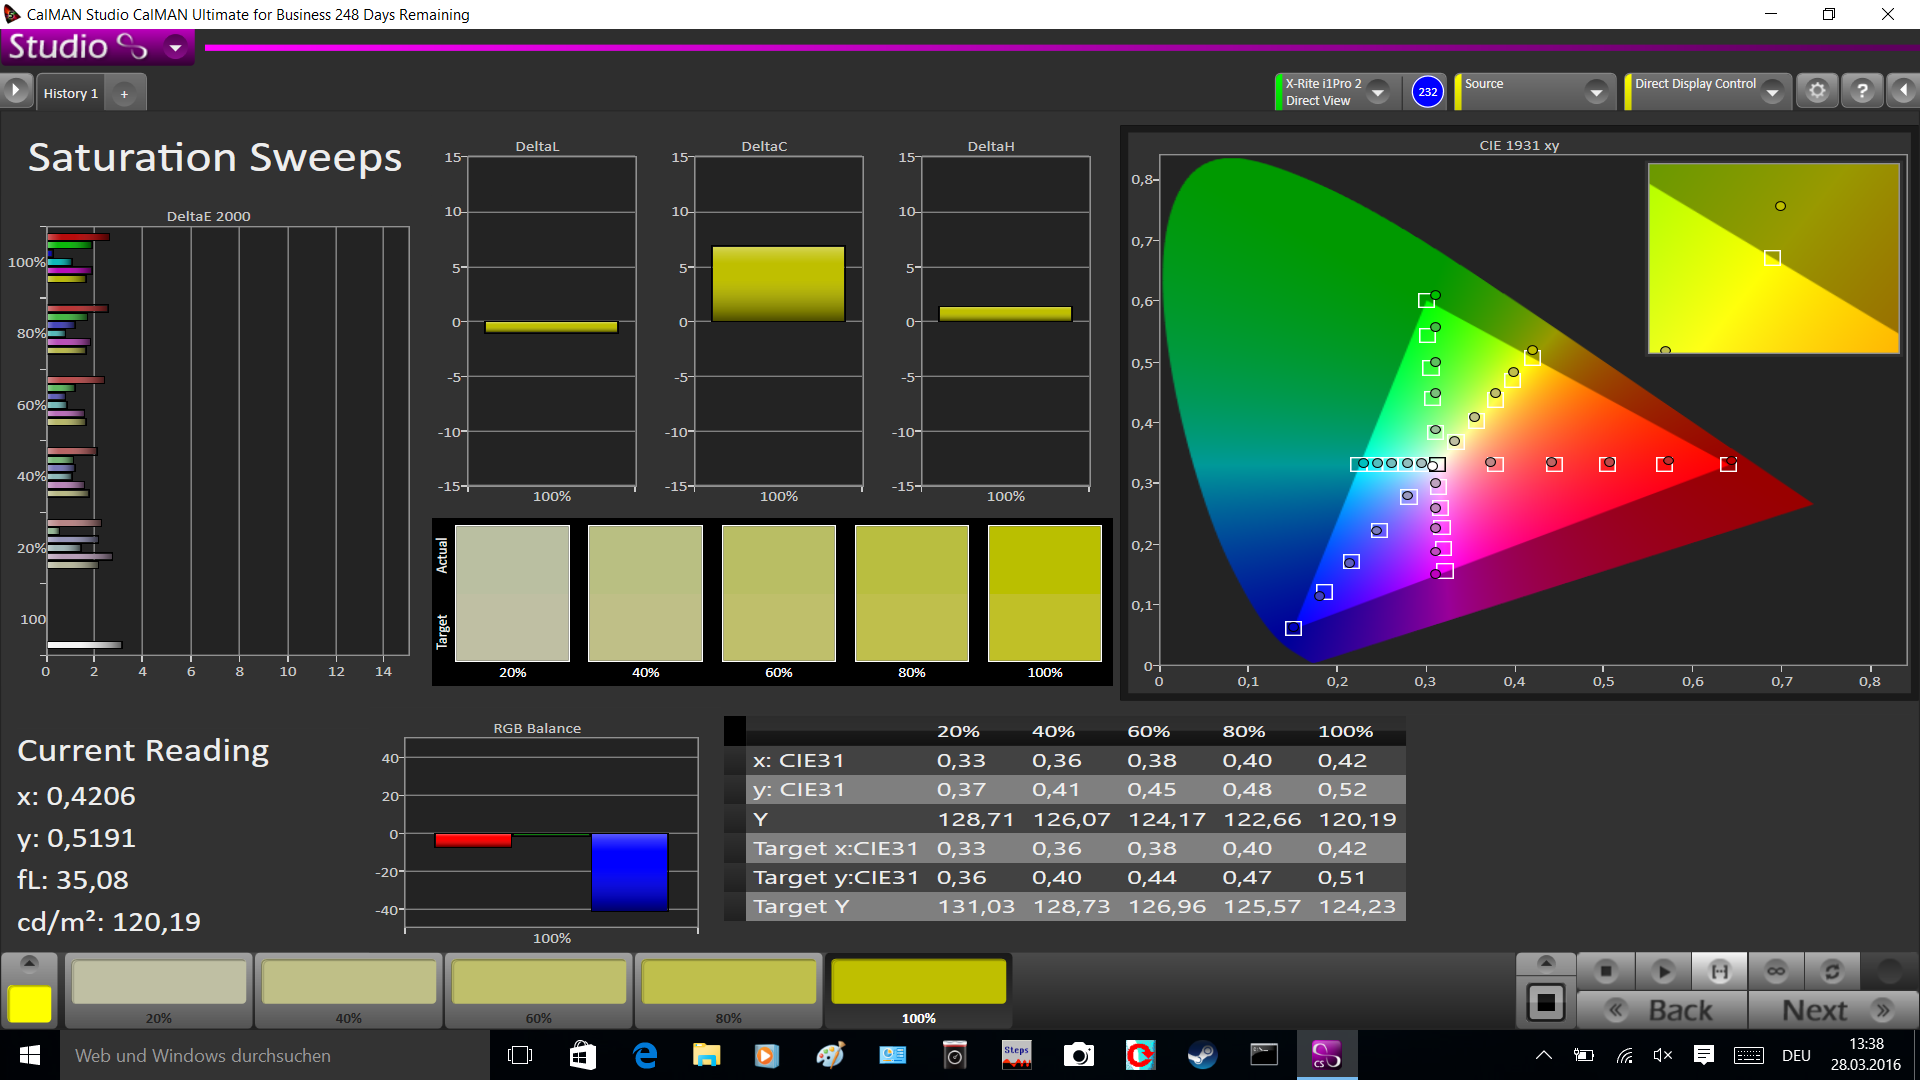
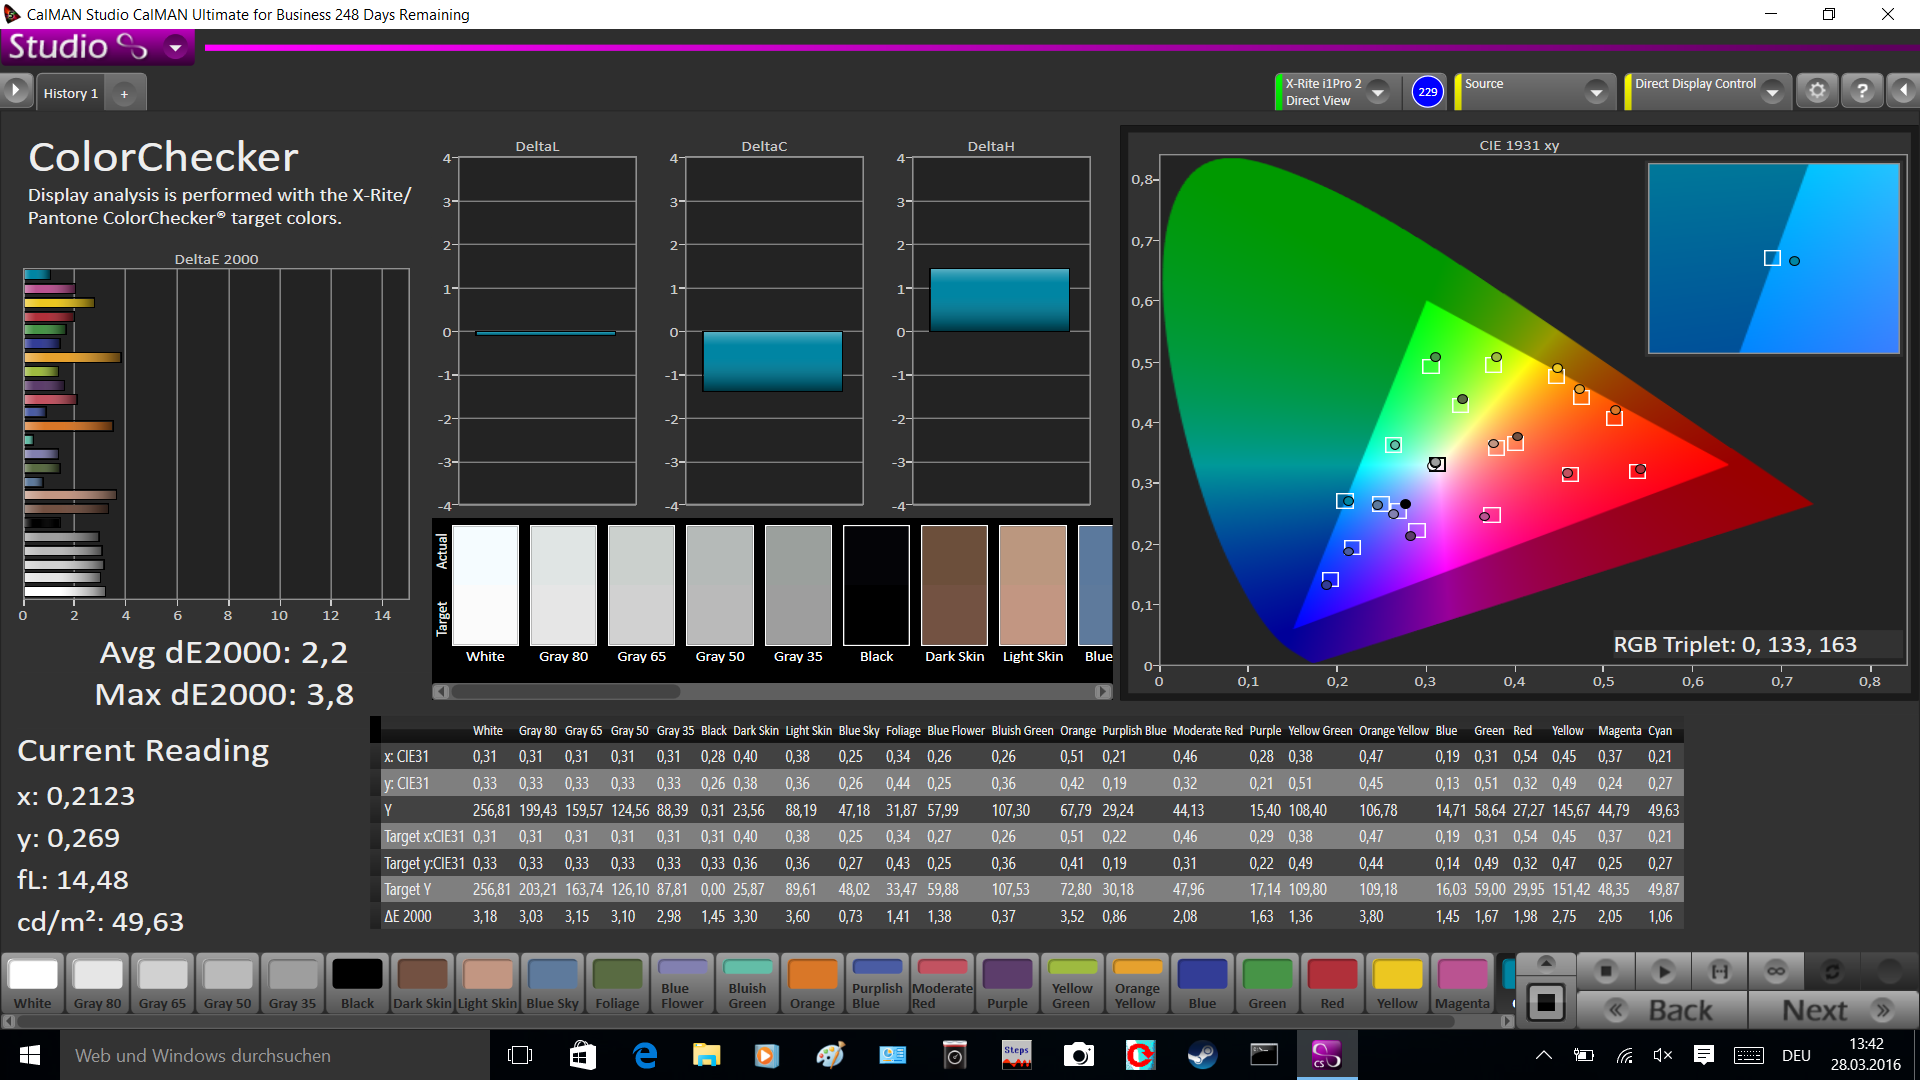
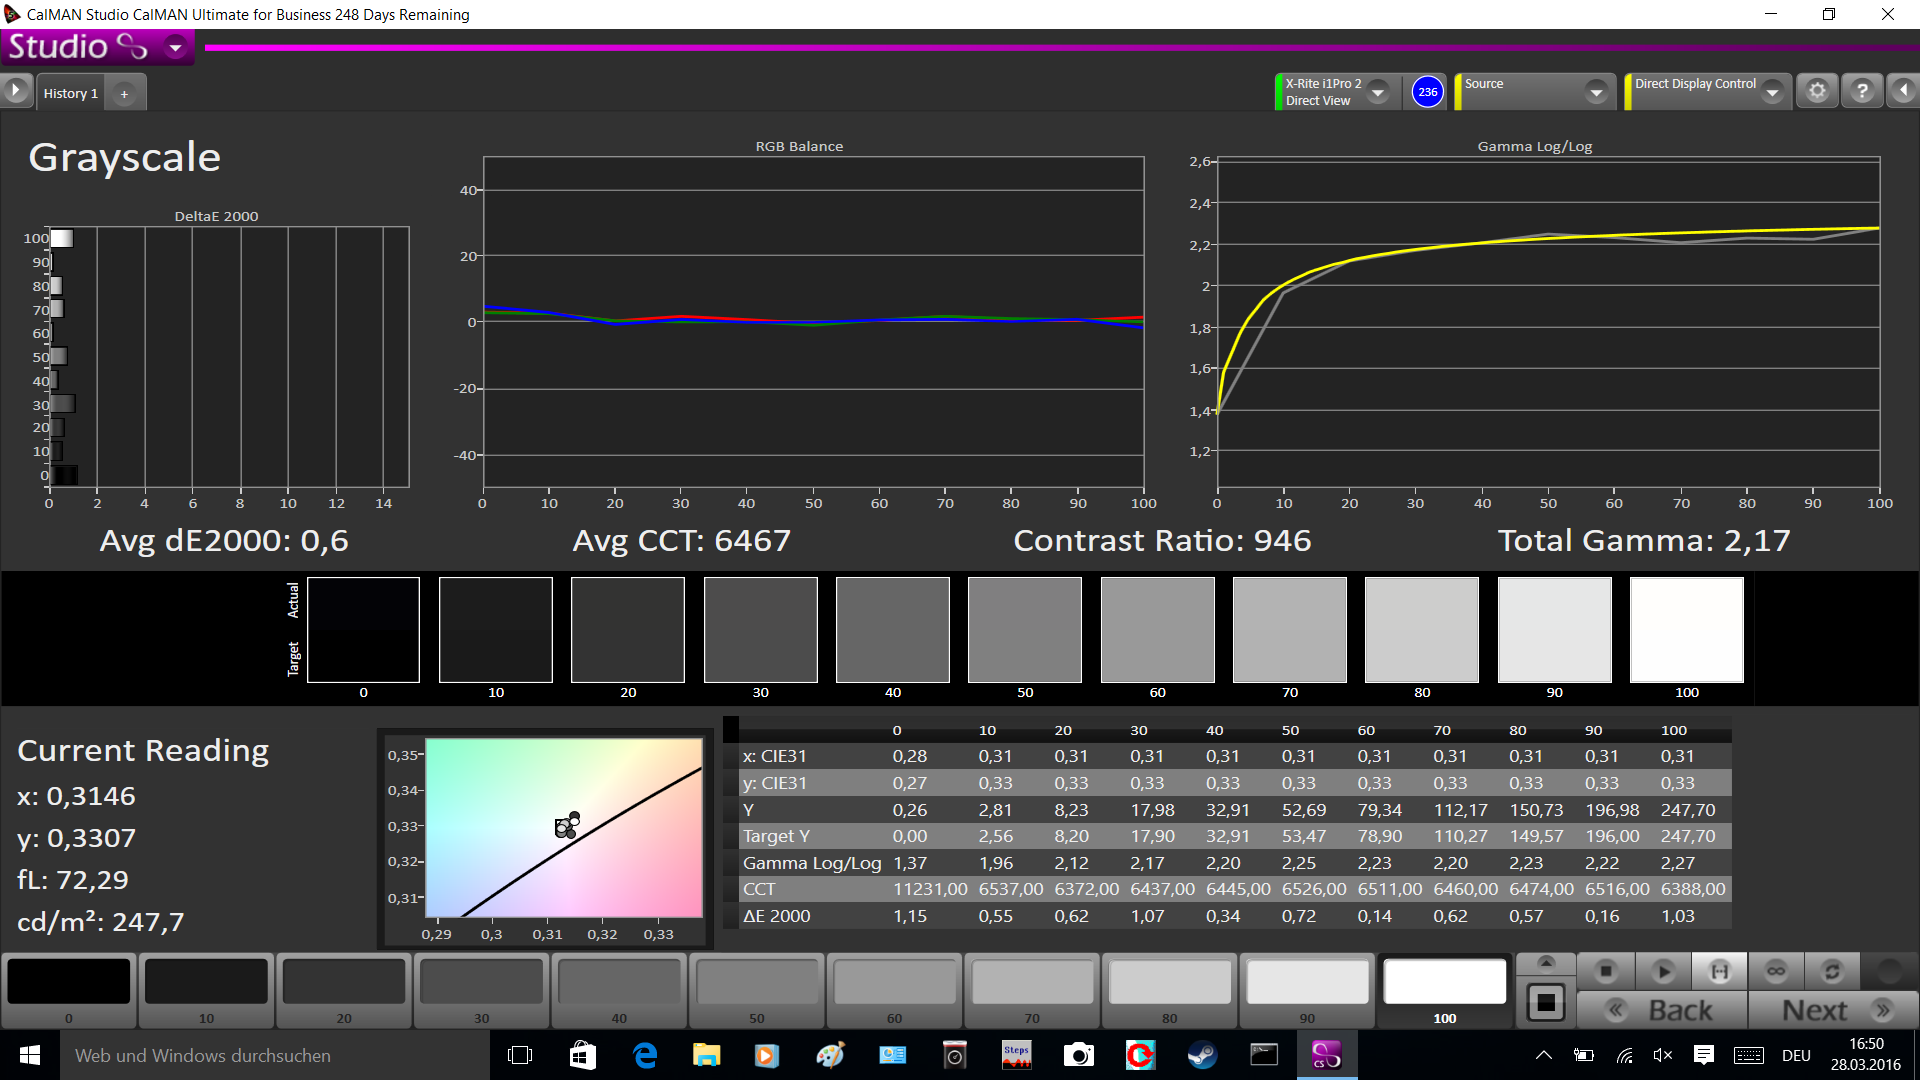
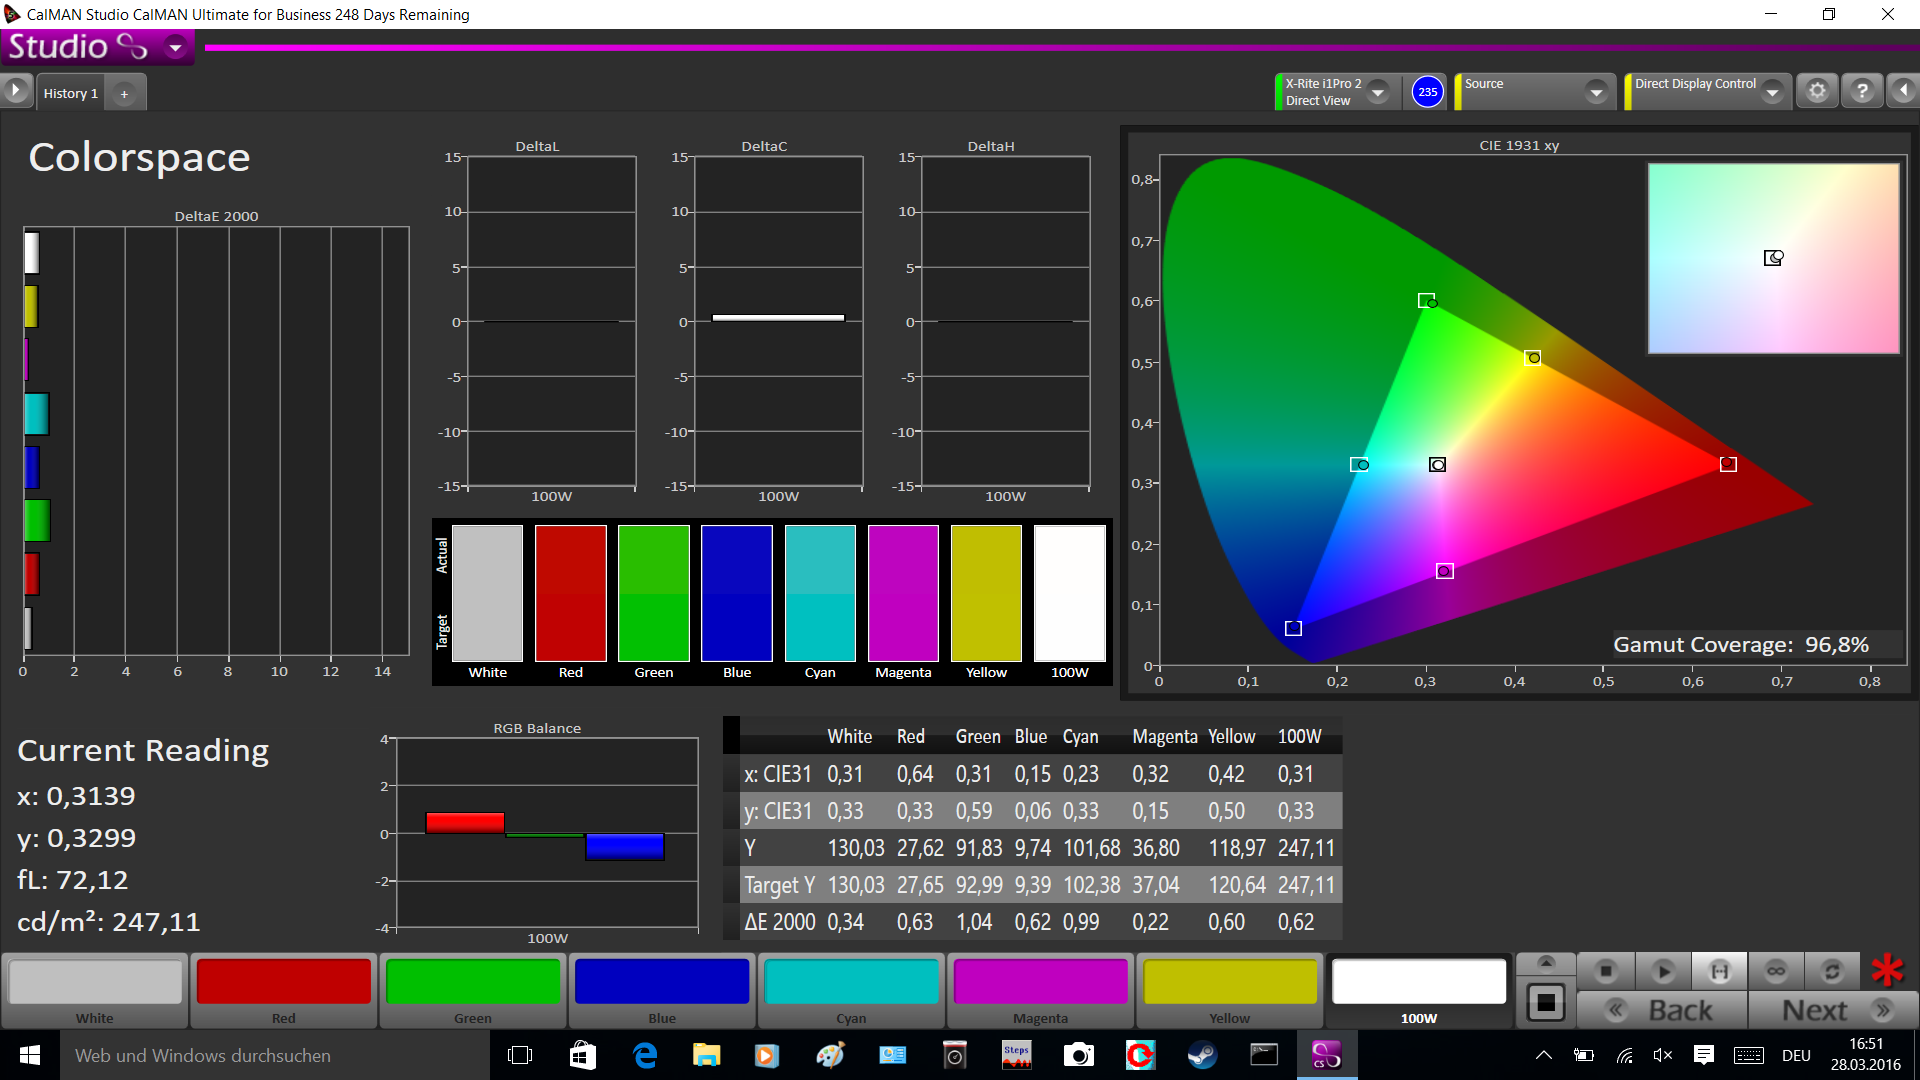
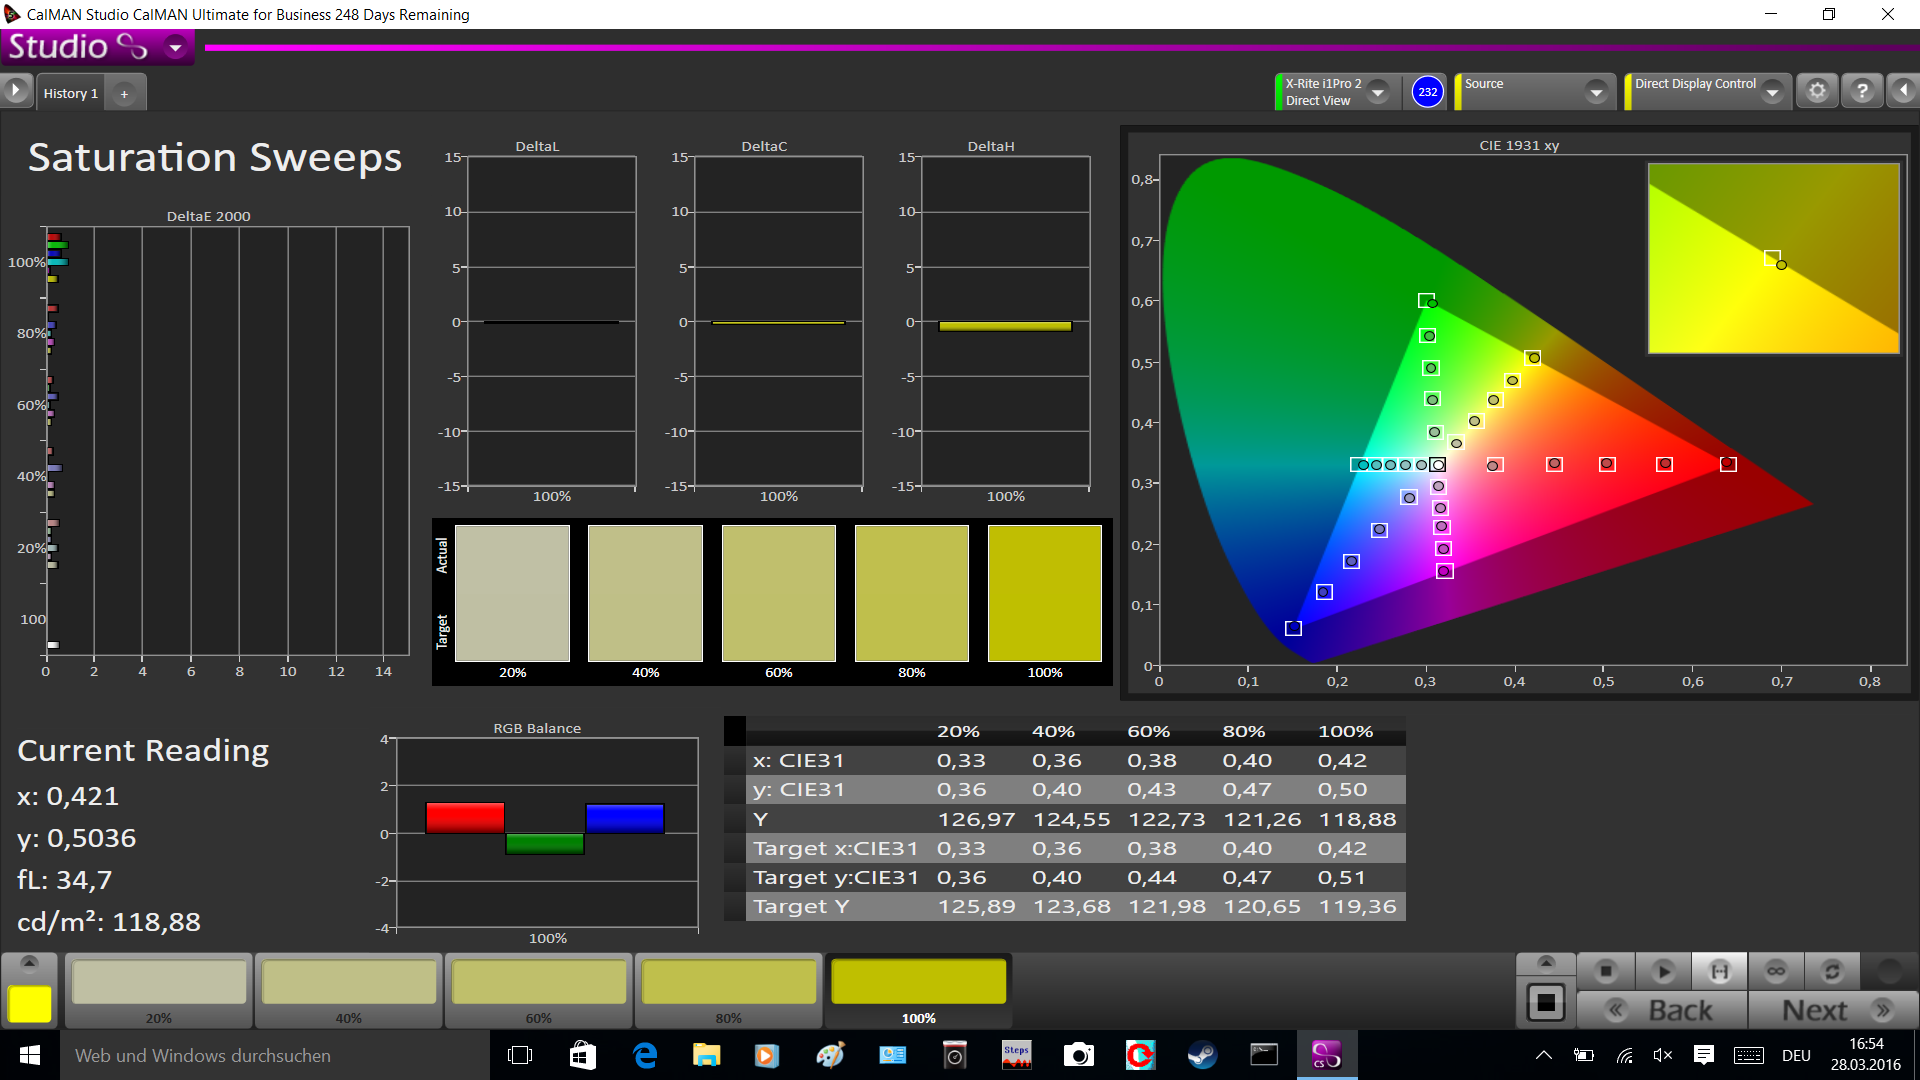
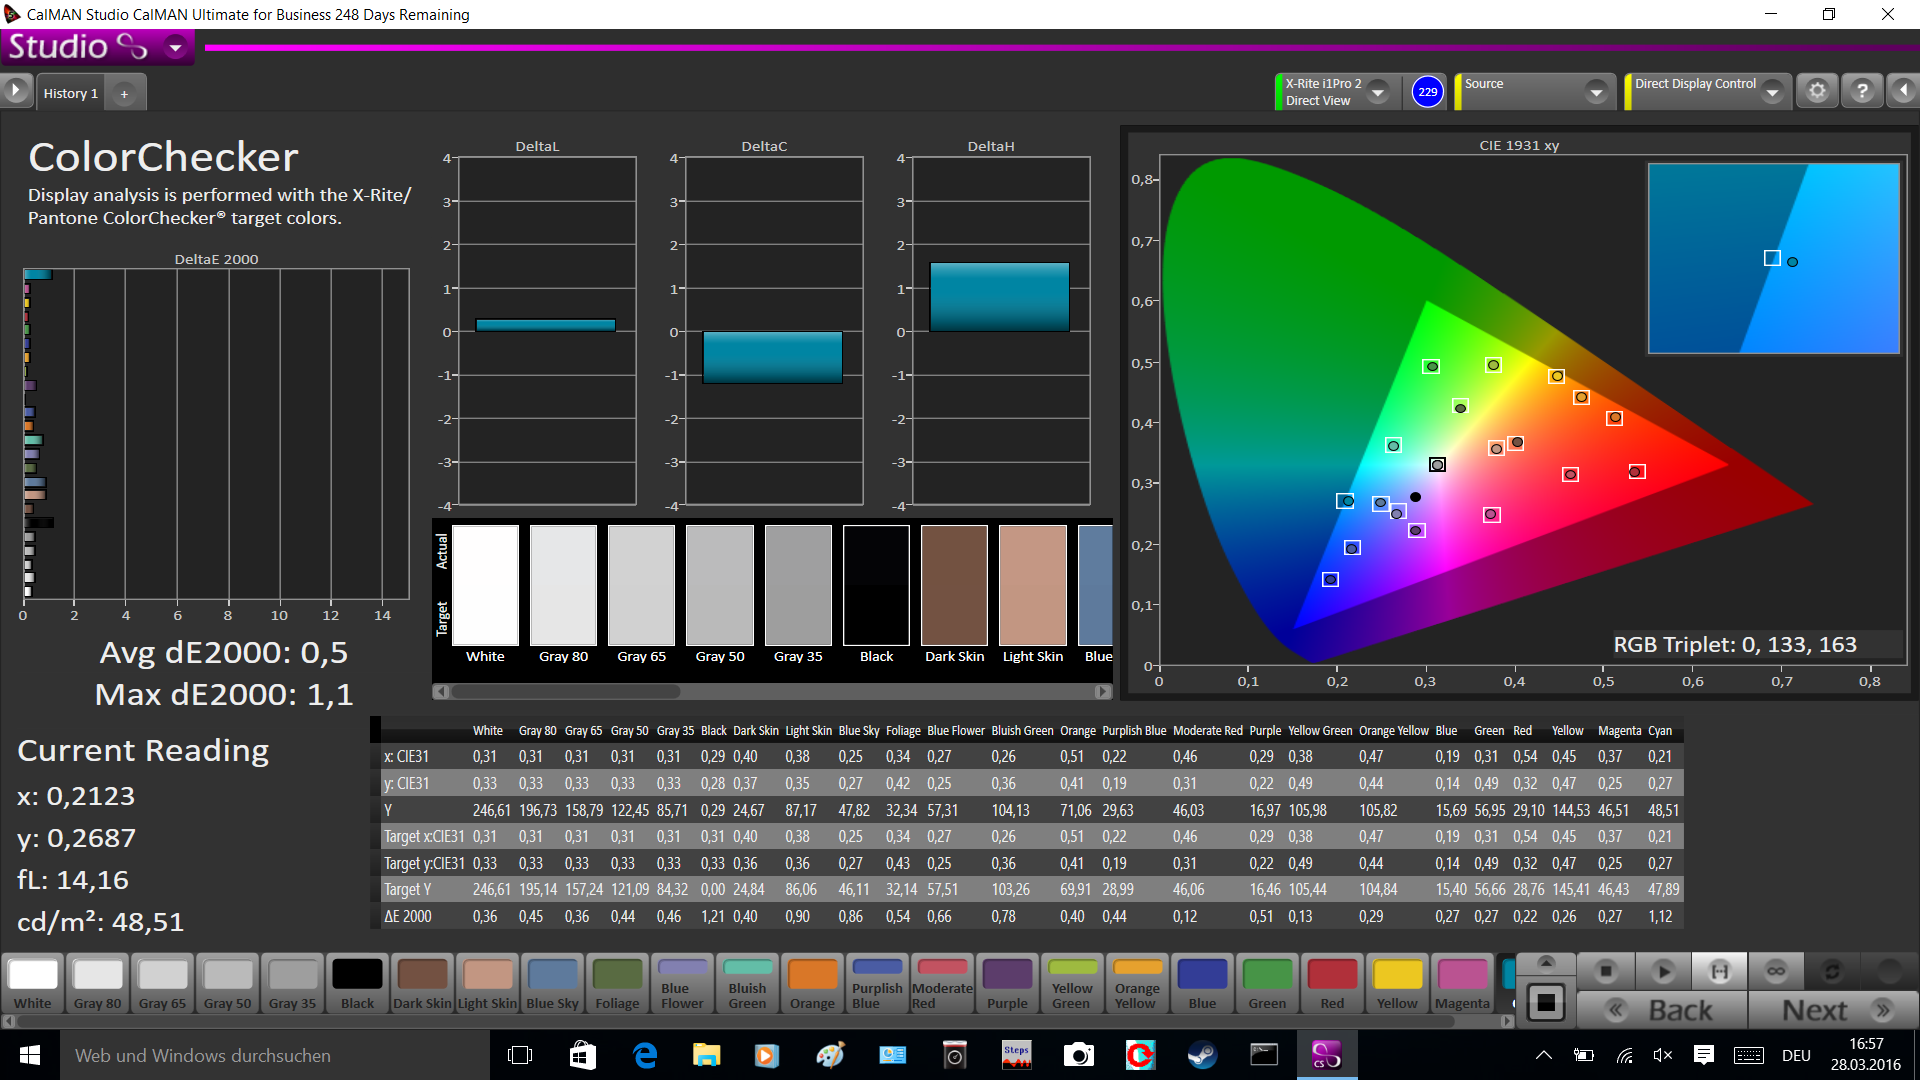
Almost all the display measurements are very good, only the luminance of the review unit clearly falls behind the rivals. We can only determine slightly more than 240 cd/m² on average. This is sufficient indoors in combination with the matte panel surface, but a more powerful background illumination would have been nice, especially when you consider the price. That's all our criticism though, because the other results are very good. The low black value of 0.21 cd/m² results in an extremely high contrast of 1200:1, and the average DeltaE-2000 deviations of the colors and the grayscale are already below 3 ex-works. Deviations are therefore not visible to the human eye. Color temperature and gamma value are also close to their respective ideal values. The results are even better after a calibration and the average deviations for the colors and the grayscale drop to just 0.5 and 0.6, respectively.
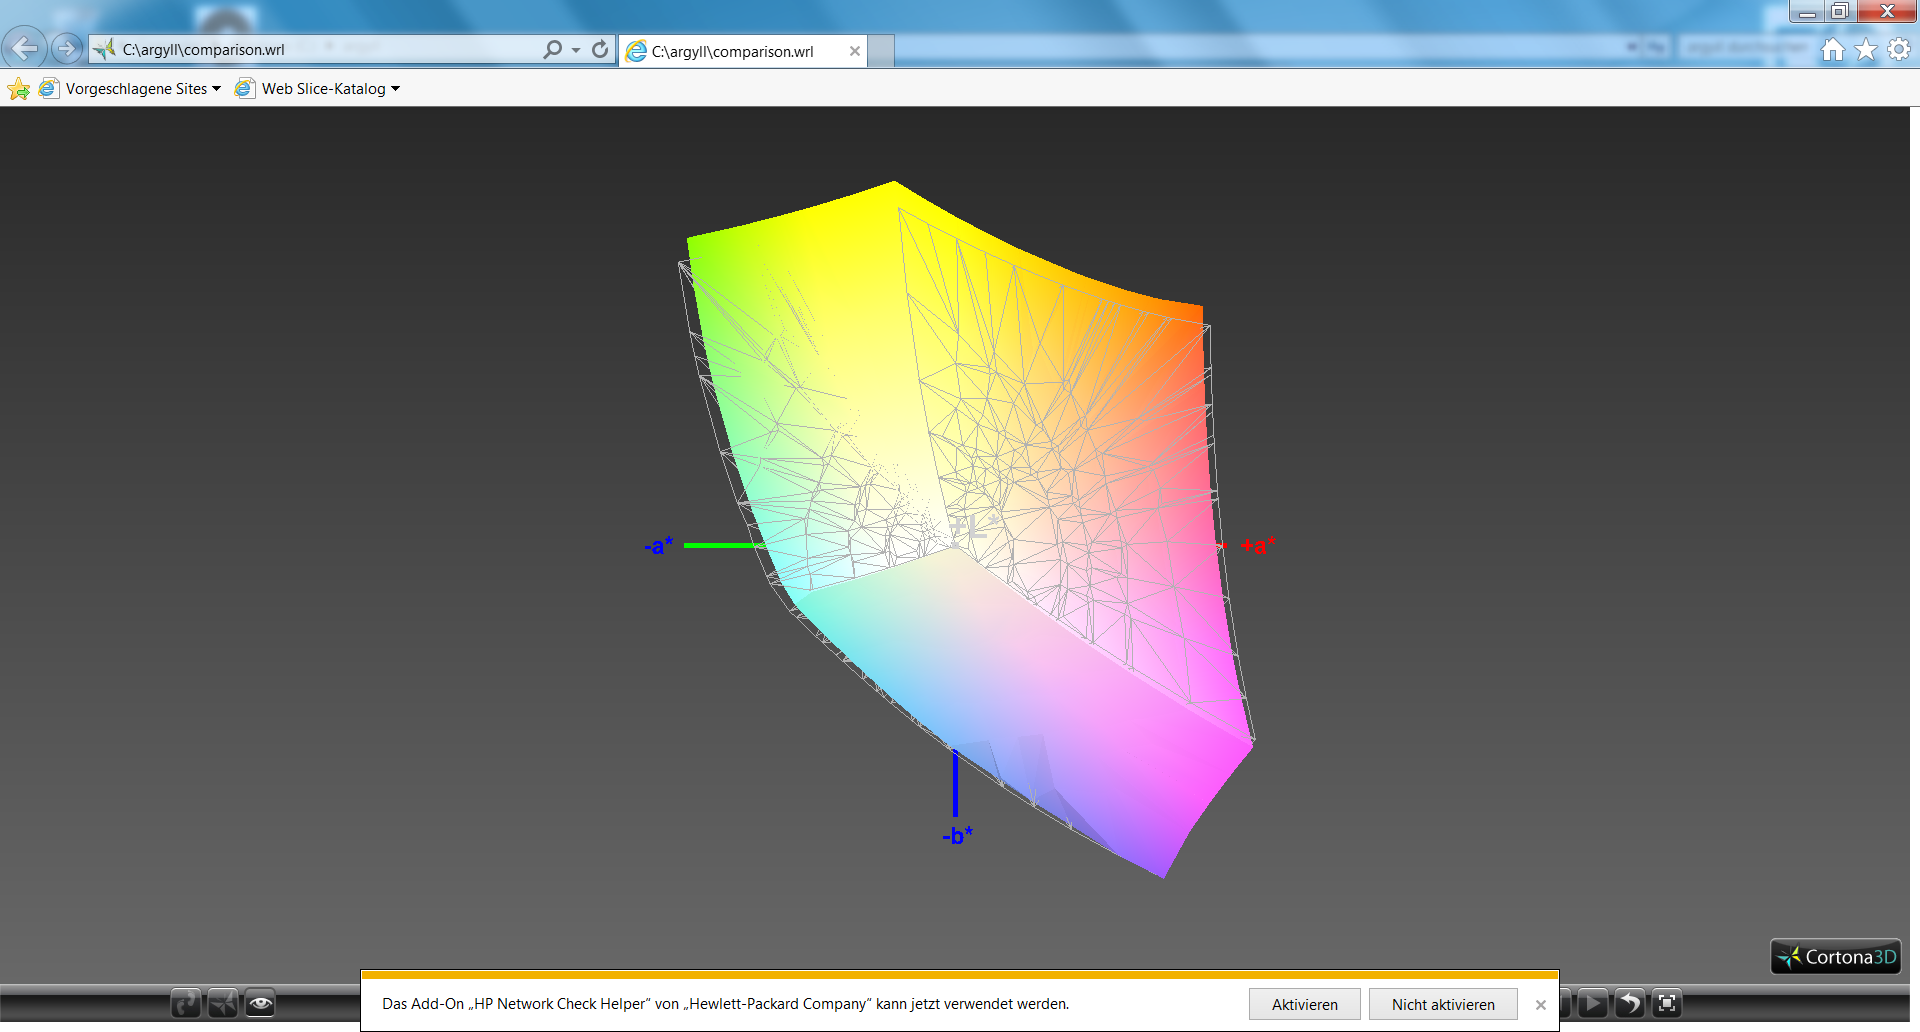
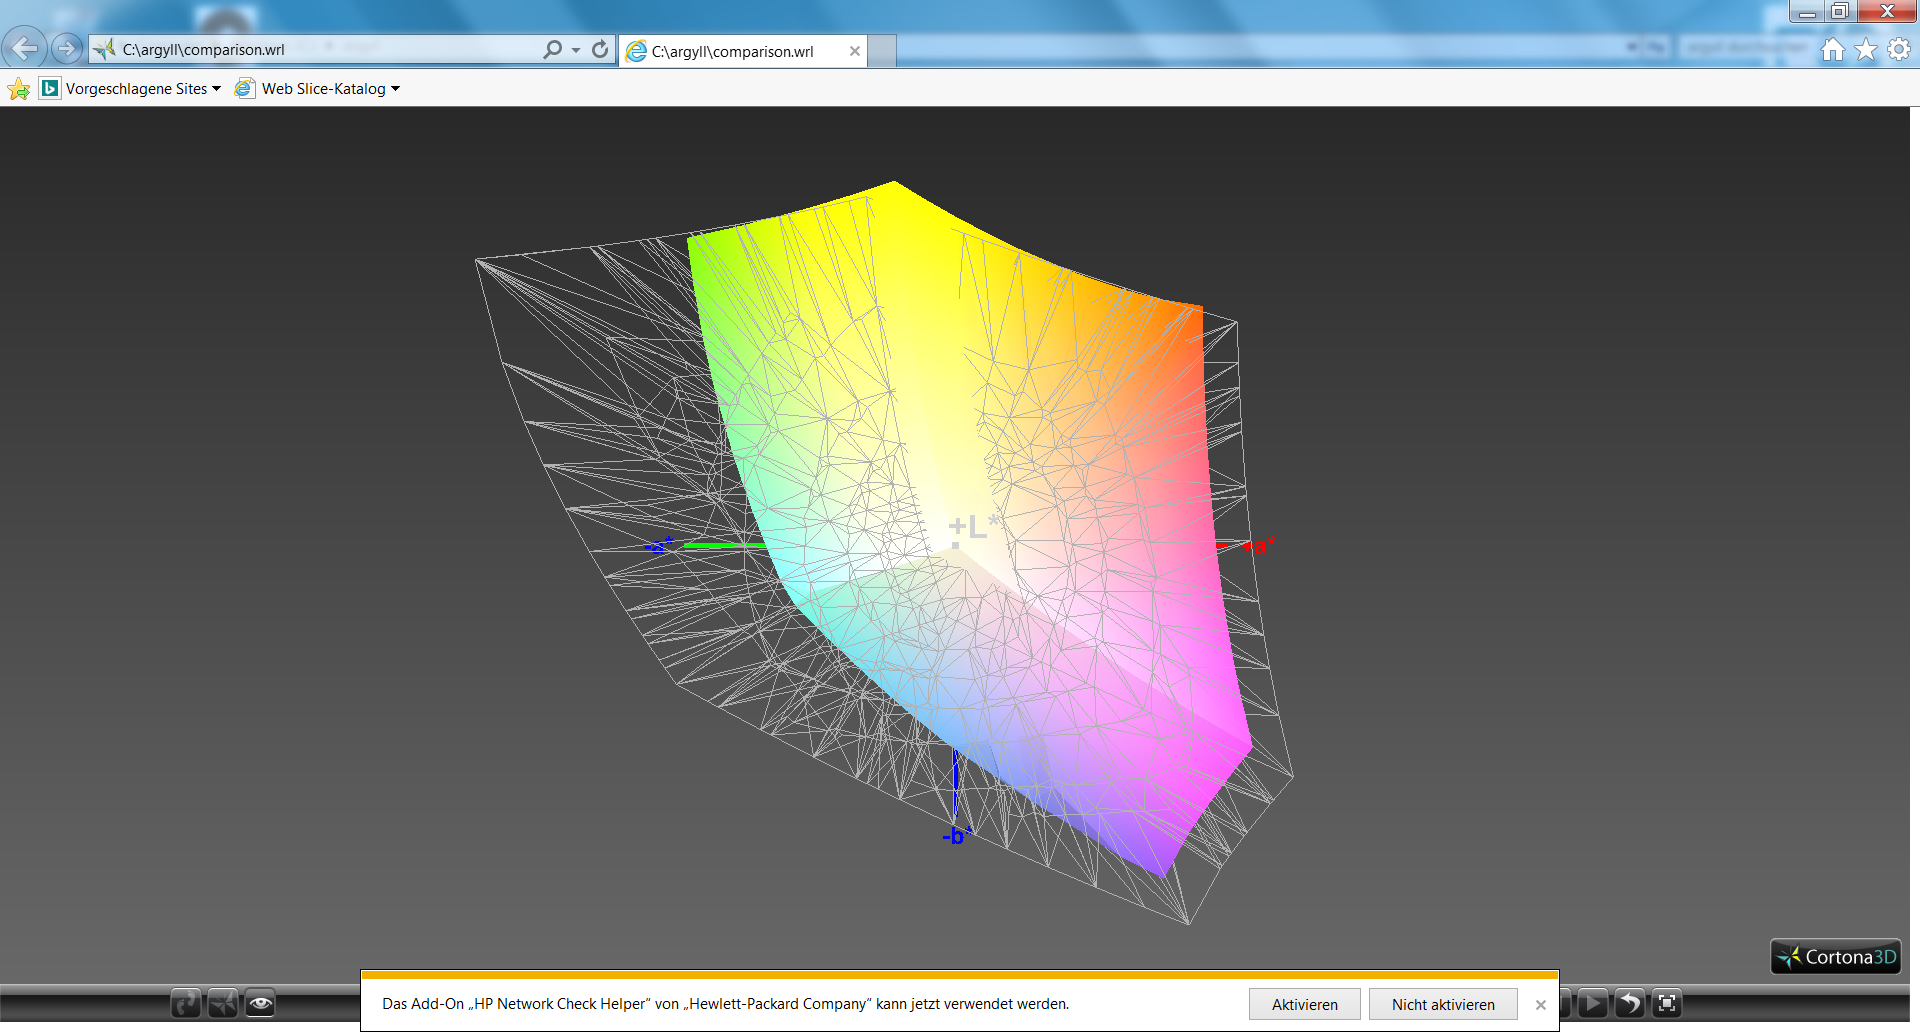
The display covers almost the whole sRGB color space (96%) and the wider AdobeRGB reference at least by 62%. The 4K panel of the ThinkPad P70 performs a bit better and the Dell Precision 7710 is on par. The optional DreamColor display will be interesting, even though HP does not give any specific information about the color gamut.
Display Response Times
| ↔ Response Time Black to White | ||
|---|---|---|
| 28.4 ms ... rise ↗ and fall ↘ combined | ↗ 7.2 ms rise | 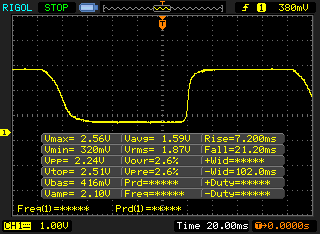 |
| ↘ 21.2 ms fall | ||
| The screen shows relatively slow response rates in our tests and may be too slow for gamers. In comparison, all tested devices range from 0.1 (minimum) to 240 (maximum) ms. » 75 % of all devices are better. This means that the measured response time is worse than the average of all tested devices (19.9 ms). | ||
| ↔ Response Time 50% Grey to 80% Grey | ||
| 50.4 ms ... rise ↗ and fall ↘ combined | ↗ 17.2 ms rise | 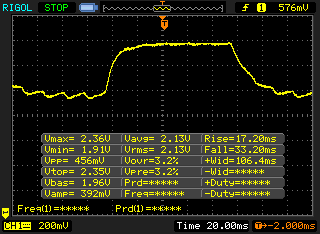 |
| ↘ 33.2 ms fall | ||
| The screen shows slow response rates in our tests and will be unsatisfactory for gamers. In comparison, all tested devices range from 0.165 (minimum) to 636 (maximum) ms. » 87 % of all devices are better. This means that the measured response time is worse than the average of all tested devices (31.1 ms). | ||
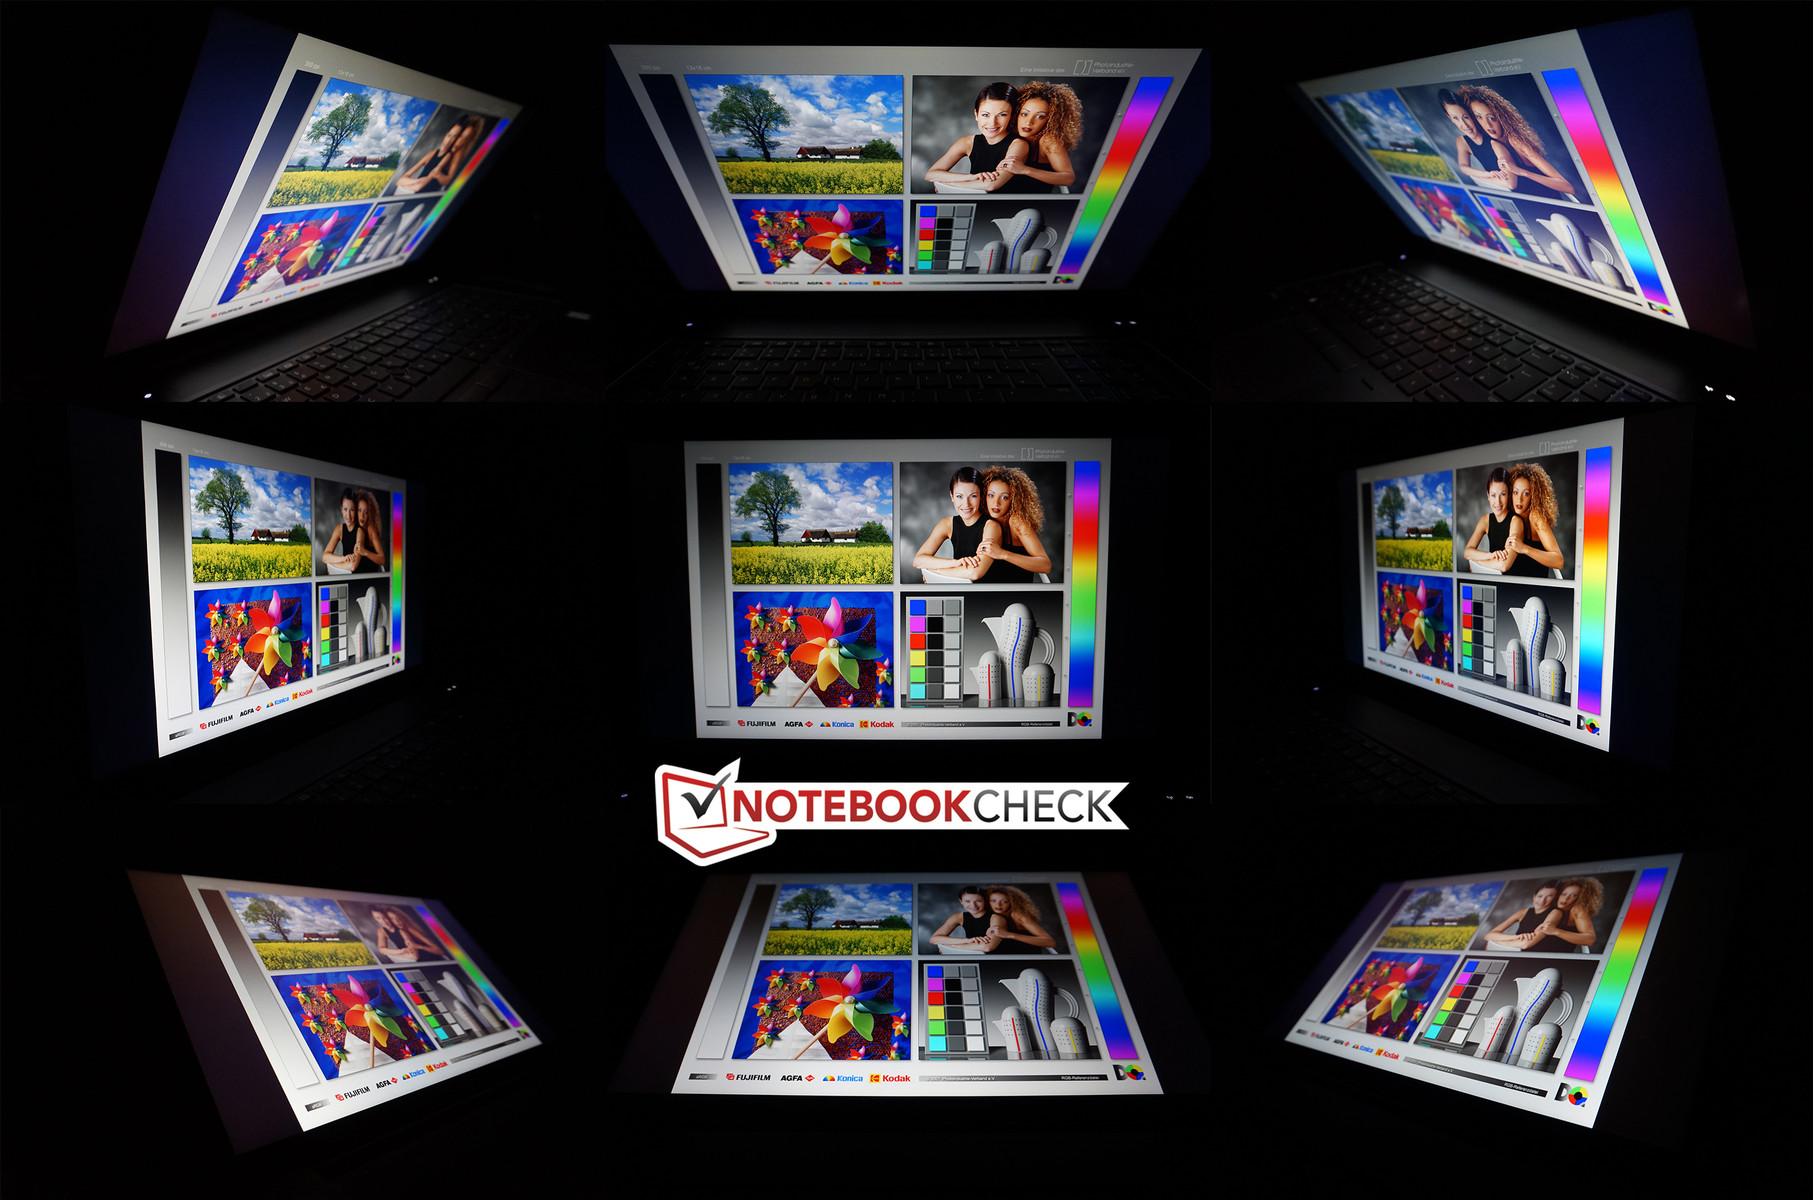
Despite the matte panel surface, we would like to have a higher luminance in bright environments, so the handling would be more comfortable. The brightness is at least not reduced on battery power and you can still see the display content even on bright days. The viewing-angle stability of the IPS display is, as expected, very good. The contrast will only drop when you look from an angle from below, but there are no limitations. Even multiple people can look at the screen of the ZBook 17 G3 simultaneously.
Performance
HP's ZBook 17 G3 meets the requirements for a high-end workstation and is available with the fastest components you can currently get for a mobile device. However, you can also choose slower components, so the workstation can cover a wide range of applications. Every configuration is equipped with a quad-core processor from Intel (Core i5, Core 7, Xeon) as well as a professional GPU from AMD (FirePro W6150M) or Nvidia (Quadro M1000M, M2000M, M3000M, M4000M, M5000M). There are also numerous options for the memory and storage equipment, including ECC-RAM in combination with the mobile Xeon processors. Our review unit, however, uses common DDR4 memory.
Processor
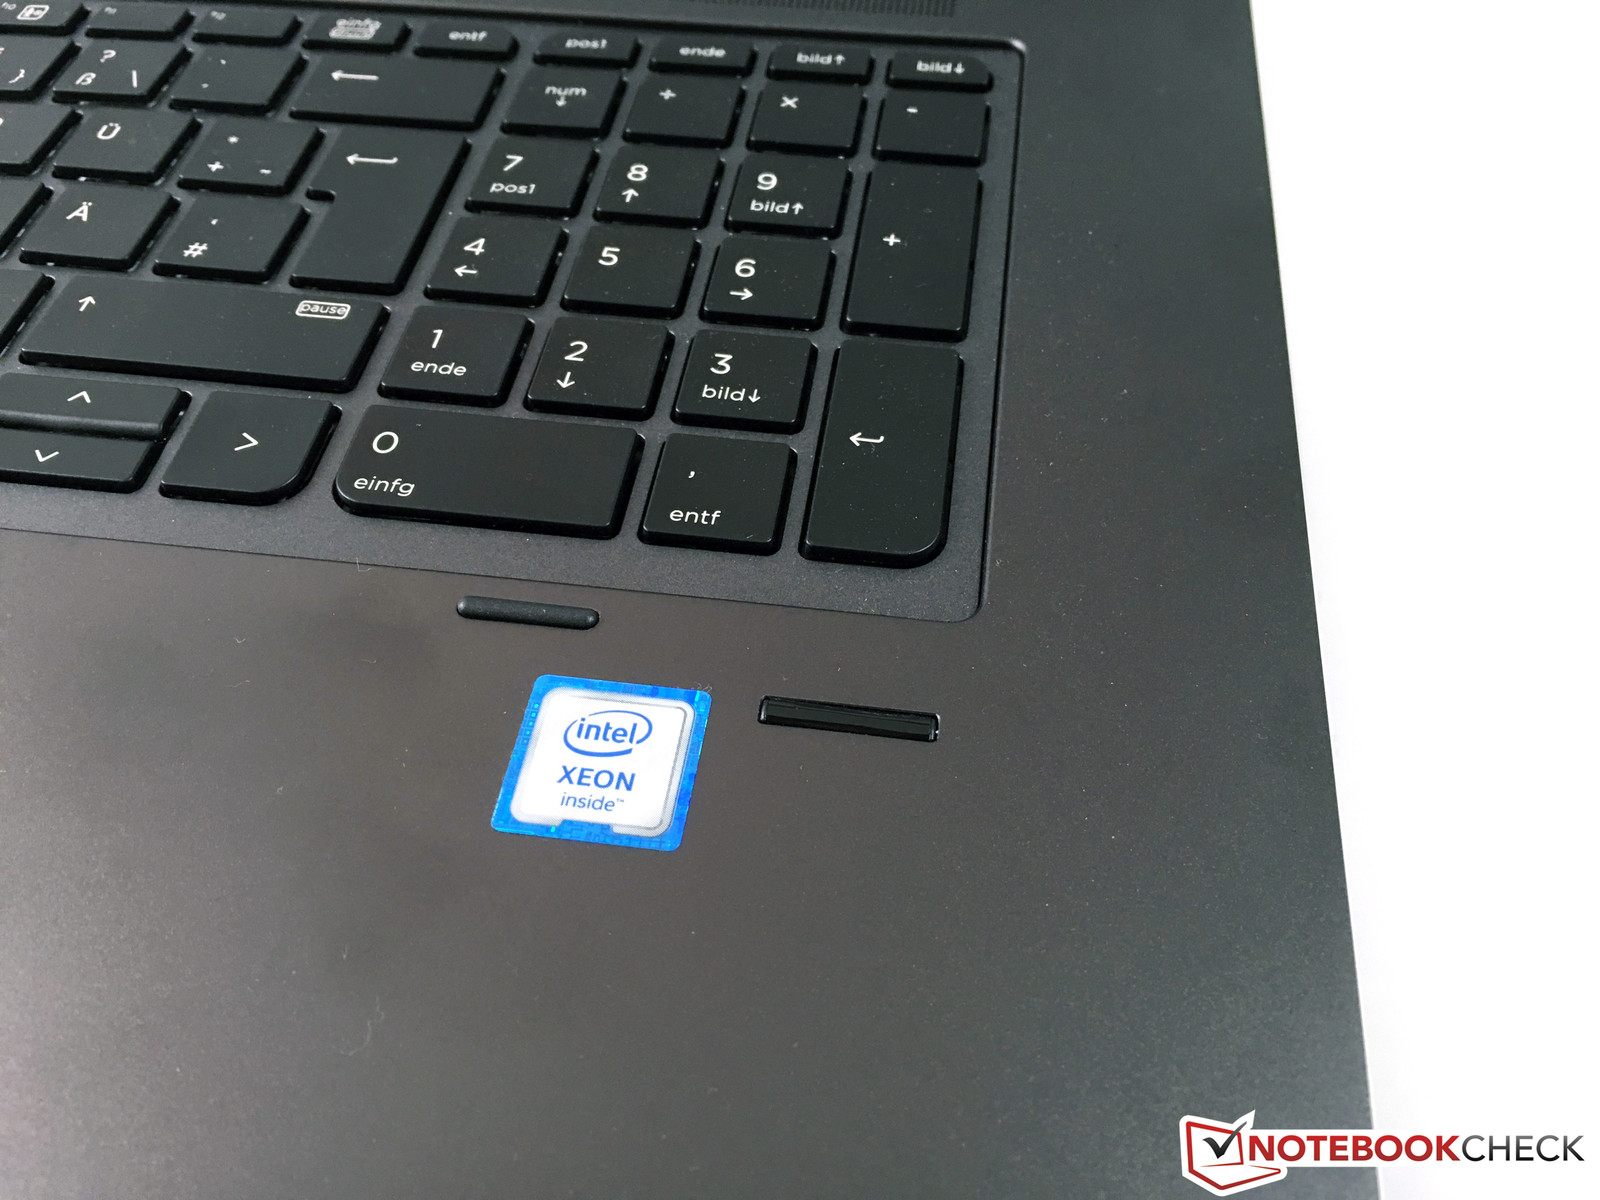
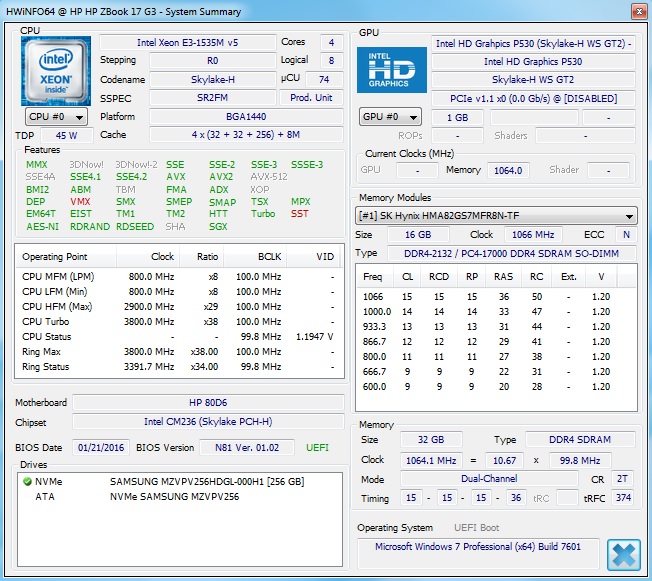
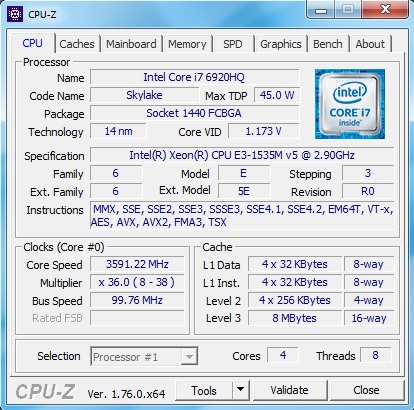
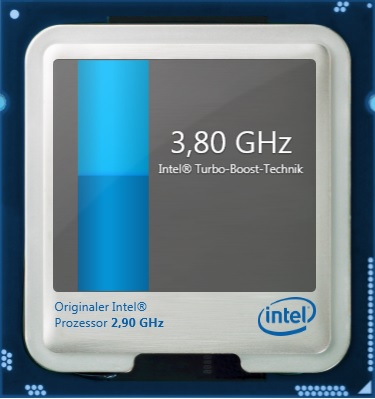
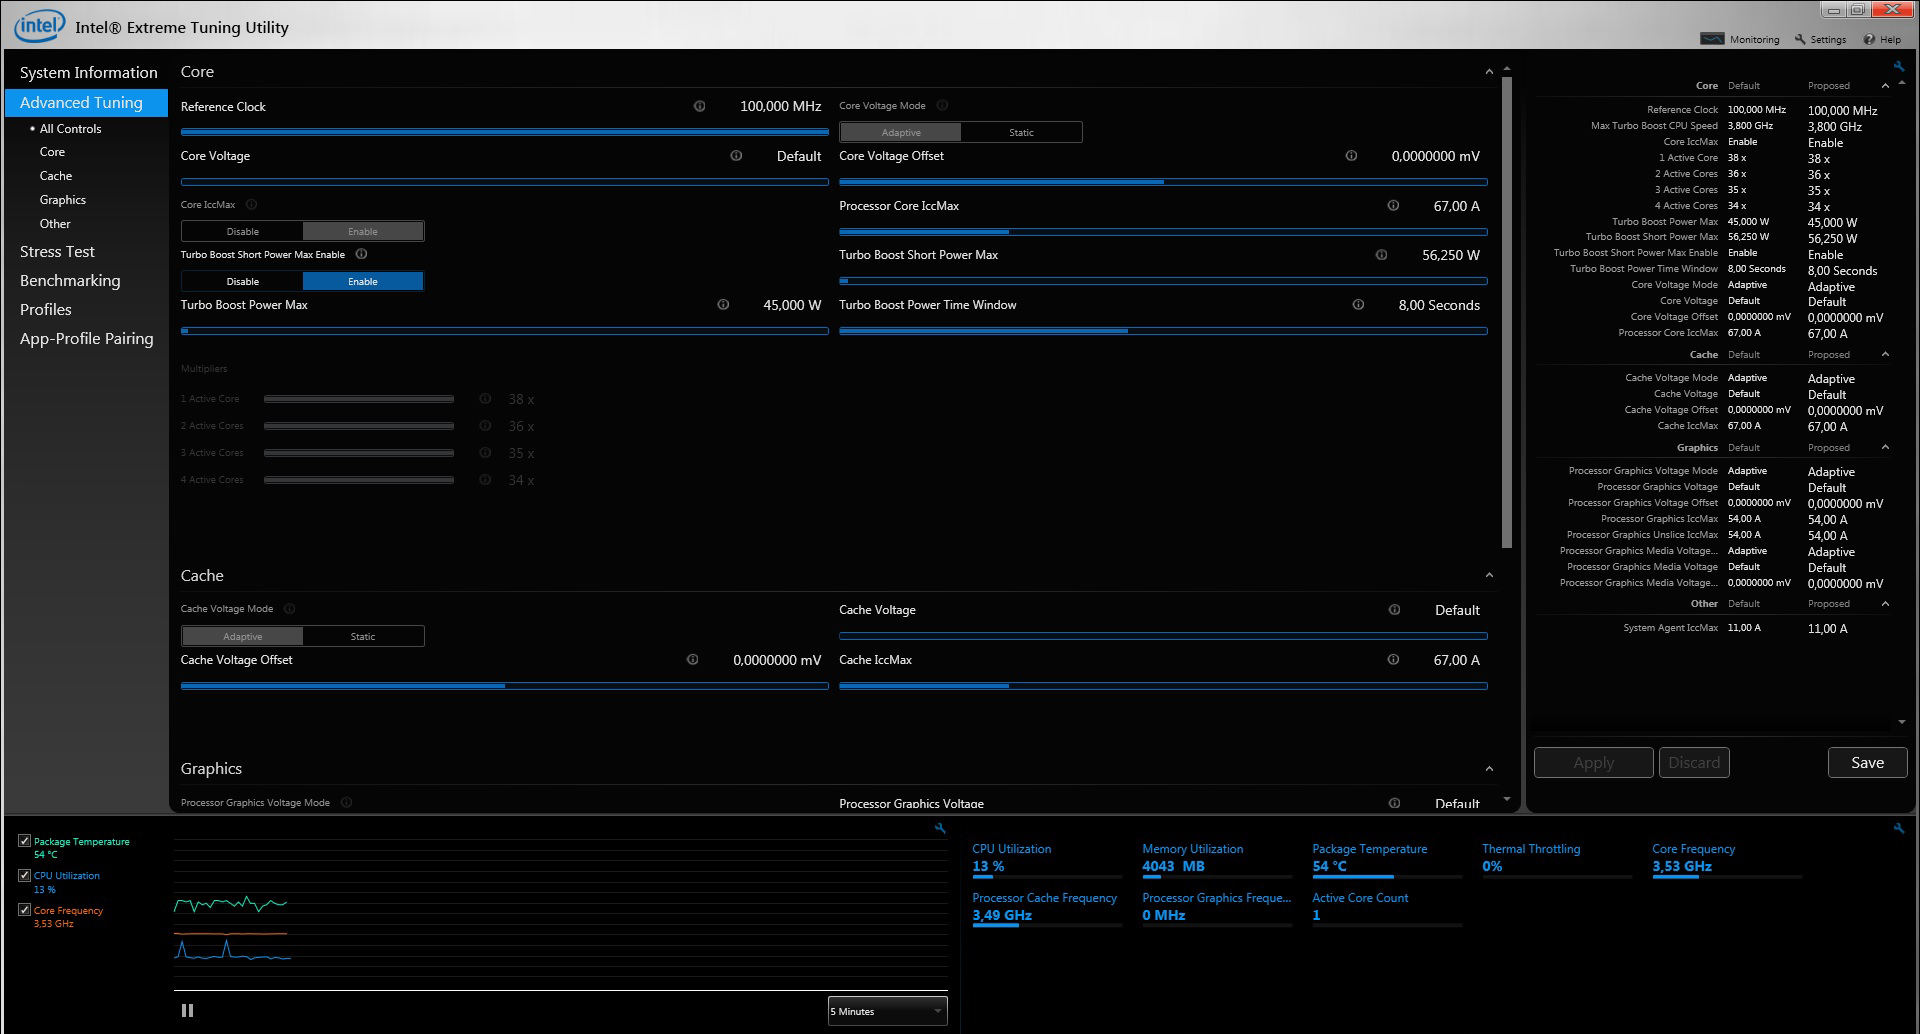
The mobile Intel Xeon E3-1535M v5 is currently one of the fastest mobile processors and is based on the Skylake architecture. The clock is up to 3.8 GHz via Turbo Boost (4 cores: 3.4 GHz), but the chip is slightly held back by the TDP of 45 Watts when you really stress it. The clock drops to 3.3 GHz after 8 seconds in the Cinebench tests and even to 3.1 GHz under extreme load by Prime95. Our review unit is therefore slightly behind the Dell Precision 7710, where the processor can utilize its maximum performance all the time. Our review unit cannot maintain the maximum 3.8 GHz in the single-tests, either, and it will occasionally drop to 3.6 GHz.
The results are still very good and are usually only beaten by the previously mentioned rivals from Dell as well as the Bullman E-Klasse with the desktop processor (+7 up to +14%). The maximum consumption of the processor is limited to ~27 Watts on battery power, and the Turbo Boost is not available, either. This results in a performance drop of up to 20% in the benchmarks (8.16 vs. 6.57 points @CB11.5 Multi). More benchmarks with the E3-1535M v5 are available in our database.
| Cinebench R15 | |
| CPU Multi 64Bit | |
| Bullman E-Klasse 5 | |
| Dell Precision 7710 | |
| HP ZBook 17 G3 TZV66eA | |
| MSI WT72-6QM | |
| Lenovo ThinkPad P70 | |
| HP ZBook 17 G2 J8Z55ET | |
| CPU Single 64Bit | |
| Bullman E-Klasse 5 | |
| Dell Precision 7710 | |
| MSI WT72-6QM | |
| HP ZBook 17 G3 TZV66eA | |
| Lenovo ThinkPad P70 | |
| HP ZBook 17 G2 J8Z55ET | |
| Cinebench R11.5 | |
| CPU Multi 64Bit | |
| Bullman E-Klasse 5 | |
| Dell Precision 7710 | |
| HP ZBook 17 G3 TZV66eA | |
| MSI WT72-6QM | |
| Lenovo ThinkPad P70 | |
| HP ZBook 17 G2 J8Z55ET | |
| CPU Single 64Bit | |
| Bullman E-Klasse 5 | |
| Dell Precision 7710 | |
| HP ZBook 17 G3 TZV66eA | |
| MSI WT72-6QM | |
| Lenovo ThinkPad P70 | |
| HP ZBook 17 G2 J8Z55ET | |
| Cinebench R10 | |
| Rendering Multiple CPUs 32Bit | |
| Bullman E-Klasse 5 | |
| Dell Precision 7710 | |
| HP ZBook 17 G3 TZV66eA | |
| MSI WT72-6QM | |
| Lenovo ThinkPad P70 | |
| HP ZBook 17 G2 J8Z55ET | |
| Rendering Single 32Bit | |
| Bullman E-Klasse 5 | |
| Dell Precision 7710 | |
| HP ZBook 17 G3 TZV66eA | |
| MSI WT72-6QM | |
| Lenovo ThinkPad P70 | |
| HP ZBook 17 G2 J8Z55ET | |
| Rendering Multiple CPUs 64Bit | |
| Bullman E-Klasse 5 | |
| HP ZBook 17 G3 TZV66eA | |
| Dell Precision 7710 | |
| MSI WT72-6QM | |
| Lenovo ThinkPad P70 | |
| HP ZBook 17 G2 J8Z55ET | |
| Rendering Single CPUs 64Bit | |
| Bullman E-Klasse 5 | |
| Dell Precision 7710 | |
| MSI WT72-6QM | |
| HP ZBook 17 G3 TZV66eA | |
| Lenovo ThinkPad P70 | |
| HP ZBook 17 G2 J8Z55ET | |
System Performance
Thanks to the fast components, the handling of the ZBook 17 G3 is very responsive and there are basically no waiting times. The preloaded Windows 7 Professional (license for Windows 10 Pro included) boots quickly, and our inputs are always executed without delays. The PCMark results for our review unit are still just average, but the order can also change depending on the test. The Lenovo ThinkPad P70, for example, is beaten in all tests, while the Dell Precision 7710 is sometimes faster and sometimes slower than our review unit.
| PCMark 7 - Score | |
| MSI WT72-6QM | |
| Bullman E-Klasse 5 | |
| HP ZBook 17 G3 TZV66eA | |
| Dell Precision 7710 | |
| Lenovo ThinkPad P70 | |
| HP ZBook 17 G2 J8Z55ET | |
| PCMark 8 | |
| Work Score Accelerated v2 | |
| MSI WT72-6QM | |
| Dell Precision 7710 | |
| Bullman E-Klasse 5 | |
| HP ZBook 17 G3 TZV66eA | |
| HP ZBook 17 G2 J8Z55ET | |
| Lenovo ThinkPad P70 | |
| Creative Score Accelerated v2 | |
| Dell Precision 7710 | |
| HP ZBook 17 G2 J8Z55ET | |
| Bullman E-Klasse 5 | |
| HP ZBook 17 G3 TZV66eA | |
| Home Score Accelerated v2 | |
| Dell Precision 7710 | |
| MSI WT72-6QM | |
| HP ZBook 17 G2 J8Z55ET | |
| Bullman E-Klasse 5 | |
| HP ZBook 17 G3 TZV66eA | |
| Lenovo ThinkPad P70 | |
| PCMark 7 Score | 5487 points | |
| PCMark 8 Home Score Accelerated v2 | 4133 points | |
| PCMark 8 Creative Score Accelerated v2 | 4564 points | |
| PCMark 8 Work Score Accelerated v2 | 5271 points | |
Help | ||
Storage Devices
We already mentioned that the review unit can be equipped with up to four storage devices. The two M.2 slots are attached via PCIe-NVMe, while the other two slots are limited to SATA-III. Our review unit is equipped with the HP Z Turbo Drive, which indicates the PCIe-NVMe-SSD. Our model is provided by Samsung (SM951) and has a capacity of 256 GB. This is pretty meager considering the enormous price, and we would have at least expected the 512 GB version or an additional drive.
The sequential transfer rates are very high at ~1500/1200 MB/s (read/write) according to CrystalDiskMark, so the drive has a clear advantage over SATA-III SSDs (limited at around 500-550 MB/s). The advantage over the mechanical hard drive in the predecessor ZBook 17 G2 is particularly big, as it only managed about 85 MB/s on average. More benchmarks with HDDs/SSDs are available in our Tech section.

GPU Performance
The Nvidia Quadro M3000M is based on the current Maxwell GM 204 chip and is very similar to the consumer GeForce GTX 965M with its 1024 shaders. The video memory, however, is much bigger at 4 GB GDDR-VRAM, which is also the case for the 256-bit interface. Compared to its predecessor, the Quadro K3100M, both the performance as well as the efficiency should be much higher. Thanks to the Optimus support, the graphics are handled by the integrated Intel HD Graphics P530 when you use simple applications or in the power-saving mode.
The professional chip differs from the consumer GeForce cards in terms of a modified BIOS as well as special drivers, which are designed for stability. Comprehensive certifications also ensure a trouble-free operation between hardware and software. The drivers can result in a significant performance advantage in OpenGL-optimized applications in particular. We use the benchmarks SPECviewperf 11 and 12 for professional purposes. They cover the areas CAD, CAM, geology and medical MRI. Overall, the Quadro M3000M performs very well and is often more than twice as fast as the direct predecessor, the Quadro K3100M. Another interesting aspect is the comparison between the two Quadro M3000M GPUs. They are often on par, but our card is sometimes (Siemens NX, for example) much faster. The reason is probably the newer driver version. The AMD FirePro W7170M from the Dell Precision 7710 can only beat the Quadro M3000M in a handful of tests.
Calculations can be transferred from the processor to the graphics card via the OpenCL interface, but the standards differ depending on the manufacturer. This includes Quick Sync (Intel), APP (AMD) or in our case CUDA, for example. Those methods are mainly used for picture and video conversions, financial analysis as well as encryption in practice. We use the two tools LuxMark 2.0 (ray tracing) and SiSoft Sandra 16 (GPGPU). LuxMark 2.0 shows the advantages of the new Maxwell GPU, because our Quadro M3000M can clearly beat the rivals and is even neck and neck with the supposedly much faster Quadro M5000M inside the MSI WT72. The results are also very good in SiSoft Sandra 16, but the FirePro W7170M from AMD (Dell Precision 7710) is much faster in two of three tests.
| LuxMark v2.0 64Bit | |
| Room GPUs-only | |
| MSI WT72-6QM | |
| HP ZBook 17 G3 TZV66eA | |
| Lenovo ThinkPad P70 | |
| Dell Precision 7710 | |
| HP ZBook 17 G2 J8Z55ET | |
| Bullman E-Klasse 5 | |
| Sala GPUs-only | |
| HP ZBook 17 G3 TZV66eA | |
| Lenovo ThinkPad P70 | |
| MSI WT72-6QM | |
| Dell Precision 7710 | |
| HP ZBook 17 G2 J8Z55ET | |
| Bullman E-Klasse 5 | |
| SiSoft Sandra 2016 | |
| Image Processing | |
| Dell Precision 7710 | |
| Lenovo ThinkPad P70 | |
| HP ZBook 17 G3 TZV66eA | |
| GP Cryptography (Higher Security AES256+SHA2-512) | |
| HP ZBook 17 G3 TZV66eA | |
| Dell Precision 7710 | |
| Lenovo ThinkPad P70 | |
| GP Financial Analysis (FP High/Double Precision) | |
| Dell Precision 7710 | |
| Lenovo ThinkPad P70 | |
| HP ZBook 17 G3 TZV66eA | |
DirectX applications, which also include games, are more dependent on the raw performance of the hardware. The Fire Strike test (Graphics) of the current 3DMark determines 6658 points for our ZBook 17 G3, which is just ahead of the ThinkPad P70, but the FirePro W7170M in the Dell is even a bit faster. The Quadro M5000M in the MSI WT72 has a significant advantage of around 36%.
It is interesting to compare the results with the consumer chips from the GeForce series. The GeForce GTX 965M, which has very similar specs, is 8% slower, while the GTX 970M is 15% faster.
You can compare the DirectX and the OpenGL performance (without optimizations) in the two benchmarks Unigine Heaven 3.0 and Unigine Valley 1.0, and the DirectX results are a bit better. The big OpenGL advantage (Unigine Heaven 3.0) compared to the Quadro M3000M in the ThinkPad P70 (+ 76%) is striking, which is also a result of the driver update.
The graphics performance is reduced by around 20% on battery power (8313 vs. 6711 points in 3DMark 11).
| Unigine Heaven 3.0 | |
| 1920x1080 DX 11, Normal Tessellation, High Shaders AA:Off AF:Off | |
| MSI WT72-6QM | |
| HP ZBook 17 G3 TZV66eA | |
| Lenovo ThinkPad P70 | |
| Dell Precision 7710 | |
| HP ZBook 17 G2 J8Z55ET | |
| Bullman E-Klasse 5 | |
| 1920x1080 OpenGL, Normal Tessellation, High Shaders AA:Off AF:Off | |
| MSI WT72-6QM | |
| HP ZBook 17 G3 TZV66eA | |
| Dell Precision 7710 | |
| HP ZBook 17 G2 J8Z55ET | |
| Lenovo ThinkPad P70 | |
| Bullman E-Klasse 5 | |
| Unigine Valley 1.0 | |
| 1920x1080 Extreme HD DirectX AA:x8 | |
| MSI WT72-6QM | |
| HP ZBook 17 G3 TZV66eA | |
| Lenovo ThinkPad P70 | |
| Dell Precision 7710 | |
| 1920x1080 Extreme HD Preset OpenGL AA:x8 | |
| HP ZBook 17 G3 TZV66eA | |
| Dell Precision 7710 | |
| Lenovo ThinkPad P70 | |
| 3DMark | |
| 1920x1080 Fire Strike Score | |
| MSI WT72-6QM | |
| Acer Predator 15 G9-592-7925 | |
| Dell Precision 7710 | |
| HP ZBook 17 G3 TZV66eA | |
| Lenovo ThinkPad P70 | |
| Schenker XMG A726 | |
| MSI GE62-6QD16H11 | |
| HP ZBook 17 G2 J8Z55ET | |
| Bullman E-Klasse 5 | |
| 1920x1080 Fire Strike Graphics | |
| MSI WT72-6QM | |
| Acer Predator 15 G9-592-7925 | |
| Dell Precision 7710 | |
| HP ZBook 17 G3 TZV66eA | |
| Lenovo ThinkPad P70 | |
| Schenker XMG A726 | |
| MSI GE62-6QD16H11 | |
| HP ZBook 17 G2 J8Z55ET | |
| Bullman E-Klasse 5 | |
| 3DMark 06 Standard Score | 27895 points | |
| 3DMark 11 Performance | 8586 points | |
| 3DMark Ice Storm Standard Score | 91685 points | |
| 3DMark Cloud Gate Standard Score | 23083 points | |
| 3DMark Fire Strike Score | 6108 points | |
Help | ||
Gaming Performance
Thanks to the fast GPU, the HP ZBook 17 G3 can also handle games really well. Our gaming table shows that even modern titles like Rise of the Tomb Raider easily run in the native FHD resolution. You should only waive the highest settings to ensure smooth gameplay in every situation. We did not have any problems with crashes or graphics errors during our review. More gaming benchmarks with the Quadro M3000M are available here.
| low | med. | high | ultra | |
|---|---|---|---|---|
| BioShock Infinite (2013) | 226.3 | 182.7 | 166.7 | 69.8 |
| The Witcher 3 (2015) | 122.7 | 74.6 | 42.4 | 22.5 |
| Rise of the Tomb Raider (2016) | 114.9 | 69.9 | 40.2 | 33.4 |
Emissions
System Noise
The two fans of the HP ZBook 17 G3 only know two states: off or not audible, respectively, and loud. However, the noise is still much more convenient compared to the recently reviewed ZBook Studio G3, because the fans are not acting independently and there is no pulsating, either. Almost 49 dB(A) under load is obviously still clearly audible, but the deep murmur was subjectively not annoying. Many of the rivals, particularly the ThinkPad P70 and the MSI WT72, are still much more restrained.
Another small issue of the ZBook 17 G3 is a quiet coil whining, which is mainly audible after load, but sometimes also while idling. Compared to other notebooks, however, it is pretty quiet and therefore hardly annoying.
Noise level
| Idle |
| 30 / 30 / 30 dB(A) |
| Load |
| 48.9 / 48.9 dB(A) |
 | ||
30 dB silent 40 dB(A) audible 50 dB(A) loud |
||
min: | ||
| HP ZBook 17 G3 TZV66eA Quadro M3000M | Dell Precision 7710 FirePro W7170M | Lenovo ThinkPad P70 Quadro M3000M | MSI WT72-6QM Quadro M5000M | Bullman E-Klasse 5 Quadro K3100M | HP ZBook 17 G2 J8Z55ET FirePro M6100 | |
|---|---|---|---|---|---|---|
| Noise | 3% | 7% | 1% | 3% | 2% | |
| off / environment * (dB) | 30 | 30 -0% | 30 -0% | |||
| Idle Minimum * (dB) | 30 | 30 -0% | 30 -0% | 33.3 -11% | 28.5 5% | 29.2 3% |
| Idle Average * (dB) | 30 | 30 -0% | 30 -0% | 33.4 -11% | 28.5 5% | 29.9 -0% |
| Idle Maximum * (dB) | 30 | 30 -0% | 30 -0% | 33.5 -12% | 28.5 5% | 29.9 -0% |
| Load Average * (dB) | 48.9 | 43.2 12% | 36.5 25% | 38.8 21% | 47.8 2% | 46.8 4% |
| Load Maximum * (dB) | 48.9 | 47.13 4% | 40.8 17% | 40.2 18% | 50.8 -4% | 46.8 4% |
* ... smaller is better
Temperature
The chassis of the HP ZBook 17 G3 basically does not warm up at all while idling and under light workloads. This will change under load, because we can measure up to 55 °C at the top and bottom of the base unit during our stress test. The surrounding areas will warm up as well, including the central keyboard area. You can also feel it during typing, but there are no limitations. All the rivals are cooler under load, especially the ThinkPad P70 and the predecessor ZBook 17 G2.
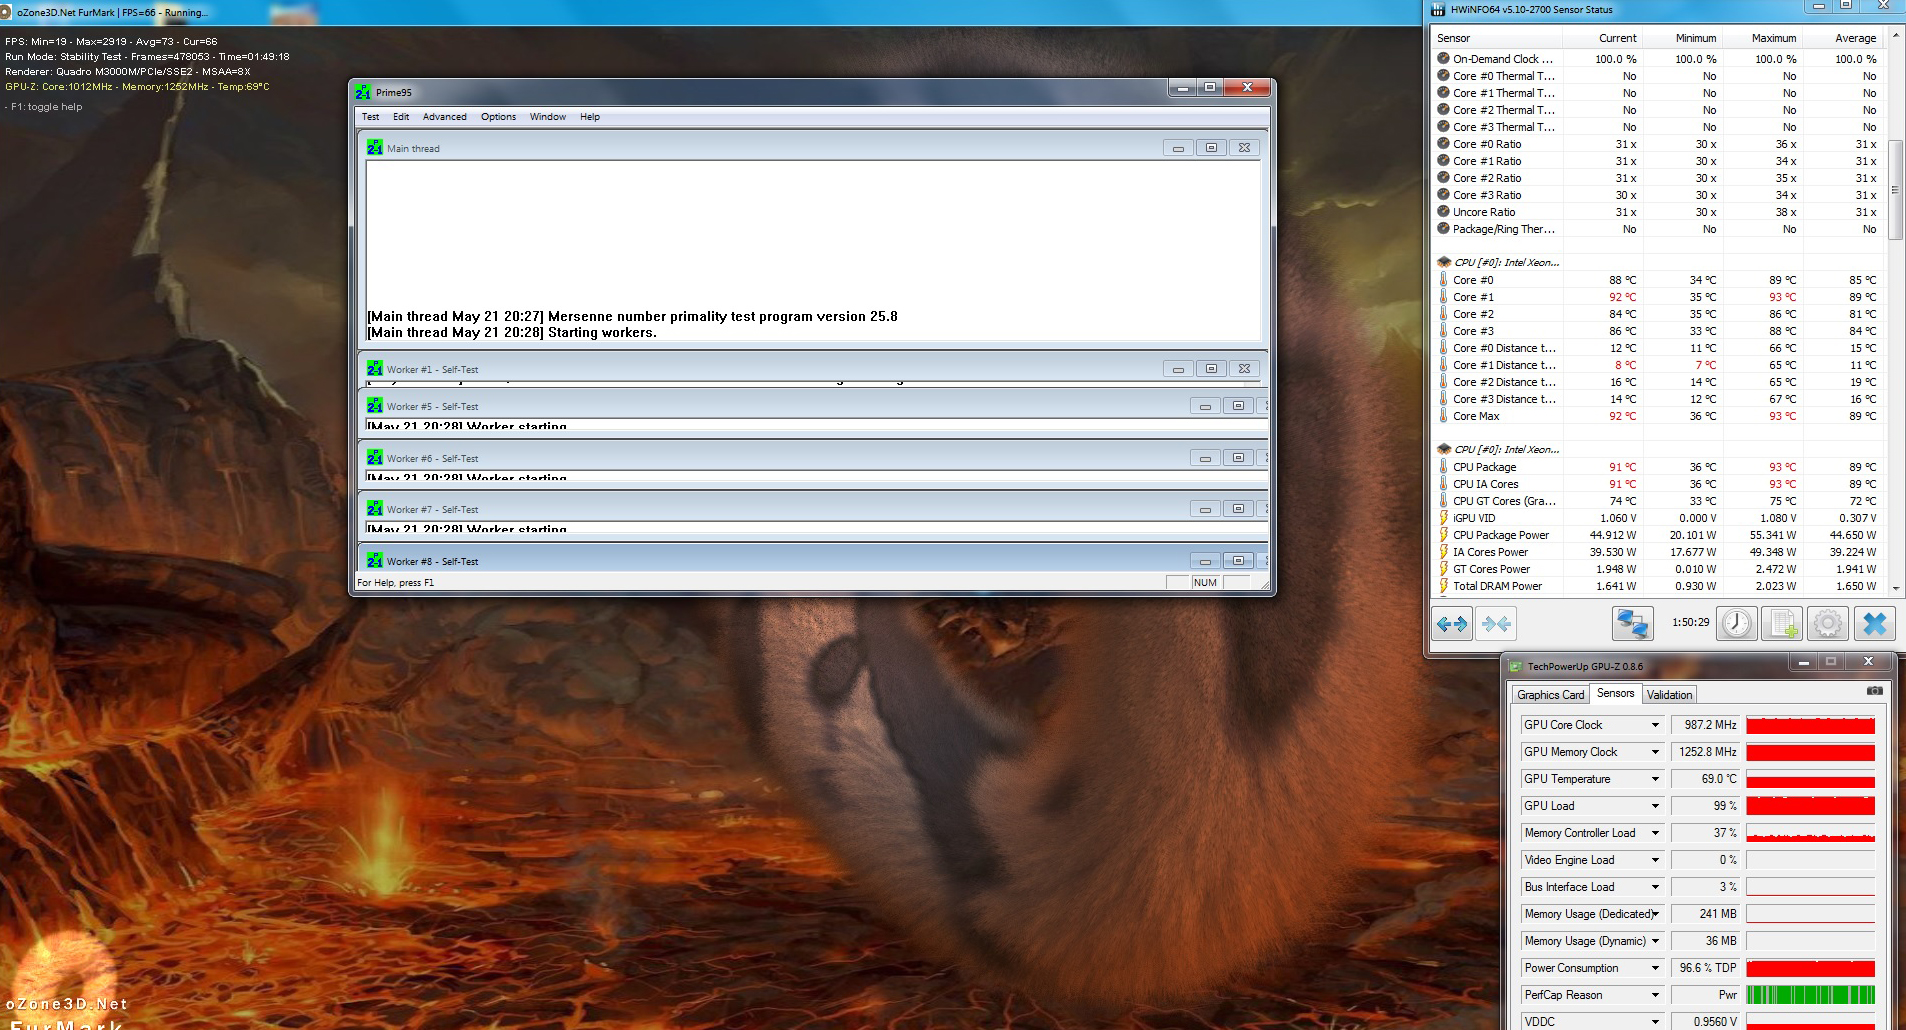
We use our stress test (Prime95 and FurMark for at least one hour) to check the behavior of the components in an extreme situation. The GPU is very stable and runs with a core clock between 987-1050 MHz (up to 69 °C) during the whole test. The situation is a bit different for the processor: The full 3.4 GHz is once again only available in the first 8 seconds, before the clock drops to 3.1 GHz. After another ~15 minutes, the chip will start to fluctuate between 3.0-3.1 GHz, which does not change over the course of the test. The maximum temperature of 93 °C is reached after about half an hour. A 3DMark 11 run immediately after the stress test did not determine a lower score.
(-) The maximum temperature on the upper side is 55.5 °C / 132 F, compared to the average of 38.2 °C / 101 F, ranging from 22.2 to 69.8 °C for the class Workstation.
(-) The bottom heats up to a maximum of 55.8 °C / 132 F, compared to the average of 41.1 °C / 106 F
(+) In idle usage, the average temperature for the upper side is 26.4 °C / 80 F, compared to the device average of 32 °C / 90 F.
(+) The palmrests and touchpad are cooler than skin temperature with a maximum of 29.4 °C / 84.9 F and are therefore cool to the touch.
(±) The average temperature of the palmrest area of similar devices was 27.8 °C / 82 F (-1.6 °C / -2.9 F).
| HP ZBook 17 G3 TZV66eA E3-1535M v5, Quadro M3000M | Dell Precision 7710 E3-1535M v5, FirePro W7170M | Lenovo ThinkPad P70 6820HQ, Quadro M3000M | MSI WT72-6QM E3-1505M v5, Quadro M5000M | Bullman E-Klasse 5 4790K, Quadro K3100M | HP ZBook 17 G2 J8Z55ET 4710MQ, FirePro M6100 | |
|---|---|---|---|---|---|---|
| Heat | 6% | 12% | 5% | -12% | 12% | |
| Maximum Upper Side * (°C) | 55.5 | 35.6 36% | 39 30% | 40.6 27% | 42.3 24% | 39.2 29% |
| Maximum Bottom * (°C) | 55.8 | 55 1% | 35.4 37% | 42.6 24% | 44.2 21% | 37.2 33% |
| Idle Upper Side * (°C) | 29.1 | 29.3 -1% | 30.8 -6% | 28.2 3% | 41.6 -43% | 28.9 1% |
| Idle Bottom * (°C) | 29 | 32.8 -13% | 33.1 -14% | 38.6 -33% | 43.9 -51% | 33 -14% |
* ... smaller is better
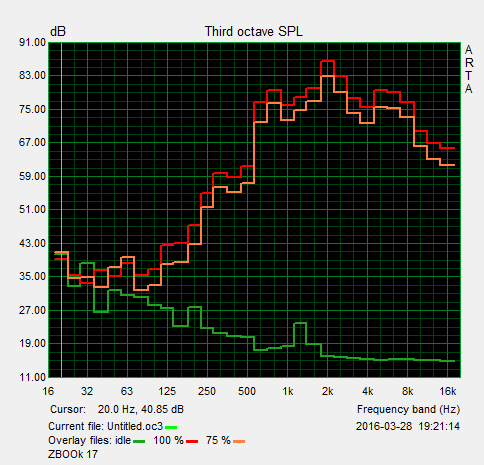
Speakers
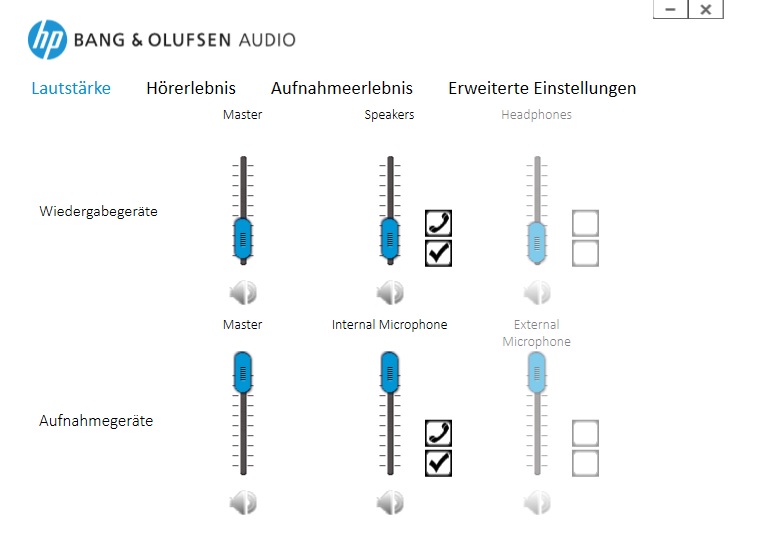
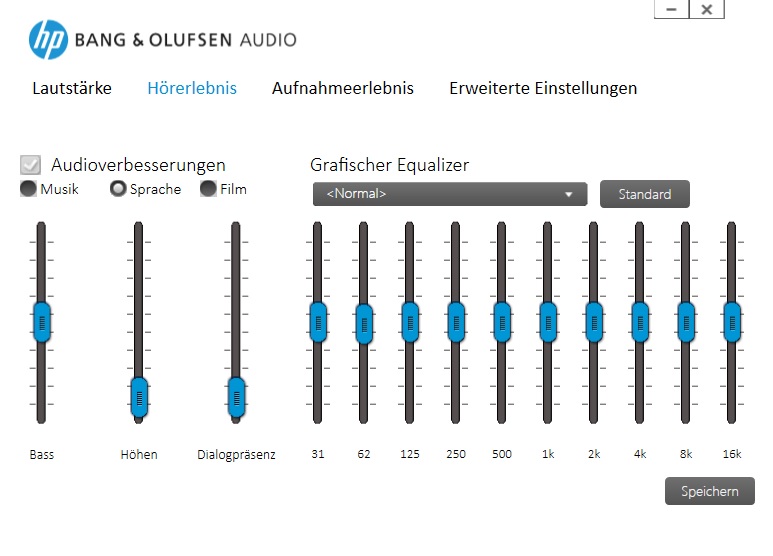
Similar to the smaller ZBook 15 G3, the perforated grill above the keyboard suggests speakers that are faced towards the user. They are, however, located at the bottom front of the ZBook 17 G3 and direct the sound towards the bottom. The sound will be reflected towards the user on solid ground, but it can be a bit muffled on softer surfaces. You can actually notice a certain stereo effect due to the distance between both modules, and they leave a pretty good impression in general. They are really loud at up to 92 dB(A) and the sound is pretty balanced, but an additional subwoofer would have been nice. The performance is definitely sufficient for YouTube videos and some background music. The addition Bang & Olufsen refers to the software, which provides multiple presets including an equalizer. They will result in a slightly richer sound, especially at lower volume levels, but you should deactivate the software when you use good headphones.
Energy Management
Power Consumption
Our consumption measurements show pretty low idle values for the review unit, but the ZBook 17 G3 also benefits from its darker display and also the lower resolution compared to some rivals. The consumption will reach almost 160 Watts under load, so the bulky 200-Watt power adapter (~1 kg, 17 x 9.5 x 2.5 cm) is sufficient for our configuration.
| Off / Standby | |
| Idle | |
| Load |
|
Key:
min: | |
| HP ZBook 17 G3 TZV66eA E3-1535M v5, Quadro M3000M, 1920x1080 | Dell Precision 7710 E3-1535M v5, FirePro W7170M, 1920x1080 | Lenovo ThinkPad P70 6820HQ, Quadro M3000M, 3840x2160 | MSI WT72-6QM E3-1505M v5, Quadro M5000M, 1920x1080 | Bullman E-Klasse 5 4790K, Quadro K3100M, 1920x1080 | HP ZBook 17 G2 J8Z55ET 4710MQ, FirePro M6100, 1920x1080 | |
|---|---|---|---|---|---|---|
| Power Consumption | -47% | -31% | -108% | -175% | -164% | |
| Idle Minimum * (Watt) | 6.7 | 6.04 10% | 12.1 -81% | 24.8 -270% | 33.7 -403% | 29.7 -343% |
| Idle Average * (Watt) | 12.5 | 15.2 -22% | 19.7 -58% | 29.7 -138% | 39.3 -214% | 41.6 -233% |
| Idle Maximum * (Watt) | 13.2 | 42.3 -220% | 20.5 -55% | 30.1 -128% | 40.2 -205% | 42.3 -220% |
| Load Average * (Watt) | 128.2 | 112.8 12% | 94.3 26% | 105.2 18% | 148 -15% | 136.1 -6% |
| Load Maximum * (Watt) | 158.9 | 182.2 -15% | 139.6 12% | 192.2 -21% | 221 -39% | 184 -16% |
* ... smaller is better
Battery Runtime
Inside the ZBook 17 G3 is a 6-cell battery with a capacity of 96 Wh. This is, together with the ThinkPad P70, the highest capacity within this comparison. Our realistic battery tests with a brightness of around 150 cd/m² determine runtimes of about 5 hours for the review unit. These are decent results for such a powerful device, but the ThinkPad P70 in particular lasts even longer. One reason is the PWM control of the ThinkPad, which is already working at these brightness levels. The review unit on the other hand only uses PWM for lower brightness levels.
In addition to our usual load test with the Battery Eater Classic Test, we also check the minimum battery runtime for workstations with a loop of the SPECviewperf 12 benchmark. The review unit only lasts 62 minutes before the battery is empty. This is the worst-case scenario. A complete recharge of the battery takes little more than 2.5 hours.


| HP ZBook 17 G3 TZV66eA 96 Wh, mAh | Dell Precision 7710 72 Wh, mAh | Lenovo ThinkPad P70 96 Wh, mAh | MSI WT72-6QM Wh, 86580 mAh | Bullman E-Klasse 5 82 Wh, mAh | HP ZBook 17 G2 J8Z55ET 75 Wh, mAh | |
|---|---|---|---|---|---|---|
| Battery runtime | -5% | -4% | -33% | -53% | -64% | |
| Reader / Idle (h) | 15.9 | 12.9 -19% | 7.7 -52% | 6.9 -57% | 2.8 -82% | 2.7 -83% |
| H.264 (h) | 5 | 4.7 -6% | 7.5 50% | 2.1 -58% | 2.4 -52% | |
| WiFi v1.3 (h) | 4.8 | 6.1 27% | 6 25% | 4.1 -15% | 2.4 -50% | |
| Load (h) | 1.8 | 1.4 -22% | 1.1 -39% | 1.3 -28% | 1.4 -22% | 0.8 -56% |
| WiFi (h) | 2.5 |
Pros
Cons
Verdict
Is the HP ZBook 17 G3 the perfect workstation? The answer is no, but HP still offers a very good device. We particularly like the current case design of the G3-series, which is certainly among the best in terms of quality. We get modern ports, a wide range of components and the maintainability is excellent.
One bigger drawback is the emissions, because some of the rivals perform much better, despite similarly powerful components. The Full HD display could not completely convince us, either. It is already very accurate out of the box, and the contrast is very high as well, but the luminance is much lower compared to the rivals, including the predecessor. The optional 4K DreamColor display should perform better in this respect, but corresponding configurations are not available yet. Another problem of our review unit is the squeaking hinge, but we consider it to be an isolated incident.
The HP ZBook 17 G3 is a very good workstation with modern interfaces and an excellent chassis. The tested configuration, however, is also the most expensive device by quite a margin but is still beaten by the rivals in some sections.
Another quite important aspect is obviously the price, and our test model is extremely expensive at more than 4,500 Euros (~$5014). It will certainly pay off to have a look at some lower-spec configurations, which already start at around 2,100 Euros (~$2340). We have now reviewed all current workstations from the big manufacturers, and it is not easy to determine a clear winner. The ZBook 17 G3 manages a slightly higher rating, but every device has its own set of advantages and drawbacks, so the personal preferences and obviously the planned usage scenario will be important as well. The emissions of the ZBook 17 G3 in particular still leave room for improvements.
HP ZBook 17 G3 TZV66eA
- 05/24/2016 v5.1 (old)
Andreas Osthoff
Price comparison

