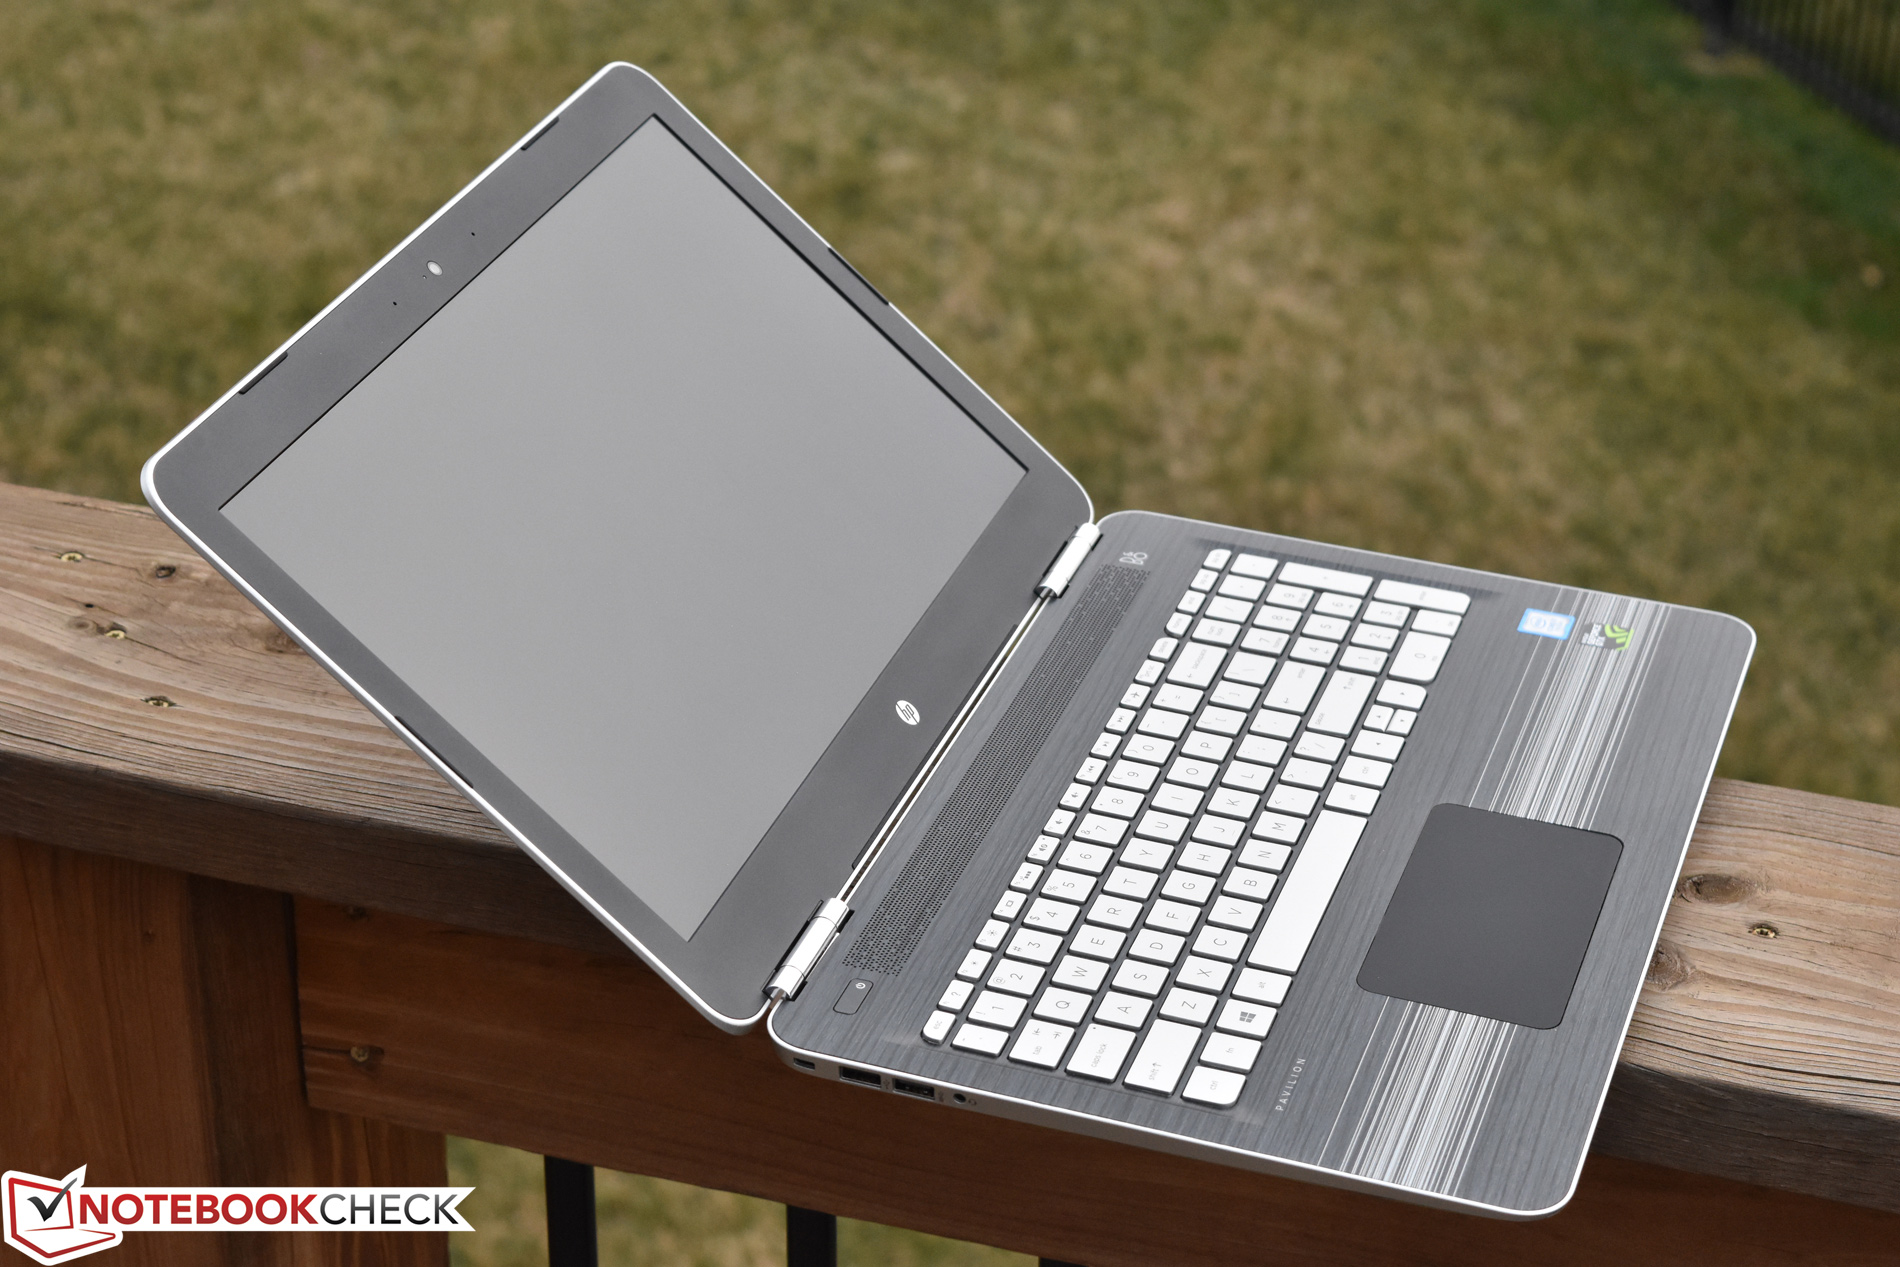
HP Pavilion 15t-bc200 X7P44AV (7700HQ, UHD, GTX 1050) Laptop Review
It was just last month when we evaluated the Pavilion 15t, a head-turner in the midrange entertainment notebook sector when judging by the spec sheet alone. Our review unit was (well) equipped with an Intel Core i7-7700 HQ, 16 GB of dual-channel DDR4 memory, an NVIDIA GTX 1050 GPU, and an M.2 solid-state drive. It also featured a FHD (1080p) IPS anti-glare display, but in spite of the great viewing angles and anti-glare finish, we lamented its weak brightness and poor color reproduction.
Today, we have largely the same model in front of us, except now, the SSD has been upgraded to an NVMe model, and the display panel is a much nicer UHD display. Although HP refers to it as UHD/4K, however, it should be noted that the subpixel geometry is RGBW, which does reduce image quality in spite of technically still achieving a 3840 x 2160 resolution. We’ll get into slightly more detail on this in our display section, but until then, the question becomes: is this enough to propel the Pavilion 15t into our subset of recommended machines?
As of today, this exact configuration is available for purchase from Computer Upgrade King (the supplier who provided us with today’s review unit) for around $1141.
Please note: We have reviewed numerous machines from this series already, with the previous Pavilion 15t literally qualifying as identical otherwise in terms of everything from construction to connections and input devices. As such, we will be skipping most of those sections entirely in today’s review. For much more detailed information on those aspects of the machine, please see our most recent reviews of related machines here and here.
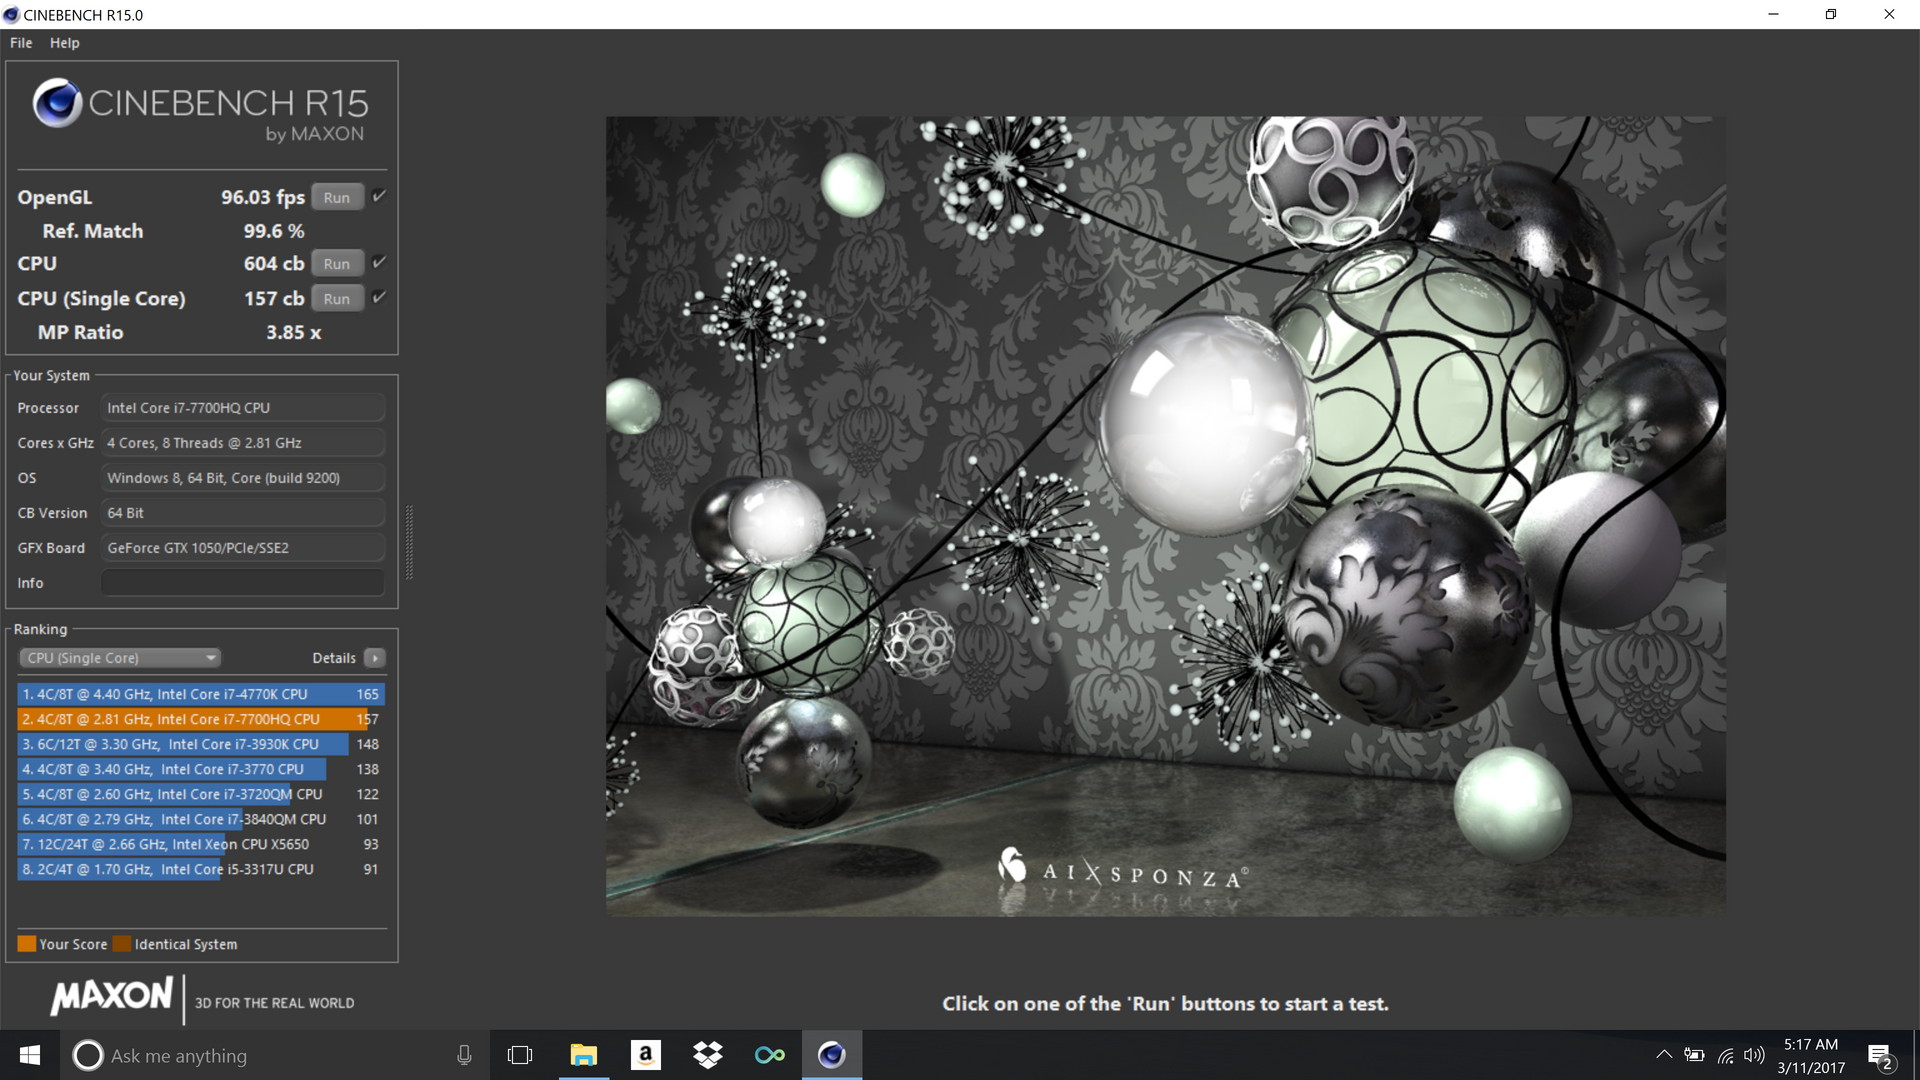
Also please note: As we’ve covered numerous times in our previous reviews, these machines are afflicted by unfortunate and unpredictable firmware-level issues which, as of yet, have not seen a complete resolution by the manufacturer. These issues include inconsistent benchmark performance (especially CPU) and random hangs/hiccups, even with the most recent BIOS version (F.35 REV A)—and before the BIOS upgrade, we also experienced regular machine crashes. This review attempts to take those issues into account during our testing of the machine, however, please keep in mind that benchmarks have been necessarily affected by these limitations. We do not feel it’s fair to provide the machine with additional opportunities to produce a higher score after all firmware-level upgrades have already been performed, so we have not re-run benchmarks in pursuit of higher scores even if they seem artificially low. This will be evident during our Cinebench R15 section, where the sustained performance graph records higher numbers than our actual initial benchmark in the database.
Preliminary Notes
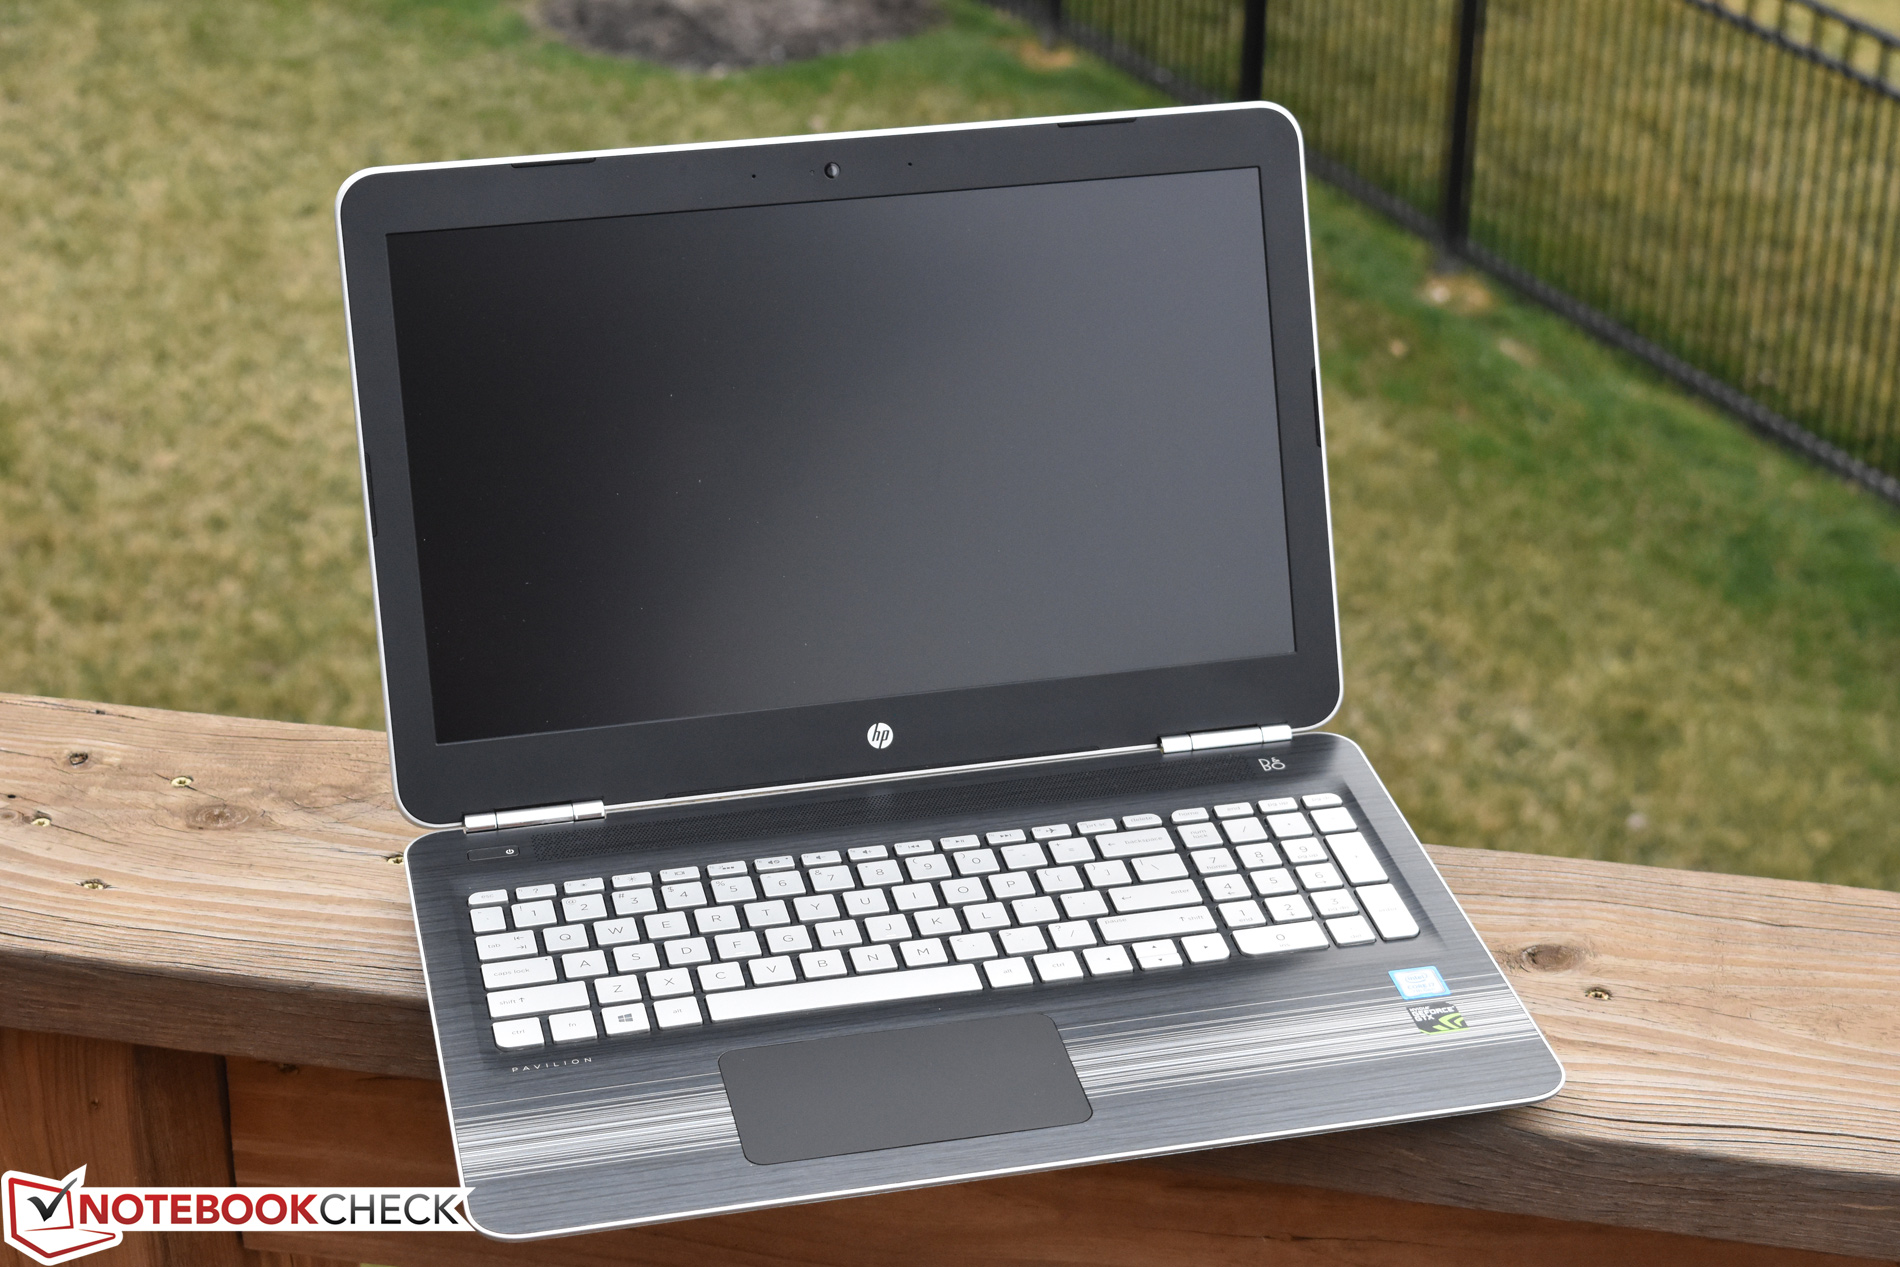
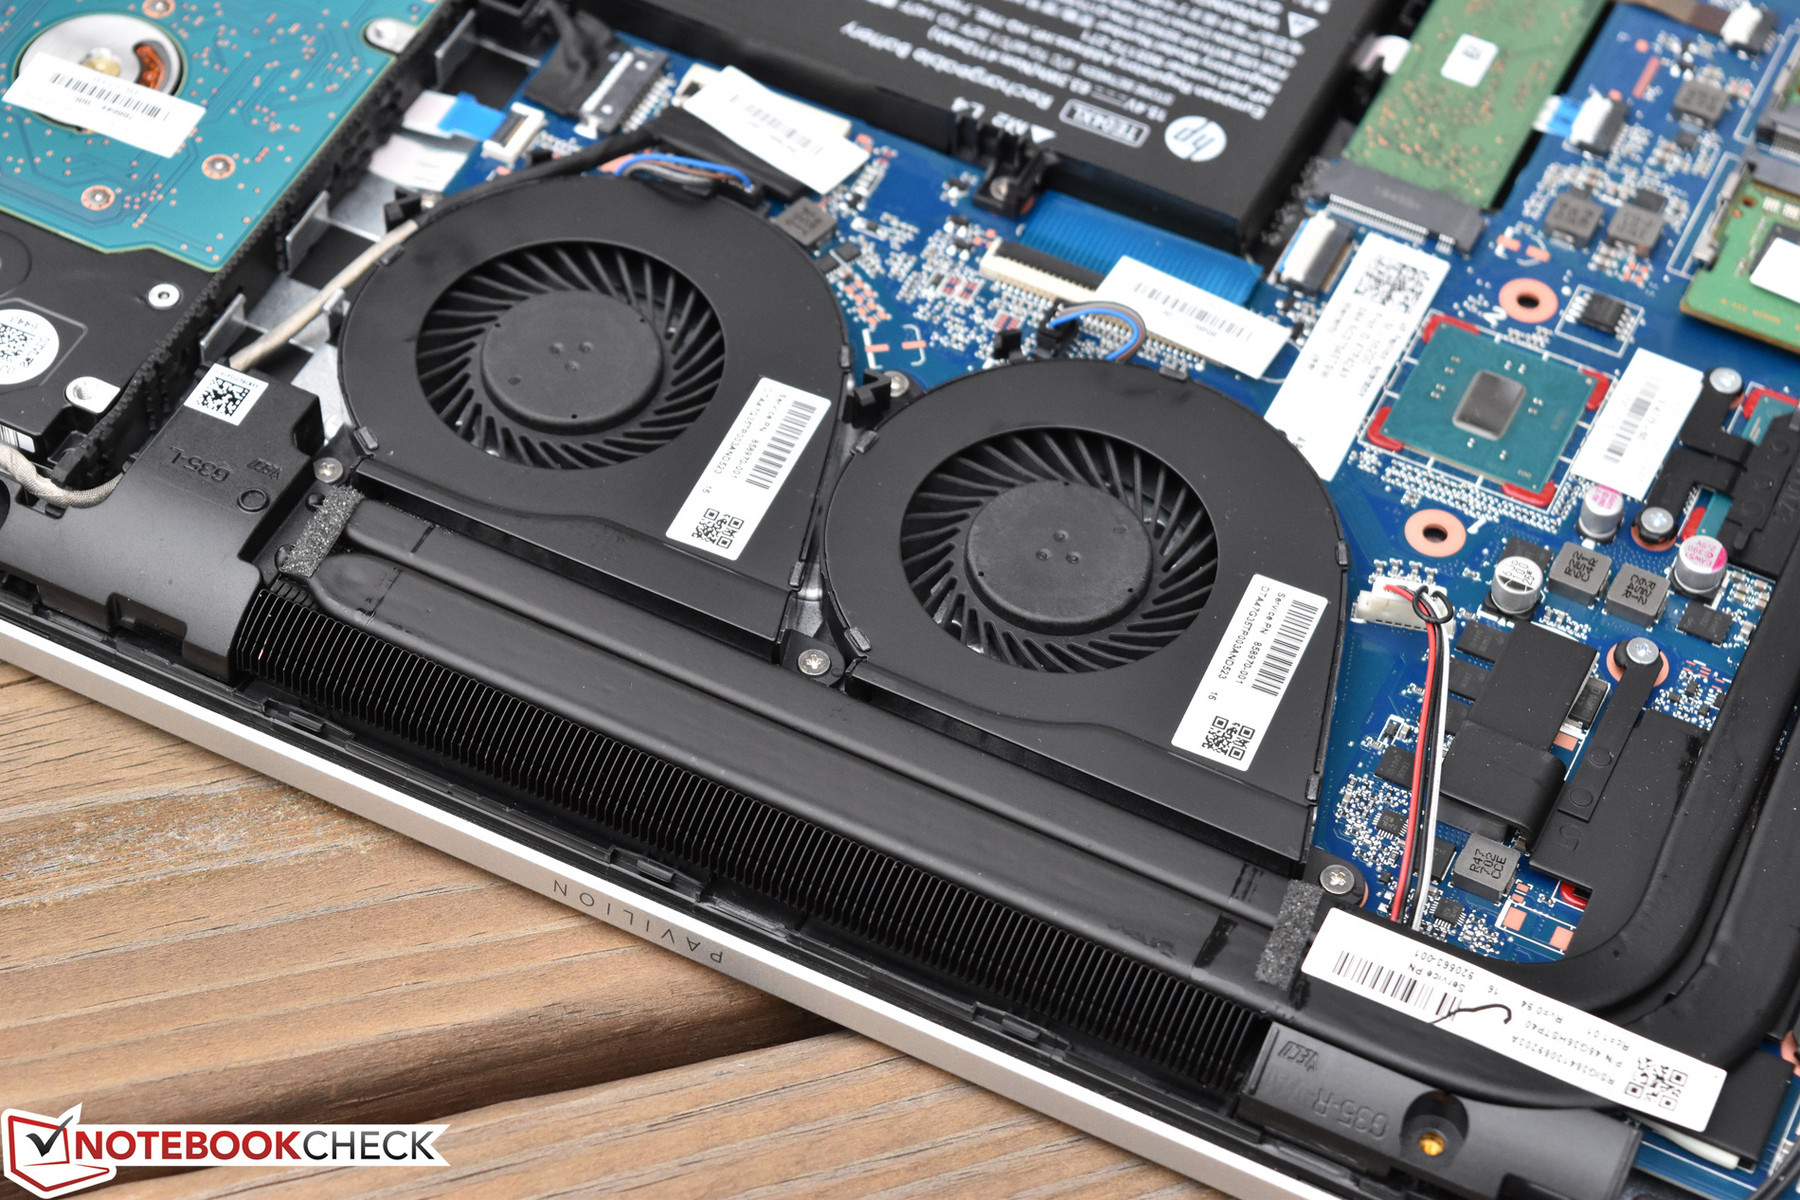
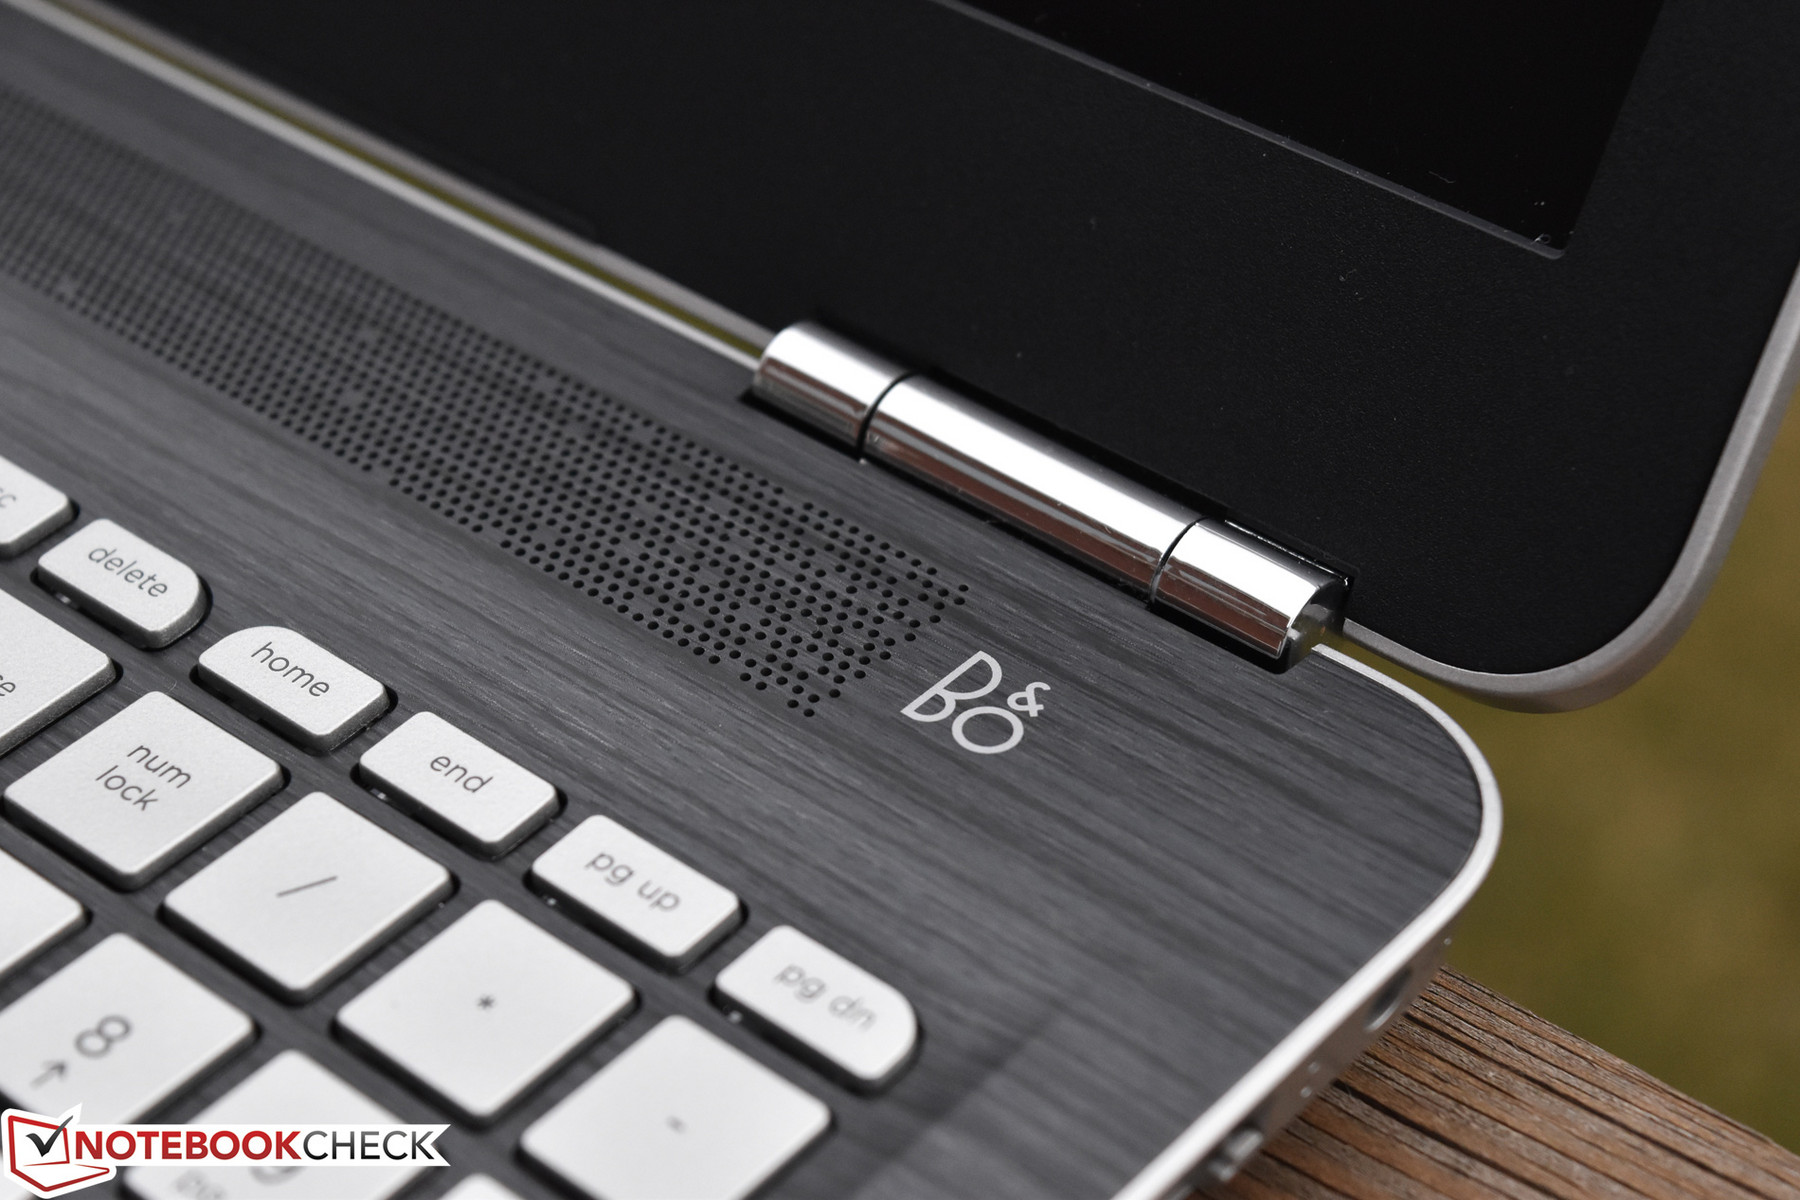
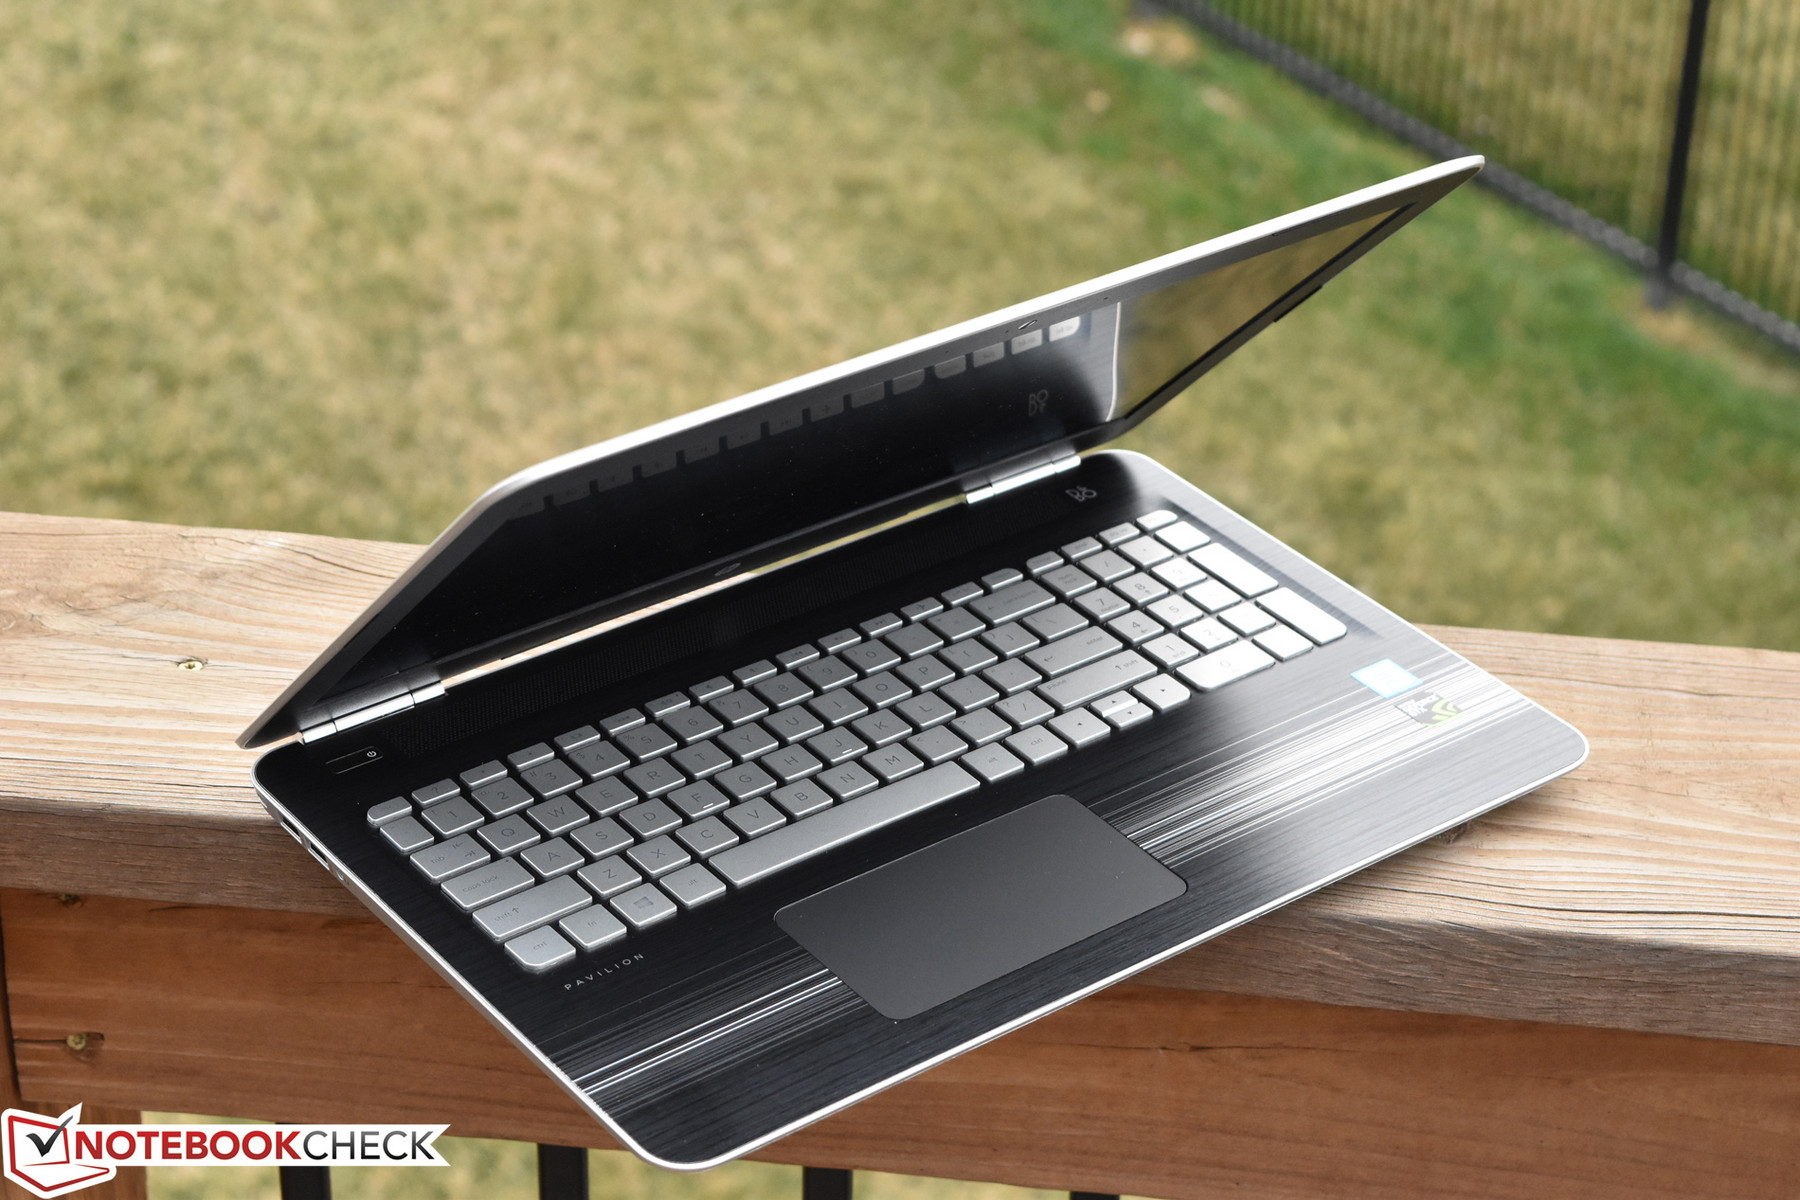
To quickly reiterate/summarize the most pertinent of our previous findings from recent reviews of similar models, the Pavilion 15t’s case is constructed from a flimsy plastic which is quite easy to damage while disassembling. It is a lightweight computer for its size and class, but this is entirely thanks to the use of this plastic rather than the metal employed in higher-quality machines like the HP Spectre x360 15 and Dell XPS 15 9560. Maintenance is also unfortunately challenging, requiring the removal of the entire palmrest/top cover—which is a perilous undertaking given the fragility of the construction materials. We also are not impressed by the touchpad, and the keyboard is average at best. When compared with many other machines in this price range, the Pavilion 15t seems overpriced.
SD Card Reader
Our benchmarks of the card reader reveal average transfer rates comparable to those of the Pavilion 15t we evaluated last month. See our graphs below for more detail.
| SD Card Reader | |
| average JPG Copy Test (av. of 3 runs) | |
| Dell XPS 15 9560 (i7-7700HQ, UHD) | |
| HP Pavilion 15t-X7P42AV | |
| HP Pavilion 15t-bc200 X7P44AV | |
| Lenovo ThinkPad E570-20H6S00000 | |
| Acer Aspire VN7-593G-73HP V15 Nitro BE | |
| maximum AS SSD Seq Read Test (1GB) | |
| Dell XPS 15 9560 (i7-7700HQ, UHD) | |
| HP Pavilion 15t-bc200 X7P44AV | |
| HP Pavilion 15t-X7P42AV | |
| Lenovo ThinkPad E570-20H6S00000 | |
| Acer Aspire VN7-593G-73HP V15 Nitro BE | |
Communication
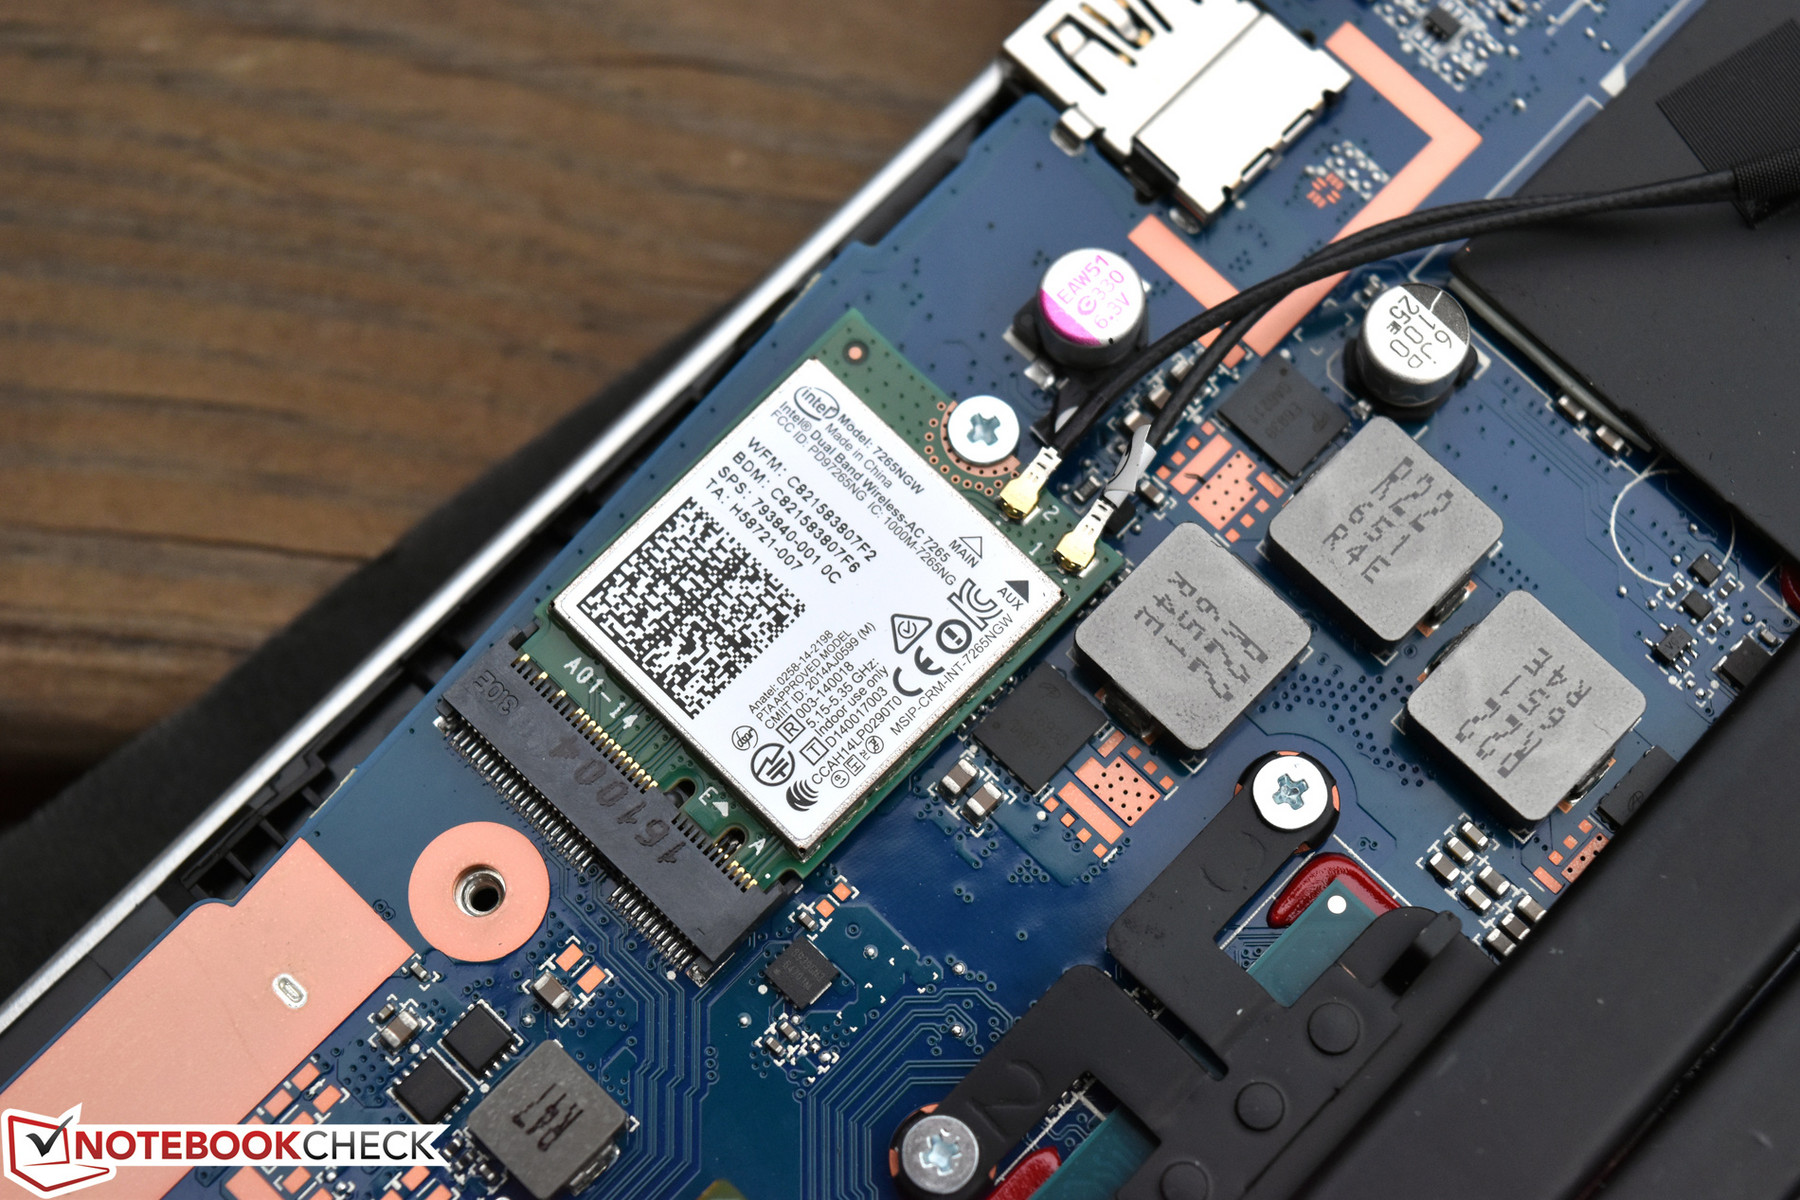
Again, the same networking hardware—an Intel Dual Band Wireless-AC 7265, specifically—is present in this month’s review model as we saw in the FHD configuration. Speeds were quite good overall in our tests.
Display
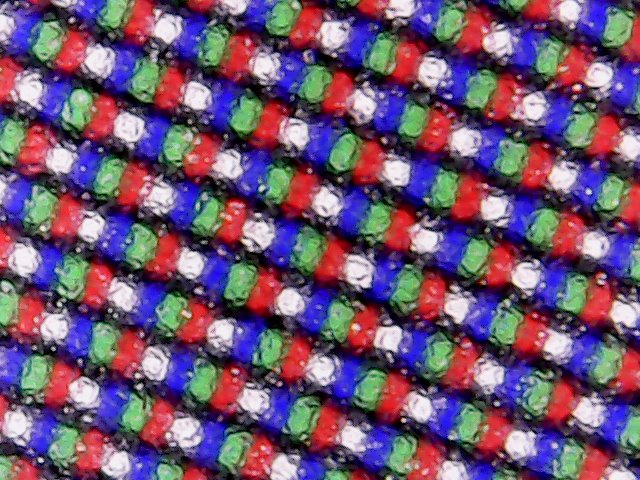
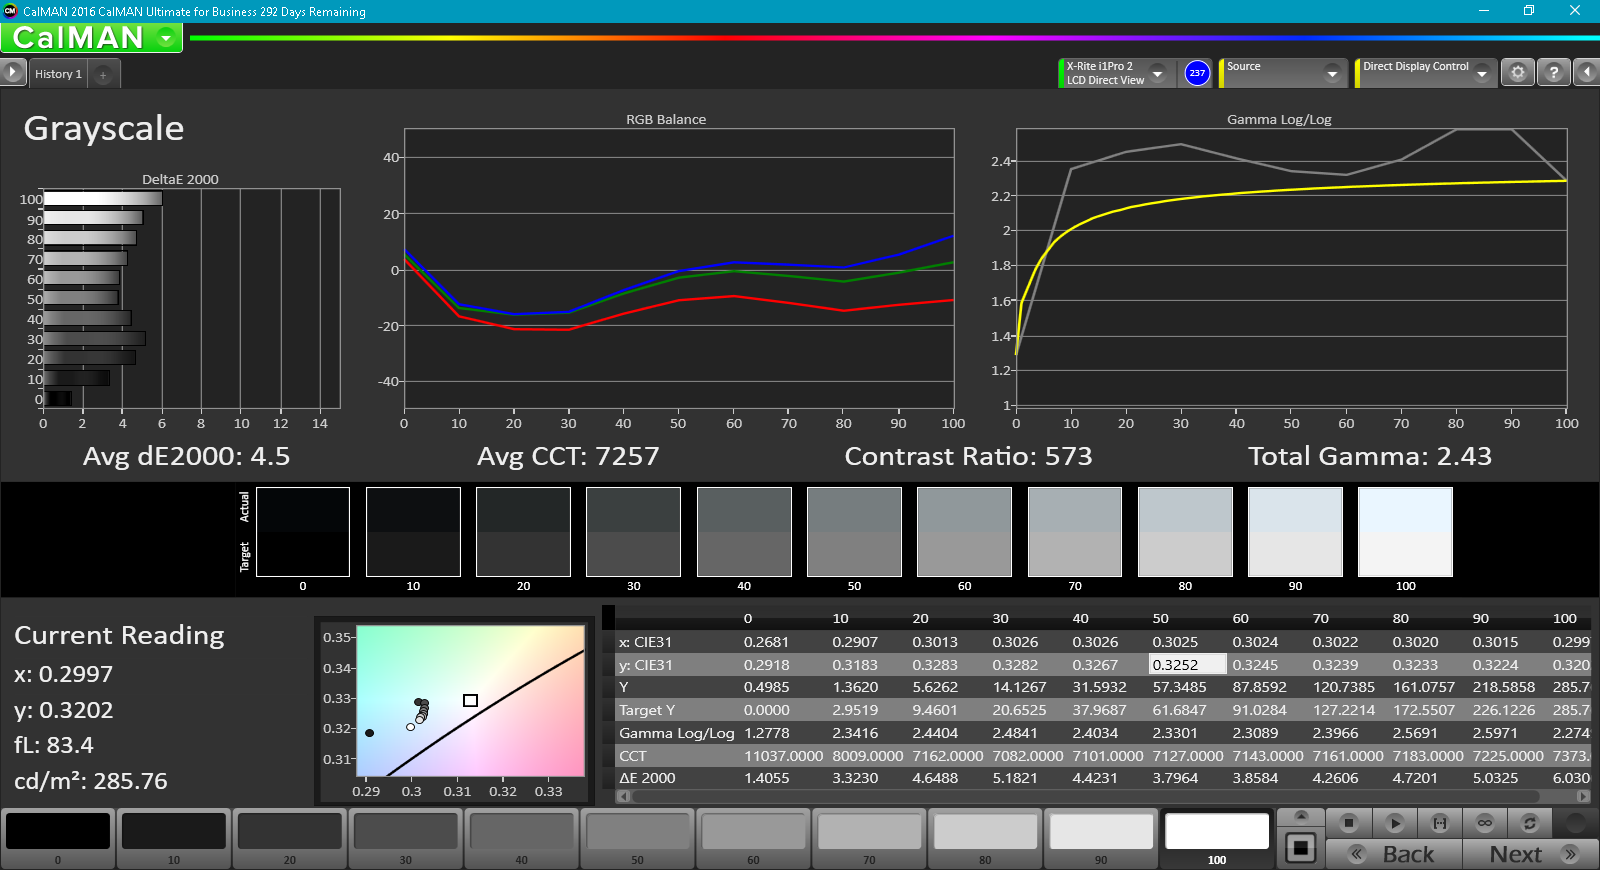
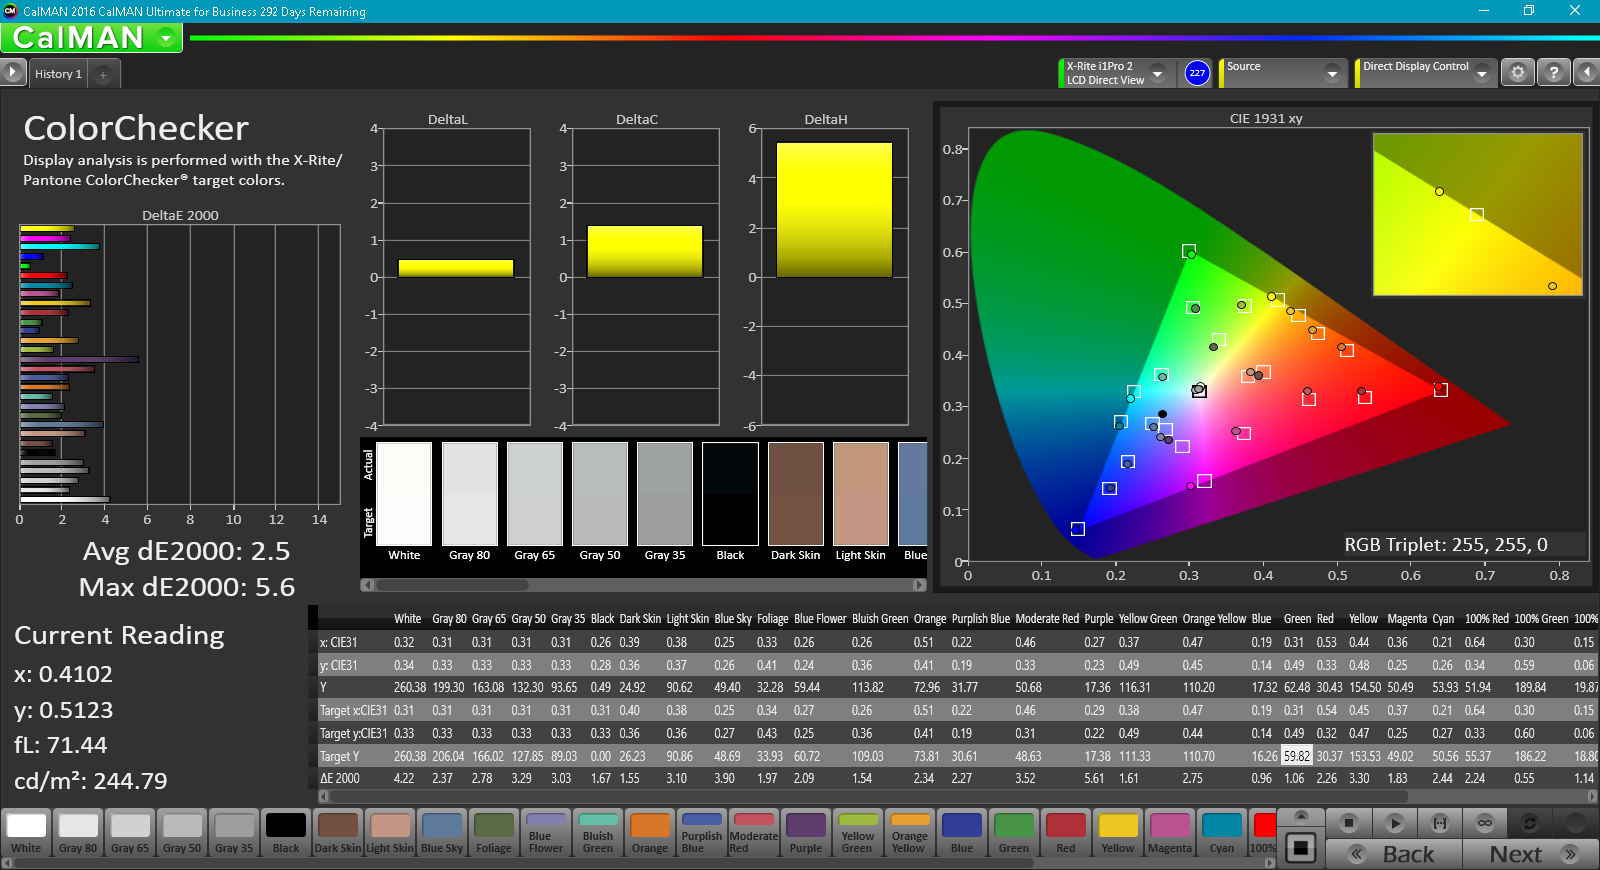
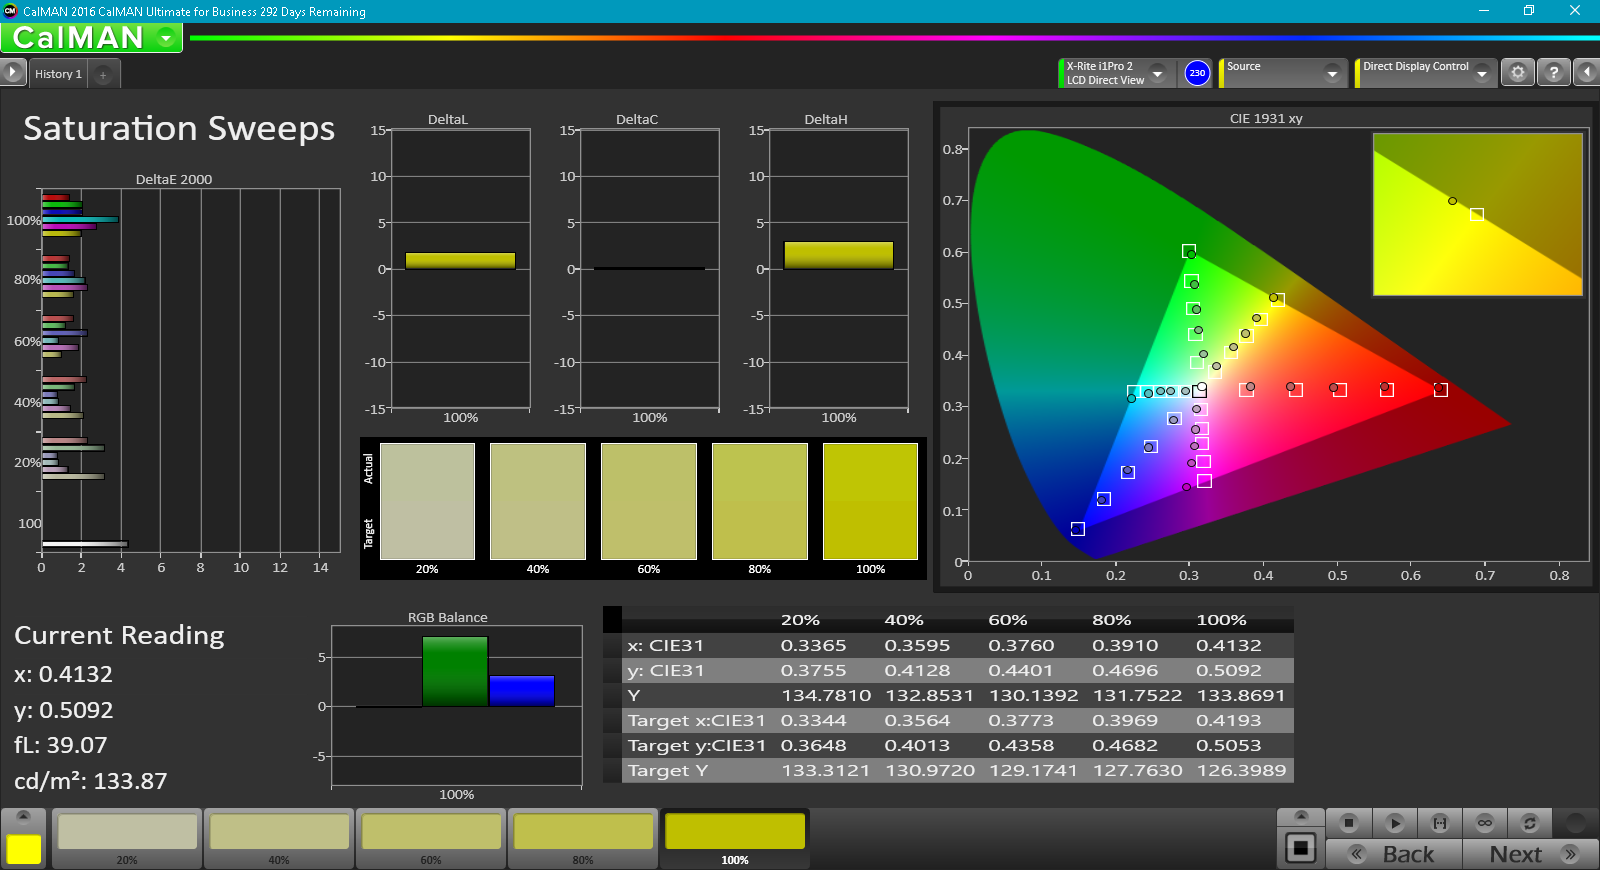
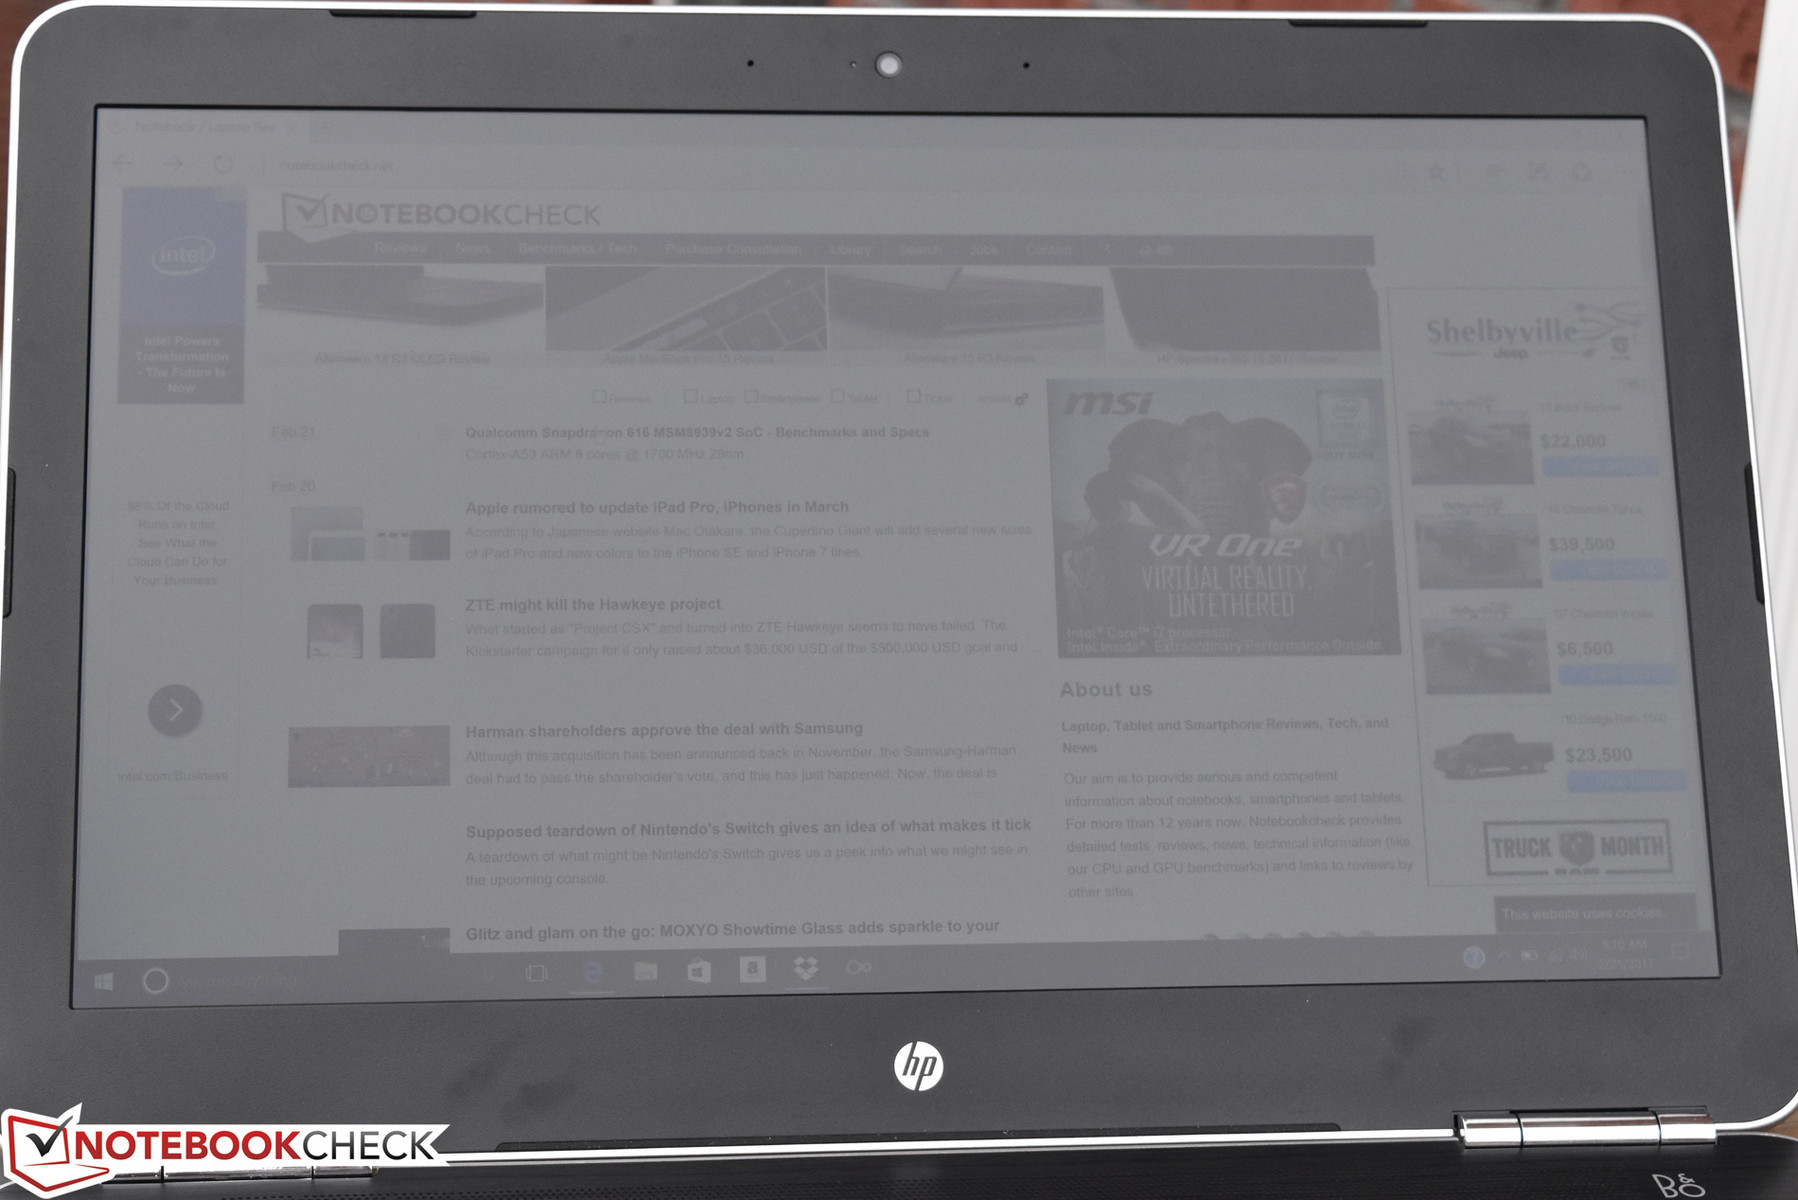
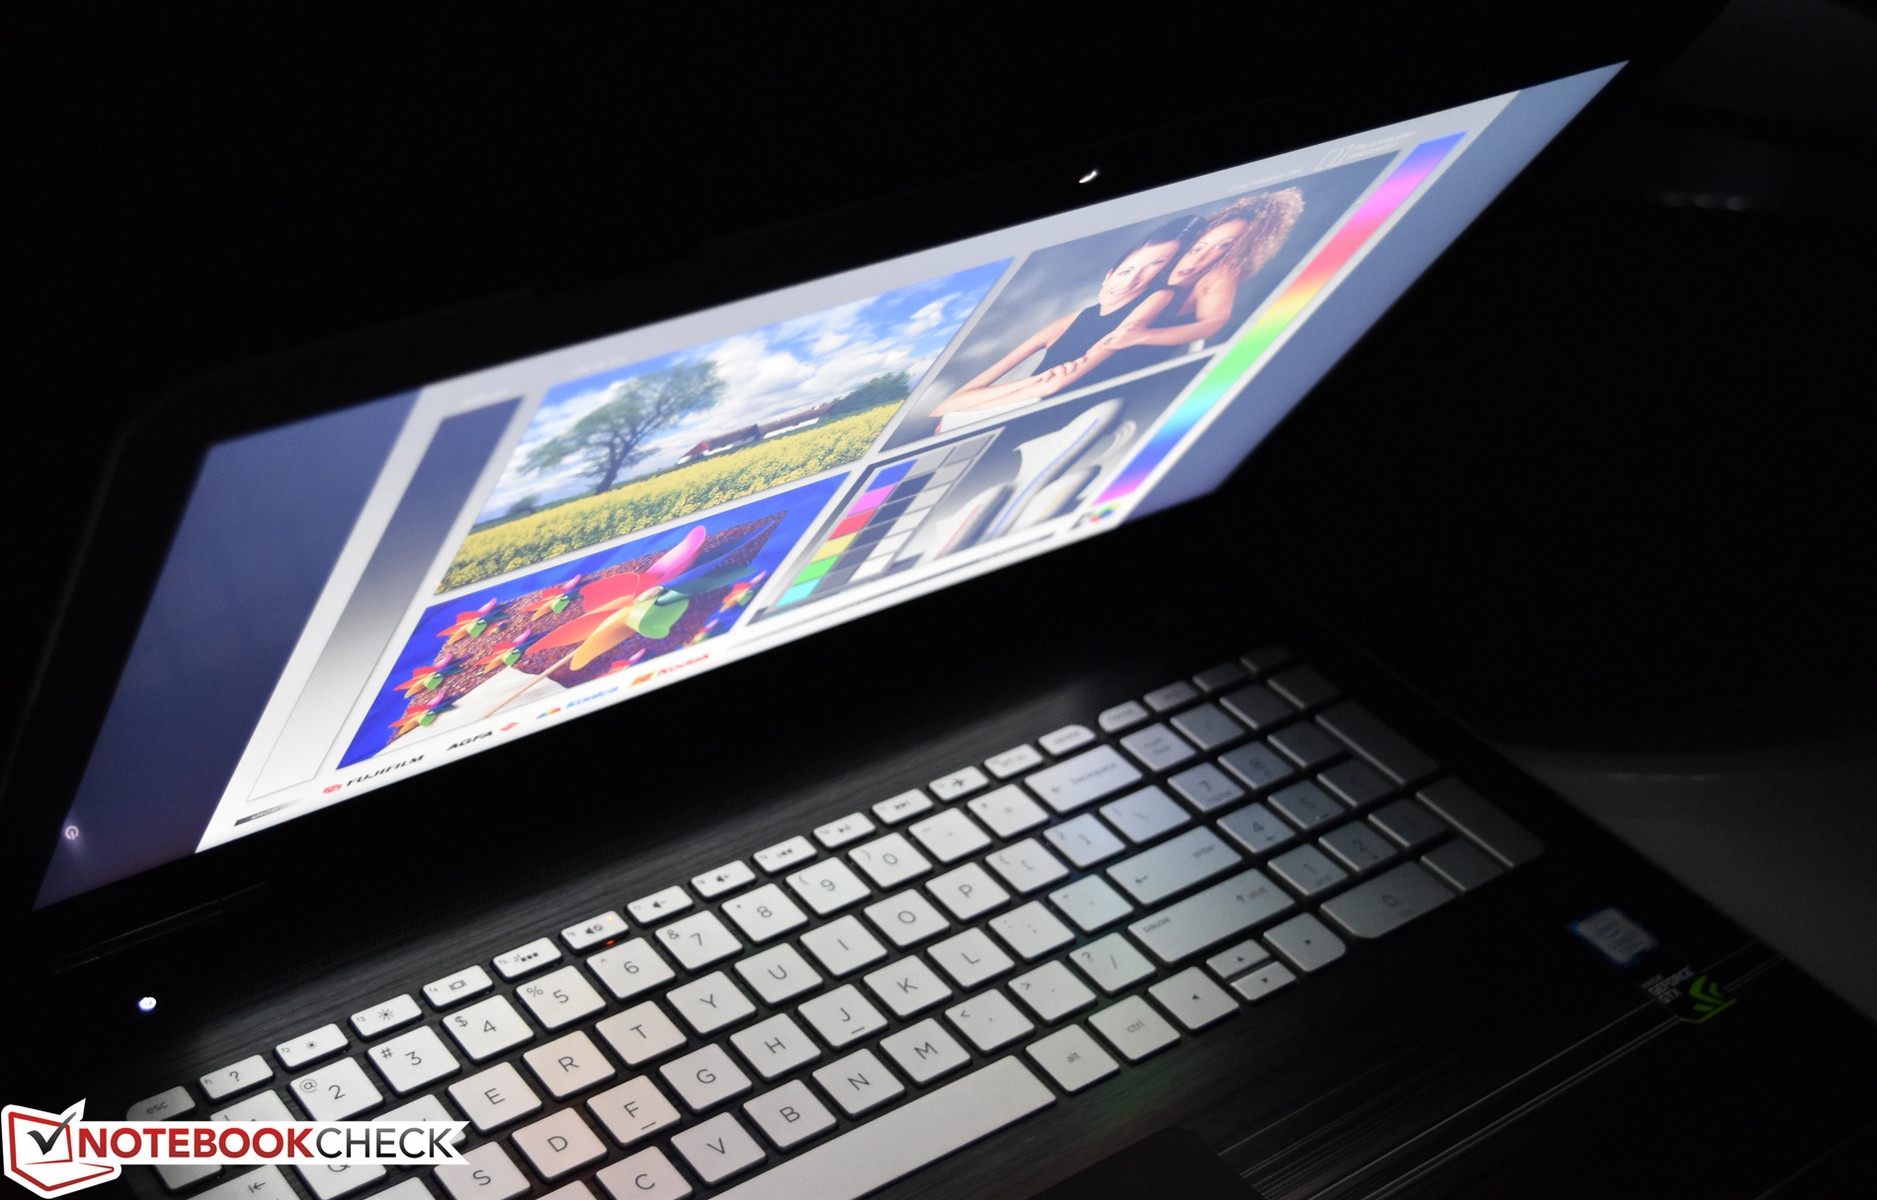
Let’s jump right into it. The most significant differentiating factor between last month’s Pavilion 15t and today’s is the much nicer UHD anti-glare display panel. Even at first glance, it quite obviously provides much more vivid color reproduction and a considerably higher brightness. However, before we move further, we should clarify that it’s not all positive unfortunately. The particular LG panel in use in the Pavilion 15t carries a subpixel arrangement of RGBW, which results in a markedly lower image quality as compared to authentic RGB 4K/UHD displays. In short, although the full UHD resolution of 3840x2160 is achieved, the methods used to reach that value are disingenuous and carry negative results for the user’s experience. On the bright side, these limitations are less noticeable, fortunately, on a 15.6 inch display panel than they are on, say, a 55-inch television. For a much more detailed explanation of this technical conundrum, please see this excellent explanatory page from 4k.com.
| |||||||||||||||||||||||||
Brightness Distribution: 87 %
Center on Battery: 259 cd/m²
Contrast: 508:1 (Black: 0.51 cd/m²)
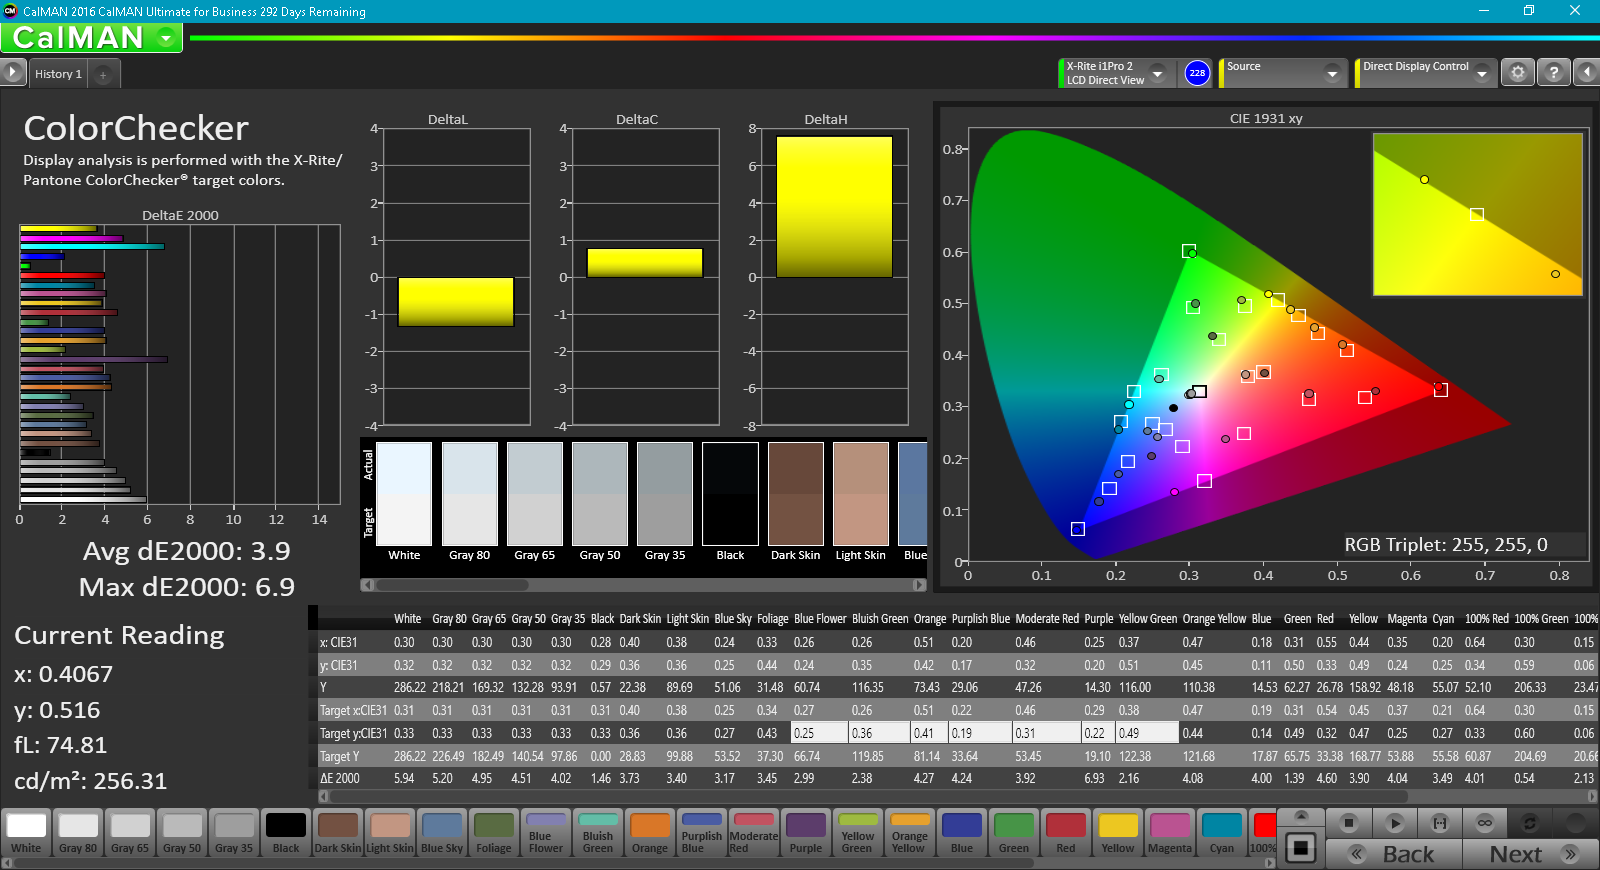
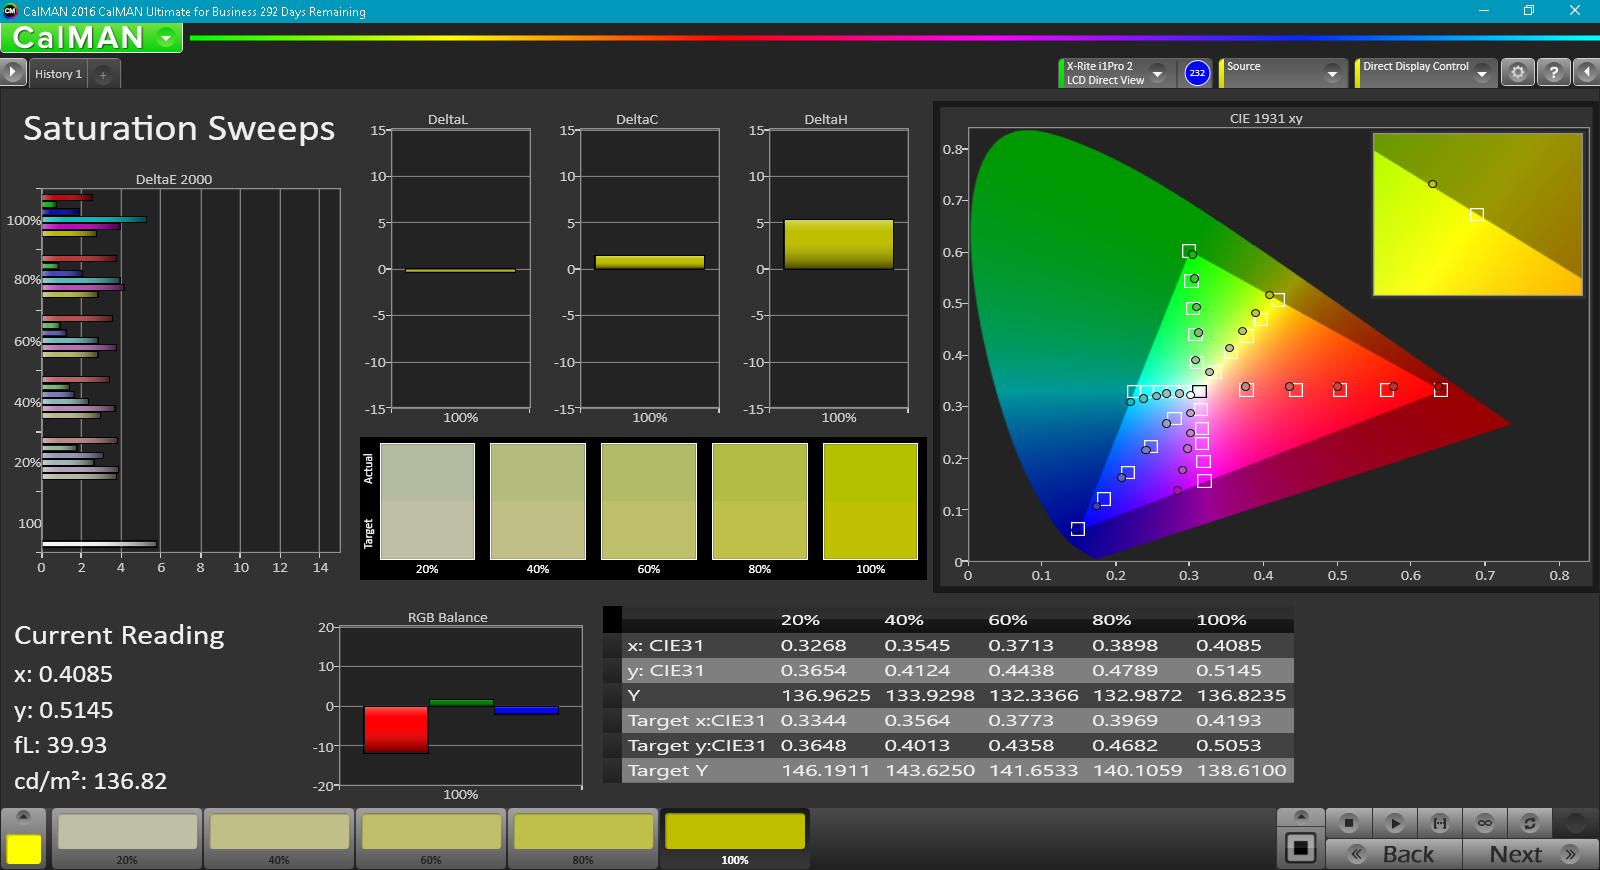
ΔE ColorChecker Calman: 3.9 | ∀{0.5-29.43 Ø4.73}
ΔE Greyscale Calman: 4.5 | ∀{0.09-98 Ø4.97}
94.1% sRGB (Calman 2D)
59.5% AdobeRGB 1998 (Argyll 1.6.3 3D)
64.8% AdobeRGB 1998 (Argyll 3D)
94.4% sRGB (Argyll 3D)
63% Display P3 (Argyll 3D)
Gamma: 2.43
CCT: 7257 K
| HP Pavilion 15t-bc200 X7P44AV LGD04D4, , 15.6", 3840x2160 | Dell XPS 15 9560 (i7-7700HQ, UHD) IGZO IPS, 15.6", 3840x2160 | HP Pavilion 15t-X7P42AV AU Optronics AUO41ED, IPS, 15.6", 1920x1080 | Acer Aspire VN7-593G-73HP V15 Nitro BE LG Display LP156WF6-SPP1, AH-IPS, Normally Black, Transmissive, 15.6", 1920x1080 | Lenovo ThinkPad E570-20H6S00000 AUO B156HAN04.4, IPS LED, 15.6", 1920x1080 | |
|---|---|---|---|---|---|
| Display | 34% | -40% | -3% | -39% | |
| Display P3 Coverage (%) | 63 | 89.7 42% | 38.03 -40% | 65.8 4% | 38.65 -39% |
| sRGB Coverage (%) | 94.4 | 100 6% | 56.5 -40% | 85.1 -10% | 58 -39% |
| AdobeRGB 1998 Coverage (%) | 64.8 | 100 54% | 39.29 -39% | 62.2 -4% | 39.94 -38% |
| Response Times | -73% | -28% | -36% | -25% | |
| Response Time Grey 50% / Grey 80% * (ms) | 30.4 ? | 57.2 ? -88% | 44.4 ? -46% | 41 ? -35% | 44.8 ? -47% |
| Response Time Black / White * (ms) | 24.8 ? | 39.2 ? -58% | 27.2 ? -10% | 34 ? -37% | 25.6 ? -3% |
| PWM Frequency (Hz) | 962 | ||||
| Screen | 19% | -36% | 12% | 6% | |
| Brightness middle (cd/m²) | 259 | 370.1 43% | 209.7 -19% | 322 24% | 242 -7% |
| Brightness (cd/m²) | 255 | 356 40% | 193 -24% | 297 16% | 243 -5% |
| Brightness Distribution (%) | 87 | 87 0% | 75 -14% | 86 -1% | 75 -14% |
| Black Level * (cd/m²) | 0.51 | 0.37 27% | 0.19 63% | 0.31 39% | 0.24 53% |
| Contrast (:1) | 508 | 1000 97% | 1104 117% | 1039 105% | 1008 98% |
| Colorchecker dE 2000 * | 3.9 | 5.3 -36% | 7.8 -100% | 4.73 -21% | 4.65 -19% |
| Colorchecker dE 2000 max. * | 6.9 | 9.9 -43% | 24.1 -249% | 12.37 -79% | 9.64 -40% |
| Greyscale dE 2000 * | 4.5 | 4.6 -2% | 7.3 -62% | 2.99 34% | 3.39 25% |
| Gamma | 2.43 91% | 2.31 95% | 2.39 92% | 2.32 95% | 2.7 81% |
| CCT | 7257 90% | 6284 103% | 5771 113% | 6905 94% | 6246 104% |
| Color Space (Percent of AdobeRGB 1998) (%) | 59.5 | 88.3 48% | 39.3 -34% | 56 -6% | 36.69 -38% |
| Color Space (Percent of sRGB) (%) | 100 | 56.5 | 85 | 57.66 | |
| Total Average (Program / Settings) | -7% /
9% | -35% /
-36% | -9% /
2% | -19% /
-8% |
* ... smaller is better
There are a few other disappointing findings as well: although the brightness is well above that of its predecessor, the Pavilion 15t still achieves a pedestrian 255 cd/m²—a long way from the 300+ we like to see for sufficient luminosity in outdoor and brighter environments. Contrast is also a ho-hum 508:1, which is actually far below that of the previous configuration (1104:1).
But the rest of the story is much more positive. Sharply higher than our previous configuration are the color space coverage numbers, with 94 percent of sRGB and 59 percent of AdobeRGB addressed. These aren’t competitive with the best screens we’ve reviewed (such as the Dell XPS 15 in our comparison field), but they’re still overall quite good.

CalMAN 5 also reports positive results, with DeltaE averages of 3.9 and 4.5 (ideal: 0) for Colorchecker and Greyscale, respectively—well below those of the previous panel. The Total Gamma value of 2.43 (ideal: 2.2) and CCT average of 7257 (ideal: 6500K) are also not far off the mark.
Display Response Times
| ↔ Response Time Black to White | ||
|---|---|---|
| 24.8 ms ... rise ↗ and fall ↘ combined | ↗ 10 ms rise | 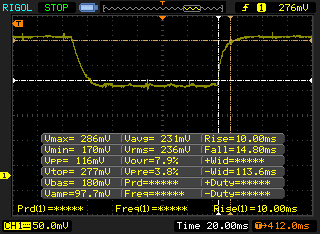 |
| ↘ 14.8 ms fall | ||
| The screen shows good response rates in our tests, but may be too slow for competitive gamers. In comparison, all tested devices range from 0.1 (minimum) to 240 (maximum) ms. » 58 % of all devices are better. This means that the measured response time is worse than the average of all tested devices (19.9 ms). | ||
| ↔ Response Time 50% Grey to 80% Grey | ||
| 30.4 ms ... rise ↗ and fall ↘ combined | ↗ 12.4 ms rise | 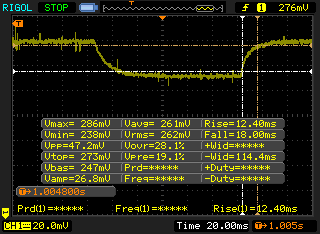 |
| ↘ 18 ms fall | ||
| The screen shows slow response rates in our tests and will be unsatisfactory for gamers. In comparison, all tested devices range from 0.165 (minimum) to 636 (maximum) ms. » 41 % of all devices are better. This means that the measured response time is similar to the average of all tested devices (31.1 ms). | ||
Screen Flickering / PWM (Pulse-Width Modulation)
| Screen flickering / PWM not detected | 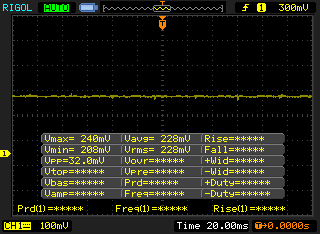 | ||
In comparison: 52 % of all tested devices do not use PWM to dim the display. If PWM was detected, an average of 7794 (minimum: 5 - maximum: 343500) Hz was measured. | |||
Outdoors, the machine holds its own in all but bright sunlight, wherein the middling luminosity and relatively weak contrast can’t keep up. Thanks to the IPS panel, however, viewing angles are excellent.
Performance
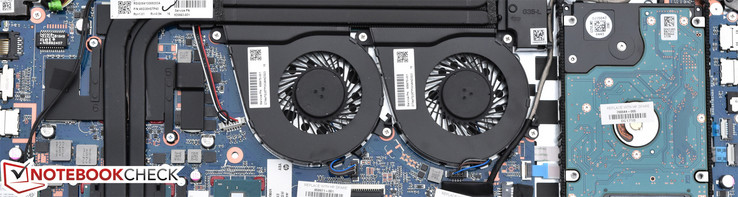
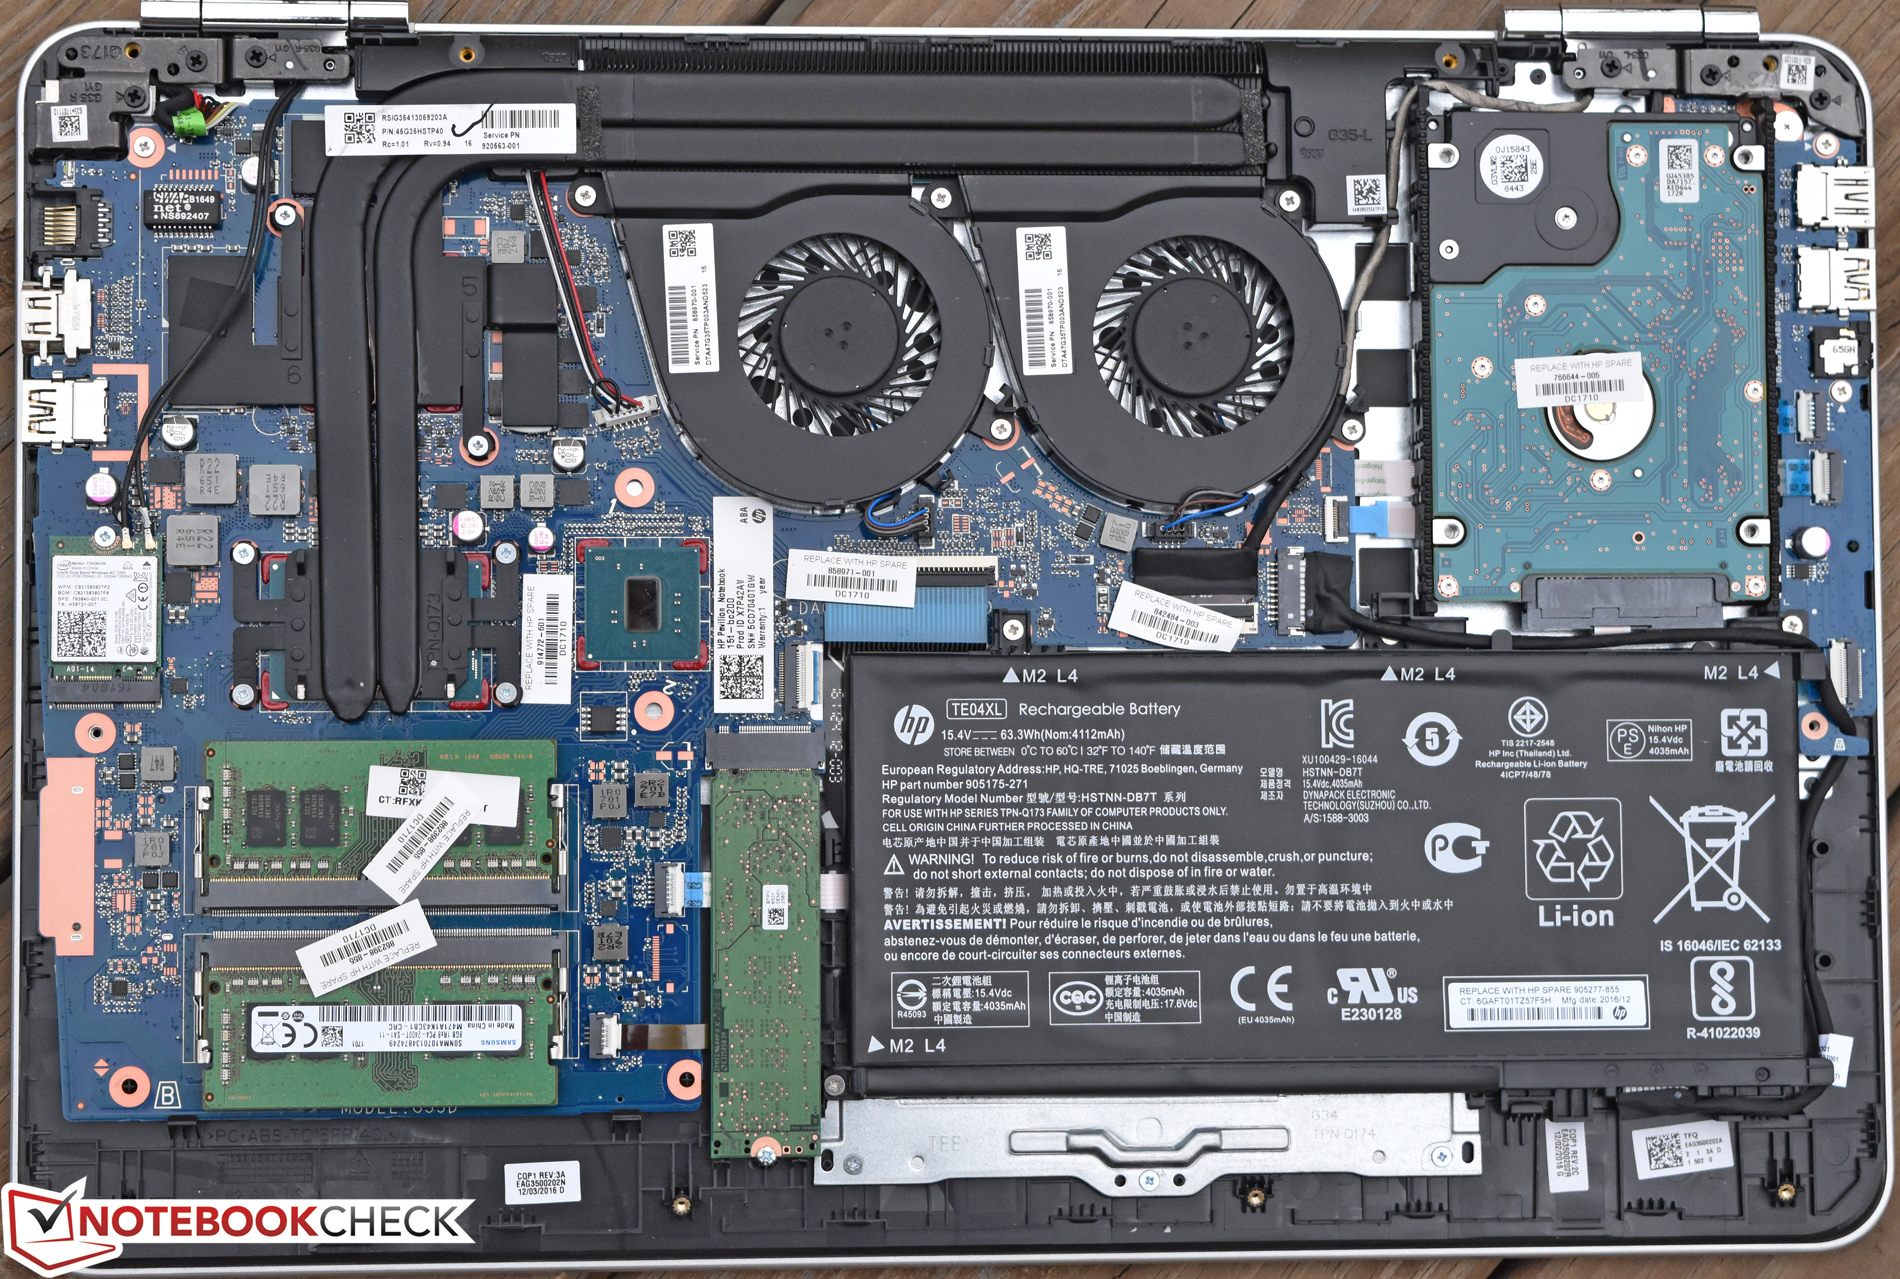
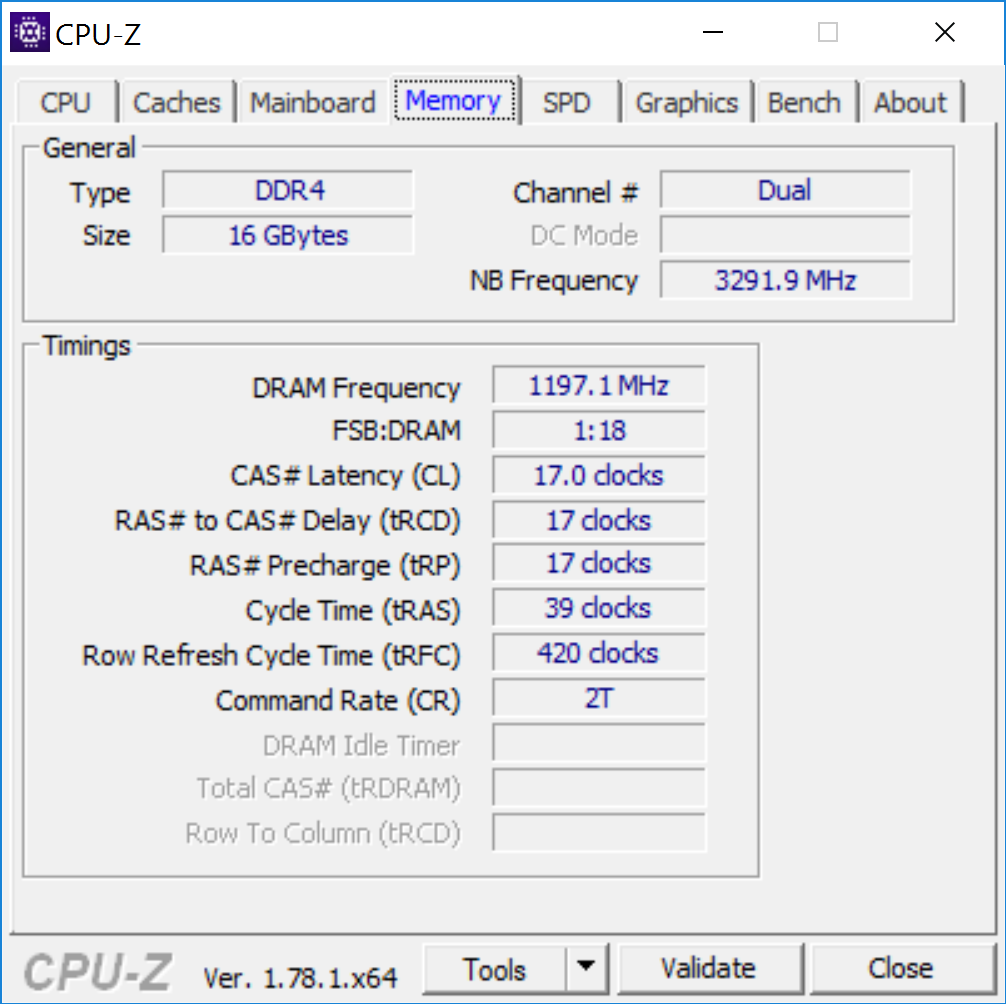
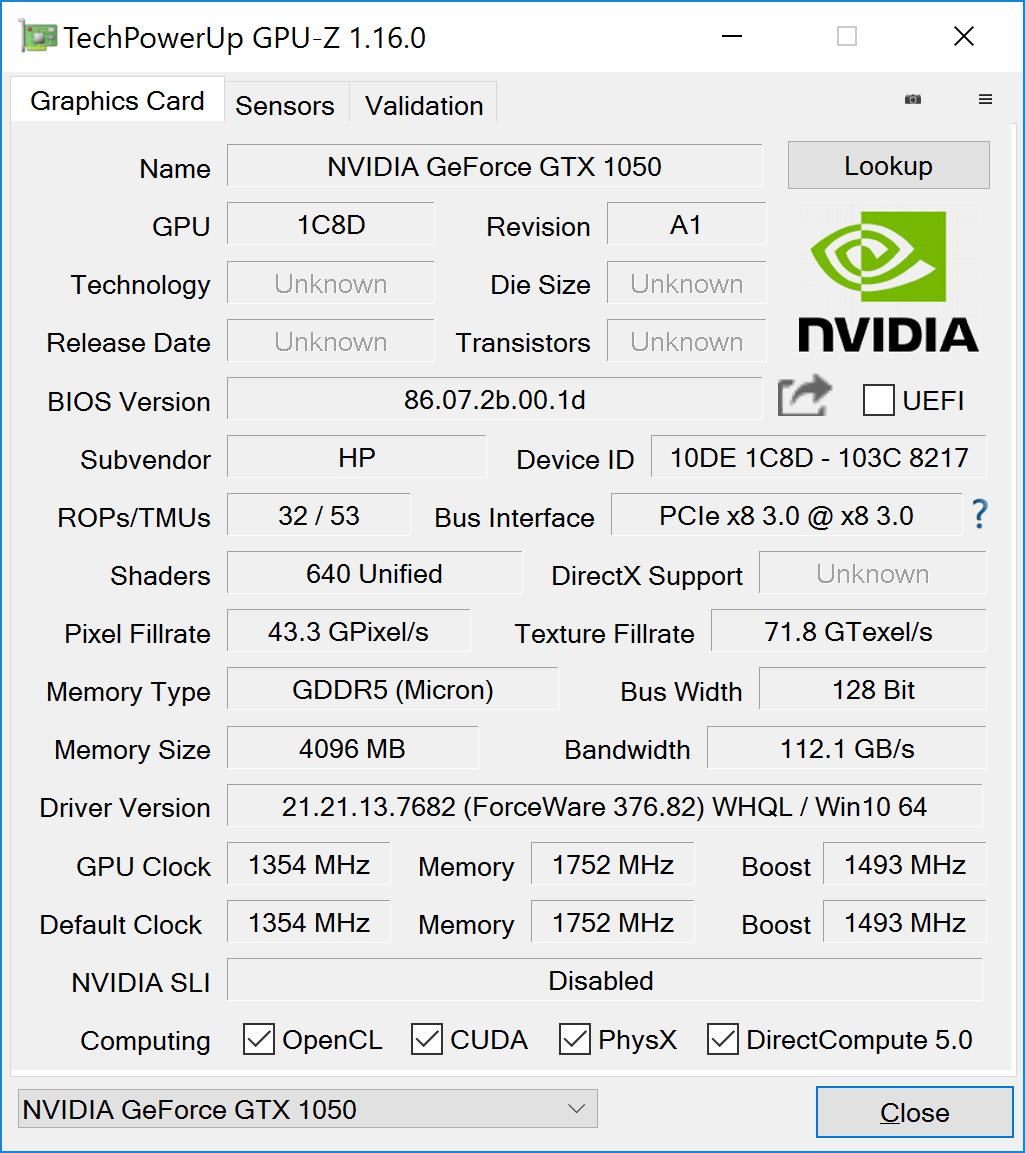
Our machine retains the same Kaby Lake Core i7-7700HQ as the previous configuration we reviewed, along with the same 16 GB of dual-channel DDR4 memory, a solid-state drive, and an NVIDIA GTX 1050. Aftermarket upgrades and modifications are not ideal on the Pavilion 15t, however, thanks to an unnecessarily inconvenient maintenance design (which will very likely see you damaging your case, however subtly, during the process). Again, for much more detail about this shortcoming, please reference our previous reviews of machines in this series.
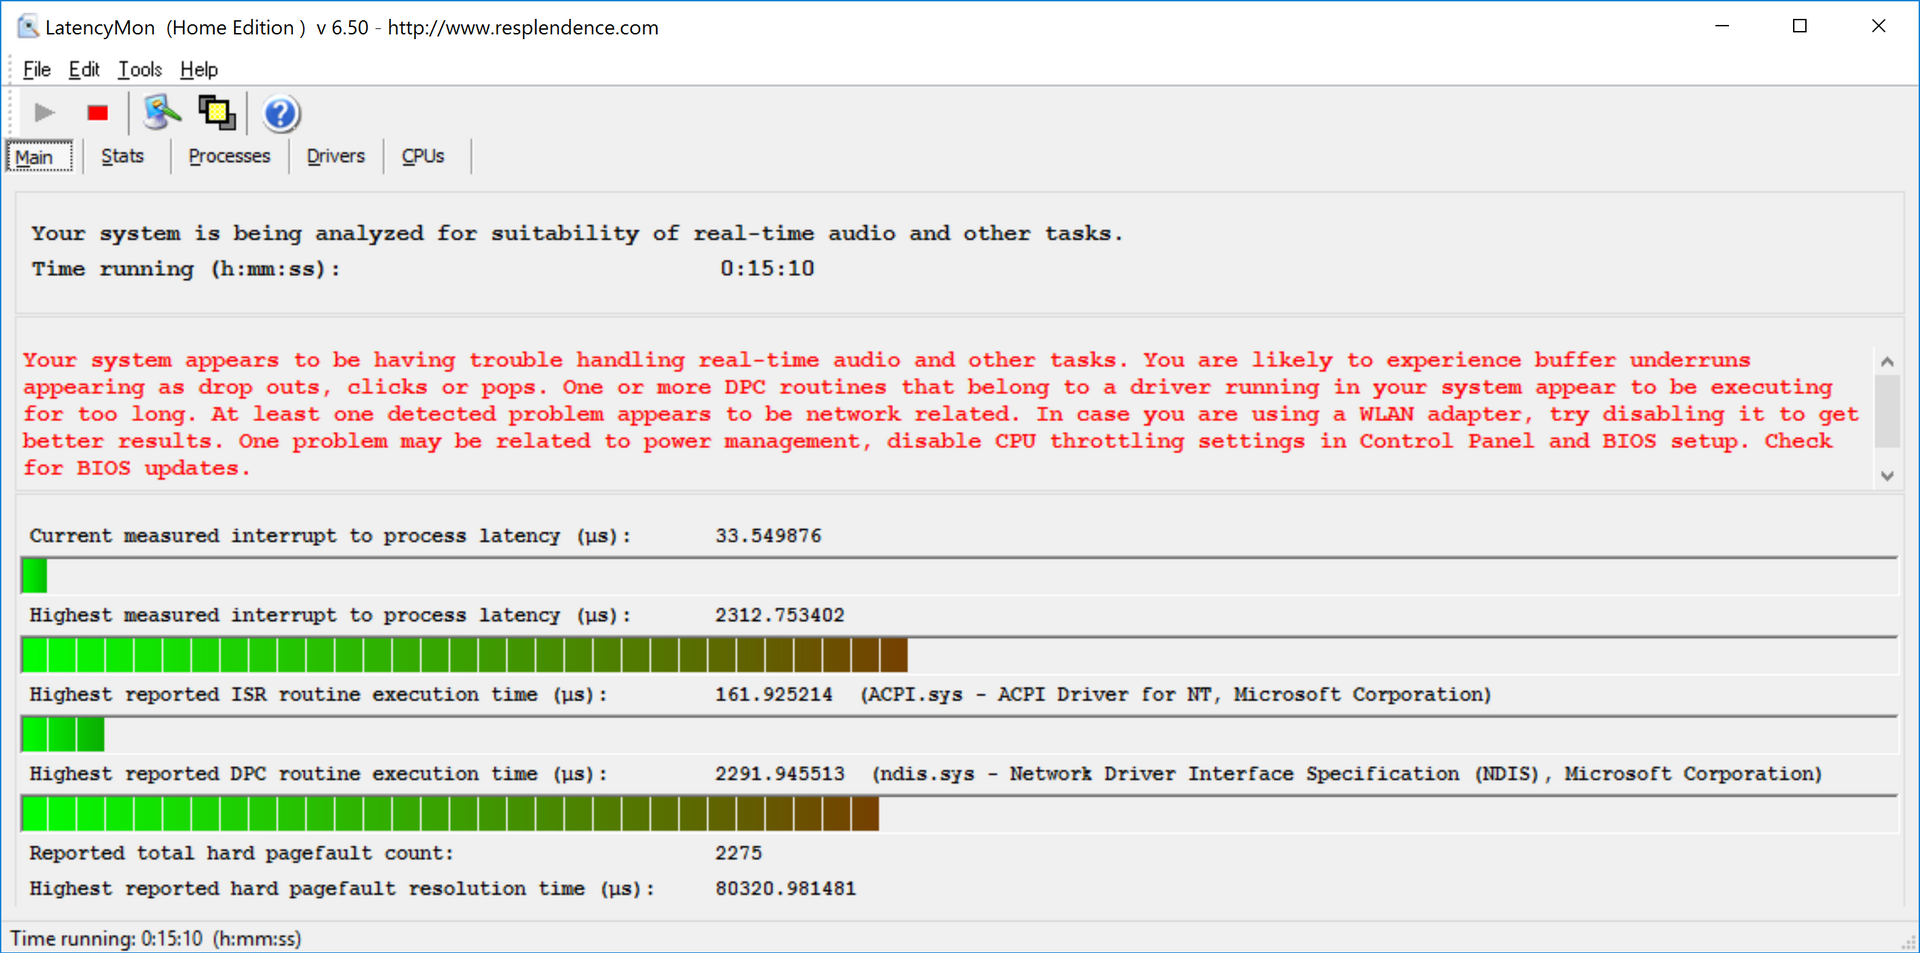
We performed a second run of 3DMark 11 while unplugged and noted that performance is lower (as expected) while running on battery power (we received a lower score of 5365 as compared to our original score of 7735). Finally, LatencyMon reported some issues with streaming real-time audio and video; disabling the WLAN adapter did not resolve this.
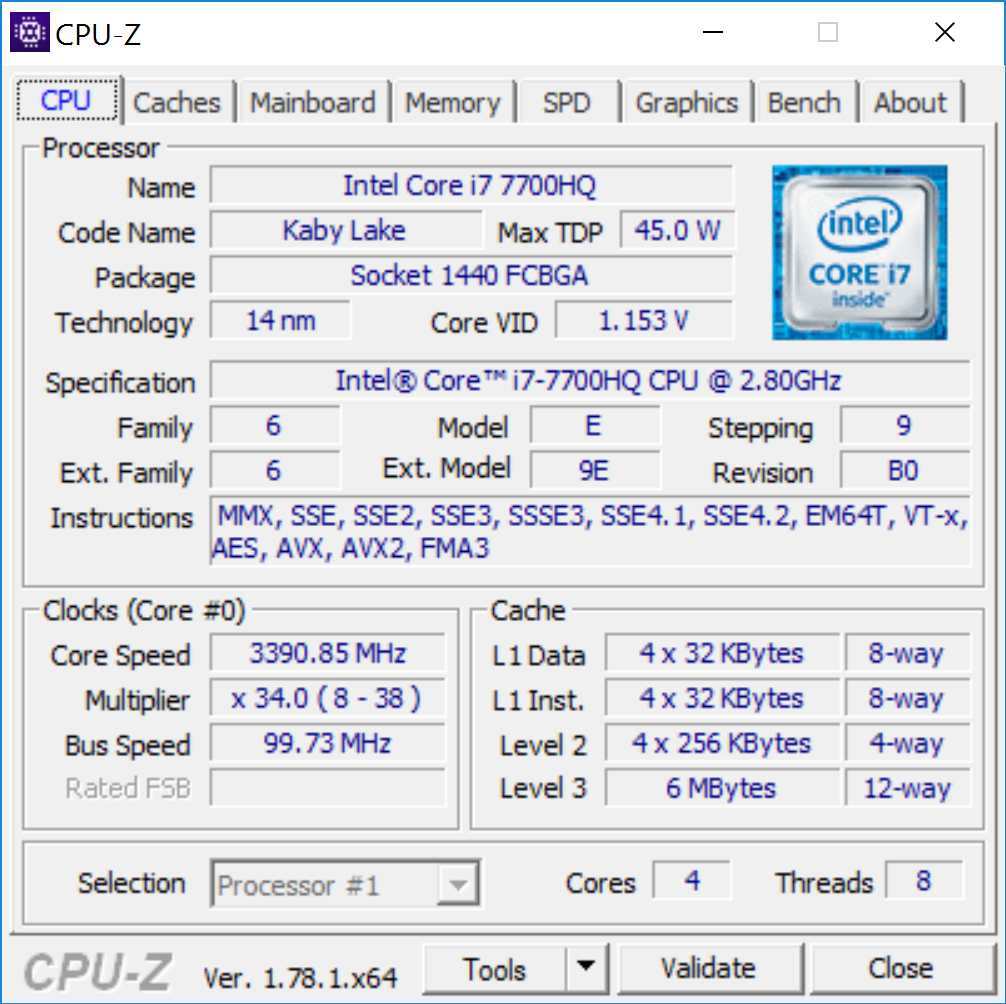
Processor
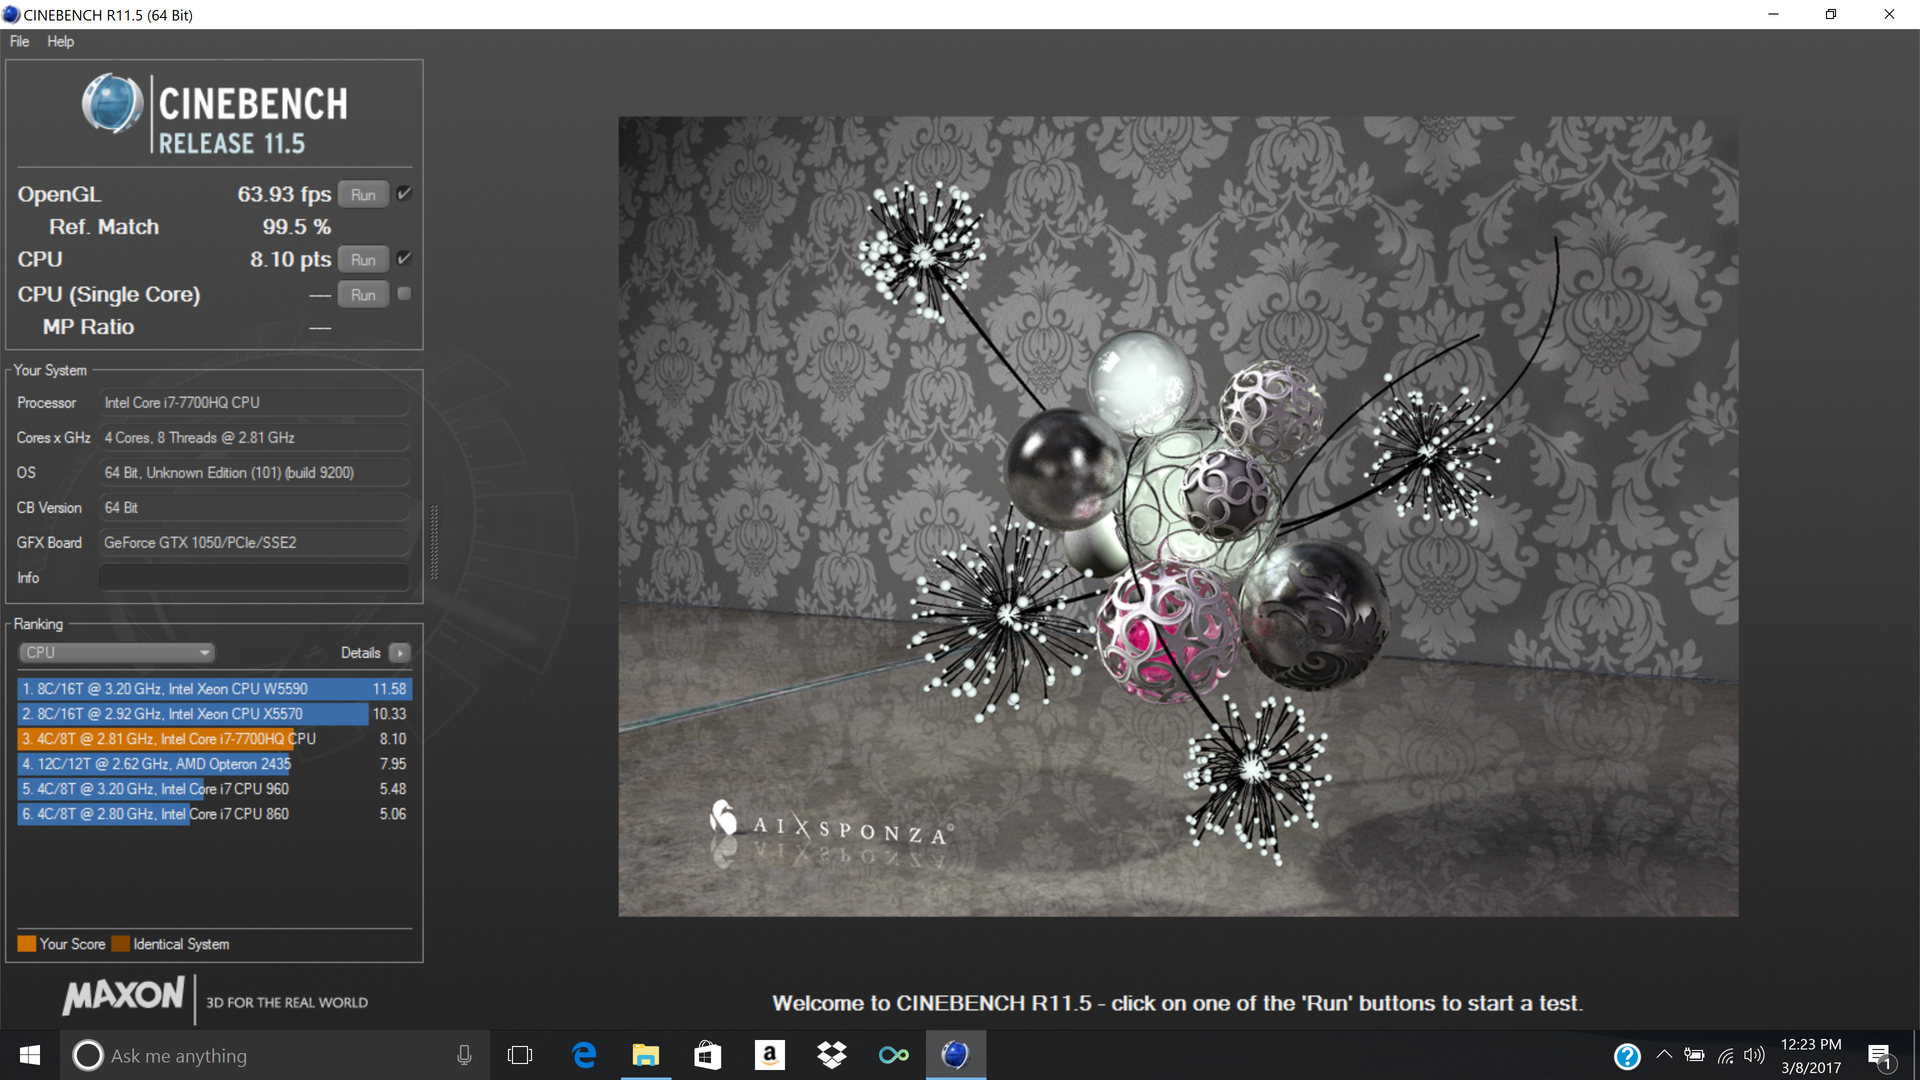
The Core i7-7700HQ remains a top performer, but unfortunately, as with all Pavilion 15t and 17t models we’ve seen recently, inconsistency is the name of the game here. Our benchmarks were literally all over the place during our time with the machine—especially those dependent upon CPU performance, and without any good explanation to boot. As we have covered in our previous reviews of these notebooks, this appears to be a firmware-level issue; hopefully HP will resolve it soon.
Take a look at our benchmarks below (all performed on the latest BIOS, F.35 REV A), and you’ll likely find yourself equally puzzled.
| Cinebench R11.5 - CPU Multi 64Bit | |
| Dell XPS 15 9560 (i7-7700HQ, UHD) | |
| HP Pavilion 15t-bc200 X7P44AV | |
| HP Pavilion 15t-X7P42AV | |
| wPrime 2.10 - 1024m | |
| HP Pavilion 15t-bc200 X7P44AV | |
| HP Pavilion 15t-X7P42AV | |
| Dell XPS 15 9560 (i7-7700HQ, UHD) | |
* ... smaller is better
System Performance
Regardless, the Pavilion 15t does feel speedy—at least, when it isn’t hiccupping randomly as it often does during usage. These hiccups were common across all of our recently-reviewed HP Pavilion notebooks, and they have not been resolved by the latest BIOS update.
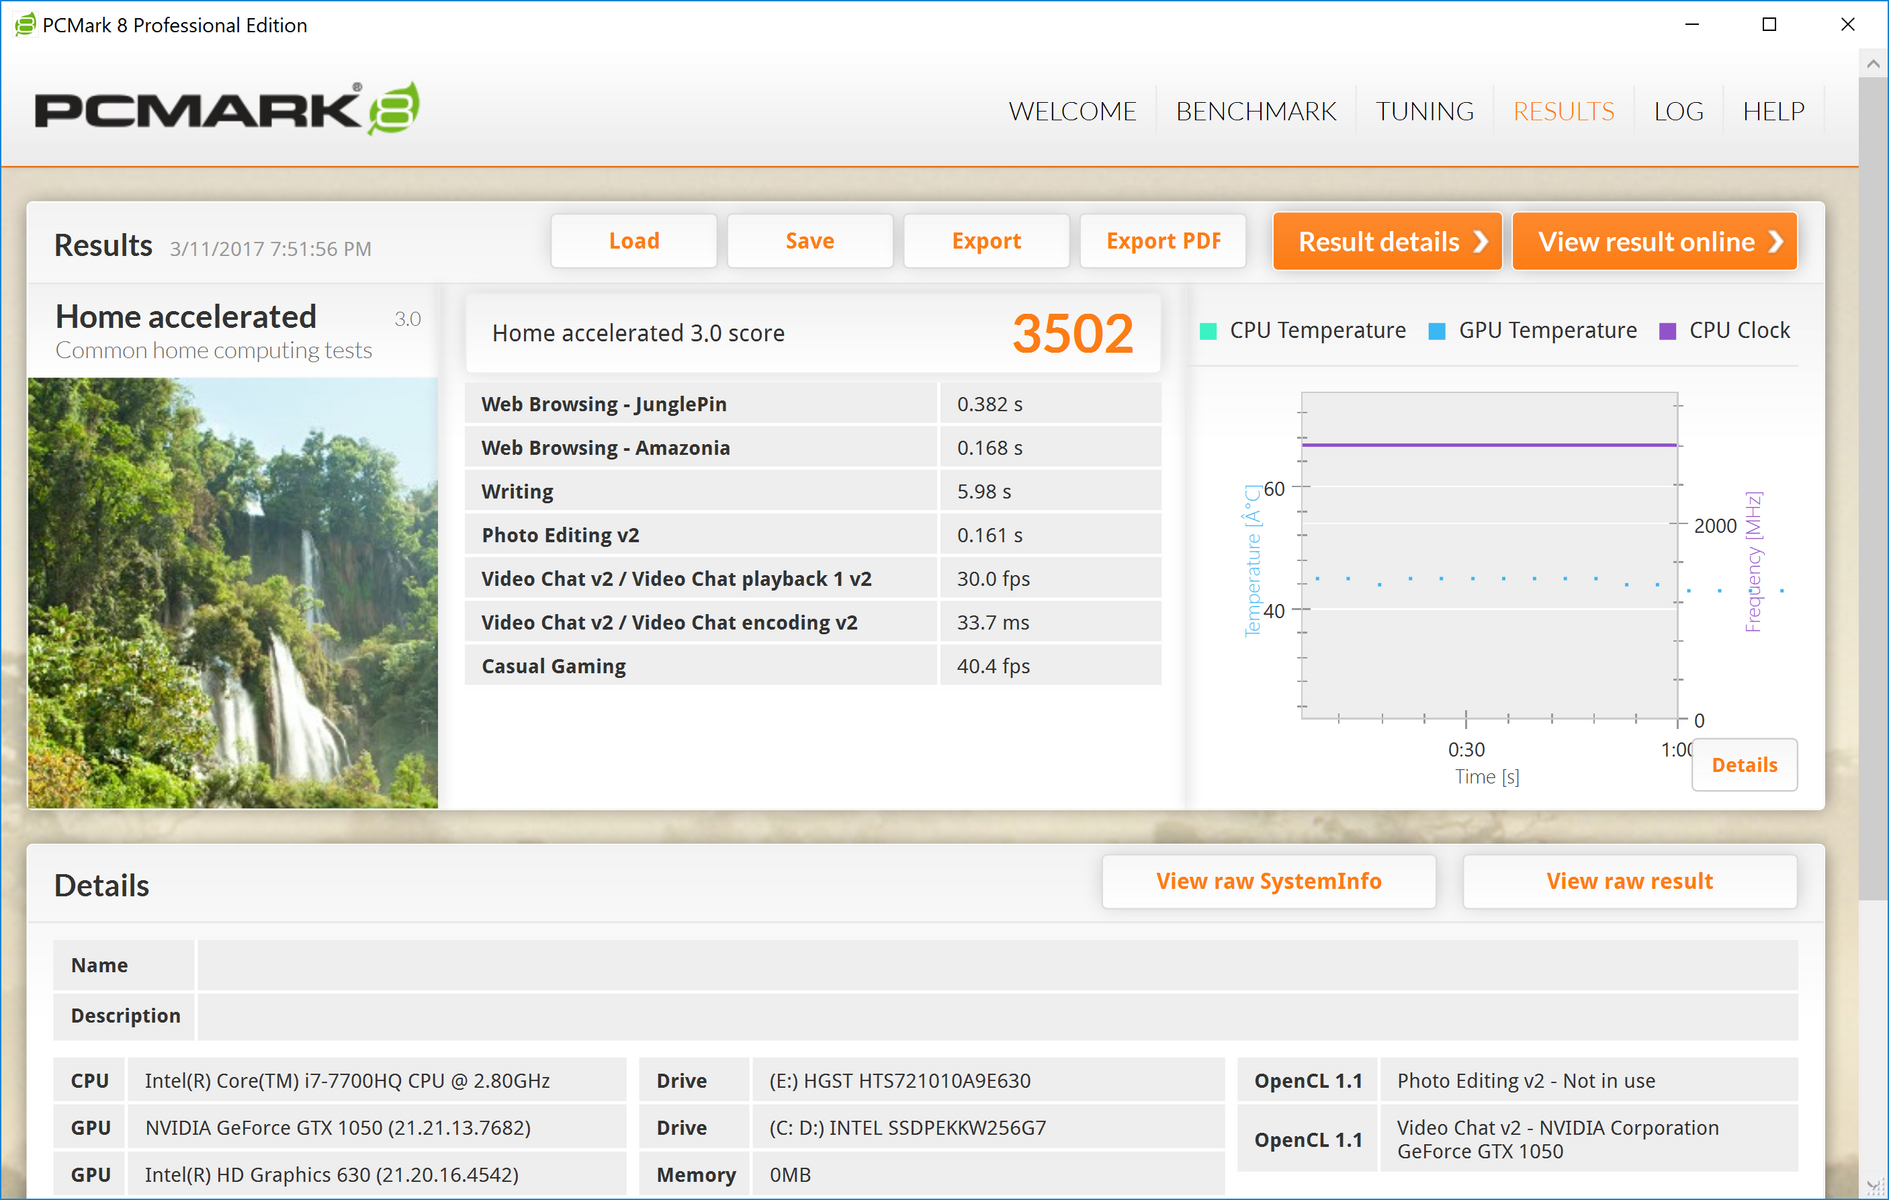
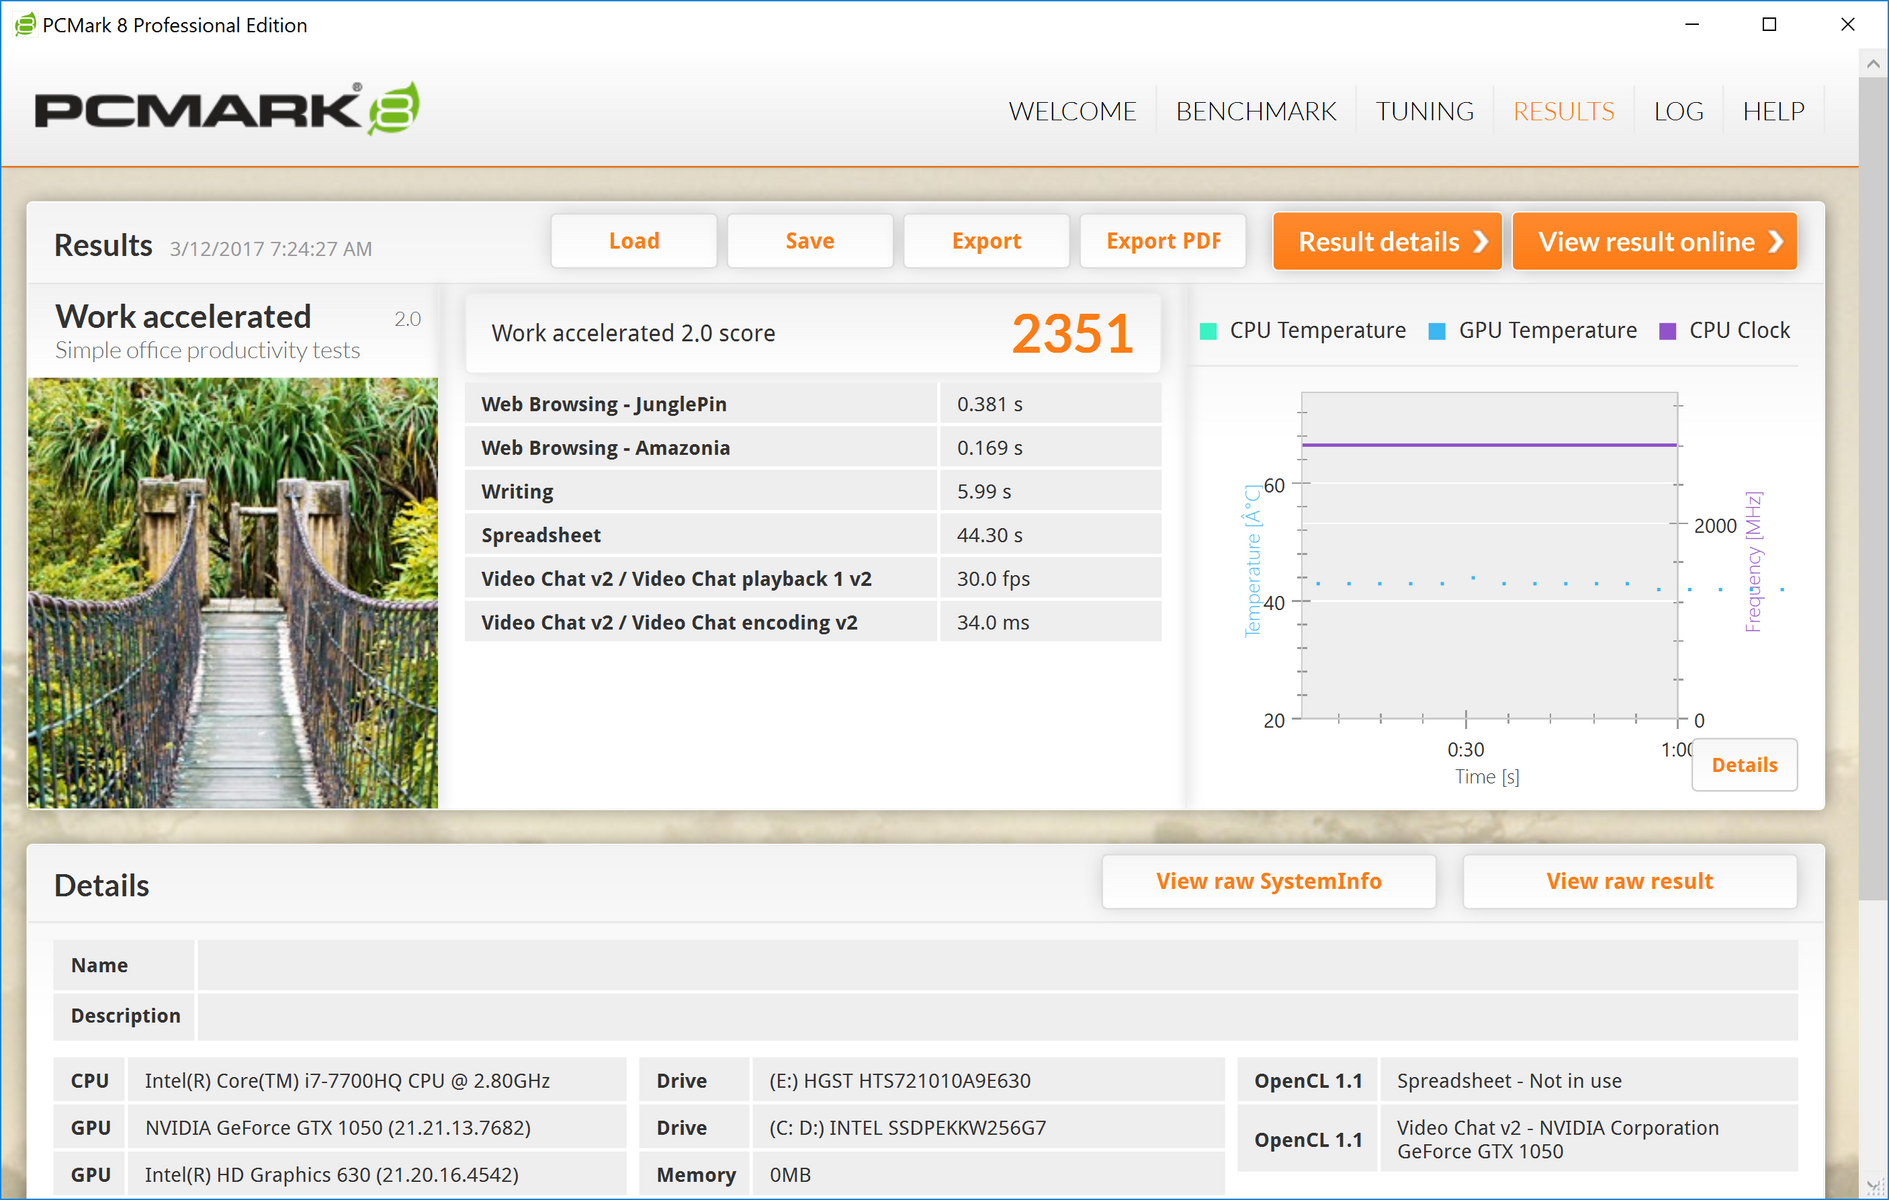
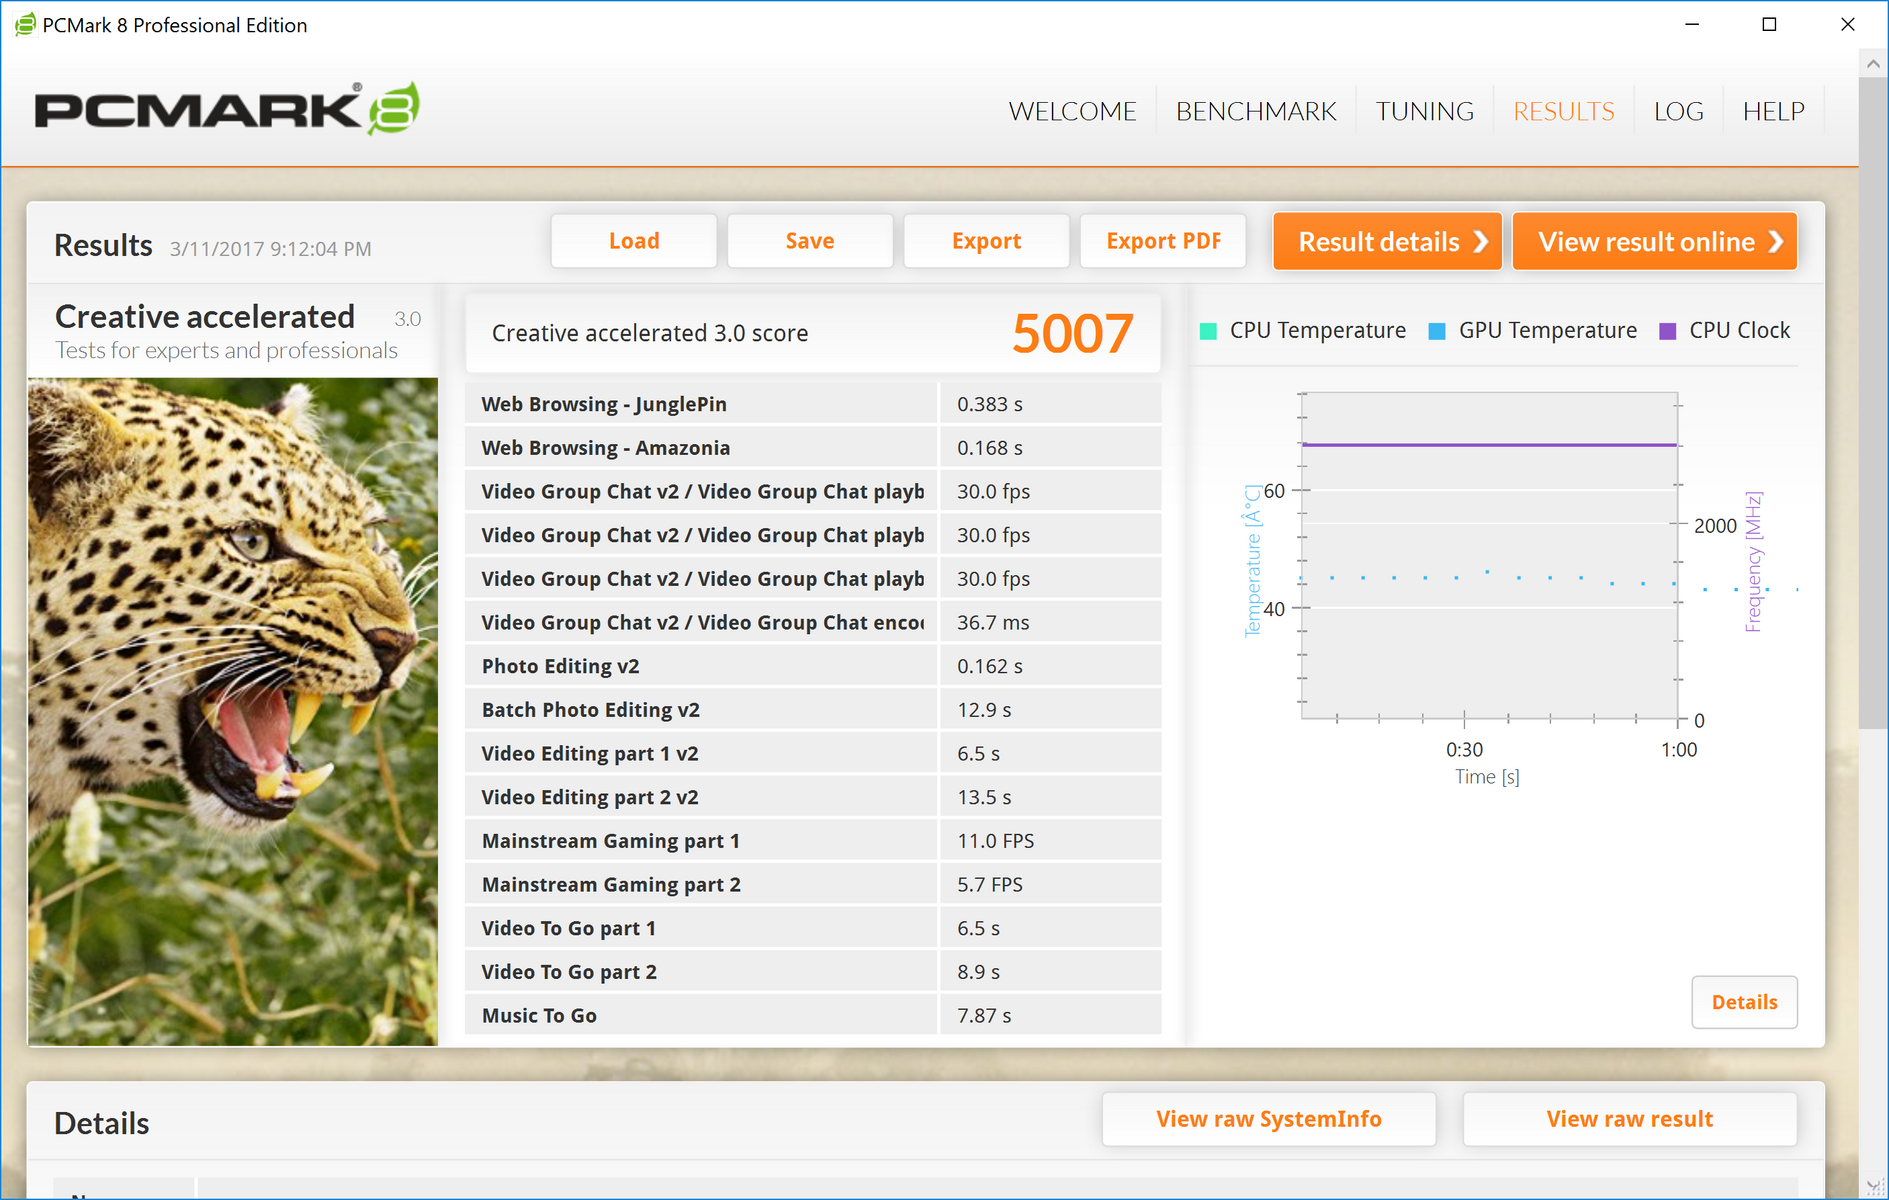
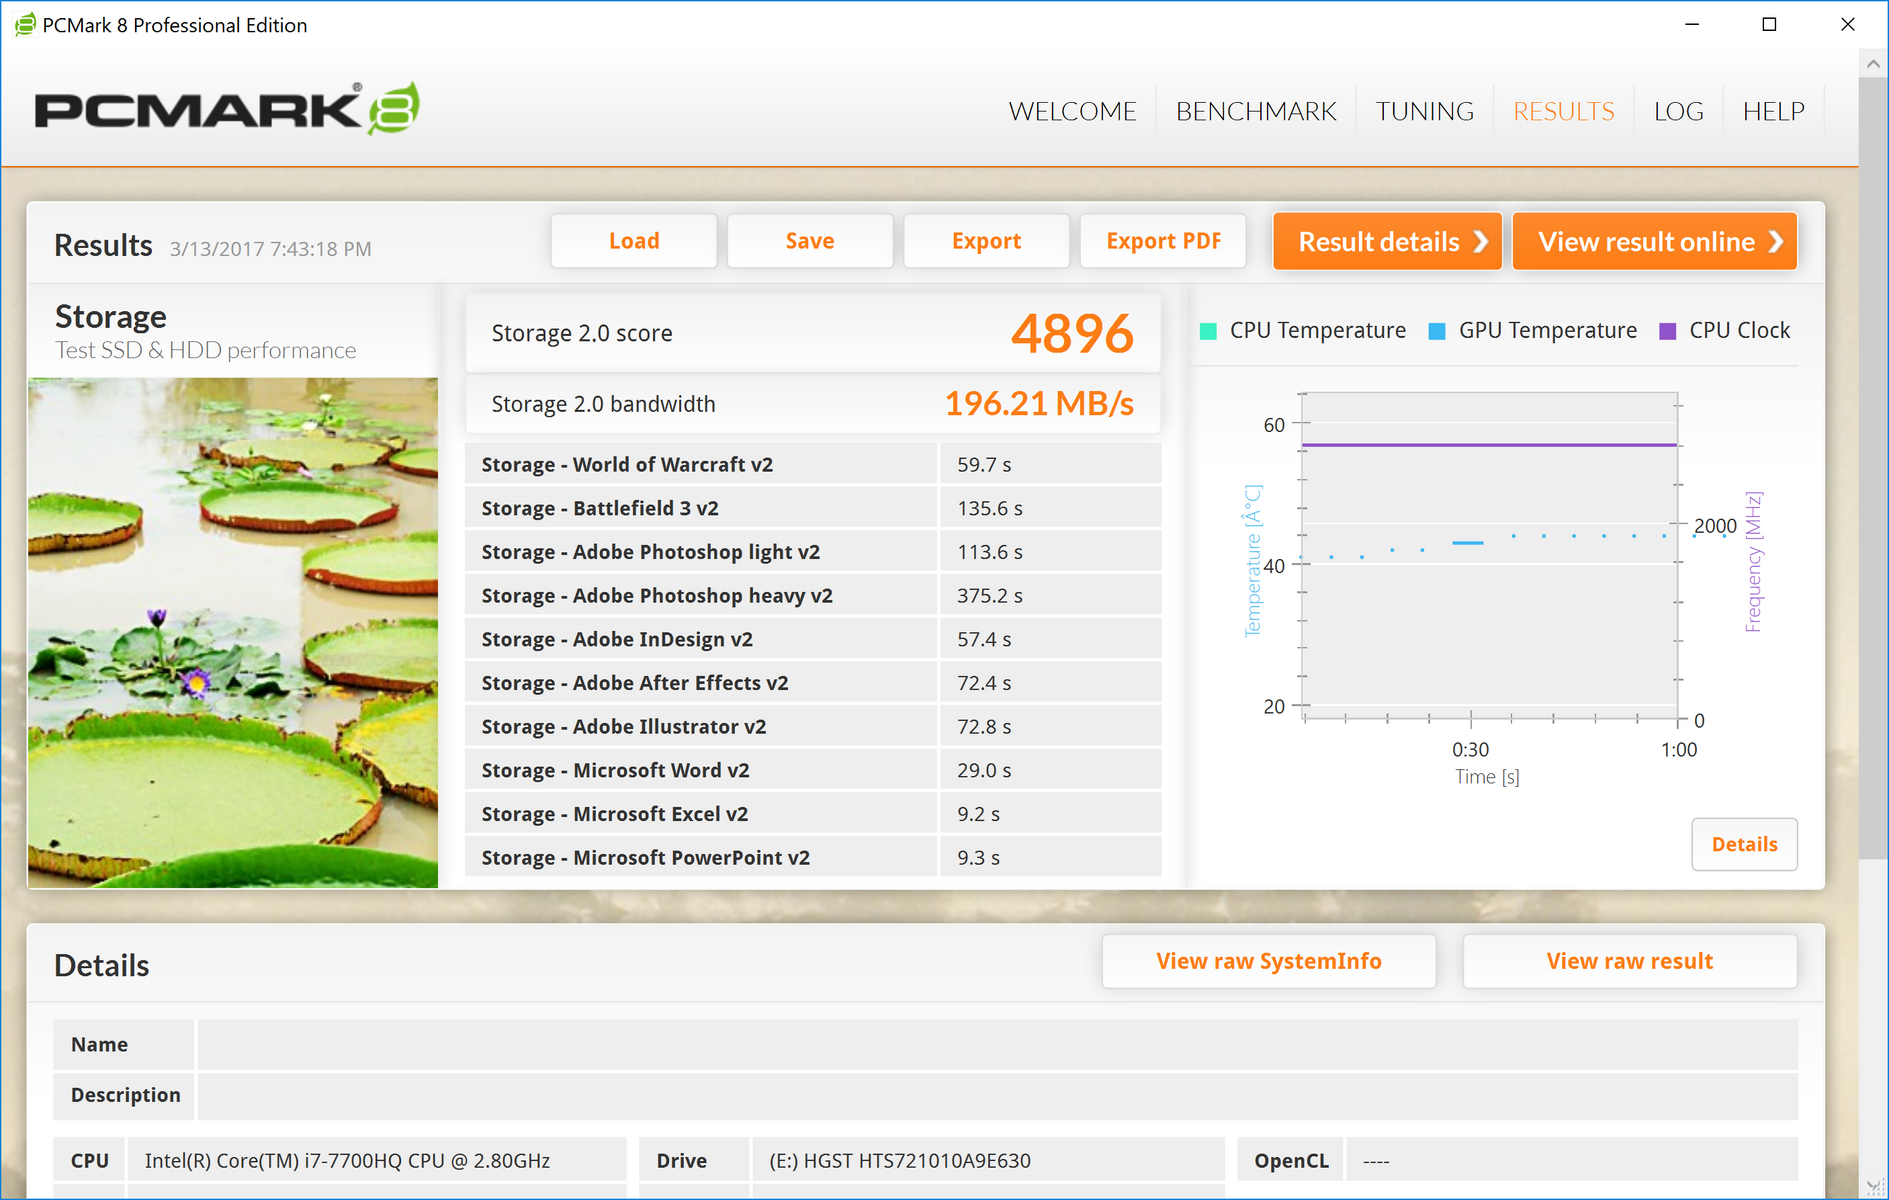
PCMark 8 posts scores which are predictably below those of lower-resolution display configurations (always a point worth repeating), but even still, we continue to receive bafflingly low scores in the PCMark 8 Work Score Accelerated benchmark (the same problem we have experienced with the other recent Pavilion machines). Either way, the higher scores of the bunch (Creative and Home) are directly competitive with the far more expensive Dell XPS 15 9560—so that’s a definitive positive.
| PCMark 8 | |
| Home Score Accelerated v2 | |
| HP Pavilion 15t-X7P42AV | |
| Dell XPS 15 9560 (i7-7700HQ, UHD) | |
| Lenovo ThinkPad E570-20H6S00000 | |
| HP Pavilion 15t-bc200 X7P44AV | |
| Work Score Accelerated v2 | |
| Lenovo ThinkPad E570-20H6S00000 | |
| Dell XPS 15 9560 (i7-7700HQ, UHD) | |
| HP Pavilion 15t-X7P42AV | |
| HP Pavilion 15t-bc200 X7P44AV | |
| Creative Score Accelerated v2 | |
| HP Pavilion 15t-X7P42AV | |
| Dell XPS 15 9560 (i7-7700HQ, UHD) | |
| HP Pavilion 15t-bc200 X7P44AV | |
| PCMark 8 Home Score Accelerated v2 | 3502 points | |
| PCMark 8 Creative Score Accelerated v2 | 5007 points | |
| PCMark 8 Work Score Accelerated v2 | 2351 points | |
Help | ||
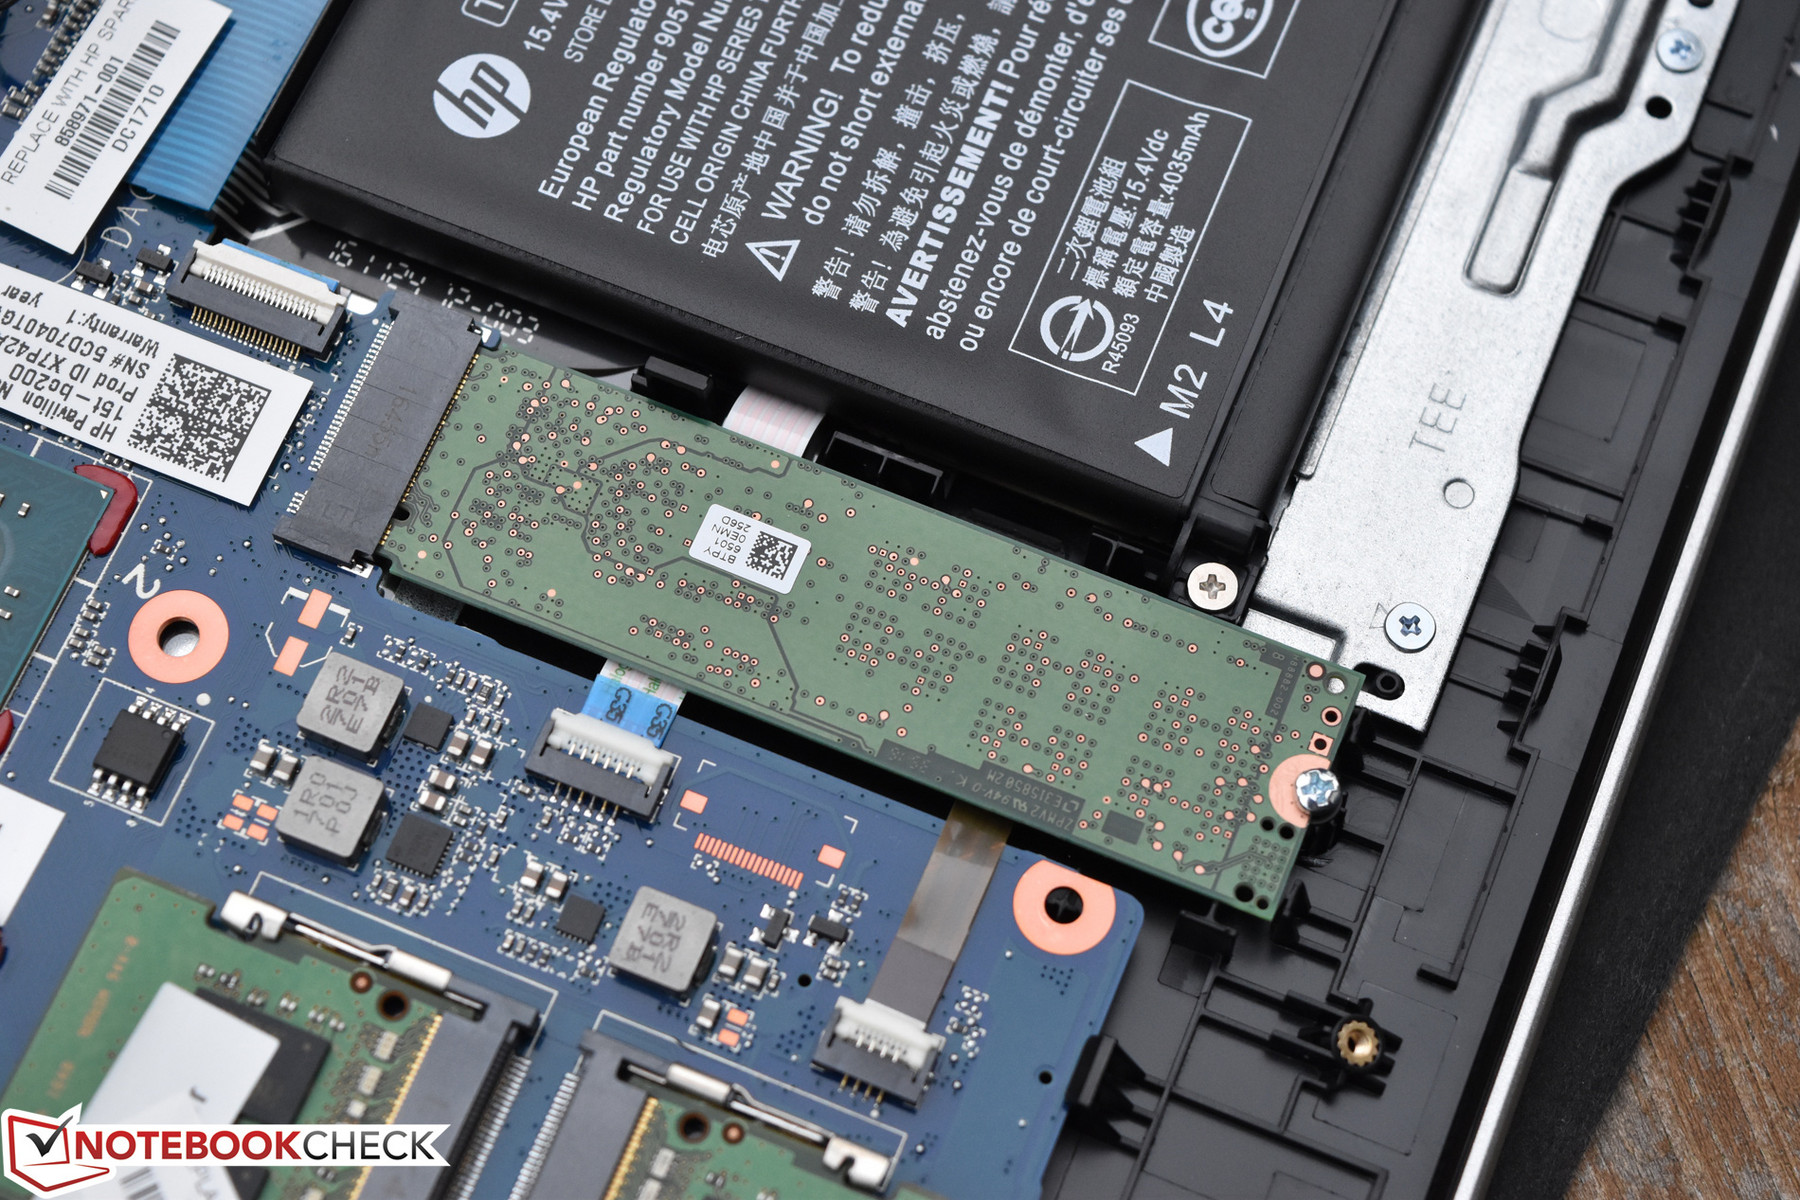
Storage Devices
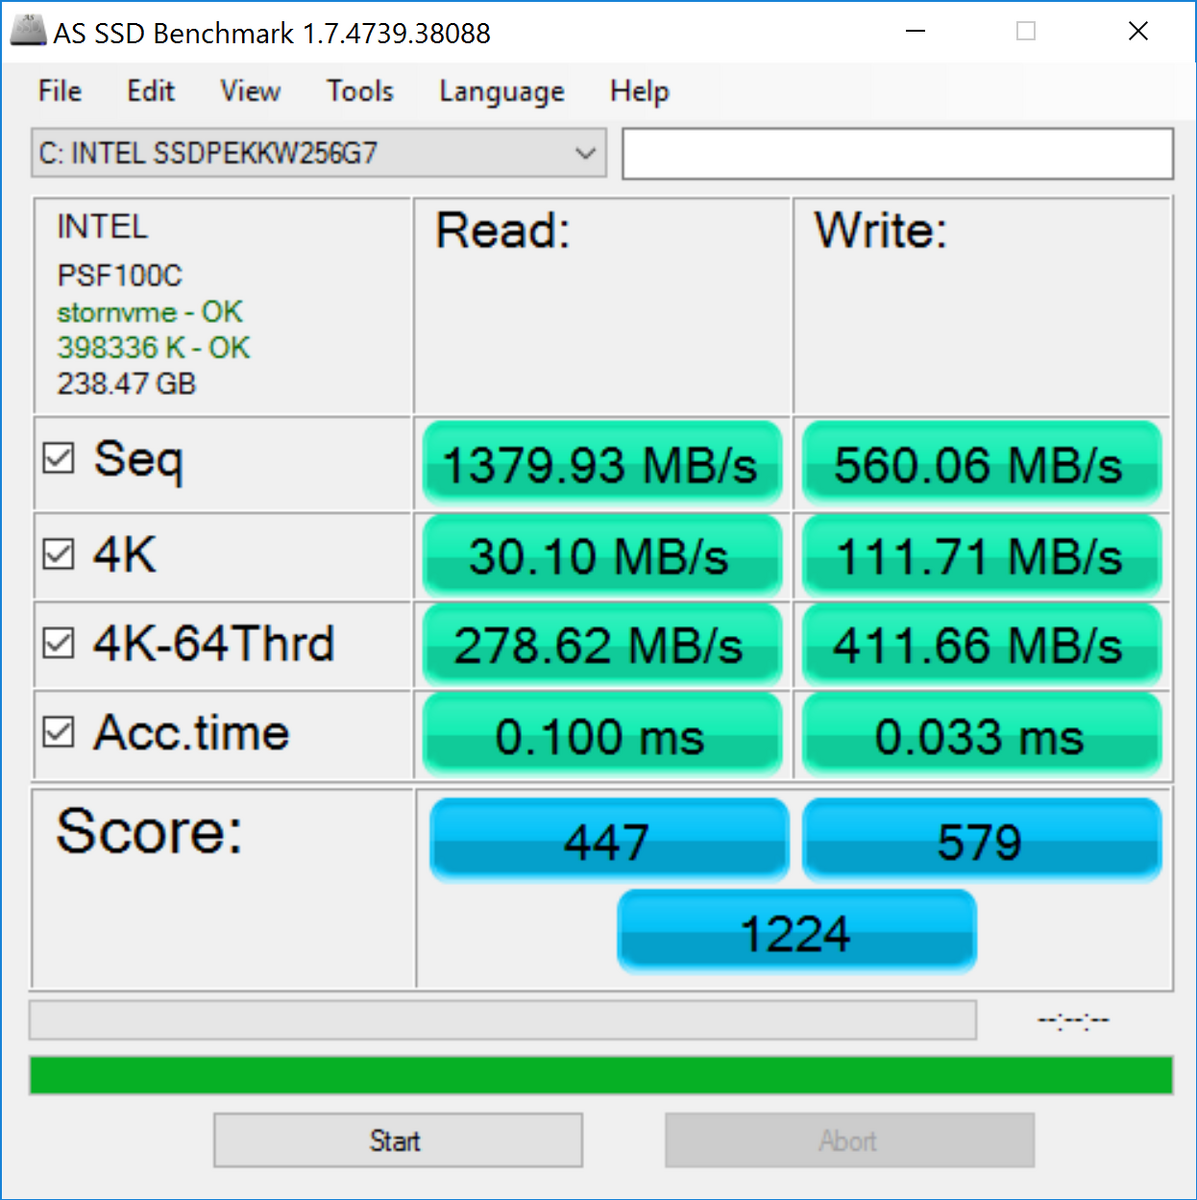
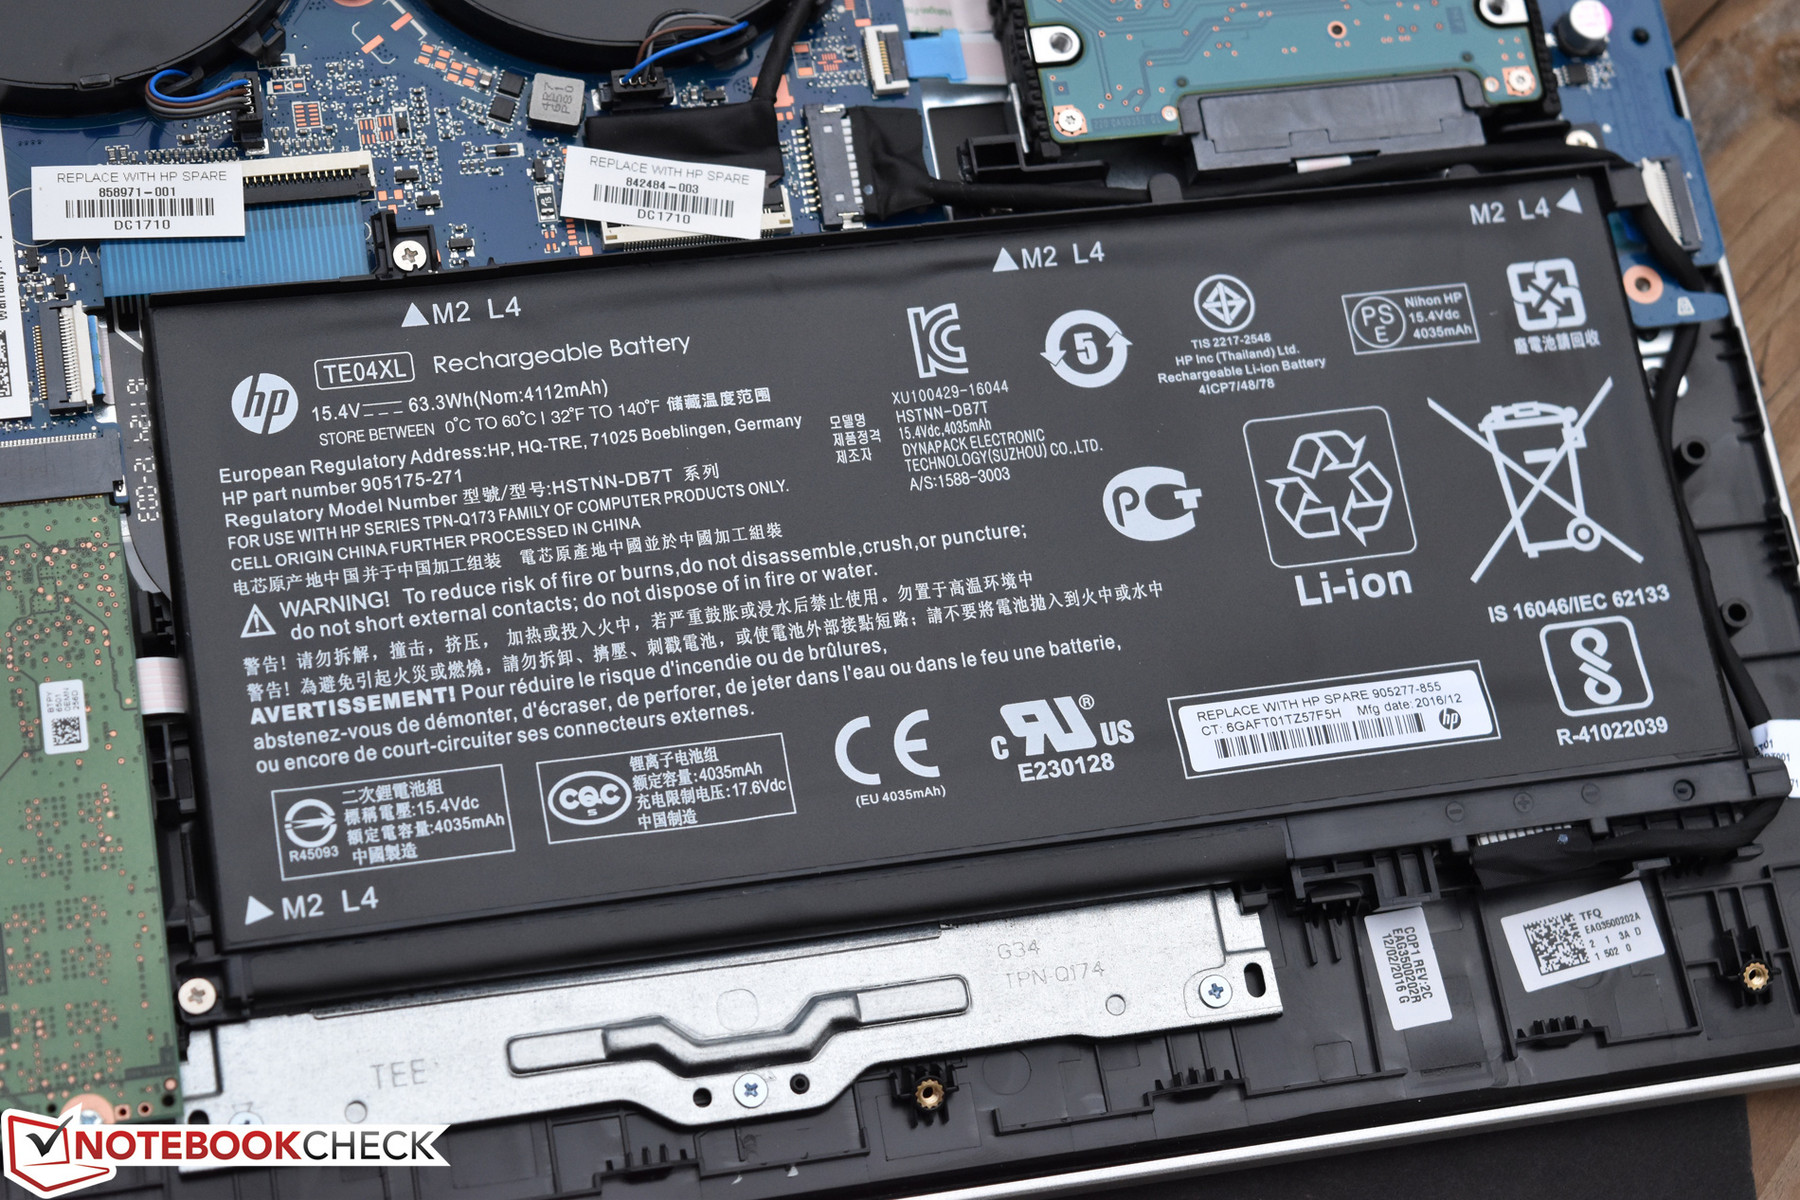
Whereas the previous Pavilion 15t model we reviewed included a Samsung CM871a 128 GB SSD, today’s unit has been upgraded to a 256 GB Intel 600p NVMe SSD. The performance does partially reflect this—however, it doesn’t make as much of a difference as do many other NVMe SSDs we’ve benchmarked. With AS SSD read/write scores of 447 and 579 (vs. 448 and 226 previously) and a total score of 1224 (previously 912), performance is somewhat quicker overall, but it’s nothing show-stopping. Regardless, the solid-state drive is never likely to a noticeable bottleneck in any of these machines. For much more information, check out our full storage benchmarks below.
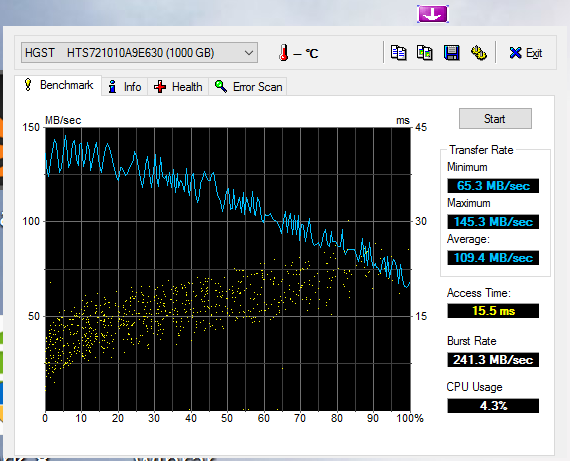
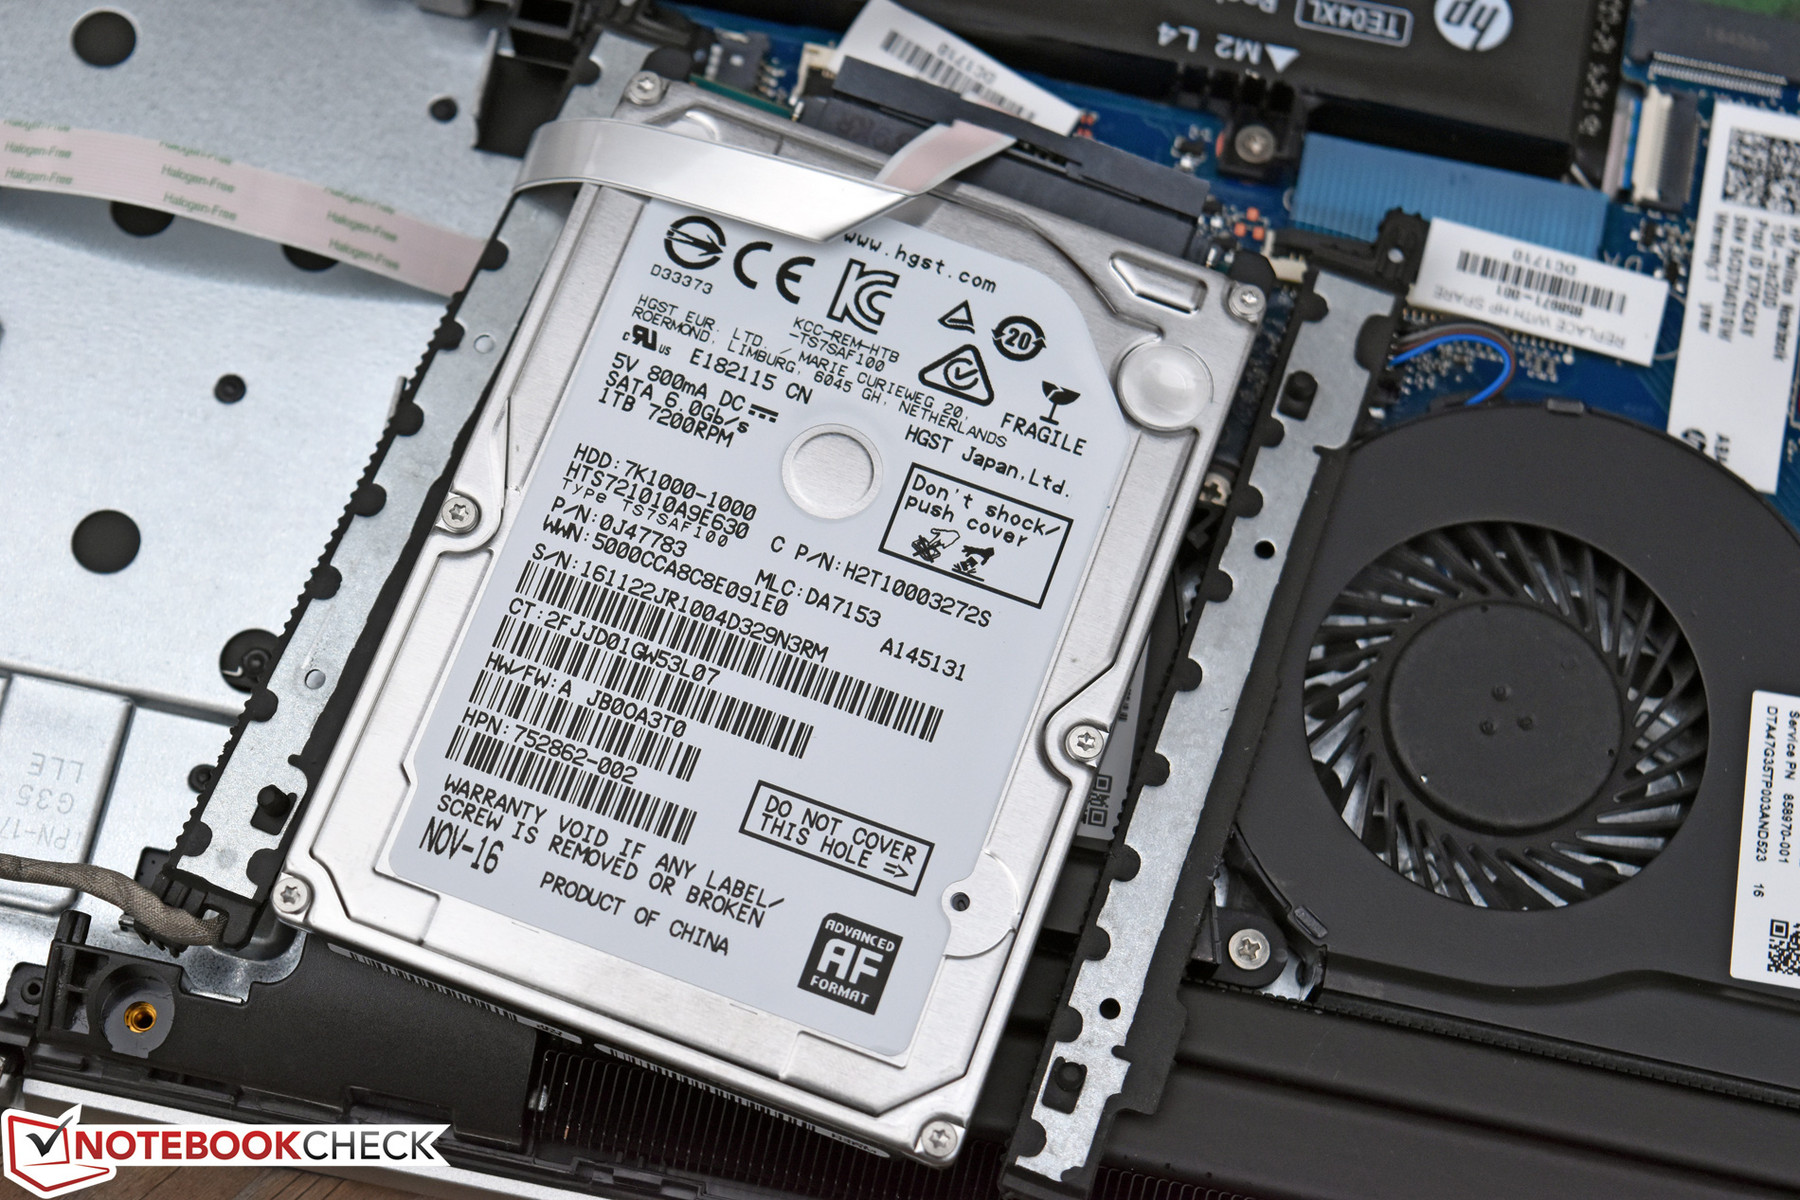
Our system also included a supplemental 2.5-inch 1 TB HGST Travelstar 7K1000 conventional hard drive for storage. Performance is quite good for a mechanical drive; with a Transfer Rate Average of 109.4 MB/s (as measured by HD Tune), it’s amongst the faster hard drives available in this form factor.
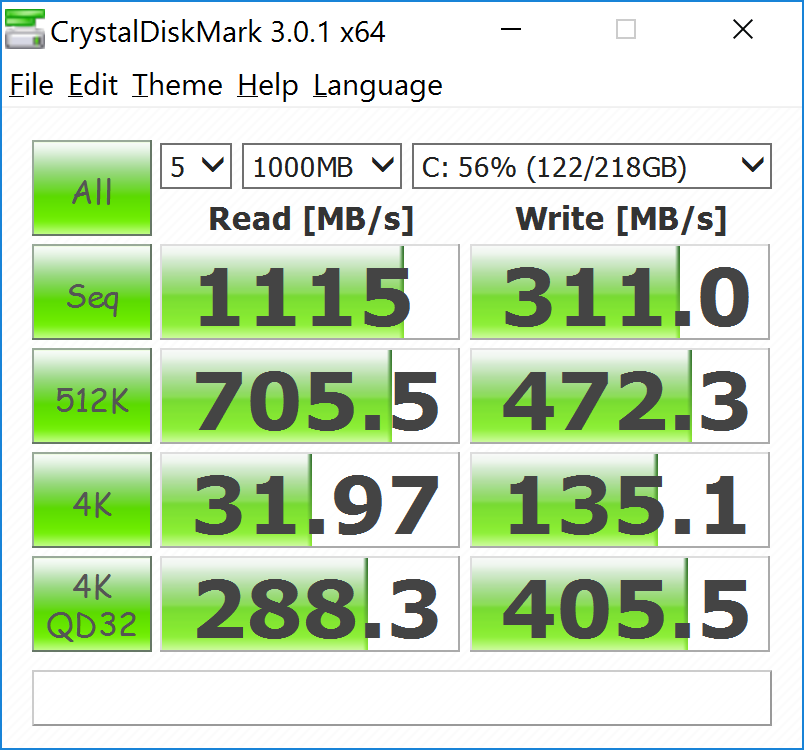
| HP Pavilion 15t-bc200 X7P44AV Intel SSD 600p SSDPEKKW256G7 | Dell XPS 15 9560 (i7-7700HQ, UHD) Lite-On CX2-8B512-Q11 | HP Pavilion 15t-X7P42AV Samsung CM871a MZNTY128HDHP | Acer Aspire VN7-593G-73HP V15 Nitro BE Seagate Mobile HDD 1TB ST1000LM035 | Lenovo ThinkPad E570-20H6S00000 Toshiba THNSF5256GPUK | |
|---|---|---|---|---|---|
| CrystalDiskMark 3.0 | 75% | -20% | -92% | 14% | |
| Read Seq (MB/s) | 1115 | 1684 51% | 522 -53% | 120.9 -89% | 1140 2% |
| Write Seq (MB/s) | 311 | 1106 256% | 476.6 53% | 101.8 -67% | 468.1 51% |
| Read 512 (MB/s) | 706 | 977 38% | 399.7 -43% | 37.83 -95% | 759 8% |
| Write 512 (MB/s) | 472.3 | 1119 137% | 185.4 -61% | 84.4 -82% | 414 -12% |
| Read 4k (MB/s) | 31.97 | 45.14 41% | 33.12 4% | 0.473 -99% | 34.3 7% |
| Write 4k (MB/s) | 135.1 | 134.1 -1% | 89.8 -34% | 0.313 -100% | 123.4 -9% |
| Read 4k QD32 (MB/s) | 288.3 | 509 77% | 400.9 39% | 1.133 -100% | 530 84% |
| Write 4k QD32 (MB/s) | 405.5 | 398.1 -2% | 140.2 -65% | 0.274 -100% | 319.2 -21% |

GPU Performance
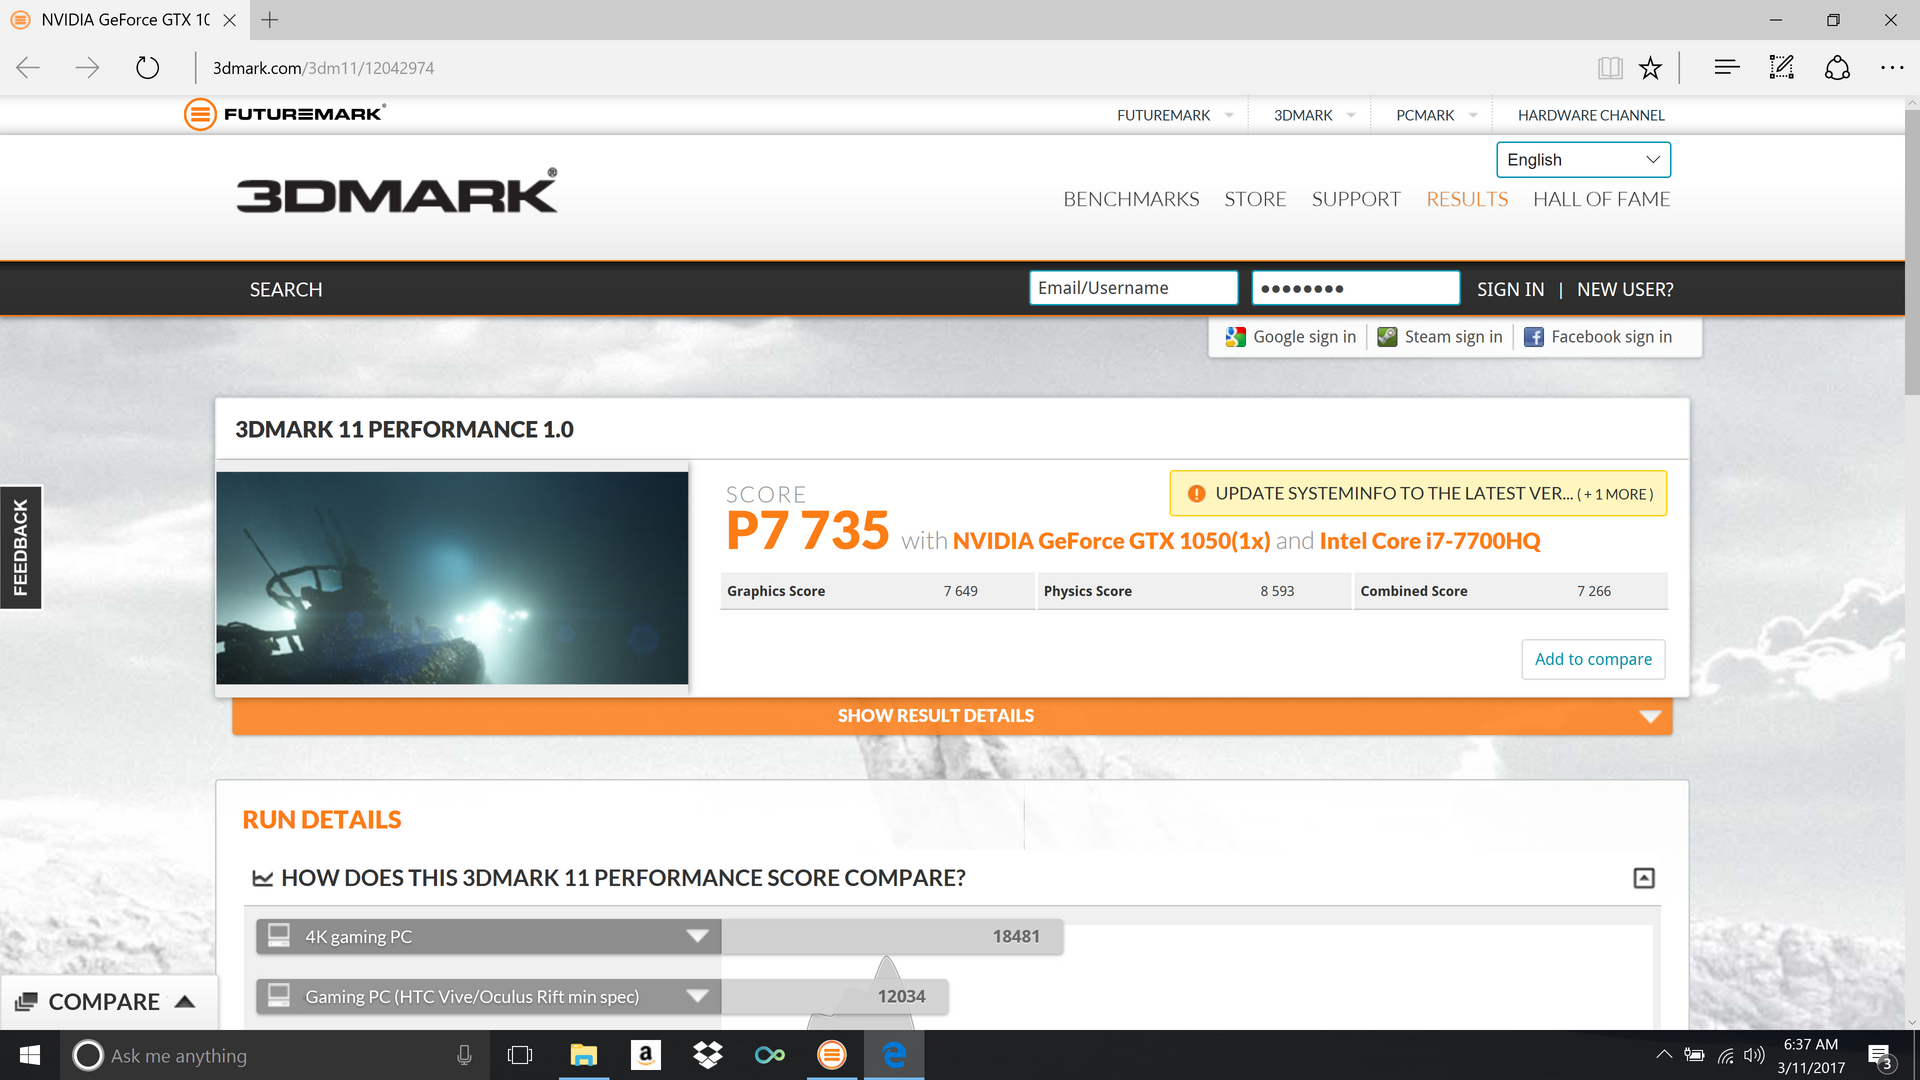
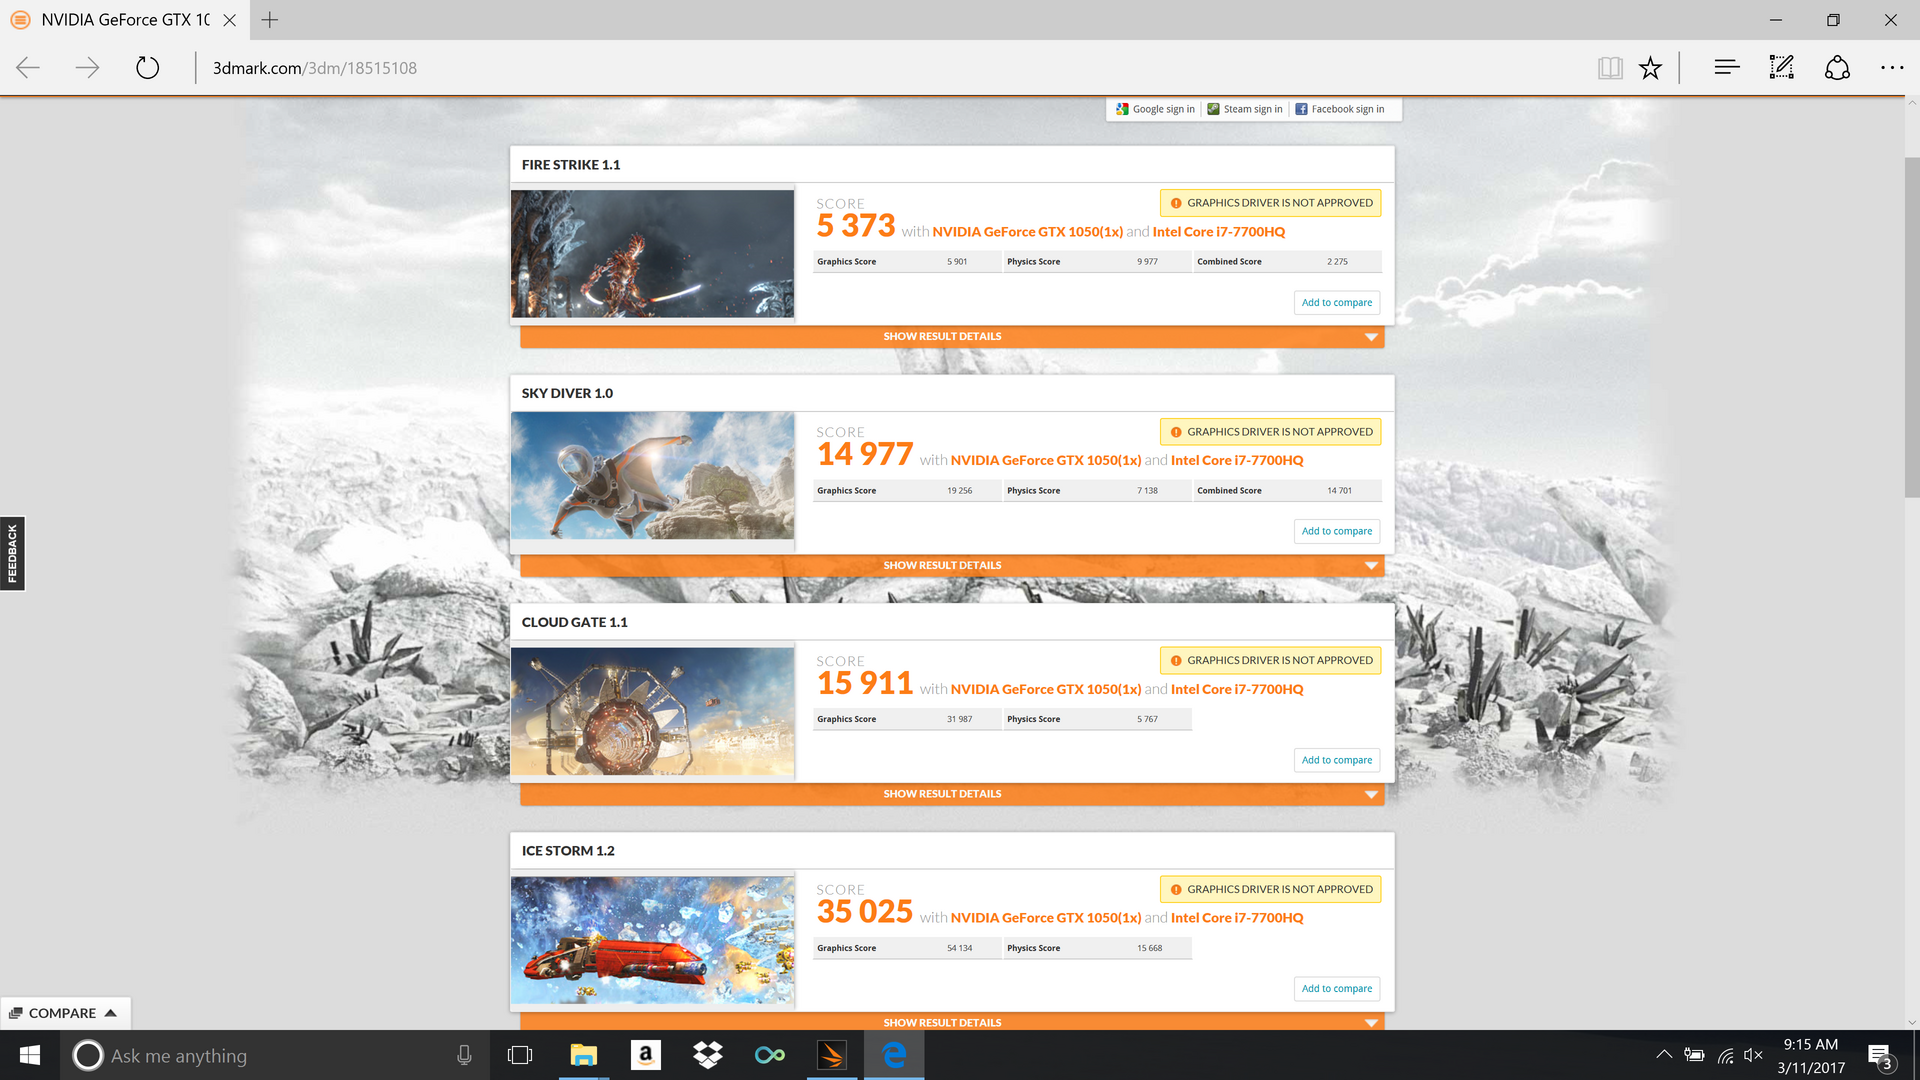
With GPU performance, we finally reach a category for which we can confidently proclaim that the Pavilion 15t does as well as we can reasonably expect given its configuration. Here, we recorded scores which were mostly consistent, as well as roughly equivalent with those of the Dell XPS 15 9560, which is respected company (although that’s a much more compact machine as well). Scores of 5901 in 3DMark Fire Strike and 7649 in 3DMark 11 Performance GPU are not at all bad results.
| 3DMark 11 | |
| 1280x720 Performance GPU | |
| Acer Aspire VN7-593G-73HP V15 Nitro BE | |
| HP Pavilion 15t-bc200 X7P44AV | |
| HP Pavilion 15t-X7P42AV | |
| Lenovo ThinkPad E570-20H6S00000 | |
| 1280x720 Performance Combined | |
| Acer Aspire VN7-593G-73HP V15 Nitro BE | |
| HP Pavilion 15t-X7P42AV | |
| HP Pavilion 15t-bc200 X7P44AV | |
| Lenovo ThinkPad E570-20H6S00000 | |
| 3DMark 06 Standard Score | 27237 points | |
| 3DMark 11 Performance | 7735 points | |
| 3DMark Ice Storm Standard Score | 35025 points | |
| 3DMark Cloud Gate Standard Score | 15911 points | |
| 3DMark Fire Strike Score | 5373 points | |
Help | ||
Gaming Performance
During gaming, although UHD resolution is (predictably) out of the question, the 15t does well enough with more reasonable settings. Since we’ve already extensively tested this precise model on all lower resolutions in gaming, the only benchmarks we performed on the UHD model were in 4K resolution.
We also performed a benchmark of Bioshock Infinite at 4K resolution and received a result of 106.5 fps, as well as Metro: Last Light in 4K (very high) which yielded 42.69 fps.
| Doom - 3840x2160 High Preset AA:FX (sort by value) | |
| HP Pavilion 15t-bc200 X7P44AV | |
| Dell XPS 15 9560 (i7-7700HQ, UHD) | |
| Rise of the Tomb Raider - 3840x2160 High Preset AA:FX AF:4x (sort by value) | |
| HP Pavilion 15t-bc200 X7P44AV | |
| Dell XPS 15 9560 (i7-7700HQ, UHD) | |
| Batman: Arkham Knight - 3840x2160 High / On (Interactive Smoke & Paper Debris Off) AA:SM AF:8x (sort by value) | |
| HP Pavilion 15t-bc200 X7P44AV | |
| Dell XPS 15 9560 (i7-7700HQ, UHD) | |
| low | med. | high | ultra | 4K | |
|---|---|---|---|---|---|
| Batman: Arkham Knight (2015) | 16 | ||||
| Rise of the Tomb Raider (2016) | 14 | ||||
| Doom (2016) | 18 |
Stress Test
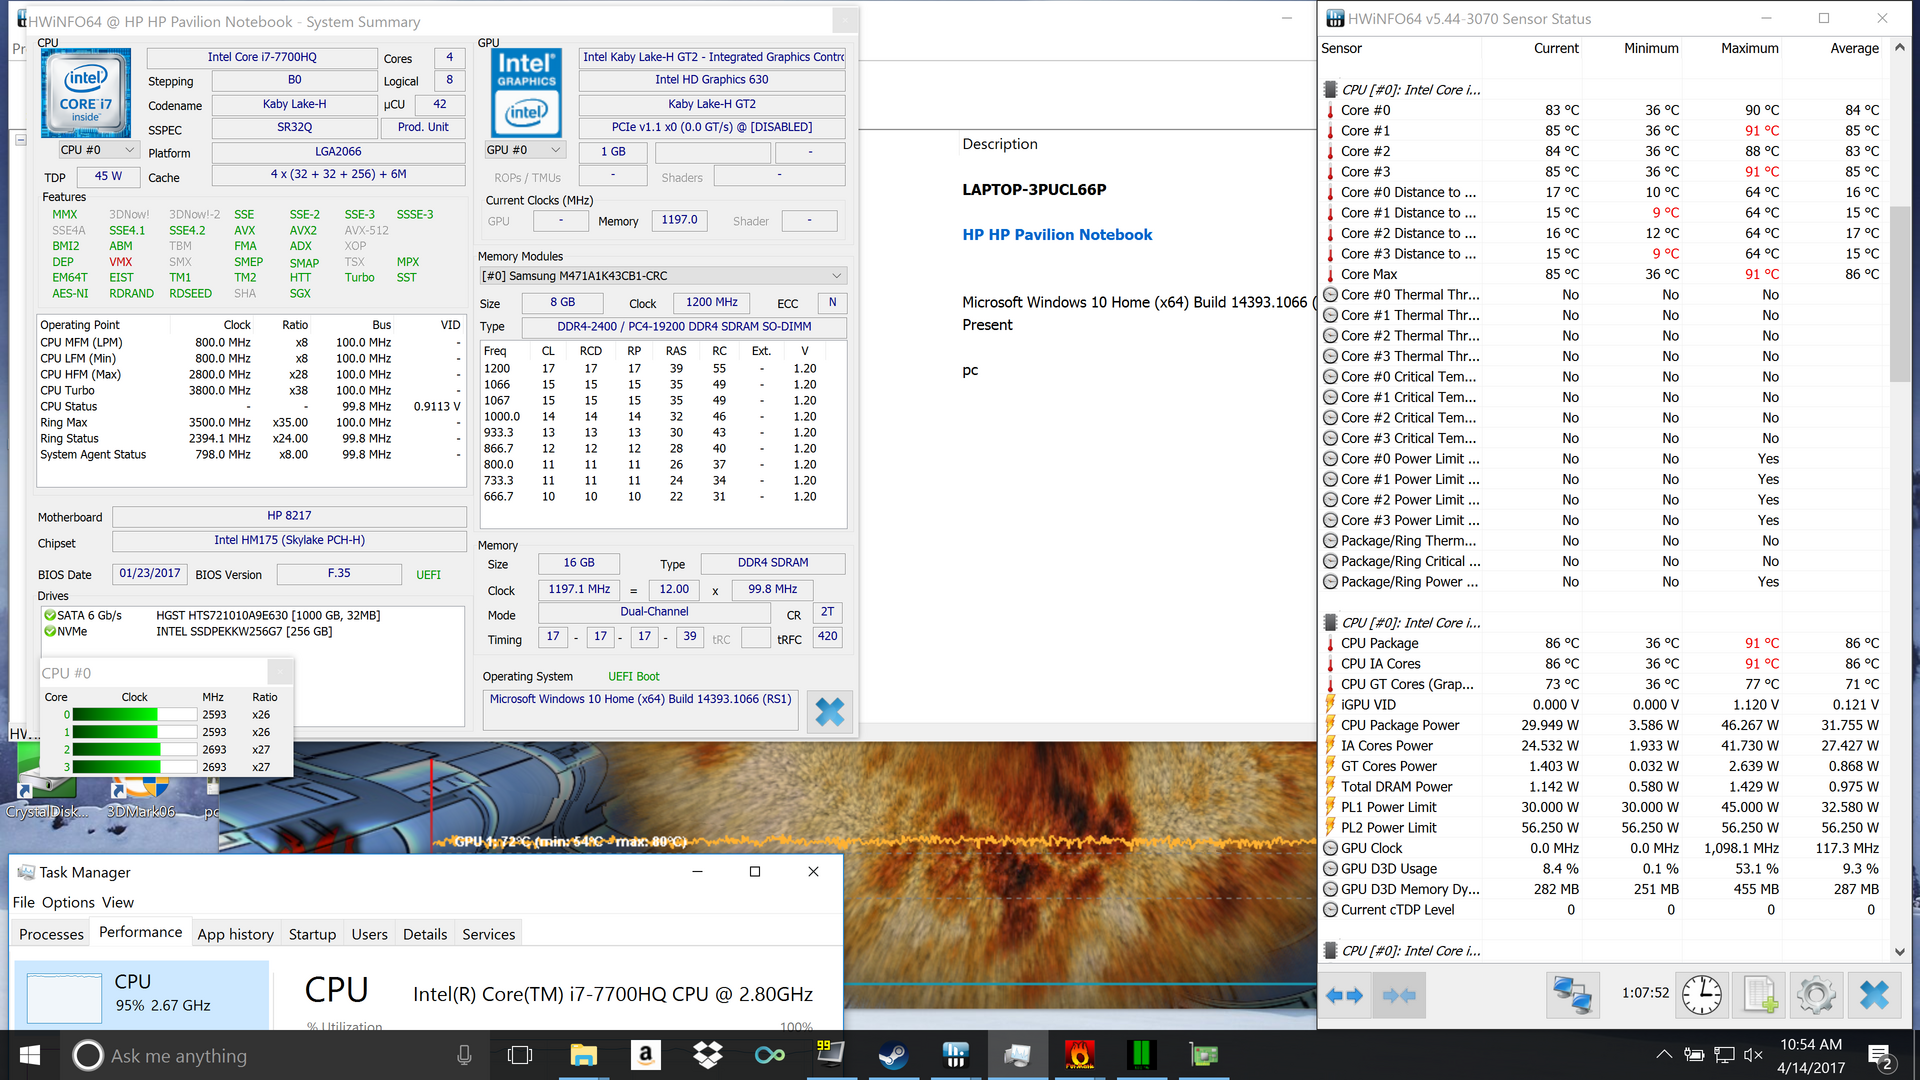
The Pavilion 15t UHD handled our routine stress tests without too much trouble, though maximum frequencies were never sustained for any lengthy period of time. Combined CPU and GPU stress, meanwhile, resulted in high temperatures of 86 °C / 76 °C for CPU / GPU respectively, and the CPU reduced its clock rate back to 2.6 GHz, which is just below the base frequency of 2.8 GHz.
One of the newest additions to our test repertoire is the Cinebench R15 Multi-CPU continuous test, where we perform the benchmark numerous times consecutively and record the results. We then chart these results to reveal any trends in performance degradation or inconsistencies which might be encountered by the user during actual real-world sustained performance demands. It should come as no surprise that, in this test, the Pavilion 15t’s performance fluctuates rather wildly. We recorded results ranging between 675 and 725, with the highest two scores achieved during the first two benchmarks. This suggests thermal or firmware-level limitations during real-world sustained usage which could result in lower CPU performance by up to around 7 percent.
| CPU Clock (GHz) | GPU Clock (MHz) | Average CPU Temperature (°C) | Average GPU Temperature (°C) | |
| Prime95 Stress | 3.4 | - | 82 | - |
| FurMark Stress | - | 1468 | - | 68 |
| Prime95 + FurMark Stress | 2.6 | 1670 | 86 | 76 |
Emissions
System Noise
Not much has changed on the subject of system noise with this revised configuration of the Pavilion 15t. We still measured values of above 40 dB(A) under load, though the noise wasn’t exactly bothersome and was devoid of any sort of detectable whine. The Dell XPS 15 is only slightly louder in spite of its thinner profile. While idle, at least, the machine is nearly silent at just 32.3 dB(A).
Noise level
| Idle |
| 32.3 / 32.3 / 32.3 dB(A) |
| Load |
| 43.2 / 45.2 dB(A) |
 | ||
30 dB silent 40 dB(A) audible 50 dB(A) loud |
||
min: | ||
| HP Pavilion 15t-bc200 X7P44AV GeForce GTX 1050 Mobile, i7-7700HQ, Intel SSD 600p SSDPEKKW256G7 | Dell XPS 15 9560 (i7-7700HQ, UHD) GeForce GTX 1050 Mobile, i7-7700HQ, Lite-On CX2-8B512-Q11 | HP Pavilion 15t-X7P42AV GeForce GTX 1050 Mobile, i7-7700HQ, Samsung CM871a MZNTY128HDHP | Acer Aspire VN7-593G-73HP V15 Nitro BE GeForce GTX 1060 Mobile, i7-7700HQ, Seagate Mobile HDD 1TB ST1000LM035 | Lenovo ThinkPad E570-20H6S00000 GeForce GTX 950M, i5-7200U, Toshiba THNSF5256GPUK | |
|---|---|---|---|---|---|
| Noise | 2% | -2% | 2% | 10% | |
| off / environment * (dB) | 28.9 | 28.4 2% | 29.3 -1% | 30.4 -5% | 29 -0% |
| Idle Minimum * (dB) | 32.3 | 29 10% | 32.3 -0% | 30.9 4% | 29 10% |
| Idle Average * (dB) | 32.3 | 29 10% | 32.3 -0% | 30.9 4% | 29 10% |
| Idle Maximum * (dB) | 32.3 | 32.2 -0% | 32.4 -0% | 31.5 2% | 29 10% |
| Load Average * (dB) | 43.2 | 47.1 -9% | 44.4 -3% | 40.7 6% | 34.3 21% |
| Load Maximum * (dB) | 45.2 | 47.1 -4% | 49.2 -9% | 43.9 3% | 40.1 11% |
| Witcher 3 ultra * (dB) | 52 | 45.5 |
* ... smaller is better
Temperature
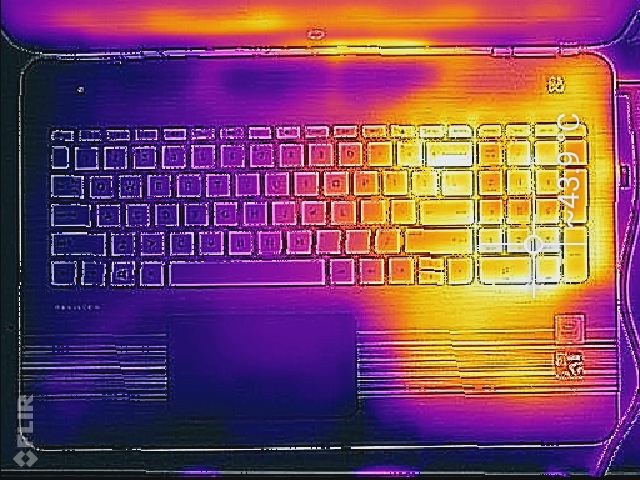
Yet again, surface temperatures remain nearly identical to those of last month’s configuration. With average temperatures of just 28.6 °C and 26.3 °C on top and bottom, respectively, the machine still remains notably cool under load. Also like its predecessor, however, the right palm rest heats up conspicuously more than the left—37.2 °C vs. 21 °C, which is a huge margin. That makes operation under load rather irritating—unless, of course, you don’t rest your hands on the palm rest or keyboard, where the maximum load temperature of 42 °C is encountered. Just to put that in perspective, that’s 21 degrees higher than the 21 °C we recorded on the left side of the keyboard.
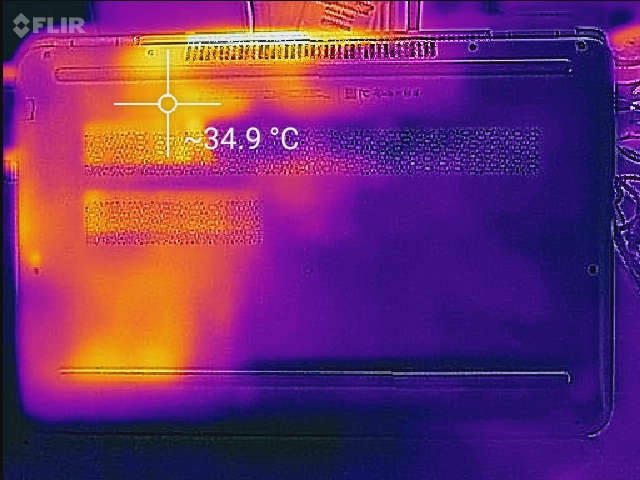
Although lap-based use is probably less likely under heavy load, the same situation, of course, applies to the bottom of the machine. The left side is nearly 10 °C warmer than the right, a situation which is not exactly comfortable for the user’s legs.
(±) The maximum temperature on the upper side is 42 °C / 108 F, compared to the average of 36.8 °C / 98 F, ranging from 21 to 71 °C for the class Multimedia.
(+) The bottom heats up to a maximum of 34.8 °C / 95 F, compared to the average of 39.1 °C / 102 F
(+) In idle usage, the average temperature for the upper side is 22.7 °C / 73 F, compared to the device average of 31.3 °C / 88 F.
(±) The palmrests and touchpad can get very hot to the touch with a maximum of 37.2 °C / 99 F.
(-) The average temperature of the palmrest area of similar devices was 28.7 °C / 83.7 F (-8.5 °C / -15.3 F).
Speakers
Although the speakers reach reasonable volume levels (74.05 dB), there is very little low-frequency reproduction to speak of, and midrange frequencies aren’t as consistent as we’d like. Most devices in the entertainment category fare better, including the Dell XPS 15, which (again) is a much slimmer device.
HP Pavilion 15t-bc200 X7P44AV audio analysis
(±) | speaker loudness is average but good (74.1 dB)
Bass 100 - 315 Hz
(-) | nearly no bass - on average 19.5% lower than median
(±) | linearity of bass is average (8.9% delta to prev. frequency)
Mids 400 - 2000 Hz
(±) | higher mids - on average 5.6% higher than median
(±) | linearity of mids is average (11% delta to prev. frequency)
Highs 2 - 16 kHz
(+) | balanced highs - only 3.4% away from median
(±) | linearity of highs is average (8.8% delta to prev. frequency)
Overall 100 - 16.000 Hz
(-) | overall sound is not linear (32.1% difference to median)
Compared to same class
» 97% of all tested devices in this class were better, 1% similar, 2% worse
» The best had a delta of 5%, average was 17%, worst was 45%
Compared to all devices tested
» 91% of all tested devices were better, 2% similar, 7% worse
» The best had a delta of 4%, average was 24%, worst was 134%
Dell XPS 15 9560 (i7-7700HQ, UHD) audio analysis
(-) | not very loud speakers (70.9 dB)
Bass 100 - 315 Hz
(±) | reduced bass - on average 12.9% lower than median
(±) | linearity of bass is average (14.3% delta to prev. frequency)
Mids 400 - 2000 Hz
(+) | balanced mids - only 3.5% away from median
(±) | linearity of mids is average (8.9% delta to prev. frequency)
Highs 2 - 16 kHz
(+) | balanced highs - only 2.3% away from median
(±) | linearity of highs is average (7.3% delta to prev. frequency)
Overall 100 - 16.000 Hz
(±) | linearity of overall sound is average (16.2% difference to median)
Compared to same class
» 41% of all tested devices in this class were better, 7% similar, 51% worse
» The best had a delta of 5%, average was 17%, worst was 45%
Compared to all devices tested
» 26% of all tested devices were better, 6% similar, 68% worse
» The best had a delta of 4%, average was 24%, worst was 134%
Frequency Comparison (Checkbox selectable!)
Graph 1: Pink Noise 100% Vol.; Graph 2: Audio off
Energy Management
Power Consumption
It’s hardly a surprise that power consumption is up over the previous Pavilion 15t, thanks most assuredly to the higher-resolution, brighter display panel (and, to a much lesser extent, the NVMe storage). The idle average has jumped all the way to 14.3 W in our measurements, which leaves only the Dell XPS 15 (the only other device in our comparison field with a UHD panel) at the top. The previous 15t recorded 8.9 W average idle use, which is 38 percent lower. Load average is now 82.7 W, up over 77.1 W previously on the FHD Pavilion 15t. By comparison, the Dell XPS 15, with its power hungry and bright IGZO IPS panel, tops off our measurements with a high 94.7 W.
| Off / Standby | |
| Idle | |
| Load |
|
Key:
min: | |
| HP Pavilion 15t-bc200 X7P44AV i7-7700HQ, GeForce GTX 1050 Mobile, Intel SSD 600p SSDPEKKW256G7, , 3840x2160, 15.6" | Dell XPS 15 9560 (i7-7700HQ, UHD) i7-7700HQ, GeForce GTX 1050 Mobile, Lite-On CX2-8B512-Q11, IGZO IPS, 3840x2160, 15.6" | HP Pavilion 15t-X7P42AV i7-7700HQ, GeForce GTX 1050 Mobile, Samsung CM871a MZNTY128HDHP, IPS, 1920x1080, 15.6" | Acer Aspire VN7-593G-73HP V15 Nitro BE i7-7700HQ, GeForce GTX 1060 Mobile, Seagate Mobile HDD 1TB ST1000LM035, AH-IPS, Normally Black, Transmissive, 1920x1080, 15.6" | Lenovo ThinkPad E570-20H6S00000 i5-7200U, GeForce GTX 950M, Toshiba THNSF5256GPUK, IPS LED, 1920x1080, 15.6" | |
|---|---|---|---|---|---|
| Power Consumption | -11% | 19% | 7% | 54% | |
| Idle Minimum * (Watt) | 11.4 | 11.9 -4% | 8.29 27% | 7.2 37% | 2.8 75% |
| Idle Average * (Watt) | 14.3 | 17.1 -20% | 8.9 38% | 10.5 27% | 6.3 56% |
| Idle Maximum * (Watt) | 14.3 | 17.3 -21% | 10.2 29% | 16 -12% | 6.9 52% |
| Load Average * (Watt) | 82.7 | 94.7 -15% | 77.1 7% | 82 1% | 51.6 38% |
| Load Maximum * (Watt) | 131.1 | 122 7% | 136.6 -4% | 155 -18% | 69.7 47% |
| Witcher 3 ultra * (Watt) | 104.8 | 124 |
* ... smaller is better
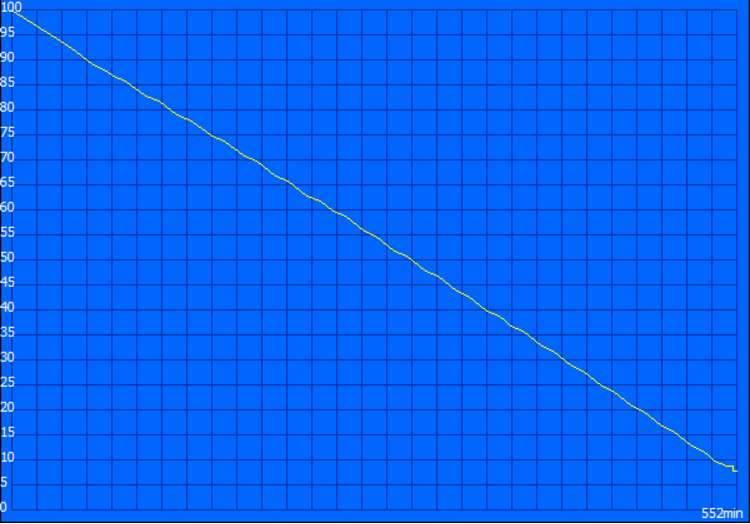
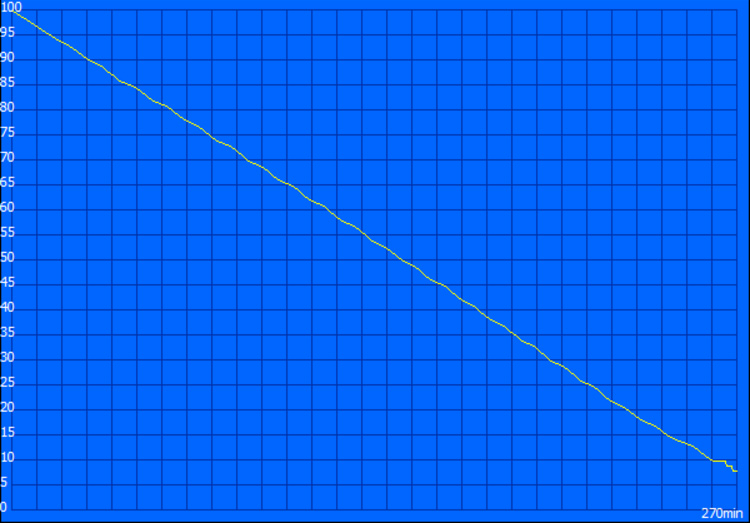
Battery Life
Unsurprisingly, with higher average power consumptions also comes lower average battery runtimes. With the Pavilion 15t’s 63.3 Wh internal battery, we measured a somewhat disappointing 4 hours and 30 minutes of runtime during our web-surfing battery test, some 61 percent below the Dell XPS 15—which, in spite of weighing less than the Pavilion 15t, manages to include a 97 Wh battery to explain most of the difference here. This is also 44 percent below the result we received from the FHD Pavilion 15t configuration, which is perhaps a greater difference than we would have expected.
Our other measurements carry similar trends when compared to the rest of the field. Whereas the previous Pavilion 15t might have sufficed as a palatable work or school laptop (thanks to its 6:29 runtime while web surfing), the UHD configuration does not appear well-suited to the task.

| HP Pavilion 15t-bc200 X7P44AV i7-7700HQ, GeForce GTX 1050 Mobile, 63.3 Wh | Dell XPS 15 9560 (i7-7700HQ, UHD) i7-7700HQ, GeForce GTX 1050 Mobile, 97 Wh | HP Pavilion 15t-X7P42AV i7-7700HQ, GeForce GTX 1050 Mobile, 63.3 Wh | Acer Aspire VN7-593G-73HP V15 Nitro BE i7-7700HQ, GeForce GTX 1060 Mobile, 69 Wh | Lenovo ThinkPad E570-20H6S00000 i5-7200U, GeForce GTX 950M, 41 Wh | |
|---|---|---|---|---|---|
| Battery runtime | 41% | 48% | 28% | 59% | |
| Reader / Idle (h) | 9.2 | 13.9 51% | 16 74% | 8.4 -9% | 14.7 60% |
| WiFi v1.3 (h) | 4.5 | 7.2 60% | 6.5 44% | 6 33% | 7.7 71% |
| Load (h) | 1.5 | 1.7 13% | 1.9 27% | 2.4 60% | 2.2 47% |
Pros
Cons
Verdict

In spite of its respectable GPU performance (thanks to the GTX 1050) and good overall CPU performance, the HP Pavilion 15t we reviewed last month definitely had its share of issues—specifically, puzzling firmware limitations resulting in inconsistent CPU performance, random hiccups/hangs during operation, and a flimsy plastic construction. It also packed a mediocre display with washed-out color and a weak brightness. However, to an extent, some of these problems could be overlooked in light of the relatively affordable price and acceptable battery life.
Today’s Pavilion 15t (mostly) addresses our complaints about the display with a (faux-)UHD panel featuring great color saturation and reproduction (with relatively good accuracy) and better brightness. It’s much nicer to look at, though the brightness is still below average and the contrast ratio is nothing special. Still, it’s a much better screen overall—a definite upgrade. Unfortunately, its inclusion introduces two new negatives: reduced battery life and a much higher price. According to our tests, battery life has been slashed by 2 whole hours to 4:30 (from 6:29 before on the FHD model), and the previously palatable $800 price tag has ballooned to a much less enticing $1141. The higher cost places the Pavilion 15t in direct competition with the likes of machines such as the Dell XPS 15 9560 (and even the HP Spectre x360 15-bl002xx if the user does not require a dedicated GPU)—which are fundamentally and inarguably superior devices by comparison.
The Pavilion 15t UHD’s strengths are relatively few in comparison to other devices of its class and price range, and its shortcomings are comparably numerous.
Moreover, the rest of the drawbacks we listed previously still apply to this latest configuration. The flimsy construction, lopsided temperatures, uninspiring input devices, and difficult maintenance are substantial concerns—but perhaps the most significant of them all, the inconsistent CPU performance and random hangs/hiccups during operation, has still yet to be resolved by HP via a BIOS update.
Therefore, it’s tough to say for precisely whom the Pavilion 15t UHD is intended. Its strengths are relatively few in comparison to other devices of its class and price range, and its shortcomings are comparably numerous. We’d recommend looking elsewhere; at this price, perhaps a Dell XPS 15, HP Spectre, or Lenovo Yoga 720 would fit the bill instead.
HP Pavilion 15t-bc200 X7P44AV
- 04/15/2017 v6 (old)
Steve Schardein
Price comparison
