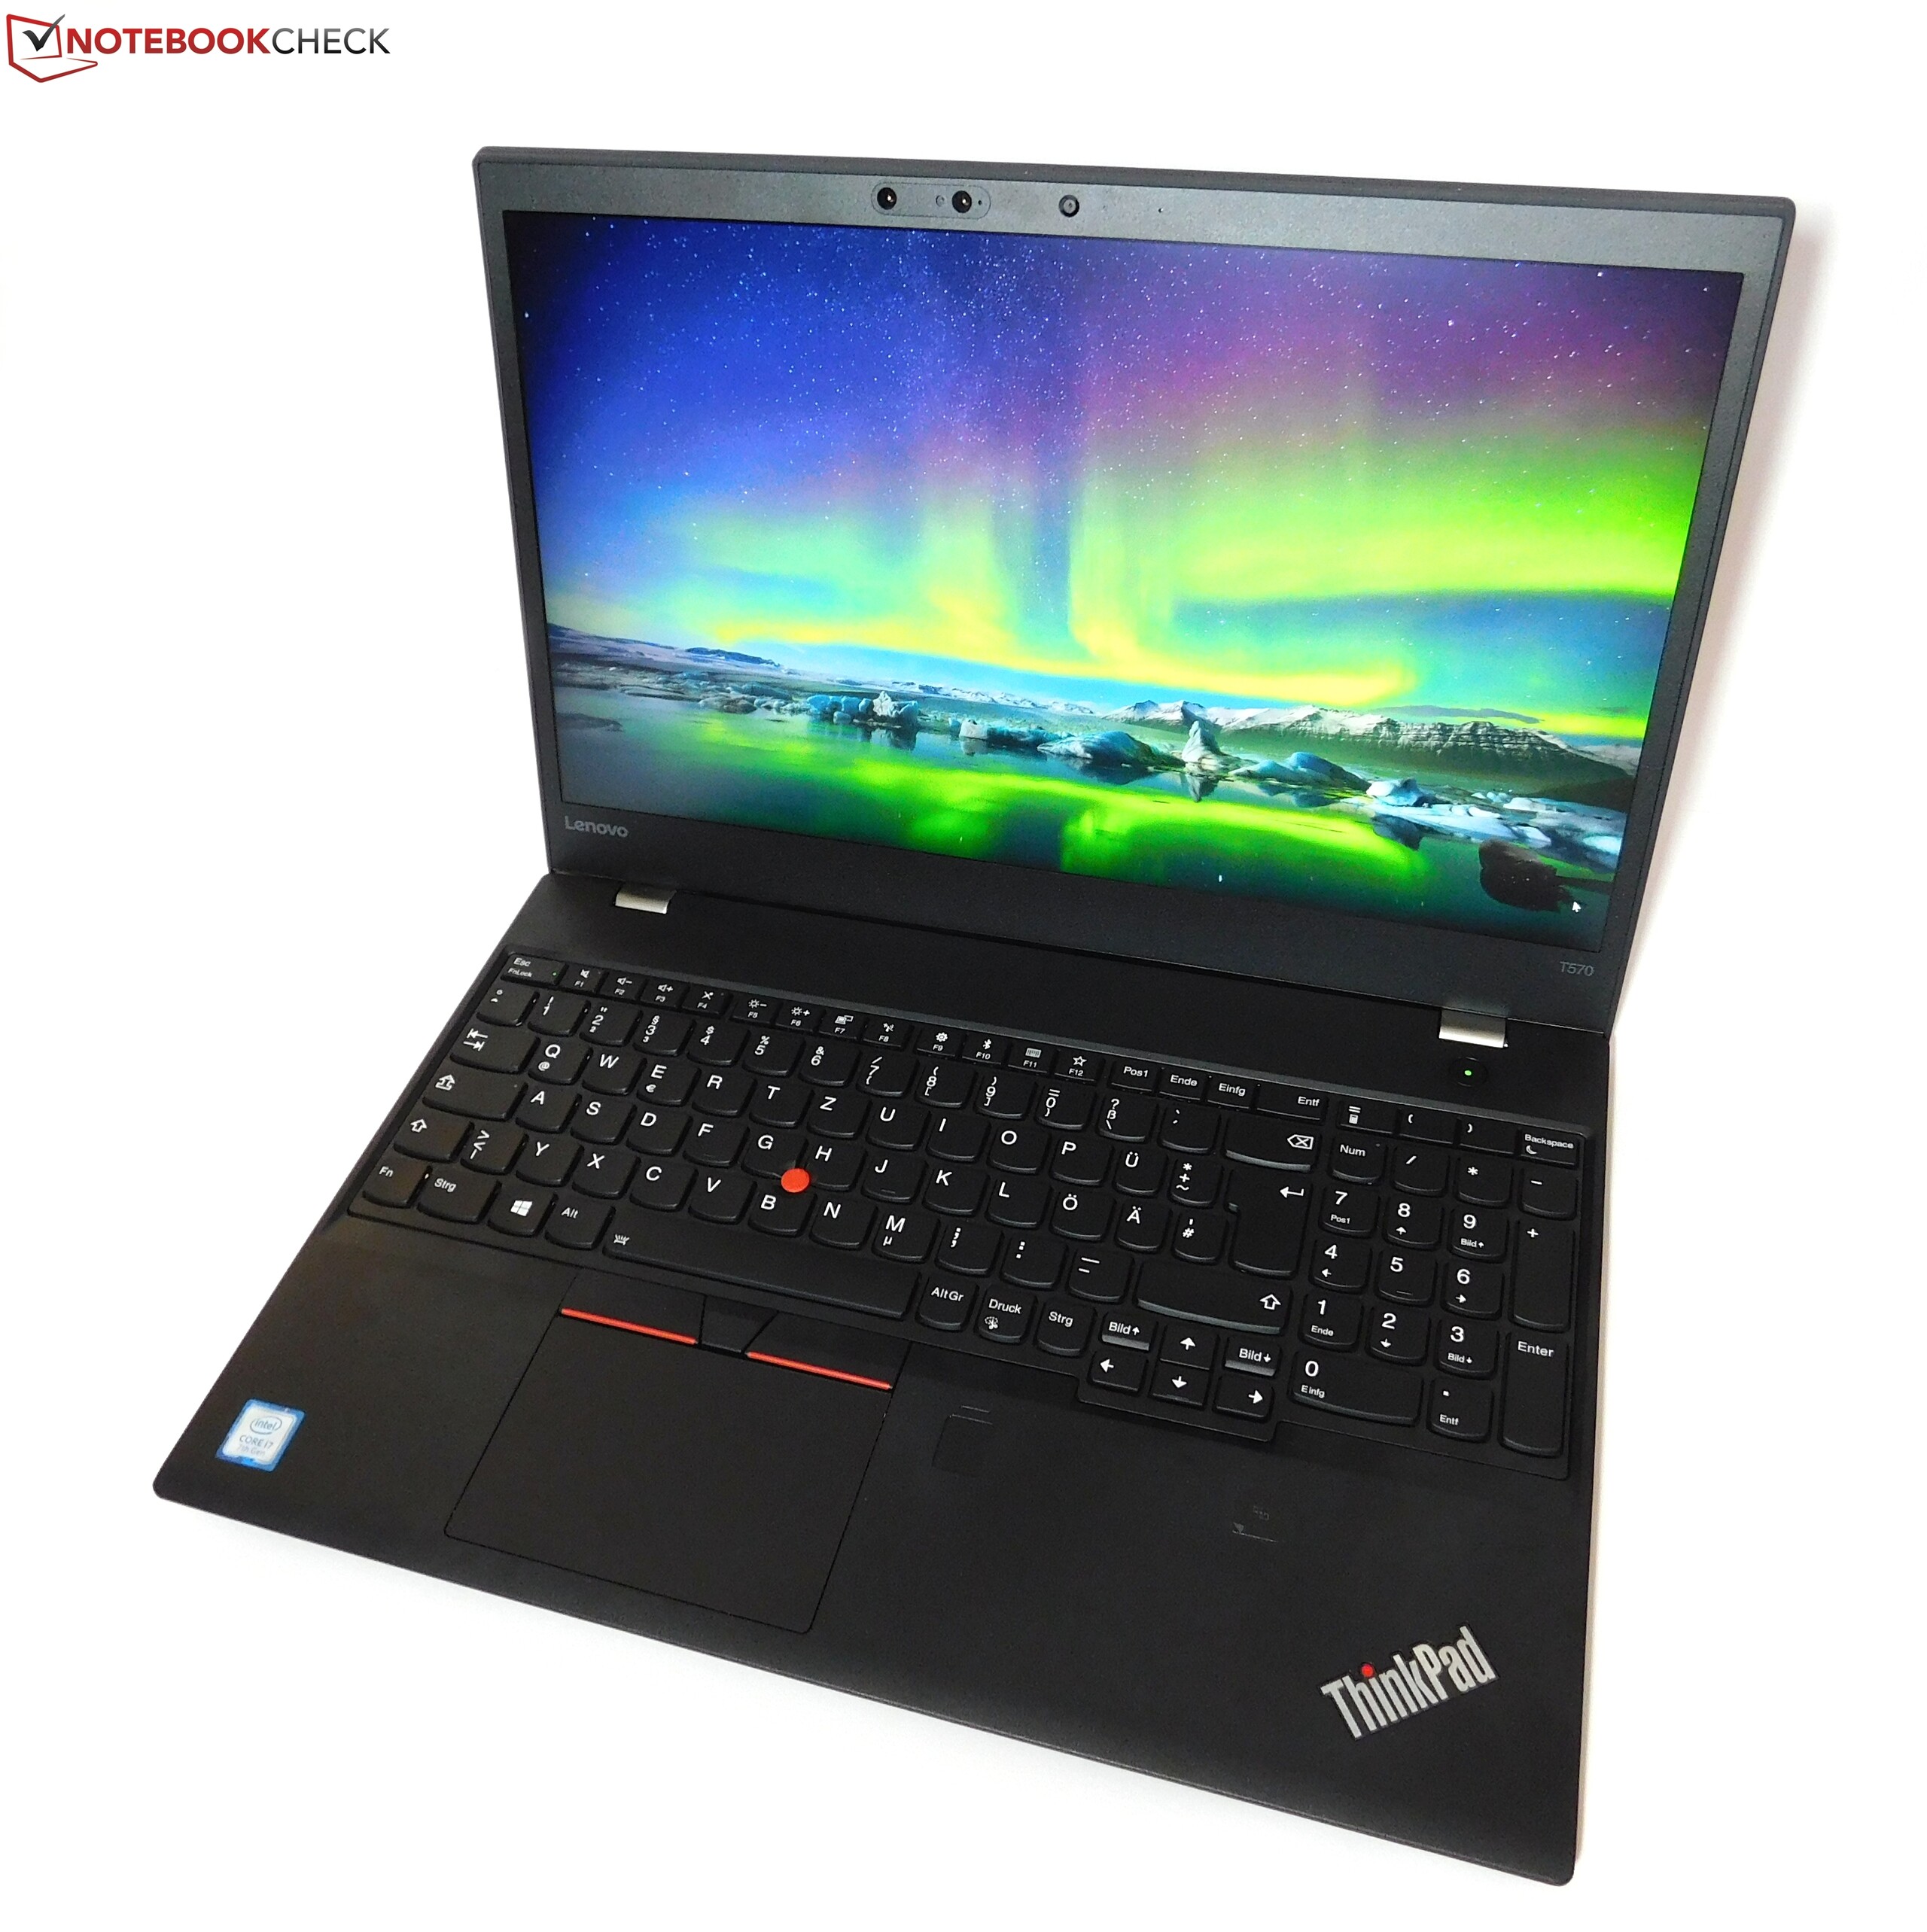
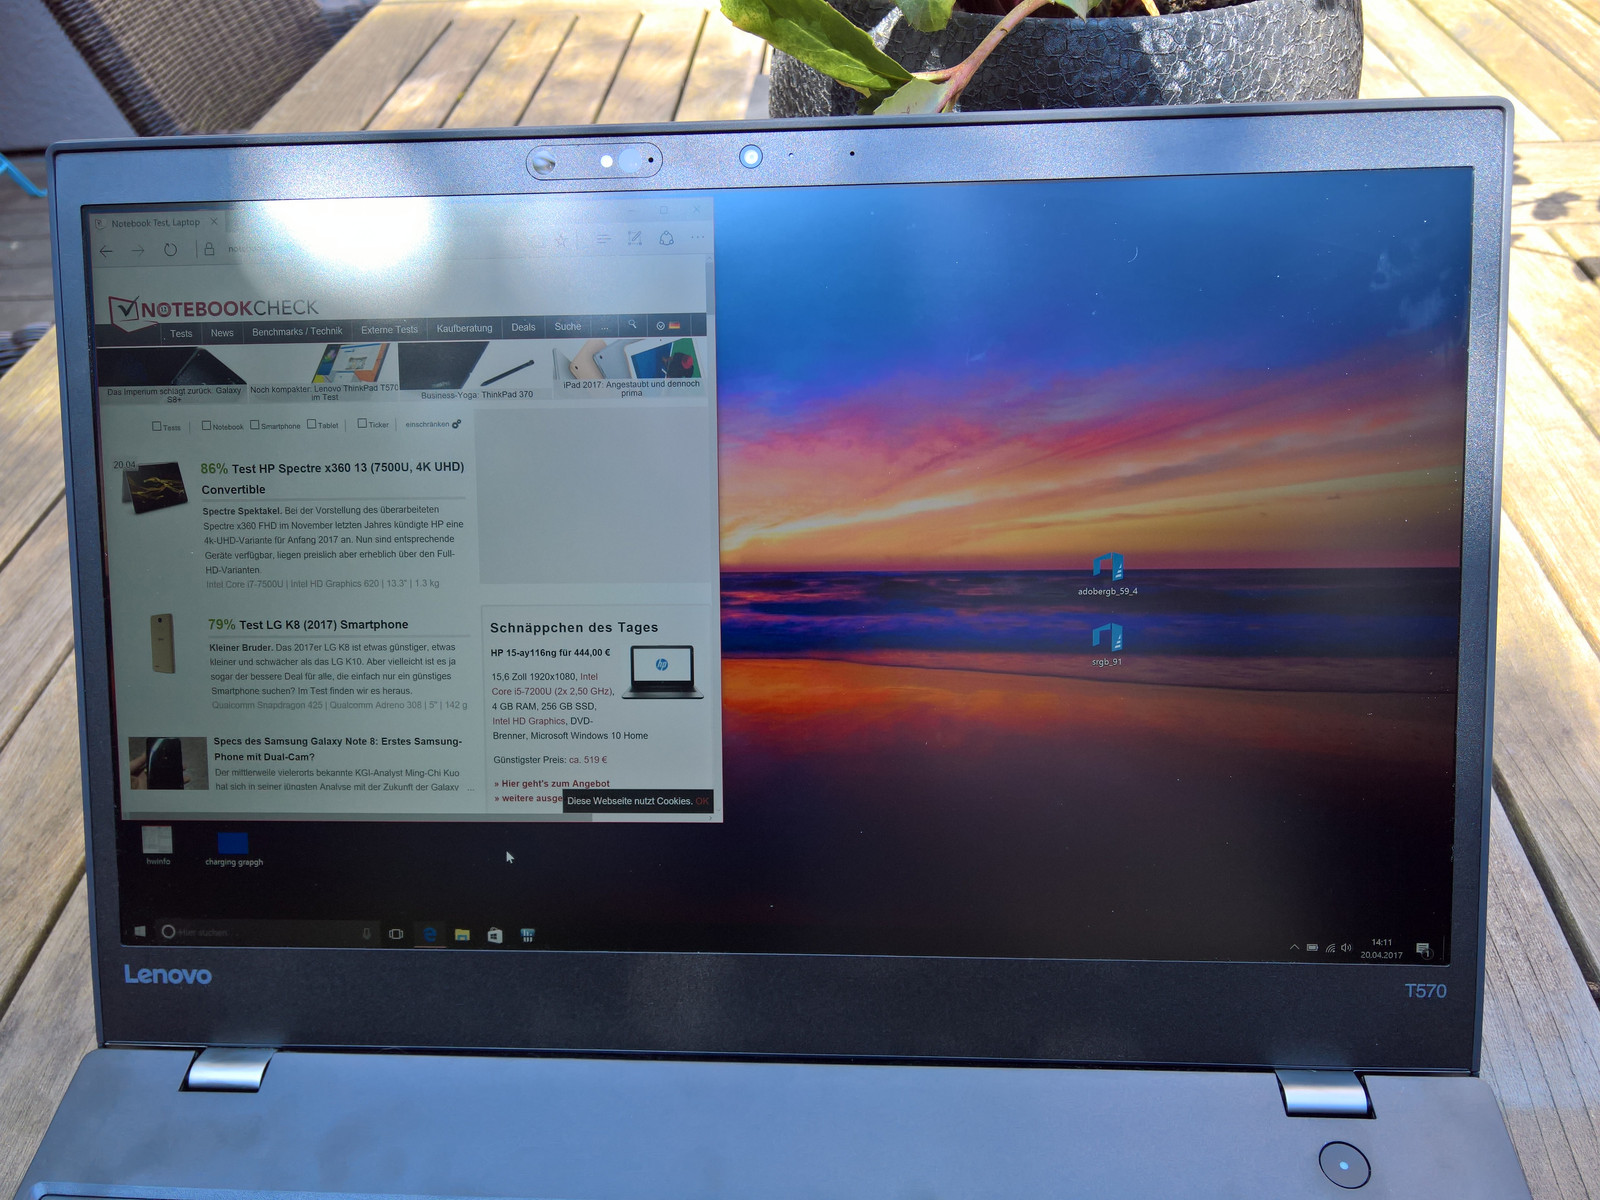
Lenovo ThinkPad T570 (Core i7, 4K, 940MX) Laptop Review

For the original German review, see here.
Some devices are worth taking a second look. This is particularly the case if there are many different models that vary greatly in the way they are equipped. The ThinkPad T570 is such a case. In our first test we examined a basic model, equipped with a Full HD IPS display, a Core-i5 processor, as well as a 256 GB PCIe SSD. In this test update, we test a configuration with the expensive 4K IPS display, i7 CPU, and a 512 GB PCIe SSD. Also on-board: a mid-range Nvidia GPU.
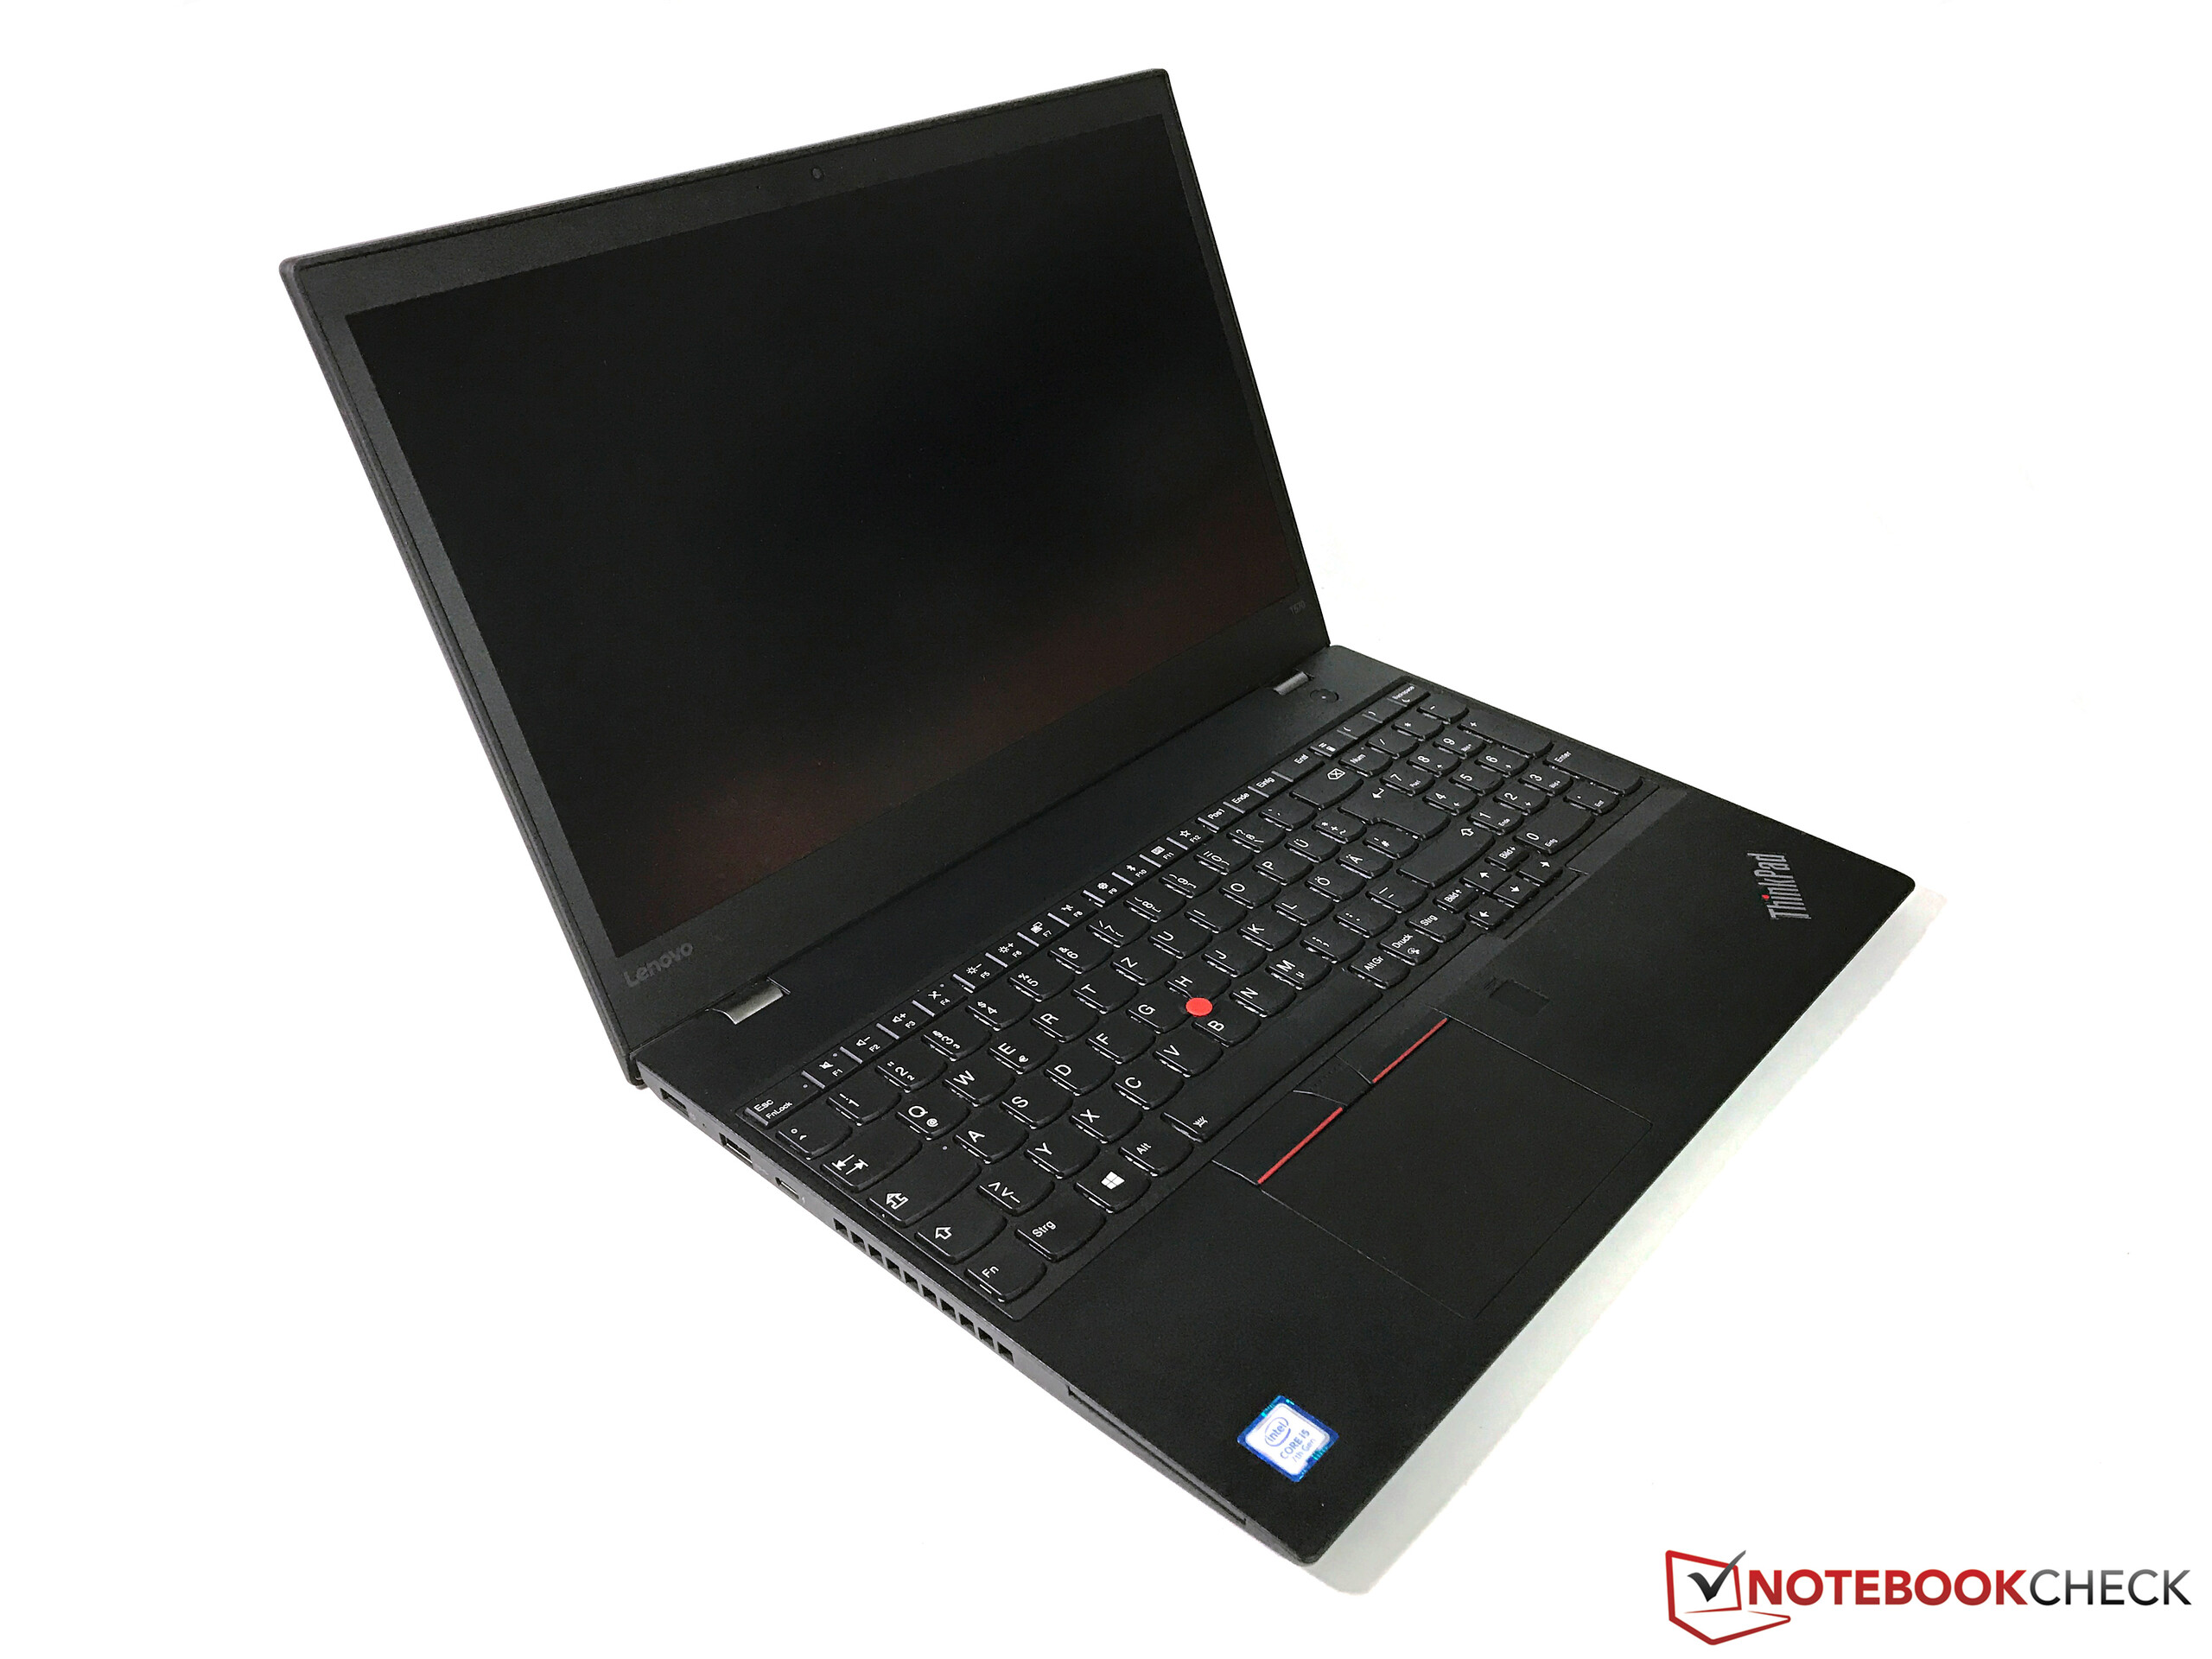
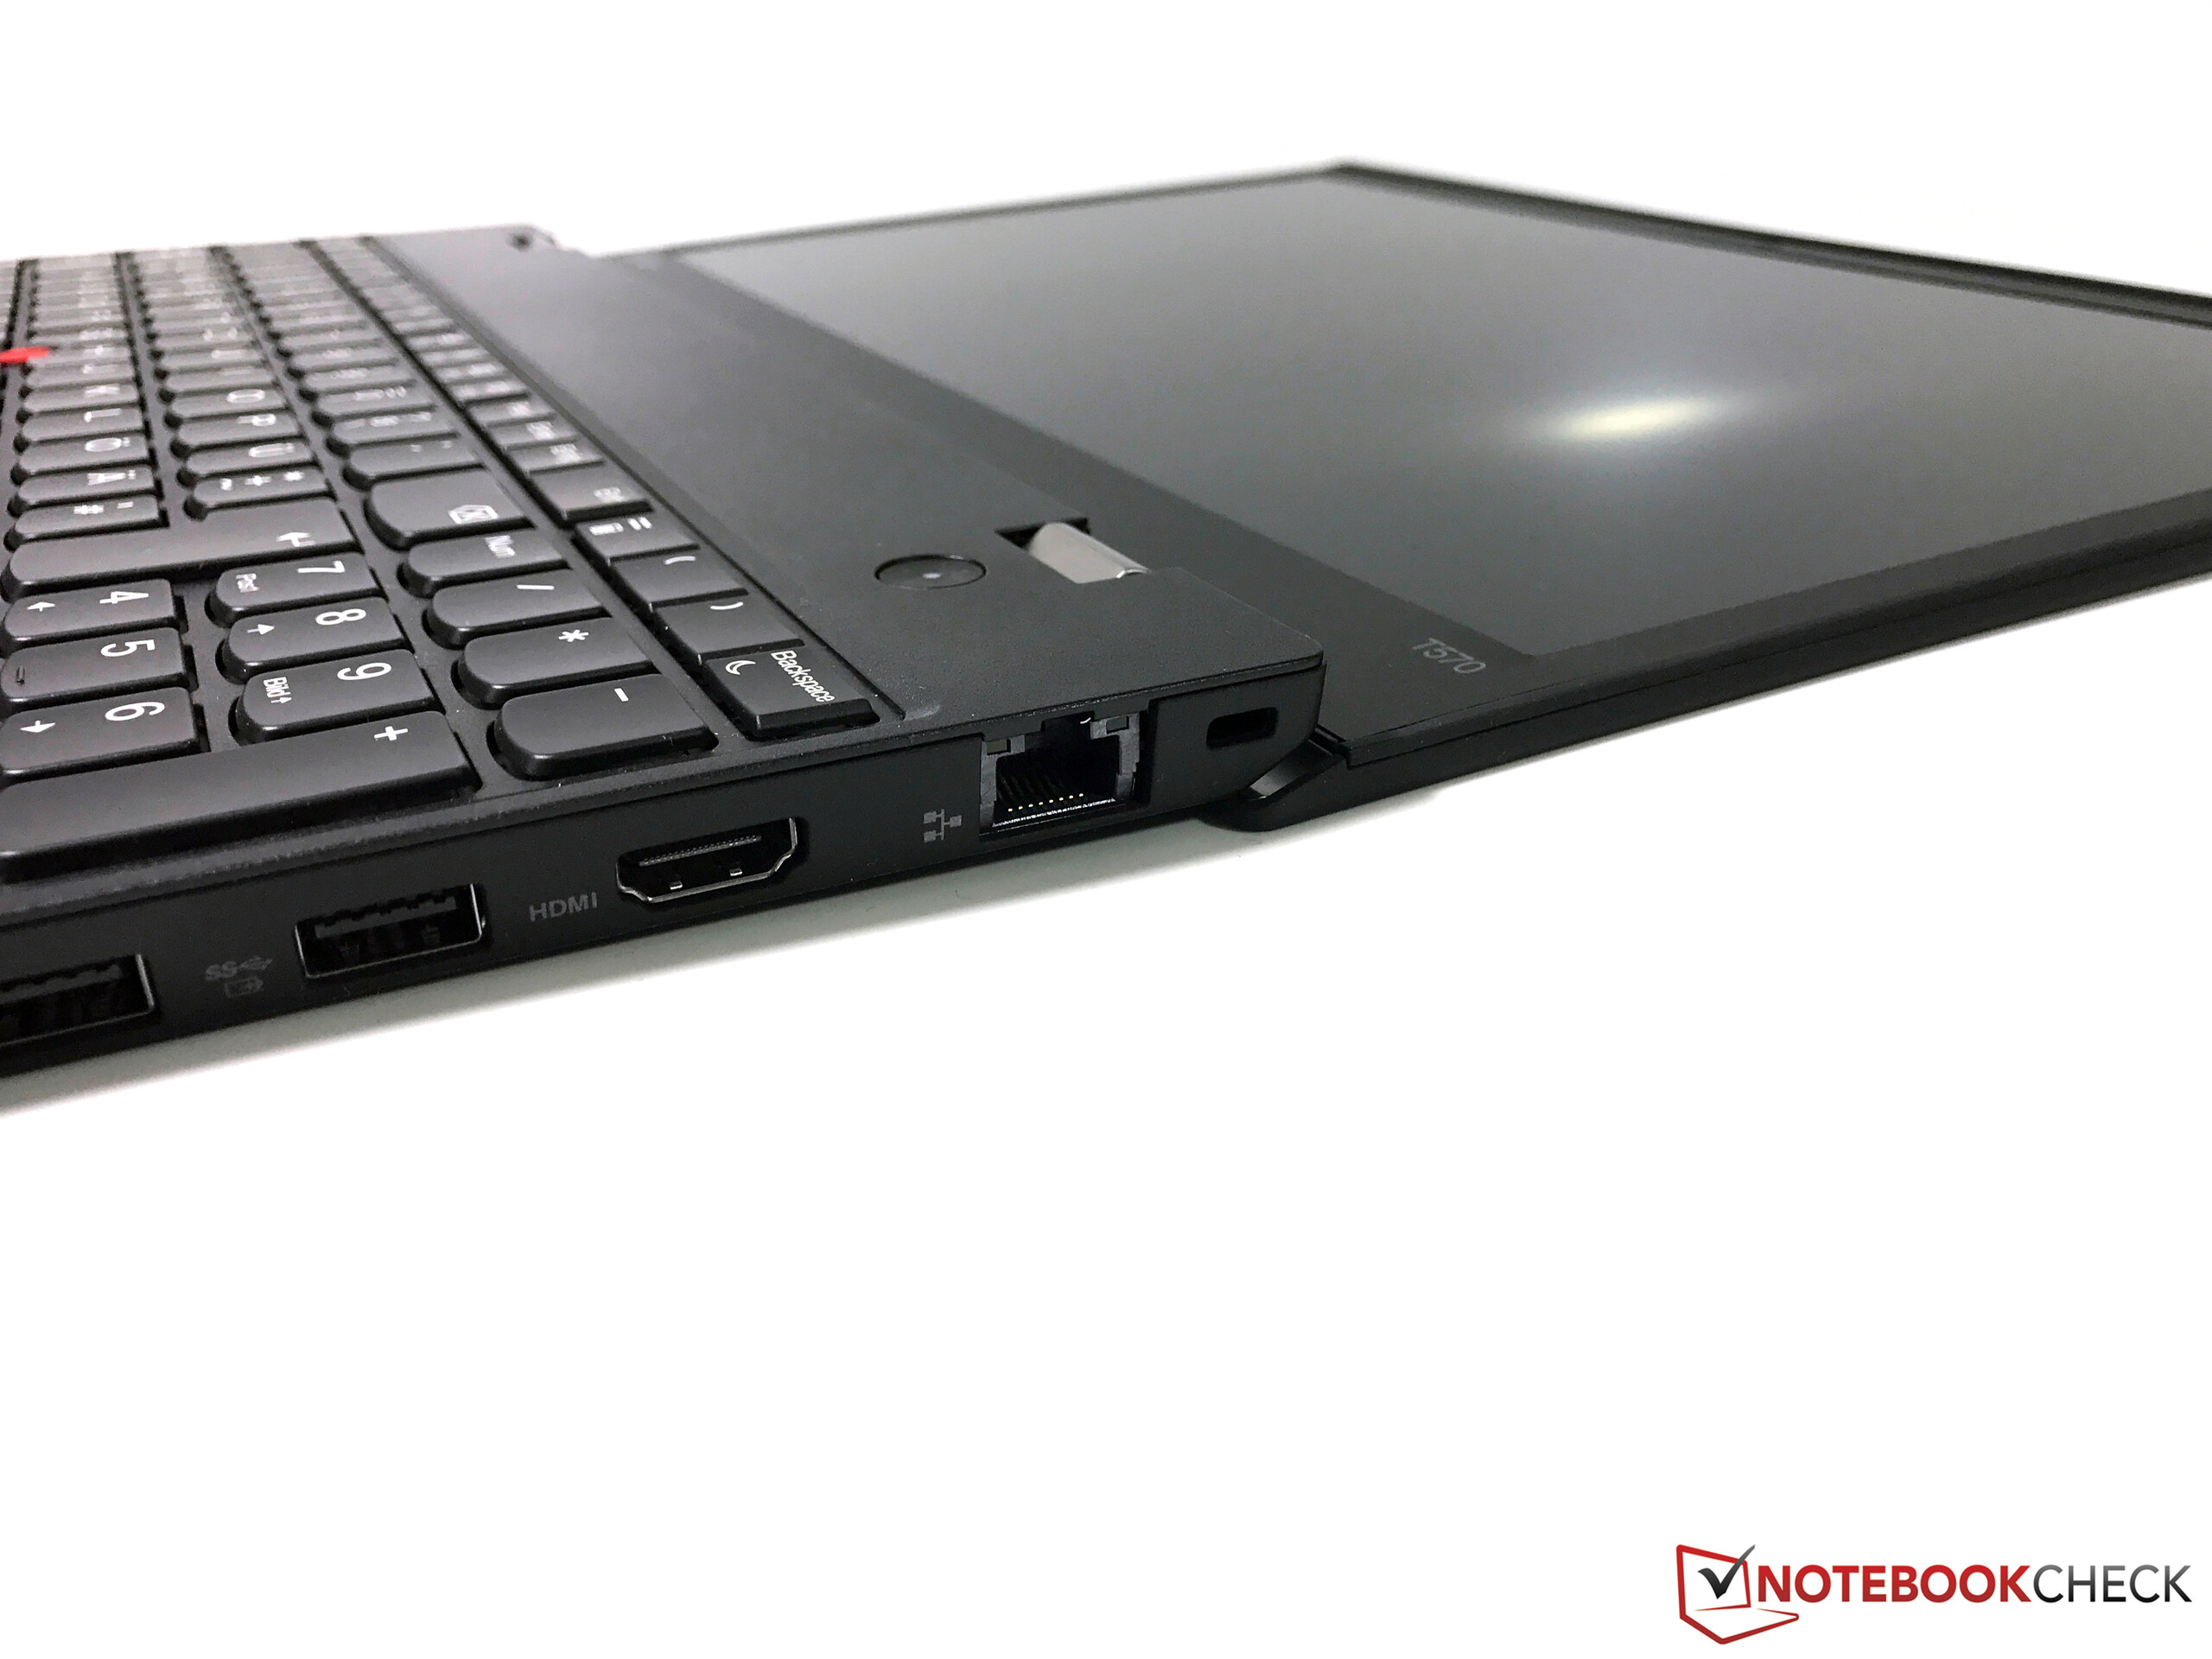
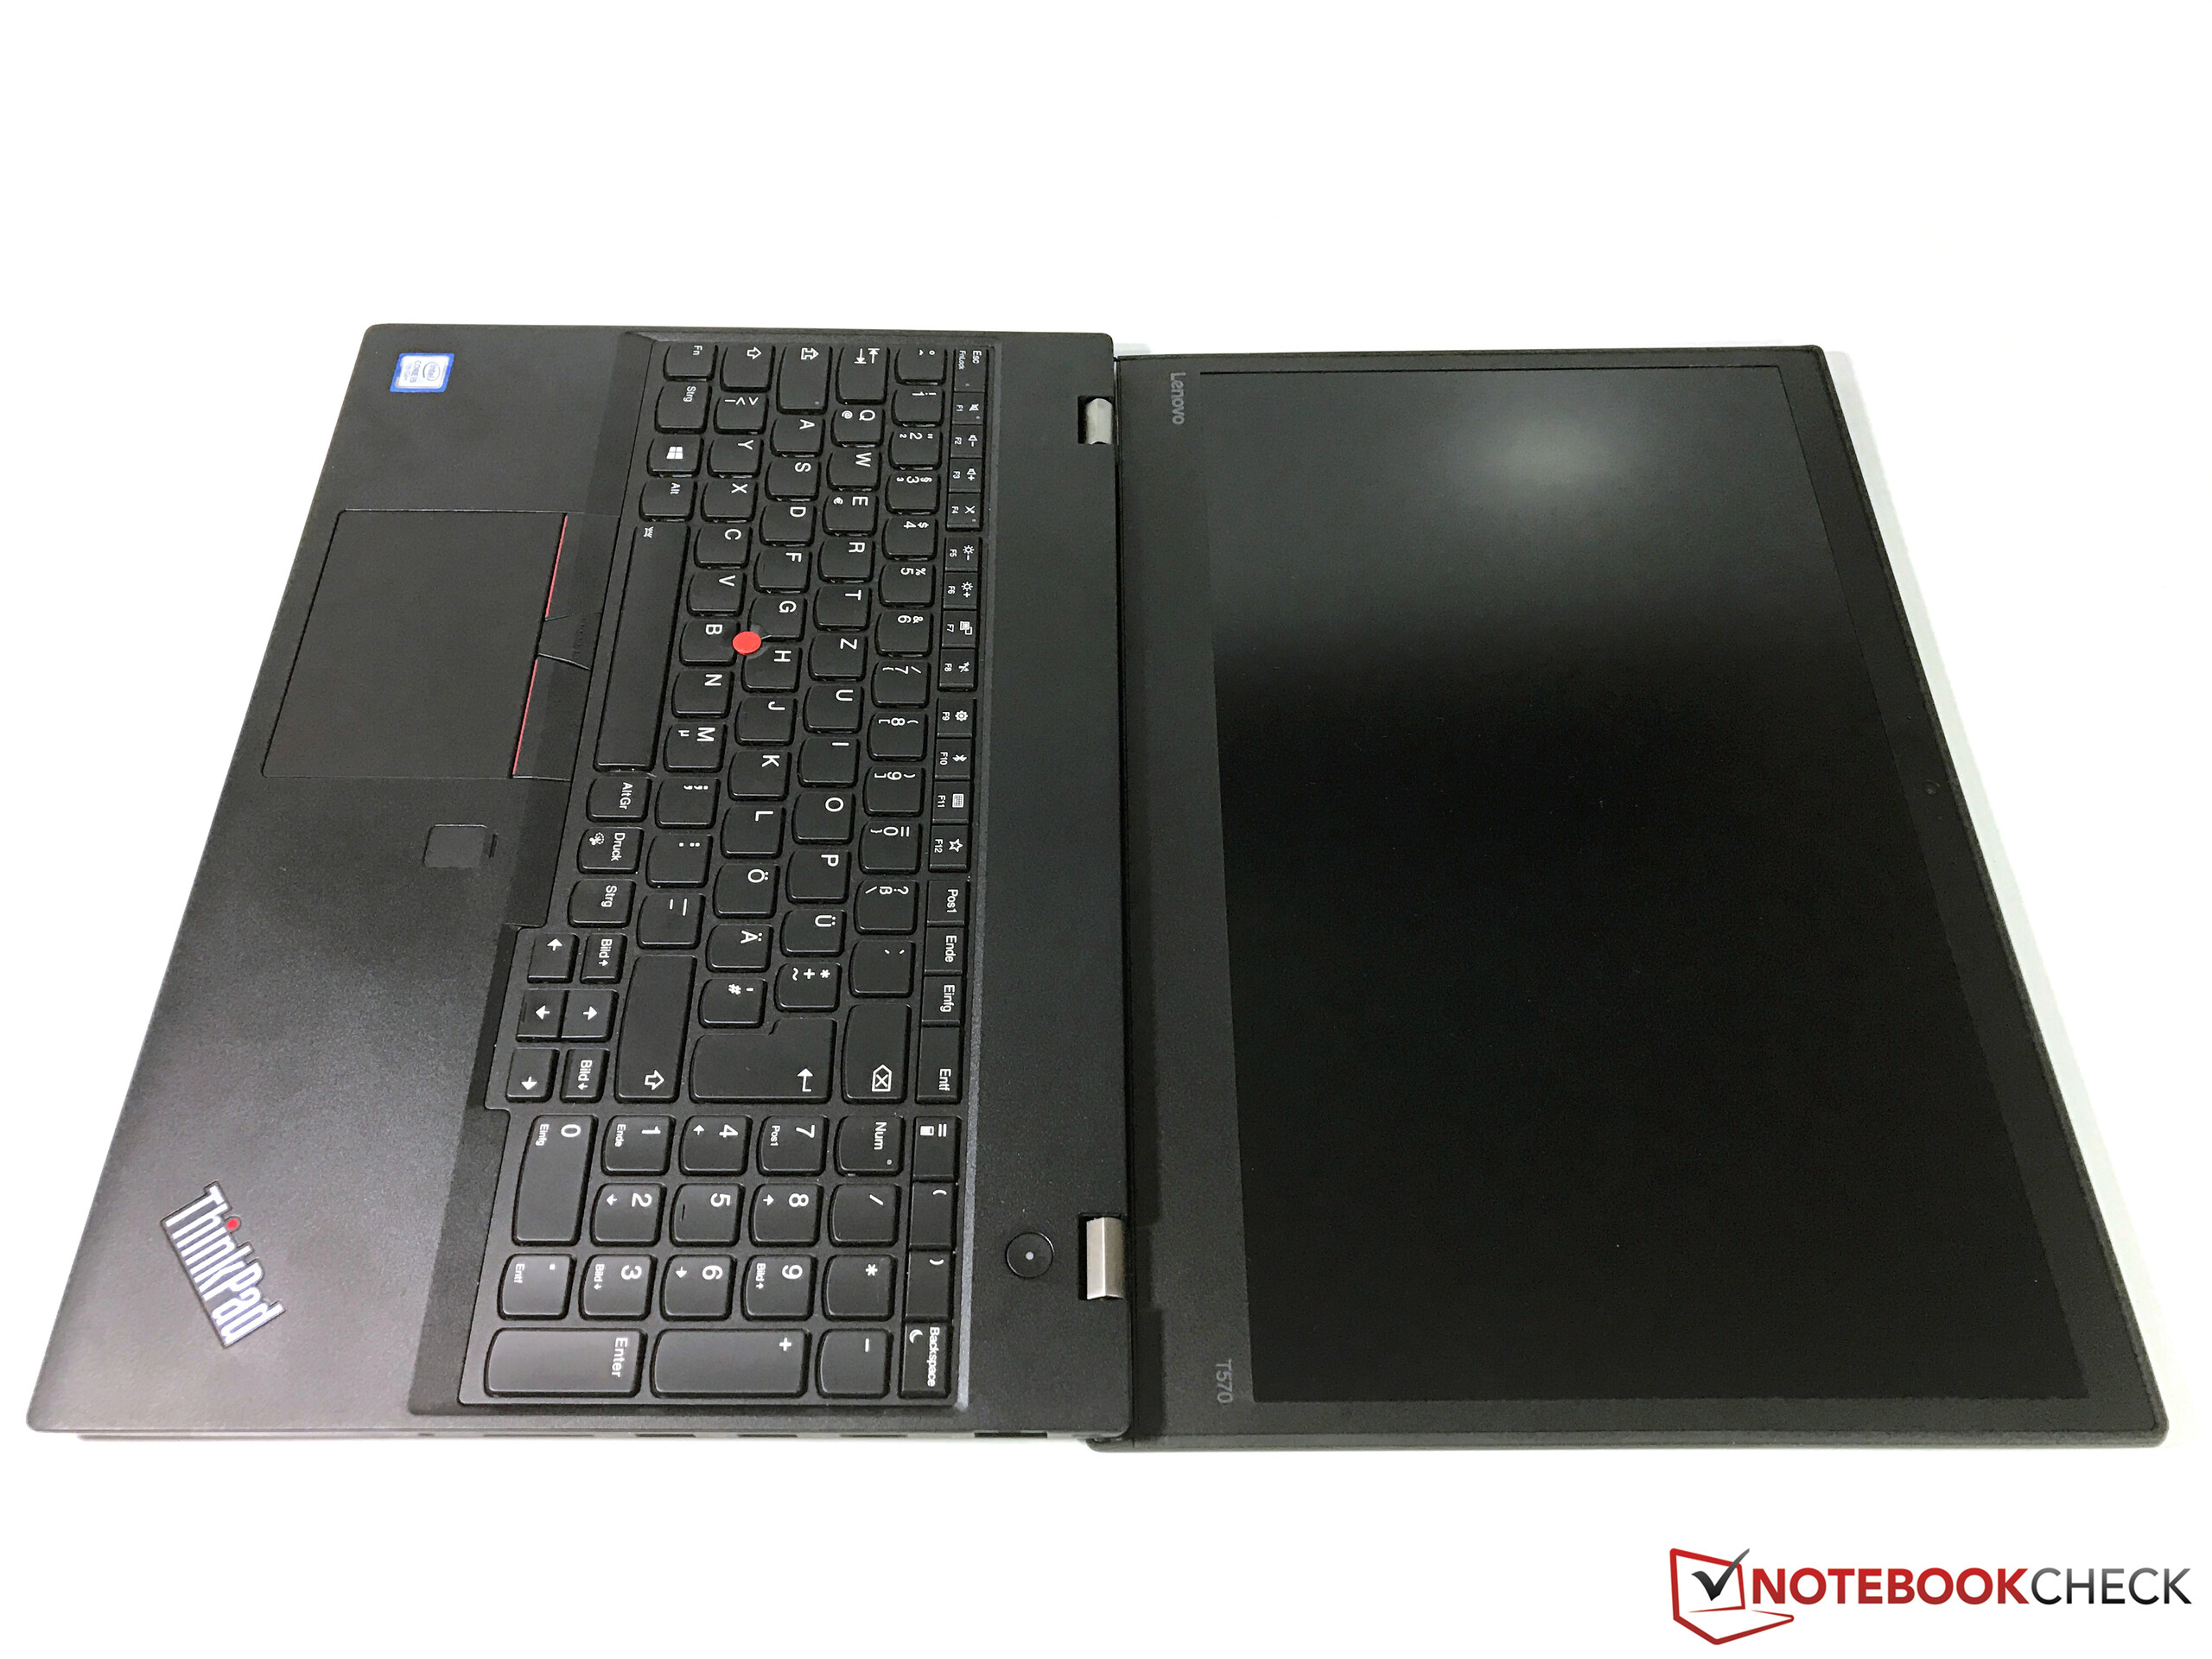
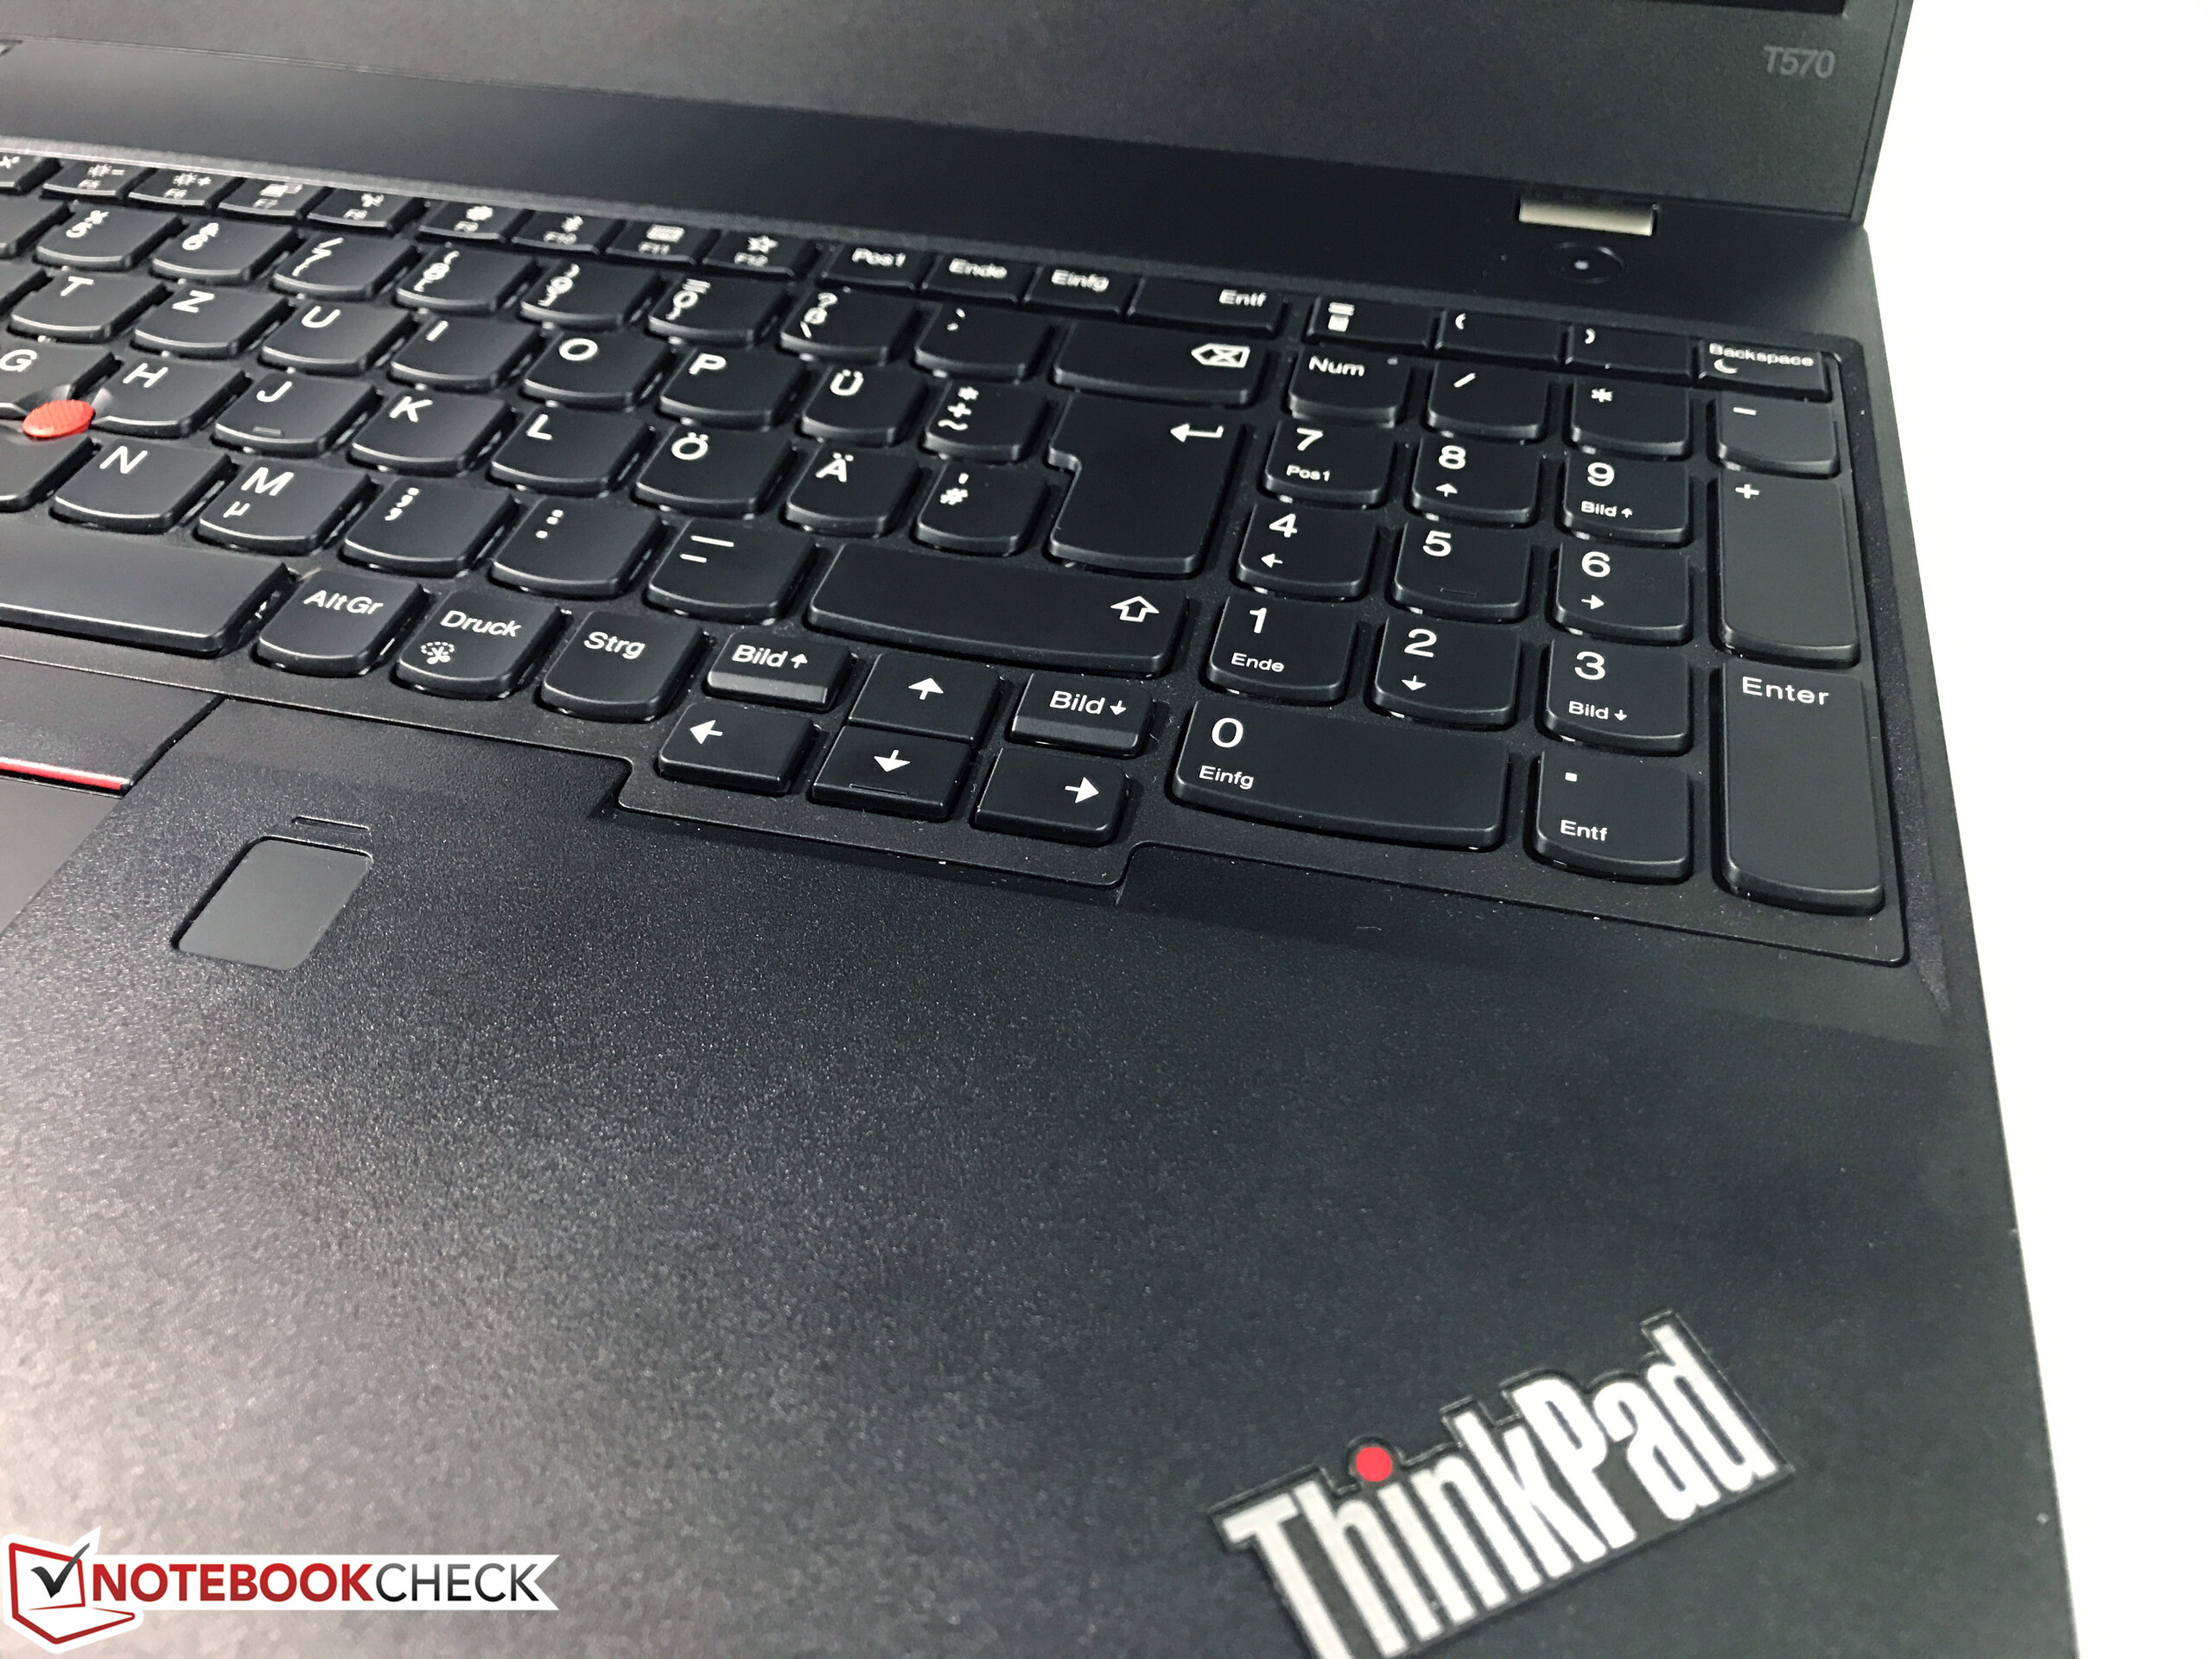
As usual for a test update, we refer to the initial, complete test of the T570 for information on the casing, input devices, speaker, and features. This test focuses mainly on the display, performance, as well as the battery life and cooling system.
Note that the only similar model with a 4K display that appears to be available in the US is the 20H9004RUS, which can currently be found for $2162.99, but does not include the Nvidia GPU.
| SD Card Reader | |
| average JPG Copy Test (av. of 3 runs) | |
| Lenovo ThinkPad T570-20HAS01E00 | |
| Fujitsu LifeBook U757 | |
| HP EliteBook 850 G4-Z2W86ET | |
| Dell XPS 15 2017 9560 (7300HQ, Full-HD) | |
| maximum AS SSD Seq Read Test (1GB) | |
| Dell XPS 15 2017 9560 (7300HQ, Full-HD) | |
| Lenovo ThinkPad T570-20HAS01E00 | |
| HP EliteBook 850 G4-Z2W86ET | |
| Fujitsu LifeBook U757 | |
Security
As far as the security features are concerned, the test device is to a large extent identical to the Full HD model that we tested before. There is an important difference, however: Next to the webcam in the display frame sits an additional infrared camera for face recognition with Windows Hello. In practice, this works very well, even if you might need to run through the recognition improvement process several times until the infrared camera recognizes the face really reliably.
Display

One of the main attractions of our better-equipped T570 model is surely the built-in UHD IPS display (3840x2160). Among other things, this is also because Lenovo's other display options are semi-great at most. As customary for business laptops, there is an HD TN option (1366x768), which the buyers should definitely avoid. The display option that is built into most of the T570 units is the Full HD IPS (1920x1080) display, which we evaluated in our first test. That display was not quite able to convince us: Although, as is typical for IPS displays, the viewing angles and the contrast are good, the comparatively low brightness of 245 cd/m² and the very low color space coverage left much to be desired. We already knew that from the predecessor, the T560. The old curse that business devices have displays that are rather below average, has not been completely overcome yet.
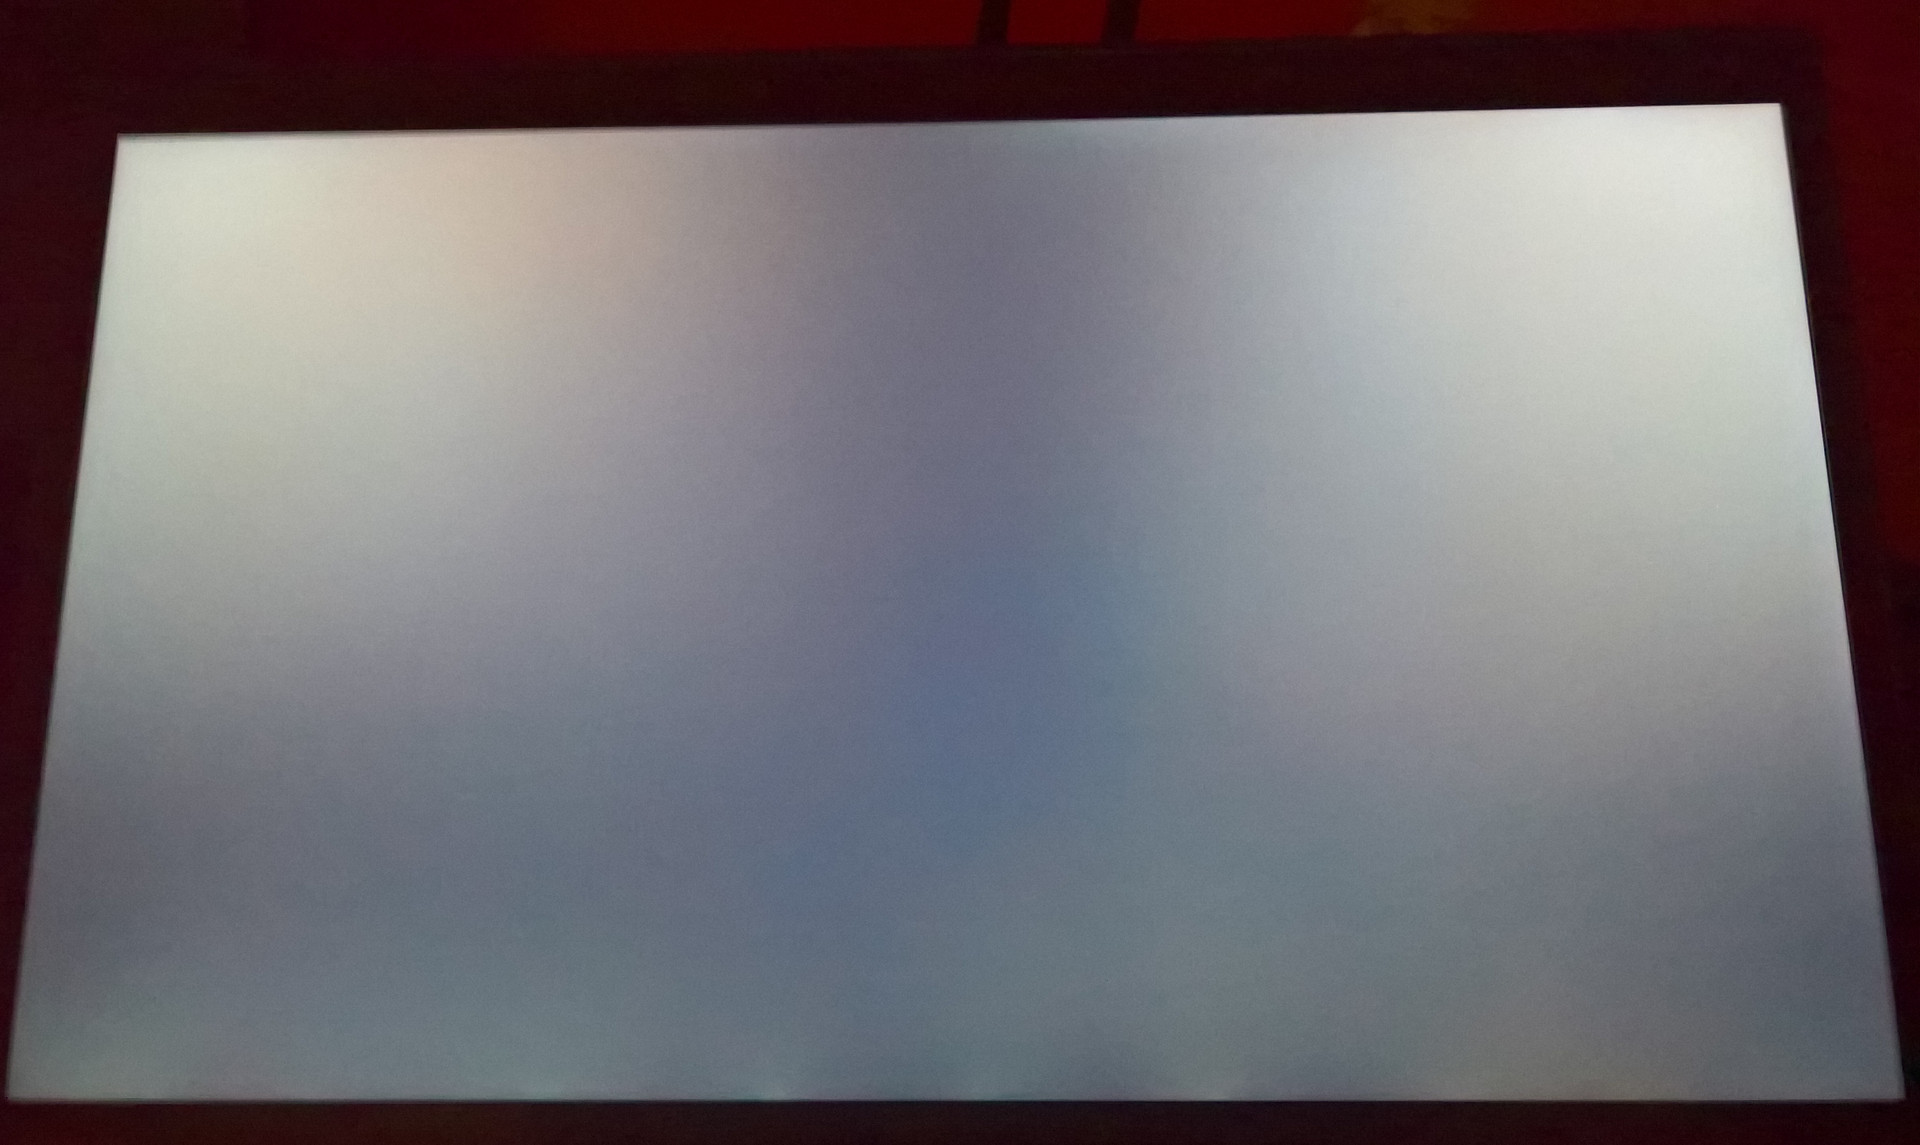
On the basis of the measurements of the 4K/UHD display, we can say with a clear conscience that at least in the most expensive display option, Lenovo has done almost everything right. It was also true in the T560, whose 3K IPS display option (2880x1620) is replaced by the 4K display (the T570 is the first ThinkPad of the T-series with a 4K display ever). Just the display brightness is reason enough to reach for the expensive display option. At 314 cd/m² on average, the built-in panel coming from BOE is considerably brighter than the Full HD display. With this, the 4K display does almost as well as the 3K display in the predecessor: a good result, even if the displays in the Dell XPS 15 and especially in the Apple MacBook Pro 15 are again much brighter than that. As with the 3K predecessor, the 4K panel has some PWM, although it is with a much higher frequency of 925 Hz, which should give no cause for concern to most users. The display hardly shows any backlight bleeding; only during bootup it can be seen minimally on the bottom edge. At 89% the brightness distribution is good, but not outstanding. Shadowing cannot be seen with the naked eye.
| |||||||||||||||||||||||||
Brightness Distribution: 89 %
Center on Battery: 339 cd/m²
Contrast: 942:1 (Black: 0.36 cd/m²)
ΔE ColorChecker Calman: 4.2 | ∀{0.5-29.43 Ø4.71}
ΔE Greyscale Calman: 5.1 | ∀{0.09-98 Ø4.96}
91% sRGB (Argyll 1.6.3 3D)
59.4% AdobeRGB 1998 (Argyll 1.6.3 3D)
66.7% AdobeRGB 1998 (Argyll 3D)
91.1% sRGB (Argyll 3D)
70% Display P3 (Argyll 3D)
Gamma: 2.16
CCT: 6569 K
Screen Flickering / PWM (Pulse-Width Modulation)
| Screen flickering / PWM detected | 926 Hz | ≤ 90 % brightness setting | 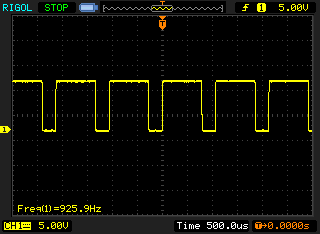 |
The display backlight flickers at 926 Hz (worst case, e.g., utilizing PWM) Flickering detected at a brightness setting of 90 % and below. There should be no flickering or PWM above this brightness setting. The frequency of 926 Hz is quite high, so most users sensitive to PWM should not notice any flickering. In comparison: 52 % of all tested devices do not use PWM to dim the display. If PWM was detected, an average of 7757 (minimum: 5 - maximum: 343500) Hz was measured. | |||
| Lenovo ThinkPad T570-20HAS01E00 BOE NV156QUM-N44, , 3840x2160, 15.6" | Lenovo ThinkPad T570-20H90002GE N156HCA-EAA, , 1920x1080, 15.6" | Lenovo ThinkPad T560-20FH002RGE Panasonic VVX16T028J00, , 2880x1620, 15.6" | HP EliteBook 850 G4-Z2W86ET AUO35ED, , 1920x1080, 15.6" | Fujitsu LifeBook U757 LP156WF6-SPP1, , 1920x1080, 15.6" | Apple MacBook Pro 15 2016 (2.6 GHz, 450) 2880x1800, 15.4" | Dell XPS 15 9560 (i7-7700HQ, UHD) 3840x2160, 15.6" | |
|---|---|---|---|---|---|---|---|
| Display | -32% | -5% | -13% | -7% | 29% | ||
| Display P3 Coverage (%) | 70 | 44.08 -37% | 64.4 -8% | 56.8 -19% | 65.8 -6% | 89.7 28% | |
| sRGB Coverage (%) | 91.1 | 65.6 -28% | 87.8 -4% | 83.7 -8% | 84.8 -7% | 100 10% | |
| AdobeRGB 1998 Coverage (%) | 66.7 | 45.66 -32% | 64.1 -4% | 58.7 -12% | 62 -7% | 100 50% | |
| Response Times | -19% | -13% | -7% | -31% | -60% | -98% | |
| Response Time Grey 50% / Grey 80% * (ms) | 41.6 ? | 41.6 ? -0% | 32.8 ? 21% | 47.2 ? -13% | 36 ? 13% | 47.3 ? -14% | 57.2 ? -38% |
| Response Time Black / White * (ms) | 15.2 ? | 20.8 ? -37% | 22.4 ? -47% | 15.2 ? -0% | 26.4 ? -74% | 31.2 ? -105% | 39.2 ? -158% |
| PWM Frequency (Hz) | 926 ? | 26040 ? | 220 ? | 199.2 ? | 117000 ? | 962 | |
| Screen | -6% | -11% | -65% | -1% | 45% | 4% | |
| Brightness middle (cd/m²) | 339 | 262 -23% | 339 0% | 338 0% | 313 -8% | 483 42% | 370.1 9% |
| Brightness (cd/m²) | 314 | 245 -22% | 322 3% | 341 9% | 294 -6% | 465 48% | 356 13% |
| Brightness Distribution (%) | 89 | 89 0% | 88 -1% | 90 1% | 84 -6% | 92 3% | 87 -2% |
| Black Level * (cd/m²) | 0.36 | 0.24 33% | 0.32 11% | 0.81 -125% | 0.27 25% | 0.33 8% | 0.37 -3% |
| Contrast (:1) | 942 | 1092 16% | 1059 12% | 417 -56% | 1159 23% | 1464 55% | 1000 6% |
| Colorchecker dE 2000 * | 4.2 | 4.5 -7% | 5.88 -40% | 10.9 -160% | 4.5 -7% | 1.4 67% | 5.3 -26% |
| Colorchecker dE 2000 max. * | 7.8 | 10.5 -35% | 11.08 -42% | 18.7 -140% | 10.5 -35% | 3 62% | 9.9 -27% |
| Greyscale dE 2000 * | 5.1 | 3.5 31% | 7.41 -45% | 13.3 -161% | 4 22% | 1.5 71% | 4.6 10% |
| Gamma | 2.16 102% | 2.32 95% | 2.36 93% | 2.11 104% | 2.24 98% | 2.34 94% | 2.31 95% |
| CCT | 6569 99% | 6524 100% | 6036 108% | 16030 41% | 6387 102% | 6650 98% | 6284 103% |
| Color Space (Percent of AdobeRGB 1998) (%) | 59.4 | 42.04 -29% | 57.14 -4% | 53.8 -9% | 55.3 -7% | 88.3 49% | |
| Color Space (Percent of sRGB) (%) | 91 | 65.4 -28% | 87.68 -4% | 83.4 -8% | 84.74 -7% | 100 10% | |
| Total Average (Program / Settings) | -19% /
-13% | -10% /
-10% | -28% /
-47% | -13% /
-6% | -8% /
24% | -22% /
-5% |
* ... smaller is better
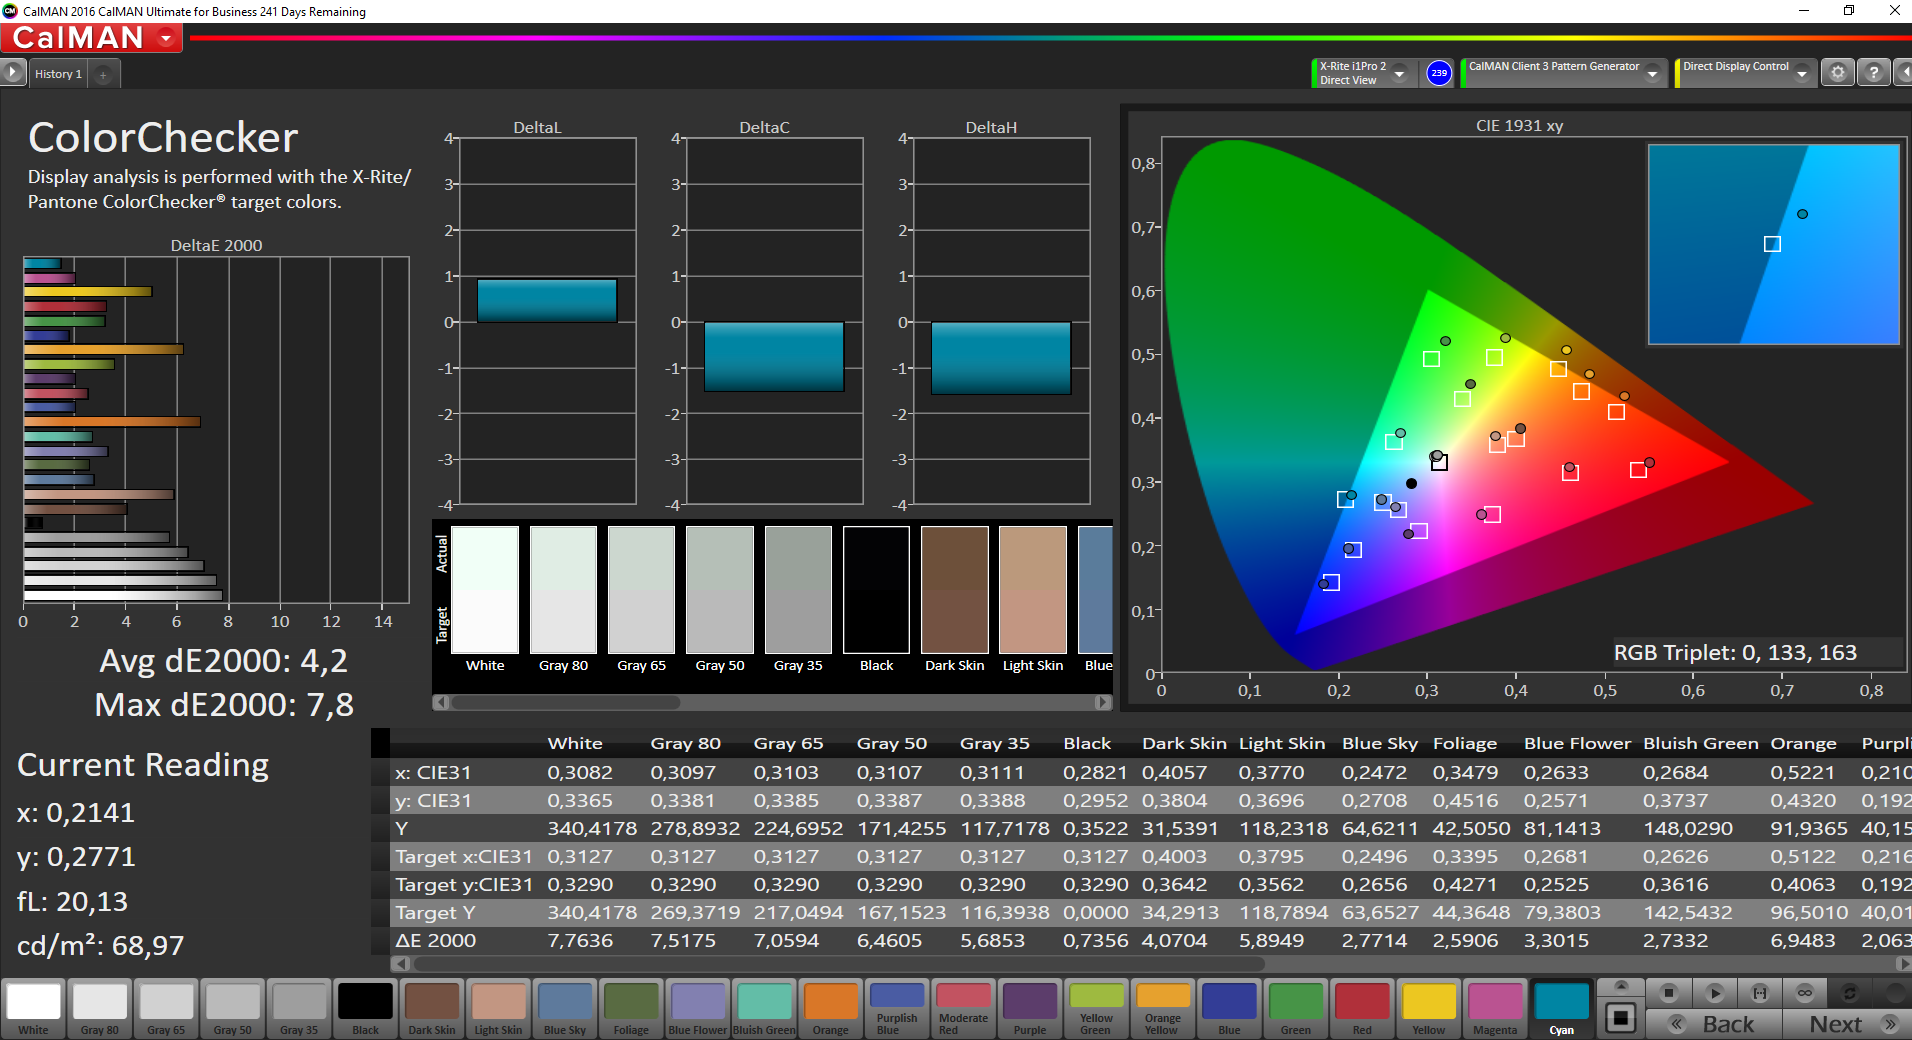
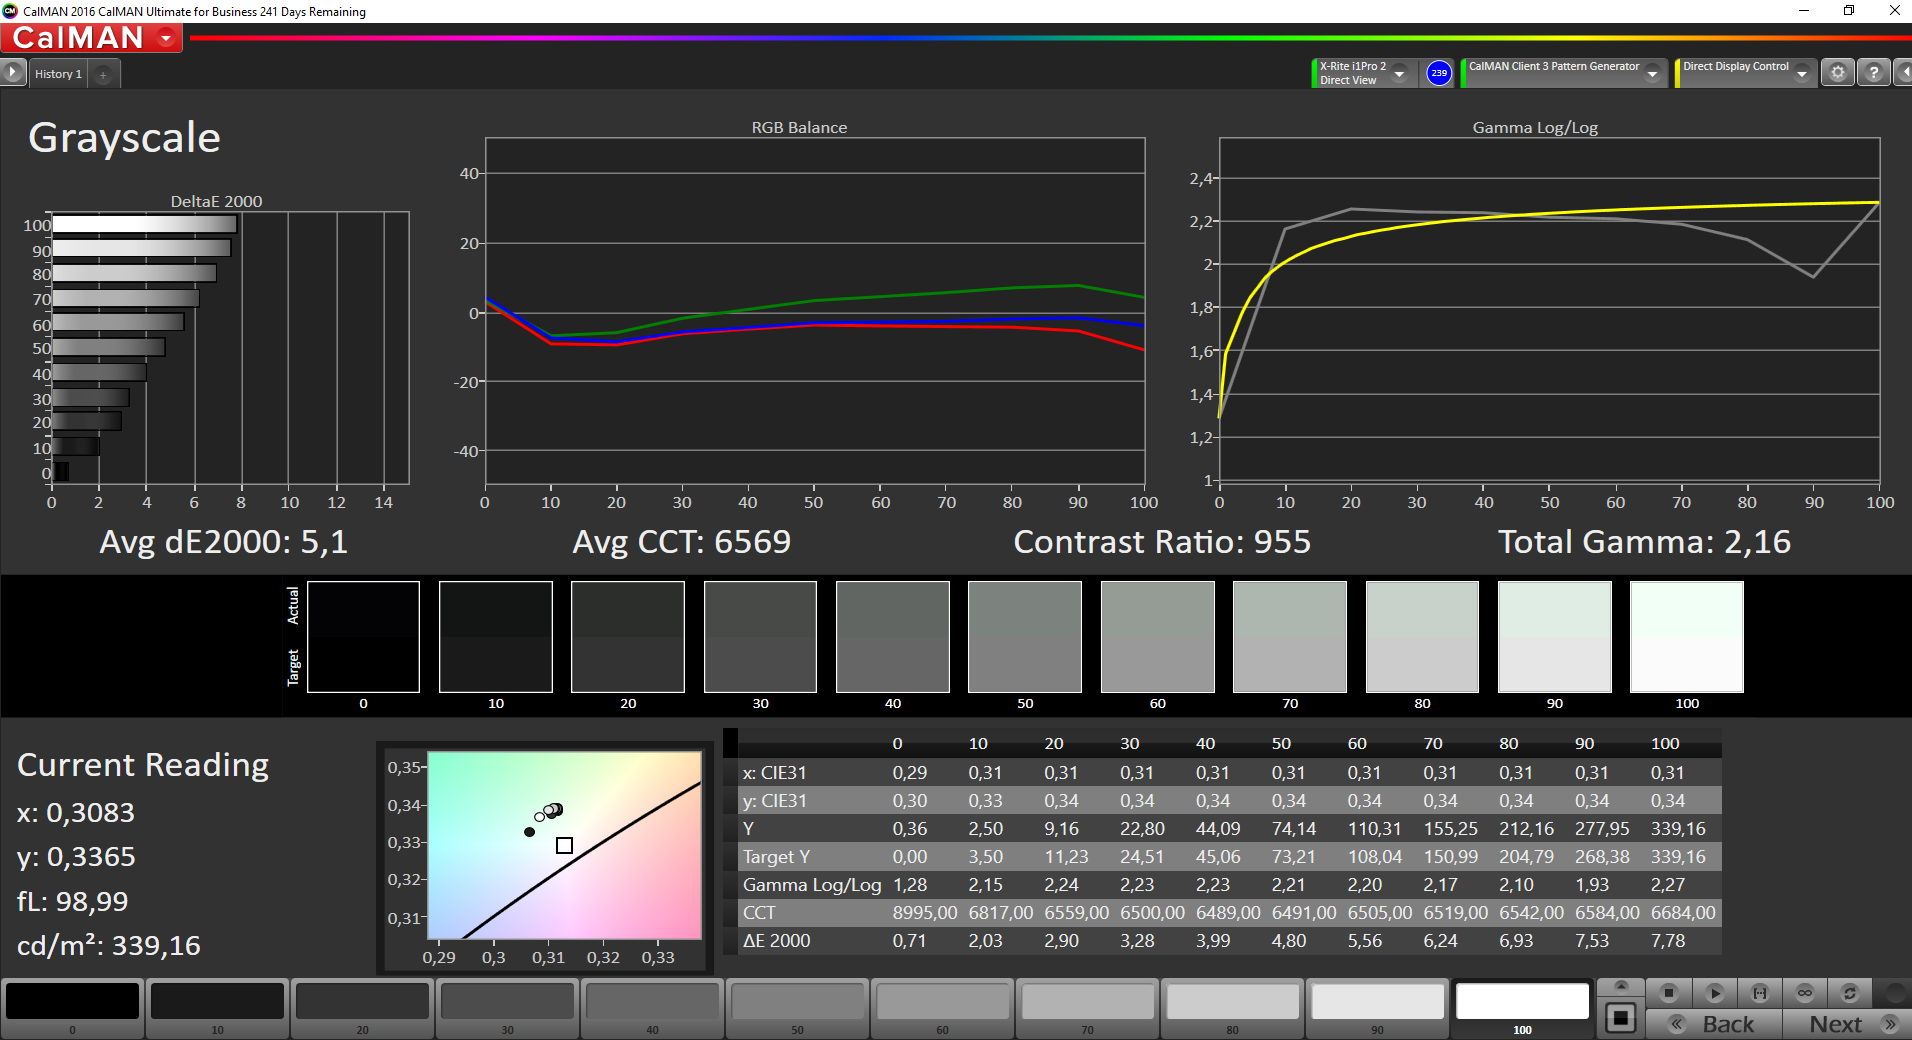
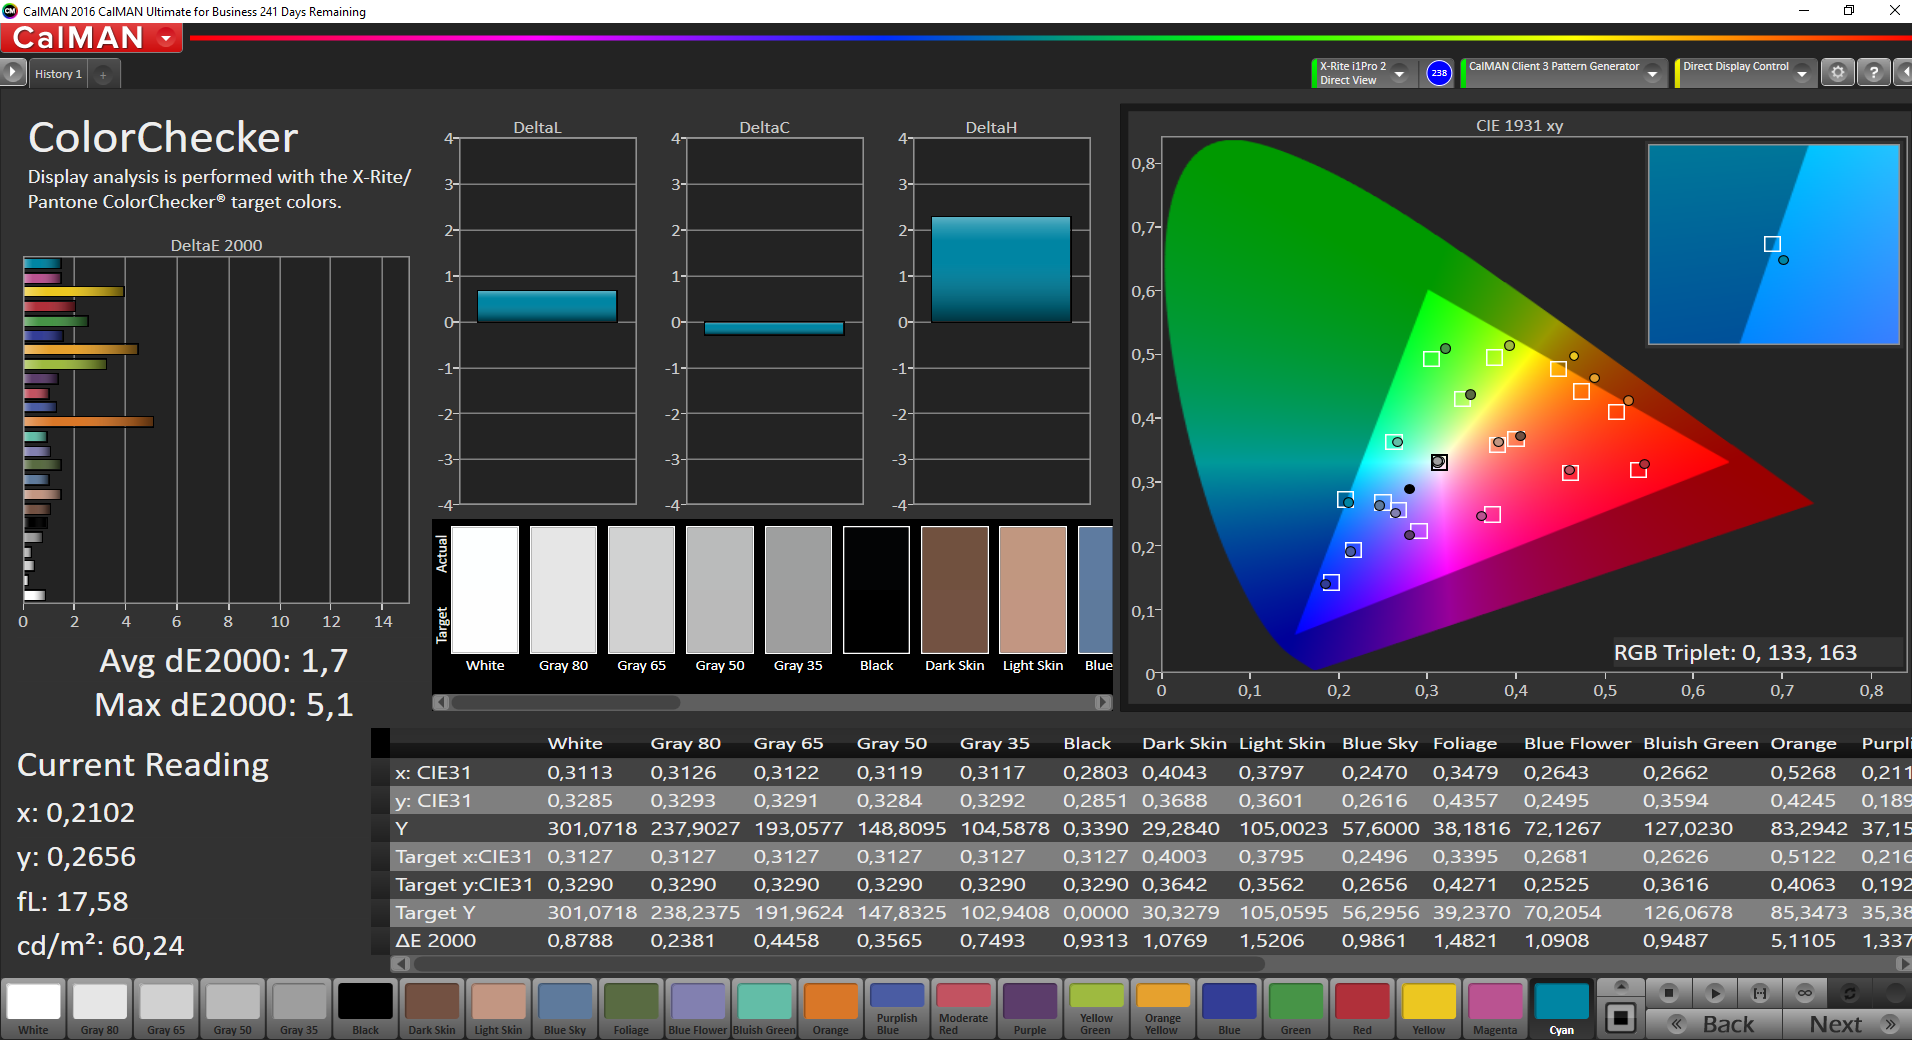
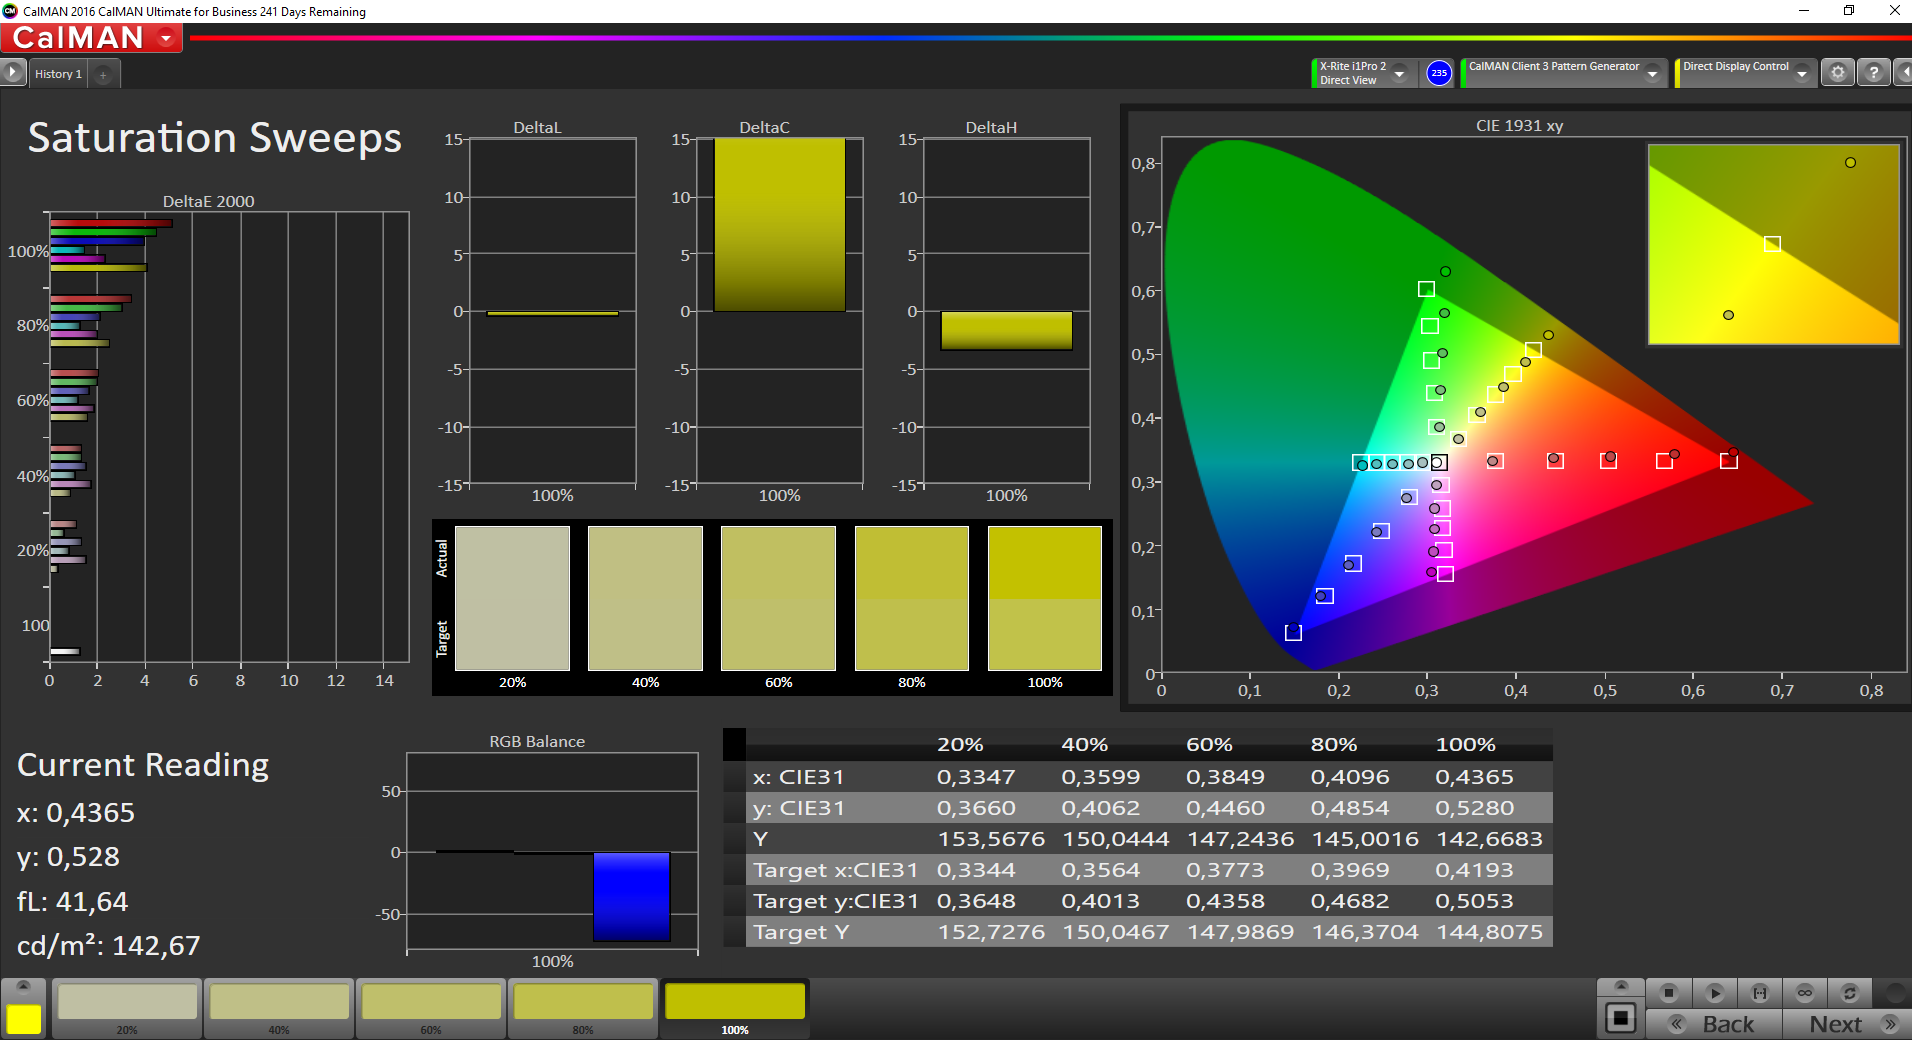
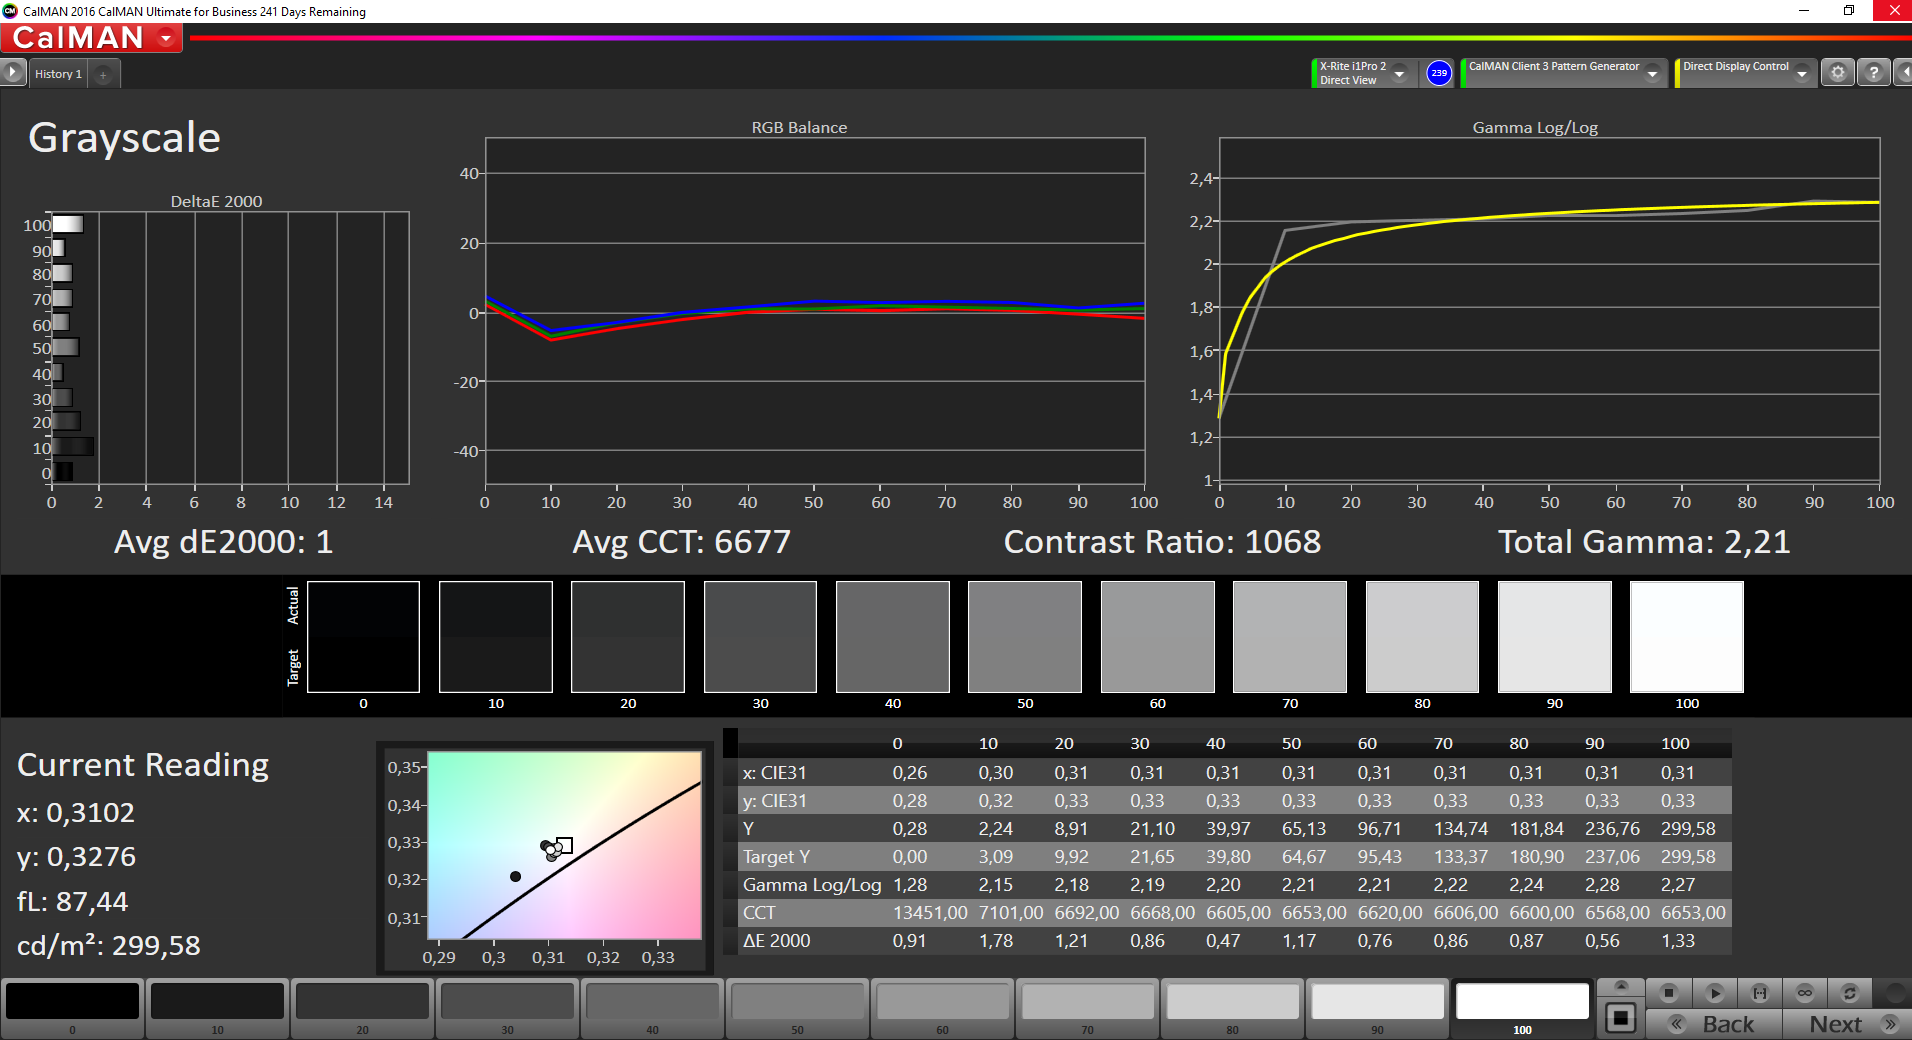
In terms of contrast, the display falls slightly behind the Full HD panel of the first T570 test: 942:1 is neither a very good, nor a particularly bad value, but simply average for an IPS display. Subjectively, the presentation of black as well as text can absolutely convince. As set by the manufacturer, the BOE display has a slight green tint, which can be removed by a calibration. As always, our ICC color profile can be downloaded above. Unfortunately, even with calibration you still cannot achieve a perfect result, and especially with saturation, the top values deviate a little.
As with brightness, the 4K display also clearly does better in the color space coverage than the Full HD display. At 91% sRGB, it just misses a really good value (95 - 100% sRGB). This is also due to the fact that the display projects even beyond AdobeRGB in the yellow-green color area, but lacks colors in particular in the purple-red and green-blue areas. Thus, the AdobeRGB coverage is also slightly disappointing; the BOE 4K display is not a wide gamut panel. Here we are curious about the 4K IPS display in Lenovo's ThinkPad P51 (test coming soon), which Lenovo advertises with a 100% NTSC color space.

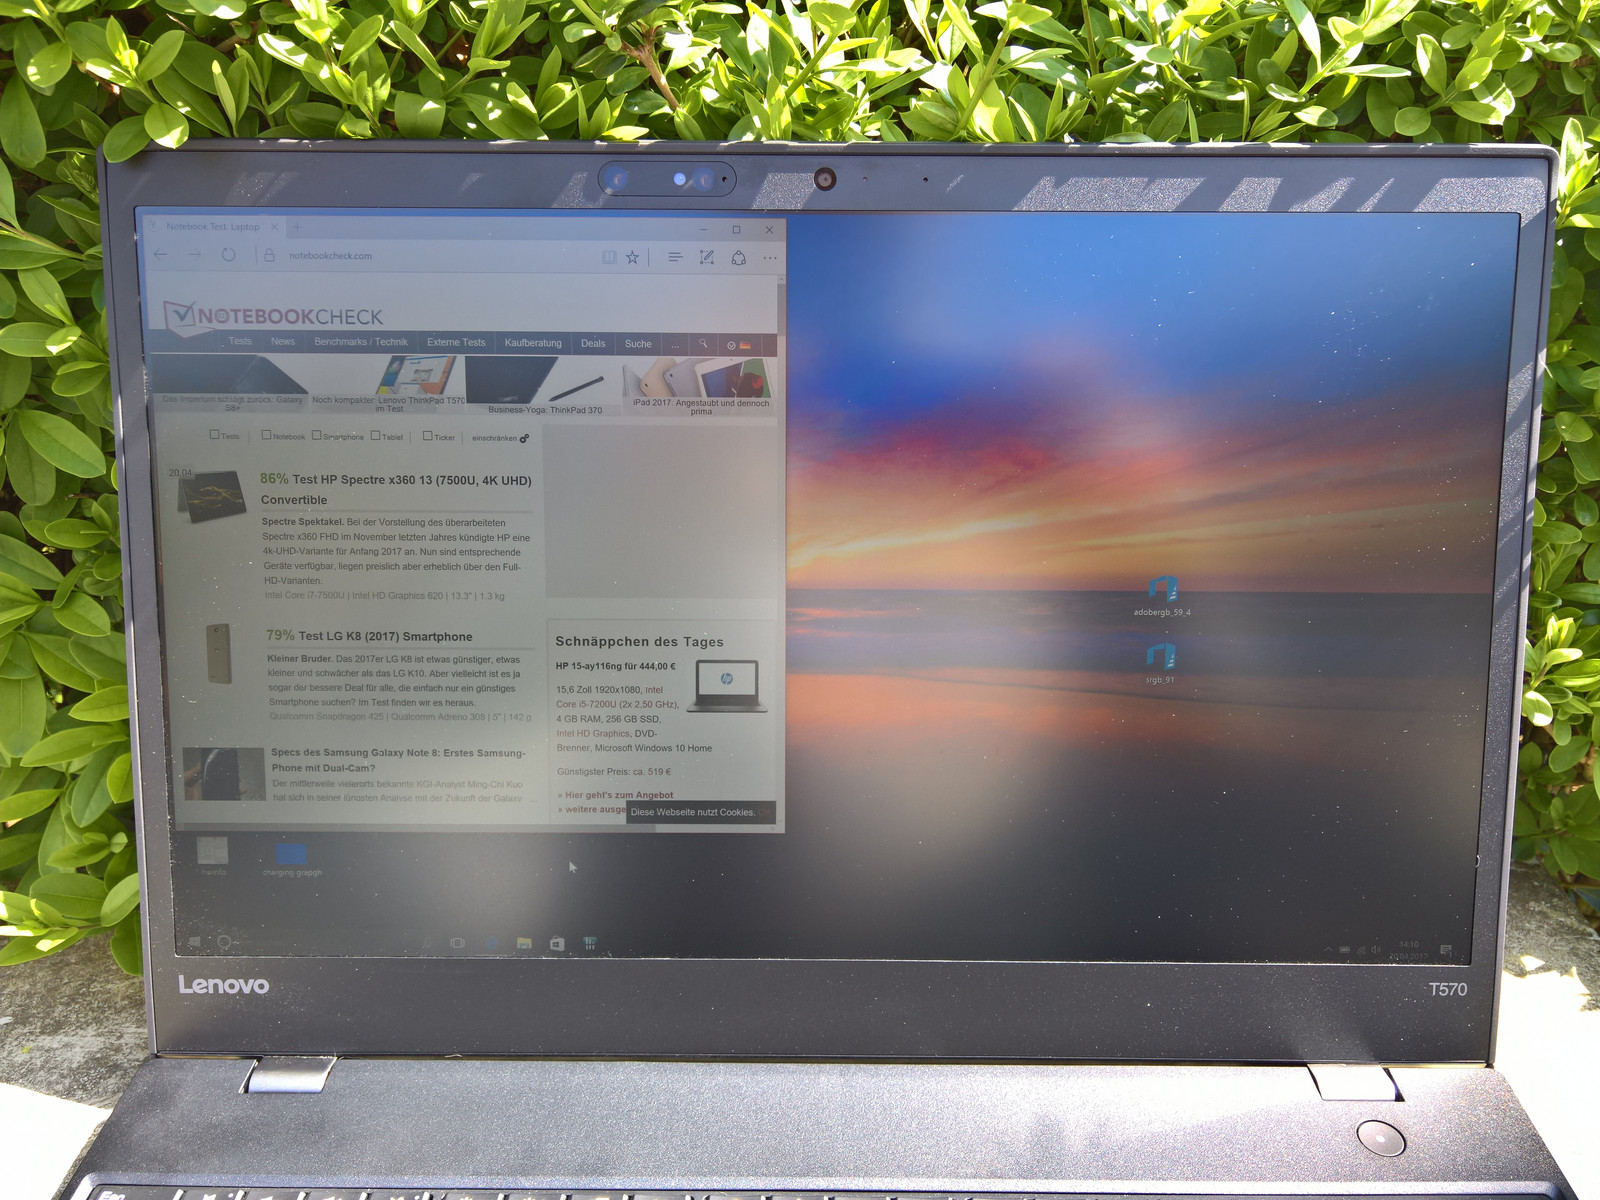
With its matte display surface and brightness of above 300 cd/m², the T570 can be used very well outdoors, as long as you do not sit in direct sunlight. In indirect sunlight, the contents can be recognized fairly well. Of course you can work most comfortably, if you look for a shady place.
Display Response Times
| ↔ Response Time Black to White | ||
|---|---|---|
| 15.2 ms ... rise ↗ and fall ↘ combined | ↗ 2 ms rise | 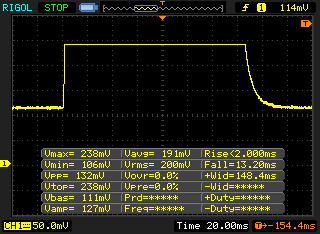 |
| ↘ 13.2 ms fall | ||
| The screen shows good response rates in our tests, but may be too slow for competitive gamers. In comparison, all tested devices range from 0.1 (minimum) to 240 (maximum) ms. » 37 % of all devices are better. This means that the measured response time is better than the average of all tested devices (19.8 ms). | ||
| ↔ Response Time 50% Grey to 80% Grey | ||
| 41.6 ms ... rise ↗ and fall ↘ combined | ↗ 13.2 ms rise | 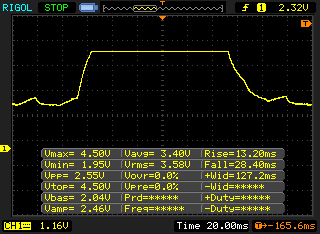 |
| ↘ 28.4 ms fall | ||
| The screen shows slow response rates in our tests and will be unsatisfactory for gamers. In comparison, all tested devices range from 0.165 (minimum) to 636 (maximum) ms. » 67 % of all devices are better. This means that the measured response time is worse than the average of all tested devices (31 ms). | ||
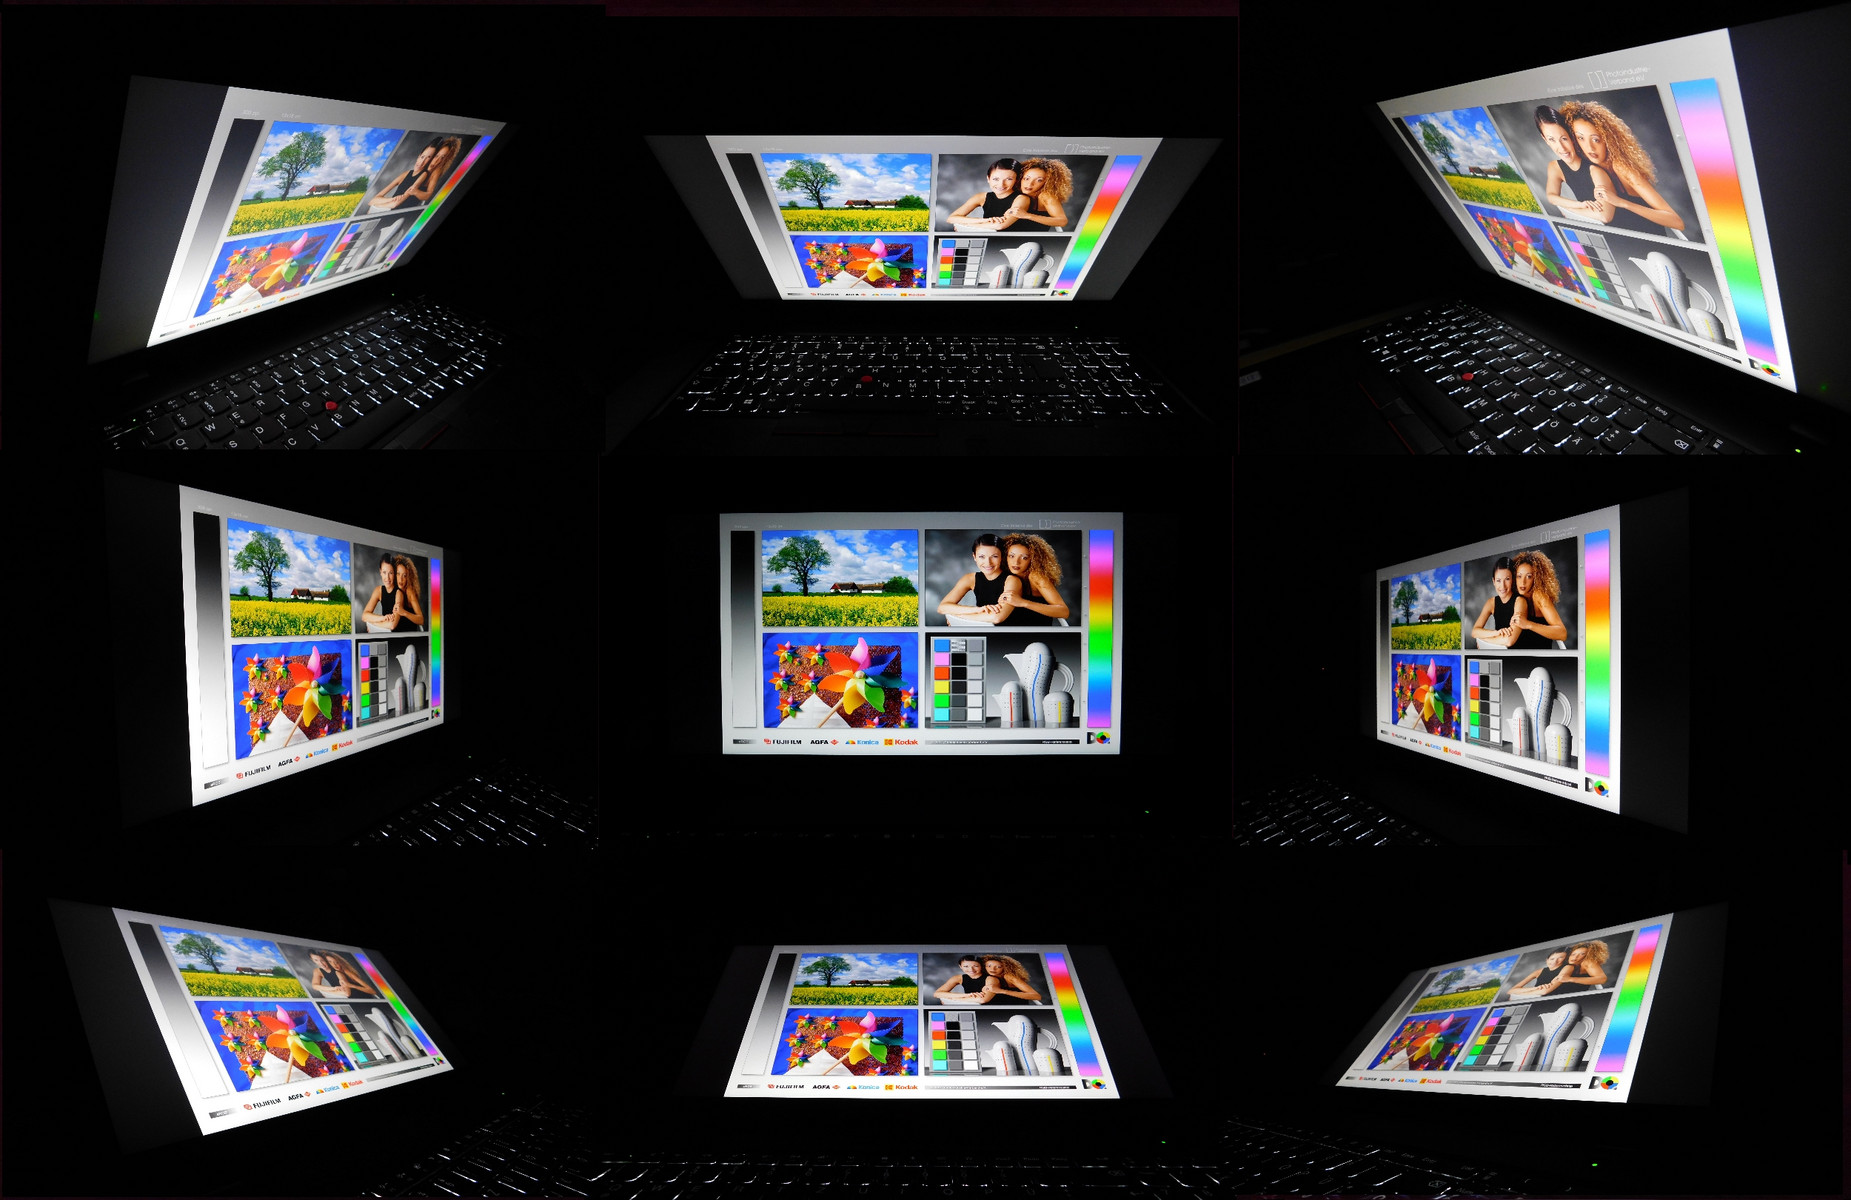
As typical for an IPS display, the stability of the viewing angles is outstanding. In the T570 with Full HD display we complained that the brightness drops quicker from wide viewing angles. This is almost not at all the case in the 4K display, which is a sign of a high-quality IPS display.
Image outputs via Thunderbolt 3/USB Type-C and HDMI are razor-sharp.
Performance
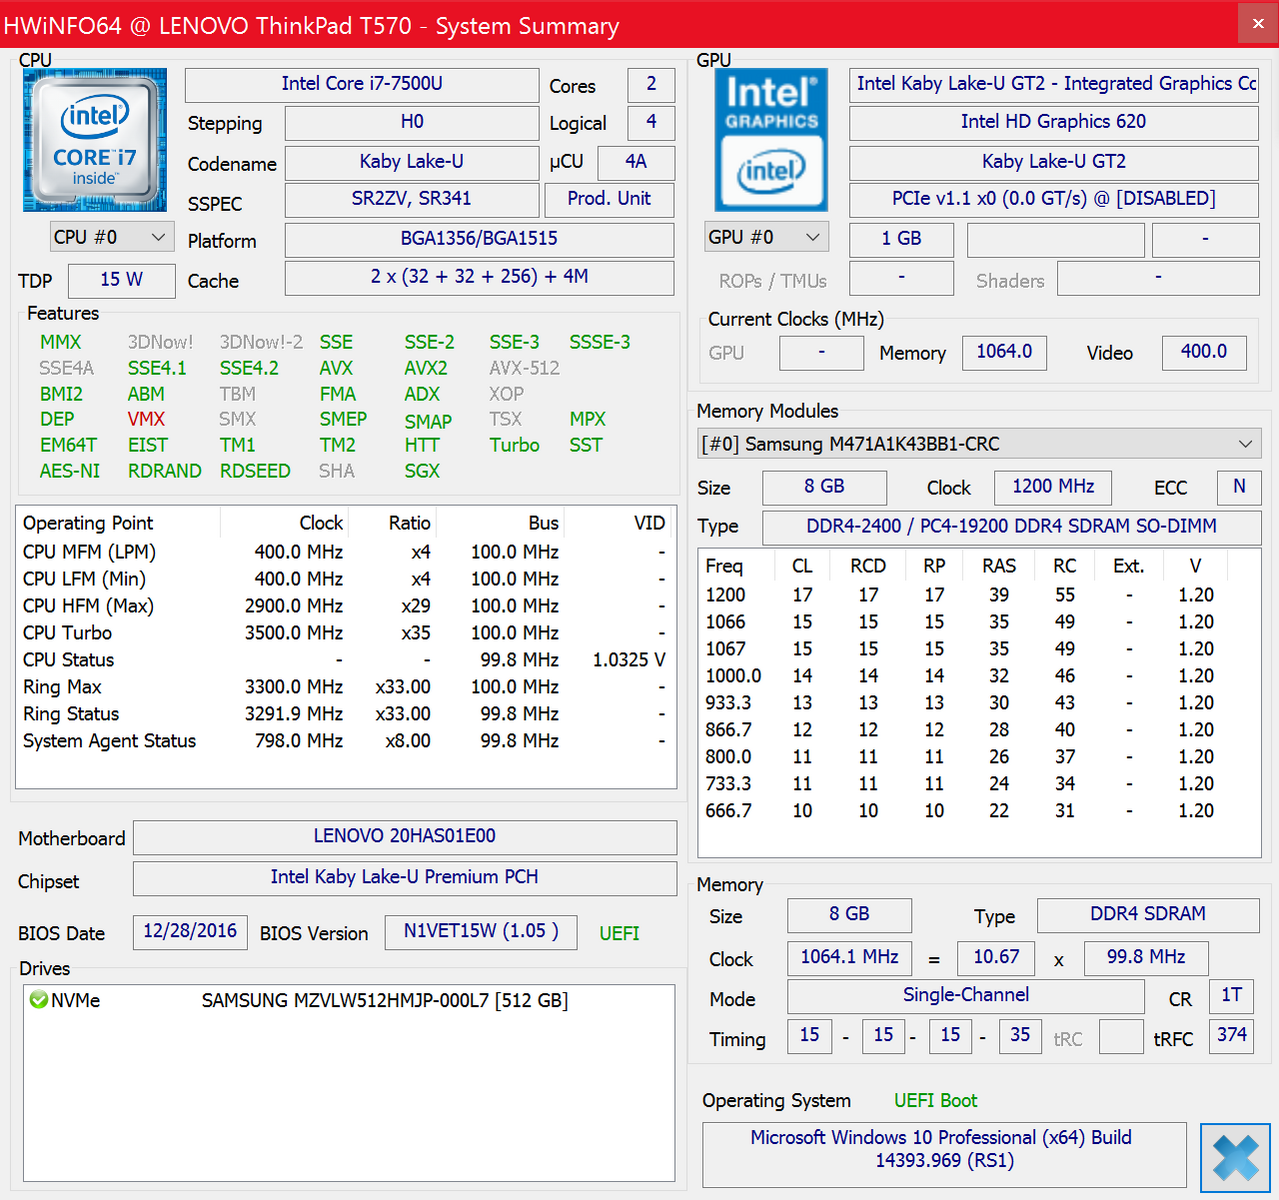
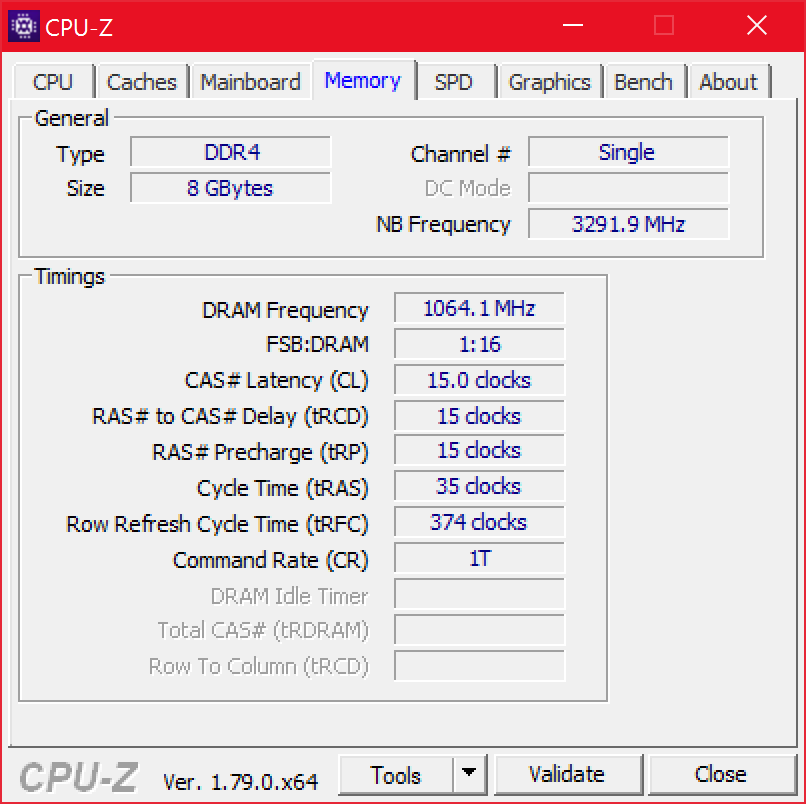
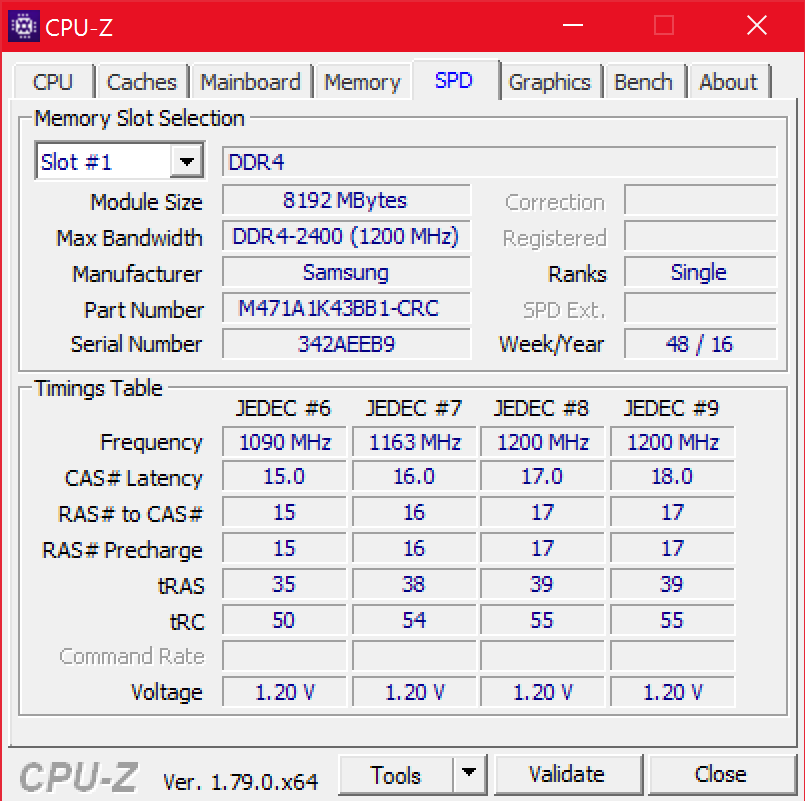
Our test unit (20HAS01E00) corresponds roughly to the top configuration of the T570, with the 4K display, Intel Core i7-7500U, GeForce 940MX, 512 GB SSD, and 8 GB of RAM (DDR4-2400, 1 of 2 slots empty). All this can be purchased for 1599 Euros (~$1743). Is this a price too good to be true for a high-quality business device? Yes, somewhat, since it is a configuration from the Lenovo Campus educational program. Regular customers cannot purchase this configuration. However, a similar configuration (20H9001EGE), with the same Core i7-7600U, GPU and SSD, but with 16 GB of RAM instead of 8 GB as well as supporting WWAN, can be purchased by anyone for 2299 Euros (~$2506).
Processor
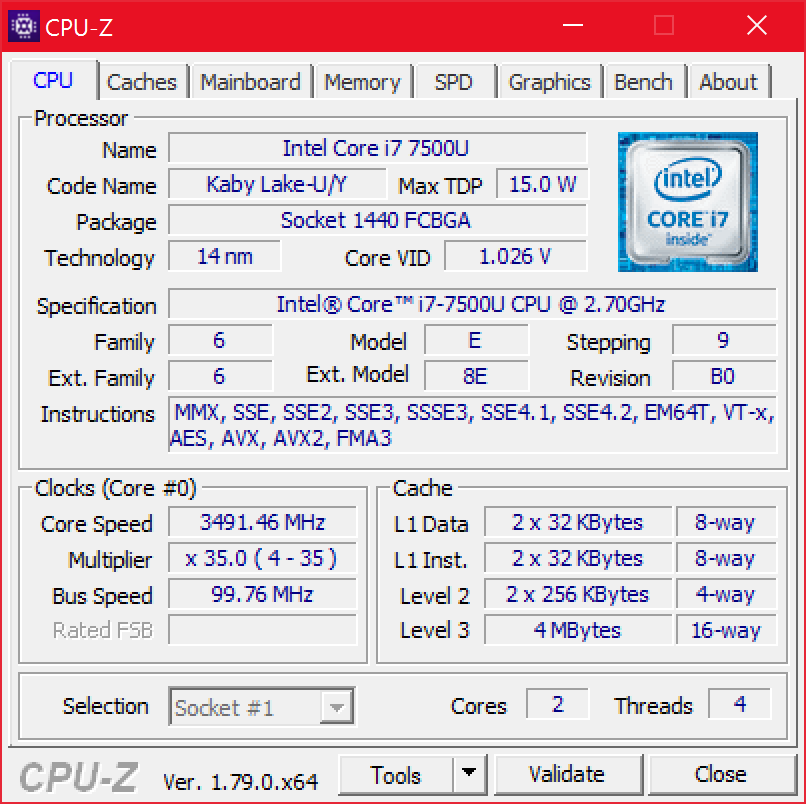
The Core i7-7500U used in our test unit is the second fastest processor of Intel's U-series with a TDP of 15 watts. It is a dual-core processor with four threads (due to Hyperthreading), as well as a base clock speed of 2.7 GHz. According to Intel's specifications, the CPU can clock up to a maximum of 3.5 GHz (Turbo-Boost). You can directly compare with other mobile processors in our processor-benchmark comparison.
Our first T570 test unit uses the Core i5-7200U. This device shows some interesting characteristics, such as a TDP that was raised to 25 watts, which all the T/X-ThinkPads of the 2017 generation that we tested bring along as well. This is also the case in our test unit, so that the processor can exhaust its full performance potential. However, as in the other test unit, we notice in the tests that the performance varies widely from one benchmark run to the next. This is not due to the BIOS, but a setting in the pre-installed Lenovo Settings app: here the "Intelligent Cooling" must be deactivated to achieve constant results. During the Cinebench R15 multi-core loop test which lasts 30 minutes, the maximum result is achieved and can also be maintained with some small variations.
In any case, the Cinebench test performance of the T570 is impressive for a ULV. In the single-core test, it is even slightly ahead of Apple's MacBook Pro 15, which uses the older i7-6700HQ. But of course the processor cannot keep up with the quad-core processors in the multi-core tests. In comparison to the T570 with the i5-7200U, our test unit is about 13% faster.
Unfortunately, the performance is reduced during battery operation as well. In this case, the processor clock speed drops to about 2.5 to 2.7 GHz. The performance brake could not be deactivated even after a BIOS update and various settings changes.
System Performance
To our surprise, the test unit achieves fairly weak results in the PCMark test and came in last place in both tests. The T570 with iGPU ends up in first place in the work test, which is strange, since our test unit really has the stronger equipment. The SSD has about the same speed in both units. We suspect that the high resolution impacted the test result negatively. In everyday usage, the weak results are definitely not reflected, and the T570 runs quite as fast as you would expect from a notebook with such relatively fast components.
| PCMark 8 Home Score Accelerated v2 | 3049 points | |
| PCMark 8 Work Score Accelerated v2 | 3892 points | |
Help | ||
Storage Devices
While the other T570 is still equipped with the 256 GB version of the Samsung PM961, the more expensive T570 uses the Samsung PM961 with 512 GB of capacity. The PM961 is a PCIe-NVMe SSD of the latest generation that is built into the T570 as a 2280-M.2 SSD. Despite the PCIe-x2 limitation of the T570, the SSD delivers very good results. The PM871 that was built into the T560 predecessor is about 50% slower. The PM961 also gets excellent results in the important read/write 4K benchmarks. Here, the T570 shows a good update of its predecessor, which could not handle a M.2-PCIe SSD yet.
You can compare further benchmarks with other SSDs and HDDs as well in our benchmark tool.
| Lenovo ThinkPad T570-20HAS01E00 Samsung PM961 NVMe MZVLW512HMJP | Lenovo ThinkPad T560-20FH002RGE Samsung SSD PM871 MZ7LN256HCHP | HP EliteBook 850 G4-Z2W86ET Samsung PM951 NVMe MZVLV256 | Fujitsu LifeBook U757 Samsung CM871a MZNTY256HDHP | Apple MacBook Pro 15 2016 (2.6 GHz, 450) Apple SSD SM0256L | Dell XPS 15 9560 (i7-7700HQ, UHD) Lite-On CX2-8B512-Q11 | Lenovo ThinkPad T470s-20HGS00V00 Samsung SSD PM961 1TB M.2 PCIe 3.0 x4 NVMe (MZVLW1T0) | |
|---|---|---|---|---|---|---|---|
| CrystalDiskMark 3.0 | -50% | -29% | -47% | -16% | 4% | 18% | |
| Read Seq (MB/s) | 1210 | 513 -58% | 1245 3% | 509 -58% | 1298 7% | 1684 39% | 1760 45% |
| Write Seq (MB/s) | 1134 | 306.1 -73% | 298.6 -74% | 488.4 -57% | 1343 18% | 1106 -2% | 1666 47% |
| Read 512 (MB/s) | 789 | 450.6 -43% | 673 -15% | 414.3 -47% | 842 7% | 977 24% | 832 5% |
| Write 512 (MB/s) | 903 | 305.5 -66% | 298.8 -67% | 321.7 -64% | 945 5% | 1119 24% | 1064 18% |
| Read 4k (MB/s) | 58.4 | 33.4 -43% | 41.79 -28% | 36.43 -38% | 9.8 -83% | 45.14 -23% | 53.2 -9% |
| Write 4k (MB/s) | 144.1 | 85.6 -41% | 138.4 -4% | 88.4 -39% | 13 -91% | 134.1 -7% | 167.4 16% |
| Read 4k QD32 (MB/s) | 559 | 346.9 -38% | 495 -11% | 402.8 -28% | 630 13% | 509 -9% | 630 13% |
| Write 4k QD32 (MB/s) | 474.4 | 278.9 -41% | 297.5 -37% | 256.7 -46% | 443 -7% | 398.1 -16% | 533 12% |

Graphics card
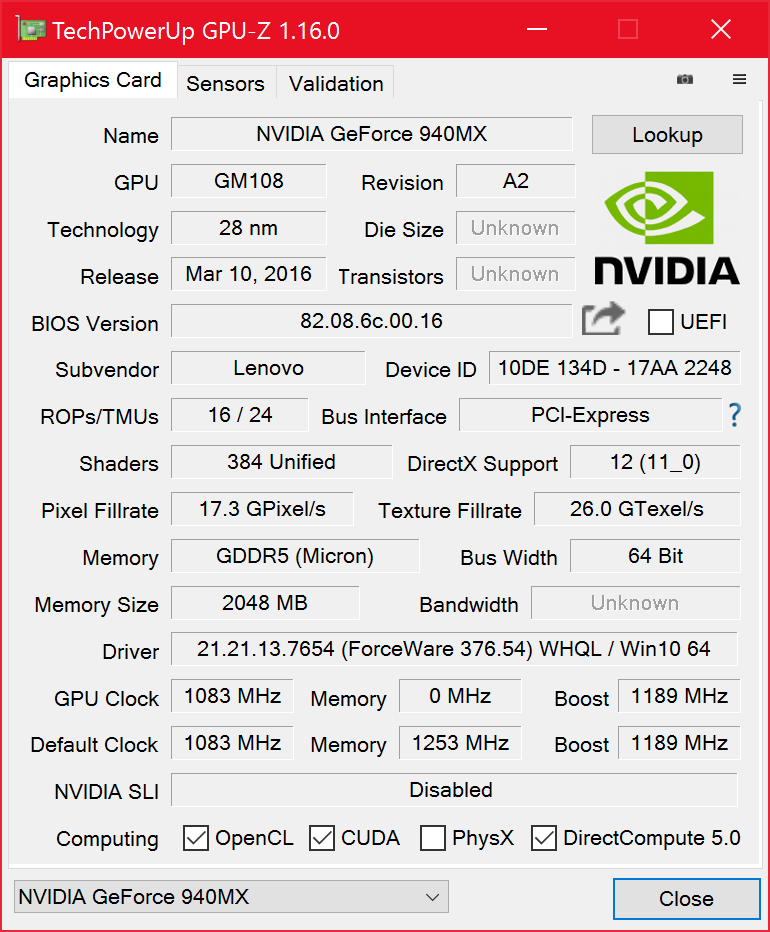
At the first glance, you might think that Lenovo has left everything as is in the dedicated graphics chip, since the T560 predecessor was already equipped with the GeForce 940MX. However, this year Lenovo has finally made use of the 940MX's advantage over the direct 940M predecessor, using GDDR5 instead of DDR3 storage. Otherwise, not much changed with the chip; it is still a GPU of the lower mid-range which uses the outdated Maxwell architecture. A successor based on the Pascal architecture is not yet in sight.
The move to GDDR5 pays off: compared to the predecessor, the T570 is clearly more or less faster, depending on the benchmark. In the 3DMark Cloud Gate benchmark where the T570 is ahead of the T560 by 34%, the difference is particularly large, but also in the Fire Strike benchmark, it can clearly move ahead by an increase of 28%. The older 3DMark11 results in a smaller increase of 16%, however. Despite this performance improvement, it is still far behind the Pascal-based GeForce GTX 1050, which is built into the Dell XPS 15.
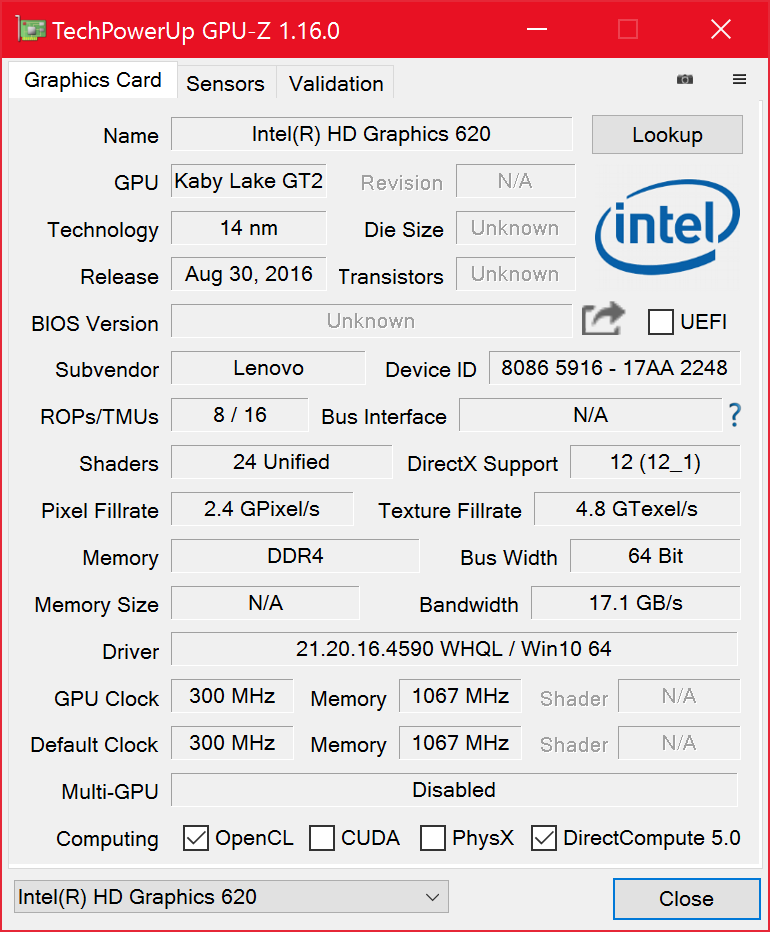
Unlike the CPU, the Nvidia GPU is not throttled during battery operation and its full power remains available. This is an important difference compared with the T570 without dGPU, since there, the integrated Intel HD Graphics 620 GPU was affected by performance throttling like the CPU. By the way, the Intel HD 620 is losing in the benchmarks to the GeForce 940MX in the T570 by about 47 to 64%, depending on the test.
| 3DMark 11 Performance | 2931 points | |
| 3DMark Cloud Gate Standard Score | 8308 points | |
| 3DMark Fire Strike Score | 2098 points | |
Help | ||
Gaming Performance
Due to the dedicated graphics card, the T570 becomes almost suitable for gaming. But of course for newer games, the details have to be reduced considerably in some cases, and forget about gaming in 4K resolution. If you want to play, you should definitely get a configuration with a dGPU. The distance to the T570 with iGPU is more than clear, and also the T560 predecessor is left behind noticeably. Yet, it has no chance against the GeForce GTX 1050 in the gaming test as well. So anyone who really wants to play seriously should look for a notebook with at least that GPU. The T570 is something rather for the occasional gamers or those who like older games, which however, can be played with higher details.
| BioShock Infinite - 1366x768 High Preset | |
| Dell XPS 15 9560 (i7-7700HQ, UHD) | |
| Lenovo ThinkPad T570-20HAS01E00 | |
| Lenovo ThinkPad T560-20FH002RGE | |
| HP EliteBook 850 G4-Z2W86ET | |
| Lenovo ThinkPad T570-20H90002GE | |
| low | med. | high | ultra | 4K | |
|---|---|---|---|---|---|
| BioShock Infinite (2013) | 137.9 | 72.4 | 64.3 | 21.5 | |
| The Witcher 3 (2015) | 42.5 | 25.7 | 11.5 | ||
| Civilization 6 (2016) | 52.1 | 30.7 | 16.4 | 12.6 | 10.1 |
Emissions
Noise emissions
While idling, the fan is turned off permanently, as it should be for a 15.6-inch notebook with an energy saving ULV processor. During everyday operation, the test unit remains quiet as well, at least as far as the fan is concerned. If you hold your ear closer to the keyboard, a sort of hiss becomes audible near the TrackPoint. Not good for something like this to occur in a device of this price range.
During load, the fan turns on and can be clearly heard at a maximum of 41.3 dB(A), although the whirring of the fan does not have a frequency that feels uncomfortable. Also, it is not so loud as to become a massive disturbance.
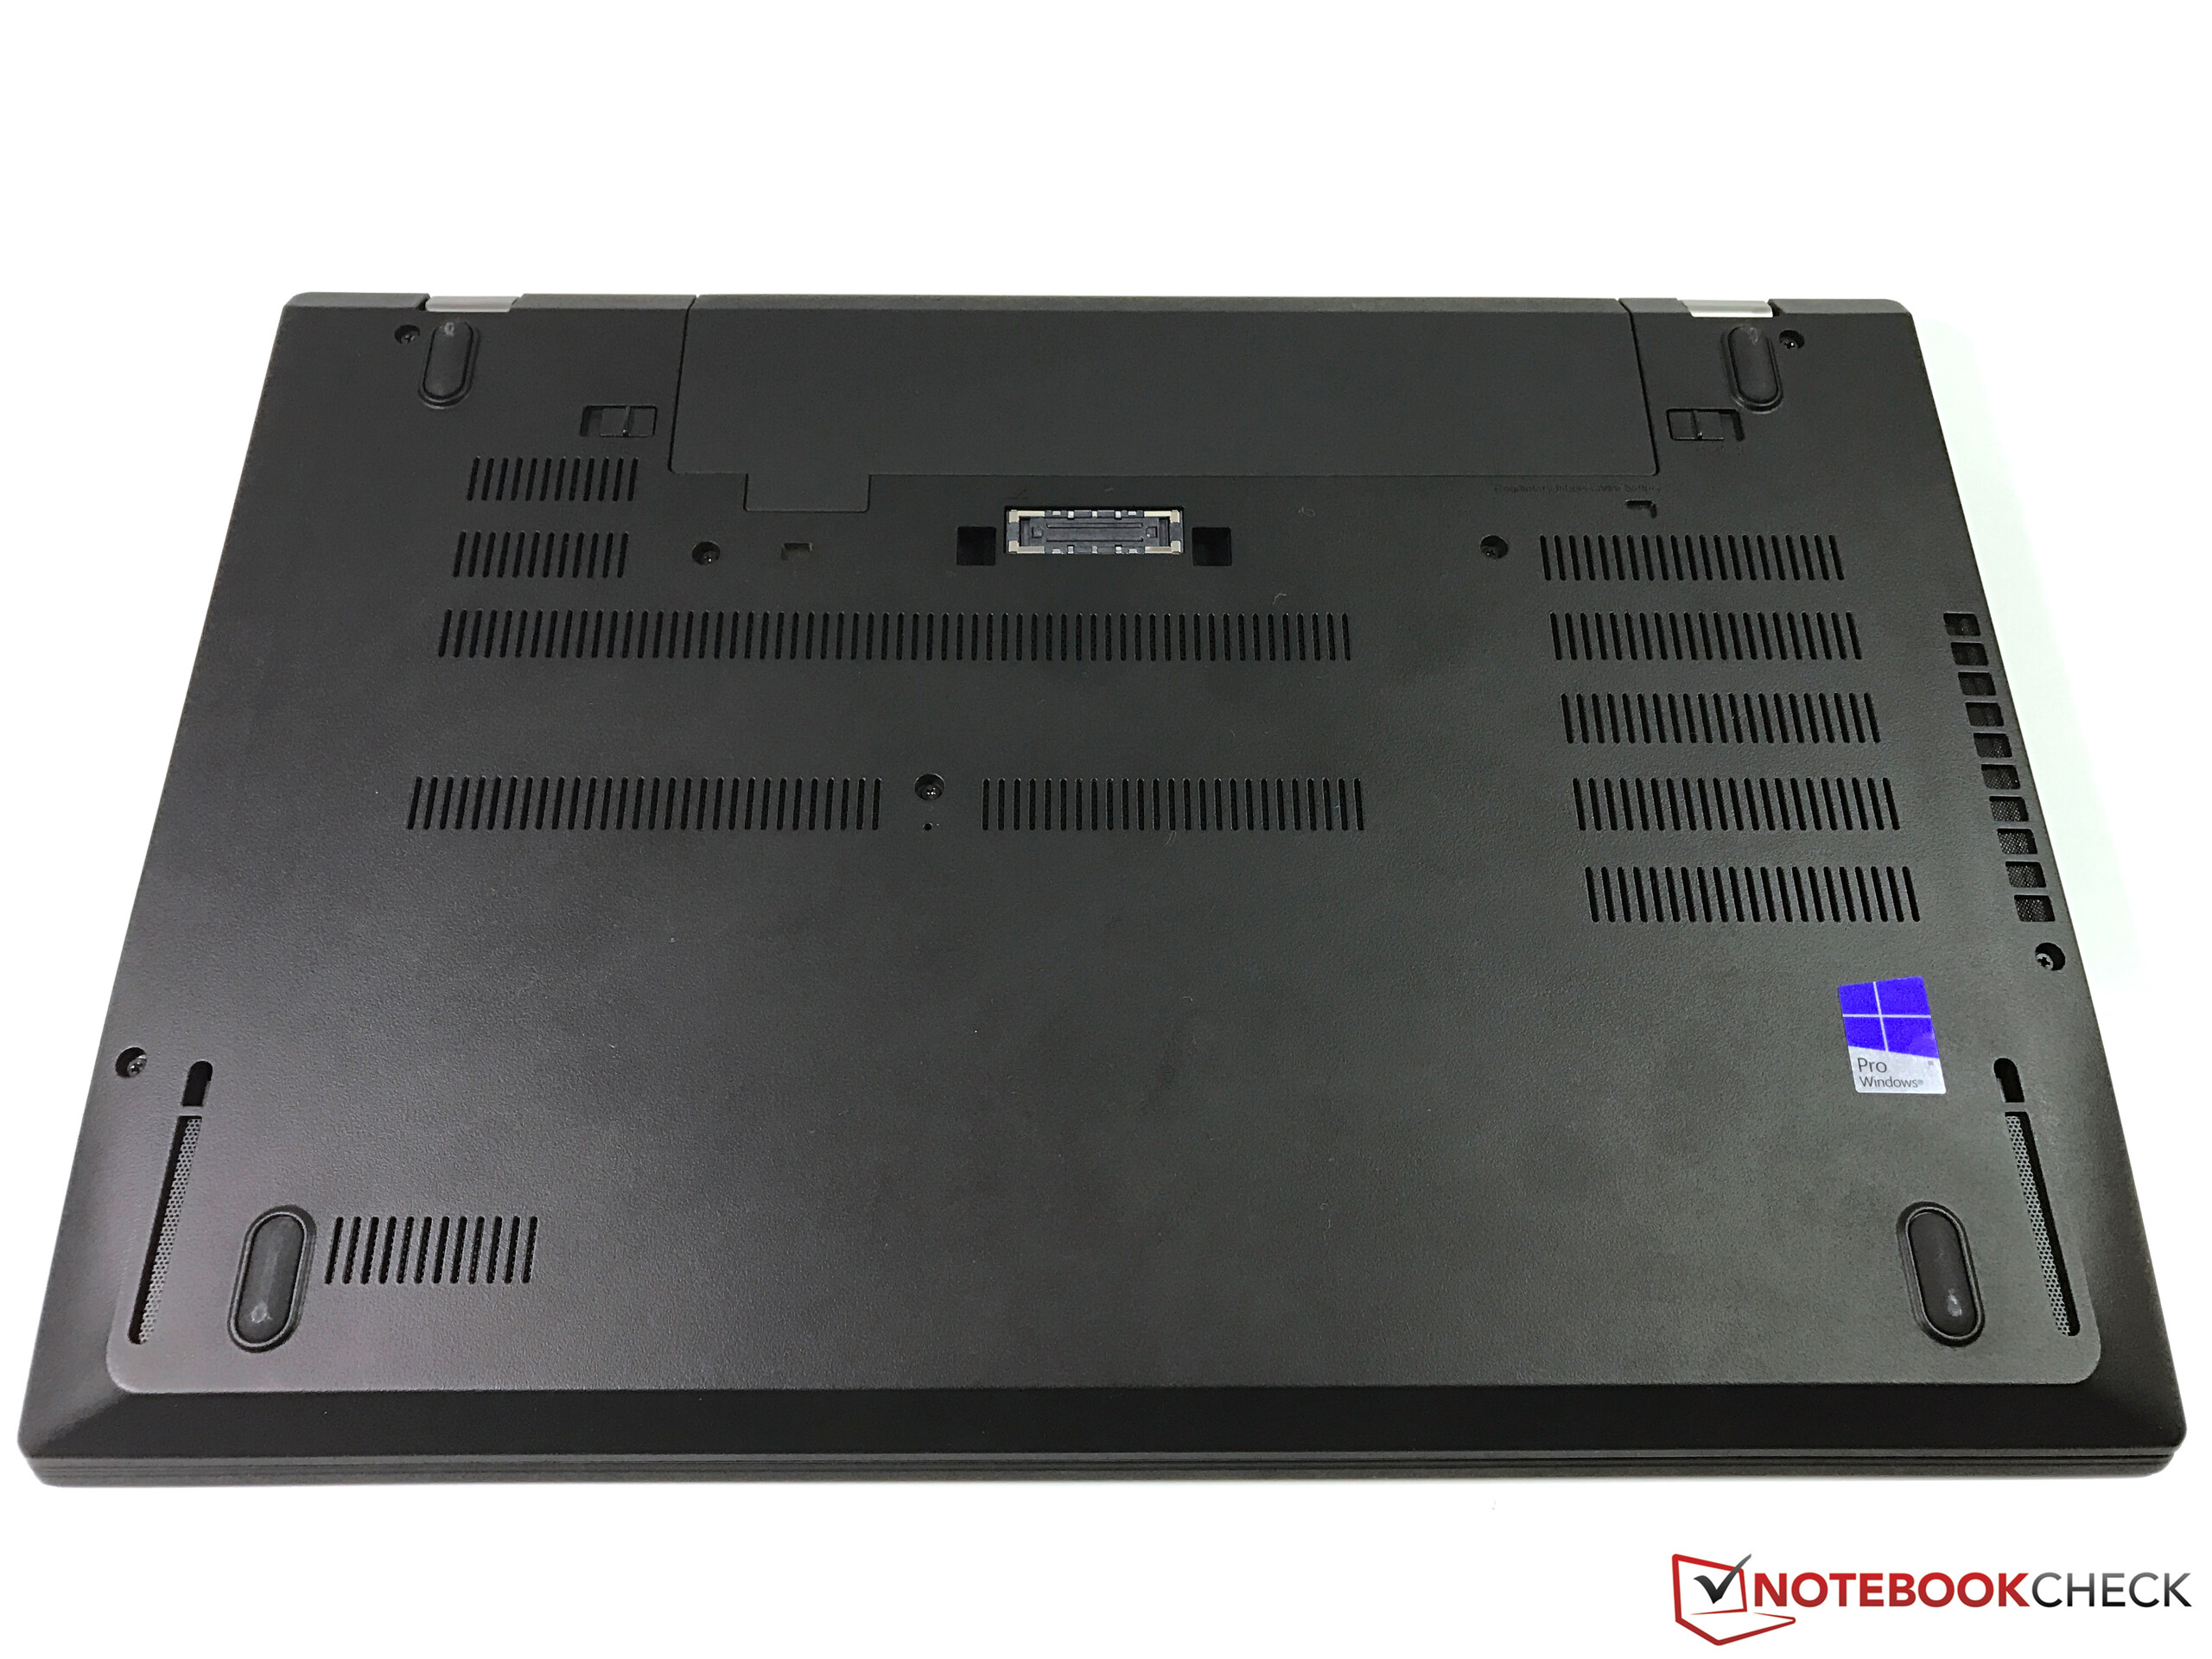
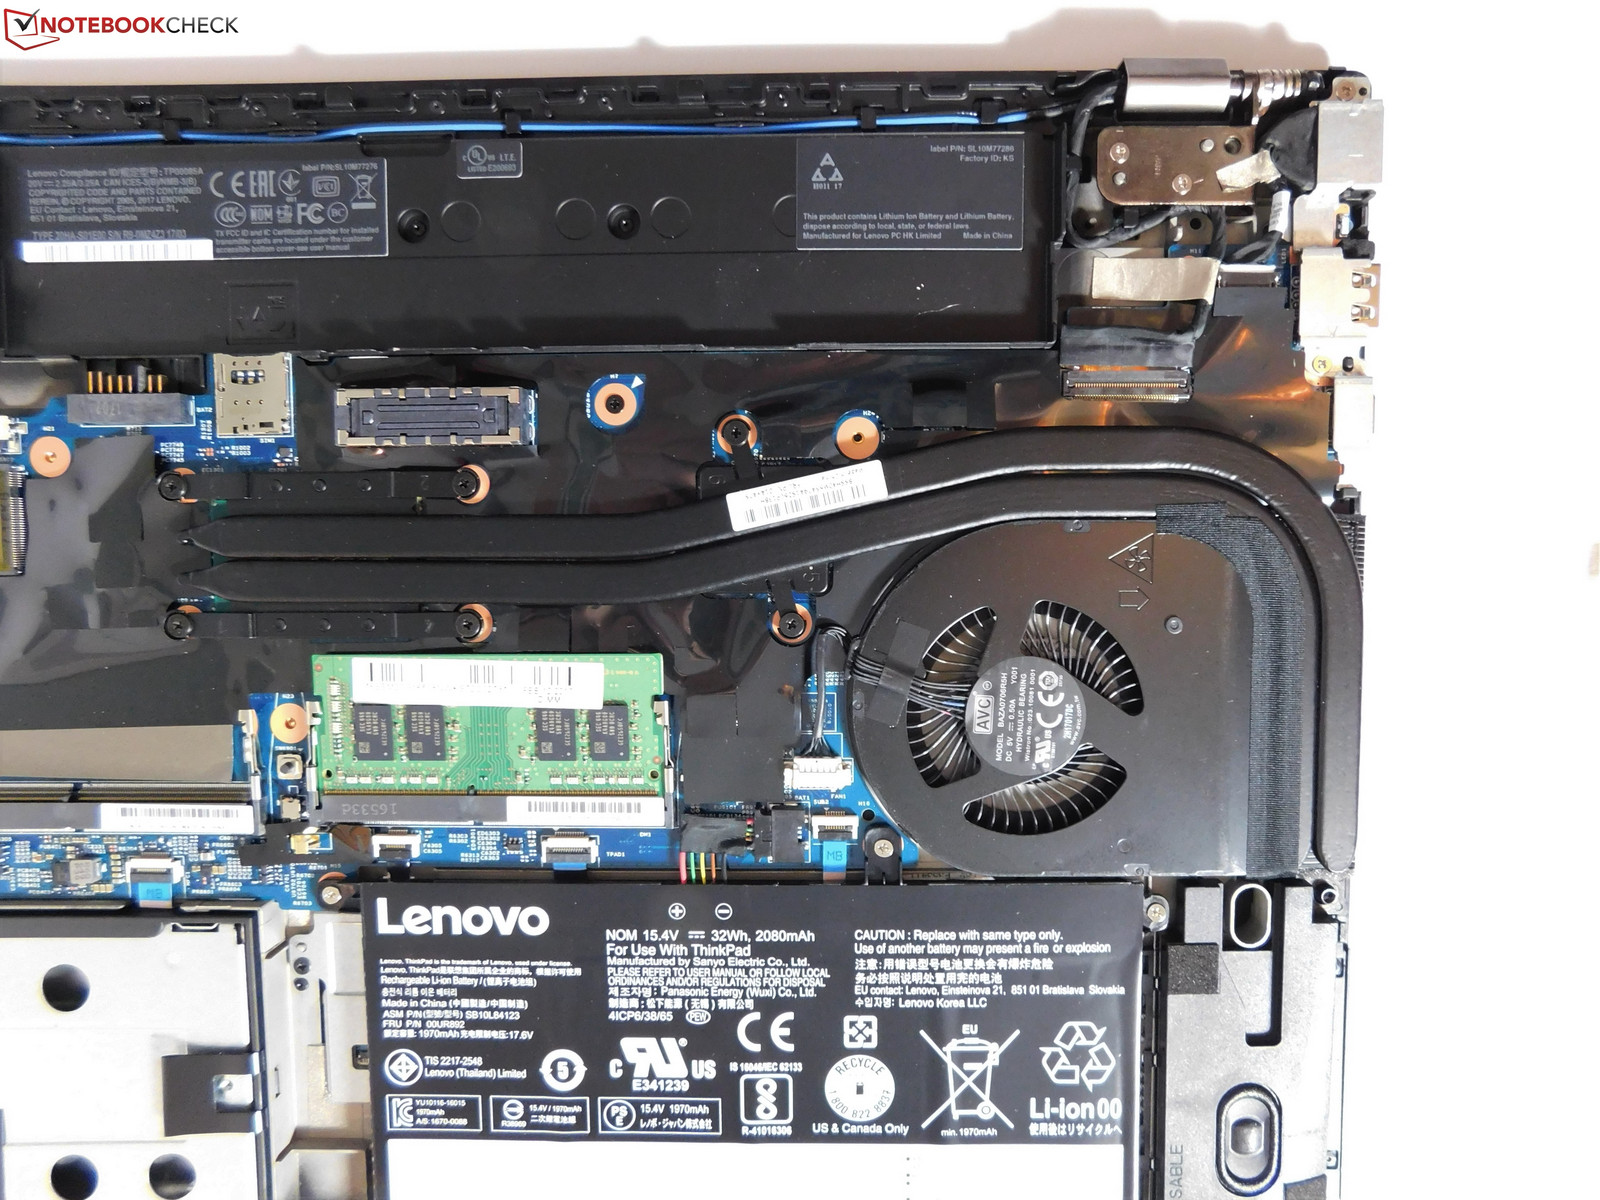
As expected, in the model with dGPU, Lenovo uses a cooling system that is slightly stronger. The biggest difference is having two copper heat pipes, instead of just one.
Noise level
| Idle |
| 29.3 / 29.3 / 31.1 dB(A) |
| Load |
| 35.2 / 41.3 dB(A) |
 | ||
30 dB silent 40 dB(A) audible 50 dB(A) loud |
||
min: | ||
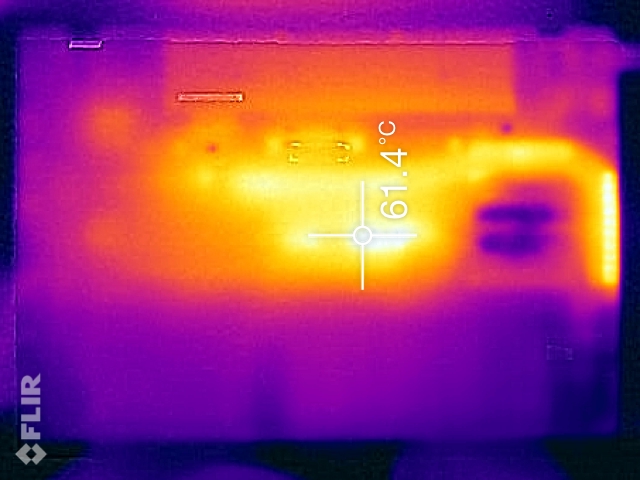
Temperature
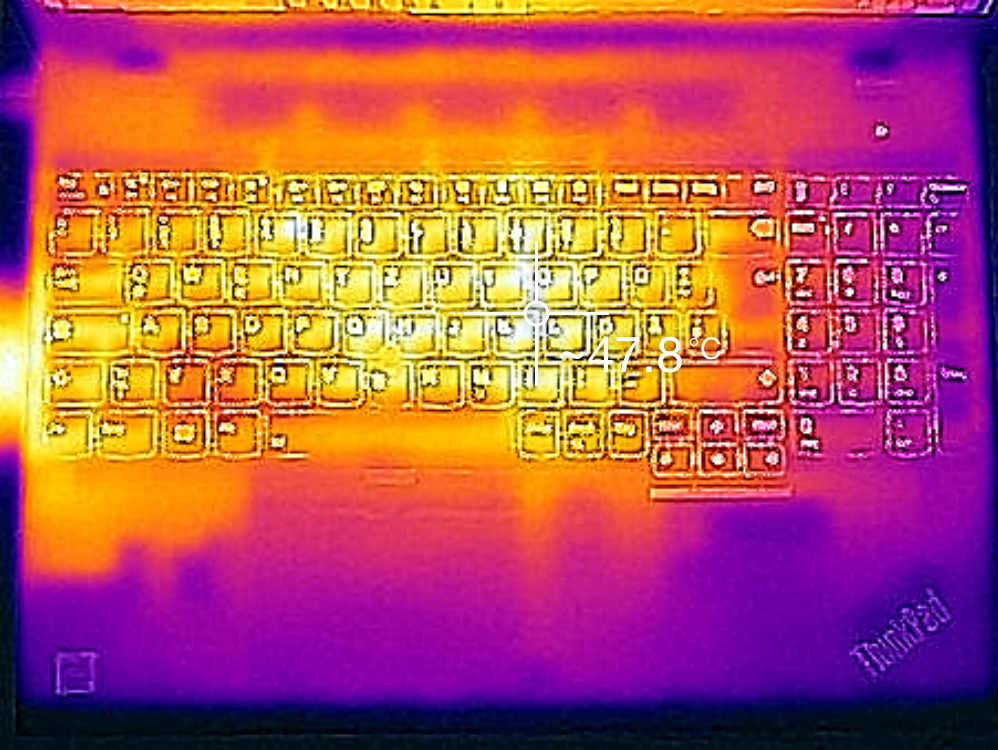
While idling, the T570 with dGPU remains cool and quiet. Not surprising, since thanks to Optimus, the dedicated GPU is deactivated during idle mode, so there is no difference here. Under load, however, the difference is dramatic: Particularly on the bottom, the T570 becomes very hot, and the 60 °C mark (140 °F) is crossed at the hot spot in the center of the bottom. This makes using it on your lap impossible under load. At least the hand rest warms up only moderately, preventing the T570 from becoming too hot to be usable. Undoubtedly, this is a negative point.
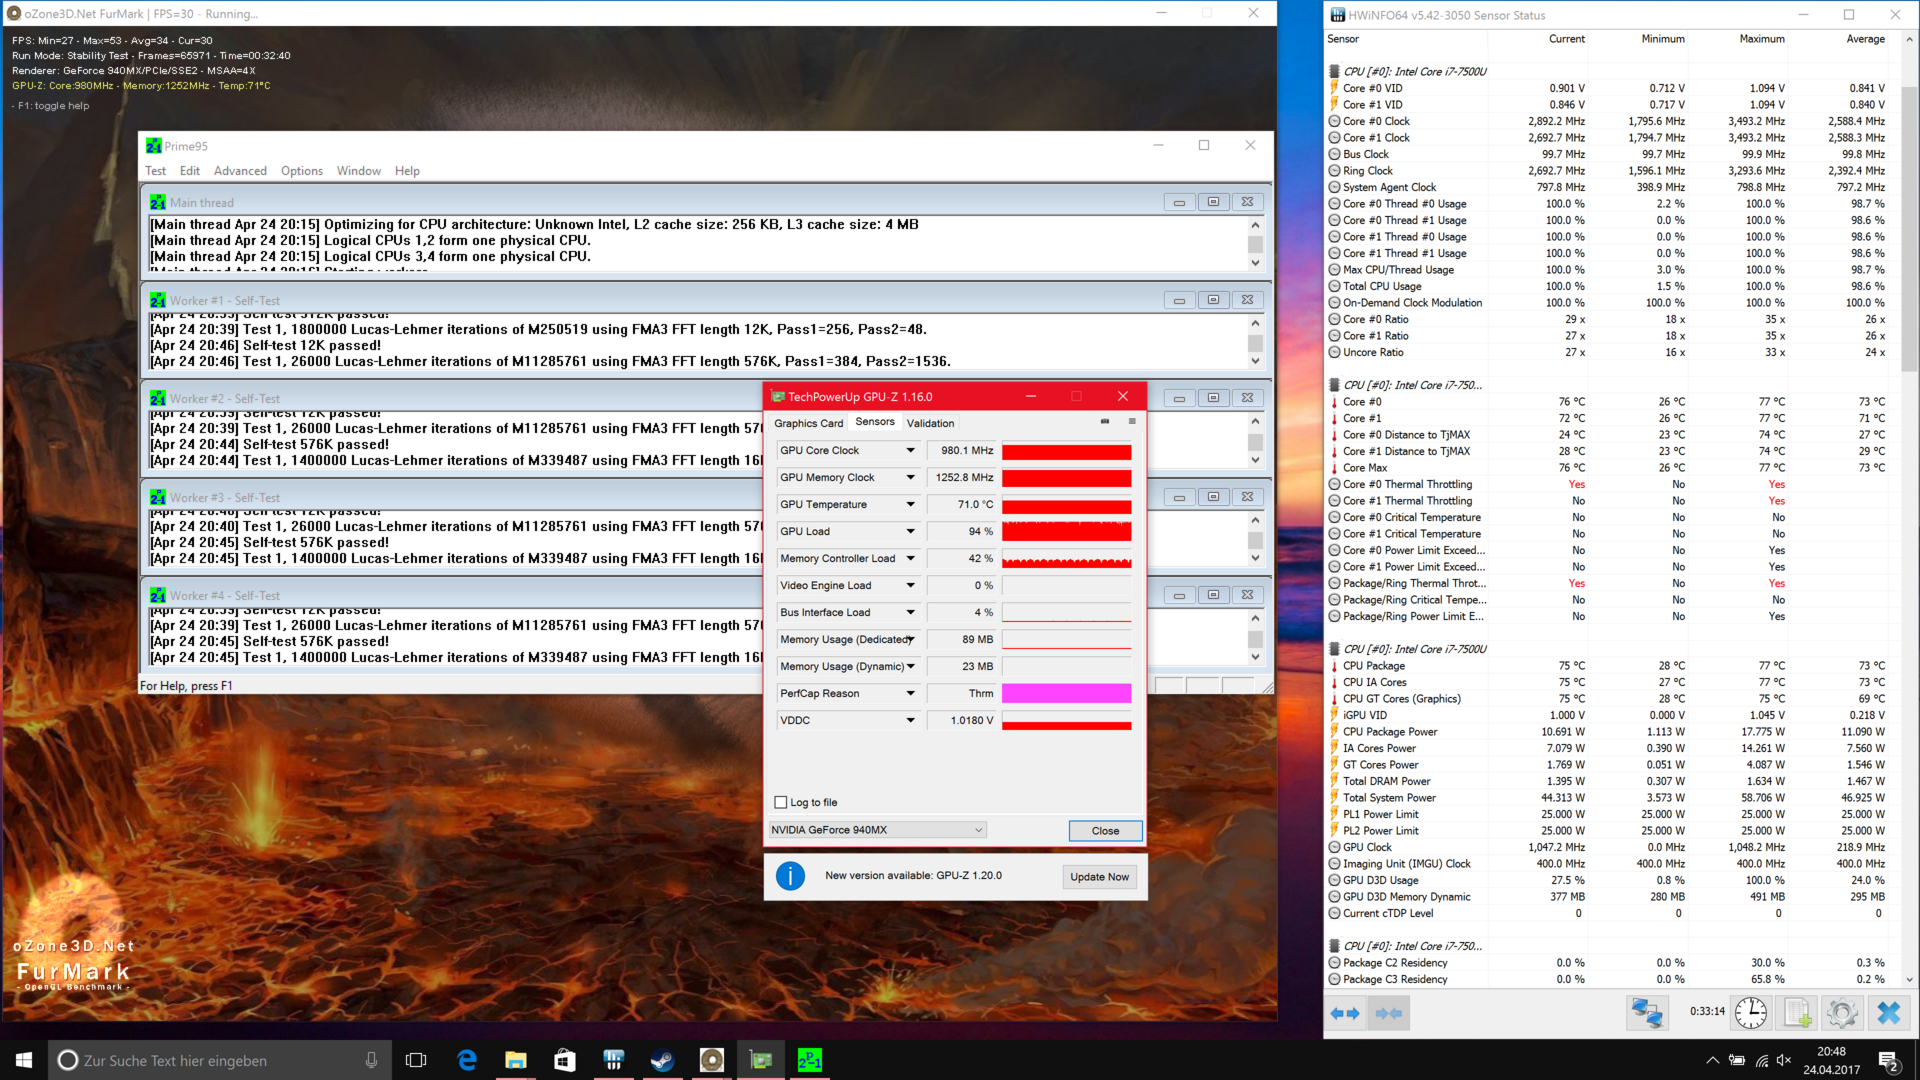
Despite the high surface temperatures, the T570 with the GeForce GPU does not entirely come off badly. As in the test unit without dGPU, the TDP increase to 25 watts in the stress test remains without effect: after several seconds with the full Turbo, the clock drops to around 2.2 GHz, varying significantly, sometimes even dropping down to 1.8 GHz. After about 5 minutes, the clock speed stabilizes above the 2 GHz mark, at times reaching 2.8 GHz, staying at 2.6 GHz on average. Thus we have throttling, but it is not dramatic. This is caused by the temperature as well as the TDP: the TDP of the CPU is at around 12 watts during the stress test; in addition, Lenovo sets a temperature limit of 75 °C (167 °F), which was only crossed minimally in the test. The GPU can maintain its maximum clock speed of 1150 MHz for a long time, but after about 20 minutes, the clock speed falls to 980 MHz.
A 3DMark11 benchmark run right after the stress test was unremarkable, so in everyday use, the throttling problems remain within limits.
(±) The maximum temperature on the upper side is 43.1 °C / 110 F, compared to the average of 34.3 °C / 94 F, ranging from 21.2 to 62.5 °C for the class Office.
(-) The bottom heats up to a maximum of 55.4 °C / 132 F, compared to the average of 36.8 °C / 98 F
(+) In idle usage, the average temperature for the upper side is 24 °C / 75 F, compared to the device average of 29.5 °C / 85 F.
(±) The palmrests and touchpad can get very hot to the touch with a maximum of 39.6 °C / 103.3 F.
(-) The average temperature of the palmrest area of similar devices was 27.5 °C / 81.5 F (-12.1 °C / -21.8 F).
Frequency diagram in comparison (checkboxes above can be checked or unchecked!)
Power Management
Power Consumption
If you compare our test unit with the base configuration of the T570, the power consumption is significantly higher. This is not surprising, since the 4K display and GeForce 940MX use considerably more, with the latter in particular contributing to the much higher rate during load. The two competing devices by HP and Fujitsu reach consumption rates similar to the T570 with iGPU and Full HD display; despite the quad-core, the Apple MacBook Pro 15, however, is almost on the same level as the 4K T570. During load, the T570 has the advantage, during idle, the MacBook. Only the Dell XPS 15 uses considerably more power.
Lenovo supplies the T570 with a 65-watt power supply. As we are seeing, however, the T570 uses up to 75 watts under load, so the power supply is clearly under-sized. During the stress test, the power consumption under load falls below 65 watts, though. However, Lenovo should really supply the T570 with 4K panel and dGPU with a 90-watt power supply. To save on this point, is incomprehensible and a bad decision.
| Off / Standby | |
| Idle | |
| Load |
|
Key:
min: | |
| Lenovo ThinkPad T570-20HAS01E00 i7-7500U, GeForce 940MX, Samsung PM961 NVMe MZVLW512HMJP, IPS, 3840x2160, 15.6" | Lenovo ThinkPad T570-20H90002GE i5-7200U, HD Graphics 620, Samsung PM961 MZVLW256HEHP, IPS, 1920x1080, 15.6" | HP EliteBook 850 G4-Z2W86ET i5-7200U, HD Graphics 620, Samsung PM951 NVMe MZVLV256, TN LED, 1920x1080, 15.6" | Fujitsu LifeBook U757 i5-7200U, HD Graphics 620, Samsung CM871a MZNTY256HDHP, IPS LED, 1920x1080, 15.6" | Apple MacBook Pro 15 2016 (2.6 GHz, 450) 6700HQ, Radeon Pro 450, Apple SSD SM0256L, IPS, 2880x1800, 15.4" | Dell XPS 15 9560 (i7-7700HQ, UHD) i7-7700HQ, GeForce GTX 1050 Mobile, Lite-On CX2-8B512-Q11, IGZO IPS, 3840x2160, 15.6" | |
|---|---|---|---|---|---|---|
| Power Consumption | 31% | 39% | 33% | 2% | -83% | |
| Idle Minimum * (Watt) | 4.7 | 3.6 23% | 3.58 24% | 3.96 16% | 2.9 38% | 11.9 -153% |
| Idle Average * (Watt) | 9.9 | 7.7 22% | 5.97 40% | 7.74 22% | 9.7 2% | 17.1 -73% |
| Idle Maximum * (Watt) | 10.9 | 8.2 25% | 6.81 38% | 8.64 21% | 10.1 7% | 17.3 -59% |
| Load Average * (Watt) | 56.1 | 30.8 45% | 29.4 48% | 28.8 49% | 65 -16% | 94.7 -69% |
| Load Maximum * (Watt) | 75 | 46.1 39% | 39.7 47% | 32 57% | 89.5 -19% | 122 -63% |
| Witcher 3 ultra * (Watt) | 104.8 |
* ... smaller is better
Battery Life
Our current test model has the same battery configuration as the other ThinkPad T570. That is, it has an internal 32-Wh and an external 24-Wh battery, bringing the total battery capacity to 56 Wh. This capacity can optionally be doubled by upgrading to a 72-Wh battery. Please note, however, that this battery will then protrude from the case.
The relatively high rates of power consumption were also a foretaste of the mediocre battery life. The T570 model with iGPU runs about 40 minutes longer in the WLAN test, and the HP EliteBook 840 G4 with a smaller battery, for about two hours longer. For really good battery runtimes, the optional large battery is recommended, since the runtimes are only average with the small battery.
Charging the test unit takes quite long, which is probably due to the dual-battery configuration. Initially, the internal battery is charged up to 80%. Next, the external battery is charged fully, and only then the internal battery is charged up to 100%. Overall the charging process takes more than 3.5 hours.
| Lenovo ThinkPad T570-20HAS01E00 i7-7500U, GeForce 940MX, 56 Wh | Lenovo ThinkPad T570-20H90002GE i5-7200U, HD Graphics 620, 56 Wh | HP EliteBook 850 G4-Z2W86ET i5-7200U, HD Graphics 620, 51 Wh | Fujitsu LifeBook U757 i5-7200U, HD Graphics 620, 50 Wh | Apple MacBook Pro 15 2016 (2.6 GHz, 450) 6700HQ, Radeon Pro 450, 76 Wh | Dell XPS 15 9560 (i7-7700HQ, UHD) i7-7700HQ, GeForce GTX 1050 Mobile, 97 Wh | |
|---|---|---|---|---|---|---|
| Battery runtime | 24% | 22% | 6% | -6% | -11% | |
| Reader / Idle (h) | 13.3 | 19.5 47% | 18 35% | 13.9 5% | ||
| H.264 (h) | 8.1 | 9.8 21% | 10.6 31% | 8.6 6% | ||
| WiFi v1.3 (h) | 6.9 | 7.6 10% | 8.8 28% | 7.3 6% | 10 45% | 7.2 4% |
| Load (h) | 2.9 | 3.4 17% | 2.7 -7% | 0.9 -69% | 1.7 -41% |
Verdict
Pros
Cons
The more expensive T570 can convince us just as much as the more affordable model. It has many good characteristics that our initial test unit also had: the robust, relatively compact case, the comfortable input devices, as well as the many connection options. Practical features such as PowerBridge or the infrared camera turn the T570 into a very flexible laptop. In addition to the advantages from the affordable T570, now also come the 4K display of a convincing quality and the NVIDIA GPU, which, despite being an older model, is considerably more powerful than the Intel GPU integrated into the CPU.
However, this model is also not without problems. Our biggest complaint is the enforced CPU performance reduction during battery operation. During mains operation, we could avoid the performance fluctuations in this model with a settings change, but the performance during battery operation cannot be raised in this way. An added, new problem is the heat development on the bottom during load, which can probably be attributed to the Nvidia GPU. In terms of this problem, the T560 did a little better, perhaps due to its thicker and larger case. In addition, the price for the non-student version of the T570 with 4K display and Nvidia GPU is not really very affordable, and the supplied power supply is not sufficiently sized for operation during load.
With the 4K display, the T570 presents a good overall package and is a promising candidate in the 15.6-inch segment, since it offers an interesting combination of business features and multimedia characteristics.
In summary, the T570 with a 4K display can be clearly recommended. With this display, it was markedly improved in a crucial area where the initial test unit had disappointed. If it were not for the performance reduction during battery operation, it would have achieved a "very good" recommendation. Here we reduce the end note by two percentage points. With this, the reduction is slightly less than for the first test unit, since at this time, the GPU is not affected by the performance reduction and the performance in mains operation is stable.
There are countless alternatives with a 15.6-inch display, whereas the business sector in particular is more concentrated on the 14-inch format. The MacBook Pro 15 and the Dell XPS 15 are strong competitors, which do not offer the business features and the excellent keyboard of the T570, but considerably stronger GPU and CPU options, instead.
Lenovo ThinkPad T570-20HAS01E00
- 04/25/2017 v6 (old)
Benjamin Herzig
Price comparison
