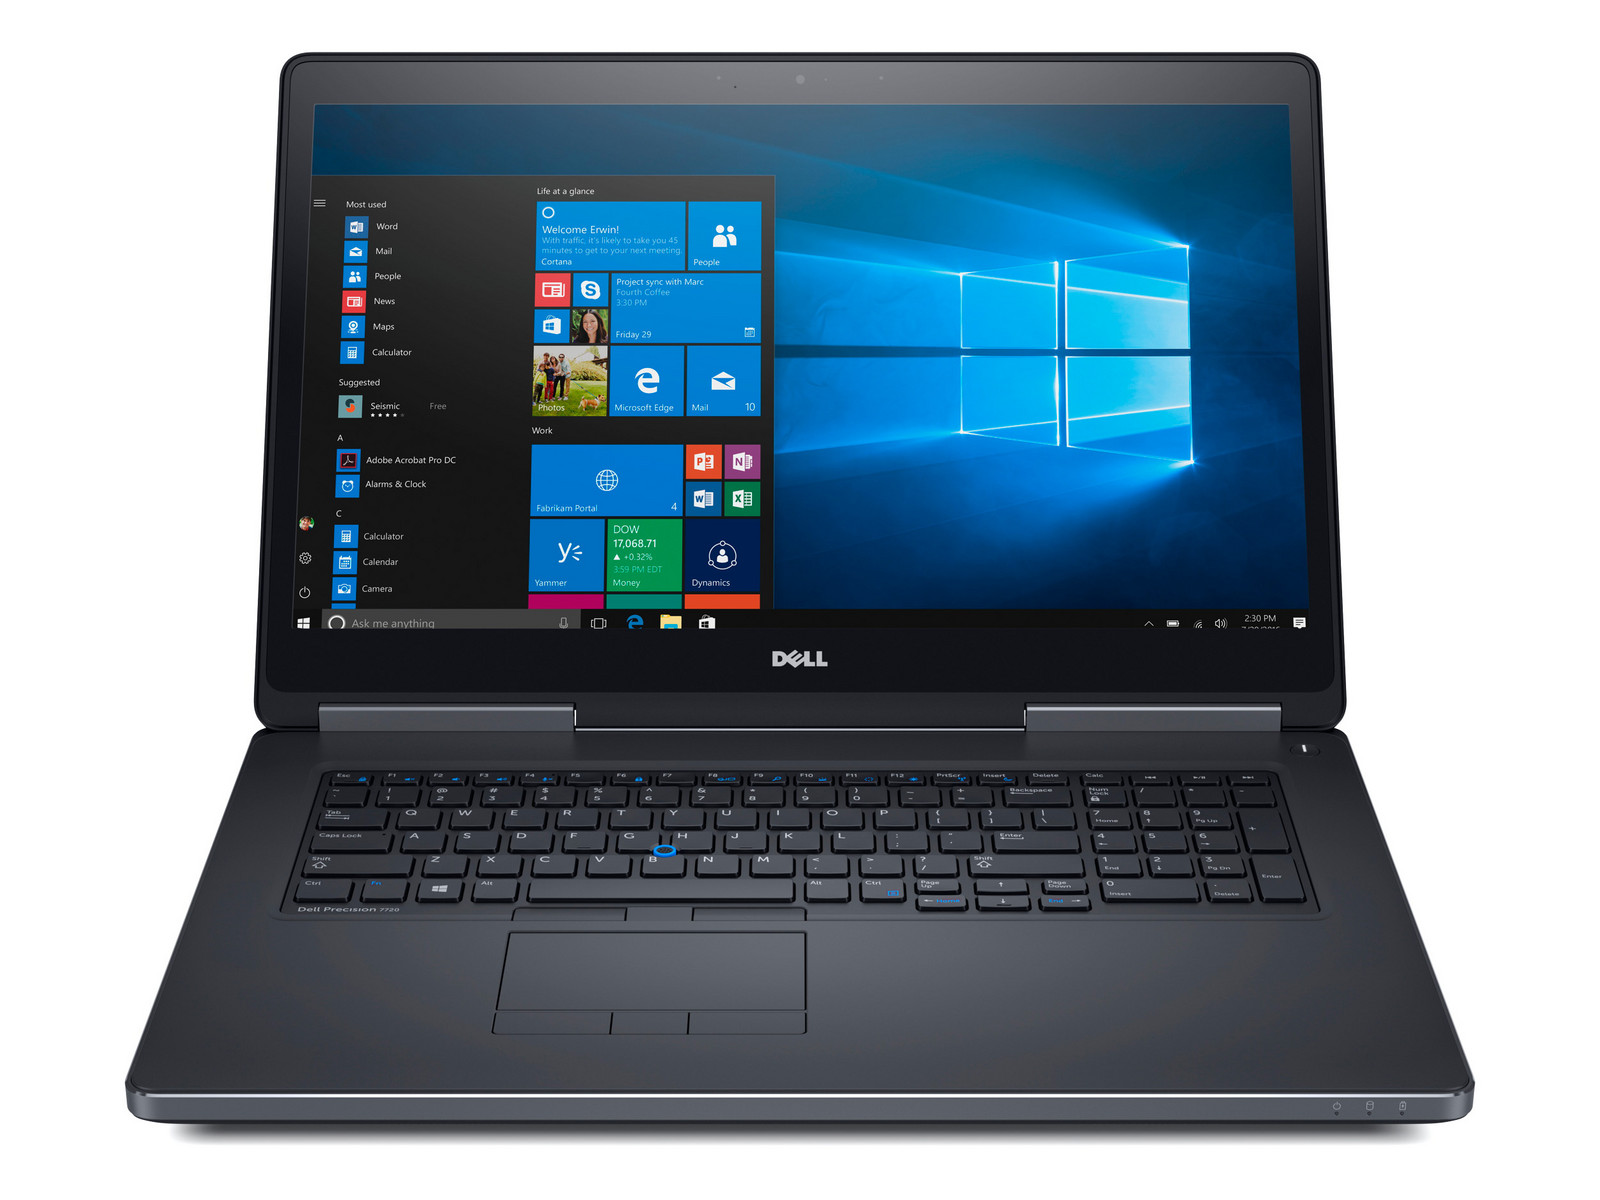
Dell Precision 7720 (Xeon, P5000, 4K) Workstation Review

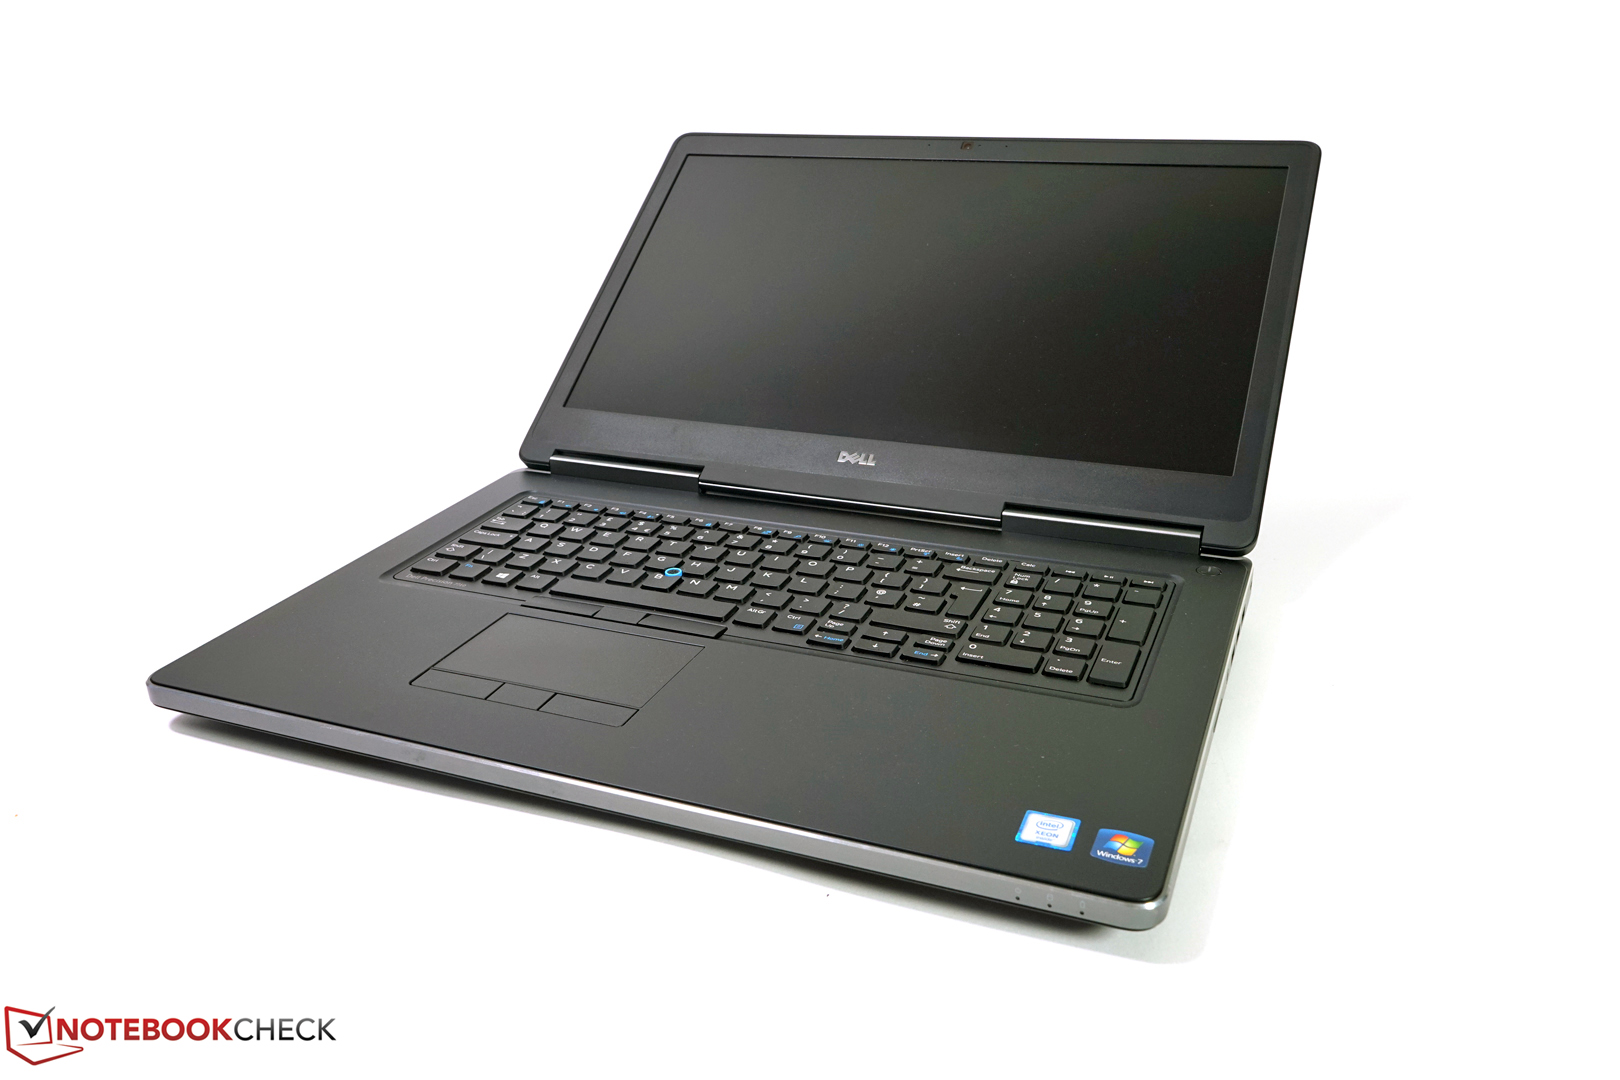
The market for big mobile workstations (17-inch) is not that interesting this year, because none of the major manufacturers have introduced new models. Instead, we get evolutionary approaches that are mainly limited to the components. However, last year's models were hardly disappointing, so there is no criticism from our side. This is also the case for our test model today, the Dell Precision 7720. Its predecessor Precision 7710 also managed a good score in our review.
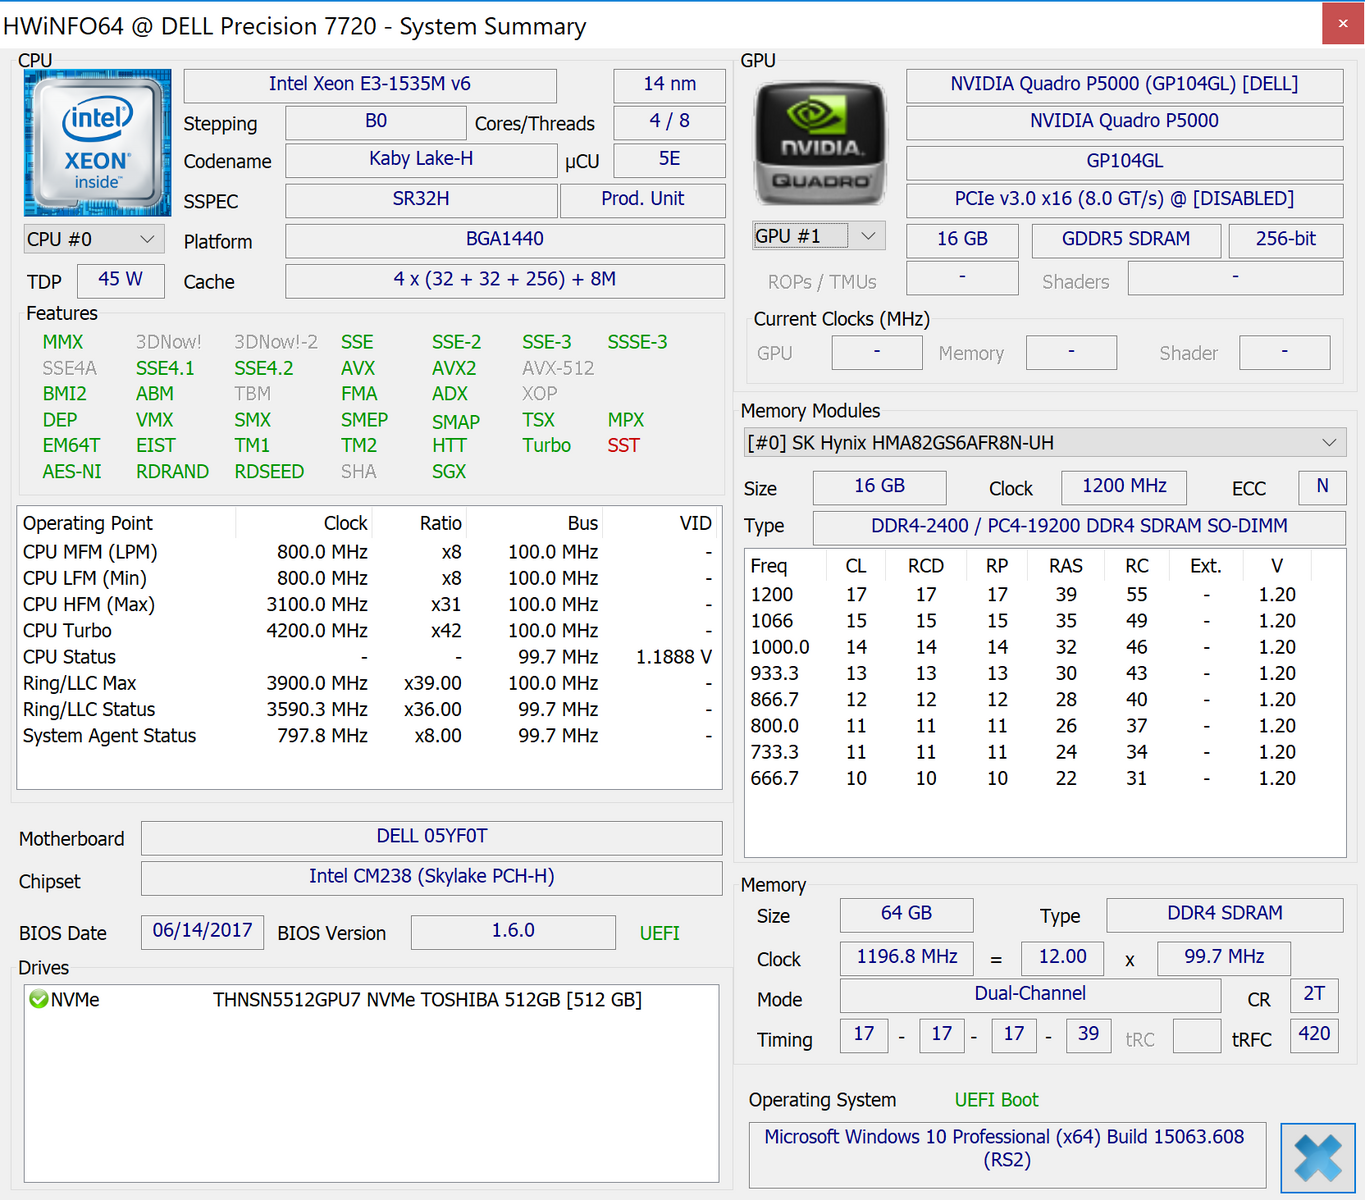
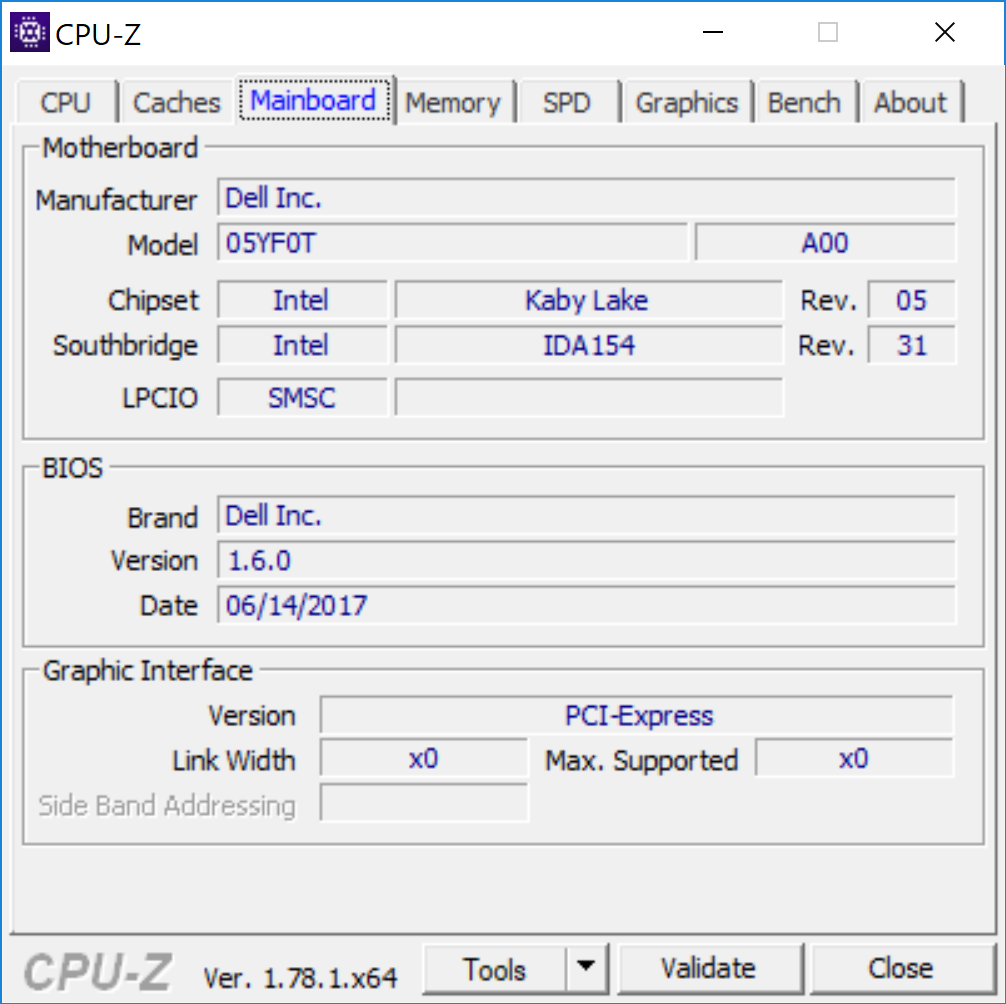
As per usual in this segment, Dell offers many different components and individual configurations. It is no problem to create a model perfectly suited for your requirements. Fast CPU with small dGPU, or vice versa – no problem. However, this also creates a huge price margin. Currently it starts at around 2200 Euros (~$2735), but can you quickly get into the five-figure range when you check all the boxes (plus VAT). Our test model, which was provided by Dell, is well equipped including Xeon E3-1535M v6, 64 GB of RAM, the modern Nvidia Quadro P5000 with 16 GB of VRAM, and a high-resolution 4K PremierColor display, which promises full AdobeRGB gamut. This results in a price of almost 5500 Euros (~$6836; plus VAT), and the GPU is the biggest price factor.
The competition for the Precision 7720 traditionally includes the Lenovo ThinkPad P71 as well as HP's ZBook 17 G4, but we also include the corresponding systems from Fujitsu (Celsius H970) as well as MSI (WE72).
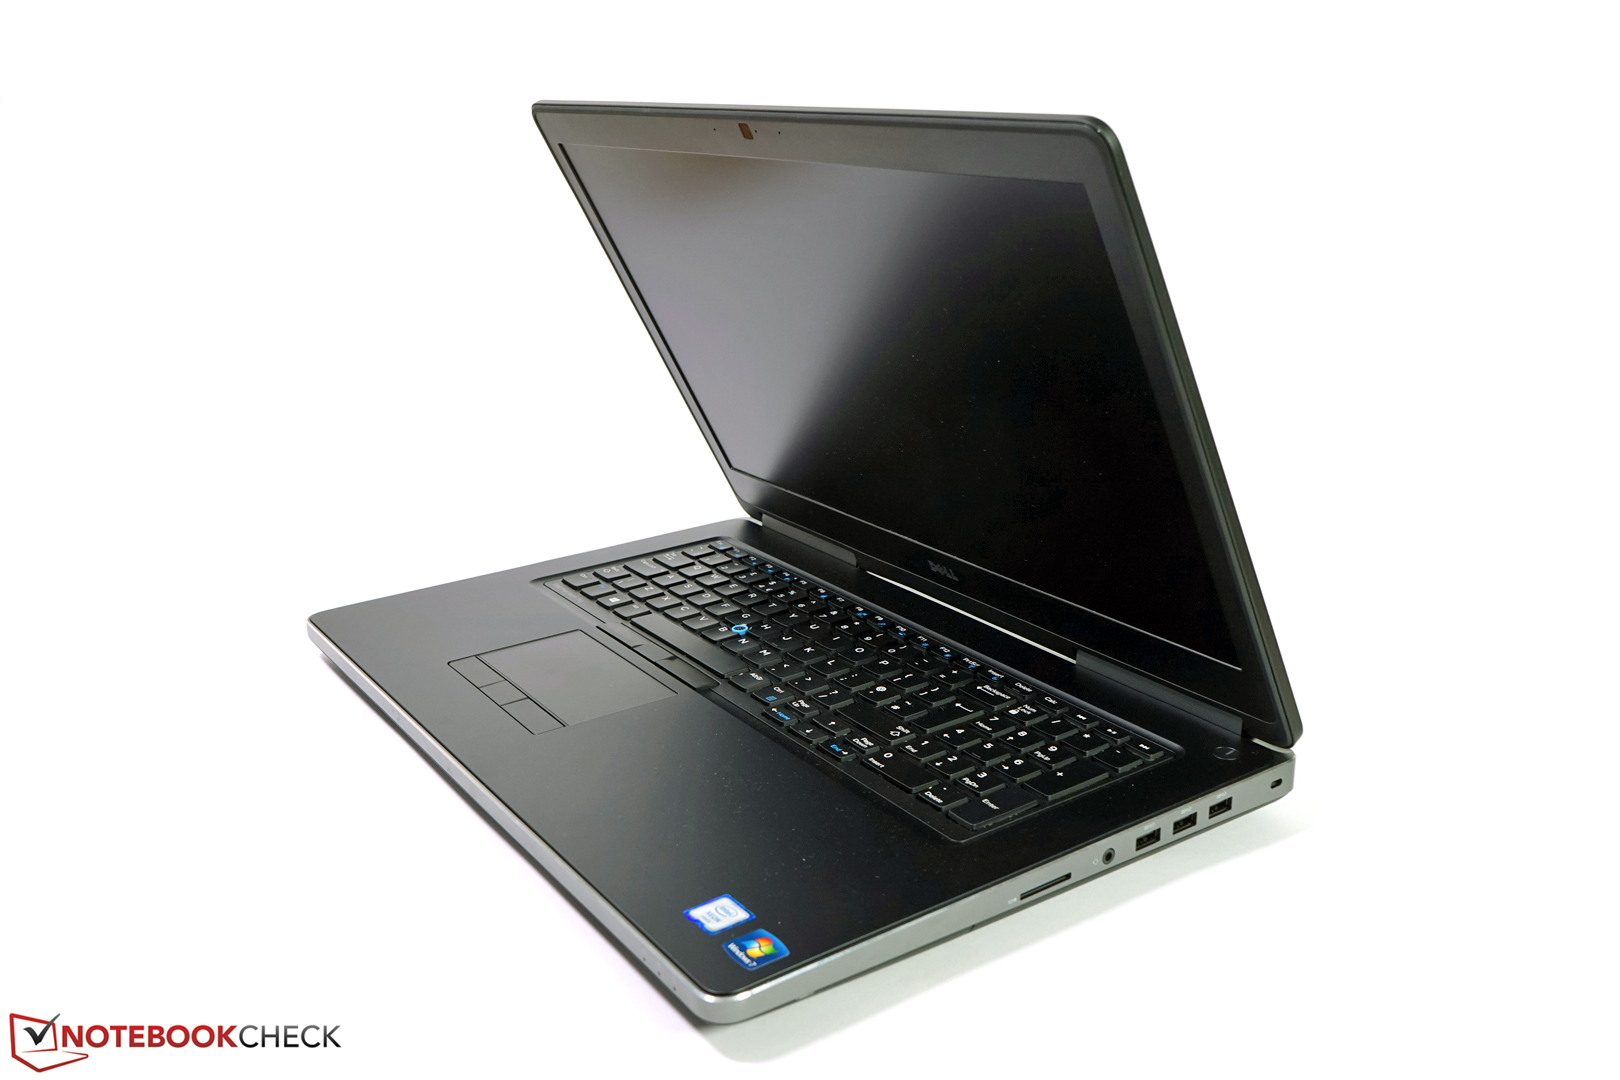
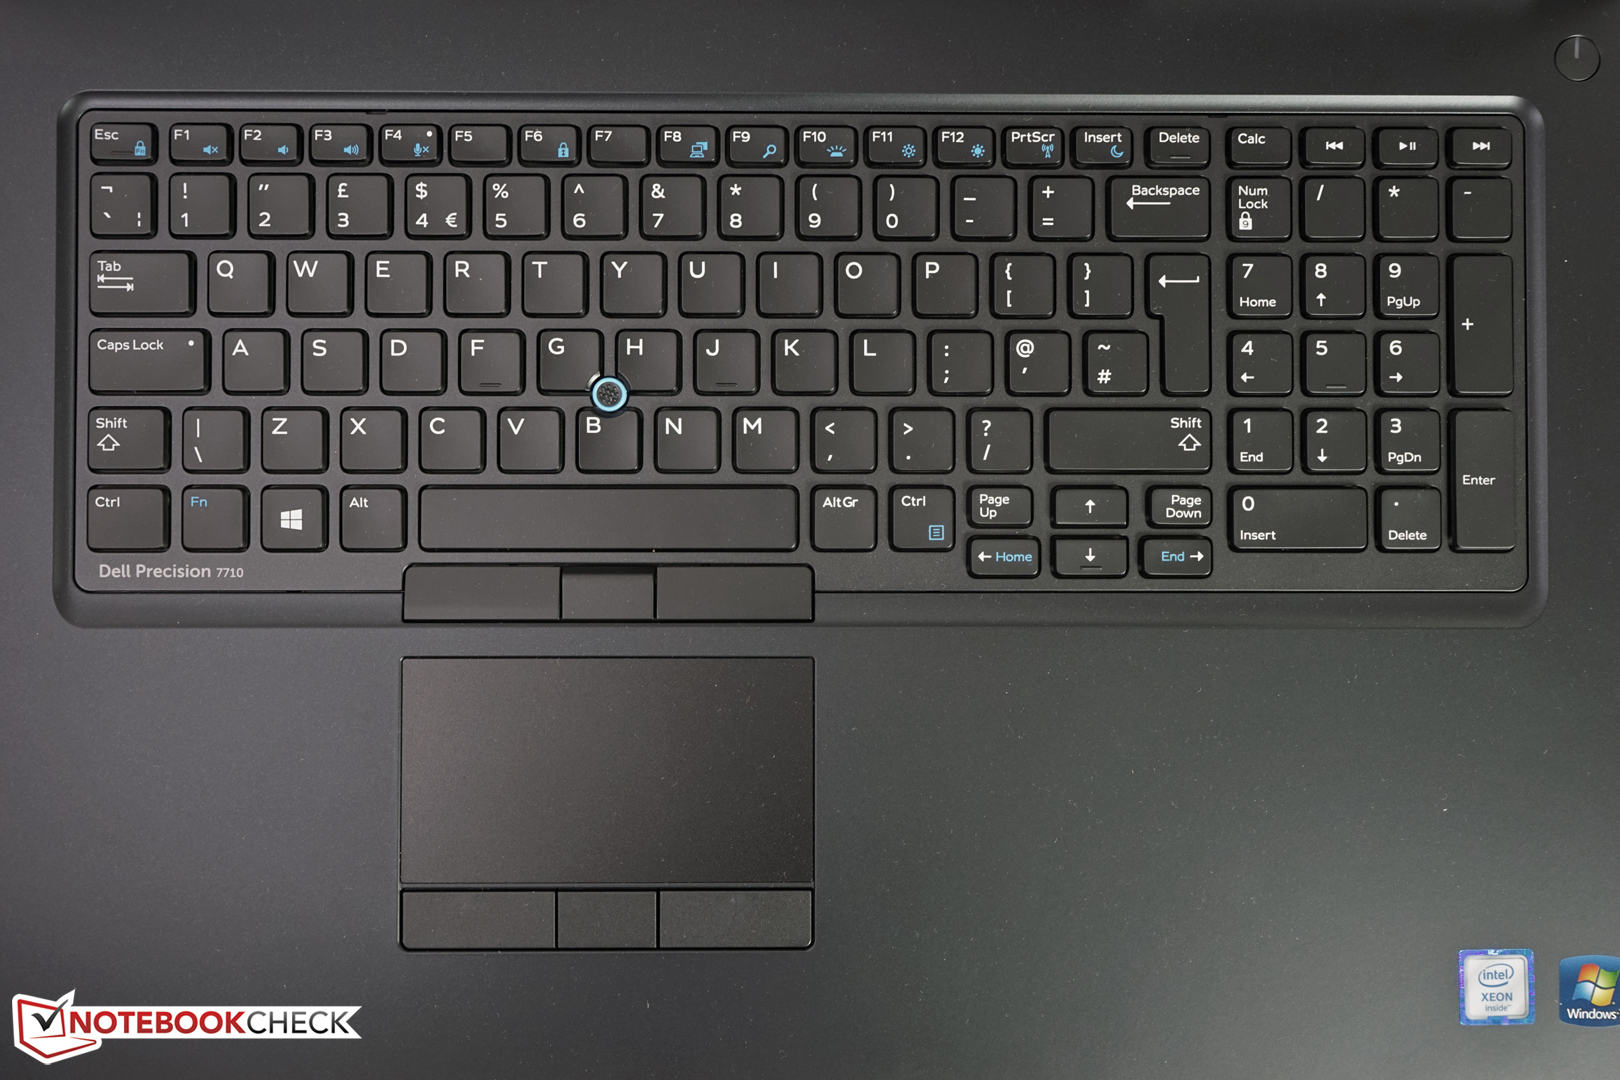
The basic construction has not changed, which is why we will not cover all the sections in this review and focus on the new components instead. We recommend checking our review of the old Precision 7710 for more information on the case, the connectivity, the input devices, and the speakers.
Changes / New Features
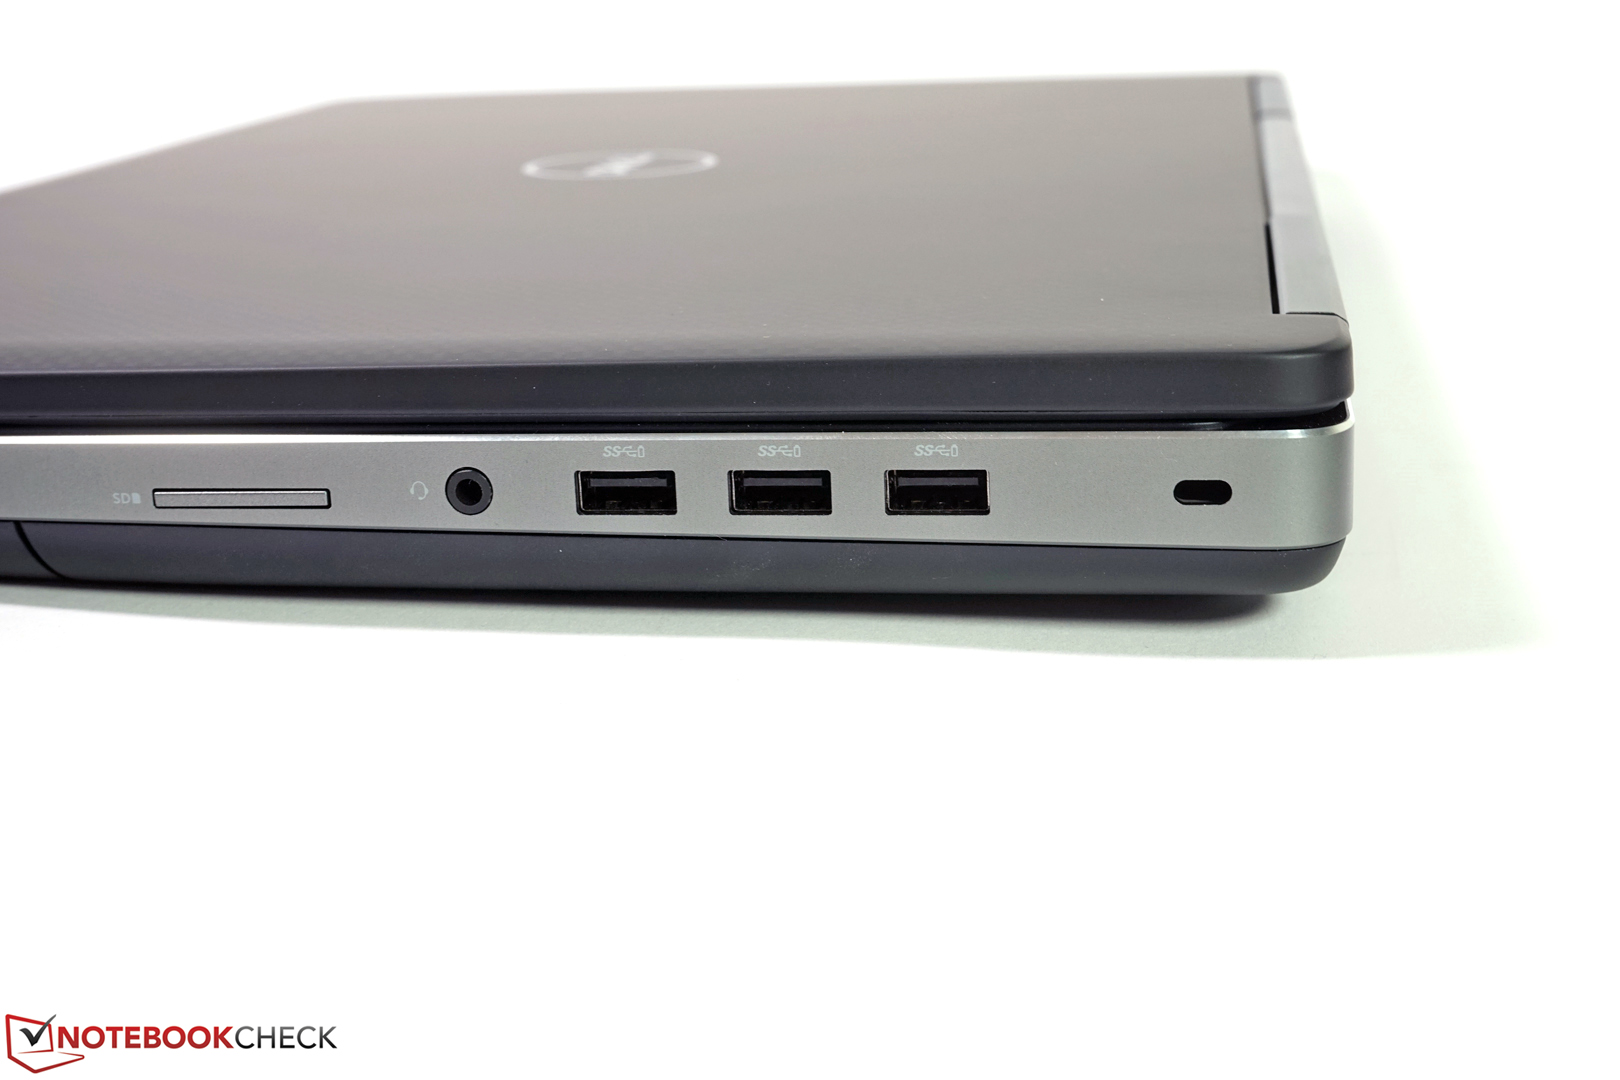
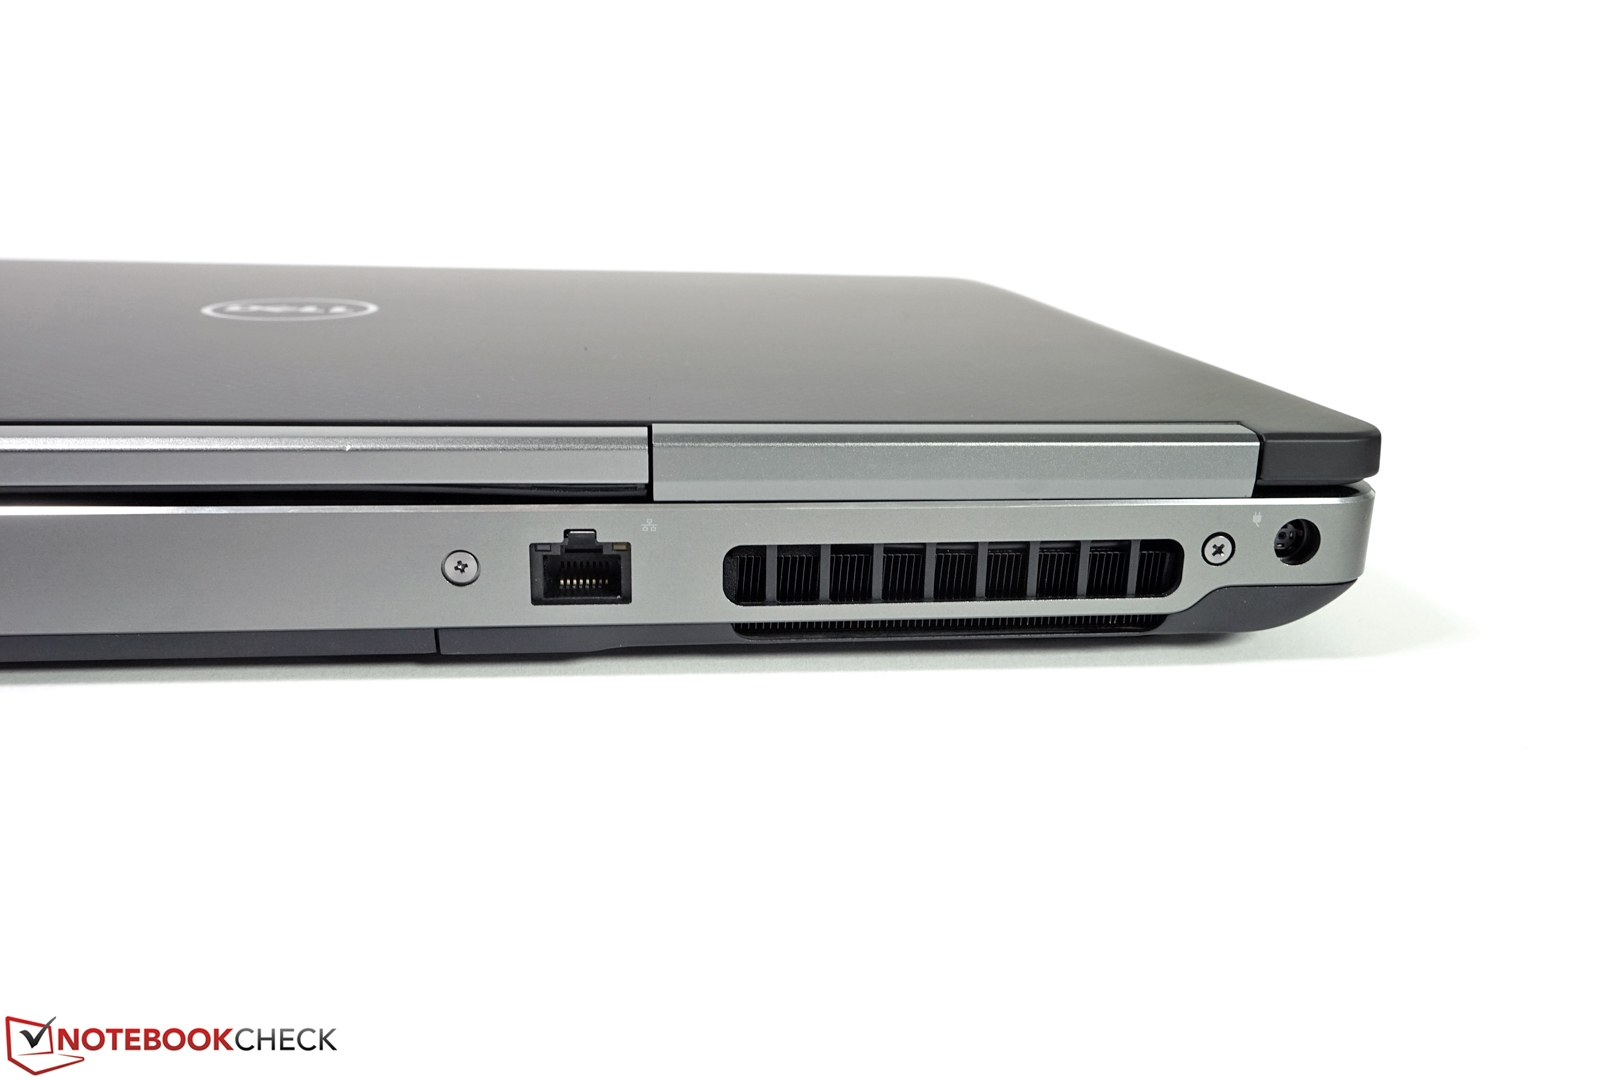
The basic construction of the 7720 is identical to the predecessor, but you now get an additional Thunderbolt 3 port by default, which was still optional on the 7710. It is located on the left side, but you still get four regular USB ports (3.0 with PowerShare). Thanks to the Mini-DisplayPort 1.4, the 7720 supports up to 8K video output with HDR. VR is another important topic, which is supported in combination with Nvidia's Pascal GPUs.
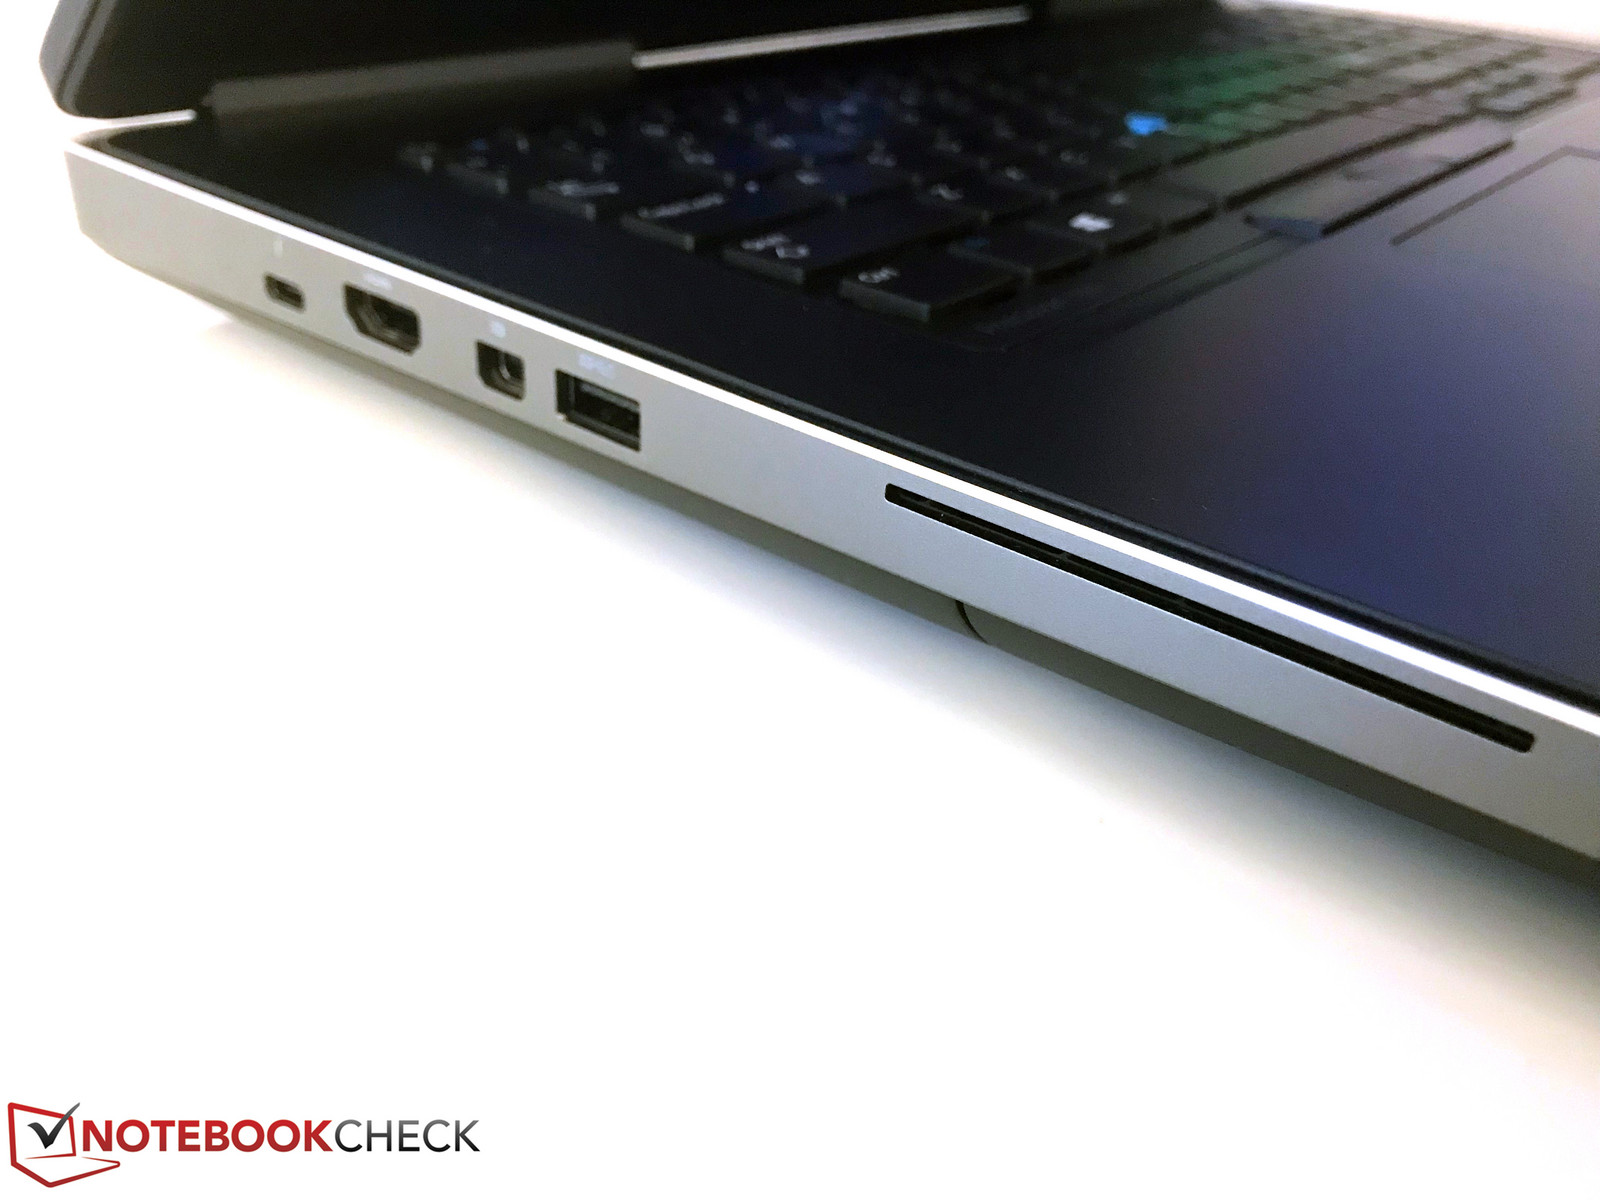
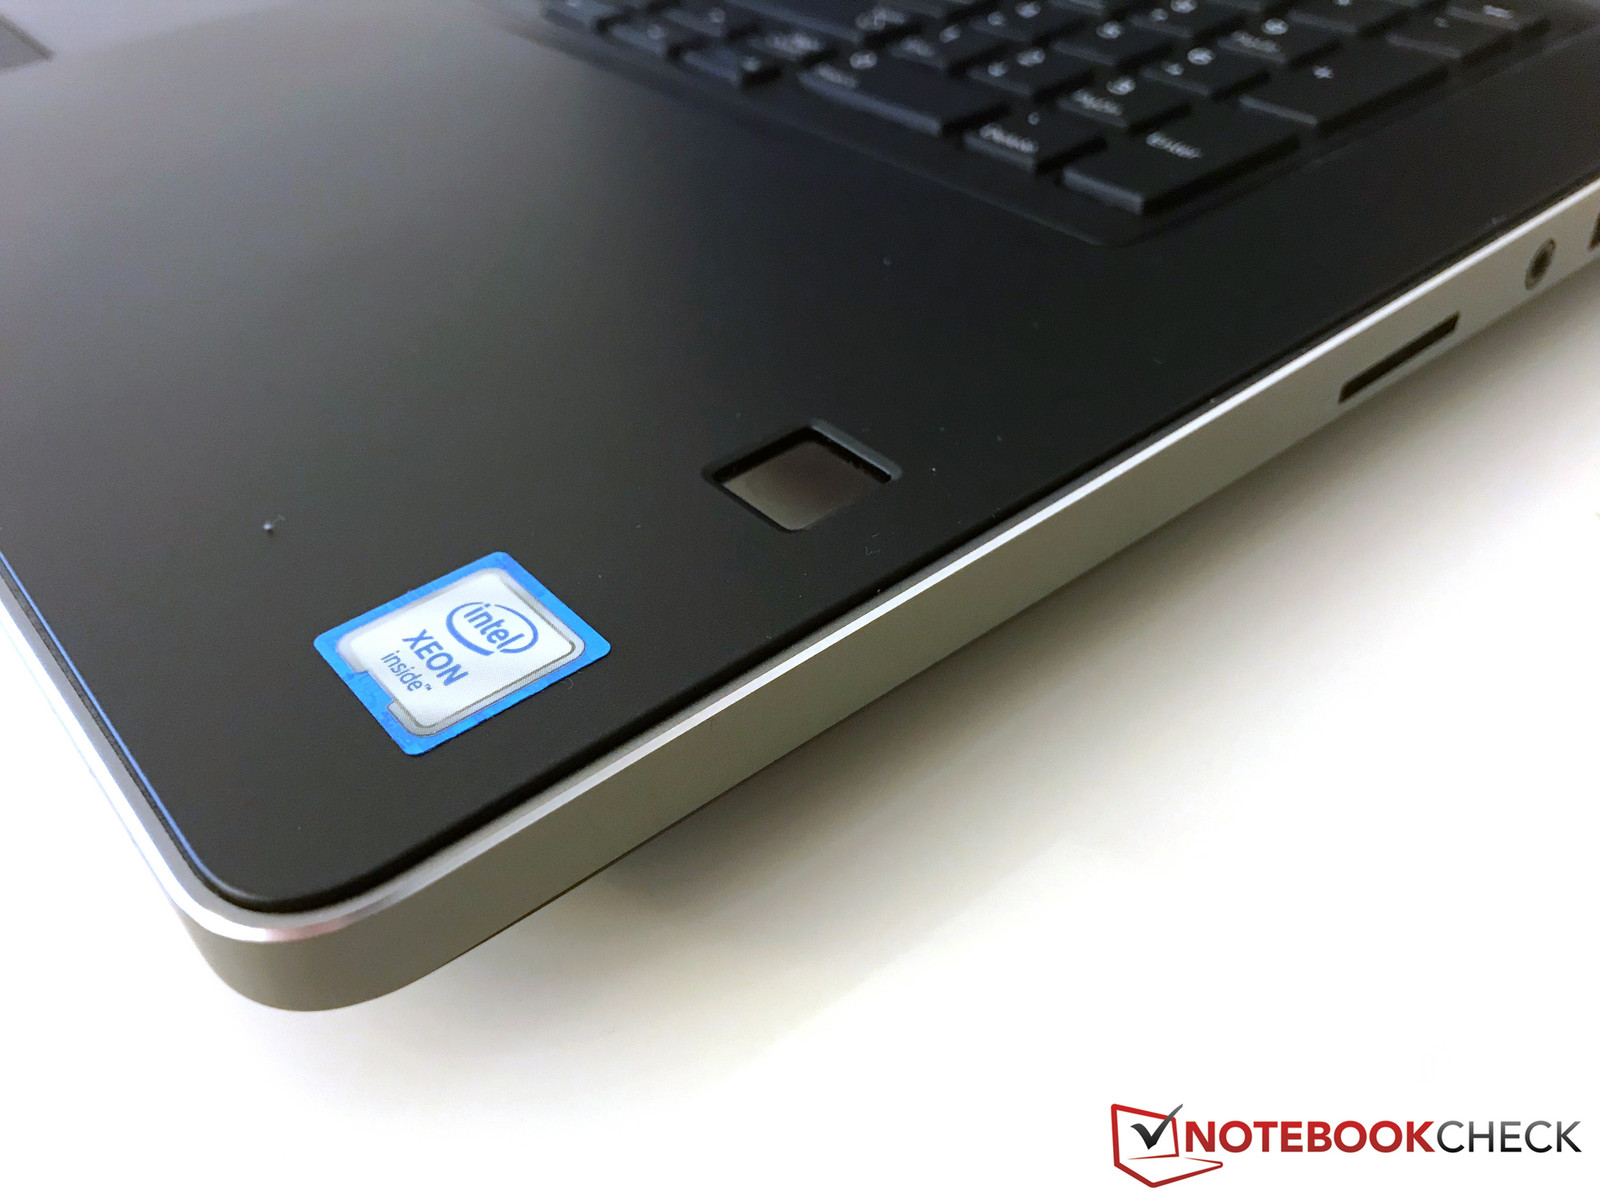
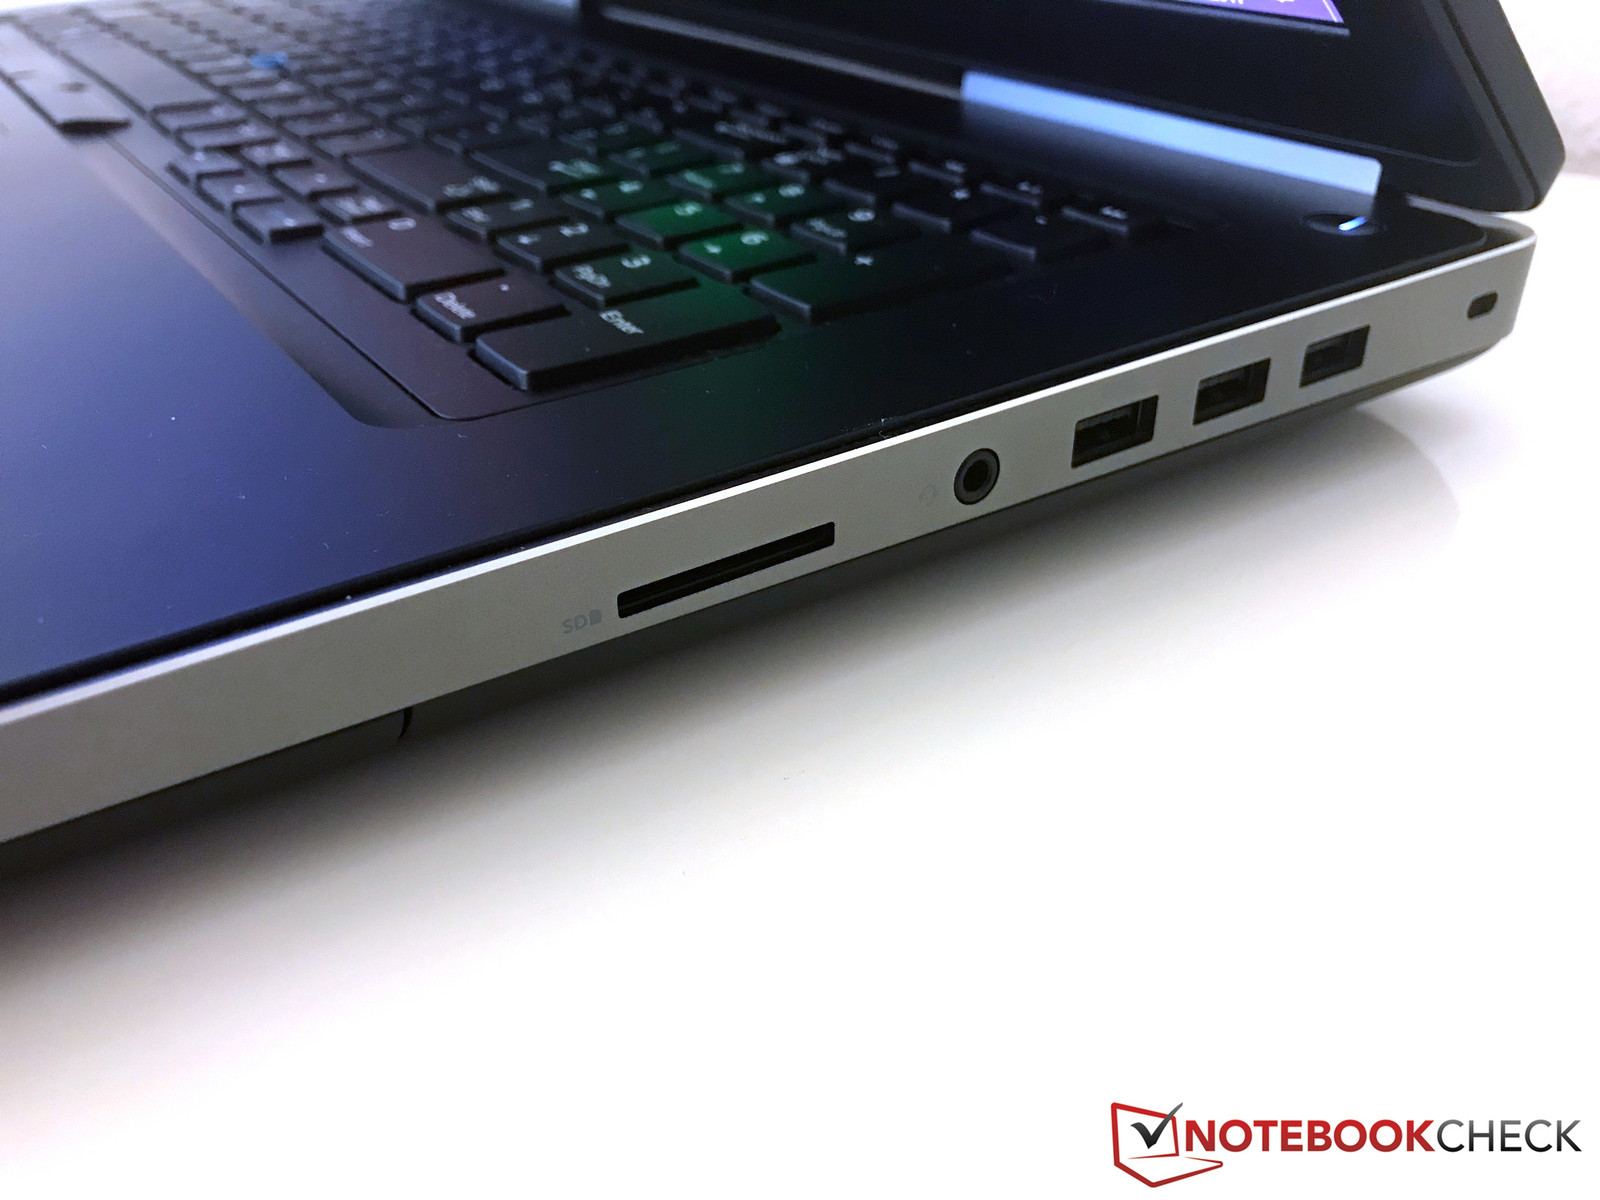
The quality of the test sample meets the expectations for such a high price. The build quality is very good and all materials are nice to touch. All in all, the quality is on par with the ZBook 17 G4 from HP and one step above Lenovo's ThinkPad P71, followed by the mobile workstations from Fujitsu as well as MSI. The following pictures show the predecessor Precision 7710.
Connectivity
SD Card Reader
The Precision 7720 features a full-size SD card reader. However, it did not work on our test model (even though it was activated in the BIOS). This should be an isolated incident though. Dell usually equips its Precision laptops with very fast card readers. The slim Precision 5520 is a good example, where we determined transfer rates of more than 250 MB/s in combination with our reference card from Toshiba (Exceria Pro UHS-II 64 GB).
Communication
Besides the Gigabit Ethernet jack (I219-LM), the Precision 7720 obviously also supports all common WLAN standards including fast 802.11ac as well as Bluetooth 4.2. We have already reviewed the Intel 8265 many times and it is also used on many comparison devices. The transfer rates in combination with our reference router Linksys EA8500 are on the expected level when the device sends data, but the Dell is slower compared to the mobile workstations from Fujitsu and Lenovo when it receives data. We still enjoyed a stable network connection during our review period.
The Precision 7720 can also be equipped with an LTE module (Snapdragon X7). The corresponding Micro-SIM slot is located inside the case right next to the WWAN module, so you have to remove two covers at the bottom before you can access it. This is not a good solution and prevents a quick exchange of the card (in other countries, for example).
Warranty
Dell ships the Precision 7720 with a three-year on-site service on the next business day by default. This service can be expanded up to 5 years and you can add more services during the checkout (keep your hard drive, additional battery warranty, etc.).
Please see our Guarantees, Return Policies and Warranties FAQ for country-specific information.
Display
Dell offers three different 17.3-inch panels for the Precision 7720. Except for the size and the matte surface, however, the three models have nothing in common. The default option is a TN panel with 1600x900 pixels and a color gamut of 42%, but Dell does not specify the reference (probably AdobeRGB). The 1080p IPS panel with 72% color gamut is available for 60 Euros (~$75) extra.
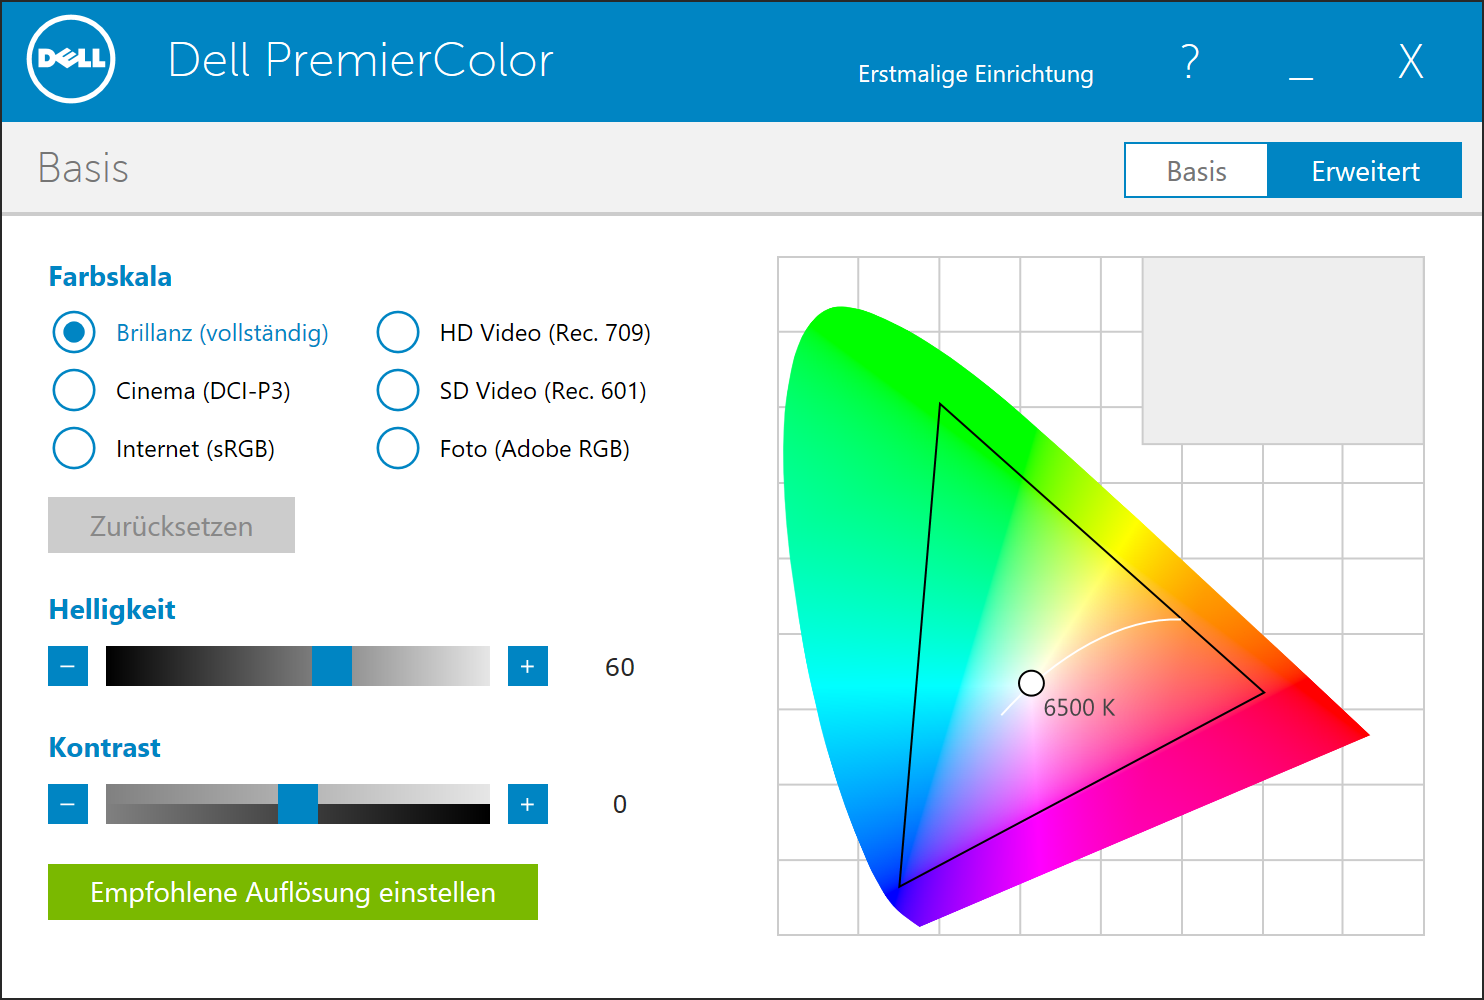
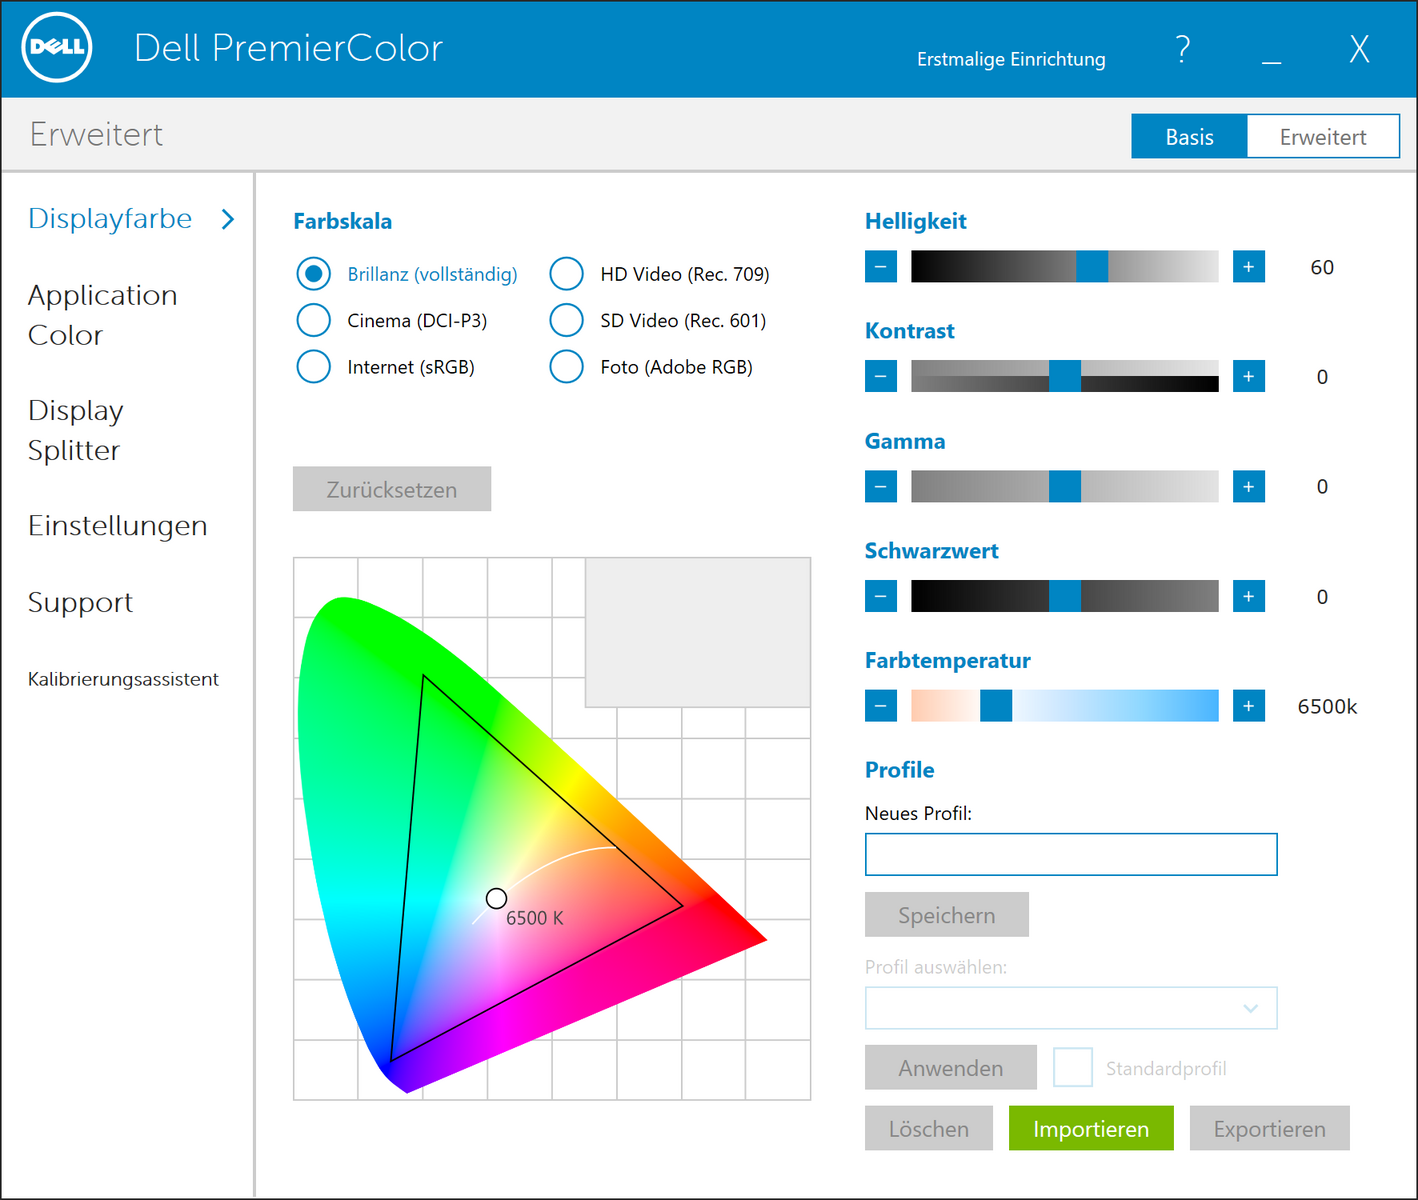
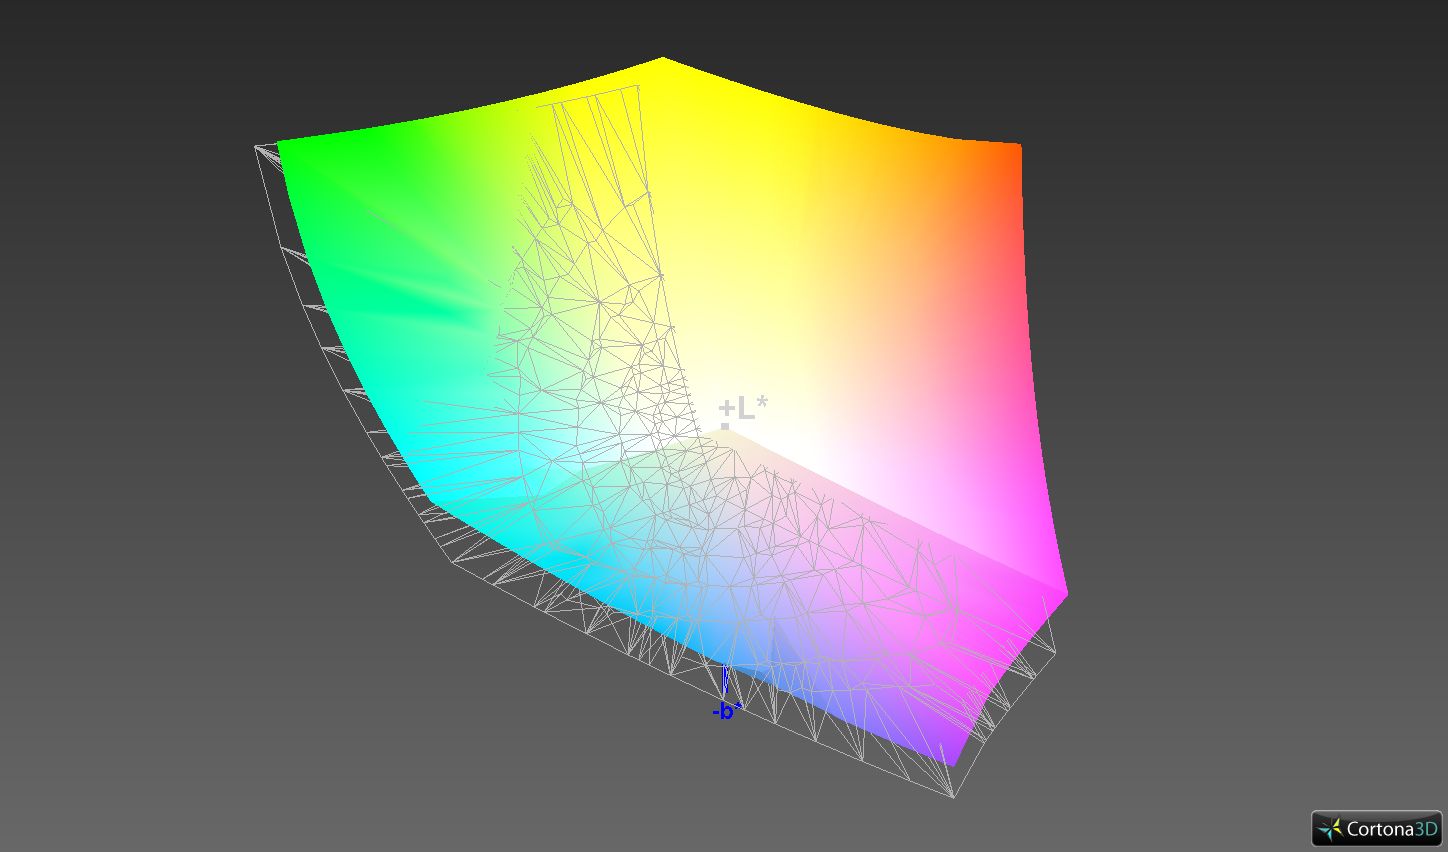
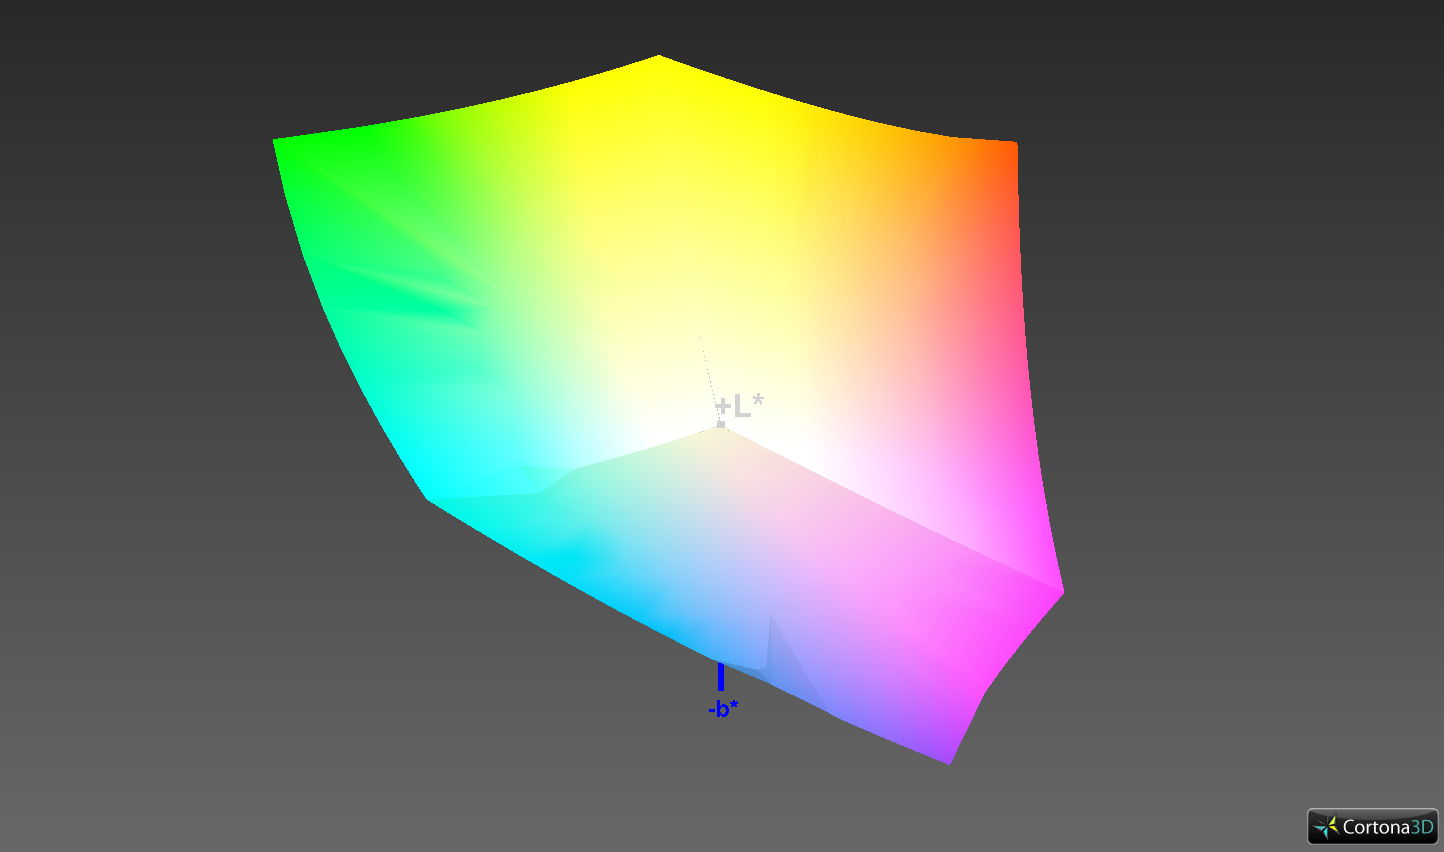
The 4K panel (3840x2160 pixels, IGZO, Sharp), which is also installed on our test model, charges a hefty additional charge of 425 Euros (~$528). Not only does Dell advertise it with 100% AdobeRGB gamut, but you also get the PremierColor software with enhanced color settings. You can, for example, set the color space that you want to work in. We performed the following measurements with the default Brilliant preset compared to the AdobeRGB reference.
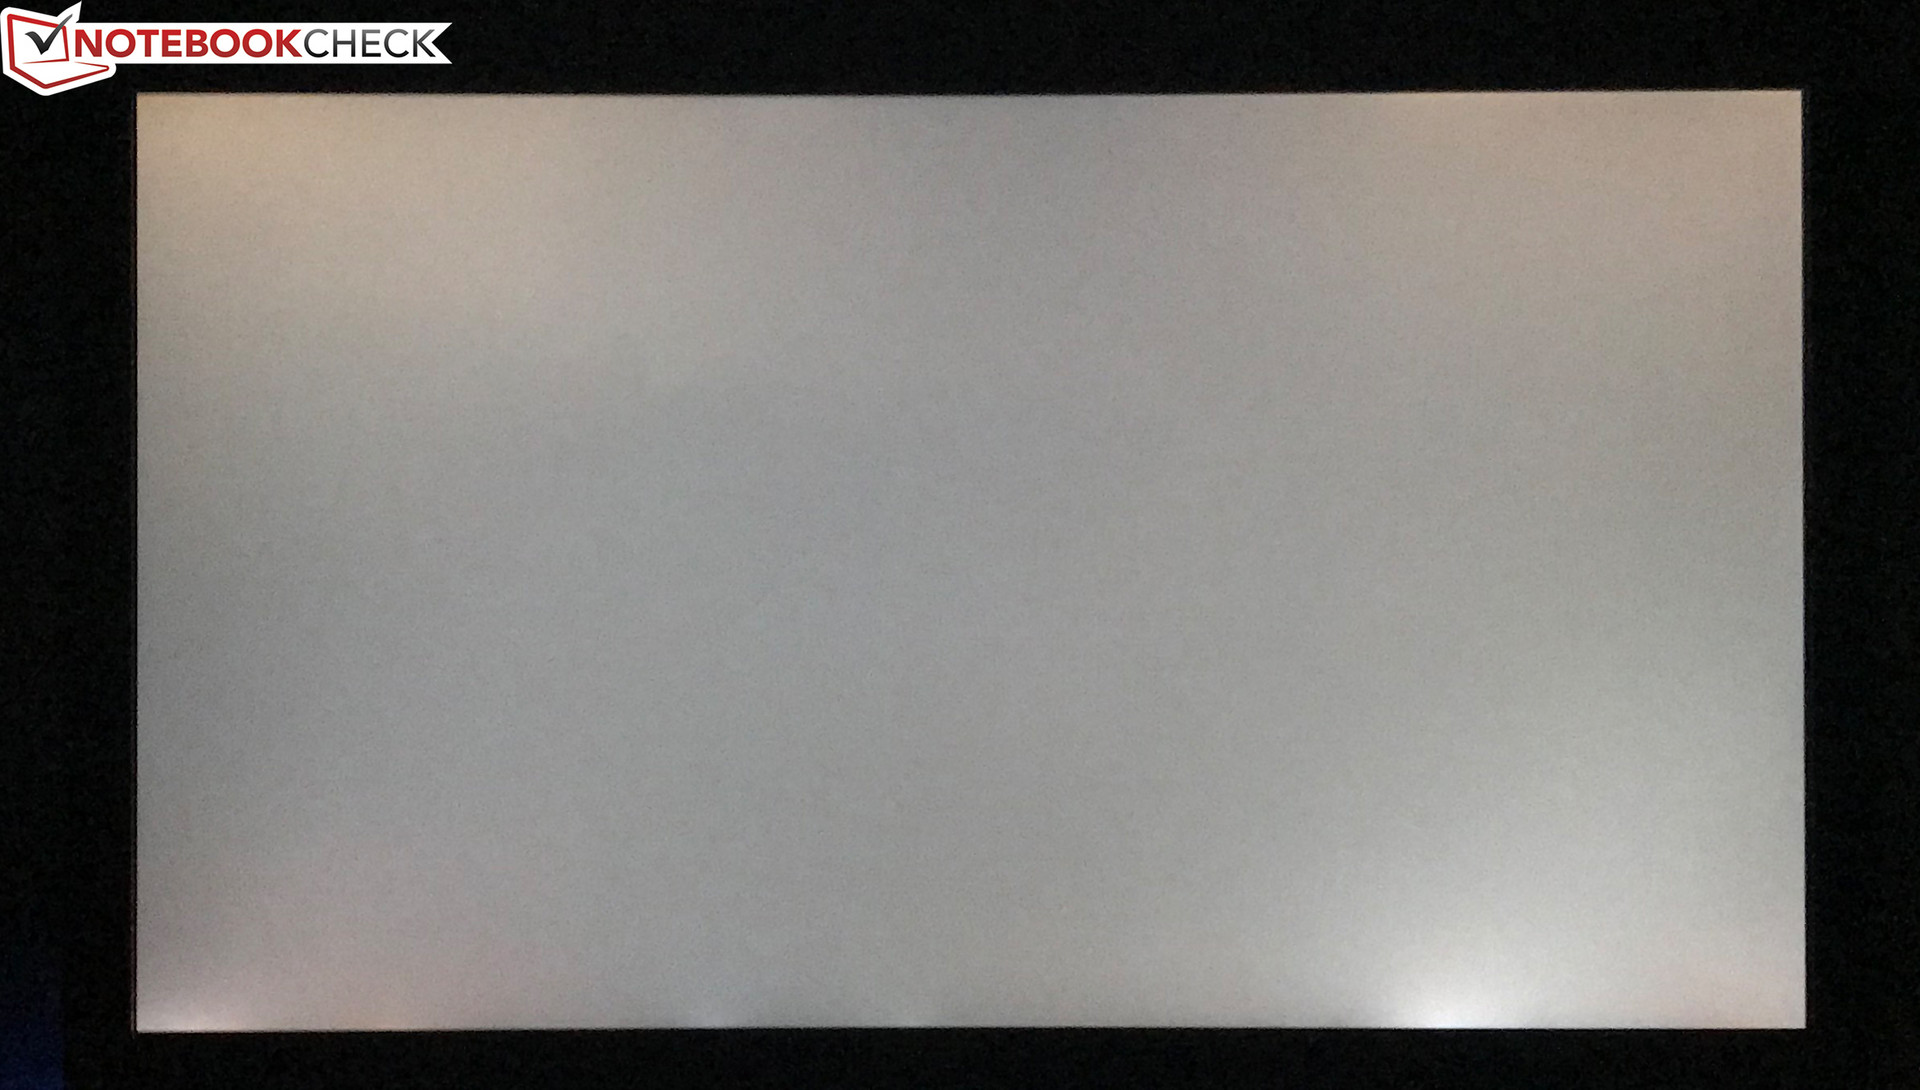
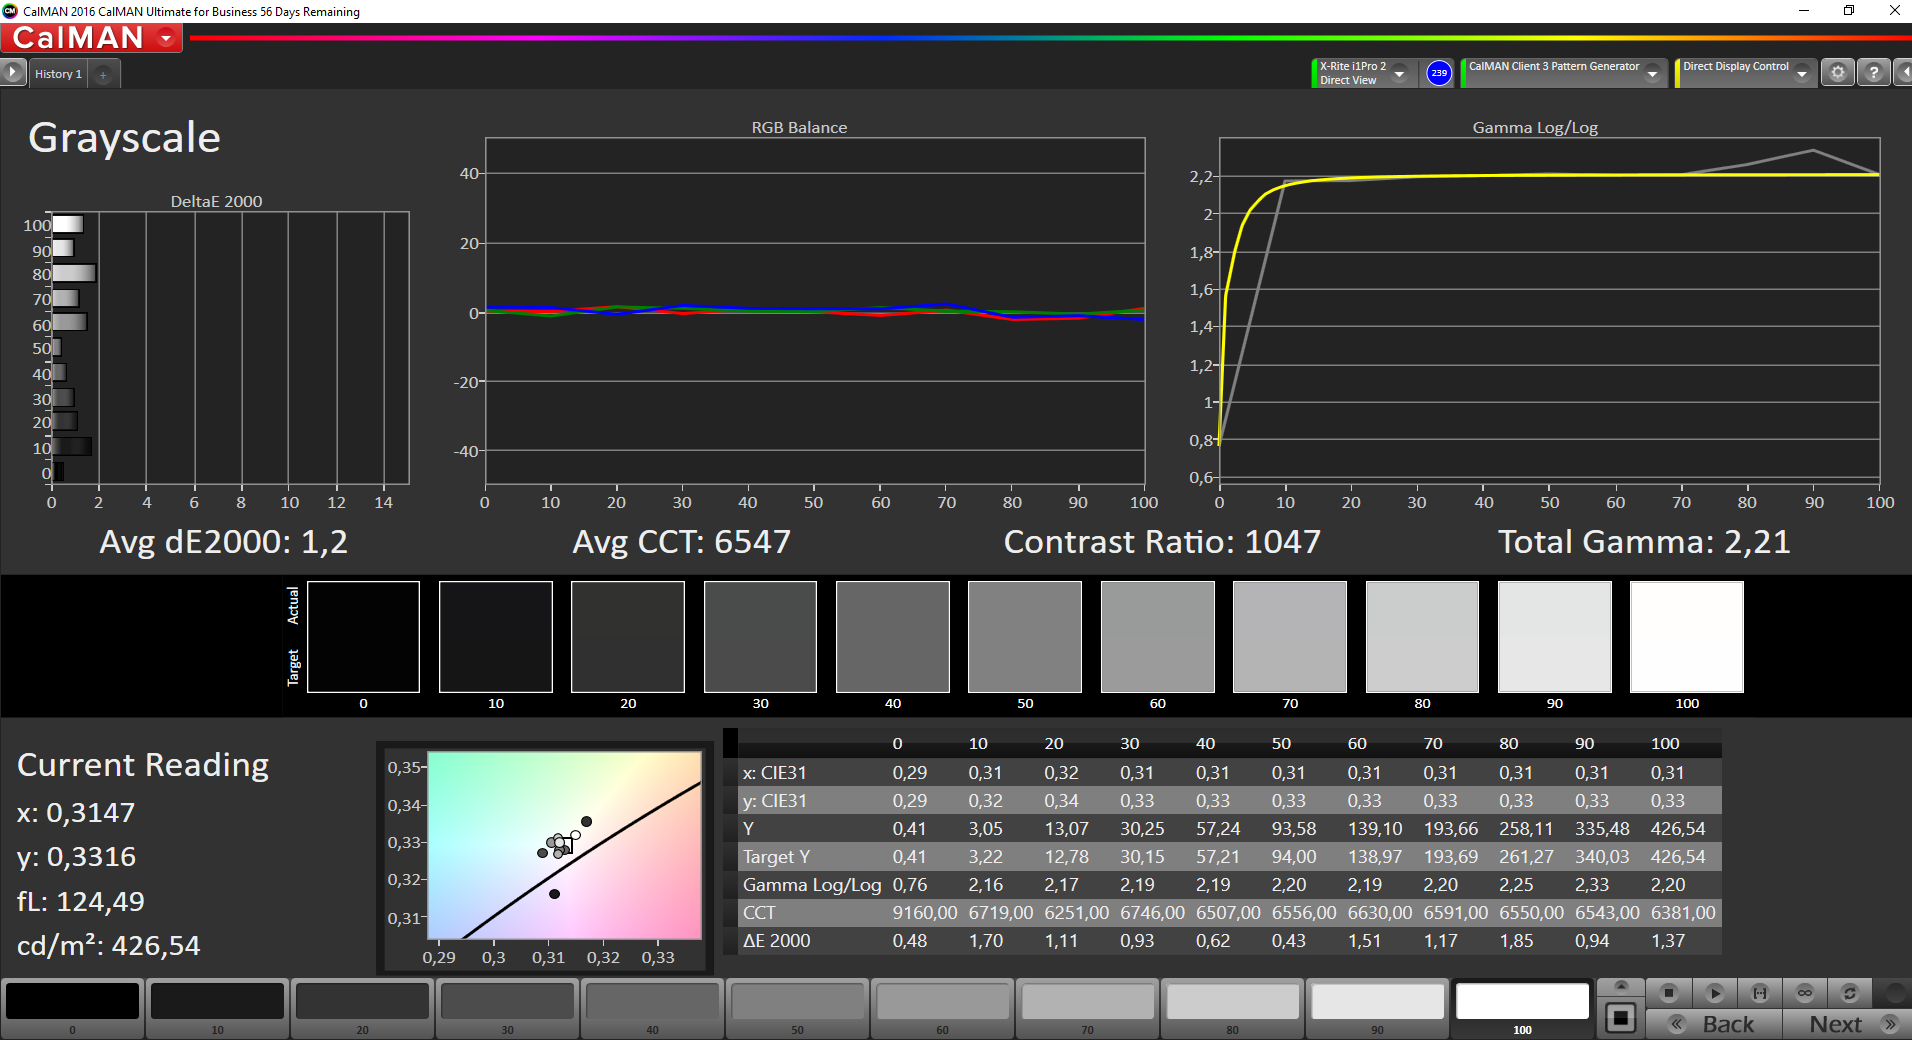
Subjectively, the picture looks very good. We can measure an average luminance of more than 440 nits, and the brightness distribution at 89% is still okay considering the large panel size. The backlight bleeding at the lower edge is a bigger problem. It is slightly intensified on our picture, but you will notice it on darker contents. Overall, the black value at 0.45 cd/m² is slightly high, but this is also a result of the high luminance. It still results in a very good contrast ratio of more than 1000:1.
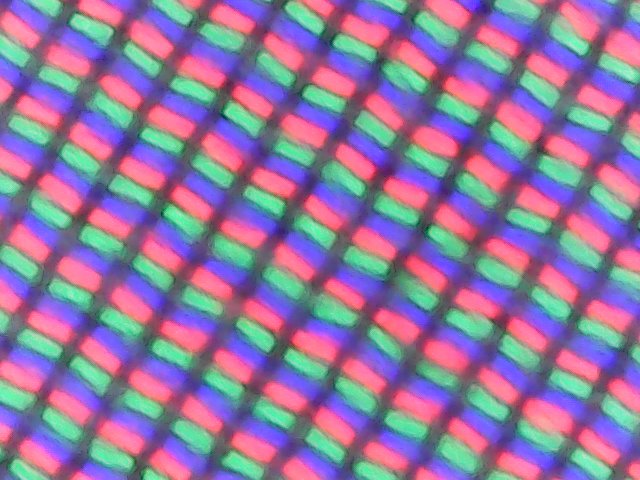
The display uses PWM for the brightness regulation as soon as the setting is at 20% or lower. The brightness levels of the Precision 7720 are very linear (the setting is 32% for the typical 150 nits), so you will be in this range quite often, especially in darker environments. The frequency is quite high at 1 kHz, but sensitive users should still consider it.
Screen Flickering / PWM (Pulse-Width Modulation)
| Screen flickering / PWM detected | 1020 Hz | ≤ 20 % brightness setting | 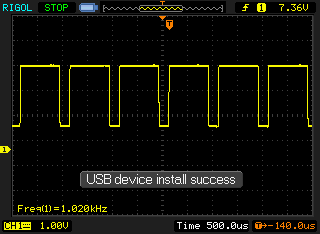 |
The display backlight flickers at 1020 Hz (worst case, e.g., utilizing PWM) Flickering detected at a brightness setting of 20 % and below. There should be no flickering or PWM above this brightness setting. The frequency of 1020 Hz is quite high, so most users sensitive to PWM should not notice any flickering. In comparison: 52 % of all tested devices do not use PWM to dim the display. If PWM was detected, an average of 7794 (minimum: 5 - maximum: 343500) Hz was measured. | |||
| |||||||||||||||||||||||||
Brightness Distribution: 89 %
Center on Battery: 462 cd/m²
Contrast: 1031:1 (Black: 0.45 cd/m²)
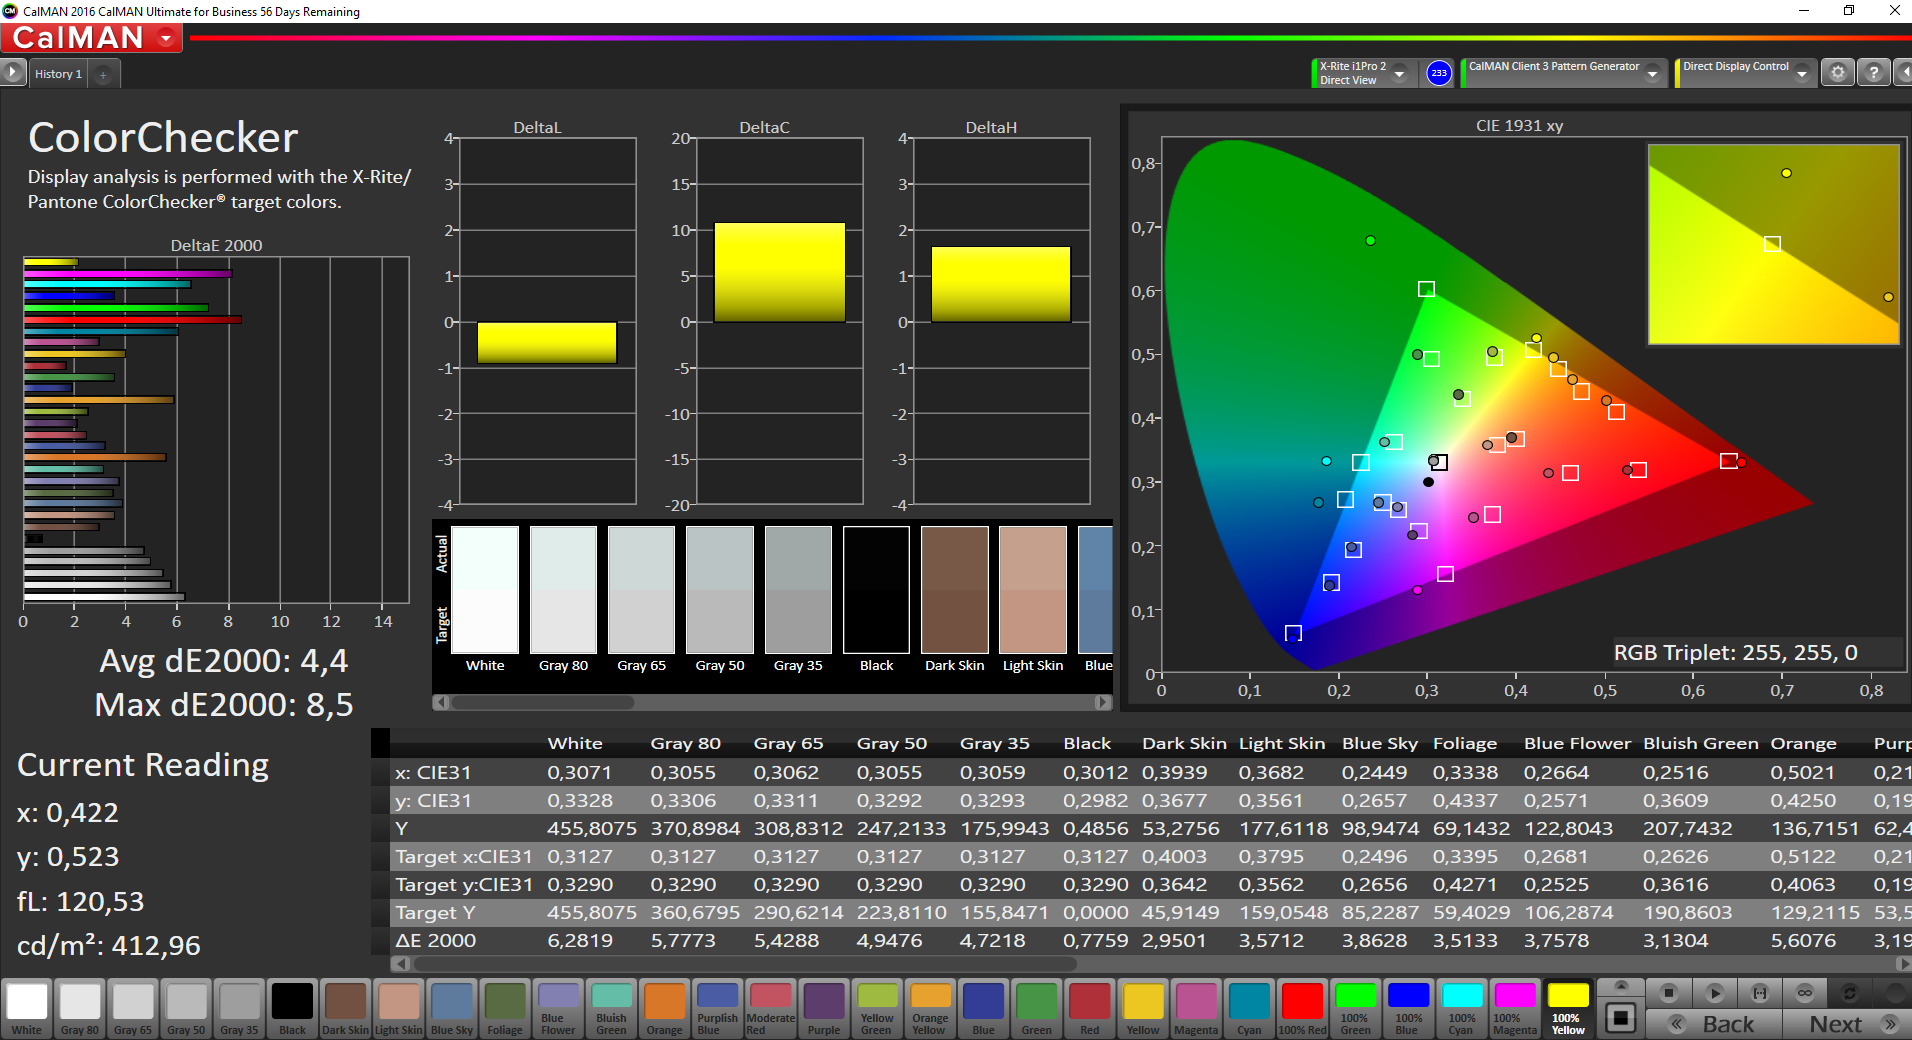
ΔE ColorChecker Calman: 3.2 | ∀{0.5-29.43 Ø4.73}
ΔE Greyscale Calman: 4.2 | ∀{0.09-98 Ø4.97}
100% sRGB (Argyll 1.6.3 3D)
88.1% AdobeRGB 1998 (Argyll 1.6.3 3D)
99.2% AdobeRGB 1998 (Argyll 3D)
100% sRGB (Argyll 3D)
87.6% Display P3 (Argyll 3D)
Gamma: 2.01
CCT: 6736 K
| Dell Precision 7720 SHP1446 (LQ173D1), , 3840x2160, 17.3" | Lenovo ThinkPad P71-20HK0004GE LEN4123, VVX17P051J00, , 3840x2160, 17.3" | HP ZBook 17 G4-Y3J82AV Sharp SHP144C, , 3840x2160, 17.3" | MSI WE72 7RJ LP173WF4-SPF1, , 1920x1080, 17.3" | Fujitsu Celsius H970 LP173WF4-SPF3, , 1920x1080, 17.3" | Dell Precision 7710 SDC8151, VHN17_173HL, , 1920x1080, 17.3" | |
|---|---|---|---|---|---|---|
| Display | 0% | -25% | -26% | -19% | ||
| Display P3 Coverage (%) | 87.6 | 88 0% | 67.4 -23% | 66.8 -24% | 66.6 -24% | |
| sRGB Coverage (%) | 100 | 100 0% | 85.3 -15% | 84.6 -15% | 96.9 -3% | |
| AdobeRGB 1998 Coverage (%) | 99.2 | 99.6 0% | 62.4 -37% | 61.8 -38% | 68.6 -31% | |
| Response Times | 43% | 11% | 34% | 45% | 20% | |
| Response Time Grey 50% / Grey 80% * (ms) | 60 ? | 39.2 ? 35% | 56.8 ? 5% | 45.2 ? 25% | 32 ? 47% | 50 ? 17% |
| Response Time Black / White * (ms) | 46.4 ? | 23.2 ? 50% | 38.4 ? 17% | 26.4 ? 43% | 26.4 ? 43% | 36 ? 22% |
| PWM Frequency (Hz) | 1020 ? | 1412 ? | 1020 ? | 198 ? | ||
| Screen | 10% | 17% | -33% | -28% | -7% | |
| Brightness middle (cd/m²) | 464 | 358 -23% | 391 -16% | 302 -35% | 368 -21% | 332 -28% |
| Brightness (cd/m²) | 441 | 338 -23% | 360 -18% | 306 -31% | 360 -18% | 307 -30% |
| Brightness Distribution (%) | 89 | 83 -7% | 87 -2% | 93 4% | 91 2% | 83 -7% |
| Black Level * (cd/m²) | 0.45 | 0.31 31% | 0.35 22% | 0.31 31% | 0.3 33% | 0.33 27% |
| Contrast (:1) | 1031 | 1155 12% | 1117 8% | 974 -6% | 1227 19% | 1006 -2% |
| Colorchecker dE 2000 * | 3.2 | 2.1 34% | 1.3 59% | 6.2 -94% | 6.4 -100% | 3 6% |
| Colorchecker dE 2000 max. * | 6.1 | 3.6 41% | 2.5 59% | 10.6 -74% | 10.1 -66% | |
| Greyscale dE 2000 * | 4.2 | 2 52% | 1.8 57% | 7.3 -74% | 7.2 -71% | 4 5% |
| Gamma | 2.01 109% | 2.16 102% | 2.11 104% | 2.08 106% | 2.02 109% | 2 110% |
| CCT | 6736 96% | 6216 105% | 6461 101% | 7020 93% | 6882 94% | 7089 92% |
| Color Space (Percent of AdobeRGB 1998) (%) | 88.1 | 77 -13% | 87.9 0% | 56 -36% | 55.5 -37% | 62 -30% |
| Color Space (Percent of sRGB) (%) | 100 | 99.97 0% | 100 0% | 85.2 -15% | 84.4 -16% | 97 -3% |
| Total Average (Program / Settings) | 27% /
16% | 9% /
13% | -8% /
-22% | -3% /
-17% | -2% /
-6% |
* ... smaller is better
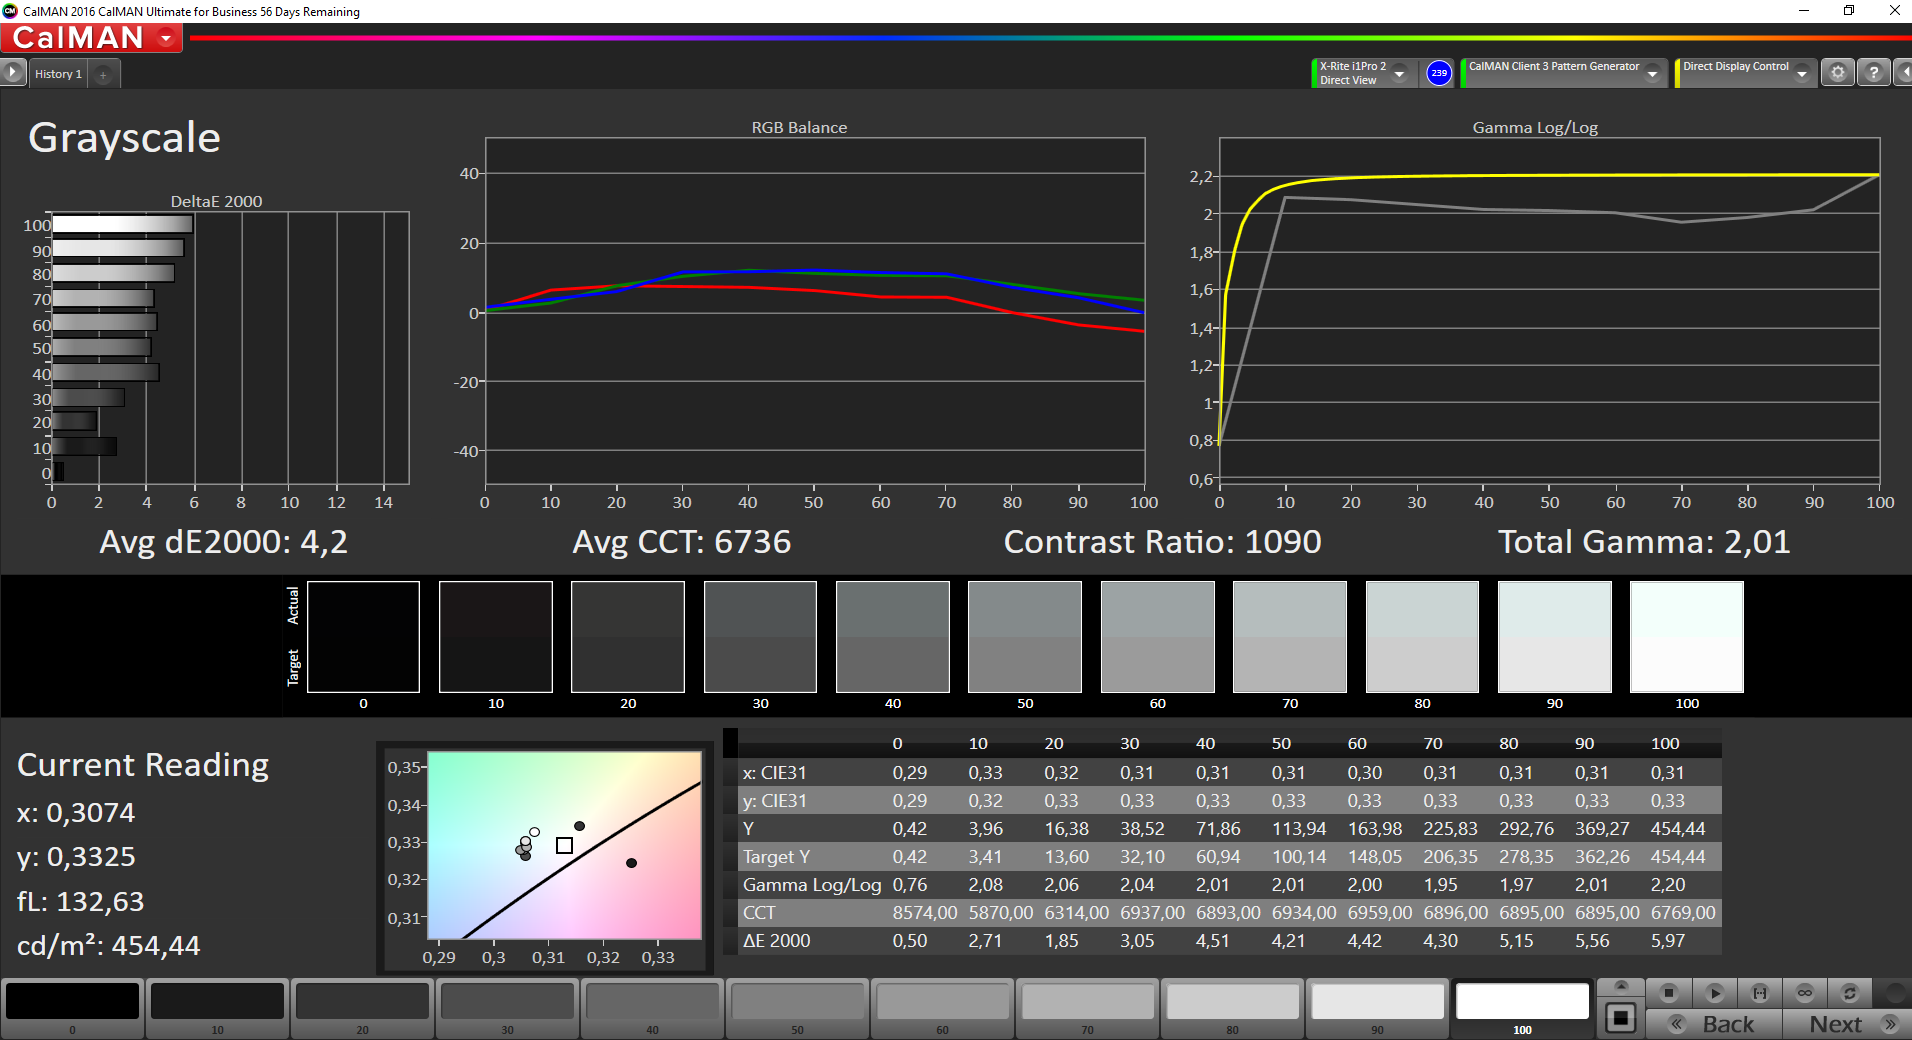
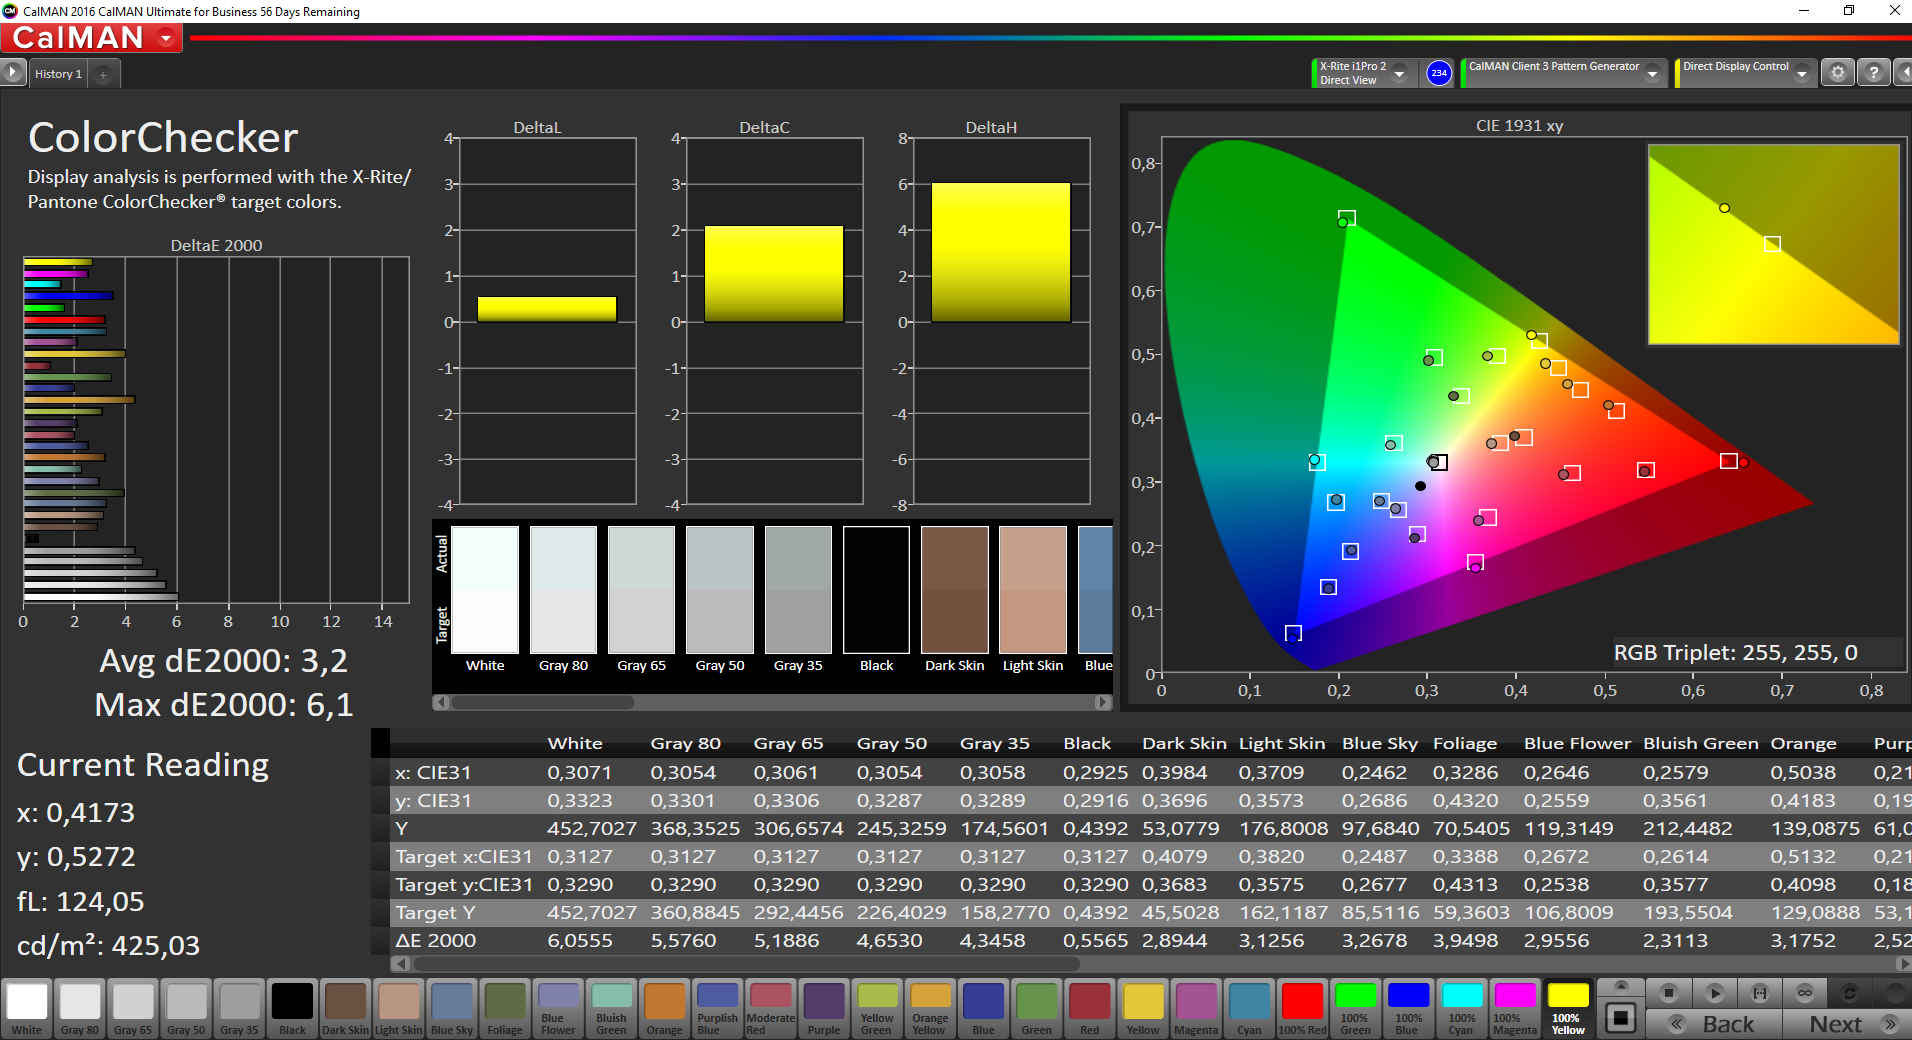


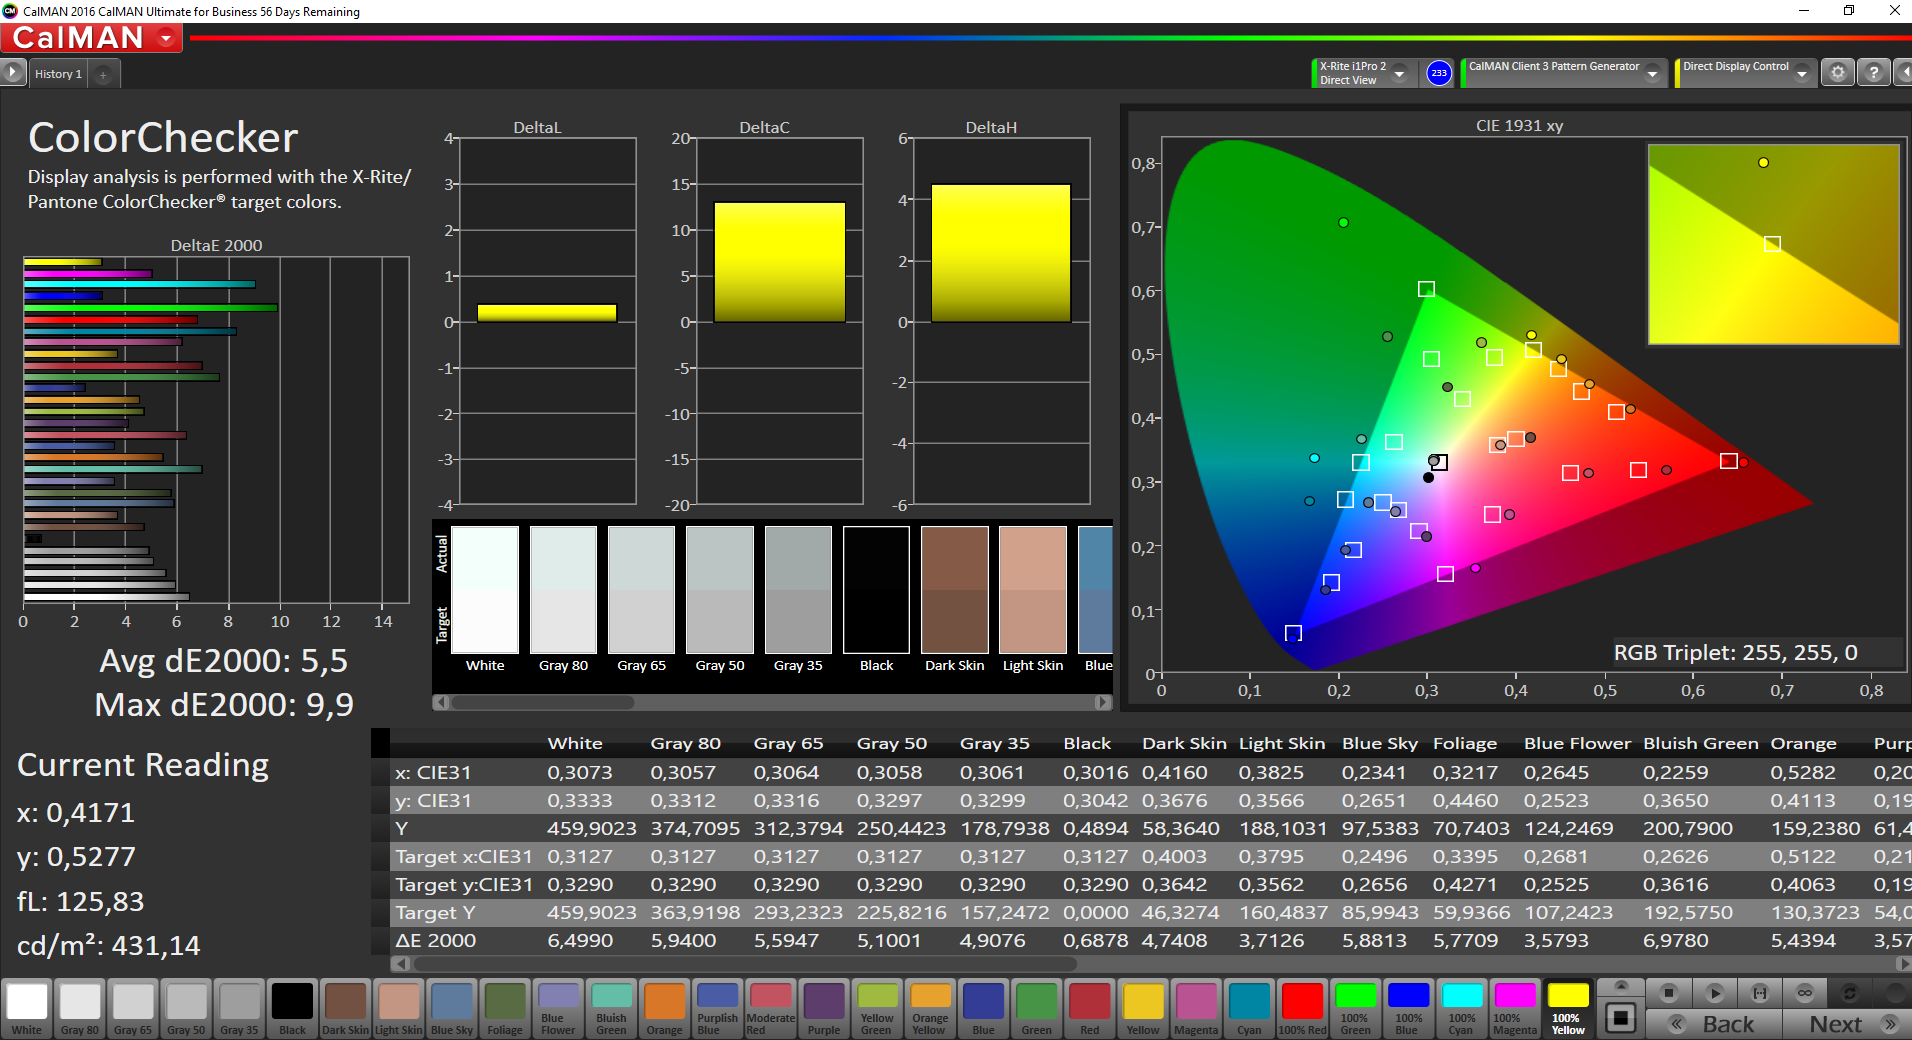

The DeltaE-2000 deviations are not particularly good ex-works, especially considering the big premium and the performance of the two rivals from HP and Lenovo. None of the presets manages average values below 3. This mark is important, because it is the limit where the human eye cannot see a difference to the reference color anymore. However, this is the case for all tested profiles, and there are big deviations compared to the sRGB reference in particular. This means that you should calibrate the panel if possible. Subjectively, you will notice a difference between the presets. We preferred the default preset Brilliant followed by Photo. The colors look much less vivid when you select Internet, which is particularly noticeable when you watch videos or look at pictures.
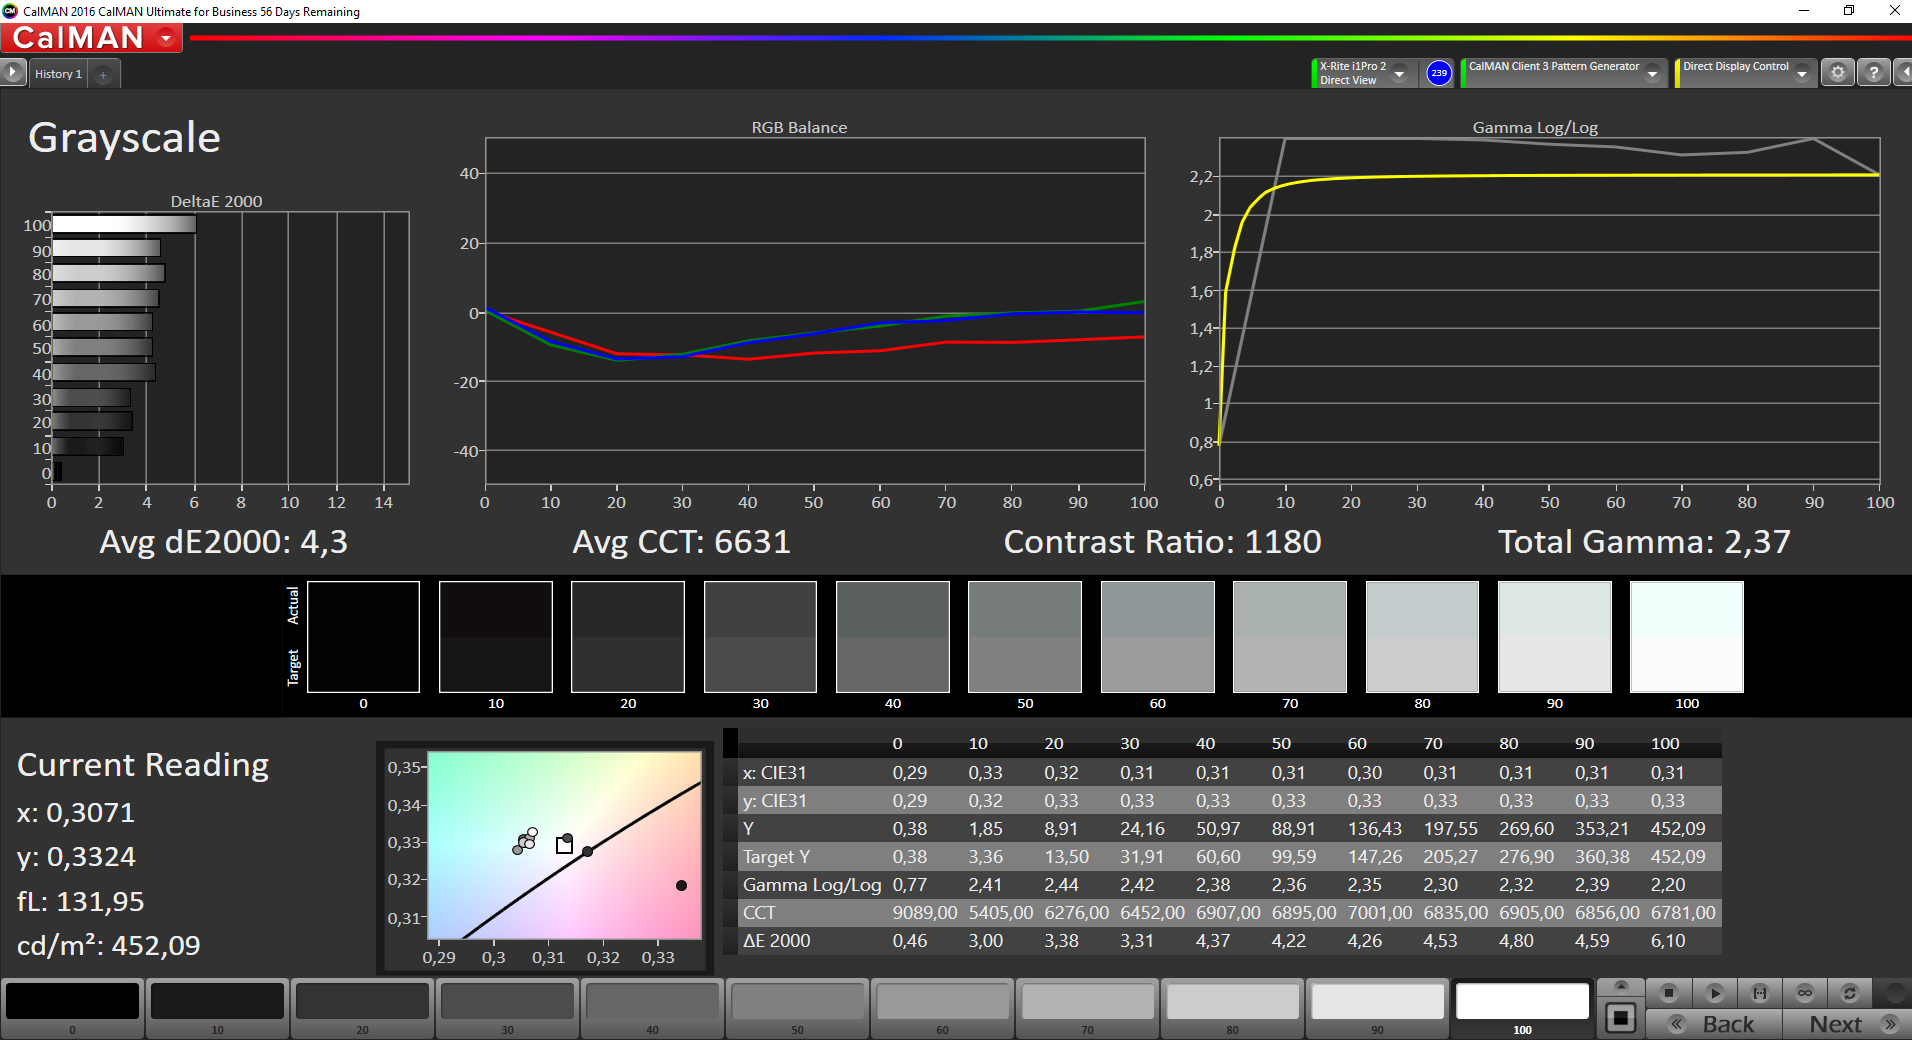
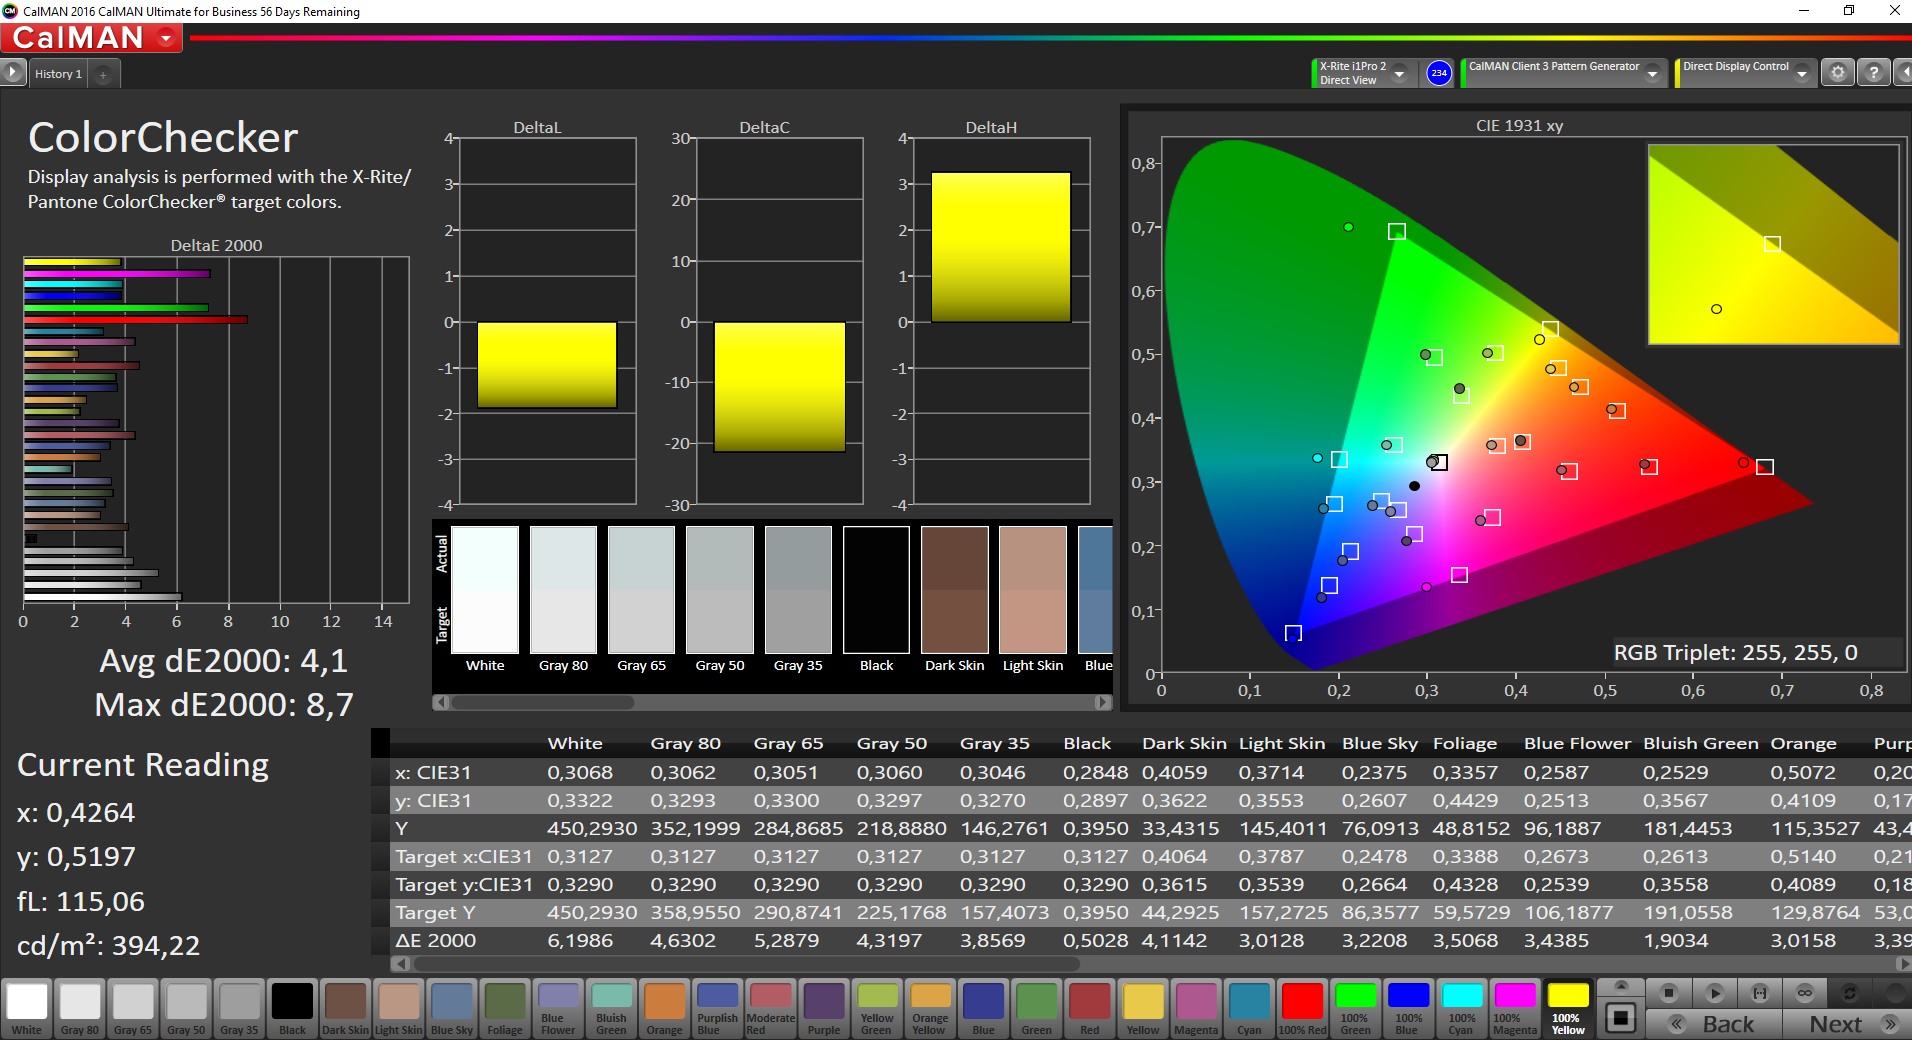

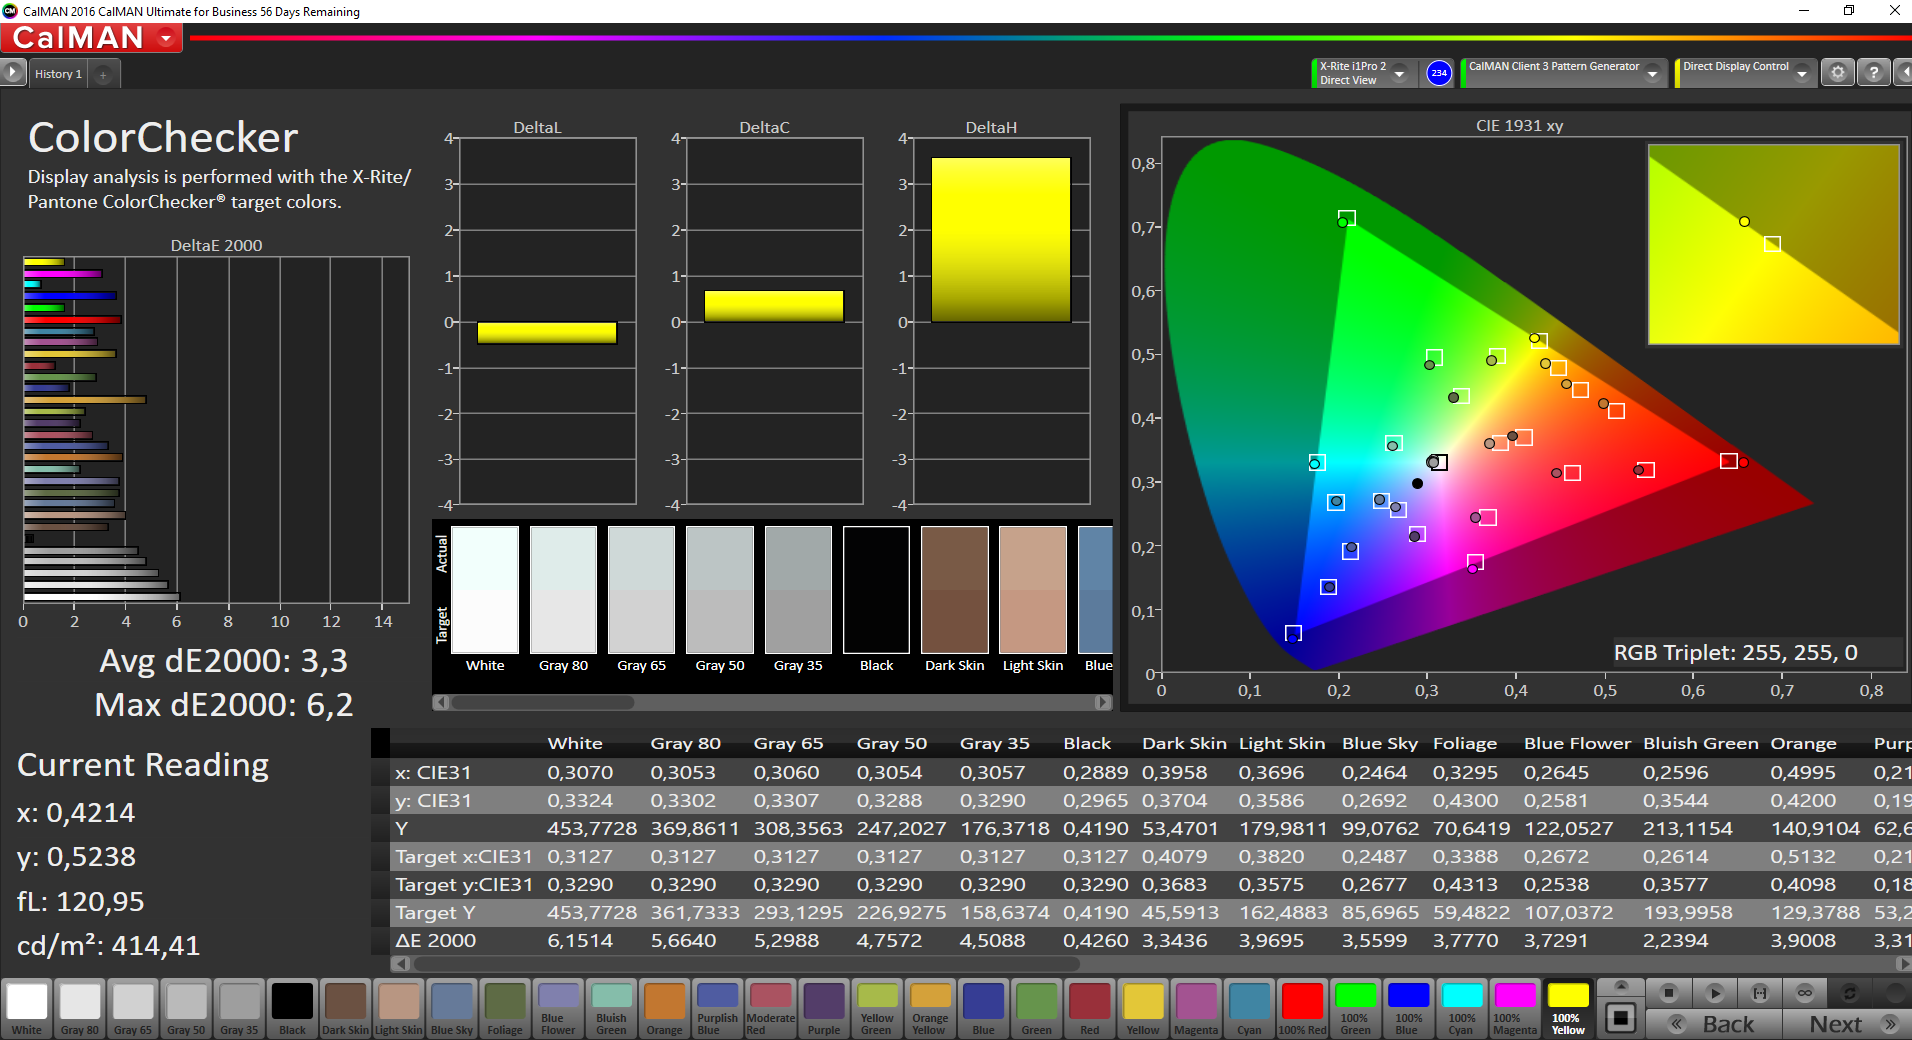
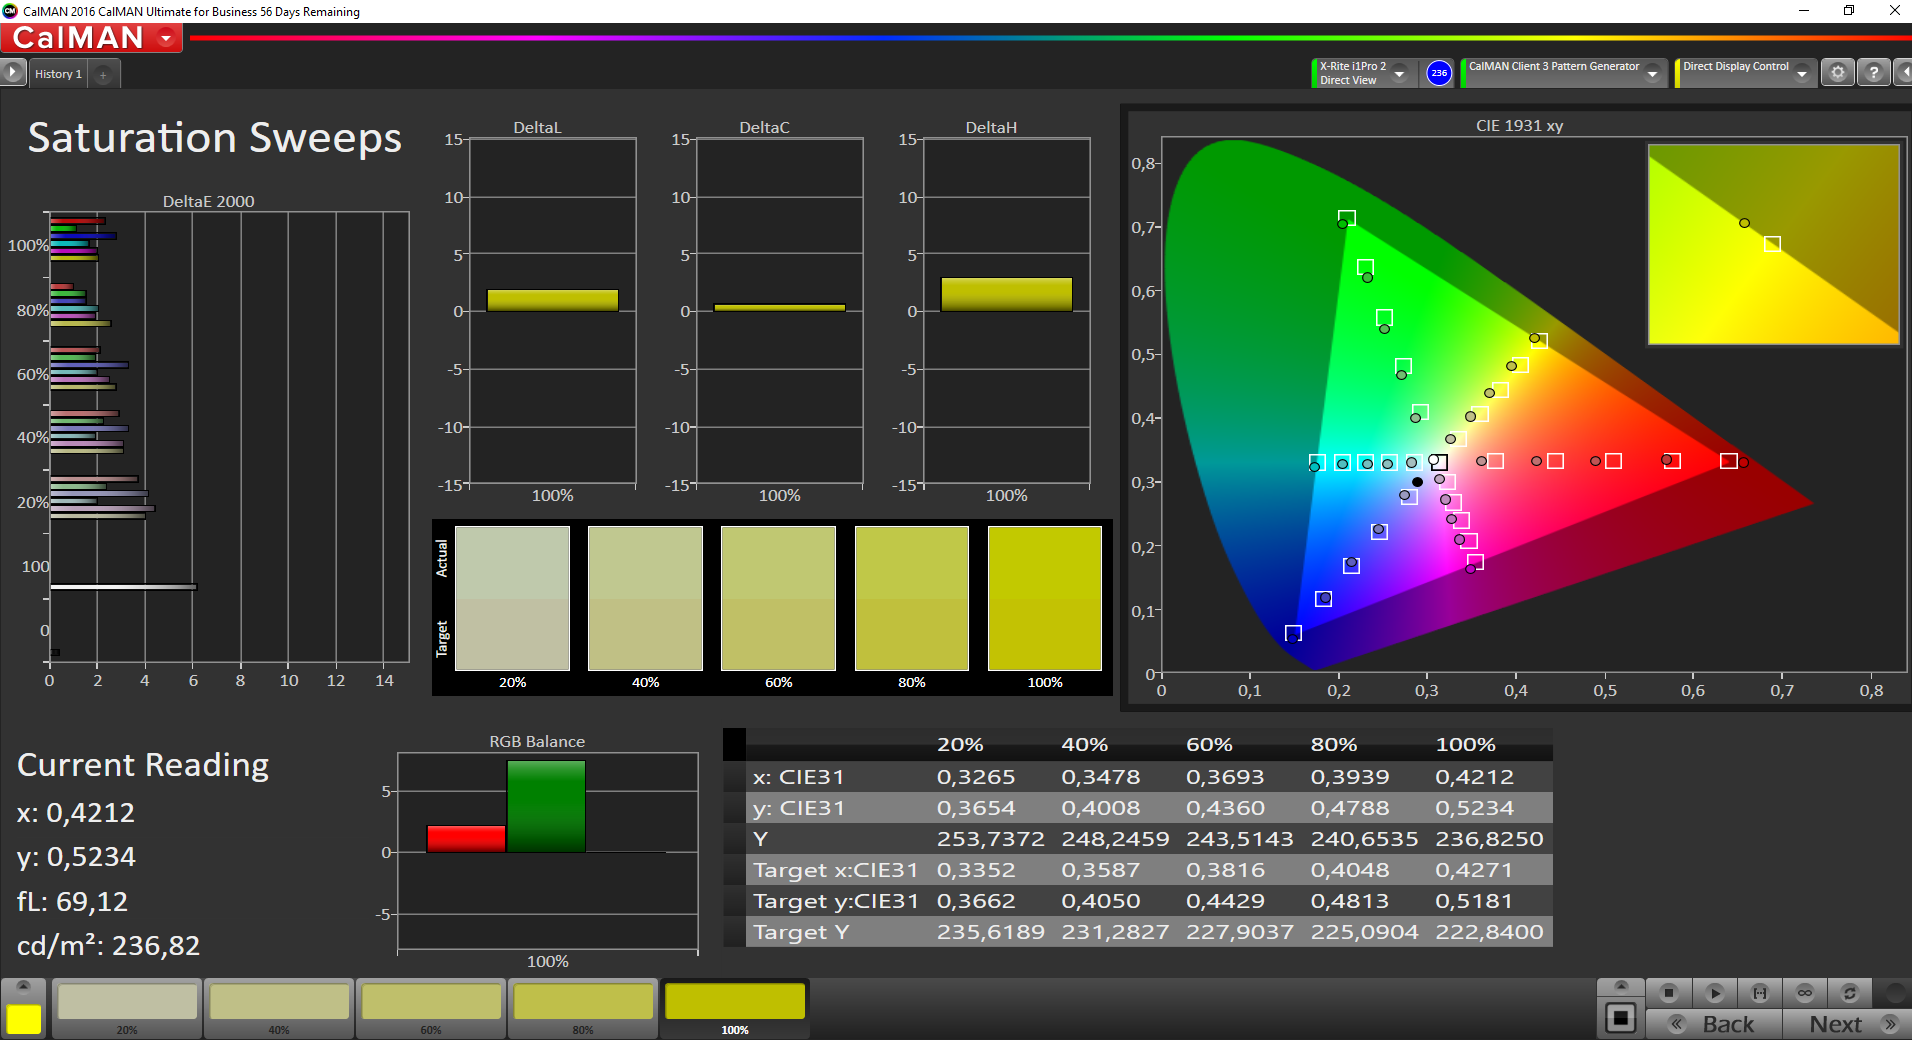

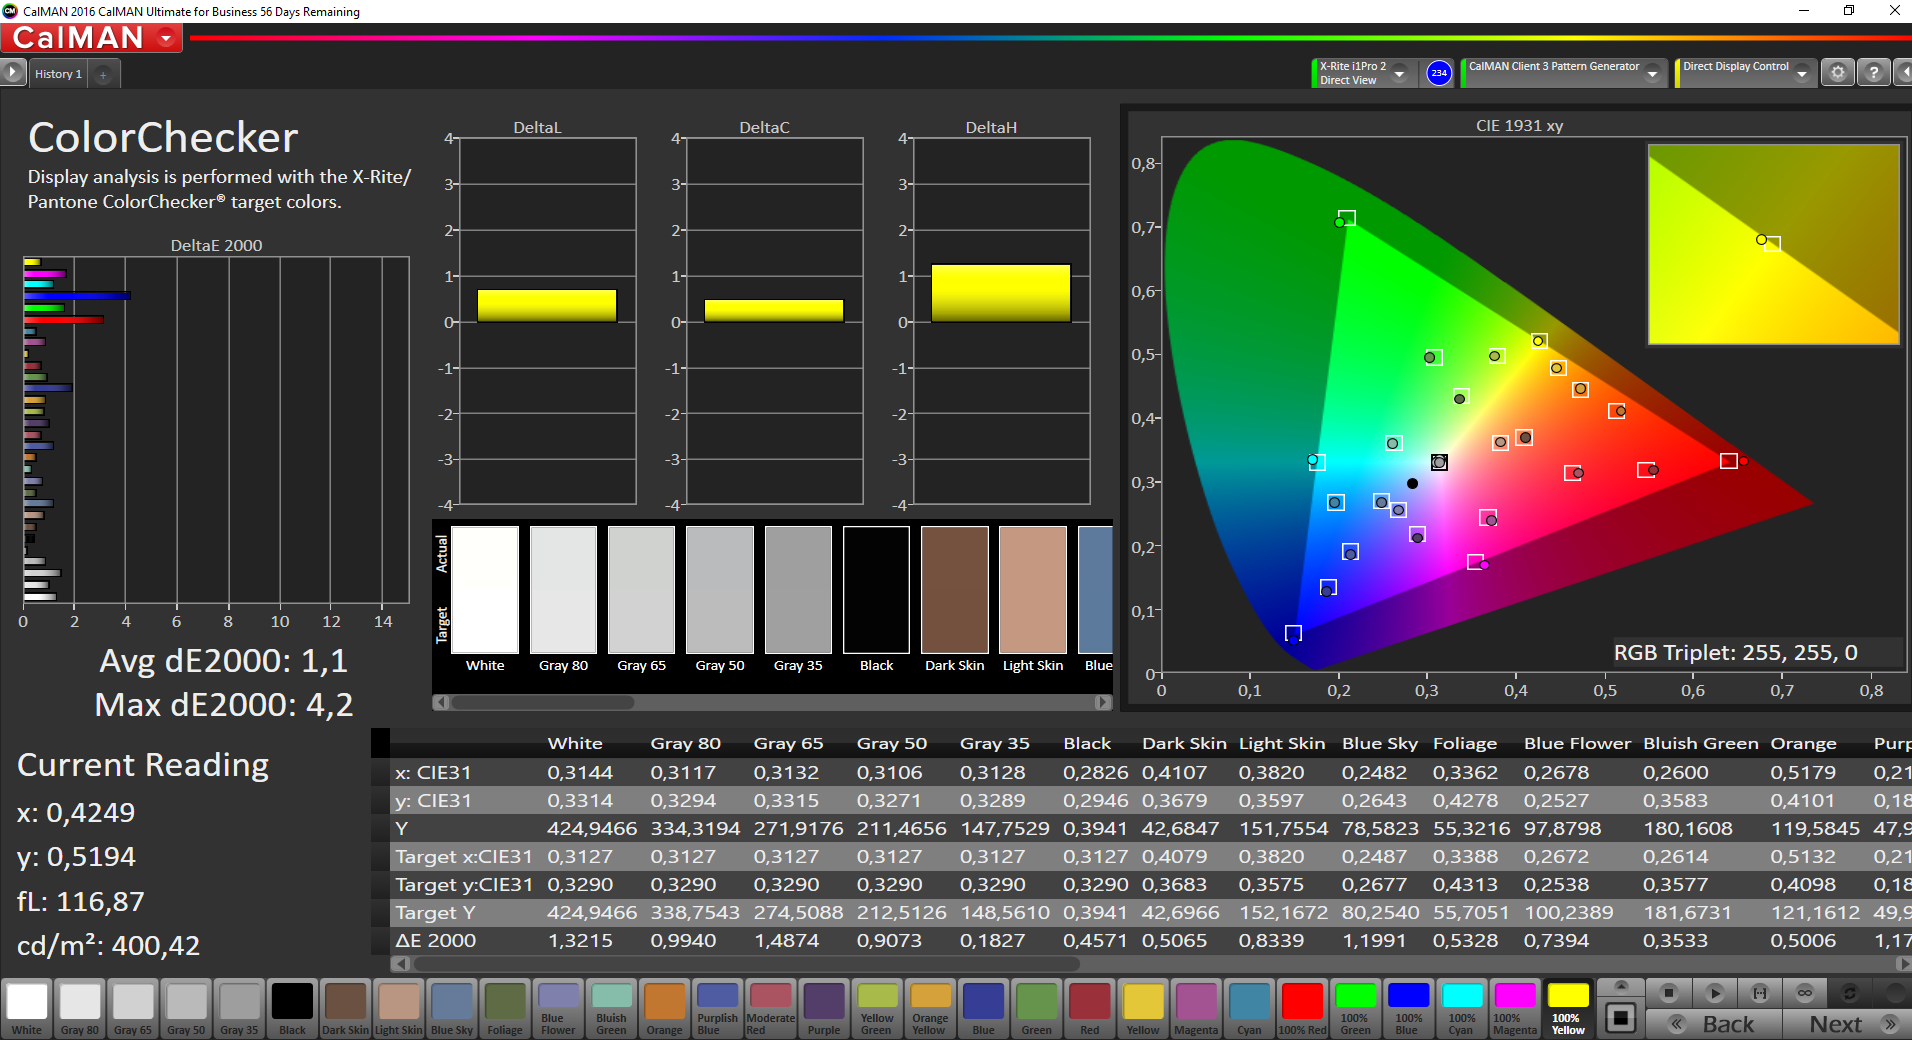
We calibrated the PremierColor display with our X-Rite i1 Pro 2 spectrophotometer; the corresponding ICC file is linked in the box above (how to install a color profile). The calibration improves the grayscale performance in particular. The colors are more accurate as well, but there are still two outliers with red and blue.

The smaller sRGB reference is fully covered and Dell also advertises 100% AdobeRGB gamut. We cannot confirm the latter, but 88% is still among the best values you can get in a laptop. The ZBook 17 G4 (also 4K panel from Sharp) is comparable, while the 4K screen in the Lenovo ThinkPad P71 is slightly worse at 77%.
Display Response Times
| ↔ Response Time Black to White | ||
|---|---|---|
| 46.4 ms ... rise ↗ and fall ↘ combined | ↗ 28.4 ms rise | 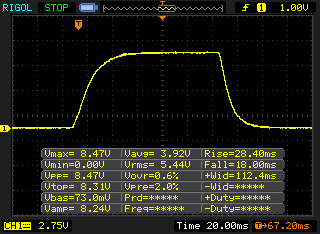 |
| ↘ 18 ms fall | ||
| The screen shows slow response rates in our tests and will be unsatisfactory for gamers. In comparison, all tested devices range from 0.1 (minimum) to 240 (maximum) ms. » 99 % of all devices are better. This means that the measured response time is worse than the average of all tested devices (19.9 ms). | ||
| ↔ Response Time 50% Grey to 80% Grey | ||
| 60 ms ... rise ↗ and fall ↘ combined | ↗ 26.8 ms rise | 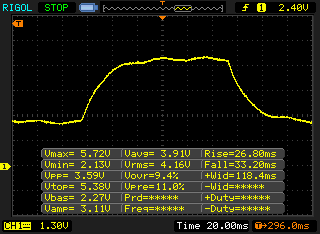 |
| ↘ 33.2 ms fall | ||
| The screen shows slow response rates in our tests and will be unsatisfactory for gamers. In comparison, all tested devices range from 0.165 (minimum) to 636 (maximum) ms. » 96 % of all devices are better. This means that the measured response time is worse than the average of all tested devices (31.1 ms). | ||
The visibility outdoors is decent thanks to the high luminance as long as you avoid direct reflections. The viewing angle stability is also very good, but you can see a slight red cast from extreme angles (especially at an angle from above/below). However, it did not bother us in practice.

Performance
Dell offers several components for the mobile workstation Precision 7720. It is, for example, possible to select a powerful processor or just a powerful graphics card to meet your requirements. Our test sample is equipped with the most powerful mobile Xeon CPU as well as the Quadro P5000, but you can also select a regular Core i7 or even a Core i5 quad-core. You can decide between the current Pascal chips from Nvidia (P3000, P4000 & P5000) and two AMD chips (Radeon Pro WX4130 & 7100).
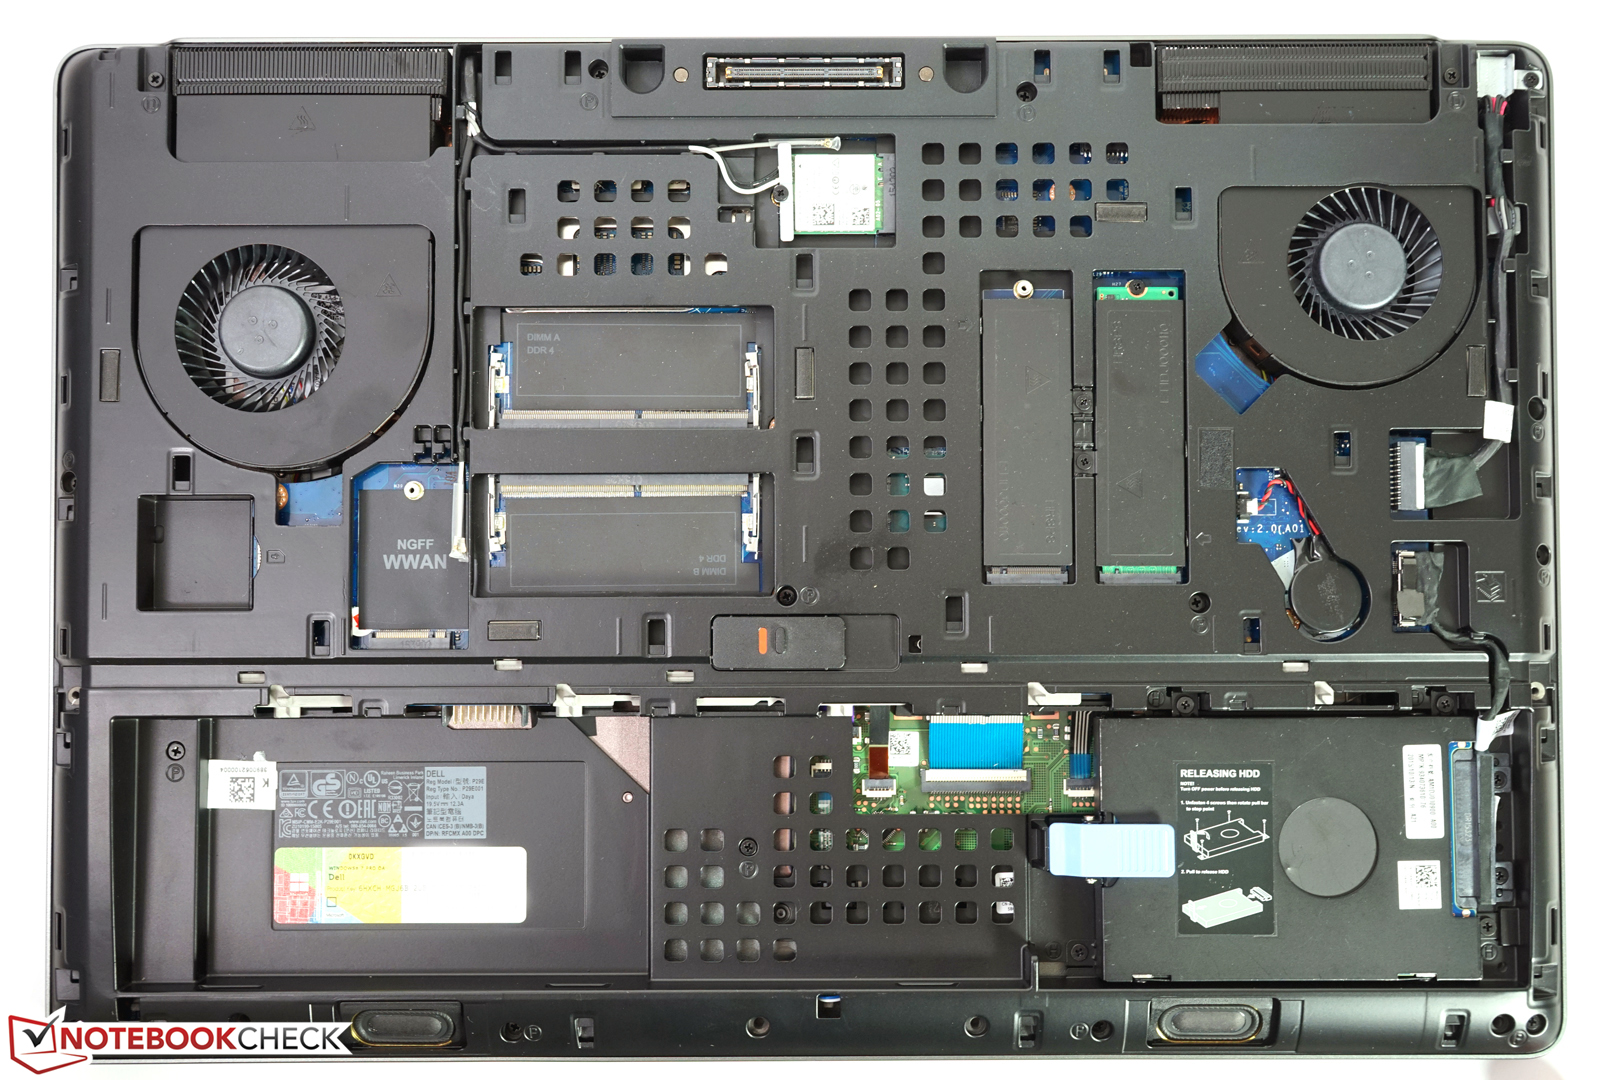
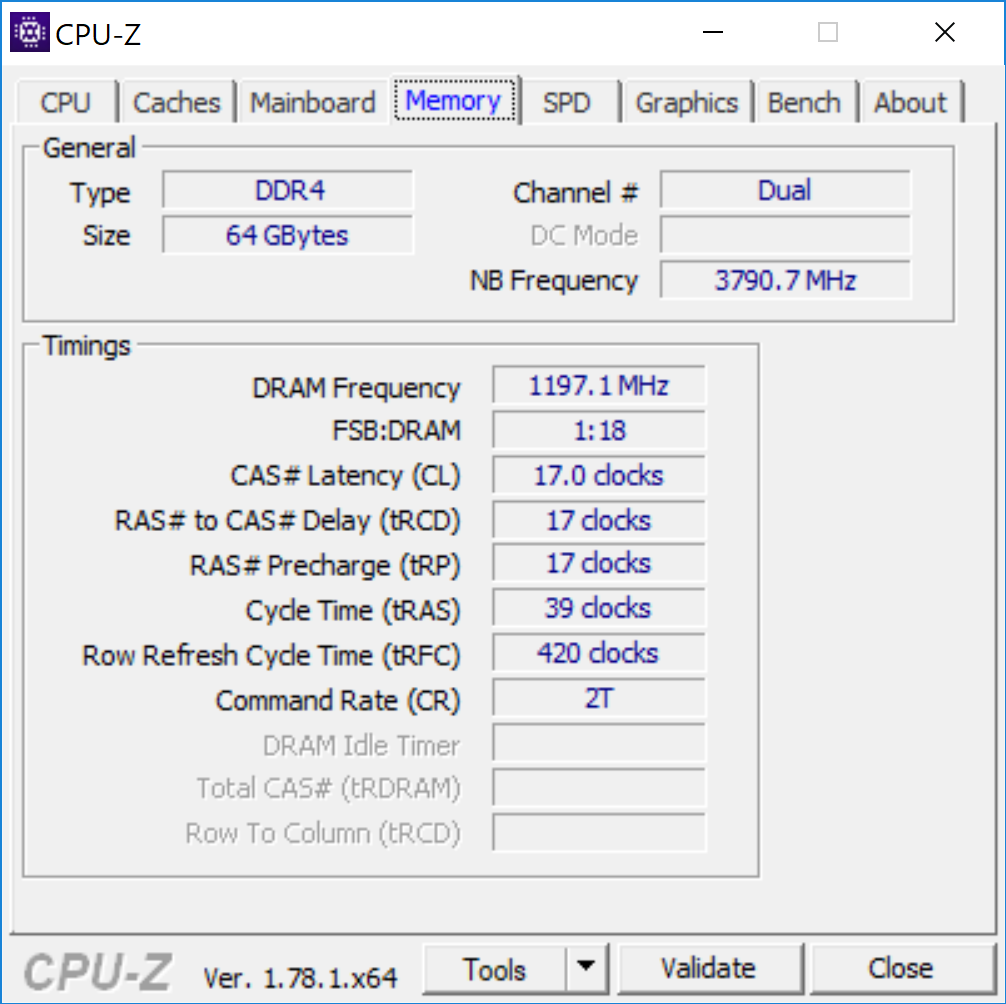
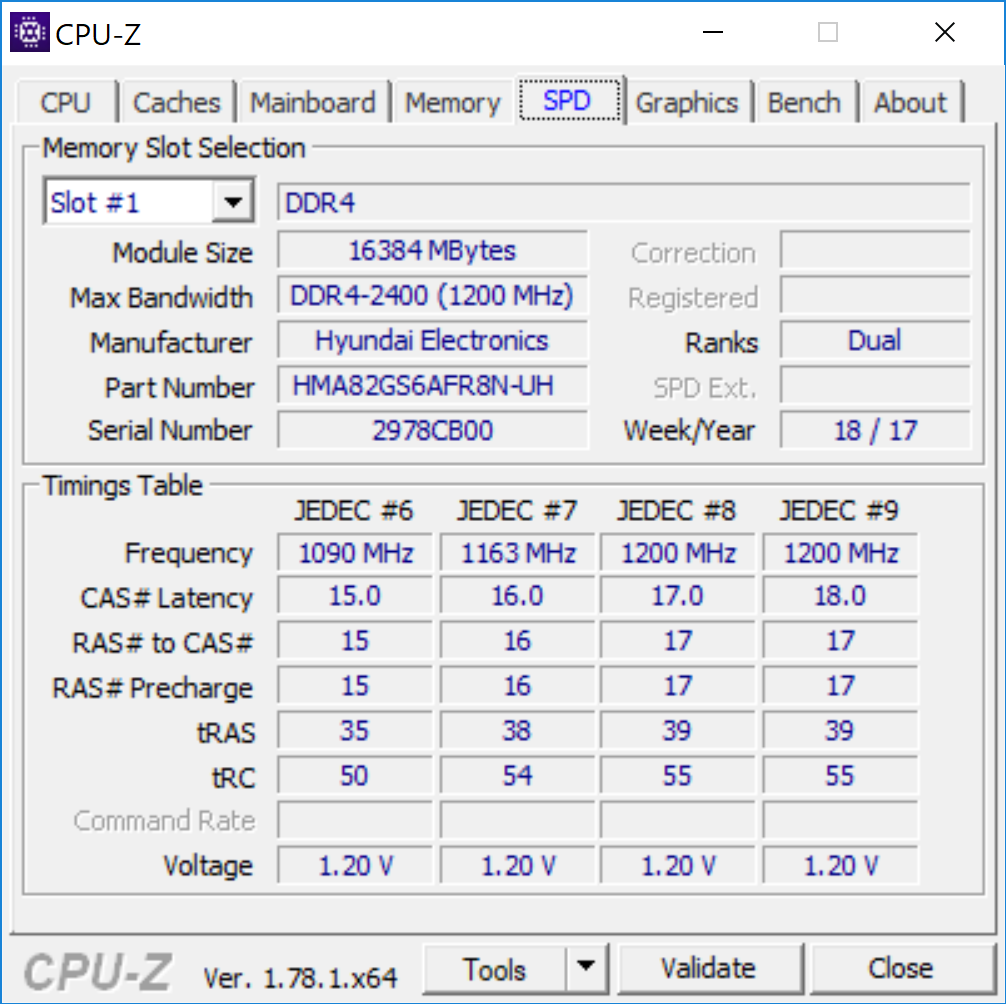
The mobile Xeon processors can also be combined with ECC-RAM for improved error correction, but our sample uses regular DDR4-2400 RAM. You can store data on up to two M.2 drives and one 2.5-inch hard drive.
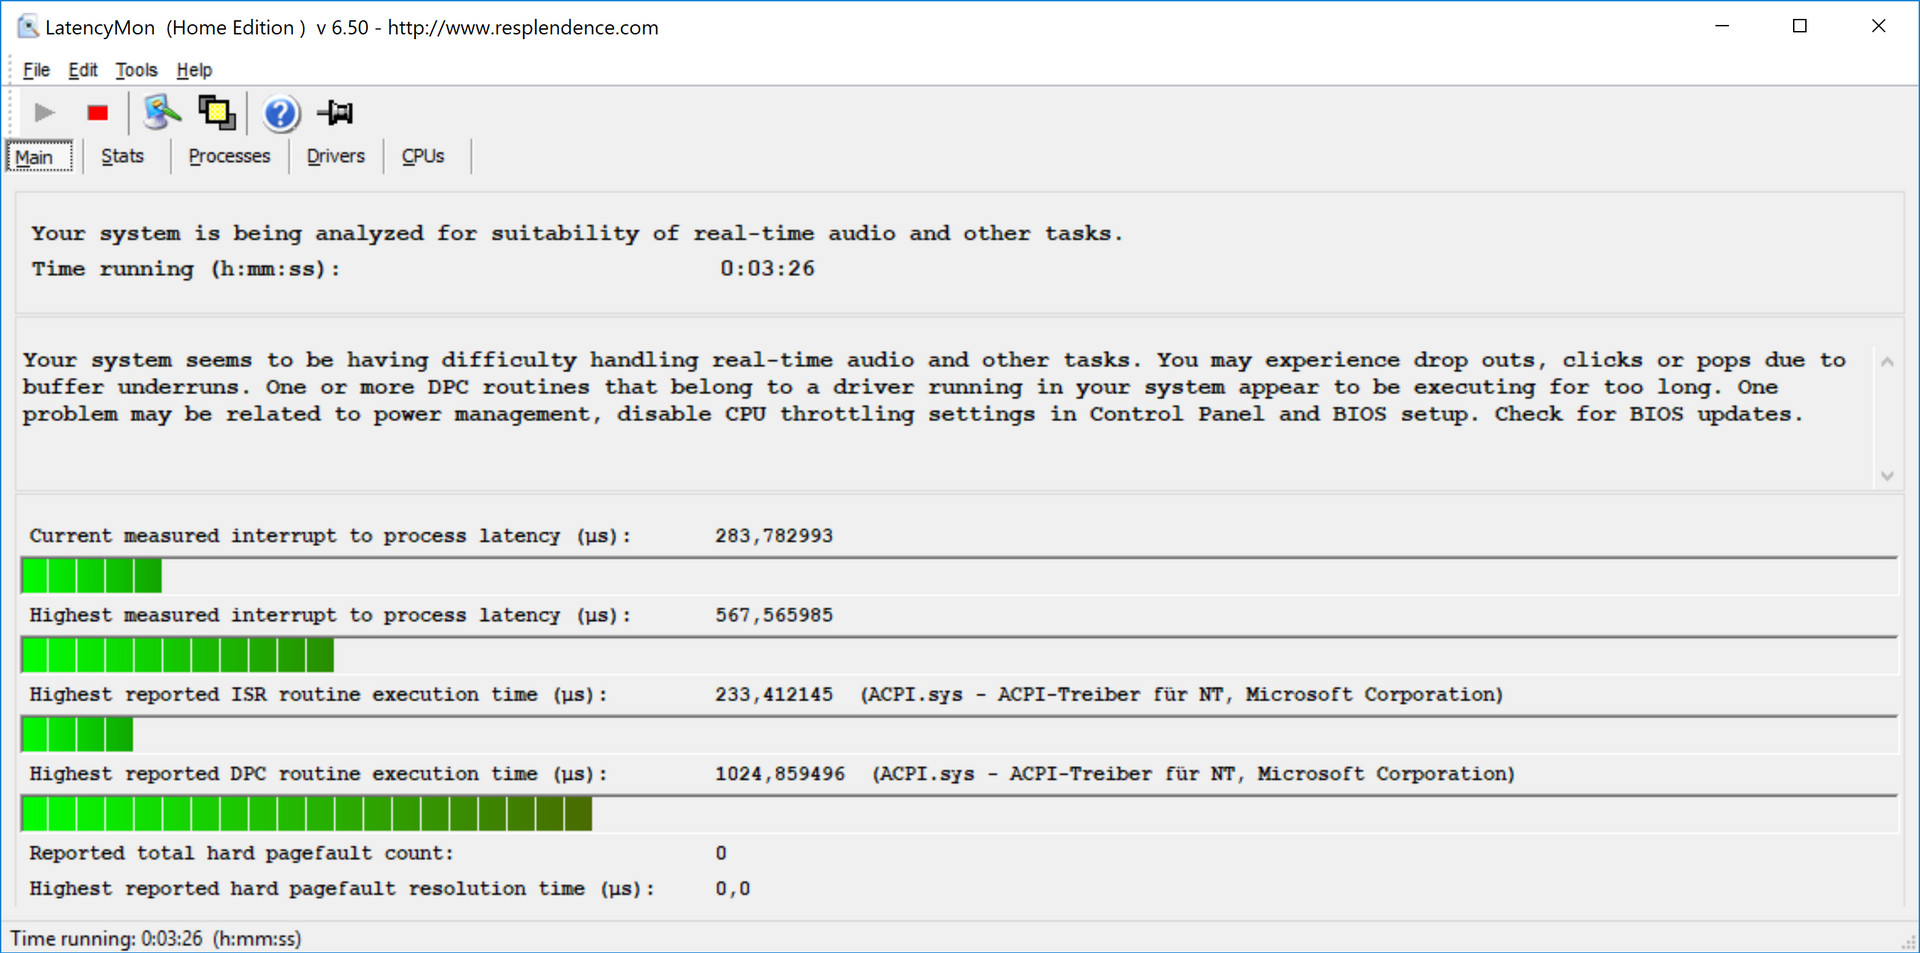
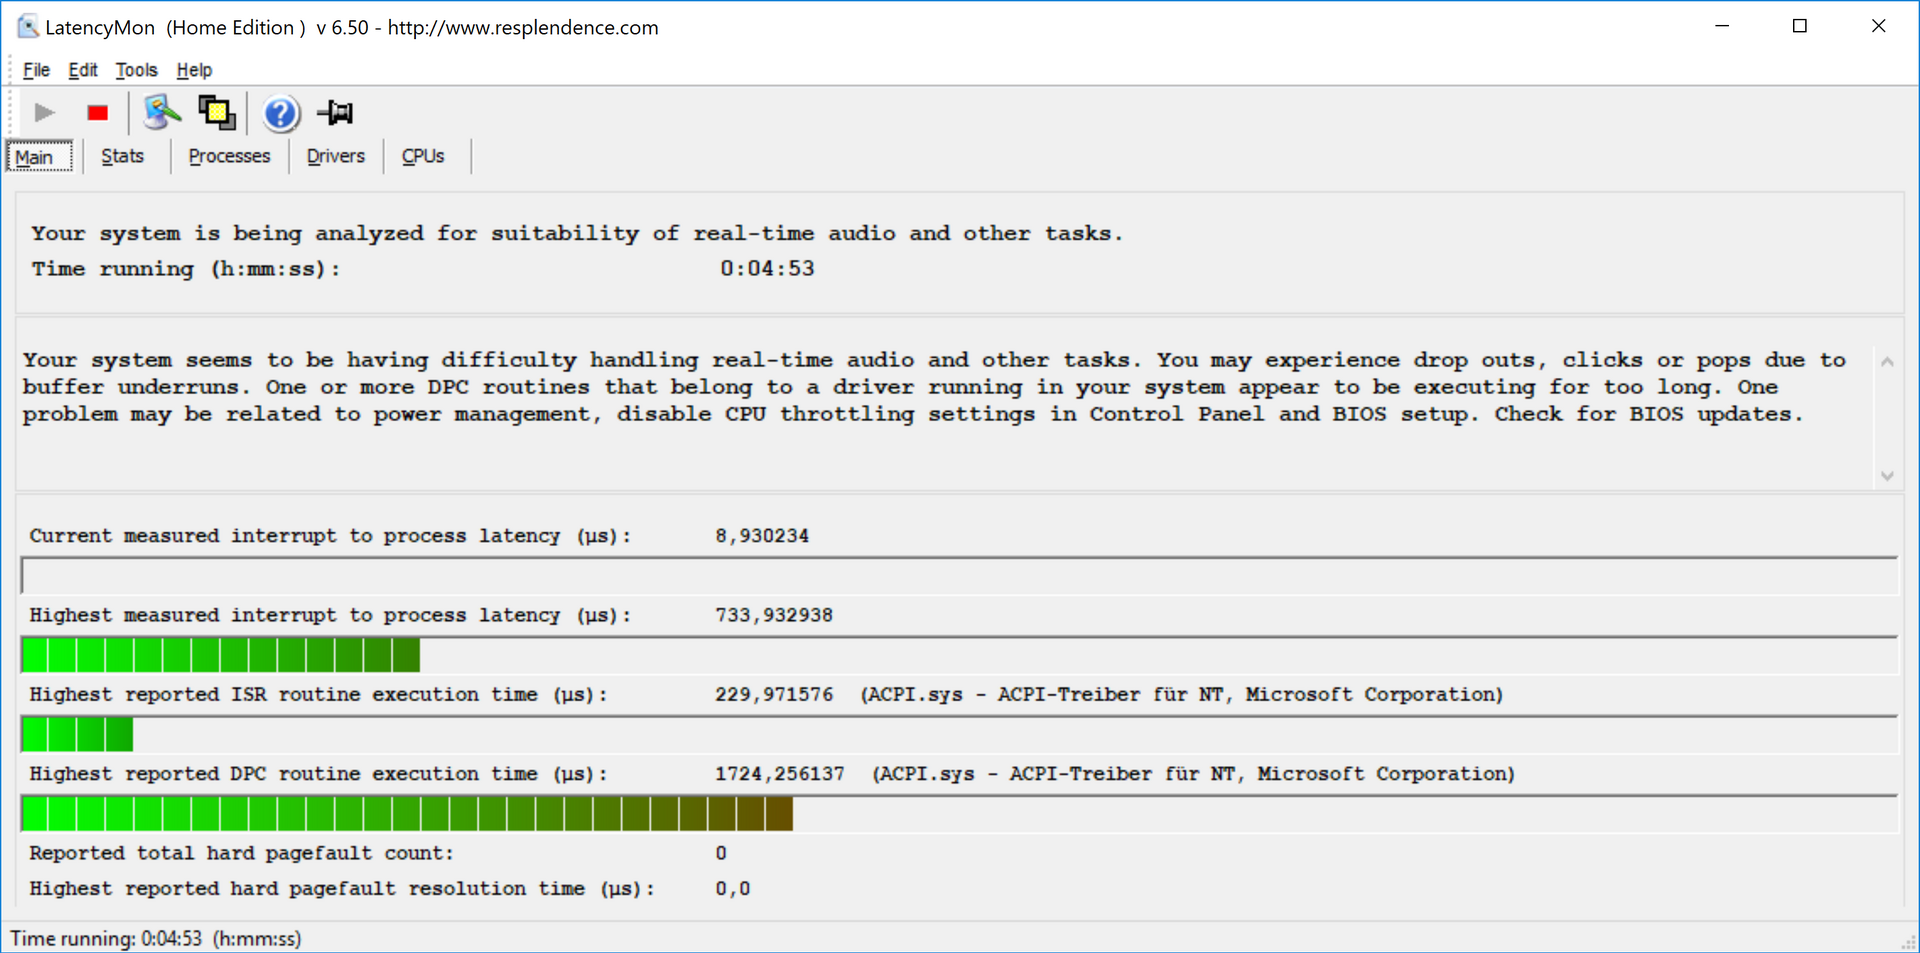
LatencyMon determined some issues for our test model, regardless of whether the wireless connections were active or not.
Processor
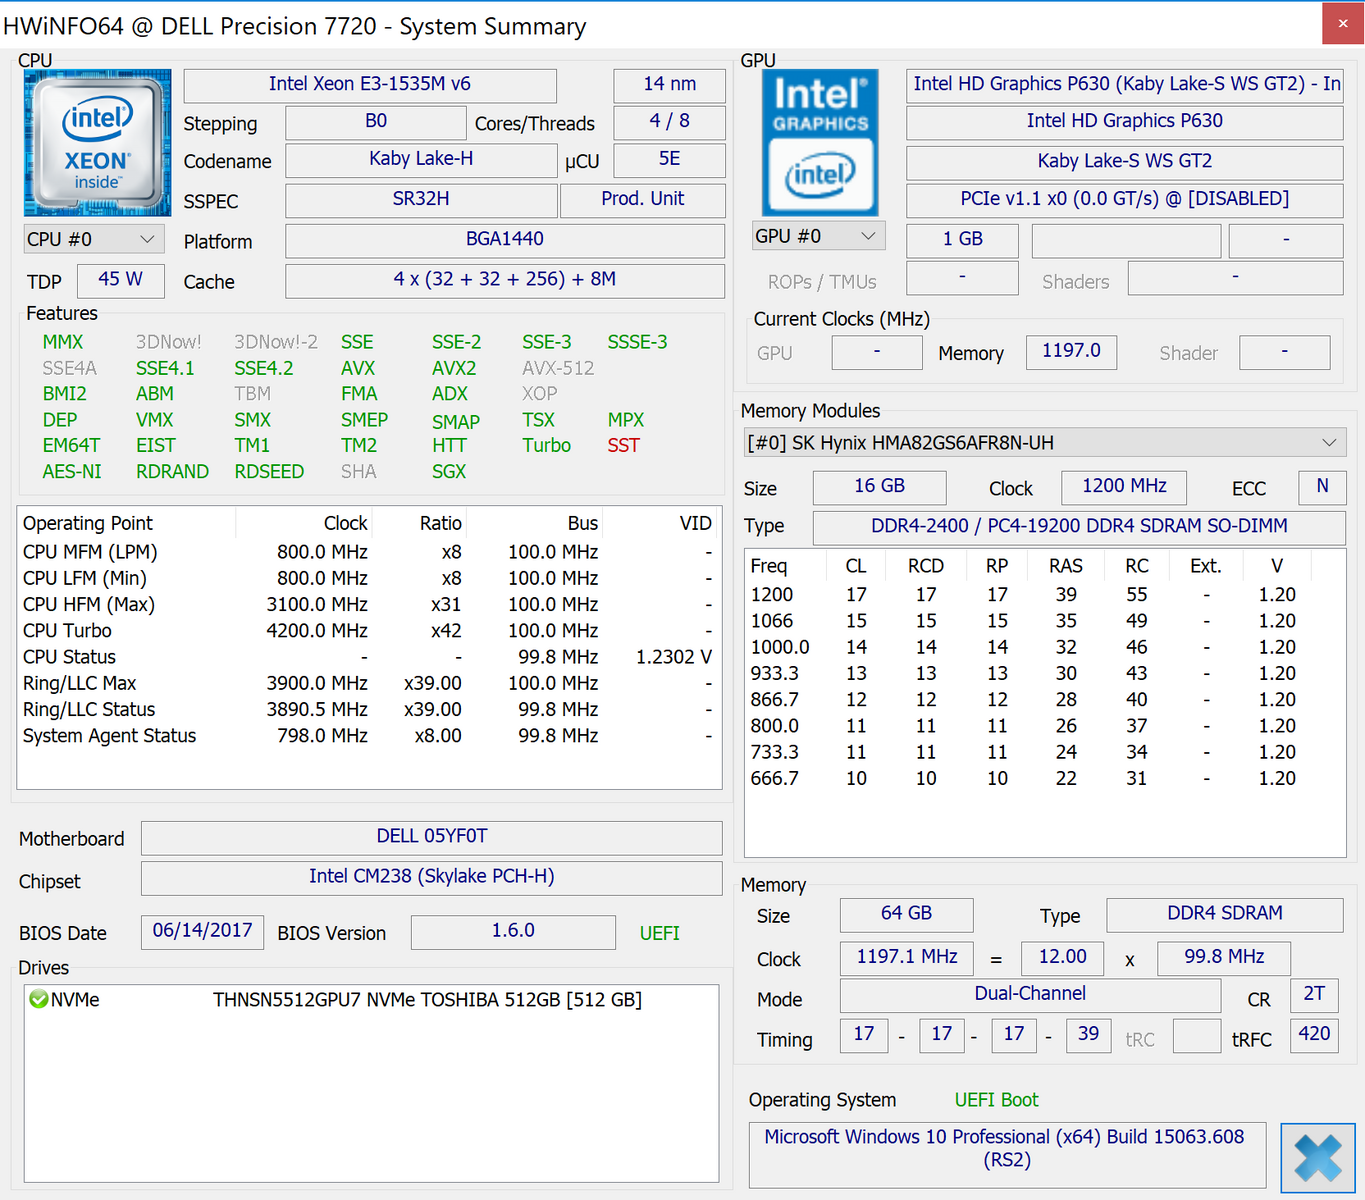
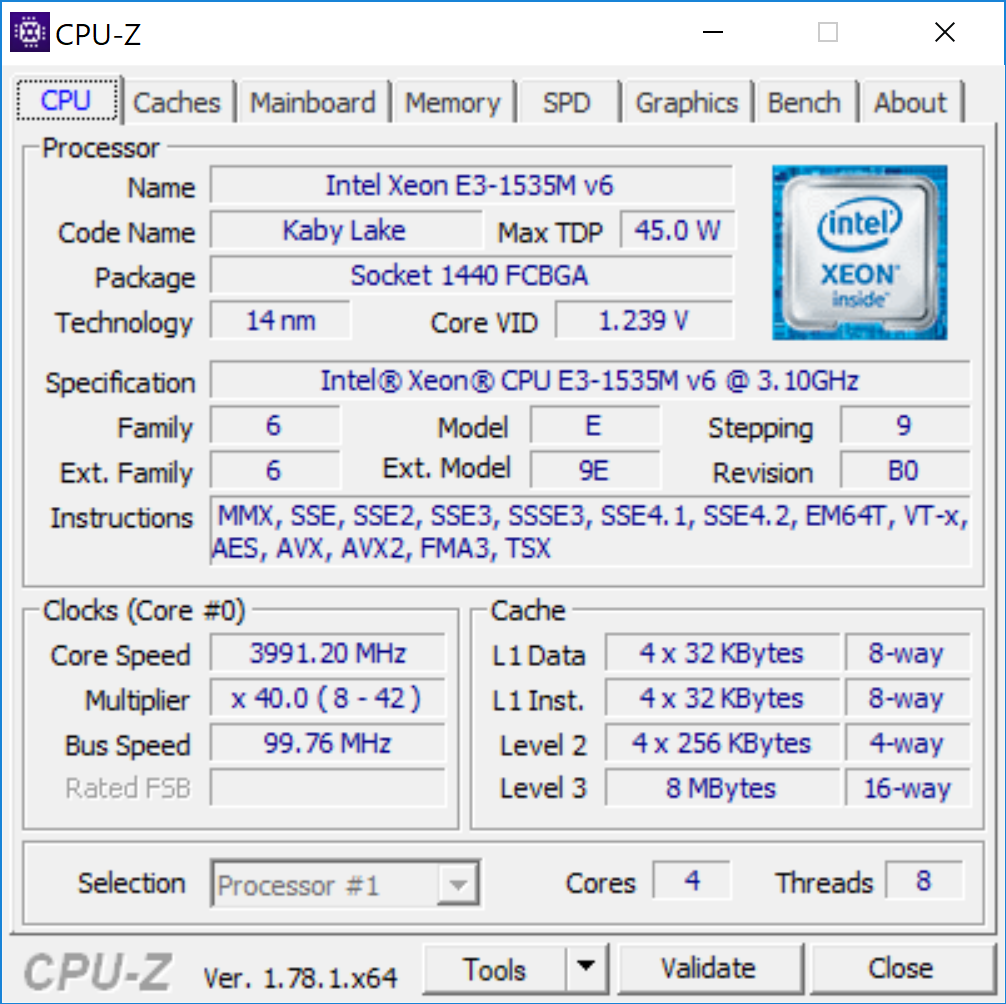
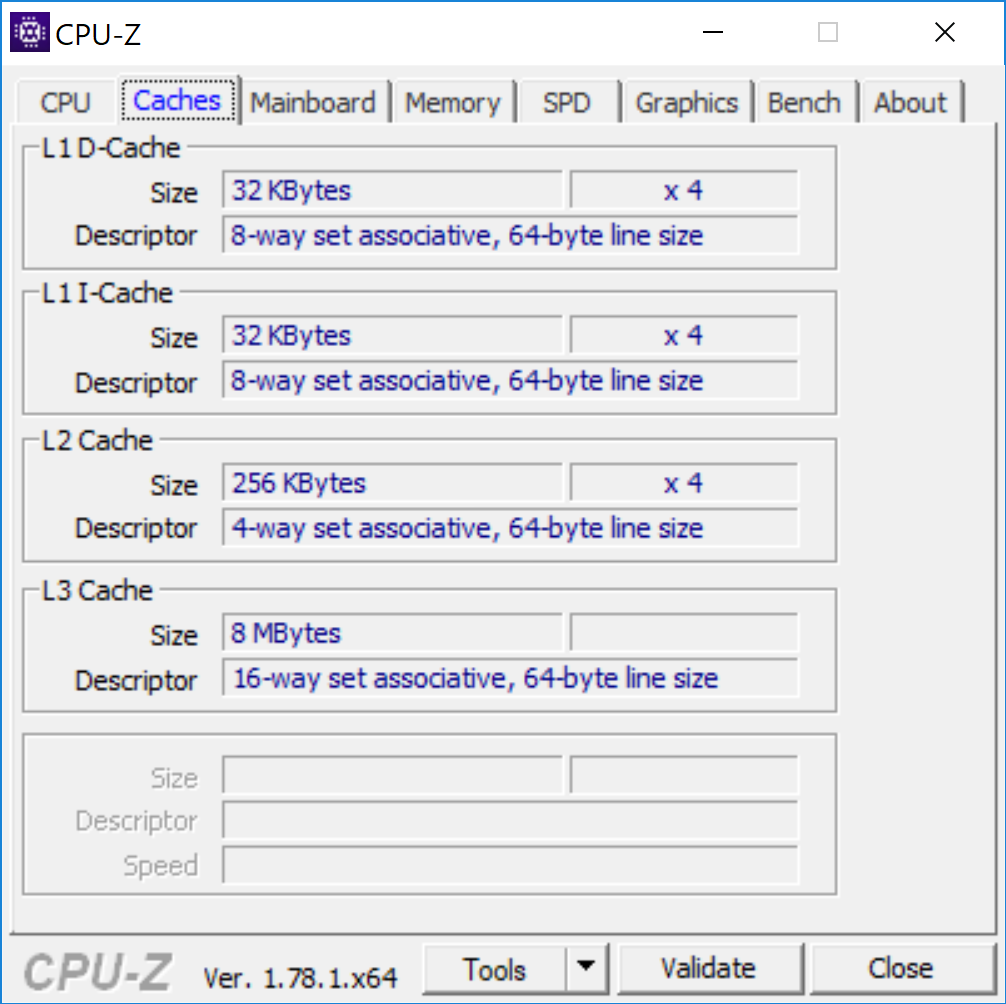
Our processor carries the designation Xeon E3-1535M V6 and is based on Intel's Kaby Lake architecture. Thanks to a maximum Turbo Boost of 4.2 GHz (4 cores up to 3.9 GHz), it is currently the fastest quad-core processor from Intel. The important question with such high frequencies is always how long they can be maintained. The CPU is still a 45-W CPU just like the popular i7-7700HQ, but the maximum 3.9 GHz consumes much more than 45 W. Manufacturers can therefore – obviously depending on the cooling capabilities – increase the TDP limits. Many compact Ultrabooks use this as well, but with limited success. There are also mobile workstations where you cannot always use the full performance potential.
Fortunately, the Precision 7720 is not one of these devices. Dell sets the long-term limit to 60 W, which explains the excellent Cinebench scores. We cannot see the full 4.2 GHz (4.0 - 4.1 GHz), but this can quickly be affected by background tasks. The mobile Xeon can, however, utilize the full 3.9 GHz for all four cores in the Multi test. It consumes about 57 W and warms up to ~80 °C (~176 °F) – good results. This behavior does not change on battery power.
This means that the mobile Xeon is basically on par with the desktop processor Core i7-7700; the 7700K is still a few percent faster.
We also use our Cinebench loop to check how long the system can sustain the performance. The score is mostly stable, and the small deviations are negligible. This means that the Precision 7720 is one of the few systems where the additional price for the mobile Xeon chips pays off – at least if you need the enormous performance.
More technical information and benchmarks for the Xeon E3-1535M v6 are listed in our Tech section.
System Performance
Despite the very powerful components, the Precision 7720 is often beaten by the rivals in the synthetic PCMarks. The problem is not as pronounced in the current PCMark 10, but the older PCMark 8 tests in particular are probably affected by Toshiba's NVMe-SSD. We will see that SSD benchmarks also have problems with the drive in the next section.
The subjective impression, however, is very good, and we did not encounter any issues with the hard- or software during our review period. The system boots up quickly, is very responsive, and applications are launched with minimal loading times.
| PCMark 8 | |
| Home Score Accelerated v2 | |
| Dell Precision 7710 | |
| HP ZBook 17 G4-Y3J82AV | |
| MSI WE72 7RJ | |
| Dell Precision 7720 | |
| Lenovo ThinkPad P71-20HK0004GE | |
| Work Score Accelerated v2 | |
| Dell Precision 7710 | |
| Fujitsu Celsius H970 | |
| MSI WE72 7RJ | |
| HP ZBook 17 G4-Y3J82AV | |
| Dell Precision 7720 | |
| Creative Score Accelerated v2 | |
| HP ZBook 17 G4-Y3J82AV | |
| Fujitsu Celsius H970 | |
| Lenovo ThinkPad P71-20HK0004GE | |
| Dell Precision 7710 | |
| Dell Precision 7720 | |
| PCMark 10 - Score | |
| HP ZBook 17 G4-Y3J82AV | |
| Dell Precision 7720 | |
| Fujitsu Celsius H970 | |
| PCMark 8 Home Score Accelerated v2 | 3772 points | |
| PCMark 8 Creative Score Accelerated v2 | 5498 points | |
| PCMark 8 Work Score Accelerated v2 | 4460 points | |
| PCMark 10 Score | 5248 points | |
Help | ||
Storage Devices
We have already mentioned that the Precision 7720 can be equipped with up to three drives: 2x PCIe M.2-2280 SSD with NVMe support and a 2.5-inch slot for a SATA drive. Dell offers different options in its online shop, but you can also install additional drives by yourself.
Our test sample is equipped with a single 512 GB PCIe-SSD (404/475 GB free after the initial start), but it seems that Dell uses different vendors and we got a Toshiba drive. AS SSD in particular still has problems with these models, so the corresponding benchmarks results are missing. However, the CrystalDiskMark 5 scores are decent and easily beat regular SATA-3 SSDs. We did not experience any other problems with the drive either. Samsung's SSDs, however, perform even better, and would also be a good choice for the high-end workstation.
Our comprehensive HDD/SSD list shows how the Toshiba SSD performs compared to other models.

GPU Performance
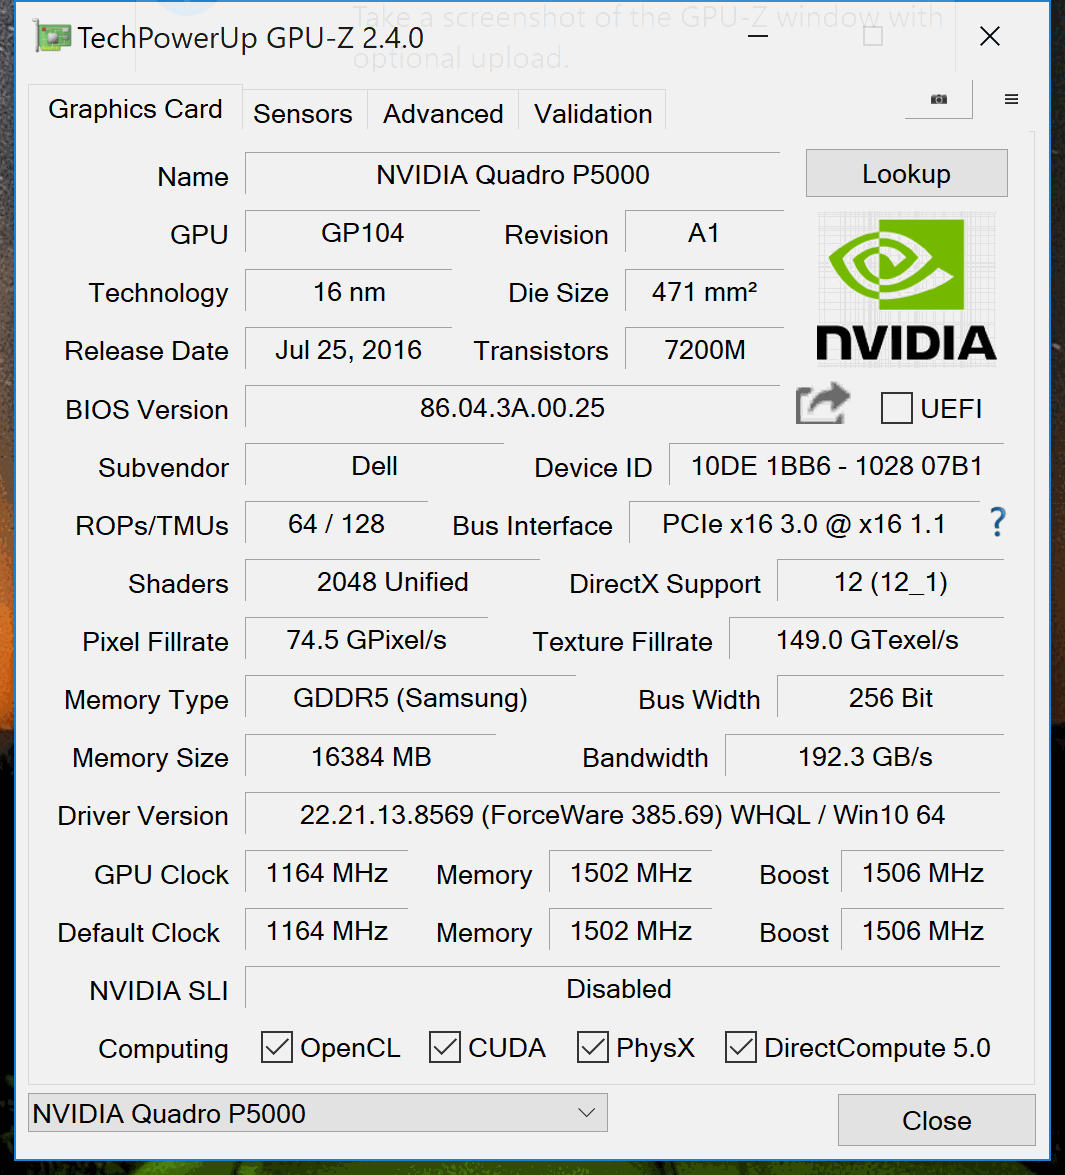
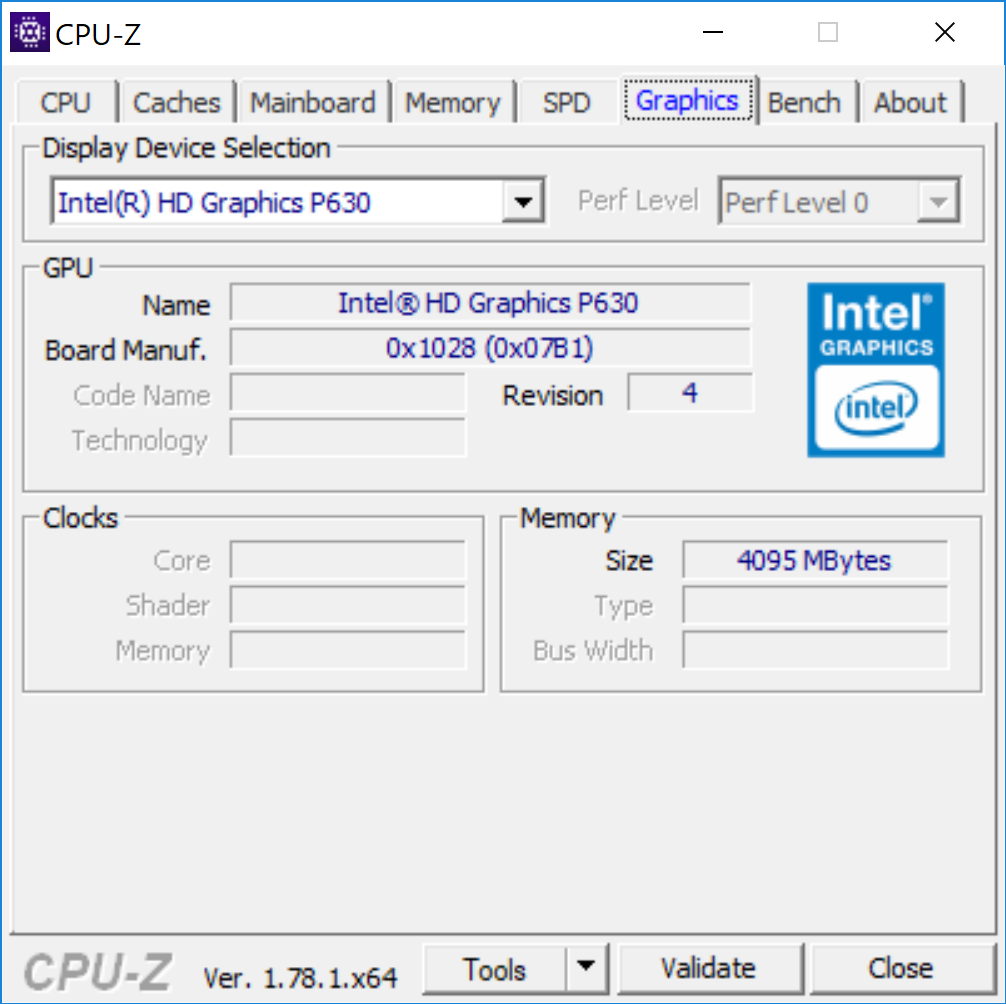
Dell's Precision 7720 supports Nvidia's Optimus technology, so simple workloads are handled by the integrated Intel HD Graphics P630 of the processor. This creates less heat (less fan activity) and the power consumption is lower. Nvidia's Quadro P5000 automatically kicks in when you need more performance. It is based on Nvidia's Pascal architecture and can be compared with the consumer GeForce GTX 1070, but Nvidia has equipped the P5000 with twice the amount of VRAM (16 GB GDDR5). The lower clock of the P5000 is another difference (1164 - 1506 MHz vs. 1443 vs. 1645 MHz), so the performance should be slightly lower.
The professional Quadro GPUs are equipped with special drivers and ISV certifications to ensure compatibility with professional applications. Drivers can result in enormous performance gains, especially in OpenGL optimized software. We use the benchmarks SPECviewperf 11 & 12, which cover scenarios such as CAD, CAM, geology, and medical applications (MRI).
The results are quite interesting, and we can clearly see that the P5000 is not the best choice for every application. The advantage over the other Pascal GPUs is only minor in some cases and certainly does not justify the enormous price difference, while the P5000 is much faster in other tests. The influence of the drivers is easily visible on the comparison chart for SPECviewperf 12. We added some consumer models, which have better specifications and should be faster. This is the case in some sub tests, but they can be found at the bottom of the rankings in others.
Many calculations can be transferred from the processor to the graphics card via OpenCL interface, and there are different standards depending on the manufacturer (QuickSync, APP, CUDA). This is frequently used for video conversion, encryption tasks or financial analysis. We use the benchmarks LuxMark as well as SiSoft Sandra 2016. The situation is much better for the Quadro P5000 and it can take the clear lead over the smaller siblings and the predecessor Quadro M5000M.
| SiSoft Sandra 2016 | |
| Image Processing | |
| Dell Precision 7720 | |
| HP ZBook 17 G4-Y3J82AV | |
| Dell Precision 7710 | |
| Lenovo ThinkPad P71-20HK0004GE | |
| GP Cryptography (Higher Security AES256+SHA2-512) | |
| HP ZBook 17 G4-Y3J82AV | |
| Dell Precision 7720 | |
| Lenovo ThinkPad P71-20HK0004GE | |
| Dell Precision 7710 | |
| GP Financial Analysis (FP High/Double Precision) | |
| Dell Precision 7720 | |
| HP ZBook 17 G4-Y3J82AV | |
| Dell Precision 7710 | |
| Lenovo ThinkPad P71-20HK0004GE | |
Lastly, there are DirectX applications, where the raw performance is more important than the drivers. This includes the synthetic 3DMarks and obviously games. Once again we have added some consumer GPUs to give a clearer picture of the classification. As we already expected from the lower clocks, the Quadro P5000 is slightly slower than the GTX 1070, but it still has a comfortable lead over the smaller GTX 1060. The previous Quadro M5000M is also clearly beaten in this segment. All in all, there are no surprises in the DirectX benchmarks.
Unlike the processor, the GPU performance is significantly reduced on battery power. The 3DMark 11 GPU score drops from 19569 to 13059 points, which is a deficit of more than 30%.
| Unigine Heaven 4.0 | |
| Extreme Preset DX11 | |
| Schenker XMG U507 2017 | |
| Asus Zephyrus GX501 | |
| Dell Precision 7720 | |
| HP ZBook 17 G4-Y3J82AV | |
| Lenovo ThinkPad P71-20HK0004GE | |
| MSI WE72 7RJ | |
| Extreme Preset OpenGL | |
| Dell Precision 7720 | |
| HP ZBook 17 G4-Y3J82AV | |
| Lenovo ThinkPad P71-20HK0004GE | |
| MSI WE72 7RJ | |
| Unigine Valley 1.0 | |
| 1920x1080 Extreme HD DirectX AA:x8 | |
| HP ZBook 17 G4-Y3J82AV | |
| Dell Precision 7720 | |
| Lenovo ThinkPad P71-20HK0004GE | |
| MSI WT72-6QM | |
| Dell Precision 7710 | |
| MSI WE72 7RJ | |
| 1920x1080 Extreme HD Preset OpenGL AA:x8 | |
| HP ZBook 17 G4-Y3J82AV | |
| Dell Precision 7720 | |
| Lenovo ThinkPad P71-20HK0004GE | |
| Dell Precision 7710 | |
| MSI WE72 7RJ | |
| 3DMark 11 Performance | 16158 points | |
| 3DMark Ice Storm Standard Score | 58131 points | |
| 3DMark Cloud Gate Standard Score | 28999 points | |
| 3DMark Fire Strike Score | 12298 points | |
| 3DMark Time Spy Score | 4823 points | |
Help | ||
Gaming Performance
The Quadro P5000 is basically also a good choice for gaming. We just saw that the performance of the professional GPU is just behind a regular GeForce GTX 1070 (Laptop) and the drivers are not a big problem either (which was not the case a few years ago). Only brand-new titles sometimes require a newer driver version. You will either have to wait for an update from Nvidia or switch to the regular GeForce drivers, which work as well.
We still encountered an interesting phenomenon during our gaming benchmarks, because some titles were limited to 60 frames per second. We checked the settings (both in-game and drivers) several times, but could not find a solution. Therefore, we have not included results that hit this barrier in the following table. This was the case in the following games: “Witcher 3”, “Rainbow Six Siege”, and “Battlefield 1”. The performance of the P5000 is usually sufficient for smooth gameplay, even in the native resolution (4K preset).
More gaming benchmarks for the Quadro P5000 are listed here. You can also take the performance of the GTX 1070 as a reference (more results).
| low | med. | high | ultra | 4K | |
|---|---|---|---|---|---|
| The Witcher 3 (2015) | 53.4 | 36 | |||
| Star Wars Battlefront (2015) | 118.5 | 44 | |||
| Rainbow Six Siege (2015) | 55.6 | ||||
| Rise of the Tomb Raider (2016) | 97.9 | 84 | 35.8 | ||
| Battlefield 1 (2016) | 40.8 | ||||
| For Honor (2017) | 127.9 | 121.1 | 95.1 | 37.6 | |
| Ghost Recon Wildlands (2017) | 83.9 | 76.5 | 42.8 | 27.5 | |
| Prey (2017) | 125.2 | 47.8 |
Emissions
System Noise
The cooling solution is a big advantage of the Precision 7720, because the fans are deactivated when you perform simple tasks such as browsing the Internet or installing applications. Peak load is no problem either, which is confirmed by 3DMark 06. The fans only start spinning after around 30 seconds, but are hardly audible at 31 dB(A). The next level is 35 dB(A) after another 45 seconds.
The fan speed is obviously higher when you really start to stress the system. We see 35 dB(A) in “Witcher 3” at first before the fan noise levels off at 41 dB(A). This is also the level for pure CPU load in Prime95. The only really loud scenario is our stress with 45 and later 47.8 dB(A). We would still say the fan noise is not annoying since there are no high frequencies or pulsating fans. We can hardly criticize the noise levels considering the powerful components (and good performance utilization), and the situation should be better when you choose slower hardware (especially GPU).
Our test sample did not show any signs of typical coil whine, but we did hear a light whining noise from the SSD when we accessed data.
Noise level
| Idle |
| 29.5 / 29.5 / 29.5 dB(A) |
| Load |
| 35 / 47.8 dB(A) |
 | ||
30 dB silent 40 dB(A) audible 50 dB(A) loud |
||
min: | ||
| Dell Precision 7720 Quadro P5000, E3-1535M v6, Toshiba NVMe THNSN5512GPU7 | Lenovo ThinkPad P71-20HK0004GE Quadro P3000, i7-7820HQ, Samsung PM961 NVMe MZVLW512HMJP | HP ZBook 17 G4-Y3J82AV Quadro P5000, E3-1535M v6, Samsung SSD SM961 1TB M.2 MZVKW1T0HMLH | MSI WE72 7RJ Quadro M2200, i7-7700HQ, Samsung SM961 MZVPW256 m.2 PCI-e | Fujitsu Celsius H970 Quadro P4000, E3-1535M v6, Samsung SM961 MZVKW512HMJP m.2 PCI-e | |
|---|---|---|---|---|---|
| Noise | 2% | -7% | -14% | -10% | |
| off / environment * (dB) | 29.5 | 29.2 1% | 29.6 -0% | 29.3 1% | 30.2 -2% |
| Idle Minimum * (dB) | 29.5 | 29.2 1% | 29.6 -0% | 36.3 -23% | 30.2 -2% |
| Idle Average * (dB) | 29.5 | 29.2 1% | 31.7 -7% | 36.3 -23% | 32.8 -11% |
| Idle Maximum * (dB) | 29.5 | 32.2 -9% | 34.4 -17% | 36.6 -24% | 32.8 -11% |
| Load Average * (dB) | 35 | 34.7 1% | 41.3 -18% | 40.4 -15% | 47.3 -35% |
| Witcher 3 ultra * (dB) | 41 | 45.6 -11% | |||
| Load Maximum * (dB) | 47.8 | 39.1 18% | 45.6 5% | 46.6 3% | 47.3 1% |
* ... smaller is better
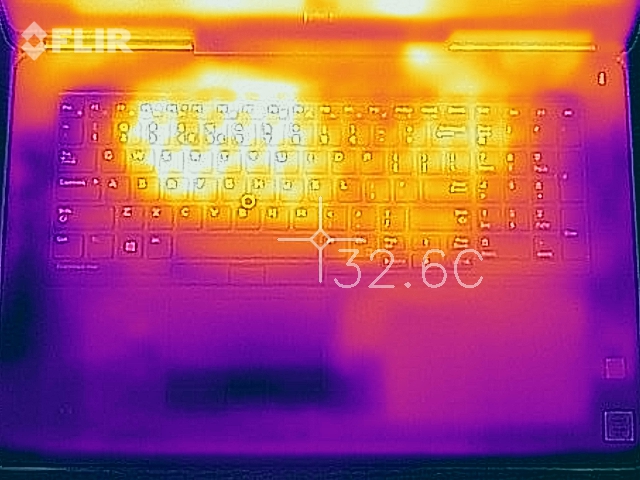
Temperature
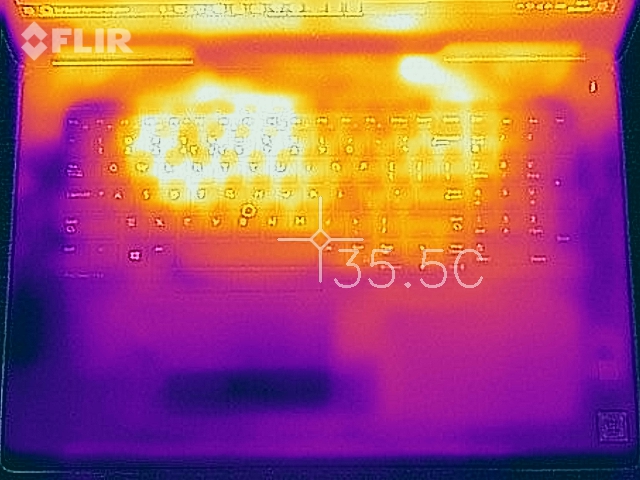
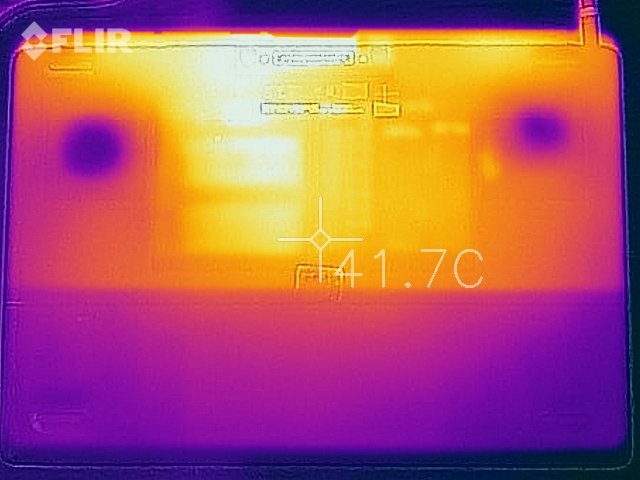
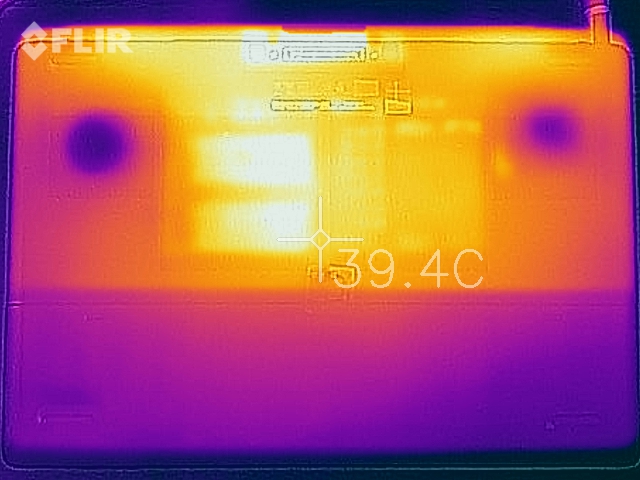
The surface temperatures are well under control, despite the high performance. The whole chassis remains very cool during light workloads and while idling, but the temperature distribution is also very convincing under load. The warmest area is the top center, and the heat radiates from there. You will notice the warm keyboard during typing, but it is never uncomfortable, and the palm rests always stay cool. The hot spot is at the bottom, but 45 °C (~113 °F) is hardly troubling for the level of performance.
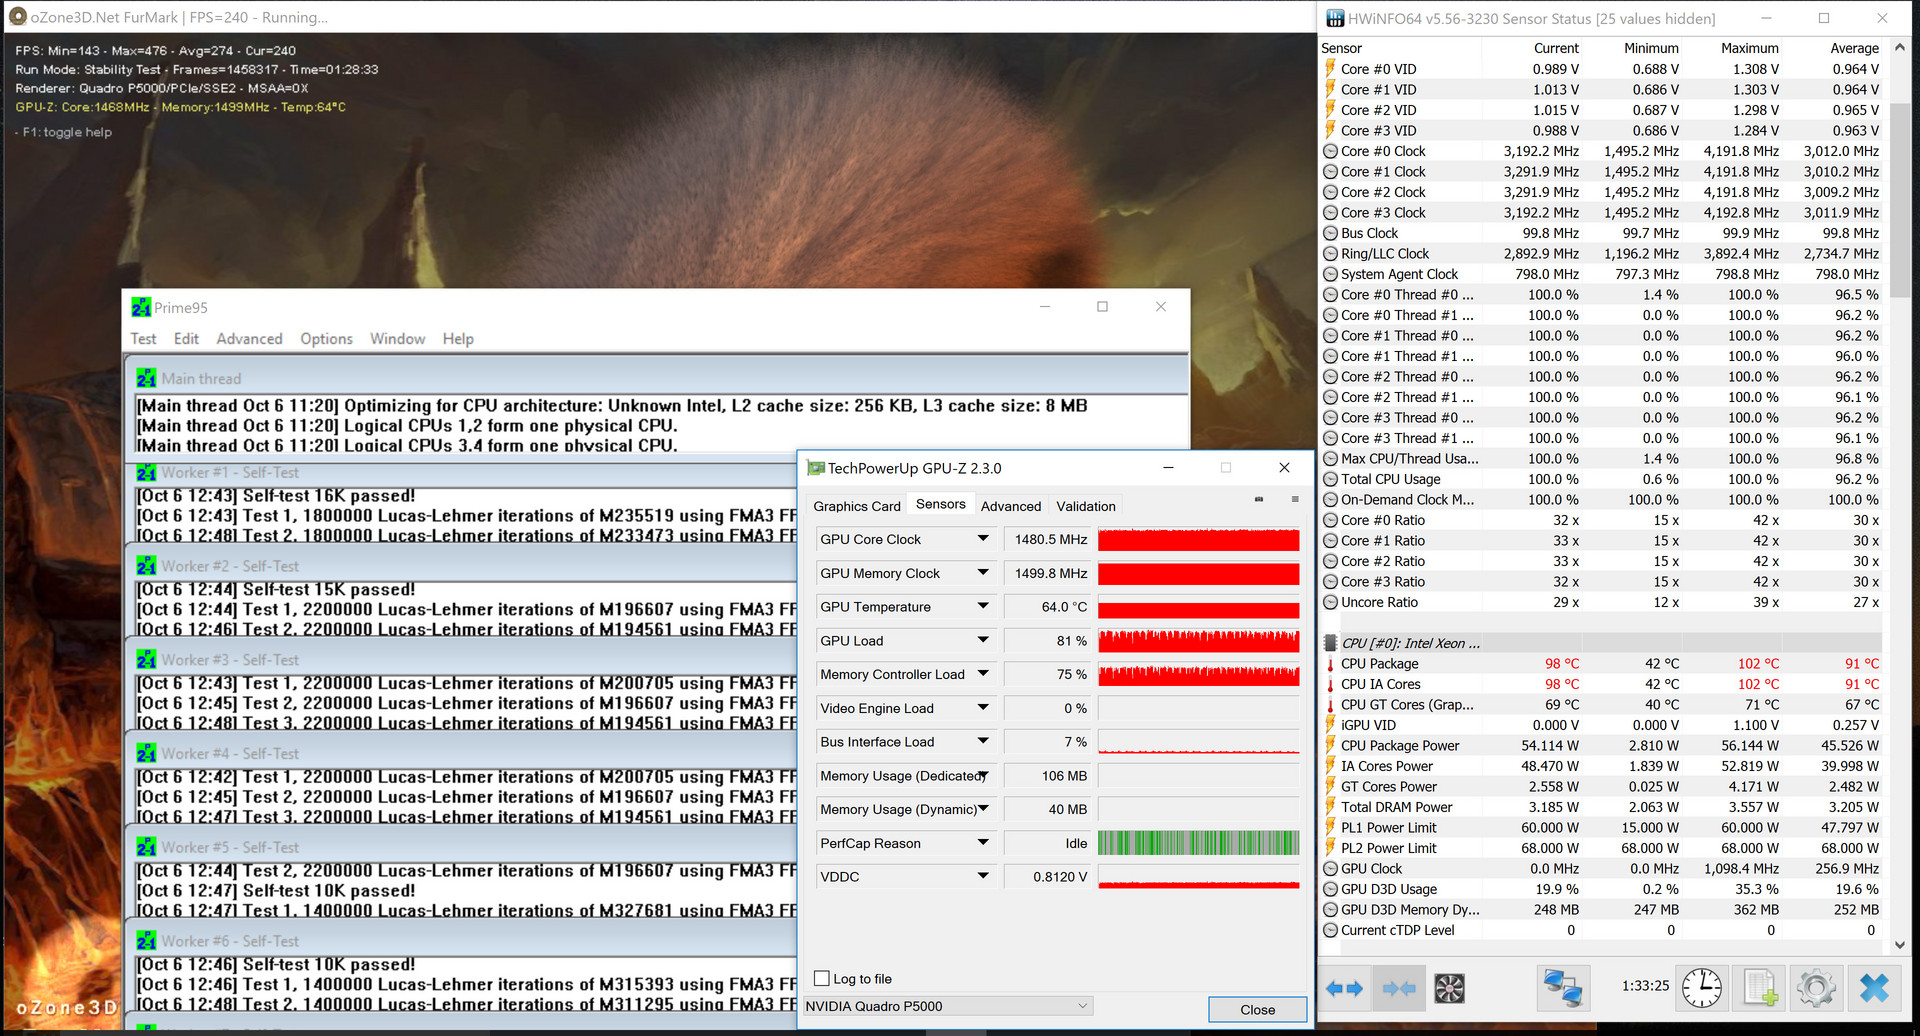
Both components perform very well individually, but the stress test with the tools Prime95 and FurMark still shows the limitations of the cooling solution. The CPU starts with 4x 3.3 GHz (~55 W), but quickly warms up to more than 90 °C (~194 °F). The GPU on the other hand manages a core clock between 1490 - 1582 MHz.
The CPU gets close to 100 °C (~212 °F) after five minutes and drops to just 2.7 - 2.8 GHz as soon as it hits 98 °C (~208 °F). However, the clocks will rise again as soon as the temperature drops. This loop continues over the course of the test and the result is an average consumption of 45 W, which corresponds with a clock of 3 GHz. It might have been a better solution to just set a fixed limit at 45 W for this scenario. The power consumption also fluctuates between 160 and 200 W depending on the clocks.
The GPU levels off at 1400 - 1500 MHz after five minutes and does not get too hot at 64 °C (~147 °F). A 3DMark 11 run immediately after the stress test did not show any performance limitations.
(±) The maximum temperature on the upper side is 42.3 °C / 108 F, compared to the average of 38.2 °C / 101 F, ranging from 22.2 to 69.8 °C for the class Workstation.
(±) The bottom heats up to a maximum of 44.9 °C / 113 F, compared to the average of 41.1 °C / 106 F
(+) In idle usage, the average temperature for the upper side is 25.2 °C / 77 F, compared to the device average of 32 °C / 90 F.
(±) Playing The Witcher 3, the average temperature for the upper side is 35.1 °C / 95 F, compared to the device average of 32 °C / 90 F.
(+) The palmrests and touchpad are cooler than skin temperature with a maximum of 27.3 °C / 81.1 F and are therefore cool to the touch.
(±) The average temperature of the palmrest area of similar devices was 27.8 °C / 82 F (+0.5 °C / 0.9 F).
Energy Management
Power Consumption
The Precision 7720 consumes a lot of power, but there is not much criticism when you consider the bright 4K screen and the powerful components. The value fluctuates between 160 and the maximum 202 W (depending on the CPU clock) under load. However, the comparison with the old Quadro M5000M in the MSI WT72 shows that the new Quadro P5000 is much more efficient. The MSI is much slower and only has a 1080p screen, but consumes a similar amount of power under load.
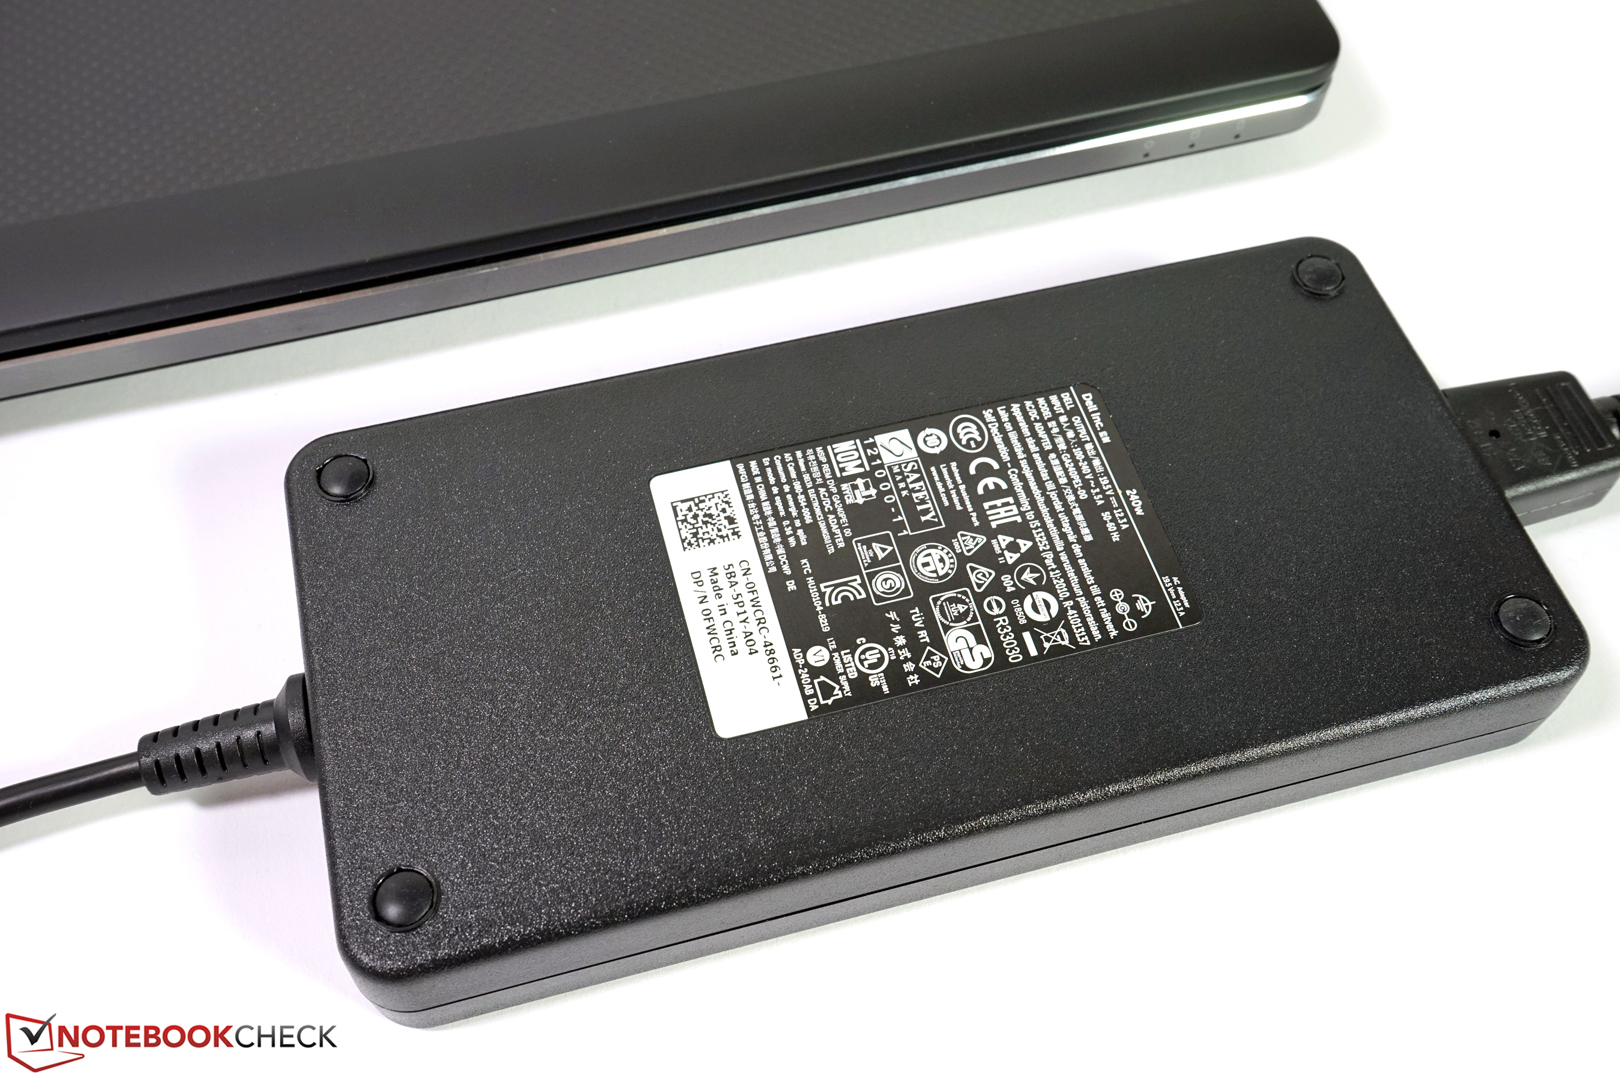
The 240-W power adapter is not very light at 972 g (~2.1 lb), but still has plenty of headroom in return.
| Off / Standby | |
| Idle | |
| Load |
|
Key:
min: | |
| Dell Precision 7720 E3-1535M v6, Quadro P5000, Toshiba NVMe THNSN5512GPU7, IGZO, 3840x2160, 17.3" | Lenovo ThinkPad P71-20HK0004GE i7-7820HQ, Quadro P3000, Samsung PM961 NVMe MZVLW512HMJP, IPS, 3840x2160, 17.3" | HP ZBook 17 G4-Y3J82AV E3-1535M v6, Quadro P5000, Samsung SSD SM961 1TB M.2 MZVKW1T0HMLH, IPS, 3840x2160, 17.3" | MSI WE72 7RJ i7-7700HQ, Quadro M2200, Samsung SM961 MZVPW256 m.2 PCI-e, IPS, 1920x1080, 17.3" | Fujitsu Celsius H970 E3-1535M v6, Quadro P4000, Samsung SM961 MZVKW512HMJP m.2 PCI-e, IPS LED, 1920x1080, 17.3" | MSI WT72-6QM E3-1505M v5, Quadro M5000M, Toshiba NVMe THNSN5256GPU7, IPS, 1920x1080, 17.3" | |
|---|---|---|---|---|---|---|
| Power Consumption | 17% | -5% | -2% | 14% | -48% | |
| Idle Minimum * (Watt) | 9.6 | 7.44 22% | 12.9 -34% | 15 -56% | 10.7 -11% | 24.8 -158% |
| Idle Average * (Watt) | 20.5 | 18 12% | 19.6 4% | 20.1 2% | 15.8 23% | 29.7 -45% |
| Idle Maximum * (Watt) | 22.9 | 21.8 5% | 23.6 -3% | 23.8 -4% | 17.8 22% | 30.1 -31% |
| Load Average * (Watt) | 96.8 | 77.1 20% | 92.8 4% | 85.6 12% | 92 5% | 105.2 -9% |
| Load Maximum * (Watt) | 202.1 | 150.5 26% | 190 6% | 128 37% | 137 32% | 192.2 5% |
| Witcher 3 ultra * (Watt) | 148.5 |
* ... smaller is better
Battery Runtime
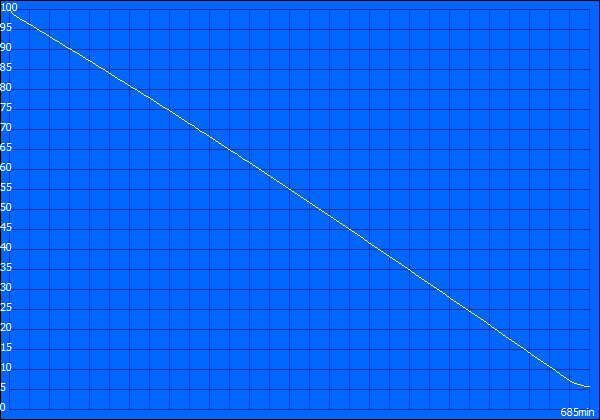
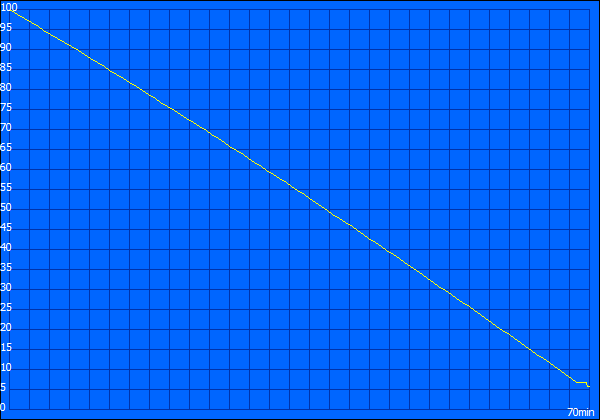
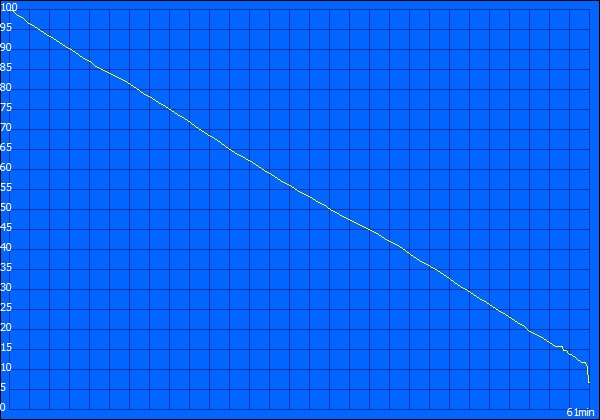
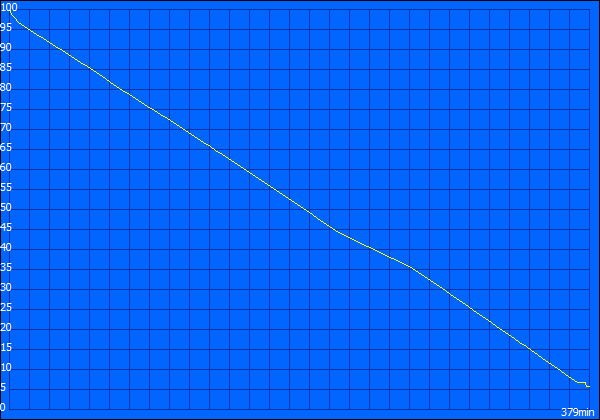
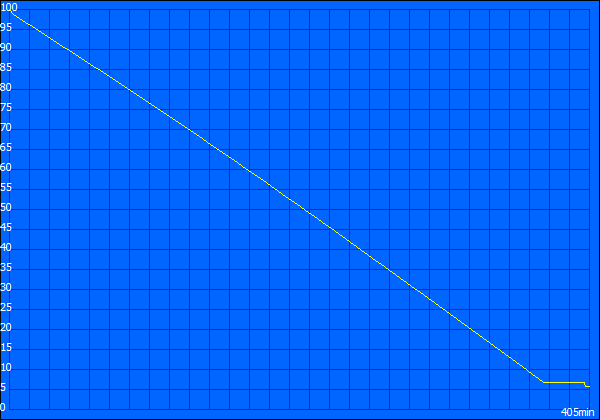
Our test sample of the predecessor Precision 7710 was still equipped with a 72 Wh battery, but the 7720 now gets a 91 Wh module (6 cells) by default (the 72 Wh battery is still available as an accessory). The mobile workstation performs well, thanks to the switchable graphics, and the results should be even better when you get an SKU with a lower display resolution. The maximum runtime is more than 11 hours, but the battery only lasts for little more than one hour under load. The SPECviewperf 12 benchmarks also drain the battery after just 61 minutes. The GPU performance in particular is reduced in this scenario, otherwise the battery would discharge too quickly (high temperature), which could damage the battery.
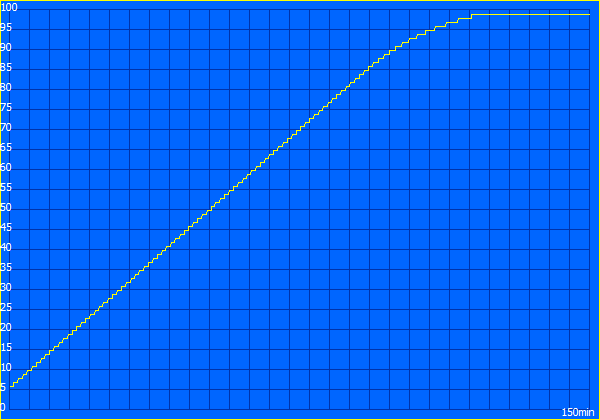
We can determine more than six hours in our tests at an adjusted luminance of 150 nits (WLAN and Video). The charging process is pretty fast. A full charge takes about 2.5 hours, but 30% after 30 minutes and 50% after 50 minutes is not bad.
| Dell Precision 7720 E3-1535M v6, Quadro P5000, 91 Wh | Lenovo ThinkPad P71-20HK0004GE i7-7820HQ, Quadro P3000, 96 Wh | HP ZBook 17 G4-Y3J82AV E3-1535M v6, Quadro P5000, 95 Wh | MSI WE72 7RJ i7-7700HQ, Quadro M2200, 51 Wh | Fujitsu Celsius H970 E3-1535M v6, Quadro P4000, 96 Wh | Dell Precision 7710 E3-1535M v5, FirePro W7170M, 72 Wh | |
|---|---|---|---|---|---|---|
| Battery runtime | 10% | -13% | -53% | 33% | -1% | |
| Reader / Idle (h) | 11.4 | 14.5 27% | 7.8 -32% | 4.5 -61% | 16.7 46% | 12.9 13% |
| H.264 (h) | 6.8 | 8.6 26% | 5.3 -22% | 3 -56% | 9.6 41% | 4.7 -31% |
| WiFi v1.3 (h) | 6.3 | 6 -5% | 4.9 -22% | 3 -52% | 9 43% | 6.1 -3% |
| Load (h) | 1.2 | 1.1 -8% | 1.5 25% | 0.7 -42% | 1.2 0% | 1.4 17% |
Verdict
Pros
Cons
Dell's Precision 7720 is a very powerful mobile workstation. The high-quality case is basically unchanged from the previous generation and you now get a Thunderbolt 3 port by default. The predecessor still had problems to utilize its potential in combined workloads for CPU & GPU, but it seems the manufacturer has improved this aspect. Our test sample is equipped with the most powerful components, but the performance utilization is still very good, even under extreme load. Whether you need this amount of performance is obviously another question. The graphics card in particular is not necessary for many scenarios.
We are rather disappointed by the 4K PremierColor display. This is obviously moaning on a high level, but we would have expected better results ex-works for the additional price. A calibration is definitely recommended for this device. The backlight bleeding at the bottom edge is also a bit annoying, and the panel uses PWM at low brightness levels.
The Precision 7720 is a good choice when you need a lot performance, because the mobile workstation can actually utilize the performance of the expensive components.
There is no problem with annoying fans, despite the high performance. Sure, you can clearly hear them under high workloads, but they are often turned off when you perform simple tasks. We cannot really criticize the temperature development either, which is also the case for the battery runtime.
Except for the drawbacks of the display, you have to look closely to find issues. The list obviously includes the SD reader, which did not work on our test model, but this should be an isolated incident. The SIM slot is located inside the chassis and hard to reach, which prevents a quick switch of the data card in other countries, for example.
All of this performance is obviously not cheap, but this is the case for the competition as well. All in all, the Precision 7720 can secure a very good rating (89%).
Dell Precision 7720
- 01/21/2018 v6 (old)
Andreas Osthoff
