Dell Precision 5530 (Xeon E-2176M, Quadro P2000) Workstation Review
Last year, Dell's Precision 5520 brought high expectations that were ultimately left unfulfilled. While the machine aimed to realize the dream of a thin-and-light workstation, performance hiccups and CPU instability poisoned the well and left a bad taste in our mouth. With that in mind, we approach the Precision 5530 with some trepidation. After all, the Precision 5530 is externally indistinguishable from the 5520. Has Dell made the internal changes needed to pack workstation performance into a highly portable chassis? We shall see.
The Precision 5530 is a carbon-copy of the Precision 5520, which is itself a copy of the Precision 5510. As the old saying goes, if it ain't broke, don't fix it; the design language remains elegant and striking three years on, leaving little room for improvement. While we would like to see more ports, the Thunderbolt 3 connection opens up a world of peripheral options. Since the case has remained unchanged, we will skip discussion of the build quality, port selection, and input devices. For details on these pieces, please refer to our Precision 5520 review here.
The Dell Precision 5530 sits in a unique space in the laptop world. While it uses similar components to mid-range workstations, it fits them into a case similar to ultrabooks. As such, we will compare the Precision 5530 to a variety of other workstations. Some manufacturers have picked up the "thin-and-light" design language and translated it to their workstation lines with varying success. These include the Lenovo ThinkPad P52s and the MSI WS63VR. We will also compare staples in the workstation world, including Lenovo's ThinkPad P51, the HP ZBook 15 G4, and Dell's Precision 3530. Let's dive in.
| SD Card Reader | |
| average JPG Copy Test (av. of 3 runs) | |
| HP ZBook 15 G4-Y4E80AV (Toshiba Exceria Pro SDXC 64 GB UHS-II) | |
| Dell Precision 3530 (Toshiba Exceria Pro SDXC 64 GB UHS-II) | |
| Dell Precision 5530 Xeon E-2176M (Toshiba Exceria Pro SDXC 64 GB UHS-II) | |
| Dell Precision 5520 UHD (Toshiba Exceria Pro SDXC 64 GB UHS-II) | |
| Lenovo ThinkPad P51 20HH0016GE (Toshiba Exceria Pro SDXC 64 GB UHS-II) | |
| MSI WS63VR 7RL-023US | |
| Average of class Workstation (49.6 - 681, n=14, last 2 years) | |
| Lenovo ThinkPad P52S-20LB001FUS (Toshiba Exceria Pro SDXC 64 GB UHS-II) | |
| maximum AS SSD Seq Read Test (1GB) | |
| Dell Precision 5520 UHD (Toshiba Exceria Pro SDXC 64 GB UHS-II) | |
| Average of class Workstation (87.6 - 1455, n=14, last 2 years) | |
| Lenovo ThinkPad P51 20HH0016GE (Toshiba Exceria Pro SDXC 64 GB UHS-II) | |
| MSI WS63VR 7RL-023US | |
| HP ZBook 15 G4-Y4E80AV (Toshiba Exceria Pro SDXC 64 GB UHS-II) | |
| Dell Precision 3530 (Toshiba Exceria Pro SDXC 64 GB UHS-II) | |
| Dell Precision 5530 Xeon E-2176M (Toshiba Exceria Pro SDXC 64 GB UHS-II) | |
| Lenovo ThinkPad P52S-20LB001FUS (Toshiba Exceria Pro SDXC 64 GB UHS-II) | |
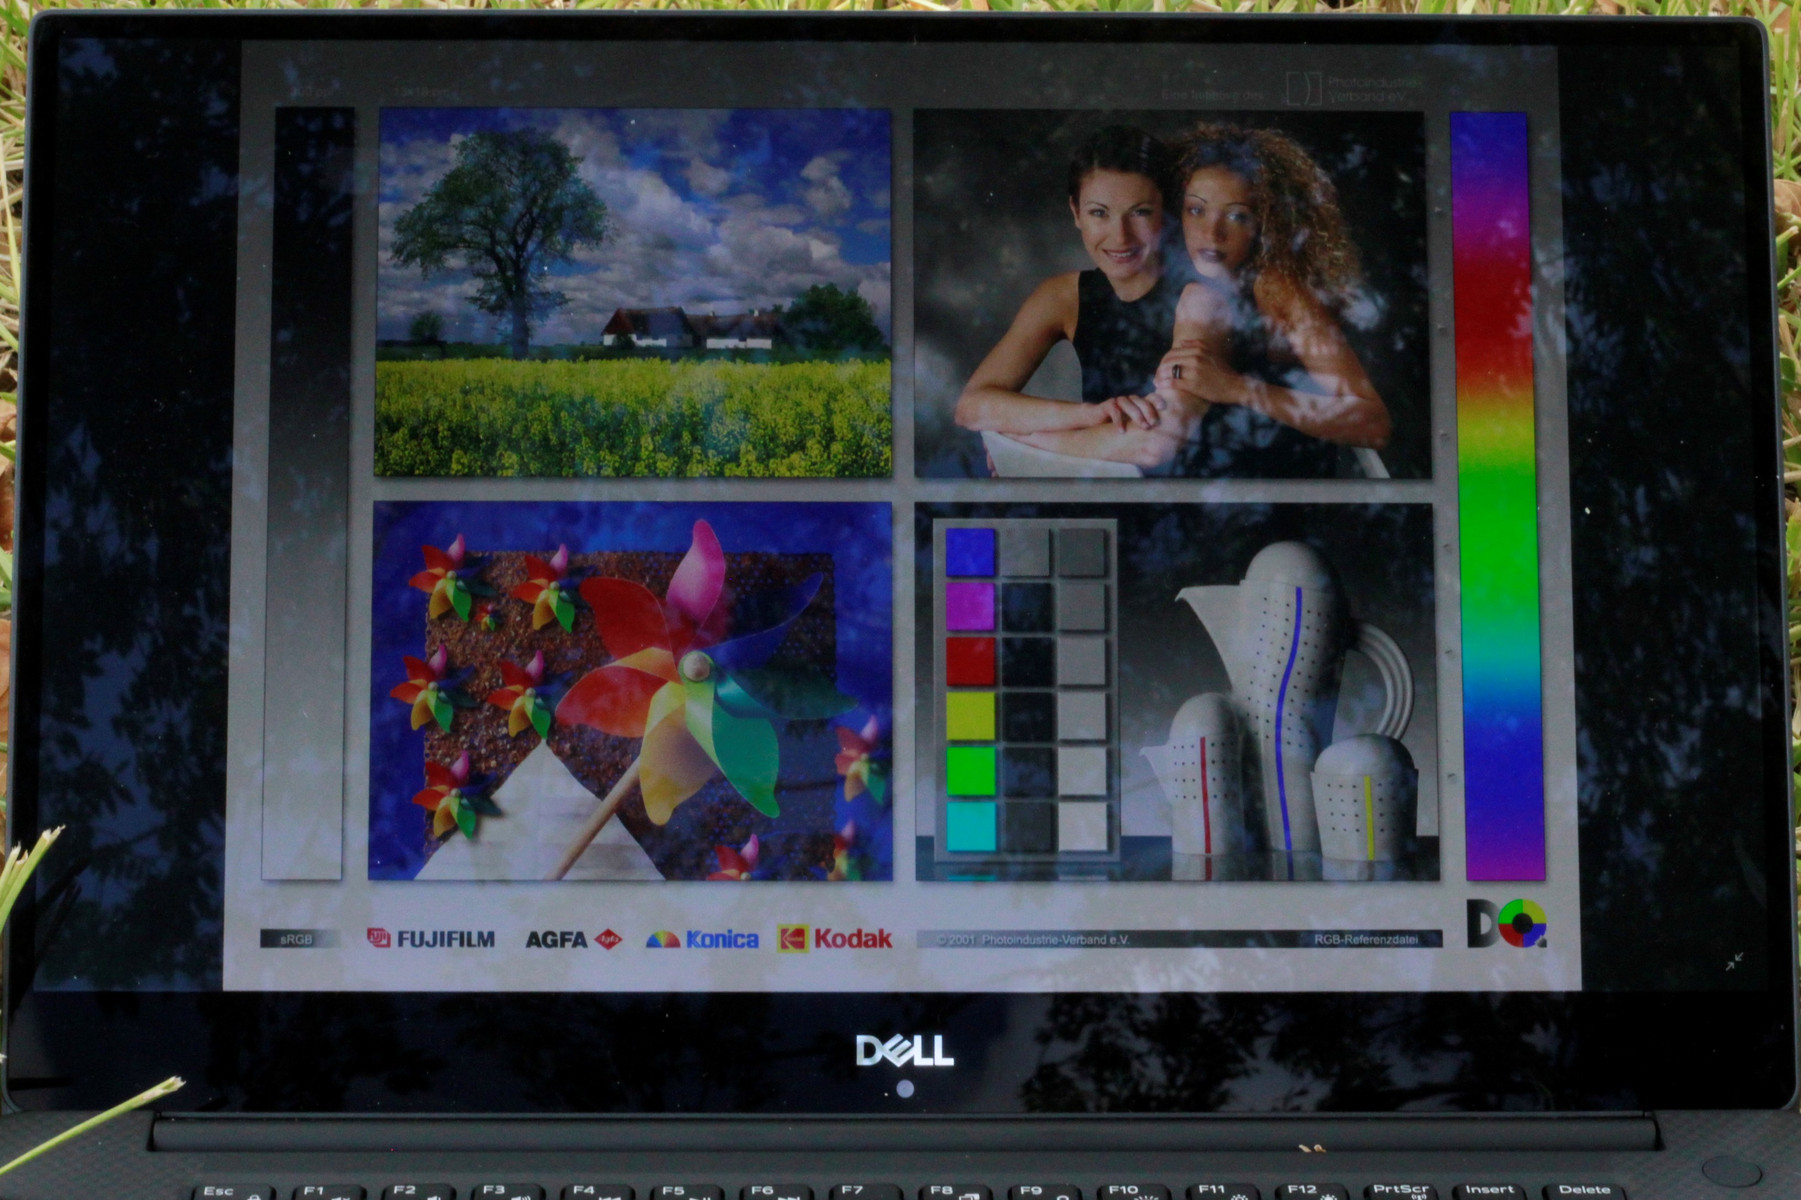
Display
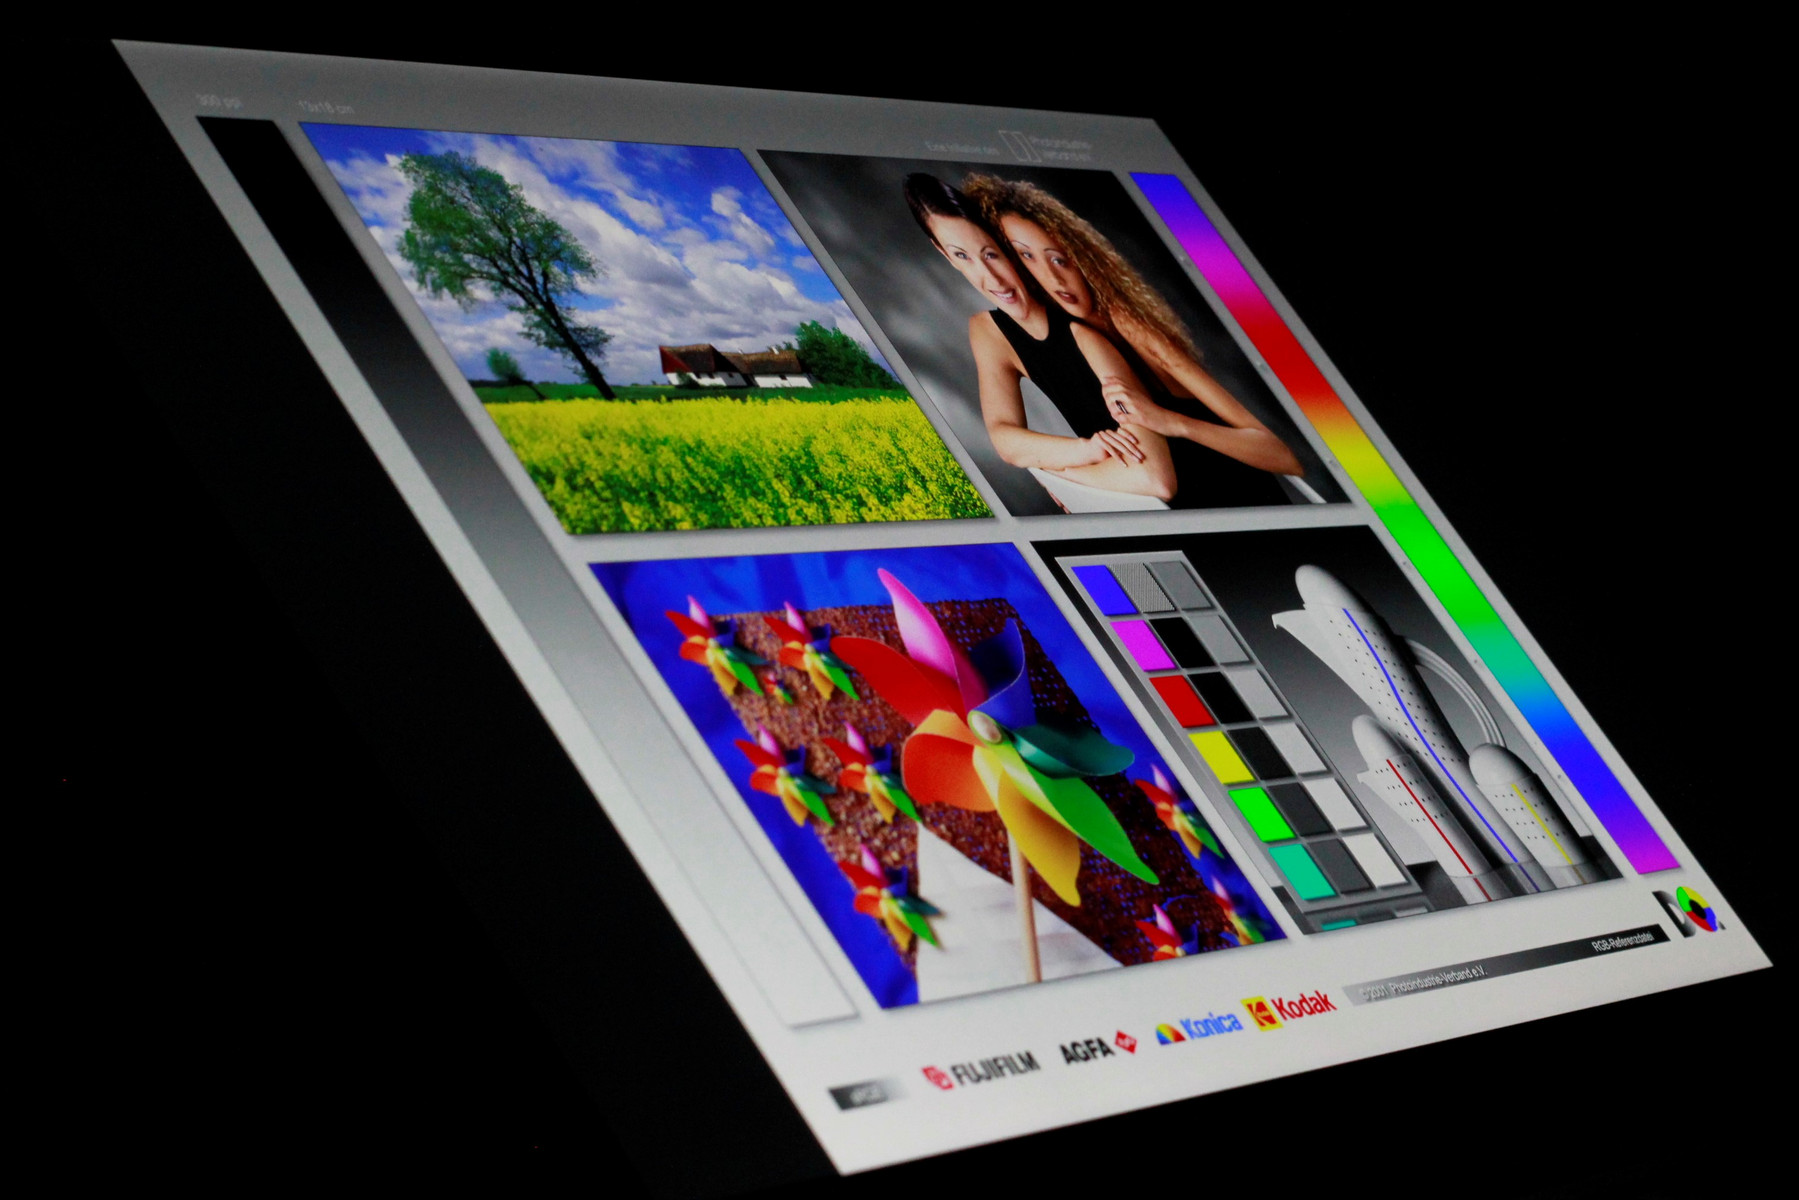
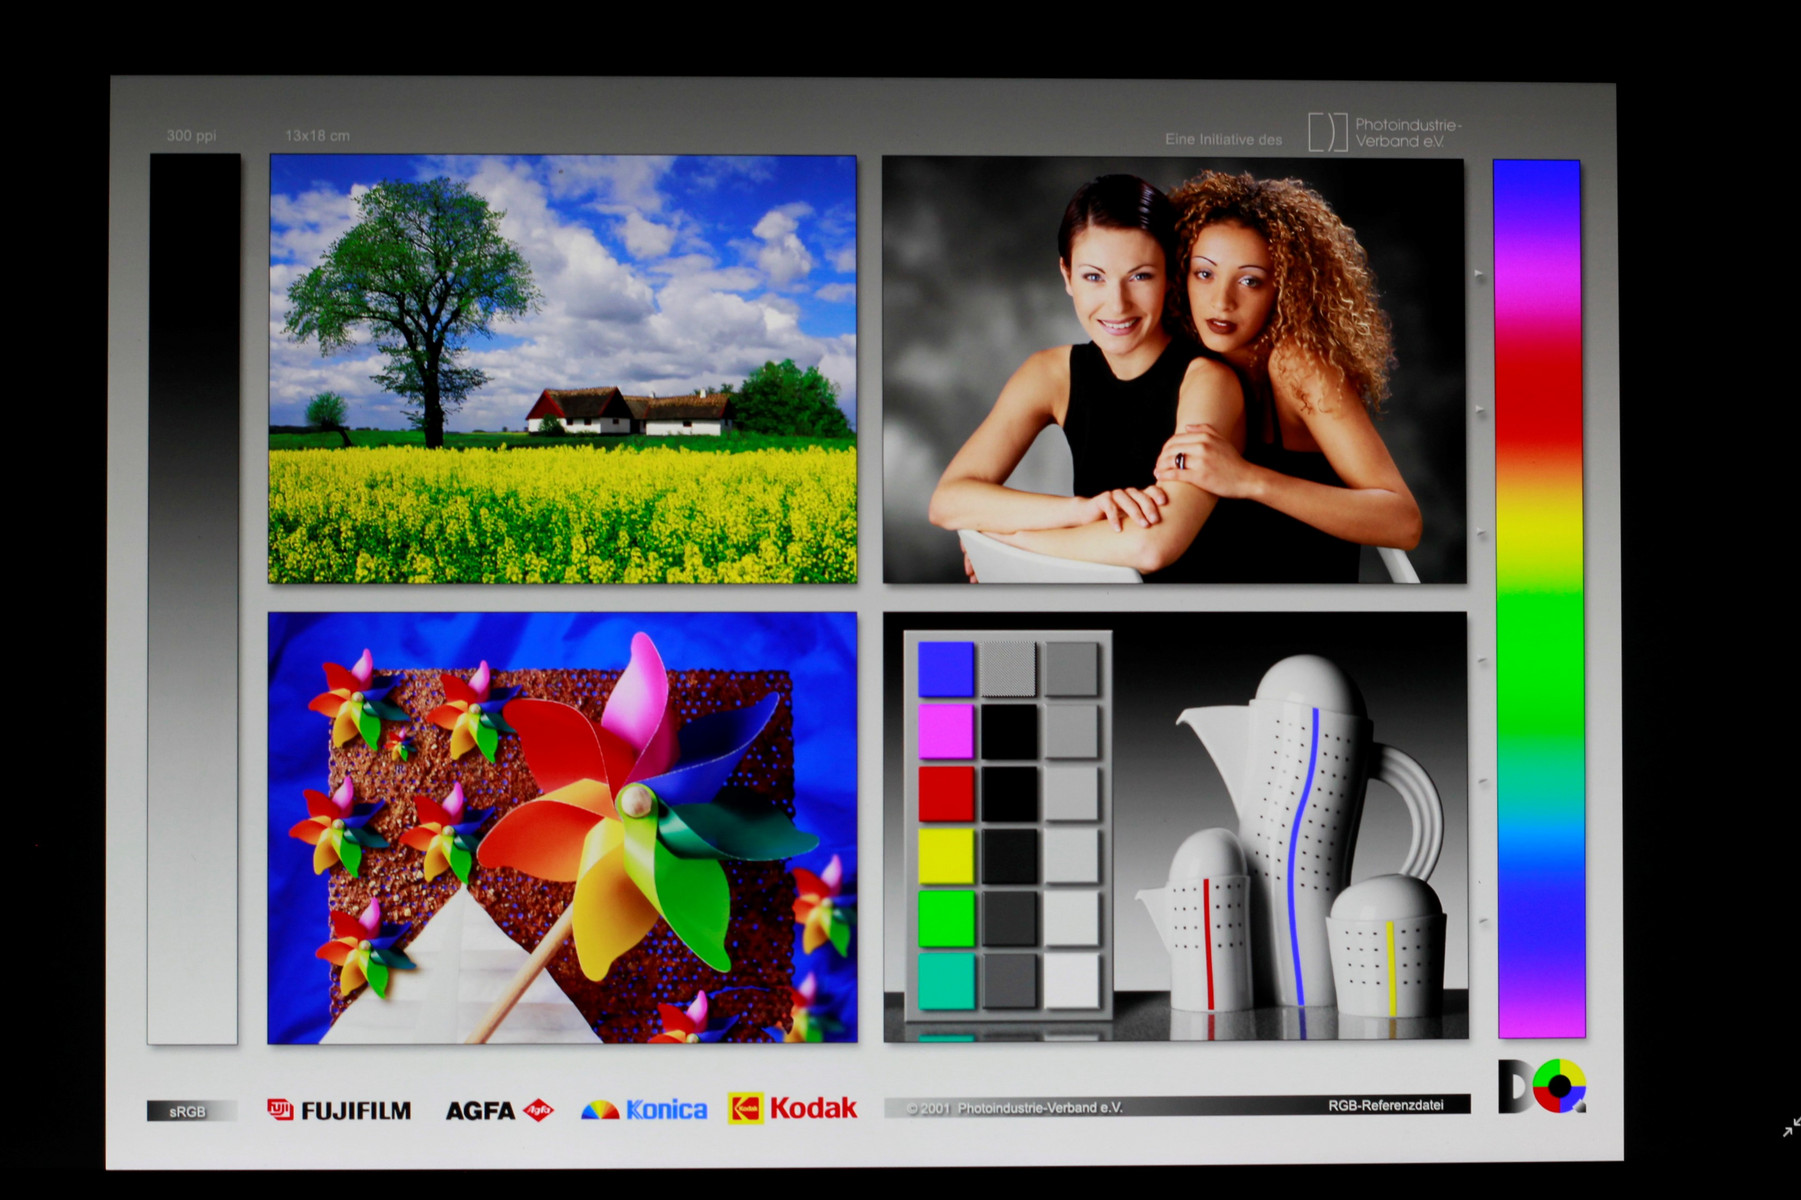
The 4K IGZO panel is bright, vibrant, and crisp. Response times are a bit on the slow side, and the presence of PWM is a downside. However, these factors are unlikely to be noticed by users. The screen is otherwise excellent. The Sharp panel is one of the brightest we've reviewed (440 nits on average), and the backlight is very even (90% distribution). Apple's MacBook Pro has a brighter screen, but it is one of the few notebooks that outshines the 5530. The 5530's panel can get relatively dim (23 nits minimum), making it suitable for use either in bright rooms or low light. Contrast is good as well, making colors, text, and images pop off the screen. All said, the Precision 5530's display leaves little room for improvement.
| |||||||||||||||||||||||||
Brightness Distribution: 90 %
Center on Battery: 451.7 cd/m²
Contrast: 1129:1 (Black: 0.4 cd/m²)
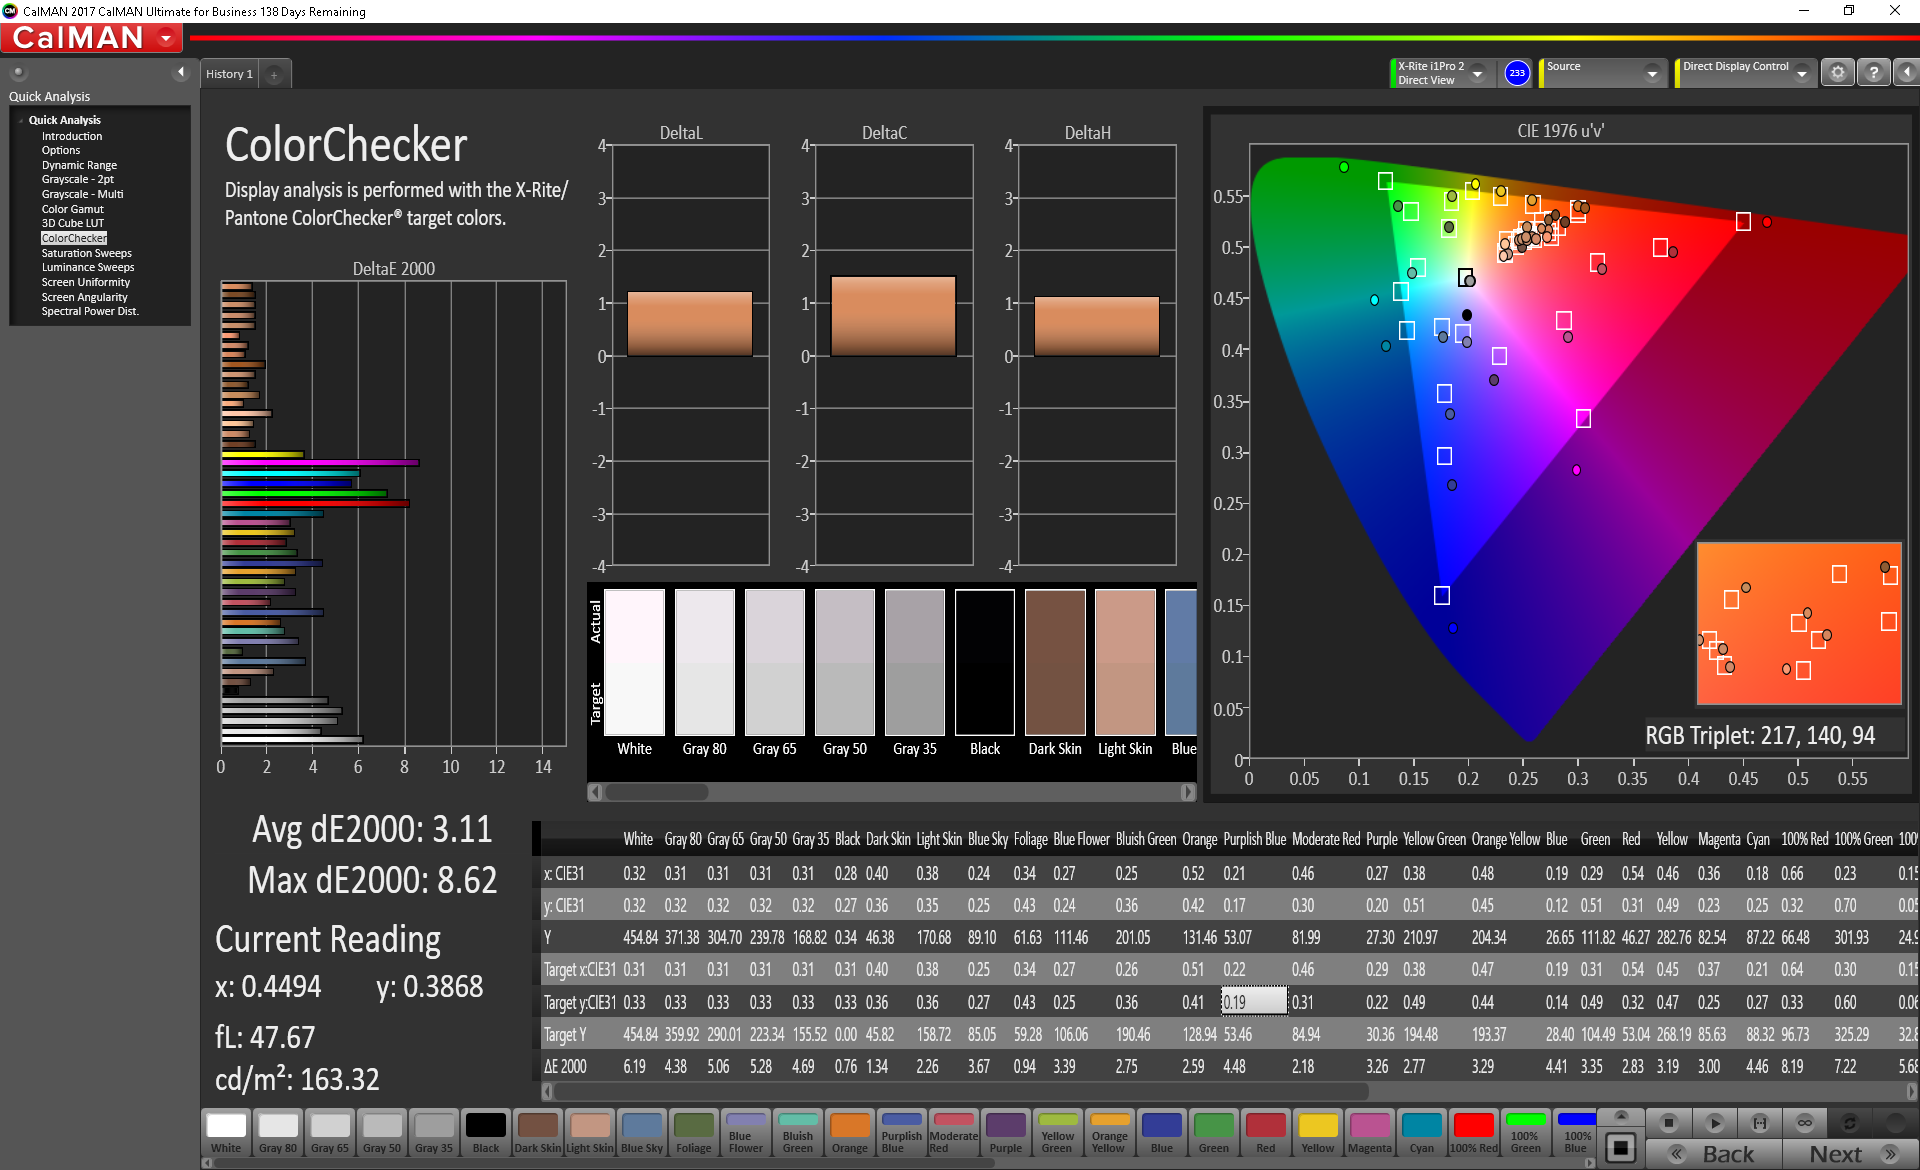
ΔE ColorChecker Calman: 3.11 | ∀{0.5-29.43 Ø4.71}
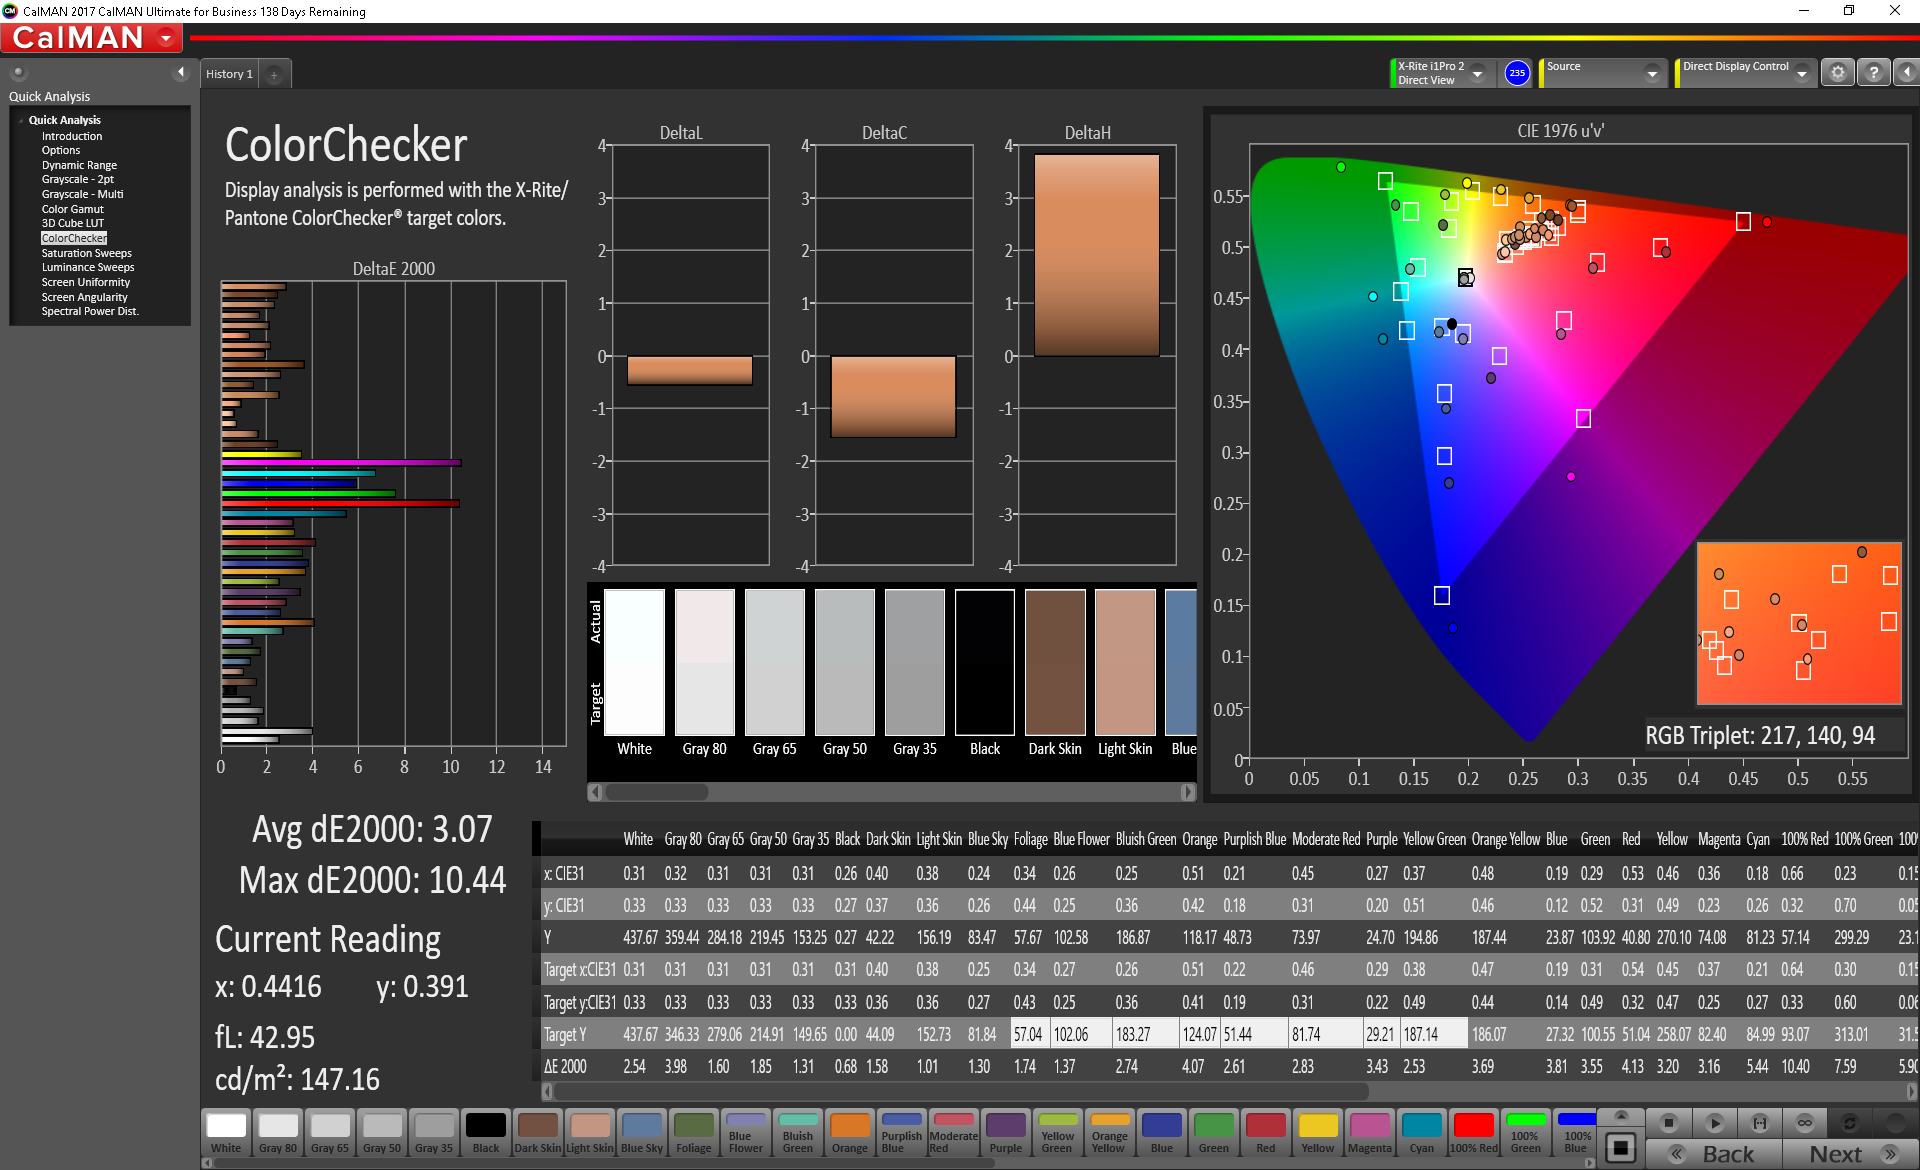
calibrated: 3.07
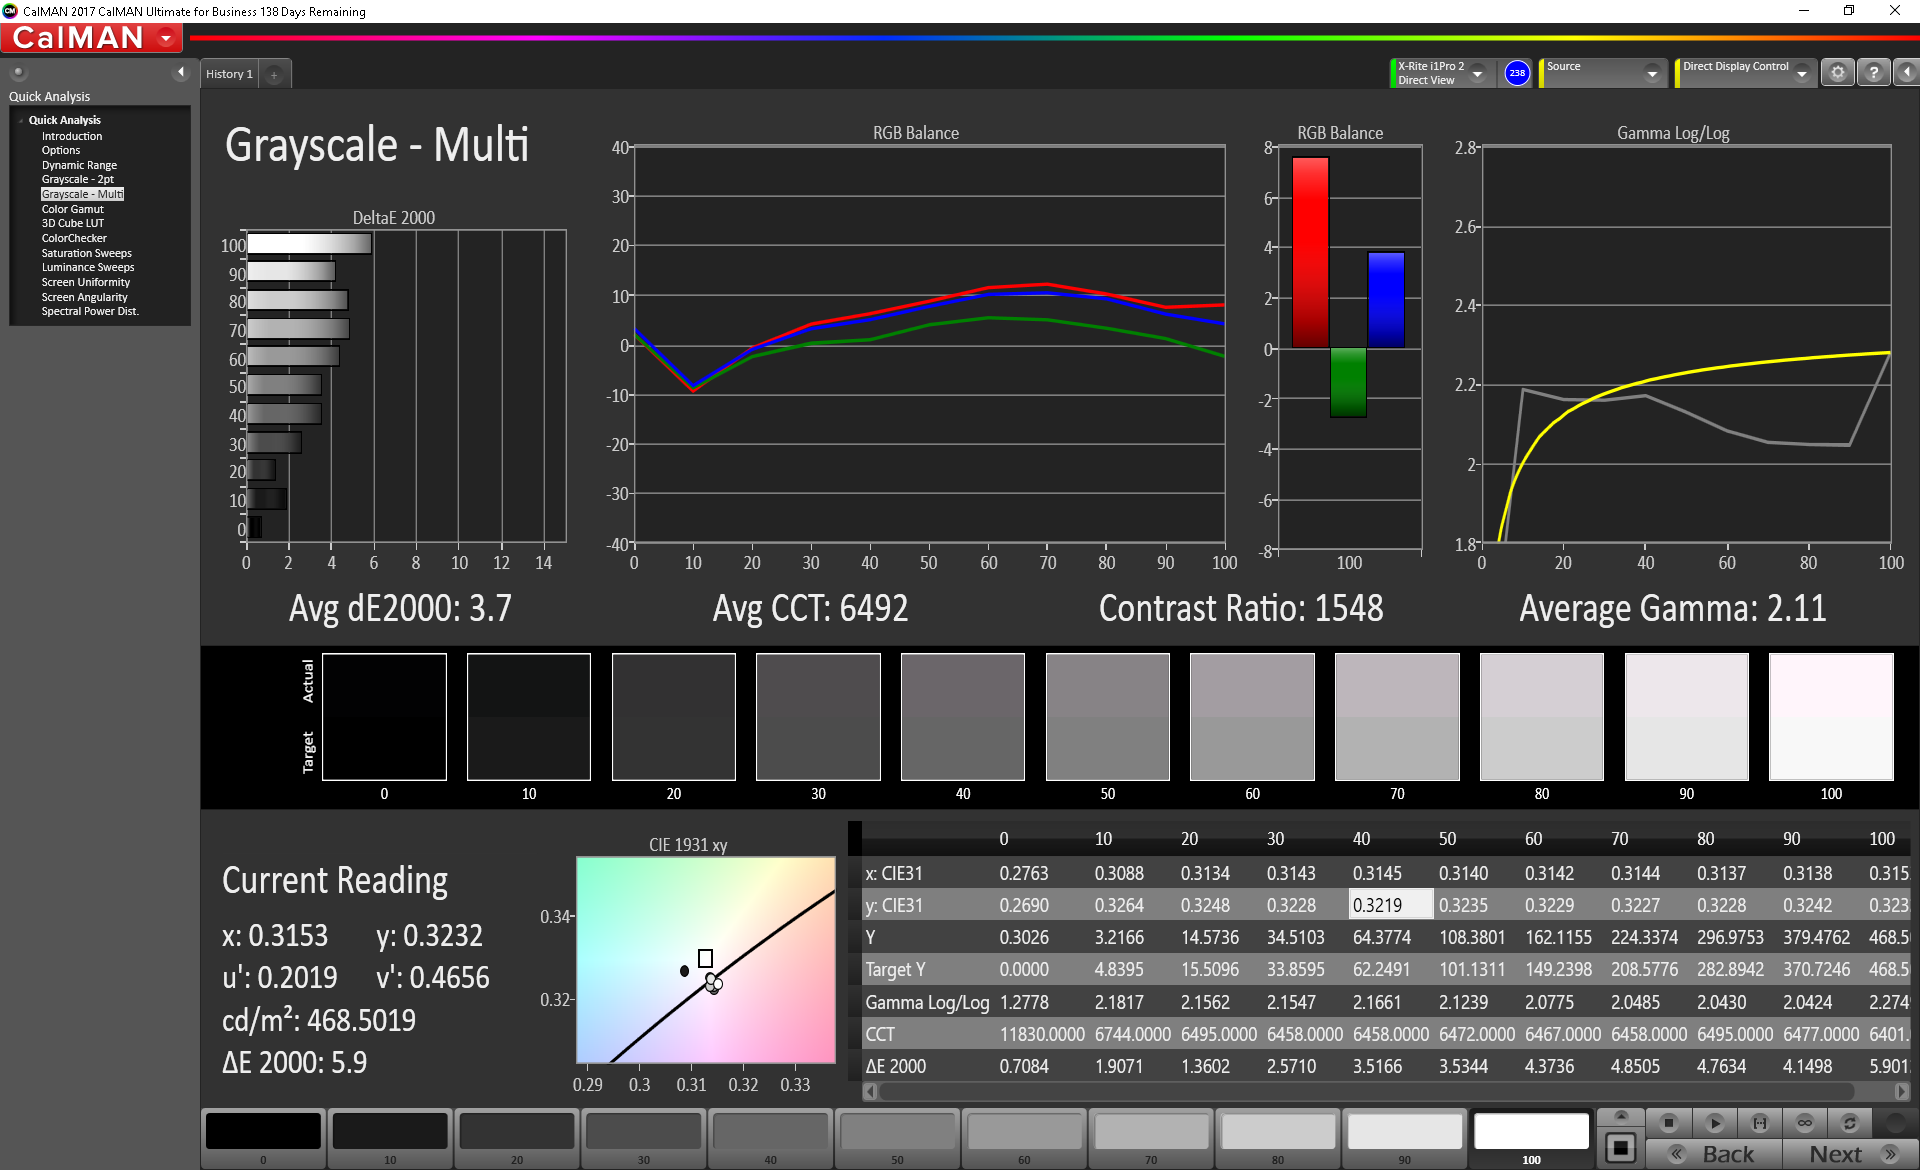
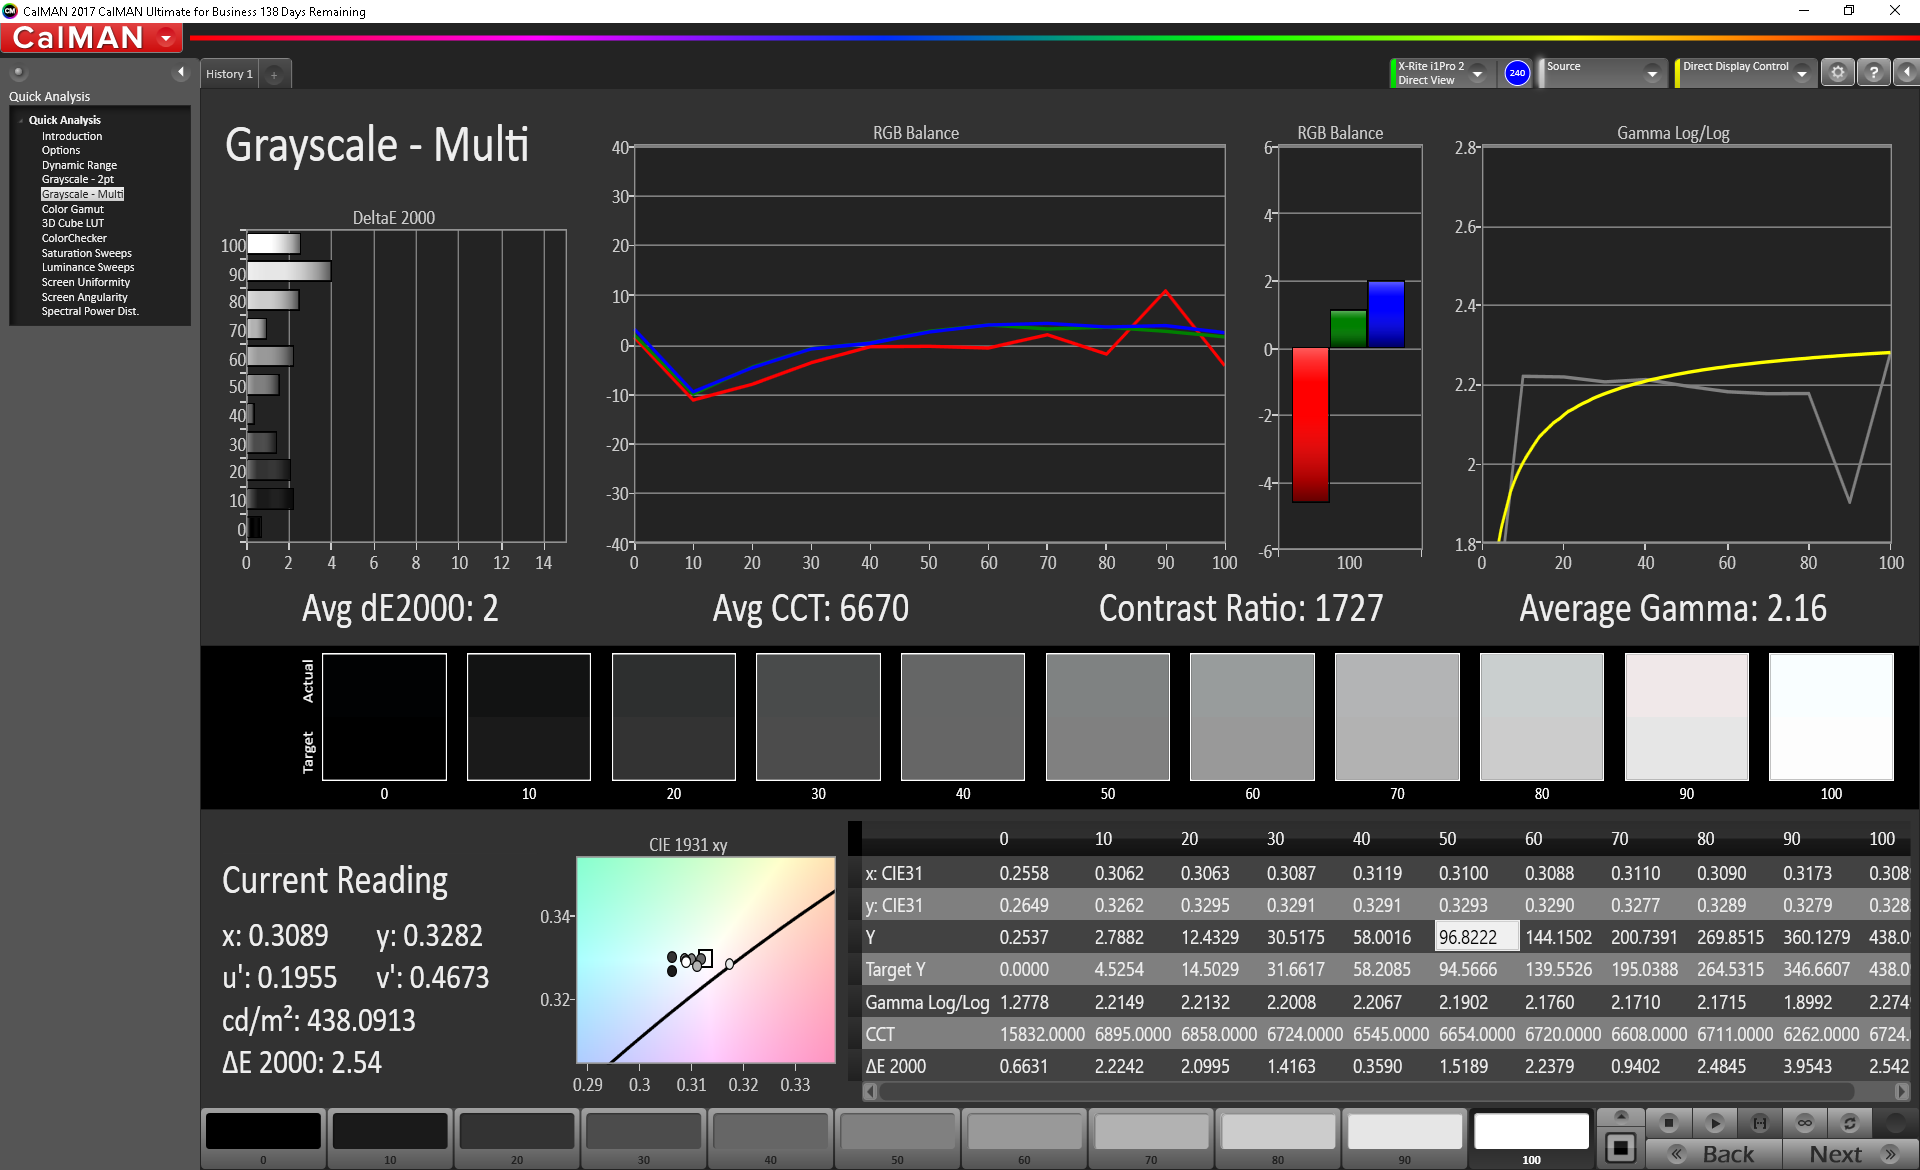
ΔE Greyscale Calman: 3.7 | ∀{0.09-98 Ø4.96}
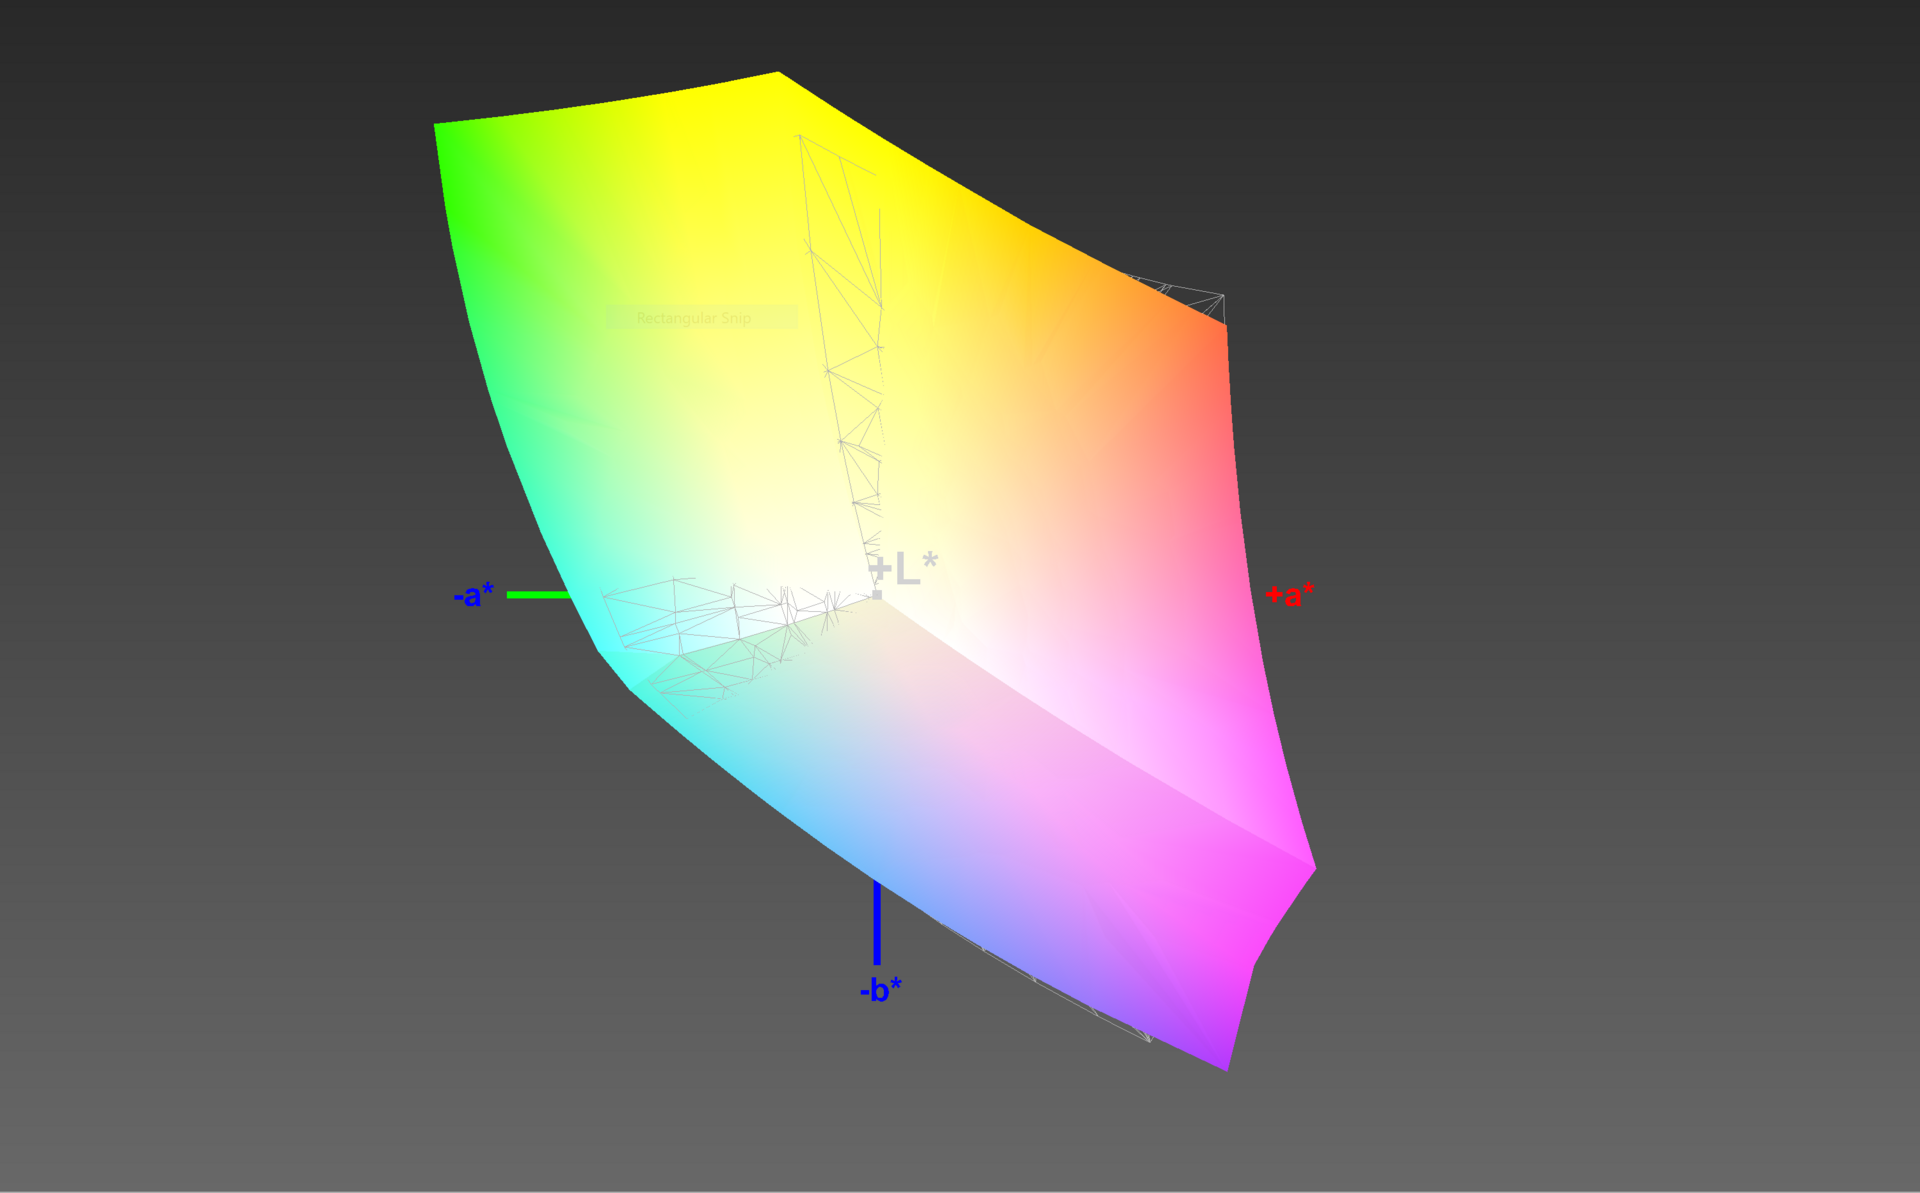
98% sRGB (Argyll 1.6.3 3D)
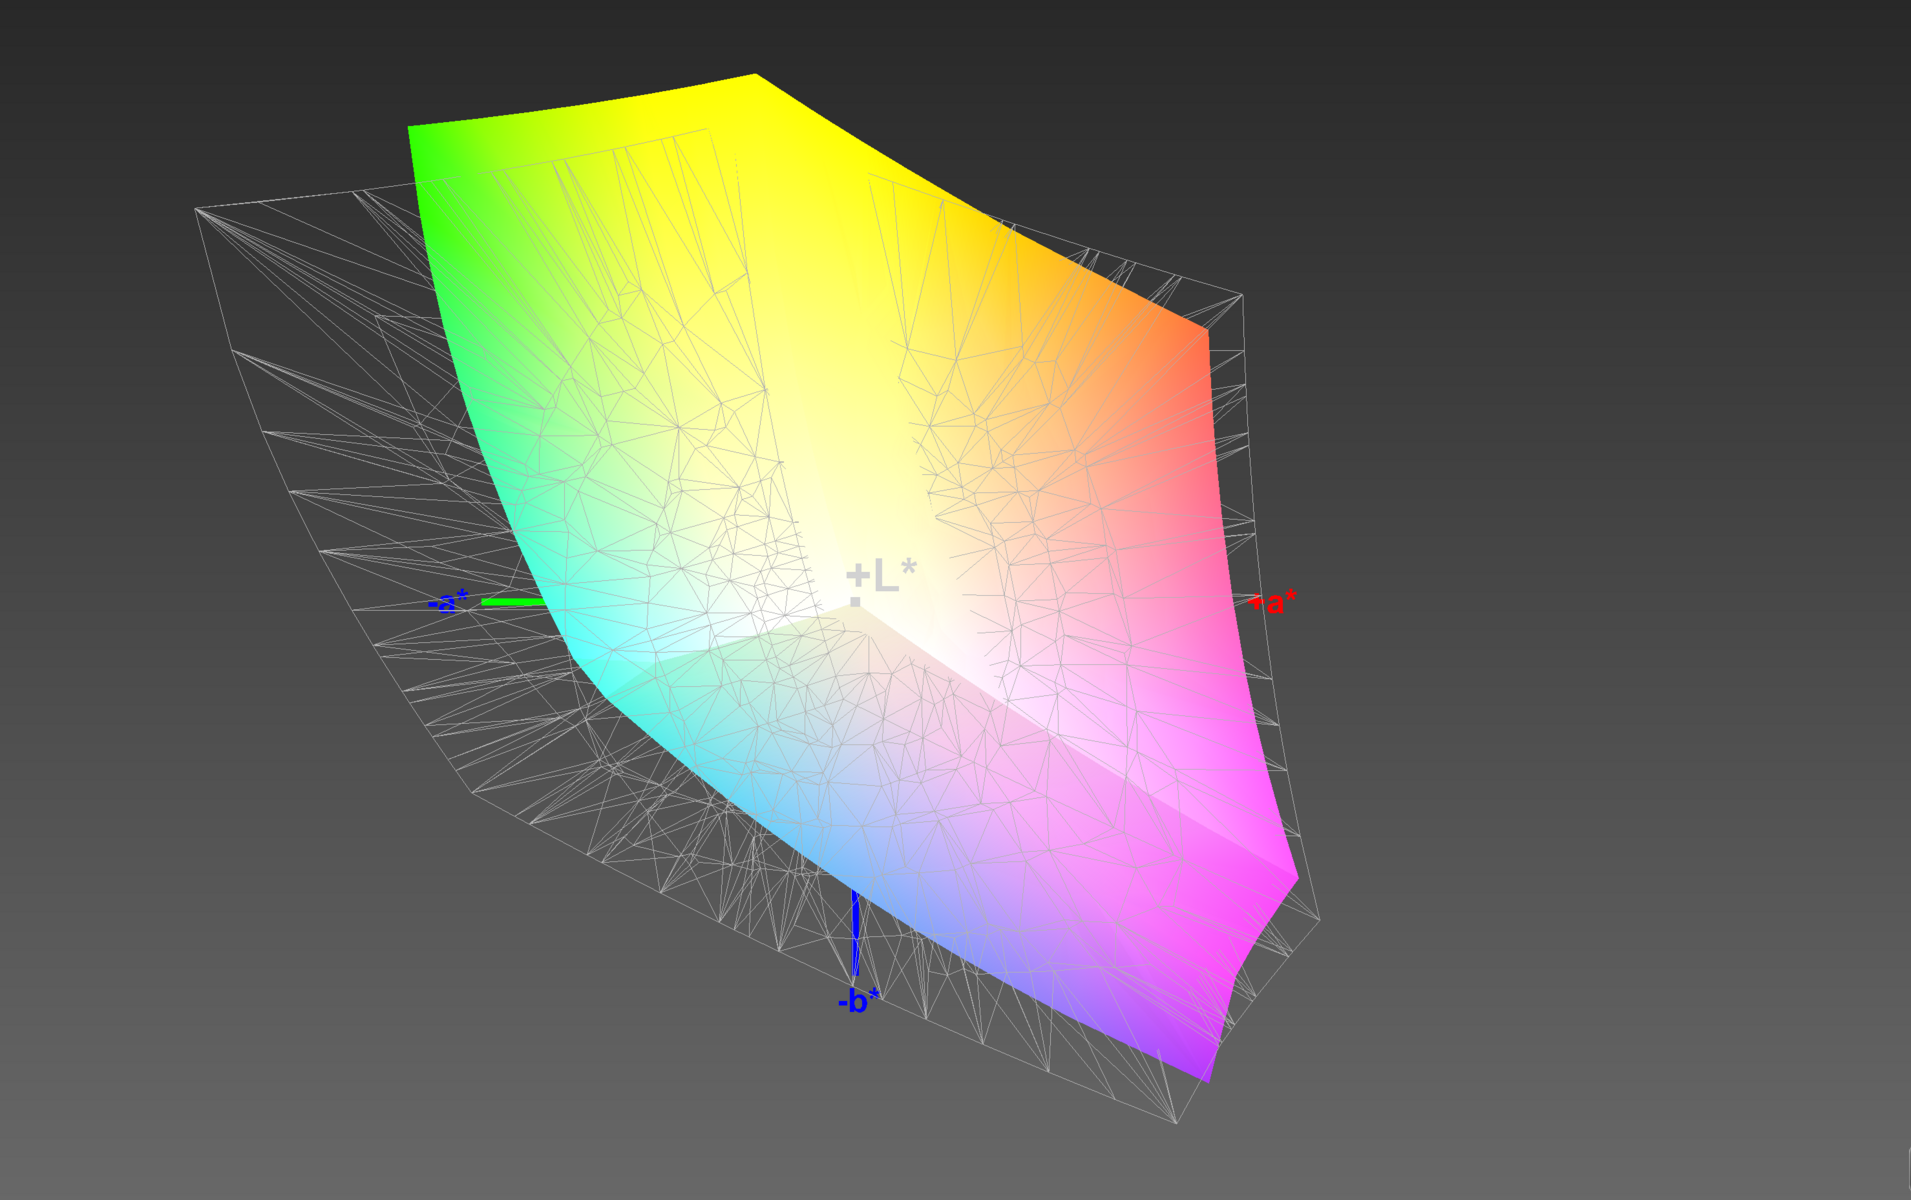
69% AdobeRGB 1998 (Argyll 1.6.3 3D)
76.4% AdobeRGB 1998 (Argyll 3D)
98.4% sRGB (Argyll 3D)
76.5% Display P3 (Argyll 3D)
Gamma: 2.11
CCT: 6492 K
| Dell Precision 5530 Xeon E-2176M Sharp SHP148D / LQ156D1, IGZO, 15.6", 3840x2160 | Dell Precision 5520 UHD SHP1476, IPS, 15.6", 3840x2160 | Lenovo ThinkPad P52S-20LB001FUS Lenovo LEN40BD, IPS, 15.6", 3840x2160 | Dell Precision 3530 BOE BOE06F1, IPS, 15.6", 1920x1080 | HP ZBook 15 G4-Y4E80AV LG Philips LGD057E, IPS, 15.6", 1920x1080 | Lenovo ThinkPad P51 20HH0016GE LEN40BD, B156ZAN02.1, IPS, 15.6", 3840x2160 | MSI WS63VR 7RL-023US SAMSUNG LƒFL156FL02-101 , IPS, 15.6", 3840x2160 | Apple MacBook Pro 15 2018 (2.6 GHz, 560X) APPA040, IPS, 15.4", 2880x1800 | |
|---|---|---|---|---|---|---|---|---|
| Display | -7% | -12% | -6% | -18% | 15% | -34% | 15% | |
| Display P3 Coverage (%) | 76.5 | 67.4 -12% | 67.3 -12% | 72.8 -5% | 64 -16% | 86.3 13% | 47.43 -38% | 98.7 29% |
| sRGB Coverage (%) | 98.4 | 98.5 0% | 89.4 -9% | 94.6 -4% | 82.7 -16% | 99.5 1% | 71.4 -27% | 99.9 2% |
| AdobeRGB 1998 Coverage (%) | 76.4 | 68.9 -10% | 65.4 -14% | 69.3 -9% | 60.4 -21% | 99.3 30% | 49 -36% | 86.6 13% |
| Response Times | -24% | 28% | 6% | 21% | 20% | 19% | 9% | |
| Response Time Grey 50% / Grey 80% * (ms) | 48 ? | 59.2 ? -23% | 43.2 ? 10% | 40.4 ? 16% | 39.2 ? 18% | 40.8 ? 15% | 36.8 ? 23% | 43.2 ? 10% |
| Response Time Black / White * (ms) | 33.6 ? | 41.6 ? -24% | 18 ? 46% | 34.8 ? -4% | 25.6 ? 24% | 25.2 ? 25% | 28.4 ? 15% | 31.2 ? 7% |
| PWM Frequency (Hz) | 1000 | 980 | 1053 ? | 20830 ? | 1351 ? | 117000 ? | ||
| Screen | -4% | -6% | -23% | -10% | 4% | -33% | 31% | |
| Brightness middle (cd/m²) | 451.7 | 372.4 -18% | 305.5 -32% | 285.7 -37% | 321 -29% | 317 -30% | 259.4 -43% | 520 15% |
| Brightness (cd/m²) | 440 | 368 -16% | 282 -36% | 275 -37% | 320 -27% | 309 -30% | 247 -44% | 492 12% |
| Brightness Distribution (%) | 90 | 90 0% | 78 -13% | 85 -6% | 89 -1% | 89 -1% | 85 -6% | 88 -2% |
| Black Level * (cd/m²) | 0.4 | 0.48 -20% | 0.24 40% | 0.31 23% | 0.29 28% | 0.36 10% | 0.43 -8% | 0.39 2% |
| Contrast (:1) | 1129 | 776 -31% | 1273 13% | 922 -18% | 1107 -2% | 881 -22% | 603 -47% | 1333 18% |
| Colorchecker dE 2000 * | 3.11 | 2.6 16% | 3.51 -13% | 5.84 -88% | 4.5 -45% | 2.7 13% | 5.5 -77% | 1.2 61% |
| Colorchecker dE 2000 max. * | 8.62 | 5.6 35% | 7.28 16% | 8.76 -2% | 9.5 -10% | 4.1 52% | 12.7 -47% | 2.3 73% |
| Colorchecker dE 2000 calibrated * | 3.07 | 3.15 -3% | 3.14 -2% | |||||
| Greyscale dE 2000 * | 3.7 | 3.7 -0% | 4 -8% | 6.5 -76% | 2.9 22% | 3 19% | 3.6 3% | 1.3 65% |
| Gamma | 2.11 104% | 2.14 103% | 2.18 101% | 2.383 92% | 2.27 97% | 2.27 97% | 2.24 98% | 2.18 101% |
| CCT | 6492 100% | 7096 92% | 7291 89% | 7176 91% | 6519 100% | 6077 107% | 7163 91% | 6738 96% |
| Color Space (Percent of AdobeRGB 1998) (%) | 69 | 63 -9% | 58 -16% | 62 -10% | 54.2 -21% | 87.6 27% | 45 -35% | |
| Color Space (Percent of sRGB) (%) | 98 | 99 1% | 89 -9% | 94 -4% | 82.6 -16% | 99.5 2% | 71 -28% | |
| Total Average (Program / Settings) | -12% /
-7% | 3% /
-3% | -8% /
-16% | -2% /
-7% | 13% /
8% | -16% /
-26% | 18% /
23% |
* ... smaller is better
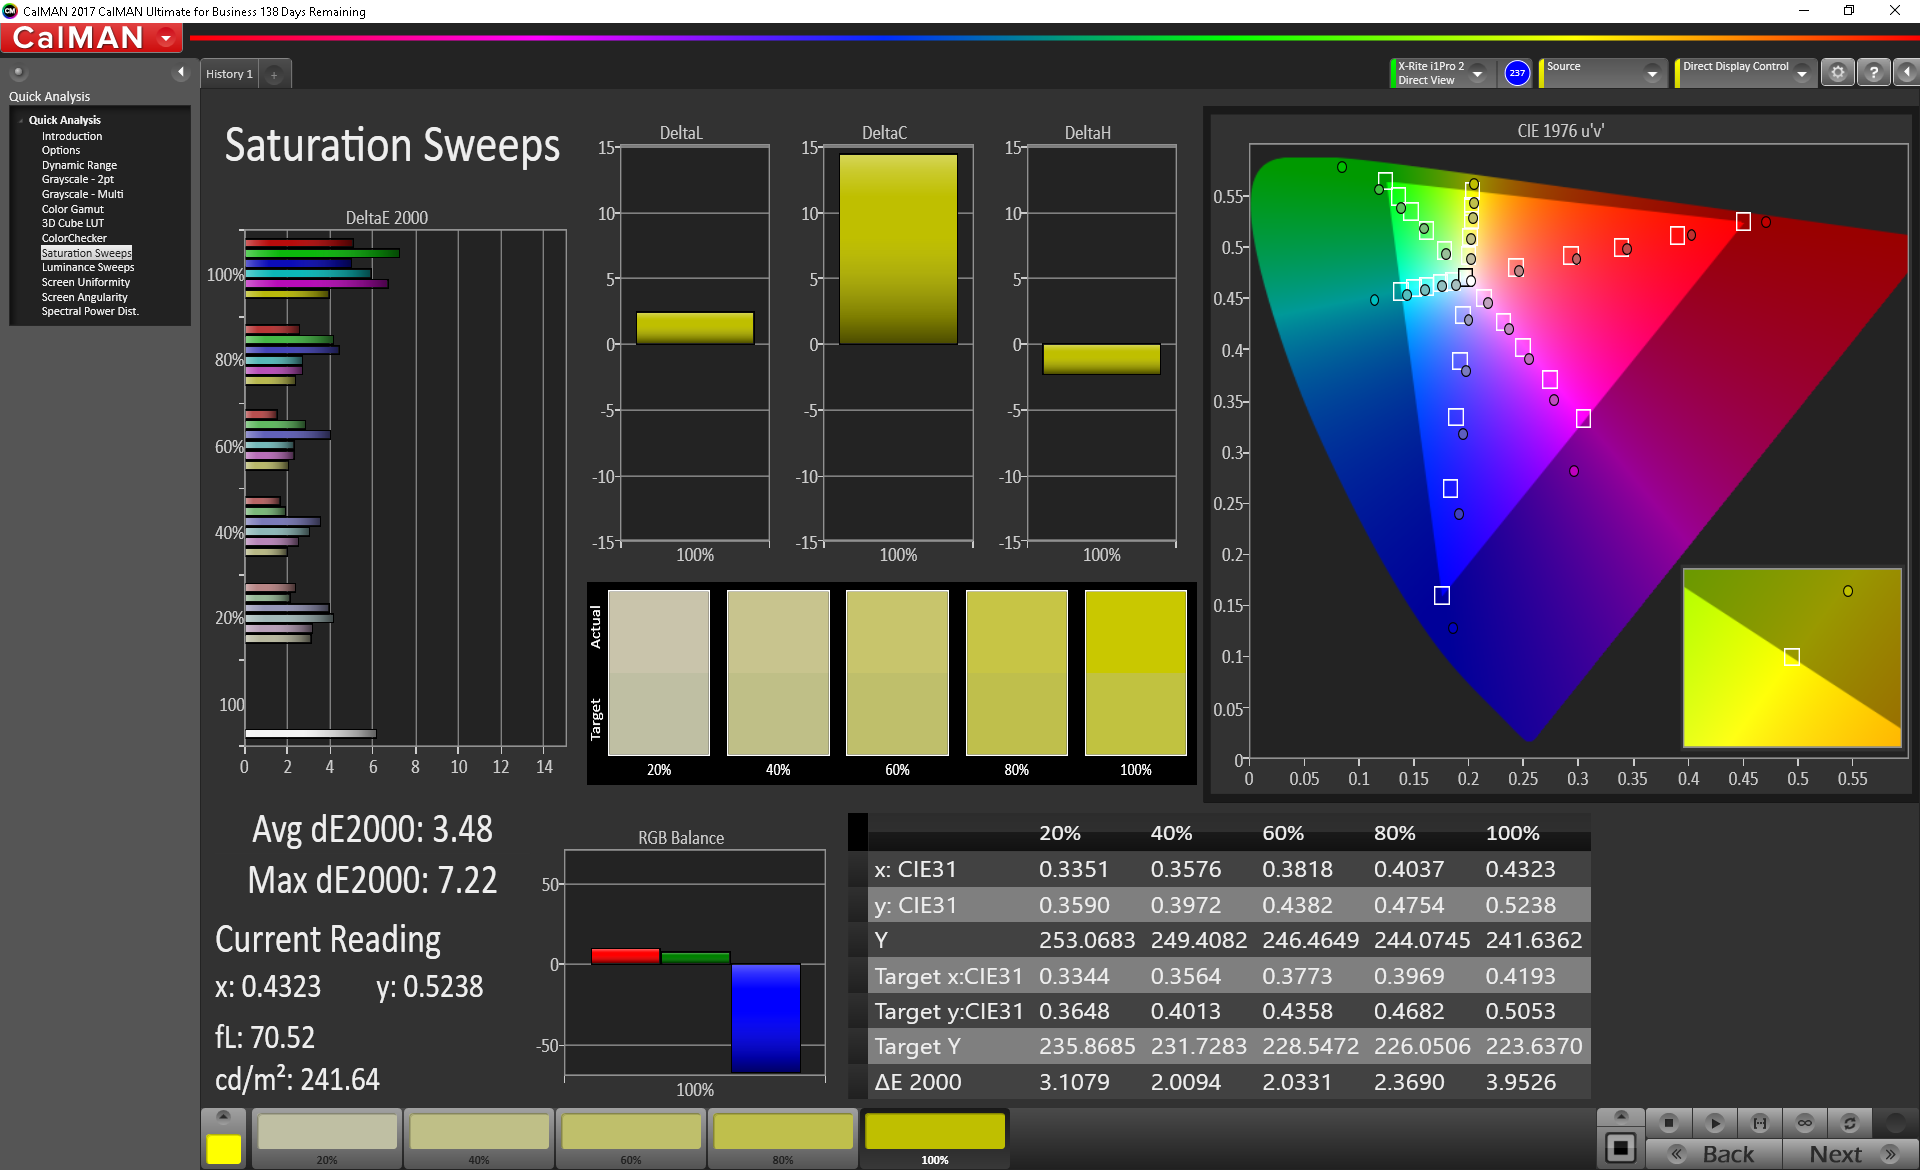
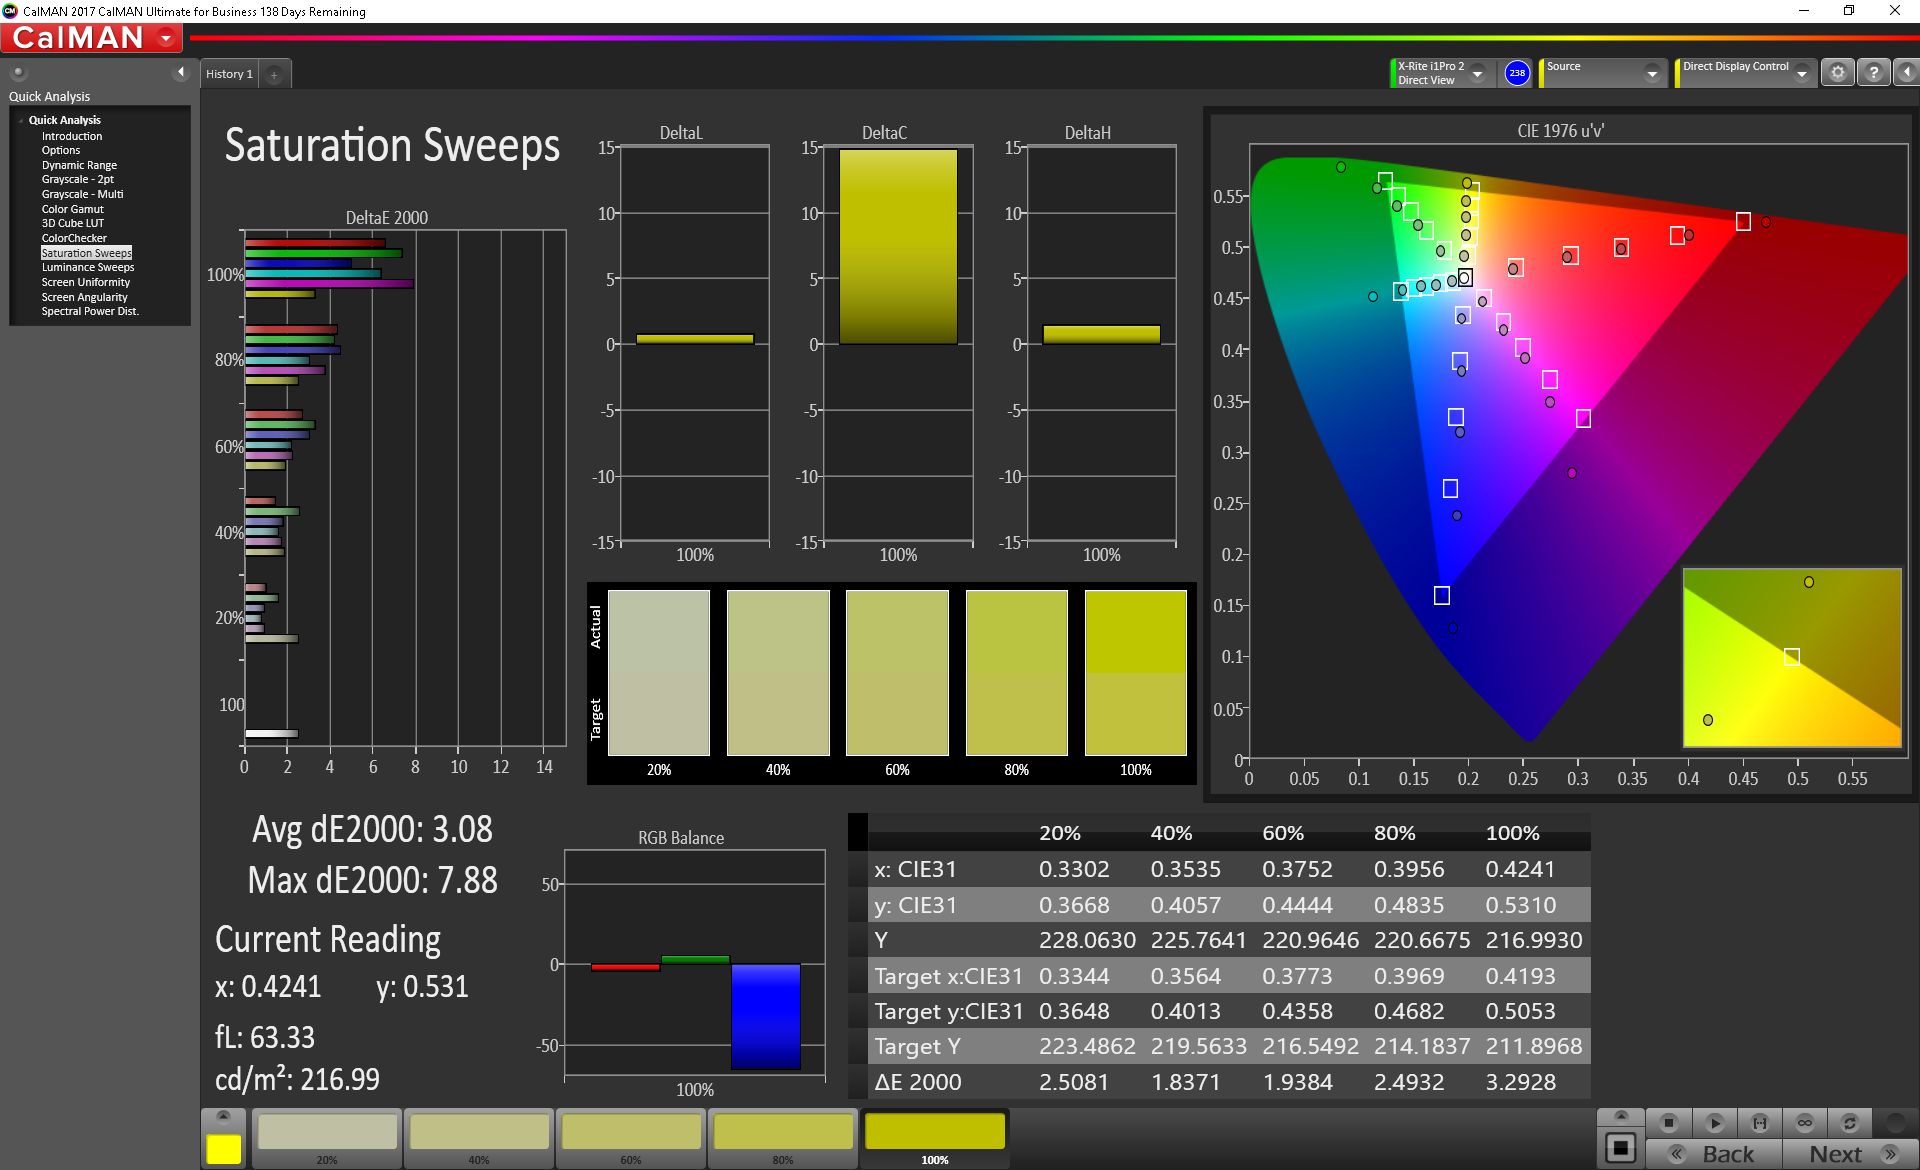
The Precision 5530's display covers almost the entire sRGB gamut and about 70% of the AdobeRGB gamut, placing it above most other workstations. The sRGB gamut should provide more than enough colors for most professionals, but those that work with color (such as photographers and graphic designers) may need a bit more selection. Those users should look at ThinkPad P51, which covers the sRGB gamut and 88% of the AdobeRGB gamut. For all others, the Precision 5530 is more than adequate.
The IGZO display flirts with professional-grade color accuracy. The DeltaE2000 score for color sits at 3.11 out of the box. This is just outside the range of what is generally considered acceptable for professional color work (DeltaE2000 of 3 or less). Calibration improves this number slightly, which could mean that Dell tunes the display prior to shipping the device. Either way, the color accuracy positions the Precision 5530 as a machine suitable for amateur or semi-professional photography and videography jobs. The ThinkPad P51 and 2018 MacBook Pro 15 are better options for color work.
Display Response Times
| ↔ Response Time Black to White | ||
|---|---|---|
| 33.6 ms ... rise ↗ and fall ↘ combined | ↗ 19.6 ms rise | 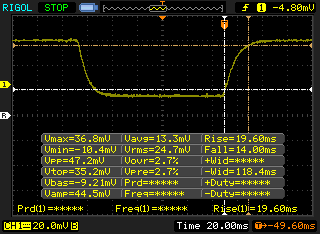 |
| ↘ 14 ms fall | ||
| The screen shows slow response rates in our tests and will be unsatisfactory for gamers. In comparison, all tested devices range from 0.1 (minimum) to 240 (maximum) ms. » 90 % of all devices are better. This means that the measured response time is worse than the average of all tested devices (19.8 ms). | ||
| ↔ Response Time 50% Grey to 80% Grey | ||
| 48 ms ... rise ↗ and fall ↘ combined | ↗ 24.4 ms rise | 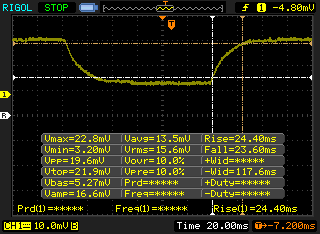 |
| ↘ 23.6 ms fall | ||
| The screen shows slow response rates in our tests and will be unsatisfactory for gamers. In comparison, all tested devices range from 0.165 (minimum) to 636 (maximum) ms. » 82 % of all devices are better. This means that the measured response time is worse than the average of all tested devices (31 ms). | ||
Screen Flickering / PWM (Pulse-Width Modulation)
| Screen flickering / PWM detected | 1000 Hz | 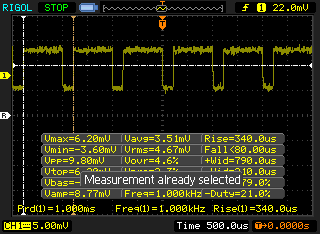 | |
The display backlight flickers at 1000 Hz (worst case, e.g., utilizing PWM) . The frequency of 1000 Hz is quite high, so most users sensitive to PWM should not notice any flickering. In comparison: 52 % of all tested devices do not use PWM to dim the display. If PWM was detected, an average of 7754 (minimum: 5 - maximum: 343500) Hz was measured. | |||
Due to its bright backlight, the Precision 5530 can be used outdoors under most conditions. If there is some cloud cover or a bit of shade, the screen remains completely visible. In direct sunlight, however, the reflective glass does the screen no favors.
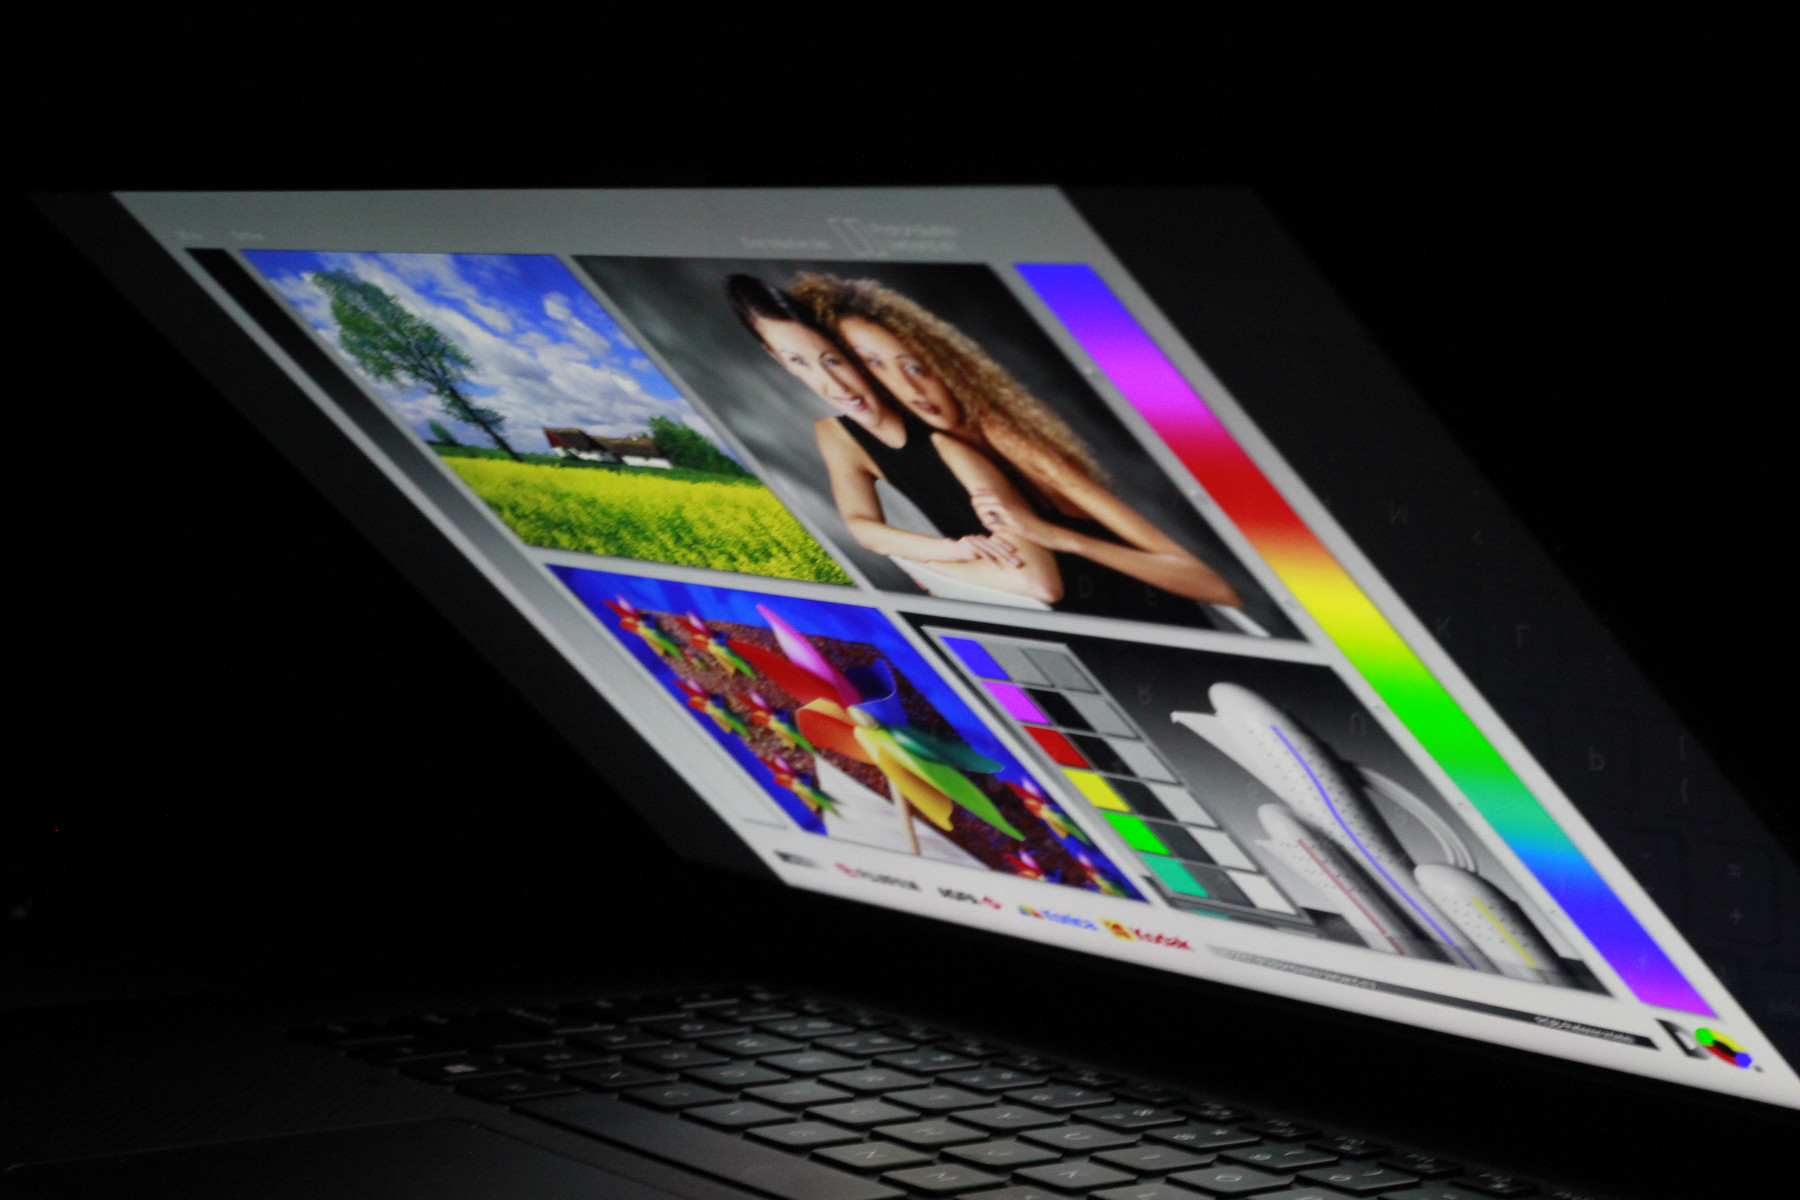
Backlight bleed is minimal and is only seen in the bottom corners. This isn't distracting during normal use. Viewing angles are excellent; the screen remains sharp and vibrant when viewed from almost any angle.


Performance
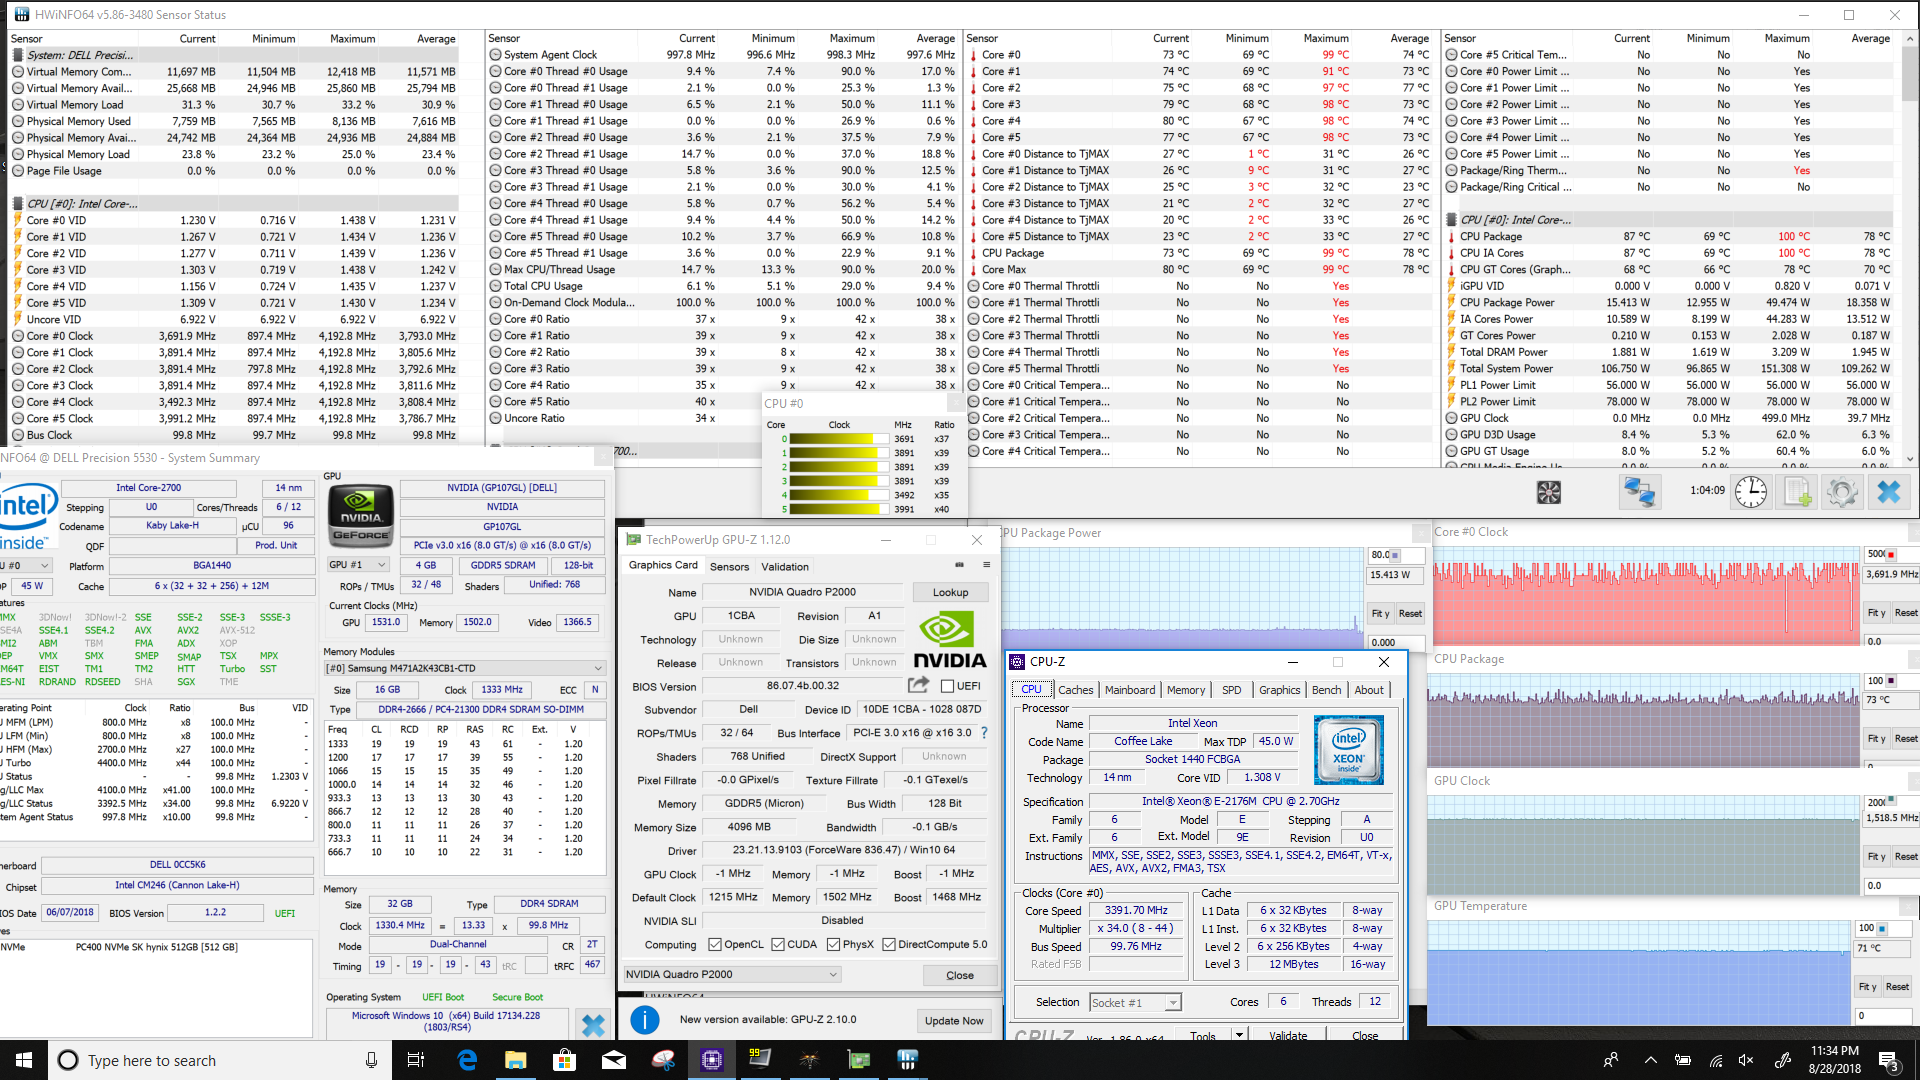
We are particularly interested in the Precision's 5530 performance. Last year's Precision 5520 put up decent numbers, but inconsistency and thermal throttling plagued the CPU. Can the Precision 5530, with its new six-core Xeon CPU and more powerful Quadro GPU, improve performance without succumbing to the same throttling issues? Let's take a look.
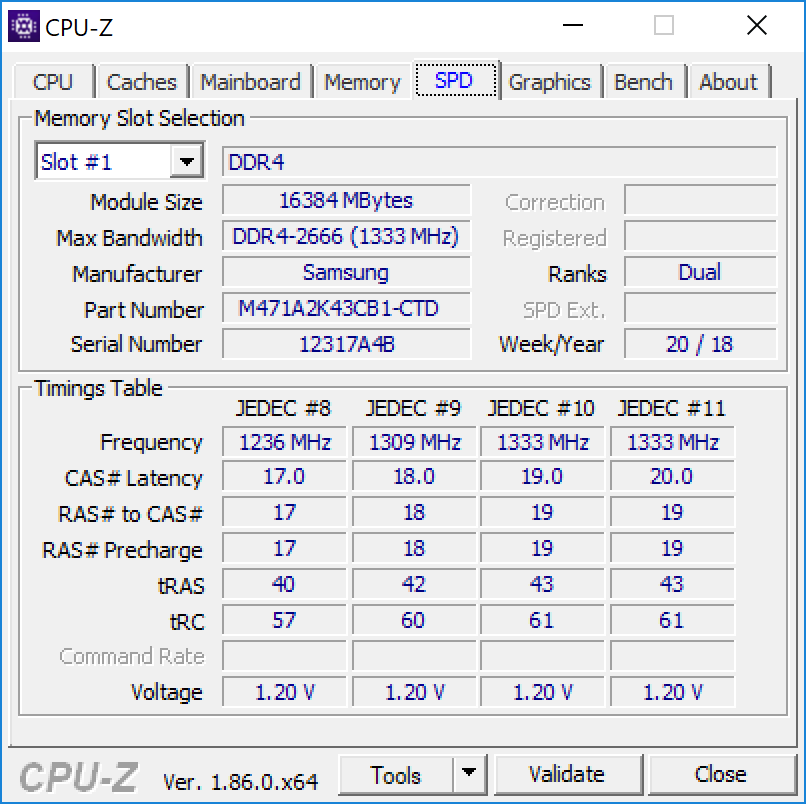
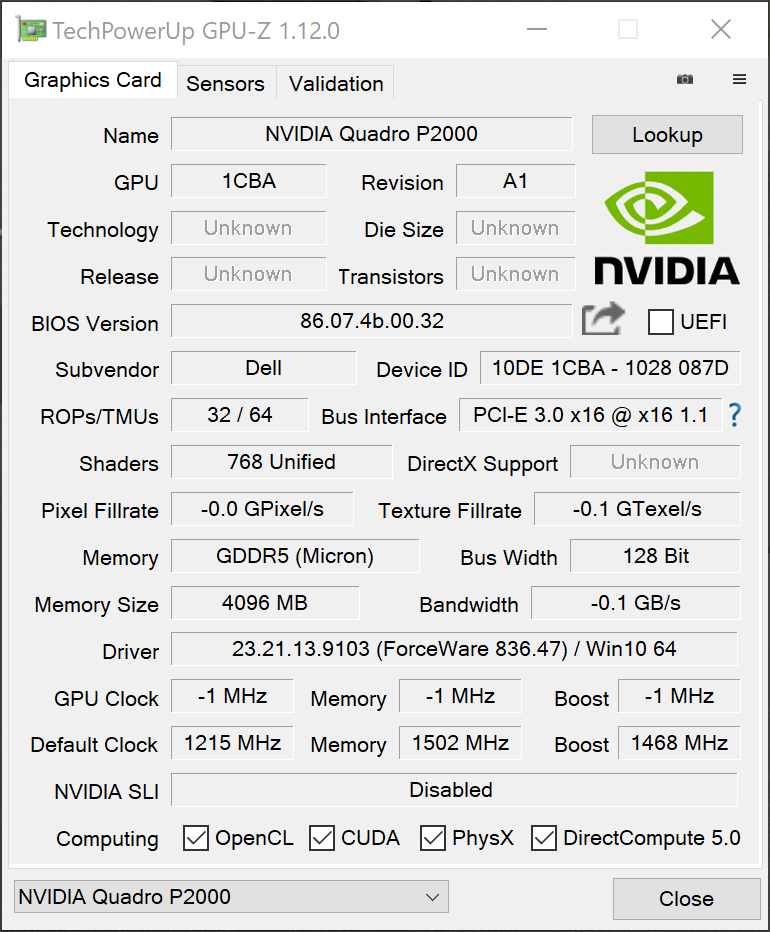
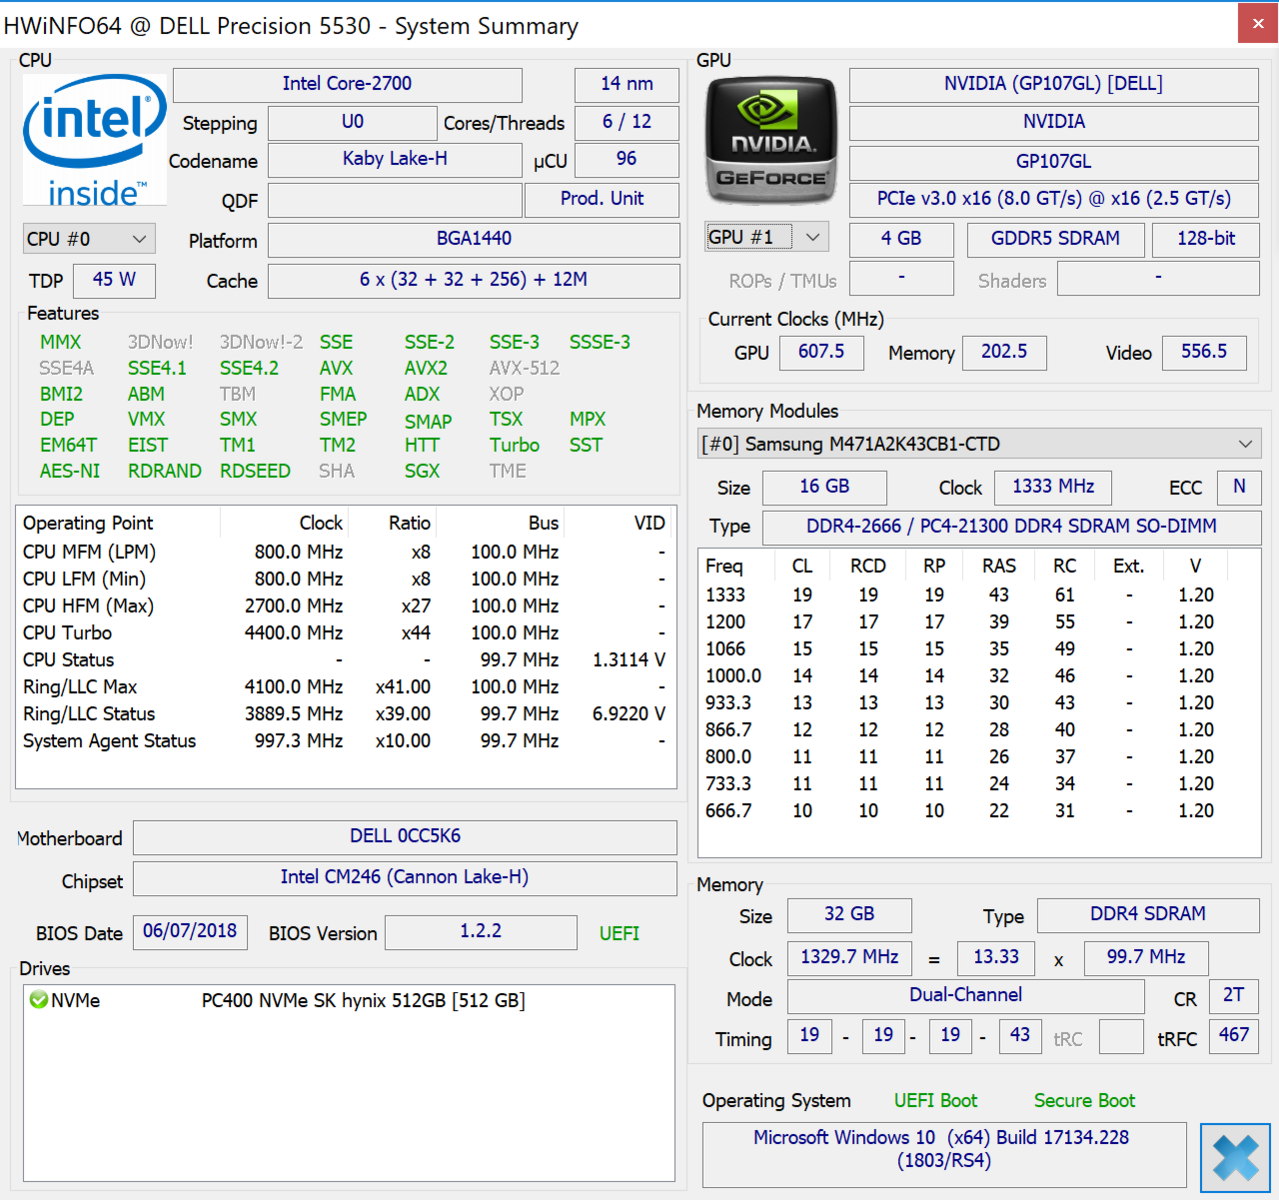
The Precision 5530 can be configured with a variety of CPU options ranging from the Core i5-8300H up to the Core i9-8950HK. GPU options include integrated Intel HD Graphics, the Nvidia Quadro P1000, or the Nvidia Quadro P2000. ECC RAM is not available from Dell. Our model is powered by the Intel Core Xeon E-2176M (2.7 - 4.4 GHz) and Nvidia Quadro P2000.
(Note: the Xeon E-2176M CPU and Quadro P2000 GPU are so new that HWiNFO and GPU-Z were not able to recognize them. However, the software was able to accurately measure clock speeds and temperatures for both chips.)

Processor
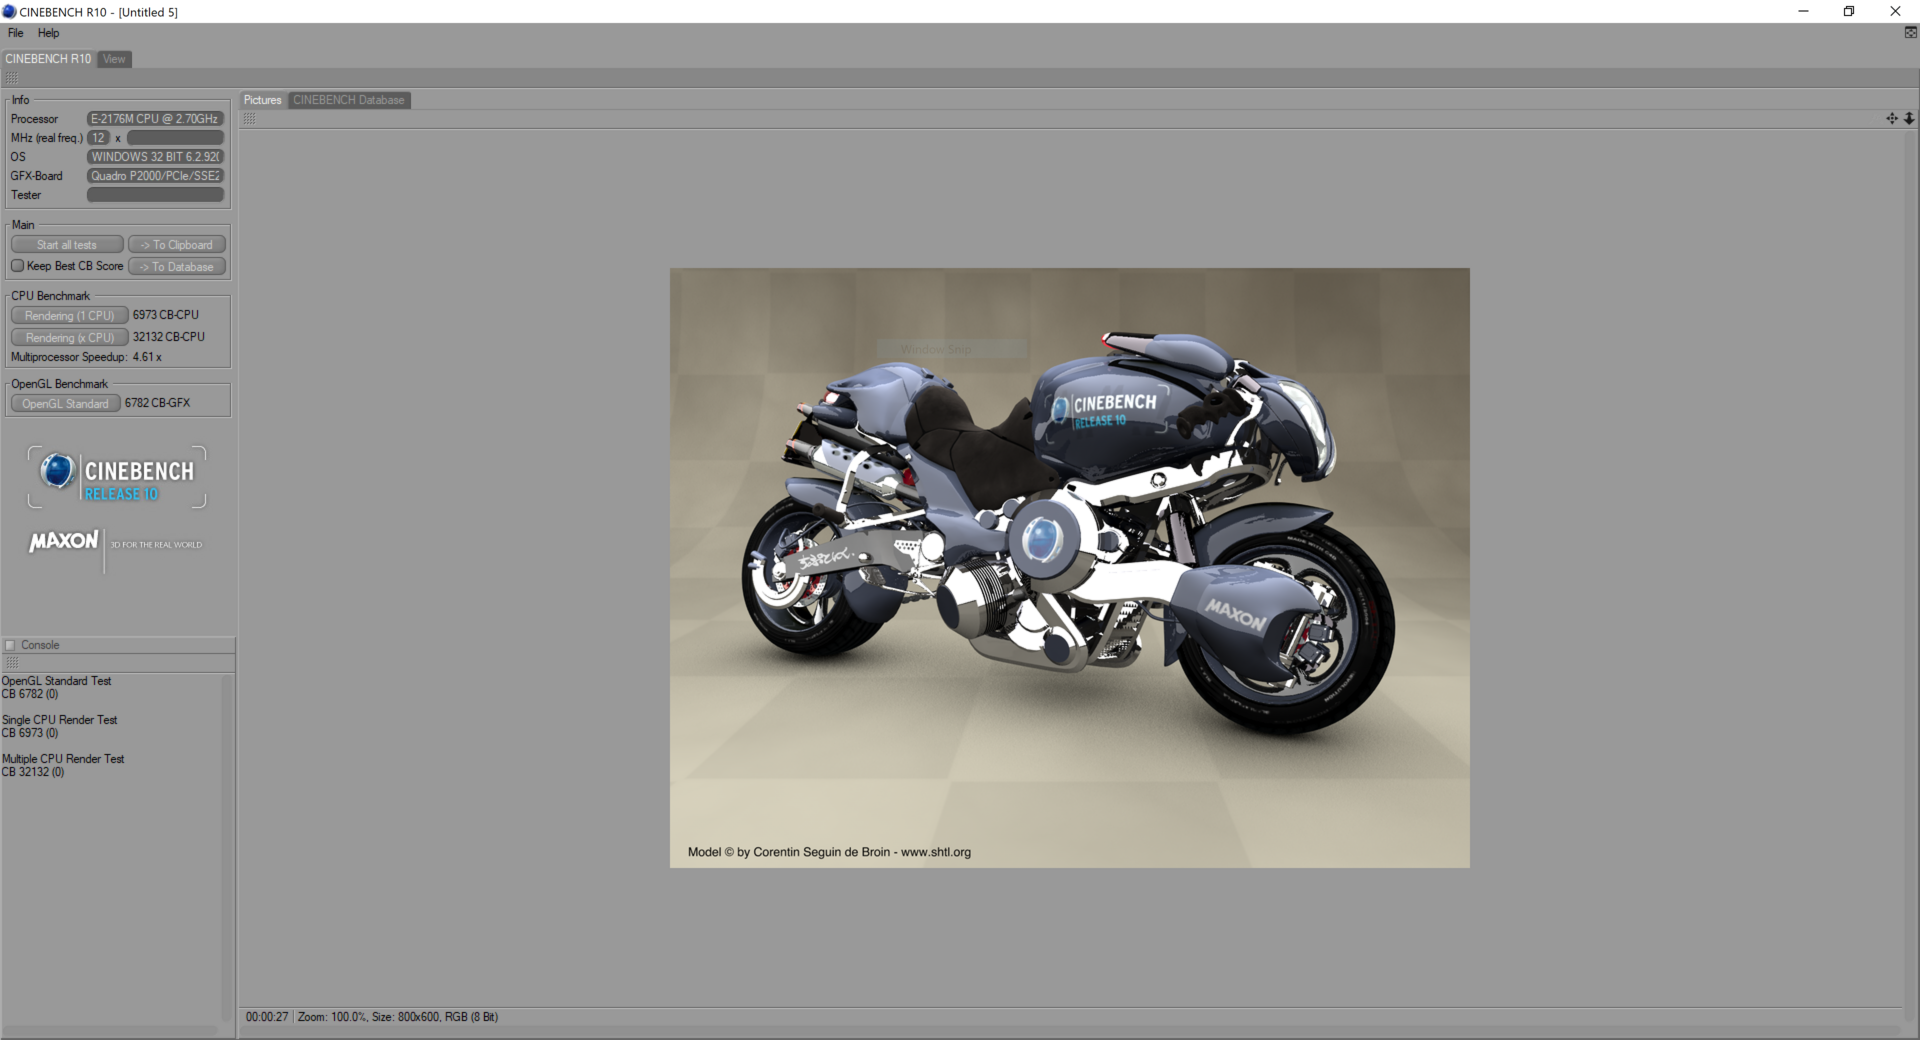
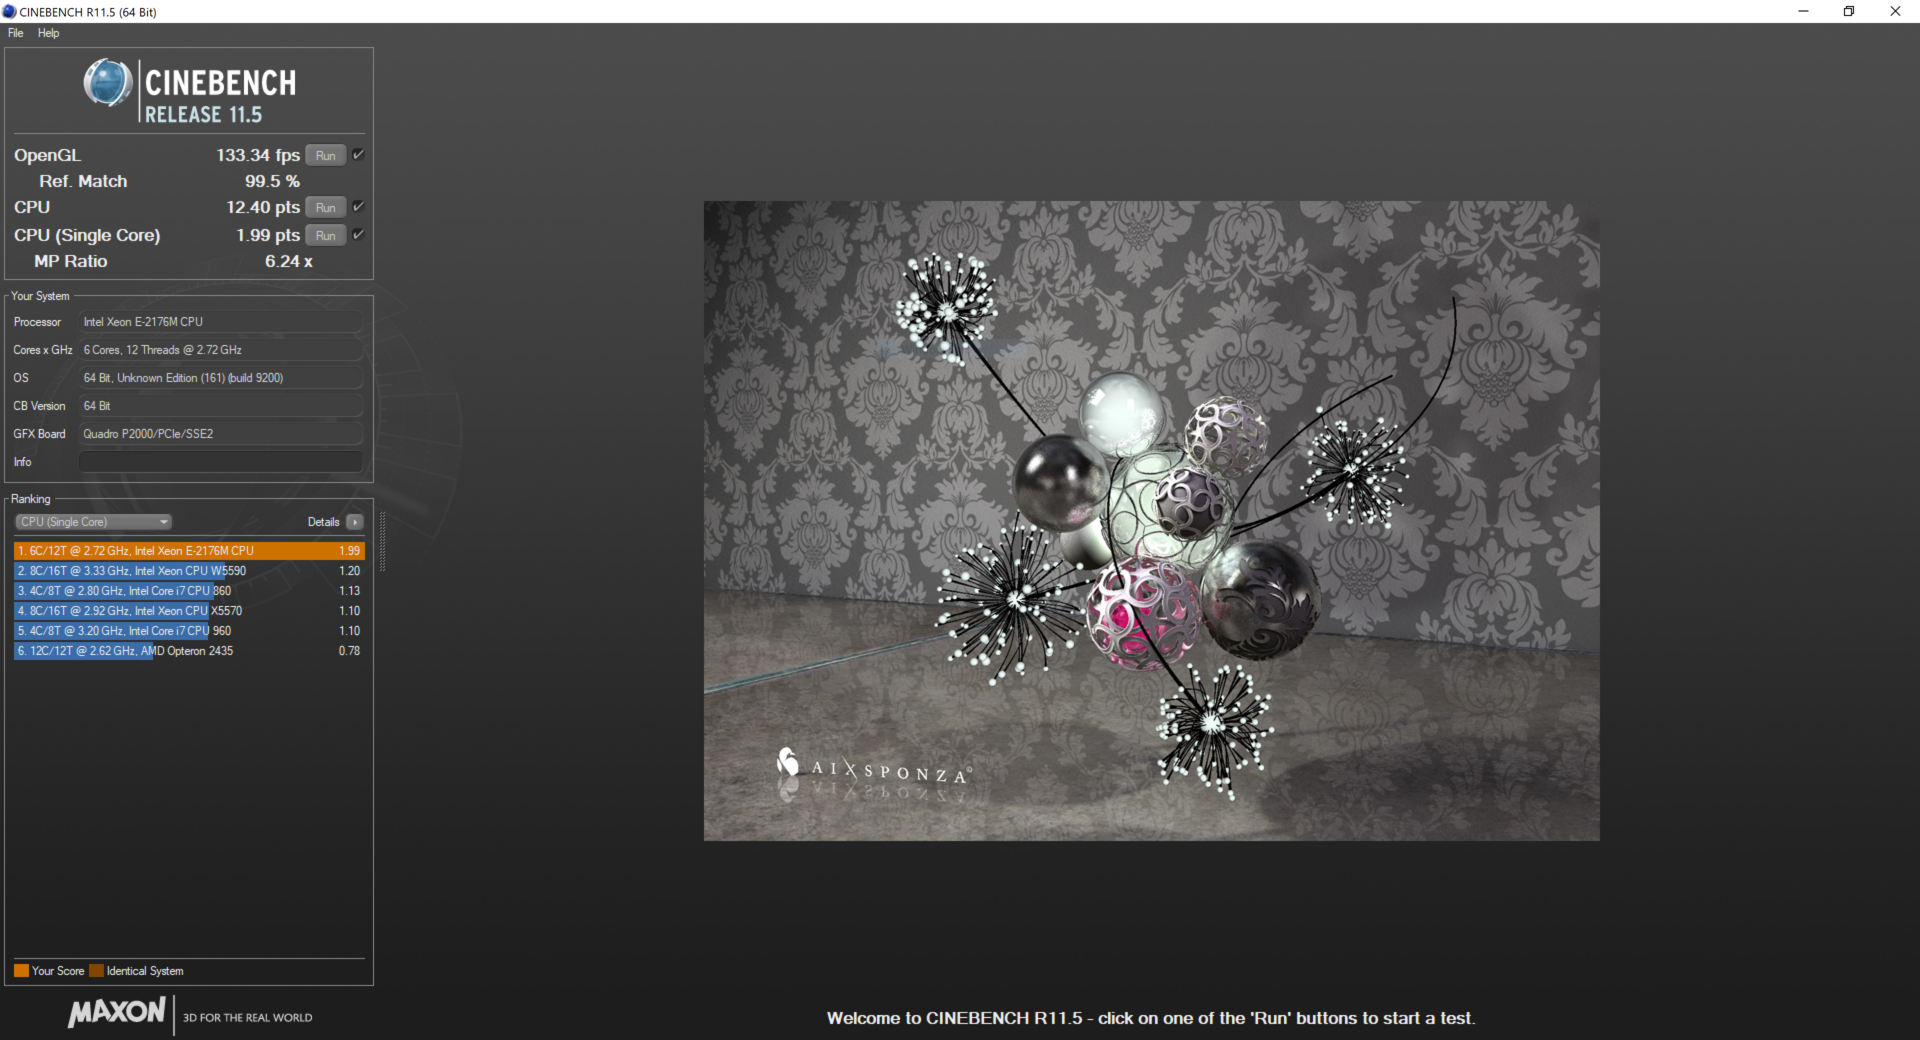
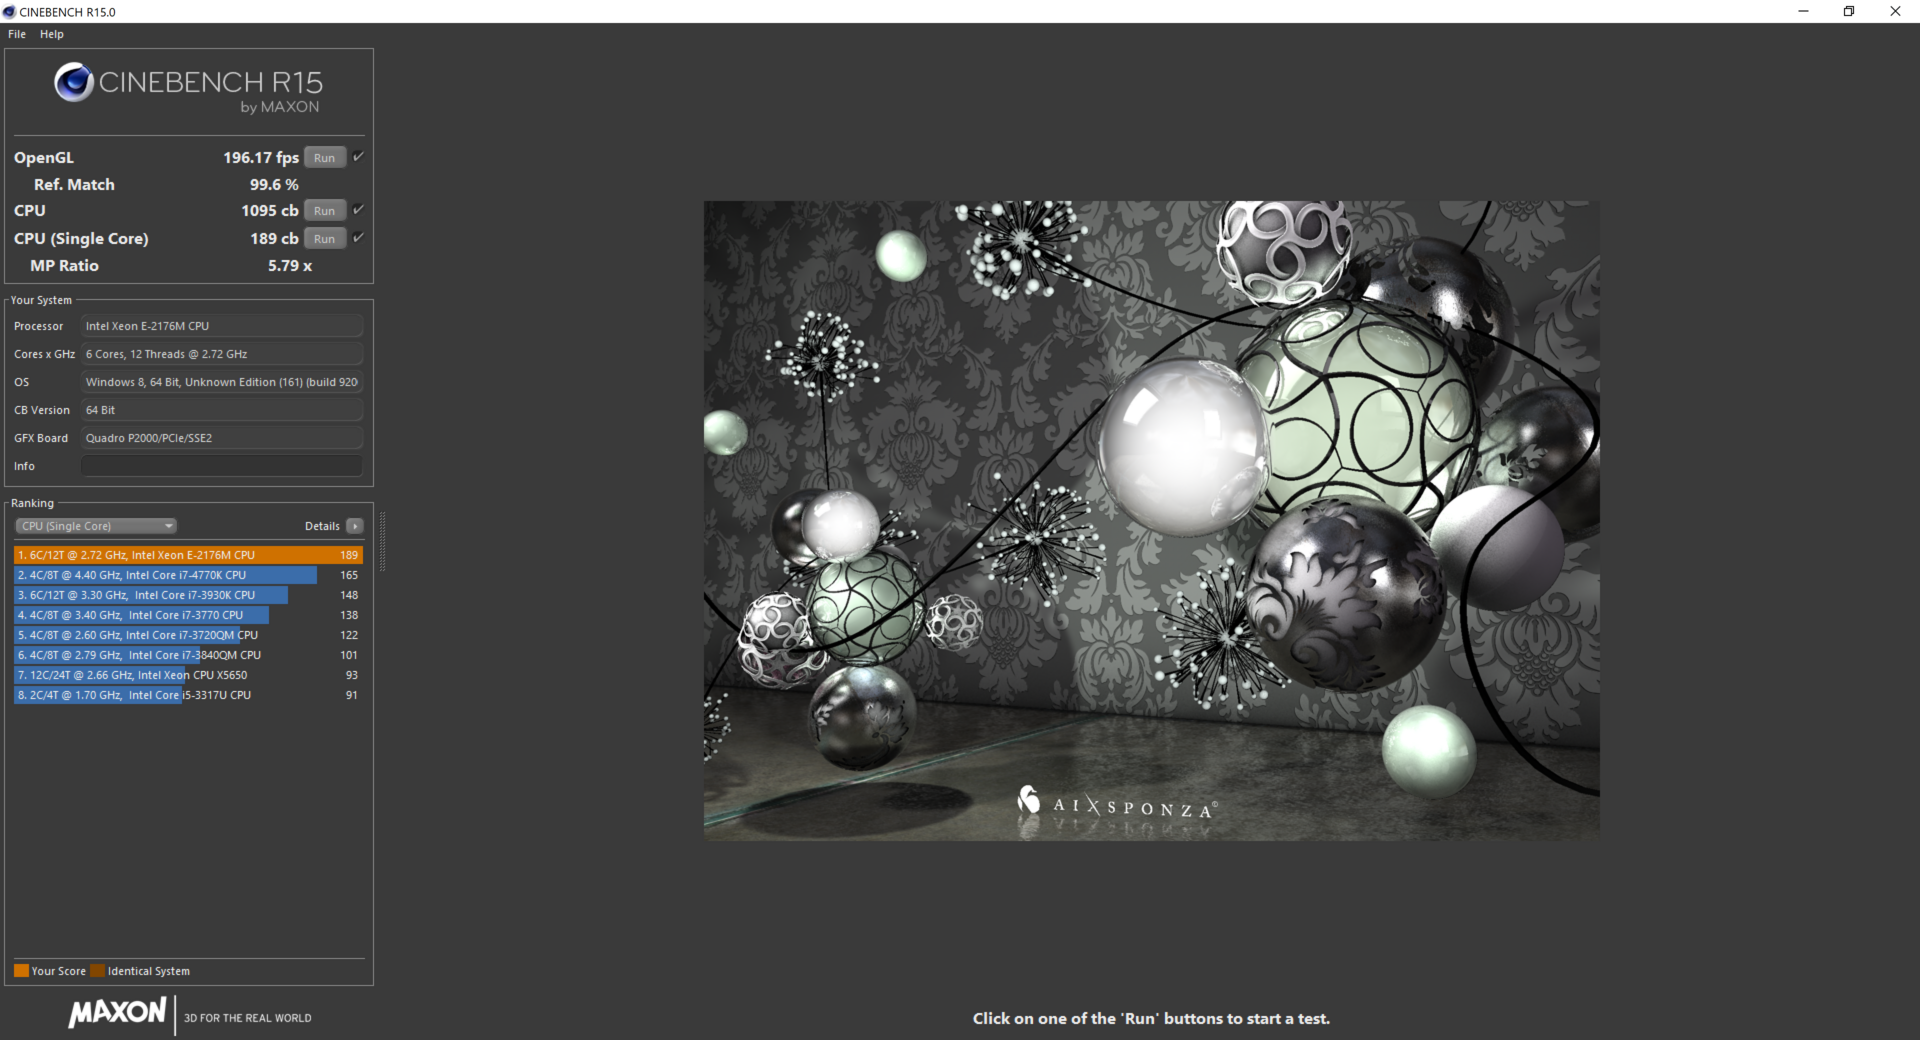
The Xeon E-2176M is a new workstation-grade CPU from Intel. With six hyperthreaded cores rather than four, we can expect some significant improvement over the Xeon E3-1505M used in the Precision 5520. This is indeed what we see; in Cinebench R15's multi-core test, the Precision 5530 outperforms its older brother by 67%. The Xeon E-2176M is about as powerful as the Coffee Lake Core i7-8750H used in many new gaming laptops. Users should therefore expect similar performance in multi-threaded workloads.
Perhaps the best change brought by the Precision 5530 is improved CPU stability. While the Precision 5520 showed wild and erratic behavior in our Cinebench R15 loop, the 5530 remains fairly stable. There is a slight drop in performance after the first run (about 9%), but the CPU settles in with little variance over the next 49 iterations. On battery, the Precision 5530 is able to maintain 85-90% of its plugged-in performance.
For more information about the Intel Xeon E-2176M, please see our dedicated CPU page here.
| wPrime 2.10 - 1024m | |
| Dell Precision 5520 UHD | |
| Eurocom Tornado F5W | |
| Average of class Workstation (n=1last 2 years) | |
| Average Intel Xeon E-2176M (147 - 179.6, n=2) | |
| Dell Precision 5530 Xeon E-2176M | |
* ... smaller is better
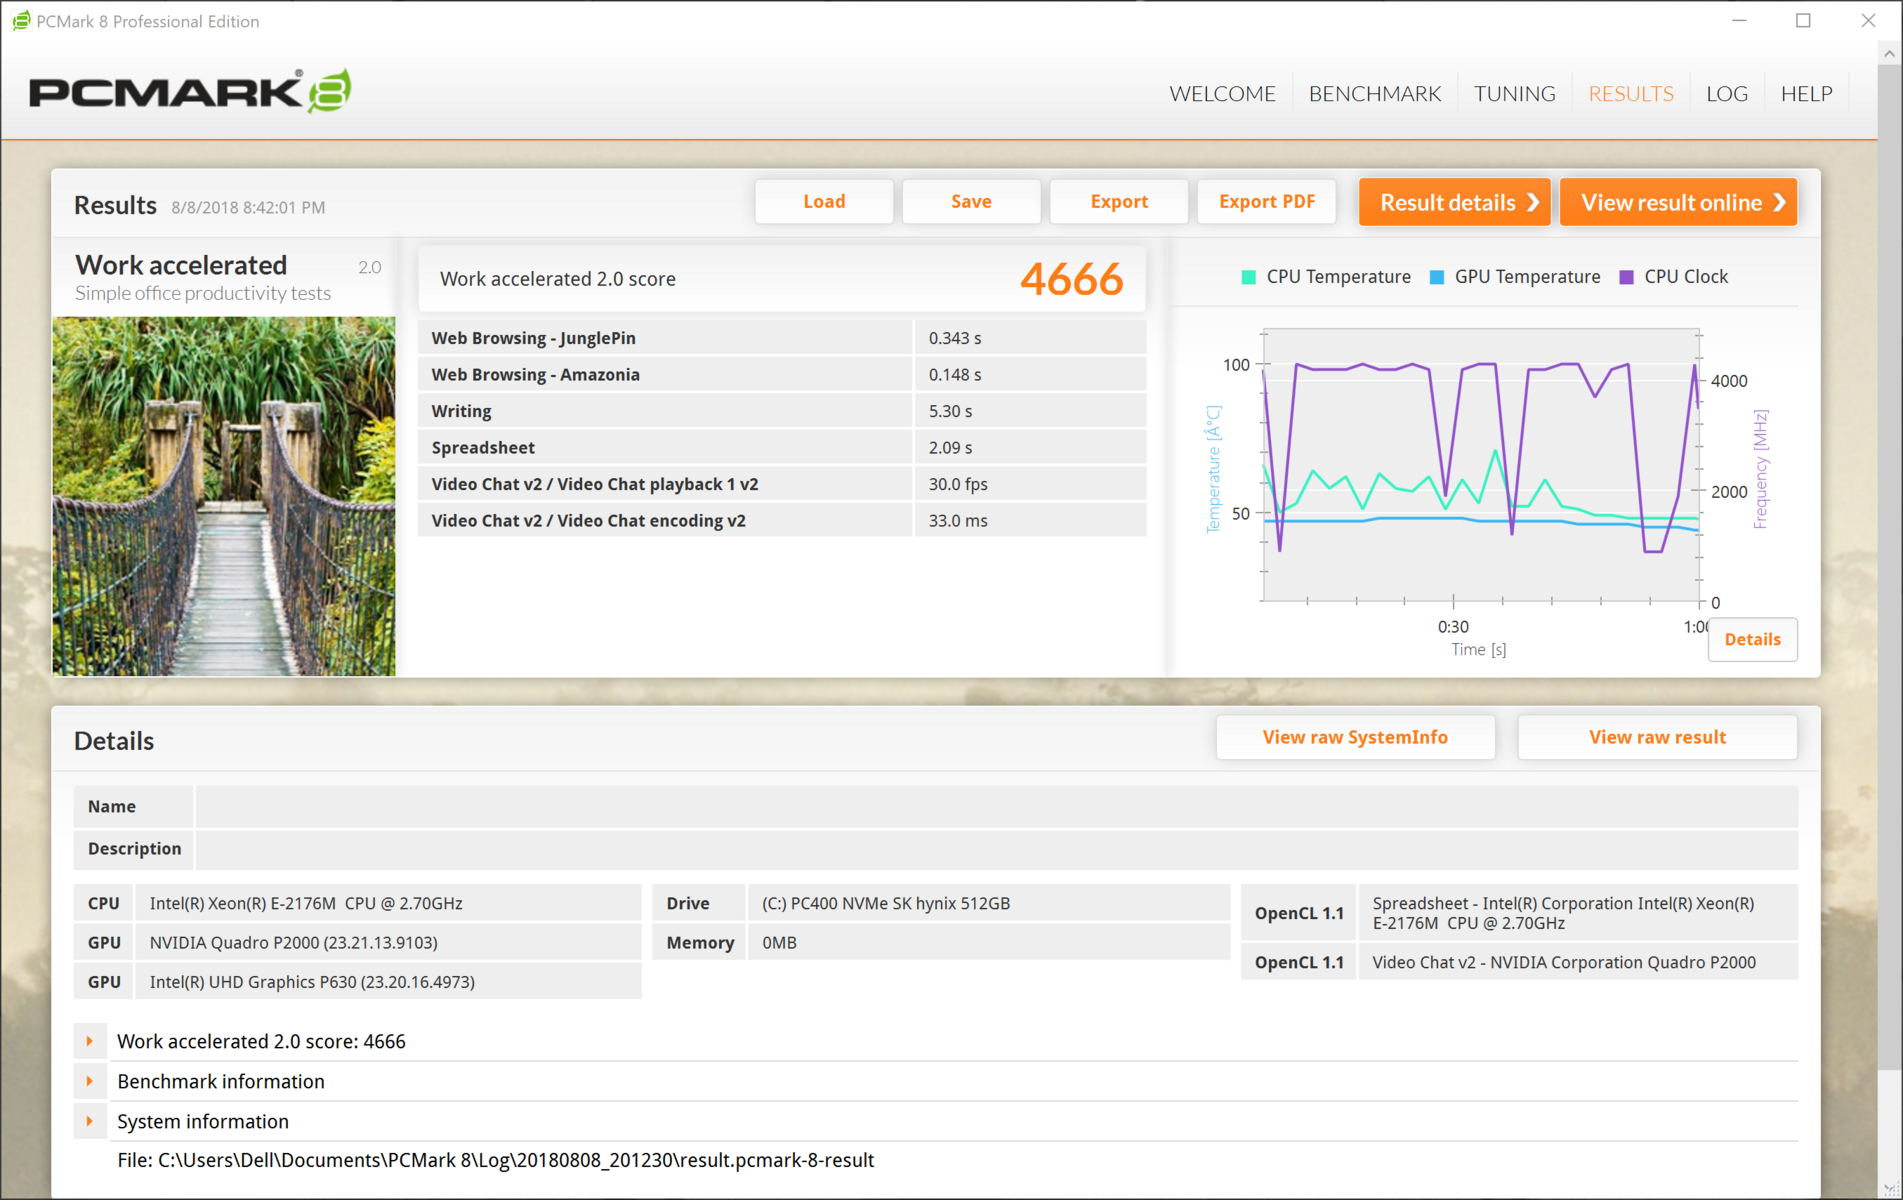
System Performance
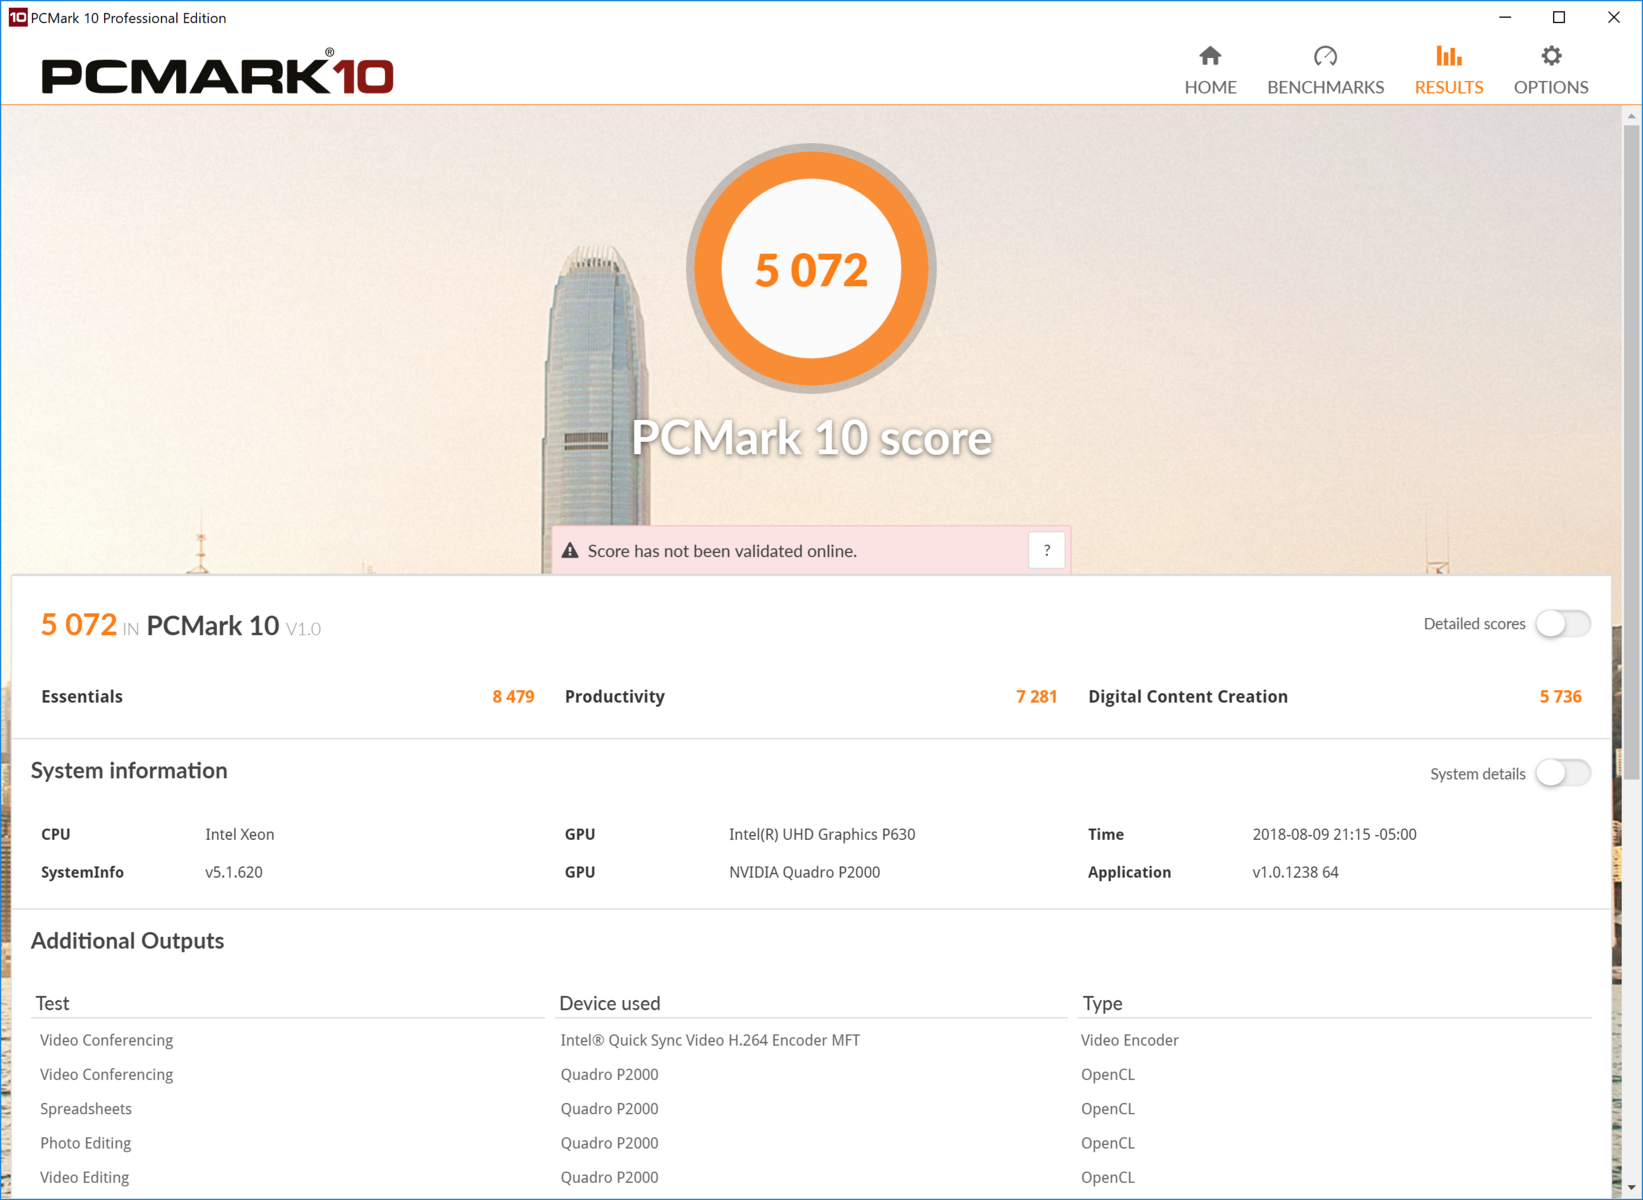
System performance is about average for a workstation. The Xeon E-2176M and Quadro P2000 are well-paired and make short work of any basic task thrown their way. Heavier workloads, such as drafting or modelling, should be manageable.
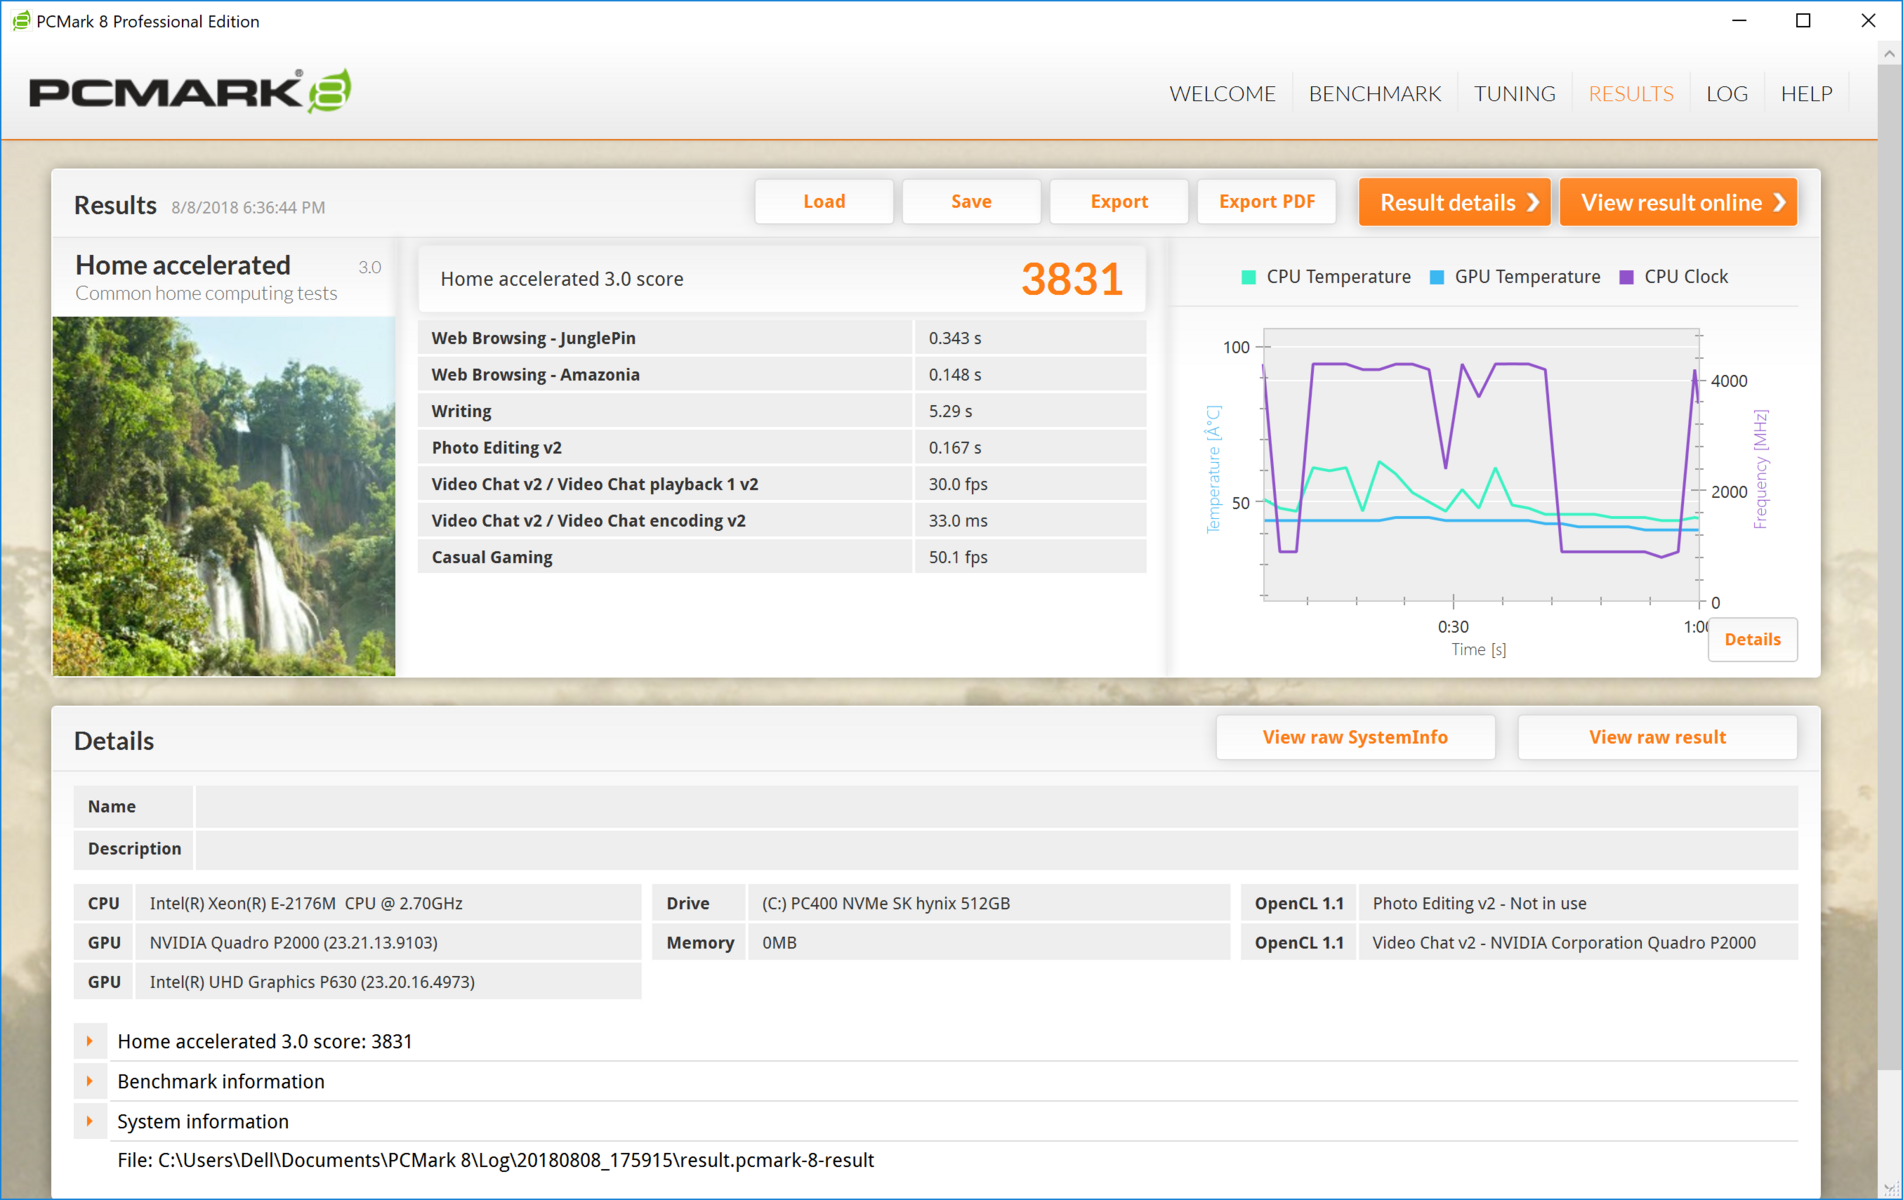
| PCMark 8 Home Score Accelerated v2 | 3831 points | |
| PCMark 8 Creative Score Accelerated v2 | 5351 points | |
| PCMark 8 Work Score Accelerated v2 | 4666 points | |
| PCMark 10 Score | 5072 points | |
Help | ||
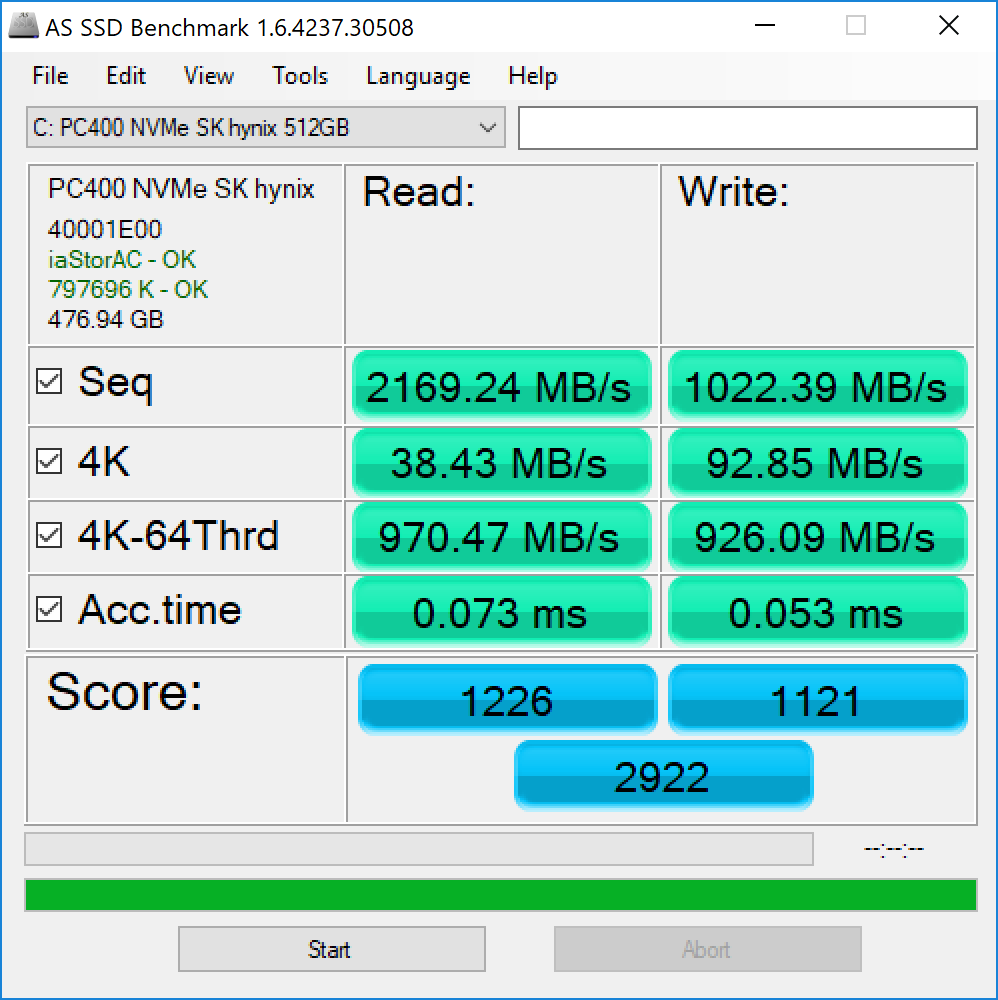
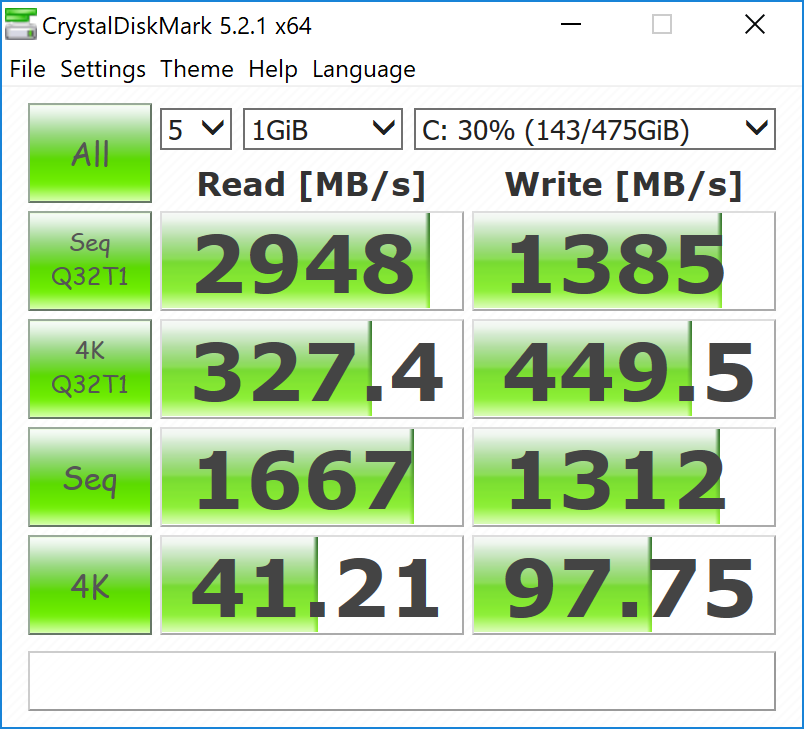
Storage Devices
The SK Hynix PCIe SSD is quick but falls short of Samsung's NVMe drives. Still, most users will find little complaint with the included SSD. In typical Dell fashion, there are several storage options available to the end user, up to a 2 TB M.2 NVMe SSD and a 2 TB 2.5" SATA drive. However, the 2.5" drives are only available in models with a smaller 56 Wh battery. Our model, which has a 97 Wh battery, can only accept one M.2 SSD. The drive is replaceable by end users.
| Dell Precision 5530 Xeon E-2176M SK hynix PC400 512 GB | Dell Precision 5520 UHD Samsung SM961 MZVKW512HMJP m.2 PCI-e | Lenovo ThinkPad P52S-20LB001FUS Samsung SSD PM981 MZVLB1T0HALR | Dell Precision 3530 SK hynix PC400 512 GB | HP ZBook 15 G4-Y4E80AV Samsung SSD SM961 1TB M.2 MZVKW1T0HMLH | Lenovo ThinkPad P51 20HH0016GE Samsung PM961 NVMe MZVLW512HMJP | MSI WS63VR 7RL-023US Toshiba NVMe THNSN5512GPU7 | Apple MacBook Pro 15 2018 (2.6 GHz, 560X) Apple SSD AP0512 | Average SK hynix PC400 512 GB | |
|---|---|---|---|---|---|---|---|---|---|
| AS SSD | 38% | 25% | 0% | 48% | 29% | -17% | -48% | -2% | |
| Copy Game MB/s (MB/s) | 921 | 1050 | 982 | 1140 | 1050 ? | ||||
| Copy Program MB/s (MB/s) | 372.8 | 346.1 | 325.4 | 425.6 | 346 ? | ||||
| Copy ISO MB/s (MB/s) | 1659 | 1701 | 1486 | 1607 | 1701 ? | ||||
| Score Total (Points) | 2922 | 3681 26% | 4038 38% | 3013 3% | 4303 47% | 3424 17% | 1979 -32% | 2119 -27% | 2905 ? -1% |
| Score Write (Points) | 1121 | 1379 23% | 1468 31% | 1138 2% | 1472 31% | 917 -18% | 557 -50% | 347 -69% | 1102 ? -2% |
| Score Read (Points) | 1226 | 1554 27% | 1703 39% | 1288 5% | 1902 55% | 1690 38% | 962 -22% | 1199 -2% | 1228 ? 0% |
| Access Time Write * (ms) | 0.053 | 0.023 57% | 0.04 25% | 0.053 -0% | 0.023 57% | 0.025 53% | 0.033 38% | 0.053 ? -0% | |
| Access Time Read * (ms) | 0.073 | 0.038 48% | 0.04 45% | 0.099 -36% | 0.034 53% | 0.032 56% | 0.128 -75% | 0.225 -208% | 0.082 ? -12% |
| 4K-64 Write (MB/s) | 926 | 1055 14% | 1245 34% | 908 -2% | 1136 23% | 623 -33% | 314 -66% | 163.5 -82% | 899 ? -3% |
| 4K-64 Read (MB/s) | 970 | 1223 26% | 1524 57% | 994 2% | 1578 63% | 1372 41% | 710 -27% | 965 -1% | 973 ? 0% |
| 4K Write (MB/s) | 92.8 | 155.3 67% | 100.5 8% | 102.8 11% | 158 70% | 143.1 54% | 114.6 23% | 18.78 -80% | 95.9 ? 3% |
| 4K Read (MB/s) | 38.43 | 51.5 34% | 44.33 15% | 25.98 -32% | 51.7 35% | 55.6 45% | 40.2 5% | 9.46 -75% | 34.5 ? -10% |
| Seq Write (MB/s) | 1022 | 1694 66% | 1220 19% | 1272 24% | 1777 74% | 1506 47% | 1287 26% | 1644 61% | 1075 ? 5% |
| Seq Read (MB/s) | 2169 | 2799 29% | 1351 -38% | 2682 24% | 2719 25% | 2624 21% | 2133 -2% | 2239 3% | 2198 ? 1% |
* ... smaller is better

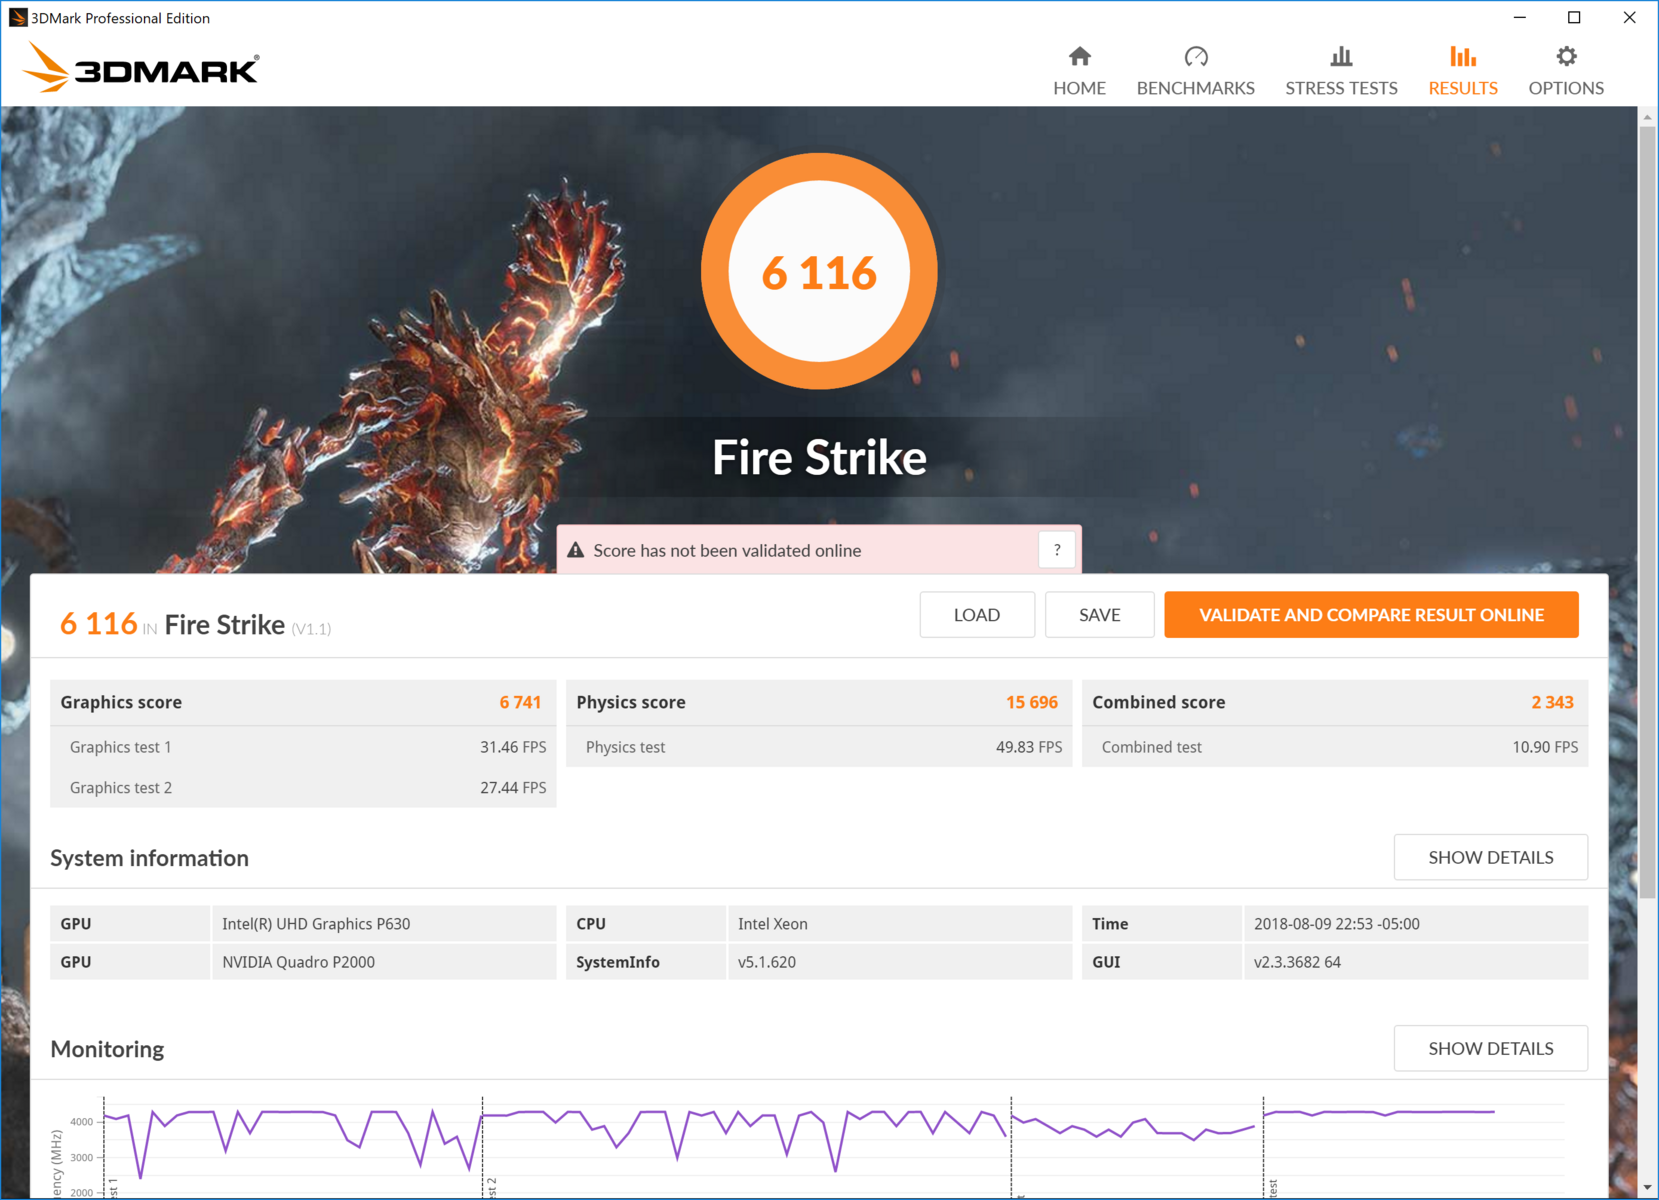
GPU Performance
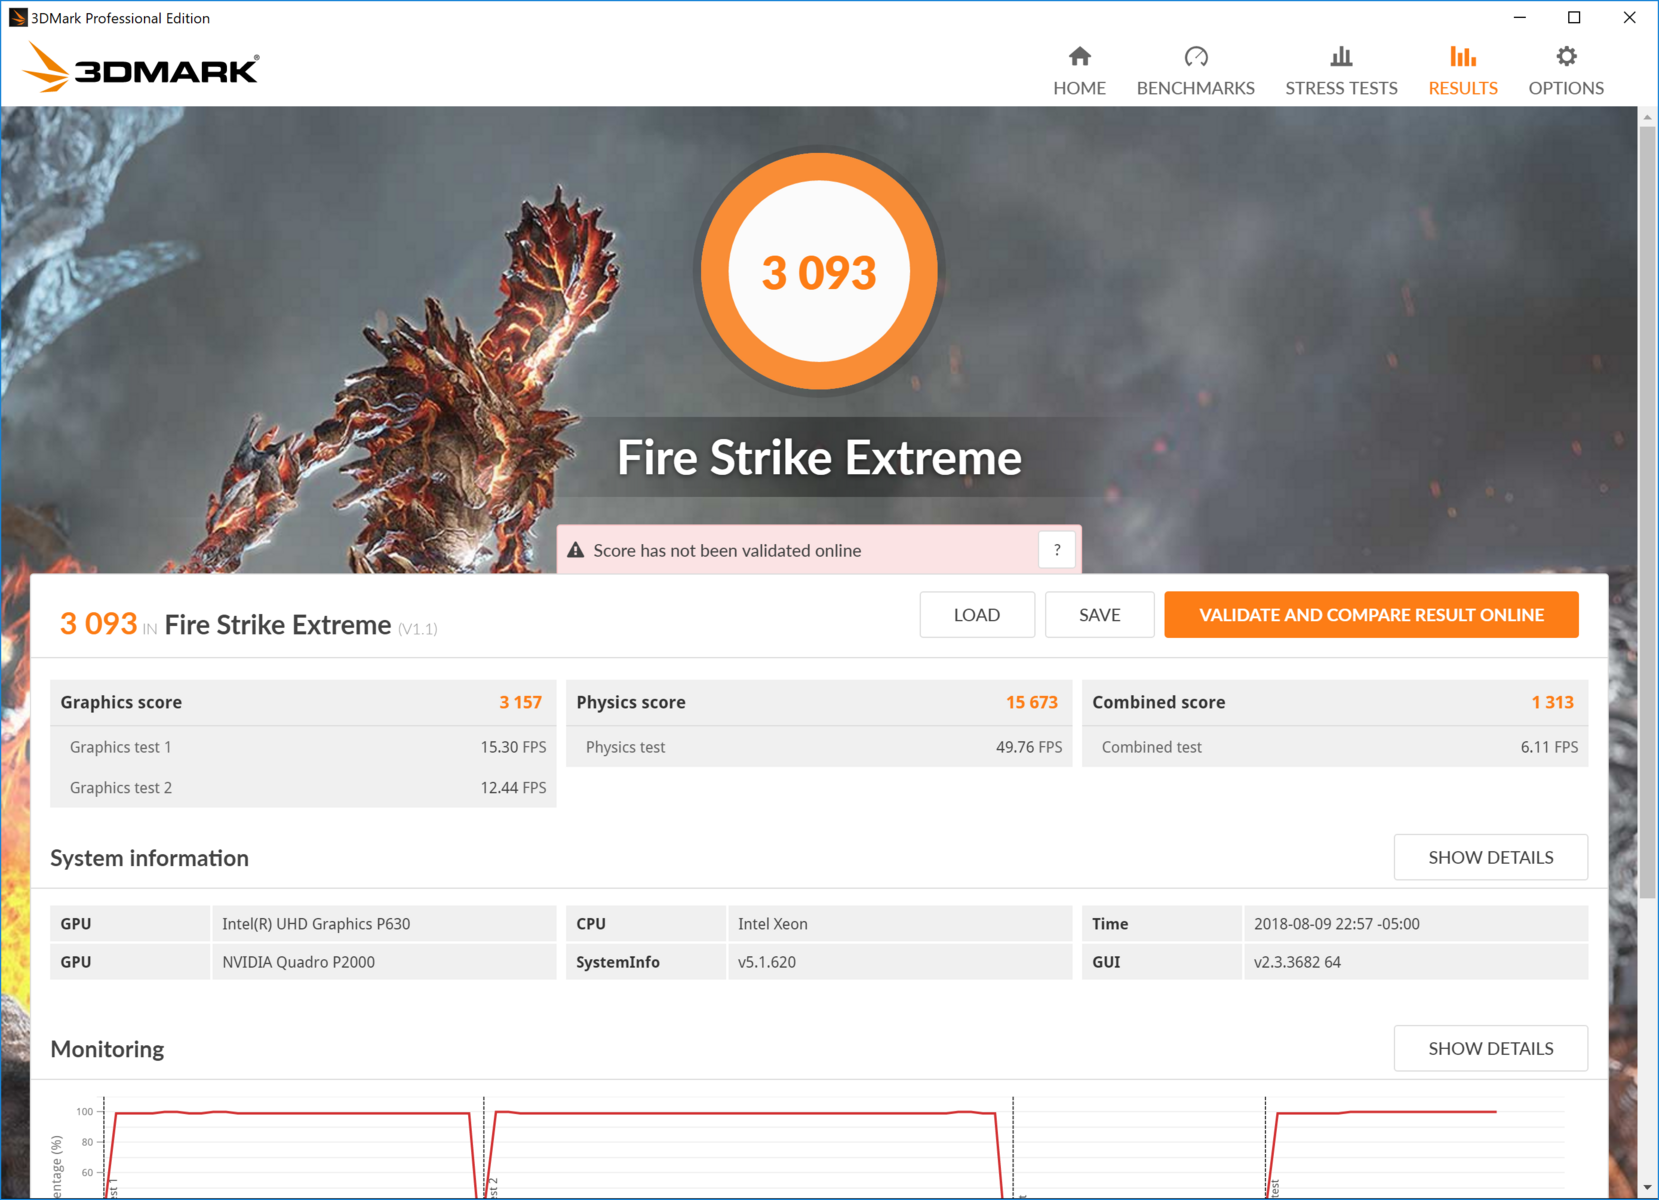
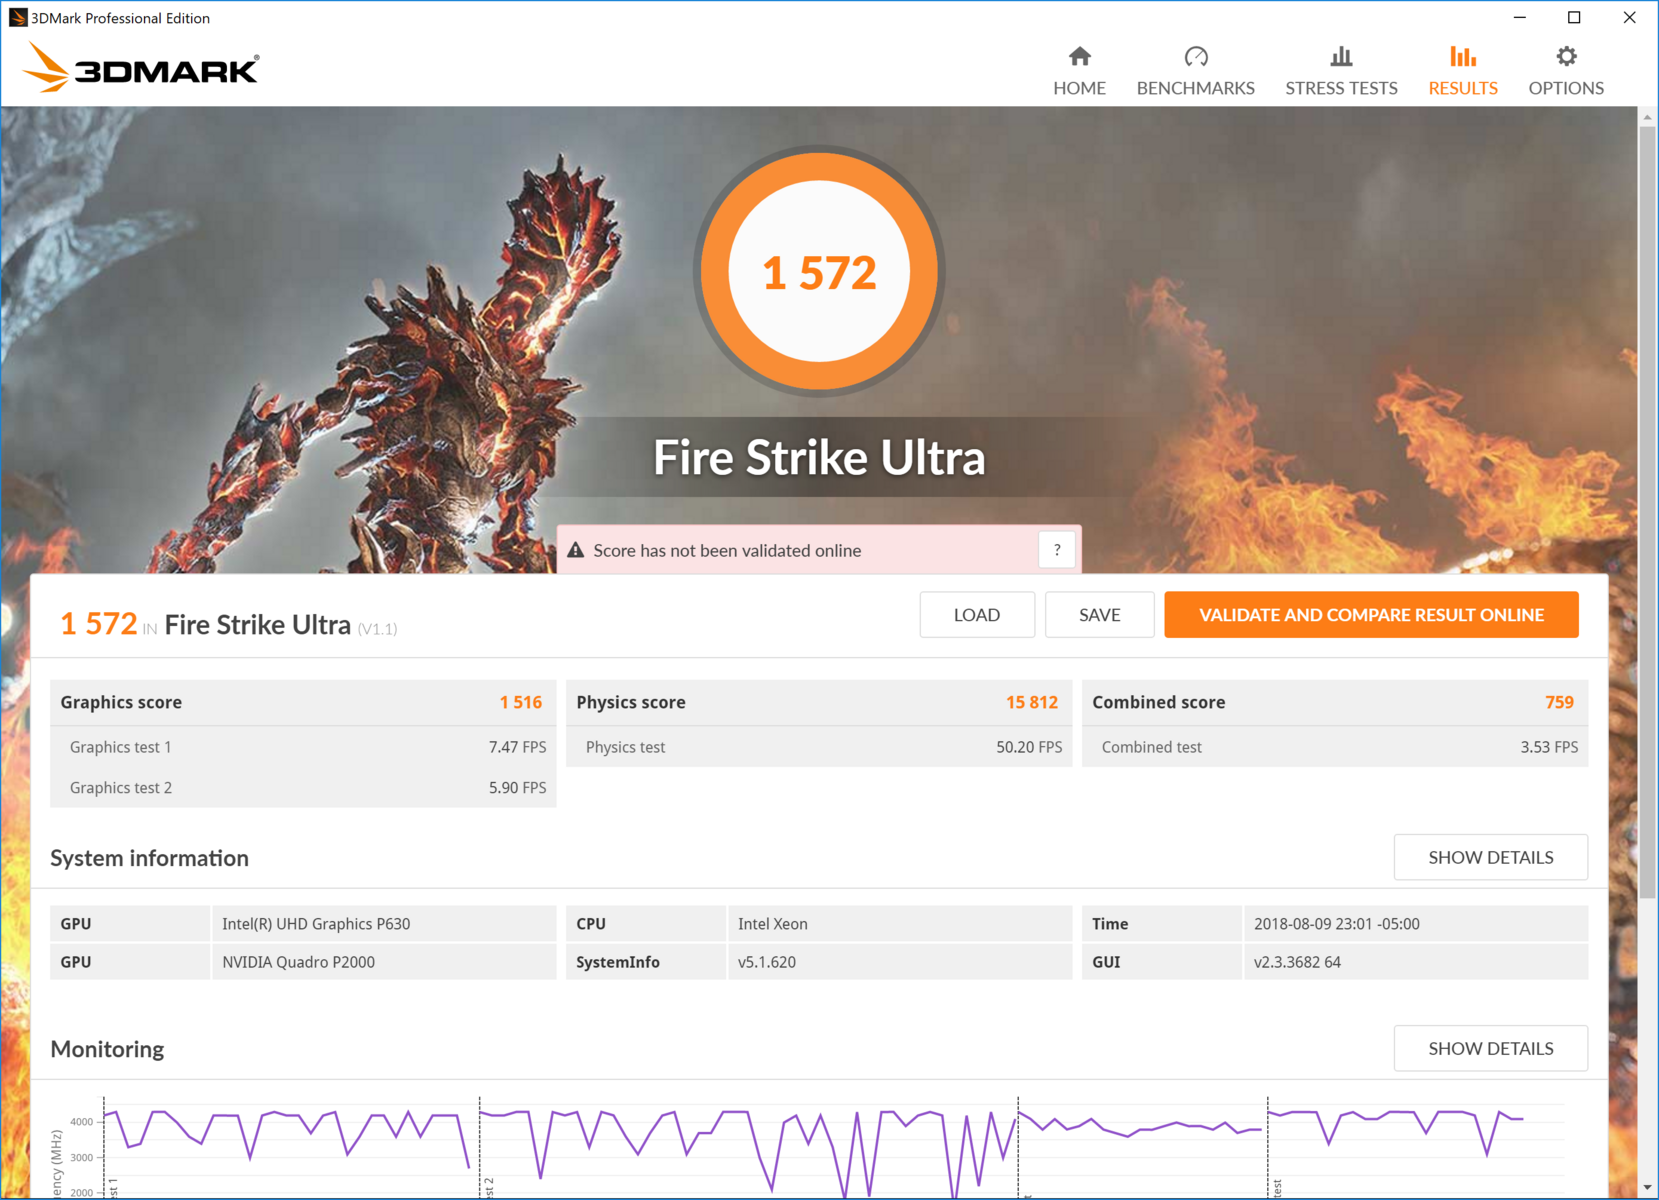
The Nvidia Quadro P2000 is the latest GPU in Nvidia's Quadro line. Designed to replace the Quadro M2200, the P2000 features 1024 CUDA cores and 4 GB of GDDR5 VRAM on a 128-bit bus. It sits comfortably between the older M2200 and the Quadro P3000. The closest consumer equivalent is the GeForce GTX 1050 Ti. Of course, the Quadro P2000 has the added benefit of certified drivers tuned for professional applications.
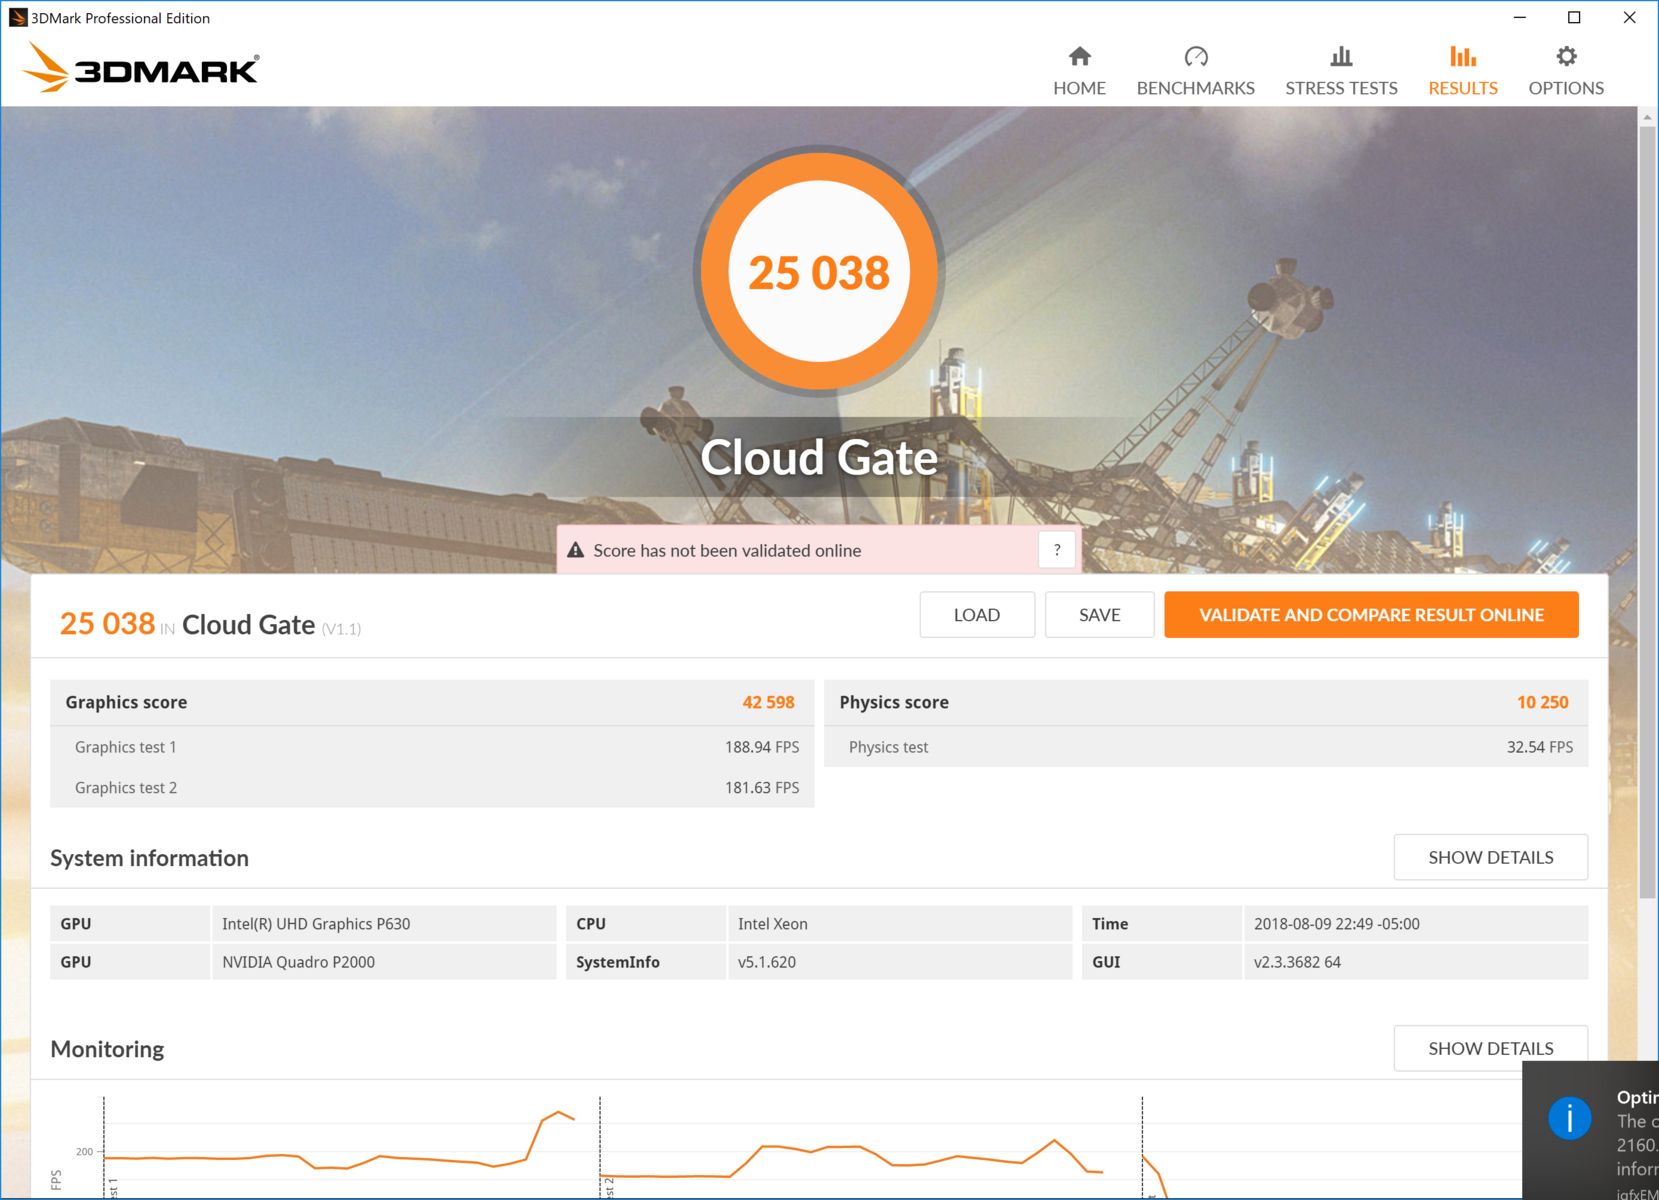
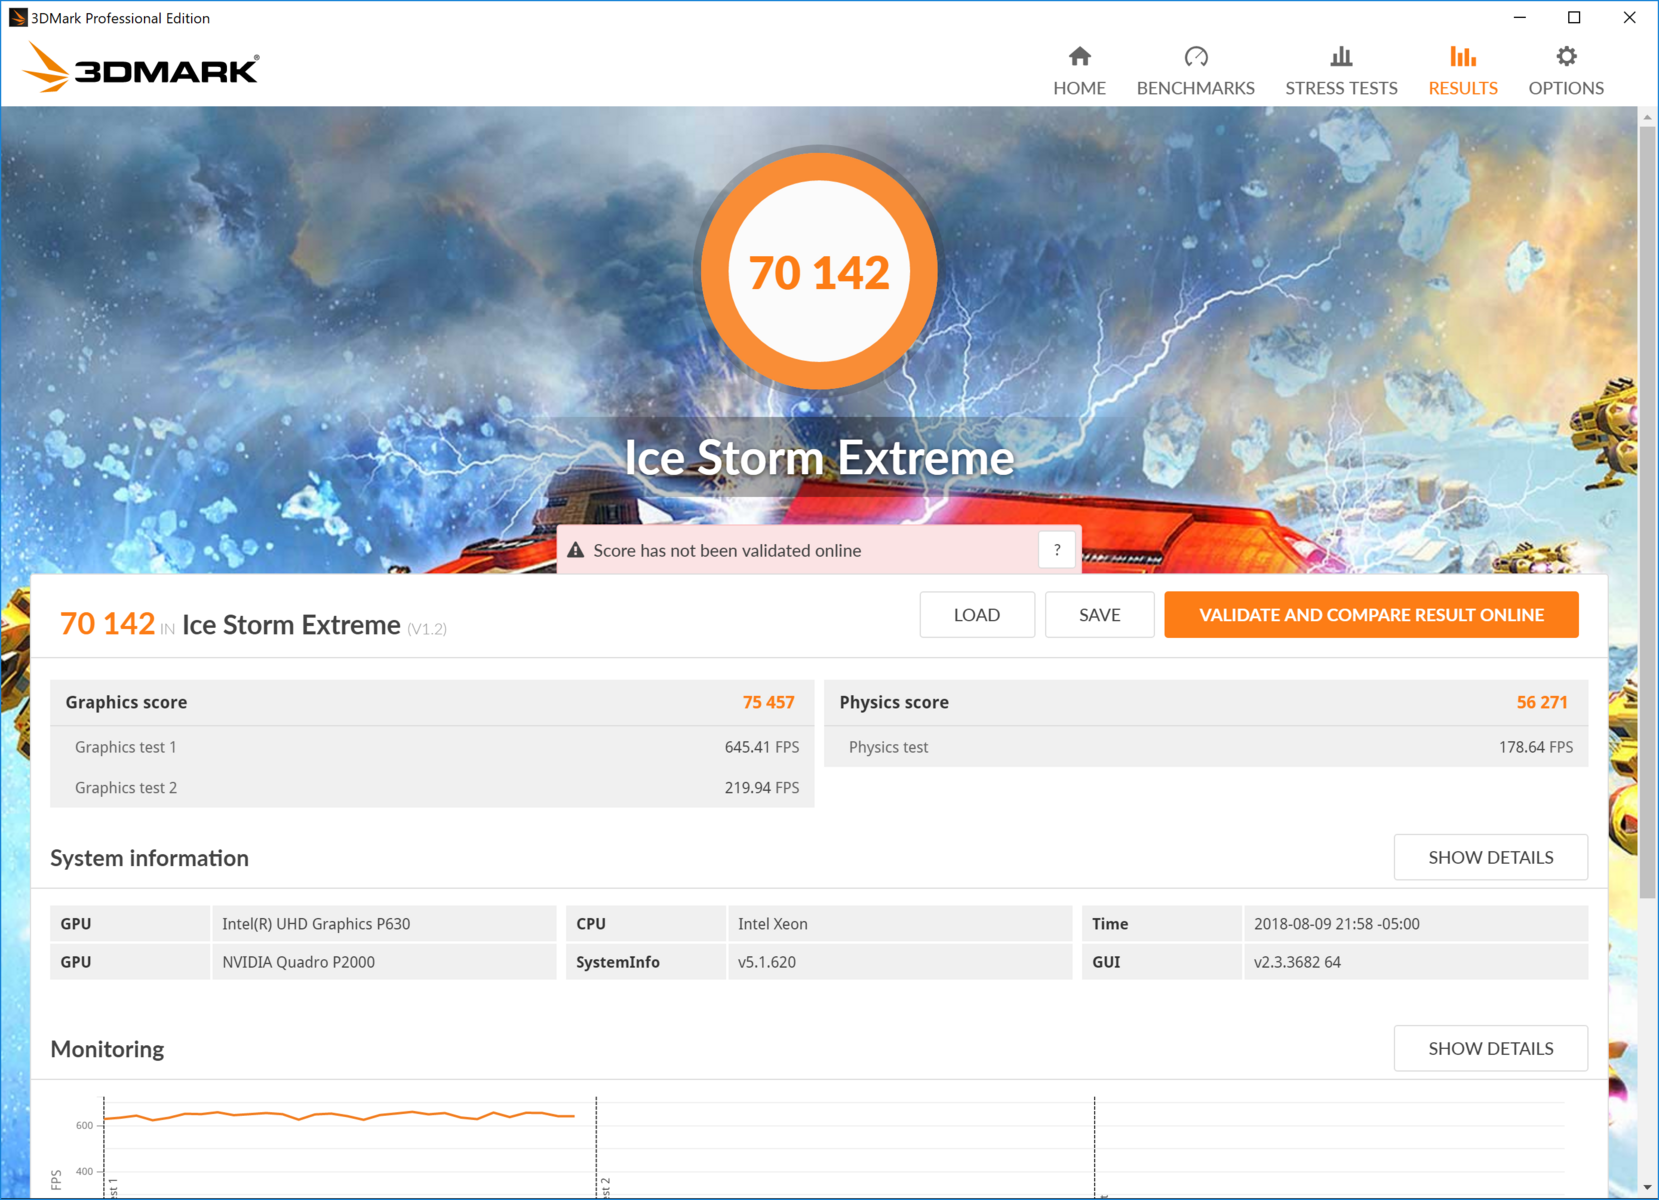
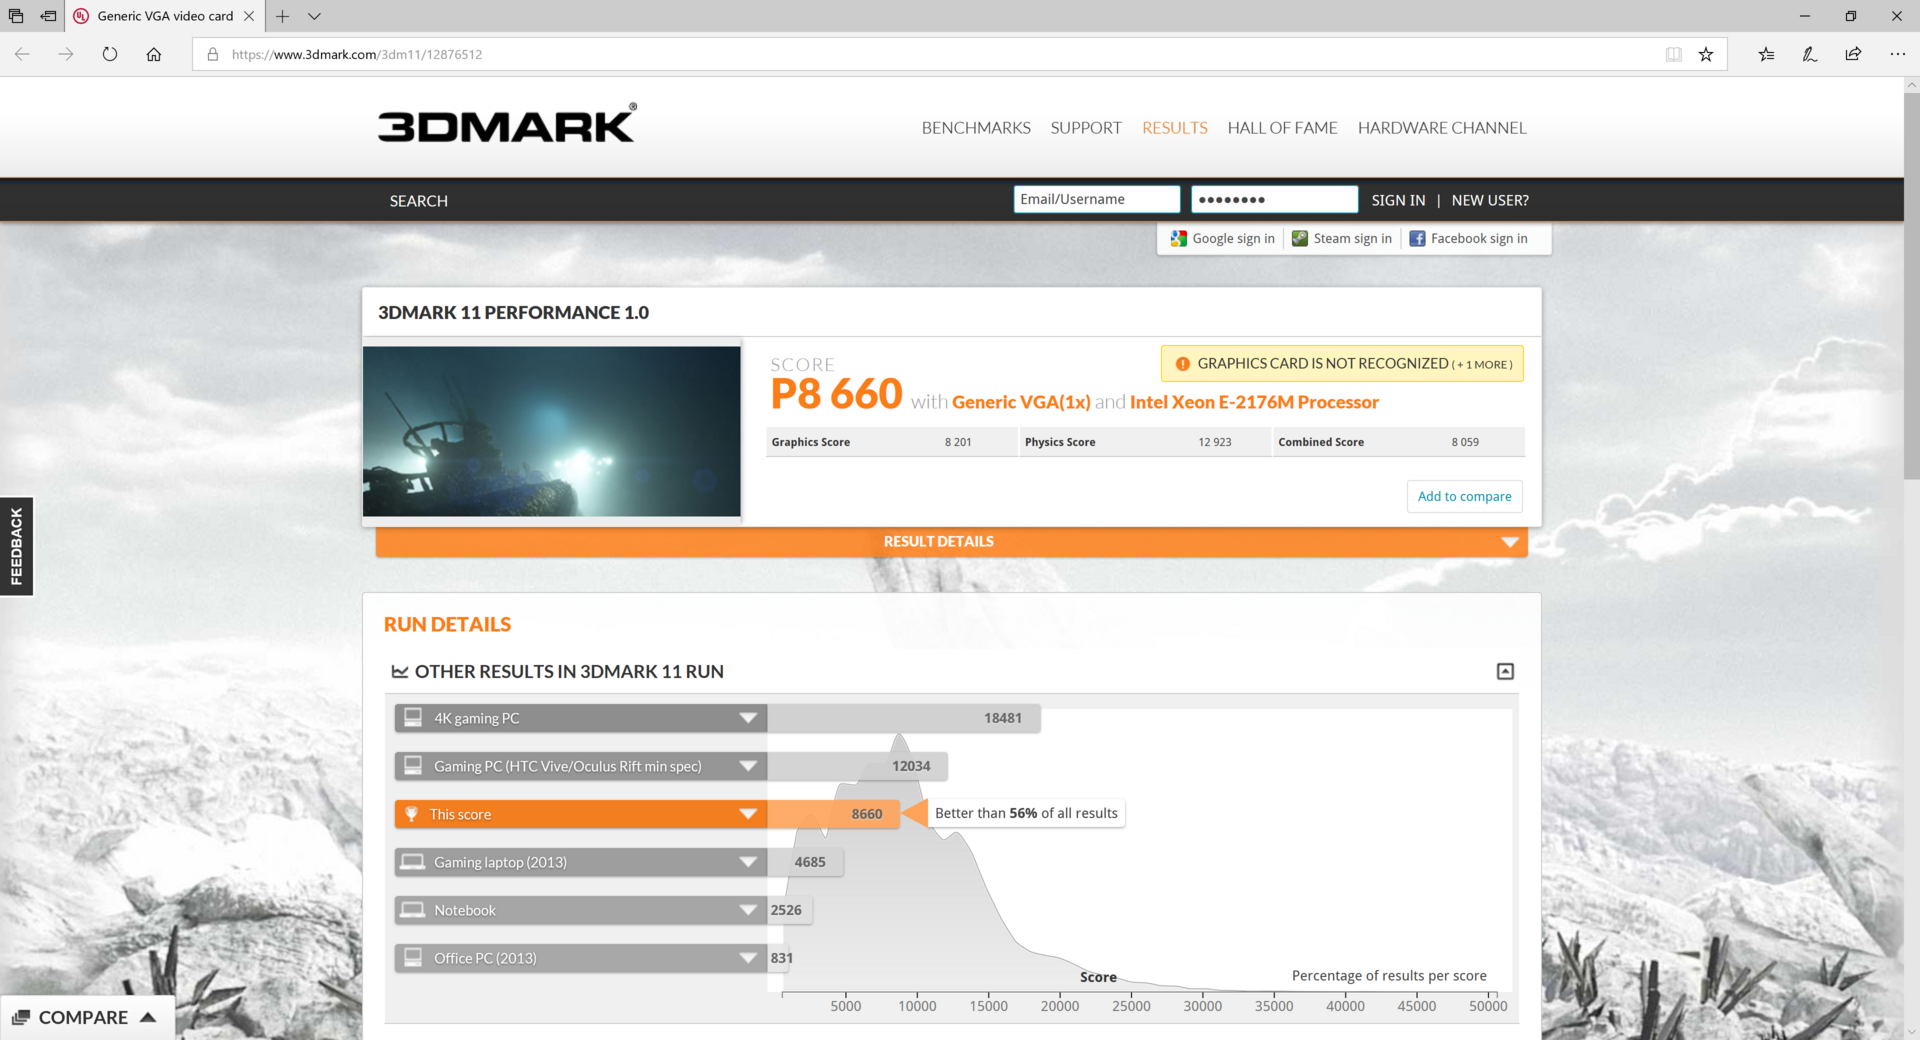
The Precision 5530 is the P2000's Notebookcheck debut, and it comes out swinging. Compared to the Quadro M2200 it's replacing, the Quadro P2000 scores 15-20% better in 3DMark's Fire Strike. More importantly, the Precision 5530 is about 60% better than the Precision 5520 in Fire Strike. Like the CPU, the GPU is a major improvement over the older machine. The story is similar in Specviewperf 12, which tests the GPU in more professional applications. Graphically, the Precision 5530 is significantly more powerful than the 5520.
For more information about the Nvidia Quadro P2000, please see our dedicated GPU page here.
| 3DMark 06 Standard Score | 33795 points | |
| 3DMark Vantage P Result | 32964 points | |
| 3DMark 11 Performance | 8660 points | |
| 3DMark Ice Storm Standard Score | 53148 points | |
| 3DMark Cloud Gate Standard Score | 25038 points | |
| 3DMark Fire Strike Score | 6116 points | |
| 3DMark Fire Strike Extreme Score | 3093 points | |
| 3DMark Time Spy Score | 2259 points | |
Help | ||
Gaming Performance
While the Precision 5530 is not designed for gaming, its powerful components can handle most modern titles at Full HD and Medium settings. Gaming performance is about on par with the Quadro M2200 and just behind the GTX 1050 Ti. Unfortunately, gaming at the display's native resolution of 3840x2160 is out of reach. Some competitive and casual titles (e.g., Rocket League) can hit playable framerates at 4K as long as settings are dialed back.
| The Witcher 3 - 1920x1080 High Graphics & Postprocessing (Nvidia HairWorks Off) (sort by value) | |
| Dell Precision 5530 Xeon E-2176M | |
| Dell Precision 5520 UHD | |
| Lenovo ThinkPad P52S-20LB001FUS | |
| Dell Precision 3530 | |
| HP ZBook 15 G4-Y4E80AV | |
| MSI WS63VR 7RL-023US | |
| Apple MacBook Pro 15 2018 (2.6 GHz, 560X) | |
| MSI GS73 Stealth 8RF-011 | |
| Average NVIDIA Quadro P2000 (33 - 43.2, n=2) | |
| Average of class Workstation (n=1last 2 years) | |
| low | med. | high | ultra | QHD | 4K | |
|---|---|---|---|---|---|---|
| BioShock Infinite (2013) | 317 | 213 | 184 | 68 | ||
| Thief (2014) | 133 | 99 | 85 | 47 | ||
| The Witcher 3 (2015) | 103 | 71 | 33 | 26 | 13 | |
| Batman: Arkham Knight (2015) | 109 | 95 | 52 | 36 | 17 | |
| Metal Gear Solid V (2015) | 60 | 60 | 60 | 60 | 25 | |
| Fallout 4 (2015) | 98 | 88 | 51 | 38 | 13 | |
| Rise of the Tomb Raider (2016) | 82 | 62 | 38 | 32 | 15 | |
| Hitman 2016 (2016) | 88 | 78 | 37 | 36 | 16 | |
| Ashes of the Singularity (2016) | 70 | 41 | 36 | 16 | ||
| Doom (2016) | 112 | 101 | 60 | 54 | 17 | |
| Deus Ex Mankind Divided (2016) | 87 | 63 | 34 | 17 | 11 | |
| Civilization 6 (2016) | 116 | 89 | 51 | 46 | 30 | |
| Farming Simulator 17 (2016) | 350 | 288 | 162 | 114 | 62 | |
| Resident Evil 7 (2017) | 244 | 119 | 60 | 25 | 17 | |
| Prey (2017) | 125 | 89 | 78 | 62 | 20 | |
| Rocket League (2017) | 249 | 164 | 110 | 39 | ||
| Dirt 4 (2017) | 201 | 105 | 59 | 40 | 19 | |
| Playerunknown's Battlegrounds (PUBG) (2017) | 101 | 53 | 41 | 29 | 7 | |
| F1 2017 (2017) | 169 | 89 | 63 | 38 | 11 | |
| Ark Survival Evolved (2017) | 85 | 30 | 19 | 12 | 3 | |
| Middle-earth: Shadow of War (2017) | 115 | 61 | 41 | 28 | 9 | |
| The Evil Within 2 (2017) | 59 | 32 | 29 | 28 | 3 | |
| Fortnite (2018) | 201 | 144 | 60 | 45 | 24 | 10 |
| Final Fantasy XV Benchmark (2018) | 59 | 35 | 26 | 10 | ||
| Kingdom Come: Deliverance (2018) | 104 | 42 | 33 | 26 | 14 | 7 |
| Far Cry 5 (2018) | 89 | 47 | 41 | 35 | 21 | 9 |
| F1 2018 (2018) | 139 | 77 | 61 | 32 | 22 | 12 |
Stress Test
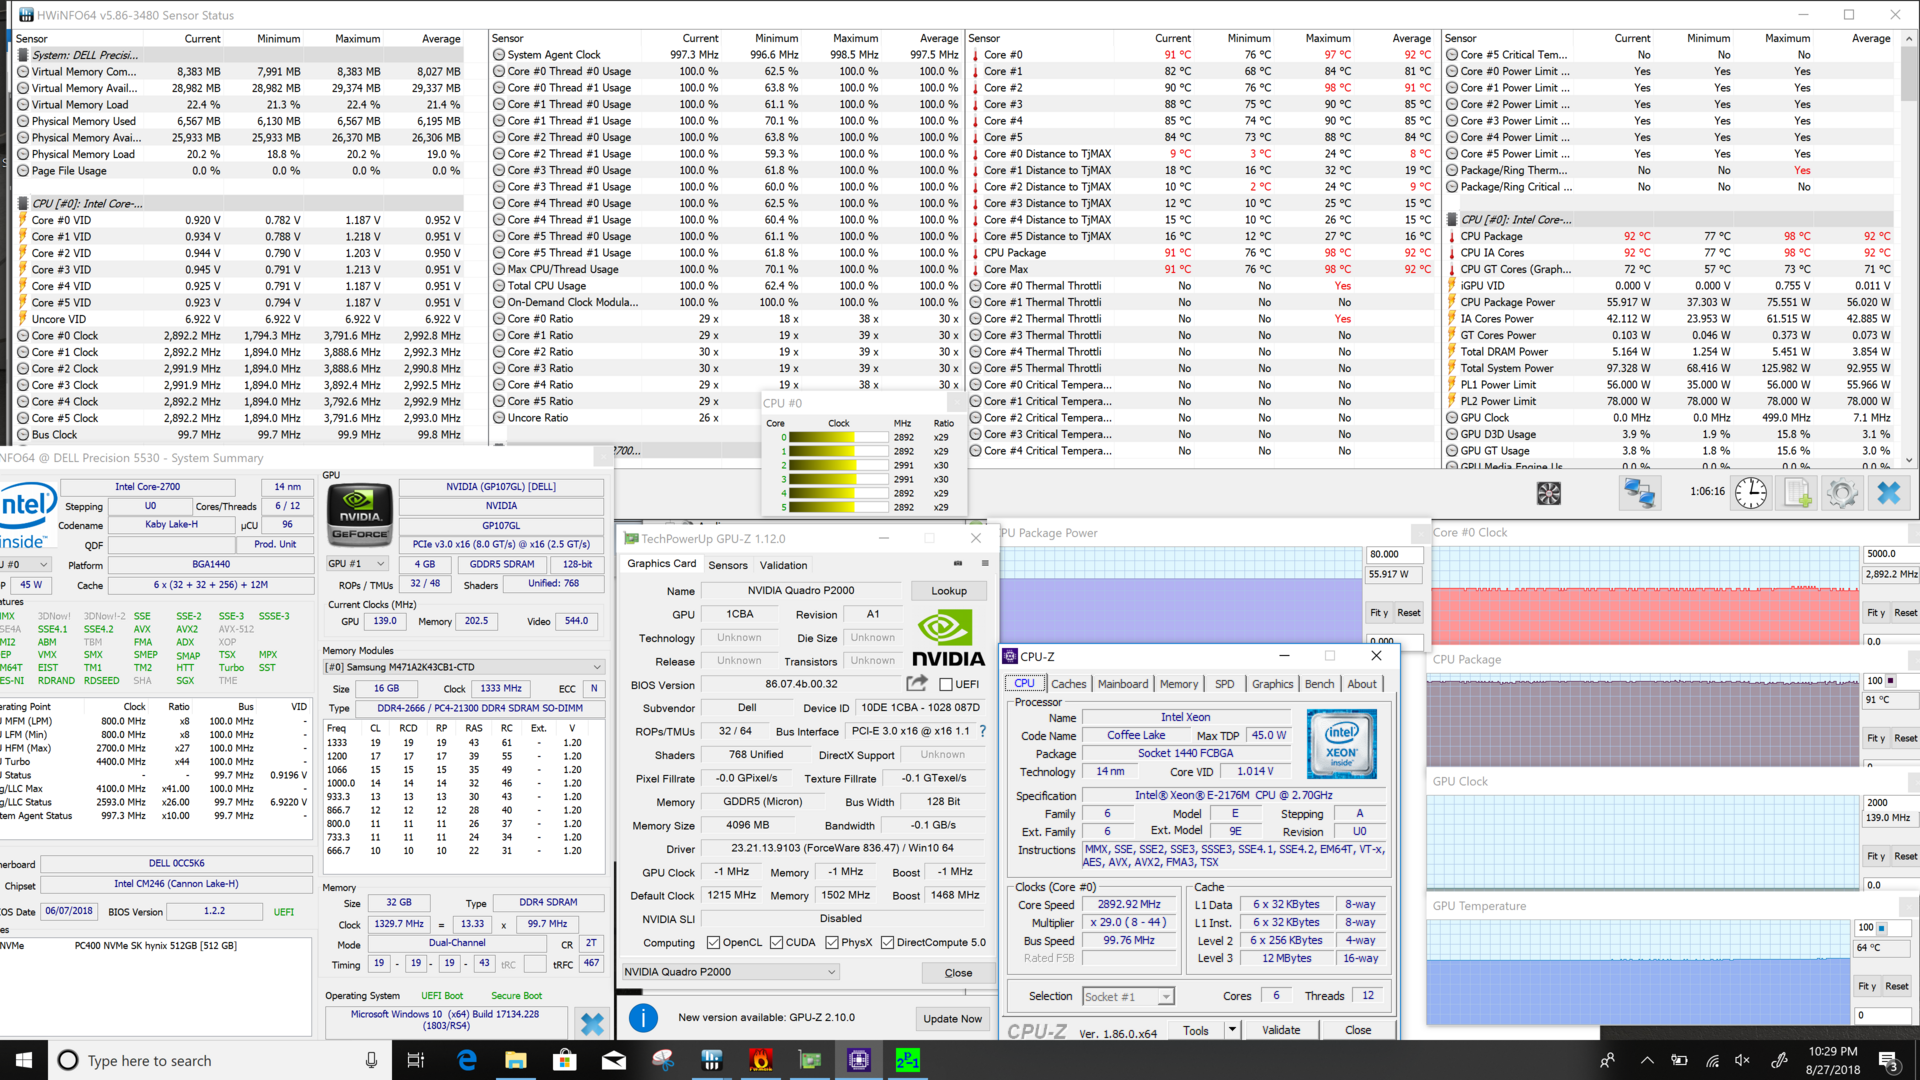
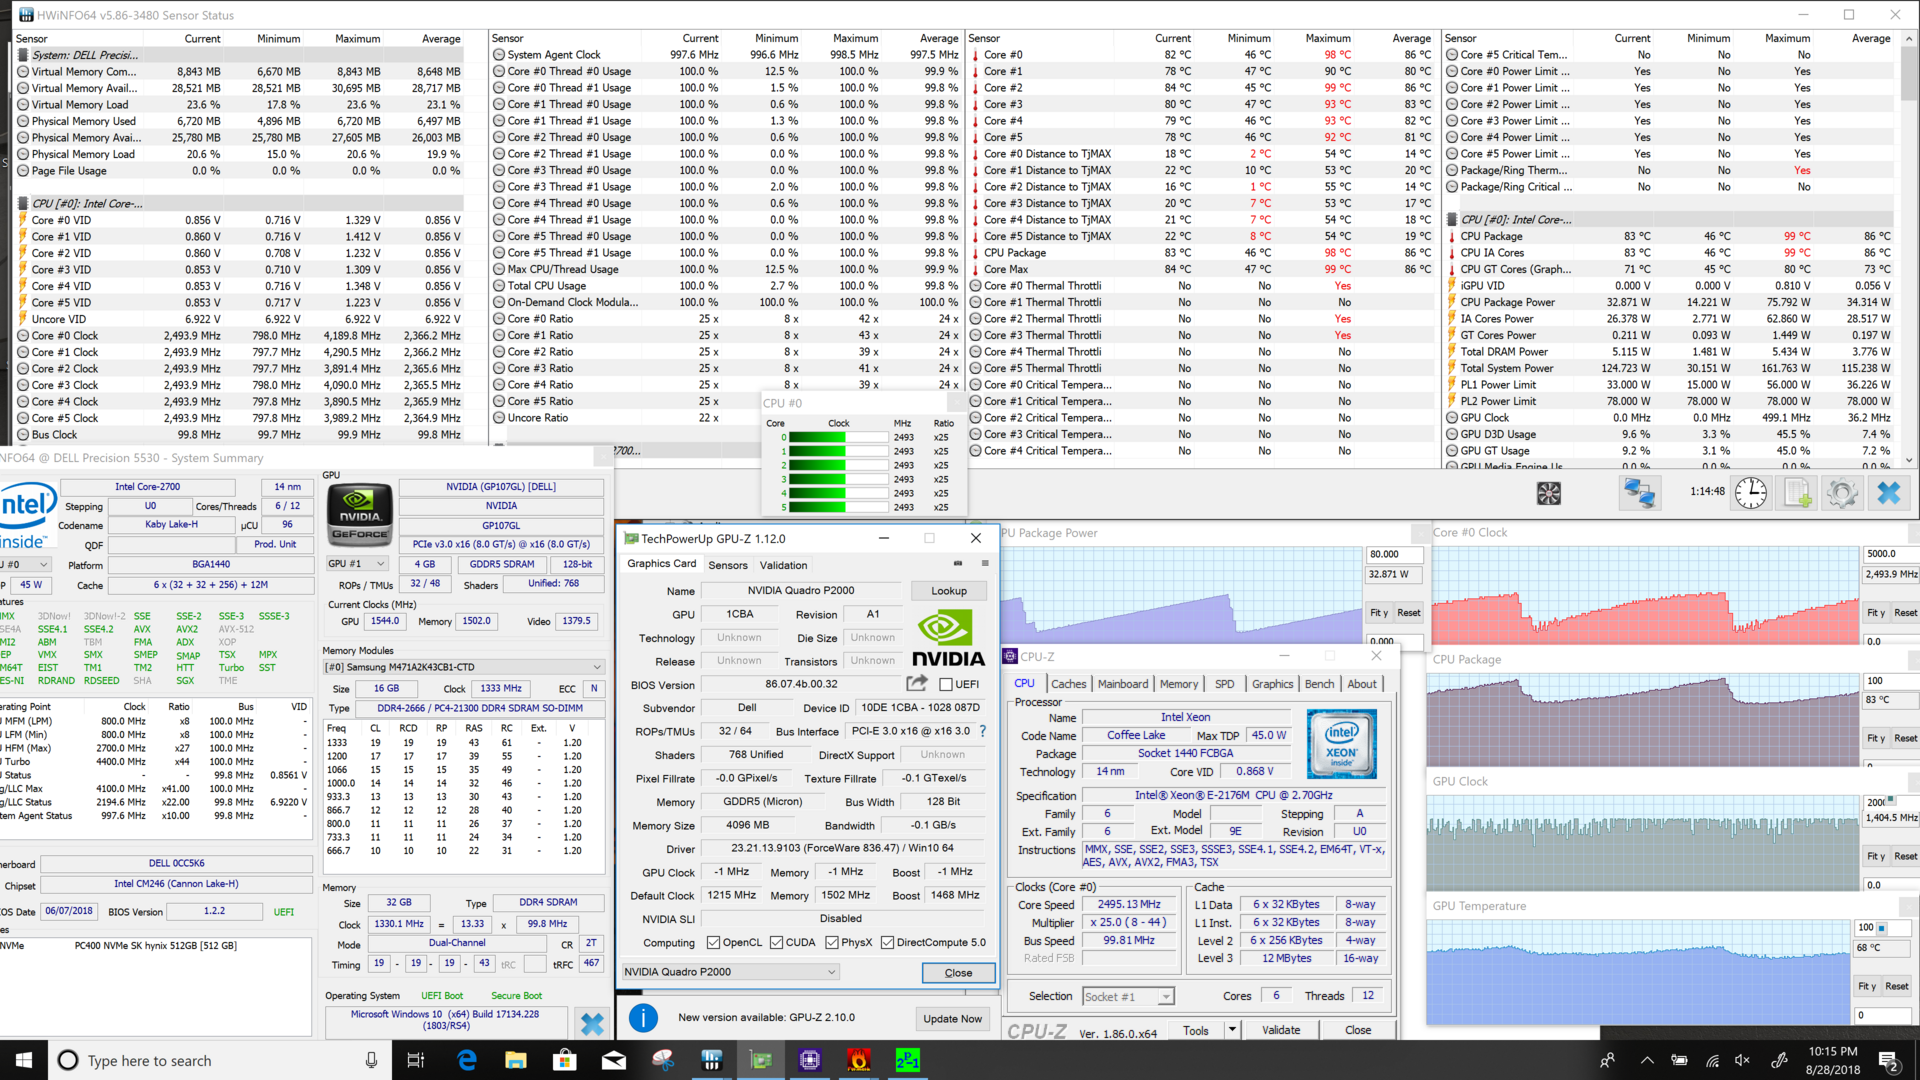
Stress management was a sore point with the Precision 5520. Not only did the CPU heavily throttle under load, its performance was erratic and inconsistent. While the Precision 5530 does throttle under heavy work, the problem isn't nearly as prevalent as it is in the Precision 5520. For example, after running Prime95 for an hour, the Precision 5530 manages to stay above its base clock at 2.9 GHz, though CPU temperatures get warm at about 92° C. An hour-long playthrough of The Witcher 3, which gives a better idea of real-world use, sees the CPU shine. The Xeon silicon boosts intermittently to 4.2 GHz and averages about 3.8 GHz. Temperatures spike just shy of 100° C before pulling back to the 70-80° C range.
The GPU is rock solid throughout. No matter the load (FurMark, The Witcher 3), the GPU settles in quickly and doesn't move much during stress tests. Temperatures across the GPU die are well-managed and steady.
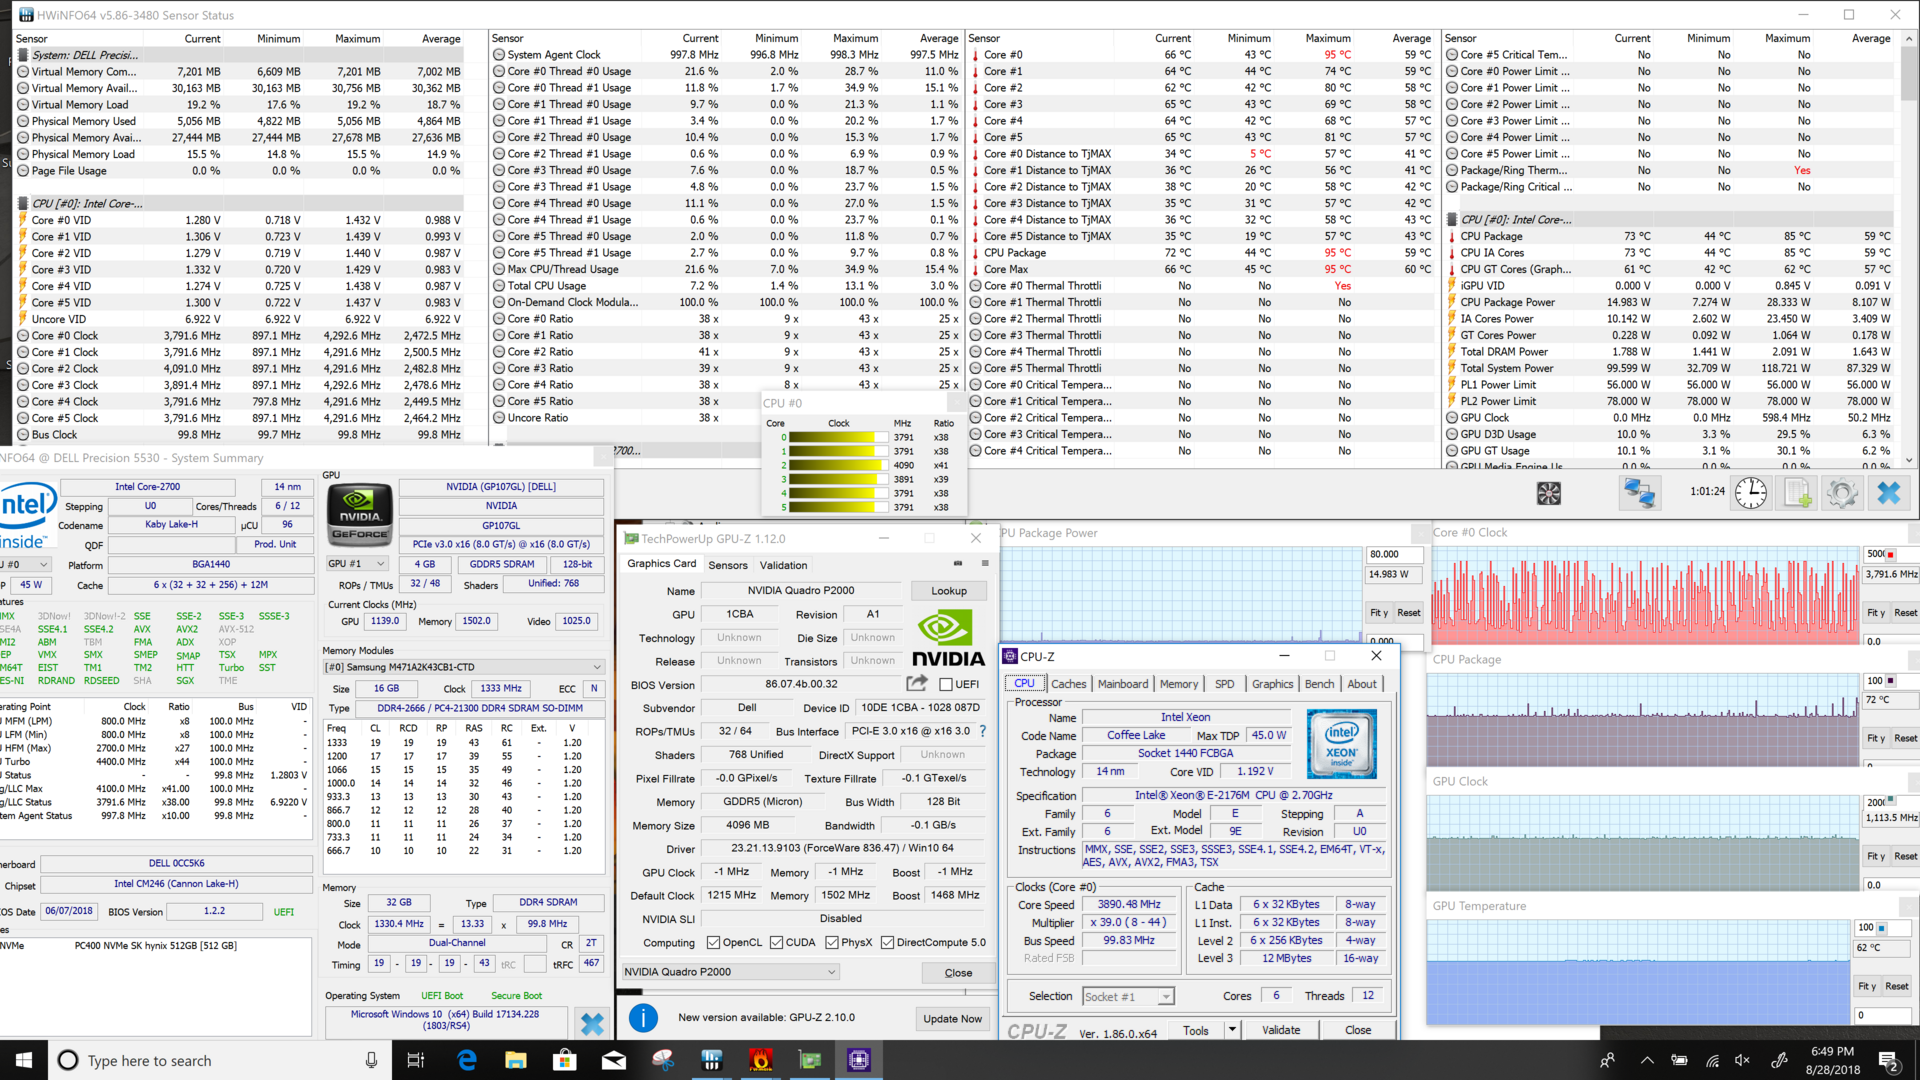
Running Prime95 and FurMark together produces a curious result. The CPU follows a tidal pattern. After hitting 2.5 GHz, temperatures (which hit 99° C) force the CPU to throttle back down to 800 MHz. The chip then steadily climbs up to 2.5 GHz before dropping again. This pattern is reflected in the CPU's power usage, which confirms throttling. It is interesting to see the 5530 continually fight for better performance until it is forced to retreat, beginning the climb once again.
| CPU Clock (GHz) | GPU Clock (MHz) | Average CPU Temperature (°C) | Average GPU Temperature (°C) | |
| Prime95 Stress | 2.9 | - | 92 | - |
| FurMark Stress | 2.5 (erratic) | 1113 | 60 | 62 |
| Prime95 + FurMark Stress | 0.8-2.5 (oscillating) | 1400 | 72-99 (oscillating) | 73 |
| Witcher 3 Stress | 3.8 | 1518 | 75 | 71 |
Emissions
System Noise
Since it uses the same cooling system, the Precision 5530's fan noise is almost verbatim of the 5520's. That said, the 5530's fans will either be off or will run full blast. When idle, the 5530 is completely silent, save for a slight bit of coil whine that can only be heard directly above the keyboard. However, under a moderate amount of load, the fans will ramp up aggressively to about 46.5 dB(A). While thicker machines (like the ThinkPad P51) have much quieter fan noise, the 5530 is in line with other thin workstations.
Noise level
| Idle |
| 28.4 / 28.4 / 28.4 dB(A) |
| Load |
| 46.5 / 46.5 dB(A) |
 | ||
30 dB silent 40 dB(A) audible 50 dB(A) loud |
||
min: | ||
| Dell Precision 5530 Xeon E-2176M Quadro P2000, E-2176M, SK hynix PC400 512 GB | Dell Precision 5520 UHD Quadro M1200, E3-1505M v6, Samsung SM961 MZVKW512HMJP m.2 PCI-e | Lenovo ThinkPad P52S-20LB001FUS Quadro P500, i7-8650U, Samsung SSD PM981 MZVLB1T0HALR | Dell Precision 3530 Quadro P600, E-2176M, SK hynix PC400 512 GB | HP ZBook 15 G4-Y4E80AV Quadro M2200, E3-1535M v6, Samsung SSD SM961 1TB M.2 MZVKW1T0HMLH | Lenovo ThinkPad P51 20HH0016GE Quadro M2200, E3-1505M v6, Samsung PM961 NVMe MZVLW512HMJP | MSI WS63VR 7RL-023US Quadro P4000 Max-Q, i7-7700HQ, Toshiba NVMe THNSN5512GPU7 | Apple MacBook Pro 15 2018 (2.6 GHz, 560X) Radeon Pro 560X, i7-8850H, Apple SSD AP0512 | |
|---|---|---|---|---|---|---|---|---|
| Noise | -2% | 5% | -1% | 5% | 6% | -2% | -0% | |
| off / environment * (dB) | 28.4 | 28.7 -1% | 28.3 -0% | 28.1 1% | 29.5 -4% | 29.6 -4% | 28 1% | 29.6 -4% |
| Idle Minimum * (dB) | 28.4 | 28.7 -1% | 28.3 -0% | 28.3 -0% | 29.5 -4% | 29.6 -4% | 33.2 -17% | 30.1 -6% |
| Idle Average * (dB) | 28.4 | 32.1 -13% | 28.3 -0% | 28.3 -0% | 29.5 -4% | 29.6 -4% | 33.2 -17% | 30.1 -6% |
| Idle Maximum * (dB) | 28.4 | 32.1 -13% | 29.8 -5% | 28.4 -0% | 30 -6% | 29.6 -4% | 33.2 -17% | 30.1 -6% |
| Load Average * (dB) | 46.5 | 41.3 11% | 40.6 13% | 46.2 1% | 39.5 15% | 32.2 31% | 41.4 11% | 46.8 -1% |
| Witcher 3 ultra * (dB) | 46.5 | 45.5 2% | 40.6 13% | 39.5 15% | 38.4 17% | 36 23% | ||
| Load Maximum * (dB) | 46.5 | 45.5 2% | 40.6 13% | 48.6 -5% | 36 23% | 36.6 21% | 43.5 6% | 46.8 -1% |
* ... smaller is better
Temperature
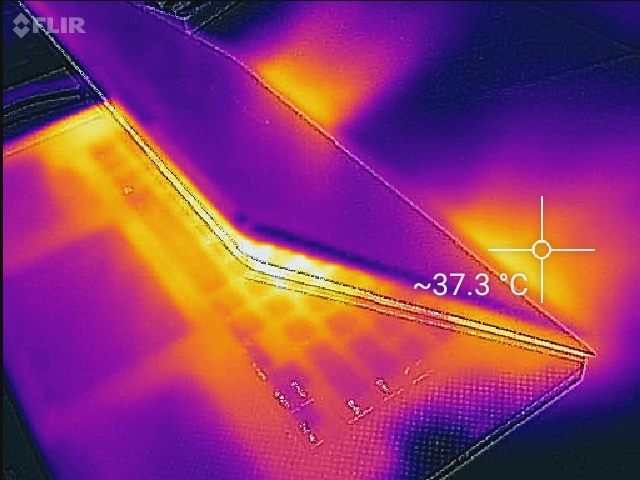
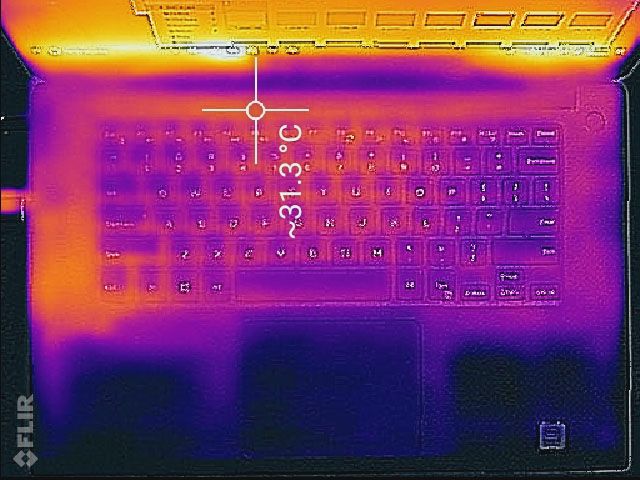
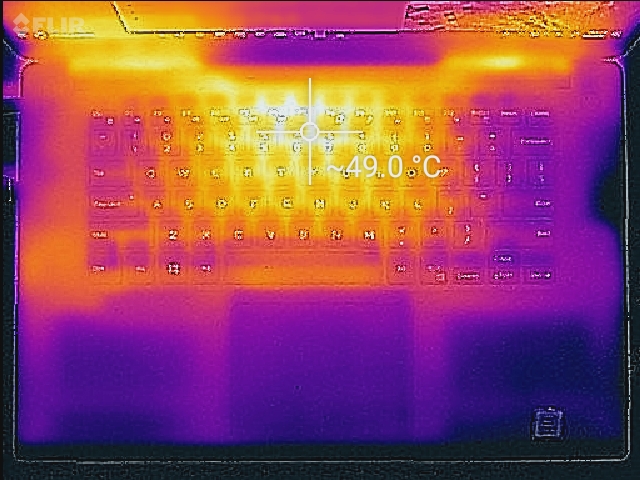
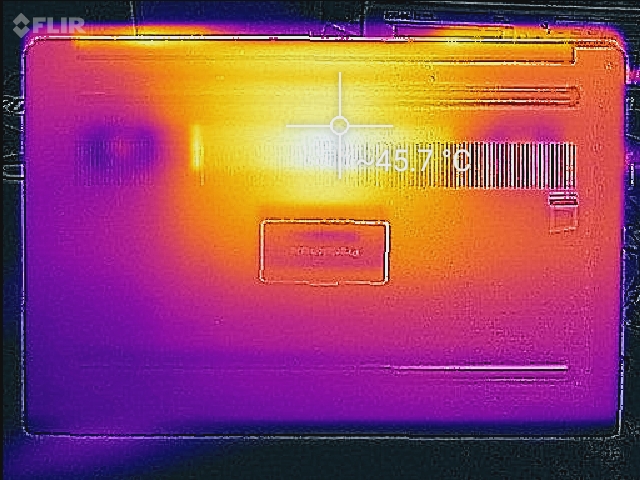
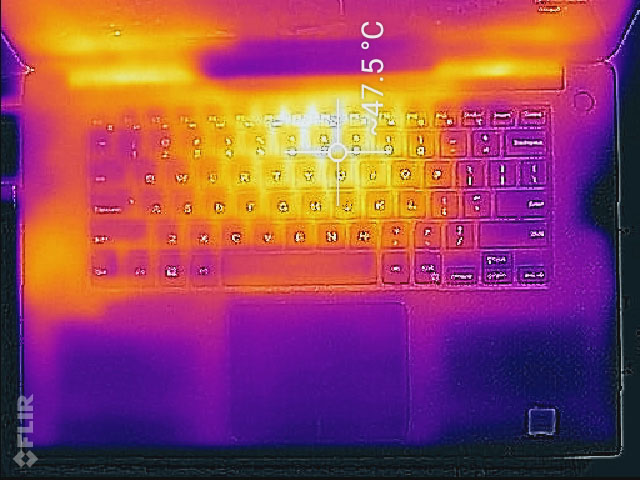
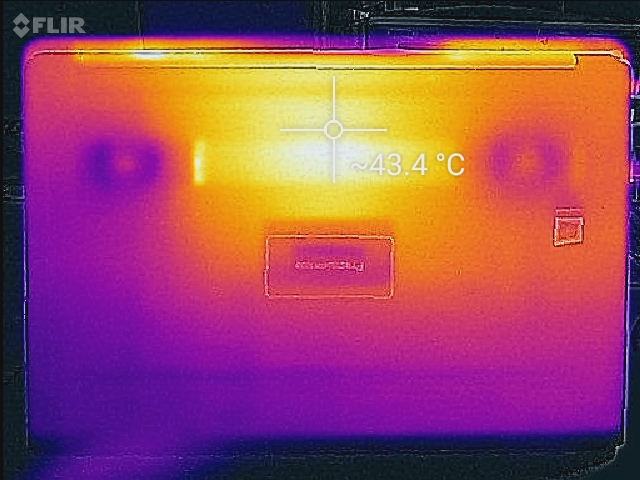
Despite the high internal temperatures seen under stress, heat across the case is fairly well-managed. The Precision 5530 unsurprisingly has hot spots in the same places as the Precision 5520, notably in the top middle of the keyboard (between the 6 and 7 keys). This is the only hot spot on the keyboard, though; the rest of the deck gets moderately warm but never uncomfortable. Heat is exhausted underneath the screen hinge and tends to flow directly above and directly below the bottom of the display. As such, laps will feel toasty after about 10 minutes of heavy use, but the heat is not unbearable.
(-) The maximum temperature on the upper side is 50 °C / 122 F, compared to the average of 38.2 °C / 101 F, ranging from 22.2 to 69.8 °C for the class Workstation.
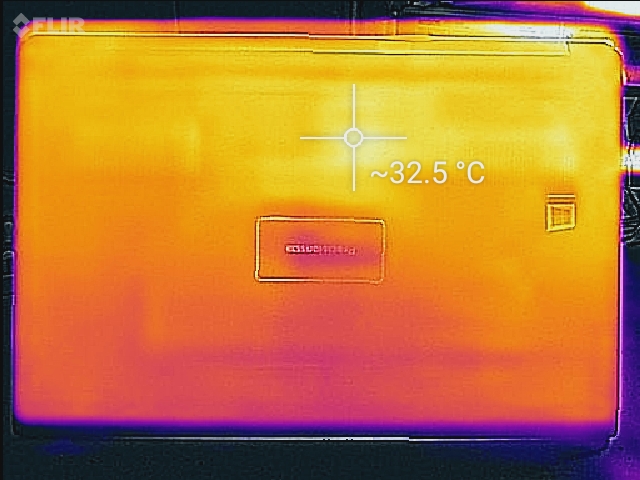
(-) The bottom heats up to a maximum of 46.2 °C / 115 F, compared to the average of 41.1 °C / 106 F
(+) In idle usage, the average temperature for the upper side is 29.7 °C / 85 F, compared to the device average of 32 °C / 90 F.
(±) Playing The Witcher 3, the average temperature for the upper side is 34.2 °C / 94 F, compared to the device average of 32 °C / 90 F.
(+) The palmrests and touchpad are cooler than skin temperature with a maximum of 29.4 °C / 84.9 F and are therefore cool to the touch.
(±) The average temperature of the palmrest area of similar devices was 27.8 °C / 82 F (-1.6 °C / -2.9 F).
Speakers

The speakers are surprisingly good considering the small chassis. Bass is weak, but the sound profile is otherwise excellent. Mids and highs are well balanced, and the speakers remain crisp and clear at any volume. While not quite up to the level of Apple's MacBook Pro, the speakers are close and should be adequate for an enjoyable media experience.
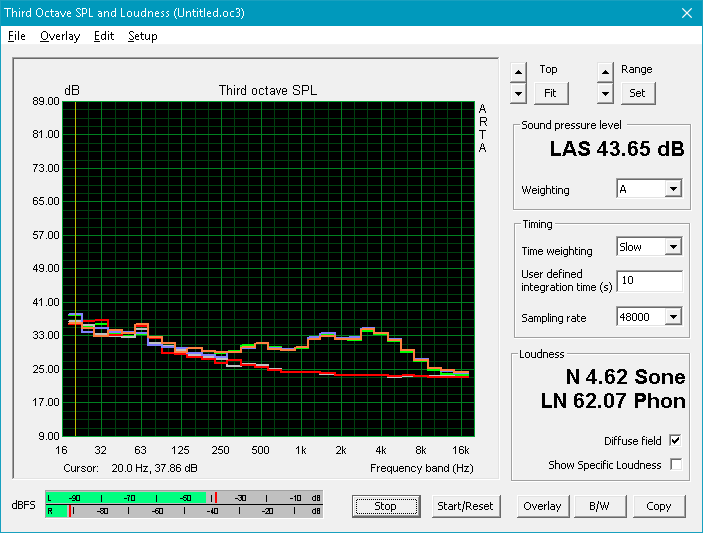
Dell Precision 5530 Xeon E-2176M audio analysis
(±) | speaker loudness is average but good (74.9 dB)
Bass 100 - 315 Hz
(-) | nearly no bass - on average 17.9% lower than median
(±) | linearity of bass is average (9.1% delta to prev. frequency)
Mids 400 - 2000 Hz
(±) | higher mids - on average 6.7% higher than median
(±) | linearity of mids is average (10.2% delta to prev. frequency)
Highs 2 - 16 kHz
(+) | balanced highs - only 4% away from median
(±) | linearity of highs is average (8.4% delta to prev. frequency)
Overall 100 - 16.000 Hz
(±) | linearity of overall sound is average (23% difference to median)
Compared to same class
» 83% of all tested devices in this class were better, 3% similar, 14% worse
» The best had a delta of 7%, average was 17%, worst was 35%
Compared to all devices tested
» 69% of all tested devices were better, 5% similar, 26% worse
» The best had a delta of 4%, average was 23%, worst was 134%
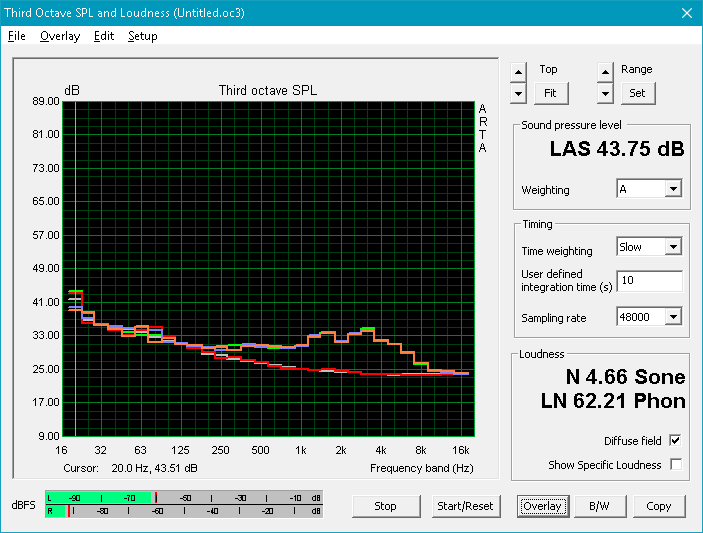
Apple MacBook Pro 15 2018 (2.6 GHz, 560X) audio analysis
(+) | speakers can play relatively loud (85 dB)
Bass 100 - 315 Hz
(+) | good bass - only 4.7% away from median
(±) | linearity of bass is average (8.3% delta to prev. frequency)
Mids 400 - 2000 Hz
(+) | balanced mids - only 1.8% away from median
(+) | mids are linear (3.5% delta to prev. frequency)
Highs 2 - 16 kHz
(+) | balanced highs - only 2.6% away from median
(+) | highs are linear (5.7% delta to prev. frequency)
Overall 100 - 16.000 Hz
(+) | overall sound is linear (6.4% difference to median)
Compared to same class
» 4% of all tested devices in this class were better, 1% similar, 95% worse
» The best had a delta of 5%, average was 17%, worst was 45%
Compared to all devices tested
» 1% of all tested devices were better, 0% similar, 99% worse
» The best had a delta of 4%, average was 23%, worst was 134%
Energy Management
Power Consumption
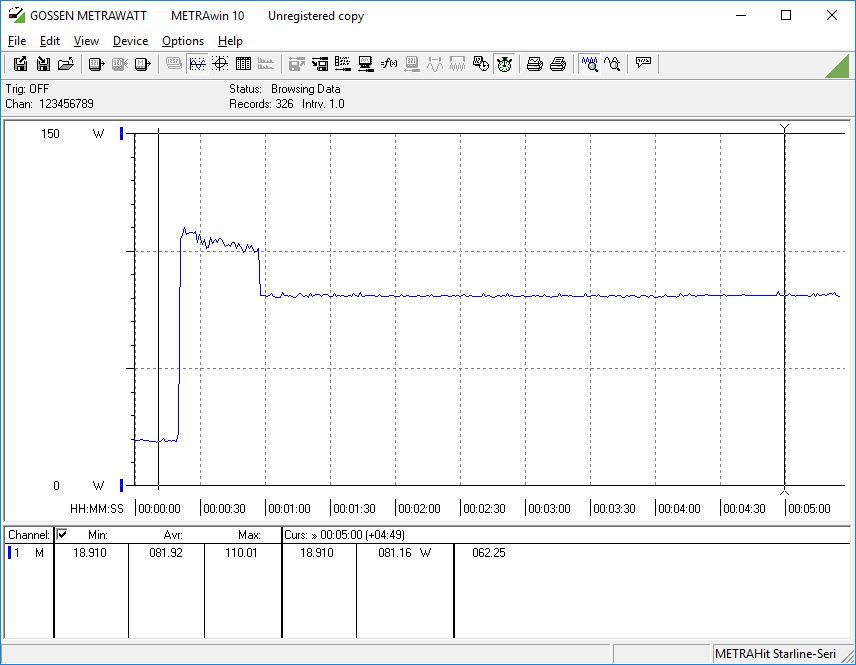
Power consumption is about average for a mid-range workstation. Under lighter workloads, the Precision 5530 pulls more power than similarly-specced machines, partially because of the bright 4K panel. Under full load, the 5530 draws about 115 Watts, which is a 10% drop from the 5520. The included 130 W power adapter provides more than enough juice.
| Off / Standby | |
| Idle | |
| Load |
|
Key:
min: | |
| Dell Precision 5530 Xeon E-2176M E-2176M, Quadro P2000, SK hynix PC400 512 GB, IGZO, 3840x2160, 15.6" | Dell Precision 5520 UHD E3-1505M v6, Quadro M1200, Samsung SM961 MZVKW512HMJP m.2 PCI-e, IPS, 3840x2160, 15.6" | Lenovo ThinkPad P52S-20LB001FUS i7-8650U, Quadro P500, Samsung SSD PM981 MZVLB1T0HALR, IPS, 3840x2160, 15.6" | Dell Precision 3530 E-2176M, Quadro P600, SK hynix PC400 512 GB, IPS, 1920x1080, 15.6" | HP ZBook 15 G4-Y4E80AV E3-1535M v6, Quadro M2200, Samsung SSD SM961 1TB M.2 MZVKW1T0HMLH, IPS, 1920x1080, 15.6" | Lenovo ThinkPad P51 20HH0016GE E3-1505M v6, Quadro M2200, Samsung PM961 NVMe MZVLW512HMJP, IPS, 3840x2160, 15.6" | MSI WS63VR 7RL-023US i7-7700HQ, Quadro P4000 Max-Q, Toshiba NVMe THNSN5512GPU7, IPS, 3840x2160, 15.6" | Apple MacBook Pro 15 2018 (2.6 GHz, 560X) i7-8850H, Radeon Pro 560X, Apple SSD AP0512, IPS, 2880x1800, 15.4" | |
|---|---|---|---|---|---|---|---|---|
| Power Consumption | 1% | 33% | 23% | 12% | -2% | -10% | 31% | |
| Idle Minimum * (Watt) | 9.8 | 8.9 9% | 5.9 40% | 5.3 46% | 5.9 40% | 8.6 12% | 13.3 -36% | 3.4 65% |
| Idle Average * (Watt) | 16.8 | 13.6 19% | 11.7 30% | 10.7 36% | 8.9 47% | 15.9 5% | 17.2 -2% | 11 35% |
| Idle Maximum * (Watt) | 16.9 | 14.1 17% | 15.6 8% | 14.1 17% | 12.7 25% | 22.1 -31% | 17.9 -6% | 14.9 12% |
| Load Average * (Watt) | 102.3 | 100.3 2% | 63 38% | 85.4 17% | 95.2 7% | 84.4 17% | 83.7 18% | 78.9 23% |
| Witcher 3 ultra * (Watt) | 76.5 | 100.2 -31% | 48.4 37% | 75.5 1% | 87.7 -15% | 101.9 -33% | ||
| Load Maximum * (Watt) | 114.5 | 126.3 -10% | 63.1 45% | 91.9 20% | 154 -34% | 130.6 -14% | 114.3 -0% | 91.2 20% |
* ... smaller is better
Battery Life
One of the biggest improvements over last year's model is battery life. The Precision 5530 hit 8 hours 21 minutes in our WiFi v1.3 batter test; as such, it should last close to a full workday of standard office tasks. Heavier work will have the machine begging for the power adapter before long; the 5530 died in less than two hours under load. Both of these runtimes are double those of the Precision 5520 despite the same battery capacity. Dell offers a model of the Precision 5530 with a 56 Wh battery that leaves room for a second storage drive, but we highly recommend the 97 Wh battery.
| Dell Precision 5530 Xeon E-2176M E-2176M, Quadro P2000, 97 Wh | Dell Precision 5520 UHD E3-1505M v6, Quadro M1200, 97 Wh | Lenovo ThinkPad P52S-20LB001FUS i7-8650U, Quadro P500, 80 Wh | Dell Precision 3530 E-2176M, Quadro P600, 92 Wh | HP ZBook 15 G4-Y4E80AV E3-1535M v6, Quadro M2200, 90 Wh | Lenovo ThinkPad P51 20HH0016GE E3-1505M v6, Quadro M2200, 90 Wh | MSI WS63VR 7RL-023US i7-7700HQ, Quadro P4000 Max-Q, 48 Wh | Apple MacBook Pro 15 2018 (2.6 GHz, 560X) i7-8850H, Radeon Pro 560X, 83 Wh | |
|---|---|---|---|---|---|---|---|---|
| Battery runtime | -40% | 23% | 5% | 8% | -10% | -64% | 21% | |
| Reader / Idle (h) | 16.5 | 12.1 -27% | 17.2 4% | 18.8 14% | 18.3 11% | 16.4 -1% | 3.9 -76% | |
| WiFi v1.3 (h) | 8.4 | 4.2 -50% | 11.1 32% | 9.3 11% | 9.1 8% | 6.9 -18% | 2.9 -65% | 10.2 21% |
| Load (h) | 1.8 | 1 -44% | 2.4 33% | 1.6 -11% | 1.9 6% | 1.6 -11% | 0.9 -50% | |
| Witcher 3 ultra (h) | 1.5 |
Pros
Cons
Verdict
This is more like it. Dell has tried for three years to perfect the thin-and-light workstation, and the Precision 5530 is their best effort yet. This is the machine we were hoping the Precision 5520 was going to be, and it is good to see such refinement in such a small package.
The Precision 5530 is not without its faults, though. Thermal throttling is still a problem, although not to the degree we saw in the 5520 (or other thin-and-light workstations, for that matter). Demanding synthetic workloads bring the device to its knees, but not without a valiant fight. Still, considering workstations are normally designed to run full-tilt for extended periods, the restricted CPU performance under load and the high temperatures across the package are a definite chink in the Precision 5530's armor.
It should be noted that the Precision 5530 fills a very specific niche. Due to its form factor, it is missing quite a few features available in thicker workstations like the ThinkPad P series or HP's ZBook line. Maintenance options are limited, port selection is thin, and the lack of ECC RAM options may be a dealbreaker for some. Those that need the full workstation experience should look at Dell's Precision 7000 series or the aforementioned ThinkPad and ZBook machines.
The rest of the machine is so good that it almost overshadows the CPU throttling. The display is absolutely gorgeous and one of the best we've seen outside of Apple's MacBook Pro line. The screen is bright, crisp, and vivid; images pop and everything looks beautiful. The chassis continues to be a strong point. Build quality is excellent and the design is striking (especially in the "Brushed Onyx" color of our unit). There are few notebooks that can match the Precision 5530 in terms of design and even fewer workstations that are this beautiful.
The Precision 5530 is undoubtedly one of the best ultraportable workstations. Some manufacturers focus on power while ignoring design and portability. Others focus on making the body as thin as possible, forgoing professional-grade components. The Precision 5530 is the best balance of these two ideas that we've seen, and if Dell can work out the thermal throttling issues, next year's Precision 5540 may be the perfect ultraportable workstation. However, at over USD $3500, the Precision 5530 is not for the faint of heart (or pocketbook). Well done, Dell.
Dell Precision 5530 Xeon E-2176M
- 09/02/2018 v6 (old)
Sam Medley
Price comparison
