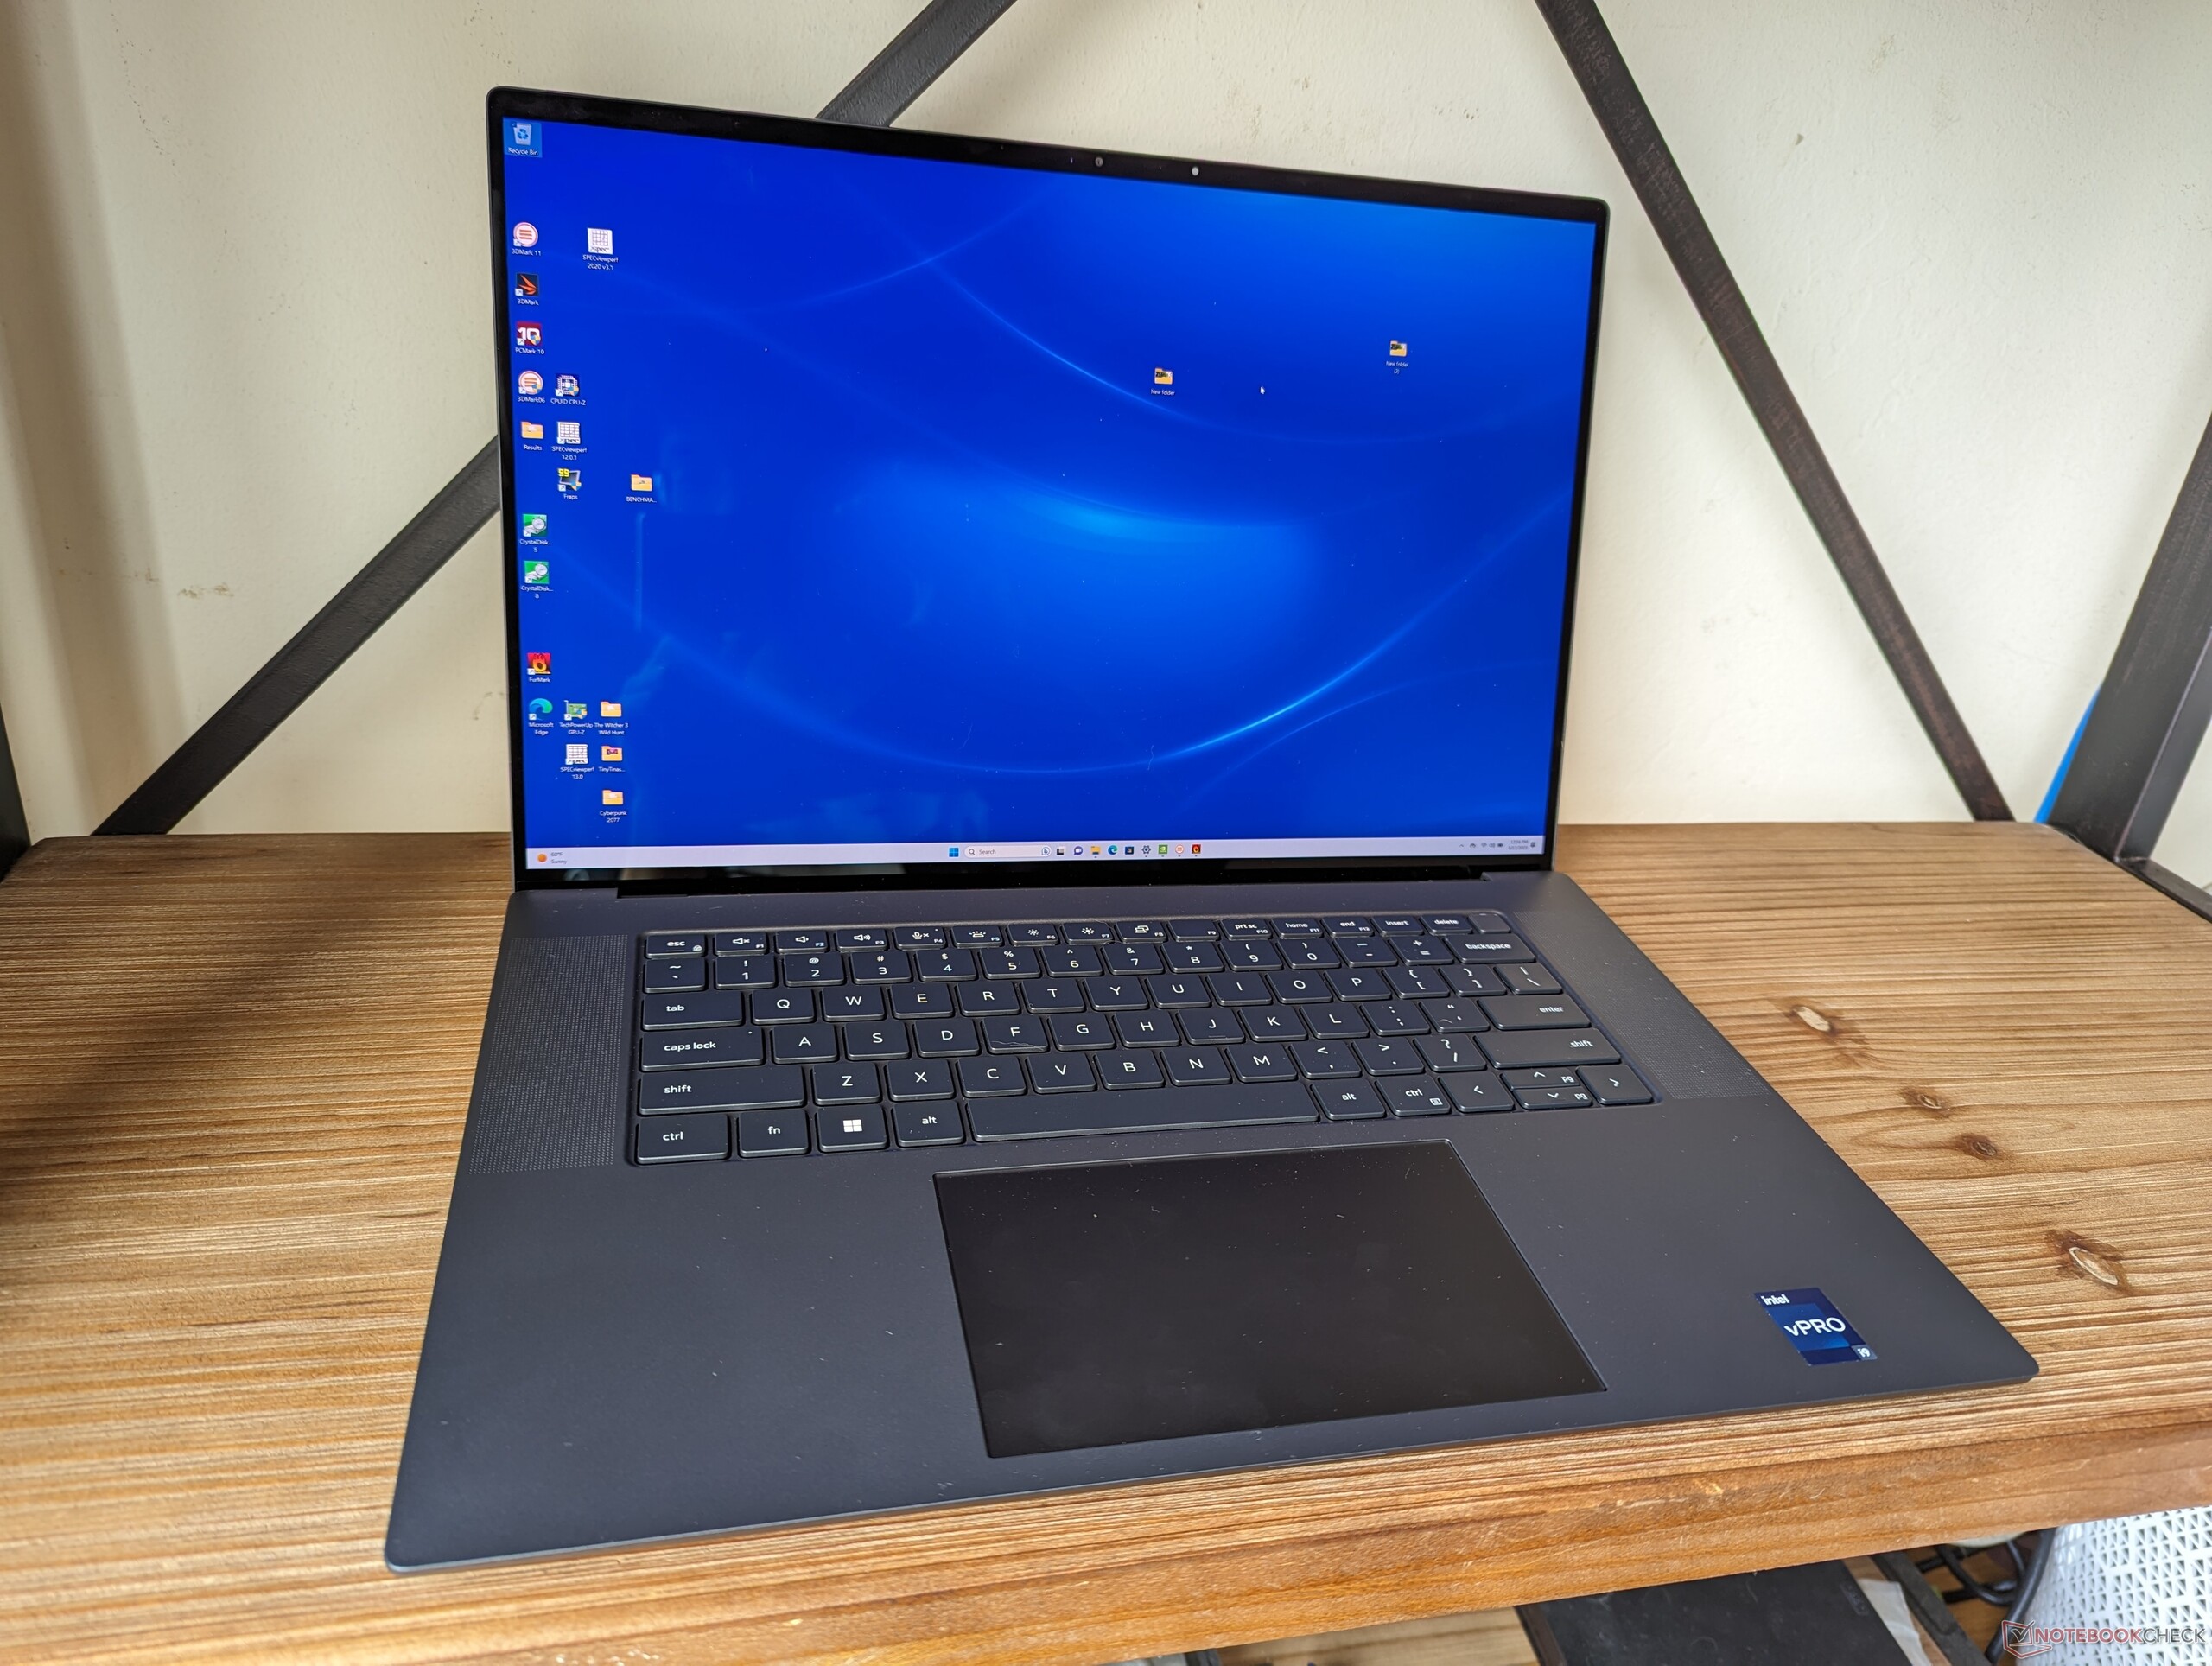
Dell Precision 5680 review: Ada Lovelace dominates on workstations

The Precision 5680 is the first 16-inch model in the Precision 5000 series to complement the existing 14-inch Precision 5470, 15-inch Precision 5560, and 17-inch Precision 5750. It's a high-end mobile workstation that's thinner and lighter than a Precision 7000 model albeit with fewer integrated auxiliary features.
Our test unit is a higher-end configuration with the 13th gen Raptor Lake-H Core i9-13900H CPU, 75 W Nvidia RTX 5000 GPU, and 2400p OLED touchscreen for approximately $6500 USD. Lesser SKUs are available with the Core i5-13600H, no discrete GPU, and 1200p IPS display for a lower starting price of about $2490.
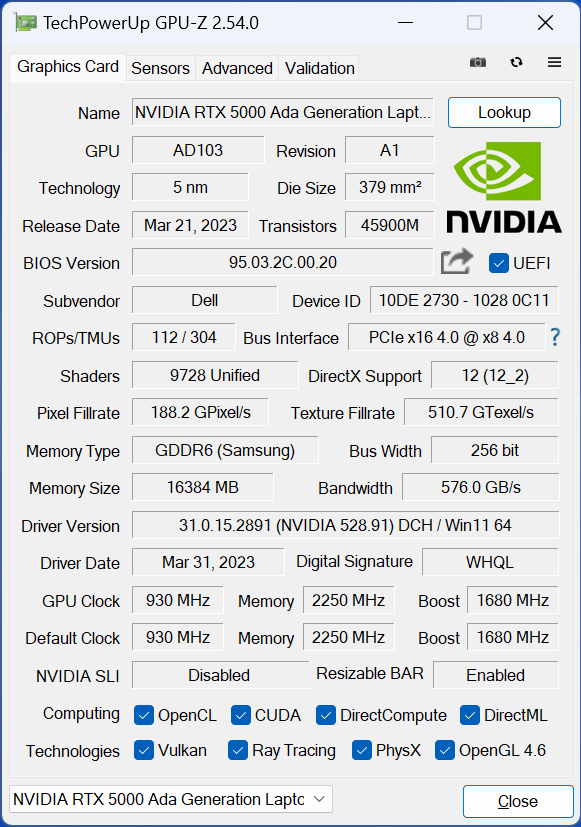
This also happens to be one of the first workstations to ship with the RTX 5000 Ada Lovelace mobile GPU which shouldn't be confused with the Turing-based Quadro RTX 5000 or Ampere-based RTX A5000.
Competitors in this space include other 16-inch workstations like the HP ZBook Fury 16 G9, Lenovo ThinkPad P16 G1, MSI CreatorPro Z16P, or the Asus ProArt StudioBook 16 series.
More Dell reviews:
Potential Competitors in Comparison
Rating | Date | Model | Weight | Height | Size | Resolution | Price |
|---|---|---|---|---|---|---|---|
| 89 % v7 (old) | 08 / 2023 | Dell Precision 5000 5680 i9-13900H, RTX 5000 Ada Generation Laptop | 2.3 kg | 22.17 mm | 16.00" | 3840x2400 | |
| 89.1 % v7 (old) | 12 / 2022 | Dell Precision 7000 7670 Performance i9-12950HX, RTX A5500 Laptop GPU | 2.8 kg | 25.95 mm | 16.00" | 3840x2400 | |
| 91 % v7 (old) | 06 / 2023 | HP ZBook Fury 16 G9 i9-12950HX, RTX A5500 Laptop GPU | 2.6 kg | 28.5 mm | 16.00" | 3840x2400 | |
| 91 % v7 (old) | 02 / 2023 | Lenovo ThinkPad P16 G1 RTX A5500 i9-12950HX, RTX A5500 Laptop GPU | 3 kg | 30.23 mm | 16.00" | 3840x2400 | |
| 84.3 % v7 (old) | 11 / 2022 | MSI CreatorPro Z16P B12UKST i7-12700H, RTX A3000 Laptop GPU | 2.4 kg | 19 mm | 16.00" | 2560x1600 | |
| 89.6 % v7 (old) | 01 / 2023 | Asus ExpertBook B6 Flip B6602FC2 i9-12950HX, RTX A2000 Laptop GPU | 2.8 kg | 27.2 mm | 16.00" | 2560x1600 |
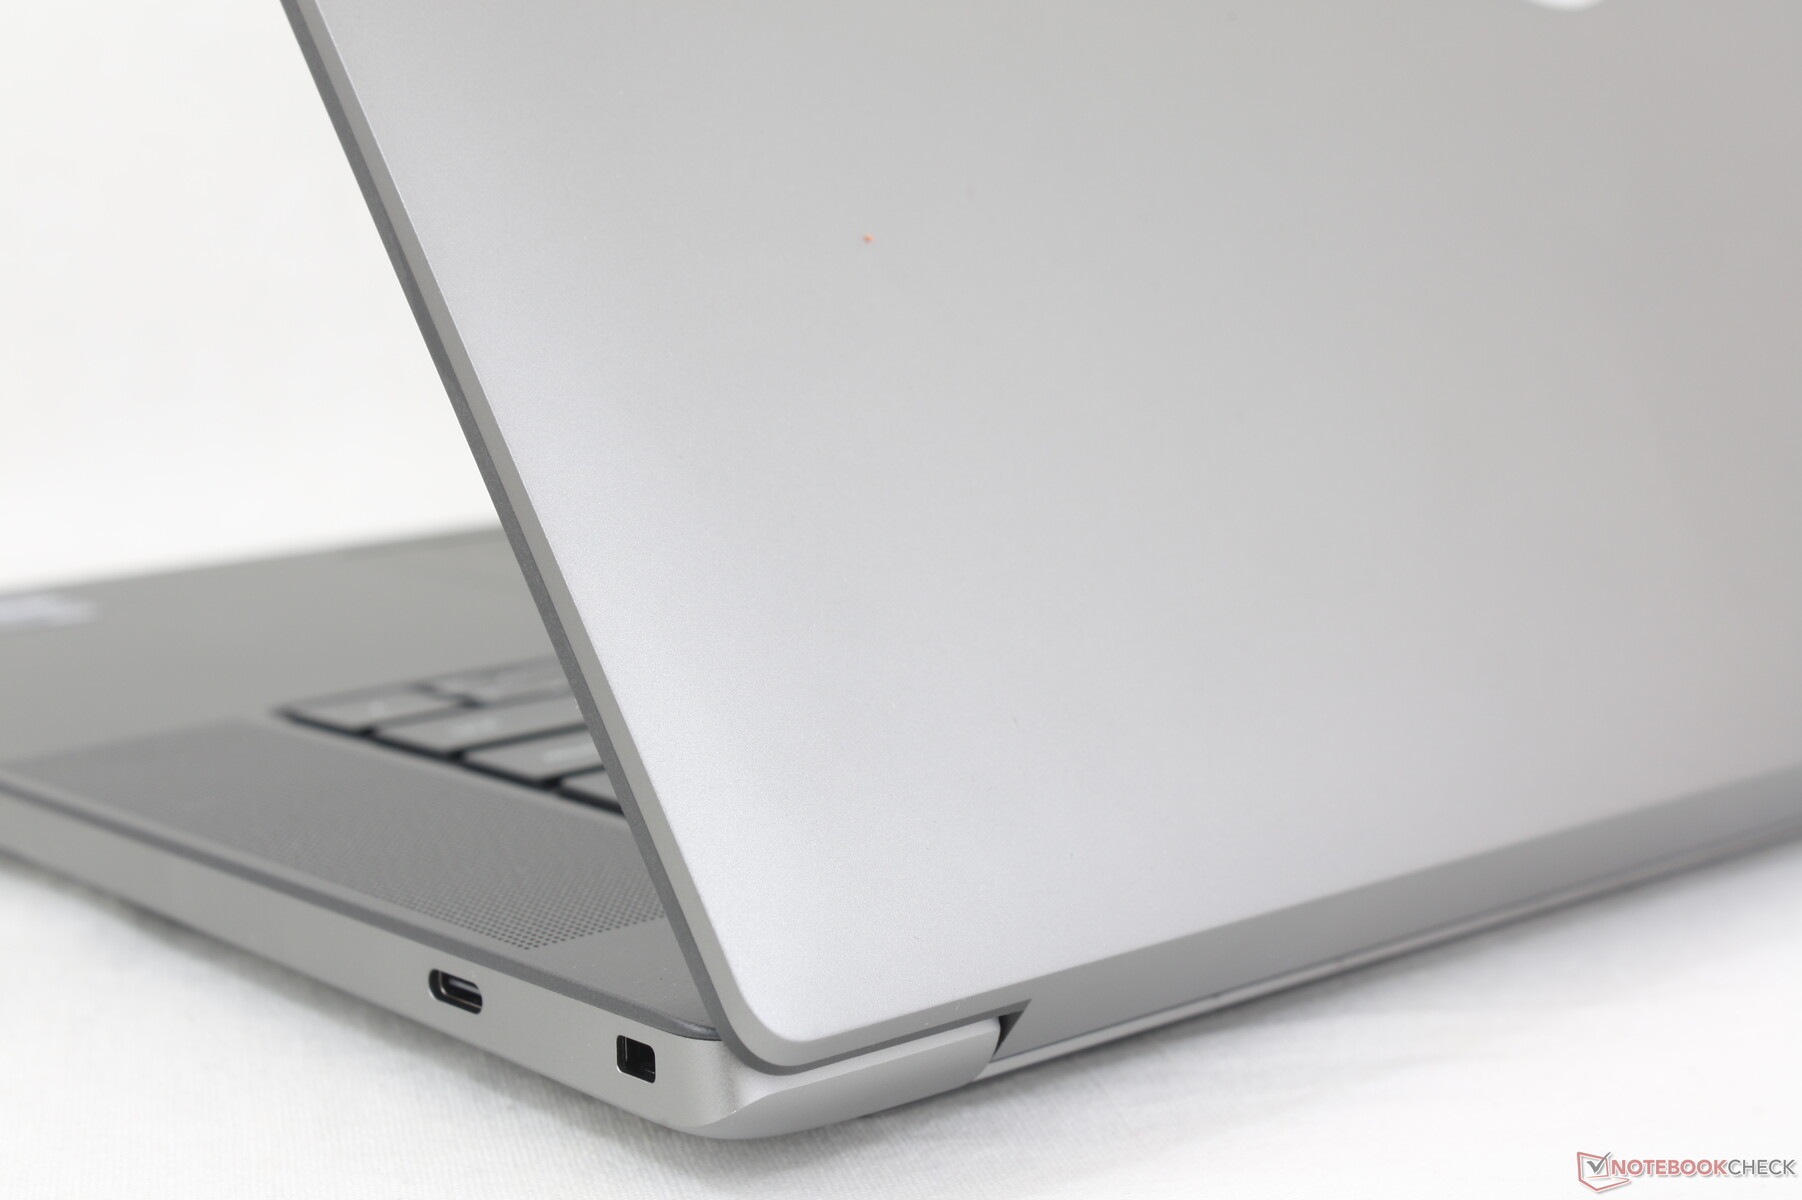
Case — XPS Roots
The inspiration for the Precision 5680 design is obvious as it is essentially the 16-inch version of the 15-inch XPS 15 and 17-inch XPS 17. If you've had experience with an XPS model before, then the Precision 5680 should feel instantly familiar. It seemingly precedes a hypothetical "XPS 16" and we wouldn't be surprised to see such a model in the near future with a chassis based on the Precision 5680.
Build quality compares favorably against alternatives like the ZBook Fury 16 G9 or CreatorPro Z16P which also consist mostly of metal alloys for strong first impressions.
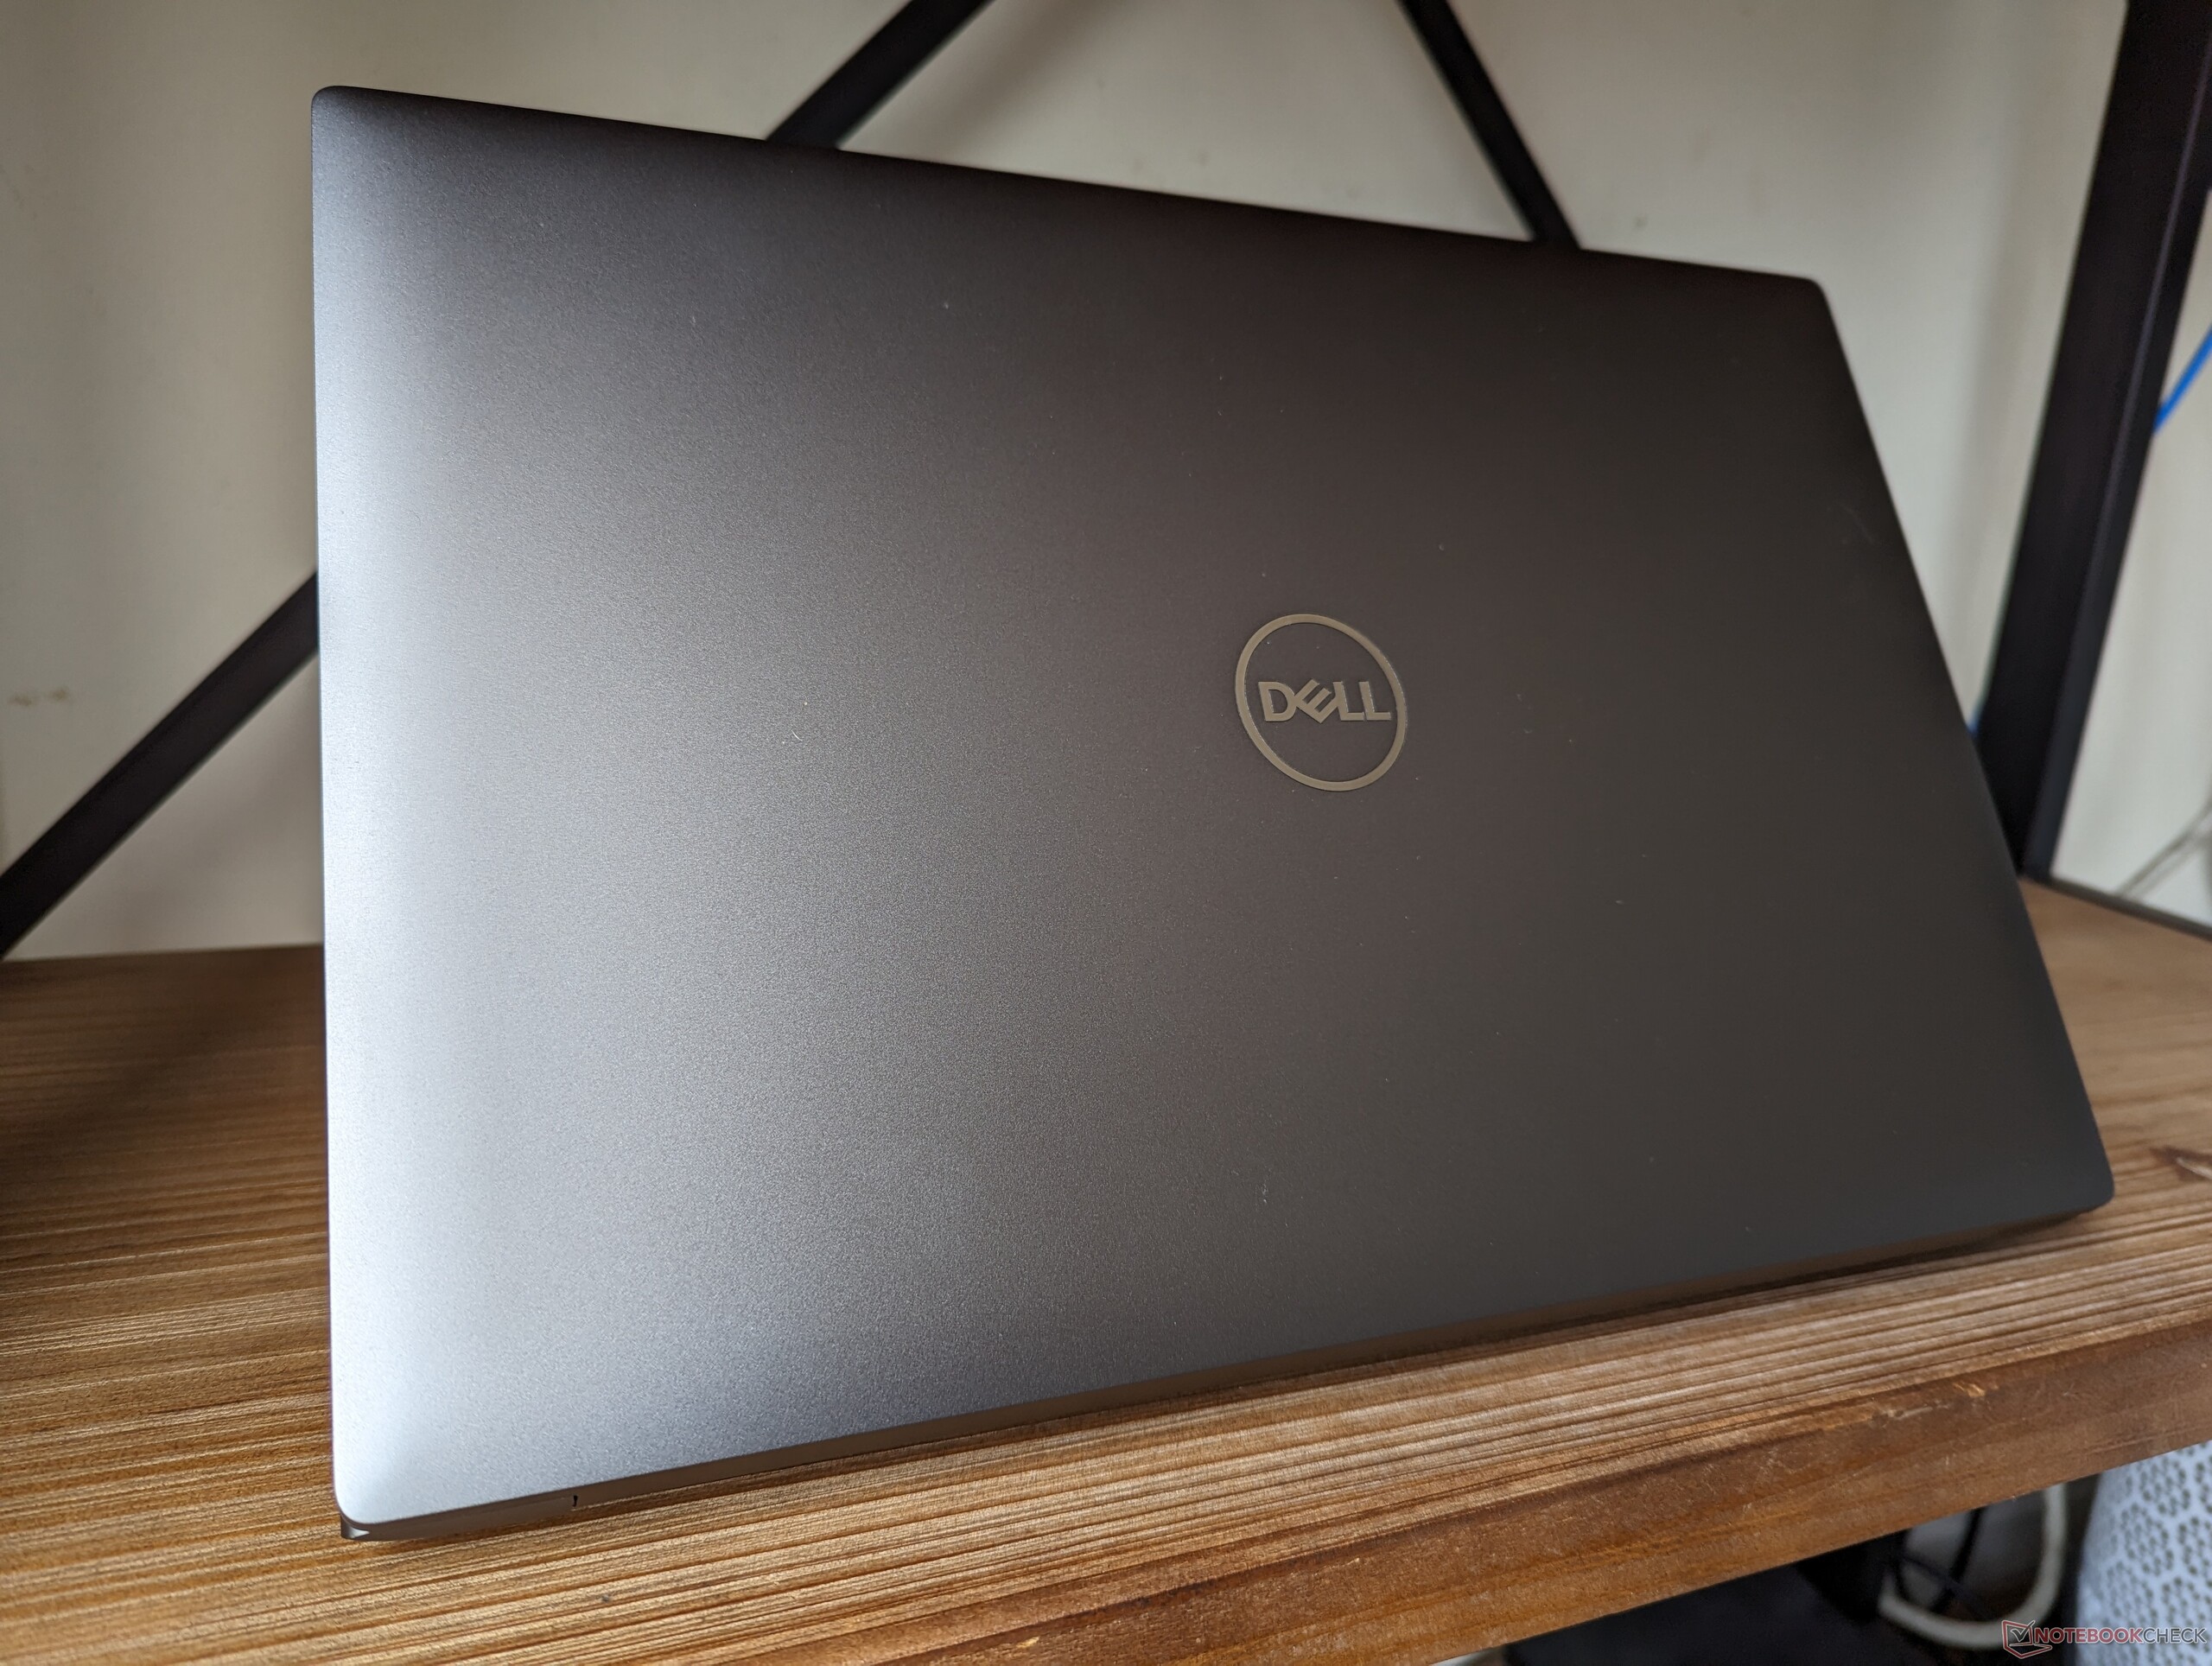
At just 2.3 kg, the Precision 5680 is one of the lightest 16-inch workstations available by decent margins. The CreatorPro Z16P and HP ZBook Fury 16 G9, for example, are about 100 g and 300 g heavier, respectively, while also being larger in footprint than our Dell as well. The Precision 5680 is surprisingly portable considering its performance.
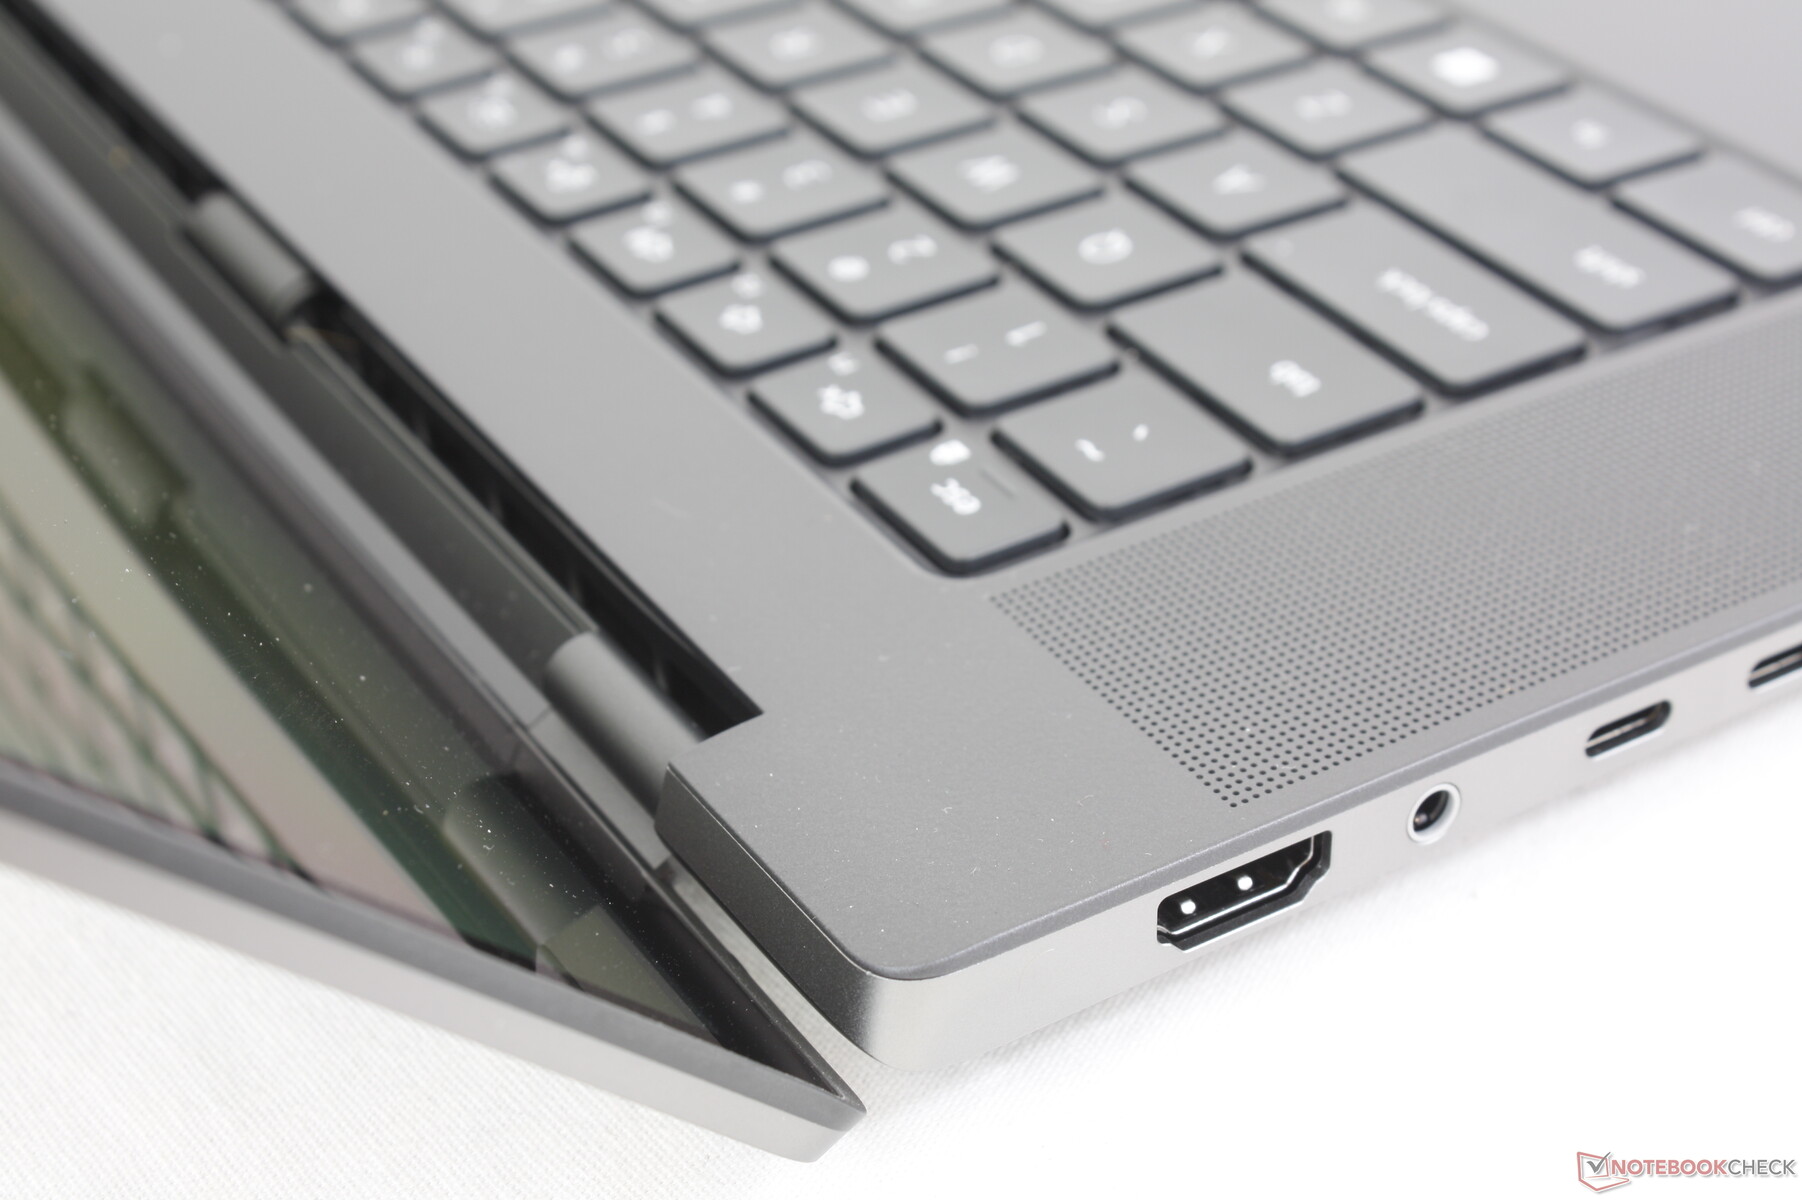
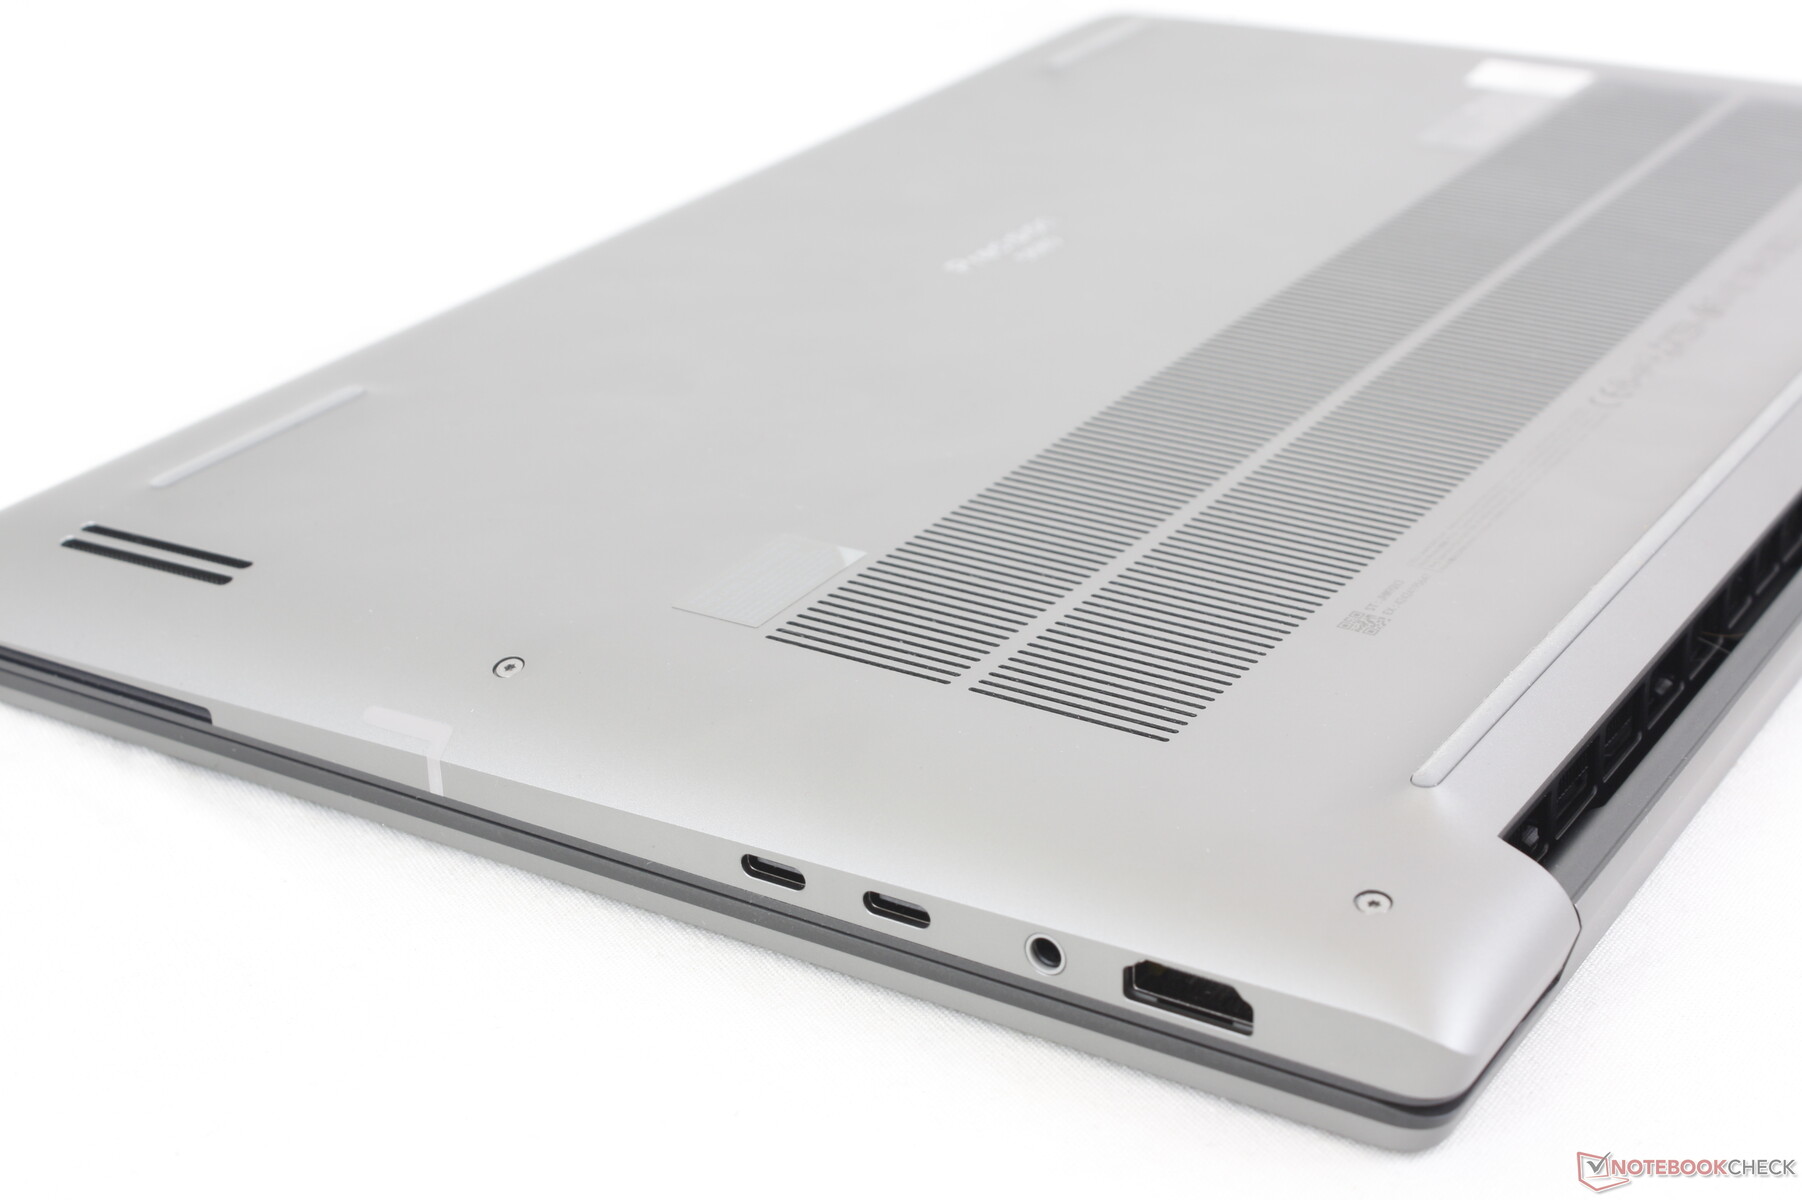

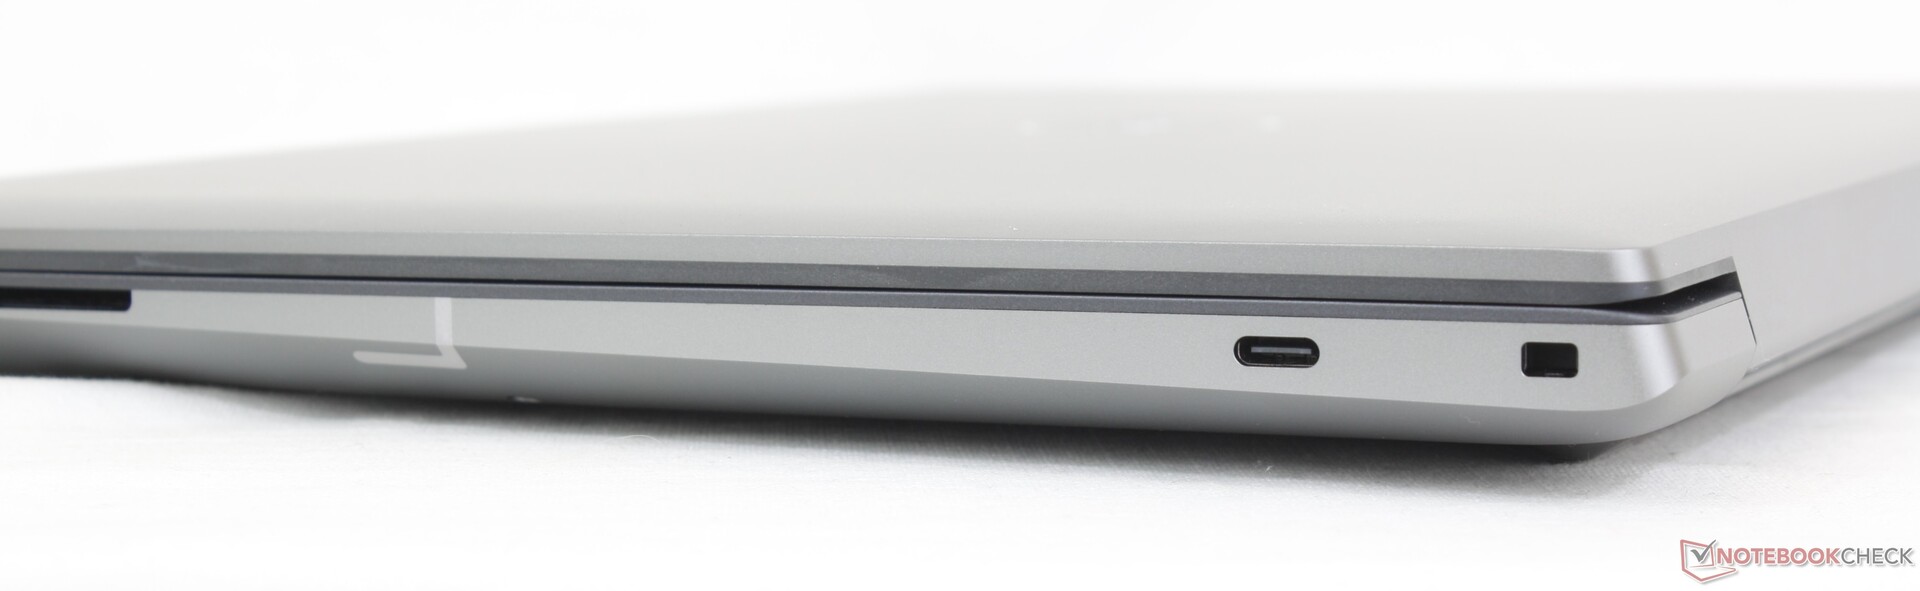
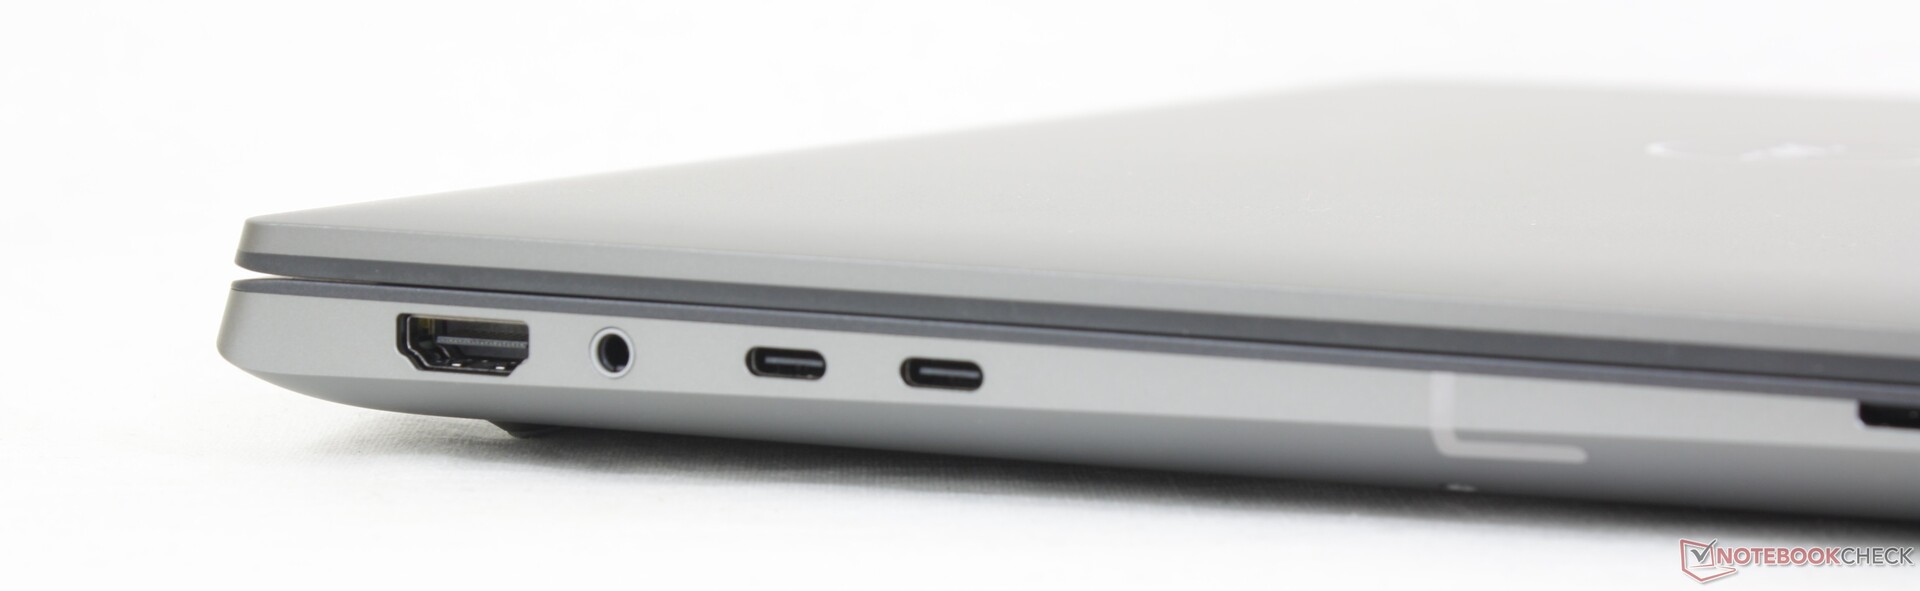
Connectivity — Not A Lot For A Workstation
Port options are forward-thinking for better or worse. It's better in the sense that each port is highly versatile when it comes to adapters and peripherals, but it's also worse in the sense that there are no staple ports such as full-size USB or RJ-45. Alternatives like the ThinkPad P1 G4 or ExpertBook B6 Flip each offer a wider variety of ports than our Dell. Be prepared to rely on adapters or docking stations when using the Precision 5680 as a result.
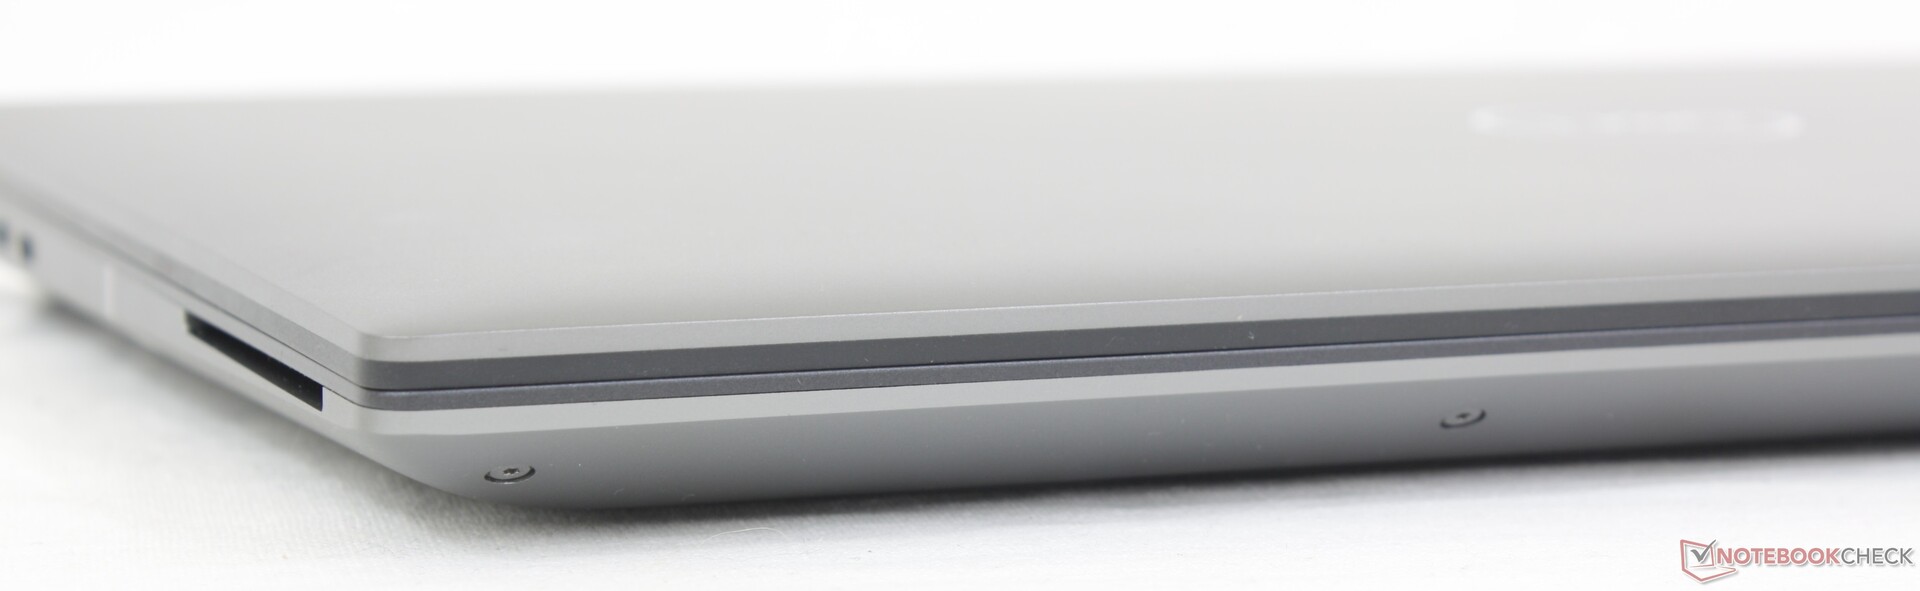
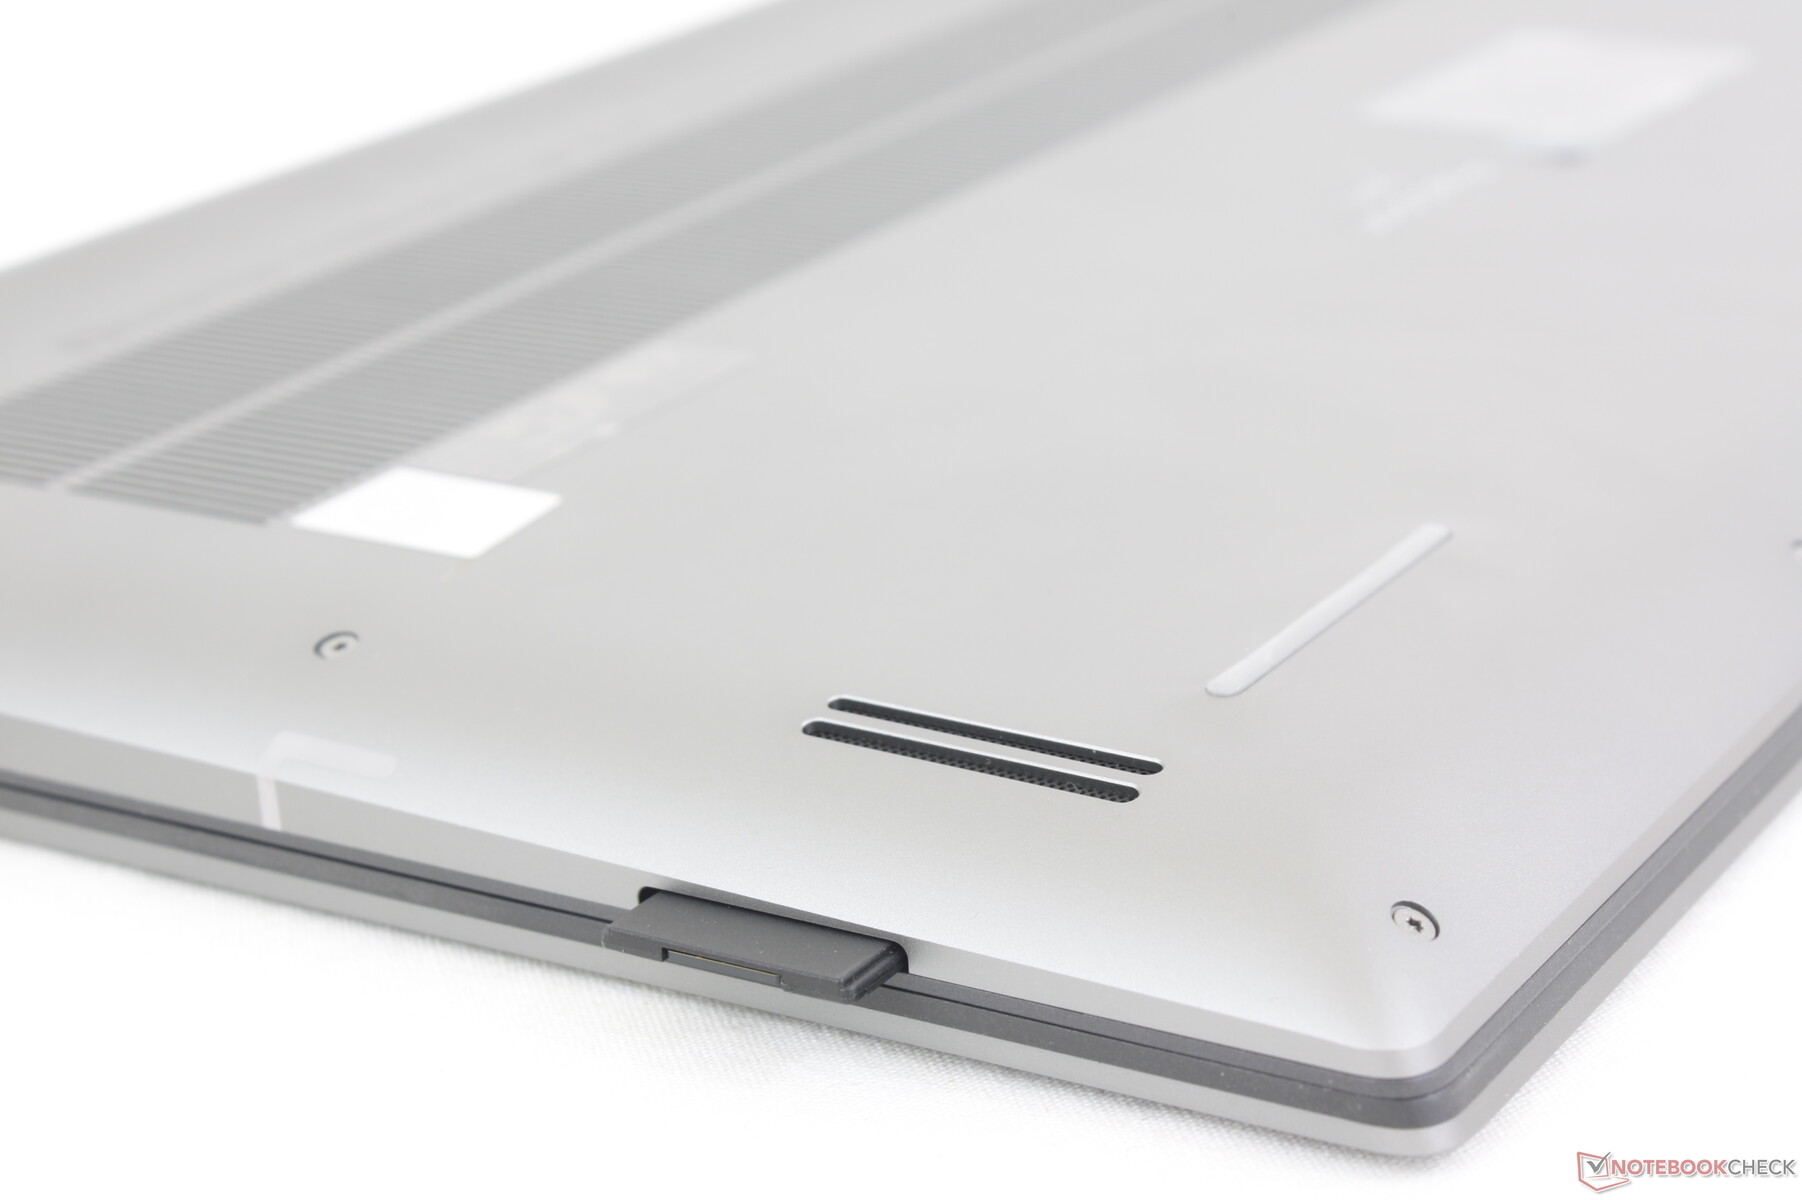
SD Card Reader
XPS and Precision models have some of the fastest integrated SD card readers and this continues to hold true for our Precision 5680. Read rates are over 2x faster than on the ZBook Fury 16 G9 or ThinkPad P16 G1 and so it would take just 5 to 6 seconds to transfer 1 GB of data from our UHS-II test card to desktop.
| SD Card Reader | |
| average JPG Copy Test (av. of 3 runs) | |
| Dell Precision 5000 5680 (Toshiba Exceria Pro SDXC 64 GB UHS-II) | |
| Dell Precision 7000 7670 Performance (Toshiba Exceria Pro SDXC 64 GB UHS-II) | |
| MSI CreatorPro Z16P B12UKST (AV Pro V60) | |
| HP ZBook Fury 16 G9 (PNY EliteX-PRO60) | |
| Lenovo ThinkPad P16 G1 RTX A5500 (Toshiba Exceria Pro SDXC 64 GB UHS-II) | |
| maximum AS SSD Seq Read Test (1GB) | |
| Dell Precision 7000 7670 Performance (Toshiba Exceria Pro SDXC 64 GB UHS-II) | |
| Dell Precision 5000 5680 (Toshiba Exceria Pro SDXC 64 GB UHS-II) | |
| HP ZBook Fury 16 G9 (PNY EliteX-PRO60) | |
| MSI CreatorPro Z16P B12UKST (AV Pro V60) | |
| Lenovo ThinkPad P16 G1 RTX A5500 (Toshiba Exceria Pro SDXC 64 GB UHS-II) | |
Communication
An Intel AX211 comes standard for Wi-Fi 6E and Bluetooth 5.3 connectivity. Transfer rates would be steady when paired to our Asus AXE11000 6GHz network.
WAN options are unfortunately not supported unlike on the competing ZBook Fury 16 G9.
Webcam
Dell has upped the webcam from 1 MP on the Precision 5550 to 2 MP on our Precision 5680. Even so, there is annoyingly still no integrated privacy shutter.


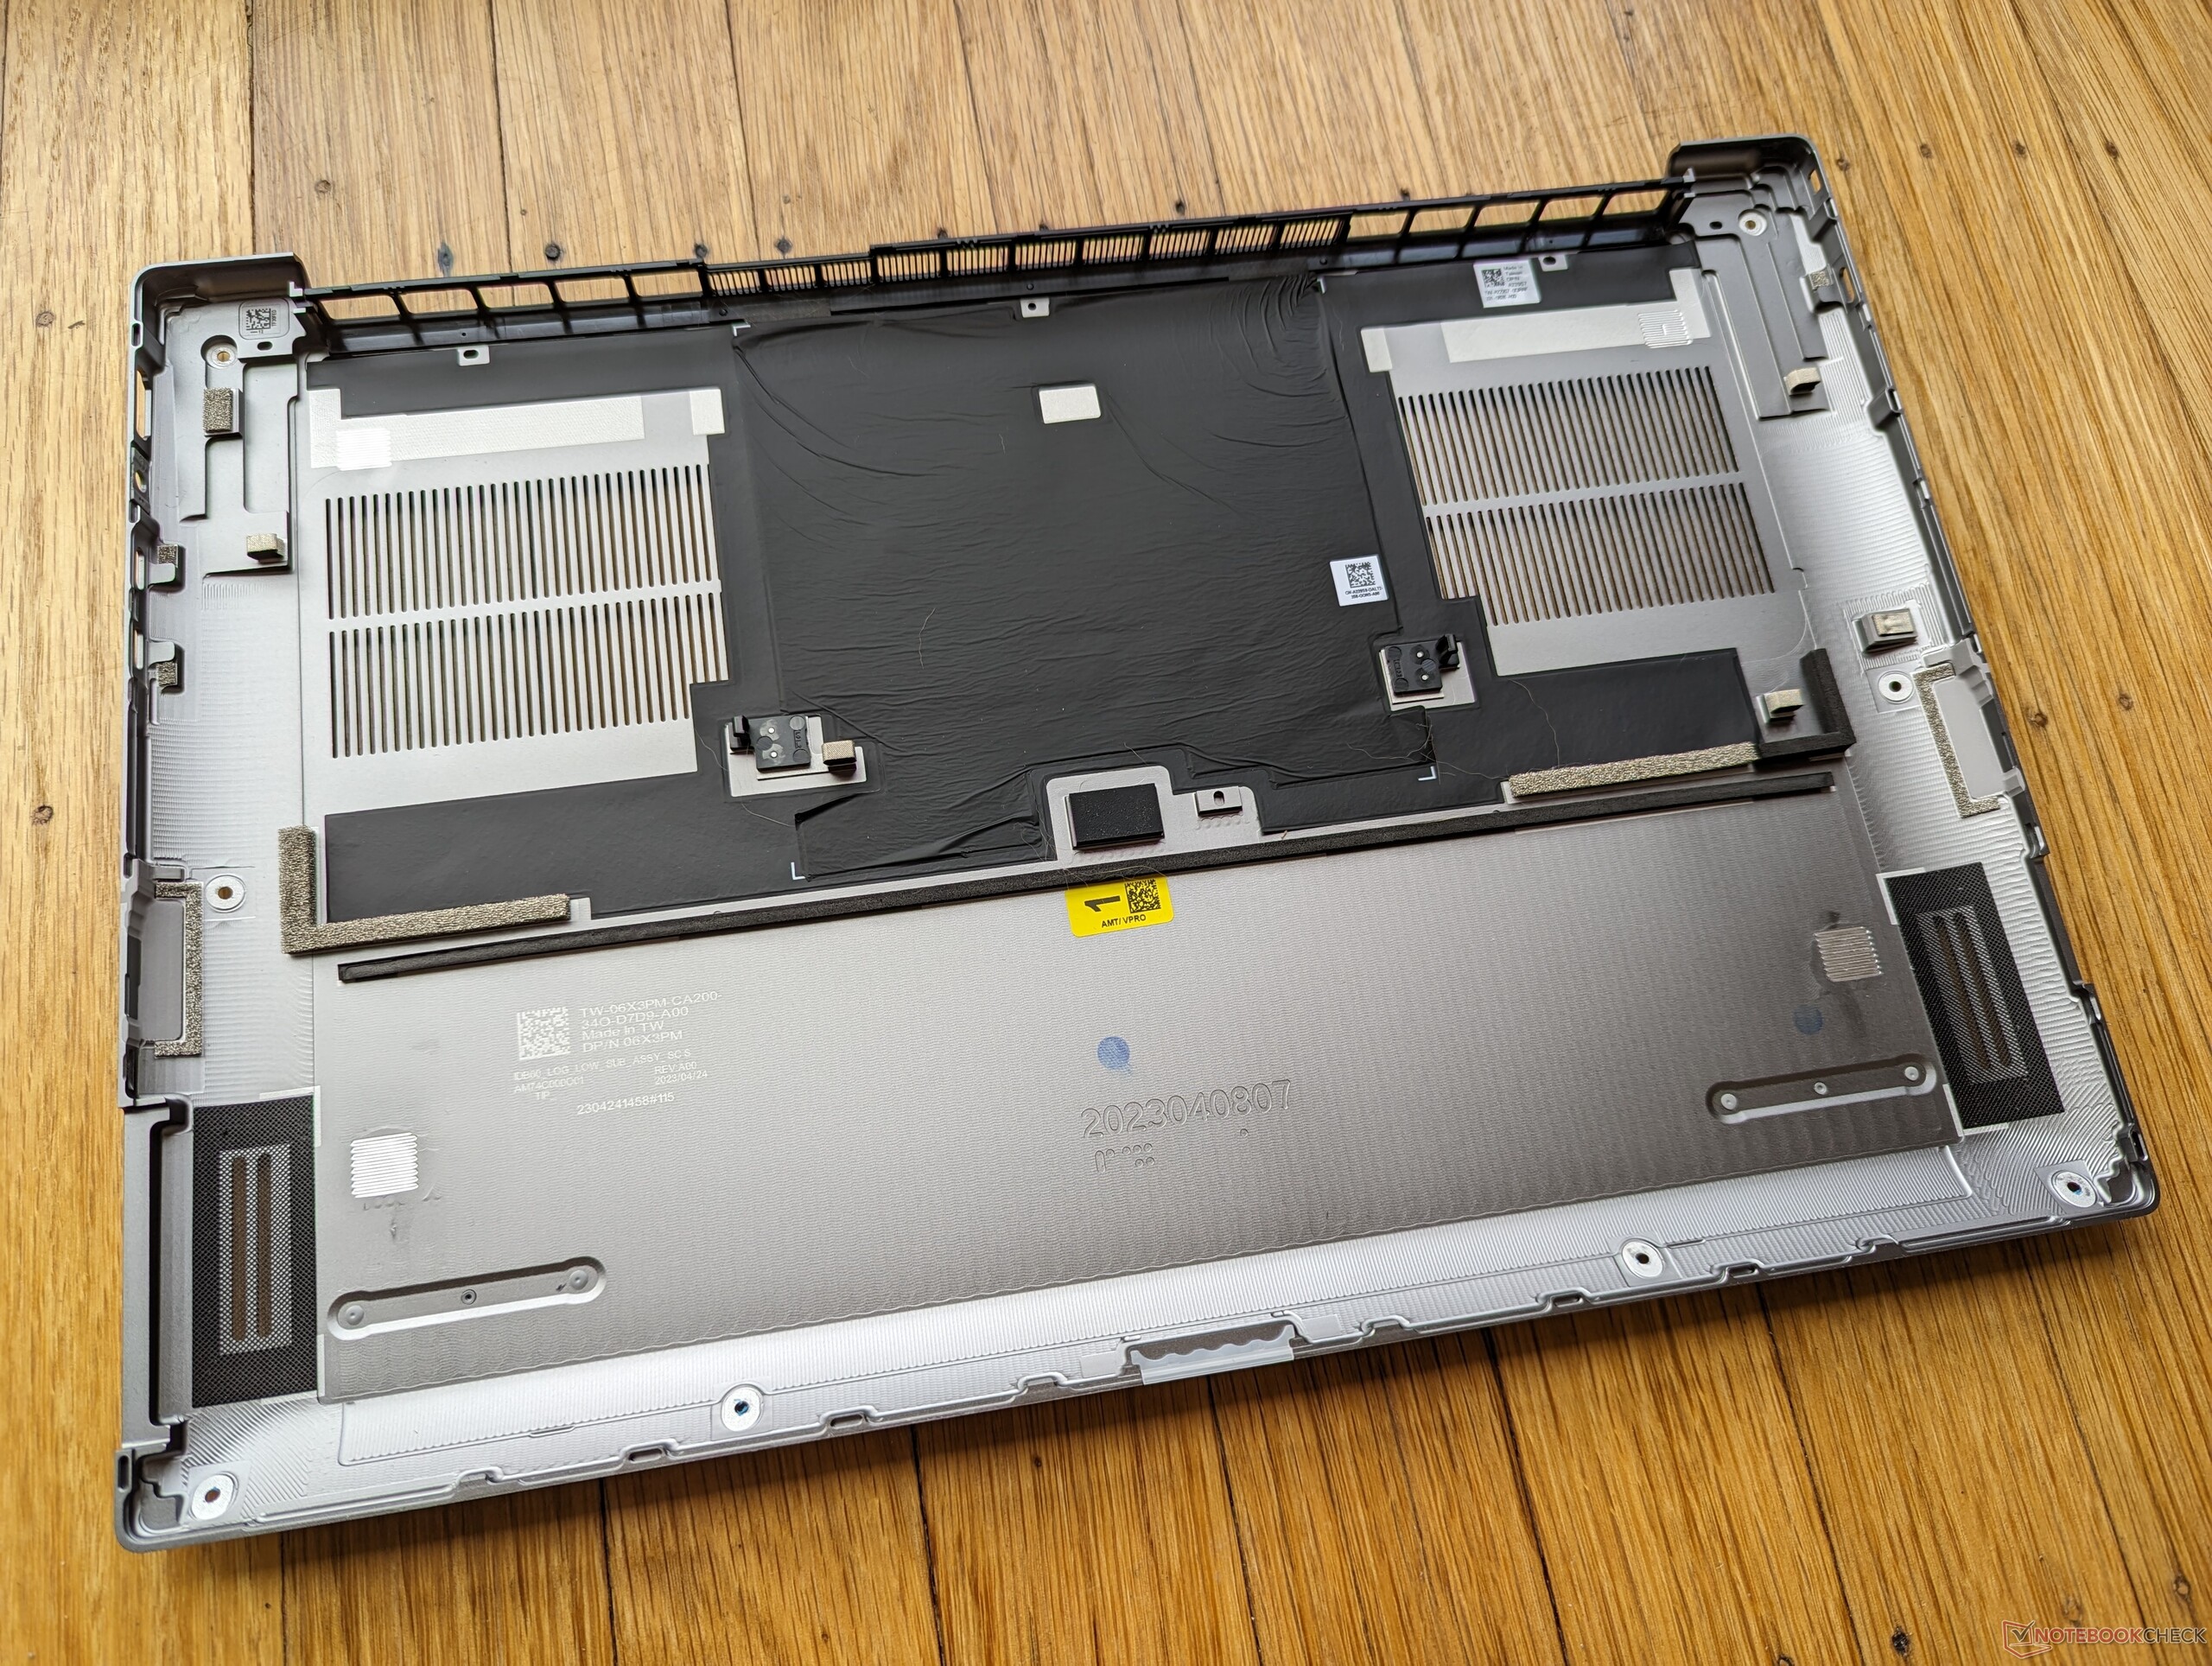
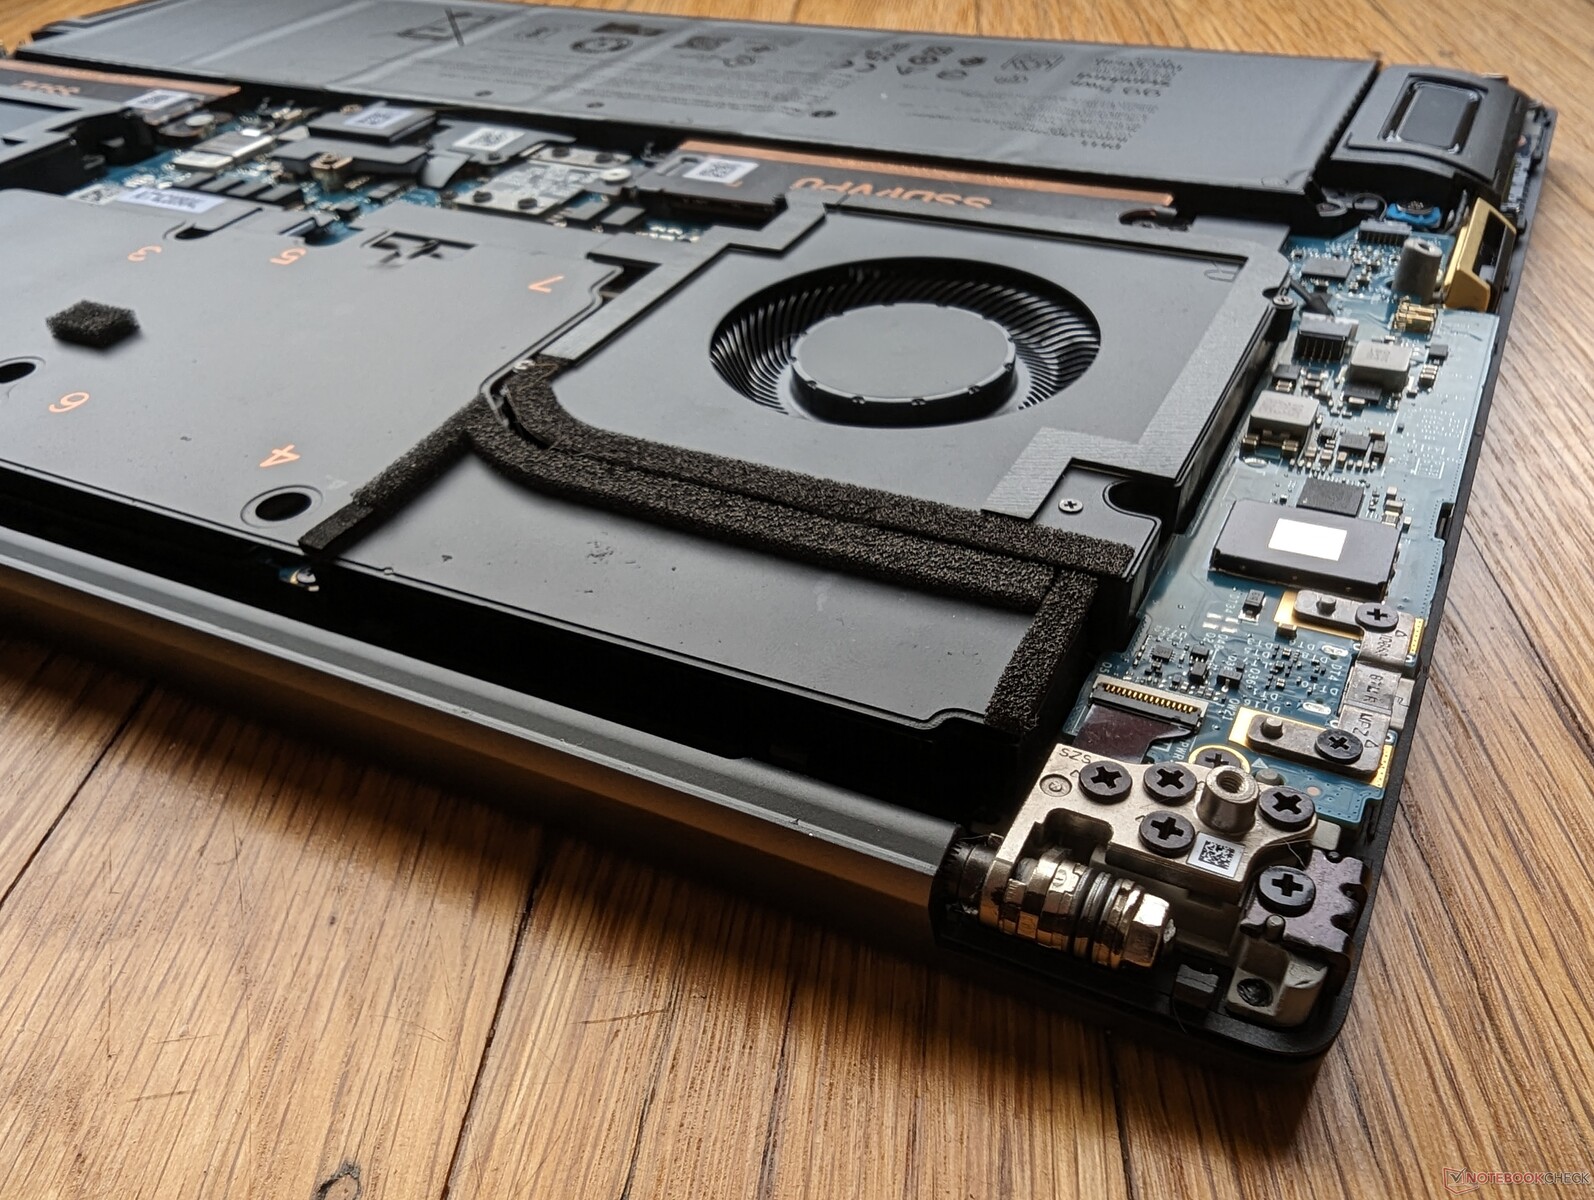
Maintenance
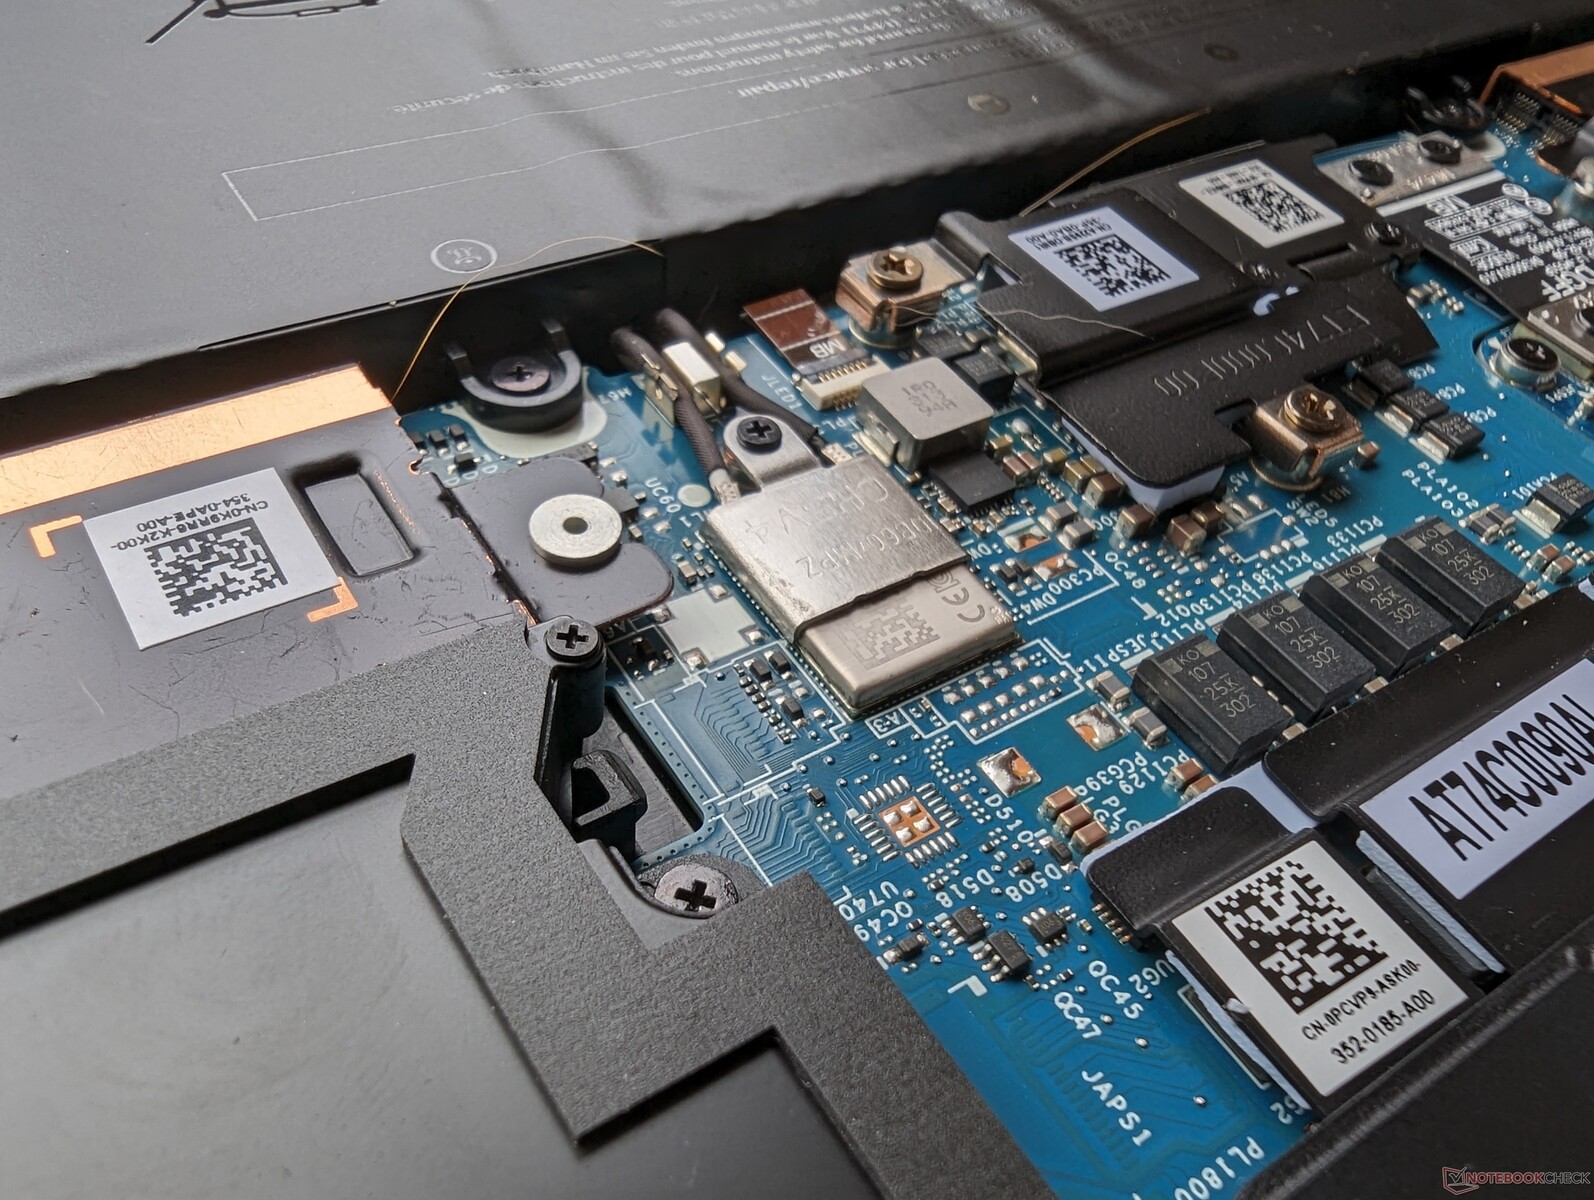
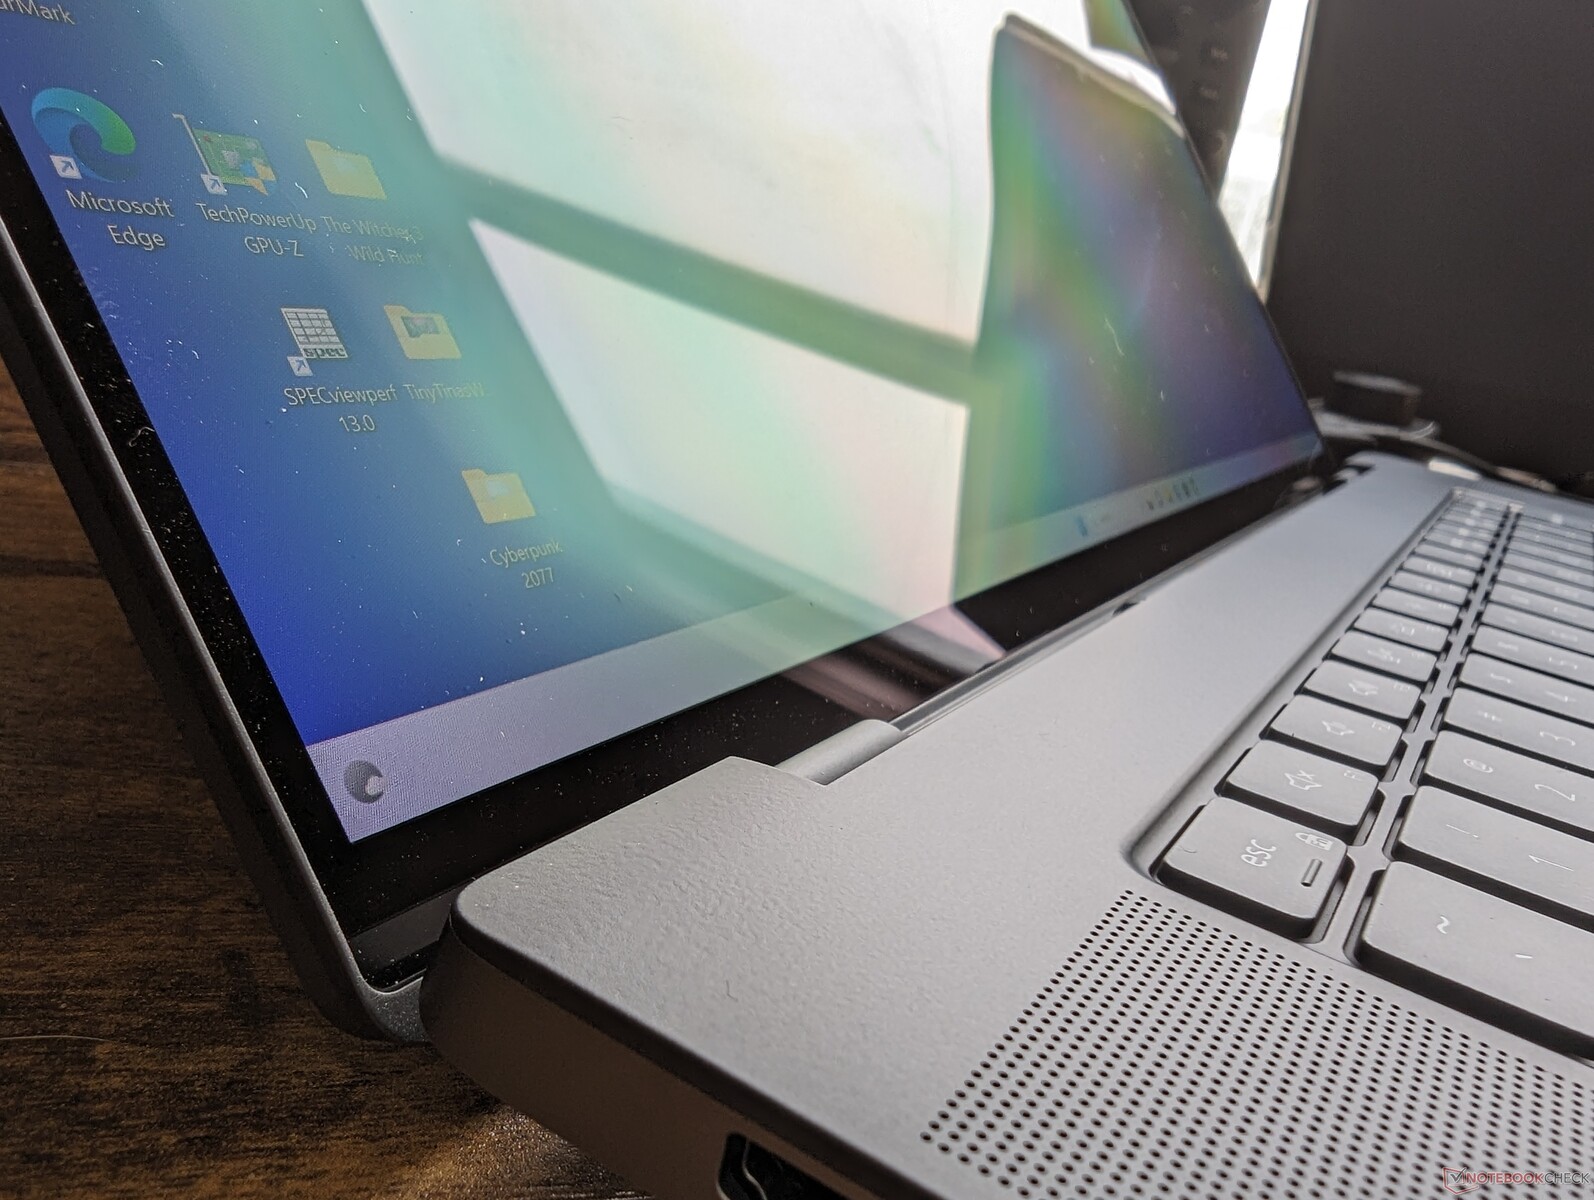
The bottom panel is slightly more difficult to remove than expected since the edges of the metal plate are both sharp and tightly latched much like on the XPS 15 or XPS 17. A Torx screw and flat edge are recommended when servicing the system.
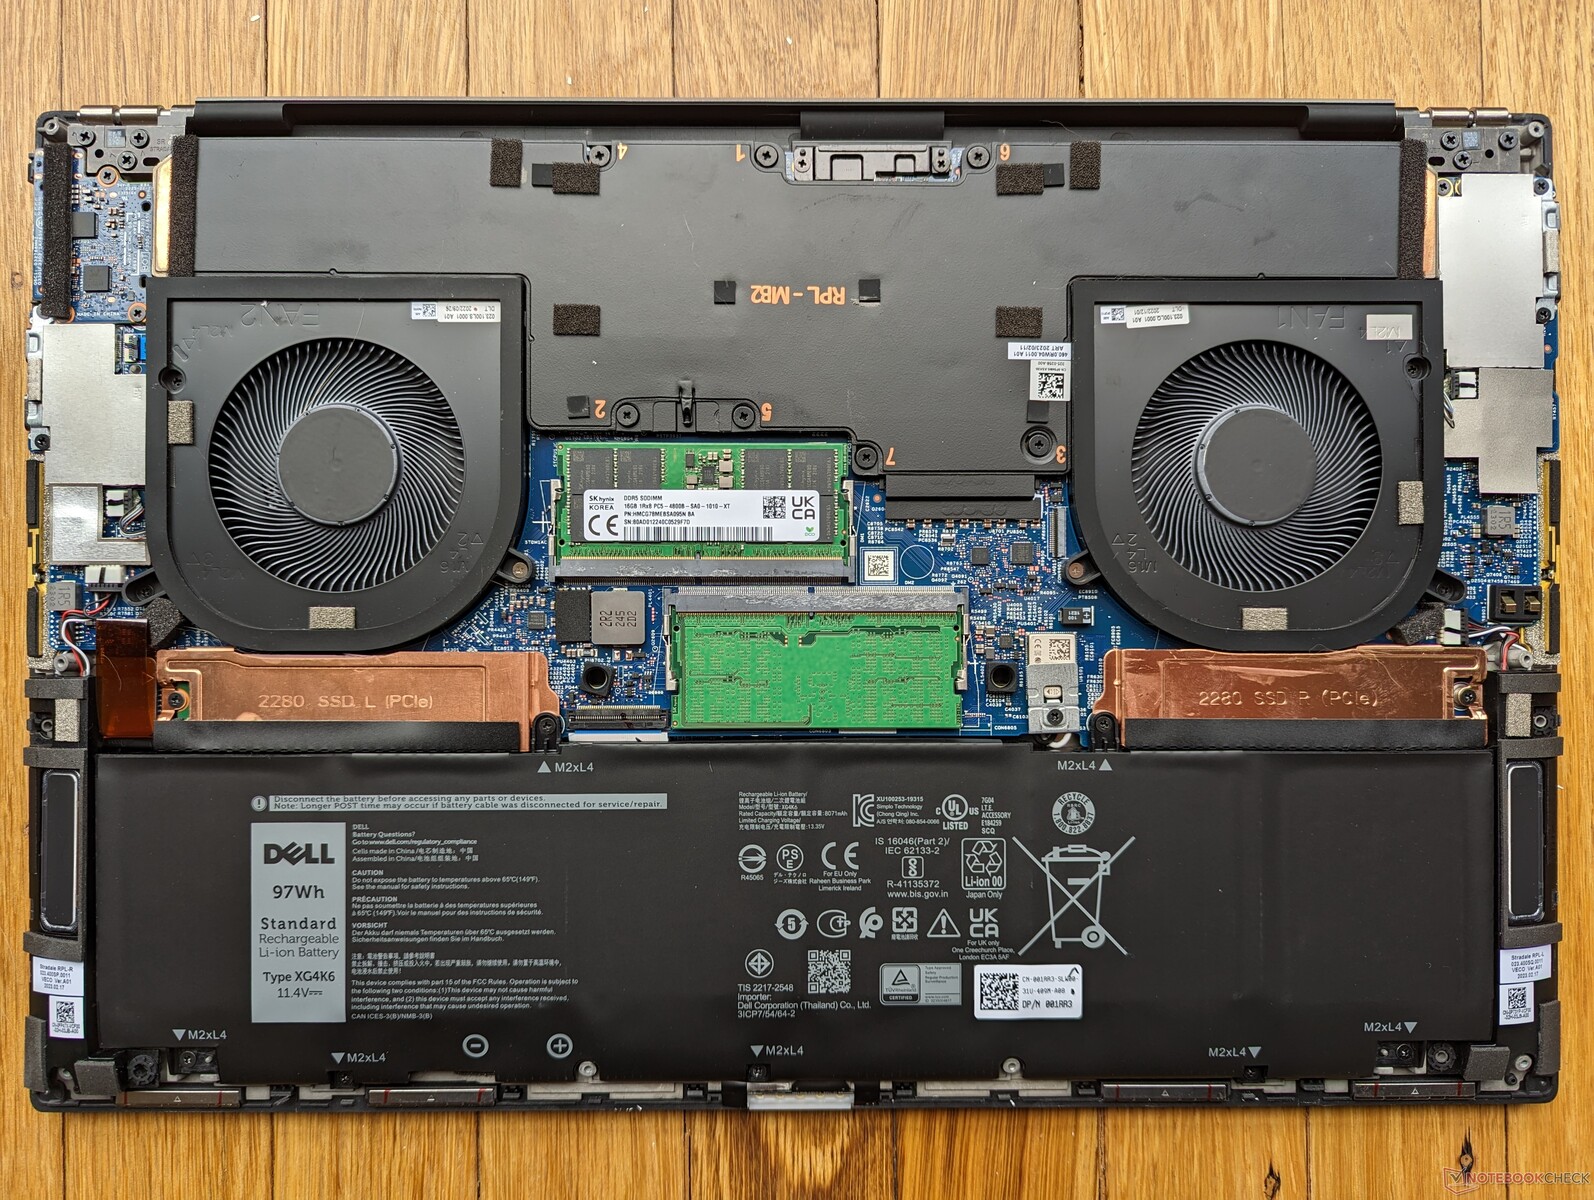
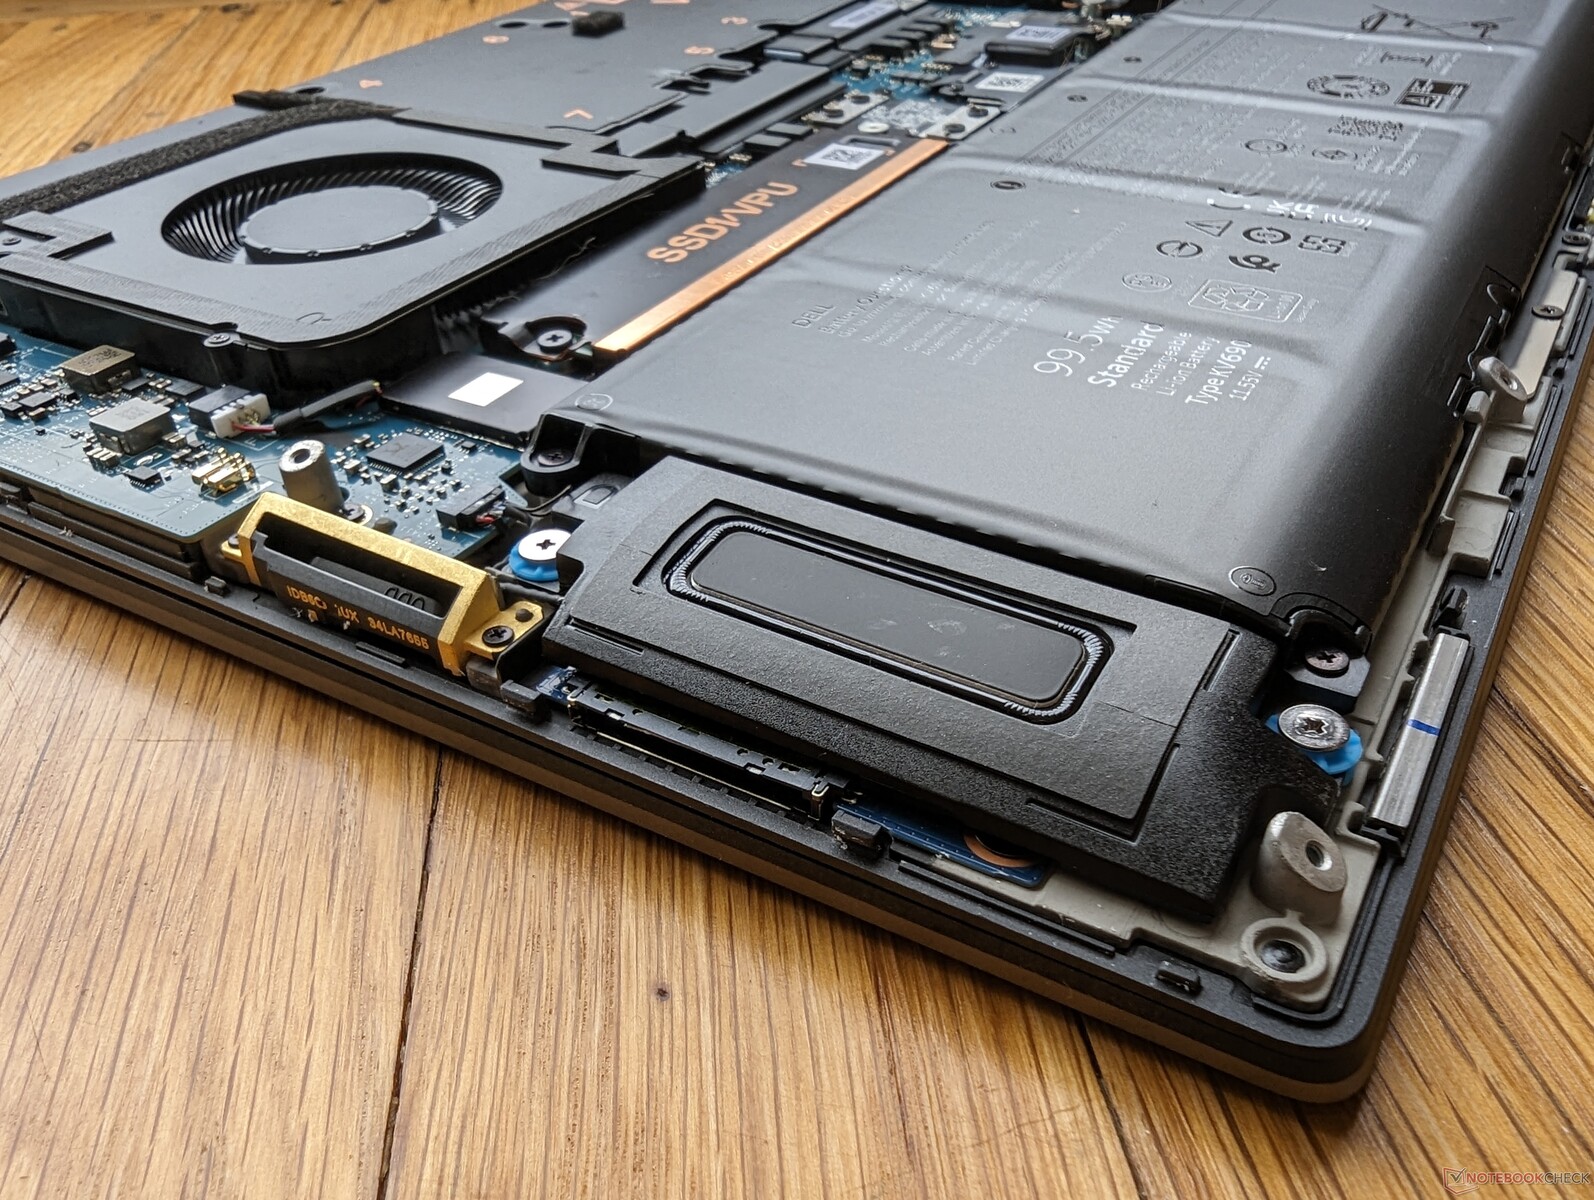
Both the WLAN and RAM modules are soldered unlike on most other workstations of this screen size. Both the highly integrated modules and limited port options are likely drawbacks to the otherwise sleek design and relatively low weight.
Accessories And Warranty
The retail box includes a small USB-C to USB-A adapter to make up for the fact that there are no full-size USB ports on the system.
A base three-year limited manufacturer warranty with on-site repair applies if purchased in the US.
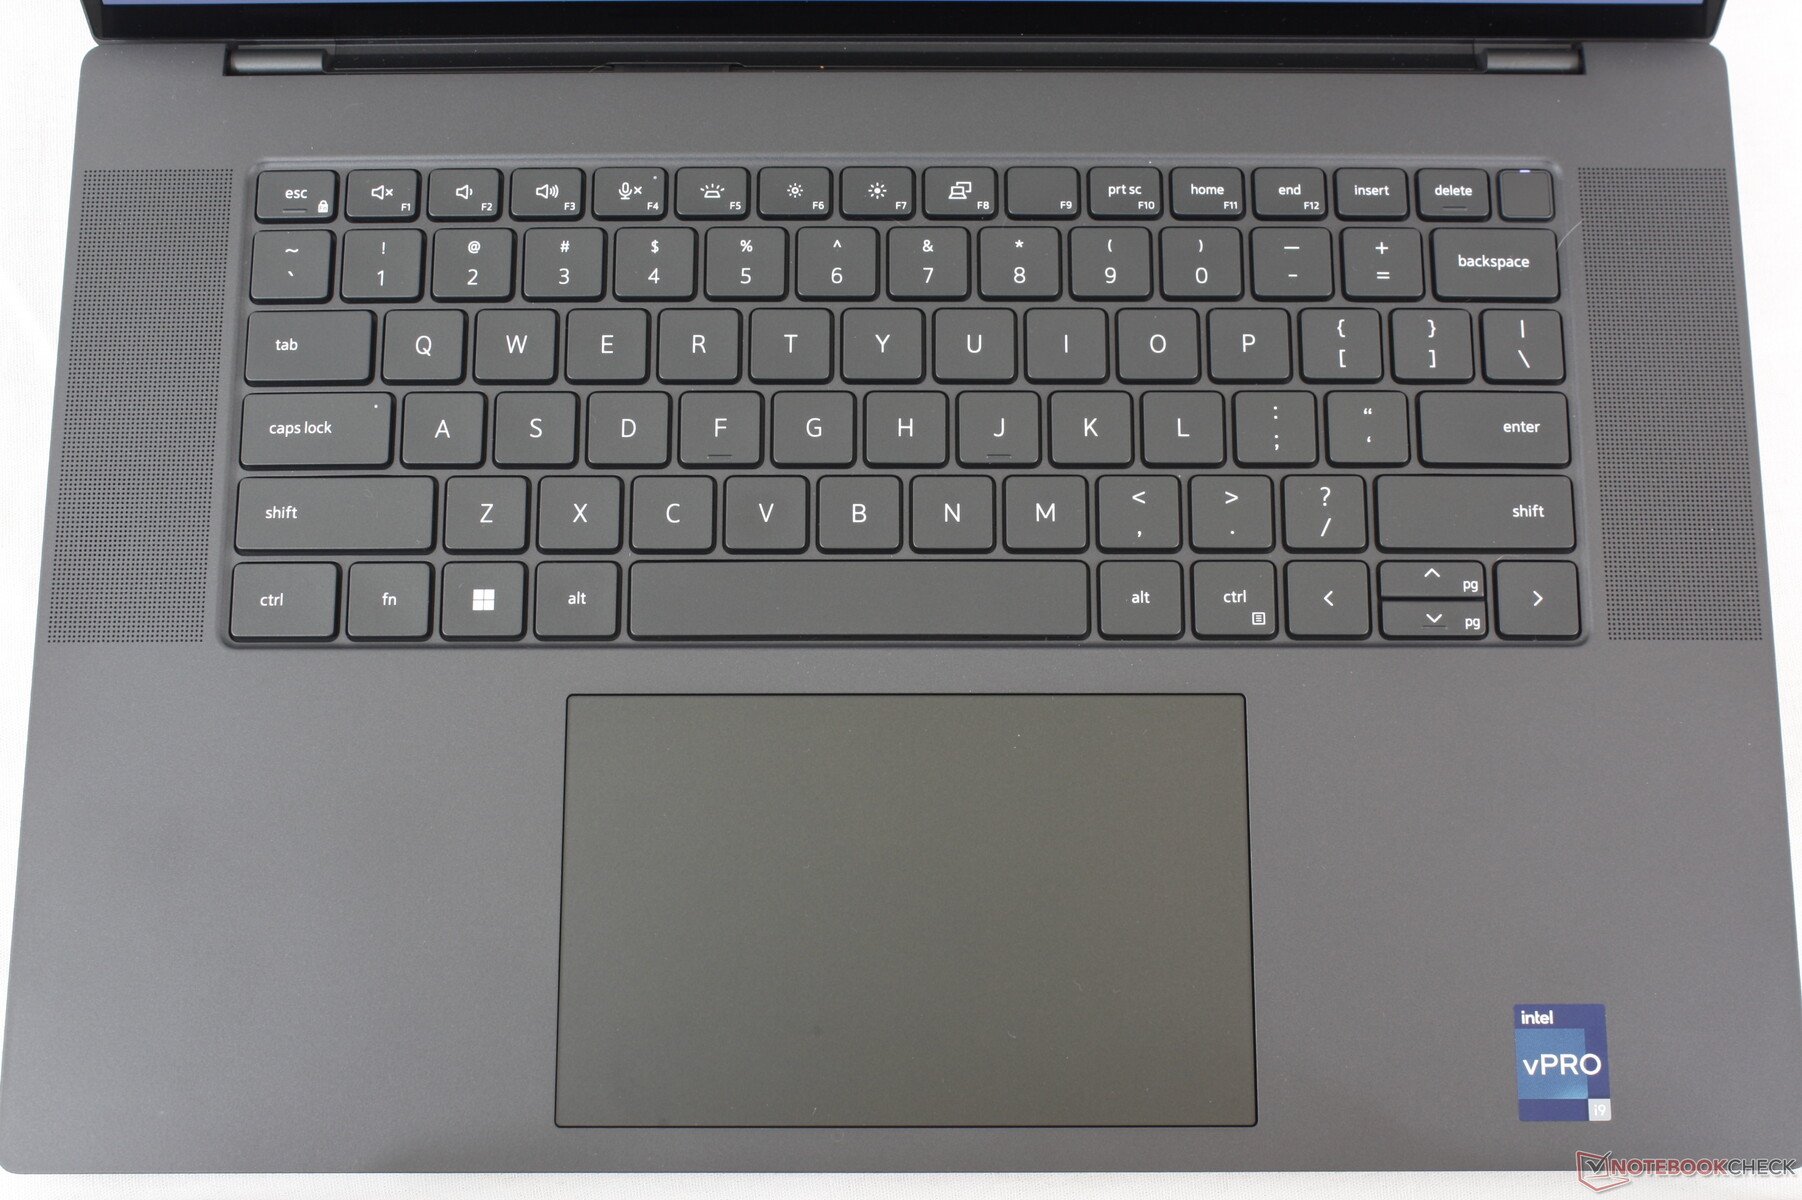
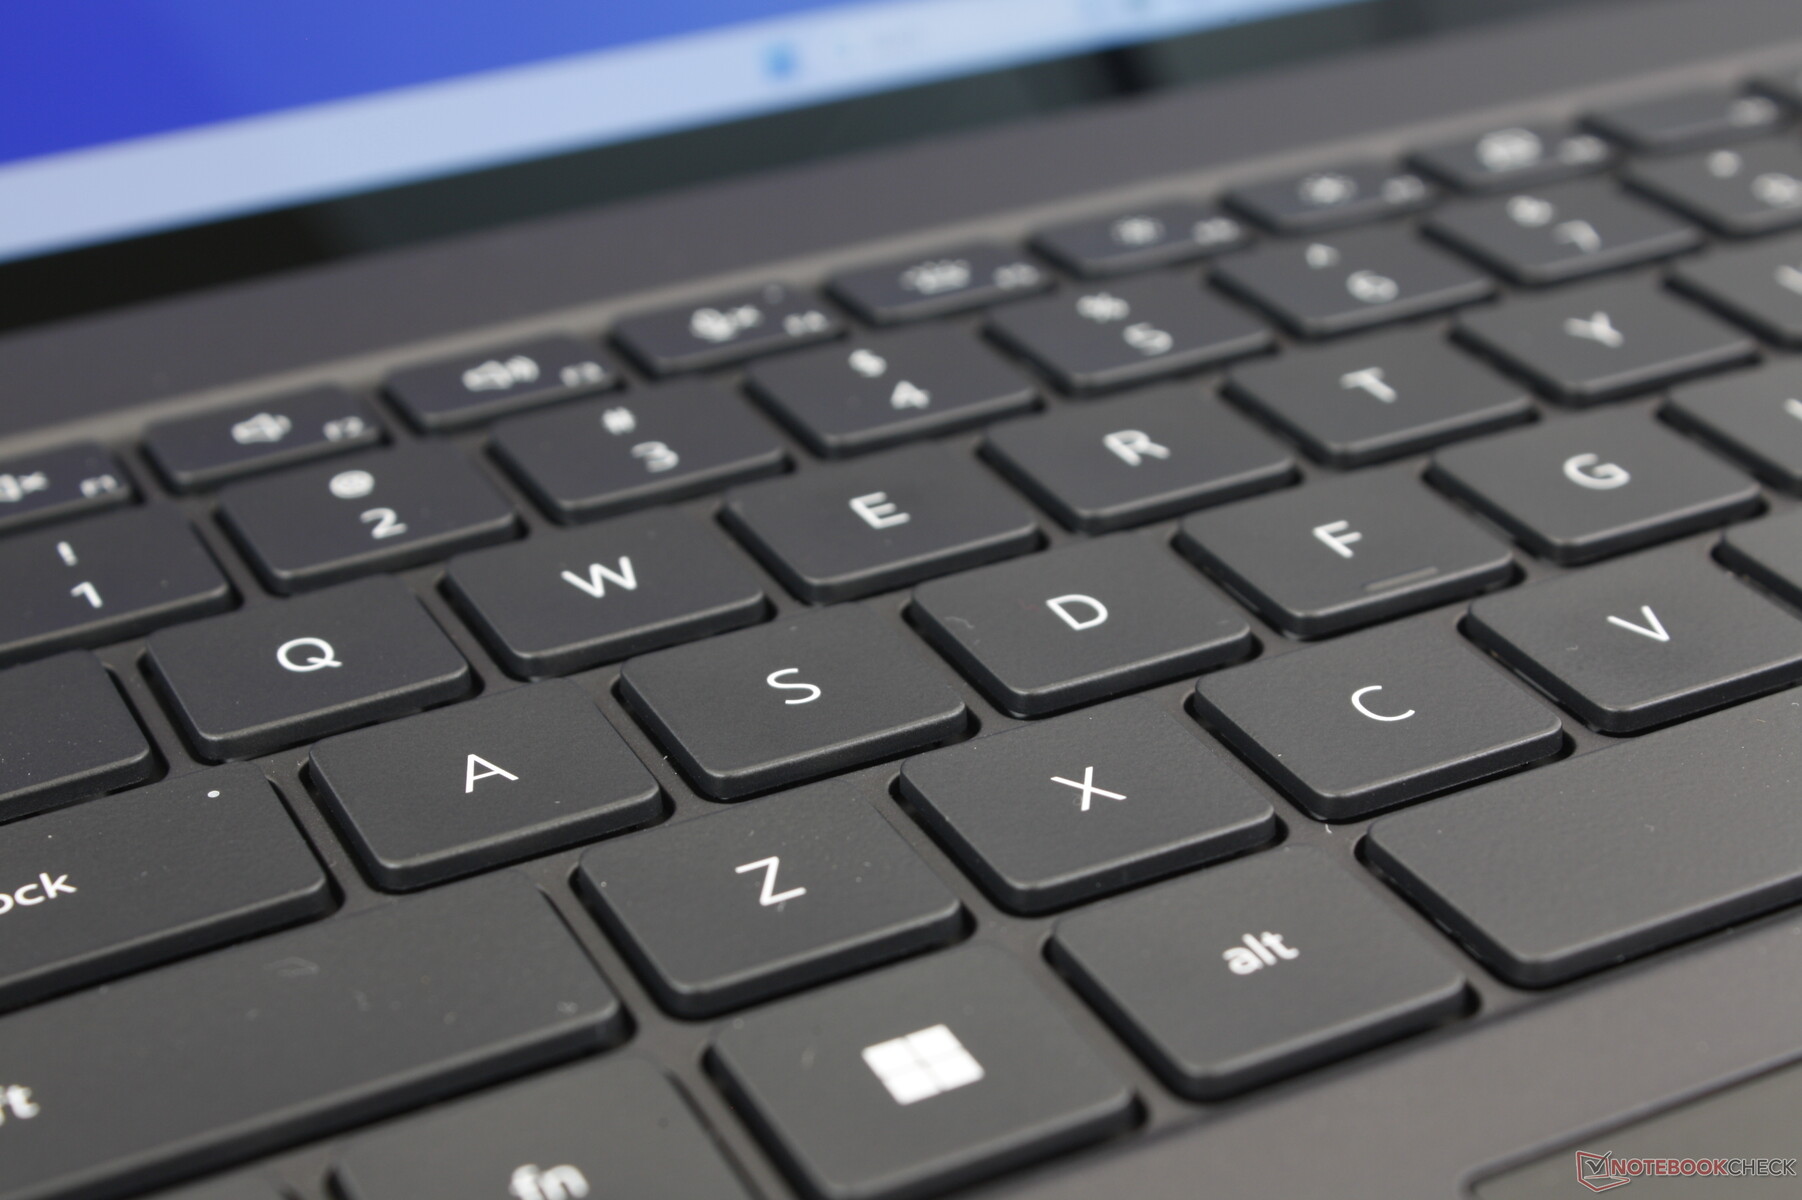
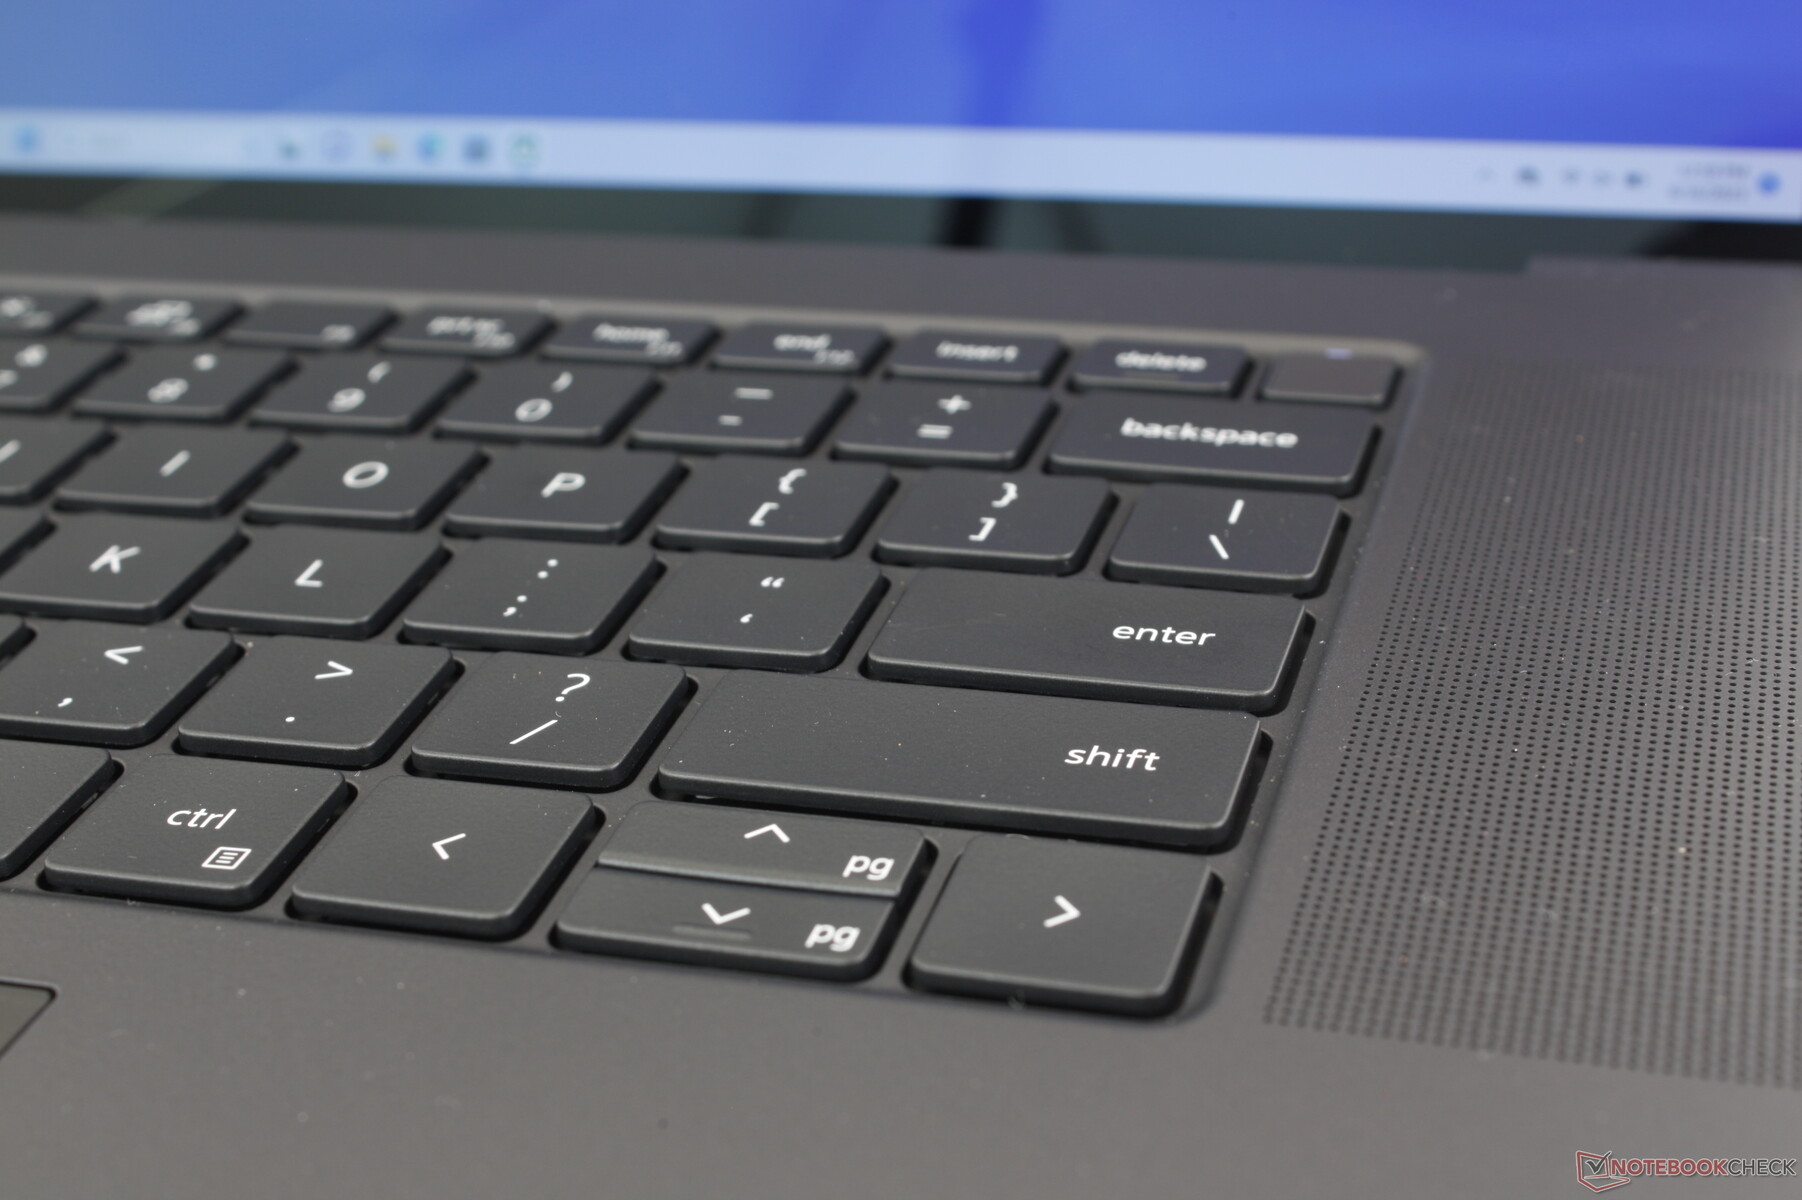
Input Devices — Slightly Different Than XPS
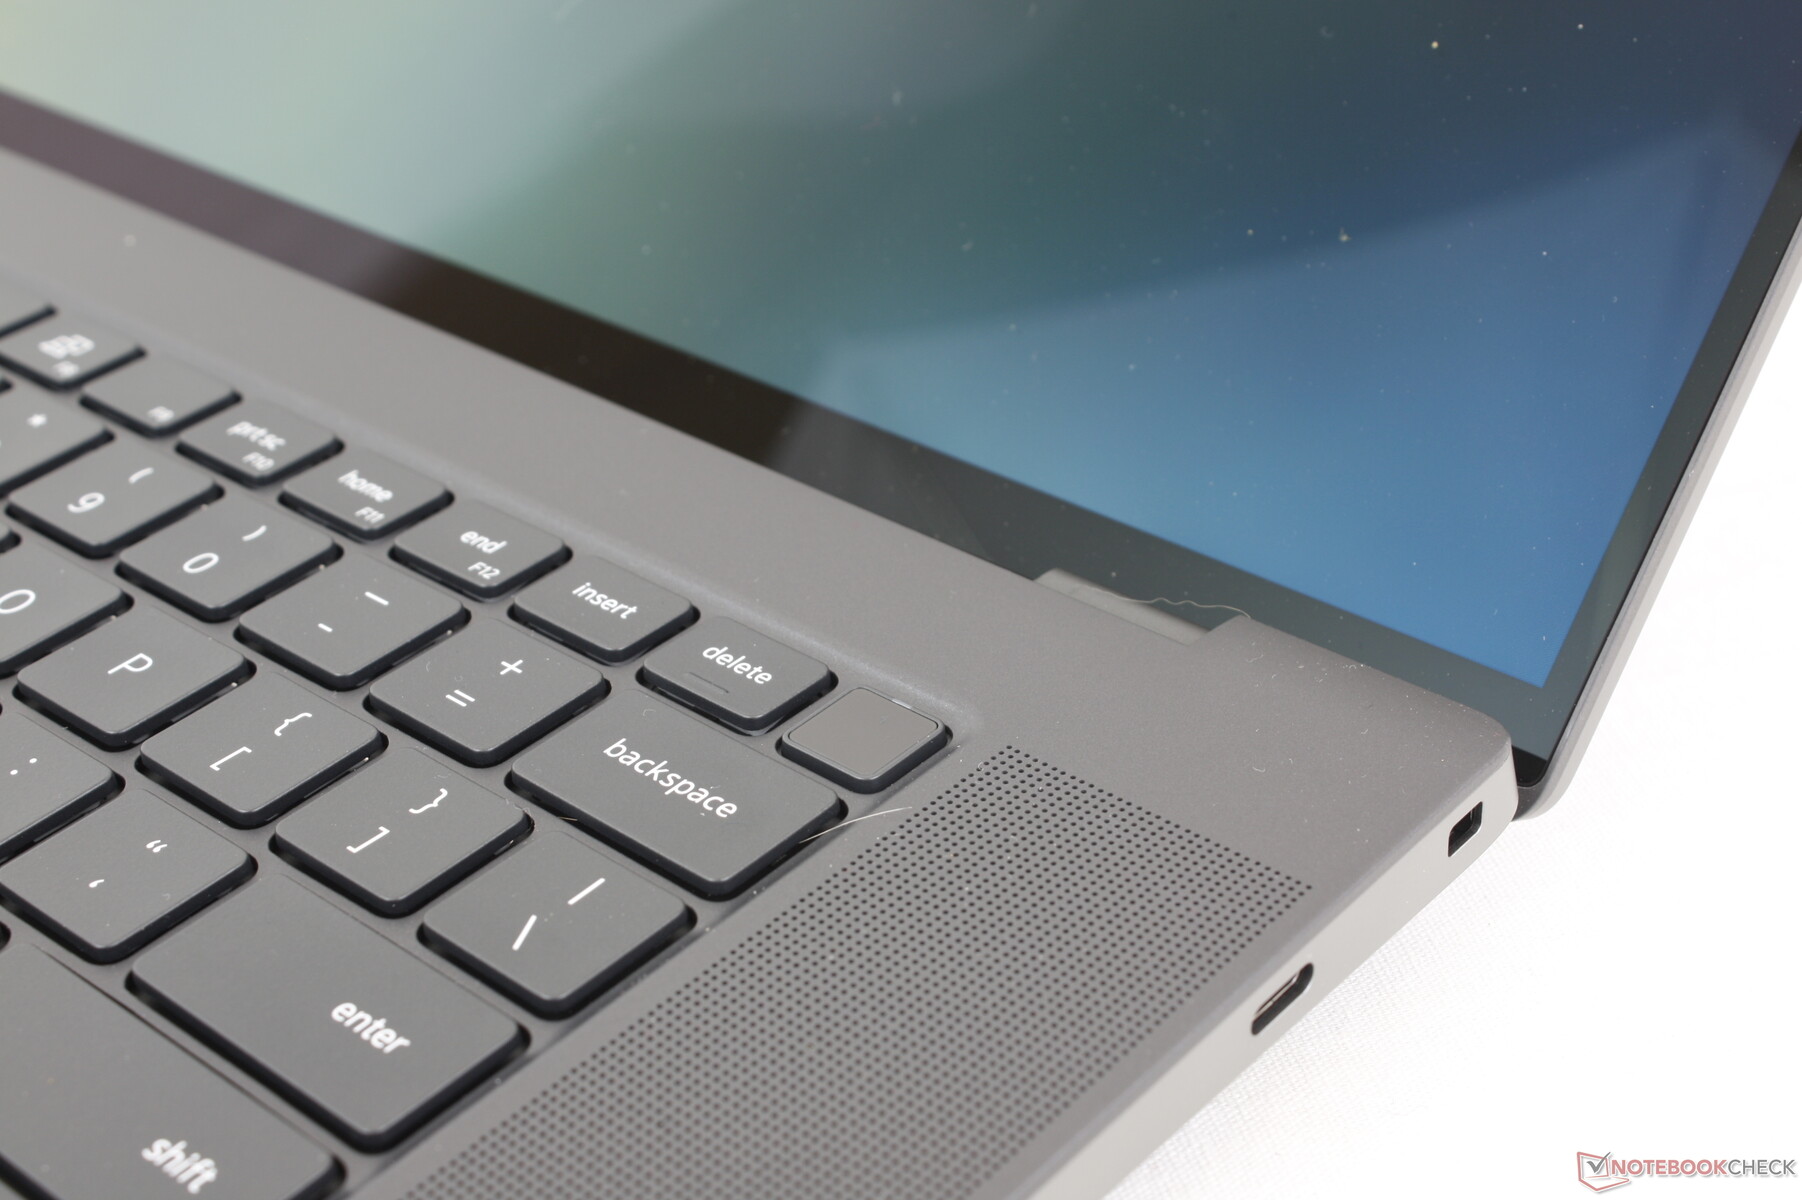
Keyboard
The keyboard may appear identical to the keyboards on the XPS 15 or Precision 5550 at first glance, but there are a couple of important changes. Firstly, the top row of function keys are now larger as some XPS 15 owners have been complaining about them being too narrow. And secondly, a few of the keys along the edges are now slightly shorter including the Backspace, Enter, Shift, Tab, Ctrl, and Shift keys. The typing experience otherwise remains the same for a familiar XPS feel.
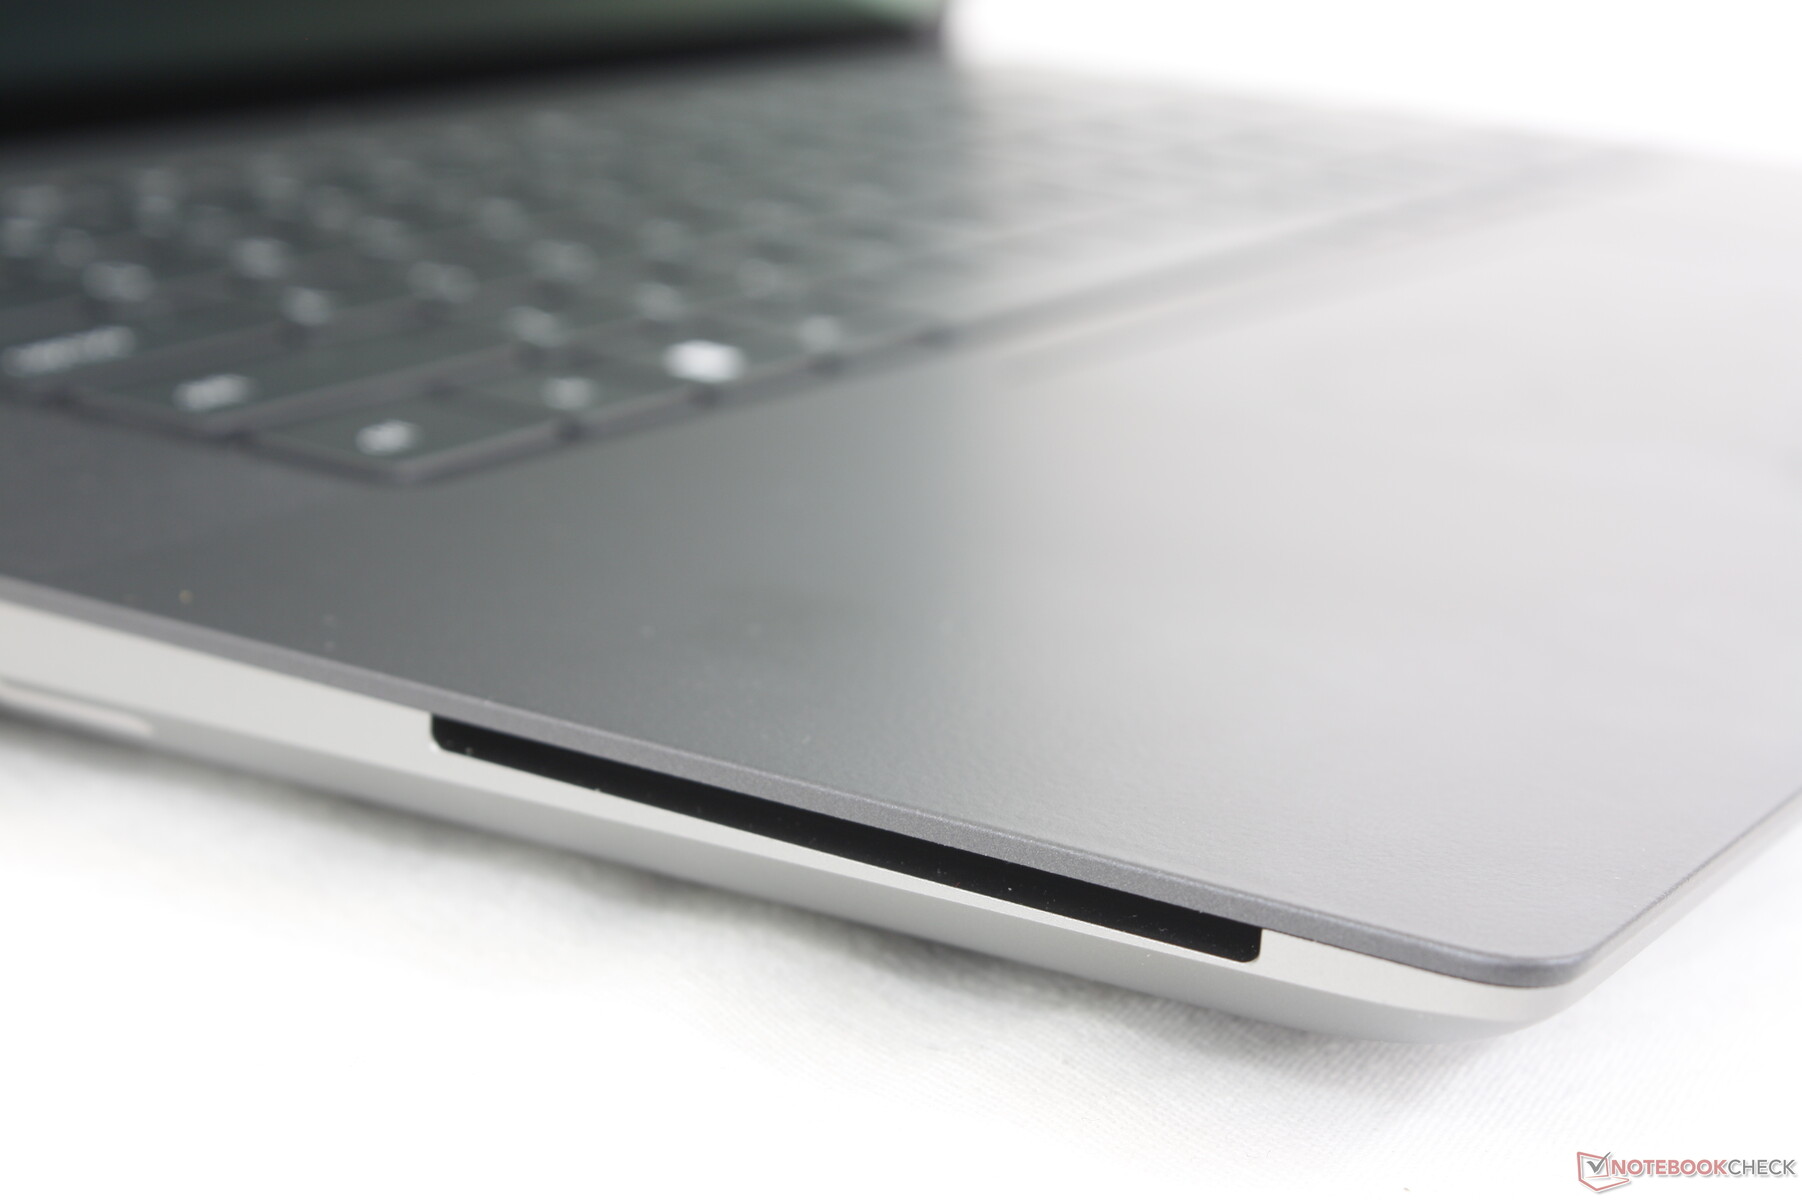
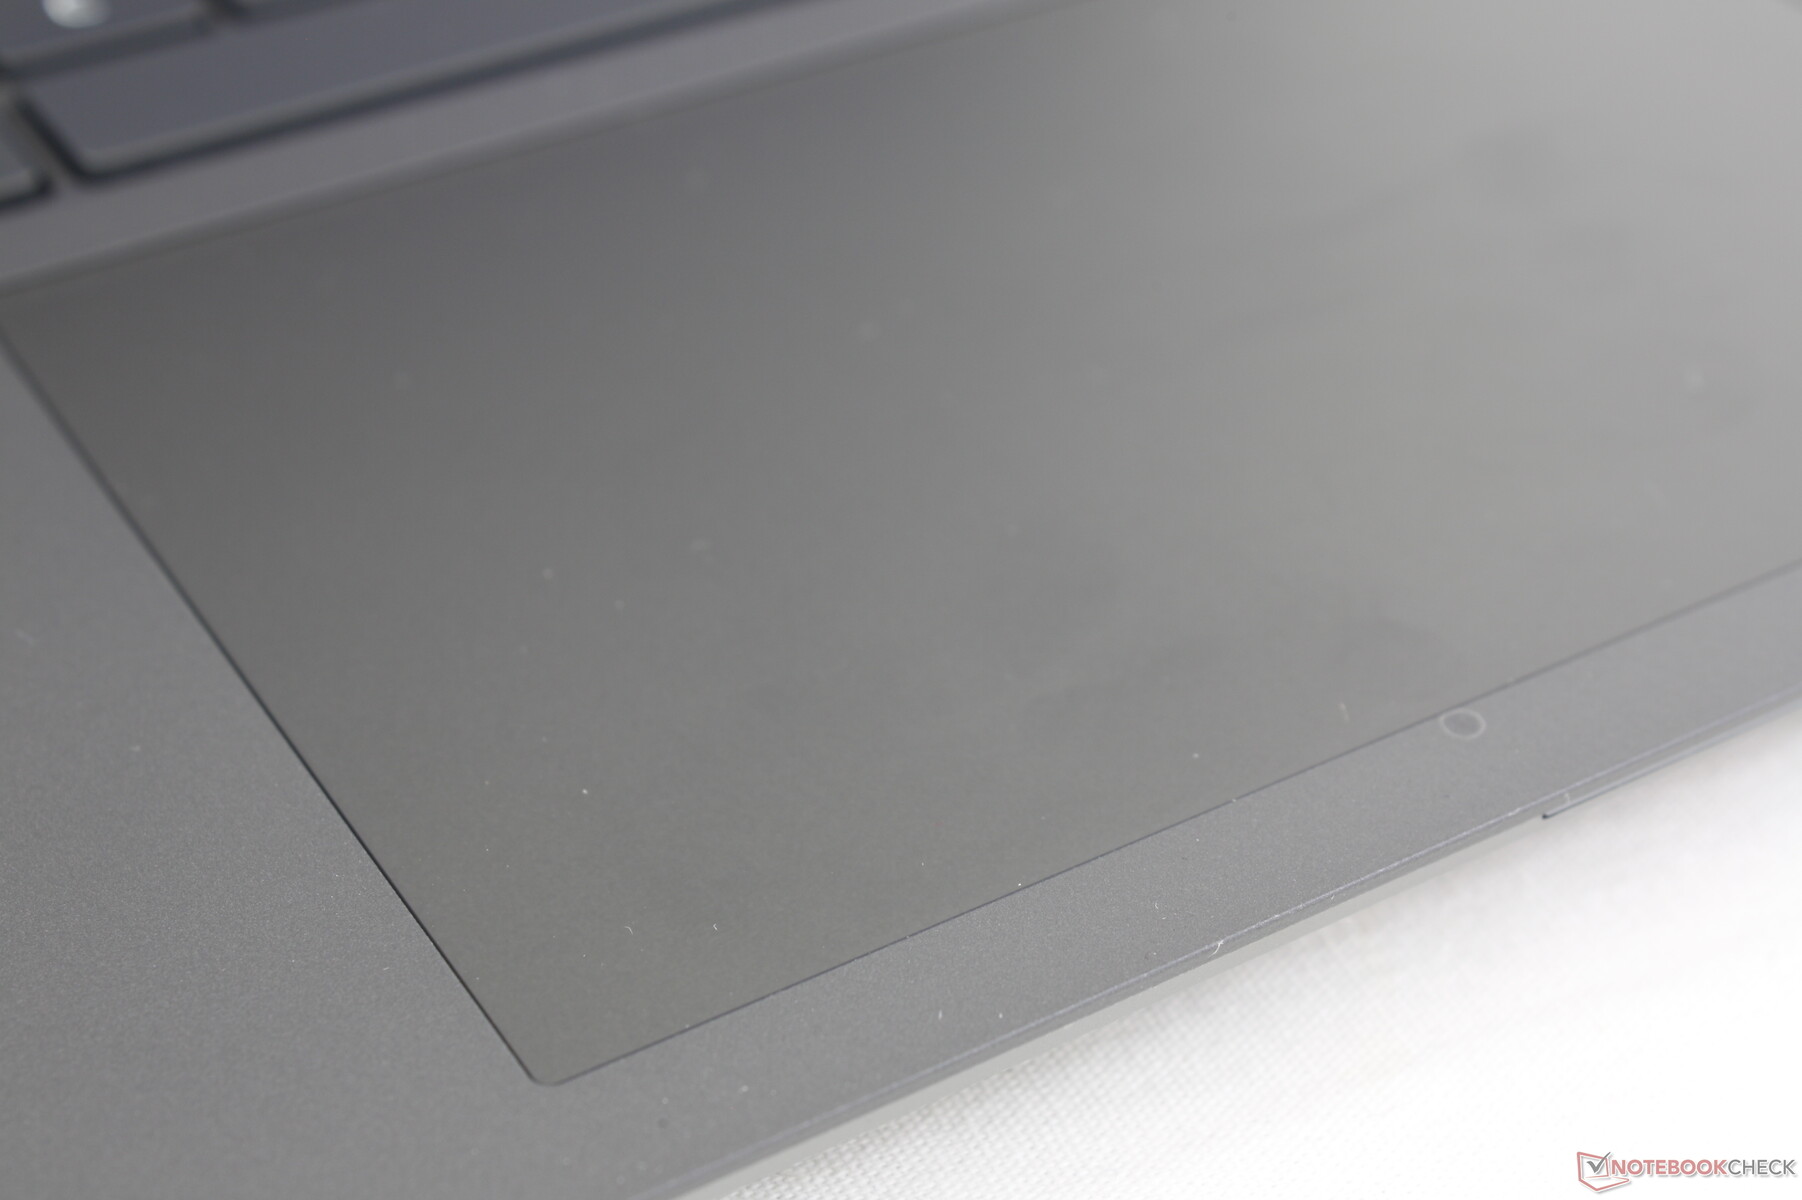
Touchpad
The clickpad is actually smaller than the clickpad on the 15-inch Precision 5550 (13.7 x 8.5 cm vs. 15.1 x 9 cm) despite our larger screen size. Even so, it still feels spacious with smooth and reliable gliding properties much like on an XPS 15.
Unfortunately, feedback when clicking on the haptic clickpad is almost nonexistent. In fact, there is almost no travel or audible feedback at all. A mouse is highly recommend for more accurate drag-and-drop actions.
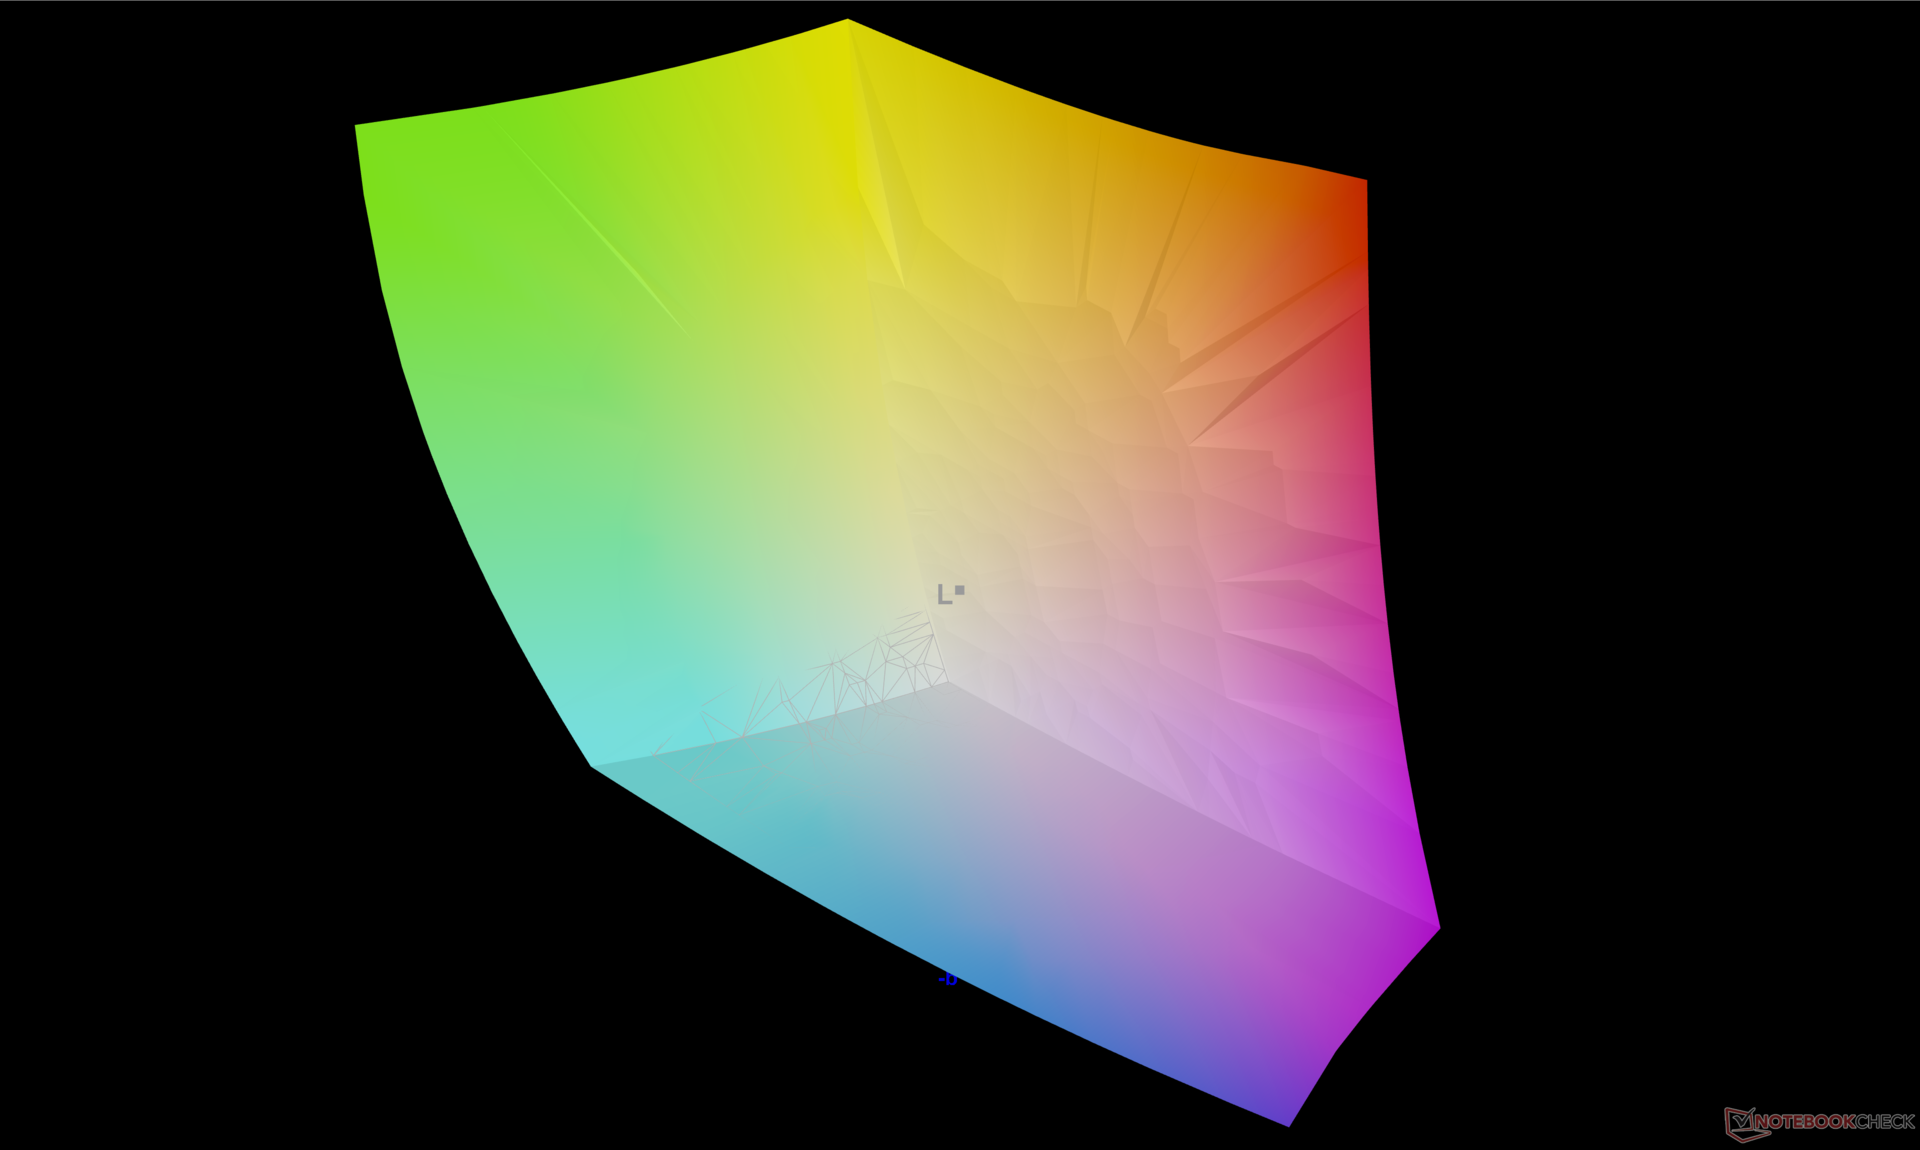
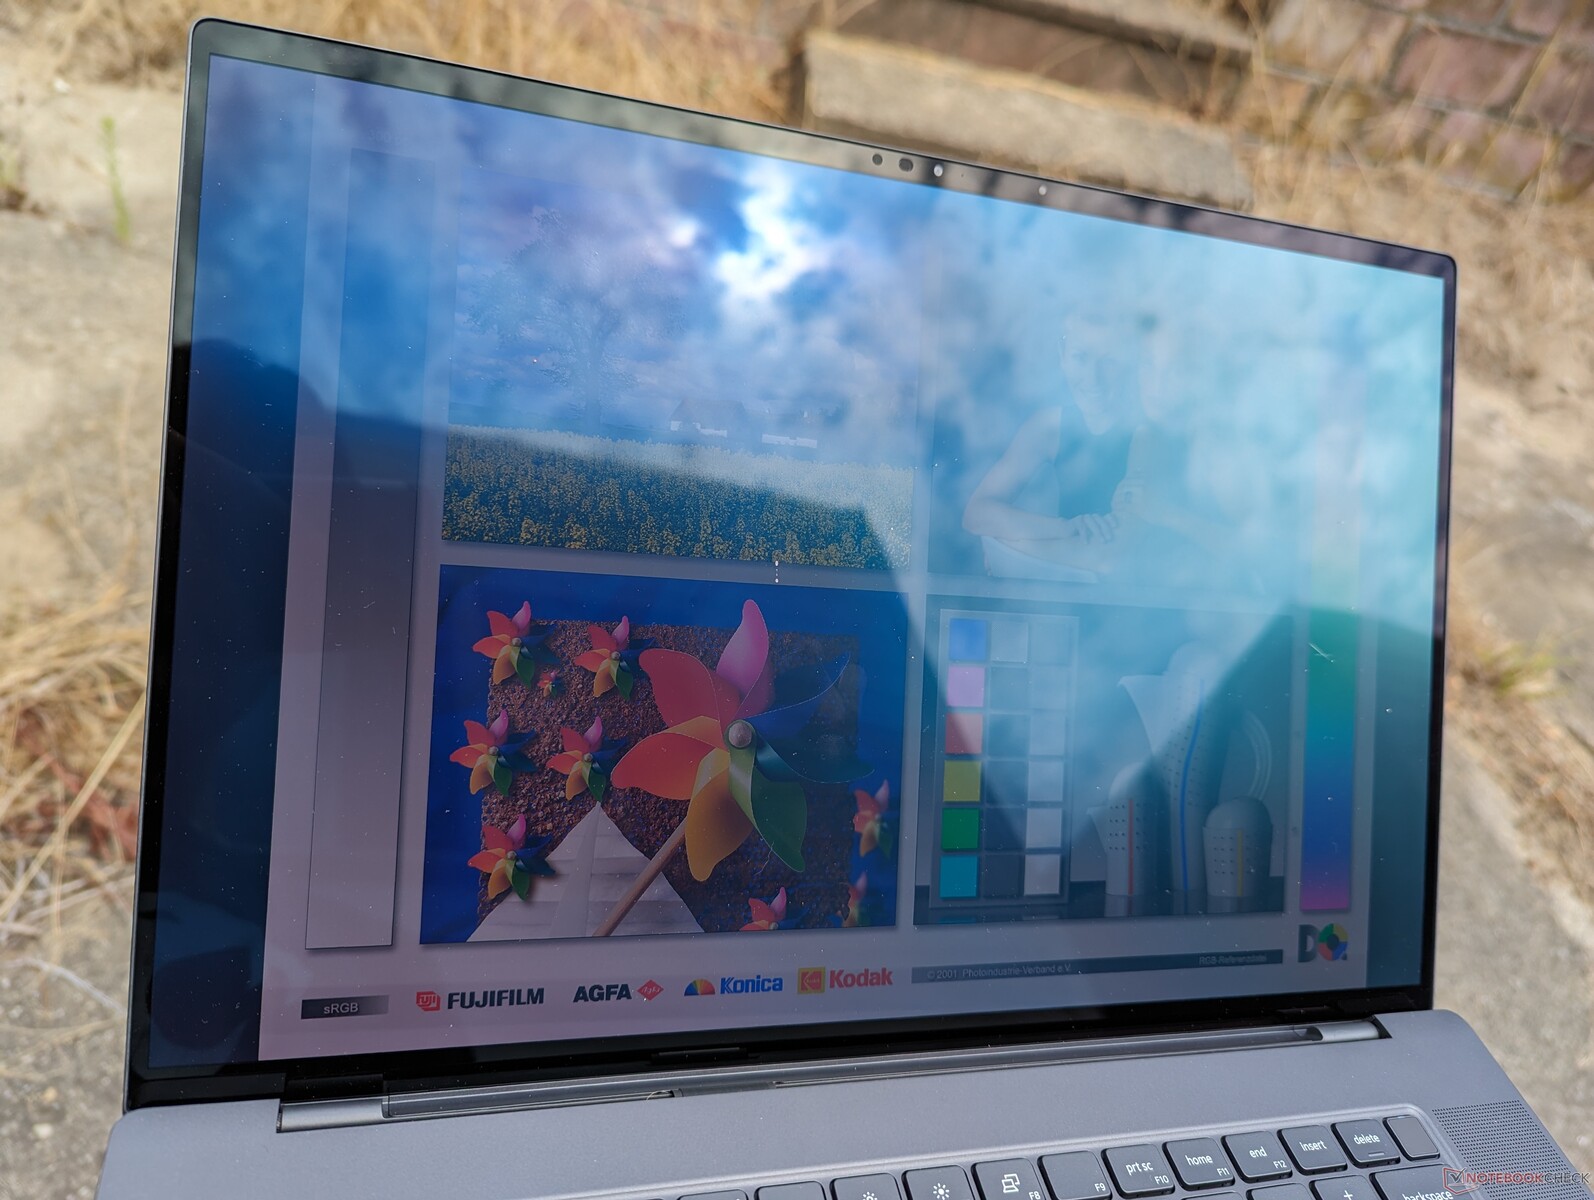
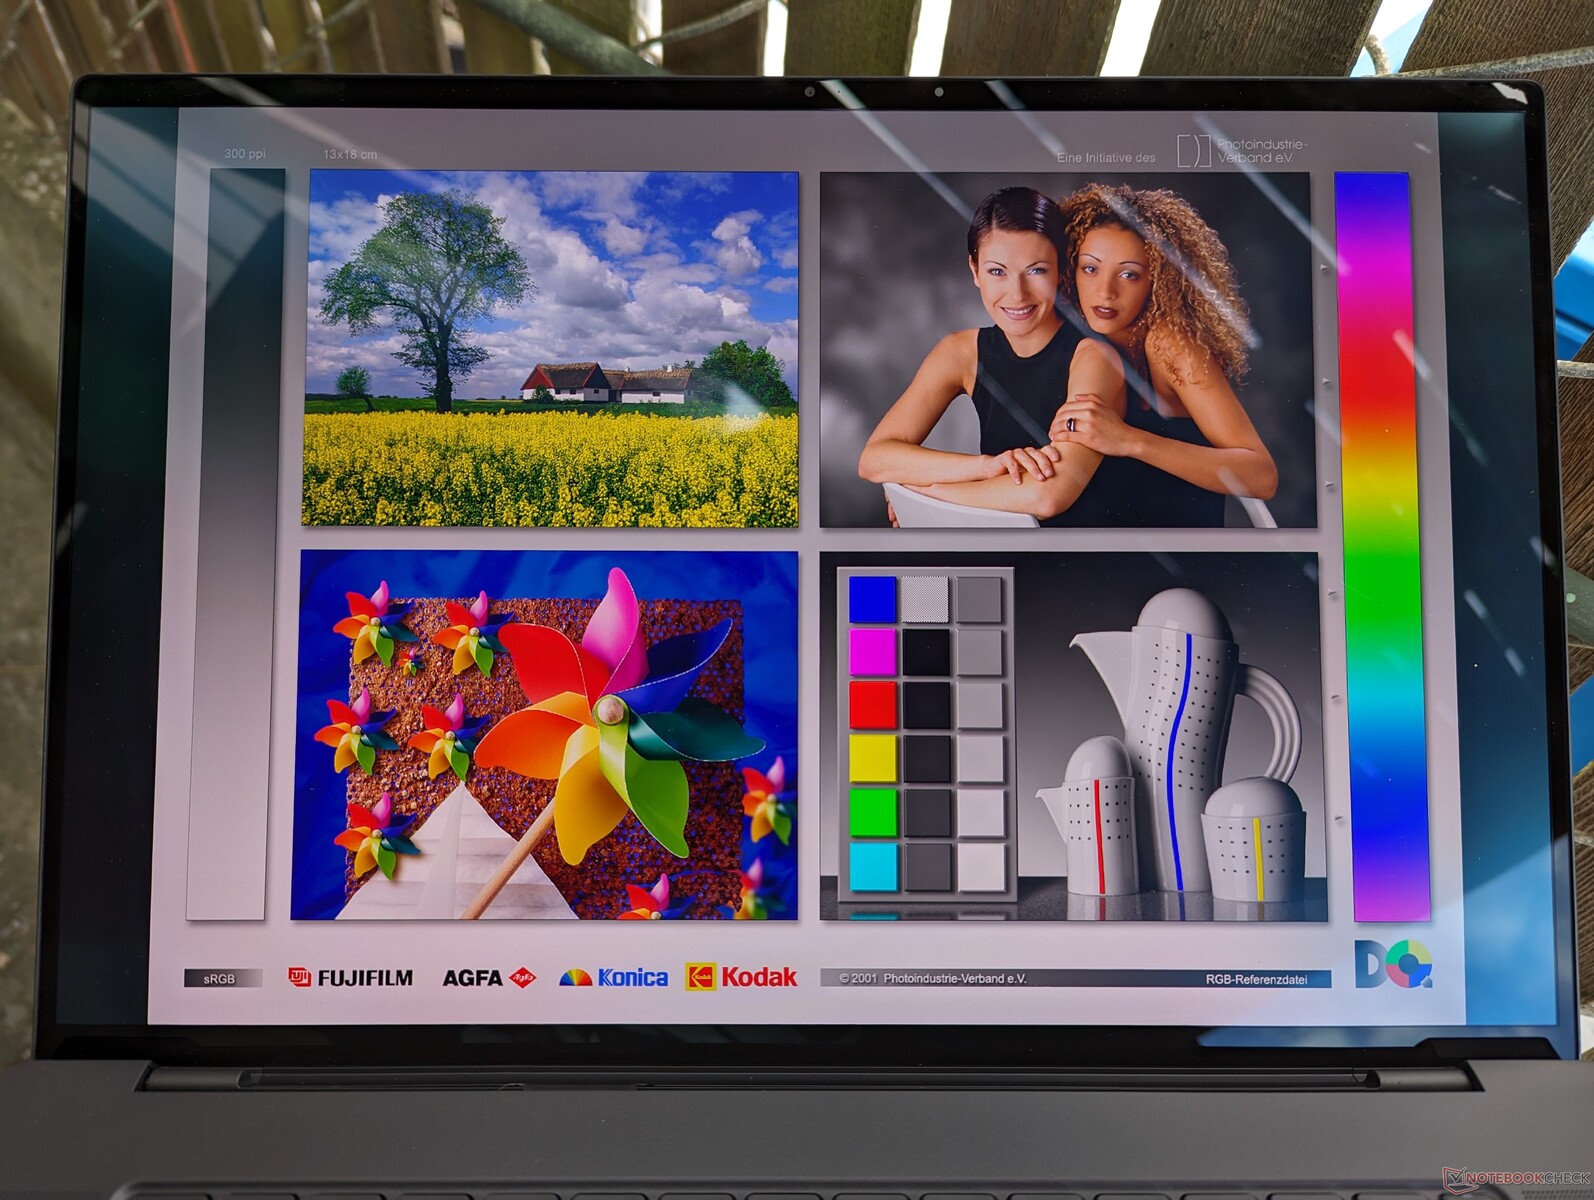
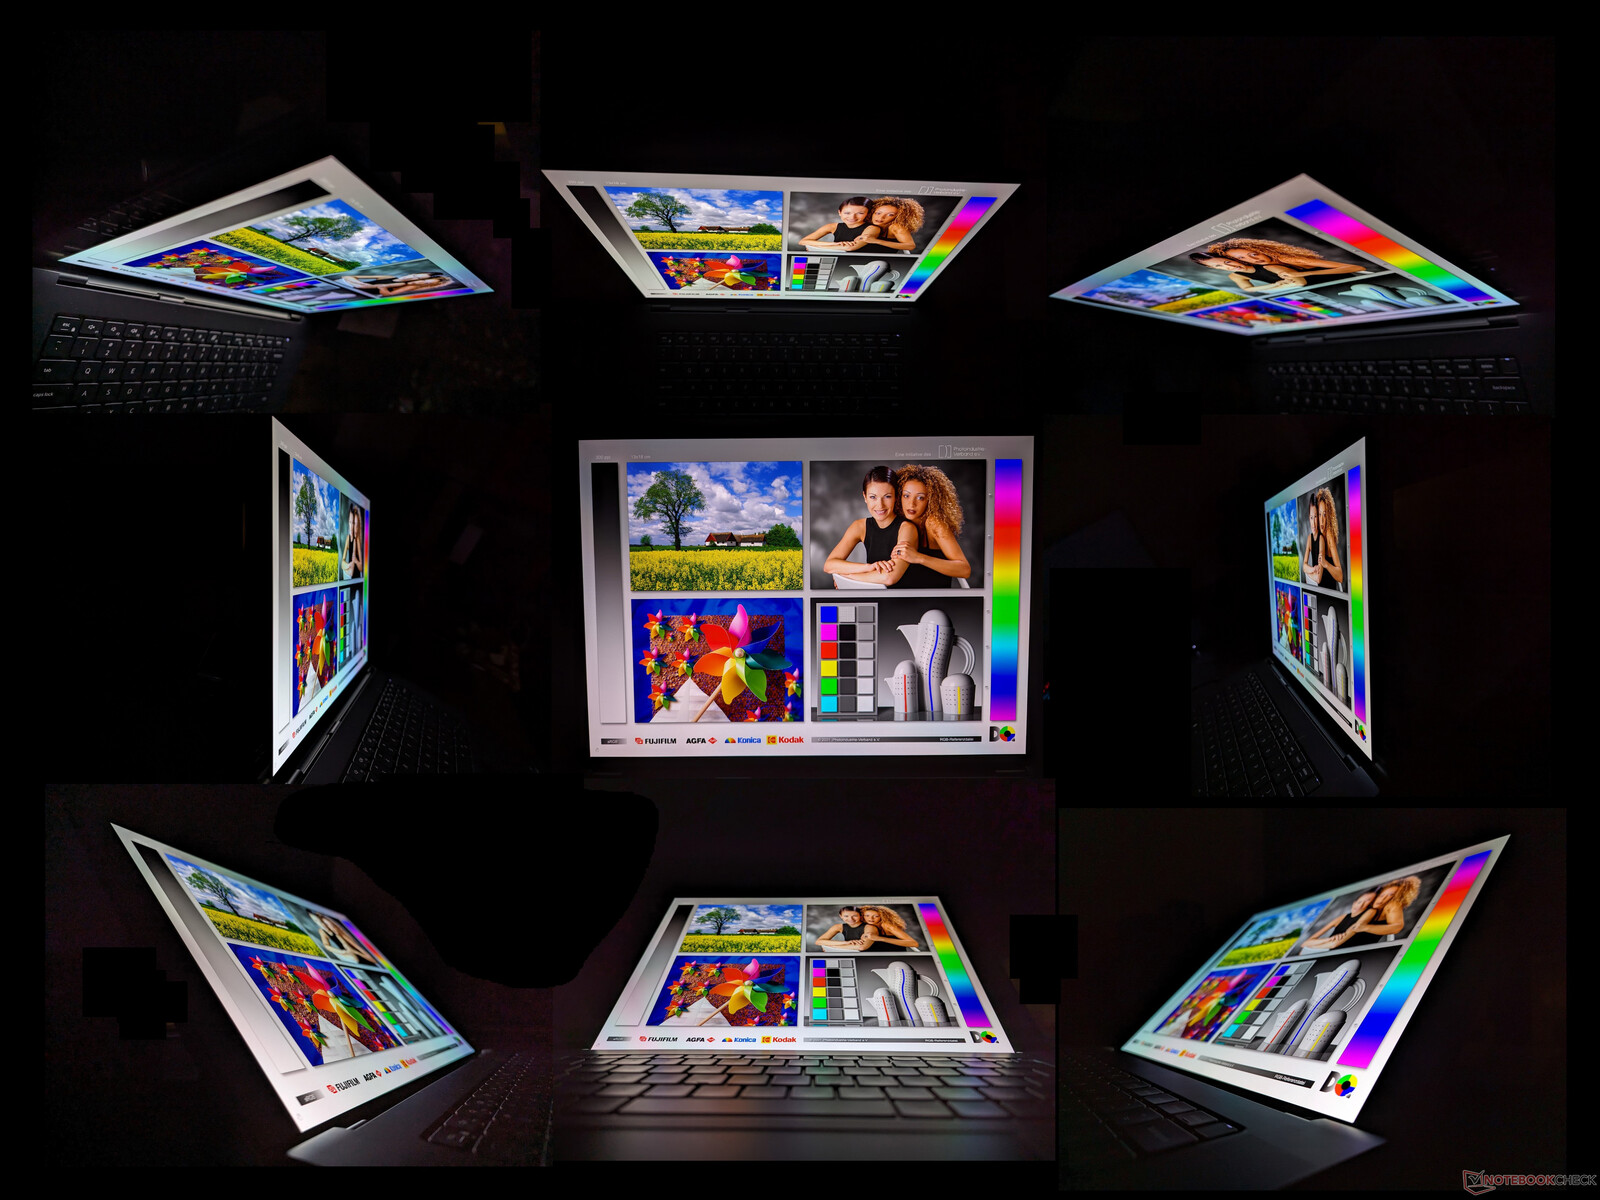
Display
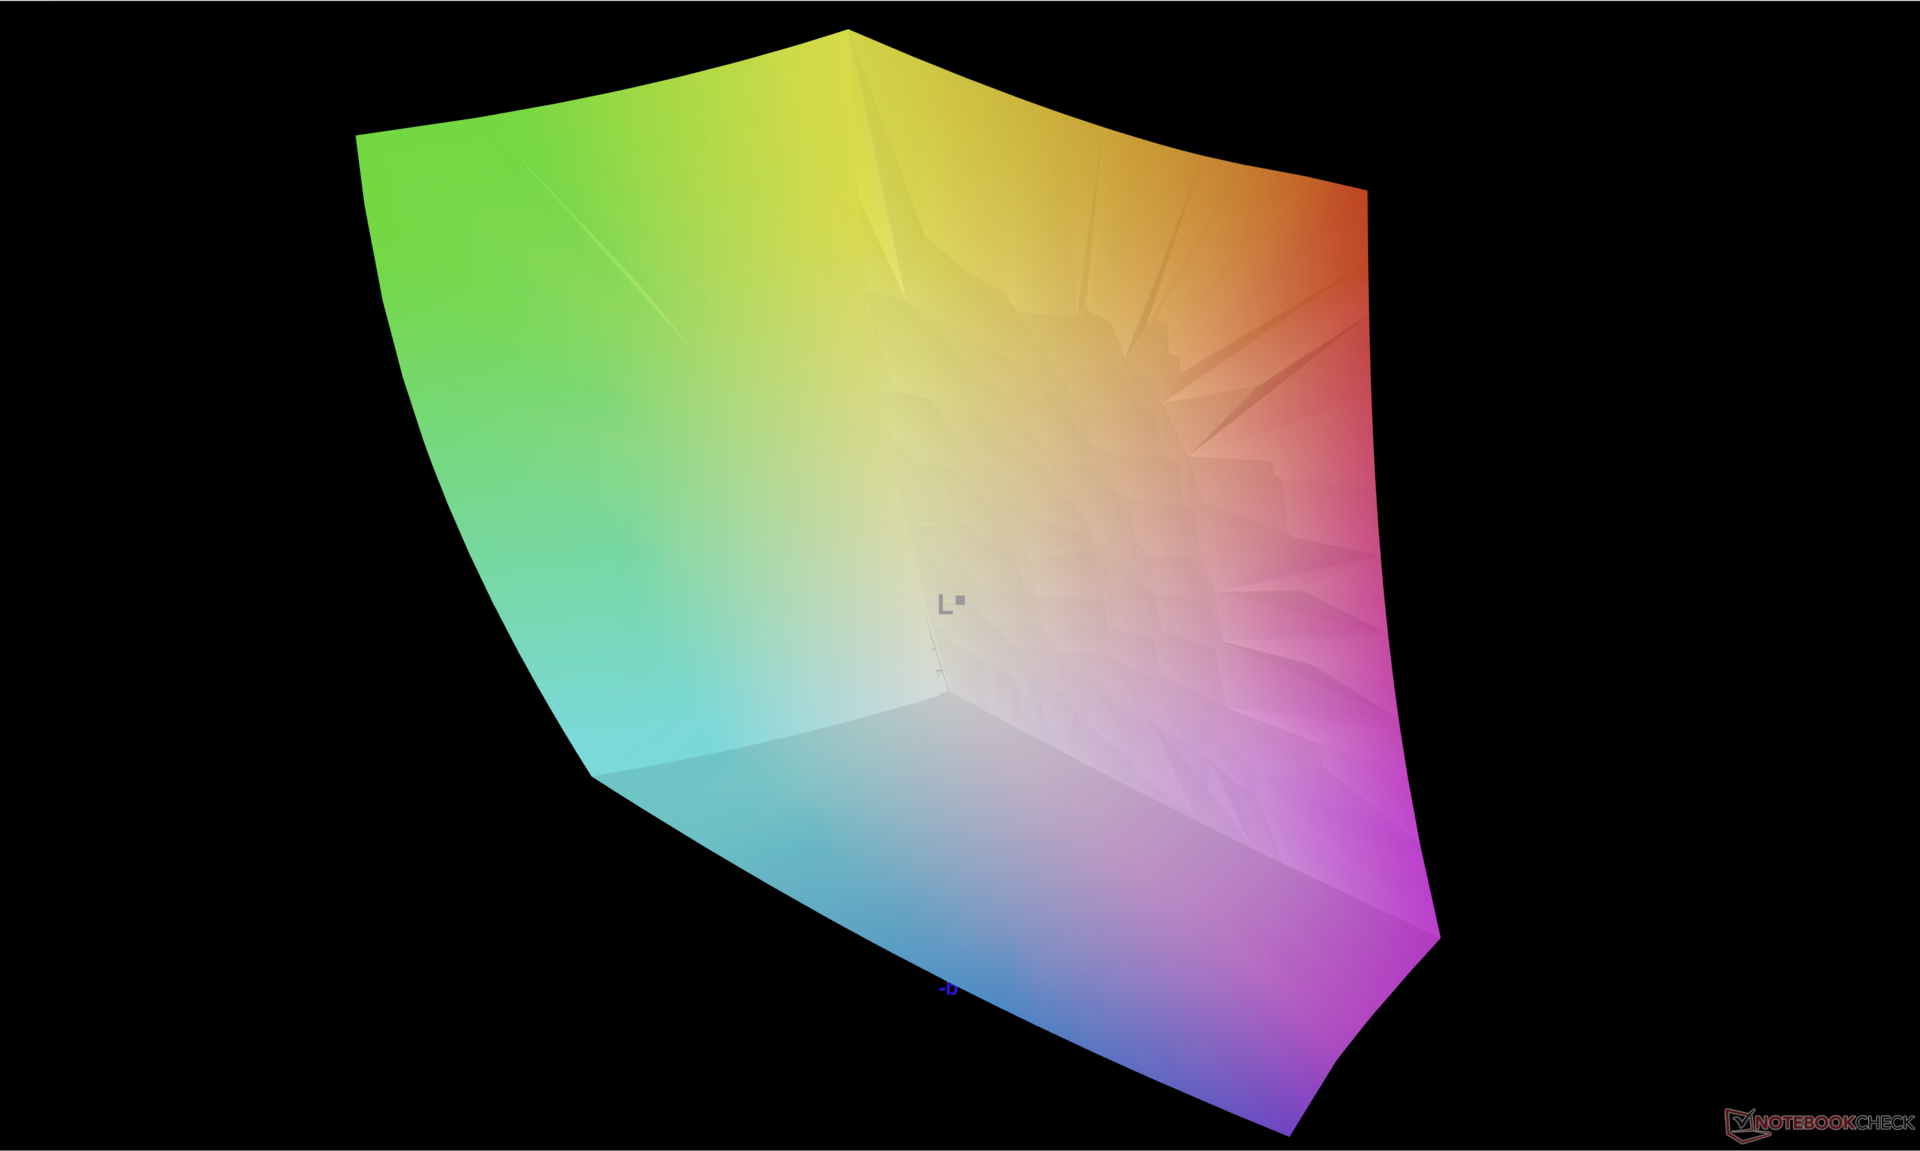
Dell employs the same Samsung 160YV03 OLED panel for both its 16-inch Precision 5680 and 16-inch Precision 7670. Thus, both models offer the same visual experience down to their similar response times, full DCI-P3 colors, and even brightness levels as shown by the comparison table below. Hopefully we can see some higher refresh rate options in the near future.
| |||||||||||||||||||||||||
Brightness Distribution: 98 %
Center on Battery: 345.7 cd/m²
Contrast: ∞:1 (Black: 0 cd/m²)
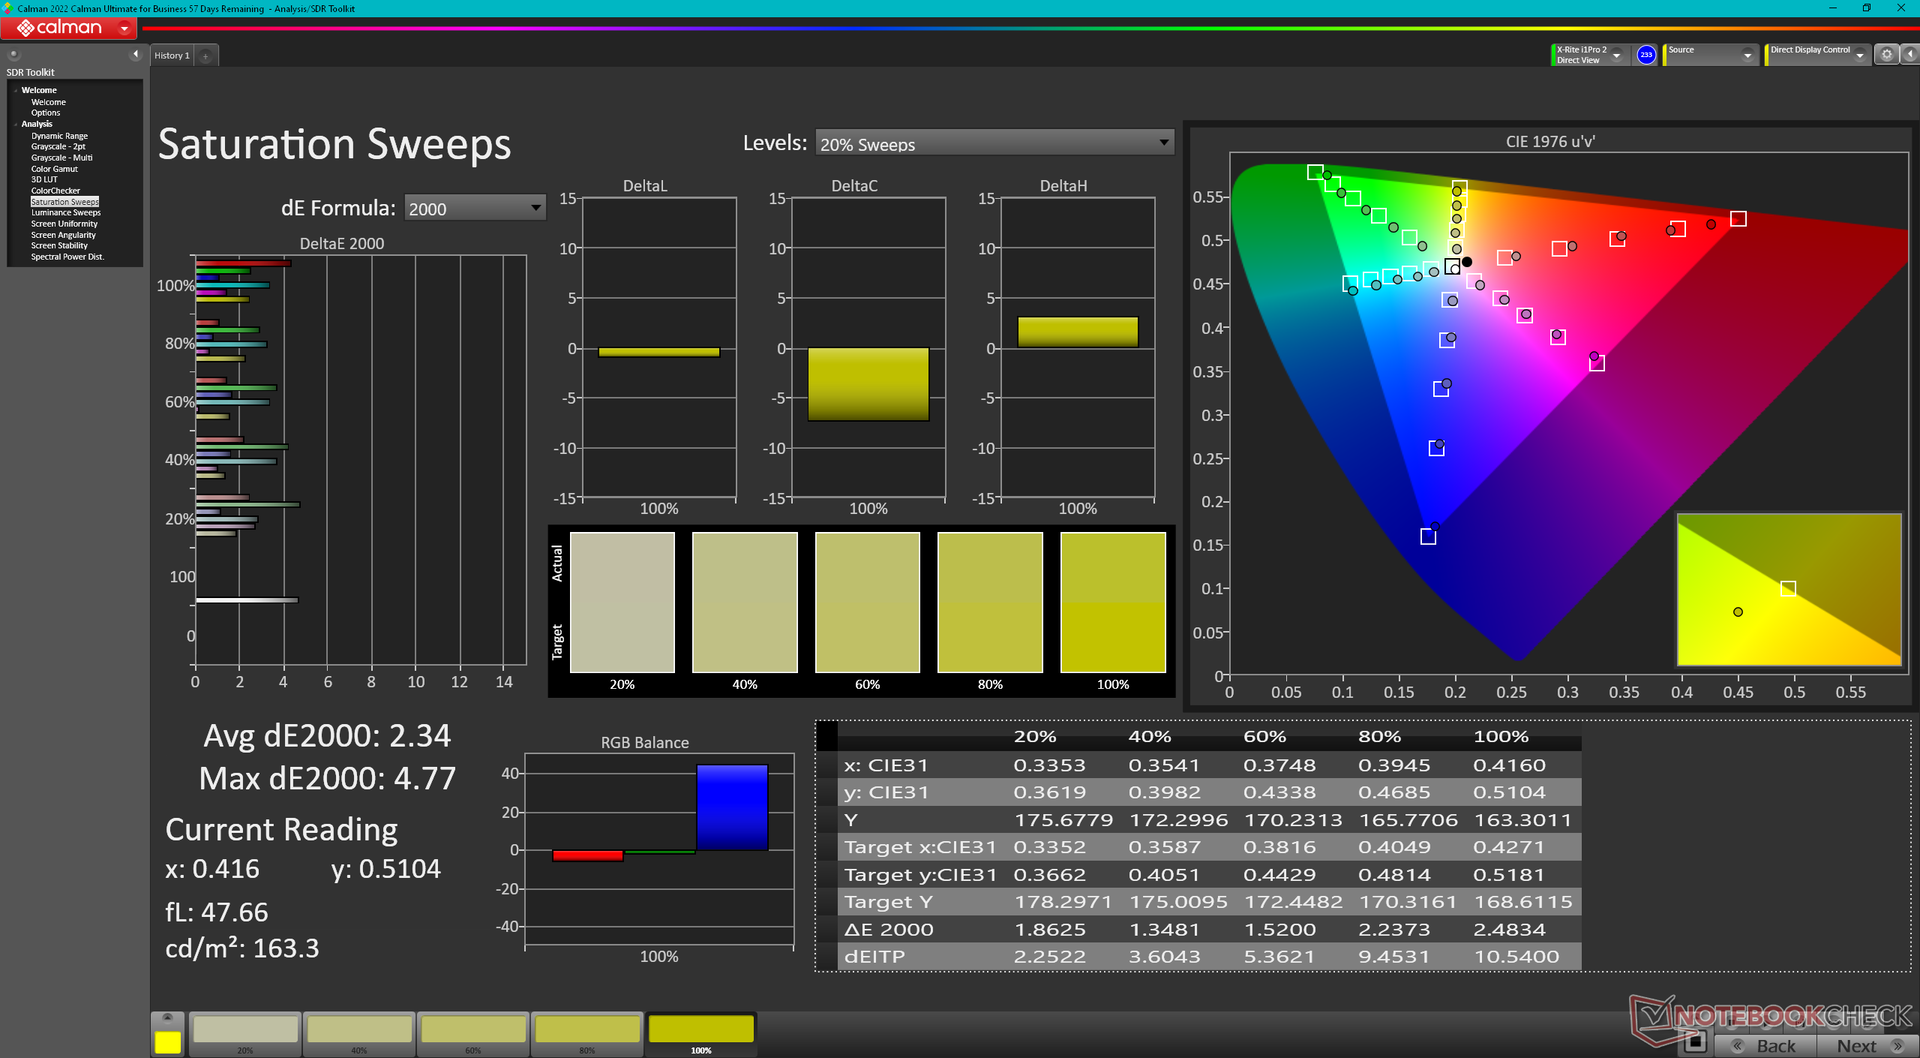
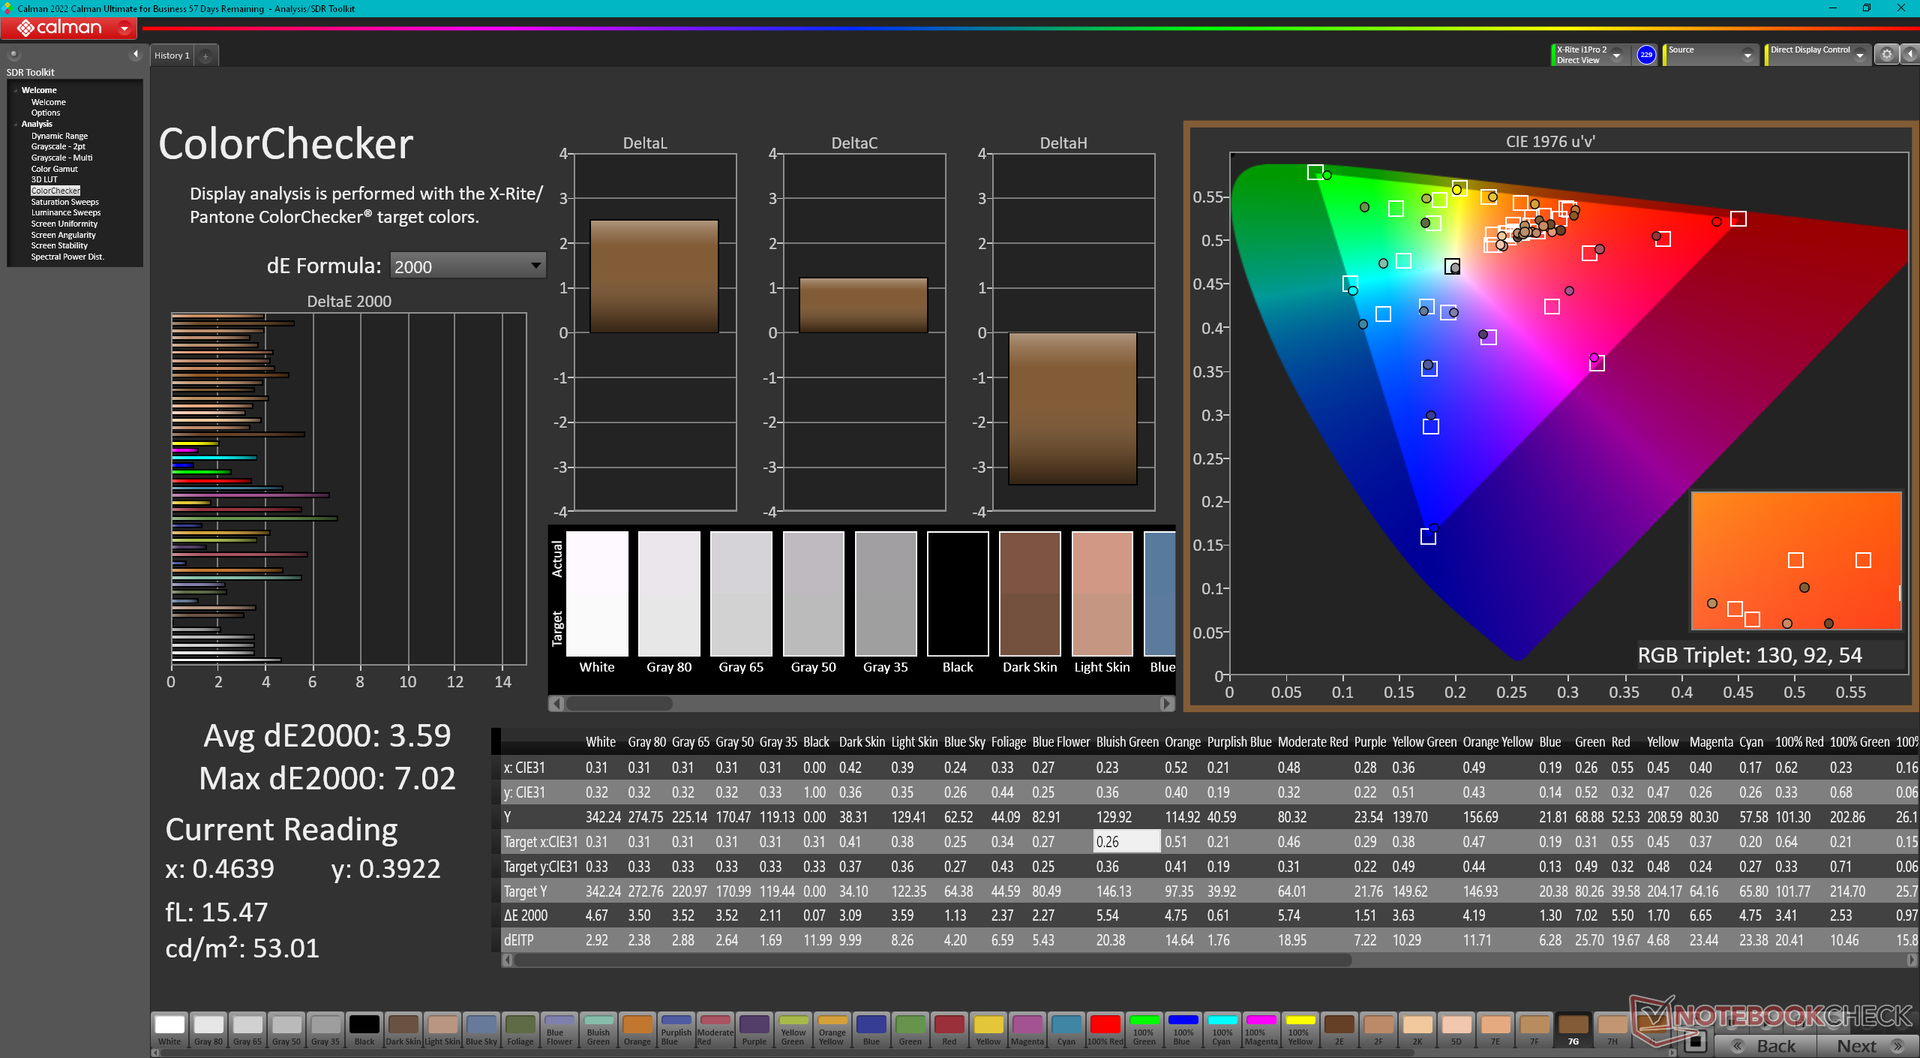
ΔE ColorChecker Calman: 3.59 | ∀{0.5-29.43 Ø4.71}
calibrated: 0.99
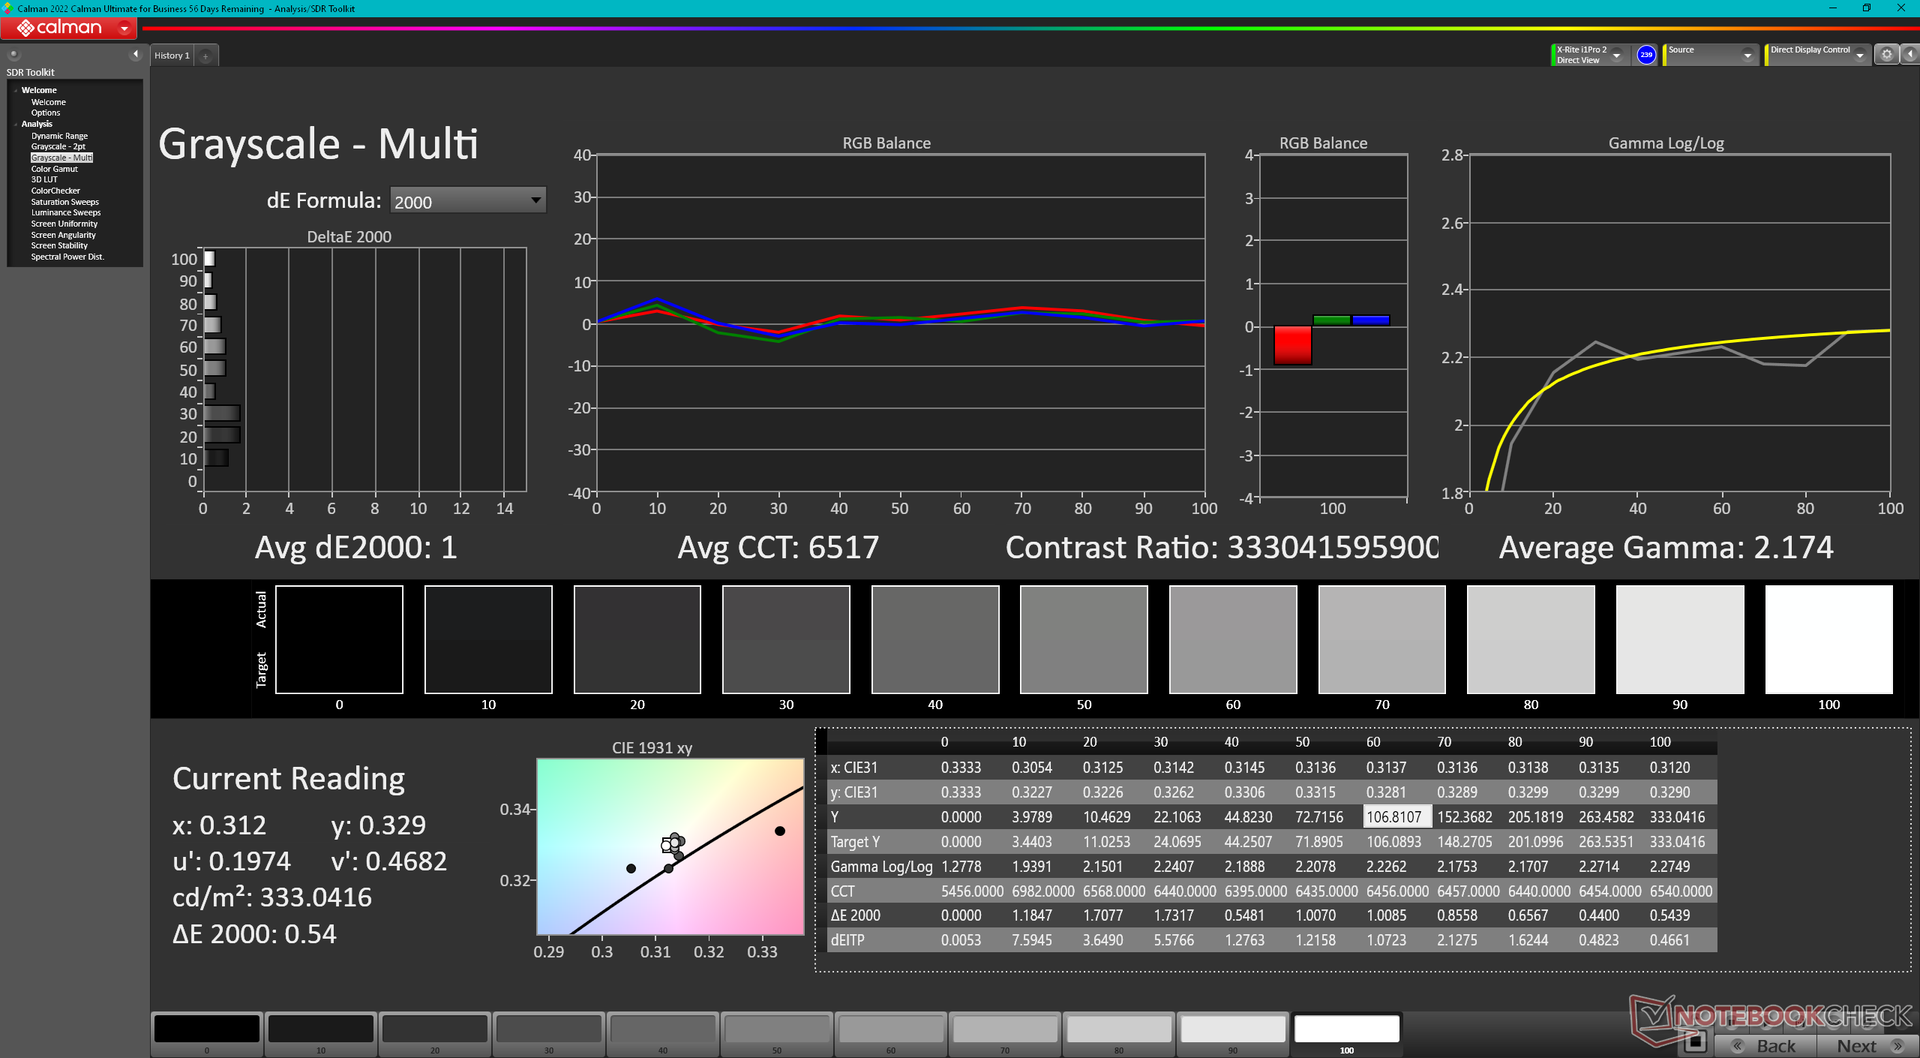
ΔE Greyscale Calman: 3.1 | ∀{0.09-98 Ø4.96}
97.5% AdobeRGB 1998 (Argyll 3D)
100% sRGB (Argyll 3D)
99.9% Display P3 (Argyll 3D)
Gamma: 2.13
CCT: 6448 K
| Dell Precision 5000 5680 Samsung 160YV03, OLED, 3840x2400, 16" | Dell Precision 7000 7670 Performance Samsung 160YV03, OLED, 3840x2400, 16" | HP ZBook Fury 16 G9 BOE0A52, IPS, 3840x2400, 16" | Lenovo ThinkPad P16 G1 RTX A5500 LP160UQ1-SPB1, IPS, 3840x2400, 16" | MSI CreatorPro Z16P B12UKST B160QAN02.N, IPS, 2560x1600, 16" | Asus ExpertBook B6 Flip B6602FC2 AU Optronics Model: AUOE495, IPS, 2560x1600, 16" | |
|---|---|---|---|---|---|---|
| Display | 0% | -5% | -7% | -4% | -5% | |
| Display P3 Coverage (%) | 99.9 | 99.9 0% | 97.4 -3% | 82.9 -17% | 97.6 -2% | 97.9 -2% |
| sRGB Coverage (%) | 100 | 100 0% | 99.9 0% | 98.9 -1% | 99.9 0% | 99.89 0% |
| AdobeRGB 1998 Coverage (%) | 97.5 | 98.1 1% | 86.3 -11% | 95.9 -2% | 87.4 -10% | 85.52 -12% |
| Response Times | -9% | -551% | -2297% | -490% | -1452% | |
| Response Time Grey 50% / Grey 80% * (ms) | 1.68 ? | 1.84 ? -10% | 13.7 ? -715% | 45.6 ? -2614% | 12.8 ? -662% | 36 ? -2043% |
| Response Time Black / White * (ms) | 1.77 ? | 1.92 ? -8% | 8.6 ? -386% | 36.8 ? -1979% | 7.4 ? -318% | 17 ? -860% |
| PWM Frequency (Hz) | 60 ? | 59.52 ? | ||||
| Screen | -5% | -33% | 33% | 30% | -6% | |
| Brightness middle (cd/m²) | 345.7 | 325.2 -6% | 530.5 53% | 601.9 74% | 407 18% | 440 27% |
| Brightness (cd/m²) | 349 | 328 -6% | 476 36% | 569 63% | 388 11% | 418 20% |
| Brightness Distribution (%) | 98 | 97 -1% | 83 -15% | 77 -21% | 88 -10% | 82 -16% |
| Black Level * (cd/m²) | 0.57 | 0.47 | 0.36 | 0.3 | ||
| Colorchecker dE 2000 * | 3.59 | 4.59 -28% | 2.26 37% | 2.45 32% | 1.3 64% | 2.81 22% |
| Colorchecker dE 2000 max. * | 7.02 | 7.65 -9% | 4.46 36% | 2.5 64% | 4.62 34% | |
| Colorchecker dE 2000 calibrated * | 0.99 | 4.73 -378% | 0.7 29% | 2.99 -202% | ||
| Greyscale dE 2000 * | 3.1 | 2.5 19% | 1 68% | 2.6 16% | 2.1 32% | 0.91 71% |
| Gamma | 2.13 103% | 2.1 105% | 2.28 96% | 2.3 96% | 2.26 97% | 2.2 100% |
| CCT | 6448 101% | 6541 99% | 6543 99% | 6805 96% | 6437 101% | 6600 98% |
| Contrast (:1) | 931 | 1281 | 1131 | 1467 | ||
| Total Average (Program / Settings) | -5% /
-4% | -196% /
-119% | -757% /
-401% | -155% /
-65% | -488% /
-247% |
* ... smaller is better
The display is decently calibrated out of the box with average deltaE values between 3 and 4. Our calibrated ICM profile is available to download above for free.

Display Response Times
| ↔ Response Time Black to White | ||
|---|---|---|
| 1.77 ms ... rise ↗ and fall ↘ combined | ↗ 0.8 ms rise |  |
| ↘ 0.97 ms fall | ||
| The screen shows very fast response rates in our tests and should be very well suited for fast-paced gaming. In comparison, all tested devices range from 0.1 (minimum) to 240 (maximum) ms. » 10 % of all devices are better. This means that the measured response time is better than the average of all tested devices (19.8 ms). | ||
| ↔ Response Time 50% Grey to 80% Grey | ||
| 1.68 ms ... rise ↗ and fall ↘ combined | ↗ 0.97 ms rise |  |
| ↘ 0.71 ms fall | ||
| The screen shows very fast response rates in our tests and should be very well suited for fast-paced gaming. In comparison, all tested devices range from 0.165 (minimum) to 636 (maximum) ms. » 9 % of all devices are better. This means that the measured response time is better than the average of all tested devices (31 ms). | ||
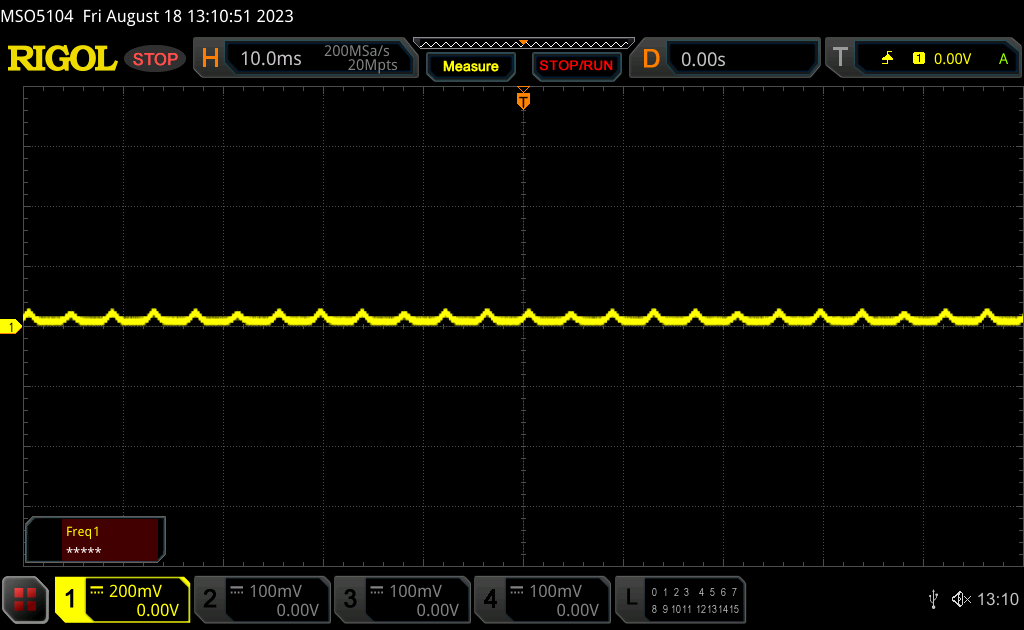
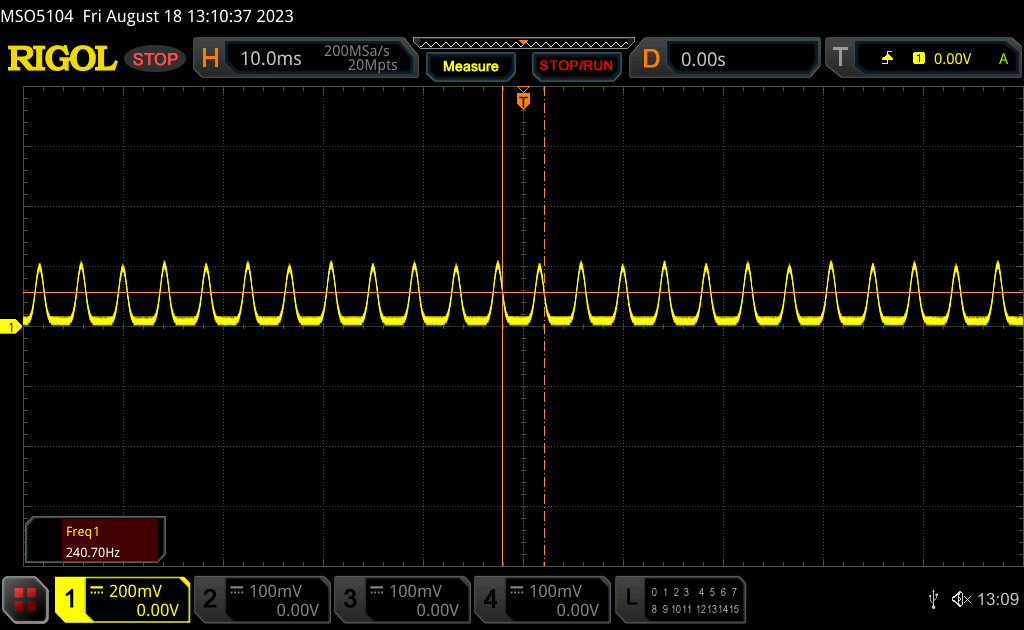
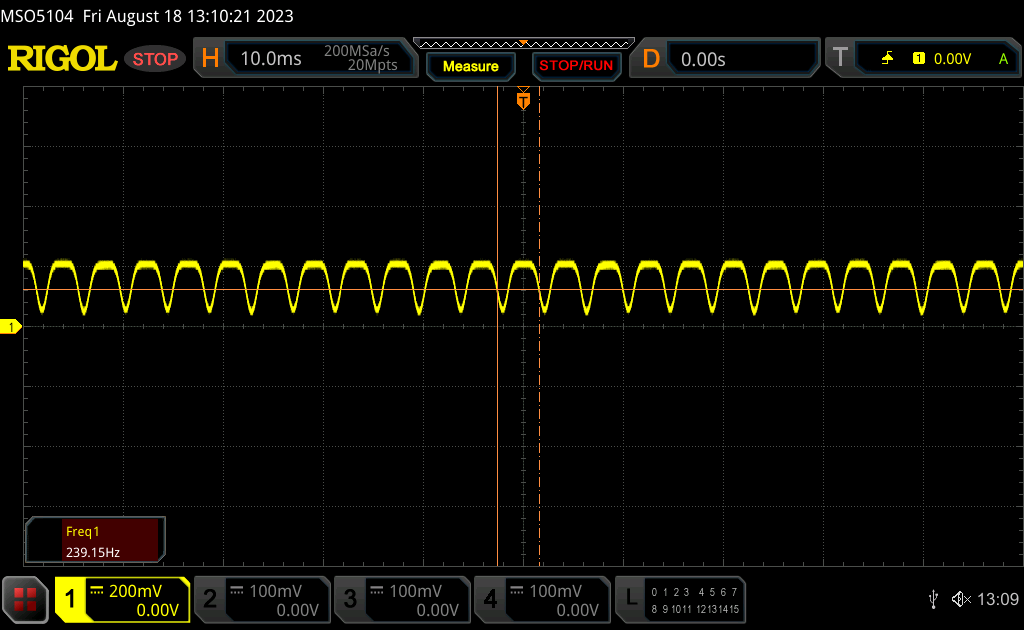
Screen Flickering / PWM (Pulse-Width Modulation)
| Screen flickering / PWM detected | 60 Hz | ≤ 100 % brightness setting | 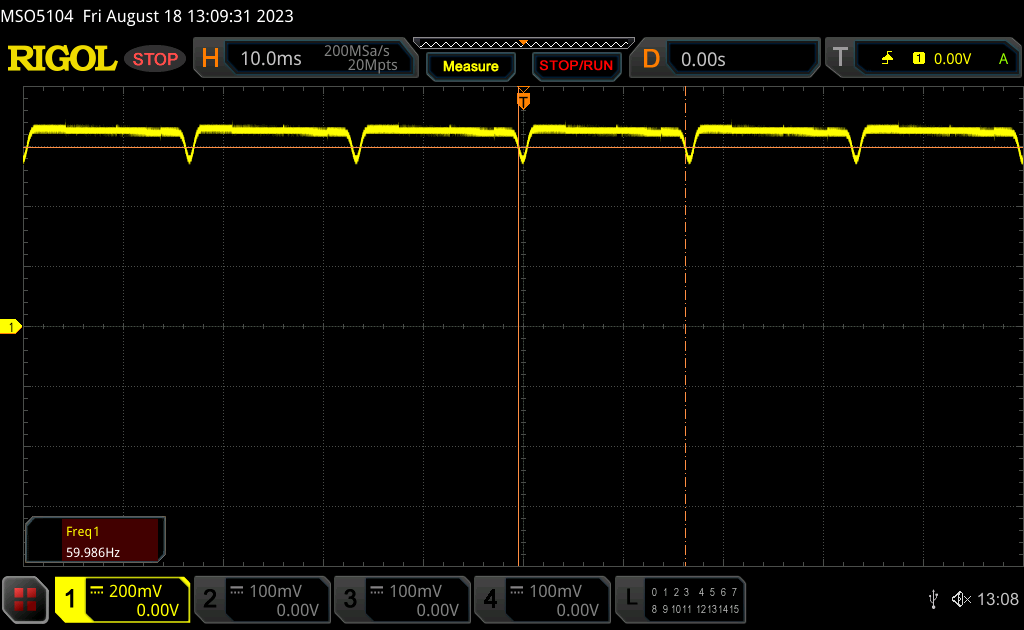 |
The display backlight flickers at 60 Hz (worst case, e.g., utilizing PWM) Flickering detected at a brightness setting of 100 % and below. There should be no flickering or PWM above this brightness setting. The frequency of 60 Hz is very low, so the flickering may cause eyestrain and headaches after extended use. In comparison: 52 % of all tested devices do not use PWM to dim the display. If PWM was detected, an average of 7754 (minimum: 5 - maximum: 343500) Hz was measured. | |||
Flickering is present on all brightness levels similar to smartphones and other laptops equipped with OLED panels. The frequency would be stable at 239 Hz from 0 to 54 percent brightness and 60 Hz from 55 to 100 percent brightness.
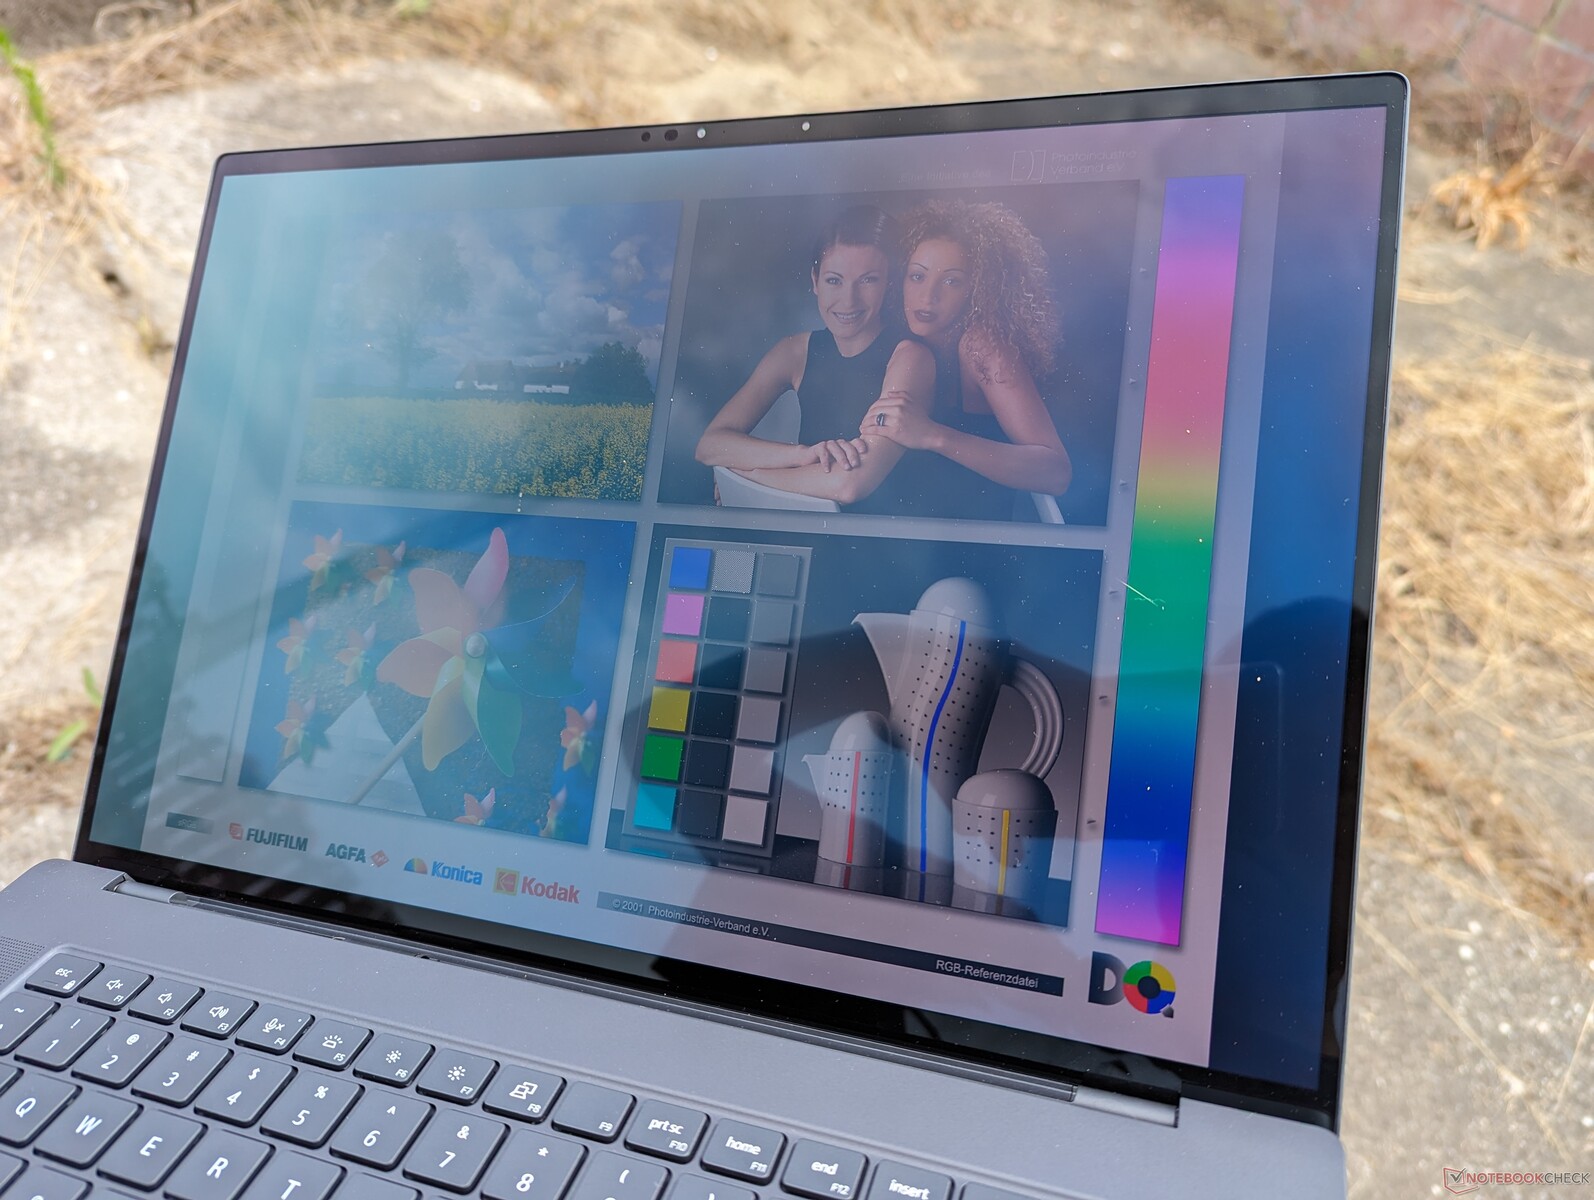
Outdoor visibility is average at best as the 350-nit glossy OLED touchscreen isn't nearly as bright as the IPS displays on the ZBook Fury 16 G9 or ThinkPad P16 G1 which can approach 500 to 600 nits.
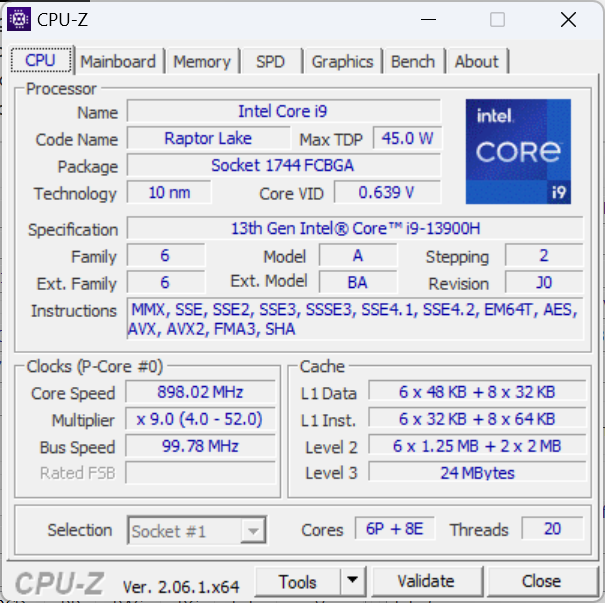
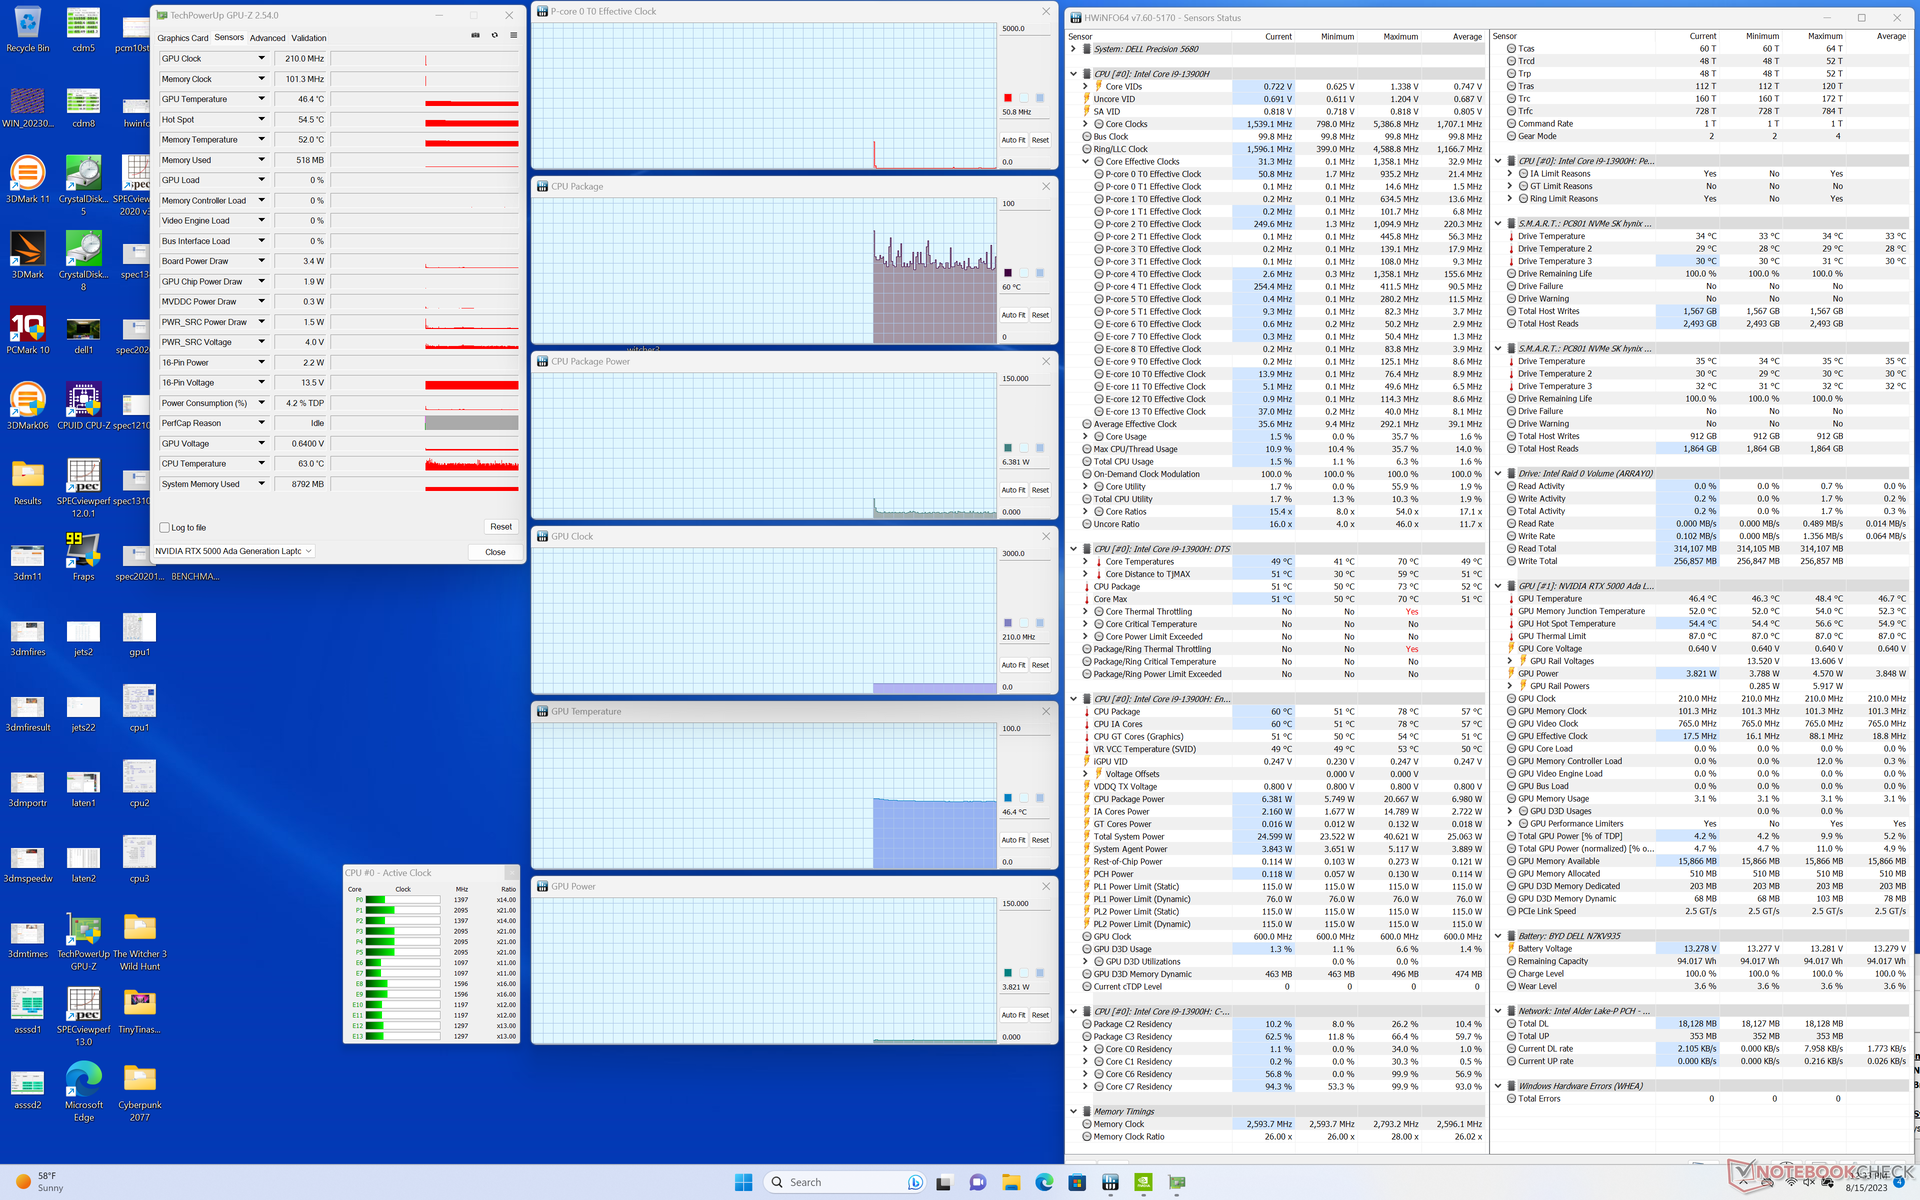
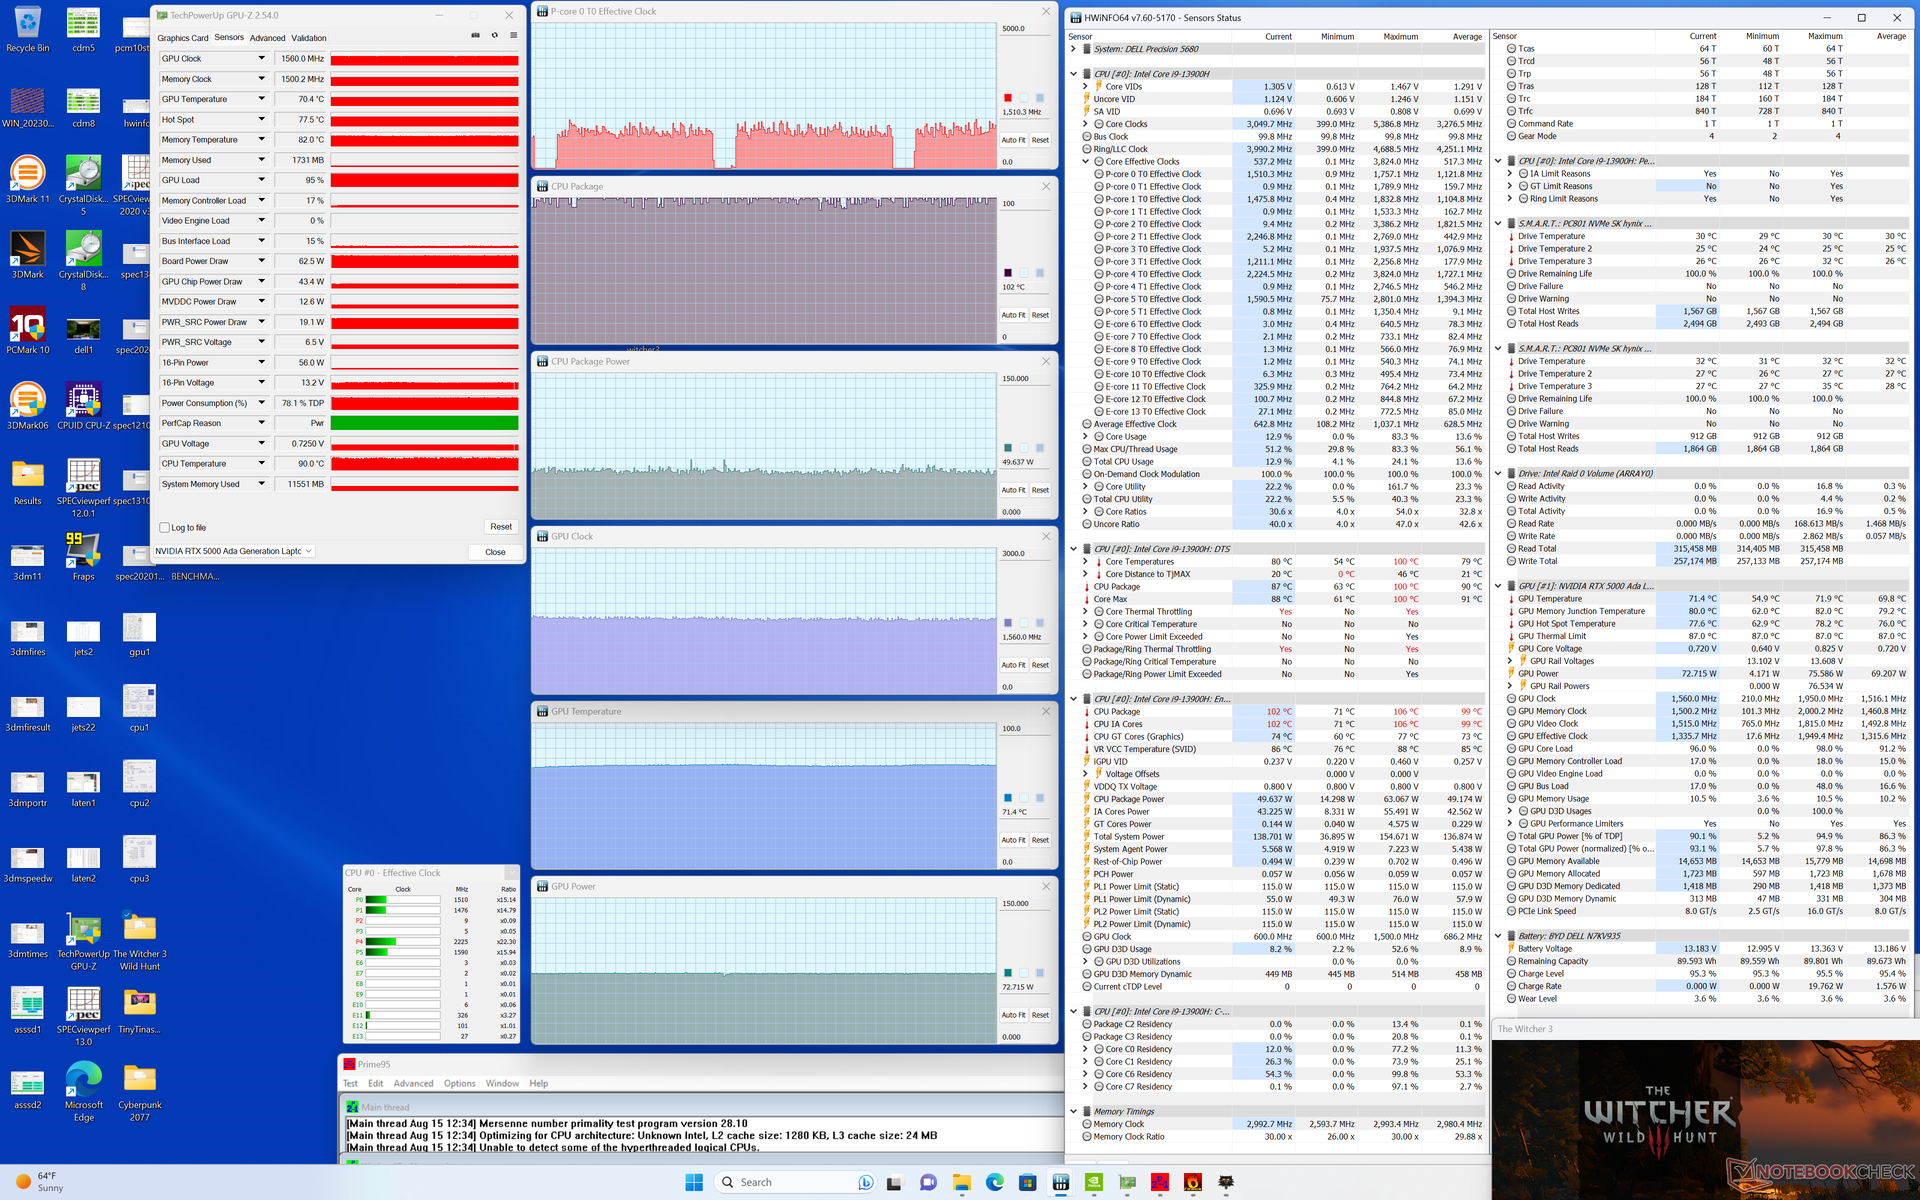
Performance — Intel 13th Gen Raptor Lake-H
Testing Conditions
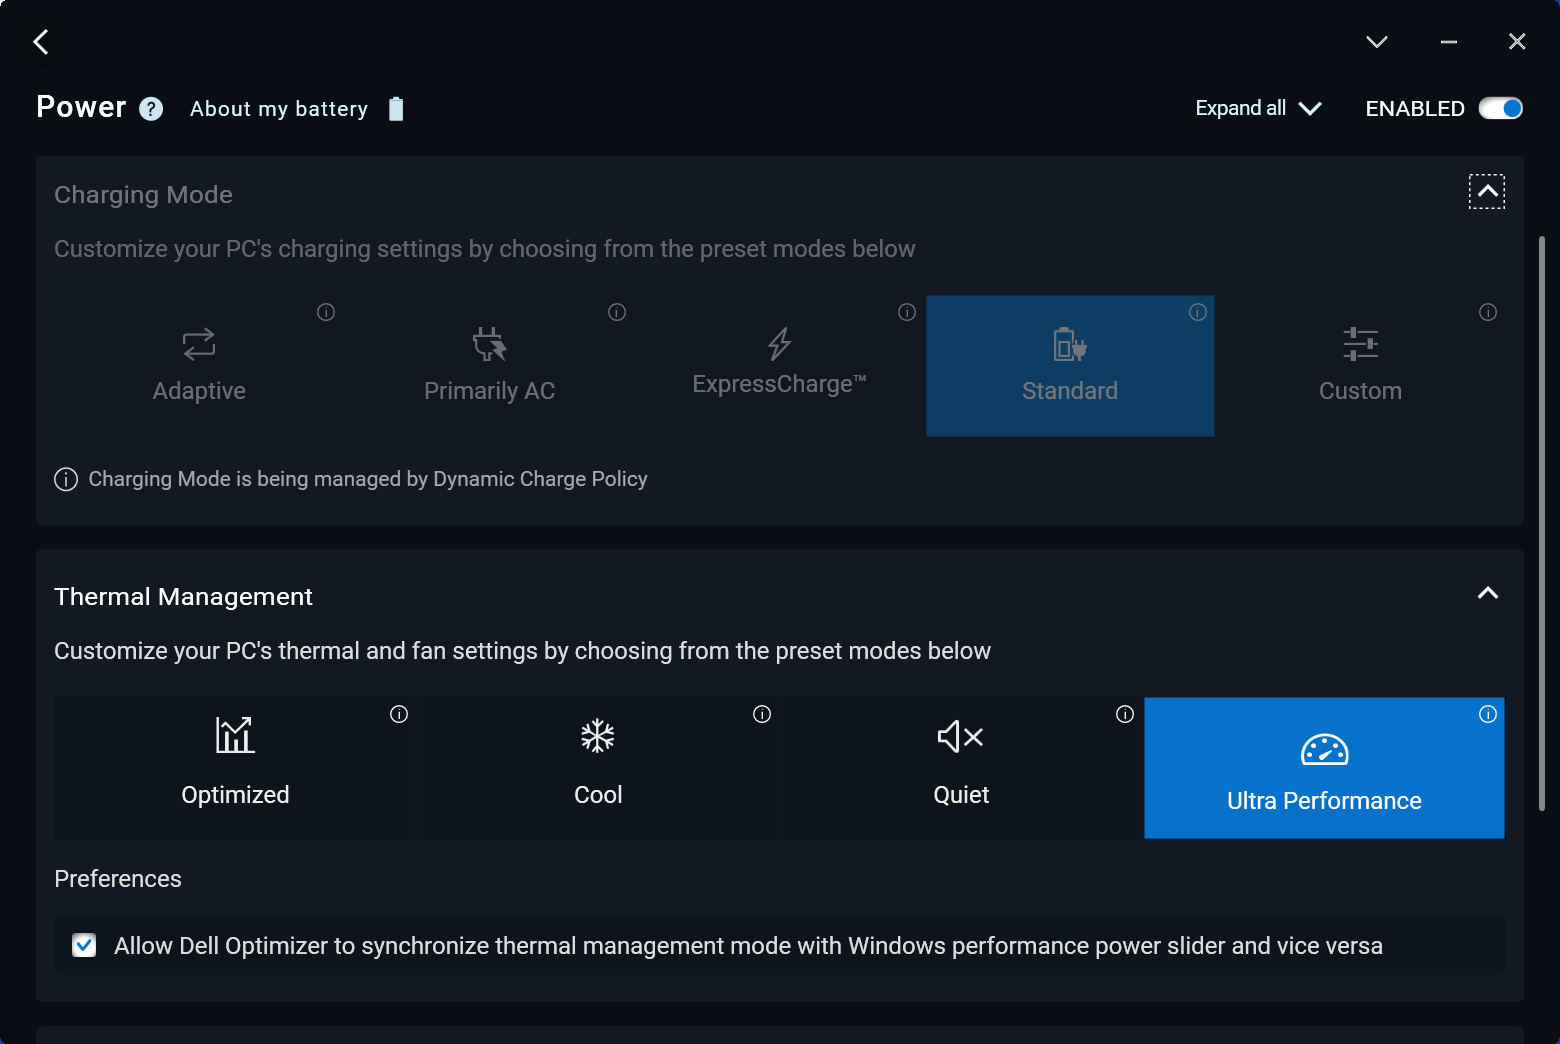
We set our unit to Ultra Performance mode via the Dell Optimizer software prior to running the benchmarks below. The Optimizer power profiles can conveniently sync with the Windows power profiles unlike the specialized power profiles on most other makers.
Advanced Optimus or Optimus 2.0 is not supported. However, new to Ada Lovelace workstation GPUs is ECC VRAM mode which can be toggled on or off via the Nvidia Control Panel. A reboot is required when toggling this feature.
Processor
The 13th gen Core i9-13900H is disappointing in the sense that it isn't a noticeable leap forward over last year's 12th gen Core i9-12900H. Performance, for example, would be essentially identical to the Asus ProArt StudioBook 16 running on the older Core i9-12900H save for just a minor 5 to 10 percent boost in single-threaded operations. It's too bad that the Precision 5680 doesn't offer a Core i9-13900HX option which would have provided a much more significant boost in performance over any Alder Lake-H mobile processor.
Note that there are also no Xeon or W-class processor options meaning no support for ECC RAM on the Precision 5680 series. Dell offers ECC RAM for its larger Precision 7000 series instead.
Downgrading to the Core i7-13700H from our i9-13900H is expected to reduce multi-thread performance by about 20 percent based on our time with the Schenker Vision 16 Pro.
Cinebench R15 Multi Loop
Cinebench R23: Multi Core | Single Core
Cinebench R20: CPU (Multi Core) | CPU (Single Core)
Cinebench R15: CPU Multi 64Bit | CPU Single 64Bit
Blender: v2.79 BMW27 CPU
7-Zip 18.03: 7z b 4 | 7z b 4 -mmt1
Geekbench 5.5: Multi-Core | Single-Core
HWBOT x265 Benchmark v2.2: 4k Preset
LibreOffice : 20 Documents To PDF
R Benchmark 2.5: Overall mean
* ... smaller is better
AIDA64: FP32 Ray-Trace | FPU Julia | CPU SHA3 | CPU Queen | FPU SinJulia | FPU Mandel | CPU AES | CPU ZLib | FP64 Ray-Trace | CPU PhotoWorxx
| Performance rating | |
| Lenovo ThinkPad P16 G1 RTX A5500 | |
| HP ZBook Fury 16 G9 | |
| Dell Precision 5000 5680 | |
| MSI CreatorPro Z16P B12UKST | |
| Asus ExpertBook B6 Flip B6602FC2 | |
| Average Intel Core i9-13900H | |
| Dell Precision 7000 7670 Performance | |
| AIDA64 / FP32 Ray-Trace | |
| Lenovo ThinkPad P16 G1 RTX A5500 | |
| HP ZBook Fury 16 G9 | |
| Asus ExpertBook B6 Flip B6602FC2 | |
| Dell Precision 5000 5680 | |
| Dell Precision 7000 7670 Performance | |
| Average Intel Core i9-13900H (6788 - 19557, n=25) | |
| MSI CreatorPro Z16P B12UKST | |
| AIDA64 / FPU Julia | |
| HP ZBook Fury 16 G9 | |
| Lenovo ThinkPad P16 G1 RTX A5500 | |
| Asus ExpertBook B6 Flip B6602FC2 | |
| Dell Precision 5000 5680 | |
| Dell Precision 7000 7670 Performance | |
| Average Intel Core i9-13900H (22551 - 95579, n=25) | |
| MSI CreatorPro Z16P B12UKST | |
| AIDA64 / CPU SHA3 | |
| Lenovo ThinkPad P16 G1 RTX A5500 | |
| HP ZBook Fury 16 G9 | |
| MSI CreatorPro Z16P B12UKST | |
| Average Intel Core i9-13900H (2491 - 4270, n=25) | |
| Dell Precision 5000 5680 | |
| Asus ExpertBook B6 Flip B6602FC2 | |
| Dell Precision 7000 7670 Performance | |
| AIDA64 / CPU Queen | |
| Dell Precision 5000 5680 | |
| Average Intel Core i9-13900H (65121 - 120936, n=25) | |
| Lenovo ThinkPad P16 G1 RTX A5500 | |
| Dell Precision 7000 7670 Performance | |
| Asus ExpertBook B6 Flip B6602FC2 | |
| HP ZBook Fury 16 G9 | |
| MSI CreatorPro Z16P B12UKST | |
| AIDA64 / FPU SinJulia | |
| Lenovo ThinkPad P16 G1 RTX A5500 | |
| HP ZBook Fury 16 G9 | |
| Asus ExpertBook B6 Flip B6602FC2 | |
| Dell Precision 7000 7670 Performance | |
| Dell Precision 5000 5680 | |
| Average Intel Core i9-13900H (6108 - 11631, n=25) | |
| MSI CreatorPro Z16P B12UKST | |
| AIDA64 / FPU Mandel | |
| HP ZBook Fury 16 G9 | |
| Lenovo ThinkPad P16 G1 RTX A5500 | |
| Asus ExpertBook B6 Flip B6602FC2 | |
| Dell Precision 5000 5680 | |
| Average Intel Core i9-13900H (11283 - 48474, n=25) | |
| Dell Precision 7000 7670 Performance | |
| MSI CreatorPro Z16P B12UKST | |
| AIDA64 / CPU AES | |
| MSI CreatorPro Z16P B12UKST | |
| HP ZBook Fury 16 G9 | |
| Lenovo ThinkPad P16 G1 RTX A5500 | |
| Average Intel Core i9-13900H (3691 - 149377, n=25) | |
| Asus ExpertBook B6 Flip B6602FC2 | |
| Dell Precision 7000 7670 Performance | |
| Dell Precision 5000 5680 | |
| AIDA64 / CPU ZLib | |
| Lenovo ThinkPad P16 G1 RTX A5500 | |
| HP ZBook Fury 16 G9 | |
| Average Intel Core i9-13900H (789 - 1254, n=25) | |
| Asus ExpertBook B6 Flip B6602FC2 | |
| MSI CreatorPro Z16P B12UKST | |
| Dell Precision 5000 5680 | |
| Dell Precision 7000 7670 Performance | |
| AIDA64 / FP64 Ray-Trace | |
| Lenovo ThinkPad P16 G1 RTX A5500 | |
| HP ZBook Fury 16 G9 | |
| Asus ExpertBook B6 Flip B6602FC2 | |
| Dell Precision 5000 5680 | |
| Dell Precision 7000 7670 Performance | |
| Average Intel Core i9-13900H (3655 - 10716, n=25) | |
| MSI CreatorPro Z16P B12UKST | |
| AIDA64 / CPU PhotoWorxx | |
| Dell Precision 5000 5680 | |
| MSI CreatorPro Z16P B12UKST | |
| Dell Precision 7000 7670 Performance | |
| Lenovo ThinkPad P16 G1 RTX A5500 | |
| Average Intel Core i9-13900H (10871 - 50488, n=25) | |
| HP ZBook Fury 16 G9 | |
| Asus ExpertBook B6 Flip B6602FC2 | |
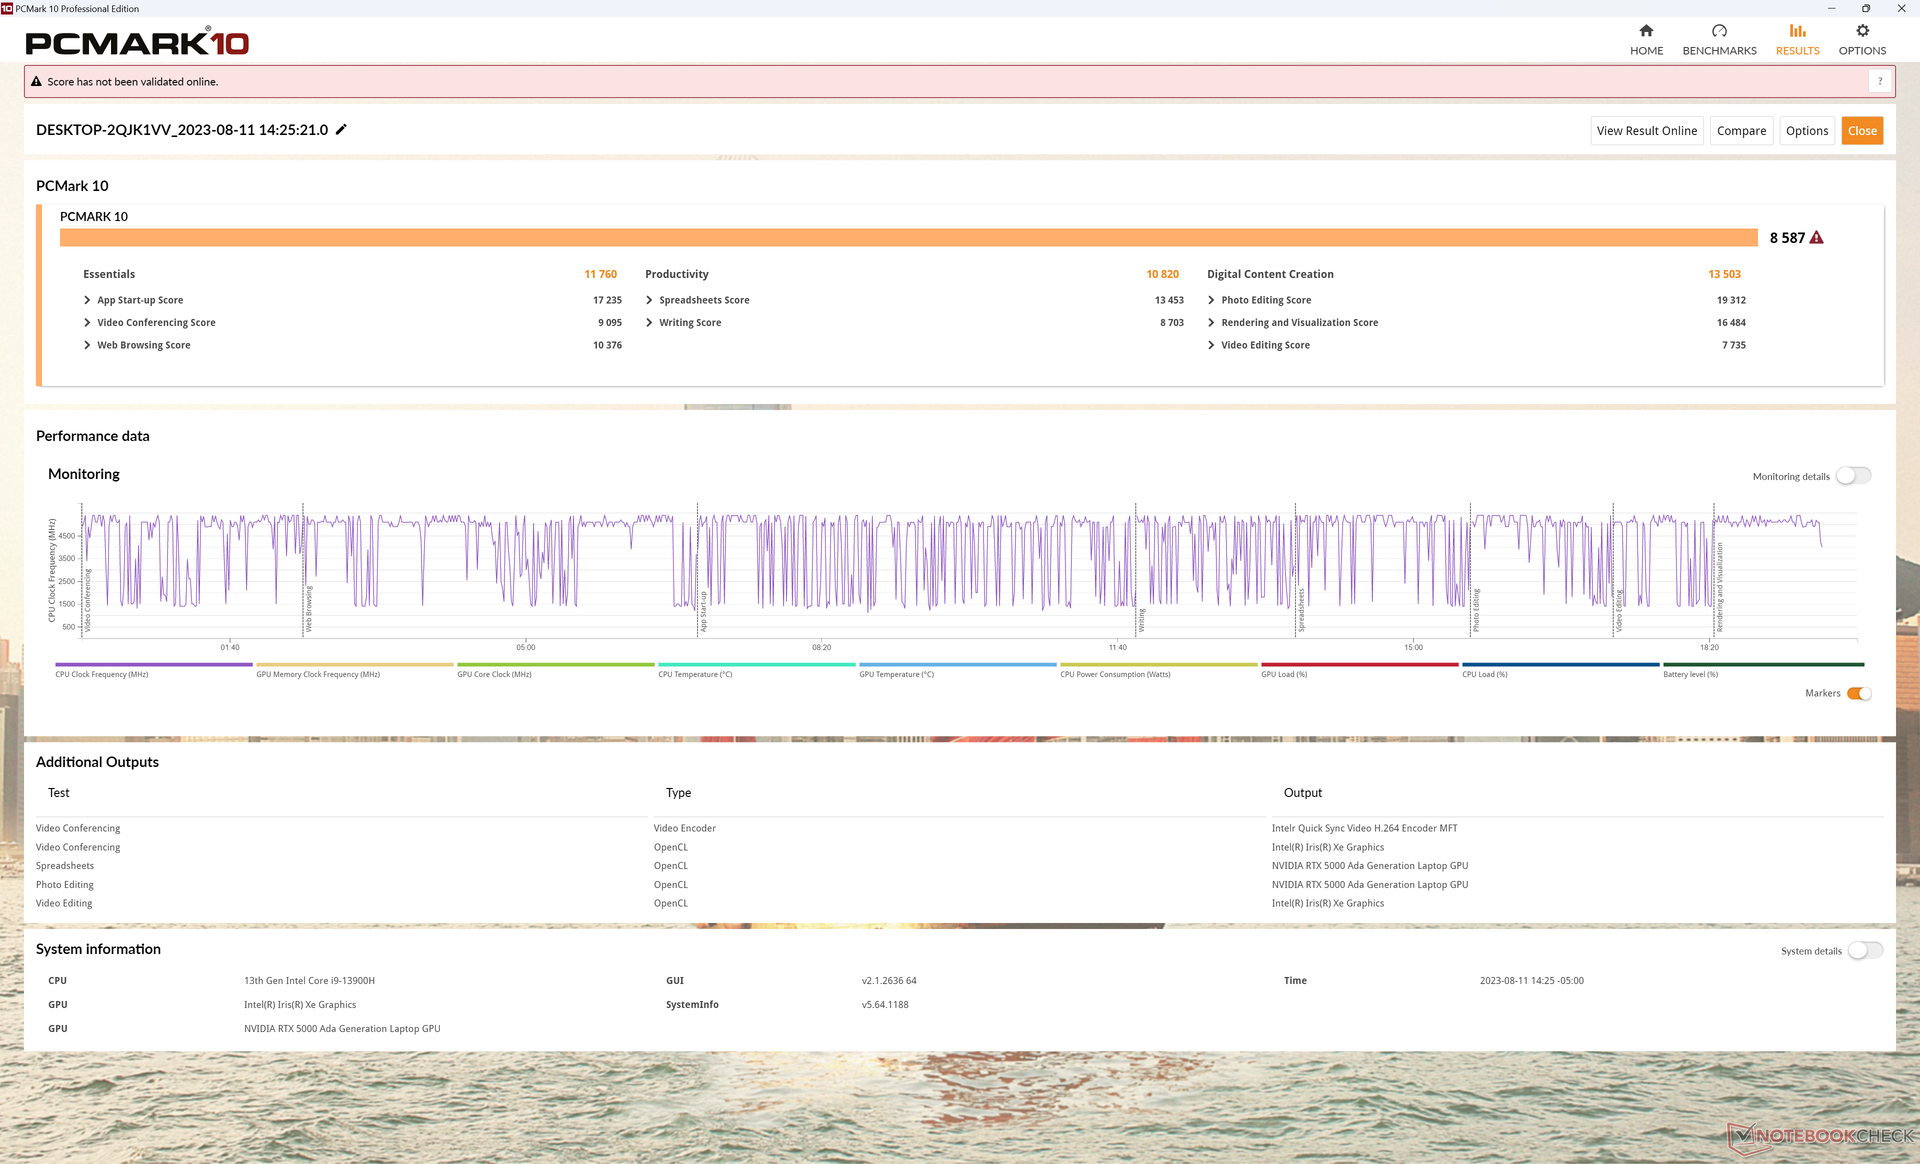
System Performance
PCMark scores are higher than on most other workstations by relatively wide margins including even some powerhouses like the HP ZBook Fury 16 G9 or Precision 7670 Performance. This can be attributed to our RAID 0 SSD configuration and RTX 5000 GPU whereas most other workstations are running on single SSDs and older generation GPUs.
CrossMark: Overall | Productivity | Creativity | Responsiveness
| PCMark 10 / Score | |
| Dell Precision 5000 5680 | |
| Average Intel Core i9-13900H, NVIDIA RTX 5000 Ada Generation Laptop (n=1) | |
| Asus ExpertBook B6 Flip B6602FC2 | |
| Lenovo ThinkPad P16 G1 RTX A5500 | |
| MSI CreatorPro Z16P B12UKST | |
| HP ZBook Fury 16 G9 | |
| Dell Precision 7000 7670 Performance | |
| PCMark 10 / Essentials | |
| Dell Precision 5000 5680 | |
| Average Intel Core i9-13900H, NVIDIA RTX 5000 Ada Generation Laptop (n=1) | |
| Dell Precision 7000 7670 Performance | |
| HP ZBook Fury 16 G9 | |
| Lenovo ThinkPad P16 G1 RTX A5500 | |
| Asus ExpertBook B6 Flip B6602FC2 | |
| MSI CreatorPro Z16P B12UKST | |
| PCMark 10 / Productivity | |
| Dell Precision 5000 5680 | |
| Average Intel Core i9-13900H, NVIDIA RTX 5000 Ada Generation Laptop (n=1) | |
| Asus ExpertBook B6 Flip B6602FC2 | |
| Lenovo ThinkPad P16 G1 RTX A5500 | |
| MSI CreatorPro Z16P B12UKST | |
| HP ZBook Fury 16 G9 | |
| Dell Precision 7000 7670 Performance | |
| PCMark 10 / Digital Content Creation | |
| Dell Precision 5000 5680 | |
| Average Intel Core i9-13900H, NVIDIA RTX 5000 Ada Generation Laptop (n=1) | |
| Lenovo ThinkPad P16 G1 RTX A5500 | |
| MSI CreatorPro Z16P B12UKST | |
| Dell Precision 7000 7670 Performance | |
| HP ZBook Fury 16 G9 | |
| Asus ExpertBook B6 Flip B6602FC2 | |
| CrossMark / Overall | |
| Asus ExpertBook B6 Flip B6602FC2 | |
| MSI CreatorPro Z16P B12UKST | |
| Dell Precision 5000 5680 | |
| Average Intel Core i9-13900H, NVIDIA RTX 5000 Ada Generation Laptop (n=1) | |
| HP ZBook Fury 16 G9 | |
| Lenovo ThinkPad P16 G1 RTX A5500 | |
| Dell Precision 7000 7670 Performance | |
| CrossMark / Productivity | |
| Asus ExpertBook B6 Flip B6602FC2 | |
| MSI CreatorPro Z16P B12UKST | |
| Dell Precision 5000 5680 | |
| Average Intel Core i9-13900H, NVIDIA RTX 5000 Ada Generation Laptop (n=1) | |
| HP ZBook Fury 16 G9 | |
| Lenovo ThinkPad P16 G1 RTX A5500 | |
| Dell Precision 7000 7670 Performance | |
| CrossMark / Creativity | |
| Lenovo ThinkPad P16 G1 RTX A5500 | |
| Dell Precision 5000 5680 | |
| Average Intel Core i9-13900H, NVIDIA RTX 5000 Ada Generation Laptop (n=1) | |
| Asus ExpertBook B6 Flip B6602FC2 | |
| HP ZBook Fury 16 G9 | |
| MSI CreatorPro Z16P B12UKST | |
| Dell Precision 7000 7670 Performance | |
| CrossMark / Responsiveness | |
| MSI CreatorPro Z16P B12UKST | |
| Asus ExpertBook B6 Flip B6602FC2 | |
| HP ZBook Fury 16 G9 | |
| Dell Precision 5000 5680 | |
| Average Intel Core i9-13900H, NVIDIA RTX 5000 Ada Generation Laptop (n=1) | |
| Dell Precision 7000 7670 Performance | |
| Lenovo ThinkPad P16 G1 RTX A5500 | |
| PCMark 10 Score | 8587 points | |
Help | ||
| AIDA64 / Memory Copy | |
| Dell Precision 5000 5680 | |
| Dell Precision 7000 7670 Performance | |
| Lenovo ThinkPad P16 G1 RTX A5500 | |
| MSI CreatorPro Z16P B12UKST | |
| Average Intel Core i9-13900H (37448 - 74486, n=25) | |
| HP ZBook Fury 16 G9 | |
| Asus ExpertBook B6 Flip B6602FC2 | |
| AIDA64 / Memory Read | |
| Dell Precision 7000 7670 Performance | |
| Dell Precision 5000 5680 | |
| MSI CreatorPro Z16P B12UKST | |
| Lenovo ThinkPad P16 G1 RTX A5500 | |
| Average Intel Core i9-13900H (41599 - 75433, n=25) | |
| Asus ExpertBook B6 Flip B6602FC2 | |
| HP ZBook Fury 16 G9 | |
| AIDA64 / Memory Write | |
| Dell Precision 5000 5680 | |
| MSI CreatorPro Z16P B12UKST | |
| Dell Precision 7000 7670 Performance | |
| Average Intel Core i9-13900H (36152 - 88505, n=25) | |
| Lenovo ThinkPad P16 G1 RTX A5500 | |
| Asus ExpertBook B6 Flip B6602FC2 | |
| HP ZBook Fury 16 G9 | |
| AIDA64 / Memory Latency | |
| MSI CreatorPro Z16P B12UKST | |
| Asus ExpertBook B6 Flip B6602FC2 | |
| Dell Precision 5000 5680 | |
| HP ZBook Fury 16 G9 | |
| Lenovo ThinkPad P16 G1 RTX A5500 | |
| Average Intel Core i9-13900H (75.8 - 102.3, n=25) | |
| Dell Precision 7000 7670 Performance | |
* ... smaller is better
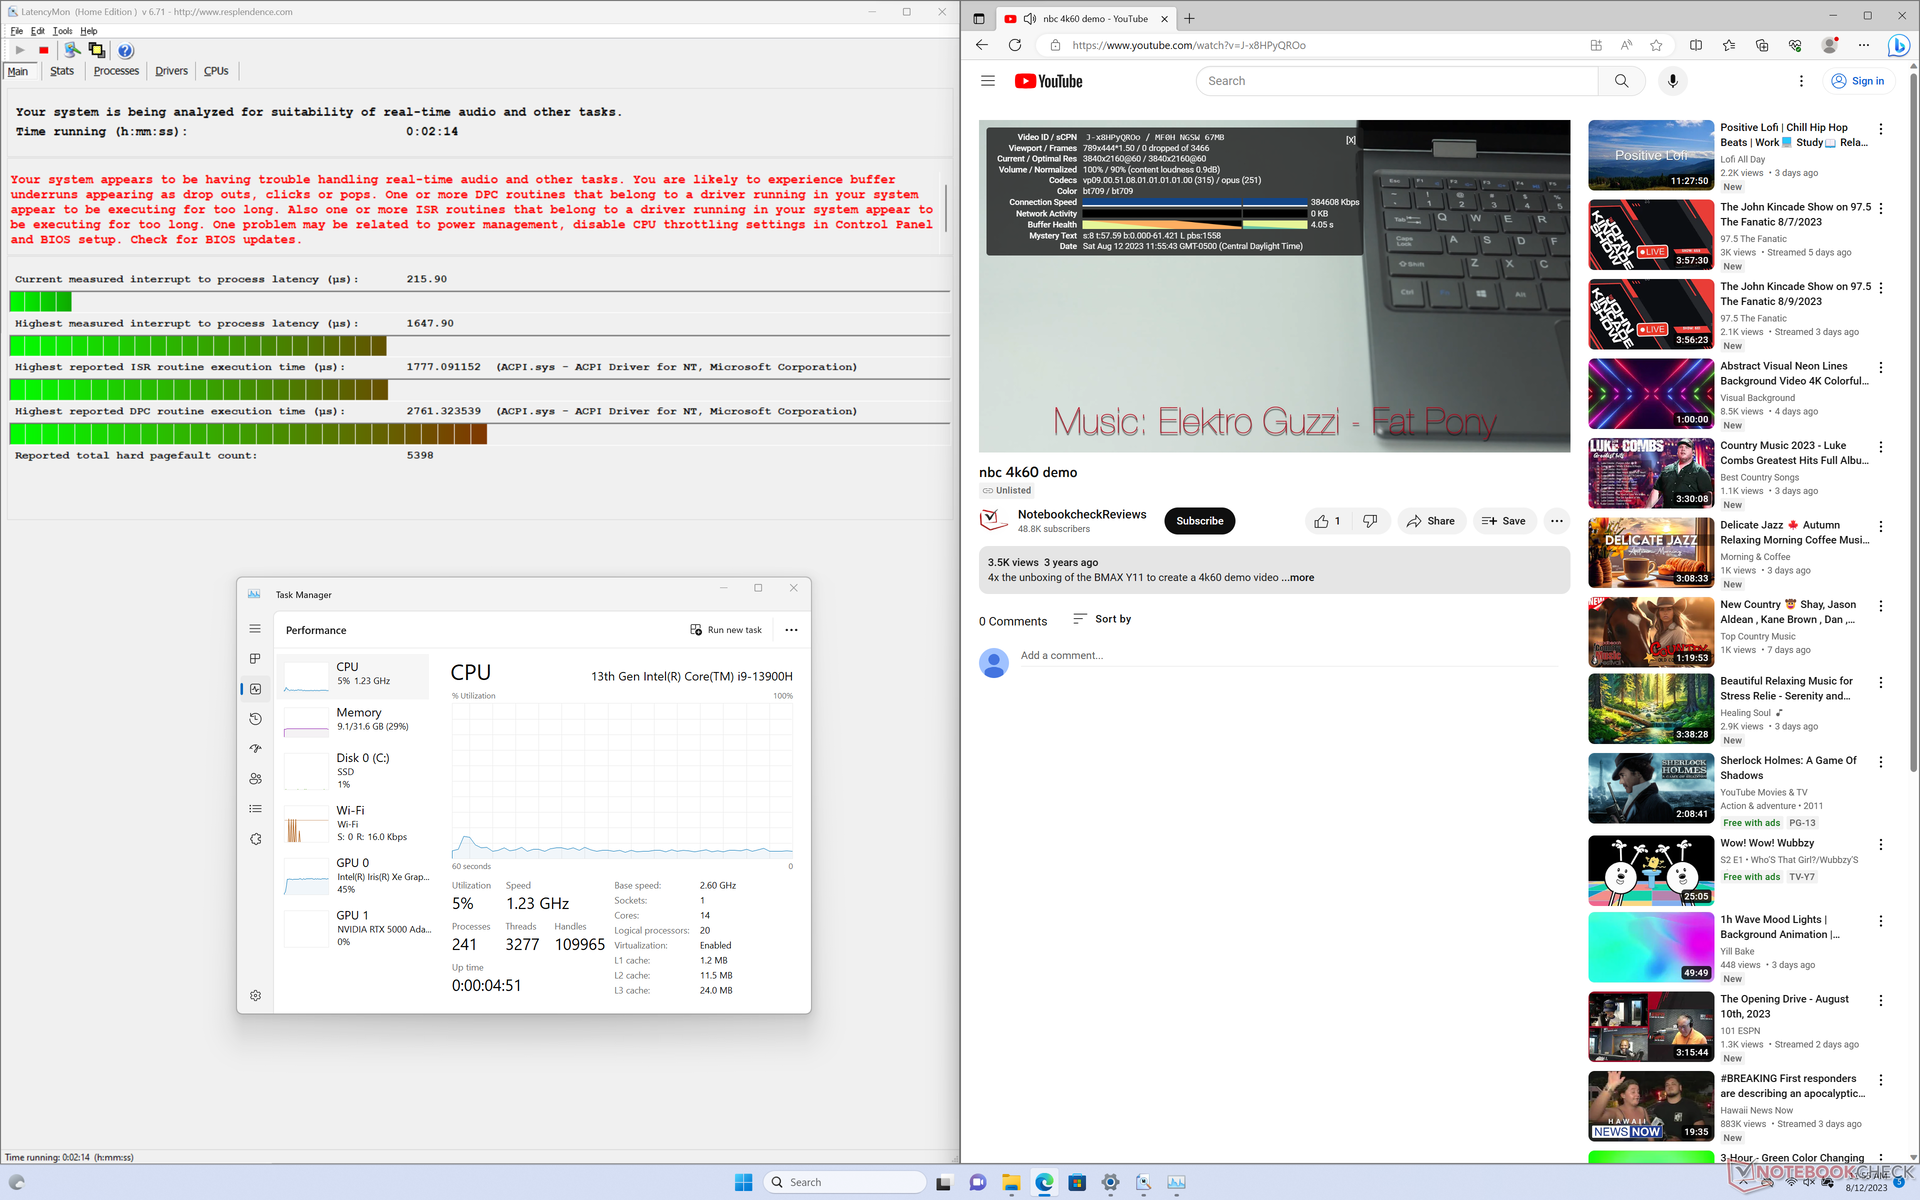
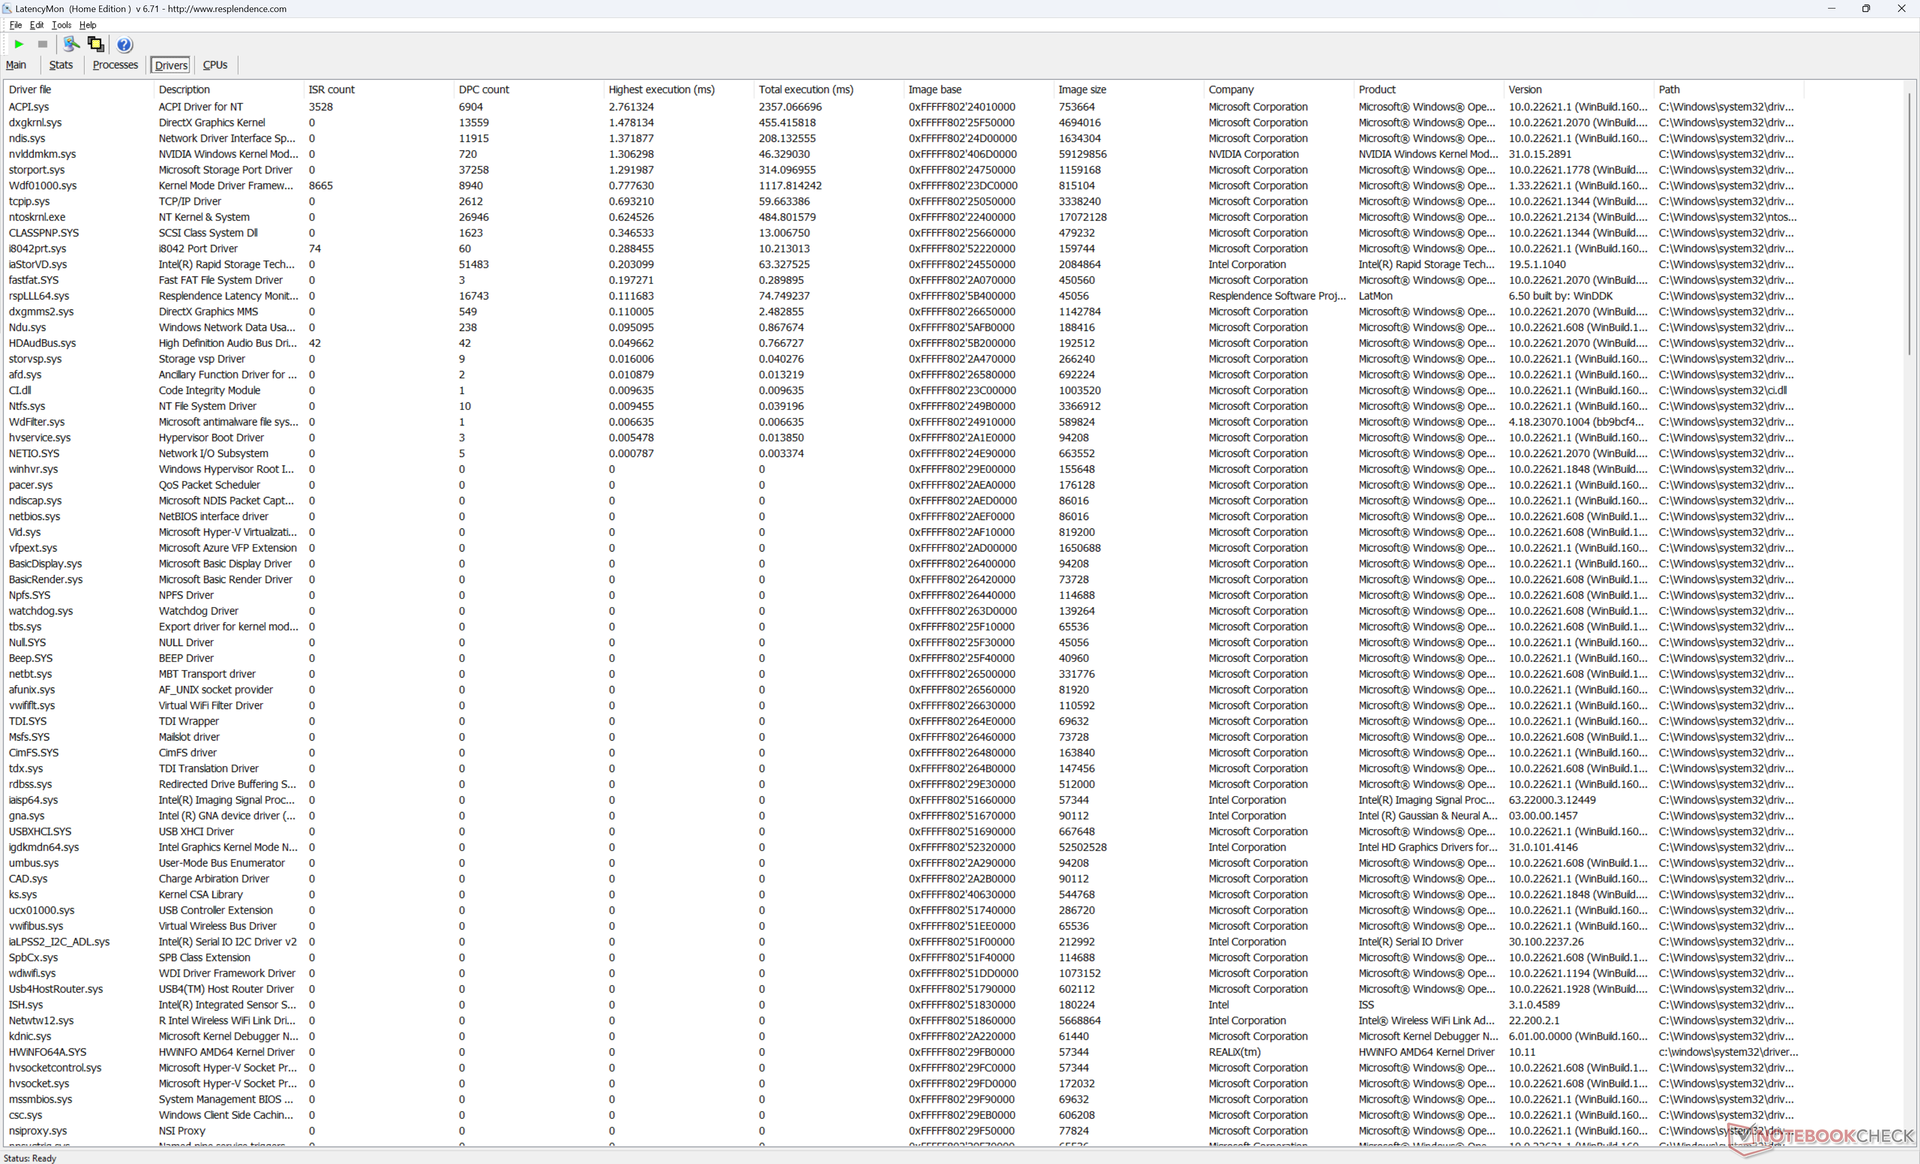
DPC Latency
LatencyMon reveals slight DPC issues when opening multiple browser tabs of our homepage similar to what we observed on the Precision 7670. 4K video playback at 60 FPS is otherwise perfect with no dropped frames recorded.
| DPC Latencies / LatencyMon - interrupt to process latency (max), Web, Youtube, Prime95 | |
| HP ZBook Fury 16 G9 | |
| Asus ExpertBook B6 Flip B6602FC2 | |
| Dell Precision 7000 7670 Performance | |
| Dell Precision 5000 5680 | |
| Lenovo ThinkPad P16 G1 RTX A5500 | |
| MSI CreatorPro Z16P B12UKST | |
* ... smaller is better
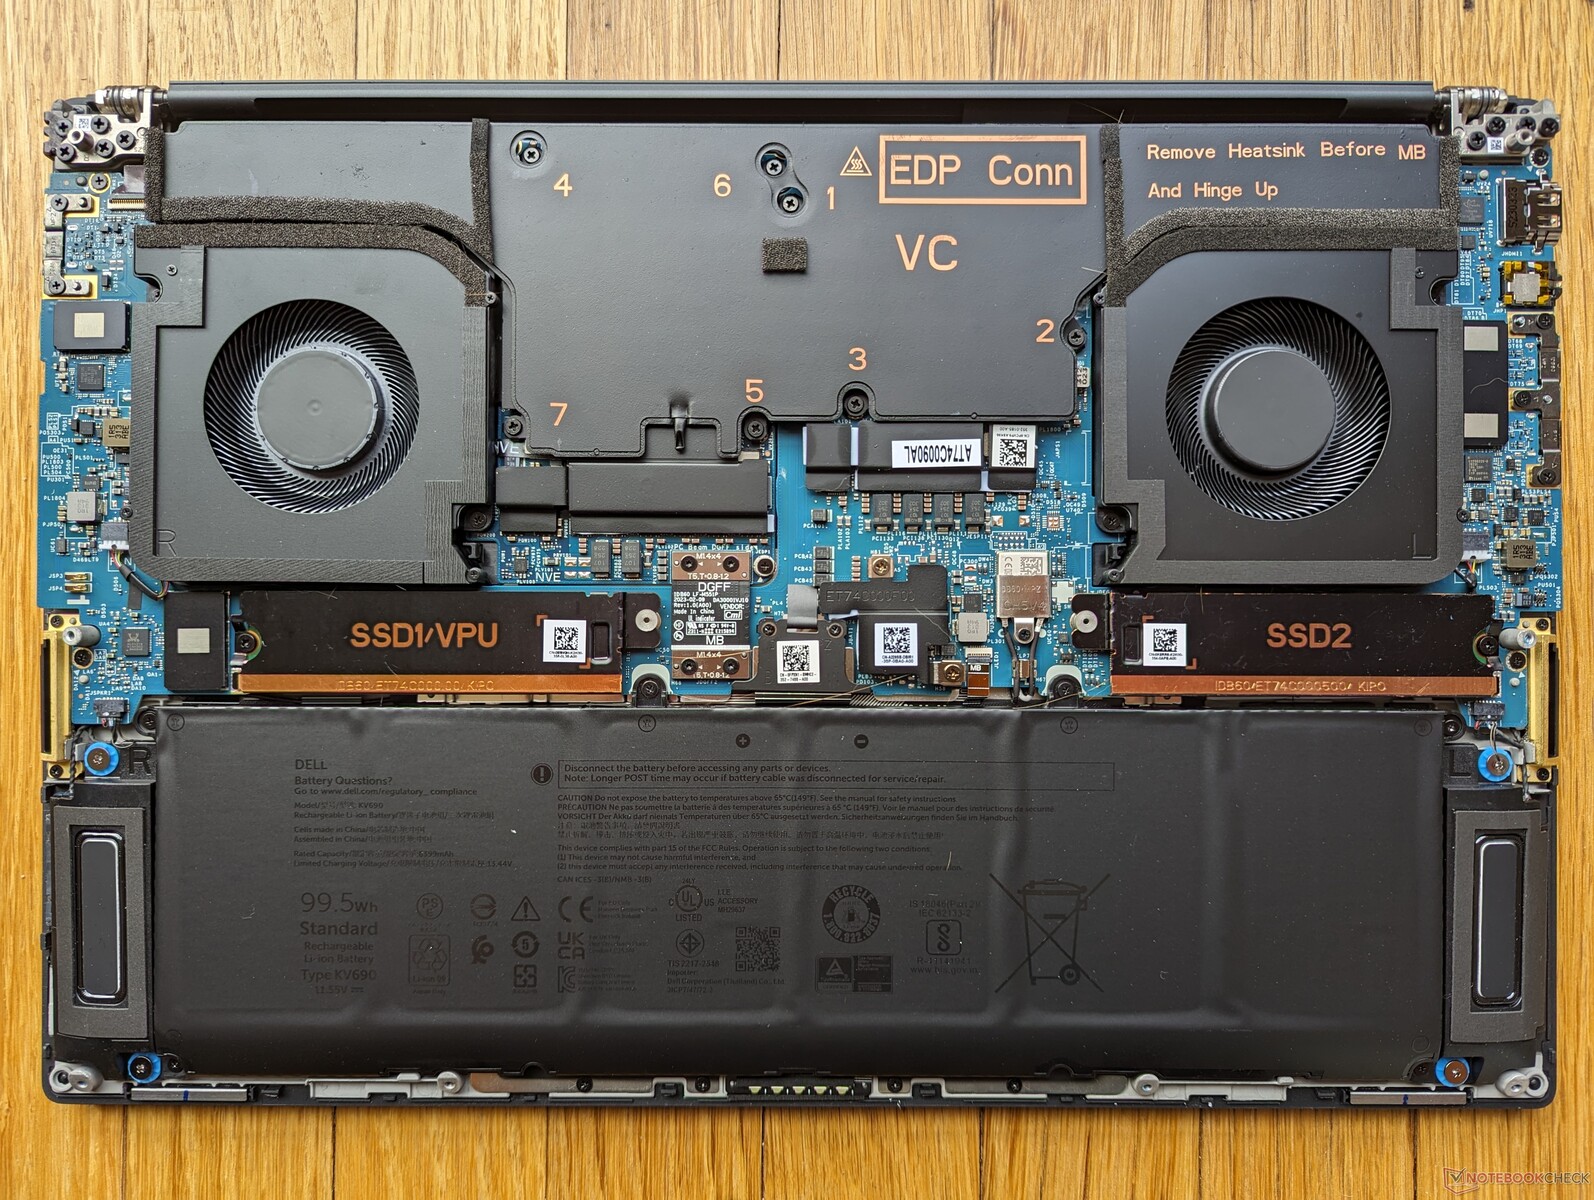
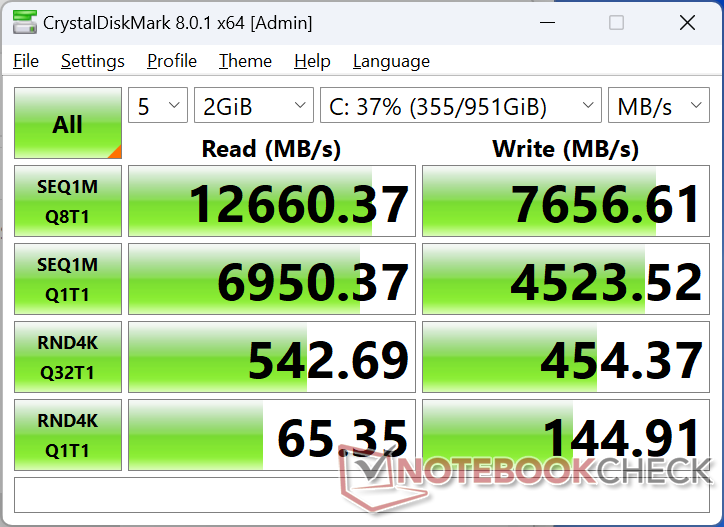
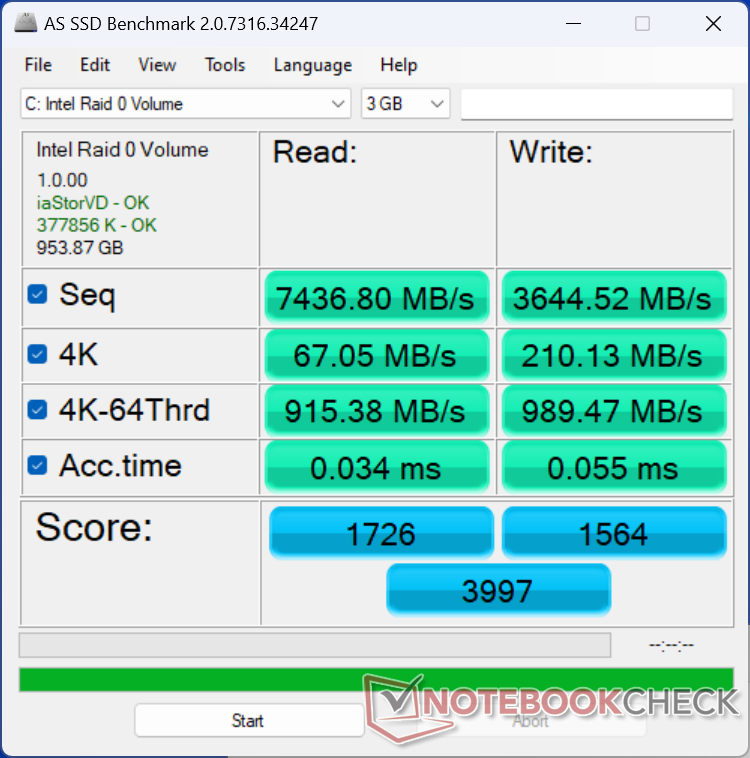
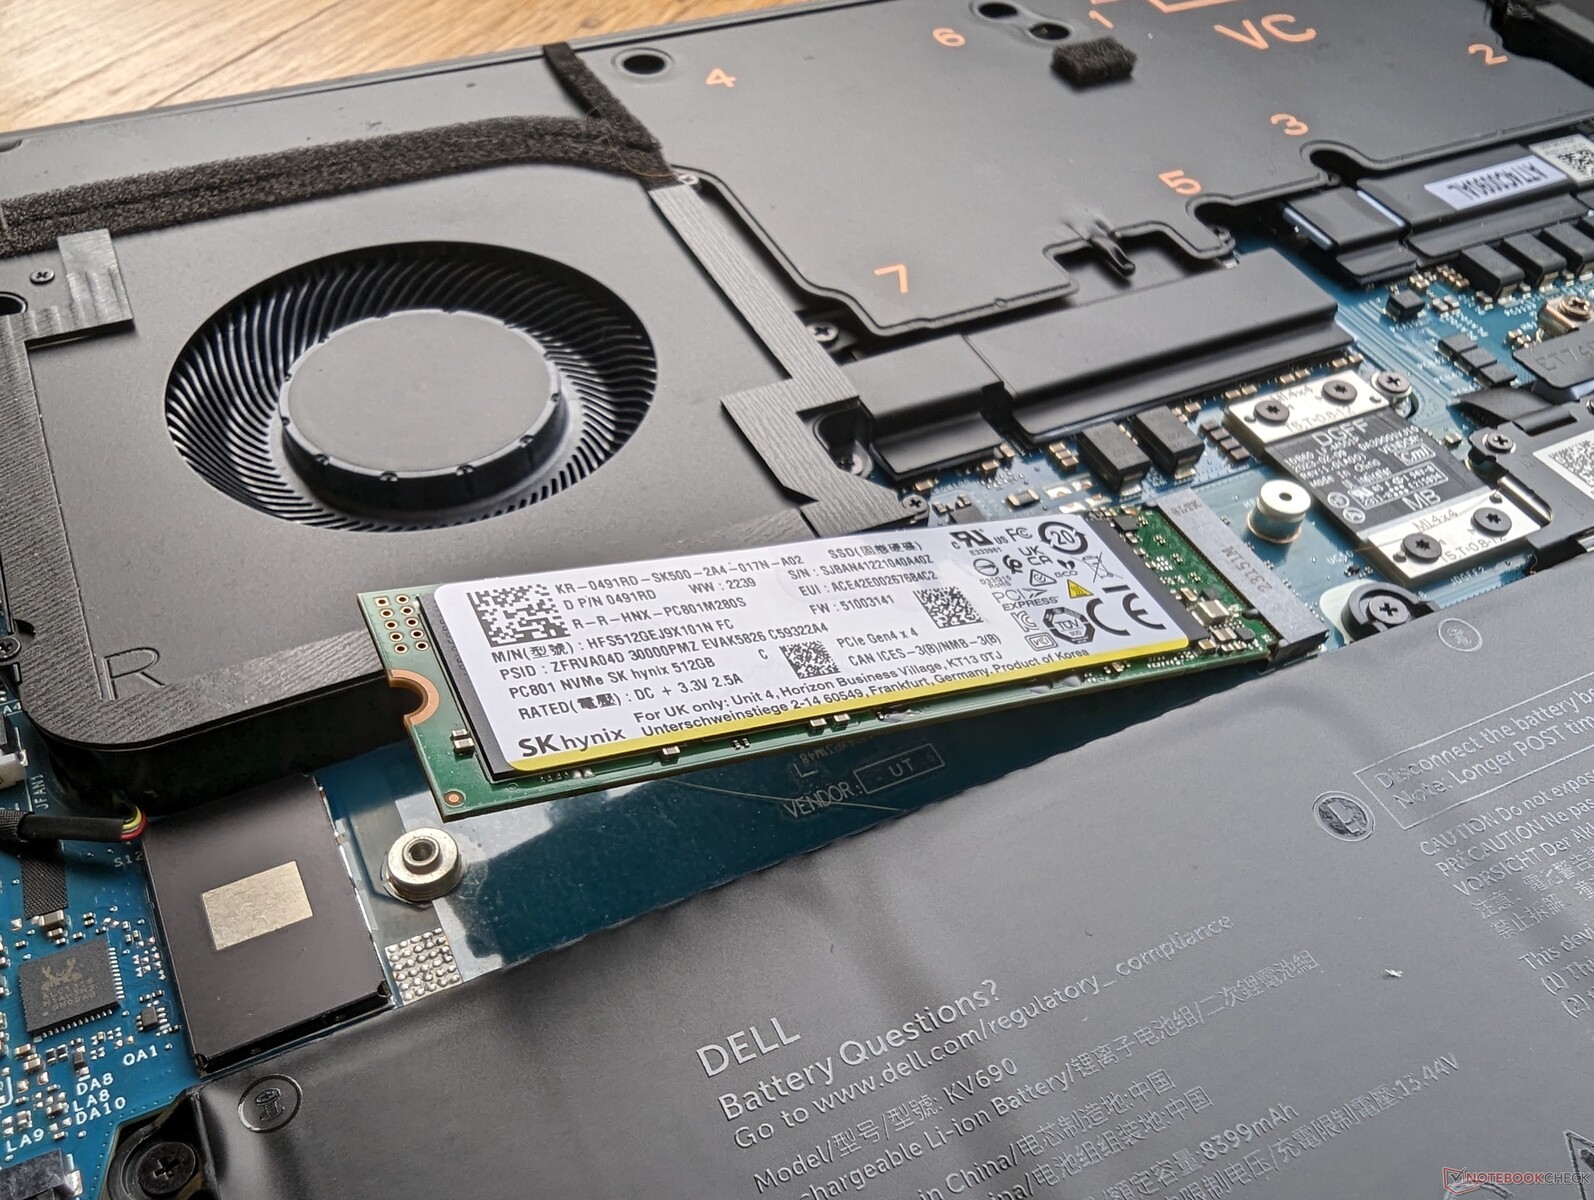
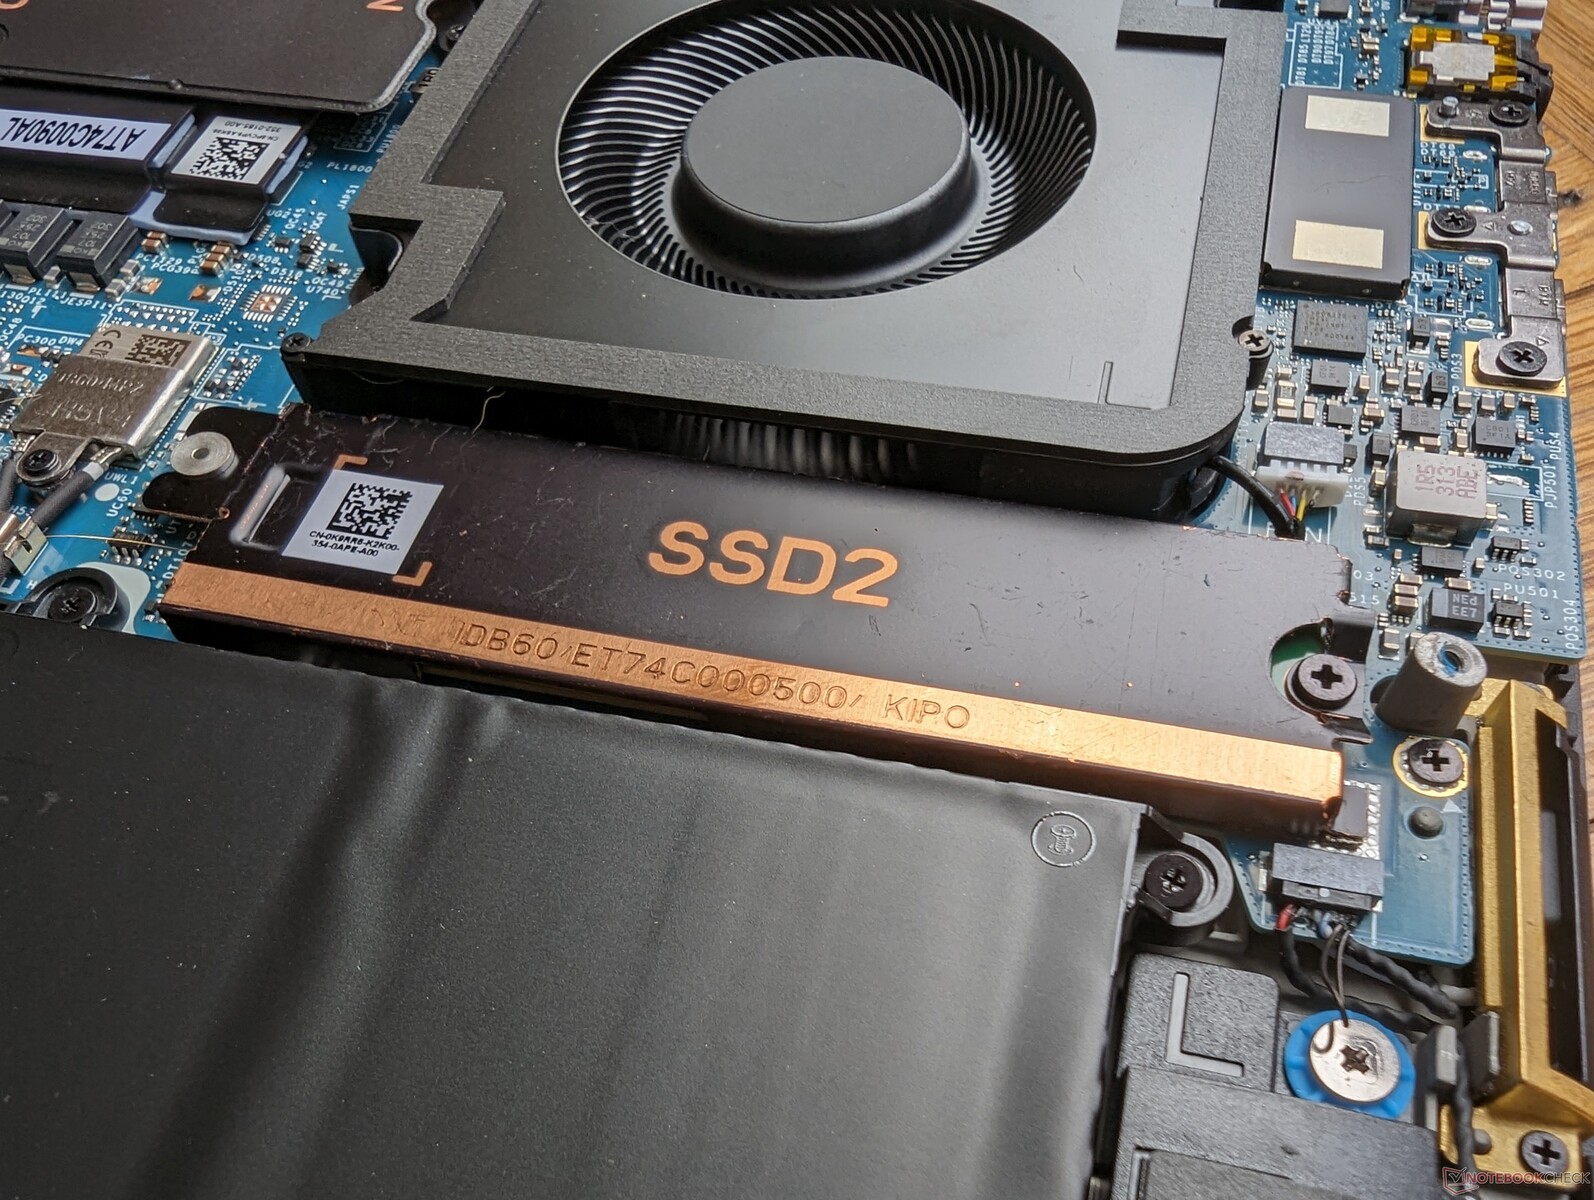
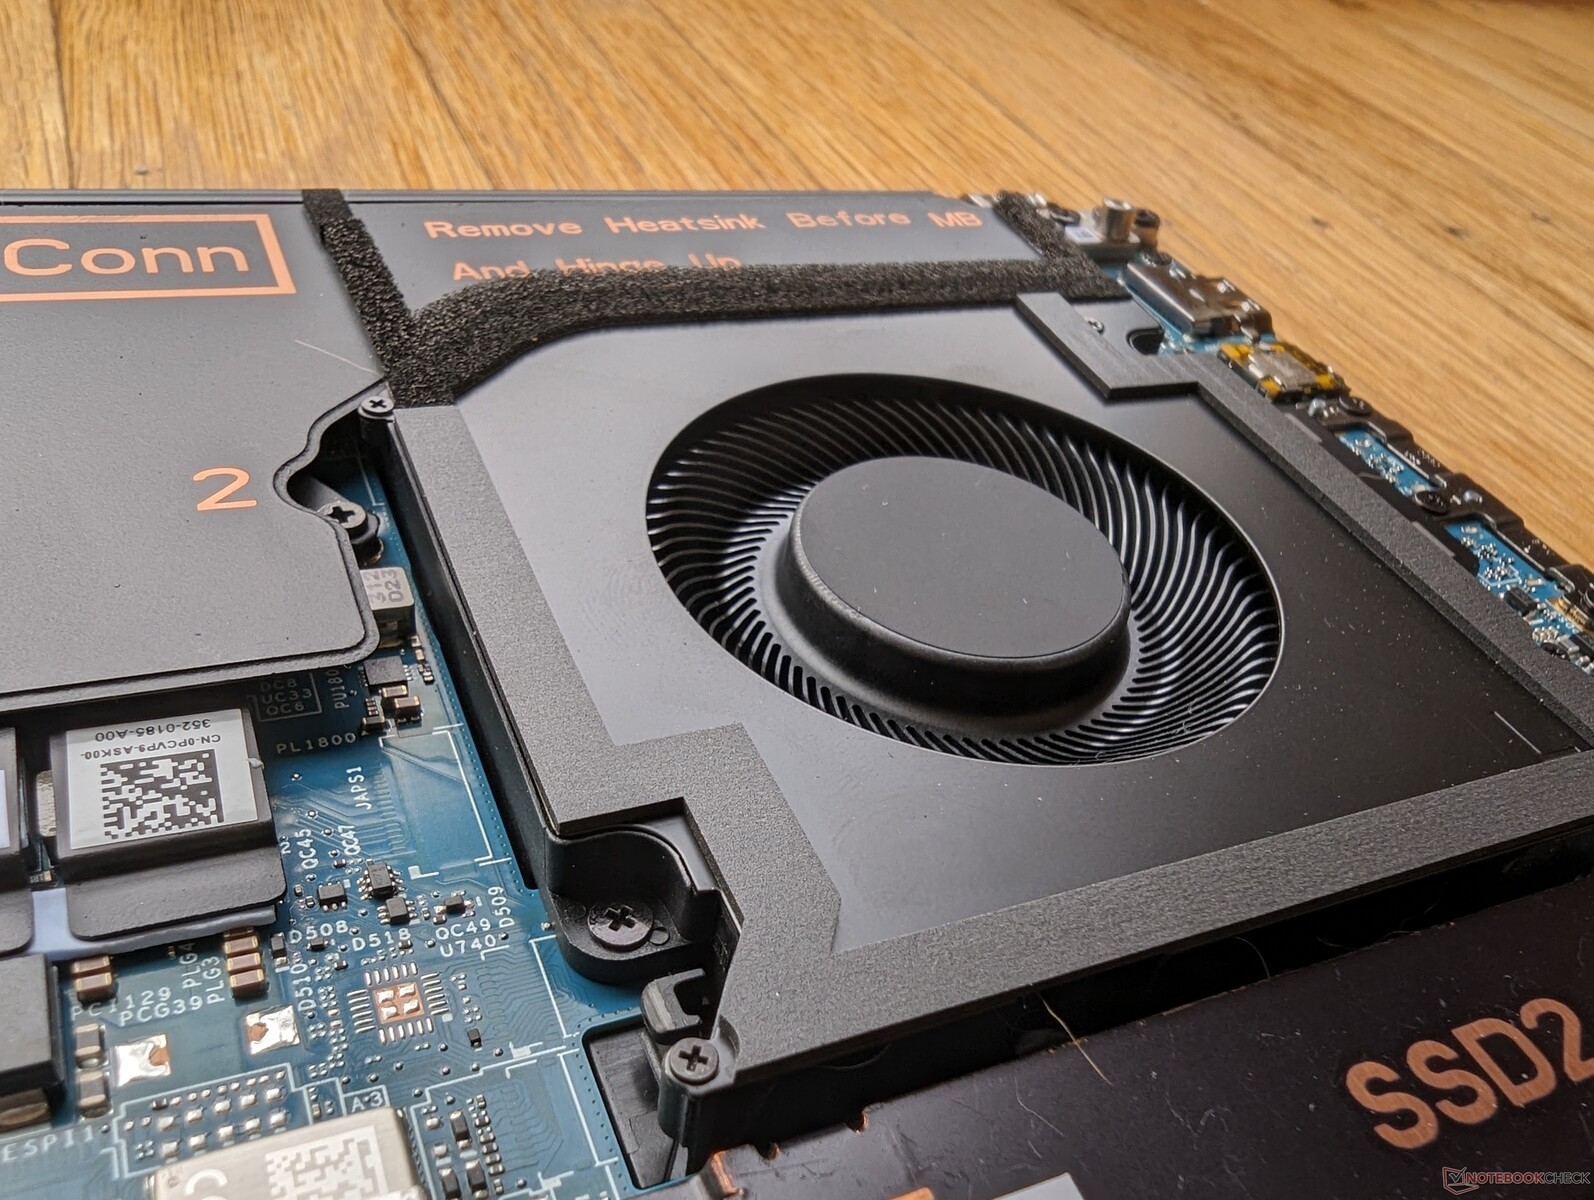
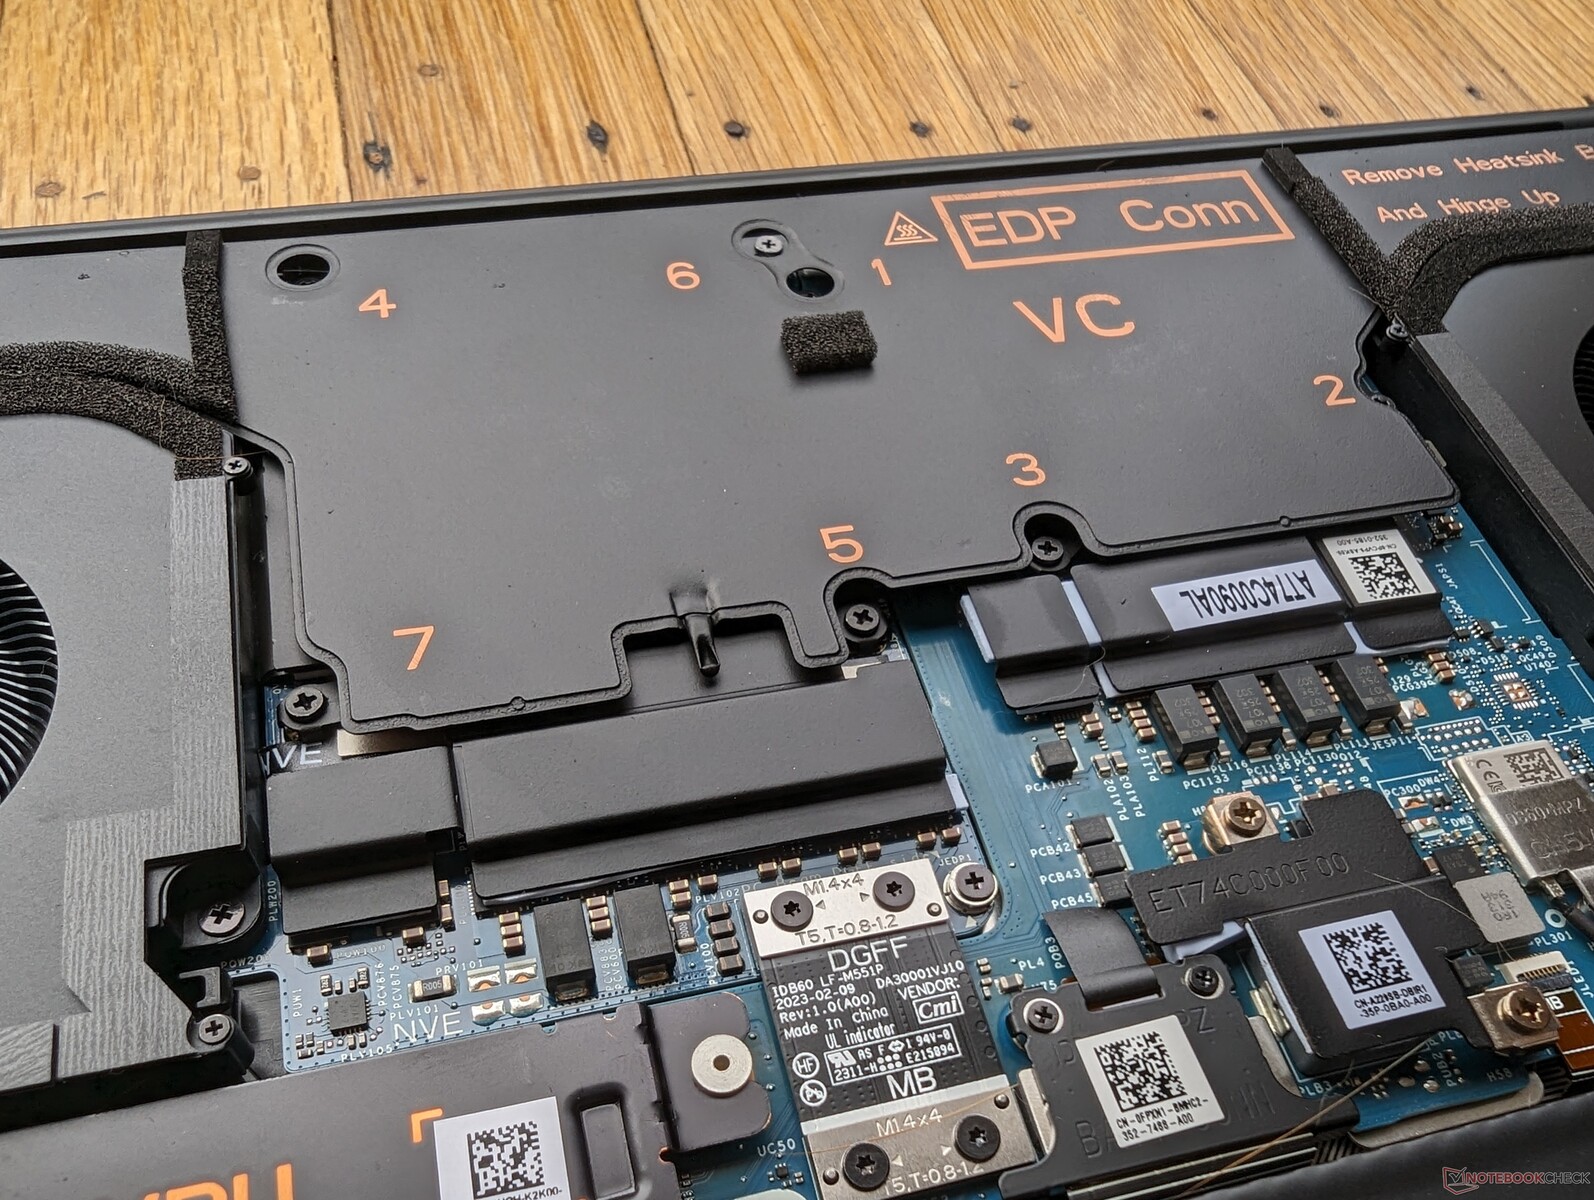
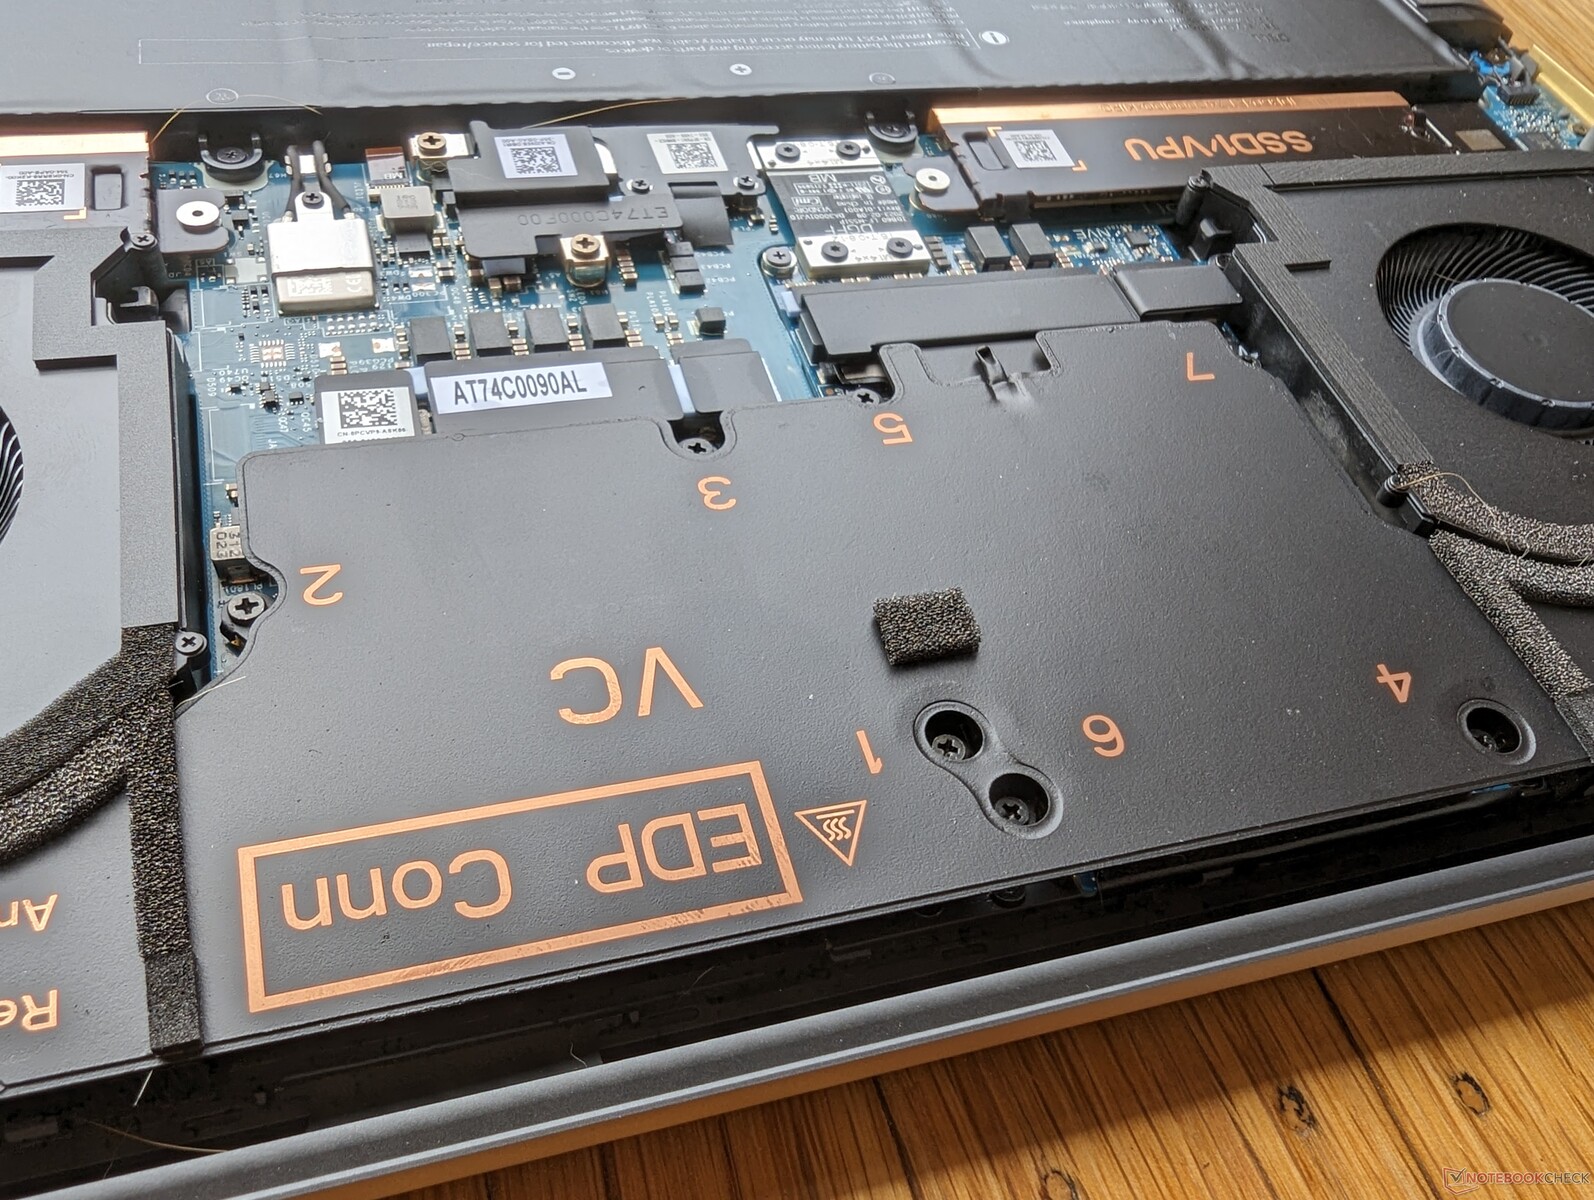
Storage Devices — Up To Two PCIe4 x4 NVMe SSDs
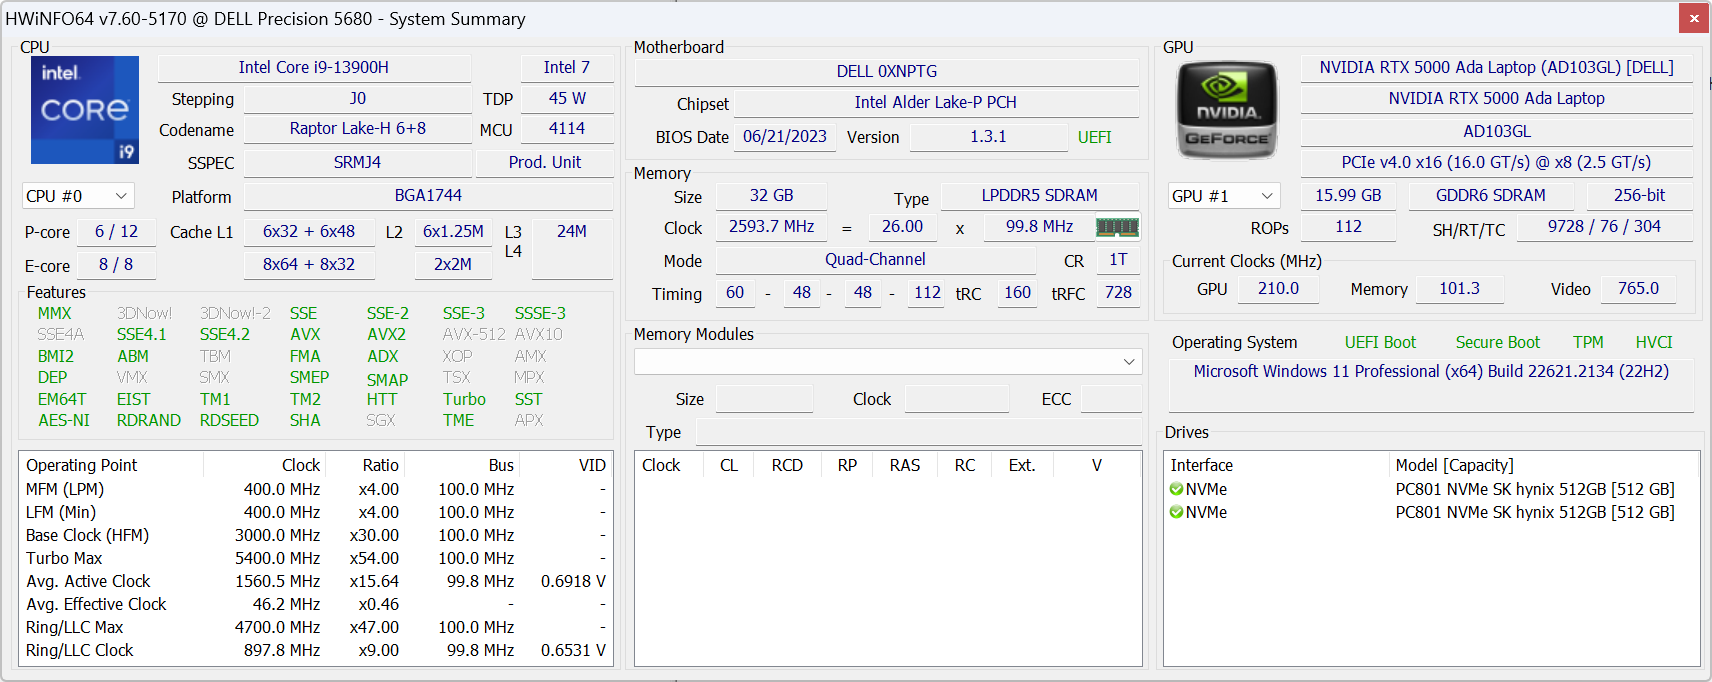
Our test unit ships with the same SK hynix PC801 PCIe4 x4 NVMe SSDs in RAID 0 configuration as found on the Precision 7670 series. While PCIe5 support like in certain gaming laptops would have been nice to see, it's not an important feature at the moment given how rare PCIe5 SSDs still are. Dell offers self-encrypting SSD options for additional security.
Each M.2 SSD slot comes with a copper heat spreader as shown below to aid in cooling. Each drive in our unit would have no issues maintaining high transfer rates of ~5400 MB/s over long periods to show no major throttling issues.

* ... smaller is better
Disk Throttling: DiskSpd Read Loop, Queue Depth 8
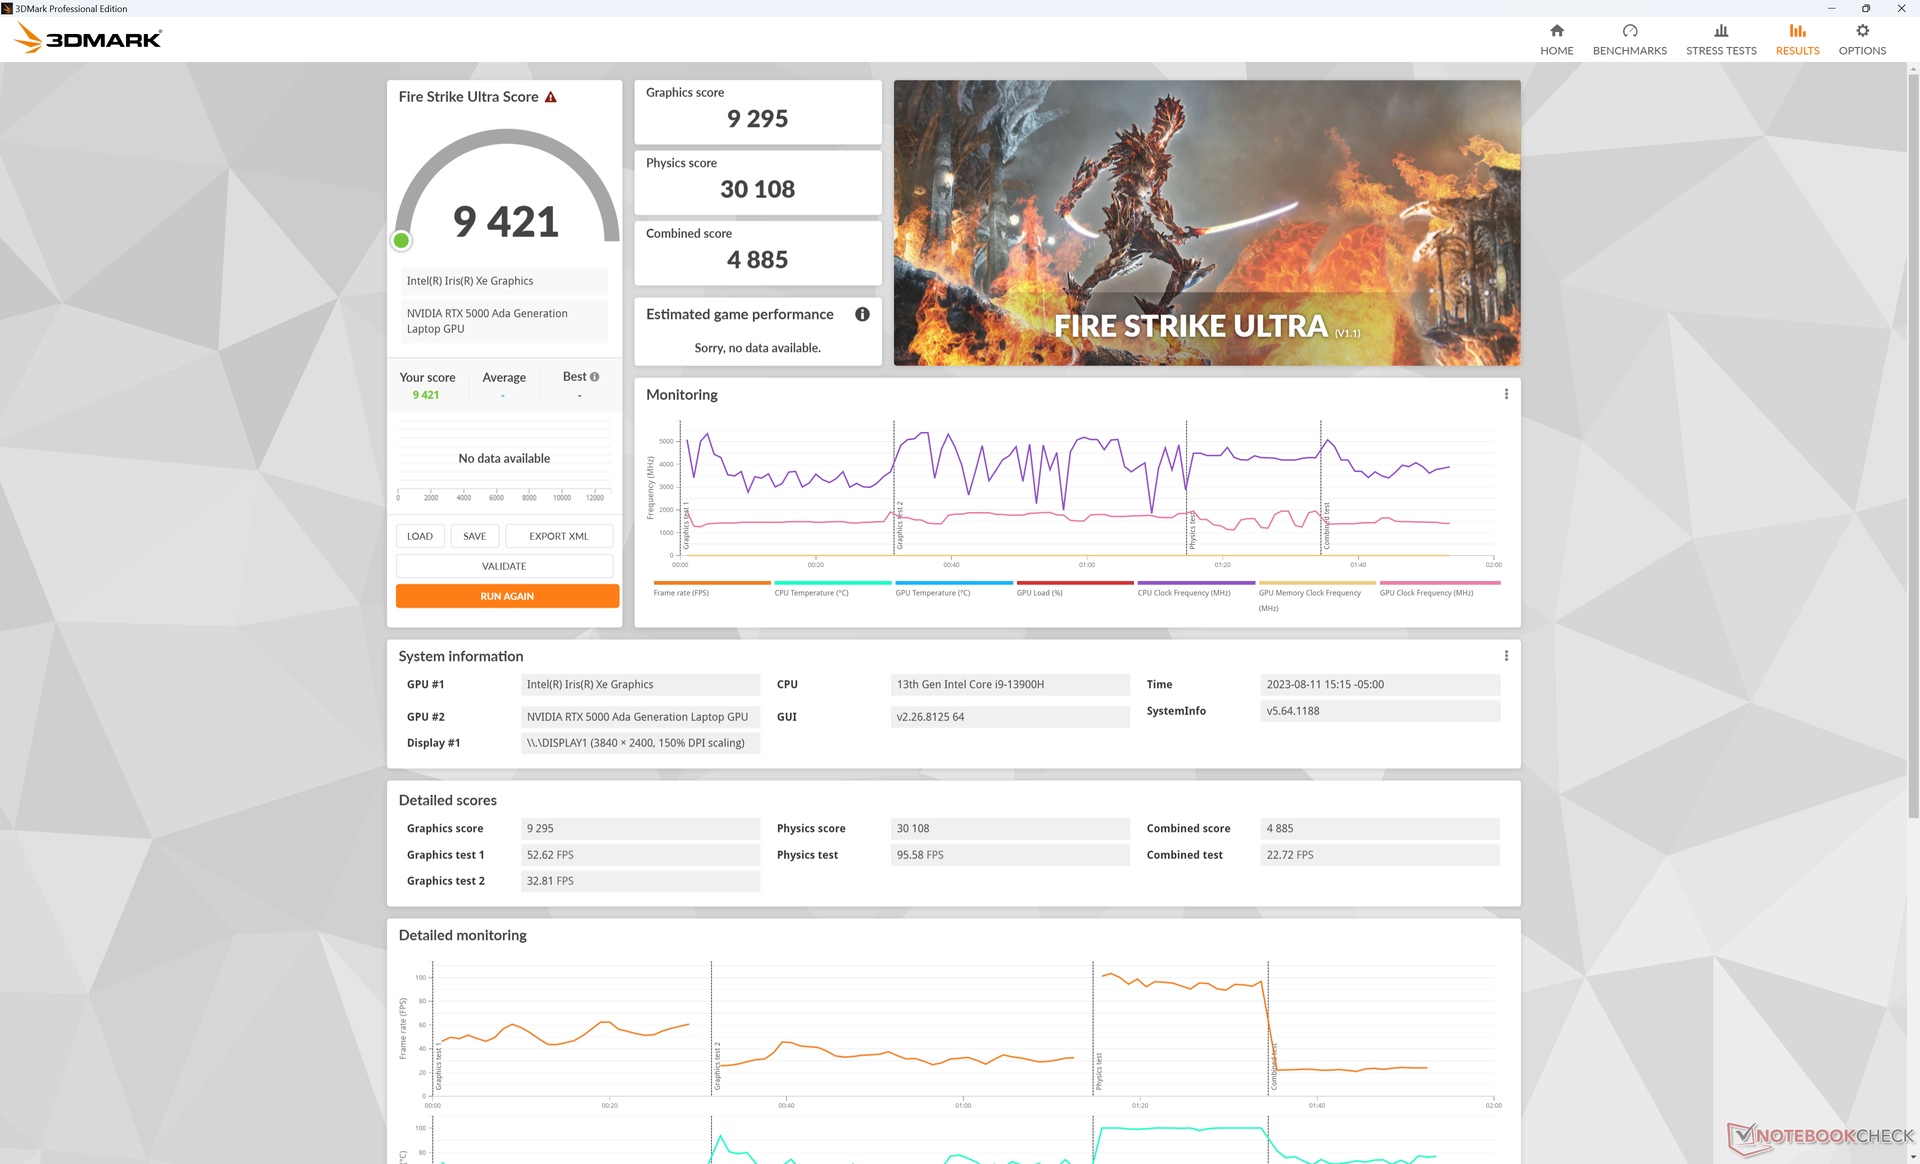
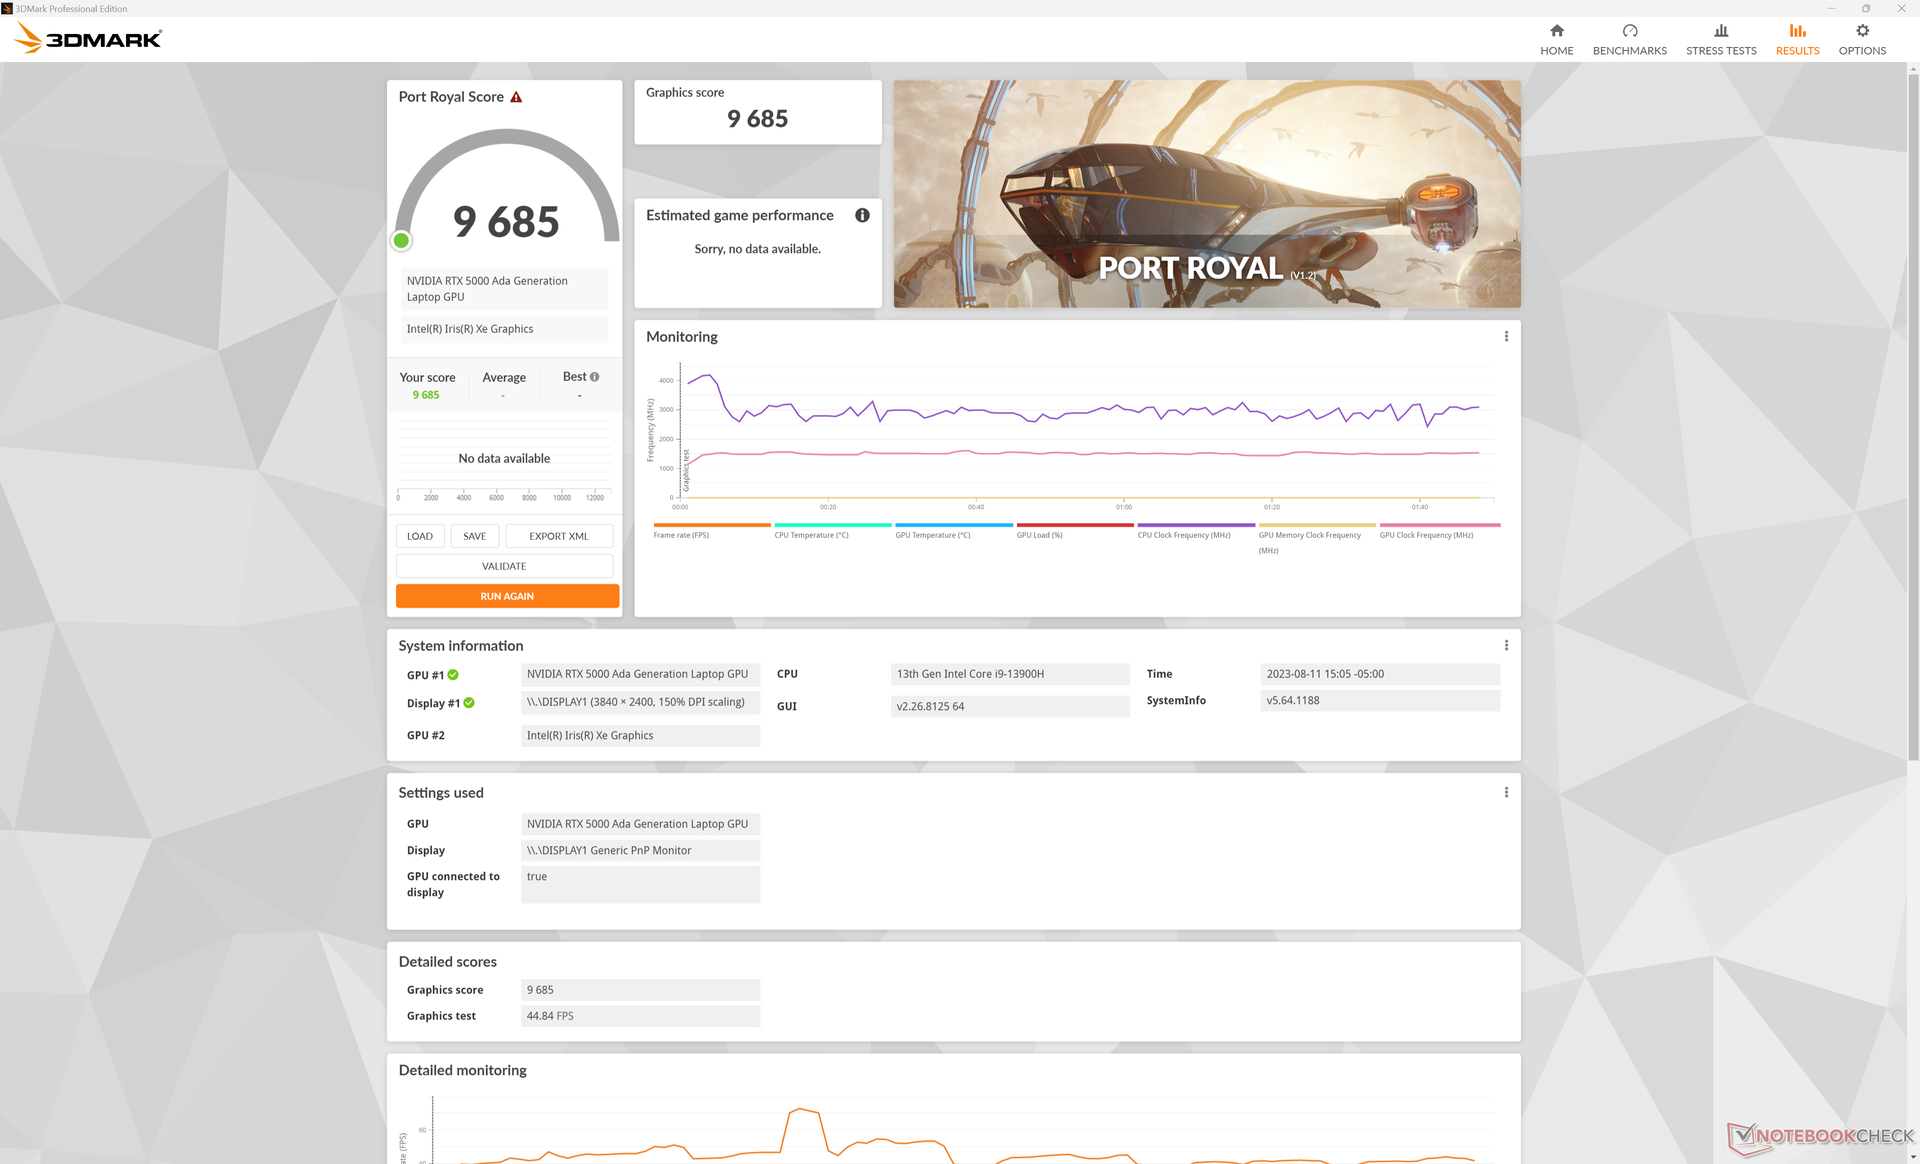
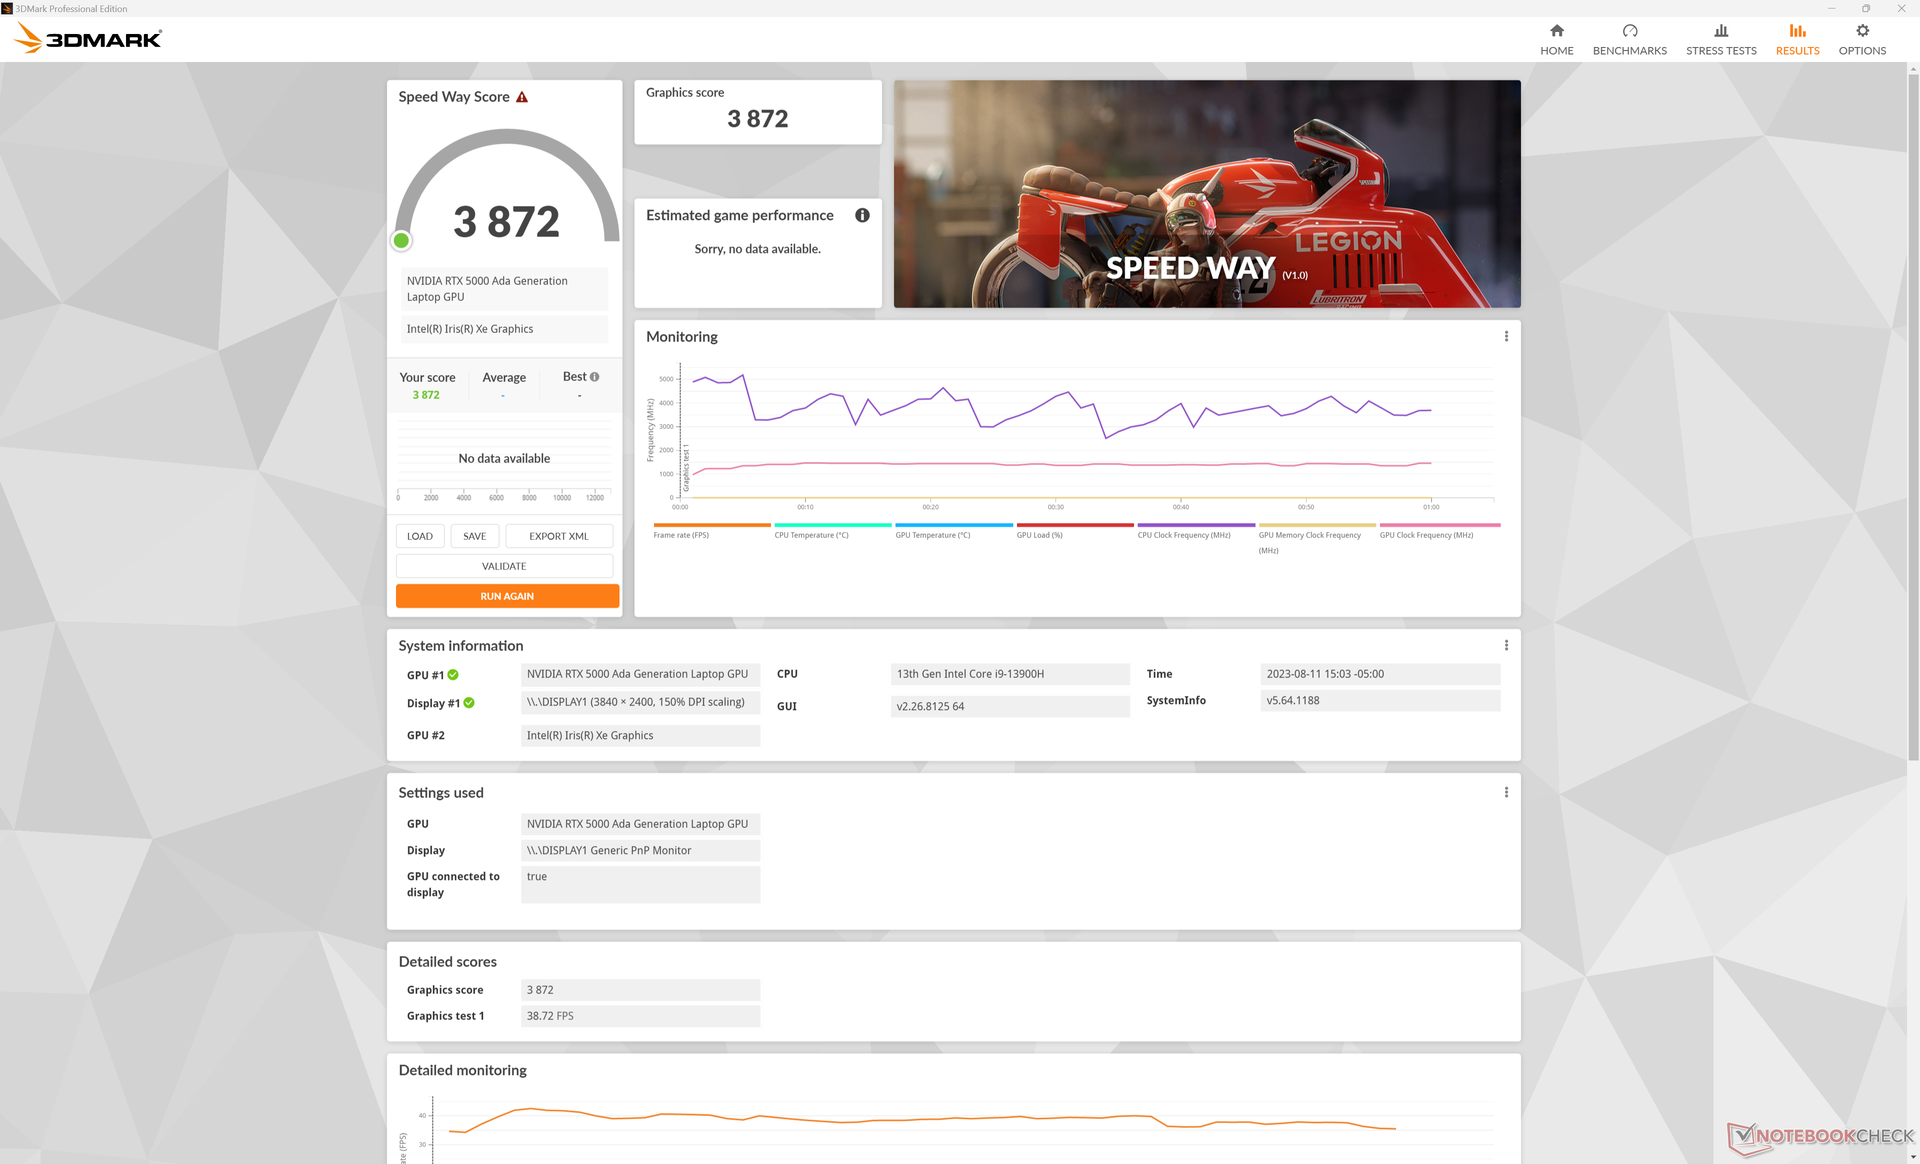
GPU Performance — 70 W Nvidia Ada Lovelace
The new RTX 5000 offers notable performance advantages over last year's RTX A5000 and A5500 especially in DX12 applications and Blender CUDA acceleration. Time Spy, for example, would score 30 to 40 percent higher on our Precision than on the MSI WE76 or Lenovo ThinkPad P16 G1 each running on older Ampere GPUs. The advantages extend into most Specviewperf subtests as well.
Enabling ECC VRAM mode does not appear to impact memory clock rates, but the maximum available VRAM would decrease from 16384 MB to 15360 MB according to GPU-Z.
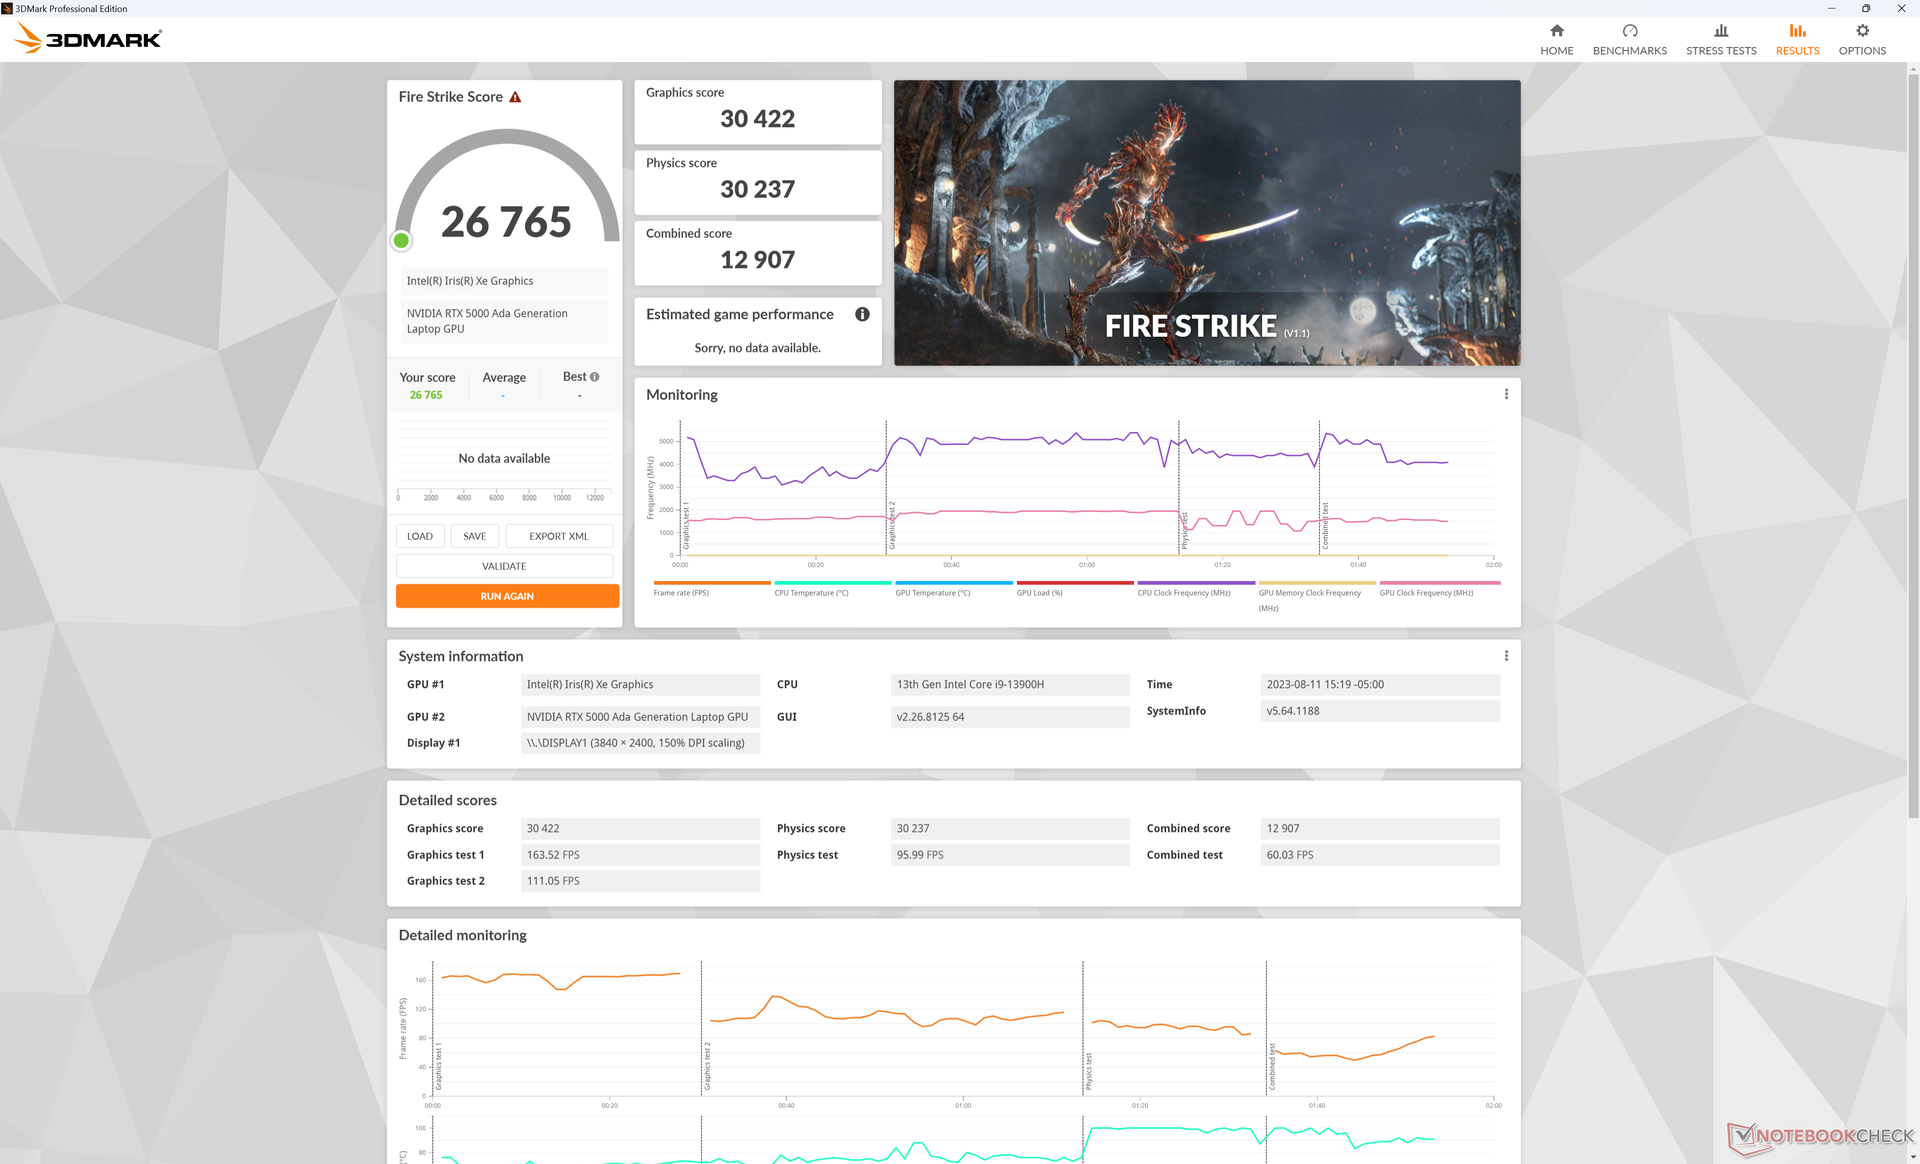
Note that there is no major impact to GPU performance when moving from Performance mode to Balanced mode as shown by the Fire Strike results below. Instead, CPU performance would take a noticeable hit.
| Power Profile | Physics Score | Graphics Score | Combined Score |
| Battery Power | 20938 (-31%) | 27514 (-10%) | 8910 (-31%) |
| Balanced Mode | 24828 (-18%) | 30588 (-0%) | 11365 (-12%) |
| Performance Mode | 30237 | 30422 | 12907 |
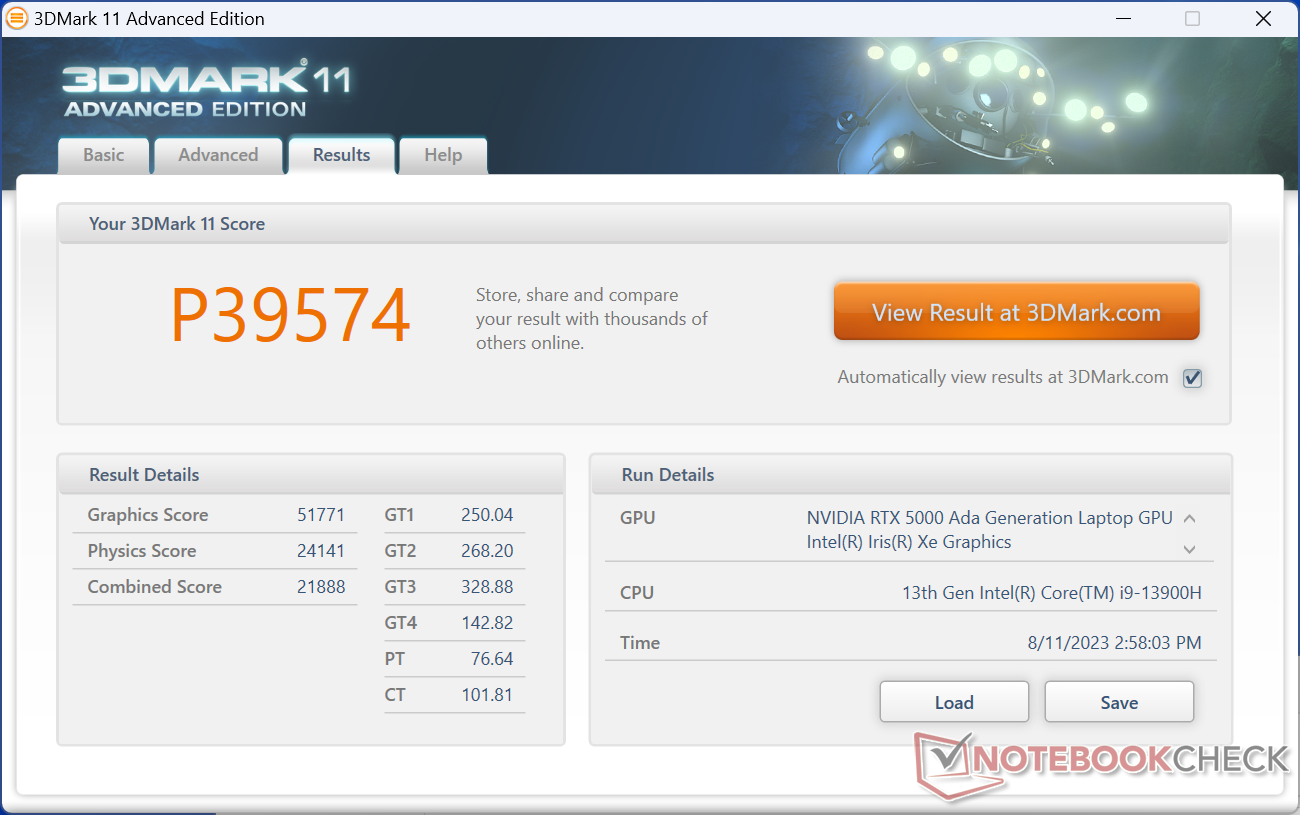
| 3DMark 11 Performance | 39574 points | |
| 3DMark Fire Strike Score | 26765 points | |
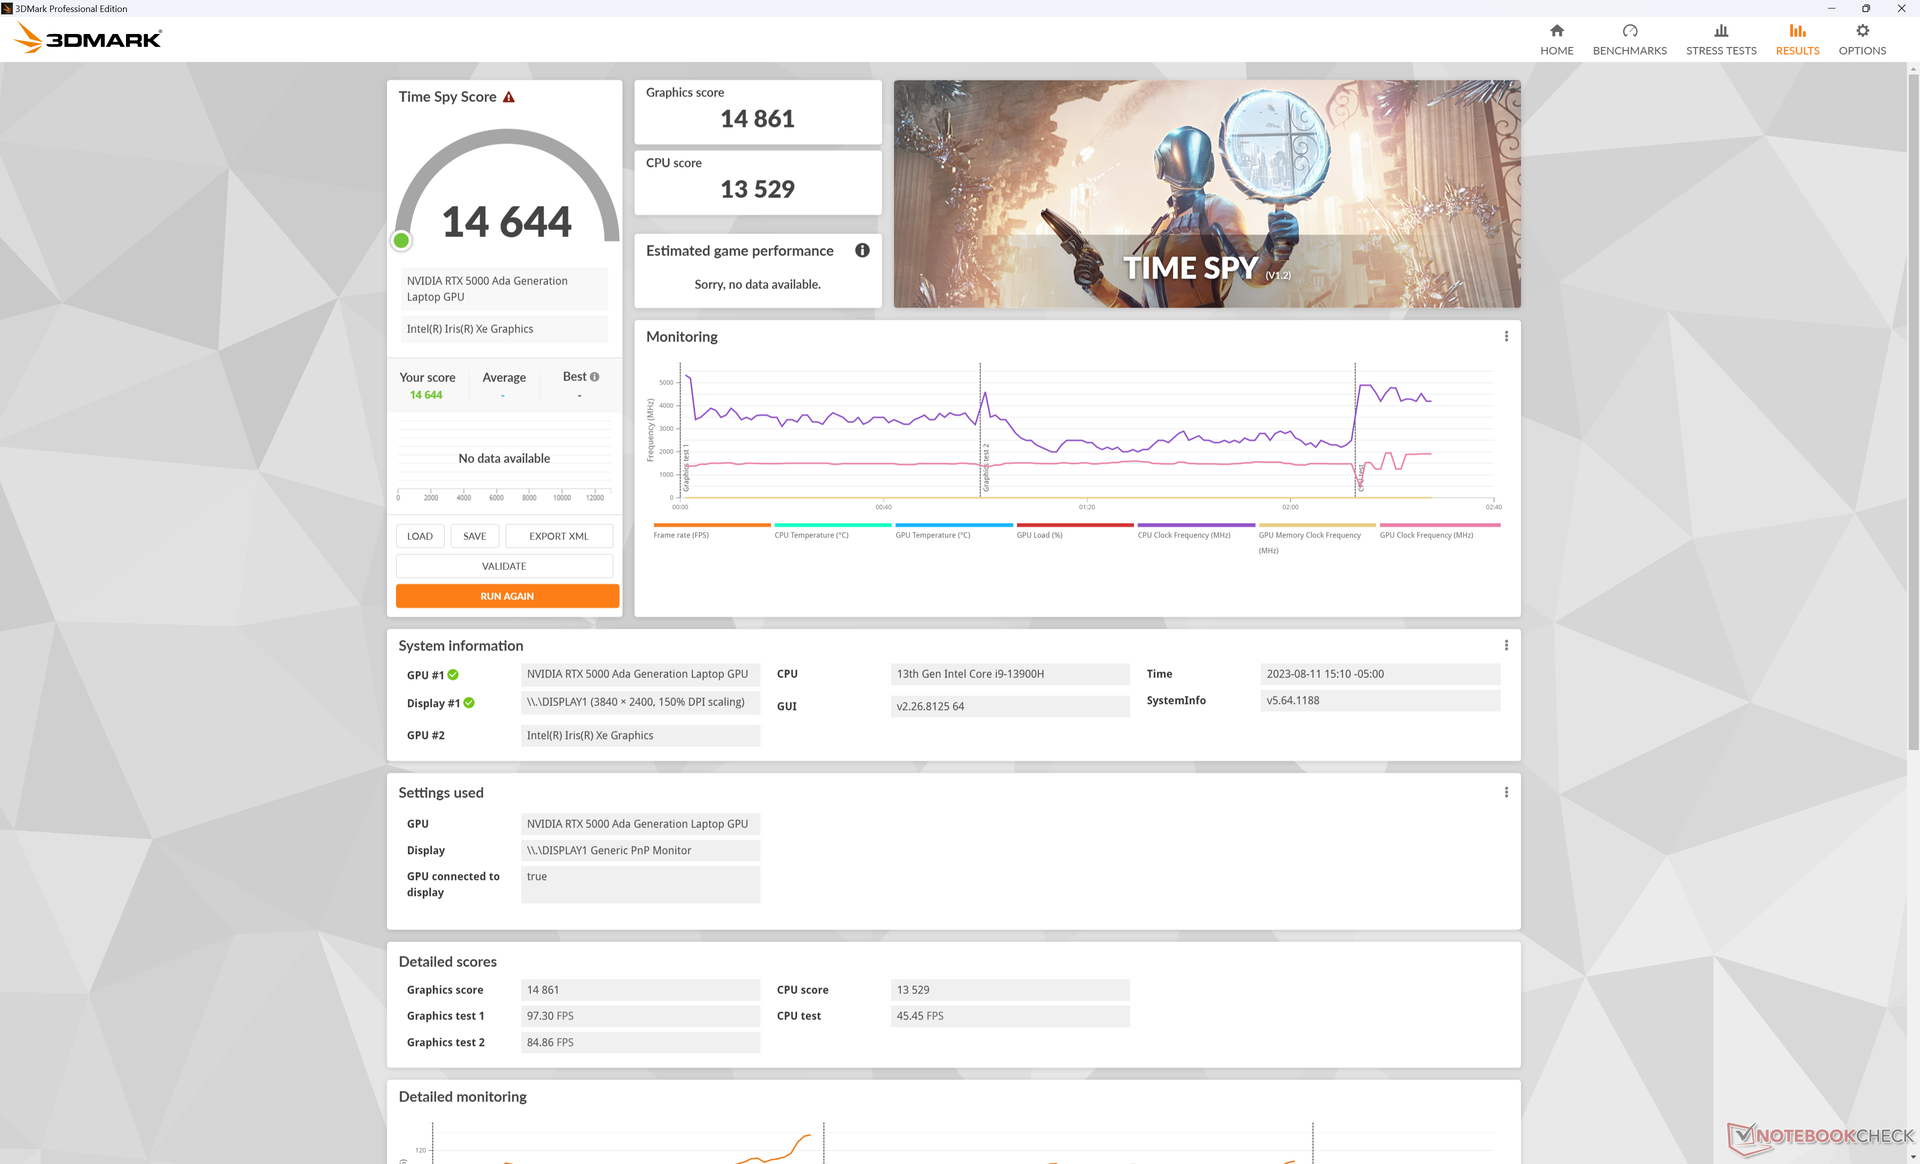
| 3DMark Time Spy Score | 14644 points | |
Help | ||
* ... smaller is better
Gaming Performance
While not a gaming laptop, the Precision 5680 is still wholly capable of playing the latest demanding titles with no compatibility issues during testing. Overall gaming performance lies in between the mobile GeForce RTX 4060 and mobile RTX 4070 as found on dedicated gaming laptops like the HP Omen Transcend 16.
Witcher 3 FPS Chart
| low | med. | high | ultra | QHD | 4K | |
|---|---|---|---|---|---|---|
| GTA V (2015) | 185.4 | 179.7 | 175.3 | 117.1 | 106.6 | 108 |
| The Witcher 3 (2015) | 412.7 | 329.6 | 256 | 137 | 97 | |
| Dota 2 Reborn (2015) | 178 | 161.7 | 154 | 144 | 142.5 | |
| Final Fantasy XV Benchmark (2018) | 196.3 | 165.6 | 127.4 | 100.8 | 60.4 | |
| X-Plane 11.11 (2018) | 155.3 | 133 | 102.4 | 86.2 | ||
| Far Cry 5 (2018) | 145 | 132 | 129 | 132 | 114 | 70 |
| Cyberpunk 2077 1.6 (2022) | 124.9 | 122.7 | 107.7 | 100 | 66.2 | 32.2 |
| Tiny Tina's Wonderlands (2022) | 220 | 202.3 | 152.6 | 125 | 90.1 | 50.9 |
| F1 22 (2022) | 232 | 218 | 202 | 84.5 | 56.1 | 28.8 |
| Returnal (2023) | 98 | 94 | 90 | 81 | 60 | 34 |
Emissions — Quiet Most Of The Time
System Noise
Noise levels are most similar to the Precision 5550 even though our Precision 5680 carries a significantly faster GPU. The fans tend to hover in the mid-to-high 20 dB(A) range when running undemanding loads like web browsers while more demanding loads would induce a steady noise of 51 dB(A).
Interestingly, the maximum fan noise level on Balanced mode is the same as on Performance mode.
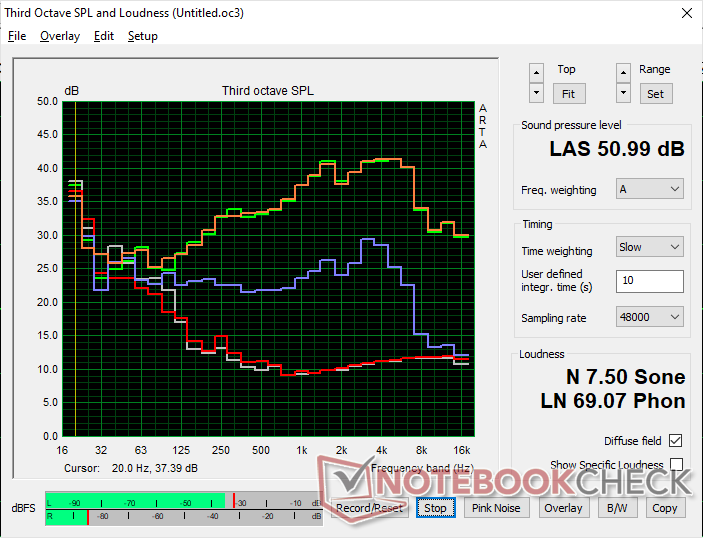
Noise level
| Idle |
| 23 / 23 / 23 dB(A) |
| Load |
| 37.2 / 51 dB(A) |
 | ||
30 dB silent 40 dB(A) audible 50 dB(A) loud |
||
min: | ||
| Dell Precision 5000 5680 RTX 5000 Ada Generation Laptop, i9-13900H, 2x SK hynix PC801 HFS512GEJ9X101N RAID 0 | Dell Precision 7000 7670 Performance RTX A5500 Laptop GPU, i9-12950HX | HP ZBook Fury 16 G9 RTX A5500 Laptop GPU, i9-12950HX, Micron 3400 1TB MTFDKBA1T0TFH | Lenovo ThinkPad P16 G1 RTX A5500 RTX A5500 Laptop GPU, i9-12950HX, WDC PC SN810 2TB | MSI CreatorPro Z16P B12UKST RTX A3000 Laptop GPU, i7-12700H, Samsung PM9A1 MZVL21T0HCLR | Asus ExpertBook B6 Flip B6602FC2 RTX A2000 Laptop GPU, i9-12950HX, Samsung PM9A1 MZVL21T0HCLR | |
|---|---|---|---|---|---|---|
| Noise | -11% | -2% | 3% | -8% | -30% | |
| off / environment * (dB) | 22.8 | 23.9 -5% | 22.6 1% | 23.1 -1% | 24.1 -6% | 26 -14% |
| Idle Minimum * (dB) | 23 | 24 -4% | 22.7 1% | 23.1 -0% | 27.1 -18% | 32.4 -41% |
| Idle Average * (dB) | 23 | 24 -4% | 22.7 1% | 23.1 -0% | 27.1 -18% | 32.4 -41% |
| Idle Maximum * (dB) | 23 | 38 -65% | 28.8 -25% | 23.1 -0% | 27.1 -18% | 32.4 -41% |
| Load Average * (dB) | 37.2 | 46.3 -24% | 36.2 3% | 28.9 22% | 42.9 -15% | 51.9 -40% |
| Witcher 3 ultra * (dB) | 51 | 41.9 18% | 49.5 3% | 51.6 -1% | 44 14% | |
| Load Maximum * (dB) | 51 | 47.9 6% | 49.3 3% | 51.4 -1% | 47 8% | 52.1 -2% |
* ... smaller is better
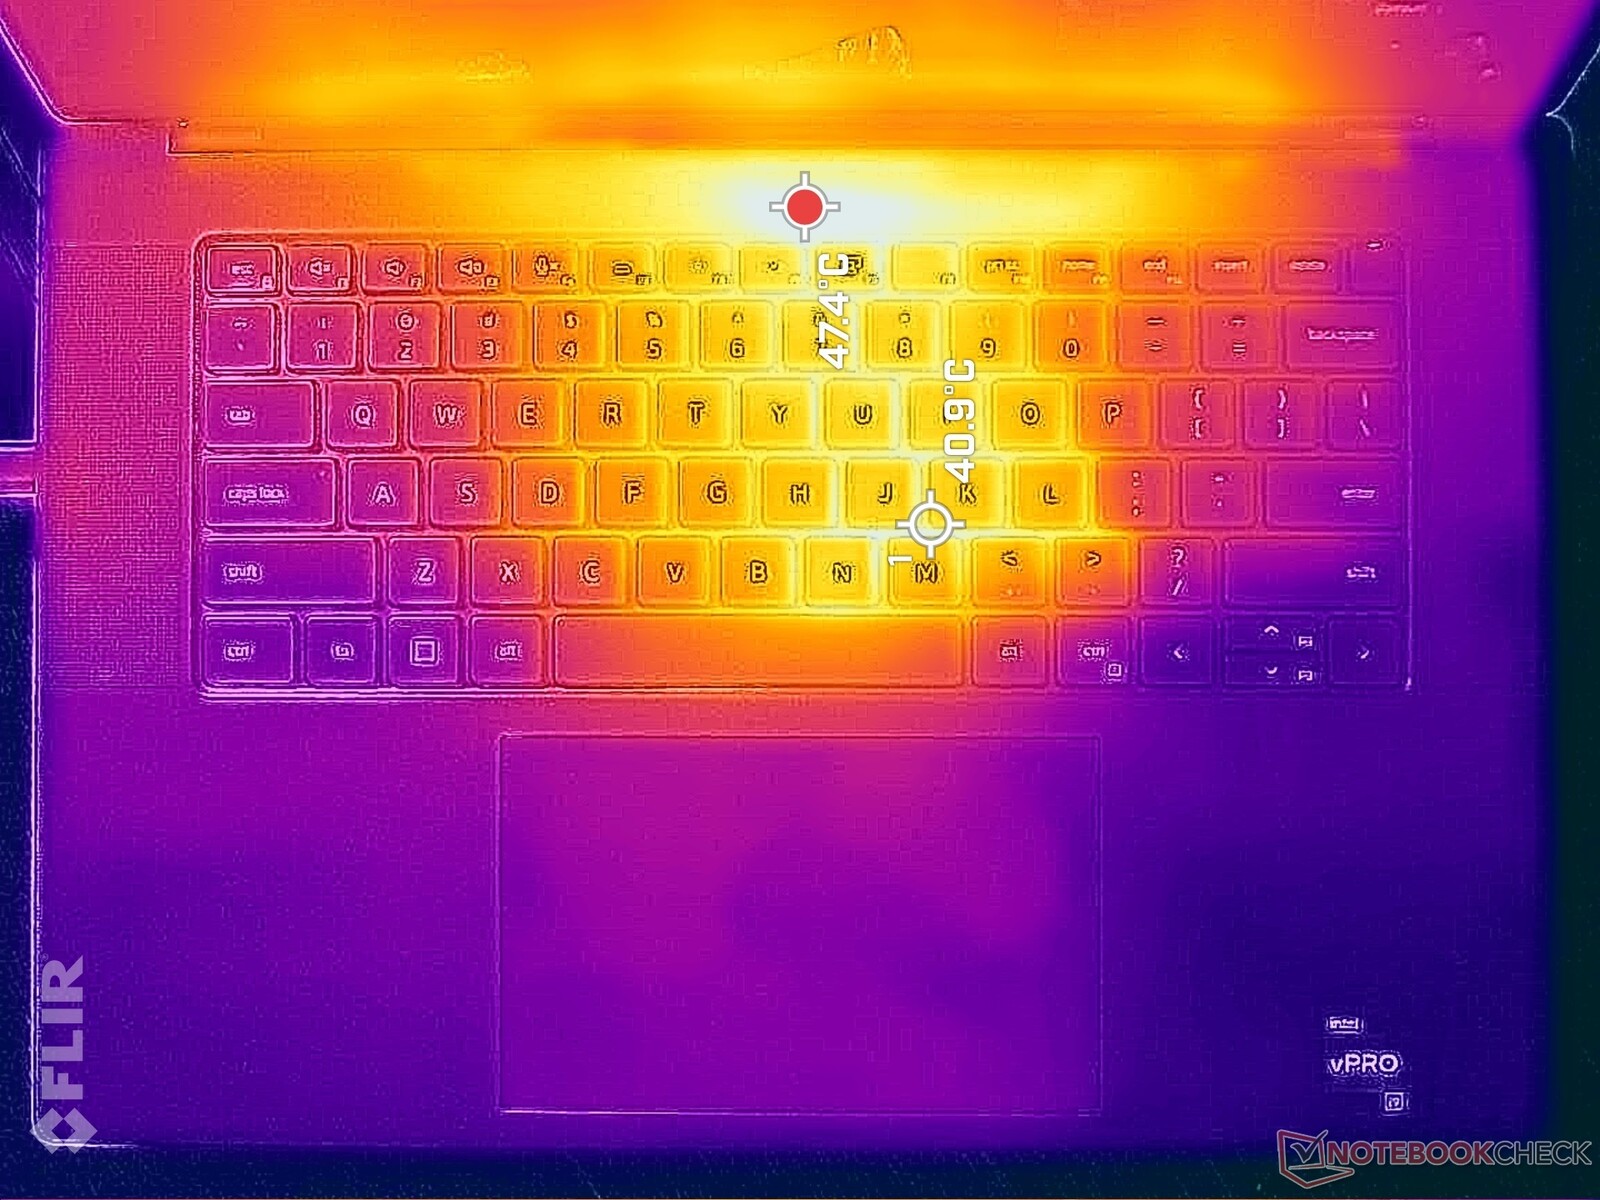
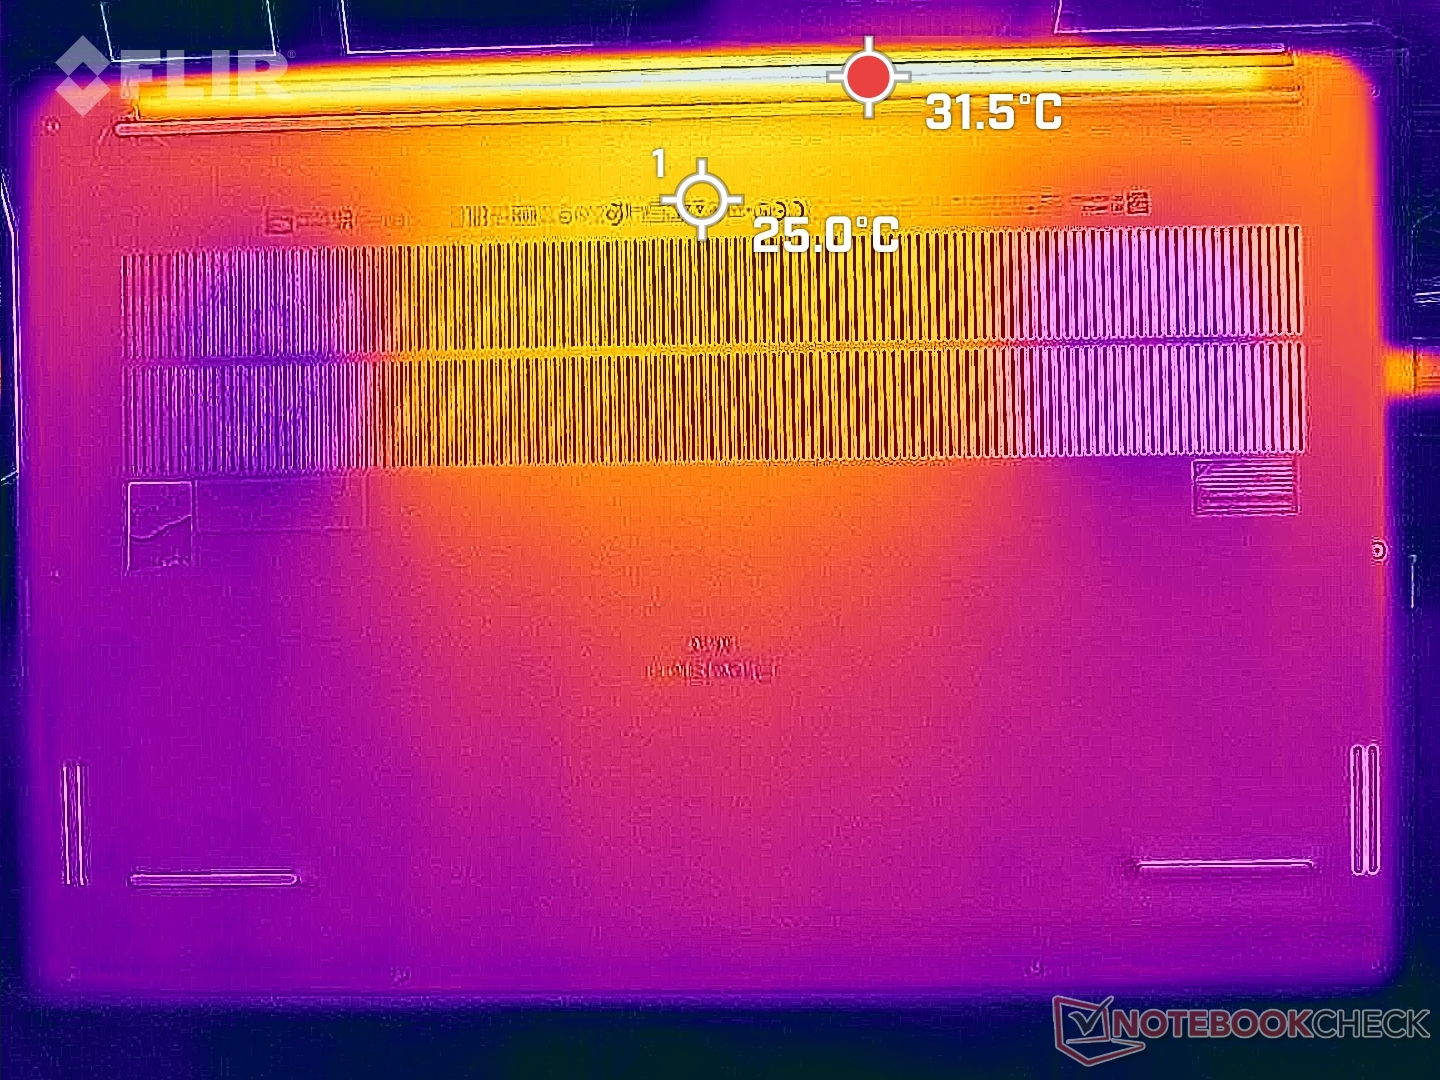
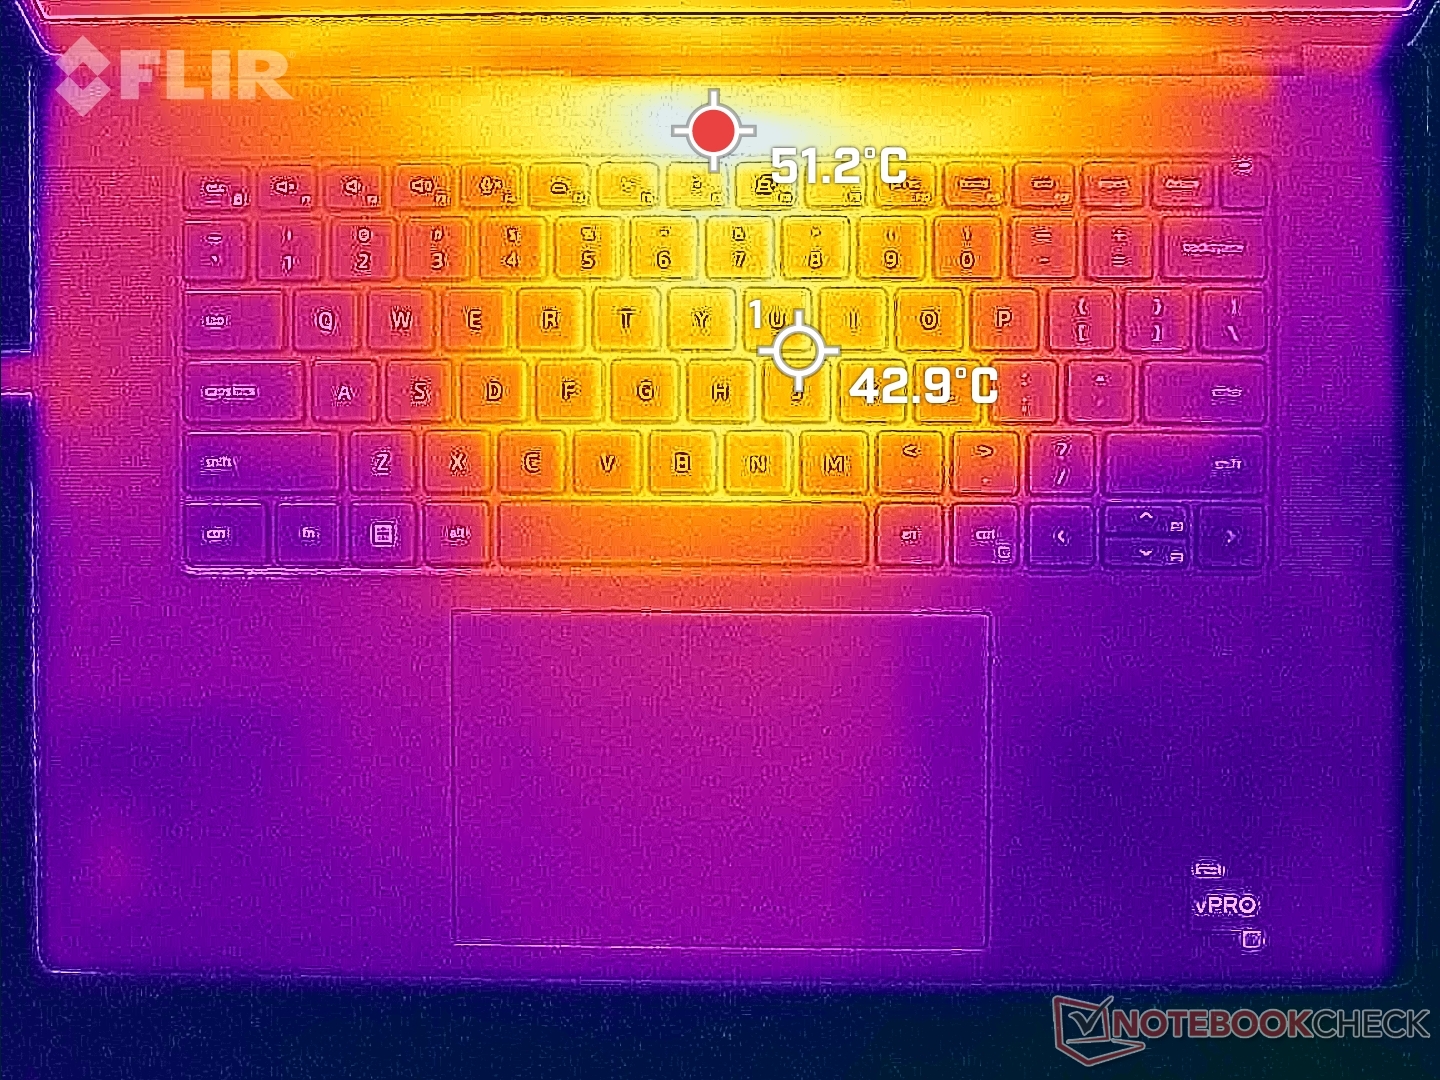
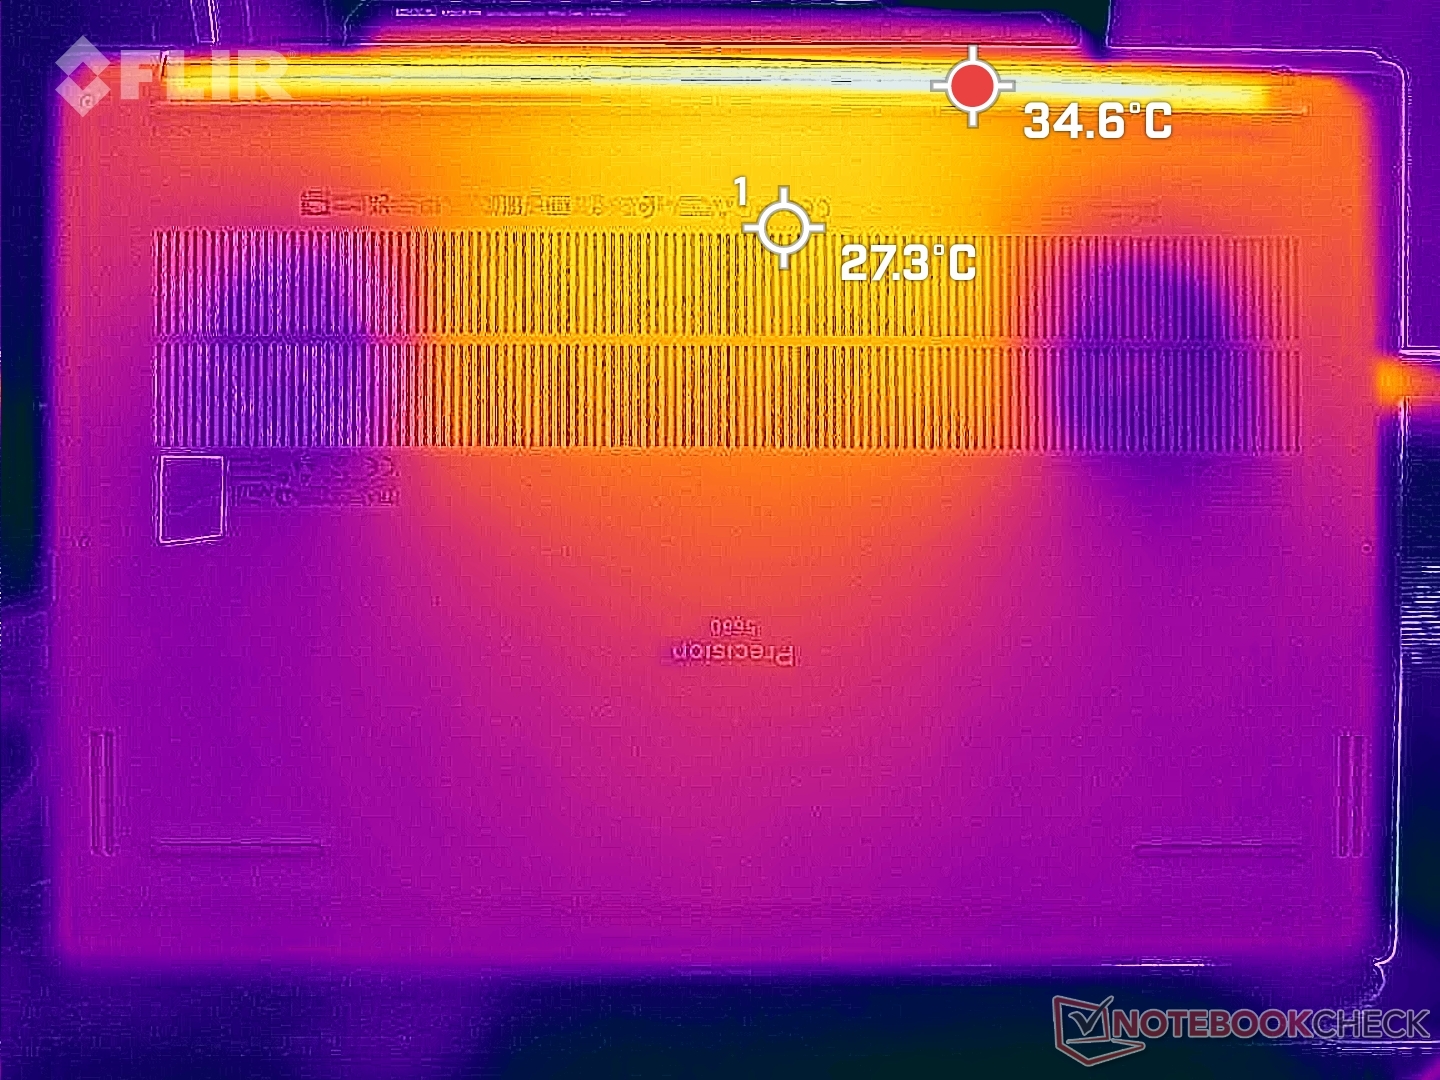
Temperature
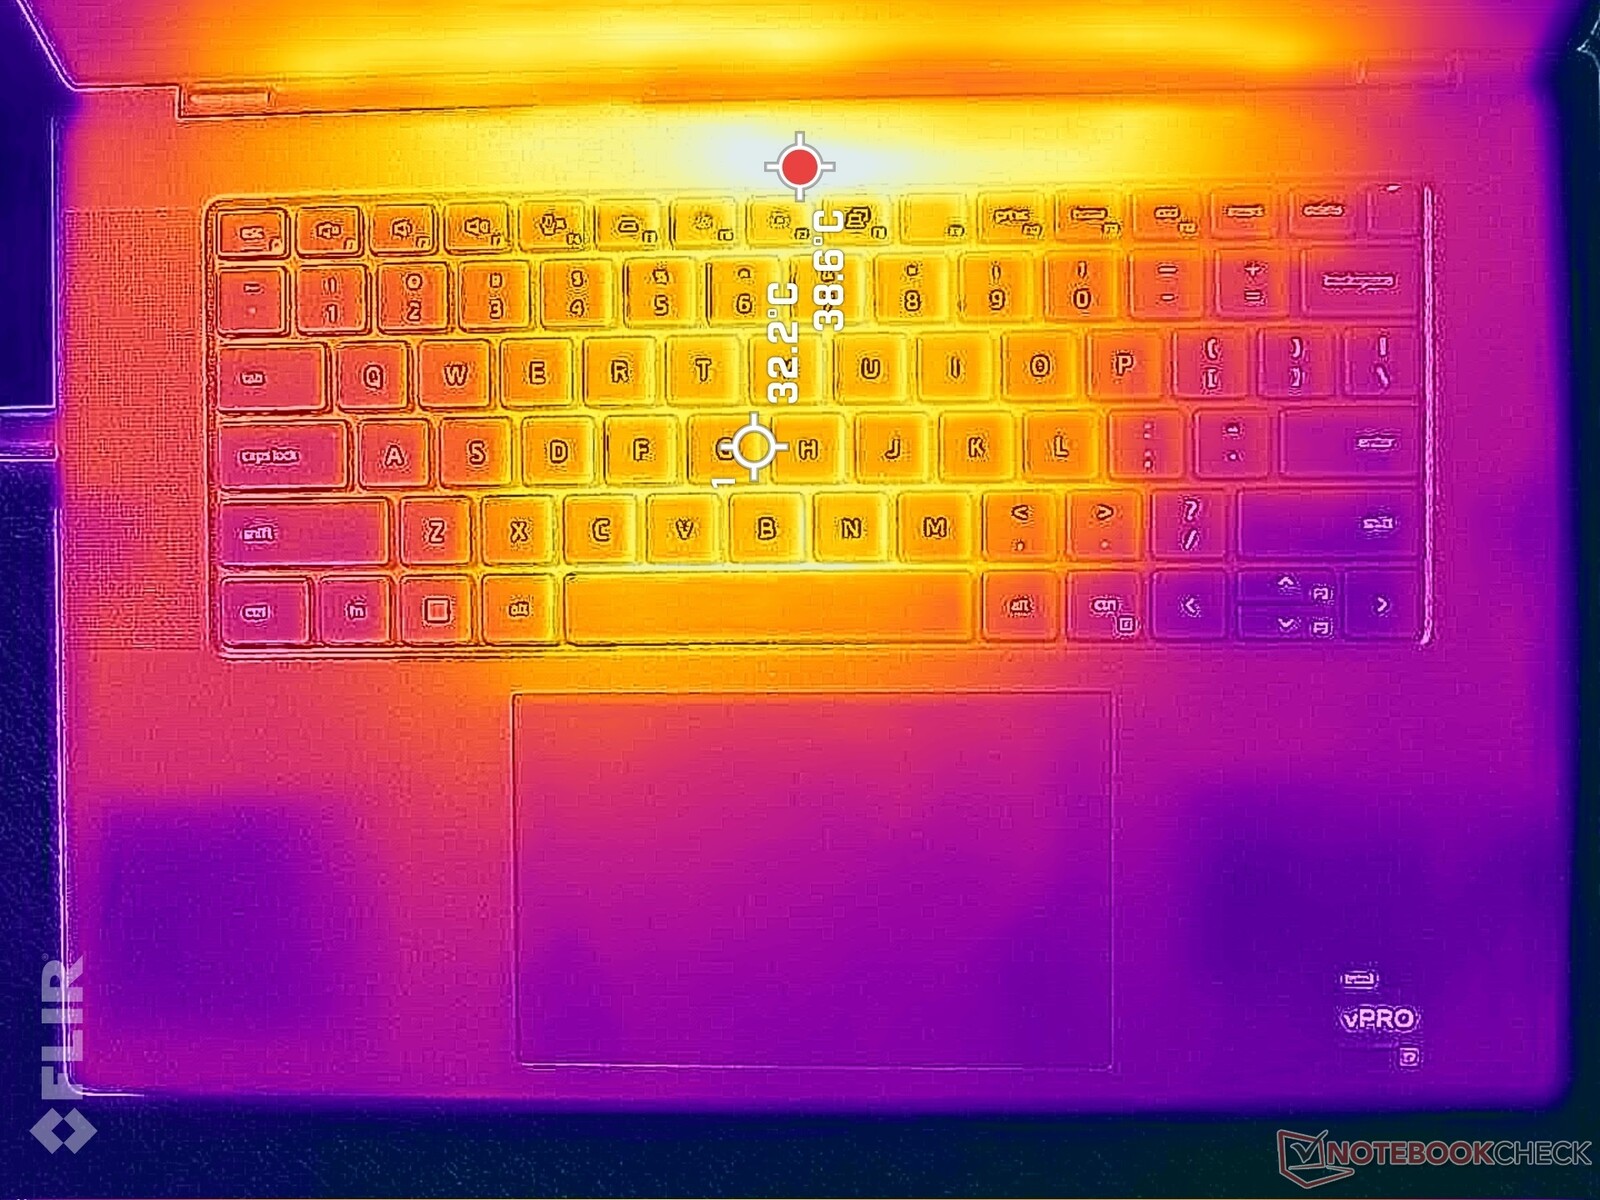
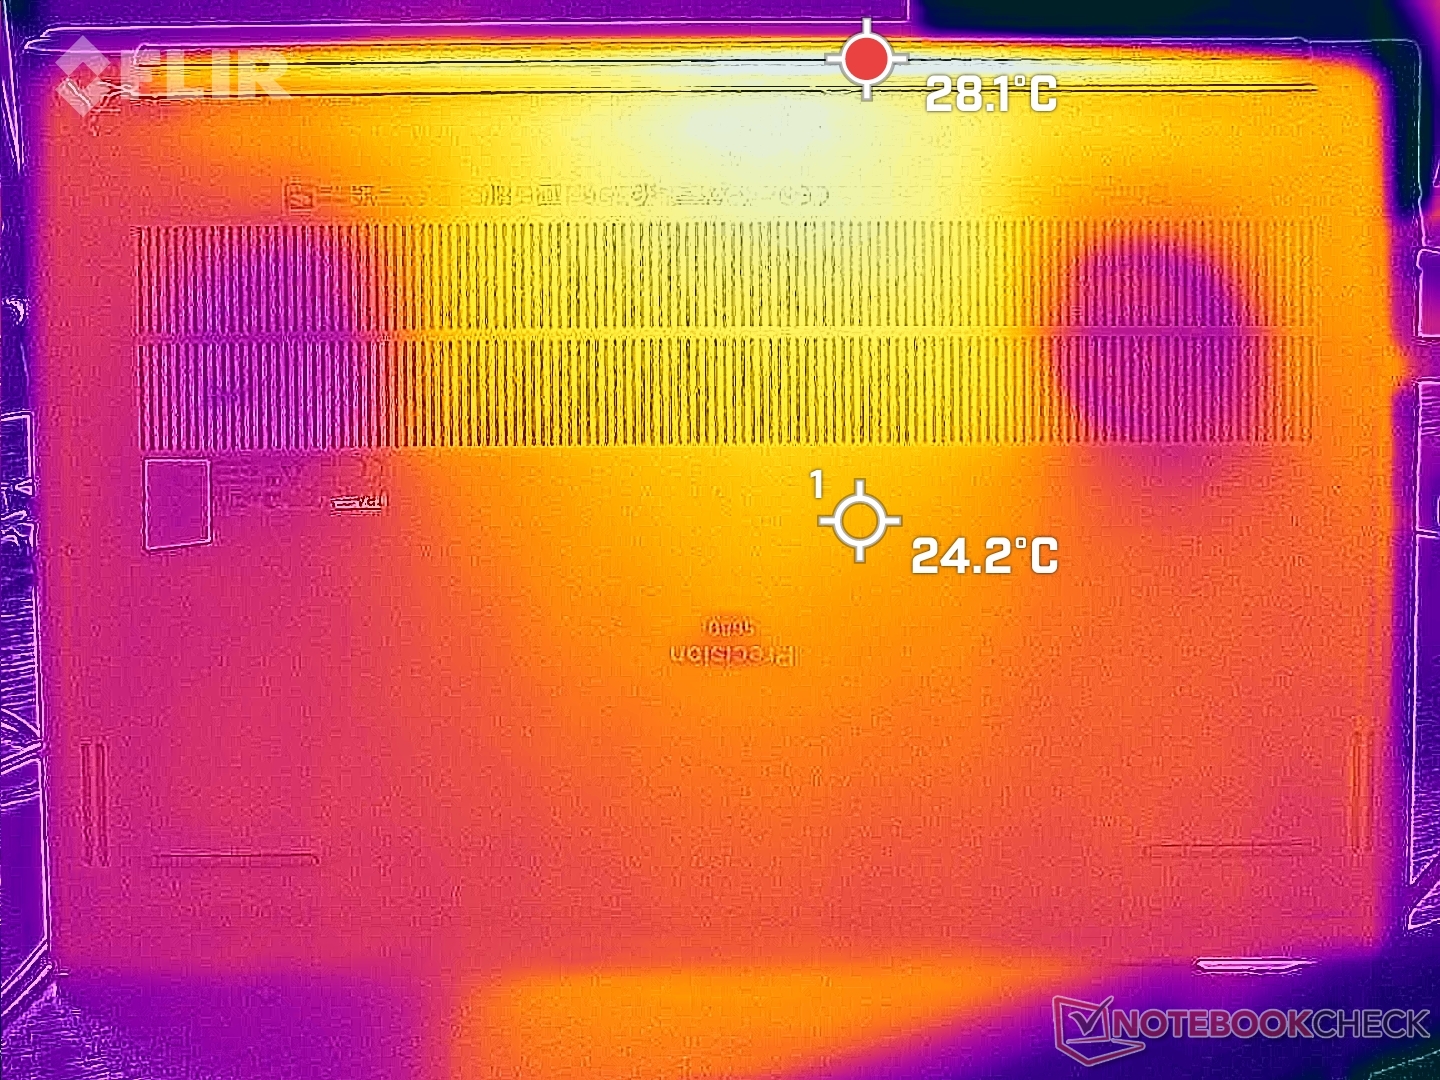
Surface temperatures when idling are warmer than expected since the fans tend to idle until needed. Hot spots can be as warm as 37 C and 32 C on the top and bottom sides, respectively, compared to under 30 C on the ExpertBook B6 Flip.
When running more demanding loads, the keyboard center can reach over 50 C while the bottom surface would barely warm up at all due in part to the Gore insulators. Fingers and palms only touch the keyboard center infrequently and so the warm hot spots generally do not impact comfort.
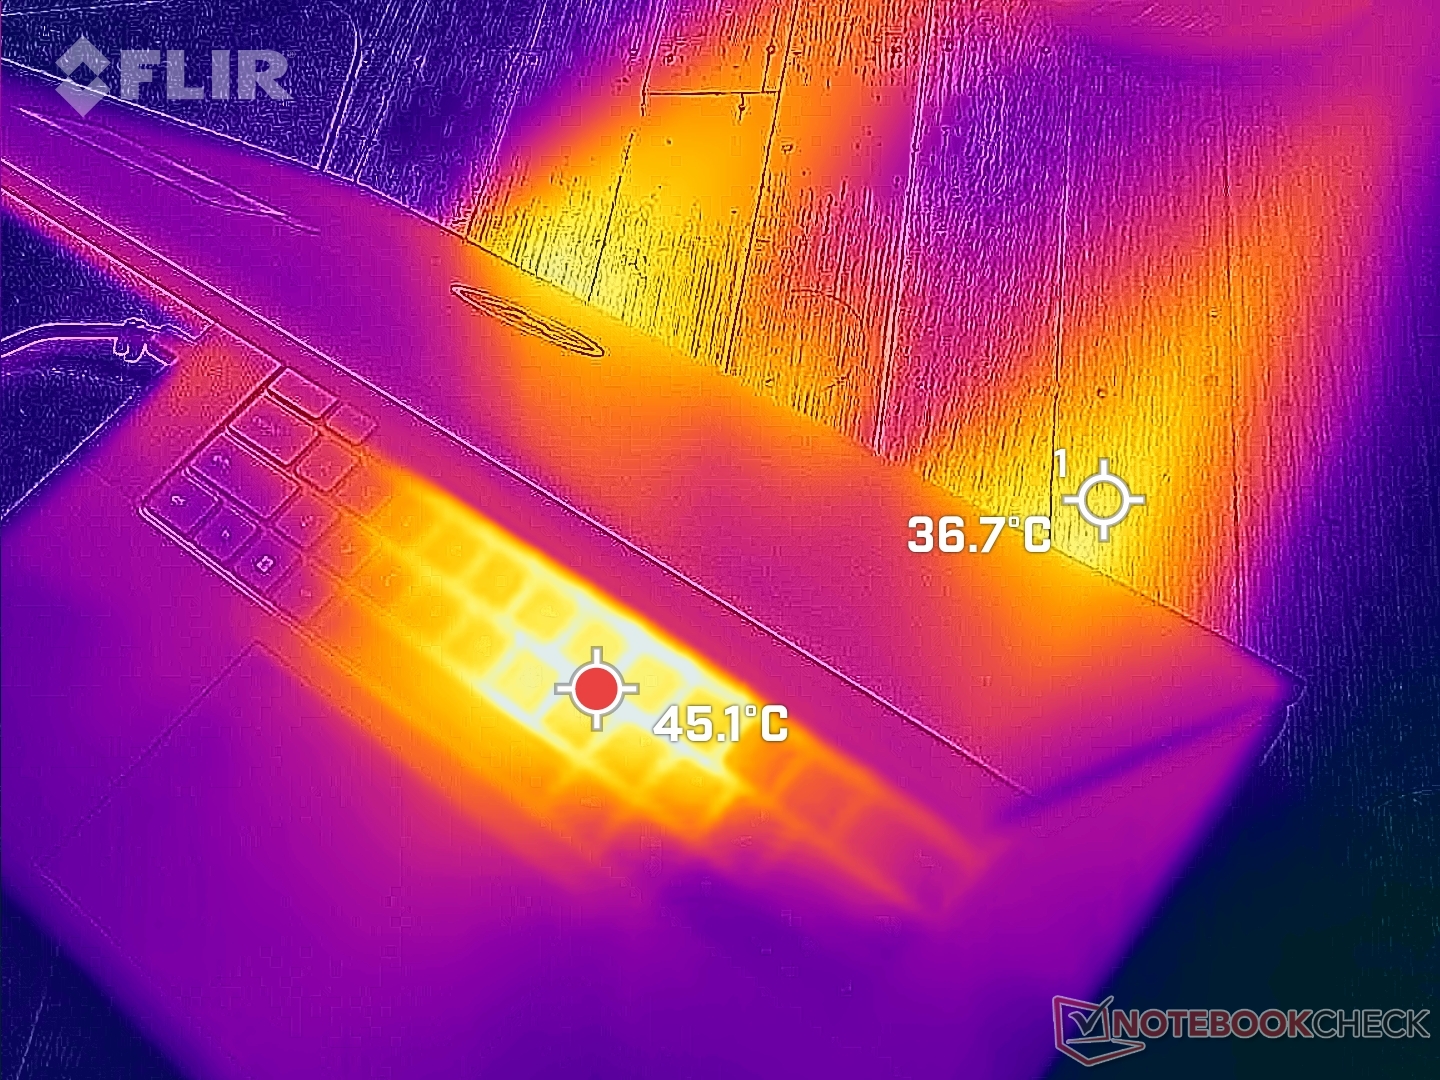
(-) The maximum temperature on the upper side is 50.2 °C / 122 F, compared to the average of 38.2 °C / 101 F, ranging from 22.2 to 69.8 °C for the class Workstation.
(+) The bottom heats up to a maximum of 32 °C / 90 F, compared to the average of 41.1 °C / 106 F
(+) In idle usage, the average temperature for the upper side is 30.1 °C / 86 F, compared to the device average of 32 °C / 90 F.
(±) Playing The Witcher 3, the average temperature for the upper side is 34.6 °C / 94 F, compared to the device average of 32 °C / 90 F.
(+) The palmrests and touchpad are cooler than skin temperature with a maximum of 27.6 °C / 81.7 F and are therefore cool to the touch.
(±) The average temperature of the palmrest area of similar devices was 27.8 °C / 82 F (+0.2 °C / 0.3 F).
| Dell Precision 5000 5680 Intel Core i9-13900H, NVIDIA RTX 5000 Ada Generation Laptop | Dell Precision 7000 7670 Performance Intel Core i9-12950HX, NVIDIA RTX A5500 Laptop GPU | HP ZBook Fury 16 G9 Intel Core i9-12950HX, NVIDIA RTX A5500 Laptop GPU | Lenovo ThinkPad P16 G1 RTX A5500 Intel Core i9-12950HX, NVIDIA RTX A5500 Laptop GPU | MSI CreatorPro Z16P B12UKST Intel Core i7-12700H, NVIDIA RTX A3000 Laptop GPU | Asus ExpertBook B6 Flip B6602FC2 Intel Core i9-12950HX, NVIDIA RTX A2000 Laptop GPU | |
|---|---|---|---|---|---|---|
| Heat | -12% | -3% | -13% | -19% | -8% | |
| Maximum Upper Side * (°C) | 50.2 | 53 -6% | 43.2 14% | 44.8 11% | 56.3 -12% | 48.4 4% |
| Maximum Bottom * (°C) | 32 | 43.2 -35% | 50.4 -58% | 49.8 -56% | 68.3 -113% | 52.3 -63% |
| Idle Upper Side * (°C) | 37.4 | 36.8 2% | 28.6 24% | 30.6 18% | 25.2 33% | 27.8 26% |
| Idle Bottom * (°C) | 31.2 | 33.8 -8% | 28.2 10% | 38.6 -24% | 25.9 17% | 30.3 3% |
* ... smaller is better
Stress Test
When running Prime95 stress, the CPU would boost to 3.9 GHz, 117 W, and 100 C lasting for only about 15 seconds. Thereafter, Turbo Boost potential would drop and then stabilize at around 2.8 GHz and 56 W for a more reasonable core temperature of 75 C. Maximum Turbo Boost is therefore not sustainable on the Precision 5680 even when set to Performance mode.
Running on Balanced mode instead of Performance mode does not negatively impact GPU performance as mentioned above. GPU clock, temperature, and power draw when running Witcher 3 on Performance mode would stabilize at 1560 MHz, 72 C, and 63 W, respectively, compared to 1665 MHz, 65 C, and 69 W when on Balanced mode. The biggest difference between Balanced and Performance modes appears to be CPU temperature which can be as warm as 100+ C on Performance mode for higher Turbo Boost potential compared to just ~80 C on Balanced mode.
Note that we're only able to reach a maximum GPU board power draw of 75 W even though the target TGP is 95 W according to Nvidia Control Panel.
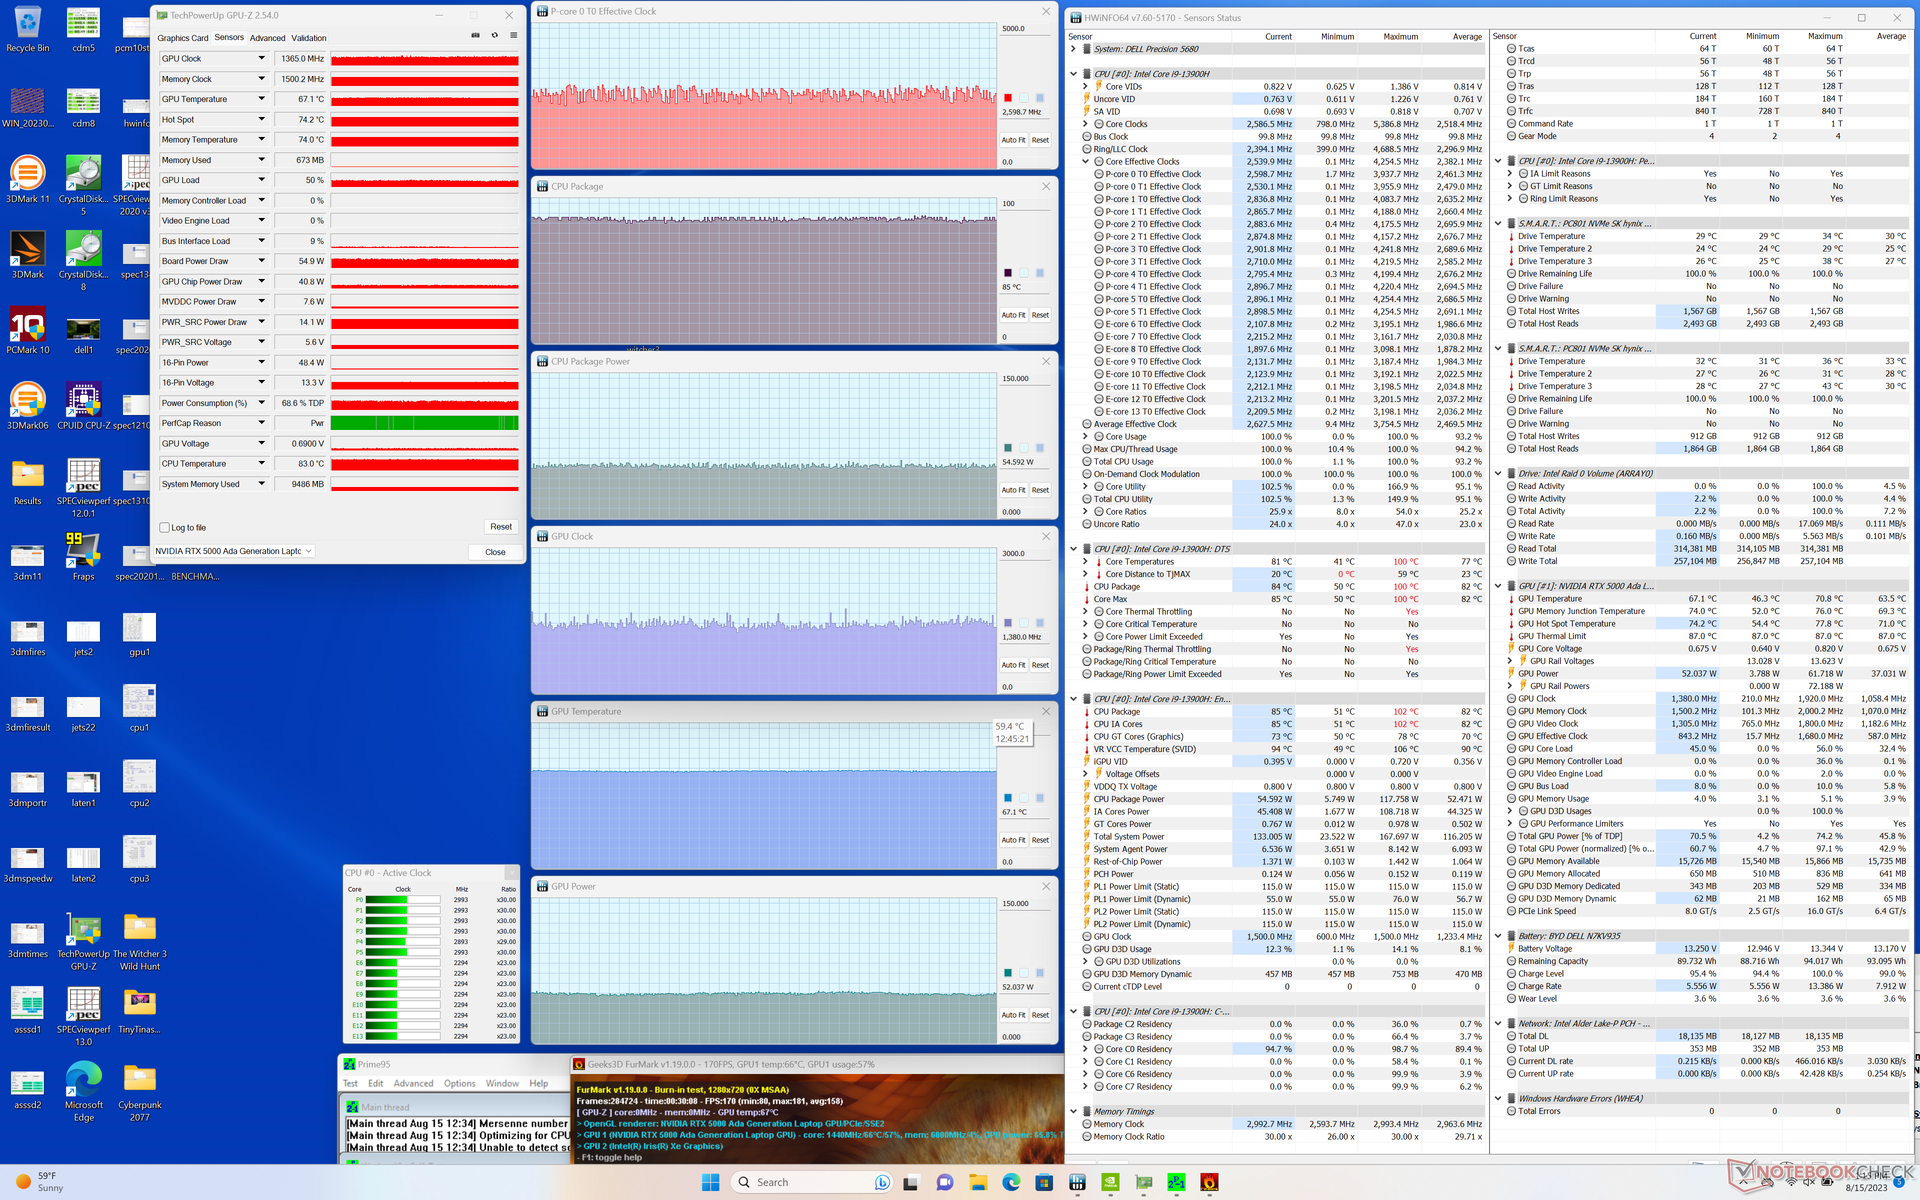
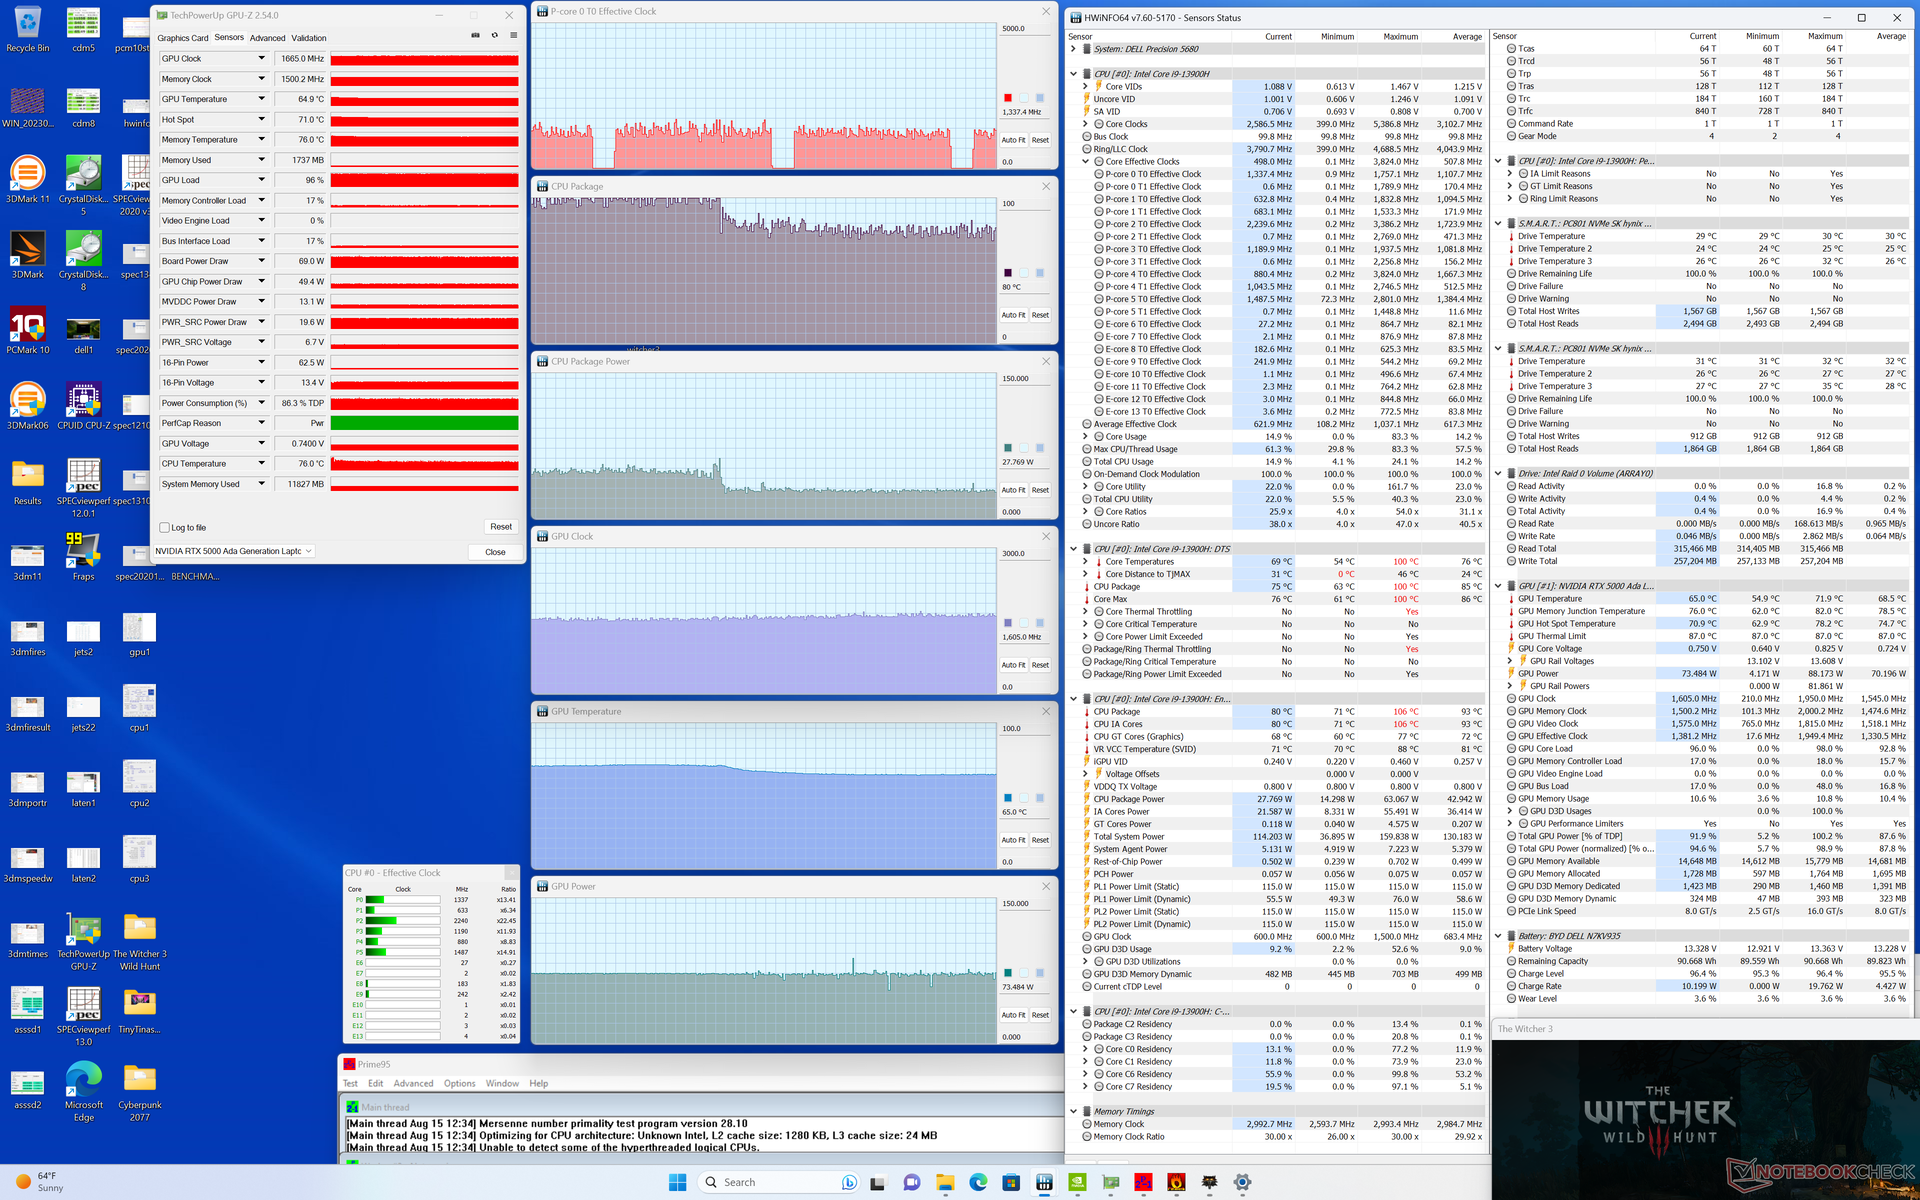
| CPU Clock (GHz) | GPU Clock (MHz) | Average CPU Temperature (°C) | Average GPU Temperature (°C) | |
| System Idle | -- | -- | 60 | 46 |
| Prime95 Stress | ~2.8 | -- | 75 | 55 |
| Prime95 + FurMark Stress | ~2.6 | 1365 | 85 | 67 |
| Witcher 3 Stress (Performance mode) | ~1.5 | 1560 | 100 | 72 |
| Witcher 3 Stress (Balanced mode) | ~1.3 | 1665 | 80 | 65 |
Speakers
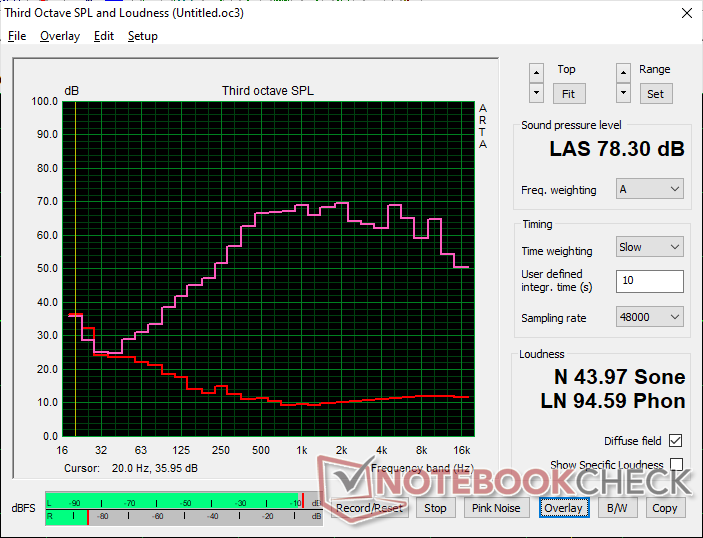
Dell Precision 5000 5680 audio analysis
(±) | speaker loudness is average but good (78.3 dB)
Bass 100 - 315 Hz
(-) | nearly no bass - on average 16.4% lower than median
(±) | linearity of bass is average (7.5% delta to prev. frequency)
Mids 400 - 2000 Hz
(+) | balanced mids - only 3.9% away from median
(+) | mids are linear (4.5% delta to prev. frequency)
Highs 2 - 16 kHz
(+) | balanced highs - only 2.2% away from median
(±) | linearity of highs is average (8.3% delta to prev. frequency)
Overall 100 - 16.000 Hz
(±) | linearity of overall sound is average (15.5% difference to median)
Compared to same class
» 35% of all tested devices in this class were better, 10% similar, 55% worse
» The best had a delta of 7%, average was 17%, worst was 35%
Compared to all devices tested
» 23% of all tested devices were better, 4% similar, 73% worse
» The best had a delta of 4%, average was 23%, worst was 134%
Apple MacBook Pro 16 2021 M1 Pro audio analysis
(+) | speakers can play relatively loud (84.7 dB)
Bass 100 - 315 Hz
(+) | good bass - only 3.8% away from median
(+) | bass is linear (5.2% delta to prev. frequency)
Mids 400 - 2000 Hz
(+) | balanced mids - only 1.3% away from median
(+) | mids are linear (2.1% delta to prev. frequency)
Highs 2 - 16 kHz
(+) | balanced highs - only 1.9% away from median
(+) | highs are linear (2.7% delta to prev. frequency)
Overall 100 - 16.000 Hz
(+) | overall sound is linear (4.6% difference to median)
Compared to same class
» 0% of all tested devices in this class were better, 0% similar, 100% worse
» The best had a delta of 5%, average was 17%, worst was 45%
Compared to all devices tested
» 0% of all tested devices were better, 0% similar, 100% worse
» The best had a delta of 4%, average was 23%, worst was 134%
Energy Management — Ada Lovelace Shines
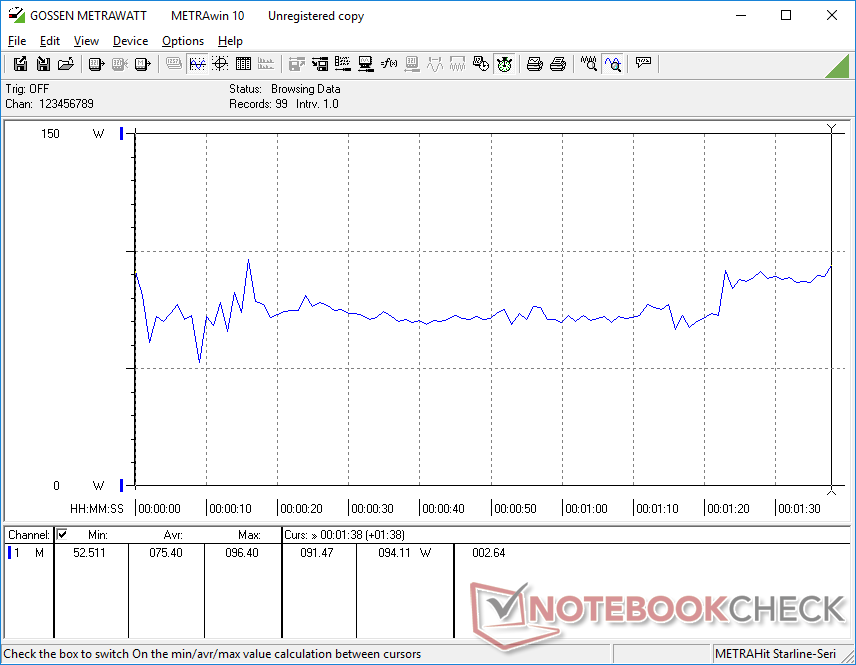
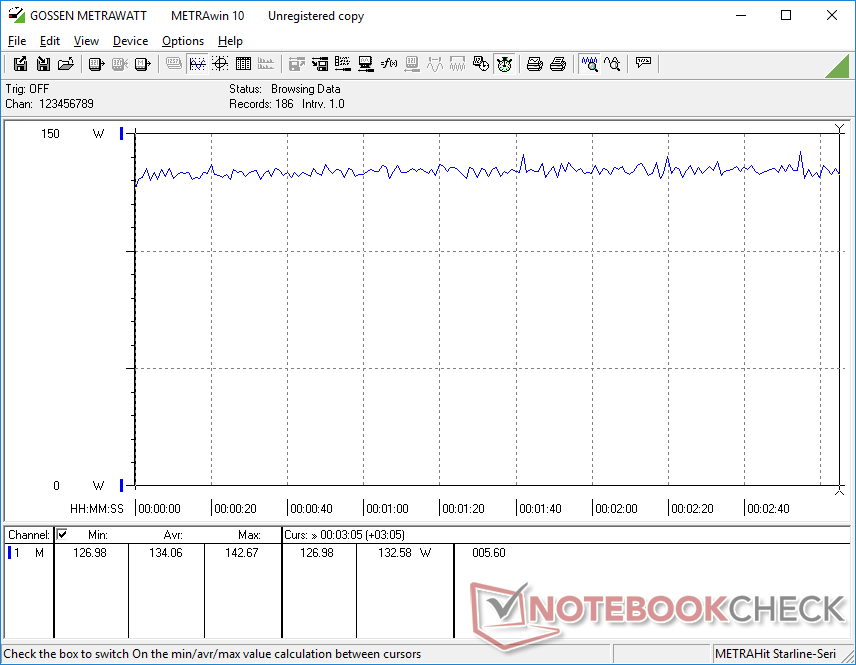
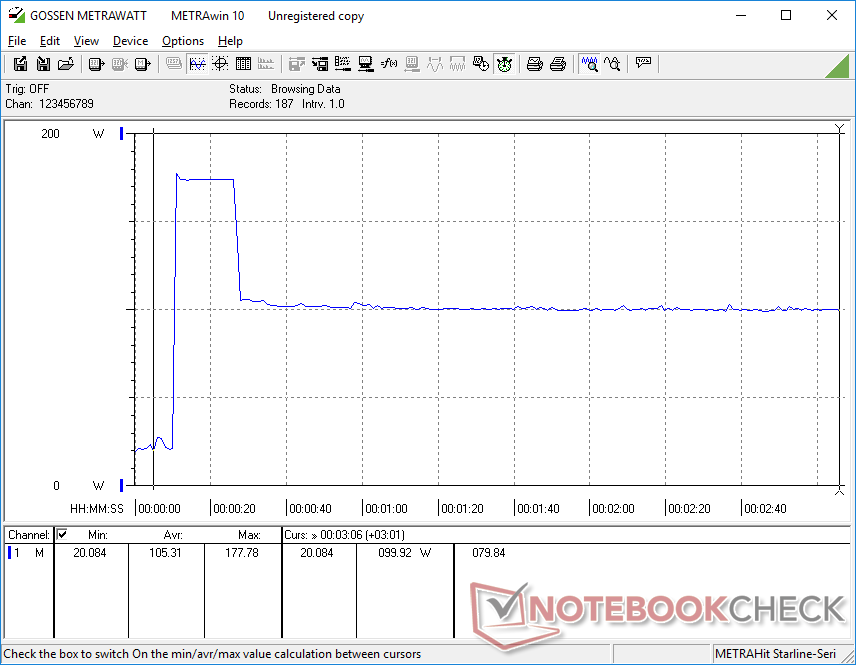
Power Consumption
Performance-per-watt is significantly ahead of most other workstations since our Precision is using a newer generation Ada Lovelace GPU. Running Witcher 3, for example, would consume just 134 W on our system compared to 159 W and 189 W on the Precision 7670 Performance and HP ZBook Fury 16 G9, respectively, even though our RTX 5000 GPU would outperform their RTX A5500 GPUs as noted above.
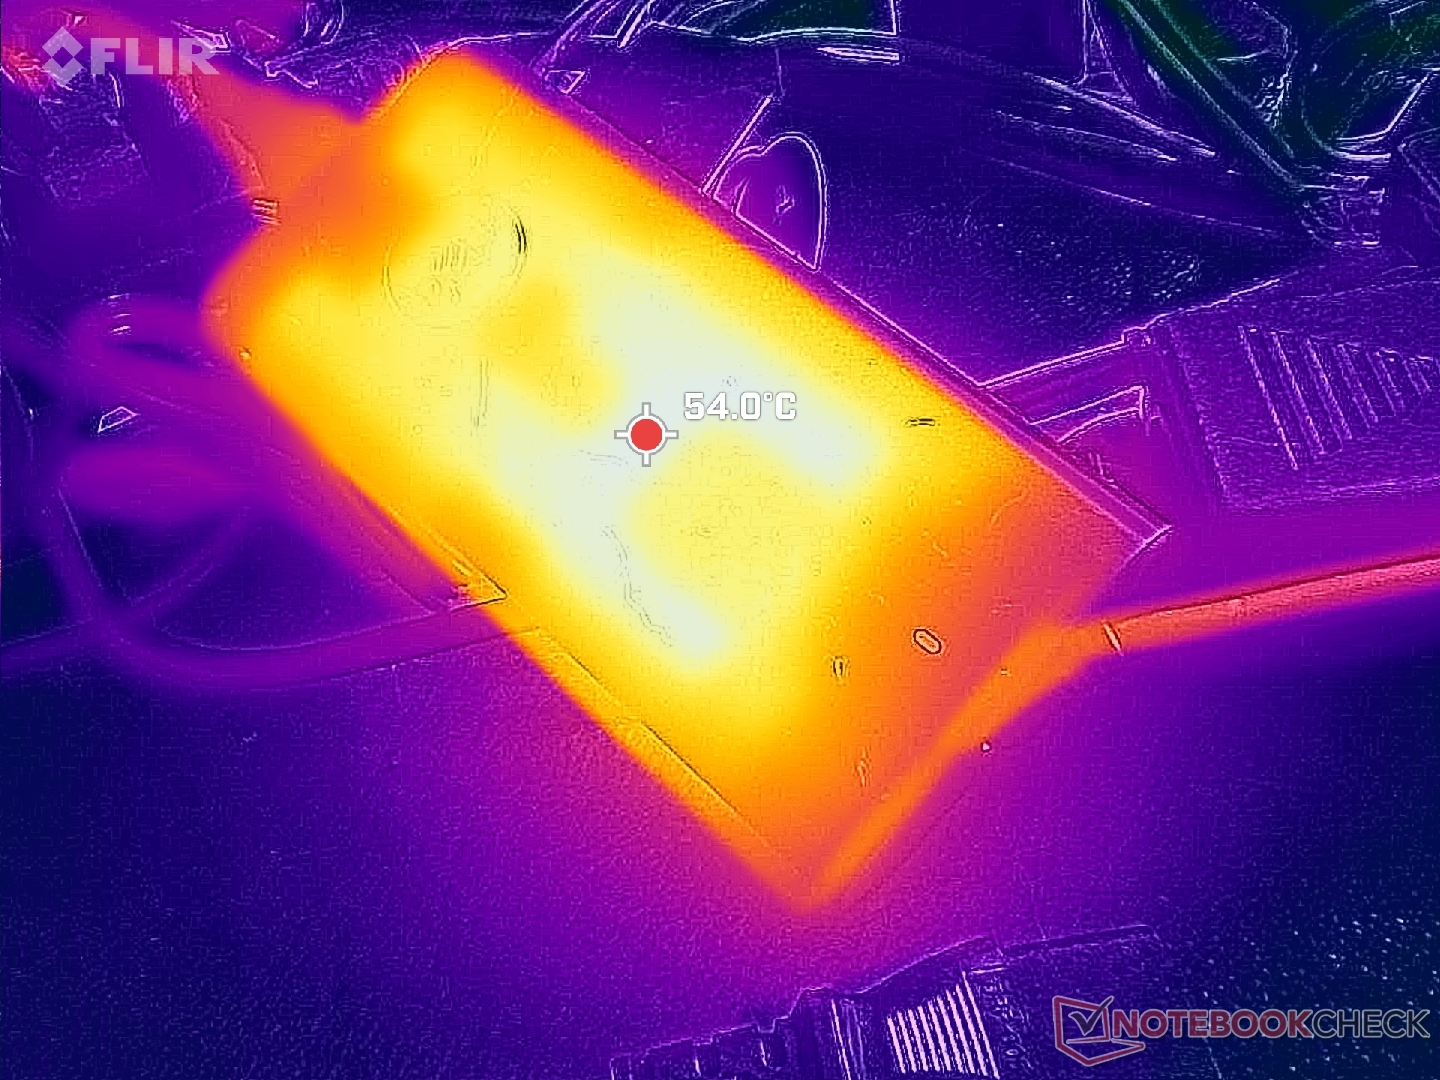
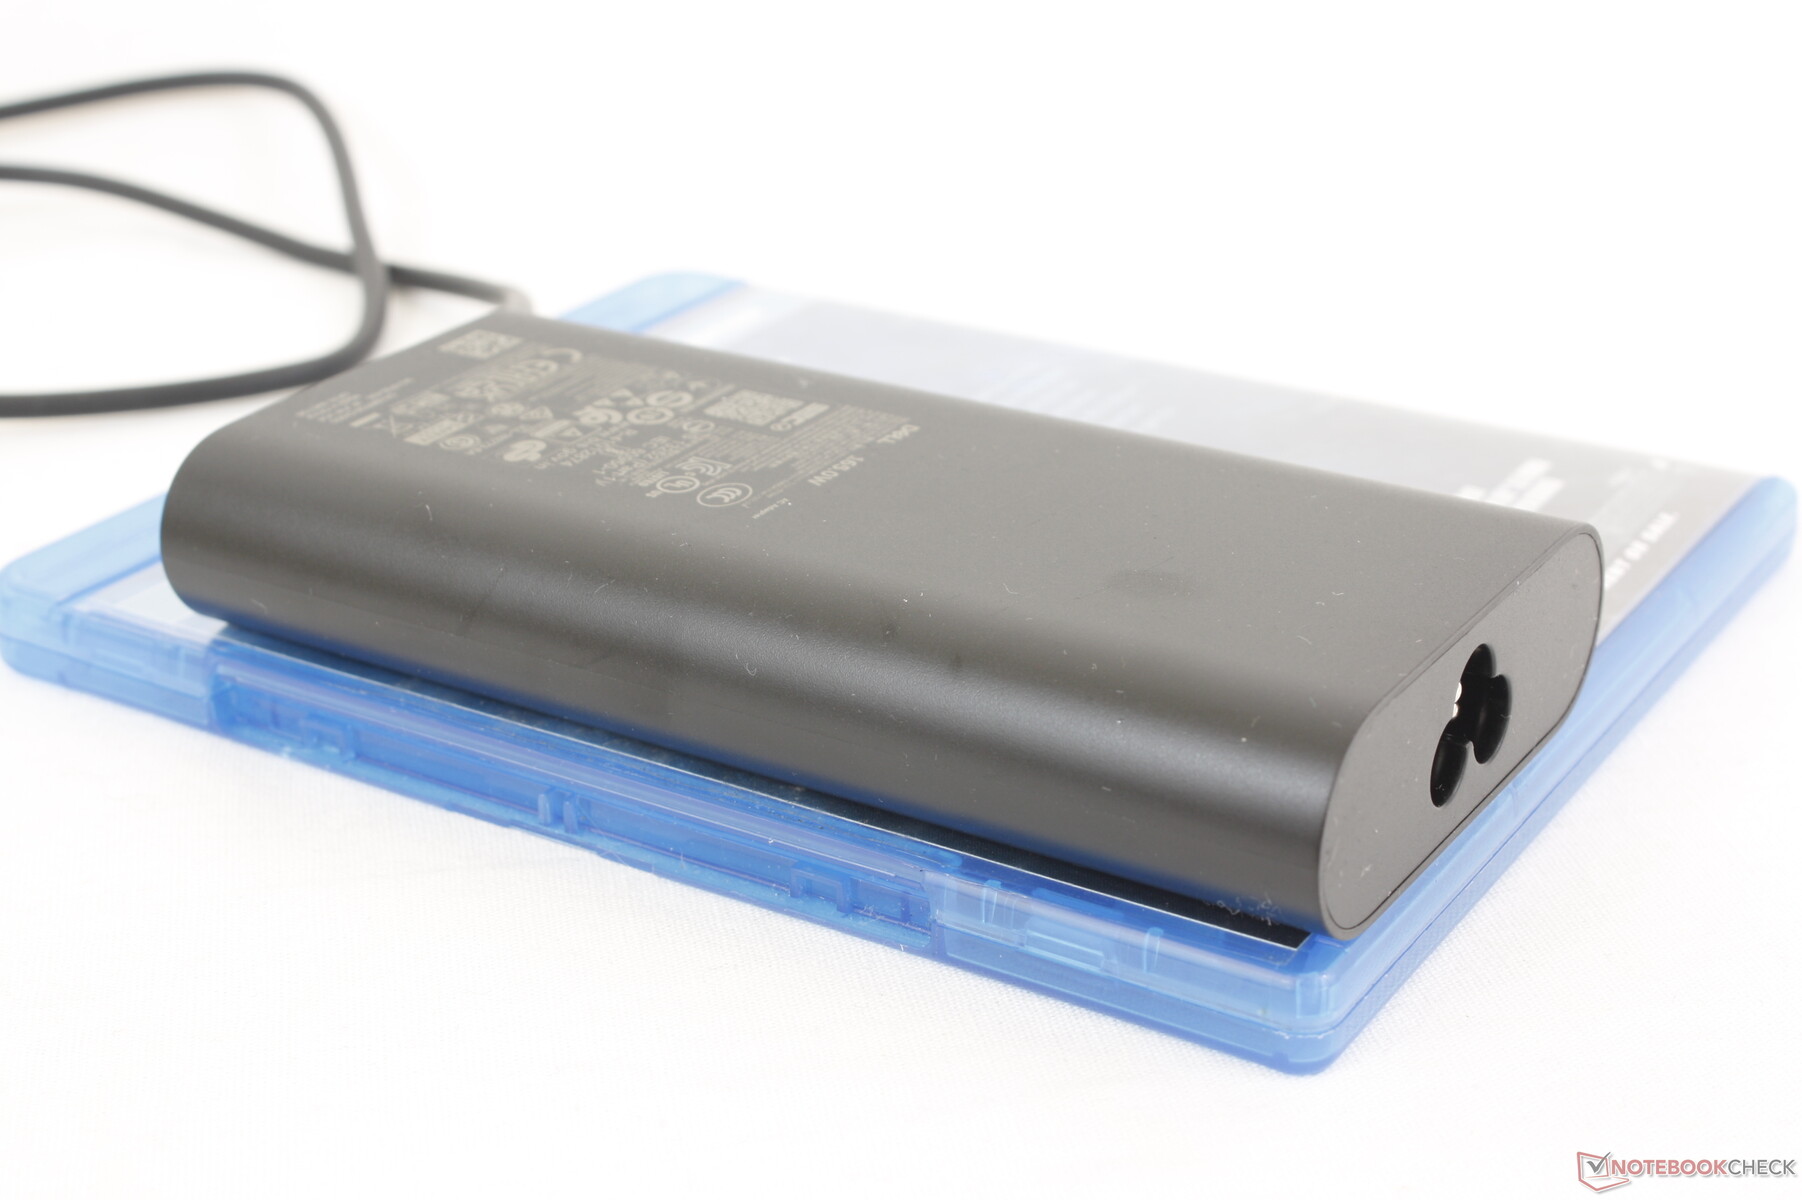
The relatively small (~13.5 x 6.5 x 2.2 cm) 165 W USB-C AC adapter deserves a mention as well for its high power output. Most existing USB-C adapters are limited to just 100 W to 140 W at most which makes our 165 W adapter one of the most versatile. This new adapter directly solves the battery charging issues we experienced on the older Precision 7000 model which shipped with a less capable 130 W USB-C adapter.

| Off / Standby | |
| Idle | |
| Load |
|
Key:
min: | |
| Dell Precision 5000 5680 i9-13900H, RTX 5000 Ada Generation Laptop, 2x SK hynix PC801 HFS512GEJ9X101N RAID 0, OLED, 3840x2400, 16" | Dell Precision 7000 7670 Performance i9-12950HX, RTX A5500 Laptop GPU, , OLED, 3840x2400, 16" | HP ZBook Fury 16 G9 i9-12950HX, RTX A5500 Laptop GPU, Micron 3400 1TB MTFDKBA1T0TFH, IPS, 3840x2400, 16" | Lenovo ThinkPad P16 G1 RTX A5500 i9-12950HX, RTX A5500 Laptop GPU, WDC PC SN810 2TB, IPS, 3840x2400, 16" | MSI CreatorPro Z16P B12UKST i7-12700H, RTX A3000 Laptop GPU, Samsung PM9A1 MZVL21T0HCLR, IPS, 2560x1600, 16" | Asus ExpertBook B6 Flip B6602FC2 i9-12950HX, RTX A2000 Laptop GPU, Samsung PM9A1 MZVL21T0HCLR, IPS, 2560x1600, 16" | |
|---|---|---|---|---|---|---|
| Power Consumption | -99% | -86% | -53% | -18% | -35% | |
| Idle Minimum * (Watt) | 8 | 16.4 -105% | 19.5 -144% | 7.5 6% | 10.8 -35% | 10.5 -31% |
| Idle Average * (Watt) | 10.4 | 35.9 -245% | 29 -179% | 20.1 -93% | 16.3 -57% | 11.9 -14% |
| Idle Maximum * (Watt) | 30.5 | 47 -54% | 40.7 -33% | 40 -31% | 16.9 45% | 18 41% |
| Load Average * (Watt) | 75.4 | 147.1 -95% | 142.1 -88% | 137 -82% | 111.7 -48% | 182 -141% |
| Witcher 3 ultra * (Watt) | 134 | 158.8 -19% | 188.6 -41% | 208 -55% | 152.1 -14% | 177.5 -32% |
| Load Maximum * (Watt) | 175 | 311 -78% | 224.4 -28% | 285.9 -63% | 177.4 -1% | 229 -31% |
* ... smaller is better
Power Consumption Witcher 3 / Stresstest
Power Consumption external Monitor
Battery Life
Battery life is excellent considering the high performance and demanding 4K OLED panel. We're able to record almost 10 hours of real-world WLAN browsing when on the Balanced profile with the iGPU active compared to almost half that on alternatives like the Lenovo ThinkPad P16 G1 or MSI CreatorPro Z16P.
Charging from empty to full capacity takes about 2 hours with the included 165 W AC adapter. Our third-party 65 W USB-C adapter can also recharge the system albeit at a slower rate.
| Dell Precision 5000 5680 i9-13900H, RTX 5000 Ada Generation Laptop, 98 Wh | Dell Precision 7000 7670 Performance i9-12950HX, RTX A5500 Laptop GPU, 93 Wh | HP ZBook Fury 16 G9 i9-12950HX, RTX A5500 Laptop GPU, 95 Wh | Lenovo ThinkPad P16 G1 RTX A5500 i9-12950HX, RTX A5500 Laptop GPU, 94 Wh | MSI CreatorPro Z16P B12UKST i7-12700H, RTX A3000 Laptop GPU, 90 Wh | Asus ExpertBook B6 Flip B6602FC2 i9-12950HX, RTX A2000 Laptop GPU, 90 Wh | |
|---|---|---|---|---|---|---|
| Battery runtime | -53% | -46% | -41% | -41% | -14% | |
| Reader / Idle (h) | 17.9 | 5.3 -70% | 12.5 -30% | |||
| WiFi v1.3 (h) | 9.9 | 4.7 -53% | 6 -39% | 5.8 -41% | 5.8 -41% | 8.7 -12% |
| Load (h) | 1.7 | 1.2 -29% | 1.7 0% | |||
| H.264 (h) | 5.8 |
Pros
Cons
Verdict — More Powerful Than It Looks
The Precision 5680 is lowkey one of the leanest and fastest mobile workstations in Dell's entire lineup. The portable design, 165 W USB-C adapter, excellent 4K OLED display, and powerful RTX 5000 GPU all stand out as the strongest features of the model. The latter in particular is responsible for much of the performance boosts and battery life advantages over most other workstations due to its Ada Lovelace architecture and very high performance-per-watt.
The Precision 5680 offers some of the highest performance-per-watt in the growing thin-and-light workstation category.
Hardcore workstation users may still prefer larger and thicker models like the HP ZBook Fury 16 or Precision 7670 as the slim Precision 5680 design foregoes some key features like expandable RAM, WAN, ECC RAM, and wider port options. Its terrible clickpad isn't nearly as accurate as the touchpads on the HP or Lenovo ThinkPad P16 which have actual mouse buttons for better control.
Price and Availability
Dell is now shipping the Precision 5680 starting at $2490 USD up to over $6500 as reviewed.
Dell Precision 5000 5680
- 08/18/2023 v7 (old)
Allen Ngo
Transparency
The selection of devices to be reviewed is made by our editorial team. The test sample was provided to the author as a loan by the manufacturer or retailer for the purpose of this review. The lender had no influence on this review, nor did the manufacturer receive a copy of this review before publication. There was no obligation to publish this review. As an independent media company, Notebookcheck is not subjected to the authority of manufacturers, retailers or publishers.
This is how Notebookcheck is testing
Every year, Notebookcheck independently reviews hundreds of laptops and smartphones using standardized procedures to ensure that all results are comparable. We have continuously developed our test methods for around 20 years and set industry standards in the process. In our test labs, high-quality measuring equipment is utilized by experienced technicians and editors. These tests involve a multi-stage validation process. Our complex rating system is based on hundreds of well-founded measurements and benchmarks, which maintains objectivity. Further information on our test methods can be found here.
Price comparison
