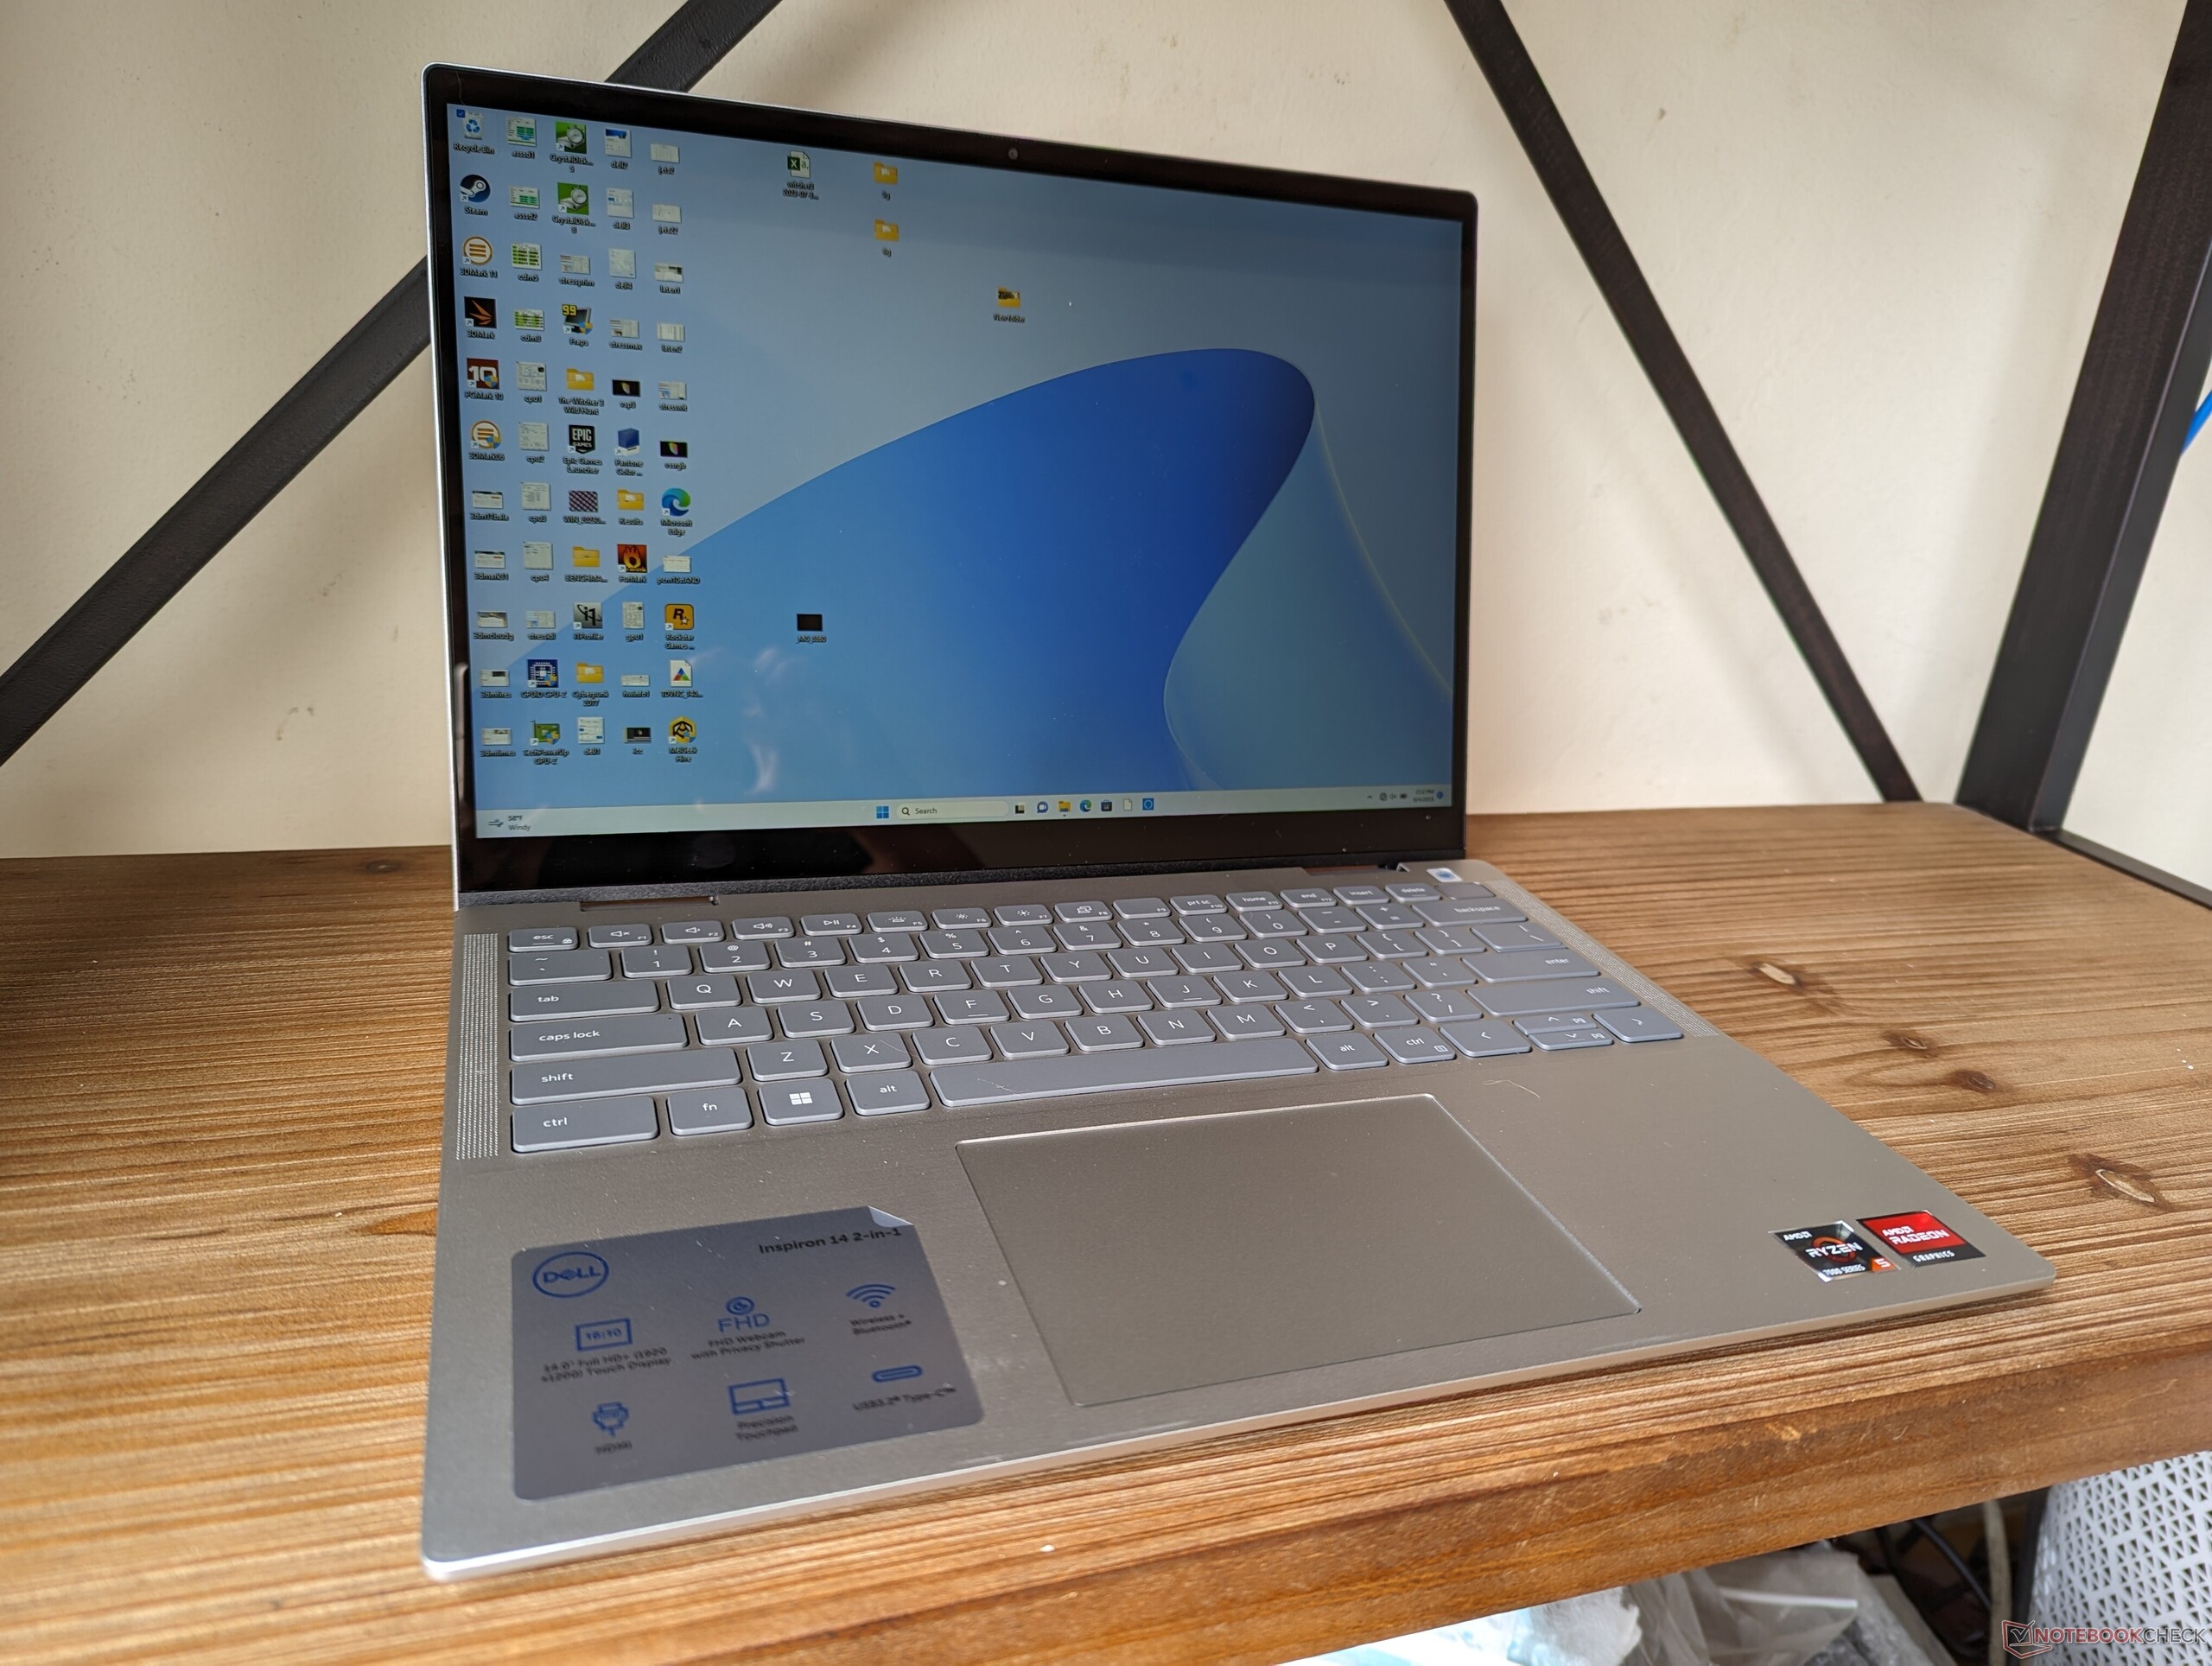
Dell Inspiron 14 7435 2-in-1 convertible review: Ryzen 5 7530U for budget users

The Inspiron 14 7435 2-in-1 is the AMD version of the Intel-based Inspiron 14 7430 2-in-1. It directly replaces last year's Inspiron 14 7420 2-in-1 with both upgraded internals and externals.
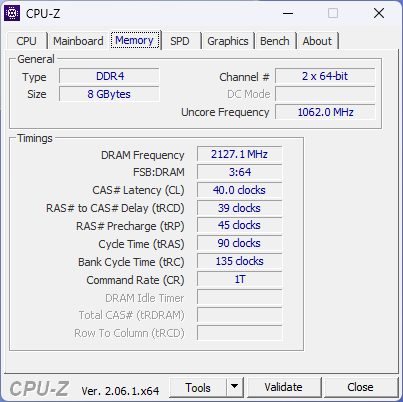
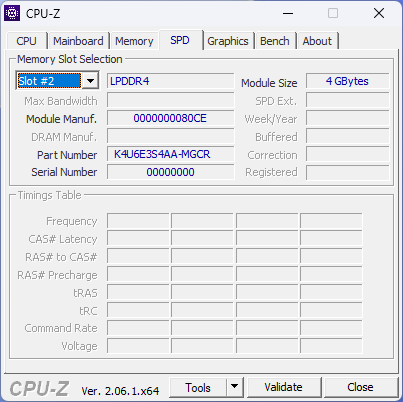
Our specific review configuration is a lower-end SKU with the Ryzen 5 7530U CPU and 8 GB of soldered LPDDR4x-4266 RAM for only $550 USD. A higher-end version with double the RAM and the Ryzen 7 7730U CPU is also available, but all configurations otherwise come with the same 1200p IPS touchscreen and integrated Radeon Vega graphics.
Competitors include other budget-oriented convertibles like the Acer Aspire 5 Spin 14, Lenovo IdeaPad Flex 7i, or HP Pavilion x360 14. A 16-inch version of this model exists called the Inspiron 16 7635 2-in-1.
More Dell reviews:
Potential Competitors in Comparison
Rating | Date | Model | Weight | Height | Size | Resolution | Price |
|---|---|---|---|---|---|---|---|
| 84.5 % v7 (old) | 08 / 2023 | Dell Inspiron 14 7435 2-in-1 R5 7530U, Vega 7 | 1.6 kg | 18.6 mm | 14.00" | 1920x1200 | |
| 83.7 % v7 (old) | 06 / 2022 | Dell Inspiron 14 7420 2-in-1 i7-1255U, Iris Xe G7 96EUs | 1.6 kg | 17.86 mm | 14.00" | 1920x1200 | |
| 83.2 % v7 (old) | 12 / 2022 | Lenovo IdeaPad Flex 7i 14IAU7 i7-1255U, Iris Xe G7 96EUs | 1.5 kg | 18.9 mm | 14.00" | 2240x1400 | |
| 82.2 % v7 (old) | 06 / 2023 | Acer Aspire 5 Spin 14 i5-1335U, Iris Xe G7 80EUs | 1.6 kg | 17.99 mm | 14.00" | 1920x1200 | |
| 87.5 % v7 (old) | 05 / 2022 | LG Gram 14T90P i5-1135G7, Iris Xe G7 80EUs | 1.2 kg | 17 mm | 14.00" | 1900x1200 | |
| 81.8 % v7 (old) | 07 / 2021 | HP Pavilion x360 14-dy0157ng i5-1135G7, Iris Xe G7 80EUs | 1.5 kg | 19.9 mm | 14.00" | 1920x1080 |
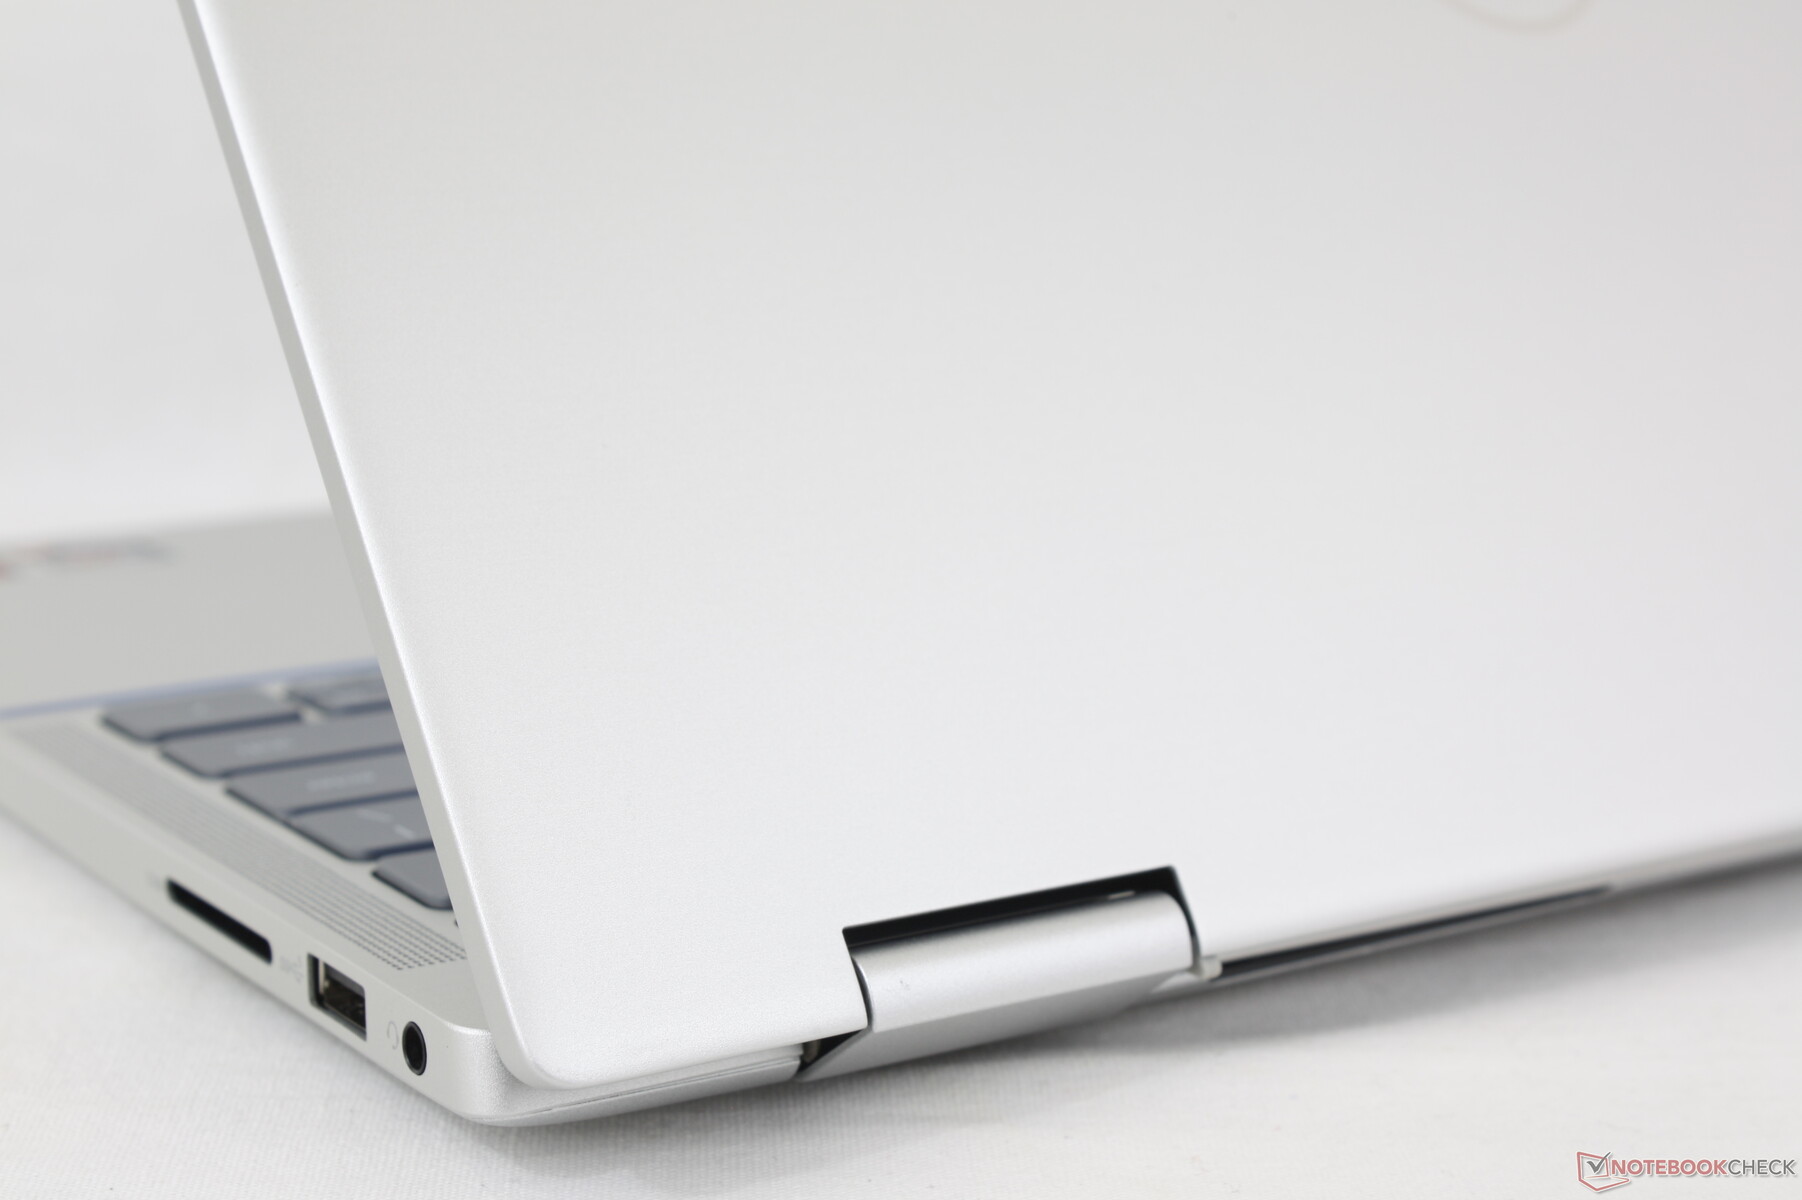
Case — Revised Speakers And Hinges
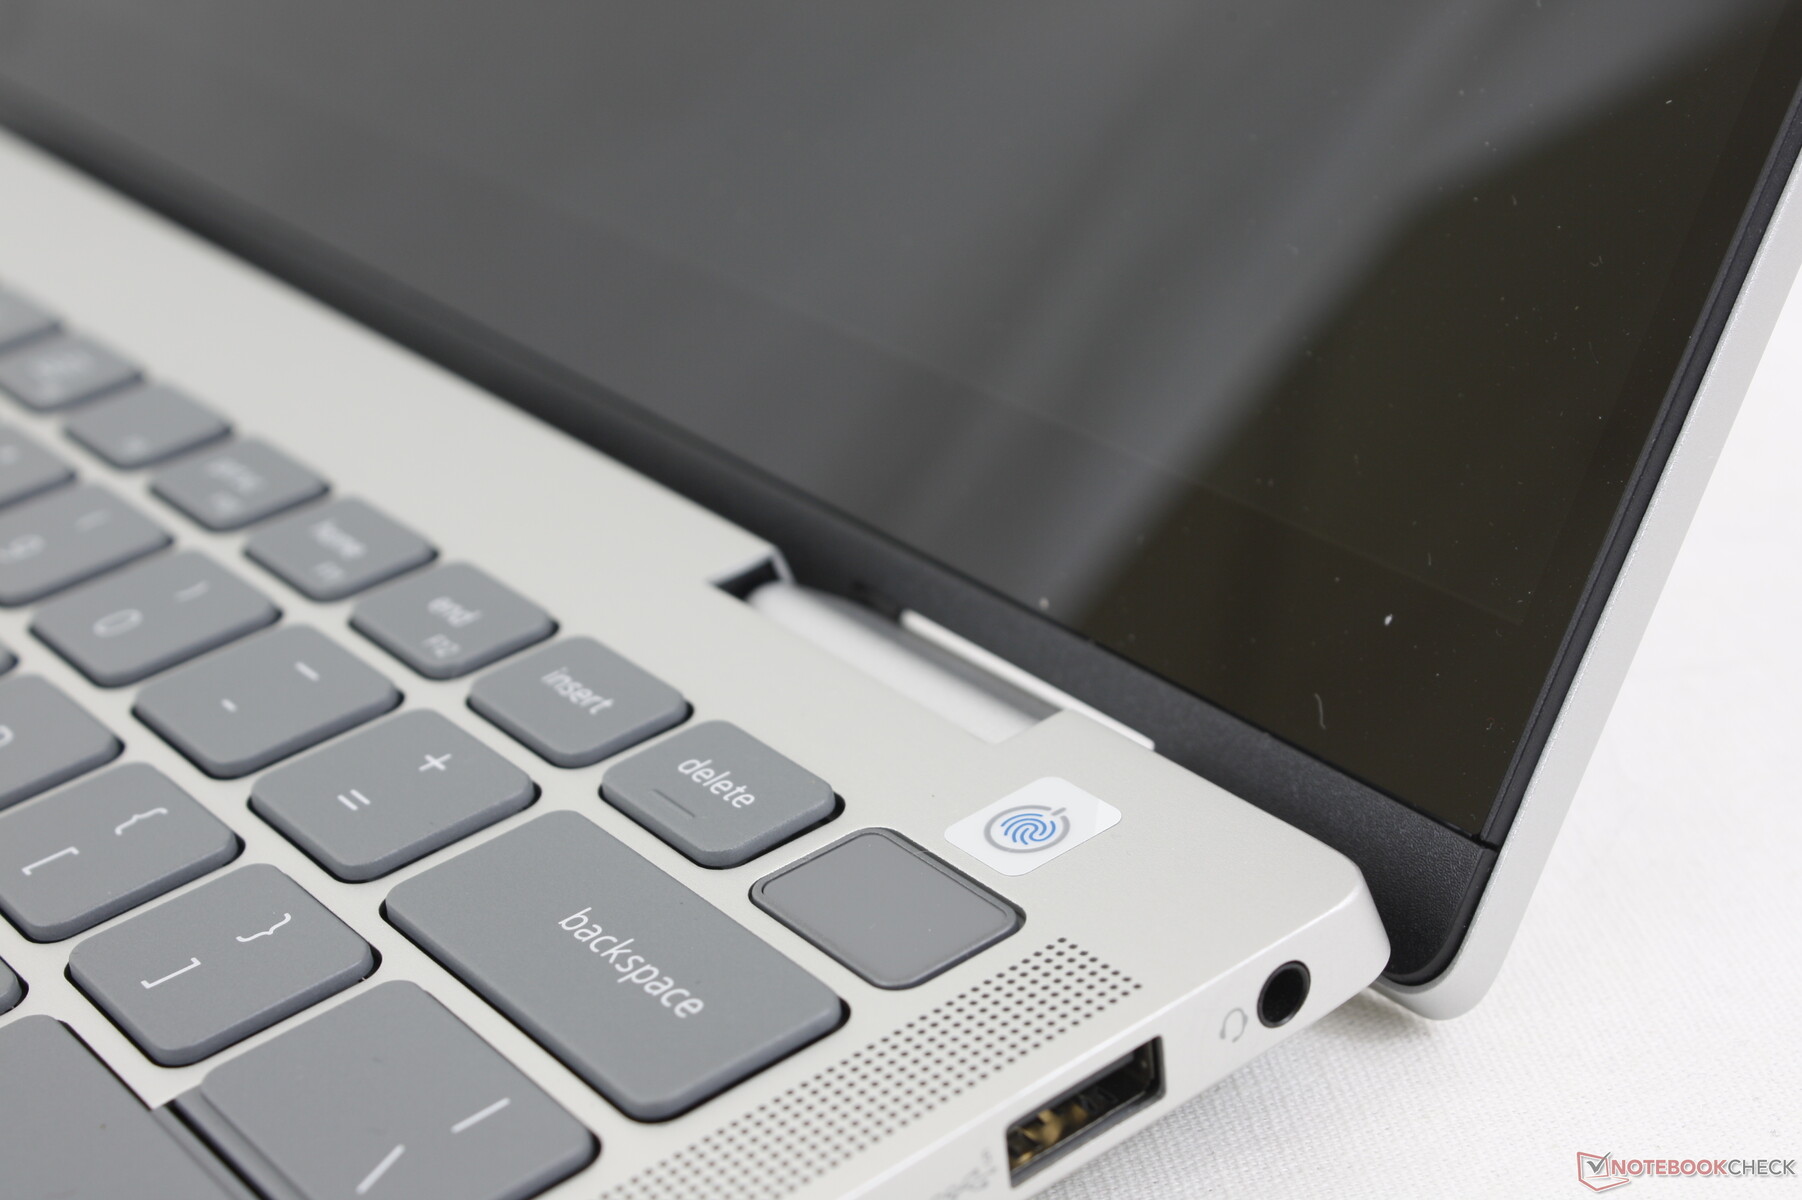
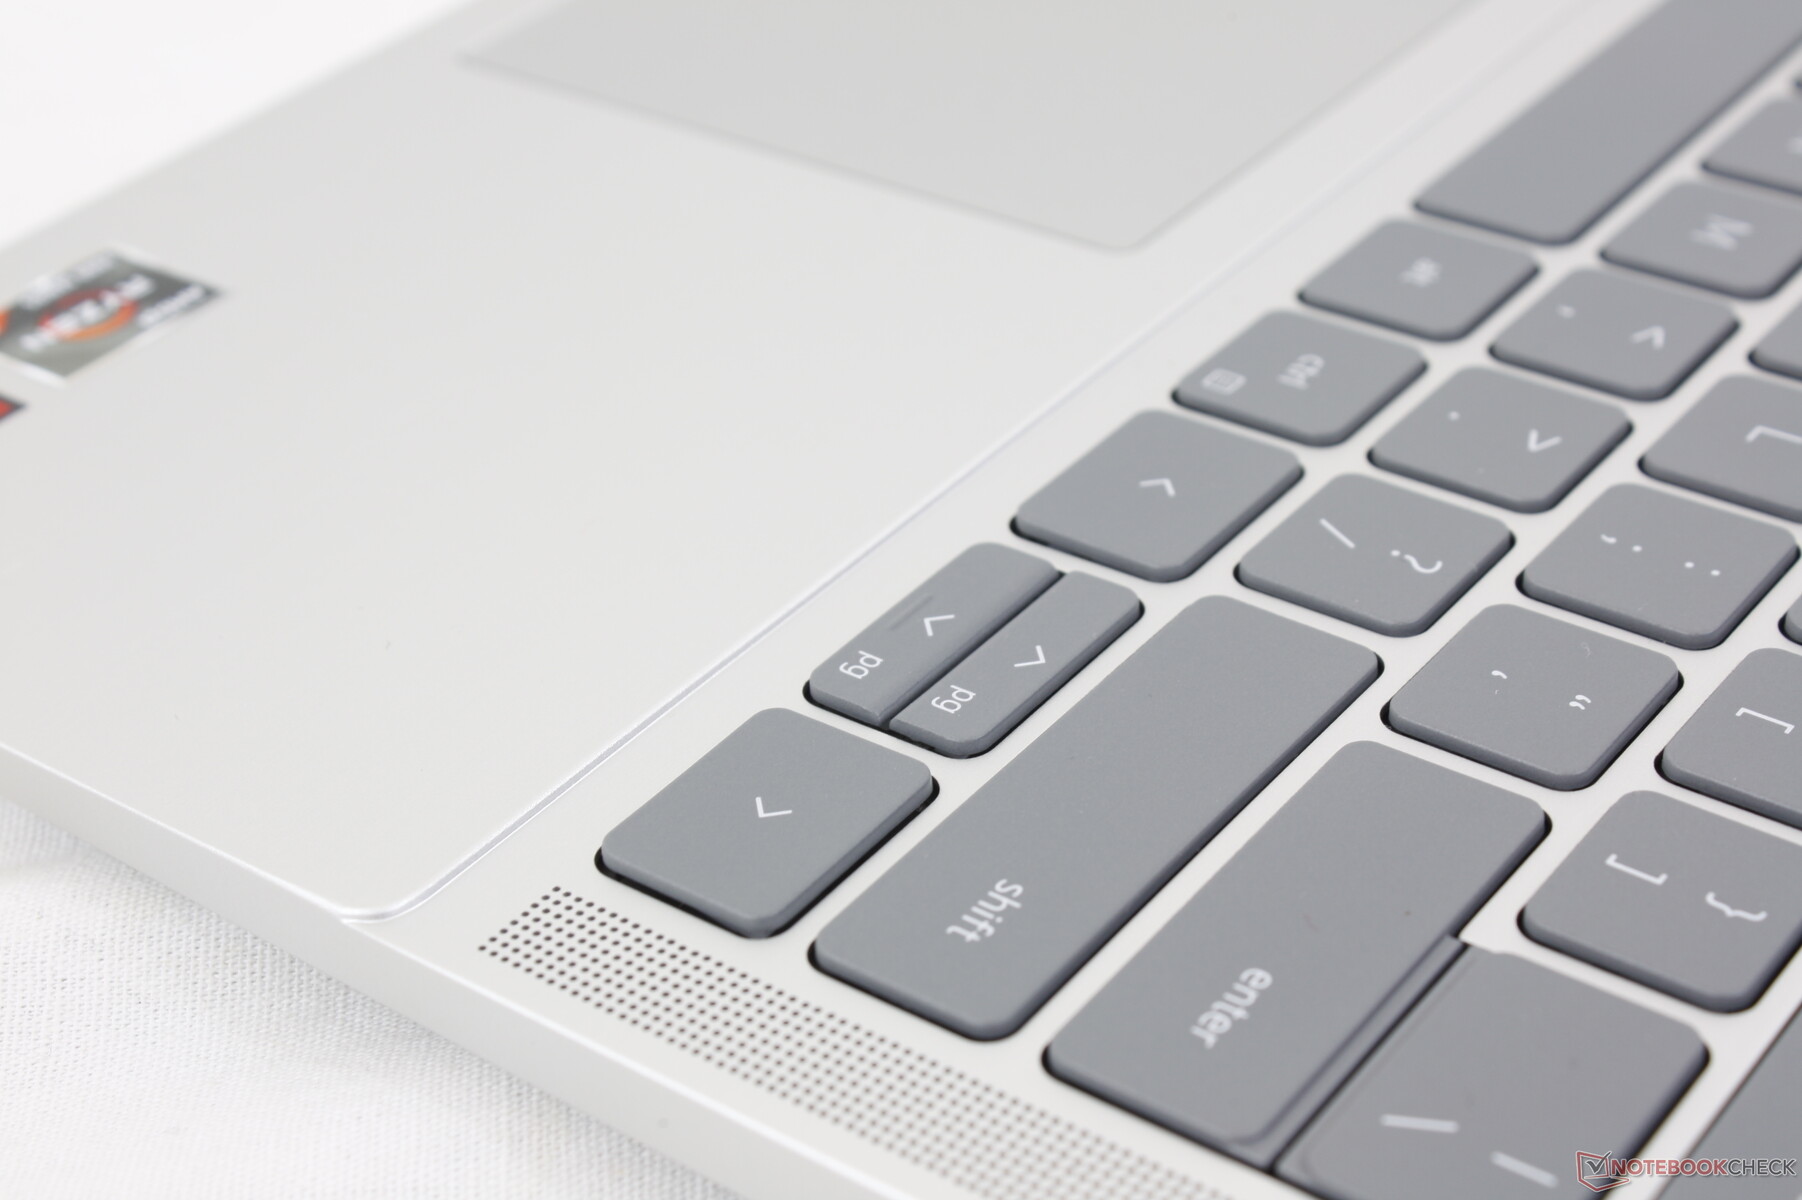
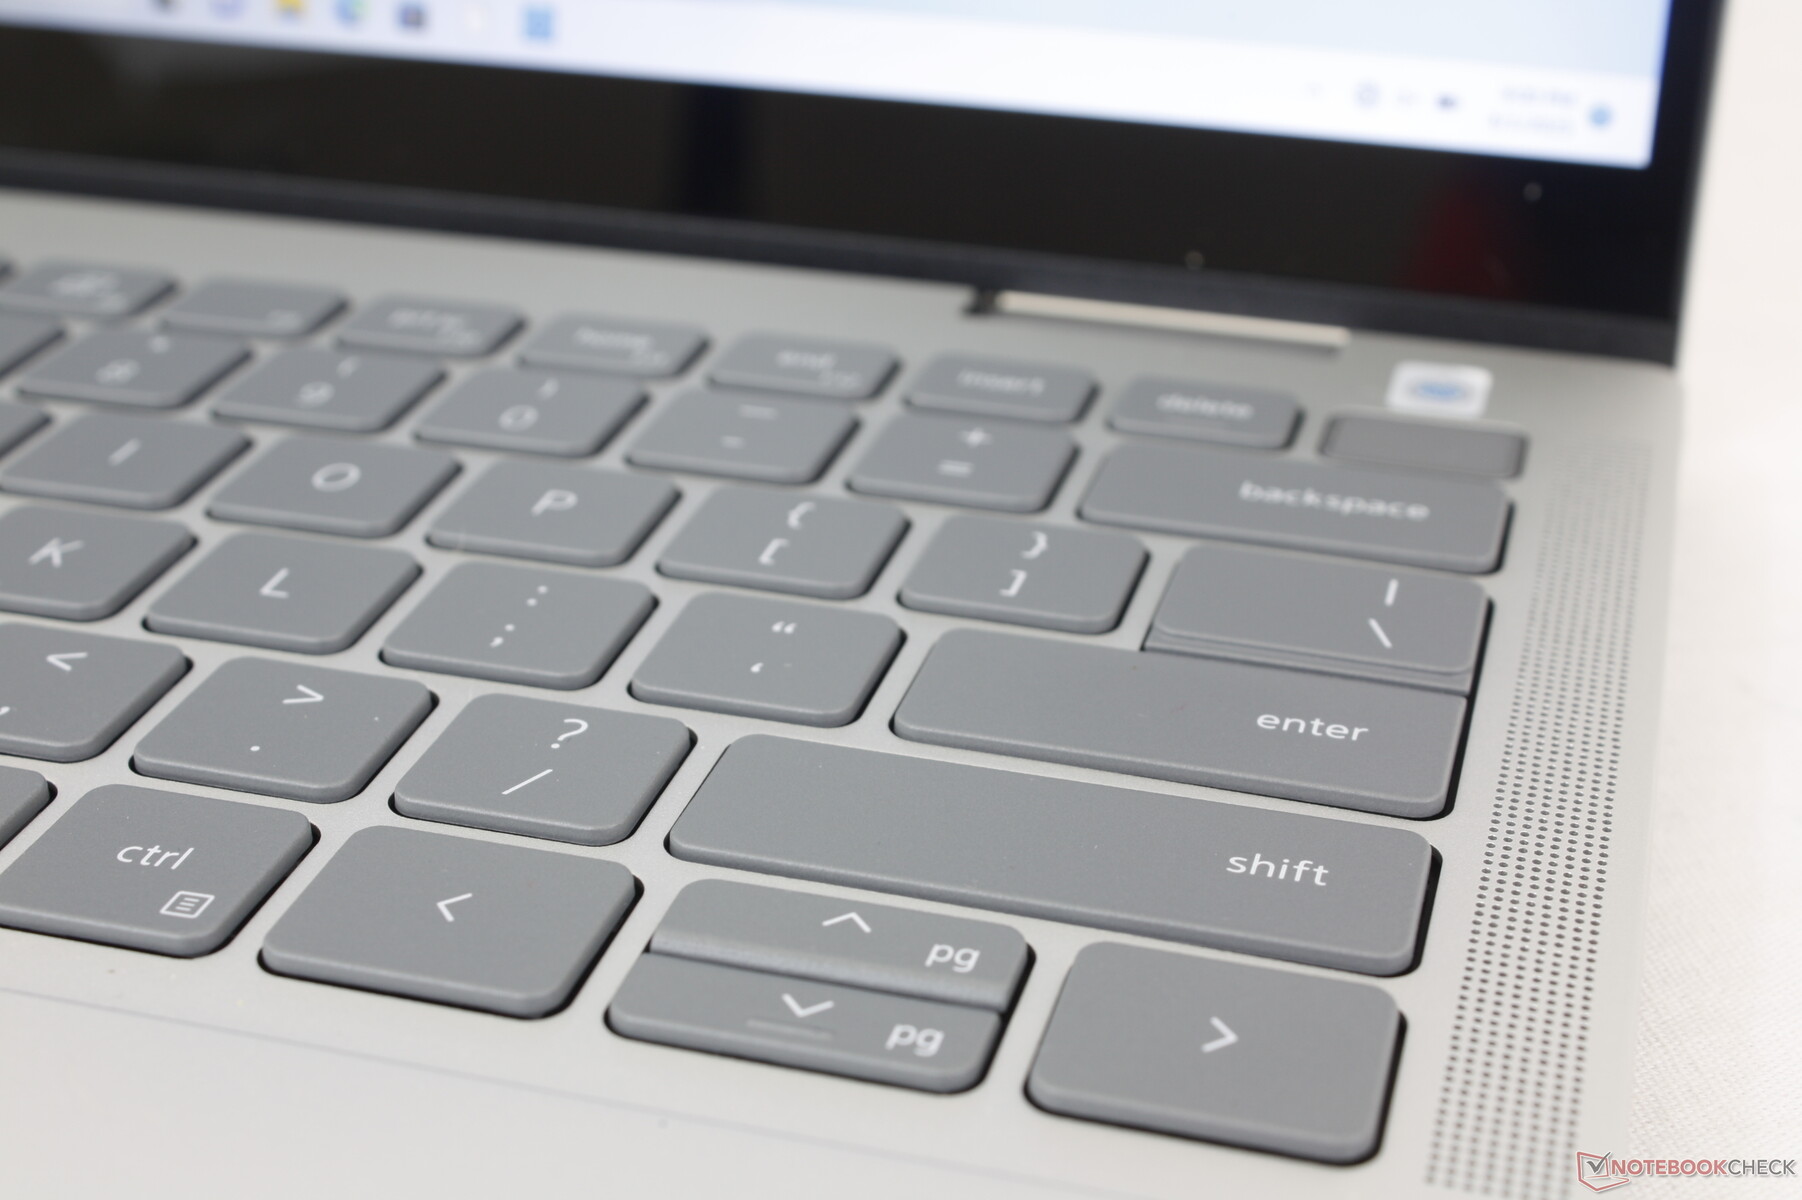
Though it appears identical to the 2022 Inspiron 14 7620 2-in-1 at first glance, several differences are noticeable upon closer inspection. Firstly, the much-touted Mylar palm rests have been removed in favor of more ABS plastic. The special material was supposed to protect the palm rests and clickpad from grease buildup, but it ultimately proved to be unnecessary on a budget laptop such as this. Secondly, the hinges have been redesigned to be slightly larger and flatter which should hopefully improve longevity. And lastly, the speakers have been repositioned from the front corners of the chassis to the keyboard edges and so they now face upwards directly toward the user.
Chassis rigidity remains about the same as before due to their similar skeletons and choice of plastic materials.

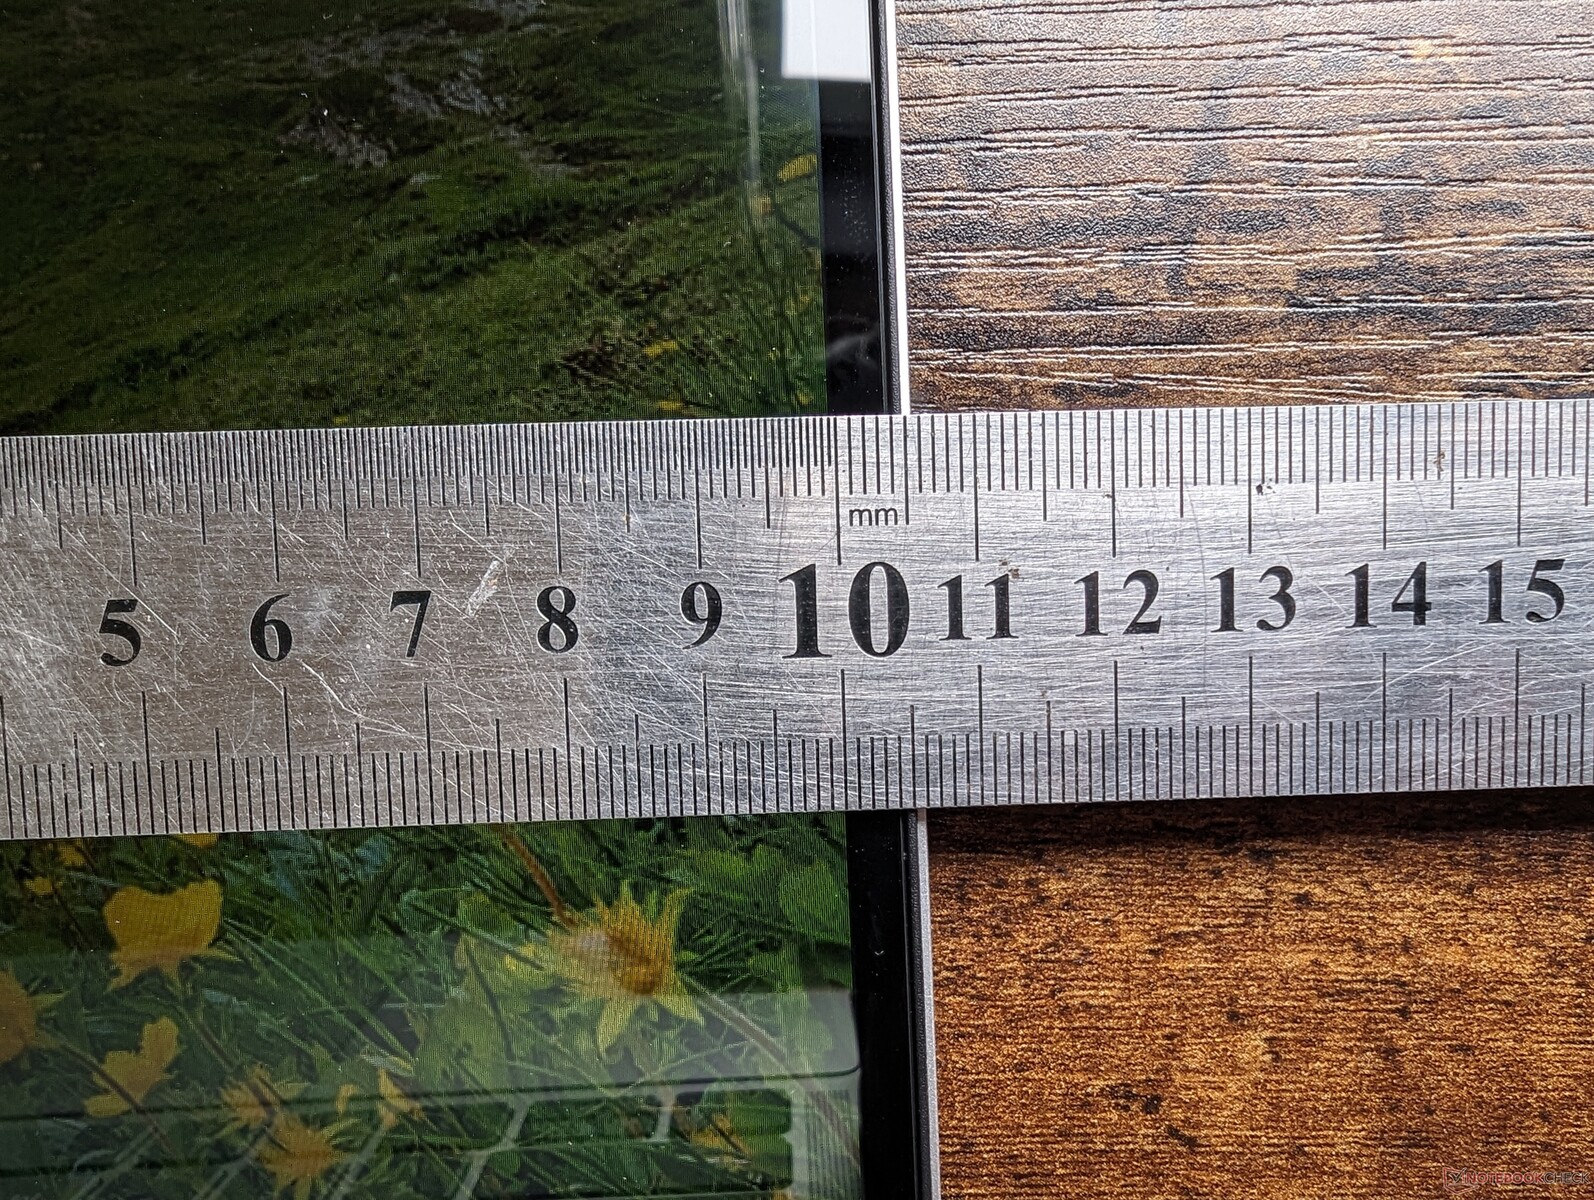
Dimensions and weight are nearly identical to last year's model despite all the external and internal changes. This isn't necessarily a bad thing since the model is still comparable to alternatives like the Pavilion x360 14 or IdeaPad Flex 14 7i, but Dell could have gone the extra mile to make the Inspiron even more portable and lucrative to potential buyers.
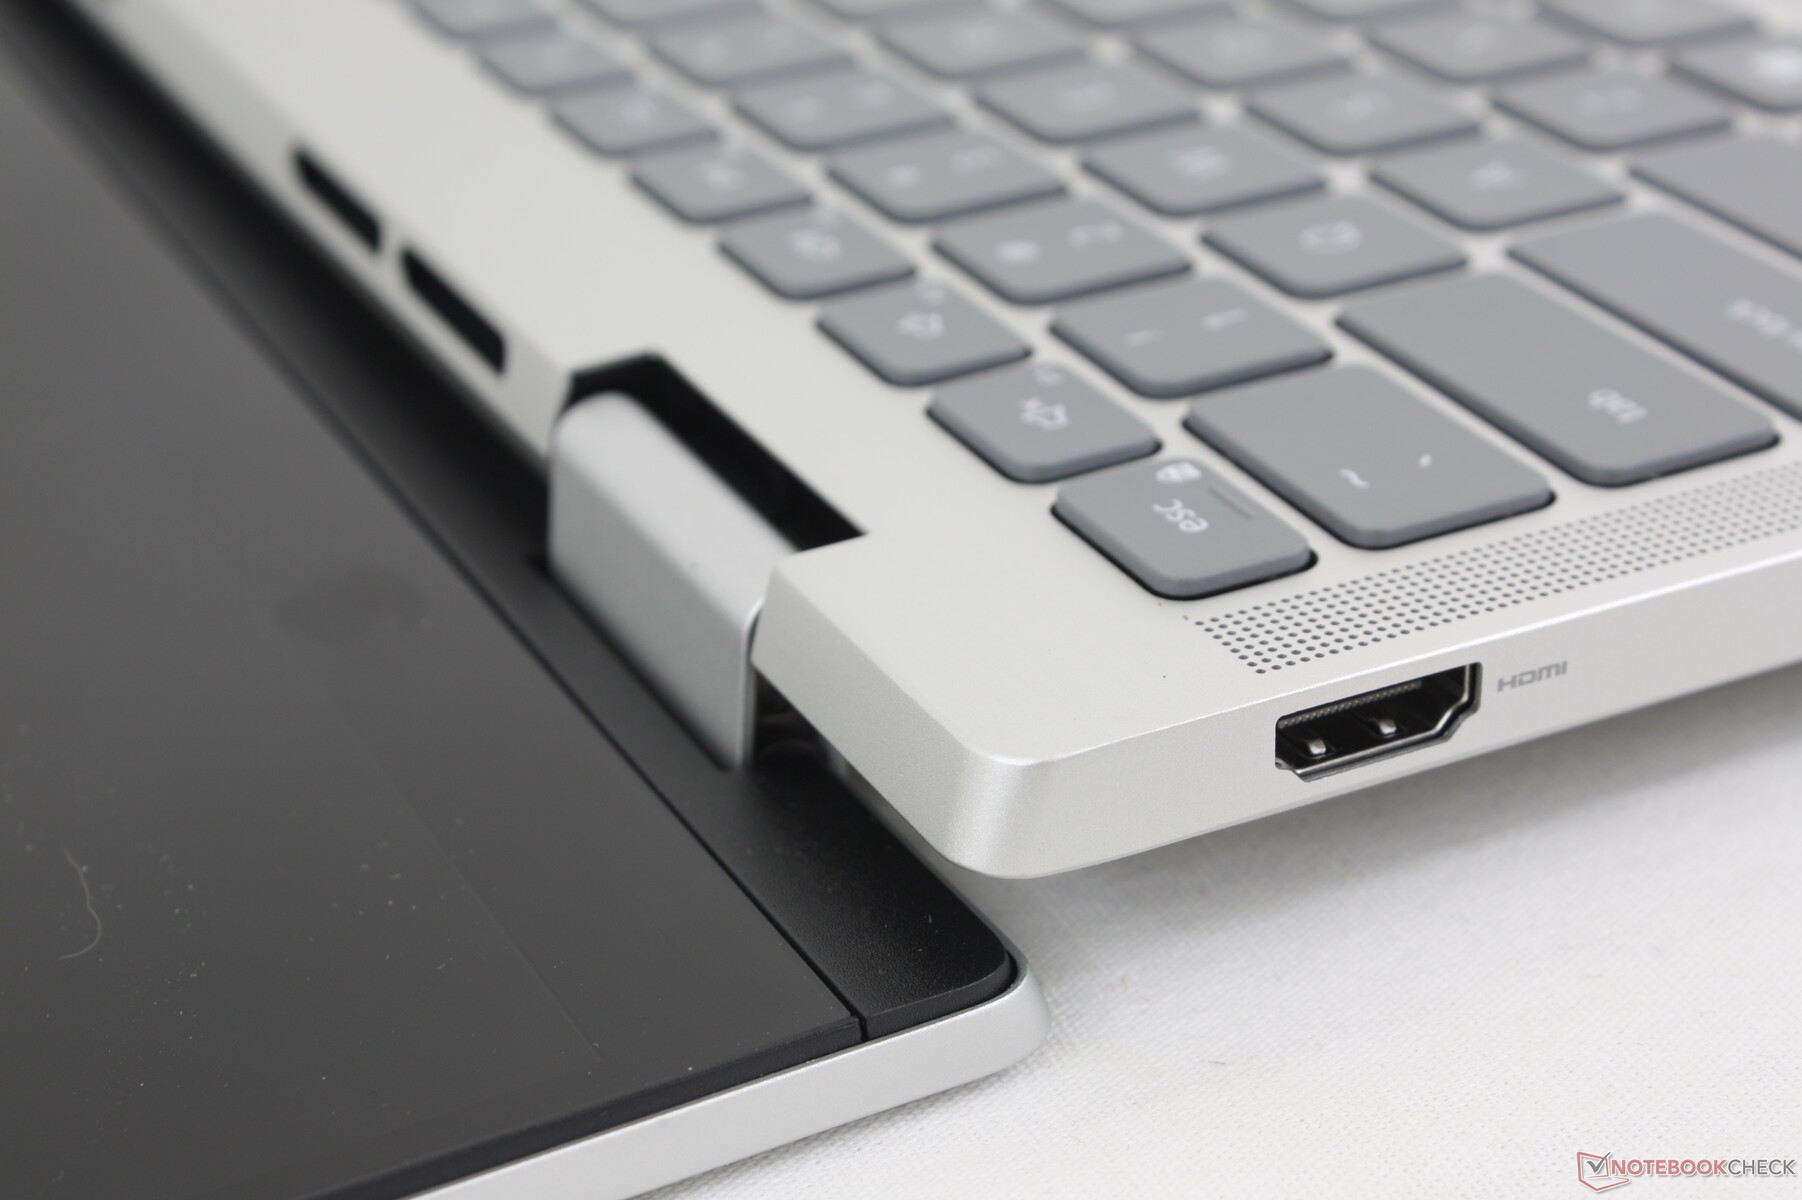
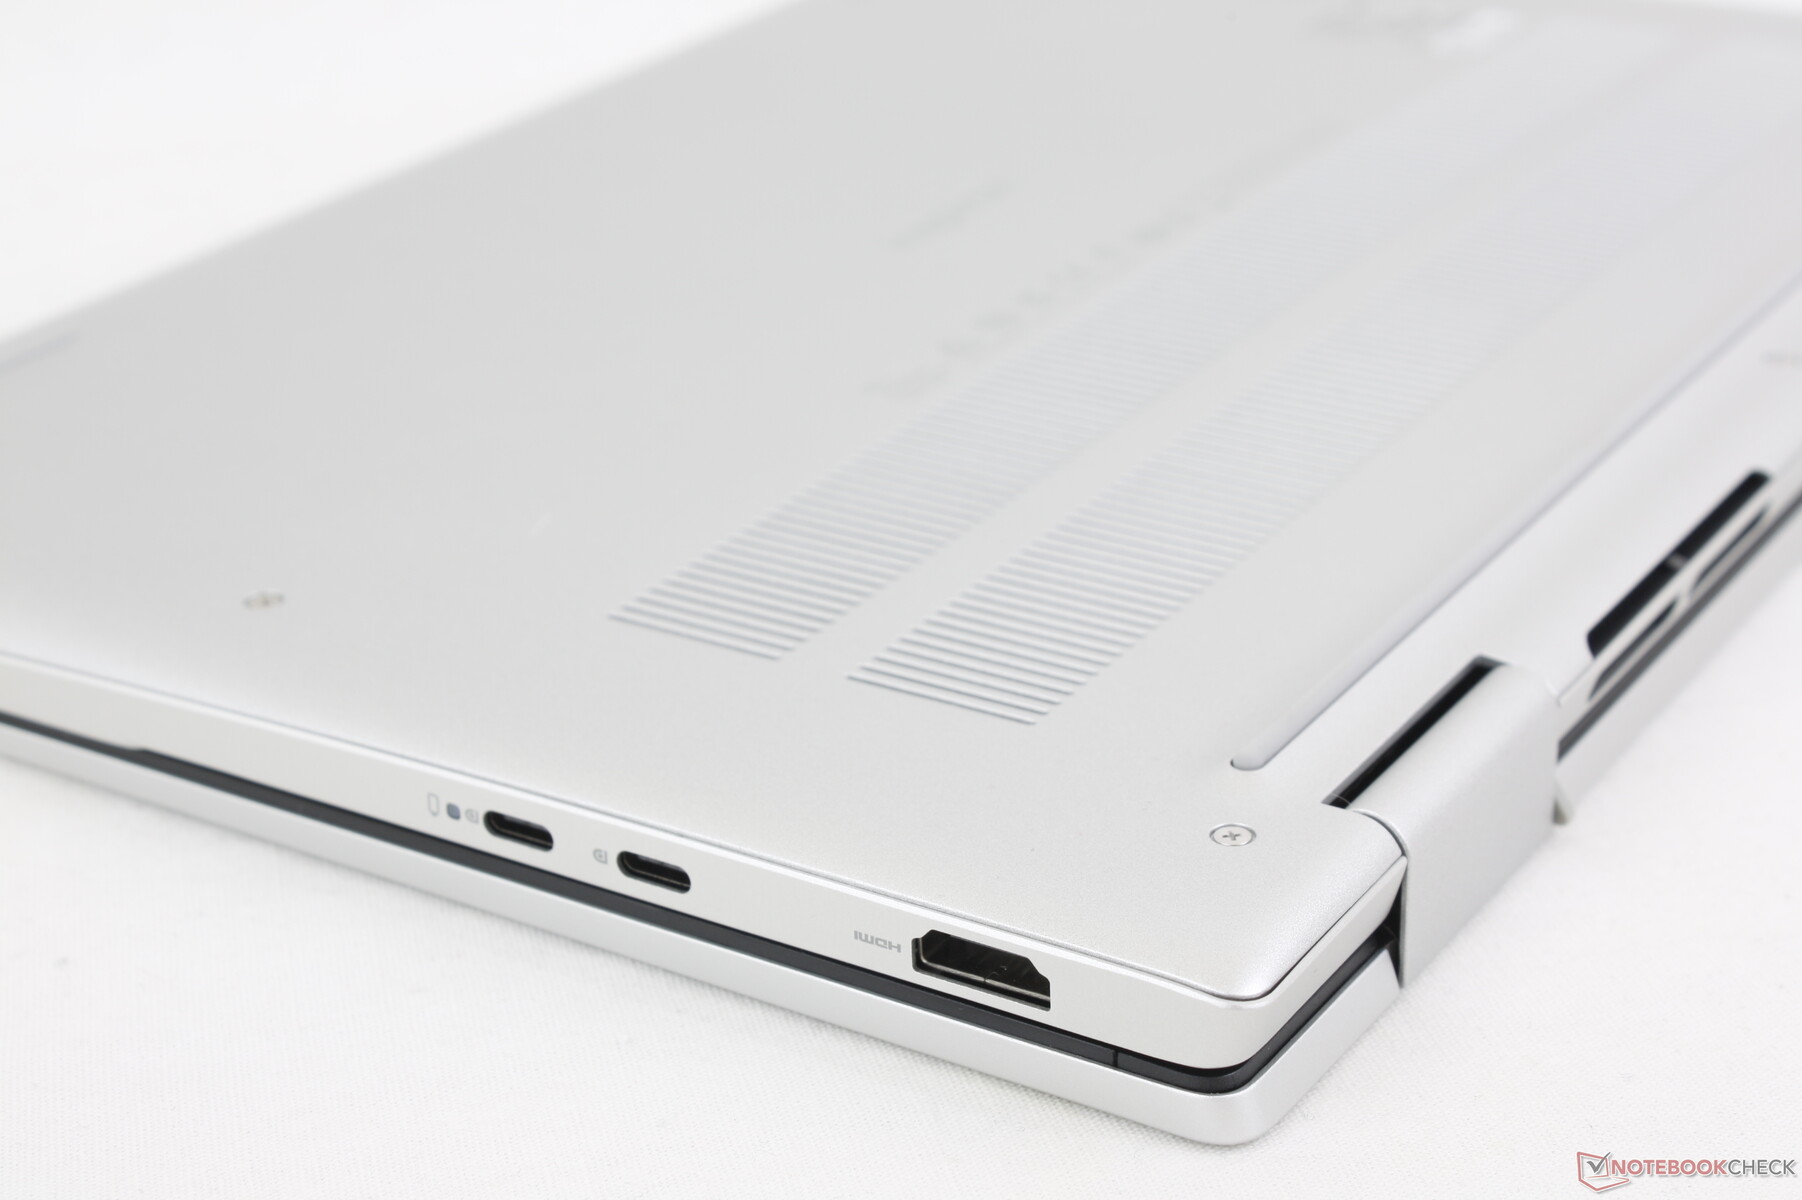
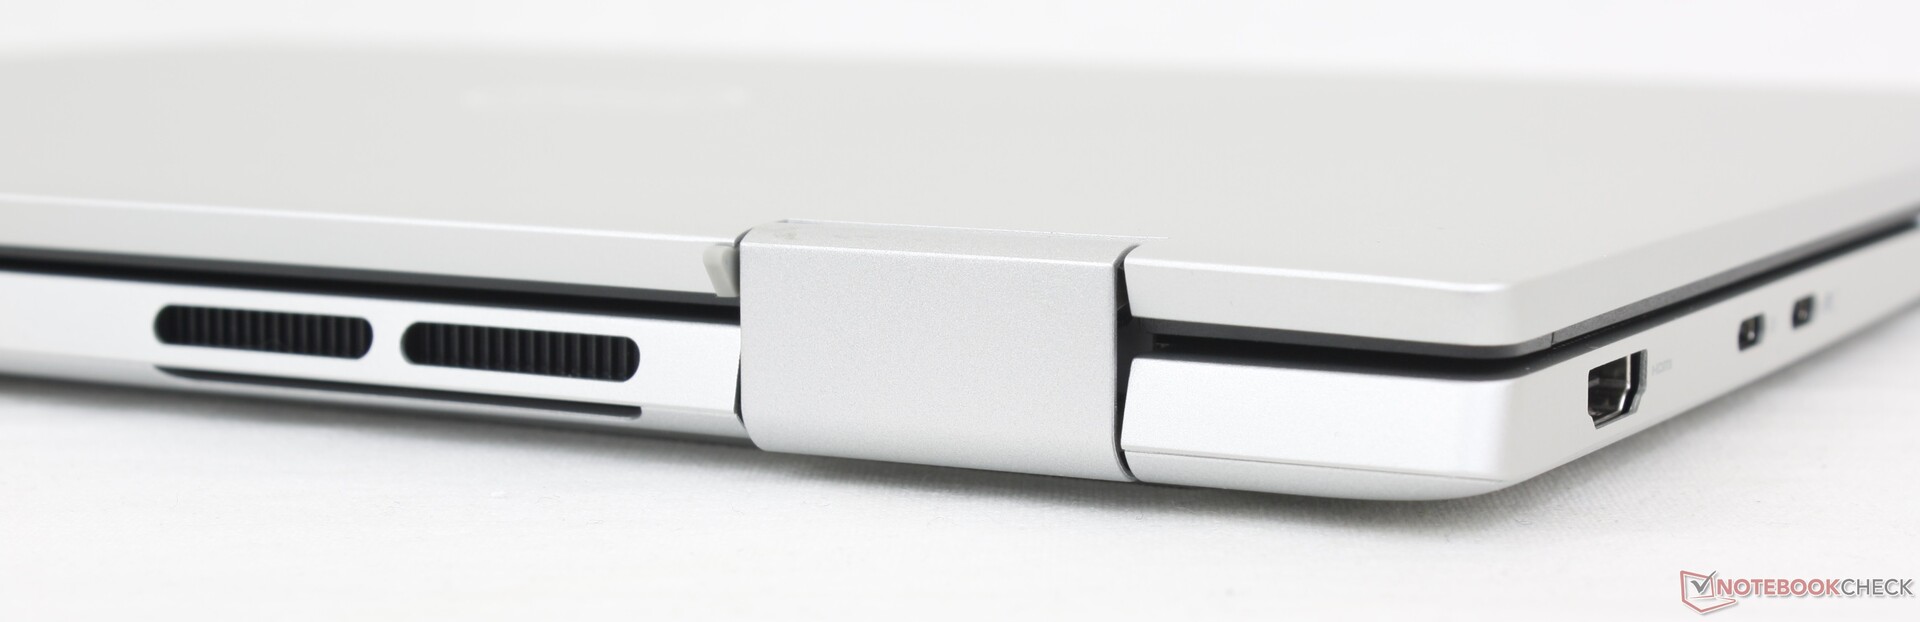
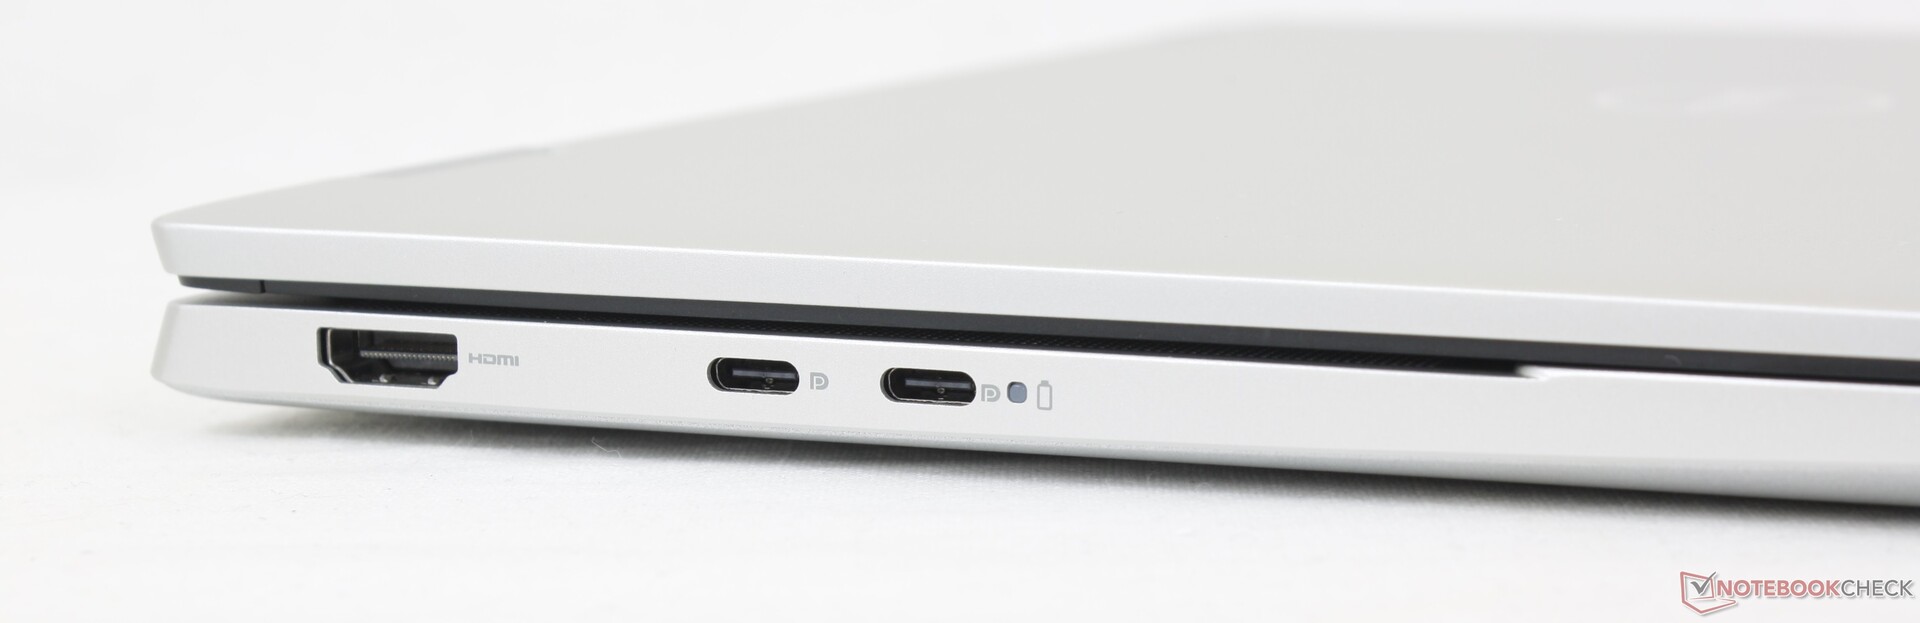
Connectivity
Port options are comparable to the IdeaPad Flex 5i 14 and Pavilion x360 14 with just slight differences in the number of USB ports. Keep in mind that the USB-C ports on our AMD configuration lack Thunderbolt support unlike on the Intel-powered Inspiron 7430 2-in-1.
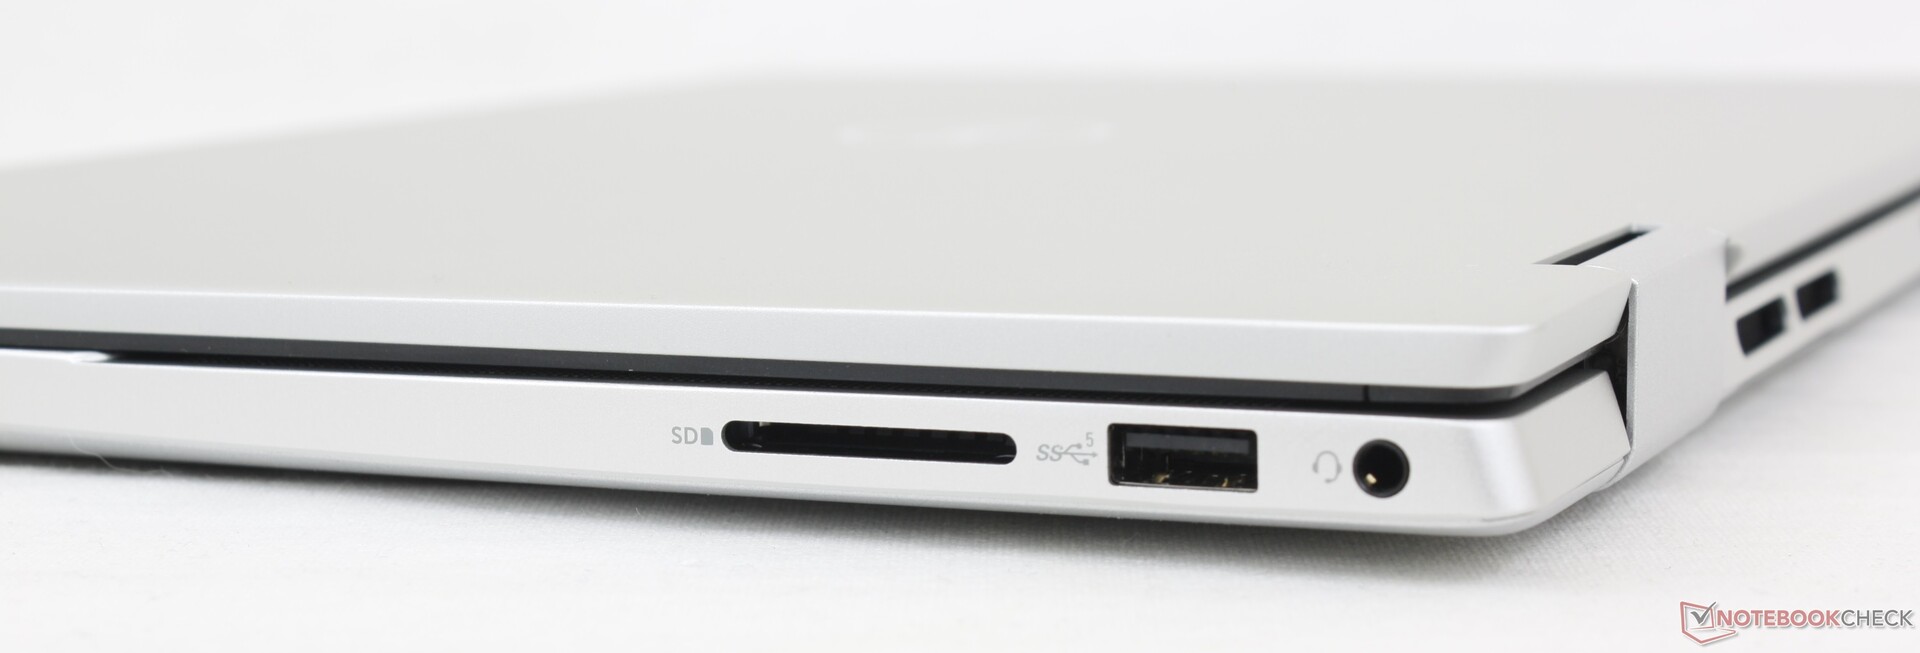
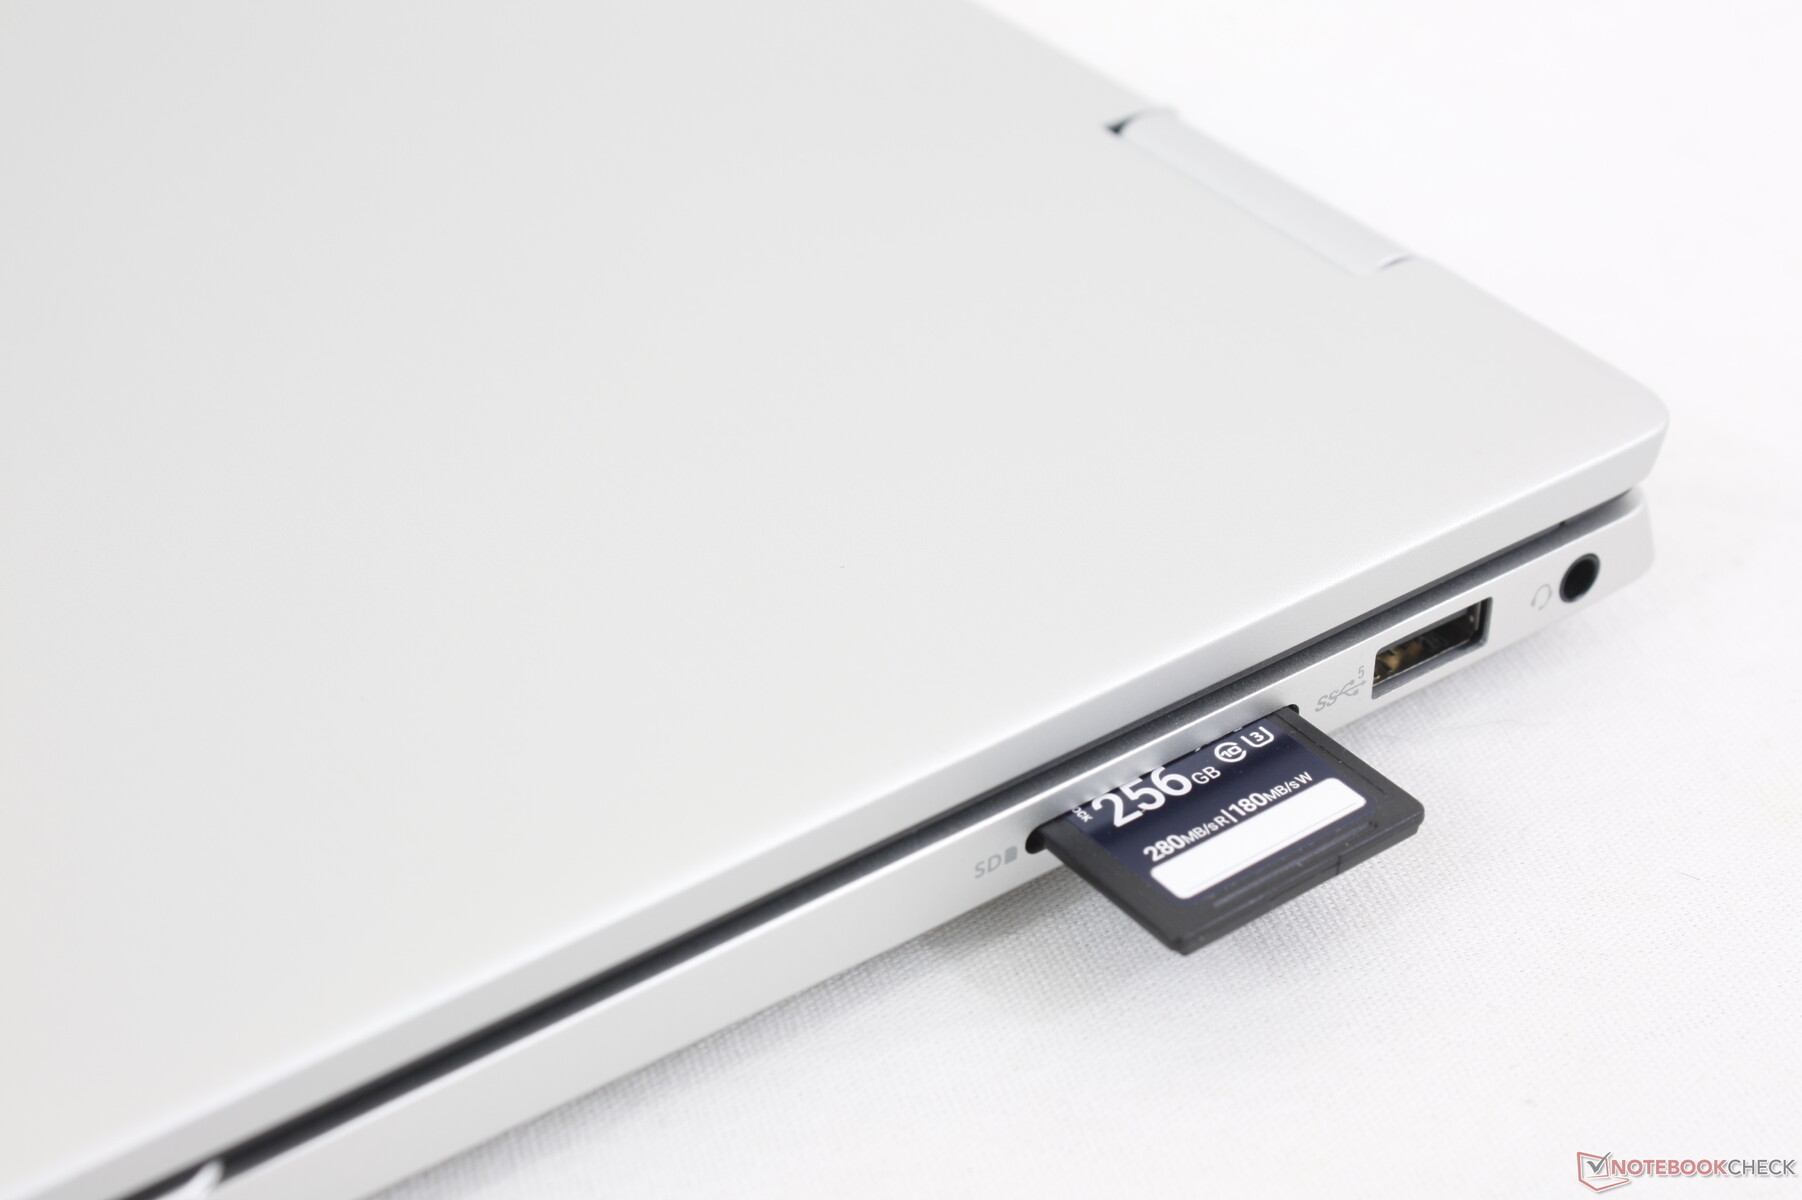
SD Card Reader
Transfer rates from the integrated SD card reader have improved slightly from ~20 MB/s on last year's Inspiron 7420 to ~35 MB/s on our latest model. Even so, the SD readers on competing models like the IdeaPad Flex 7i or Pavilion x360 14 are much faster by over 2x.
| SD Card Reader | |
| average JPG Copy Test (av. of 3 runs) | |
| Lenovo IdeaPad Flex 7i 14IAU7 (Toshiba Exceria Pro SDXC 64 GB UHS-II) | |
| HP Pavilion x360 14-dy0157ng (Toshiba Exceria Pro M501 microSDXC 64GB) | |
| LG Gram 14T90P (AV Pro V60) | |
| Dell Inspiron 14 7435 2-in-1 (PNY EliteX-Pro60 V60 256 GB) | |
| Dell Inspiron 14 7420 2-in-1 (Toshiba Exceria Pro SDXC 64 GB UHS-II) | |
| maximum AS SSD Seq Read Test (1GB) | |
| Lenovo IdeaPad Flex 7i 14IAU7 (Toshiba Exceria Pro SDXC 64 GB UHS-II) | |
| LG Gram 14T90P (AV Pro V60) | |
| HP Pavilion x360 14-dy0157ng (Toshiba Exceria Pro M501 microSDXC 64GB) | |
| Dell Inspiron 14 7435 2-in-1 (PNY EliteX-Pro60 V60 256 GB) | |
| Dell Inspiron 14 7420 2-in-1 (Toshiba Exceria Pro SDXC 64 GB UHS-II) | |
Communication
We're surprised to see Wi-Fi6E support on our base configuration. Transfer rates are steady when paired to our Asus AXE11000 6 GHz network, but receive rates are definitely slower than expected by almost half when compared to laptops with the Intel AX211.
| Networking | |
| iperf3 transmit AX12 | |
| HP Pavilion x360 14-dy0157ng | |
| iperf3 receive AX12 | |
| HP Pavilion x360 14-dy0157ng | |
| iperf3 transmit AXE11000 | |
| Acer Aspire 5 Spin 14 | |
| Dell Inspiron 14 7435 2-in-1 | |
| Lenovo IdeaPad Flex 7i 14IAU7 | |
| LG Gram 14T90P | |
| iperf3 receive AXE11000 | |
| Acer Aspire 5 Spin 14 | |
| LG Gram 14T90P | |
| Lenovo IdeaPad Flex 7i 14IAU7 | |
| Dell Inspiron 14 7435 2-in-1 | |
| iperf3 transmit AXE11000 6GHz | |
| Dell Inspiron 14 7435 2-in-1 | |
| Acer Aspire 5 Spin 14 | |
| Lenovo IdeaPad Flex 7i 14IAU7 | |
| Dell Inspiron 14 7420 2-in-1 | |
| iperf3 receive AXE11000 6GHz | |
| Acer Aspire 5 Spin 14 | |
| Dell Inspiron 14 7420 2-in-1 | |
| Lenovo IdeaPad Flex 7i 14IAU7 | |
| Dell Inspiron 14 7435 2-in-1 | |
Webcam
Dell has made no changes to the 2 MP or 1080p webcam. A privacy shutter is included while IR continues to be omitted to save on costs.


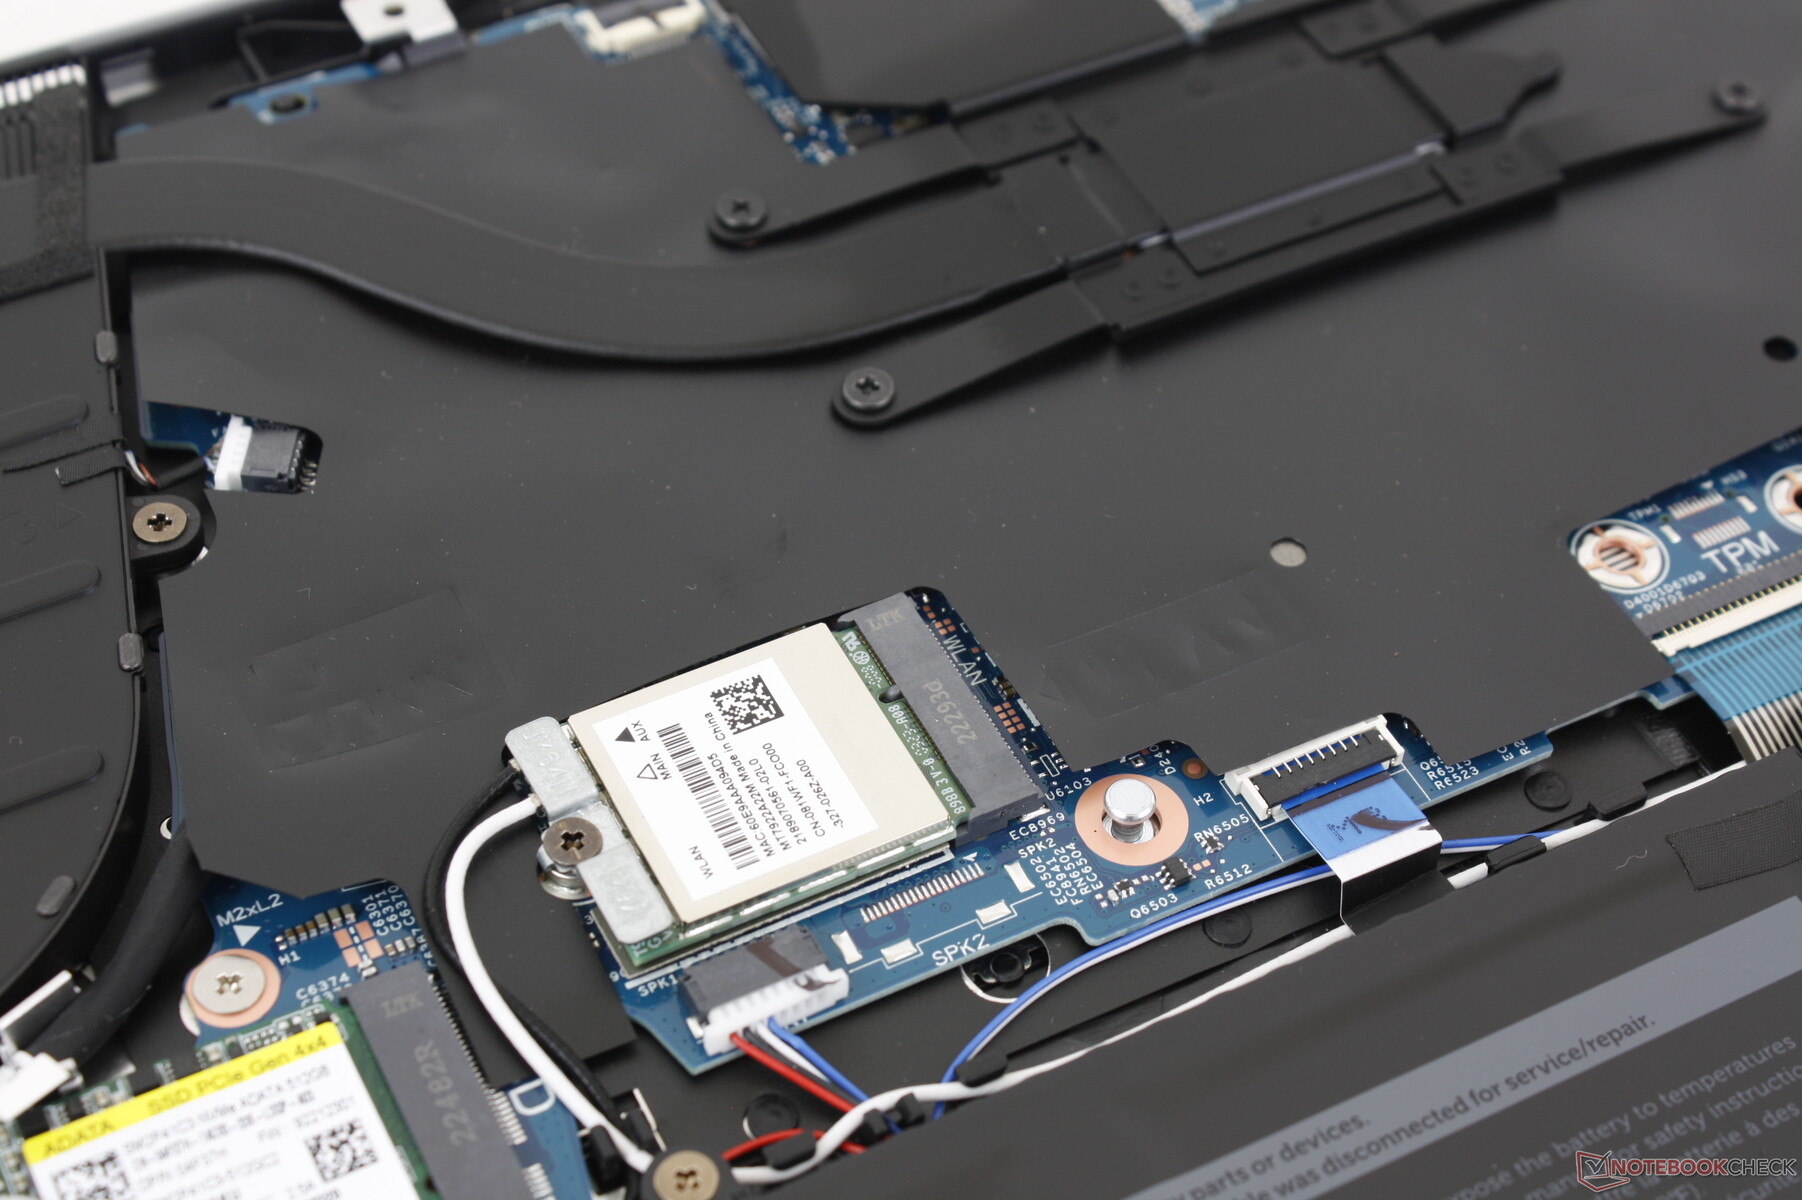
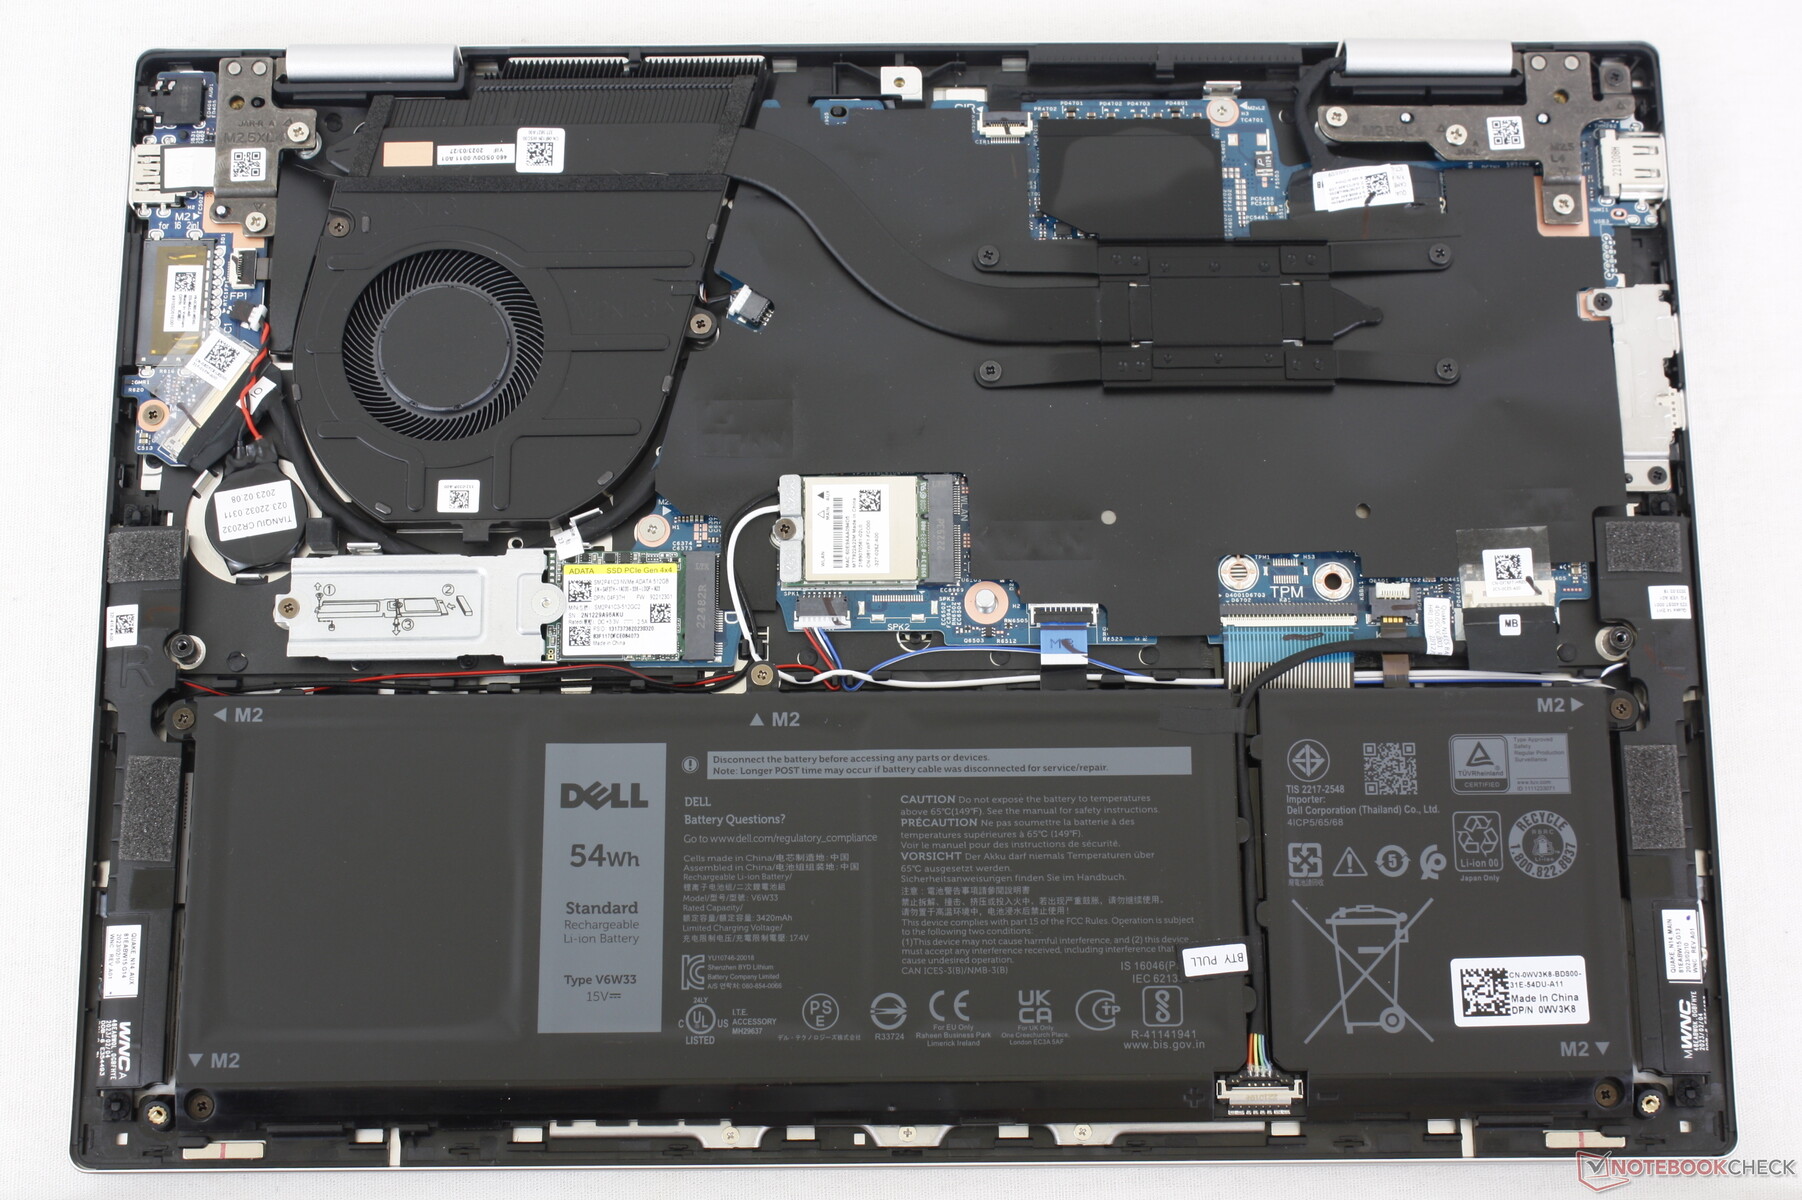
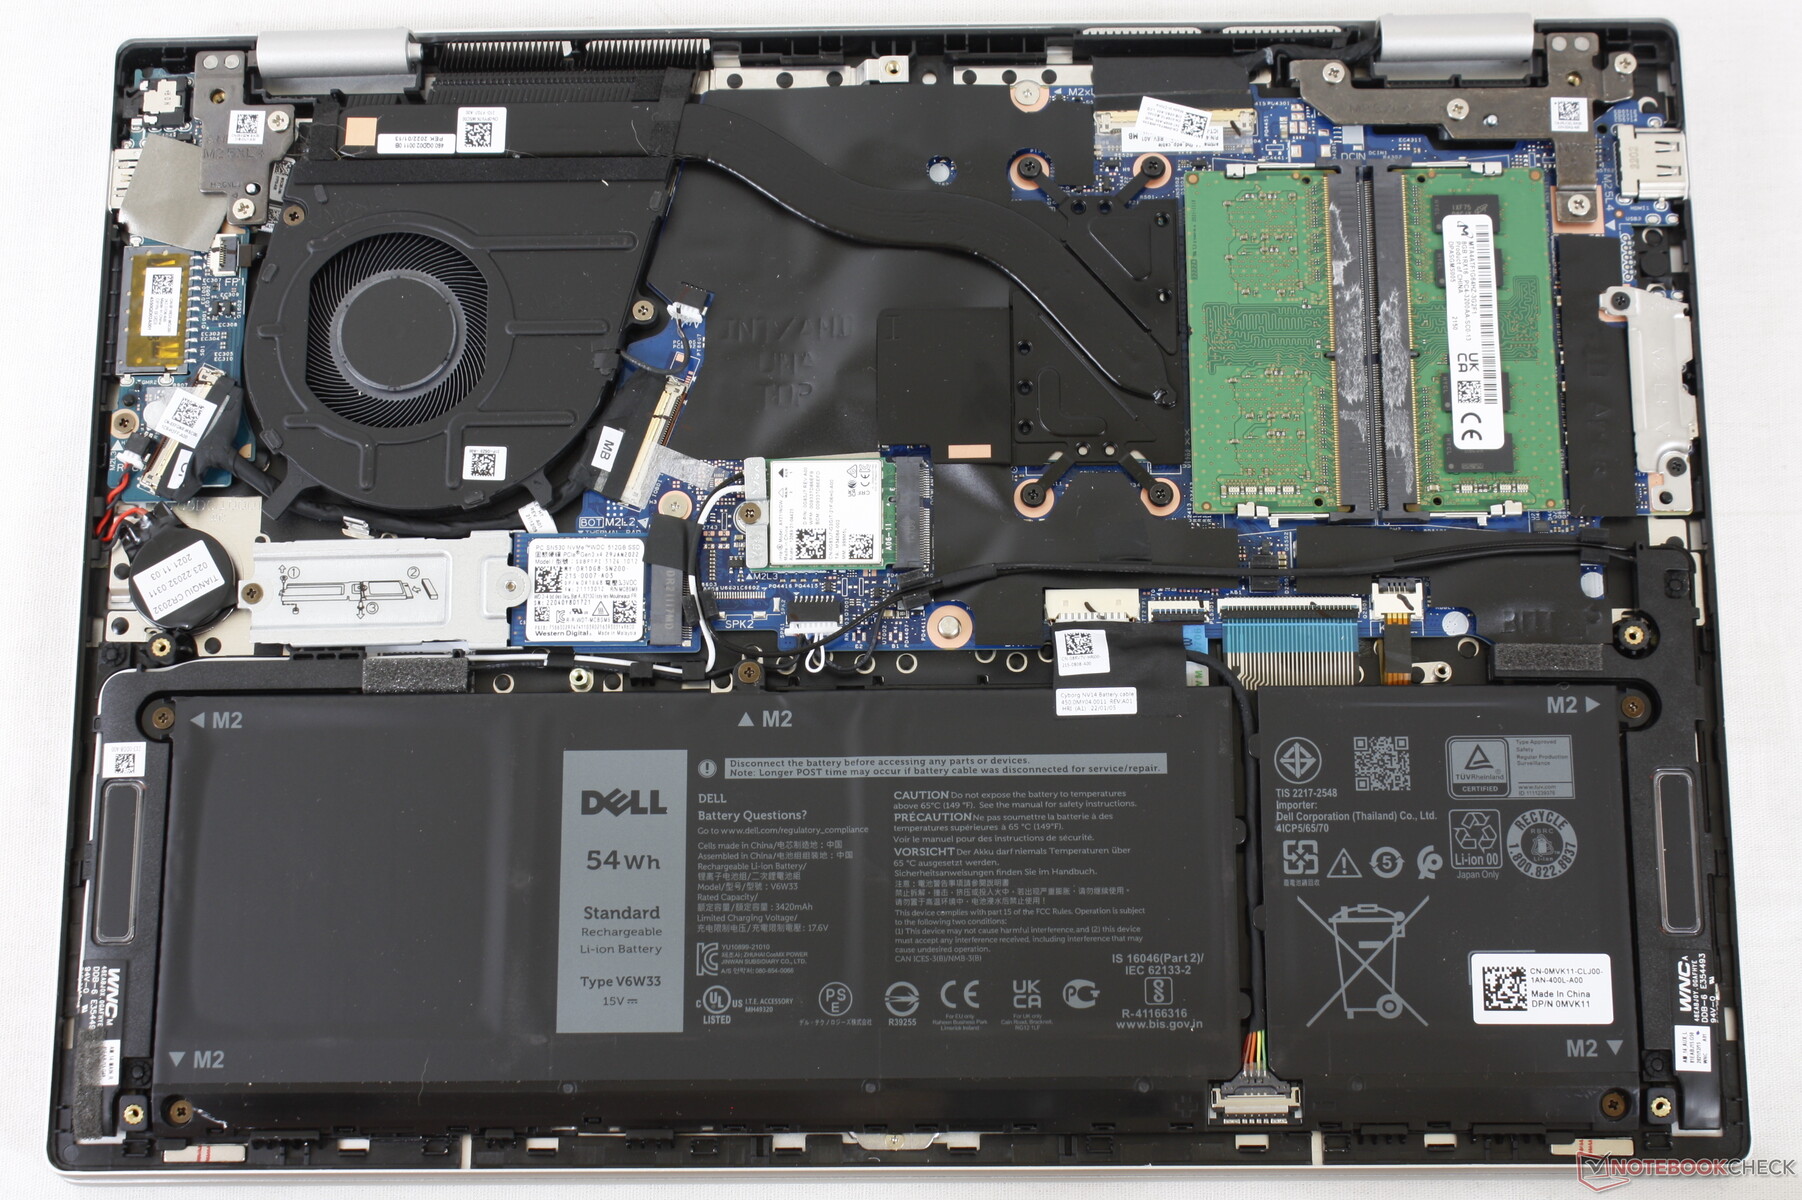
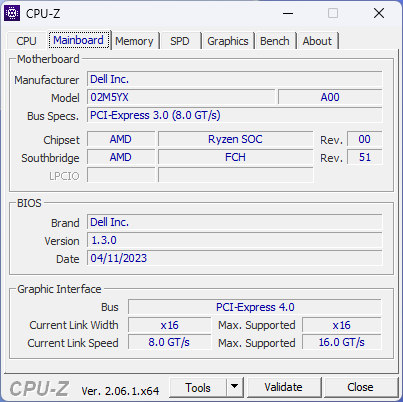
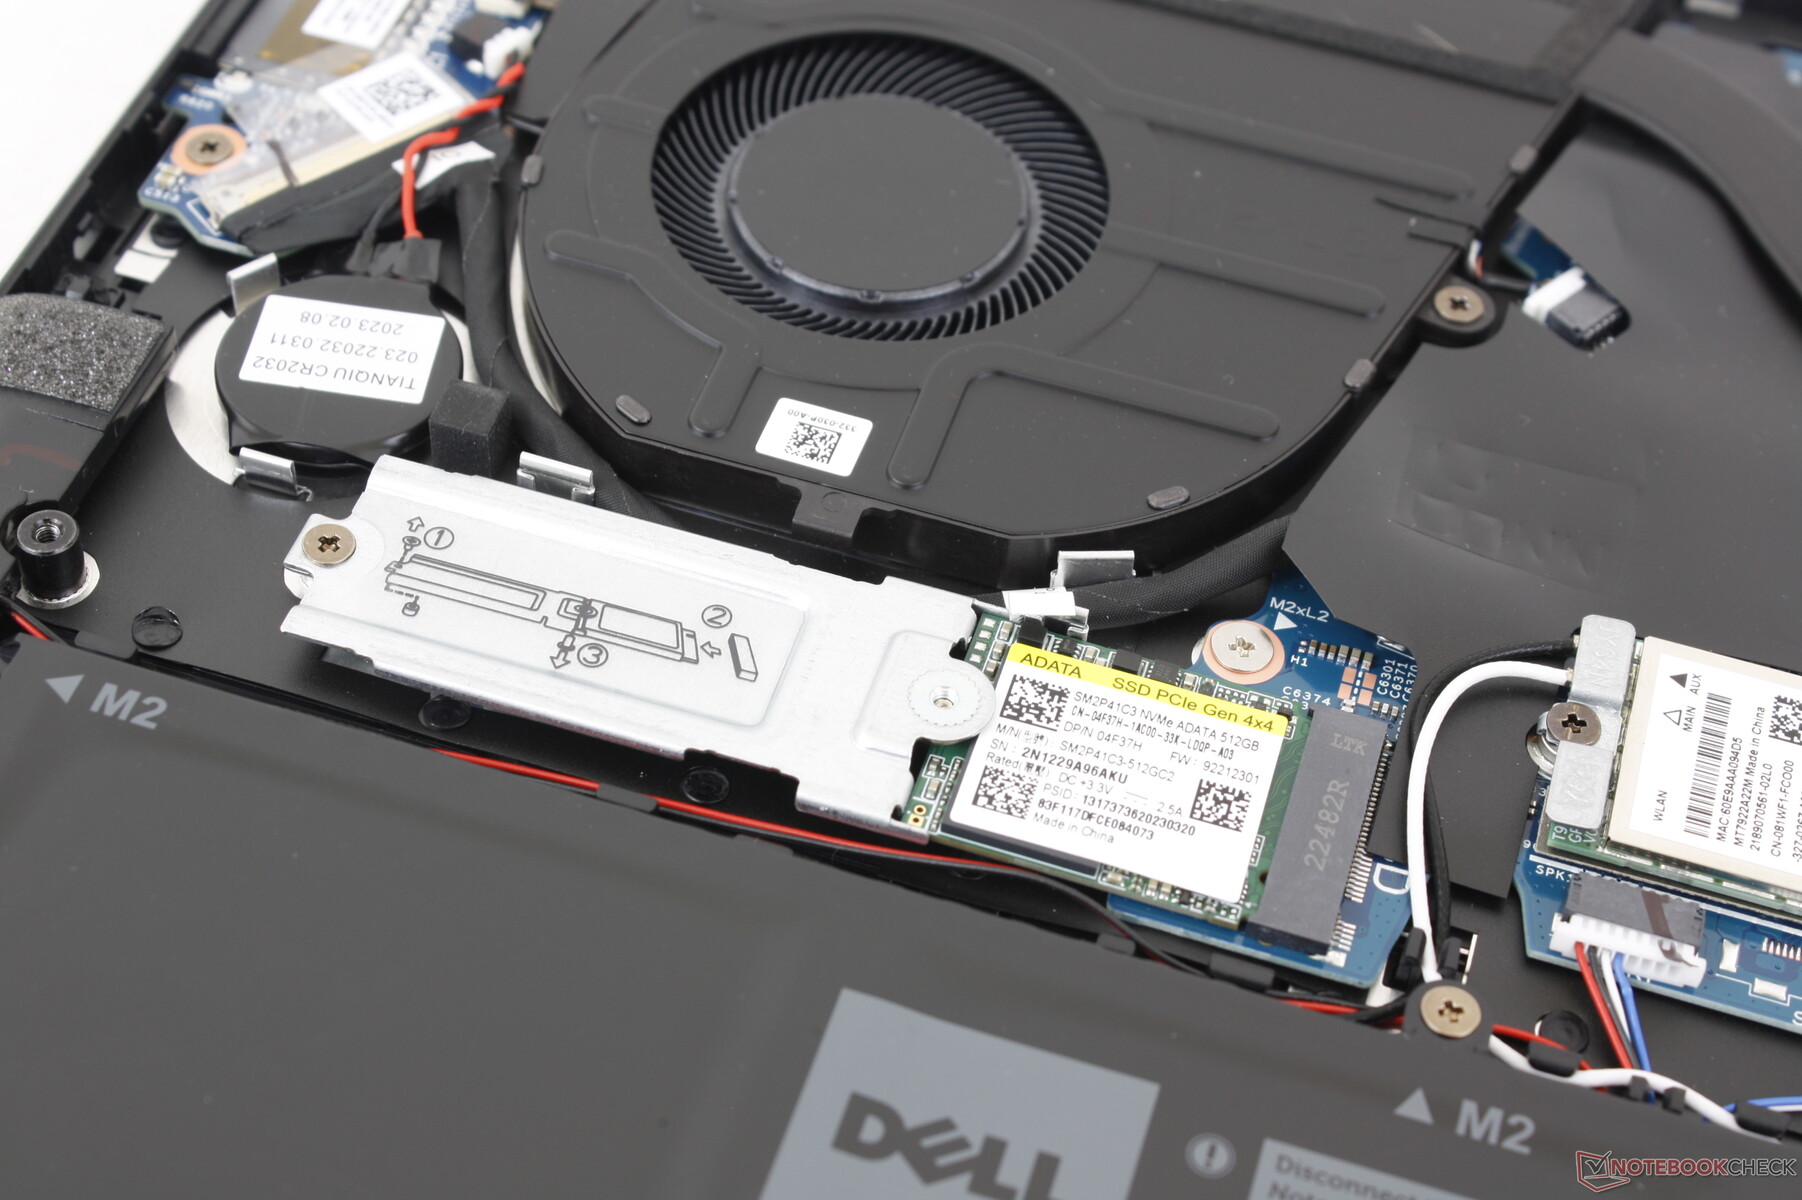
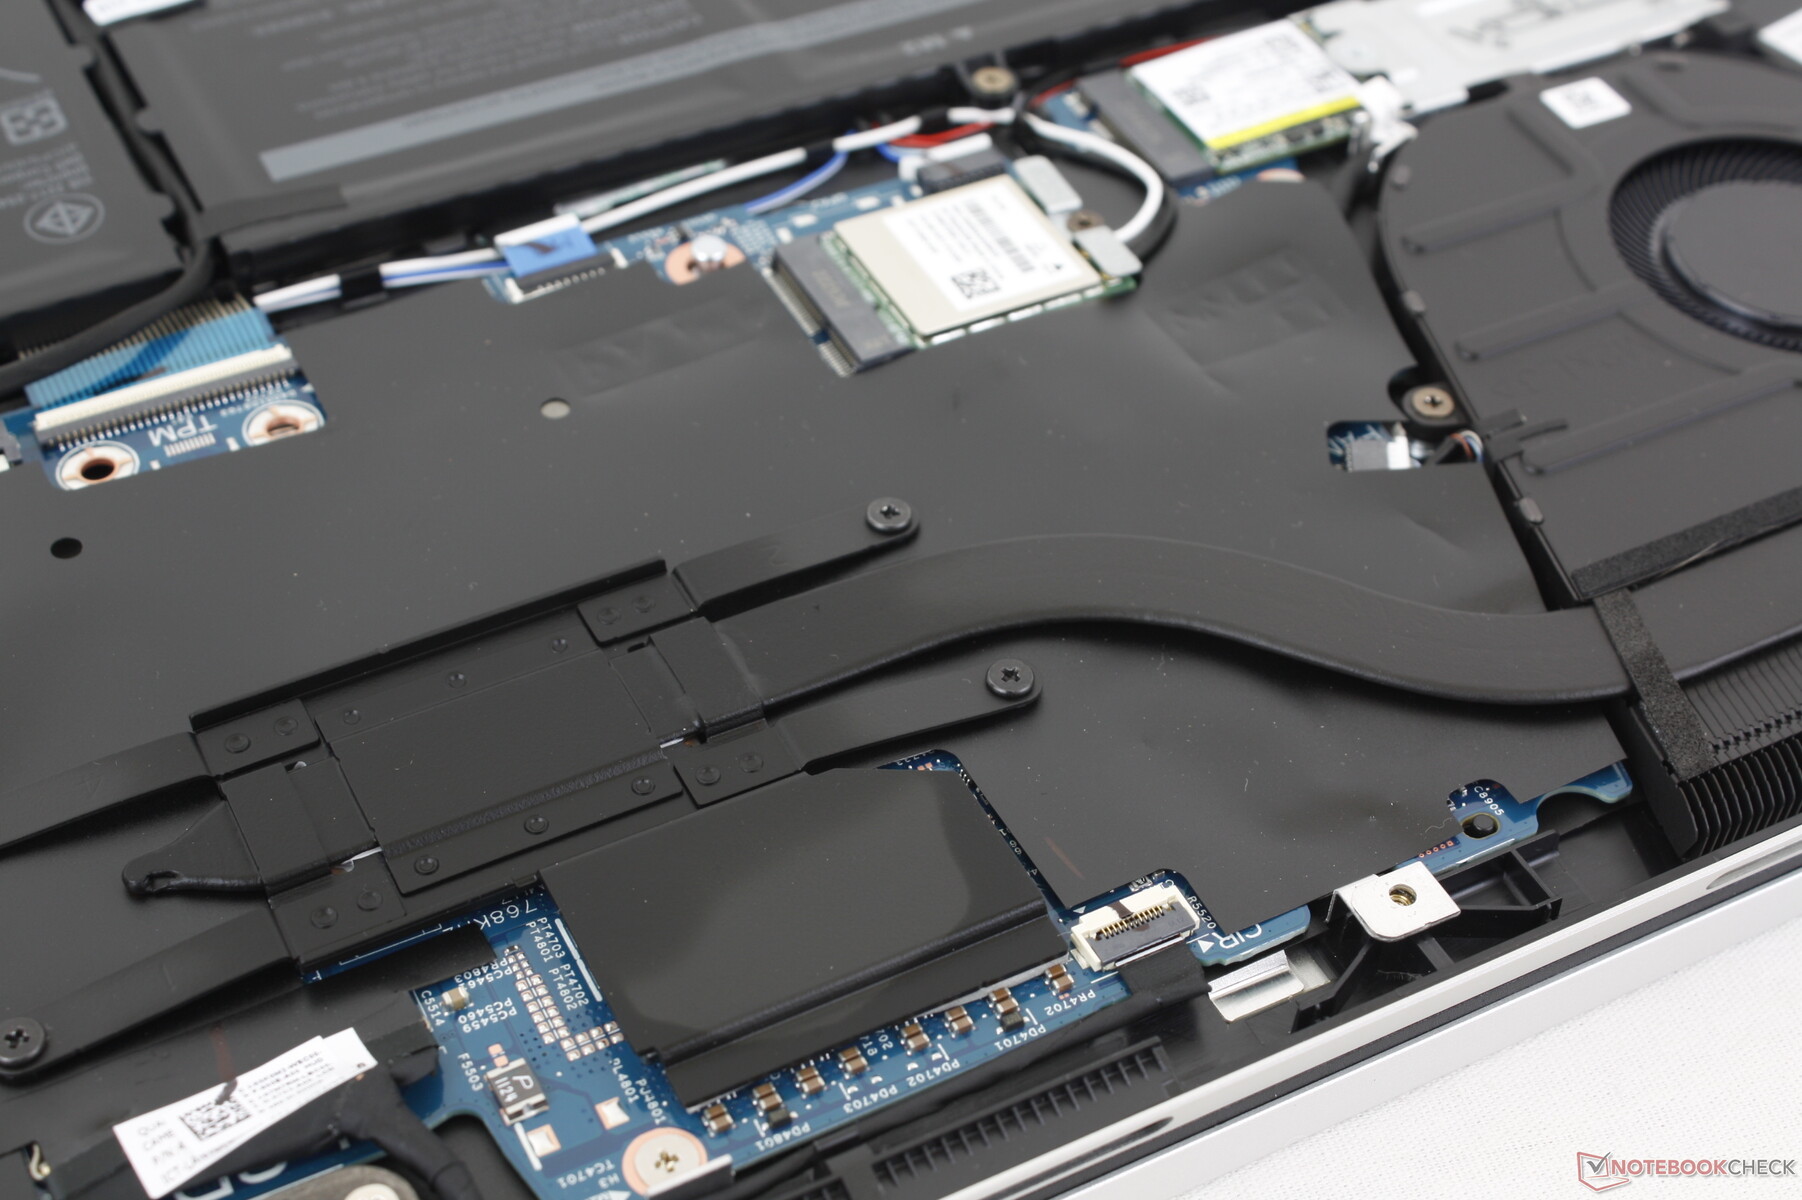
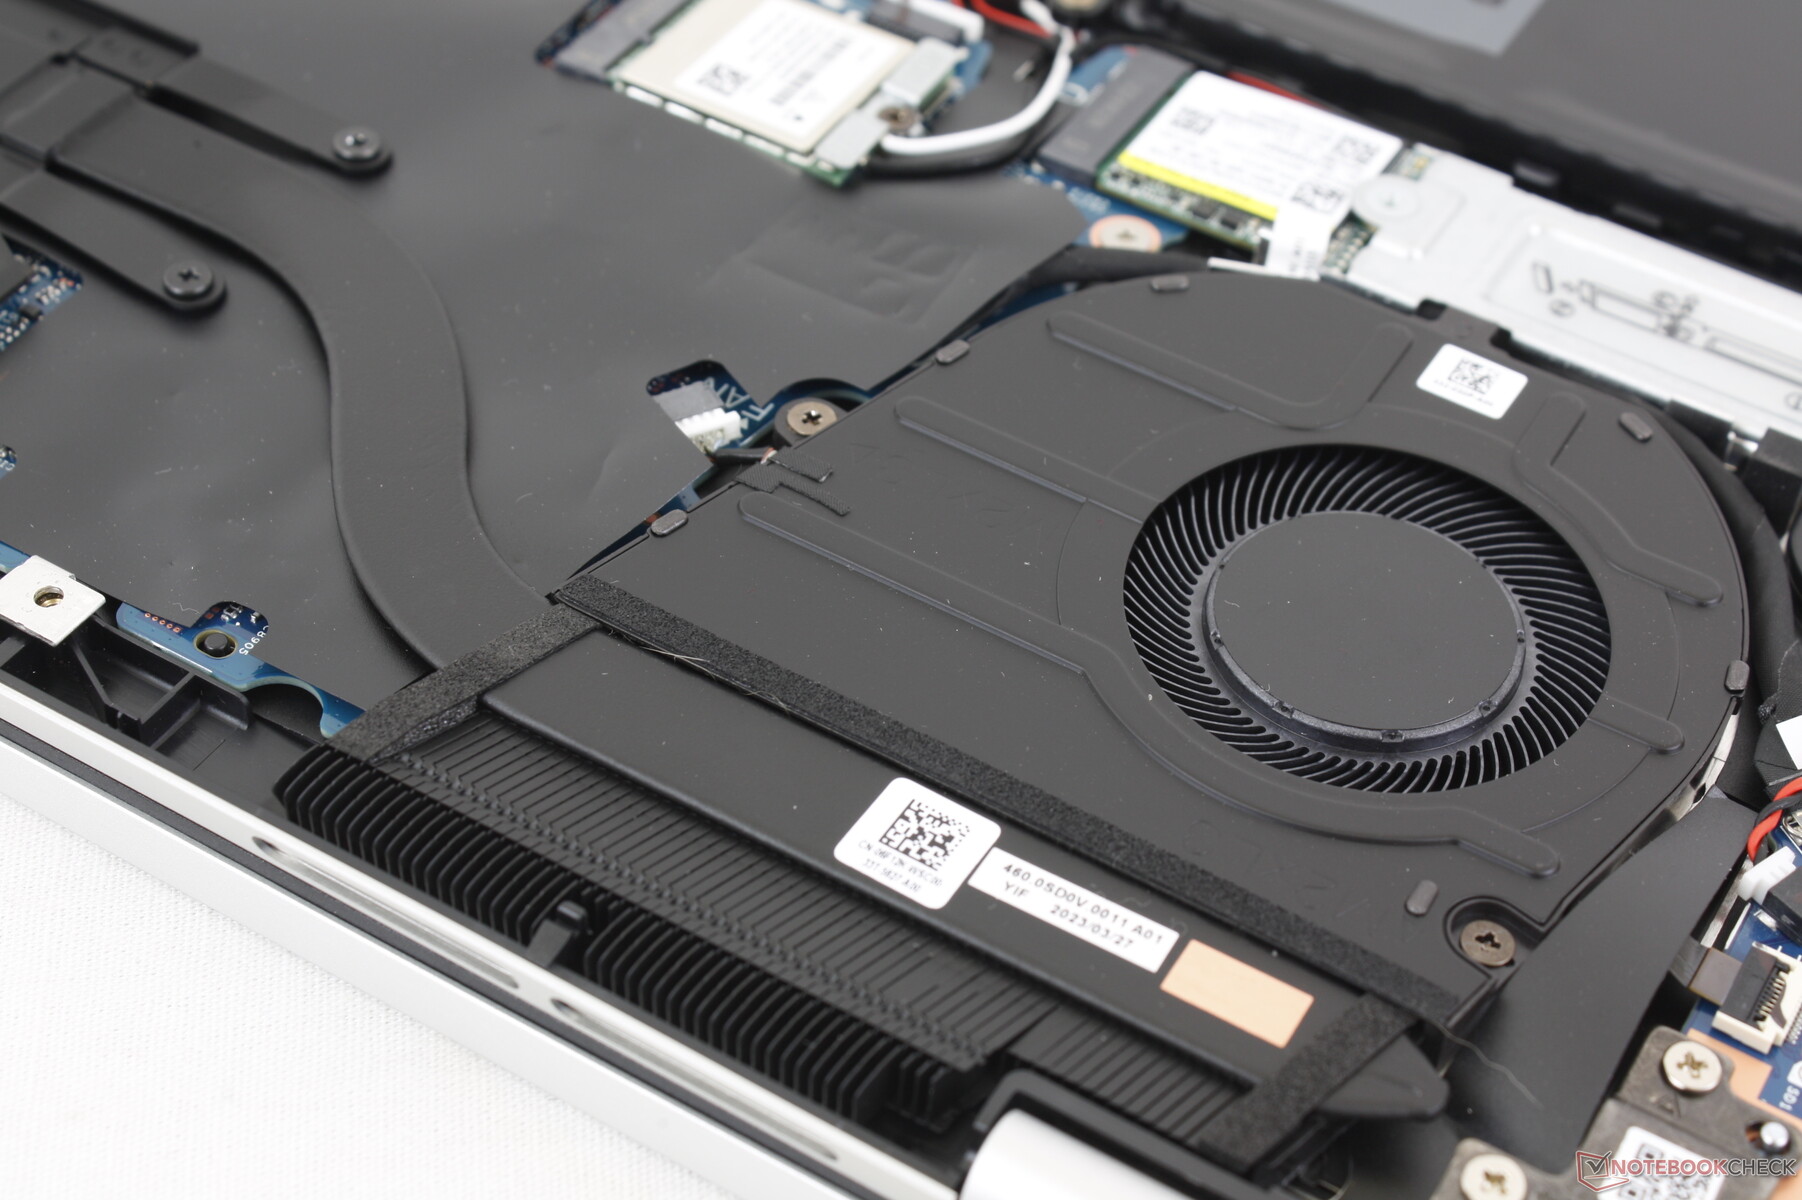
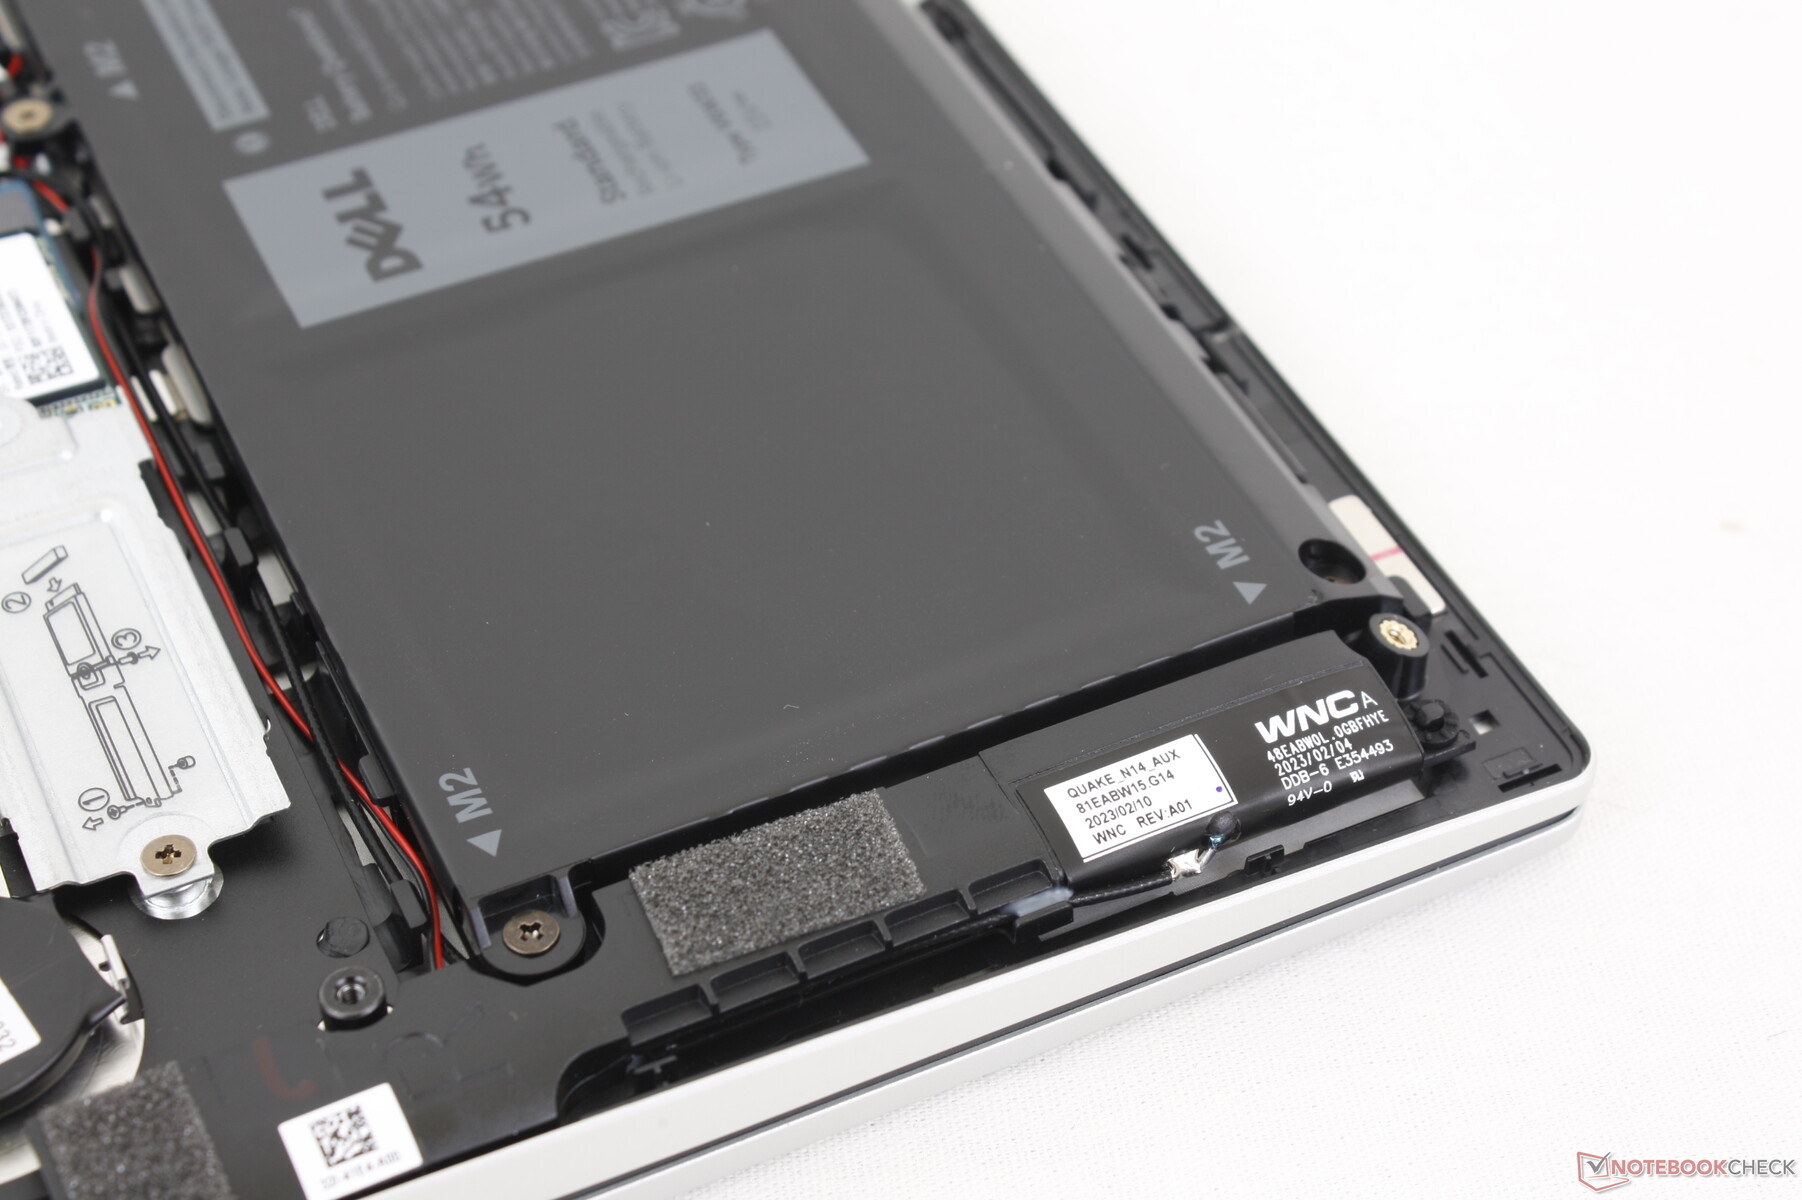
Maintenance
Dell has made one major change to the motherboard when compared to last year's design: RAM is now soldered instead of socketed as shown by the images below. Though unfortunate to see, soldered RAM is common on other budget convertibles like the IdeaPad Flex 7 or Acer Aspire 5 Spin 14.
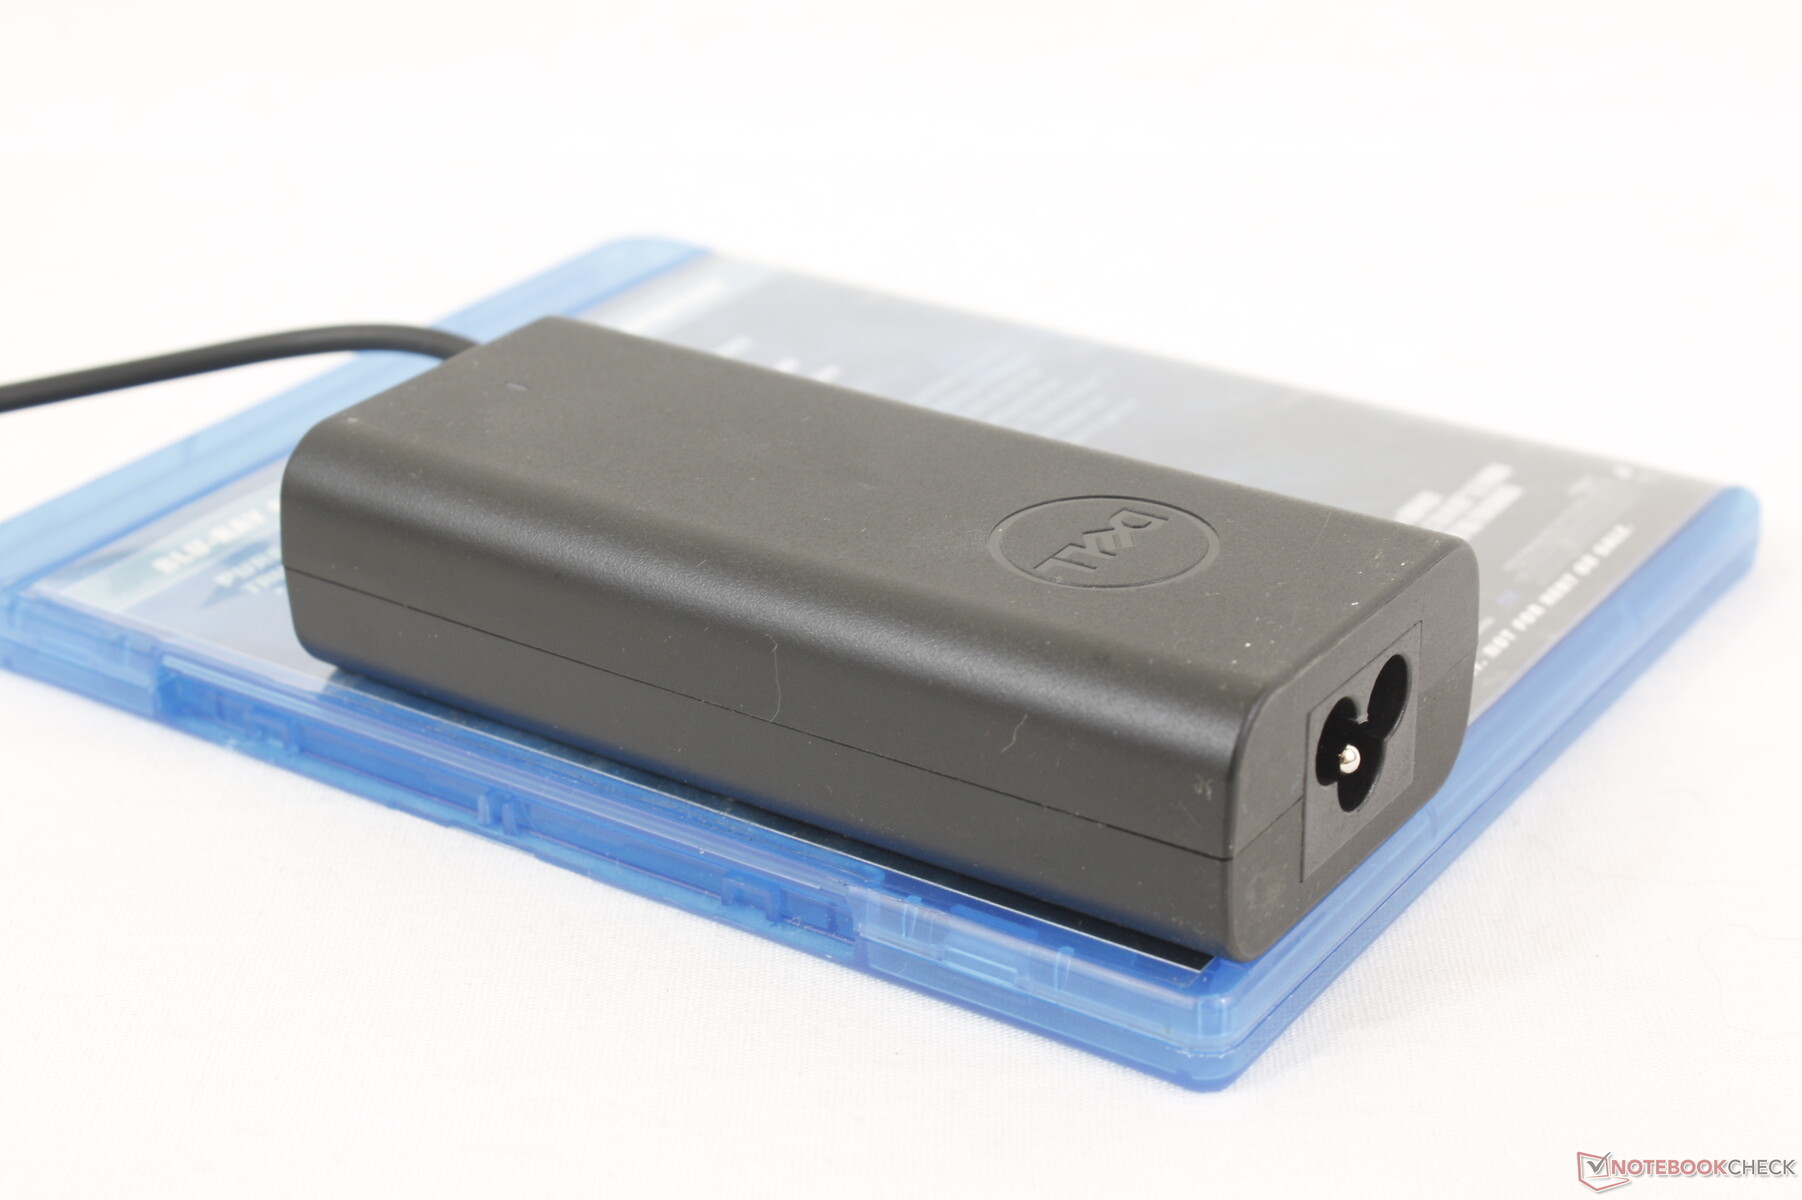
Accessories And Warranty
There are no extras in the box other than the AC adapter and paperwork. The usual one-year limited manufacturer warranty applies.
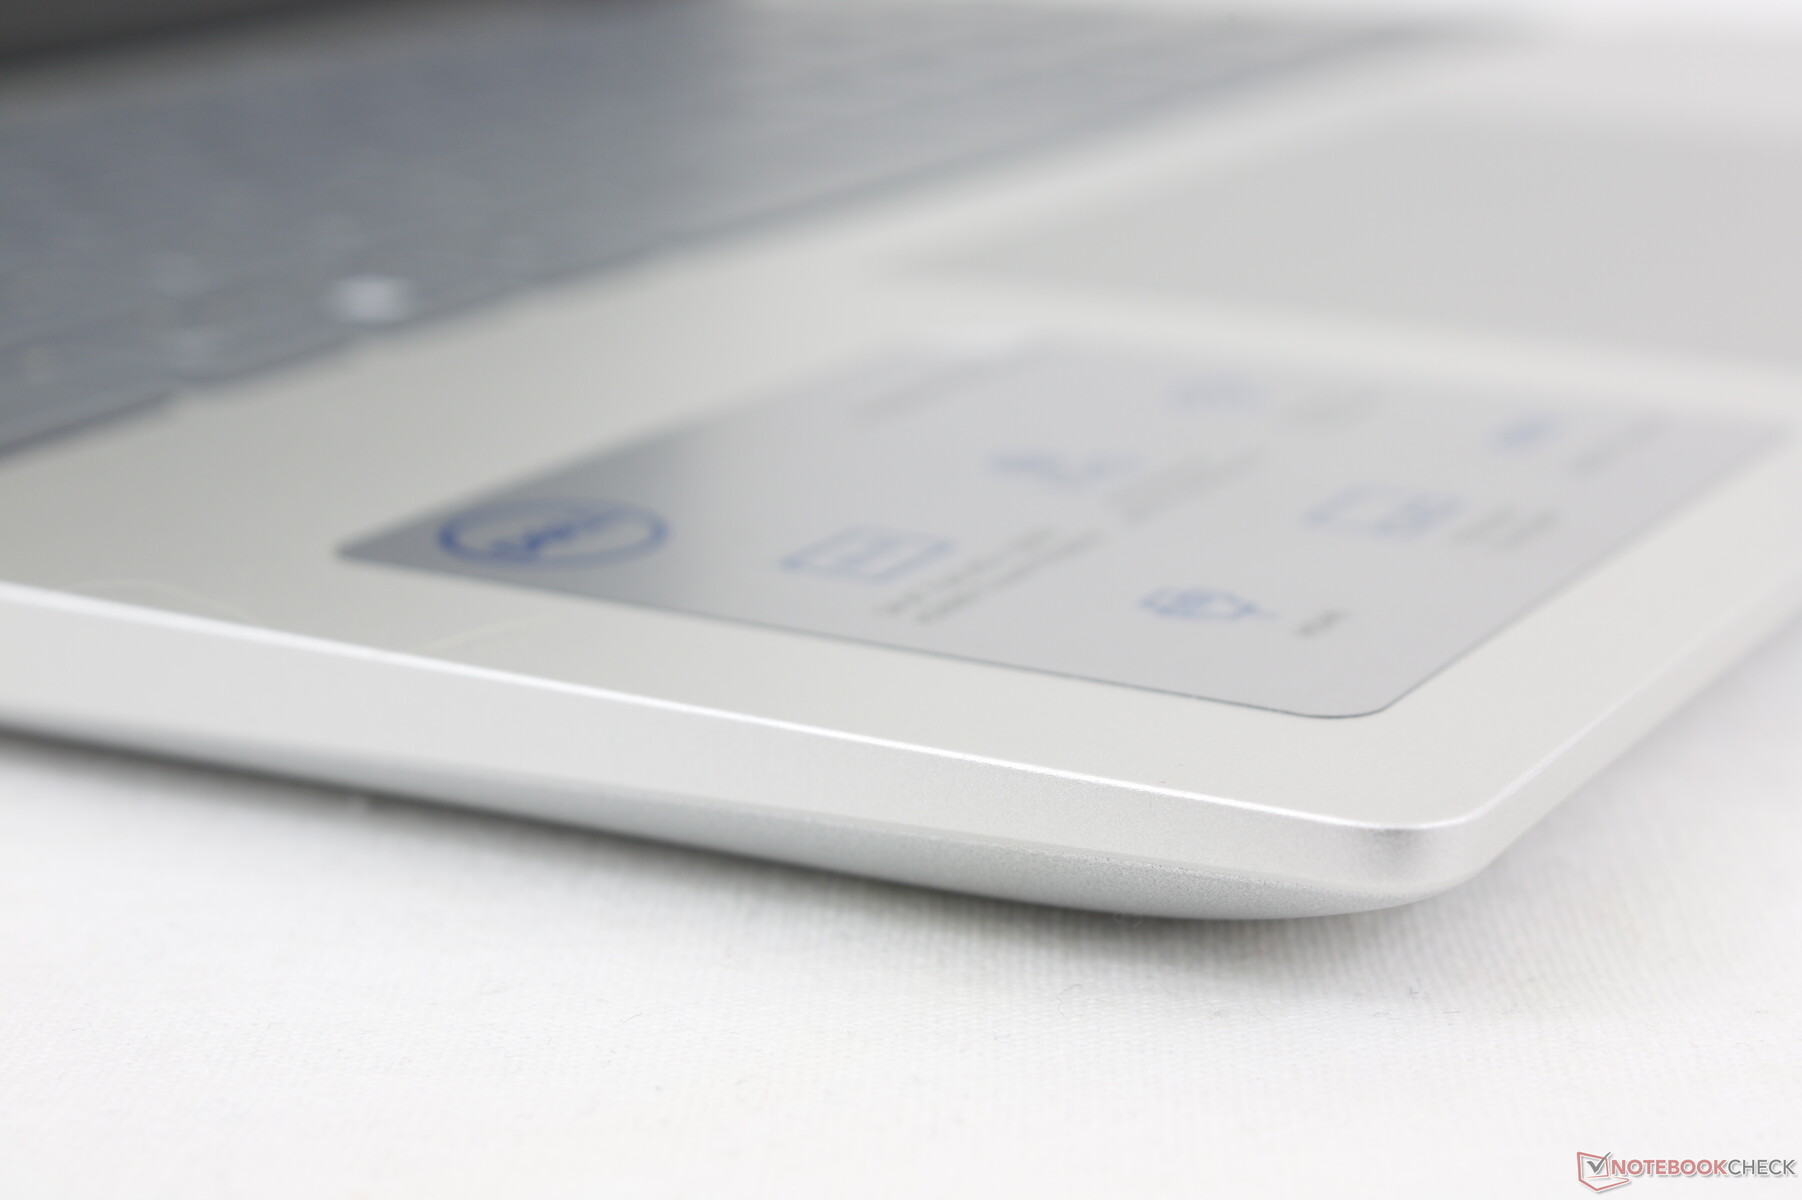
Input Devices — No More Mylar
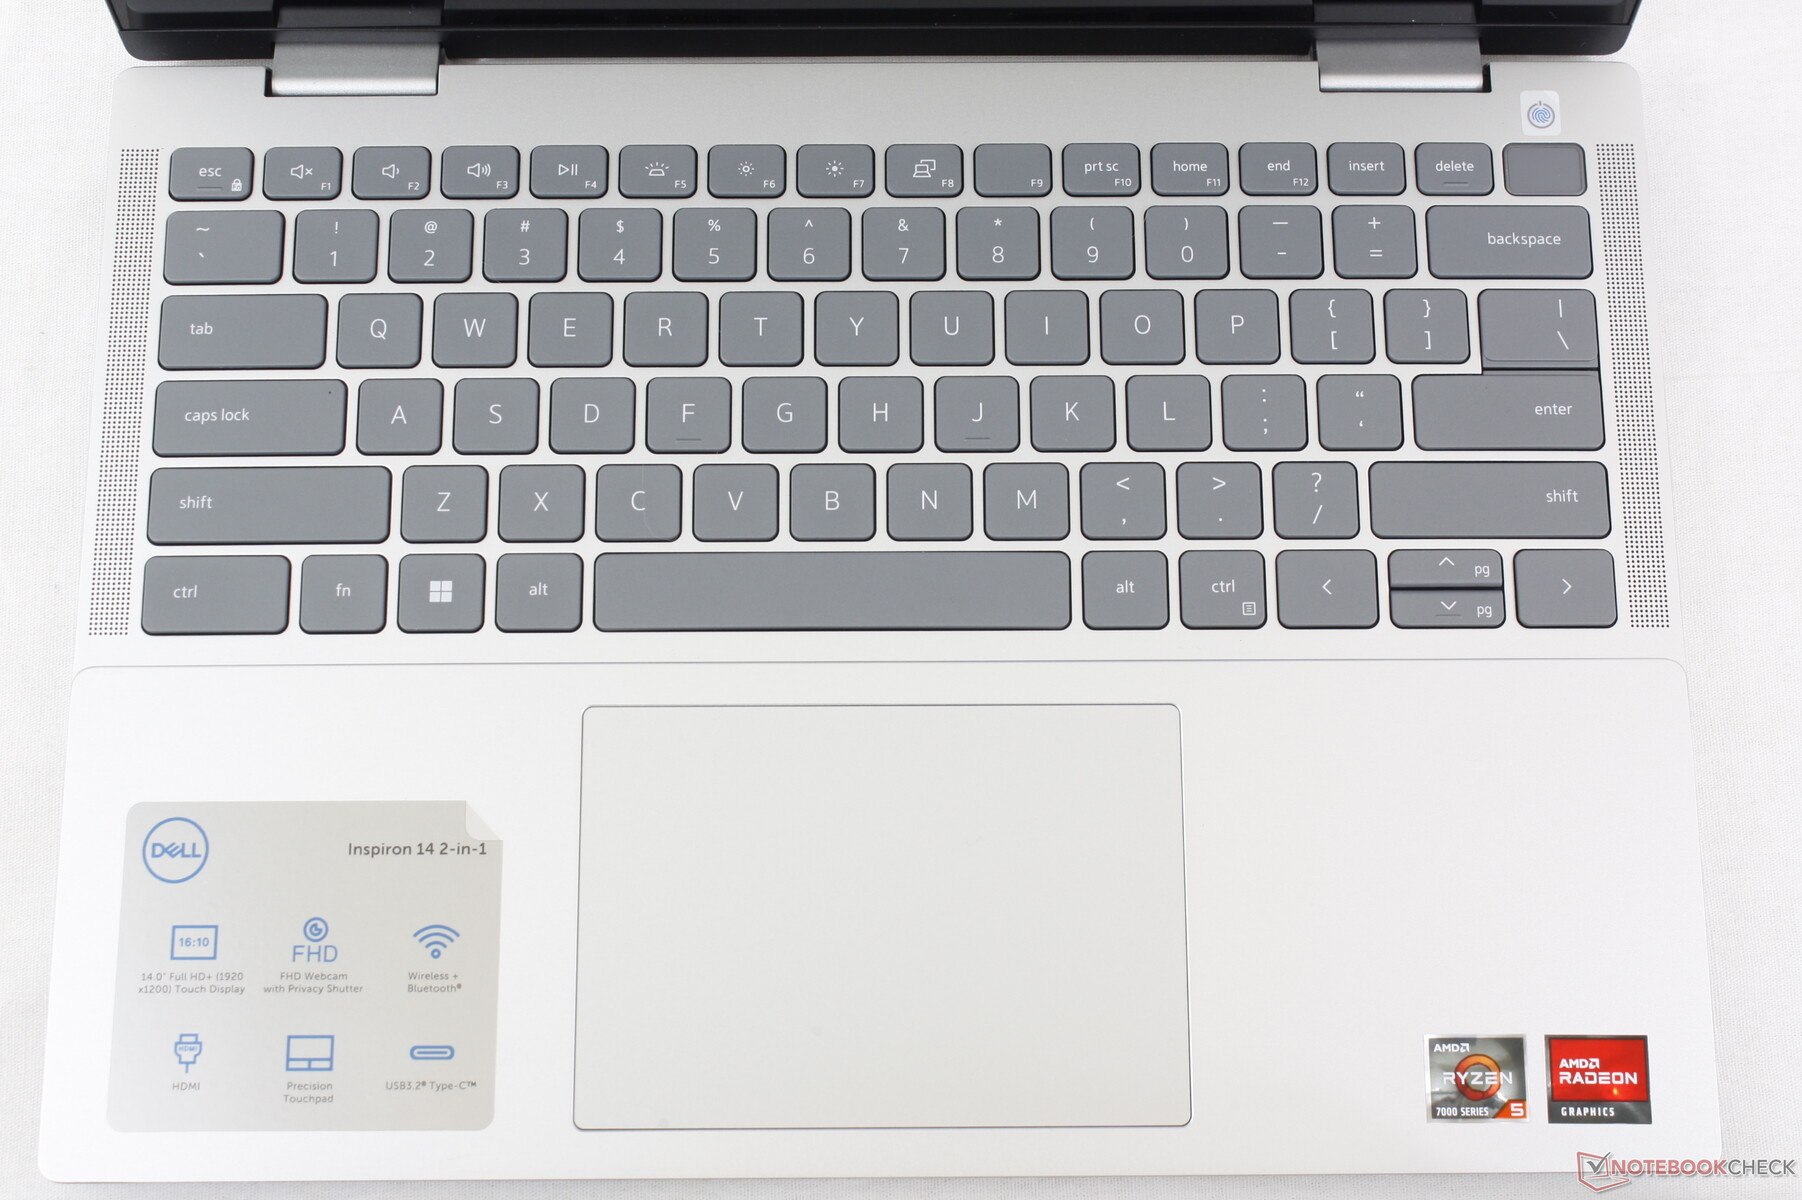
Keyboard And Touchpad
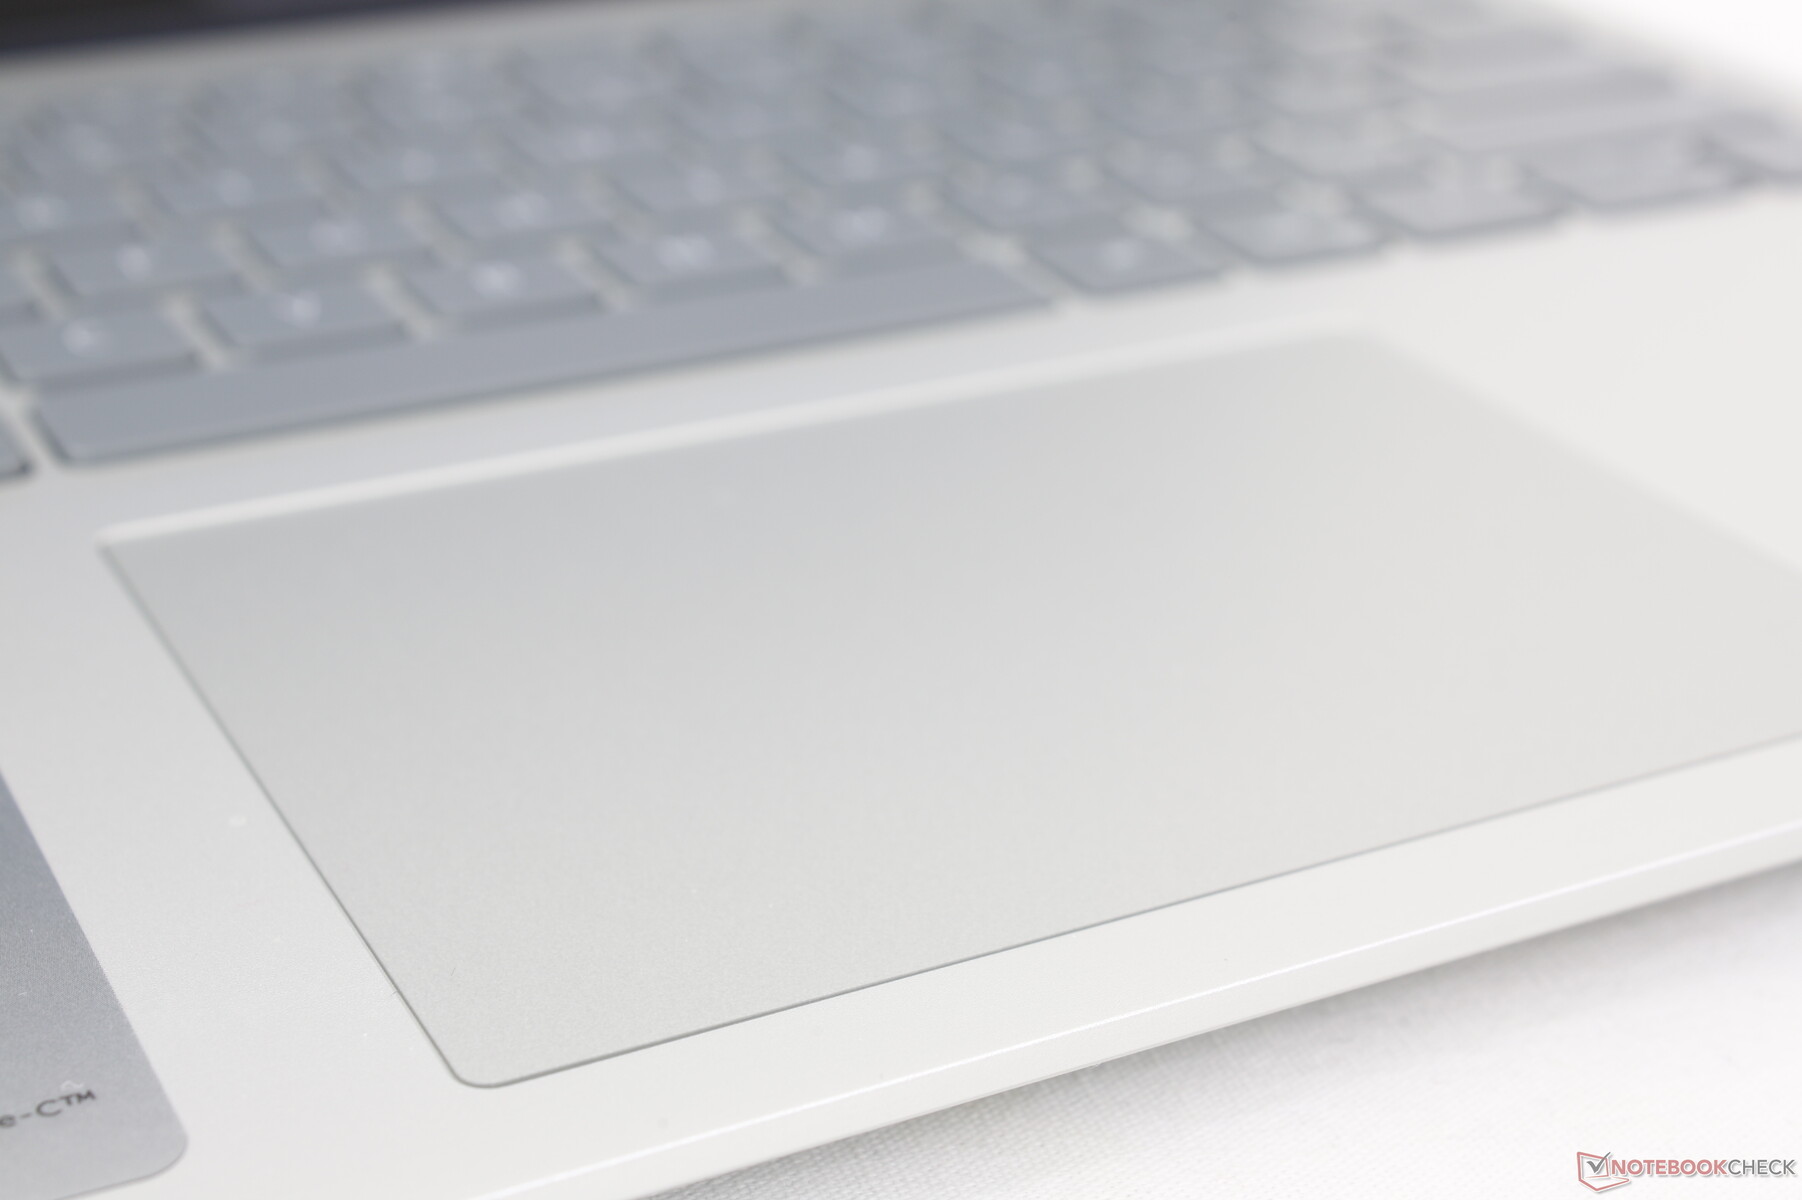
While the keyboard typing experience remains the same as on last year's Inspiron 14 7420, the design of the clickpad has changed due to the removal of the Mylar layer. It now sports a more traditional appearance while maintaining the original 11.5 x 8 cm surface area. Unfortunately, feedback when clicking hasn't improved as it still feels spongy and a bit too shallow.

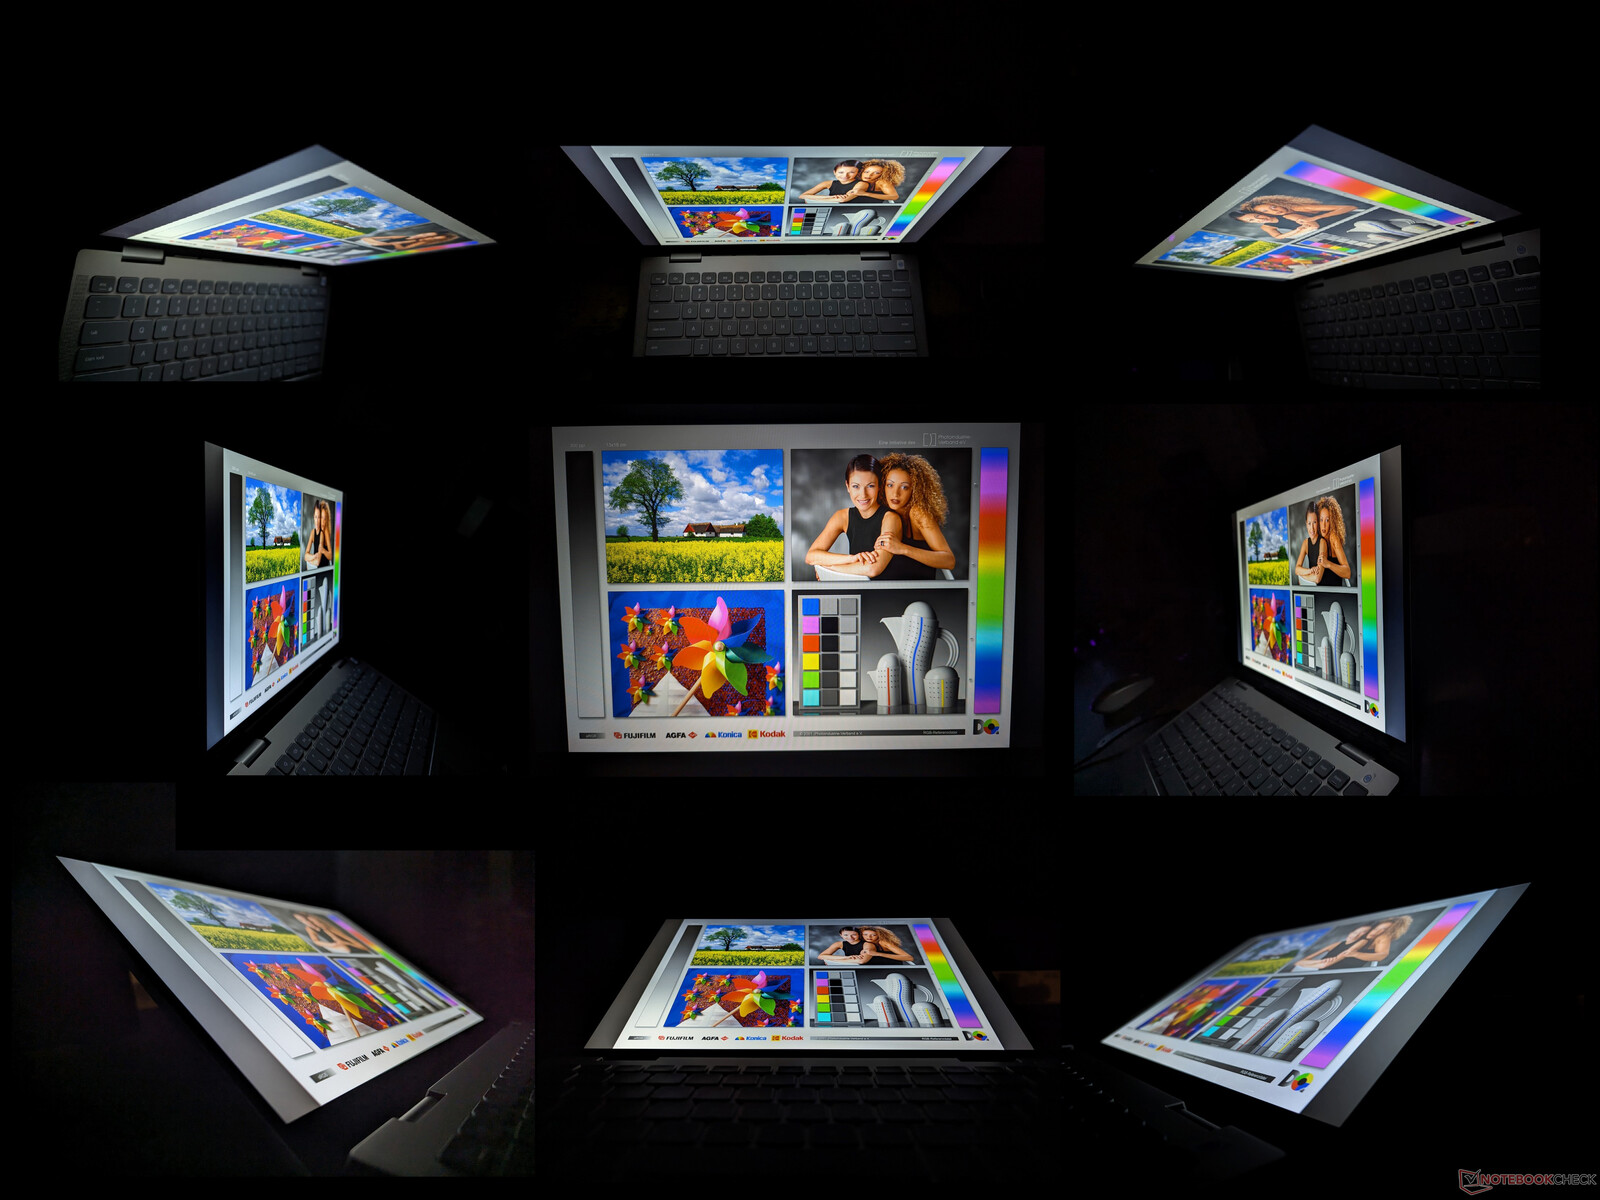
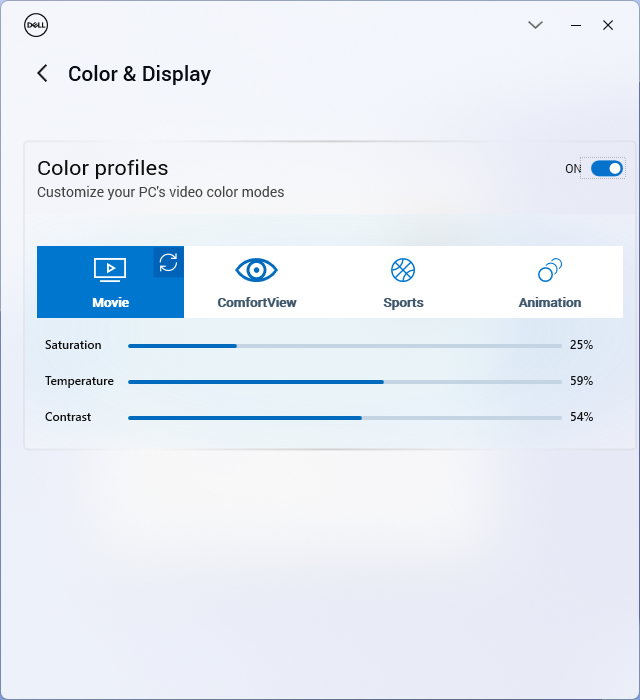
Display — 60 Hz, 45% NTSC, 1200p, 16:10
This year's model ships with the LG Philips 140WU2 IPS panel to replace the BOE NV14N42 panel on last year's Inspiron 14 9420 2-in-1. Core attributes are otherwise almost identical for a similar viewing experience between them. The narrow color range, average response times, and mediocre contrast ratio are par for the course at this particular price range.
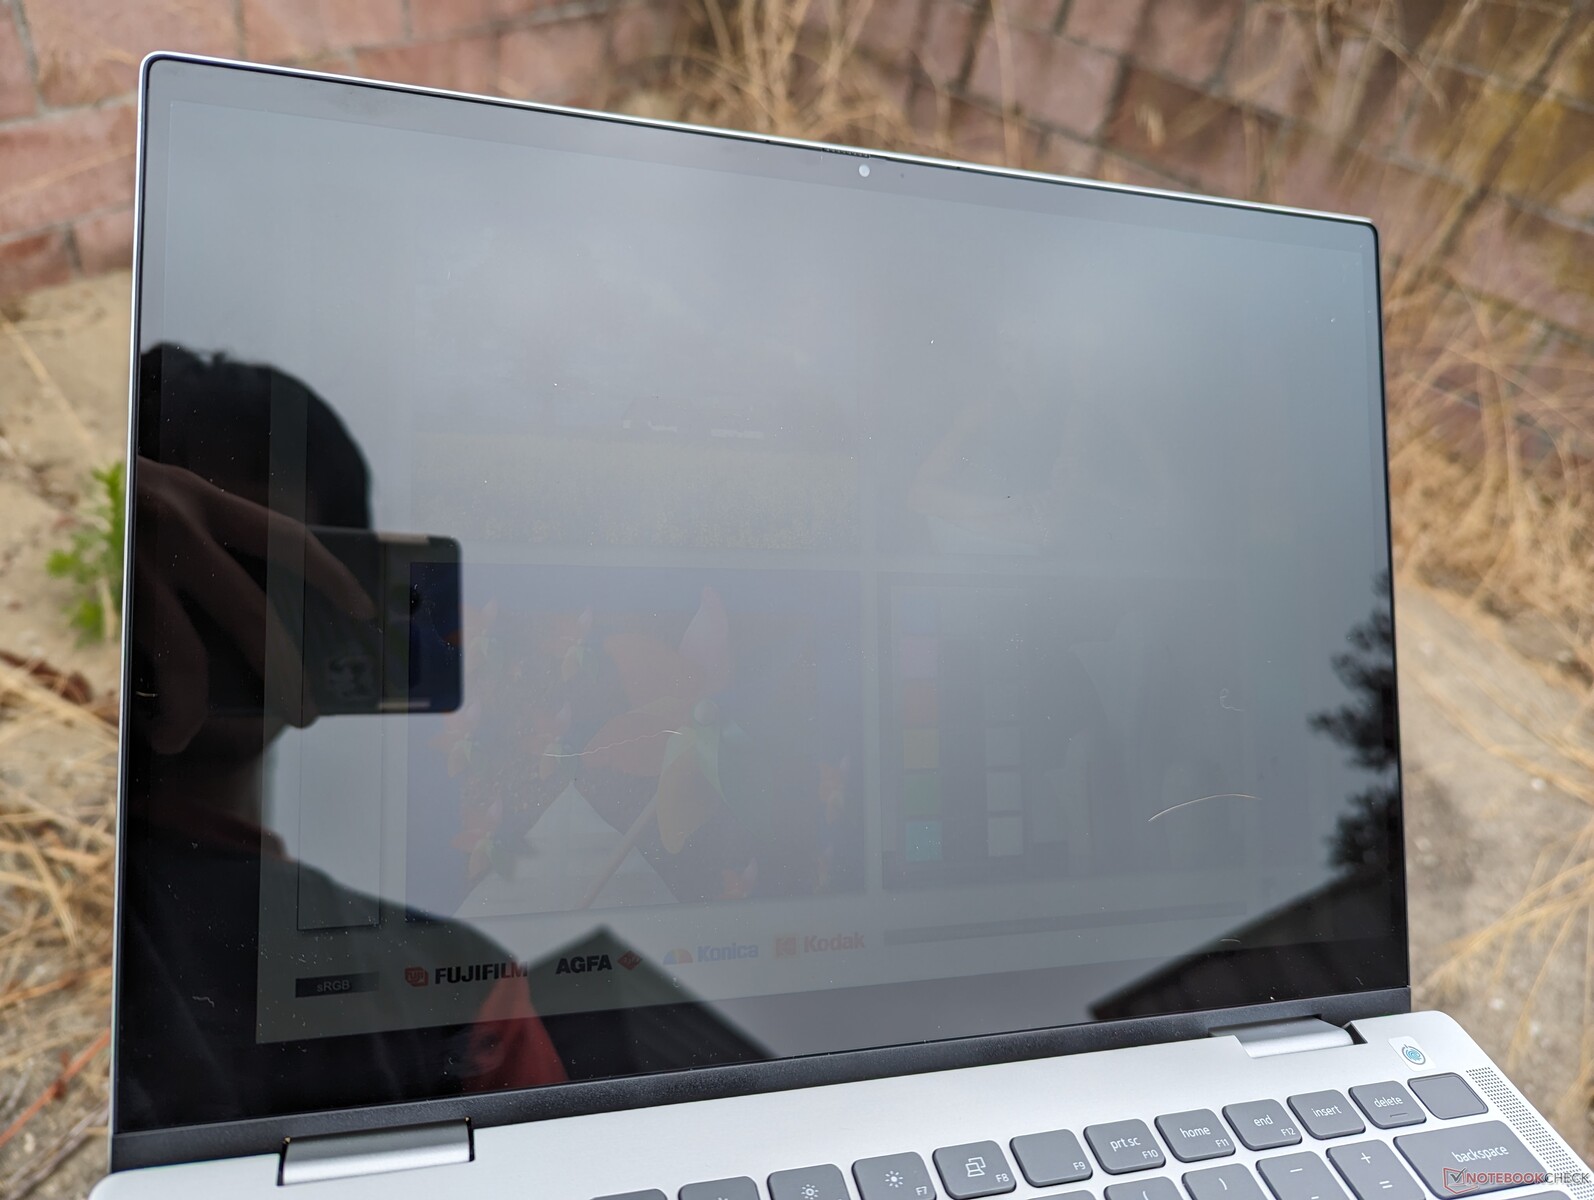
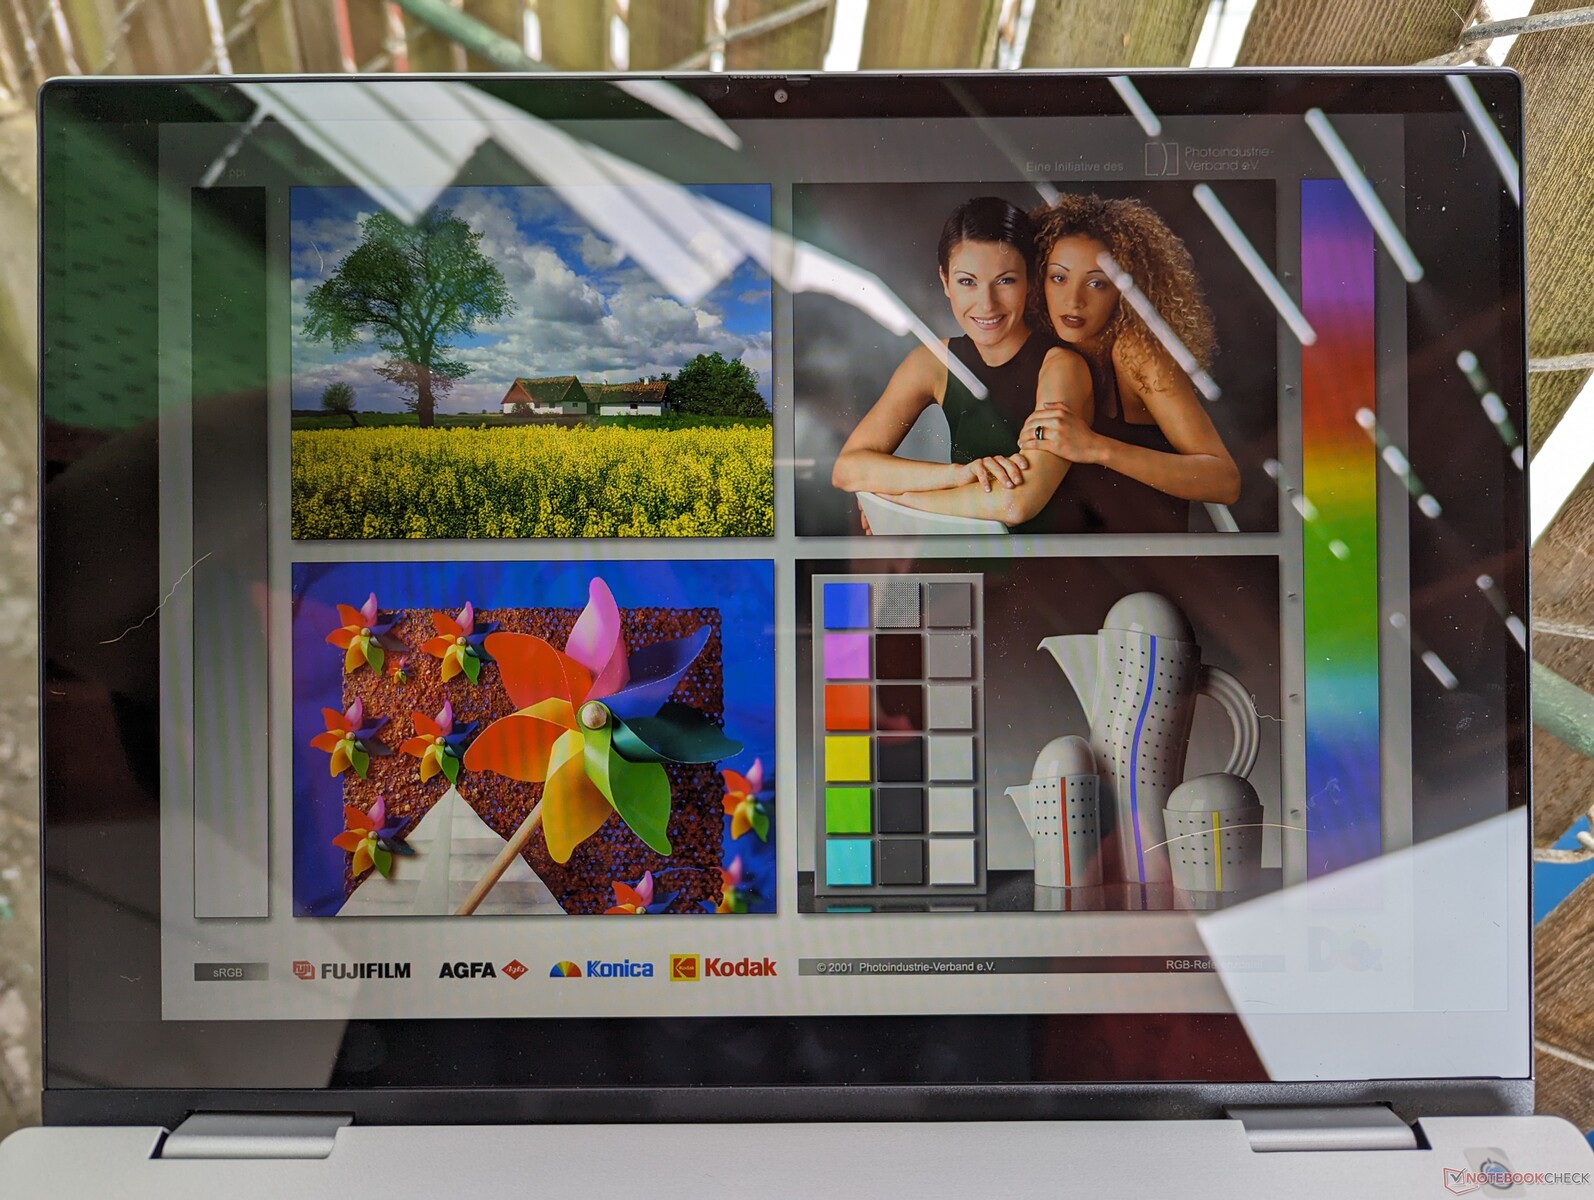
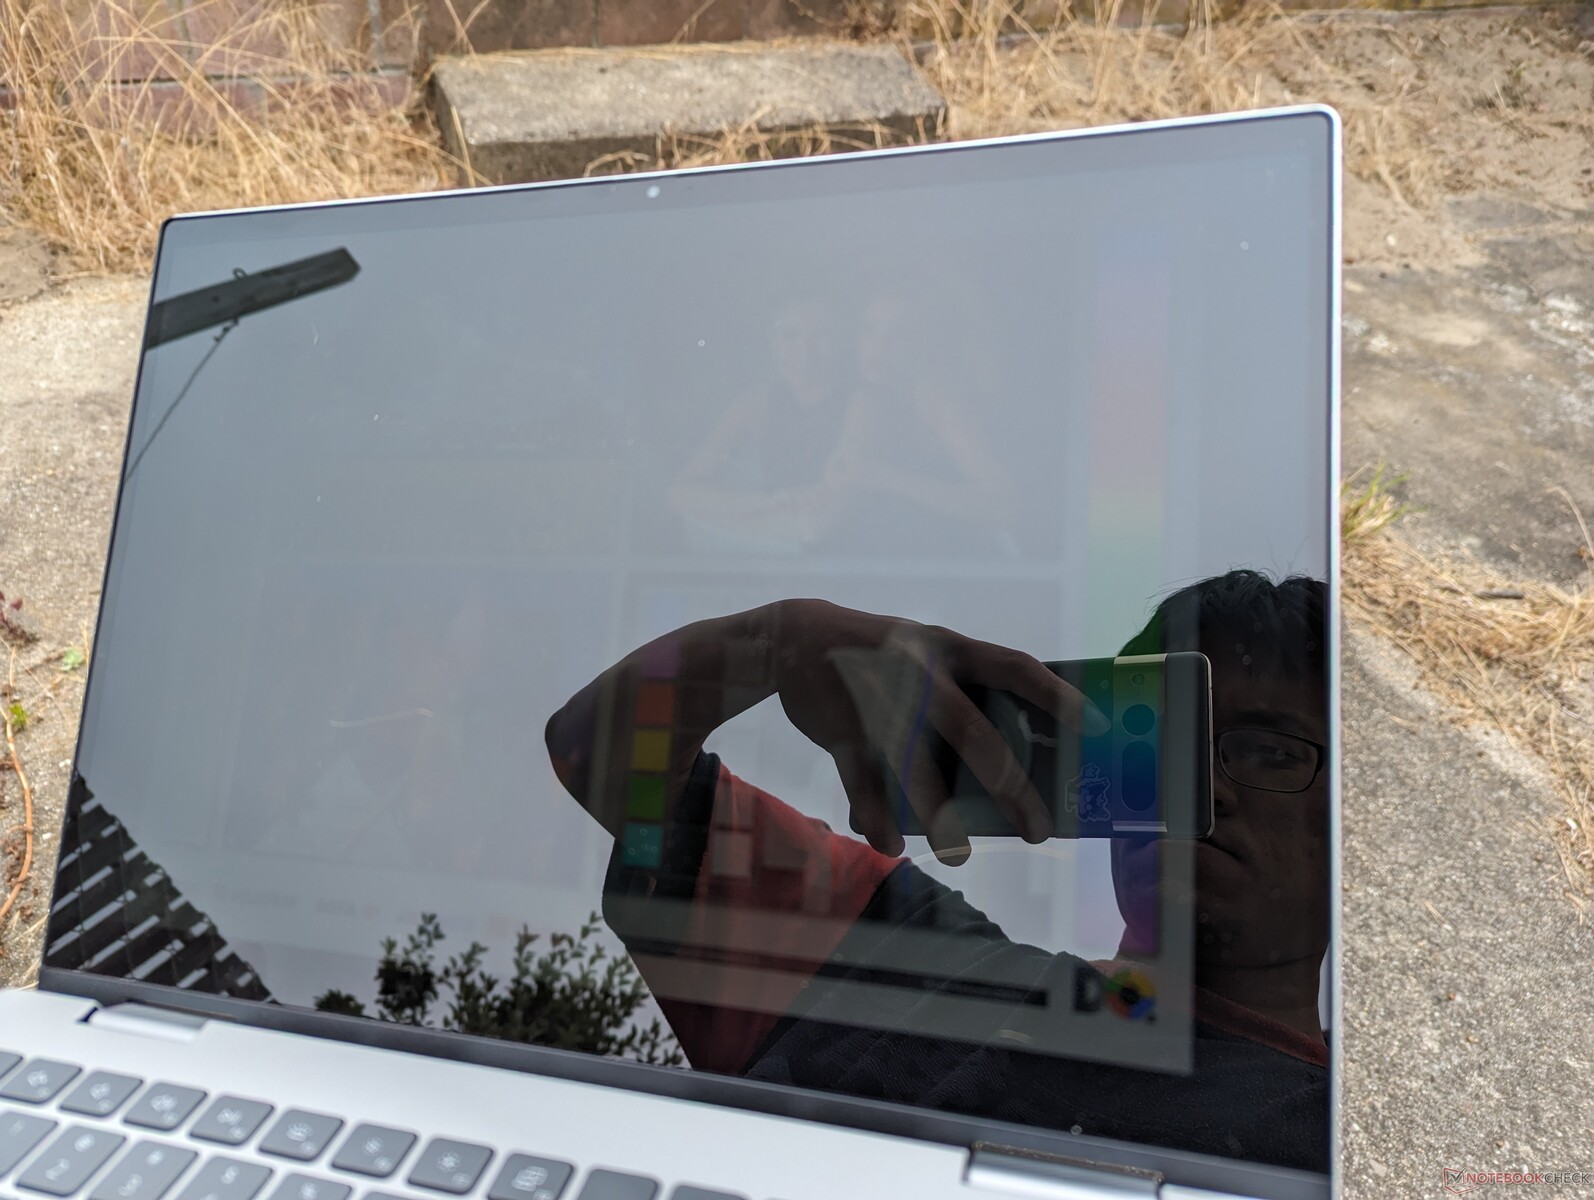
One aspect that deserved more attention relates to the dim brightness of the touchscreen. The low 200-nit range is sufficient for indoor environments, but our expectations are higher for convertibles since owners are more likely to use them when traveling or in brighter outdoor conditions. If outdoor visibility is a concern, then potential buyers should consider the pricier XPS 13 9315 2-in-1 instead which is 2x brighter than our Inspiron.
| |||||||||||||||||||||||||
Brightness Distribution: 87 %
Center on Battery: 231.8 cd/m²
Contrast: 859:1 (Black: 0.27 cd/m²)
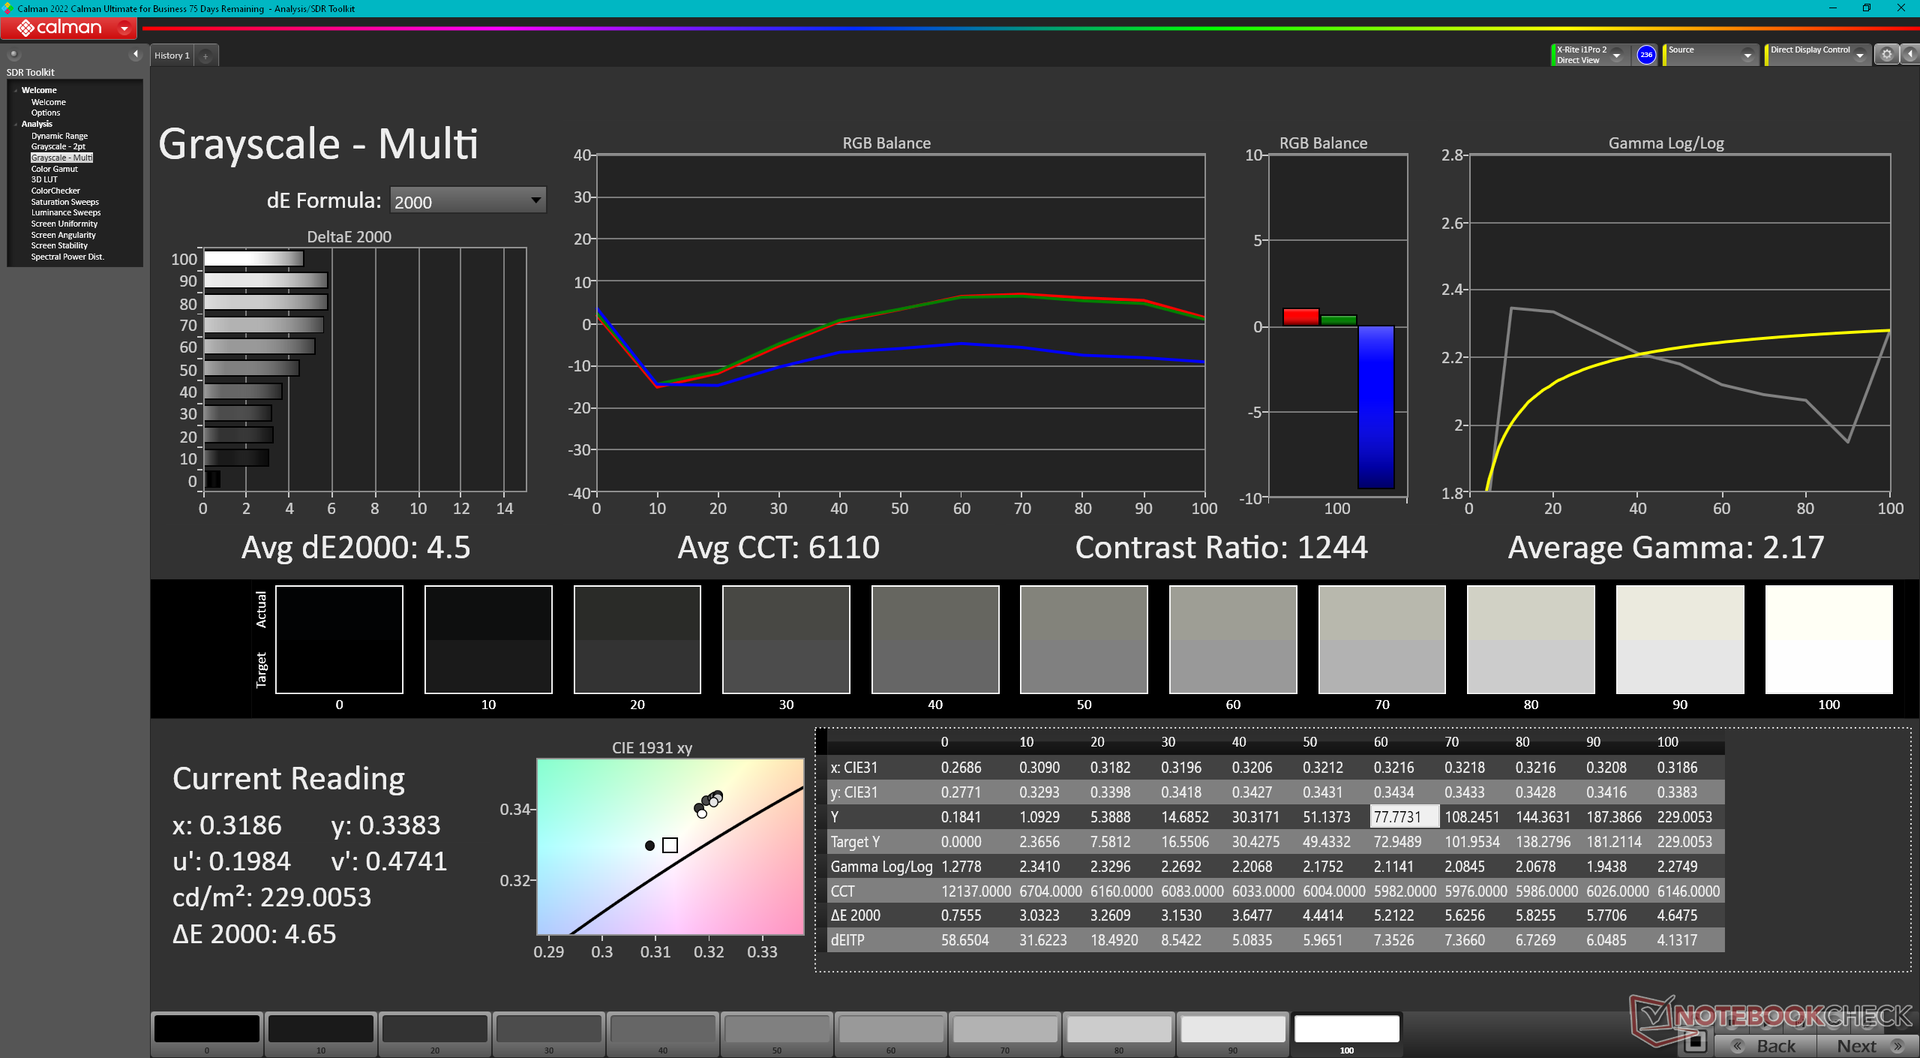
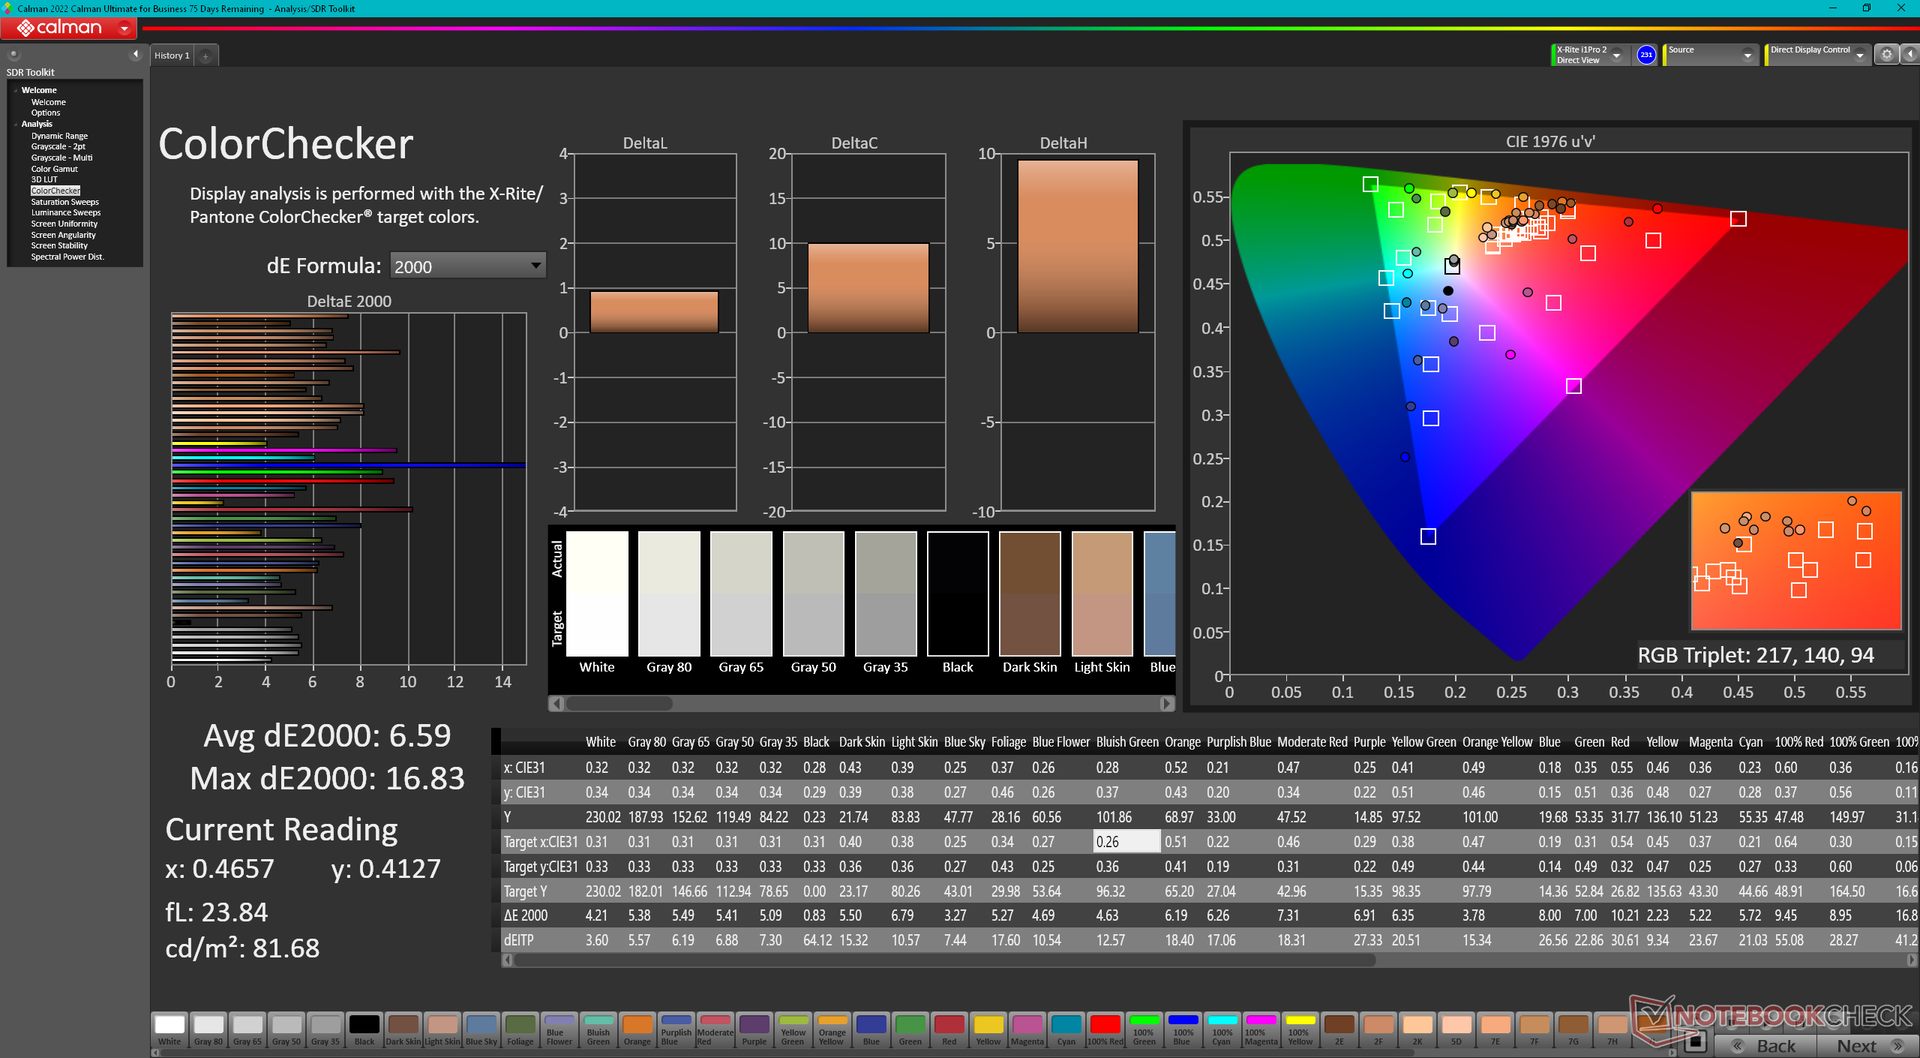
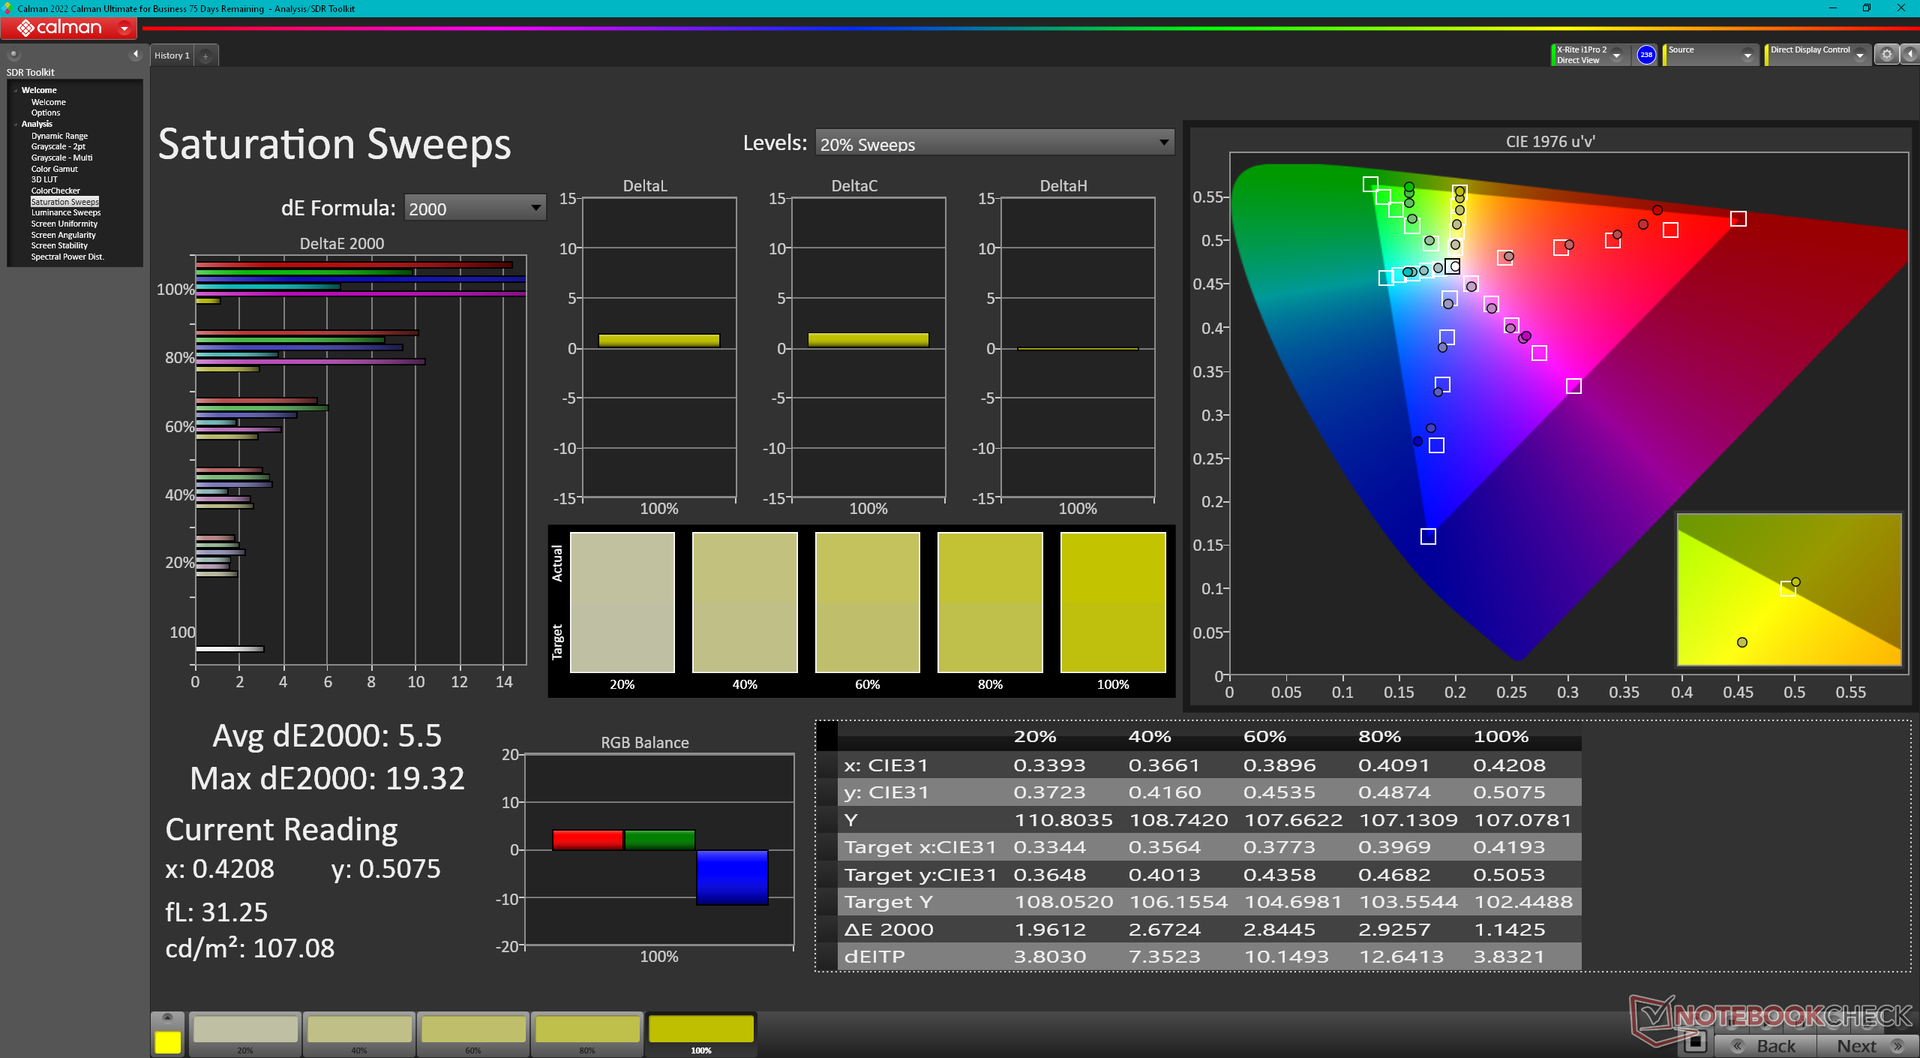
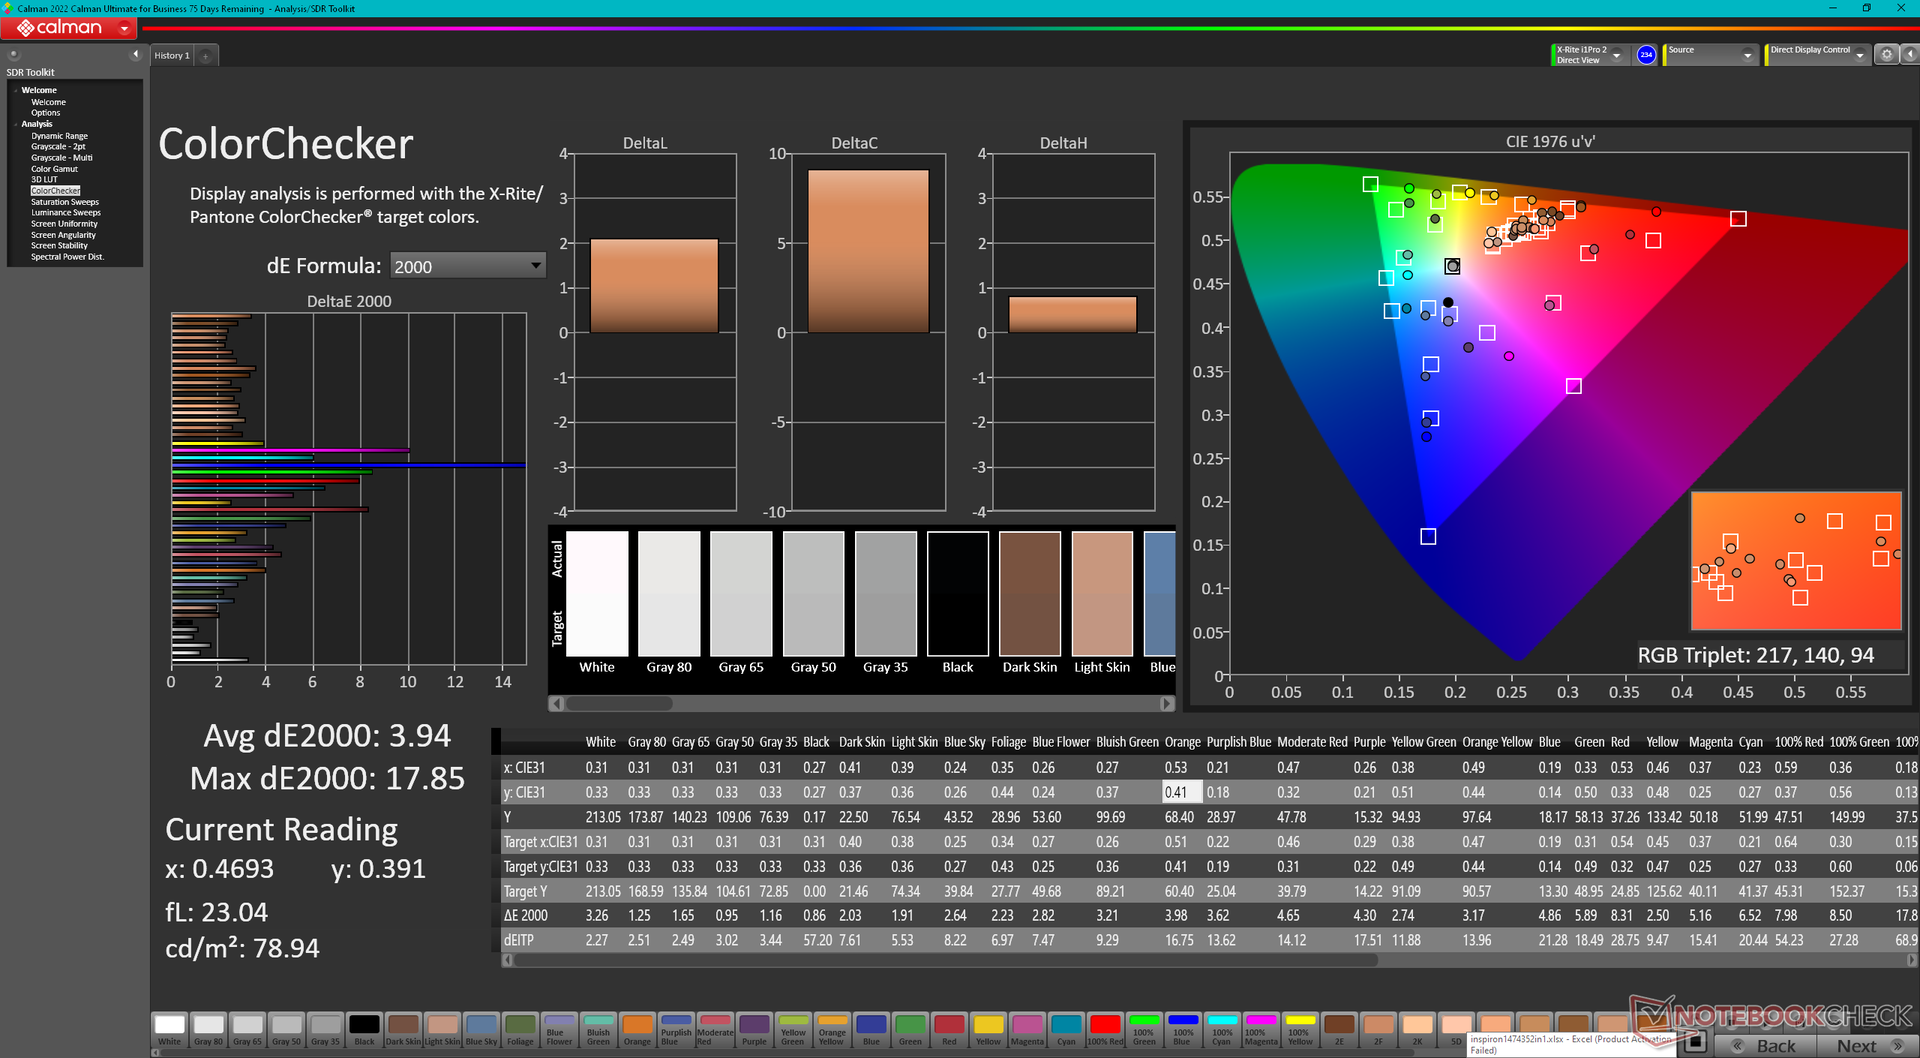
ΔE ColorChecker Calman: 6.59 | ∀{0.5-29.43 Ø4.71}
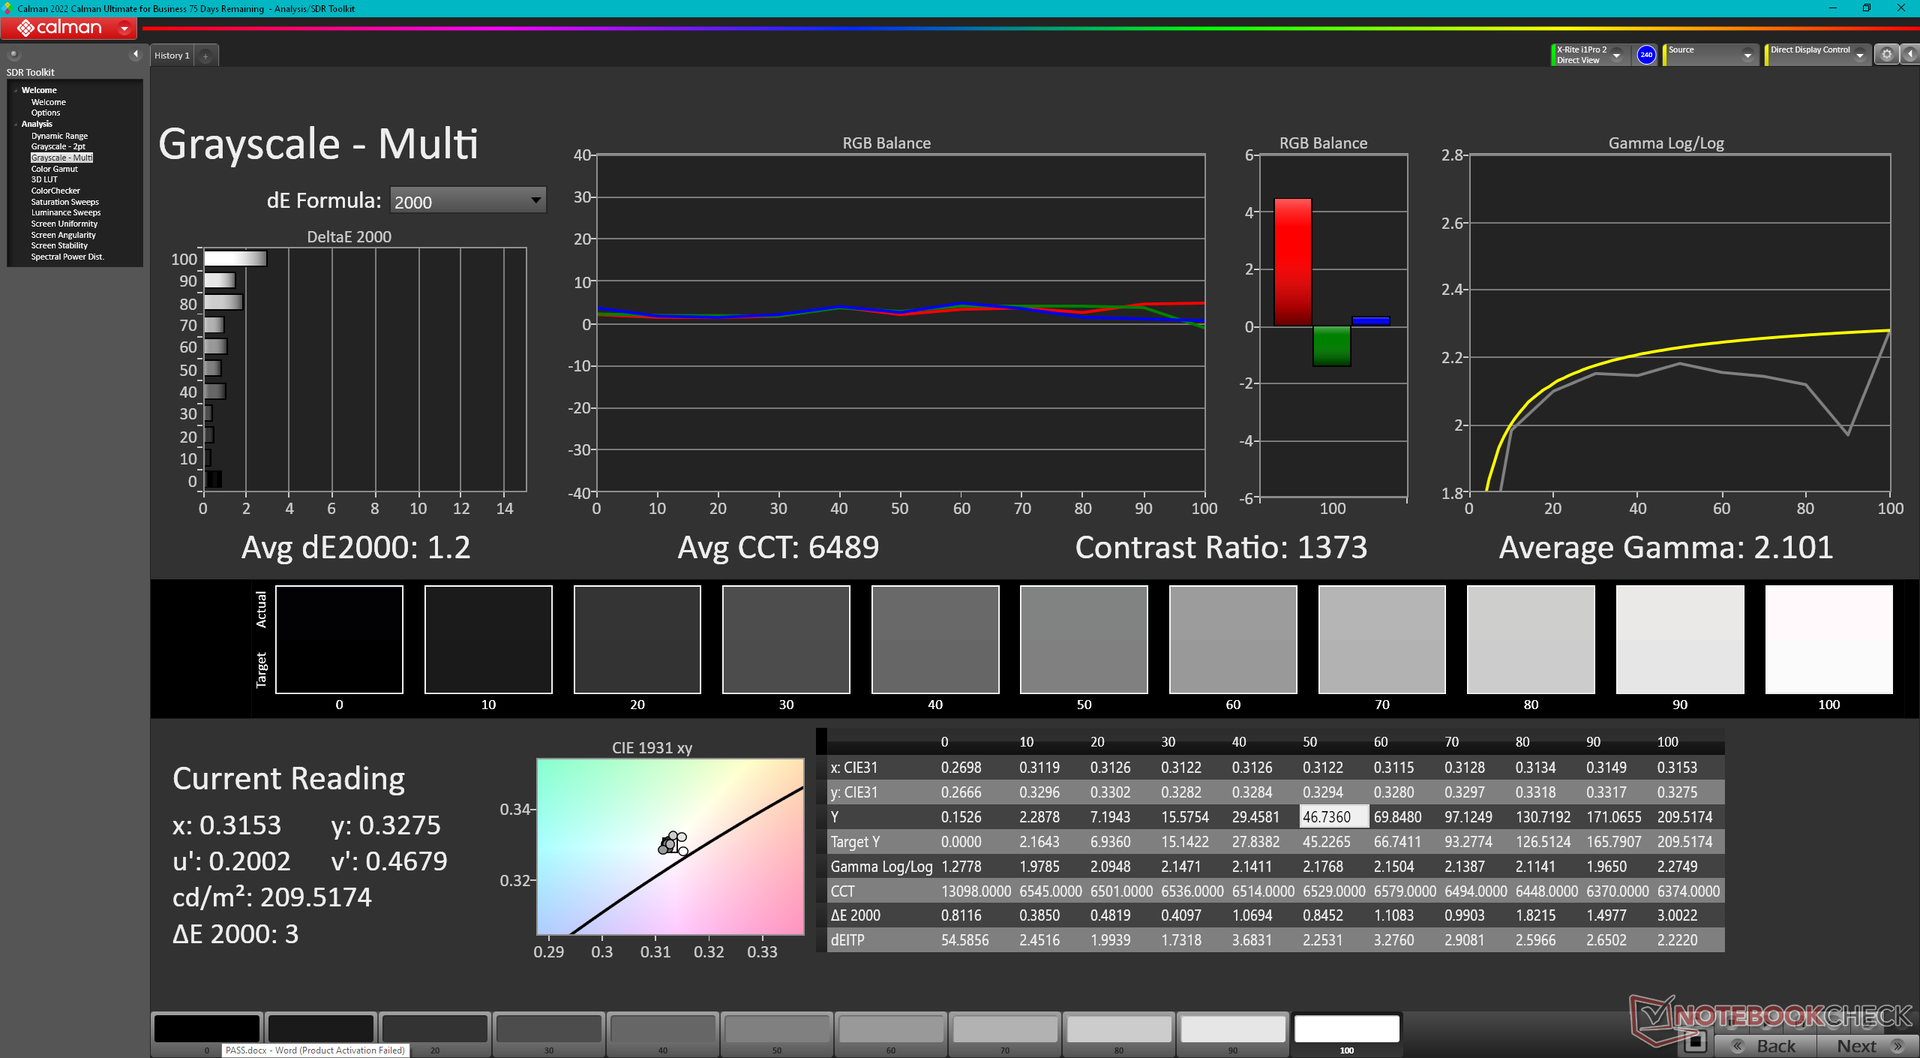
calibrated: 3.94
ΔE Greyscale Calman: 4.5 | ∀{0.09-98 Ø4.96}
45.8% AdobeRGB 1998 (Argyll 3D)
64.4% sRGB (Argyll 3D)
44.4% Display P3 (Argyll 3D)
Gamma: 2.17
CCT: 6110 K
| Dell Inspiron 14 7435 2-in-1 LG Philips 140WU2, IPS, 1920x1200, 14" | Dell Inspiron 14 7420 2-in-1 BOE NV14N42, IPS, 1920x1200, 14" | Lenovo IdeaPad Flex 7i 14IAU7 BOE CQ NV140DRM-162, IPS, 2240x1400, 14" | Acer Aspire 5 Spin 14 BOE CQ NV140WUM-N41, IPS, 1920x1200, 14" | LG Gram 14T90P LG Philips LP140WU1-SPA1, IPS, 1900x1200, 14" | HP Pavilion x360 14-dy0157ng Chi Mei N140HCA-E5B, IPS, 1920x1080, 14" | |
|---|---|---|---|---|---|---|
| Display | -13% | 56% | -12% | 89% | -3% | |
| Display P3 Coverage (%) | 44.4 | 38.6 -13% | 69.8 57% | 38.5 -13% | 98.8 123% | 42.7 -4% |
| sRGB Coverage (%) | 64.4 | 56.2 -13% | 98 52% | 57.3 -11% | 100 55% | 63.7 -1% |
| AdobeRGB 1998 Coverage (%) | 45.8 | 39.9 -13% | 72.2 58% | 39.8 -13% | 44.2 -3% | |
| Response Times | -24% | -101% | -23% | -90% | -39% | |
| Response Time Grey 50% / Grey 80% * (ms) | 19.6 ? | 27.2 ? -39% | 44.4 ? -127% | 29 ? -48% | 44 ? -124% | 32 ? -63% |
| Response Time Black / White * (ms) | 19.3 ? | 20.8 ? -8% | 33.6 ? -74% | 19 ? 2% | 30 ? -55% | 22 ? -14% |
| PWM Frequency (Hz) | ||||||
| Screen | -6% | 31% | 12% | 34% | 39% | |
| Brightness middle (cd/m²) | 231.8 | 269.4 16% | 317.3 37% | 249 7% | 305.5 32% | 269 16% |
| Brightness (cd/m²) | 216 | 260 20% | 301 39% | 235 9% | 289 34% | 241 12% |
| Brightness Distribution (%) | 87 | 89 2% | 90 3% | 85 -2% | 87 0% | 82 -6% |
| Black Level * (cd/m²) | 0.27 | 0.41 -52% | 0.22 19% | 0.27 -0% | 0.27 -0% | 0.11 59% |
| Contrast (:1) | 859 | 657 -24% | 1442 68% | 922 7% | 1131 32% | 2445 185% |
| Colorchecker dE 2000 * | 6.59 | 6.53 1% | 3.99 39% | 5 24% | 3.31 50% | 5.68 14% |
| Colorchecker dE 2000 max. * | 16.83 | 19.76 -17% | 9.34 45% | 8.32 51% | 6.12 64% | 9.61 43% |
| Colorchecker dE 2000 calibrated * | 3.94 | 3.13 21% | 0.6 85% | 5.06 -28% | ||
| Greyscale dE 2000 * | 4.5 | 5.4 -20% | 6.9 -53% | 2.86 36% | 1.9 58% | 4.95 -10% |
| Gamma | 2.17 101% | 2.05 107% | 2.19 100% | 2.19 100% | 2.04 108% | 2.17 101% |
| CCT | 6110 106% | 6007 108% | 6161 106% | 6419 101% | 6706 97% | 6628 98% |
| Color Space (Percent of AdobeRGB 1998) (%) | 44.2 | |||||
| Color Space (Percent of sRGB) (%) | 63.7 | |||||
| Total Average (Program / Settings) | -14% /
-10% | -5% /
18% | -8% /
2% | 11% /
22% | -1% /
18% |
* ... smaller is better
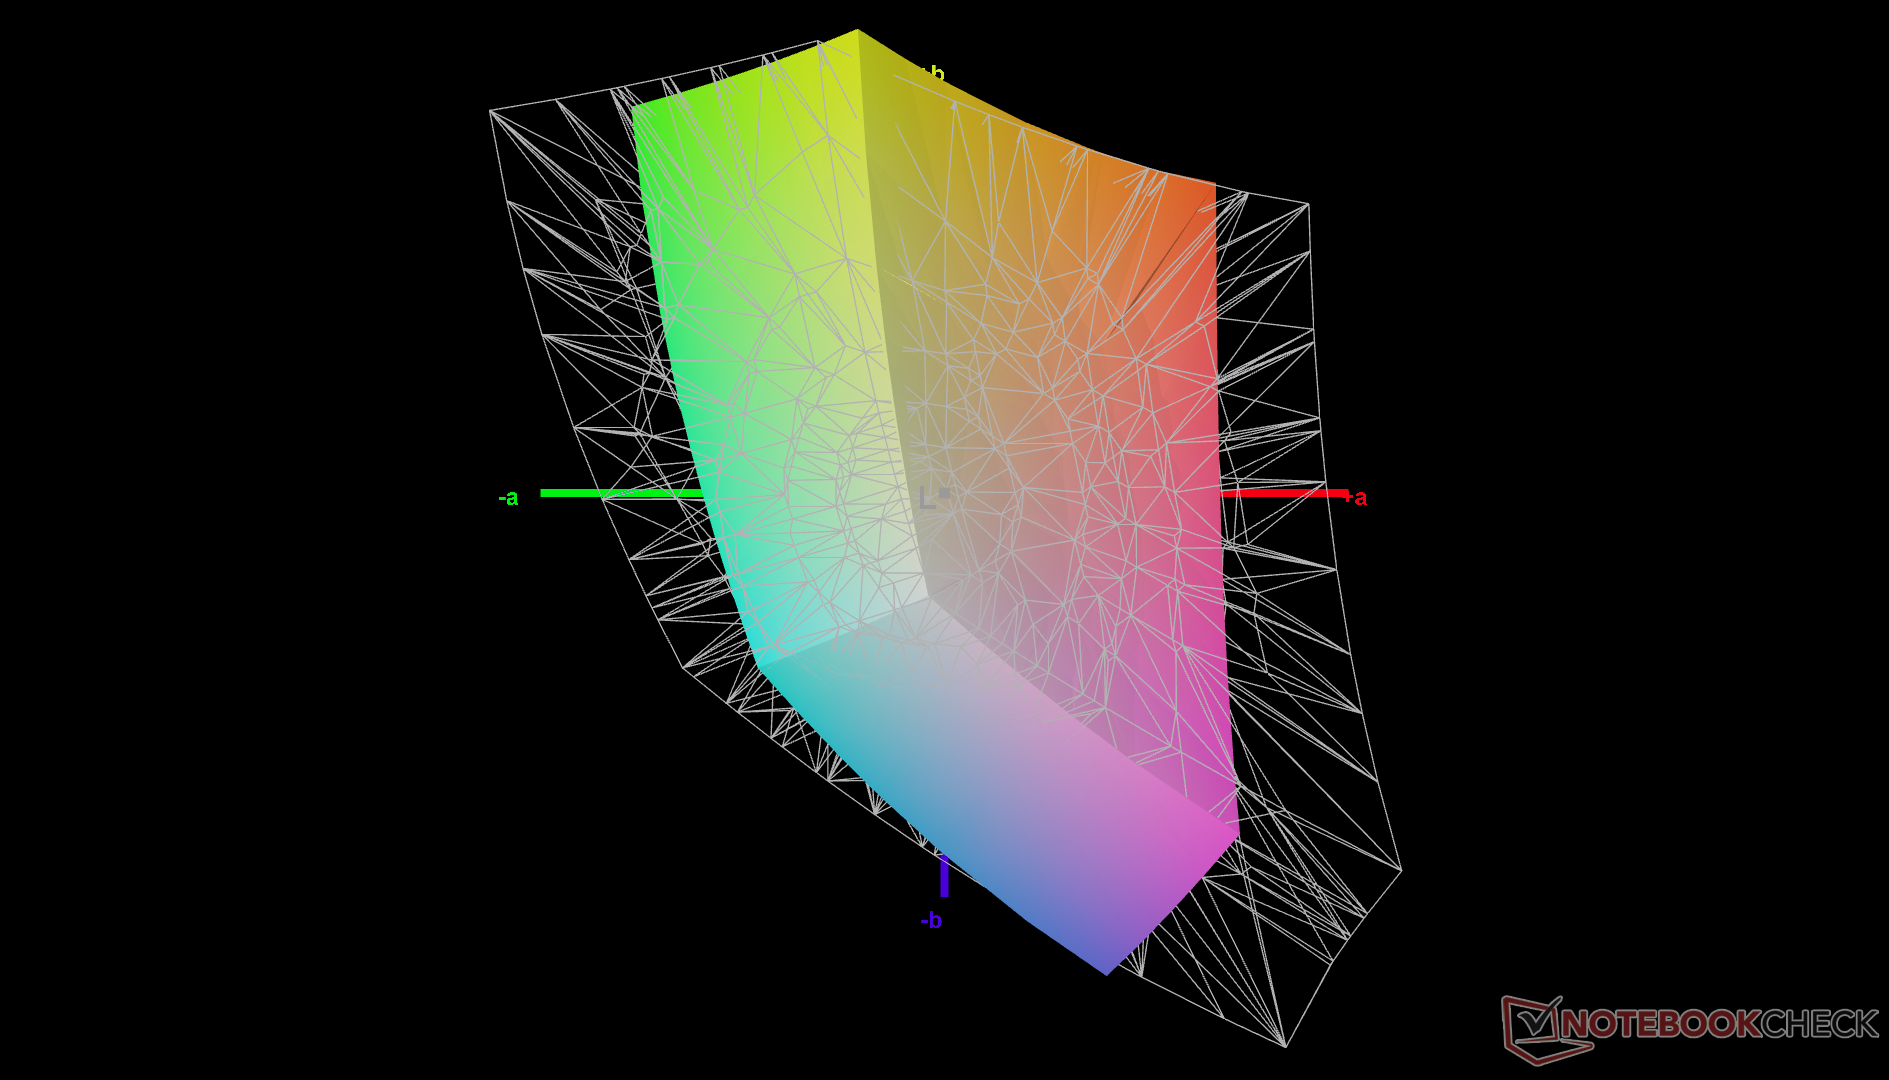
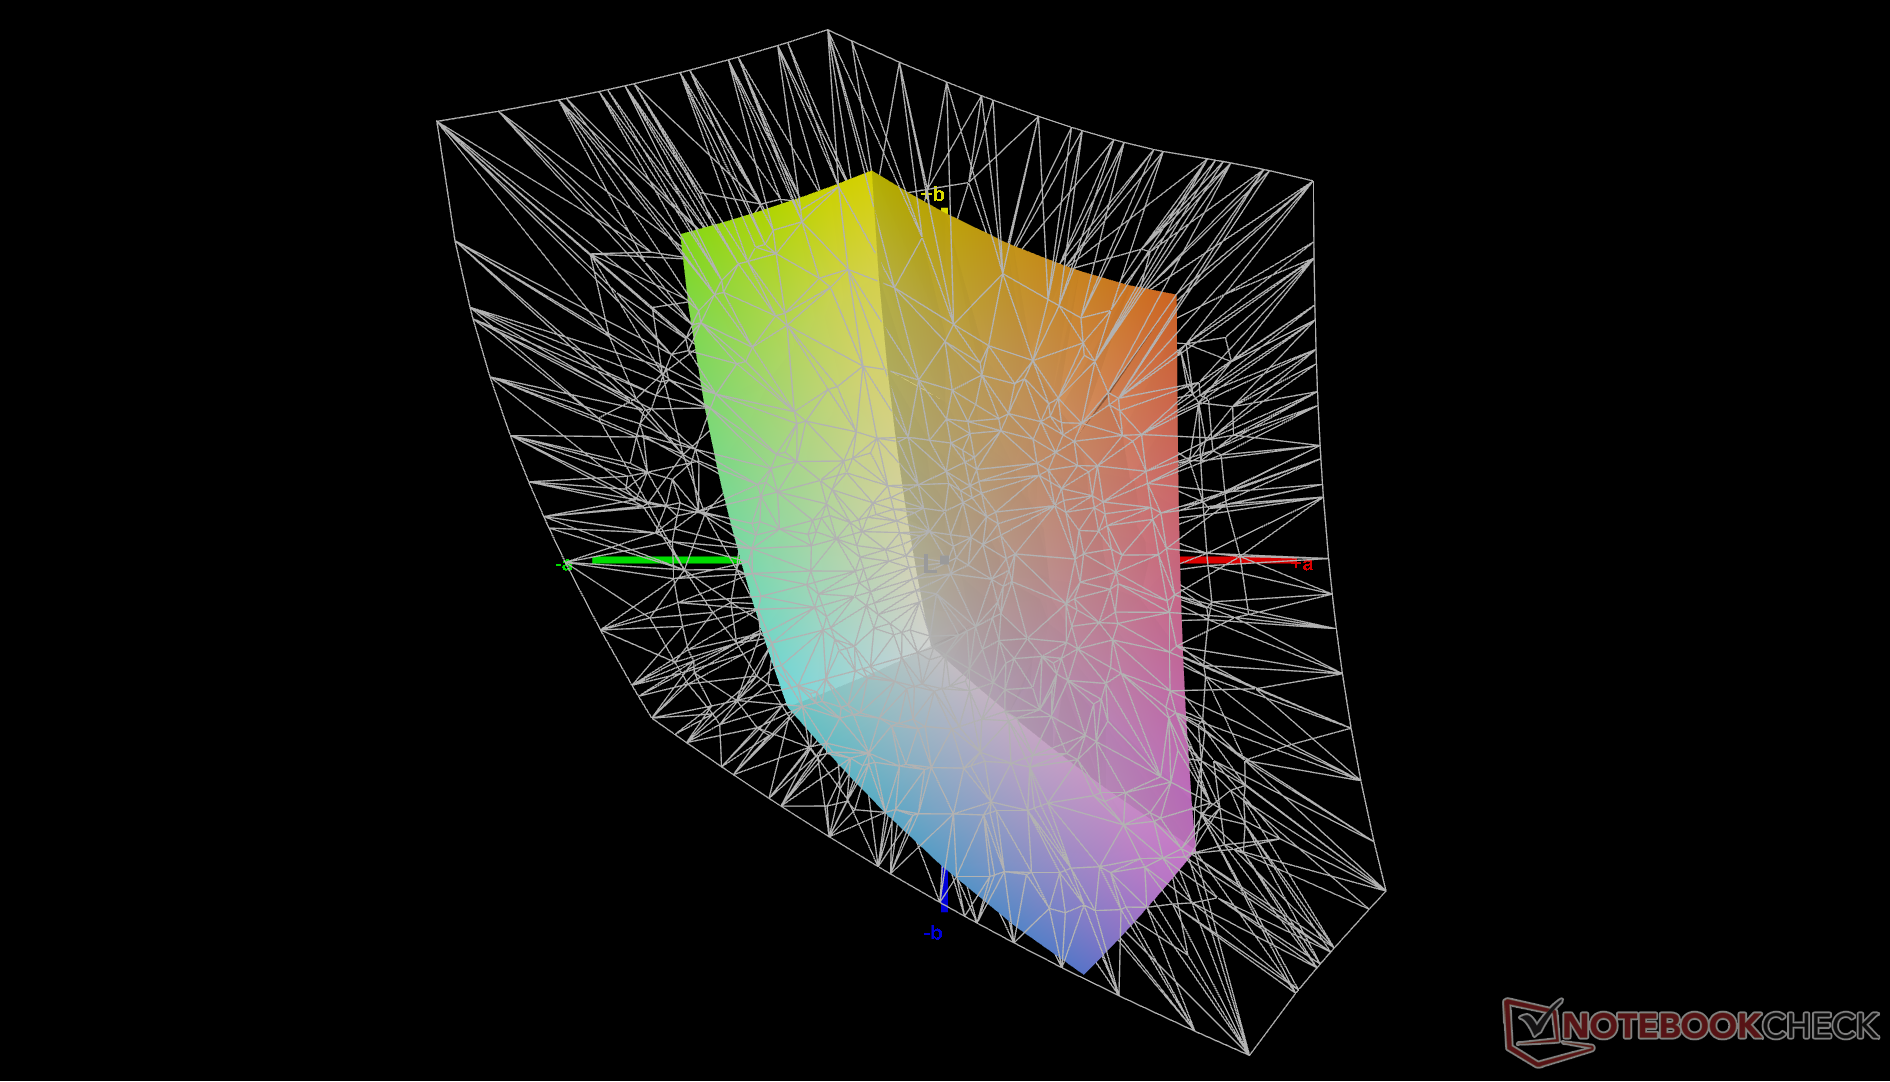
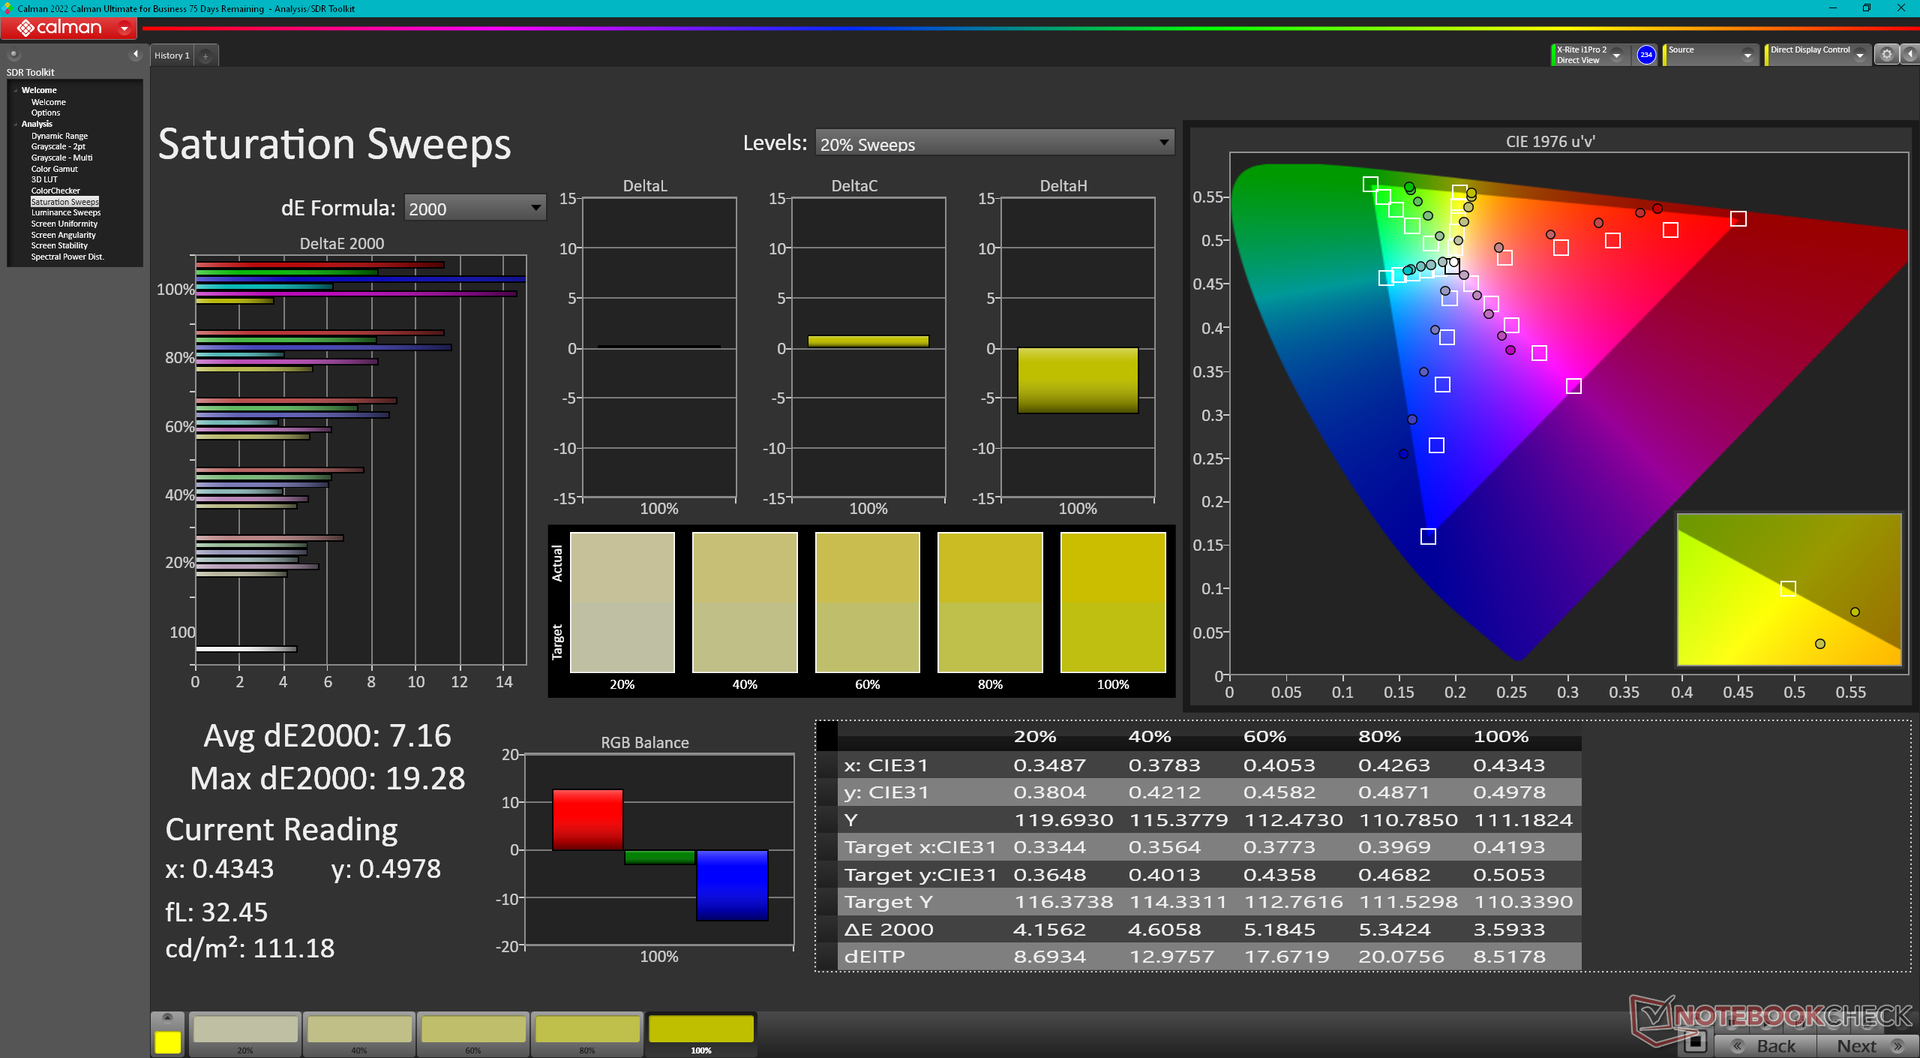
Color temperature is slightly too warm out of the box. A calibration with our X-Rite colorimeter addresses this problem for more accurate colors overall. However, note that colors will still be inaccurate at higher saturation levels due to the limited sRGB coverage mentioned above.
Display Response Times
| ↔ Response Time Black to White | ||
|---|---|---|
| 19.3 ms ... rise ↗ and fall ↘ combined | ↗ 10.6 ms rise | 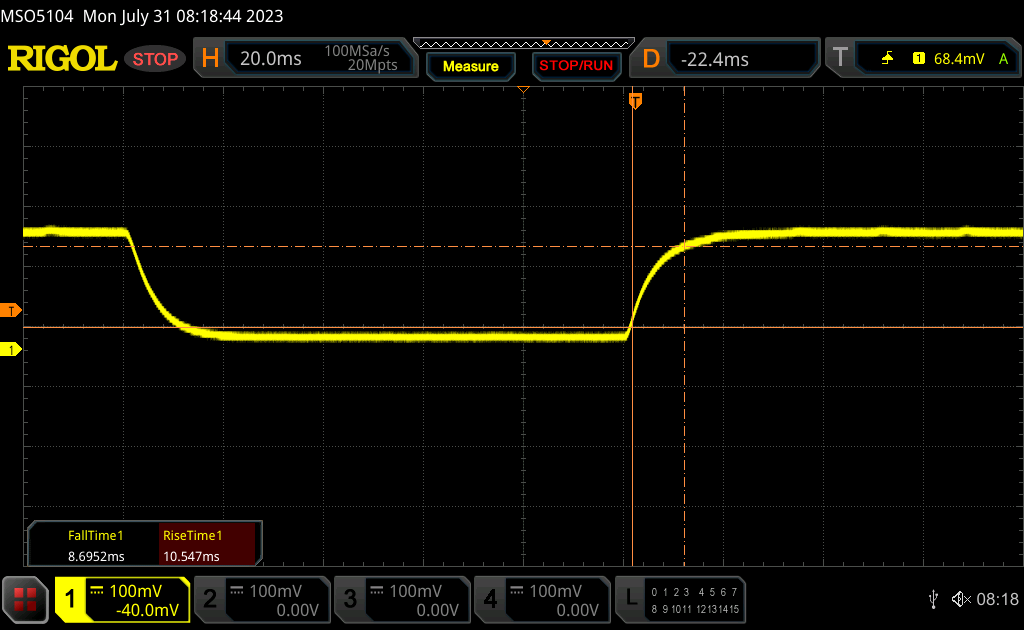 |
| ↘ 8.7 ms fall | ||
| The screen shows good response rates in our tests, but may be too slow for competitive gamers. In comparison, all tested devices range from 0.1 (minimum) to 240 (maximum) ms. » 43 % of all devices are better. This means that the measured response time is similar to the average of all tested devices (19.8 ms). | ||
| ↔ Response Time 50% Grey to 80% Grey | ||
| 19.6 ms ... rise ↗ and fall ↘ combined | ↗ 13.6 ms rise | 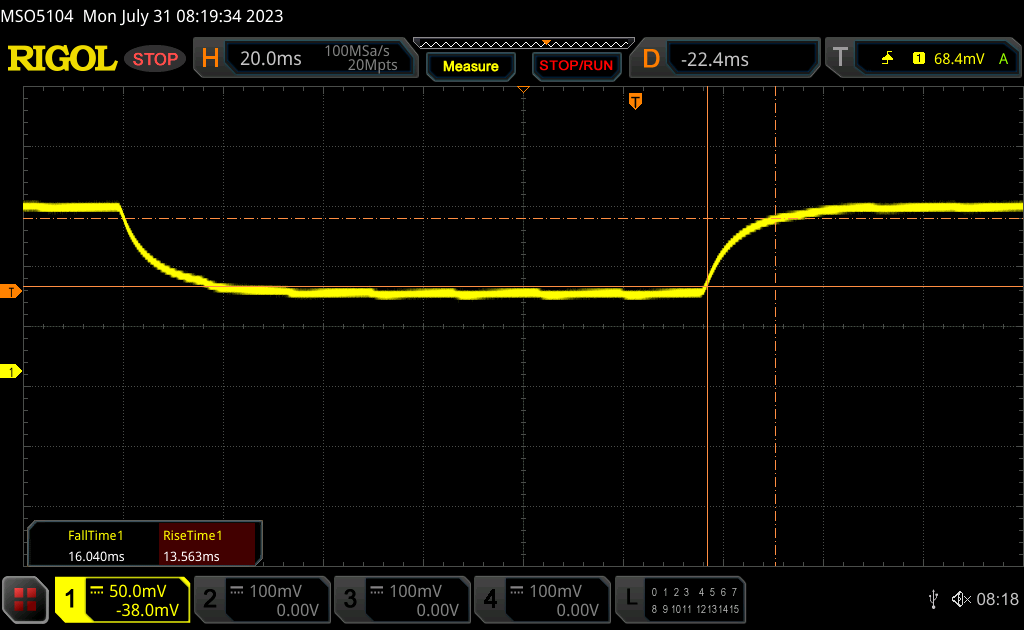 |
| ↘ 16 ms fall | ||
| The screen shows good response rates in our tests, but may be too slow for competitive gamers. In comparison, all tested devices range from 0.165 (minimum) to 636 (maximum) ms. » 33 % of all devices are better. This means that the measured response time is better than the average of all tested devices (30.9 ms). | ||
Screen Flickering / PWM (Pulse-Width Modulation)
| Screen flickering / PWM not detected |  | ||
In comparison: 52 % of all tested devices do not use PWM to dim the display. If PWM was detected, an average of 7744 (minimum: 5 - maximum: 343500) Hz was measured. | |||
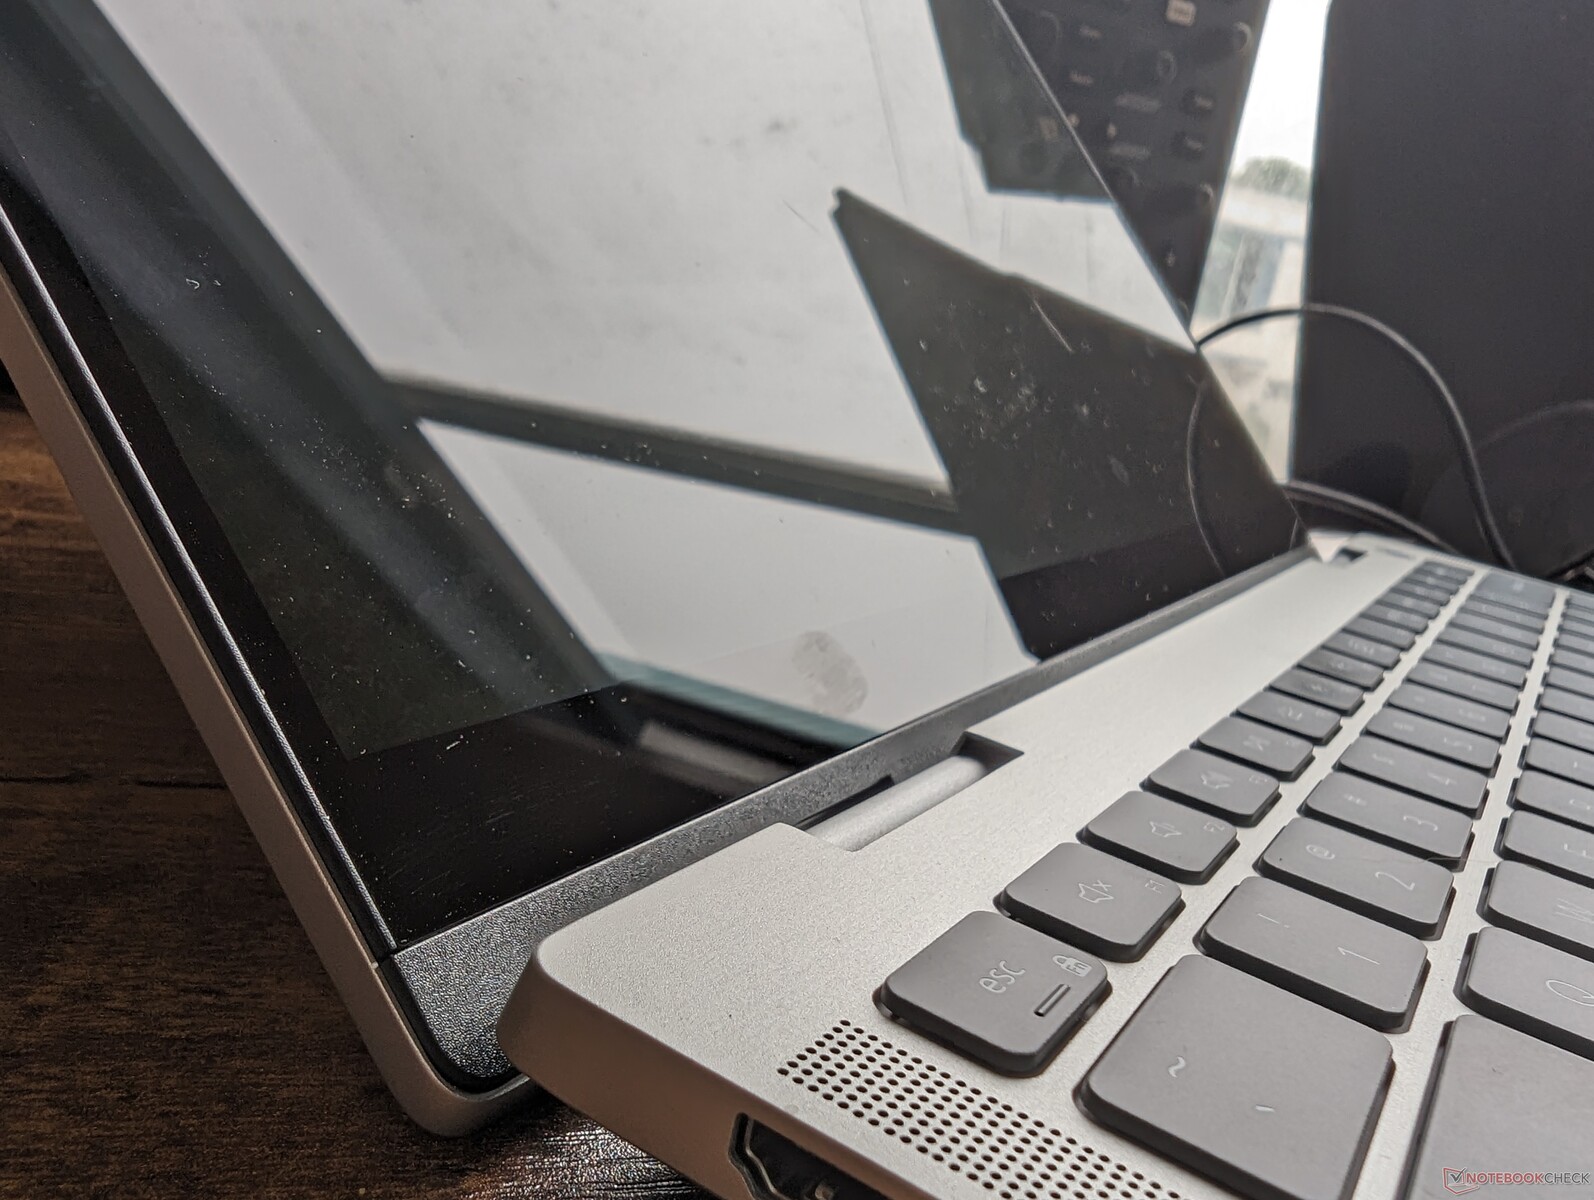
Glare is noticeable even when using the laptop indoors or under shade. The dim backlight is unable to overcome much of the glare from the glossy overlay which severely impacts viewability under outdoor conditions.
Performance — AMD Zen 3 At Heart
Testing Conditions
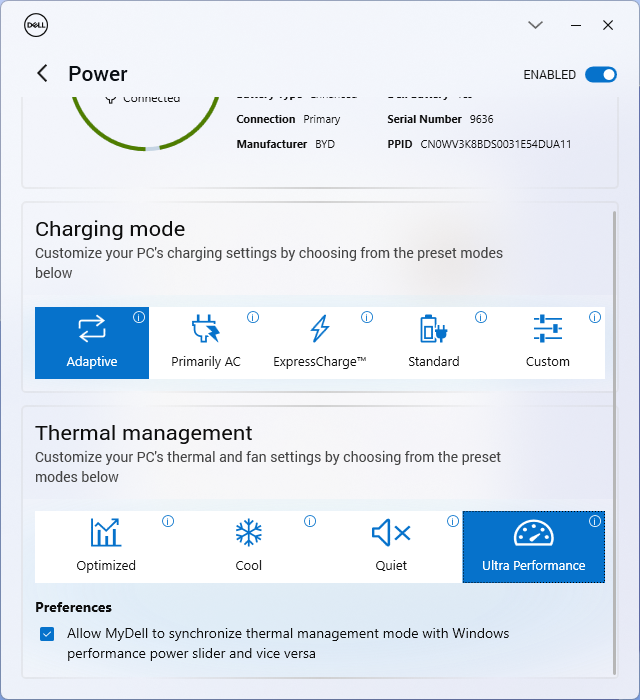
We set our unit to Performance mode via the MyDell software prior to running the benchmarks below. Conveniently, the MyDell power profiles are synced with the Windows power profiles unlike on most other models from competing manufacturers.
Processor
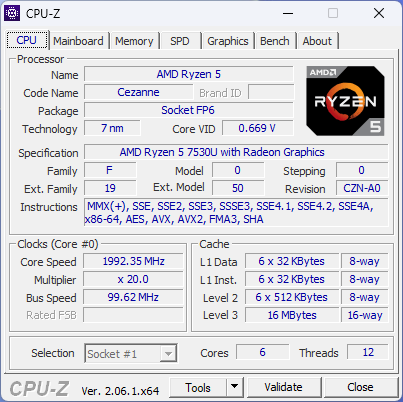
The 6-core Ryzen 5 7530U performs almost identically to the Ryzen 5 6600U since both are based on the Zen 3 architecture. Overall performance is comparable to the midrange Core i5-1335U as found on models like the Acer Aspire 5 Spin 14 while being well above any mobile Core i3 solution. AMD has tuned this CPU to be competitive against the Core i5 series in both performance and price.
Upgrading to the 8-core Ryzen 7 7730U configuration is expected to boost multi-thread performance by about 30 to 40 percent based on our time with the Asus Zenbook 14.
Cinebench R15 Multi Loop
Cinebench R23: Multi Core | Single Core
Cinebench R20: CPU (Multi Core) | CPU (Single Core)
Cinebench R15: CPU Multi 64Bit | CPU Single 64Bit
Blender: v2.79 BMW27 CPU
7-Zip 18.03: 7z b 4 | 7z b 4 -mmt1
Geekbench 5.5: Multi-Core | Single-Core
HWBOT x265 Benchmark v2.2: 4k Preset
LibreOffice : 20 Documents To PDF
R Benchmark 2.5: Overall mean
* ... smaller is better
* ... smaller is better
AIDA64: FP32 Ray-Trace | FPU Julia | CPU SHA3 | CPU Queen | FPU SinJulia | FPU Mandel | CPU AES | CPU ZLib | FP64 Ray-Trace | CPU PhotoWorxx
| Performance rating | |
| Average AMD Ryzen 5 7530U | |
| Dell Inspiron 14 7435 2-in-1 | |
| Lenovo IdeaPad Flex 7i 14IAU7 | |
| Acer Aspire 5 Spin 14 | |
| LG Gram 14T90P | |
| HP Pavilion x360 14-dy0157ng | |
| Dell Inspiron 14 7420 2-in-1 | |
| AIDA64 / FP32 Ray-Trace | |
| Dell Inspiron 14 7435 2-in-1 | |
| Average AMD Ryzen 5 7530U (7609 - 10970, n=9) | |
| Lenovo IdeaPad Flex 7i 14IAU7 | |
| Acer Aspire 5 Spin 14 | |
| LG Gram 14T90P | |
| HP Pavilion x360 14-dy0157ng | |
| Dell Inspiron 14 7420 2-in-1 | |
| AIDA64 / FPU Julia | |
| Dell Inspiron 14 7435 2-in-1 | |
| Average AMD Ryzen 5 7530U (48473 - 68384, n=9) | |
| Lenovo IdeaPad Flex 7i 14IAU7 | |
| Acer Aspire 5 Spin 14 | |
| LG Gram 14T90P | |
| HP Pavilion x360 14-dy0157ng | |
| Dell Inspiron 14 7420 2-in-1 | |
| AIDA64 / CPU SHA3 | |
| Average AMD Ryzen 5 7530U (1591 - 2323, n=9) | |
| Lenovo IdeaPad Flex 7i 14IAU7 | |
| Dell Inspiron 14 7435 2-in-1 | |
| LG Gram 14T90P | |
| Acer Aspire 5 Spin 14 | |
| HP Pavilion x360 14-dy0157ng | |
| Dell Inspiron 14 7420 2-in-1 | |
| AIDA64 / CPU Queen | |
| Dell Inspiron 14 7435 2-in-1 | |
| Average AMD Ryzen 5 7530U (66646 - 78105, n=8) | |
| Lenovo IdeaPad Flex 7i 14IAU7 | |
| Dell Inspiron 14 7420 2-in-1 | |
| Acer Aspire 5 Spin 14 | |
| LG Gram 14T90P | |
| HP Pavilion x360 14-dy0157ng | |
| AIDA64 / FPU SinJulia | |
| Dell Inspiron 14 7435 2-in-1 | |
| Average AMD Ryzen 5 7530U (7611 - 9248, n=9) | |
| Lenovo IdeaPad Flex 7i 14IAU7 | |
| Dell Inspiron 14 7420 2-in-1 | |
| LG Gram 14T90P | |
| Acer Aspire 5 Spin 14 | |
| HP Pavilion x360 14-dy0157ng | |
| AIDA64 / FPU Mandel | |
| Dell Inspiron 14 7435 2-in-1 | |
| Average AMD Ryzen 5 7530U (26912 - 37624, n=9) | |
| Lenovo IdeaPad Flex 7i 14IAU7 | |
| LG Gram 14T90P | |
| Acer Aspire 5 Spin 14 | |
| HP Pavilion x360 14-dy0157ng | |
| Dell Inspiron 14 7420 2-in-1 | |
| AIDA64 / CPU AES | |
| Acer Aspire 5 Spin 14 | |
| LG Gram 14T90P | |
| HP Pavilion x360 14-dy0157ng | |
| Average AMD Ryzen 5 7530U (33314 - 92360, n=9) | |
| Lenovo IdeaPad Flex 7i 14IAU7 | |
| Dell Inspiron 14 7435 2-in-1 | |
| Dell Inspiron 14 7420 2-in-1 | |
| AIDA64 / CPU ZLib | |
| Acer Aspire 5 Spin 14 | |
| Lenovo IdeaPad Flex 7i 14IAU7 | |
| Dell Inspiron 14 7420 2-in-1 | |
| Dell Inspiron 14 7435 2-in-1 | |
| Average AMD Ryzen 5 7530U (443 - 612, n=9) | |
| LG Gram 14T90P | |
| HP Pavilion x360 14-dy0157ng | |
| AIDA64 / FP64 Ray-Trace | |
| Dell Inspiron 14 7435 2-in-1 | |
| Average AMD Ryzen 5 7530U (4008 - 5738, n=9) | |
| Lenovo IdeaPad Flex 7i 14IAU7 | |
| LG Gram 14T90P | |
| Acer Aspire 5 Spin 14 | |
| HP Pavilion x360 14-dy0157ng | |
| Dell Inspiron 14 7420 2-in-1 | |
| AIDA64 / CPU PhotoWorxx | |
| Lenovo IdeaPad Flex 7i 14IAU7 | |
| LG Gram 14T90P | |
| Acer Aspire 5 Spin 14 | |
| HP Pavilion x360 14-dy0157ng | |
| Dell Inspiron 14 7420 2-in-1 | |
| Dell Inspiron 14 7435 2-in-1 | |
| Average AMD Ryzen 5 7530U (9832 - 19525, n=9) | |
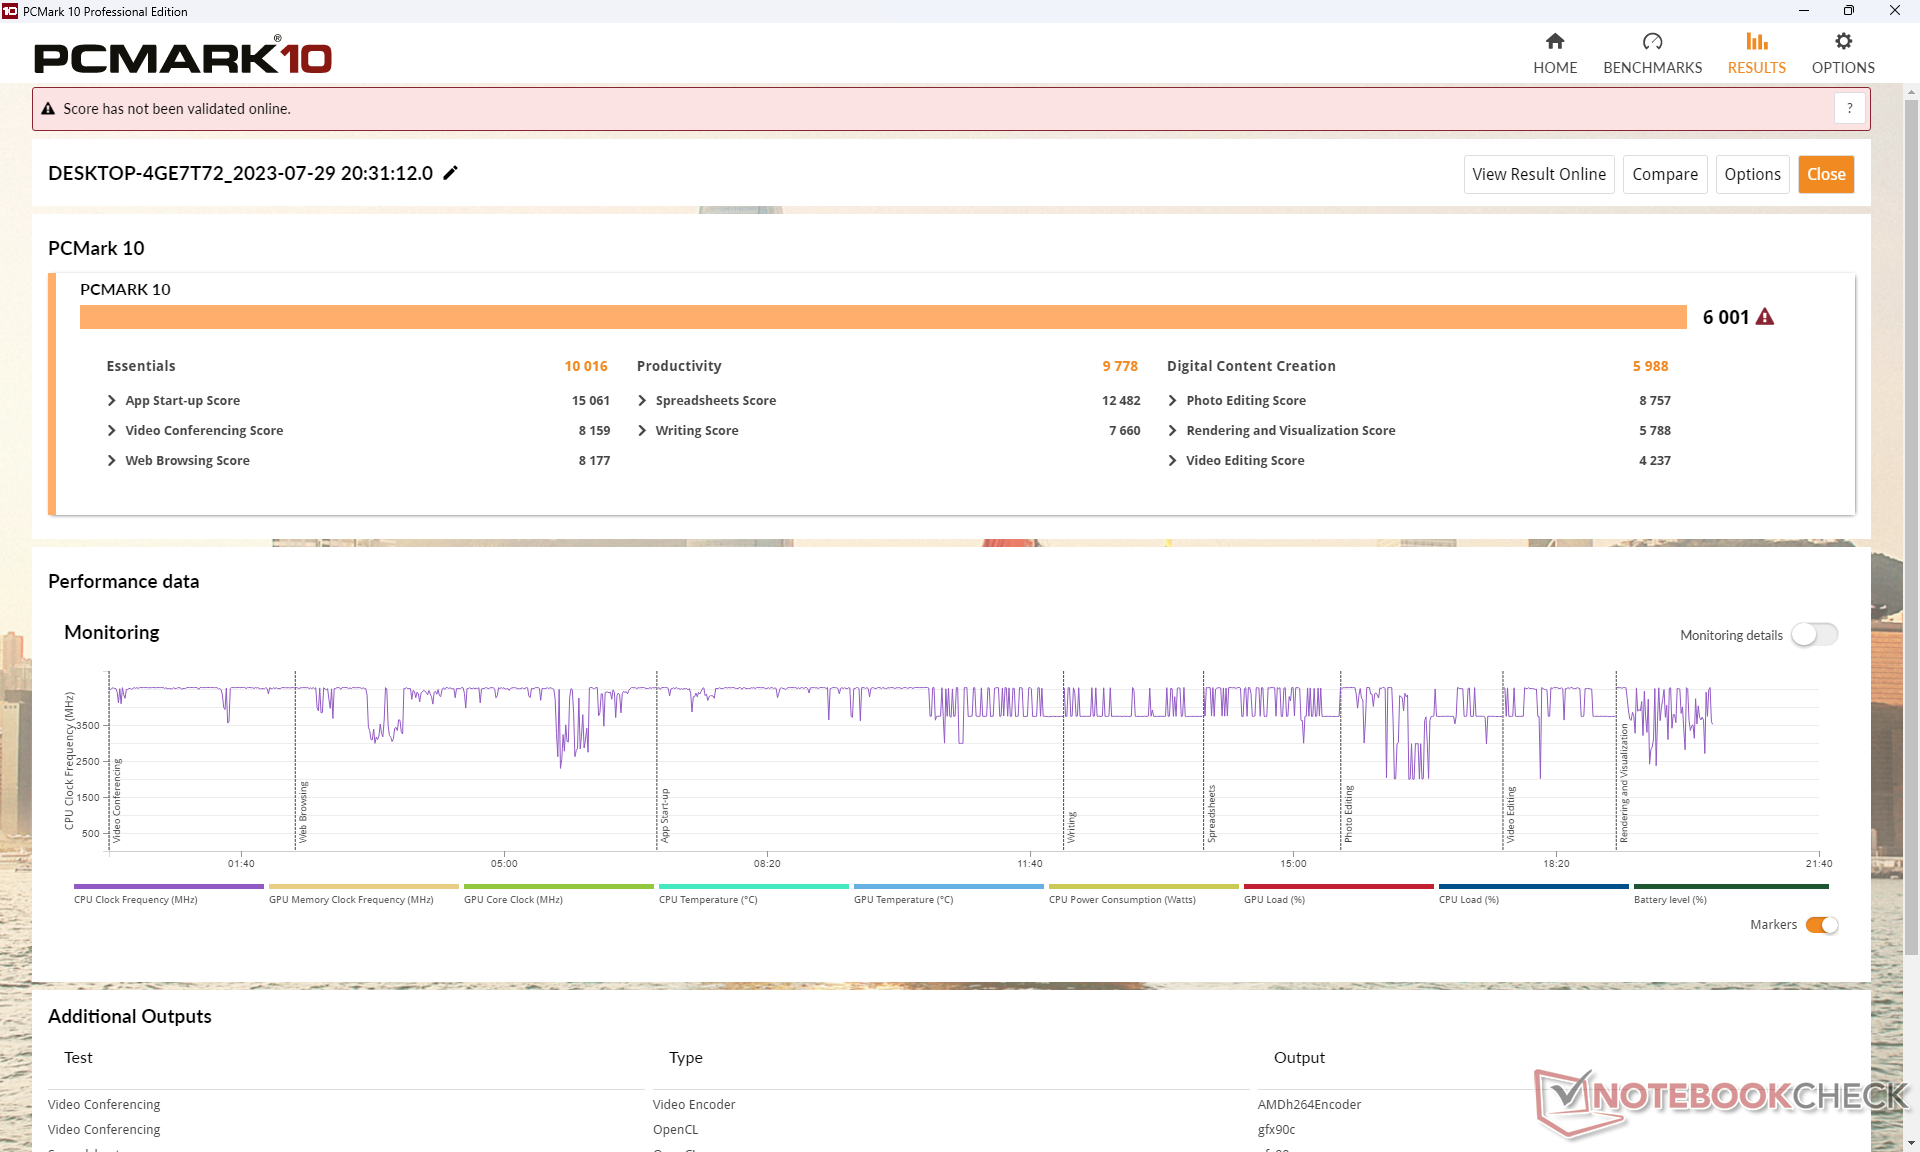
System Performance
PCMark scores are higher than on most other inexpensive subnotebooks particularly in the Productivity subtest. We suspect this could be due to the 6-core/12-thread configuration of the processor which may have a larger influence on the benchmark than the P-core and E-Core configurations of Intel CPUs.
CrossMark: Overall | Productivity | Creativity | Responsiveness
| PCMark 10 / Score | |
| Dell Inspiron 14 7435 2-in-1 | |
| Average AMD Ryzen 5 7530U, AMD Radeon RX Vega 7 (5686 - 6209, n=8) | |
| Lenovo IdeaPad Flex 7i 14IAU7 | |
| Dell Inspiron 14 7420 2-in-1 | |
| Acer Aspire 5 Spin 14 | |
| LG Gram 14T90P | |
| HP Pavilion x360 14-dy0157ng | |
| PCMark 10 / Essentials | |
| Lenovo IdeaPad Flex 7i 14IAU7 | |
| Average AMD Ryzen 5 7530U, AMD Radeon RX Vega 7 (9183 - 11242, n=8) | |
| Acer Aspire 5 Spin 14 | |
| Dell Inspiron 14 7420 2-in-1 | |
| Dell Inspiron 14 7435 2-in-1 | |
| LG Gram 14T90P | |
| HP Pavilion x360 14-dy0157ng | |
| PCMark 10 / Productivity | |
| Average AMD Ryzen 5 7530U, AMD Radeon RX Vega 7 (8983 - 14037, n=8) | |
| Dell Inspiron 14 7435 2-in-1 | |
| Lenovo IdeaPad Flex 7i 14IAU7 | |
| Acer Aspire 5 Spin 14 | |
| Dell Inspiron 14 7420 2-in-1 | |
| LG Gram 14T90P | |
| HP Pavilion x360 14-dy0157ng | |
| PCMark 10 / Digital Content Creation | |
| Dell Inspiron 14 7435 2-in-1 | |
| Dell Inspiron 14 7420 2-in-1 | |
| Lenovo IdeaPad Flex 7i 14IAU7 | |
| Acer Aspire 5 Spin 14 | |
| Average AMD Ryzen 5 7530U, AMD Radeon RX Vega 7 (4941 - 6093, n=8) | |
| HP Pavilion x360 14-dy0157ng | |
| LG Gram 14T90P | |
| CrossMark / Overall | |
| Acer Aspire 5 Spin 14 | |
| Lenovo IdeaPad Flex 7i 14IAU7 | |
| Dell Inspiron 14 7420 2-in-1 | |
| LG Gram 14T90P | |
| Average AMD Ryzen 5 7530U, AMD Radeon RX Vega 7 (1029 - 1336, n=7) | |
| Dell Inspiron 14 7435 2-in-1 | |
| CrossMark / Productivity | |
| Acer Aspire 5 Spin 14 | |
| Dell Inspiron 14 7420 2-in-1 | |
| Lenovo IdeaPad Flex 7i 14IAU7 | |
| LG Gram 14T90P | |
| Average AMD Ryzen 5 7530U, AMD Radeon RX Vega 7 (1115 - 1370, n=7) | |
| Dell Inspiron 14 7435 2-in-1 | |
| CrossMark / Creativity | |
| Lenovo IdeaPad Flex 7i 14IAU7 | |
| Dell Inspiron 14 7420 2-in-1 | |
| Acer Aspire 5 Spin 14 | |
| Average AMD Ryzen 5 7530U, AMD Radeon RX Vega 7 (992 - 1390, n=7) | |
| Dell Inspiron 14 7435 2-in-1 | |
| LG Gram 14T90P | |
| CrossMark / Responsiveness | |
| Acer Aspire 5 Spin 14 | |
| LG Gram 14T90P | |
| Dell Inspiron 14 7420 2-in-1 | |
| Lenovo IdeaPad Flex 7i 14IAU7 | |
| Dell Inspiron 14 7435 2-in-1 | |
| Average AMD Ryzen 5 7530U, AMD Radeon RX Vega 7 (900 - 1096, n=7) | |
| PCMark 10 Score | 6001 points | |
Help | ||
| AIDA64 / Memory Copy | |
| LG Gram 14T90P | |
| Lenovo IdeaPad Flex 7i 14IAU7 | |
| Acer Aspire 5 Spin 14 | |
| HP Pavilion x360 14-dy0157ng | |
| Dell Inspiron 14 7420 2-in-1 | |
| Dell Inspiron 14 7435 2-in-1 | |
| Average AMD Ryzen 5 7530U (20155 - 42853, n=9) | |
| AIDA64 / Memory Read | |
| LG Gram 14T90P | |
| Lenovo IdeaPad Flex 7i 14IAU7 | |
| HP Pavilion x360 14-dy0157ng | |
| Acer Aspire 5 Spin 14 | |
| Dell Inspiron 14 7420 2-in-1 | |
| Dell Inspiron 14 7435 2-in-1 | |
| Average AMD Ryzen 5 7530U (23068 - 40270, n=9) | |
| AIDA64 / Memory Write | |
| Acer Aspire 5 Spin 14 | |
| LG Gram 14T90P | |
| Lenovo IdeaPad Flex 7i 14IAU7 | |
| HP Pavilion x360 14-dy0157ng | |
| Dell Inspiron 14 7420 2-in-1 | |
| Dell Inspiron 14 7435 2-in-1 | |
| Average AMD Ryzen 5 7530U (22954 - 41838, n=9) | |
| AIDA64 / Memory Latency | |
| Dell Inspiron 14 7435 2-in-1 | |
| Acer Aspire 5 Spin 14 | |
| Average AMD Ryzen 5 7530U (88.1 - 110.8, n=9) | |
| Lenovo IdeaPad Flex 7i 14IAU7 | |
| LG Gram 14T90P | |
| HP Pavilion x360 14-dy0157ng | |
| Dell Inspiron 14 7420 2-in-1 | |
* ... smaller is better
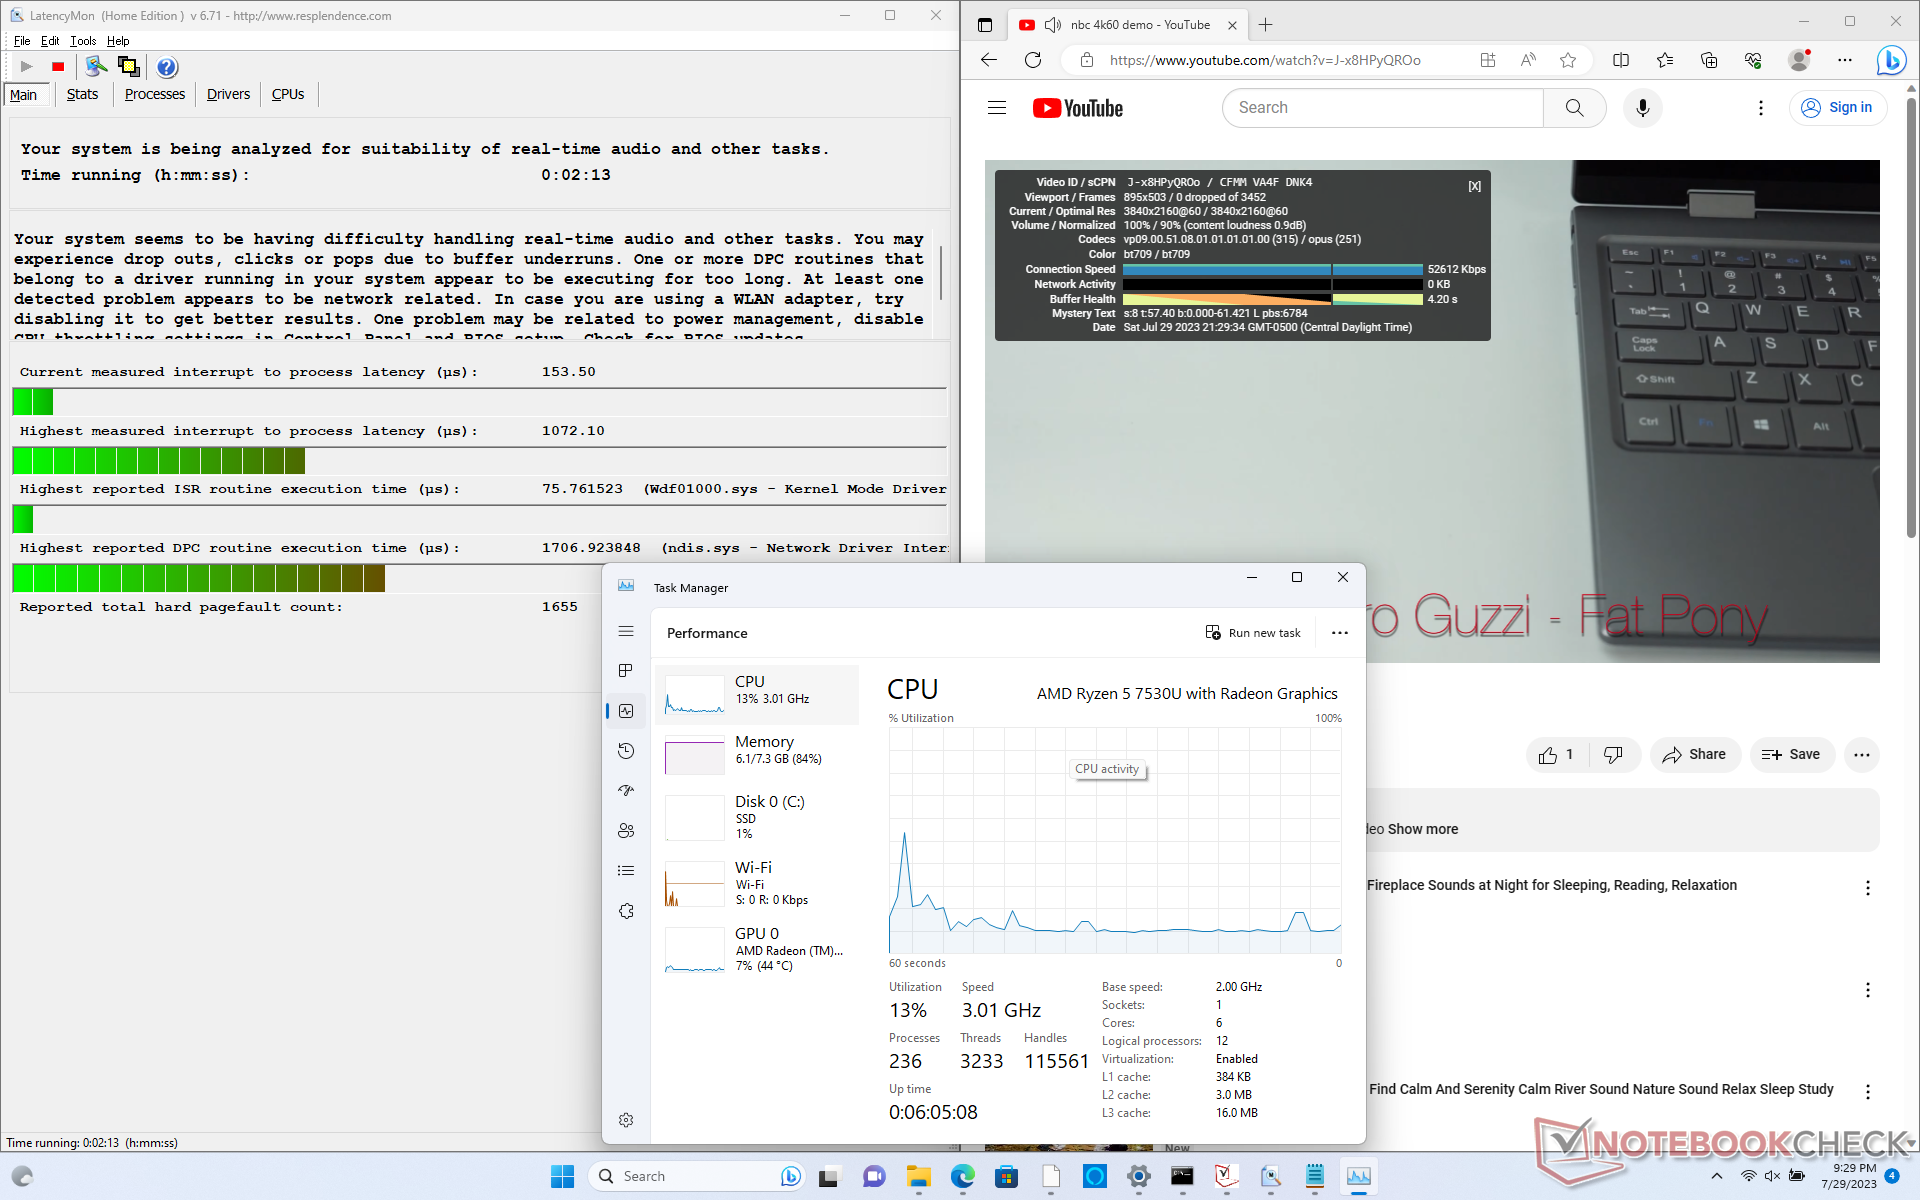
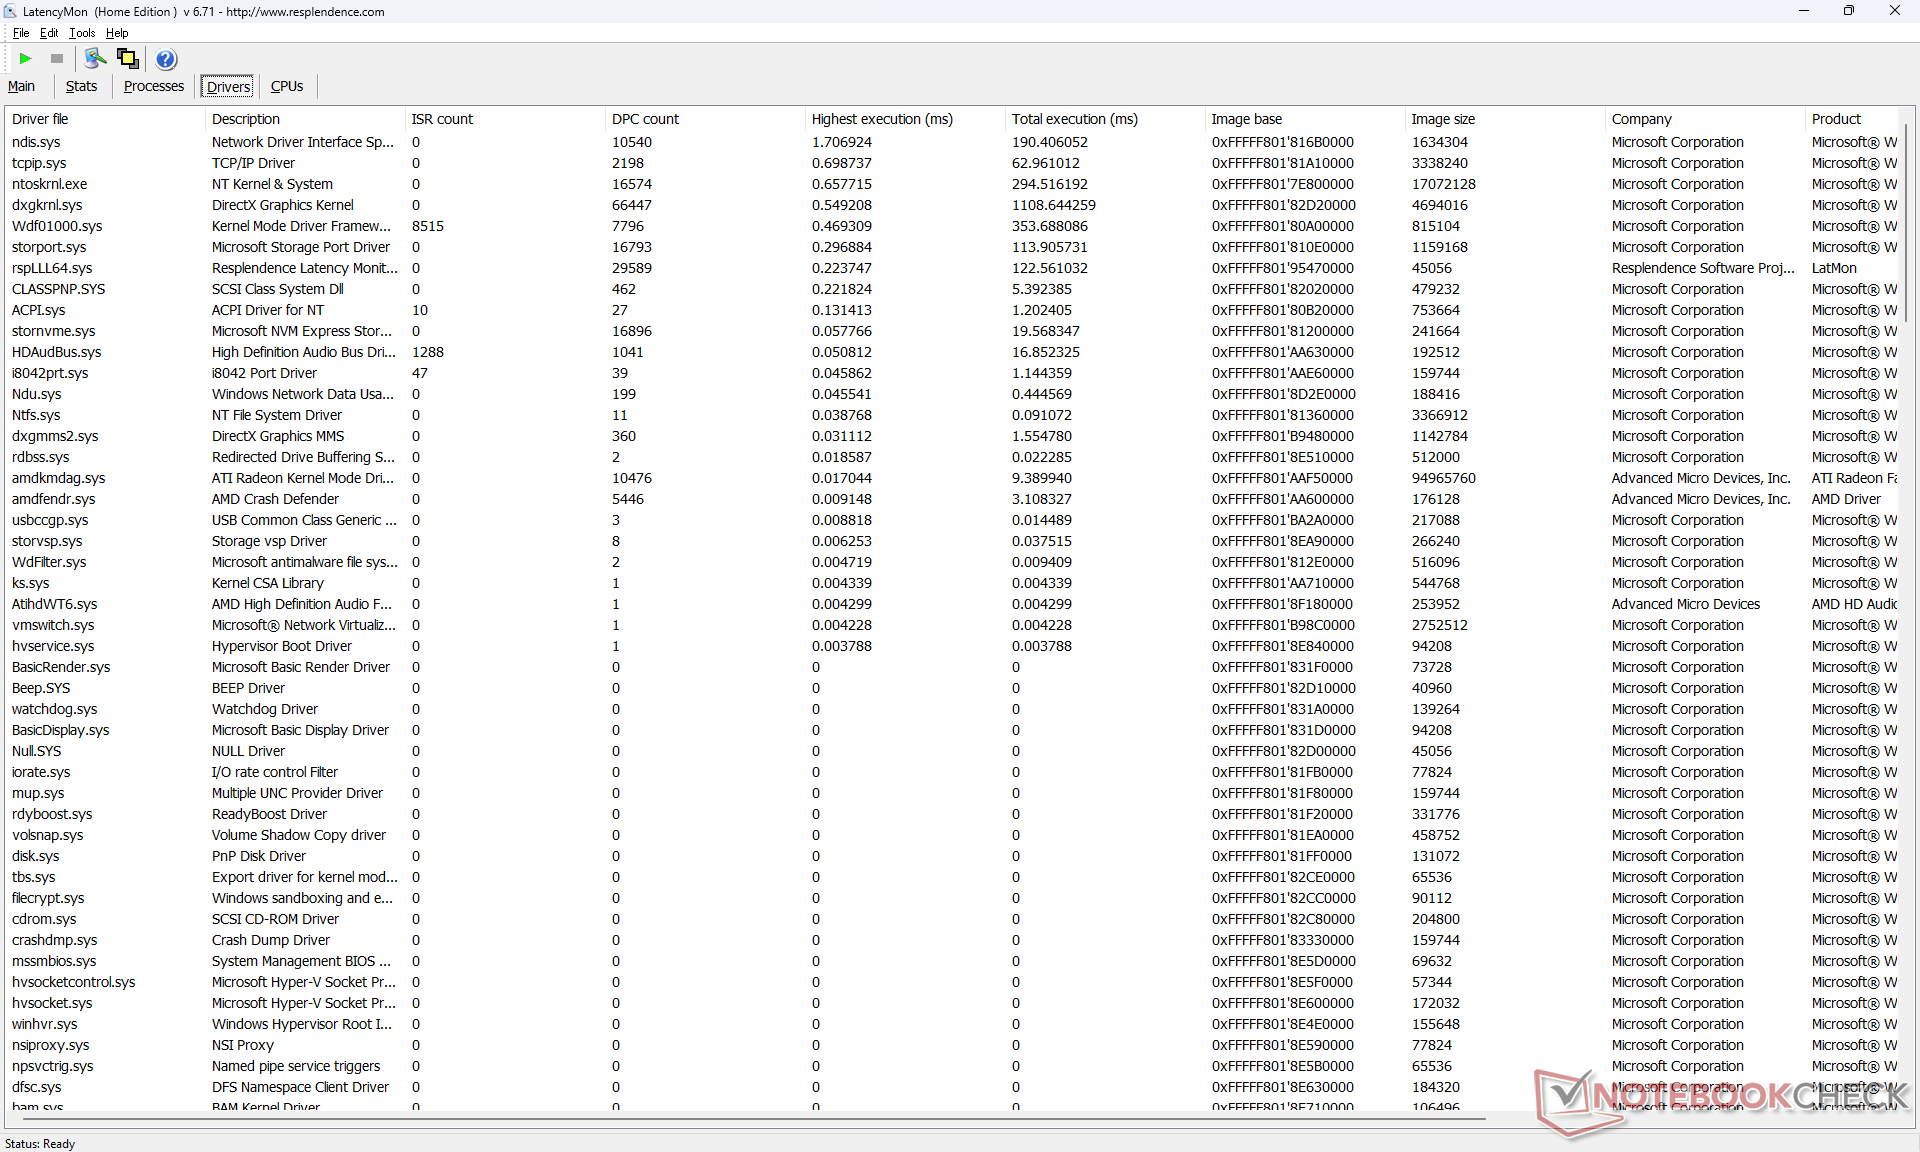
DPC Latency
LatencyMon reveals minor DPC issues when opening multiple browser tabs of our homepage. 4K video playback at 60 FPS is otherwise perfect with no dropped frames recorded.
| DPC Latencies / LatencyMon - interrupt to process latency (max), Web, Youtube, Prime95 | |
| Acer Aspire 5 Spin 14 | |
| Dell Inspiron 14 7435 2-in-1 | |
| LG Gram 14T90P | |
| HP Pavilion x360 14-dy0157ng | |
| Lenovo IdeaPad Flex 7i 14IAU7 | |
| Dell Inspiron 14 7420 2-in-1 | |
* ... smaller is better
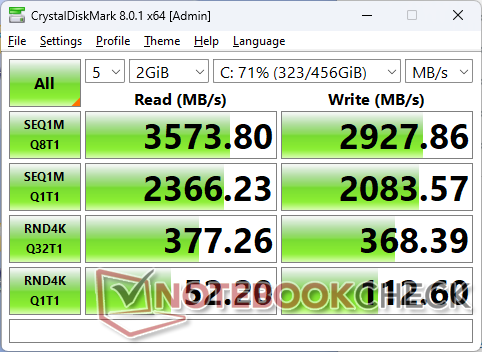
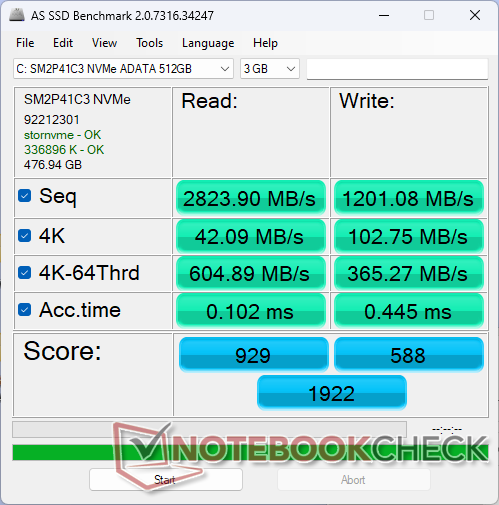
Storage Devices
Our test unit ships with a budget 512 GB ADATA SM2P41C3 PCIe4 x4 NVMe SSD offering read and write rates of up to 3600 MB/s and 3000 MB/s, respectively. It balances well with the Ryzen 5 CPU since super-fast SSDs are of little benefit to the target audience of casual home users or students.
There are no internal secondary SSD options unlike on the pricier LG Gram 14T90P convertible.

| Drive Performance rating - Percent | |
| Acer Aspire 5 Spin 14 | |
| LG Gram 14T90P | |
| Lenovo IdeaPad Flex 7i 14IAU7 | |
| HP Pavilion x360 14-dy0157ng | |
| Dell Inspiron 14 7420 2-in-1 | |
| Dell Inspiron 14 7435 2-in-1 | |
* ... smaller is better
Disk Throttling: DiskSpd Read Loop, Queue Depth 8
GPU Performance — Older Radeon RX Vega
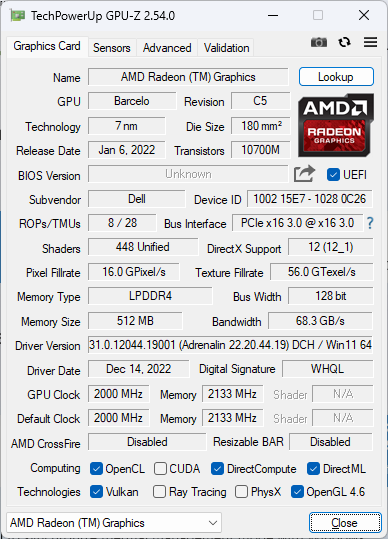
The Ryzen 5 7530U and Ryzen 7 7730U run on older integrated Radeon RX Vega graphics instead of the newer Radeon 680M or 780M which is a shame as the newer solutions can be up to 2x to 2.5x faster. Aside from very undemanding games like Dota 2 Reborn, the system can't handle modern titles especially when considering its limited 8 GB of RAM. F1 22, for example, would only run on very low settings as anything higher would crash.
Frame rates would periodically dip to the mid 50s before jumping back up to the high 60s when idling on Witcher 3. The dips would occur at consistent intervals as shown by our FPS graph below to suggest poor handling of active background applications.
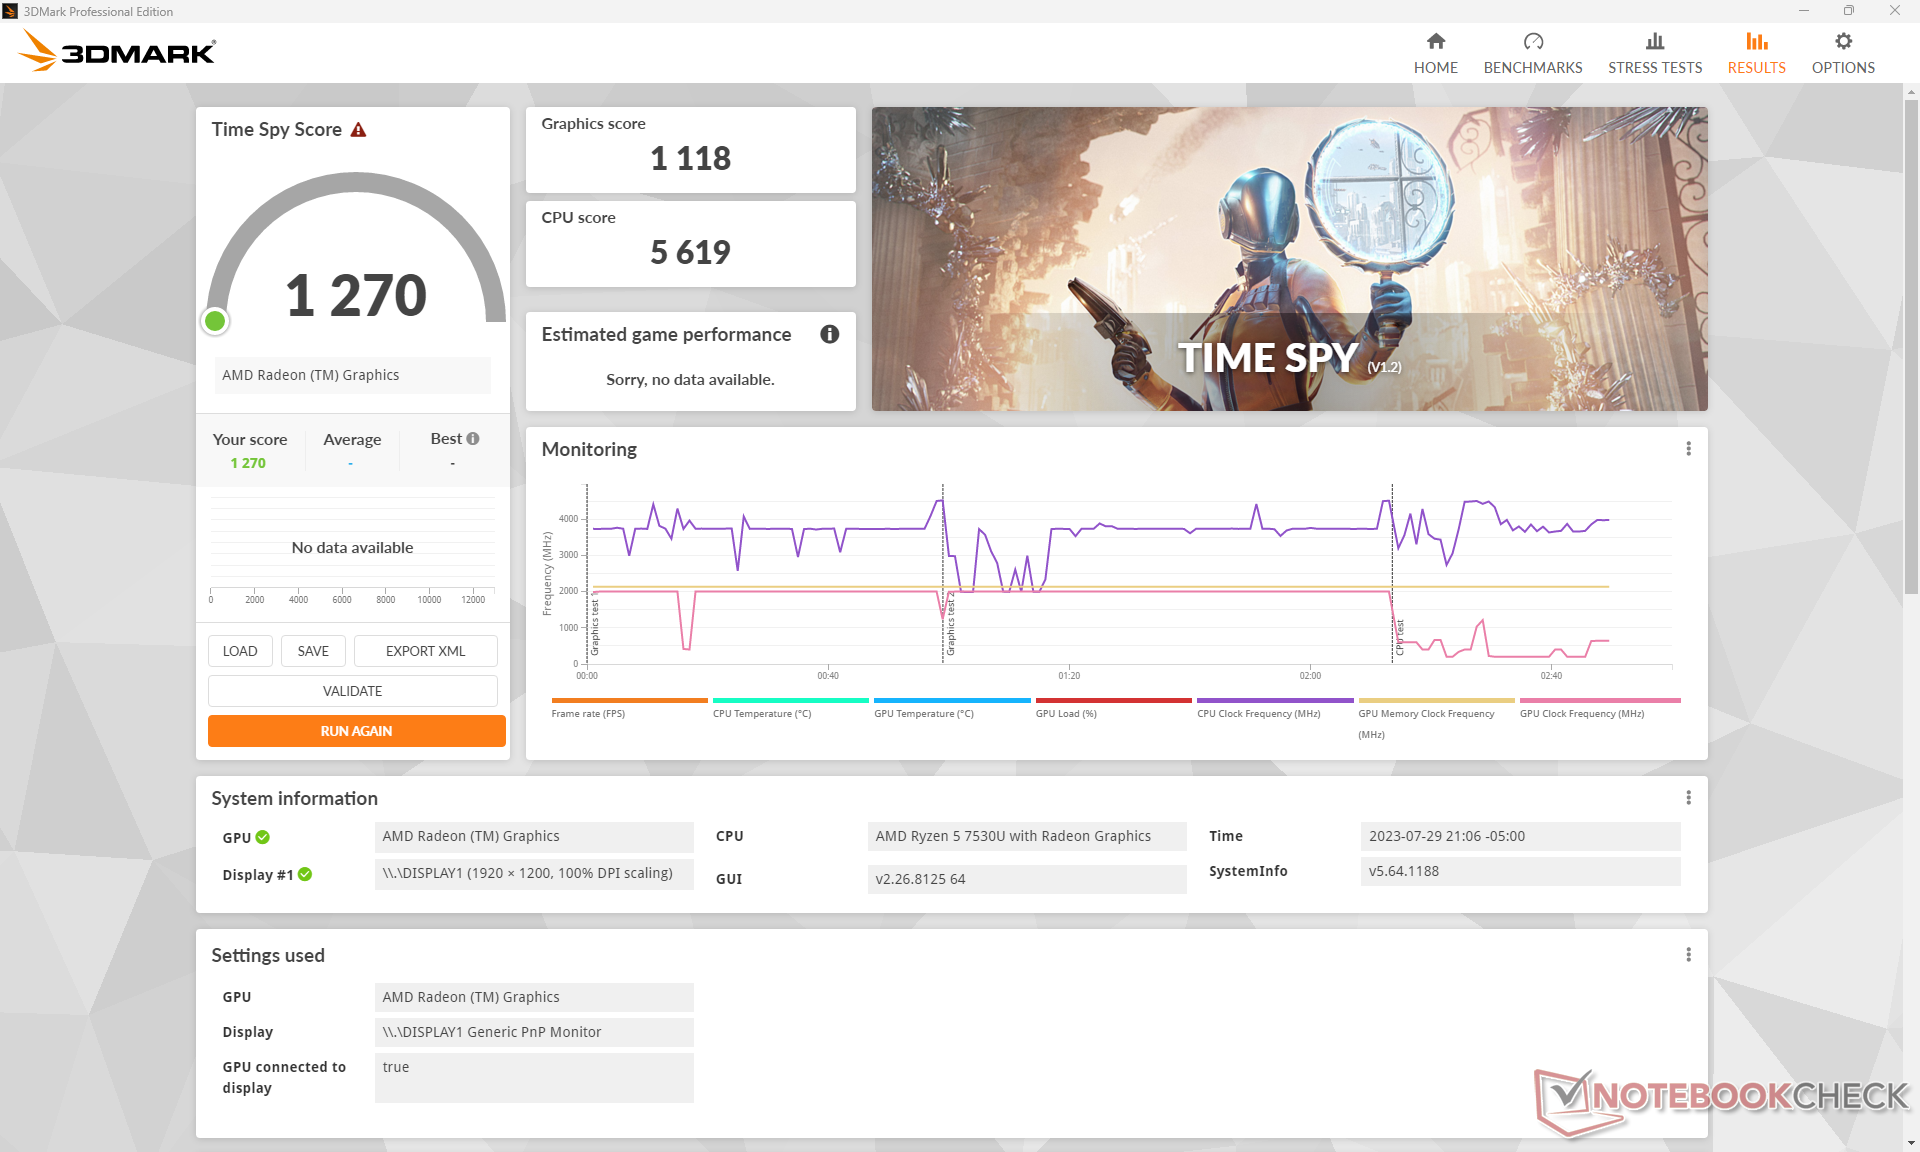
Overall performance is reduced by about 10 percent if running on Balanced mode as shown by our 3DMark 11 table below.
| Power Profile | Graphics Score | Physics Score | Combined Score |
| Battery | 5798 (-4%) | 11906 (-5%) | 4161 (-6%) |
| Balanced | 5472 (-9%) | 10908 (-13%) | 4195 (-5%) |
| Performance | 6024 | 12492 | 4419 |
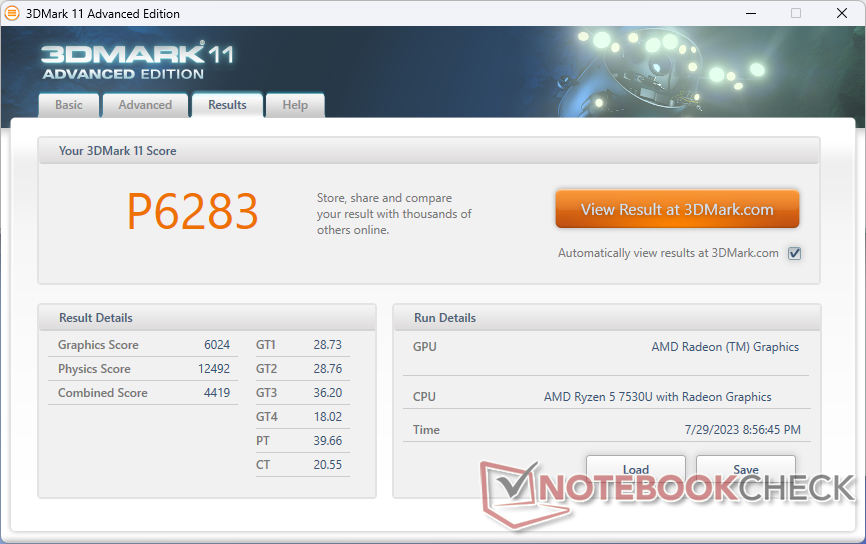
| 3DMark 11 Performance | 6283 points | |
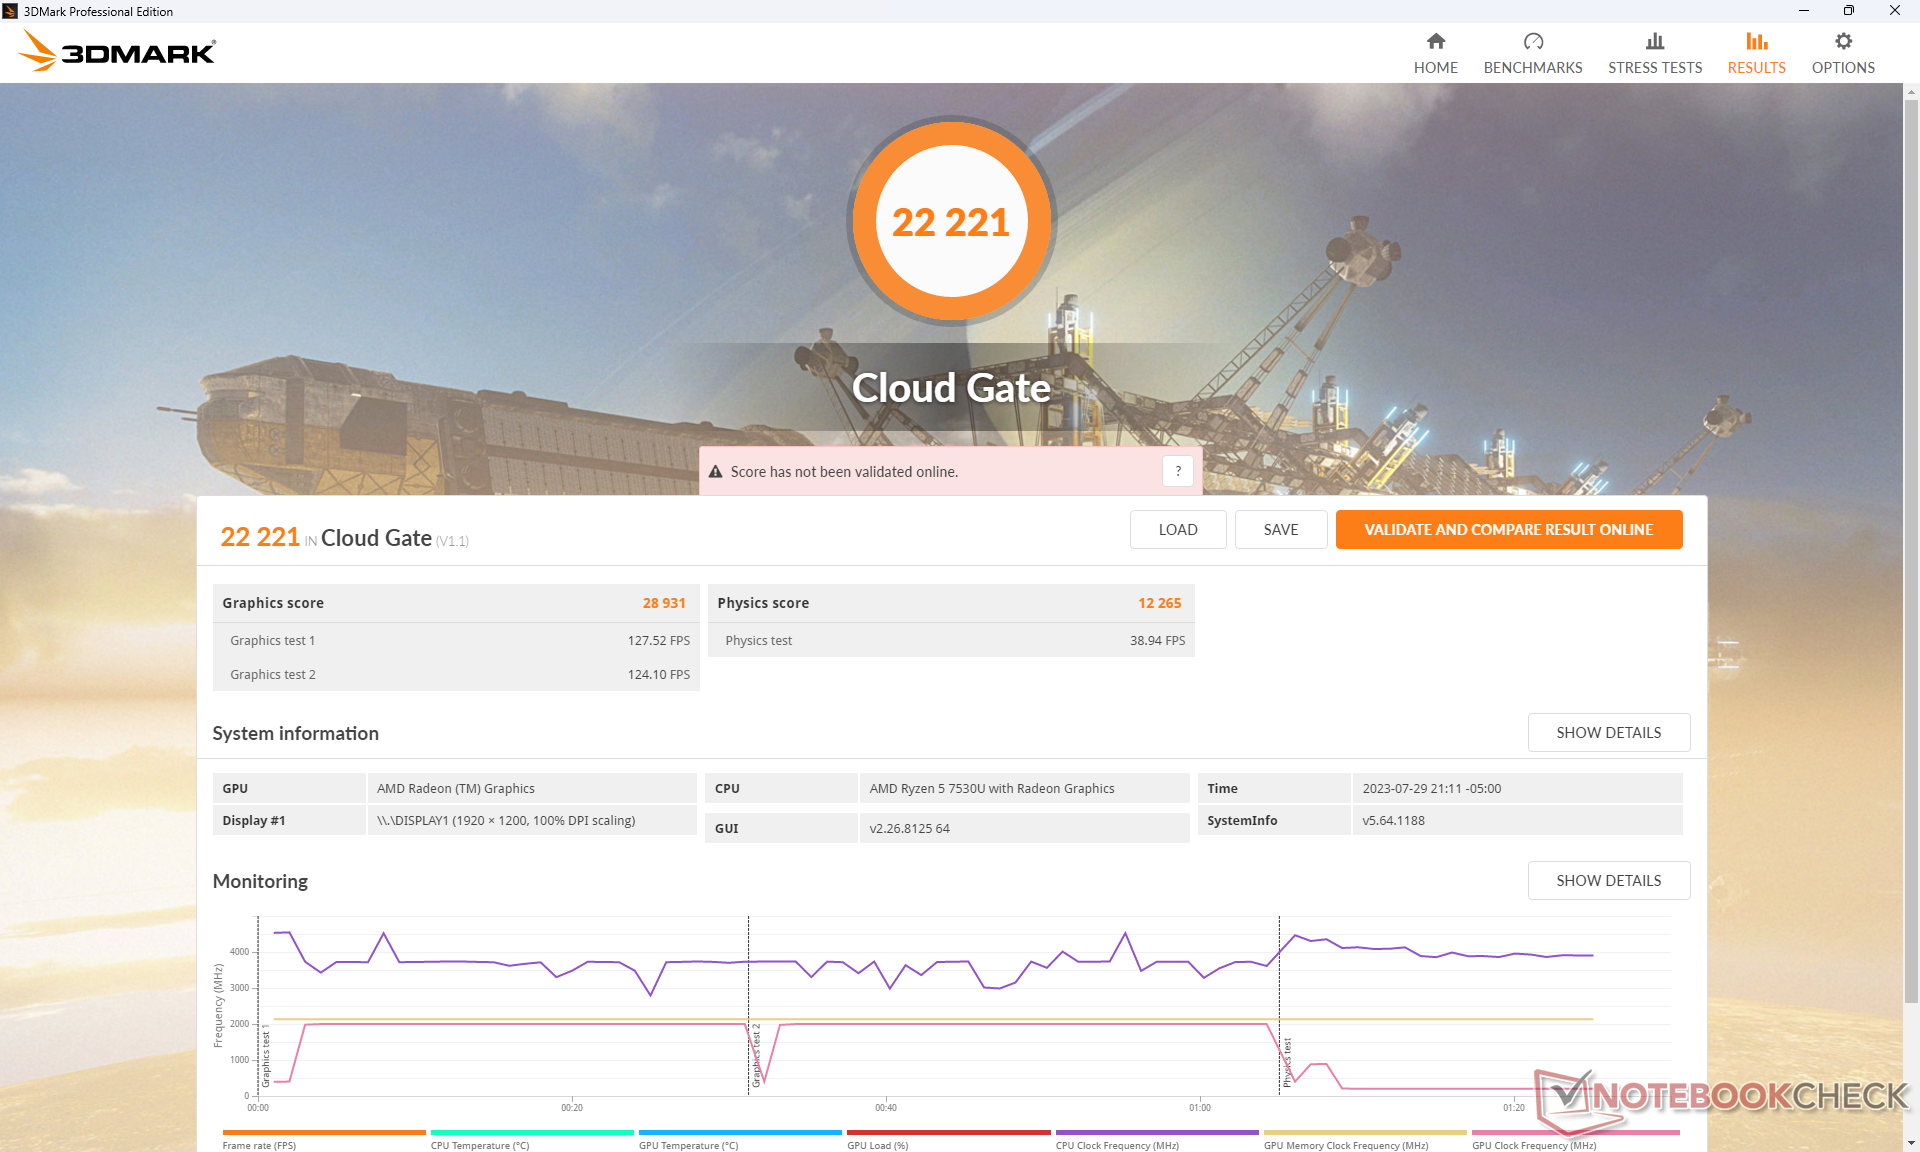
| 3DMark Cloud Gate Standard Score | 22221 points | |
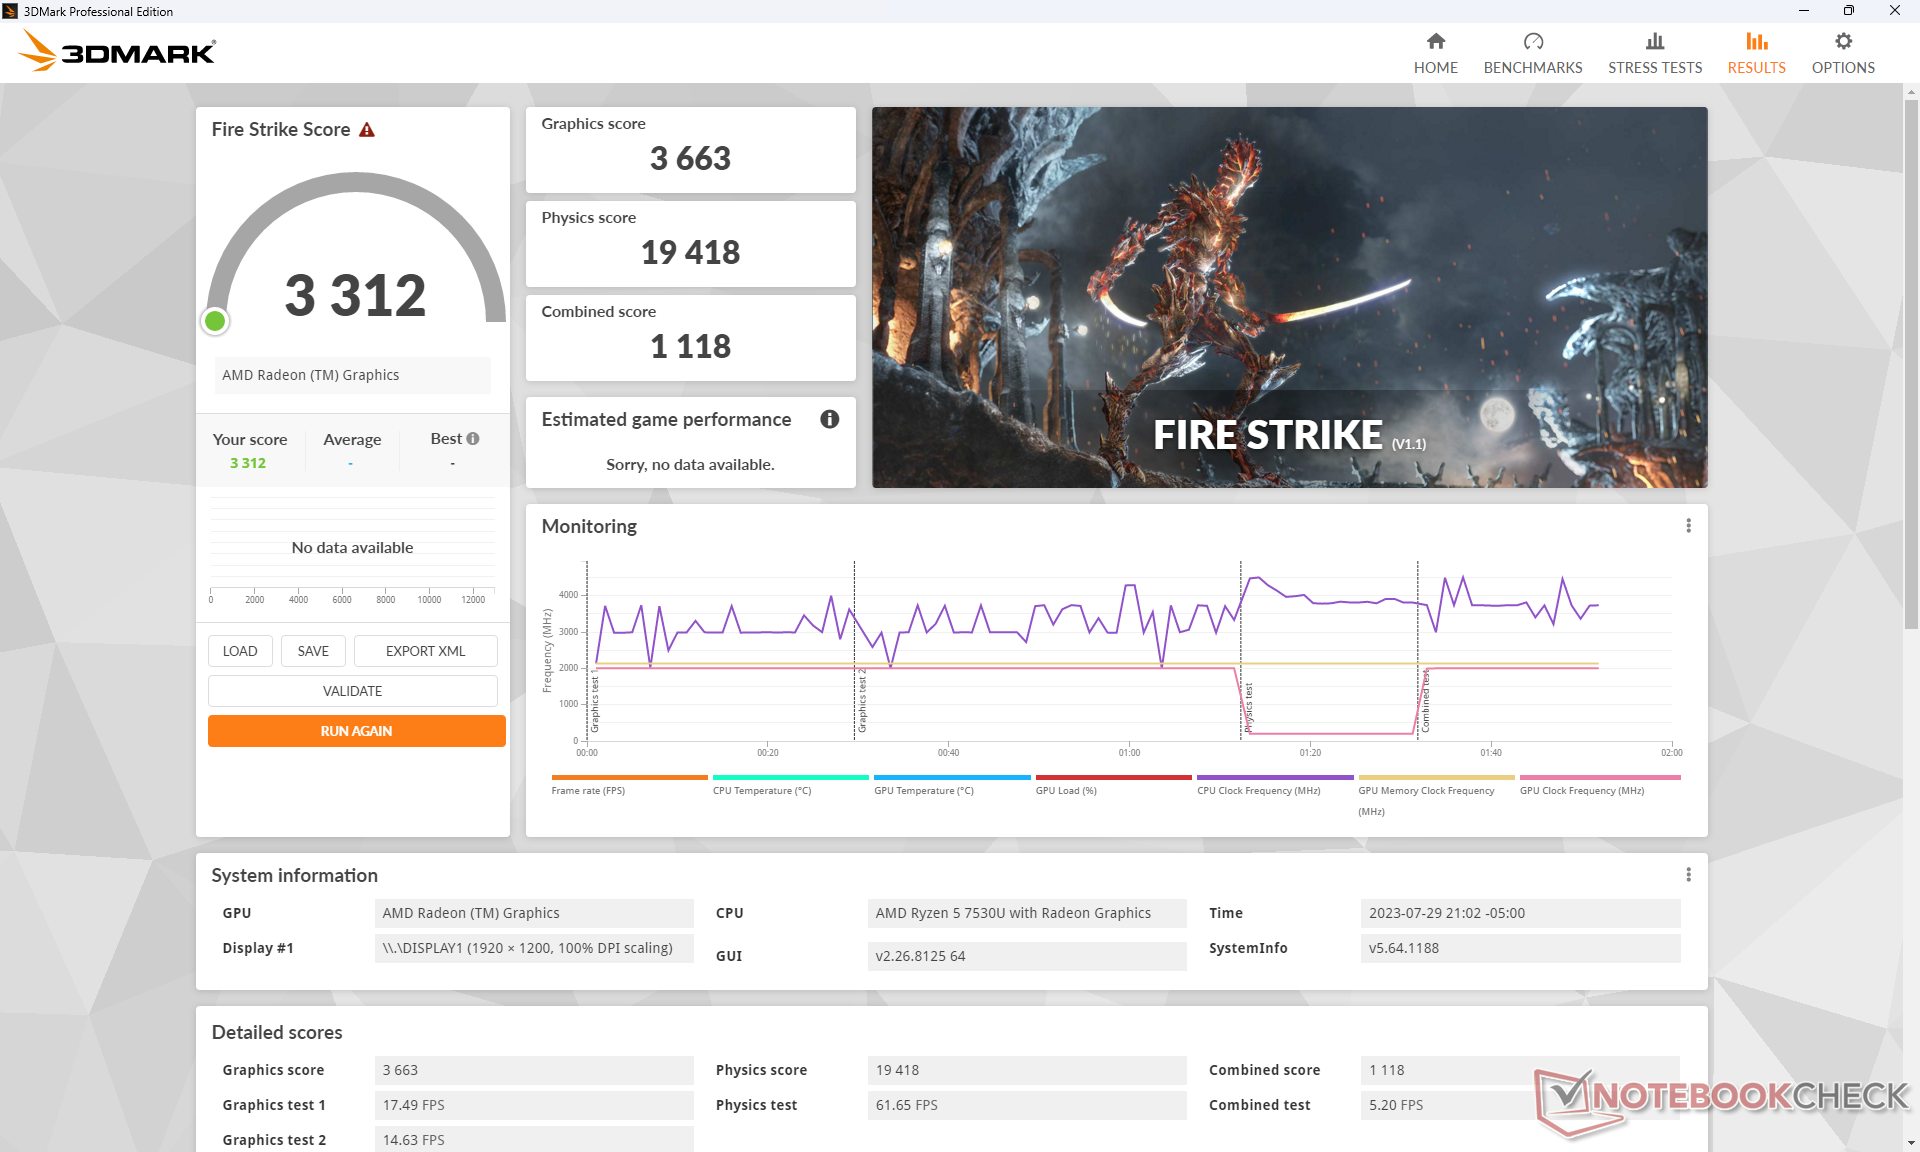
| 3DMark Fire Strike Score | 3312 points | |
| 3DMark Time Spy Score | 1270 points | |
Help | ||
| F1 22 - 1280x720 Ultra Low Preset AA:T AF:16x | |
| Dell Latitude 9440 2-in-1 | |
| Lenovo ThinkPad X1 Yoga G8 i7-1355U | |
| Average AMD Radeon RX Vega 7 (43.6 - 80.8, n=11) | |
| Dell Inspiron 14 7435 2-in-1 | |
| Tiny Tina's Wonderlands - 1280x720 Lowest Preset (DX12) | |
| Average AMD Radeon RX Vega 7 (49.7 - 70.4, n=7) | |
| Dell Inspiron 14 7435 2-in-1 | |
| Dell Latitude 9440 2-in-1 | |
| Lenovo ThinkPad X1 Yoga G8 i7-1355U | |
Witcher 3 FPS Chart
| low | med. | high | ultra | |
|---|---|---|---|---|
| GTA V (2015) | 107.7 | 25.7 | 10.2 | |
| The Witcher 3 (2015) | 76 | 21.5 | 14.5 | |
| Dota 2 Reborn (2015) | 107.4 | 87.3 | 49.9 | 47.1 |
| Final Fantasy XV Benchmark (2018) | 35.1 | 17.5 | 12.1 | |
| X-Plane 11.11 (2018) | 37.4 | 29.5 | 26.4 | |
| Strange Brigade (2018) | 79.5 | 31.4 | 25.6 | 22.3 |
| Cyberpunk 2077 1.6 (2022) | 16.3 | 12.8 | 8.9 | 6.7 |
| Tiny Tina's Wonderlands (2022) | 26.5 | |||
| F1 22 (2022) |
Emissions
System Noise
The internal fan tends to pulse between idle and 33.3 dB(A) when browsing the web or video streaming. Increases in fan noise tend to be sudden and sharp instead of gradual which unfortunately makes the noise more noticeable.
Consistent high loads like games would induce a fan noise of almost 41 dB(A) if on Performance mode. If on Balanced mode, fan noise would dip slightly to 39.8 dB(A).
We're able to notice slight coil whining or electronic noise from our test unit and so it is never truly silent even when the fan is idle. The low 40 dB(A) range is quieter than the Acer Aspire 5 Spin 14 while being louder than the LG Gram 14T90P.
Noise level
| Idle |
| 23.2 / 23.2 / 23.2 dB(A) |
| Load |
| 33 / 41.3 dB(A) |
 | ||
30 dB silent 40 dB(A) audible 50 dB(A) loud |
||
min: | ||
| Dell Inspiron 14 7435 2-in-1 Vega 7, R5 7530U | Dell Inspiron 14 7420 2-in-1 Iris Xe G7 96EUs, i7-1255U, WDC PC SN530 SDBPMPZ-512G | Lenovo IdeaPad Flex 7i 14IAU7 Iris Xe G7 96EUs, i7-1255U, Samsung PM9B1 512GB MZAL4512HBLU | Acer Aspire 5 Spin 14 Iris Xe G7 80EUs, i5-1335U, Micron 2450 512GB MTFDKBA512TFK | LG Gram 14T90P Iris Xe G7 80EUs, i5-1135G7, Samsung SSD PM981a MZVLB512HBJQ | HP Pavilion x360 14-dy0157ng Iris Xe G7 80EUs, i5-1135G7, Toshiba KBG40ZNV512G | |
|---|---|---|---|---|---|---|
| Noise | -3% | 1% | -22% | 0% | -10% | |
| off / environment * (dB) | 22.8 | 23.1 -1% | 23.3 -2% | 26 -14% | 25.4 -11% | 27 -18% |
| Idle Minimum * (dB) | 23.2 | 24.7 -6% | 23.3 -0% | 27.7 -19% | 25.5 -10% | 27 -16% |
| Idle Average * (dB) | 23.2 | 24.7 -6% | 23.3 -0% | 27.7 -19% | 25.5 -10% | 27 -16% |
| Idle Maximum * (dB) | 23.2 | 24.7 -6% | 23.3 -0% | 29.7 -28% | 25.5 -10% | 27 -16% |
| Load Average * (dB) | 33 | 27.7 16% | 34.3 -4% | 46.3 -40% | 28.3 14% | 38.3 -16% |
| Witcher 3 ultra * (dB) | 40.9 | 45.1 -10% | 37.8 8% | 35 14% | ||
| Load Maximum * (dB) | 41.3 | 45.1 -9% | 37.8 8% | 45.4 -10% | 35 15% | 33.2 20% |
* ... smaller is better
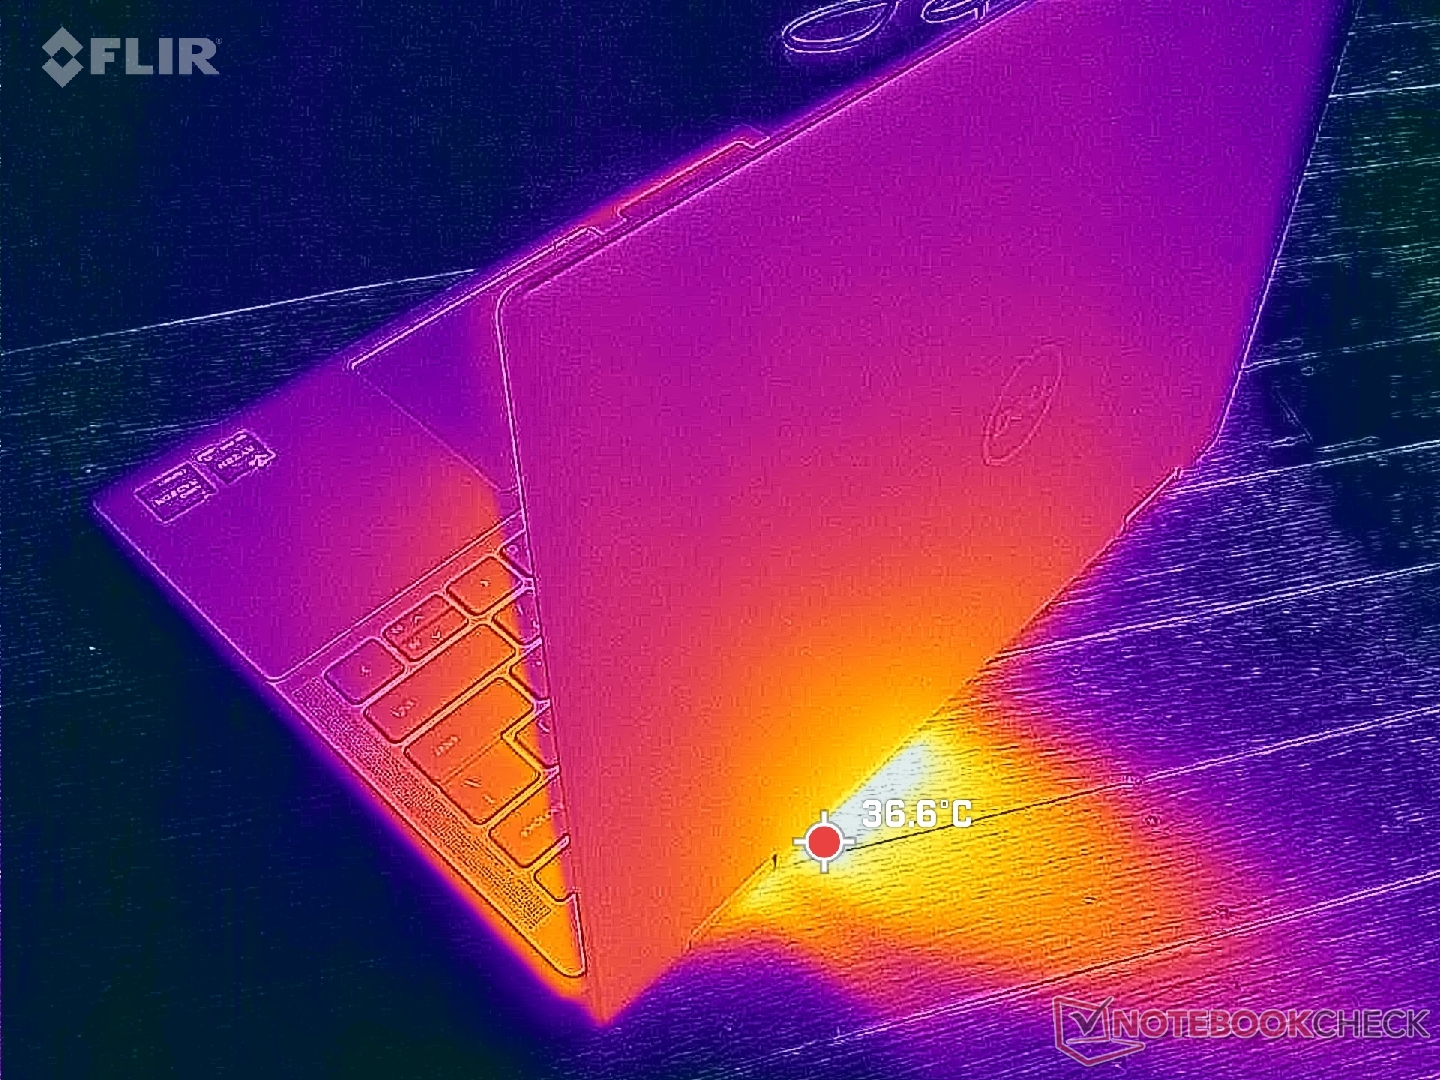
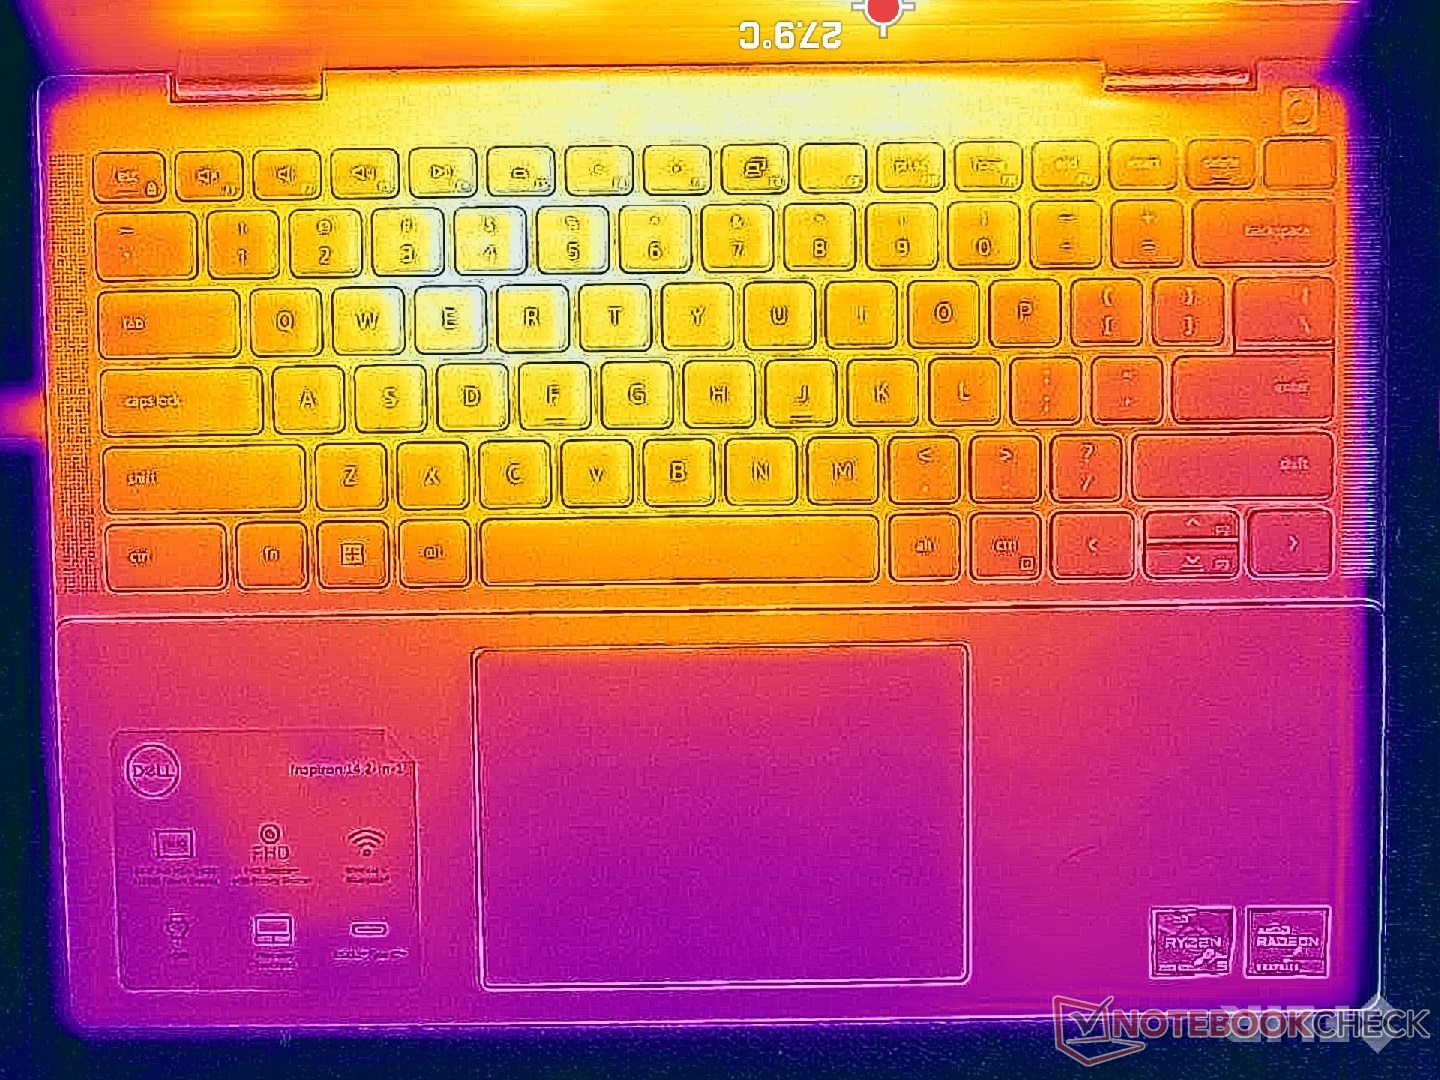
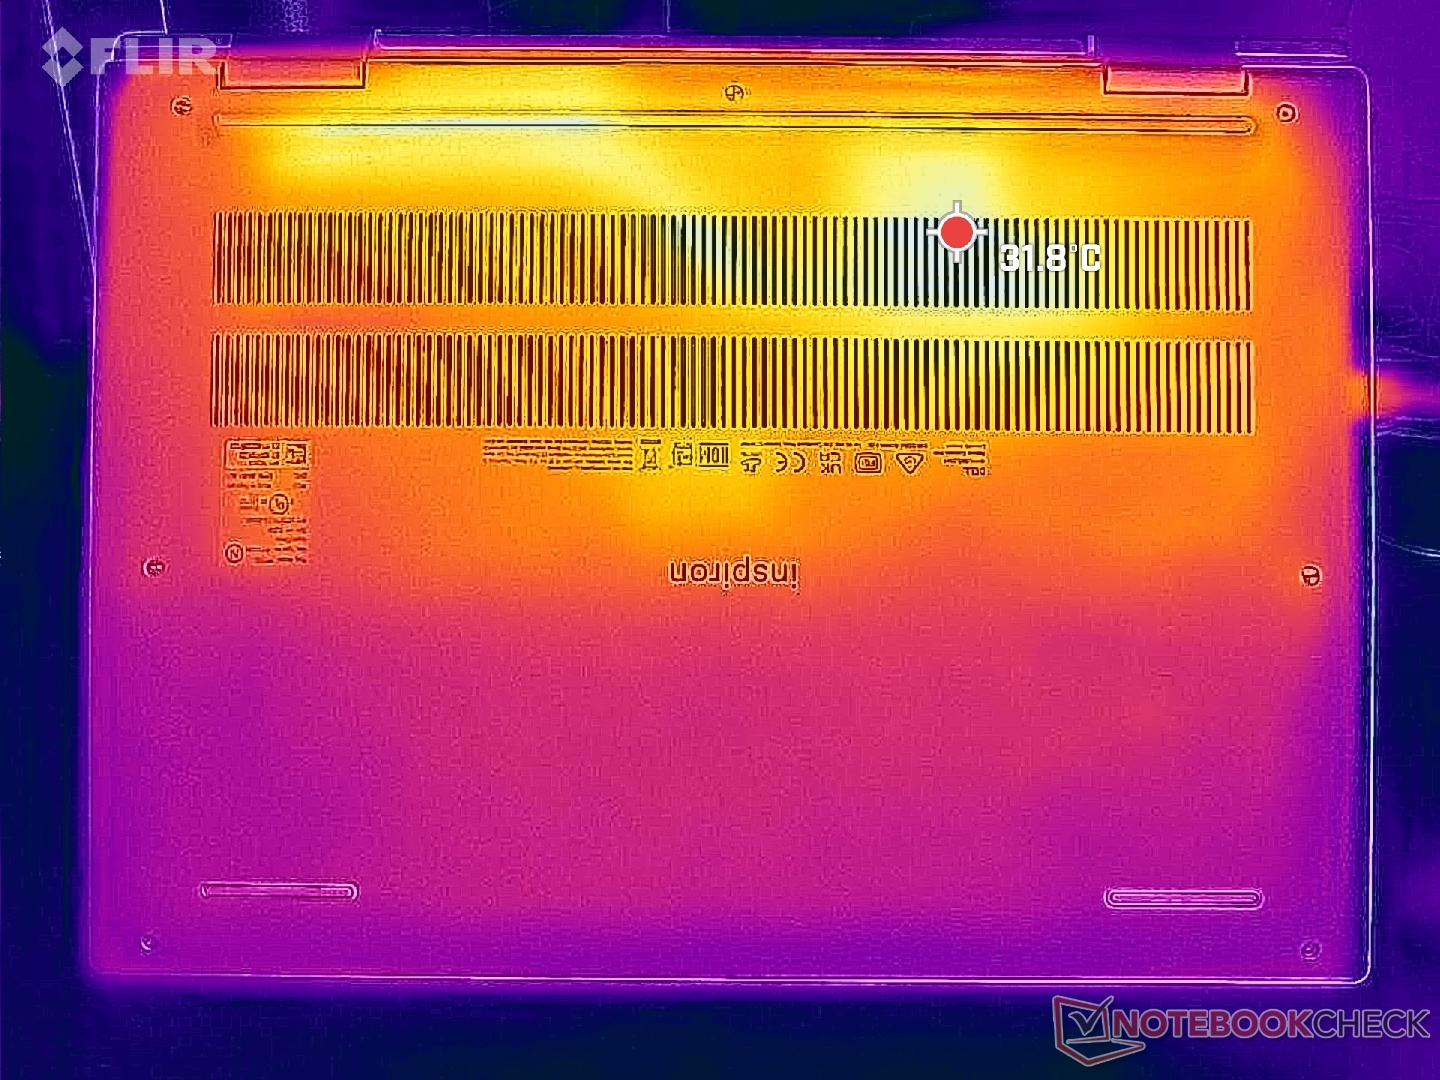
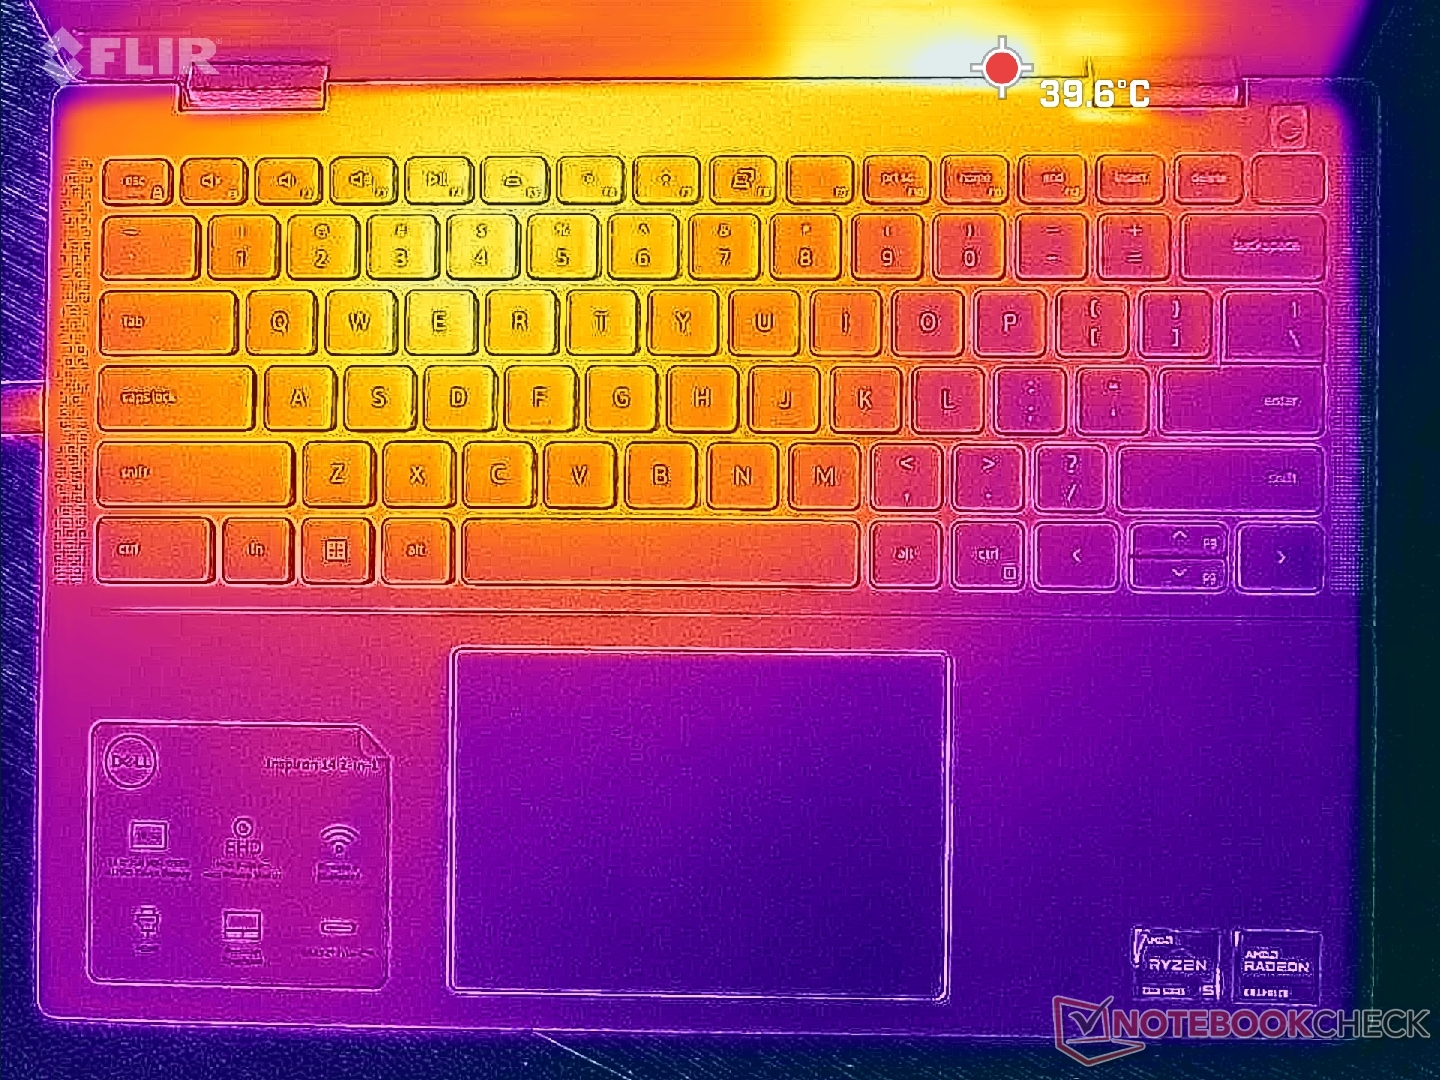
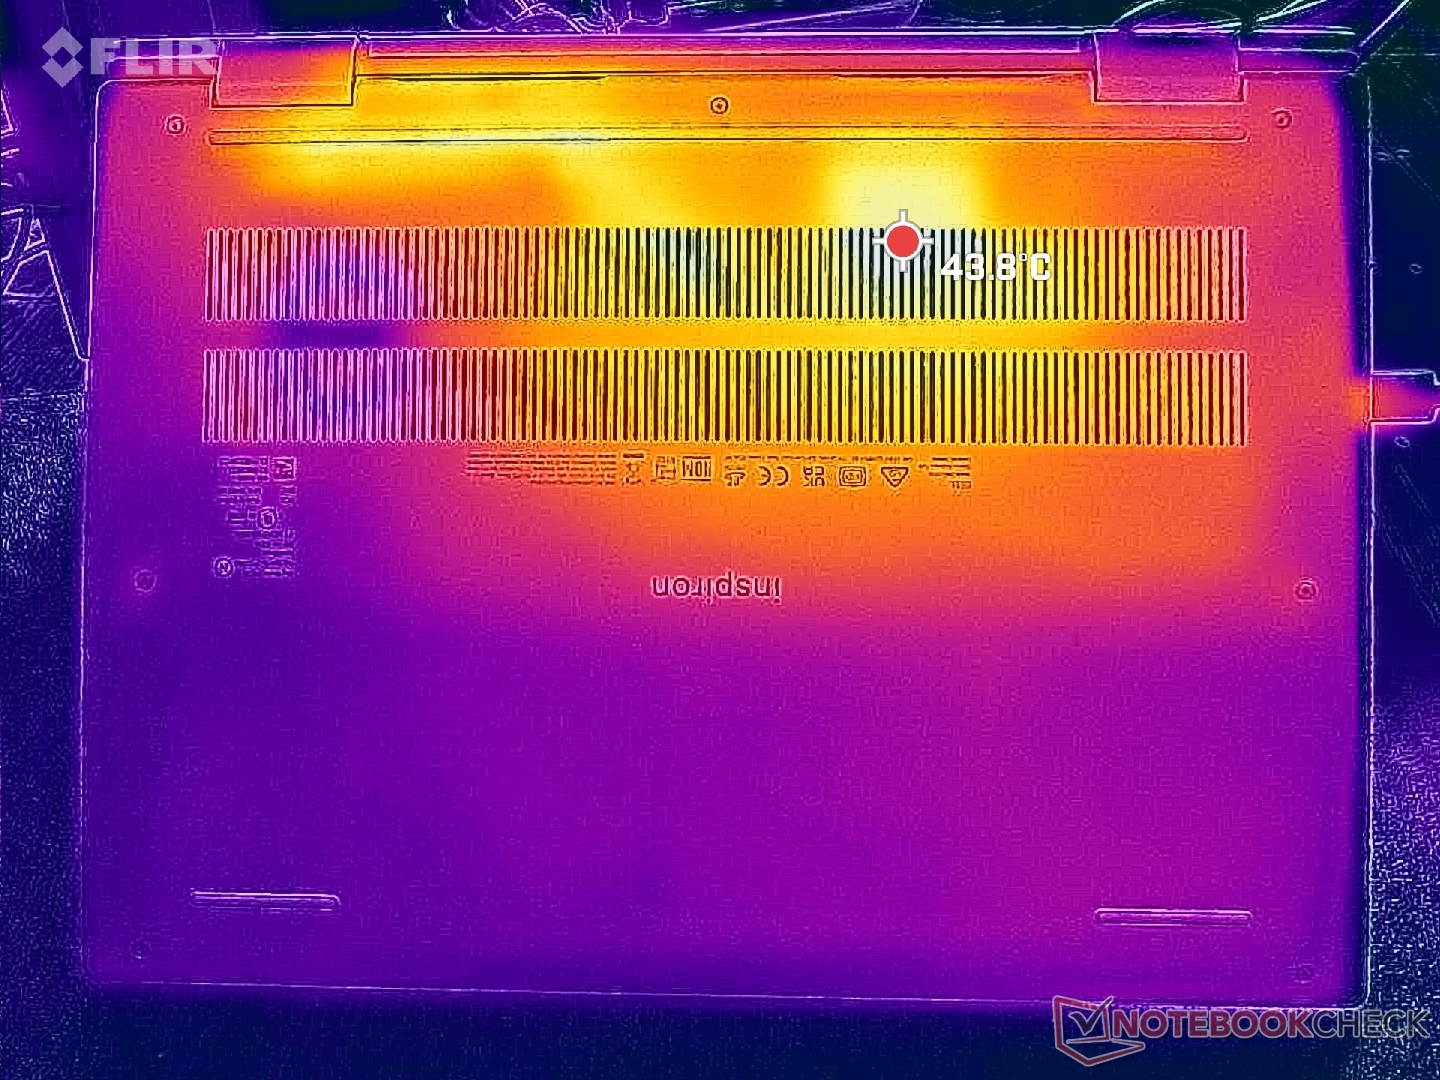
Temperature
Surface temperatures are cooler than what we recorded on last year's Inspiron 14 7620 2-in-1. When under load, for example, hot spots on the top and bottom would approach just 36 C and 39 C, respectively, compared to 46 C on last year's model. The high 30 C range is comparable to models like the IdeaPad Flex 7i 14.
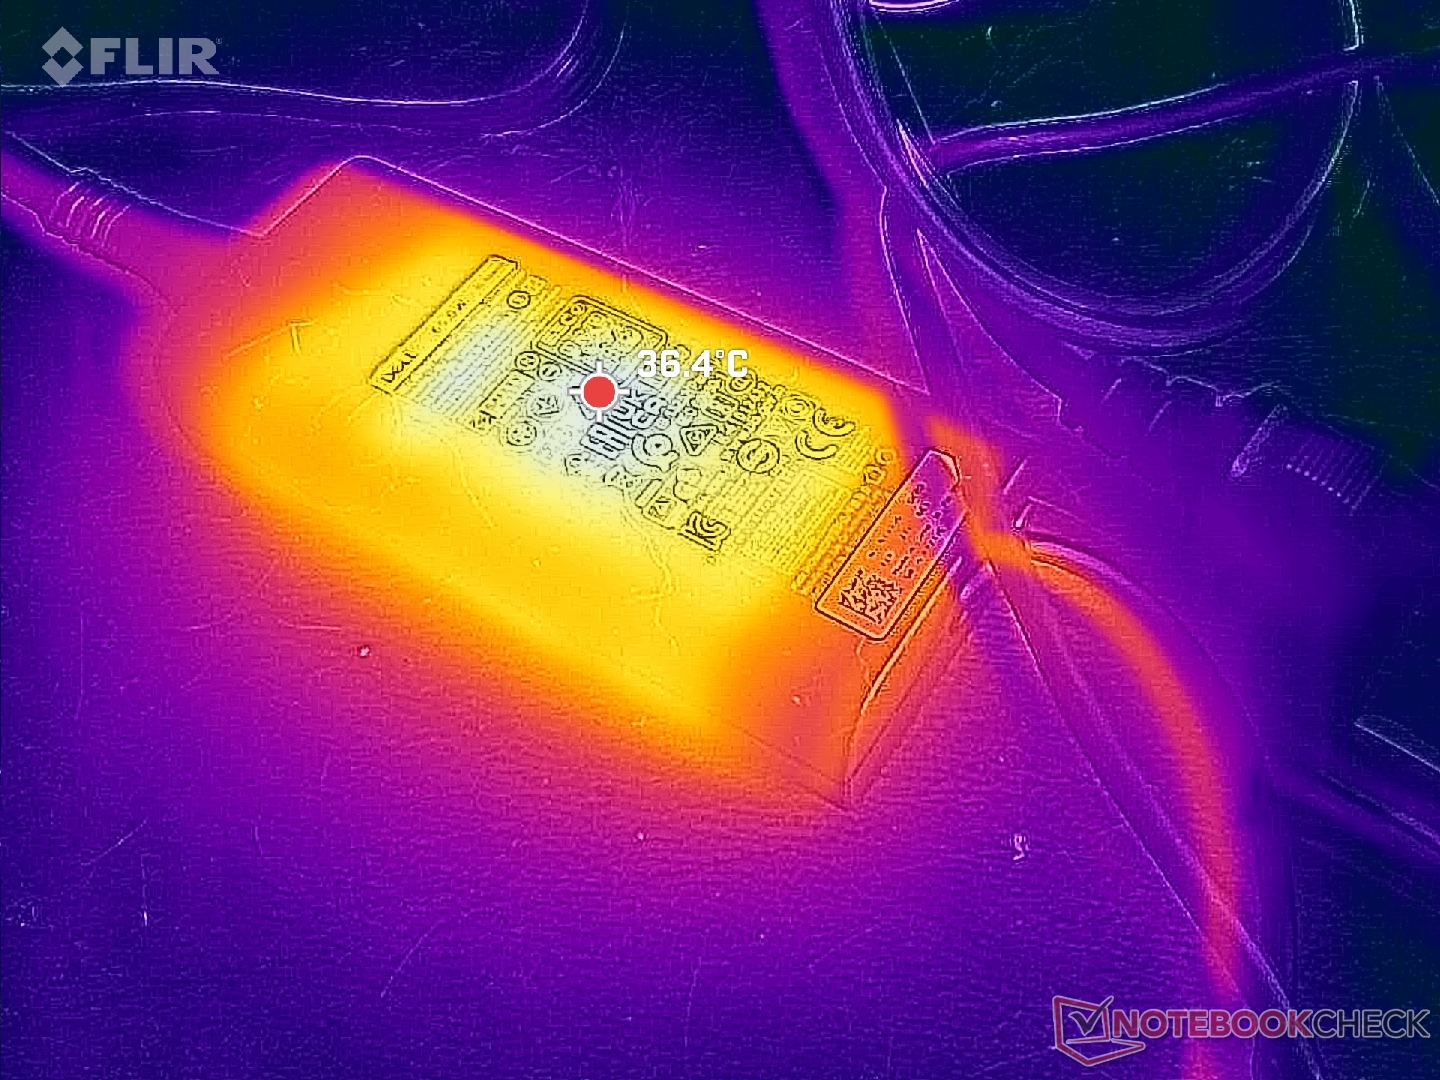
The AC adapter would run cooler as well at about 36 C instead of 46 C.
(+) The maximum temperature on the upper side is 35.2 °C / 95 F, compared to the average of 35.4 °C / 96 F, ranging from 19.6 to 60 °C for the class Convertible.
(+) The bottom heats up to a maximum of 38.2 °C / 101 F, compared to the average of 36.9 °C / 98 F
(+) In idle usage, the average temperature for the upper side is 28.7 °C / 84 F, compared to the device average of 30.3 °C / 87 F.
(+) The palmrests and touchpad are cooler than skin temperature with a maximum of 26.6 °C / 79.9 F and are therefore cool to the touch.
(±) The average temperature of the palmrest area of similar devices was 28 °C / 82.4 F (+1.4 °C / 2.5 F).
| Dell Inspiron 14 7435 2-in-1 AMD Ryzen 5 7530U, AMD Radeon RX Vega 7 | Dell Inspiron 14 7420 2-in-1 Intel Core i7-1255U, Intel Iris Xe Graphics G7 96EUs | Lenovo IdeaPad Flex 7i 14IAU7 Intel Core i7-1255U, Intel Iris Xe Graphics G7 96EUs | Acer Aspire 5 Spin 14 Intel Core i5-1335U, Intel Iris Xe Graphics G7 80EUs | LG Gram 14T90P Intel Core i5-1135G7, Intel Iris Xe Graphics G7 80EUs | HP Pavilion x360 14-dy0157ng Intel Core i5-1135G7, Intel Iris Xe Graphics G7 80EUs | |
|---|---|---|---|---|---|---|
| Heat | -2% | 11% | -14% | 3% | -2% | |
| Maximum Upper Side * (°C) | 35.2 | 38.2 -9% | 35.4 -1% | 41.7 -18% | 41.6 -18% | 38.9 -11% |
| Maximum Bottom * (°C) | 38.2 | 45.6 -19% | 38.8 -2% | 54.4 -42% | 46.2 -21% | 40.3 -5% |
| Idle Upper Side * (°C) | 31.2 | 27.4 12% | 22.6 28% | 30.4 3% | 22.6 28% | 31.8 -2% |
| Idle Bottom * (°C) | 30.4 | 28.4 7% | 24.2 20% | 29.8 2% | 23.2 24% | 27.4 10% |
* ... smaller is better
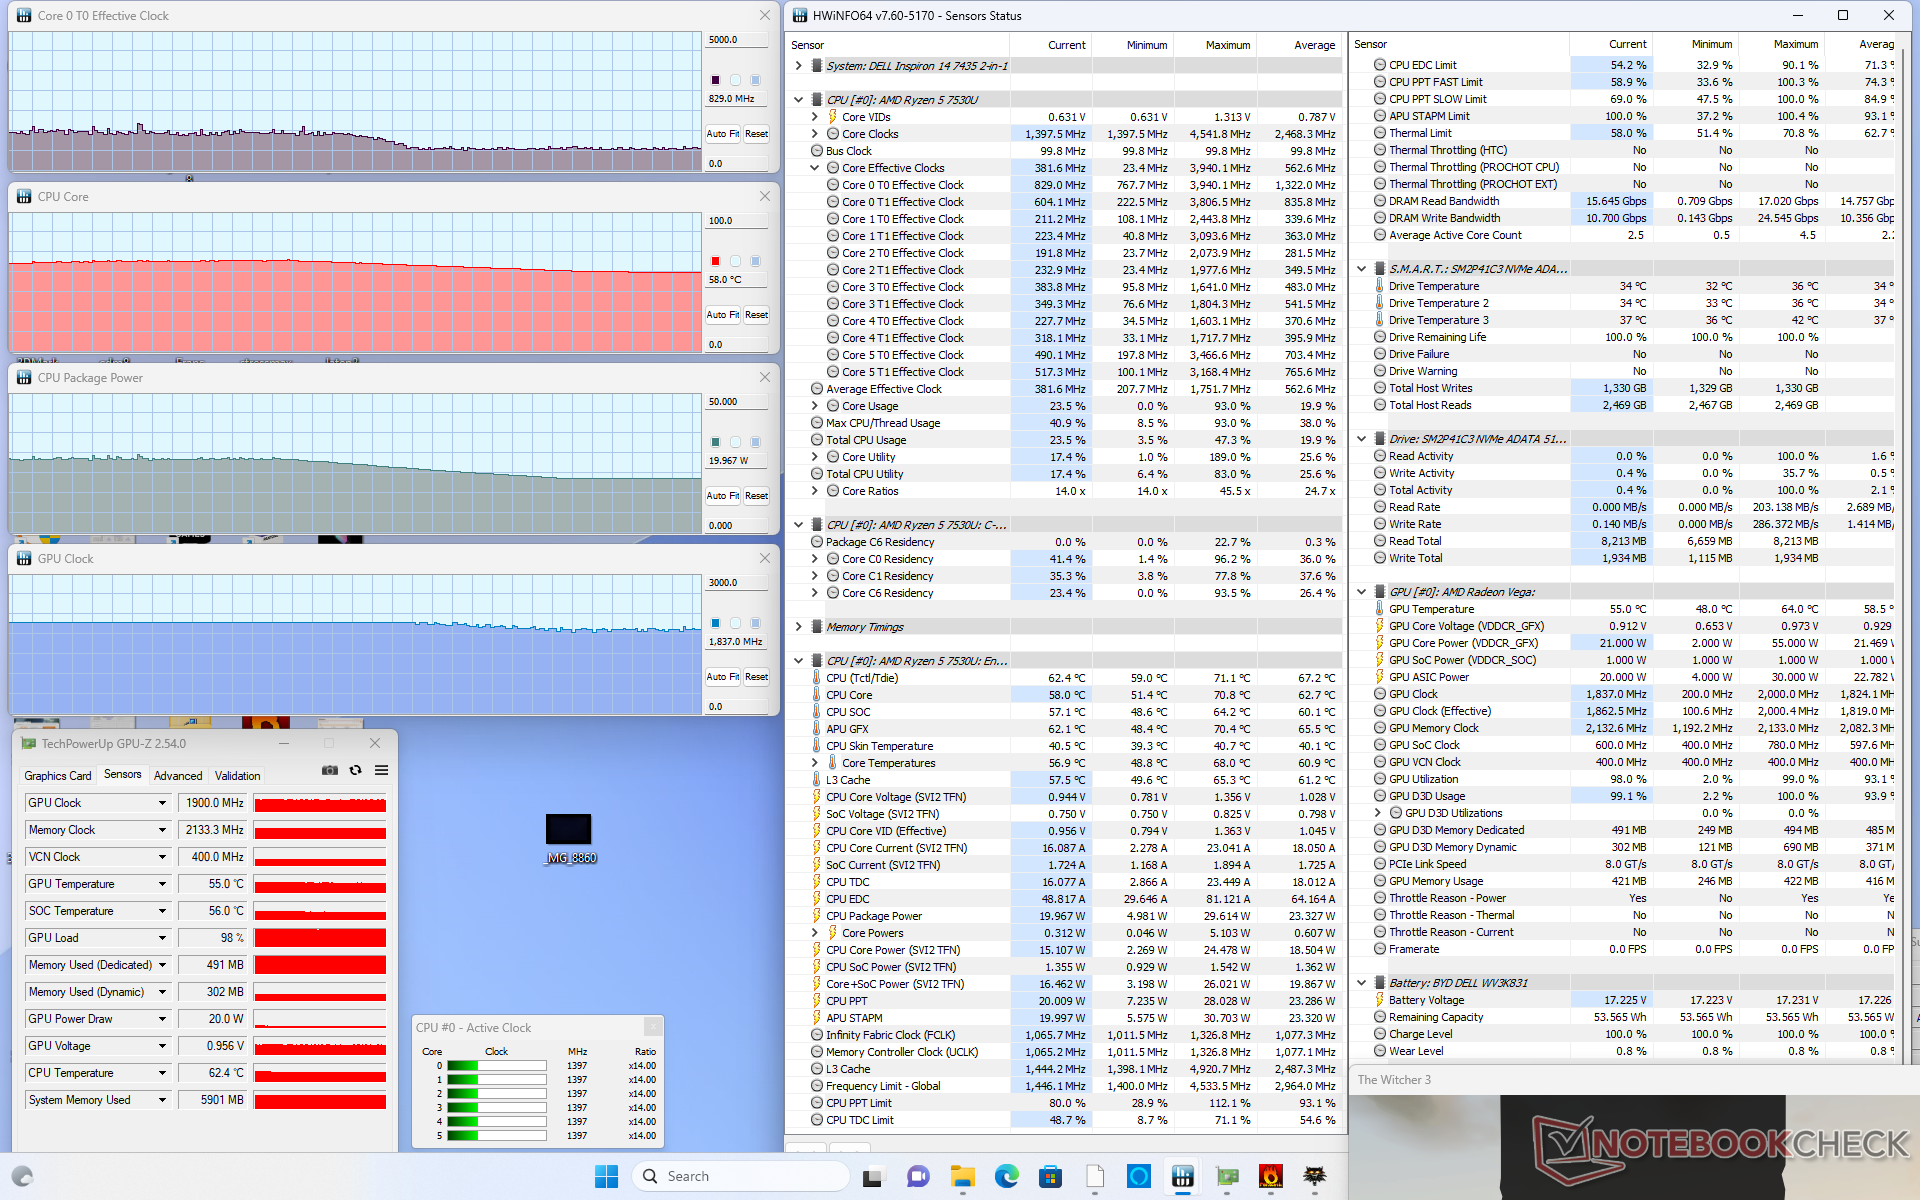
Stress Test
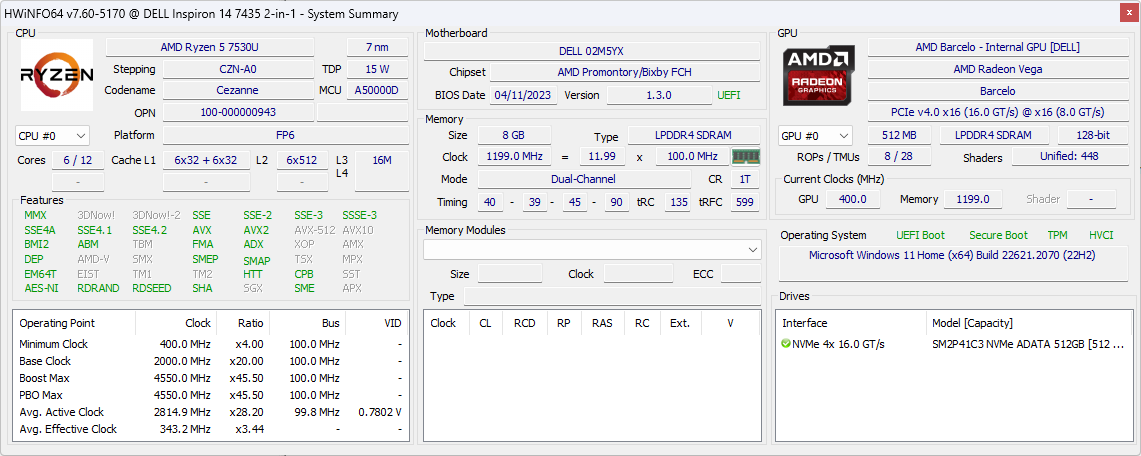
When running Prime95, the CPU would boost to 3.8 GHz and 34 W for just a couple of seconds before falling and stabilizing at 2.7 GHz and 20 W. Core temperature would remain relatively cool at 66 C even when under load which is comparable to the Intel-powered Inspiron 14 7420 2-in-1 under similar conditions. We suspect that the higher-end Ryzen 7 or Core i7 SKUs would run warmer than what we recorded on our base Ryzen 5 configuration.
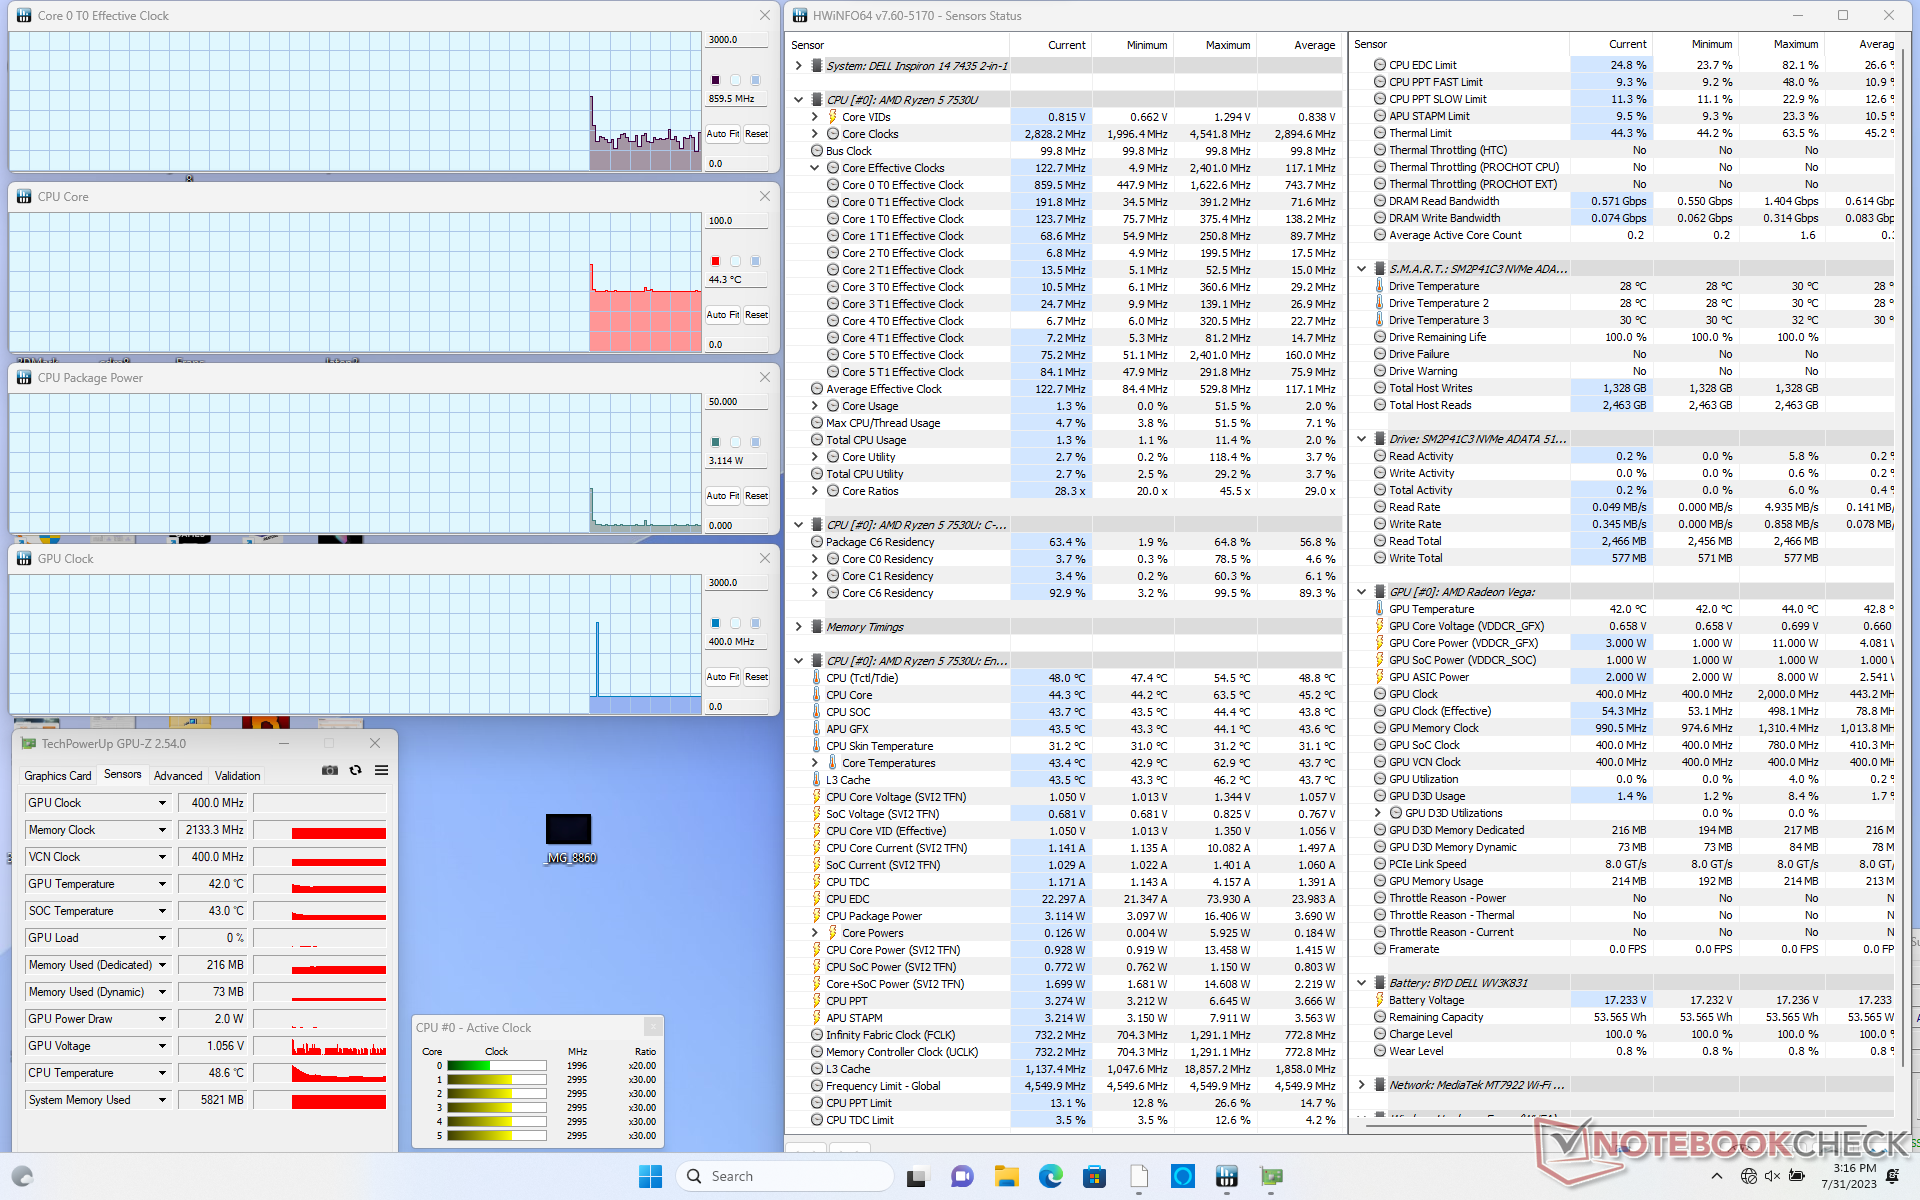
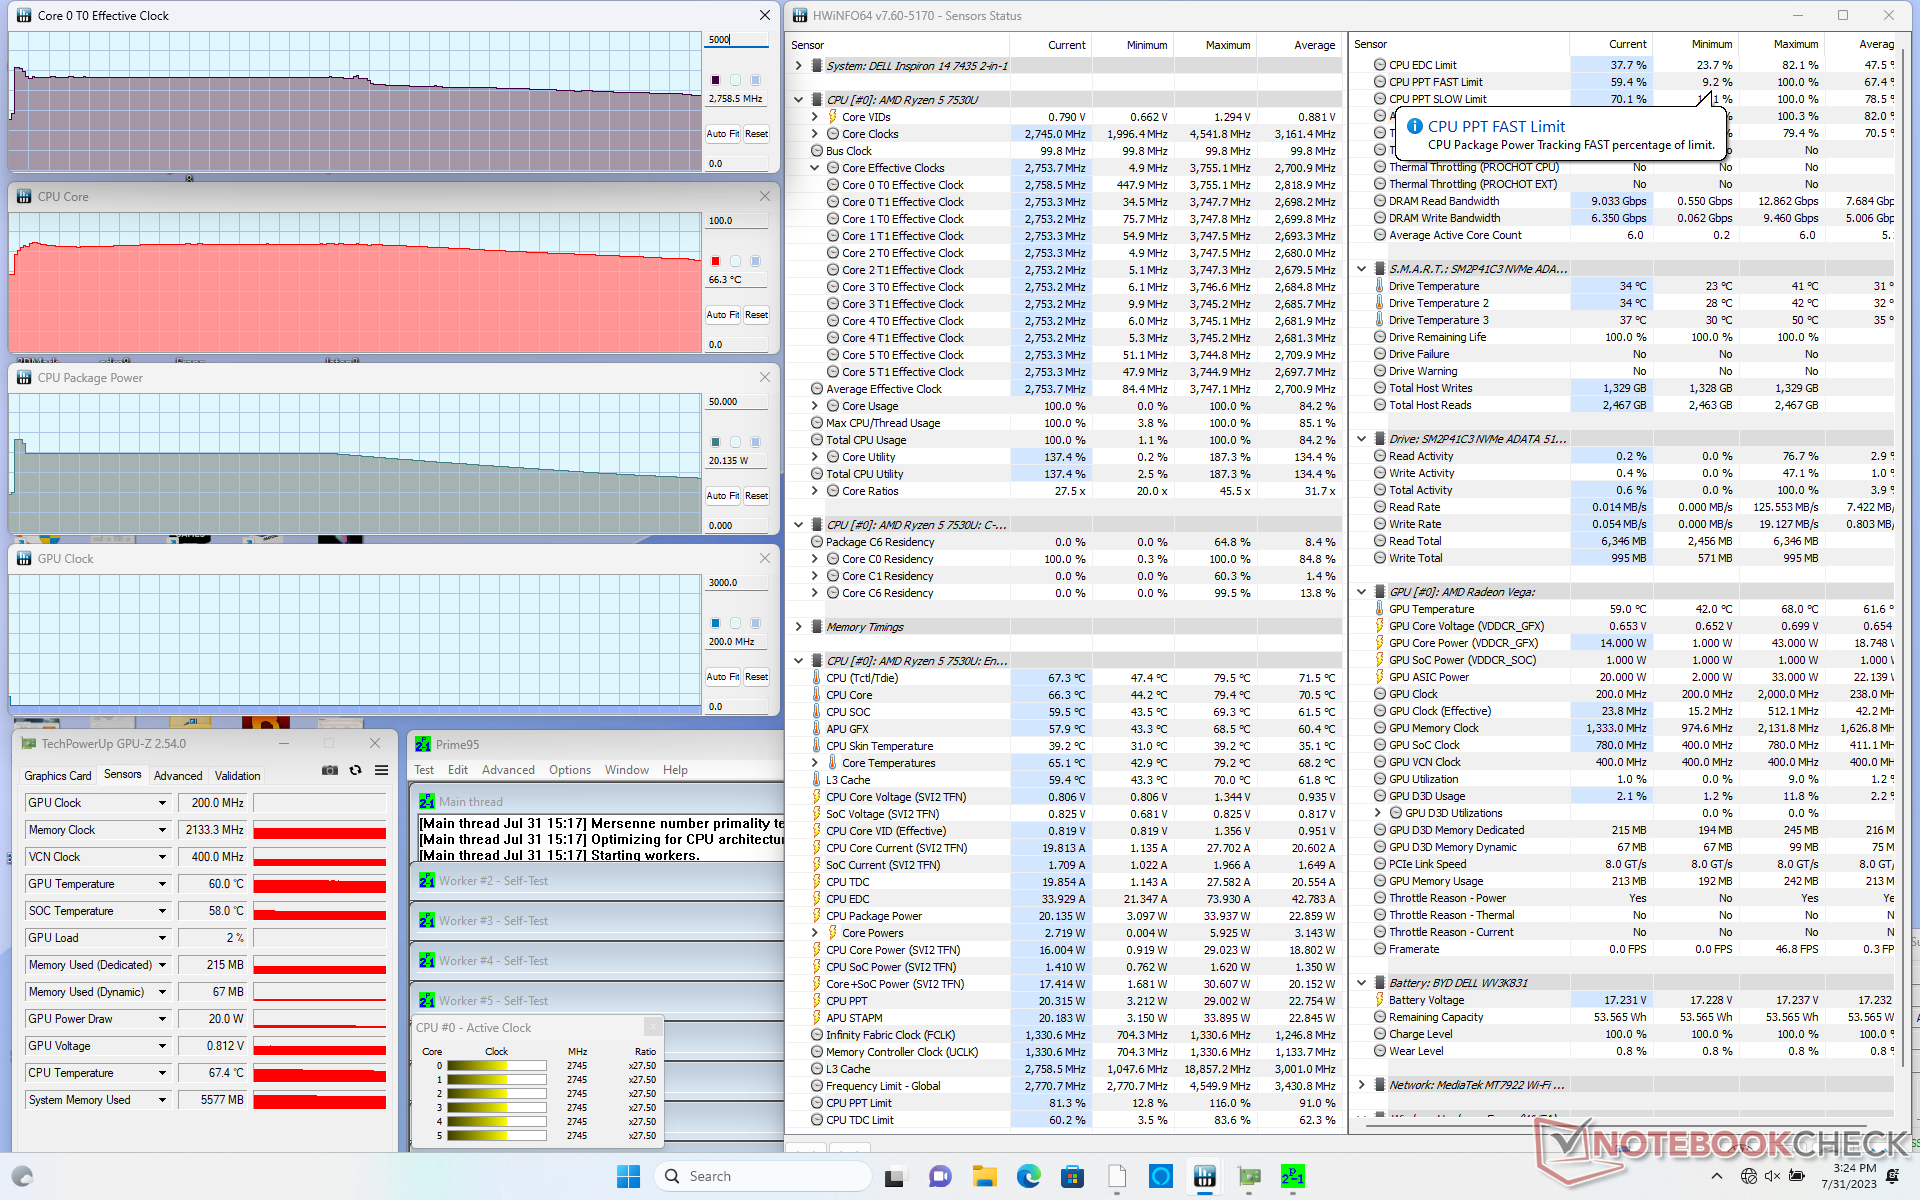

| CPU Clock (GHz) | GPU Clock (MHz) | Average CPU Temperature (°C) | |
| System Idle | -- | -- | 44 |
| Prime95 Stress | 2.7 | -- | 66 |
| Prime95 + FurMark Stress | 2.9 | 1050 | 60 |
| Witcher 3 Stress | 0.8 | 1900 | 58 |
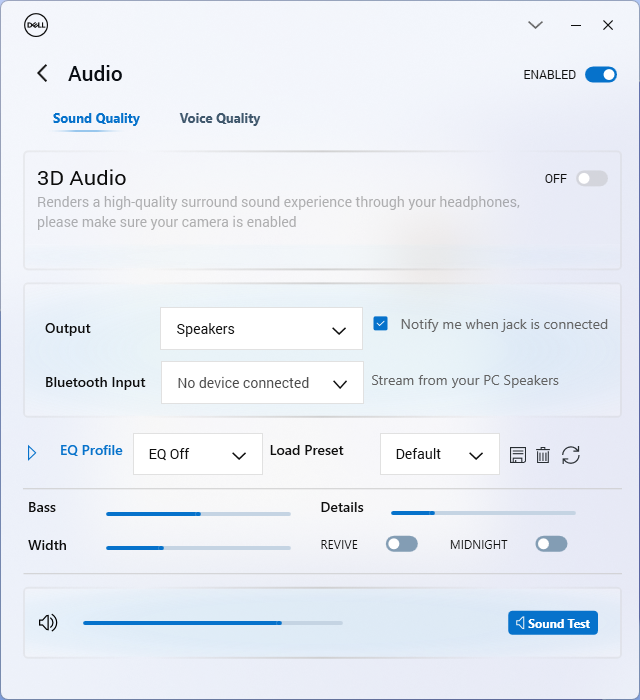
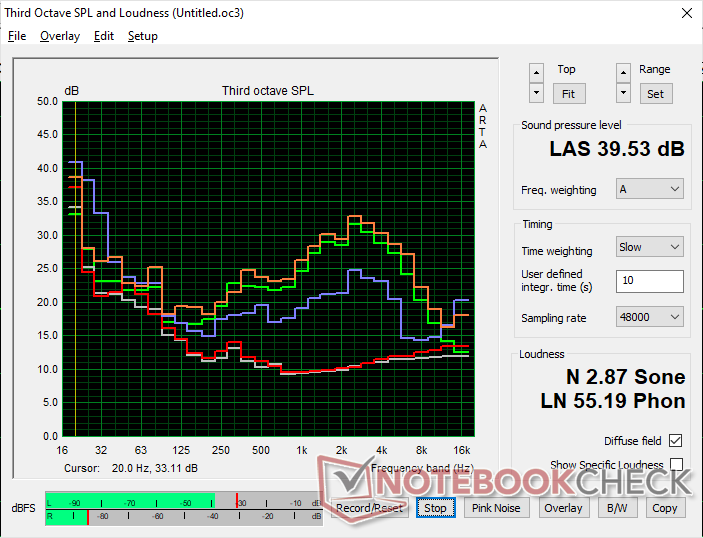
Speakers
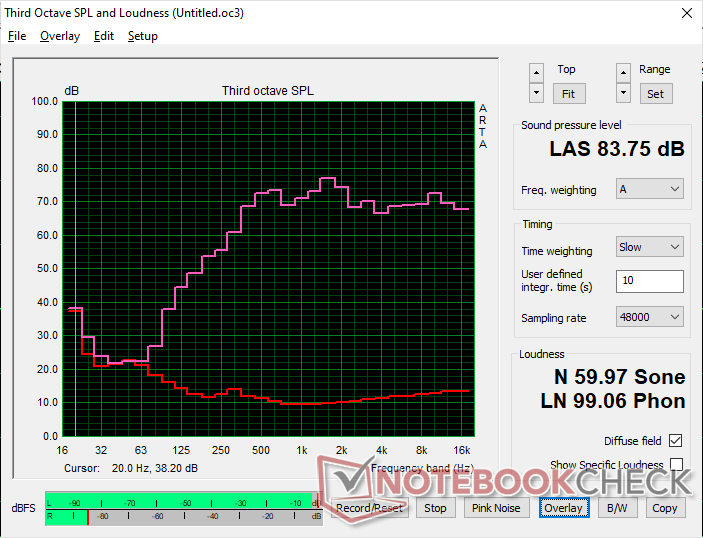
Dell Inspiron 14 7435 2-in-1 audio analysis
(+) | speakers can play relatively loud (83.8 dB)
Bass 100 - 315 Hz
(-) | nearly no bass - on average 18.8% lower than median
(±) | linearity of bass is average (9.9% delta to prev. frequency)
Mids 400 - 2000 Hz
(+) | balanced mids - only 3.5% away from median
(+) | mids are linear (6.1% delta to prev. frequency)
Highs 2 - 16 kHz
(+) | balanced highs - only 1.2% away from median
(+) | highs are linear (4.4% delta to prev. frequency)
Overall 100 - 16.000 Hz
(+) | overall sound is linear (12.3% difference to median)
Compared to same class
» 14% of all tested devices in this class were better, 3% similar, 83% worse
» The best had a delta of 6%, average was 20%, worst was 57%
Compared to all devices tested
» 10% of all tested devices were better, 3% similar, 87% worse
» The best had a delta of 4%, average was 23%, worst was 134%
Apple MacBook Pro 16 2021 M1 Pro audio analysis
(+) | speakers can play relatively loud (84.7 dB)
Bass 100 - 315 Hz
(+) | good bass - only 3.8% away from median
(+) | bass is linear (5.2% delta to prev. frequency)
Mids 400 - 2000 Hz
(+) | balanced mids - only 1.3% away from median
(+) | mids are linear (2.1% delta to prev. frequency)
Highs 2 - 16 kHz
(+) | balanced highs - only 1.9% away from median
(+) | highs are linear (2.7% delta to prev. frequency)
Overall 100 - 16.000 Hz
(+) | overall sound is linear (4.6% difference to median)
Compared to same class
» 0% of all tested devices in this class were better, 0% similar, 100% worse
» The best had a delta of 5%, average was 17%, worst was 45%
Compared to all devices tested
» 0% of all tested devices were better, 0% similar, 100% worse
» The best had a delta of 4%, average was 23%, worst was 134%
Energy Management
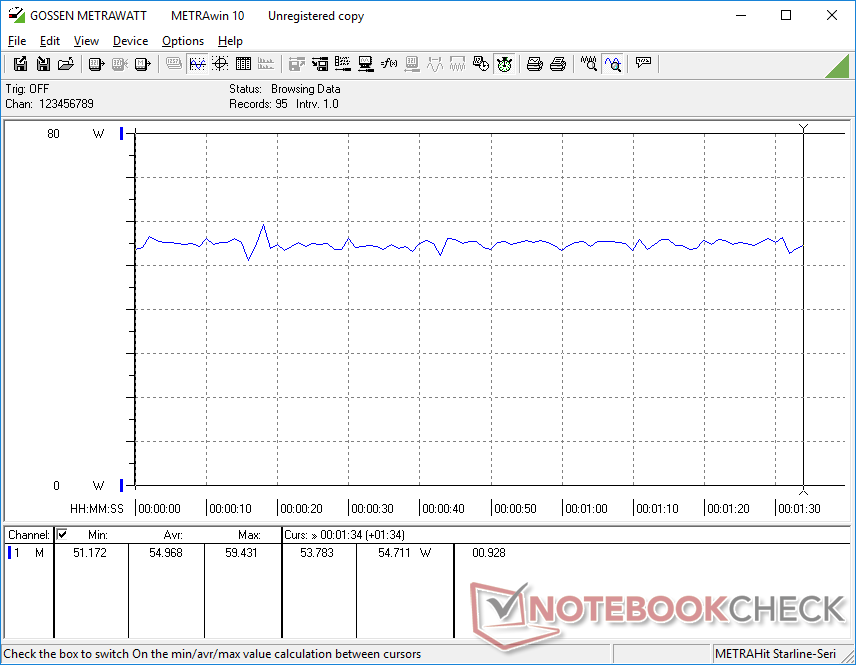
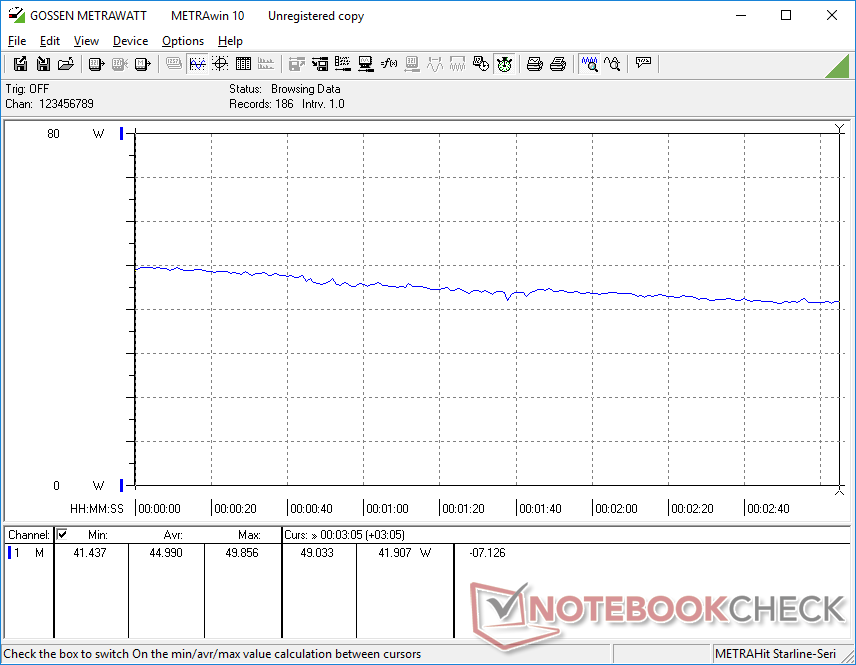
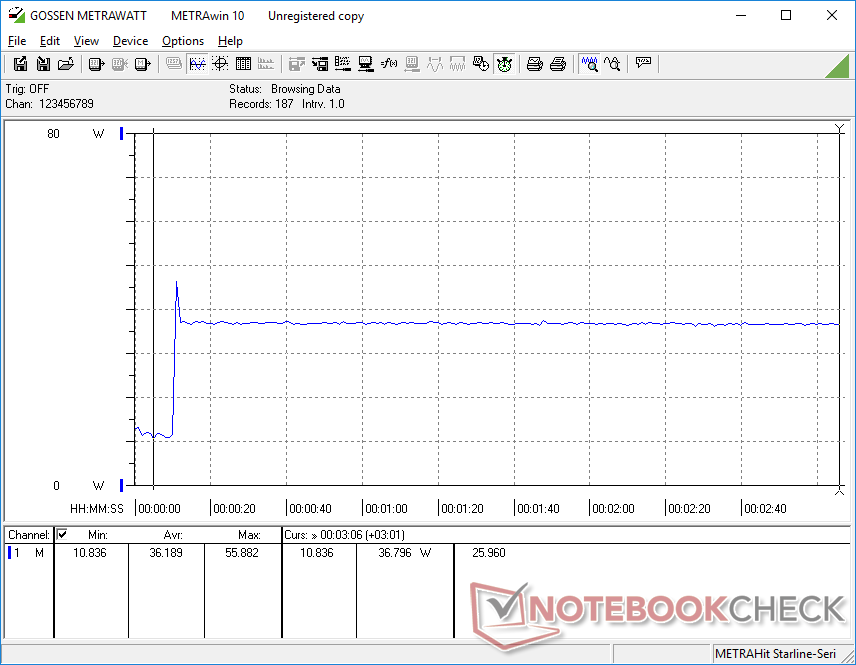
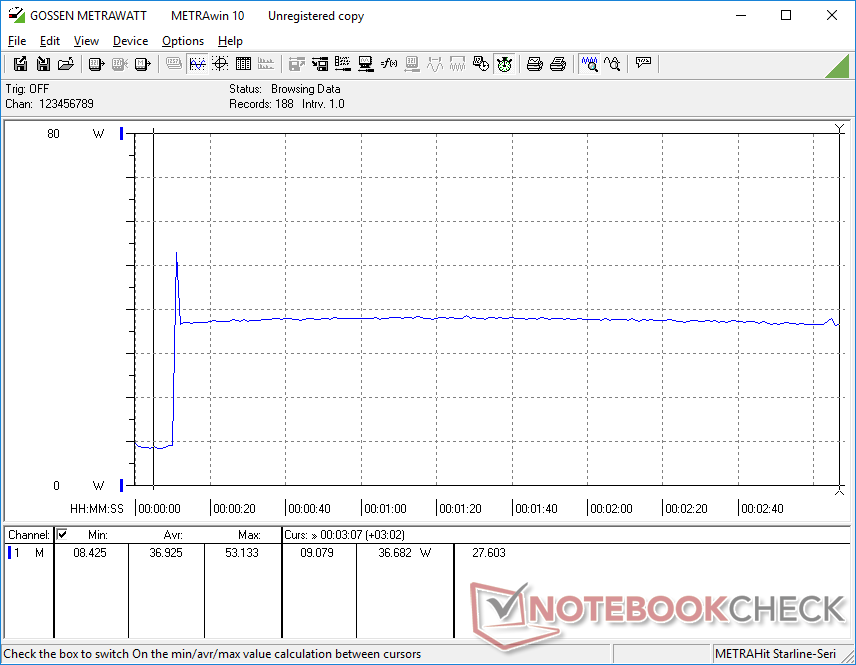
Power Consumption
Power consumption is comparable to the Intel-powered Inspiron 14 7420 during undemanding loads, but it is consistently higher when running more demanding loads like games. This suggests that the integrated AMD GPU is slightly less power efficient than the competing Iris Xe 96 EUs while CPU performance-per-watt are more similar.
We're able to measure a maximum draw of 56 W from the small (11.1 x 5.1 x 2.8 cm) 65 W USB-C adapter when the CPU is at 100 percent utilization. However, this rate is very short-lived as shown by our screenshots below due to the limited Turbo Boost potential of the system.
| Off / Standby | |
| Idle | |
| Load |
|
Key:
min: | |
| Dell Inspiron 14 7435 2-in-1 R5 7530U, Vega 7, , IPS, 1920x1200, 14" | Dell Inspiron 14 7420 2-in-1 i7-1255U, Iris Xe G7 96EUs, WDC PC SN530 SDBPMPZ-512G, IPS, 1920x1200, 14" | Lenovo IdeaPad Flex 7i 14IAU7 i7-1255U, Iris Xe G7 96EUs, Samsung PM9B1 512GB MZAL4512HBLU, IPS, 2240x1400, 14" | Acer Aspire 5 Spin 14 i5-1335U, Iris Xe G7 80EUs, Micron 2450 512GB MTFDKBA512TFK, IPS, 1920x1200, 14" | LG Gram 14T90P i5-1135G7, Iris Xe G7 80EUs, Samsung SSD PM981a MZVLB512HBJQ, IPS, 1900x1200, 14" | HP Pavilion x360 14-dy0157ng i5-1135G7, Iris Xe G7 80EUs, Toshiba KBG40ZNV512G, IPS, 1920x1080, 14" | |
|---|---|---|---|---|---|---|
| Power Consumption | 6% | -10% | 12% | 24% | 33% | |
| Idle Minimum * (Watt) | 5.3 | 5.2 2% | 7.1 -34% | 4.3 19% | 2.8 47% | 4 25% |
| Idle Average * (Watt) | 9.1 | 8.2 10% | 11 -21% | 5.8 36% | 5.5 40% | 6.7 26% |
| Idle Maximum * (Watt) | 9.4 | 9.9 -5% | 11.4 -21% | 8.8 6% | 6.4 32% | 8.2 13% |
| Load Average * (Watt) | 54.9 | 44.4 19% | 43.7 20% | 44 20% | 45.4 17% | 29.6 46% |
| Witcher 3 ultra * (Watt) | 45 | 35 22% | 35.1 22% | 41.5 8% | 34 24% | 29.6 34% |
| Load Maximum * (Watt) | 55.8 | 62.5 -12% | 71 -27% | 67 -20% | 65.9 -18% | 26.7 52% |
* ... smaller is better
Power Consumption Witcher 3 / Stresstest
Power Consumption external Monitor
Battery Life
Runtimes have increased noticeably year-over-year despite having no changes to battery capacity. We're able to clock in 11 hours of real-world WLAN browsing on our AMD-powered unit compared to 7.5 hours on last year's Intel-powered model. The Inspiron 14 7435 2-in-1 is subsequently longer-lasting than many other subnotebooks in its price rage.
Charging from empty to full capacity takes roughly two hours.
| Dell Inspiron 14 7435 2-in-1 R5 7530U, Vega 7, 54 Wh | Dell Inspiron 14 7420 2-in-1 i7-1255U, Iris Xe G7 96EUs, 54 Wh | Lenovo IdeaPad Flex 7i 14IAU7 i7-1255U, Iris Xe G7 96EUs, 59 Wh | Acer Aspire 5 Spin 14 i5-1335U, Iris Xe G7 80EUs, 54.6 Wh | LG Gram 14T90P i5-1135G7, Iris Xe G7 80EUs, 72 Wh | HP Pavilion x360 14-dy0157ng i5-1135G7, Iris Xe G7 80EUs, 43 Wh | |
|---|---|---|---|---|---|---|
| Battery runtime | -16% | -32% | 0% | 12% | -22% | |
| Reader / Idle (h) | 19.9 | 15.9 -20% | 17.7 -11% | |||
| WiFi v1.3 (h) | 11.1 | 7.6 -32% | 7.6 -32% | 11.1 0% | 12.1 9% | 7.1 -36% |
| Load (h) | 2 | 2.1 5% | 2.3 15% | 1.6 -20% | ||
| H.264 (h) | 8.9 |
Pros
Cons
Verdict — Good Performance For The Price, But The Display Could Use Some Work
From a performance point-of-view, our $550 USD Ryzen 5 Inspiron 14 7435 2-in-1 performs just as well as the $800 Core i5 Inspiron 14 7430 2-in-1 without any compromises to battery life, display quality, speakers, or other physical features. If Thunderbolt support isn't high up on your list, then you can save almost $200 by going AMD instead of Intel for this particular model.
The Ryzen 5 configuration is perfectly tuned to perform as well as the Core i5 configuration for hundreds of dollars less. The costly RAM upgrades and dim touchscreen, however, knock down the model a bit.
The soldered RAM is a major drawback to the model this year because a simple upgrade from 8 GB to 16 GB is an extra $150 at the least. For what is supposed to be a budget convertible, the costly upgrade can be a turn off to the target audience. Otherwise, the changes to the speakers, clickpad, and hinges are all welcomed improvements.
We would love to see future revisions incorporate brighter touchscreen options for better outdoor visibility. The current 250-nit display limits the model to indoor environments which is unfortunate as buyers may want to use the 14-inch convertible on-the-go. Such a feature would give the Inspiron 14 7435 2-in-1 a notable leg up against competitors like the Acer Aspire 5 Spin 14, Lenovo IdeaPad Flex 7i, or HP Pavilion x360 14.
Price and Availability
Dell is now shipping its Inspiron 14 7435 2-in-1 starting at $549 USD for our reviewed Ryzen 5 configuration up to $699 for the Ryzen 7 configuration. Alternatively, the Intel Inspiron 14 7430 2-in-1 starts at $799 for the Core i5 configuration.
Dell Inspiron 14 7435 2-in-1
- 08/08/2023 v7 (old)
Allen Ngo
