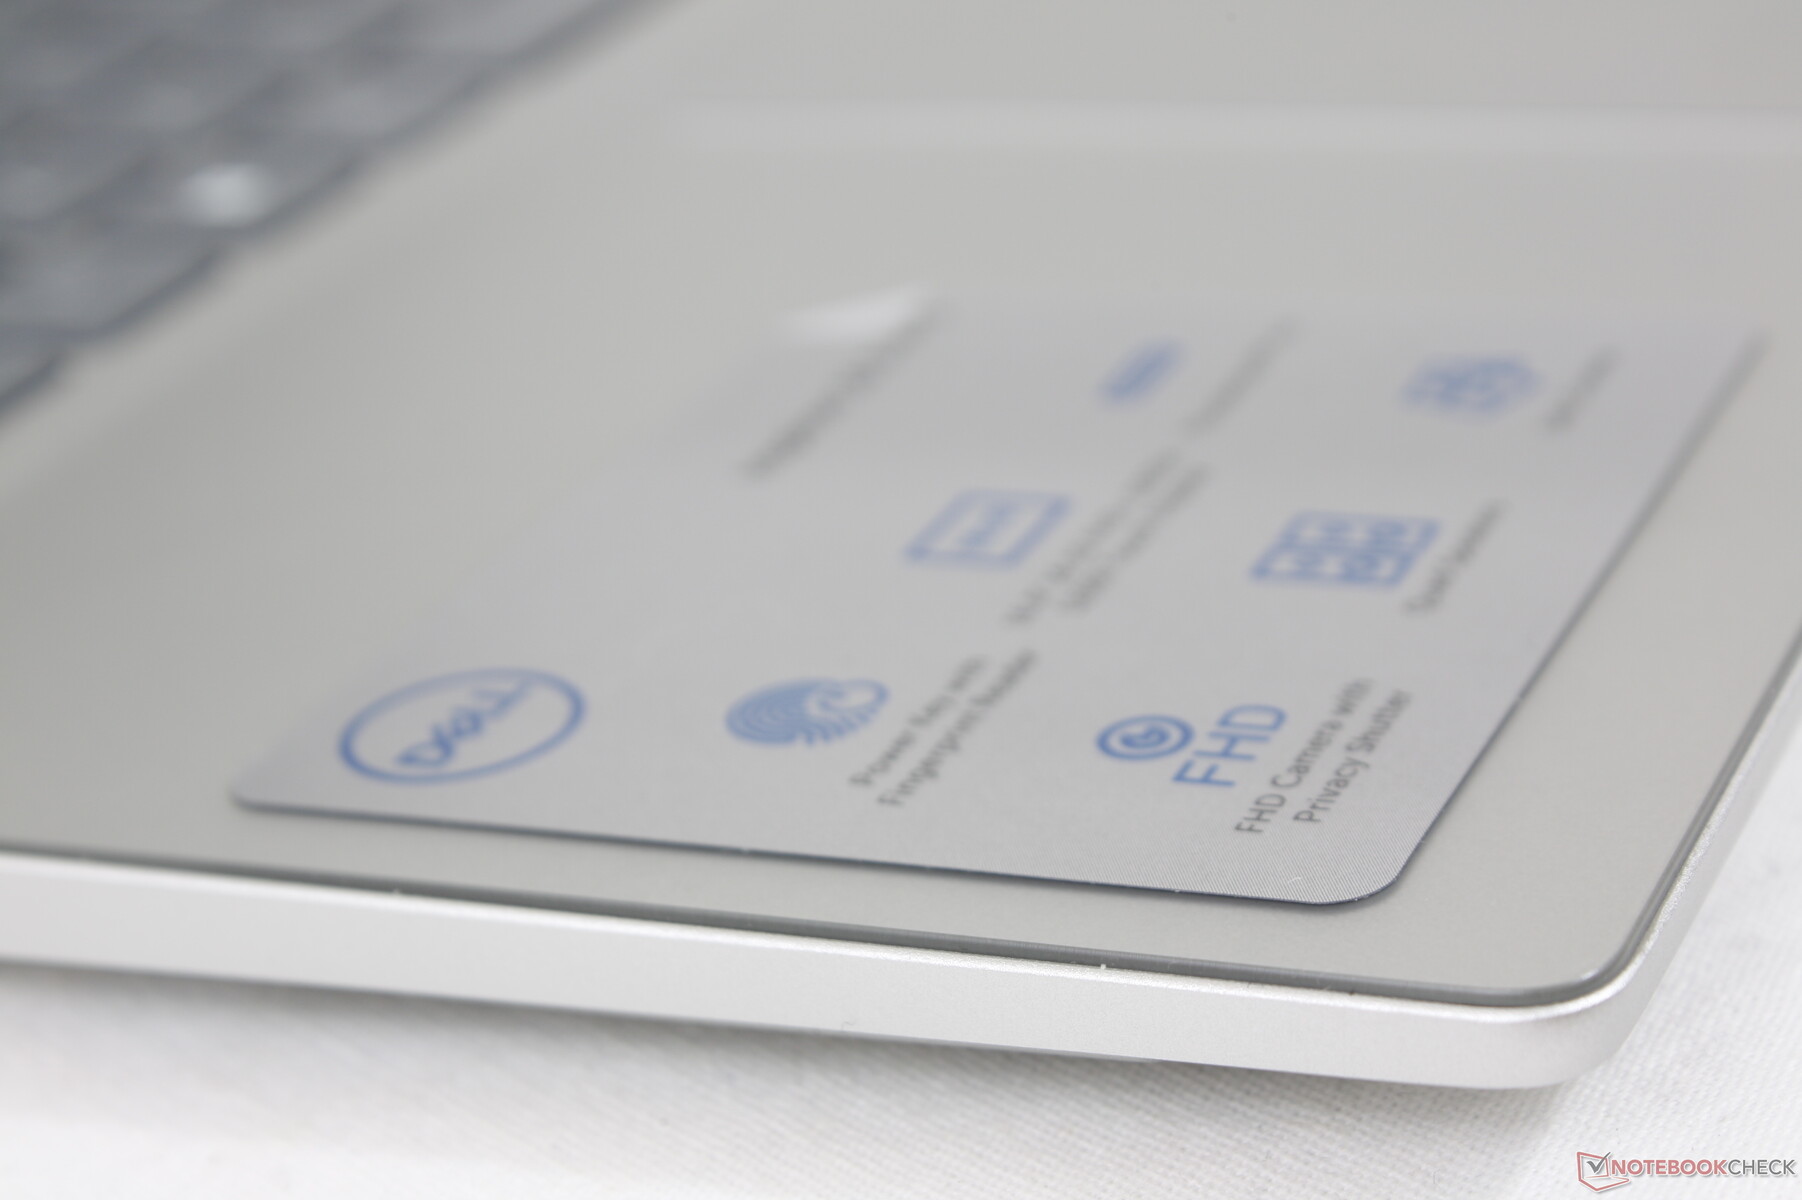
Dell Inspiron 16 7620 2-in-1 convertible review: Mylar and aluminum chassis
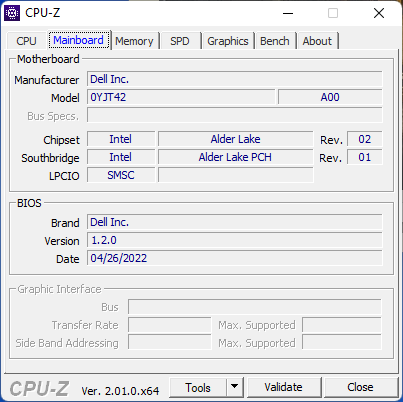
The Inspiron 16 7620 2-in-1 succeeds the older Inspiron 16 7610 that ran on Intel 11th gen CPUs. It introduces both 12th gen Intel Core P-series CPU options and a new convertible chassis design that's similar to the 14-inch Inspiron 14 7420 2-in-1.
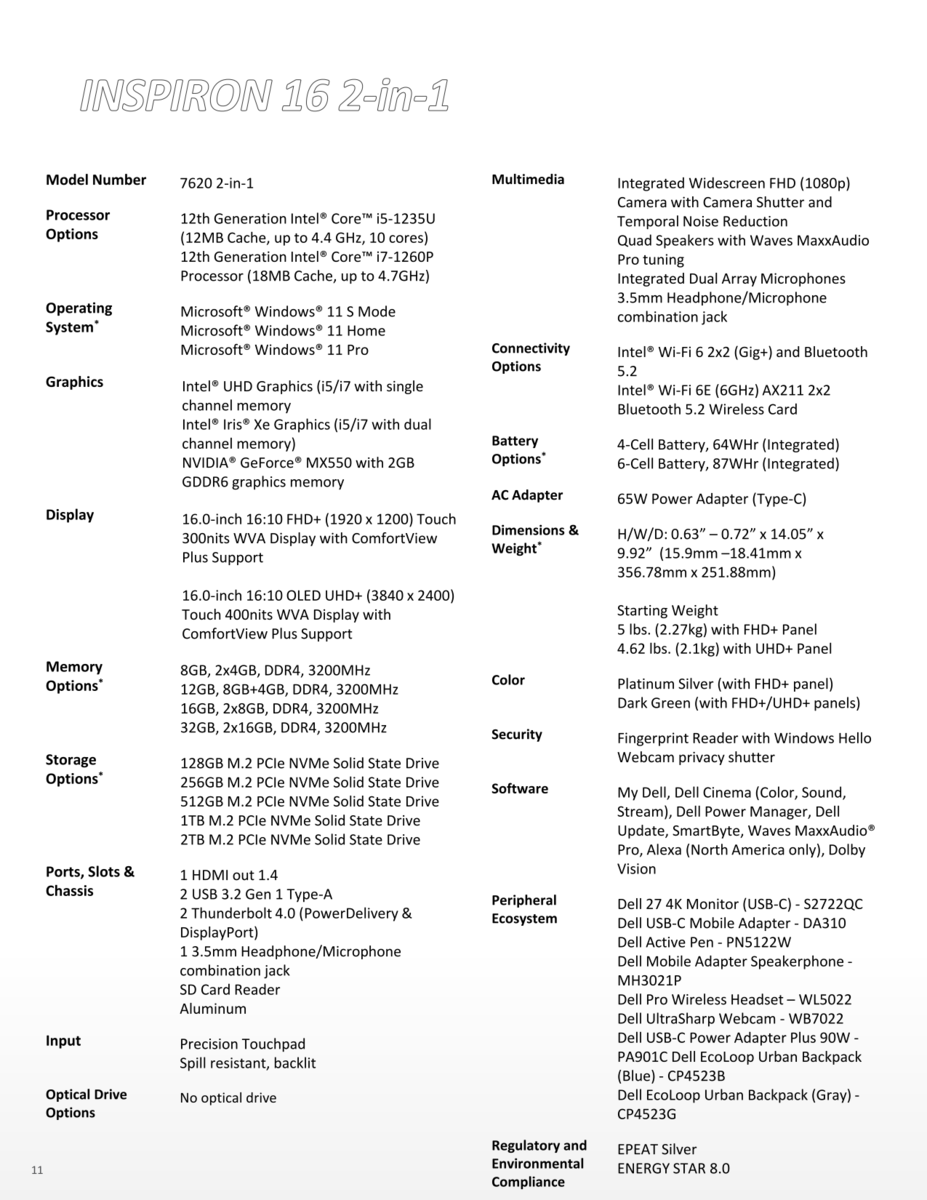
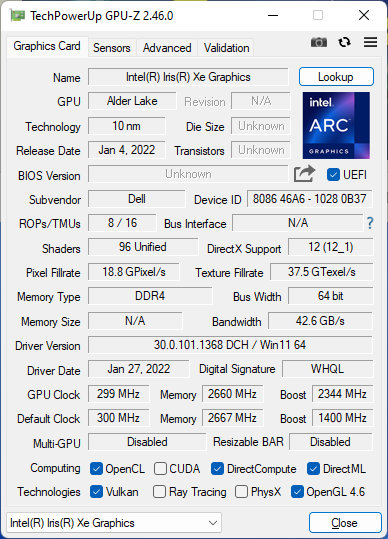
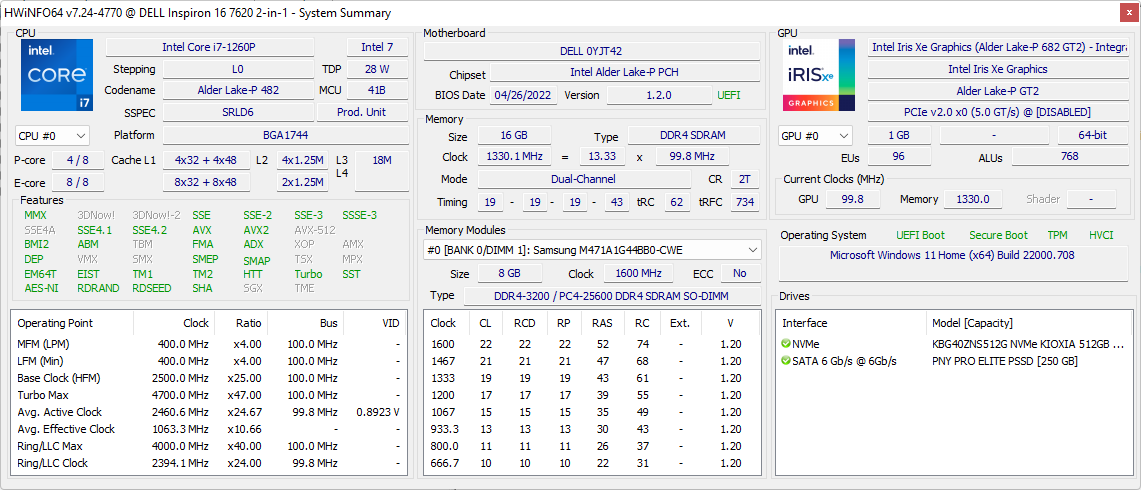
SKUs range from the Core i5-1235U up to the Core i7-1260P with UHD Graphics, Iris Xe, or discrete GeForce MX550 graphics and either a 1200p or 2400p touchscreen. Our SKU in review is a mid-range option with the Core i7-1260P CPU, integrated Iris Xe, and 1200p touchscreen for approximately $1250 USD retail.
Direct competitors to the Inspiron 16 7620 2-in-1 include other 16.0-inch convertibles like the LG Gram 16 2-in-1 or HP Spectre x360 16. More commonly, users will find 15.6-inch convertibles instead like the Samsung Galaxy Book Pro 360 15, HP Envy x360 15, or Asus ZenBook Flip 15.
More Dell reviews:

Potential Competitors in Comparison
Rating | Date | Model | Weight | Height | Size | Resolution | Price |
|---|---|---|---|---|---|---|---|
| 85.7 % v7 (old) | 06 / 2022 | Dell Inspiron 16 7620 2-in-1 i7-1260P, Iris Xe G7 96EUs | 2.1 kg | 18.41 mm | 16.00" | 1920x1200 | |
| 85.8 % v7 (old) | 04 / 2021 | LG Gram 16 2-in-1 16T90P i7-1165G7, Iris Xe G7 96EUs | 1.5 kg | 17 mm | 16.00" | 2560x1600 | |
| 86.6 % v7 (old) | 03 / 2022 | Samsung Galaxy Book Pro 360 15 NP950QDB-KC3DE i5-1135G7, Iris Xe G7 80EUs | 1.4 kg | 11 mm | 15.60" | 1920x1080 | |
| 86.5 % v7 (old) | 03 / 2020 | Asus ZenBook Flip 15 UX563FD-A1027T i7-10510U, GeForce GTX 1050 Max-Q | 1.9 kg | 19.9 mm | 15.60" | 3840x2160 | |
| 81.2 % v6 (old) | 06 / 2018 | Dell Inspiron 15 5579-9672 i5-8250U, UHD Graphics 620 | 2.1 kg | 20.2 mm | 15.60" | 1920x1080 | |
| 85 % v7 (old) | 01 / 2020 | HP Spectre X360 15-5ZV31AV i7-10510U, GeForce MX250 | 2.1 kg | 19.3 mm | 15.60" | 3840x2160 |
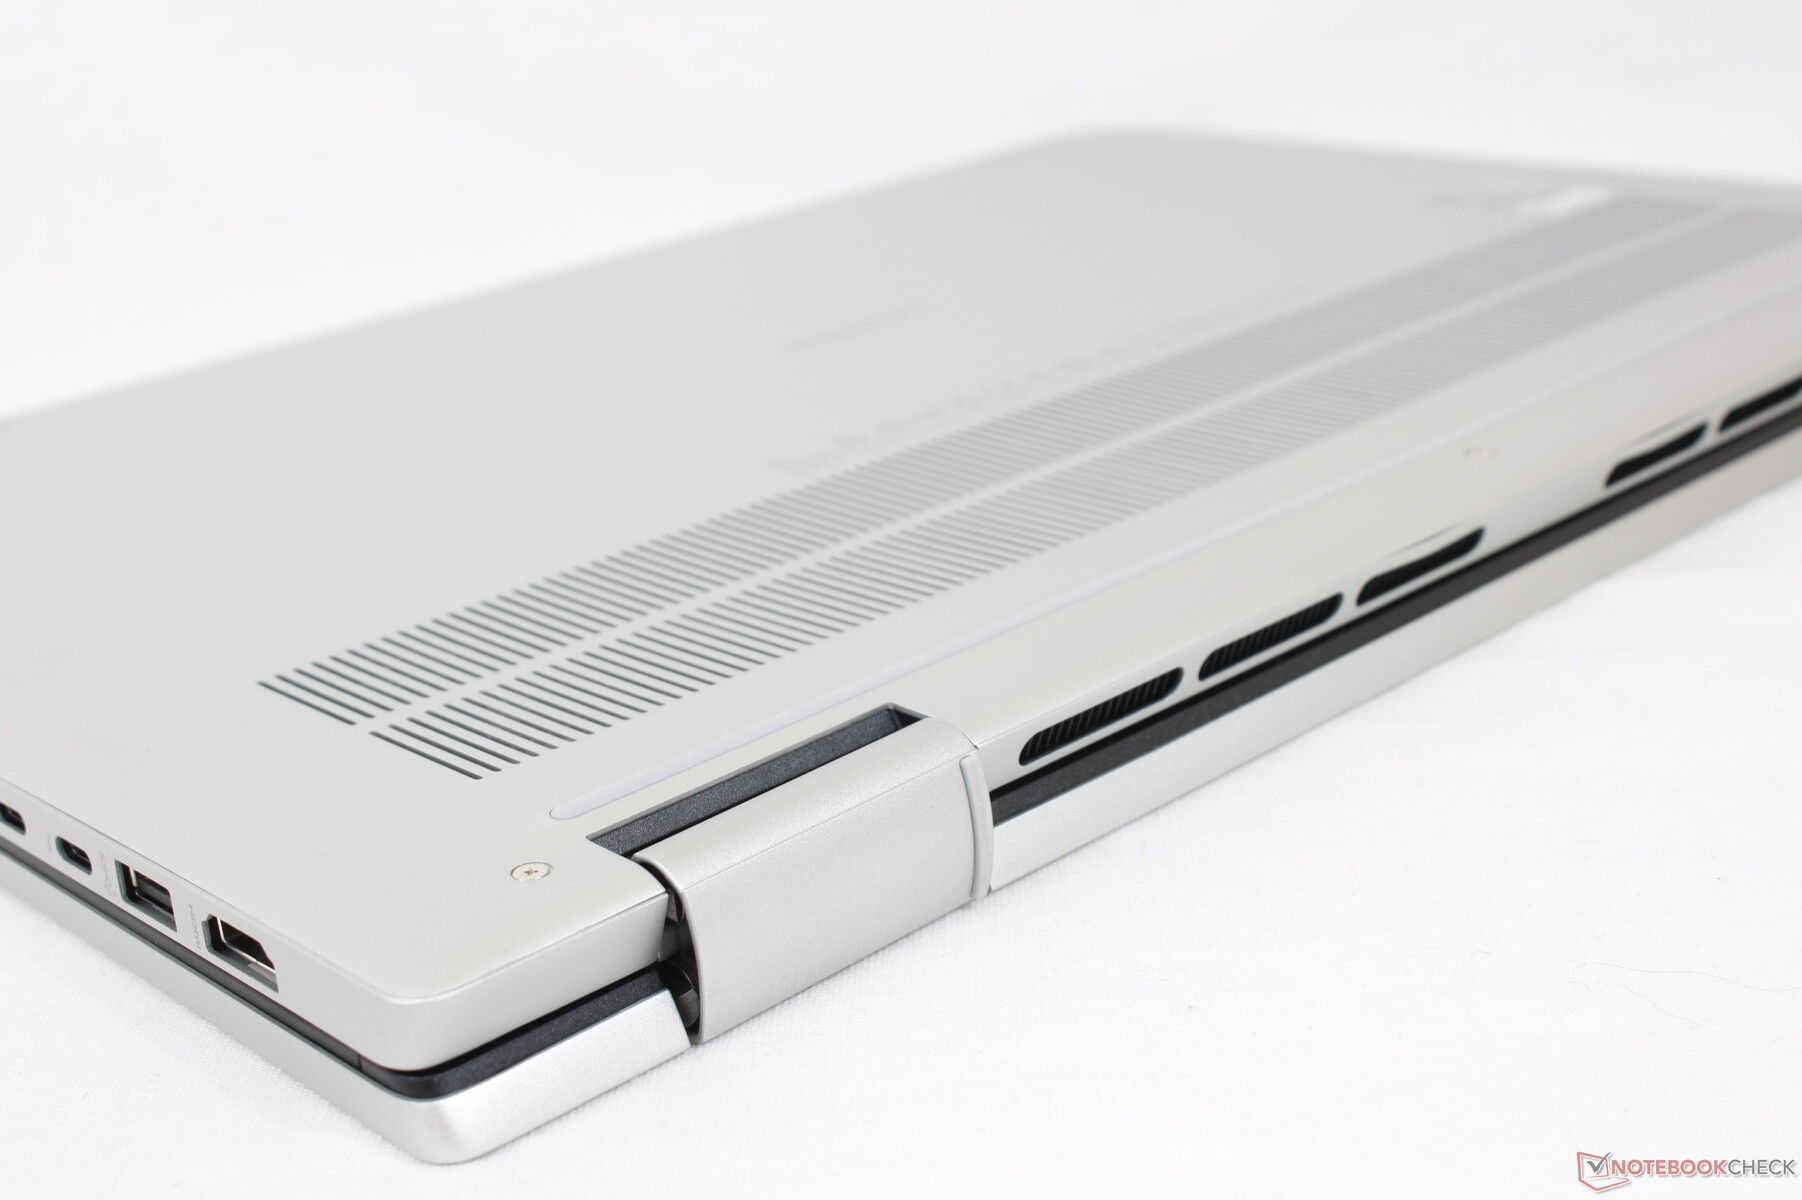
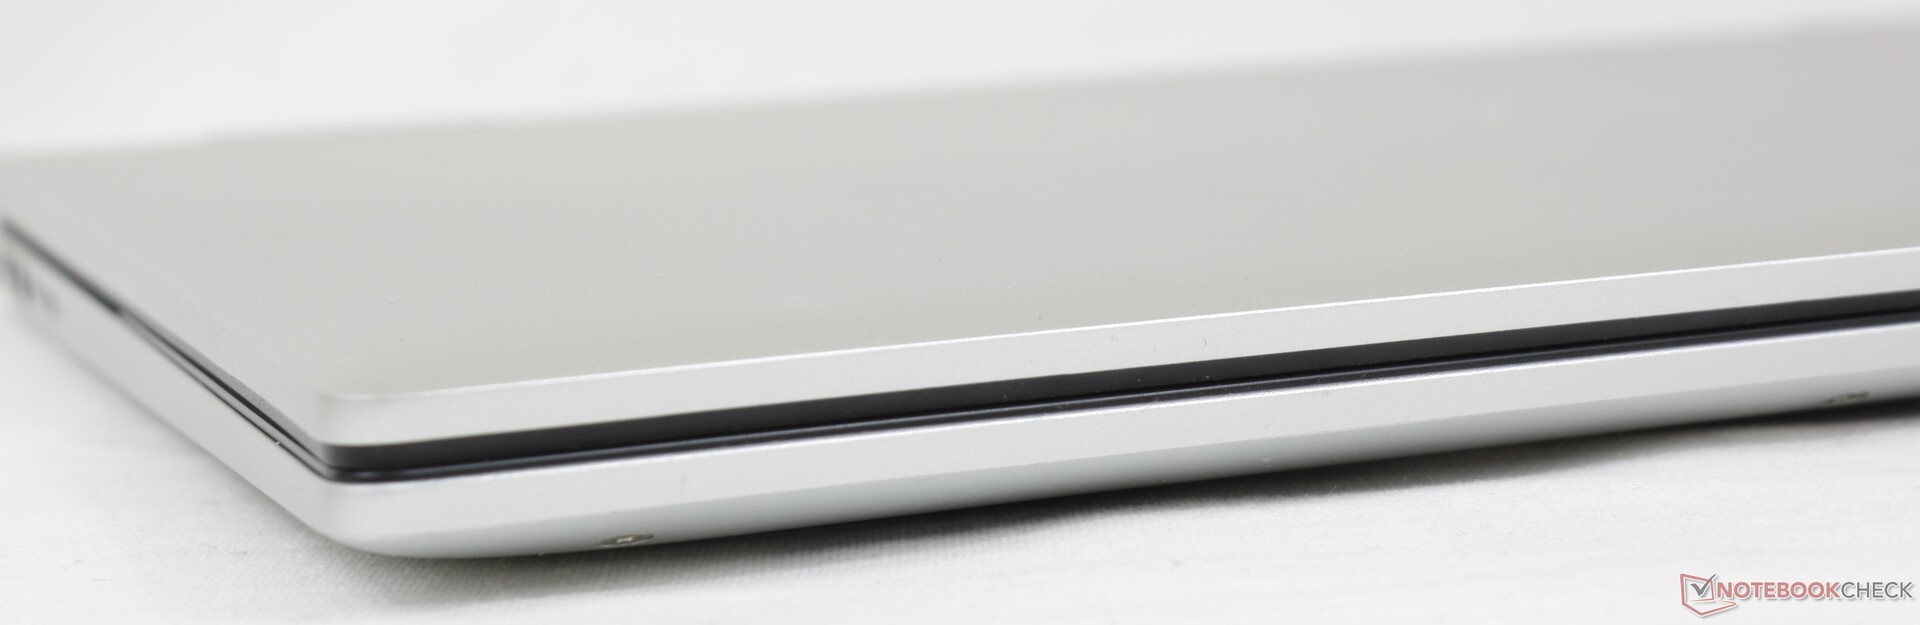
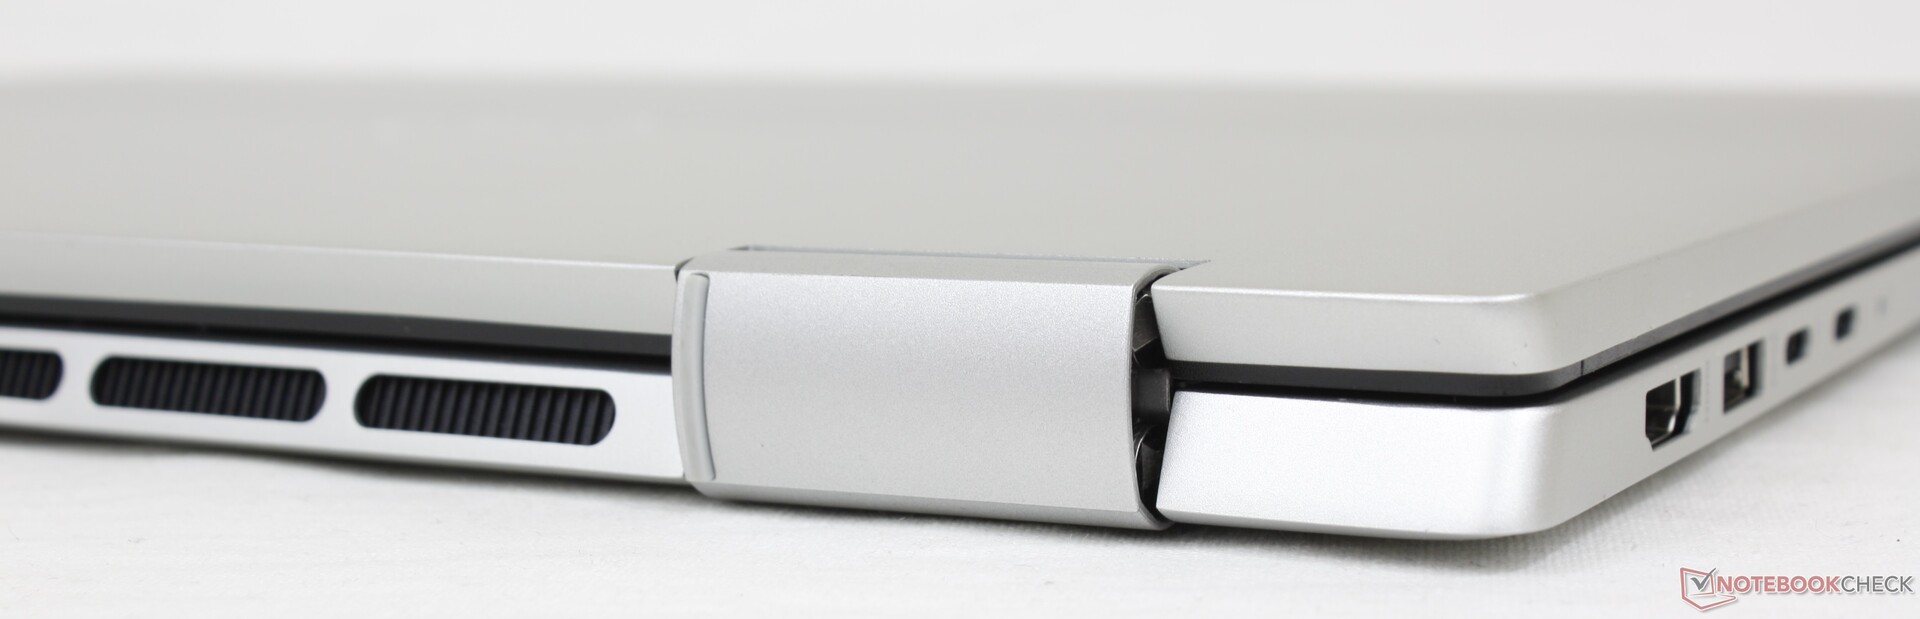
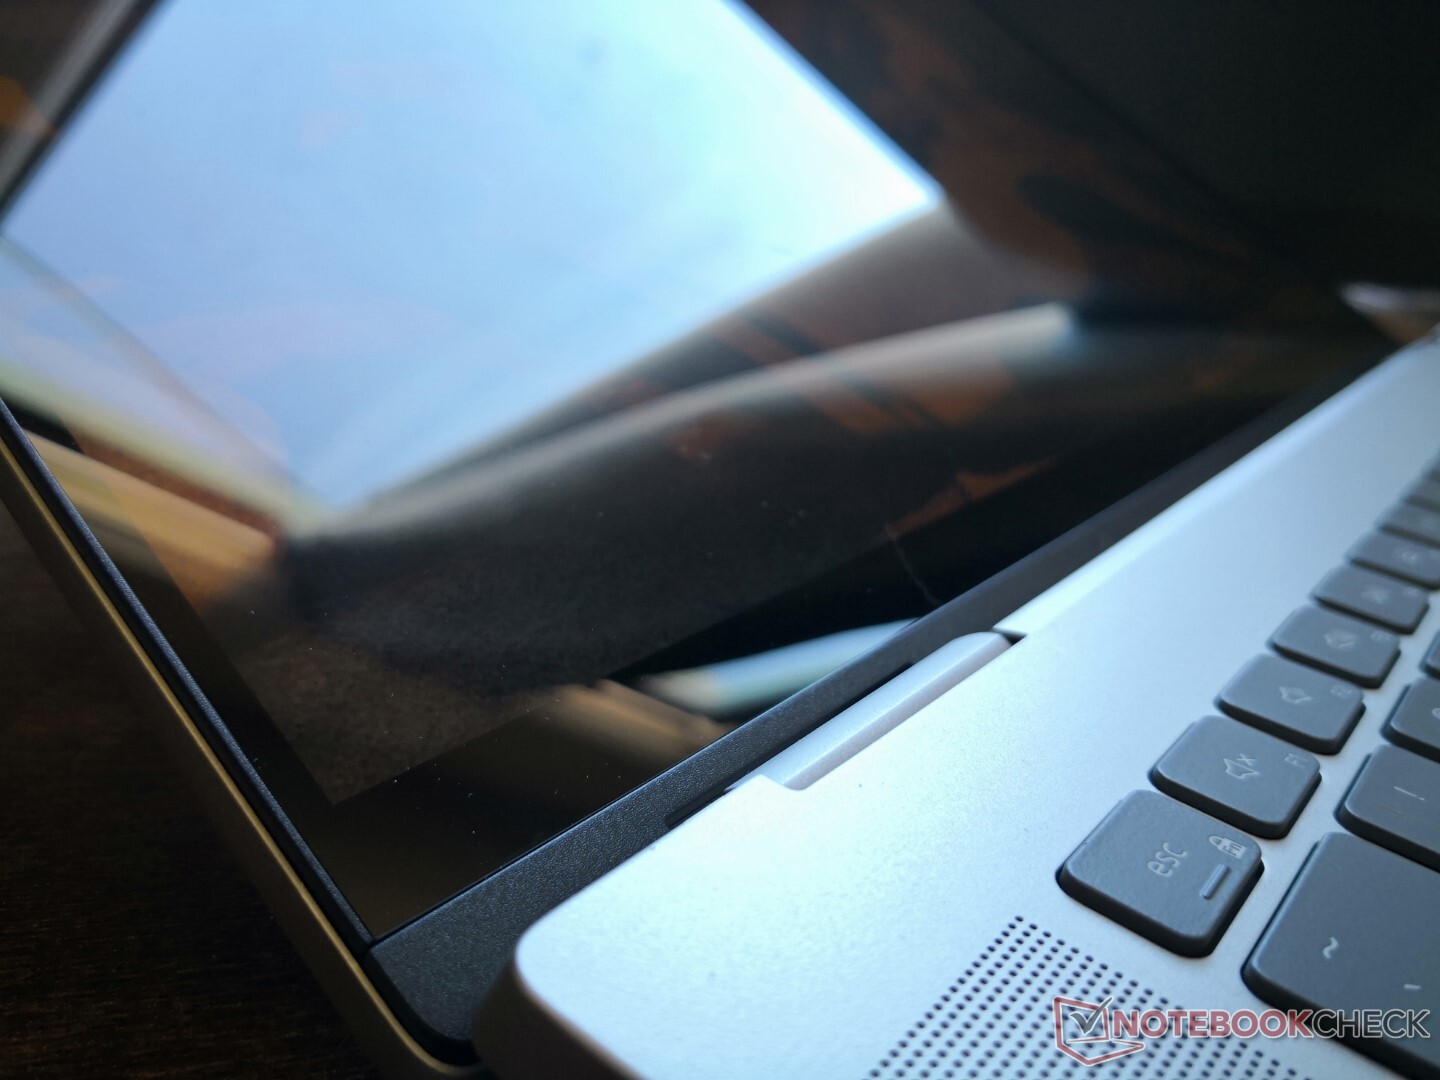
Case — Strong But Heavy
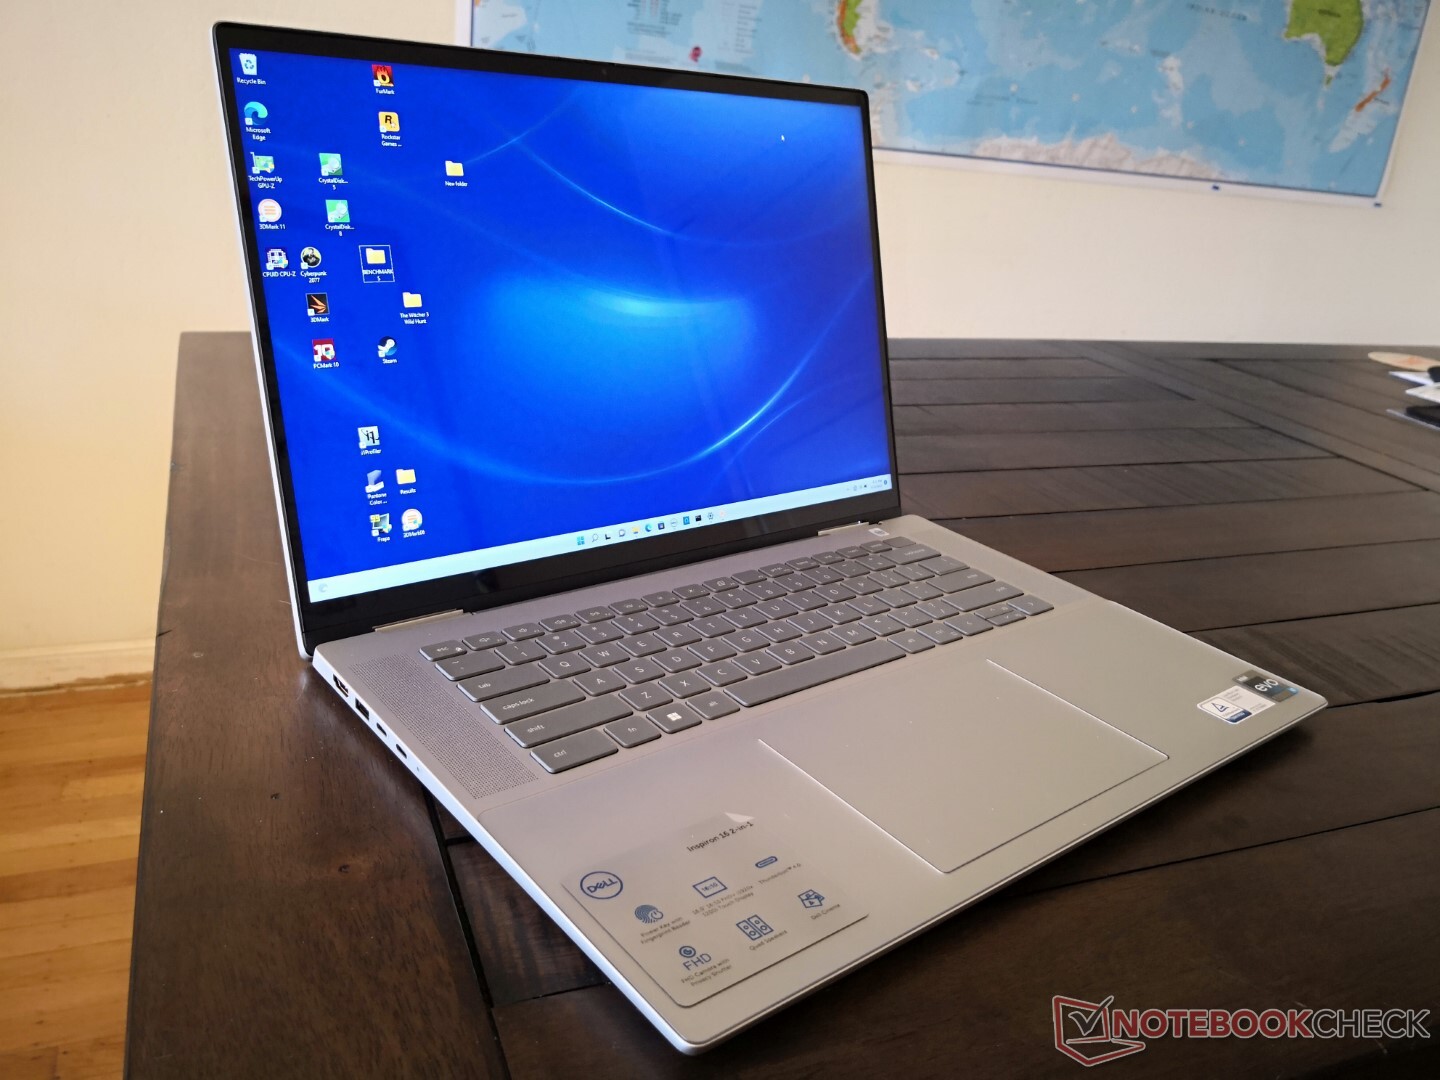
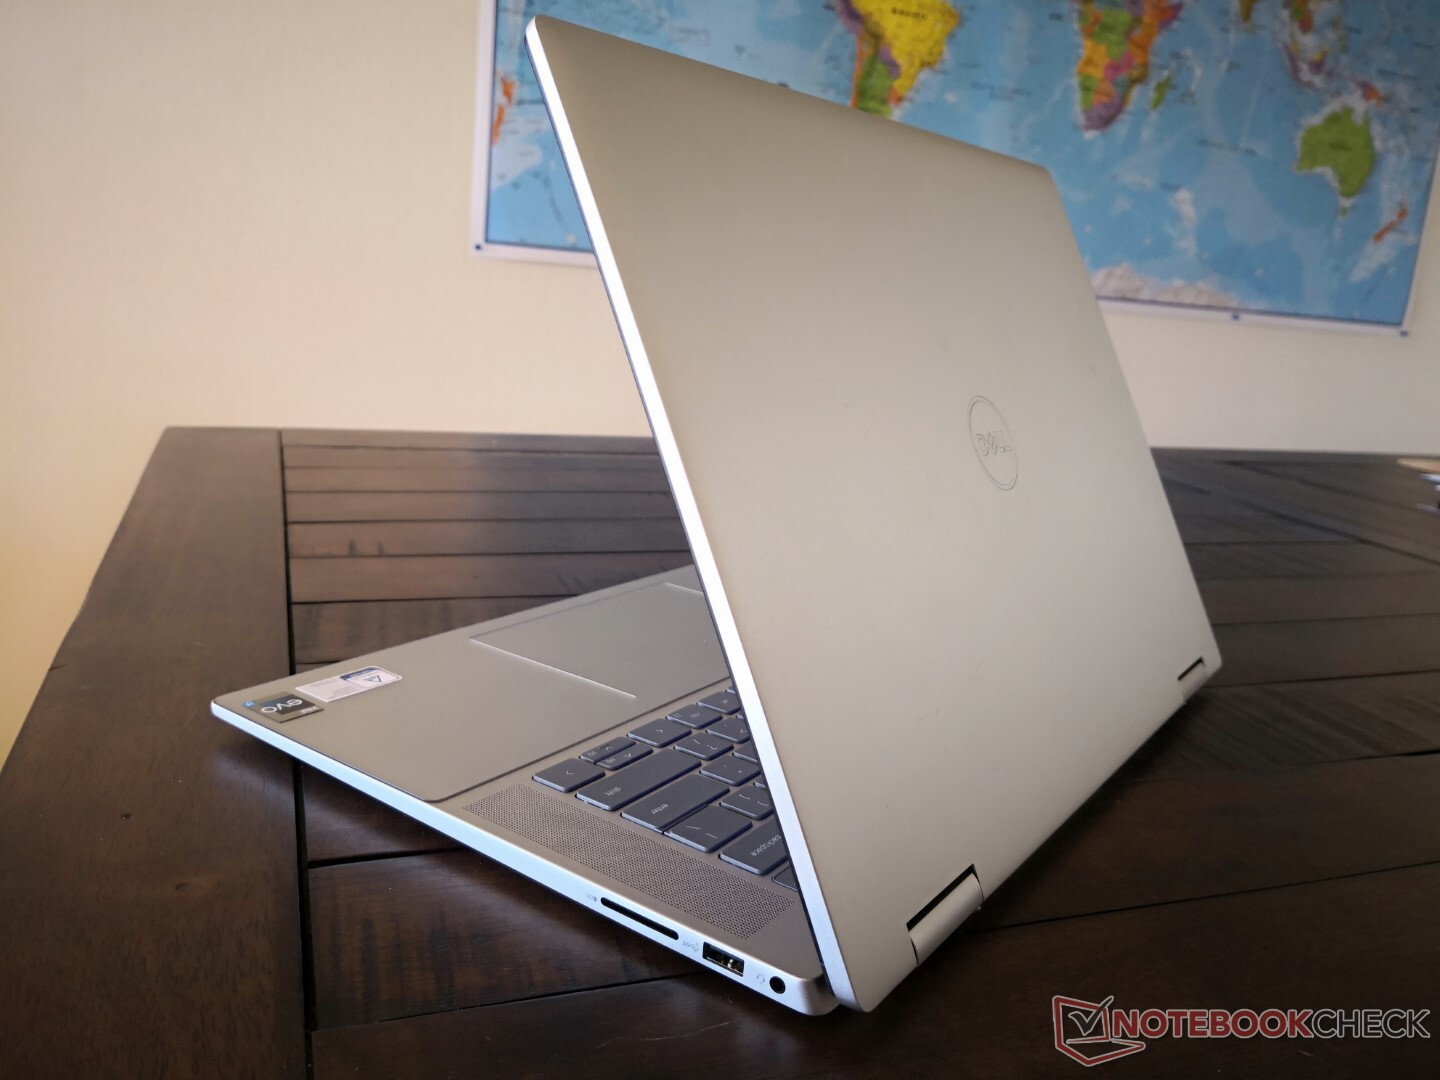
The system design is essentially an enlarged version of the Inspiron 14 7420 2-in-1. The smooth matte aluminum chassis remains as well as the signature layer of mylar atop the palm rests and clickpad. Build quality is solid and comparable to the previous generation Inspiron 7610 with only minor warping when applying pressure on the keyboard center or outer lid. The skeleton is noticeably stronger than with the LG Gram 16 2-in-1 or Samsung Galaxy Book Pro x360 15, for example.
In terms of size and weight, the model is actually slightly larger and heavier than the outgoing Inspiron 7610 as shown by our comparison plugin below. We suspect that the decision to turn the 7620 series into a convertible instead of a traditional clamshell likely contributed to the size and weight increase. Dimensions are quite close to the 2019 HP Spectre x360 15 and LG Gram 16 2-in-1 while weighing over half a kilogram more than the superlight LG. The extra weight is the price that Inspiron users will have to pay for the physically stronger chassis.
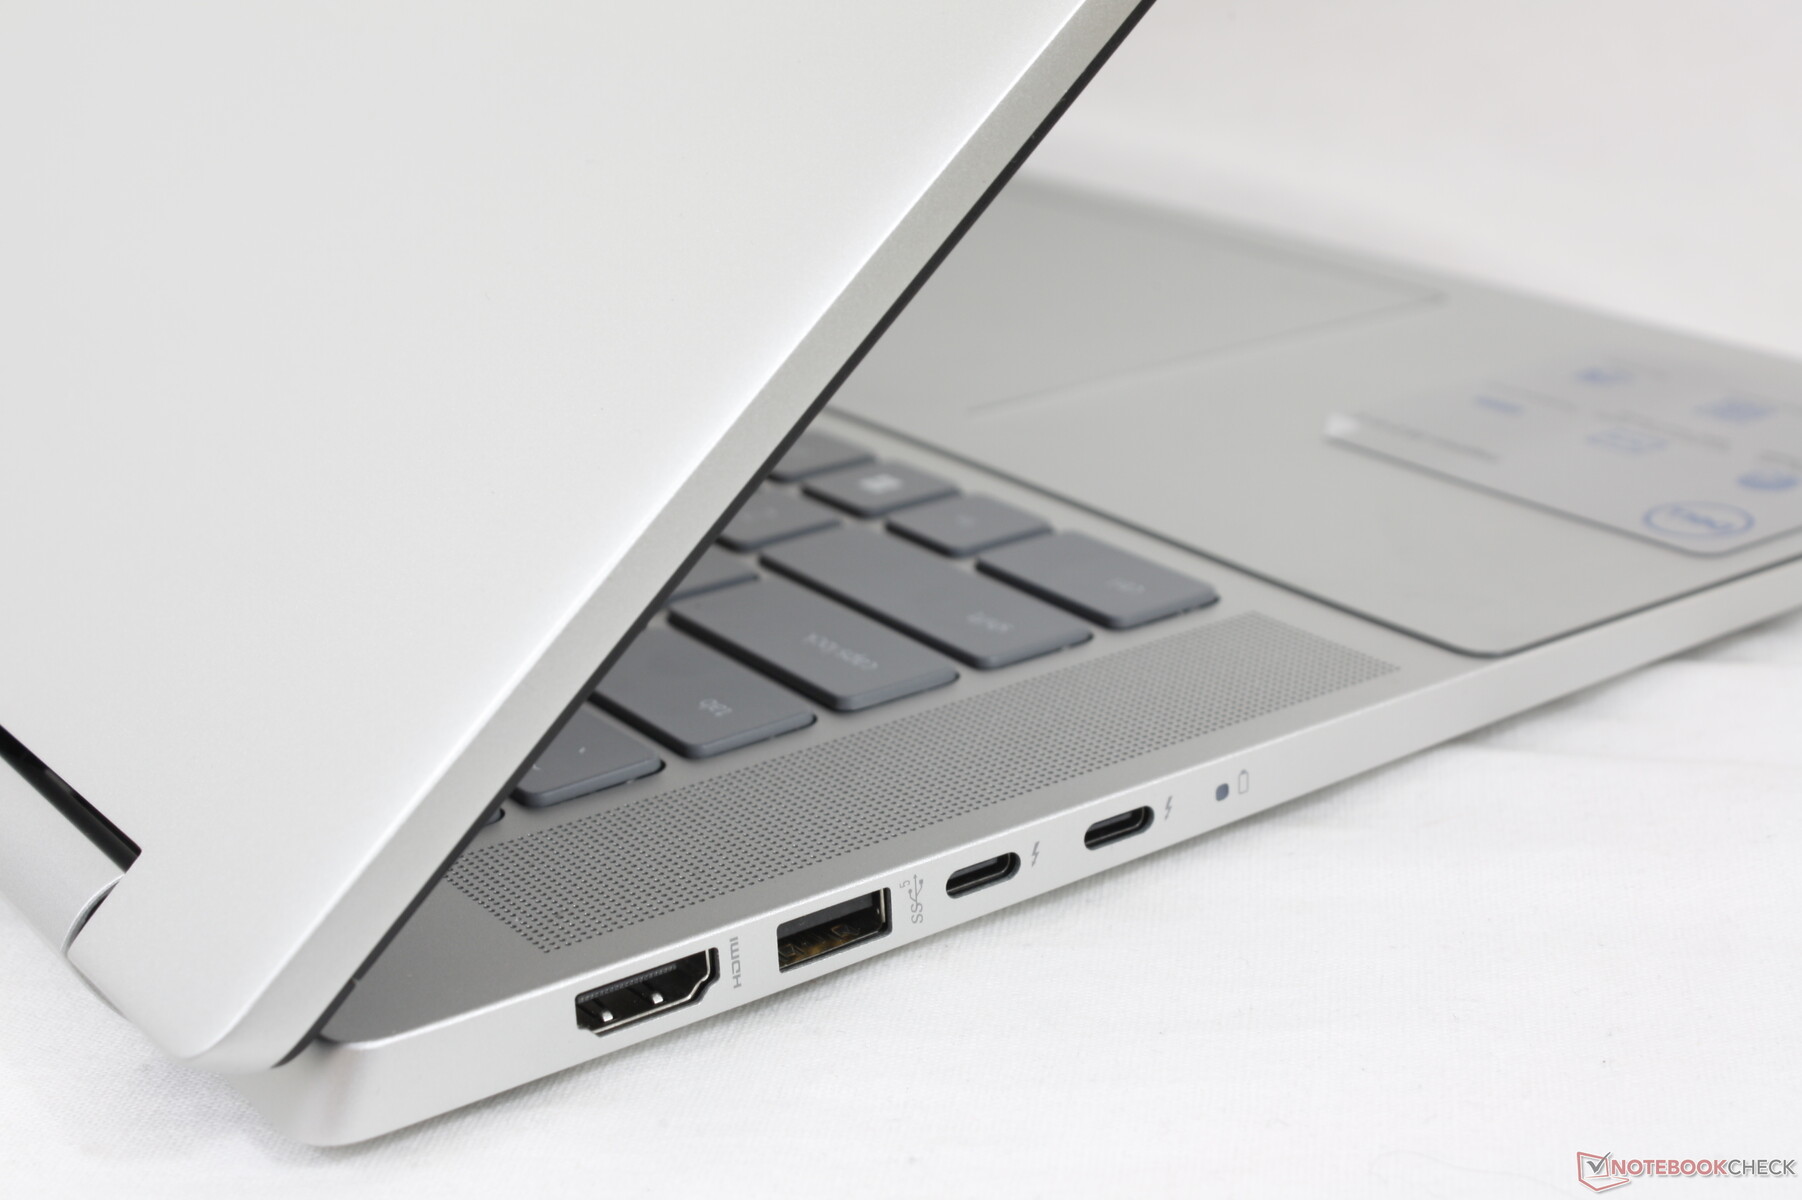
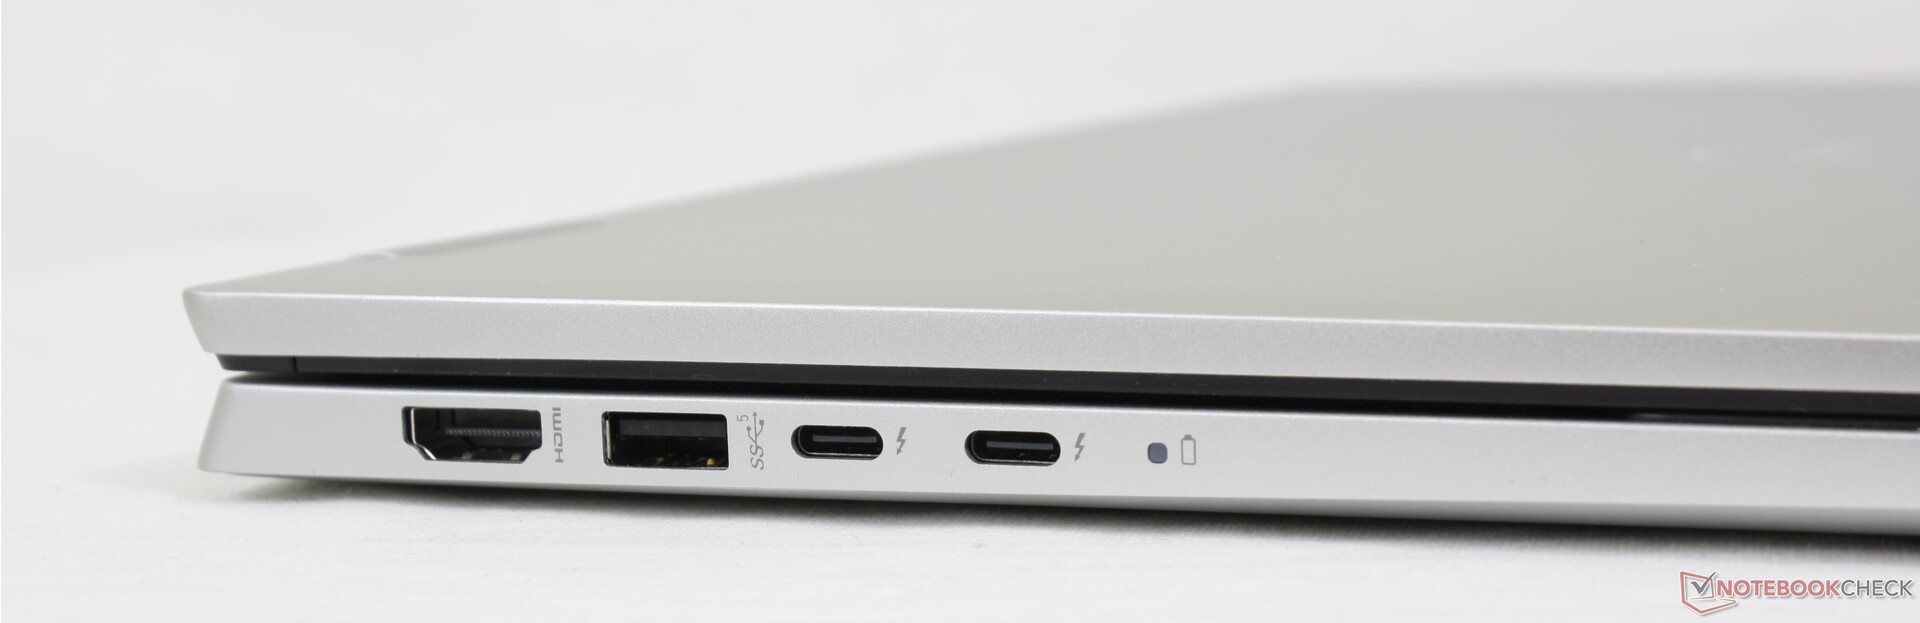
Connectivity — Dual Thunderbolt 4
Port options are excellent as competing models like the LG Gram 16 2-in-1 or Spectre x360 15 tend to come with fewer USB-A ports or no HDMI option at all. However, keep in mind that the HDMI 1.4 port here cannot support 4K video output at 60 FPS.
Both USB-C ports along the left edge support Thunderbolt devices meaning users can connect external GPUs if desired.
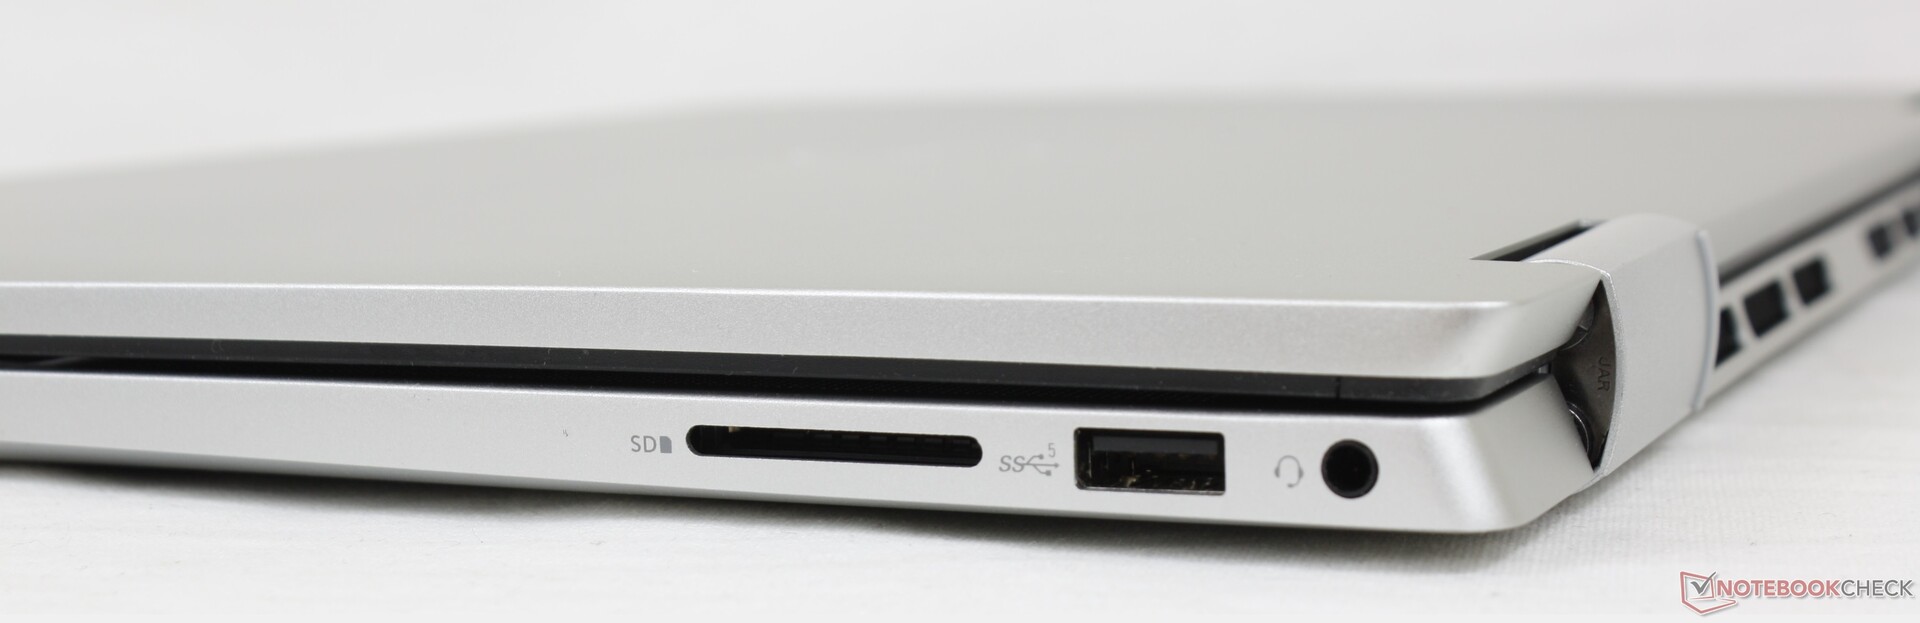
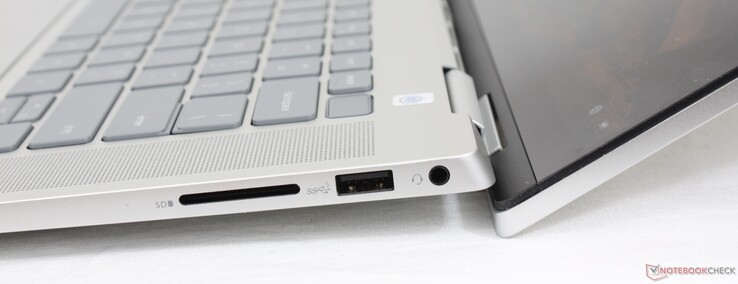
SD Card Reader
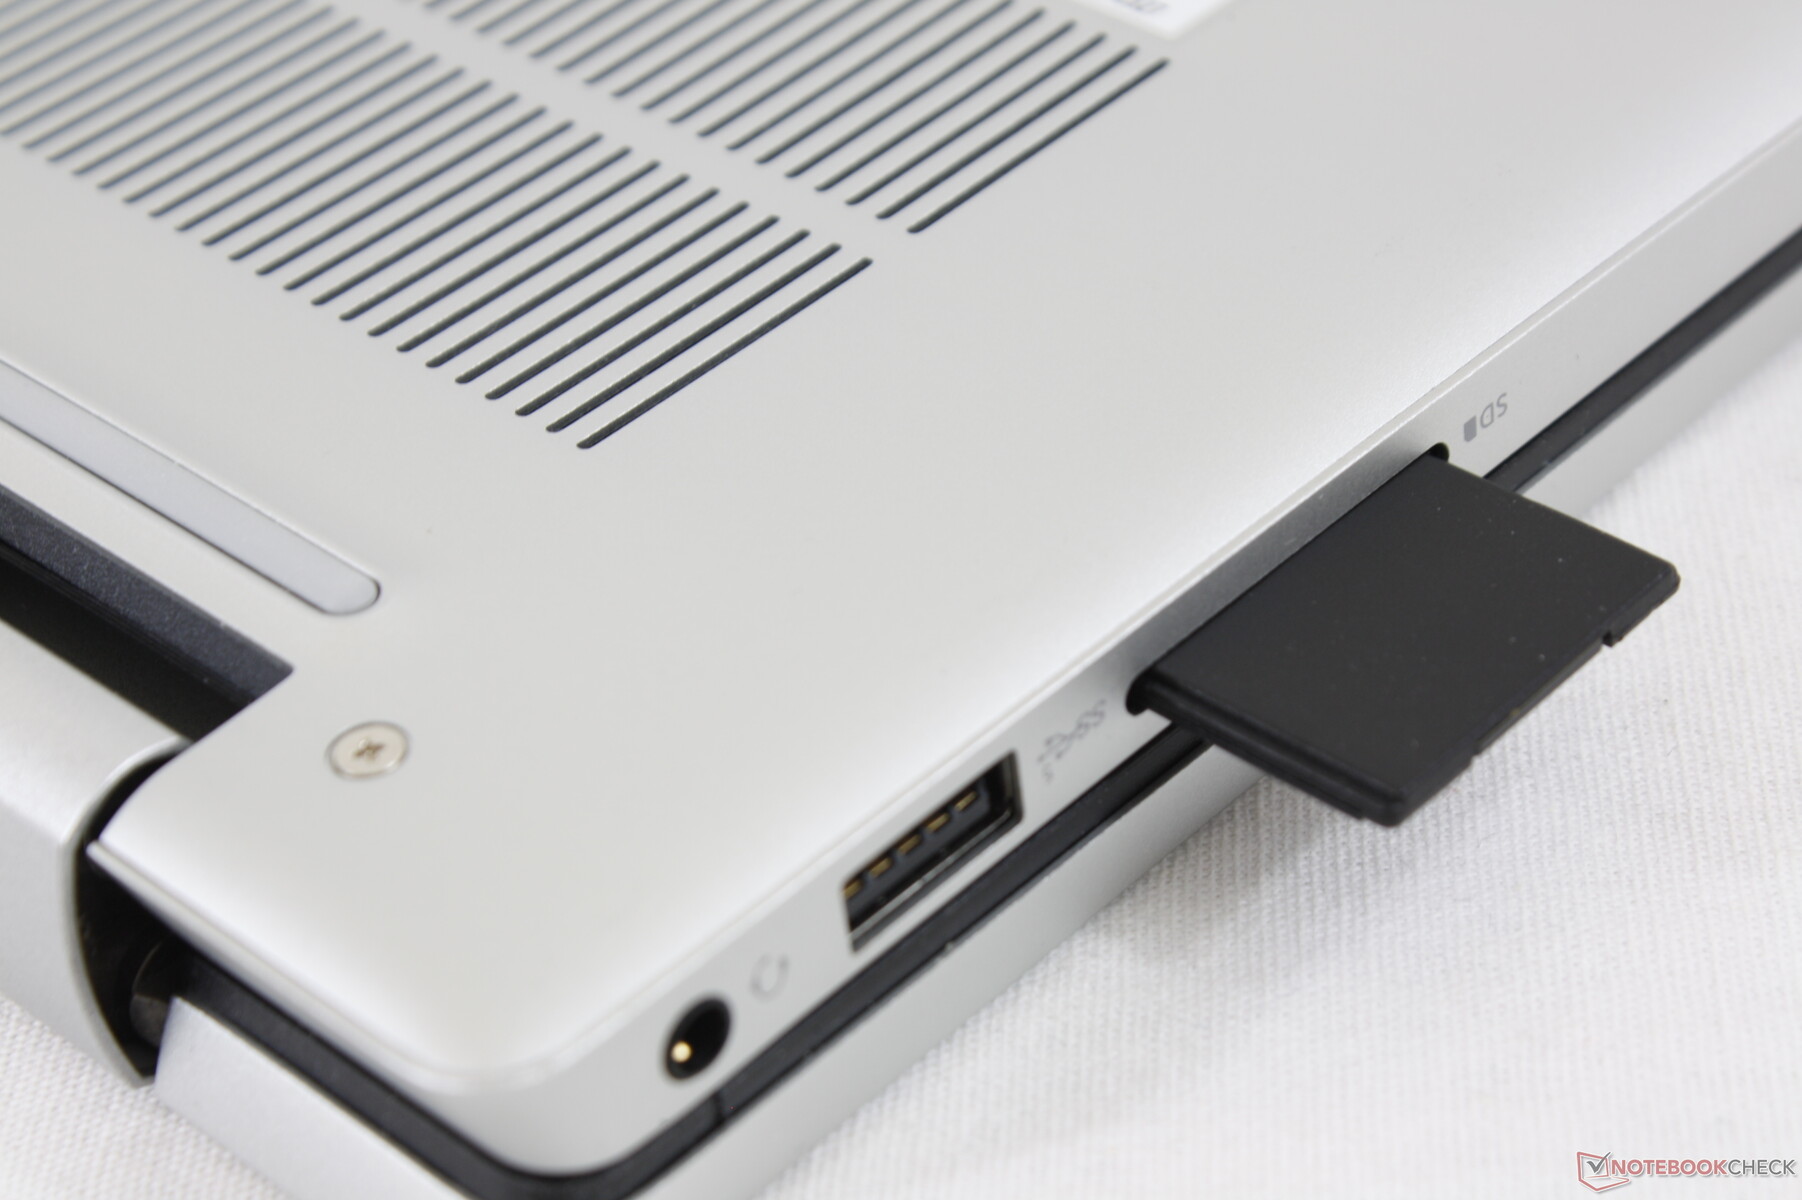
Like with other Inspiron laptops, the integrated SD card reader here is very slow at just 20 to 30 MB/s at best. Users will have to upgrade to a faster XPS or Latitude model for faster SD card transfer rates.
| SD Card Reader | |
| average JPG Copy Test (av. of 3 runs) | |
| HP Spectre X360 15-5ZV31AV (Toshiba Exceria Pro M501 UHS-II) | |
| LG Gram 16 2-in-1 16T90P (Toshiba Exceria Pro M501 UHS-II) | |
| Asus ZenBook Flip 15 UX563FD-A1027T (Toshiba Exceria Pro SDXC 64 GB UHS-II) | |
| Dell Inspiron 15 5579-9672 (Toshiba Exceria Pro SDXC 64 GB UHS-II) | |
| Samsung Galaxy Book Pro 360 15 NP950QDB-KC3DE (AV Pro SD microSD 128 GB V60) | |
| Dell Inspiron 16 7620 2-in-1 (Toshiba Exceria Pro SDXC 64 GB UHS-II) | |
| maximum AS SSD Seq Read Test (1GB) | |
| HP Spectre X360 15-5ZV31AV (Toshiba Exceria Pro M501 UHS-II) | |
| LG Gram 16 2-in-1 16T90P (Toshiba Exceria Pro M501 UHS-II) | |
| Dell Inspiron 15 5579-9672 (Toshiba Exceria Pro SDXC 64 GB UHS-II) | |
| Dell Inspiron 16 7620 2-in-1 (Toshiba Exceria Pro SDXC 64 GB UHS-II) | |
| Samsung Galaxy Book Pro 360 15 NP950QDB-KC3DE (AV Pro SD microSD 128 GB V60) | |
Communication
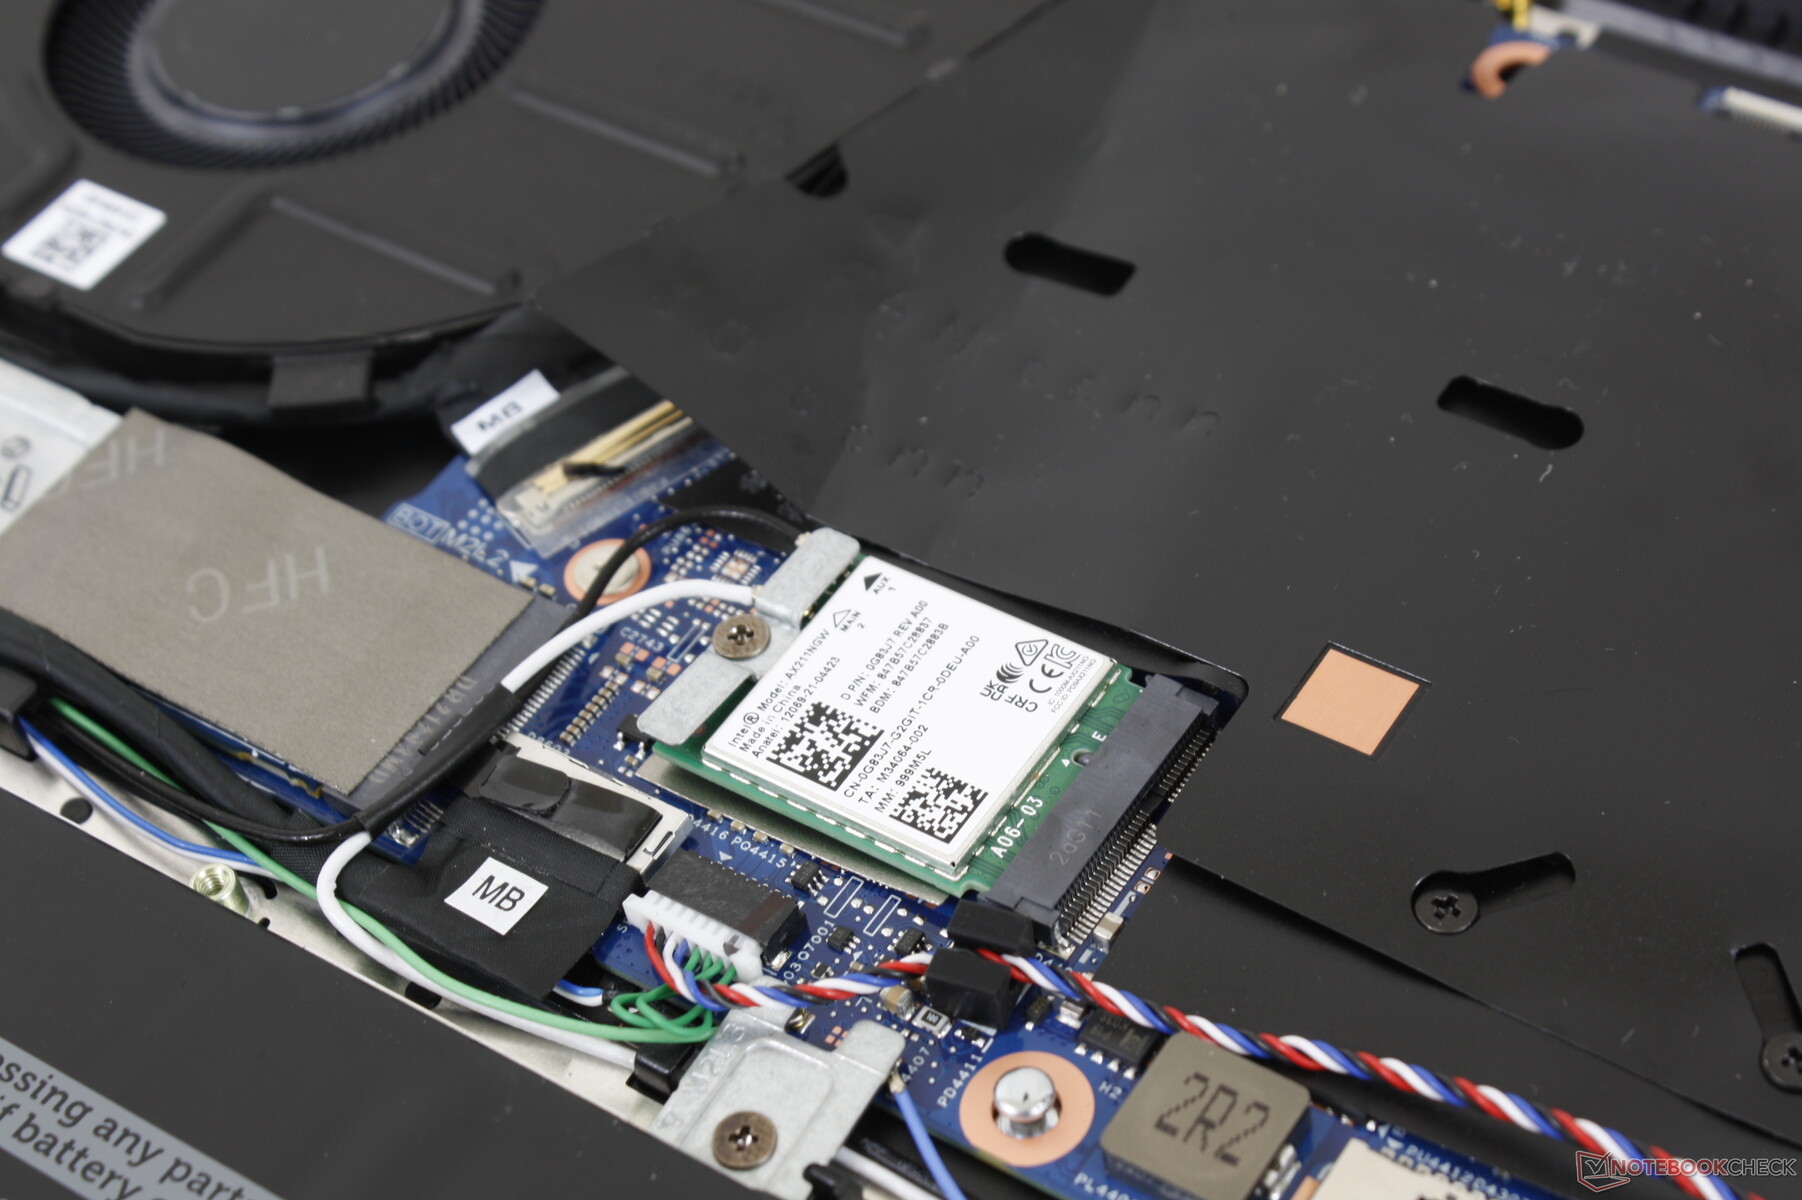
An Intel AX211 comes standard for Wi-Fi 6E and Bluetooth 5.2 connectivity. Performance is stable when paired to our 6 GHz network with no noticeable connection issues during our time with the unit.
| Networking | |
| iperf3 transmit AX12 | |
| Samsung Galaxy Book Pro 360 15 NP950QDB-KC3DE | |
| LG Gram 16 2-in-1 16T90P | |
| Dell Inspiron 15 5579-9672 | |
| Asus ZenBook Flip 15 UX563FD-A1027T | |
| iperf3 receive AX12 | |
| LG Gram 16 2-in-1 16T90P | |
| Samsung Galaxy Book Pro 360 15 NP950QDB-KC3DE | |
| Asus ZenBook Flip 15 UX563FD-A1027T | |
| Dell Inspiron 15 5579-9672 | |
| iperf3 receive AXE11000 6GHz | |
| Dell Inspiron 16 7620 2-in-1 | |
| iperf3 transmit AXE11000 6GHz | |
| Dell Inspiron 16 7620 2-in-1 | |
Webcam
The integrated camera is 1080p for a sharper image than the typical 720p on most other budget to midrange laptops. Colors are still poor, however.
There is no IR camera and so Windows Hello is not supported. A manual webcam slider comes standard instead of an electronic shutter switch.


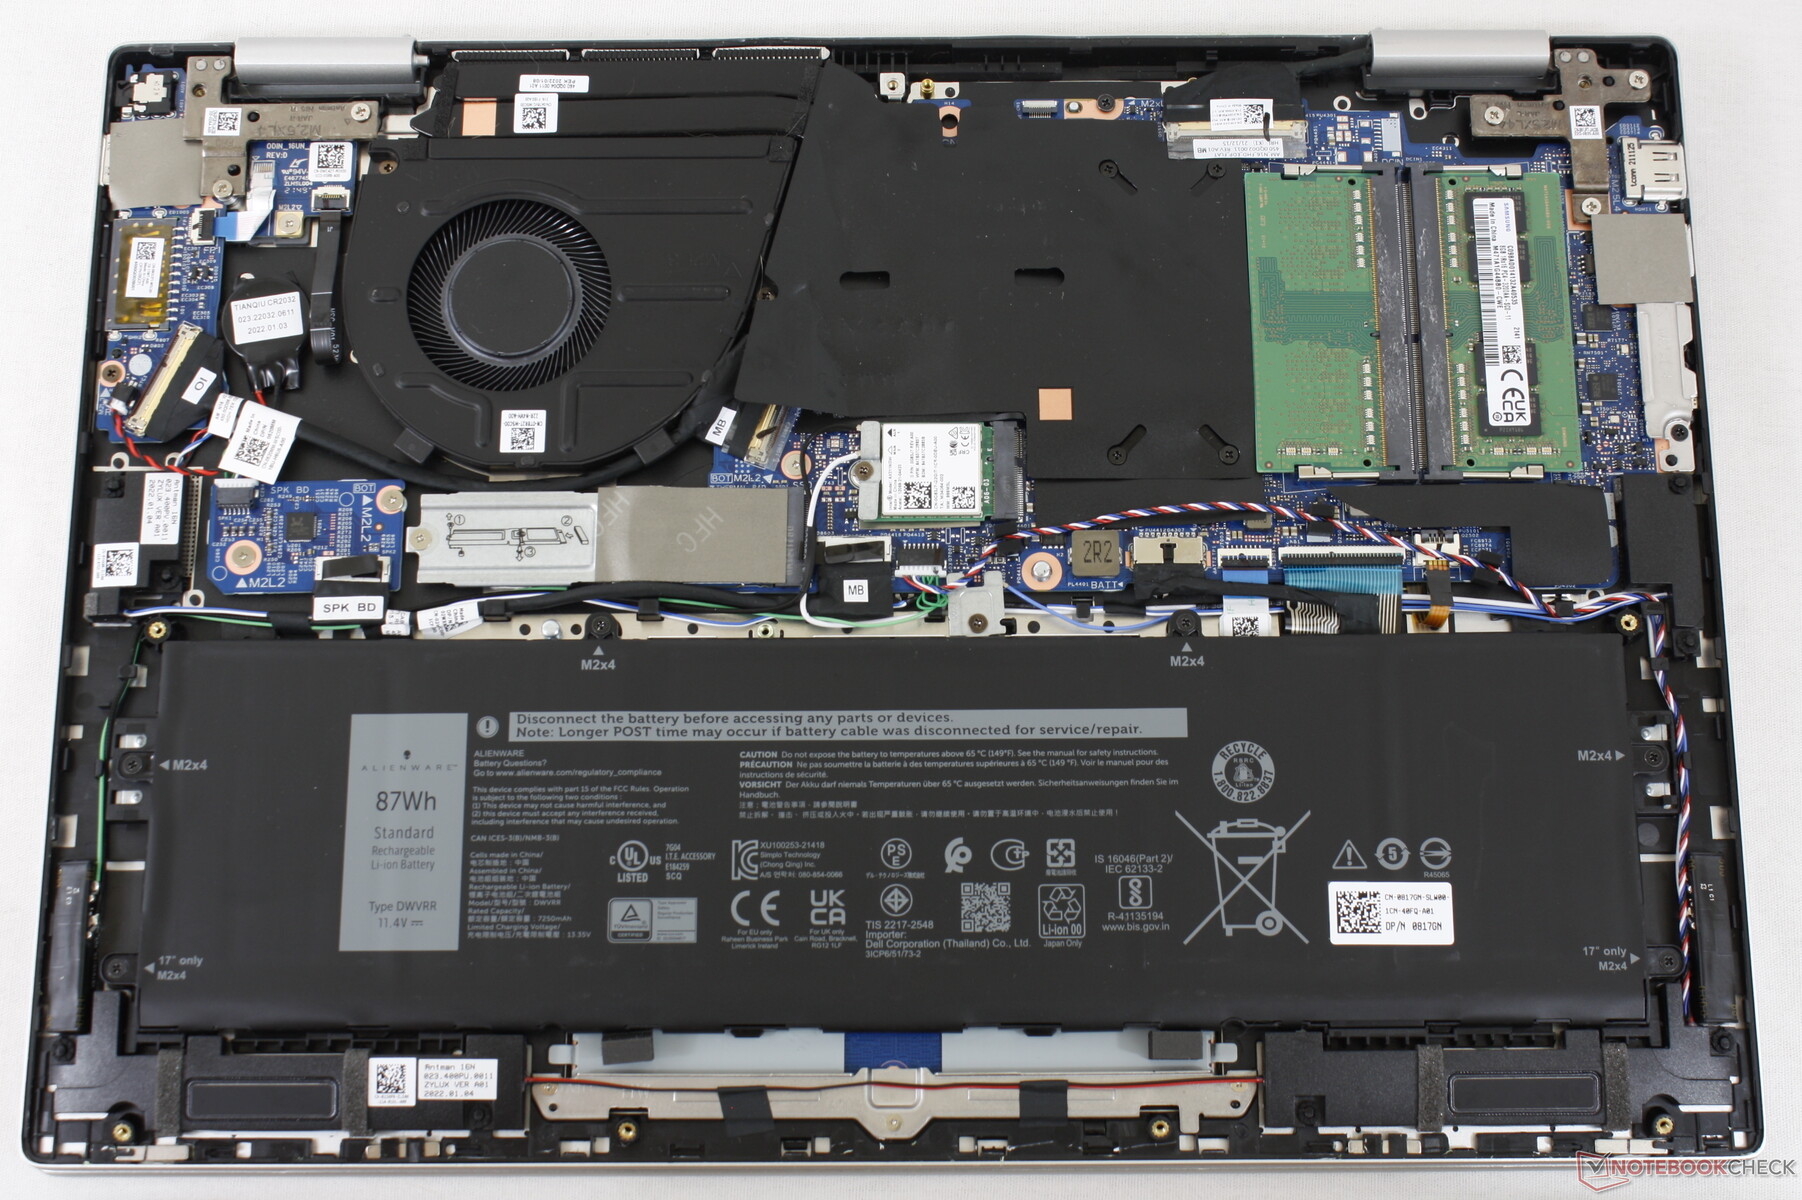
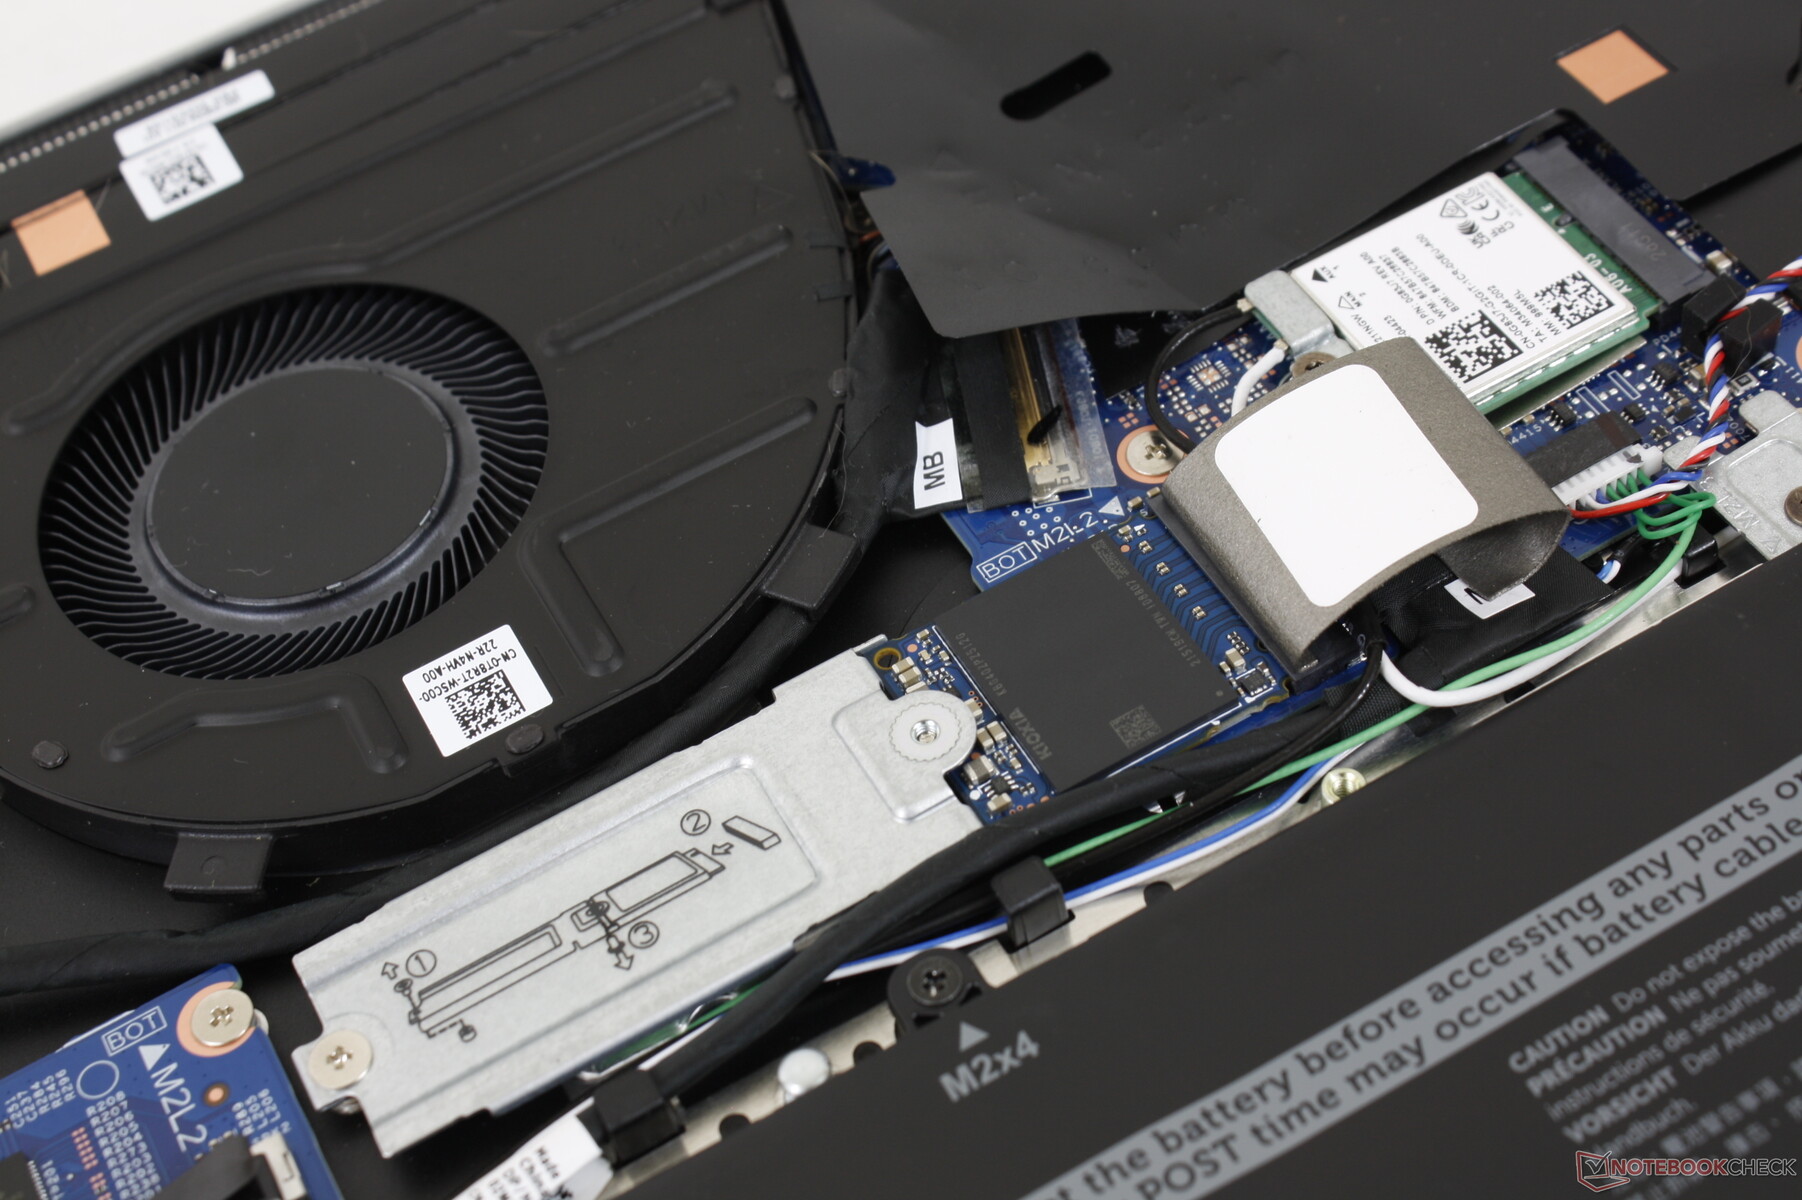
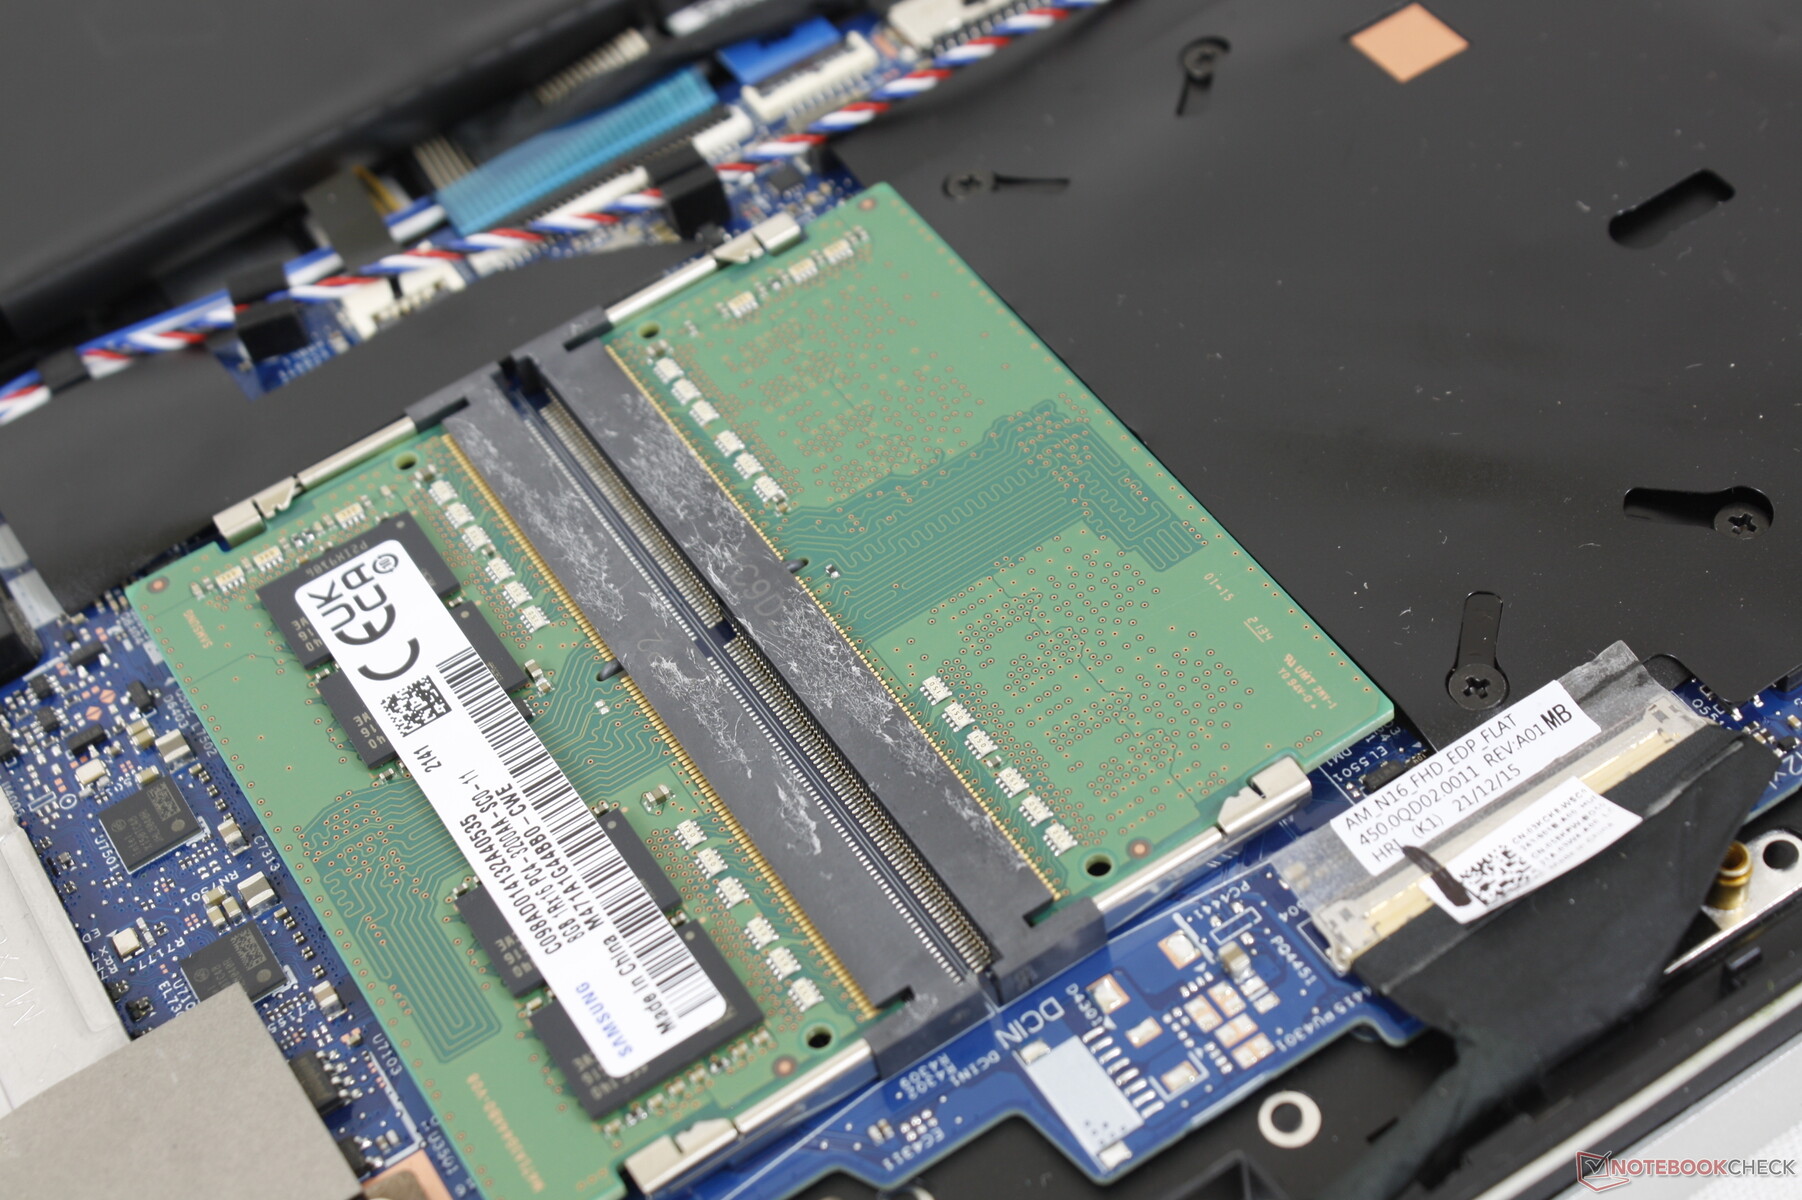
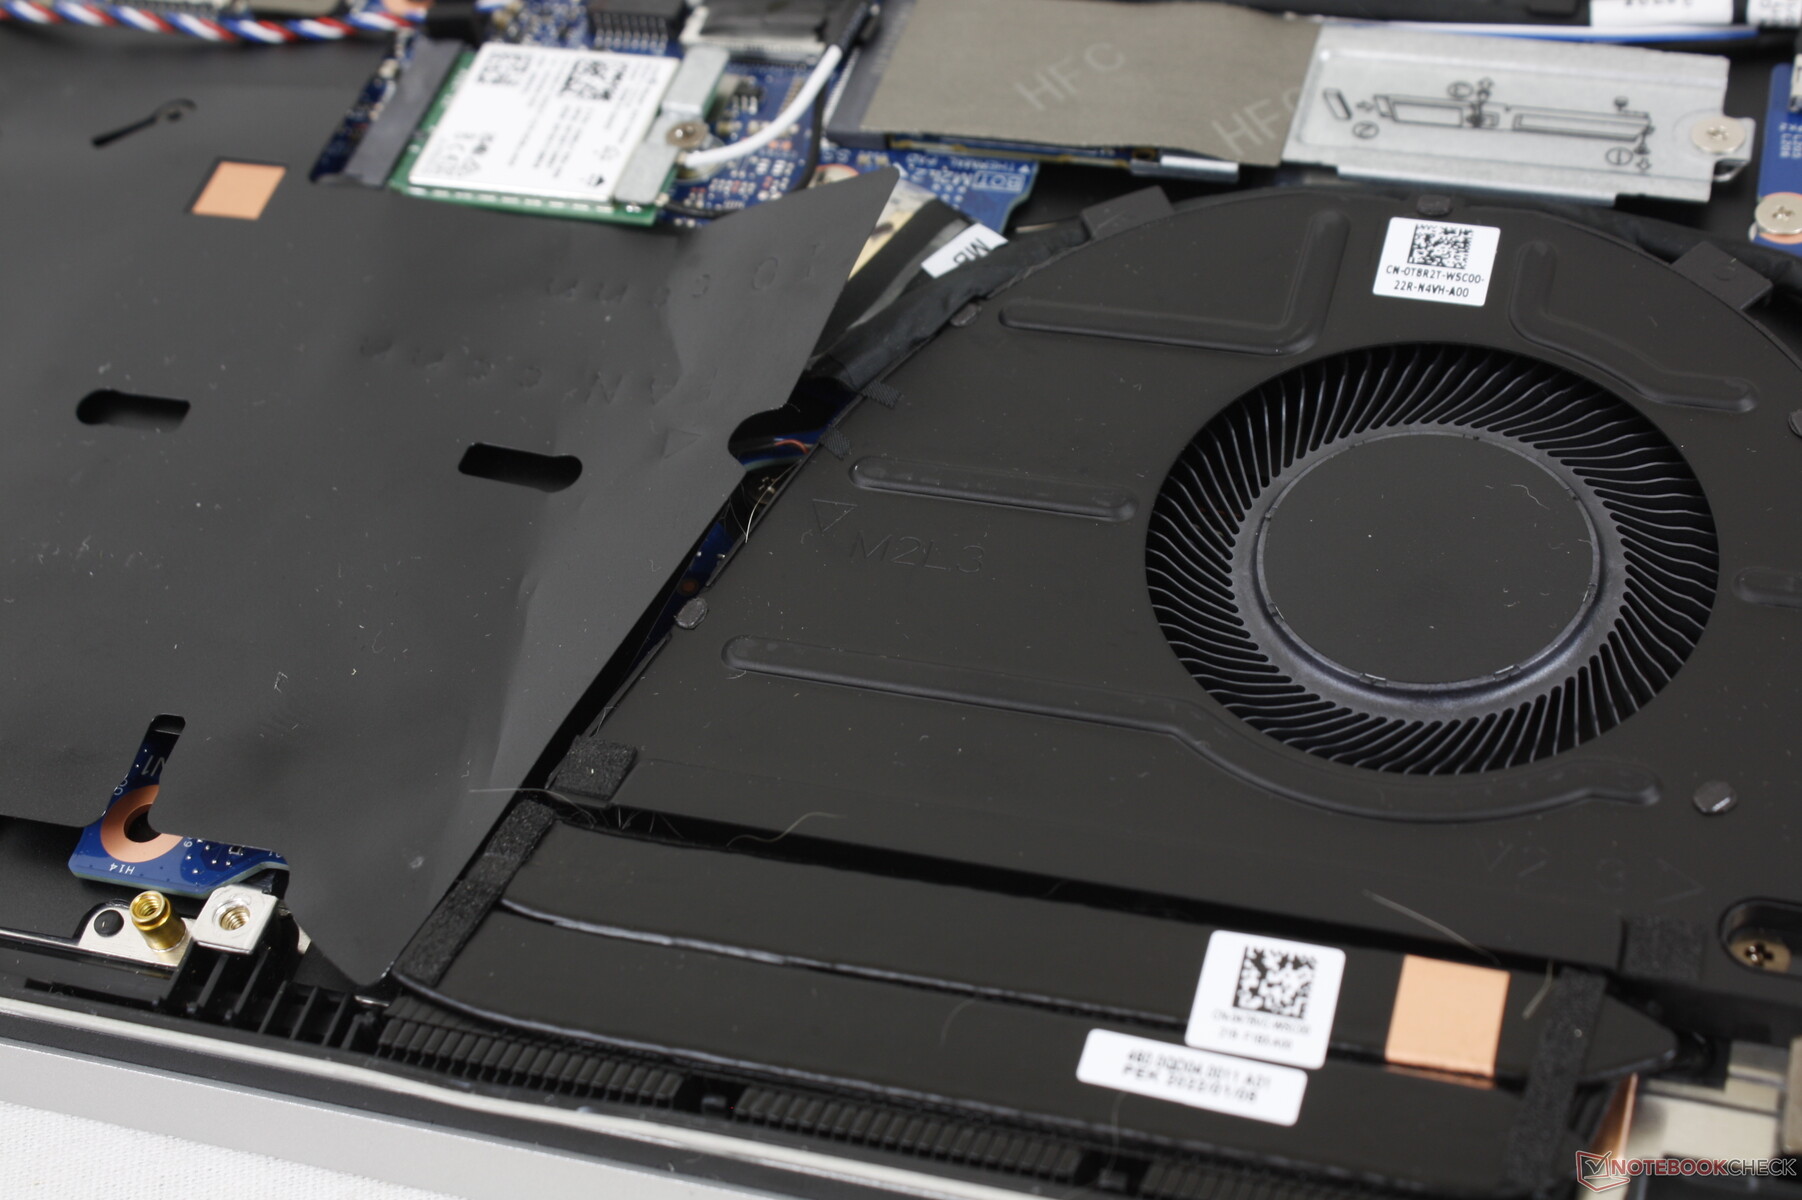
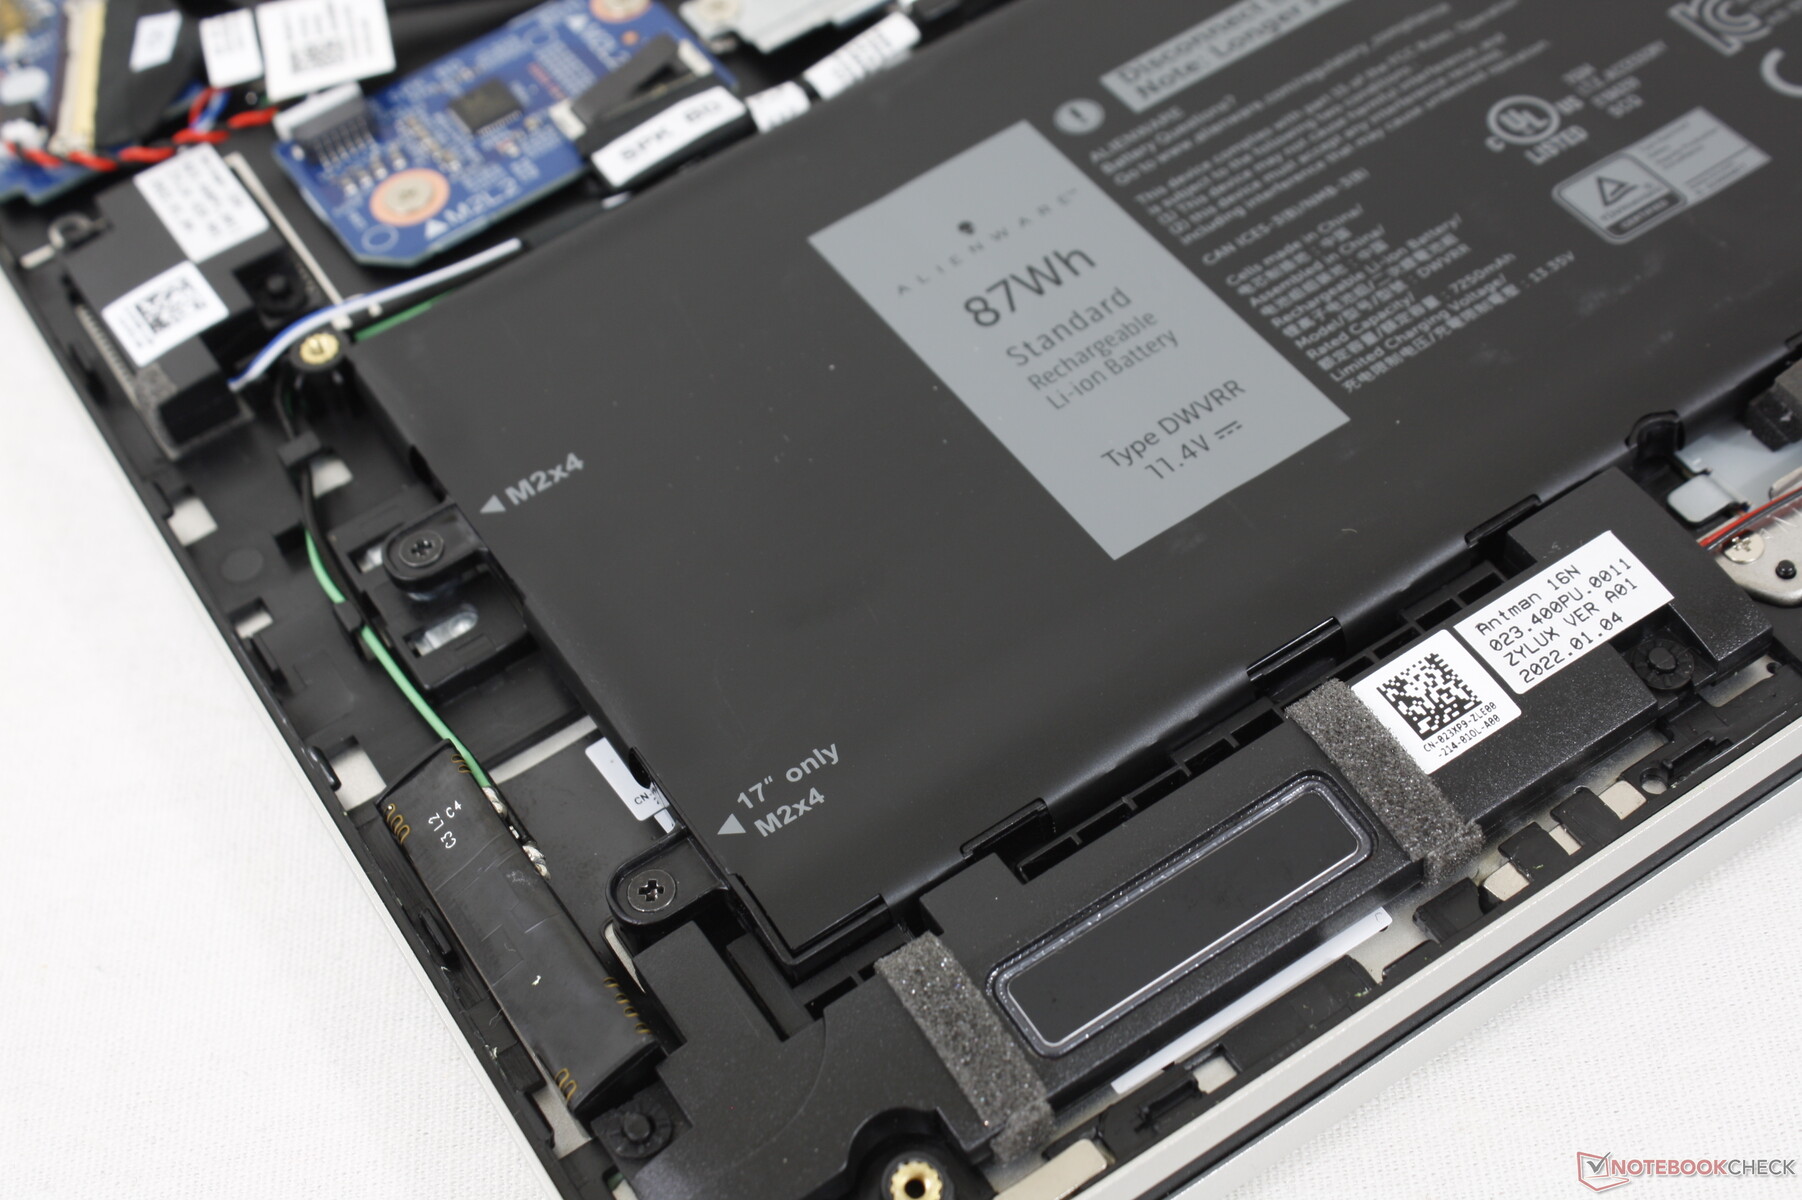
Maintenance
The bottom panel is secured by 9 Philips screws for easy serviceability. Users can remove or replace the 2x SODIMM modules, WLAN module, battery, or M.2 drive if desired. In comparison, many other convertibles like the LG Gram 16 2-in-1 make it very difficult for the end-user to add more storage or swap other common components.
Accessories and Warranty
There are no included extras beyond the paperwork and AC adapter. The model is compatible with the pressure sensitive PN5122W active stylus.
The standard one-year limited warranty applies if purchased in the US.
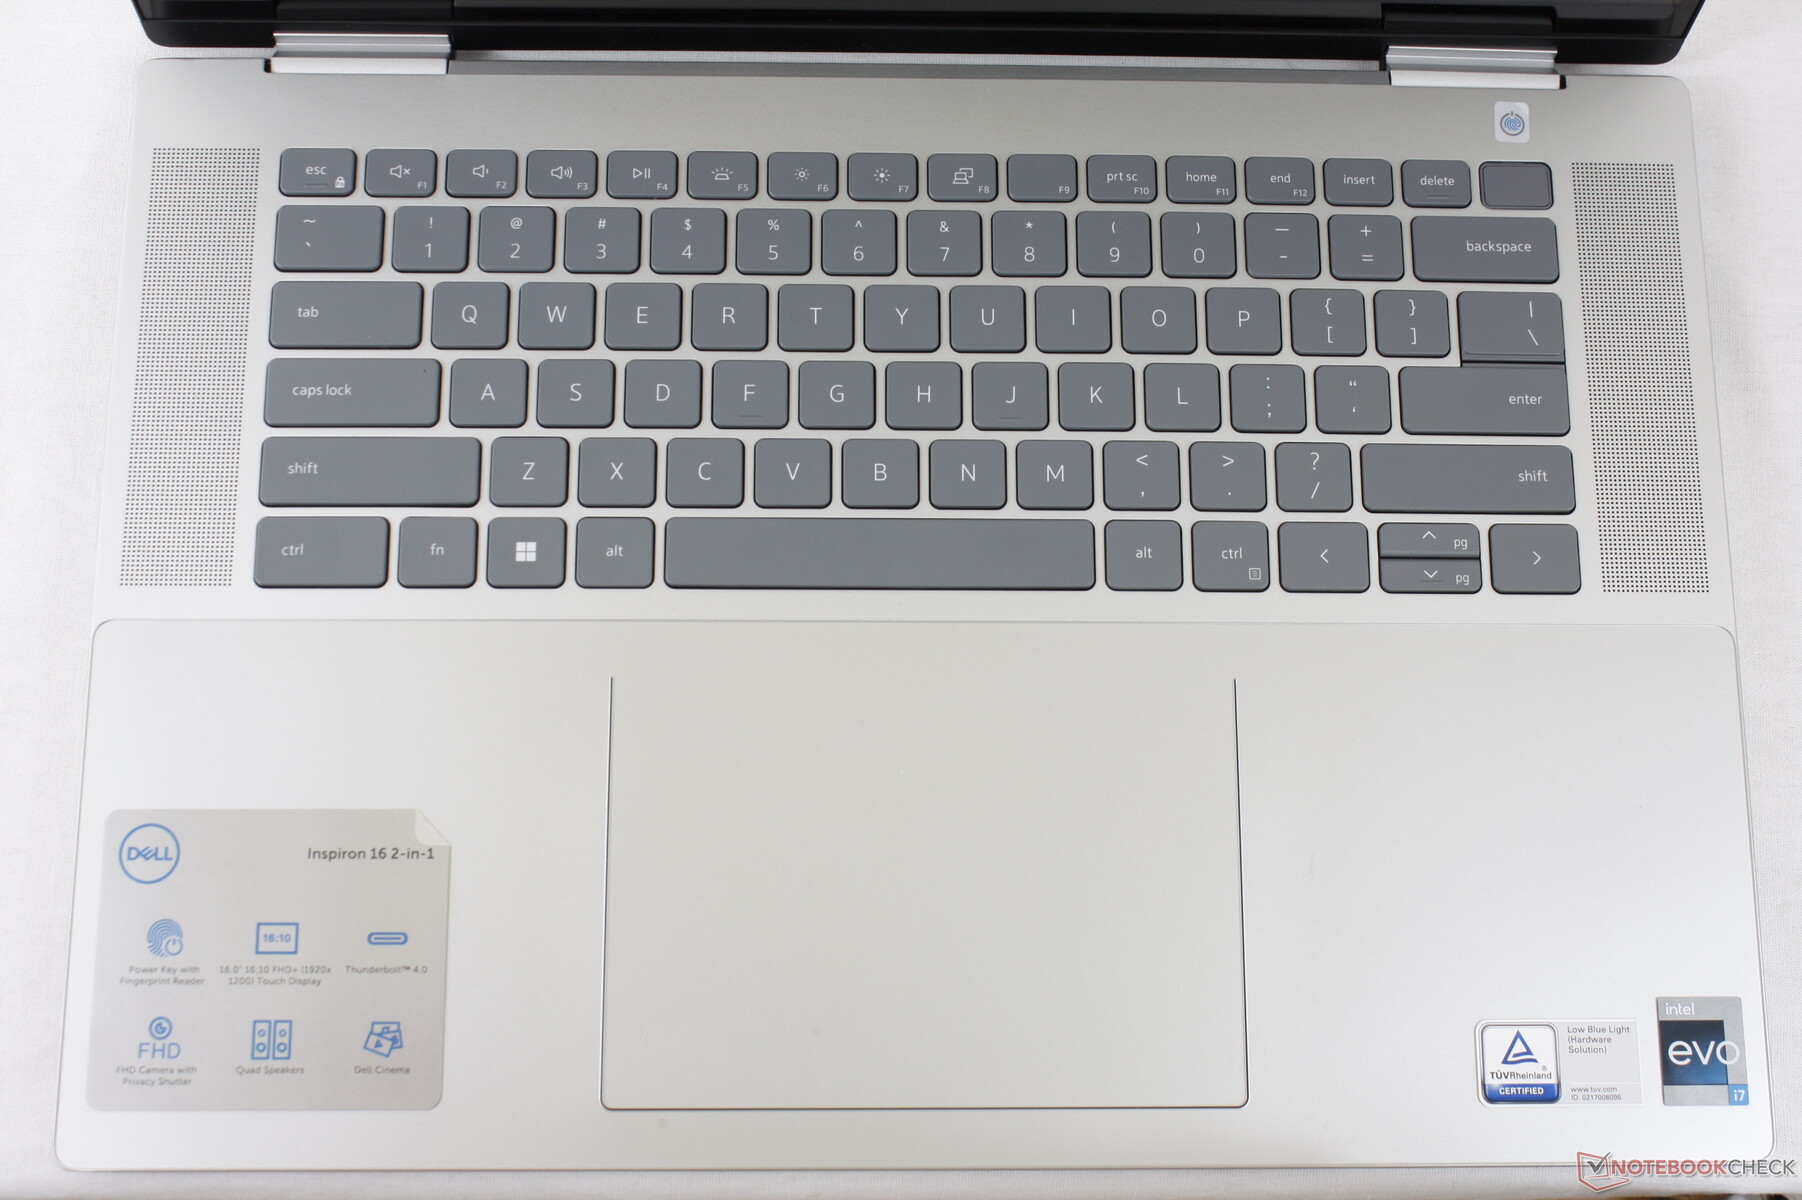
Input Devices — Nothing To Write Home About
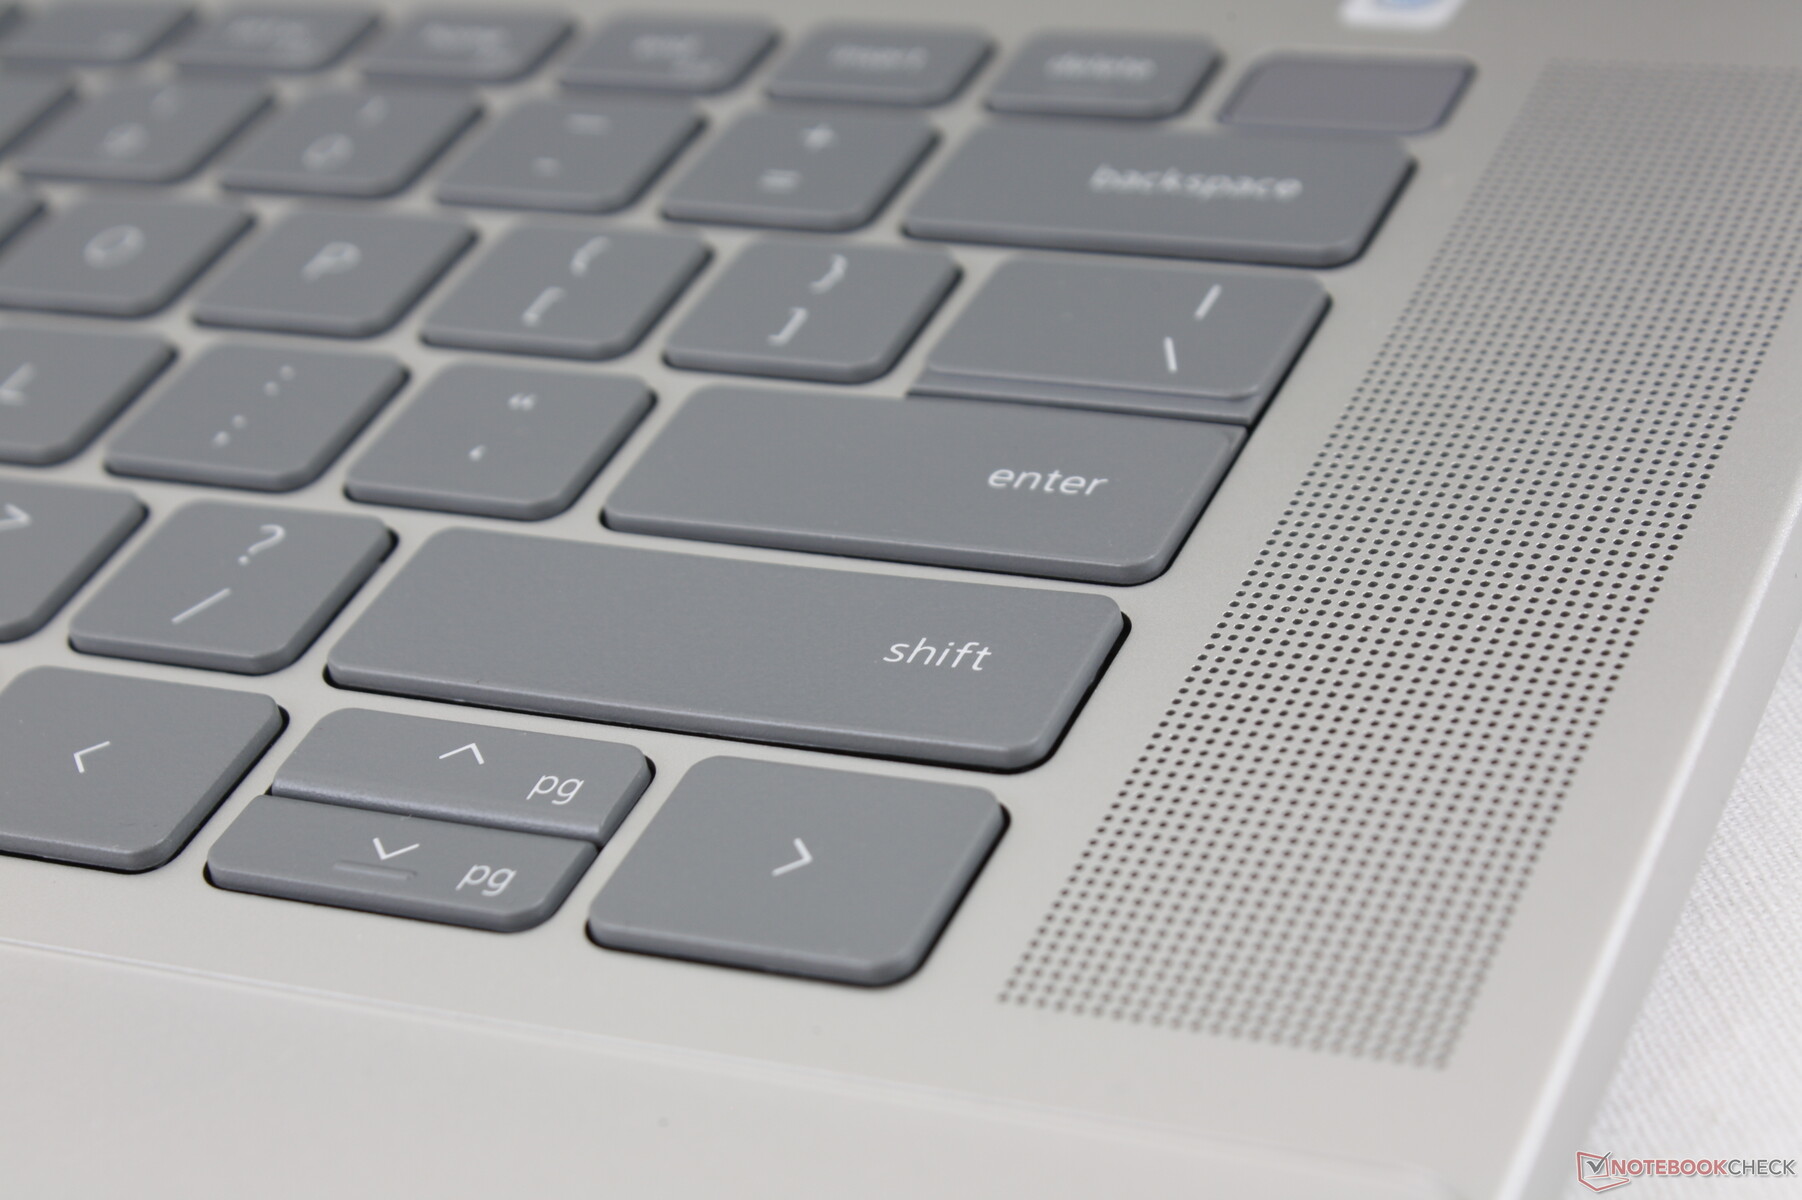
Keyboard
Our comments on the 14-inch Inspiron 14 7420 2-in-1 keyboard apply here on the Inspiron 16 7620 2-in-1 since they both share the same keyboard despite their form factor differences. Though the typing experience is average and nothing to write home about, we do find the keys to be softer and less clicky than the firmer keys on the more expensive LG Gram 16 2-in-1 or HP Spectre x360 series.
When compared to the Inspiron 16 7610 keyboard, Dell has dropped the integrated numpad in favor of speakers for better or worse. There doesn't appear to be any significant improvements made to the feedback of the keys year-over-year.
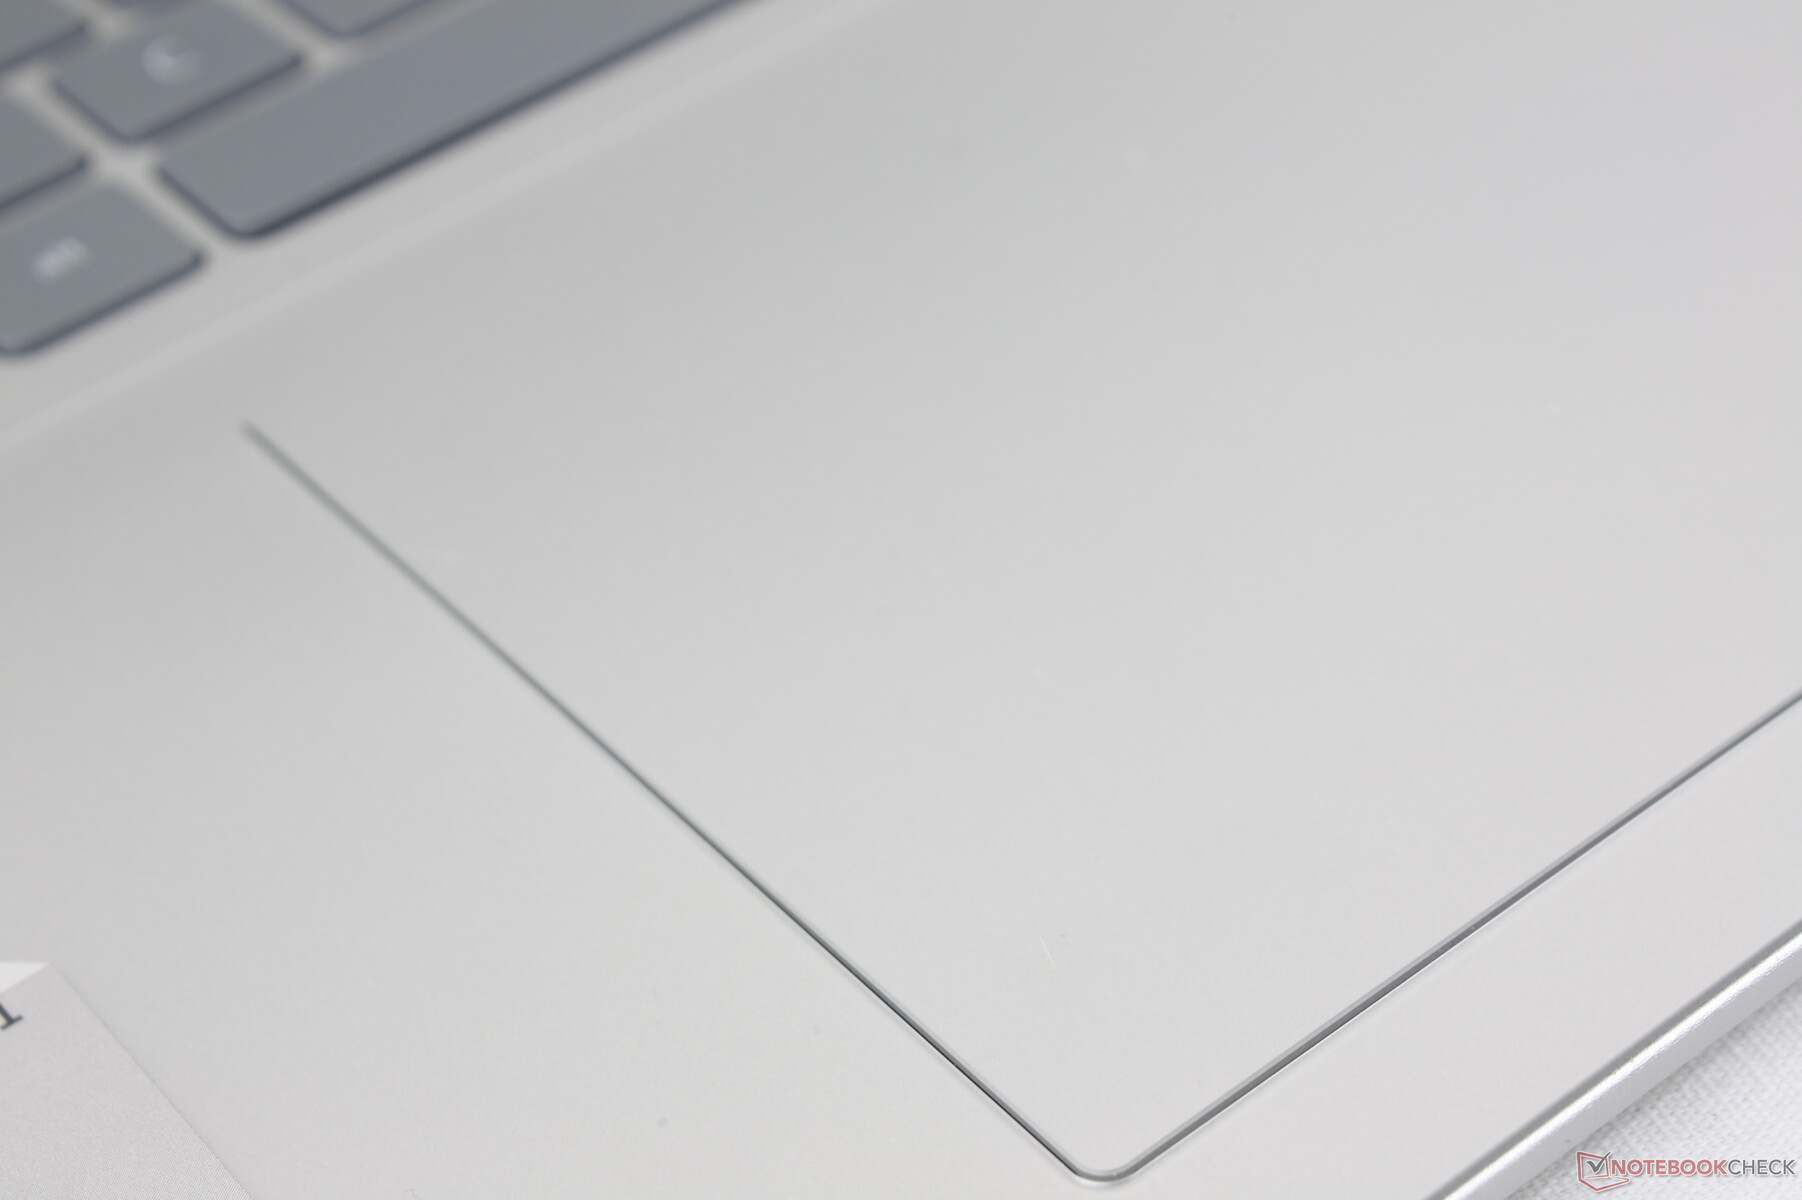
Touchpad
The clickpad is slightly larger than the clickpad on the LG Gram 16 2-in-1 (~13.3 x 9 cm vs. 13.2 x 8.3 cm). Gliding at medium-to-fast speeds is smooth and with less fingerprint buildup than on most other laptops due to the unique mylar layer atop of the aluminum base. Clatter is louder than expected relative to the average feedback and shallow travel when pressed.

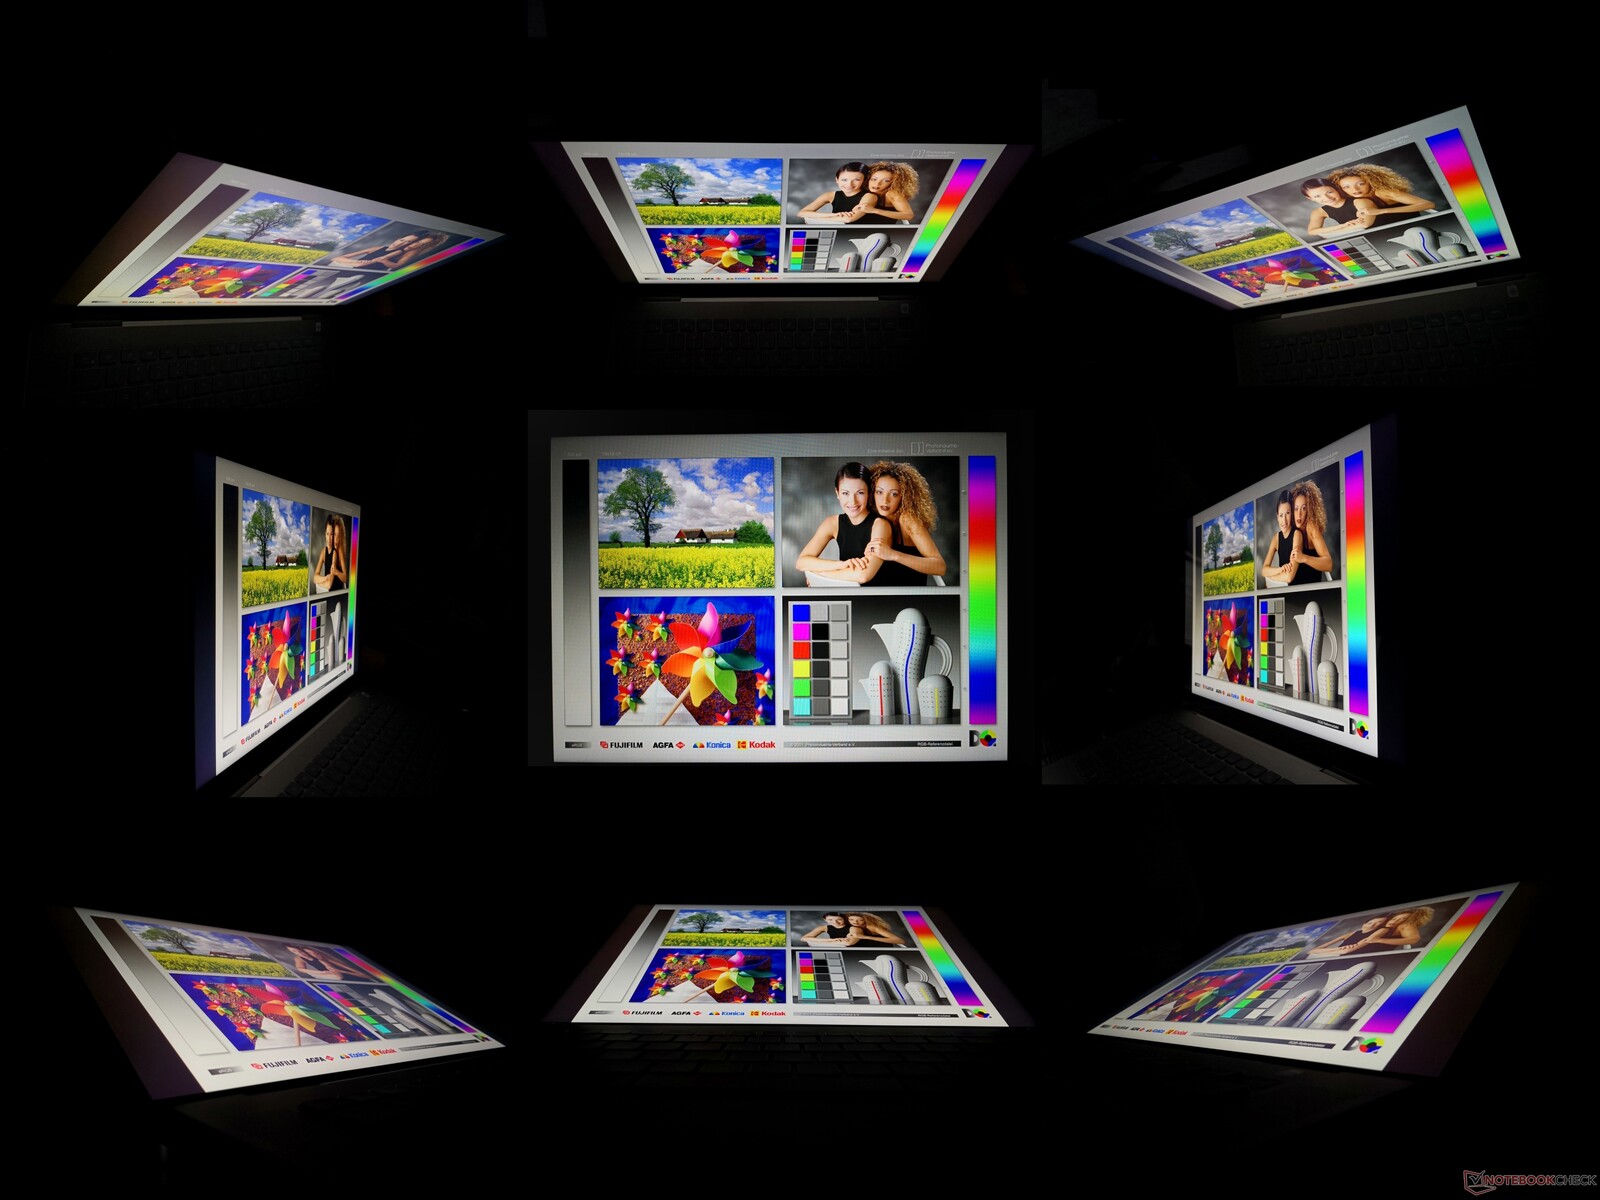
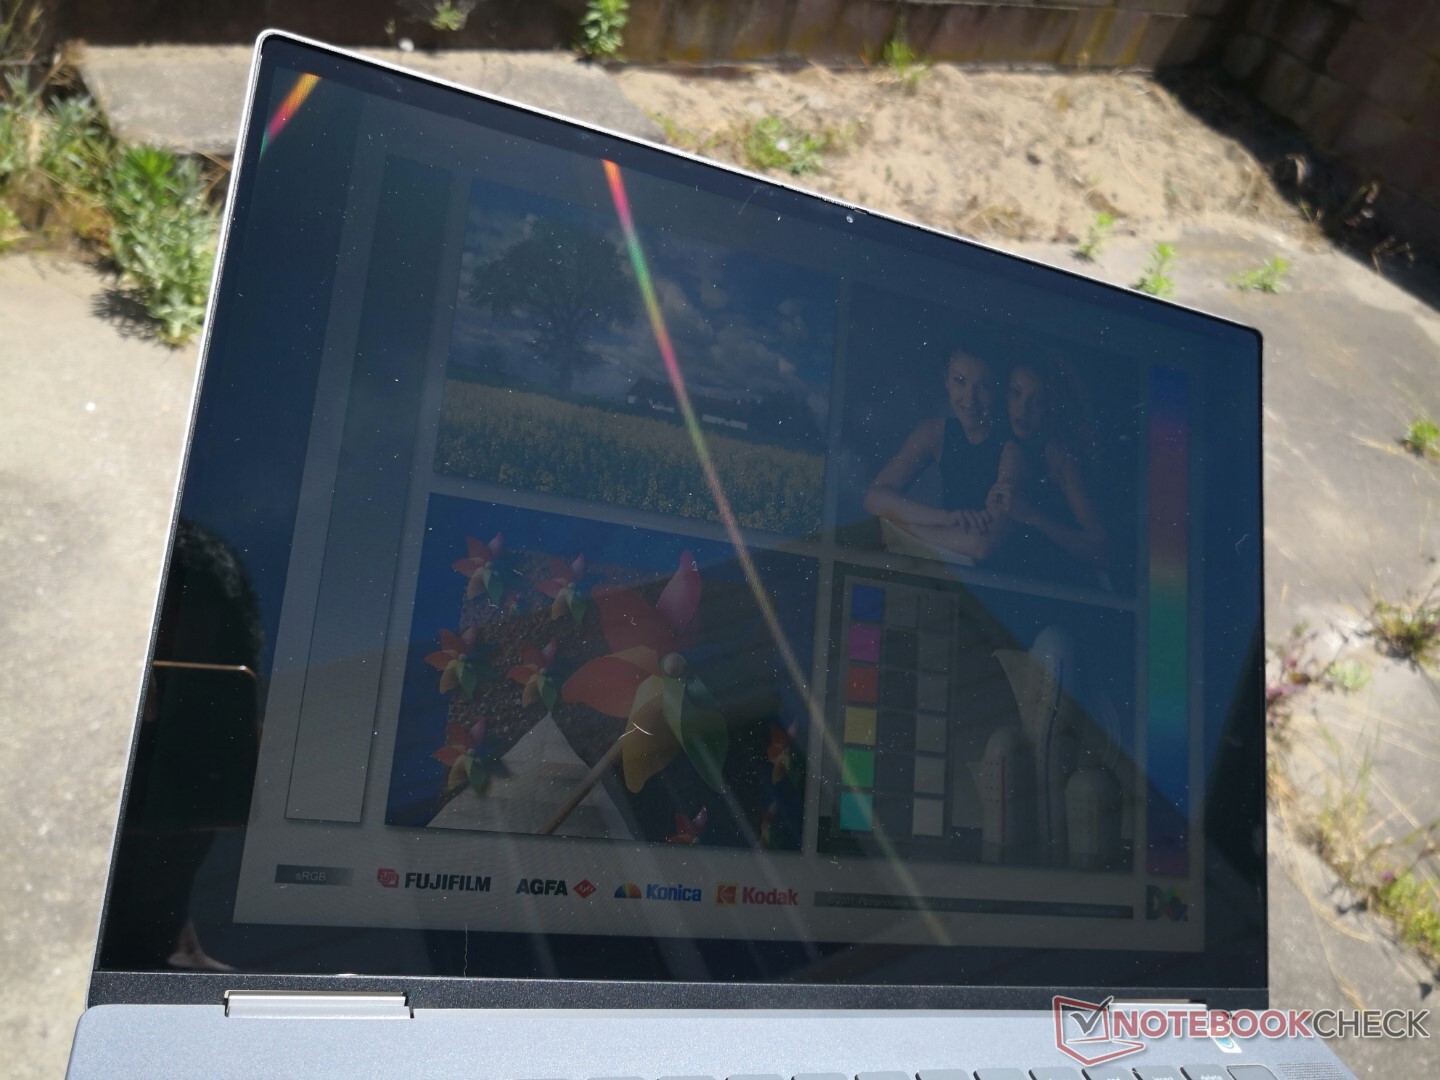
Display — Worthy Of An XPS
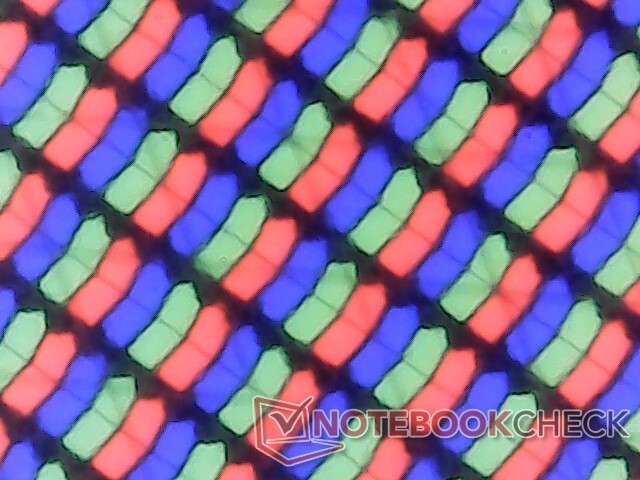
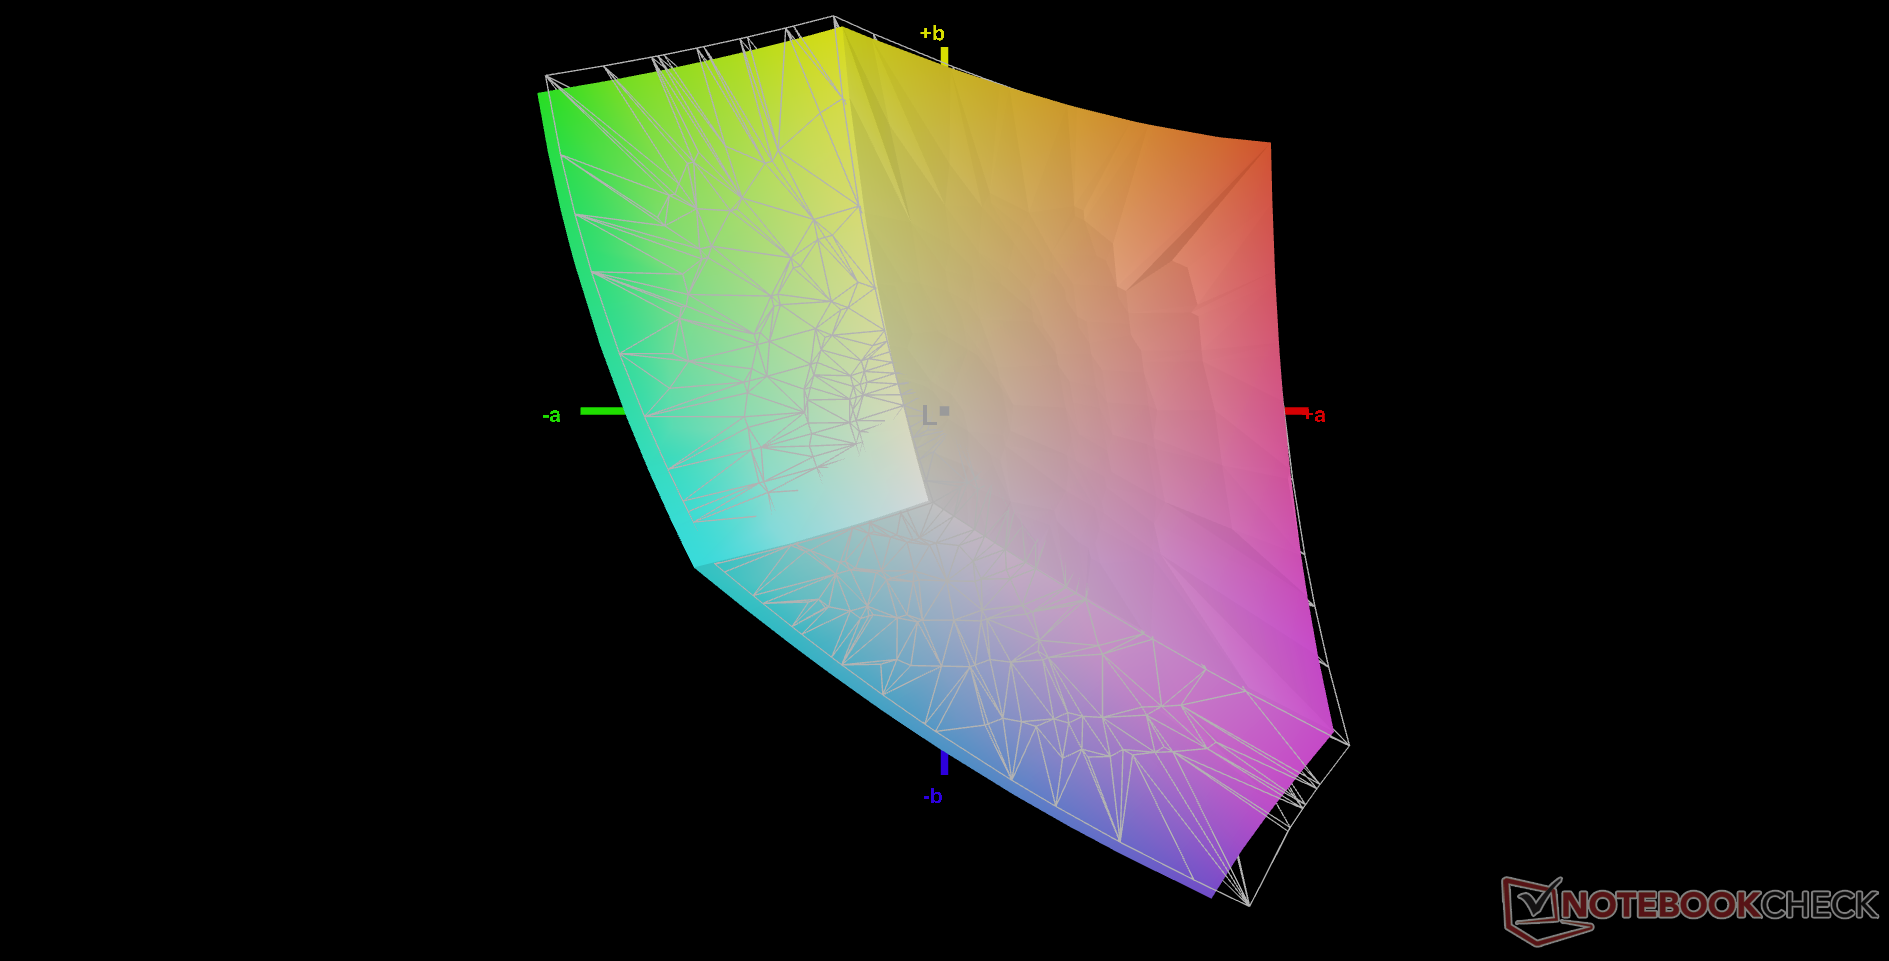
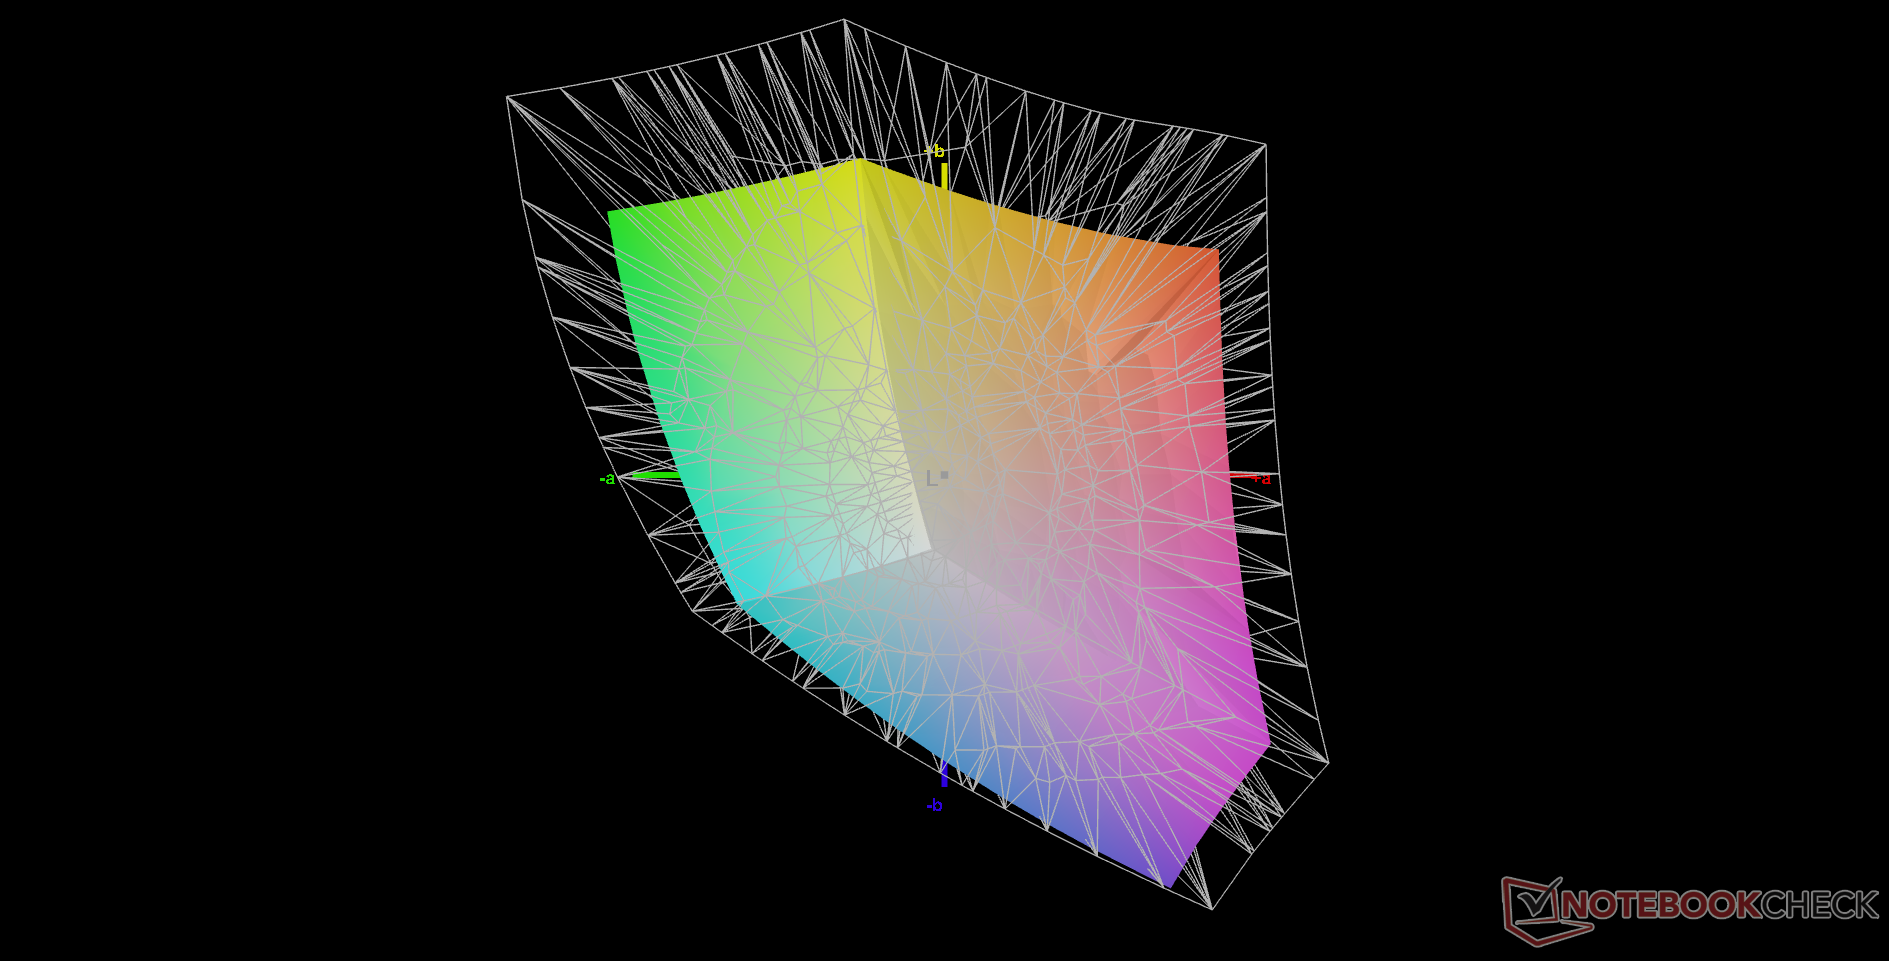
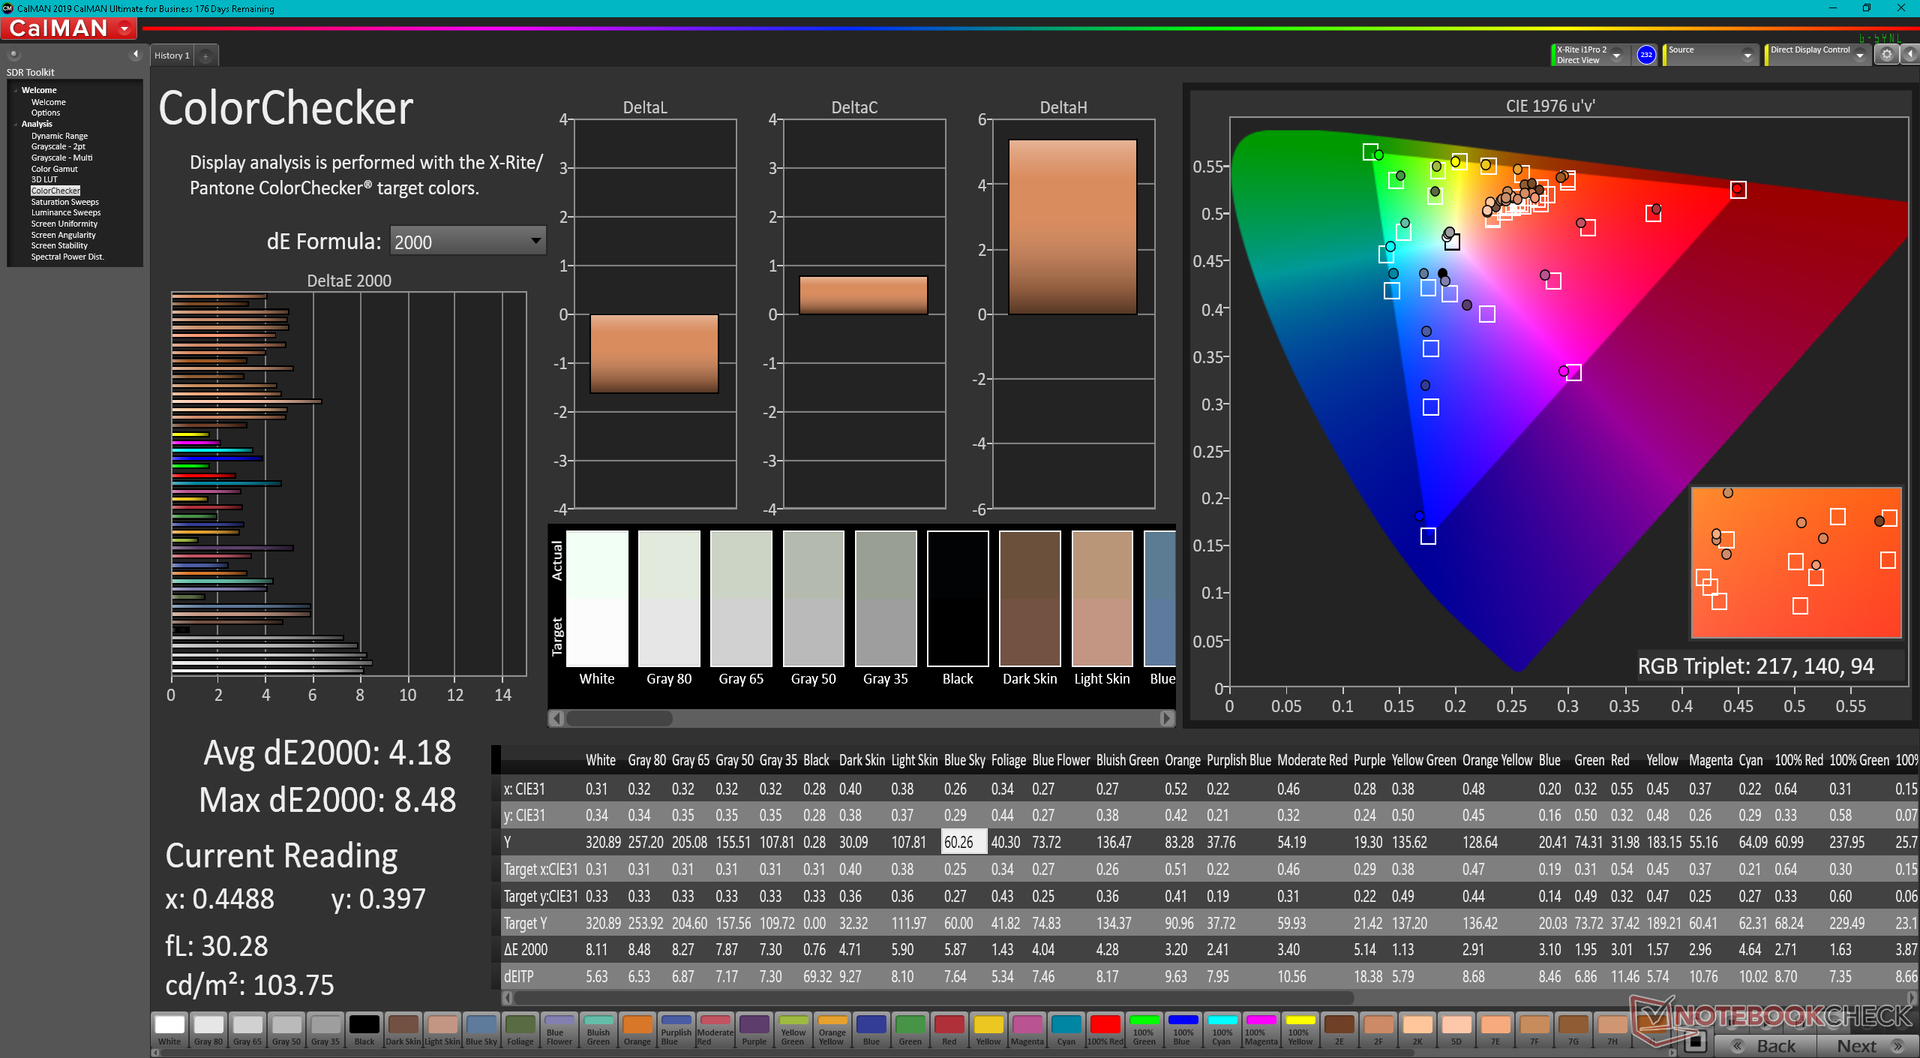
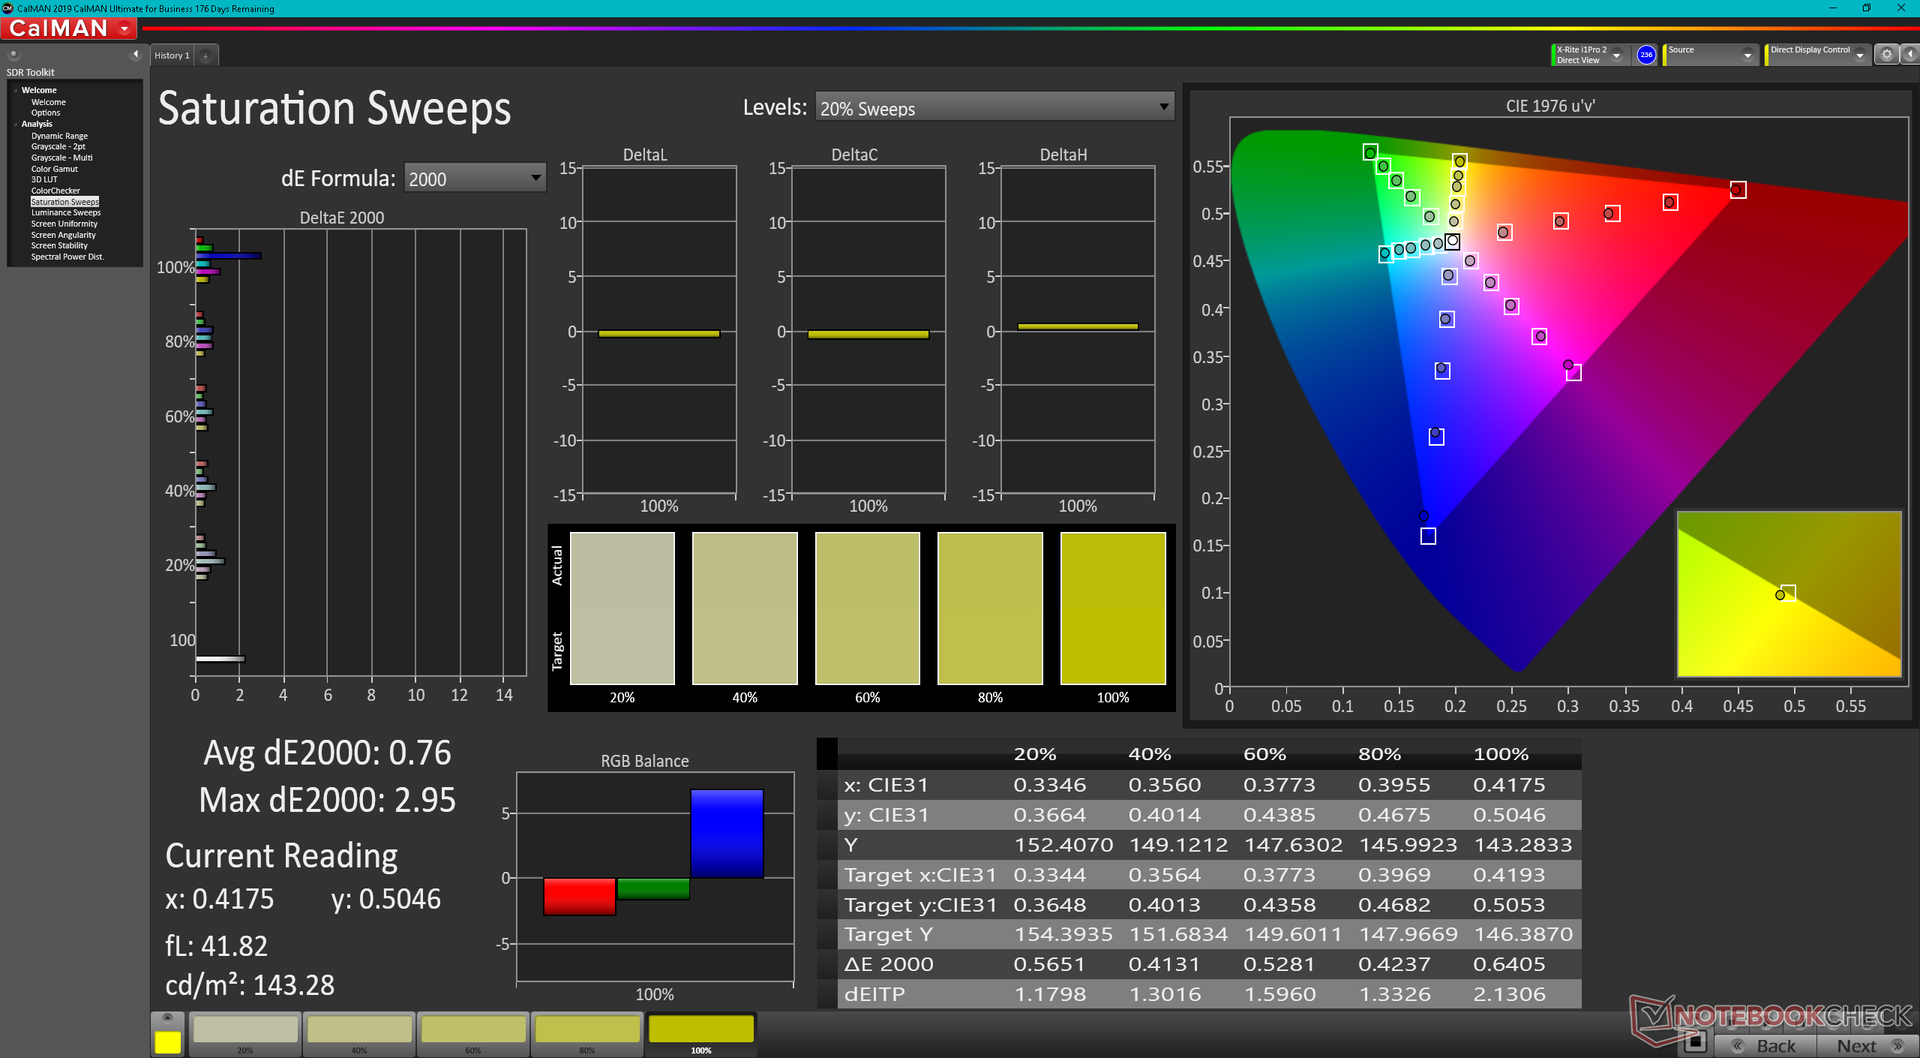
The BOE NV16N45 IPS panel on our Inspiron 16 7620 2-in-1 is the first to appear in our database. Last year's Inspiron 16 Plus 7610, for example, would ship with an IPS panel from AU Optronics instead. When compared to the older AUO panel, the BOE panel offers similar color reproduction but with faster response times for reduced ghosting. Contrast ratio is unfortunately not as deep this time at just under 1000:1. Nonetheless, we're still happy to see that full sRGB coverage comes standard on the Inspiron 16 which is more than what we can say for the Inspiron 15 series. Display quality is therefore comparable to the IPS panels on many higher-end convertibles like the Spectre X360 15 or Zenbook Flip 15.
| |||||||||||||||||||||||||
Brightness Distribution: 90 %
Center on Battery: 320.7 cd/m²
Contrast: 891:1 (Black: 0.36 cd/m²)
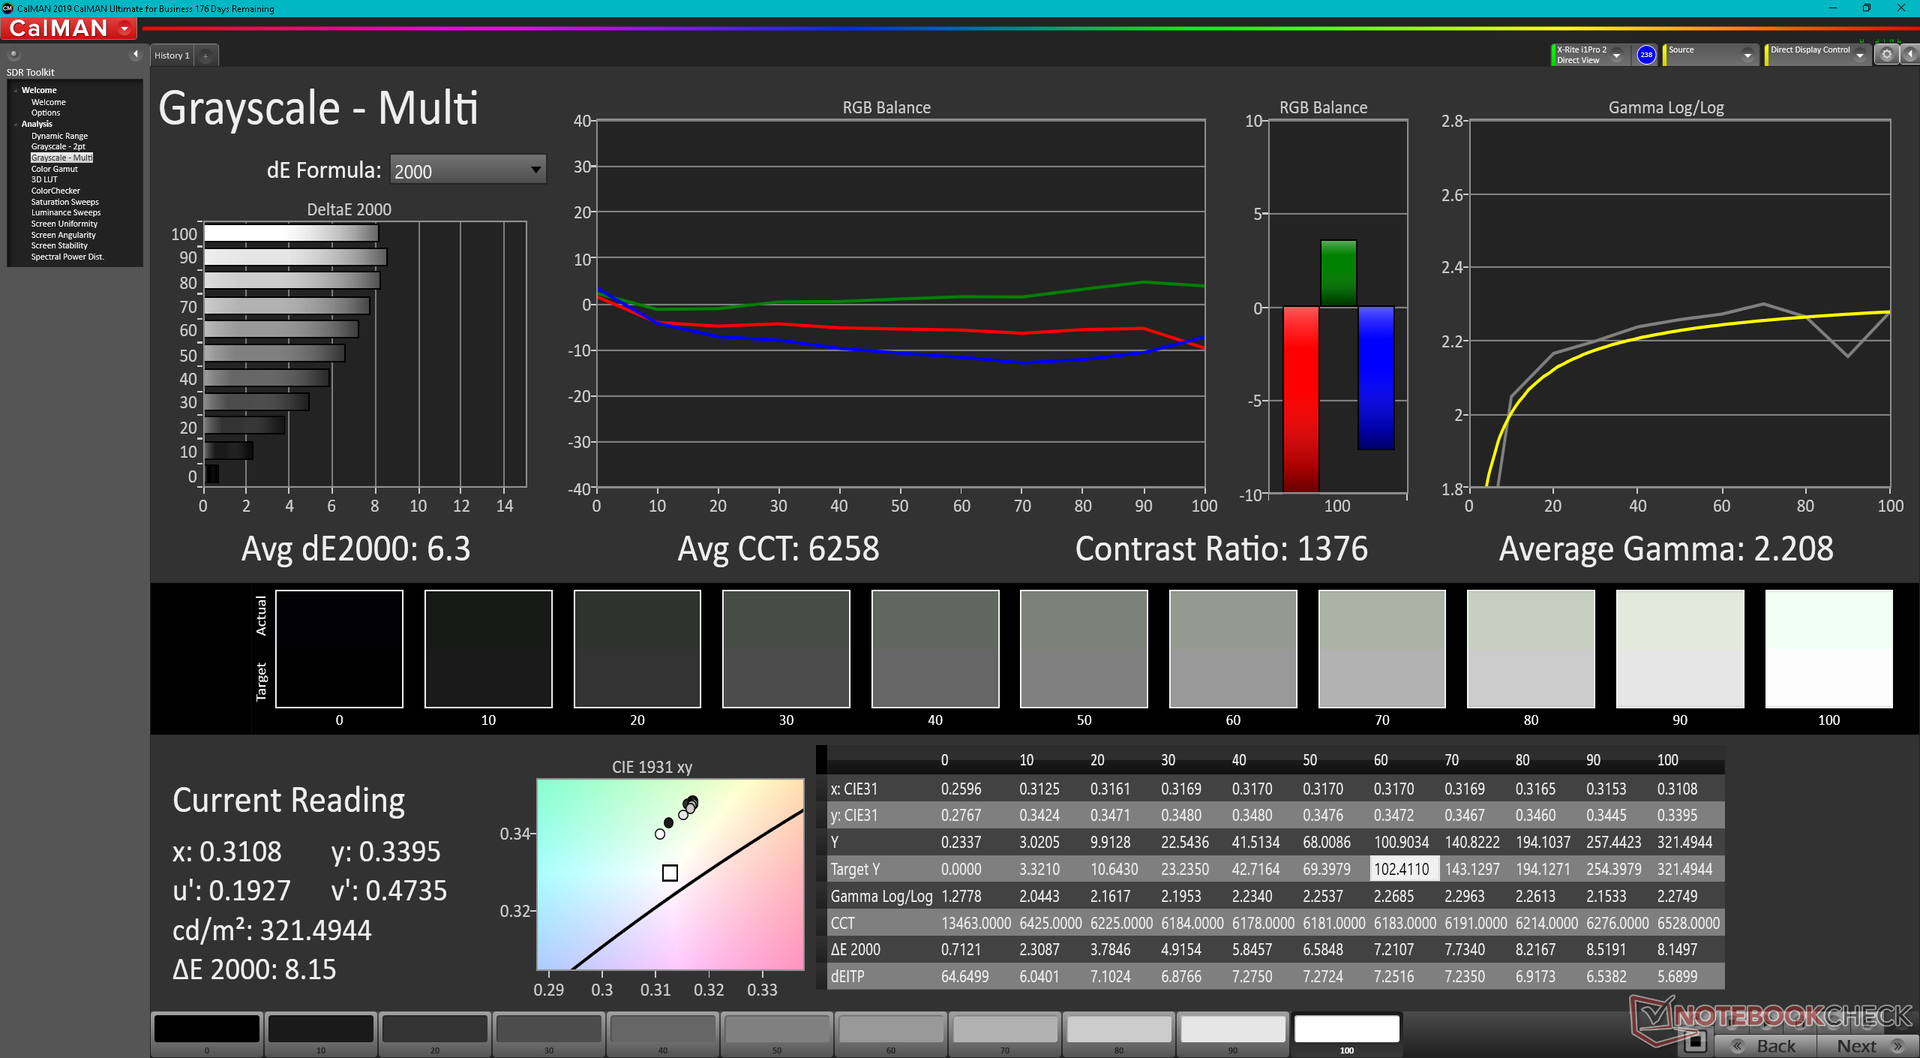
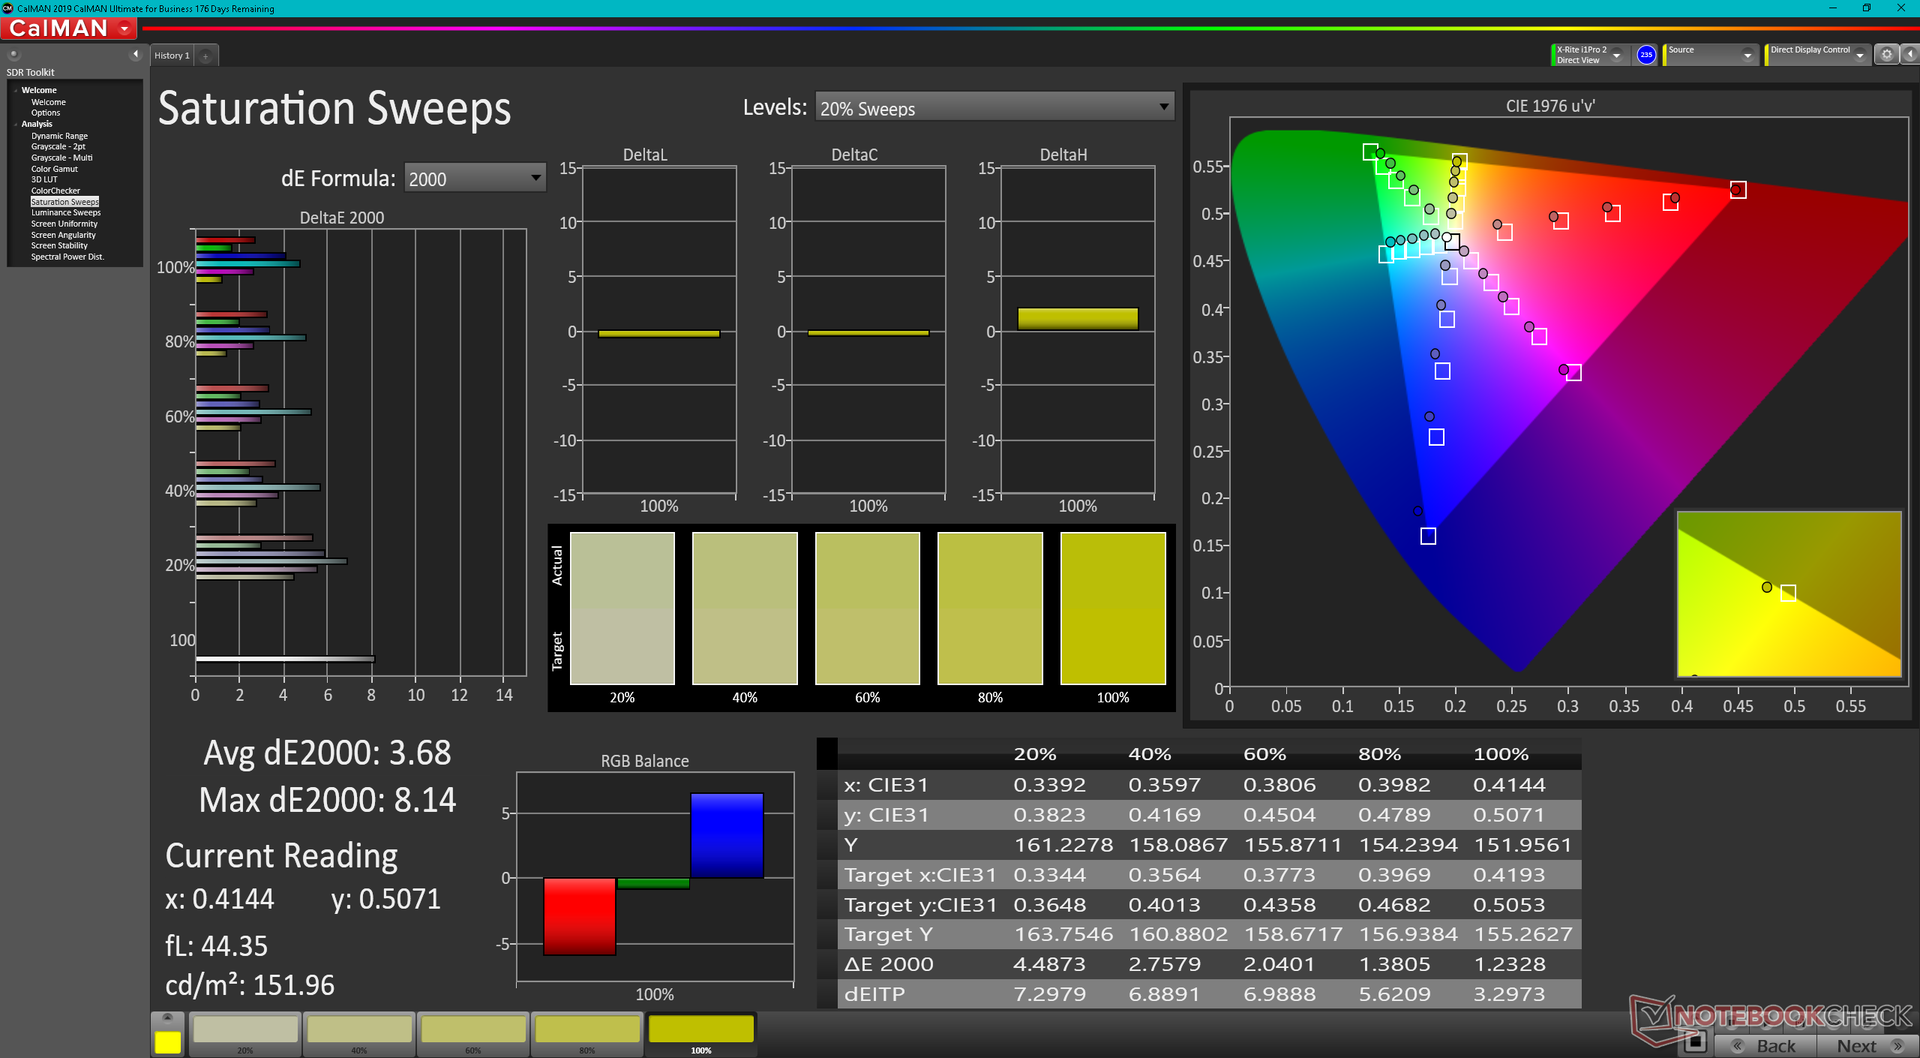
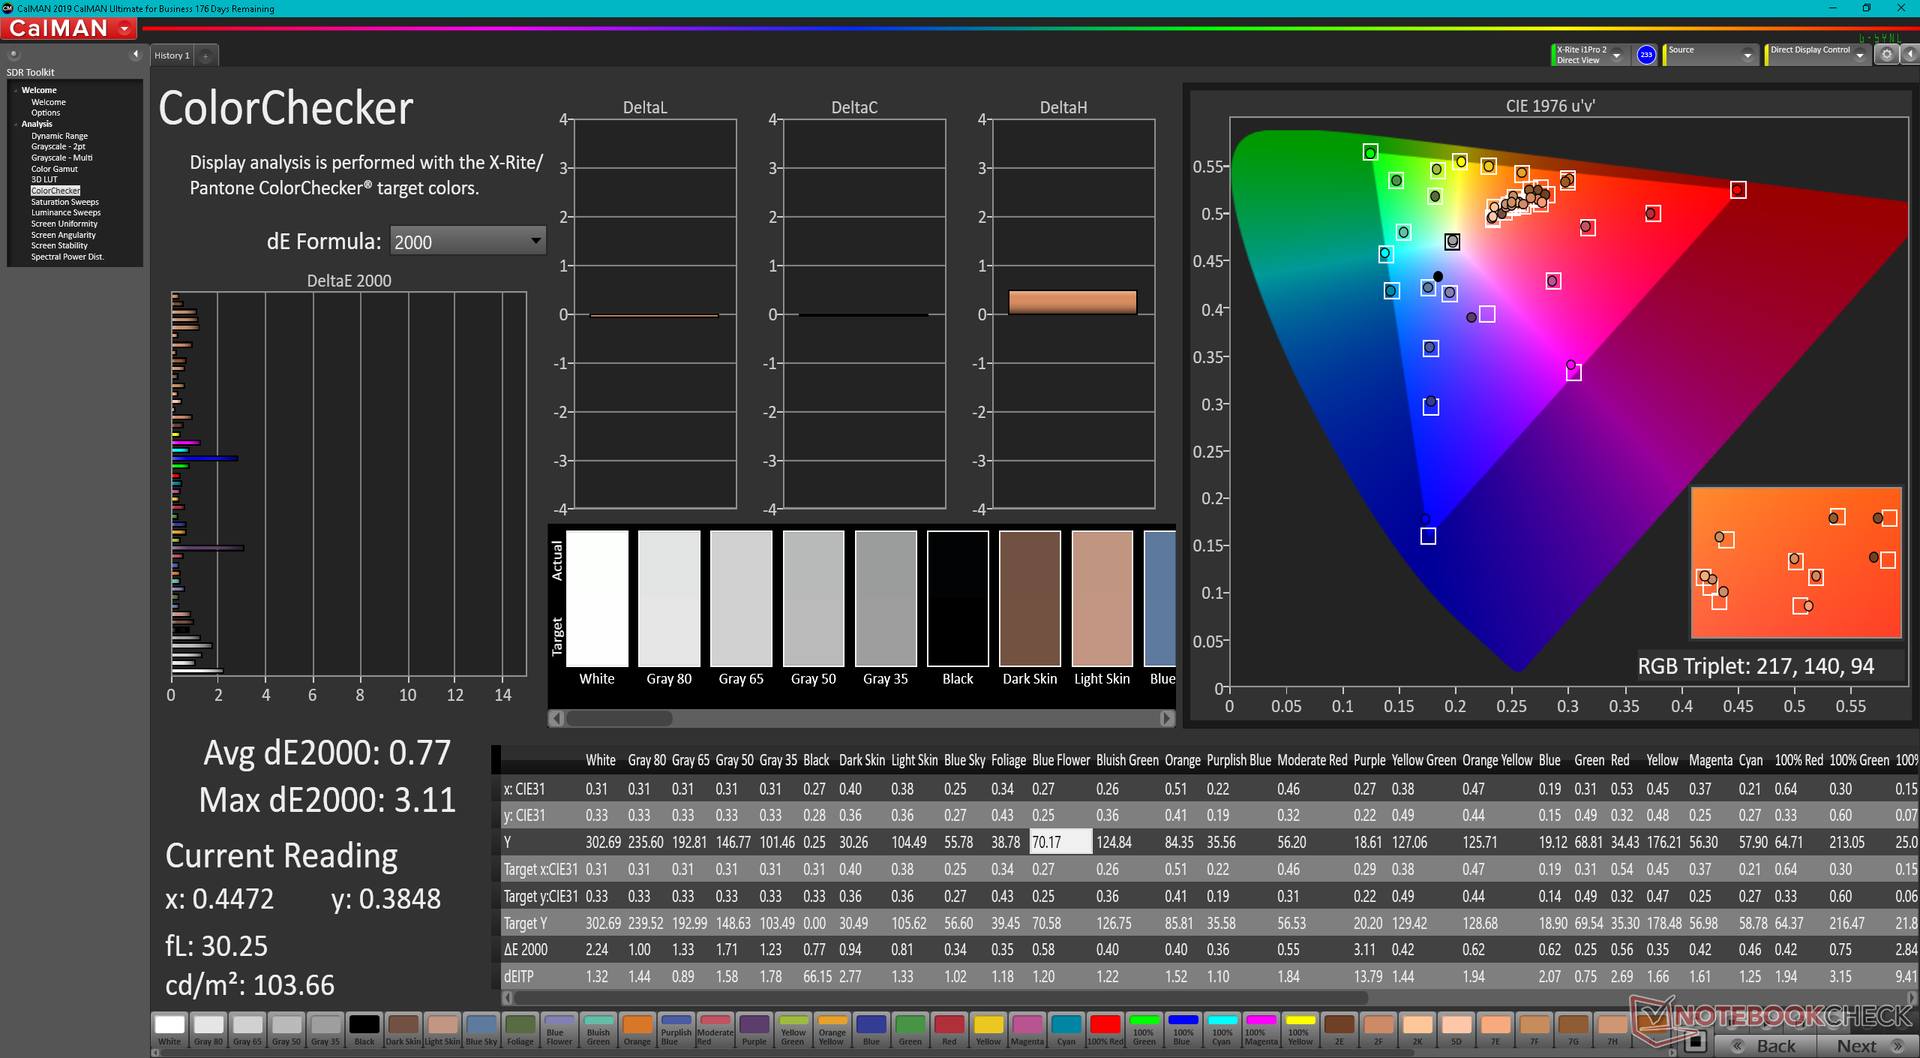
ΔE ColorChecker Calman: 4.18 | ∀{0.5-29.43 Ø4.73}
calibrated: 0.77
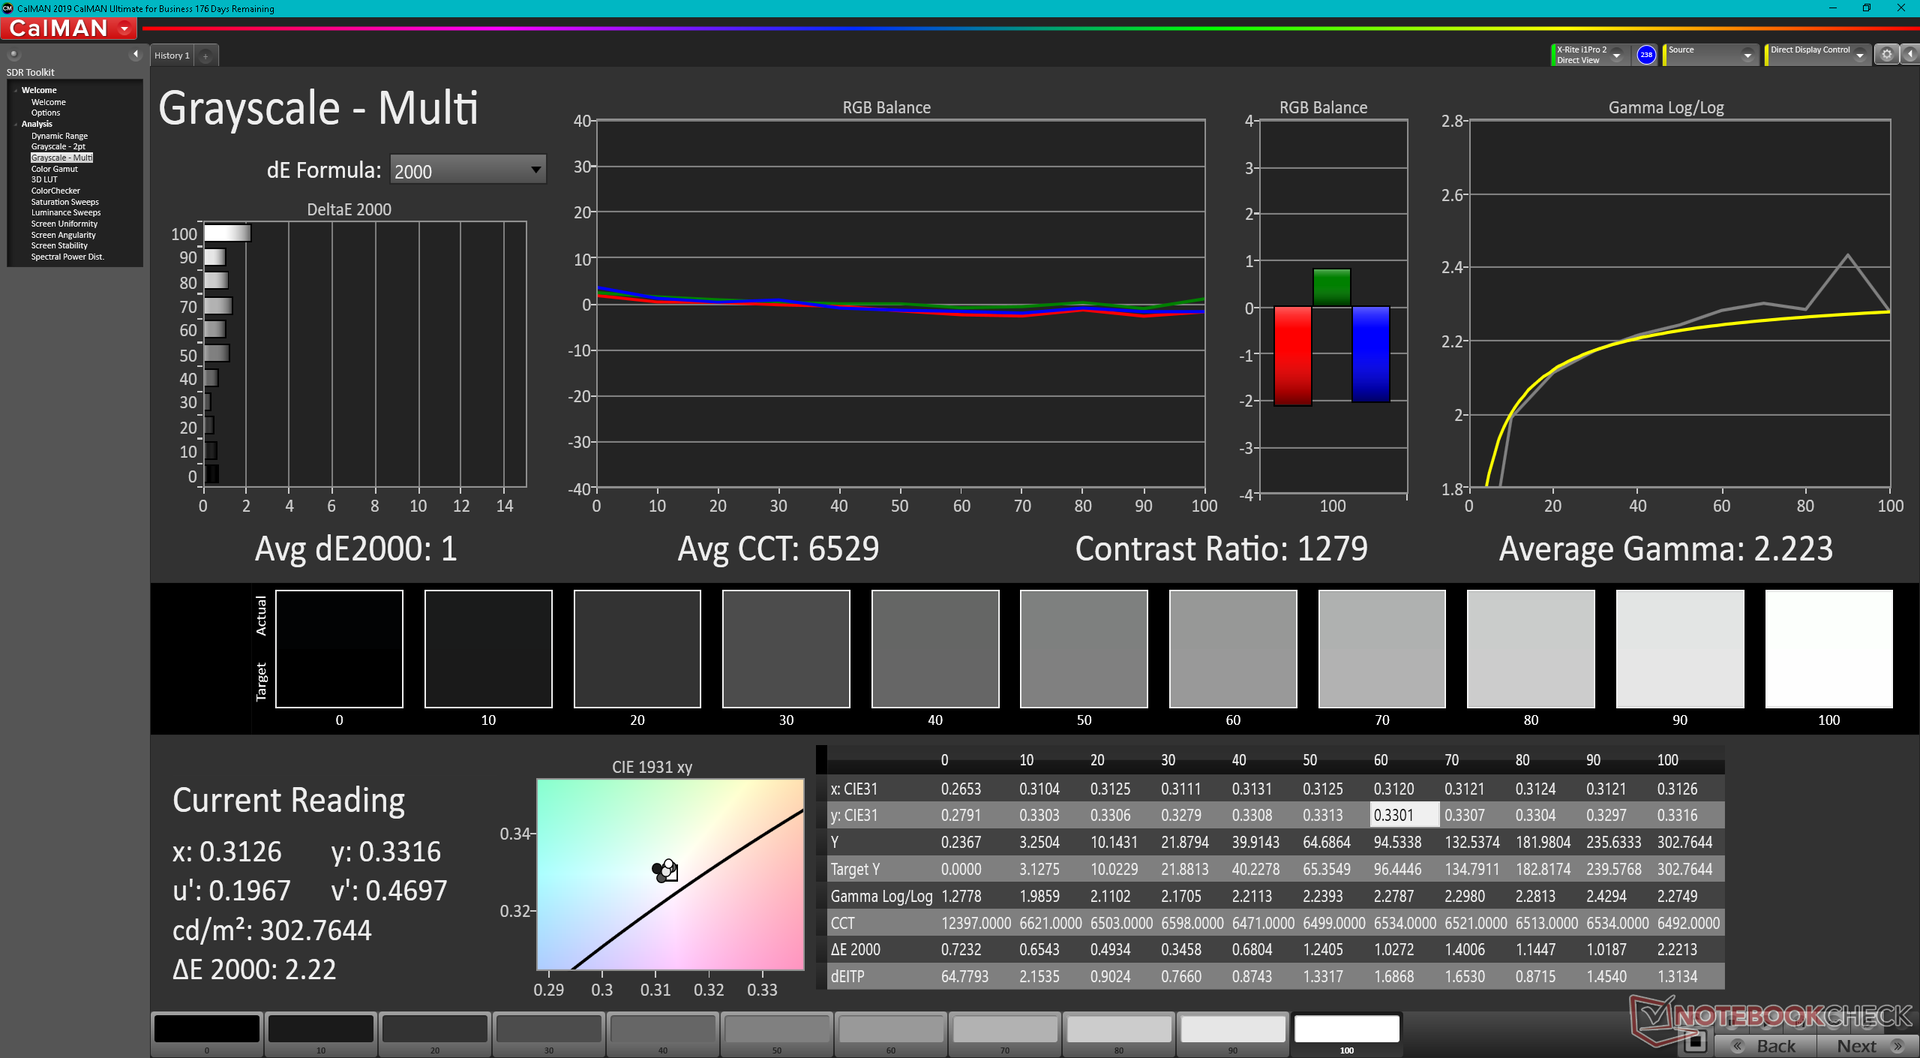
ΔE Greyscale Calman: 6.3 | ∀{0.09-98 Ø4.97}
69.3% AdobeRGB 1998 (Argyll 3D)
95.9% sRGB (Argyll 3D)
67% Display P3 (Argyll 3D)
Gamma: 2.21
CCT: 6258 K
| Dell Inspiron 16 7620 2-in-1 BOE NV16N45, IPS, 1920x1200, 16" | LG Gram 16 2-in-1 16T90P LG Philips LP160WQ1-SPA1, IPS, 2560x1600, 16" | Samsung Galaxy Book Pro 360 15 NP950QDB-KC3DE SDC4159, OLED, 1920x1080, 15.6" | Asus ZenBook Flip 15 UX563FD-A1027T BOE HF NE156QUM-N64, IPS, 3840x2160, 15.6" | Dell Inspiron 15 5579-9672 AUO, B156HW01, IPS, 1920x1080, 15.6" | HP Spectre X360 15-5ZV31AV AU Optronics AUO30EB, IPS, 3840x2160, 15.6" | |
|---|---|---|---|---|---|---|
| Display | 23% | 31% | -0% | -44% | -0% | |
| Display P3 Coverage (%) | 67 | 96.3 44% | 99.9 49% | 66.2 -1% | 37 -45% | 68.3 2% |
| sRGB Coverage (%) | 95.9 | 99.9 4% | 100 4% | 97.2 1% | 55.6 -42% | 94.3 -2% |
| AdobeRGB 1998 Coverage (%) | 69.3 | 84.7 22% | 97.6 41% | 68.3 -1% | 38.23 -45% | 68.4 -1% |
| Response Times | -22% | 92% | -78% | -34% | -87% | |
| Response Time Grey 50% / Grey 80% * (ms) | 32 ? | 36.4 ? -14% | 2 ? 94% | 60 ? -88% | 41 ? -28% | 56.8 ? -78% |
| Response Time Black / White * (ms) | 20.8 ? | 26.8 ? -29% | 2 ? 90% | 35 ? -68% | 29 ? -39% | 40.8 ? -96% |
| PWM Frequency (Hz) | 60 | |||||
| Screen | -36% | 64% | 31% | 5% | -17% | |
| Brightness middle (cd/m²) | 320.7 | 325.3 1% | 290 -10% | 351 9% | 251 -22% | 284.6 -11% |
| Brightness (cd/m²) | 309 | 311 1% | 290 -6% | 335 8% | 240 -22% | 285 -8% |
| Brightness Distribution (%) | 90 | 92 2% | 99 10% | 87 -3% | 84 -7% | 85 -6% |
| Black Level * (cd/m²) | 0.36 | 0.35 3% | 0.05 86% | 0.31 14% | 0.2 44% | 0.25 31% |
| Contrast (:1) | 891 | 929 4% | 5800 551% | 1132 27% | 1255 41% | 1138 28% |
| Colorchecker dE 2000 * | 4.18 | 4.91 -17% | 1.84 56% | 1.74 58% | 5.25 -26% | 3.52 16% |
| Colorchecker dE 2000 max. * | 8.48 | 10.96 -29% | 3.83 55% | 2.76 67% | 10.04 -18% | 5.56 34% |
| Colorchecker dE 2000 calibrated * | 0.77 | 2.83 -268% | 2.69 -249% | 3 -290% | ||
| Greyscale dE 2000 * | 6.3 | 7.7 -22% | 1.24 80% | 2.22 65% | 3.28 48% | 3.2 49% |
| Gamma | 2.21 100% | 2.12 104% | 2.2 100% | 2.35 94% | 2.15 102% | 2.28 96% |
| CCT | 6258 104% | 8272 79% | 6686 97% | 6667 97% | 6502 100% | 7070 92% |
| Color Space (Percent of AdobeRGB 1998) (%) | 75.8 | 62 | 35 | 61.1 | ||
| Color Space (Percent of sRGB) (%) | 99.8 | 97 | 55 | 93.8 | ||
| Total Average (Program / Settings) | -12% /
-21% | 62% /
61% | -16% /
7% | -24% /
-12% | -35% /
-24% |
* ... smaller is better
Color space covers over 95 percent of sRGB to be fit for most amateur graphics editing tasks. The more expensive OLED option can offer DCI-P3 coverage for even deeper colors if desired.
The display is not calibrated out of the box which is to be expected from the relatively inexpensive Inspiron series. Color temperature, for example, is warmer than it needs to be. Once calibrated, average grayscale and color DeltaE values would improve significantly from 6.3 to 1.0 and 4.18 to 0.77, respectively. It's recommend to apply our calibrated ICM profile above or to calibrate the display on your own to better exploit the excellent sRGB coverage of the panel.
Display Response Times
| ↔ Response Time Black to White | ||
|---|---|---|
| 20.8 ms ... rise ↗ and fall ↘ combined | ↗ 11.6 ms rise | 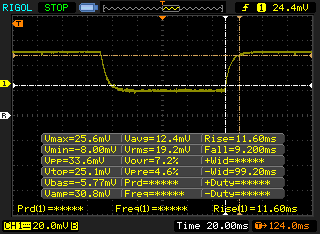 |
| ↘ 9.2 ms fall | ||
| The screen shows good response rates in our tests, but may be too slow for competitive gamers. In comparison, all tested devices range from 0.1 (minimum) to 240 (maximum) ms. » 46 % of all devices are better. This means that the measured response time is similar to the average of all tested devices (19.9 ms). | ||
| ↔ Response Time 50% Grey to 80% Grey | ||
| 32 ms ... rise ↗ and fall ↘ combined | ↗ 16 ms rise | 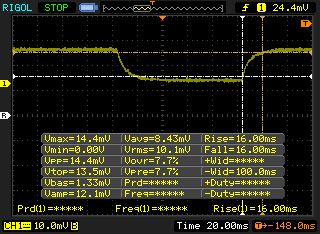 |
| ↘ 16 ms fall | ||
| The screen shows slow response rates in our tests and will be unsatisfactory for gamers. In comparison, all tested devices range from 0.165 (minimum) to 636 (maximum) ms. » 43 % of all devices are better. This means that the measured response time is similar to the average of all tested devices (31.1 ms). | ||
Screen Flickering / PWM (Pulse-Width Modulation)
| Screen flickering / PWM not detected | 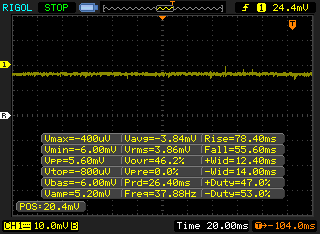 | ||
In comparison: 52 % of all tested devices do not use PWM to dim the display. If PWM was detected, an average of 7798 (minimum: 5 - maximum: 343500) Hz was measured. | |||
At around 320 nits maximum, the display is about average in terms or brightness for its size category. Opting for the pricier OLED SKU will up brightness to 400 nits for a better outdoor viewing experience.
Performance — Fast Intel 12th Gen Options
Testing Conditions
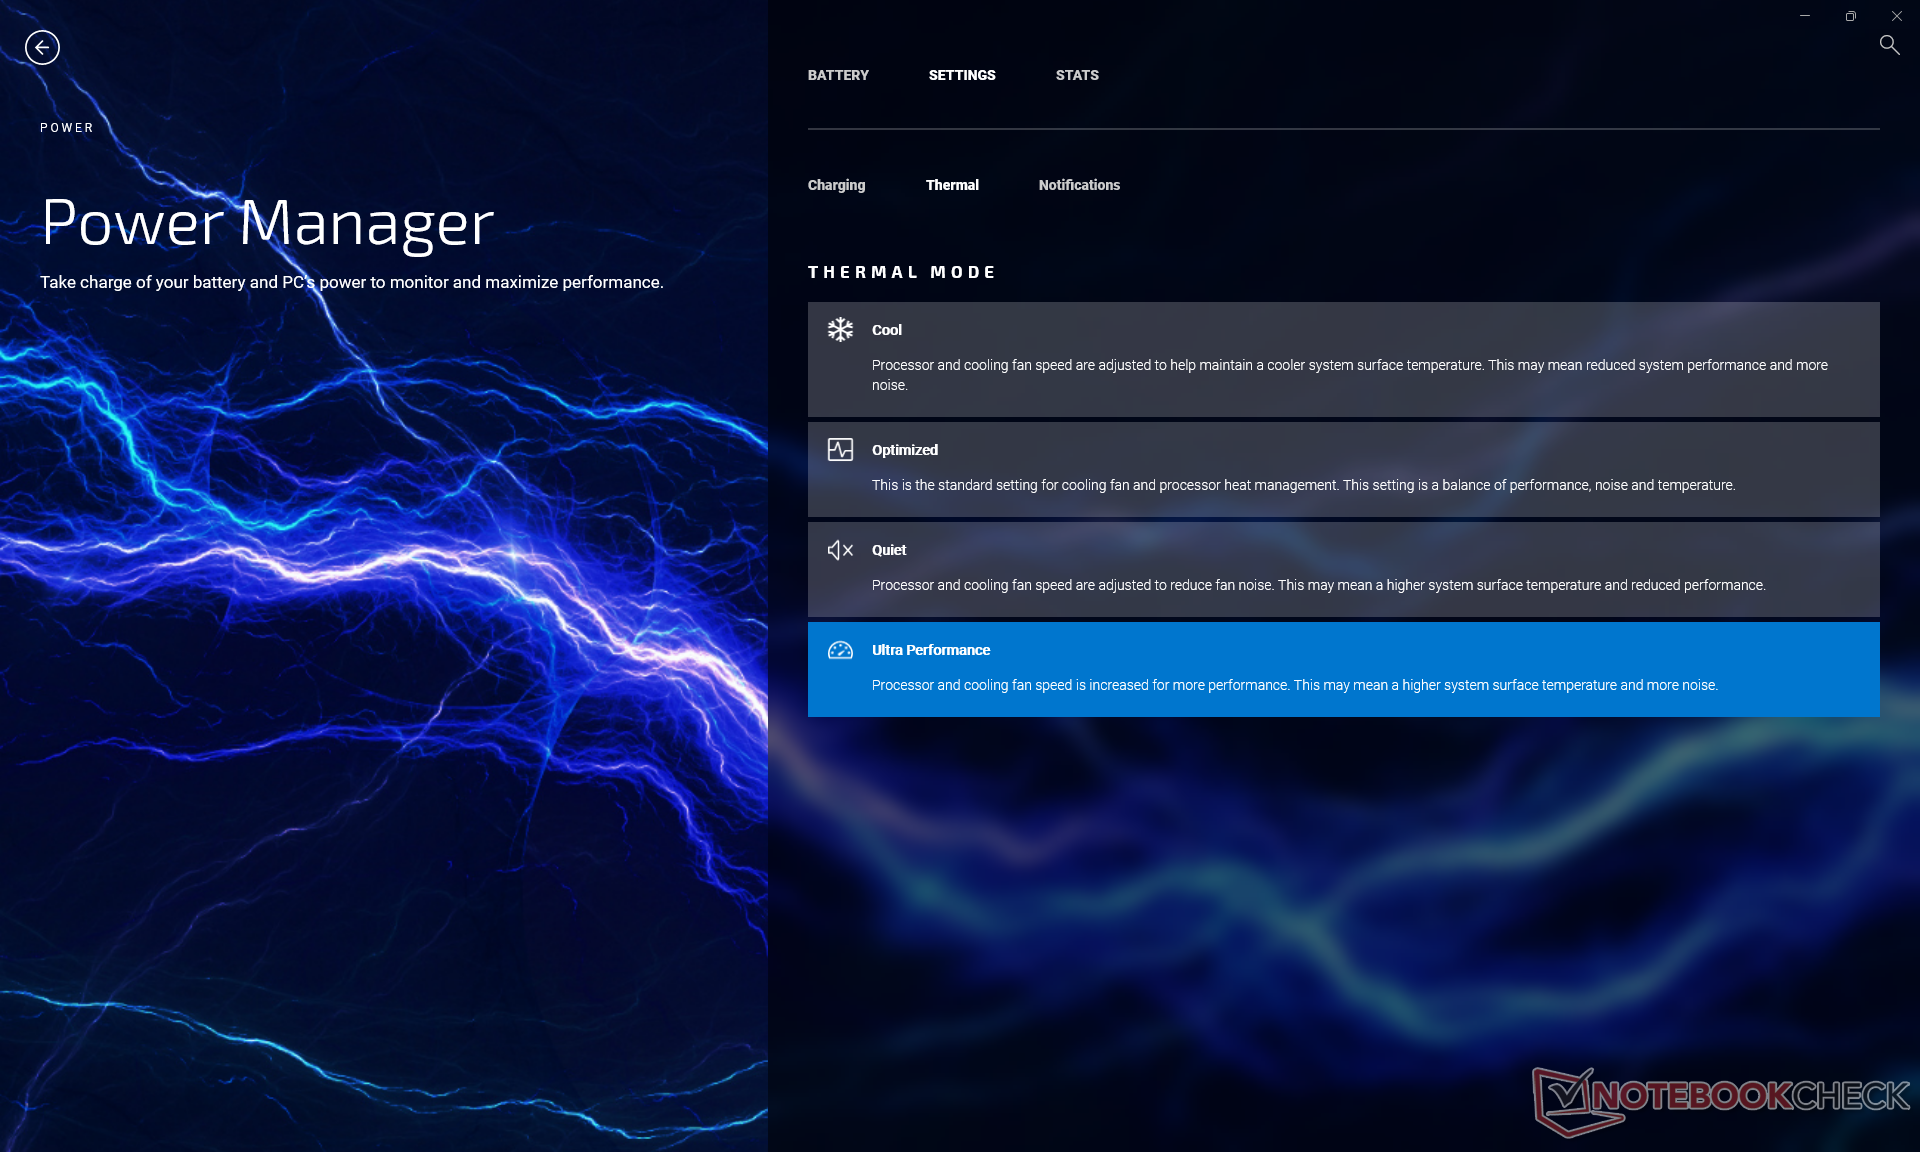
Our unit was set to Performance mode via Windows and Ultra Performance mode via the My Dell software for the highest possible benchmark scores. It's recommended to become familiar with the My Dell software for any warranty, support, battery, and performance details.
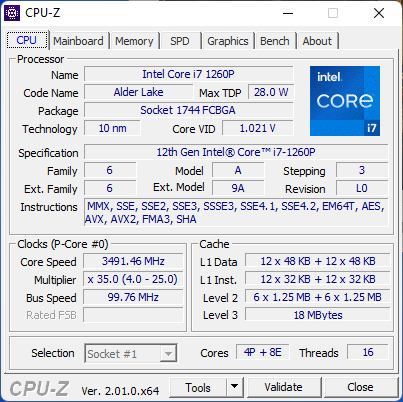
Processor
CPU performance is excellent with multi-thread results that are within striking distance of the H-series Ryzen 6 5600H and with 20 percent faster single-thread performance as well despite the lower power demands of the Intel CPU. When compared to the Core i7-1255U, our Core i7-1260P is able to offer about 25 percent faster multi-thread performance.
The performance gains over the common 11th gen U-series Core i7-1165G7 are significant in terms of multi-threaded workloads where our Core i7-1260P can be up to 50 to 80 percent faster even after accounting for any performance throttling. CPU performance from our Inspiron would drop by about 15 percent when running CineBench R15 xT in a loop.
Cinebench R15 Multi Loop
Cinebench R23: Multi Core | Single Core
Cinebench R15: CPU Multi 64Bit | CPU Single 64Bit
Blender: v2.79 BMW27 CPU
7-Zip 18.03: 7z b 4 | 7z b 4 -mmt1
Geekbench 5.5: Multi-Core | Single-Core
HWBOT x265 Benchmark v2.2: 4k Preset
LibreOffice : 20 Documents To PDF
R Benchmark 2.5: Overall mean
* ... smaller is better
AIDA64: FP32 Ray-Trace | FPU Julia | CPU SHA3 | CPU Queen | FPU SinJulia | FPU Mandel | CPU AES | CPU ZLib | FP64 Ray-Trace | CPU PhotoWorxx
| Performance rating | |
| Average Intel Core i7-1260P | |
| Samsung Galaxy Book Pro 360 15 NP950QDB-KC3DE | |
| LG Gram 16 2-in-1 16T90P | |
| Dell Inspiron 16 7620 2-in-1 | |
| AIDA64 / FP32 Ray-Trace | |
| Samsung Galaxy Book Pro 360 15 NP950QDB-KC3DE | |
| Average Intel Core i7-1260P (2176 - 10898, n=26) | |
| LG Gram 16 2-in-1 16T90P | |
| Dell Inspiron 16 7620 2-in-1 | |
| AIDA64 / FPU Julia | |
| Average Intel Core i7-1260P (11015 - 56906, n=26) | |
| Samsung Galaxy Book Pro 360 15 NP950QDB-KC3DE | |
| LG Gram 16 2-in-1 16T90P | |
| Dell Inspiron 16 7620 2-in-1 | |
| AIDA64 / CPU SHA3 | |
| Samsung Galaxy Book Pro 360 15 NP950QDB-KC3DE | |
| LG Gram 16 2-in-1 16T90P | |
| Average Intel Core i7-1260P (669 - 2709, n=26) | |
| Dell Inspiron 16 7620 2-in-1 | |
| AIDA64 / CPU Queen | |
| Dell Inspiron 16 7620 2-in-1 | |
| Average Intel Core i7-1260P (42571 - 82493, n=26) | |
| LG Gram 16 2-in-1 16T90P | |
| Samsung Galaxy Book Pro 360 15 NP950QDB-KC3DE | |
| AIDA64 / FPU SinJulia | |
| Dell Inspiron 16 7620 2-in-1 | |
| Average Intel Core i7-1260P (2901 - 6975, n=26) | |
| LG Gram 16 2-in-1 16T90P | |
| Samsung Galaxy Book Pro 360 15 NP950QDB-KC3DE | |
| AIDA64 / FPU Mandel | |
| Samsung Galaxy Book Pro 360 15 NP950QDB-KC3DE | |
| LG Gram 16 2-in-1 16T90P | |
| Average Intel Core i7-1260P (5950 - 26376, n=26) | |
| Dell Inspiron 16 7620 2-in-1 | |
| AIDA64 / CPU AES | |
| Samsung Galaxy Book Pro 360 15 NP950QDB-KC3DE | |
| LG Gram 16 2-in-1 16T90P | |
| Average Intel Core i7-1260P (16041 - 92356, n=26) | |
| Dell Inspiron 16 7620 2-in-1 | |
| AIDA64 / CPU ZLib | |
| Dell Inspiron 16 7620 2-in-1 | |
| Average Intel Core i7-1260P (259 - 771, n=26) | |
| Samsung Galaxy Book Pro 360 15 NP950QDB-KC3DE | |
| LG Gram 16 2-in-1 16T90P | |
| AIDA64 / FP64 Ray-Trace | |
| Samsung Galaxy Book Pro 360 15 NP950QDB-KC3DE | |
| Average Intel Core i7-1260P (1237 - 5858, n=26) | |
| LG Gram 16 2-in-1 16T90P | |
| Dell Inspiron 16 7620 2-in-1 | |
| AIDA64 / CPU PhotoWorxx | |
| LG Gram 16 2-in-1 16T90P | |
| Samsung Galaxy Book Pro 360 15 NP950QDB-KC3DE | |
| Average Intel Core i7-1260P (13261 - 43652, n=26) | |
| Dell Inspiron 16 7620 2-in-1 | |
System Performance
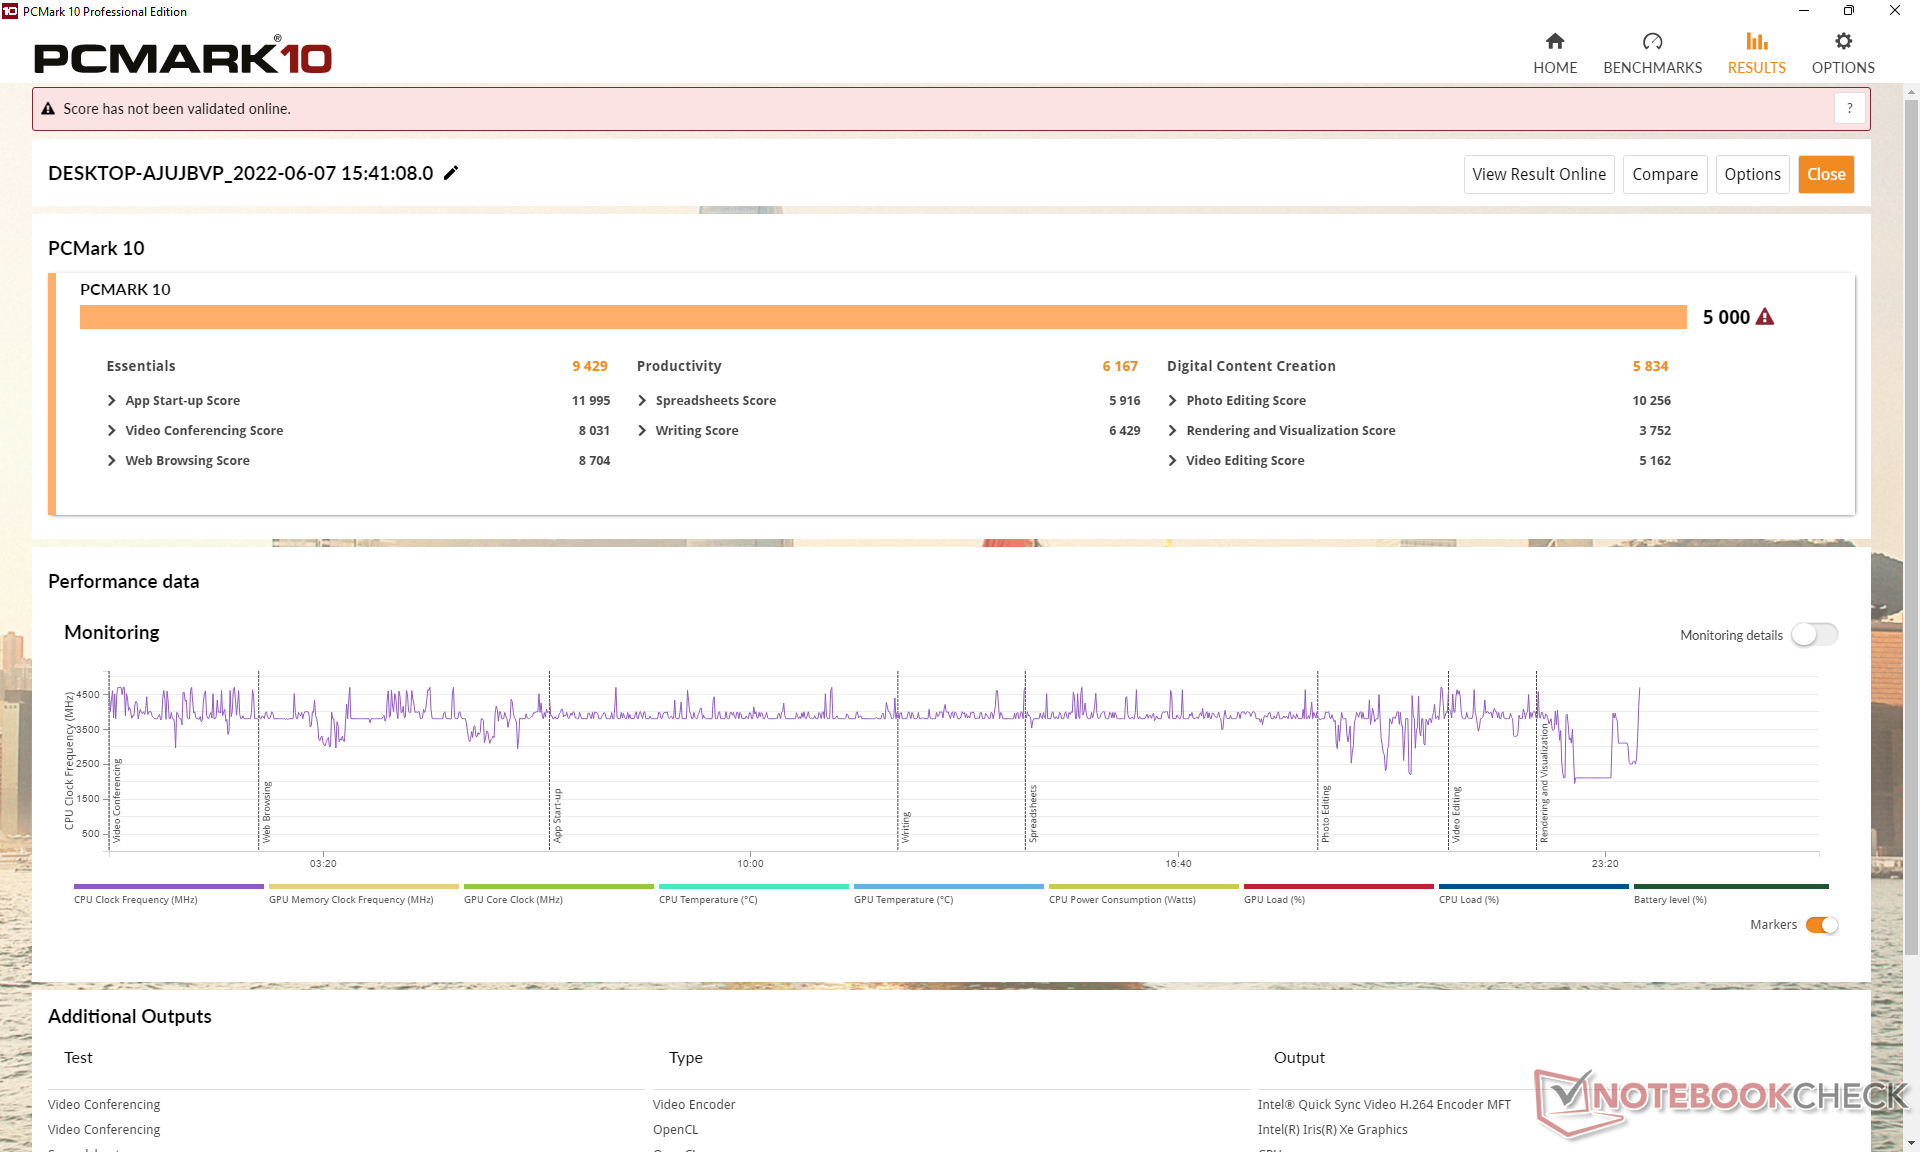
PCMark 10 results are comparable to higher-end and more expensive alternatives like the LG Gram 16 2-in-1 16T90P or Samsung Galaxy Book Pro 360 15. The Digital Content Creation subscore in particular is higher than anticipated.
CrossMark: Overall | Productivity | Creativity | Responsiveness
| PCMark 10 / Score | |
| Average Intel Core i7-1260P, Intel Iris Xe Graphics G7 96EUs (4796 - 6068, n=17) | |
| Dell Inspiron 16 7620 2-in-1 | |
| LG Gram 16 2-in-1 16T90P | |
| Samsung Galaxy Book Pro 360 15 NP950QDB-KC3DE | |
| Asus ZenBook Flip 15 UX563FD-A1027T | |
| HP Spectre X360 15-5ZV31AV | |
| Dell Inspiron 15 5579-9672 | |
| PCMark 10 / Essentials | |
| Average Intel Core i7-1260P, Intel Iris Xe Graphics G7 96EUs (9260 - 11251, n=17) | |
| LG Gram 16 2-in-1 16T90P | |
| Samsung Galaxy Book Pro 360 15 NP950QDB-KC3DE | |
| HP Spectre X360 15-5ZV31AV | |
| Dell Inspiron 16 7620 2-in-1 | |
| Asus ZenBook Flip 15 UX563FD-A1027T | |
| Dell Inspiron 15 5579-9672 | |
| PCMark 10 / Productivity | |
| Asus ZenBook Flip 15 UX563FD-A1027T | |
| Average Intel Core i7-1260P, Intel Iris Xe Graphics G7 96EUs (6167 - 8629, n=17) | |
| LG Gram 16 2-in-1 16T90P | |
| HP Spectre X360 15-5ZV31AV | |
| Samsung Galaxy Book Pro 360 15 NP950QDB-KC3DE | |
| Dell Inspiron 16 7620 2-in-1 | |
| Dell Inspiron 15 5579-9672 | |
| PCMark 10 / Digital Content Creation | |
| Average Intel Core i7-1260P, Intel Iris Xe Graphics G7 96EUs (5231 - 6908, n=17) | |
| Dell Inspiron 16 7620 2-in-1 | |
| Samsung Galaxy Book Pro 360 15 NP950QDB-KC3DE | |
| LG Gram 16 2-in-1 16T90P | |
| Asus ZenBook Flip 15 UX563FD-A1027T | |
| HP Spectre X360 15-5ZV31AV | |
| Dell Inspiron 15 5579-9672 | |
| CrossMark / Overall | |
| Average Intel Core i7-1260P, Intel Iris Xe Graphics G7 96EUs (1484 - 1811, n=16) | |
| Dell Inspiron 16 7620 2-in-1 | |
| CrossMark / Productivity | |
| Average Intel Core i7-1260P, Intel Iris Xe Graphics G7 96EUs (1486 - 1755, n=16) | |
| Dell Inspiron 16 7620 2-in-1 | |
| CrossMark / Creativity | |
| Average Intel Core i7-1260P, Intel Iris Xe Graphics G7 96EUs (1451 - 1872, n=16) | |
| Dell Inspiron 16 7620 2-in-1 | |
| CrossMark / Responsiveness | |
| Average Intel Core i7-1260P, Intel Iris Xe Graphics G7 96EUs (1253 - 1807, n=16) | |
| Dell Inspiron 16 7620 2-in-1 | |
| PCMark 10 Score | 5000 points | |
Help | ||
| AIDA64 / Memory Copy | |
| LG Gram 16 2-in-1 16T90P | |
| Samsung Galaxy Book Pro 360 15 NP950QDB-KC3DE | |
| Average Intel Core i7-1260P (25125 - 71544, n=25) | |
| Dell Inspiron 16 7620 2-in-1 | |
| AIDA64 / Memory Read | |
| LG Gram 16 2-in-1 16T90P | |
| Samsung Galaxy Book Pro 360 15 NP950QDB-KC3DE | |
| Average Intel Core i7-1260P (24983 - 72065, n=25) | |
| Dell Inspiron 16 7620 2-in-1 | |
| AIDA64 / Memory Write | |
| LG Gram 16 2-in-1 16T90P | |
| Samsung Galaxy Book Pro 360 15 NP950QDB-KC3DE | |
| Average Intel Core i7-1260P (23512 - 66799, n=25) | |
| Dell Inspiron 16 7620 2-in-1 | |
| AIDA64 / Memory Latency | |
| LG Gram 16 2-in-1 16T90P | |
| Samsung Galaxy Book Pro 360 15 NP950QDB-KC3DE | |
| Average Intel Core i7-1260P (77.9 - 118.4, n=21) | |
* ... smaller is better
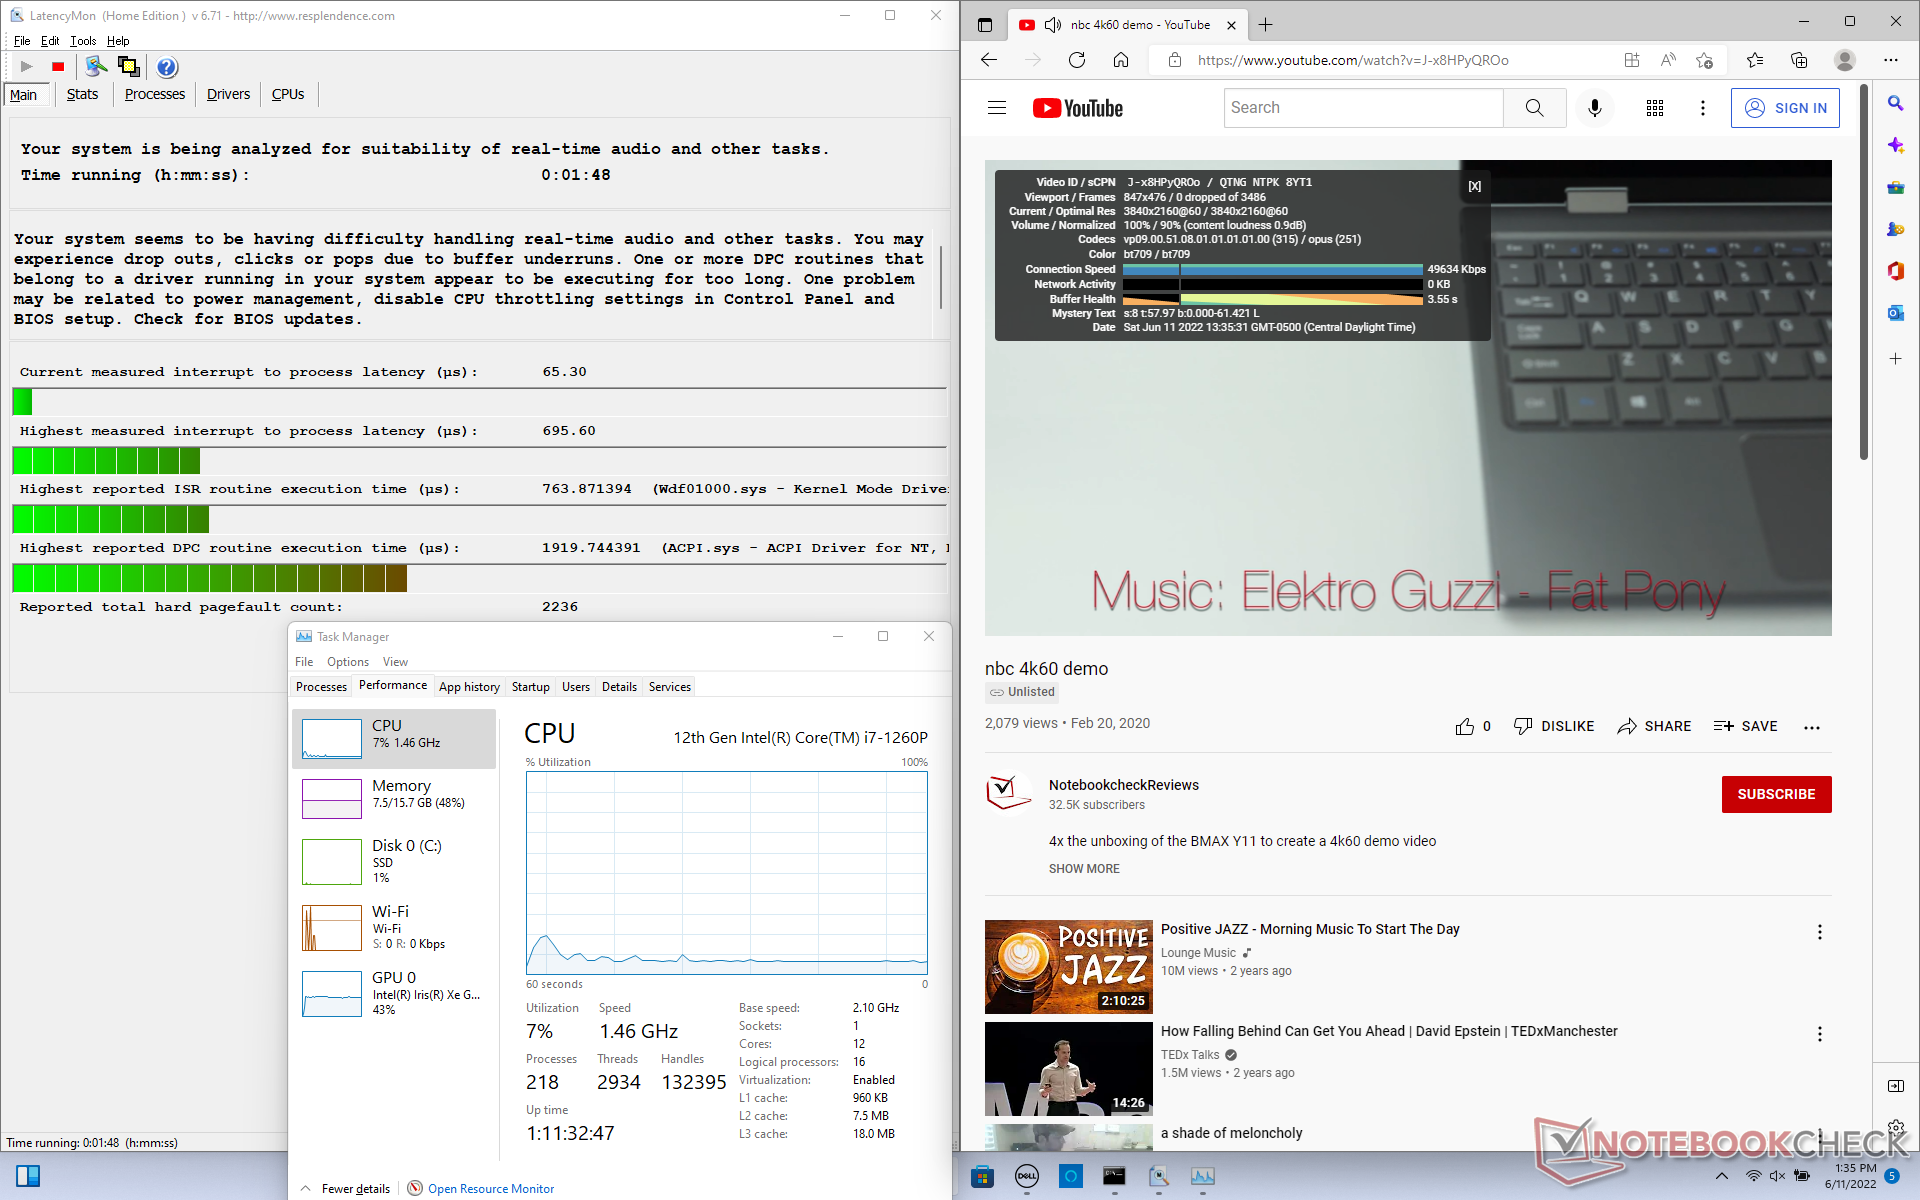
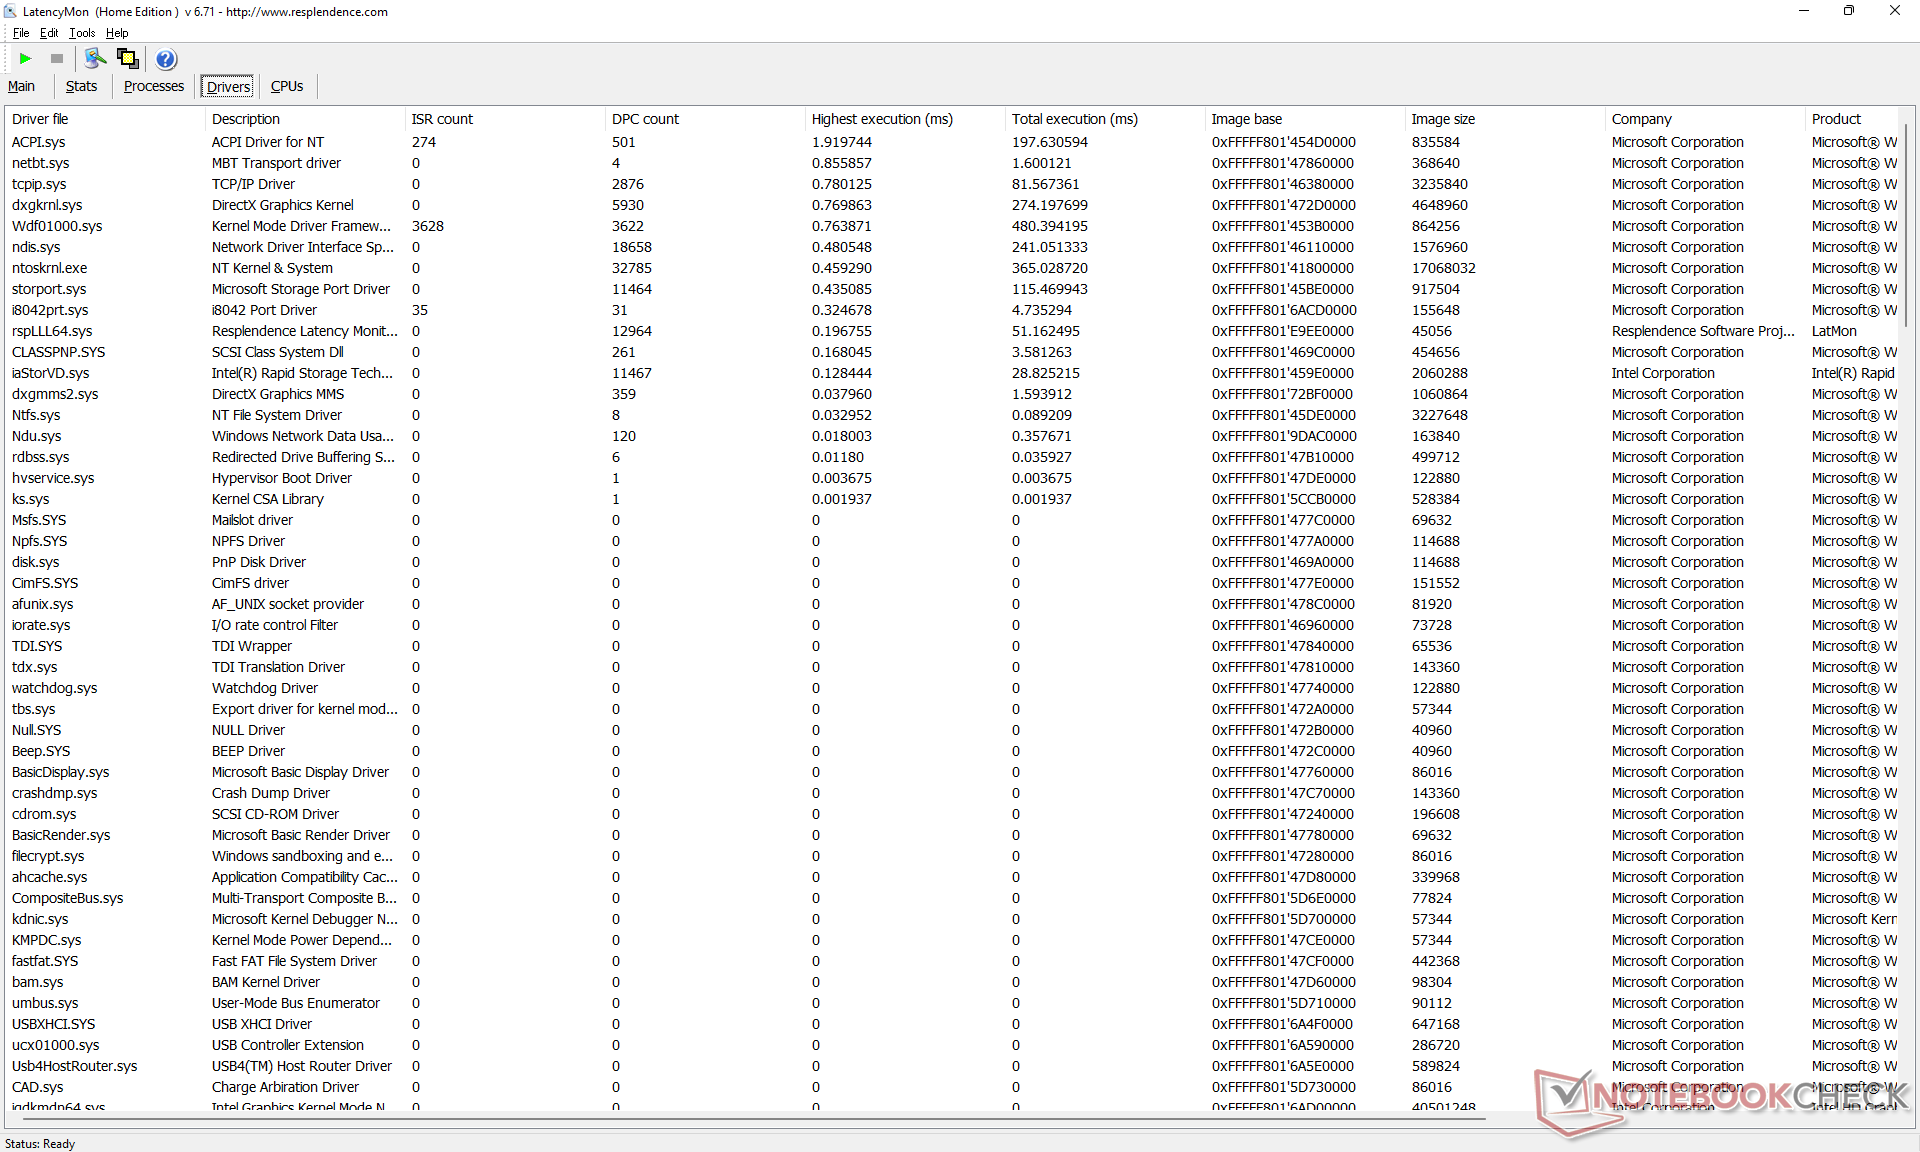
DPC Latency
LatencyMon reveals minor DPC issues when opening multiple browser tabs of our homepage. 4K video playback at 60 FPS is otherwise smooth and with no dropped frames during our tests.
| DPC Latencies / LatencyMon - interrupt to process latency (max), Web, Youtube, Prime95 | |
| Samsung Galaxy Book Pro 360 15 NP950QDB-KC3DE | |
| LG Gram 16 2-in-1 16T90P | |
| Dell Inspiron 16 7620 2-in-1 | |
* ... smaller is better
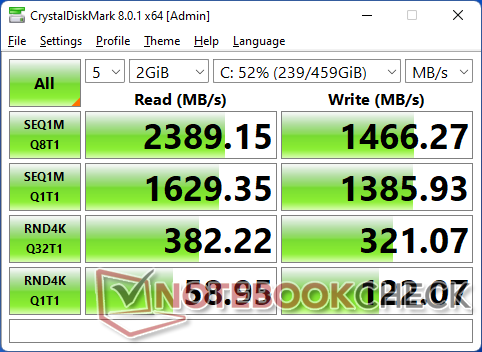
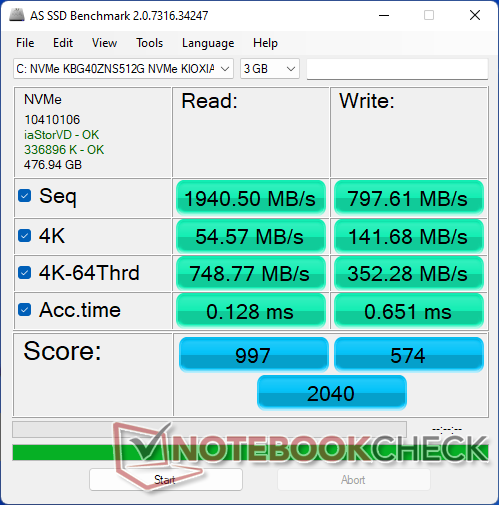
Storage Devices
Our test unit comes with a midrange Toshiba KBG40ZNS512G M.2 PCIe3 NVMe SSD which is appropriate for a midrange laptop series like the Inspiron. Maximum transfer rates can reach over 2400 MB/s, but inefficient cooling means performance can fall to as slow as 1200 MB/s when stressed as shown by our DiskSpd loop test results below. Though it's not something that the target audience of home or office users will notice, performance users will likely be disappointed by the lack of cooling for the SSD here.

* ... smaller is better
Disk Throttling: DiskSpd Read Loop, Queue Depth 8
GPU Performance — Slightly Underperforming
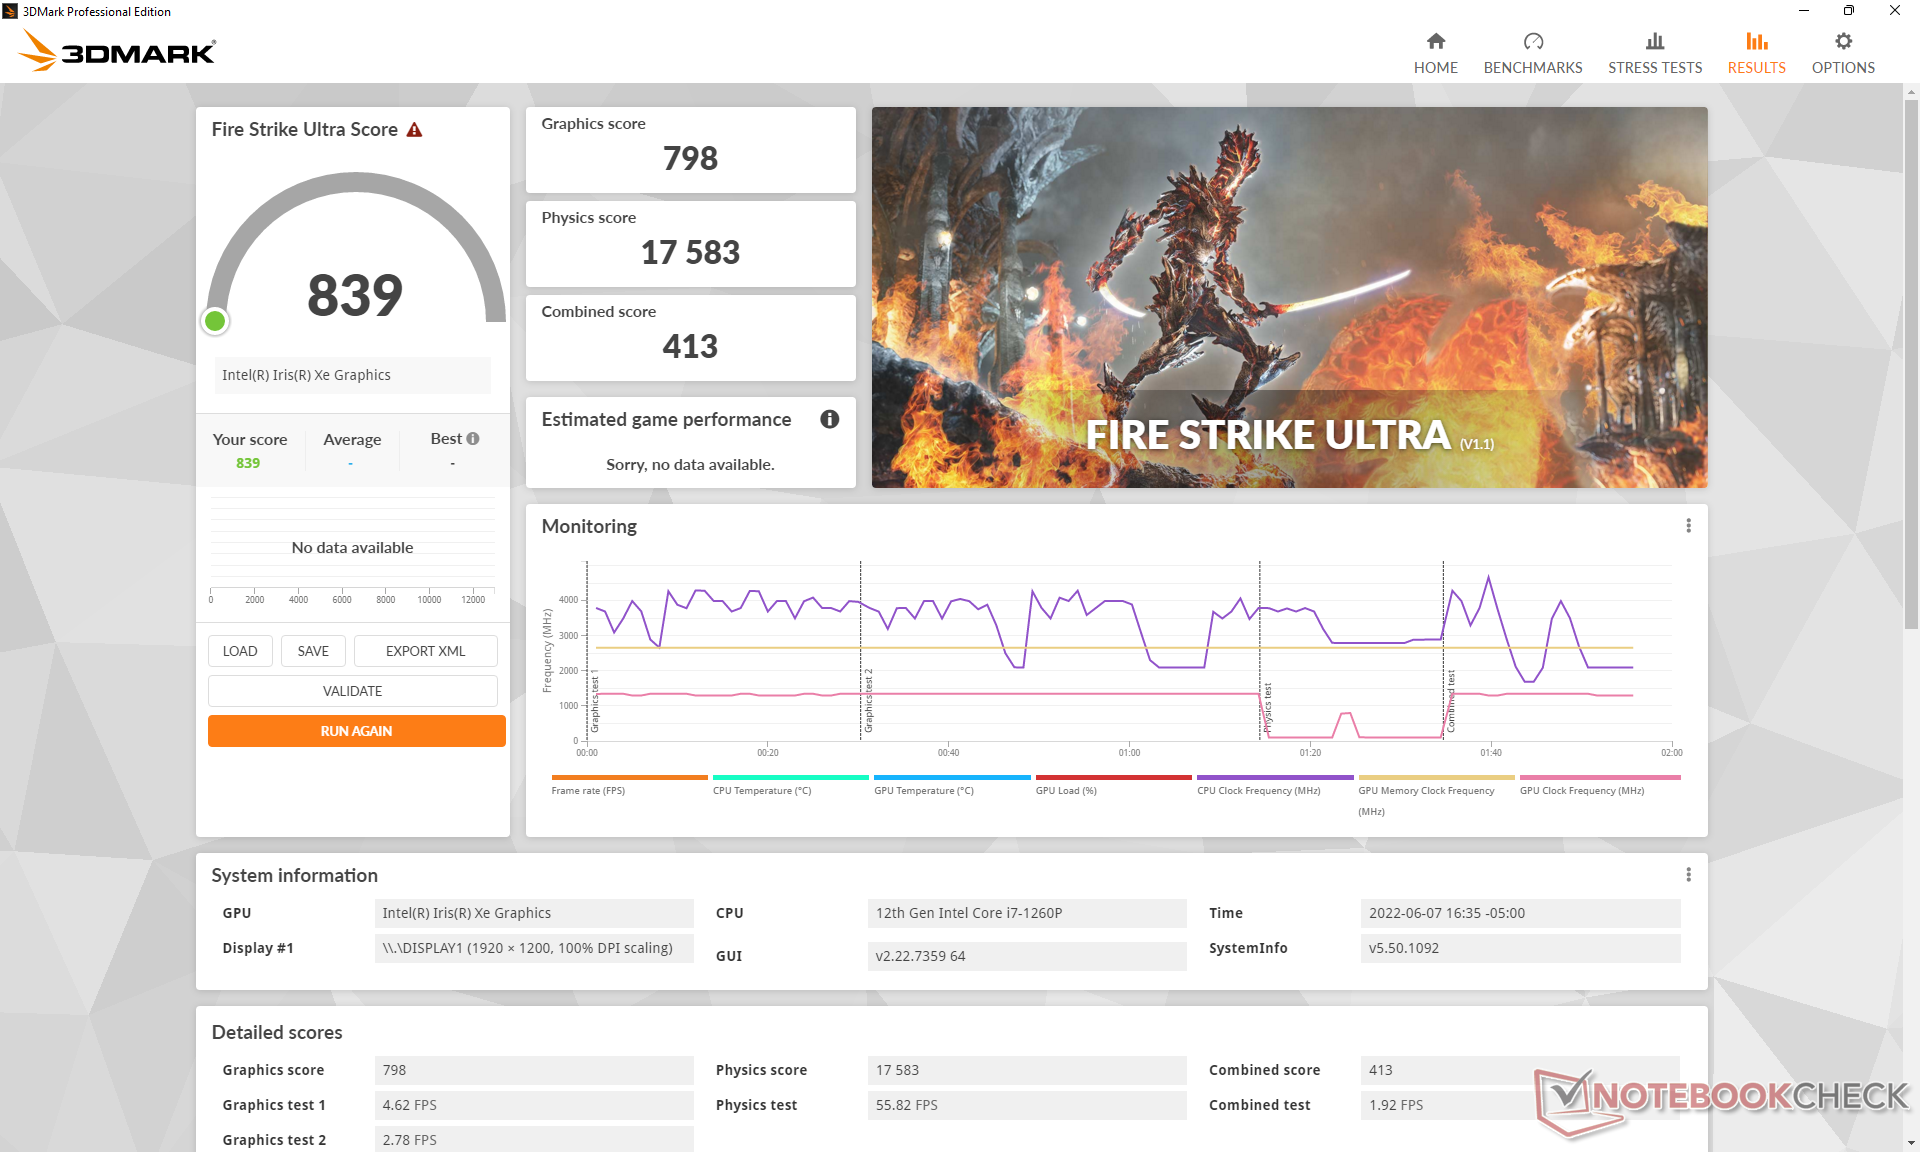
Graphics performance is slower than expected at about 5 to 15 percent slower than the average Iris Xe 96 EUs in our database. The Lenovo Yoga 9 14IAP7, which comes with the exact same CPU and GPU as our Inspiron, is able to run games up to 30 or 40 percent faster. Overall performance is still superior to any AMD mobile Zen 3 or lower integrated Radeon solution to be good enough to run most undemanding games like DOTA 2 Reborn at low 1080p settings.
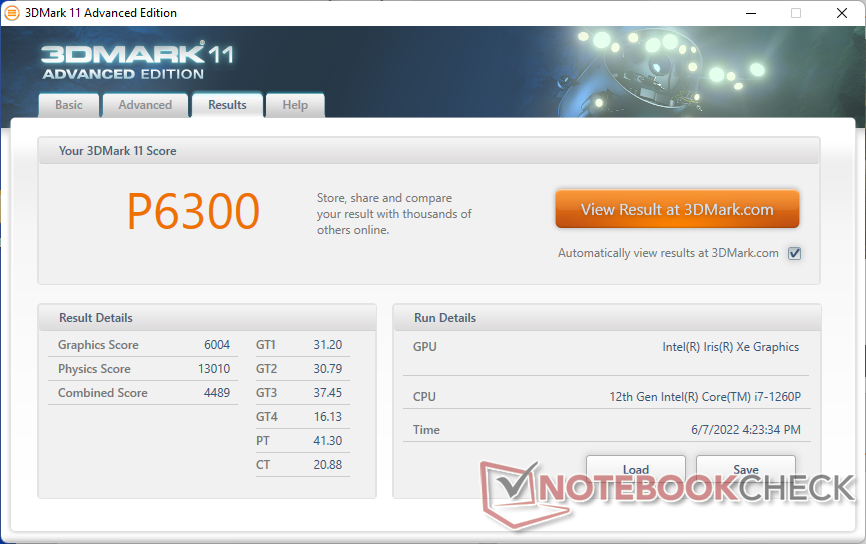
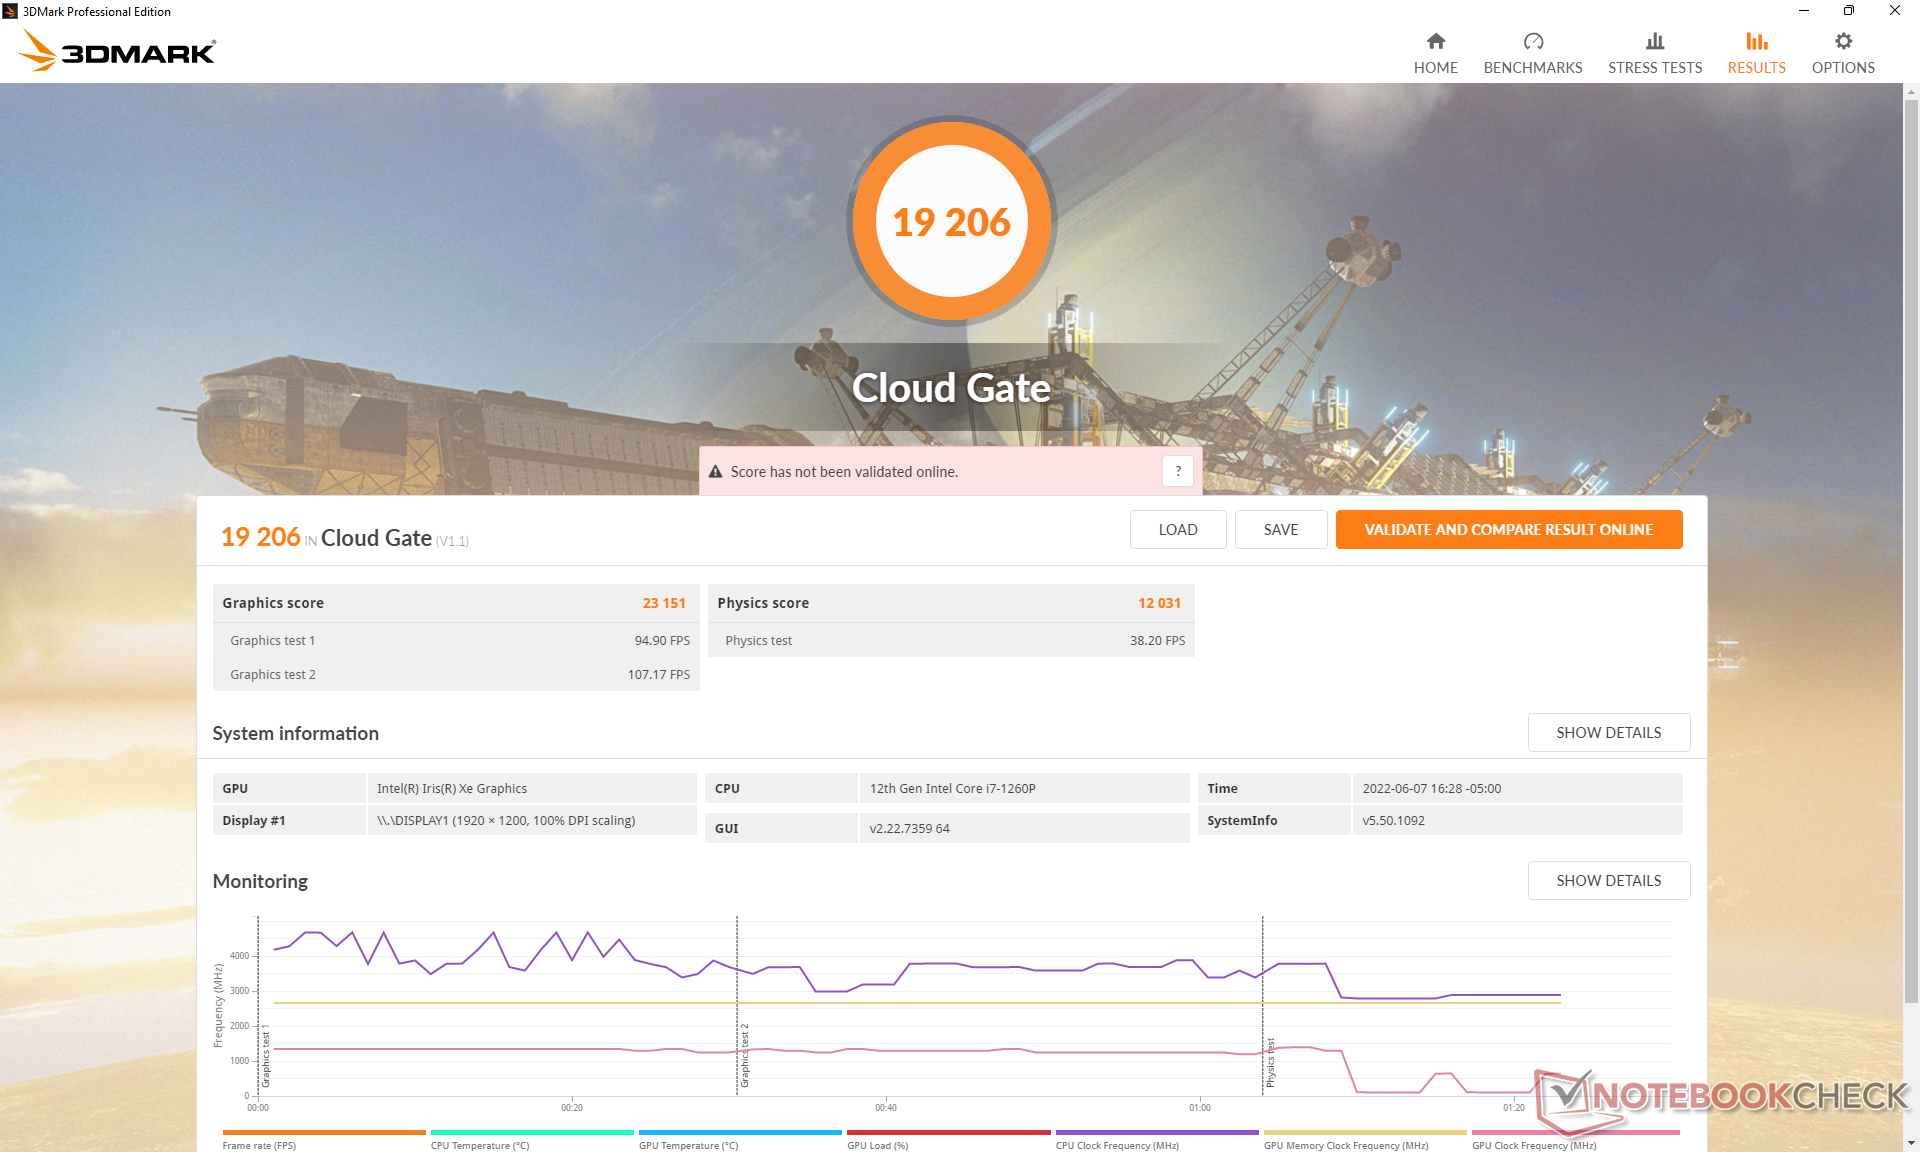
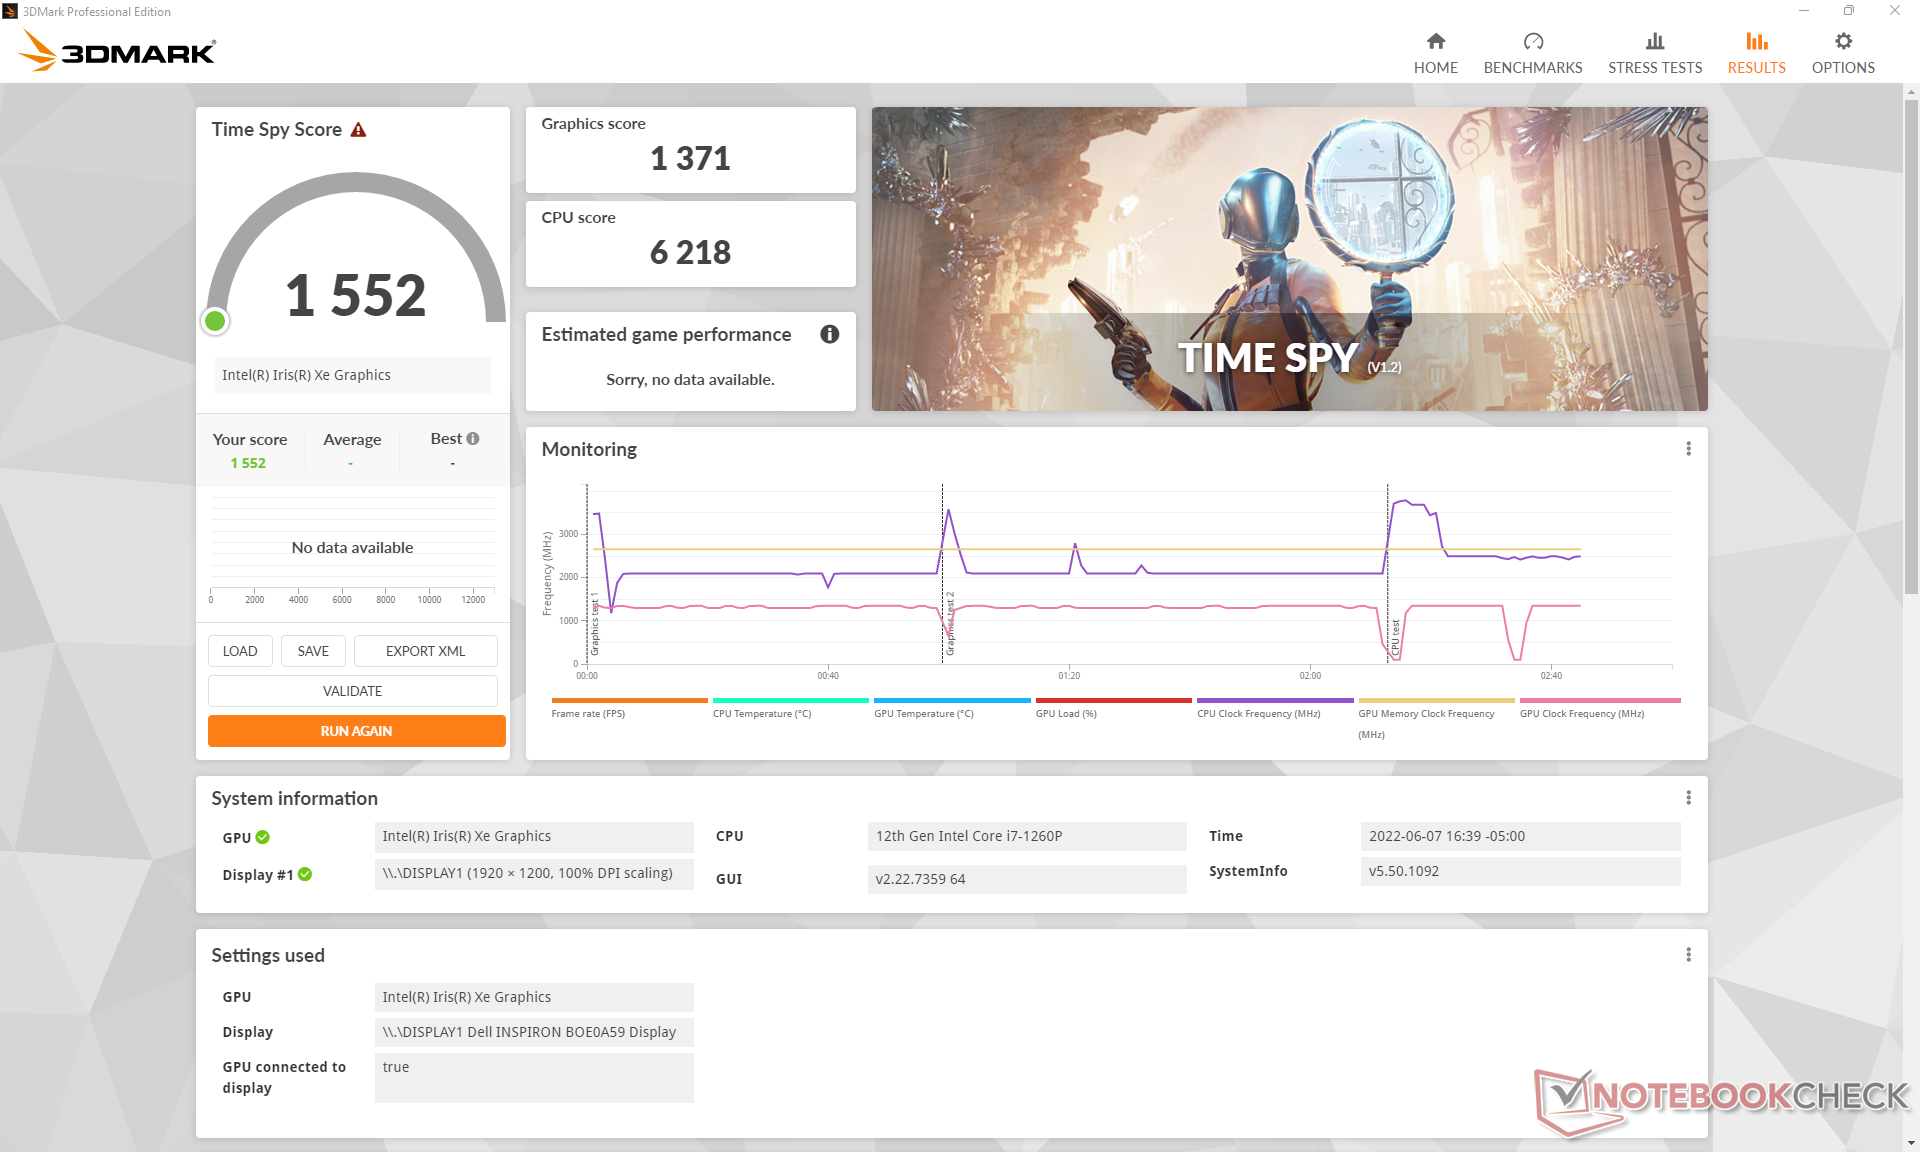
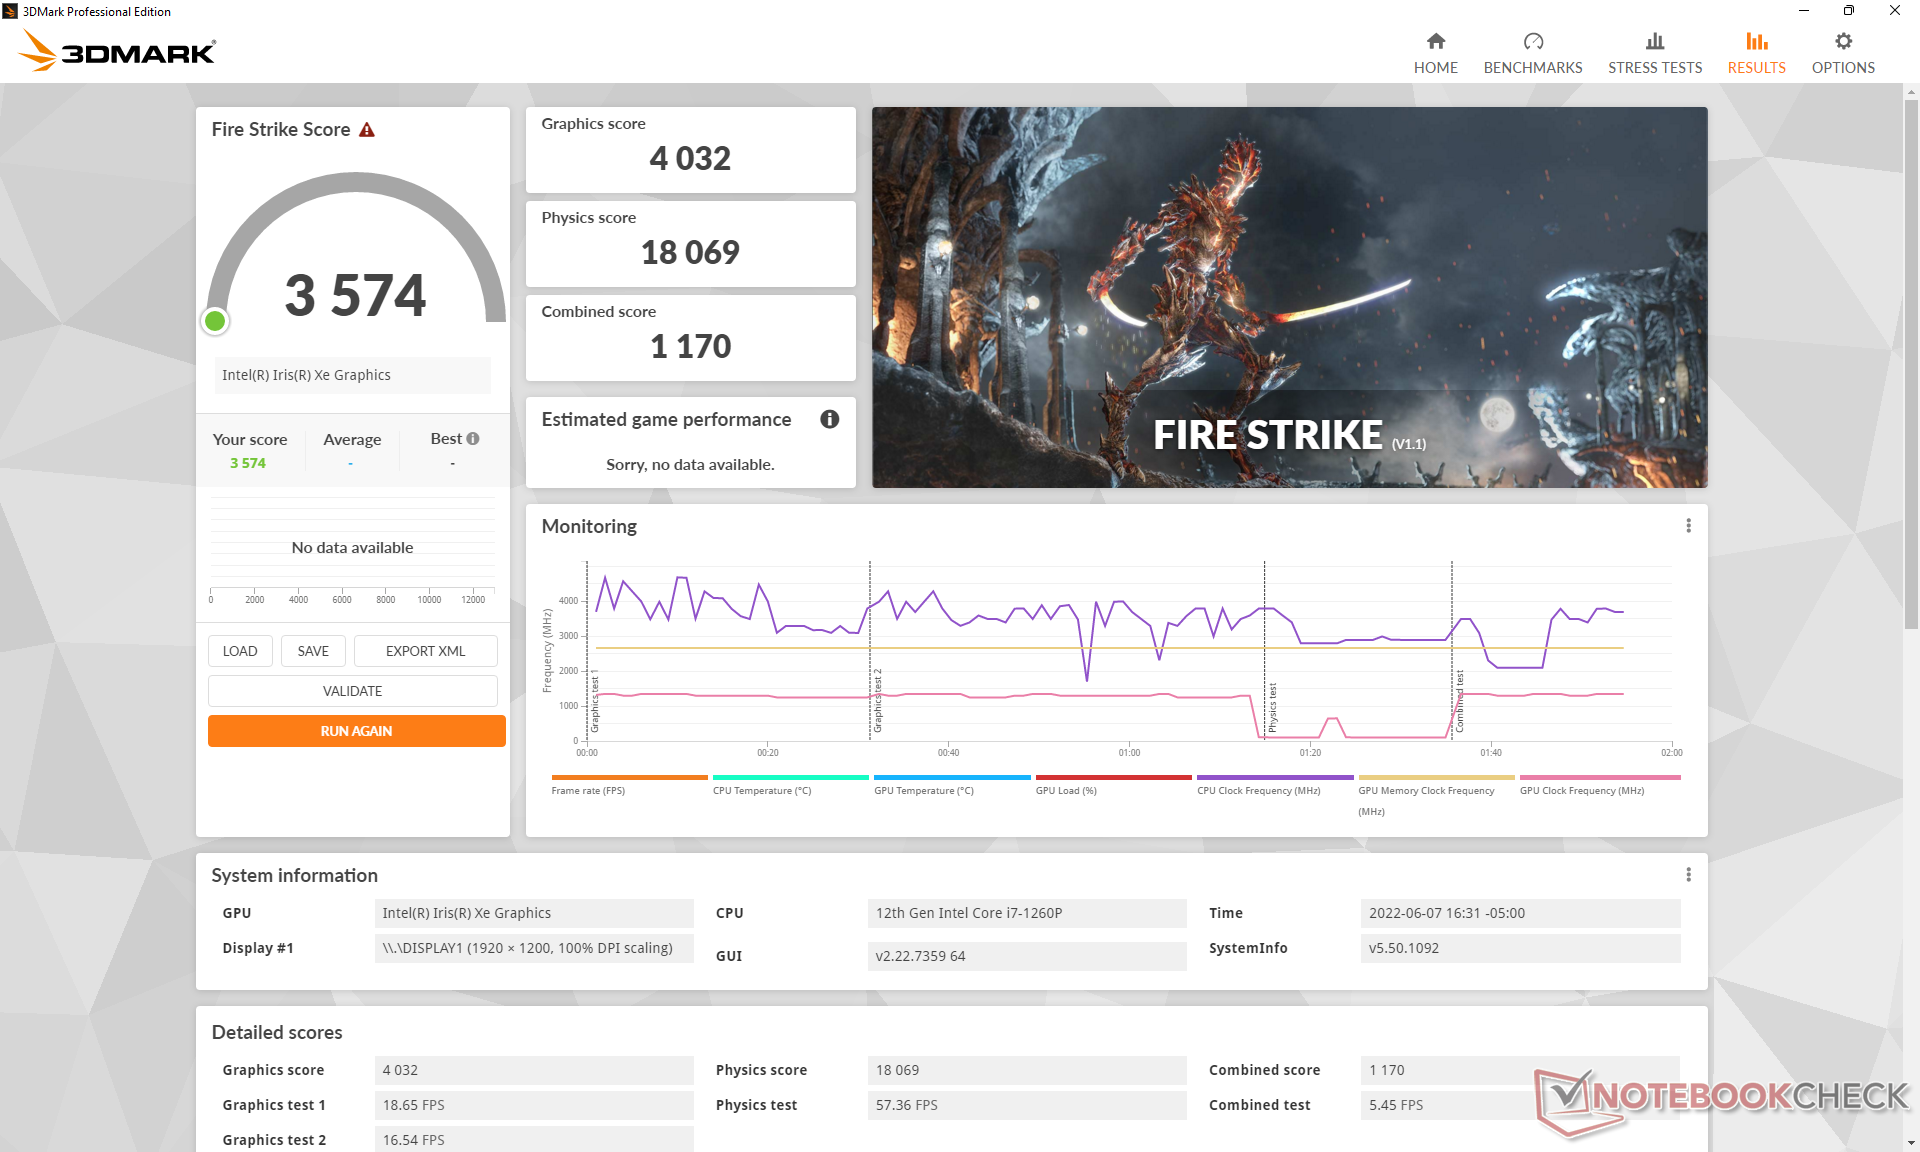
| 3DMark 11 Performance | 6300 points | |
| 3DMark Cloud Gate Standard Score | 19206 points | |
| 3DMark Fire Strike Score | 3574 points | |
| 3DMark Time Spy Score | 1552 points | |
Help | ||
Witcher 3 FPS Chart
| low | med. | high | ultra | |
|---|---|---|---|---|
| GTA V (2015) | 92.1 | 75.9 | 13.8 | 5.98 |
| The Witcher 3 (2015) | 79.2 | 47.7 | 24.2 | 11.8 |
| Dota 2 Reborn (2015) | 105.7 | 77.4 | 50.8 | 46.5 |
| Final Fantasy XV Benchmark (2018) | 34 | 18.1 | 13.3 | |
| X-Plane 11.11 (2018) | 48.7 | 39.6 | 35.3 | |
| Strange Brigade (2018) | 76.5 | 31.7 | 26.7 | 21.4 |
| Cyberpunk 2077 1.6 (2022) | 18.4 | 14.9 | 11 | 9 |
Emissions — Large System, Quiet Fan
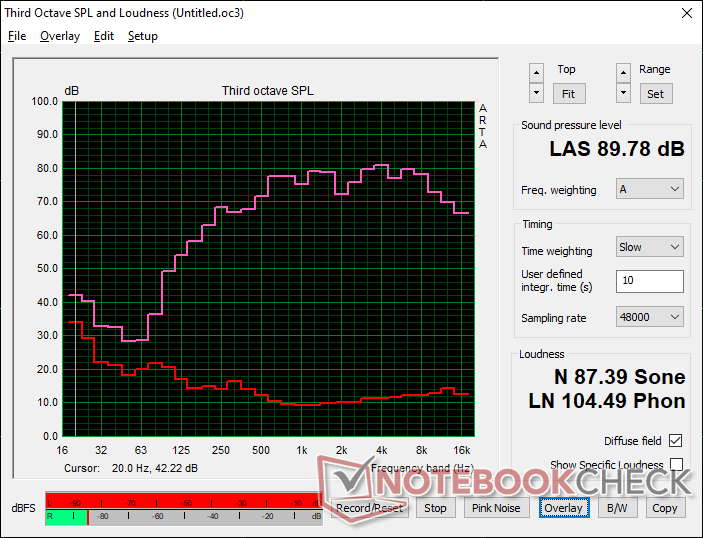
System Noise
Fan noise is generally very quiet with results that are slightly quieter than other convertible laptops. Running the first benchmark scene of 3DMark 06, for example, only induces a fan noise of 29 dB(A) compared to 32 to 33 dB(A) on the LG Gram 16 2-in-1 or Galaxy Book 360 15 under similar conditions. At worst, we're able to record a fan noise of up to 40 dB(A) when running gaming or more demanding loads.
Keep in mind that the cooling solution does not change if configuring with discrete GeForce MX550 graphics. Thus, expect the fans to pulse more frequently or increase in speed sooner when running typical loads that may otherwise be nearly silent on our iGPU-only review unit.
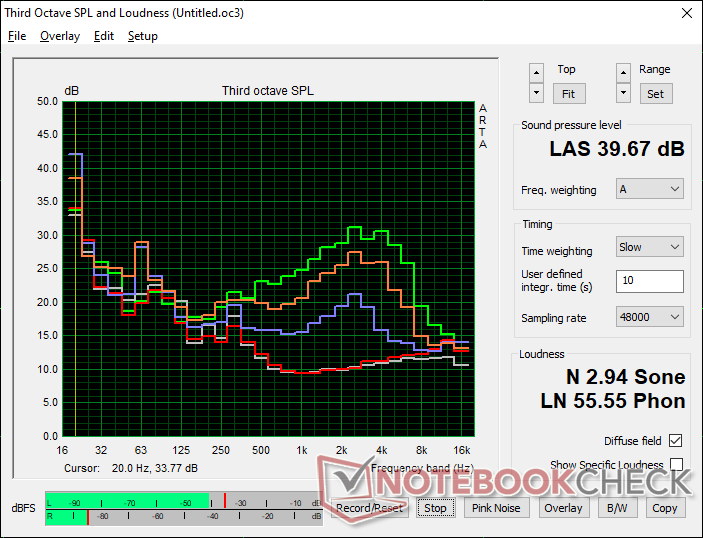
Noise level
| Idle |
| 23.5 / 23.5 / 23.5 dB(A) |
| Load |
| 29.4 / 39.7 dB(A) |
 | ||
30 dB silent 40 dB(A) audible 50 dB(A) loud |
||
min: | ||
| Dell Inspiron 16 7620 2-in-1 Iris Xe G7 96EUs, i7-1260P, Toshiba KBG40ZNS512G NVMe | LG Gram 16 2-in-1 16T90P Iris Xe G7 96EUs, i7-1165G7, SK Hynix PC401 512GB M.2 (HFS512GD9TNG) | Samsung Galaxy Book Pro 360 15 NP950QDB-KC3DE Iris Xe G7 80EUs, i5-1135G7, Samsung PM991 MZVLQ256HAJD | Asus ZenBook Flip 15 UX563FD-A1027T GeForce GTX 1050 Max-Q, i7-10510U, Samsung SSD PM981 MZVLB1T0HALR | Dell Inspiron 15 5579-9672 UHD Graphics 620, i5-8250U, SK hynix SC311 SATA | HP Spectre X360 15-5ZV31AV GeForce MX250, i7-10510U, Intel SSD 660p 2TB SSDPEKNW020T8 | |
|---|---|---|---|---|---|---|
| Noise | -4% | -7% | -19% | -18% | -19% | |
| off / environment * (dB) | 23.2 | 25.1 -8% | 25 -8% | 30.3 -31% | 30.4 -31% | 30.1 -30% |
| Idle Minimum * (dB) | 23.5 | 25.2 -7% | 25 -6% | 30.3 -29% | 30.4 -29% | 30.1 -28% |
| Idle Average * (dB) | 23.5 | 25.2 -7% | 25 -6% | 30.3 -29% | 30.4 -29% | 30.1 -28% |
| Idle Maximum * (dB) | 23.5 | 25.2 -7% | 25 -6% | 30.3 -29% | 31.2 -33% | 30.1 -28% |
| Load Average * (dB) | 29.4 | 32.1 -9% | 32.7 -11% | 33.7 -15% | 31.5 -7% | 30.1 -2% |
| Witcher 3 ultra * (dB) | 35.6 | 34.9 2% | 37.4 -5% | 39.7 -12% | ||
| Load Maximum * (dB) | 39.7 | 37.8 5% | 42 -6% | 38.9 2% | 31.5 21% | 42 -6% |
* ... smaller is better
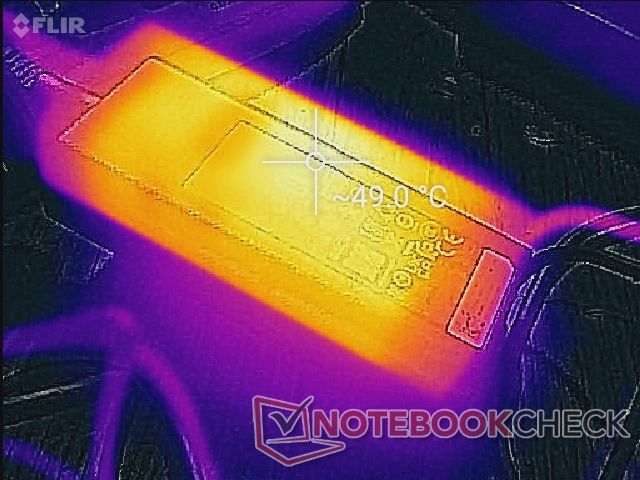
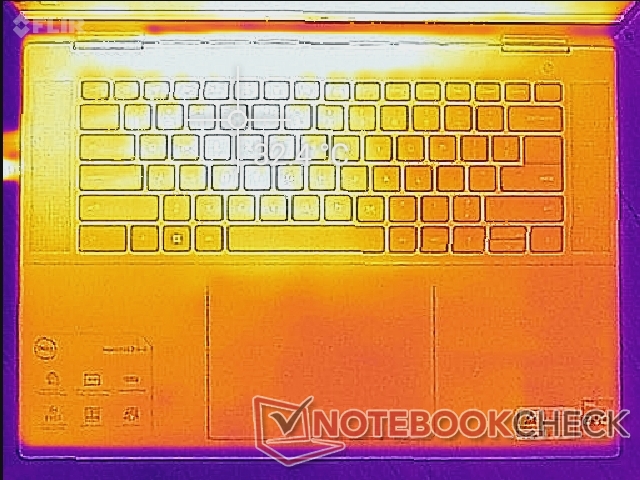
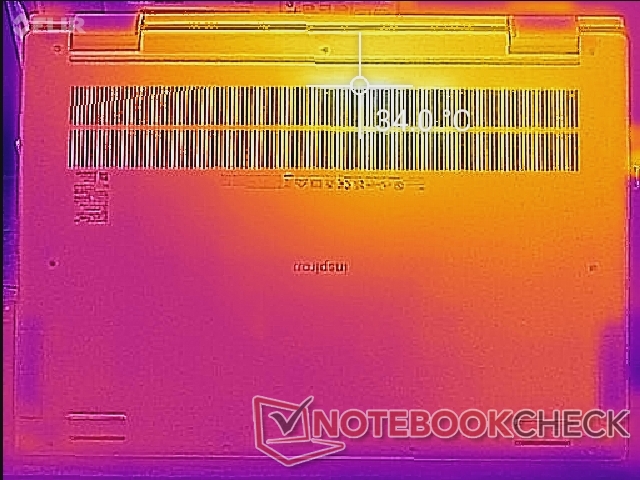
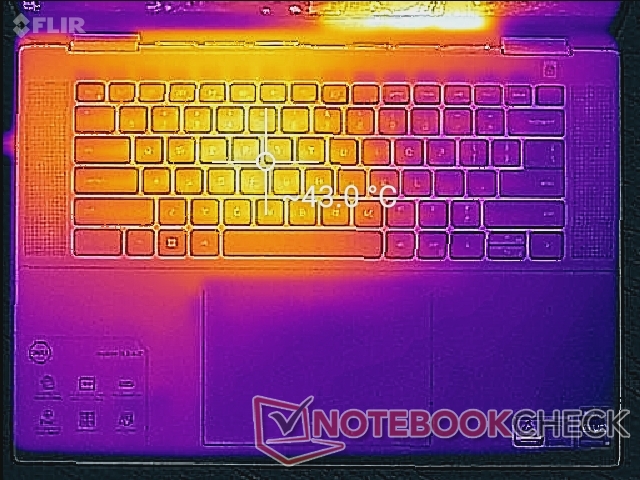
Temperature
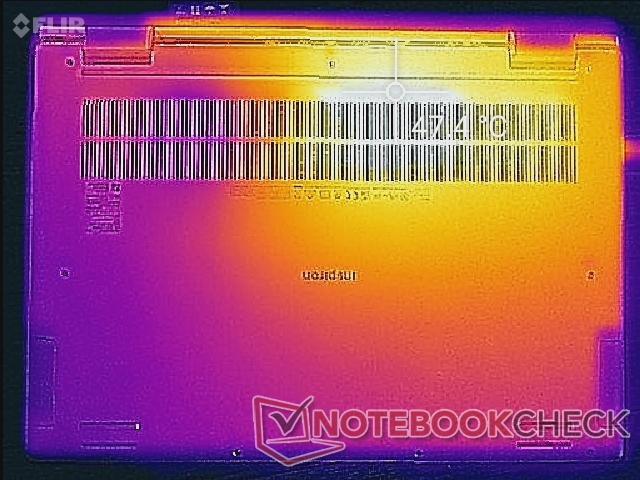
Surface temperature gradient is similar to the LG Gram 16 2-in-1 since the motherboard, battery, and cooling solution of the Inspiron are all positioned similarly inside. Hot spots on the keyboard center and bottom surface can reach 43 C and 48 C, respectively, compared to 42 C or 46 C on the LG Gram. The high 40 C range is common amongst many convertible models including the HP Spectre x360 15.
Interestingly, surface temperatures when idling are higher than expected at 33 C compared to the lower 20 C to 25 C range on the LG Gram or HP Spectre. We recorded high idling surface temperatures on last year's Inspiron 16 7610 as well.
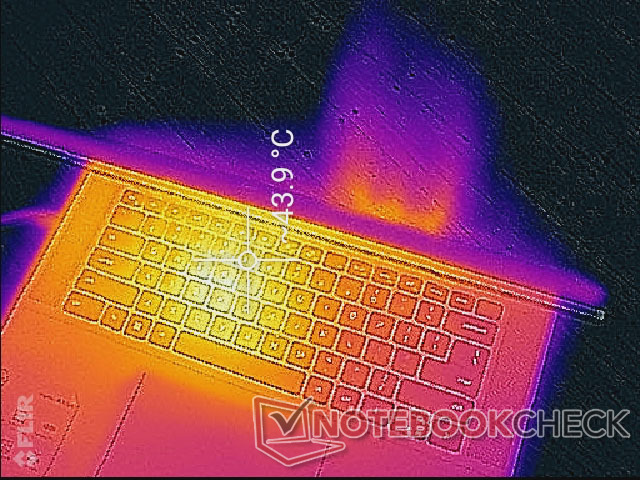
(±) The maximum temperature on the upper side is 42.2 °C / 108 F, compared to the average of 35.4 °C / 96 F, ranging from 19.6 to 60 °C for the class Convertible.
(-) The bottom heats up to a maximum of 47.4 °C / 117 F, compared to the average of 36.9 °C / 98 F
(+) In idle usage, the average temperature for the upper side is 30.3 °C / 87 F, compared to the device average of 30.3 °C / 87 F.
(+) The palmrests and touchpad are cooler than skin temperature with a maximum of 29.8 °C / 85.6 F and are therefore cool to the touch.
(±) The average temperature of the palmrest area of similar devices was 28 °C / 82.4 F (-1.8 °C / -3.2 F).
| Dell Inspiron 16 7620 2-in-1 Intel Core i7-1260P, Intel Iris Xe Graphics G7 96EUs | LG Gram 16 2-in-1 16T90P Intel Core i7-1165G7, Intel Iris Xe Graphics G7 96EUs | Samsung Galaxy Book Pro 360 15 NP950QDB-KC3DE Intel Core i5-1135G7, Intel Iris Xe Graphics G7 80EUs | Asus ZenBook Flip 15 UX563FD-A1027T Intel Core i7-10510U, NVIDIA GeForce GTX 1050 Max-Q | Dell Inspiron 15 5579-9672 Intel Core i5-8250U, Intel UHD Graphics 620 | HP Spectre X360 15-5ZV31AV Intel Core i7-10510U, NVIDIA GeForce MX250 | |
|---|---|---|---|---|---|---|
| Heat | 10% | 14% | 13% | 14% | 12% | |
| Maximum Upper Side * (°C) | 42.2 | 42.2 -0% | 42.6 -1% | 42.6 -1% | 41.6 1% | 47 -11% |
| Maximum Bottom * (°C) | 47.4 | 46.2 3% | 40.8 14% | 41.5 12% | 41.9 12% | 47.4 -0% |
| Idle Upper Side * (°C) | 32.2 | 26 19% | 25.9 20% | 26.4 18% | 26.1 19% | 22.8 29% |
| Idle Bottom * (°C) | 33.6 | 27.6 18% | 26.1 22% | 26.3 22% | 25.7 24% | 23.6 30% |
* ... smaller is better
Stress Test
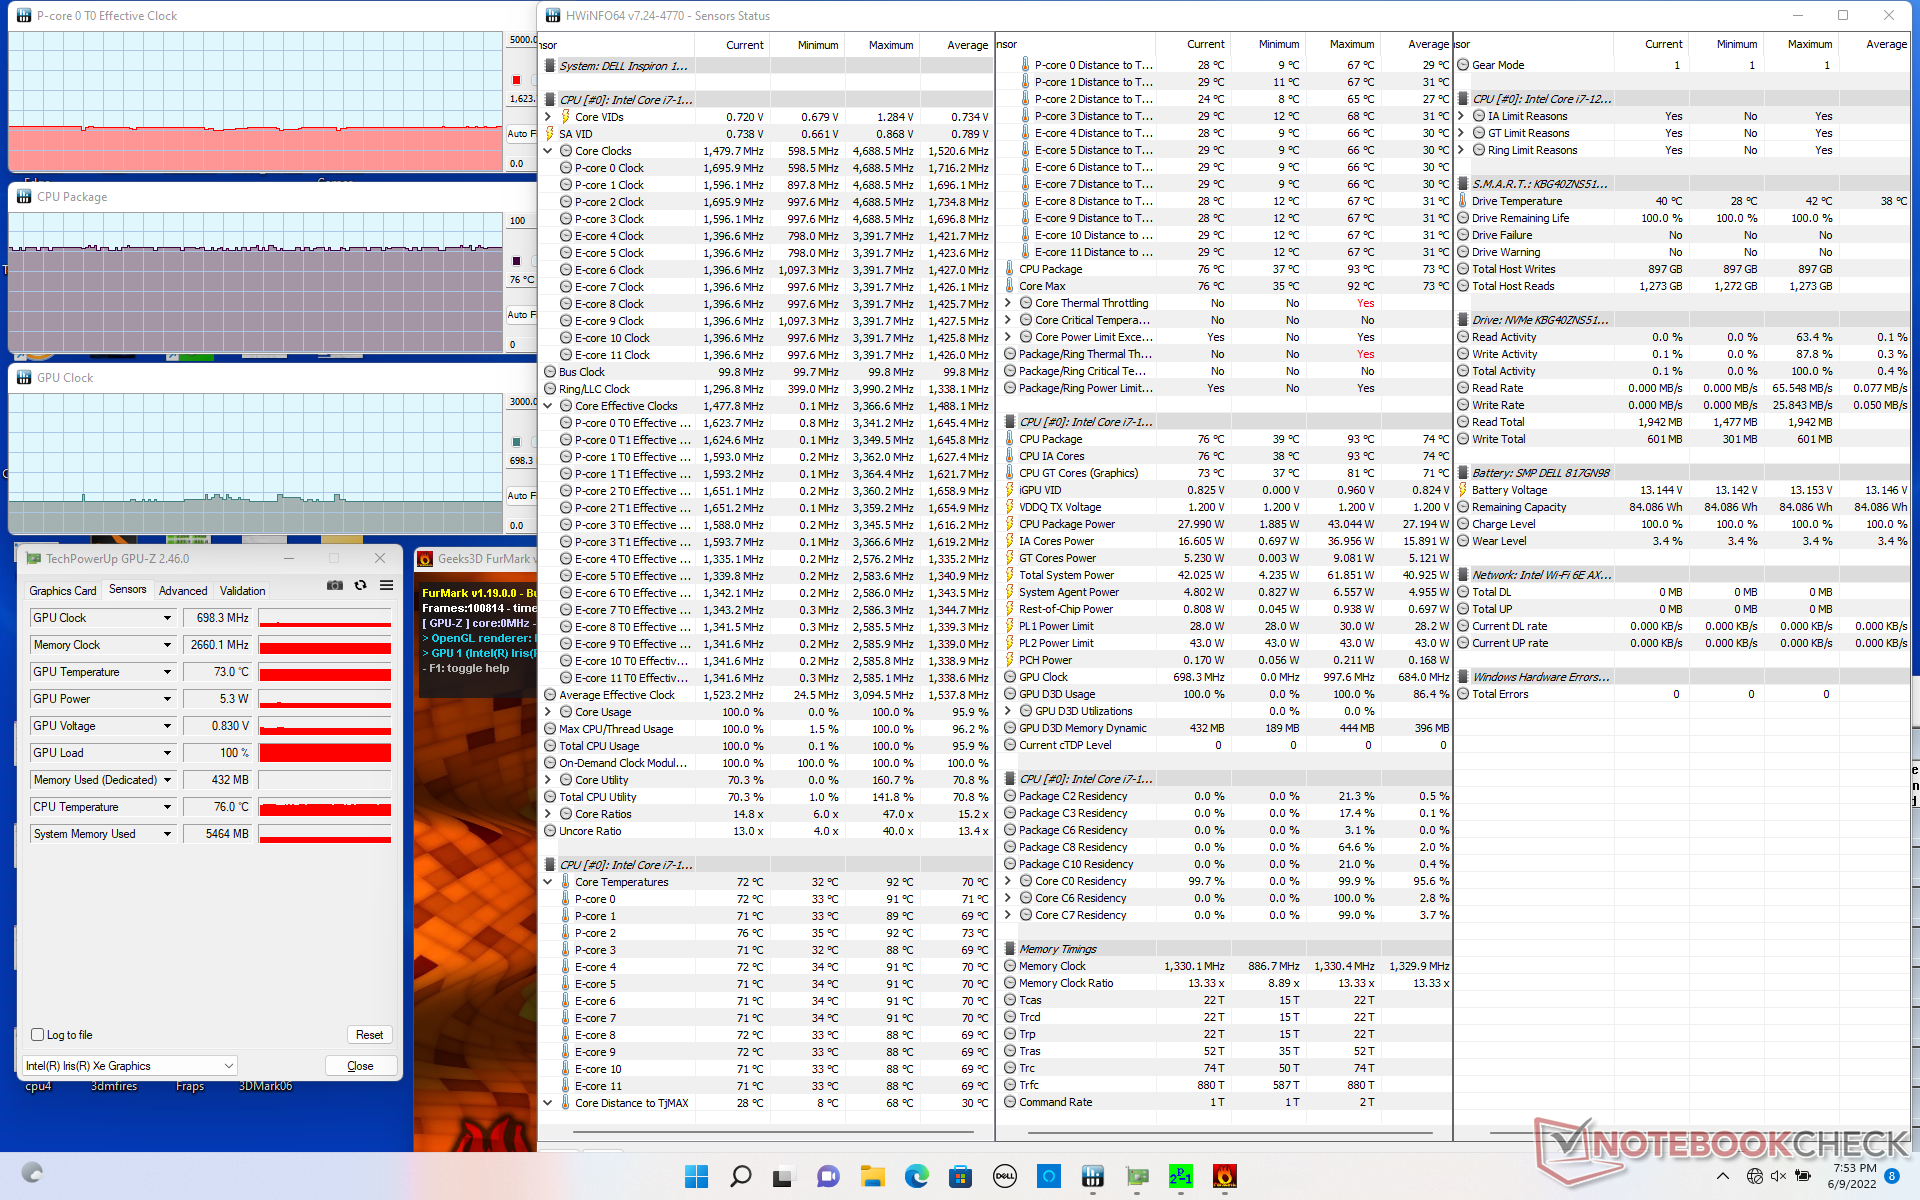
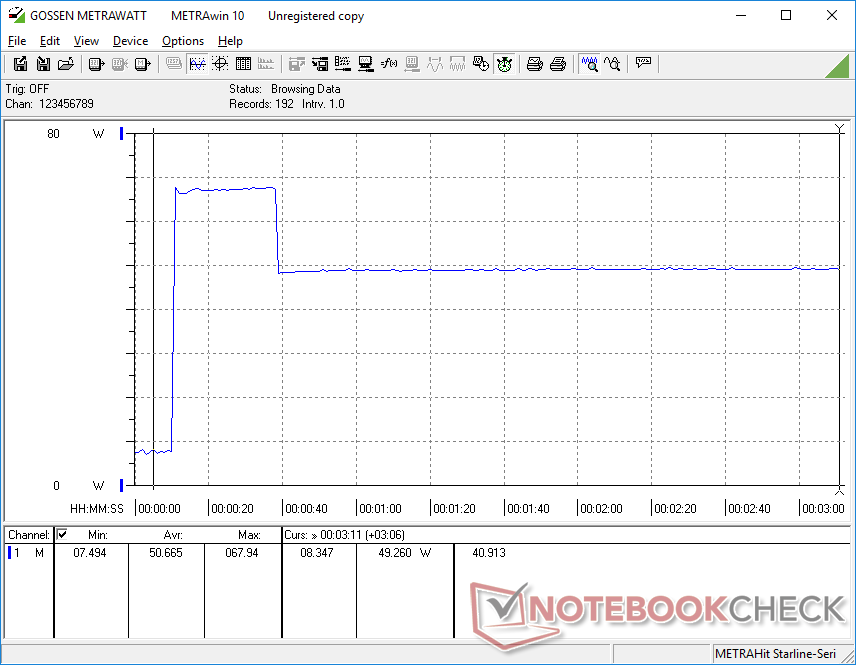
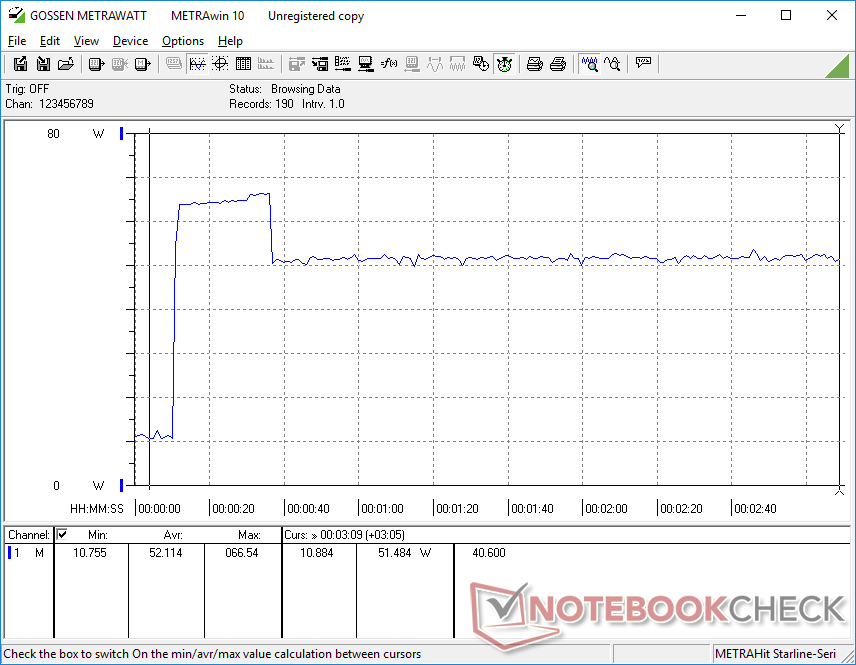
When running Prime95 to stress the CPU, clock rates would boost to 3.3 GHz for the first 10 seconds or so before hitting a core temperature of 92 C. Clock rates would subsequently drop to as low as 2.1 GHz for a more reasonable core temperature of 81 C. CPU package power would be as high as 43 W during the start of the test before stabilizing at just 30 W due to the thermal limitations of the cooling solution. Running this same test on the Lenovo Yoga 9 with the same Core i7-1260P CPU would result in a similar stable clock rate albeit at a cooler 66 C core temperature.
GPU clock rates and temperature would stabilize at 1296 MHz and 82 C, respectively, compared to 1200 MHz and 73 C on the LG Gram 16 2-in-1 with the older Core i7-1165G7. Memory clock rate is slower on the Inspiron when compared to the aforementioned Lenovo due to its slower RAM (DDR4 vs. LPDDR5) which may have contributed to the relatively slower Iris Xe performance of our Inspiron.
Running on battery power limits performance. A Fire Strike test on batteries would return Physics and Graphics scores of 11924 and 3147 points, respectively, compared to 18069 and 4032 points when on mains.
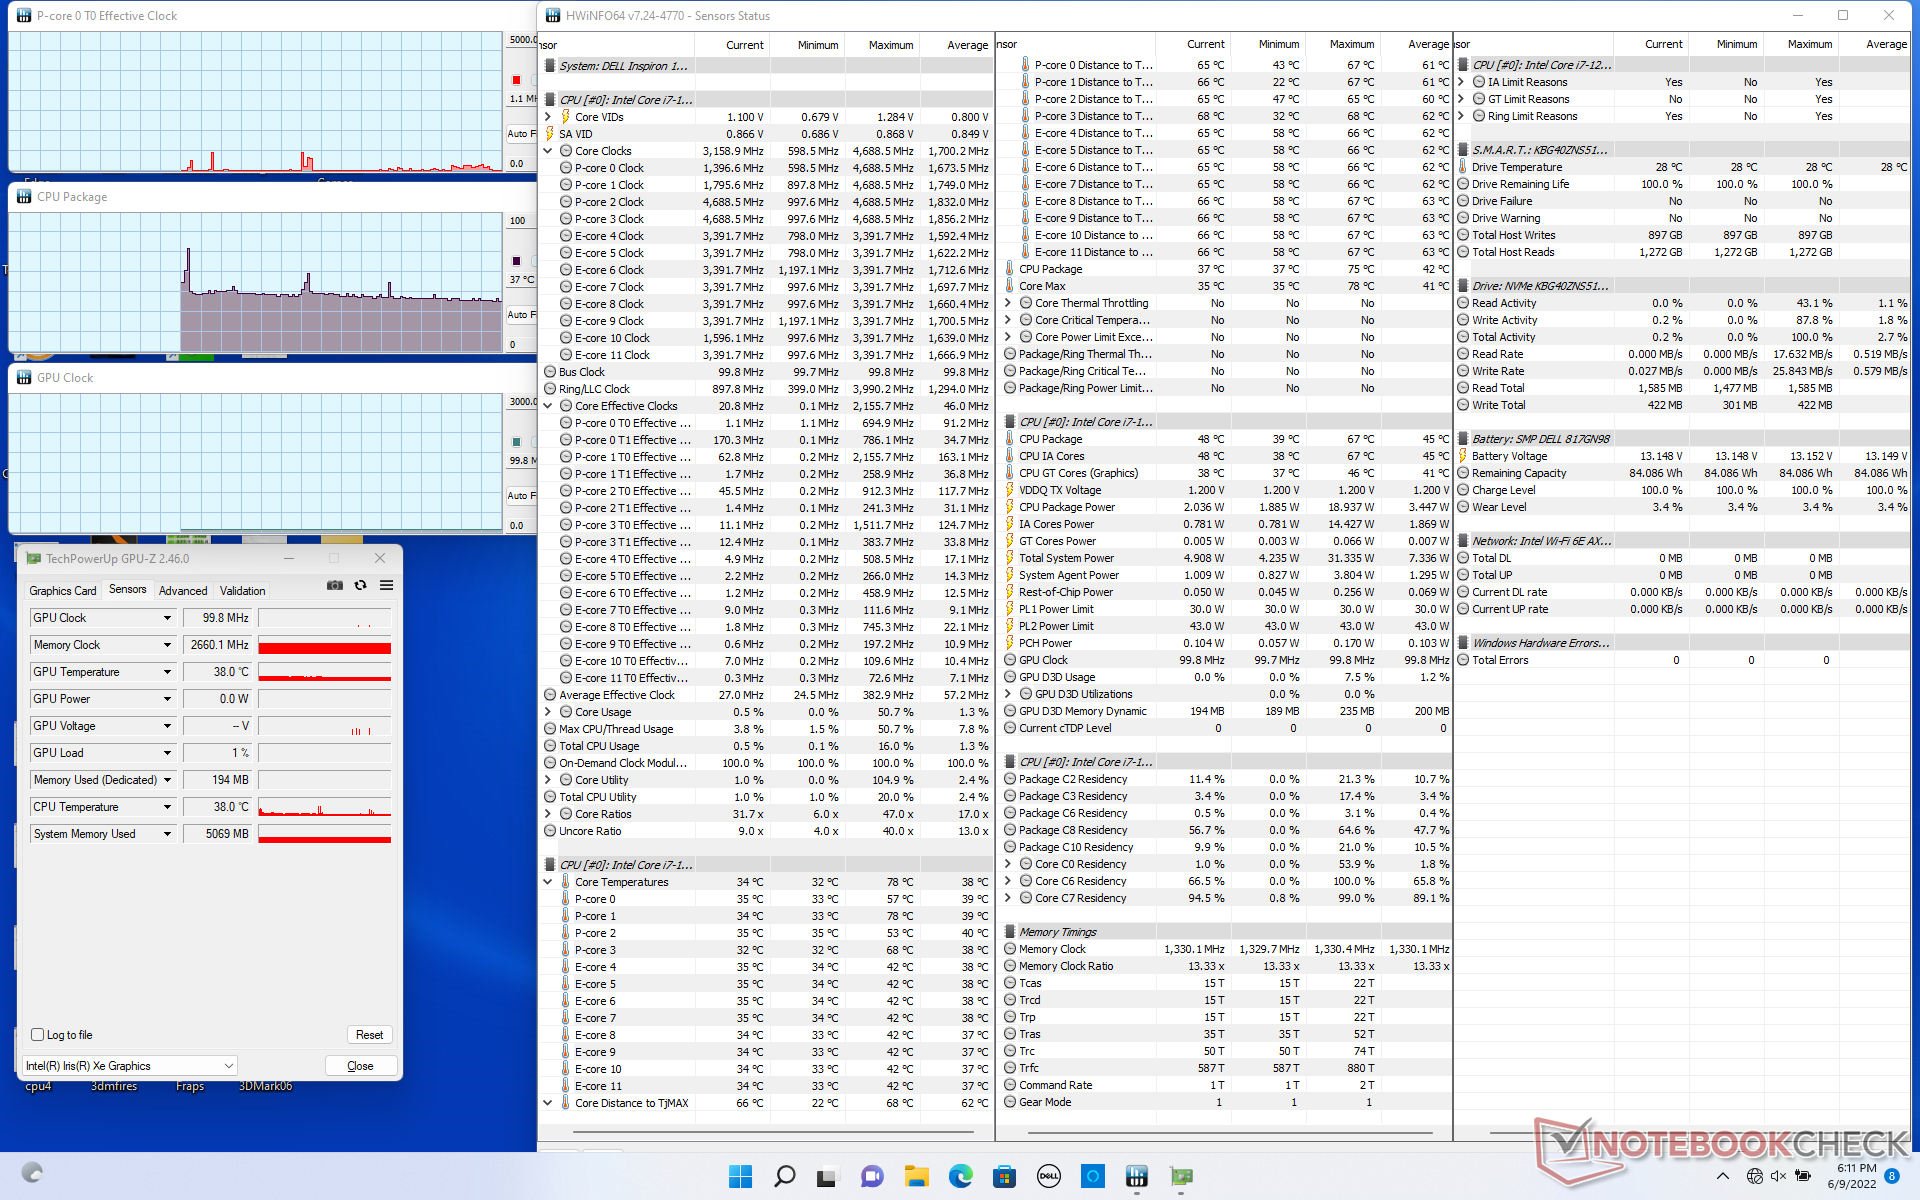
| CPU Clock (GHz) | GPU Clock (MHz) | Average CPU Temperature (°C) | |
| System Idle | -- | -- | 37 |
| Prime95 Stress | 2.1 | -- | 81 |
| Prime95 + FurMark Stress | 1.6 | 698 | 76 |
| Witcher 3 Stress | ~1.2 | 1296 | 82 |
Speakers
Dell Inspiron 16 7620 2-in-1 audio analysis
(+) | speakers can play relatively loud (89.8 dB)
Bass 100 - 315 Hz
(-) | nearly no bass - on average 15.3% lower than median
(±) | linearity of bass is average (8.8% delta to prev. frequency)
Mids 400 - 2000 Hz
(+) | balanced mids - only 3.3% away from median
(+) | mids are linear (4.8% delta to prev. frequency)
Highs 2 - 16 kHz
(+) | balanced highs - only 3.2% away from median
(+) | highs are linear (5% delta to prev. frequency)
Overall 100 - 16.000 Hz
(+) | overall sound is linear (11.5% difference to median)
Compared to same class
» 9% of all tested devices in this class were better, 3% similar, 88% worse
» The best had a delta of 6%, average was 20%, worst was 57%
Compared to all devices tested
» 8% of all tested devices were better, 2% similar, 90% worse
» The best had a delta of 4%, average was 24%, worst was 134%
Apple MacBook Pro 16 2021 M1 Pro audio analysis
(+) | speakers can play relatively loud (84.7 dB)
Bass 100 - 315 Hz
(+) | good bass - only 3.8% away from median
(+) | bass is linear (5.2% delta to prev. frequency)
Mids 400 - 2000 Hz
(+) | balanced mids - only 1.3% away from median
(+) | mids are linear (2.1% delta to prev. frequency)
Highs 2 - 16 kHz
(+) | balanced highs - only 1.9% away from median
(+) | highs are linear (2.7% delta to prev. frequency)
Overall 100 - 16.000 Hz
(+) | overall sound is linear (4.6% difference to median)
Compared to same class
» 0% of all tested devices in this class were better, 0% similar, 100% worse
» The best had a delta of 5%, average was 17%, worst was 45%
Compared to all devices tested
» 0% of all tested devices were better, 0% similar, 100% worse
» The best had a delta of 4%, average was 24%, worst was 134%
Energy Management
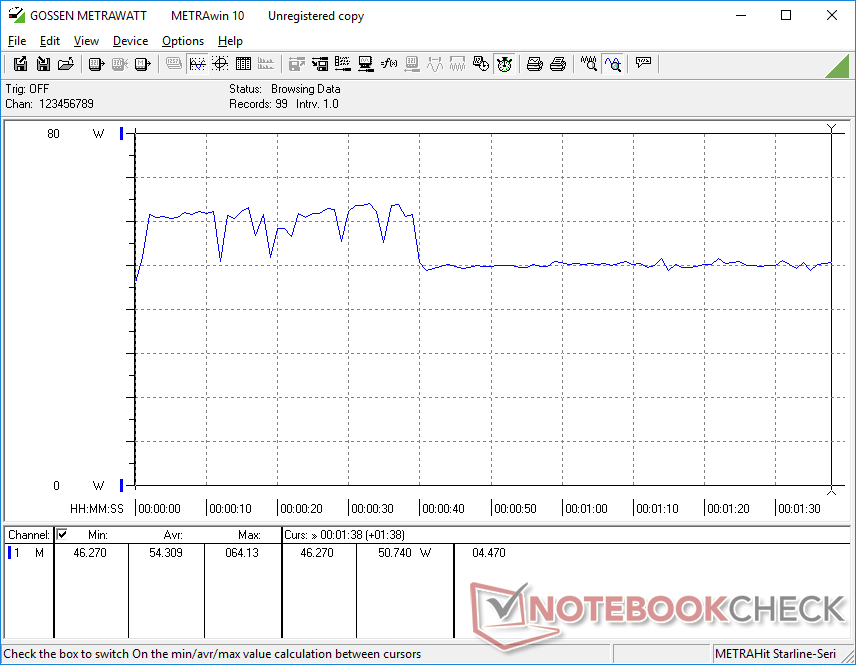
Power Consumption - Very High Performance-Per-Watt
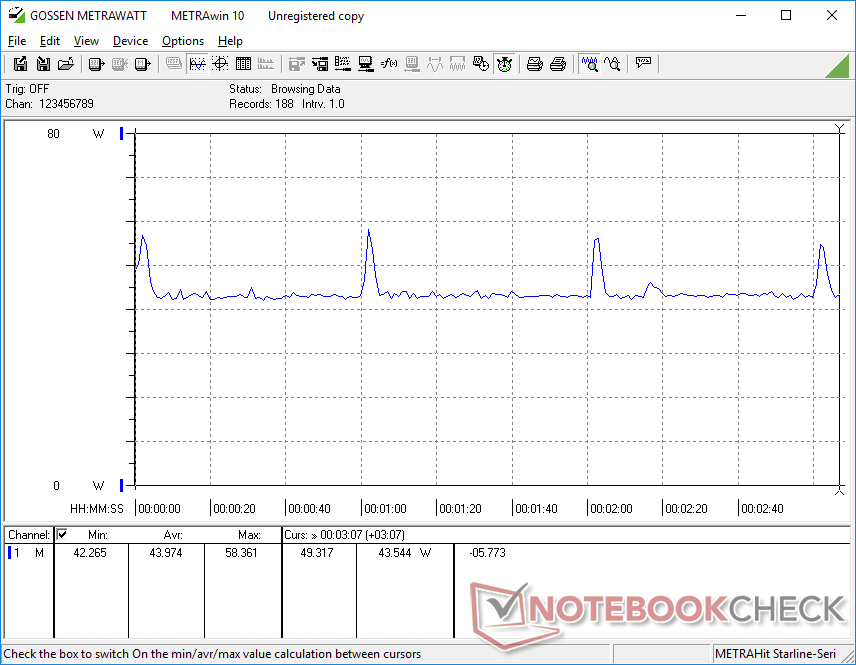
Idling on desktop demands between 5 W and 10 W depending on the power profile and brightness setting. Running higher loads like games demands between 44 W and 54 W which is noticeably higher than on the 11th gen-powered LG Gram 16 2-in-1 by 10 to 20 percent when under similar conditions. The higher consumption is expected since the Inspiron 16 7620 2-in-1 is utilizing a Core P-series CPU instead of the more common U-series. We find the increase in power consumption to be worthwhile since the raw CPU performance increase over the Core i7-1165G7 in the LG is much higher at up to 80 percent.
We're able to measure a temporary maximum draw of 70 W from the small (~11.1 x 5.1 x 2.7 cm) 65 W USB-C AC adapter when running Prime95 stress. This is the exact same adapter that also ships with the Inspiron 14 7420 2-in-1.
| Off / Standby | |
| Idle | |
| Load |
|
Key:
min: | |
| Dell Inspiron 16 7620 2-in-1 i7-1260P, Iris Xe G7 96EUs, Toshiba KBG40ZNS512G NVMe, IPS, 1920x1200, 16" | LG Gram 16 2-in-1 16T90P i7-1165G7, Iris Xe G7 96EUs, SK Hynix PC401 512GB M.2 (HFS512GD9TNG), IPS, 2560x1600, 16" | Samsung Galaxy Book Pro 360 15 NP950QDB-KC3DE i5-1135G7, Iris Xe G7 80EUs, Samsung PM991 MZVLQ256HAJD, OLED, 1920x1080, 15.6" | Asus ZenBook Flip 15 UX563FD-A1027T i7-10510U, GeForce GTX 1050 Max-Q, Samsung SSD PM981 MZVLB1T0HALR, IPS, 3840x2160, 15.6" | Dell Inspiron 15 5579-9672 i5-8250U, UHD Graphics 620, SK hynix SC311 SATA, IPS, 1920x1080, 15.6" | HP Spectre X360 15-5ZV31AV i7-10510U, GeForce MX250, Intel SSD 660p 2TB SSDPEKNW020T8, IPS, 3840x2160, 15.6" | |
|---|---|---|---|---|---|---|
| Power Consumption | 6% | 20% | -25% | 29% | -12% | |
| Idle Minimum * (Watt) | 5.3 | 4.4 17% | 4 25% | 2.3 57% | 3.9 26% | 5.2 2% |
| Idle Average * (Watt) | 8.3 | 9 -8% | 5.6 33% | 10.3 -24% | 6.6 20% | 8.5 -2% |
| Idle Maximum * (Watt) | 9.6 | 10.1 -5% | 10.1 -5% | 11 -15% | 9.3 3% | 8.7 9% |
| Load Average * (Watt) | 54.3 | 45.5 16% | 34.7 36% | 77 -42% | 30.2 44% | 65.6 -21% |
| Witcher 3 ultra * (Watt) | 43.9 | 39.6 10% | 34.7 21% | 68 -55% | 56.5 -29% | |
| Load Maximum * (Watt) | 70 | 67 4% | 63 10% | 118 -69% | 33.2 53% | 92.4 -32% |
* ... smaller is better
Power Consumption Witcher 3 / Stresstest
Power Consumption external Monitor
Battery Life
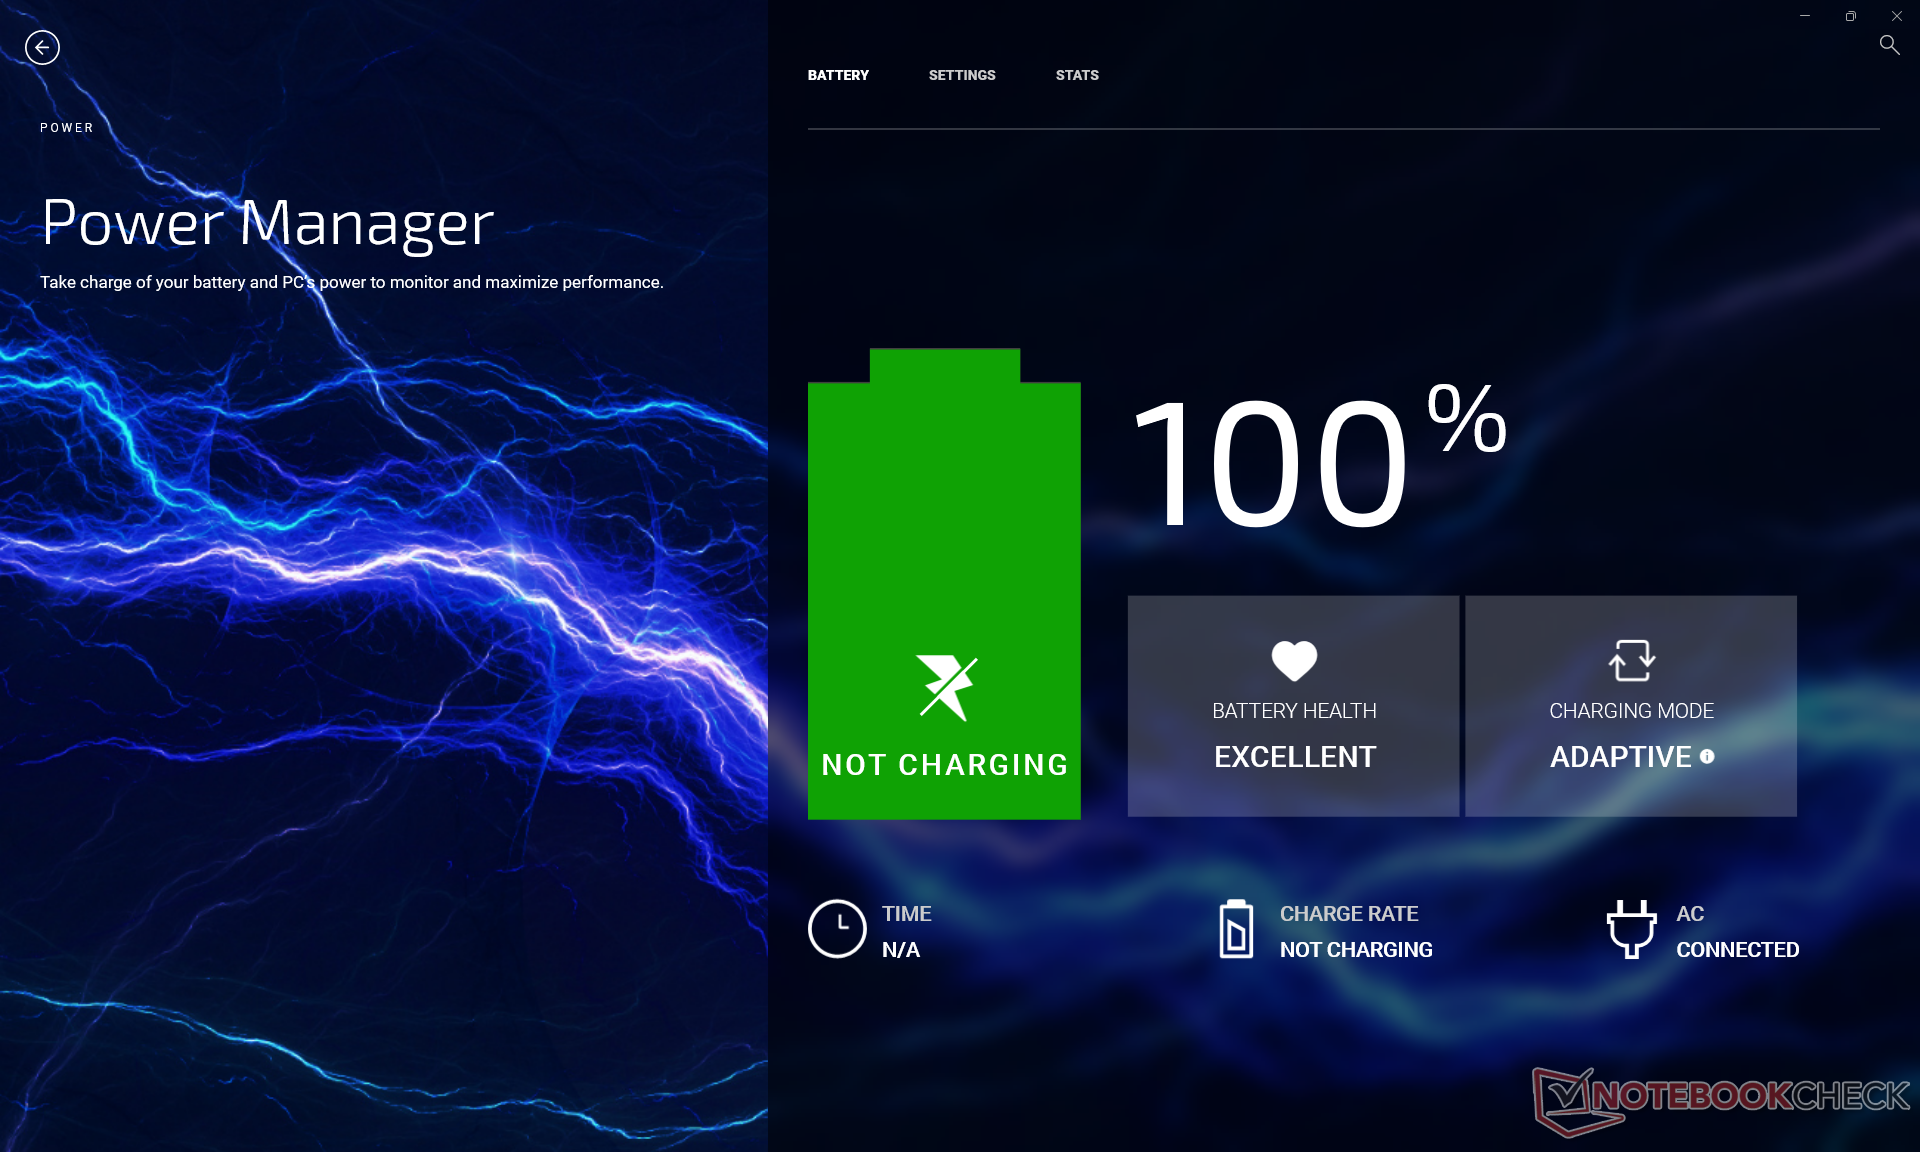
Runtimes are very long at over 14 hours of real-world WLAN usage when on the Balanced power profile. Competing 15.6-inch convertibles like the HP Spectre X360 15 or Galaxy Book Pro 360 15 last for a few hours shorter when under similar conditions. However, keep in mind that there are SKUs with a smaller 64 Wh battery compared to the 87 Wh battery in our test unit. The smaller battery option trades capacity for a lighter and thus more travel-friendly system.
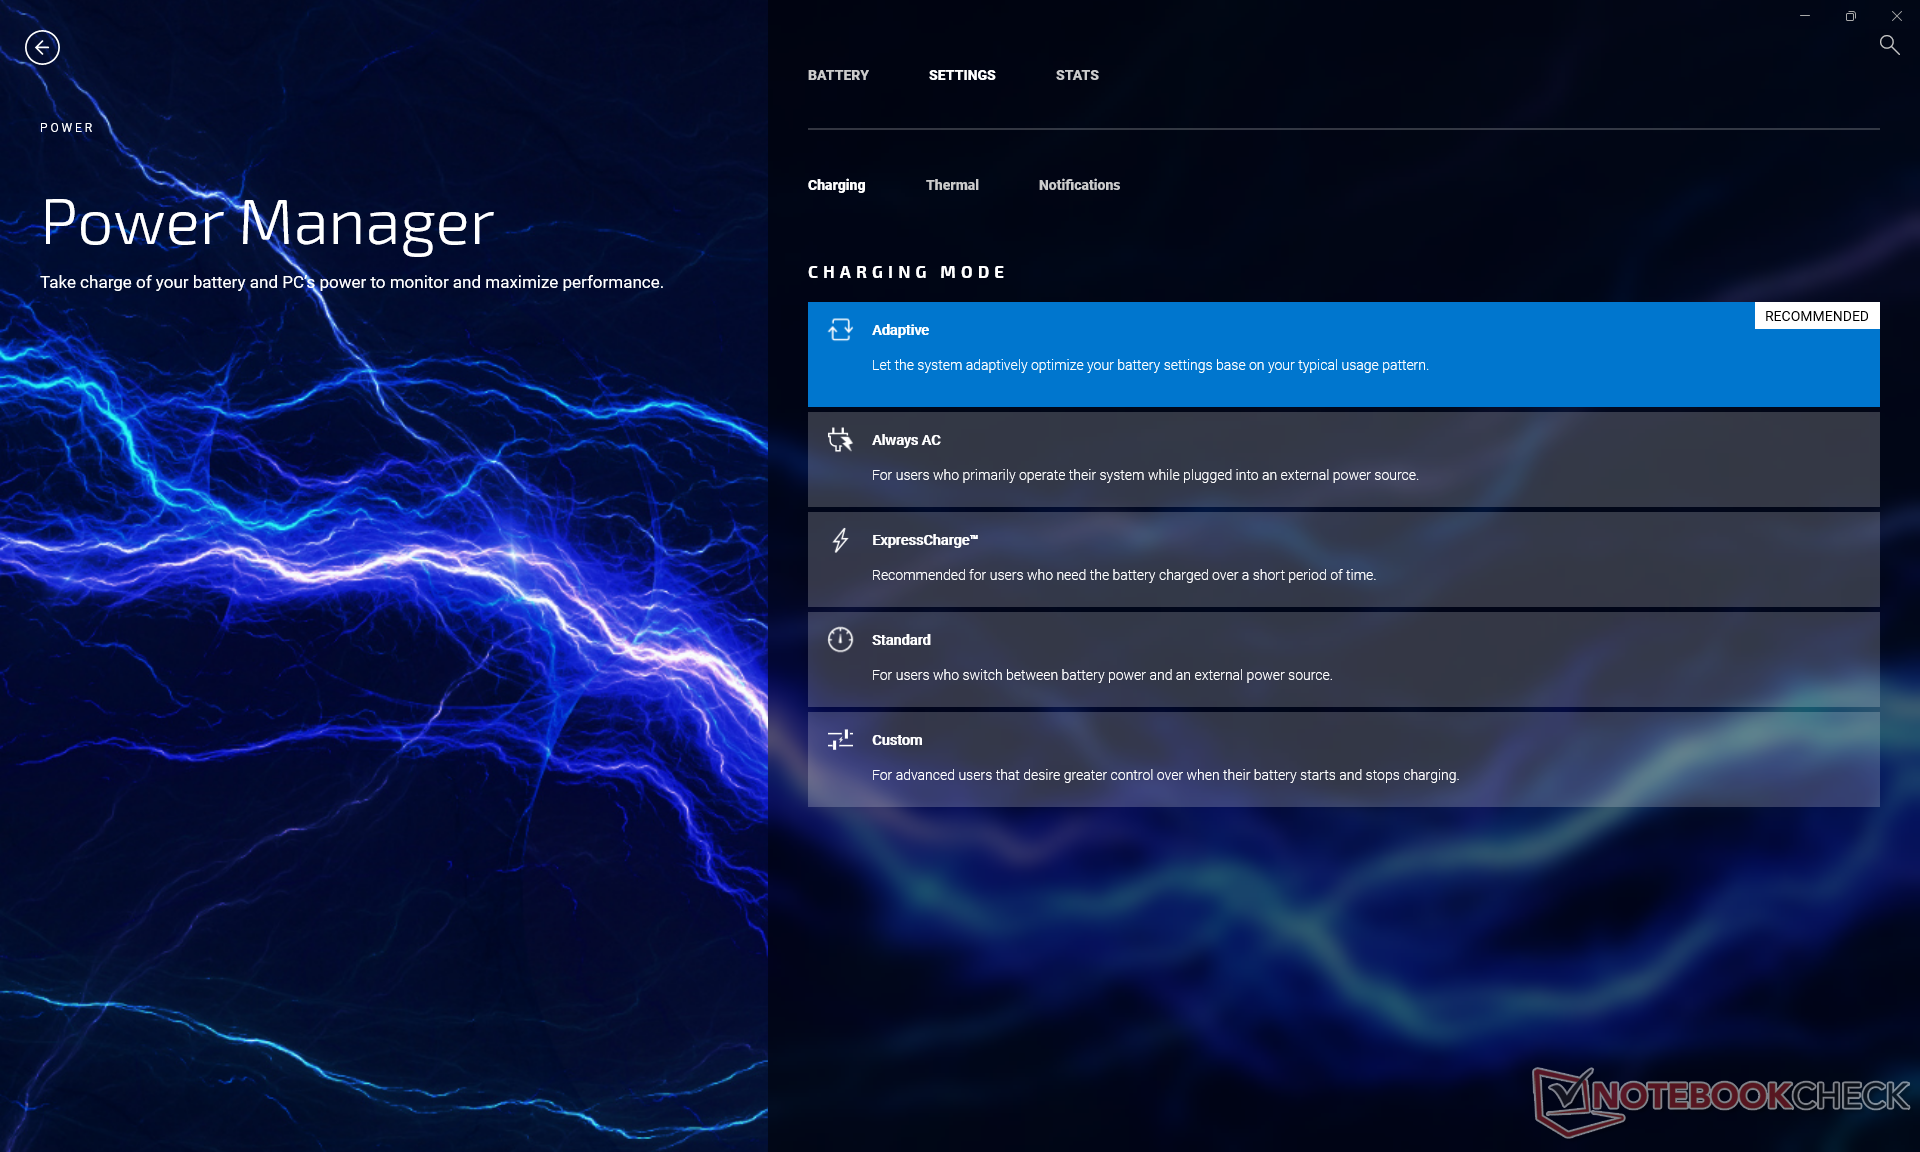
Charging from empty to full capacity takes 2 hours and 15 minutes or about half an hour longer than on the smaller Inspiron 14 7420 2-in-1.
| Dell Inspiron 16 7620 2-in-1 i7-1260P, Iris Xe G7 96EUs, 87 Wh | LG Gram 16 2-in-1 16T90P i7-1165G7, Iris Xe G7 96EUs, 80 Wh | Samsung Galaxy Book Pro 360 15 NP950QDB-KC3DE i5-1135G7, Iris Xe G7 80EUs, 67 Wh | Asus ZenBook Flip 15 UX563FD-A1027T i7-10510U, GeForce GTX 1050 Max-Q, 71 Wh | Dell Inspiron 15 5579-9672 i5-8250U, UHD Graphics 620, 42 Wh | HP Spectre X360 15-5ZV31AV i7-10510U, GeForce MX250, 84 Wh | |
|---|---|---|---|---|---|---|
| Battery runtime | 21% | 2% | -14% | -43% | -1% | |
| Reader / Idle (h) | 17 | 29.6 74% | 27.6 62% | 19.5 15% | 11.2 -34% | 22.6 33% |
| WiFi v1.3 (h) | 14.6 | 15.7 8% | 11.3 -23% | 9.4 -36% | 7.3 -50% | 10.8 -26% |
| Load (h) | 3.2 | 2.6 -19% | 2.1 -34% | 2.5 -22% | 1.8 -44% | 2.9 -9% |
| H.264 (h) | 11.2 | 6.7 |
Pros
Cons
Verdict — Very Different From The Inspiron 16 7610
The Inspiron 16 7620 2-in-1 has dropped the Core H-series CPU and GeForce RTX GPU options of the Inspiron 7610 in favor of Core U-series and Core P-series CPUs with GeForce MX graphics. Though performance hunters may be disappointed, we find this to be a respectable change given the target audience of multimedia users and amateur graphic editors. The display in particular hasn't taken a hit at all and so users are still getting full sRGB coverage despite the losses in CPU and GPU performance.
This isn't to say that the Inspiron 16 7620 2-in-1 is slow as it is still one of the faster 16-inch convertibles currently available. Its optional GeForce MX550 GPU is uncommon amongst convertible laptops for a higher level of graphics performance for those who need it.
Multimedia users will love the display, strong 2-in-1 form factor, port options, and lean performance of the Inspiron 16 7620 2-in-1. Frequent travelers may want something lighter, however.
One of the biggest drawbacks to the model is its weight. While no 16-inch laptop is going to be very light, the Inspiron here is much heavier than the LG Gram 16 2-in-1 or Samsung Galaxy Book Pro 360 15. Such alternatives may be worth considering if you don't mind trading in some performance and chassis rigidity for a model that is much more backpack friendly.
Price and Availability
The Dell Inspiron 16 7620 2-in-1 is not yet widely available across most third-party retailers. We recommend ordering directly from Dell where multiple configurations are available starting at $1250 USD with FHD and no discrete graphics up to $1550 with 4K OLED and dedicated GeForce MX550 graphics.
Dell Inspiron 16 7620 2-in-1
- 06/15/2022 v7 (old)
Allen Ngo
Price comparison
