Asus ROG Zephyrus Duo 16 review: An unusual gaming laptop with a good battery life

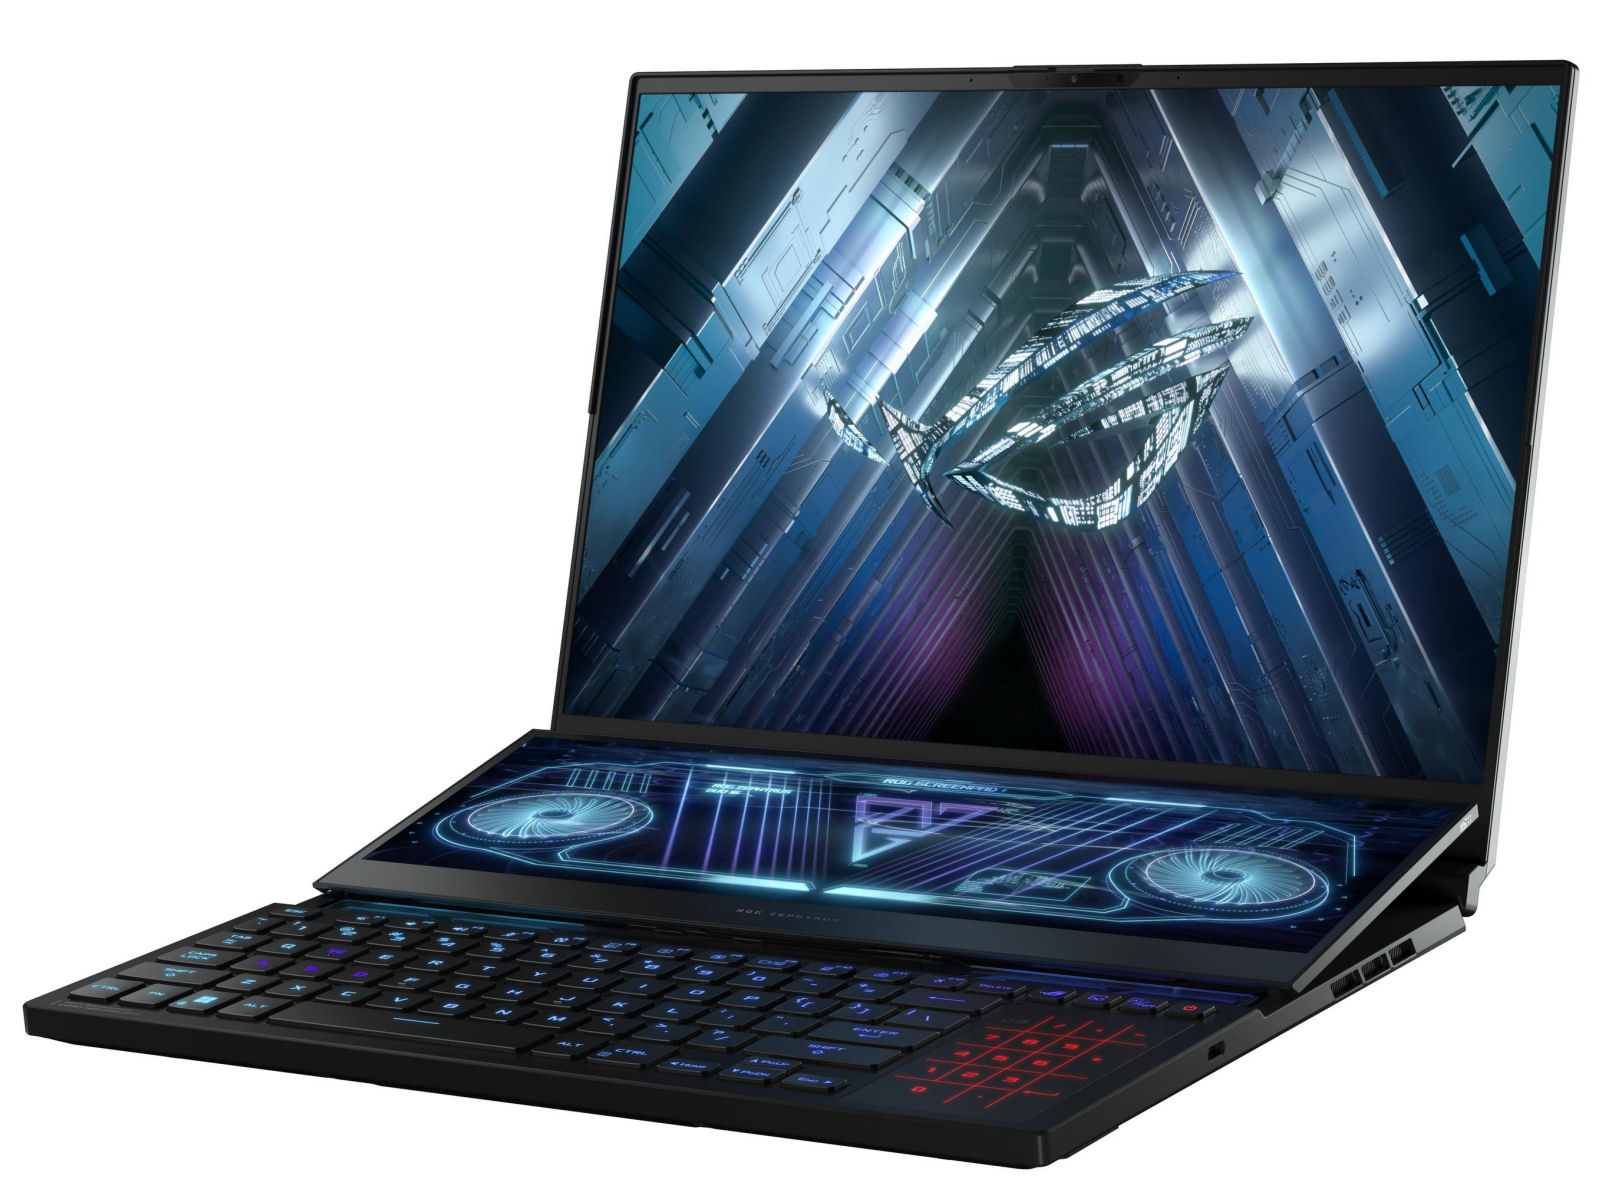
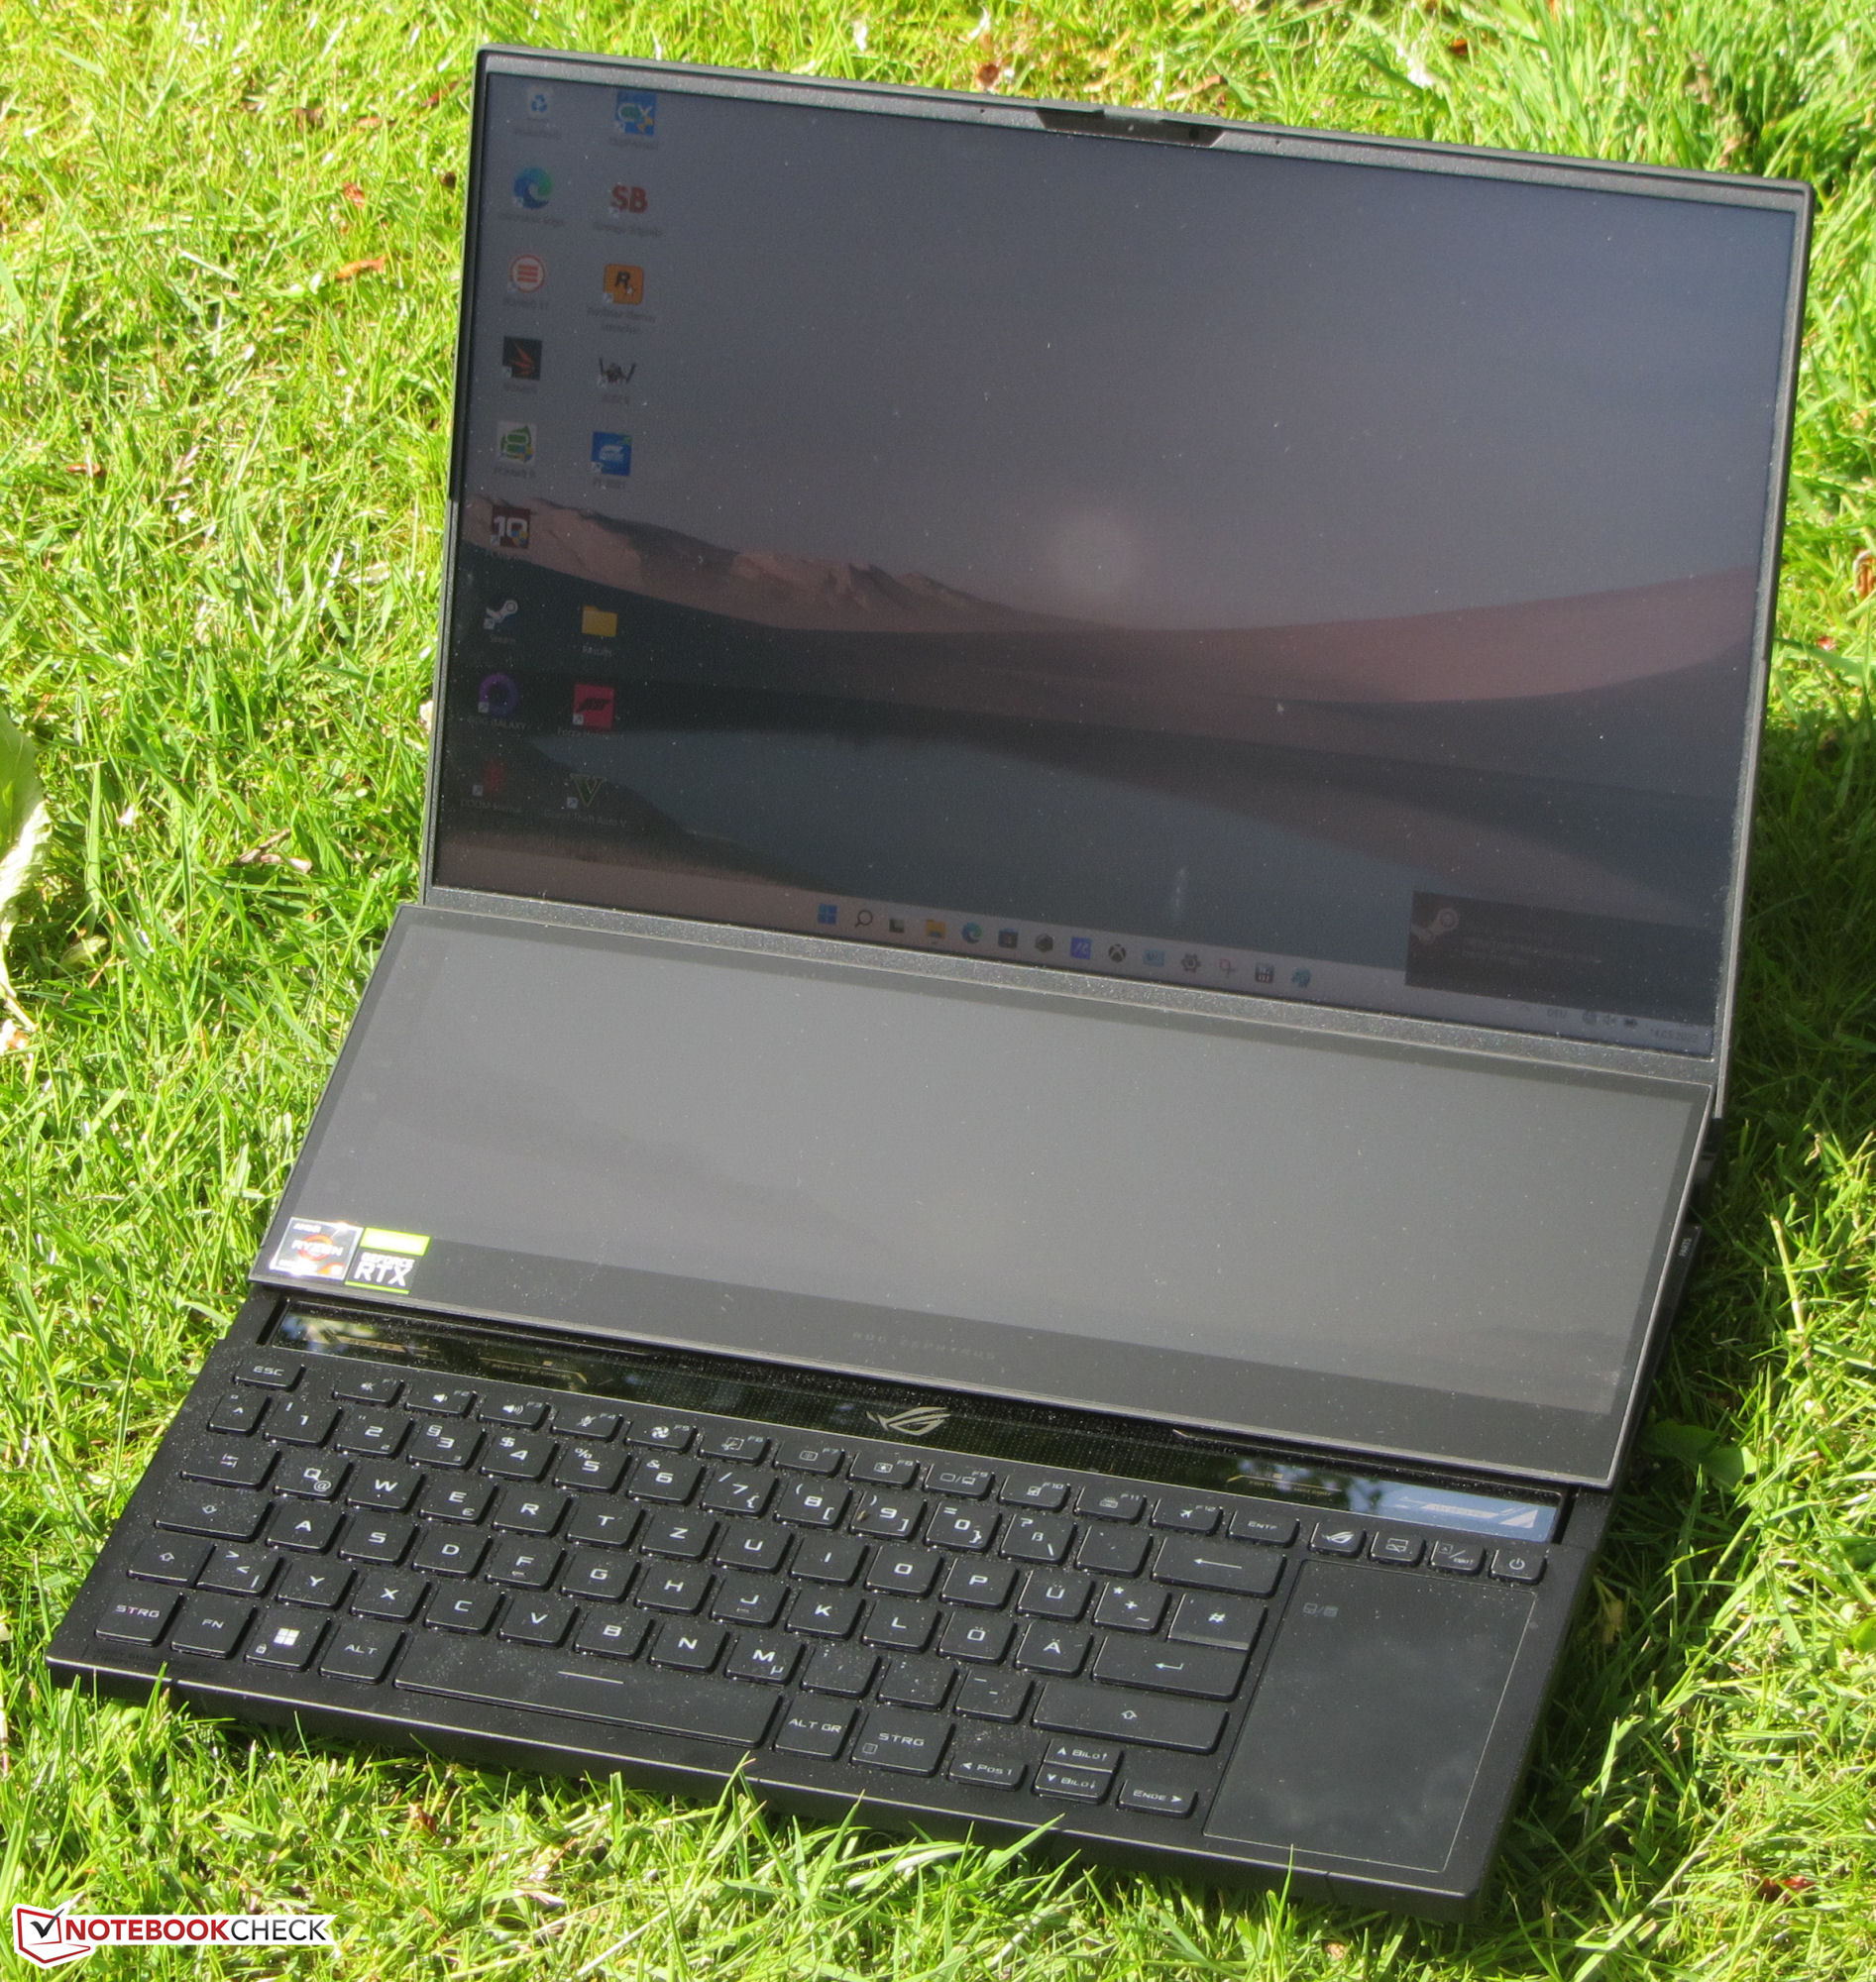
With the Zephyrus Duo 16, Asus presents a laptop for gamers, streamers, and content creators, whose most striking feature becomes immediately apparent: Placed above the keyboard is a second display including touchscreen functionality (Screenpad Plus). The competitors include devices such as the Razer Blade 15 Advanced Model, the Gigabyte Aero 16 YE5, the MSI GE76 Raider, the Medion Erazer Beast X30, and the Apple MacBook Pro 16 2021.
Possible Competitors in Comparison
Rating | Date | Model | Weight | Height | Size | Resolution | Price |
|---|---|---|---|---|---|---|---|
| 88.2 % v7 (old) | 05 / 2022 | Asus ROG Zephyrus Duo 16 GX650RX R9 6900HX, GeForce RTX 3080 Ti Laptop GPU | 2.6 kg | 20.5 mm | 16.00" | 3840x2400 | |
| 92.5 % v7 (old) | 11 / 2021 | Apple MacBook Pro 16 2021 M1 Max M1 Max, M1 Max 32-Core GPU | 2.2 kg | 16.8 mm | 16.20" | 3456x2234 | |
| 88.3 % v7 (old) | 05 / 2022 | Razer Blade 15 Advanced Model Early 2022 i7-12800H, GeForce RTX 3080 Ti Laptop GPU | 2.1 kg | 16.99 mm | 15.60" | 1920x1080 | |
| 87.5 % v7 (old) | 01 / 2022 | MSI GE76 Raider i9-12900HK, GeForce RTX 3080 Ti Laptop GPU | 3 kg | 26 mm | 17.30" | 1920x1080 | |
| 86.7 % v7 (old) | 05 / 2022 | Medion Erazer Beast X30 i9-12900HK, GeForce RTX 3080 Ti Laptop GPU | 2.2 kg | 23 mm | 17.30" | 2560x1440 | |
| 84.7 % v7 (old) | 03 / 2022 | Gigabyte Aero 16 YE5 i9-12900HK, GeForce RTX 3080 Ti Laptop GPU | 2.3 kg | 22.4 mm | 16.00" | 3840x2400 |
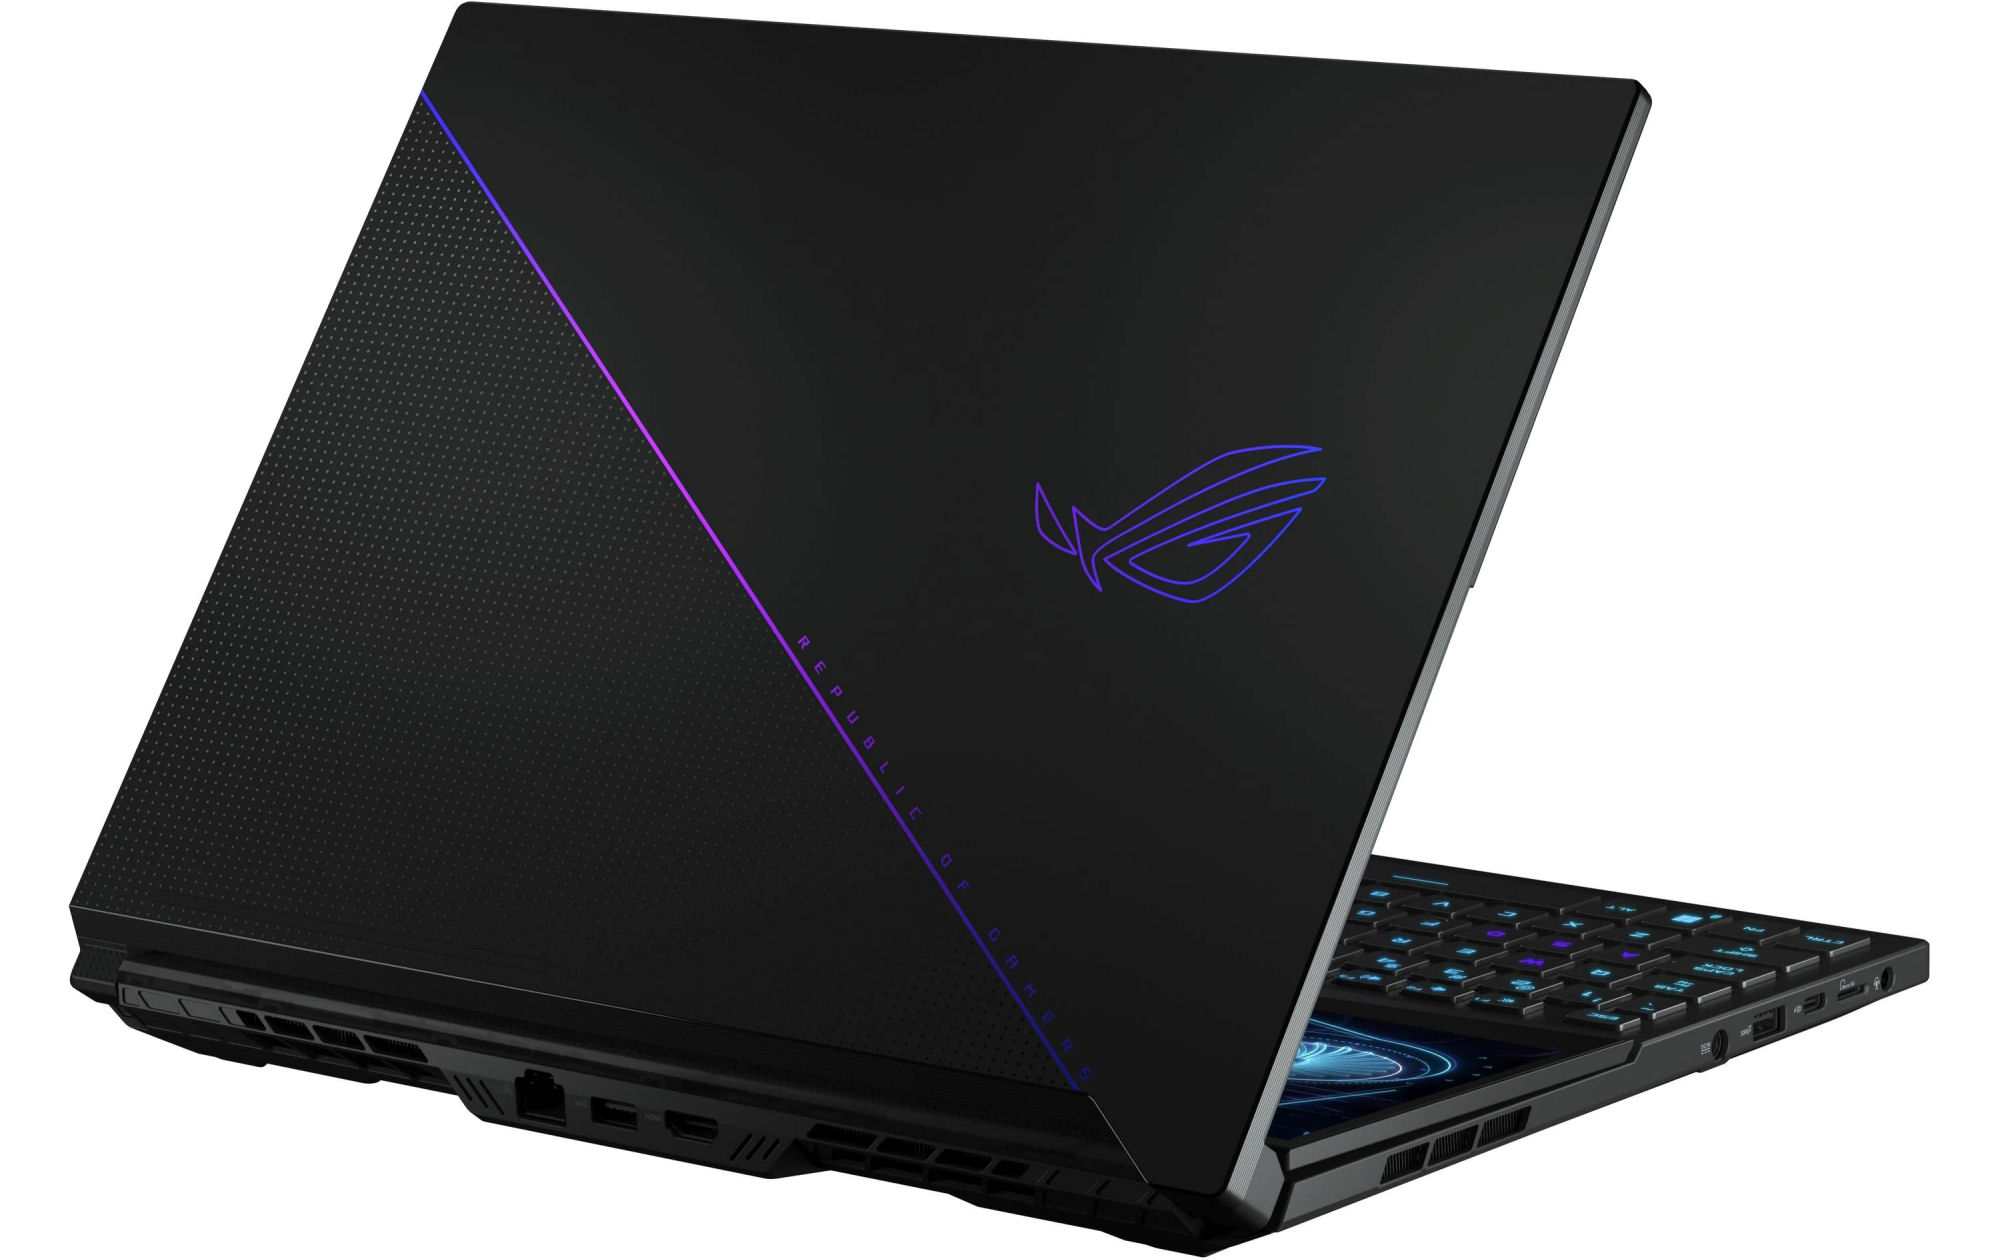
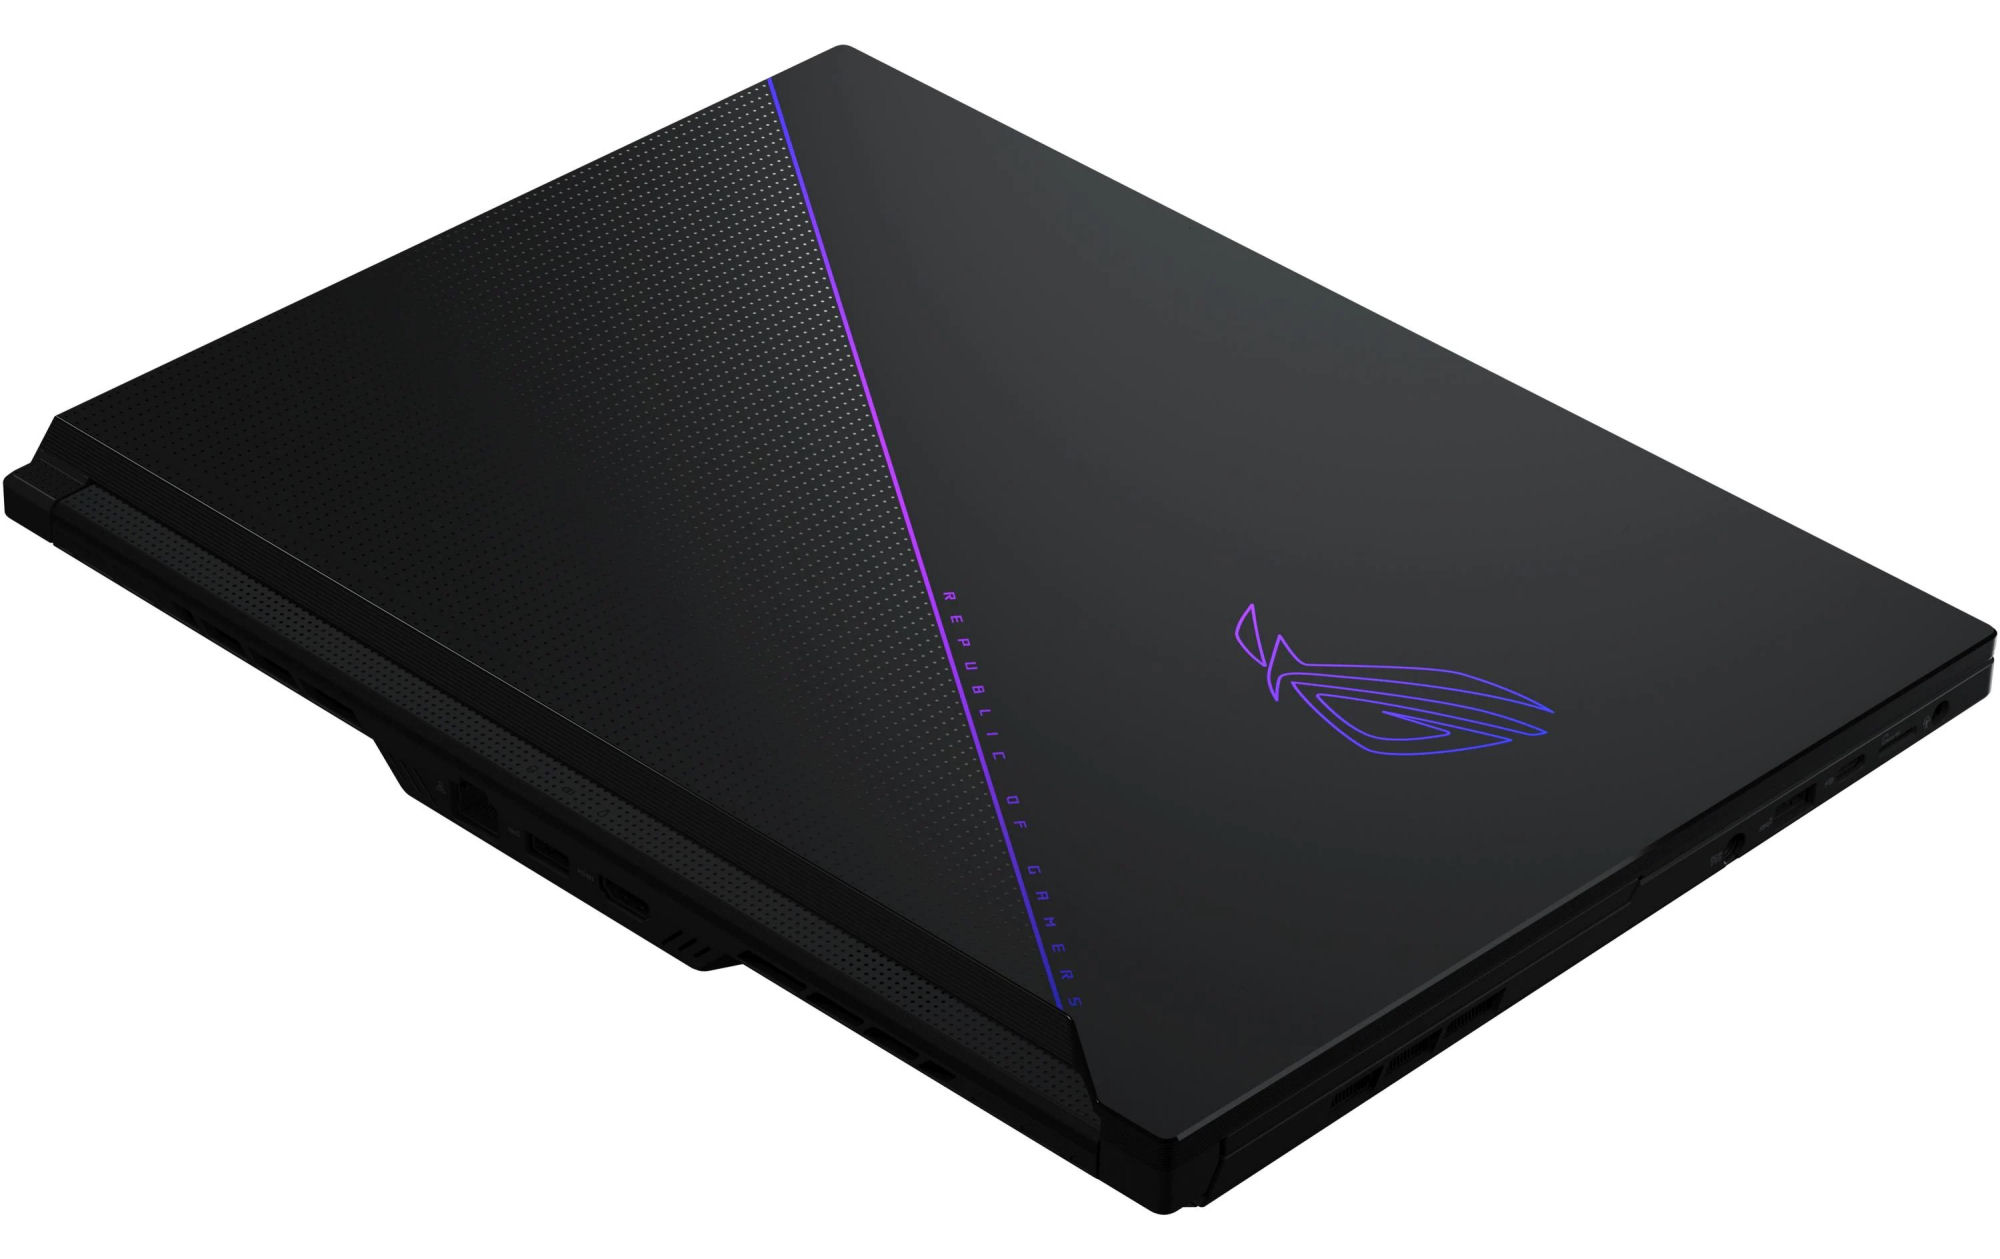
Case - GX650 with a robust metal case
The matte black metal case offers a good workmanship. There are no apparent gaps and no noticeable sharp edges. Another positive point is that the base unit cannot be warped. On the other hand, the lid could use a bit more stiffness. The hinges are able to hold the lid tightly in position. The maximum opening angle is about 130 degrees, and you can open the lid with one hand.
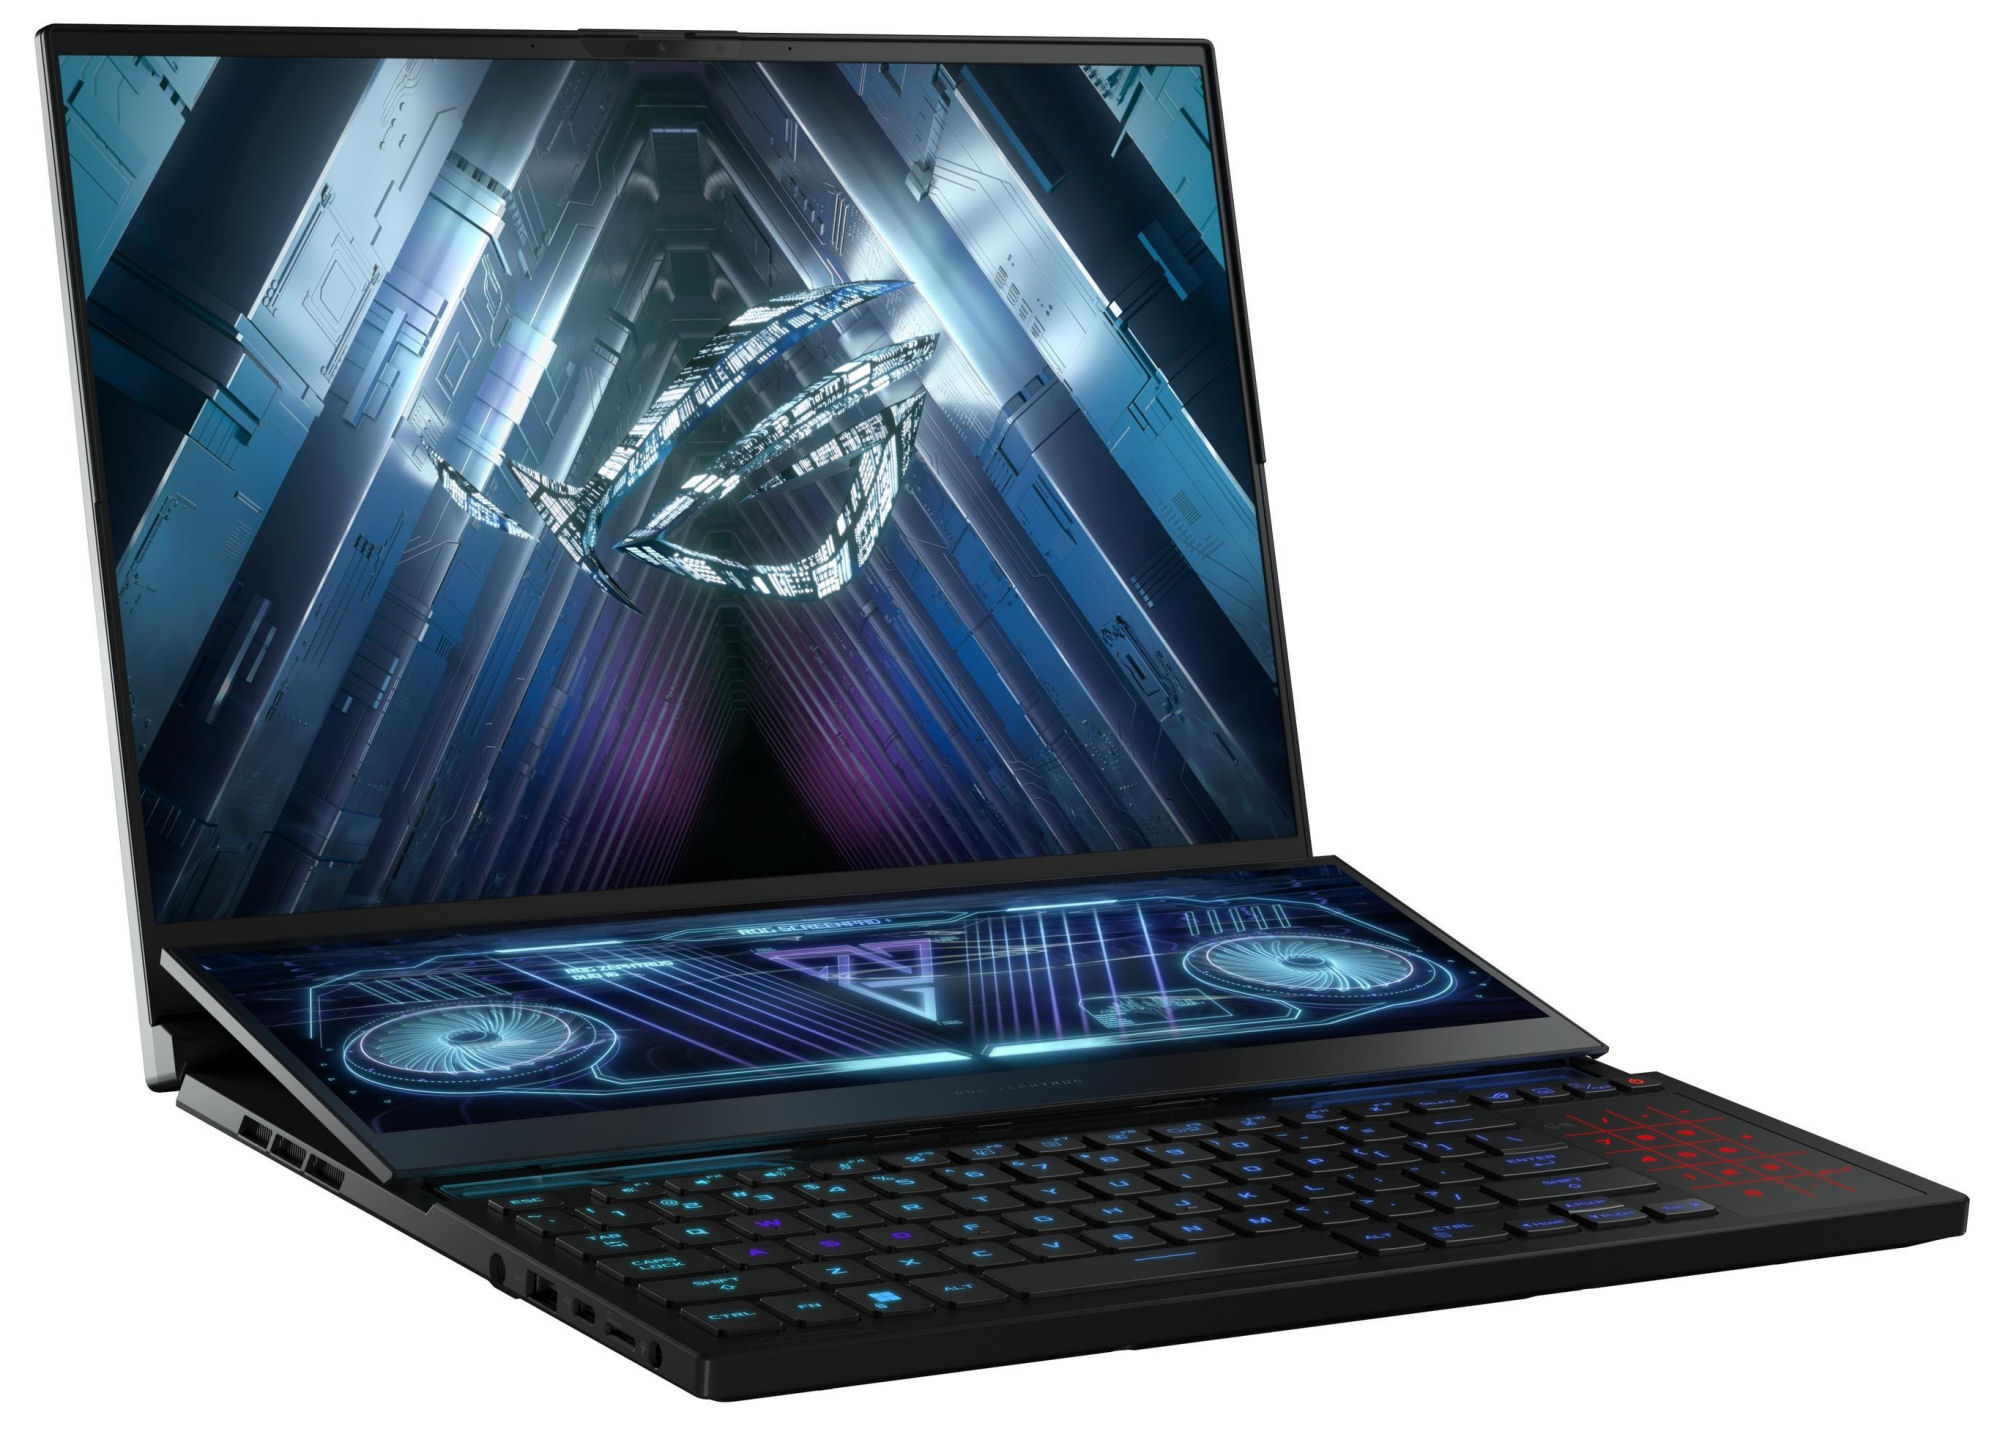
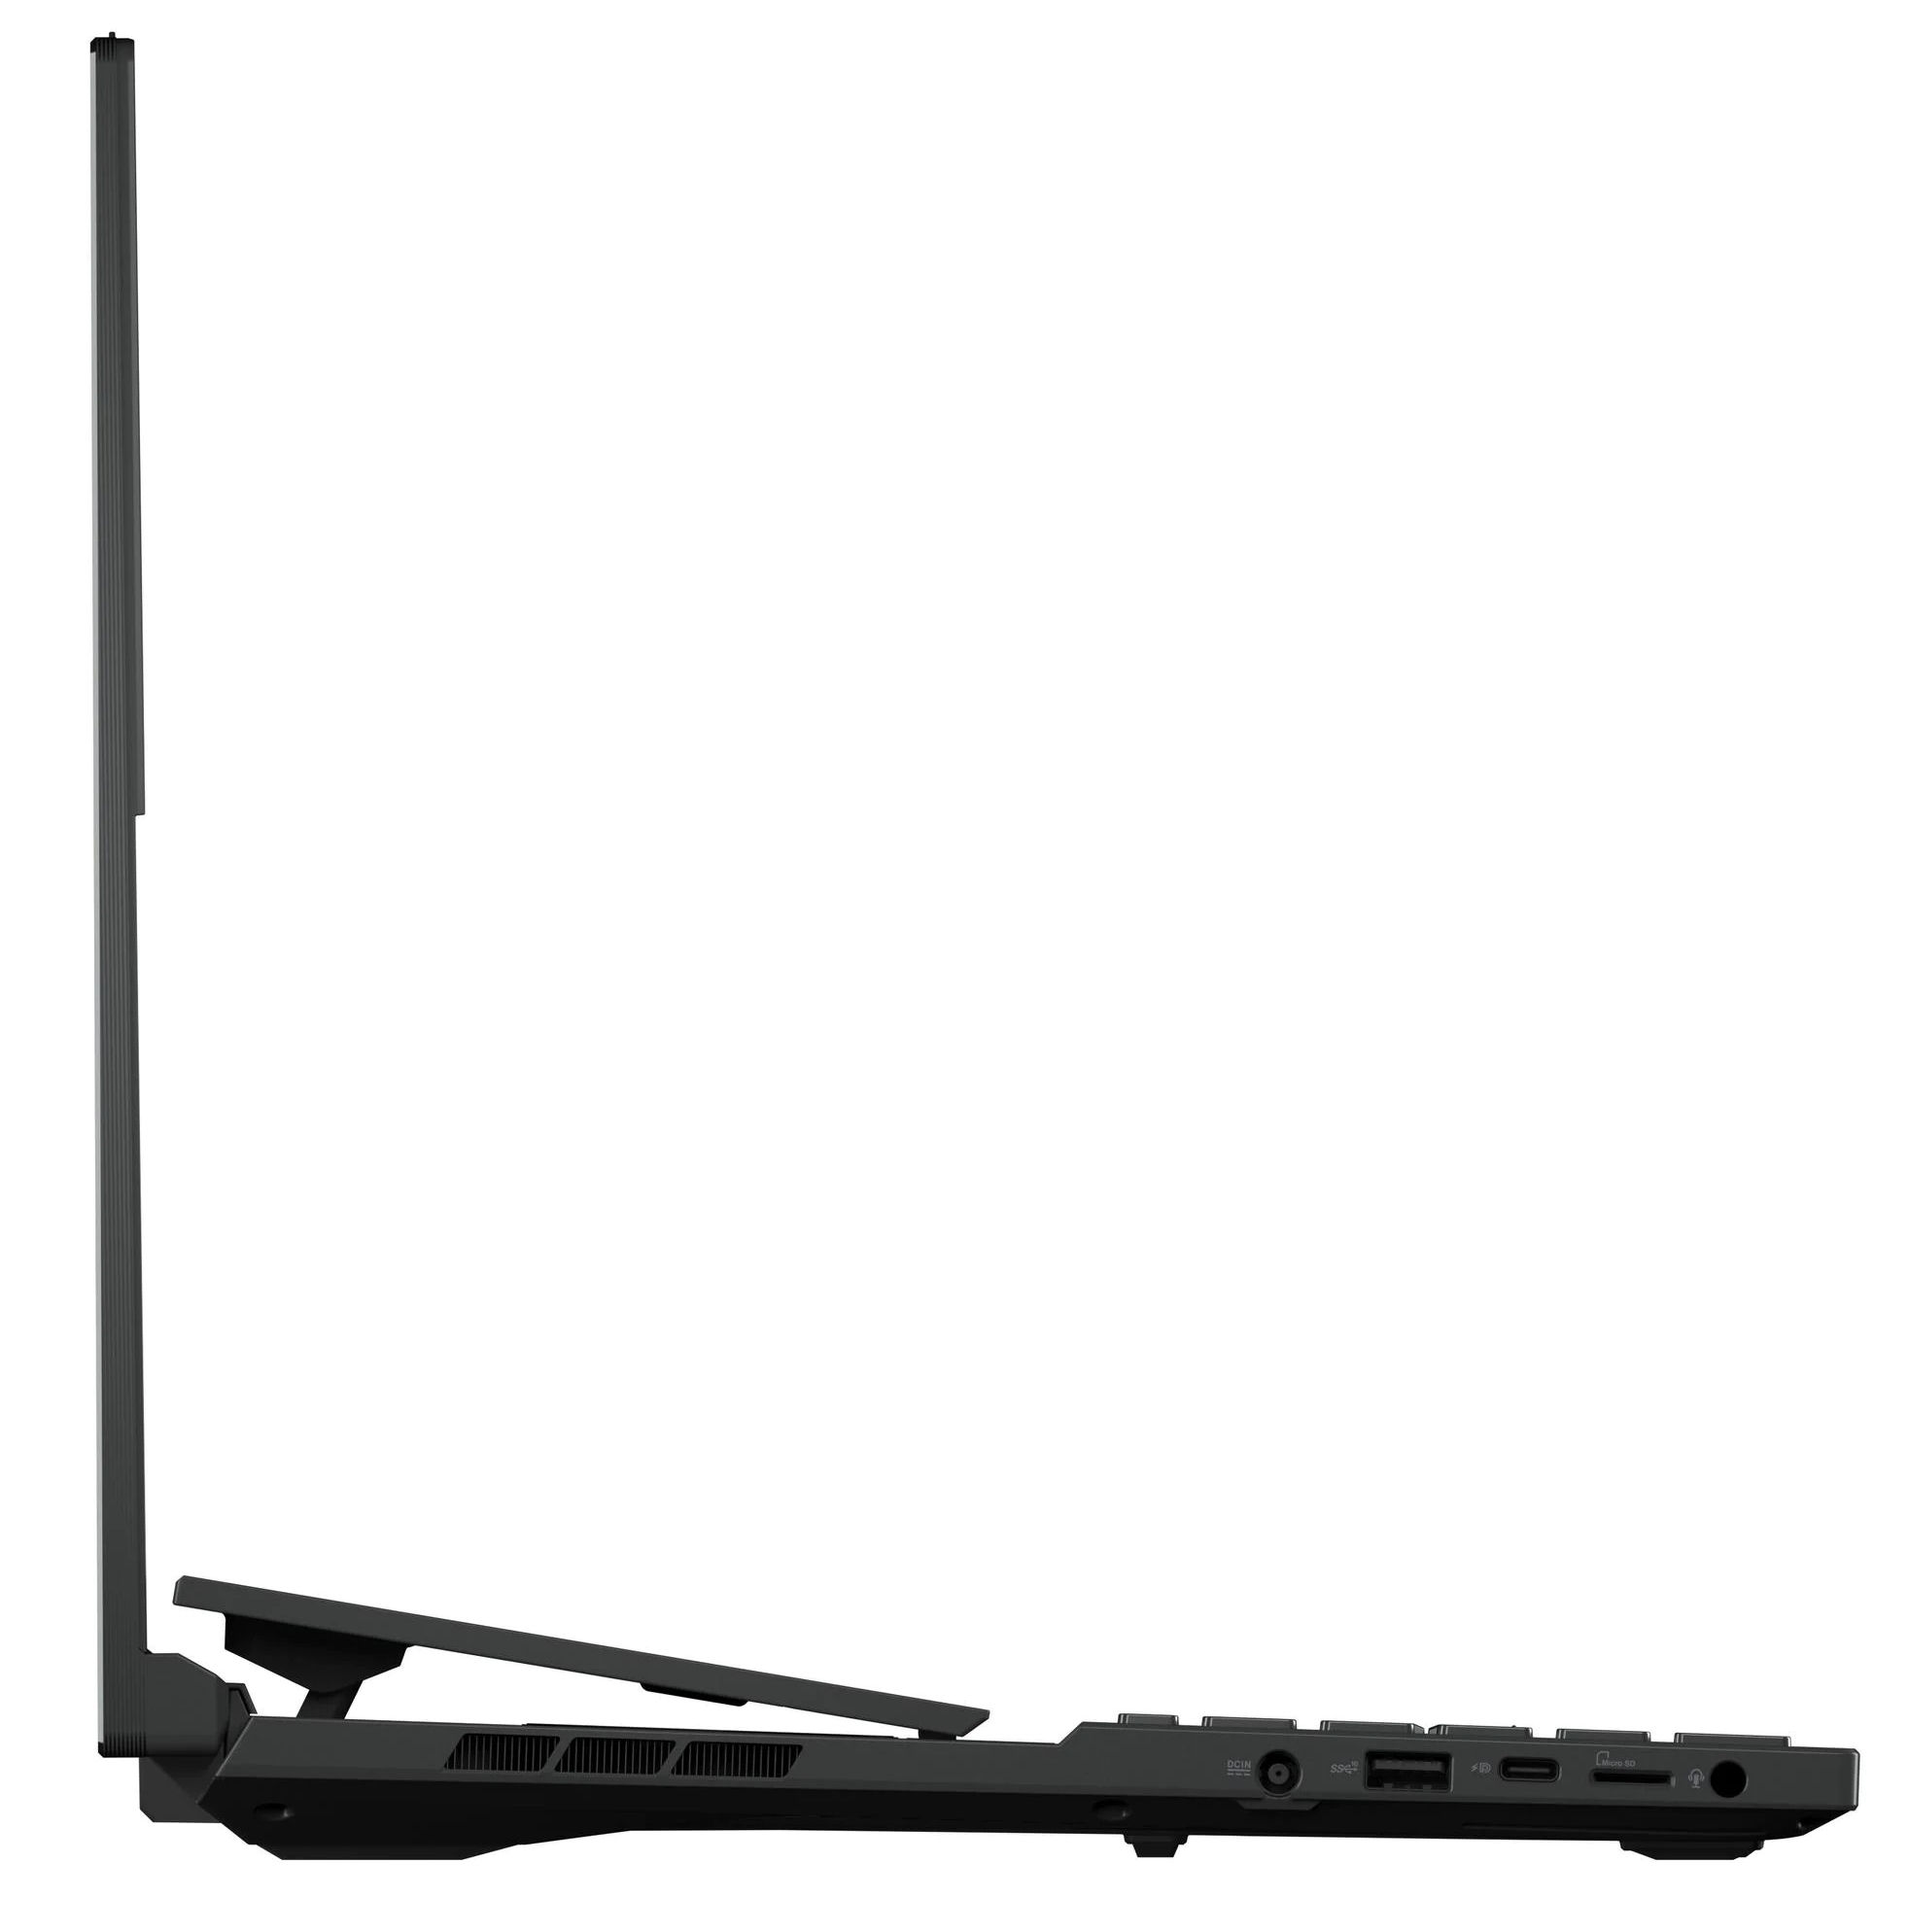
Once you open the display lid, the Screenpad, a second display with touchscreen functionality, is raised by a fixed angle of about 15 degrees towards the user. In addition, it is moved by about 2 cm (~0.8 in) toward the main screen. The resulting gap shows a transparent plastic plate that offers a glimpse into the insides of the case in some places. The raising of the Screenpad has not only ergonomic reasons, but there are also vent openings below the display to allow air flow into the case.


The Zephyrus is one of the heavier laptops in our comparison field. Only the MSI GE76 Raider is heavier. The dimensions also turn out slightly larger than comparable 16-inch laptops such as the MacBook Pro 16.
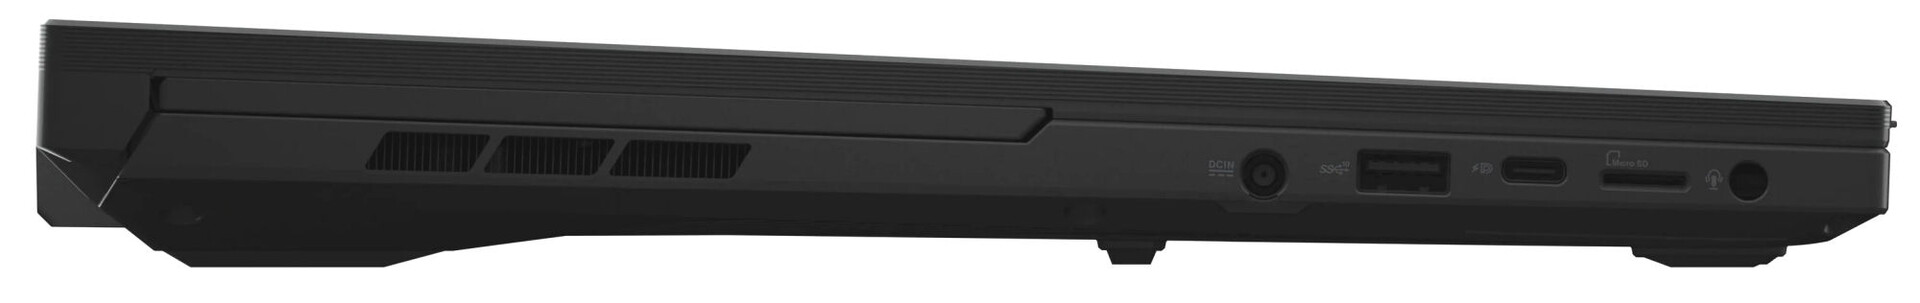
Equipment - The Zephyrus does not offer Thunderbolt 4
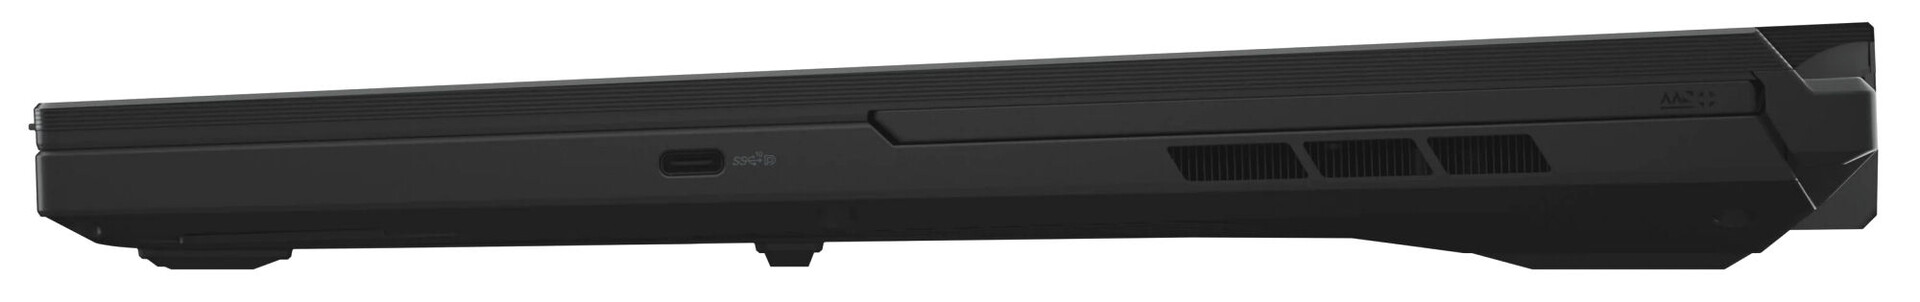
All four USB connections (2x USB-A, 2x USB-C) support the USB 3.2 Gen 2 standard. One of the two USB-C ports offers Power Delivery, and both ports support DisplayPort via USB-C. With this, the laptop offers three video output ports together with the HDMI 2.1 connection. The connections are completed by a combined audio port and a Gigabit Ethernet port.

SD Card Reader
The MicroSD storage card reader is one of the fast models with maximum transfer rates of 155 MB/s (transferring 250 jpg image files of about 5 MB each) and 185 MB/s (copying large data blocks) using our AV PRO microSD 128 GB V60 reference storage card.
| SD Card Reader | |
| average JPG Copy Test (av. of 3 runs) | |
| Razer Blade 15 Advanced Model Early 2022 (AV PRO microSD 128 GB V60) | |
| Asus ROG Zephyrus Duo 16 GX650RX (AV PRO microSD 128 GB V60) | |
| Average of class Gaming (20.9 - 210, n=53, last 2 years) | |
| MSI GE76 Raider (AV PRO microSD 128 GB V60) | |
| Medion Erazer Beast X30 (AV PRO microSD 128 GB V60) | |
| maximum AS SSD Seq Read Test (1GB) | |
| Asus ROG Zephyrus Duo 16 GX650RX (AV PRO microSD 128 GB V60) | |
| Average of class Gaming (25.5 - 261, n=50, last 2 years) | |
| Medion Erazer Beast X30 (AV PRO microSD 128 GB V60) | |
Communication
The WLAN transfer rates determined under optimal conditions (with no additional WLAN devices nearby and the laptop and server PC in close proximity) turn out excellent and correspond to the capabilities of the WiFi chip (Mediatek MT7922; 802.11 ax, WiFi 6E). Wired network connections are handled by a Gigabit Ethernet chip (RTL8125) from Realtek.
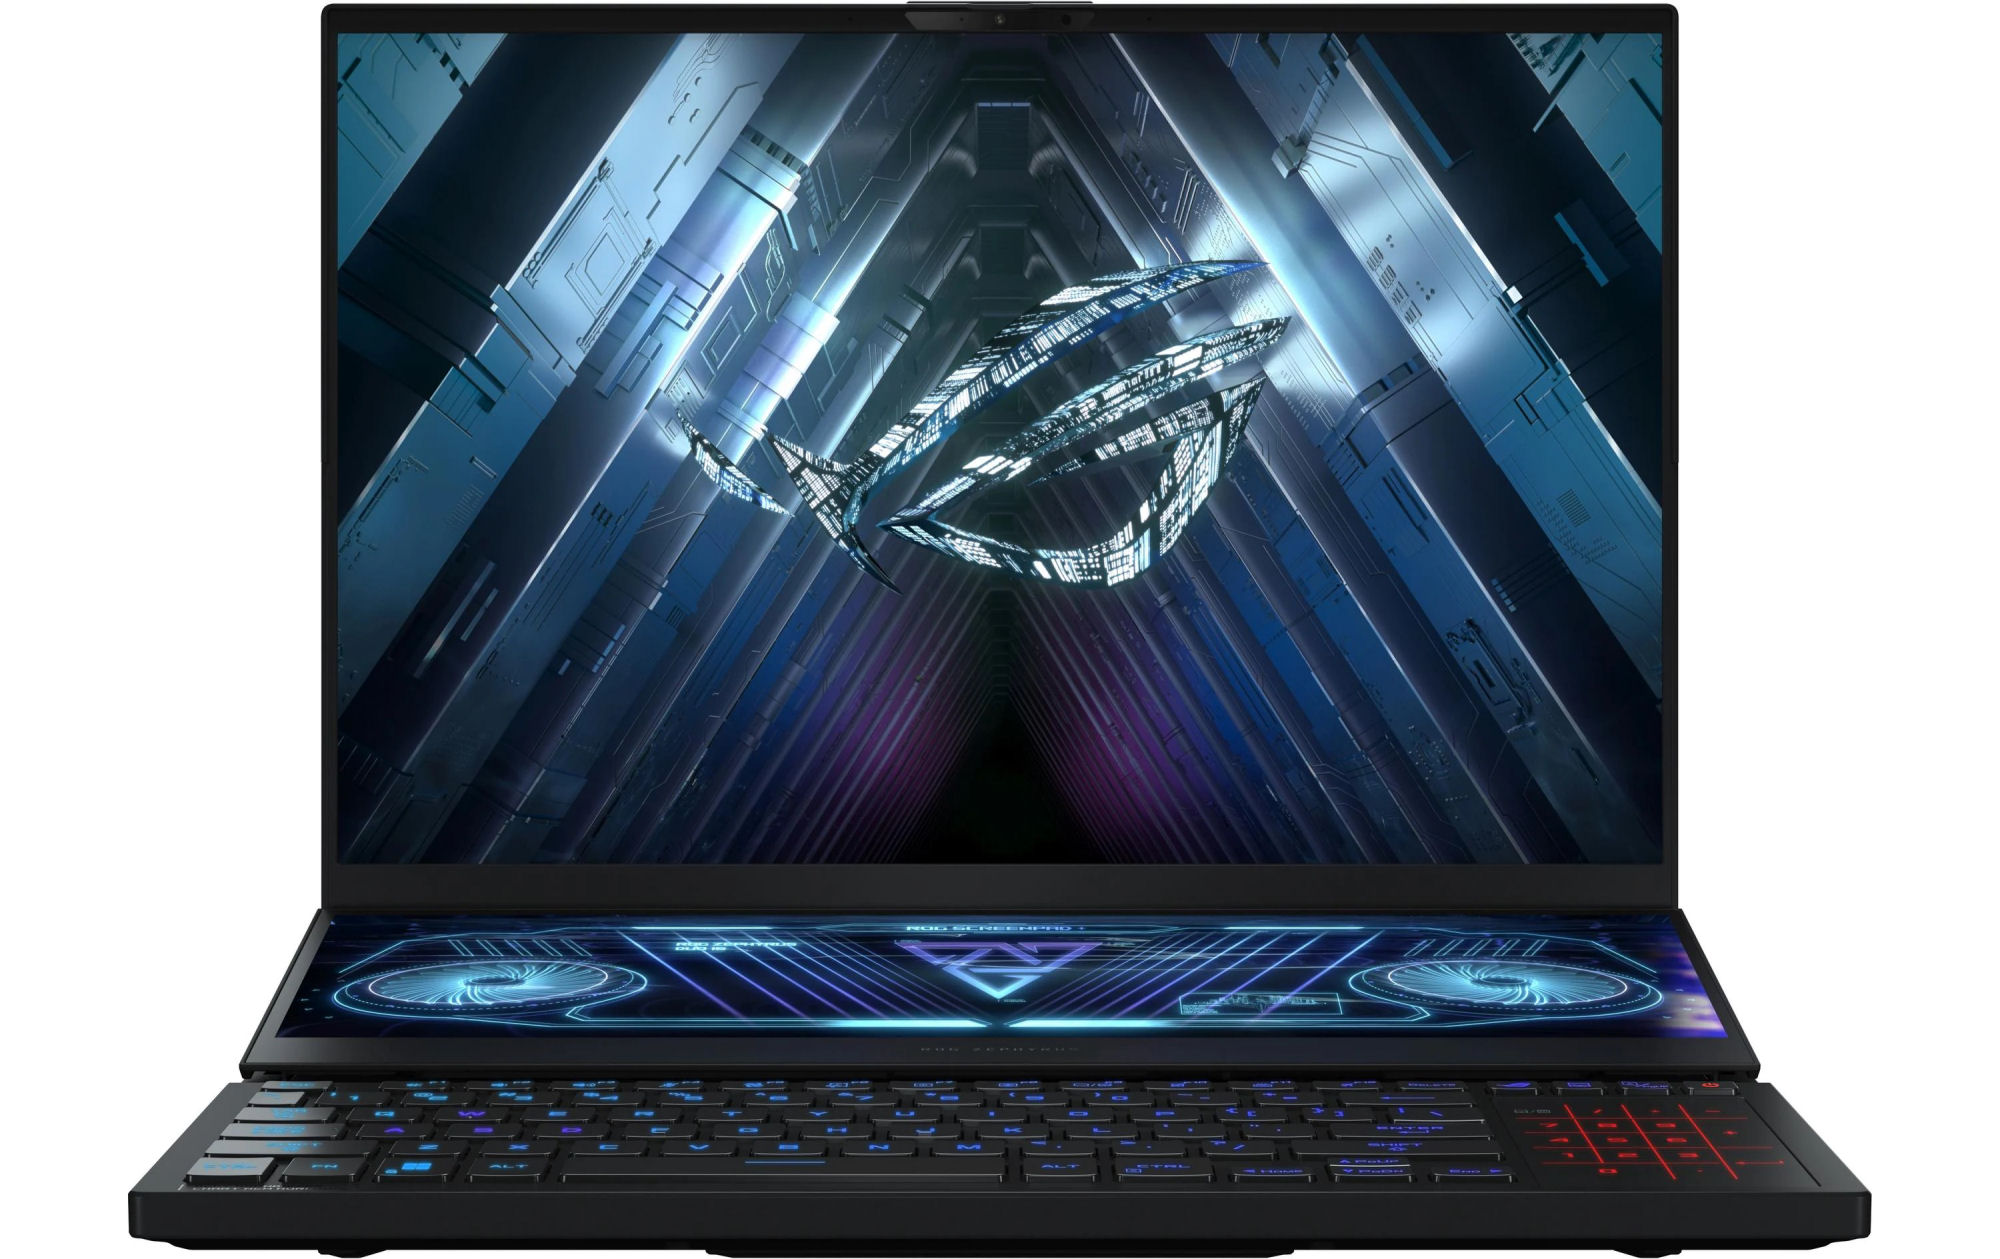
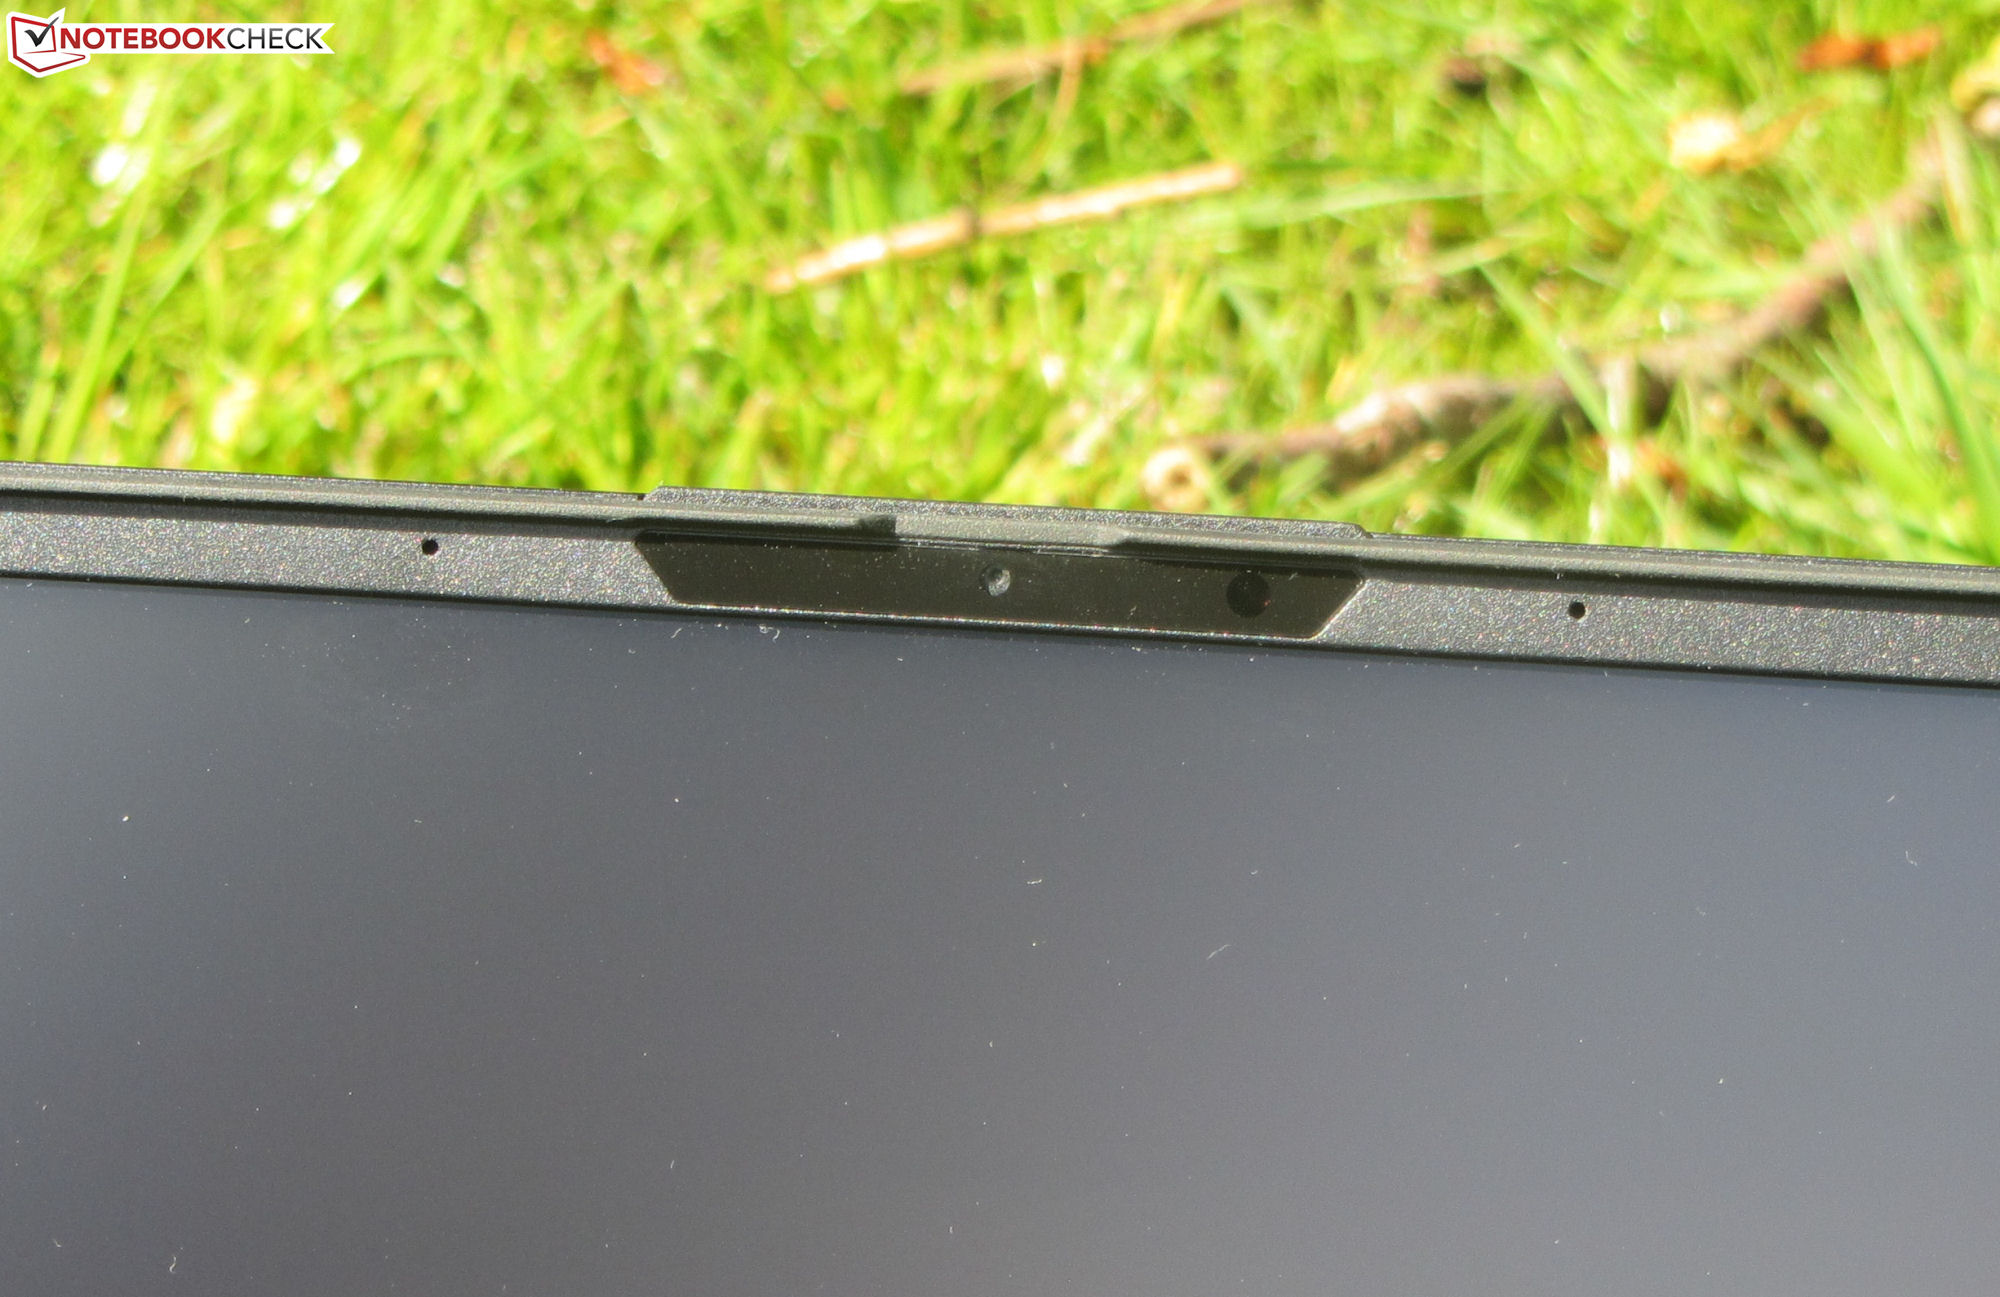
Webcam
The 0.9 MP webcam of the Zephyrus produces images with a maximum resolution of 1280 x 720 pixels. It lacks color accuracy, and the colors deviate significantly from the target. The camera does not possess a mechanical cover.

")
")
Accessories
In addition to the usual documentation (quick start manual and warranty information), the laptop also includes a rubber palm rest.
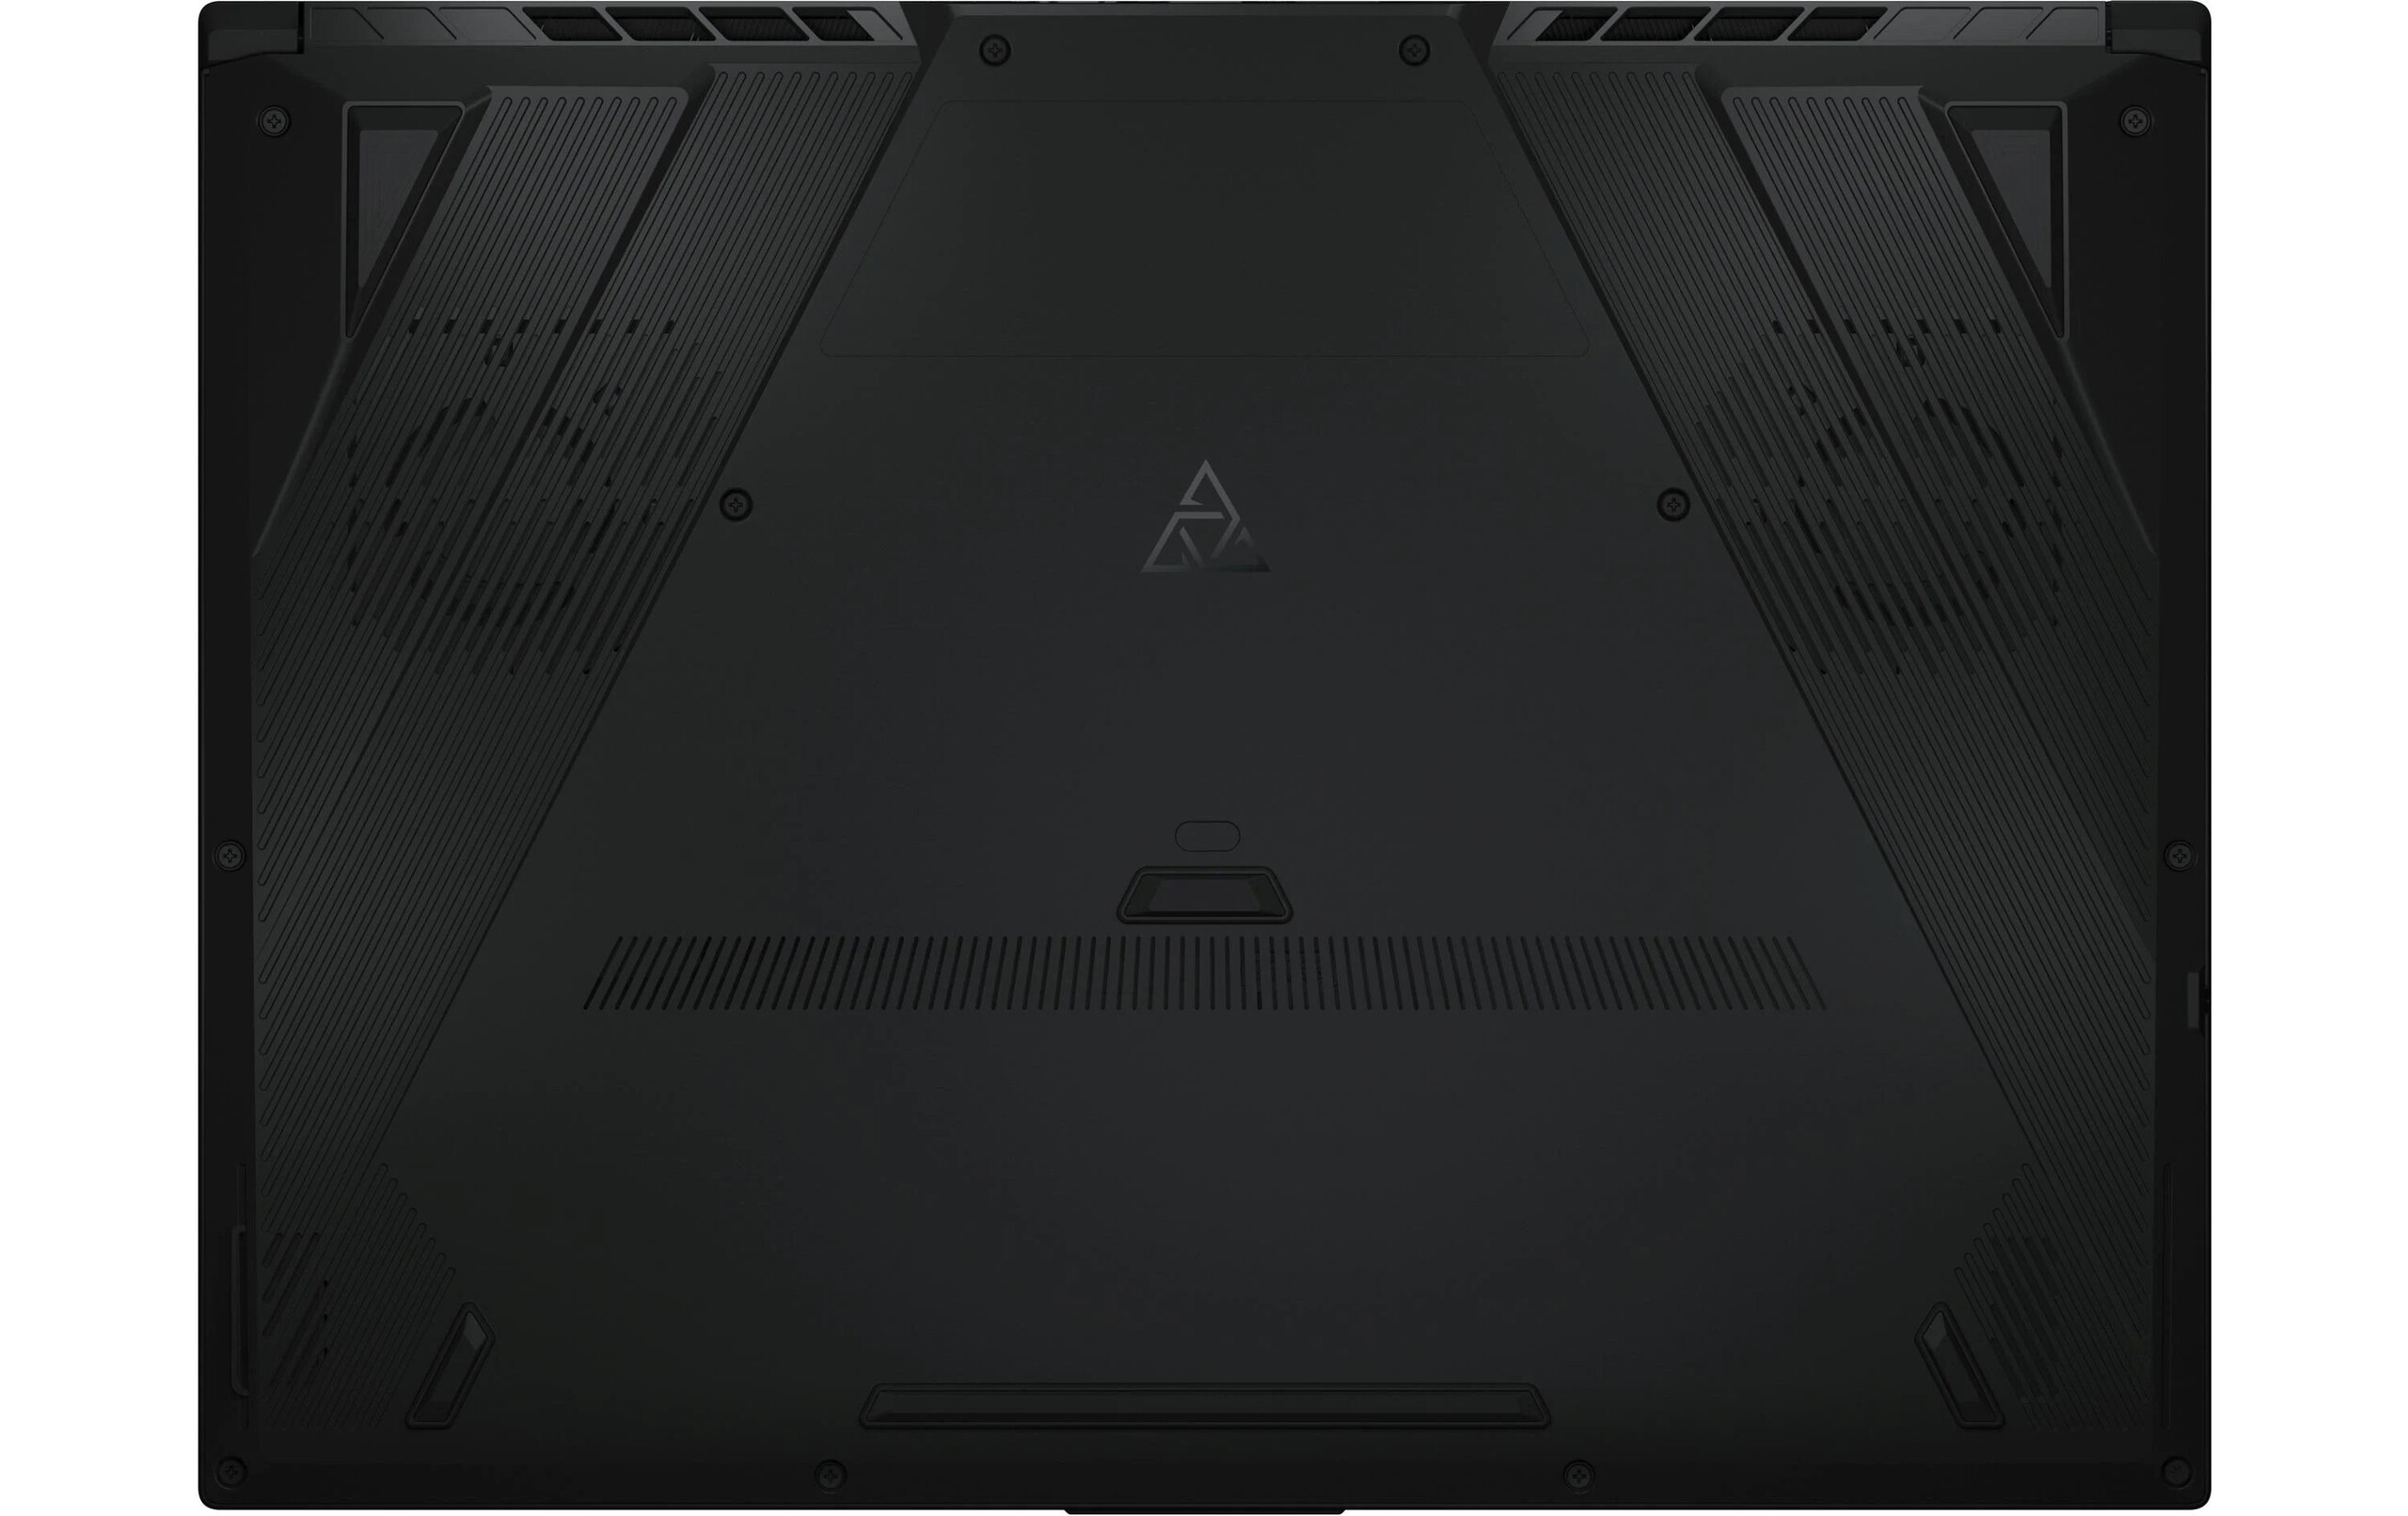
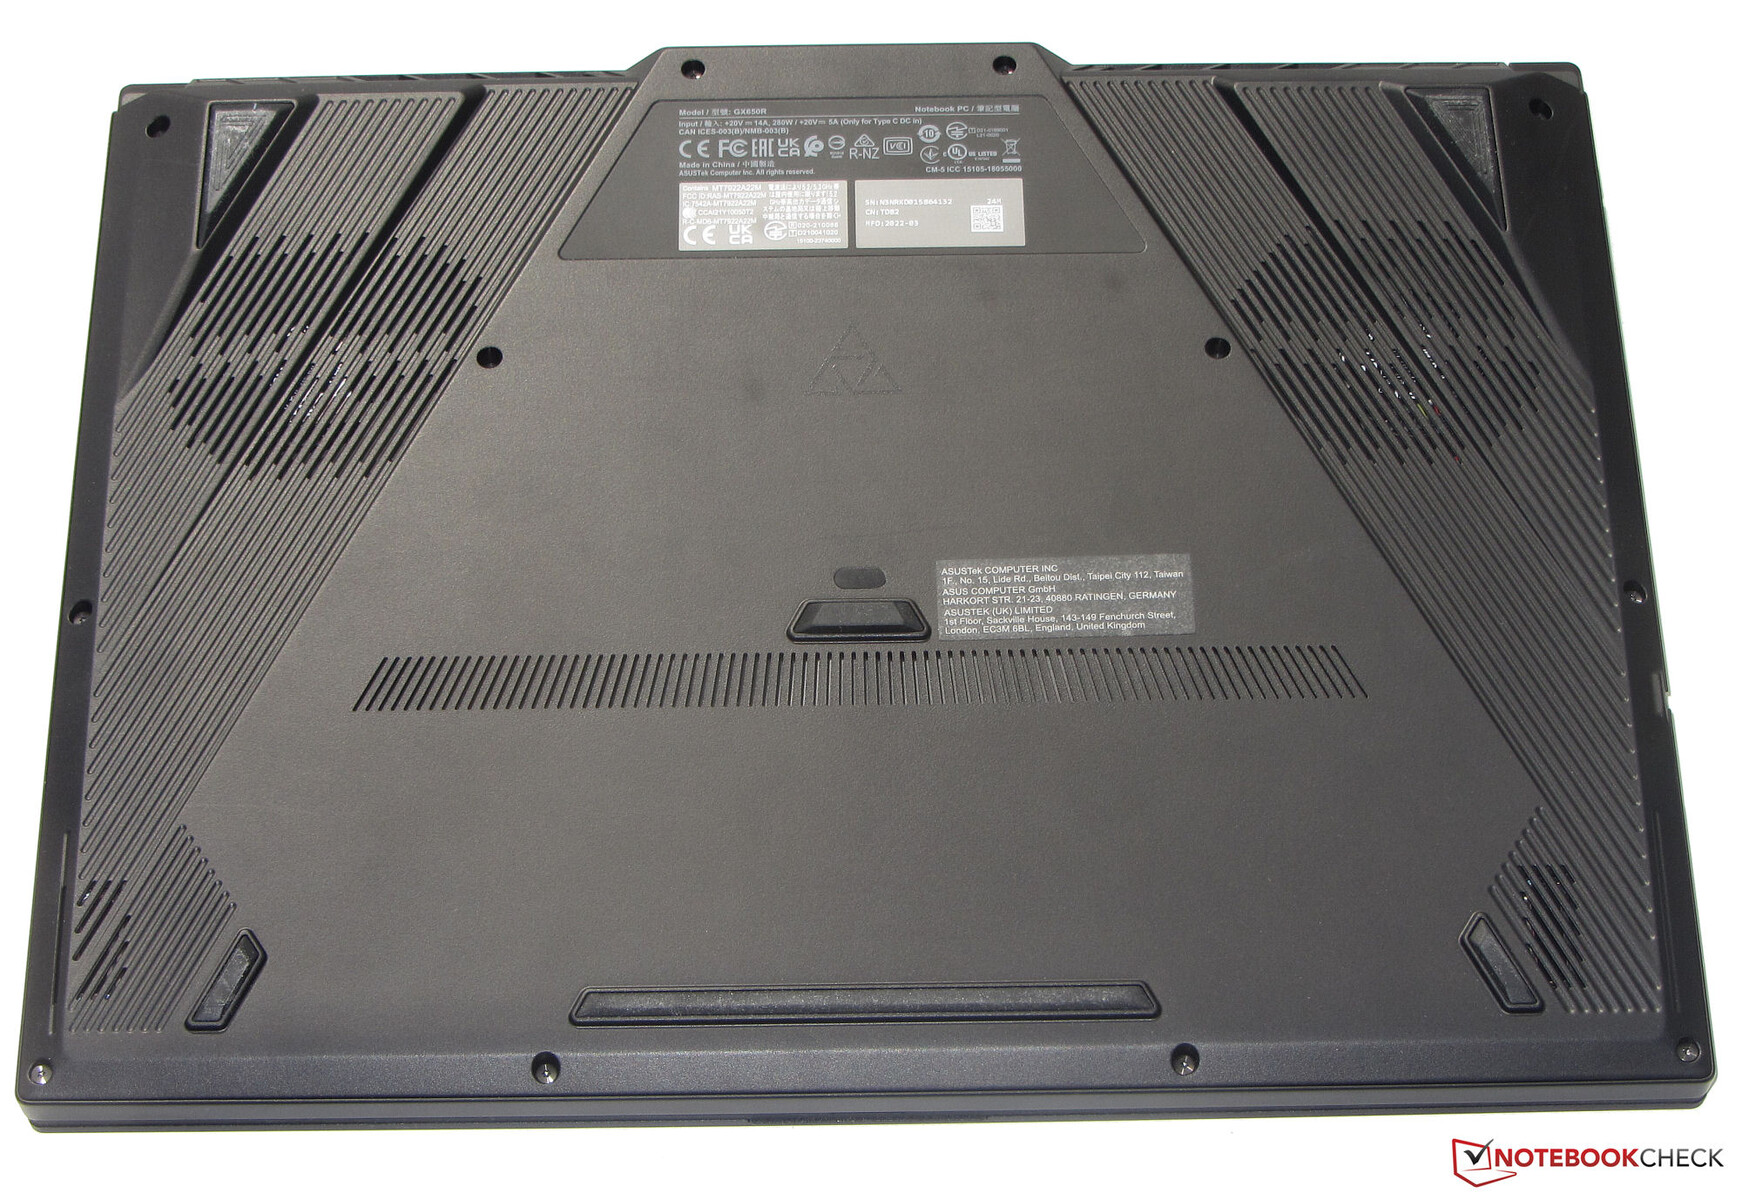
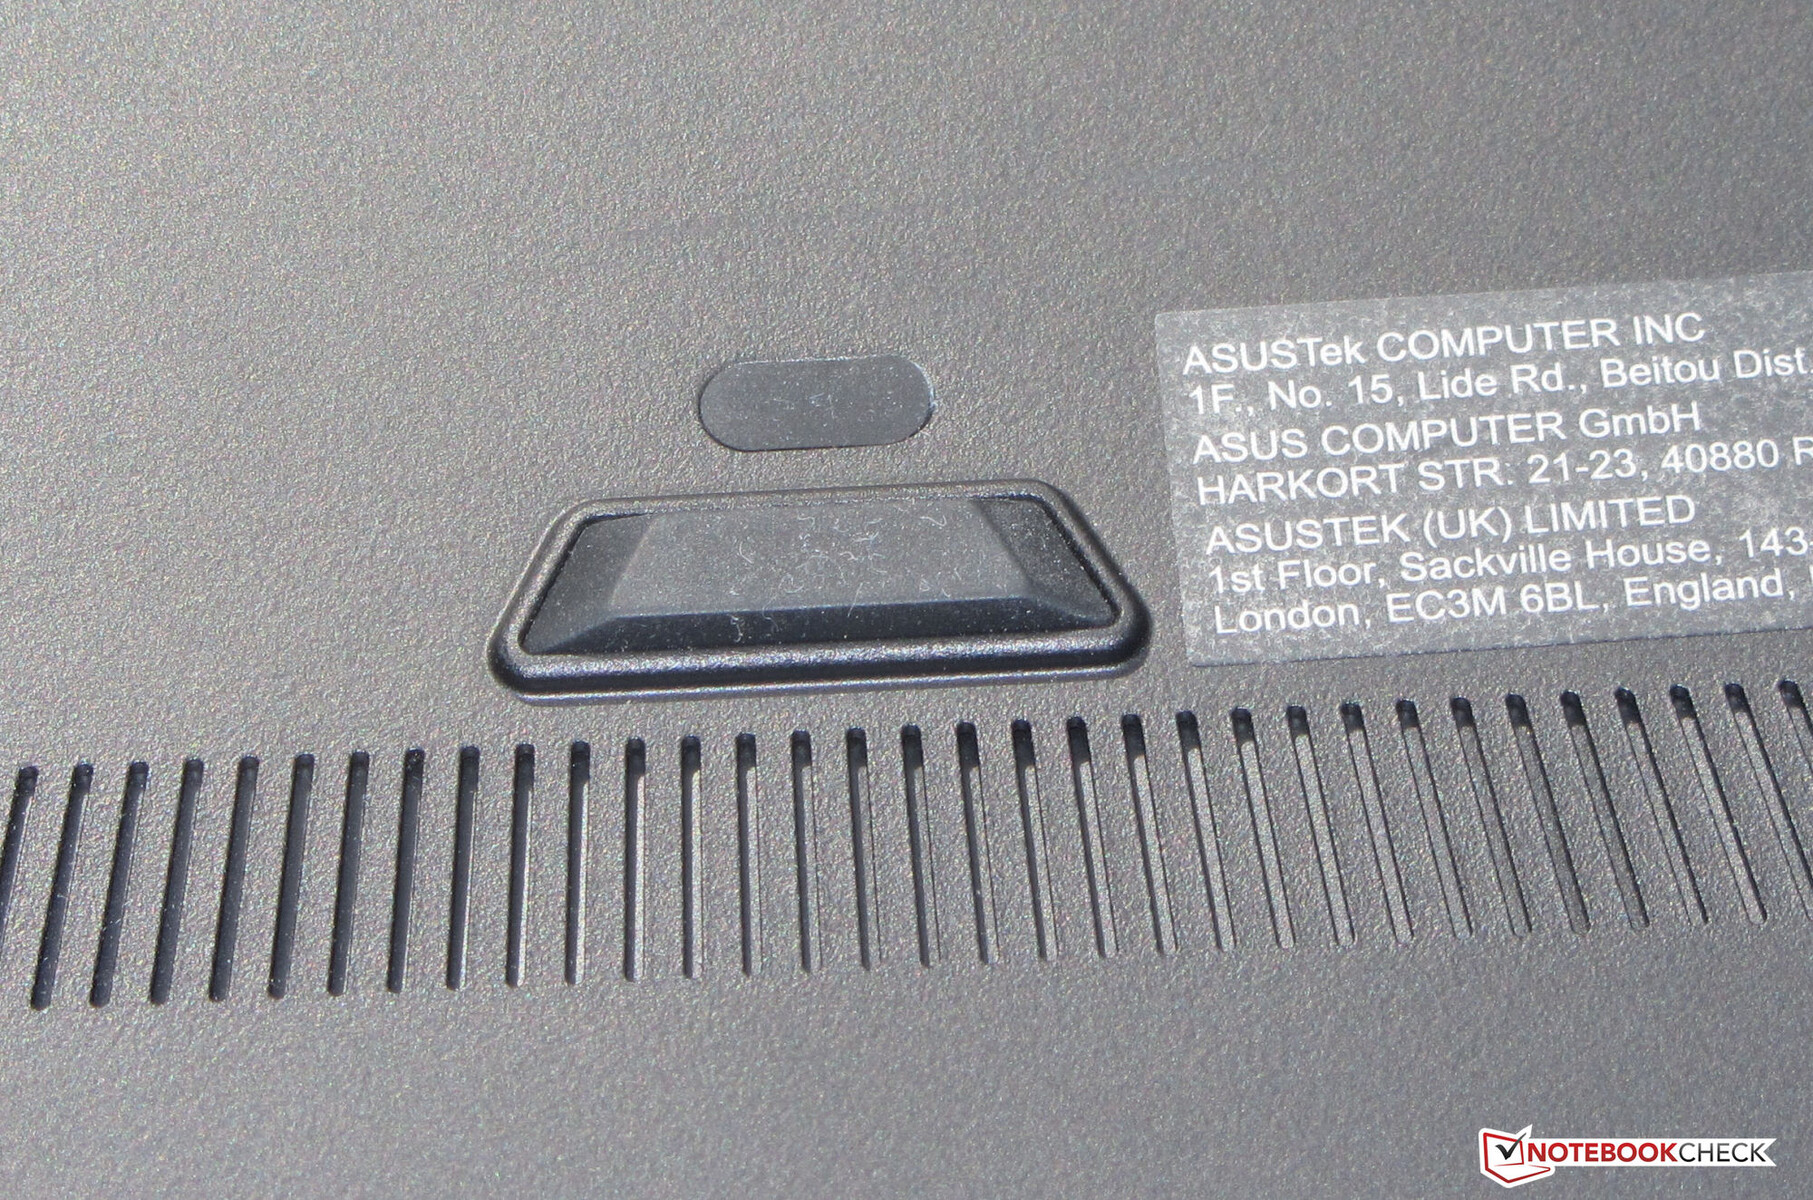
Maintenance
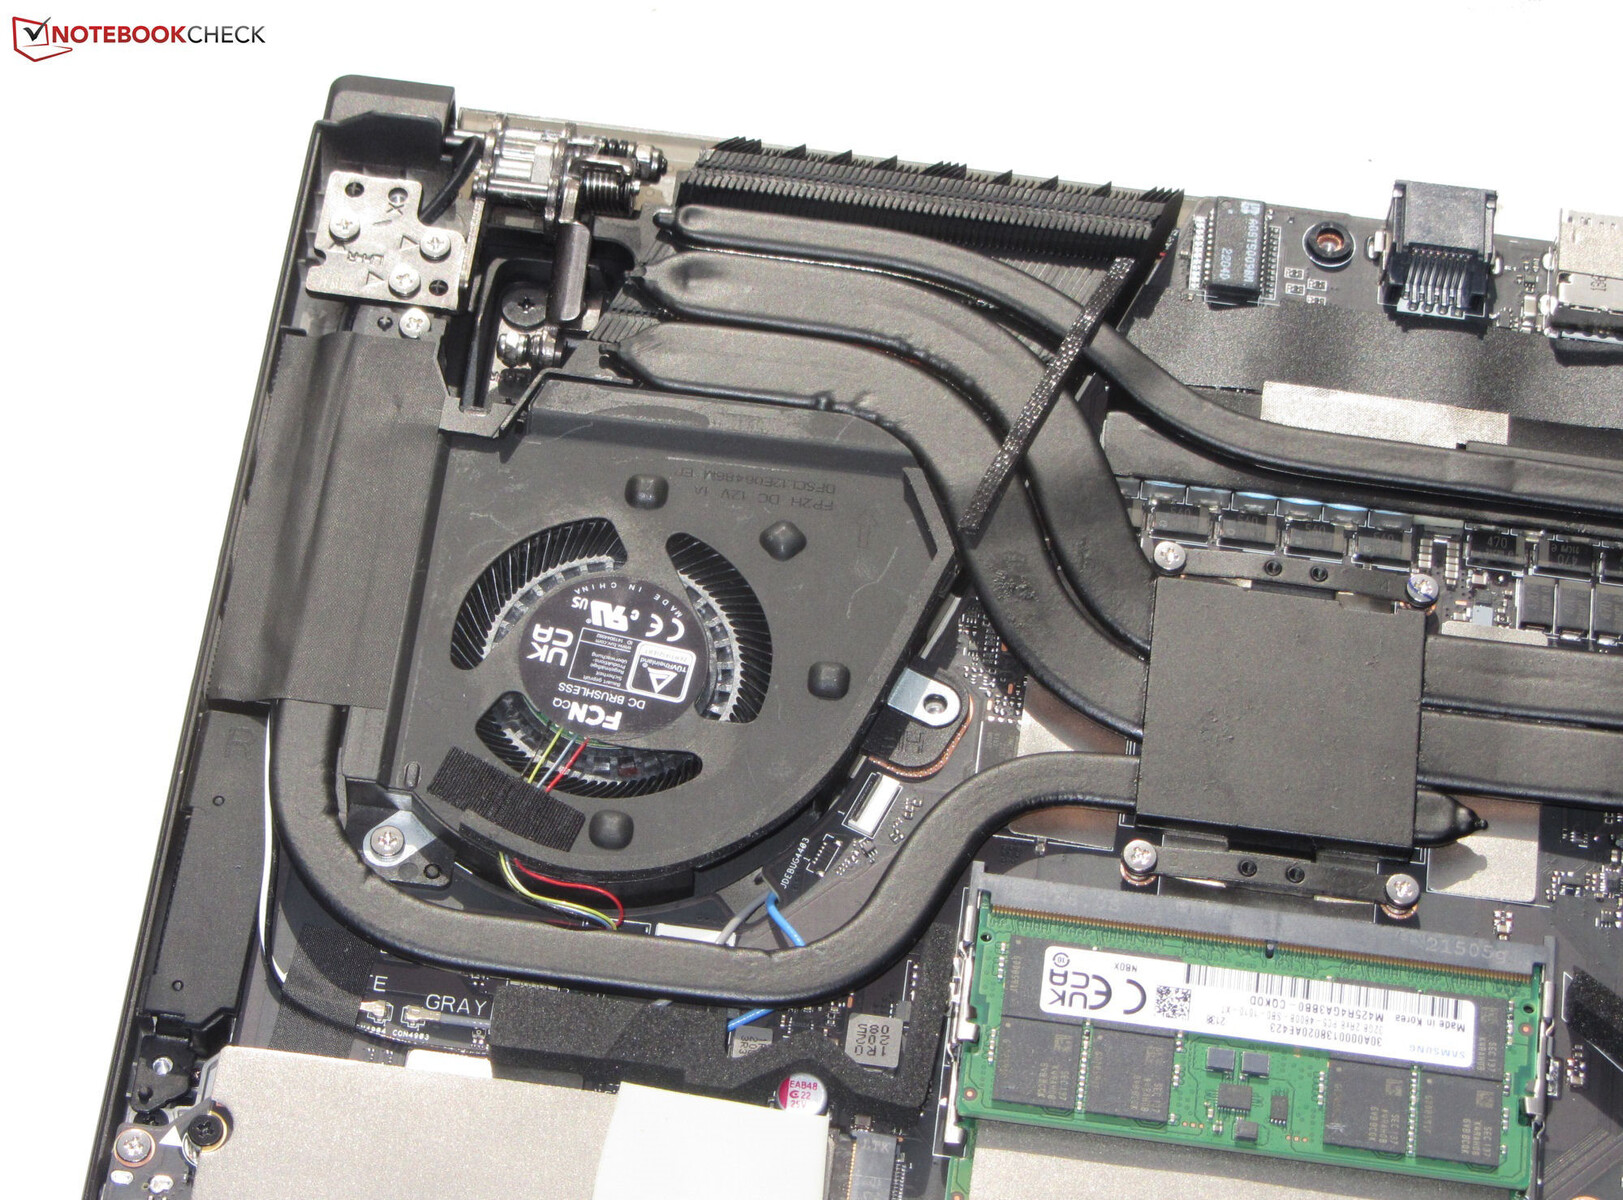
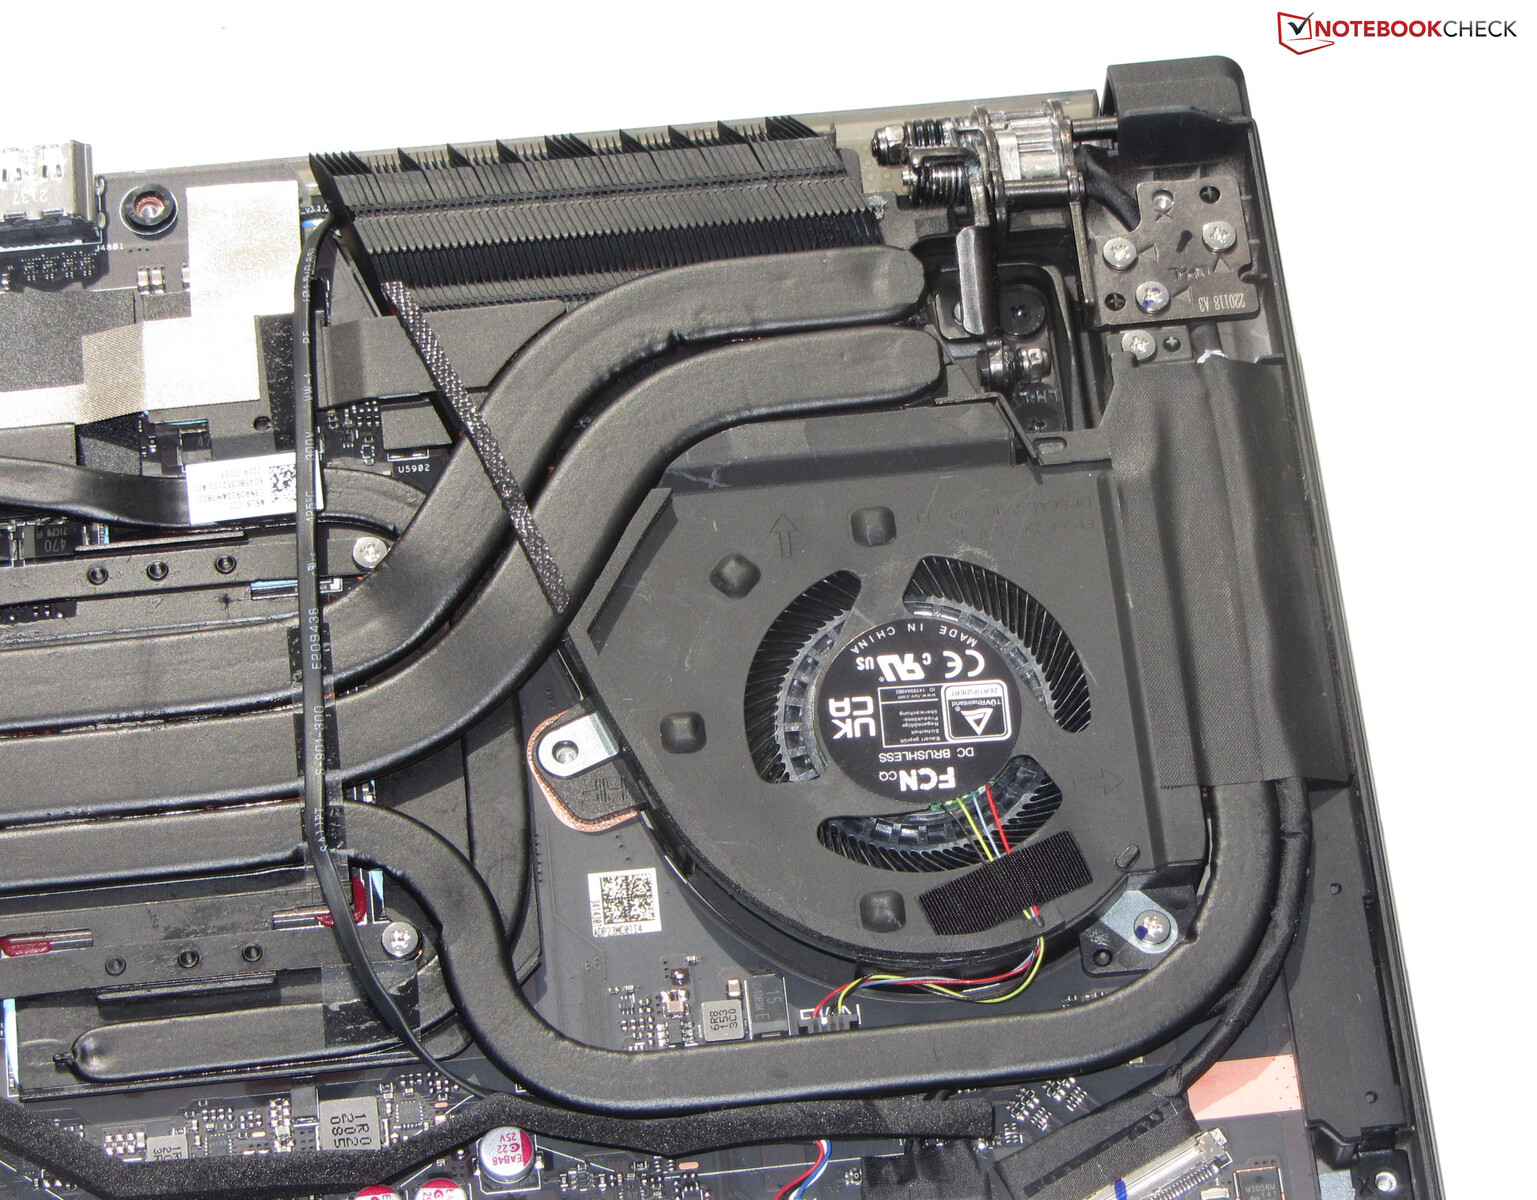
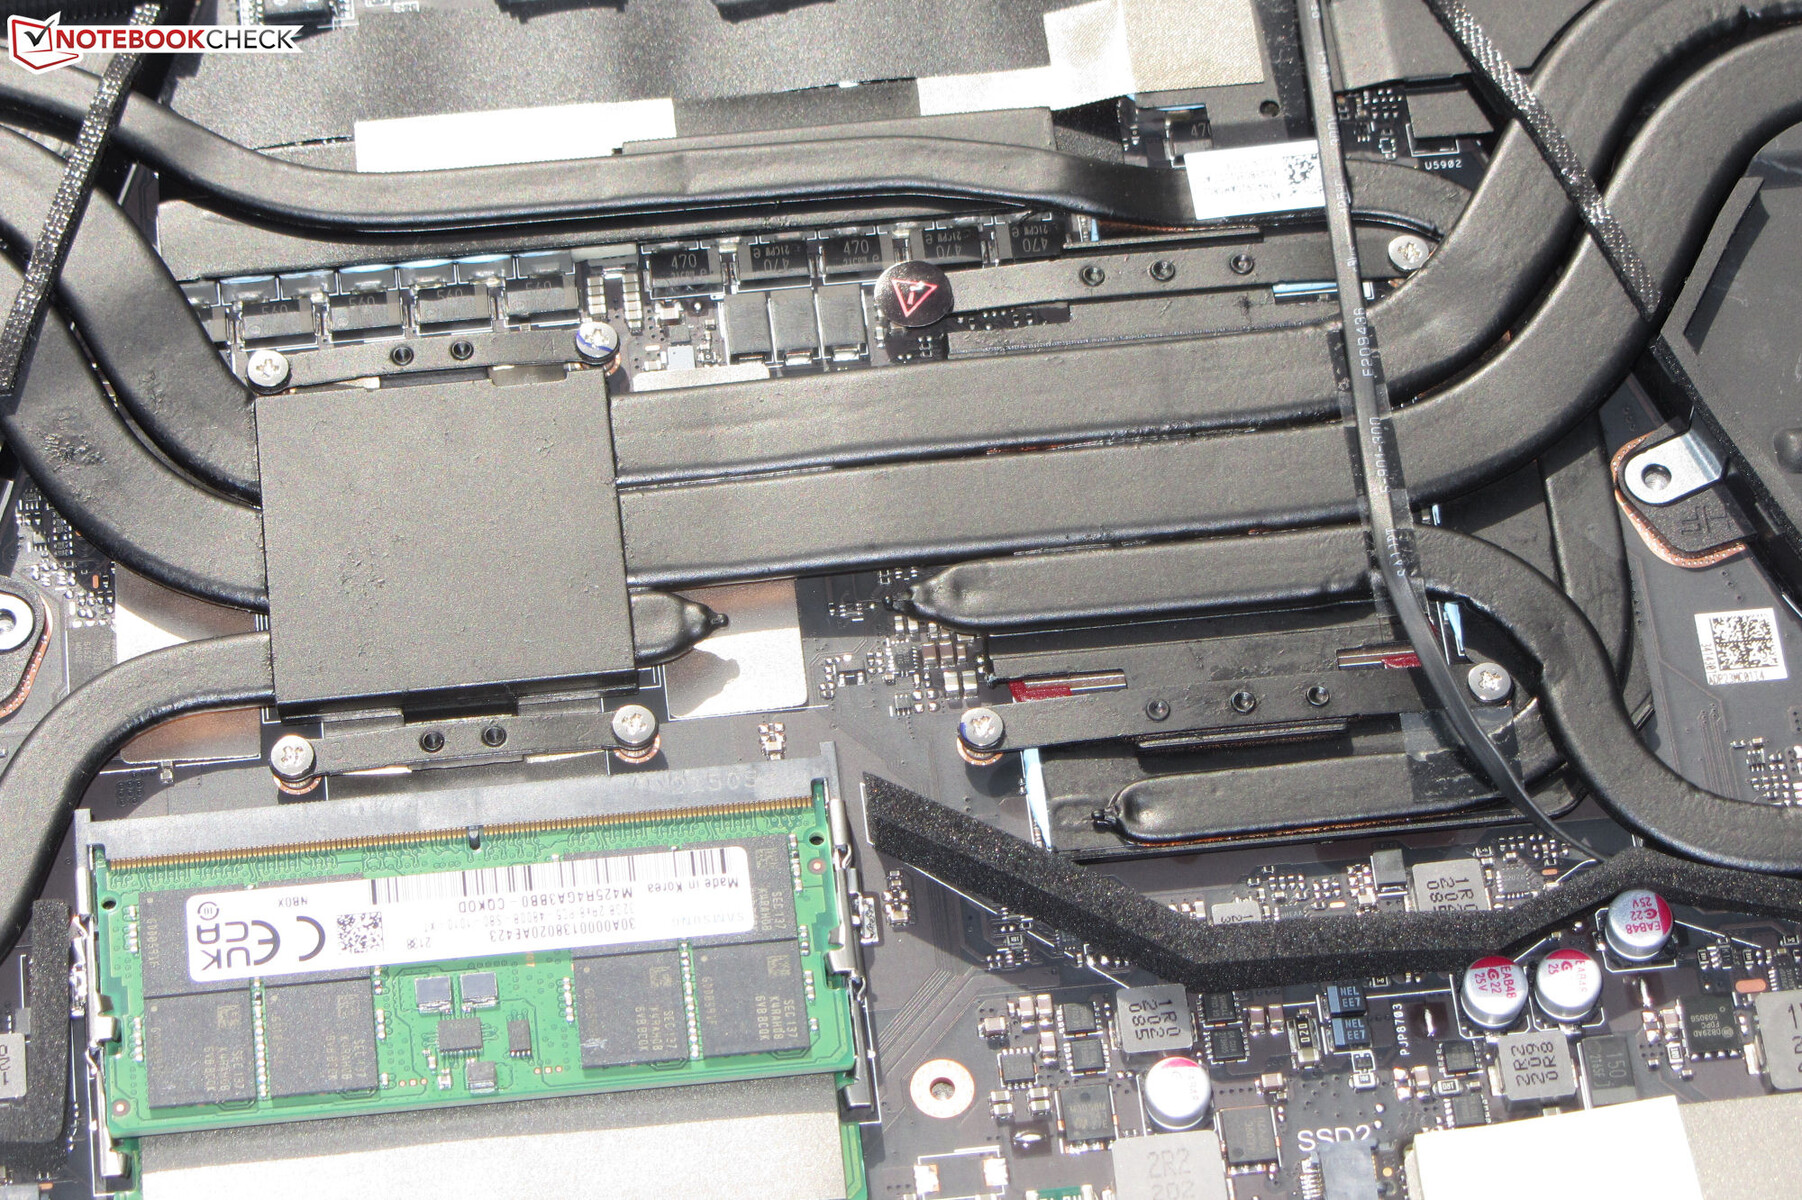
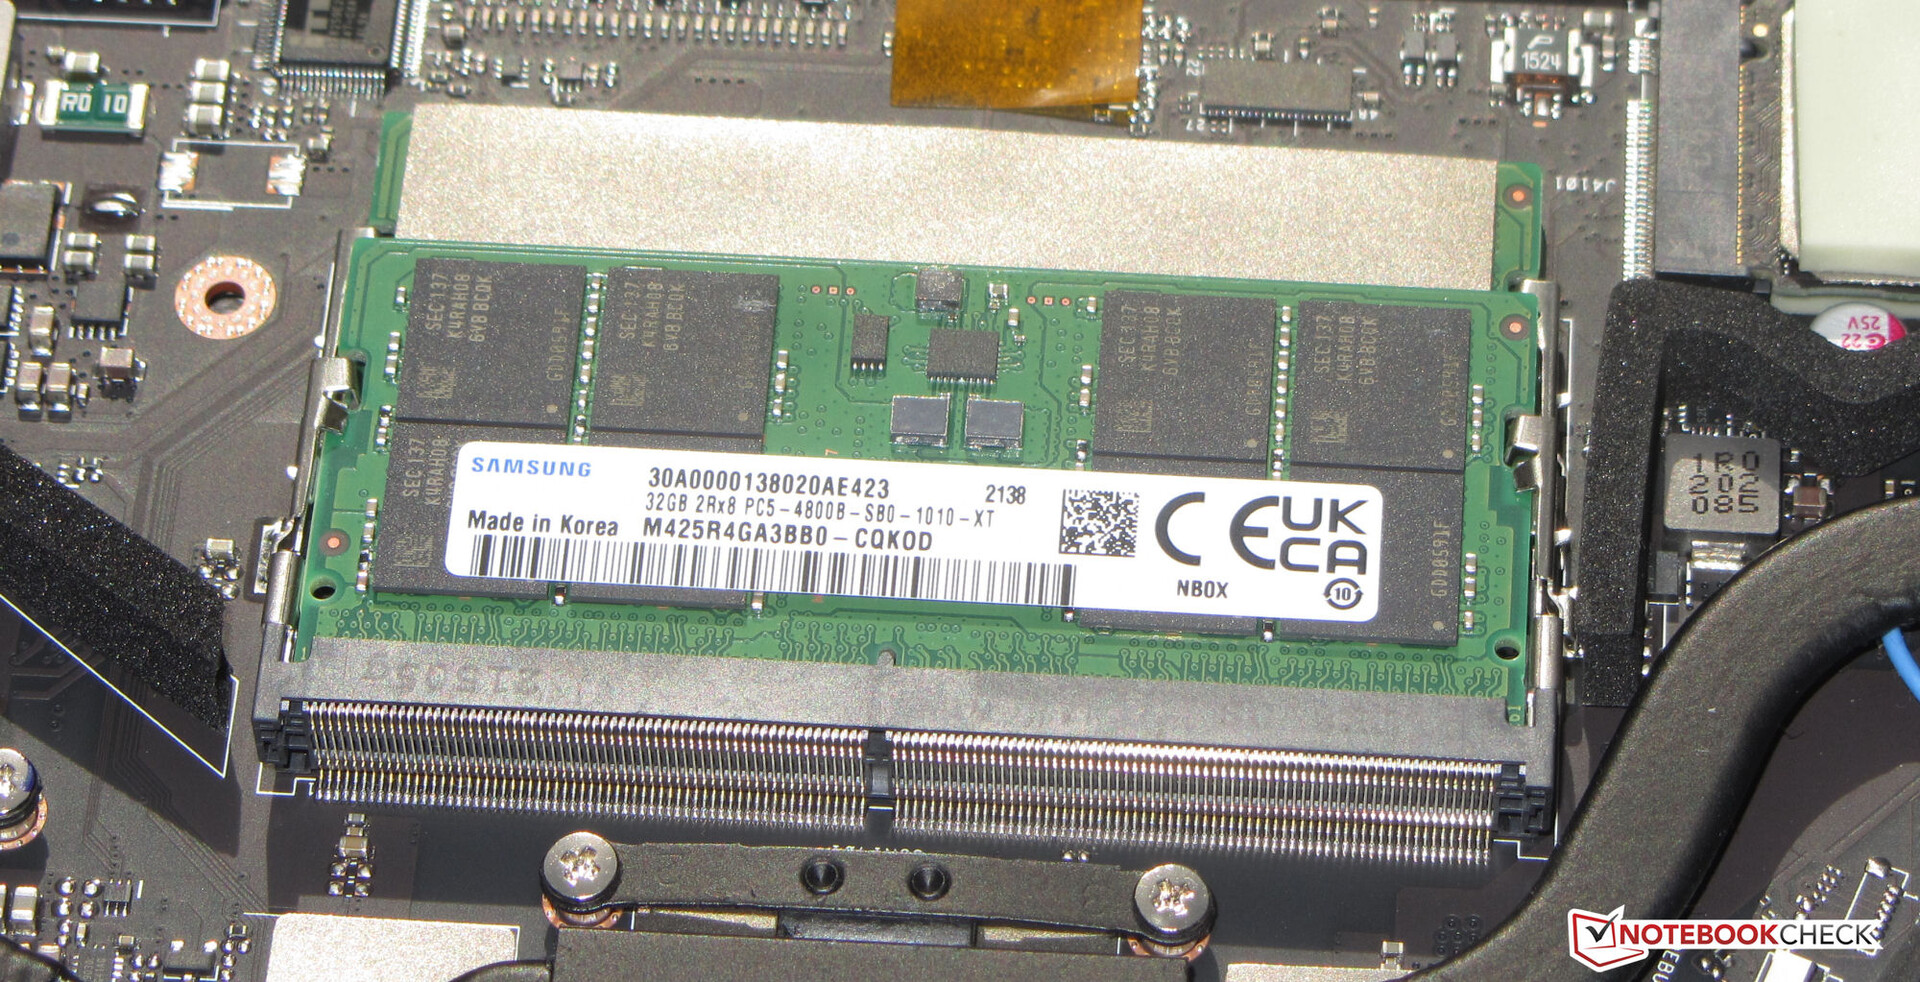
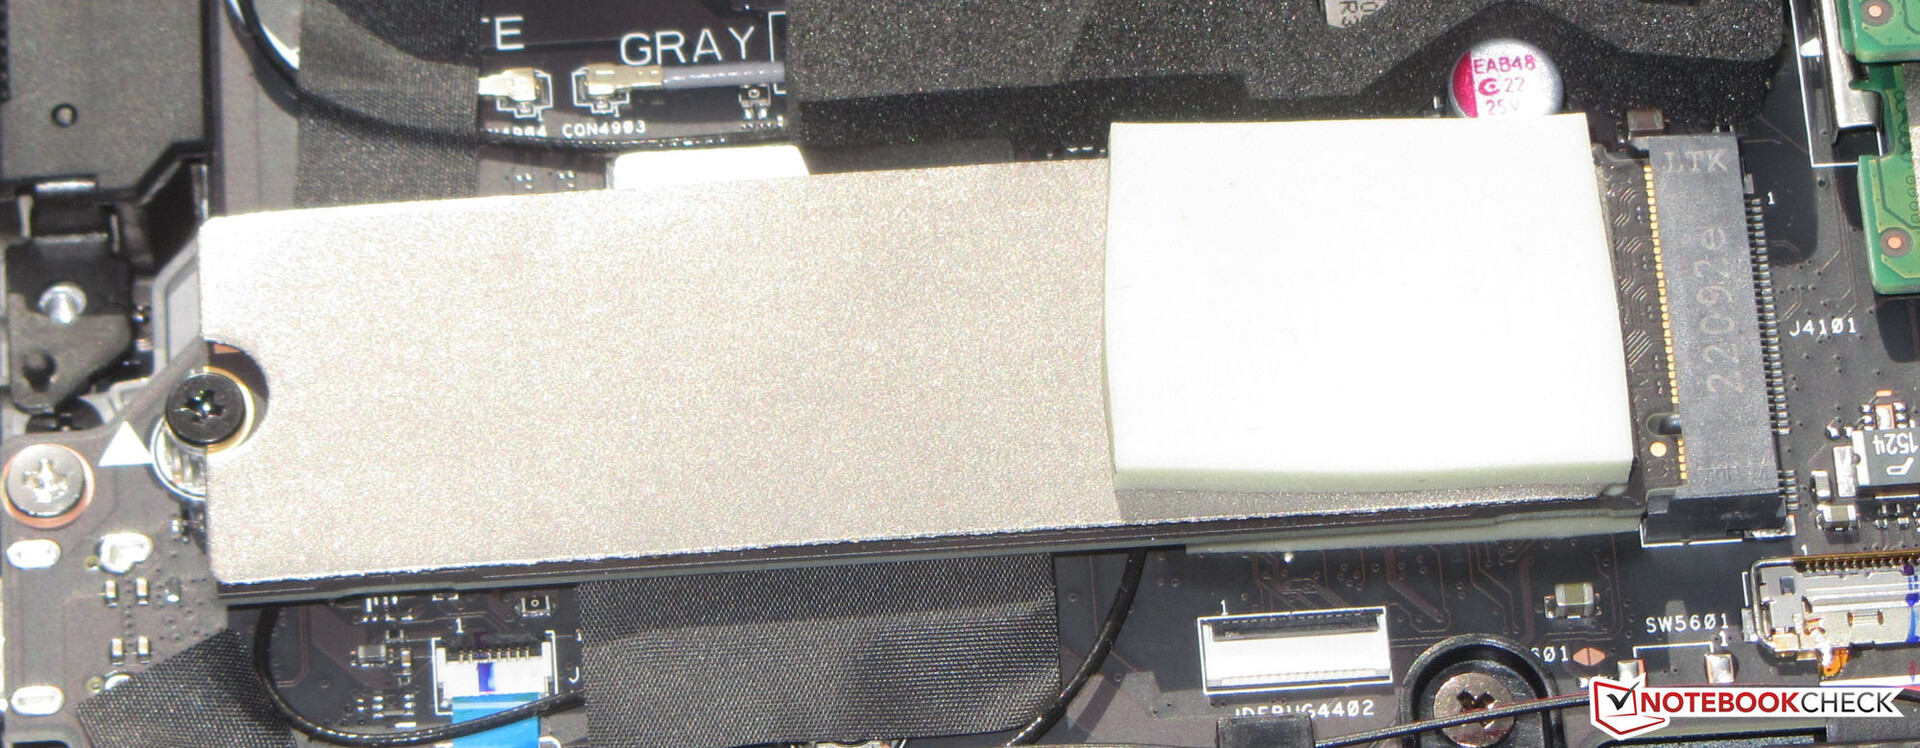
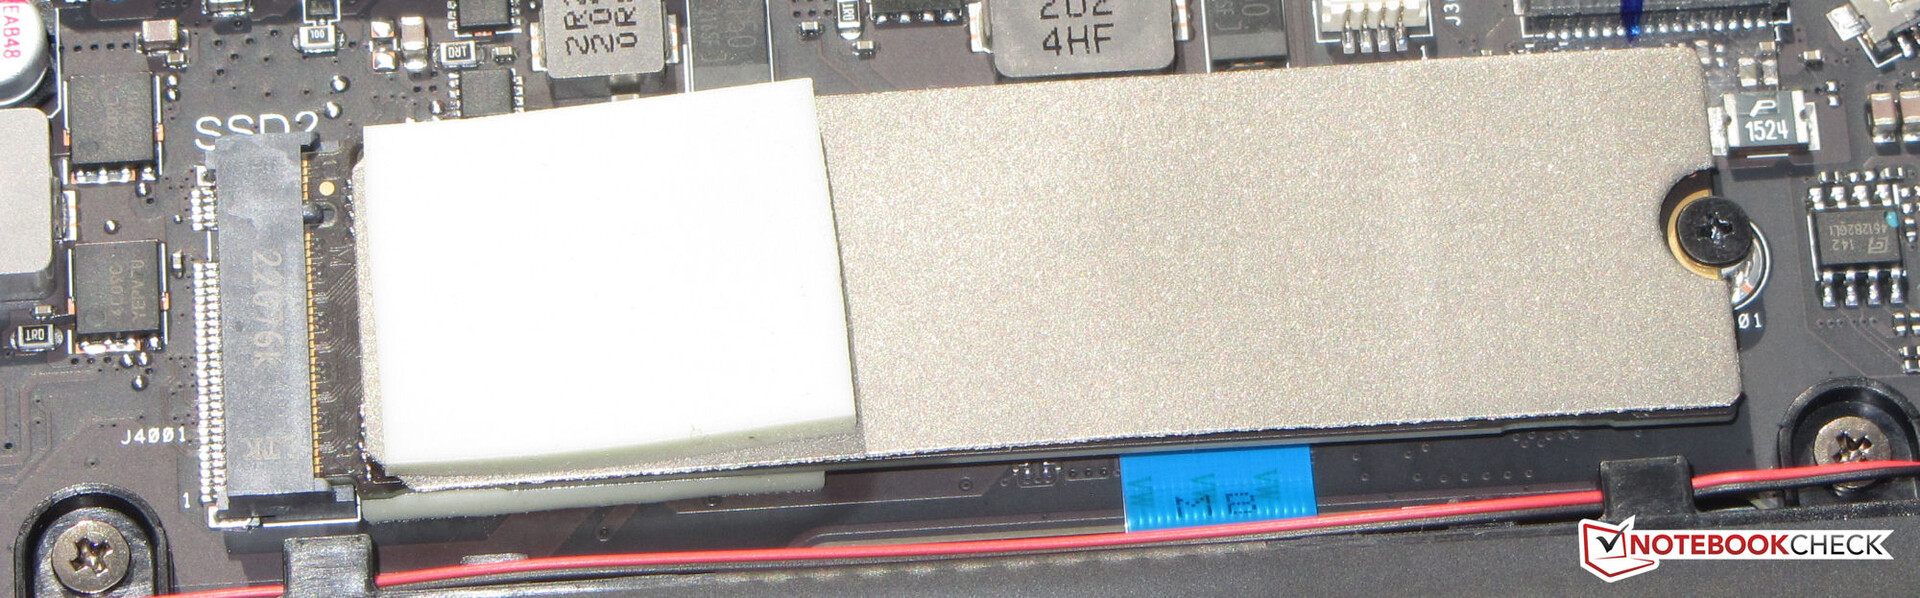
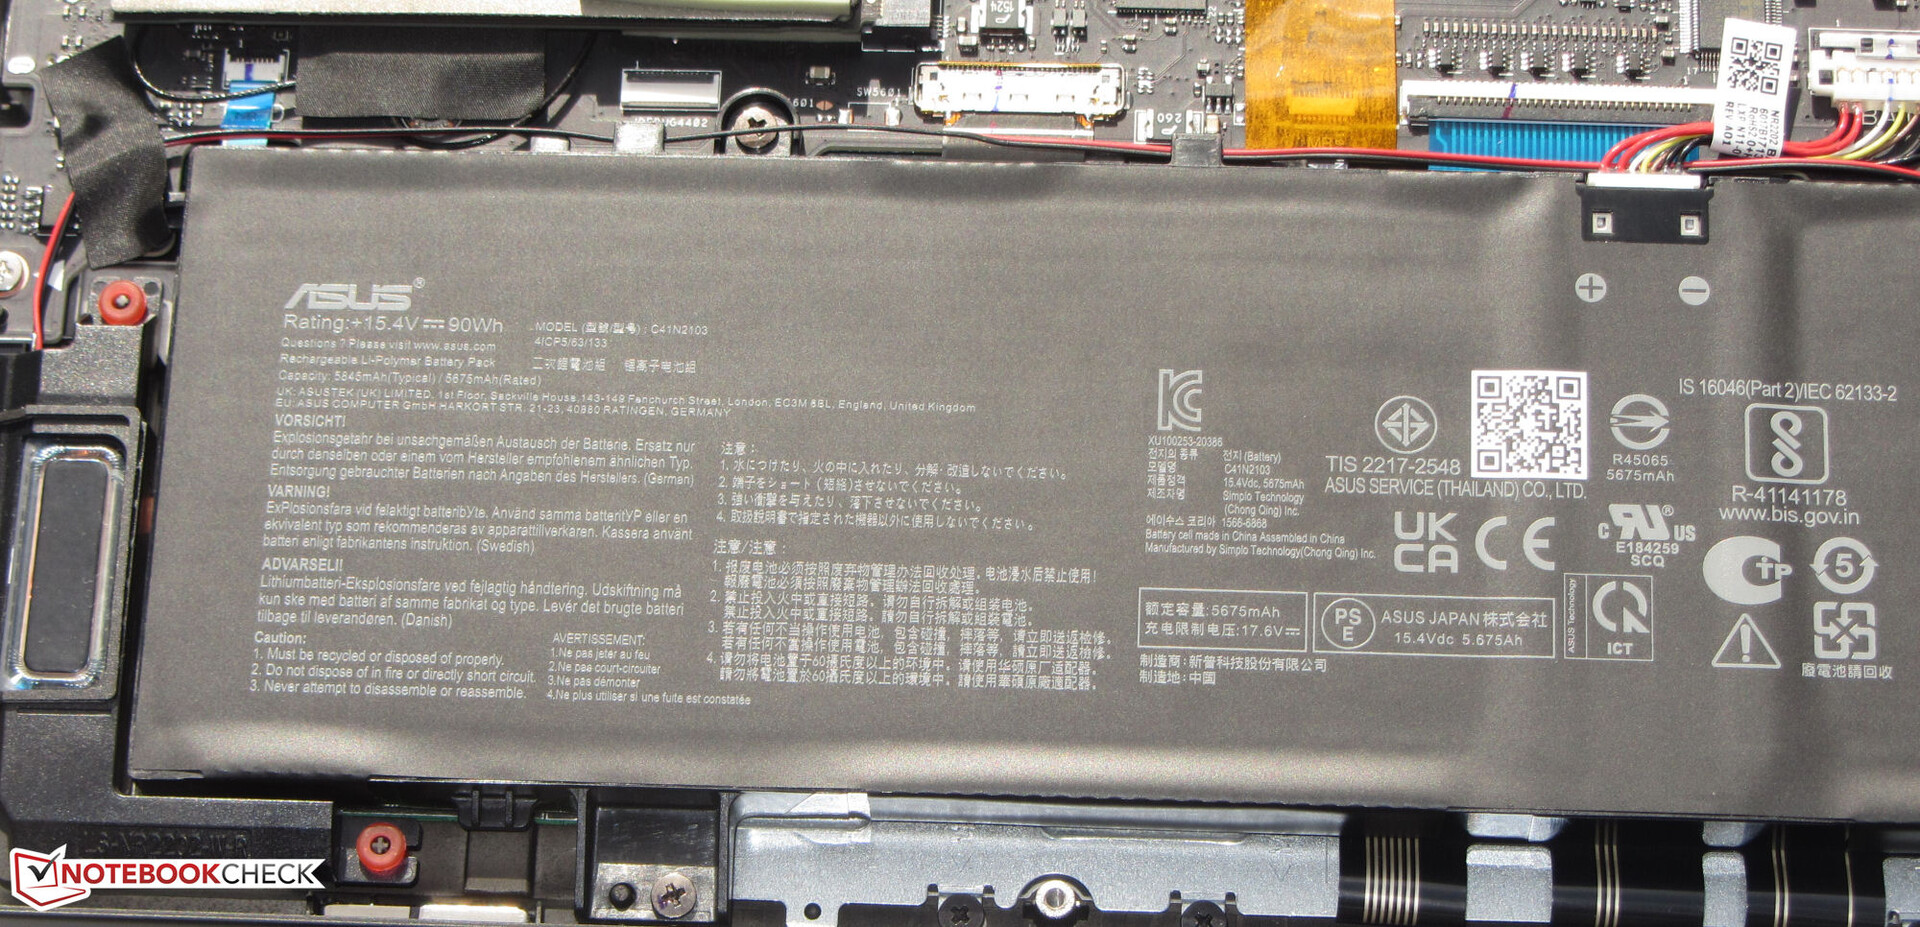
To take off the bottom of the case, you first have to remove the screws at the bottom. But you need to pay attention, since one of the screws in the middle of the case is covered by a little rubber plate. The back of the case is also kept in place by some clips that can be loosened by some careful wiggling or with the help of a flat prying tool. After removing the case bottom, you get access to the working memory banks (both occupied), the two SSDs (PCIe 4), the fans, and the battery.


Warranty
Asus offers a 2-year warranty on the Zephyrus. A warranty extension to 3 years will cost an extra 129 Euros (~$136).
Input Devices - A second display for the Asus laptop
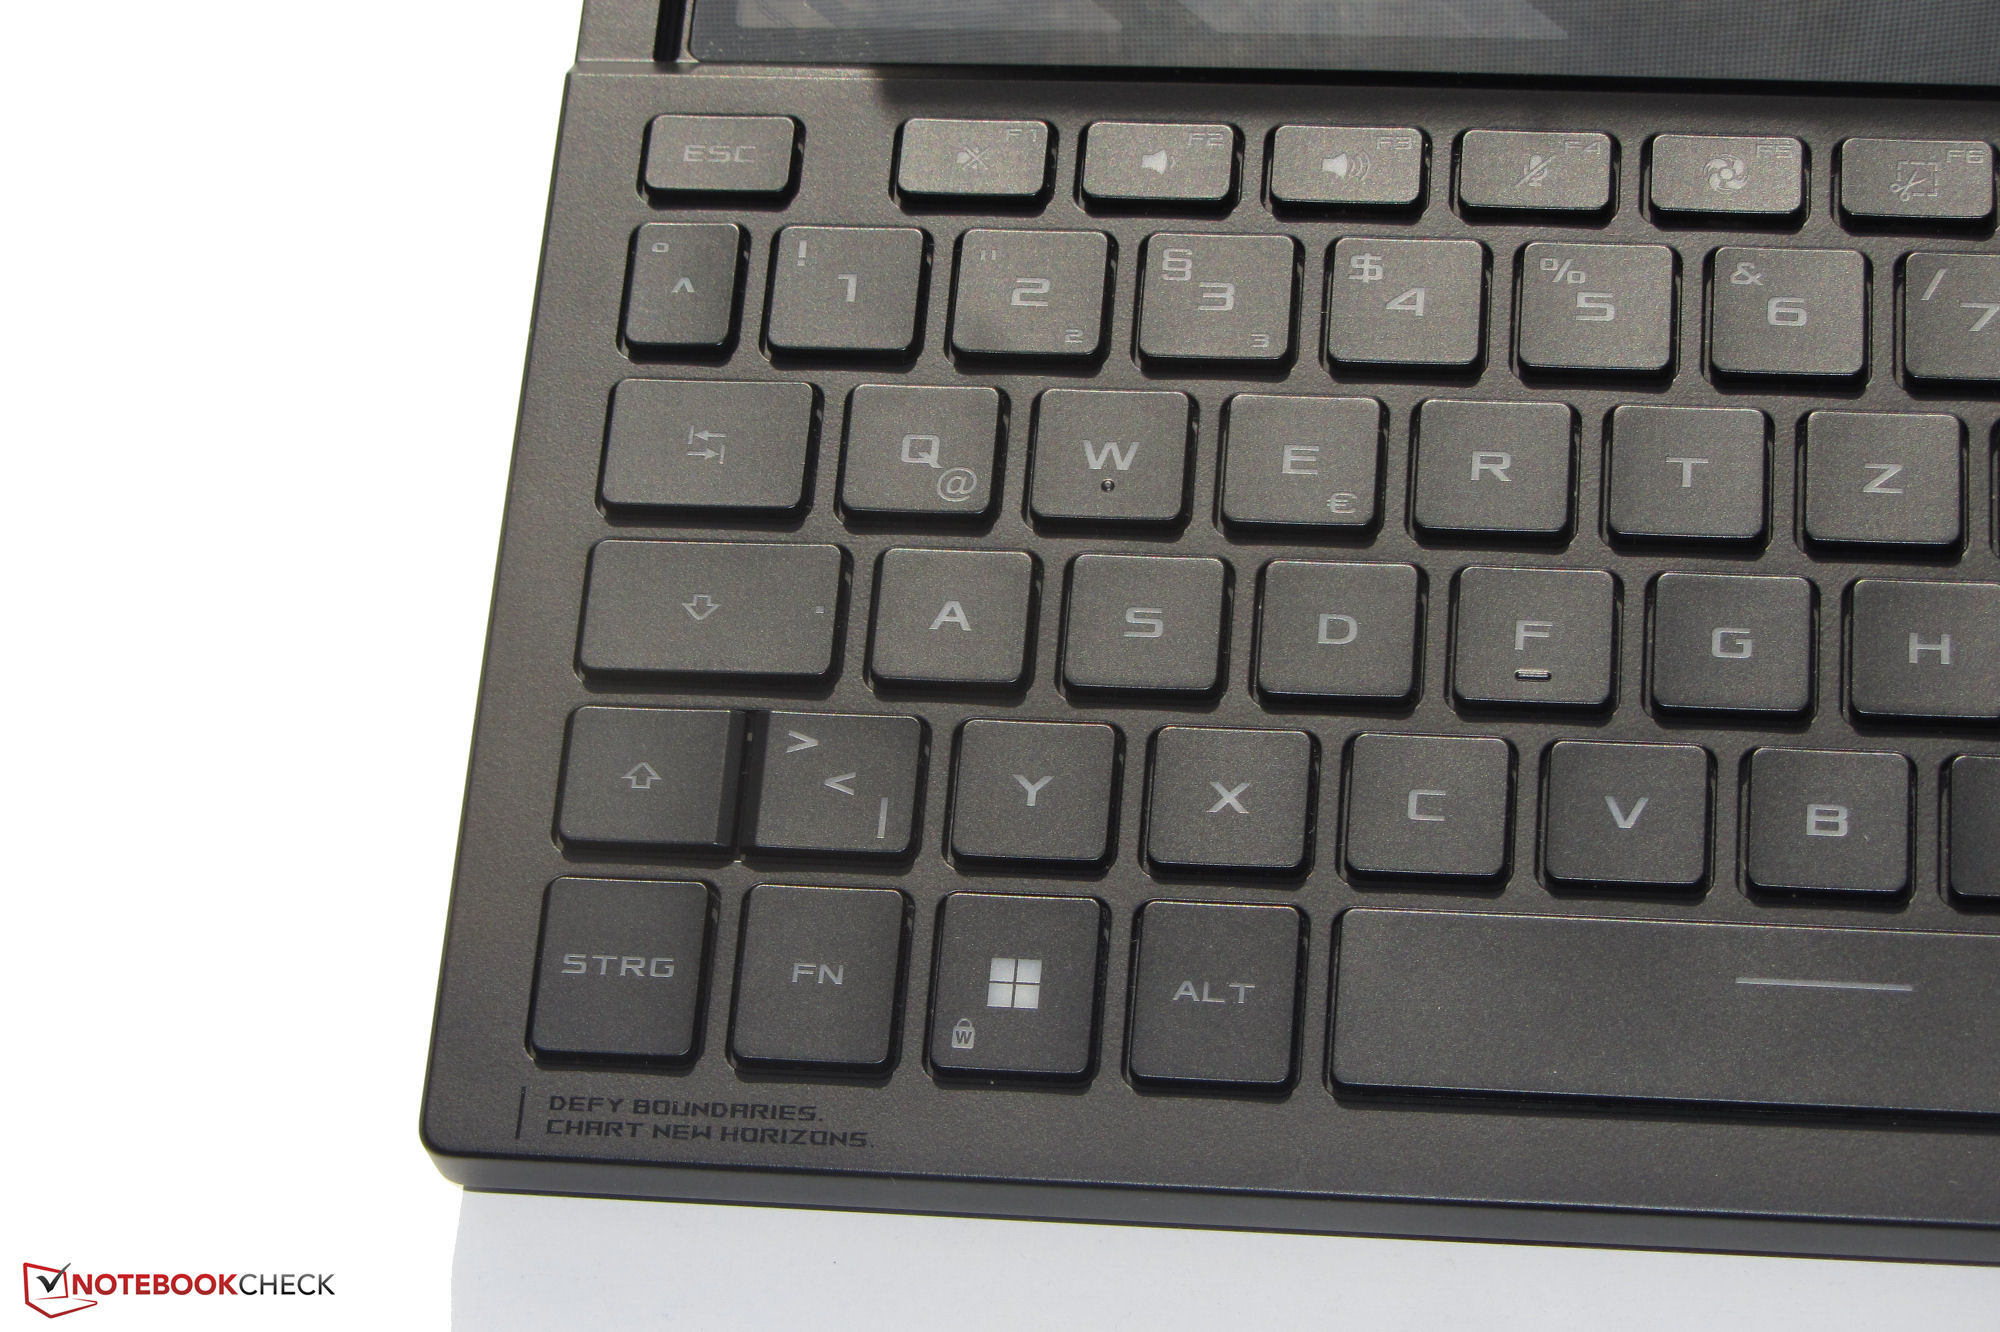
Keyboard
The keyboard only allows for comfortable typing if you use the included palm rest made from rubber (depth: ~5.5 cm, 2.2 in, angled). While it does a fairly good job, it really only works on a fixed surface. The smooth keys of the illuminated chiclet keyboard have a short stroke and clear pressure point. The key resistance is okay, and the keyboard doesn't bend while typing. The three-step RGB illumination is controlled via a function key. Overall, Asus delivers a keyboard here that is suitable for everyday tasks.
Touchpad
A multitouch-capable Clickpad (~5.8 x 9.6 cm, ~2.3 x 3.8 in) in portrait orientation serves as the mouse replacement. Its smooth surface facilitates sliding of the fingers. The pad has a short stroke and clear pressure point. Tapping the corresponding symbol on the pad will display a number pad.

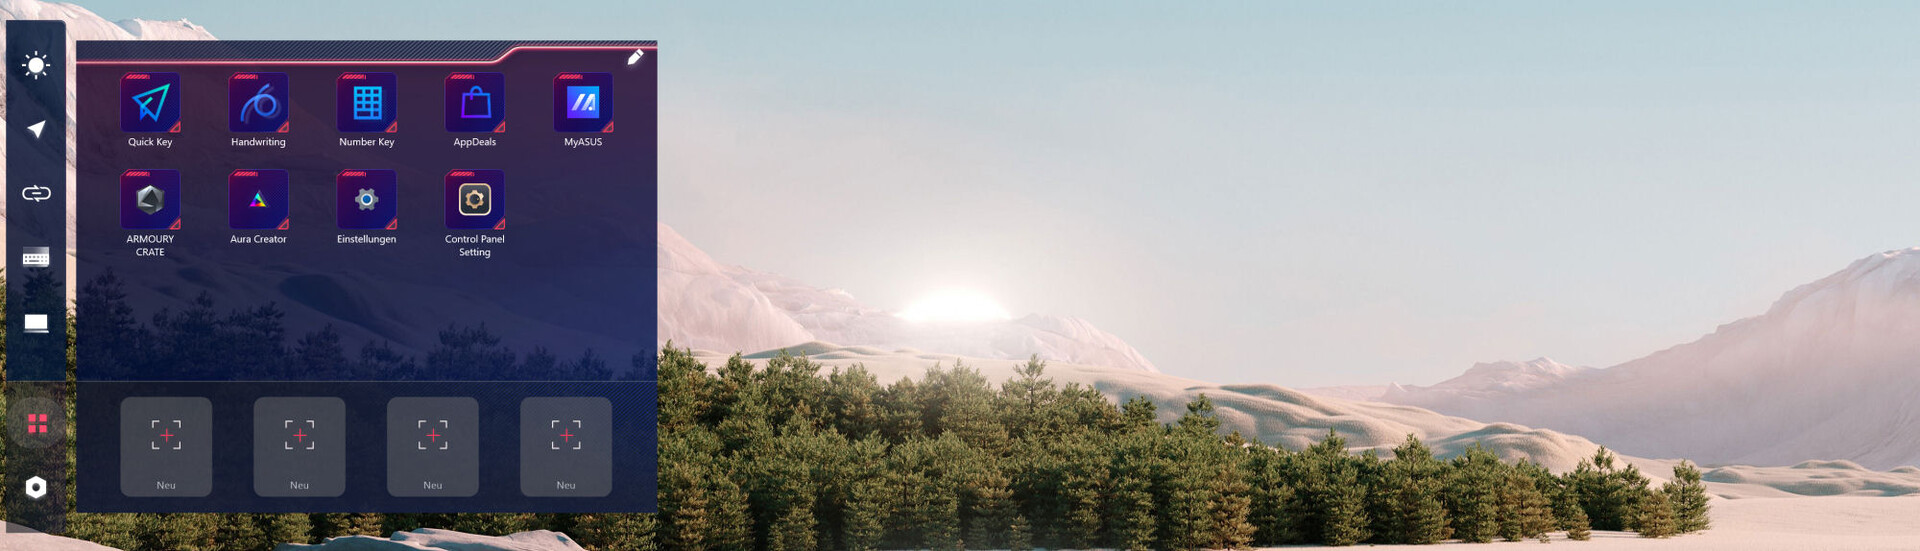
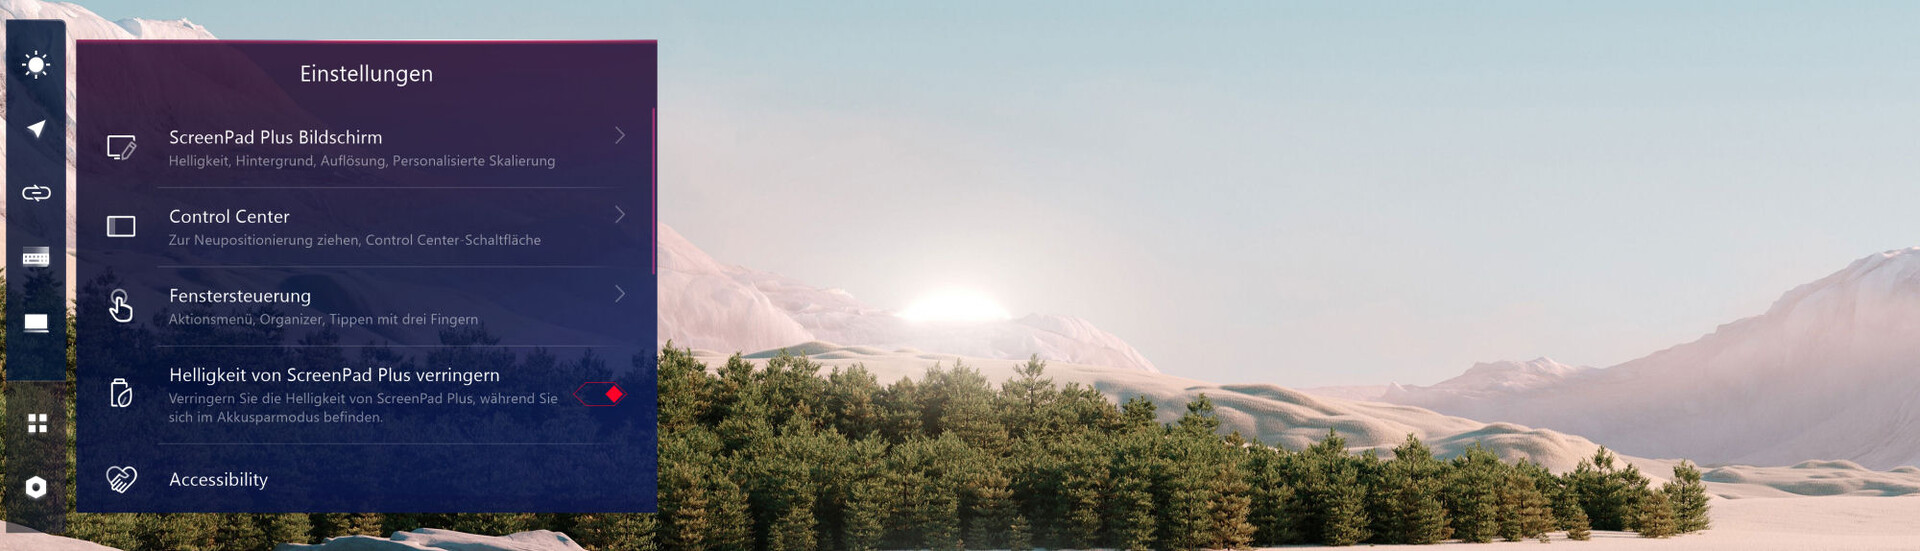
Asus Screenpad Plus
There is an additional input option in form of the Screenpad Plus (14 in, 3840 x 1100 pixels, matte), which is a second display that includes touchscreen functionality (support for active input pens). It behaves like any other plugged-in external display and can be turned on and off via separate key.
The Screenpad gives the option to move applications or their navigation elements to the touchscreen. The latter depends on whether the application supports this. For example, we are able to move the chat window to the Screenpad, while a game is running on the main screen.
There are several small apps preinstalled that give an impression of the possibilities of the Screenpad. For example, there is a calculator and a field for handwriting input, and a Quick Key application bundles often used functions such as cut, copy, and paste.


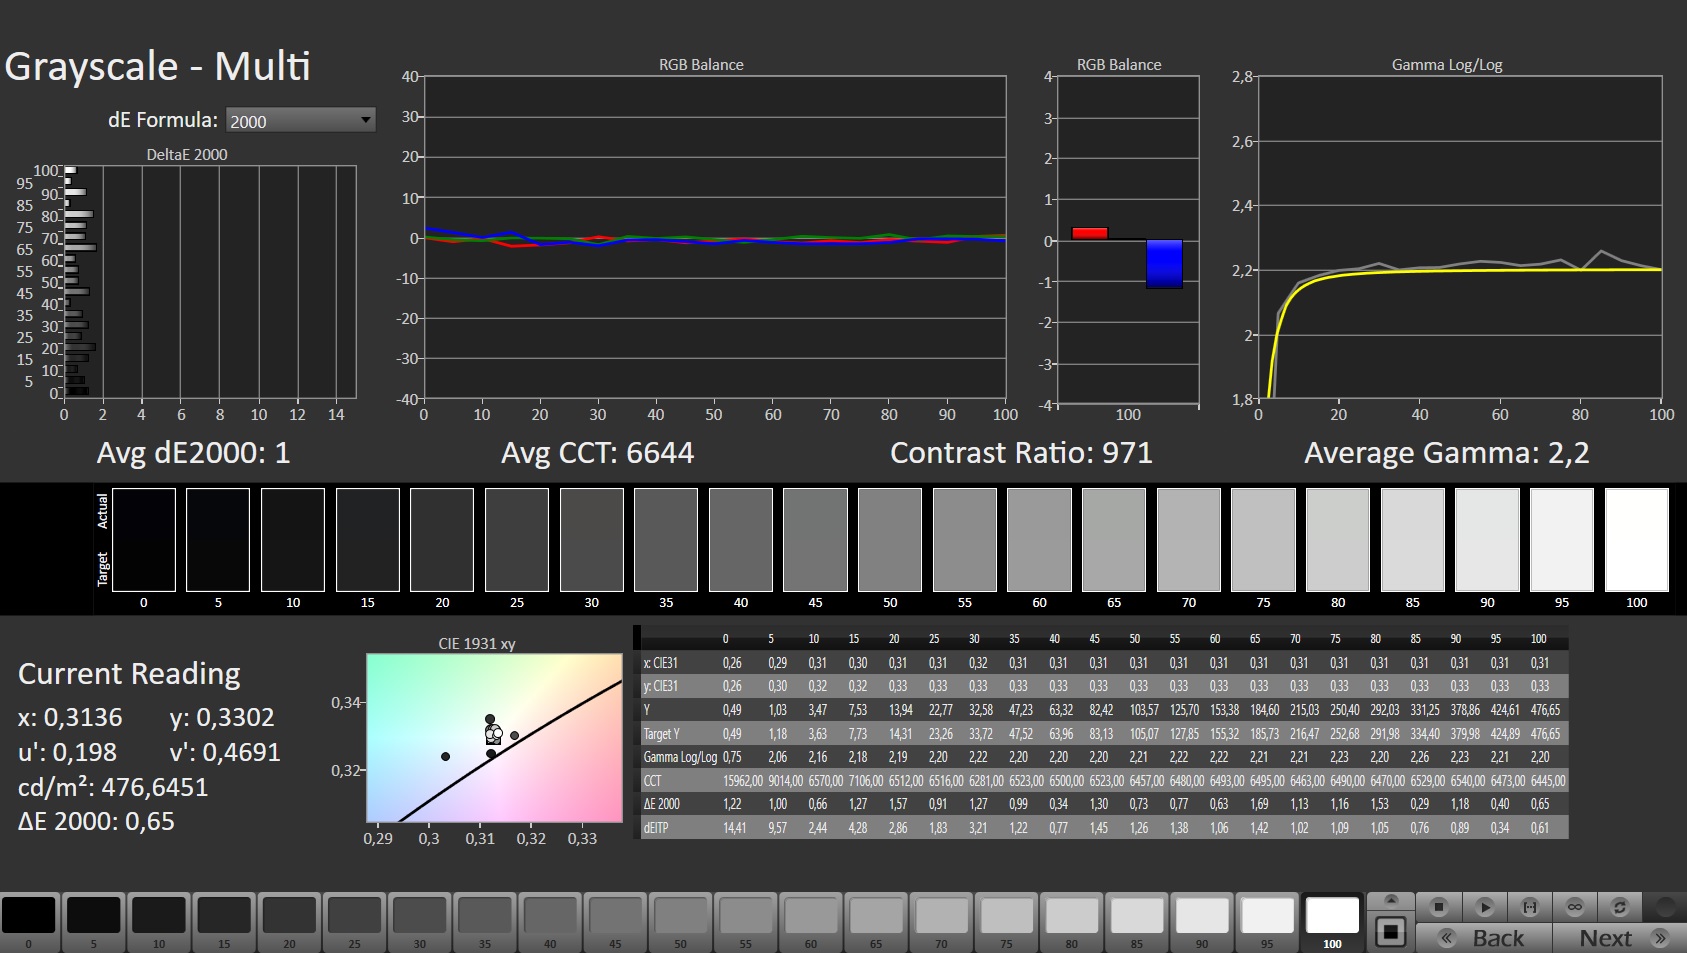
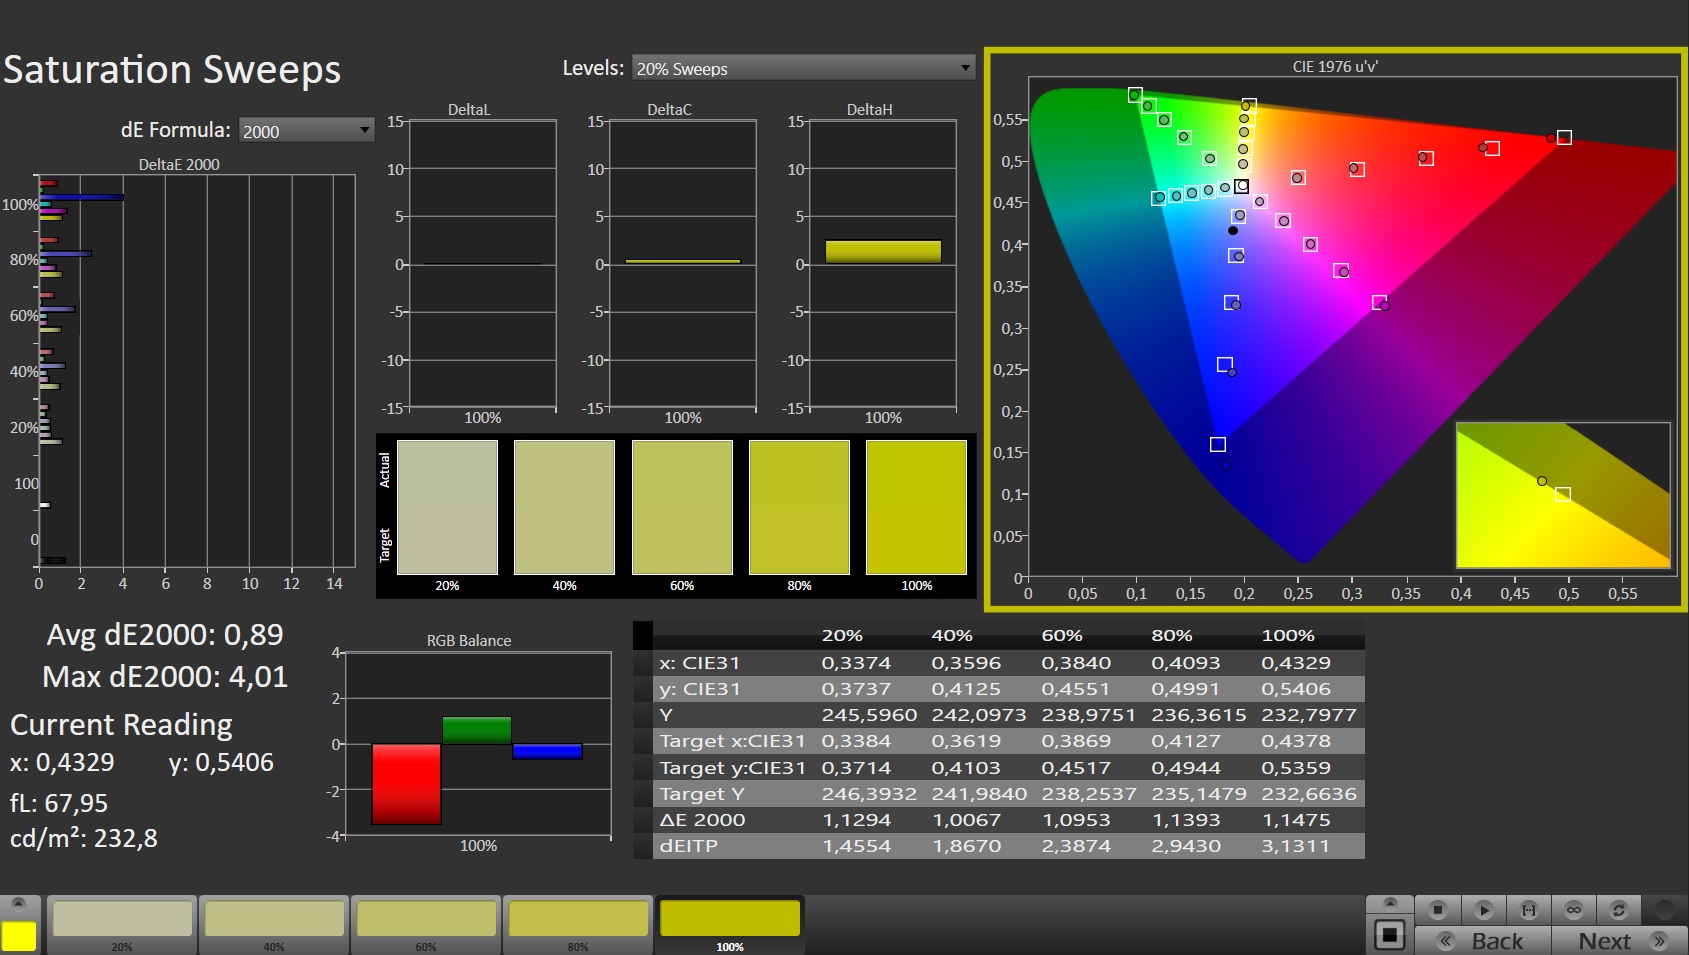
Display - Good color reproduction
The brightness (433.9 cd/m²) and contrast (1043:1) of the matte 16-inch display (3840 x 2400 pixels) fulfill the requirements. Positive points are the fast response times and lack of PWM flickering.
The display supports AMD's FreeSync technology, which dynamically adjusts the refresh rates of the display and frame rates of the GPU to each other. In this way, the created image is supposed to be as smooth as possible, particularly during computer games.
| |||||||||||||||||||||||||
Brightness Distribution: 88 %
Center on Battery: 459 cd/m²
Contrast: 1043:1 (Black: 0.44 cd/m²)
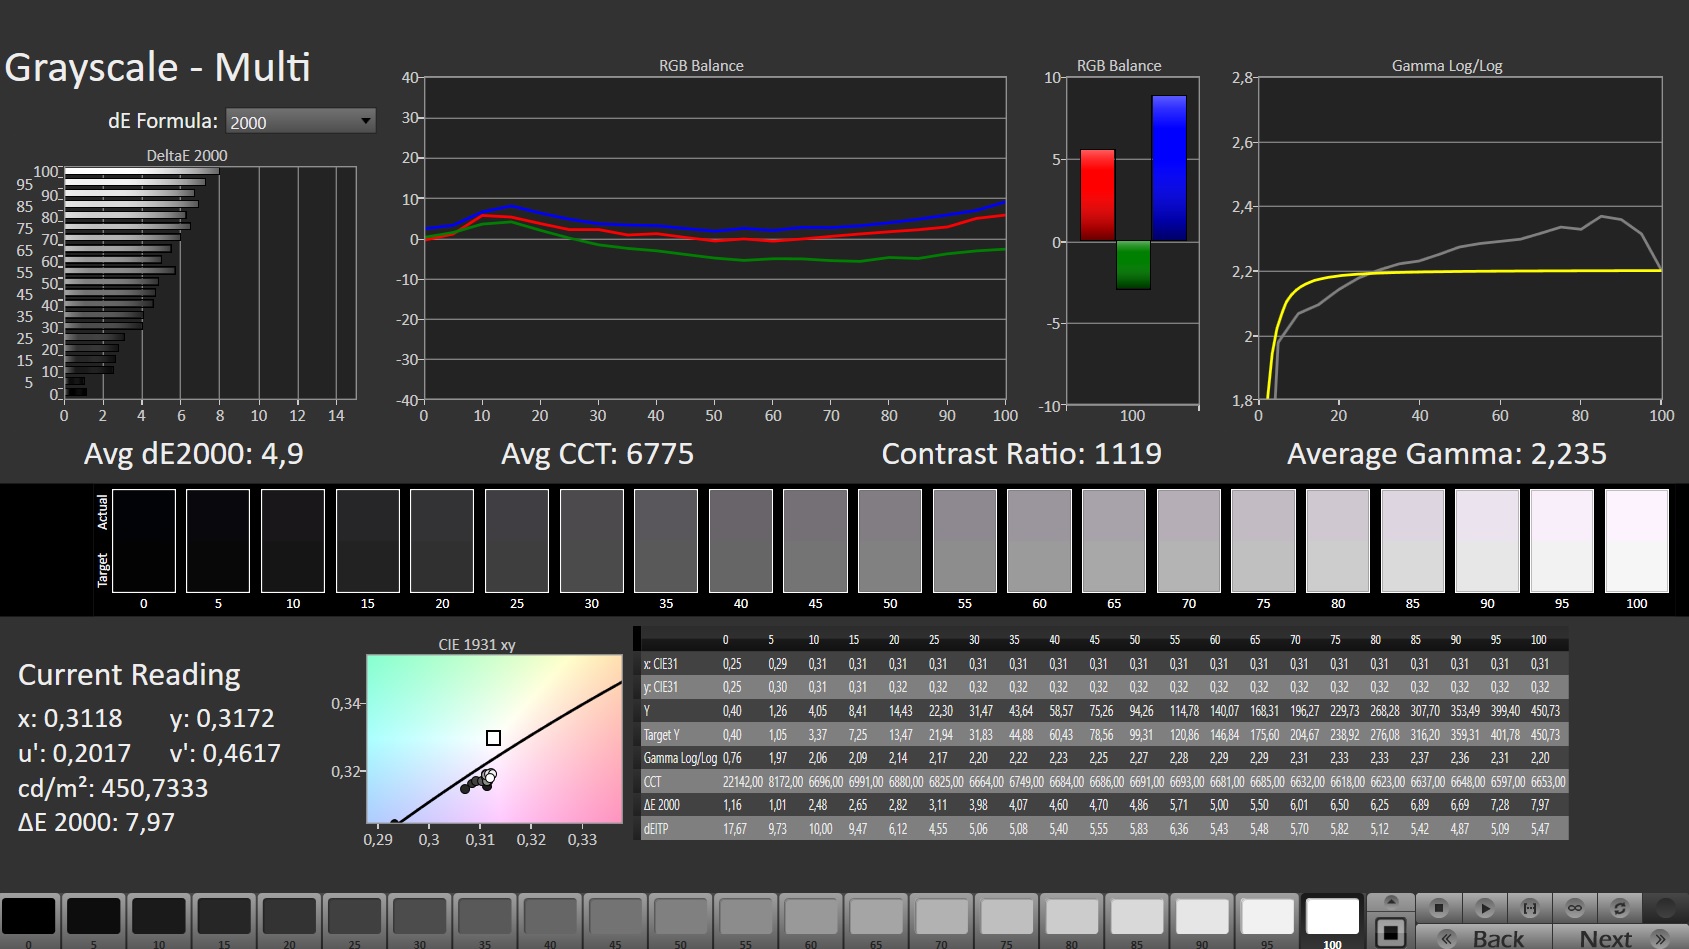
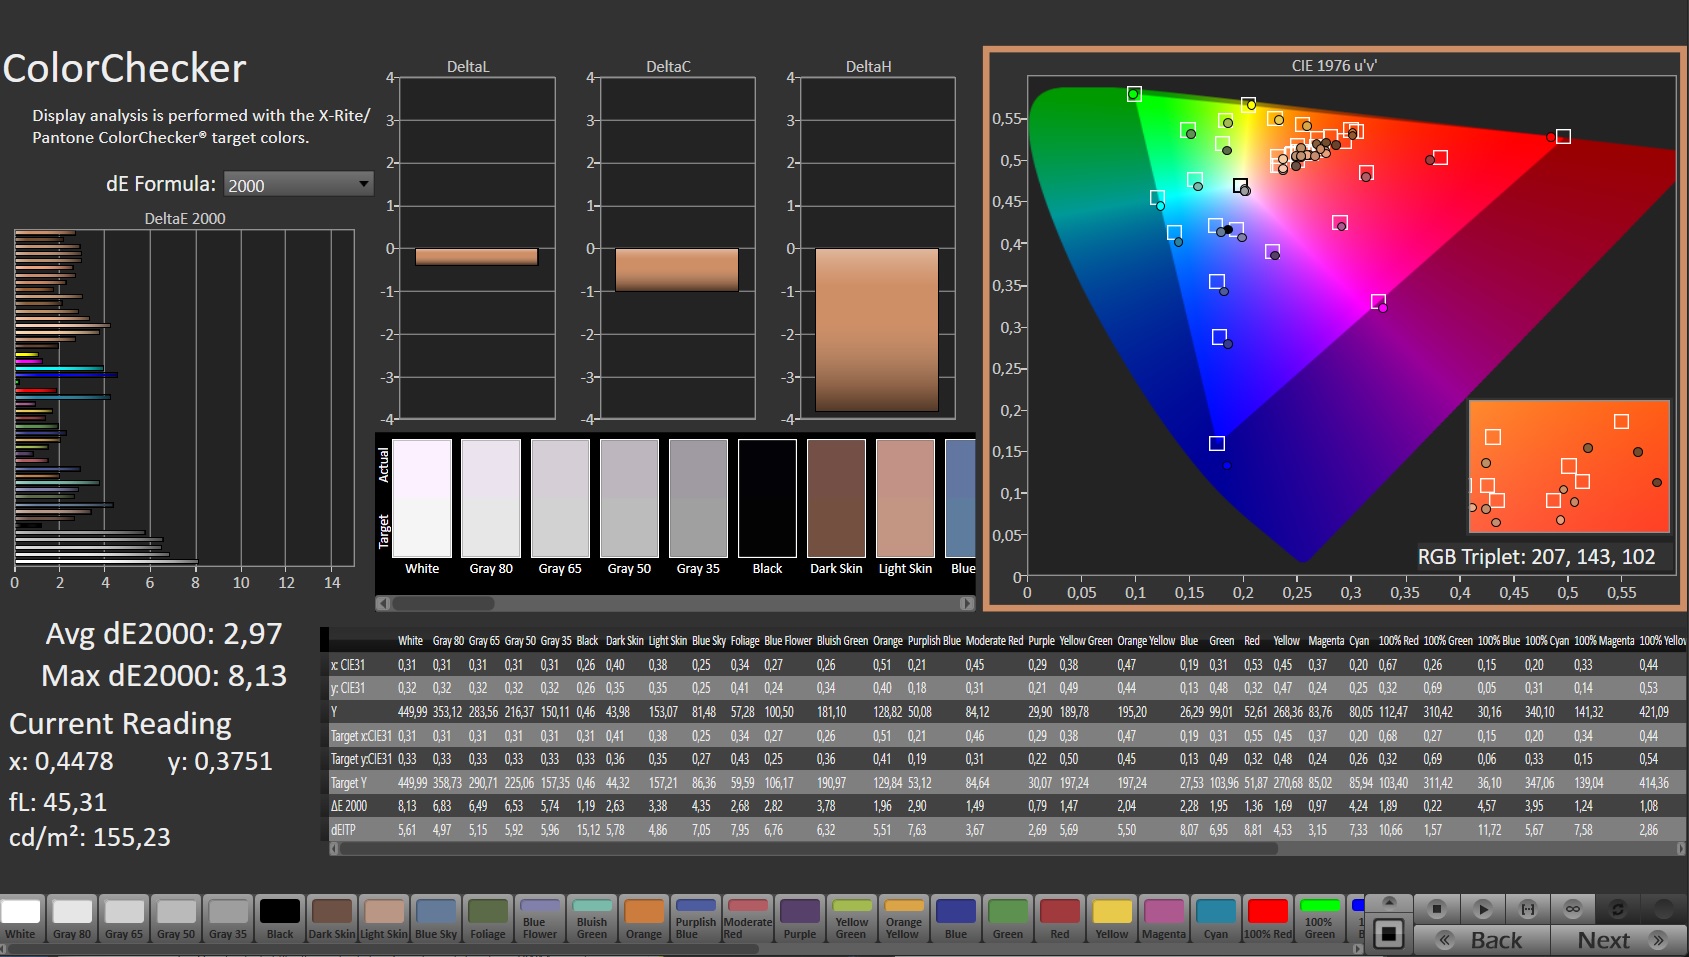
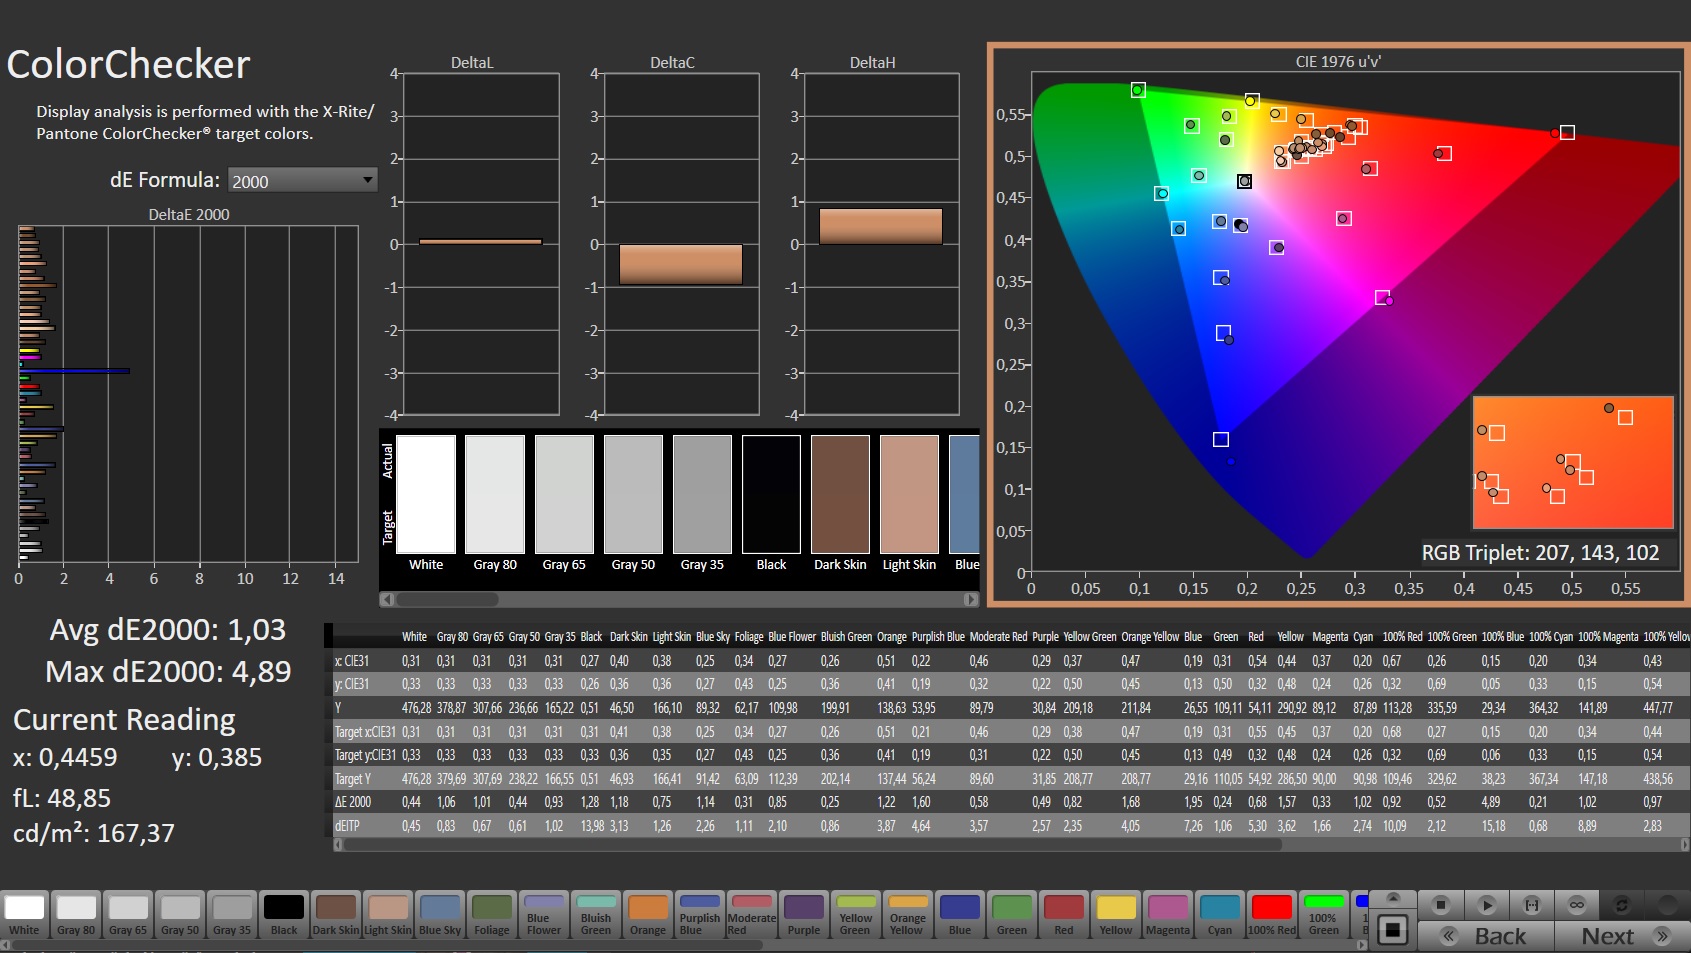
ΔE ColorChecker Calman: 2.97 | ∀{0.5-29.43 Ø4.72}
calibrated: 1.03
ΔE Greyscale Calman: 4.9 | ∀{0.09-98 Ø4.97}
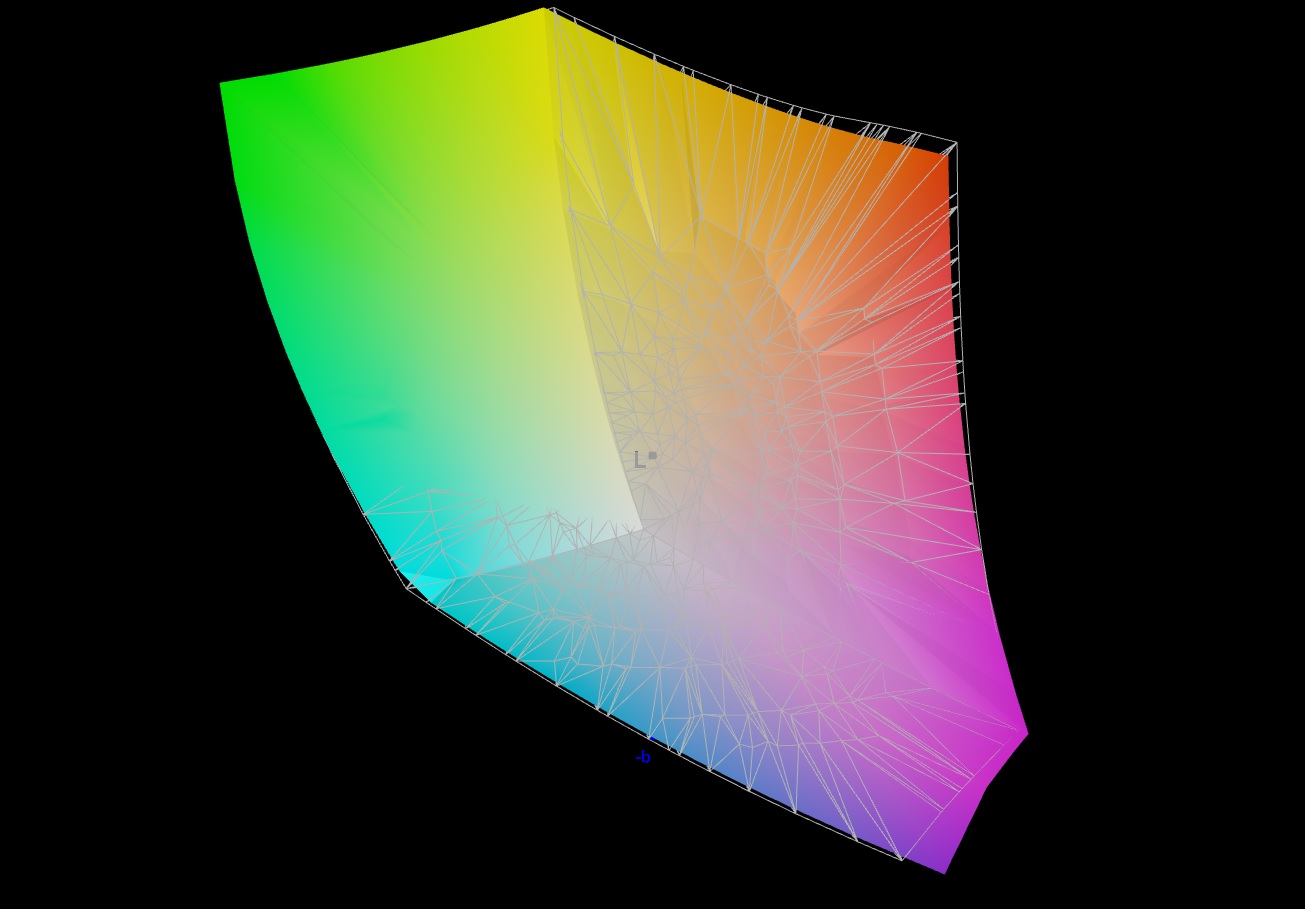
86.3% AdobeRGB 1998 (Argyll 3D)
99.9% sRGB (Argyll 3D)
98% Display P3 (Argyll 3D)
Gamma: 2.235
CCT: 6775 K
| Asus ROG Zephyrus Duo 16 GX650RX BOE NE160QAM-NX1, IPS-Level, 3840x2400, 16" | Apple MacBook Pro 16 2021 M1 Max Mini-LED, 3456x2234, 16.2" | Razer Blade 15 Advanced Model Early 2022 TL156VDXP02-0, IPS, 1920x1080, 15.6" | MSI GE76 Raider AU Optronics B173HAN05.4 (AUOE295), IPS-Level, 1920x1080, 17.3" | Medion Erazer Beast X30 BOE CQ NE173QHM-NZ3, IPS, 2560x1440, 17.3" | Gigabyte Aero 16 YE5 Samsung SDC416B, AMOLED, 3840x2400, 16" | |
|---|---|---|---|---|---|---|
| Display | -23% | -22% | -18% | |||
| Display P3 Coverage (%) | 98 | 65.3 -33% | 63.1 -36% | 67.7 -31% | ||
| sRGB Coverage (%) | 99.9 | 85.1 -15% | 94 -6% | 97.6 -2% | ||
| AdobeRGB 1998 Coverage (%) | 86.3 | 67.4 -22% | 65.2 -24% | 69.2 -20% | ||
| Response Times | -9% | -5% | -26% | 74% | ||
| Response Time Grey 50% / Grey 80% * (ms) | 14.6 ? | 4.3 ? 71% | 5.6 ? 62% | 14.7 ? -1% | 2.4 ? 84% | |
| Response Time Black / White * (ms) | 5.6 ? | 10.5 ? -88% | 9.6 ? -71% | 8.4 ? -50% | 2 ? 64% | |
| PWM Frequency (Hz) | 60 ? | |||||
| Screen | 329% | 27% | 20% | 3% | 456% | |
| Brightness middle (cd/m²) | 459 | 507 10% | 330 -28% | 290 -37% | 377 -18% | 368 -20% |
| Brightness (cd/m²) | 434 | 494 14% | 315 -27% | 290 -33% | 352 -19% | 368 -15% |
| Brightness Distribution (%) | 88 | 96 9% | 89 1% | 96 9% | 86 -2% | 93 6% |
| Black Level * (cd/m²) | 0.44 | 0.02 95% | 0.24 45% | 0.23 48% | 0.32 27% | 0.01 98% |
| Contrast (:1) | 1043 | 25350 2330% | 1375 32% | 1261 21% | 1178 13% | 36800 3428% |
| Colorchecker dE 2000 * | 2.97 | 1.4 53% | 1.47 51% | 1.59 46% | 2.91 2% | 2.33 22% |
| Colorchecker dE 2000 max. * | 8.13 | 2.8 66% | 2.73 66% | 3.17 61% | 6.78 17% | 4.34 47% |
| Colorchecker dE 2000 calibrated * | 1.03 | 0.63 39% | 0.87 16% | 1.3 -26% | ||
| Greyscale dE 2000 * | 4.9 | 2.3 53% | 1.8 63% | 2.5 49% | 3.4 31% | 0.8 84% |
| Gamma | 2.235 98% | 2.27 97% | 2.282 96% | 2.253 98% | 2.109 104% | 2.119 104% |
| CCT | 6775 96% | 6792 96% | 6499 100% | 6640 98% | 7273 89% | 6569 99% |
| Total Average (Program / Settings) | 329% /
329% | -2% /
11% | -2% /
8% | -14% /
-6% | 265% /
380% |
* ... smaller is better
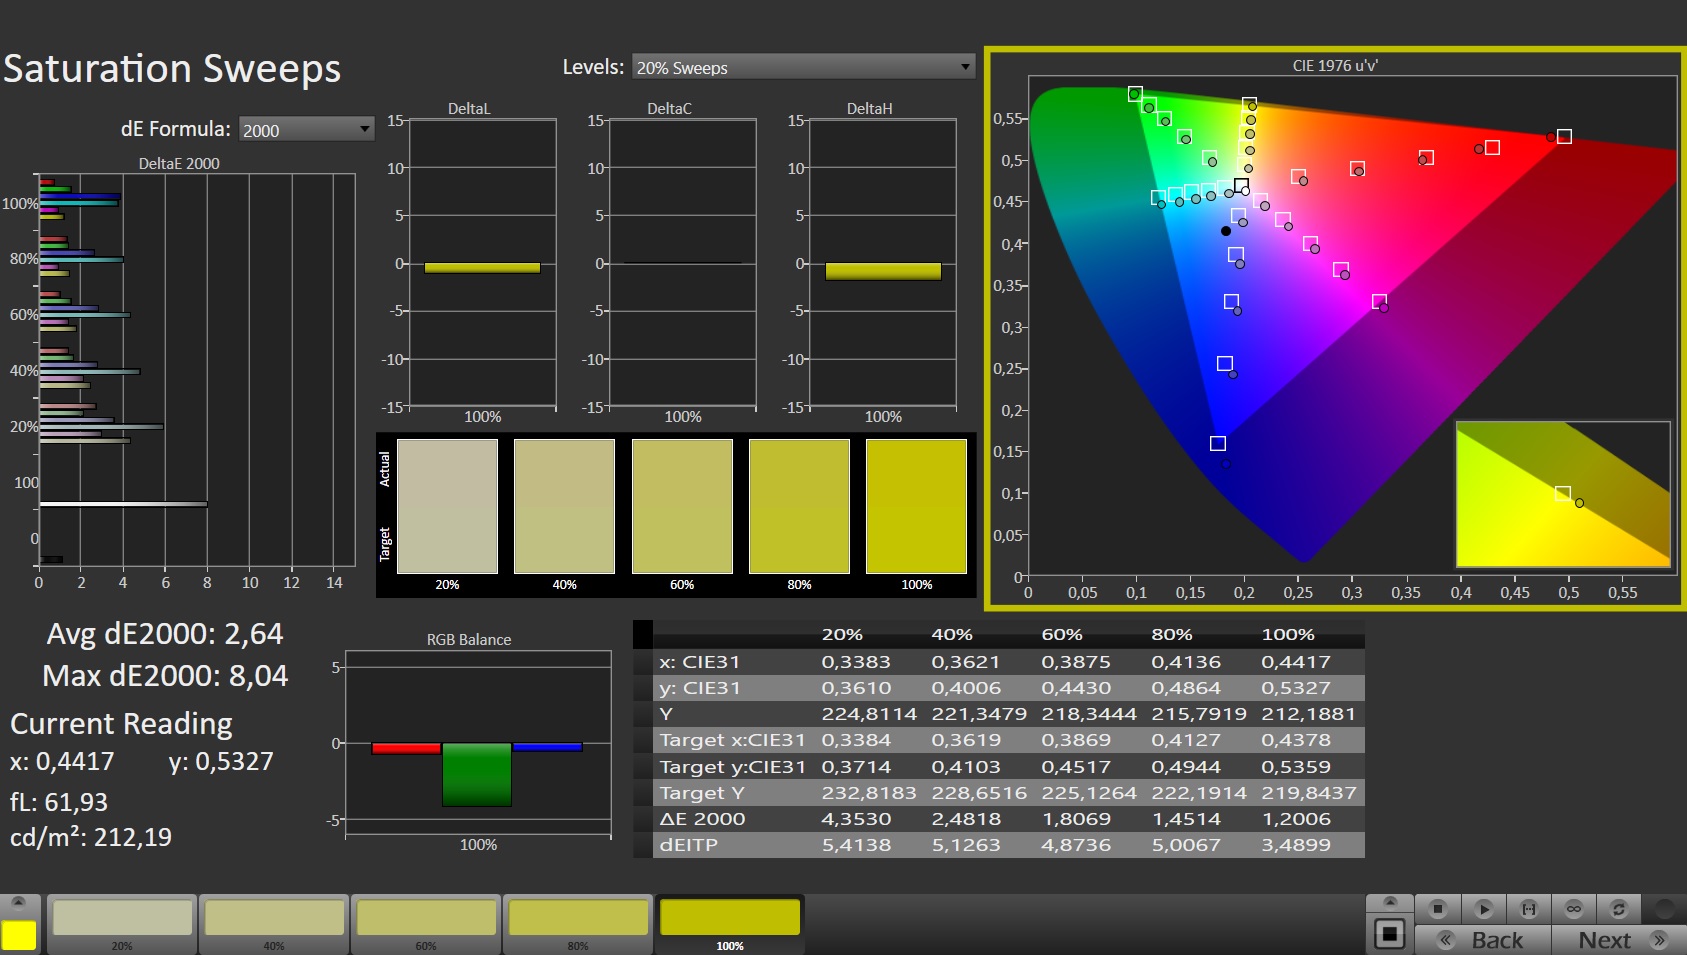
The X Rite Pantone certification of the display ensures a very natural color reproduction. Correspondingly, the color display is fairly accurate already in the state of delivery. While the color deviation remains within the target limits, a calibration still brings significant improvements. The screen is able to display the sRGB (99.9%) and DCI-P3 (98%) color spaces almost completely, and 86% of the AdobeRGB color space are also covered.


Display Response Times
| ↔ Response Time Black to White | ||
|---|---|---|
| 5.6 ms ... rise ↗ and fall ↘ combined | ↗ 2 ms rise | 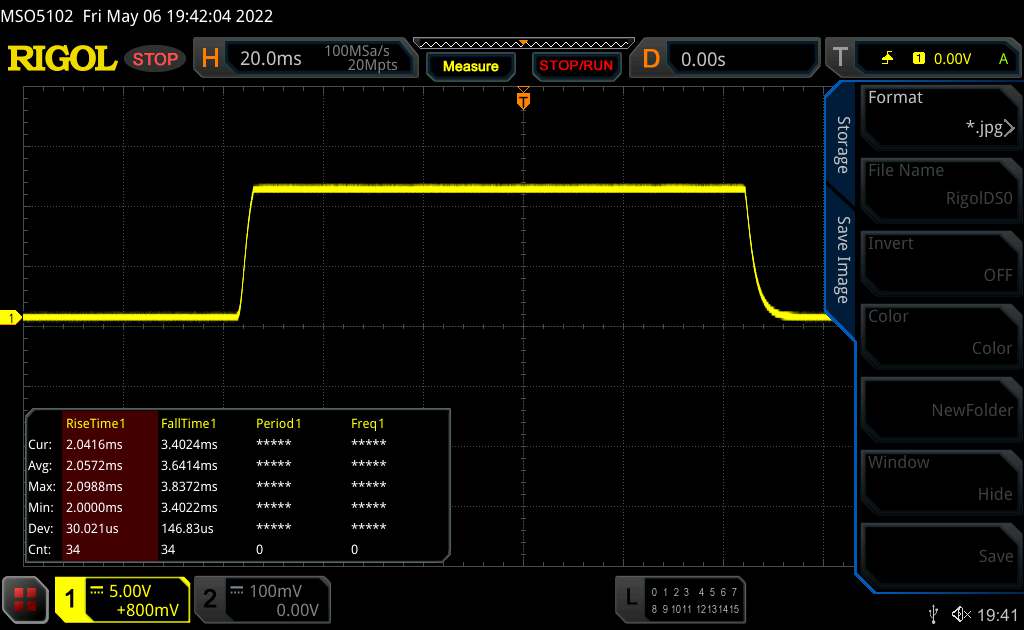 |
| ↘ 3.6 ms fall | ||
| The screen shows very fast response rates in our tests and should be very well suited for fast-paced gaming. In comparison, all tested devices range from 0.1 (minimum) to 240 (maximum) ms. » 18 % of all devices are better. This means that the measured response time is better than the average of all tested devices (19.8 ms). | ||
| ↔ Response Time 50% Grey to 80% Grey | ||
| 14.6 ms ... rise ↗ and fall ↘ combined | ↗ 6.7 ms rise | 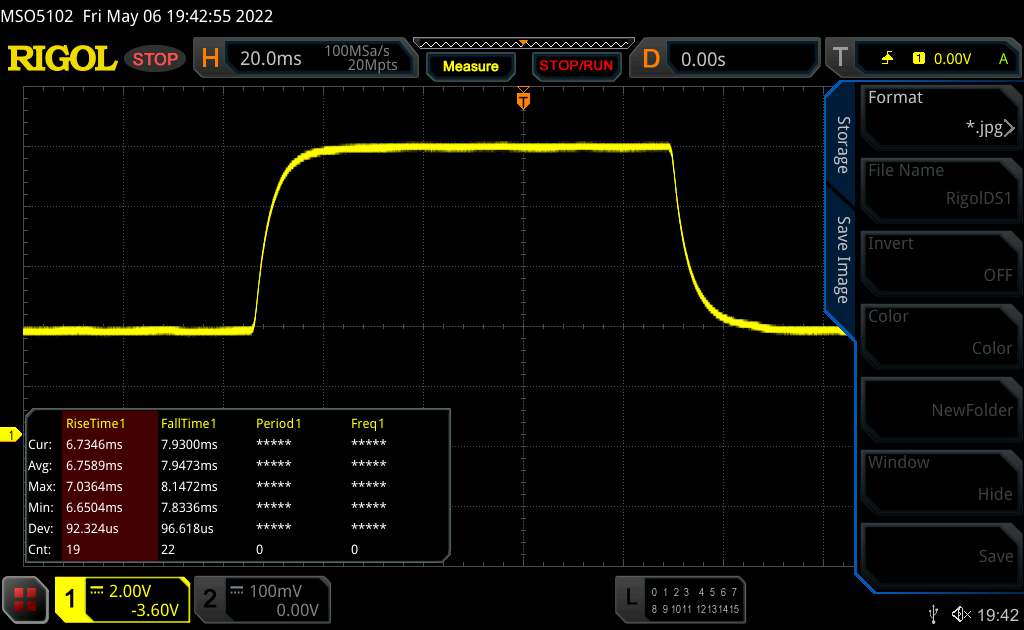 |
| ↘ 7.9 ms fall | ||
| The screen shows good response rates in our tests, but may be too slow for competitive gamers. In comparison, all tested devices range from 0.165 (minimum) to 636 (maximum) ms. » 29 % of all devices are better. This means that the measured response time is better than the average of all tested devices (31 ms). | ||
Screen Flickering / PWM (Pulse-Width Modulation)
| Screen flickering / PWM not detected | 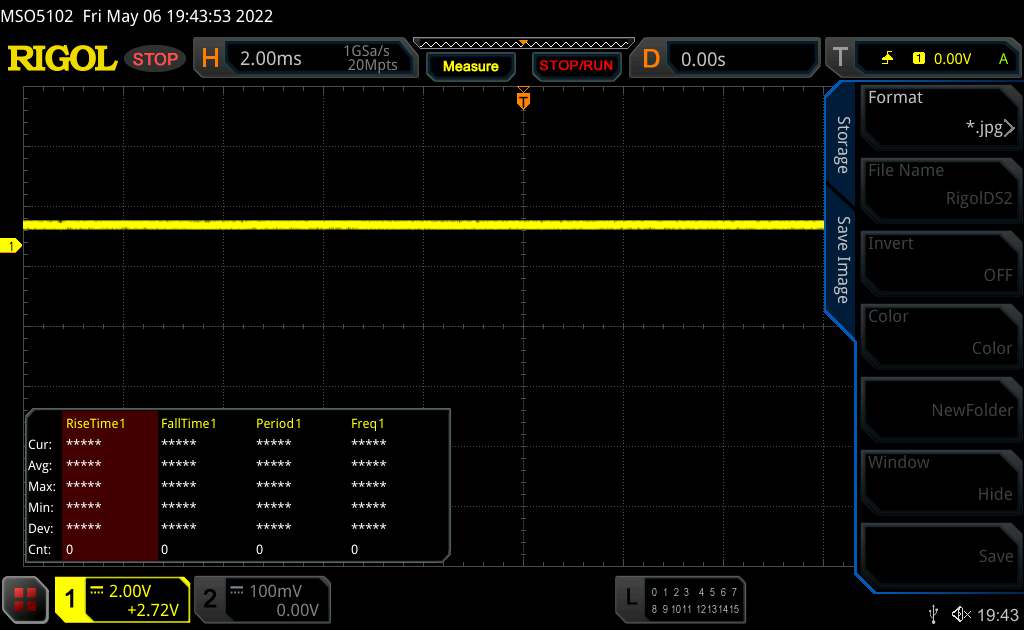 | ||
In comparison: 52 % of all tested devices do not use PWM to dim the display. If PWM was detected, an average of 7753 (minimum: 5 - maximum: 343500) Hz was measured. | |||
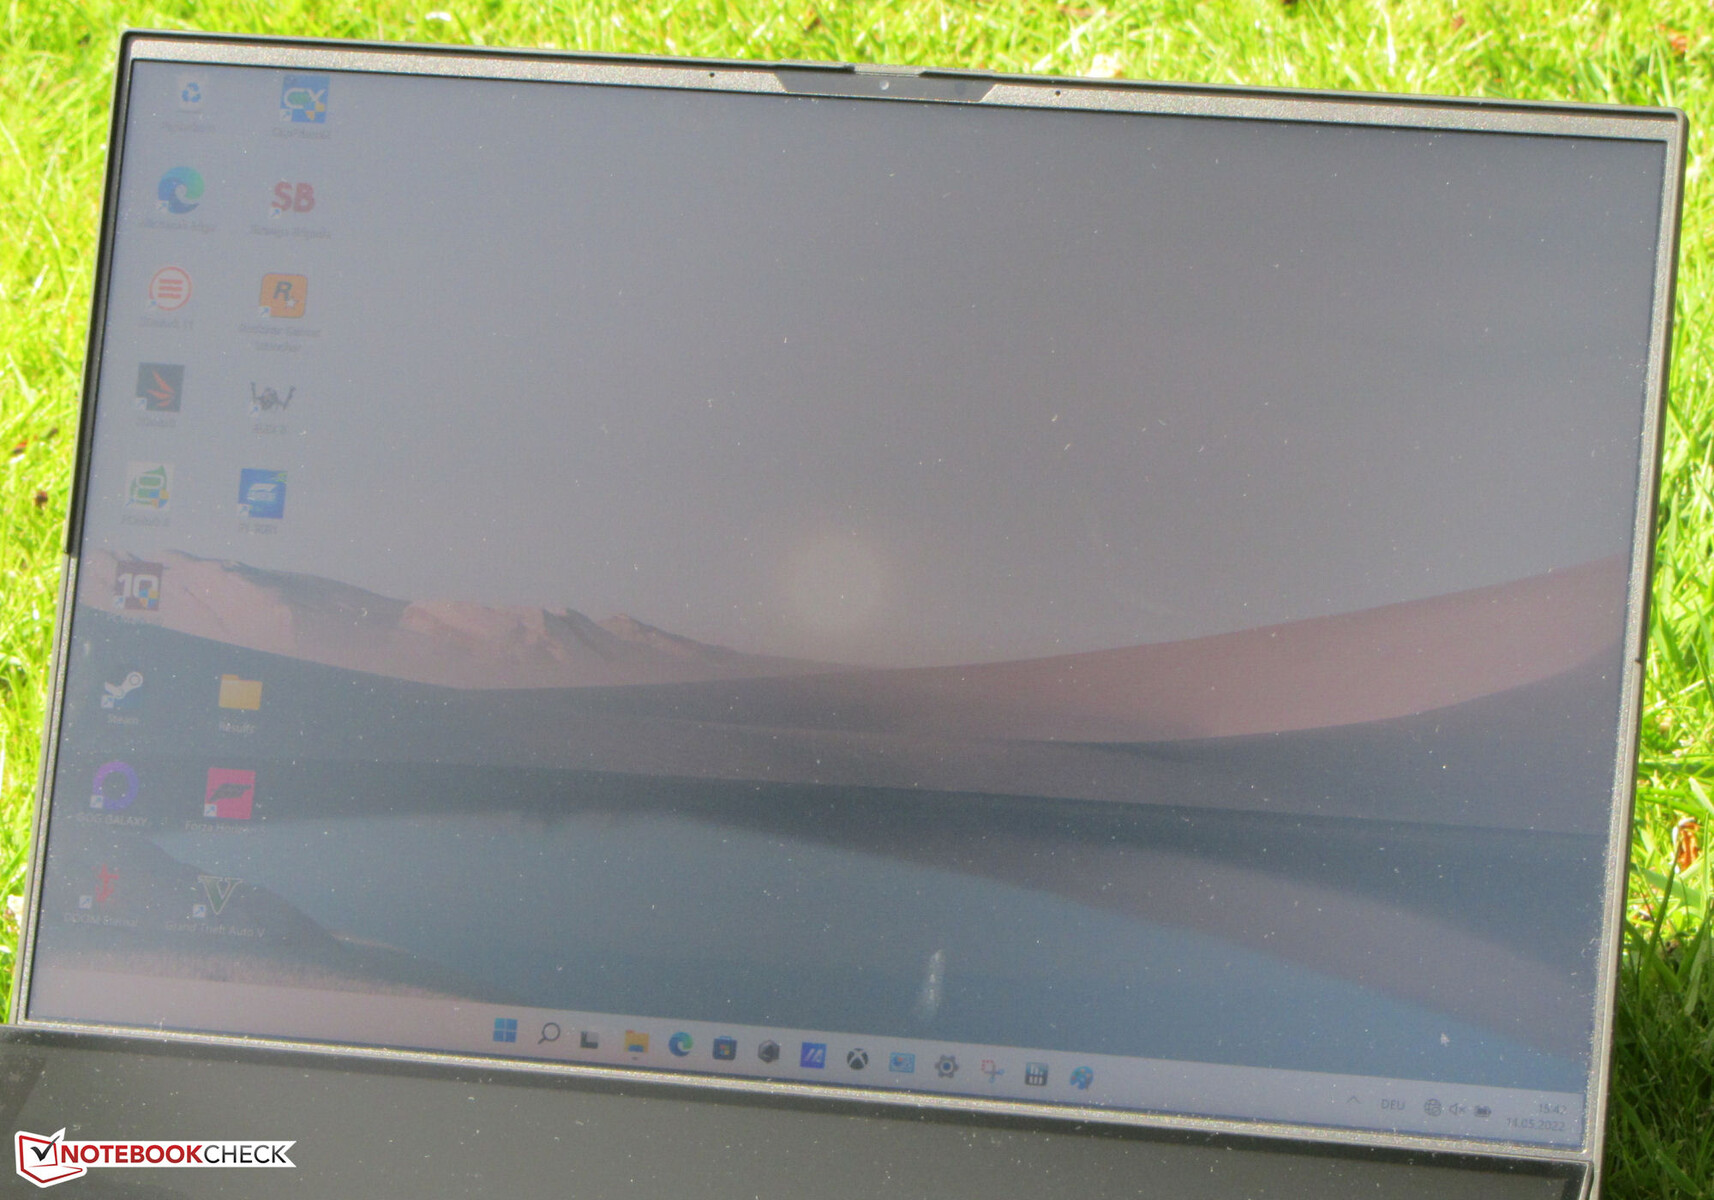
The viewing angles of the IPS panel are stable, and it can be read from any angle. The display can be read outdoors, if the sunlight isn't too bright.

Performance - Rembrandt meets Ampere
With the Zephyrus Duo 16 GX650RX, Asus offers a 16-inch laptop that is primarily positioned as a gaming laptop. However, the device is also targeted towards streamers and content creators.

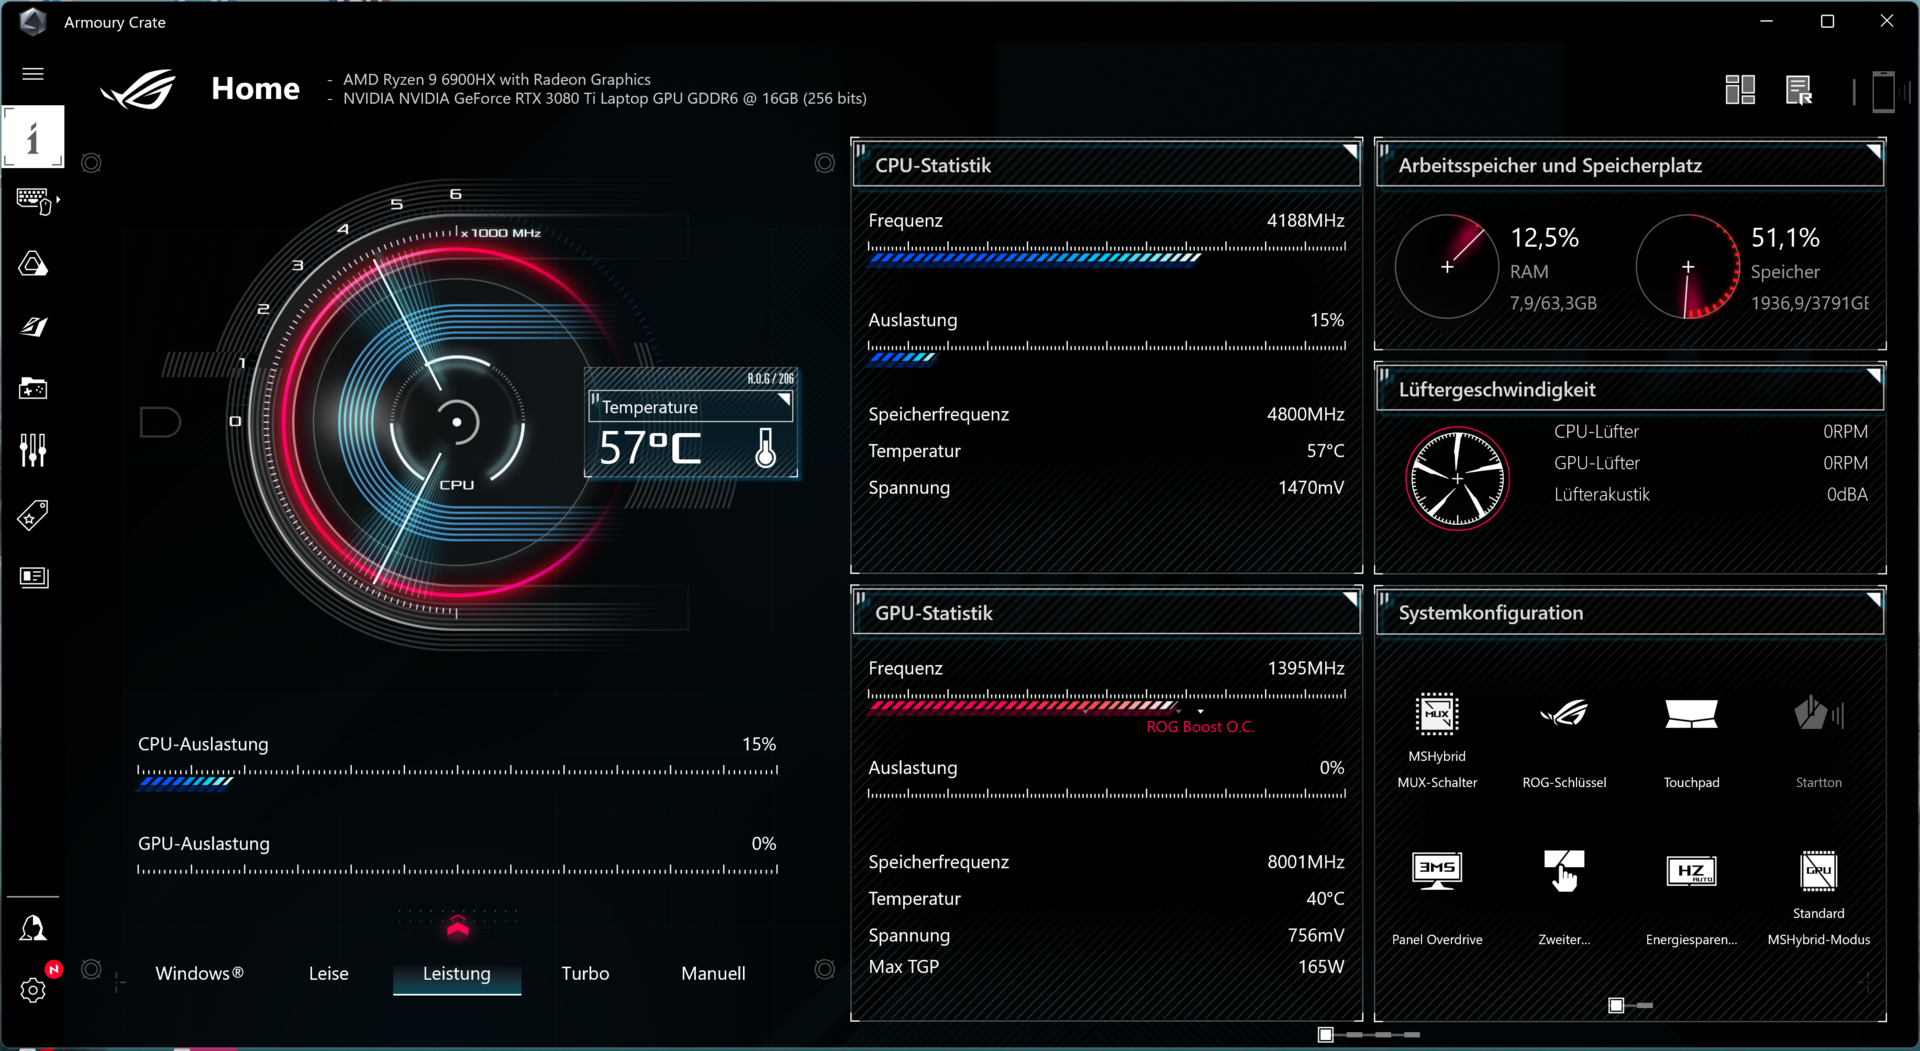
Test Conditions
The laptop offers three manufacturer specific performance profiles ("Silent", "Performance", and "Turbo"), and you can switch between them by using the "Fn" + "F5" key combination. The "Turbo" profile can only be used in mains operation. Our battery tests were performed using the "Silent" profile and all the benchmarks with the "Performance" profile activated.
| Performance | Turbo | Silent | |
|---|---|---|---|
| Power Limit 1 | 80 Watt | 100 Watt | 70 Watt |
| Power Limit 2 | 80 Watt | 125 Watt | 70 Watt |
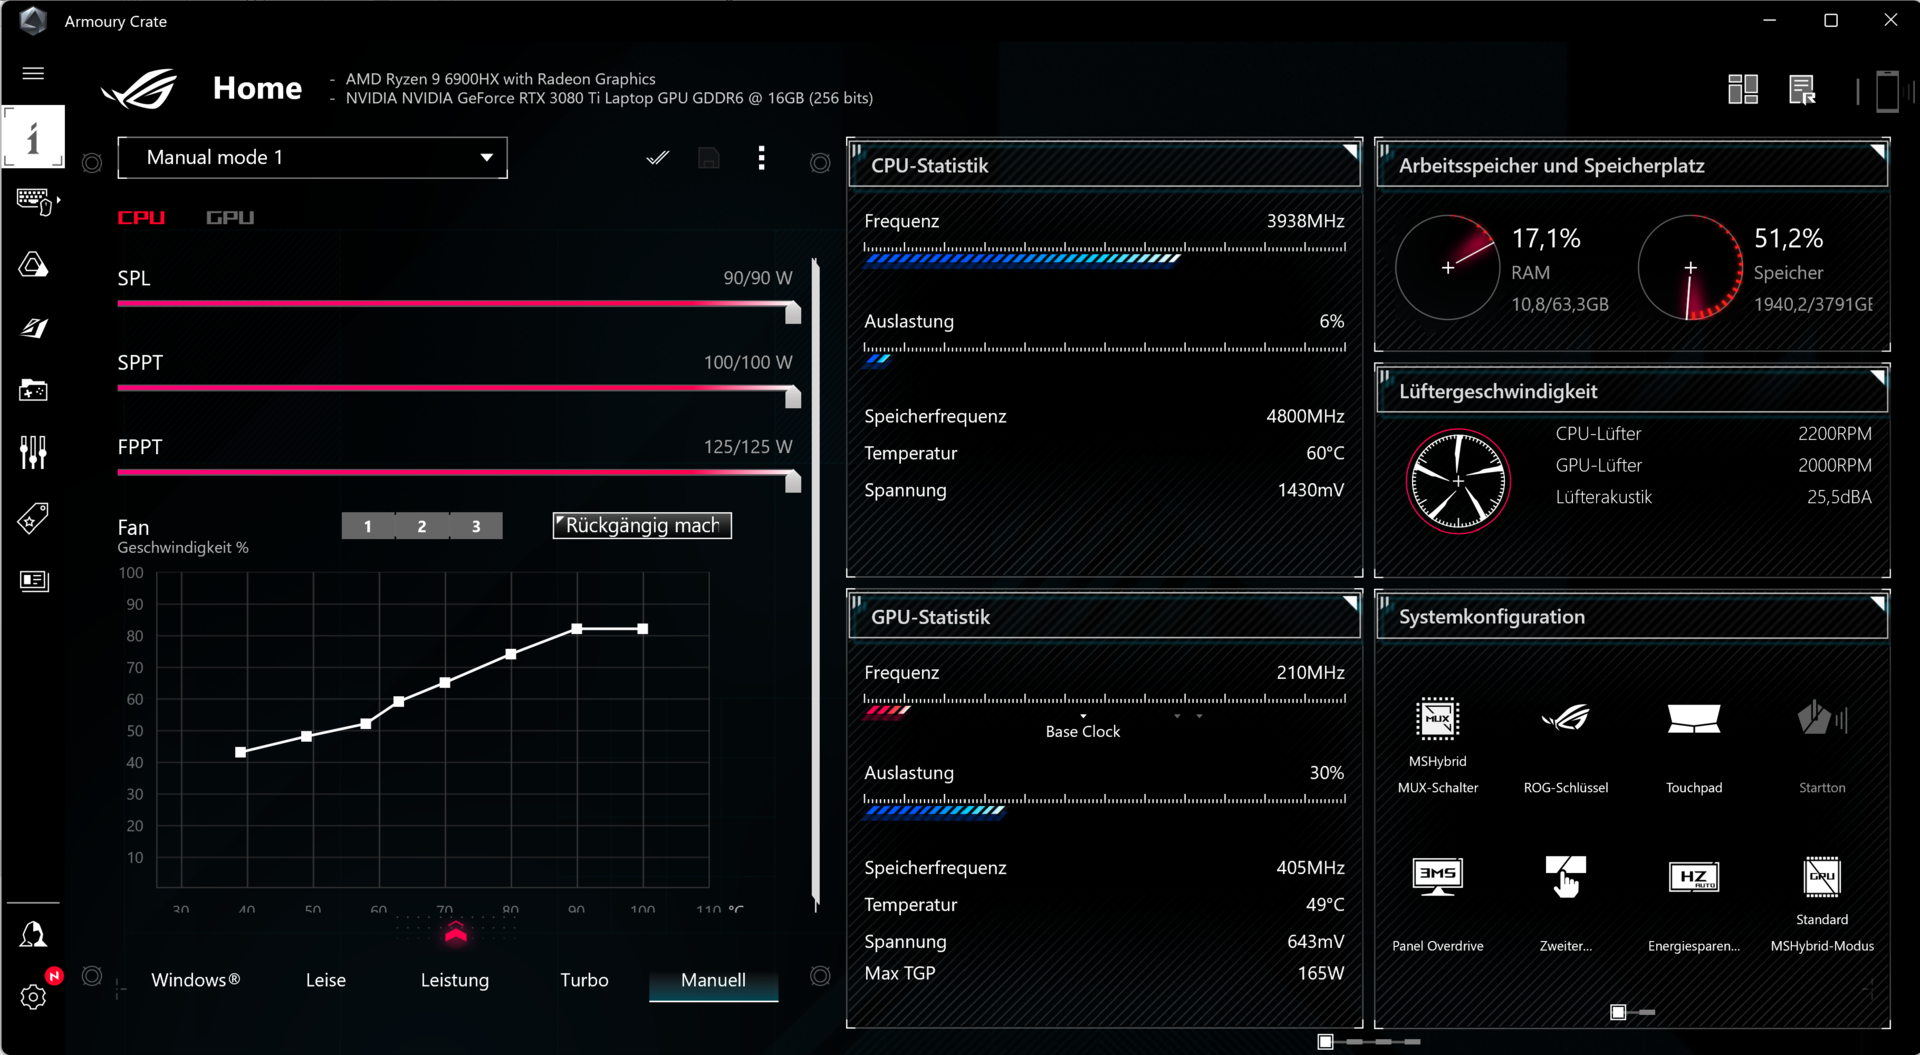
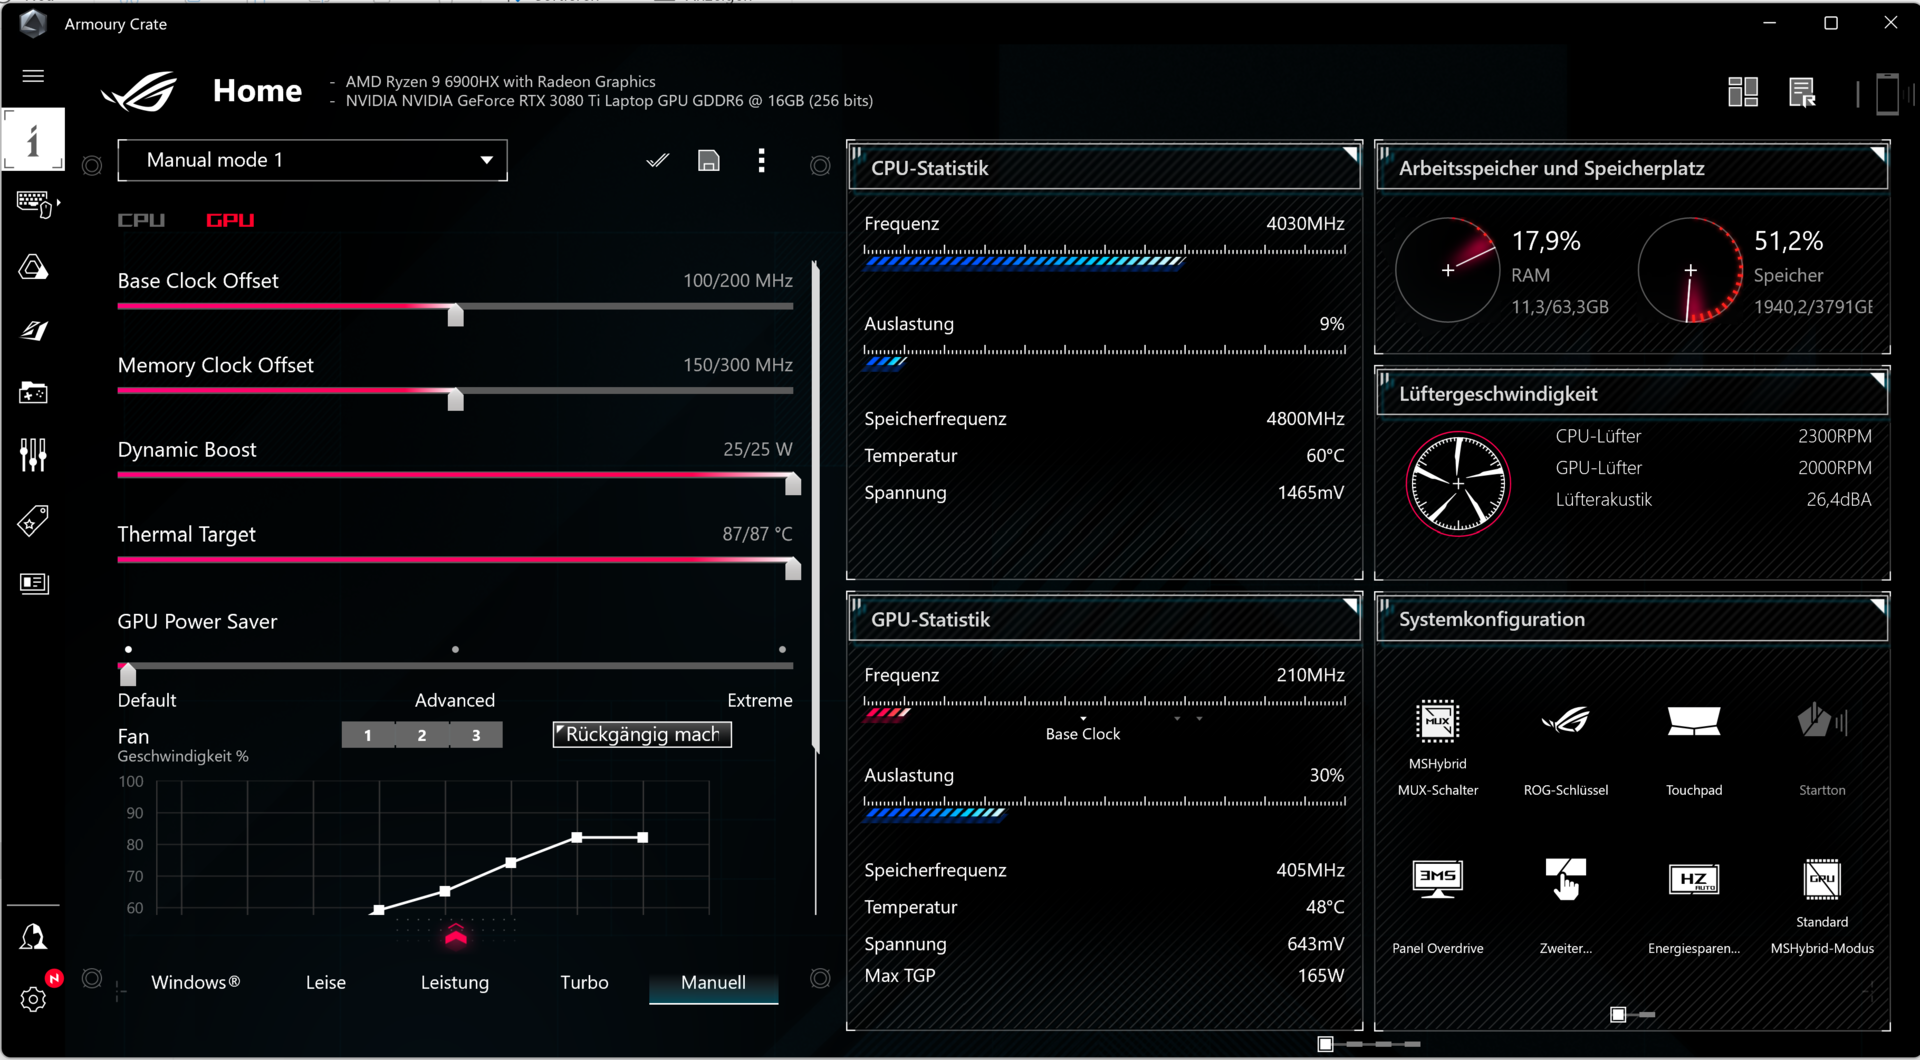
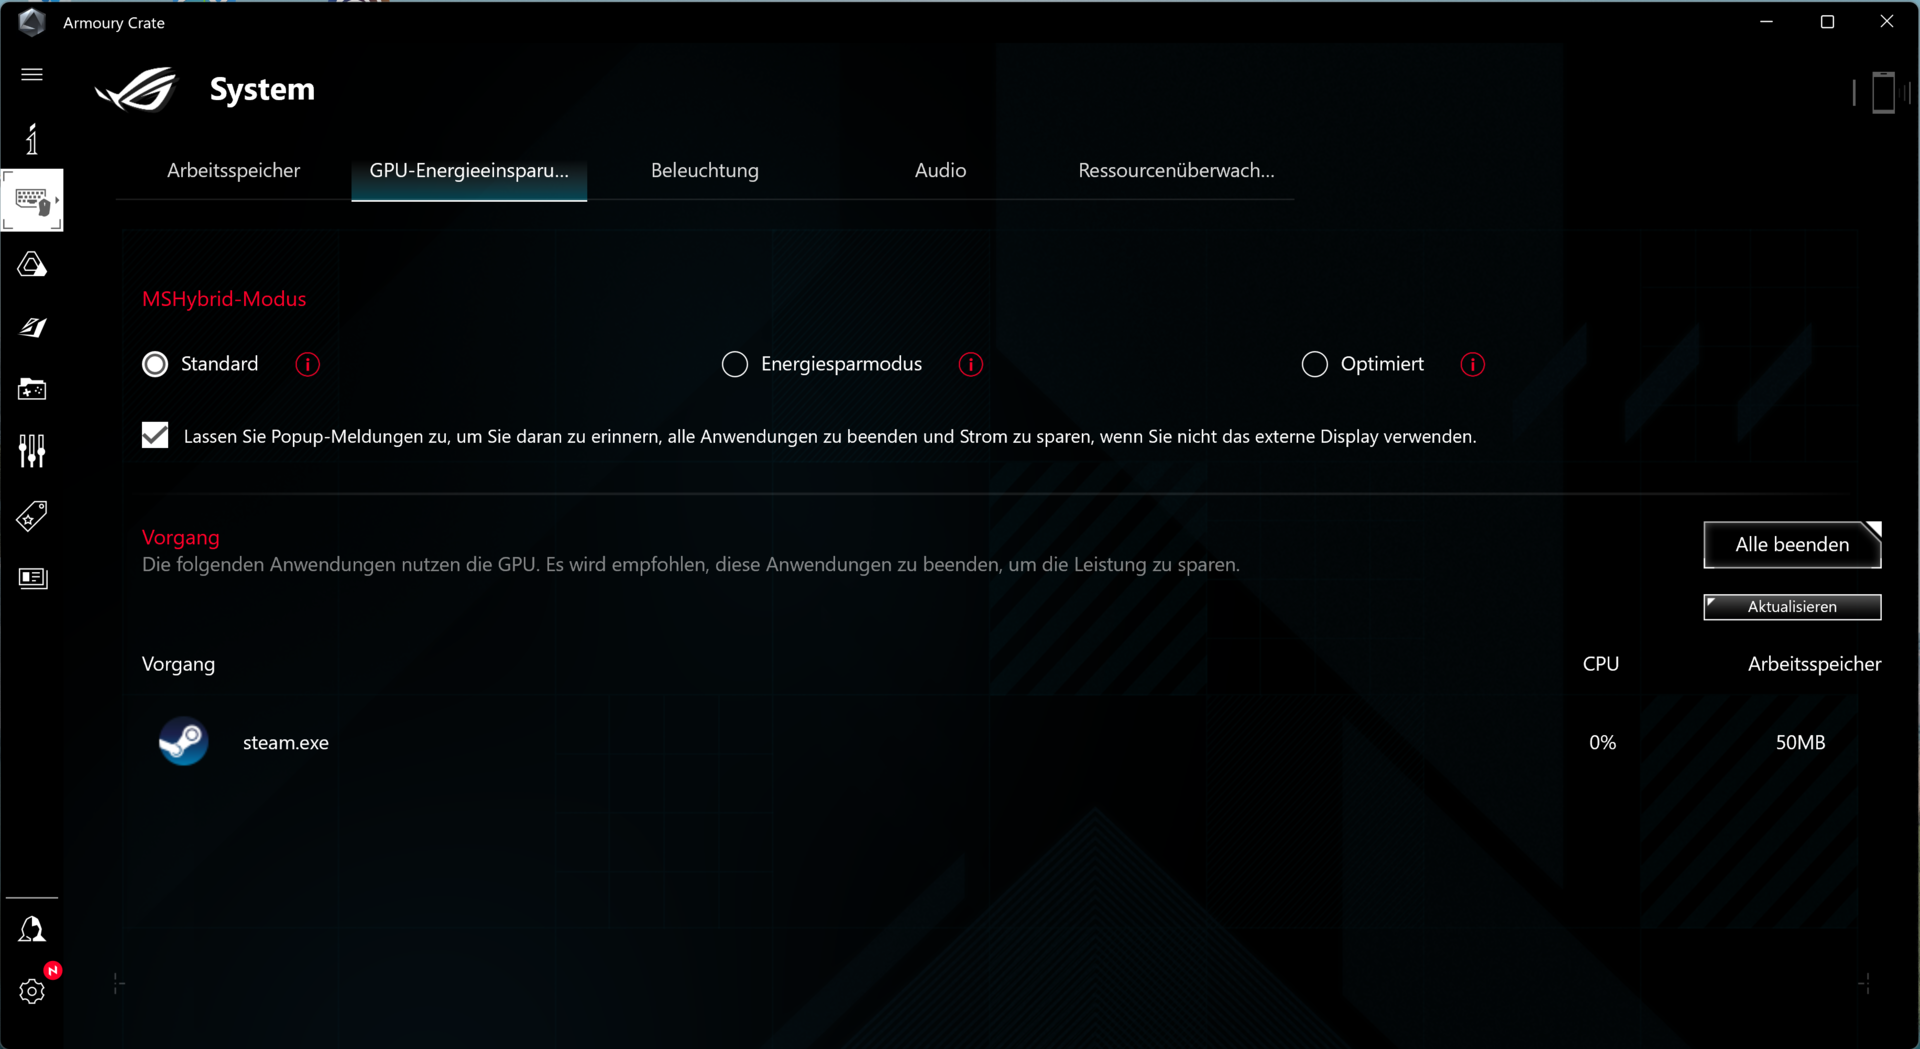
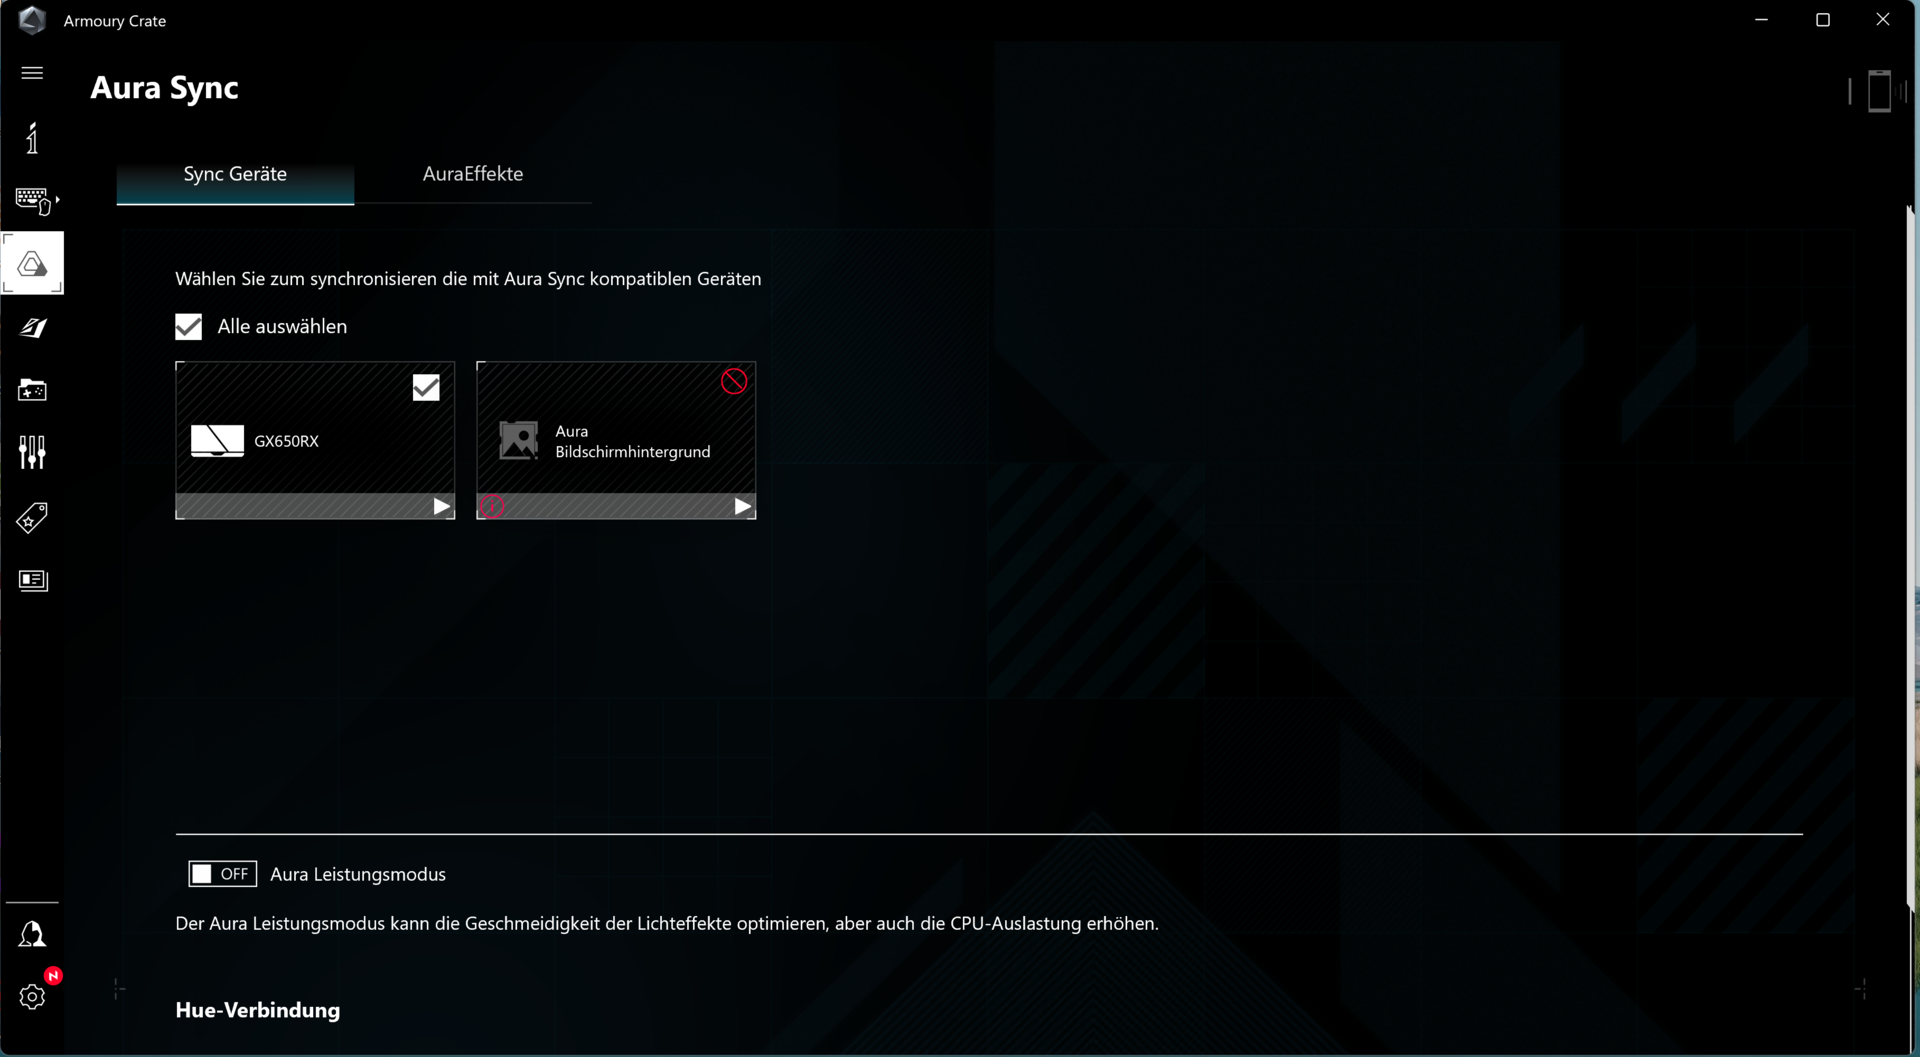
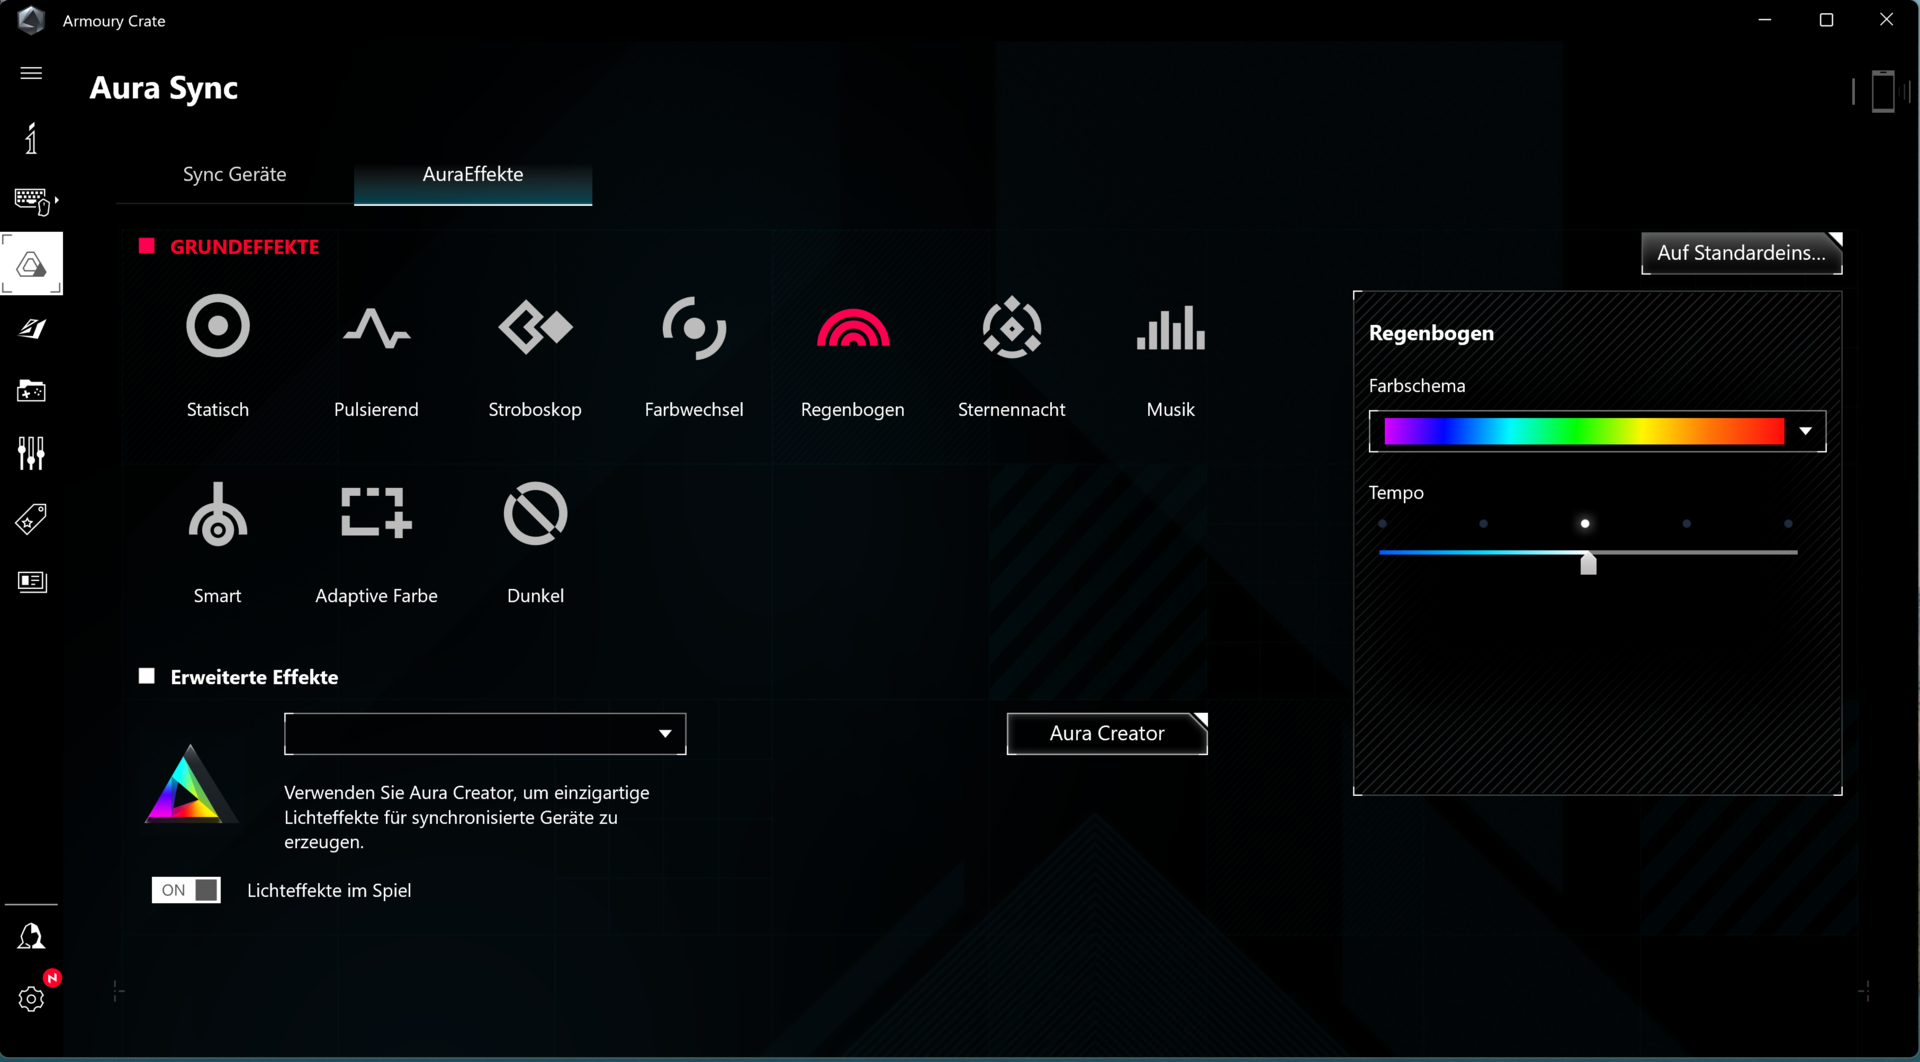
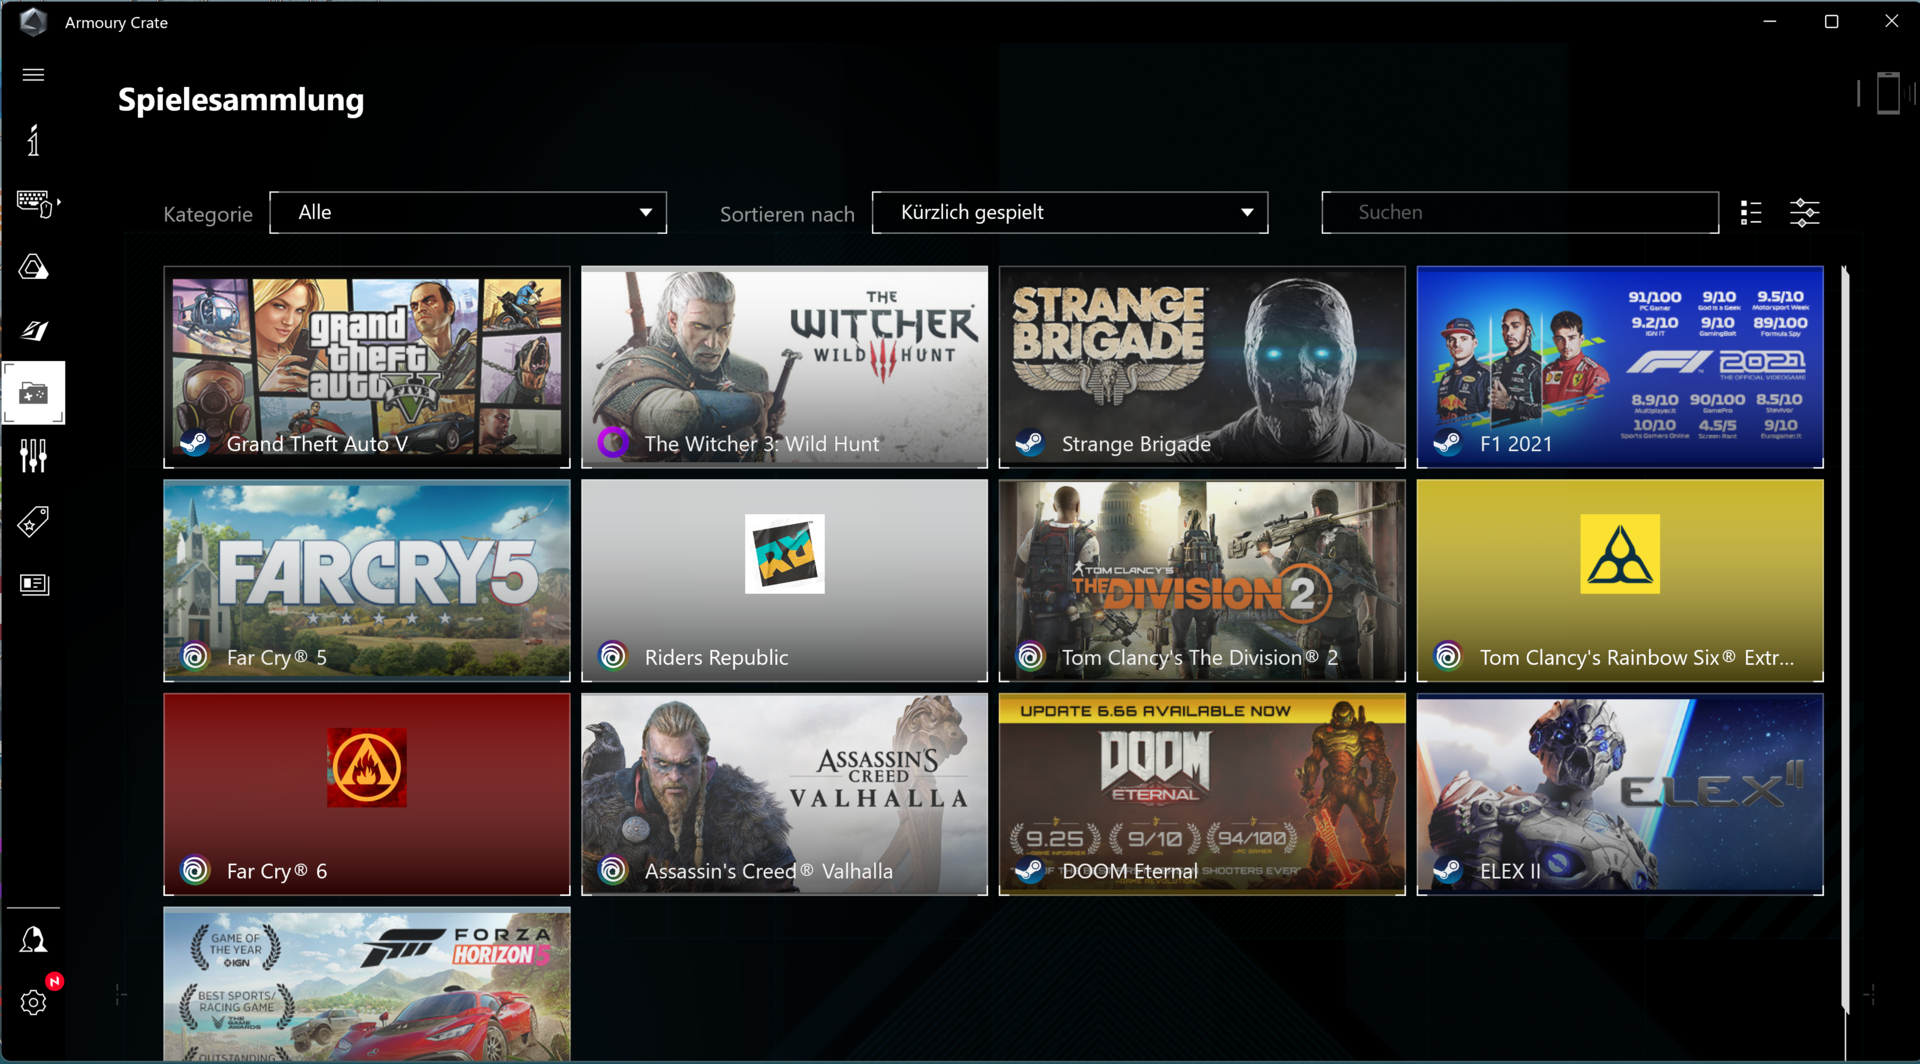
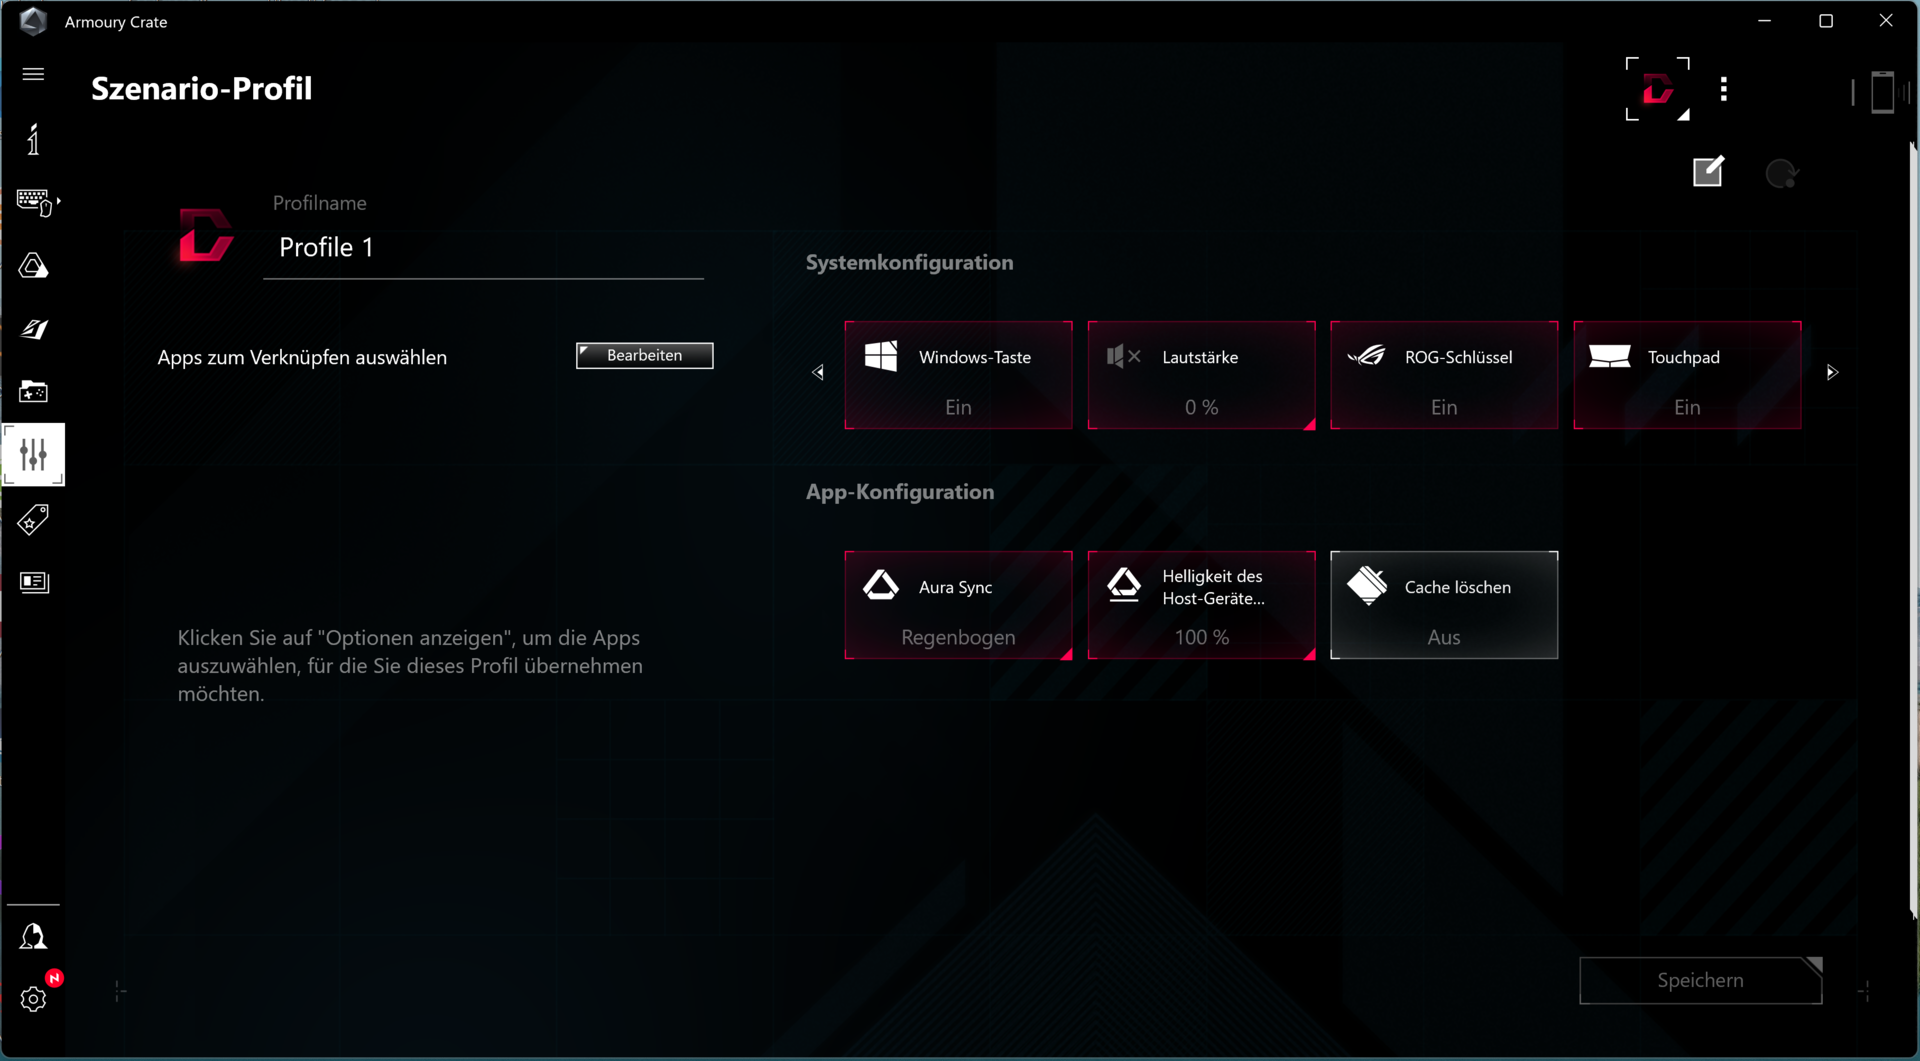
The preinstalled Armoury Crate software allows you to create individual profiles ("Manual"). For example, we configured the power limits of the CPU and the dynamic boost of the GPU individually. You can also overclock the graphics storage.
Processor
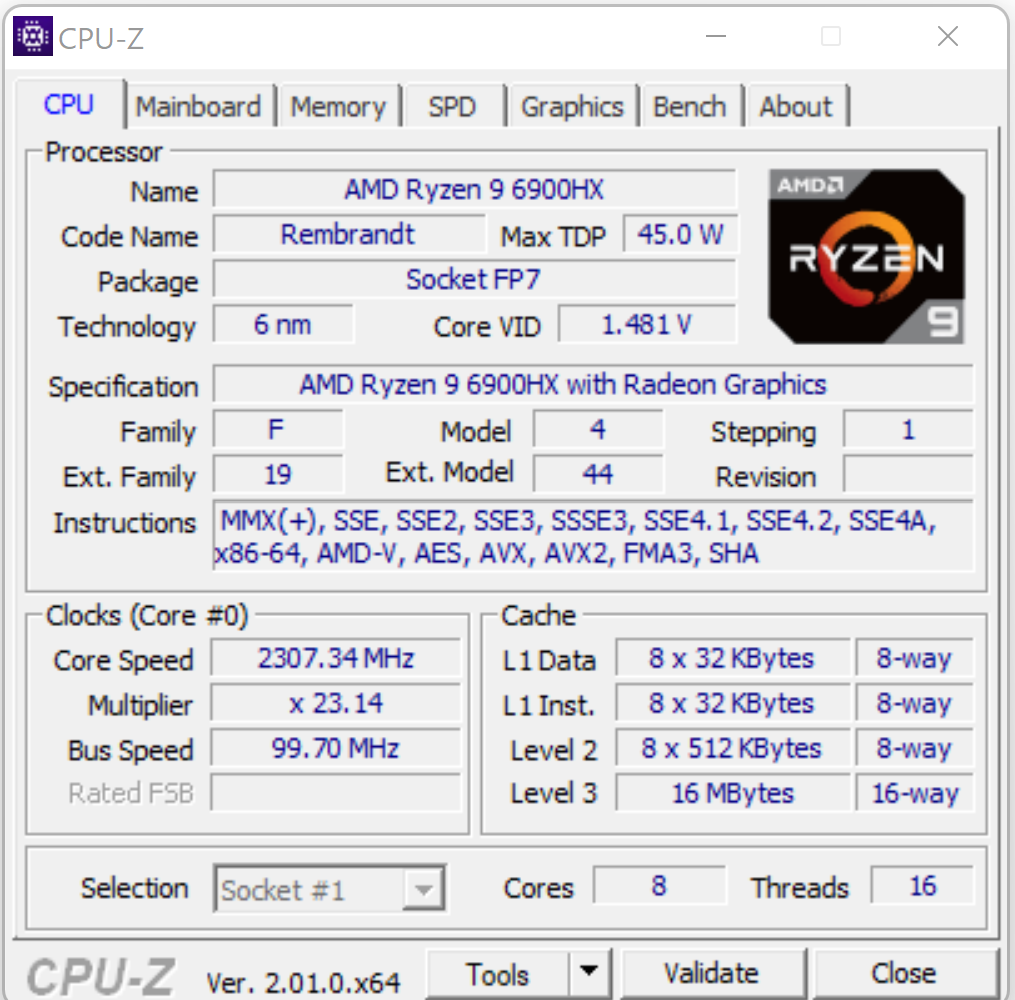
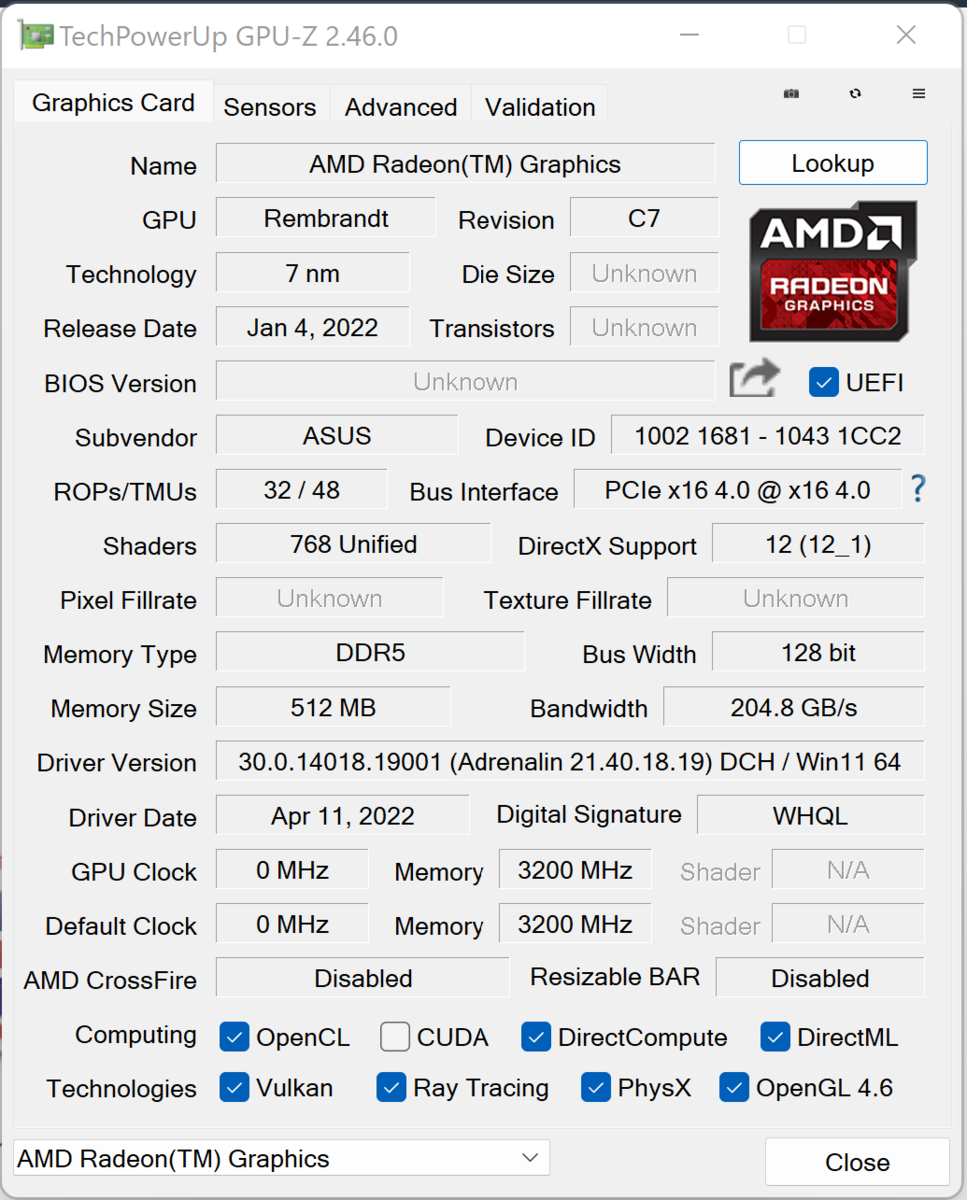
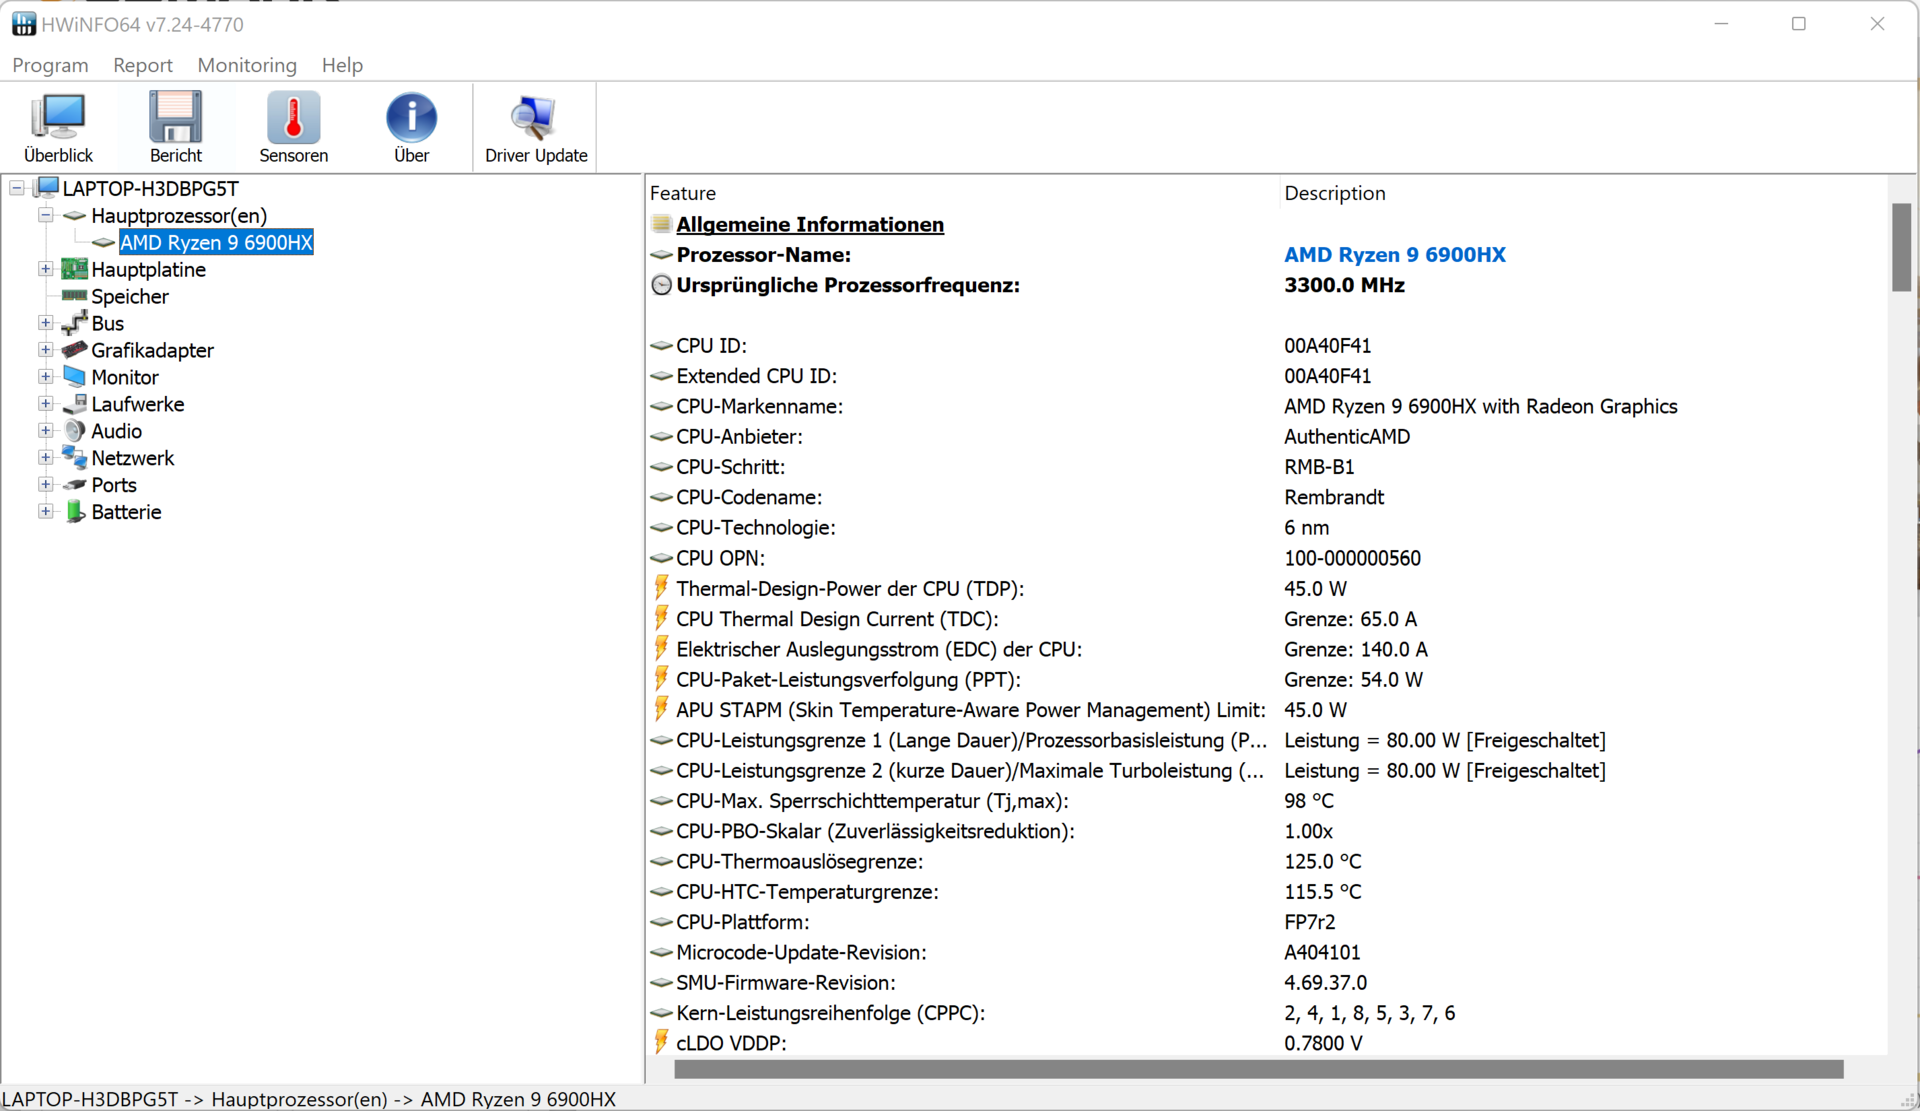
The CPU segment of the Ryzen 9 6900HX APU (Rembrandt) consists of an octa-core processor that runs at a basic clock speed of 3.3 GHz. The speed can be increased up to 4.9 GHz via Turbo. Simultaneous multithreading (two threads per core) is supported.
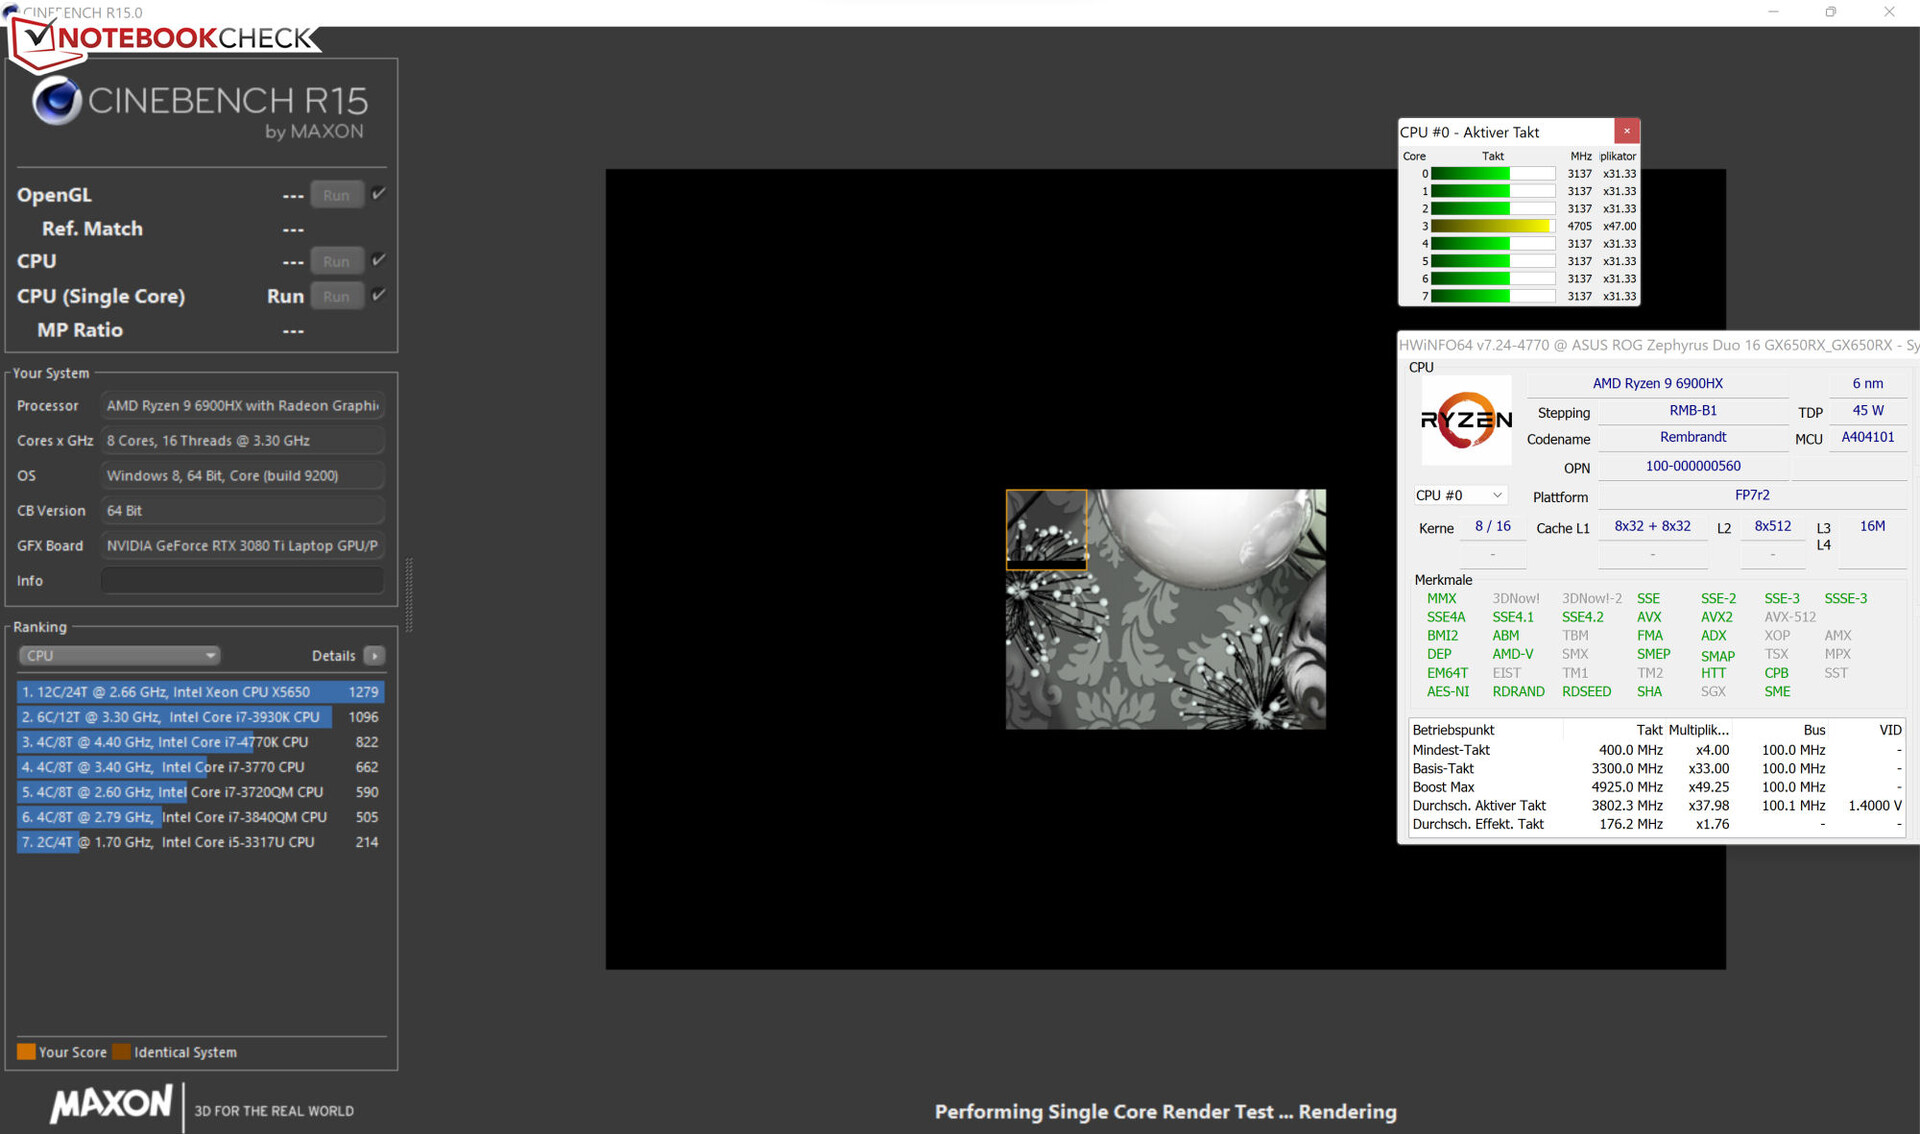
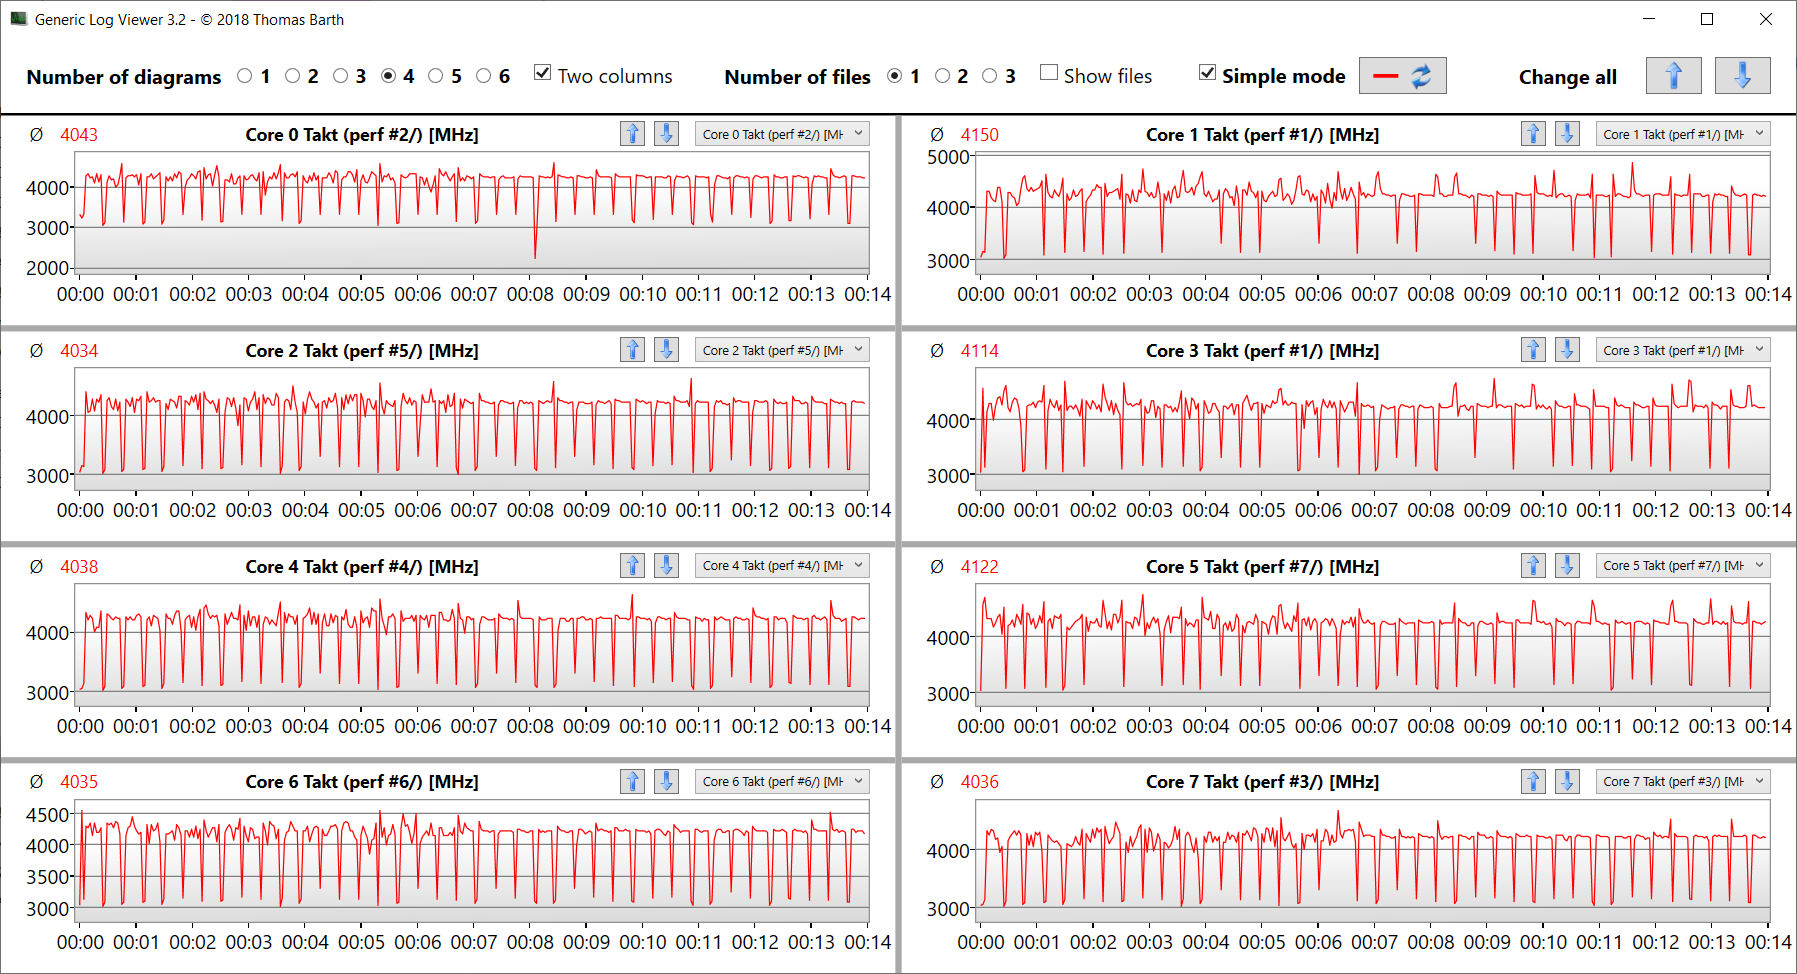
The multithread test of the Cinebench R15 benchmark briefly runs at clock speeds between 4 and 4.4 GHz, and the single-thread test between 3.1 and 4.7 GHz. In battery operation, the CPU runs at 3 to 4.1 GHz (multithread) and 2 to 4.7 GHz (single-thread).
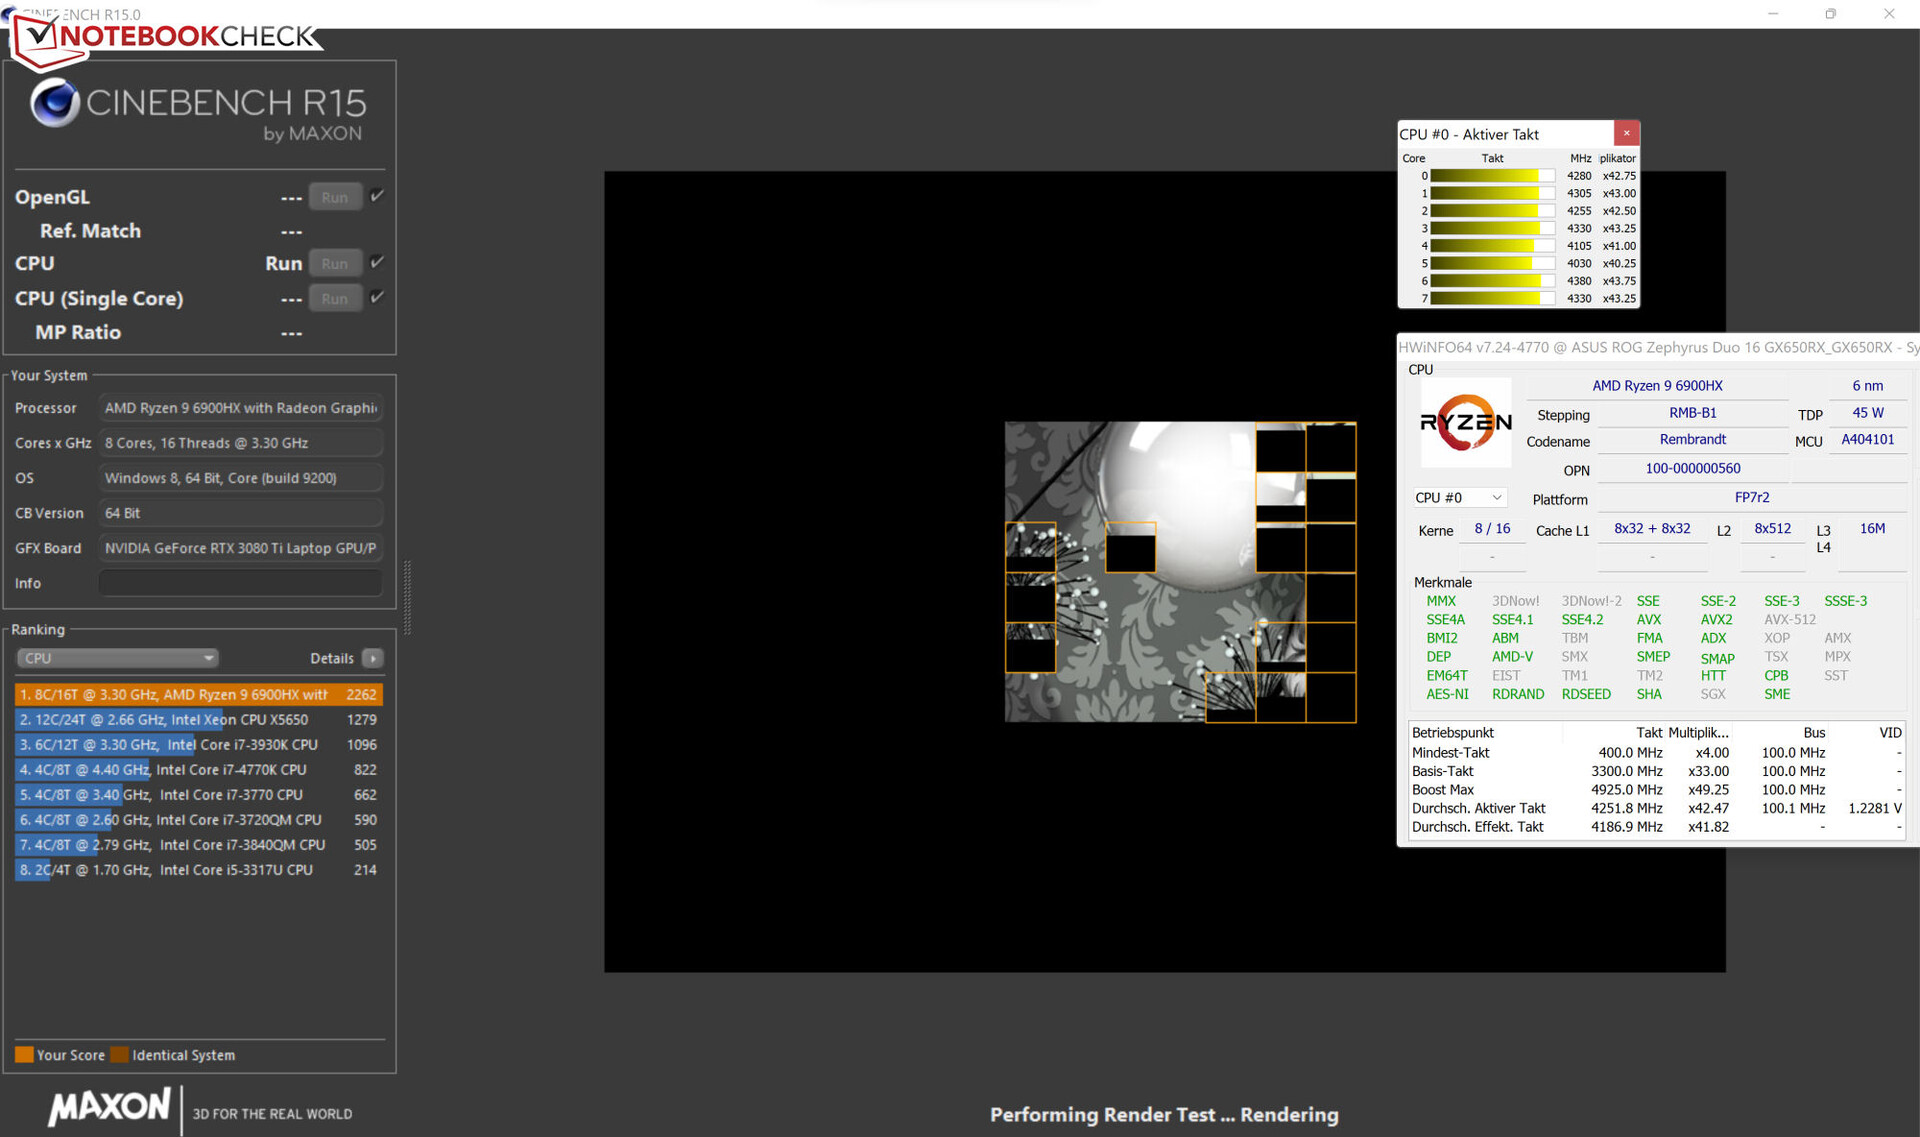
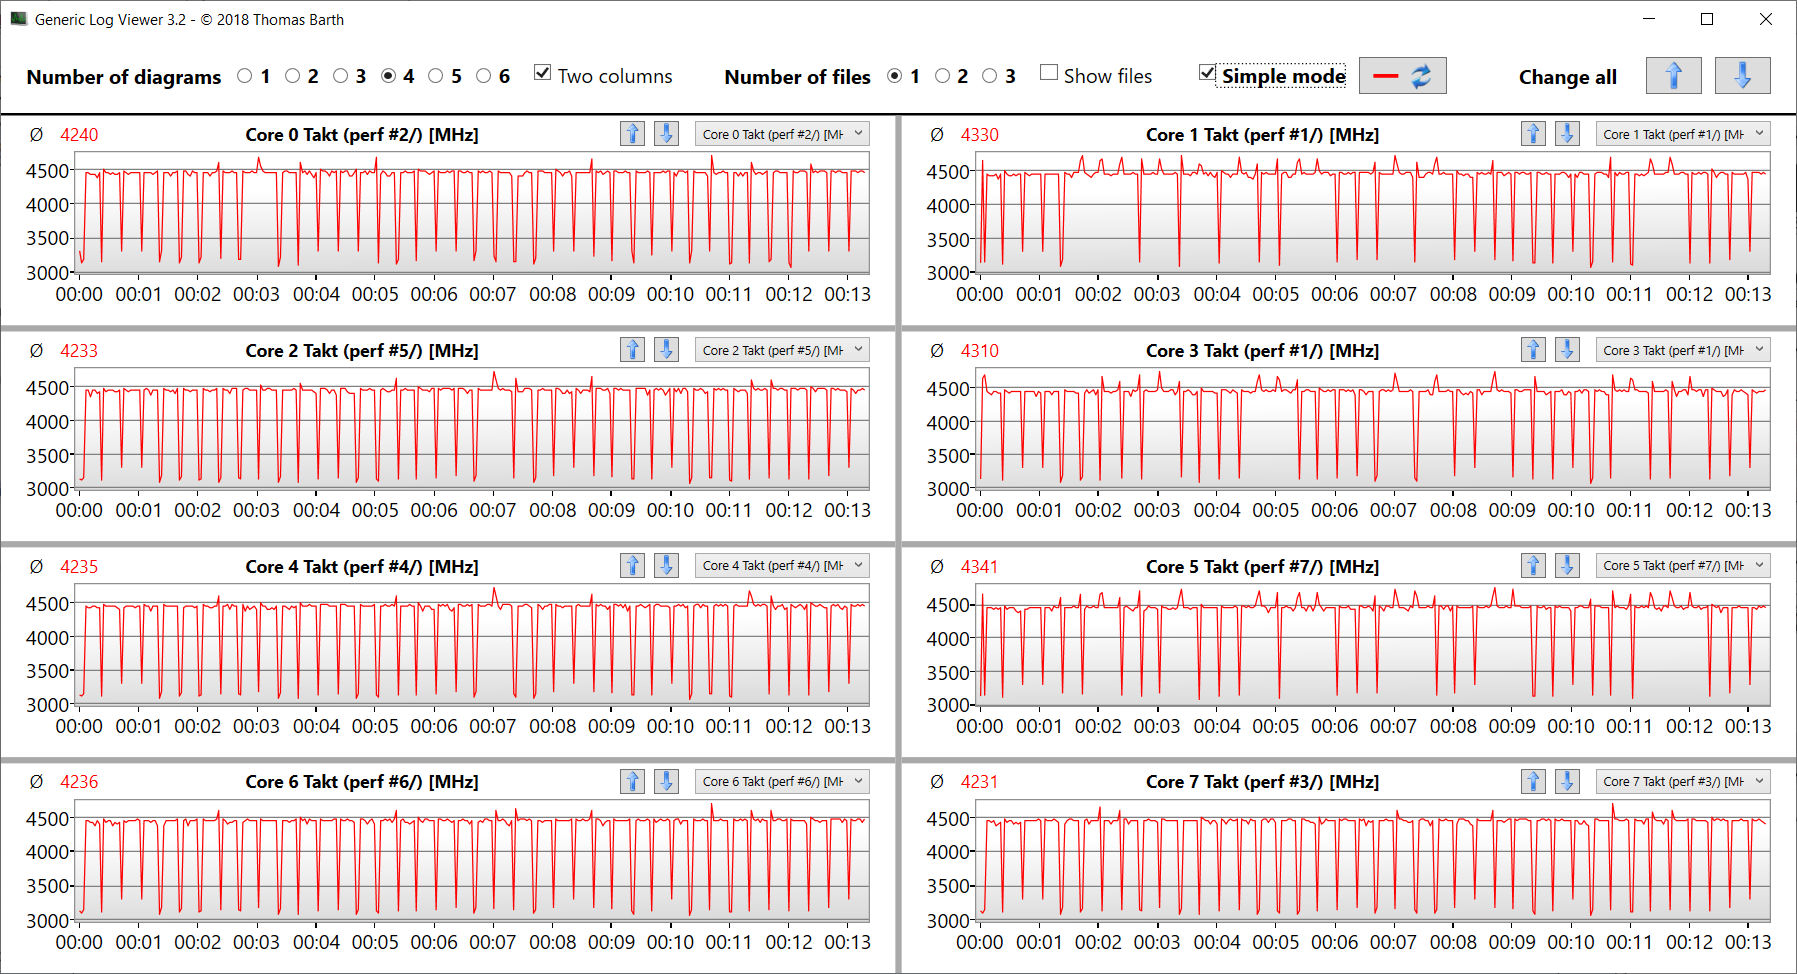
We evaluate whether the CPU Turbo is used constantly in mains operation by running the multithread test of the Cinebench R15 benchmark for at least 30 minutes in a constant loop. The Turbo is used at a high level. By using the "Turbo" performance profile, the clock speed can be increased still slightly higher.
Cinebench R15 Multi Constant Load Test

| CPU Performance rating - Percent | |
| Average of class Gaming | |
| MSI GE76 Raider | |
| Gigabyte Aero 16 YE5 | |
| Medion Erazer Beast X30 | |
| Asus ROG Zephyrus Duo 16 GX650RX | |
| Asus ROG Zephyrus Duo 16 GX650RX | |
| Asus ROG Zephyrus Duo 16 GX650RX | |
| Apple MacBook Pro 16 2021 M1 Max -5! | |
| Average AMD Ryzen 9 6900HX | |
| Razer Blade 15 Advanced Model Early 2022 | |
| Cinebench R23 | |
| Multi Core | |
| Average of class Gaming (10488 - 40970, n=107, last 2 years) | |
| Medion Erazer Beast X30 | |
| MSI GE76 Raider | |
| Gigabyte Aero 16 YE5 | |
| Asus ROG Zephyrus Duo 16 GX650RX (Turbo) | |
| Asus ROG Zephyrus Duo 16 GX650RX | |
| Asus ROG Zephyrus Duo 16 GX650RX (Leise) | |
| Average AMD Ryzen 9 6900HX (9709 - 15100, n=19) | |
| Apple MacBook Pro 16 2021 M1 Max | |
| Razer Blade 15 Advanced Model Early 2022 | |
| Single Core | |
| Average of class Gaming (1166 - 2356, n=107, last 2 years) | |
| Gigabyte Aero 16 YE5 | |
| MSI GE76 Raider | |
| Razer Blade 15 Advanced Model Early 2022 | |
| Medion Erazer Beast X30 | |
| Asus ROG Zephyrus Duo 16 GX650RX (Leise) | |
| Asus ROG Zephyrus Duo 16 GX650RX (Turbo) | |
| Asus ROG Zephyrus Duo 16 GX650RX | |
| Average AMD Ryzen 9 6900HX (1516 - 1616, n=19) | |
| Apple MacBook Pro 16 2021 M1 Max | |
| Cinebench R20 | |
| CPU (Multi Core) | |
| Average of class Gaming (4029 - 16108, n=106, last 2 years) | |
| Medion Erazer Beast X30 | |
| Gigabyte Aero 16 YE5 | |
| MSI GE76 Raider | |
| Asus ROG Zephyrus Duo 16 GX650RX (Turbo) | |
| Asus ROG Zephyrus Duo 16 GX650RX | |
| Asus ROG Zephyrus Duo 16 GX650RX (Leise) | |
| Average AMD Ryzen 9 6900HX (3742 - 5813, n=19) | |
| Razer Blade 15 Advanced Model Early 2022 | |
| Apple MacBook Pro 16 2021 M1 Max | |
| CPU (Single Core) | |
| Average of class Gaming (442 - 895, n=106, last 2 years) | |
| MSI GE76 Raider | |
| Razer Blade 15 Advanced Model Early 2022 | |
| Gigabyte Aero 16 YE5 | |
| Asus ROG Zephyrus Duo 16 GX650RX (Turbo) | |
| Asus ROG Zephyrus Duo 16 GX650RX (Leise) | |
| Average AMD Ryzen 9 6900HX (595 - 631, n=19) | |
| Medion Erazer Beast X30 | |
| Asus ROG Zephyrus Duo 16 GX650RX | |
| Apple MacBook Pro 16 2021 M1 Max | |
| Cinebench R15 | |
| CPU Multi 64Bit | |
| Average of class Gaming (1578 - 6271, n=105, last 2 years) | |
| MSI GE76 Raider | |
| Medion Erazer Beast X30 | |
| Gigabyte Aero 16 YE5 | |
| Asus ROG Zephyrus Duo 16 GX650RX (Turbo) | |
| Asus ROG Zephyrus Duo 16 GX650RX | |
| Asus ROG Zephyrus Duo 16 GX650RX (Leise) | |
| Average AMD Ryzen 9 6900HX (1588 - 2411, n=19) | |
| Apple MacBook Pro 16 2021 M1 Max (Rosetta 2) | |
| Razer Blade 15 Advanced Model Early 2022 | |
| CPU Single 64Bit | |
| Average of class Gaming (188.8 - 343, n=106, last 2 years) | |
| Gigabyte Aero 16 YE5 | |
| MSI GE76 Raider | |
| Asus ROG Zephyrus Duo 16 GX650RX (Turbo) | |
| Average AMD Ryzen 9 6900HX (241 - 261, n=19) | |
| Asus ROG Zephyrus Duo 16 GX650RX | |
| Asus ROG Zephyrus Duo 16 GX650RX (Leise) | |
| Razer Blade 15 Advanced Model Early 2022 | |
| Medion Erazer Beast X30 | |
| Apple MacBook Pro 16 2021 M1 Max (Rosetta 2) | |
| Blender - v2.79 BMW27 CPU | |
| Razer Blade 15 Advanced Model Early 2022 | |
| Asus ROG Zephyrus Duo 16 GX650RX (Leise) | |
| Average AMD Ryzen 9 6900HX (212 - 357, n=21) | |
| Asus ROG Zephyrus Duo 16 GX650RX | |
| Asus ROG Zephyrus Duo 16 GX650RX (Turbo) | |
| Gigabyte Aero 16 YE5 | |
| Apple MacBook Pro 16 2021 M1 Max (Blender 3.0 beta for mac) | |
| MSI GE76 Raider | |
| Medion Erazer Beast X30 | |
| Average of class Gaming (80 - 330, n=104, last 2 years) | |
| 7-Zip 18.03 | |
| 7z b 4 | |
| Average of class Gaming (33491 - 148086, n=105, last 2 years) | |
| Medion Erazer Beast X30 | |
| MSI GE76 Raider | |
| Gigabyte Aero 16 YE5 | |
| Asus ROG Zephyrus Duo 16 GX650RX (Turbo) | |
| Asus ROG Zephyrus Duo 16 GX650RX | |
| Asus ROG Zephyrus Duo 16 GX650RX (Leise) | |
| Average AMD Ryzen 9 6900HX (49526 - 65336, n=20) | |
| Razer Blade 15 Advanced Model Early 2022 | |
| 7z b 4 -mmt1 | |
| Average of class Gaming (4199 - 7436, n=105, last 2 years) | |
| Gigabyte Aero 16 YE5 | |
| MSI GE76 Raider | |
| Asus ROG Zephyrus Duo 16 GX650RX (Turbo) | |
| Razer Blade 15 Advanced Model Early 2022 | |
| Asus ROG Zephyrus Duo 16 GX650RX (Leise) | |
| Average AMD Ryzen 9 6900HX (5090 - 6070, n=20) | |
| Asus ROG Zephyrus Duo 16 GX650RX | |
| Medion Erazer Beast X30 | |
| Geekbench 5.5 | |
| Multi-Core | |
| Average of class Gaming (6460 - 27010, n=105, last 2 years) | |
| Gigabyte Aero 16 YE5 | |
| MSI GE76 Raider | |
| Apple MacBook Pro 16 2021 M1 Max | |
| Medion Erazer Beast X30 | |
| Asus ROG Zephyrus Duo 16 GX650RX (Turbo) | |
| Asus ROG Zephyrus Duo 16 GX650RX | |
| Asus ROG Zephyrus Duo 16 GX650RX (Leise) | |
| Average AMD Ryzen 9 6900HX (8313 - 10490, n=21) | |
| Razer Blade 15 Advanced Model Early 2022 | |
| Single-Core | |
| Average of class Gaming (986 - 2474, n=105, last 2 years) | |
| MSI GE76 Raider | |
| Gigabyte Aero 16 YE5 | |
| Razer Blade 15 Advanced Model Early 2022 | |
| Apple MacBook Pro 16 2021 M1 Max | |
| Asus ROG Zephyrus Duo 16 GX650RX (Turbo) | |
| Medion Erazer Beast X30 | |
| Asus ROG Zephyrus Duo 16 GX650RX | |
| Average AMD Ryzen 9 6900HX (1523 - 1652, n=21) | |
| Asus ROG Zephyrus Duo 16 GX650RX (Leise) | |
| HWBOT x265 Benchmark v2.2 - 4k Preset | |
| Average of class Gaming (11.5 - 44.3, n=105, last 2 years) | |
| Medion Erazer Beast X30 | |
| MSI GE76 Raider | |
| Asus ROG Zephyrus Duo 16 GX650RX (Turbo) | |
| Gigabyte Aero 16 YE5 | |
| Asus ROG Zephyrus Duo 16 GX650RX | |
| Asus ROG Zephyrus Duo 16 GX650RX (Leise) | |
| Average AMD Ryzen 9 6900HX (12.6 - 18.7, n=20) | |
| Razer Blade 15 Advanced Model Early 2022 | |
| LibreOffice - 20 Documents To PDF | |
| Average AMD Ryzen 9 6900HX (44.8 - 81.7, n=20) | |
| Average of class Gaming (33.2 - 88.8, n=105, last 2 years) | |
| Medion Erazer Beast X30 | |
| Asus ROG Zephyrus Duo 16 GX650RX (Leise) | |
| Asus ROG Zephyrus Duo 16 GX650RX | |
| Asus ROG Zephyrus Duo 16 GX650RX (Turbo) | |
| Razer Blade 15 Advanced Model Early 2022 | |
| Gigabyte Aero 16 YE5 | |
| MSI GE76 Raider | |
| R Benchmark 2.5 - Overall mean | |
| Medion Erazer Beast X30 | |
| Average AMD Ryzen 9 6900HX (0.4627 - 0.4974, n=20) | |
| Asus ROG Zephyrus Duo 16 GX650RX (Leise) | |
| Asus ROG Zephyrus Duo 16 GX650RX | |
| Asus ROG Zephyrus Duo 16 GX650RX (Turbo) | |
| Razer Blade 15 Advanced Model Early 2022 | |
| Average of class Gaming (0.3439 - 0.759, n=106, last 2 years) | |
| MSI GE76 Raider | |
| Gigabyte Aero 16 YE5 | |
* ... smaller is better
| Performance rating - Percent | |
| Average of class Gaming | |
| Asus ROG Zephyrus Duo 16 GX650RX | |
| Asus ROG Zephyrus Duo 16 GX650RX | |
| Asus ROG Zephyrus Duo 16 GX650RX | |
| Average AMD Ryzen 9 6900HX | |
| MSI GE76 Raider | |
| Medion Erazer Beast X30 | |
| Gigabyte Aero 16 YE5 | |
| Razer Blade 15 Advanced Model Early 2022 | |
System Performance
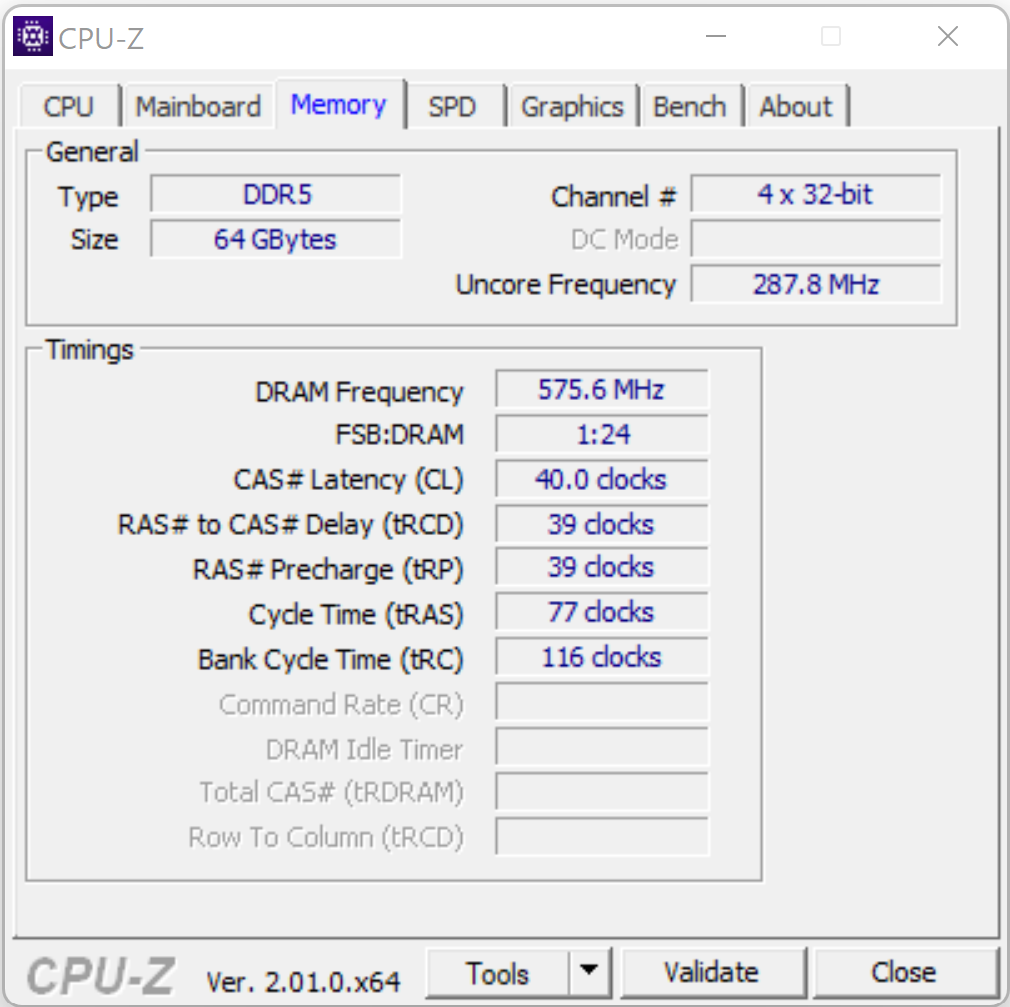
The smoothly running system offers sufficient performance for gaming, video editing, and rendering for the next few years. The transfer rates of the built-in working memory remain beneath the values of comparable laptops that are equipped with DDR5-4800 storage. This is accompanied by very good PC-Mark results.
| PCMark 8 Home Score Accelerated v2 | 4418 points | |
| PCMark 8 Creative Score Accelerated v2 | 5798 points | |
| PCMark 8 Work Score Accelerated v2 | 4622 points | |
| PCMark 10 Score | 6351 points | |
Help | ||
CrossMark: Overall | Productivity | Creativity | Responsiveness
| PCMark 10 / Score | |
| Average of class Gaming (5828 - 11574, n=93, last 2 years) | |
| MSI GE76 Raider | |
| Gigabyte Aero 16 YE5 | |
| Razer Blade 15 Advanced Model Early 2022 | |
| Medion Erazer Beast X30 | |
| Asus ROG Zephyrus Duo 16 GX650RX | |
| PCMark 10 / Essentials | |
| Gigabyte Aero 16 YE5 | |
| MSI GE76 Raider | |
| Average of class Gaming (8810 - 11935, n=97, last 2 years) | |
| Razer Blade 15 Advanced Model Early 2022 | |
| Medion Erazer Beast X30 | |
| Asus ROG Zephyrus Duo 16 GX650RX | |
| PCMark 10 / Productivity | |
| Average of class Gaming (6845 - 21327, n=95, last 2 years) | |
| MSI GE76 Raider | |
| Gigabyte Aero 16 YE5 | |
| Razer Blade 15 Advanced Model Early 2022 | |
| Medion Erazer Beast X30 | |
| Asus ROG Zephyrus Duo 16 GX650RX | |
| PCMark 10 / Digital Content Creation | |
| Average of class Gaming (7602 - 19657, n=95, last 2 years) | |
| MSI GE76 Raider | |
| Gigabyte Aero 16 YE5 | |
| Medion Erazer Beast X30 | |
| Razer Blade 15 Advanced Model Early 2022 | |
| Asus ROG Zephyrus Duo 16 GX650RX | |
| CrossMark / Overall | |
| Gigabyte Aero 16 YE5 | |
| Average of class Gaming (1366 - 2409, n=93, last 2 years) | |
| Razer Blade 15 Advanced Model Early 2022 | |
| Medion Erazer Beast X30 | |
| Asus ROG Zephyrus Duo 16 GX650RX | |
| Apple MacBook Pro 16 2021 M1 Max | |
| CrossMark / Productivity | |
| Gigabyte Aero 16 YE5 | |
| Average of class Gaming (1386 - 2254, n=93, last 2 years) | |
| Razer Blade 15 Advanced Model Early 2022 | |
| Asus ROG Zephyrus Duo 16 GX650RX | |
| Medion Erazer Beast X30 | |
| Apple MacBook Pro 16 2021 M1 Max | |
| CrossMark / Creativity | |
| Average of class Gaming (1343 - 2729, n=93, last 2 years) | |
| Gigabyte Aero 16 YE5 | |
| Apple MacBook Pro 16 2021 M1 Max | |
| Medion Erazer Beast X30 | |
| Razer Blade 15 Advanced Model Early 2022 | |
| Asus ROG Zephyrus Duo 16 GX650RX | |
| CrossMark / Responsiveness | |
| Gigabyte Aero 16 YE5 | |
| Asus ROG Zephyrus Duo 16 GX650RX | |
| Average of class Gaming (1226 - 2334, n=93, last 2 years) | |
| Razer Blade 15 Advanced Model Early 2022 | |
| Medion Erazer Beast X30 | |
| Apple MacBook Pro 16 2021 M1 Max | |
| AIDA64 / Memory Copy | |
| Average of class Gaming (21750 - 129946, n=104, last 2 years) | |
| MSI GE76 Raider (v6.50.5800) | |
| Gigabyte Aero 16 YE5 (v6.50.5800) | |
| Razer Blade 15 Advanced Model Early 2022 (v6.50.5800) | |
| Medion Erazer Beast X30 (v6.50.5800) | |
| Asus ROG Zephyrus Duo 16 GX650RX | |
| Average AMD Ryzen 9 6900HX (47938 - 53345, n=20) | |
| AIDA64 / Memory Read | |
| Average of class Gaming (22956 - 118858, n=104, last 2 years) | |
| Medion Erazer Beast X30 (v6.50.5800) | |
| Gigabyte Aero 16 YE5 (v6.50.5800) | |
| MSI GE76 Raider (v6.50.5800) | |
| Razer Blade 15 Advanced Model Early 2022 (v6.50.5800) | |
| Asus ROG Zephyrus Duo 16 GX650RX (v6.50.5800) | |
| Average AMD Ryzen 9 6900HX (43892 - 53321, n=20) | |
| AIDA64 / Memory Write | |
| Average of class Gaming (22297 - 135096, n=104, last 2 years) | |
| Razer Blade 15 Advanced Model Early 2022 (v6.50.5800) | |
| Medion Erazer Beast X30 (v6.50.5800) | |
| MSI GE76 Raider (v6.50.5800) | |
| Gigabyte Aero 16 YE5 (v6.50.5800) | |
| Asus ROG Zephyrus Duo 16 GX650RX (v6.50.5800) | |
| Average AMD Ryzen 9 6900HX (51085 - 57202, n=20) | |
| AIDA64 / Memory Latency | |
| Average of class Gaming (75.3 - 259, n=104, last 2 years) | |
| Razer Blade 15 Advanced Model Early 2022 (v6.50.5800) | |
| MSI GE76 Raider (v6.50.5800) | |
| Asus ROG Zephyrus Duo 16 GX650RX (v6.50.5800) | |
| Gigabyte Aero 16 YE5 (v6.50.5800) | |
| Average AMD Ryzen 9 6900HX (80.7 - 120.6, n=20) | |
| Medion Erazer Beast X30 (v6.50.5800) | |
* ... smaller is better
DPC Latencies
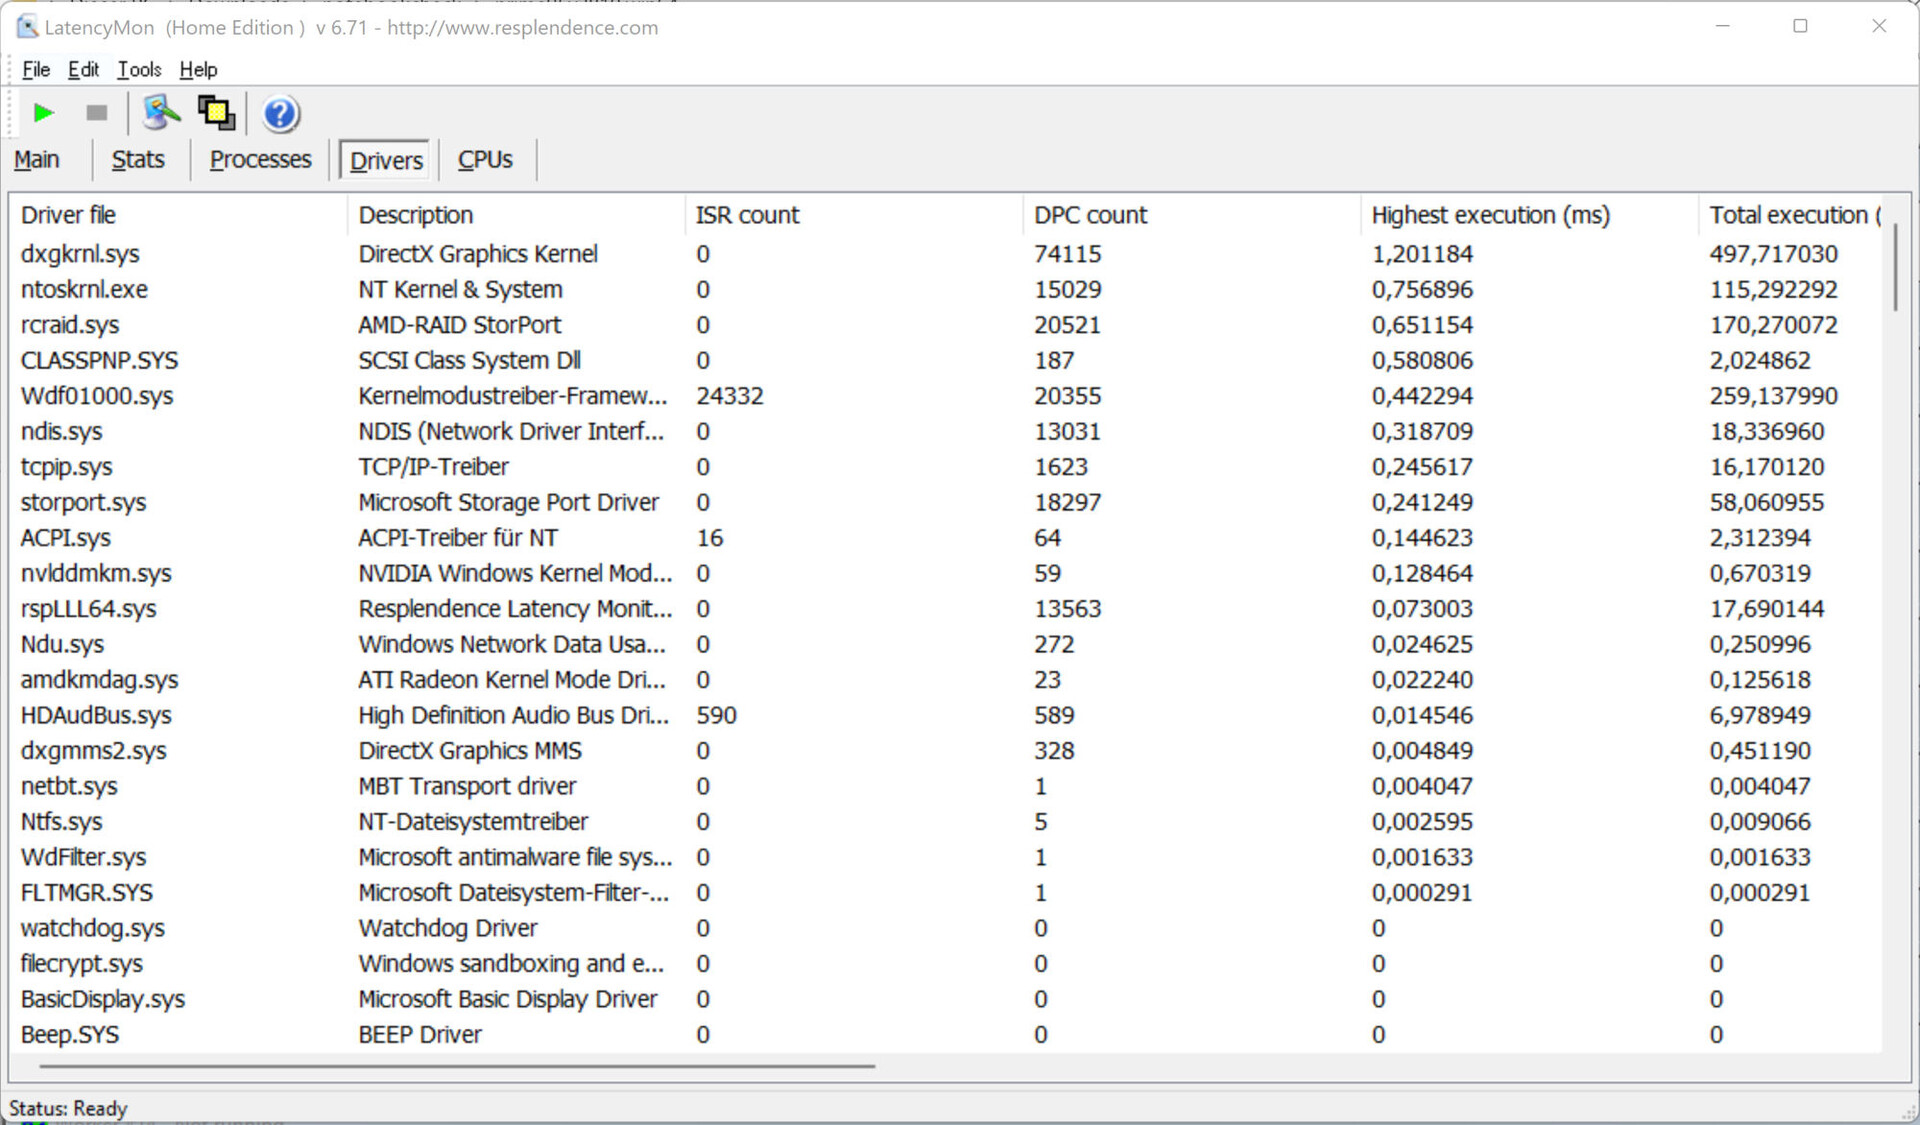
The standardized Latency Monitor test (web surfing, 4k video reproduction, Prime95 high load) revealed some conspicuous delays in the DPC latencies. The system doesn't appear to be suited for real-time video and audio processing. However, future software updates might lead to some improvements or even make things worse.

| DPC Latencies / LatencyMon - interrupt to process latency (max), Web, Youtube, Prime95 | |
| Razer Blade 15 Advanced Model Early 2022 | |
| MSI GE76 Raider | |
| Medion Erazer Beast X30 | |
| Gigabyte Aero 16 YE5 | |
| Asus ROG Zephyrus Duo 16 GX650RX | |
* ... smaller is better
Storage Solution
Two PCIe 4 SSDs (M.2-2280) with a storage capacity of 2 TB are combined in a RAID 0 array, so the operating system sees the two SSDs as a single 4-TB SSD. All the data to be stored is distributed across both SSDs. The resulting high transfer rates and short load times are optimal for games.

| Drive Performance rating - Percent | |
| Gigabyte Aero 16 YE5 | |
| Asus ROG Zephyrus Duo 16 GX650RX | |
| MSI GE76 Raider | |
| Razer Blade 15 Advanced Model Early 2022 | |
| Medion Erazer Beast X30 | |
| Average of class Gaming | |
* ... smaller is better
Constant Performance Reading: DiskSpd Read Loop, Queue Depth 8
Graphics Card
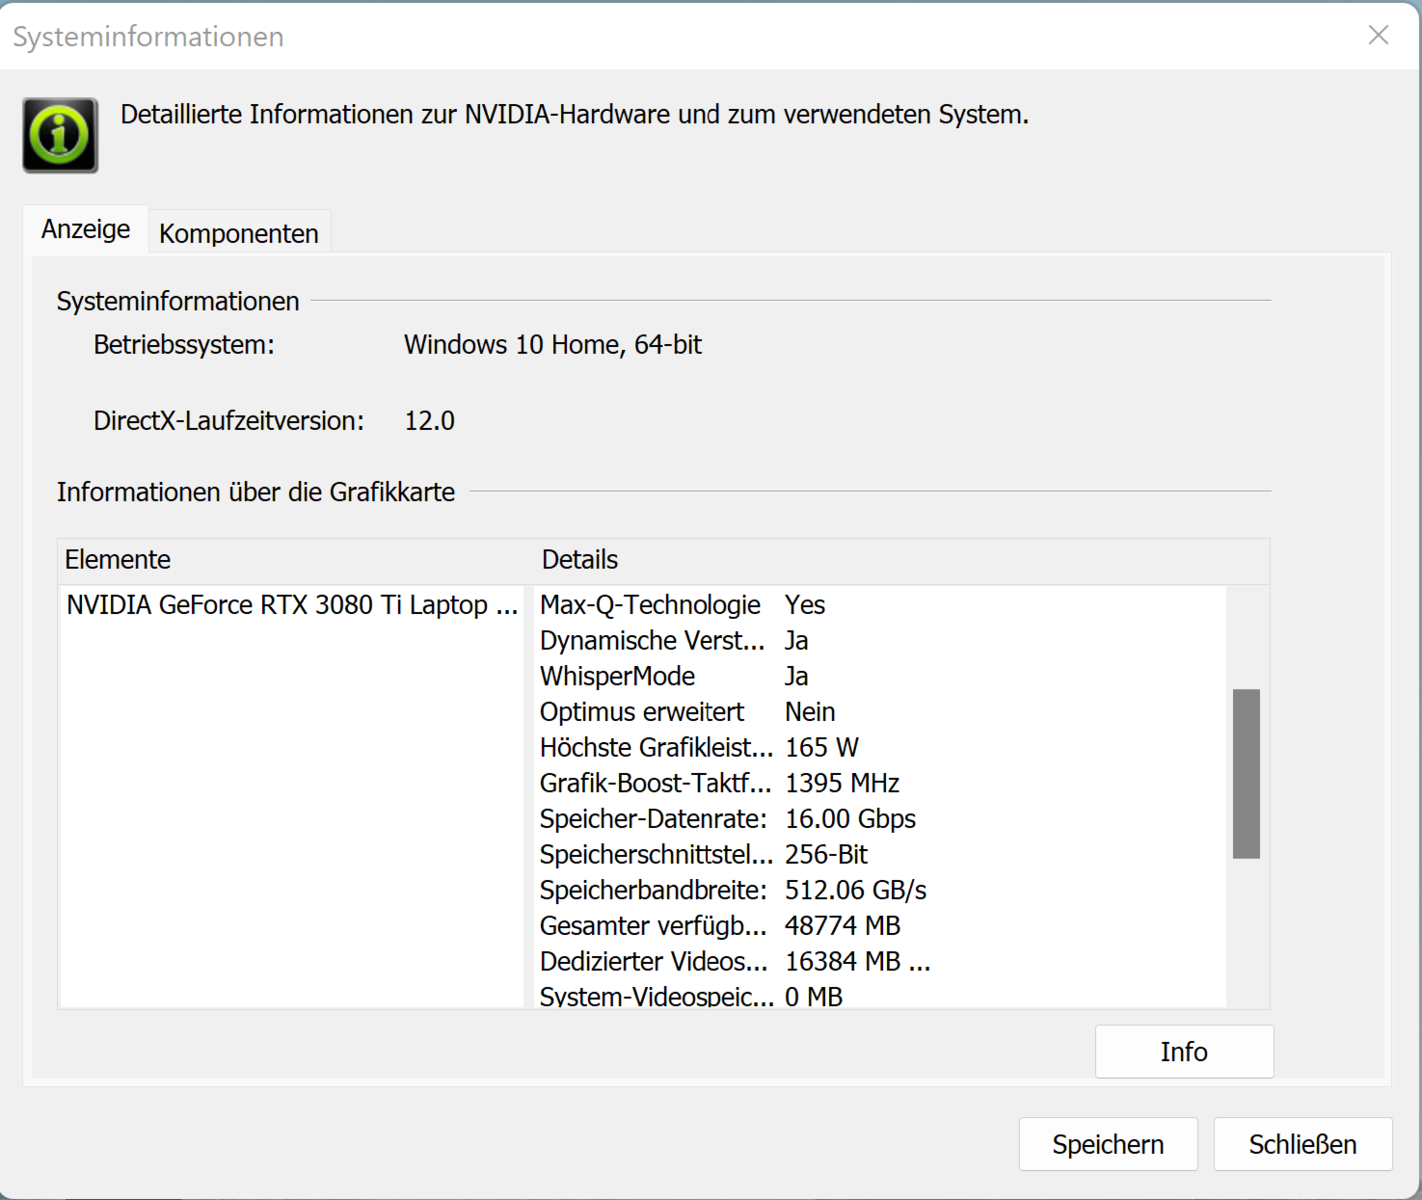
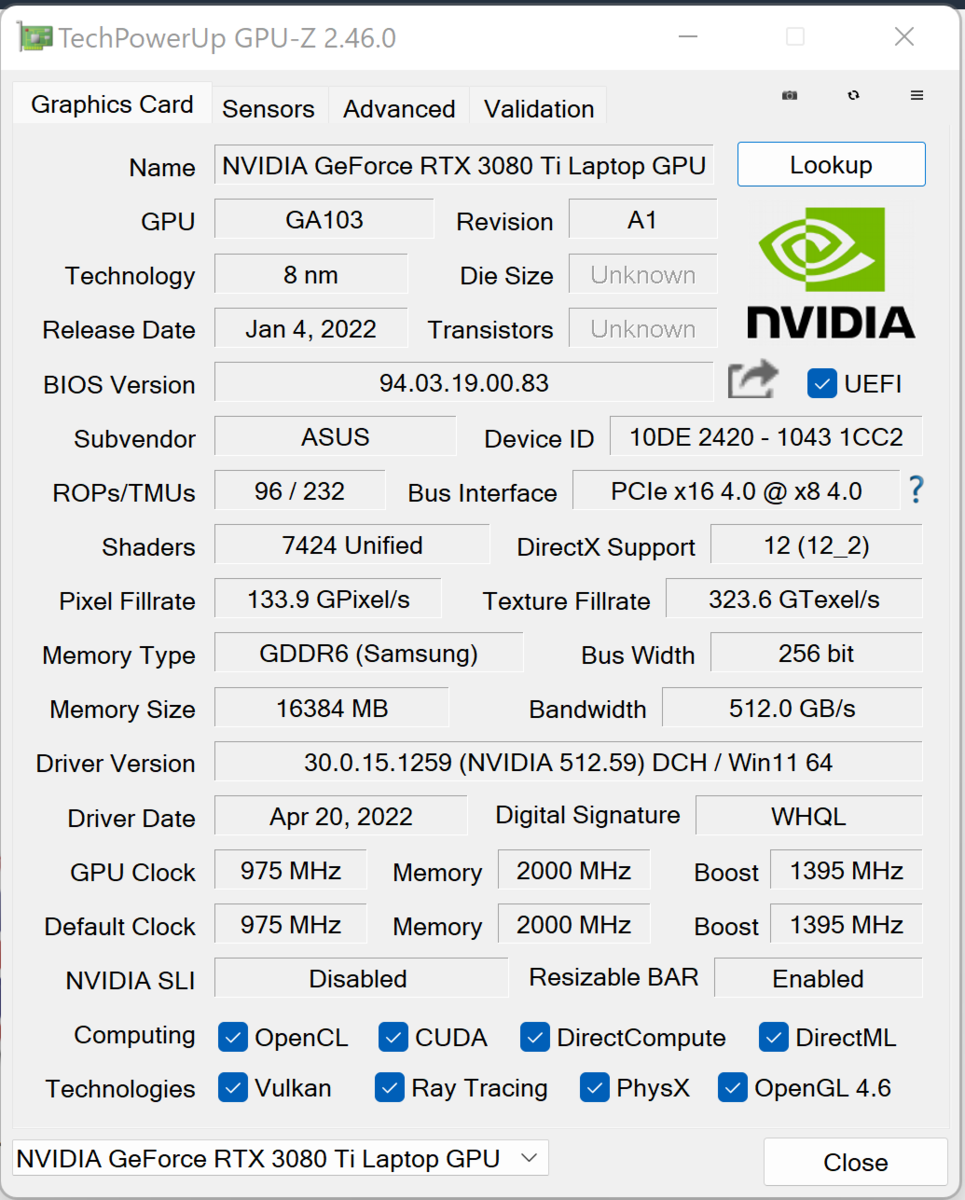
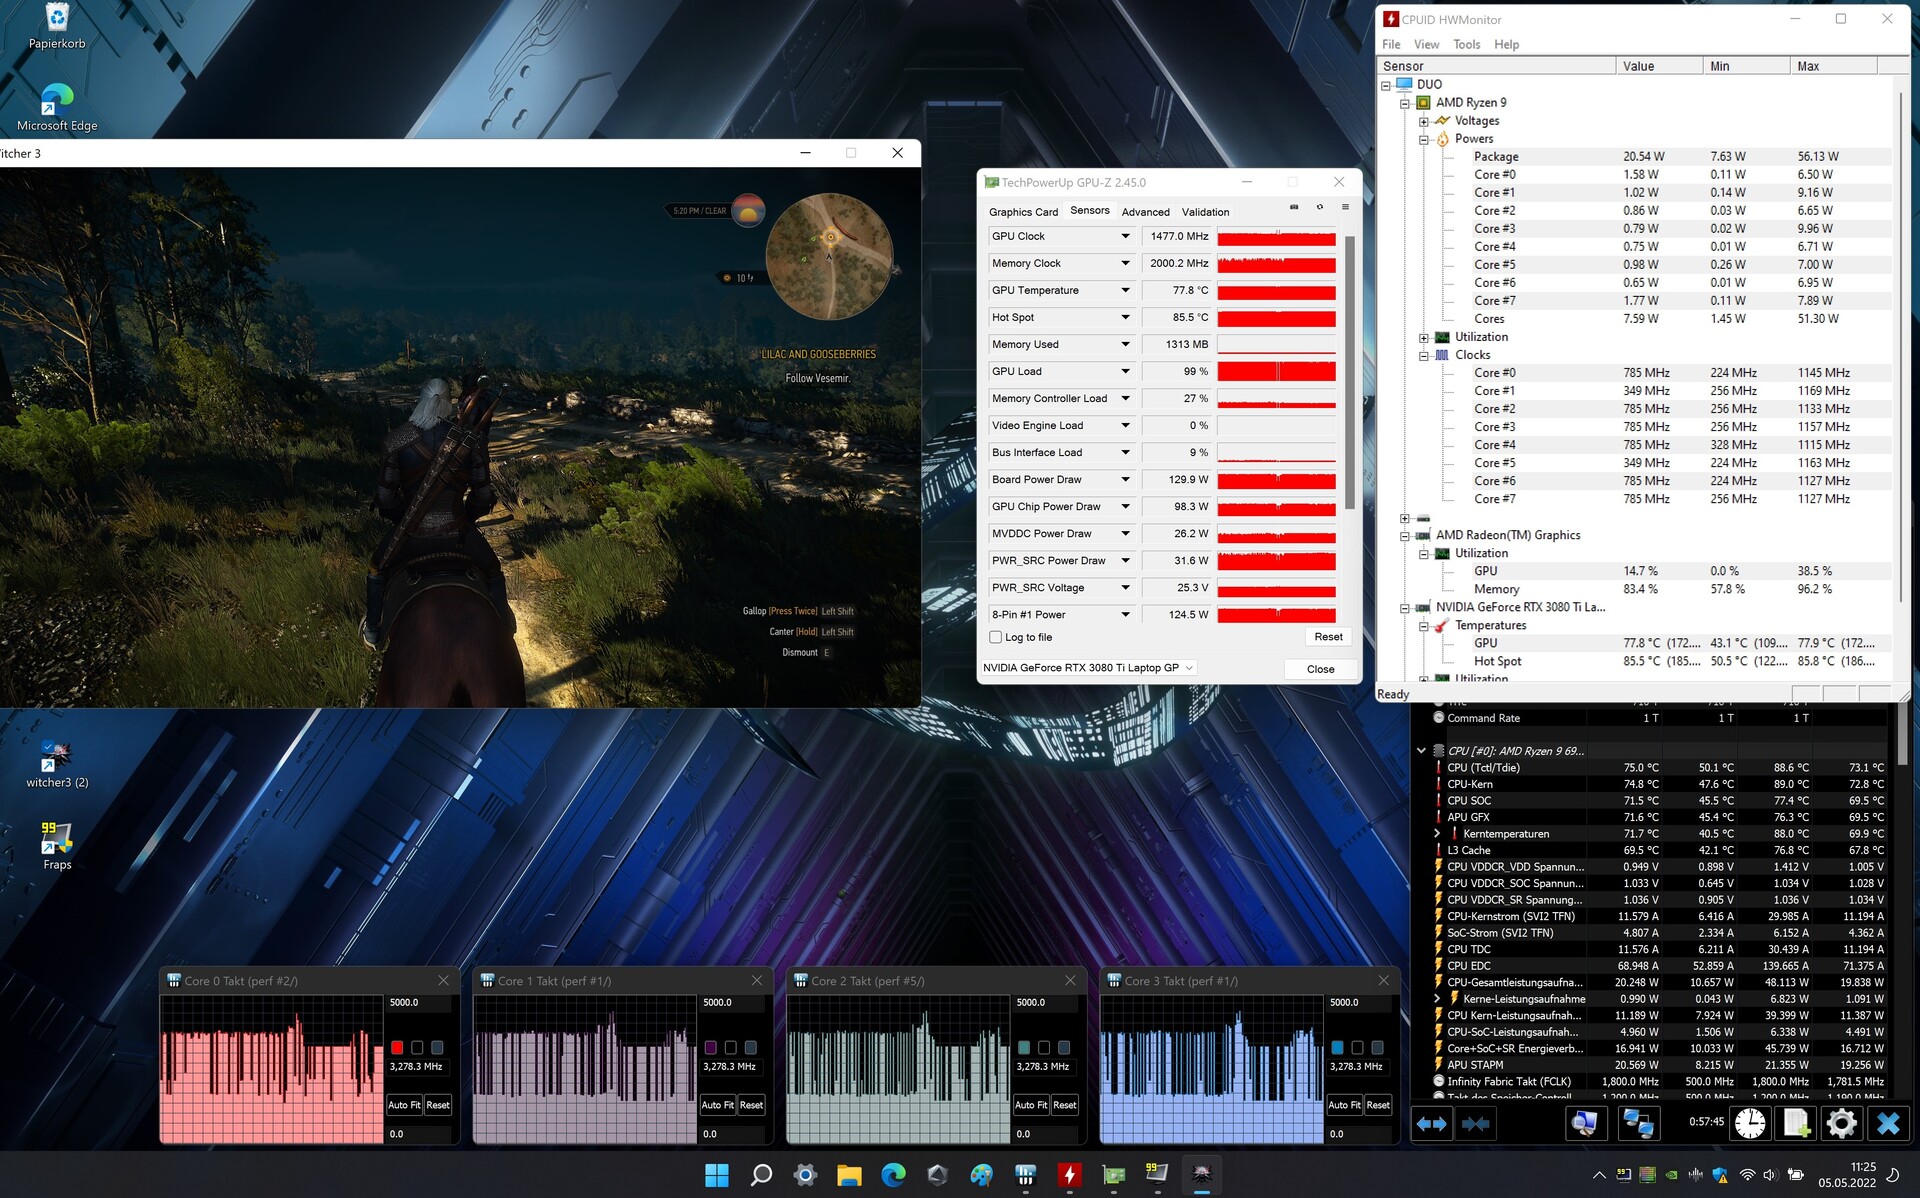
The actual performance of an RTX 3000 GPU depends on several factors: the cooling, the storage equipment, and the maximum TGP that a manufacturer configures within the limits defined by Nvidia. Asus allows the GeForce RTX 3080 Ti Laptop GPU a maximum TGP of 165 watts (140 watts + 25 watts dynamic boost). The GPU is able to use fast GDDR6 graphics storage (16,384 MB).
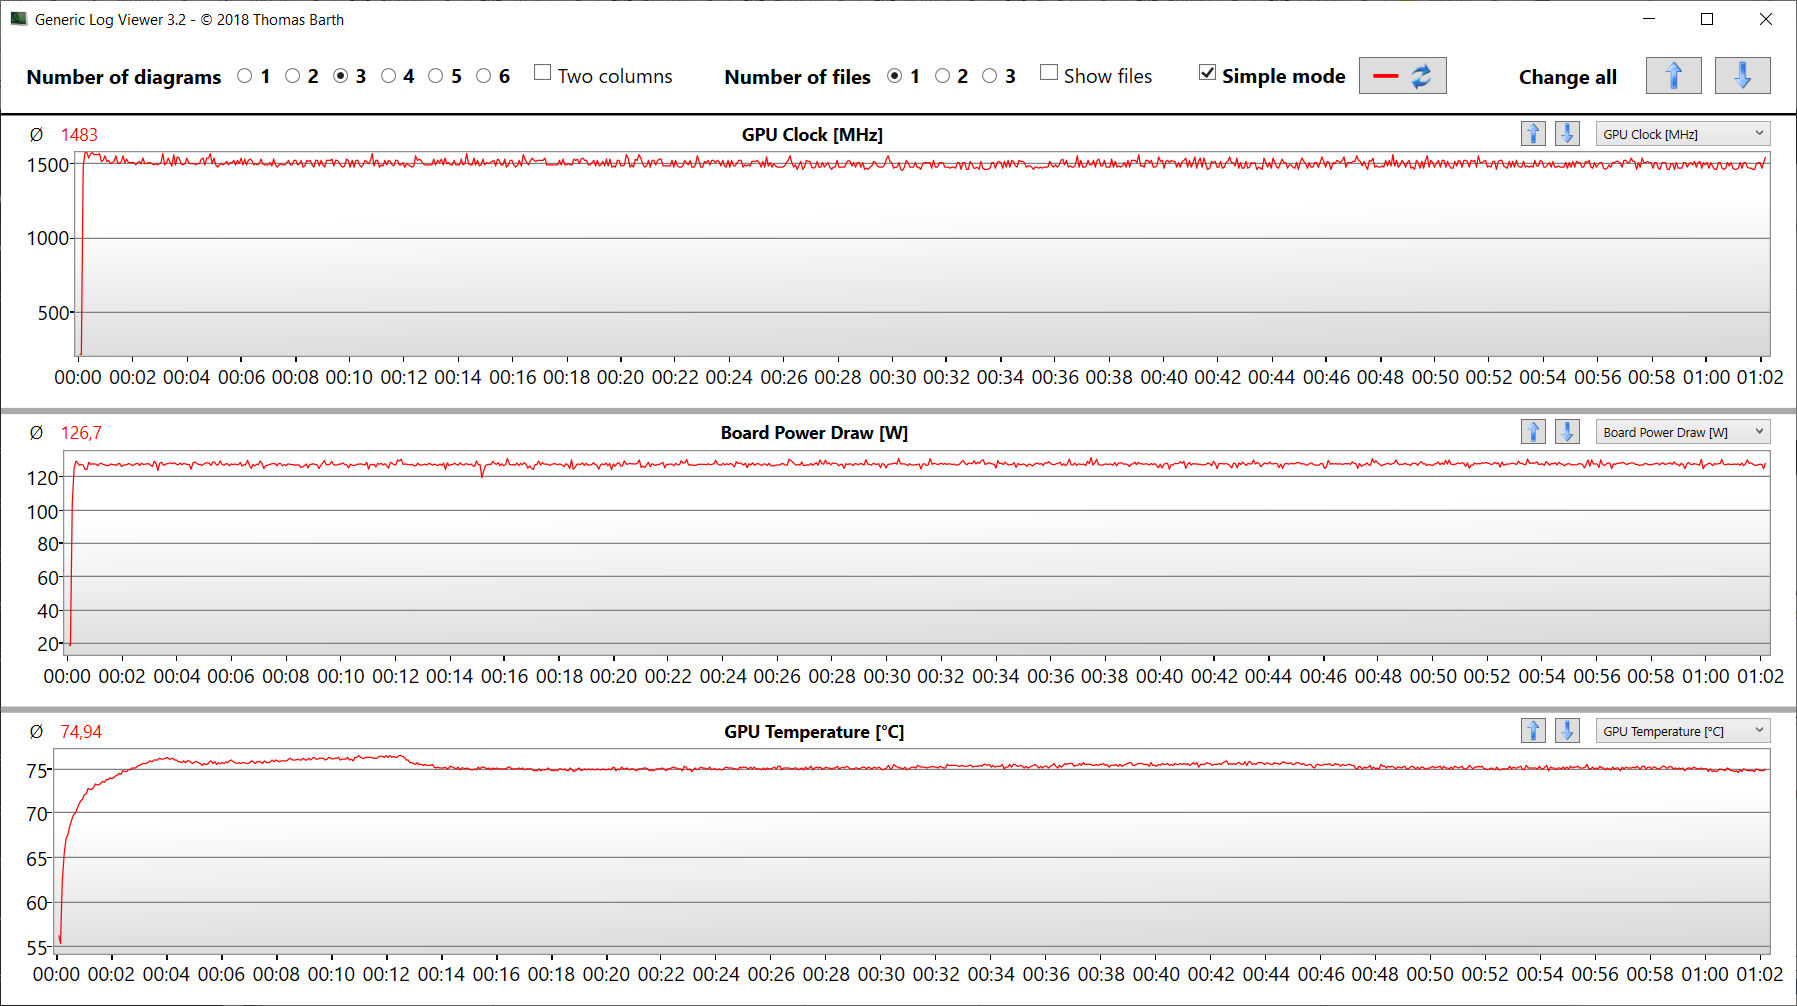
According to Asus, the dynamic boost (10 watts max.) is only available if the "Turbo" performance profile is selected, and the Witcher 3 test confirms this. The maximum (25 watts) would need to be enabled using the Armoury Crate software ("Manual" profile). The benchmark results range just above the RTX 3080 Ti average that we determined so far.
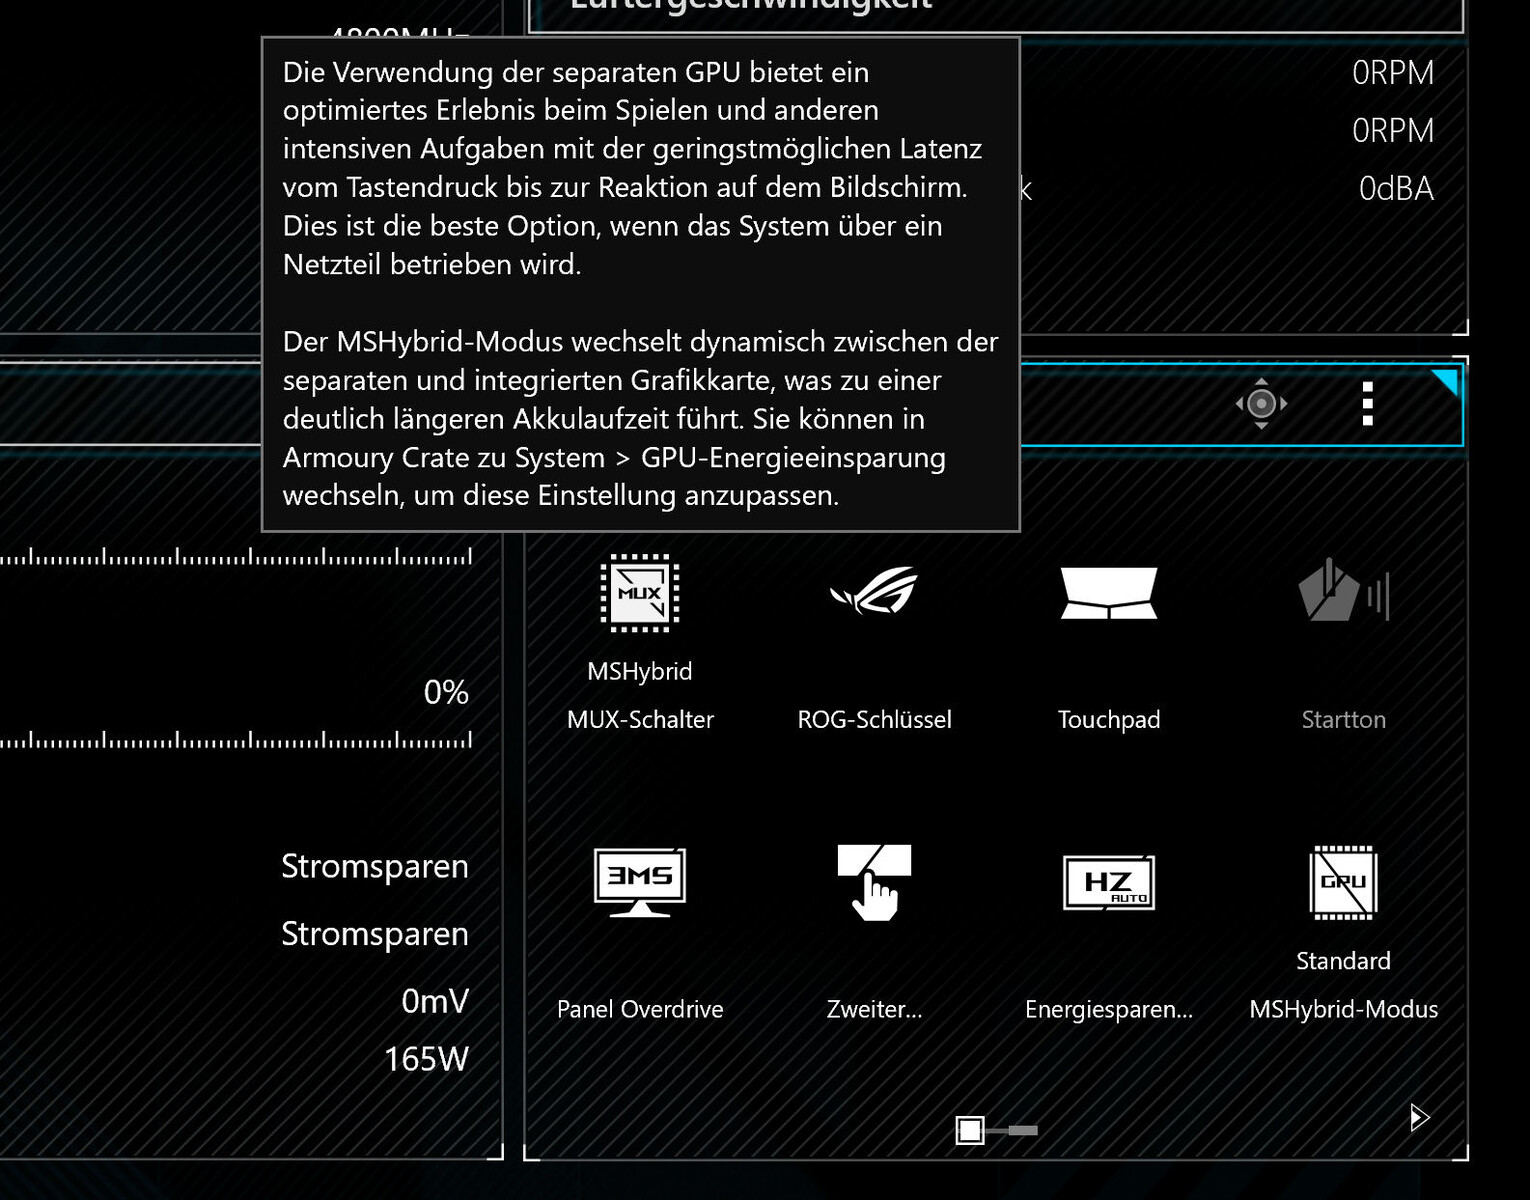
But this isn't the end of it. There is also the option of direct image output via GeForce GPU (Armoury Crate, MUX switch: separate GPU). In combination with a manual increase of the dynamic boost to 25 watts, the graphics performance increases noticeably.


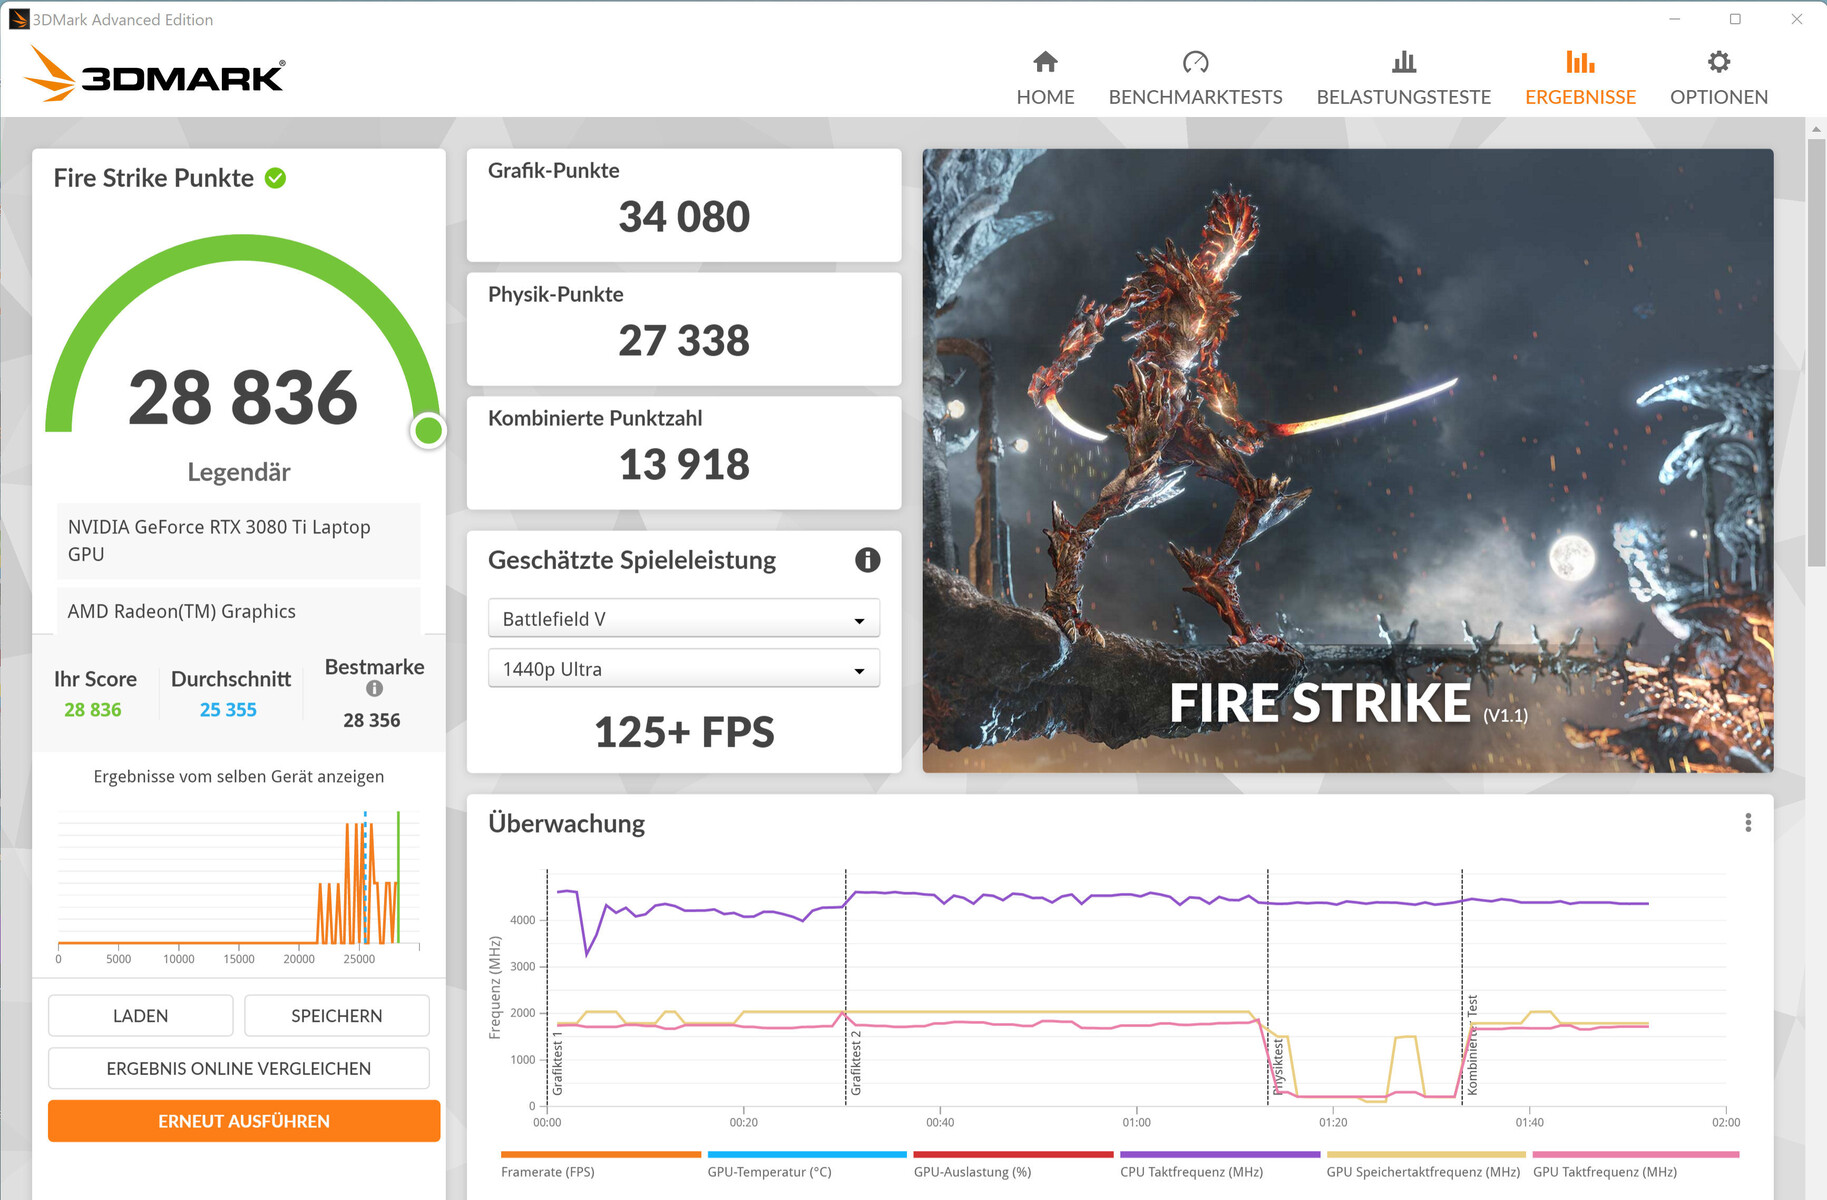
| 3DMark 11 Performance | 31771 points | |
| 3DMark Cloud Gate Standard Score | 47119 points | |
| 3DMark Fire Strike Score | 24278 points | |
Help | ||
| 3DMark Performance rating - Percent | |
| MSI GE76 Raider -25! | |
| Average NVIDIA GeForce RTX 3080 Ti Laptop GPU | |
| Asus ROG Zephyrus Duo 16 GX650RX -25! | |
| Average of class Gaming -2! | |
| Asus ROG Zephyrus Duo 16 GX650RX -2! | |
| Medion Erazer Beast X30 -25! | |
| Asus ROG Zephyrus Duo 16 GX650RX -25! | |
| Gigabyte Aero 16 YE5 -1! | |
| Razer Blade 15 Advanced Model Early 2022 -25! | |
| Asus ROG Zephyrus Duo 16 GX650RX -25! | |
| 3DMark 11 - 1280x720 Performance GPU | |
| Average of class Gaming (21841 - 80022, n=104, last 2 years) | |
| MSI GE76 Raider | |
| Asus ROG Zephyrus Duo 16 GX650RX (Turbo) | |
| Asus ROG Zephyrus Duo 16 GX650RX (sep. GPU, 25W) | |
| Medion Erazer Beast X30 | |
| Asus ROG Zephyrus Duo 16 GX650RX | |
| Average NVIDIA GeForce RTX 3080 Ti Laptop GPU (13920 - 45841, n=45) | |
| Gigabyte Aero 16 YE5 | |
| Razer Blade 15 Advanced Model Early 2022 | |
| Asus ROG Zephyrus Duo 16 GX650RX (Leise) | |
Gaming Performance
The hardware brings all the current games smoothly to the screen in FHD to QHD resolution and maximum settings. Using the full display resolution of 3840 x 2400 pixels requires reduced settings at times. The frame rates range around the RTX 3080 Ti average. The direct image output via GeForce GPU (MUX switch: separate GPU) in combination with an increase of the dynamic boost to 25 watt leads to a slight increase of the frame rates.
The low frame rates when the "Silent" profile is activated are due to the "Whisper mode 2.0" of the GeForce GPU, which is supposed to keep the noise level as low as possible while the frame rate level is still sufficient for a game (at least 30 to 60 fps). This means that the GPU doesn't have to run at full power, thus producing less heat and allowing the fans to remain quieter.
| The Witcher 3 | |
| 1920x1080 Ultra Graphics & Postprocessing (HBAO+) | |
| Average of class Gaming (104.7 - 240, n=6, last 2 years) | |
| MSI GE76 Raider | |
| Asus ROG Zephyrus Duo 16 GX650RX (sep. GPU, 25W) | |
| Asus ROG Zephyrus Duo 16 GX650RX (Turbo) | |
| Medion Erazer Beast X30 | |
| Average NVIDIA GeForce RTX 3080 Ti Laptop GPU (30 - 130.6, n=43) | |
| Asus ROG Zephyrus Duo 16 GX650RX | |
| Gigabyte Aero 16 YE5 | |
| Razer Blade 15 Advanced Model Early 2022 | |
| Asus ROG Zephyrus Duo 16 GX650RX (Leise) | |
| 3840x2160 Ultra Graphics & Postprocessing (HBAO+) | |
| Average of class Gaming (n=1last 2 years) | |
| Average NVIDIA GeForce RTX 3080 Ti Laptop GPU (44.8 - 62.7, n=5) | |
| Asus ROG Zephyrus Duo 16 GX650RX | |
| Gigabyte Aero 16 YE5 | |
| Dota 2 Reborn | |
| 1920x1080 ultra (3/3) best looking | |
| Gigabyte Aero 16 YE5 | |
| MSI GE76 Raider | |
| Average of class Gaming (84.8 - 248, n=107, last 2 years) | |
| Medion Erazer Beast X30 | |
| Average NVIDIA GeForce RTX 3080 Ti Laptop GPU (29.9 - 170.5, n=45) | |
| Asus ROG Zephyrus Duo 16 GX650RX (sep. GPU, 25W) | |
| Asus ROG Zephyrus Duo 16 GX650RX (Turbo) | |
| Asus ROG Zephyrus Duo 16 GX650RX | |
| Razer Blade 15 Advanced Model Early 2022 | |
| Asus ROG Zephyrus Duo 16 GX650RX (Leise) | |
| 3840x2160 ultra (3/3) best looking | |
| Average of class Gaming (114.9 - 199.2, n=30, last 2 years) | |
| Average NVIDIA GeForce RTX 3080 Ti Laptop GPU (70.8 - 155.6, n=19) | |
| Gigabyte Aero 16 YE5 | |
| Asus ROG Zephyrus Duo 16 GX650RX (Leise) | |
| Asus ROG Zephyrus Duo 16 GX650RX (Turbo) | |
| Asus ROG Zephyrus Duo 16 GX650RX | |
| X-Plane 11.11 | |
| 3840x2160 high (fps_test=3) | |
| Average of class Gaming (60 - 124.1, n=30, last 2 years) | |
| Average NVIDIA GeForce RTX 3080 Ti Laptop GPU (32.9 - 109.5, n=20) | |
| Gigabyte Aero 16 YE5 | |
| Asus ROG Zephyrus Duo 16 GX650RX (Turbo) | |
| Asus ROG Zephyrus Duo 16 GX650RX | |
| Asus ROG Zephyrus Duo 16 GX650RX (Leise) | |
| 1920x1080 high (fps_test=3) | |
| MSI GE76 Raider | |
| Gigabyte Aero 16 YE5 | |
| Average NVIDIA GeForce RTX 3080 Ti Laptop GPU (32.6 - 127, n=45) | |
| Medion Erazer Beast X30 | |
| Average of class Gaming (52.1 - 143.5, n=109, last 2 years) | |
| Razer Blade 15 Advanced Model Early 2022 | |
| Asus ROG Zephyrus Duo 16 GX650RX (sep. GPU, 25W) | |
| Asus ROG Zephyrus Duo 16 GX650RX (Turbo) | |
| Asus ROG Zephyrus Duo 16 GX650RX | |
| Asus ROG Zephyrus Duo 16 GX650RX (Leise) | |
| Final Fantasy XV Benchmark | |
| 3840x2160 High Quality | |
| Average of class Gaming (49.1 - 111.8, n=31, last 2 years) | |
| Asus ROG Zephyrus Duo 16 GX650RX (1.3, sep. GPU, 25W) | |
| Asus ROG Zephyrus Duo 16 GX650RX (1.3, Turbo) | |
| Average NVIDIA GeForce RTX 3080 Ti Laptop GPU (35.1 - 61.2, n=18) | |
| Asus ROG Zephyrus Duo 16 GX650RX (1.3) | |
| Asus ROG Zephyrus Duo 16 GX650RX (1.3, Leise) | |
| Gigabyte Aero 16 YE5 (1.3) | |
| 1920x1080 High Quality | |
| Average of class Gaming (41 - 215, n=95, last 2 years) | |
| MSI GE76 Raider | |
| Asus ROG Zephyrus Duo 16 GX650RX (1.3, sep. GPU, 25W) | |
| Asus ROG Zephyrus Duo 16 GX650RX (1.3, Turbo) | |
| Average NVIDIA GeForce RTX 3080 Ti Laptop GPU (30.7 - 140.6, n=42) | |
| Asus ROG Zephyrus Duo 16 GX650RX (1.3) | |
| Razer Blade 15 Advanced Model Early 2022 (1.3) | |
| Medion Erazer Beast X30 (1.3) | |
| Gigabyte Aero 16 YE5 (1.3) | |
| GTA V | |
| 3840x2160 Highest AA:4xMSAA + FX AF:16x | |
| Average of class Gaming (53.9 - 116.7, n=23, last 2 years) | |
| Asus ROG Zephyrus Duo 16 GX650RX (Turbo) | |
| Asus ROG Zephyrus Duo 16 GX650RX | |
| Average NVIDIA GeForce RTX 3080 Ti Laptop GPU (37.7 - 67.2, n=14) | |
| Gigabyte Aero 16 YE5 | |
| 1920x1080 Highest AA:4xMSAA + FX AF:16x | |
| Average of class Gaming (48.3 - 186.9, n=94, last 2 years) | |
| MSI GE76 Raider | |
| Gigabyte Aero 16 YE5 | |
| Average NVIDIA GeForce RTX 3080 Ti Laptop GPU (30 - 139.2, n=42) | |
| Medion Erazer Beast X30 | |
| Asus ROG Zephyrus Duo 16 GX650RX (sep. GPU, 25W) | |
| Asus ROG Zephyrus Duo 16 GX650RX (Turbo) | |
| Asus ROG Zephyrus Duo 16 GX650RX | |
| Razer Blade 15 Advanced Model Early 2022 | |
| Asus ROG Zephyrus Duo 16 GX650RX (Leise) | |
| F1 2021 | |
| 3840x2160 Ultra High Preset + Raytracing AA:T AF:16x | |
| MSI GE76 Raider | |
| Asus ROG Zephyrus Duo 16 GX650RX (874931, sep. GPU, 25W) | |
| Asus ROG Zephyrus Duo 16 GX650RX (874931, Turbo) | |
| Average NVIDIA GeForce RTX 3080 Ti Laptop GPU (41.1 - 70.2, n=18) | |
| Asus ROG Zephyrus Duo 16 GX650RX (874931) | |
| Asus ROG Zephyrus Duo 16 GX650RX (874931, Leise) | |
| Gigabyte Aero 16 YE5 (852849) | |
| 1920x1080 Ultra High Preset + Raytracing AA:T AF:16x | |
| MSI GE76 Raider | |
| Asus ROG Zephyrus Duo 16 GX650RX (874931, sep. GPU, 25W) | |
| Asus ROG Zephyrus Duo 16 GX650RX (874931, Turbo) | |
| Asus ROG Zephyrus Duo 16 GX650RX (874931) | |
| Medion Erazer Beast X30 (874931) | |
| Average NVIDIA GeForce RTX 3080 Ti Laptop GPU (30.2 - 160.6, n=30) | |
| Gigabyte Aero 16 YE5 (852849) | |
| Asus ROG Zephyrus Duo 16 GX650RX (874931, Leise) | |
| Strange Brigade | |
| 3840x2160 ultra AA:ultra AF:16 | |
| Average of class Gaming (83 - 187.2, n=32, last 2 years) | |
| Asus ROG Zephyrus Duo 16 GX650RX (1.47.22.14 D3D12, Turbo) | |
| Average NVIDIA GeForce RTX 3080 Ti Laptop GPU (61.7 - 100.7, n=15) | |
| Asus ROG Zephyrus Duo 16 GX650RX (1.47.22.14 D3D12) | |
| Gigabyte Aero 16 YE5 (1.47.22.14 D3D12) | |
| 1920x1080 ultra AA:ultra AF:16 | |
| Average of class Gaming (76.3 - 456, n=85, last 2 years) | |
| MSI GE76 Raider (1.47.22.14 D3D12) | |
| Asus ROG Zephyrus Duo 16 GX650RX (1.47.22.14 D3D12, sep. GPU, 25W) | |
| Medion Erazer Beast X30 (1.47.22.14 D3D12) | |
| Asus ROG Zephyrus Duo 16 GX650RX (1.47.22.14 D3D12, Turbo) | |
| Average NVIDIA GeForce RTX 3080 Ti Laptop GPU (42.3 - 224, n=41) | |
| Asus ROG Zephyrus Duo 16 GX650RX (1.47.22.14 D3D12) | |
| Gigabyte Aero 16 YE5 (1.47.22.14 D3D12) | |
| Razer Blade 15 Advanced Model Early 2022 (1.47.22.14 D3D12) | |
| Asus ROG Zephyrus Duo 16 GX650RX (1.47.22.14 D3D12, Leise) | |
| Cyberpunk 2077 1.6 | |
| 1920x1080 Ray Tracing Ultra Preset (DLSS off) | |
| Gigabyte Aero 16 YE5 | |
| Average NVIDIA GeForce RTX 3080 Ti Laptop GPU (39.2 - 49.9, n=7) | |
| Asus ROG Zephyrus Duo 16 GX650RX | |
| 3840x2160 Ultra Preset | |
| Average NVIDIA GeForce RTX 3080 Ti Laptop GPU (19.6 - 32.4, n=6) | |
| Asus ROG Zephyrus Duo 16 GX650RX | |
| Gigabyte Aero 16 YE5 | |
| 1920x1080 Ultra Preset | |
| Asus ROG Zephyrus Duo 16 GX650RX | |
| Average NVIDIA GeForce RTX 3080 Ti Laptop GPU (54 - 144.1, n=16) | |
| Gigabyte Aero 16 YE5 | |
| Far Cry 6 | |
| 1920x1080 Ultra Graphics Quality + HD Textures AA:T | |
| Average of class Gaming (n=1last 2 years) | |
| MSI GE76 Raider | |
| Average NVIDIA GeForce RTX 3080 Ti Laptop GPU (71.3 - 114, n=6) | |
| Asus ROG Zephyrus Duo 16 GX650RX | |
| Asus ROG Zephyrus Duo 16 GX650RX | |
| 3840x2160 Ultra Graphics Quality + HD Textures AA:T | |
| MSI GE76 Raider | |
| Average NVIDIA GeForce RTX 3080 Ti Laptop GPU (46.2 - 57, n=4) | |
| Asus ROG Zephyrus Duo 16 GX650RX | |
| 1920x1080 Ultra Graphics Quality + HD Textures + DXR AA:T | |
| Average of class Gaming (n=1last 2 years) | |
| Average NVIDIA GeForce RTX 3080 Ti Laptop GPU (91 - 92, n=3) | |
| MSI GE76 Raider | |
| Rainbow Six Extraction | |
| 1920x1080 Ultra Preset (with Fixed Resolution Quality) | |
| Asus ROG Zephyrus Duo 16 GX650RX | |
| Medion Erazer Beast X30 | |
| Average NVIDIA GeForce RTX 3080 Ti Laptop GPU (128 - 169, n=3) | |
| Gigabyte Aero 16 YE5 | |
| 3840x2160 Ultra Preset (with Fixed Resolution Quality) | |
| Asus ROG Zephyrus Duo 16 GX650RX | |
| Average NVIDIA GeForce RTX 3080 Ti Laptop GPU (44 - 57, n=2) | |
| Gigabyte Aero 16 YE5 | |
| Ghostwire Tokyo | |
| 1920x1080 Highest Settings | |
| Asus ROG Zephyrus Duo 16 GX650RX | |
| Average NVIDIA GeForce RTX 3080 Ti Laptop GPU (125 - 143.3, n=2) | |
| Medion Erazer Beast X30 | |
| 3840x2160 Highest Settings | |
| Asus ROG Zephyrus Duo 16 GX650RX | |
| Average NVIDIA GeForce RTX 3080 Ti Laptop GPU (n=1) | |
| 1920x1080 Highest Settings + Maximum Ray Tracing | |
| Medion Erazer Beast X30 | |
| Average NVIDIA GeForce RTX 3080 Ti Laptop GPU (66.1 - 68.3, n=2) | |
| Asus ROG Zephyrus Duo 16 GX650RX | |
| Tiny Tina's Wonderlands | |
| 1920x1080 Badass Preset (DX12) | |
| Average NVIDIA GeForce RTX 3080 Ti Laptop GPU (100.7 - 110.5, n=4) | |
| Asus ROG Zephyrus Duo 16 GX650RX | |
| Medion Erazer Beast X30 | |
| Average of class Gaming (55 - 159.4, n=5, last 2 years) | |
| 3840x2160 Badass Preset (DX12) | |
| Average of class Gaming (n=1last 2 years) | |
| Average NVIDIA GeForce RTX 3080 Ti Laptop GPU (40.1 - 43.9, n=2) | |
| Asus ROG Zephyrus Duo 16 GX650RX | |
| Guardians of the Galaxy | |
| 1920x1080 Ultra Preset | |
| MSI GE76 Raider | |
| Average NVIDIA GeForce RTX 3080 Ti Laptop GPU (112 - 155, n=3) | |
| Asus ROG Zephyrus Duo 16 GX650RX | |
| 3840x2160 Ultra Preset | |
| MSI GE76 Raider | |
| Average NVIDIA GeForce RTX 3080 Ti Laptop GPU (60 - 75, n=2) | |
| Asus ROG Zephyrus Duo 16 GX650RX | |
| 1920x1080 Ultra Preset + Ultra Ray-Tracing | |
| MSI GE76 Raider | |
| Average NVIDIA GeForce RTX 3080 Ti Laptop GPU (82 - 104, n=2) | |
| Asus ROG Zephyrus Duo 16 GX650RX | |
| Alan Wake Remastered | |
| 3840x2160 High Preset | |
| MSI GE76 Raider | |
| Average NVIDIA GeForce RTX 3080 Ti Laptop GPU (71.6 - 89, n=2) | |
| Asus ROG Zephyrus Duo 16 GX650RX | |
| 1920x1080 High Preset | |
| MSI GE76 Raider | |
| Average NVIDIA GeForce RTX 3080 Ti Laptop GPU (118.8 - 155, n=2) | |
| Asus ROG Zephyrus Duo 16 GX650RX | |
| Dying Light 2 | |
| 1920x1080 High Quality Raytracing | |
| Asus ROG Zephyrus Duo 16 GX650RX | |
| Average NVIDIA GeForce RTX 3080 Ti Laptop GPU (33.4 - 42.3, n=5) | |
| Gigabyte Aero 16 YE5 | |
| 3840x2160 High Quality | |
| Asus ROG Zephyrus Duo 16 GX650RX | |
| Average NVIDIA GeForce RTX 3080 Ti Laptop GPU (27.3 - 31, n=2) | |
| Gigabyte Aero 16 YE5 | |
| 1920x1080 High Quality | |
| Average NVIDIA GeForce RTX 3080 Ti Laptop GPU (69.2 - 88.4, n=5) | |
| Asus ROG Zephyrus Duo 16 GX650RX | |
| Gigabyte Aero 16 YE5 | |
To evaluate whether the frame rates remain fairly constant over a longer time period, we let the game "The Witcher 3" run for about 60 minutes in Full-HD resolution and maximum quality settings, without moving the gaming character. We did not notice a drop in the frame rates.
The Witcher 3 FPS Chart


| low | med. | high | ultra | QHD | 4K | |
|---|---|---|---|---|---|---|
| GTA V (2015) | 180.4 | 175.4 | 158.9 | 101.5 | 92.2 | 101.5 |
| The Witcher 3 (2015) | 345 | 298 | 197.9 | 111.1 | 80.5 | |
| Dota 2 Reborn (2015) | 133.8 | 122.2 | 114.8 | 111.3 | 89.2 | |
| Final Fantasy XV Benchmark (2018) | 177.8 | 138.7 | 108 | 84.6 | 51.4 | |
| X-Plane 11.11 (2018) | 112.9 | 95.1 | 78.2 | 66.1 | ||
| Far Cry 5 (2018) | 146 | 124 | 120 | 111 | 104 | 60 |
| Strange Brigade (2018) | 359 | 229 | 198.8 | 182.4 | 140.2 | 84.5 |
| F1 2021 (2021) | 330 | 275 | 225 | 130.2 | 102.5 | 60 |
| Alan Wake Remastered (2021) | 142.4 | 123.4 | 118.8 | 114.4 | 71.6 | |
| Far Cry 6 (2021) | 116.2 | 100.3 | 90.9 | 71.3 | 75.2 | 46.2 |
| Guardians of the Galaxy (2021) | 118 | 113 | 112 | 112 | 103 | 60 |
| Rainbow Six Extraction (2022) | 243 | 207 | 202 | 169 | 113 | 57 |
| Dying Light 2 (2022) | 106.9 | 88.4 | 77.6 | 55.8 | 31 | |
| Cyberpunk 2077 1.6 (2022) | 136.3 | 119.6 | 98.3 | 99.1 | 53.7 | 25.2 |
| Ghostwire Tokyo (2022) | 148.1 | 146.8 | 143.8 | 143.3 | 110.6 | 59.9 |
| Tiny Tina's Wonderlands (2022) | 192.7 | 167.3 | 128.9 | 104.3 | 73.5 | 40.1 |
Emissions - Asus ROG 16 with acceptable noise and heat development
Noise Emissions
During everyday operation with office and Internet tasks, the two fans take it easy, producing only very little noise. At times, they even remain turned off. On the other hand, under full load they get loud with a maximum noise level of 50 dB(A) during the stress test and 48 dB(A) during the Witcher 3 test. While the noise development can be reduced by selecting the "Silent" profile, this happens at the cost of computing performance.
Noise level
| Idle |
| 26 / 27 / 29 dB(A) |
| Load |
| 41 / 50 dB(A) |
 | ||
30 dB silent 40 dB(A) audible 50 dB(A) loud |
||
min: | ||
| Asus ROG Zephyrus Duo 16 GX650RX R9 6900HX, GeForce RTX 3080 Ti Laptop GPU | Apple MacBook Pro 16 2021 M1 Max M1 Max, M1 Max 32-Core GPU | Razer Blade 15 Advanced Model Early 2022 i7-12800H, GeForce RTX 3080 Ti Laptop GPU | MSI GE76 Raider i9-12900HK, GeForce RTX 3080 Ti Laptop GPU | Medion Erazer Beast X30 i9-12900HK, GeForce RTX 3080 Ti Laptop GPU | Gigabyte Aero 16 YE5 i9-12900HK, GeForce RTX 3080 Ti Laptop GPU | |
|---|---|---|---|---|---|---|
| Noise | 10% | 4% | -11% | -8% | -9% | |
| off / environment * (dB) | 26 | 24.2 7% | 26 -0% | 26 -0% | 26 -0% | 25 4% |
| Idle Minimum * (dB) | 26 | 24.2 7% | 26 -0% | 26 -0% | 27 -4% | 30 -15% |
| Idle Average * (dB) | 27 | 24.2 10% | 27 -0% | 27 -0% | 29 -7% | 32 -19% |
| Idle Maximum * (dB) | 29 | 24.2 17% | 29 -0% | 40 -38% | 34 -17% | 33 -14% |
| Load Average * (dB) | 41 | 42.9 -5% | 37 10% | 50 -22% | 48 -17% | 45 -10% |
| Witcher 3 ultra * (dB) | 48 | 39.5 18% | 44 8% | 53 -10% | 51 -6% | 50 -4% |
| Load Maximum * (dB) | 50 | 42.9 14% | 45 10% | 53 -6% | 53 -6% | 52 -4% |
* ... smaller is better
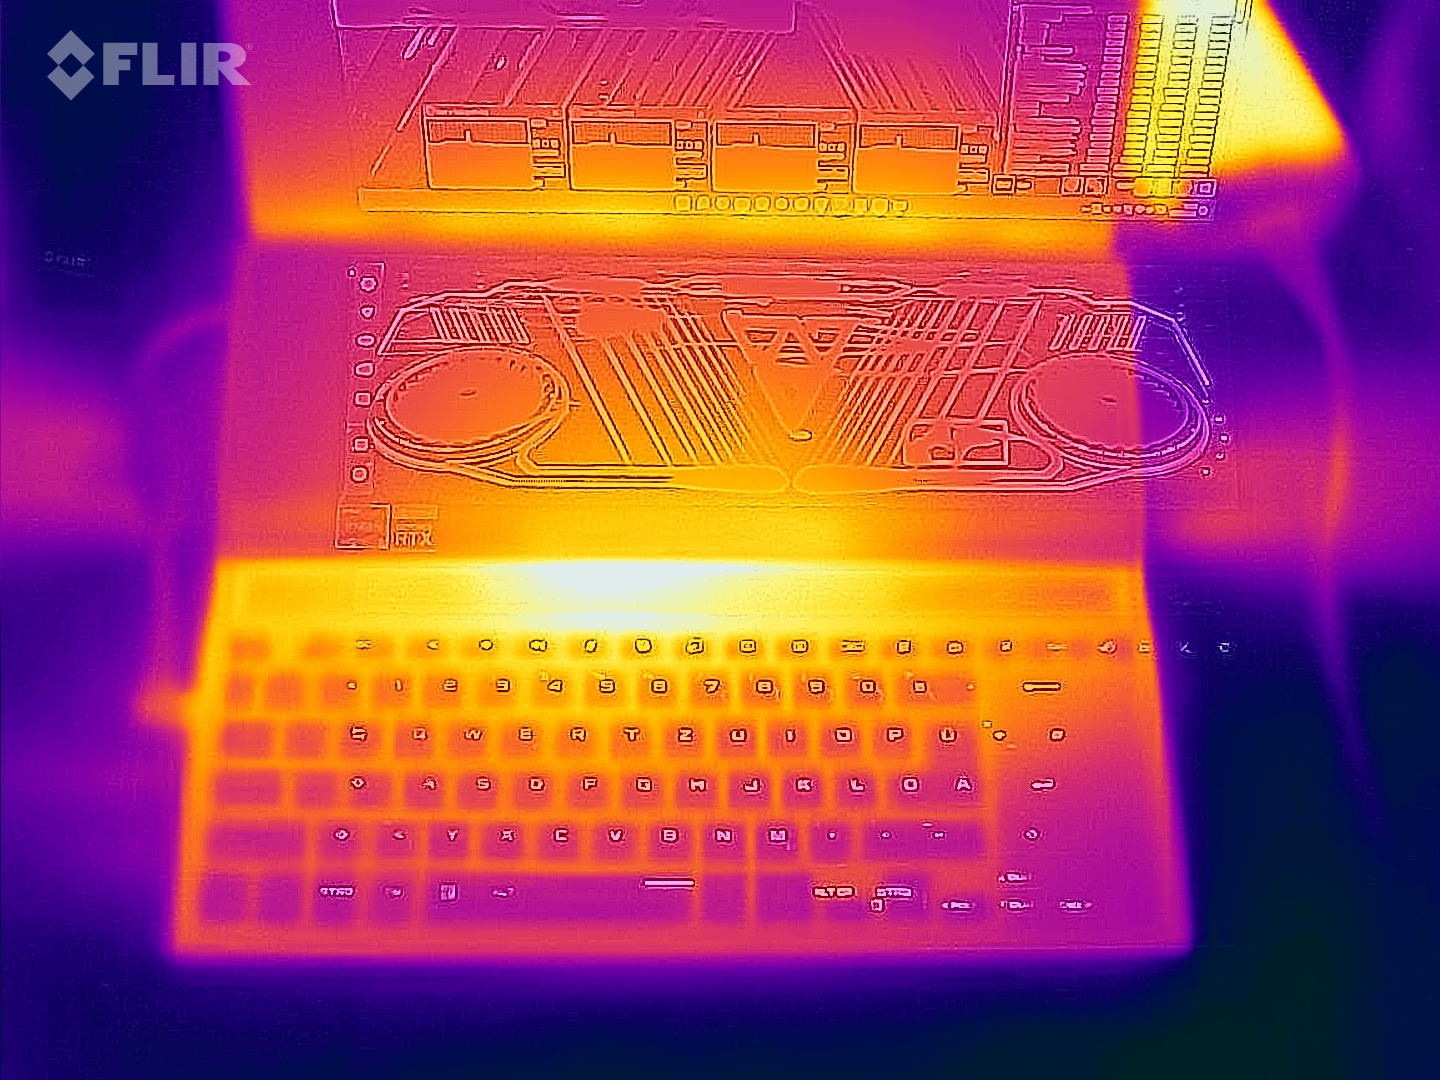
Temperatures
During everyday operation (office, Internet), the case temperatures remain within the green range. Under load (stress test, Witcher 3 test), the laptop warms up without becoming excessively hot. The CPU temperatures range within acceptable levels.
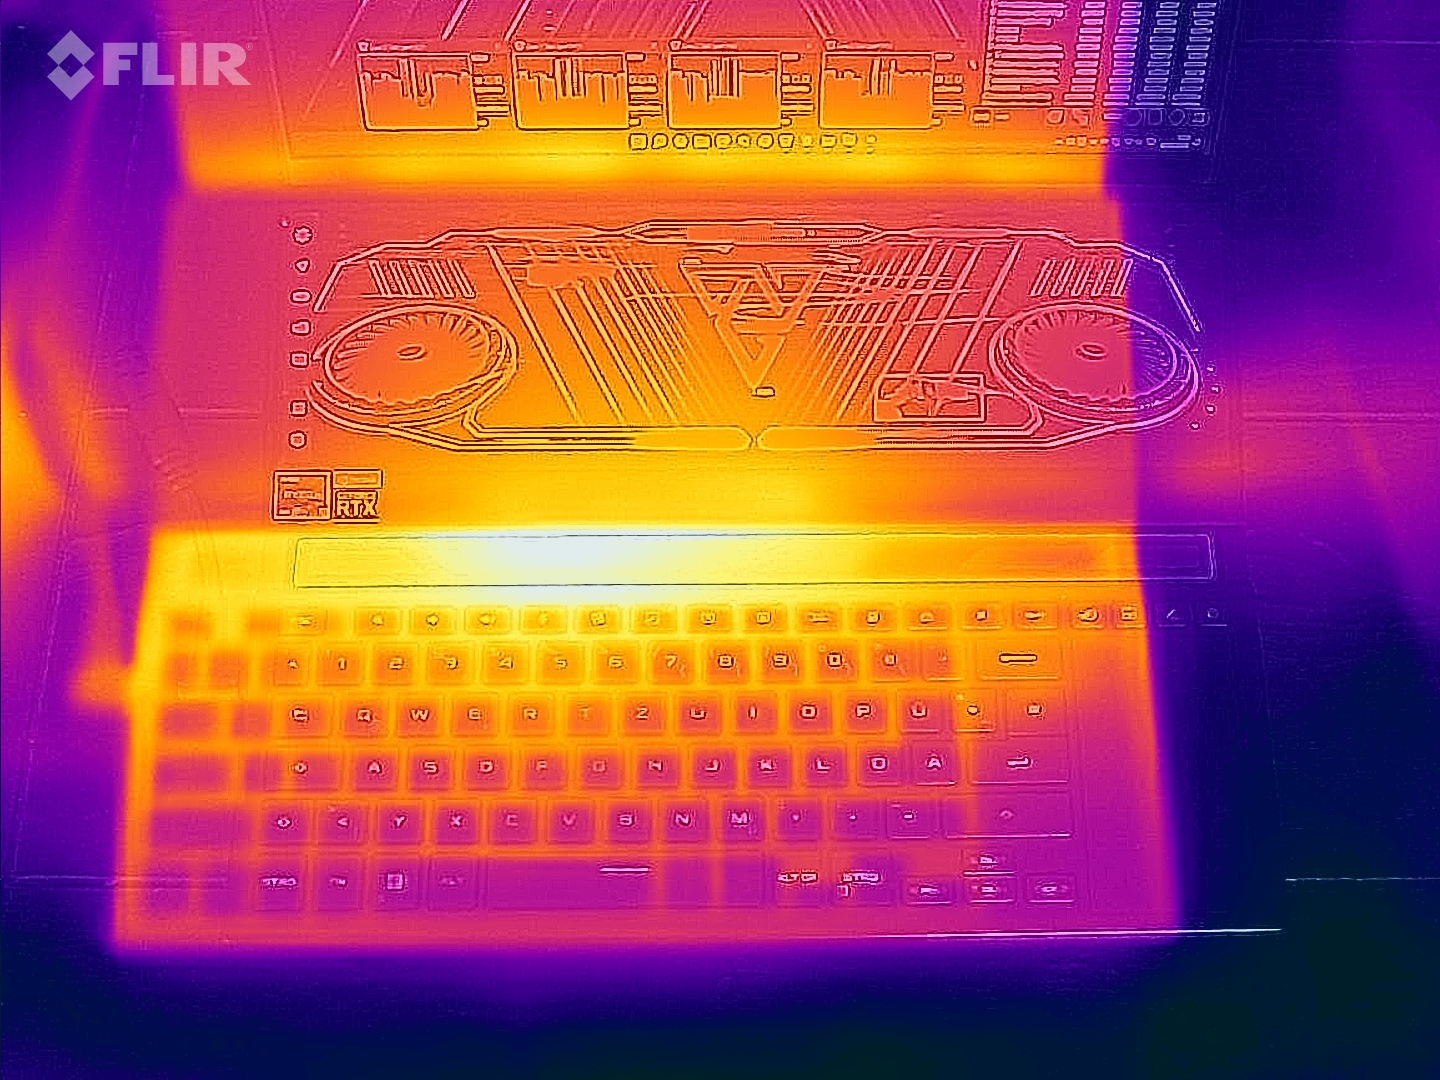
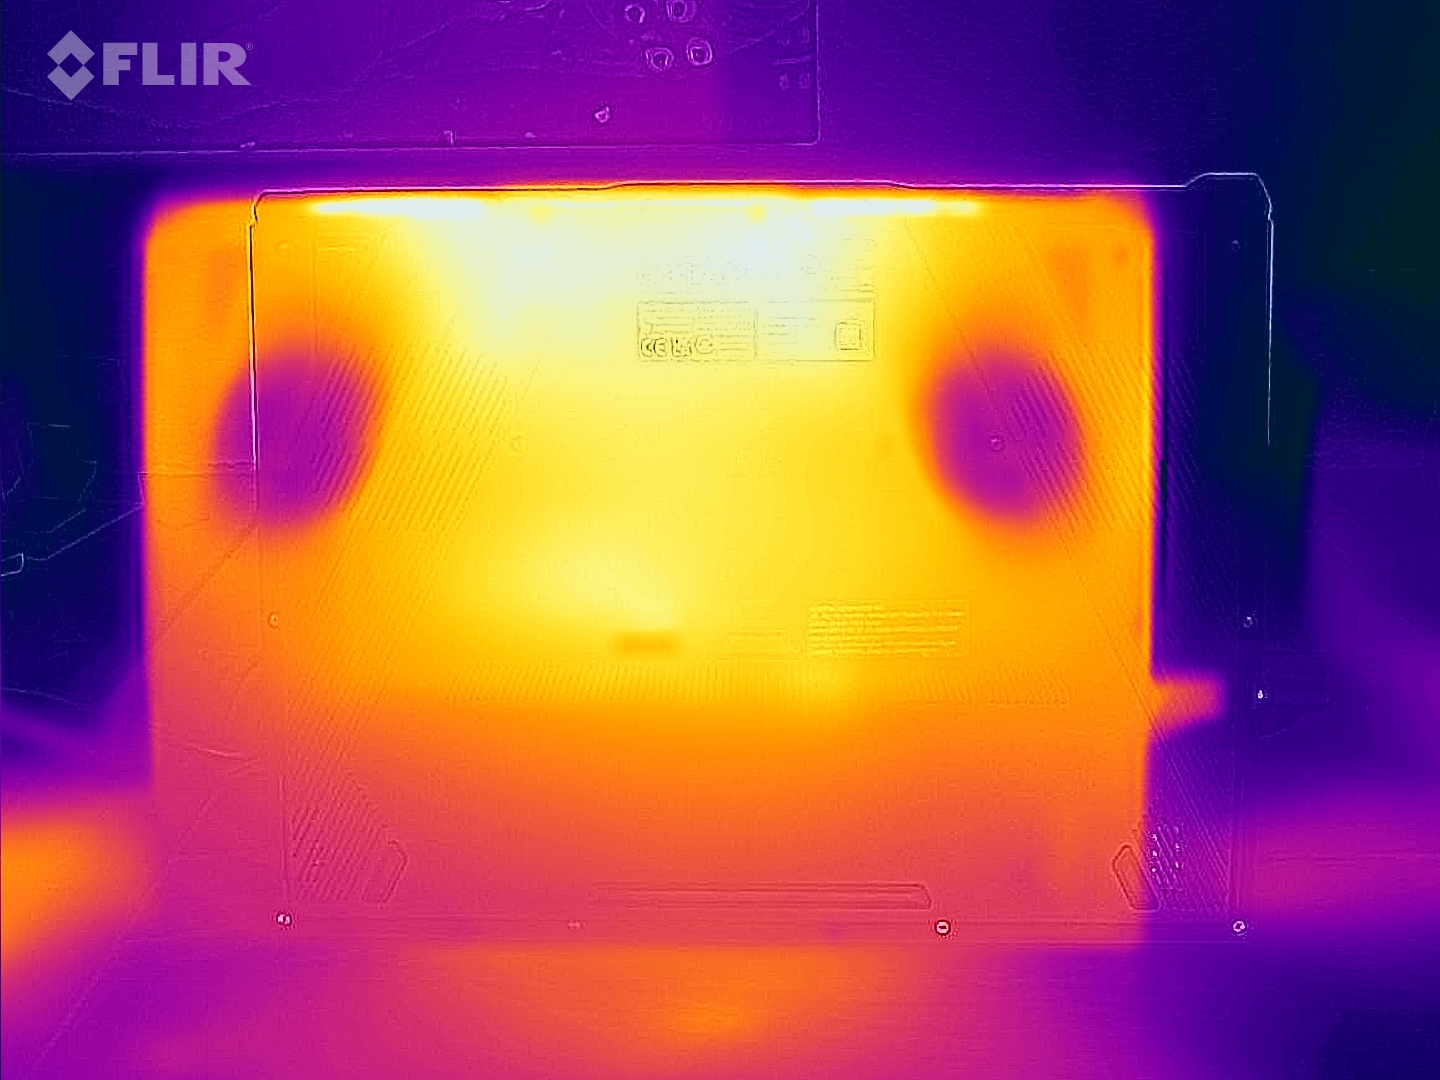
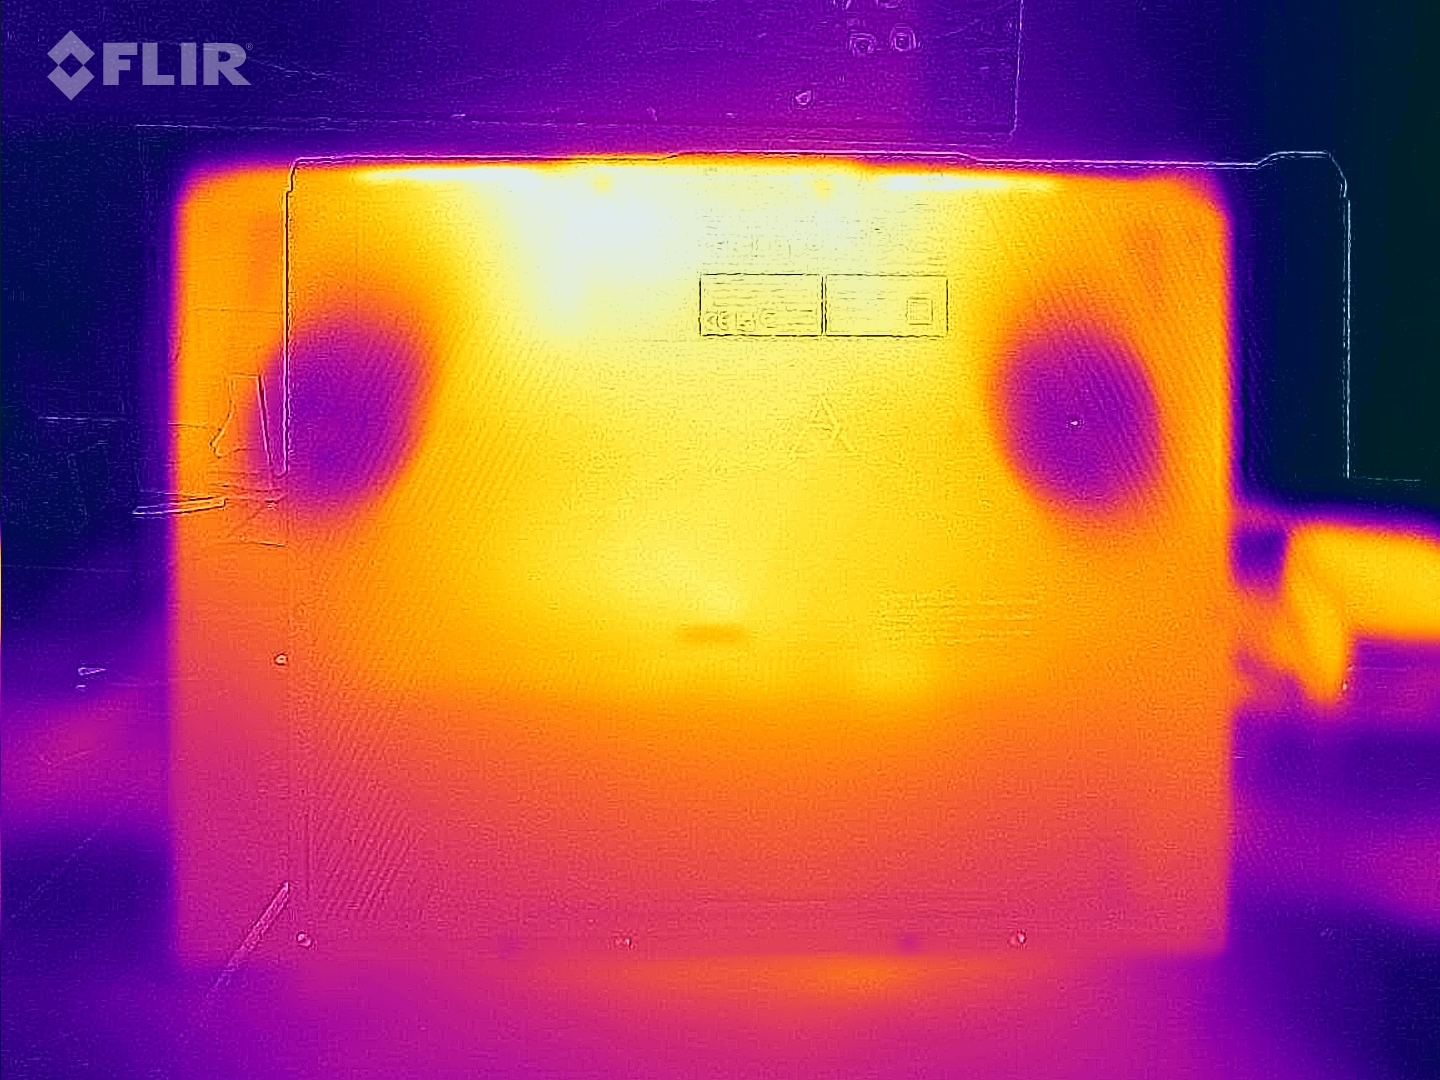
(±) The maximum temperature on the upper side is 45 °C / 113 F, compared to the average of 40.4 °C / 105 F, ranging from 21.2 to 68.8 °C for the class Gaming.
(-) The bottom heats up to a maximum of 50 °C / 122 F, compared to the average of 43.2 °C / 110 F
(+) In idle usage, the average temperature for the upper side is 29.8 °C / 86 F, compared to the device average of 33.9 °C / 93 F.
(-) Playing The Witcher 3, the average temperature for the upper side is 40.1 °C / 104 F, compared to the device average of 33.9 °C / 93 F.
(-) The palmrests and touchpad can get very hot to the touch with a maximum of 42 °C / 107.6 F.
(-) The average temperature of the palmrest area of similar devices was 28.8 °C / 83.8 F (-13.2 °C / -23.8 F).
| Asus ROG Zephyrus Duo 16 GX650RX AMD Ryzen 9 6900HX, NVIDIA GeForce RTX 3080 Ti Laptop GPU | Apple MacBook Pro 16 2021 M1 Max Apple M1 Max, Apple M1 Max 32-Core GPU | Razer Blade 15 Advanced Model Early 2022 Intel Core i7-12800H, NVIDIA GeForce RTX 3080 Ti Laptop GPU | MSI GE76 Raider Intel Core i9-12900HK, NVIDIA GeForce RTX 3080 Ti Laptop GPU | Medion Erazer Beast X30 Intel Core i9-12900HK, NVIDIA GeForce RTX 3080 Ti Laptop GPU | Gigabyte Aero 16 YE5 Intel Core i9-12900HK, NVIDIA GeForce RTX 3080 Ti Laptop GPU | |
|---|---|---|---|---|---|---|
| Heat | 20% | -12% | -1% | -13% | -5% | |
| Maximum Upper Side * (°C) | 45 | 42.3 6% | 53 -18% | 43 4% | 55 -22% | 49 -9% |
| Maximum Bottom * (°C) | 50 | 41.7 17% | 53 -6% | 47 6% | 62 -24% | 55 -10% |
| Idle Upper Side * (°C) | 33 | 23.9 28% | 36 -9% | 33 -0% | 32 3% | 33 -0% |
| Idle Bottom * (°C) | 33 | 23.9 28% | 38 -15% | 37 -12% | 36 -9% | 33 -0% |
* ... smaller is better
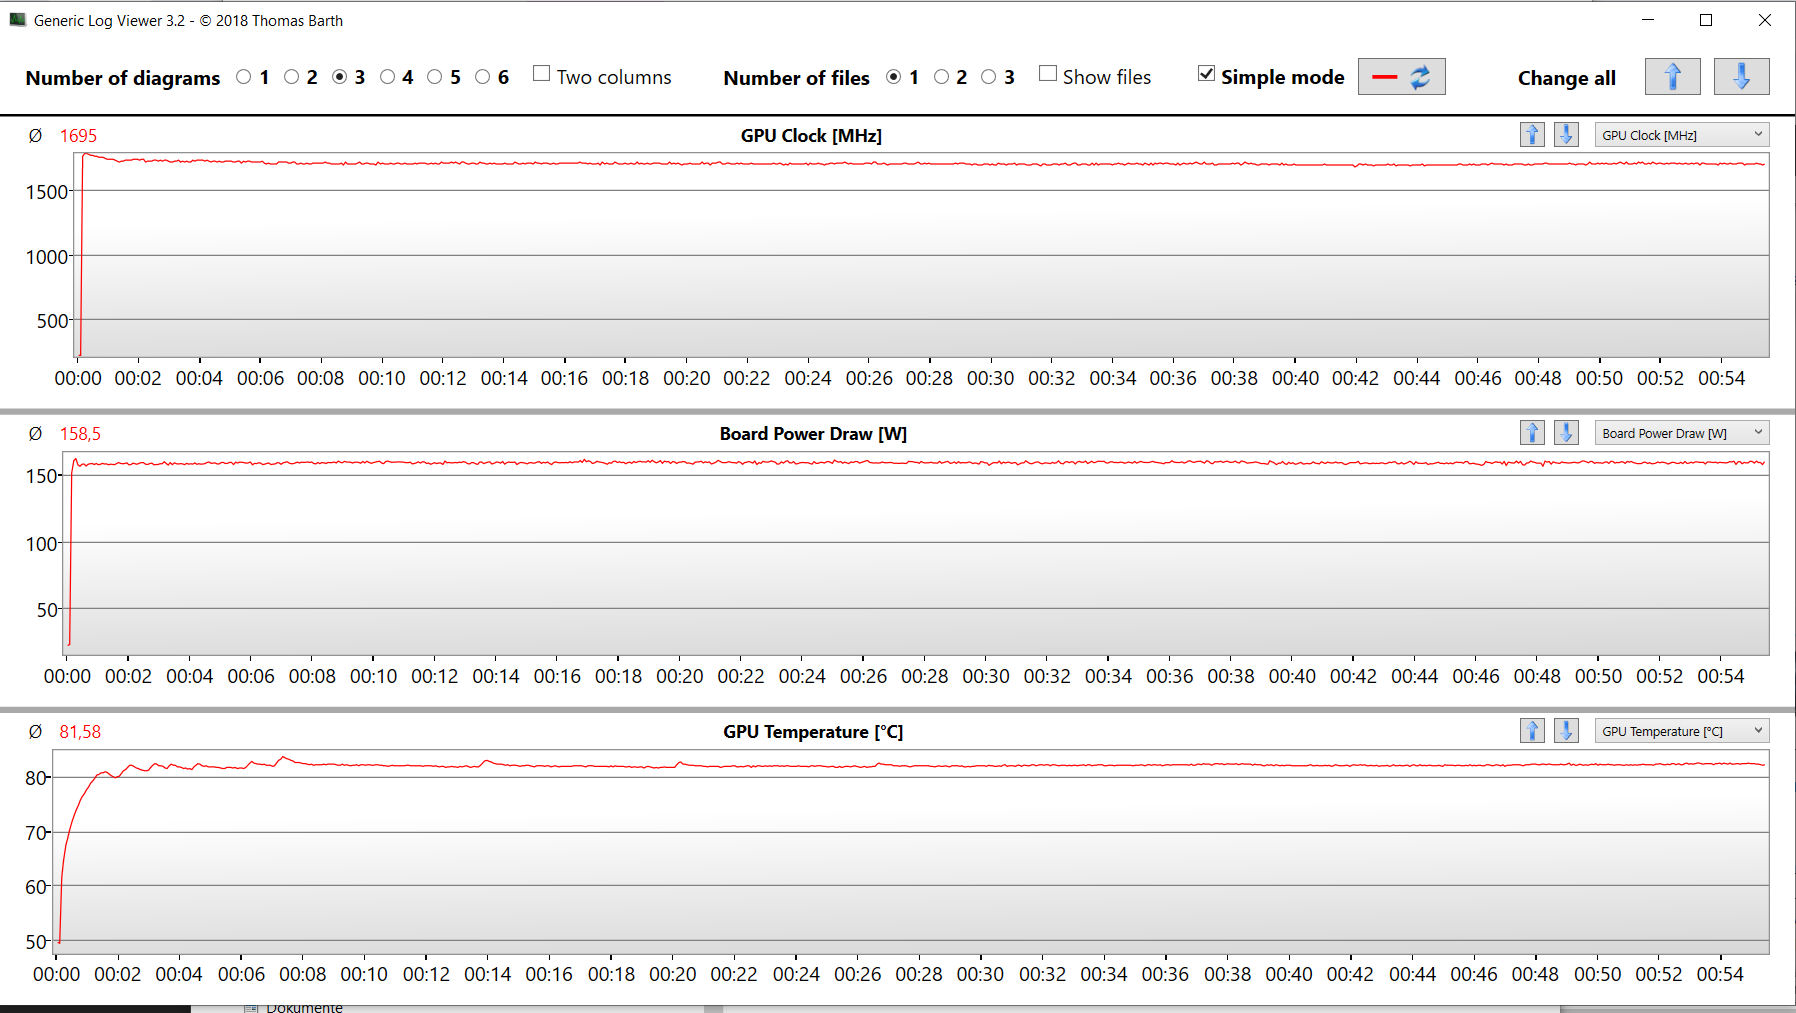
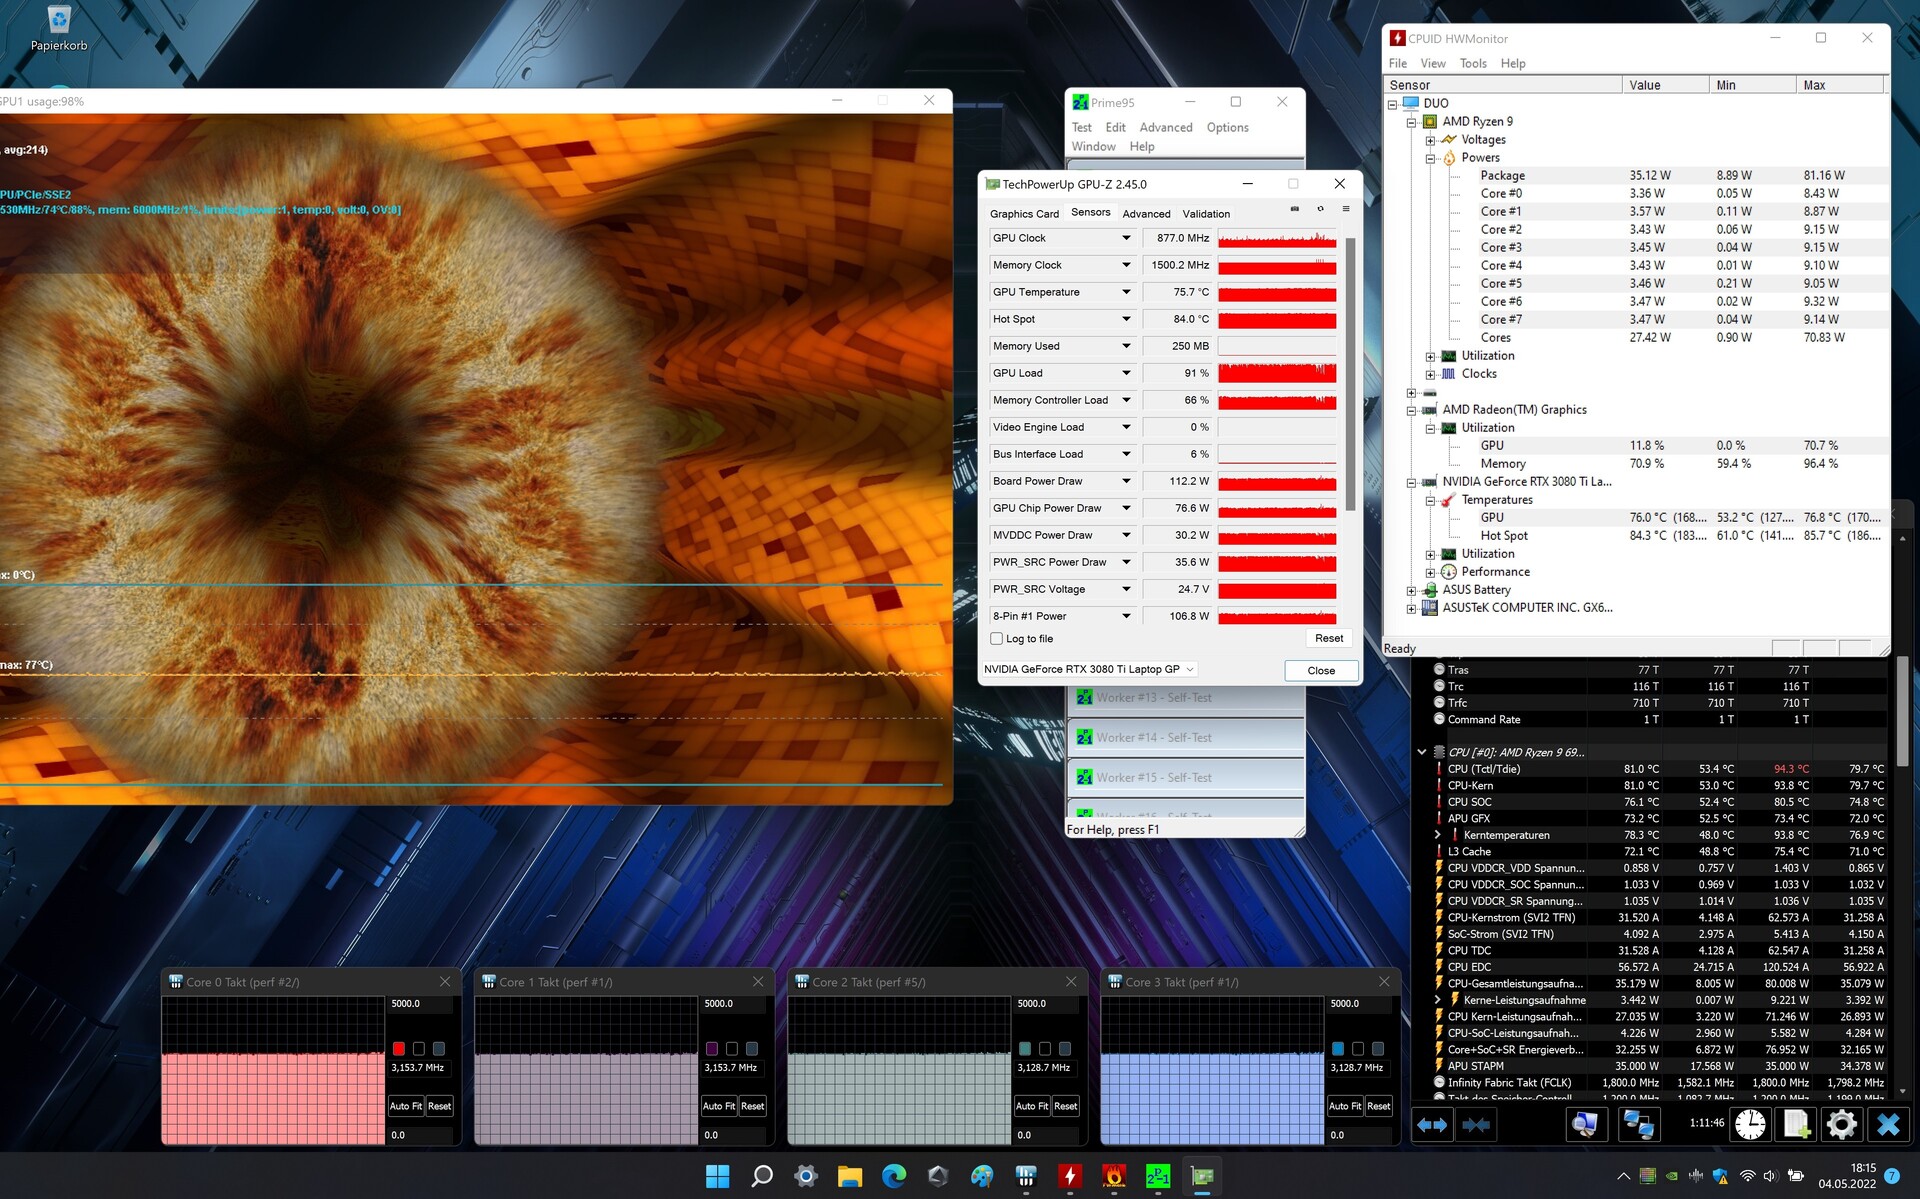
Stress Test
In the beginning of the stress test with Prime95 and Furmark running for at least one hour, the CPU (4 to 4.1 GHz) and GPU (1,000 to 1,600 MHz) run at high clock speeds. Continuing, the values drop to between 3 and 3.1 GHz (CPU) and between 850 and 900 MHz (GPU). The stress test represents an extreme scenario, and we use this test to evaluate whether the system remains stable under full load.
Speakers
The stereo speakers produce a decent sound, although it could use more bass. For a better sound experience, using headphones or external speakers is recommended.
Asus ROG Zephyrus Duo 16 GX650RX audio analysis
(±) | speaker loudness is average but good (80 dB)
Bass 100 - 315 Hz
(±) | reduced bass - on average 8.9% lower than median
(±) | linearity of bass is average (12.4% delta to prev. frequency)
Mids 400 - 2000 Hz
(±) | higher mids - on average 6.8% higher than median
(+) | mids are linear (4.3% delta to prev. frequency)
Highs 2 - 16 kHz
(±) | reduced highs - on average 6% lower than median
(±) | linearity of highs is average (7.3% delta to prev. frequency)
Overall 100 - 16.000 Hz
(±) | linearity of overall sound is average (16.5% difference to median)
Compared to same class
» 42% of all tested devices in this class were better, 7% similar, 51% worse
» The best had a delta of 6%, average was 18%, worst was 132%
Compared to all devices tested
» 28% of all tested devices were better, 6% similar, 66% worse
» The best had a delta of 4%, average was 23%, worst was 134%
Power Management - The Zephyrus Duo offers a good battery life
Power Consumption
During idle operation, the GX650 has a slightly higher power consumption than most other Windows competitors. However, none of the other competitors can reach the low values of the MacBook Pro 16. The stress test or Witcher-3 test lead to an increase of the Zephyrus consumption up to a maximum of 256 watts or 186.5 watts on average, which are normal values for the hardware used here. While the power consumption remains constant during the Witcher 3 test, it drops slightly during the course of the stress test. Rated at 280 watts, the included power supply is sized sufficiently large.
| Off / Standby | |
| Idle | |
| Load |
|
Key:
min: | |
| Asus ROG Zephyrus Duo 16 GX650RX R9 6900HX, GeForce RTX 3080 Ti Laptop GPU | Apple MacBook Pro 16 2021 M1 Max M1 Max, M1 Max 32-Core GPU | Razer Blade 15 Advanced Model Early 2022 i7-12800H, GeForce RTX 3080 Ti Laptop GPU | MSI GE76 Raider i9-12900HK, GeForce RTX 3080 Ti Laptop GPU | Medion Erazer Beast X30 i9-12900HK, GeForce RTX 3080 Ti Laptop GPU | Gigabyte Aero 16 YE5 i9-12900HK, GeForce RTX 3080 Ti Laptop GPU | Average of class Gaming | |
|---|---|---|---|---|---|---|---|
| Power Consumption | 42% | 16% | 4% | 9% | -15% | 14% | |
| Idle Minimum * (Watt) | 19 | 5.4 72% | 17 11% | 12 37% | 12 37% | 26 -37% | 13 ? 32% |
| Idle Average * (Watt) | 24 | 16.4 32% | 19 21% | 17 29% | 16 33% | 30 -25% | 18.6 ? 22% |
| Idle Maximum * (Watt) | 31 | 16.7 46% | 25 19% | 28 10% | 22 29% | 37 -19% | 24.2 ? 22% |
| Load Average * (Watt) | 104 | 94 10% | 108 -4% | 118 -13% | 118 -13% | 127 -22% | 108.7 ? -5% |
| Witcher 3 ultra * (Watt) | 186.5 | 104 44% | 150 20% | 252 -35% | 223 -20% | 176 6% | |
| Load Maximum * (Watt) | 256 | 135 47% | 179 30% | 272 -6% | 290 -13% | 236 8% | 255 ? -0% |
* ... smaller is better
Power Consumption The Witcher 3 / Stress Test
Power Consumption With External Monitor
Battery Life
In the WLAN test where websites are loaded via script and in the video test running the short movie Big Buck Bunny (H.264-coding, FHD) in a constant loop, the 16-inch laptop lasts for 7:49 hours and 9:19 hours respectively. During both tests, the power saving functions of the laptop are deactivated and the display brightness adjusted to about 150 cd/m². While running the video test, the communication modules are also turned off.
| Asus ROG Zephyrus Duo 16 GX650RX R9 6900HX, GeForce RTX 3080 Ti Laptop GPU, 90 Wh | Apple MacBook Pro 16 2021 M1 Max M1 Max, M1 Max 32-Core GPU, 99.6 Wh | Razer Blade 15 Advanced Model Early 2022 i7-12800H, GeForce RTX 3080 Ti Laptop GPU, 80 Wh | MSI GE76 Raider i9-12900HK, GeForce RTX 3080 Ti Laptop GPU, 99.99 Wh | Medion Erazer Beast X30 i9-12900HK, GeForce RTX 3080 Ti Laptop GPU, 91.2 Wh | Gigabyte Aero 16 YE5 i9-12900HK, GeForce RTX 3080 Ti Laptop GPU, 99 Wh | Average of class Gaming | |
|---|---|---|---|---|---|---|---|
| Battery runtime | 61% | -2% | -35% | 11% | -2% | 1% | |
| Reader / Idle (h) | 12.5 | 8.1 -35% | 7.7 -38% | 8.9 -29% | 8.71 ? -30% | ||
| H.264 (h) | 9.3 | 17 83% | 5.9 -37% | 6.4 -31% | 7.5 -19% | 8.64 ? -7% | |
| WiFi v1.3 (h) | 7.8 | 14.9 91% | 4.9 -37% | 5.1 -35% | 5.7 -27% | 6.4 -18% | 7.07 ? -9% |
| Load (h) | 1 | 1.1 10% | 2 100% | 2.4 140% | 1.6 60% | 1.502 ? 50% |
Pros
Cons
Verdict - A powerful laptop for the creative segment
Asus advertises the Zephyrus primarily as a gaming laptop, but the concept of the laptop is also targeted toward content creators: Video and image processing, rendering and of course also gaming are the core disciplines. 4k gaming is possible in high to maximum settings.
While the Screenpad Plus should offer a certain added value in some application scenarios, it also increases the weight, purchase price, and size of the laptop.
A Ryzen 9 6900HX APU and GeForce RTX 3080-Ti Laptop GPU deliver the necessary computing performance, and both components run at a constant, high clock speed. Two PCIe 4 SSDs (RAID 0) ensure short load times and offer a lot of storage space (4 TB). The whole package is rounded by 64 GB of working memory.
The noise and heat development under load range at the usual level for this class of laptop. However, during everyday operation the laptop remains very quiet. The good 16-inch display in the 16:10 format scores with an excellent color reproduction (Pantone certification) and covers the DCI-P3 color space completely.
Despite the high computing performance, you don't have to live with a short battery life. One battery charge (90 Wh) lasts for a WLAN runtime of almost 8 hours. Another positive point is the ability to charge the battery using a universal USB-C charger (45 watts min.), since the left USB-C Gen 2 port also supports Power Delivery. This means that you don't necessarily have to bring along the hefty 280-Watt power supply.
An alternative to the Zephyrus would be Gigabyte Aero 16, which offers a higher CPU performance and a Thunderbolt 4 port. The disadvantages are a worse battery life, a reflective display, and more heat development. If you need a powerful computing performance and battery life that is as long as possible, you can hardly get around the Apple MacBook Pro 16. On the other hand, you then could neither replace or expand the SSD, nor the working memory. In addition, the MacBook also uses a reflective screen.
Price and Availability
While the ROG Zephyrus Duo 16 GX650RX is already listed on Asus' US website at the time of this test, other online shops such as CDW ($4097) and B&H Photo ($4000) show it as not in stock yet.
Asus ROG Zephyrus Duo 16 GX650RX
- 05/23/2022 v7 (old)
Sascha Mölck
Price comparison

