Verdict - Asus Zephyrus Duo is a unique and powerful dual-screen convertible
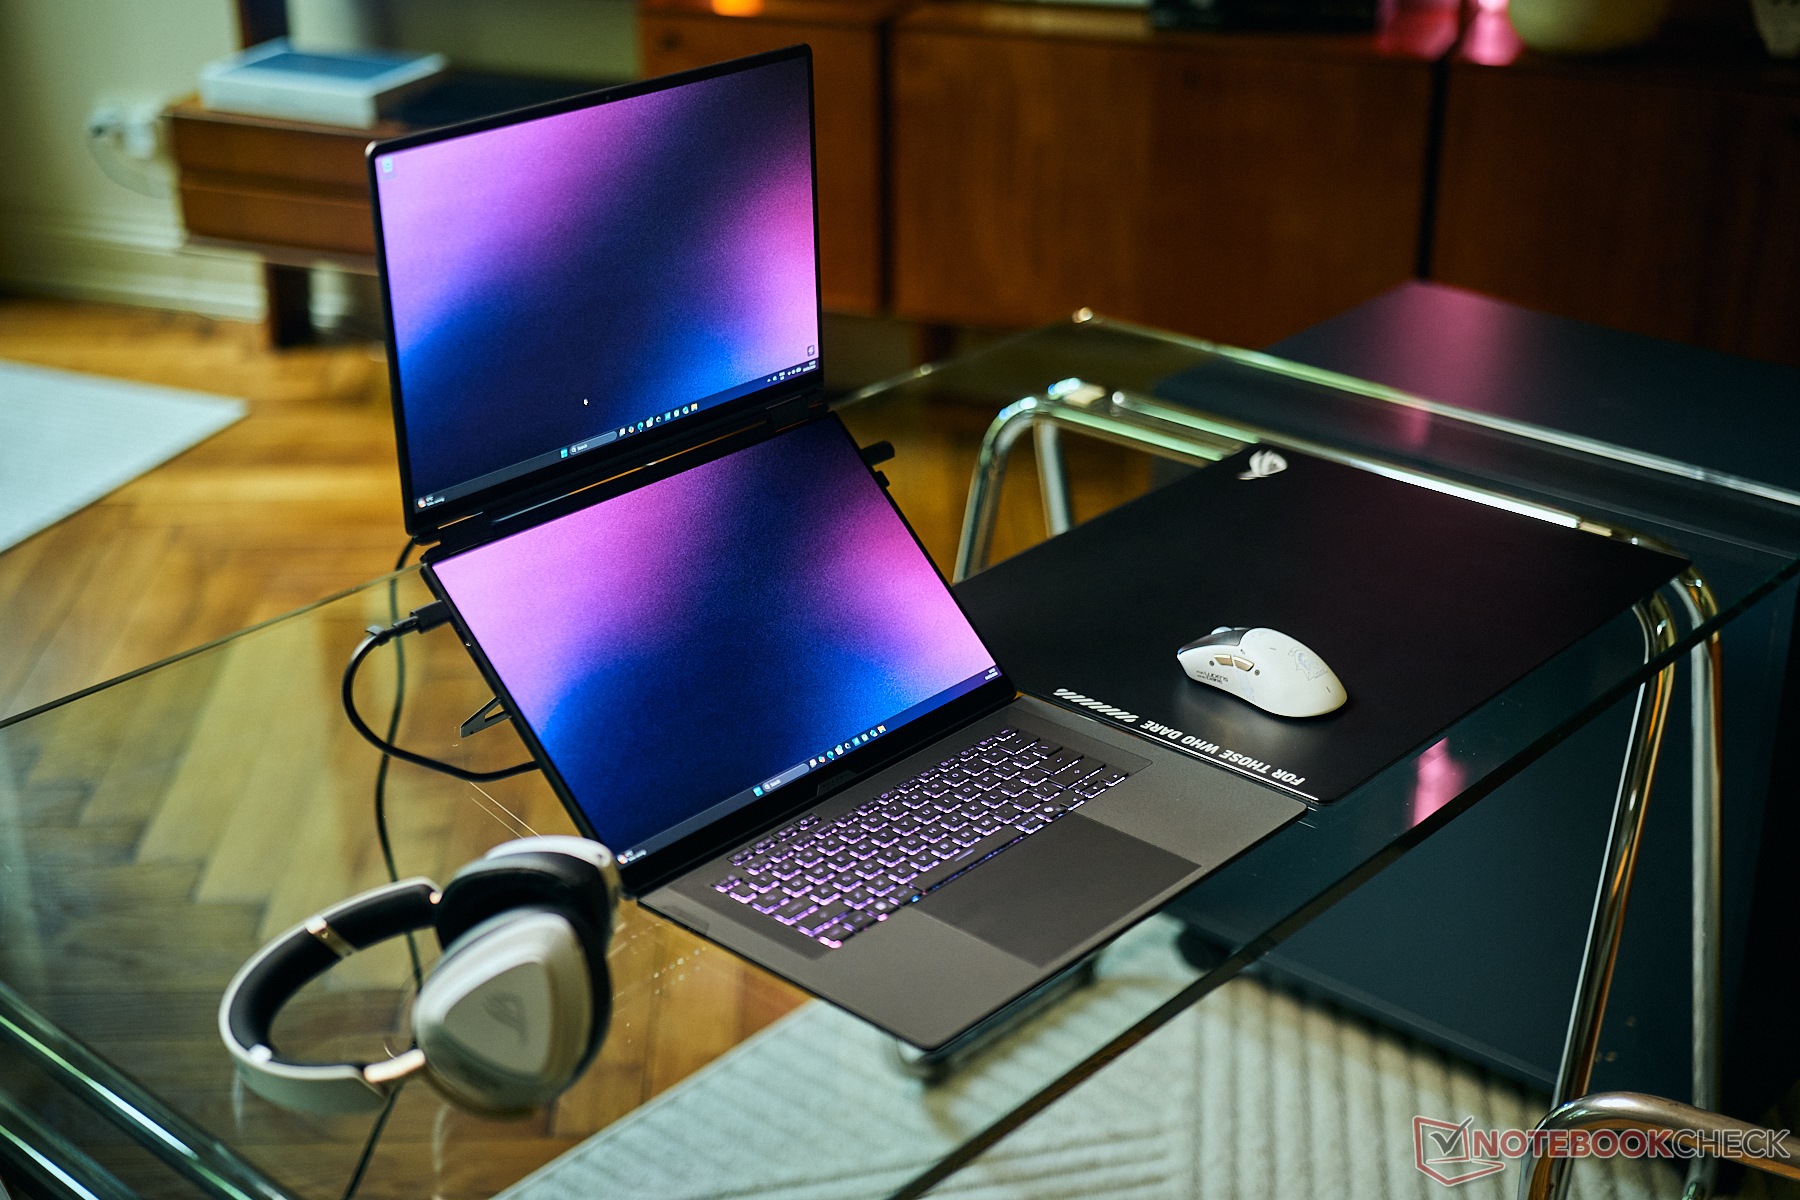
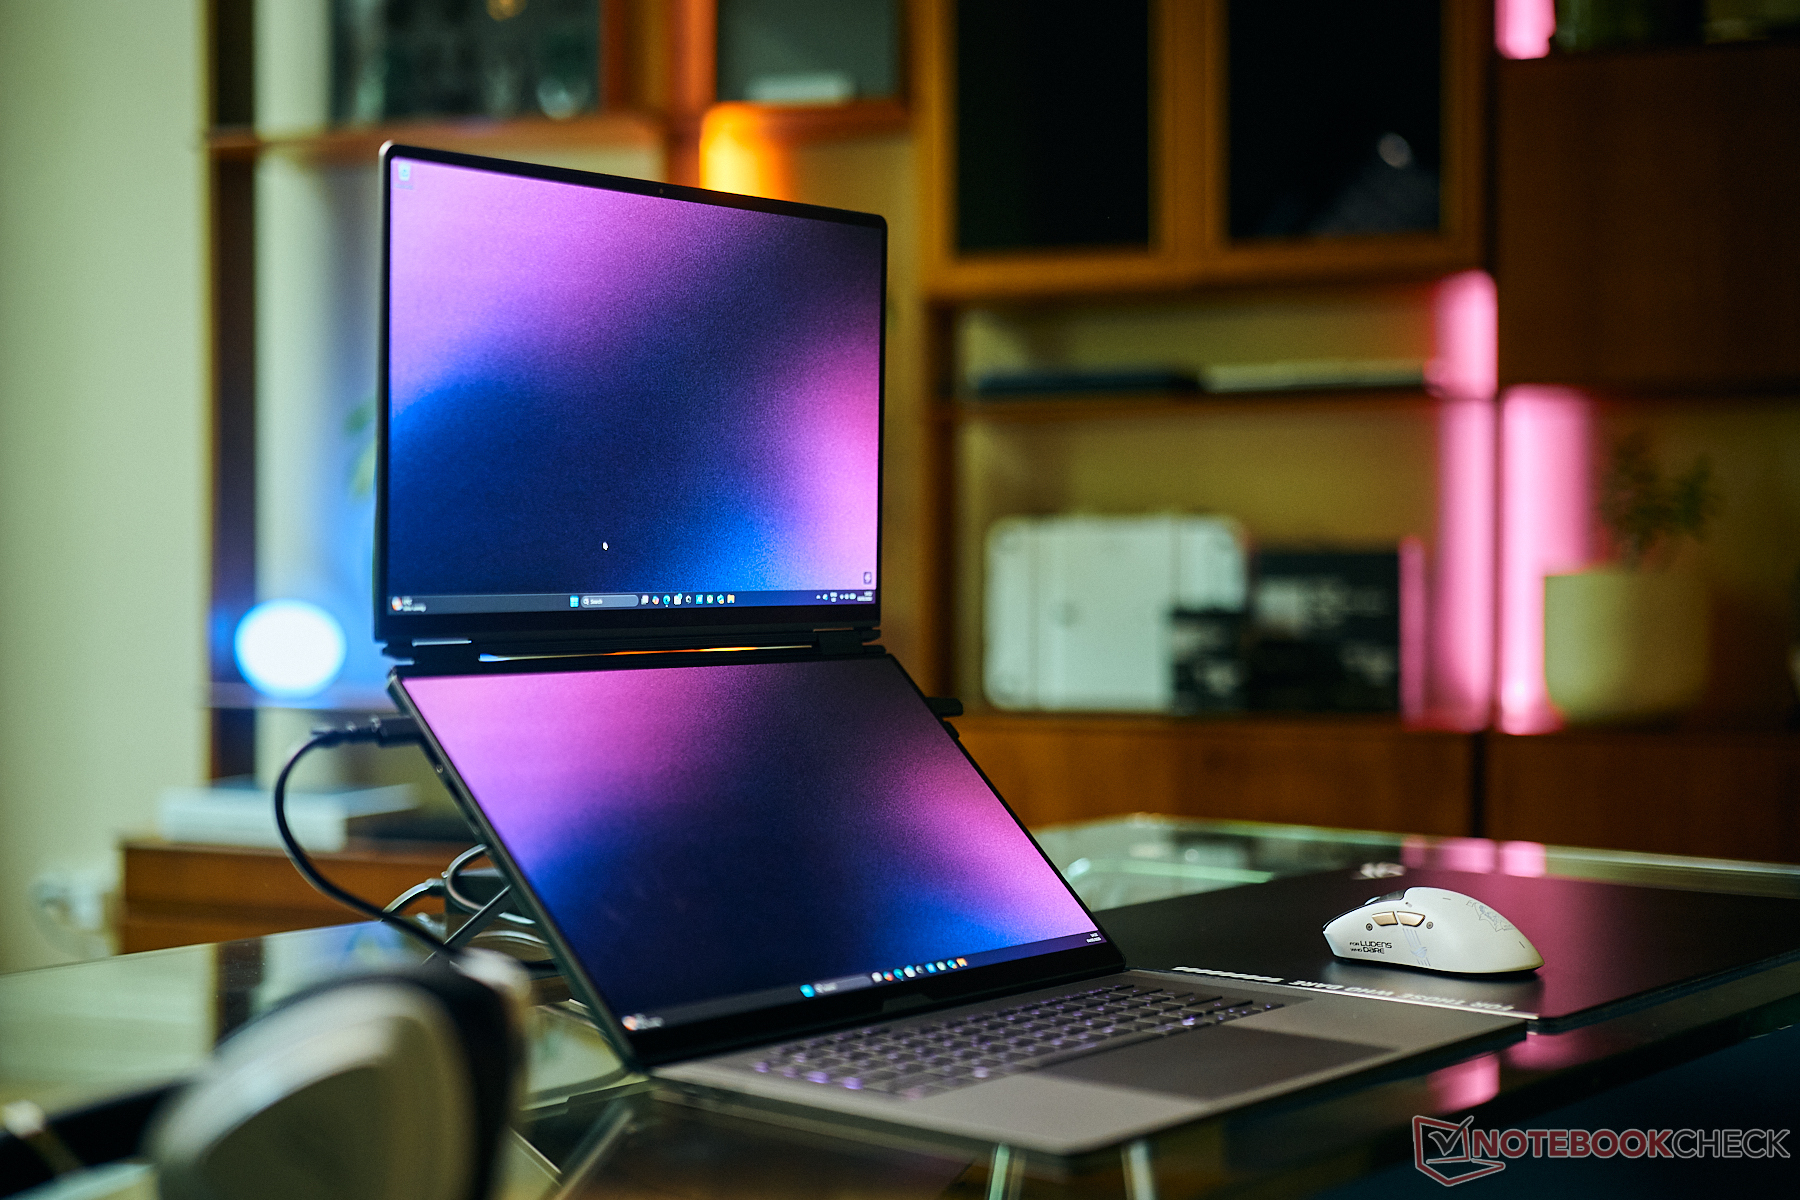
The new Asus ROG Zephyrus Duo GX651 is a very unique product and while it carries the ROG Zephyrus brand for gaming devices, it can also be a very interesting device for content creators or professionals in need for two screens and the powerful GeForce RTX 5090 GPU. The user experience is very good and you notice that Asus has plenty of experience with dual-screen devices, so it simply works very well. Image quality is also very good, even though the touch layer results in a slightly grainy image on bright contents.
The performance with the new Panther Lake CPU and the GeForce RTX 5090 GPU is very good overall, but it cannot keep up with the fastest gaming laptops that use higher wattage versions of the GPU in combination with faster HX-series CPUs. The limitation to 64 GB RAM is also not ideal for content creators, so overall, this is only a recommendation if you really rely on two screens for your workflow. If you only need the second screen occasionally, we would recommend the ProArt P16 (with the awesome tandem OLED panel) or the regular Zephyrus G16 (or another high-end gamer) instead and use an external display if necessary.
Pros
Cons
Price and Availability
The new ROG Zephyrus DUO GX651 is currently available for pre-order and the RTX 5090 SKU with 32 GB RAM is listed for $5499.
- $4,499.99ASUS ROG Zephyrus Duo Gaming Laptop, 16” OLED ROG Nebula HDR 16:10 3K 120Hz/0.2ms, the Intel Core Ultra 9 386H Processor, NVIDIA GeForce RTX 5070Ti Laptop GPU, 32GB LPDDR5X, 1TB PCIe 4.0 NVMe M.2 SSD
- $5,499.99ASUS ROG Zephyrus Duo Dual Touchscreen Detachable 16" 3K OLED ROG Nebula HDR 120Hz Copilot+ PC Gaming Notebook Intel Core Ultra 9 386H 32GB RAM 1TB SSD NVIDIA GeForce RTX 5090 Stellar Grey
- $4,699.99EXCaliberPC [2026] ASUS ROG Zephyrus Duo GX651AR-DB96 (Intel Ultra 9 386H, 32GB RAM, 1TB NVMe SSD, NVIDIA GeForce RTX 5070Ti, 16" 120Hz OLED Touch, Windows 11) Gaming Laptop
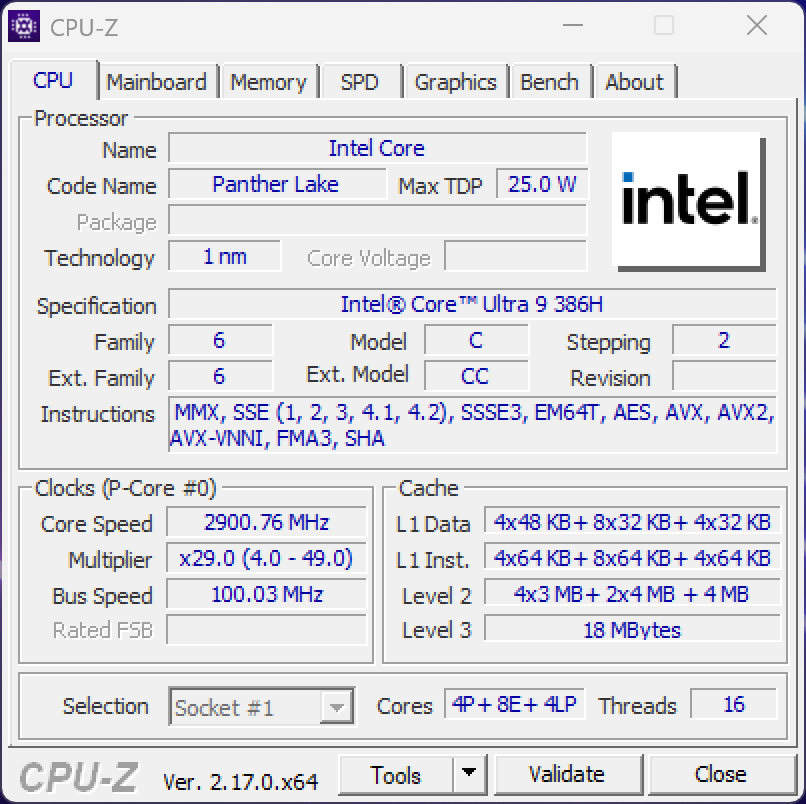
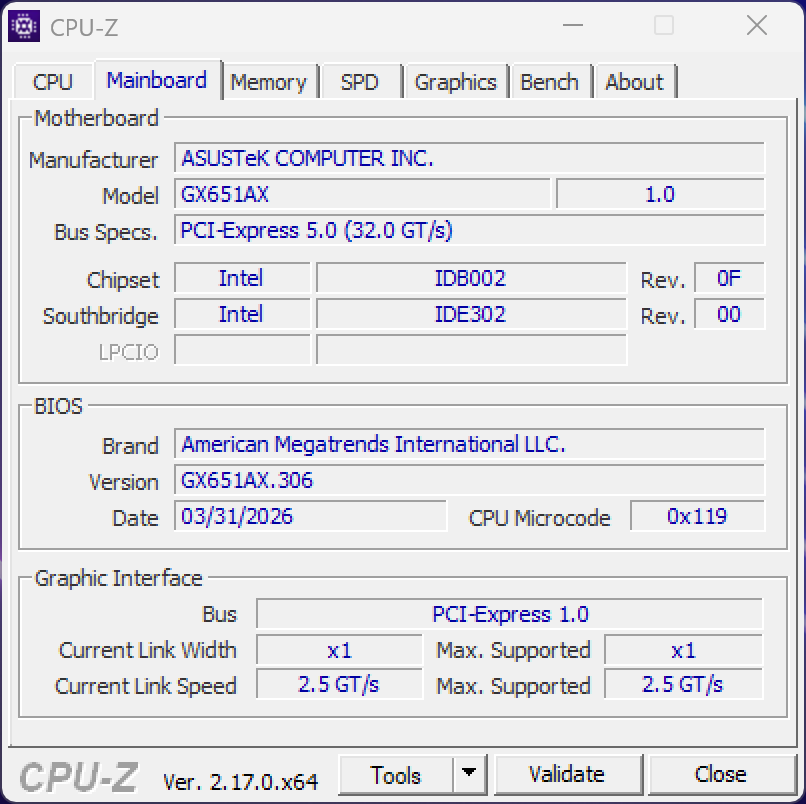
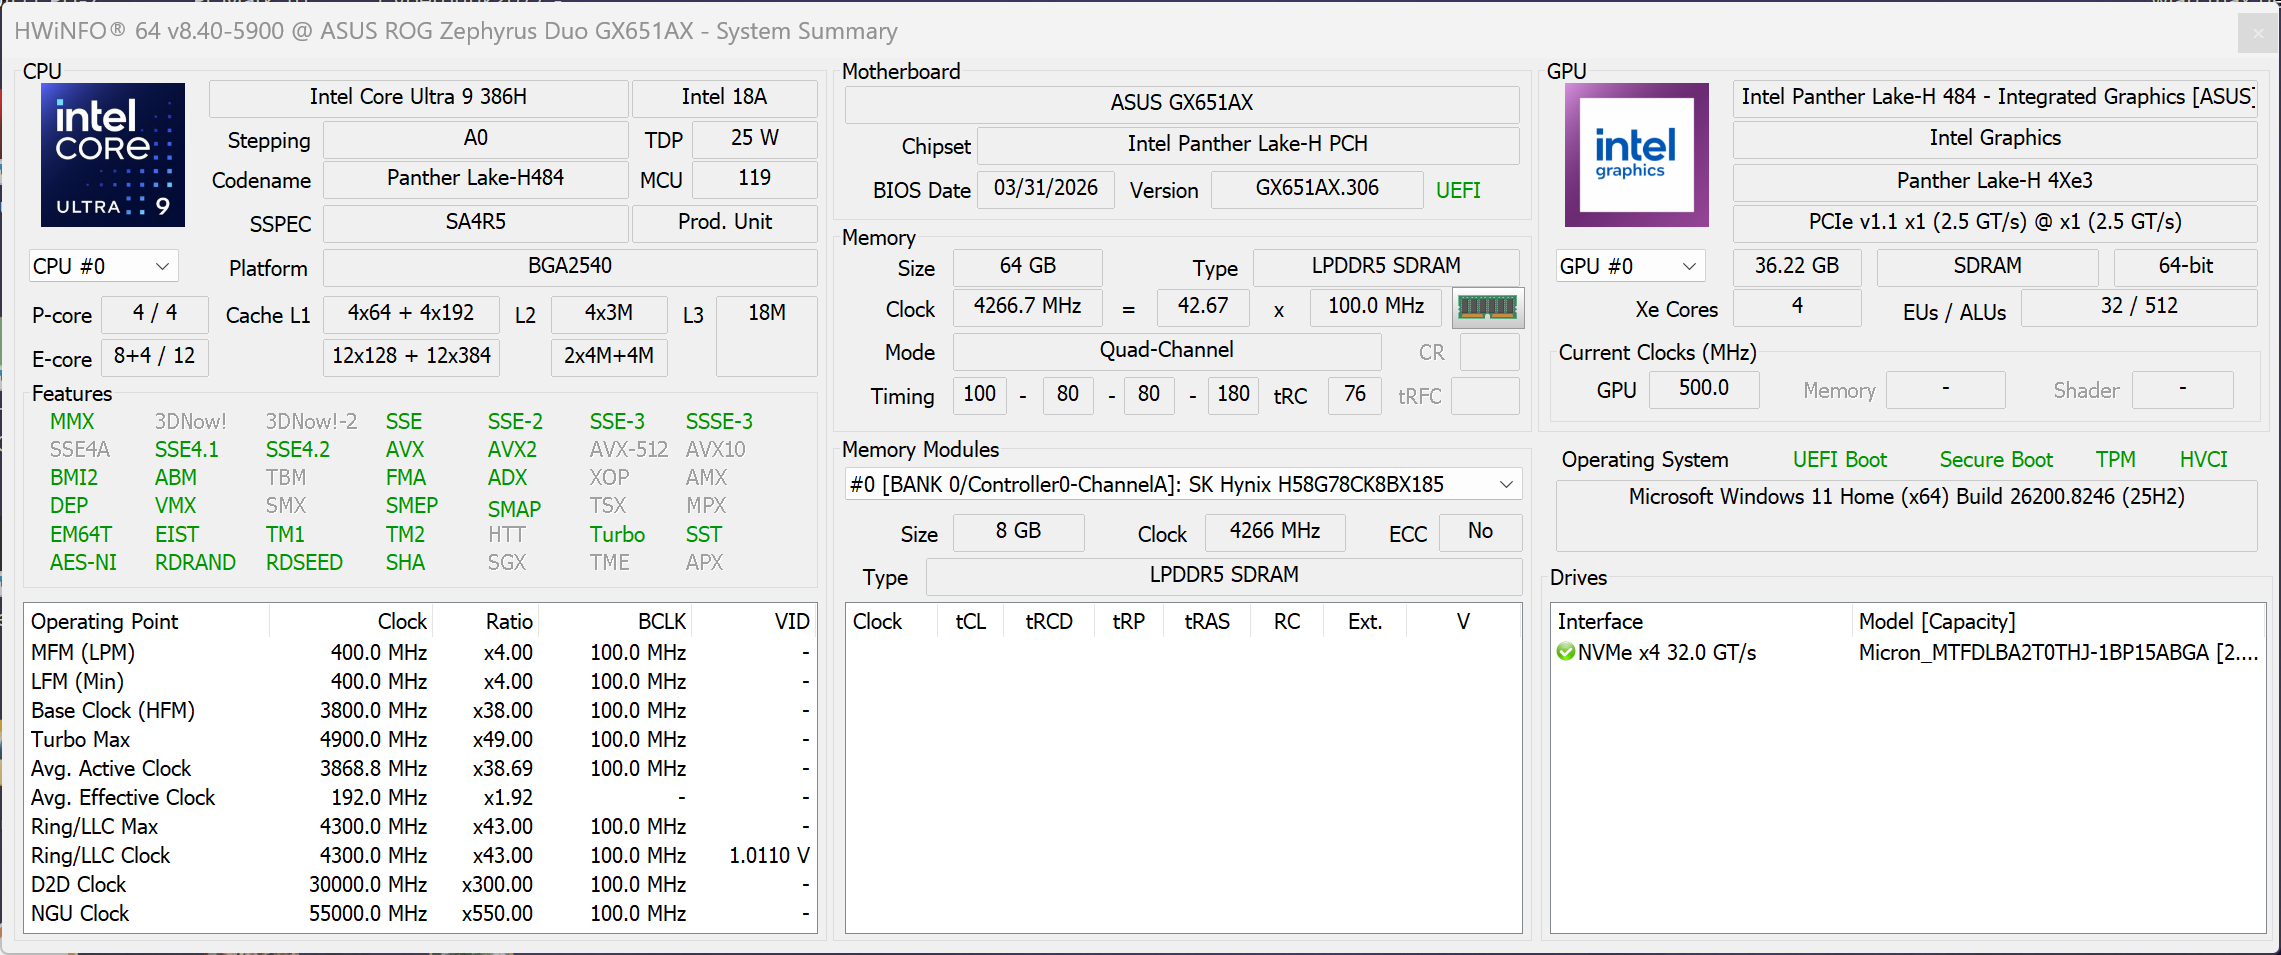
Asus expands its ROG Zephyrus lineup with a brand-new high performance dual-screen convertible powered by Intel's latest Panther Lake mobile CPUs as well as Nvidia's flagship GPU GeForce RTX 5090. Our review unit of the new Zephyrus Duo GX651 features two 2.8K OLED screens with 120 Hz, the RTX 5090, 64 GB RAM as well as a 2 TB SSD.
Specifications
Case and Connectivity
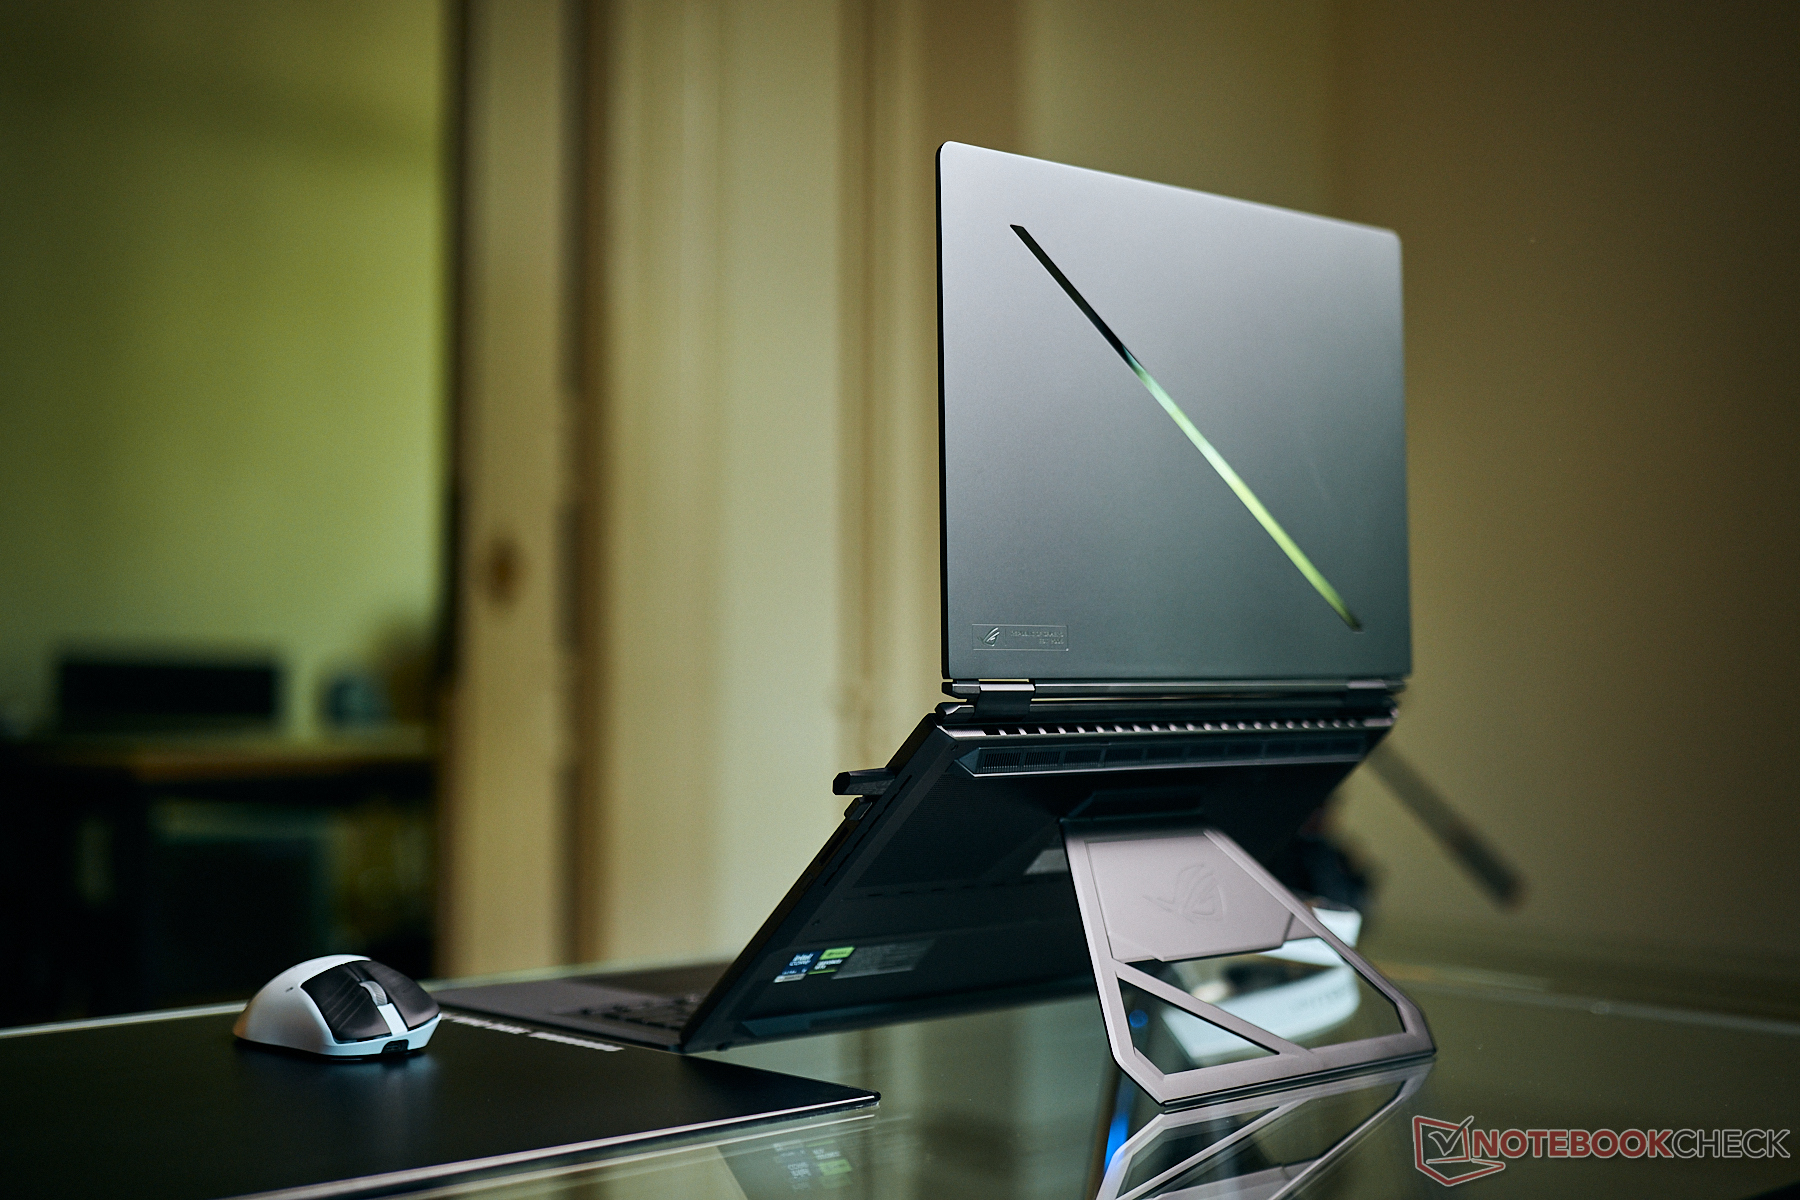
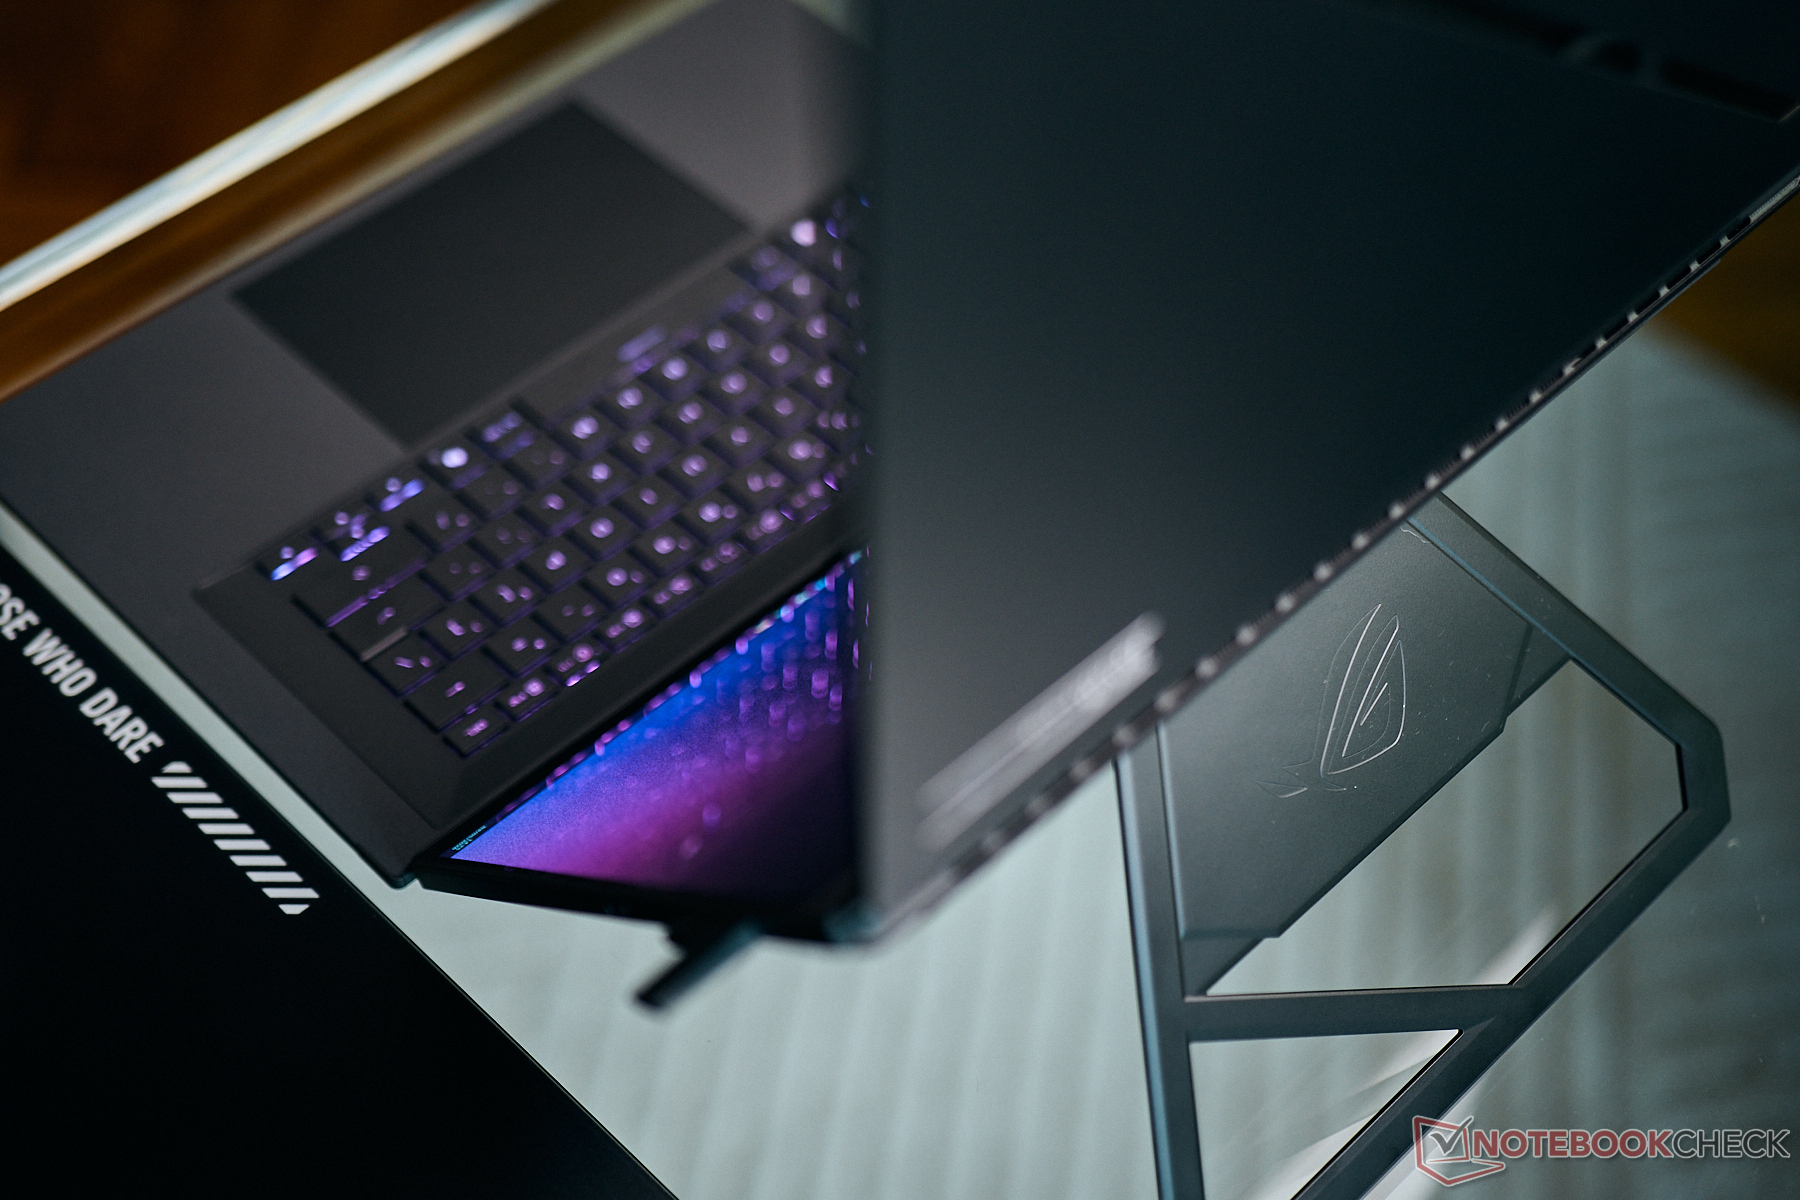
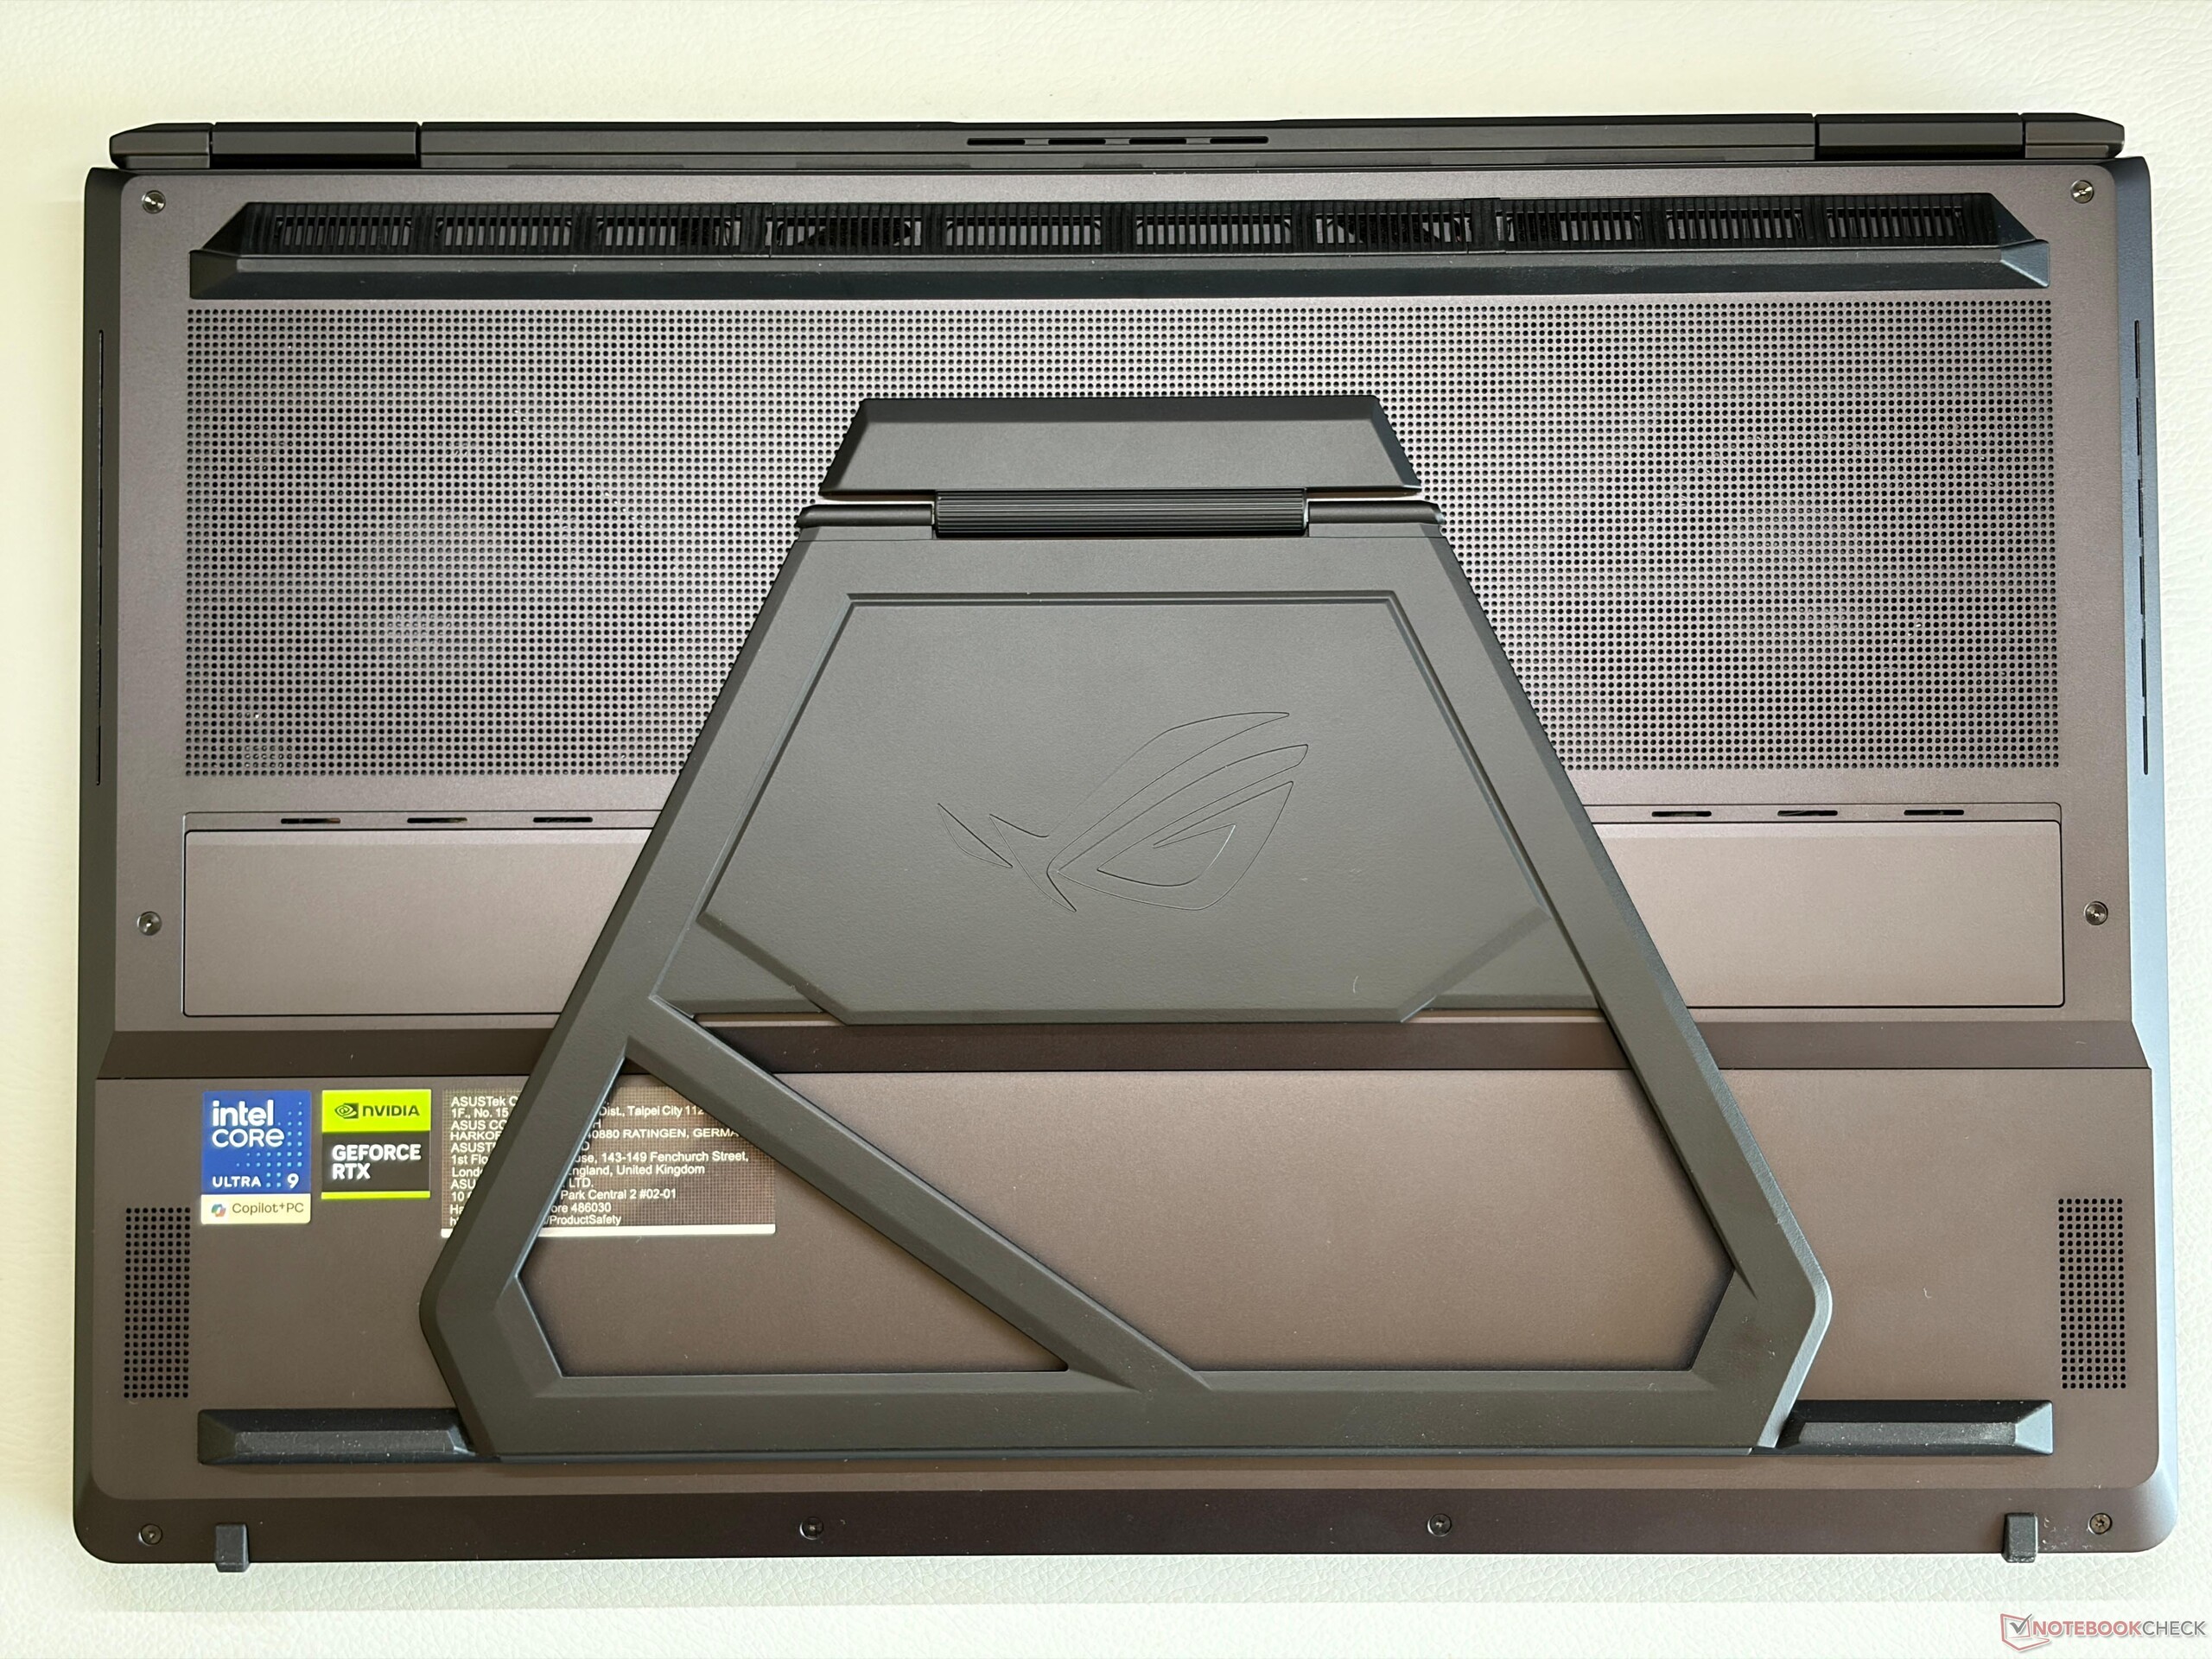
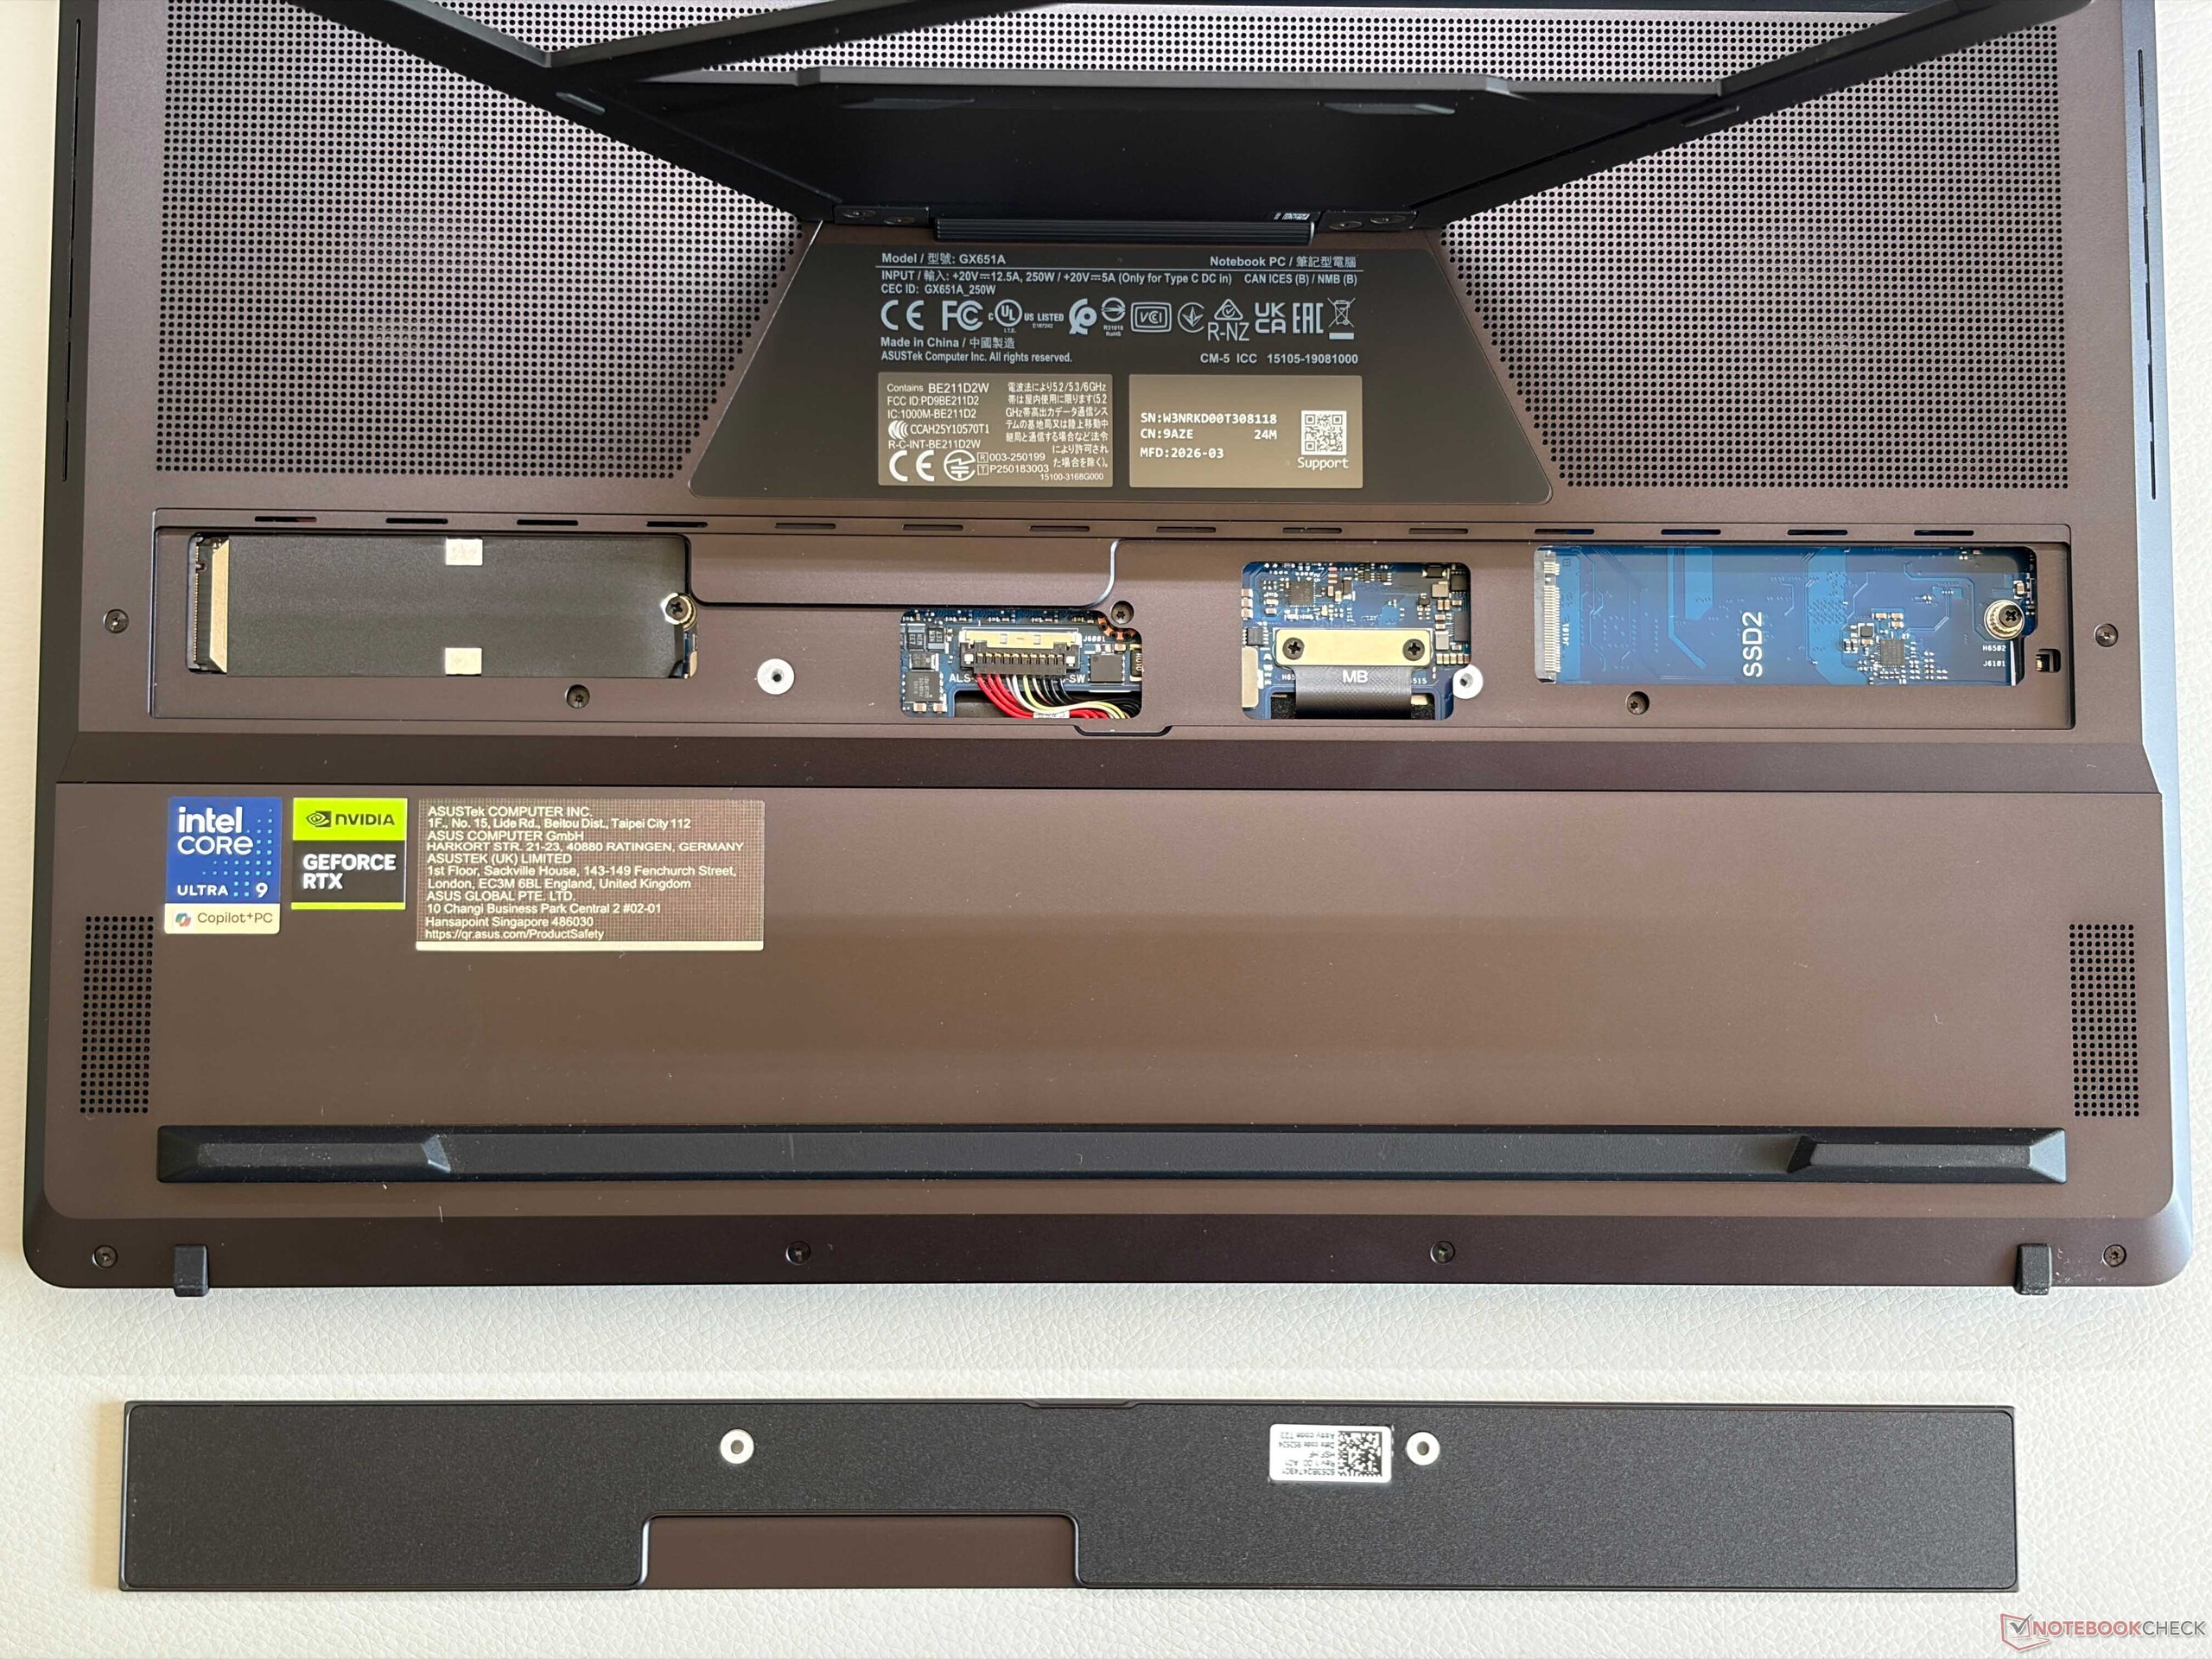
The new ROG Zephyrus Duo is a massive device with a thick base unit including a proper metal kick stand and a weight of 2.8 kg. Following the regular Zephyrus G16, you once again get a very subtle styling and the only flashy element is the slash lighting stripe across the lid. The overall chassis quality is excellent and there is no flex. The display hinges are well adjusted and there is only minor wobbling. The keyboard is detachable and is connected via Bluetooth or pogo pins, so it is also charged automatically. Asus implements a maintenance cover at the bottom with quick access to the two M.2-2280-SSD slots, but access to the fans requires a full disassembly of base unit including the touchscreen.
Connectivity is excellent with two Thunderbolt 4 ports and two regular USB-A ports. The SD-card reader is fast, but does not support the latest SD-Express standard. The Wi-Fi 7 module manages excellent transfer rates in combination with a Wi-Fi 7 router and we did not experience any stability issues. Asus only includes a 1080p webcam and the image quality is not very good.


| SD Card Reader | |
| average JPG Copy Test (av. of 3 runs) | |
| Lenovo ThinkPad T1g Gen 8 21TD003GE (ADATA SD8.0 Express 512 GBAV Pro V60) | |
| Lenovo ThinkPad T1g Gen 8 21TD003GE (Angelbird AV Pro V60) | |
| Asus ROG Zephyrus Duo GX651 (Angelbird AV Pro) | |
| Razer Blade 16 2025 RTX 5090 (Angelbird AV Pro V60) | |
| Average of class Gaming (20.9 - 210, n=54, last 2 years) | |
| Lenovo Yoga Pro 9i 16 RTX 5070 (Angelbird AV Pro V60) | |
| Samsung Galaxy Book6 Ultra (Angelbird AV Pro V60) | |
| maximum AS SSD Seq Read Test (1GB) | |
| Lenovo ThinkPad T1g Gen 8 21TD003GE (ADATA SD8.0 Express 512 GB) | |
| Lenovo ThinkPad T1g Gen 8 21TD003GE (Angelbird AV Pro V60) | |
| Asus ROG Zephyrus Duo GX651 (Angelbird AV Pro) | |
| Razer Blade 16 2025 RTX 5090 (Angelbird AV Pro V60) | |
| Average of class Gaming (25.5 - 261, n=51, last 2 years) | |
| Lenovo Yoga Pro 9i 16 RTX 5070 (Angelbird AV Pro V60) | |
| Samsung Galaxy Book6 Ultra (Angelbird AV Pro V60) | |
| Networking | |
| Asus ROG Zephyrus Duo GX651 | |
| iperf3 receive RT-BE96U WiFi7 | |
| iperf3 transmit RT-BE96U WiFi7 | |
| Samsung Galaxy Book6 Ultra | |
| iperf3 transmit AXE11000 | |
| iperf3 receive AXE11000 | |
| Lenovo ThinkPad T1g Gen 8 21TD003GE | |
| iperf3 transmit AXE11000 | |
| iperf3 receive AXE11000 | |
| Lenovo Yoga Pro 9i 16 RTX 5070 | |
| iperf3 transmit AXE11000 | |
| iperf3 receive AXE11000 | |
| Razer Blade 16 2025 RTX 5090 | |
| iperf3 transmit AXE11000 | |
| iperf3 receive AXE11000 | |


Input Devices
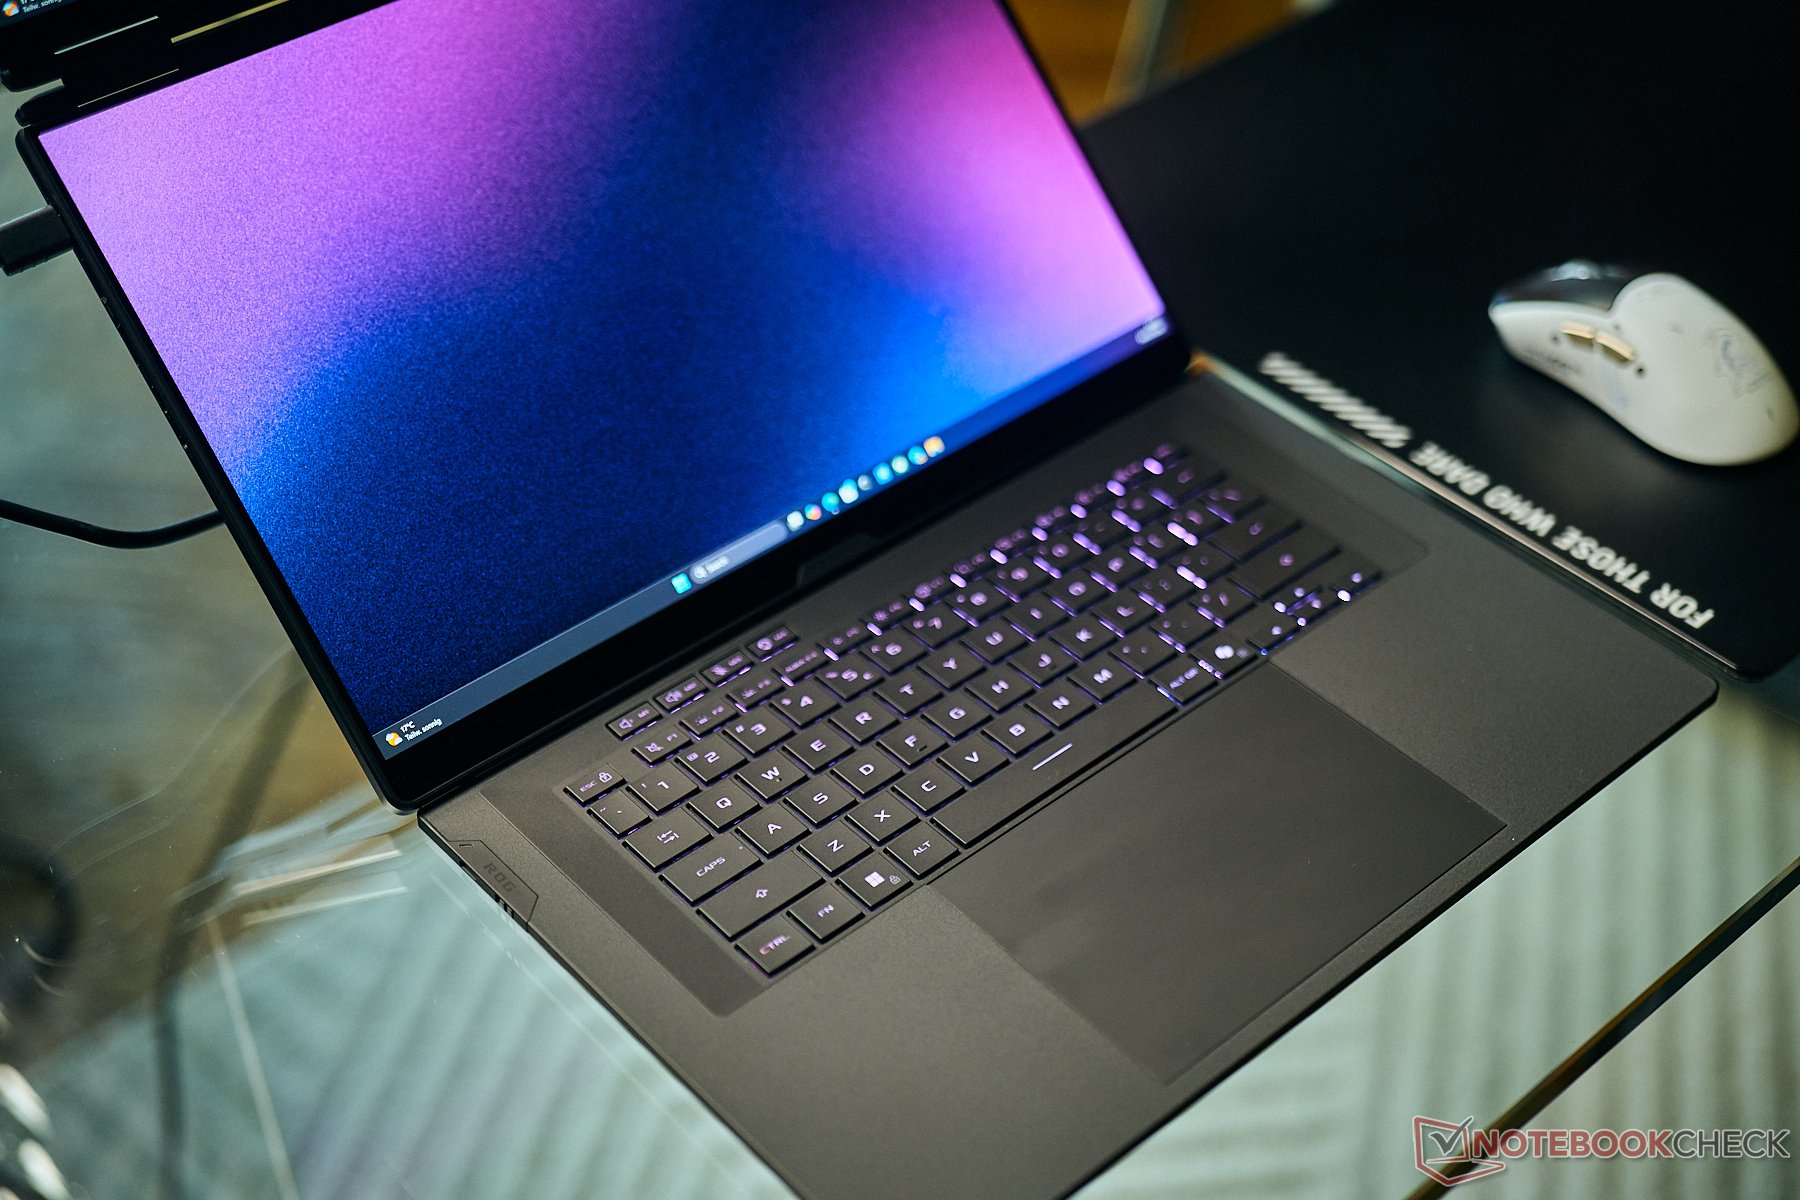
The attachable keyboard (single-zone illumination) is a very sturdy unit and offers a comfortable typing experience overall, which is comparable to the regular ROG Zephyrus G16. The clickpad is very large (15 x 10 cm) and we had no issues with it. It supports mechanical clicks in the lower half and the clicking noise was not too loud. It is also possible to use the secondary screen as a keyboard and you can obviously use the touchscreens, but our unit was not shipped with a stylus.


Display
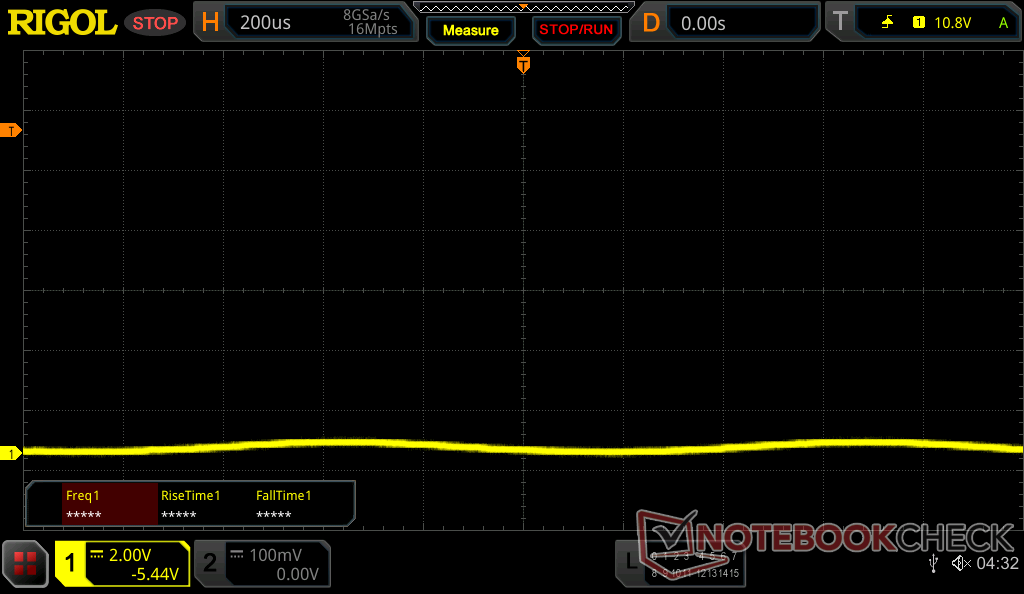
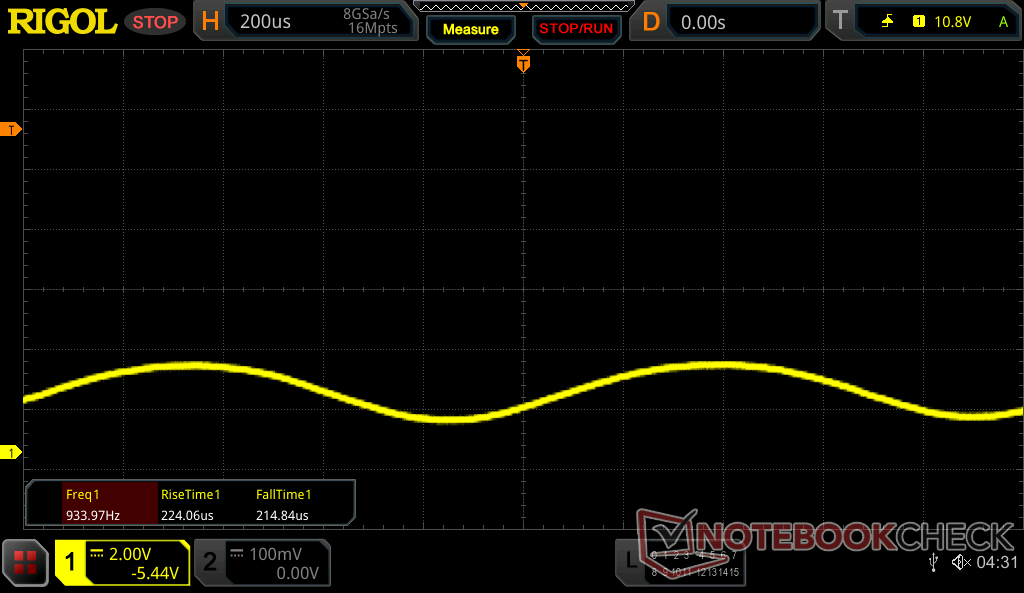
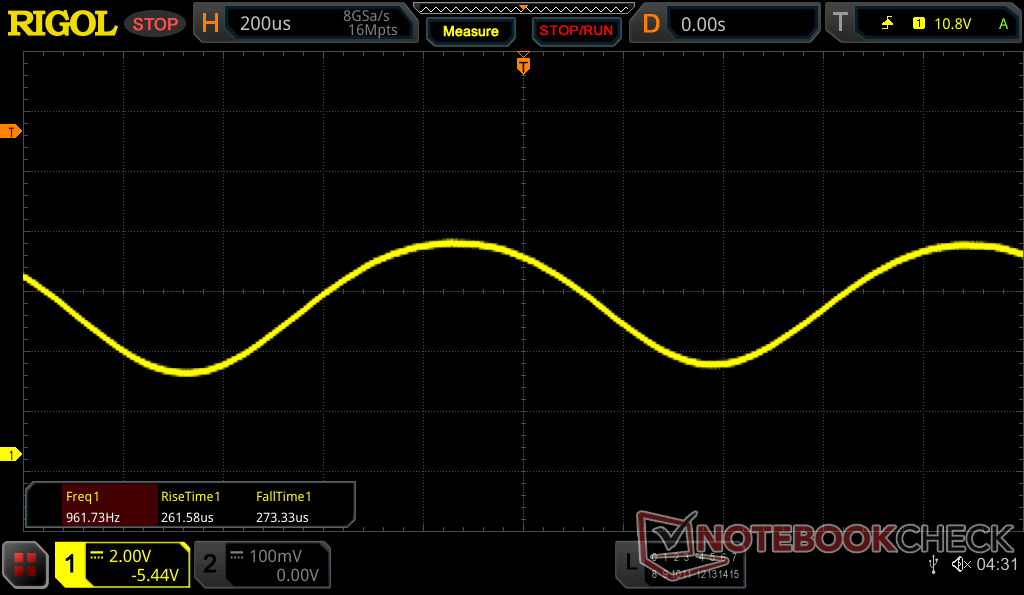
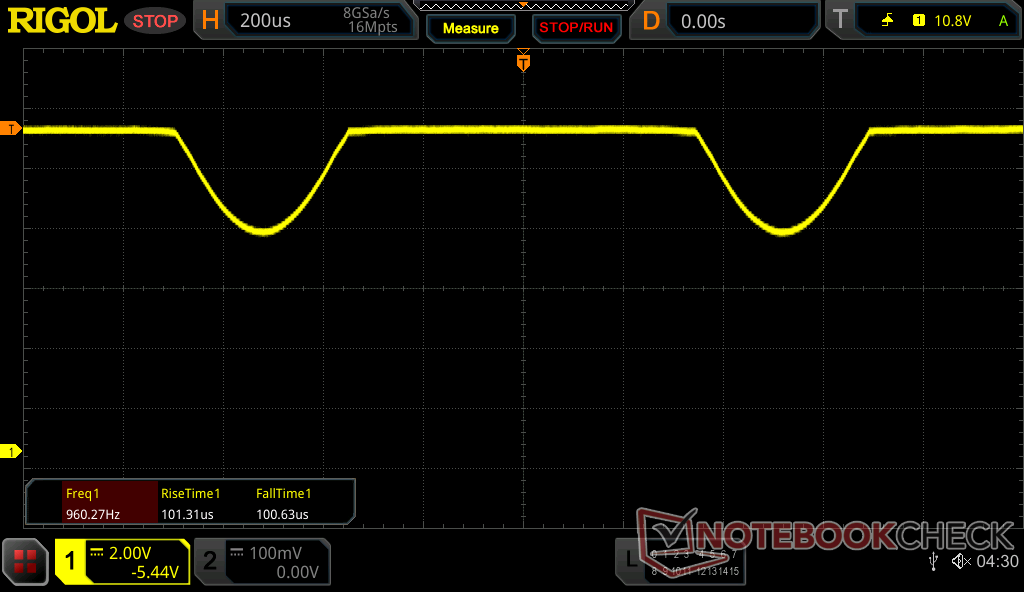
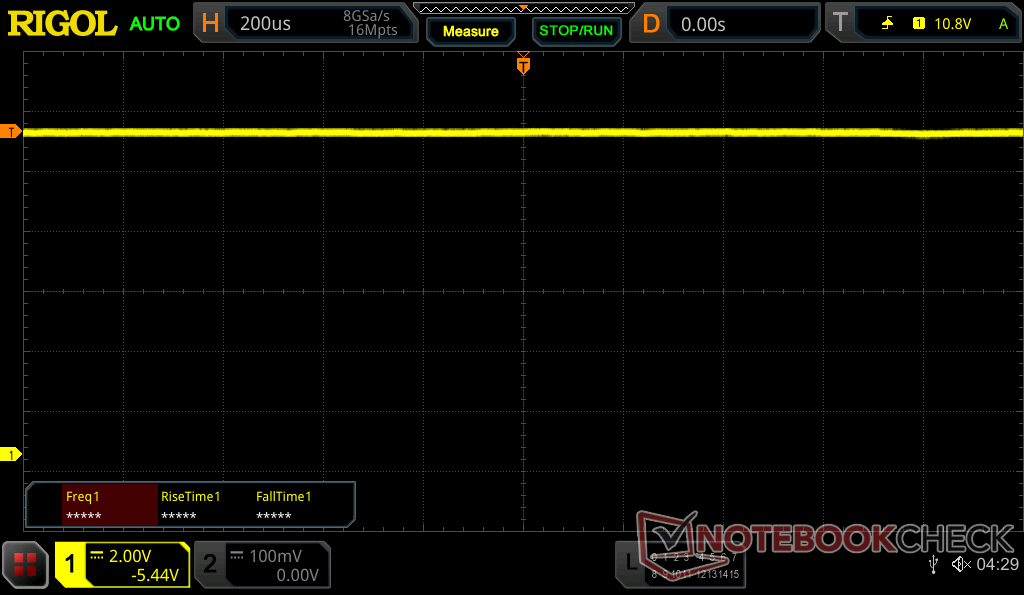
Asus uses two identical OLED touchscreens with a resolution of 2880 x 1800 pixels and a refresh rate of 120 Hz. The subjective picture quality of the glossy screens is very good, but bright contents appear slightly grainy due to the touch layer, even though this is barely noticeable at a regular seating distance. Otherwise, you get rich colors, deep blacks and fast response times. We directed PWM flickering at all brightness levels, but the frequency is pretty high at 960 Hz and should not be an issue for most users.
Our analysis with the professional CalMAN software reveals a maximum SDR brightness of 500 nits and up to 1120 nits for HDR contents (720 nits for a completely white image). This is better compared to the 240 Hz OLED of the G16, but not as good as the 4K tandem OLED screen of the ProArt P16. Asus once again includes accurate color profiles for sRGB as well as P3. We did not improve the image quality any further with our own calibration.
| |||||||||||||||||||||||||
Brightness Distribution: 98 %
Center on Battery: 499 cd/m²
Contrast: ∞:1 (Black: 0 cd/m²)
ΔE ColorChecker Calman: 1.3 | ∀{0.5-29.43 Ø4.73}
ΔE Greyscale Calman: 2.4 | ∀{0.09-98 Ø4.97}
88.1% AdobeRGB 1998 (Argyll 3D)
100% sRGB (Argyll 3D)
99.6% Display P3 (Argyll 3D)
Gamma: 2.18
CCT: 6440 K
| Asus ROG Zephyrus Duo GX651 ATNA60HR07-0, OLED, 2880x1800, 16", 120 Hz | Asus ProArt P16 RTX 5090 ATNA60HC03-0, OLED, 3840x2400, 16", 120 Hz | Asus ROG Zephyrus G16 GU605CX ATNA60DL01-0, OLED, 2560x1600, 16", 240 Hz | Razer Blade 16 2025 RTX 5090 ATNA60DL04-0, OLED, 2560x1600, 16", 240 Hz | Lenovo Yoga Pro 9i 16 RTX 5070 ATNA60KA01-0, OLED, 3200x2000, 16", 120 Hz | Samsung Galaxy Book6 Ultra ATNA60HR05-0, OLED, 2880x1800, 16", 120 Hz | Lenovo ThinkPad T1g Gen 8 21TD003GE ATNA60KA02-0, Tandem-OLED, 3200x2000, 16", 120 Hz | |
|---|---|---|---|---|---|---|---|
| Display | 0% | 3% | -3% | 3% | -2% | 0% | |
| Display P3 Coverage (%) | 99.6 | 98.9 -1% | 99.9 0% | 96.1 -4% | 97.4 -2% | 97 -3% | 98.8 -1% |
| sRGB Coverage (%) | 100 | 100 0% | 100 0% | 99.9 0% | 100 0% | 99.9 0% | 100 0% |
| AdobeRGB 1998 Coverage (%) | 88.1 | 88.6 1% | 96.9 10% | 85 -4% | 96.8 10% | 85.3 -3% | 88.9 1% |
| Response Times | 36% | 67% | 48% | 53% | -5% | 50% | |
| Response Time Grey 50% / Grey 80% * (ms) | 2.1 ? | 0.3 ? 86% | 0.22 90% | 0.2 ? 90% | 0.27 ? 87% | 0.5 ? 76% | 0.26 ? 88% |
| Response Time Black / White * (ms) | 0.44 ? | 0.45 ? -2% | 0.25 43% | 0.25 ? 43% | 0.37 ? 16% | 0.4 ? 9% | 0.42 ? 5% |
| PWM Frequency (Hz) | 960 ? | 480 ? | 960 | 960 ? | 1200 | 240 ? | 1200 ? |
| PWM Amplitude * (%) | 50 | 38 24% | 44 12% | 22 56% | 100 -100% | 22 56% | |
| Screen | 43% | -7% | -2% | 52% | 16% | -7% | |
| Brightness middle (cd/m²) | 499 | 661 32% | 416 -17% | 391 -22% | 974 95% | 499 0% | 578 16% |
| Brightness (cd/m²) | 500 | 663 33% | 418 -16% | 393 -21% | 979 96% | 505 1% | 583 17% |
| Brightness Distribution (%) | 98 | 99 1% | 96 -2% | 98 0% | 98 0% | 97 -1% | 98 0% |
| Black Level * (cd/m²) | |||||||
| Colorchecker dE 2000 * | 1.3 | 0.5 62% | 1.6 -23% | 1.2 8% | 0.9 31% | 0.9 31% | 1.6 -23% |
| Colorchecker dE 2000 max. * | 3.1 | 1.4 55% | 2.1 32% | 3.2 -3% | 1.7 45% | 2.1 32% | 4.5 -45% |
| Greyscale dE 2000 * | 2.4 | 0.6 75% | 2.7 -13% | 1.8 25% | 1.3 46% | 1.6 33% | 2.6 -8% |
| Gamma | 2.18 101% | 2.19 100% | 2.16 102% | 2.2 100% | 2.21 100% | 2.22 99% | 2.19 100% |
| CCT | 6440 101% | 6565 99% | 6331 103% | 6493 100% | 6751 96% | 6445 101% | 6527 100% |
| Total Average (Program / Settings) | 26% /
31% | 21% /
9% | 14% /
10% | 36% /
40% | 3% /
6% | 14% /
9% |
* ... smaller is better


Display Response Times
| ↔ Response Time Black to White | ||
|---|---|---|
| 0.44 ms ... rise ↗ and fall ↘ combined | ↗ 0.24 ms rise | 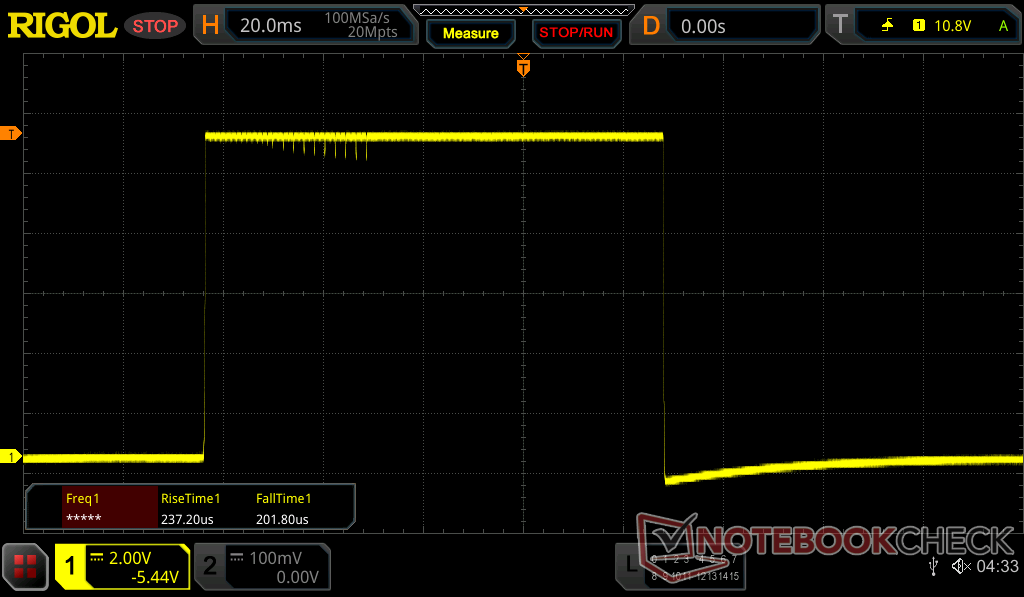 |
| ↘ 0.2 ms fall | ||
| The screen shows very fast response rates in our tests and should be very well suited for fast-paced gaming. In comparison, all tested devices range from 0.1 (minimum) to 240 (maximum) ms. » 1 % of all devices are better. This means that the measured response time is better than the average of all tested devices (19.9 ms). | ||
| ↔ Response Time 50% Grey to 80% Grey | ||
| 2.1 ms ... rise ↗ and fall ↘ combined | ↗ 1.1 ms rise | 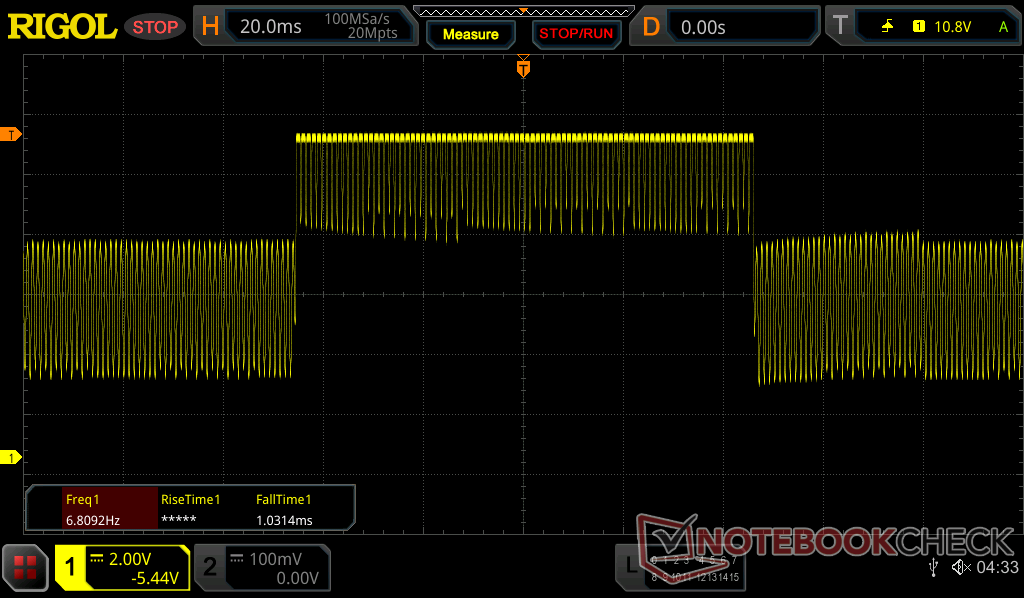 |
| ↘ 1 ms fall | ||
| The screen shows very fast response rates in our tests and should be very well suited for fast-paced gaming. In comparison, all tested devices range from 0.165 (minimum) to 636 (maximum) ms. » 11 % of all devices are better. This means that the measured response time is better than the average of all tested devices (31.1 ms). | ||
Screen Flickering / PWM (Pulse-Width Modulation)
| Screen flickering / PWM detected | 960 Hz Amplitude: 50 % | ≤ 100 % brightness setting | 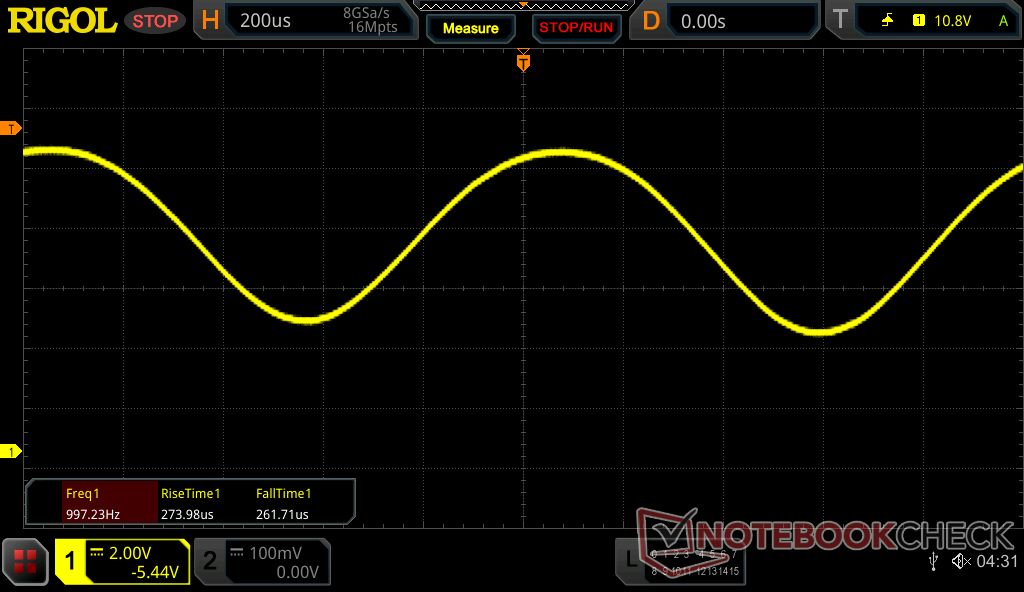 |
The display backlight flickers at 960 Hz (worst case, e.g., utilizing PWM) Flickering detected at a brightness setting of 100 % and below. There should be no flickering or PWM above this brightness setting. The frequency of 960 Hz is quite high, so most users sensitive to PWM should not notice any flickering. In comparison: 52 % of all tested devices do not use PWM to dim the display. If PWM was detected, an average of 7794 (minimum: 5 - maximum: 343500) Hz was measured. | |||


Performance
Asus combines Nvidia's high-end Blackwell GPUs with Intel's new Panther Lake CPUs and you either get 32 or 64 GB onboard RAM, which cannot be upgraded.
Testing Conditions
Asus provides multiple power profiles. We used the Turbo mode to the best GPU performance, while the CPU performance is pretty much identical for all profiles. There is a manual mode (max. TGP 150W), but the performance gains are minimal.
| Energy profile | CPU TDP | CB24 Multi | GPU TGP | Time Spy Graphics | Cyberpunk 2077 QHD Ultra | max. fan noise |
|---|---|---|---|---|---|---|
| Silent | 70 W | 1262 pts | 55 W | 11338 pts | 55 fps | 39.7 dB(A) |
| Performance | 70 W | 1270 pts | 105 W | 18144 pts | 81.9 fps | 48.1 dB(A) |
| Turbo | 70 W | 1271 pts | 135 W | 20420 pts | 91.6 fps | 54.1 dB(A) |
| Battery (Performance) | 60 W | 1249 pts | 55 W | 9703 pts | 46.1 fps | 38.4 dB(A) |
Processor
Intel's new Core Ultra 9 386H runs at 70 Watts and performs well, but Panther Lake has a bigger focus on efficiency and is also slightly slower than the Core Ultra 9 285H in the Zephyrus G16, for example. The old Zephyrus Duo with the Ryzen 9 7945 HX (130W) from 2023 offers much more multi-core performance, for example. This is also the case for other high-end gaming laptops with faster HX-series CPUs.
Cinebench R15 Multi Loop
Cinebench 2024: CPU Multi Core | CPU Single Core
Cinebench R23: Multi Core | Single Core
Cinebench R20: CPU (Multi Core) | CPU (Single Core)
Cinebench R15: CPU Multi 64Bit | CPU Single 64Bit
Blender: v2.79 BMW27 CPU
7-Zip 18.03: 7z b 4 | 7z b 4 -mmt1
Geekbench 6.7: Multi-Core | Single-Core
Geekbench 5.5: Multi-Core | Single-Core
HWBOT x265 Benchmark v2.2: 4k Preset
LibreOffice : 20 Documents To PDF
R Benchmark 2.5: Overall mean
| CPU Performance rating | |
| Asus Zephyrus Duo 16 GX650PY-NM006W -4! | |
| Lenovo Yoga Pro 9i 16 RTX 5070 | |
| Average of class Gaming | |
| Razer Blade 16 2025 RTX 5090 | |
| Lenovo ThinkPad T1g Gen 8 21TD003GE | |
| Asus ROG Zephyrus G16 GU605CX | |
| Asus ROG Zephyrus Duo GX651 | |
| Asus ProArt P16 RTX 5090 | |
| Samsung Galaxy Book6 Ultra | |
| Average Intel Core Ultra 9 386H | |
| Cinebench 2024 / CPU Multi Core | |
| Average of class Gaming (486 - 2298, n=91, last 2 years) | |
| Razer Blade 16 2025 RTX 5090 | |
| Asus ROG Zephyrus Duo GX651 | |
| Asus ProArt P16 RTX 5090 | |
| Samsung Galaxy Book6 Ultra | |
| Asus ROG Zephyrus G16 GU605CX | |
| Lenovo Yoga Pro 9i 16 RTX 5070 | |
| Average Intel Core Ultra 9 386H (873 - 1271, n=7) | |
| Lenovo ThinkPad T1g Gen 8 21TD003GE | |
| Cinebench 2024 / CPU Single Core | |
| Asus ROG Zephyrus G16 GU605CX | |
| Lenovo Yoga Pro 9i 16 RTX 5070 | |
| Asus ROG Zephyrus Duo GX651 | |
| Lenovo ThinkPad T1g Gen 8 21TD003GE | |
| Average Intel Core Ultra 9 386H (118.1 - 126.8, n=7) | |
| Samsung Galaxy Book6 Ultra | |
| Average of class Gaming (95 - 138.2, n=91, last 2 years) | |
| Razer Blade 16 2025 RTX 5090 | |
| Asus ProArt P16 RTX 5090 | |
| Cinebench R23 / Multi Core | |
| Asus Zephyrus Duo 16 GX650PY-NM006W | |
| Average of class Gaming (10488 - 40970, n=112, last 2 years) | |
| Asus ProArt P16 RTX 5090 | |
| Razer Blade 16 2025 RTX 5090 | |
| Lenovo Yoga Pro 9i 16 RTX 5070 | |
| Lenovo ThinkPad T1g Gen 8 21TD003GE | |
| Asus ROG Zephyrus G16 GU605CX | |
| Samsung Galaxy Book6 Ultra | |
| Asus ROG Zephyrus Duo GX651 | |
| Average Intel Core Ultra 9 386H (12144 - 21186, n=7) | |
| Cinebench R23 / Single Core | |
| Lenovo Yoga Pro 9i 16 RTX 5070 | |
| Lenovo ThinkPad T1g Gen 8 21TD003GE | |
| Asus ROG Zephyrus G16 GU605CX | |
| Asus ROG Zephyrus Duo GX651 | |
| Average Intel Core Ultra 9 386H (2010 - 2101, n=7) | |
| Samsung Galaxy Book6 Ultra | |
| Razer Blade 16 2025 RTX 5090 | |
| Asus ProArt P16 RTX 5090 | |
| Average of class Gaming (1166 - 2356, n=112, last 2 years) | |
| Asus Zephyrus Duo 16 GX650PY-NM006W | |
| Cinebench R20 / CPU (Multi Core) | |
| Asus Zephyrus Duo 16 GX650PY-NM006W | |
| Average of class Gaming (4029 - 16108, n=111, last 2 years) | |
| Razer Blade 16 2025 RTX 5090 | |
| Asus ProArt P16 RTX 5090 | |
| Lenovo Yoga Pro 9i 16 RTX 5070 | |
| Lenovo ThinkPad T1g Gen 8 21TD003GE | |
| Asus ROG Zephyrus G16 GU605CX | |
| Samsung Galaxy Book6 Ultra | |
| Asus ROG Zephyrus Duo GX651 | |
| Average Intel Core Ultra 9 386H (4757 - 8405, n=7) | |
| Cinebench R20 / CPU (Single Core) | |
| Lenovo Yoga Pro 9i 16 RTX 5070 | |
| Lenovo ThinkPad T1g Gen 8 21TD003GE | |
| Asus ROG Zephyrus G16 GU605CX | |
| Razer Blade 16 2025 RTX 5090 | |
| Asus ROG Zephyrus Duo GX651 | |
| Asus ProArt P16 RTX 5090 | |
| Average Intel Core Ultra 9 386H (762 - 796, n=7) | |
| Samsung Galaxy Book6 Ultra | |
| Average of class Gaming (442 - 895, n=111, last 2 years) | |
| Asus Zephyrus Duo 16 GX650PY-NM006W | |
| Cinebench R15 / CPU Multi 64Bit | |
| Asus Zephyrus Duo 16 GX650PY-NM006W | |
| Average of class Gaming (1578 - 6271, n=111, last 2 years) | |
| Asus ProArt P16 RTX 5090 | |
| Razer Blade 16 2025 RTX 5090 | |
| Lenovo Yoga Pro 9i 16 RTX 5070 | |
| Lenovo ThinkPad T1g Gen 8 21TD003GE | |
| Asus ROG Zephyrus G16 GU605CX | |
| Asus ROG Zephyrus Duo GX651 | |
| Samsung Galaxy Book6 Ultra | |
| Average Intel Core Ultra 9 386H (2197 - 3347, n=7) | |
| Cinebench R15 / CPU Single 64Bit | |
| Lenovo Yoga Pro 9i 16 RTX 5070 | |
| Lenovo ThinkPad T1g Gen 8 21TD003GE | |
| Asus ROG Zephyrus G16 GU605CX | |
| Razer Blade 16 2025 RTX 5090 | |
| Asus Zephyrus Duo 16 GX650PY-NM006W | |
| Samsung Galaxy Book6 Ultra | |
| Average of class Gaming (188.8 - 343, n=111, last 2 years) | |
| Average Intel Core Ultra 9 386H (249 - 314, n=7) | |
| Asus ROG Zephyrus Duo GX651 | |
| Asus ProArt P16 RTX 5090 | |
| Blender / v2.79 BMW27 CPU | |
| Average Intel Core Ultra 9 386H (156 - 299, n=7) | |
| Samsung Galaxy Book6 Ultra | |
| Asus ROG Zephyrus G16 GU605CX | |
| Lenovo ThinkPad T1g Gen 8 21TD003GE | |
| Asus ROG Zephyrus Duo GX651 | |
| Average of class Gaming (80 - 330, n=109, last 2 years) | |
| Lenovo Yoga Pro 9i 16 RTX 5070 | |
| Razer Blade 16 2025 RTX 5090 | |
| Asus ProArt P16 RTX 5090 | |
| Asus Zephyrus Duo 16 GX650PY-NM006W | |
| 7-Zip 18.03 / 7z b 4 | |
| Asus Zephyrus Duo 16 GX650PY-NM006W | |
| Average of class Gaming (33491 - 148086, n=110, last 2 years) | |
| Razer Blade 16 2025 RTX 5090 | |
| Asus ProArt P16 RTX 5090 | |
| Asus ROG Zephyrus Duo GX651 | |
| Lenovo Yoga Pro 9i 16 RTX 5070 | |
| Samsung Galaxy Book6 Ultra | |
| Asus ROG Zephyrus G16 GU605CX | |
| Lenovo ThinkPad T1g Gen 8 21TD003GE | |
| Average Intel Core Ultra 9 386H (44980 - 72882, n=7) | |
| 7-Zip 18.03 / 7z b 4 -mmt1 | |
| Asus Zephyrus Duo 16 GX650PY-NM006W | |
| Asus ROG Zephyrus Duo GX651 | |
| Average of class Gaming (4199 - 7436, n=110, last 2 years) | |
| Samsung Galaxy Book6 Ultra | |
| Razer Blade 16 2025 RTX 5090 | |
| Lenovo Yoga Pro 9i 16 RTX 5070 | |
| Average Intel Core Ultra 9 386H (5488 - 6493, n=7) | |
| Asus ROG Zephyrus G16 GU605CX | |
| Asus ProArt P16 RTX 5090 | |
| Lenovo ThinkPad T1g Gen 8 21TD003GE | |
| Geekbench 6.7 / Multi-Core | |
| Lenovo Yoga Pro 9i 16 RTX 5070 | |
| Lenovo ThinkPad T1g Gen 8 21TD003GE | |
| Asus ROG Zephyrus Duo GX651 | |
| Asus ROG Zephyrus G16 GU605CX | |
| Samsung Galaxy Book6 Ultra | |
| Average Intel Core Ultra 9 386H (13776 - 17405, n=9) | |
| Average of class Gaming (6625 - 22104, n=111, last 2 years) | |
| Razer Blade 16 2025 RTX 5090 | |
| Asus ProArt P16 RTX 5090 | |
| Geekbench 6.7 / Single-Core | |
| Lenovo Yoga Pro 9i 16 RTX 5070 | |
| Lenovo ThinkPad T1g Gen 8 21TD003GE | |
| Razer Blade 16 2025 RTX 5090 | |
| Asus ROG Zephyrus G16 GU605CX | |
| Asus ProArt P16 RTX 5090 | |
| Asus ROG Zephyrus Duo GX651 | |
| Average Intel Core Ultra 9 386H (2778 - 2919, n=9) | |
| Samsung Galaxy Book6 Ultra | |
| Average of class Gaming (1490 - 3259, n=111, last 2 years) | |
| Geekbench 5.5 / Multi-Core | |
| Asus Zephyrus Duo 16 GX650PY-NM006W | |
| Lenovo Yoga Pro 9i 16 RTX 5070 | |
| Asus ROG Zephyrus Duo GX651 | |
| Lenovo ThinkPad T1g Gen 8 21TD003GE | |
| Average of class Gaming (6460 - 27010, n=110, last 2 years) | |
| Samsung Galaxy Book6 Ultra | |
| Average Intel Core Ultra 9 386H (13098 - 17557, n=7) | |
| Asus ROG Zephyrus G16 GU605CX | |
| Asus ProArt P16 RTX 5090 | |
| Razer Blade 16 2025 RTX 5090 | |
| Geekbench 5.5 / Single-Core | |
| Asus ROG Zephyrus Duo GX651 | |
| Asus ProArt P16 RTX 5090 | |
| Razer Blade 16 2025 RTX 5090 | |
| Asus Zephyrus Duo 16 GX650PY-NM006W | |
| Lenovo Yoga Pro 9i 16 RTX 5070 | |
| Lenovo ThinkPad T1g Gen 8 21TD003GE | |
| Asus ROG Zephyrus G16 GU605CX | |
| Average Intel Core Ultra 9 386H (1992 - 2162, n=7) | |
| Samsung Galaxy Book6 Ultra | |
| Average of class Gaming (986 - 2474, n=110, last 2 years) | |
| HWBOT x265 Benchmark v2.2 / 4k Preset | |
| Asus Zephyrus Duo 16 GX650PY-NM006W | |
| Razer Blade 16 2025 RTX 5090 | |
| Asus ProArt P16 RTX 5090 | |
| Average of class Gaming (11.5 - 44.3, n=110, last 2 years) | |
| Lenovo Yoga Pro 9i 16 RTX 5070 | |
| Lenovo ThinkPad T1g Gen 8 21TD003GE | |
| Asus ROG Zephyrus G16 GU605CX | |
| Samsung Galaxy Book6 Ultra | |
| Asus ROG Zephyrus Duo GX651 | |
| Average Intel Core Ultra 9 386H (13.2 - 25.1, n=7) | |
| LibreOffice / 20 Documents To PDF | |
| Asus Zephyrus Duo 16 GX650PY-NM006W | |
| Average of class Gaming (19 - 88.8, n=110, last 2 years) | |
| Asus ProArt P16 RTX 5090 | |
| Samsung Galaxy Book6 Ultra | |
| Razer Blade 16 2025 RTX 5090 | |
| Asus ROG Zephyrus Duo GX651 | |
| Average Intel Core Ultra 9 386H (38.5 - 56.1, n=7) | |
| Lenovo Yoga Pro 9i 16 RTX 5070 | |
| Asus ROG Zephyrus G16 GU605CX | |
| Lenovo ThinkPad T1g Gen 8 21TD003GE | |
| R Benchmark 2.5 / Overall mean | |
| Asus ROG Zephyrus Duo GX651 | |
| Asus ROG Zephyrus G16 GU605CX | |
| Average of class Gaming (0.3439 - 0.759, n=111, last 2 years) | |
| Samsung Galaxy Book6 Ultra | |
| Average Intel Core Ultra 9 386H (0.4055 - 0.4384, n=7) | |
| Lenovo ThinkPad T1g Gen 8 21TD003GE | |
| Asus ProArt P16 RTX 5090 | |
| Lenovo Yoga Pro 9i 16 RTX 5070 | |
| Asus Zephyrus Duo 16 GX650PY-NM006W | |
| Razer Blade 16 2025 RTX 5090 | |
* ... smaller is better
AIDA64: FP32 Ray-Trace | FPU Julia | CPU SHA3 | CPU Queen | FPU SinJulia | FPU Mandel | CPU AES | CPU ZLib | FP64 Ray-Trace | CPU PhotoWorxx | CPU CheckMate
| Performance rating | |
| Asus ProArt P16 RTX 5090 -1! | |
| Razer Blade 16 2025 RTX 5090 -1! | |
| Average of class Gaming | |
| Lenovo Yoga Pro 9i 16 RTX 5070 -1! | |
| Asus ROG Zephyrus Duo GX651 -1! | |
| Lenovo ThinkPad T1g Gen 8 21TD003GE -1! | |
| Samsung Galaxy Book6 Ultra -1! | |
| Asus ROG Zephyrus G16 GU605CX -1! | |
| Average Intel Core Ultra 9 386H -1! | |
| AIDA64 / FP32 Ray-Trace | |
| Razer Blade 16 2025 RTX 5090 (v6.92.6600) | |
| Asus ProArt P16 RTX 5090 (v6.92.6600) | |
| Average of class Gaming (10227 - 85542, n=109, last 2 years) | |
| Lenovo Yoga Pro 9i 16 RTX 5070 (v6.92.6600) | |
| Lenovo ThinkPad T1g Gen 8 21TD003GE (v6.92.6600) | |
| Asus ROG Zephyrus G16 GU605CX (v6.92.6600) | |
| Asus ROG Zephyrus Duo GX651 (v8.20.8100) | |
| Samsung Galaxy Book6 Ultra (v8.20.8100) | |
| Average Intel Core Ultra 9 386H (10001 - 21727, n=7) | |
| AIDA64 / FPU Julia | |
| Asus ProArt P16 RTX 5090 (v6.92.6600) | |
| Razer Blade 16 2025 RTX 5090 (v6.92.6600) | |
| Average of class Gaming (51376 - 238426, n=109, last 2 years) | |
| Lenovo Yoga Pro 9i 16 RTX 5070 (v6.92.6600) | |
| Lenovo ThinkPad T1g Gen 8 21TD003GE (v6.92.6600) | |
| Asus ROG Zephyrus G16 GU605CX (v6.92.6600) | |
| Asus ROG Zephyrus Duo GX651 (v8.20.8100) | |
| Samsung Galaxy Book6 Ultra (v8.20.8100) | |
| Average Intel Core Ultra 9 386H (53370 - 113595, n=7) | |
| AIDA64 / CPU SHA3 | |
| Average of class Gaming (2180 - 9817, n=109, last 2 years) | |
| Lenovo Yoga Pro 9i 16 RTX 5070 (v6.92.6600) | |
| Razer Blade 16 2025 RTX 5090 (v6.92.6600) | |
| Asus ROG Zephyrus Duo GX651 (v8.20.8100) | |
| Lenovo ThinkPad T1g Gen 8 21TD003GE (v6.92.6600) | |
| Samsung Galaxy Book6 Ultra (v8.20.8100) | |
| Asus ROG Zephyrus G16 GU605CX (v6.92.6600) | |
| Asus ProArt P16 RTX 5090 (v6.92.6600) | |
| Average Intel Core Ultra 9 386H (2776 - 5604, n=7) | |
| AIDA64 / CPU Queen | |
| Average of class Gaming (49785 - 173351, n=100, last 2 years) | |
| Asus ProArt P16 RTX 5090 (v6.92.6600) | |
| Razer Blade 16 2025 RTX 5090 (v6.92.6600) | |
| Lenovo ThinkPad T1g Gen 8 21TD003GE (v6.92.6600) | |
| Lenovo Yoga Pro 9i 16 RTX 5070 (v6.92.6600) | |
| Asus ROG Zephyrus G16 GU605CX (v6.92.6600) | |
| AIDA64 / FPU SinJulia | |
| Razer Blade 16 2025 RTX 5090 (v6.92.6600) | |
| Asus ProArt P16 RTX 5090 (v6.92.6600) | |
| Average of class Gaming (4424 - 33636, n=109, last 2 years) | |
| Lenovo Yoga Pro 9i 16 RTX 5070 (v6.92.6600) | |
| Lenovo ThinkPad T1g Gen 8 21TD003GE (v6.92.6600) | |
| Asus ROG Zephyrus G16 GU605CX (v6.92.6600) | |
| Asus ROG Zephyrus Duo GX651 (v8.20.8100) | |
| Samsung Galaxy Book6 Ultra (v8.20.8100) | |
| Average Intel Core Ultra 9 386H (5314 - 7332, n=7) | |
| AIDA64 / FPU Mandel | |
| Asus ProArt P16 RTX 5090 (v6.92.6600) | |
| Razer Blade 16 2025 RTX 5090 (v6.92.6600) | |
| Average of class Gaming (25115 - 128721, n=109, last 2 years) | |
| Lenovo Yoga Pro 9i 16 RTX 5070 (v6.92.6600) | |
| Asus ROG Zephyrus G16 GU605CX (v6.92.6600) | |
| Asus ROG Zephyrus Duo GX651 (v8.20.8100) | |
| Lenovo ThinkPad T1g Gen 8 21TD003GE (v6.92.6600) | |
| Samsung Galaxy Book6 Ultra (v8.20.8100) | |
| Average Intel Core Ultra 9 386H (28414 - 61578, n=7) | |
| AIDA64 / CPU AES | |
| Asus ProArt P16 RTX 5090 (v6.92.6600) | |
| Average of class Gaming (39258 - 247074, n=109, last 2 years) | |
| Lenovo Yoga Pro 9i 16 RTX 5070 (v6.92.6600) | |
| Razer Blade 16 2025 RTX 5090 (v6.92.6600) | |
| Lenovo ThinkPad T1g Gen 8 21TD003GE (v6.92.6600) | |
| Asus ROG Zephyrus G16 GU605CX (v6.92.6600) | |
| Asus ROG Zephyrus Duo GX651 (v8.20.8100) | |
| Samsung Galaxy Book6 Ultra (v8.20.8100) | |
| Average Intel Core Ultra 9 386H (46362 - 72112, n=7) | |
| AIDA64 / CPU ZLib | |
| Average of class Gaming (574 - 2531, n=109, last 2 years) | |
| Razer Blade 16 2025 RTX 5090 (v6.92.6600) | |
| Asus ProArt P16 RTX 5090 (v6.92.6600) | |
| Lenovo Yoga Pro 9i 16 RTX 5070 (v6.92.6600) | |
| Lenovo ThinkPad T1g Gen 8 21TD003GE (v6.92.6600) | |
| Asus ROG Zephyrus Duo GX651 (v8.20.8100) | |
| Asus ROG Zephyrus G16 GU605CX (v6.92.6600) | |
| Samsung Galaxy Book6 Ultra (v8.20.8100) | |
| Average Intel Core Ultra 9 386H (669 - 1271, n=7) | |
| AIDA64 / FP64 Ray-Trace | |
| Razer Blade 16 2025 RTX 5090 (v6.92.6600) | |
| Asus ProArt P16 RTX 5090 (v6.92.6600) | |
| Average of class Gaming (5509 - 45446, n=109, last 2 years) | |
| Lenovo Yoga Pro 9i 16 RTX 5070 (v6.92.6600) | |
| Asus ROG Zephyrus G16 GU605CX (v6.92.6600) | |
| Lenovo ThinkPad T1g Gen 8 21TD003GE (v6.92.6600) | |
| Asus ROG Zephyrus Duo GX651 (v8.20.8100) | |
| Samsung Galaxy Book6 Ultra (v8.20.8100) | |
| Average Intel Core Ultra 9 386H (5138 - 11627, n=7) | |
| AIDA64 / CPU PhotoWorxx | |
| Asus ROG Zephyrus Duo GX651 (v8.20.8100) | |
| Samsung Galaxy Book6 Ultra (v8.20.8100) | |
| Average Intel Core Ultra 9 386H (54042 - 89891, n=7) | |
| Lenovo Yoga Pro 9i 16 RTX 5070 (v6.92.6600) | |
| Asus ROG Zephyrus G16 GU605CX (v6.92.6600) | |
| Lenovo ThinkPad T1g Gen 8 21TD003GE (v6.92.6600) | |
| Razer Blade 16 2025 RTX 5090 (v6.92.6600) | |
| Asus ProArt P16 RTX 5090 (v6.92.6600) | |
| Average of class Gaming (12271 - 89891, n=109, last 2 years) | |
| AIDA64 / CPU CheckMate | |
| Average of class Gaming (2930 - 8322, n=9, last 2 years) | |
| Asus ROG Zephyrus Duo GX651 (v8.20.8100) | |
| Average Intel Core Ultra 9 386H (4051 - 4858, n=6) | |
| Samsung Galaxy Book6 Ultra (v8.20.8100) | |
System Performance
The subjective performance impression is excellent and the benchmark scores are also very good. We did not experience any stability issues, either.
PCMark 10: Score | Essentials | Productivity | Digital Content Creation
CrossMark: Overall | Productivity | Creativity | Responsiveness
WebXPRT 3: Overall
WebXPRT 4: Overall
Mozilla Kraken 1.1: Total
| Performance rating | |
| Lenovo ThinkPad T1g Gen 8 21TD003GE | |
| Average Intel Core Ultra 9 386H, NVIDIA GeForce RTX 5090 Laptop | |
| Asus Zephyrus Duo 16 GX650PY-NM006W | |
| Asus ROG Zephyrus G16 GU605CX | |
| Asus ROG Zephyrus Duo GX651 | |
| Lenovo Yoga Pro 9i 16 RTX 5070 | |
| Samsung Galaxy Book6 Ultra | |
| Average of class Gaming | |
| Asus ProArt P16 RTX 5090 -4! | |
| Razer Blade 16 2025 RTX 5090 -4! | |
| PCMark 10 / Score | |
| Average Intel Core Ultra 9 386H, NVIDIA GeForce RTX 5090 Laptop (9457 - 10164, n=2) | |
| Lenovo ThinkPad T1g Gen 8 21TD003GE | |
| Asus ROG Zephyrus Duo GX651 | |
| Samsung Galaxy Book6 Ultra | |
| Asus Zephyrus Duo 16 GX650PY-NM006W | |
| Asus ROG Zephyrus G16 GU605CX | |
| Average of class Gaming (5828 - 11574, n=95, last 2 years) | |
| Lenovo Yoga Pro 9i 16 RTX 5070 | |
| Razer Blade 16 2025 RTX 5090 | |
| PCMark 10 / Essentials | |
| Asus Zephyrus Duo 16 GX650PY-NM006W | |
| Asus ROG Zephyrus G16 GU605CX | |
| Average of class Gaming (8810 - 12600, n=99, last 2 years) | |
| Razer Blade 16 2025 RTX 5090 | |
| Lenovo Yoga Pro 9i 16 RTX 5070 | |
| Lenovo ThinkPad T1g Gen 8 21TD003GE | |
| Average Intel Core Ultra 9 386H, NVIDIA GeForce RTX 5090 Laptop (9755 - 10840, n=2) | |
| Samsung Galaxy Book6 Ultra | |
| Asus ROG Zephyrus Duo GX651 | |
| PCMark 10 / Productivity | |
| Lenovo ThinkPad T1g Gen 8 21TD003GE | |
| Samsung Galaxy Book6 Ultra | |
| Asus ROG Zephyrus Duo GX651 | |
| Average Intel Core Ultra 9 386H, NVIDIA GeForce RTX 5090 Laptop (16063 - 16479, n=2) | |
| Asus Zephyrus Duo 16 GX650PY-NM006W | |
| Asus ROG Zephyrus G16 GU605CX | |
| Average of class Gaming (6845 - 18766, n=97, last 2 years) | |
| Razer Blade 16 2025 RTX 5090 | |
| Lenovo Yoga Pro 9i 16 RTX 5070 | |
| PCMark 10 / Digital Content Creation | |
| Asus ROG Zephyrus G16 GU605CX | |
| Lenovo Yoga Pro 9i 16 RTX 5070 | |
| Average Intel Core Ultra 9 386H, NVIDIA GeForce RTX 5090 Laptop (14280 - 16364, n=2) | |
| Asus Zephyrus Duo 16 GX650PY-NM006W | |
| Asus ROG Zephyrus Duo GX651 | |
| Average of class Gaming (7602 - 19657, n=97, last 2 years) | |
| Razer Blade 16 2025 RTX 5090 | |
| Lenovo ThinkPad T1g Gen 8 21TD003GE | |
| Samsung Galaxy Book6 Ultra | |
| CrossMark / Overall | |
| Lenovo ThinkPad T1g Gen 8 21TD003GE | |
| Average Intel Core Ultra 9 386H, NVIDIA GeForce RTX 5090 Laptop (2073 - 2185, n=2) | |
| Asus Zephyrus Duo 16 GX650PY-NM006W | |
| Lenovo Yoga Pro 9i 16 RTX 5070 | |
| Asus ROG Zephyrus Duo GX651 | |
| Asus ROG Zephyrus G16 GU605CX | |
| Average of class Gaming (1366 - 2409, n=97, last 2 years) | |
| Asus ProArt P16 RTX 5090 | |
| Samsung Galaxy Book6 Ultra | |
| CrossMark / Productivity | |
| Lenovo ThinkPad T1g Gen 8 21TD003GE | |
| Asus Zephyrus Duo 16 GX650PY-NM006W | |
| Average Intel Core Ultra 9 386H, NVIDIA GeForce RTX 5090 Laptop (1876 - 1972, n=2) | |
| Lenovo Yoga Pro 9i 16 RTX 5070 | |
| Asus ROG Zephyrus G16 GU605CX | |
| Asus ROG Zephyrus Duo GX651 | |
| Average of class Gaming (1386 - 2254, n=97, last 2 years) | |
| Asus ProArt P16 RTX 5090 | |
| Samsung Galaxy Book6 Ultra | |
| CrossMark / Creativity | |
| Average Intel Core Ultra 9 386H, NVIDIA GeForce RTX 5090 Laptop (2420 - 2558, n=2) | |
| Lenovo ThinkPad T1g Gen 8 21TD003GE | |
| Lenovo Yoga Pro 9i 16 RTX 5070 | |
| Asus ROG Zephyrus Duo GX651 | |
| Asus ROG Zephyrus G16 GU605CX | |
| Asus Zephyrus Duo 16 GX650PY-NM006W | |
| Asus ProArt P16 RTX 5090 | |
| Samsung Galaxy Book6 Ultra | |
| Average of class Gaming (1343 - 2729, n=97, last 2 years) | |
| CrossMark / Responsiveness | |
| Lenovo ThinkPad T1g Gen 8 21TD003GE | |
| Average Intel Core Ultra 9 386H, NVIDIA GeForce RTX 5090 Laptop (1755 - 1854, n=2) | |
| Asus ROG Zephyrus Duo GX651 | |
| Average of class Gaming (1226 - 2334, n=97, last 2 years) | |
| Asus Zephyrus Duo 16 GX650PY-NM006W | |
| Lenovo Yoga Pro 9i 16 RTX 5070 | |
| Asus ROG Zephyrus G16 GU605CX | |
| Samsung Galaxy Book6 Ultra | |
| Asus ProArt P16 RTX 5090 | |
| WebXPRT 3 / Overall | |
| Asus Zephyrus Duo 16 GX650PY-NM006W | |
| Lenovo Yoga Pro 9i 16 RTX 5070 | |
| Asus ROG Zephyrus G16 GU605CX | |
| Lenovo ThinkPad T1g Gen 8 21TD003GE | |
| Razer Blade 16 2025 RTX 5090 | |
| Average of class Gaming (242 - 532, n=100, last 2 years) | |
| Average Intel Core Ultra 9 386H, NVIDIA GeForce RTX 5090 Laptop (307 - 325, n=2) | |
| Asus ROG Zephyrus Duo GX651 | |
| Samsung Galaxy Book6 Ultra | |
| Asus ProArt P16 RTX 5090 | |
| WebXPRT 4 / Overall | |
| Asus ROG Zephyrus G16 GU605CX | |
| Lenovo Yoga Pro 9i 16 RTX 5070 | |
| Lenovo ThinkPad T1g Gen 8 21TD003GE | |
| Samsung Galaxy Book6 Ultra | |
| Asus Zephyrus Duo 16 GX650PY-NM006W | |
| Average of class Gaming (176.4 - 354, n=100, last 2 years) | |
| Average Intel Core Ultra 9 386H, NVIDIA GeForce RTX 5090 Laptop (242 - 301, n=2) | |
| Razer Blade 16 2025 RTX 5090 | |
| Asus ProArt P16 RTX 5090 | |
| Asus ROG Zephyrus Duo GX651 | |
| Mozilla Kraken 1.1 / Total | |
| Average of class Gaming (391 - 590, n=105, last 2 years) | |
| Samsung Galaxy Book6 Ultra | |
| Asus ROG Zephyrus G16 GU605CX | |
| Average Intel Core Ultra 9 386H, NVIDIA GeForce RTX 5090 Laptop (444 - 456, n=2) | |
| Asus Zephyrus Duo 16 GX650PY-NM006W | |
| Lenovo ThinkPad T1g Gen 8 21TD003GE | |
| Asus ROG Zephyrus Duo GX651 | |
| Lenovo Yoga Pro 9i 16 RTX 5070 | |
| Razer Blade 16 2025 RTX 5090 | |
| Asus ProArt P16 RTX 5090 | |
* ... smaller is better
| PCMark 10 Score | 9457 points | |
Help | ||
| AIDA64 / Memory Copy | |
| Asus ROG Zephyrus Duo GX651 | |
| Samsung Galaxy Book6 Ultra | |
| Average Intel Core Ultra 9 386H (75437 - 129946, n=7) | |
| Lenovo Yoga Pro 9i 16 RTX 5070 | |
| Lenovo ThinkPad T1g Gen 8 21TD003GE | |
| Razer Blade 16 2025 RTX 5090 | |
| Asus ProArt P16 RTX 5090 | |
| Average of class Gaming (21750 - 129946, n=109, last 2 years) | |
| AIDA64 / Memory Read | |
| Asus ROG Zephyrus Duo GX651 | |
| Samsung Galaxy Book6 Ultra | |
| Average Intel Core Ultra 9 386H (81021 - 118858, n=7) | |
| Razer Blade 16 2025 RTX 5090 | |
| Asus ProArt P16 RTX 5090 | |
| Lenovo Yoga Pro 9i 16 RTX 5070 | |
| Lenovo ThinkPad T1g Gen 8 21TD003GE | |
| Average of class Gaming (22956 - 118858, n=109, last 2 years) | |
| AIDA64 / Memory Write | |
| Asus ROG Zephyrus Duo GX651 | |
| Samsung Galaxy Book6 Ultra | |
| Average Intel Core Ultra 9 386H (75959 - 135096, n=7) | |
| Razer Blade 16 2025 RTX 5090 | |
| Asus ProArt P16 RTX 5090 | |
| Average of class Gaming (22297 - 135096, n=109, last 2 years) | |
| Lenovo ThinkPad T1g Gen 8 21TD003GE | |
| Lenovo Yoga Pro 9i 16 RTX 5070 | |
| AIDA64 / Memory Latency | |
| Lenovo ThinkPad T1g Gen 8 21TD003GE | |
| Lenovo Yoga Pro 9i 16 RTX 5070 | |
| Asus ProArt P16 RTX 5090 | |
| Average of class Gaming (75.3 - 259, n=109, last 2 years) | |
| Razer Blade 16 2025 RTX 5090 | |
| Average Intel Core Ultra 9 386H (87.2 - 116.9, n=7) | |
| Samsung Galaxy Book6 Ultra | |
| Asus ROG Zephyrus Duo GX651 | |
* ... smaller is better
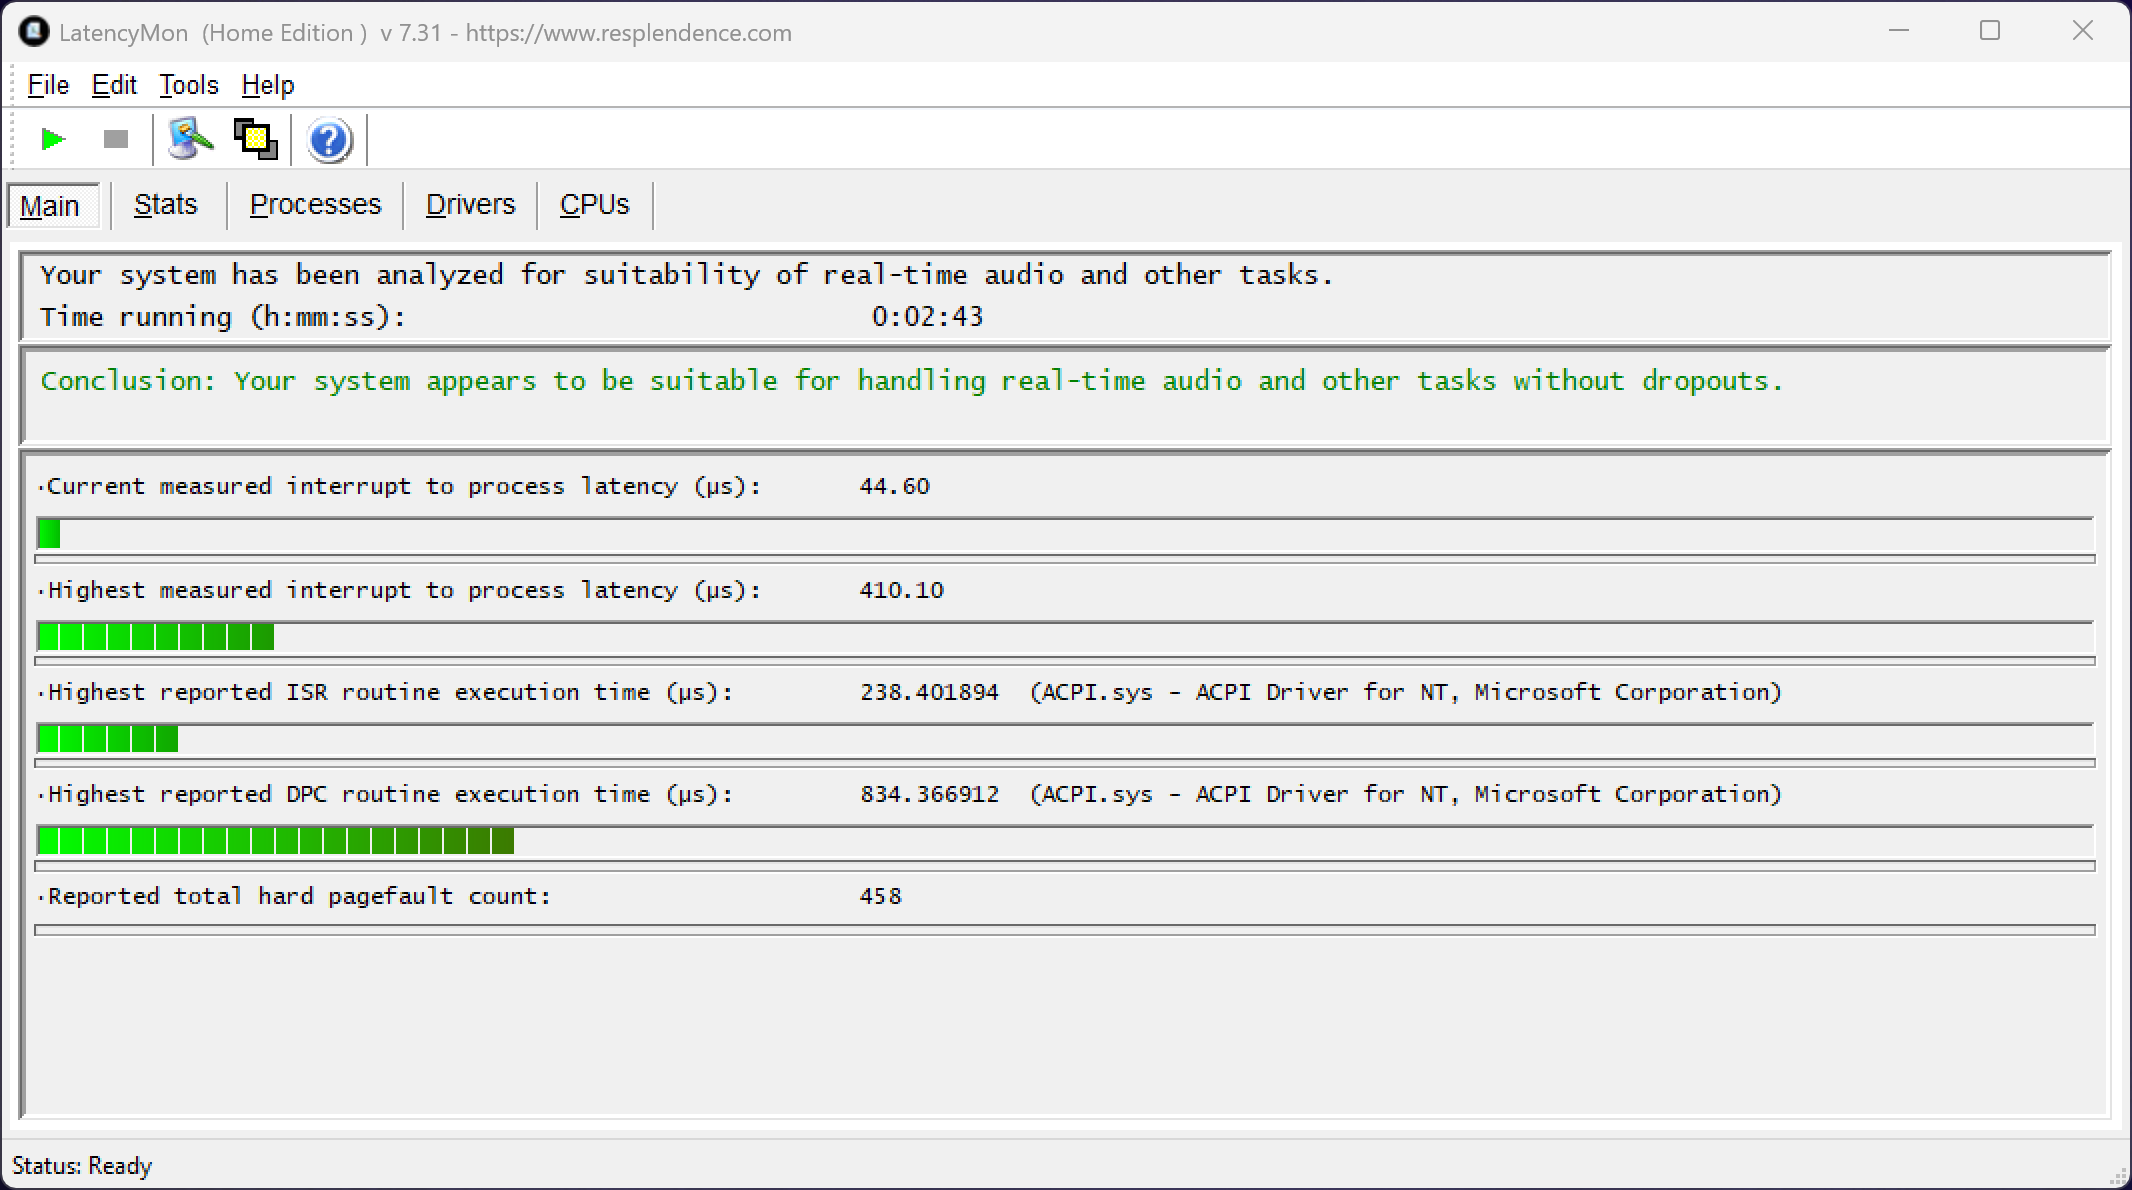
DPC Latency
Our standardized latency test (web browsing, 4K YouTube playback, CPU load) does not reveal any issues for real-time audio applications.
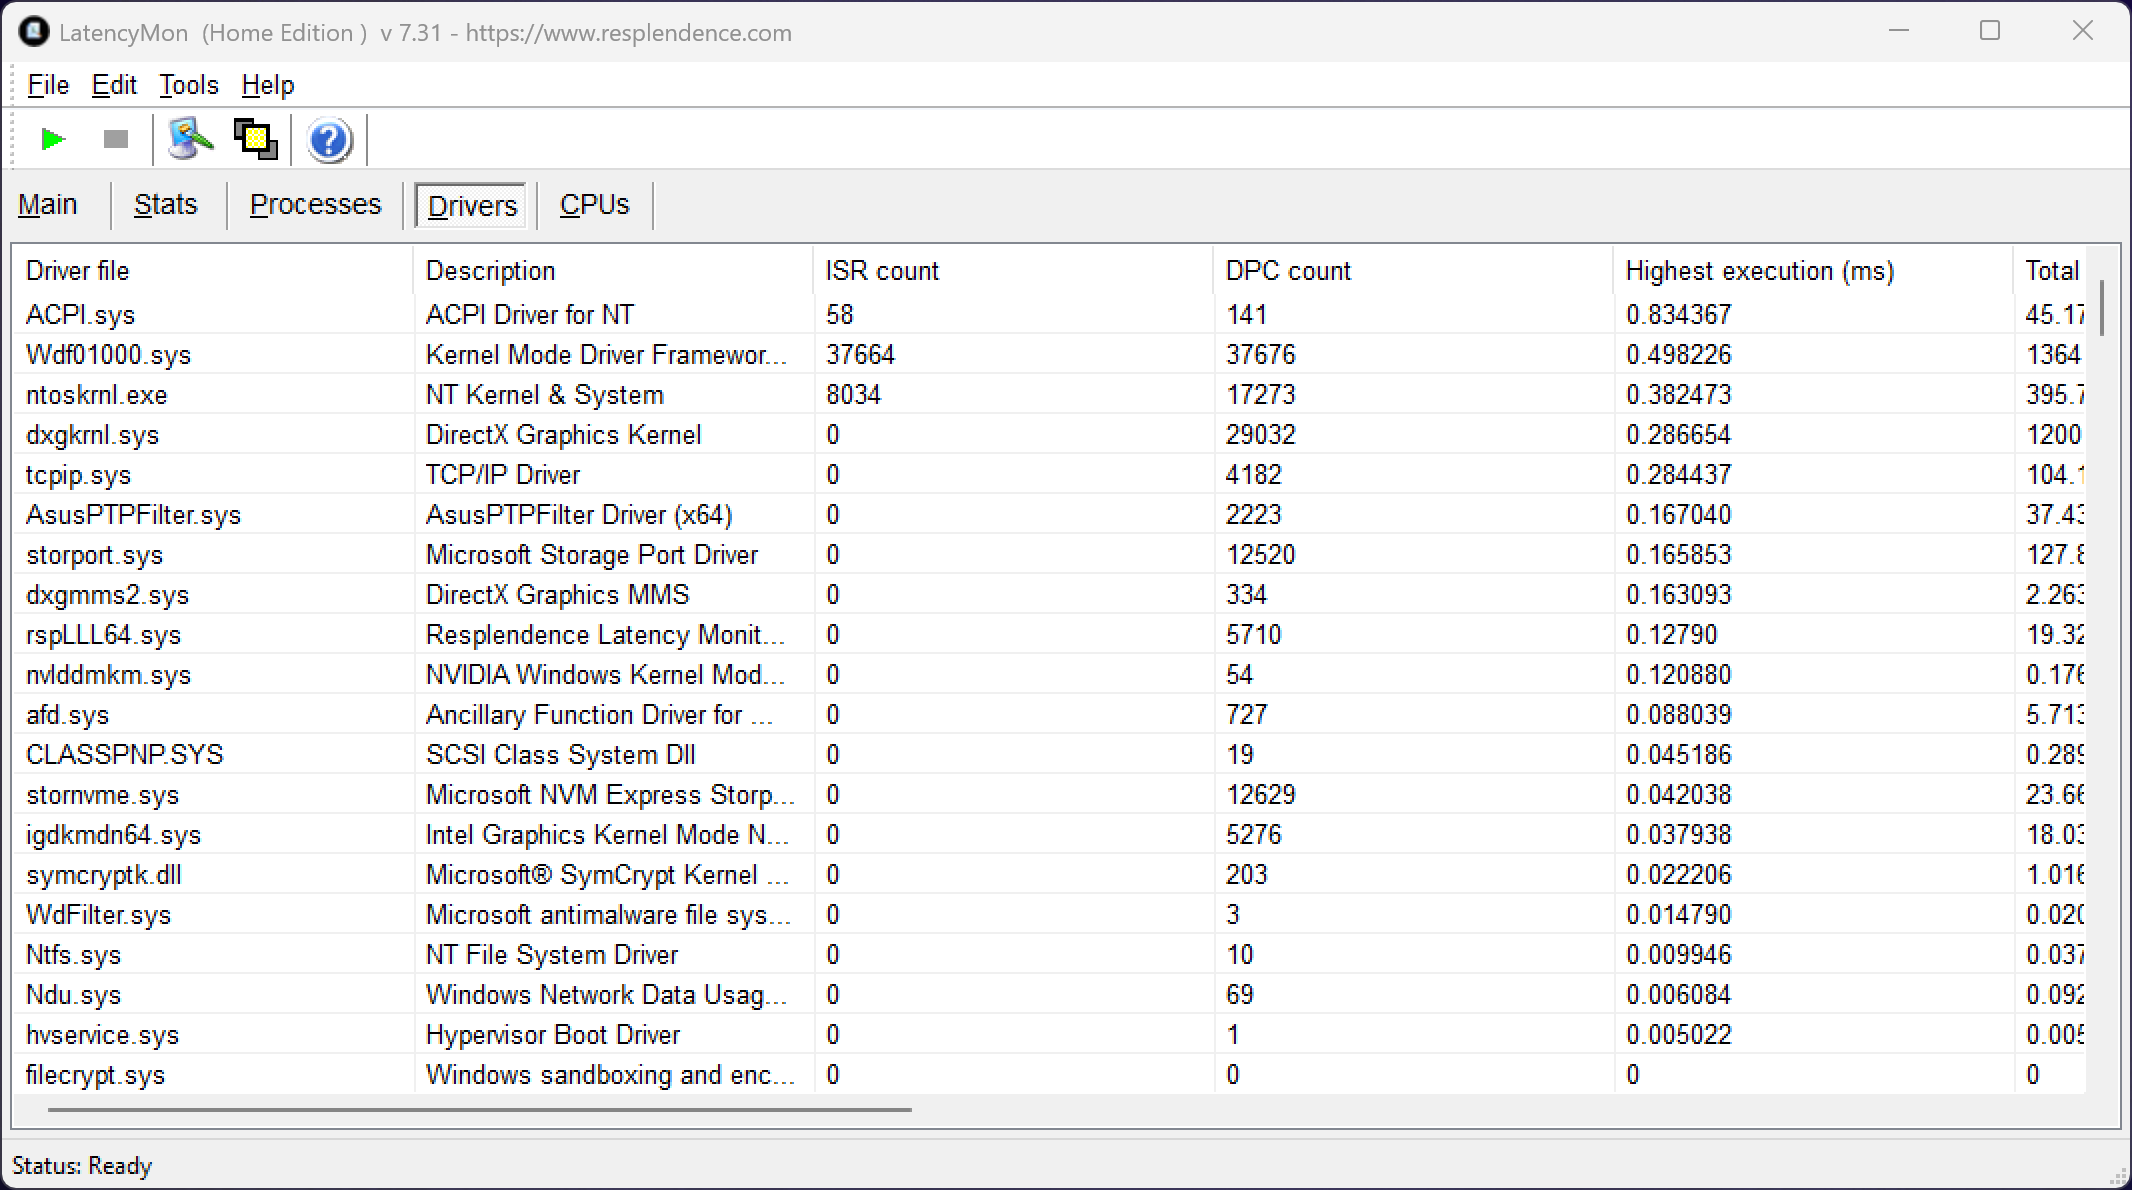
| DPC Latencies / LatencyMon - interrupt to process latency (max), Web, Youtube, Prime95 | |
| Asus ProArt P16 RTX 5090 | |
| Lenovo ThinkPad T1g Gen 8 21TD003GE | |
| Lenovo Yoga Pro 9i 16 RTX 5070 | |
| Samsung Galaxy Book6 Ultra | |
| Razer Blade 16 2025 RTX 5090 | |
| Asus ROG Zephyrus Duo GX651 | |
* ... smaller is better
Storage Devices
The 2 TB PCIe 5.0 SSD from Micron (1.71 TB free) offers very good transfer rates, even though the performance starts to fluctuate a bit under sustained workloads. There is a secondary M.2-2280 slot if you want to expand the storage capacity, but the slot is limited to PCIe 4.0-x4 speeds.

* ... smaller is better
Disk Throttling: DiskSpd Read Loop, Queue Depth 8
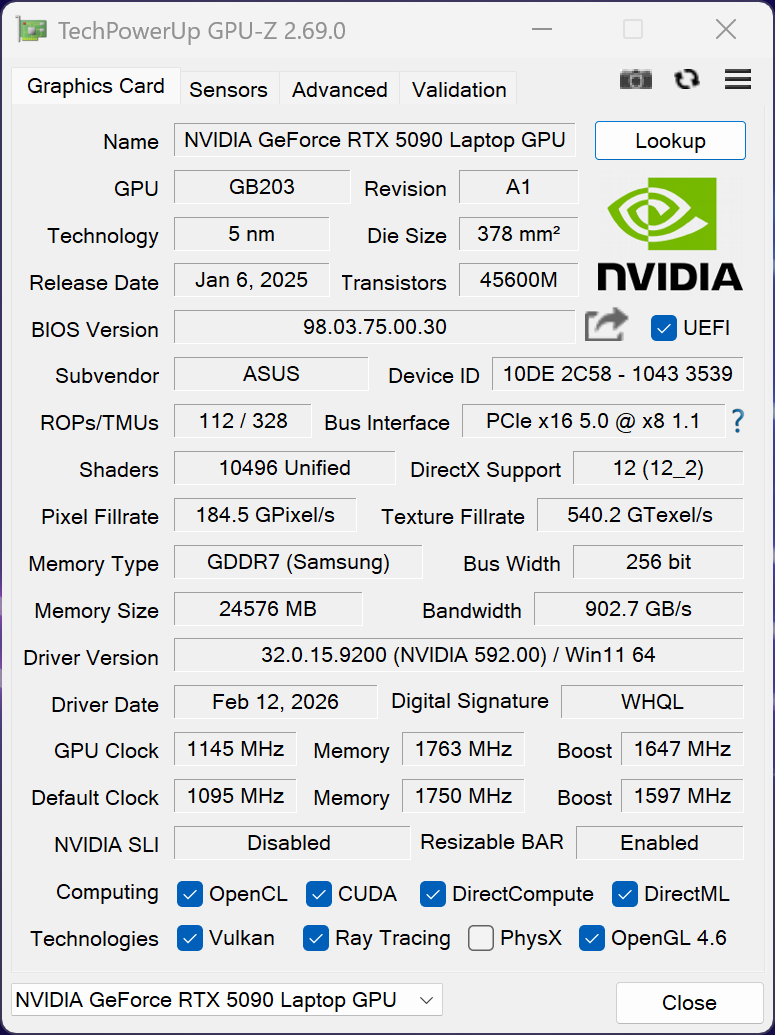
GPU Performance
Nvidia's GeForce RTX 5090 with 24 GB VRAM is still the fastest mobile GPU on the market in 2026 and it runs at up to 135 Watts in our tests. Advanced Optimus is supported and the GPU performance is good, but once again not better than the old Zephyrus Duo from 2023 with the RTX 4090 (175W). While this is not the fastest 5090 out there, the GPU performance is still superior to the ProArt P16 and the Zephyrus G16 2025, where the 5090 was limited to 120 Watts. The gaming performance is still excellent and you can easily play even demanding titles in the WQHD resolution with maximum details. The gaming performance is also very stable under sustained workloads.
| 3DMark 11 Performance | 42374 points | |
| 3DMark Fire Strike Score | 37289 points | |
| 3DMark Time Spy Score | 19487 points | |
| 3DMark Steel Nomad Score | 5271 points | |
| 3DMark Steel Nomad Light Score | 21655 points | |
Help | ||
| Blender / v3.3 Classroom OPTIX/RTX | |
| Lenovo Yoga Pro 9i 16 RTX 5070 | |
| Lenovo ThinkPad T1g Gen 8 21TD003GE | |
| Samsung Galaxy Book6 Ultra | |
| Average of class Gaming (9 - 32, n=111, last 2 years) | |
| Asus ROG Zephyrus Duo GX651 | |
| Razer Blade 16 2025 RTX 5090 | |
| Asus ROG Zephyrus G16 GU605CX | |
| Asus ProArt P16 RTX 5090 | |
| Average NVIDIA GeForce RTX 5090 Laptop (9 - 18, n=21) | |
| Blender / v3.3 Classroom CUDA | |
| Lenovo ThinkPad T1g Gen 8 21TD003GE | |
| Lenovo Yoga Pro 9i 16 RTX 5070 | |
| Samsung Galaxy Book6 Ultra | |
| Average of class Gaming (15 - 228, n=111, last 2 years) | |
| Asus ProArt P16 RTX 5090 | |
| Razer Blade 16 2025 RTX 5090 | |
| Asus ROG Zephyrus G16 GU605CX | |
| Asus ROG Zephyrus Duo GX651 | |
| Average NVIDIA GeForce RTX 5090 Laptop (15 - 37, n=20) | |
| Blender / v3.3 Classroom CPU | |
| Samsung Galaxy Book6 Ultra | |
| Lenovo ThinkPad T1g Gen 8 21TD003GE | |
| Asus ROG Zephyrus G16 GU605CX | |
| Average of class Gaming (122 - 565, n=107, last 2 years) | |
| Lenovo Yoga Pro 9i 16 RTX 5070 | |
| Asus ROG Zephyrus Duo GX651 | |
| Razer Blade 16 2025 RTX 5090 | |
| Asus ProArt P16 RTX 5090 | |
| Average NVIDIA GeForce RTX 5090 Laptop (123 - 282, n=21) | |
* ... smaller is better
| F1 25 - 2560x1440 Ultra Max Preset AA:T AF:16x | |
| Average NVIDIA GeForce RTX 5090 Laptop (30.2 - 37.5, n=8) | |
| Asus ROG Zephyrus Duo GX651 | |
| Asus ProArt P16 RTX 5090 | |
| Average of class Gaming (5 - 37.5, n=24, last 2 years) | |
| Lenovo Yoga Pro 9i 16 RTX 5070 | |
Cyberpunk 2077 ultra FPS Chart
| low | med. | high | ultra | QHD DLSS | QHD | |
|---|---|---|---|---|---|---|
| GTA V (2015) | 137.4 | 137.7 | ||||
| Dota 2 Reborn (2015) | 174.7 | 156.7 | 153.3 | 141.7 | ||
| Final Fantasy XV Benchmark (2018) | 217 | 205 | 164.2 | 134.1 | ||
| X-Plane 11.11 (2018) | 118.8 | 111.9 | 92 | |||
| Strange Brigade (2018) | 482 | 368 | 357 | 339 | 283 | |
| Baldur's Gate 3 (2023) | 205 | 183.1 | 168.7 | 167 | 122.7 | |
| Cyberpunk 2077 (2023) | 165.6 | 158.2 | 142.2 | 126.2 | 102.7 | 91.6 |
| F1 24 (2024) | 265 | 261 | 122.1 | 122.6 | 81.3 | |
| Assassin's Creed Shadows (2025) | 94 | 88 | 72 | 58 | 49 | |
| F1 25 (2025) | 205 | 190.9 | 49.1 | 51.8 | 30.7 |
Emissions & Power Consumption
System Noise
The cooling unit consists of two fans and a vapor chamber. During everyday tasks, the fans are very quiet and we recommend the Silent mode when yo do not stress the GPU. In Turbo mode, the fans will get very loud at up to 54 dB(A), so you should use headphones for gaming. The Silent mode will stay below 40 dB(A) even under heavy stress, but pretty much cuts the GPU performance in half. We did not notice any electronic noises on our unit.
Noise level
| Idle |
| 23.9 / 23.9 / 23.9 dB(A) |
| Load |
| 45.5 / 54.1 dB(A) |
 | ||
30 dB silent 40 dB(A) audible 50 dB(A) loud |
||
min: | ||
| Asus ROG Zephyrus Duo GX651 Ultra 9 386H, GeForce RTX 5090 Laptop | Asus ProArt P16 RTX 5090 Ryzen AI 9 HX 370, GeForce RTX 5090 Laptop | Asus ROG Zephyrus G16 GU605CX Ultra 9 285H, GeForce RTX 5090 Laptop | Razer Blade 16 2025 RTX 5090 Ryzen AI 9 HX 370, GeForce RTX 5090 Laptop | Lenovo Yoga Pro 9i 16 RTX 5070 Ultra 9 285H, GeForce RTX 5070 Laptop | Samsung Galaxy Book6 Ultra Ultra 7 356H, GeForce RTX 5070 Laptop | Lenovo ThinkPad T1g Gen 8 21TD003GE Ultra 9 285H, GeForce RTX 5070 Laptop | |
|---|---|---|---|---|---|---|---|
| Noise | -6% | -6% | -7% | 0% | 3% | 2% | |
| off / environment * (dB) | 23.9 | 24.2 -1% | 23.8 -0% | 24.1 -1% | 24.1 -1% | 25.1 -5% | 25 -5% |
| Idle Minimum * (dB) | 23.9 | 24.2 -1% | 23.8 -0% | 24.1 -1% | 24.1 -1% | 25.1 -5% | 25 -5% |
| Idle Average * (dB) | 23.9 | 27.6 -15% | 27.2 -14% | 30.6 -28% | 24.1 -1% | 25.1 -5% | 25 -5% |
| Idle Maximum * (dB) | 23.9 | 32.6 -36% | 31.3 -31% | 30.6 -28% | 25.1 -5% | 25.1 -5% | 27.3 -14% |
| Load Average * (dB) | 45.5 | 42.6 6% | 47.6 -5% | 45.5 -0% | 44.2 3% | 36.9 19% | 37.3 18% |
| Cyberpunk 2077 ultra * (dB) | 54.1 | 51.2 5% | 51.3 5% | 48.2 11% | 52.7 3% | 48.5 10% | 47.8 12% |
| Load Maximum * (dB) | 54.1 | 53.2 2% | 53.3 1% | 53.4 1% | 52.7 3% | 48.5 10% | 47.8 12% |
* ... smaller is better
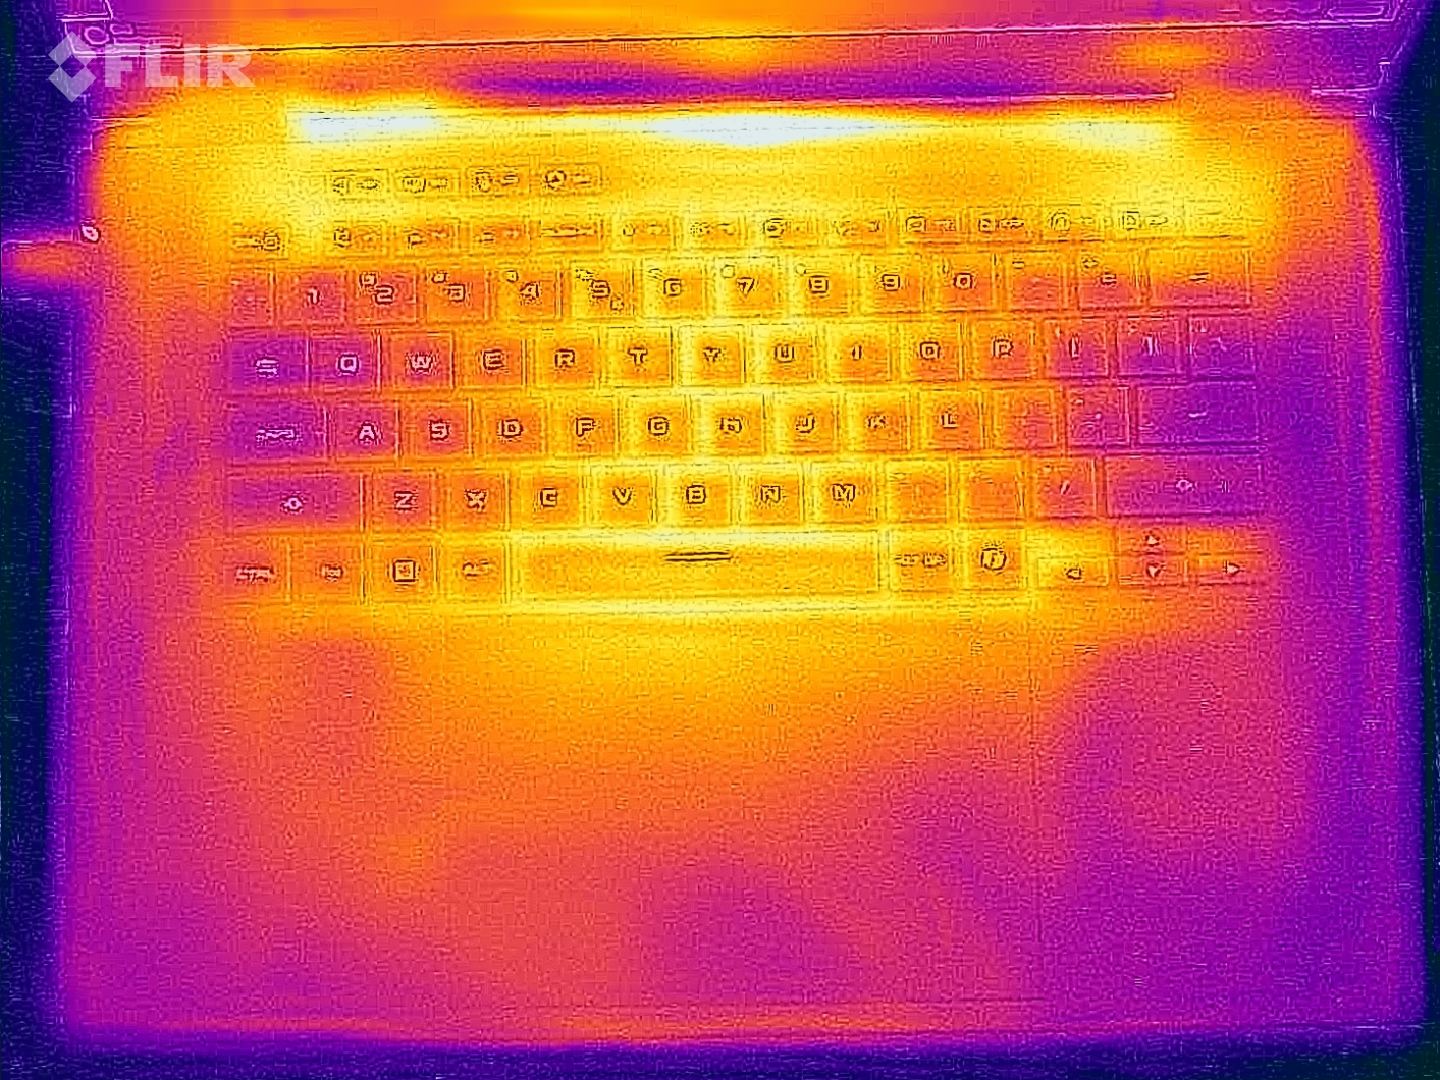
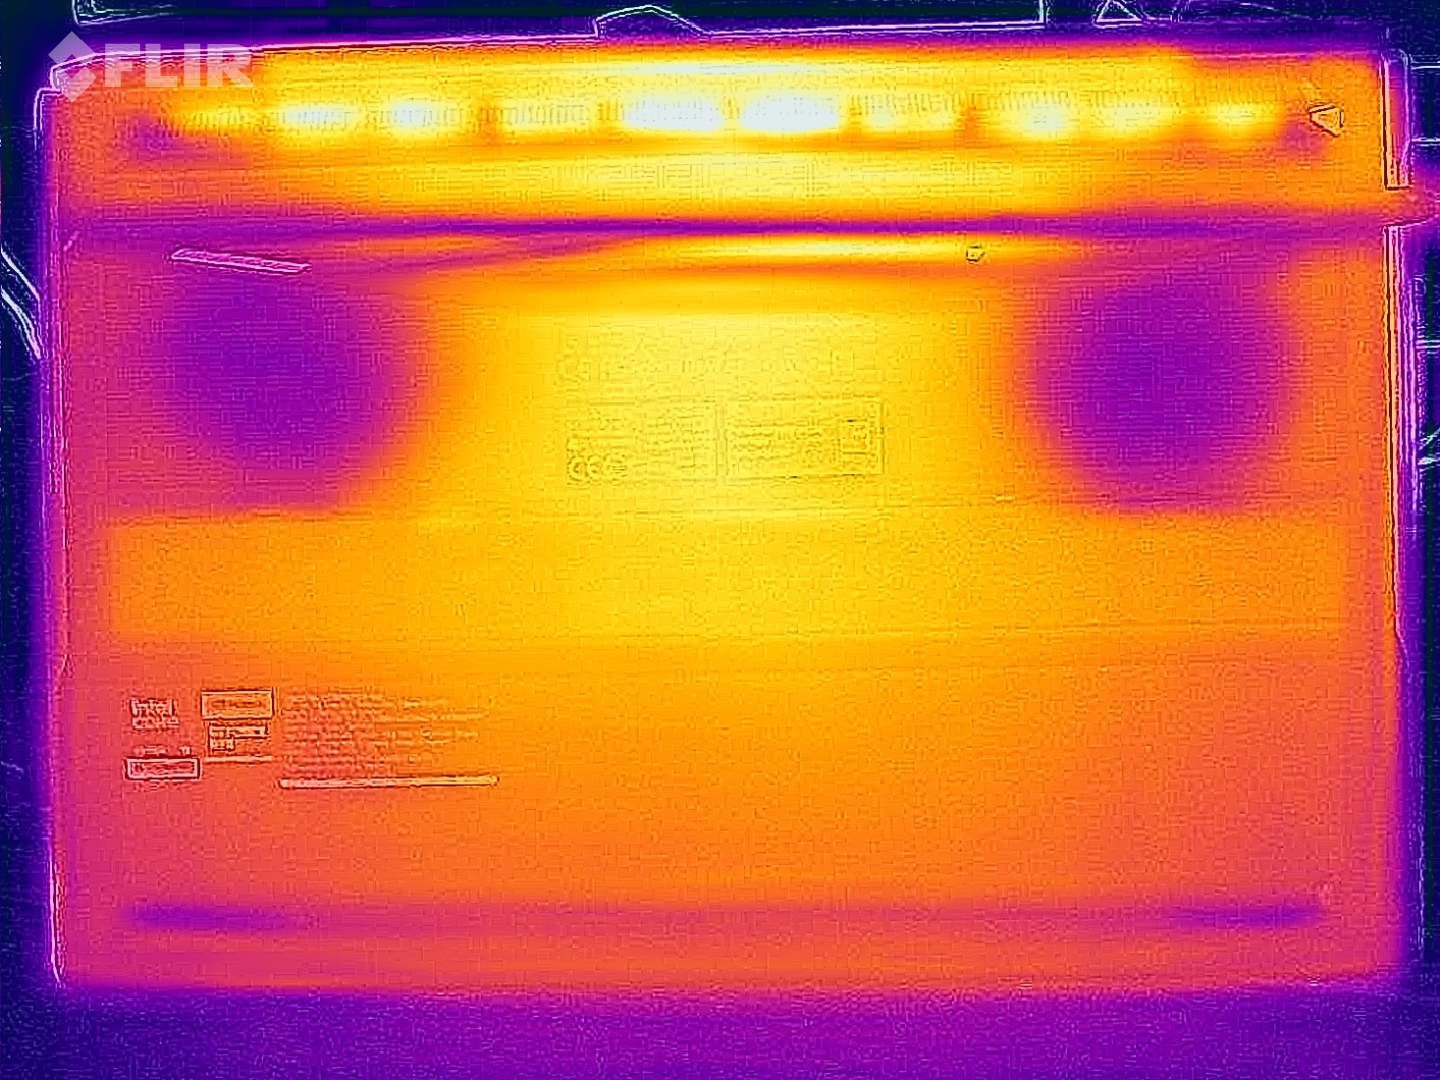
Temperature
Surface temperatures are absolutely no problem and the thick base unit is definitely an advantage. The detachable keyboard adds another layer and does not really warm up at all. During the stress test, the CPU levels off at 35 Watts (75 °C) and the GPU at ~115 Watts (68 °C).

(+) The maximum temperature on the upper side is 36.5 °C / 98 F, compared to the average of 40.4 °C / 105 F, ranging from 21.2 to 68.8 °C for the class Gaming.
(-) The bottom heats up to a maximum of 46.8 °C / 116 F, compared to the average of 43.2 °C / 110 F
(+) In idle usage, the average temperature for the upper side is 26.5 °C / 80 F, compared to the device average of 33.9 °C / 93 F.
(±) 3: The average temperature for the upper side is 32.9 °C / 91 F, compared to the average of 33.9 °C / 93 F for the class Gaming.
(+) The palmrests and touchpad are reaching skin temperature as a maximum (32.8 °C / 91 F) and are therefore not hot.
(-) The average temperature of the palmrest area of similar devices was 28.8 °C / 83.8 F (-4 °C / -7.2 F).
| Asus ROG Zephyrus Duo GX651 Ultra 9 386H, GeForce RTX 5090 Laptop | Asus ProArt P16 RTX 5090 Ryzen AI 9 HX 370, GeForce RTX 5090 Laptop | Samsung Galaxy Book6 Ultra Ultra 7 356H, GeForce RTX 5070 Laptop | Lenovo ThinkPad T1g Gen 8 21TD003GE Ultra 9 285H, GeForce RTX 5070 Laptop | Lenovo Yoga Pro 9i 16 RTX 5070 Ultra 9 285H, GeForce RTX 5070 Laptop | Razer Blade 16 2025 RTX 5090 Ryzen AI 9 HX 370, GeForce RTX 5090 Laptop | |
|---|---|---|---|---|---|---|
| Heat | -4% | 0% | -1% | -1% | -13% | |
| Maximum Upper Side * (°C) | 36.5 | 47 -29% | 42.7 -17% | 44.7 -22% | 41.8 -15% | 48.3 -32% |
| Maximum Bottom * (°C) | 46.8 | 51.6 -10% | 49.1 -5% | 42.8 9% | 47.9 -2% | 53.3 -14% |
| Idle Upper Side * (°C) | 27.3 | 24.9 9% | 25.4 7% | 26.9 1% | 26.3 4% | 28.3 -4% |
| Idle Bottom * (°C) | 30.4 | 25.5 16% | 25.5 16% | 27.3 10% | 27.6 9% | 30.3 -0% |
* ... smaller is better
Speakers
Asus implements a six-speaker sound system and the quality is good, but the ProArt P16 and the Galaxy Book 6 Ultra, for example, perform slightly better.
Asus ROG Zephyrus Duo GX651 audio analysis
(+) | speakers can play relatively loud (85.5 dB)
Bass 100 - 315 Hz
(±) | reduced bass - on average 6.3% lower than median
(±) | linearity of bass is average (7.8% delta to prev. frequency)
Mids 400 - 2000 Hz
(±) | higher mids - on average 8% higher than median
(+) | mids are linear (6.2% delta to prev. frequency)
Highs 2 - 16 kHz
(+) | balanced highs - only 3.6% away from median
(+) | highs are linear (5.2% delta to prev. frequency)
Overall 100 - 16.000 Hz
(+) | overall sound is linear (12% difference to median)
Compared to same class
» 12% of all tested devices in this class were better, 4% similar, 84% worse
» The best had a delta of 6%, average was 18%, worst was 132%
Compared to all devices tested
» 9% of all tested devices were better, 2% similar, 88% worse
» The best had a delta of 4%, average was 24%, worst was 134%
Asus ProArt P16 RTX 5090 audio analysis
(±) | speaker loudness is average but good (80.8 dB)
Bass 100 - 315 Hz
(+) | good bass - only 3.3% away from median
(±) | linearity of bass is average (7.7% delta to prev. frequency)
Mids 400 - 2000 Hz
(+) | balanced mids - only 2.9% away from median
(+) | mids are linear (1.9% delta to prev. frequency)
Highs 2 - 16 kHz
(+) | balanced highs - only 4.1% away from median
(+) | highs are linear (5.5% delta to prev. frequency)
Overall 100 - 16.000 Hz
(+) | overall sound is linear (8.3% difference to median)
Compared to same class
» 9% of all tested devices in this class were better, 2% similar, 89% worse
» The best had a delta of 5%, average was 17%, worst was 45%
Compared to all devices tested
» 2% of all tested devices were better, 1% similar, 97% worse
» The best had a delta of 4%, average was 24%, worst was 134%
Samsung Galaxy Book6 Ultra audio analysis
(+) | speakers can play relatively loud (85.6 dB)
Bass 100 - 315 Hz
(±) | reduced bass - on average 5.9% lower than median
(±) | linearity of bass is average (7.9% delta to prev. frequency)
Mids 400 - 2000 Hz
(+) | balanced mids - only 3.7% away from median
(+) | mids are linear (4.3% delta to prev. frequency)
Highs 2 - 16 kHz
(+) | balanced highs - only 2.2% away from median
(+) | highs are linear (3.4% delta to prev. frequency)
Overall 100 - 16.000 Hz
(+) | overall sound is linear (7.3% difference to median)
Compared to same class
» 6% of all tested devices in this class were better, 1% similar, 94% worse
» The best had a delta of 5%, average was 17%, worst was 45%
Compared to all devices tested
» 1% of all tested devices were better, 0% similar, 99% worse
» The best had a delta of 4%, average was 24%, worst was 134%
Lenovo ThinkPad T1g Gen 8 21TD003GE audio analysis
(+) | speakers can play relatively loud (85.6 dB)
Bass 100 - 315 Hz
(±) | reduced bass - on average 9.3% lower than median
(±) | linearity of bass is average (11.9% delta to prev. frequency)
Mids 400 - 2000 Hz
(+) | balanced mids - only 2.5% away from median
(+) | mids are linear (4% delta to prev. frequency)
Highs 2 - 16 kHz
(+) | balanced highs - only 3.4% away from median
(±) | linearity of highs is average (7.5% delta to prev. frequency)
Overall 100 - 16.000 Hz
(+) | overall sound is linear (8.7% difference to median)
Compared to same class
» 11% of all tested devices in this class were better, 2% similar, 87% worse
» The best had a delta of 5%, average was 17%, worst was 45%
Compared to all devices tested
» 3% of all tested devices were better, 1% similar, 97% worse
» The best had a delta of 4%, average was 24%, worst was 134%
Lenovo Yoga Pro 9i 16 RTX 5070 audio analysis
(±) | speaker loudness is average but good (81.4 dB)
Bass 100 - 315 Hz
(±) | reduced bass - on average 5.5% lower than median
(±) | linearity of bass is average (7.5% delta to prev. frequency)
Mids 400 - 2000 Hz
(+) | balanced mids - only 1.7% away from median
(+) | mids are linear (3.1% delta to prev. frequency)
Highs 2 - 16 kHz
(±) | reduced highs - on average 6.2% lower than median
(+) | highs are linear (3.9% delta to prev. frequency)
Overall 100 - 16.000 Hz
(+) | overall sound is linear (9.7% difference to median)
Compared to same class
» 13% of all tested devices in this class were better, 1% similar, 85% worse
» The best had a delta of 5%, average was 17%, worst was 45%
Compared to all devices tested
» 4% of all tested devices were better, 1% similar, 95% worse
» The best had a delta of 4%, average was 24%, worst was 134%
Razer Blade 16 2025 RTX 5090 audio analysis
(+) | speakers can play relatively loud (82.1 dB)
Bass 100 - 315 Hz
(±) | reduced bass - on average 11.8% lower than median
(±) | linearity of bass is average (8.5% delta to prev. frequency)
Mids 400 - 2000 Hz
(±) | higher mids - on average 5.2% higher than median
(+) | mids are linear (5% delta to prev. frequency)
Highs 2 - 16 kHz
(+) | balanced highs - only 4.5% away from median
(+) | highs are linear (4.6% delta to prev. frequency)
Overall 100 - 16.000 Hz
(+) | overall sound is linear (14.3% difference to median)
Compared to same class
» 26% of all tested devices in this class were better, 7% similar, 67% worse
» The best had a delta of 6%, average was 18%, worst was 132%
Compared to all devices tested
» 17% of all tested devices were better, 4% similar, 79% worse
» The best had a delta of 4%, average was 24%, worst was 134%
Power Consumption

The idle power measurements were taken with one active screen, and you can add between 3-8 Watts (depending on the brightness) when you use both screens. We recorded a maximum power consumption of 230 Watts, which levels off at around 180 Watts. The included 250W PSU is therefore sufficient.
| Off / Standby | |
| Idle | |
| Load |
|
Key:
min: | |
| Asus ROG Zephyrus Duo GX651 Ultra 9 386H, GeForce RTX 5090 Laptop, Micron MTFDLBA2T0PBM, OLED, 2880x1800, 16" | Asus ProArt P16 RTX 5090 Ryzen AI 9 HX 370, GeForce RTX 5090 Laptop, Micron 2500 2TB MTFDKBA2T0QGN-1BN1AABGA, OLED, 3840x2400, 16" | Asus ROG Zephyrus G16 GU605CX Ultra 9 285H, GeForce RTX 5090 Laptop, Western Digital PC SN5000S SDEPNSJ-2T00-1006, OLED, 2560x1600, 16" | Razer Blade 16 2025 RTX 5090 Ryzen AI 9 HX 370, GeForce RTX 5090 Laptop, SSSTC CA6-8D2048, OLED, 2560x1600, 16" | Lenovo Yoga Pro 9i 16 RTX 5070 Ultra 9 285H, GeForce RTX 5070 Laptop, WD PC SN7100S SDFPMSL-1T00-1101, OLED, 3200x2000, 16" | Samsung Galaxy Book6 Ultra Ultra 7 356H, GeForce RTX 5070 Laptop, Samsung PM9C1b MZVL81T0HFLB-00BH1, OLED, 2880x1800, 16" | Lenovo ThinkPad T1g Gen 8 21TD003GE Ultra 9 285H, GeForce RTX 5070 Laptop, Samsung PM9E1 MZVLC2T0HBLD, Tandem-OLED, 3200x2000, 16" | Average NVIDIA GeForce RTX 5090 Laptop | Average of class Gaming | |
|---|---|---|---|---|---|---|---|---|---|
| Power Consumption | -29% | -30% | -35% | -29% | 28% | -10% | -147% | -96% | |
| Idle Minimum * (Watt) | 6.4 | 10.9 -70% | 9.4 -47% | 10.9 -70% | 8.8 -38% | 4.4 31% | 8.5 -33% | 16.2 ? -153% | 13.2 ? -106% |
| Idle Average * (Watt) | 7.6 | 12.1 -59% | 13.6 -79% | 13.5 -78% | 16.1 -112% | 6.4 16% | 13.6 -79% | 24.3 ? -220% | 18.9 ? -149% |
| Idle Maximum * (Watt) | 7.8 | 12.5 -60% | 15.8 -103% | 13.7 -76% | 16.5 -112% | 7.1 9% | 14.1 -81% | 30.3 ? -288% | 24.3 ? -212% |
| Load Average * (Watt) | 106.1 | 129.3 -22% | 115.4 -9% | 120.2 -13% | 89.3 16% | 55.1 48% | 84.5 20% | 135.3 ? -28% | 108 ? -2% |
| Cyberpunk 2077 ultra external monitor * (Watt) | 184 | 172.8 6% | 160.4 13% | 177.6 3% | 157.9 14% | 133 28% | 118.1 36% | ||
| Cyberpunk 2077 ultra * (Watt) | 176.2 | 176.6 -0% | 164.5 7% | 178.2 -1% | 160.6 9% | 134.3 24% | 120.3 32% | ||
| Load Maximum * (Watt) | 230.7 | 233.9 -1% | 216.7 6% | 246.1 -7% | 177.4 23% | 143.9 38% | 143 38% | 336 ? -46% | 254 ? -10% |
* ... smaller is better
Power Consumption Cyberpunk / Stress Test
Power Consumption external Monitor
Battery Life
The 90 Wh battery provides very good runtimes for this class of device. The range with a dual-screen device is obviously pretty wide and heavily depends on your usage scenario. In our Wi-Fi test at 150 nits, we record 14.5 hours with one screen and still 10:12 hours with two screens. At maximum SDR brightness, the runtime drops to 8:48 hours with one screen and 6:23 hours with two screens.
Notebookcheck Rating
Asus ROG Zephyrus Duo GX651
- 05/07/2026 v8
Andreas Osthoff
 Total Sustainability Score:
 Potential Competitors in Comparison
Image | Model / Review | Price | Weight | Height | Display |
|---|---|---|---|---|---|
1. 89.3%  | Asus ROG Zephyrus Duo GX651 Intel Core Ultra 9 386H ⎘ NVIDIA GeForce RTX 5090 Laptop ⎘ 64 GB Memory, 2048 GB SSD | Amazon: 1. $4,499.99 ASUS ROG Zephyrus Duo Gaming... 2. $5,499.99 ASUS ROG Zephyrus Duo Dual T... 3. $4,699.99 EXCaliberPC [2026] ASUS ROG ... List Price: 6700€ | 2.8 kg | 24.9 mm | 16.00" 2880x1800 212 PPI OLED |
2. 89.7%  | Asus ProArt P16 RTX 5090 AMD Ryzen AI 9 HX 370 ⎘ NVIDIA GeForce RTX 5090 Laptop ⎘ 64 GB Memory, 2048 GB SSD | Amazon: List Price: 4799€ | 2 kg | 18.3 mm | 16.00" 3840x2400 283 PPI OLED |
3. 90.7%  | Samsung Galaxy Book6 Ultra Intel Core Ultra 7 356H ⎘ NVIDIA GeForce RTX 5070 Laptop ⎘ 32 GB Memory, 1000 GB SSD | Amazon: List Price: 3599€ | 1.9 kg | 15.4 mm | 16.00" 2880x1800 212 PPI OLED |
4. 92.4%  | Lenovo ThinkPad T1g Gen 8 21TD003GE Intel Core Ultra 9 285H ⎘ NVIDIA GeForce RTX 5070 Laptop ⎘ 64 GB Memory, 2048 GB SSD | Amazon: List Price: 4500€ | 1.9 kg | 15.8 mm | 16.00" 3200x2000 236 PPI Tandem-OLED |
5. 90.4%  | Lenovo Yoga Pro 9i 16 RTX 5070 Intel Core Ultra 9 285H ⎘ NVIDIA GeForce RTX 5070 Laptop ⎘ 64 GB Memory, 1024 GB SSD | Amazon: List Price: 2800€ | 1.9 kg | 17.9 mm | 16.00" 3200x2000 236 PPI OLED |
6. 87%  | Razer Blade 16 2025 RTX 5090 AMD Ryzen AI 9 HX 370 ⎘ NVIDIA GeForce RTX 5090 Laptop ⎘ 32 GB Memory, 2048 GB SSD | Amazon: List Price: 4399€ | 2.1 kg | 17.4 mm | 16.00" 2560x1600 189 PPI OLED |
Transparency
The selection of devices to be reviewed is made by our editorial team. The test sample was provided to the author as a loan by the manufacturer or retailer for the purpose of this review. The lender had no influence on this review, nor did the manufacturer receive a copy of this review before publication. There was no obligation to publish this review. As an independent media company, Notebookcheck is not subjected to the authority of manufacturers, retailers or publishers.
This is how Notebookcheck is testing
Every year, Notebookcheck independently reviews hundreds of laptops and smartphones using standardized procedures to ensure that all results are comparable. We have continuously developed our test methods for around 20 years and set industry standards in the process. In our test labs, high-quality measuring equipment is utilized by experienced technicians and editors. These tests involve a multi-stage validation process. Our complex rating system is based on hundreds of well-founded measurements and benchmarks, which maintains objectivity. Further information on our test methods can be found here.
