Verdict - The ThinkPad T16g Gen 3 is feature-packed but performs poorly
When it comes to large mobile workstations, you'd be right to expect excellent performance. However, Lenovo has made things unnecessarily difficult for itself with its new ThinkPad T16g Gen 3 and ThinkPad P16 Gen 3 by only using a weak 180-watt power supply. While the CPU performance is very good, it's the slowest GeForce RTX 5080 (105-watt TGP) we've tested so far. Even competitors packed with the RTX 5070 Ti are generally faster, and these limitations naturally also apply to the RTX PRO GPUs in the ThinkPad P16 Gen 3. Furthermore, as soon as you actually set the components to task, the battery gets repeatedly drained because the power supply is simply insufficient, and the fans get annoyingly loud.
In terms of features, maintenance options, and overall functionality, the ThinkPad T16g Gen 3 scores highly, and this makes it a "good" workstation overall. The matte tandem OLED display also provides good image quality, although the matte touchscreen makes the displayed images appear slightly grainy.
While the new chassis has improved portability, you have to wonder if the performance has been sacrificed too much.
Pros
Cons
Price and availability
The ThinkPad T16g Gen 3 is not currently listed at Lenovo, but the structurally identical ThinkPad P16 Gen 3 model can be yours for around $2,399.
Table of Contents
This year, Lenovo has completely redesigned its large ThinkPad P16 Gen 3 workstation, with the manufacturer also offering the virtually identical ThinkPad T16g Gen 3, which replaces the RTX PRO GPU with a regular GeForce GPU. We reviewed the high-end variant with the Core Ultra 9 275HX, the GeForce RTX 5080 laptop graphics card, 64 GB of RAM, and the matte tandem OLED touchscreen, priced at approximately $5,600.
Specifications
Case & features
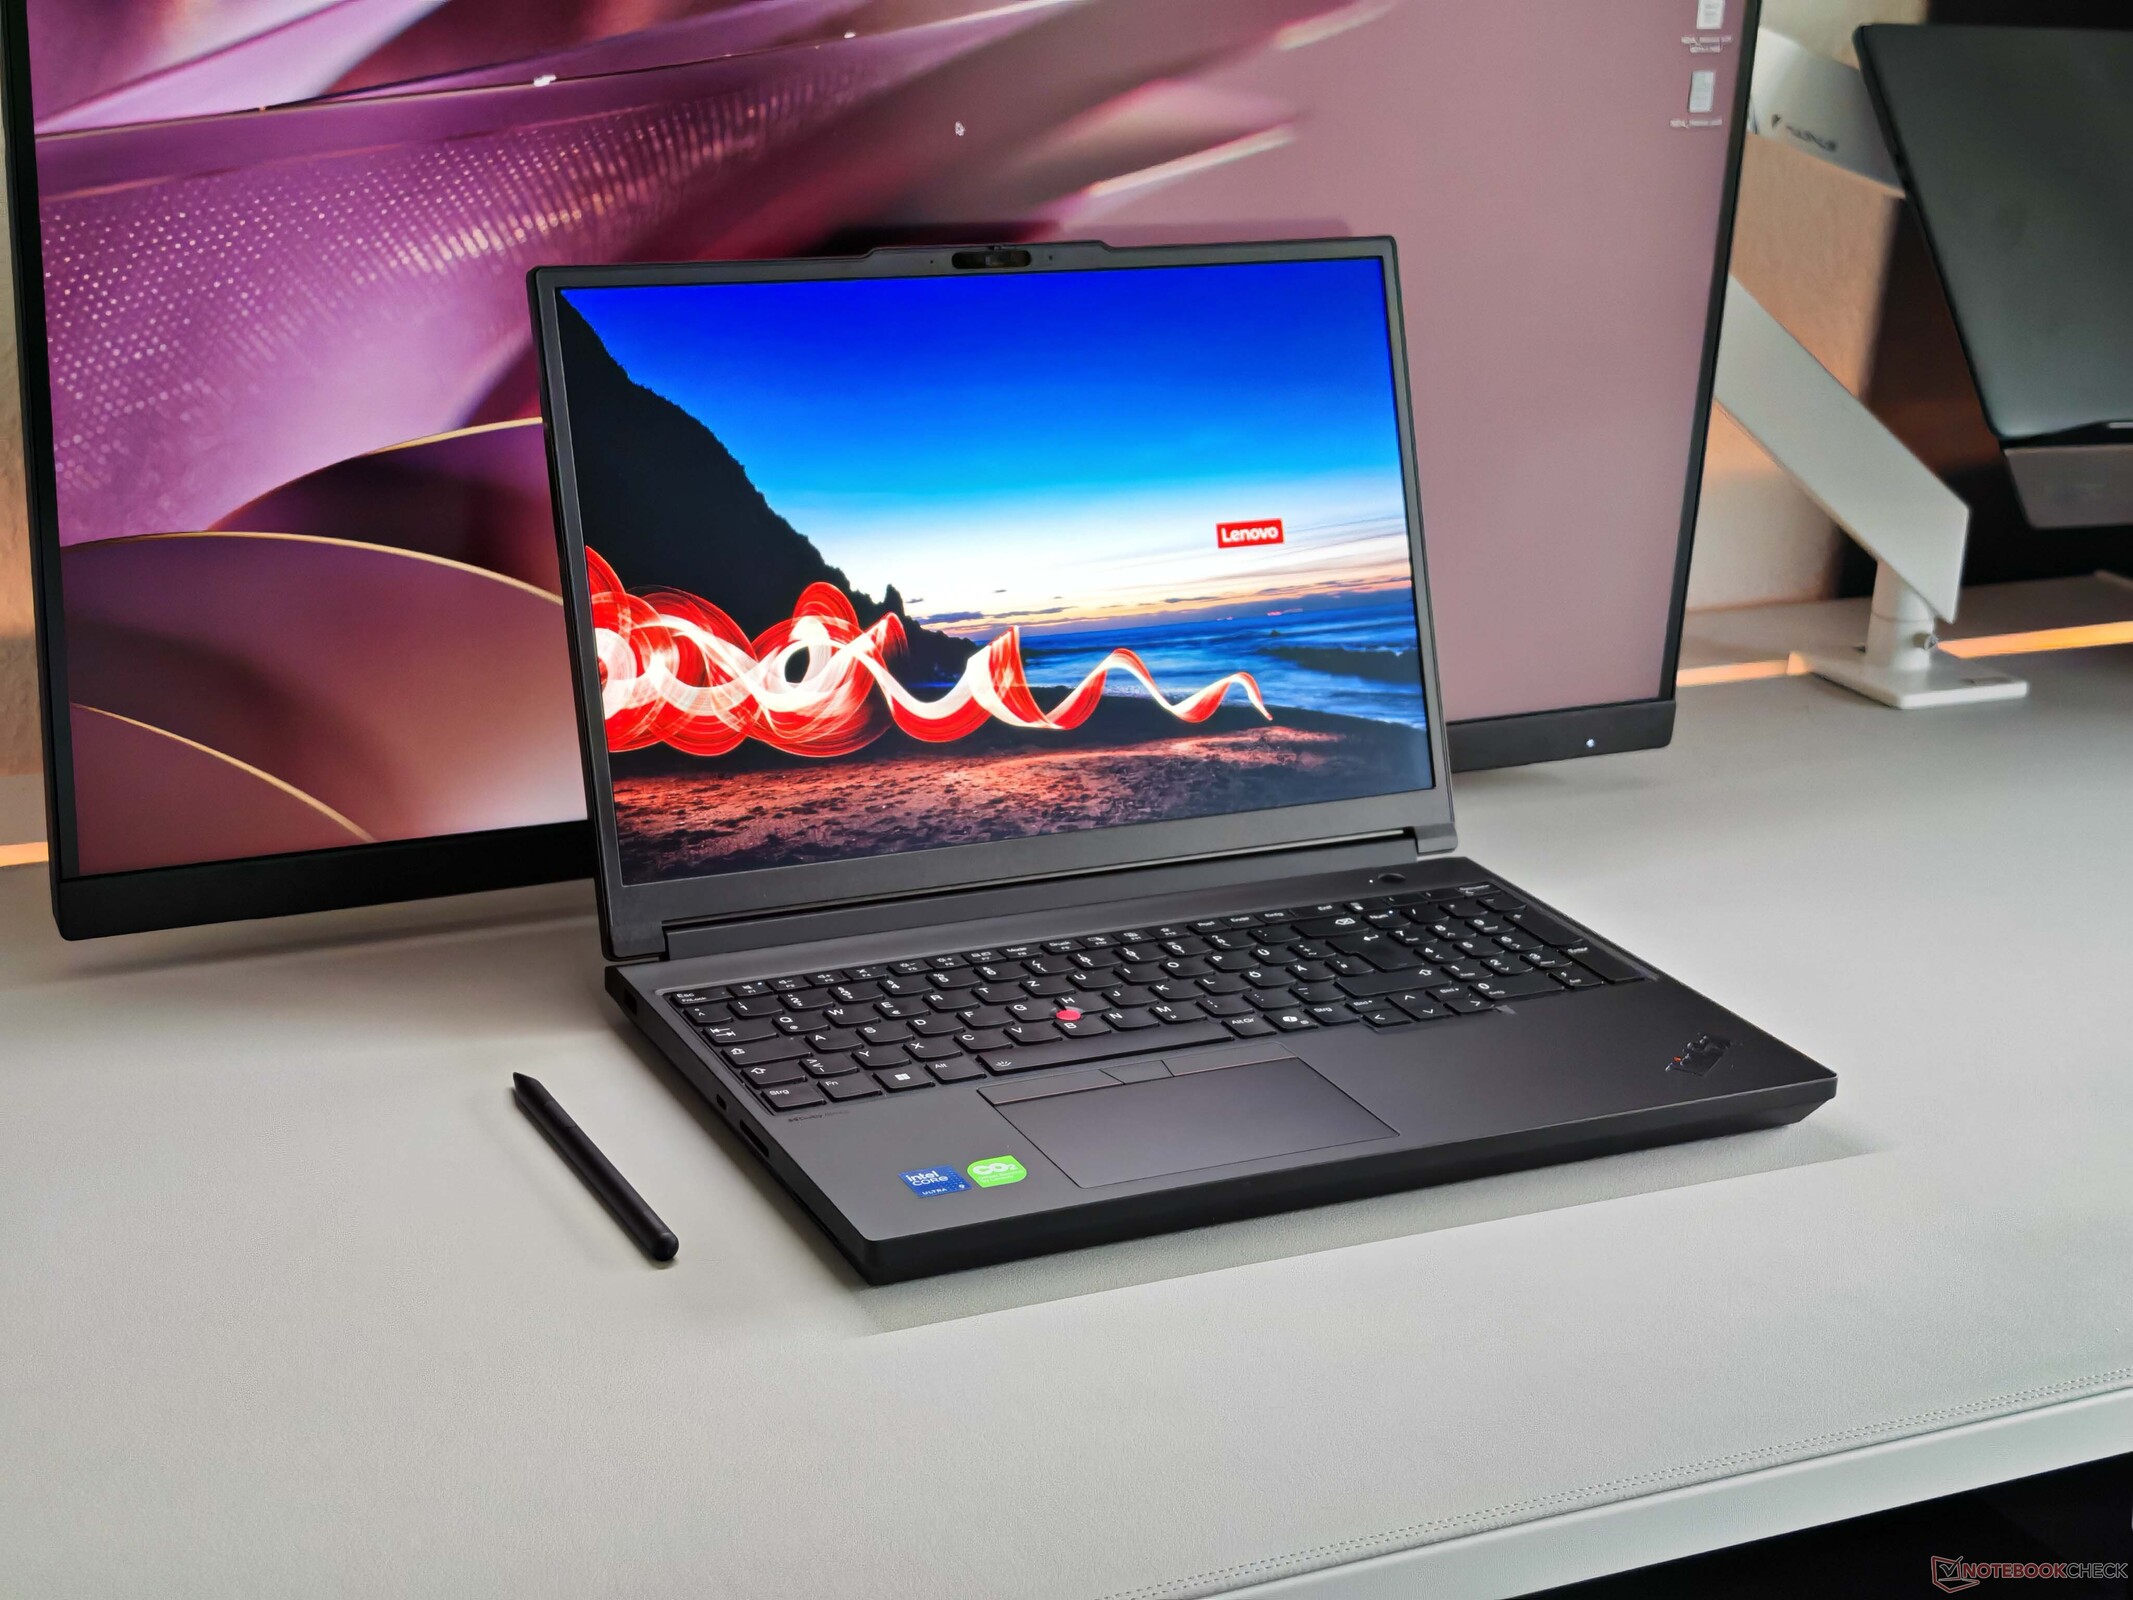
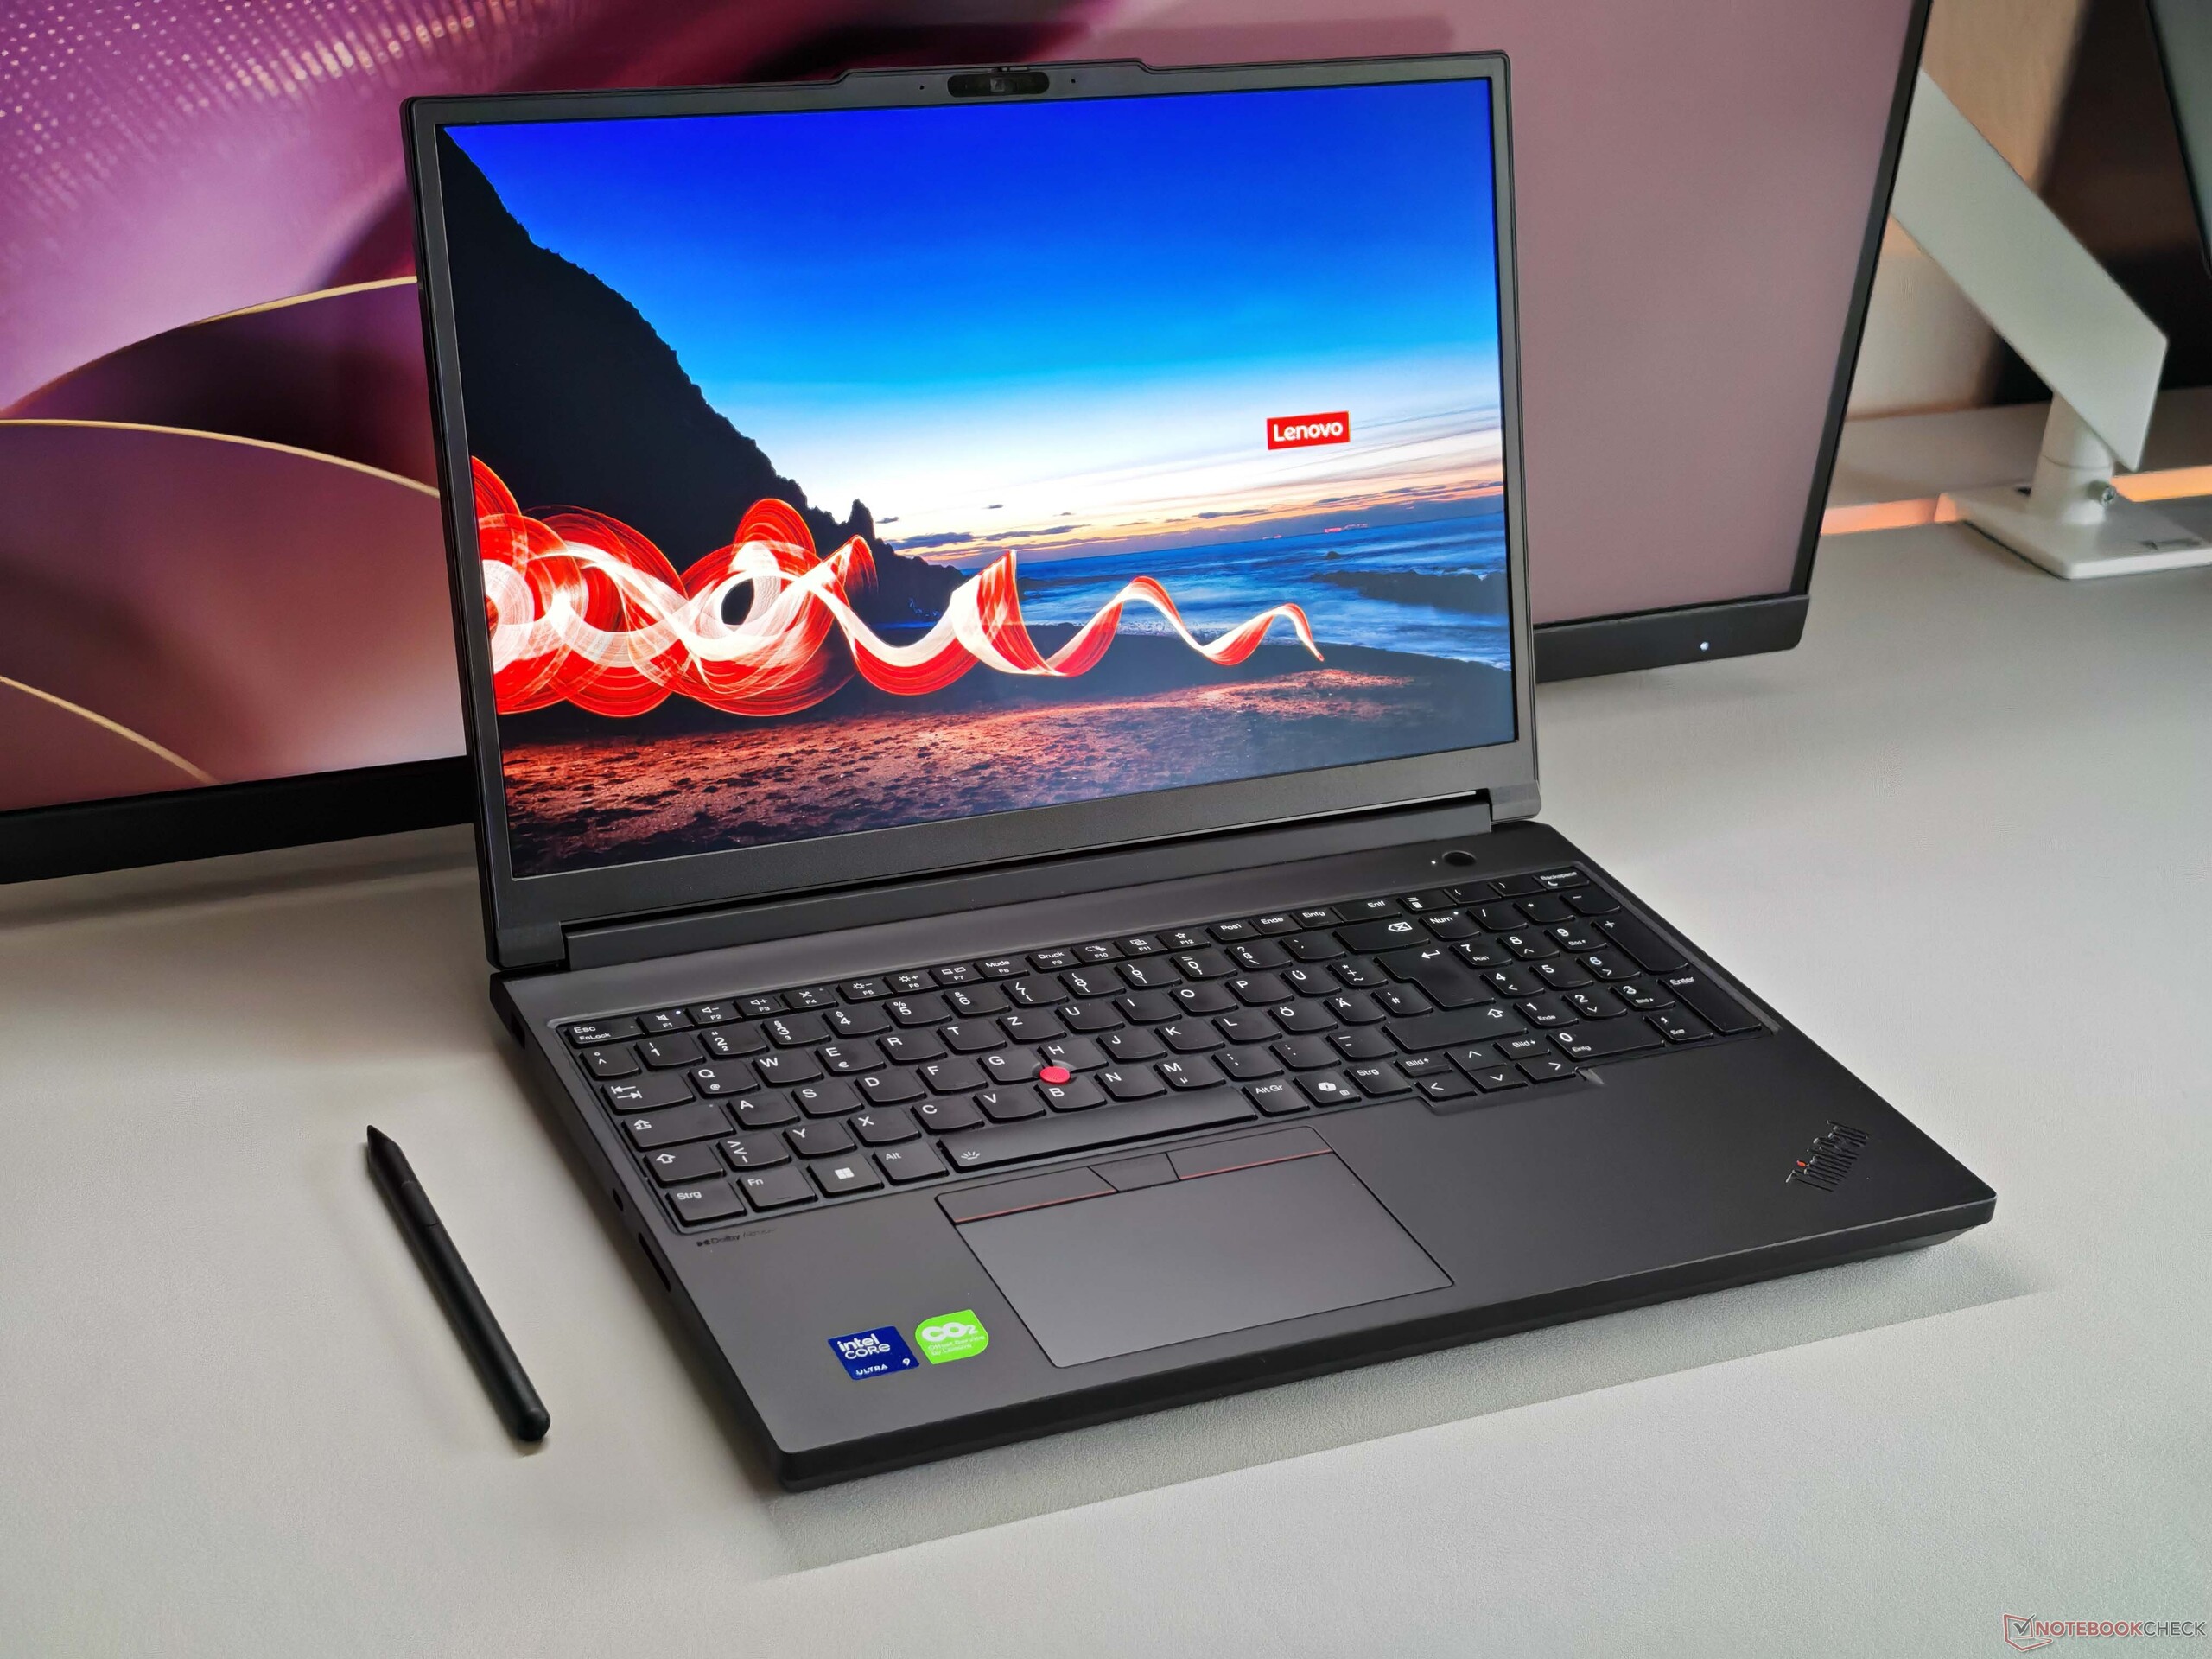
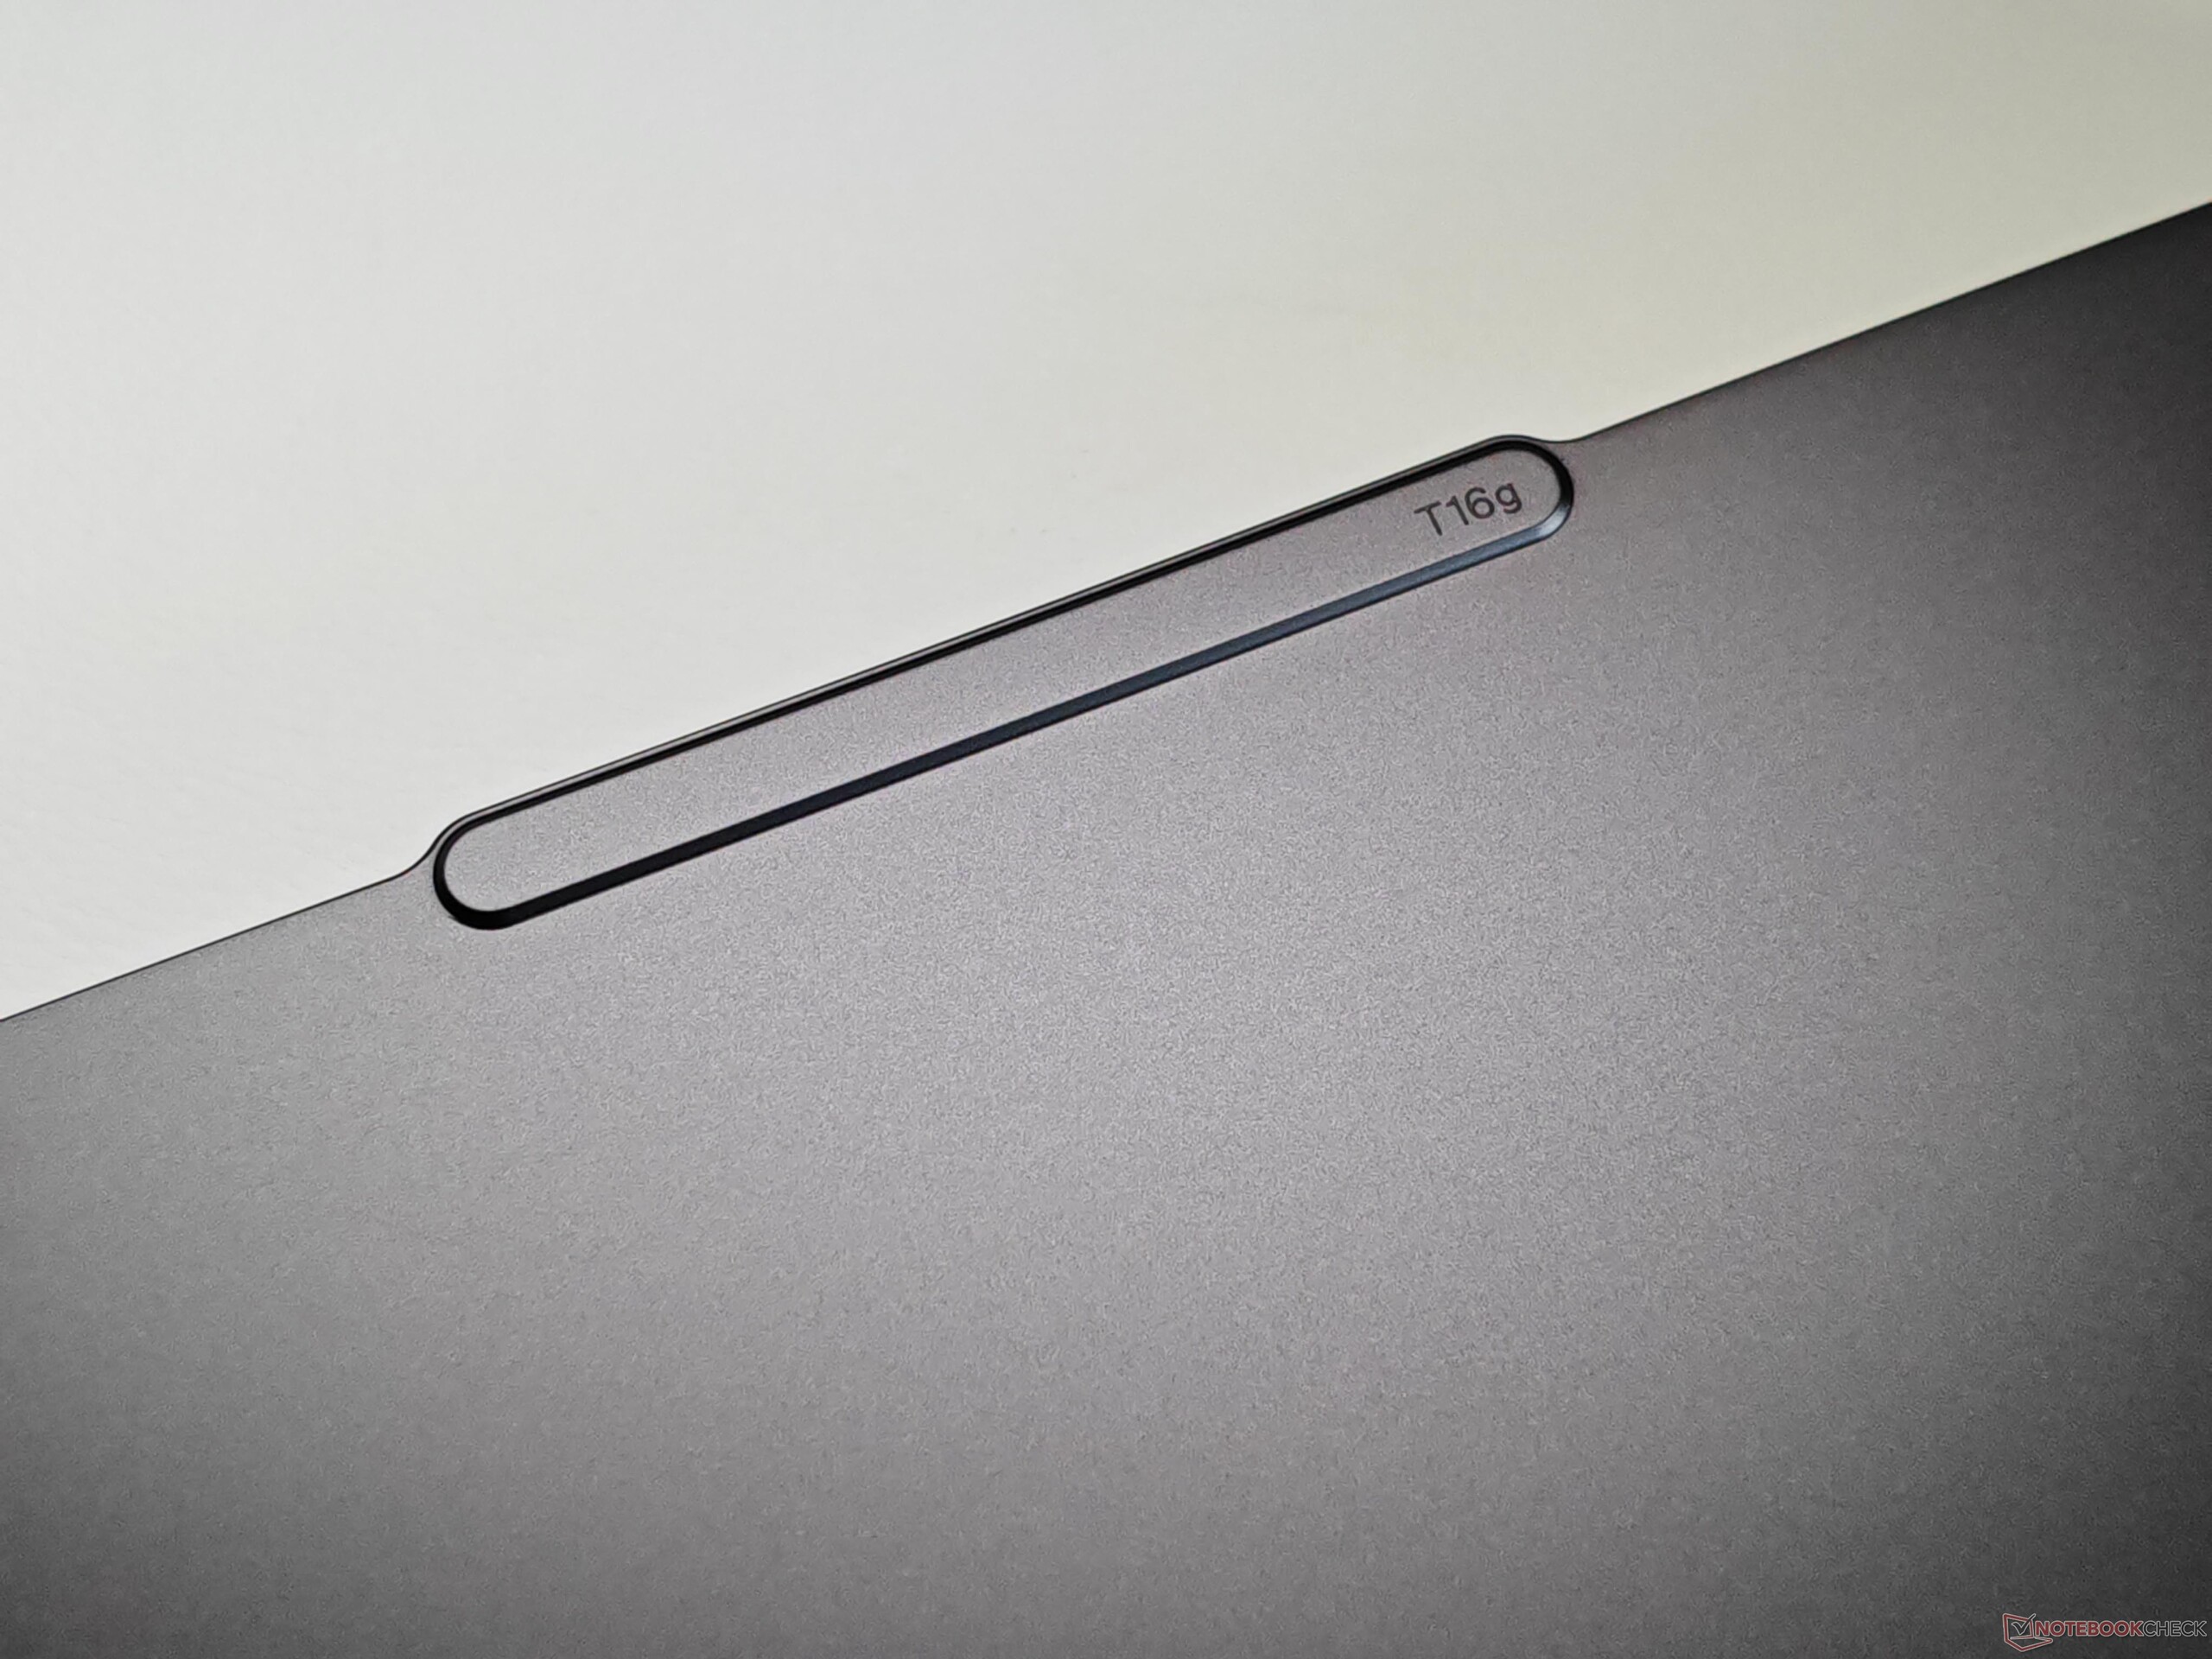
Compared to the older ThinkPad P16 Gen 2, Lenovo has completely overhauled the case, placing a greater emphasis on mobility and improved serviceability. With the new model weighing in at approximately 2.6 kg, it's almost 500 grams lighter than its predecessor, but the height has only been marginally reduced (30.2 mm vs. 29.8 mm). This weight reduction hasn't compromised stability, and both the base unit and the display lid are very robust. The aluminum display lid can be quite prone to fingerprints, but the carbon fiber-reinforced plastic top of the base unit fares better in this area. From a visual point of view, the T16g Gen 3 adheres to the ThinkPad's current design, which includes the prominent camera bump.
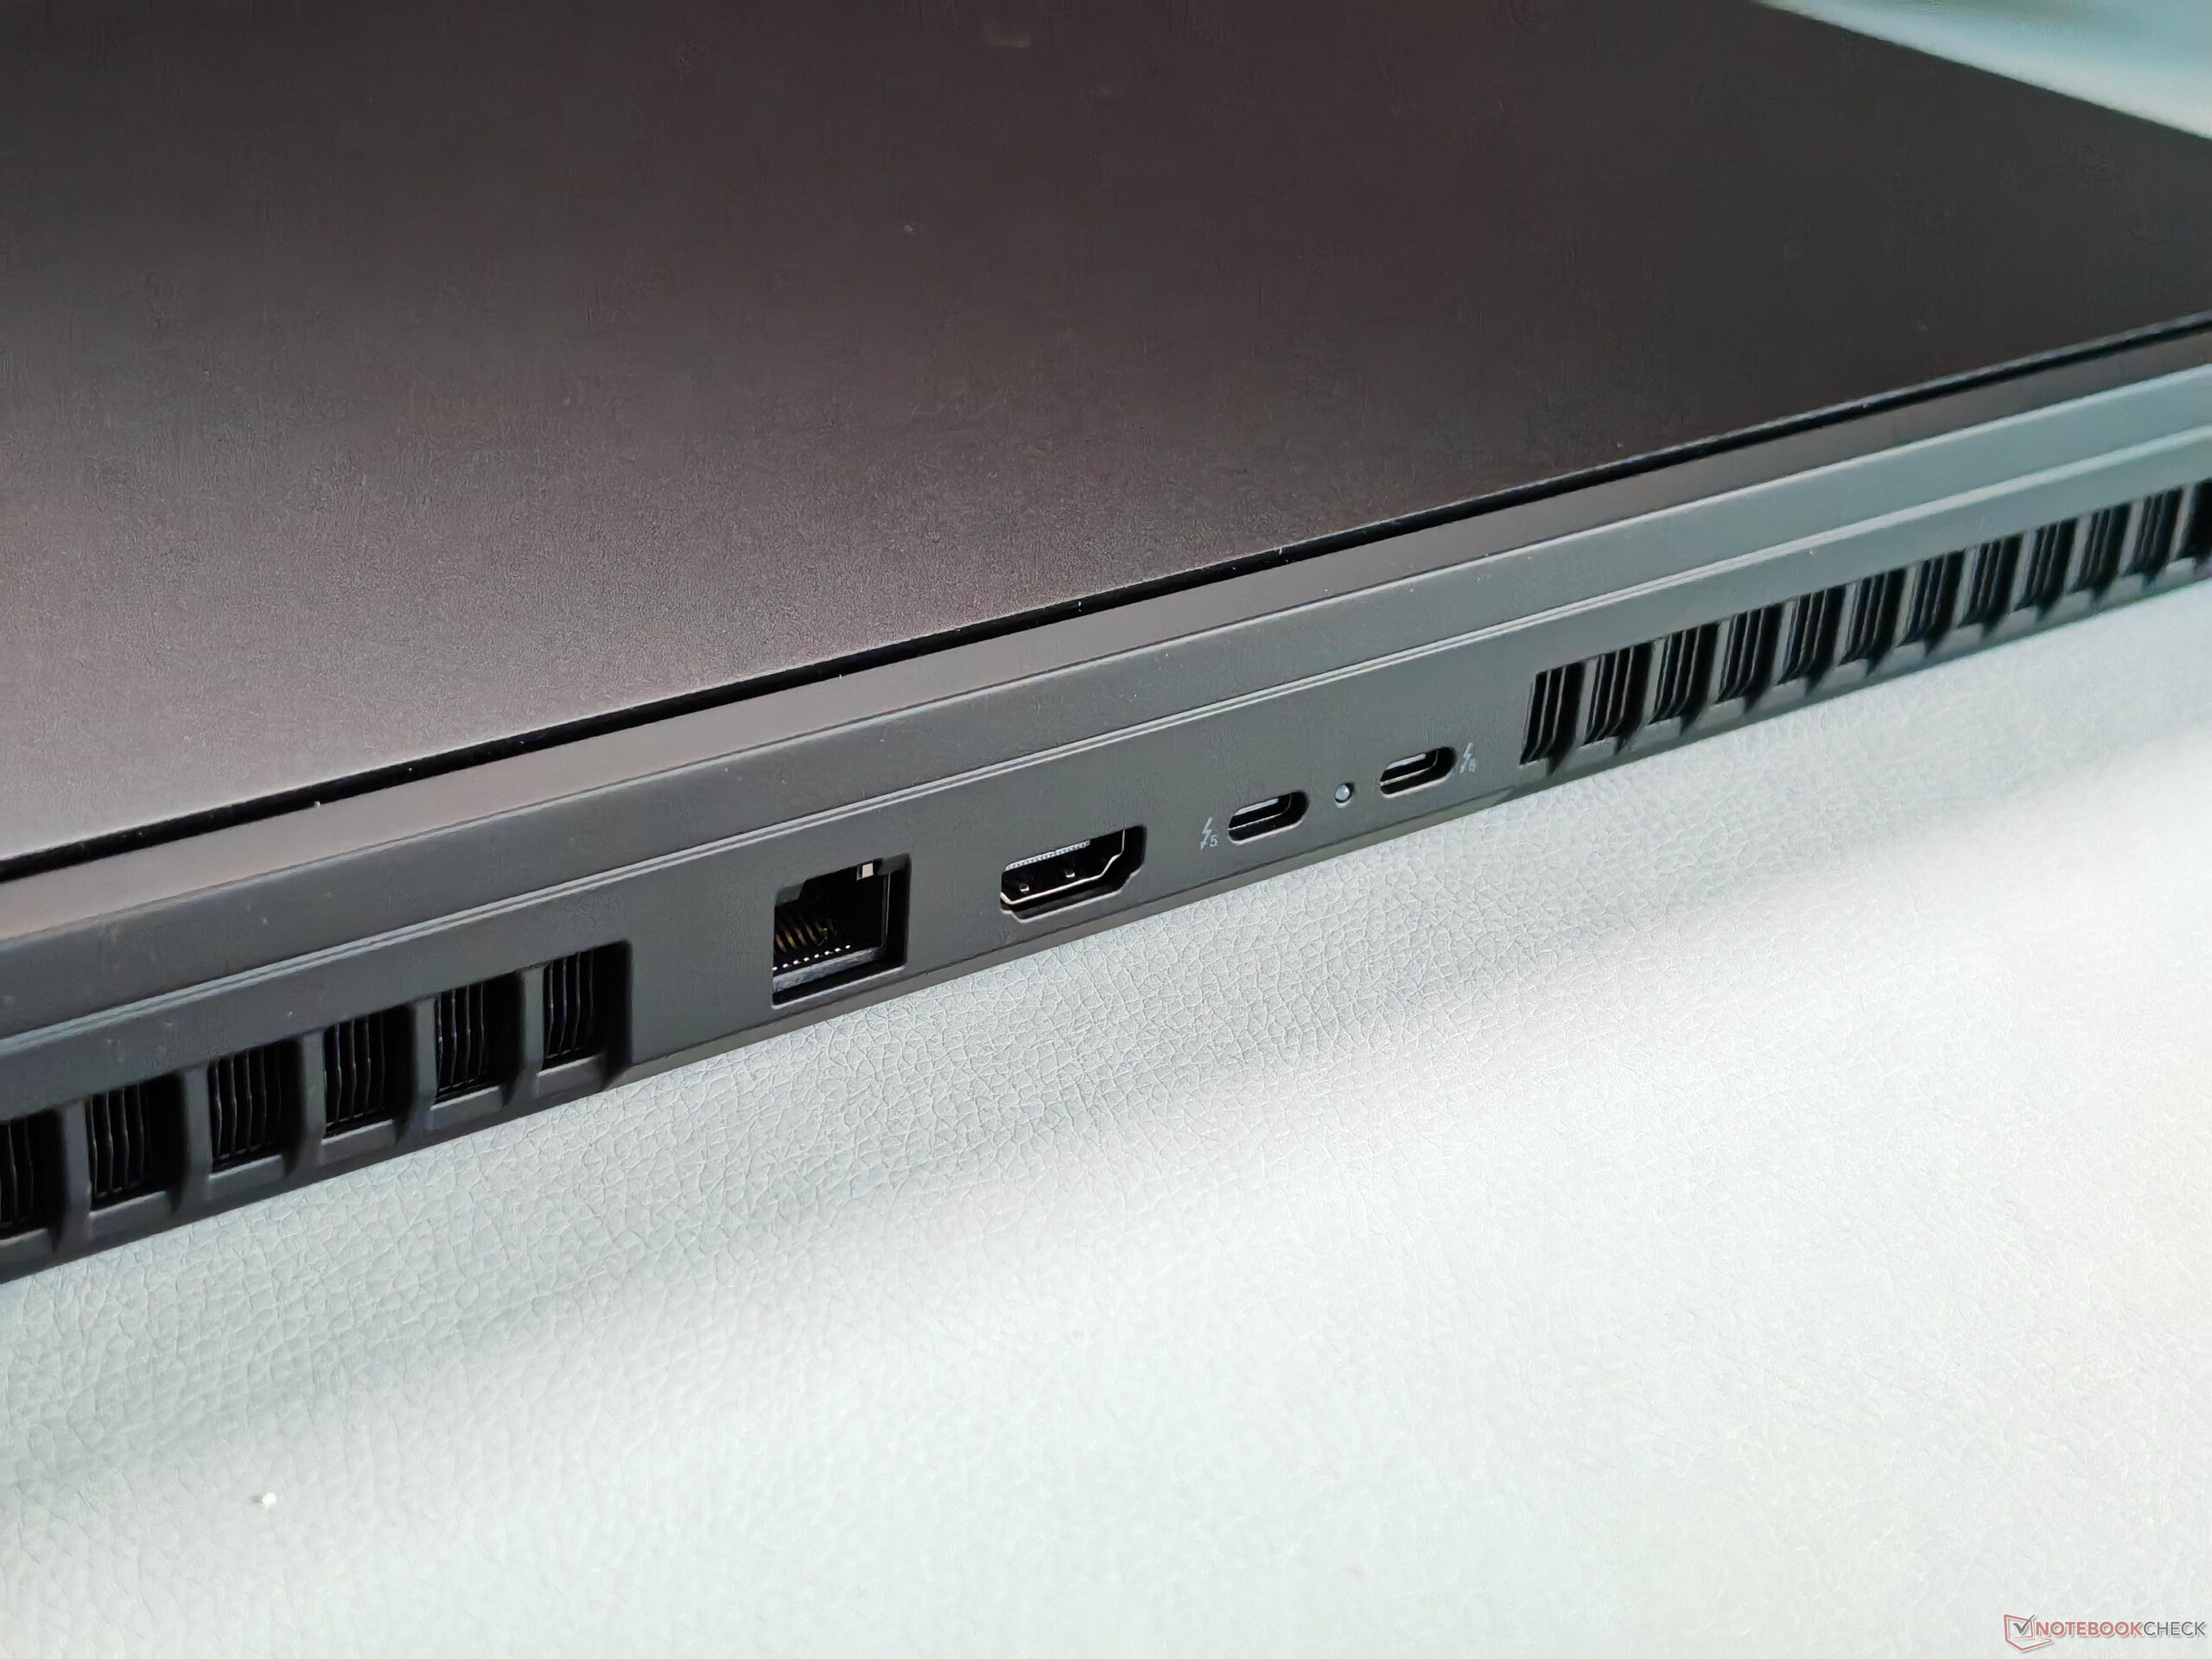
In terms of features, the T16g offers everything you could wish for (Thunderbolt 5, 2.5 Gbps Ethernet, Wi-Fi 7), and both a SmartCard reader and a 5G modem are also available as options, though these must be ordered at the same time (they cannot be retrofitted). The card reader already supports SD Express 8.0, and using a compatible card, we were able to achieve transfer speeds of over 1.4 GB/s. The 5 MP camera (with its mechanical aperture and IR for face detection) takes decent pictures. The SlimTip charging port has been removed, and the T16g is charged exclusively via USB-C.


| SD Card Reader | |
| average JPG Copy Test (av. of 3 runs) | |
| Lenovo ThinkPad T16g Gen 3 RTX 5080 (ADATA SD8.0 Express 512 GB) | |
| Lenovo ThinkPad T16g Gen 3 RTX 5080 (Angelbird AV Pro V60) | |
| Average of class Workstation (49.6 - 681, n=14, last 2 years) | |
| Schenker XMG Pro 16 (E25) (Angelbird AV Pro V60) | |
| HP ZBook Fury 16 G11 (Toshiba Exceria Pro SDXC 64 GB UHS-II) | |
| Lenovo ThinkPad P16 Gen 2 (Toshiba Exceria Pro SDXC 64 GB UHS-II) | |
| Dell Pro Max 16 Plus (Toshiba Exceria Pro SDXC 64 GB UHS-II) | |
| maximum AS SSD Seq Read Test (1GB) | |
| Lenovo ThinkPad T16g Gen 3 RTX 5080 (ADATA SD8.0 Express 512 GB) | |
| Lenovo ThinkPad T16g Gen 3 RTX 5080 (Angelbird AV Pro V60) | |
| Schenker XMG Pro 16 (E25) (Angelbird AV Pro V60) | |
| Average of class Workstation (87.6 - 1455, n=14, last 2 years) | |
| HP ZBook Fury 16 G11 (Toshiba Exceria Pro SDXC 64 GB UHS-II) | |
| Dell Pro Max 16 Plus (Toshiba Exceria Pro SDXC 64 GB UHS-II) | |
| Lenovo ThinkPad P16 Gen 2 (Toshiba Exceria Pro SDXC 64 GB UHS-II) | |
| Networking | |
| Lenovo ThinkPad T16g Gen 3 RTX 5080 | |
| iperf3 transmit AXE11000 | |
| iperf3 receive AXE11000 | |
| HP ZBook Studio 16 G11 | |
| iperf3 transmit AXE11000 | |
| iperf3 receive AXE11000 | |
| iperf3 transmit AXE11000 6GHz | |
| iperf3 receive AXE11000 6GHz | |
| Dell Pro Max 16 Plus | |
| iperf3 transmit AXE11000 | |
| iperf3 receive AXE11000 | |
| iperf3 transmit AXE11000 6GHz | |
| iperf3 receive AXE11000 6GHz | |
| Lenovo ThinkPad P16 Gen 2 | |
| iperf3 transmit AXE11000 | |
| iperf3 receive AXE11000 | |
| iperf3 transmit AXE11000 6GHz | |
| iperf3 receive AXE11000 6GHz | |
| HP ZBook Fury 16 G11 | |
| iperf3 transmit AXE11000 | |
| iperf3 receive AXE11000 | |
| iperf3 transmit AXE11000 6GHz | |
| iperf3 receive AXE11000 6GHz | |
| Schenker XMG Pro 16 (E25) | |
| iperf3 transmit AXE11000 | |
| iperf3 receive AXE11000 | |


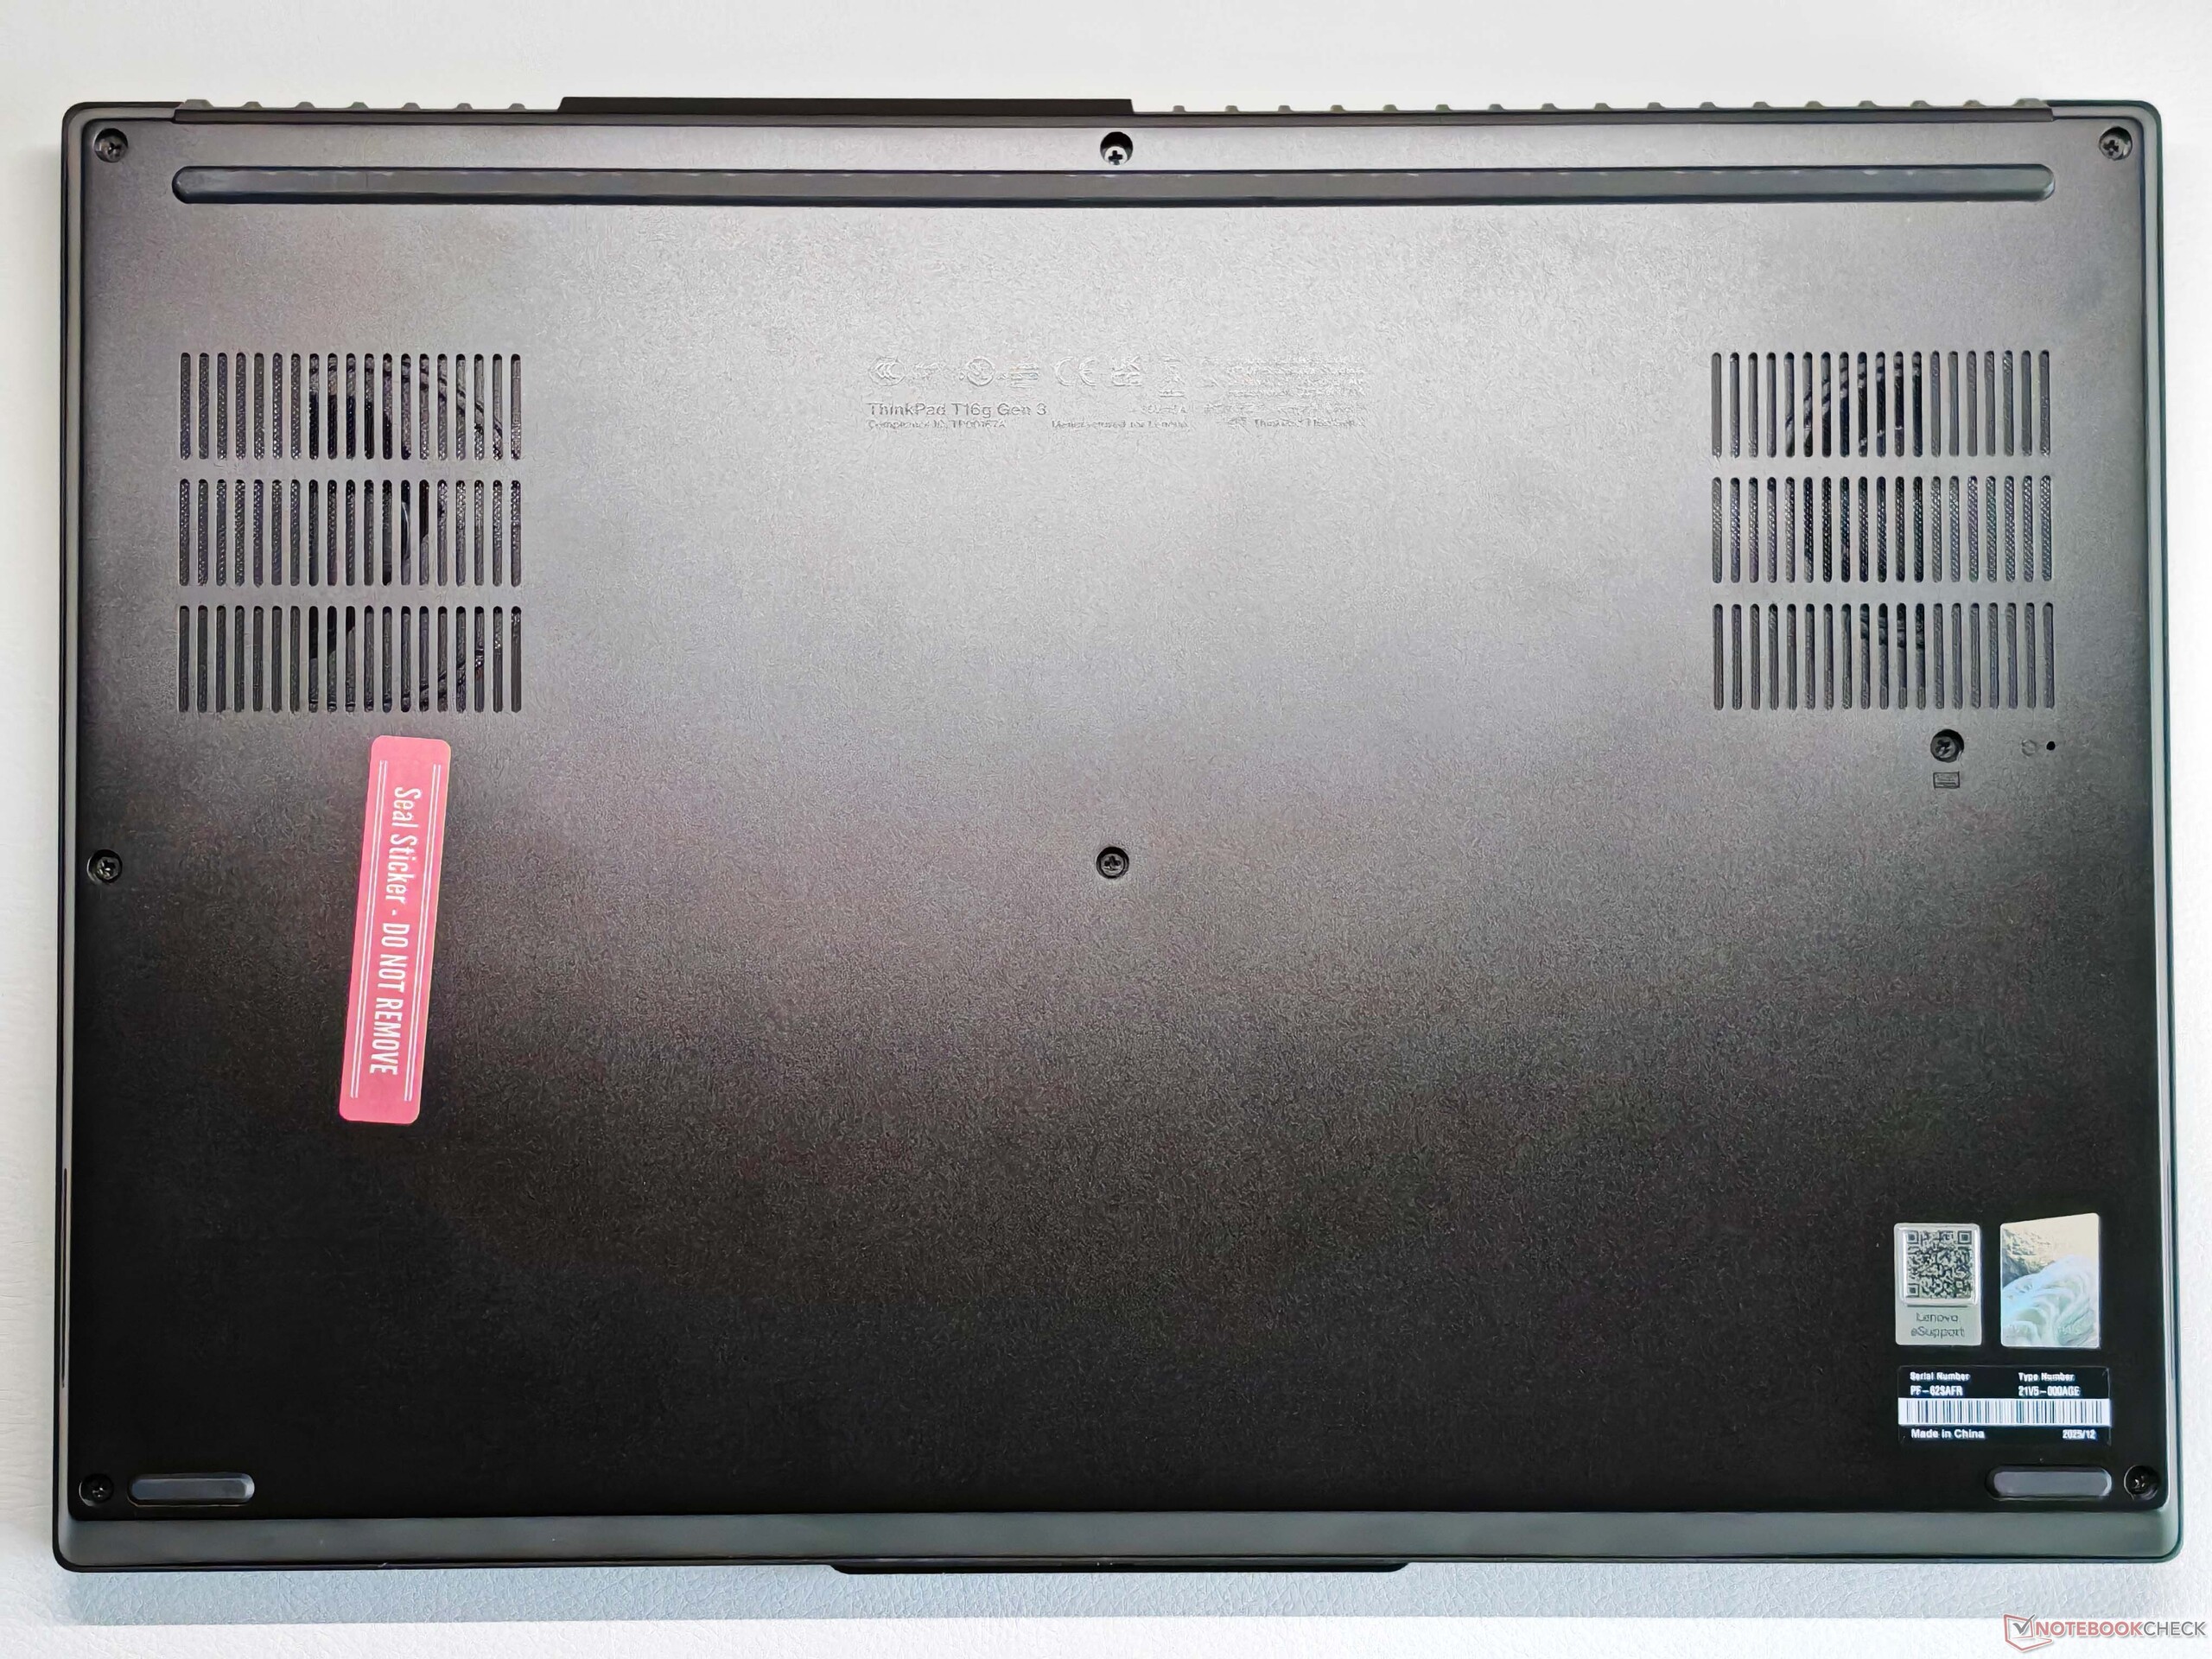
Maintenance
While the T16g Gen 3 lacks the small maintenance hatch found on the previous model, the overall maintenance options are still excellent. The bottom cover can be easily removed, revealing the Wi-Fi module, the primary SSD, and four RAM slots. Removing the keyboard will only require you to loosen two screws on the underside. This grants you access to the two additional SSD slots.


Sustainability


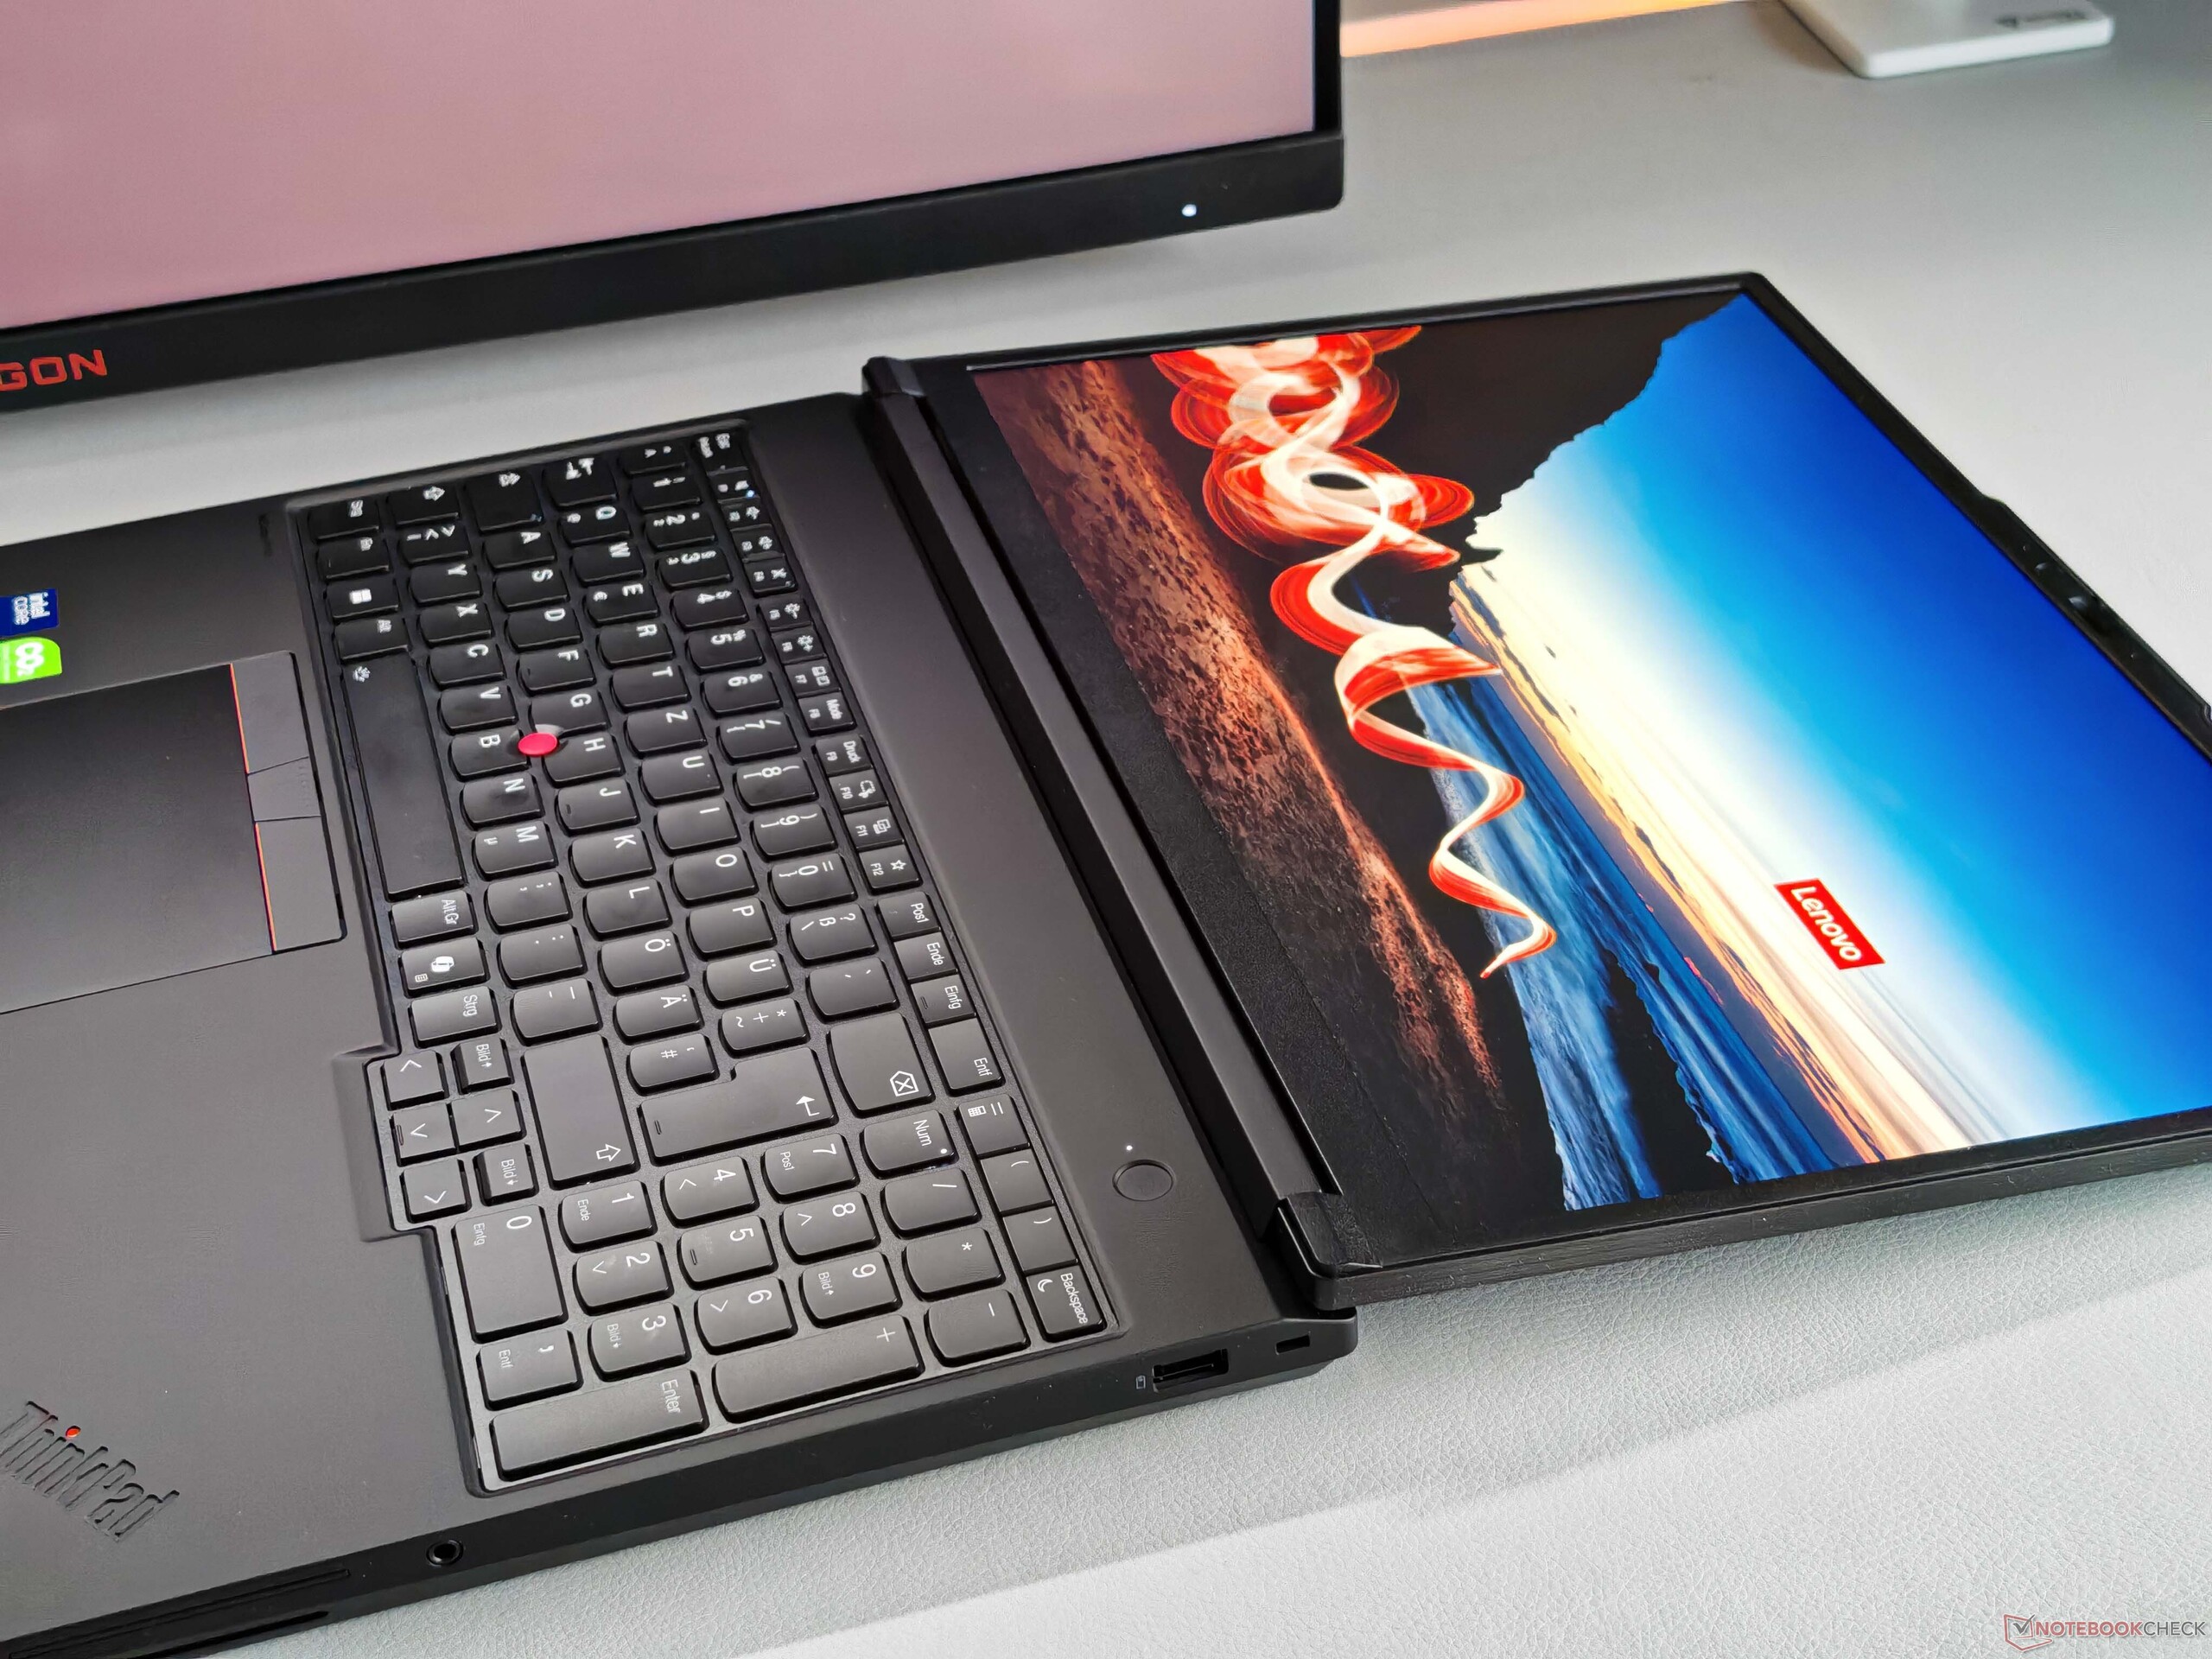
Input devices - A standard keyboard
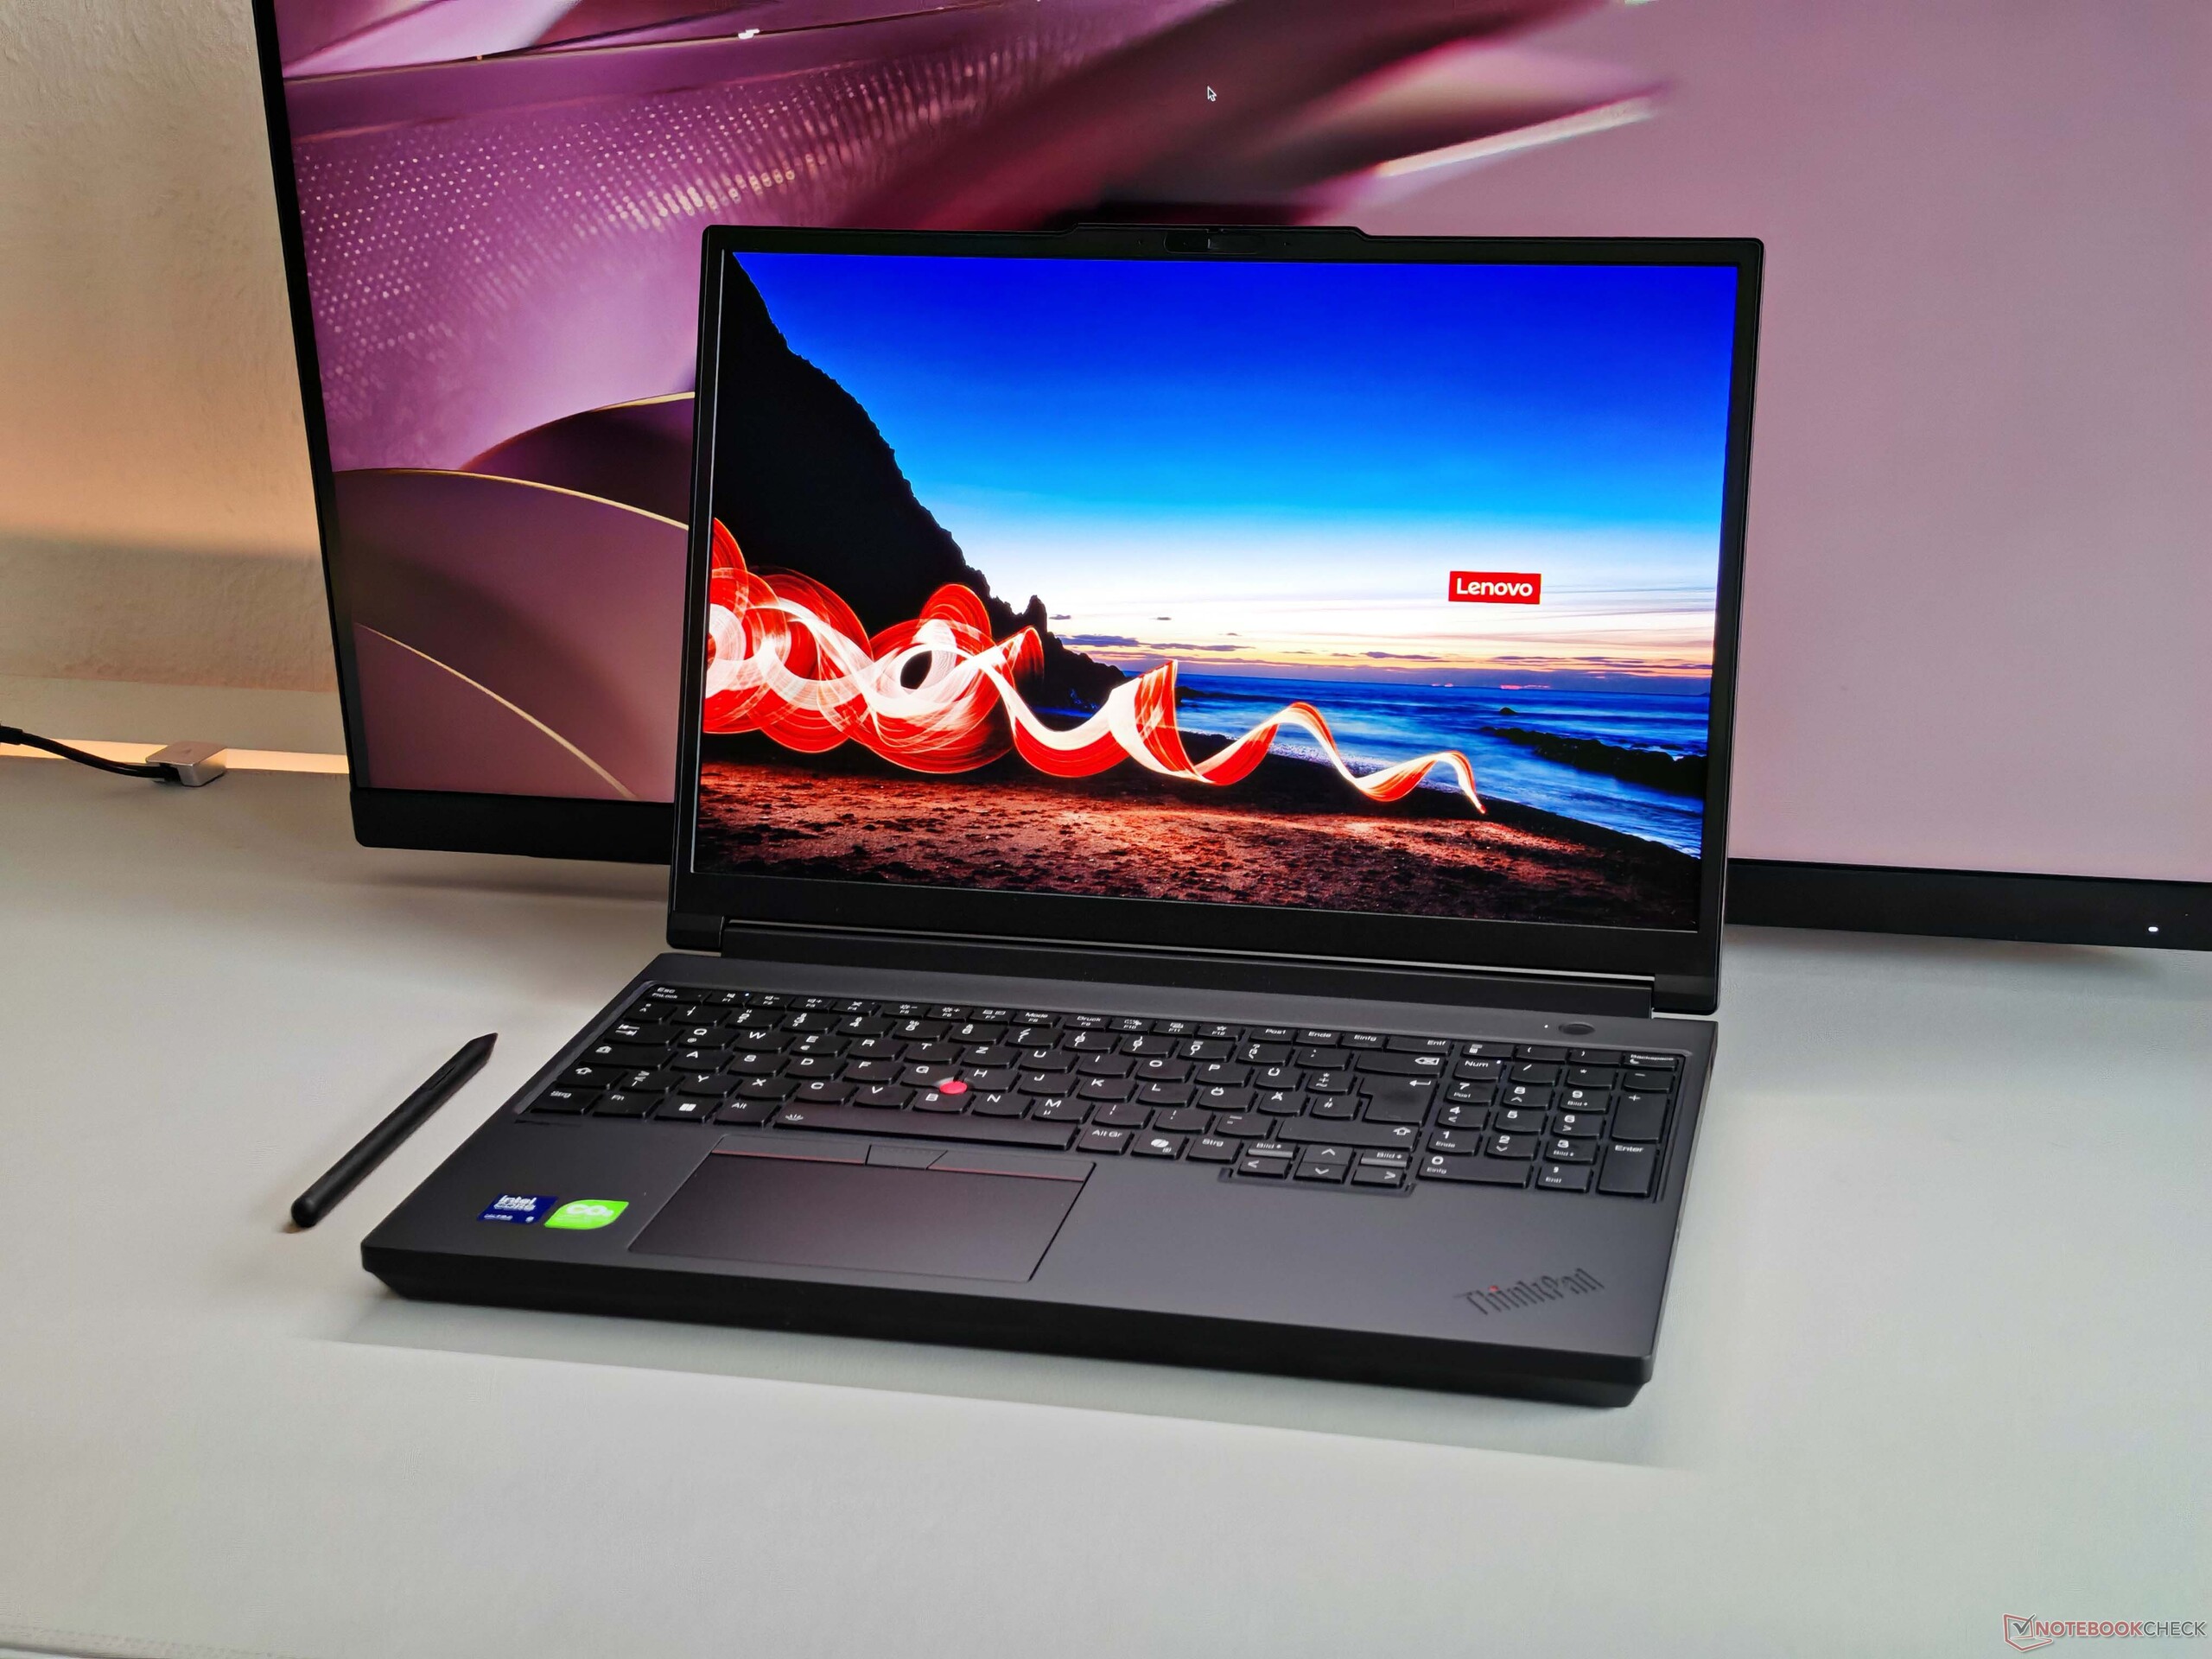
The keyboard is backlit and comes with a dedicated numeric keypad. The comfortable typing haptics (1.5 mm key travel) don't quite match the excellent ThinkPad T1g Gen 8 and are practically identical to the ThinkPad P16v in a direct comparison. With Lenovo using different keyboard suppliers, there may be slight variations depending on the specific unit.
The ClickPad and TrackPoint (including the dedicated buttons) work flawlessly, and the key mechanism feels both substantial and high-quality. The click sounds are also pleasantly quiet, and the touchscreen (which includes stylus support) also functions without any issues.


Display - Tandem OLED
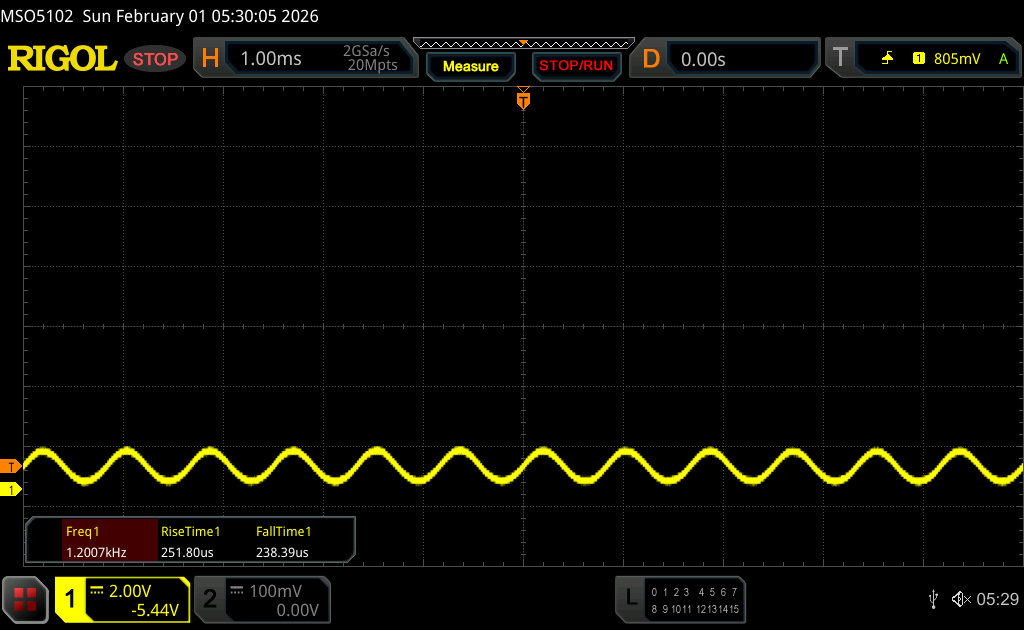
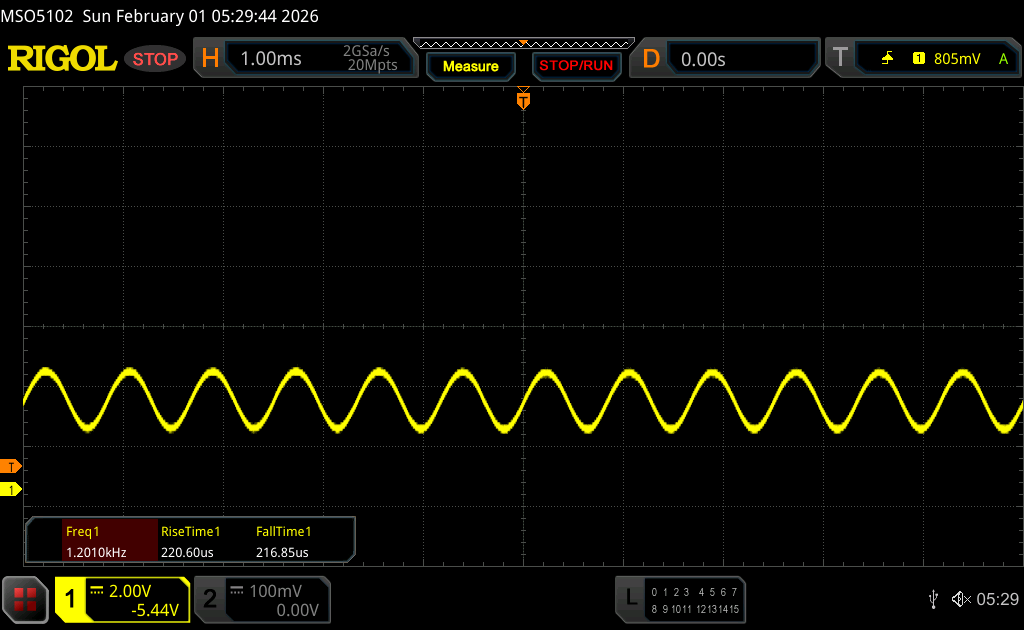
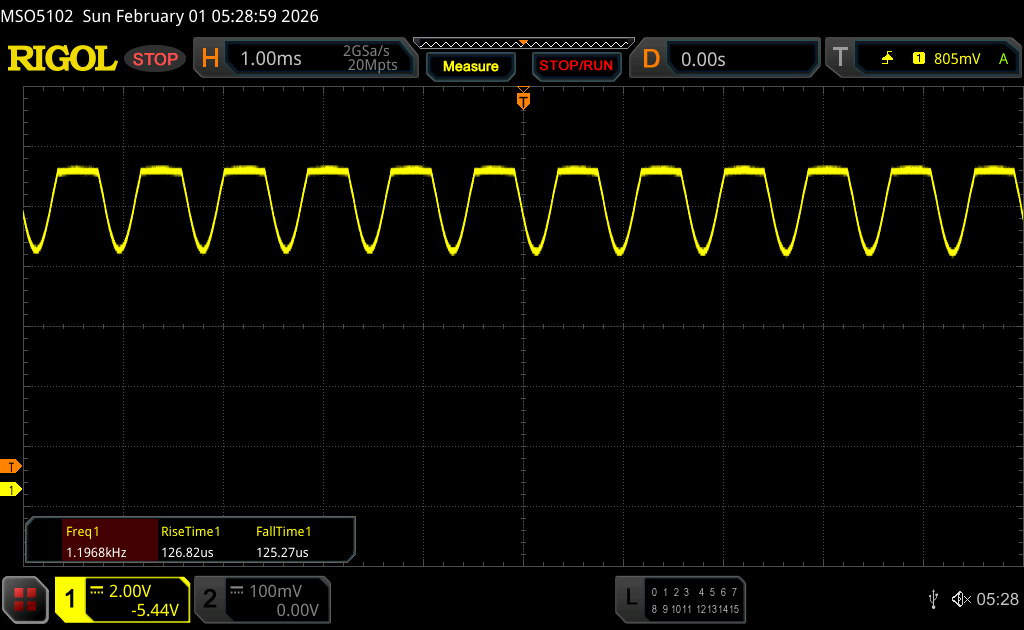
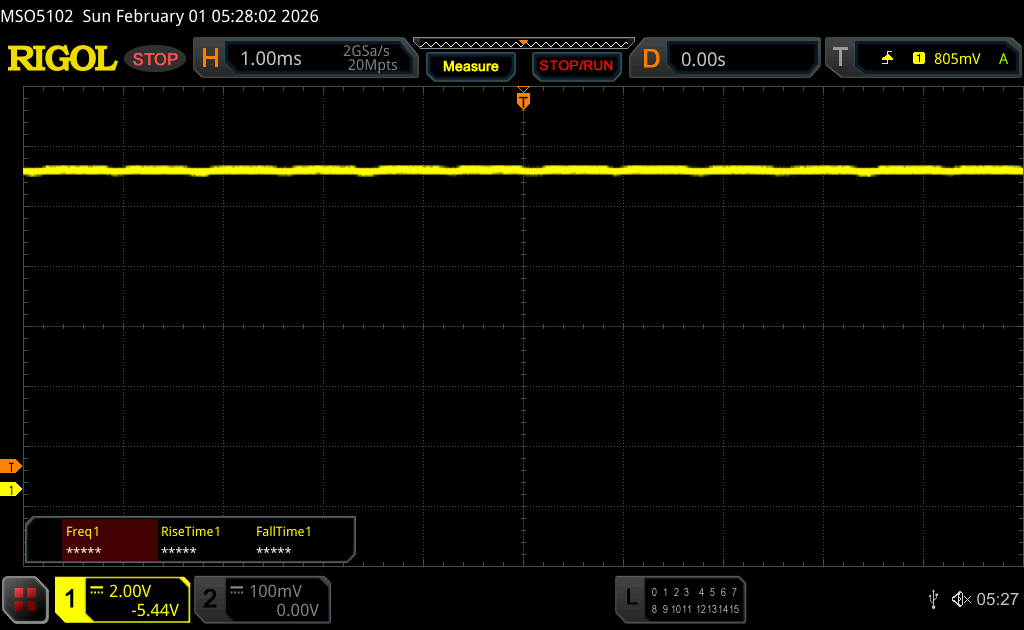
The display options are the same as on the recently reviewed ThinkPad t1g Gen 8. This means either two IPS panels with a 60 Hz refresh rate (1080p at 500 cd/m² or 4K at 800 cd/m²), or the matte tandem OLED touchscreen, which offers a 120 Hz refresh rate and is also housed in our review unit. Image quality is generally very good, and the brightness is particularly impressive. Despite this, images appear slightly grainier than what you'd expect from a glossy panel. PWM is present, but the frequency is a very high 1.2 kHz. The amplitude is also very low, so there shouldn't be any major issues here.
In SDR mode, the panel achieved a very good brightness of almost 600 cd/m², and in HDR mode, it hit more than 1,500 cd/m². Several color profiles are available, and the factory calibration already managed to perform very well in our analysis using professional CalMAN software. We were unable to improve the display any further using our own calibration.
| |||||||||||||||||||||||||
Brightness Distribution: 98 %
Center on Battery: 585 cd/m²
Contrast: ∞:1 (Black: 0 cd/m²)
ΔE ColorChecker Calman: 0.9 | ∀{0.5-29.43 Ø4.73}
ΔE Greyscale Calman: 1.4 | ∀{0.09-98 Ø4.97}
88.9% AdobeRGB 1998 (Argyll 3D)
100% sRGB (Argyll 3D)
98.8% Display P3 (Argyll 3D)
Gamma: 2.18
CCT: 6442 K
| Lenovo ThinkPad T16g Gen 3 RTX 5080 ATNA60KA02-0, OLED, 3200x2000, 16", 120 Hz | HP ZBook Studio 16 G11 AUO87A8, IPS, 3840x2400, 16", 120 Hz | Dell Pro Max 16 Plus Samsung 160HC01, OLED, 3840x2400, 16", 120 Hz | Lenovo ThinkPad P16 Gen 2 NE160QDM-NY1, IPS, 2560x1600, 16", 165 Hz | HP ZBook Fury 16 G11 AUO87A8, IPS, 3840x2400, 16", 120 Hz | Schenker XMG Pro 16 (E25) NE160QDM-NZL, IPS, 2560x1600, 16", 300 Hz | |
|---|---|---|---|---|---|---|
| Display | -2% | -1% | -18% | -1% | -13% | |
| Display P3 Coverage (%) | 98.8 | 97.7 -1% | 97.3 -2% | 68.4 -31% | 98.4 0% | 74.7 -24% |
| sRGB Coverage (%) | 100 | 99.9 0% | 100 0% | 96.9 -3% | 99.9 0% | 99.8 0% |
| AdobeRGB 1998 Coverage (%) | 88.9 | 85.7 -4% | 88.8 0% | 70.6 -21% | 86 -3% | 75.4 -15% |
| Response Times | -1575% | -24% | -1492% | -1232% | -861% | |
| Response Time Grey 50% / Grey 80% * (ms) | 1.51 ? | 14.2 ? -840% | 0.63 ? 58% | 14.1 ? -834% | 11.4 ? -655% | 10.5 ? -595% |
| Response Time Black / White * (ms) | 0.44 ? | 10.6 ? -2309% | 0.89 ? -102% | 9.9 ? -2150% | 8.4 ? -1809% | 5.4 ? -1127% |
| PWM Frequency (Hz) | 1200 ? | 479.9 ? | ||||
| PWM Amplitude * (%) | 22 | 28 -27% | ||||
| Screen | -63% | -43% | -29% | -69% | -47% | |
| Brightness middle (cd/m²) | 585 | 404.3 -31% | 530.9 -9% | 531.5 -9% | 457.6 -22% | 538 -8% |
| Brightness (cd/m²) | 590 | 405 -31% | 540 -8% | 499 -15% | 466 -21% | 508 -14% |
| Brightness Distribution (%) | 98 | 92 -6% | 95 -3% | 89 -9% | 83 -15% | 88 -10% |
| Black Level * (cd/m²) | 0.28 | 0.38 | 0.43 | 0.47 | ||
| Colorchecker dE 2000 * | 0.9 | 2.63 -192% | 2.42 -169% | 1.82 -102% | 2.78 -209% | 1.9 -111% |
| Colorchecker dE 2000 max. * | 2.7 | 4.48 -66% | 5.76 -113% | 4.1 -52% | 5.53 -105% | 4 -48% |
| Greyscale dE 2000 * | 1.4 | 2.1 -50% | 0.8 43% | 1.2 14% | 2 -43% | 2.7 -93% |
| Gamma | 2.18 101% | 2.3 96% | 2.23 99% | 2.15 102% | 2.28 96% | 2.24 98% |
| CCT | 6442 101% | 6810 95% | 6488 100% | 6484 100% | 6806 96% | 7027 93% |
| Contrast (:1) | 1444 | 1399 | 1064 | 1145 | ||
| Colorchecker dE 2000 calibrated * | 1.46 | 0.7 | 0.63 | 1.37 | ||
| Total Average (Program / Settings) | -547% /
-321% | -23% /
-28% | -513% /
-292% | -434% /
-262% | -307% /
-186% |
* ... smaller is better


Display Response Times
| ↔ Response Time Black to White | ||
|---|---|---|
| 0.44 ms ... rise ↗ and fall ↘ combined | ↗ 0.24 ms rise | 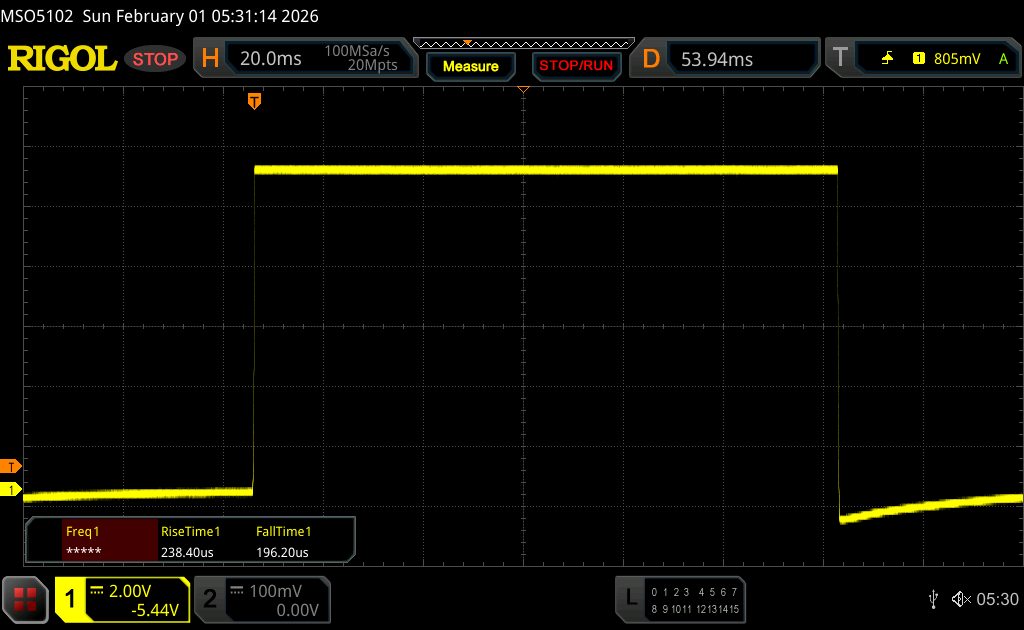 |
| ↘ 0.2 ms fall | ||
| The screen shows very fast response rates in our tests and should be very well suited for fast-paced gaming. In comparison, all tested devices range from 0.1 (minimum) to 240 (maximum) ms. » 1 % of all devices are better. This means that the measured response time is better than the average of all tested devices (19.9 ms). | ||
| ↔ Response Time 50% Grey to 80% Grey | ||
| 1.51 ms ... rise ↗ and fall ↘ combined | ↗ 0.73 ms rise | 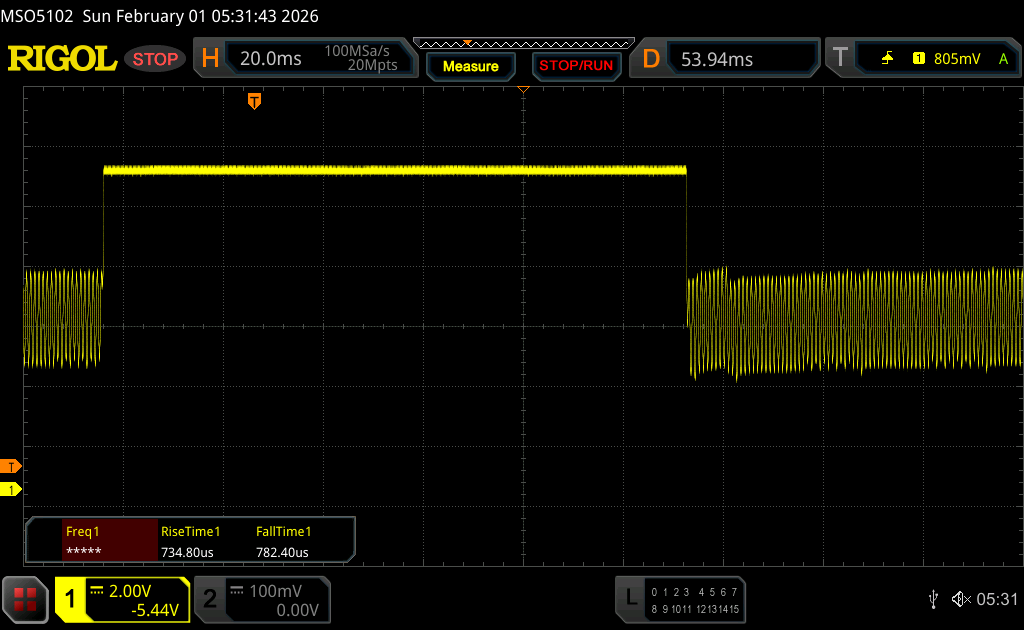 |
| ↘ 0.78 ms fall | ||
| The screen shows very fast response rates in our tests and should be very well suited for fast-paced gaming. In comparison, all tested devices range from 0.165 (minimum) to 636 (maximum) ms. » 7 % of all devices are better. This means that the measured response time is better than the average of all tested devices (31.1 ms). | ||
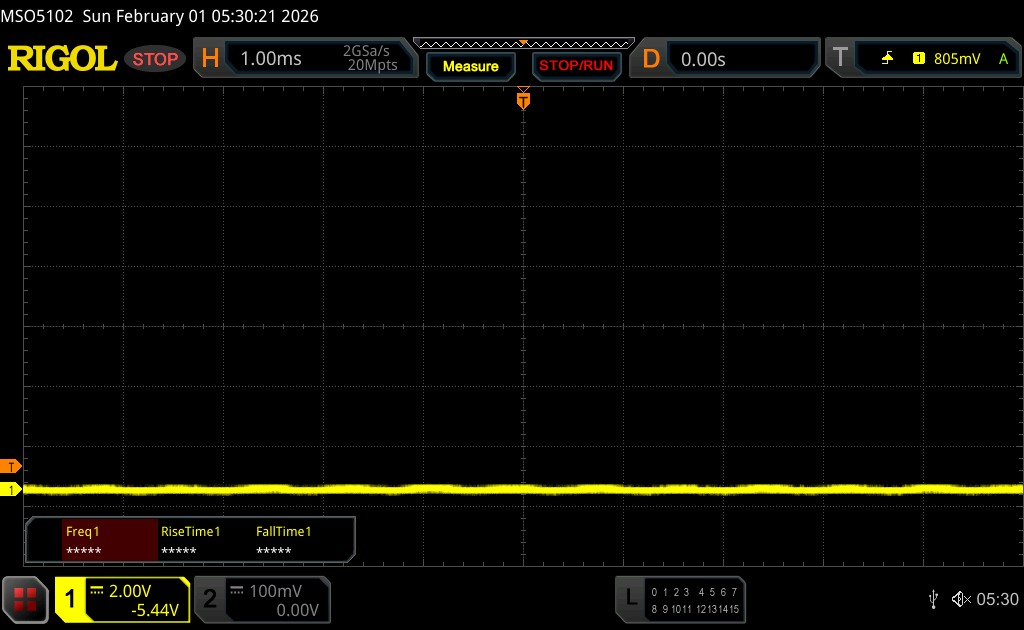
Screen Flickering / PWM (Pulse-Width Modulation)
| Screen flickering / PWM detected | 1200 Hz Amplitude: 22 % | ≤ 70 % brightness setting | 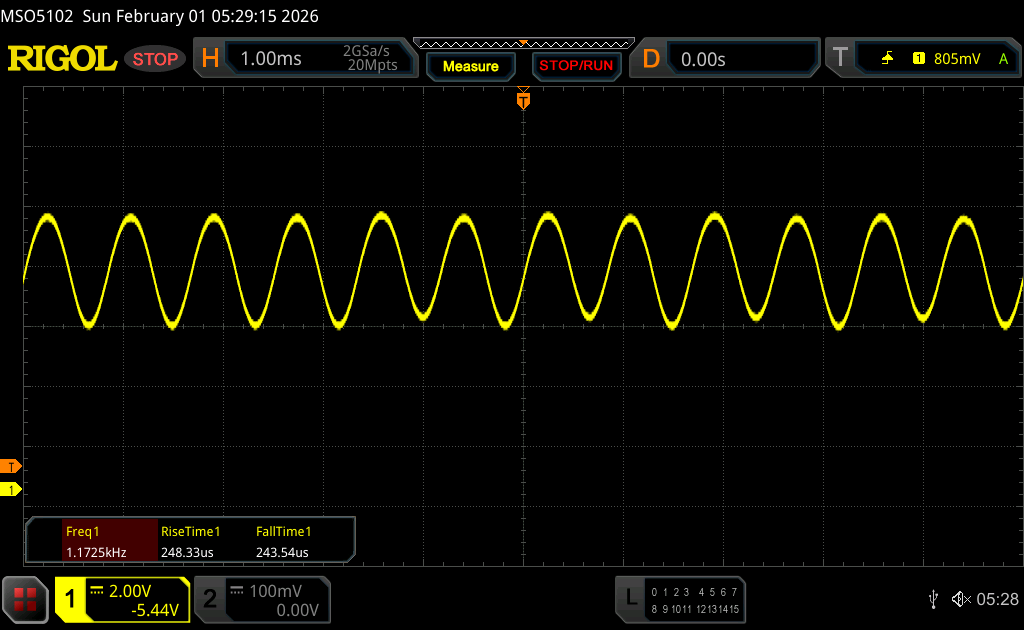 |
The display backlight flickers at 1200 Hz (worst case, e.g., utilizing PWM) Flickering detected at a brightness setting of 70 % and below. There should be no flickering or PWM above this brightness setting. The frequency of 1200 Hz is quite high, so most users sensitive to PWM should not notice any flickering. In comparison: 52 % of all tested devices do not use PWM to dim the display. If PWM was detected, an average of 7798 (minimum: 5 - maximum: 343500) Hz was measured. | |||


Performance - Arrow Lake HX and Blackwell cooking on low flame
Test conditions
Lenovo's energy profiles are linked to Windows settings. We performed the benchmarks using the Best Performance mode.
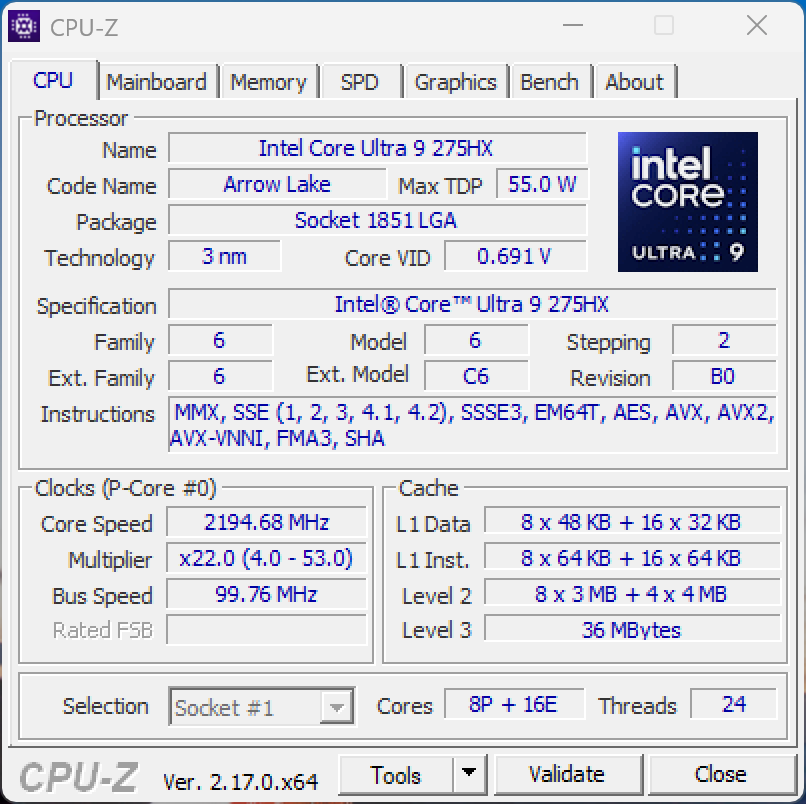
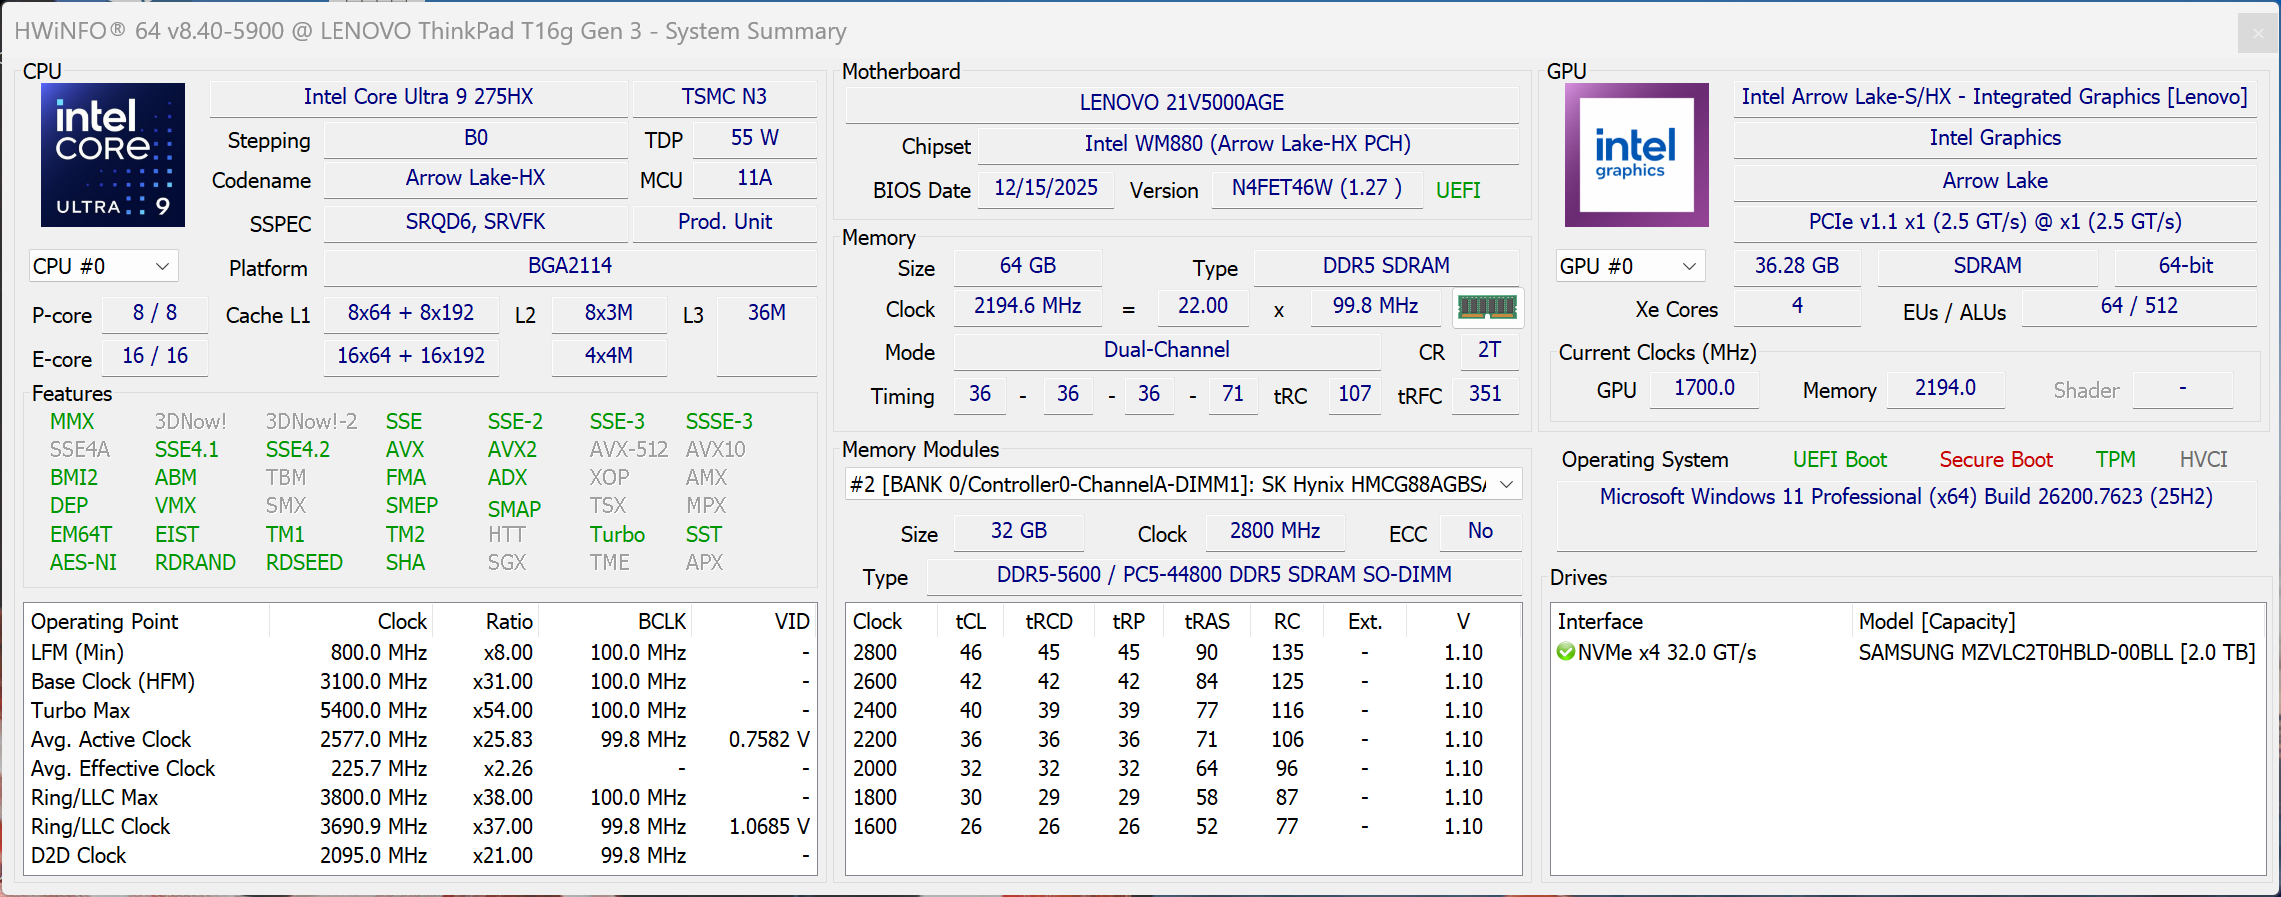
Processor

Our review device is equipped with the fast Intel Core Ultra 9 275HX (Arrow Lake HX), but its performance leaves a lot to be desired. The processor is allowed to briefly draw 160 watts, then around 110 watts, but after around one minute, the value drops to just 65 watts and subsequently fluctuates between 65 and a maximum of 90 watts. This means the short-term performance (and therefore the performance in many benchmarks) is good, but the performance is anything but stable. Overall, the result is disappointing, especially considering the large chassis. When running on battery power, the CPU is allowed to consume a maximum of 62 watts (-14% multi-core).
Cinebench R15 Multi Sustained Test
Cinebench 2024: CPU Multi Core | CPU Single Core
Cinebench R23: Multi Core | Single Core
Cinebench R20: CPU (Multi Core) | CPU (Single Core)
Cinebench R15: CPU Multi 64Bit | CPU Single 64Bit
Blender: v2.79 BMW27 CPU
7-Zip 18.03: 7z b 4 | 7z b 4 -mmt1
Geekbench 6.7: Multi-Core | Single-Core
Geekbench 5.5: Multi-Core | Single-Core
HWBOT x265 Benchmark v2.2: 4k Preset
LibreOffice : 20 Documents To PDF
R Benchmark 2.5: Overall mean
| CPU Performance rating | |
| Schenker XMG Pro 16 (E25) | |
| Average Intel Core Ultra 9 275HX | |
| Lenovo ThinkPad T16g Gen 3 RTX 5080 | |
| Dell Pro Max 16 Plus | |
| HP ZBook Fury 16 G11 | |
| Lenovo ThinkPad P16 Gen 2 | |
| Average of class Workstation | |
| HP ZBook Studio 16 G11 | |
| Cinebench 2024 / CPU Multi Core | |
| Schenker XMG Pro 16 (E25) | |
| Average Intel Core Ultra 9 275HX (1547 - 2288, n=27) | |
| Dell Pro Max 16 Plus | |
| Lenovo ThinkPad T16g Gen 3 RTX 5080 | |
| Average of class Workstation (616 - 2049, n=18, last 2 years) | |
| Lenovo ThinkPad P16 Gen 2 | |
| HP ZBook Fury 16 G11 | |
| HP ZBook Studio 16 G11 | |
| Cinebench 2024 / CPU Single Core | |
| Schenker XMG Pro 16 (E25) | |
| Average Intel Core Ultra 9 275HX (123.1 - 138.2, n=27) | |
| Lenovo ThinkPad T16g Gen 3 RTX 5080 | |
| Dell Pro Max 16 Plus | |
| HP ZBook Fury 16 G11 | |
| Lenovo ThinkPad P16 Gen 2 | |
| Average of class Workstation (101.6 - 132.2, n=17, last 2 years) | |
| HP ZBook Studio 16 G11 | |
| Cinebench R23 / Multi Core | |
| Lenovo ThinkPad T16g Gen 3 RTX 5080 | |
| Schenker XMG Pro 16 (E25) | |
| Average Intel Core Ultra 9 275HX (30712 - 40970, n=31) | |
| Dell Pro Max 16 Plus | |
| HP ZBook Fury 16 G11 | |
| Lenovo ThinkPad P16 Gen 2 | |
| Average of class Workstation (14055 - 38520, n=25, last 2 years) | |
| HP ZBook Studio 16 G11 | |
| Cinebench R23 / Single Core | |
| Schenker XMG Pro 16 (E25) | |
| Lenovo ThinkPad T16g Gen 3 RTX 5080 | |
| Average Intel Core Ultra 9 275HX (2009 - 2267, n=31) | |
| HP ZBook Fury 16 G11 | |
| Lenovo ThinkPad P16 Gen 2 | |
| Dell Pro Max 16 Plus | |
| Average of class Workstation (1712 - 2228, n=25, last 2 years) | |
| HP ZBook Studio 16 G11 | |
| Cinebench R20 / CPU (Multi Core) | |
| Lenovo ThinkPad T16g Gen 3 RTX 5080 | |
| Schenker XMG Pro 16 (E25) | |
| Average Intel Core Ultra 9 275HX (12026 - 16108, n=30) | |
| Dell Pro Max 16 Plus | |
| HP ZBook Fury 16 G11 | |
| Lenovo ThinkPad P16 Gen 2 | |
| Average of class Workstation (5471 - 15043, n=25, last 2 years) | |
| HP ZBook Studio 16 G11 | |
| Cinebench R20 / CPU (Single Core) | |
| Schenker XMG Pro 16 (E25) | |
| Lenovo ThinkPad T16g Gen 3 RTX 5080 | |
| Average Intel Core Ultra 9 275HX (774 - 870, n=30) | |
| HP ZBook Fury 16 G11 | |
| Dell Pro Max 16 Plus | |
| Lenovo ThinkPad P16 Gen 2 | |
| Average of class Workstation (671 - 857, n=25, last 2 years) | |
| HP ZBook Studio 16 G11 | |
| Cinebench R15 / CPU Multi 64Bit | |
| Lenovo ThinkPad T16g Gen 3 RTX 5080 | |
| Schenker XMG Pro 16 (E25) | |
| Average Intel Core Ultra 9 275HX (4737 - 6271, n=30) | |
| Dell Pro Max 16 Plus | |
| HP ZBook Fury 16 G11 | |
| Lenovo ThinkPad P16 Gen 2 | |
| Average of class Workstation (2489 - 5810, n=25, last 2 years) | |
| HP ZBook Studio 16 G11 | |
| Cinebench R15 / CPU Single 64Bit | |
| Schenker XMG Pro 16 (E25) | |
| Average Intel Core Ultra 9 275HX (306 - 343, n=31) | |
| Lenovo ThinkPad T16g Gen 3 RTX 5080 | |
| Dell Pro Max 16 Plus | |
| HP ZBook Fury 16 G11 | |
| Average of class Workstation (191.4 - 328, n=25, last 2 years) | |
| Lenovo ThinkPad P16 Gen 2 | |
| HP ZBook Studio 16 G11 | |
| Blender / v2.79 BMW27 CPU | |
| HP ZBook Studio 16 G11 | |
| Average of class Workstation (91 - 261, n=25, last 2 years) | |
| Lenovo ThinkPad P16 Gen 2 | |
| HP ZBook Fury 16 G11 | |
| Dell Pro Max 16 Plus | |
| Average Intel Core Ultra 9 275HX (82 - 116, n=29) | |
| Lenovo ThinkPad T16g Gen 3 RTX 5080 | |
| Schenker XMG Pro 16 (E25) | |
| 7-Zip 18.03 / 7z b 4 | |
| Schenker XMG Pro 16 (E25) | |
| Average Intel Core Ultra 9 275HX (98236 - 124155, n=30) | |
| Dell Pro Max 16 Plus | |
| Lenovo ThinkPad T16g Gen 3 RTX 5080 | |
| HP ZBook Fury 16 G11 | |
| Lenovo ThinkPad P16 Gen 2 | |
| Average of class Workstation (54741 - 116969, n=25, last 2 years) | |
| HP ZBook Studio 16 G11 | |
| 7-Zip 18.03 / 7z b 4 -mmt1 | |
| Schenker XMG Pro 16 (E25) | |
| HP ZBook Fury 16 G11 | |
| Lenovo ThinkPad P16 Gen 2 | |
| Lenovo ThinkPad T16g Gen 3 RTX 5080 | |
| Average Intel Core Ultra 9 275HX (6026 - 7149, n=30) | |
| Dell Pro Max 16 Plus | |
| Average of class Workstation (5126 - 6960, n=25, last 2 years) | |
| HP ZBook Studio 16 G11 | |
| Geekbench 6.7 / Multi-Core | |
| Dell Pro Max 16 Plus | |
| Schenker XMG Pro 16 (E25) | |
| Average Intel Core Ultra 9 275HX (16033 - 21668, n=33) | |
| Lenovo ThinkPad T16g Gen 3 RTX 5080 | |
| Lenovo ThinkPad P16 Gen 2 | |
| Average of class Workstation (12196 - 20887, n=25, last 2 years) | |
| HP ZBook Fury 16 G11 | |
| HP ZBook Studio 16 G11 | |
| Geekbench 6.7 / Single-Core | |
| Schenker XMG Pro 16 (E25) | |
| Lenovo ThinkPad T16g Gen 3 RTX 5080 | |
| Average Intel Core Ultra 9 275HX (2843 - 3160, n=33) | |
| HP ZBook Fury 16 G11 | |
| Dell Pro Max 16 Plus | |
| Lenovo ThinkPad P16 Gen 2 | |
| Average of class Workstation (2389 - 3065, n=25, last 2 years) | |
| HP ZBook Studio 16 G11 | |
| Geekbench 5.5 / Multi-Core | |
| Dell Pro Max 16 Plus | |
| Schenker XMG Pro 16 (E25) | |
| Average Intel Core Ultra 9 275HX (19105 - 25855, n=31) | |
| Lenovo ThinkPad T16g Gen 3 RTX 5080 | |
| HP ZBook Fury 16 G11 | |
| Lenovo ThinkPad P16 Gen 2 | |
| Average of class Workstation (11542 - 25554, n=25, last 2 years) | |
| HP ZBook Studio 16 G11 | |
| Geekbench 5.5 / Single-Core | |
| Schenker XMG Pro 16 (E25) | |
| Average Intel Core Ultra 9 275HX (2033 - 2292, n=31) | |
| Lenovo ThinkPad T16g Gen 3 RTX 5080 | |
| Dell Pro Max 16 Plus | |
| HP ZBook Fury 16 G11 | |
| Average of class Workstation (1781 - 2183, n=25, last 2 years) | |
| Lenovo ThinkPad P16 Gen 2 | |
| HP ZBook Studio 16 G11 | |
| HWBOT x265 Benchmark v2.2 / 4k Preset | |
| Schenker XMG Pro 16 (E25) | |
| Average Intel Core Ultra 9 275HX (30.7 - 43.8, n=30) | |
| Lenovo ThinkPad T16g Gen 3 RTX 5080 | |
| Dell Pro Max 16 Plus | |
| HP ZBook Fury 16 G11 | |
| Average of class Workstation (14.4 - 40.5, n=25, last 2 years) | |
| Lenovo ThinkPad P16 Gen 2 | |
| HP ZBook Studio 16 G11 | |
| LibreOffice / 20 Documents To PDF | |
| Schenker XMG Pro 16 (E25) | |
| HP ZBook Fury 16 G11 | |
| Average of class Workstation (37.1 - 74.7, n=25, last 2 years) | |
| Lenovo ThinkPad P16 Gen 2 | |
| Lenovo ThinkPad T16g Gen 3 RTX 5080 | |
| HP ZBook Studio 16 G11 | |
| Dell Pro Max 16 Plus | |
| Average Intel Core Ultra 9 275HX (33.2 - 62.1, n=30) | |
| R Benchmark 2.5 / Overall mean | |
| HP ZBook Studio 16 G11 | |
| Average of class Workstation (0.3825 - 0.603, n=25, last 2 years) | |
| Dell Pro Max 16 Plus | |
| Lenovo ThinkPad T16g Gen 3 RTX 5080 | |
| Average Intel Core Ultra 9 275HX (0.3943 - 0.4568, n=30) | |
| Schenker XMG Pro 16 (E25) | |
| Lenovo ThinkPad P16 Gen 2 | |
| HP ZBook Fury 16 G11 | |
* ... smaller is better
AIDA64: FP32 Ray-Trace | FPU Julia | CPU SHA3 | CPU Queen | FPU SinJulia | FPU Mandel | CPU AES | CPU ZLib | FP64 Ray-Trace | CPU PhotoWorxx
| Performance rating | |
| Average Intel Core Ultra 9 275HX | |
| Schenker XMG Pro 16 (E25) | |
| Lenovo ThinkPad T16g Gen 3 RTX 5080 | |
| Dell Pro Max 16 Plus | |
| Average of class Workstation | |
| Lenovo ThinkPad P16 Gen 2 | |
| HP ZBook Fury 16 G11 | |
| HP ZBook Studio 16 G11 | |
| AIDA64 / FP32 Ray-Trace | |
| Average Intel Core Ultra 9 275HX (28039 - 39895, n=30) | |
| Lenovo ThinkPad T16g Gen 3 RTX 5080 | |
| Schenker XMG Pro 16 (E25) | |
| Dell Pro Max 16 Plus | |
| Average of class Workstation (10658 - 61611, n=25, last 2 years) | |
| Lenovo ThinkPad P16 Gen 2 | |
| HP ZBook Fury 16 G11 | |
| HP ZBook Studio 16 G11 | |
| AIDA64 / FPU Julia | |
| Average Intel Core Ultra 9 275HX (140254 - 200744, n=30) | |
| Lenovo ThinkPad T16g Gen 3 RTX 5080 | |
| Schenker XMG Pro 16 (E25) | |
| Dell Pro Max 16 Plus | |
| Average of class Workstation (56664 - 186971, n=25, last 2 years) | |
| Lenovo ThinkPad P16 Gen 2 | |
| HP ZBook Fury 16 G11 | |
| HP ZBook Studio 16 G11 | |
| AIDA64 / CPU SHA3 | |
| Average Intel Core Ultra 9 275HX (6710 - 9817, n=30) | |
| Lenovo ThinkPad T16g Gen 3 RTX 5080 | |
| Schenker XMG Pro 16 (E25) | |
| Dell Pro Max 16 Plus | |
| Average of class Workstation (2608 - 8975, n=25, last 2 years) | |
| Lenovo ThinkPad P16 Gen 2 | |
| HP ZBook Fury 16 G11 | |
| HP ZBook Studio 16 G11 | |
| AIDA64 / CPU Queen | |
| Lenovo ThinkPad P16 Gen 2 | |
| Lenovo ThinkPad T16g Gen 3 RTX 5080 | |
| HP ZBook Fury 16 G11 | |
| Dell Pro Max 16 Plus | |
| Average Intel Core Ultra 9 275HX (113887 - 140937, n=30) | |
| Schenker XMG Pro 16 (E25) | |
| Average of class Workstation (60778 - 144411, n=25, last 2 years) | |
| HP ZBook Studio 16 G11 | |
| AIDA64 / FPU SinJulia | |
| Schenker XMG Pro 16 (E25) | |
| Average Intel Core Ultra 9 275HX (11172 - 14425, n=30) | |
| Lenovo ThinkPad T16g Gen 3 RTX 5080 | |
| Lenovo ThinkPad P16 Gen 2 | |
| HP ZBook Fury 16 G11 | |
| Average of class Workstation (8165 - 29343, n=25, last 2 years) | |
| Dell Pro Max 16 Plus | |
| HP ZBook Studio 16 G11 | |
| AIDA64 / FPU Mandel | |
| Average Intel Core Ultra 9 275HX (72596 - 104508, n=30) | |
| Lenovo ThinkPad T16g Gen 3 RTX 5080 | |
| Schenker XMG Pro 16 (E25) | |
| Dell Pro Max 16 Plus | |
| Average of class Workstation (27301 - 98153, n=25, last 2 years) | |
| Lenovo ThinkPad P16 Gen 2 | |
| HP ZBook Fury 16 G11 | |
| HP ZBook Studio 16 G11 | |
| AIDA64 / CPU AES | |
| Lenovo ThinkPad T16g Gen 3 RTX 5080 | |
| Average Intel Core Ultra 9 275HX (105608 - 247074, n=30) | |
| Schenker XMG Pro 16 (E25) | |
| Dell Pro Max 16 Plus | |
| Average of class Workstation (56077 - 187841, n=25, last 2 years) | |
| Lenovo ThinkPad P16 Gen 2 | |
| HP ZBook Fury 16 G11 | |
| HP ZBook Studio 16 G11 | |
| AIDA64 / CPU ZLib | |
| Lenovo ThinkPad T16g Gen 3 RTX 5080 | |
| Average Intel Core Ultra 9 275HX (1582 - 2263, n=30) | |
| Schenker XMG Pro 16 (E25) | |
| Dell Pro Max 16 Plus | |
| Lenovo ThinkPad P16 Gen 2 | |
| Average of class Workstation (742 - 2148, n=25, last 2 years) | |
| HP ZBook Fury 16 G11 | |
| HP ZBook Studio 16 G11 | |
| AIDA64 / FP64 Ray-Trace | |
| Lenovo ThinkPad T16g Gen 3 RTX 5080 | |
| Average Intel Core Ultra 9 275HX (14847 - 21854, n=30) | |
| Schenker XMG Pro 16 (E25) | |
| Dell Pro Max 16 Plus | |
| Average of class Workstation (5580 - 32891, n=25, last 2 years) | |
| Lenovo ThinkPad P16 Gen 2 | |
| HP ZBook Fury 16 G11 | |
| HP ZBook Studio 16 G11 | |
| AIDA64 / CPU PhotoWorxx | |
| Dell Pro Max 16 Plus | |
| Schenker XMG Pro 16 (E25) | |
| HP ZBook Studio 16 G11 | |
| Average of class Workstation (37151 - 93684, n=25, last 2 years) | |
| Average Intel Core Ultra 9 275HX (37482 - 62916, n=30) | |
| Lenovo ThinkPad P16 Gen 2 | |
| Lenovo ThinkPad T16g Gen 3 RTX 5080 | |
| HP ZBook Fury 16 G11 | |
System performance
The system performance and the subjective performance impressions are excellent, and the benchmark results can also be considered very good.
PCMark 10: Score | Essentials | Productivity | Digital Content Creation
CrossMark: Overall | Productivity | Creativity | Responsiveness
WebXPRT 3: Overall
WebXPRT 4: Overall
Mozilla Kraken 1.1: Total
| Performance rating | |
| Lenovo ThinkPad T16g Gen 3 RTX 5080 | |
| Schenker XMG Pro 16 (E25) | |
| Dell Pro Max 16 Plus -4! | |
| Average Intel Core Ultra 9 275HX, NVIDIA GeForce RTX 5080 Laptop | |
| Lenovo ThinkPad P16 Gen 2 | |
| HP ZBook Fury 16 G11 | |
| Average of class Workstation | |
| HP ZBook Studio 16 G11 | |
| PCMark 10 / Score | |
| Lenovo ThinkPad T16g Gen 3 RTX 5080 | |
| Average Intel Core Ultra 9 275HX, NVIDIA GeForce RTX 5080 Laptop (7805 - 10409, n=9) | |
| Schenker XMG Pro 16 (E25) | |
| Lenovo ThinkPad P16 Gen 2 | |
| Average of class Workstation (6436 - 10409, n=21, last 2 years) | |
| HP ZBook Fury 16 G11 | |
| HP ZBook Studio 16 G11 | |
| PCMark 10 / Essentials | |
| Schenker XMG Pro 16 (E25) | |
| Lenovo ThinkPad P16 Gen 2 | |
| Average Intel Core Ultra 9 275HX, NVIDIA GeForce RTX 5080 Laptop (10206 - 11472, n=9) | |
| HP ZBook Studio 16 G11 | |
| Average of class Workstation (9622 - 11157, n=21, last 2 years) | |
| Lenovo ThinkPad T16g Gen 3 RTX 5080 | |
| HP ZBook Fury 16 G11 | |
| PCMark 10 / Productivity | |
| Lenovo ThinkPad T16g Gen 3 RTX 5080 | |
| Average of class Workstation (8789 - 20616, n=21, last 2 years) | |
| Average Intel Core Ultra 9 275HX, NVIDIA GeForce RTX 5080 Laptop (8319 - 20616, n=9) | |
| Lenovo ThinkPad P16 Gen 2 | |
| Schenker XMG Pro 16 (E25) | |
| HP ZBook Fury 16 G11 | |
| HP ZBook Studio 16 G11 | |
| PCMark 10 / Digital Content Creation | |
| Average Intel Core Ultra 9 275HX, NVIDIA GeForce RTX 5080 Laptop (10505 - 19351, n=9) | |
| Schenker XMG Pro 16 (E25) | |
| Lenovo ThinkPad P16 Gen 2 | |
| Lenovo ThinkPad T16g Gen 3 RTX 5080 | |
| HP ZBook Fury 16 G11 | |
| Average of class Workstation (7744 - 15631, n=21, last 2 years) | |
| HP ZBook Studio 16 G11 | |
| CrossMark / Overall | |
| Lenovo ThinkPad T16g Gen 3 RTX 5080 | |
| Dell Pro Max 16 Plus | |
| Schenker XMG Pro 16 (E25) | |
| Average Intel Core Ultra 9 275HX, NVIDIA GeForce RTX 5080 Laptop (1857 - 2244, n=9) | |
| HP ZBook Fury 16 G11 | |
| Lenovo ThinkPad P16 Gen 2 | |
| Average of class Workstation (1307 - 2267, n=24, last 2 years) | |
| HP ZBook Studio 16 G11 | |
| CrossMark / Productivity | |
| Lenovo ThinkPad T16g Gen 3 RTX 5080 | |
| Schenker XMG Pro 16 (E25) | |
| Dell Pro Max 16 Plus | |
| Average Intel Core Ultra 9 275HX, NVIDIA GeForce RTX 5080 Laptop (1764 - 2122, n=9) | |
| HP ZBook Fury 16 G11 | |
| Lenovo ThinkPad P16 Gen 2 | |
| Average of class Workstation (1130 - 2122, n=24, last 2 years) | |
| HP ZBook Studio 16 G11 | |
| CrossMark / Creativity | |
| Dell Pro Max 16 Plus | |
| Schenker XMG Pro 16 (E25) | |
| Lenovo ThinkPad T16g Gen 3 RTX 5080 | |
| Average Intel Core Ultra 9 275HX, NVIDIA GeForce RTX 5080 Laptop (2115 - 2498, n=9) | |
| Lenovo ThinkPad P16 Gen 2 | |
| HP ZBook Fury 16 G11 | |
| Average of class Workstation (1657 - 2725, n=24, last 2 years) | |
| HP ZBook Studio 16 G11 | |
| CrossMark / Responsiveness | |
| Lenovo ThinkPad T16g Gen 3 RTX 5080 | |
| Average Intel Core Ultra 9 275HX, NVIDIA GeForce RTX 5080 Laptop (1466 - 2096, n=9) | |
| Dell Pro Max 16 Plus | |
| Schenker XMG Pro 16 (E25) | |
| HP ZBook Fury 16 G11 | |
| Lenovo ThinkPad P16 Gen 2 | |
| Average of class Workstation (993 - 2096, n=24, last 2 years) | |
| HP ZBook Studio 16 G11 | |
| WebXPRT 3 / Overall | |
| Schenker XMG Pro 16 (E25) | |
| Average Intel Core Ultra 9 275HX, NVIDIA GeForce RTX 5080 Laptop (306 - 378, n=9) | |
| Lenovo ThinkPad P16 Gen 2 | |
| Lenovo ThinkPad T16g Gen 3 RTX 5080 | |
| Dell Pro Max 16 Plus | |
| HP ZBook Fury 16 G11 | |
| Average of class Workstation (260 - 360, n=25, last 2 years) | |
| HP ZBook Studio 16 G11 | |
| WebXPRT 4 / Overall | |
| Schenker XMG Pro 16 (E25) | |
| Average Intel Core Ultra 9 275HX, NVIDIA GeForce RTX 5080 Laptop (285 - 336, n=9) | |
| Lenovo ThinkPad T16g Gen 3 RTX 5080 | |
| Dell Pro Max 16 Plus | |
| HP ZBook Fury 16 G11 | |
| Lenovo ThinkPad P16 Gen 2 | |
| Average of class Workstation (189.2 - 326, n=25, last 2 years) | |
| HP ZBook Studio 16 G11 | |
| Mozilla Kraken 1.1 / Total | |
| HP ZBook Studio 16 G11 | |
| Average of class Workstation (411 - 538, n=25, last 2 years) | |
| Lenovo ThinkPad P16 Gen 2 | |
| HP ZBook Fury 16 G11 | |
| Dell Pro Max 16 Plus | |
| Lenovo ThinkPad T16g Gen 3 RTX 5080 | |
| Average Intel Core Ultra 9 275HX, NVIDIA GeForce RTX 5080 Laptop (405 - 432, n=9) | |
| Schenker XMG Pro 16 (E25) | |
* ... smaller is better
| PCMark 10 Score | 10409 points | |
Help | ||
| AIDA64 / Memory Copy | |
| Dell Pro Max 16 Plus | |
| Schenker XMG Pro 16 (E25) | |
| Average of class Workstation (56003 - 164795, n=25, last 2 years) | |
| Average Intel Core Ultra 9 275HX (56003 - 94460, n=30) | |
| HP ZBook Studio 16 G11 | |
| Lenovo ThinkPad T16g Gen 3 RTX 5080 | |
| Lenovo ThinkPad P16 Gen 2 | |
| HP ZBook Fury 16 G11 | |
| AIDA64 / Memory Read | |
| Dell Pro Max 16 Plus | |
| Schenker XMG Pro 16 (E25) | |
| Average Intel Core Ultra 9 275HX (55795 - 97151, n=30) | |
| HP ZBook Studio 16 G11 | |
| Average of class Workstation (55795 - 121563, n=25, last 2 years) | |
| Lenovo ThinkPad P16 Gen 2 | |
| Lenovo ThinkPad T16g Gen 3 RTX 5080 | |
| HP ZBook Fury 16 G11 | |
| AIDA64 / Memory Write | |
| Dell Pro Max 16 Plus | |
| Schenker XMG Pro 16 (E25) | |
| Average of class Workstation (55663 - 214520, n=25, last 2 years) | |
| Average Intel Core Ultra 9 275HX (55663 - 116129, n=30) | |
| HP ZBook Studio 16 G11 | |
| Lenovo ThinkPad T16g Gen 3 RTX 5080 | |
| Lenovo ThinkPad P16 Gen 2 | |
| HP ZBook Fury 16 G11 | |
| AIDA64 / Memory Latency | |
| Lenovo ThinkPad T16g Gen 3 RTX 5080 | |
| HP ZBook Studio 16 G11 | |
| Average of class Workstation (84.5 - 165.2, n=25, last 2 years) | |
| Average Intel Core Ultra 9 275HX (105.8 - 161.6, n=30) | |
| Dell Pro Max 16 Plus | |
| Schenker XMG Pro 16 (E25) | |
| HP ZBook Fury 16 G11 | |
| Lenovo ThinkPad P16 Gen 2 | |
* ... smaller is better
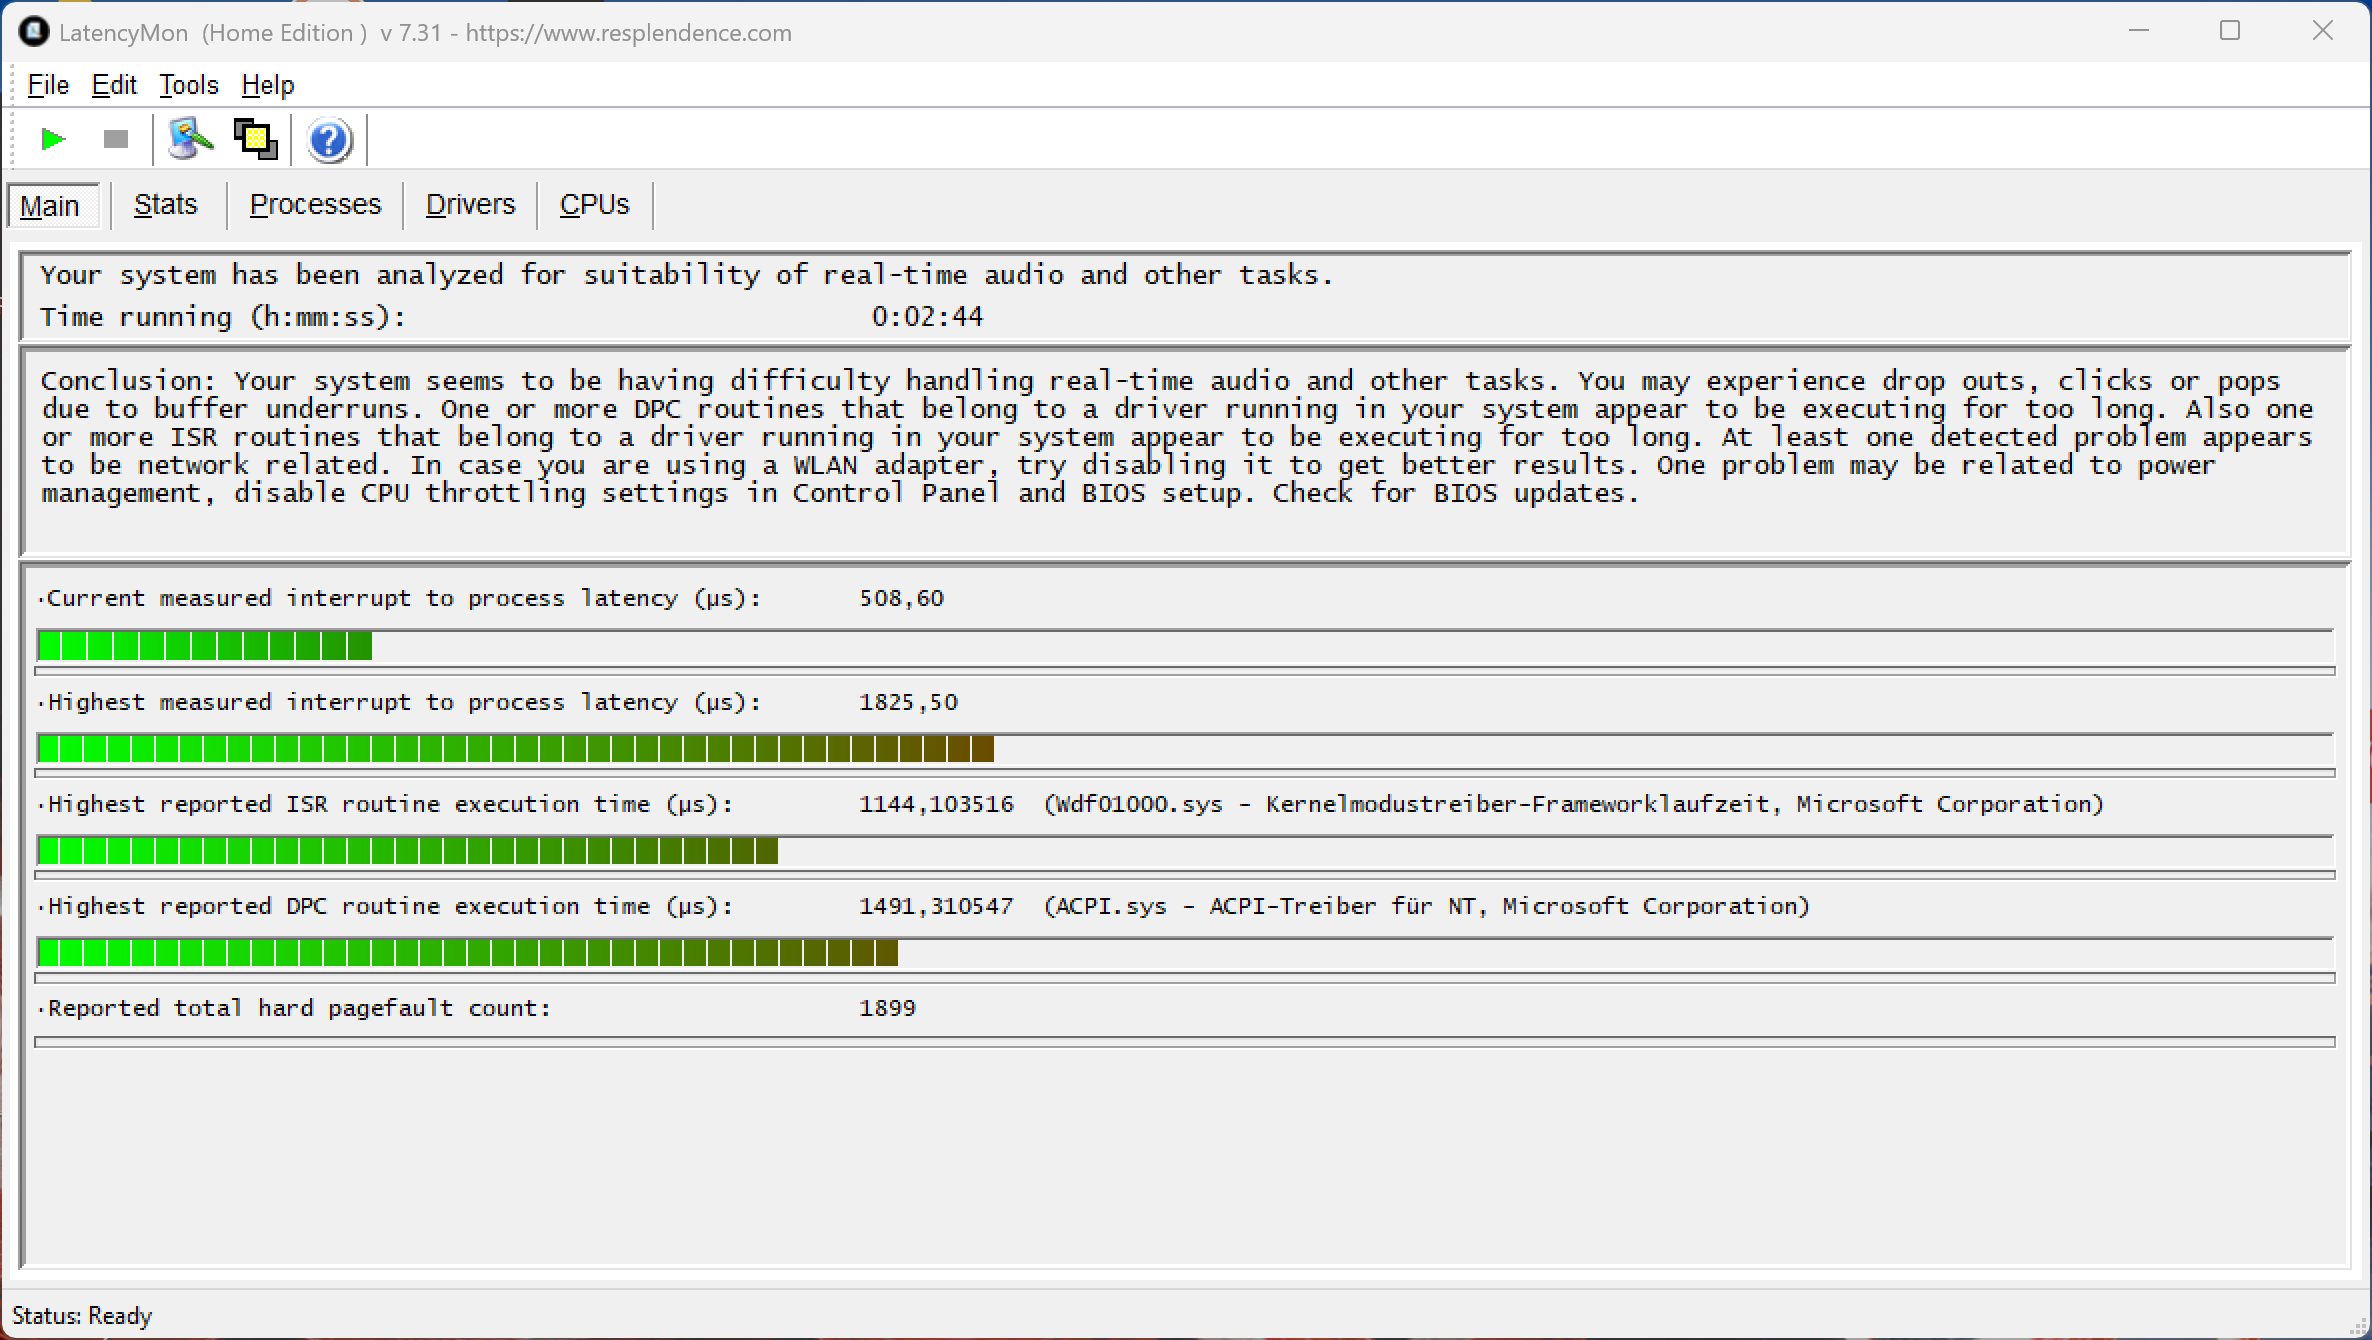
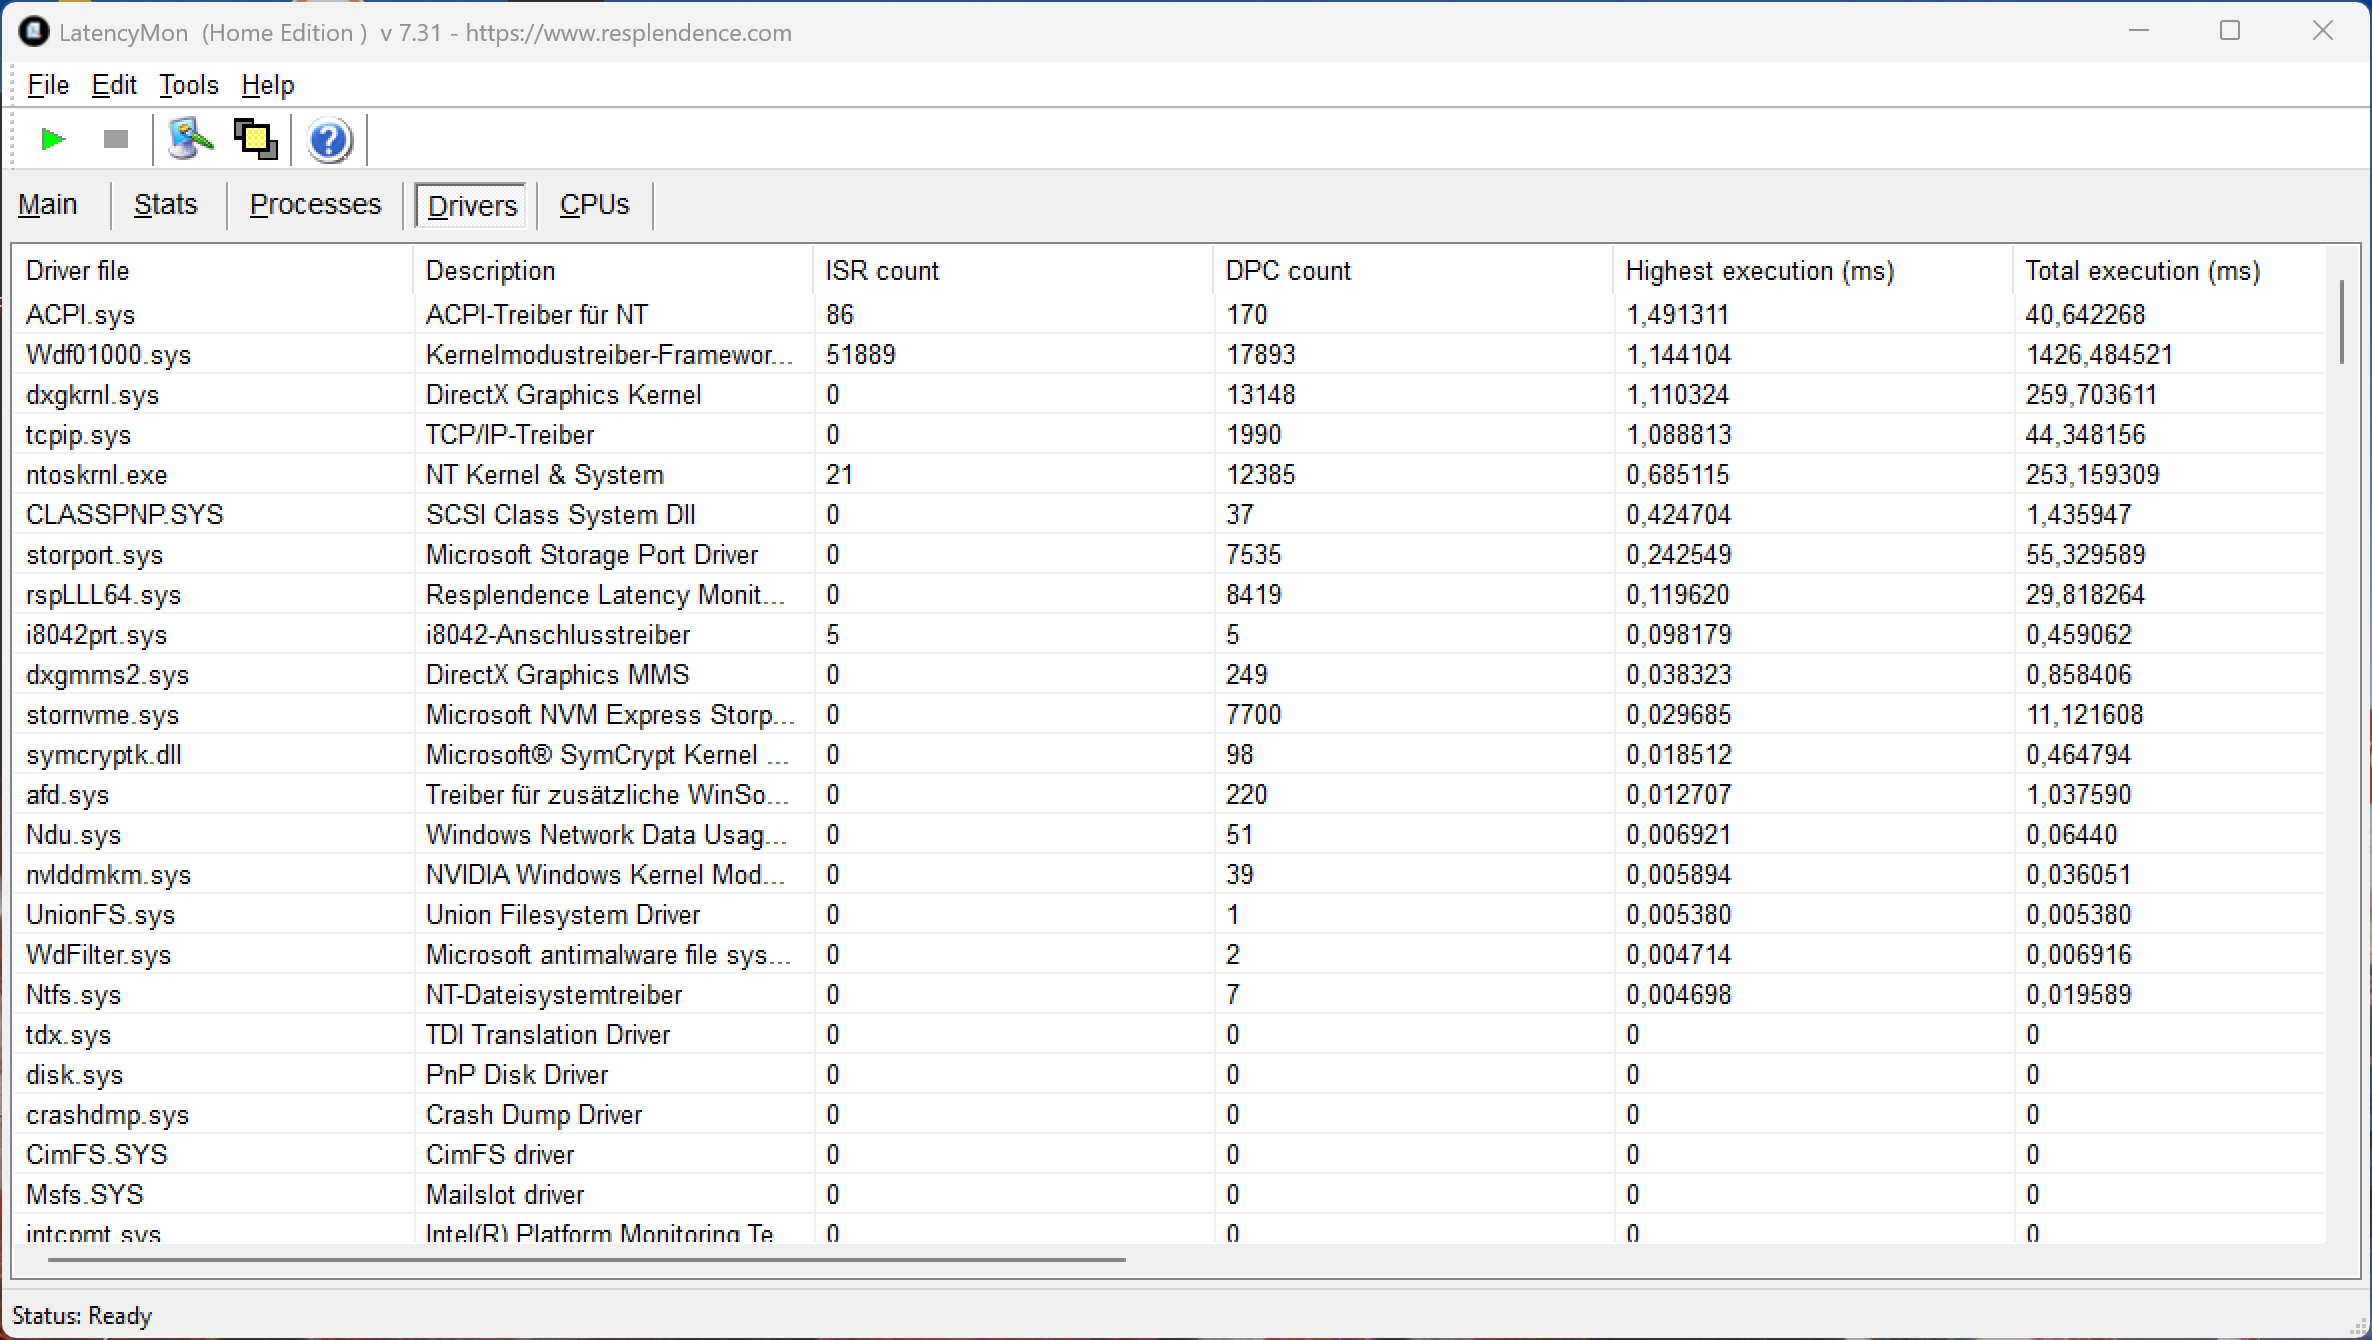
DPC latencies
In our standardized latency test, the T16g with the current BIOS version displayed slight limitations during the use of real-time audio applications.
| DPC Latencies / LatencyMon - interrupt to process latency (max), Web, Youtube, Prime95 | |
| HP ZBook Fury 16 G11 | |
| Dell Pro Max 16 Plus | |
| Lenovo ThinkPad T16g Gen 3 RTX 5080 | |
| Schenker XMG Pro 16 (E25) | |
| HP ZBook Studio 16 G11 | |
| Lenovo ThinkPad P16 Gen 2 | |
* ... smaller is better
Mass storage
The ThinkPad T16g packs a fast PCIe 5.0 slot, in which our review unit was occupied by a corresponding 2 TB Samsung SSD (1.75 TB free). With transfer speeds of up to 13 GB/s, performance is generally high, but this level cannot be maintained under sustained load, and performance drops by around 50%. Two additional SSD slots (PCIe 4.0) are available for additional storage space.

* ... smaller is better
Sustained Performance Read: DiskSpd Read Loop, Queue Depth 8
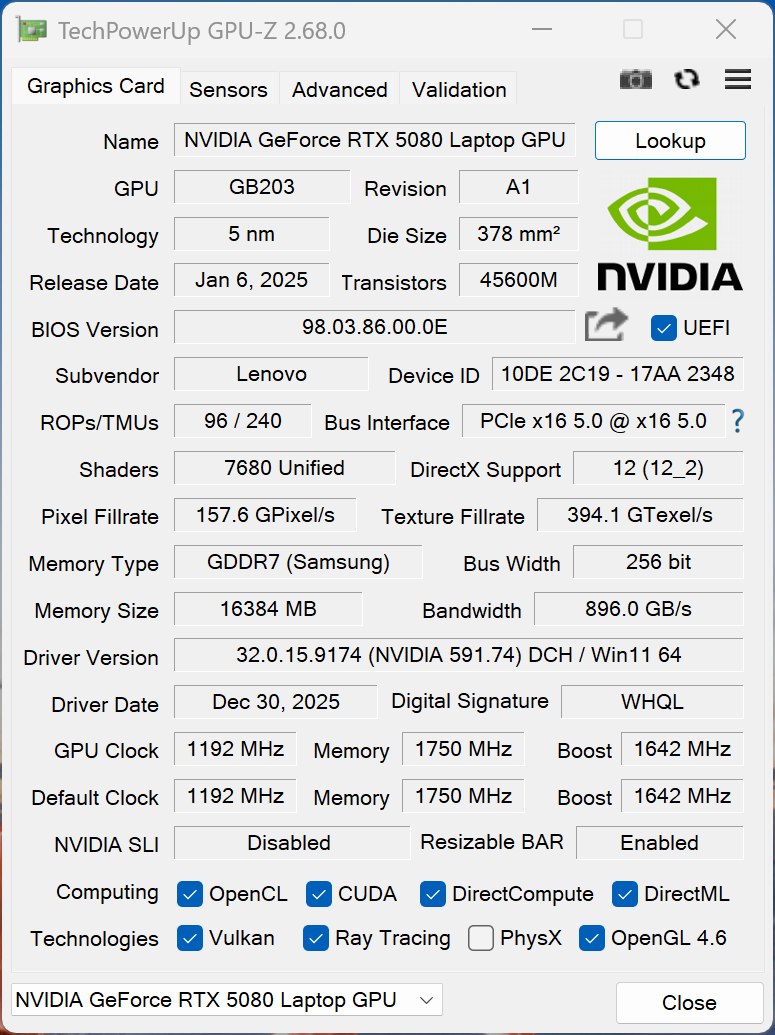
GPU performance
Lenovo has equipped the mobile GeForce RTX 5080 with a TGP of only 105 watts, making it one of the slowest implementations we've tested so far (for comparison, even the compact Asus ROG Zephyrus G14 allows the 5080 to consume 110 watts), and even the RTX 5070 Ti in the XMG Pro 16 is faster. Furthermore, in this area, the 5080 is even slower than the RTX 4000 in the older ThinkPad P16 Gen 2, which itself was based on the RTX 4080.
However, the graphics performance remains stable, and the 16 GB of VRAM can certainly be beneficial depending on the application. Even in the professional SPECviewperf tests, the 5080 performs very well in some subtests, so these applications are also possible. Gaming performance is considerably lower than on other systems with the RTX 5080. When running on battery power, the GPU is limited to a maximum consumption of 60 watts, which results in a performance reduction of approximately 35%.
| 3DMark 11 Performance | 42195 points | |
| 3DMark Fire Strike Score | 33297 points | |
| 3DMark Time Spy Score | 15900 points | |
| 3DMark Steel Nomad Score | 4022 points | |
| 3DMark Steel Nomad Light Score | 17002 points | |
Help | ||
SPECviewperf 2020: 3840x2160 Solidworks (solidworks-07) 4k | 1920x1080 Solidworks (solidworks-07) | 1920x1080 Solidworks (solidworks-05) | 1920x1080 Siemens NX (snx-04) | 1920x1080 Medical (medical-03) | 1920x1080 Maya (maya-06) | 1920x1080 Energy (energy-03) | 1920x1080 Creo (creo-03) | 1920x1080 CATIA (catia-06) | 1920x1080 3ds Max (3dsmax-07) | 3840x2160 Solidworks (solidworks-05) | 3840x2160 Siemens NX (snx-04) | 3840x2160 Medical (medical-03) | 3840x2160 Maya (maya-06) | 3840x2160 Energy (energy-03) | 3840x2160 Creo (creo-03) | 3840x2160 CATIA (catia-06) | 3840x2160 3ds Max (3dsmax-07)
| SPECviewperf 15 / Siemens NX 2406 (snx-05) | |
| Lenovo ThinkPad P16v G3 21RS000DGE | |
| Razer Blade 16 Early 2023 | |
| Lenovo ThinkPad T16g Gen 3 RTX 5080 | |
| SPECviewperf 15 / Unreal Engine 5.4.2 (unreal_engine-01) | |
| Razer Blade 16 Early 2023 | |
| Lenovo ThinkPad T16g Gen 3 RTX 5080 | |
| Lenovo ThinkPad P1 Gen 8 | |
| Lenovo ThinkPad P16v G3 21RS000DGE | |
| SPECviewperf 15 / Solidworks 2024 (solidworks-08) | |
| Lenovo ThinkPad P1 Gen 8 | |
| Lenovo ThinkPad P16v G3 21RS000DGE | |
| Razer Blade 16 Early 2023 | |
| Lenovo ThinkPad T16g Gen 3 RTX 5080 | |
| SPECviewperf 15 / Tuvok (medical-04) | |
| Lenovo ThinkPad P1 Gen 8 | |
| Lenovo ThinkPad P16v G3 21RS000DGE | |
| Razer Blade 16 Early 2023 | |
| Lenovo ThinkPad T16g Gen 3 RTX 5080 | |
| SPECviewperf 15 / Maya 2025 (maya-07) | |
| Lenovo ThinkPad T16g Gen 3 RTX 5080 | |
| Razer Blade 16 Early 2023 | |
| Lenovo ThinkPad P1 Gen 8 | |
| Lenovo ThinkPad P16v G3 21RS000DGE | |
| SPECviewperf 15 / Enscape 4.0 (enscape-01) | |
| Lenovo ThinkPad T16g Gen 3 RTX 5080 | |
| Razer Blade 16 Early 2023 | |
| Lenovo ThinkPad P1 Gen 8 | |
| Lenovo ThinkPad P16v G3 21RS000DGE | |
| SPECviewperf 15 / OpendTect (energy-04) | |
| Razer Blade 16 Early 2023 | |
| Lenovo ThinkPad T16g Gen 3 RTX 5080 | |
| Lenovo ThinkPad P1 Gen 8 | |
| Lenovo ThinkPad P16v G3 21RS000DGE | |
| SPECviewperf 15 / Creo 9 (creo-04) | |
| Razer Blade 16 Early 2023 | |
| Lenovo ThinkPad P1 Gen 8 | |
| Lenovo ThinkPad T16g Gen 3 RTX 5080 | |
| Lenovo ThinkPad P16v G3 21RS000DGE | |
| SPECviewperf 15 / Catia V5 (catia-07) | |
| Lenovo ThinkPad T16g Gen 3 RTX 5080 | |
| Razer Blade 16 Early 2023 | |
| SPECviewperf 15 / Blender 3.6 (blender-01) | |
| Lenovo ThinkPad T16g Gen 3 RTX 5080 | |
| Razer Blade 16 Early 2023 | |
| Lenovo ThinkPad P1 Gen 8 | |
| Lenovo ThinkPad P16v G3 21RS000DGE | |
| SPECviewperf 15 / 3ds Max 2023 (3dsmax-08) | |
| Lenovo ThinkPad T16g Gen 3 RTX 5080 | |
| Razer Blade 16 Early 2023 | |
| Lenovo ThinkPad P1 Gen 8 | |
| Lenovo ThinkPad P16v G3 21RS000DGE | |
| SPECviewperf 2020 / Solidworks (solidworks-07) 4k | |
| Dell Pro Max 16 Plus | |
| Lenovo ThinkPad T16g Gen 3 RTX 5080 | |
| Lenovo ThinkPad P16 Gen 2 | |
| Lenovo ThinkPad P1 Gen 8 | |
| HP ZBook Fury 16 G11 | |
| Lenovo ThinkPad P16v G3 21RS000DGE | |
| HP ZBook Studio 16 G11 | |
| SPECviewperf 2020 / Solidworks (solidworks-05) | |
| Razer Blade 16 Early 2023 | |
| SPECviewperf 2020 / Solidworks (solidworks-05) | |
| Razer Blade 16 Early 2023 | |
| Blender / v3.3 Classroom OPTIX/RTX | |
| Average of class Workstation (10 - 95, n=19, last 2 years) | |
| HP ZBook Studio 16 G11 | |
| HP ZBook Fury 16 G11 | |
| Lenovo ThinkPad T16g Gen 3 RTX 5080 | |
| Lenovo ThinkPad P16 Gen 2 | |
| Schenker XMG Pro 16 (E25) | |
| Average NVIDIA GeForce RTX 5080 Laptop (11 - 17, n=14) | |
| Dell Pro Max 16 Plus | |
| Blender / v3.3 Classroom CUDA | |
| Average of class Workstation (16 - 142, n=19, last 2 years) | |
| HP ZBook Studio 16 G11 | |
| HP ZBook Fury 16 G11 | |
| Schenker XMG Pro 16 (E25) | |
| Lenovo ThinkPad T16g Gen 3 RTX 5080 | |
| Average NVIDIA GeForce RTX 5080 Laptop (18 - 49, n=16) | |
| Lenovo ThinkPad P16 Gen 2 | |
| Dell Pro Max 16 Plus | |
| Blender / v3.3 Classroom CPU | |
| HP ZBook Studio 16 G11 | |
| Average of class Workstation (148 - 464, n=25, last 2 years) | |
| HP ZBook Fury 16 G11 | |
| Lenovo ThinkPad P16 Gen 2 | |
| Lenovo ThinkPad T16g Gen 3 RTX 5080 | |
| Dell Pro Max 16 Plus | |
| Average NVIDIA GeForce RTX 5080 Laptop (123 - 243, n=15) | |
| Schenker XMG Pro 16 (E25) | |
* ... smaller is better
| Cyberpunk 2077 - 1920x1080 Ultra Preset (FSR off) | |
| Schenker XMG Pro 16 (E25) | |
| Dell Pro Max 16 Plus | |
| Lenovo ThinkPad T16g Gen 3 RTX 5080 | |
| Lenovo ThinkPad P16 Gen 2 | |
| HP ZBook Fury 16 G11 | |
| Average of class Workstation (19.6 - 152.4, n=25, last 2 years) | |
| HP ZBook Studio 16 G11 | |
| Final Fantasy XV Benchmark - 1920x1080 High Quality | |
| Dell Pro Max 16 Plus | |
| Lenovo ThinkPad T16g Gen 3 RTX 5080 | |
| Lenovo ThinkPad P16 Gen 2 | |
| Schenker XMG Pro 16 (E25) | |
| HP ZBook Fury 16 G11 | |
| Average of class Workstation (26.4 - 197.6, n=25, last 2 years) | |
| HP ZBook Studio 16 G11 | |
| Strange Brigade - 1920x1080 ultra AA:ultra AF:16 | |
| Lenovo ThinkPad T16g Gen 3 RTX 5080 | |
| Lenovo ThinkPad P16 Gen 2 | |
| Dell Pro Max 16 Plus | |
| Average of class Workstation (54.5 - 418, n=19, last 2 years) | |
| HP ZBook Fury 16 G11 | |
| HP ZBook Studio 16 G11 | |
| Schenker XMG Pro 16 (E25) | |
| Dota 2 Reborn - 1920x1080 ultra (3/3) best looking | |
| Schenker XMG Pro 16 (E25) | |
| Dell Pro Max 16 Plus | |
| Lenovo ThinkPad T16g Gen 3 RTX 5080 | |
| Lenovo ThinkPad P16 Gen 2 | |
| HP ZBook Fury 16 G11 | |
| HP ZBook Studio 16 G11 | |
| Average of class Workstation (50.7 - 178.4, n=25, last 2 years) | |
| F1 24 - 2560x1440 Ultra High Preset AA:T AF:16x | |
| Dell Pro Max 16 Plus | |
| Average NVIDIA GeForce RTX 5080 Laptop (60.6 - 92.6, n=12) | |
| Schenker XMG Pro 16 (E25) | |
| Average of class Workstation (22 - 101.8, n=9, last 2 years) | |
| Lenovo ThinkPad T16g Gen 3 RTX 5080 | |
Cyberpunk 2077 ultra FPS diagram
| low | med. | high | ultra | QHD DLSS | QHD | 4K DLSS | 4K | |
|---|---|---|---|---|---|---|---|---|
| GTA V (2015) | 141.3 | 128.1 | ||||||
| Dota 2 Reborn (2015) | 210 | 184.4 | 176.6 | 164.8 | 148.3 | |||
| Final Fantasy XV Benchmark (2018) | 220 | 196.9 | 152.1 | 121.1 | 71.3 | |||
| X-Plane 11.11 (2018) | 154.1 | 117.8 | 110.4 | 88 | ||||
| Strange Brigade (2018) | 505 | 350 | 343 | 311 | 181.6 | 125.7 | ||
| Baldur's Gate 3 (2023) | 189.7 | 163 | 148.2 | 145.9 | 107 | 57.3 | ||
| Cyberpunk 2077 (2023) | 135.8 | 131.2 | 119 | 107.6 | 84.5 | 74.4 | 41.9 | 34.6 |
| F1 24 (2024) | 274 | 239 | 96.5 | 97.7 | 60.6 | 52.2 | 31 | |
| F1 25 (2025) | 213 | 198.3 | 179.2 | 38.6 | 42.6 | 23.6 | 21.2 | 11.2 |
Emissions & energy
Noise emissions

The fans possess both positive and negative aspects. In the two power modes, Balanced and Best Performance, the fans run constantly at a low speed, which means they rarely get loud, even during short bursts of load or everyday use. However, when full power is required, the two fans become disturbingly loud at 57 dB(A) (Balanced: 50.3 dB(A), Best Energy Efficiency: 42.7 dB(A), Battery: max. 57.7 dB(A)). Considering the performance on offer, this is much too loud and also louder than competing models. No additional electronic noises were detected.
Noise level
| Idle |
| 24.7 / 28.9 / 28.9 dB(A) |
| Load |
| 30.4 / 57.7 dB(A) |
 | ||
30 dB silent 40 dB(A) audible 50 dB(A) loud |
||
min: | ||
| Lenovo ThinkPad T16g Gen 3 RTX 5080 Ultra 9 275HX, GeForce RTX 5080 Laptop | HP ZBook Studio 16 G11 Ultra 9 185H, RTX 3000 Ada Generation Laptop | Dell Pro Max 16 Plus Ultra 9 285HX, RTX PRO 5000 Blackwell Generation Laptop | Lenovo ThinkPad P16 Gen 2 i7-14700HX, RTX 4000 Ada Generation Laptop | HP ZBook Fury 16 G11 i9-14900HX, RTX 3500 Ada Generation Laptop | Schenker XMG Pro 16 (E25) Ultra 9 275HX, GeForce RTX 5070 Ti Laptop | |
|---|---|---|---|---|---|---|
| Noise | 6% | -6% | -5% | 3% | -0% | |
| off / environment * (dB) | 24.7 | 23.8 4% | 23.2 6% | 23.9 3% | 23.2 6% | 23.3 6% |
| Idle Minimum * (dB) | 24.7 | 23.8 4% | 26.7 -8% | 29.1 -18% | 23.2 6% | 25 -1% |
| Idle Average * (dB) | 28.9 | 26.4 9% | 30.5 -6% | 29.1 -1% | 23.2 20% | 25 13% |
| Idle Maximum * (dB) | 28.9 | 26.4 9% | 34 -18% | 29.1 -1% | 29.5 -2% | 25 13% |
| Load Average * (dB) | 30.4 | 33.7 -11% | 39.8 -31% | 41 -35% | 43 -41% | 45.5 -50% |
| Cyberpunk 2077 ultra * (dB) | 57.7 | 46.1 20% | 54.3 6% | 52.8 8% | 48.2 16% | 53.3 8% |
| Load Maximum * (dB) | 57.7 | 53.2 8% | 54.3 6% | 52.9 8% | 48.2 16% | 53.3 8% |
* ... smaller is better
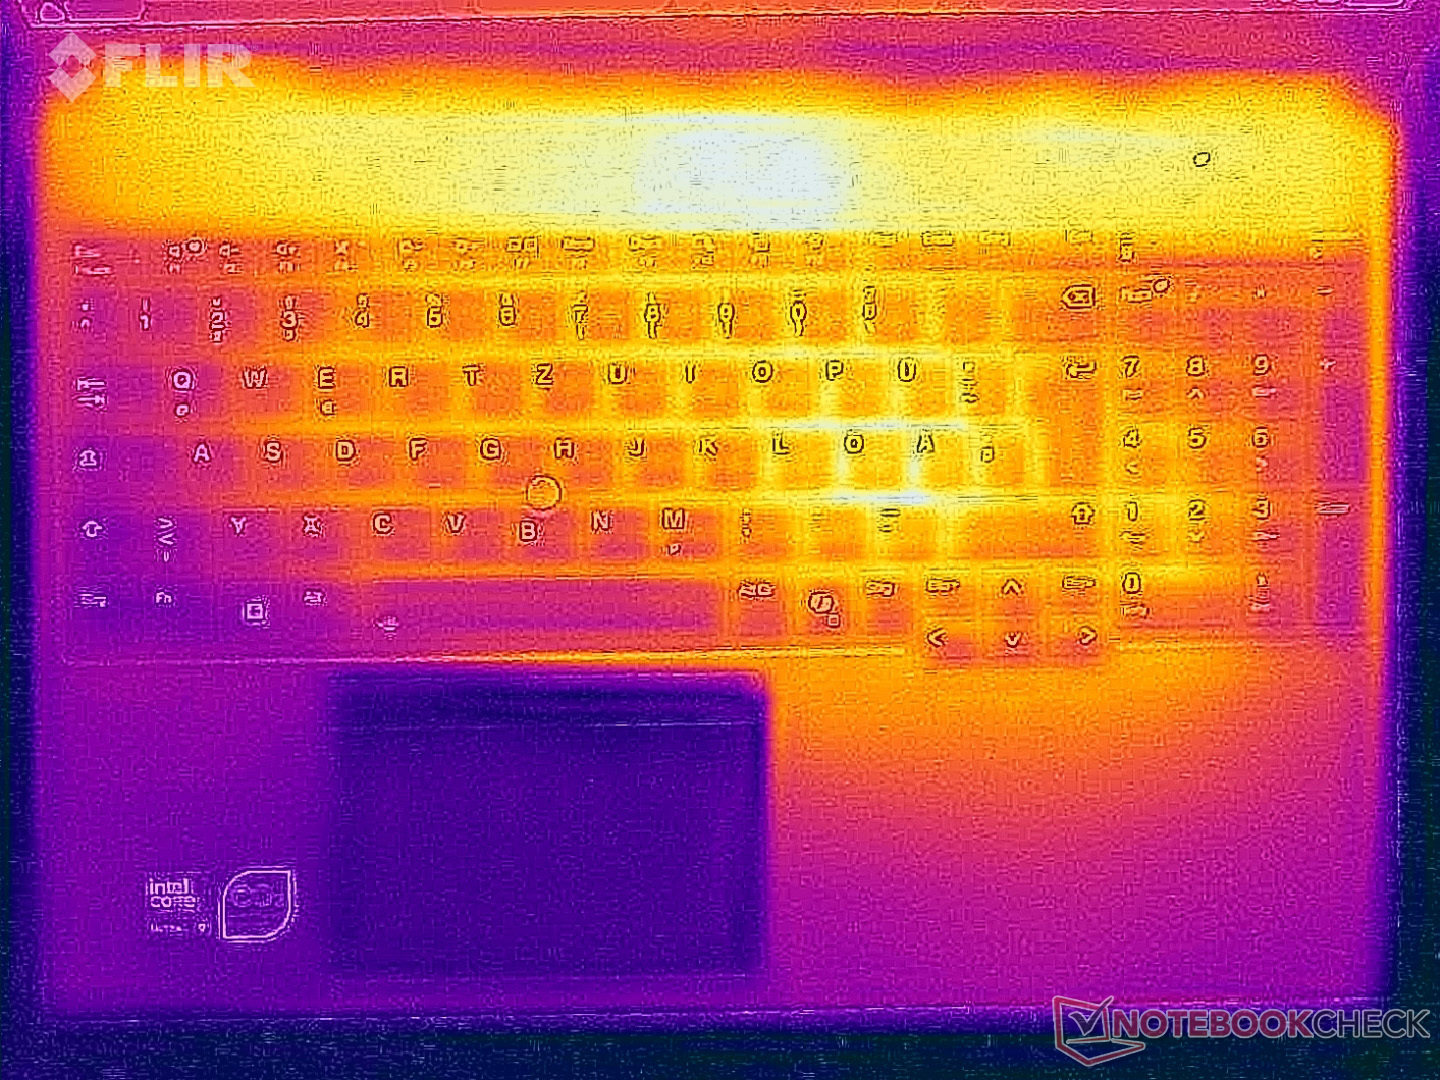
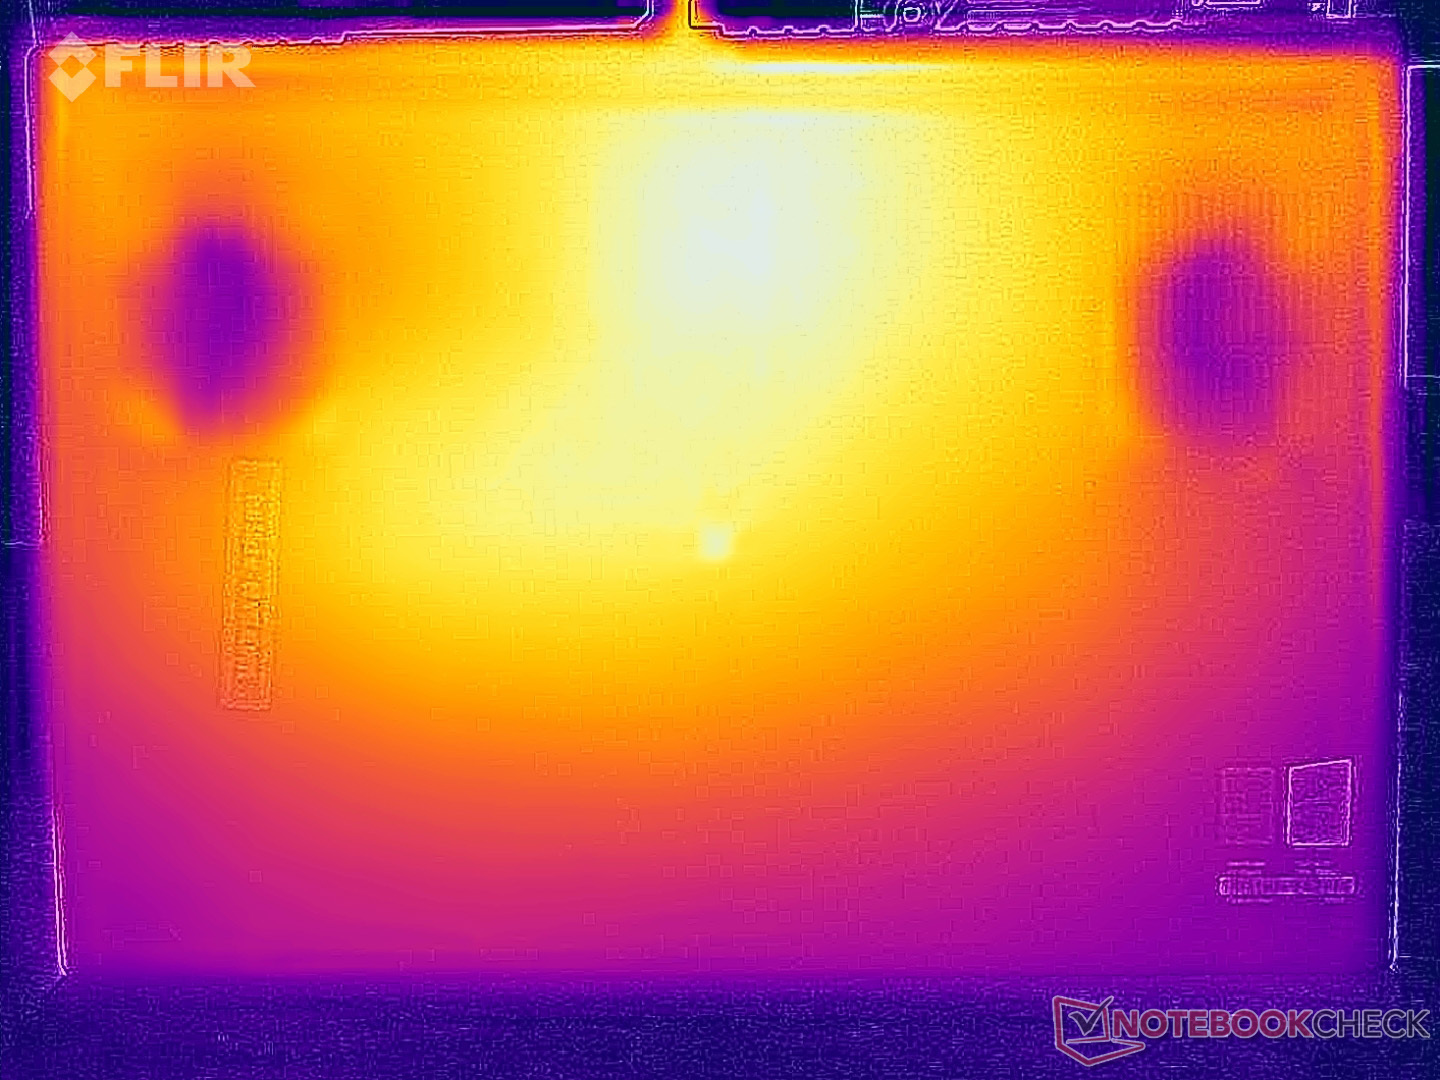
Temperature
One advantage of the high fan activity is the low surface temperatures, although this isn't exactly what you would call surprising, given the total power consumption of 130 watts in such a thick case. In the stress test, the graphics card remains at its full 105 watts (78 °C), while the processor is throttled down to just 25 watts (73 °C).

(±) The maximum temperature on the upper side is 43.9 °C / 111 F, compared to the average of 38.2 °C / 101 F, ranging from 22.2 to 69.8 °C for the class Workstation.
(-) The bottom heats up to a maximum of 45.4 °C / 114 F, compared to the average of 41.1 °C / 106 F
(+) In idle usage, the average temperature for the upper side is 27.1 °C / 81 F, compared to the device average of 32 °C / 90 F.
(-) 3: The average temperature for the upper side is 39.4 °C / 103 F, compared to the average of 32 °C / 90 F for the class Workstation.
(±) The palmrests and touchpad can get very hot to the touch with a maximum of 38 °C / 100.4 F.
(-) The average temperature of the palmrest area of similar devices was 27.8 °C / 82 F (-10.2 °C / -18.4 F).
| Lenovo ThinkPad T16g Gen 3 RTX 5080 Ultra 9 275HX, GeForce RTX 5080 Laptop | HP ZBook Studio 16 G11 Ultra 9 185H, RTX 3000 Ada Generation Laptop | Dell Pro Max 16 Plus Ultra 9 285HX, RTX PRO 5000 Blackwell Generation Laptop | Lenovo ThinkPad P16 Gen 2 i7-14700HX, RTX 4000 Ada Generation Laptop | HP ZBook Fury 16 G11 i9-14900HX, RTX 3500 Ada Generation Laptop | Schenker XMG Pro 16 (E25) Ultra 9 275HX, GeForce RTX 5070 Ti Laptop | |
|---|---|---|---|---|---|---|
| Heat | -6% | -6% | 1% | -16% | -206% | |
| Maximum Upper Side * (°C) | 43.9 | 36.6 17% | 40.4 8% | 46.6 -6% | 42.2 4% | 43.2 2% |
| Maximum Bottom * (°C) | 45.4 | 47.8 -5% | 45.6 -0% | 51 -12% | 48 -6% | 46 -1% |
| Idle Upper Side * (°C) | 27.7 | 31.4 -13% | 32.8 -18% | 24.8 10% | 37 -34% | 27.7 -0% |
| Idle Bottom * (°C) | 28.6 | 35.6 -24% | 33 -15% | 25.6 10% | 36.8 -29% | 264 -823% |
* ... smaller is better
Speakers
All in all, the speakers are very good and significantly better than the competing devices.
Lenovo ThinkPad T16g Gen 3 RTX 5080 audio analysis
(+) | speakers can play relatively loud (84.2 dB)
Bass 100 - 315 Hz
(±) | reduced bass - on average 11.5% lower than median
(±) | linearity of bass is average (13.2% delta to prev. frequency)
Mids 400 - 2000 Hz
(+) | balanced mids - only 2.9% away from median
(+) | mids are linear (3% delta to prev. frequency)
Highs 2 - 16 kHz
(+) | balanced highs - only 1.4% away from median
(+) | highs are linear (3.6% delta to prev. frequency)
Overall 100 - 16.000 Hz
(+) | overall sound is linear (10.2% difference to median)
Compared to same class
» 6% of all tested devices in this class were better, 5% similar, 89% worse
» The best had a delta of 7%, average was 17%, worst was 35%
Compared to all devices tested
» 5% of all tested devices were better, 1% similar, 94% worse
» The best had a delta of 4%, average was 24%, worst was 134%
HP ZBook Studio 16 G11 audio analysis
(+) | speakers can play relatively loud (82.7 dB)
Bass 100 - 315 Hz
(-) | nearly no bass - on average 17.4% lower than median
(±) | linearity of bass is average (11.8% delta to prev. frequency)
Mids 400 - 2000 Hz
(+) | balanced mids - only 3.4% away from median
(±) | linearity of mids is average (7% delta to prev. frequency)
Highs 2 - 16 kHz
(+) | balanced highs - only 2.4% away from median
(+) | highs are linear (2.6% delta to prev. frequency)
Overall 100 - 16.000 Hz
(±) | linearity of overall sound is average (15.2% difference to median)
Compared to same class
» 33% of all tested devices in this class were better, 10% similar, 57% worse
» The best had a delta of 7%, average was 17%, worst was 35%
Compared to all devices tested
» 21% of all tested devices were better, 4% similar, 74% worse
» The best had a delta of 4%, average was 24%, worst was 134%
Dell Pro Max 16 Plus audio analysis
(+) | speakers can play relatively loud (91.6 dB)
Bass 100 - 315 Hz
(-) | nearly no bass - on average 20.9% lower than median
(+) | bass is linear (5.9% delta to prev. frequency)
Mids 400 - 2000 Hz
(+) | balanced mids - only 4.5% away from median
(+) | mids are linear (4% delta to prev. frequency)
Highs 2 - 16 kHz
(+) | balanced highs - only 3.7% away from median
(+) | highs are linear (2.9% delta to prev. frequency)
Overall 100 - 16.000 Hz
(+) | overall sound is linear (14.3% difference to median)
Compared to same class
» 30% of all tested devices in this class were better, 4% similar, 67% worse
» The best had a delta of 7%, average was 17%, worst was 35%
Compared to all devices tested
» 17% of all tested devices were better, 4% similar, 79% worse
» The best had a delta of 4%, average was 24%, worst was 134%
Lenovo ThinkPad P16 Gen 2 audio analysis
(±) | speaker loudness is average but good (80.7 dB)
Bass 100 - 315 Hz
(±) | reduced bass - on average 10.8% lower than median
(±) | linearity of bass is average (8% delta to prev. frequency)
Mids 400 - 2000 Hz
(±) | higher mids - on average 5.4% higher than median
(+) | mids are linear (6.2% delta to prev. frequency)
Highs 2 - 16 kHz
(+) | balanced highs - only 3.3% away from median
(+) | highs are linear (5.5% delta to prev. frequency)
Overall 100 - 16.000 Hz
(±) | linearity of overall sound is average (15.6% difference to median)
Compared to same class
» 35% of all tested devices in this class were better, 11% similar, 54% worse
» The best had a delta of 7%, average was 17%, worst was 35%
Compared to all devices tested
» 23% of all tested devices were better, 5% similar, 72% worse
» The best had a delta of 4%, average was 24%, worst was 134%
HP ZBook Fury 16 G11 audio analysis
(+) | speakers can play relatively loud (88.9 dB)
Bass 100 - 315 Hz
(±) | reduced bass - on average 13.3% lower than median
(±) | linearity of bass is average (11.2% delta to prev. frequency)
Mids 400 - 2000 Hz
(+) | balanced mids - only 2.2% away from median
(+) | mids are linear (3.2% delta to prev. frequency)
Highs 2 - 16 kHz
(+) | balanced highs - only 3.7% away from median
(+) | highs are linear (4.6% delta to prev. frequency)
Overall 100 - 16.000 Hz
(+) | overall sound is linear (12.9% difference to median)
Compared to same class
» 21% of all tested devices in this class were better, 6% similar, 72% worse
» The best had a delta of 7%, average was 17%, worst was 35%
Compared to all devices tested
» 12% of all tested devices were better, 3% similar, 85% worse
» The best had a delta of 4%, average was 24%, worst was 134%
Schenker XMG Pro 16 (E25) audio analysis
(±) | speaker loudness is average but good (79.2 dB)
Bass 100 - 315 Hz
(±) | reduced bass - on average 14.2% lower than median
(±) | linearity of bass is average (10.6% delta to prev. frequency)
Mids 400 - 2000 Hz
(±) | higher mids - on average 8.2% higher than median
(±) | linearity of mids is average (9.9% delta to prev. frequency)
Highs 2 - 16 kHz
(+) | balanced highs - only 3.8% away from median
(+) | highs are linear (5.9% delta to prev. frequency)
Overall 100 - 16.000 Hz
(±) | linearity of overall sound is average (18.5% difference to median)
Compared to same class
» 60% of all tested devices in this class were better, 8% similar, 32% worse
» The best had a delta of 6%, average was 18%, worst was 132%
Compared to all devices tested
» 41% of all tested devices were better, 8% similar, 51% worse
» The best had a delta of 4%, average was 24%, worst was 134%
Power consumption

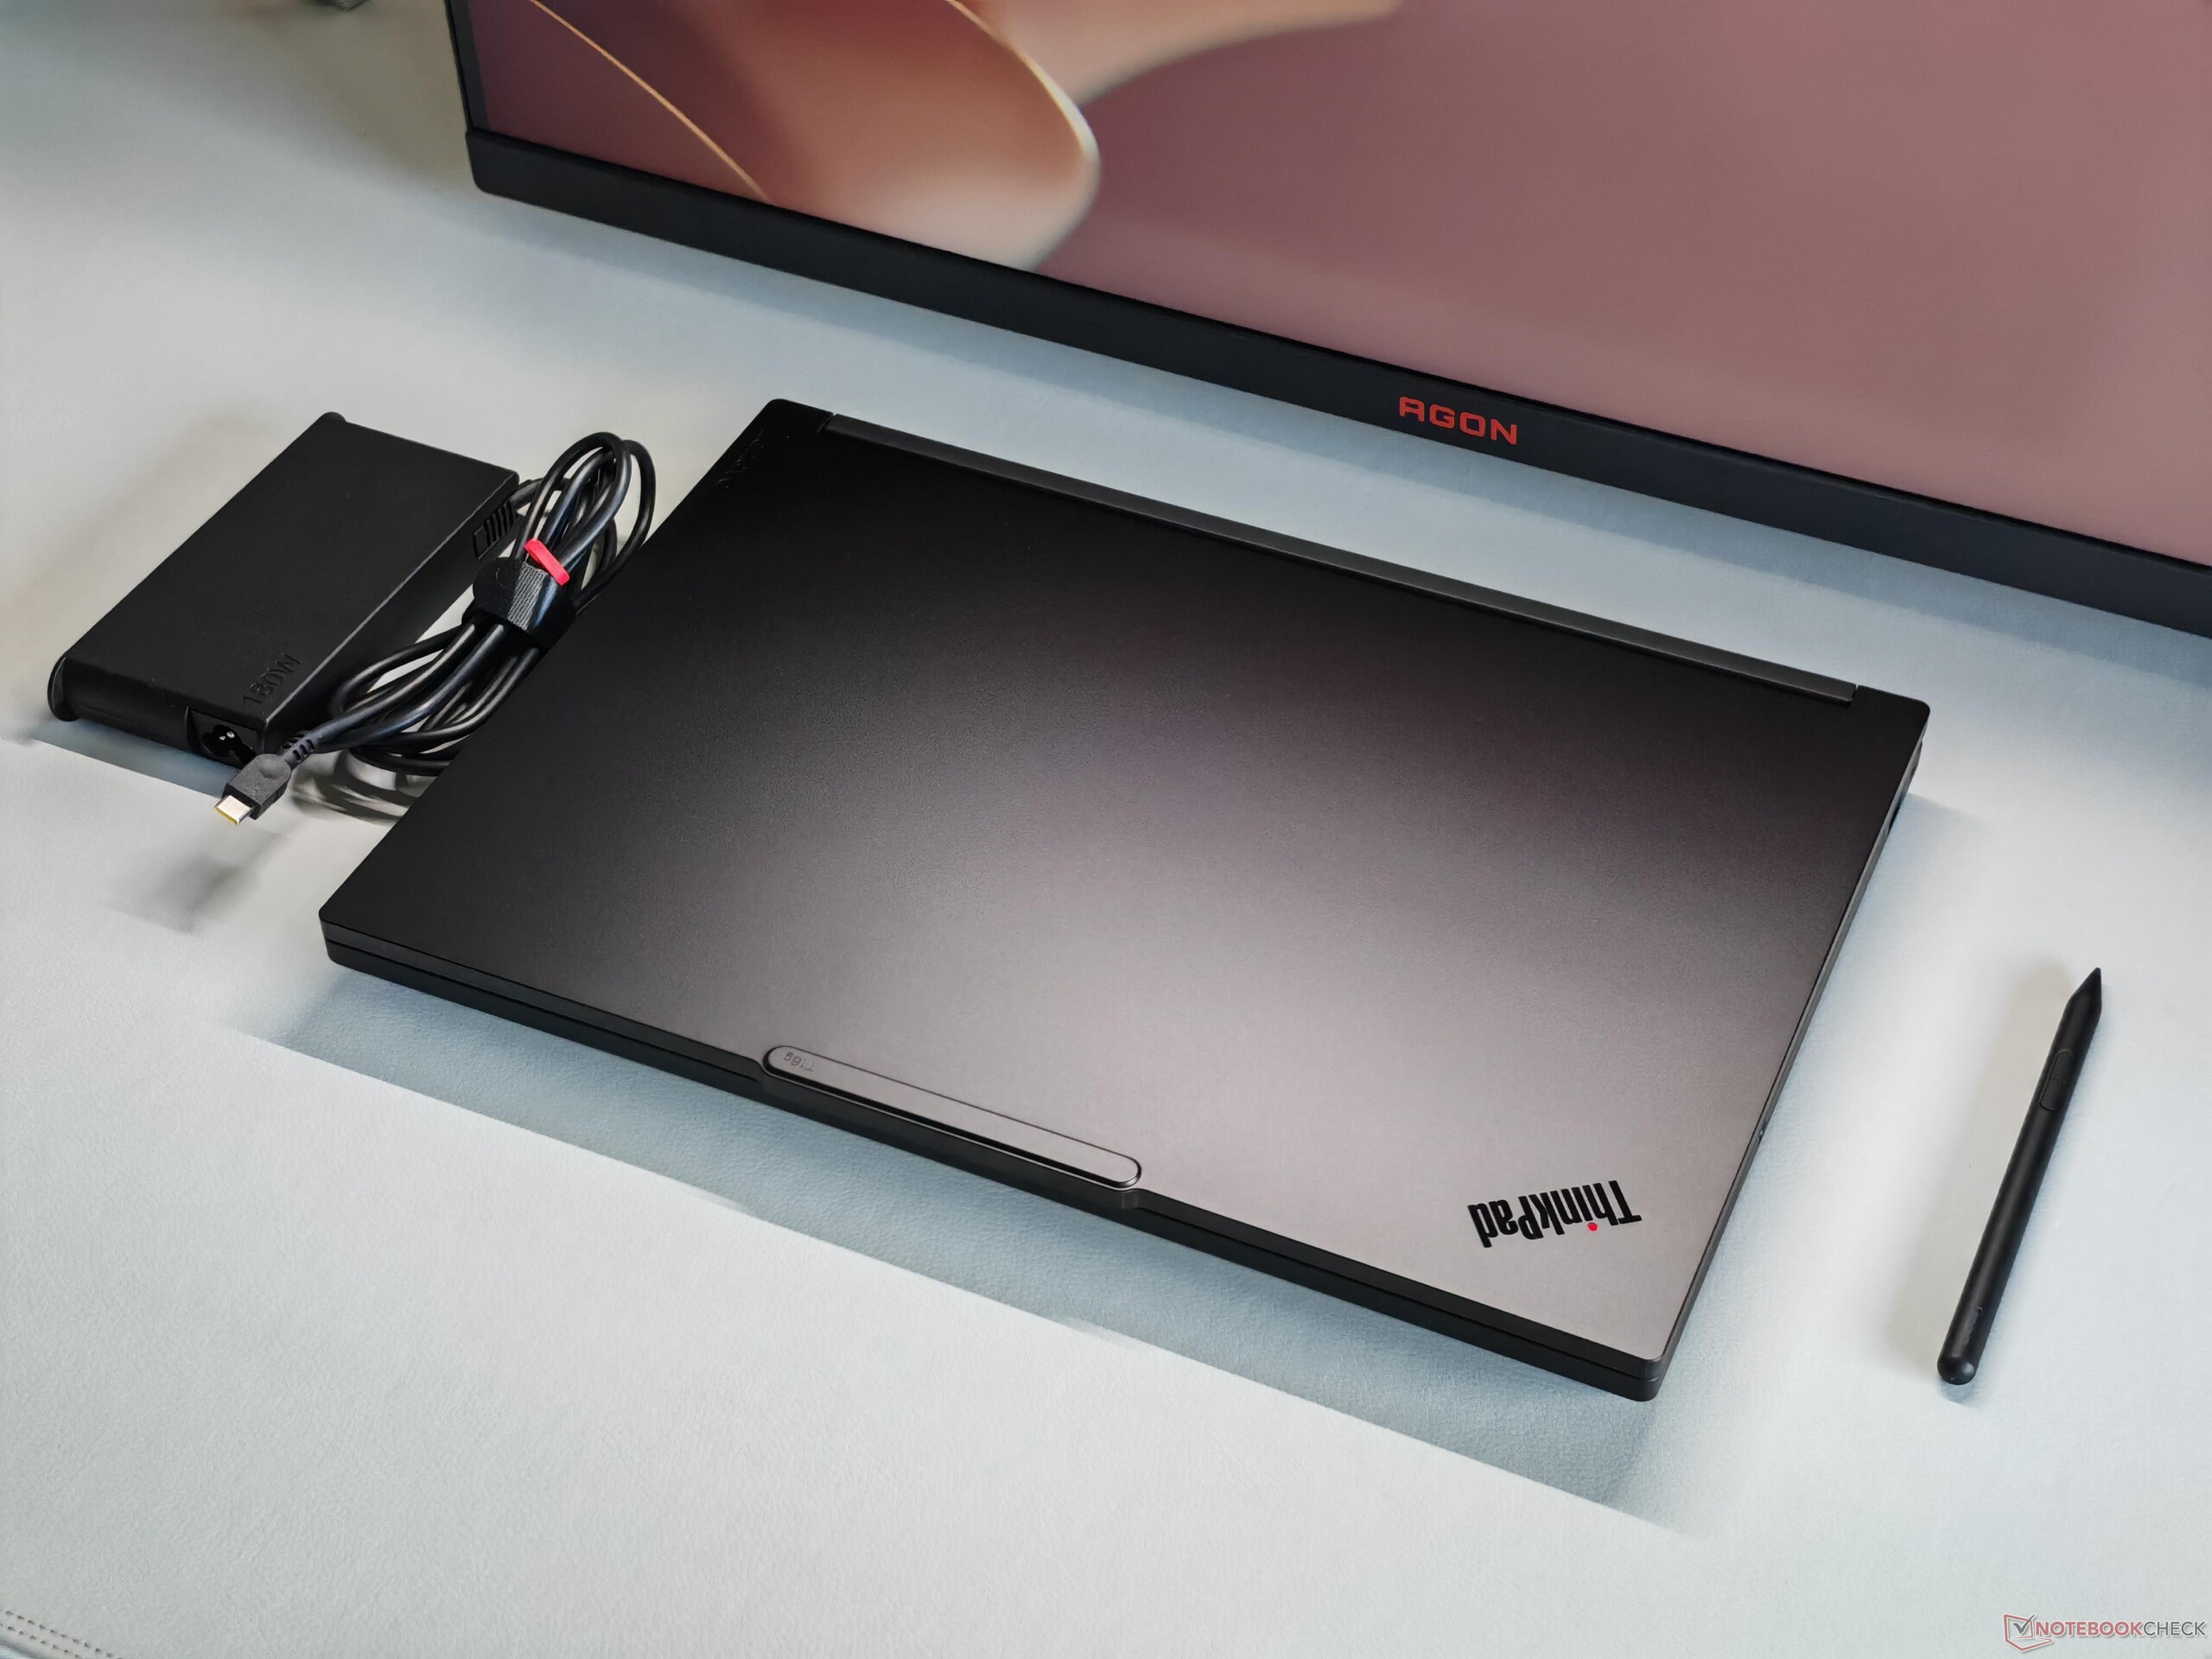
As described at the start, the T16g Gen 3 is charged exclusively via USB-C, and the ports can handle a maximum of 180 watts, which is the reason why a fairly compact 180-watt power adapter is included. When the components are under load (not just during our stress test), energy from the battery is regularly drawn for a short period, and this is definitely not good for the battery's health. At peak times, HWiNFO shows a total power consumption of more than 280 watts at the start of the combined load.
| Off / Standby | |
| Idle | |
| Load |
|
Key:
min: | |
| Lenovo ThinkPad T16g Gen 3 RTX 5080 Ultra 9 275HX, GeForce RTX 5080 Laptop, Samsung PM9E1 MZVLC2T0HBLD, OLED, 3200x2000, 16" | HP ZBook Studio 16 G11 Ultra 9 185H, RTX 3000 Ada Generation Laptop, Kioxia XG8 KXG80ZNV1T02, IPS, 3840x2400, 16" | Dell Pro Max 16 Plus Ultra 9 285HX, RTX PRO 5000 Blackwell Generation Laptop, SK hynix PCB01 HFS001TFM9X186N, OLED, 3840x2400, 16" | Lenovo ThinkPad P16 Gen 2 i7-14700HX, RTX 4000 Ada Generation Laptop, SK hynix PC801 HFS001TEJ9X162N, IPS, 2560x1600, 16" | HP ZBook Fury 16 G11 i9-14900HX, RTX 3500 Ada Generation Laptop, SK hynix PC801 HFS001TEJ9X101N, IPS, 3840x2400, 16" | Schenker XMG Pro 16 (E25) Ultra 9 275HX, GeForce RTX 5070 Ti Laptop, Samsung 9100 Pro 1 TB, IPS, 2560x1600, 16" | Average NVIDIA GeForce RTX 5080 Laptop | Average of class Workstation | |
|---|---|---|---|---|---|---|---|---|
| Power Consumption | -2% | -104% | -15% | -5% | -24% | -57% | 12% | |
| Idle Minimum * (Watt) | 9.9 | 14 -41% | 35.1 -255% | 7.9 20% | 8.6 13% | 11.7 -18% | 19.1 ? -93% | 8.94 ? 10% |
| Idle Average * (Watt) | 17.1 | 22.4 -31% | 39.2 -129% | 13.1 23% | 14.8 13% | 16.6 3% | 25.3 ? -48% | 13.8 ? 19% |
| Idle Maximum * (Watt) | 17.7 | 25.7 -45% | 56 -216% | 24.2 -37% | 15.7 11% | 17.1 3% | 30.4 ? -72% | 17.5 ? 1% |
| Load Average * (Watt) | 125.6 | 90.2 28% | 130.2 -4% | 127.4 -1% | 129.4 -3% | 122.4 3% | 128.5 ? -2% | 95 ? 24% |
| Cyberpunk 2077 ultra external monitor * (Watt) | 166.8 | 120.3 28% | 213 -28% | 219 -31% | 192.6 -15% | 241 -44% | ||
| Cyberpunk 2077 ultra * (Watt) | 160.5 | 125.4 22% | 229 -43% | 225 -40% | 199.4 -24% | 245 -53% | ||
| Load Maximum * (Watt) | 182.8 | 142 22% | 285.2 -56% | 248.5 -36% | 236.1 -29% | 291.5 -59% | 314 ? -72% | 175.2 ? 4% |
* ... smaller is better
Power consumption Cyberpunk / stress test
Power consumption with an external monitor
Battery runtimes
Lenovo has installed a 99.9 Wh battery, and the measured battery life is very good for this class of device. In our Wi-Fi test at 150 cd/m² and 60 Hz, it kept going around 9.5 hours, and even at full brightness, it still held out for a total of 6 hours.
Notebookcheck overall rating
Lenovo ThinkPad T16g Gen 3 RTX 5080
- 02/04/2026 v8
Andreas Osthoff
 Total Sustainability Score:
 Possible alternatives compared
Image | Model / Review | Price | Weight | Height | Display |
|---|---|---|---|---|---|
1. 87.3%  | Lenovo ThinkPad T16g Gen 3 RTX 5080 Intel Core Ultra 9 275HX ⎘ NVIDIA GeForce RTX 5080 Laptop ⎘ 64 GB Memory, 2048 GB SSD | Amazon: 1. $3,024.99 Lenovo ThinkPad P16 Gen 3 La... 2. $1,349.99 Lenovo ThinkPad E16 Gen 3 Bu... 3. $1,375.19 Lenovo ThinkPad E16 Gen 3 Bu... List Price: 4800€ | 2.6 kg | 29.8 mm | 16.00" 3200x2000 236 PPI OLED |
2. 84.2%  | HP ZBook Studio 16 G11 Intel Core Ultra 9 185H ⎘ NVIDIA RTX 3000 Ada Generation Laptop ⎘ 64 GB Memory, 1024 GB SSD | Amazon: List Price: 4300 USD | 1.8 kg | 19 mm | 16.00" 3840x2400 283 PPI IPS |
3. 88.4%  | Dell Pro Max 16 Plus Intel Core Ultra 9 285HX ⎘ NVIDIA RTX PRO 5000 Blackwell Generation Laptop ⎘ 128 GB Memory, SSD | Amazon: List Price: 5000 USD | 2.8 kg | 30.9 mm | 16.00" 3840x2400 283 PPI OLED |
4. 85.9%  | Lenovo ThinkPad P16 Gen 2 Intel Core i7-14700HX ⎘ NVIDIA RTX 4000 Ada Generation Laptop ⎘ 32 GB Memory, 1024 GB SSD | Amazon: List Price: 3500 USD | 3.1 kg | 30.23 mm | 16.00" 2560x1600 189 PPI IPS |
5. 85.9%  | HP ZBook Fury 16 G11 Intel Core i9-14900HX ⎘ NVIDIA RTX 3500 Ada Generation Laptop ⎘ 64 GB Memory, 1024 GB SSD | Amazon: List Price: 3300 USD | 2.6 kg | 28.5 mm | 16.00" 3840x2400 283 PPI IPS |
6. 87.4%  | Schenker XMG Pro 16 (E25) Intel Core Ultra 9 275HX ⎘ NVIDIA GeForce RTX 5070 Ti Laptop ⎘ 32 GB Memory, 1024 GB SSD | Amazon: 1. $22.79 Very Best of Michael Schenke... List Price: 2480€ | 2.5 kg | 26.5 mm | 16.00" 2560x1600 189 PPI IPS |
Transparency
The selection of devices to be reviewed is made by our editorial team. The test sample was provided to the author as a loan by the manufacturer or retailer for the purpose of this review. The lender had no influence on this review, nor did the manufacturer receive a copy of this review before publication. There was no obligation to publish this review. As an independent media company, Notebookcheck is not subjected to the authority of manufacturers, retailers or publishers.
This is how Notebookcheck is testing
Every year, Notebookcheck independently reviews hundreds of laptops and smartphones using standardized procedures to ensure that all results are comparable. We have continuously developed our test methods for around 20 years and set industry standards in the process. In our test labs, high-quality measuring equipment is utilized by experienced technicians and editors. These tests involve a multi-stage validation process. Our complex rating system is based on hundreds of well-founded measurements and benchmarks, which maintains objectivity. Further information on our test methods can be found here.

