
Verdict — High Performance With Practical Features
The Dell Pro Max 16 Plus is a significant step forward over the previous generation Precision 7680 or 7670. Aside from the expected performance boost, the revised model gets additional features not found on the older one including 120 Hz OLED, modular USB-C ports for repairability, PCIe5 SSD options, Thunderbolt 5 support, compact USB-C charging, and a higher resolution webcam. The improvements arguably outweigh the small increases in thickness and footprint.
Drawbacks are generally minor. Power consumption is now higher than before at up to 280 W compared to 240 W or less on the Precision 7680. Thus, while the Pro Max 16 Plus is certainly more powerful, it's also more demanding on the cooling solution with overall shorter battery life. CPU temperature in particular can reach the 95 C to 105 C range when stressed which impacts the Turbo Boost performance of the system. Meanwhile, the GPU tends to stabilize at 125 W even though it is rated for up to 175 W. It's therefore likely that the same CPU and GPU may run faster on thicker or larger form factors like the 18-inch Pro Max 18 Plus. The Pro Max 16 Plus system is nevertheless one of the fastest and most practical workstations available despite any cooling solution constraints.
Pros
Cons
Price and Availability
Dell is now shipping the Pro Max 16 Plus starting at $3700 USD for the base Core Ultra 7, RTX Pro 1000 configuration. Our Core Ultra 9 with RTX Pro 5000 Blackwell is not yet widely available.
- $1,574.00Dell Pro Max 16 - Intel Core Ultra 7 255H - Intel Arc Pro 140T GPU - 1TB SSD - 32GB DDR5 RAM - Windows 11 Pro
- $1,899.95Dell Pro 16 Plus PB16250 (Replaces Latitude 5550) AI Business Notebook 16" WUXGA Intel Ultra 7-265U, 32GB RAM DDR5, 1TB SSD, Wi-Fi 6E + BT, Backlit KB, FHD Webcam, RJ-45, Windows 11 Pro - Silver
- $4,578.12Dell Pro Max Premium MA16250 16" Mobile Workstation - Full HD Plus - 120 Hz - Intel Core Ultra 7 255H - 32 GB - 512 GB SSD - English (US) Keyboard - Magnetite - Intel Chip - 1920 x 1200 - Windows 11 P
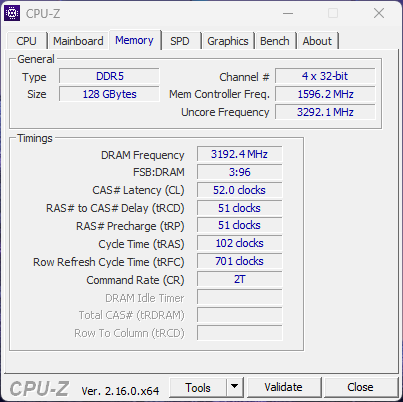
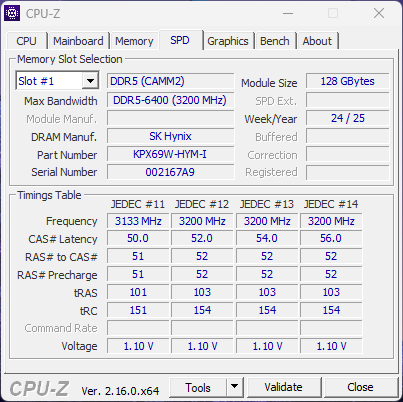
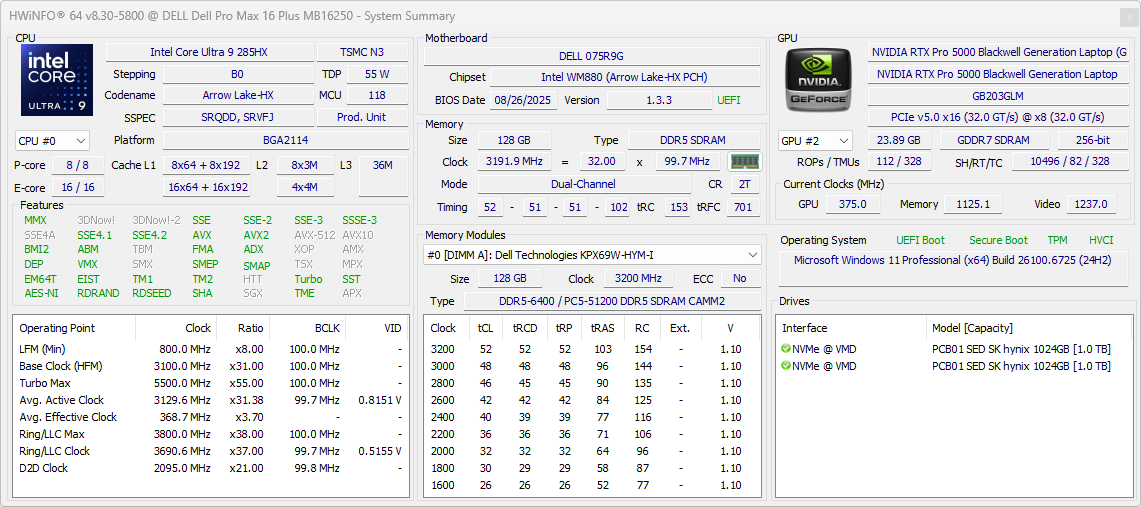
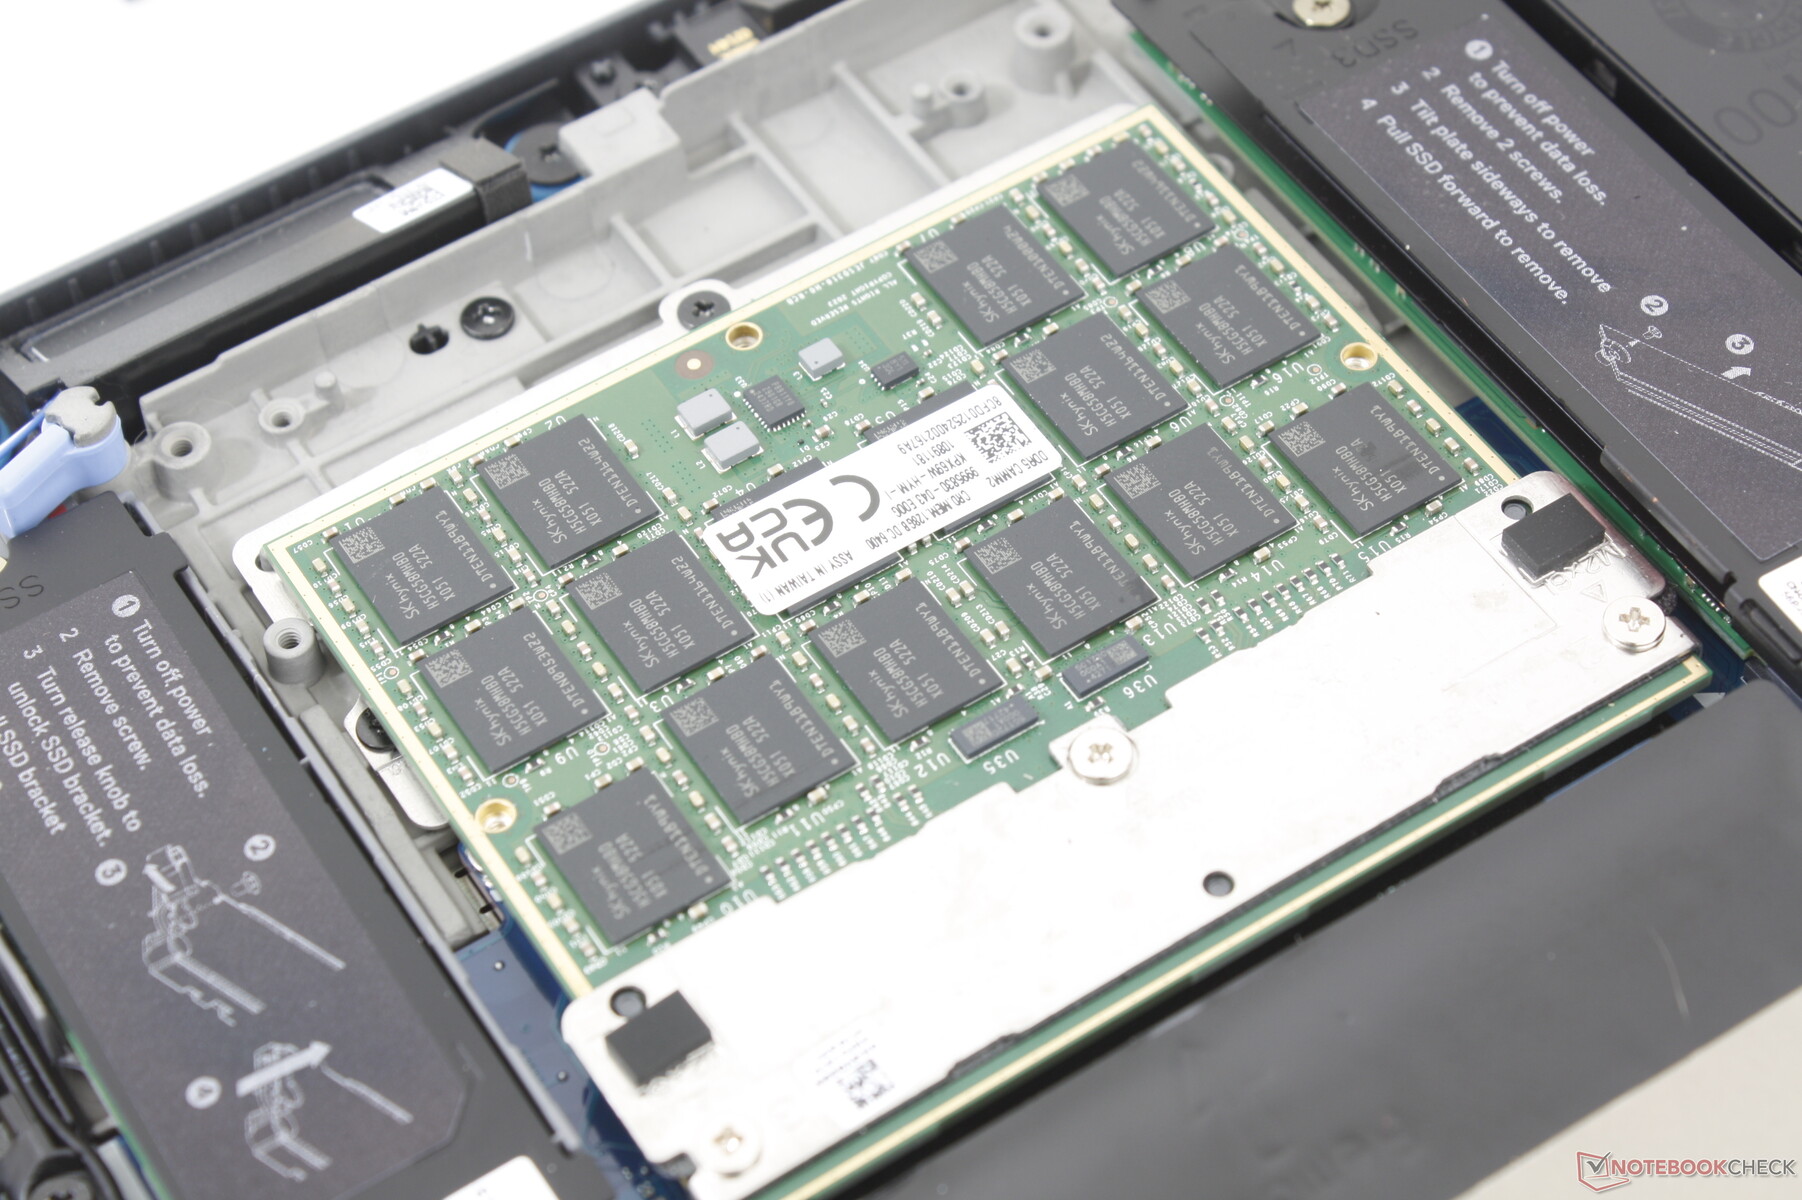
The Dell Pro Max 16 Plus is the maker's latest 16-inch mobile workstation succeeding the last generation Precision 7680 series. As such, it is a high-end workstation with advanced processors and features including Intel Arrow Lake-HX CPUs, Nvidia Pro Blackwell GPUs, and compatibility with specialized hardware like DGFF and CAMM2 modules.
Our test unit is the highest-end configuration with the Core Ultra 9 285HX, RTX Pro 5000 Blackwell, 4K UHD 120 Hz OLED touchscreen, 2 TB PCIe5 SSD, and 128 GB of CAMM2 RAM for approximately $5000. Lesser SKUs start with the Core Ultra 5 245HX, 16 GB CSoDIMM, integrated graphics only, and a basic FHD+ non-touch display for approximately $3700.
Alternatives in this space include other performance-oriented 16-inch workstations like the MSI CreatorPro Z16P, Lenovo ThinkPad P16 Gen 2, or the HP ZBook Studio 16.
More Dell reviews:
Specifications
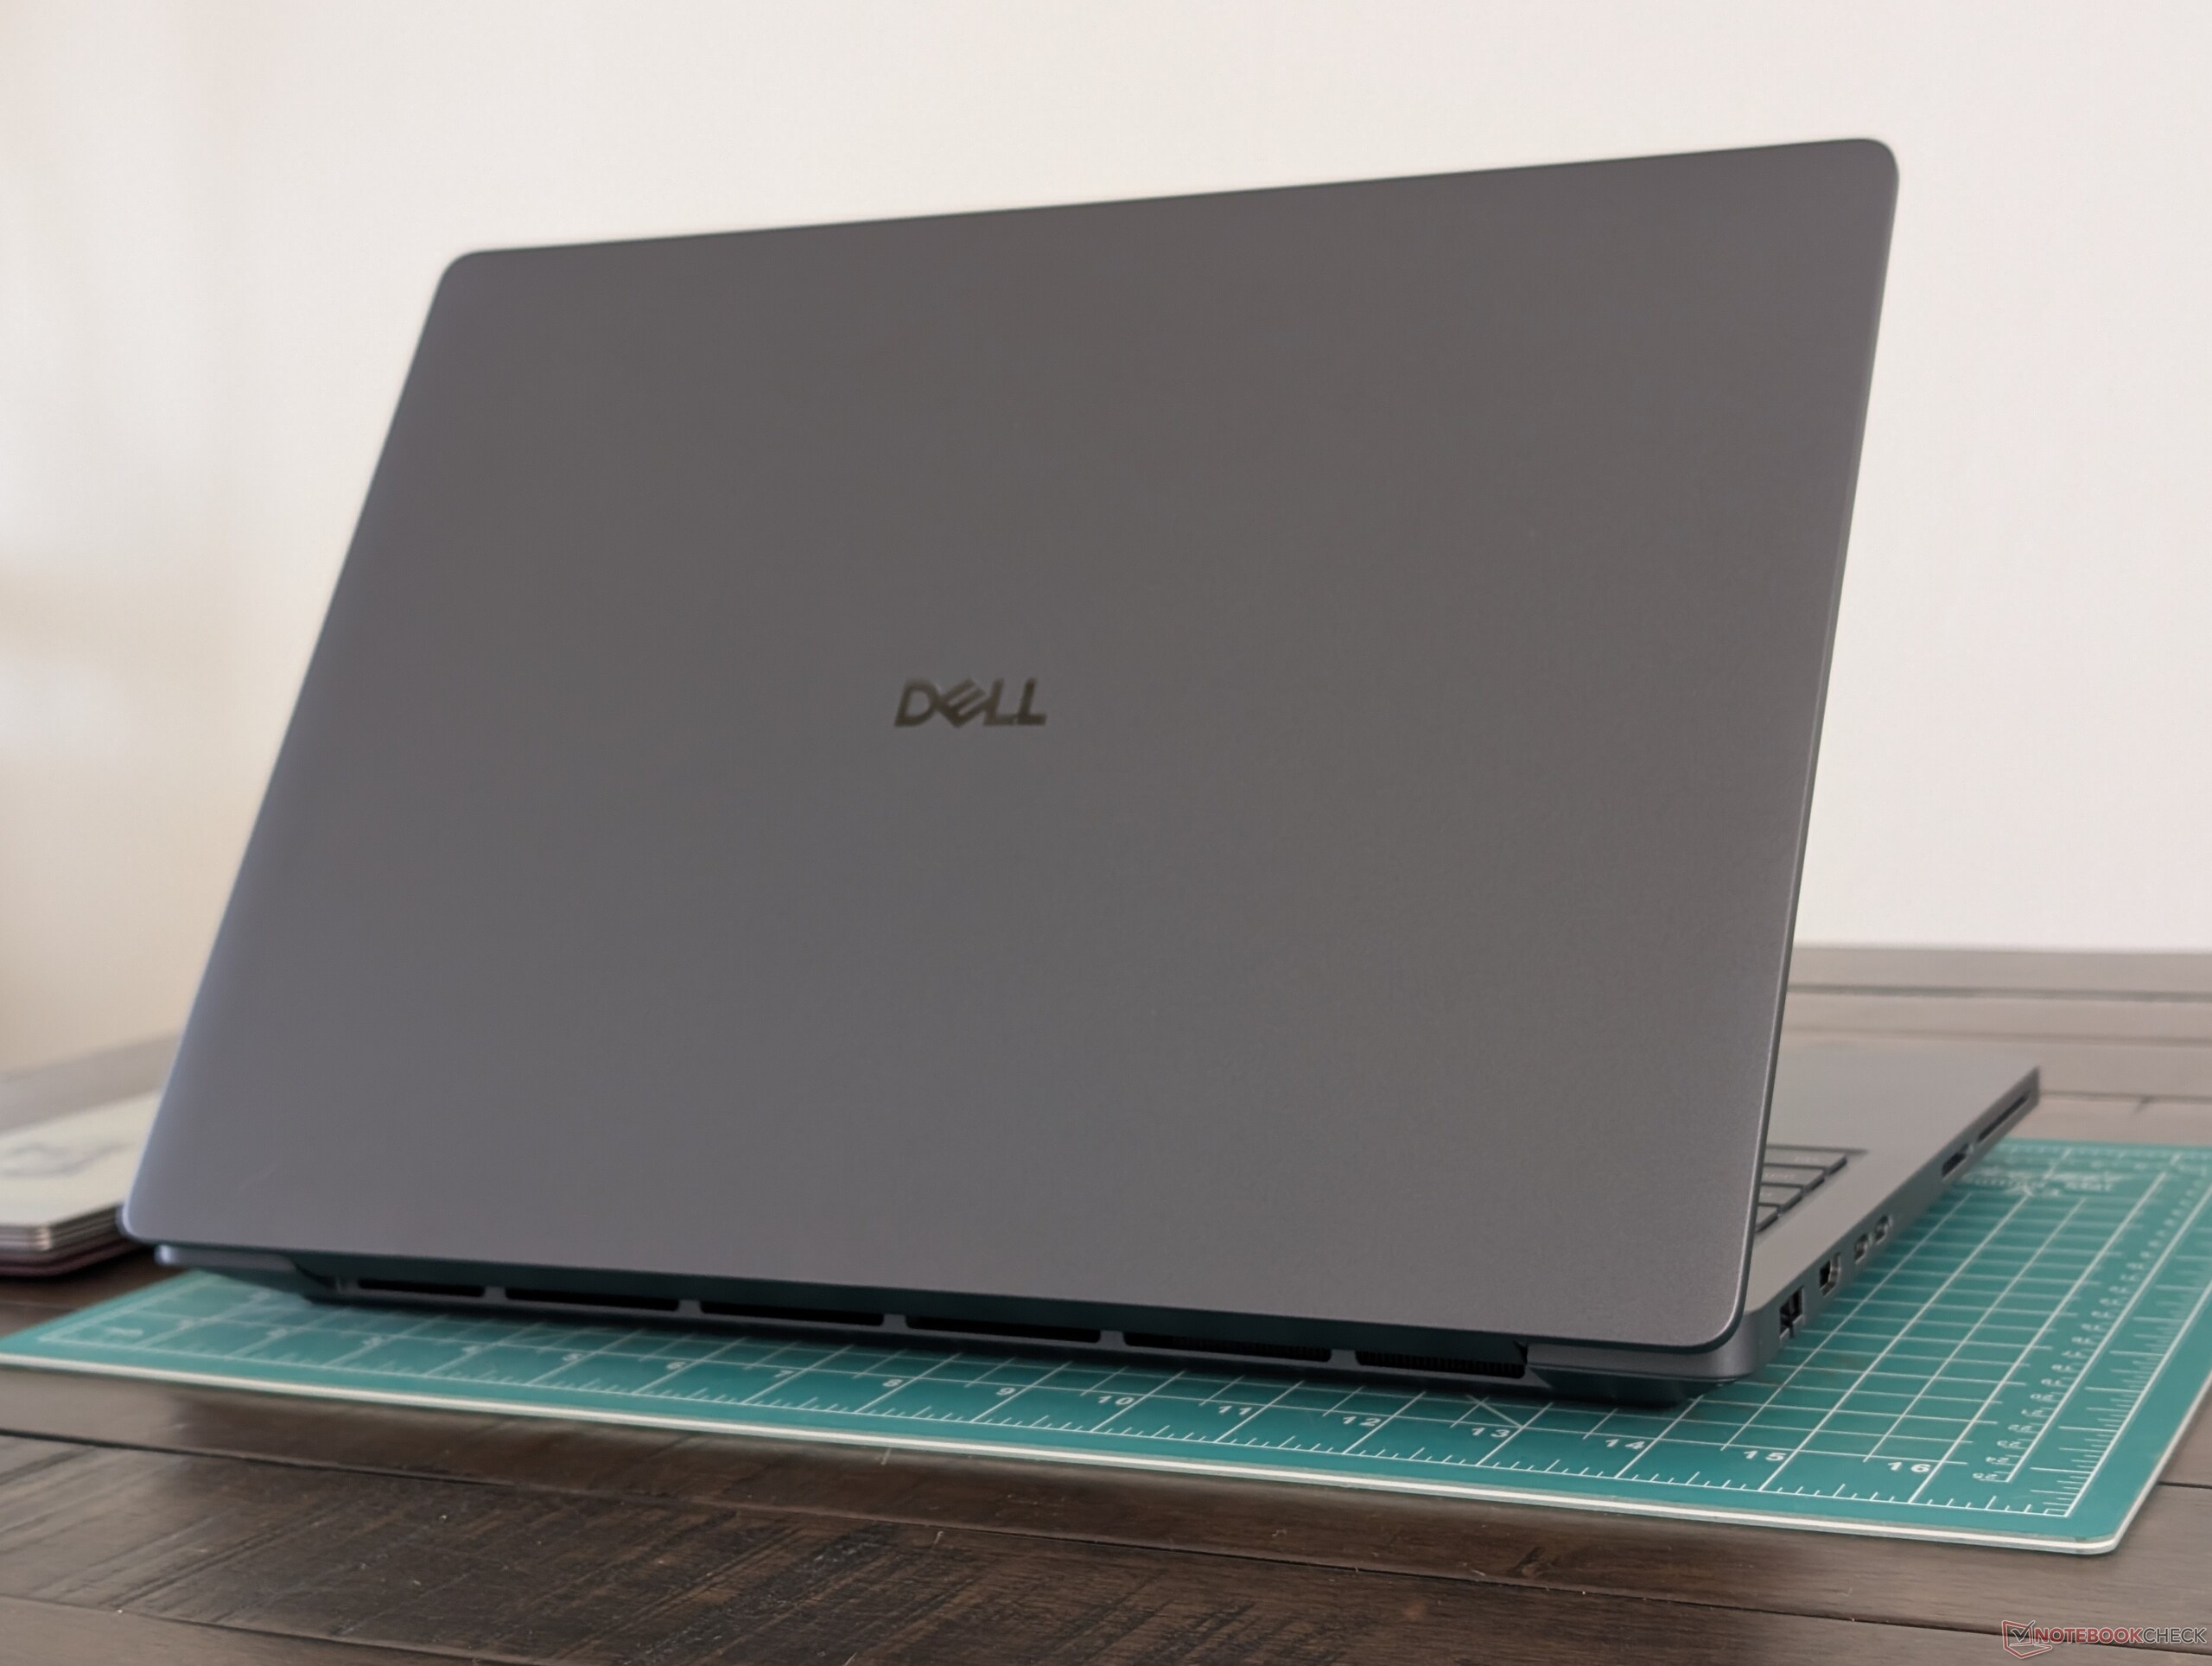
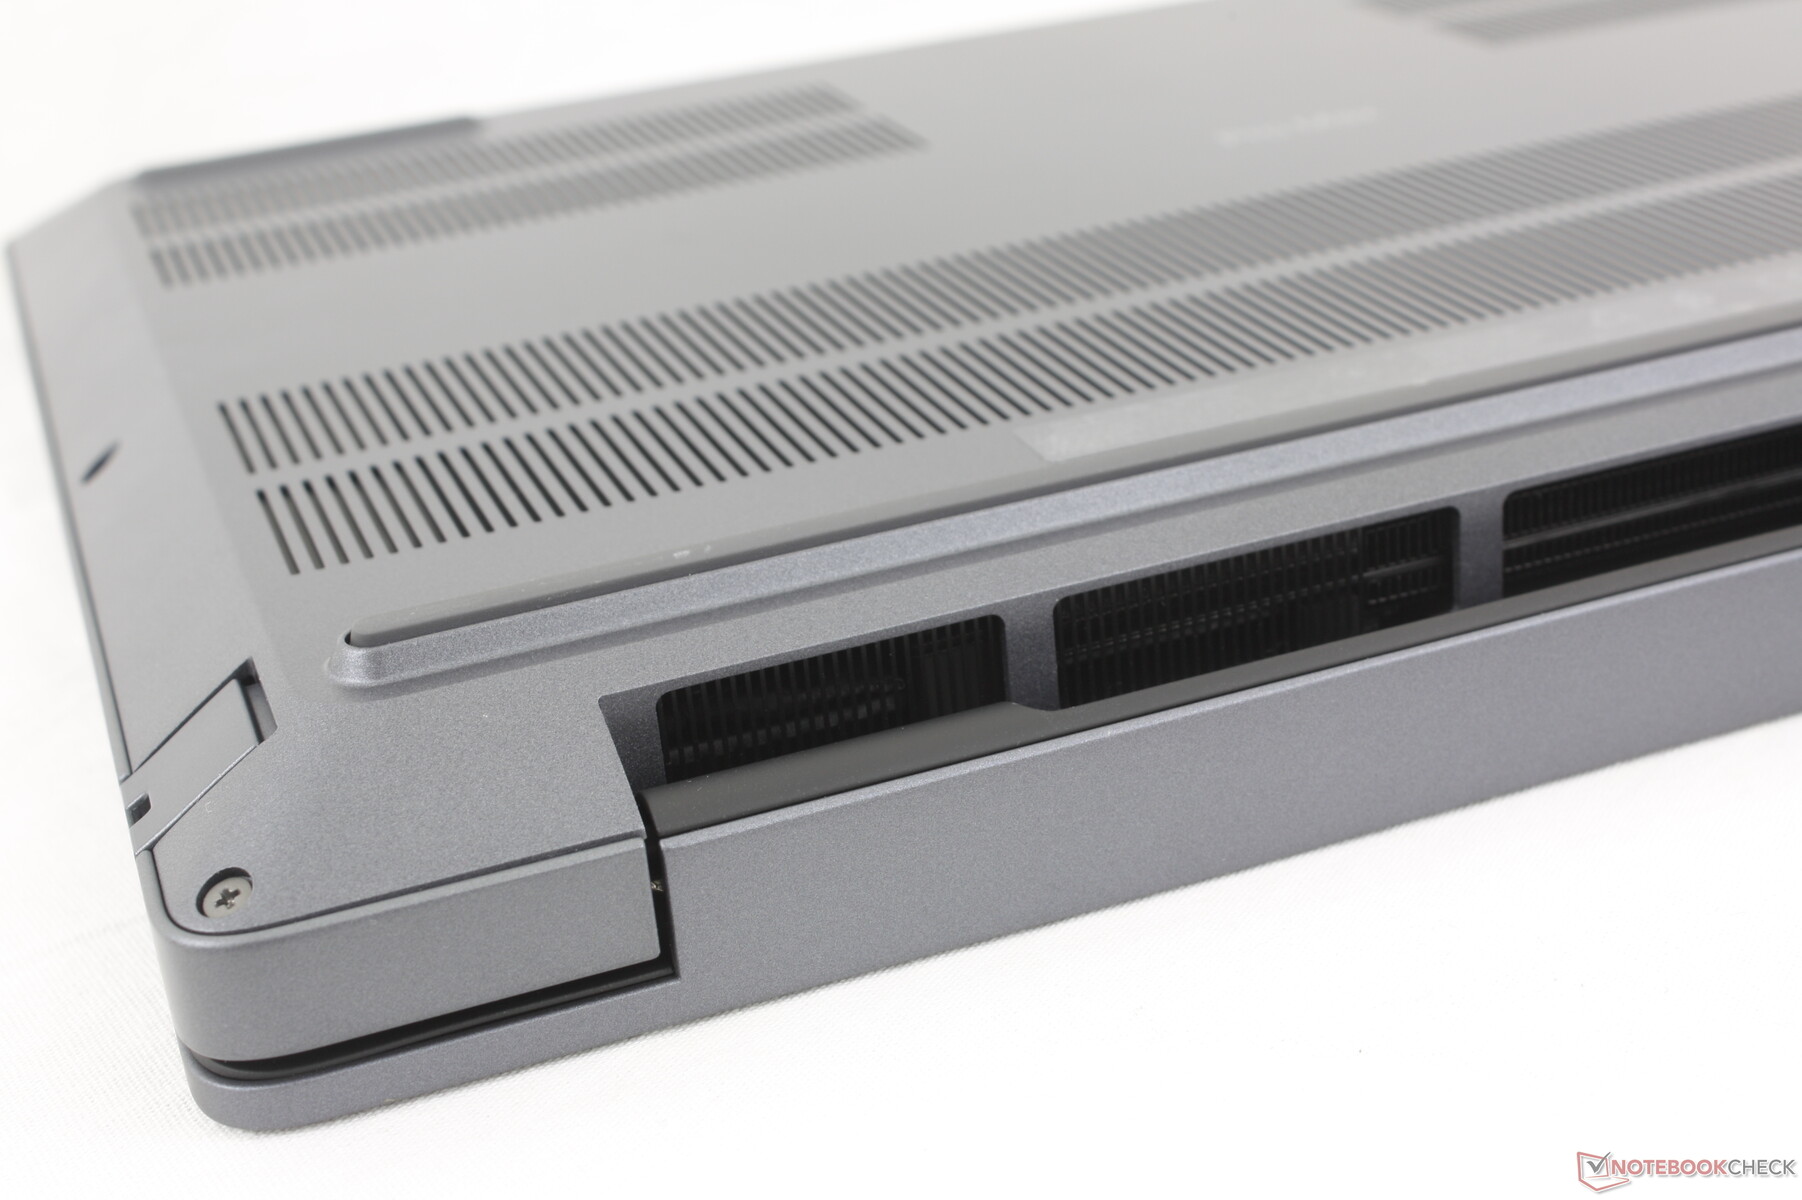
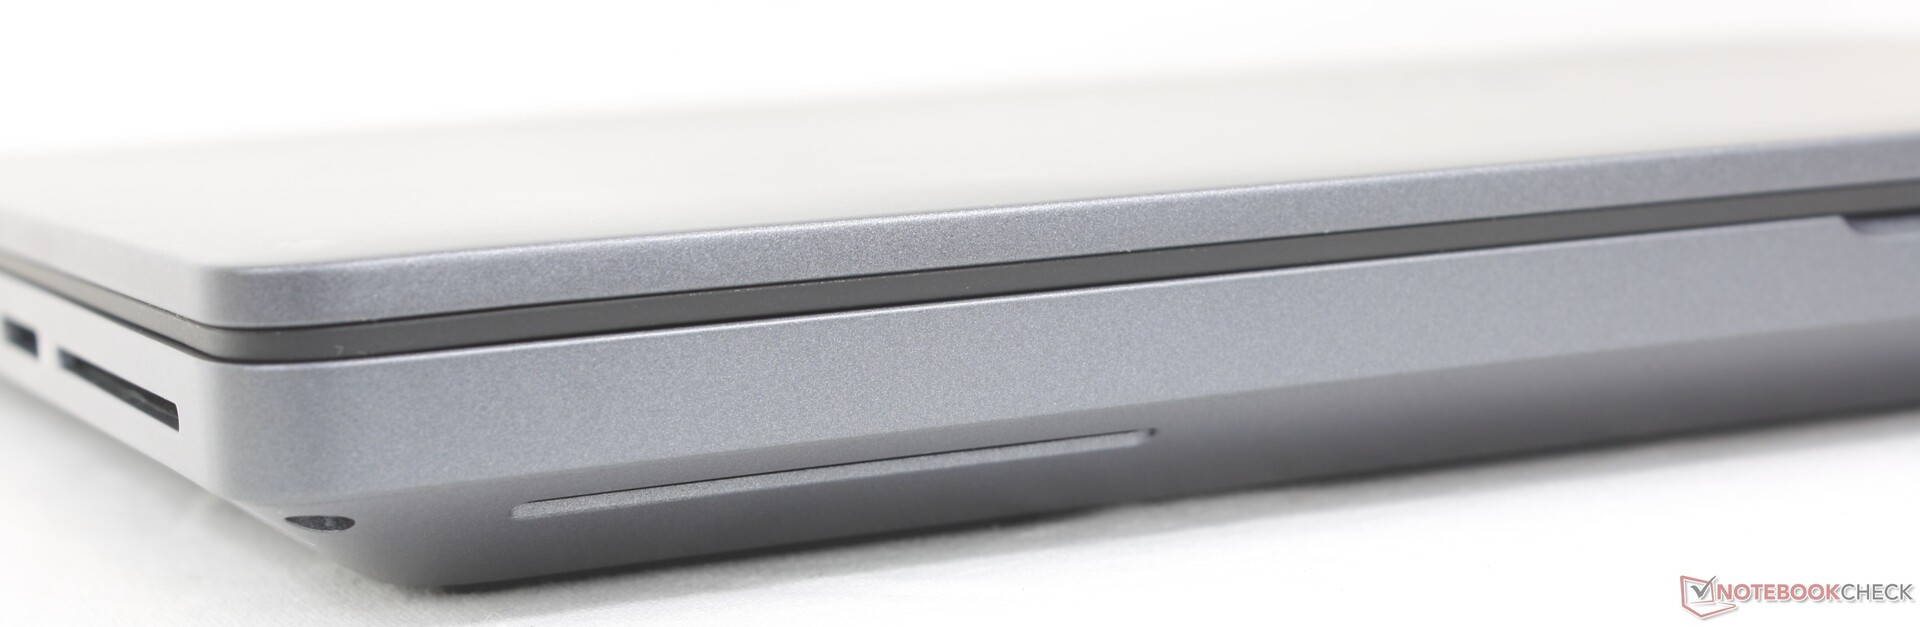
Case
The model is actually slightly larger and thicker than the 4-year old Precision 7670. Even so, the solid build quality and professional features like CAMM2, DGFF, and modular USB-C repairability arguably make the bigger size worth the investment.

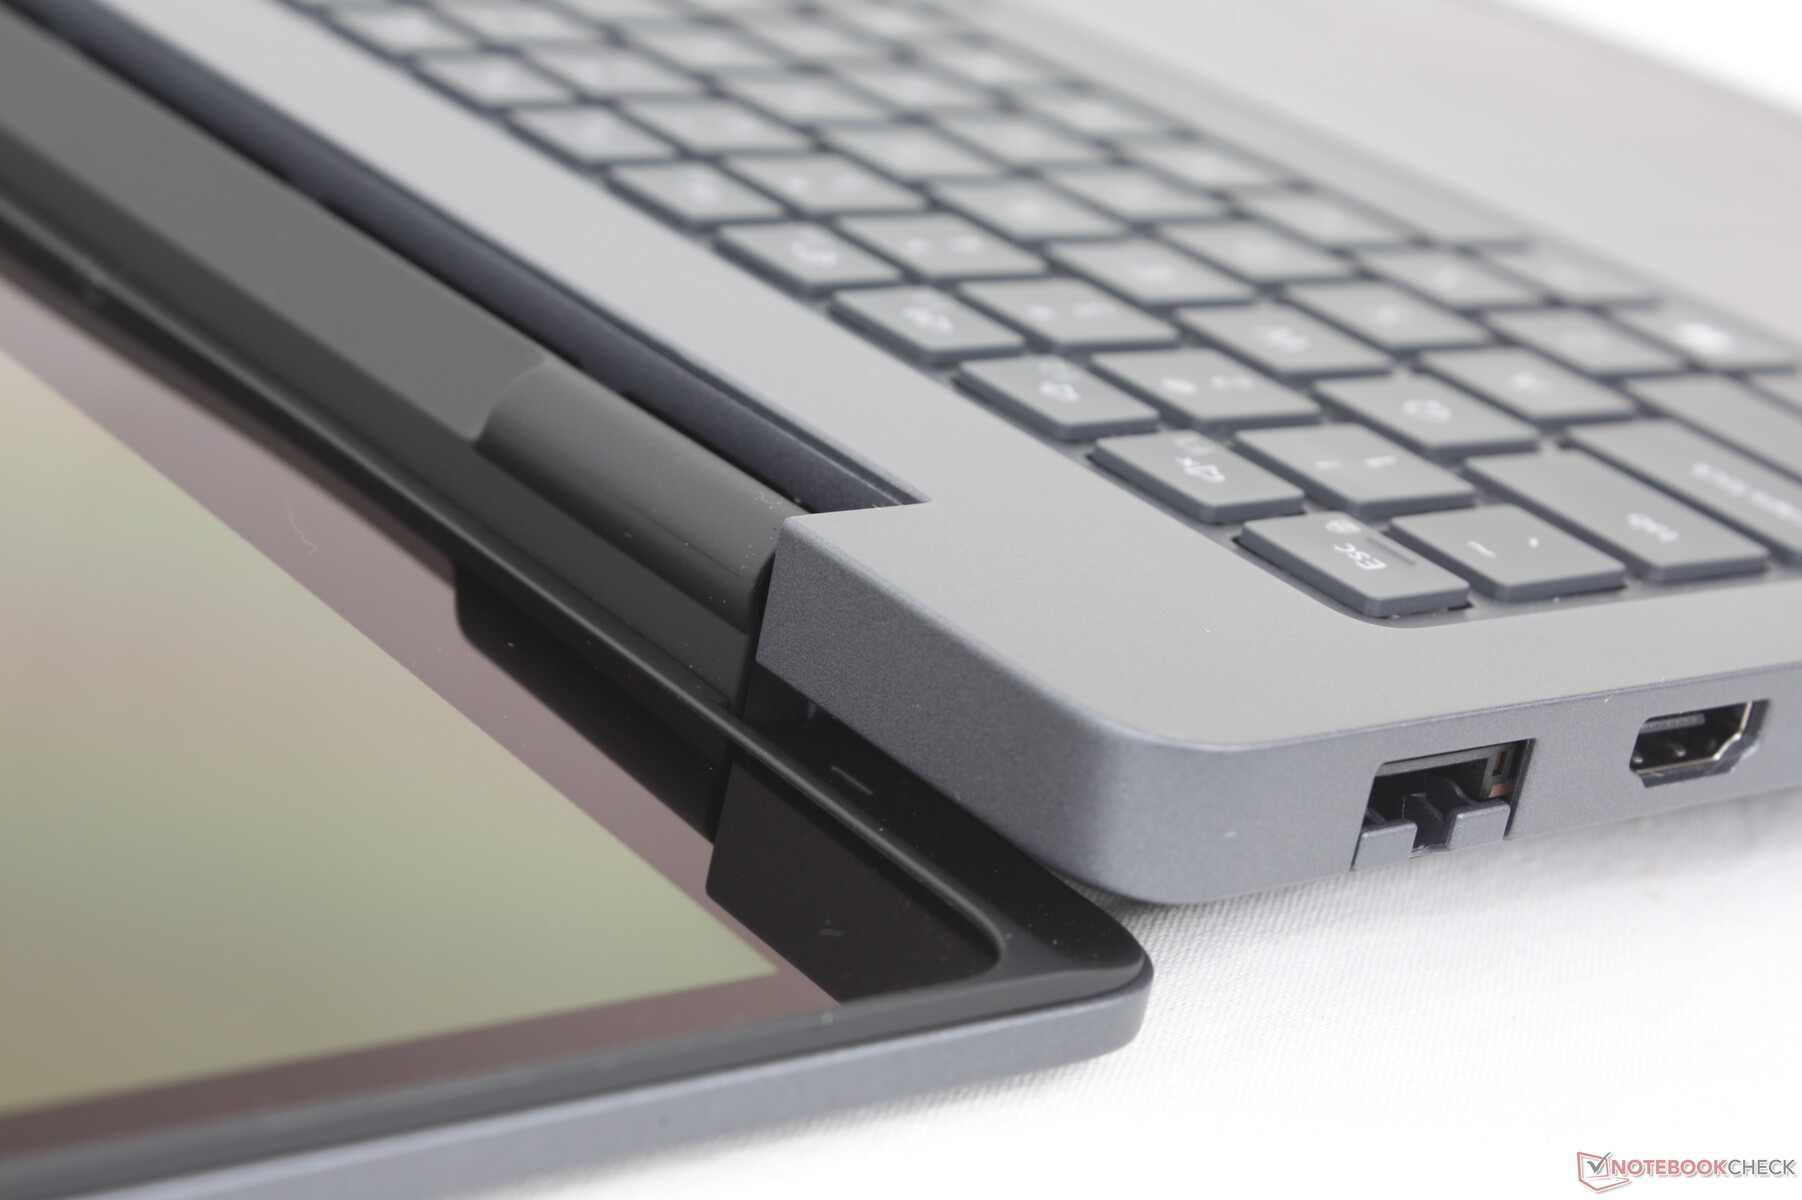

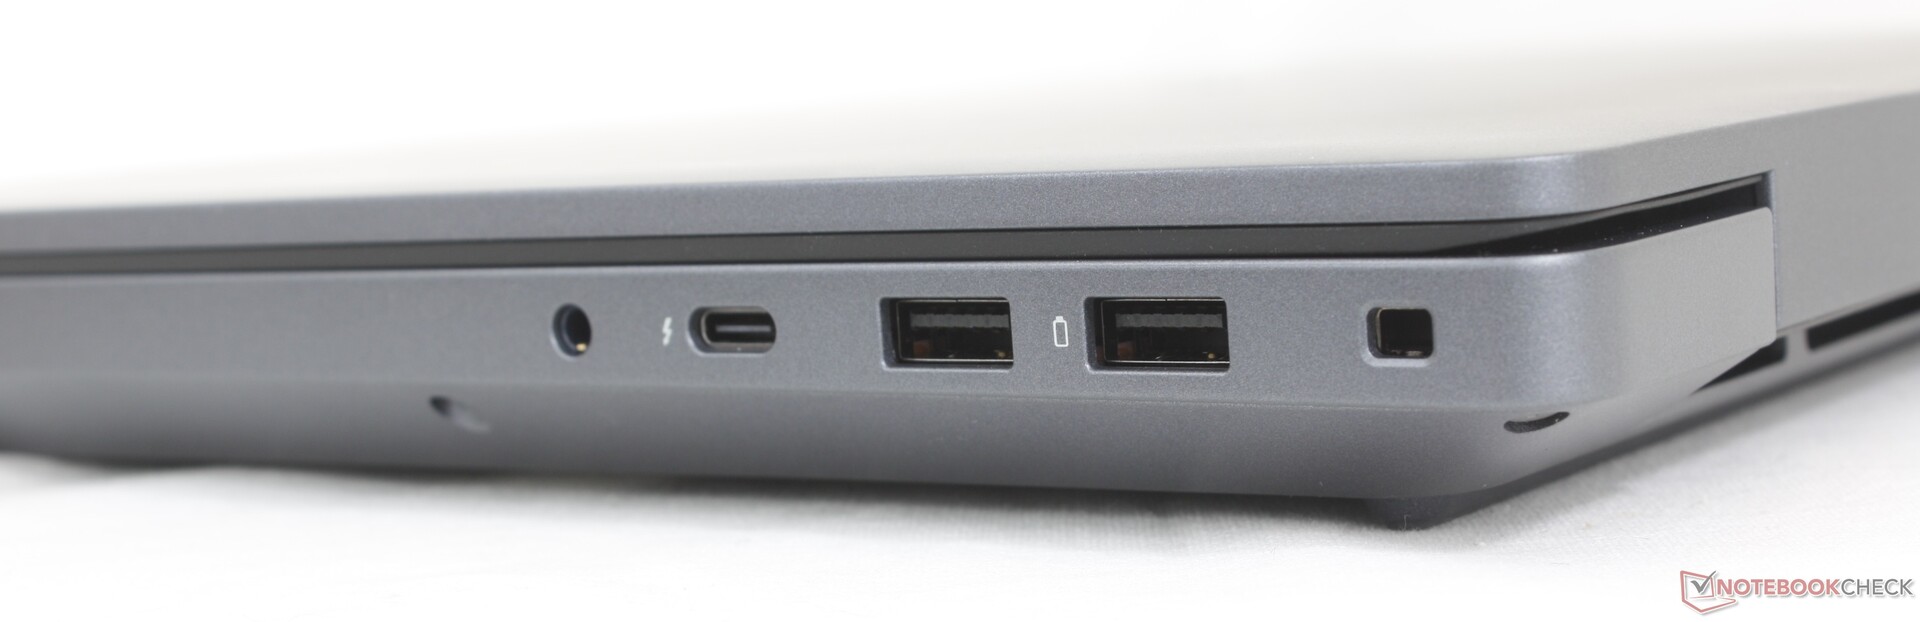
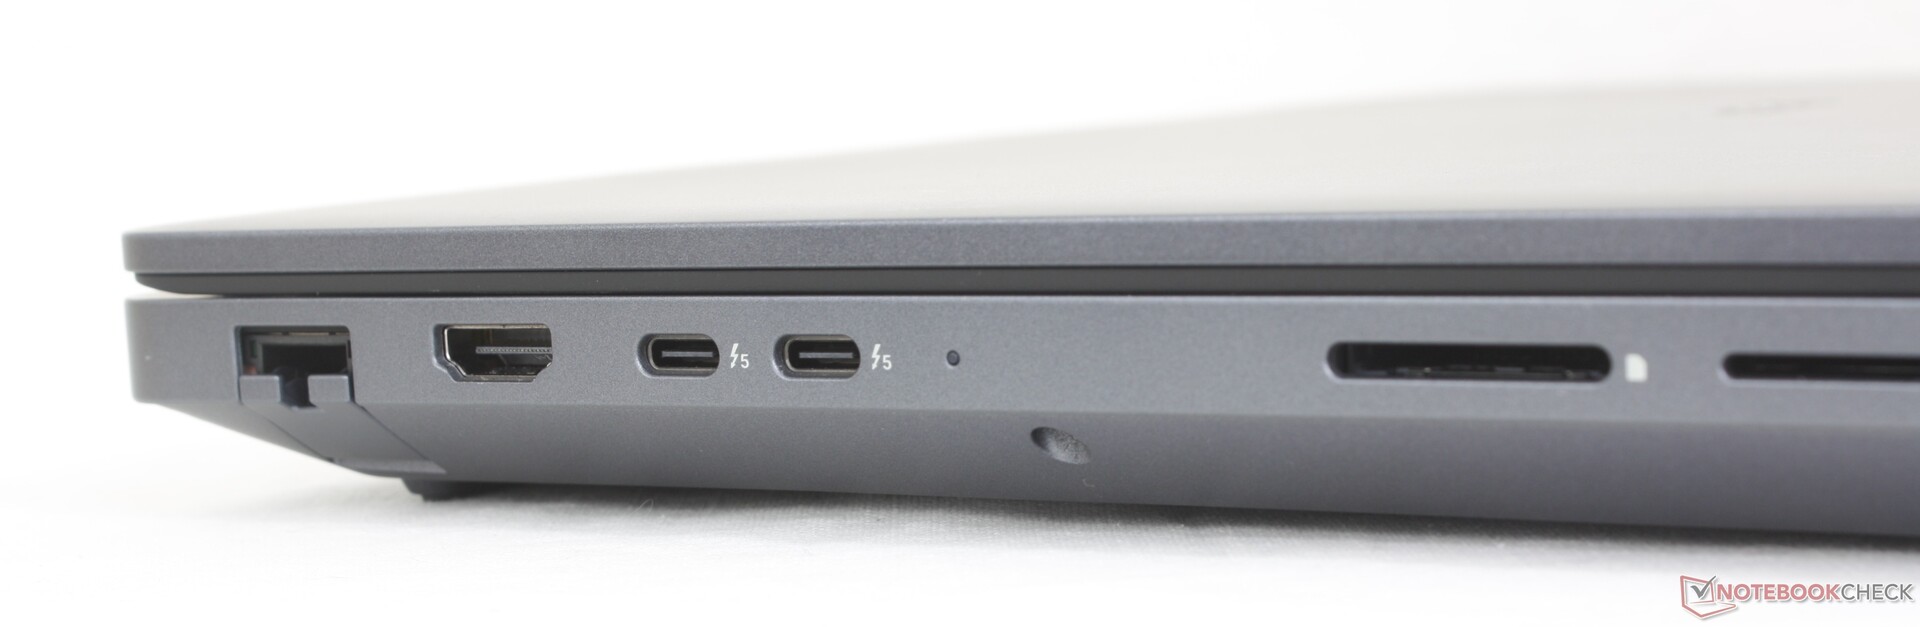
Connectivity
Port options are largely identical to the Precision 7680 albeit with some important changes. The dedicated AC adapter barrel port, for example, has been dropped on the Pro Max 16 Plus meaning that one of the three USB-C ports will almost always be occupied for charging purposes. Meanwhile, Thunderbolt 5 now comes standard for more advanced docking capabilities.

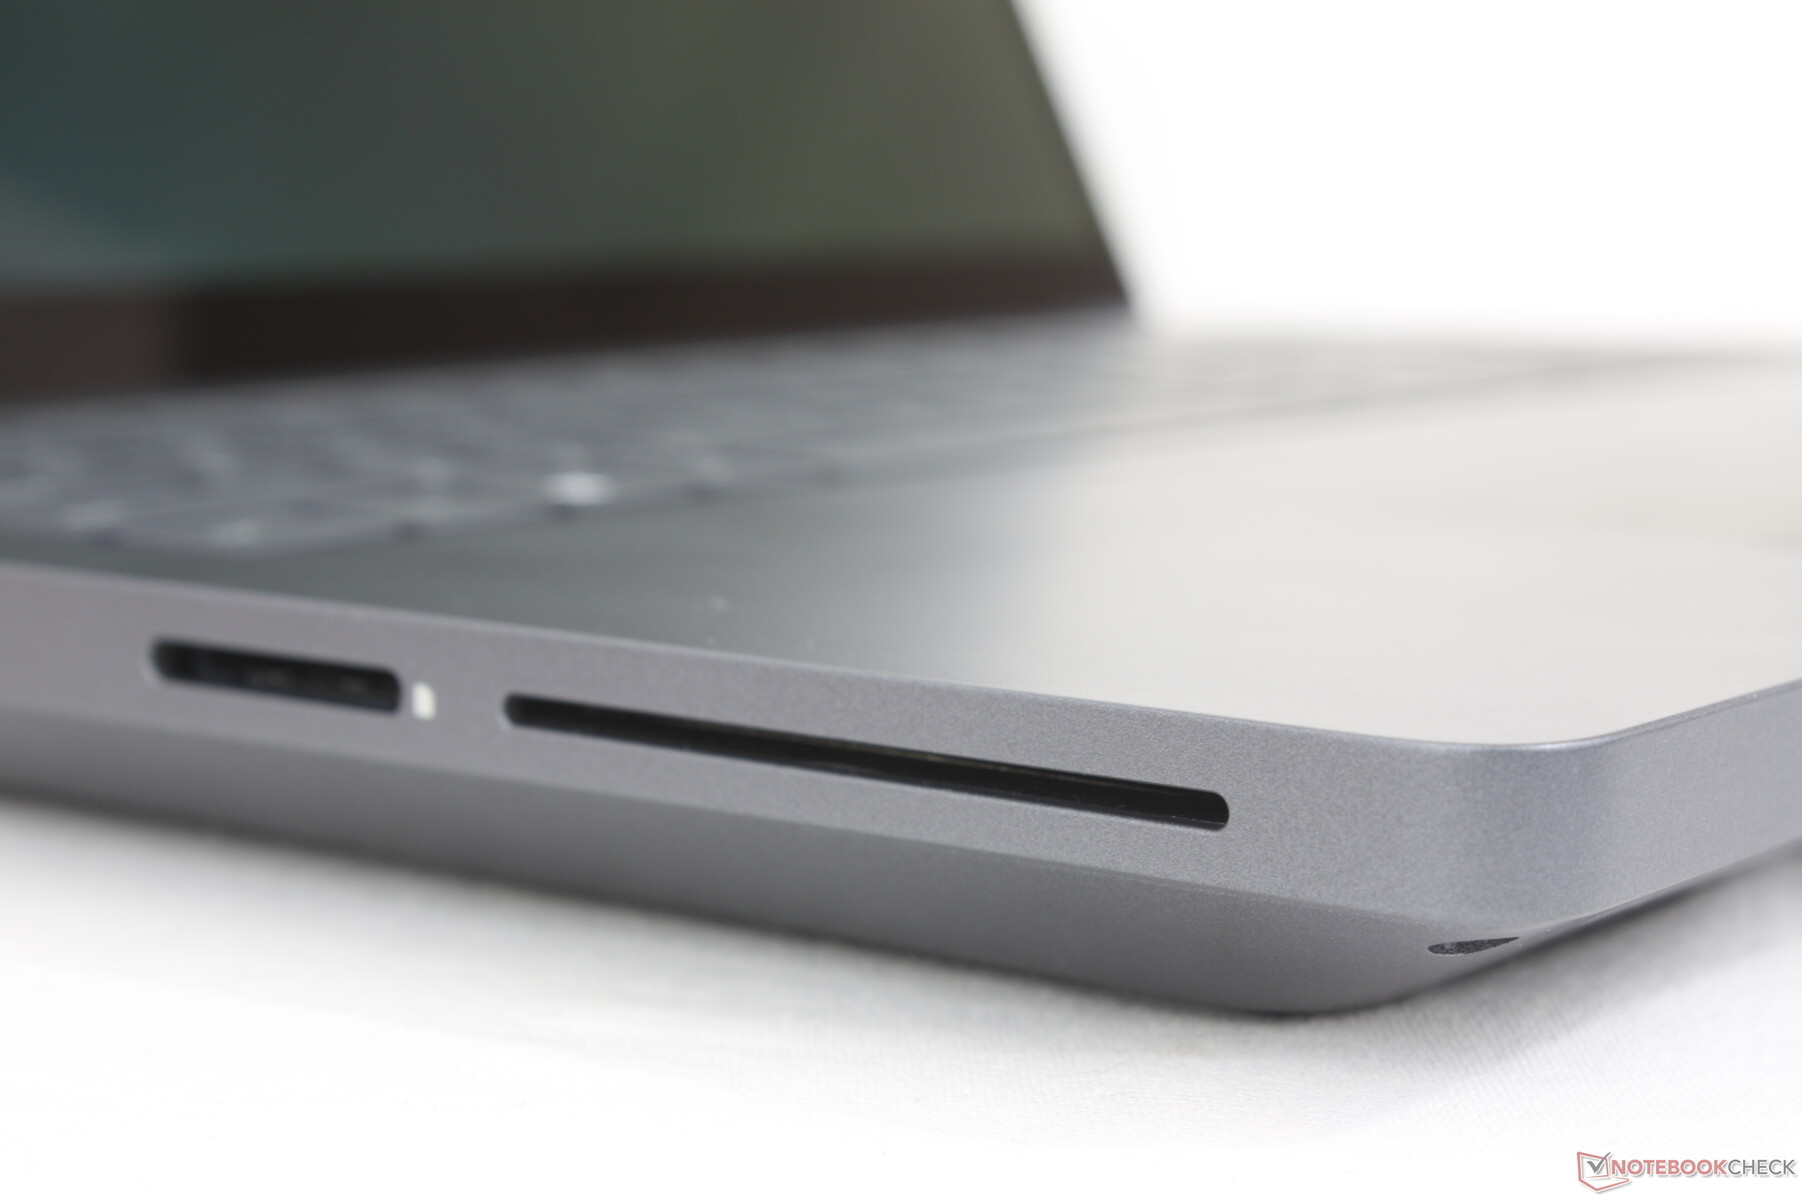
SD Card Reader
| SD Card Reader | |
| average JPG Copy Test (av. of 3 runs) | |
| Dell Precision 5000 5680 (Toshiba Exceria Pro SDXC 64 GB UHS-II) | |
| Lenovo ThinkPad P16 Gen 2 (Toshiba Exceria Pro SDXC 64 GB UHS-II) | |
| MSI CreatorPro Z16P B12UKST (AV Pro V60) | |
| Dell Pro Max 16 Plus (Toshiba Exceria Pro SDXC 64 GB UHS-II) | |
| Lenovo ThinkPad P1 Gen 7 21KV001SGE (AV Pro V60) | |
| maximum AS SSD Seq Read Test (1GB) | |
| Dell Precision 5000 5680 (Toshiba Exceria Pro SDXC 64 GB UHS-II) | |
| Dell Pro Max 16 Plus (Toshiba Exceria Pro SDXC 64 GB UHS-II) | |
| Lenovo ThinkPad P1 Gen 7 21KV001SGE (AV Pro V60) | |
| Lenovo ThinkPad P16 Gen 2 (Toshiba Exceria Pro SDXC 64 GB UHS-II) | |
| MSI CreatorPro Z16P B12UKST (AV Pro V60) | |
Communication
Webcam
Optional 8 MP webcam with IR and physical shutter.


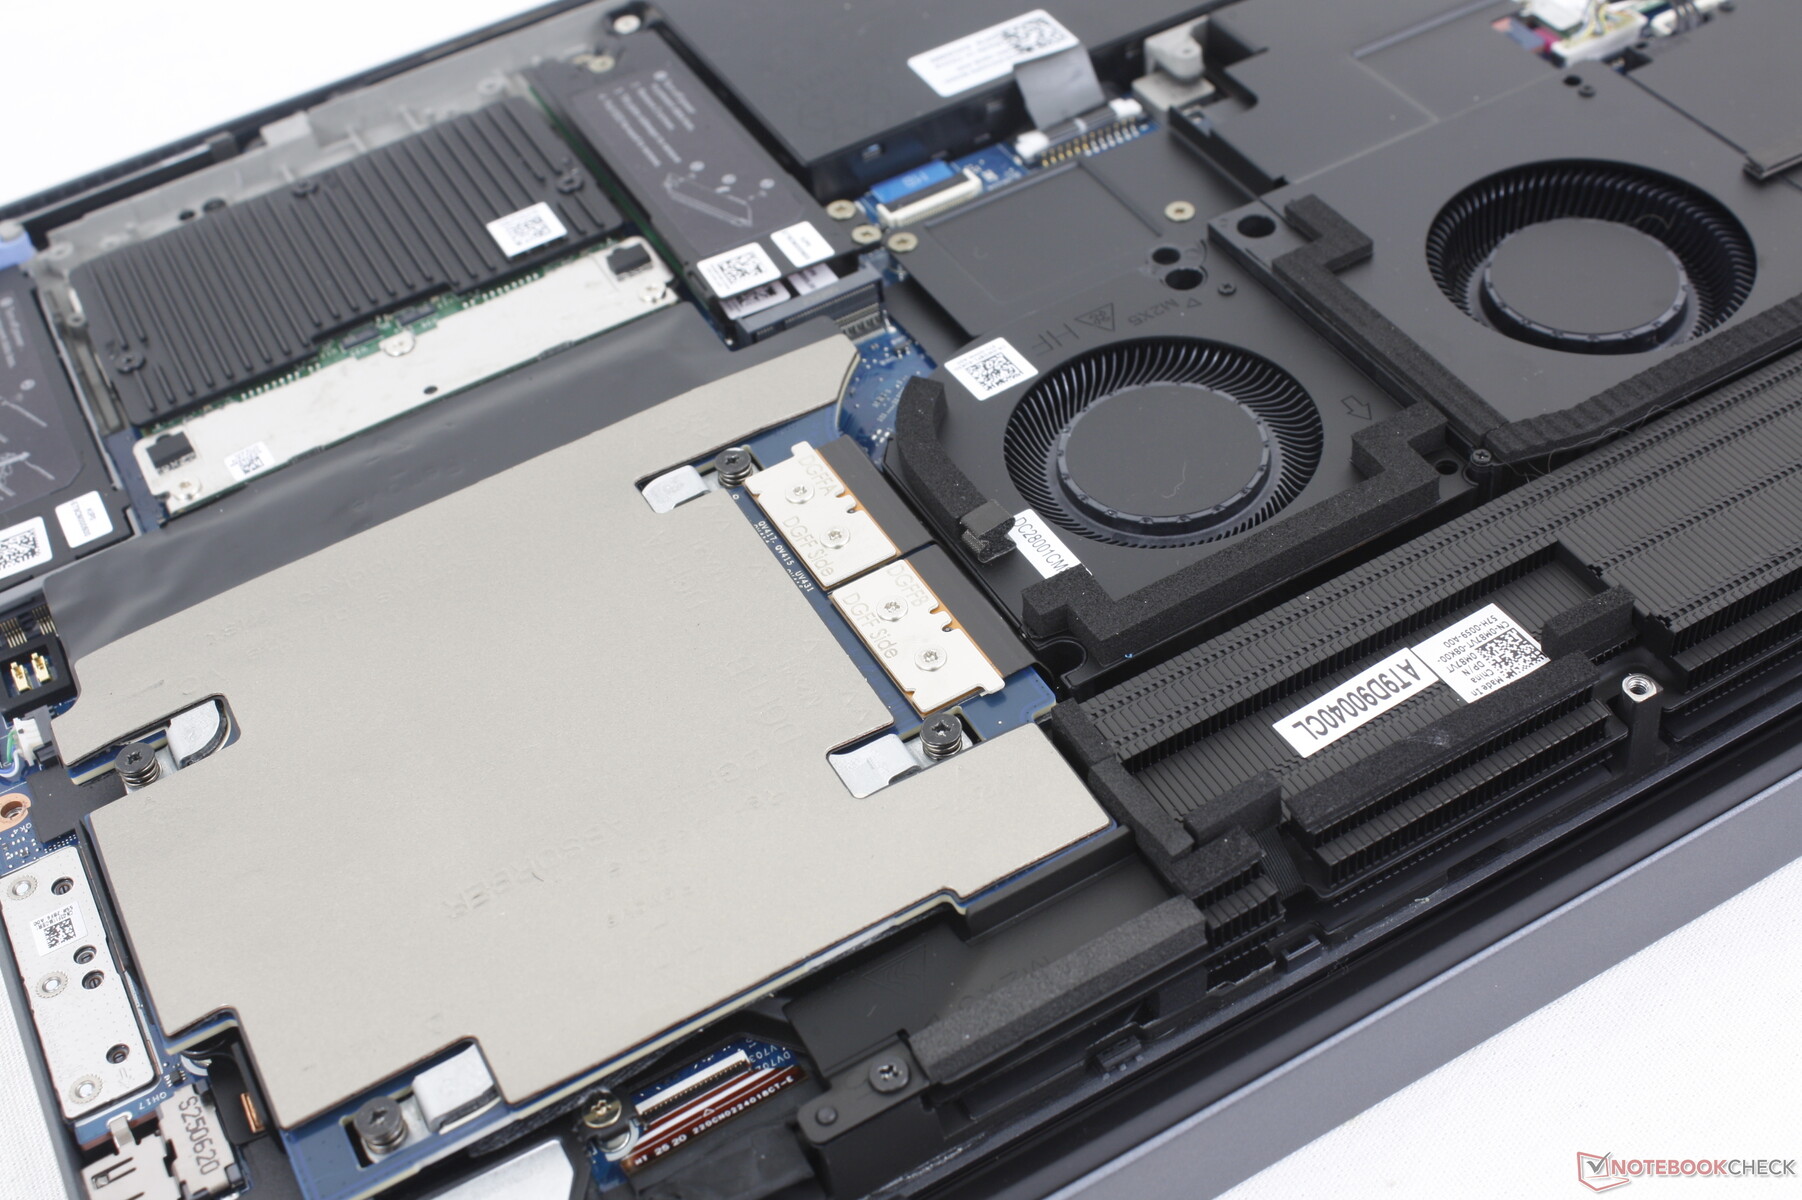
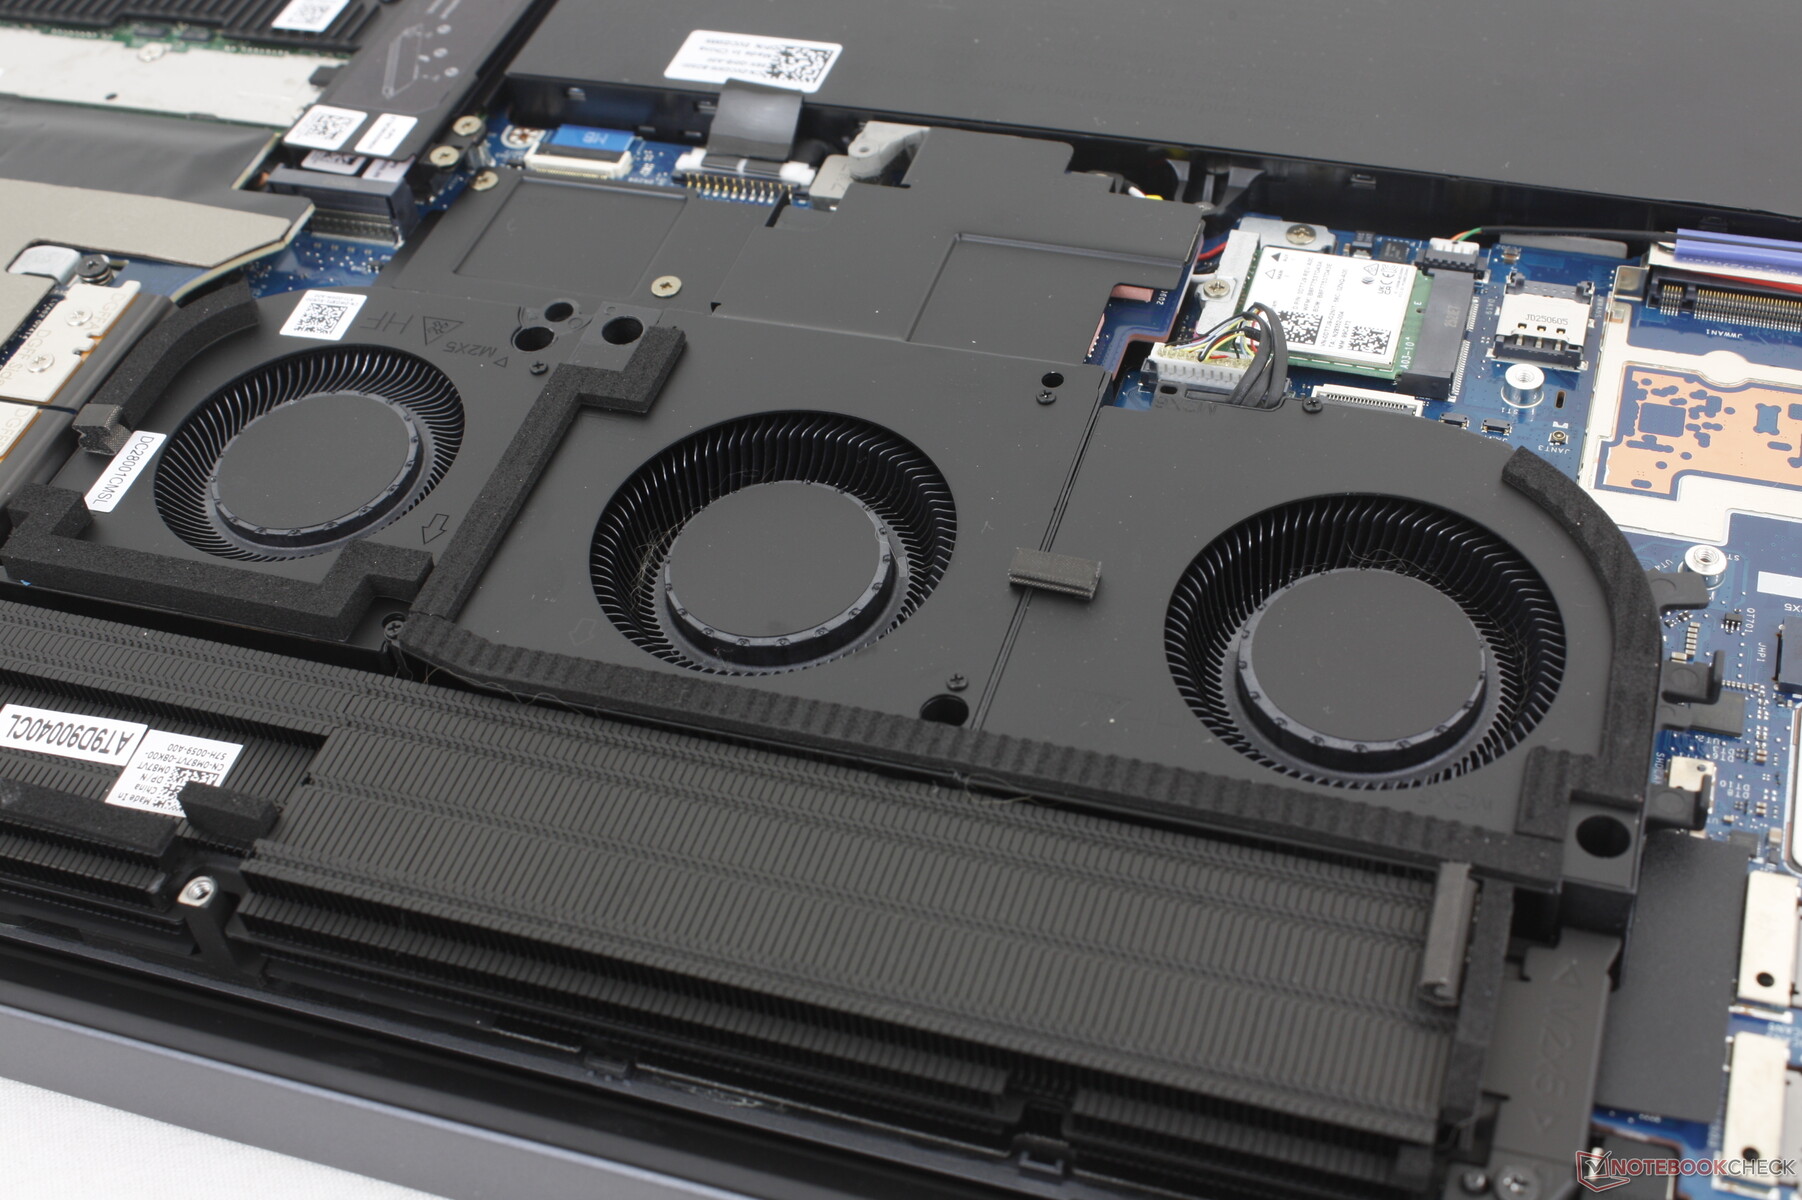
Maintenance
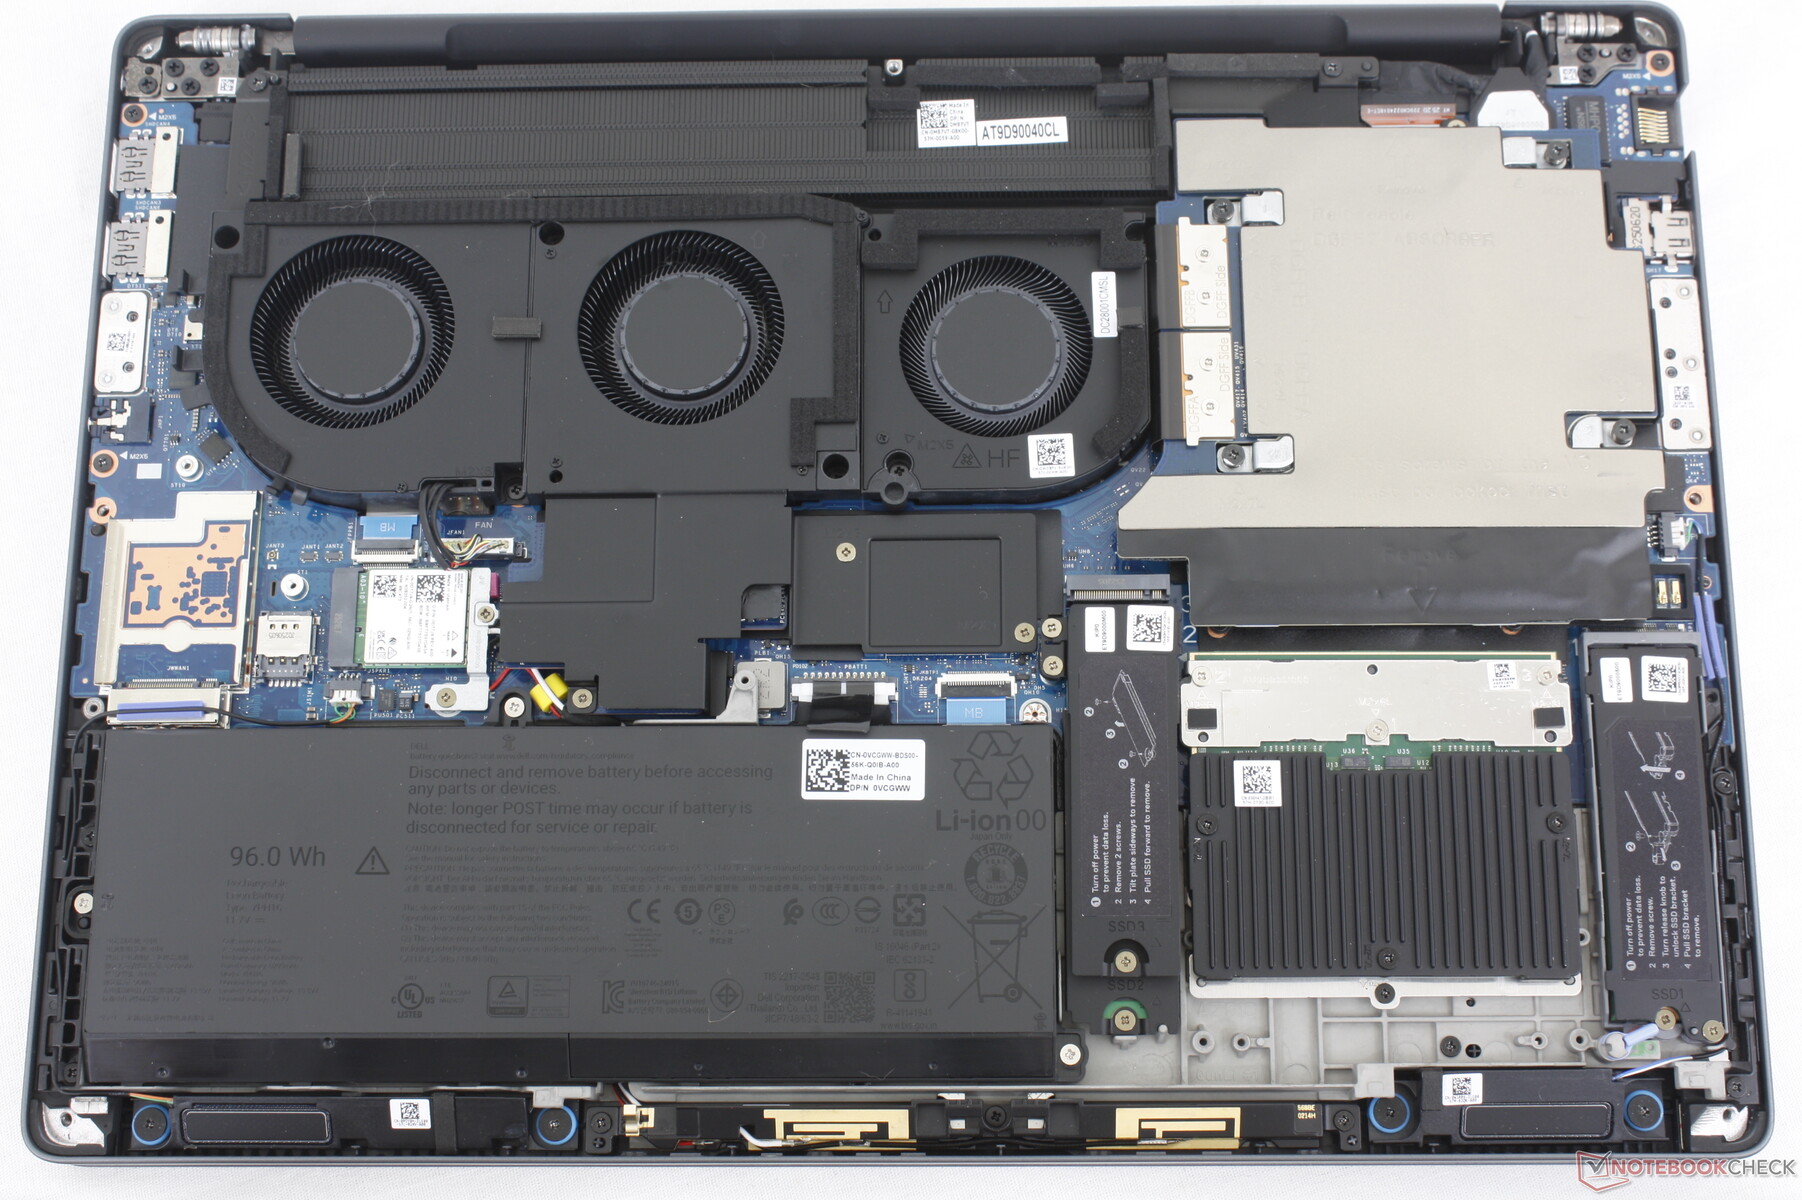
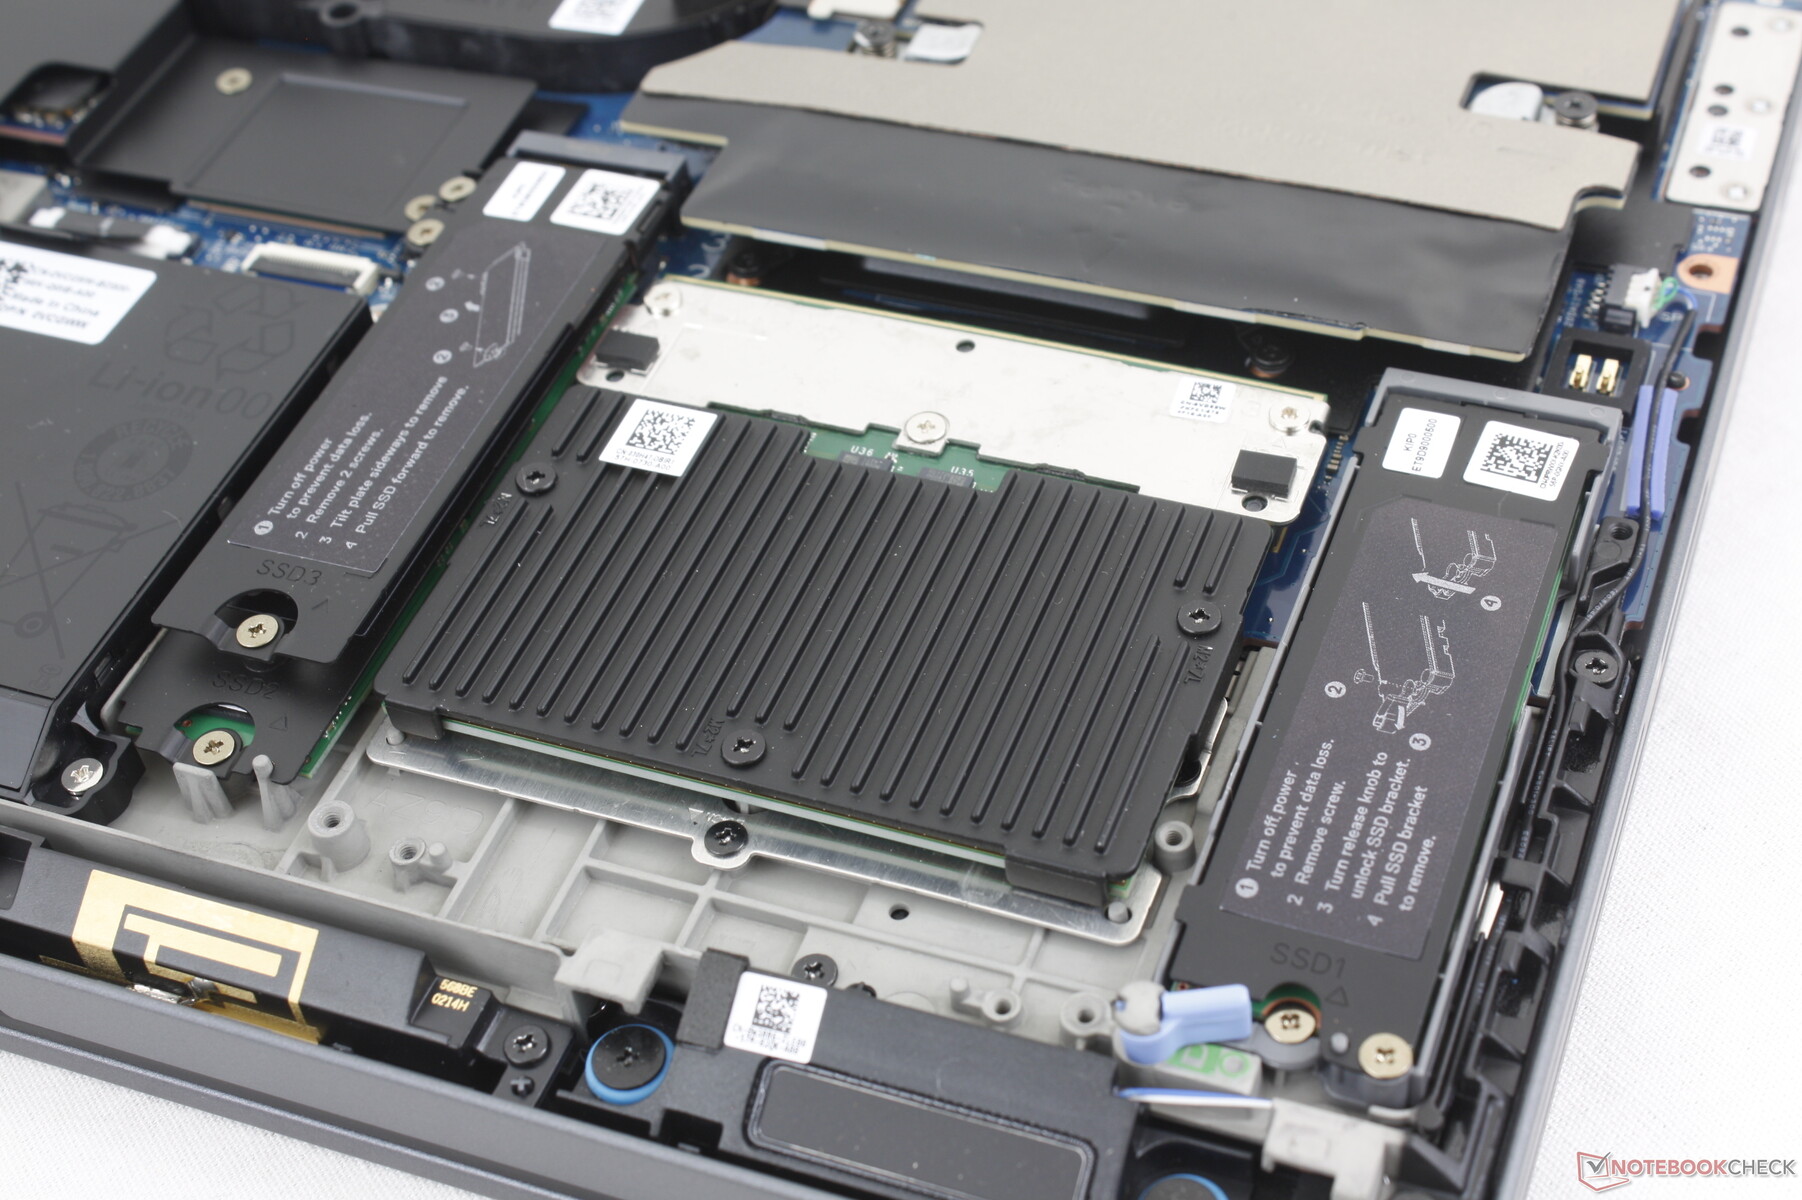
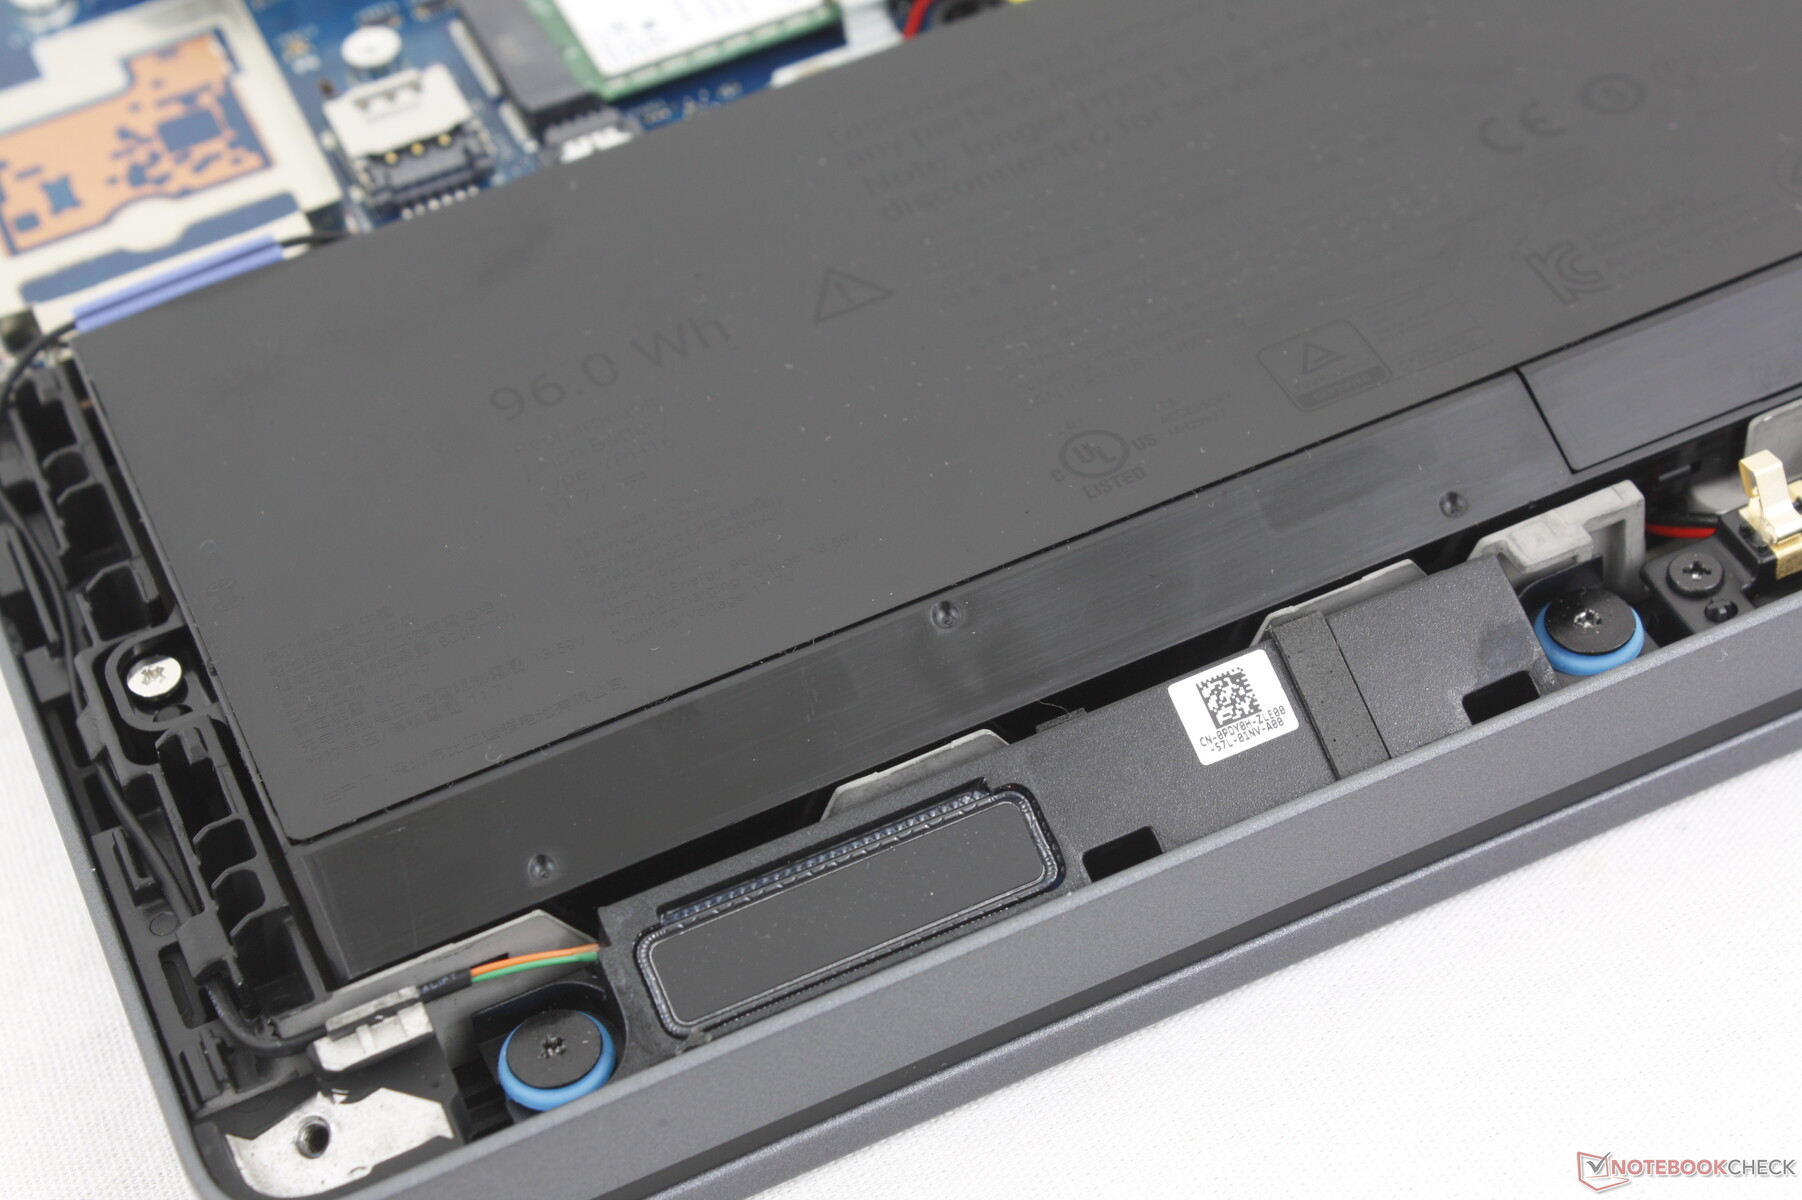
The bottom panel requires only a Phillips screwdriver to remove for easy access to the internals. The CAMM2 module, two M.2 2280 SSD slots, WLAN module, and graphics card (DGFF) are all removable.
The SSD "drive door" that was on the older Precision 7670/7680 design has been dropped.
Sustainability
The chassis consists of 90 percent recycled magnesium for the top and bottom covers, 30 percent PCC plastics for the palm rests, 46 percent bio-based plastics for the bottom bumpers, and 50 percent recycled cobalt for the 96 Whr battery. This model is also one of Dell's first to incorporate modular USB-C ports for easy replacement should the ports ever break or become loose from overuse.
Accessories And Warranty
There are no extras in the box other than the AC adapter and paperwork. A three-year manufacturer warranty comes standard.
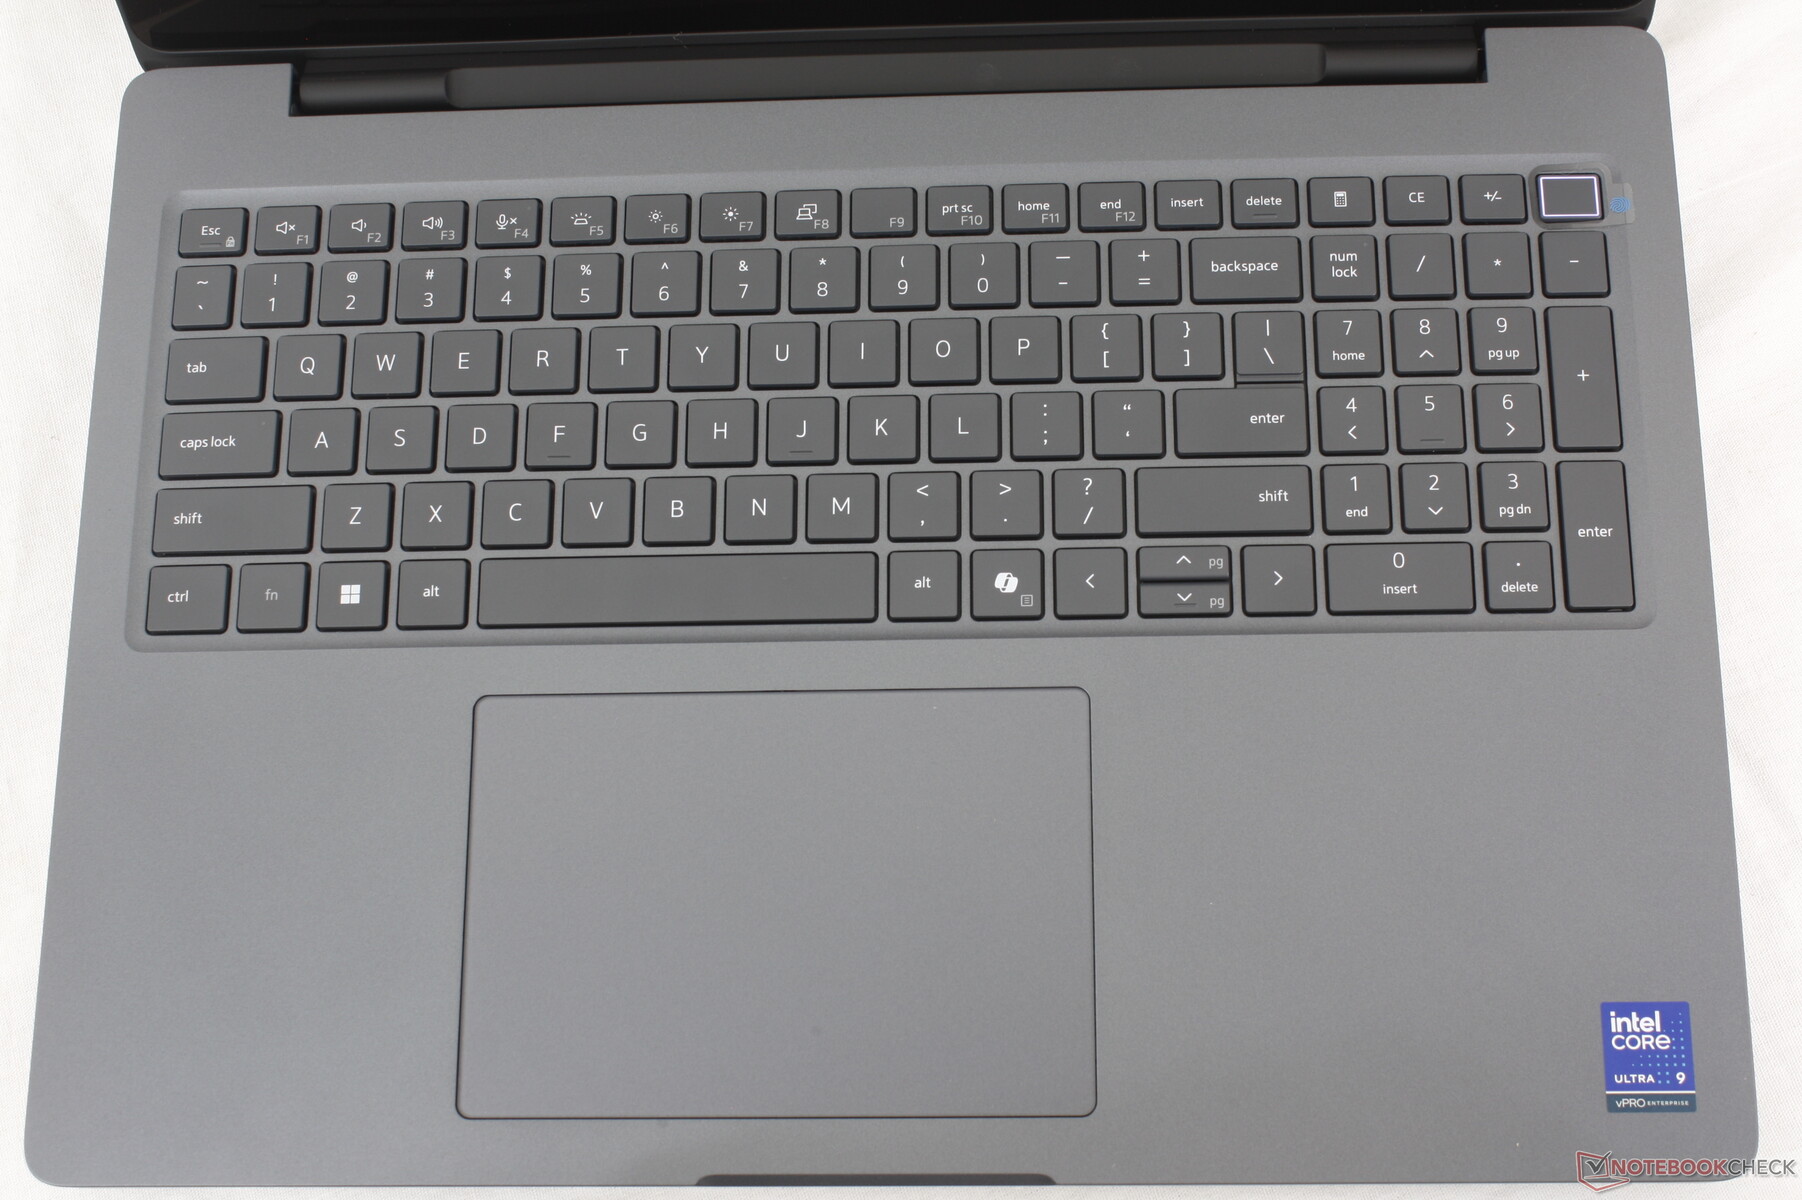
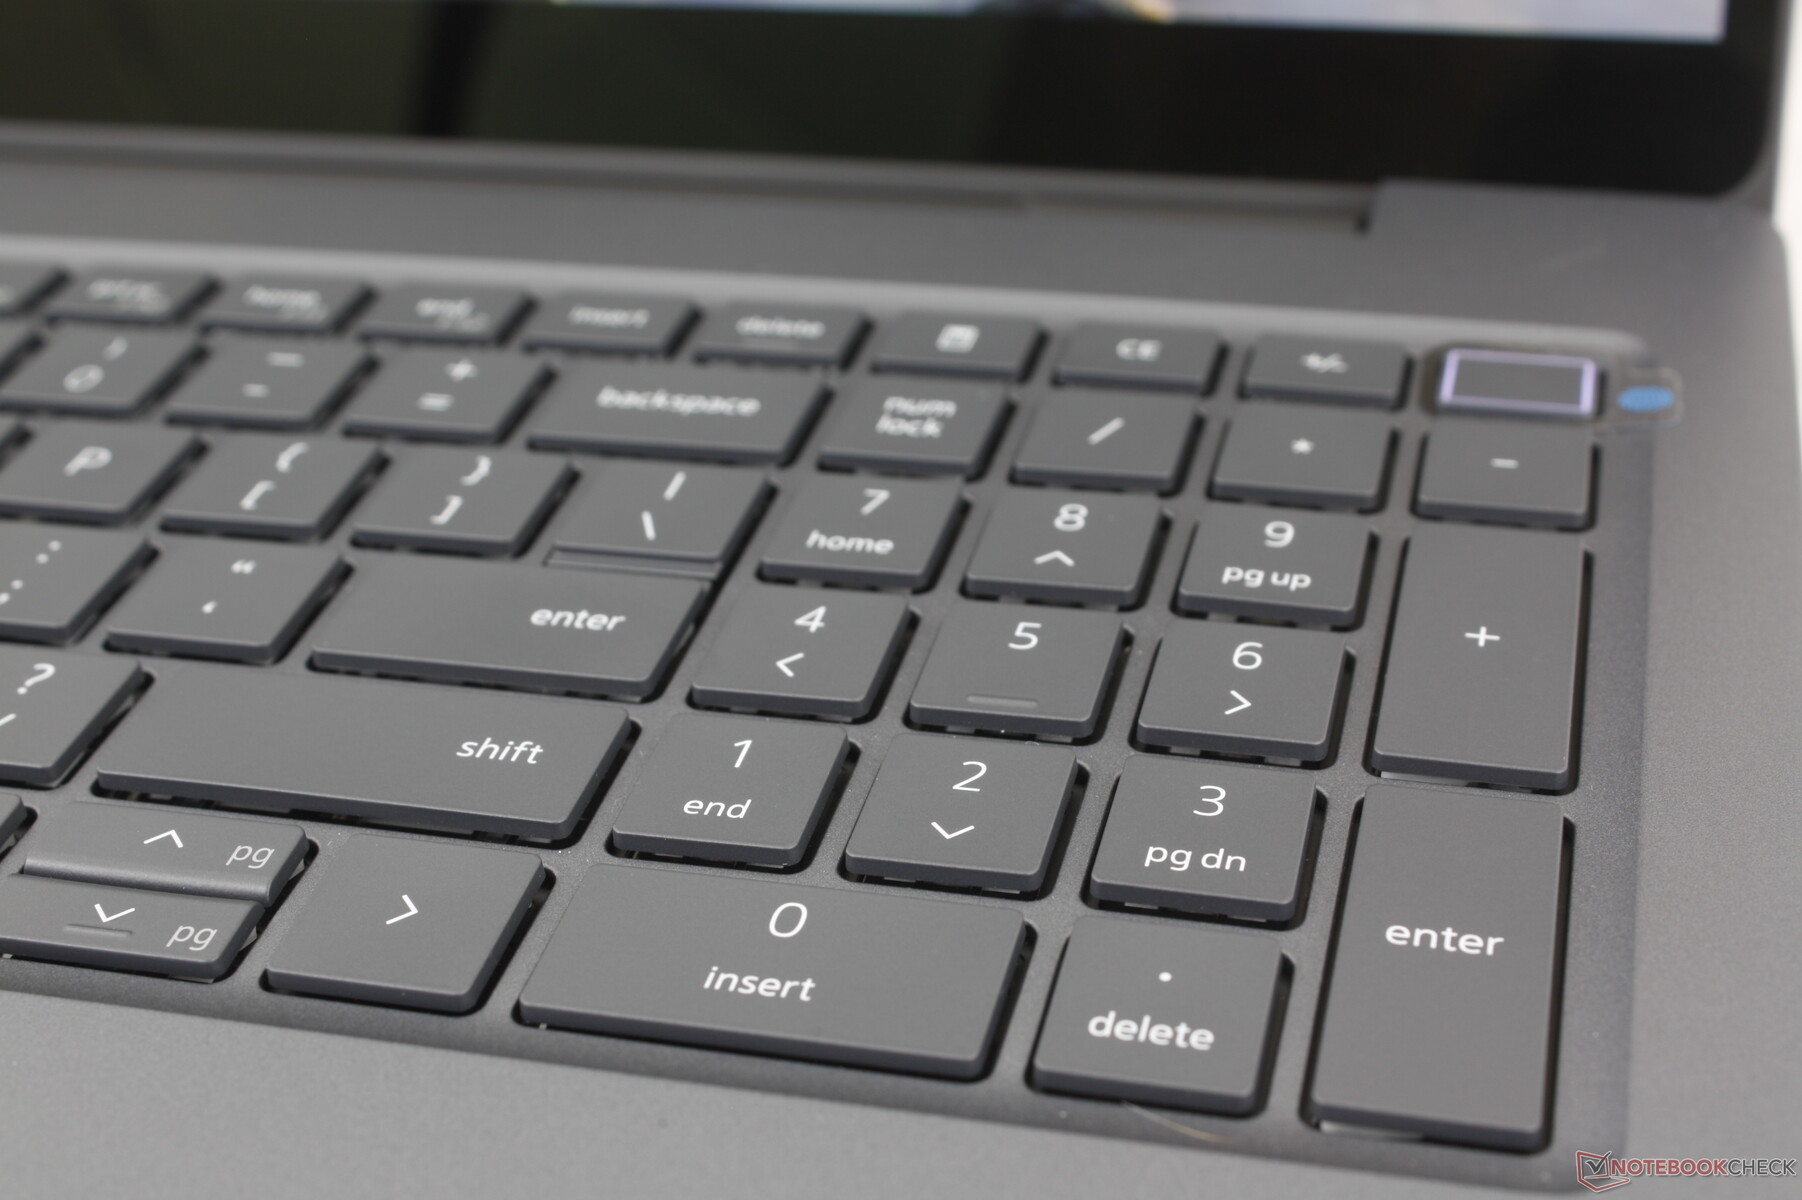
Input Devices
Keyboard And Touchpad


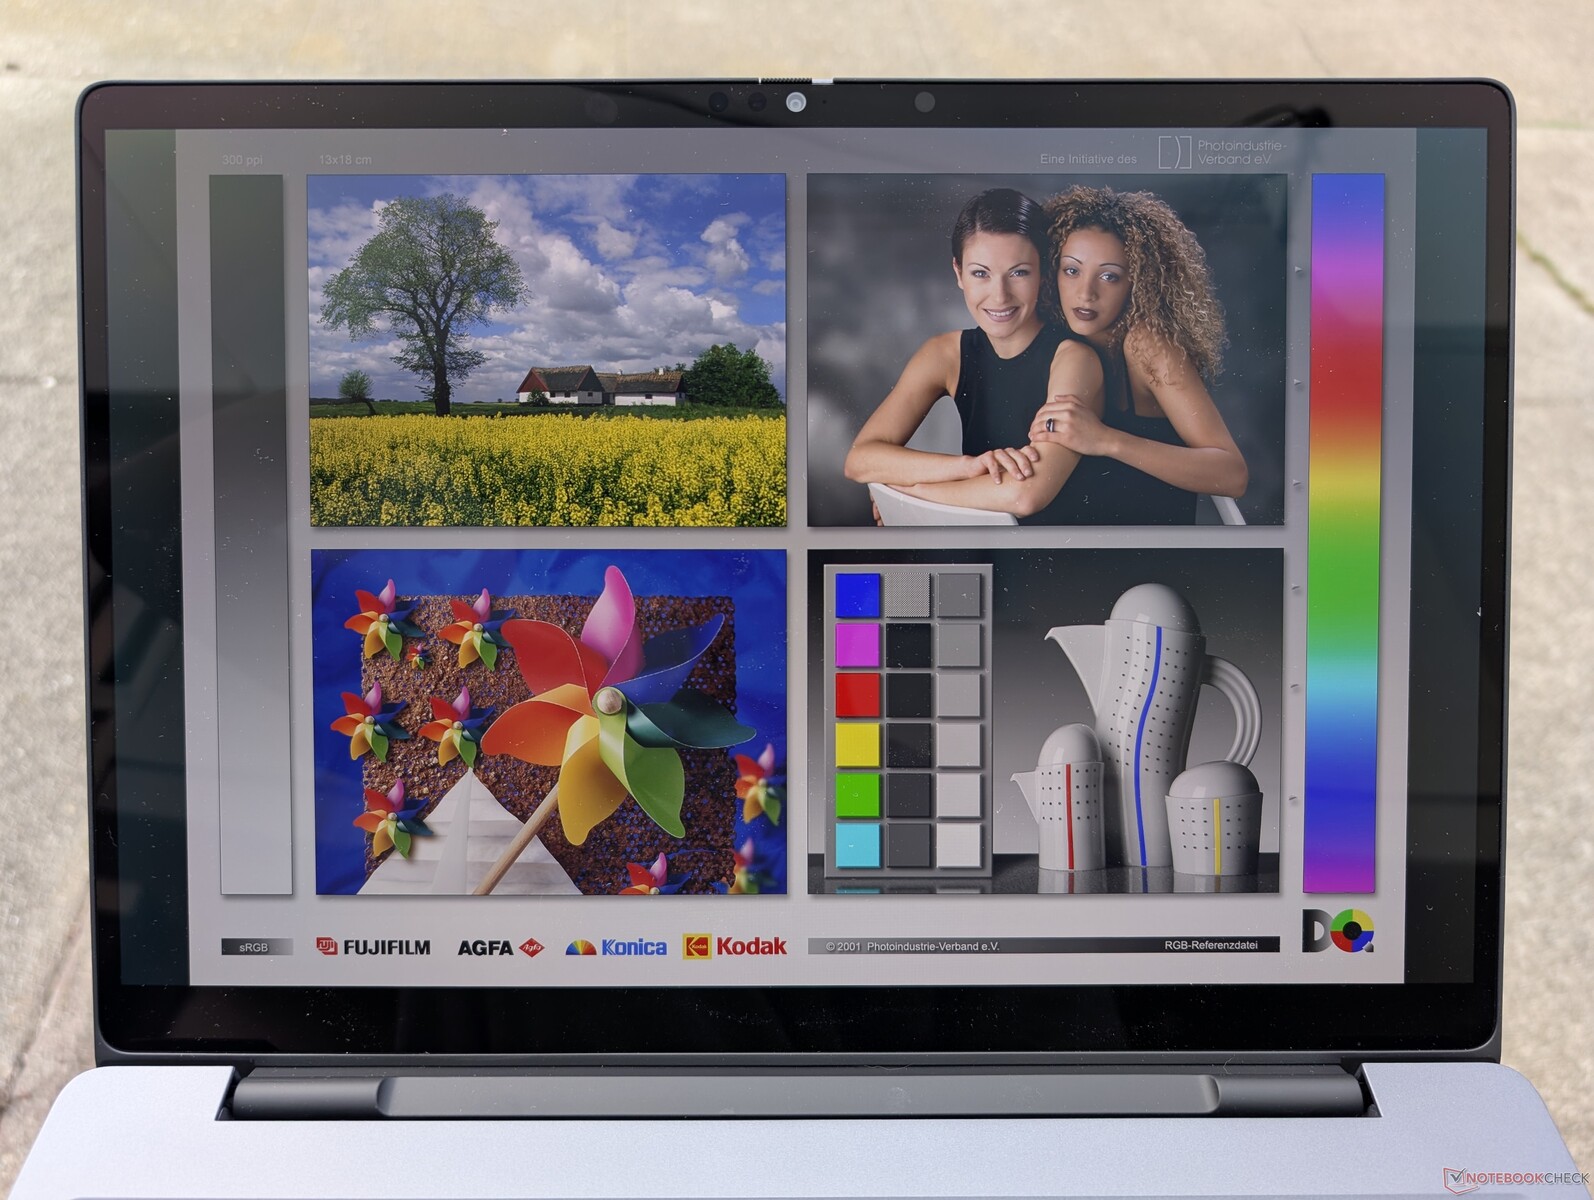
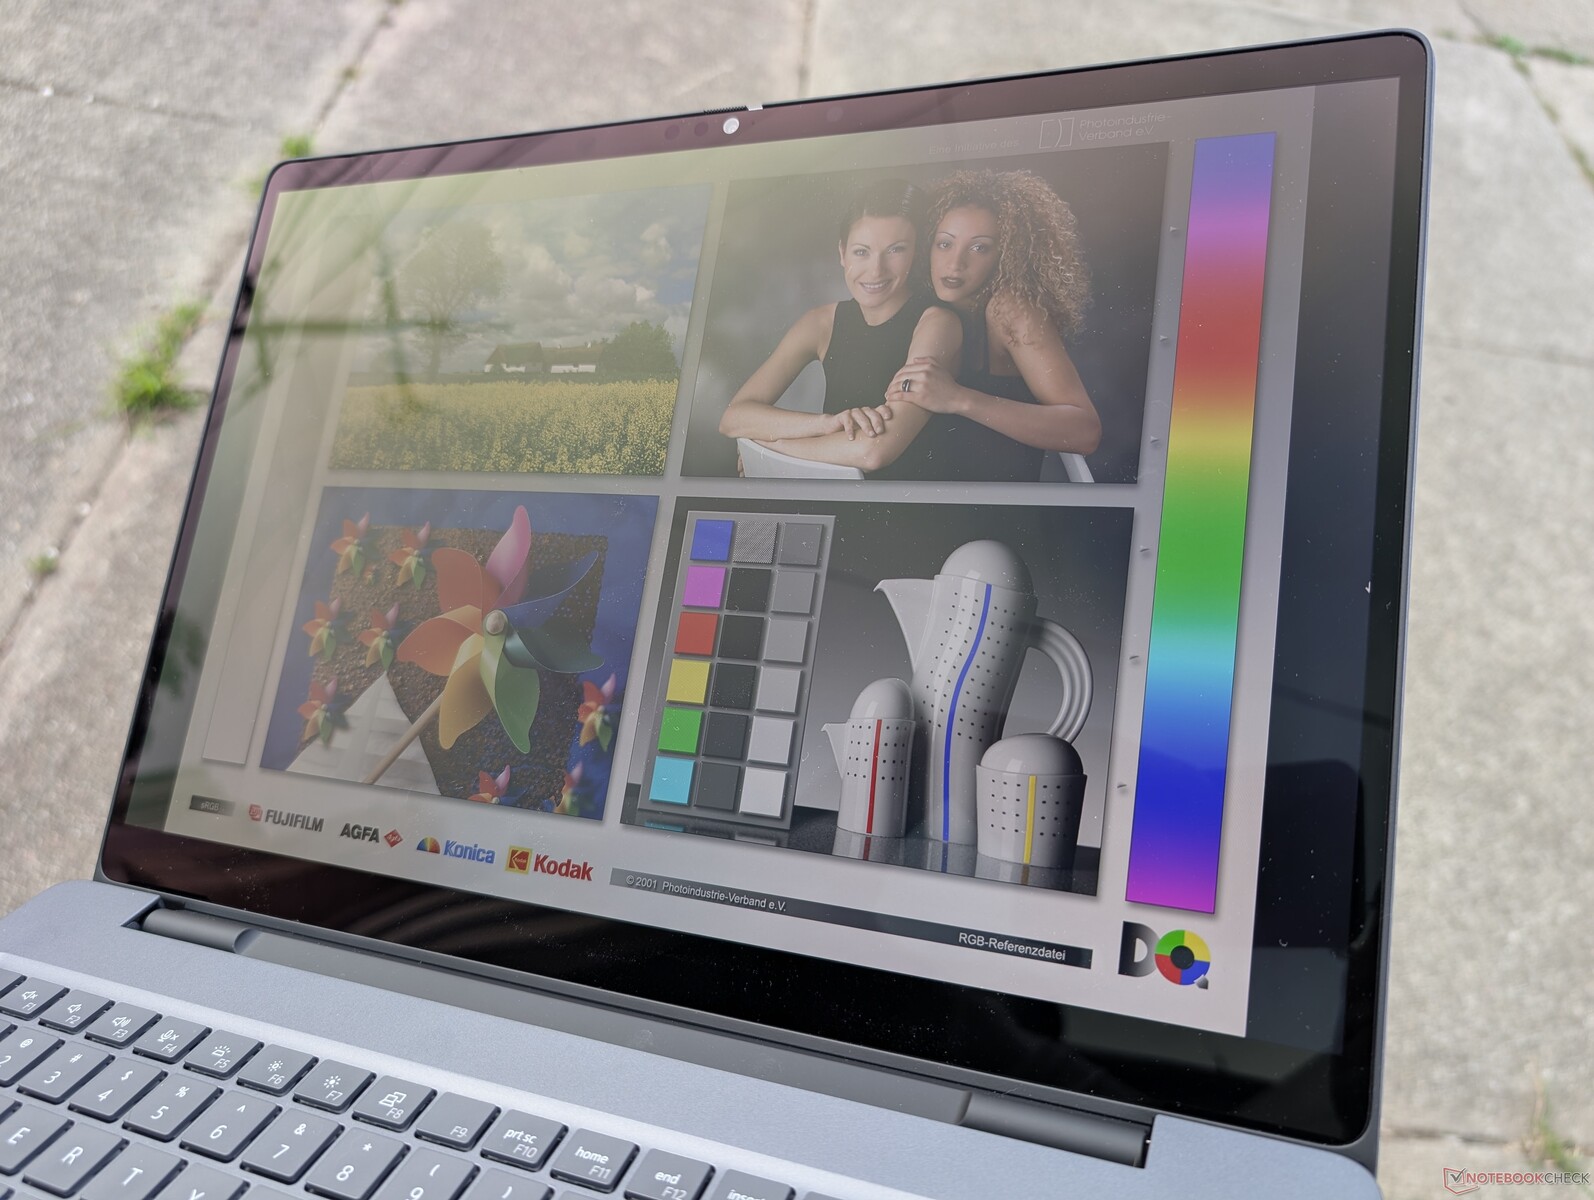
Display

Three display options are available as follows:
- 1920 x 1200, 60 Hz, non-touch, 300 nits, ~60% sRGB
- 1920 x 1200, 120 Hz, non-touch, 500 nits, 100% DCI-P3
- 3840 x 2400, 120 Hz, OLED, touch, 500 nits, 100% DCI-P3
Our test unit comes equipped with the bolded option above to be one of the few 16-inch workstations shipping with 4K 120 Hz OLED panels.
Maximum brightness tops out at ~550 nits if on SDR mode or 1066 nits if HDR mode is enabled. 4K HDR playback is therefore as good or better than most enthusiast-level consumer laptops.
| |||||||||||||||||||||||||
Brightness Distribution: 95 %
Center on Battery: 530.9 cd/m²
Contrast: ∞:1 (Black: 0 cd/m²)
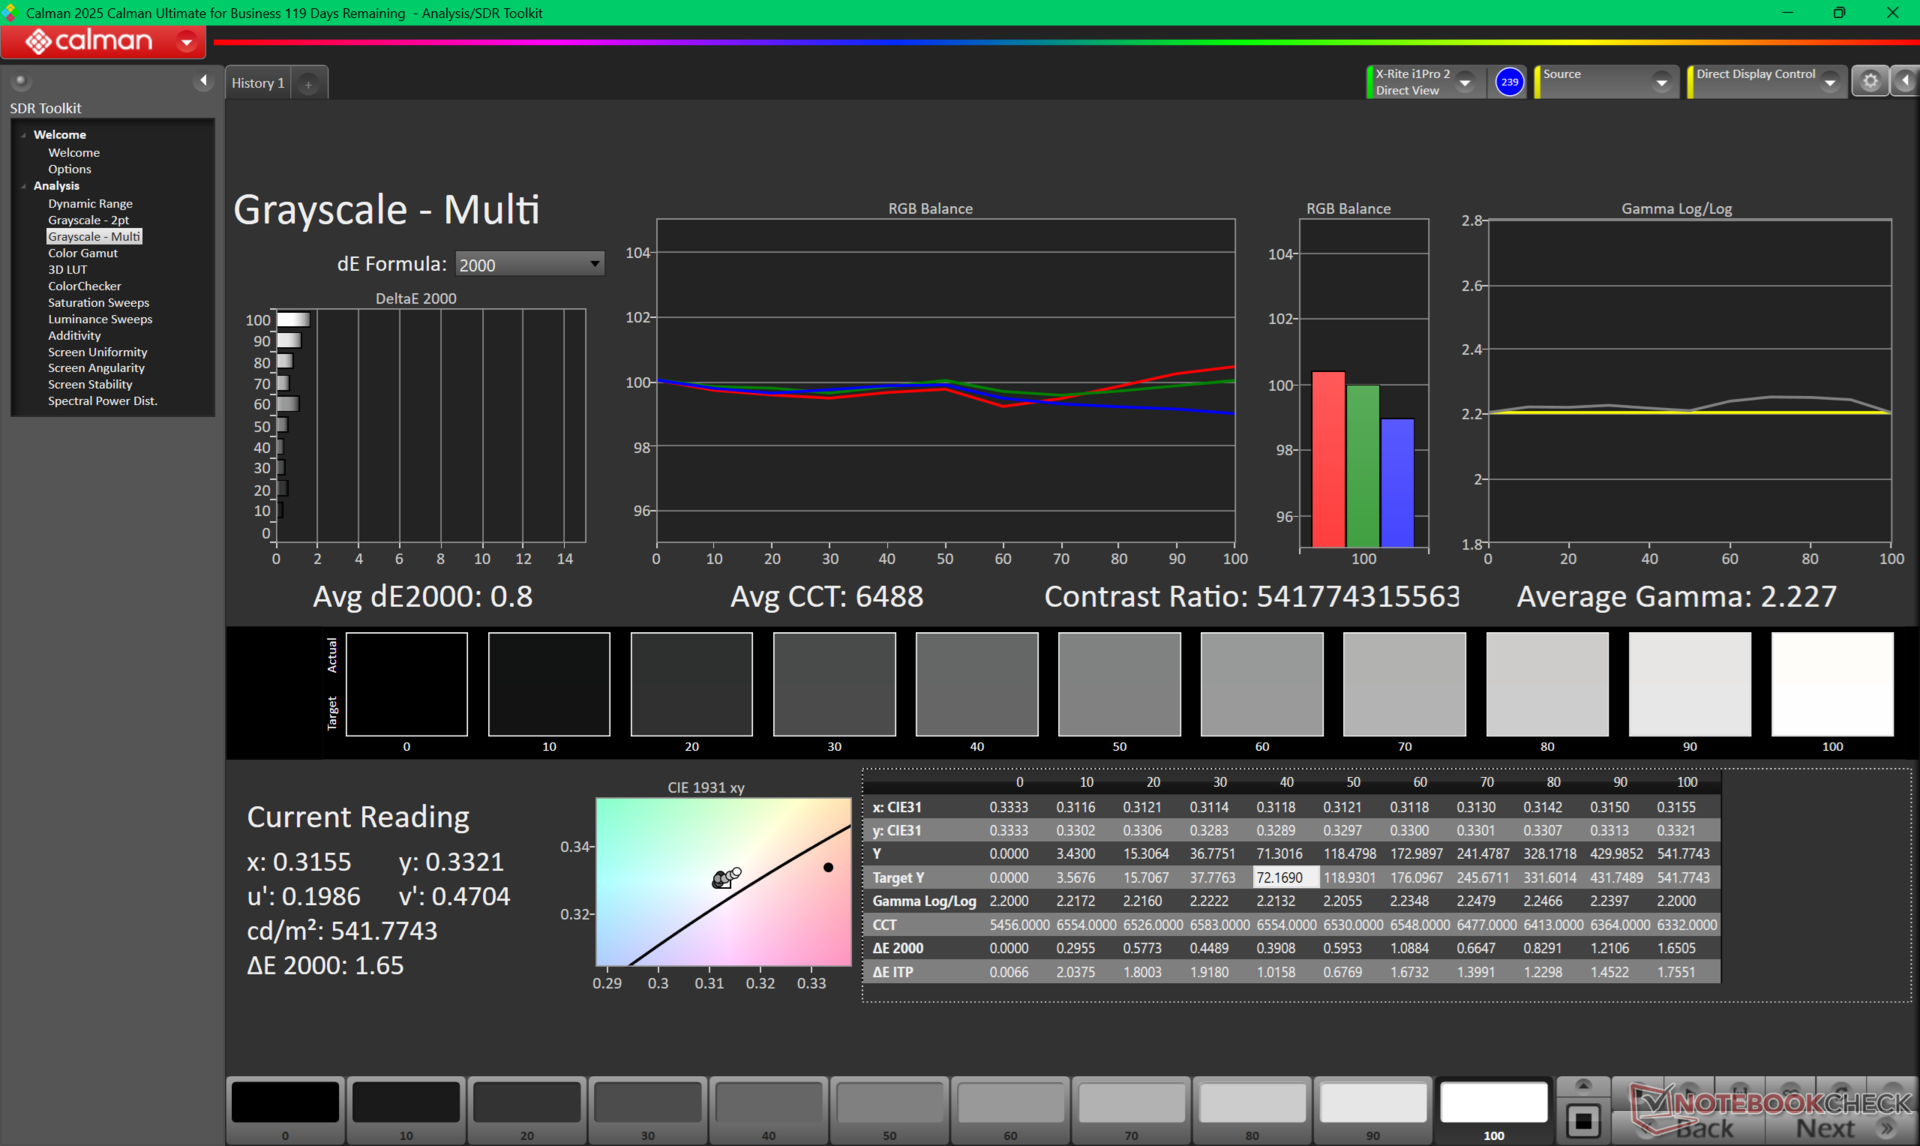
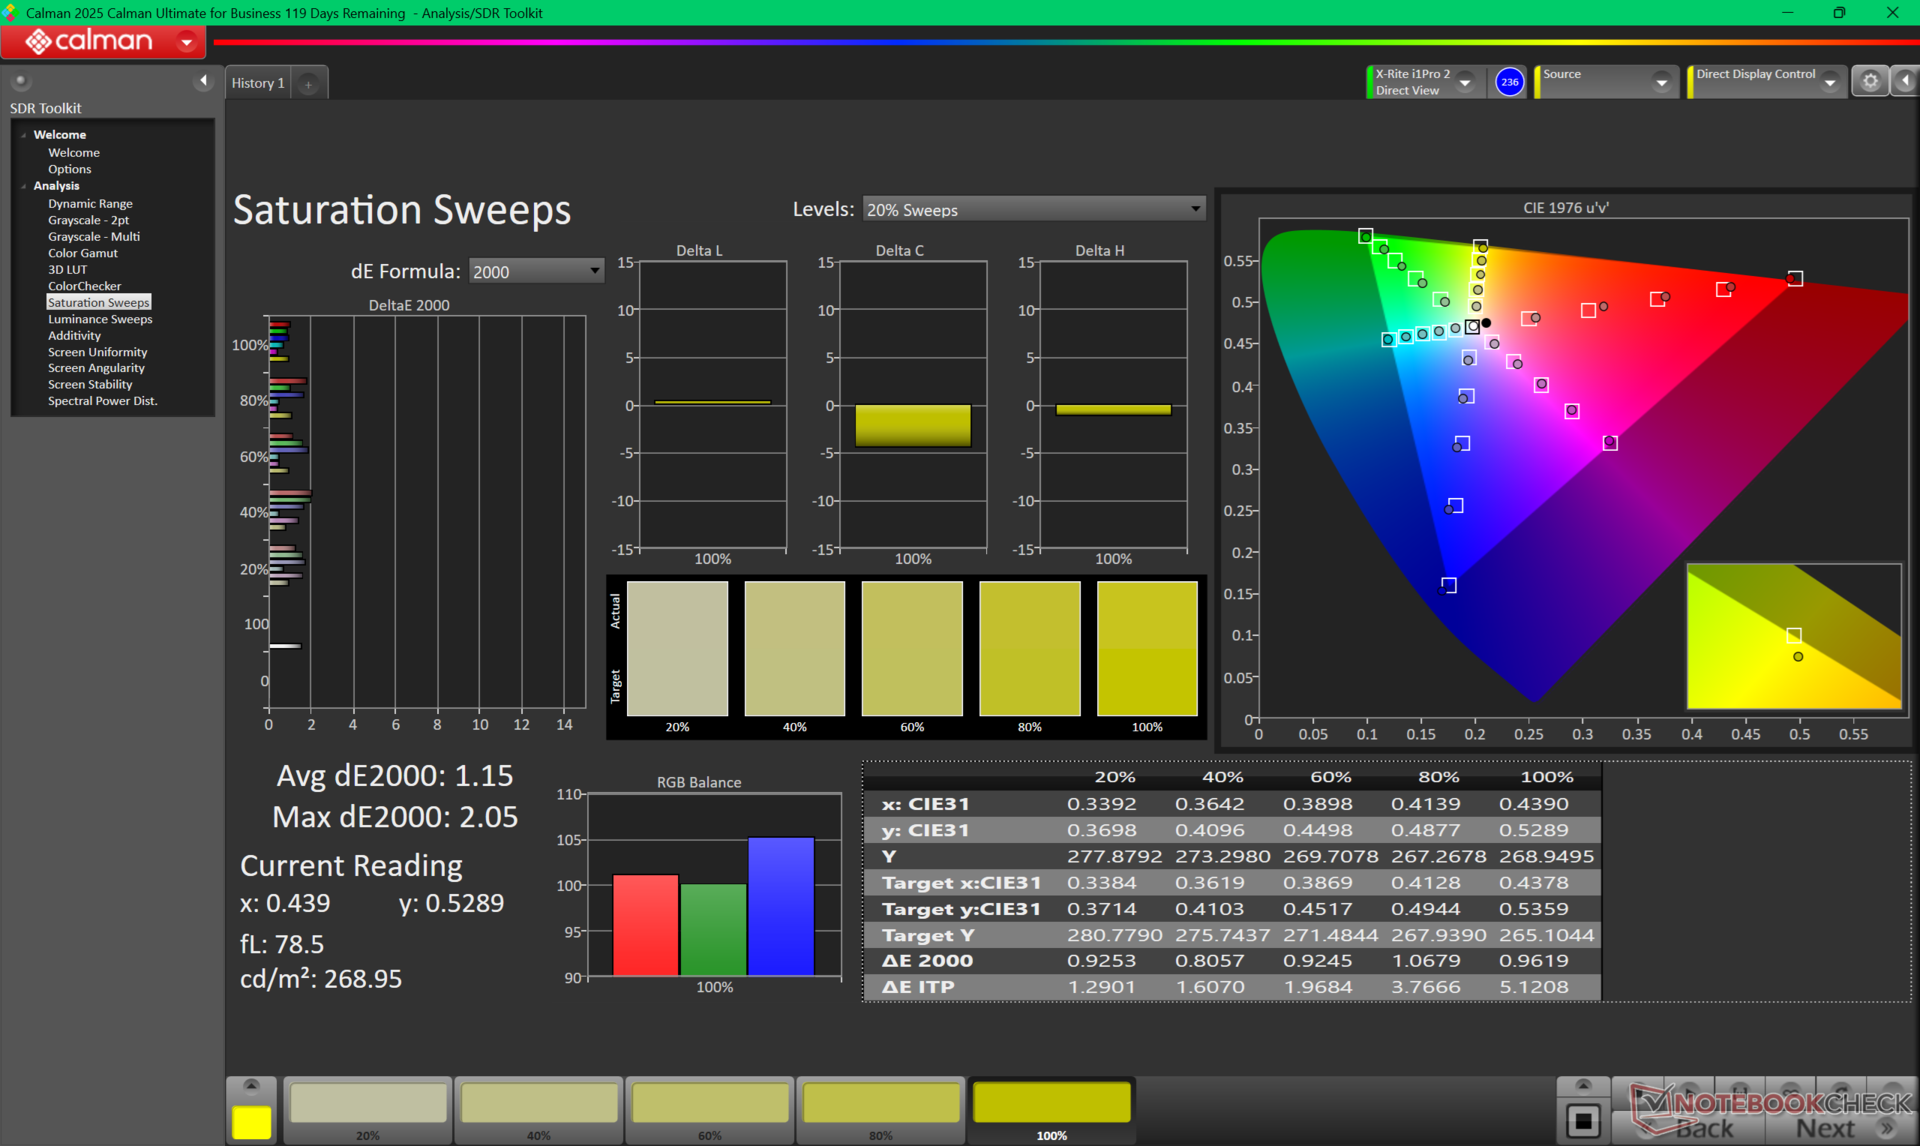
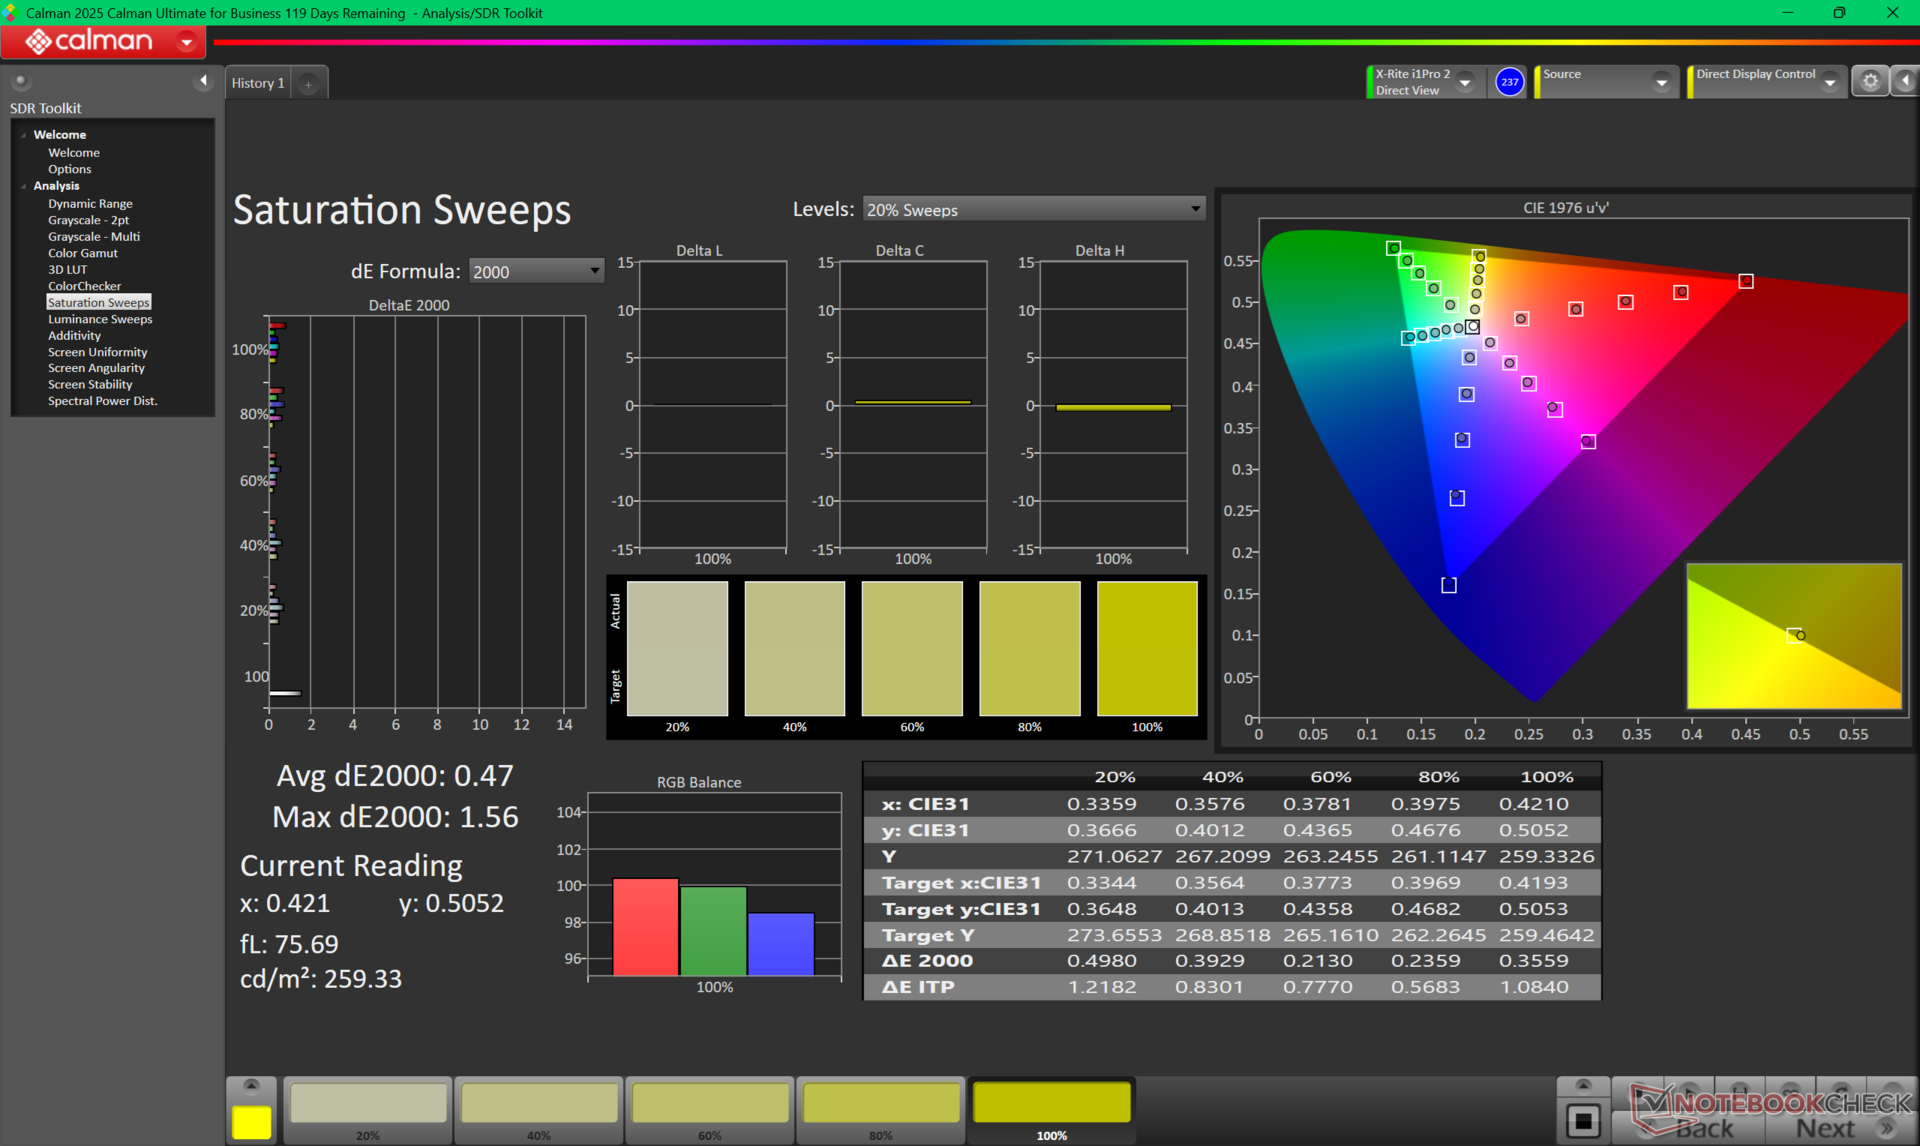
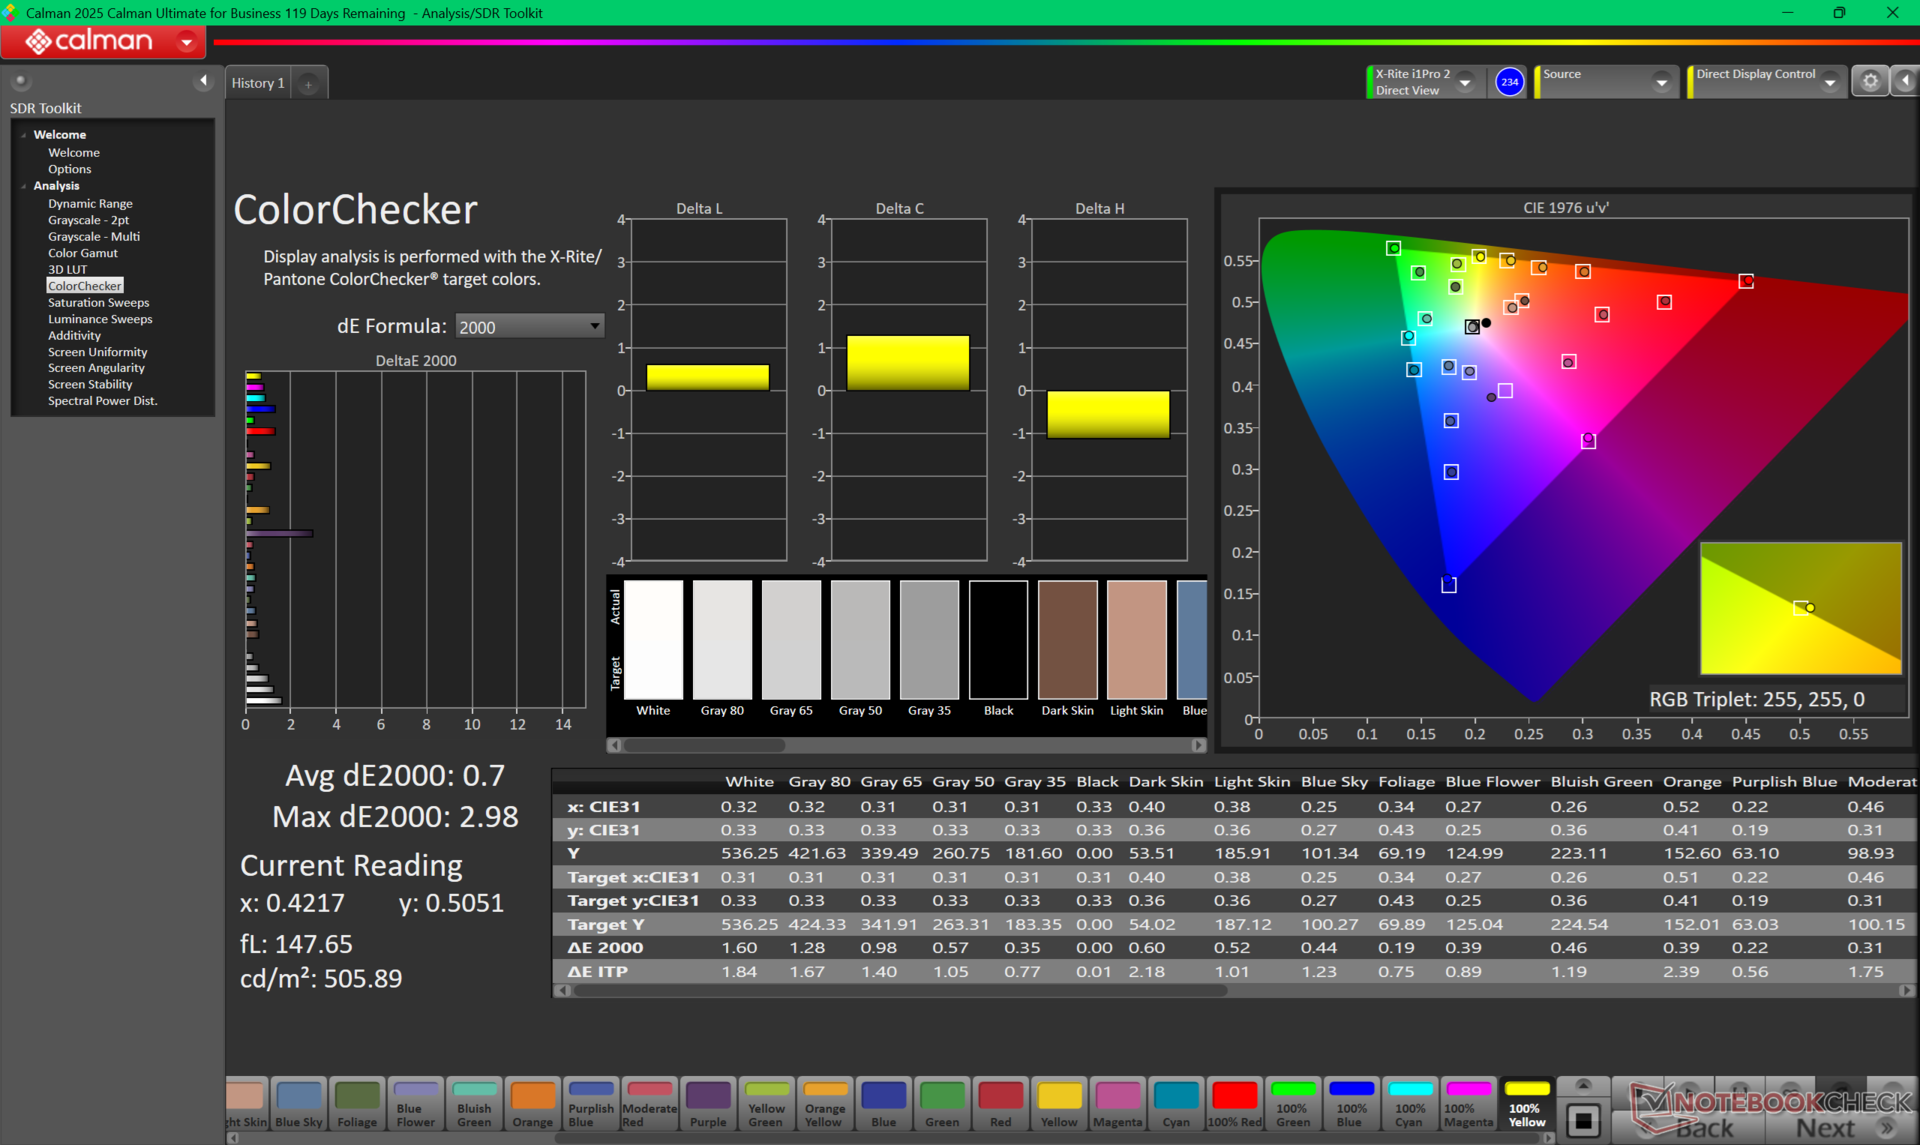
ΔE ColorChecker Calman: 2.42 | ∀{0.5-29.43 Ø4.72}
calibrated: 0.7
ΔE Greyscale Calman: 0.8 | ∀{0.09-98 Ø4.97}
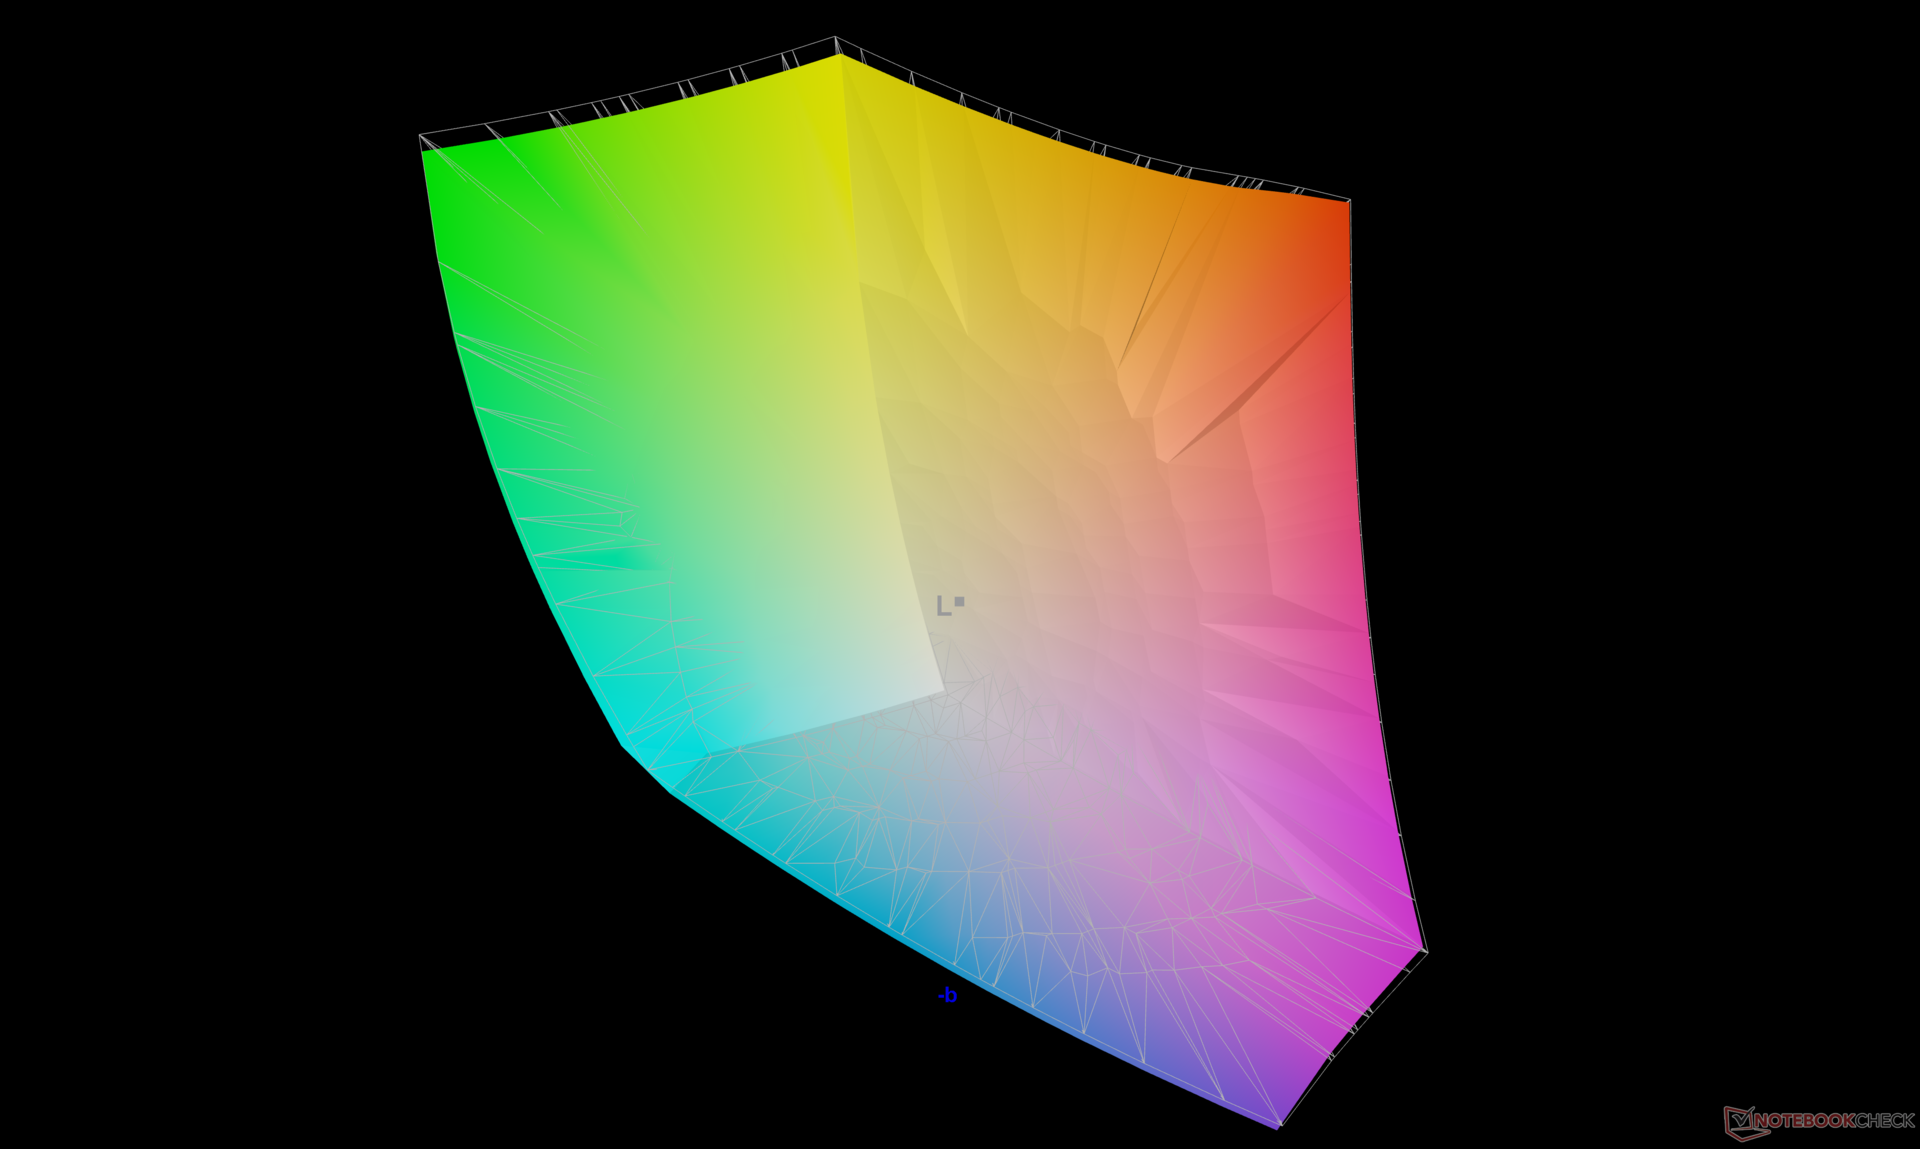
88.8% AdobeRGB 1998 (Argyll 3D)
100% sRGB (Argyll 3D)
97.3% Display P3 (Argyll 3D)
Gamma: 2.23
CCT: 6488 K
| Dell Pro Max 16 Plus Samsung 160HC01, OLED, 3840x2400, 16", 120 Hz | Dell Precision 5690 Samsung 160YV03, OLED, 3840x2400, 16", 60 Hz | Dell Precision 5000 5680 Samsung 160YV03, OLED, 3840x2400, 16", 60 Hz | Lenovo ThinkPad P16 Gen 2 NE160QDM-NY1, IPS, 2560x1600, 16", 165 Hz | Lenovo ThinkPad P1 Gen 7 21KV001SGE MNG007DA1-9 , IPS LED, 2560x1600, 16", 165 Hz | HP ZBook Studio 16 G11 AUO87A8, IPS, 3840x2400, 16", 120 Hz | MSI CreatorPro Z16P B12UKST B160QAN02.N, IPS, 2560x1600, 16", 165 Hz | |
|---|---|---|---|---|---|---|---|
| Display | 4% | 4% | -18% | -17% | -1% | -1% | |
| Display P3 Coverage (%) | 97.3 | 99.8 3% | 99.9 3% | 68.4 -30% | 69.4 -29% | 97.7 0% | 97.6 0% |
| sRGB Coverage (%) | 100 | 100 0% | 100 0% | 96.9 -3% | 97.6 -2% | 99.9 0% | 99.9 0% |
| AdobeRGB 1998 Coverage (%) | 88.8 | 96.6 9% | 97.5 10% | 70.6 -20% | 71.8 -19% | 85.7 -3% | 87.4 -2% |
| Response Times | -131% | -133% | -1575% | -1385% | -1623% | -1332% | |
| Response Time Grey 50% / Grey 80% * (ms) | 0.63 ? | 1.7 ? -170% | 1.68 ? -167% | 14.1 ? -2138% | 11.2 ? -1678% | 14.2 ? -2154% | 12.8 ? -1932% |
| Response Time Black / White * (ms) | 0.89 ? | 1.7 ? -91% | 1.77 ? -99% | 9.9 ? -1012% | 10.6 ? -1091% | 10.6 ? -1091% | 7.4 ? -731% |
| PWM Frequency (Hz) | 479.9 ? | 60 ? | 60 ? | ||||
| PWM Amplitude * (%) | 28 | ||||||
| Screen | -44% | -67% | 0% | -112% | -44% | -17% | |
| Brightness middle (cd/m²) | 530.9 | 348.1 -34% | 345.7 -35% | 531.5 0% | 516 -3% | 404.3 -24% | 407 -23% |
| Brightness (cd/m²) | 540 | 351 -35% | 349 -35% | 499 -8% | 505 -6% | 405 -25% | 388 -28% |
| Brightness Distribution (%) | 95 | 97 2% | 98 3% | 89 -6% | 89 -6% | 92 -3% | 88 -7% |
| Black Level * (cd/m²) | 0.38 | 0.41 | 0.28 | 0.36 | |||
| Colorchecker dE 2000 * | 2.42 | 4.18 -73% | 3.59 -48% | 1.82 25% | 3.5 -45% | 2.63 -9% | 1.3 46% |
| Colorchecker dE 2000 max. * | 5.76 | 6.68 -16% | 7.02 -22% | 4.1 29% | 8.8 -53% | 4.48 22% | 2.5 57% |
| Colorchecker dE 2000 calibrated * | 0.7 | 0.97 -39% | 0.99 -41% | 0.63 10% | 1.2 -71% | 1.46 -109% | 0.7 -0% |
| Greyscale dE 2000 * | 0.8 | 1.7 -113% | 3.1 -288% | 1.2 -50% | 5.6 -600% | 2.1 -163% | 2.1 -163% |
| Gamma | 2.23 99% | 2.2 100% | 2.13 103% | 2.15 102% | 2.27 97% | 2.3 96% | 2.26 97% |
| CCT | 6488 100% | 6198 105% | 6448 101% | 6484 100% | 6071 107% | 6810 95% | 6437 101% |
| Contrast (:1) | 1399 | 1259 | 1444 | 1131 | |||
| Total Average (Program / Settings) | -57% /
-46% | -65% /
-60% | -531% /
-267% | -505% /
-300% | -556% /
-297% | -450% /
-232% |
* ... smaller is better
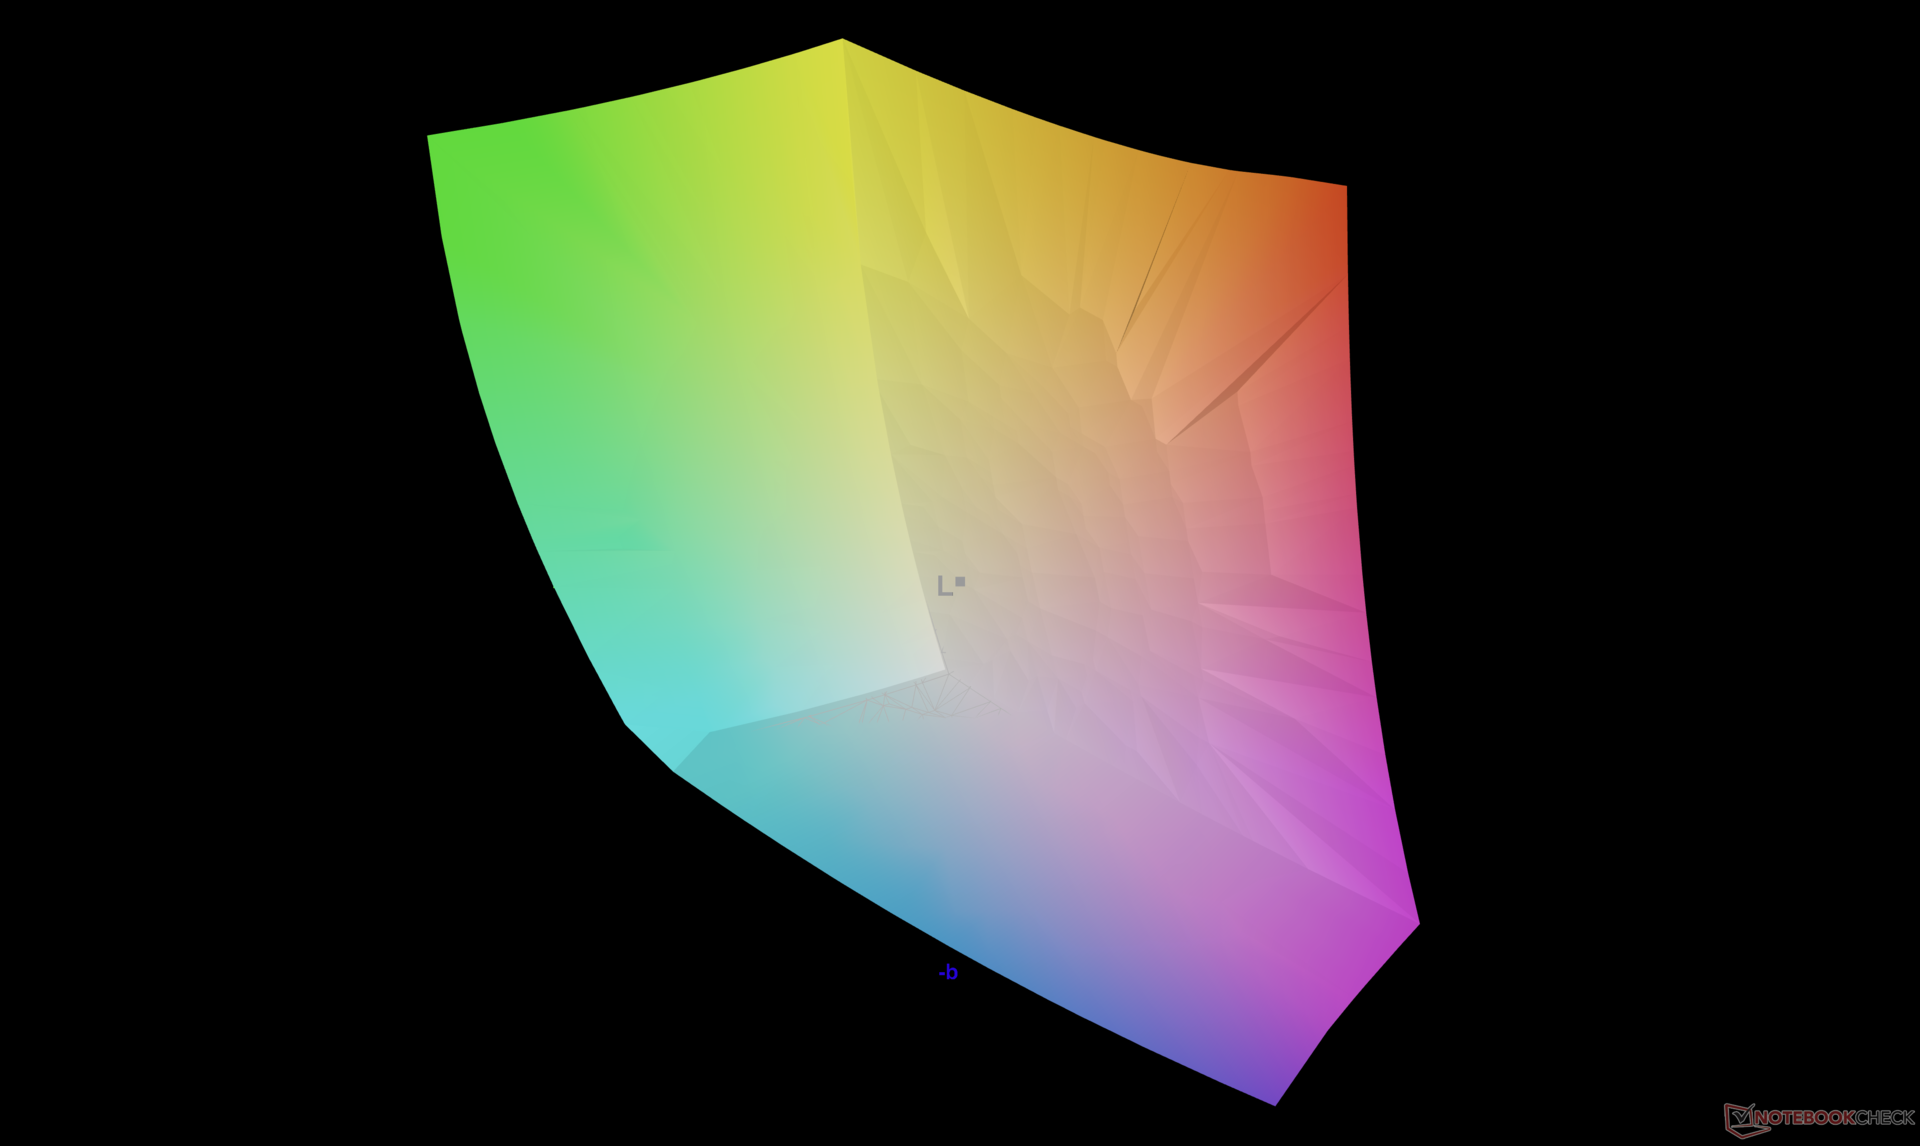
The display ships well-calibrated against the P3 standard with average grayscale and color deltaE values of just 0.8 and 2.42, respectively.


Display Response Times
| ↔ Response Time Black to White | ||
|---|---|---|
| 0.89 ms ... rise ↗ and fall ↘ combined | ↗ 0.42 ms rise | 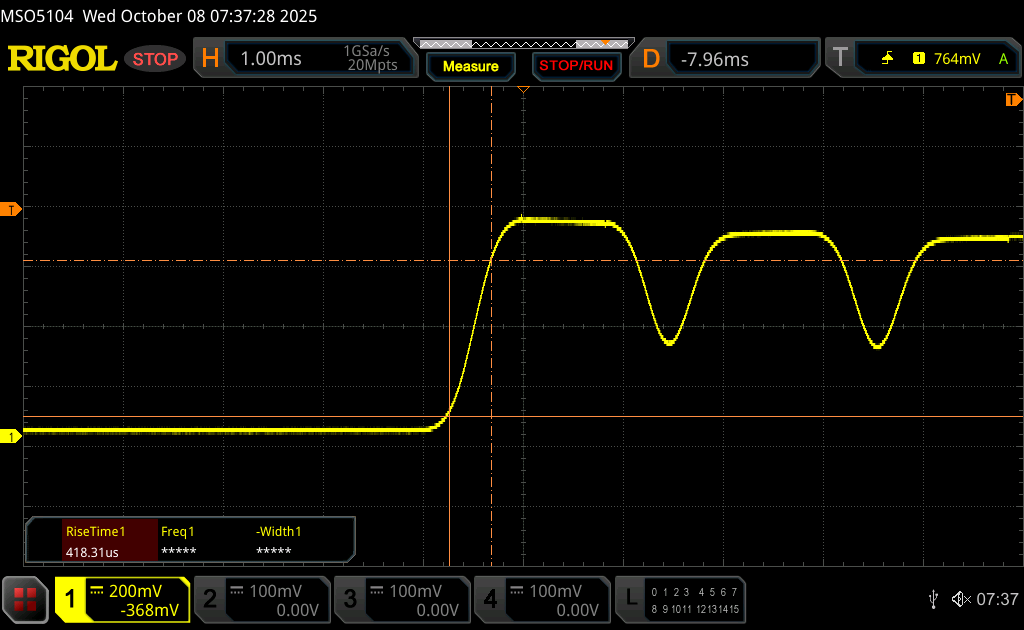 |
| ↘ 0.47 ms fall | ||
| The screen shows very fast response rates in our tests and should be very well suited for fast-paced gaming. In comparison, all tested devices range from 0.1 (minimum) to 240 (maximum) ms. » 3 % of all devices are better. This means that the measured response time is better than the average of all tested devices (19.8 ms). | ||
| ↔ Response Time 50% Grey to 80% Grey | ||
| 0.63 ms ... rise ↗ and fall ↘ combined | ↗ 0.34 ms rise | 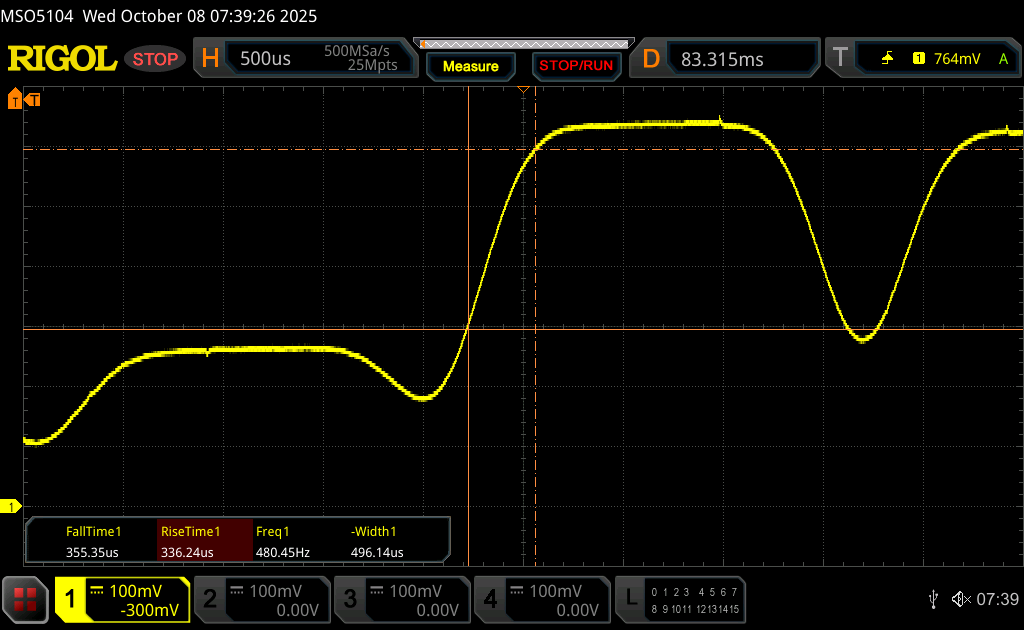 |
| ↘ 0.29 ms fall | ||
| The screen shows very fast response rates in our tests and should be very well suited for fast-paced gaming. In comparison, all tested devices range from 0.165 (minimum) to 636 (maximum) ms. » 2 % of all devices are better. This means that the measured response time is better than the average of all tested devices (31 ms). | ||
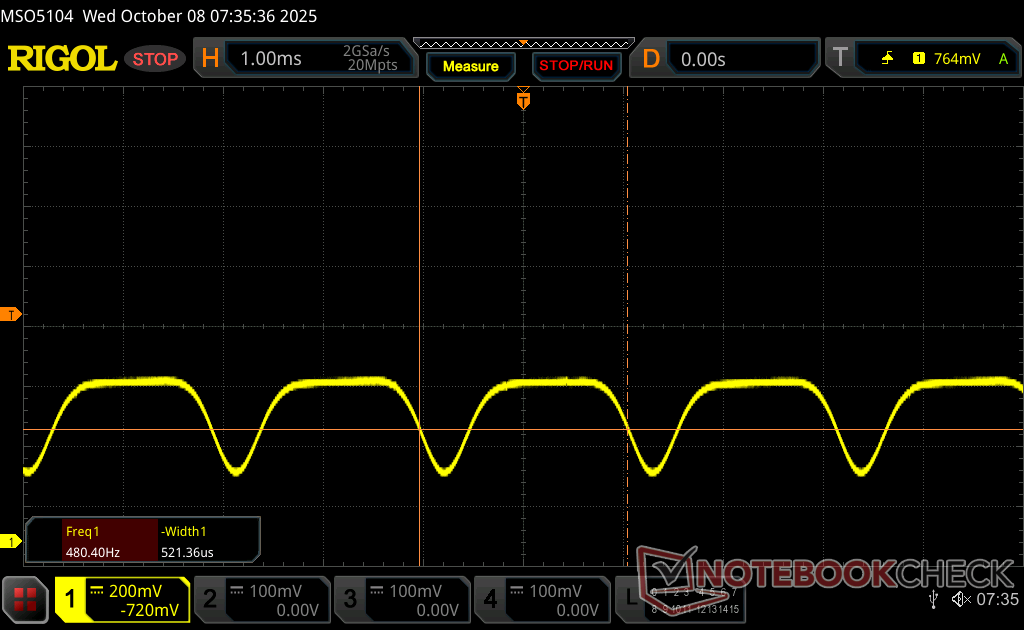
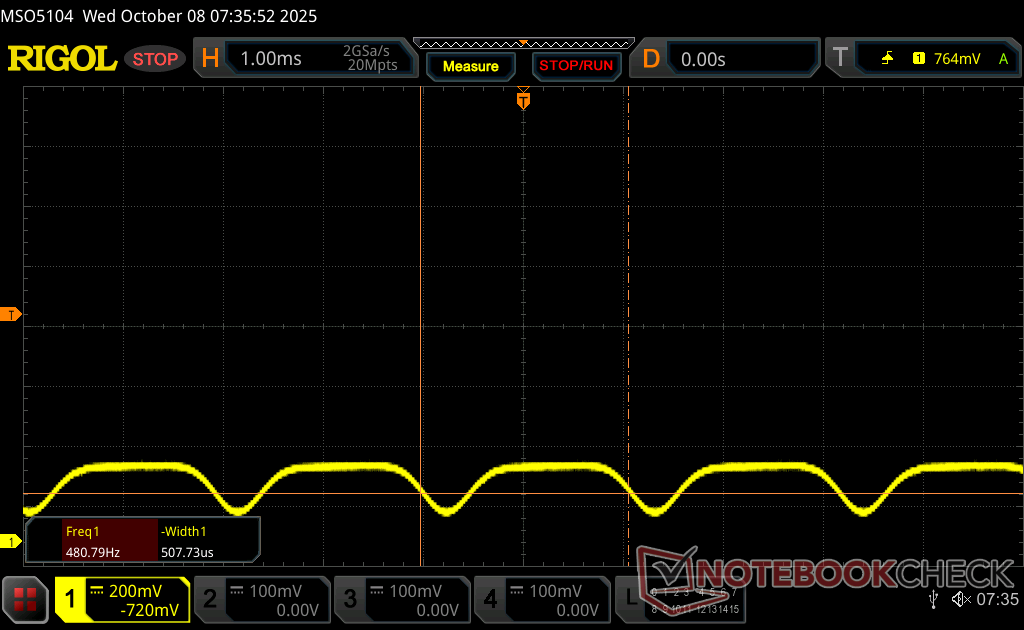
Screen Flickering / PWM (Pulse-Width Modulation)
| Screen flickering / PWM detected | 479.9 Hz Amplitude: 28 % | ≤ 100 % brightness setting | 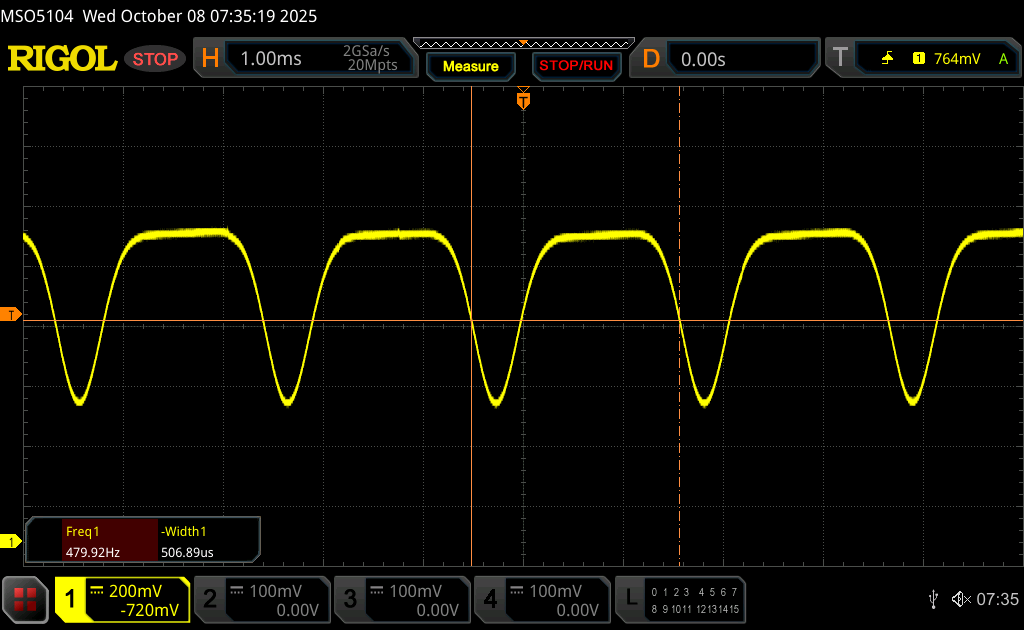 |
The display backlight flickers at 479.9 Hz (worst case, e.g., utilizing PWM) Flickering detected at a brightness setting of 100 % and below. There should be no flickering or PWM above this brightness setting. The frequency of 479.9 Hz is relatively high, so most users sensitive to PWM should not notice any flickering. However, there are reports that some users are still sensitive to PWM at 500 Hz and above, so be aware. In comparison: 52 % of all tested devices do not use PWM to dim the display. If PWM was detected, an average of 7750 (minimum: 5 - maximum: 343500) Hz was measured. | |||


Performance
Testing Conditions
We set Dell Optimizer to Performance mode and Nvidia Control Panel to discrete graphics mode prior to running the benchmarks below. Switching between Optimus and dGPU modes does not require rebooting.
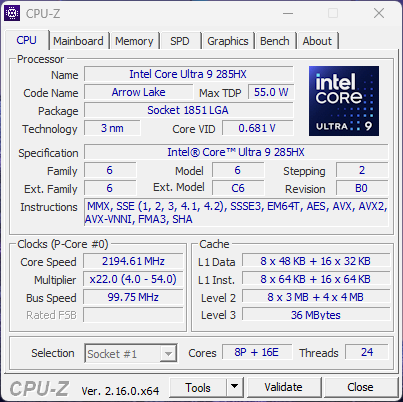
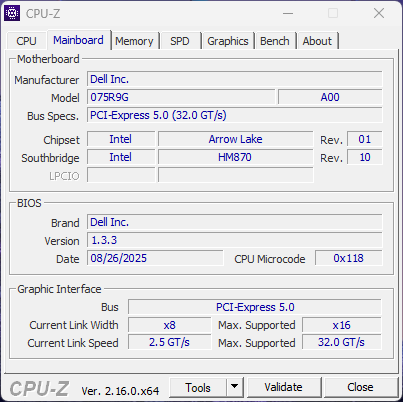
Processor
The Core Ultra 9 285HX is one of the fastest processors available on any mobile workstation for a nearly 2x performance increase over the Core Ultra 9 185H in last year's Precision 5690. Performance sustainability is nonetheless imperfect; when running CineBench R15 xT in a loop, for example, performance would drop by about 10 percent over time as shown by the comparison graph below.
Cinebench R15 Multi Loop
Cinebench R23: Multi Core | Single Core
Cinebench R20: CPU (Multi Core) | CPU (Single Core)
Cinebench R15: CPU Multi 64Bit | CPU Single 64Bit
Blender: v2.79 BMW27 CPU
7-Zip 18.03: 7z b 4 | 7z b 4 -mmt1
Geekbench 6.7: Multi-Core | Single-Core
Geekbench 5.5: Multi-Core | Single-Core
HWBOT x265 Benchmark v2.2: 4k Preset
LibreOffice : 20 Documents To PDF
R Benchmark 2.5: Overall mean
| Geekbench 6.7 / Multi-Core | |
| Dell Pro Max 16 Plus | |
| Average Intel Core Ultra 9 285HX (18212 - 22104, n=6) | |
| Lenovo ThinkPad P16 Gen 2 | |
| HP ZBook Fury 16 G10 | |
| Dell Precision 5000 5680 | |
| Dell Precision 5690 | |
| HP ZBook Studio 16 G11 | |
| Lenovo ThinkPad P1 Gen 7 21KV001SGE | |
| Lenovo ThinkPad P16s G2 21K9000CGE | |
| Geekbench 6.7 / Single-Core | |
| Average Intel Core Ultra 9 285HX (2907 - 3088, n=6) | |
| HP ZBook Fury 16 G10 | |
| Dell Pro Max 16 Plus | |
| Lenovo ThinkPad P16 Gen 2 | |
| Dell Precision 5000 5680 | |
| Dell Precision 5690 | |
| HP ZBook Studio 16 G11 | |
| Lenovo ThinkPad P16s G2 21K9000CGE | |
| Lenovo ThinkPad P1 Gen 7 21KV001SGE | |
* ... smaller is better
AIDA64: FP32 Ray-Trace | FPU Julia | CPU SHA3 | CPU Queen | FPU SinJulia | FPU Mandel | CPU AES | CPU ZLib | FP64 Ray-Trace | CPU PhotoWorxx
| Performance rating | |
| Average Intel Core Ultra 9 285HX | |
| Dell Pro Max 16 Plus | |
| Lenovo ThinkPad P16 Gen 2 | |
| Dell Precision 5690 | |
| HP ZBook Studio 16 G11 | |
| Lenovo ThinkPad P1 Gen 7 21KV001SGE | |
| MSI CreatorPro Z16P B12UKST | |
| Dell Precision 5000 5680 | |
| AIDA64 / FP32 Ray-Trace | |
| Average Intel Core Ultra 9 285HX (29076 - 42341, n=6) | |
| Dell Pro Max 16 Plus | |
| Lenovo ThinkPad P16 Gen 2 | |
| Dell Precision 5690 | |
| Lenovo ThinkPad P1 Gen 7 21KV001SGE | |
| HP ZBook Studio 16 G11 | |
| Dell Precision 5000 5680 | |
| MSI CreatorPro Z16P B12UKST | |
| AIDA64 / FPU Julia | |
| Average Intel Core Ultra 9 285HX (161276 - 210885, n=6) | |
| Dell Pro Max 16 Plus | |
| Lenovo ThinkPad P16 Gen 2 | |
| Dell Precision 5690 | |
| HP ZBook Studio 16 G11 | |
| Lenovo ThinkPad P1 Gen 7 21KV001SGE | |
| Dell Precision 5000 5680 | |
| MSI CreatorPro Z16P B12UKST | |
| AIDA64 / CPU SHA3 | |
| Average Intel Core Ultra 9 285HX (7757 - 9815, n=6) | |
| Dell Pro Max 16 Plus | |
| Lenovo ThinkPad P16 Gen 2 | |
| Dell Precision 5690 | |
| HP ZBook Studio 16 G11 | |
| Lenovo ThinkPad P1 Gen 7 21KV001SGE | |
| MSI CreatorPro Z16P B12UKST | |
| Dell Precision 5000 5680 | |
| AIDA64 / CPU Queen | |
| Lenovo ThinkPad P16 Gen 2 | |
| Average Intel Core Ultra 9 285HX (134345 - 141681, n=6) | |
| Dell Pro Max 16 Plus | |
| Dell Precision 5000 5680 | |
| MSI CreatorPro Z16P B12UKST | |
| Dell Precision 5690 | |
| HP ZBook Studio 16 G11 | |
| Lenovo ThinkPad P1 Gen 7 21KV001SGE | |
| AIDA64 / FPU SinJulia | |
| Lenovo ThinkPad P16 Gen 2 | |
| Average Intel Core Ultra 9 285HX (12559 - 14431, n=6) | |
| Dell Pro Max 16 Plus | |
| Dell Precision 5690 | |
| HP ZBook Studio 16 G11 | |
| Lenovo ThinkPad P1 Gen 7 21KV001SGE | |
| Dell Precision 5000 5680 | |
| MSI CreatorPro Z16P B12UKST | |
| AIDA64 / FPU Mandel | |
| Average Intel Core Ultra 9 285HX (84053 - 108922, n=6) | |
| Dell Pro Max 16 Plus | |
| Lenovo ThinkPad P16 Gen 2 | |
| Dell Precision 5690 | |
| Lenovo ThinkPad P1 Gen 7 21KV001SGE | |
| HP ZBook Studio 16 G11 | |
| Dell Precision 5000 5680 | |
| MSI CreatorPro Z16P B12UKST | |
| AIDA64 / CPU AES | |
| MSI CreatorPro Z16P B12UKST | |
| Average Intel Core Ultra 9 285HX (119553 - 134195, n=6) | |
| Dell Pro Max 16 Plus | |
| Lenovo ThinkPad P16 Gen 2 | |
| Dell Precision 5690 | |
| HP ZBook Studio 16 G11 | |
| Lenovo ThinkPad P1 Gen 7 21KV001SGE | |
| Dell Precision 5000 5680 | |
| AIDA64 / CPU ZLib | |
| Average Intel Core Ultra 9 285HX (1886 - 2267, n=6) | |
| Dell Pro Max 16 Plus | |
| Lenovo ThinkPad P16 Gen 2 | |
| Dell Precision 5690 | |
| HP ZBook Studio 16 G11 | |
| Lenovo ThinkPad P1 Gen 7 21KV001SGE | |
| MSI CreatorPro Z16P B12UKST | |
| Dell Precision 5000 5680 | |
| AIDA64 / FP64 Ray-Trace | |
| Average Intel Core Ultra 9 285HX (15059 - 22312, n=6) | |
| Dell Pro Max 16 Plus | |
| Lenovo ThinkPad P16 Gen 2 | |
| Dell Precision 5690 | |
| Lenovo ThinkPad P1 Gen 7 21KV001SGE | |
| HP ZBook Studio 16 G11 | |
| Dell Precision 5000 5680 | |
| MSI CreatorPro Z16P B12UKST | |
| AIDA64 / CPU PhotoWorxx | |
| Dell Pro Max 16 Plus | |
| HP ZBook Studio 16 G11 | |
| Dell Precision 5690 | |
| Average Intel Core Ultra 9 285HX (39232 - 62611, n=6) | |
| Dell Precision 5000 5680 | |
| MSI CreatorPro Z16P B12UKST | |
| Lenovo ThinkPad P1 Gen 7 21KV001SGE | |
| Lenovo ThinkPad P16 Gen 2 | |
System Performance
PCMark 10 scores are not included as the benchmark would consistently crash even when updated to the latest version and trying different GPU configurations. With that said, AIDA64 memory scores are some of the highest of any mobile workstation owing to the performance benefits of CAMM2 RAM.
CrossMark: Overall | Productivity | Creativity | Responsiveness
WebXPRT 3: Overall
WebXPRT 4: Overall
Mozilla Kraken 1.1: Total
| Performance rating | |
| Average Intel Core Ultra 9 285HX, NVIDIA RTX PRO 5000 Blackwell Generation Laptop | |
| Dell Pro Max 16 Plus | |
| Lenovo ThinkPad P16 Gen 2 | |
| Dell Precision 5000 5680 | |
| MSI CreatorPro Z16P B12UKST | |
| Dell Precision 5690 | |
| HP ZBook Studio 16 G11 | |
| Lenovo ThinkPad P1 Gen 7 21KV001SGE | |
| CrossMark / Overall | |
| Dell Pro Max 16 Plus | |
| Average Intel Core Ultra 9 285HX, NVIDIA RTX PRO 5000 Blackwell Generation Laptop (2142 - 2267, n=3) | |
| Lenovo ThinkPad P16 Gen 2 | |
| MSI CreatorPro Z16P B12UKST | |
| Dell Precision 5000 5680 | |
| Dell Precision 5690 | |
| HP ZBook Studio 16 G11 | |
| Lenovo ThinkPad P1 Gen 7 21KV001SGE | |
| CrossMark / Productivity | |
| Average Intel Core Ultra 9 285HX, NVIDIA RTX PRO 5000 Blackwell Generation Laptop (2016 - 2028, n=3) | |
| Dell Pro Max 16 Plus | |
| Lenovo ThinkPad P16 Gen 2 | |
| MSI CreatorPro Z16P B12UKST | |
| Dell Precision 5000 5680 | |
| Dell Precision 5690 | |
| HP ZBook Studio 16 G11 | |
| Lenovo ThinkPad P1 Gen 7 21KV001SGE | |
| CrossMark / Creativity | |
| Dell Pro Max 16 Plus | |
| Average Intel Core Ultra 9 285HX, NVIDIA RTX PRO 5000 Blackwell Generation Laptop (2395 - 2725, n=3) | |
| Lenovo ThinkPad P16 Gen 2 | |
| Dell Precision 5000 5680 | |
| MSI CreatorPro Z16P B12UKST | |
| Dell Precision 5690 | |
| HP ZBook Studio 16 G11 | |
| Lenovo ThinkPad P1 Gen 7 21KV001SGE | |
| CrossMark / Responsiveness | |
| MSI CreatorPro Z16P B12UKST | |
| Average Intel Core Ultra 9 285HX, NVIDIA RTX PRO 5000 Blackwell Generation Laptop (1806 - 1858, n=3) | |
| Dell Pro Max 16 Plus | |
| Lenovo ThinkPad P16 Gen 2 | |
| Dell Precision 5000 5680 | |
| Dell Precision 5690 | |
| HP ZBook Studio 16 G11 | |
| Lenovo ThinkPad P1 Gen 7 21KV001SGE | |
| WebXPRT 3 / Overall | |
| Average Intel Core Ultra 9 285HX, NVIDIA RTX PRO 5000 Blackwell Generation Laptop (327 - 360, n=3) | |
| Dell Precision 5000 5680 | |
| Lenovo ThinkPad P16 Gen 2 | |
| Dell Pro Max 16 Plus | |
| MSI CreatorPro Z16P B12UKST | |
| HP ZBook Studio 16 G11 | |
| Dell Precision 5690 | |
| Lenovo ThinkPad P1 Gen 7 21KV001SGE | |
| WebXPRT 4 / Overall | |
| Average Intel Core Ultra 9 285HX, NVIDIA RTX PRO 5000 Blackwell Generation Laptop (306 - 323, n=3) | |
| Dell Pro Max 16 Plus | |
| Lenovo ThinkPad P16 Gen 2 | |
| Dell Precision 5000 5680 | |
| Dell Precision 5690 | |
| MSI CreatorPro Z16P B12UKST | |
| HP ZBook Studio 16 G11 | |
| Lenovo ThinkPad P1 Gen 7 21KV001SGE | |
| Mozilla Kraken 1.1 / Total | |
| Lenovo ThinkPad P1 Gen 7 21KV001SGE | |
| MSI CreatorPro Z16P B12UKST | |
| HP ZBook Studio 16 G11 | |
| Dell Precision 5690 | |
| Dell Precision 5000 5680 | |
| Lenovo ThinkPad P16 Gen 2 | |
| Dell Pro Max 16 Plus | |
| Average Intel Core Ultra 9 285HX, NVIDIA RTX PRO 5000 Blackwell Generation Laptop (411 - 439, n=3) | |
* ... smaller is better
| AIDA64 / Memory Copy | |
| Dell Pro Max 16 Plus | |
| Dell Precision 5690 | |
| Average Intel Core Ultra 9 285HX (63431 - 93933, n=6) | |
| HP ZBook Studio 16 G11 | |
| Dell Precision 5000 5680 | |
| Lenovo ThinkPad P1 Gen 7 21KV001SGE | |
| Lenovo ThinkPad P16 Gen 2 | |
| MSI CreatorPro Z16P B12UKST | |
| AIDA64 / Memory Read | |
| Dell Pro Max 16 Plus | |
| Dell Precision 5690 | |
| Average Intel Core Ultra 9 285HX (67084 - 97565, n=6) | |
| HP ZBook Studio 16 G11 | |
| Lenovo ThinkPad P16 Gen 2 | |
| Dell Precision 5000 5680 | |
| MSI CreatorPro Z16P B12UKST | |
| Lenovo ThinkPad P1 Gen 7 21KV001SGE | |
| AIDA64 / Memory Write | |
| Dell Pro Max 16 Plus | |
| Dell Precision 5000 5680 | |
| Average Intel Core Ultra 9 285HX (64112 - 89691, n=6) | |
| HP ZBook Studio 16 G11 | |
| Dell Precision 5690 | |
| MSI CreatorPro Z16P B12UKST | |
| Lenovo ThinkPad P16 Gen 2 | |
| Lenovo ThinkPad P1 Gen 7 21KV001SGE | |
| AIDA64 / Memory Latency | |
| Dell Precision 5690 | |
| Lenovo ThinkPad P1 Gen 7 21KV001SGE | |
| Average Intel Core Ultra 9 285HX (104.8 - 151.7, n=6) | |
| HP ZBook Studio 16 G11 | |
| Dell Pro Max 16 Plus | |
| MSI CreatorPro Z16P B12UKST | |
| Lenovo ThinkPad P16 Gen 2 | |
| Dell Precision 5000 5680 | |
* ... smaller is better
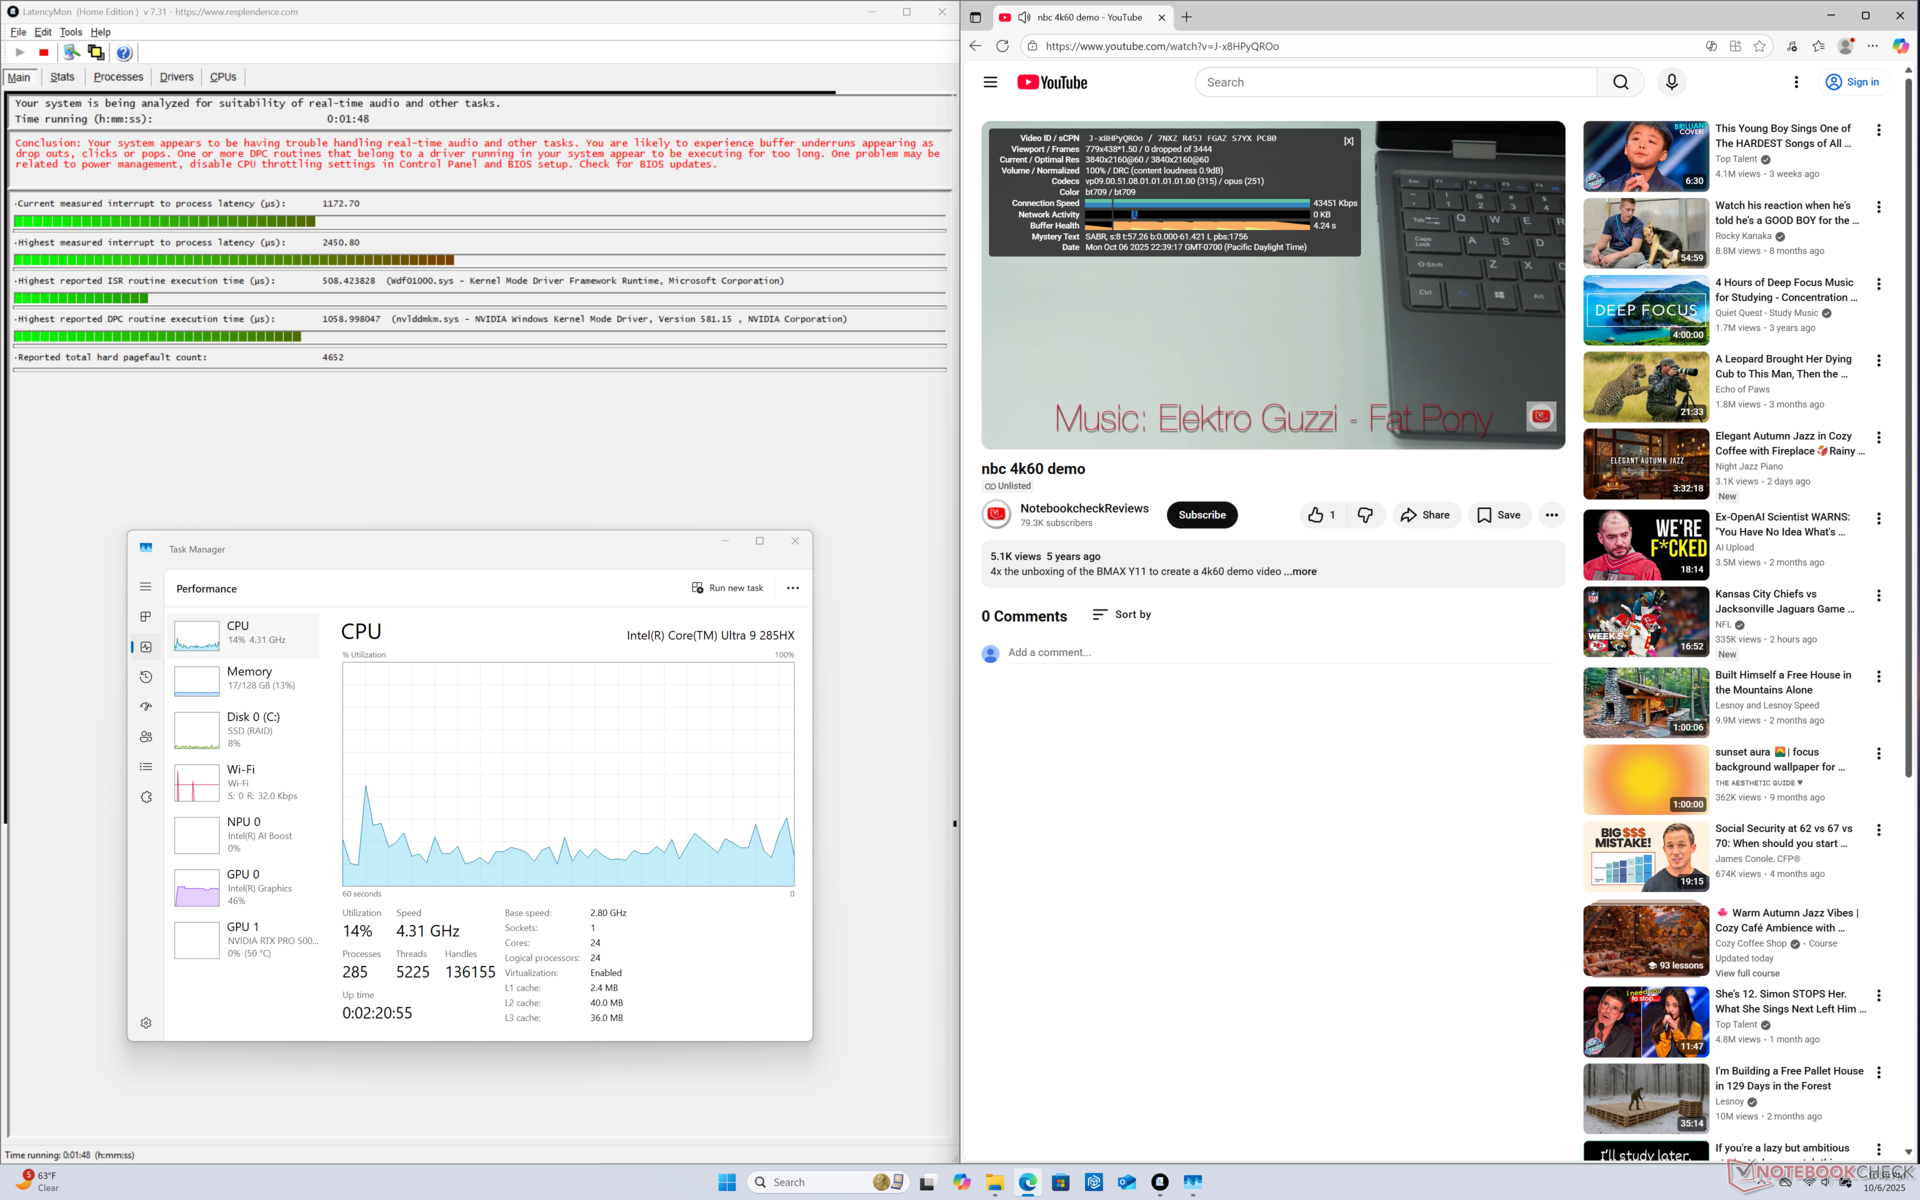
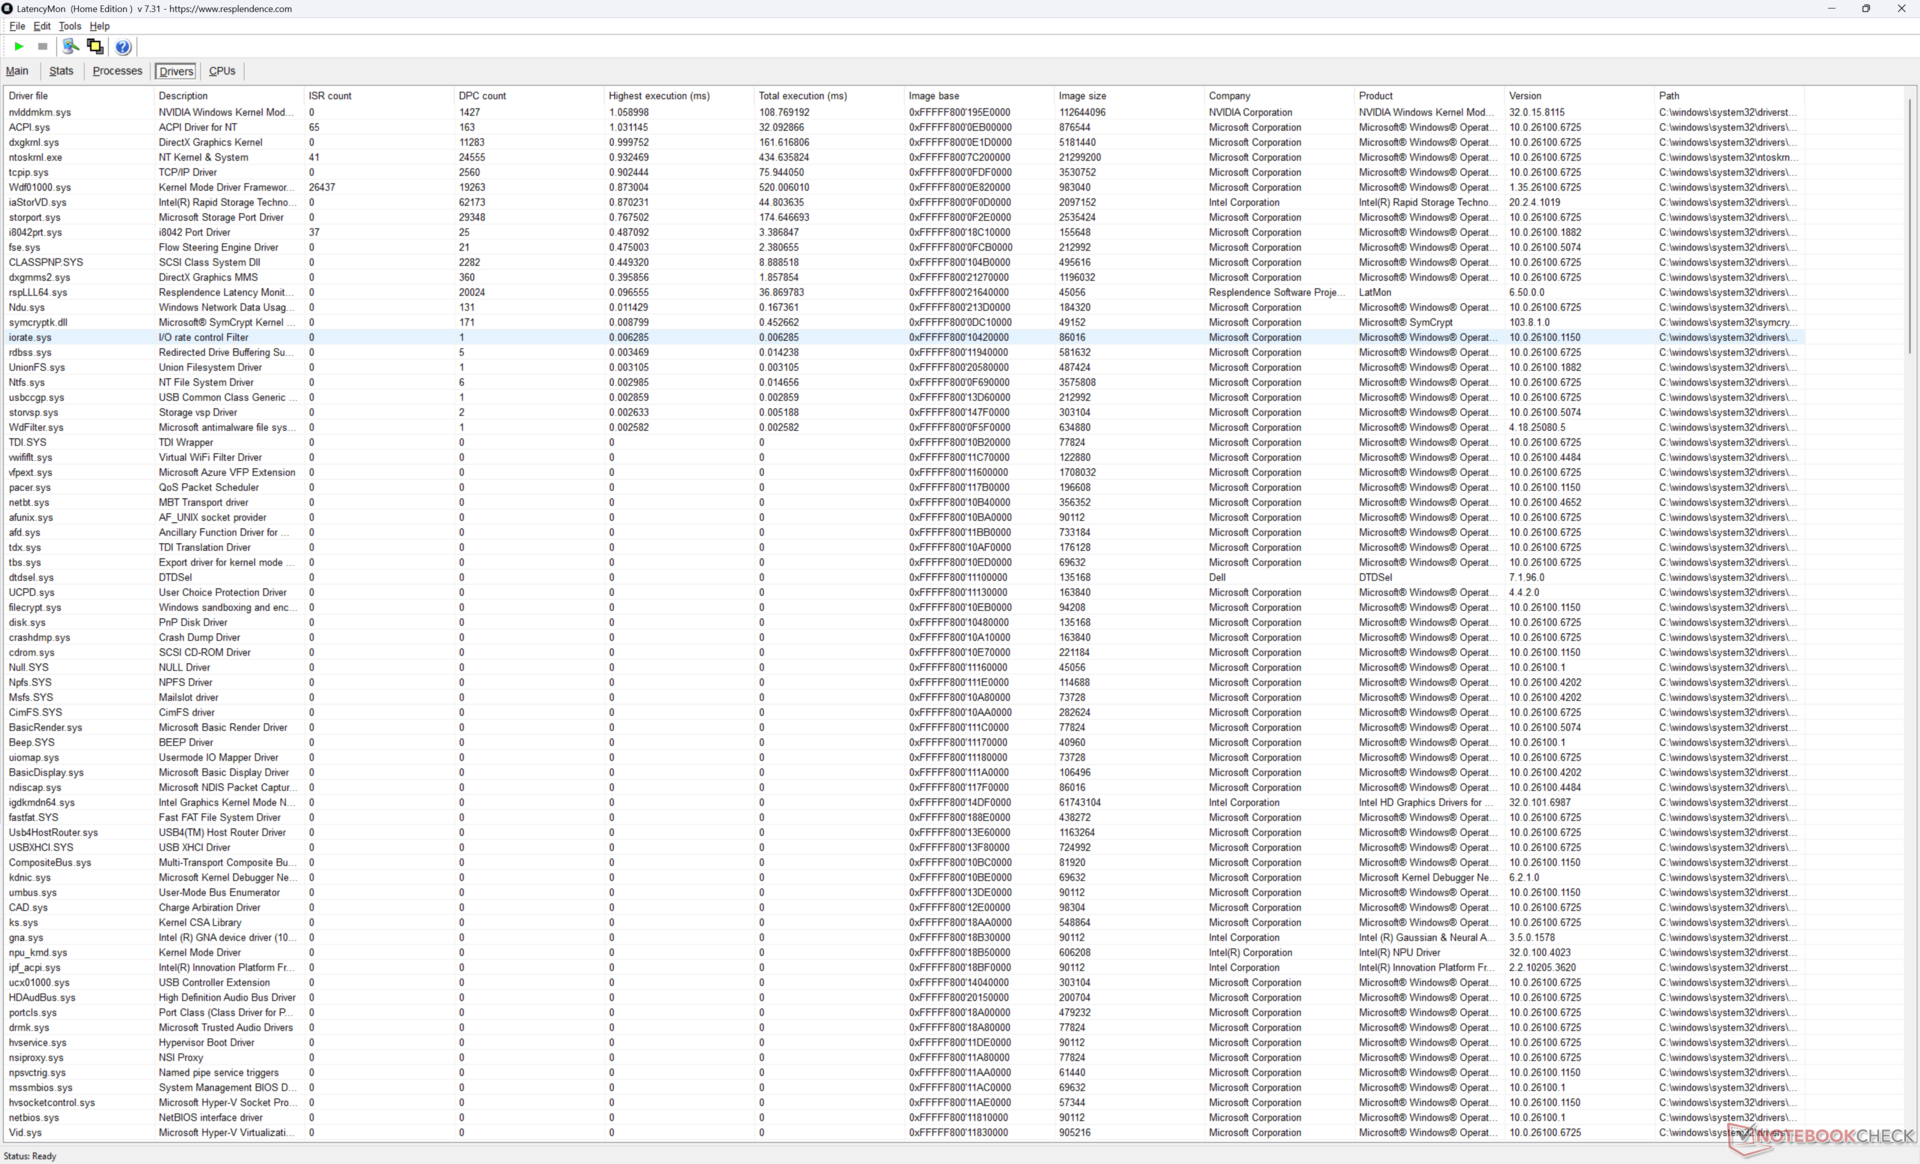
DPC Latency
LatencyMon shows minor DPC issues with otherwise no dropped frames during our 4K60 video playback test.
| DPC Latencies / LatencyMon - interrupt to process latency (max), Web, Youtube, Prime95 | |
| Dell Pro Max 16 Plus | |
| Dell Precision 5000 5680 | |
| Lenovo ThinkPad P1 Gen 7 21KV001SGE | |
| HP ZBook Studio 16 G11 | |
| Lenovo ThinkPad P16 Gen 2 | |
| MSI CreatorPro Z16P B12UKST | |
| Dell Precision 5690 | |
* ... smaller is better
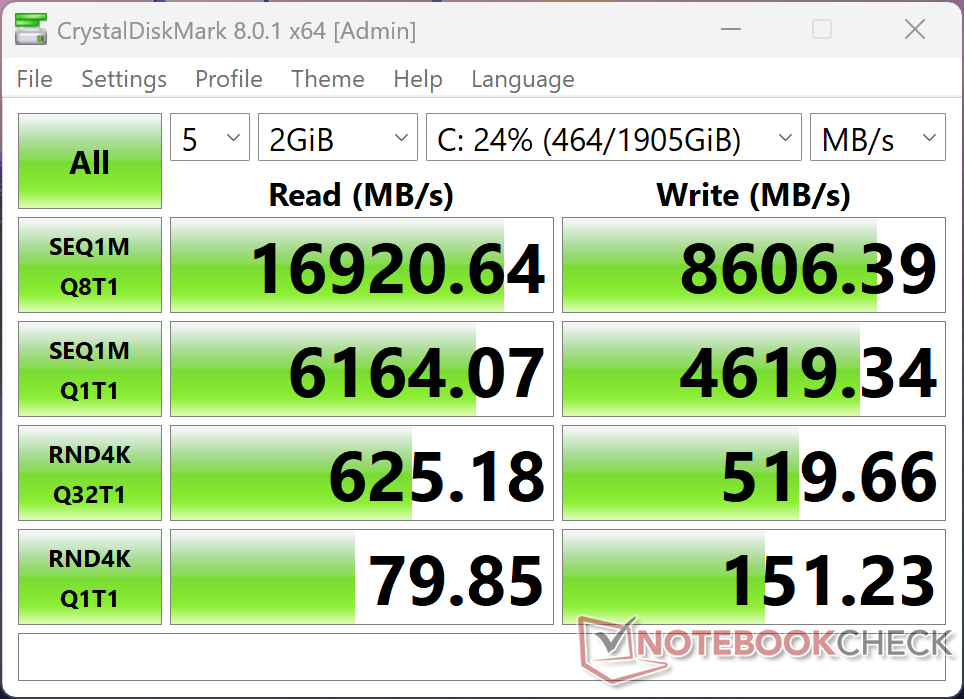
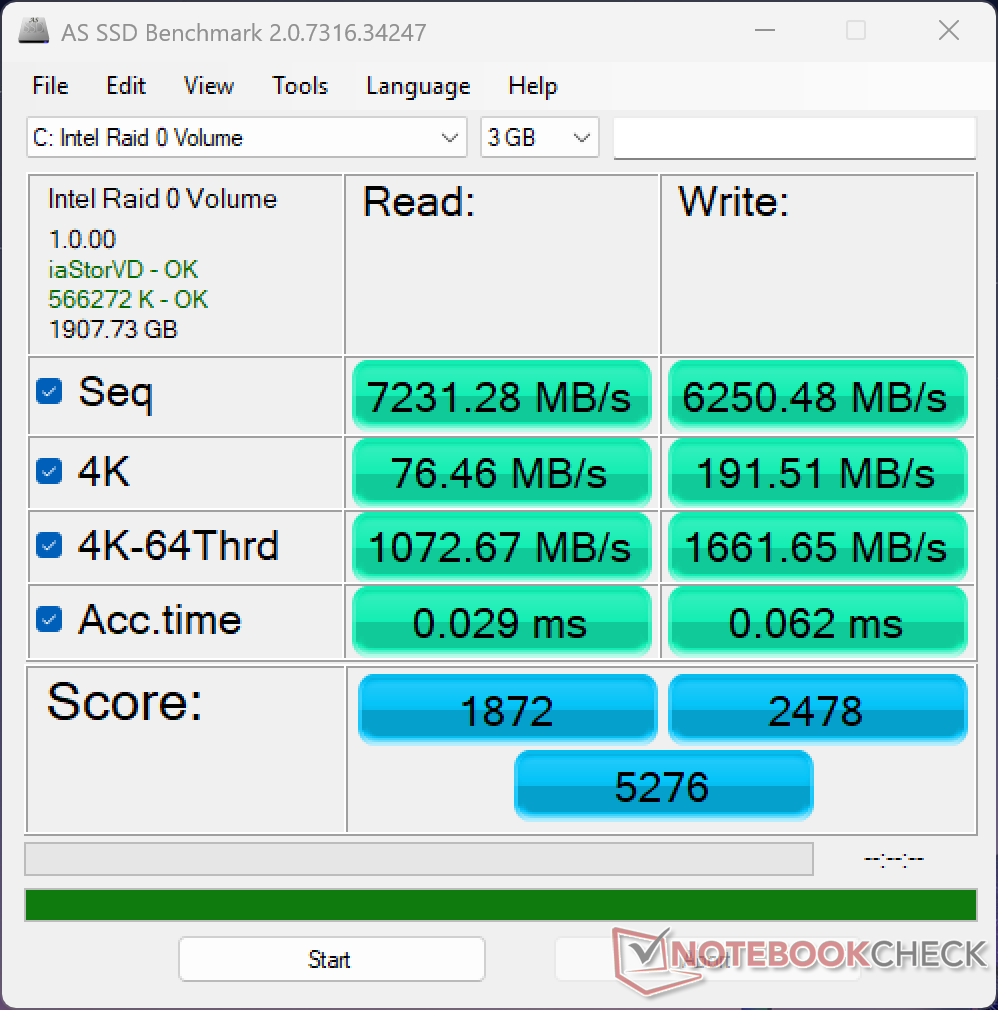
Storage Devices
Our test unit ships with the SK Hynix PCB01 PCIe5 x4 NVMe SSD for read rates of up to ~16 GB/s. Performance would drop slightly to ~13 GB/s after a few minutes into our DisKSpd stress test as shown by the graph below.

* ... smaller is better
Disk Throttling: DiskSpd Read Loop, Queue Depth 8
GPU Performance
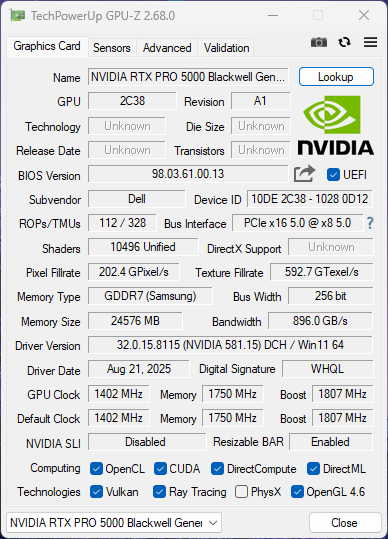
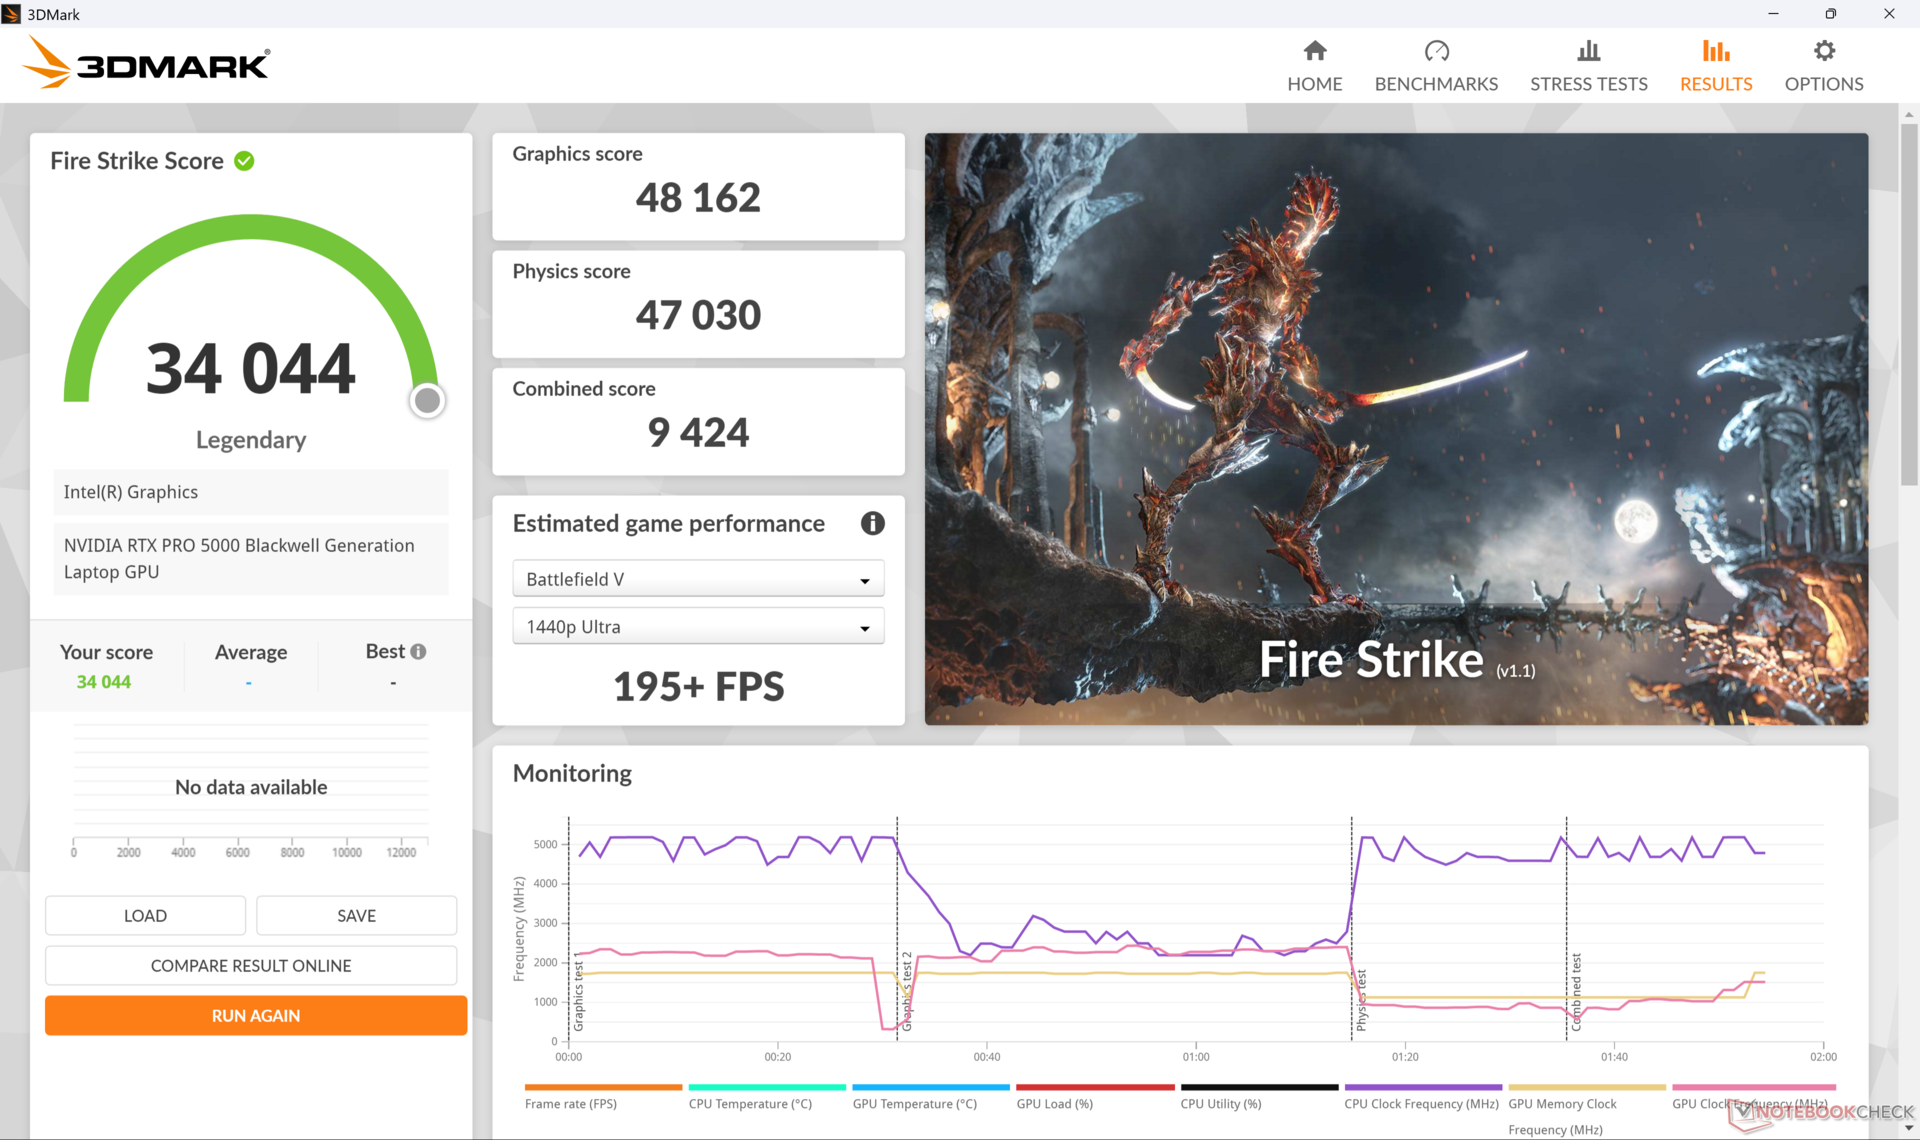
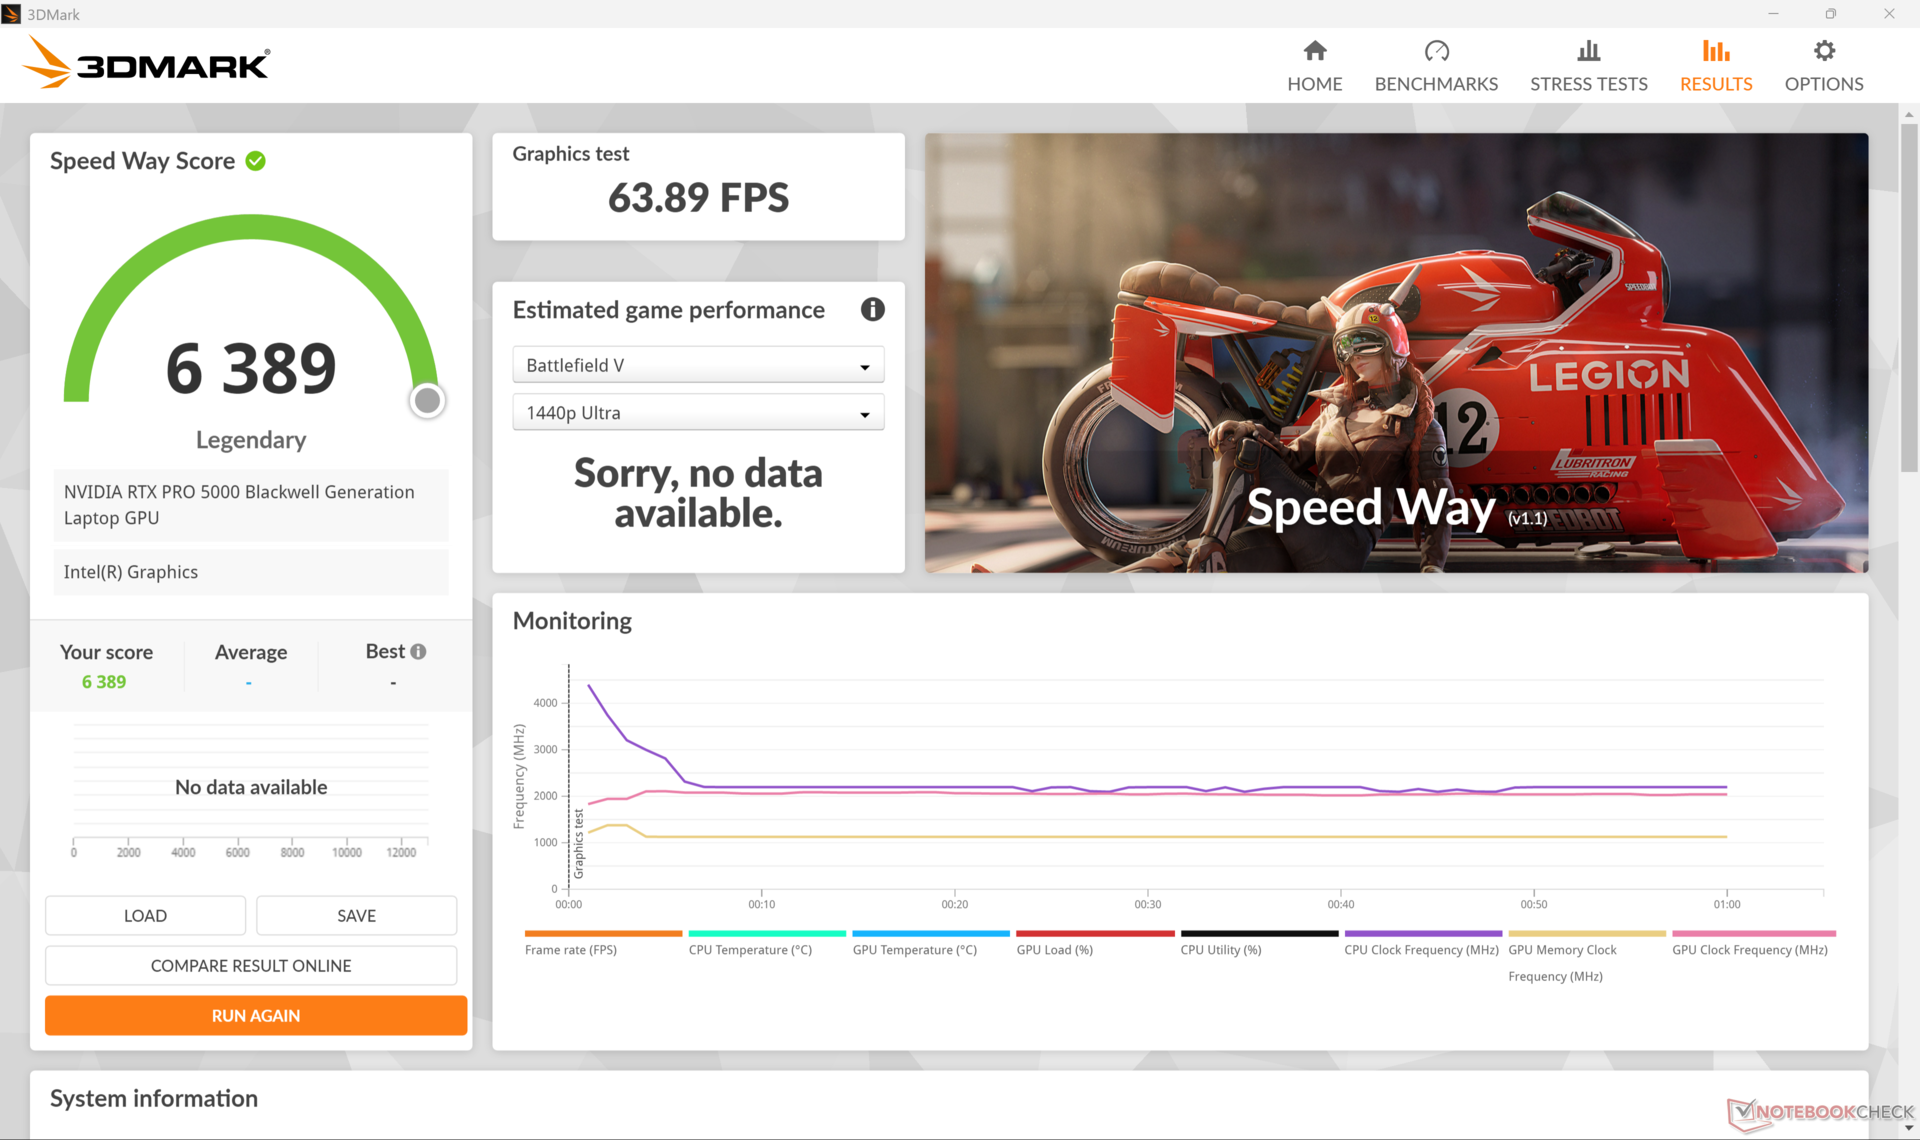
As the first workstation in our database with the RTX Pro 5000 Blackwell, the GPU handily outperforms the outgoing RTX 5000 Ada that was prevalent on previous generation flagship workstations like the HP ZBook Fury 16 G10 by about 35 to 50 percent. The advantages can be even greater if accounting for Specviewperf results. Running the system on Balanced or Optimized mode instead of Performance mode would impact performance just minimally according to 3DMark Fire Strike benchmarks.
| Power Profile | Graphics Score | Physics Score | Combined Score |
| Performance Mode (~121 W) | 48162 | 47030 | 9424 |
| Balanced Mode (~108 W) | 47134 (-2%) | 45150 (-4%) | 12212 (+30%) |
| Battery Power | 25838 (-46%) | 34253 (-27%) | 6186 (-34%) |
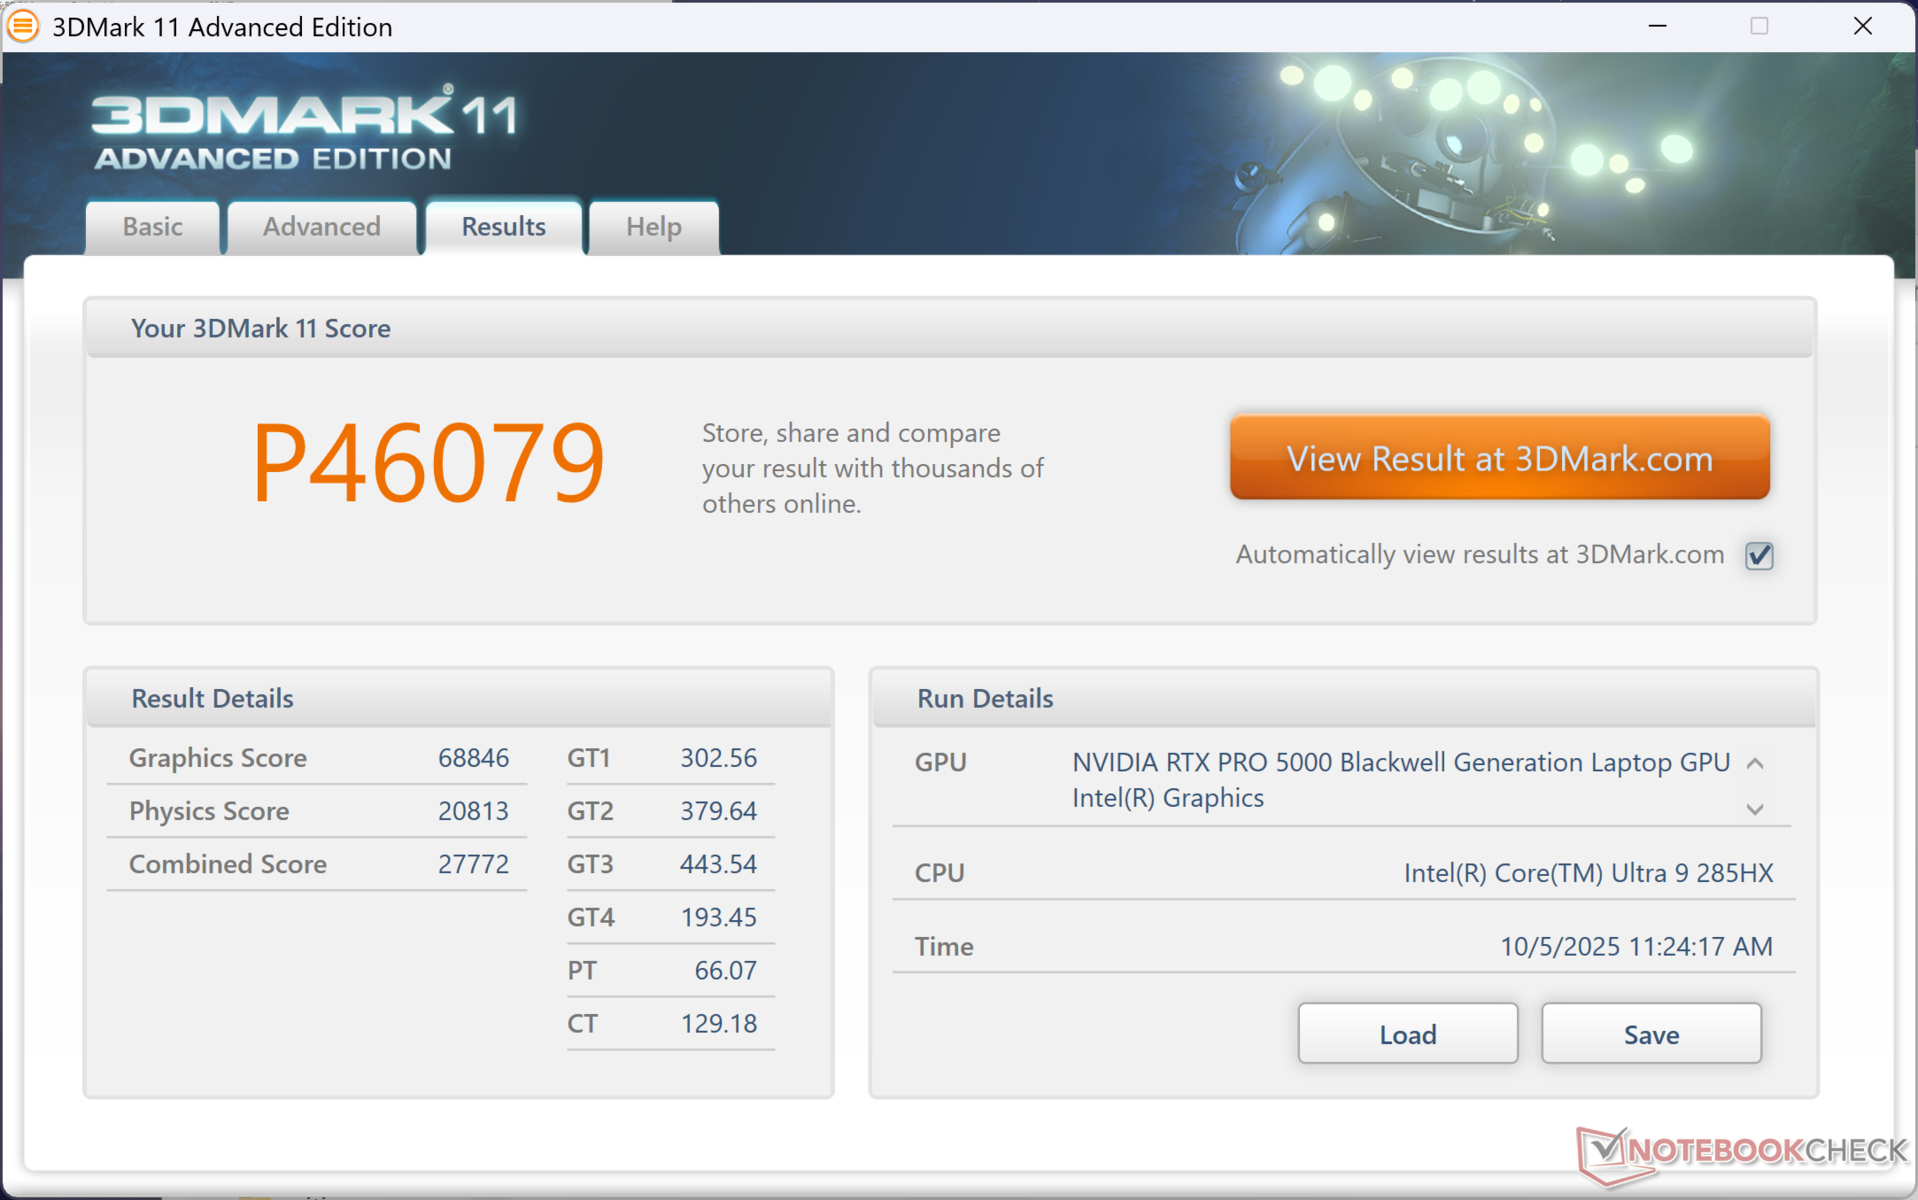

| 3DMark 11 Performance | 46079 points | |
| 3DMark Cloud Gate Standard Score | 67837 points | |
| 3DMark Fire Strike Score | 34044 points | |
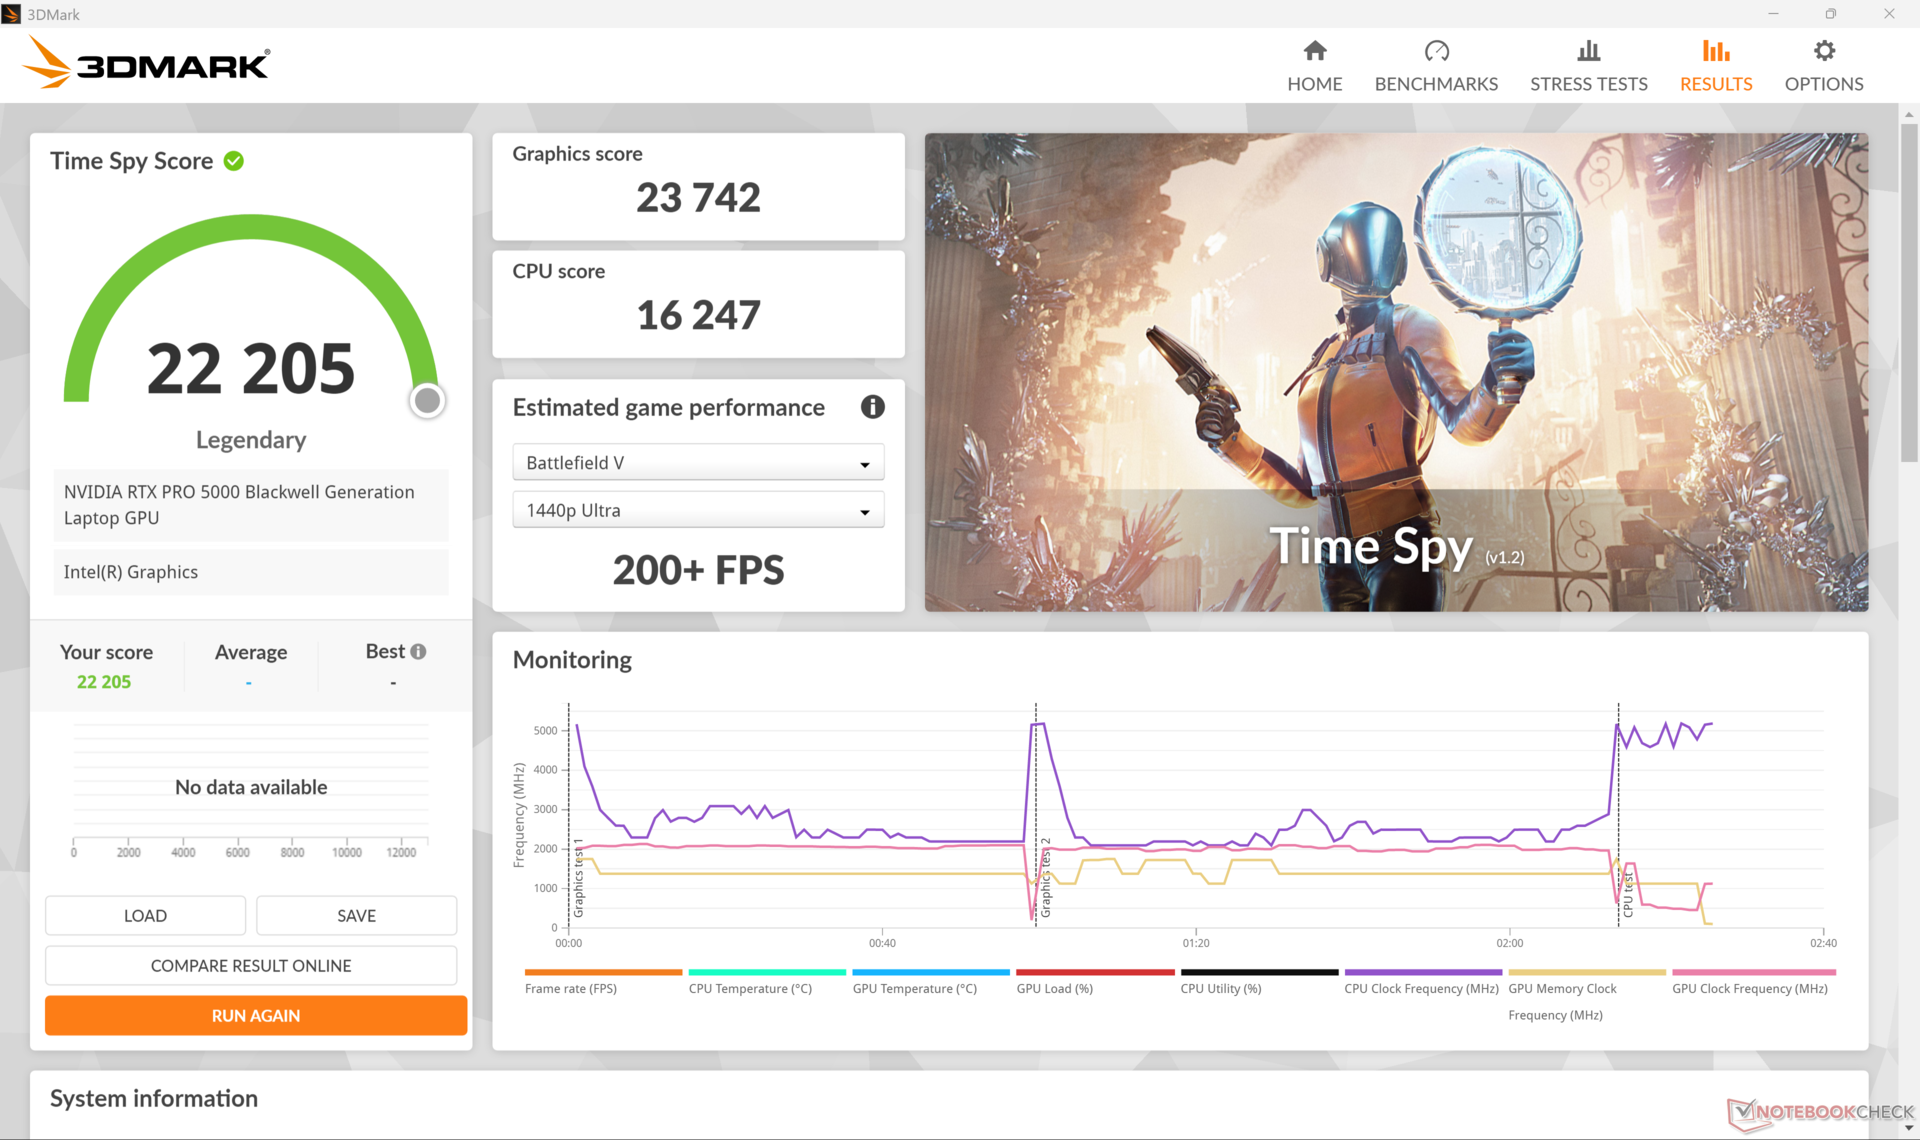
| 3DMark Time Spy Score | 22205 points | |
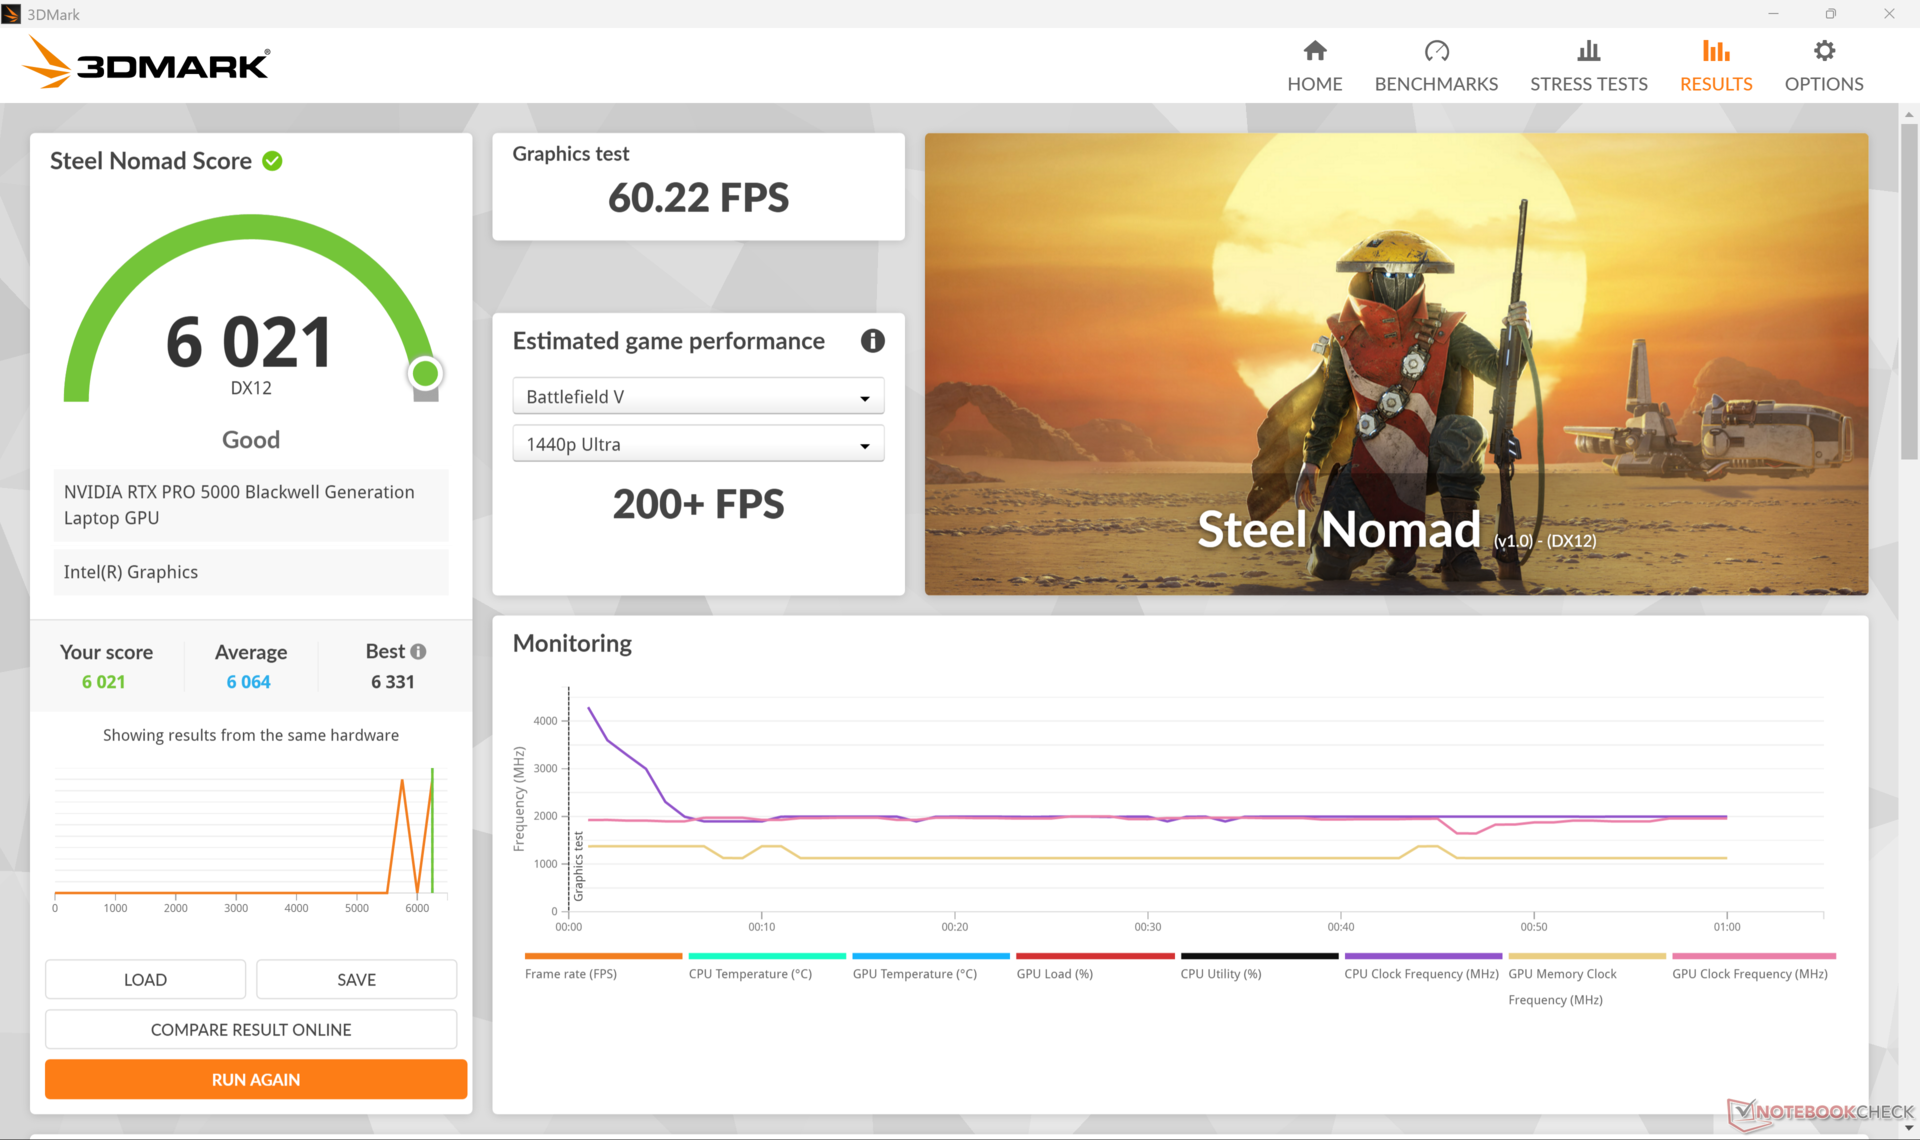
| 3DMark Steel Nomad Score | 6021 points | |
Help | ||
* ... smaller is better
Gaming Performance
Gaming performance is largely similar to the mobile GeForce RTX 5080 which is to be expected as the RTX Pro 5000 Blackwell is based on the mobile RTX 5090 chip but without the gaming optimizations. Some titles run worse or inconsistently on the RTX Pro 5000 Blackwell including Monster Hunter Wilds.
| Performance rating - Percent | |
| Dell Pro Max 16 Plus | |
| Lenovo ThinkPad P16 Gen 2 | |
| Dell Precision 5000 5680 -3! | |
| Dell Precision 5690 -1! | |
| HP ZBook Studio 16 G11 | |
| MSI CreatorPro Z16P B12UKST -2! | |
| Lenovo ThinkPad P1 Gen 7 21KV001SGE -1! | |
| Cyberpunk 2077 - 1920x1080 Ultra Preset (FSR off) | |
| Dell Pro Max 16 Plus | |
| Dell Precision 5690 | |
| Lenovo ThinkPad P16 Gen 2 | |
| Lenovo ThinkPad P1 Gen 7 21KV001SGE | |
| HP ZBook Studio 16 G11 | |
| Baldur's Gate 3 - 1920x1080 Ultra Preset AA:T | |
| Dell Pro Max 16 Plus | |
| Lenovo ThinkPad P16 Gen 2 | |
| Dell Precision 5690 | |
| HP ZBook Studio 16 G11 | |
| Lenovo ThinkPad P1 Gen 7 21KV001SGE | |
| GTA V - 1920x1080 Highest AA:4xMSAA + FX AF:16x | |
| Dell Pro Max 16 Plus | |
| Lenovo ThinkPad P16 Gen 2 | |
| Dell Precision 5000 5680 | |
| Lenovo ThinkPad P1 Gen 7 21KV001SGE | |
| HP ZBook Studio 16 G11 | |
| MSI CreatorPro Z16P B12UKST | |
| Final Fantasy XV Benchmark - 1920x1080 High Quality | |
| Dell Pro Max 16 Plus | |
| Lenovo ThinkPad P16 Gen 2 | |
| Dell Precision 5690 | |
| Dell Precision 5000 5680 | |
| HP ZBook Studio 16 G11 | |
| Lenovo ThinkPad P1 Gen 7 21KV001SGE | |
| MSI CreatorPro Z16P B12UKST | |
| Strange Brigade - 1920x1080 ultra AA:ultra AF:16 | |
| Lenovo ThinkPad P16 Gen 2 | |
| Dell Pro Max 16 Plus | |
| Dell Precision 5690 | |
| HP ZBook Studio 16 G11 | |
| MSI CreatorPro Z16P B12UKST | |
| Dota 2 Reborn - 1920x1080 ultra (3/3) best looking | |
| Dell Pro Max 16 Plus | |
| Lenovo ThinkPad P16 Gen 2 | |
| MSI CreatorPro Z16P B12UKST | |
| Dell Precision 5000 5680 | |
| HP ZBook Studio 16 G11 | |
| Dell Precision 5690 | |
| Lenovo ThinkPad P1 Gen 7 21KV001SGE | |
| X-Plane 11.11 - 1920x1080 high (fps_test=3) | |
| Lenovo ThinkPad P16 Gen 2 | |
| Dell Pro Max 16 Plus | |
| Dell Precision 5000 5680 | |
| MSI CreatorPro Z16P B12UKST | |
| Dell Precision 5690 | |
| HP ZBook Studio 16 G11 | |
| Lenovo ThinkPad P1 Gen 7 21KV001SGE | |
Cyberpunk 2077 ultra FPS Chart
| low | med. | high | ultra | QHD DLSS | QHD | 4K DLSS | 4K | |
|---|---|---|---|---|---|---|---|---|
| GTA V (2015) | 184.7 | 183.5 | 178.1 | 142.5 | 138 | 170.3 | ||
| Dota 2 Reborn (2015) | 212 | 181 | 184.8 | 166 | 146.4 | |||
| Final Fantasy XV Benchmark (2018) | 233 | 220 | 184.2 | 162.8 | 102.2 | |||
| X-Plane 11.11 (2018) | 144.4 | 125.7 | 103.2 | 82.6 | ||||
| Strange Brigade (2018) | 382 | 285 | 261 | 288 | 300 | 177.3 | ||
| Baldur's Gate 3 (2023) | 204 | 201.8 | 155.2 | 128.1 | 80.1 | |||
| Cyberpunk 2077 (2023) | 133.9 | 121.6 | 120.6 | 119.8 | 116.3 | 105.1 | 51 | |
| F1 24 (2024) | 251 | 243 | 231 | 131.2 | 128.1 | 94.9 | 82 | 47.2 |
| Black Myth: Wukong (2024) | 142 | 72 | 54 | 42 | 36 | 37 | 32 | 26 |
| Monster Hunter Wilds (2025) | 25.4 | 27 | 27.8 | 43.3 | 39 | 33.9 | 35.3 | |
| Assassin's Creed Shadows (2025) | 103 | 98 | 86 | 68 | 67 | 57 | 56 | 42 |
Emissions
System Noise
While the fans are almost always active, pulsing behavior is generally kept to a minimum to reduce sharp increases in noise. With that said, the system can be quite loud at almost 55 dB(A) when running demanding loads which is similar to what we recorded on the Lenovo ThinkPad P1 or HP ZBook Studio 16 G11.
Fan noise tops out at 49 dB(A) and 54.3 dB(A) when set to Balanced mode and Performance mode, respectively.
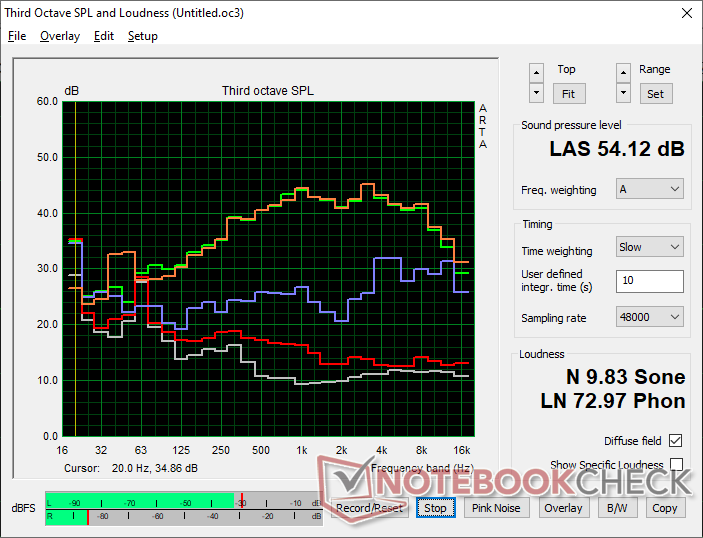
Noise level
| Idle |
| 26.7 / 30.5 / 34 dB(A) |
| Load |
| 39.8 / 54.3 dB(A) |
 | ||
30 dB silent 40 dB(A) audible 50 dB(A) loud |
||
min: | ||
| Dell Pro Max 16 Plus RTX PRO 5000 Blackwell Generation Laptop, Ultra 9 285HX, SK hynix PCB01 HFS001TFM9X186N | Dell Precision 5690 RTX 5000 Ada Generation Laptop, Ultra 9 185H, 2x Samsung PM9A1 1TB (RAID 0) | Dell Precision 5000 5680 RTX 5000 Ada Generation Laptop, i9-13900H, 2x SK hynix PC801 HFS512GEJ9X101N RAID 0 | Lenovo ThinkPad P16 Gen 2 RTX 4000 Ada Generation Laptop, i7-14700HX, SK hynix PC801 HFS001TEJ9X162N | Lenovo ThinkPad P1 Gen 7 21KV001SGE GeForce RTX 4060 Laptop GPU, Ultra 7 155H, Kioxia XG8 KXG8AZNV1T02 | HP ZBook Studio 16 G11 RTX 3000 Ada Generation Laptop, Ultra 9 185H, Kioxia XG8 KXG80ZNV1T02 | MSI CreatorPro Z16P B12UKST RTX A3000 Laptop GPU, i7-12700H, Samsung PM9A1 MZVL21T0HCLR | |
|---|---|---|---|---|---|---|---|
| Noise | 7% | 14% | 1% | 6% | 11% | 5% | |
| off / environment * (dB) | 23.2 | 23.4 -1% | 22.8 2% | 23.9 -3% | 24.7 -6% | 23.8 -3% | 24.1 -4% |
| Idle Minimum * (dB) | 26.7 | 23.6 12% | 23 14% | 29.1 -9% | 24.7 7% | 23.8 11% | 27.1 -1% |
| Idle Average * (dB) | 30.5 | 24.9 18% | 23 25% | 29.1 5% | 24.7 19% | 26.4 13% | 27.1 11% |
| Idle Maximum * (dB) | 34 | 30.9 9% | 23 32% | 29.1 14% | 24.7 27% | 26.4 22% | 27.1 20% |
| Load Average * (dB) | 39.8 | 40.4 -2% | 37.2 7% | 41 -3% | 43.7 -10% | 33.7 15% | 42.9 -8% |
| Cyberpunk 2077 ultra * (dB) | 54.3 | 52.8 3% | 53.2 2% | 46.1 15% | |||
| Load Maximum * (dB) | 54.3 | 51.9 4% | 51 6% | 52.9 3% | 53.3 2% | 53.2 2% | 47 13% |
| Witcher 3 ultra * (dB) | 48.3 | 51 | 44 |
* ... smaller is better
Temperature
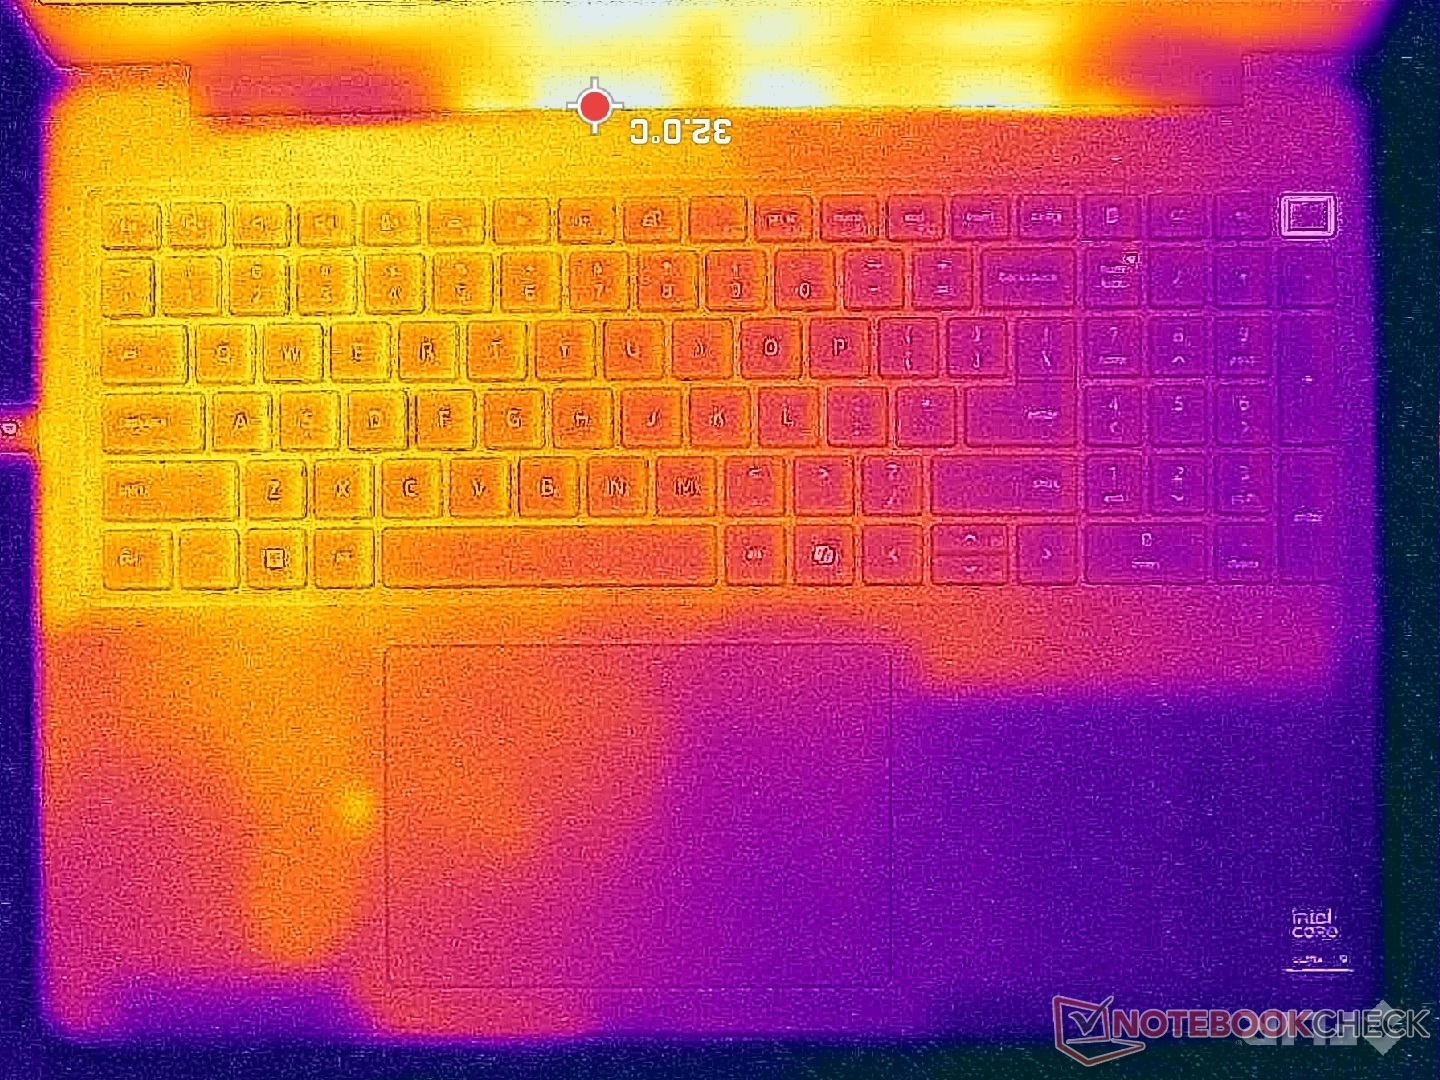
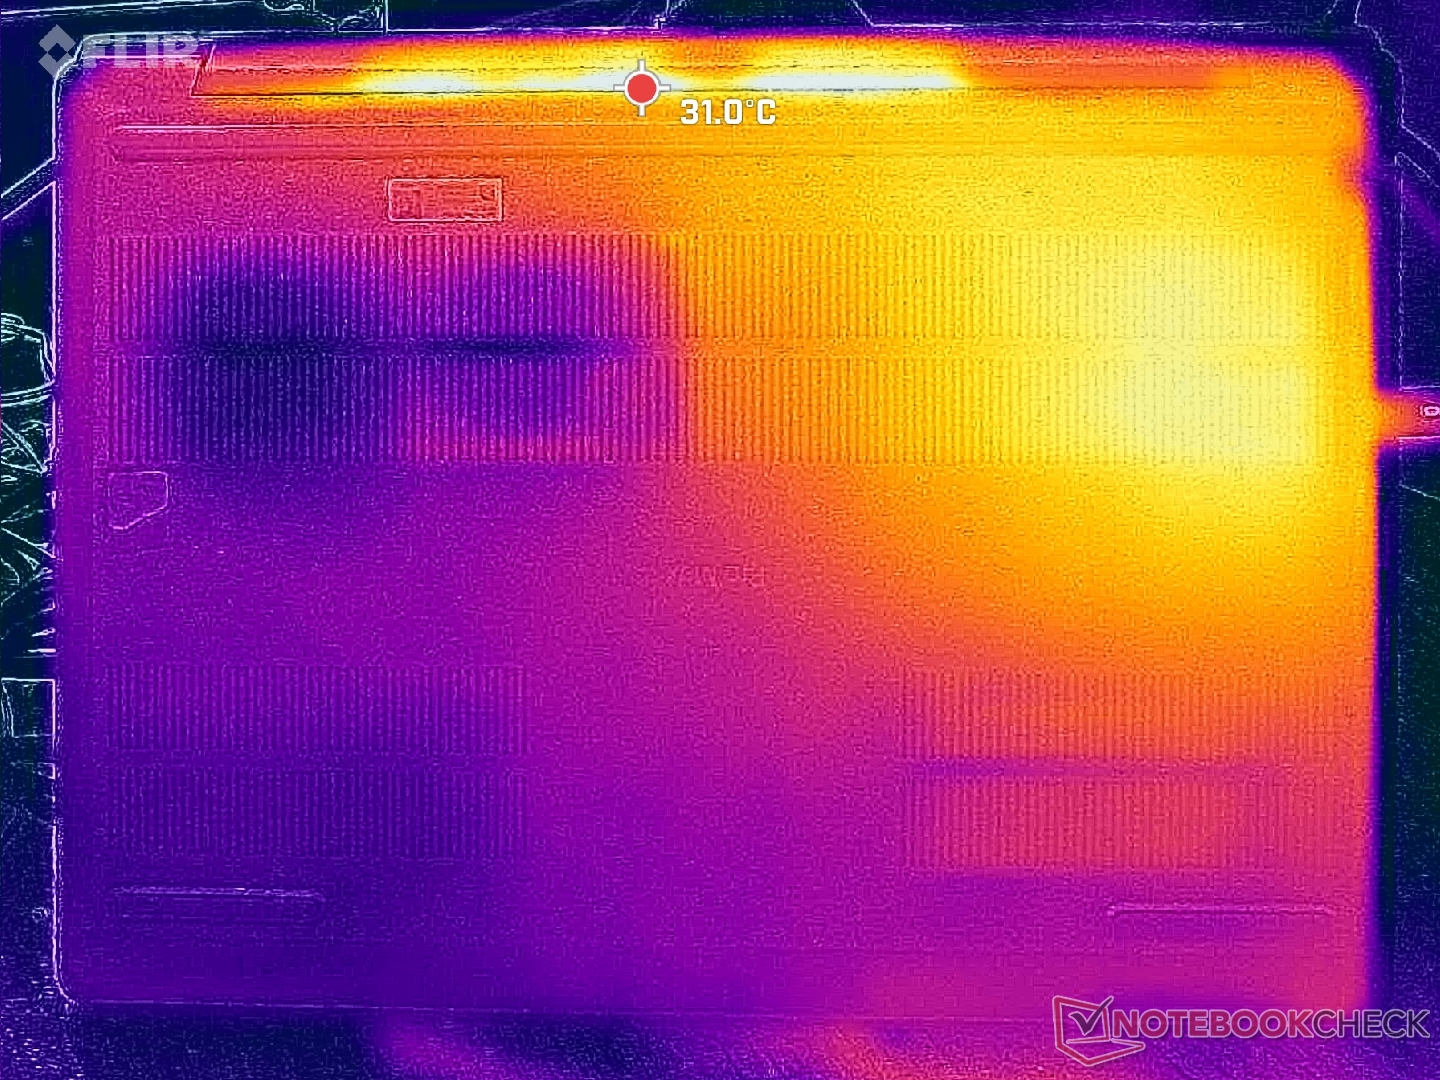
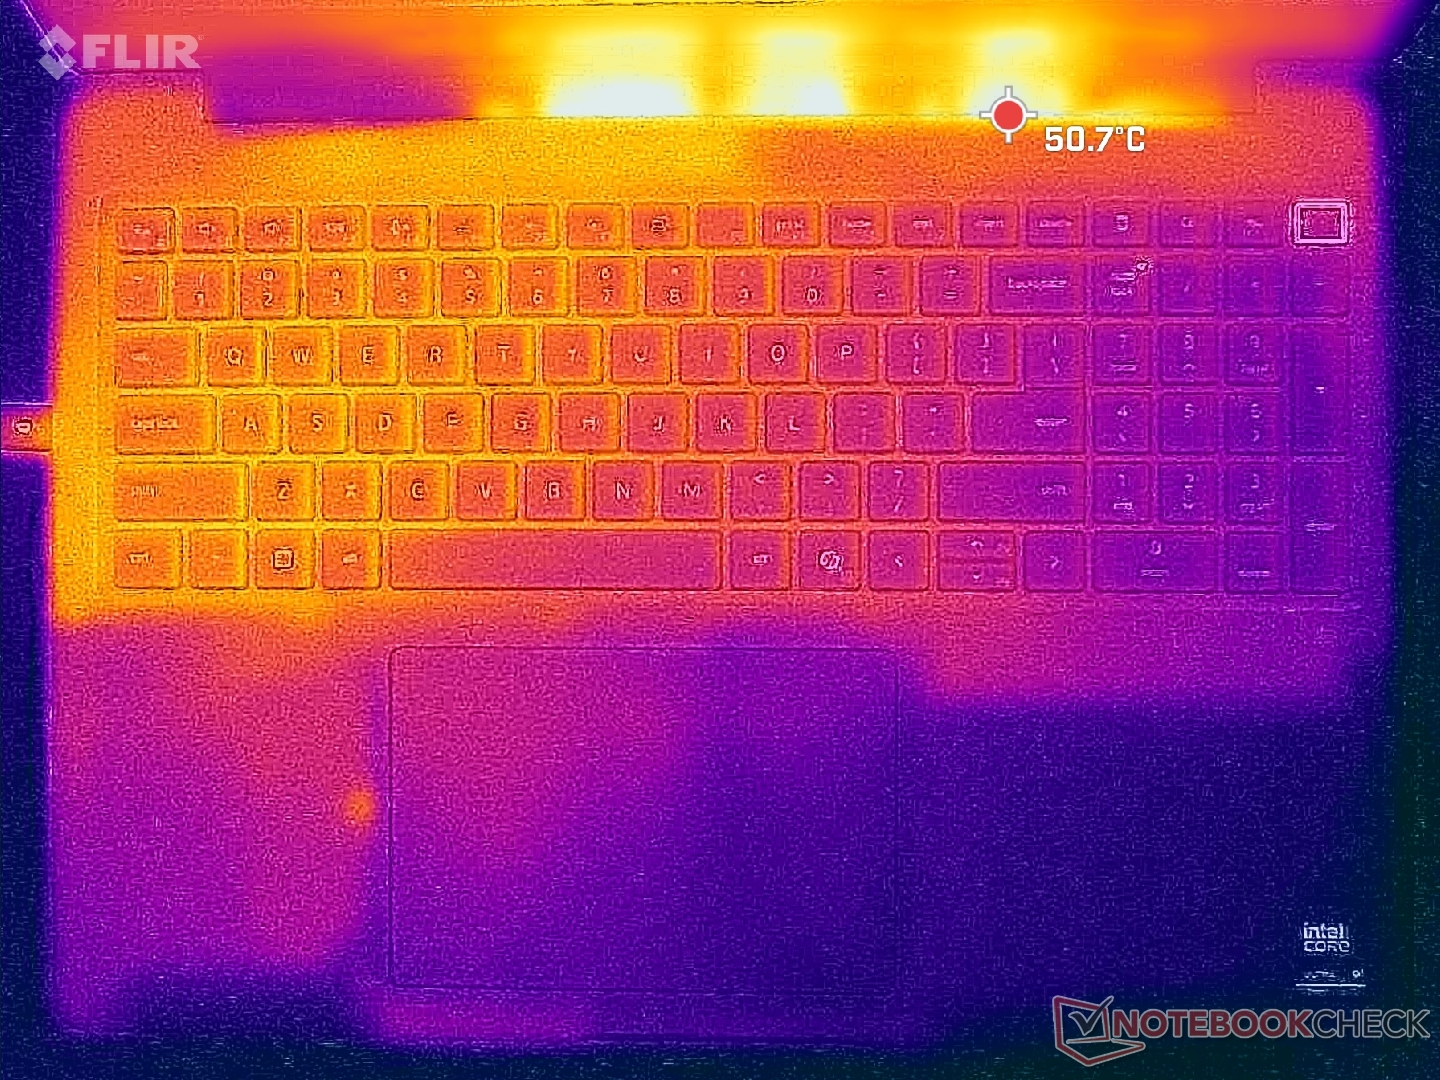
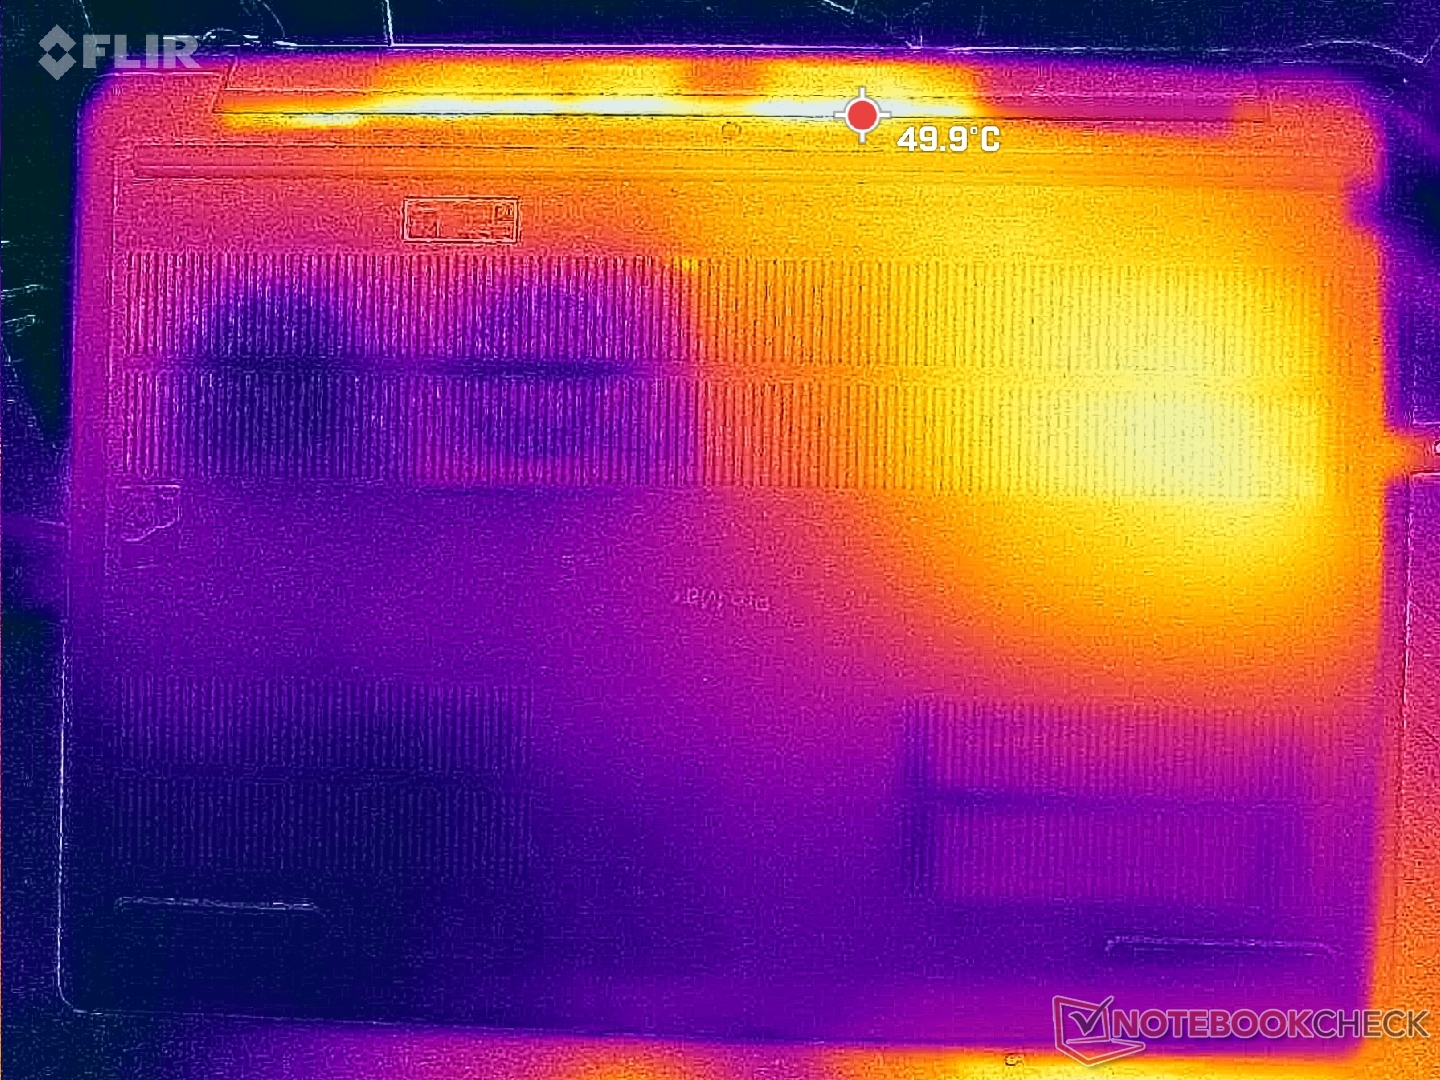
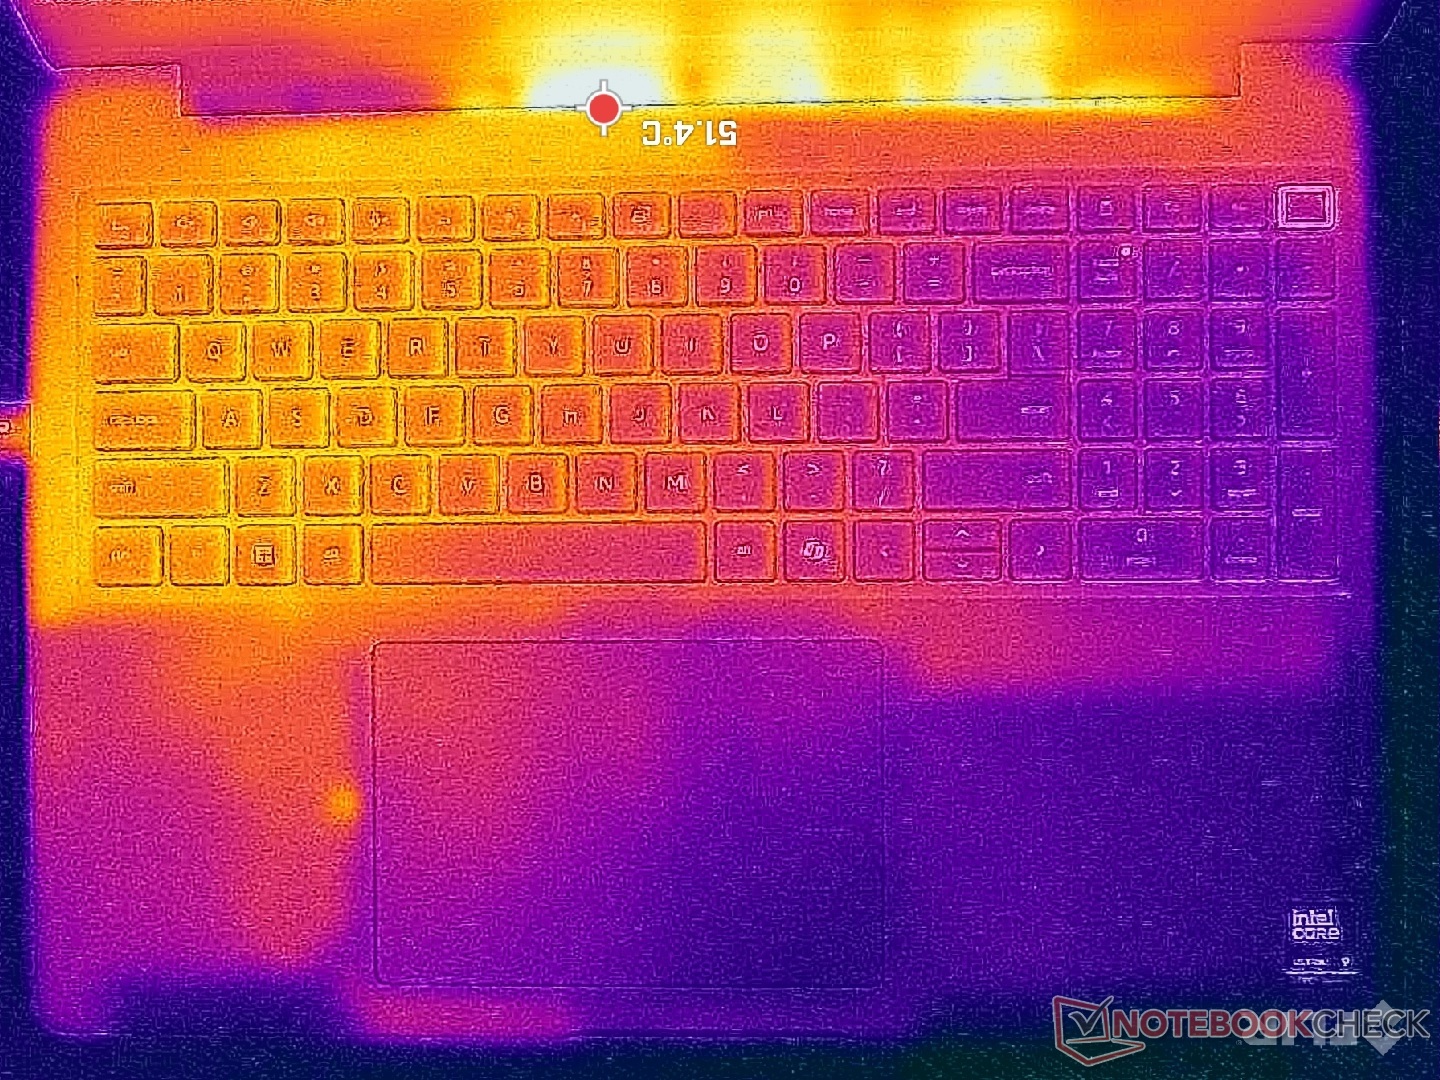
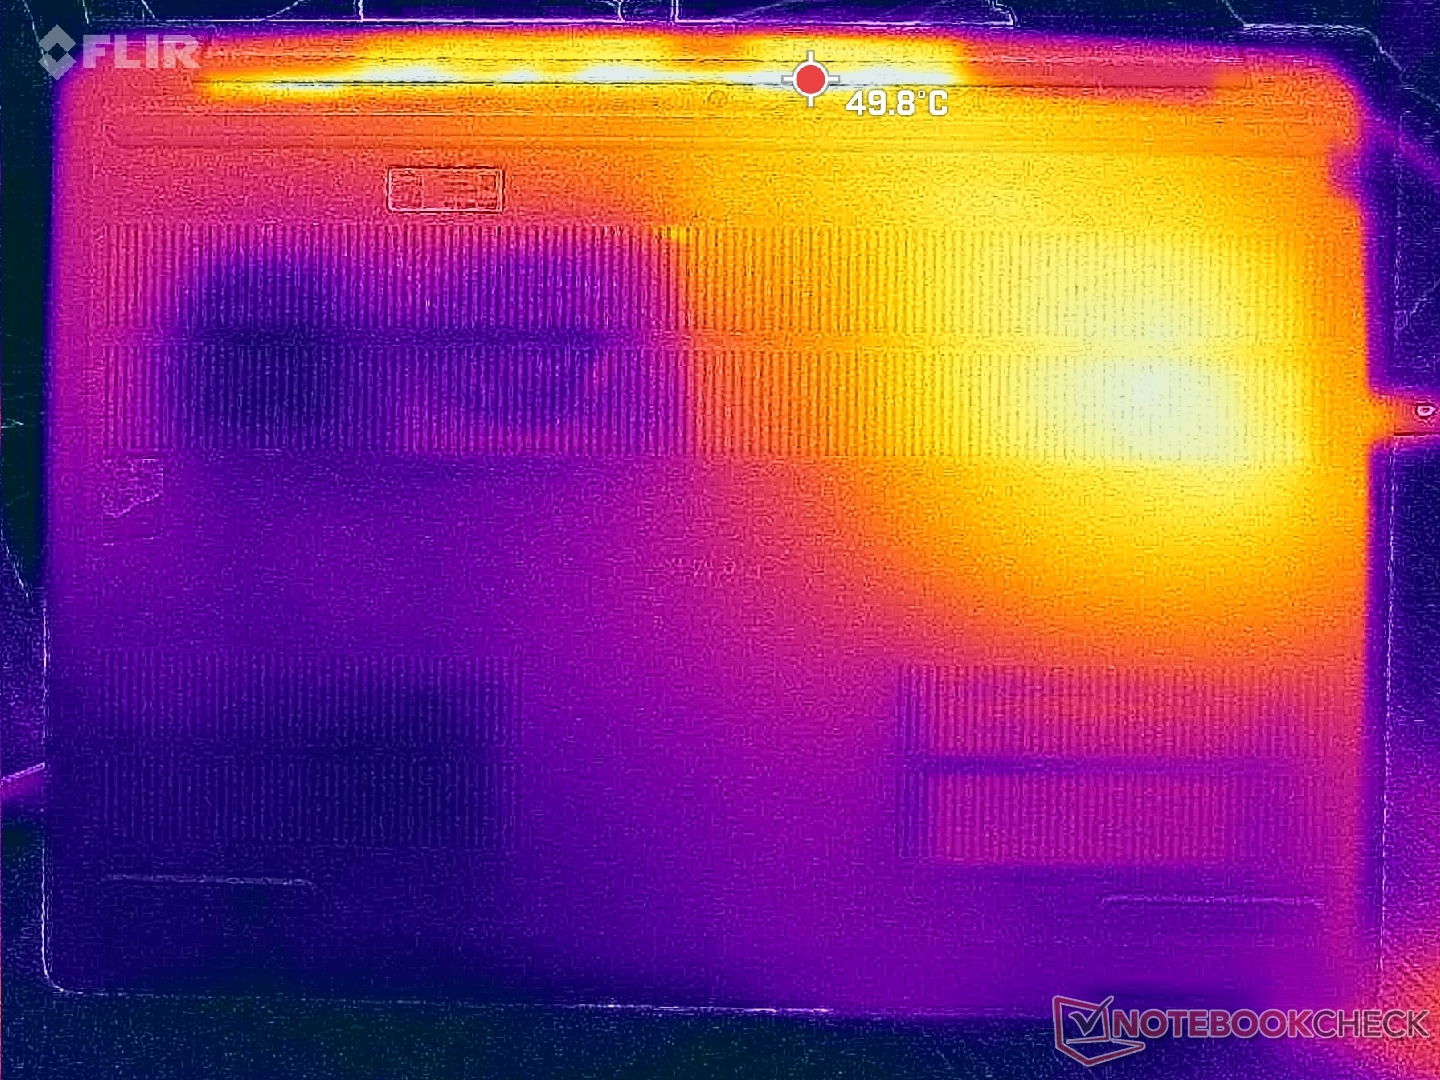
Surface temperatures are almost always warm no matter the onscreen load likely due to the lethargic fans and high-performance parts. The left half of the chassis becomes noticeably warmer than the right due to the asymmetric cooling solution.
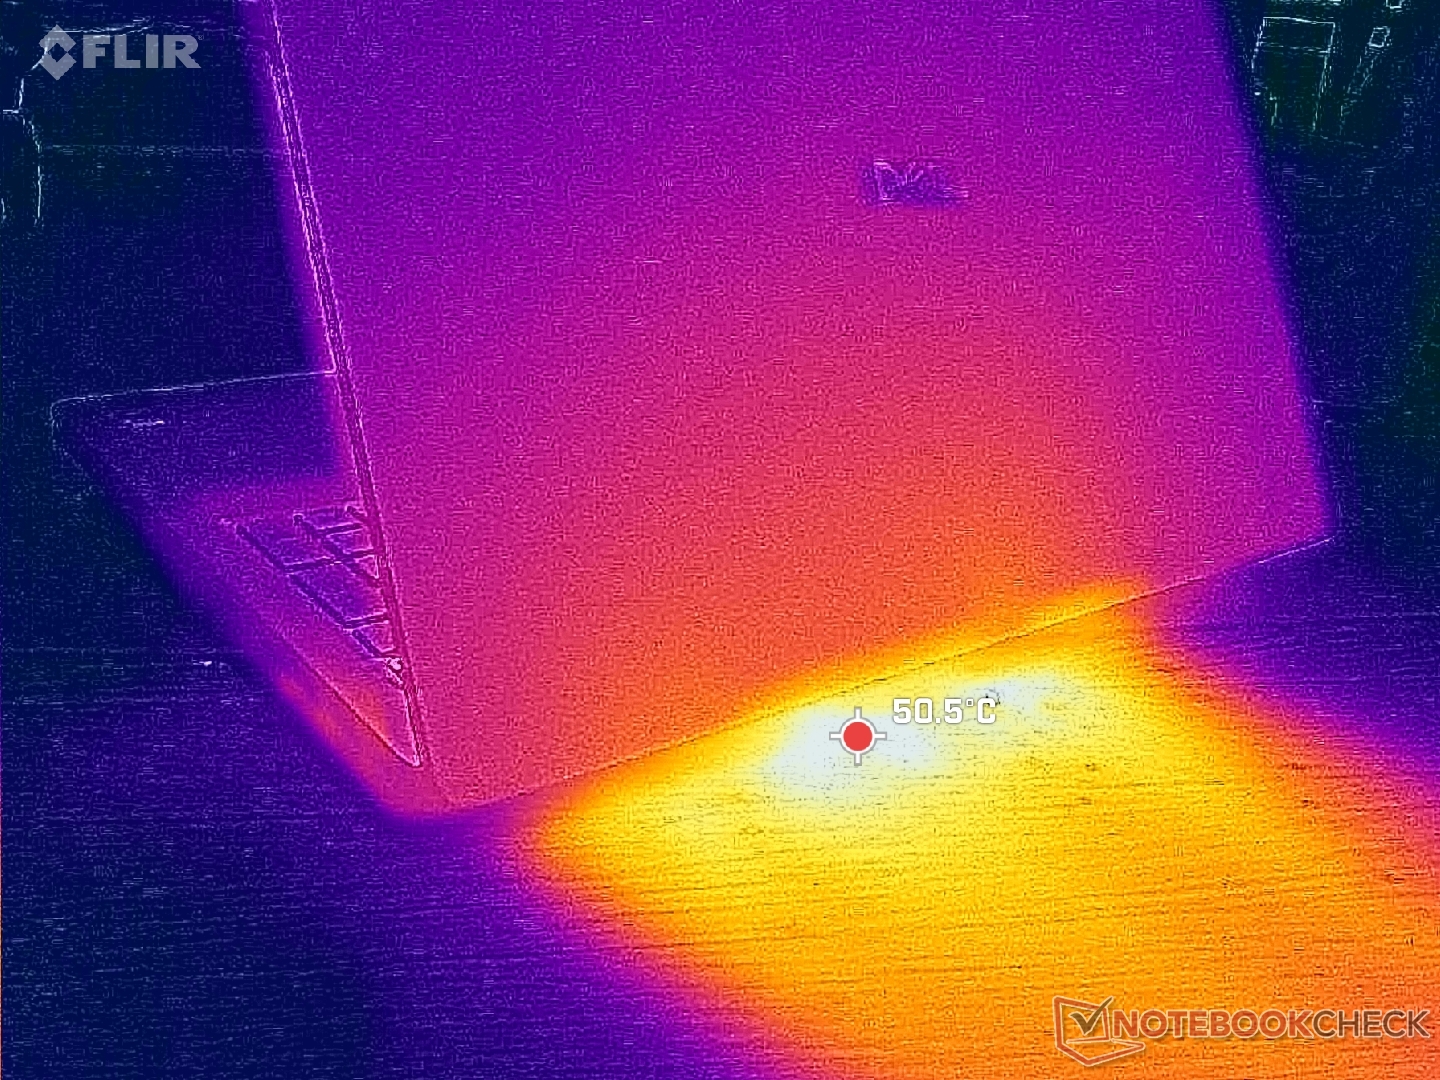
(±) The maximum temperature on the upper side is 40.4 °C / 105 F, compared to the average of 38.2 °C / 101 F, ranging from 22.2 to 69.8 °C for the class Workstation.
(-) The bottom heats up to a maximum of 45.6 °C / 114 F, compared to the average of 41.1 °C / 106 F
(+) In idle usage, the average temperature for the upper side is 29.5 °C / 85 F, compared to the device average of 32 °C / 90 F.
(±) 3: The average temperature for the upper side is 34.2 °C / 94 F, compared to the average of 32 °C / 90 F for the class Workstation.
(+) The palmrests and touchpad are reaching skin temperature as a maximum (33.2 °C / 91.8 F) and are therefore not hot.
(-) The average temperature of the palmrest area of similar devices was 27.8 °C / 82 F (-5.4 °C / -9.8 F).
| Dell Pro Max 16 Plus Intel Core Ultra 9 285HX, NVIDIA RTX PRO 5000 Blackwell Generation Laptop | Dell Precision 5690 Intel Core Ultra 9 185H, NVIDIA RTX 5000 Ada Generation Laptop | Dell Precision 5000 5680 Intel Core i9-13900H, NVIDIA RTX 5000 Ada Generation Laptop | Lenovo ThinkPad P16 Gen 2 Intel Core i7-14700HX, NVIDIA RTX 4000 Ada Generation Laptop | Lenovo ThinkPad P1 Gen 7 21KV001SGE Intel Core Ultra 7 155H, NVIDIA GeForce RTX 4060 Laptop GPU | HP ZBook Studio 16 G11 Intel Core Ultra 9 185H, NVIDIA RTX 3000 Ada Generation Laptop | MSI CreatorPro Z16P B12UKST Intel Core i7-12700H, NVIDIA RTX A3000 Laptop GPU | |
|---|---|---|---|---|---|---|---|
| Heat | 6% | -1% | 5% | 6% | 0% | -11% | |
| Maximum Upper Side * (°C) | 40.4 | 46.6 -15% | 50.2 -24% | 46.6 -15% | 50.3 -25% | 36.6 9% | 56.3 -39% |
| Maximum Bottom * (°C) | 45.6 | 33 28% | 32 30% | 51 -12% | 38 17% | 47.8 -5% | 68.3 -50% |
| Idle Upper Side * (°C) | 32.8 | 32.4 1% | 37.4 -14% | 24.8 24% | 28.3 14% | 31.4 4% | 25.2 23% |
| Idle Bottom * (°C) | 33 | 29.4 11% | 31.2 5% | 25.6 22% | 27.3 17% | 35.6 -8% | 25.9 22% |
* ... smaller is better
Stress Test
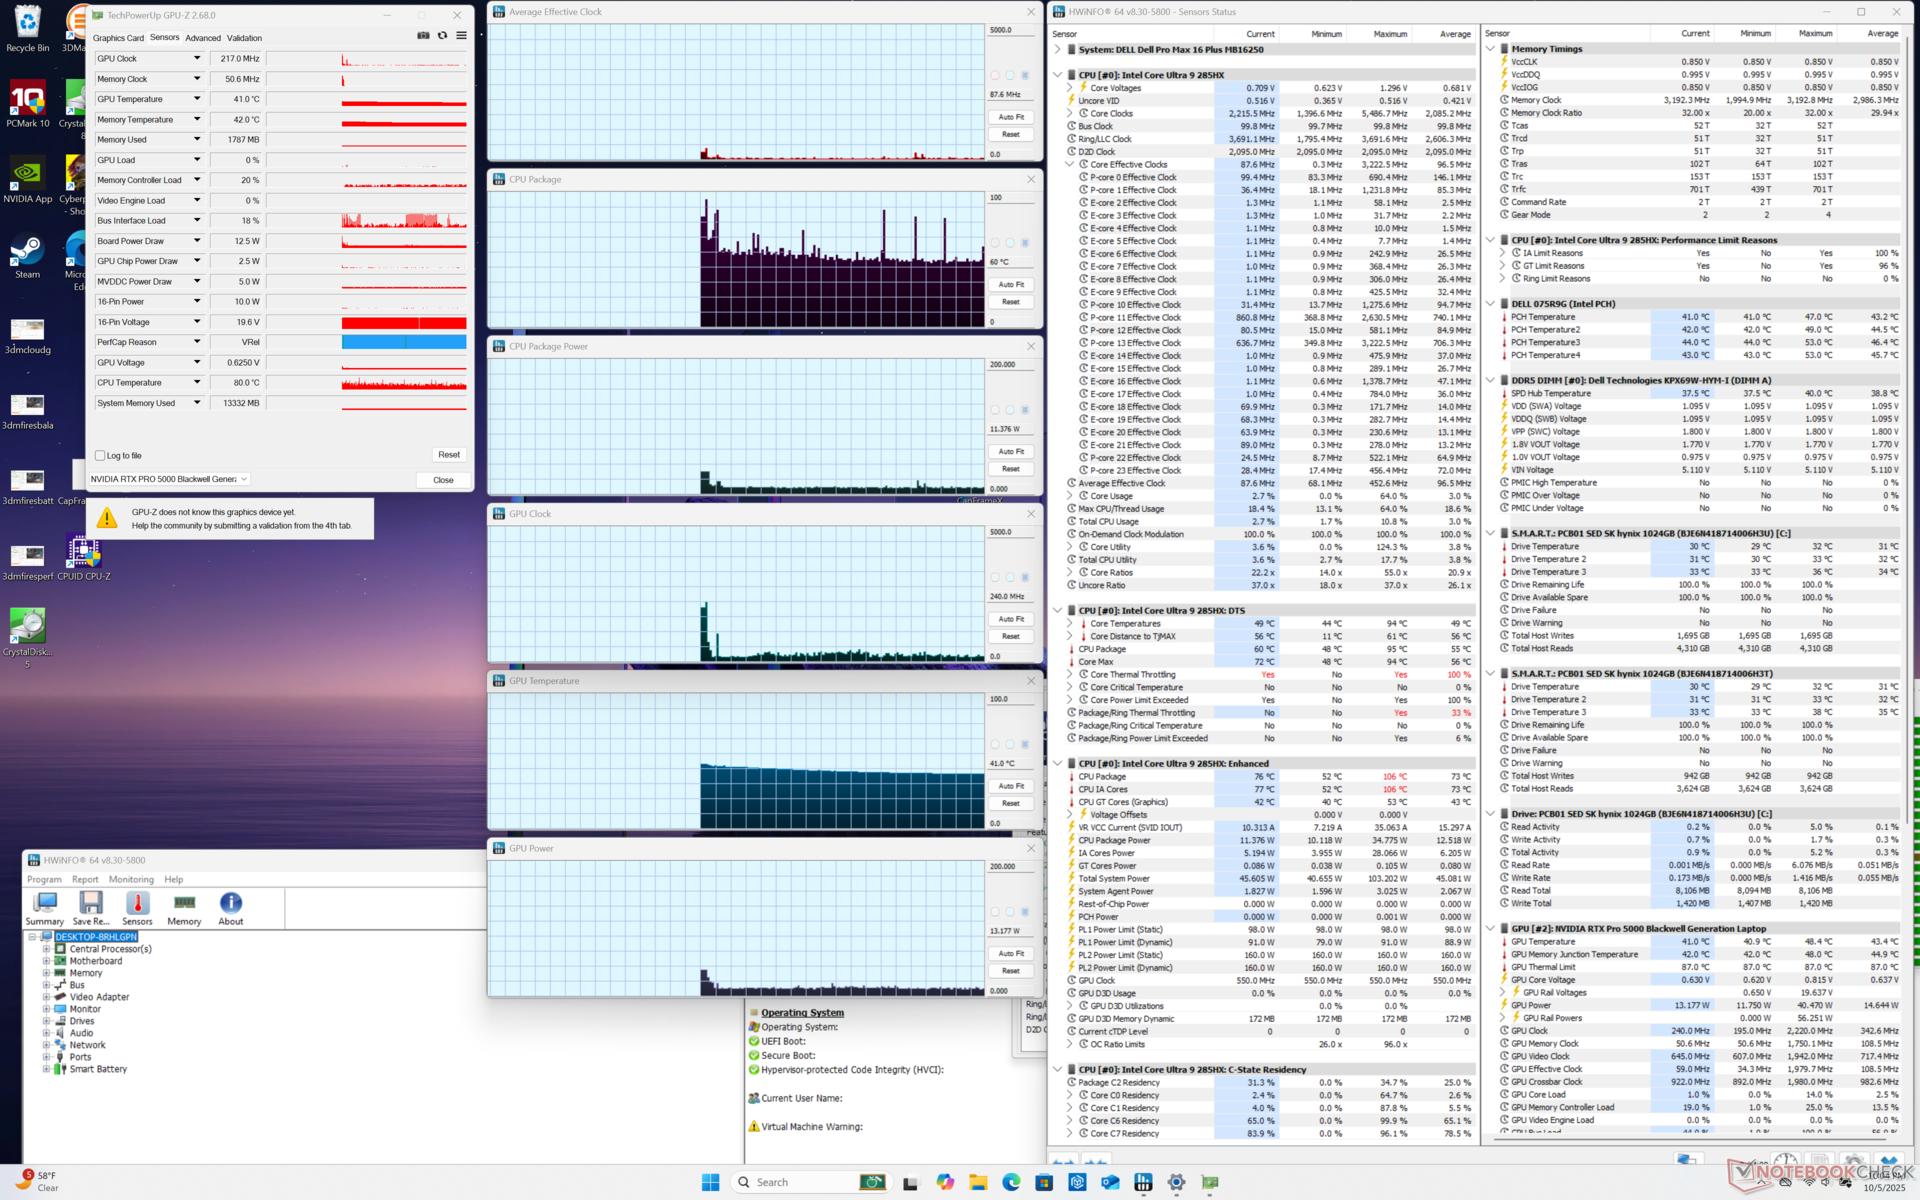
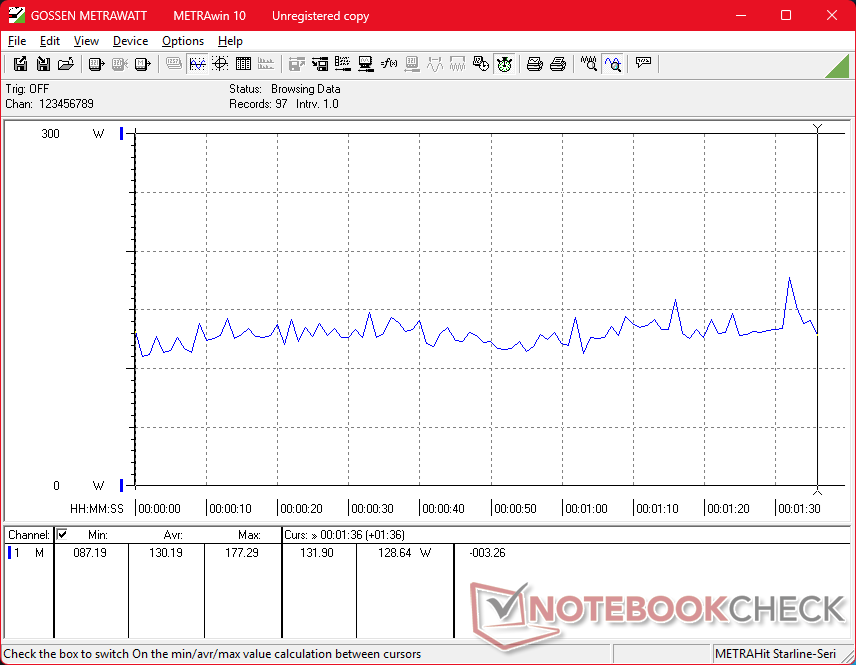
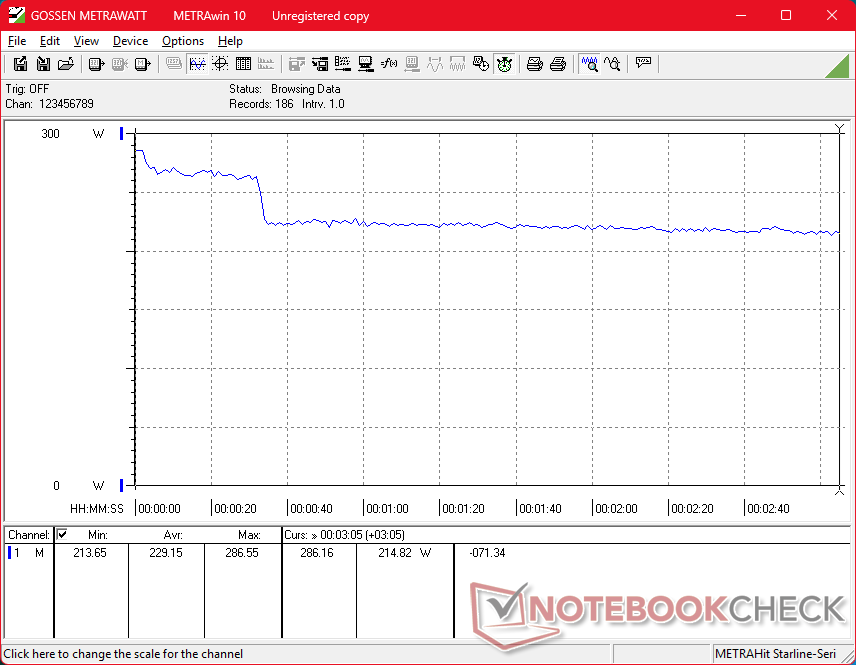
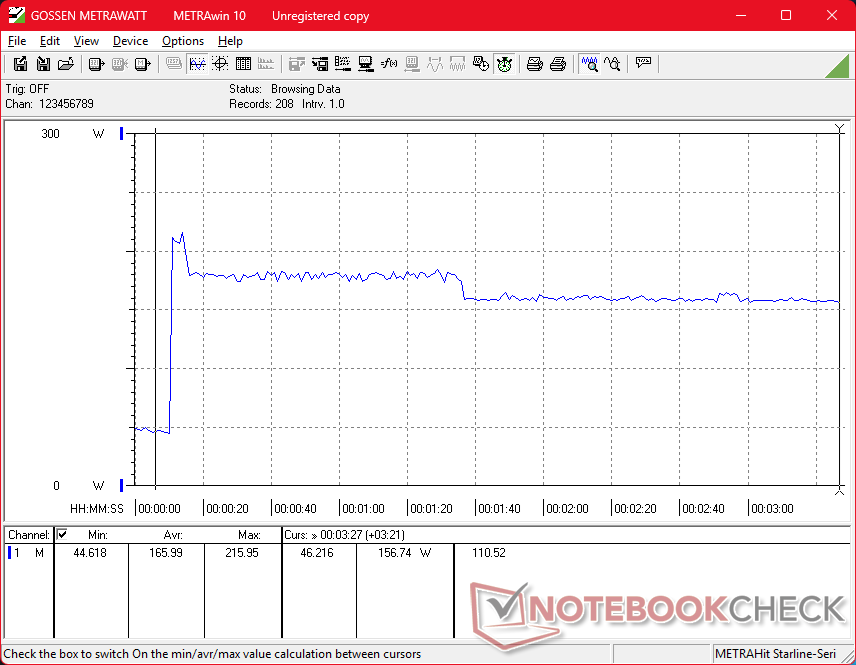
The CPU would boost to 3.8 GHz, 159 W, and 105 C when initiating Prime95 stress before quickly falling and stabilizing at 3.1 GHz, 90 W, and 96 C. Core temperature would become warmer than we would like when it is fully stressed.
Running Cyberpunk 2077 on Performance mode to represent more typical stressful conditions would see the GPU stabilizing at ~121 W. Dropping down to Balanced mode would reduce the GPU power draw ceiling to ~108 W.
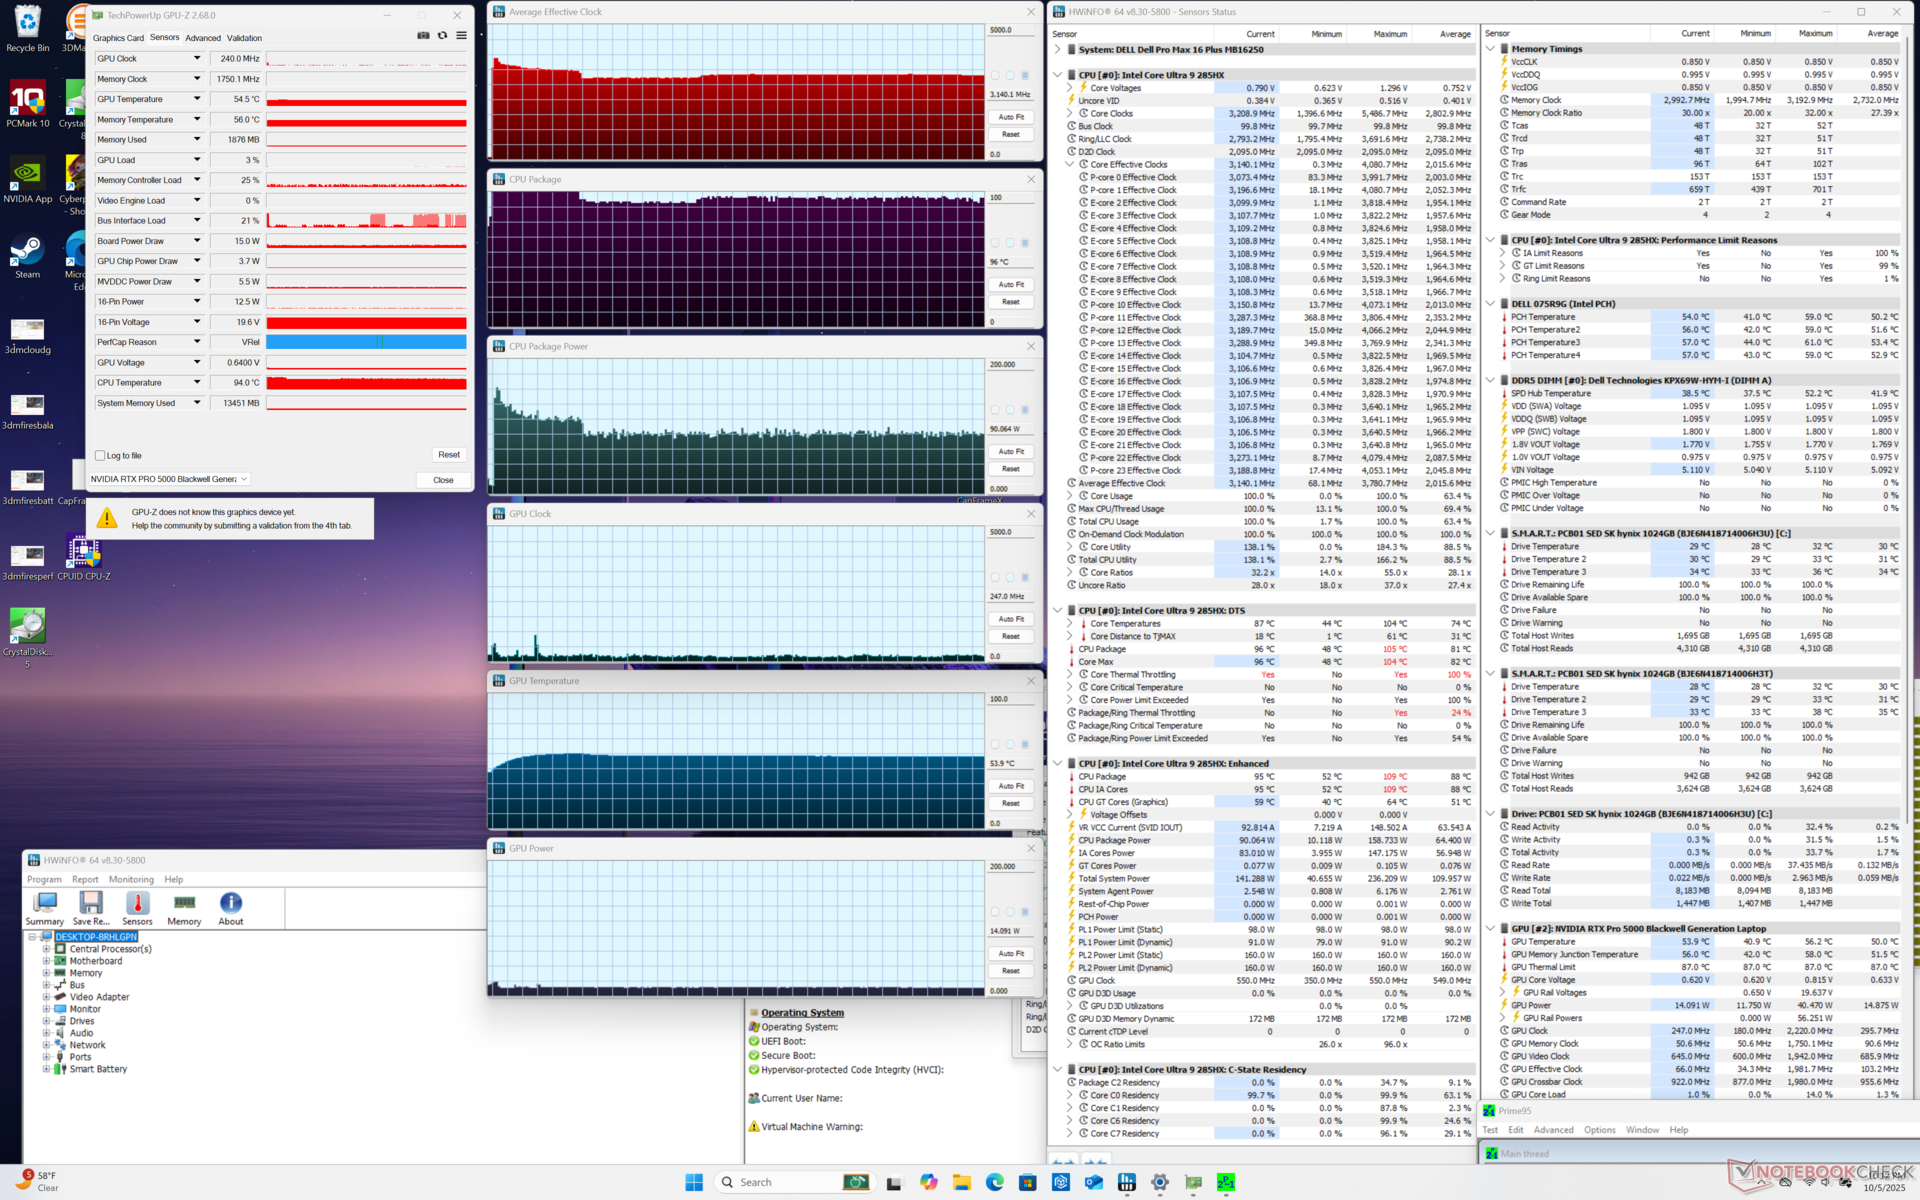
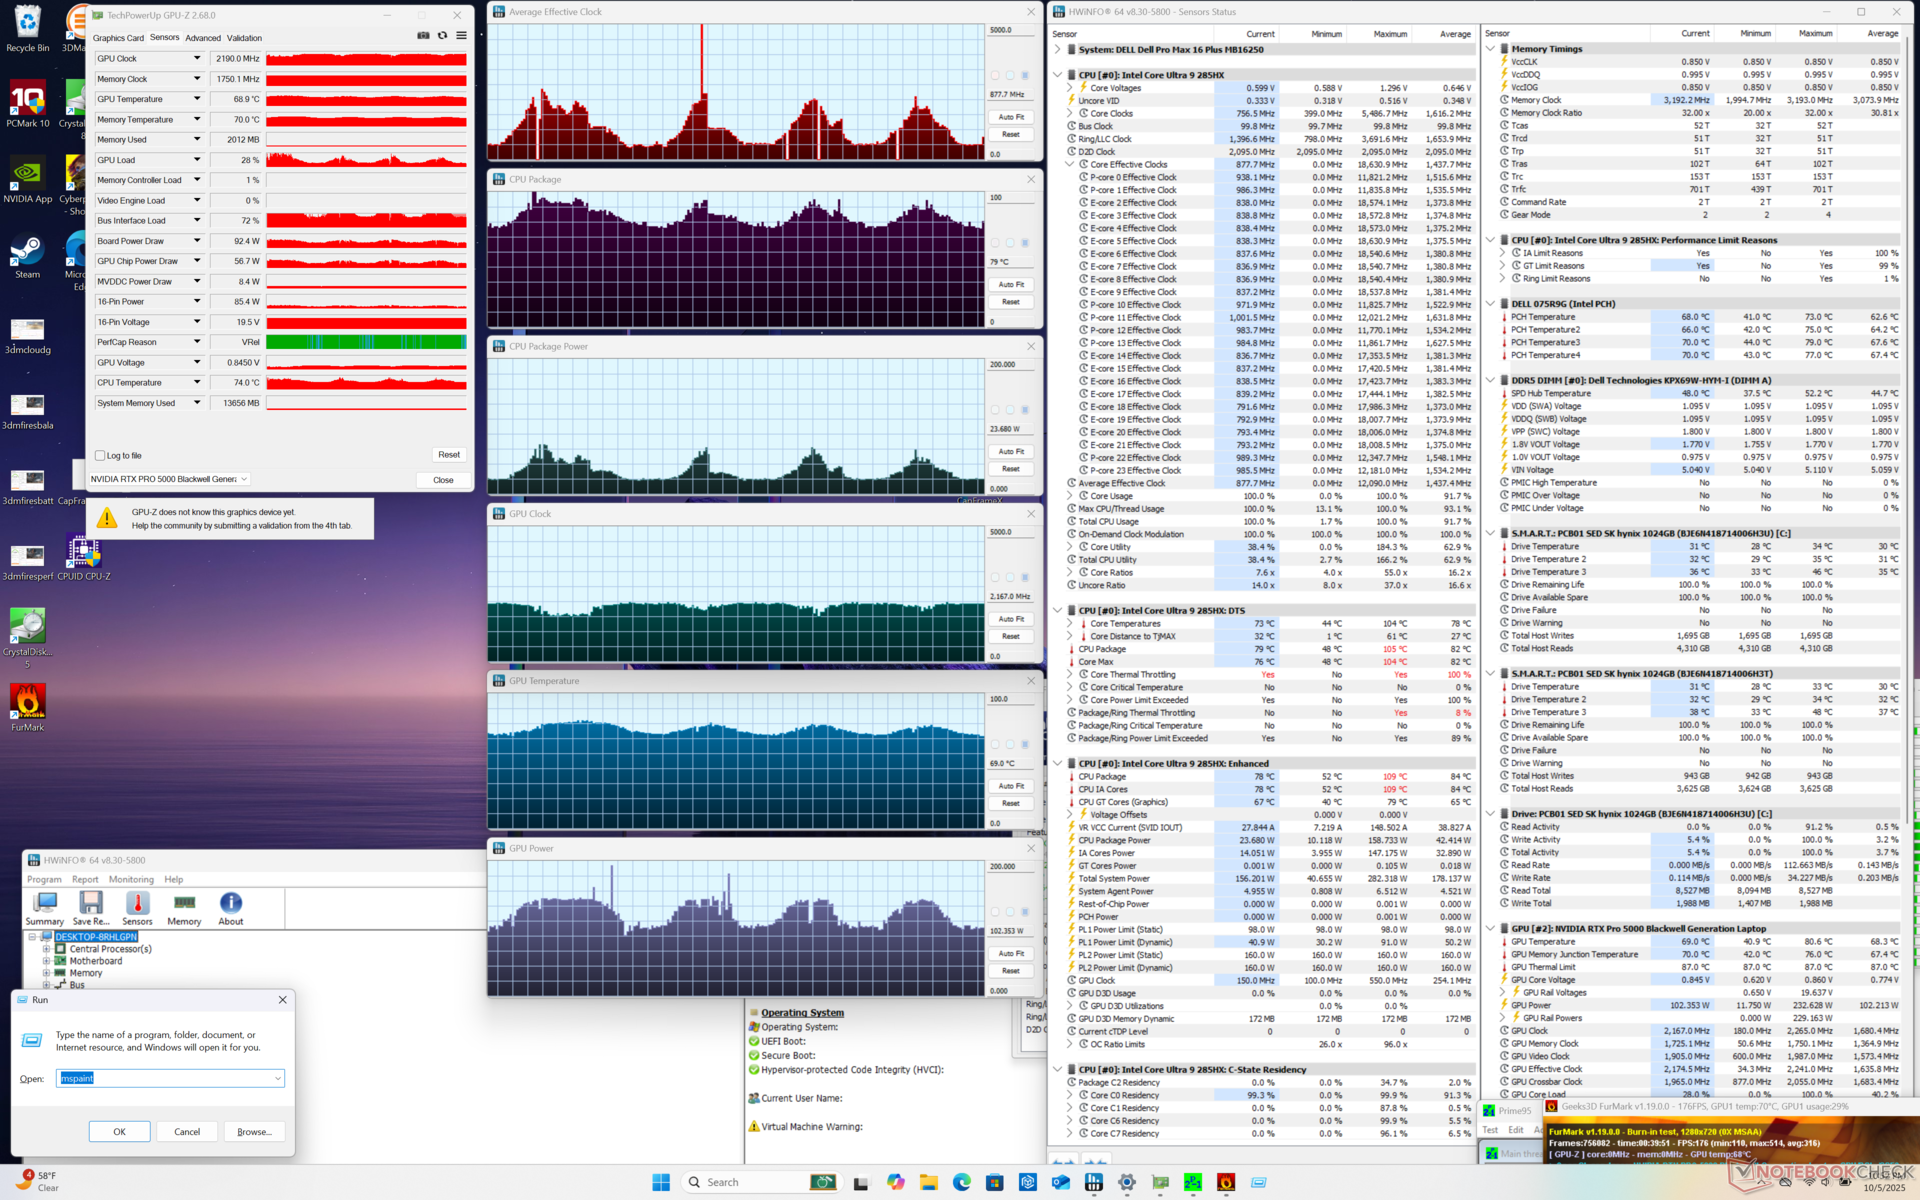
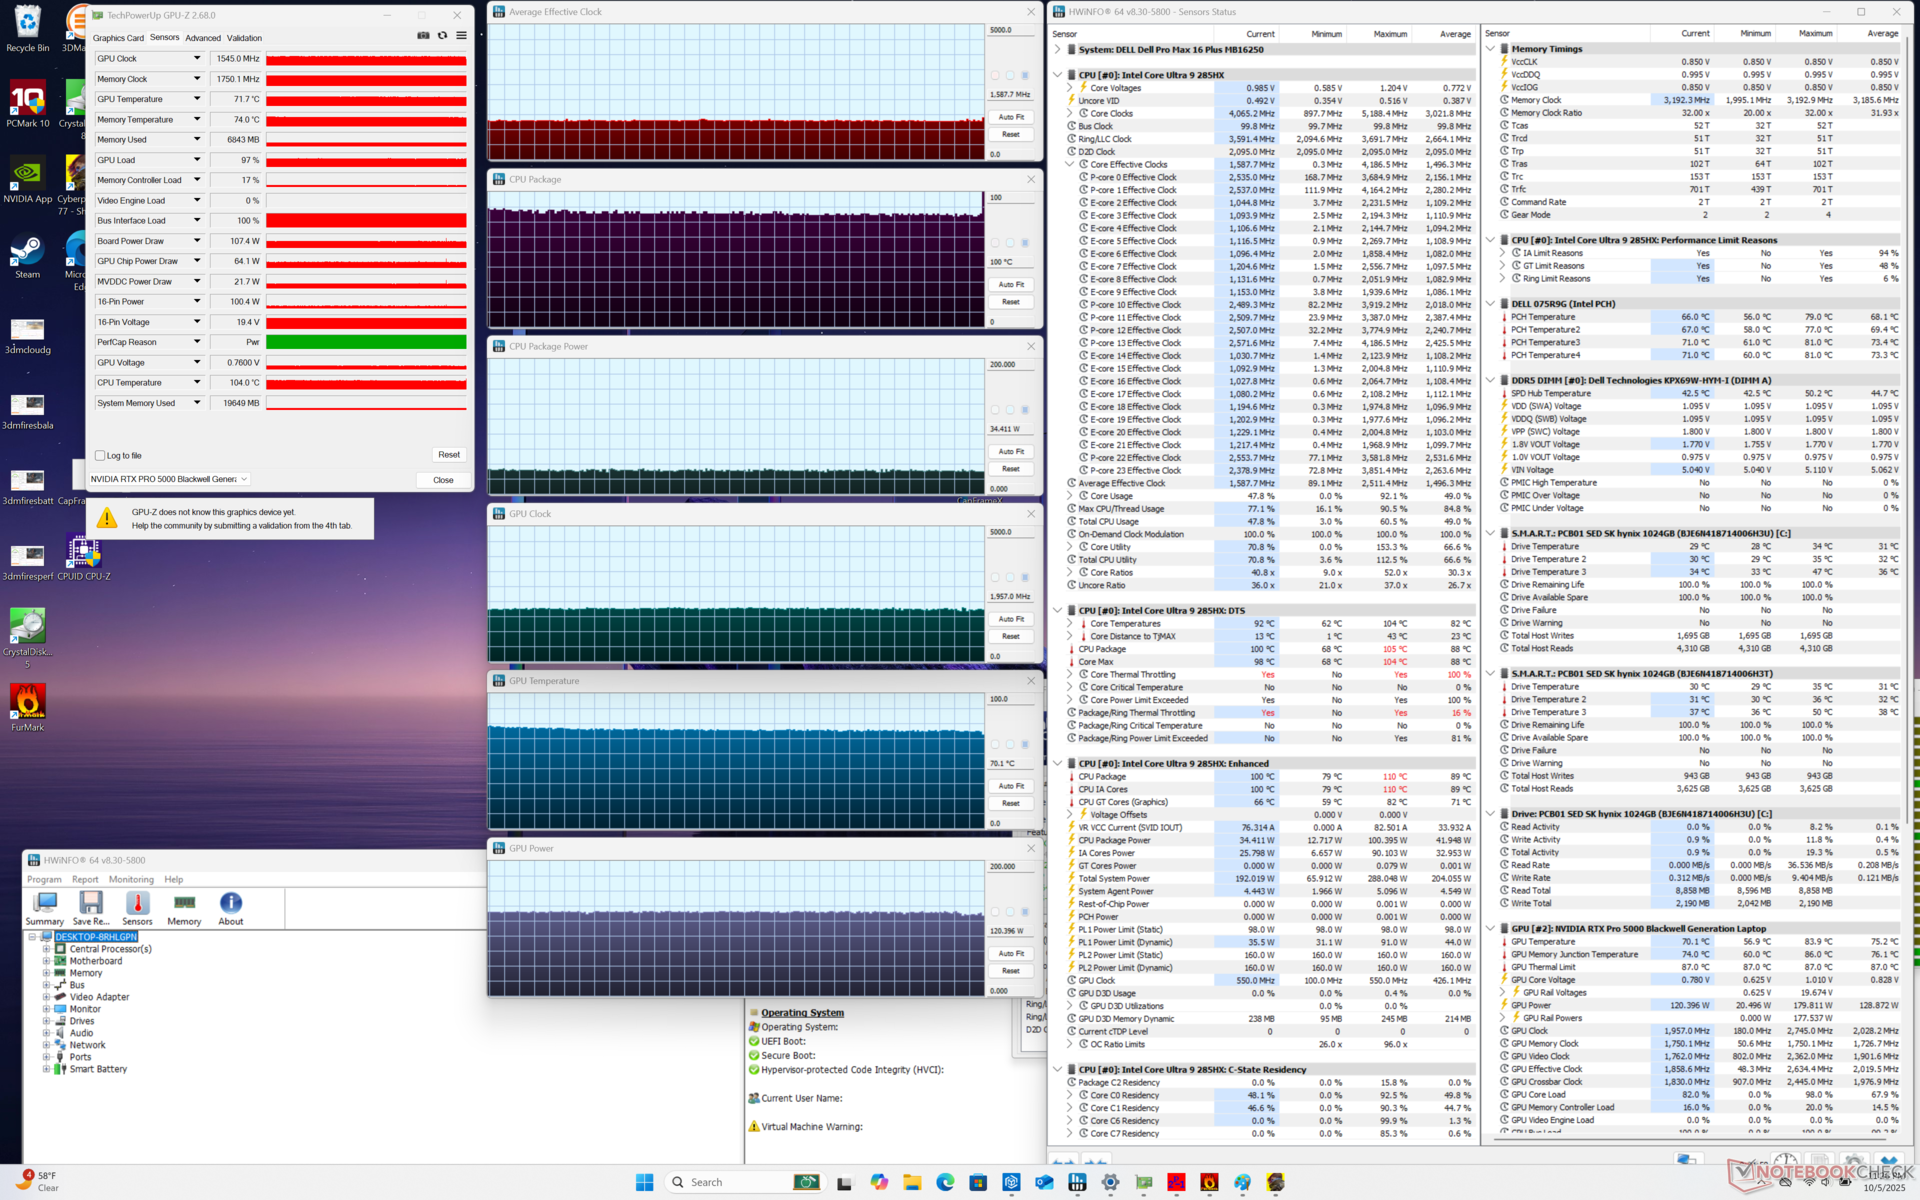
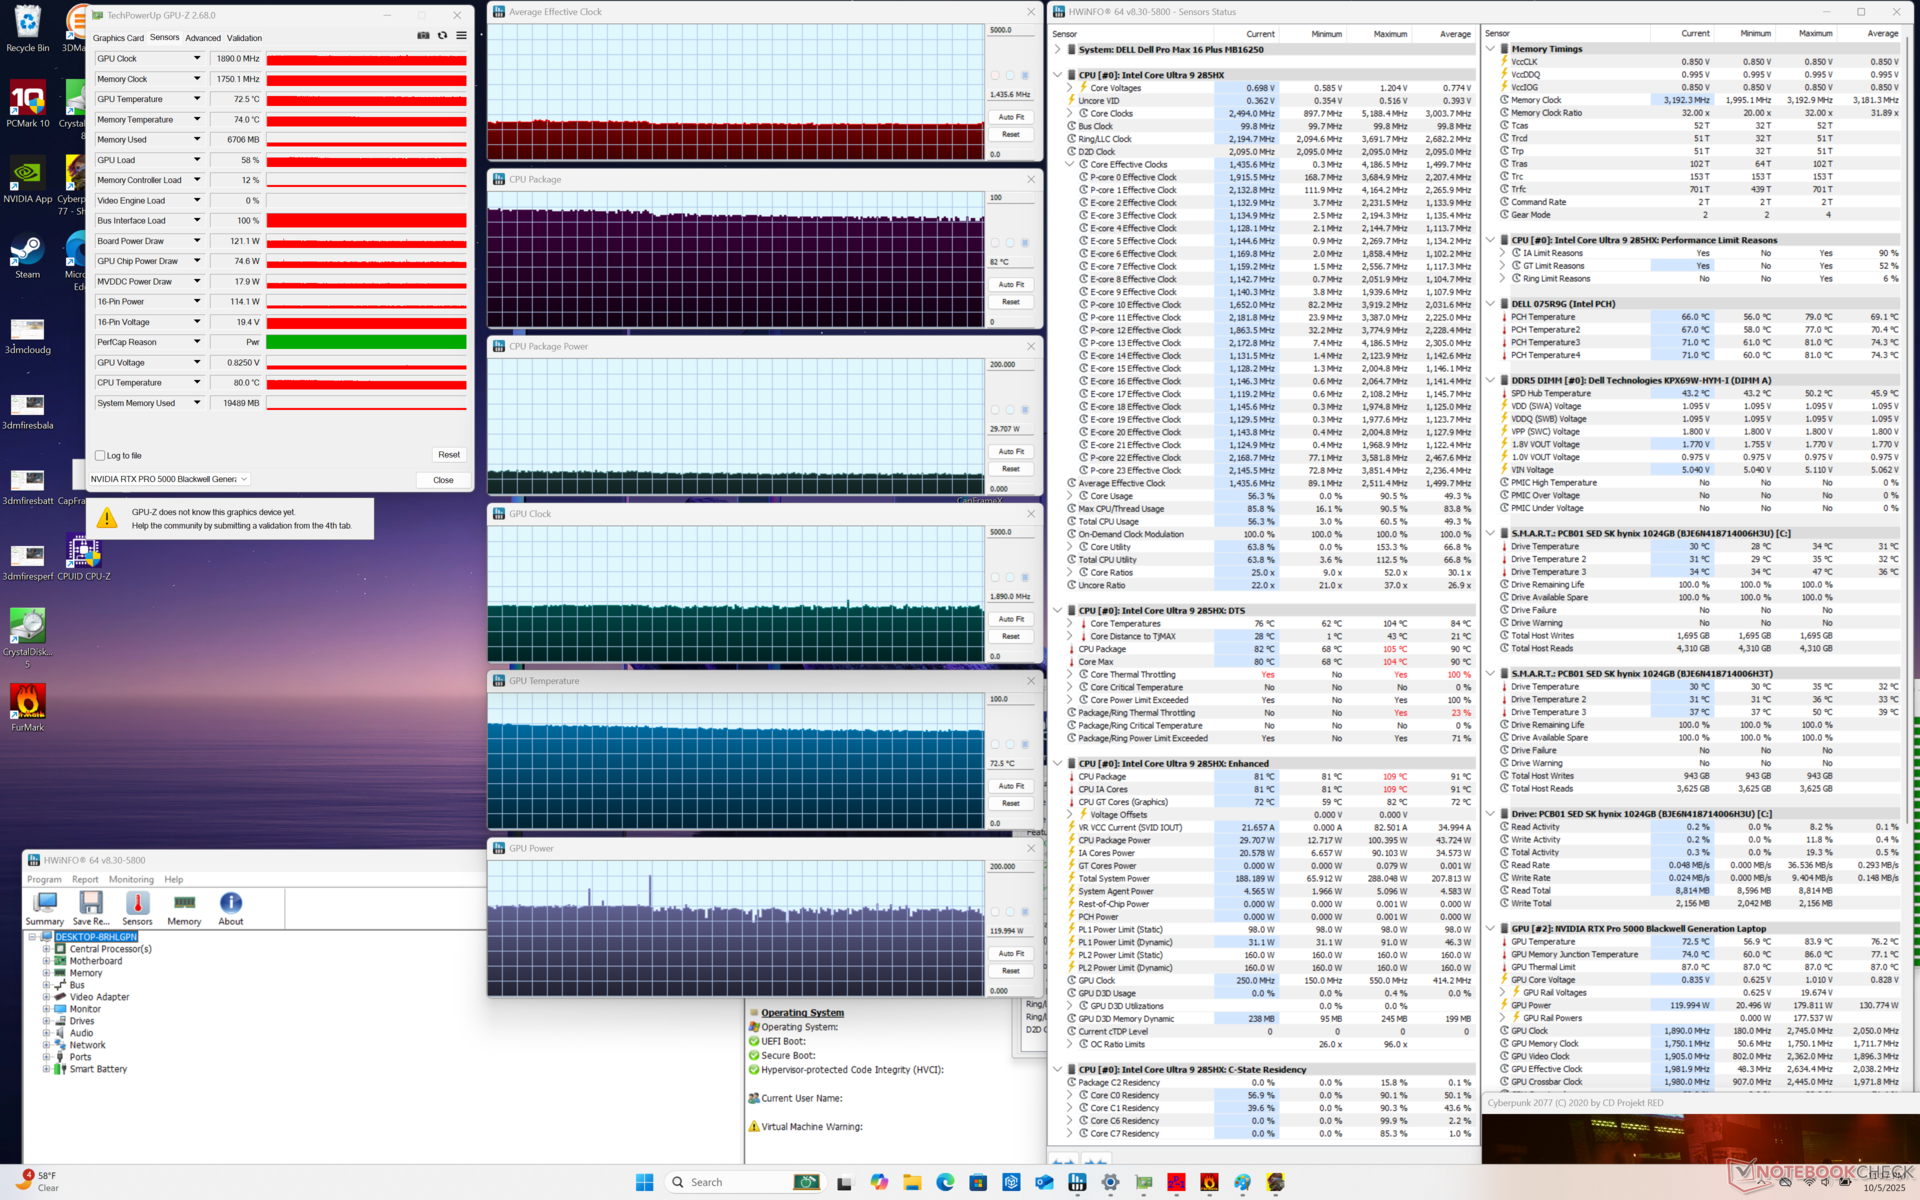
| Average CPU Clock (GHz) | GPU Clock (MHz) | Average CPU Temperature (°C) | Average GPU Temperature (°C) | |
| System Idle | -- | -- | 55 | 41 |
| Prime95 Stress | 3.1 | -- | 96 | 55 |
| Prime95 + FurMark Stress | 0.5 - 2.8 | 1.7 - 2.2 | 75 - 105 | 70 - 78 |
| Cyberpunk 2077 Stress (Balanced mode) | ~1.6 | 1545 | 82 | 71 |
| Cyberpunk 2077 Stress (Performance mode) | ~1.4 | 1890 | 82 | 73 |
Speakers
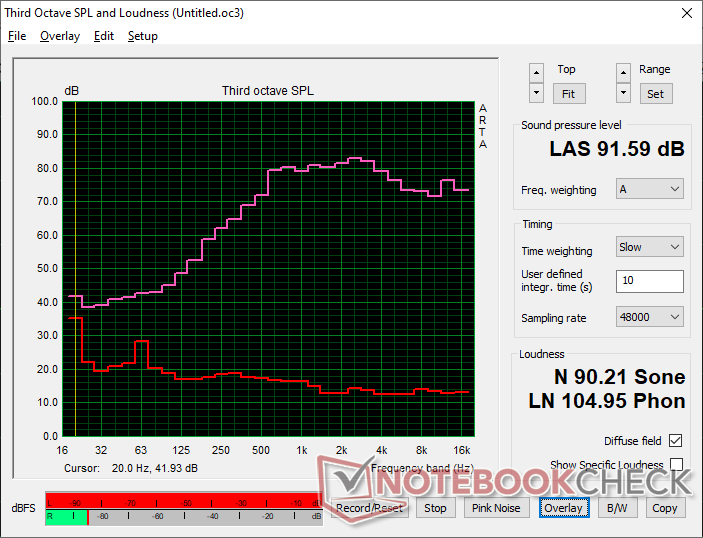
Dell Pro Max 16 Plus audio analysis
(+) | speakers can play relatively loud (91.6 dB)
Bass 100 - 315 Hz
(-) | nearly no bass - on average 20.9% lower than median
(+) | bass is linear (5.9% delta to prev. frequency)
Mids 400 - 2000 Hz
(+) | balanced mids - only 4.5% away from median
(+) | mids are linear (4% delta to prev. frequency)
Highs 2 - 16 kHz
(+) | balanced highs - only 3.7% away from median
(+) | highs are linear (2.9% delta to prev. frequency)
Overall 100 - 16.000 Hz
(+) | overall sound is linear (14.3% difference to median)
Compared to same class
» 30% of all tested devices in this class were better, 4% similar, 67% worse
» The best had a delta of 7%, average was 17%, worst was 35%
Compared to all devices tested
» 17% of all tested devices were better, 4% similar, 78% worse
» The best had a delta of 4%, average was 23%, worst was 134%
Apple MacBook Pro 16 2021 M1 Pro audio analysis
(+) | speakers can play relatively loud (84.7 dB)
Bass 100 - 315 Hz
(+) | good bass - only 3.8% away from median
(+) | bass is linear (5.2% delta to prev. frequency)
Mids 400 - 2000 Hz
(+) | balanced mids - only 1.3% away from median
(+) | mids are linear (2.1% delta to prev. frequency)
Highs 2 - 16 kHz
(+) | balanced highs - only 1.9% away from median
(+) | highs are linear (2.7% delta to prev. frequency)
Overall 100 - 16.000 Hz
(+) | overall sound is linear (4.6% difference to median)
Compared to same class
» 0% of all tested devices in this class were better, 0% similar, 100% worse
» The best had a delta of 5%, average was 17%, worst was 45%
Compared to all devices tested
» 0% of all tested devices were better, 0% similar, 100% worse
» The best had a delta of 4%, average was 23%, worst was 134%
Energy Management
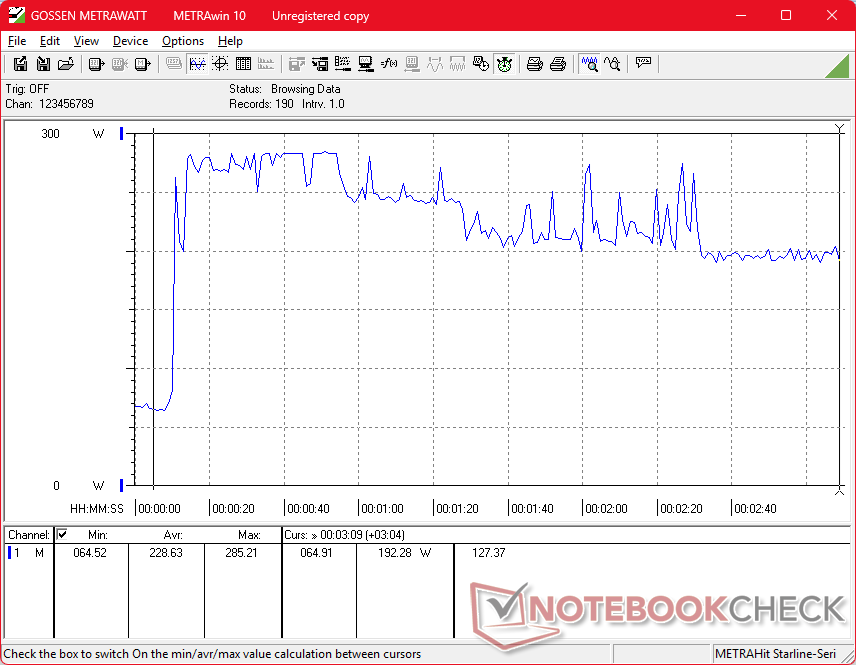
Power Consumption
Consumption rates are expectedly very high even when idling on desktop which contribute to the lower battery life and always-warm surfaces. The system is noticeably more demanding than the outgoing Precision 5690, but performance is both faster and steadier to be a fair tradeoff.
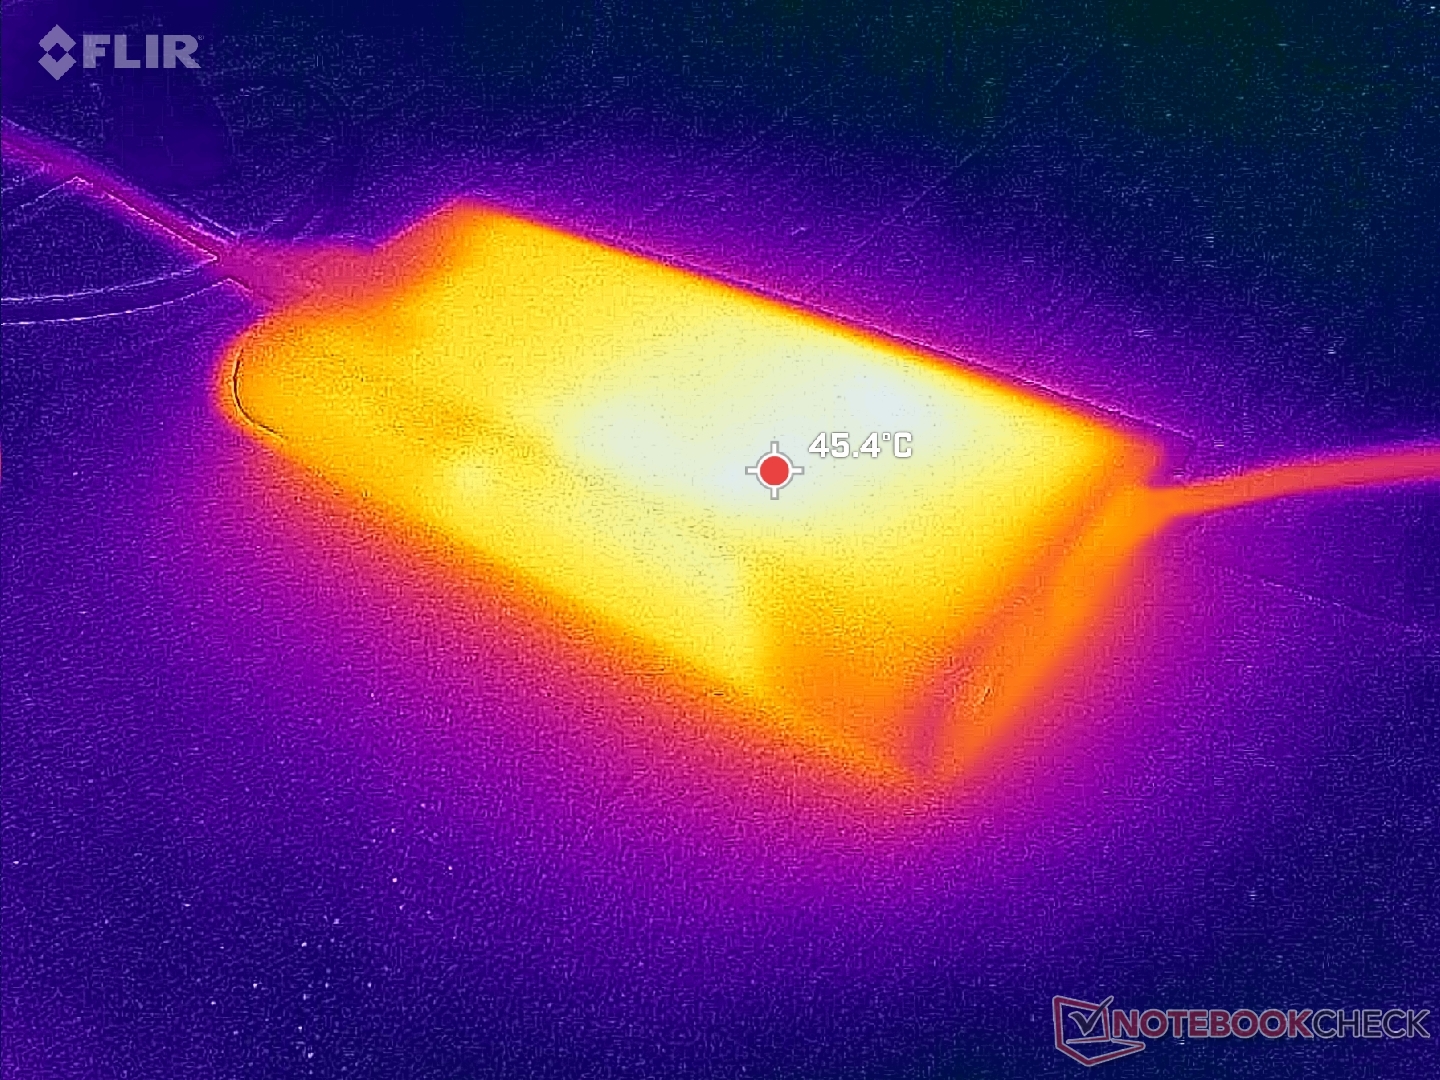
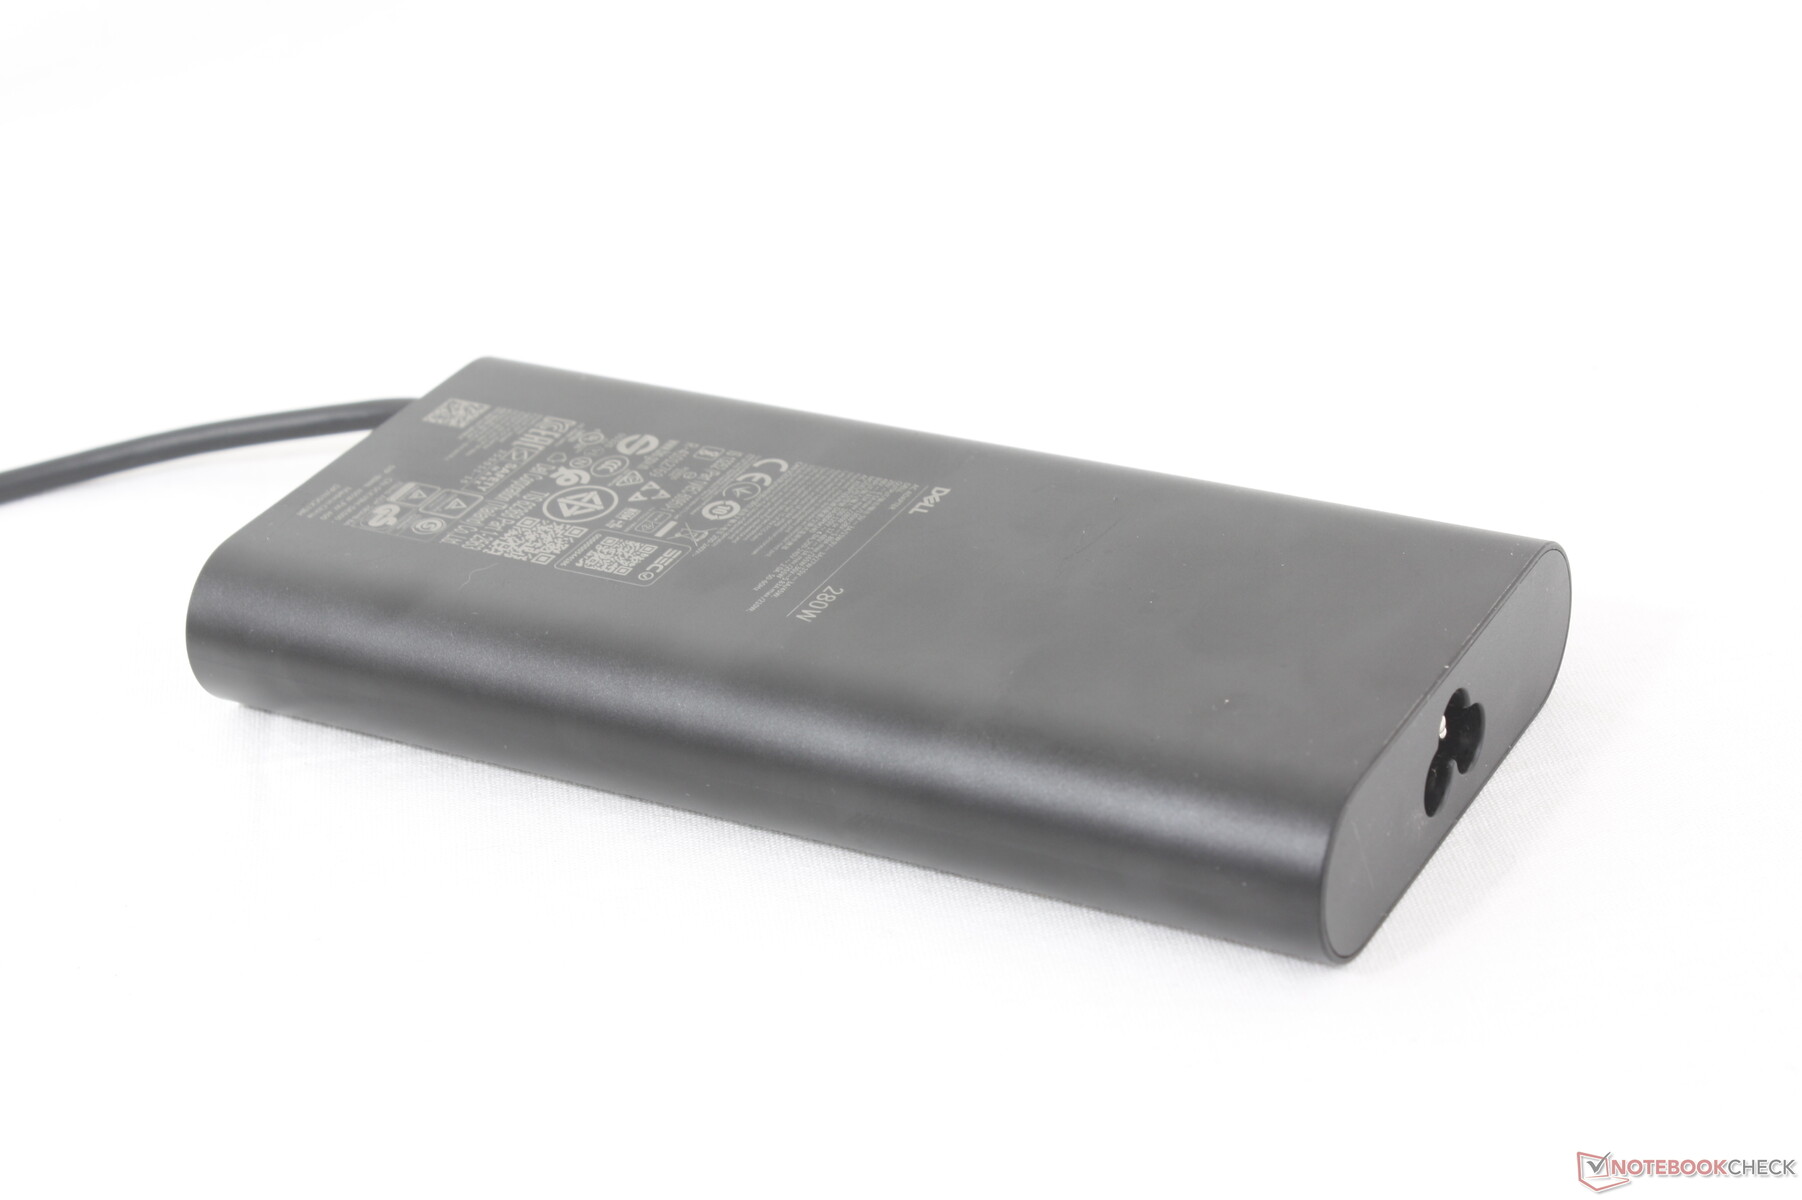
It's worth noting that this is one of the only laptops to ship with a slim (~16 x 7.8 x 2.4 cm) 280 W USB-C AC adapter as most other USB-C adapters top out at the 150 W to 240 W range.
| Off / Standby | |
| Idle | |
| Load |
|
Key:
min: | |
| Dell Pro Max 16 Plus Ultra 9 285HX, RTX PRO 5000 Blackwell Generation Laptop, SK hynix PCB01 HFS001TFM9X186N, OLED, 3840x2400, 16" | Dell Precision 5690 Ultra 9 185H, RTX 5000 Ada Generation Laptop, 2x Samsung PM9A1 1TB (RAID 0), OLED, 3840x2400, 16" | Dell Precision 5000 5680 i9-13900H, RTX 5000 Ada Generation Laptop, 2x SK hynix PC801 HFS512GEJ9X101N RAID 0, OLED, 3840x2400, 16" | Lenovo ThinkPad P16 Gen 2 i7-14700HX, RTX 4000 Ada Generation Laptop, SK hynix PC801 HFS001TEJ9X162N, IPS, 2560x1600, 16" | Lenovo ThinkPad P1 Gen 7 21KV001SGE Ultra 7 155H, GeForce RTX 4060 Laptop GPU, Kioxia XG8 KXG8AZNV1T02, IPS LED, 2560x1600, 16" | HP ZBook Studio 16 G11 Ultra 9 185H, RTX 3000 Ada Generation Laptop, Kioxia XG8 KXG80ZNV1T02, IPS, 3840x2400, 16" | MSI CreatorPro Z16P B12UKST i7-12700H, RTX A3000 Laptop GPU, Samsung PM9A1 MZVL21T0HCLR, IPS, 2560x1600, 16" | |
|---|---|---|---|---|---|---|---|
| Power Consumption | 52% | 55% | 31% | 55% | 47% | 50% | |
| Idle Minimum * (Watt) | 35.1 | 7.9 77% | 8 77% | 7.9 77% | 7.3 79% | 14 60% | 10.8 69% |
| Idle Average * (Watt) | 39.2 | 12 69% | 10.4 73% | 13.1 67% | 12.3 69% | 22.4 43% | 16.3 58% |
| Idle Maximum * (Watt) | 56 | 28.6 49% | 30.5 46% | 24.2 57% | 17.9 68% | 25.7 54% | 16.9 70% |
| Load Average * (Watt) | 130.2 | 98.8 24% | 75.4 42% | 127.4 2% | 78.2 40% | 90.2 31% | 111.7 14% |
| Cyberpunk 2077 ultra external monitor * (Watt) | 213 | 219 -3% | 117.7 45% | 120.3 44% | |||
| Cyberpunk 2077 ultra * (Watt) | 229 | 225 2% | 123.5 46% | 125.4 45% | |||
| Load Maximum * (Watt) | 285.2 | 174.8 39% | 175 39% | 248.5 13% | 167.5 41% | 142 50% | 177.4 38% |
| Witcher 3 ultra * (Watt) | 144.5 | 134 | 152.1 |
* ... smaller is better
Power Consumption Cyberpunk / Stress Test
Power Consumption external Monitor
Battery Life
WLAN runtime is short at only 3.5 hours despite the large capacity battery. Charging rate is nonetheless very fast especially for a USB-C AC adapter at just over an hour from empty to full capacity.
| Dell Pro Max 16 Plus Ultra 9 285HX, RTX PRO 5000 Blackwell Generation Laptop, 96 Wh | Dell Precision 5690 Ultra 9 185H, RTX 5000 Ada Generation Laptop, 98 Wh | Dell Precision 5000 5680 i9-13900H, RTX 5000 Ada Generation Laptop, 98 Wh | Lenovo ThinkPad P16 Gen 2 i7-14700HX, RTX 4000 Ada Generation Laptop, 94 Wh | Lenovo ThinkPad P1 Gen 7 21KV001SGE Ultra 7 155H, GeForce RTX 4060 Laptop GPU, 90 Wh | HP ZBook Studio 16 G11 Ultra 9 185H, RTX 3000 Ada Generation Laptop, 86 Wh | MSI CreatorPro Z16P B12UKST i7-12700H, RTX A3000 Laptop GPU, 90 Wh | |
|---|---|---|---|---|---|---|---|
| Battery runtime | 156% | 175% | -31% | 175% | 33% | 61% | |
| WiFi v1.3 (h) | 3.6 | 9.2 156% | 9.9 175% | 2.5 -31% | 9.9 175% | 4.8 33% | 5.8 61% |
| Reader / Idle (h) | 17.9 | ||||||
| Load (h) | 1.7 | 1.9 |
Notebookcheck Rating
Flagship Dell workstation with unique specifications including CAMM2 memory, 4K 120 Hz OLED, Arrow Lake-HX processors, and RTX 5000 Blackwell graphics.
Dell Pro Max 16 Plus
- 10/14/2025 v8
Allen Ngo
 Total Sustainability Score:
 Potential Competitors in Comparison
Image | Model / Review | Price | Weight | Height | Display |
|---|---|---|---|---|---|
1. 88.4%  | Dell Pro Max 16 Plus Intel Core Ultra 9 285HX ⎘ NVIDIA RTX PRO 5000 Blackwell Generation Laptop ⎘ 128 GB Memory, SSD | Amazon: List Price: 5000 USD | 2.8 kg | 30.9 mm | 16.00" 3840x2400 283 PPI OLED |
2. 88.3% v7 (old)  | Dell Precision 5690 Intel Core Ultra 9 185H ⎘ NVIDIA RTX 5000 Ada Generation Laptop ⎘ 32 GB Memory, 2048 GB SSD | Amazon: List Price: 5900 USD | 2.3 kg | 22.17 mm | 16.00" 3840x2400 283 PPI OLED |
3. 89% v7 (old)  | Dell Precision 5000 5680 Intel Core i9-13900H ⎘ NVIDIA RTX 5000 Ada Generation Laptop ⎘ 32 GB Memory, 1024 GB SSD | Amazon: 1. $1,699.00 Dell Precision 5000 5680 16"... 2. $1,299.99 Dell Precision 5000 5680 Wor... 3. $2,200.00 Dell Precision 5000 5680 16"... List Price: 6500 USD | 2.3 kg | 22.17 mm | 16.00" 3840x2400 283 PPI OLED |
4. 85.9%  | Lenovo ThinkPad P16 Gen 2 Intel Core i7-14700HX ⎘ NVIDIA RTX 4000 Ada Generation Laptop ⎘ 32 GB Memory, 1024 GB SSD | Amazon: List Price: 3500 USD | 3.1 kg | 30.23 mm | 16.00" 2560x1600 189 PPI IPS |
5. 83.5%  | Lenovo ThinkPad P1 Gen 7 21KV001SGE Intel Core Ultra 7 155H ⎘ NVIDIA GeForce RTX 4060 Laptop GPU ⎘ 32 GB Memory, 1024 GB SSD | Amazon: List Price: 3239 Euro | 2 kg | 20.5 mm | 16.00" 2560x1600 189 PPI IPS LED |
6. 84.2%  | HP ZBook Studio 16 G11 Intel Core Ultra 9 185H ⎘ NVIDIA RTX 3000 Ada Generation Laptop ⎘ 64 GB Memory, 1024 GB SSD | Amazon: List Price: 4300 USD | 1.8 kg | 19 mm | 16.00" 3840x2400 283 PPI IPS |
7. 84.3% v7 (old)  | MSI CreatorPro Z16P B12UKST Intel Core i7-12700H ⎘ NVIDIA RTX A3000 Laptop GPU ⎘ 32 GB Memory, 1024 GB SSD | Amazon: List Price: 3500€ | 2.4 kg | 19 mm | 16.00" 2560x1600 189 PPI IPS |
