Verdict — Mostly Minor Upgrades
The Dell 16 Premium is essentially a performance-enhanced XPS 16 9640. It ships with newer, faster, and more efficient Intel and Nvidia processors that power users might appreciate. If your daily workloads don't require significant processing horsepower, however, then the less expensive XPS 16 9640 can net you an identical user experience.
The system retains most if not all of the drawbacks associated with the XPS 16 9640 redesign including the controversial keyboard and clickpad changes. The Dell 16 Premium also exhibits slightly steeper CPU performance throttling than before. Potential buyers will want to keep in mind that the system trades away a bit of graphics performance for that smaller size and very compact AC adapter. Users who don't mind a slightly larger system may find the competing Lenovo Yoga Pro 9i 16 to be a faster alternative even when configured with similar CPU and GPU specifications.
Pros
Cons
Price and Availability
Dell is now shipping the Dell 16 Premium starting at $2200 for the base Core Ultra 7 RTX 5050 configuration up to $3400 for the Core Ultra 9 RTX 5070 configuration.
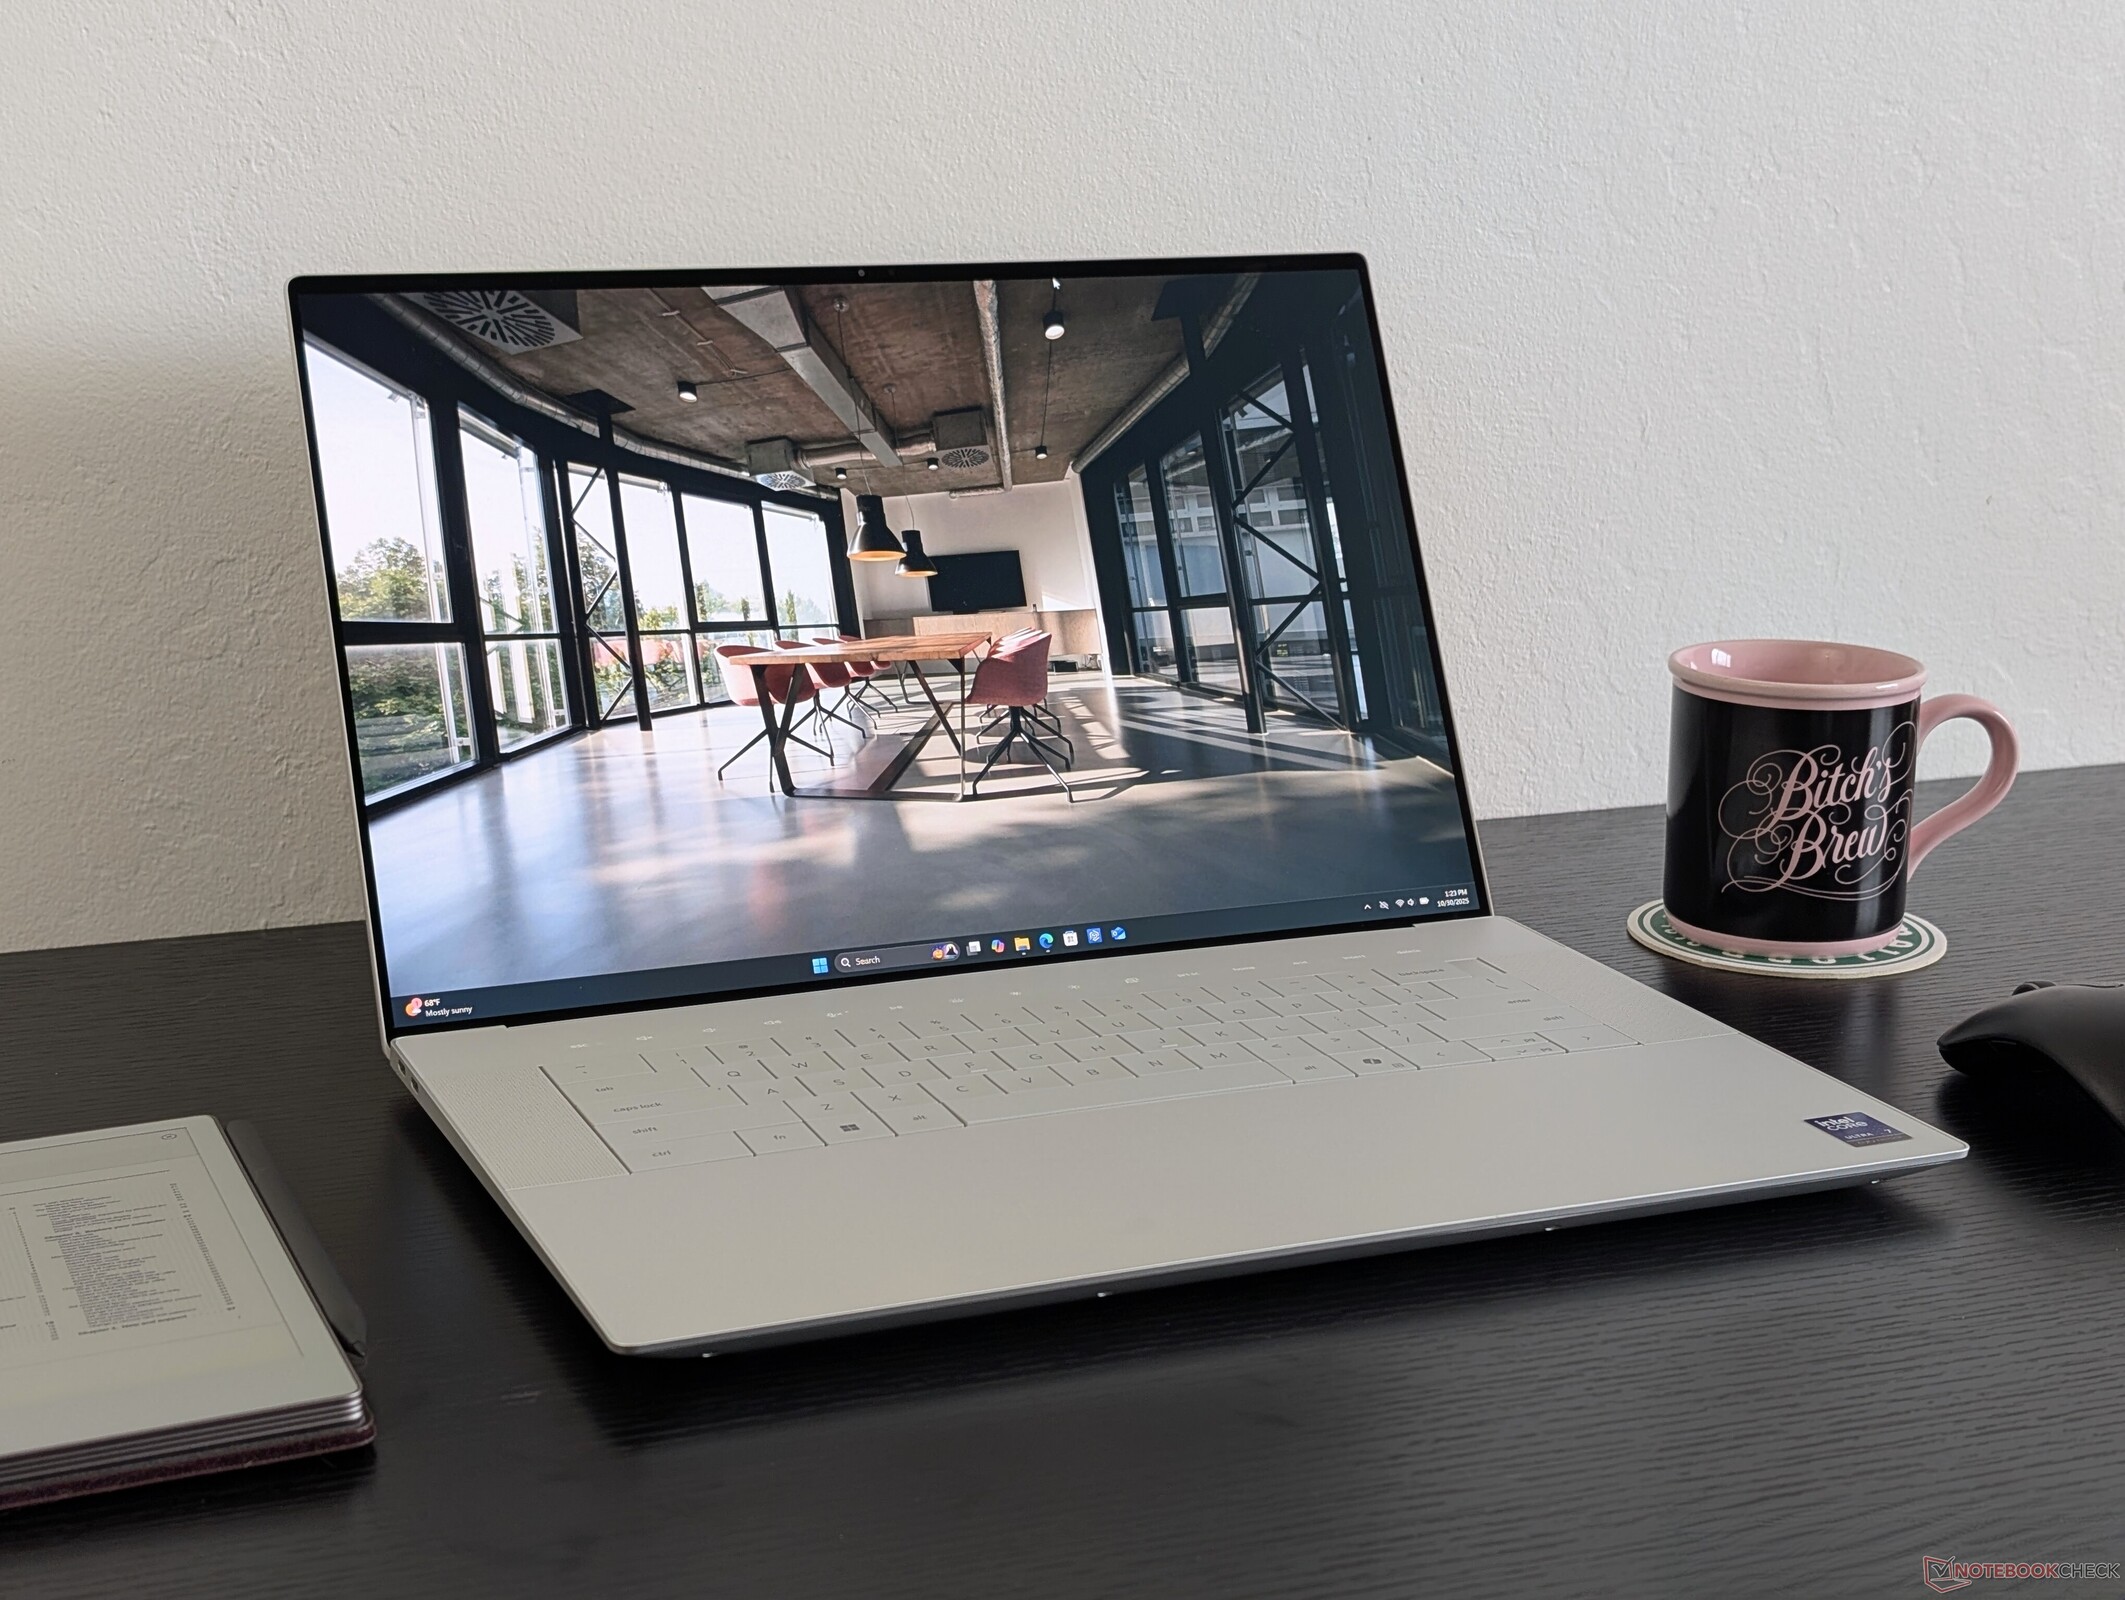
The Dell 16 Premium is the successor to the XPS 16 series. While the name has changed, the familiar design lives on for an essentially identical user experience as the 2024 version. Many of our comments on the XPS 16 9640 apply here for the Dell 16 Premium as the newer model introduces only internal changes with no major external updates.
Our test unit is a higher-end configuration with the Arrow Lake-H Core Ultra 7 255H CPU, 60 W Nvidia Blackwell GeForce RTX 5070 GPU, and 16.3-inch 4K 2400p 120 Hz OLED touchscreen for approximately $3300 to replace last year's Meteor Lake-H and Ada Lovelace processor options. Lower-end SKUs may ship with integrated graphics only, the RTX 5050, or a 2K 1200p non-touch display while the highest-end configuration ships with the Core Ultra 9 285H CPU.
Alternatives to the Dell 16 Premium include other high-end multimedia laptops like the Lenovo Yoga Pro 9i 16, HP Spectre x360 16, or Apple MacBook Pro 16. The Dell 16 Premium should not be confused with the Dell Pro 16 Premium.
More Dell reviews:
Specifications
Case
Although the Dell 16 Premium uses the same chassis design as the outgoing XPS 16 9640, the logo on the outer lid has been altered to appear without the circle. This is also one of the easiest ways to visually distinguish the Dell 16 Premium from older XPS models.

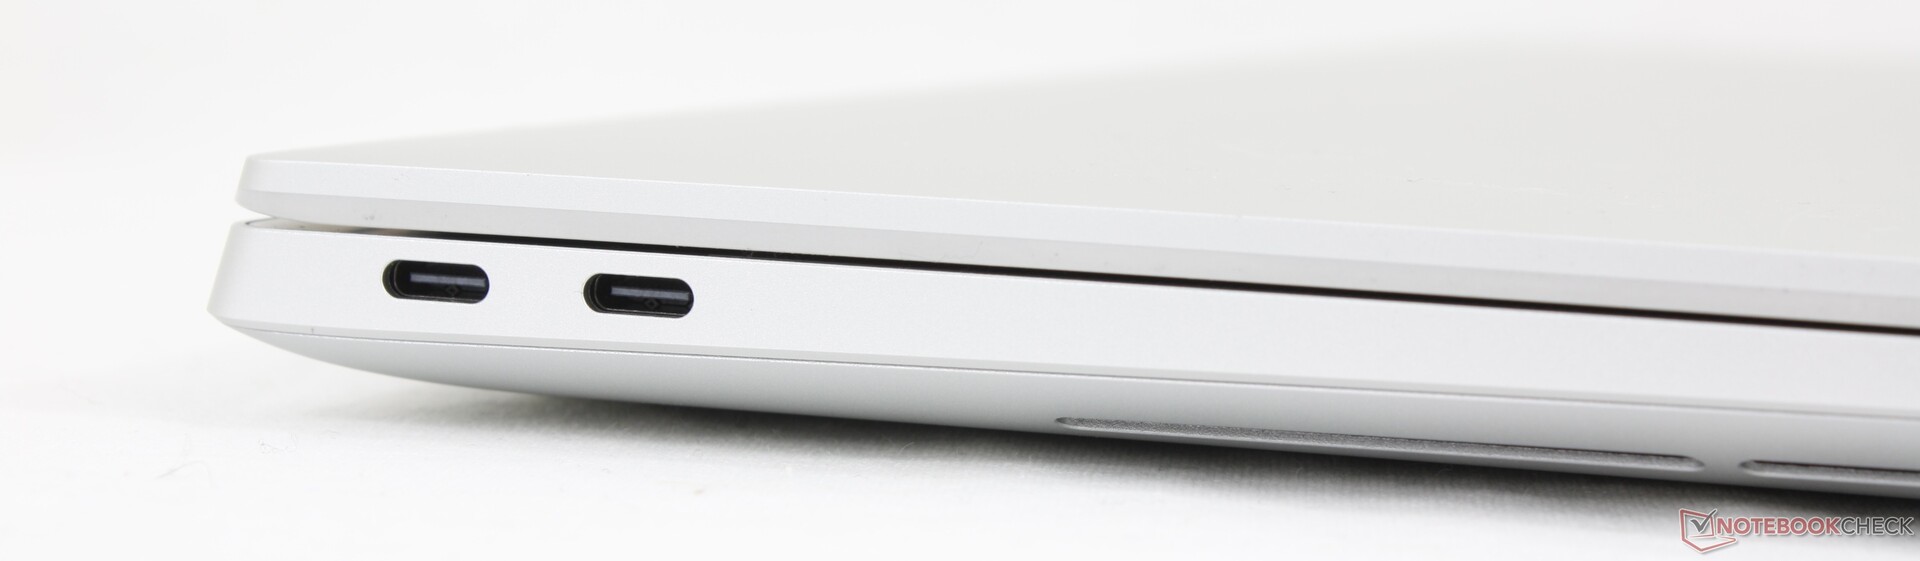
Connectivity
All USB-C ports are now Thunderbolt 4 at 40 Gbps whereas this was not true on the XPS 16 9640.


Communication
| Networking | |
| iperf3 transmit AXE11000 | |
| LG Gram Pro 16Z90TS-G.AU89G | |
| Asus Zenbook S 16 UM5606-RK333W | |
| Lenovo Yoga Pro 9i 16 RTX 5070 | |
| Dell XPS 16 9640 | |
| HP Spectre x360 16 RTX 4050 | |
| Dell 16 Premium DA16250 | |
| iperf3 receive AXE11000 | |
| Asus Zenbook S 16 UM5606-RK333W | |
| Lenovo Yoga Pro 9i 16 RTX 5070 | |
| LG Gram Pro 16Z90TS-G.AU89G | |
| Dell XPS 16 9640 | |
| HP Spectre x360 16 RTX 4050 | |
| Dell 16 Premium DA16250 | |
| iperf3 transmit AXE11000 6GHz | |
| LG Gram Pro 16Z90TS-G.AU89G | |
| Dell 16 Premium DA16250 | |
| HP Spectre x360 16 RTX 4050 | |
| iperf3 receive AXE11000 6GHz | |
| LG Gram Pro 16Z90TS-G.AU89G | |
| Dell 16 Premium DA16250 | |
| HP Spectre x360 16 RTX 4050 | |
Webcam


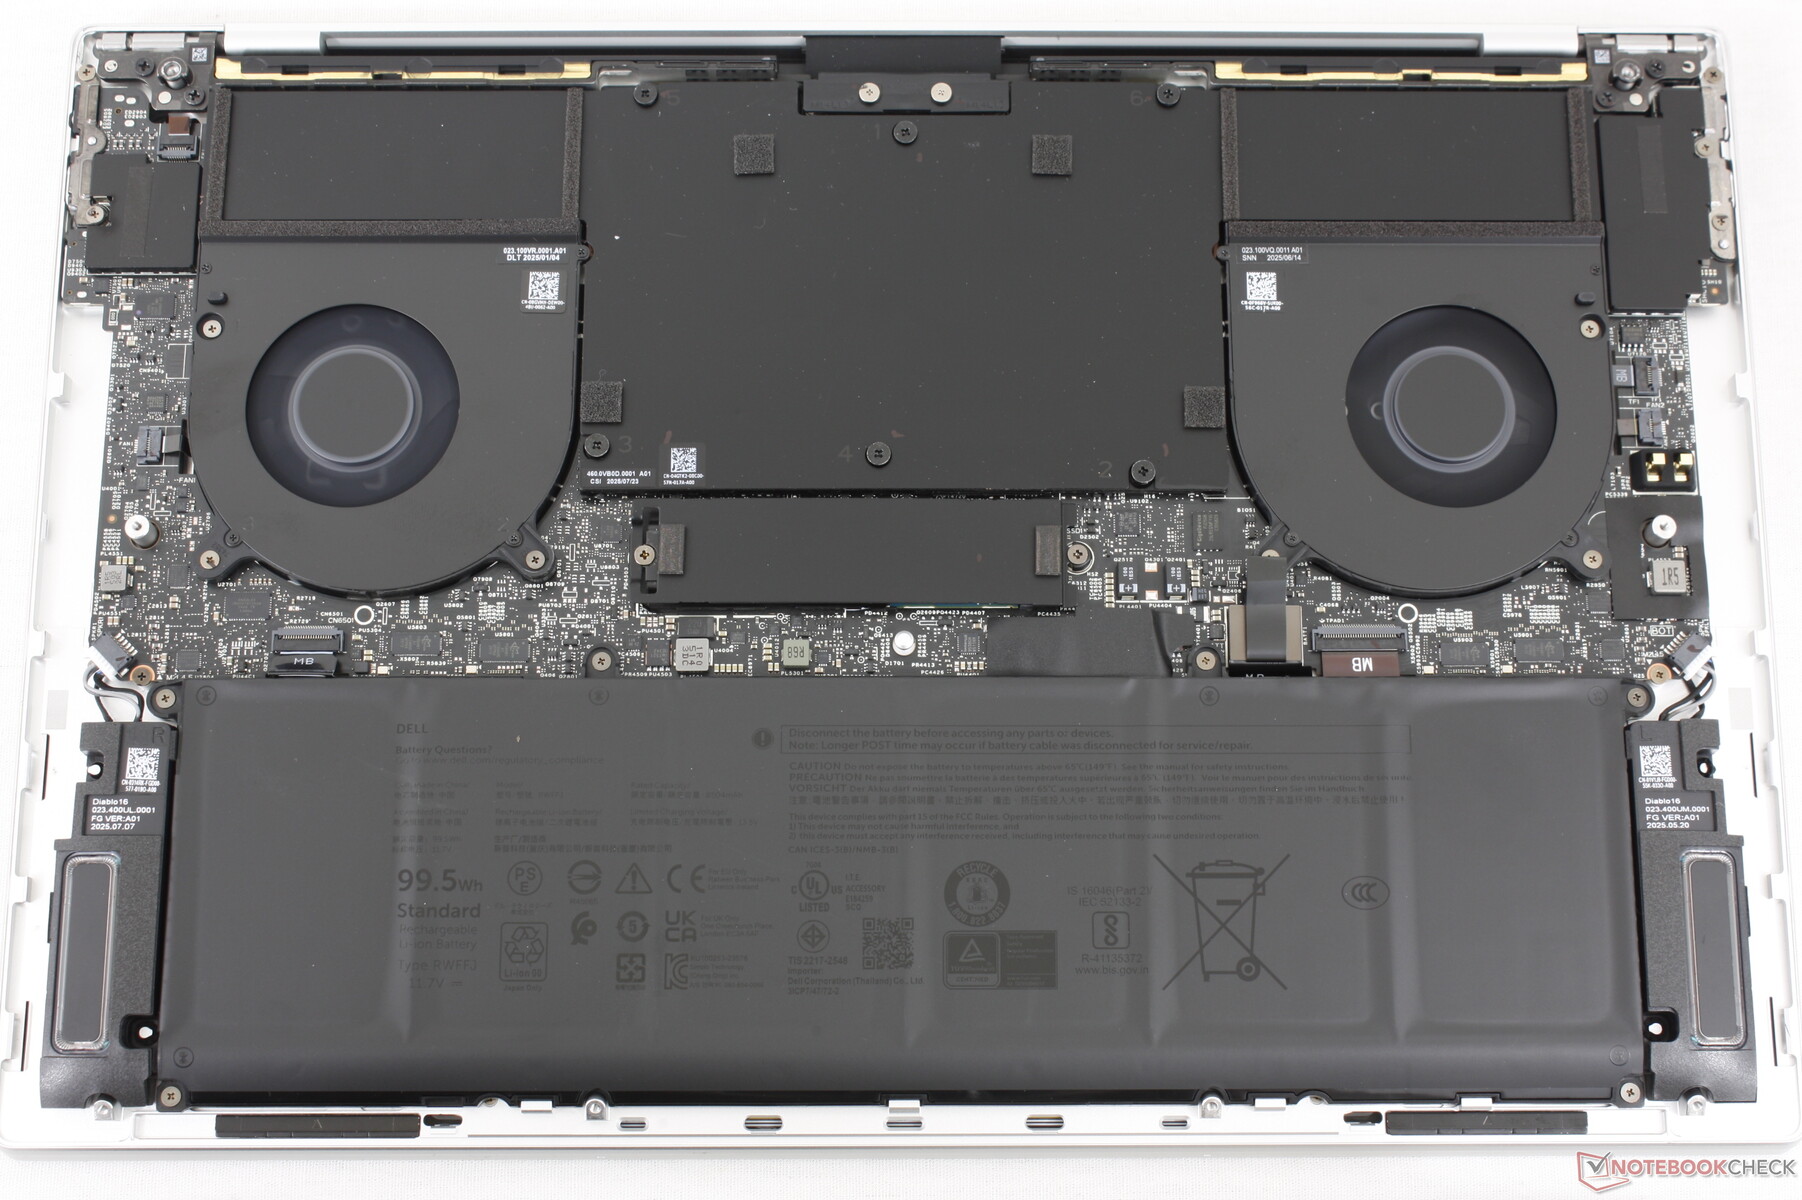
Maintenance
Sustainability
The chassis or skeleton consists of 75 percent recycled aluminum for the top cover, up to 22 percent recycled glass for the screen, 25 percent low-emission aluminum for the palm rest, 18.5 recycled plastics overall, and 100 percent recyclable packaging.
Warranty
A one-year limited manufacturer warranty comes standard if purchased in the US.
Input Devices

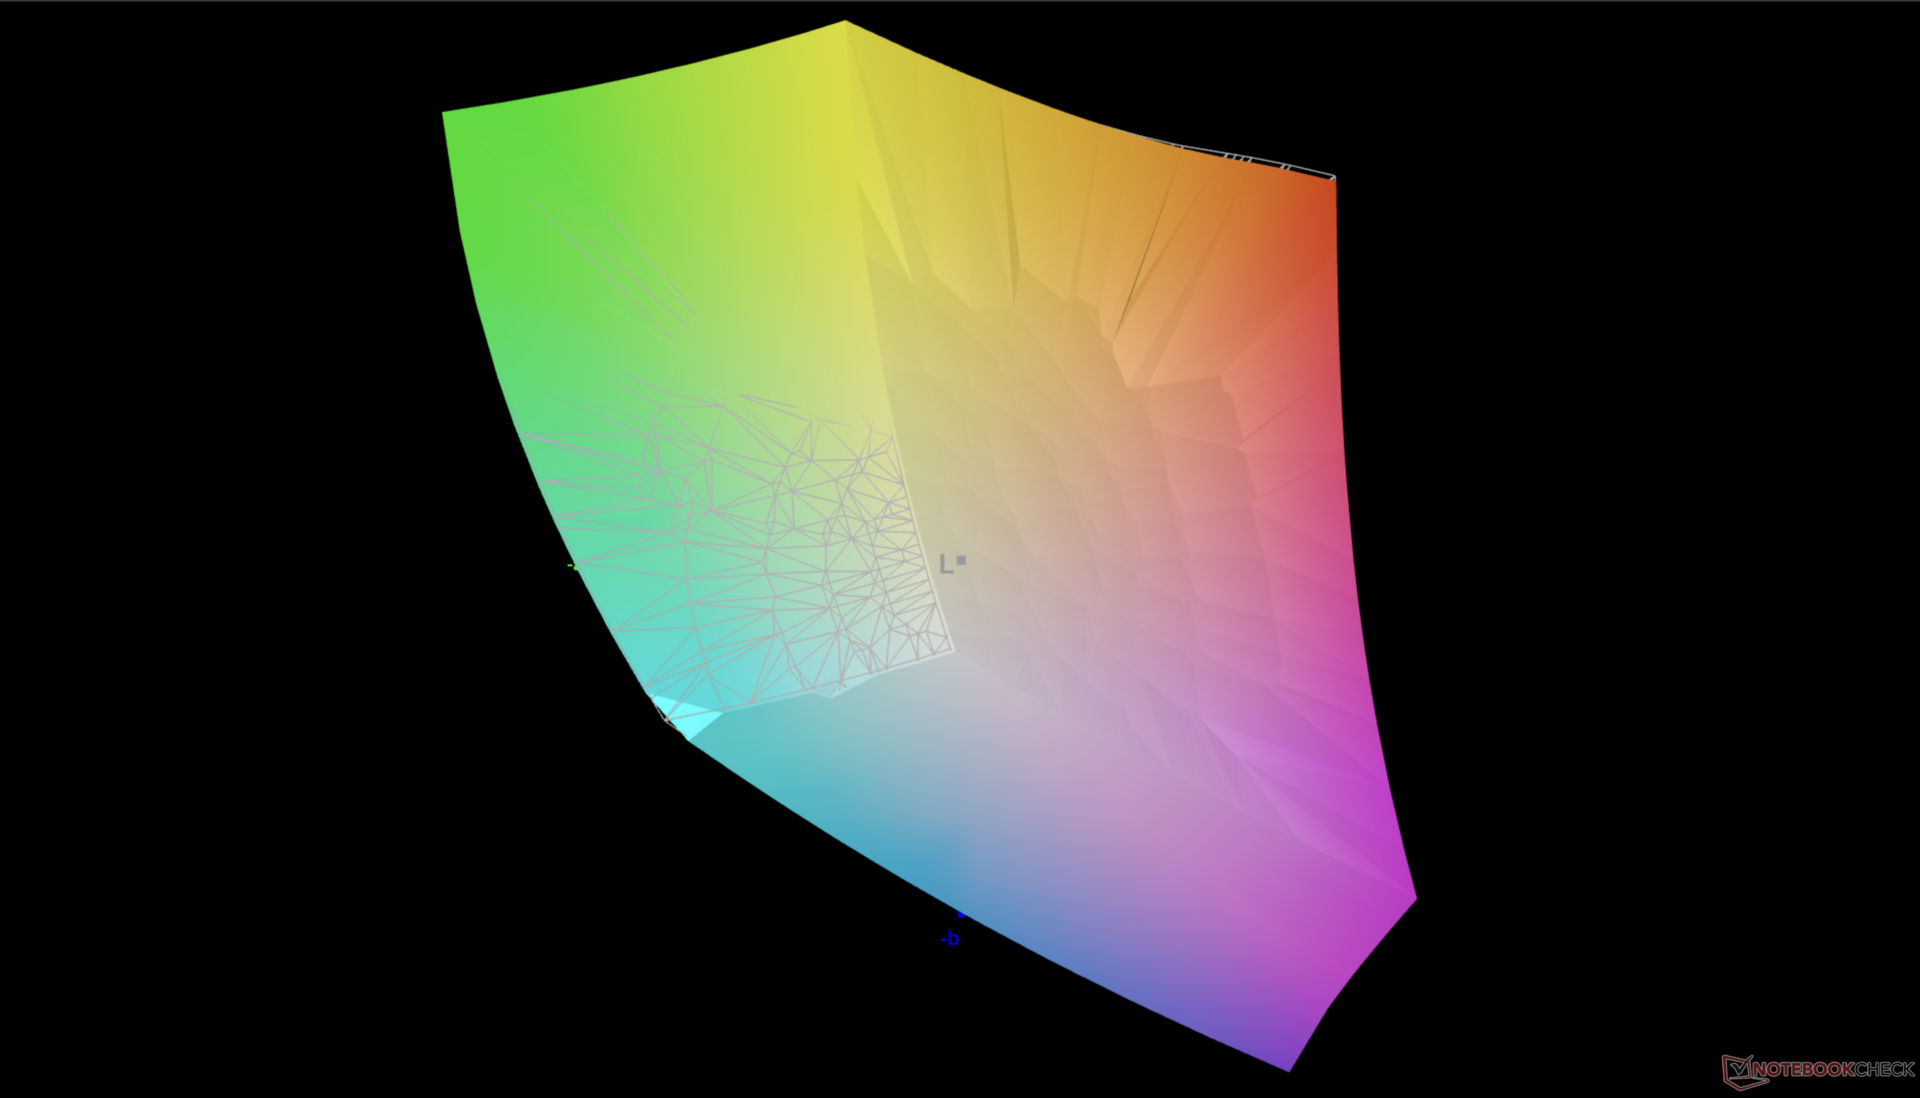
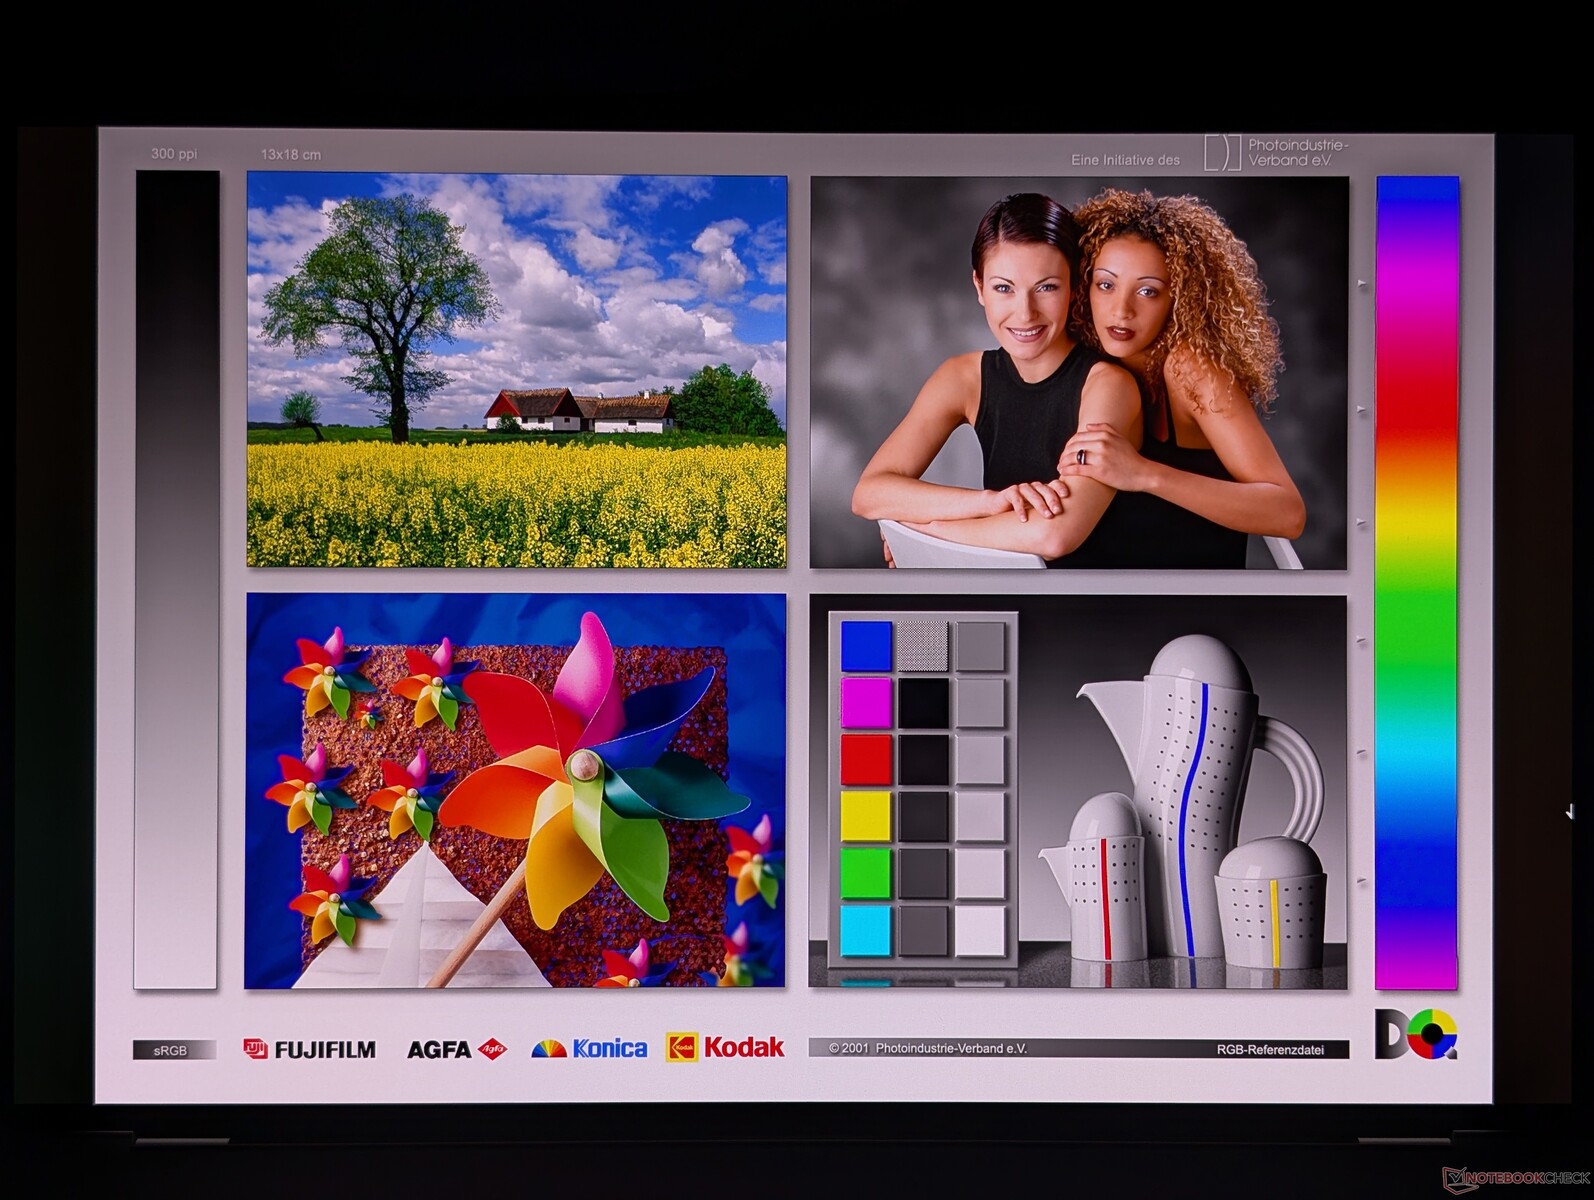
Display

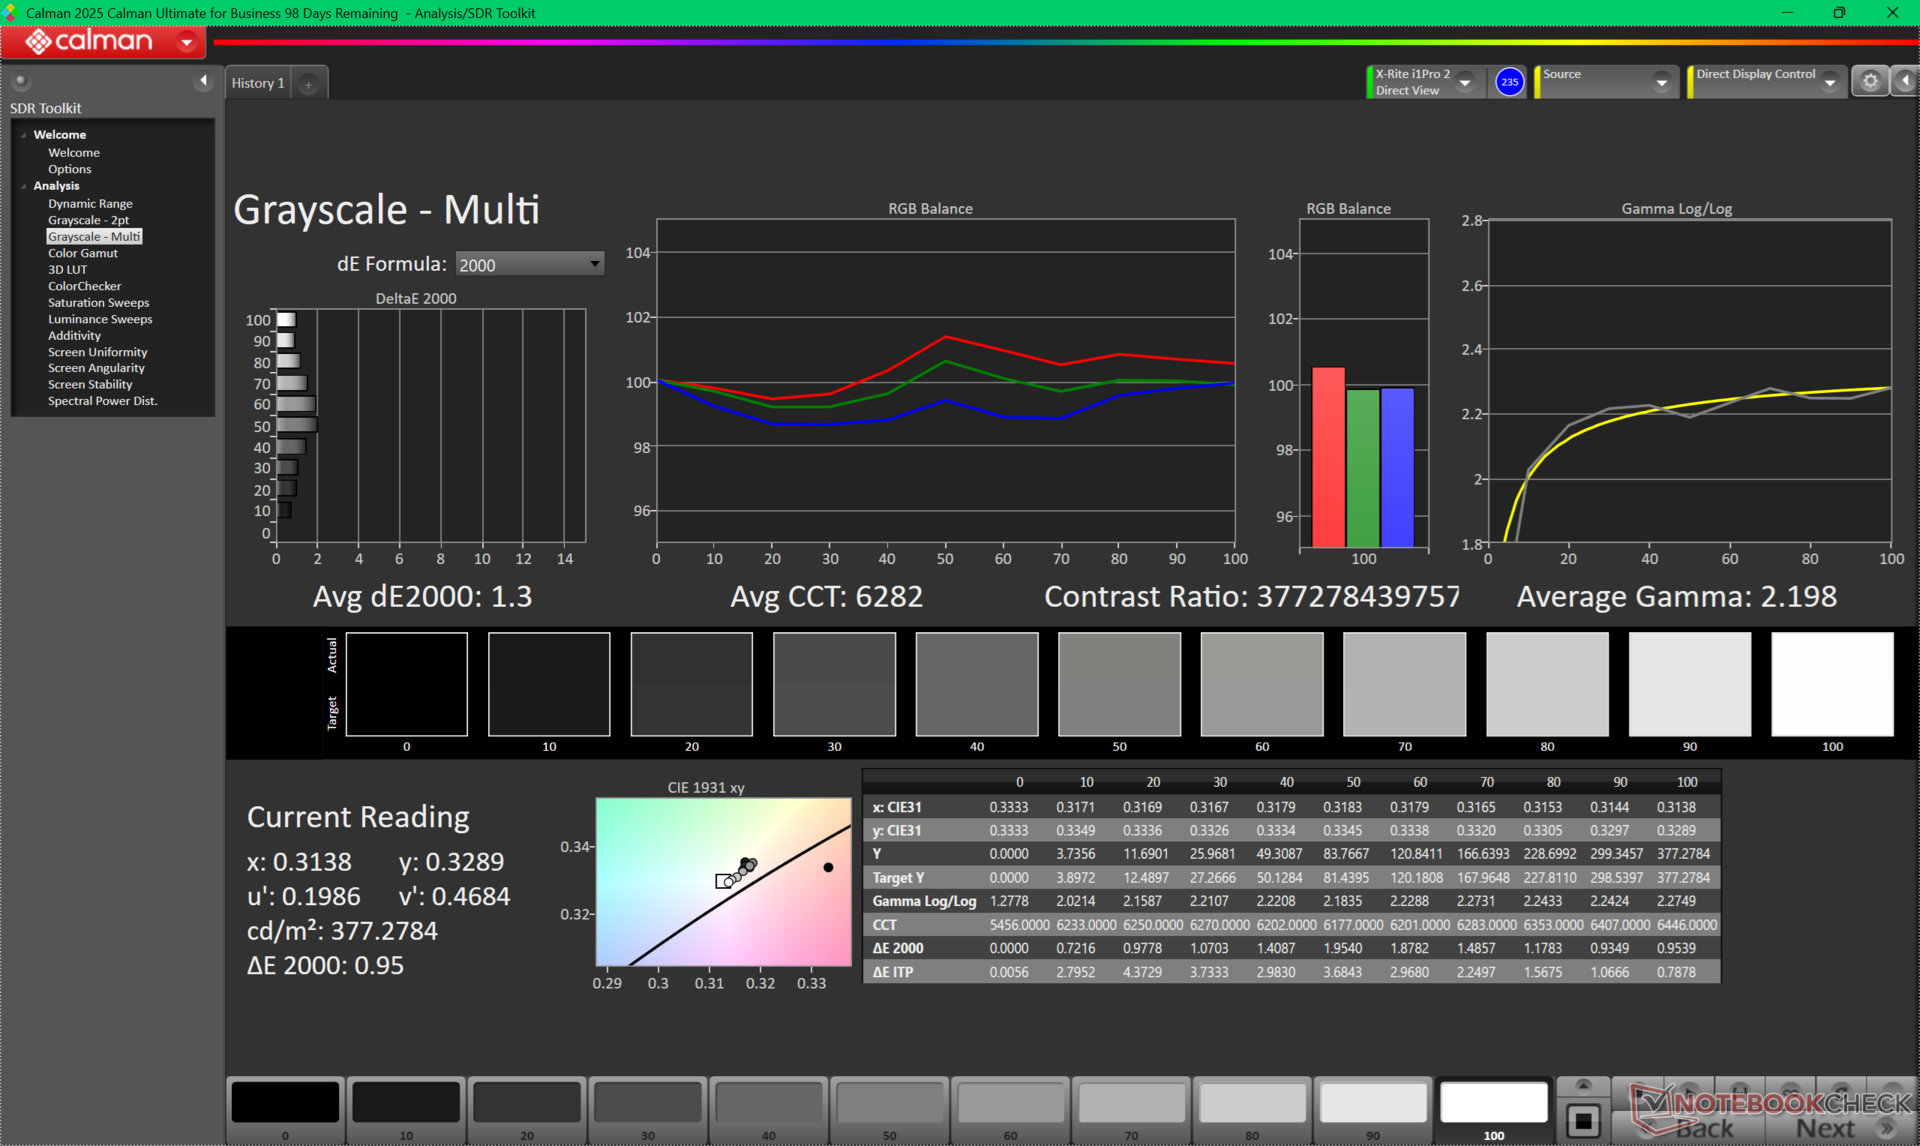
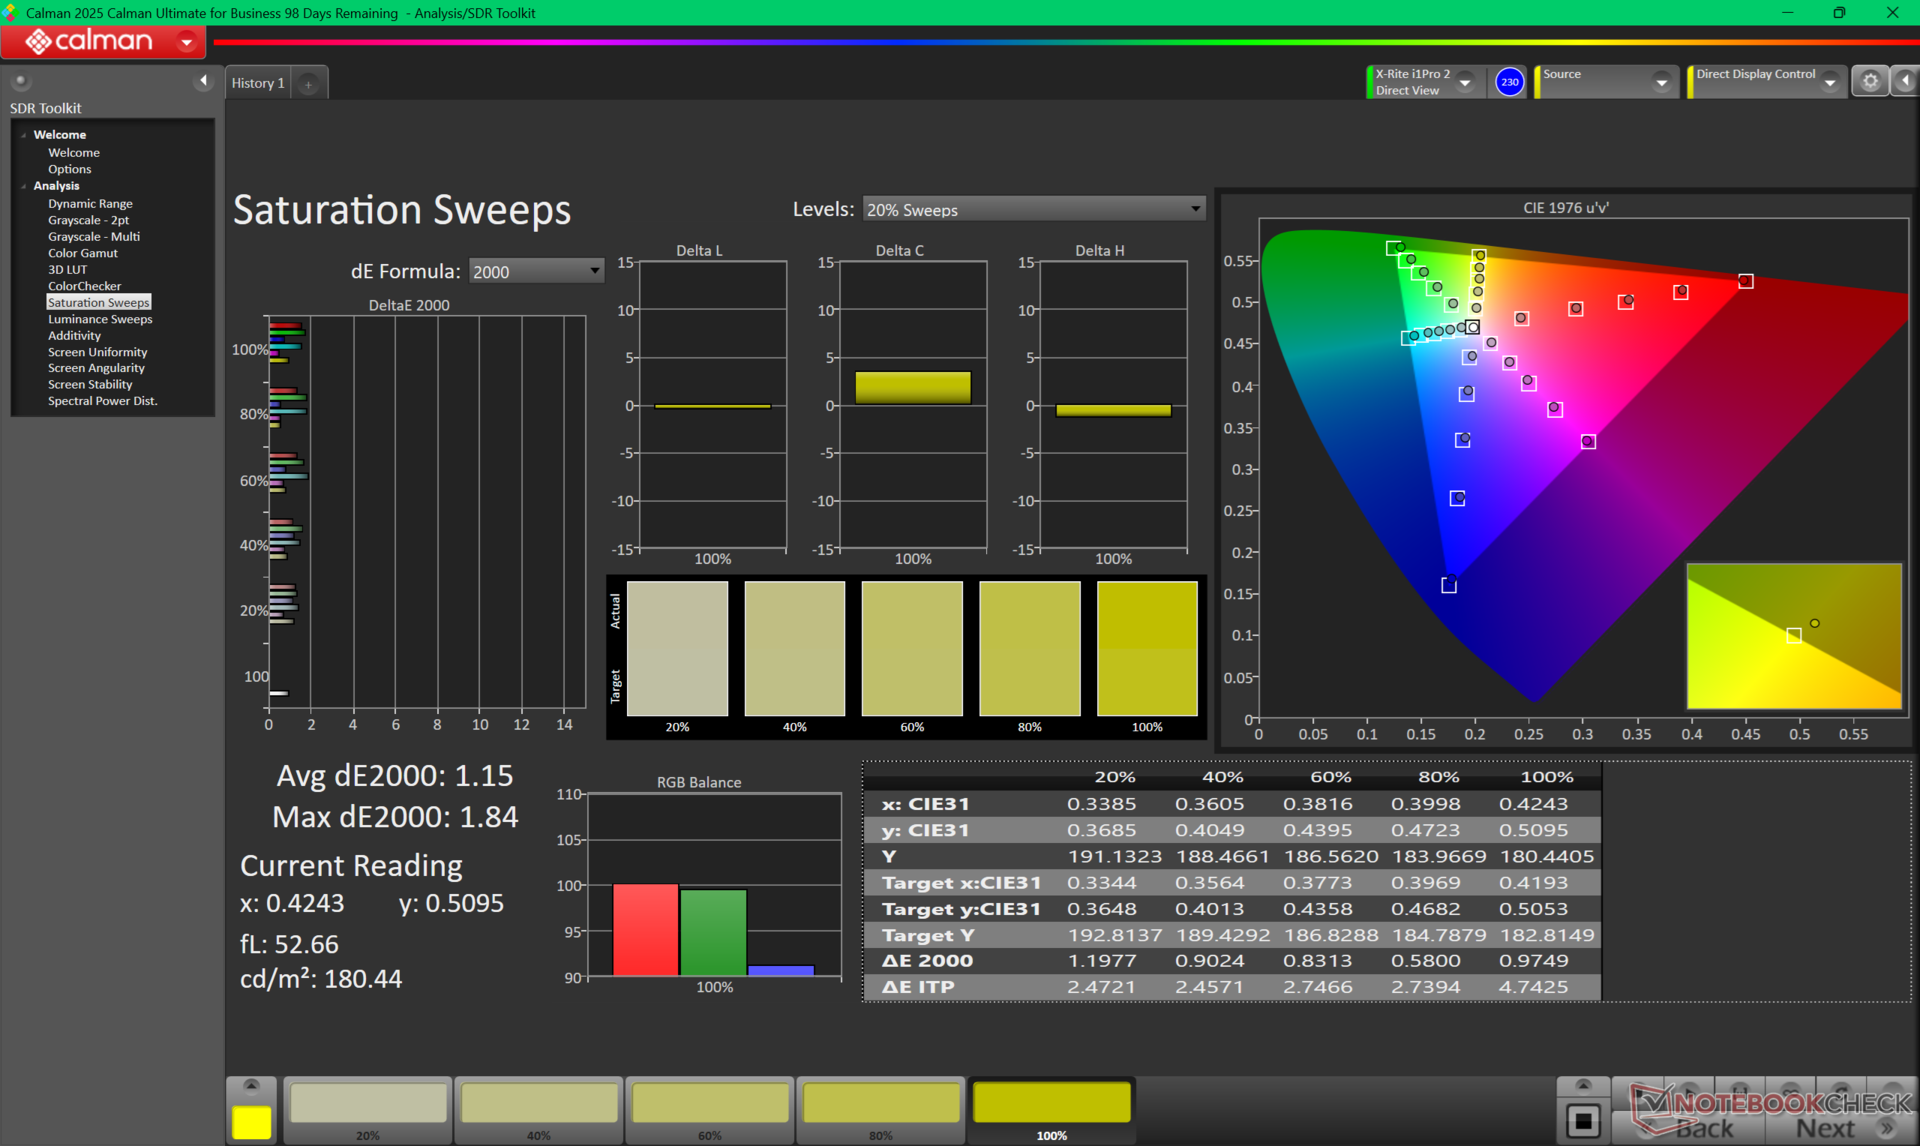
Dell has upgraded the OLED panel on last year's XPS 16 9640 from 90 Hz to 120 Hz while maximum brightness remains the same at ~400 nits. Windows VRR is supported down to 48 Hz to save on battery power. The changes are relatively minor but noteworthy nonetheless as 4K 2400p 120 Hz displays are relatively uncommon on 16-inch laptops.
| |||||||||||||||||||||||||
Brightness Distribution: 98 %
Center on Battery: 385.7 cd/m²
Contrast: ∞:1 (Black: 0 cd/m²)
ΔE ColorChecker Calman: 1.36 | ∀{0.5-29.43 Ø4.71}
calibrated: 0.65
ΔE Greyscale Calman: 1.3 | ∀{0.09-98 Ø4.96}
88.1% AdobeRGB 1998 (Argyll 3D)
100% sRGB (Argyll 3D)
99.7% Display P3 (Argyll 3D)
Gamma: 2.2
CCT: 6282 K
| Dell 16 Premium DA16250 Samsung 163DU02, OLED, 3840x2400, 16.3", 120 Hz | Dell XPS 16 9640 SDC4196, OLED, 3840x2400, 16.3", 90 Hz | HP Spectre x360 16 RTX 4050 Samsung SDC41A6, OLED, 2880x1800, 16", 120 Hz | Lenovo Yoga Pro 9i 16 RTX 5070 ATNA60KA01-0, OLED, 3200x2000, 16", 120 Hz | Asus Zenbook S 16 UM5606-RK333W ATNA60CL10-0, OLED, 2880x1800, 16", 120 Hz | LG Gram Pro 16Z90TS-G.AU89G LG DISPLAY LP160WQ2-SPF1, IPS, 2560x1600, 16", 144 Hz | |
|---|---|---|---|---|---|---|
| Display | -0% | 3% | 3% | 3% | -1% | |
| Display P3 Coverage (%) | 99.7 | 98.3 -1% | 99.6 0% | 97.4 -2% | 99.9 0% | 97.96 -2% |
| sRGB Coverage (%) | 100 | 100 0% | 100 0% | 100 0% | 100 0% | 100 0% |
| AdobeRGB 1998 Coverage (%) | 88.1 | 87.8 0% | 96.7 10% | 96.8 10% | 95.6 9% | 86.65 -2% |
| Response Times | -16% | -13% | 50% | 16% | -5457% | |
| Response Time Grey 50% / Grey 80% * (ms) | 0.61 ? | 0.82 ? -34% | 0.78 ? -28% | 0.27 ? 56% | 0.56 ? 8% | 47 ? -7605% |
| Response Time Black / White * (ms) | 0.88 ? | 0.85 ? 3% | 0.86 ? 2% | 0.37 ? 58% | 0.65 ? 26% | 30 ? -3309% |
| PWM Frequency (Hz) | 490.8 ? | 360 ? | 480 ? | 1200 | 480 | |
| PWM Amplitude * (%) | 35 | 22 37% | 30 14% | |||
| Screen | -22% | -28% | 63% | 31% | 5% | |
| Brightness middle (cd/m²) | 385.7 | 366 -5% | 385.2 0% | 974 153% | 407 6% | 442 15% |
| Brightness (cd/m²) | 387 | 367 -5% | 387 0% | 979 153% | 405 5% | 406 5% |
| Brightness Distribution (%) | 98 | 96 -2% | 99 1% | 98 0% | 97 -1% | 86 -12% |
| Black Level * (cd/m²) | 0.02 | 0.17 | ||||
| Colorchecker dE 2000 * | 1.36 | 1.3 4% | 1.73 -27% | 0.9 34% | 0.6 56% | 0.84 38% |
| Colorchecker dE 2000 max. * | 2.85 | 3.6 -26% | 3.95 -39% | 1.7 40% | 1.2 58% | 1.62 43% |
| Colorchecker dE 2000 calibrated * | 0.65 | 1 -54% | 0.88 -35% | |||
| Greyscale dE 2000 * | 1.3 | 2.2 -69% | 2.6 -100% | 1.3 -0% | 0.5 62% | 1.53 -18% |
| Gamma | 2.2 100% | 2.14 103% | 2.17 101% | 2.21 100% | 2.2 100% | 2.173 101% |
| CCT | 6282 103% | 6680 97% | 6133 106% | 6751 96% | 6453 101% | 6496 100% |
| Contrast (:1) | 20350 | 2600 | ||||
| Total Average (Program / Settings) | -13% /
-16% | -13% /
-16% | 39% /
45% | 17% /
20% | -1818% /
-907% |
* ... smaller is better


Display Response Times
| ↔ Response Time Black to White | ||
|---|---|---|
| 0.88 ms ... rise ↗ and fall ↘ combined | ↗ 0.41 ms rise |  |
| ↘ 0.47 ms fall | ||
| The screen shows very fast response rates in our tests and should be very well suited for fast-paced gaming. In comparison, all tested devices range from 0.1 (minimum) to 240 (maximum) ms. » 3 % of all devices are better. This means that the measured response time is better than the average of all tested devices (19.8 ms). | ||
| ↔ Response Time 50% Grey to 80% Grey | ||
| 0.61 ms ... rise ↗ and fall ↘ combined | ↗ 0.31 ms rise |  |
| ↘ 0.3 ms fall | ||
| The screen shows very fast response rates in our tests and should be very well suited for fast-paced gaming. In comparison, all tested devices range from 0.165 (minimum) to 636 (maximum) ms. » 2 % of all devices are better. This means that the measured response time is better than the average of all tested devices (31 ms). | ||
Screen Flickering / PWM (Pulse-Width Modulation)
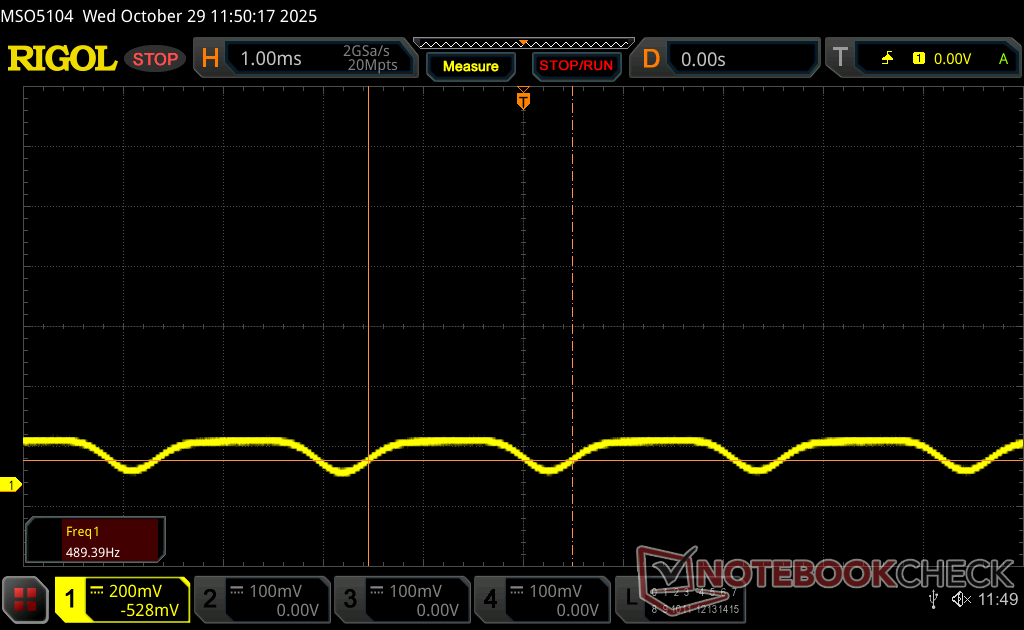
| Screen flickering / PWM detected | 490.8 Hz Amplitude: 35 % | ≤ 100 % brightness setting |  |
The display backlight flickers at 490.8 Hz (worst case, e.g., utilizing PWM) Flickering detected at a brightness setting of 100 % and below. There should be no flickering or PWM above this brightness setting. The frequency of 490.8 Hz is relatively high, so most users sensitive to PWM should not notice any flickering. However, there are reports that some users are still sensitive to PWM at 500 Hz and above, so be aware. In comparison: 52 % of all tested devices do not use PWM to dim the display. If PWM was detected, an average of 7754 (minimum: 5 - maximum: 343500) Hz was measured. | |||


Performance


Testing Conditions
We set Dell Optimizer to Performance mode and Nvidia Control Panel to discrete graphics mode prior to running the benchmarks below.
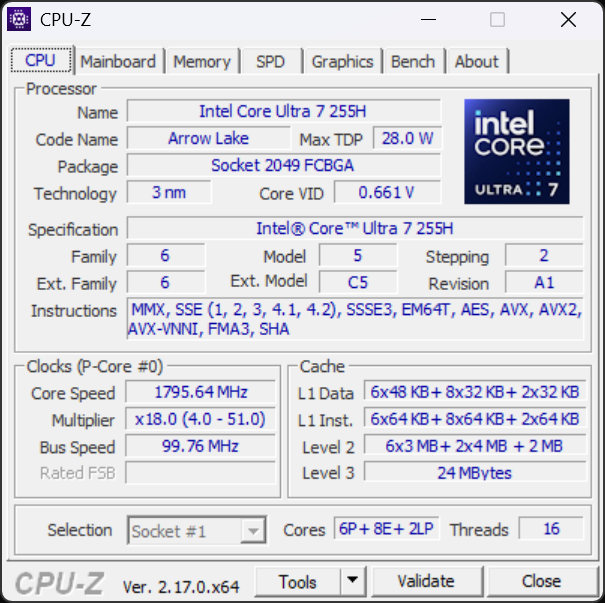
Processor
The Core Ultra 7 255H runs up to 20 percent faster than the Core Ultra 7 155H in last year's XPS 16. Upgrading to the even pricier Core Ultra 9 285H configuration is only expected to increase performance by just a few percentage points.
Turbo Boost sustainability could be better. When running CineBench R15 xT in a loop, scores would drop by almost 15 percent over time as shown by the graph below. The performance gap between the Core Ultra 7 255H and Core Ultra 7 155H in last year's model becomes narrower when the systems are stressed.
Cinebench R15 Multi Loop
Cinebench R23: Multi Core | Single Core
Cinebench R20: CPU (Multi Core) | CPU (Single Core)
Cinebench R15: CPU Multi 64Bit | CPU Single 64Bit
Blender: v2.79 BMW27 CPU
7-Zip 18.03: 7z b 4 | 7z b 4 -mmt1
Geekbench 6.7: Multi-Core | Single-Core
Geekbench 5.5: Multi-Core | Single-Core
HWBOT x265 Benchmark v2.2: 4k Preset
LibreOffice : 20 Documents To PDF
R Benchmark 2.5: Overall mean
* ... smaller is better
Stress Test
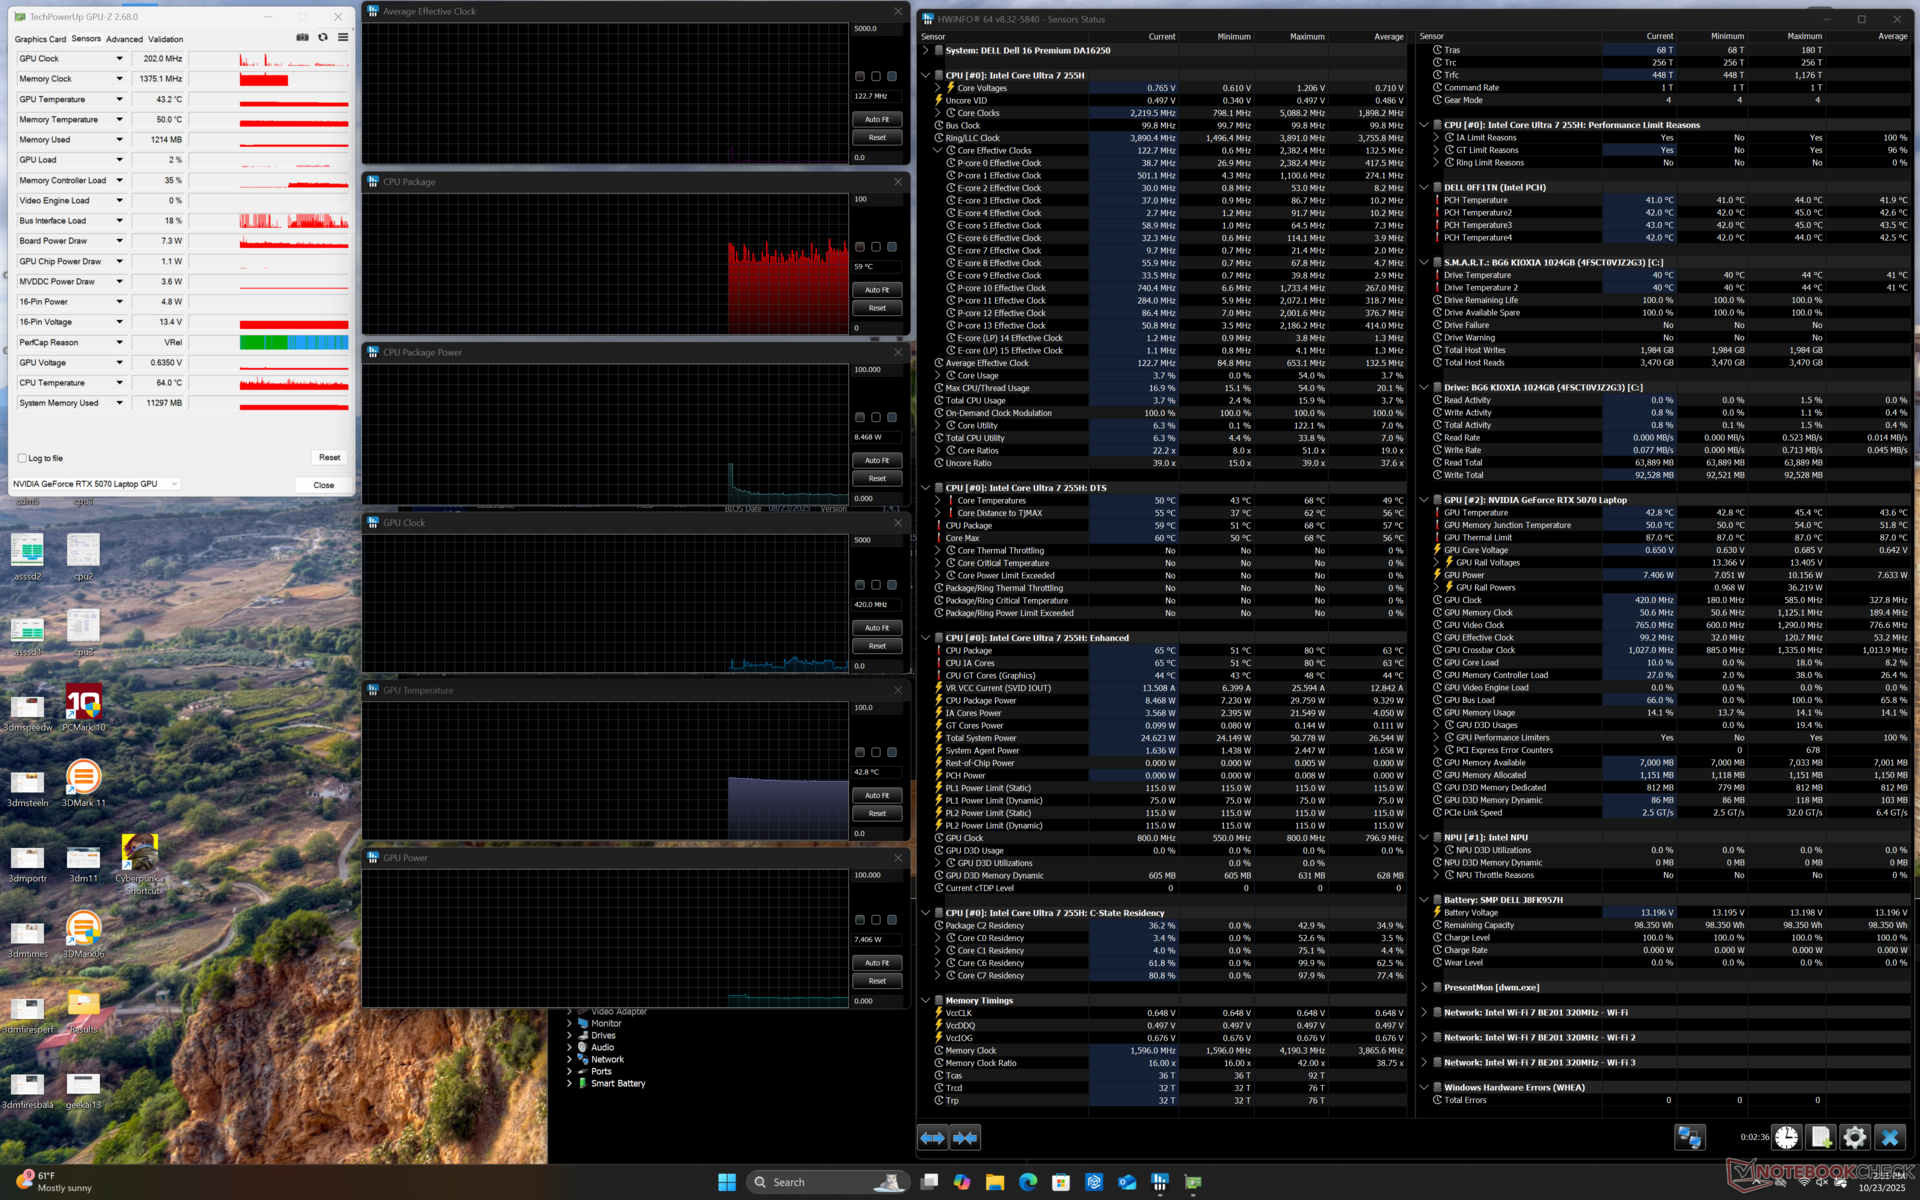
Core temperatures can still reach relatively high levels particularly for the CPU. When running Prime95 stress, for example, the CPU would boost to 3.7 GHz, 105 C, and 115 W before falling to 3 GHz, 93 C, and 67 W shortly thereafter. Maximum Turbo Boost sustainability is thus limited as exemplified above in our CPU Performance section.
GPU board power draw when running Cyberpunk 2077 averages around 55 W to 65 W compared to 115 W on a gaming laptop like the Alienware 16X Aurora with the same RTX 5070 GPU.


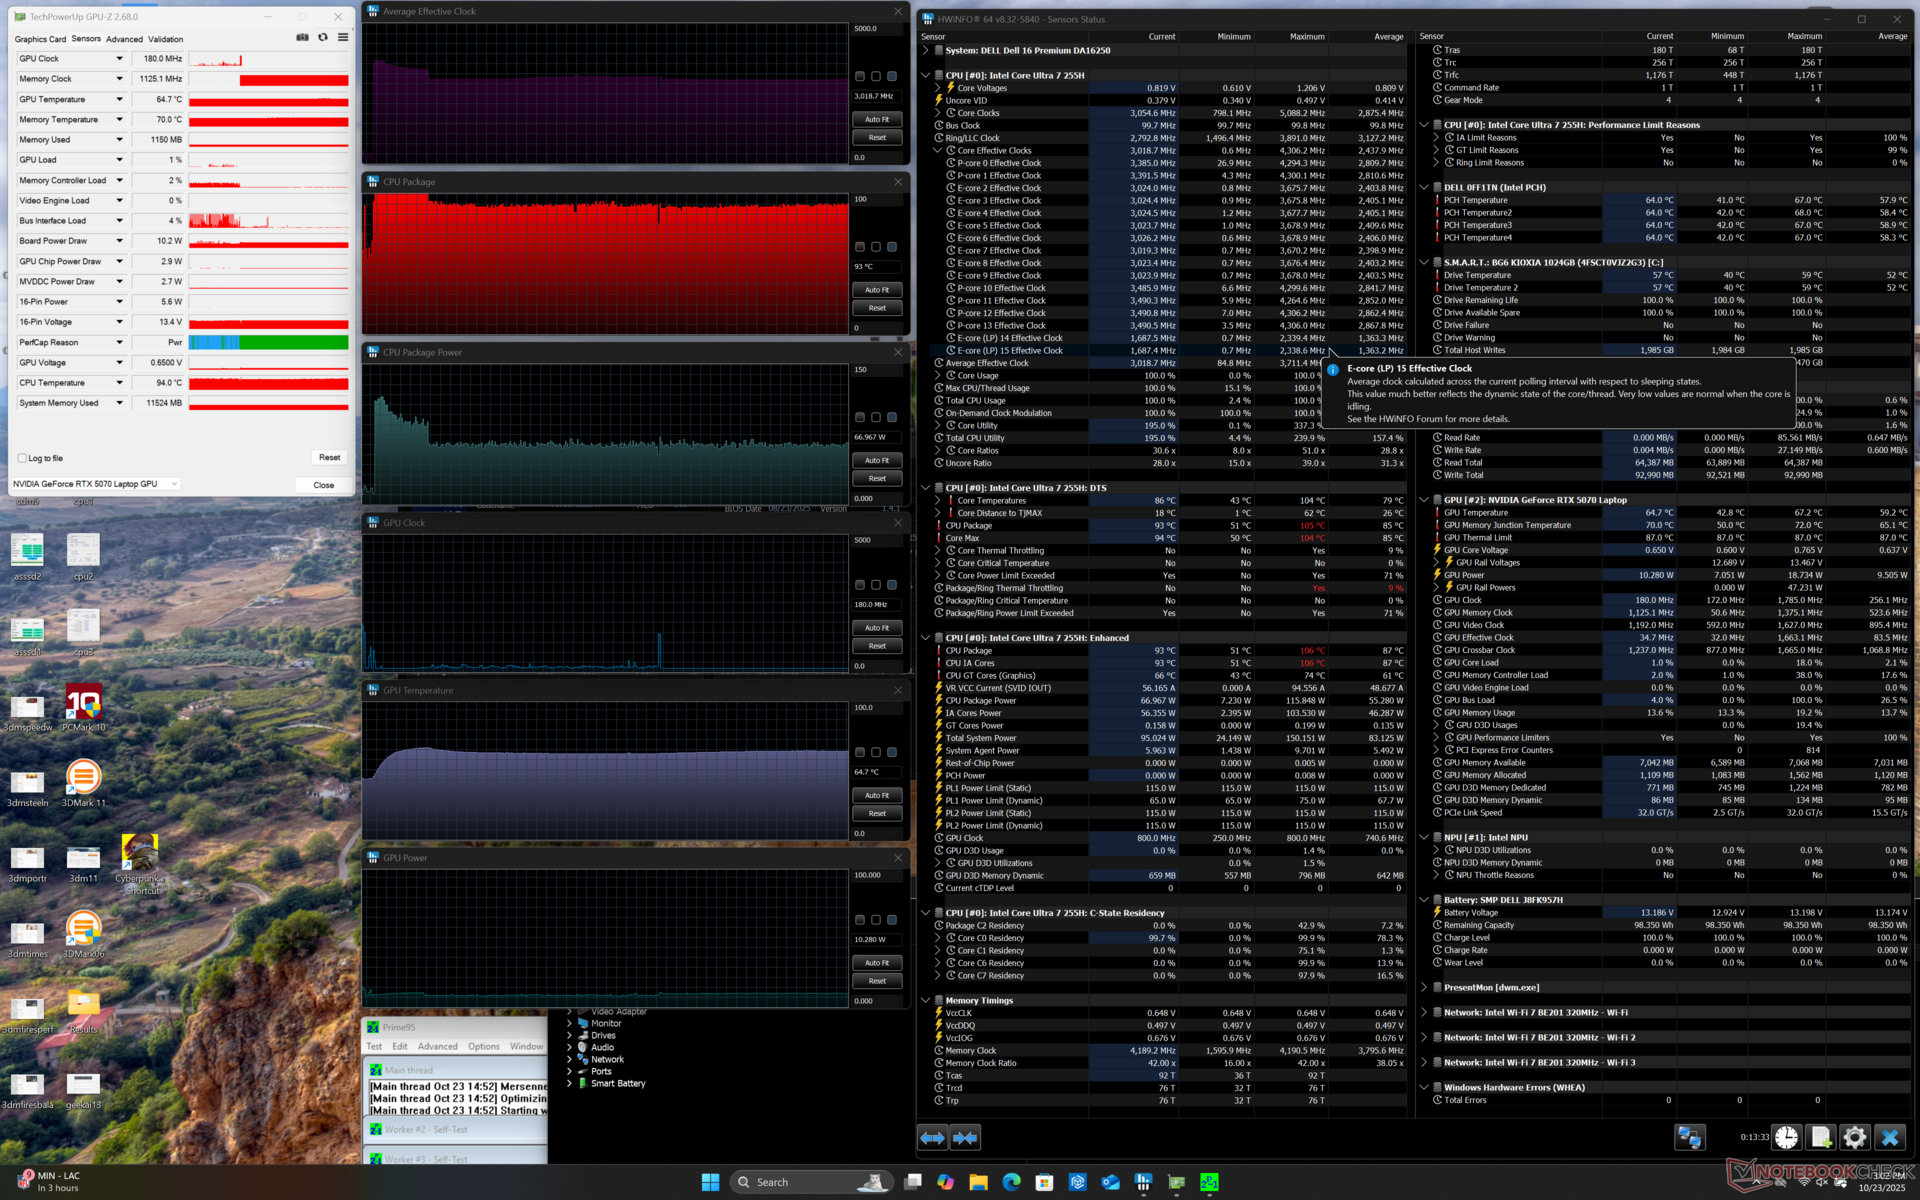
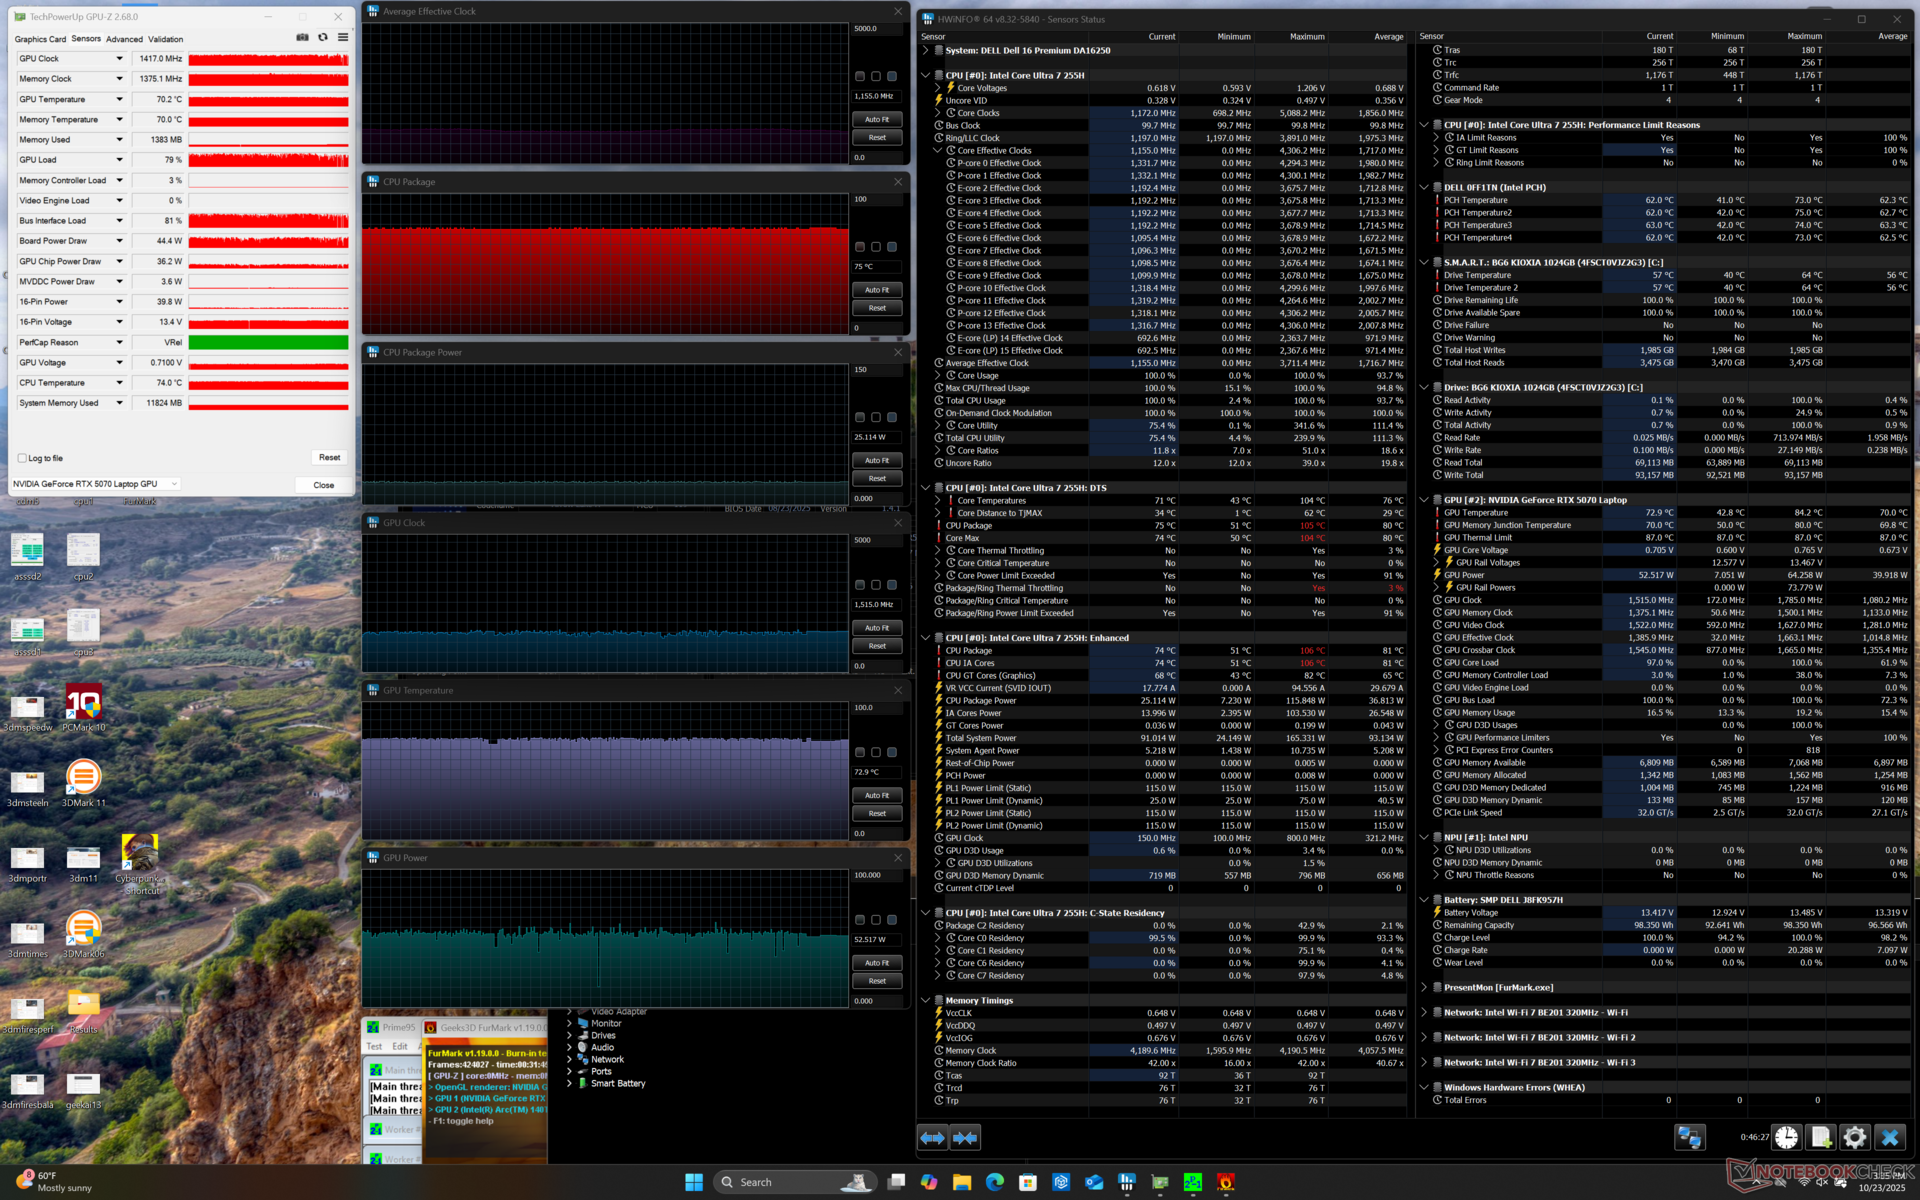
| Average CPU Clock (GHz) | GPU Clock (MHz) | Average CPU Temperature (°C) | Average GPU Temperature (°C) | |
| System Idle | -- | -- | 59 | 43 |
| Prime95 Stress | 3.0 | -- | 93 | 65 |
| Cyberpunk 2077 Stress (Balanced mode) | 1.5 | 1672 | 75 | 73 |
| Cyberpunk 2077 Stress (Performance mode) | 1.5 | 1687 | 76 | 73 |
| Prime95 + FurMark Stress | 1.2 | 1417 | 75 | 73 |
System Performance
Both AIDA64 and PCMark 10 would not run on our unit and so the scores have been omitted below.
CrossMark: Overall | Productivity | Creativity | Responsiveness
WebXPRT 3: Overall
WebXPRT 4: Overall
Mozilla Kraken 1.1: Total
| Performance rating | |
| Lenovo Yoga Pro 9i 16 RTX 5070 | |
| Dell XPS 16 9640 -1! | |
| Dell 16 Premium DA16250 | |
| Average Intel Core Ultra 7 255H, NVIDIA GeForce RTX 5070 Laptop | |
| Asus Zenbook S 16 UM5606-RK333W | |
| LG Gram Pro 16Z90TS-G.AU89G | |
| HP Spectre x360 16 RTX 4050 | |
| CrossMark / Overall | |
| Lenovo Yoga Pro 9i 16 RTX 5070 | |
| Dell 16 Premium DA16250 | |
| Average Intel Core Ultra 7 255H, NVIDIA GeForce RTX 5070 Laptop (n=1) | |
| Dell XPS 16 9640 | |
| Asus Zenbook S 16 UM5606-RK333W | |
| LG Gram Pro 16Z90TS-G.AU89G | |
| HP Spectre x360 16 RTX 4050 | |
| CrossMark / Productivity | |
| Lenovo Yoga Pro 9i 16 RTX 5070 | |
| Dell 16 Premium DA16250 | |
| Average Intel Core Ultra 7 255H, NVIDIA GeForce RTX 5070 Laptop (n=1) | |
| Dell XPS 16 9640 | |
| Asus Zenbook S 16 UM5606-RK333W | |
| LG Gram Pro 16Z90TS-G.AU89G | |
| HP Spectre x360 16 RTX 4050 | |
| CrossMark / Creativity | |
| Lenovo Yoga Pro 9i 16 RTX 5070 | |
| Dell 16 Premium DA16250 | |
| Average Intel Core Ultra 7 255H, NVIDIA GeForce RTX 5070 Laptop (n=1) | |
| Asus Zenbook S 16 UM5606-RK333W | |
| Dell XPS 16 9640 | |
| LG Gram Pro 16Z90TS-G.AU89G | |
| HP Spectre x360 16 RTX 4050 | |
| CrossMark / Responsiveness | |
| Dell 16 Premium DA16250 | |
| Average Intel Core Ultra 7 255H, NVIDIA GeForce RTX 5070 Laptop (n=1) | |
| Dell XPS 16 9640 | |
| Lenovo Yoga Pro 9i 16 RTX 5070 | |
| Asus Zenbook S 16 UM5606-RK333W | |
| LG Gram Pro 16Z90TS-G.AU89G | |
| HP Spectre x360 16 RTX 4050 | |
| WebXPRT 3 / Overall | |
| Lenovo Yoga Pro 9i 16 RTX 5070 | |
| Dell 16 Premium DA16250 | |
| Average Intel Core Ultra 7 255H, NVIDIA GeForce RTX 5070 Laptop (n=1) | |
| Asus Zenbook S 16 UM5606-RK333W | |
| Dell XPS 16 9640 | |
| HP Spectre x360 16 RTX 4050 | |
| LG Gram Pro 16Z90TS-G.AU89G | |
| WebXPRT 4 / Overall | |
| Lenovo Yoga Pro 9i 16 RTX 5070 | |
| Dell 16 Premium DA16250 | |
| Average Intel Core Ultra 7 255H, NVIDIA GeForce RTX 5070 Laptop (n=1) | |
| LG Gram Pro 16Z90TS-G.AU89G | |
| Asus Zenbook S 16 UM5606-RK333W | |
| HP Spectre x360 16 RTX 4050 | |
| Dell XPS 16 9640 | |
| Mozilla Kraken 1.1 / Total | |
| HP Spectre x360 16 RTX 4050 | |
| LG Gram Pro 16Z90TS-G.AU89G | |
| Dell 16 Premium DA16250 | |
| Average Intel Core Ultra 7 255H, NVIDIA GeForce RTX 5070 Laptop (n=1) | |
| Asus Zenbook S 16 UM5606-RK333W | |
| Lenovo Yoga Pro 9i 16 RTX 5070 | |
* ... smaller is better
DPC Latency
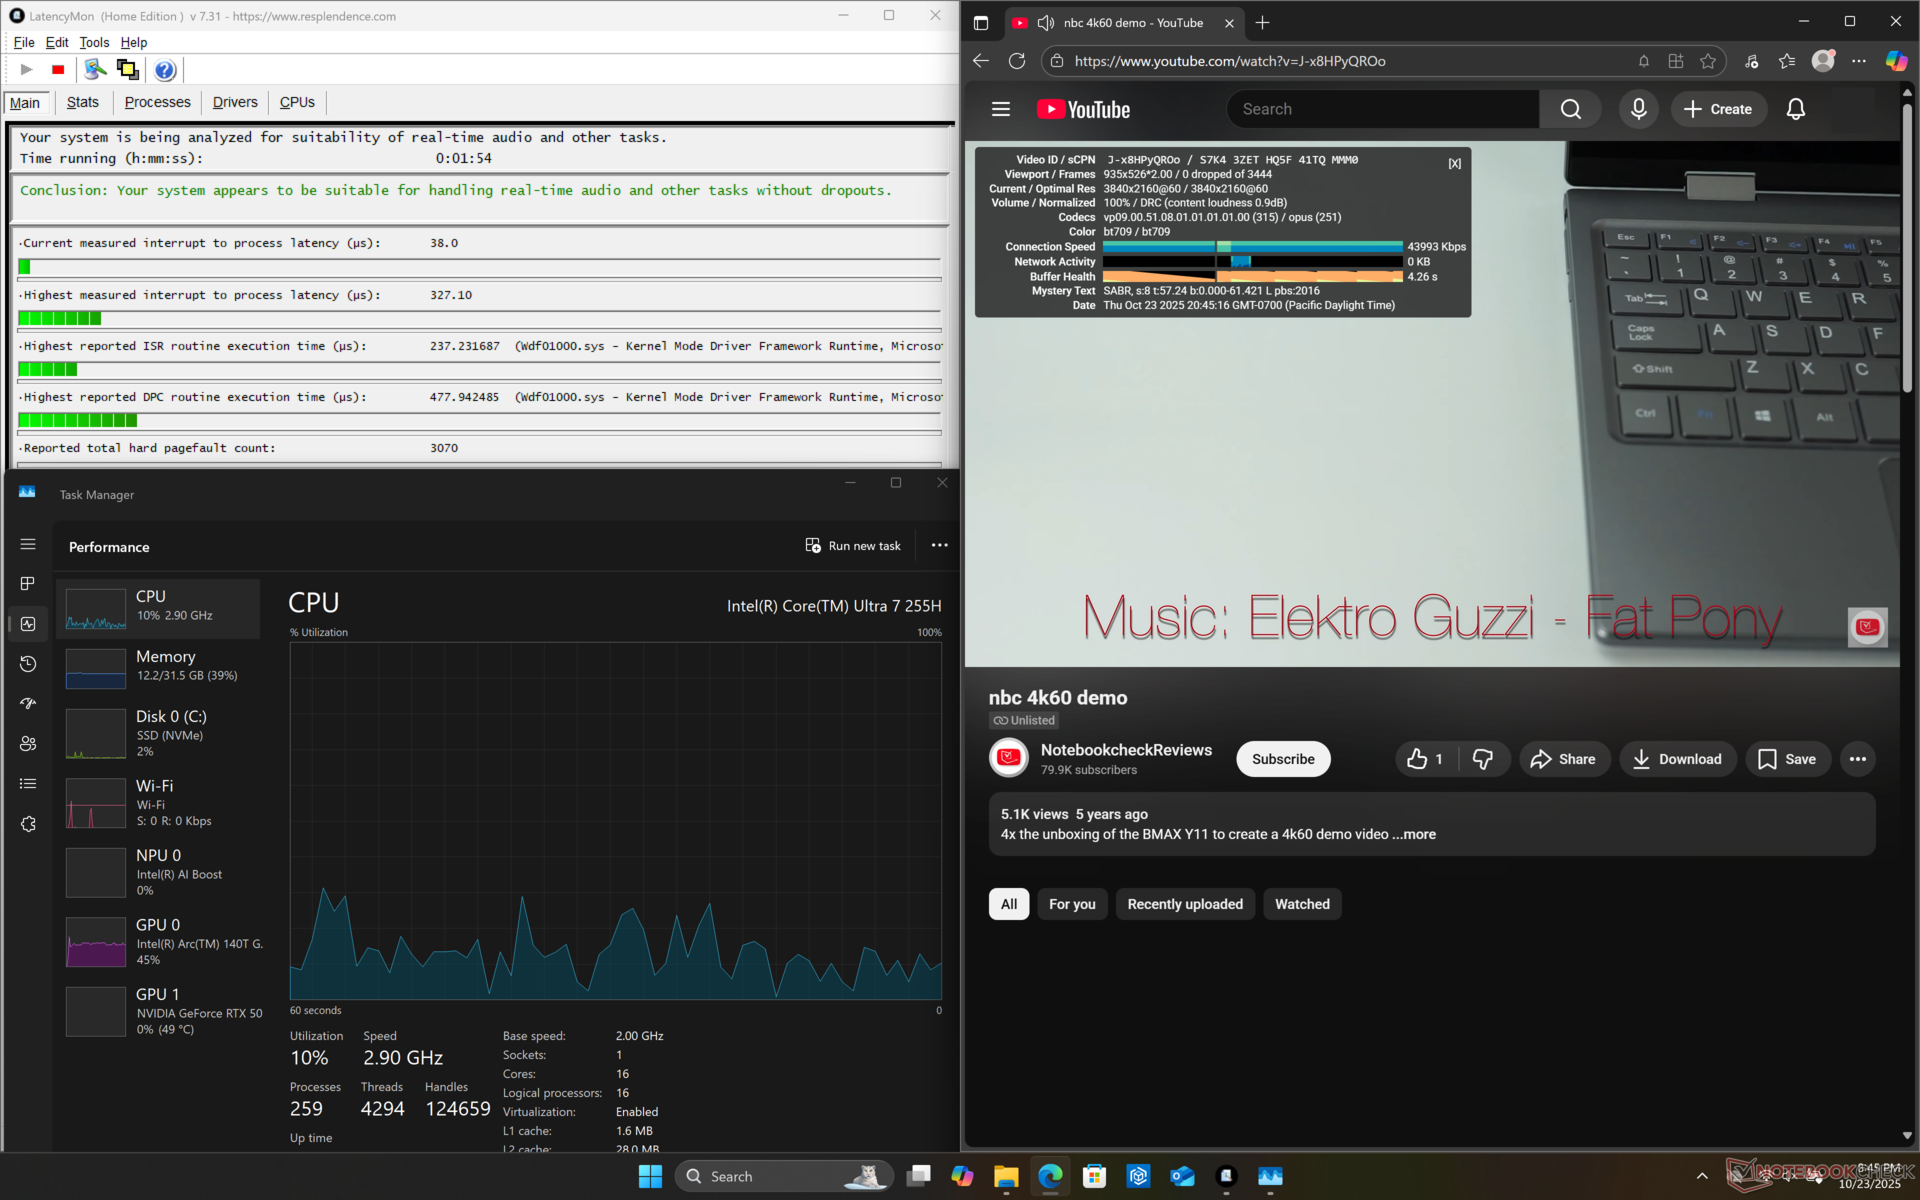

| DPC Latencies / LatencyMon - interrupt to process latency (max), Web, Youtube, Prime95 | |
| HP Spectre x360 16 RTX 4050 | |
| Lenovo Yoga Pro 9i 16 RTX 5070 | |
| Dell XPS 16 9640 | |
| Dell 16 Premium DA16250 | |
* ... smaller is better
Storage Devices

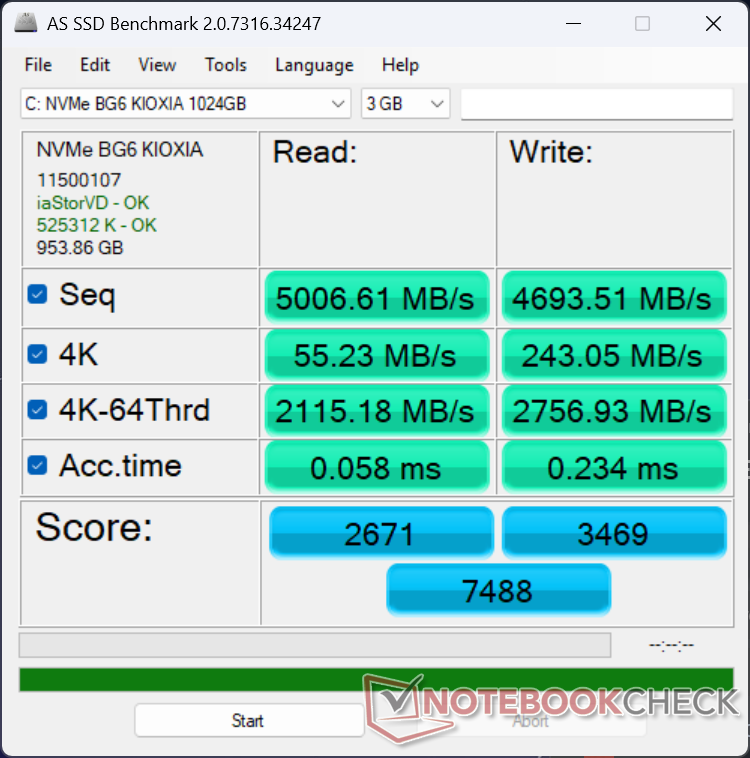

| Drive Performance rating - Percent | |
| Dell XPS 16 9640 | |
| Dell 16 Premium DA16250 | |
| Lenovo Yoga Pro 9i 16 RTX 5070 | |
| HP Spectre x360 16 RTX 4050 | |
| LG Gram Pro 16Z90TS-G.AU89G -11! | |
| Asus Zenbook S 16 UM5606-RK333W | |
* ... smaller is better
Disk Throttling: DiskSpd Read Loop, Queue Depth 8
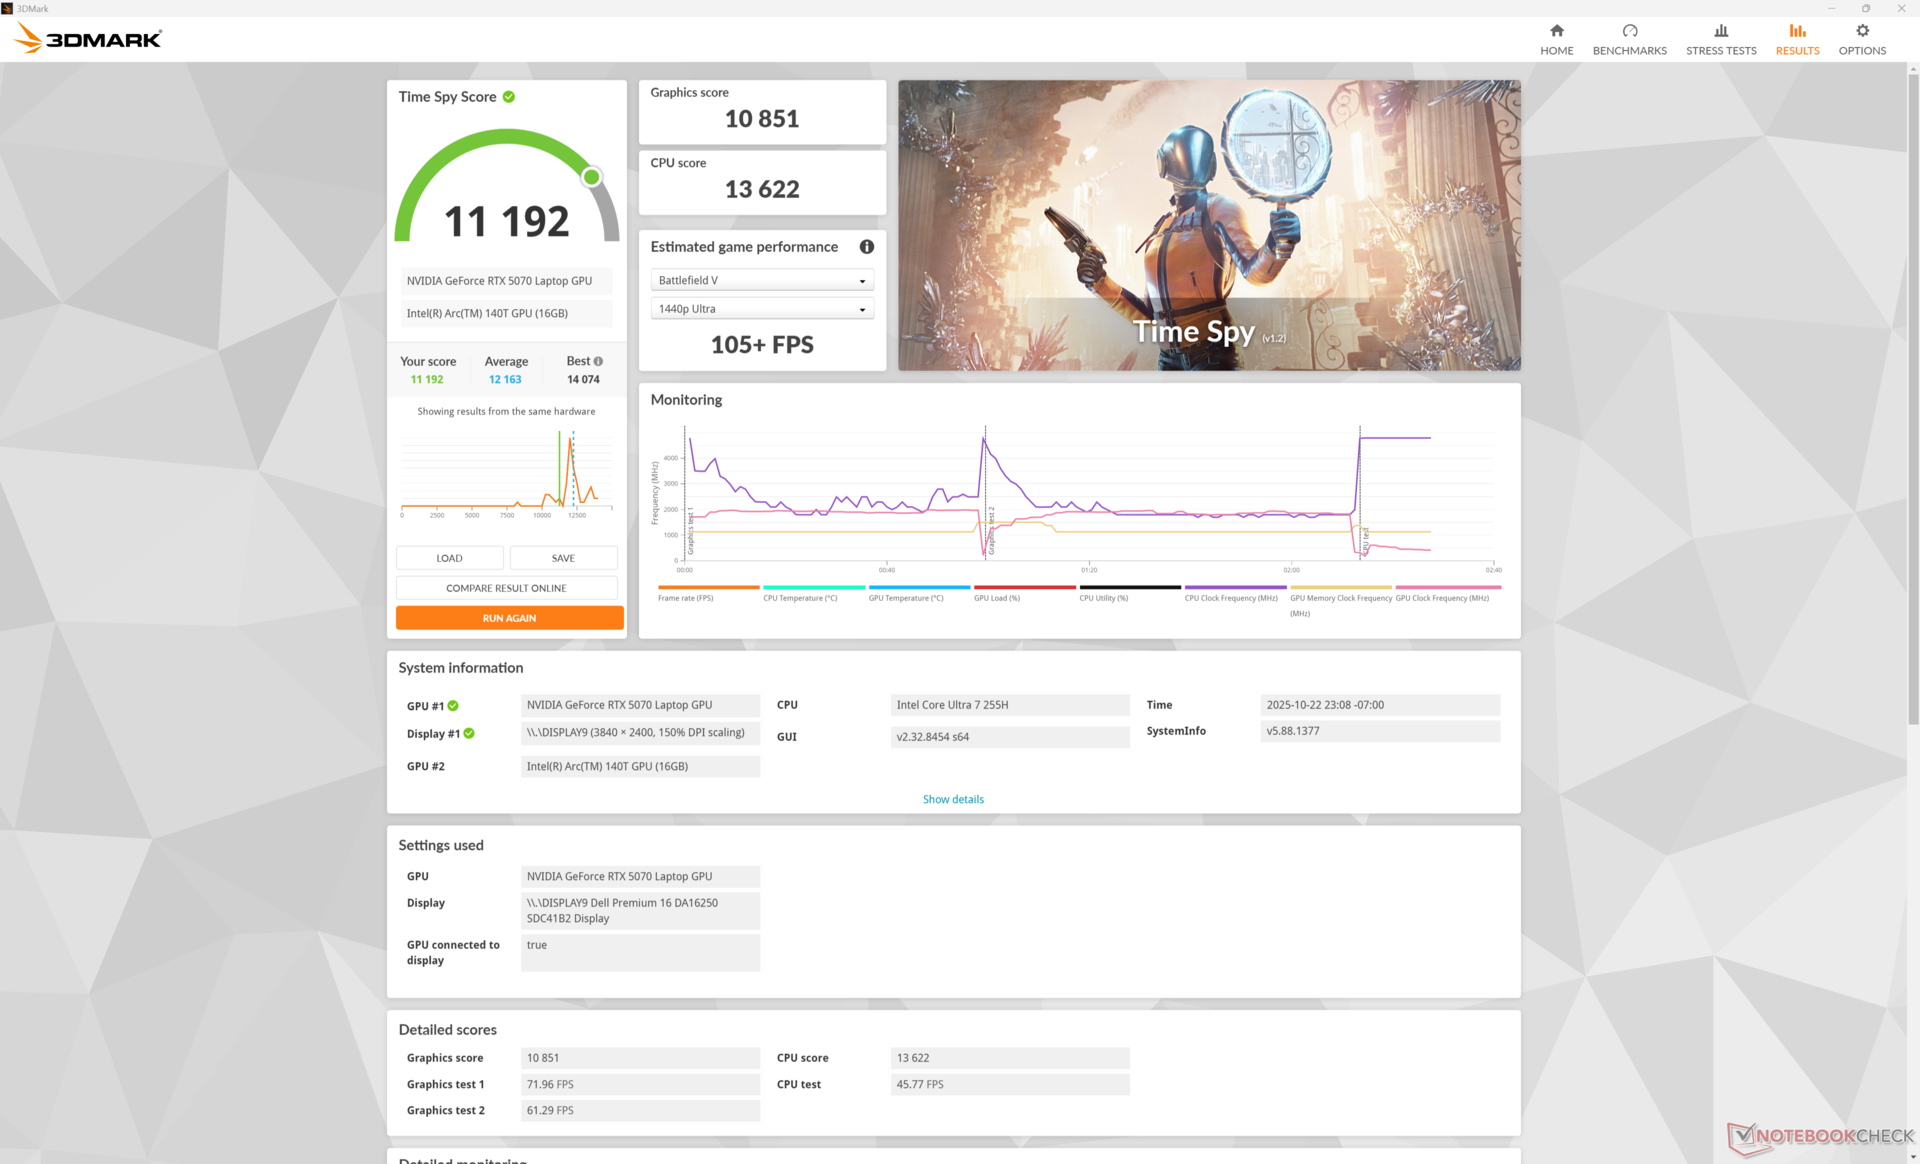
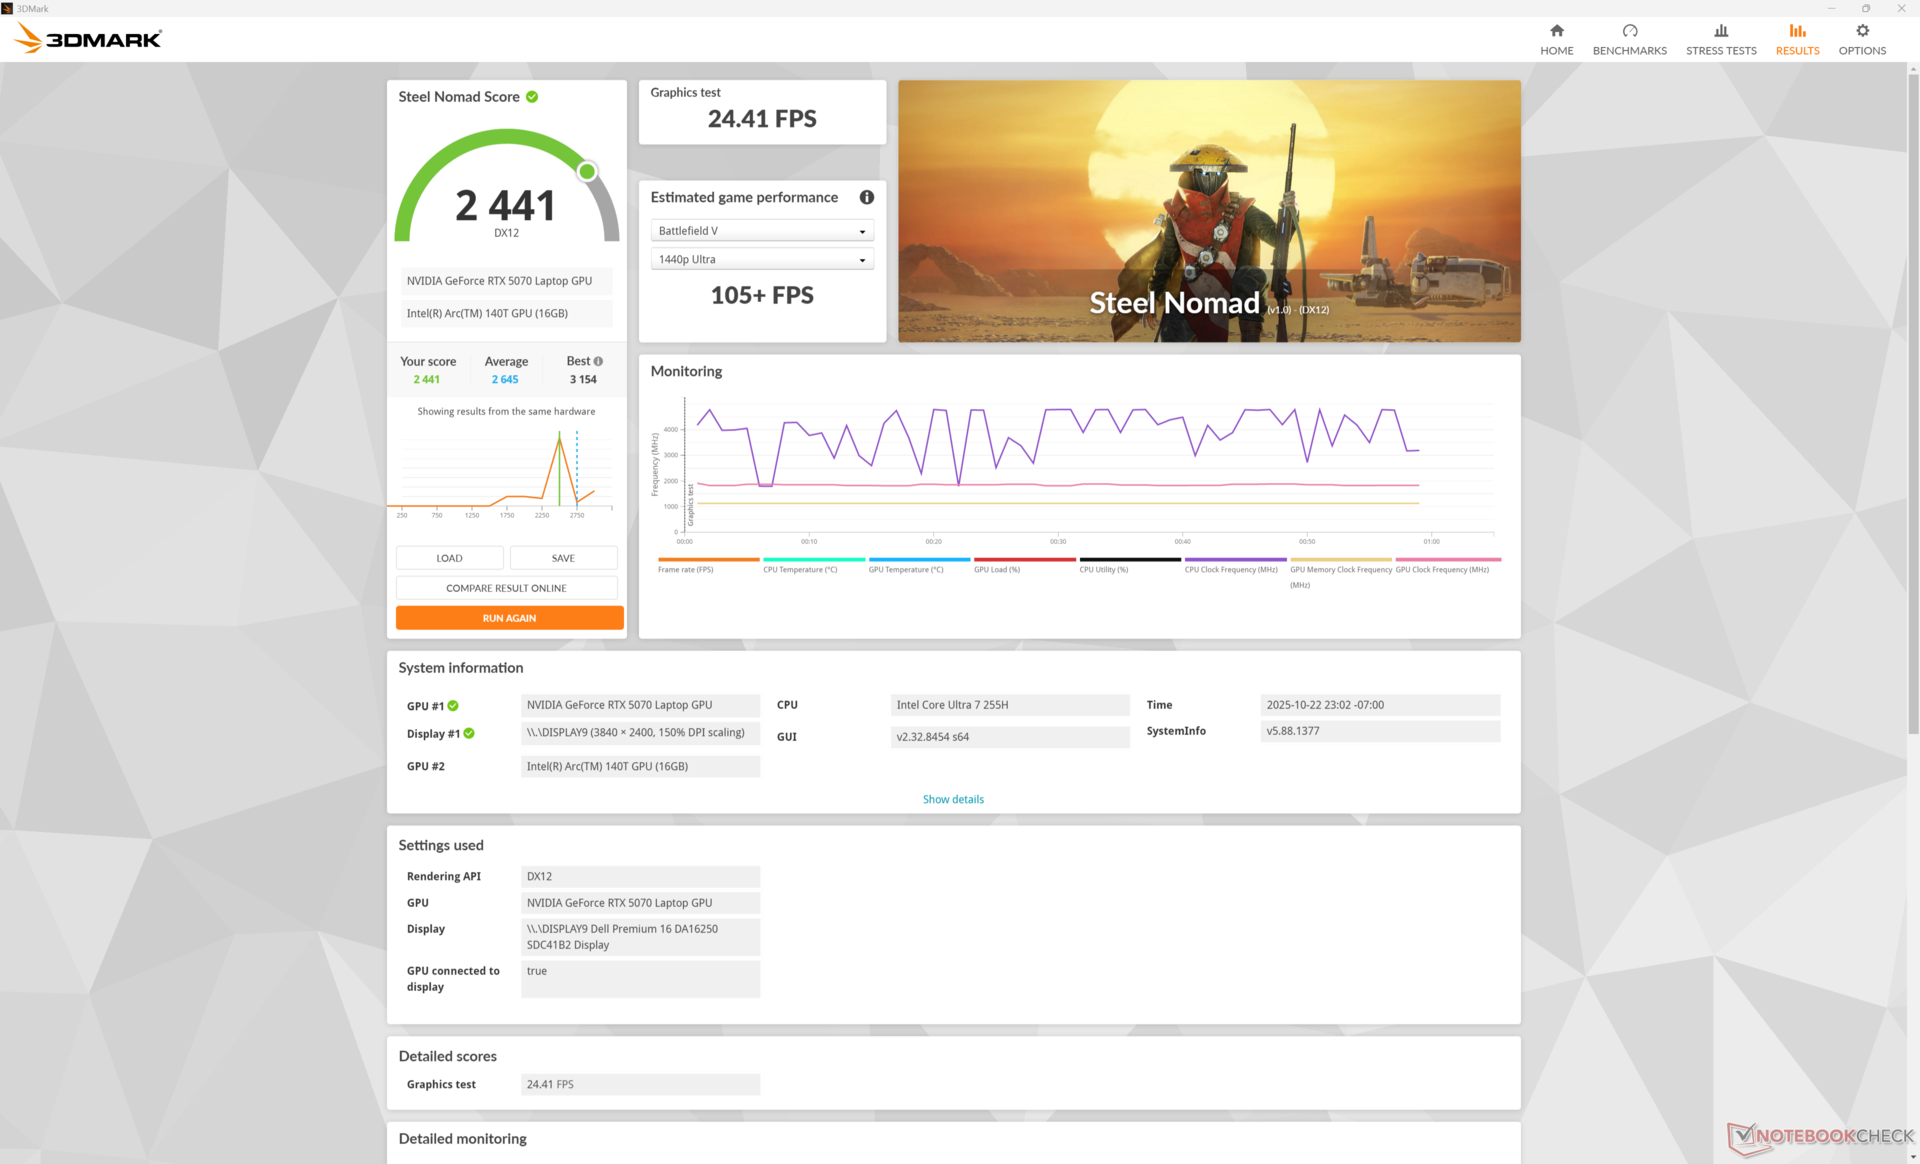
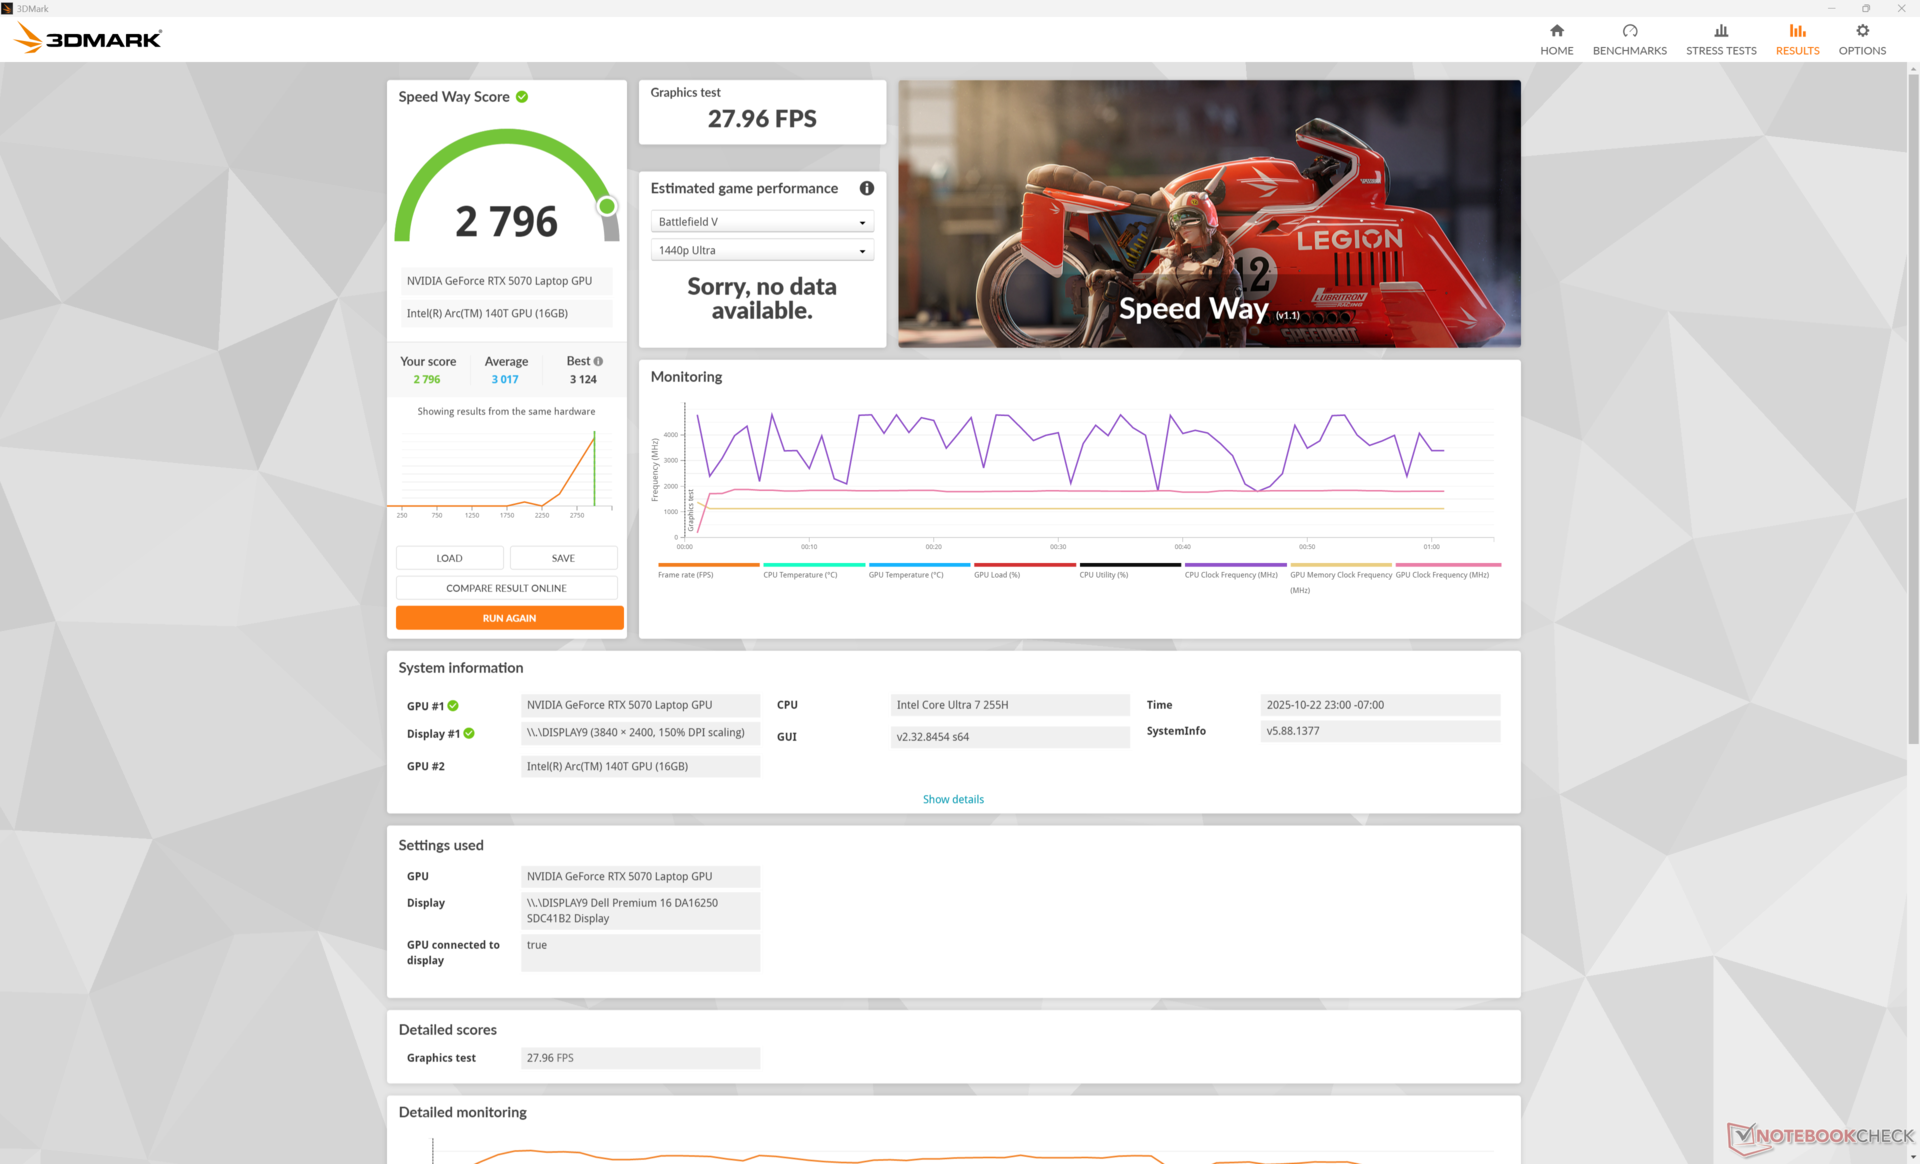
GPU Performance
The mobile GeForce RTX 5070 GPU in the Dell 16 Premium runs almost 20 percent slower than the average laptop in our database with the same RTX 5070 GPU because most laptops with this same GPU tend to be gaming laptops with higher TGP targets. Traditional rasterization performance is therefore closer to laptops with the RTX 5060.
For professional tasks like Blender, the performance discrepancy against other RTX 5070 laptops is narrower by about 10 percent on average. The Dell 16 Premium is a professional PC first and gaming laptop second.
| Power Profile | Graphics Score | Physics Score | Combined Score |
| Performance Mode | 28759 | 37491 | 11209 |
| Balanced Mode | 27915 (-3%) | 35948 (-4%) | 9874 (-12%) |
| Battery Power | 25880 (-10%) | 32601 (-13%) | 11046 (-1%) |


| 3DMark 11 Performance | 32410 points | |
| 3DMark Cloud Gate Standard Score | 65334 points | |
| 3DMark Fire Strike Score | 25640 points | |
| 3DMark Time Spy Score | 11192 points | |
| 3DMark Steel Nomad Score | 2441 points | |
Help | ||
* ... smaller is better
Gaming Performance
Games can run up to 20 percent slower than most other laptops with the same GPU. Assassin's Creed Shadows, for example, would consistently run faster on the Lenovo Yoga Pro 9i 16 in all tested settings.
| Performance rating - Percent | |
| Lenovo Yoga Pro 9i 16 RTX 5070 | |
| Dell 16 Premium DA16250 | |
| Dell XPS 16 9640 | |
| HP Spectre x360 16 RTX 4050 | |
| Asus Zenbook S 16 UM5606-RK333W | |
| LG Gram Pro 16Z90TS-G.AU89G | |
| Cyberpunk 2077 - 1920x1080 Ultra Preset (FSR off) | |
| Lenovo Yoga Pro 9i 16 RTX 5070 | |
| Dell 16 Premium DA16250 | |
| Dell XPS 16 9640 | |
| HP Spectre x360 16 RTX 4050 | |
| Asus Zenbook S 16 UM5606-RK333W | |
| LG Gram Pro 16Z90TS-G.AU89G | |
| Baldur's Gate 3 - 1920x1080 Ultra Preset AA:T | |
| Dell 16 Premium DA16250 | |
| Dell XPS 16 9640 | |
| Lenovo Yoga Pro 9i 16 RTX 5070 | |
| HP Spectre x360 16 RTX 4050 | |
| Asus Zenbook S 16 UM5606-RK333W | |
| LG Gram Pro 16Z90TS-G.AU89G | |
| GTA V - 1920x1080 Highest AA:4xMSAA + FX AF:16x | |
| Lenovo Yoga Pro 9i 16 RTX 5070 | |
| Dell 16 Premium DA16250 | |
| Dell XPS 16 9640 | |
| HP Spectre x360 16 RTX 4050 | |
| Asus Zenbook S 16 UM5606-RK333W | |
| LG Gram Pro 16Z90TS-G.AU89G | |
| Final Fantasy XV Benchmark - 1920x1080 High Quality | |
| Lenovo Yoga Pro 9i 16 RTX 5070 | |
| Dell 16 Premium DA16250 | |
| Dell XPS 16 9640 | |
| HP Spectre x360 16 RTX 4050 | |
| LG Gram Pro 16Z90TS-G.AU89G | |
| Asus Zenbook S 16 UM5606-RK333W | |
| Strange Brigade - 1920x1080 ultra AA:ultra AF:16 | |
| Lenovo Yoga Pro 9i 16 RTX 5070 | |
| Dell 16 Premium DA16250 | |
| Dell XPS 16 9640 | |
| HP Spectre x360 16 RTX 4050 | |
| LG Gram Pro 16Z90TS-G.AU89G | |
| Asus Zenbook S 16 UM5606-RK333W | |
| Dota 2 Reborn - 1920x1080 ultra (3/3) best looking | |
| Lenovo Yoga Pro 9i 16 RTX 5070 | |
| Dell 16 Premium DA16250 | |
| HP Spectre x360 16 RTX 4050 | |
| Dell XPS 16 9640 | |
| LG Gram Pro 16Z90TS-G.AU89G | |
| Asus Zenbook S 16 UM5606-RK333W | |
| X-Plane 11.11 - 1920x1080 high (fps_test=3) | |
| Lenovo Yoga Pro 9i 16 RTX 5070 | |
| Dell 16 Premium DA16250 | |
| Dell XPS 16 9640 | |
| Dell XPS 16 9640 | |
| HP Spectre x360 16 RTX 4050 | |
| Asus Zenbook S 16 UM5606-RK333W | |
| LG Gram Pro 16Z90TS-G.AU89G | |
| Assassin's Creed Shadows | |
| 1920x1080 Low | |
| Average NVIDIA GeForce RTX 5070 Laptop (39 - 100, n=9) | |
| Lenovo Yoga Pro 9i 16 RTX 5070 | |
| Dell 16 Premium DA16250 | |
| 1920x1080 Medium | |
| Average NVIDIA GeForce RTX 5070 Laptop (36 - 93, n=10) | |
| Lenovo Yoga Pro 9i 16 RTX 5070 | |
| Dell 16 Premium DA16250 | |
| 1920x1080 High | |
| Average NVIDIA GeForce RTX 5070 Laptop (32 - 77, n=11) | |
| Lenovo Yoga Pro 9i 16 RTX 5070 | |
| Dell 16 Premium DA16250 | |
| 1920x1080 Ultra High | |
| Lenovo Yoga Pro 9i 16 RTX 5070 | |
| Average NVIDIA GeForce RTX 5070 Laptop (25 - 53, n=12) | |
| Dell 16 Premium DA16250 | |
| 2560x1440 Ultra High | |
| Average NVIDIA GeForce RTX 5070 Laptop (22 - 40, n=12) | |
| Lenovo Yoga Pro 9i 16 RTX 5070 | |
| Dell 16 Premium DA16250 | |
| 2560x1440 Ultra High + DLSS Quality | |
| Average NVIDIA GeForce RTX 5070 Laptop (25 - 45, n=6) | |
| Dell 16 Premium DA16250 | |
| 2560x1440 Ultra High + GI + DLSS Quality + FG | |
| Average NVIDIA GeForce RTX 5070 Laptop (33 - 57, n=4) | |
| Dell 16 Premium DA16250 | |
| Monster Hunter Wilds | |
| 1920x1080 lowest, no upscaling | |
| Average NVIDIA GeForce RTX 5070 Laptop (69.1 - 86.5, n=3) | |
| Dell 16 Premium DA16250 | |
| 1920x1080 medium, no upscaling | |
| Average NVIDIA GeForce RTX 5070 Laptop (61.6 - 78.2, n=4) | |
| Dell 16 Premium DA16250 | |
| Black Myth: Wukong | |
| 1280x720 low TSR 100 | |
| Average NVIDIA GeForce RTX 5070 Laptop (127 - 206, n=2) | |
| Dell 16 Premium DA16250 | |
| 1920x1080 low TSR 100 | |
| Average NVIDIA GeForce RTX 5070 Laptop (83 - 197, n=4) | |
| Dell 16 Premium DA16250 | |
| 1920x1080 medium TSR 100 | |
| Average NVIDIA GeForce RTX 5070 Laptop (63 - 112, n=4) | |
| Dell 16 Premium DA16250 | |
| 1920x1080 high TSR 100 | |
| Average NVIDIA GeForce RTX 5070 Laptop (49 - 86, n=5) | |
| Dell 16 Premium DA16250 | |
| 1920x1080 cinematic TSR 100 | |
| Average NVIDIA GeForce RTX 5070 Laptop (28 - 44, n=5) | |
| Dell 16 Premium DA16250 | |
| 2560x1440 cinematic TSR 100 | |
| Average NVIDIA GeForce RTX 5070 Laptop (20 - 27, n=5) | |
| Dell 16 Premium DA16250 | |
| 2560x1440 cinematic DLSS 68 | |
| Average NVIDIA GeForce RTX 5070 Laptop (31 - 41, n=5) | |
| Dell 16 Premium DA16250 | |
| 2560x1440 cinematic RT: Very High DLSS 68 FG | |
| Average NVIDIA GeForce RTX 5070 Laptop (18 - 45, n=4) | |
| Dell 16 Premium DA16250 | |
| Alan Wake 2 | |
| 1280x720 Low Preset | |
| Dell 16 Premium DA16250 | |
| Average NVIDIA GeForce RTX 5070 Laptop (106.8 - 115.2, n=2) | |
| 1920x1080 Low Preset | |
| Average NVIDIA GeForce RTX 5070 Laptop (68.8 - 86.1, n=4) | |
| Dell 16 Premium DA16250 | |
| 1920x1080 Medium Preset | |
| Average NVIDIA GeForce RTX 5070 Laptop (68.4 - 82.4, n=4) | |
| Dell 16 Premium DA16250 | |
| 1920x1080 High Preset | |
| Average NVIDIA GeForce RTX 5070 Laptop (60 - 72.5, n=6) | |
| Dell 16 Premium DA16250 | |
| 2560x1440 High Preset | |
| Average NVIDIA GeForce RTX 5070 Laptop (35.8 - 45.1, n=6) | |
| Dell 16 Premium DA16250 | |
Cyberpunk 2077 ultra FPS Chart
| low | med. | high | ultra | QHD DLSS | QHD | 4K | |
|---|---|---|---|---|---|---|---|
| GTA V (2015) | 185.6 | 180.9 | 175.7 | 123.7 | 96.9 | ||
| Dota 2 Reborn (2015) | 168.4 | 152.9 | 147.8 | 140.4 | 106.4 | ||
| Final Fantasy XV Benchmark (2018) | 218 | 148.7 | 113.1 | 82.5 | |||
| X-Plane 11.11 (2018) | 114.3 | 110 | 91.9 | 65.7 | |||
| Strange Brigade (2018) | 507 | 282 | 232 | 204 | 140.2 | ||
| Baldur's Gate 3 (2023) | 149.5 | 125.5 | 109.8 | 109 | 107.3 | 73.8 | |
| Cyberpunk 2077 (2023) | 134.9 | 107.8 | 91 | 81.5 | 61.4 | 51.9 | |
| Alan Wake 2 (2023) | 68.8 | 68.4 | 60 | 35.8 | |||
| F1 24 (2024) | 242 | 241 | 186 | 63.8 | 62.9 | 40.3 | |
| Black Myth: Wukong (2024) | 83 | 63 | 49 | 28 | 31 | 20 | |
| Monster Hunter Wilds (2025) | 69.1 | 61.6 | |||||
| Assassin's Creed Shadows (2025) | 61 | 57 | 49 | 33 | 35 | 28 |
Emissions
System Noise
Fan noise behavior and ceiling are essentially identical to last year's model as the cooling solution and power envelope remain unchanged.
Noise level
| Idle |
| 23.2 / 23.2 / 26.6 dB(A) |
| Load |
| 39.4 / 48.9 dB(A) |
 | ||
30 dB silent 40 dB(A) audible 50 dB(A) loud |
||
min: | ||
| Dell 16 Premium DA16250 Ultra 7 255H, GeForce RTX 5070 Laptop | Dell XPS 16 9640 Ultra 7 155H, GeForce RTX 4070 Laptop GPU | HP Spectre x360 16 RTX 4050 Ultra 7 155H, GeForce RTX 4050 Laptop GPU | Lenovo Yoga Pro 9i 16 RTX 5070 Ultra 9 285H, GeForce RTX 5070 Laptop | Asus Zenbook S 16 UM5606-RK333W Ryzen AI 9 HX 370, Radeon 890M | LG Gram Pro 16Z90TS-G.AU89G Core Ultra 7 256V, Arc 140V | |
|---|---|---|---|---|---|---|
| Noise | -4% | 11% | -5% | 6% | -1% | |
| off / environment * (dB) | 23.2 | 24.5 -6% | 23.3 -0% | 24.1 -4% | 24.7 -6% | 25.2 -9% |
| Idle Minimum * (dB) | 23.2 | 24.5 -6% | 23.6 -2% | 24.1 -4% | 24.7 -6% | 25.2 -9% |
| Idle Average * (dB) | 23.2 | 24.5 -6% | 23.6 -2% | 24.1 -4% | 24.7 -6% | 25.2 -9% |
| Idle Maximum * (dB) | 26.6 | 27.5 -3% | 23.6 11% | 25.1 6% | 26.4 1% | 27.7 -4% |
| Load Average * (dB) | 39.4 | 39.6 -1% | 29.2 26% | 44.2 -12% | 35.7 9% | |
| Cyberpunk 2077 ultra * (dB) | 47.3 | 52.7 -11% | 36.8 22% | 42.6 10% | ||
| Load Maximum * (dB) | 48.9 | 49.7 -2% | 32.1 34% | 52.7 -8% | 36.8 25% | 42.7 13% |
| Witcher 3 ultra * (dB) | 49.7 | 32.1 |
* ... smaller is better
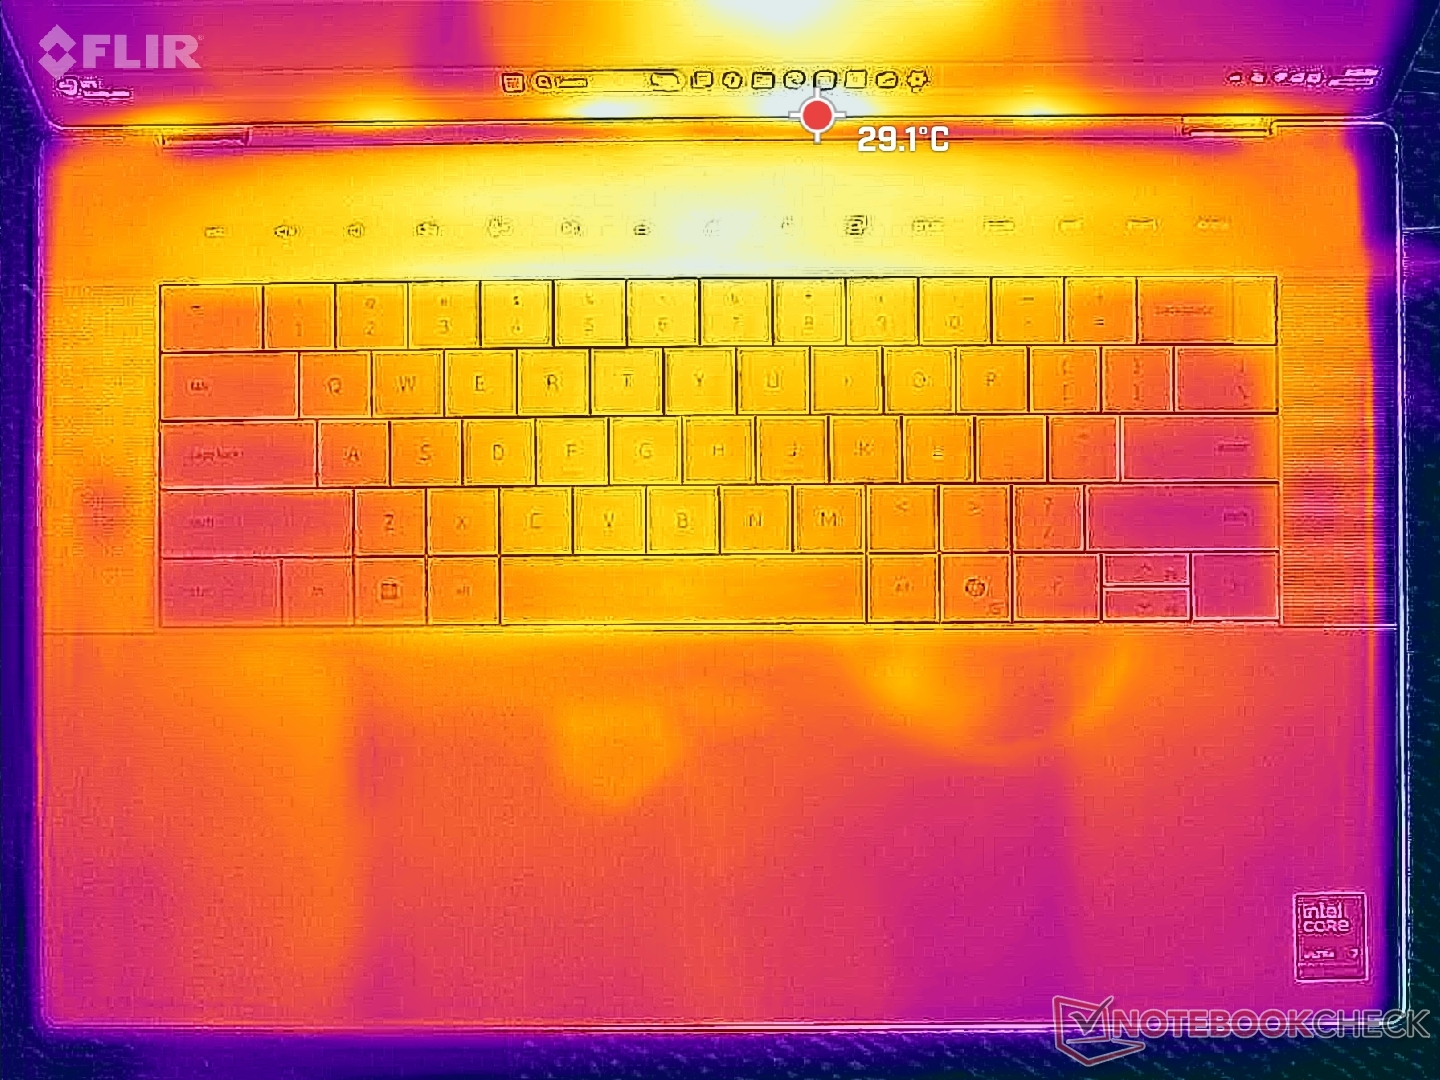
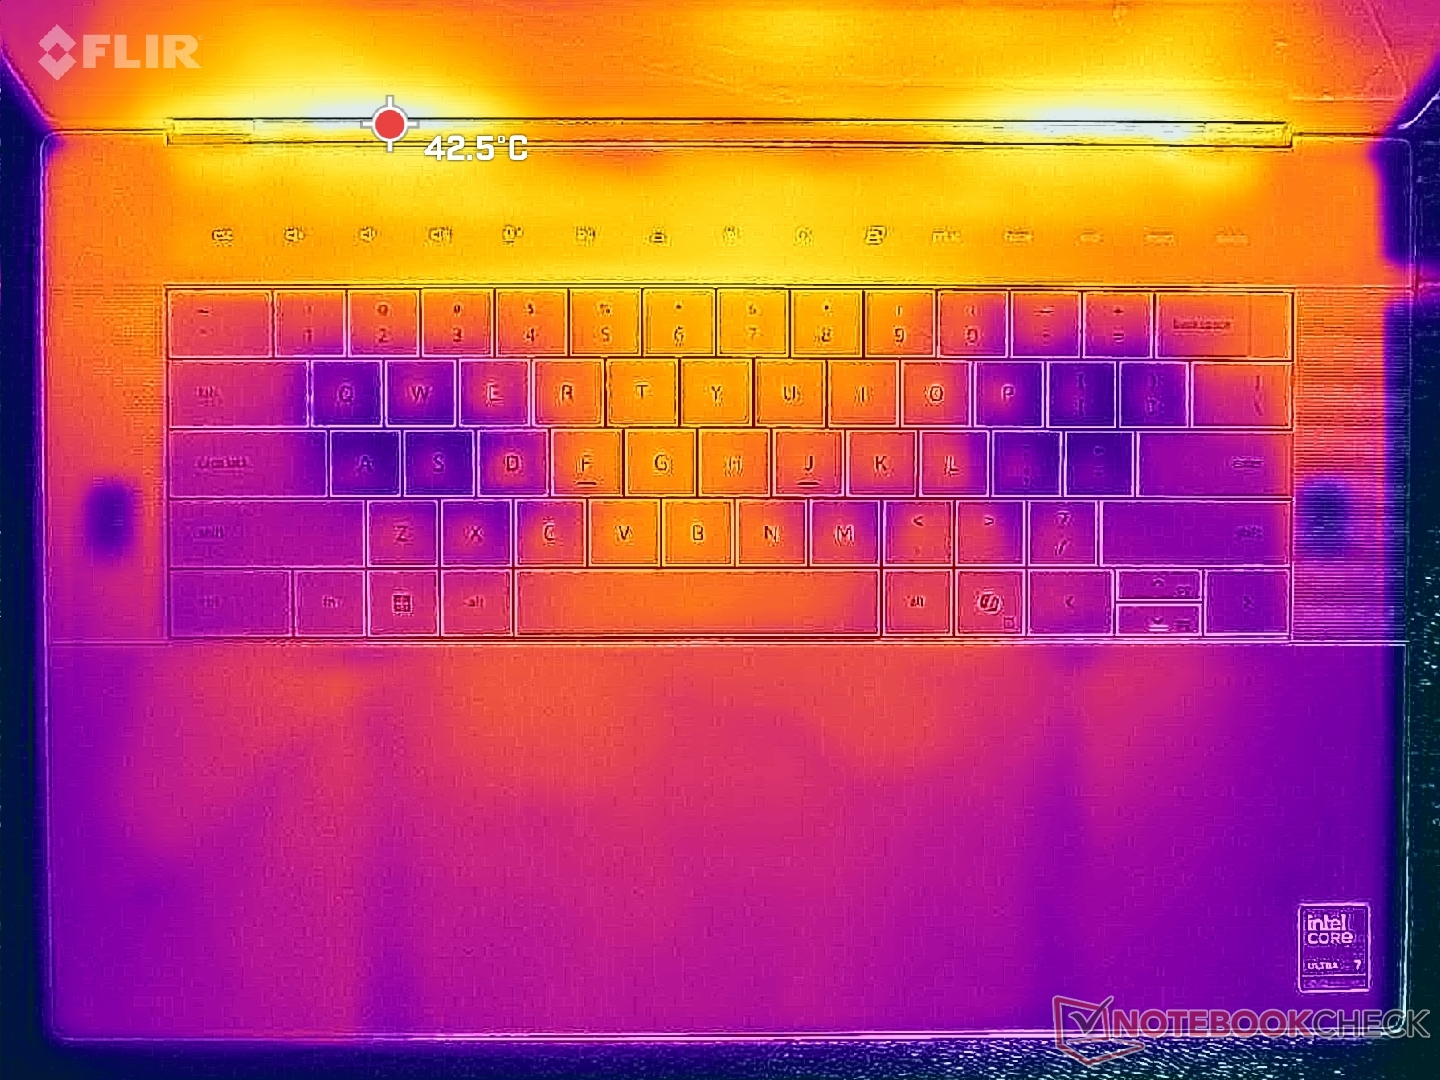
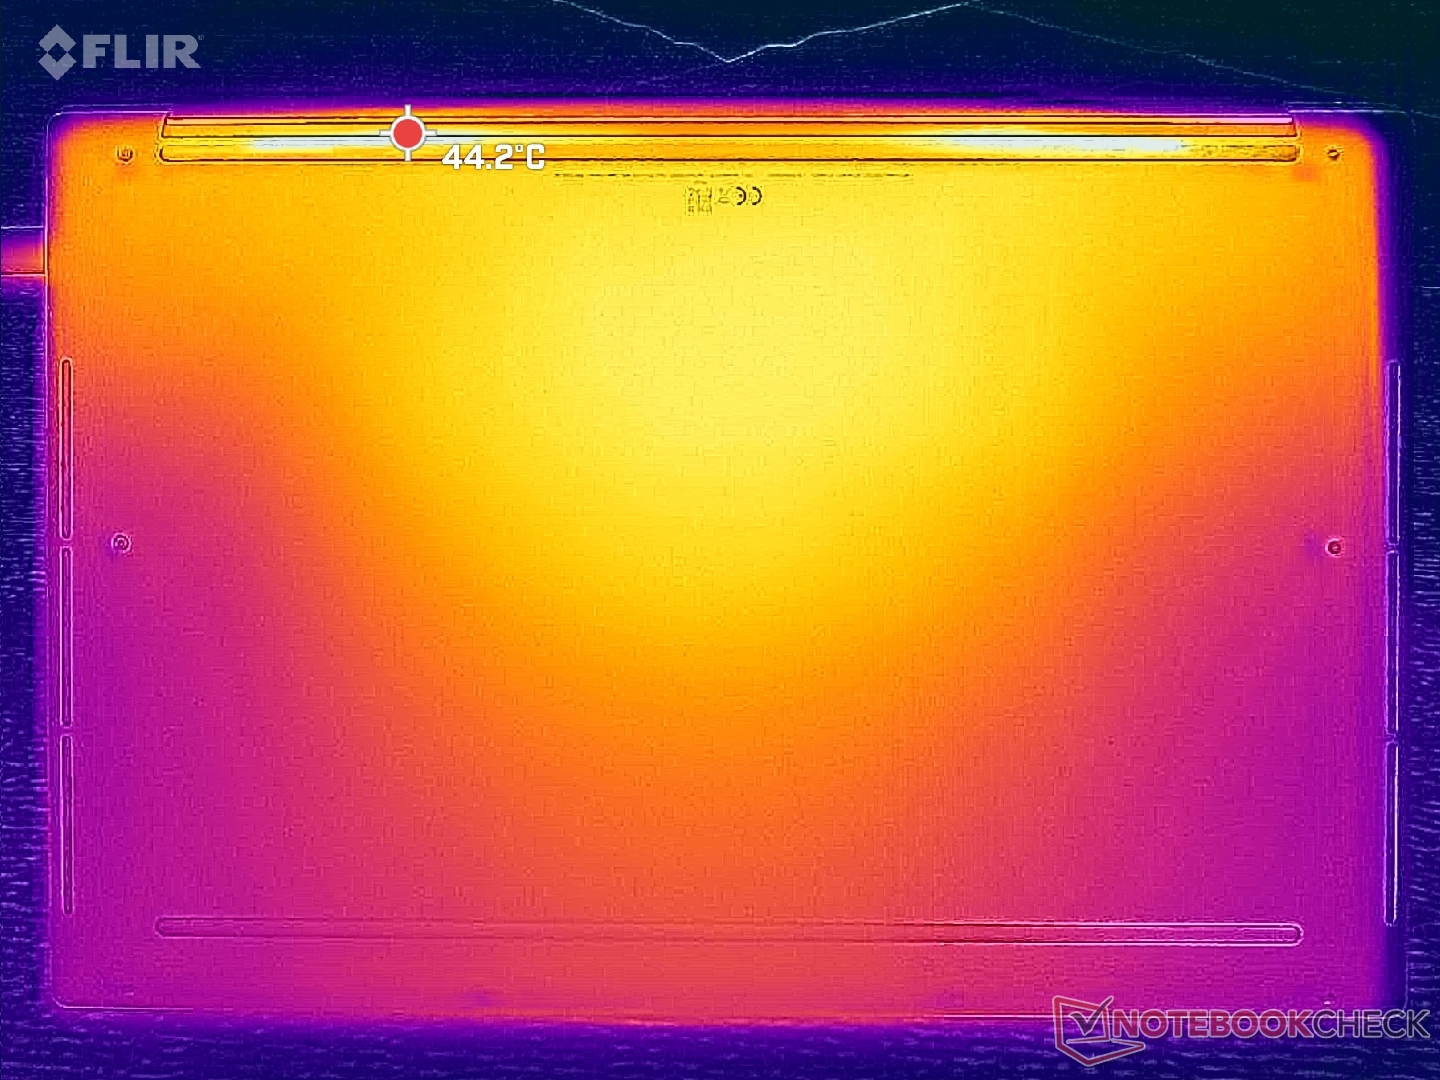
Temperature
Hot spots on the bottom cover near the vents can reach almost 45 C when running demanding loads. We can't help but to wonder if additional ventilation holes would have improved overall temperatures, but Dell are clearly prioritizing the cleaner vent-free visual design a la the MacBook series.
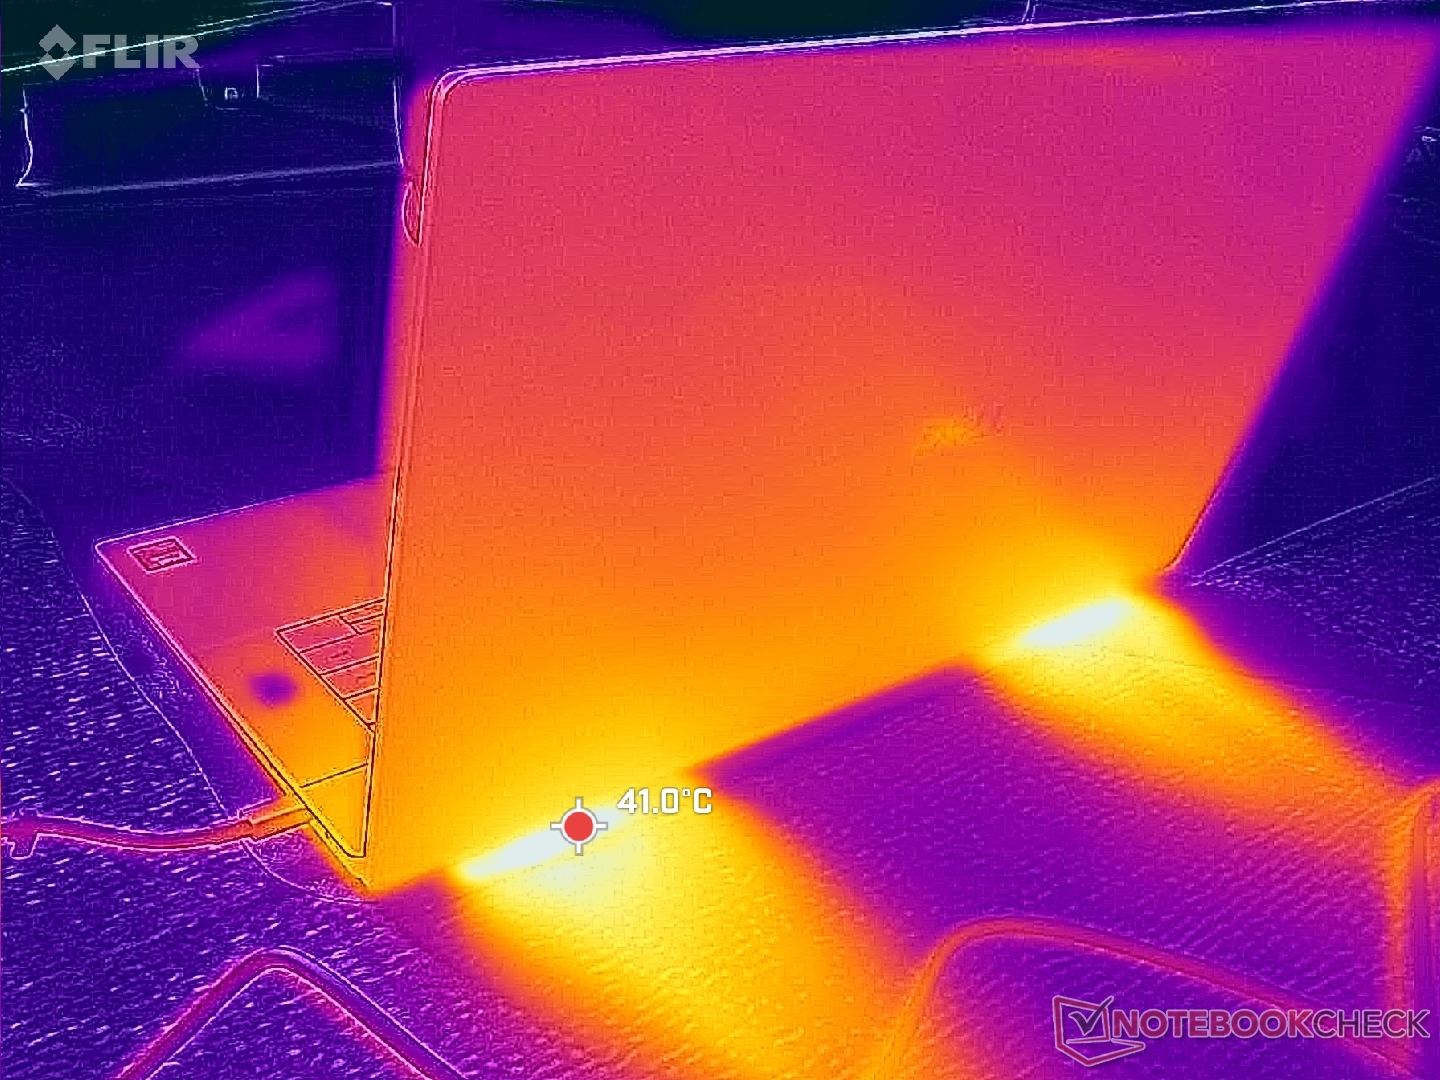
(+) The maximum temperature on the upper side is 36.8 °C / 98 F, compared to the average of 36.8 °C / 98 F, ranging from 21 to 71 °C for the class Multimedia.
(+) The bottom heats up to a maximum of 34.8 °C / 95 F, compared to the average of 39.1 °C / 102 F
(+) In idle usage, the average temperature for the upper side is 28.7 °C / 84 F, compared to the device average of 31.3 °C / 88 F.
(+) The palmrests and touchpad are cooler than skin temperature with a maximum of 28.6 °C / 83.5 F and are therefore cool to the touch.
(±) The average temperature of the palmrest area of similar devices was 28.7 °C / 83.7 F (+0.1 °C / 0.2 F).

| Dell 16 Premium DA16250 Ultra 7 255H, GeForce RTX 5070 Laptop | Dell XPS 16 9640 Ultra 7 155H, GeForce RTX 4070 Laptop GPU | HP Spectre x360 16 RTX 4050 Ultra 7 155H, GeForce RTX 4050 Laptop GPU | Lenovo Yoga Pro 9i 16 RTX 5070 Ultra 9 285H, GeForce RTX 5070 Laptop | Asus Zenbook S 16 UM5606-RK333W Ryzen AI 9 HX 370, Radeon 890M | LG Gram Pro 16Z90TS-G.AU89G Core Ultra 7 256V, Arc 140V | |
|---|---|---|---|---|---|---|
| Heat | 2% | -4% | -7% | -19% | -5% | |
| Maximum Upper Side * (°C) | 36.8 | 39.4 -7% | 39.6 -8% | 41.8 -14% | 46.9 -27% | 40.5 -10% |
| Maximum Bottom * (°C) | 34.8 | 36.9 -6% | 39.2 -13% | 47.9 -38% | 53.5 -54% | 45 -29% |
| Idle Upper Side * (°C) | 31.2 | 28.2 10% | 29 7% | 26.3 16% | 29.5 5% | 27.1 13% |
| Idle Bottom * (°C) | 30.8 | 27.4 11% | 31.6 -3% | 27.6 10% | 30.2 2% | 28.8 6% |
* ... smaller is better
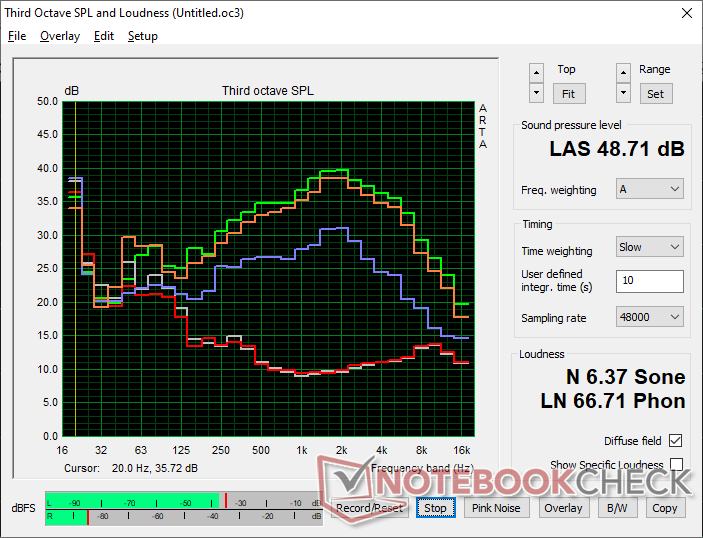
Speakers
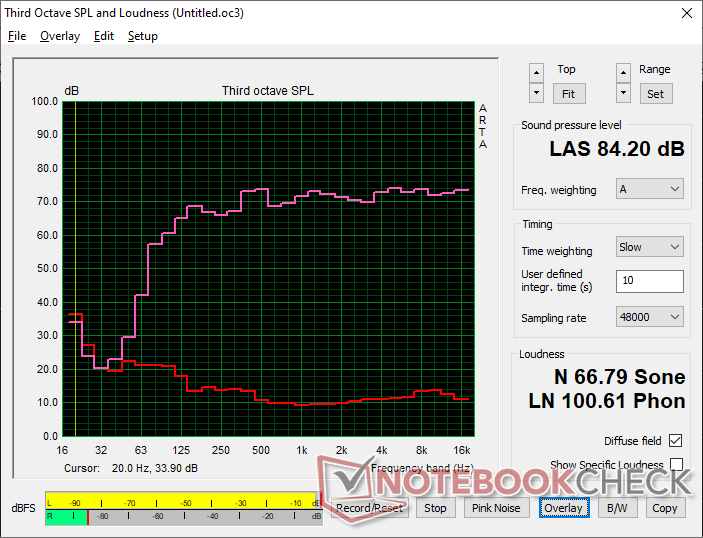
Dell 16 Premium DA16250 audio analysis
(+) | speakers can play relatively loud (84.2 dB)
Bass 100 - 315 Hz
(±) | reduced bass - on average 6.1% lower than median
(+) | bass is linear (4.2% delta to prev. frequency)
Mids 400 - 2000 Hz
(+) | balanced mids - only 1.4% away from median
(+) | mids are linear (3.6% delta to prev. frequency)
Highs 2 - 16 kHz
(+) | balanced highs - only 1.5% away from median
(+) | highs are linear (2.2% delta to prev. frequency)
Overall 100 - 16.000 Hz
(+) | overall sound is linear (5.1% difference to median)
Compared to same class
» 1% of all tested devices in this class were better, 0% similar, 99% worse
» The best had a delta of 5%, average was 17%, worst was 45%
Compared to all devices tested
» 0% of all tested devices were better, 0% similar, 100% worse
» The best had a delta of 4%, average was 23%, worst was 134%
Apple MacBook Pro 16 2021 M1 Pro audio analysis
(+) | speakers can play relatively loud (84.7 dB)
Bass 100 - 315 Hz
(+) | good bass - only 3.8% away from median
(+) | bass is linear (5.2% delta to prev. frequency)
Mids 400 - 2000 Hz
(+) | balanced mids - only 1.3% away from median
(+) | mids are linear (2.1% delta to prev. frequency)
Highs 2 - 16 kHz
(+) | balanced highs - only 1.9% away from median
(+) | highs are linear (2.7% delta to prev. frequency)
Overall 100 - 16.000 Hz
(+) | overall sound is linear (4.6% difference to median)
Compared to same class
» 0% of all tested devices in this class were better, 0% similar, 100% worse
» The best had a delta of 5%, average was 17%, worst was 45%
Compared to all devices tested
» 0% of all tested devices were better, 0% similar, 100% worse
» The best had a delta of 4%, average was 23%, worst was 134%
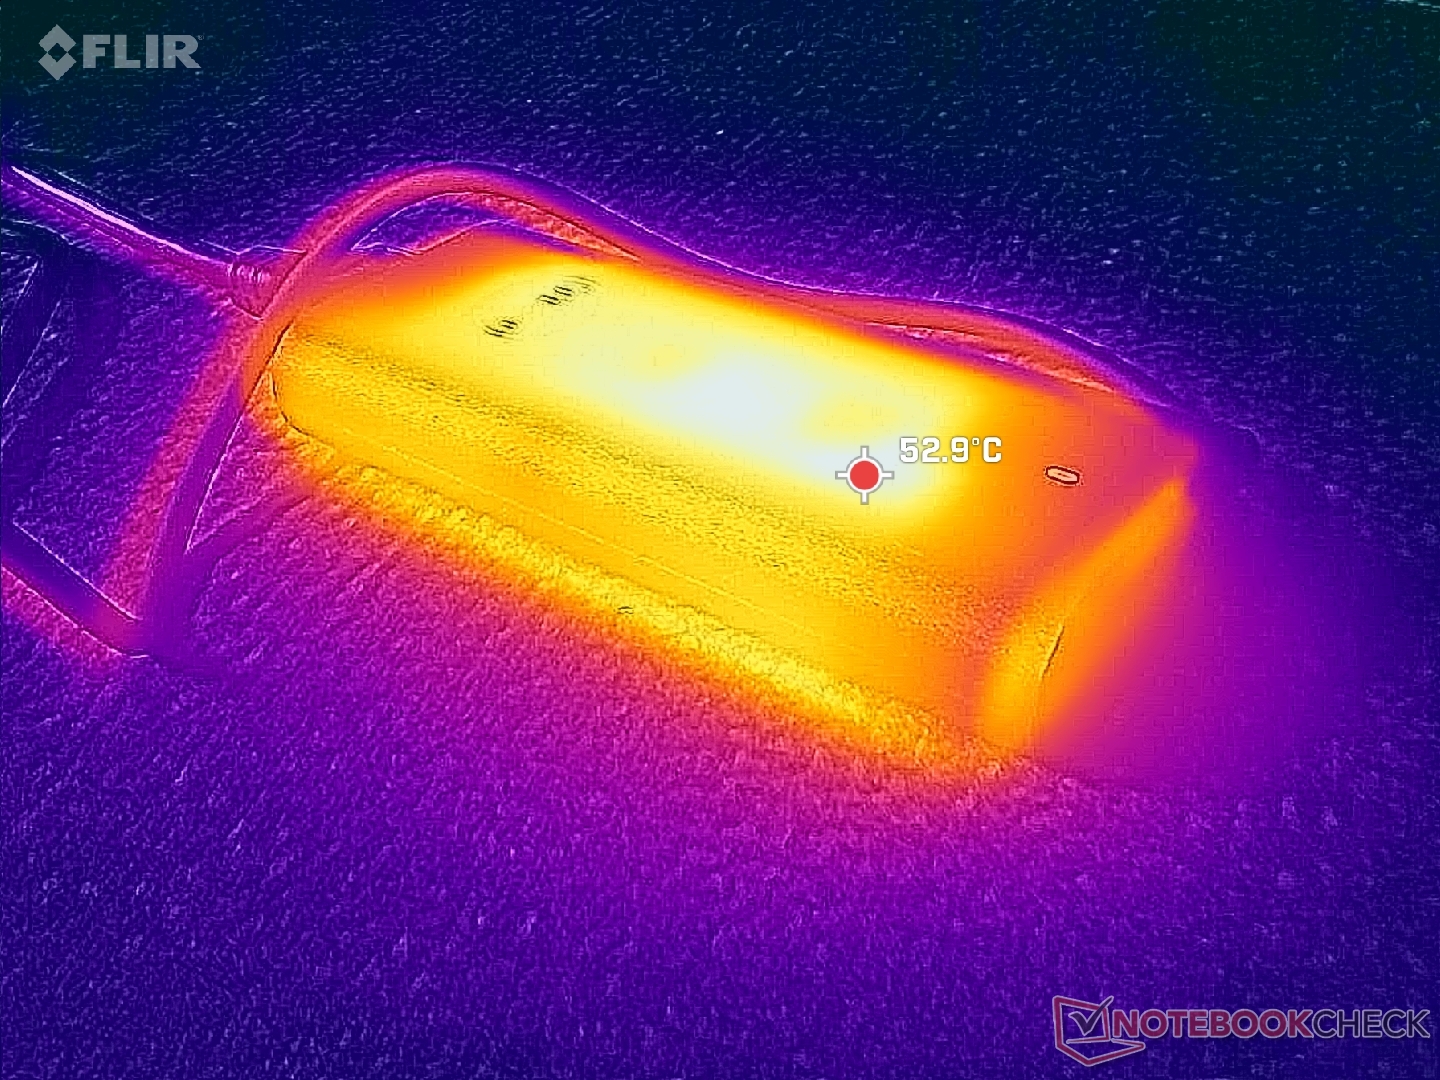
Energy Management
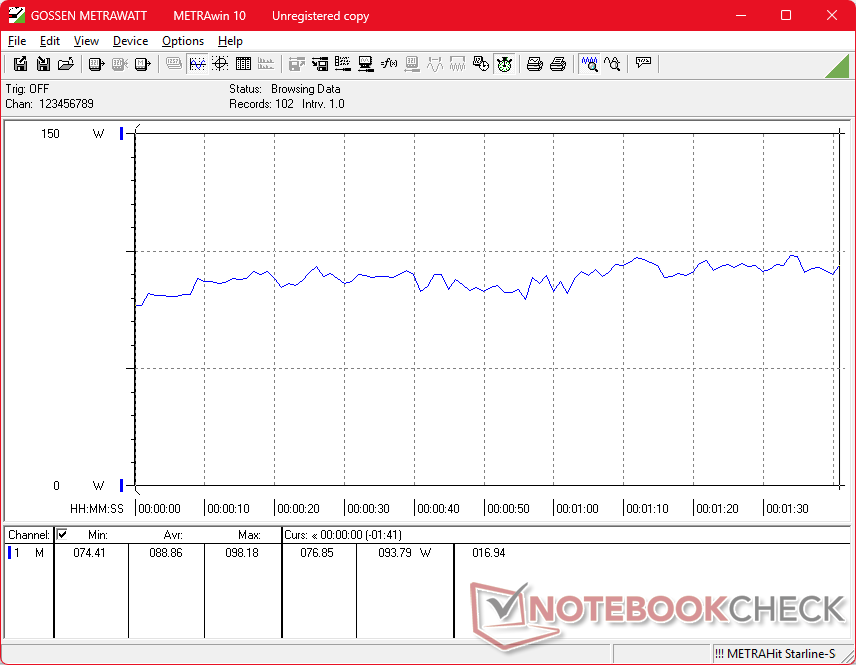
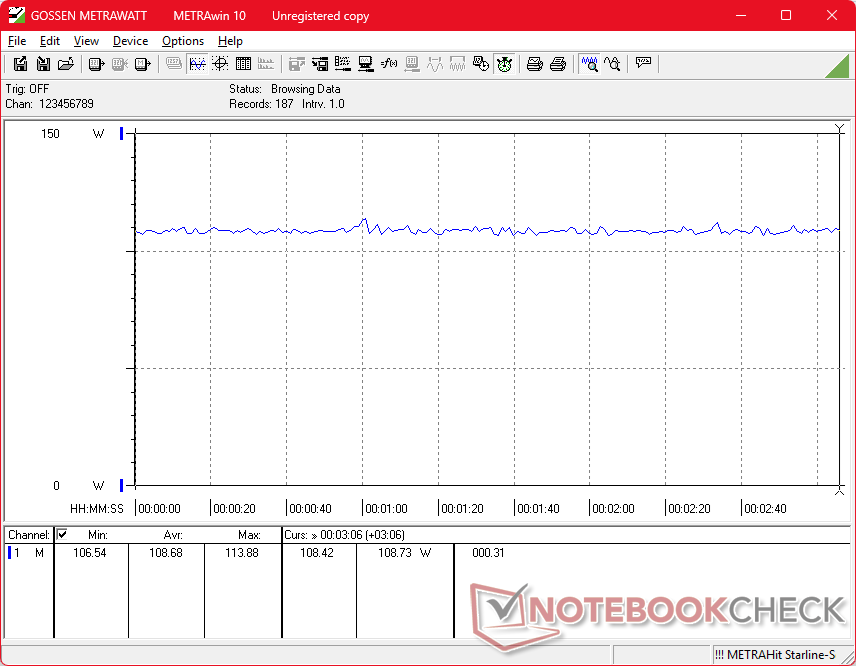
Power Consumption
Idling on desktop can draw as low as 6 W when on Power Saver mode with the iGPU active or up to 33 W on Performance mode with the dGPU active and the OLED screen displaying mostly white colors (such as when browsing). Consumption when running more demanding loads is otherwise similar to last year's model if not slightly less for improved performance-per-watt especially since the Dell 16 Premium ships with the same 130 W USB-C AC adapter (~12.8 x 5.5 x 2.3 cm) as before.
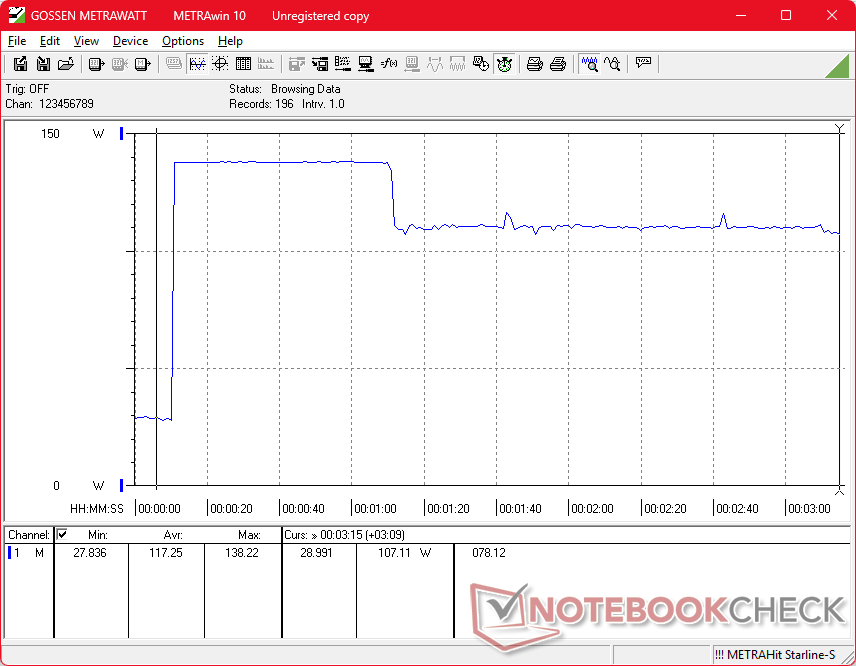
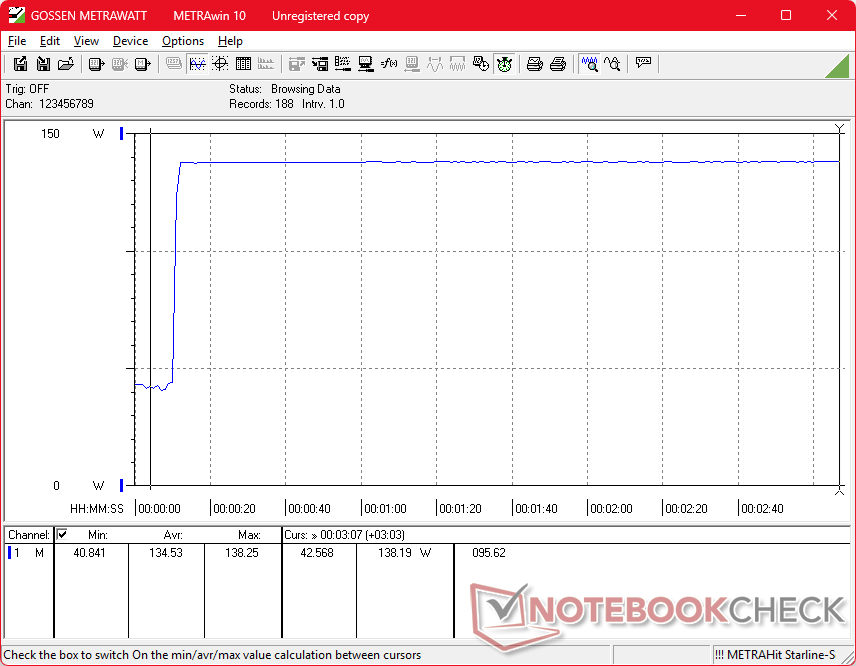
Note that power consumption is higher during the start of the Prime95 stress test when Turbo Boost potential is highest.
| Off / Standby | |
| Idle | |
| Load |
|
Key:
min: | |
| Dell 16 Premium DA16250 Ultra 7 255H, GeForce RTX 5070 Laptop, Kioxia BG6 KBG6AZNV1T02, OLED, 3840x2400, 16.3" | Dell XPS 16 9640 Ultra 7 155H, GeForce RTX 4070 Laptop GPU, Kioxia XG8 KXG80ZNV1T02, OLED, 3840x2400, 16.3" | HP Spectre x360 16 RTX 4050 Ultra 7 155H, GeForce RTX 4050 Laptop GPU, SK hynix PC801 HFS001TEJ9X101N, OLED, 2880x1800, 16" | Lenovo Yoga Pro 9i 16 RTX 5070 Ultra 9 285H, GeForce RTX 5070 Laptop, WD PC SN7100S SDFPMSL-1T00-1101, OLED, 3200x2000, 16" | Asus Zenbook S 16 UM5606-RK333W Ryzen AI 9 HX 370, Radeon 890M, Micron 2400 MTFDKBA1T0QFM, OLED, 2880x1800, 16" | LG Gram Pro 16Z90TS-G.AU89G Core Ultra 7 256V, Arc 140V, Samsung PM9A1a MZVL21T0HDLU, IPS, 2560x1600, 16" | |
|---|---|---|---|---|---|---|
| Power Consumption | 7% | -5% | -29% | 39% | 50% | |
| Idle Minimum * (Watt) | 6.5 | 7.7 -18% | 5.8 11% | 8.8 -35% | 5.4 17% | 4.15 36% |
| Idle Average * (Watt) | 8.1 | 10.3 -27% | 12.3 -52% | 16.1 -99% | 10.5 -30% | 5.4 33% |
| Idle Maximum * (Watt) | 33 | 10.6 68% | 33.9 -3% | 16.5 50% | 10.9 67% | 12.4 62% |
| Load Average * (Watt) | 88.9 | 76.5 14% | 83.3 6% | 89.3 -0% | 47.8 46% | |
| Cyberpunk 2077 ultra external monitor * (Watt) | 108.9 | 157.9 -45% | 46.7 57% | 48.1 56% | ||
| Cyberpunk 2077 ultra * (Watt) | 108.7 | 160.6 -48% | 49.2 55% | 48.2 56% | ||
| Load Maximum * (Watt) | 138.3 | 138.5 -0% | 120.8 13% | 177.4 -28% | 58.6 58% | 60.049 57% |
| Witcher 3 ultra * (Watt) | 126.4 | 89.1 |
* ... smaller is better
Power Consumption Cyberpunk / Stress Test
Power Consumption external Monitor
Battery Life
Runtimes are roughly the same as before despite the processor upgrades and faster 120 Hz refresh rate.
| Dell 16 Premium DA16250 Ultra 7 255H, GeForce RTX 5070 Laptop, 99.5 Wh | Dell XPS 16 9640 Ultra 7 155H, GeForce RTX 4070 Laptop GPU, 99.5 Wh | HP Spectre x360 16 RTX 4050 Ultra 7 155H, GeForce RTX 4050 Laptop GPU, 83 Wh | Lenovo Yoga Pro 9i 16 RTX 5070 Ultra 9 285H, GeForce RTX 5070 Laptop, 84 Wh | Asus Zenbook S 16 UM5606-RK333W Ryzen AI 9 HX 370, Radeon 890M, 78 Wh | LG Gram Pro 16Z90TS-G.AU89G Core Ultra 7 256V, Arc 140V, 77 Wh | |
|---|---|---|---|---|---|---|
| Battery runtime | -5% | 0% | 1% | -3% | 78% | |
| WiFi v1.3 (h) | 11 | 10.5 -5% | 11 0% | 11.1 1% | 10.7 -3% | 19.6 78% |
| H.264 (h) | 16.5 | 14.4 | 20.1 | |||
| Load (h) | 1.5 | 1.8 |
Notebookcheck Rating
The Dell 16 Premium offers the same user experience as the XPS 16 9640 but with faster and more efficient processors and a 120 Hz OLED display option.
Dell 16 Premium DA16250
- 10/31/2025 v8
Allen Ngo
 Total Sustainability Score:
 Potential Competitors in Comparison
Image | Model / Review | Price | Weight | Height | Display |
|---|---|---|---|---|---|
1. 87.9%  | Dell 16 Premium DA16250 Intel Core Ultra 7 255H ⎘ NVIDIA GeForce RTX 5070 Laptop ⎘ 32 GB Memory, 1024 GB SSD | Amazon: List Price: 3300 USD | 2.3 kg | 18.7 mm | 16.30" 3840x2400 278 PPI OLED |
2. 88.6% v7 (old)  | Dell XPS 16 9640 Intel Core Ultra 7 155H ⎘ NVIDIA GeForce RTX 4070 Laptop GPU ⎘ 32 GB Memory, 1024 GB SSD | Amazon: 1. $2,199.00 New XPS 16 9640 Business Lap... 2. $2,499.00 Dell XPS 16 9640 16.3" Touch... 3. $2,199.00 New XPS 16 9640 Powerful AI ... | 2.3 kg | 18.7 mm | 16.30" 3840x2400 139 PPI OLED |
3. 91.1% v7 (old)  | HP Spectre x360 16 RTX 4050 Intel Core Ultra 7 155H ⎘ NVIDIA GeForce RTX 4050 Laptop GPU ⎘ 16 GB Memory, 1024 GB SSD | Amazon: List Price: 1600 USD | 2 kg | 19.8 mm | 16.00" 2880x1800 212 PPI OLED |
4. 90.4%  | Lenovo Yoga Pro 9i 16 RTX 5070 Intel Core Ultra 9 285H ⎘ NVIDIA GeForce RTX 5070 Laptop ⎘ 64 GB Memory, 1024 GB SSD | Amazon: List Price: 2800€ | 1.9 kg | 17.9 mm | 16.00" 3200x2000 236 PPI OLED |
5. 84.7%  | Asus Zenbook S 16 UM5606-RK333W AMD Ryzen AI 9 HX 370 ⎘ AMD Radeon 890M ⎘ 32 GB Memory, 1024 GB SSD | Amazon: List Price: 2100€ | 1.5 kg | 12.9 mm | 16.00" 2880x1800 212 PPI OLED |
6. 83.9%  | LG Gram Pro 16Z90TS-G.AU89G Intel Core Ultra 7 256V ⎘ Intel Arc Graphics 140V ⎘ 16 GB Memory, 1024 GB SSD | Amazon: List Price: 2050€ | 1.2 kg | 13 mm | 16.00" 2560x1600 189 PPI IPS |
Transparency
The selection of devices to be reviewed is made by our editorial team. The test sample was provided to the author as a loan by the manufacturer or retailer for the purpose of this review. The lender had no influence on this review, nor did the manufacturer receive a copy of this review before publication. There was no obligation to publish this review. As an independent media company, Notebookcheck is not subjected to the authority of manufacturers, retailers or publishers.
This is how Notebookcheck is testing
Every year, Notebookcheck independently reviews hundreds of laptops and smartphones using standardized procedures to ensure that all results are comparable. We have continuously developed our test methods for around 20 years and set industry standards in the process. In our test labs, high-quality measuring equipment is utilized by experienced technicians and editors. These tests involve a multi-stage validation process. Our complex rating system is based on hundreds of well-founded measurements and benchmarks, which maintains objectivity. Further information on our test methods can be found here.
