Verdict — Leaner And Lighter Than Before
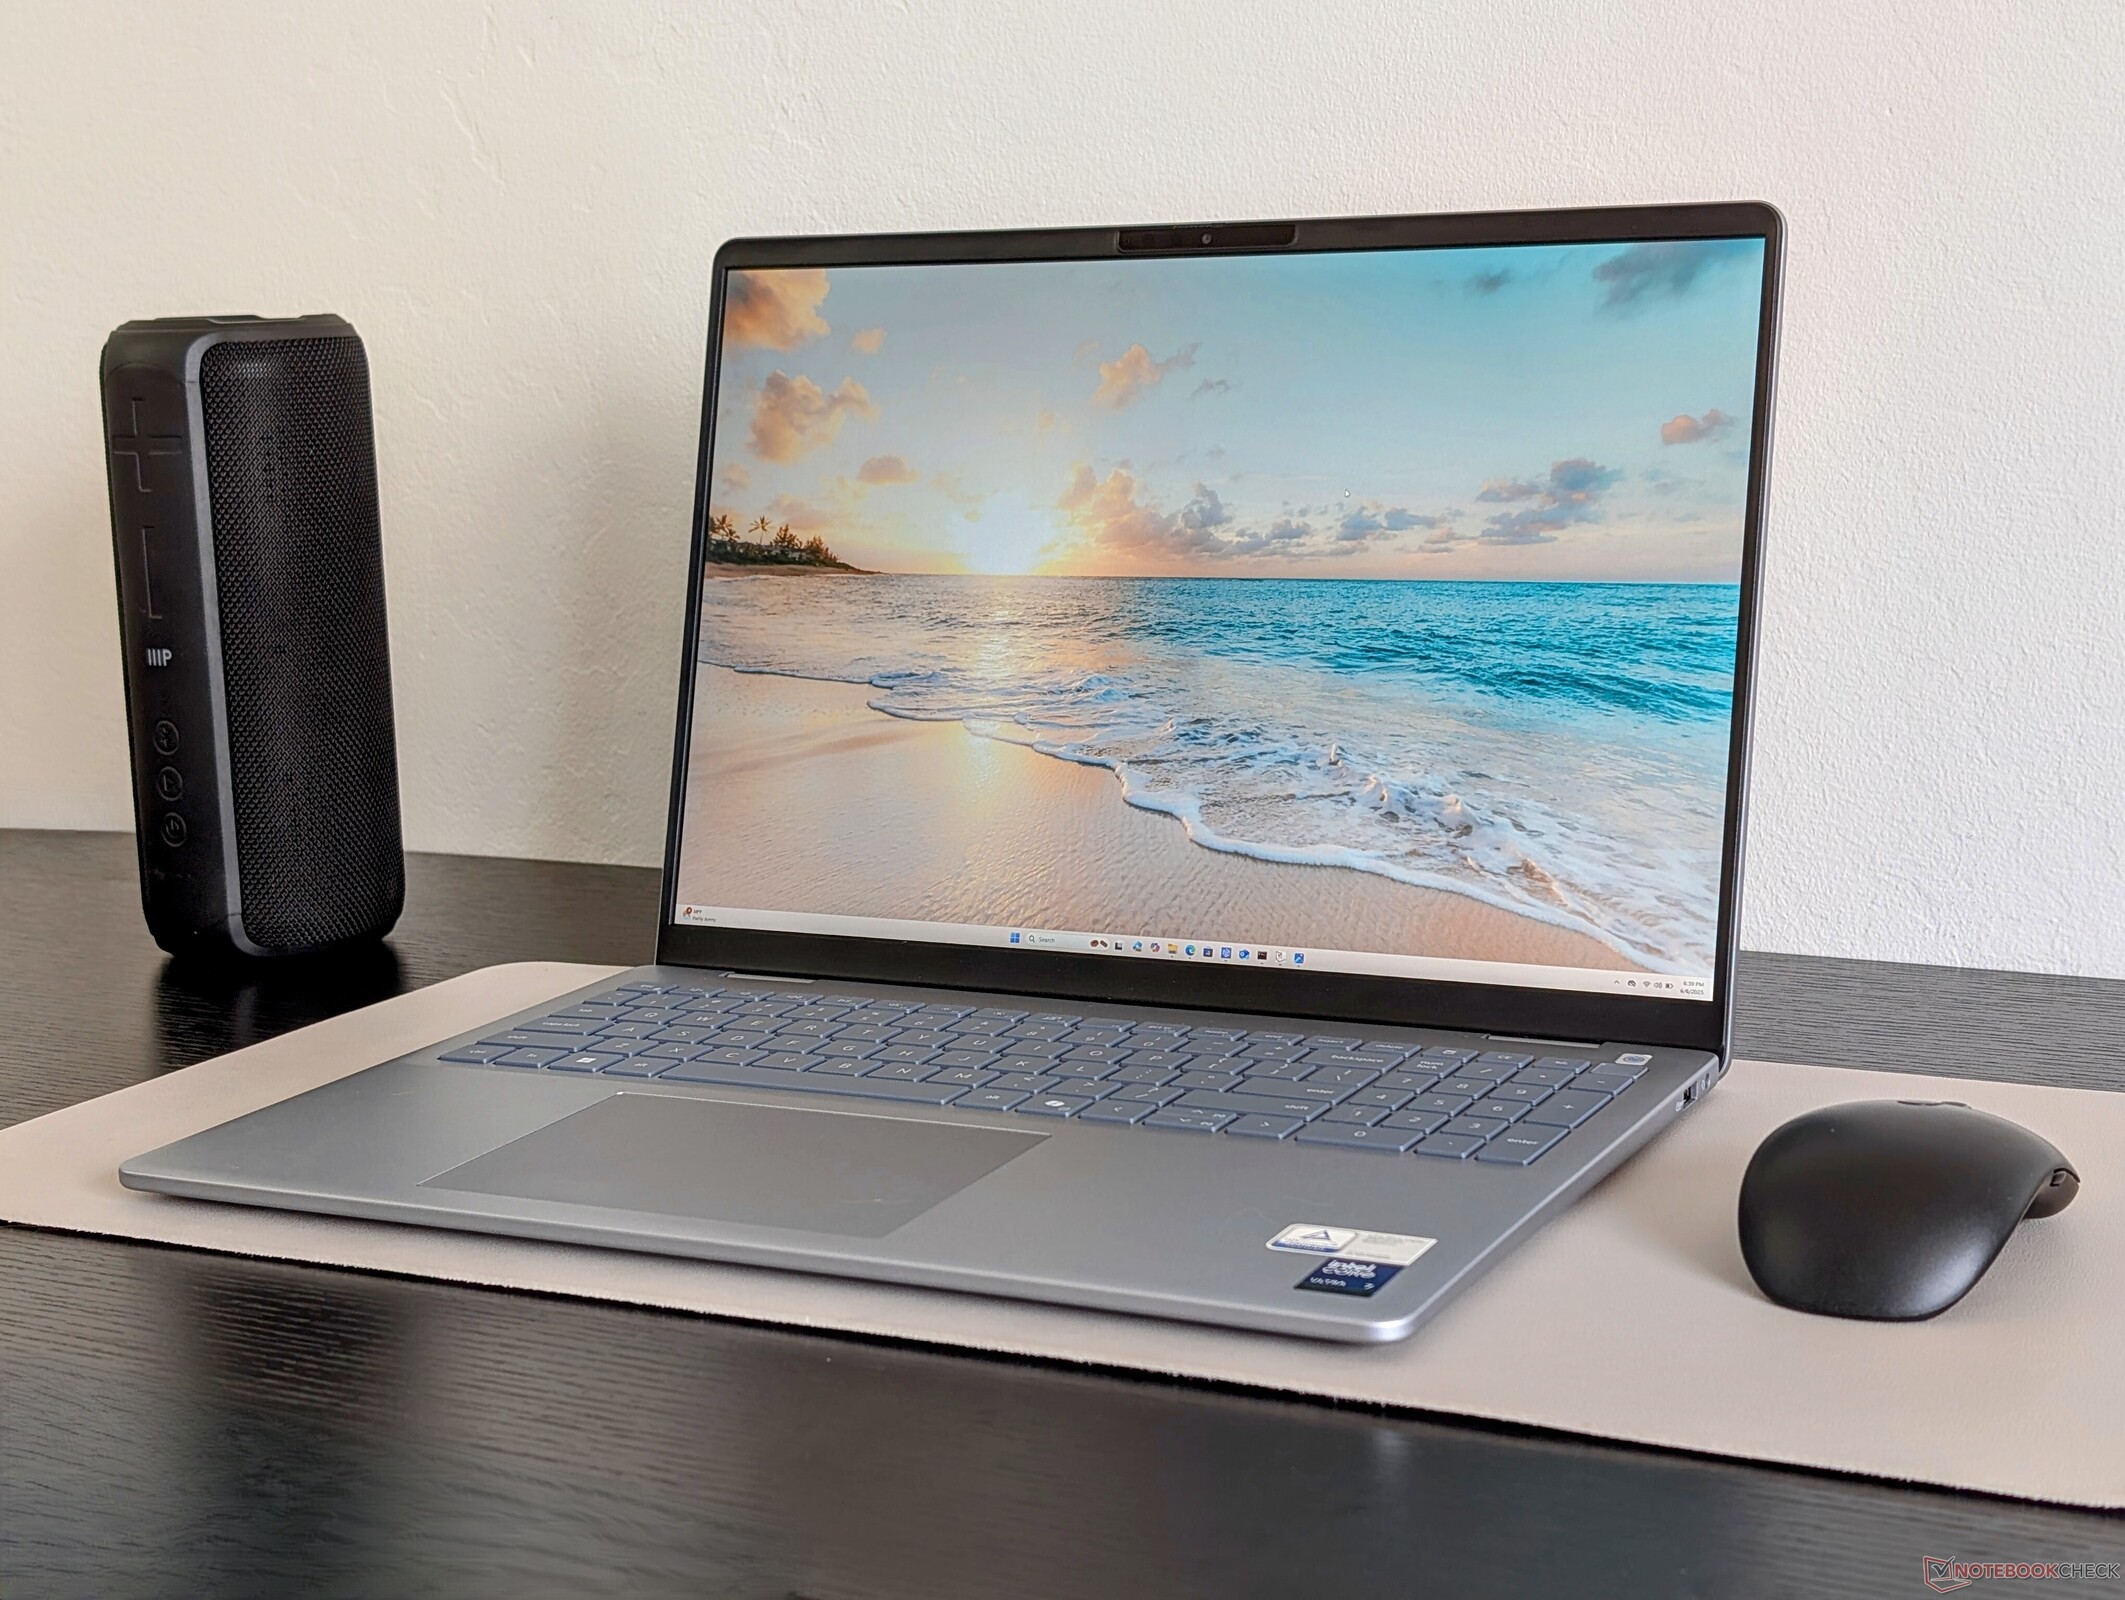
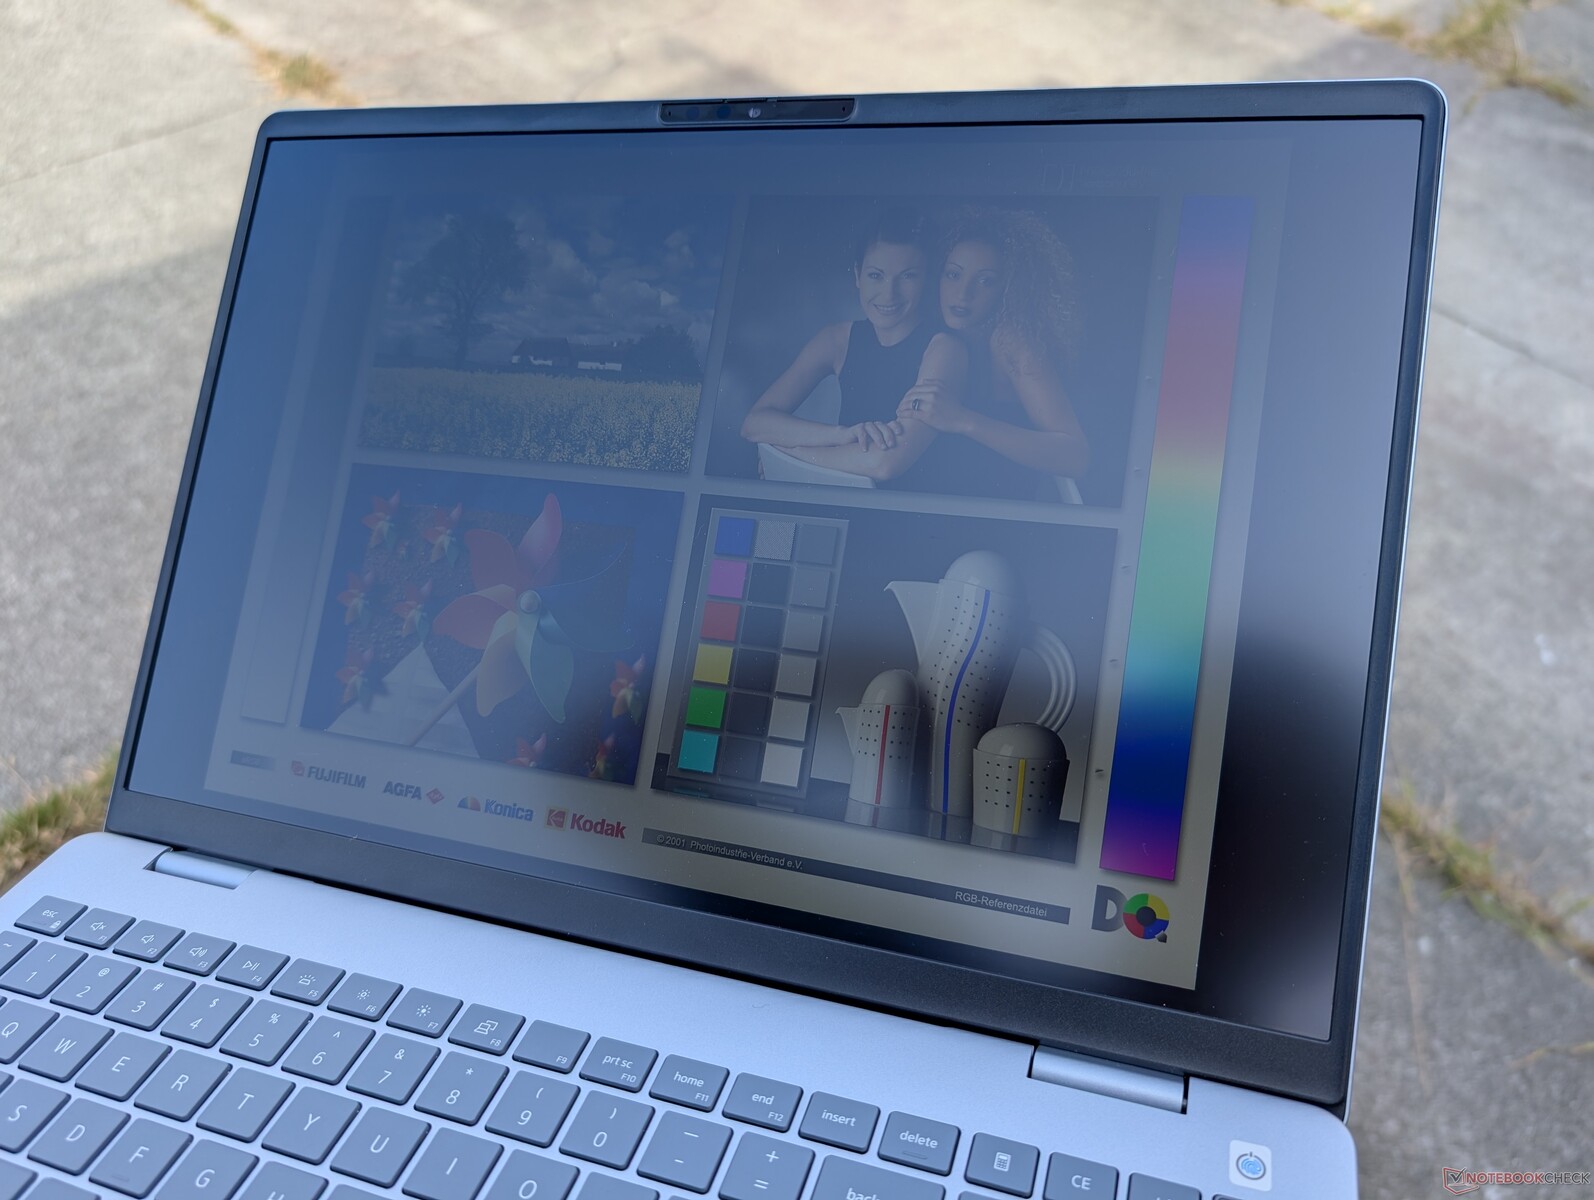
Although it may look a lot like its predecessor the Inspiron 16 Plus 7640, the Dell 16 Plus is a different beast all thanks to the change from a Core Ultra-H CPU to the newer Lunar Lake Core Ultra-V. The result is a leaner, lighter, and longer-lasting machine that should better suit a more general multimedia audience. We also appreciate that its 1600p120 IPS display comes standard meaning there are no "low-end" options with poor panels or colors.
The main sticking point about the Dell 16 Plus is its lack of performance for more demanding applications. The older Inspiron 16 Plus 7640 or Inspiron 16 7640 2-in-1 carry Core-H or discrete GPU options for much faster performance than the Dell 16 Plus. They also offer the same or even better viewing experience for roughly the same price. Users who don't need the extra horsepower will find the Dell 16 Plus to be the more appropriate option for traveling and occasional editing. Otherwise, the more powerful Dell Premium series should be considered.
Pros
Cons
Price and Availability
Dell is now shipping the Dell 16 Plus starting at $1150 as configured in our review. The Core Ultra 9 option is also shipping on Amazon for $1400.
The Dell 16 Plus replaces the last generation Inspiron 16 Plus series. While the name and processor options may be quite different, its physical features still borrow heavily from last year's Inspiron 16 Plus 7640 or Inspiron 16 7640 2-in-1 as our review will show.
Our test unit is a middle configuration with the Core Ultra 7 256V and 1600p120 IPS display starting at $1150. Higher-end SKUs offer the Core Ultra 7 258V or Core Ultra 9 288V with double the RAM and storage for $1650 while other display options include 1200p IPS or 1600p Mini-LED.
Competitors in this space include other midrange multimedia 16-inch laptops like the Lenovo IdeaPad Pro 5 16, HP Pavilion Plus 16, or Asus Vivobook 16.
More Dell reviews:
Specifications
Case
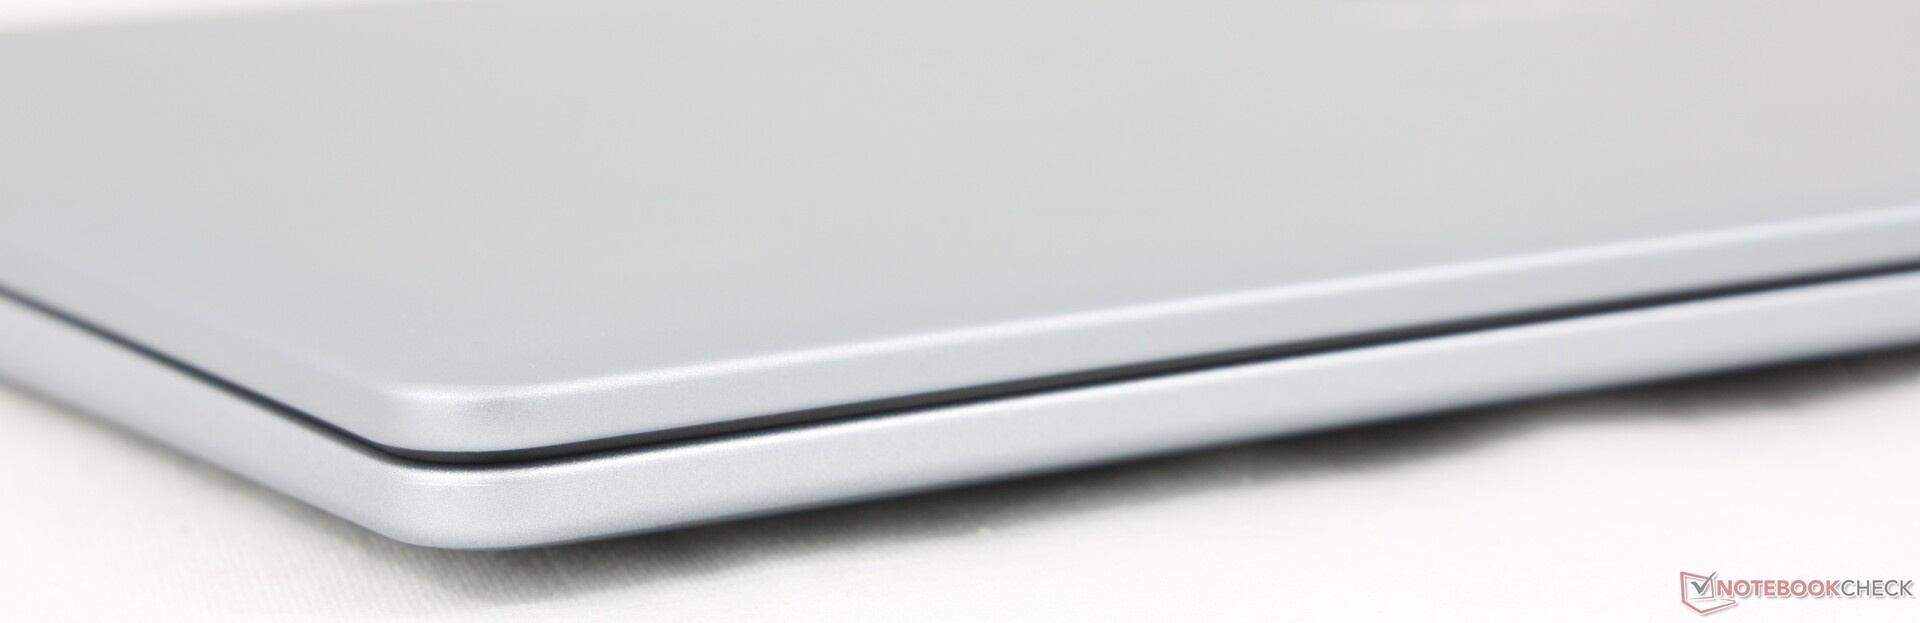
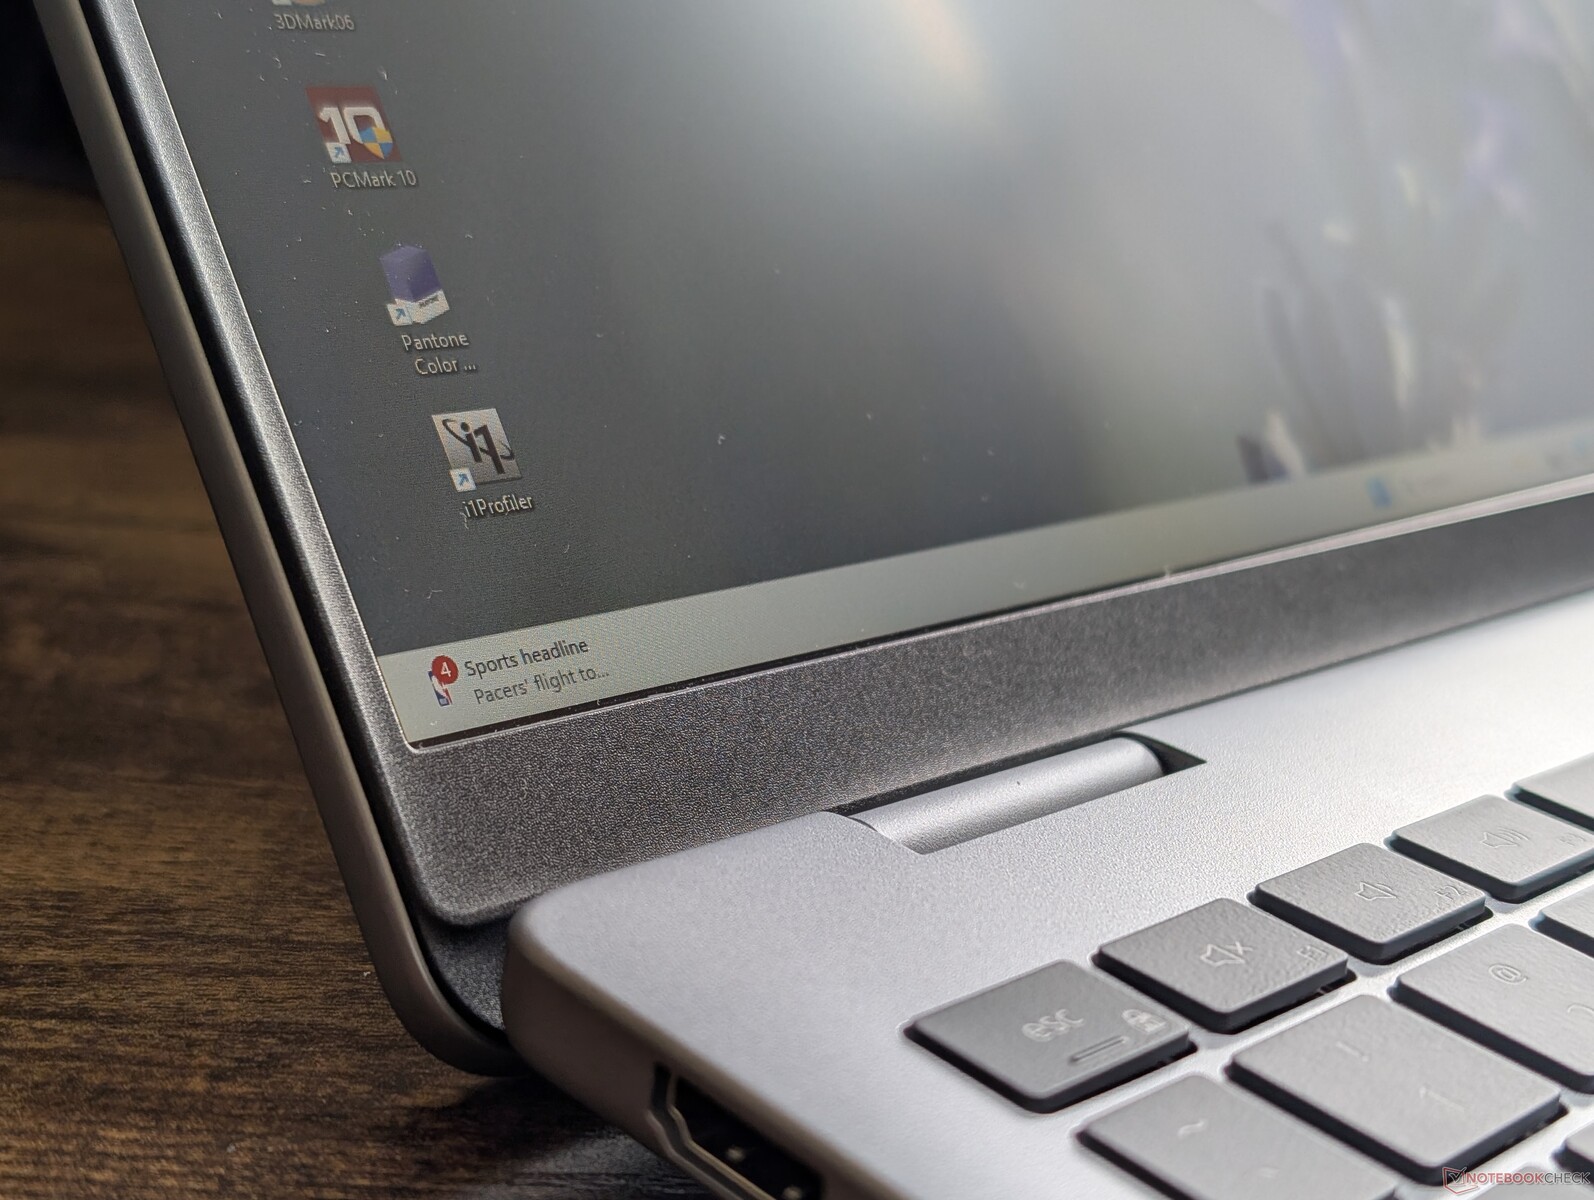
The smooth matte silver chassis should look and feel instantly familiar to anyone who has had experience with an Inspiron model. The materials and design have remained largely the same as the previous generation for similar first impressions. The chassis and lid bend more readily when compared to pricier alternatives like the XPS 16 or Lenovo Yoga Pro 9 16, but it's otherwise comparable to the HP Pavilion Plus 16 or Asus Vivobook 16.
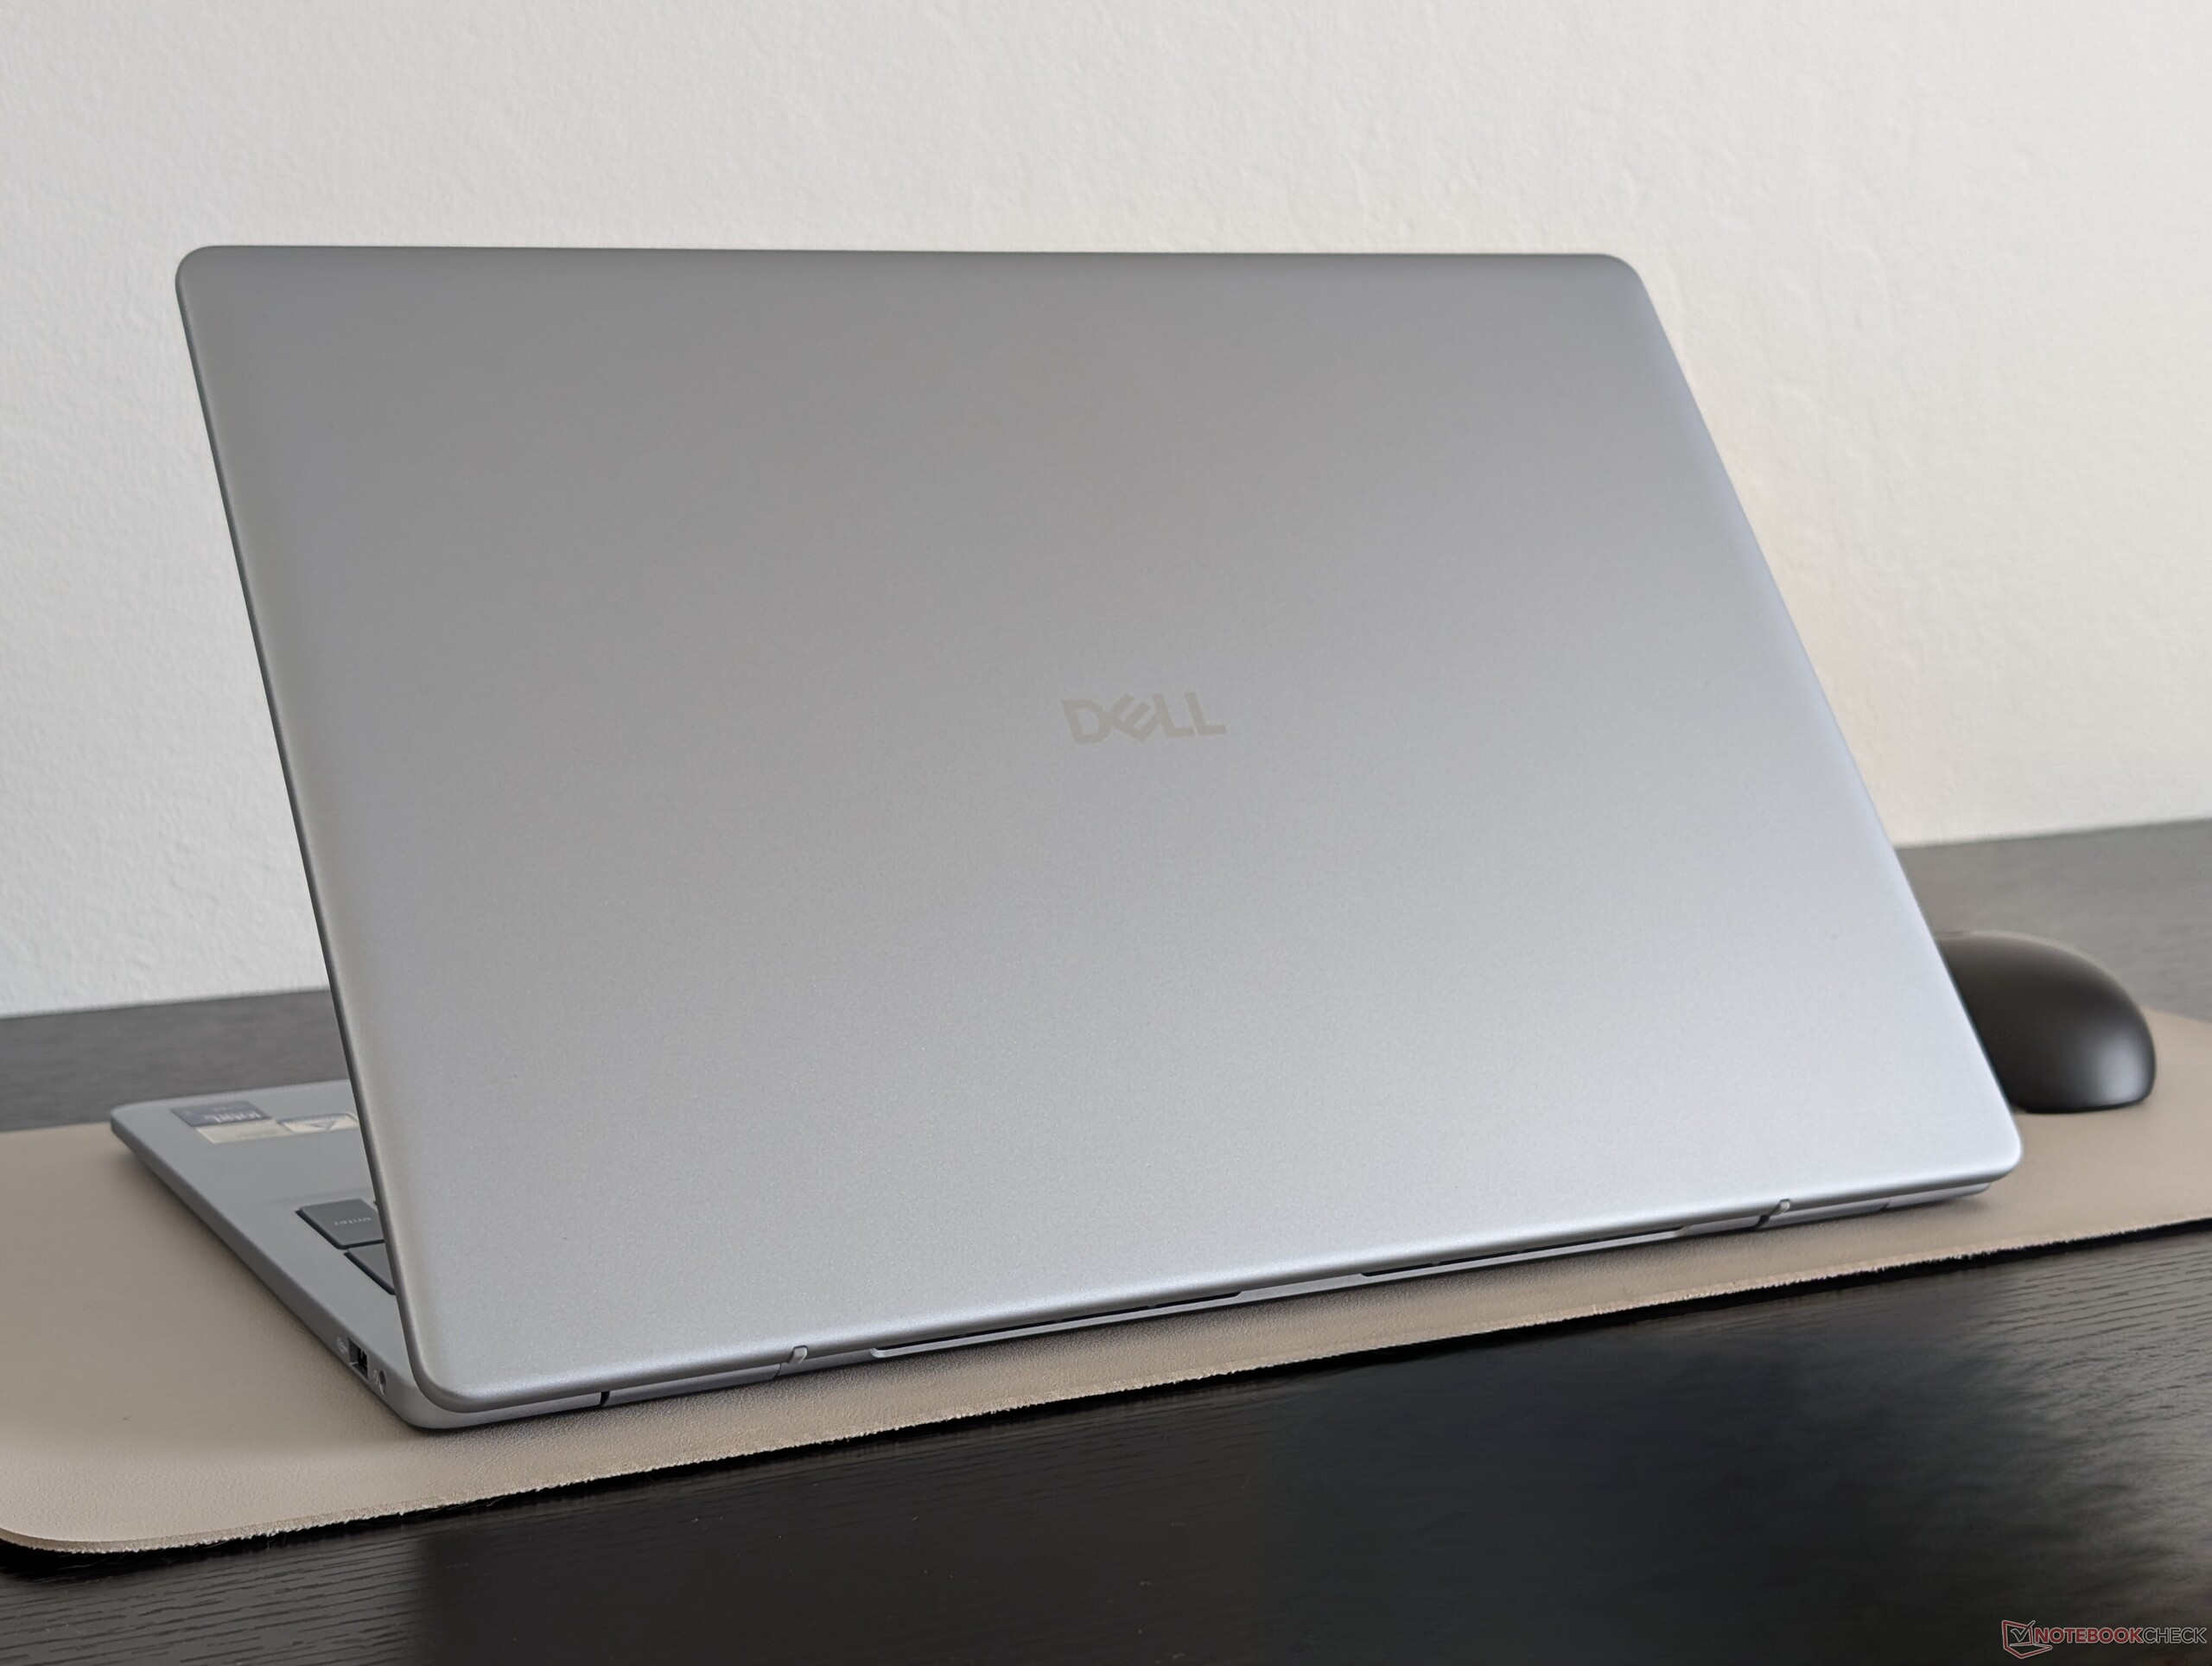
Dimensions are almost 1:1 with the outgoing Inspiron 16 Plus 7640 if not just slightly thinner. Instead, the biggest difference between them is weight as the newer model is roughly 400 g lighter largely due to the lack of any discrete GPU options.


Connectivity
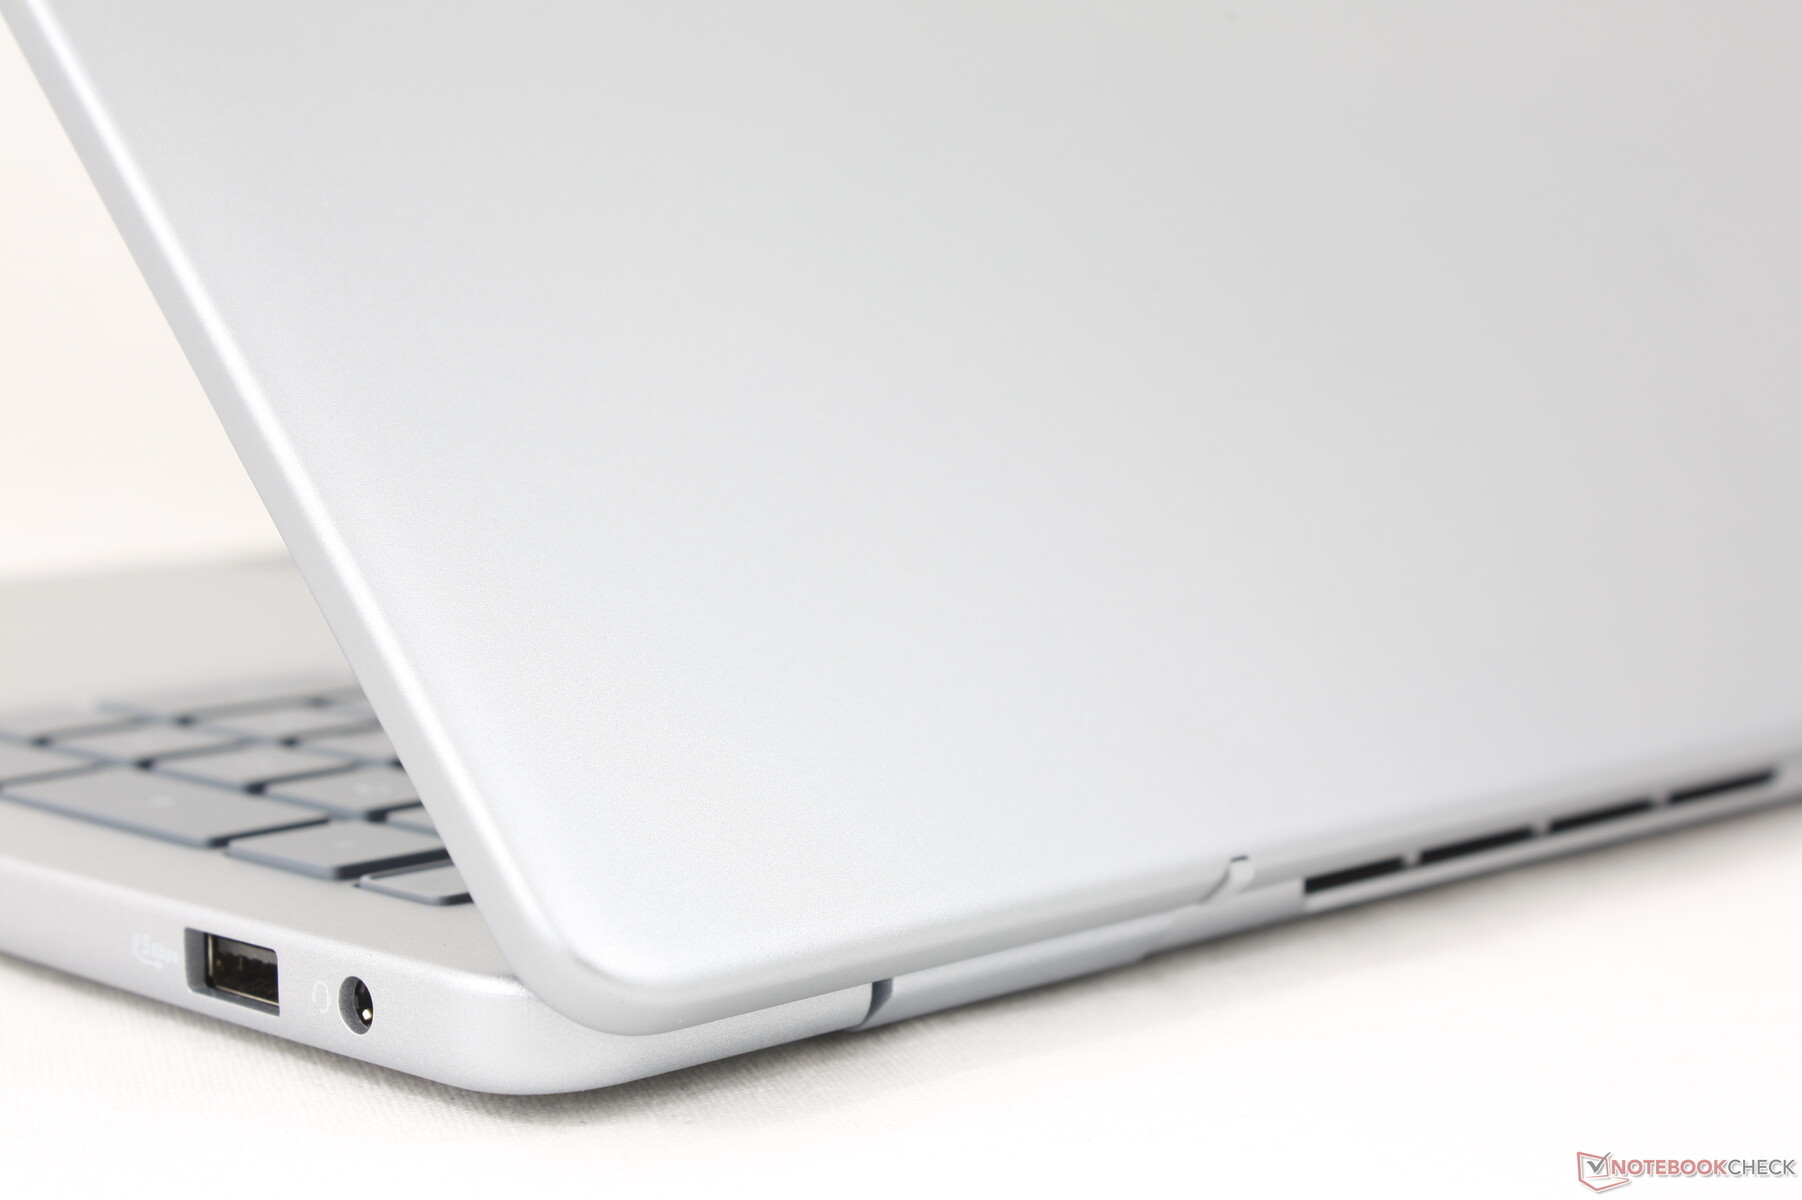
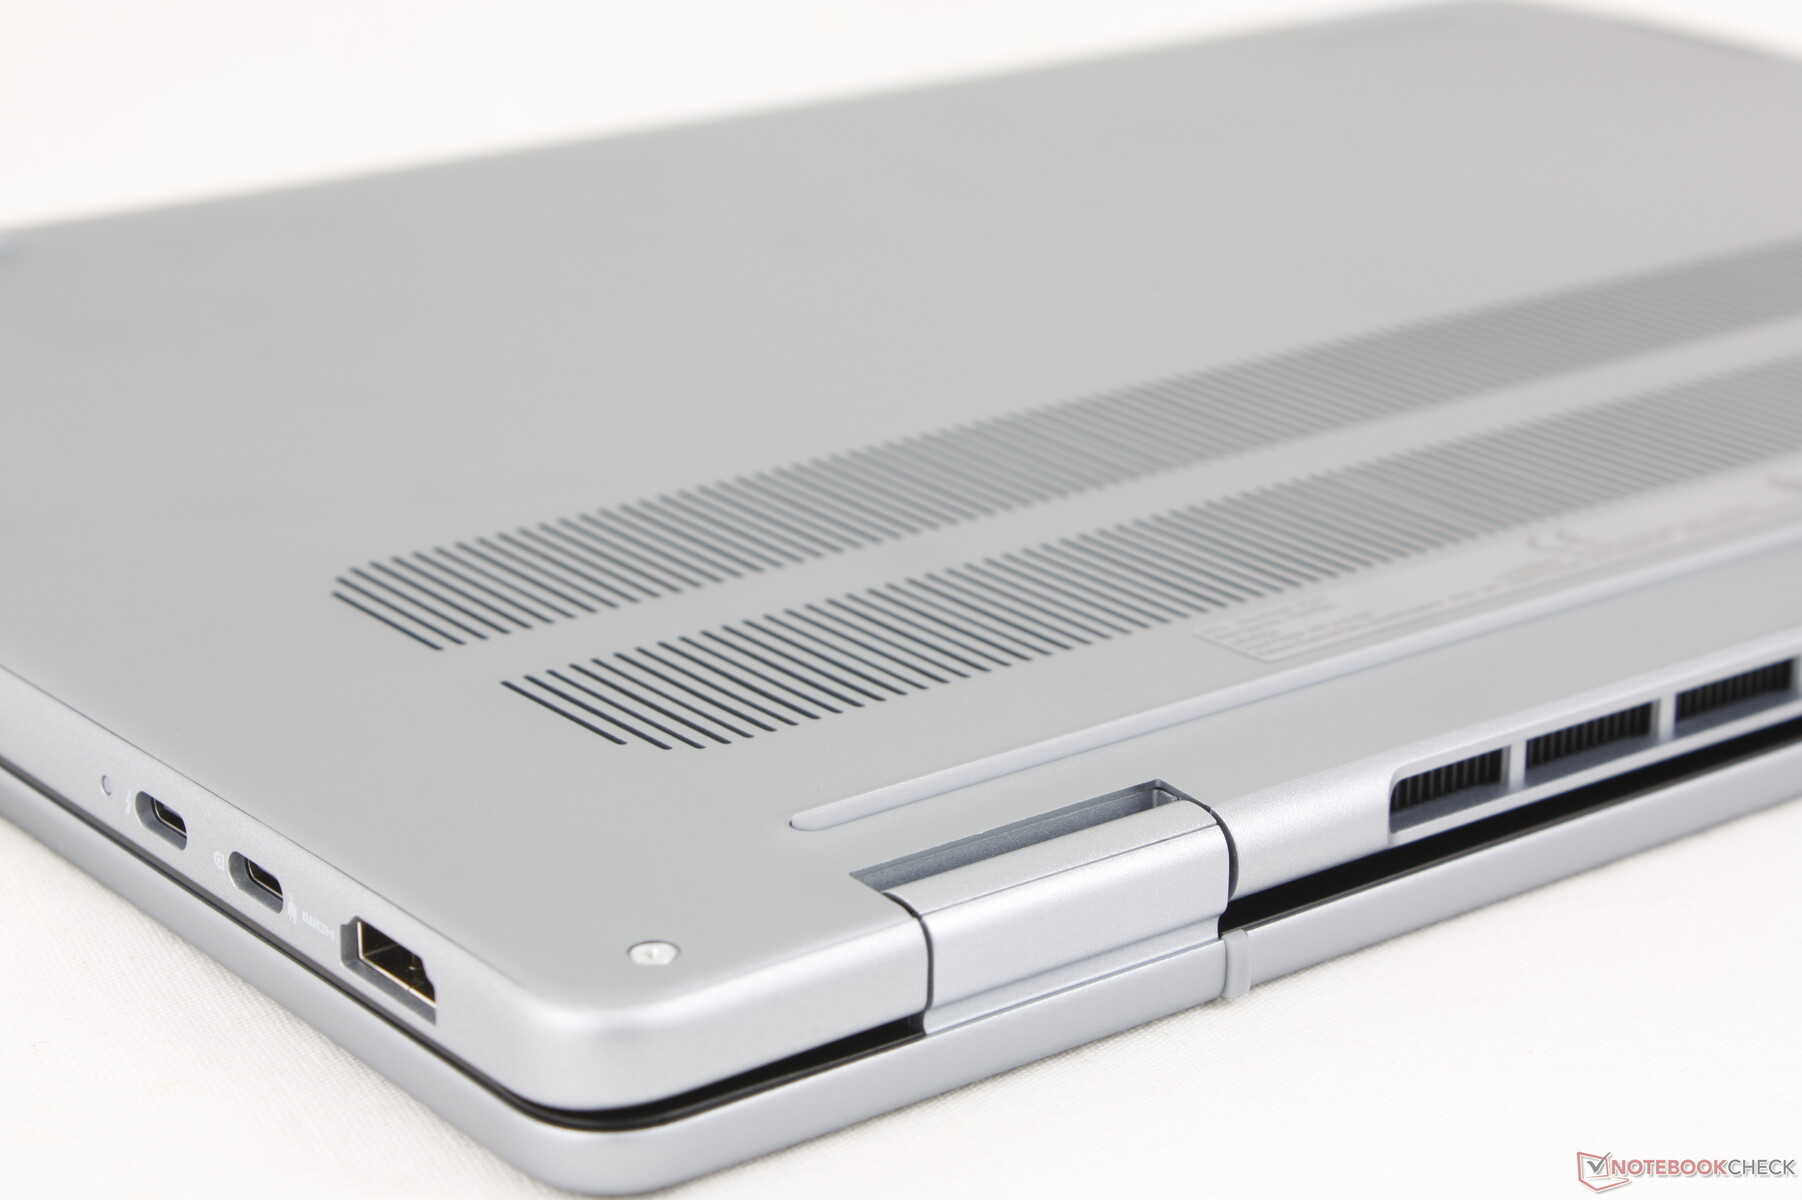
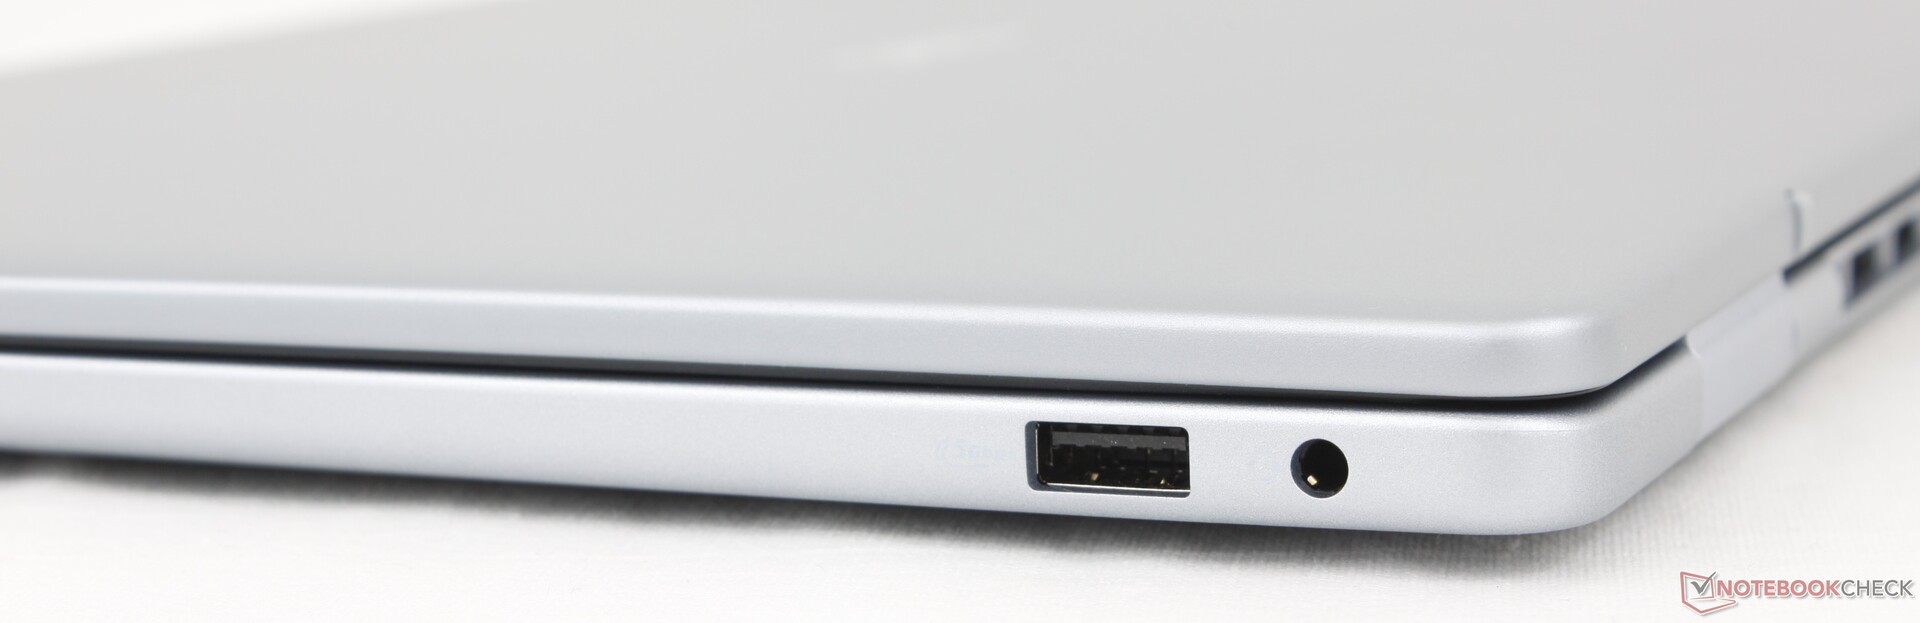
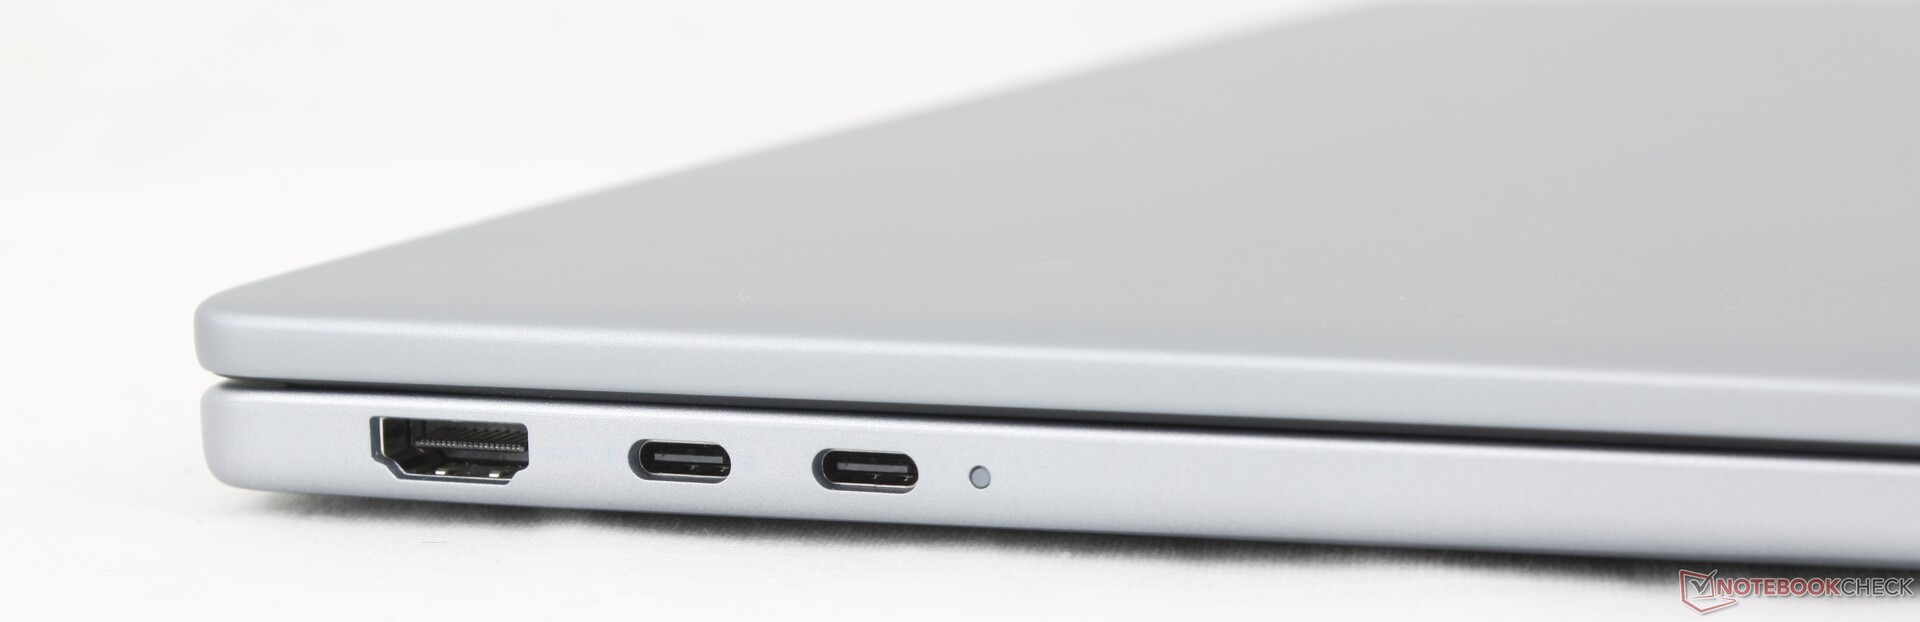
There are fewer ports than what was available on last year's Inspiron 16 Plus 7640 or 7640 2-in-1. The Dell 16 Plus has dropped the SD card reader and one of the USB-A ports in favor of a second USB-C port. Note that only one of the two USB-C ports is compatible with Thunderbolt 4 and DisplayPort 2.1.

Communication
The Intel BE201 comes standard for Wi-Fi 7 and Bluetooth 5.4 connectivity.
| Networking | |
| iperf3 transmit AXE11000 | |
| Lenovo ThinkBook 16 G7+ AMD | |
| HP Pavilion Plus 16-ab0456tx | |
| Dell 16 Plus | |
| Asus Vivobook 16 M1606K | |
| Dell Inspiron 16 Plus 7640 | |
| iperf3 receive AXE11000 | |
| Lenovo ThinkBook 16 G7+ AMD | |
| HP Pavilion Plus 16-ab0456tx | |
| Dell 16 Plus | |
| Dell Inspiron 16 Plus 7640 | |
| Asus Vivobook 16 M1606K | |
| iperf3 transmit AXE11000 6GHz | |
| HP Pavilion Plus 16-ab0456tx | |
| Dell 16 Plus | |
| Acer Swift 16 AI SF16-51T-932H, Ultra 9 288V | |
| Dell Inspiron 16 Plus 7640 | |
| iperf3 receive AXE11000 6GHz | |
| Acer Swift 16 AI SF16-51T-932H, Ultra 9 288V | |
| HP Pavilion Plus 16-ab0456tx | |
| Dell 16 Plus | |
| Dell Inspiron 16 Plus 7640 | |
Webcam
A 2 MP webcam comes standard with both IR and a physical privacy shutter.


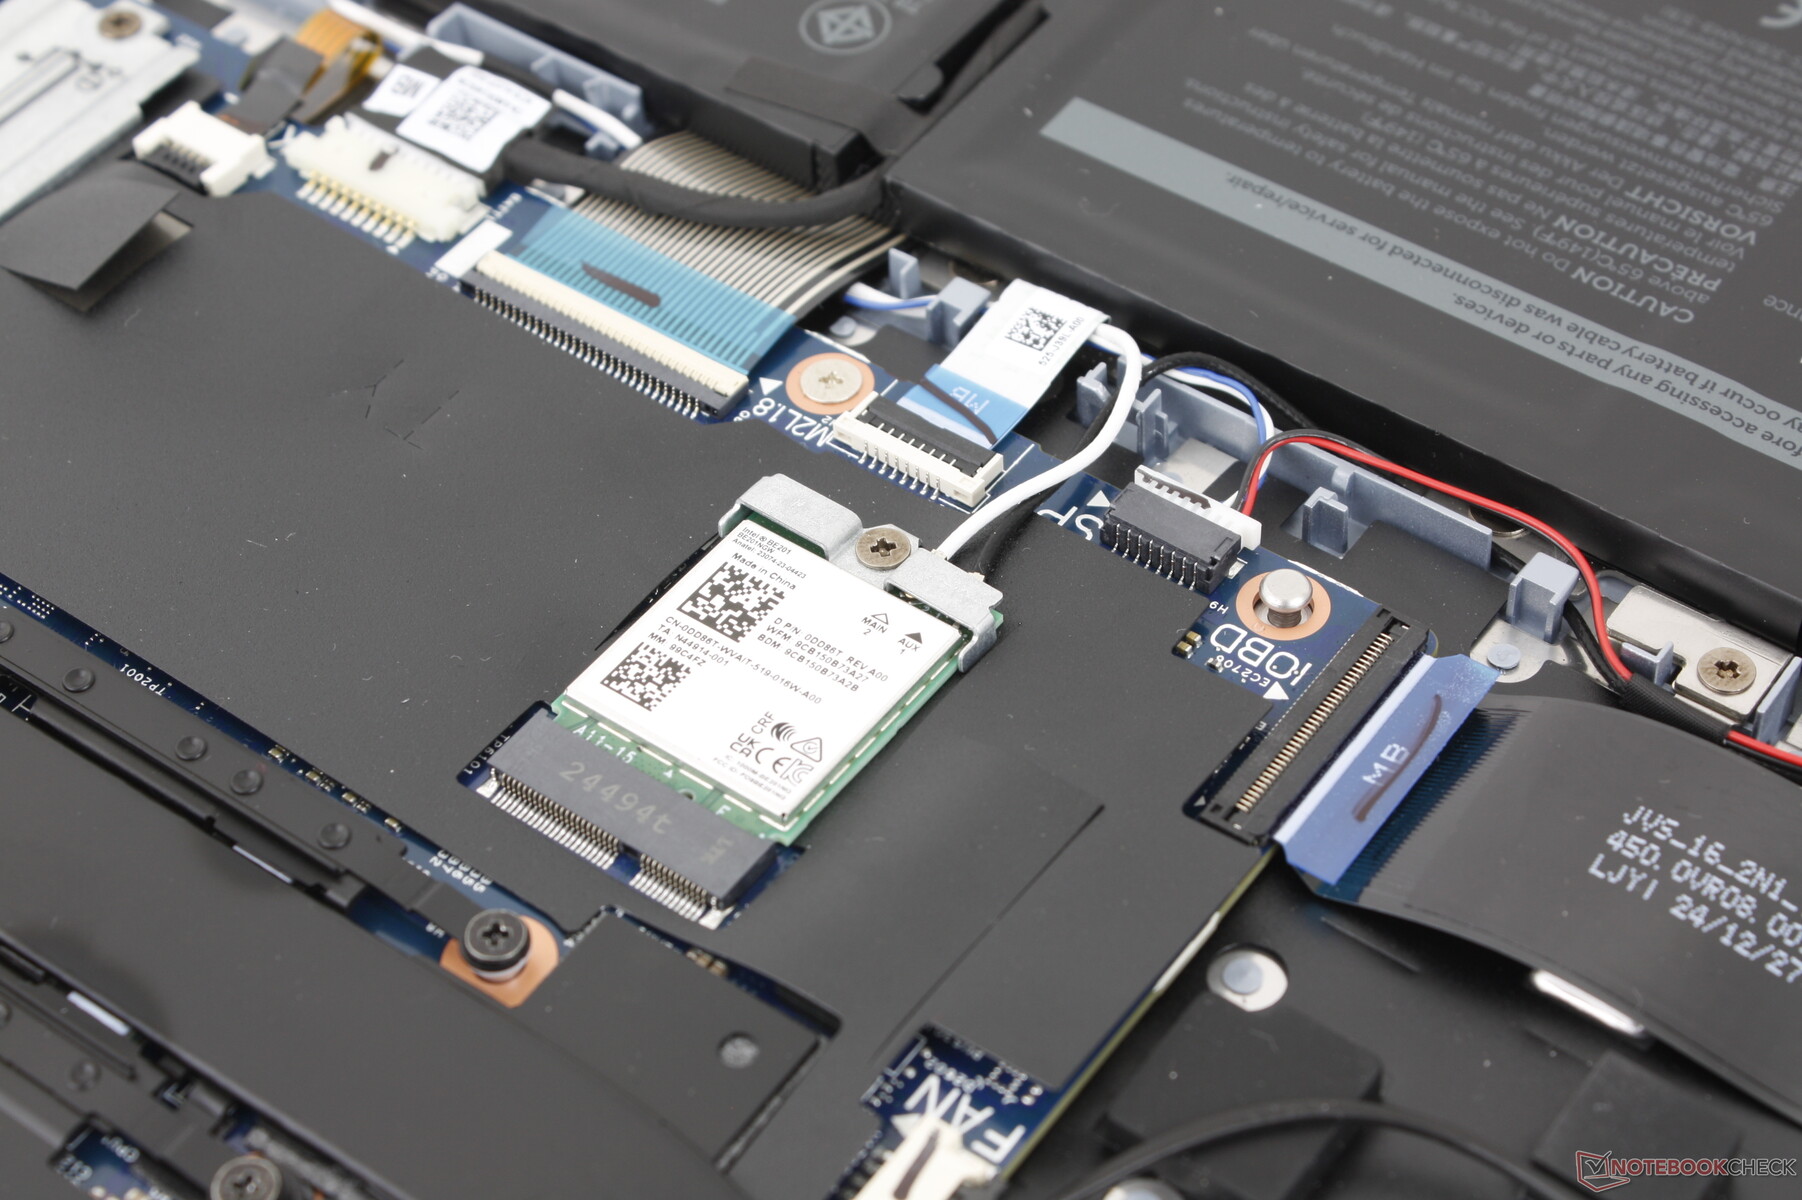
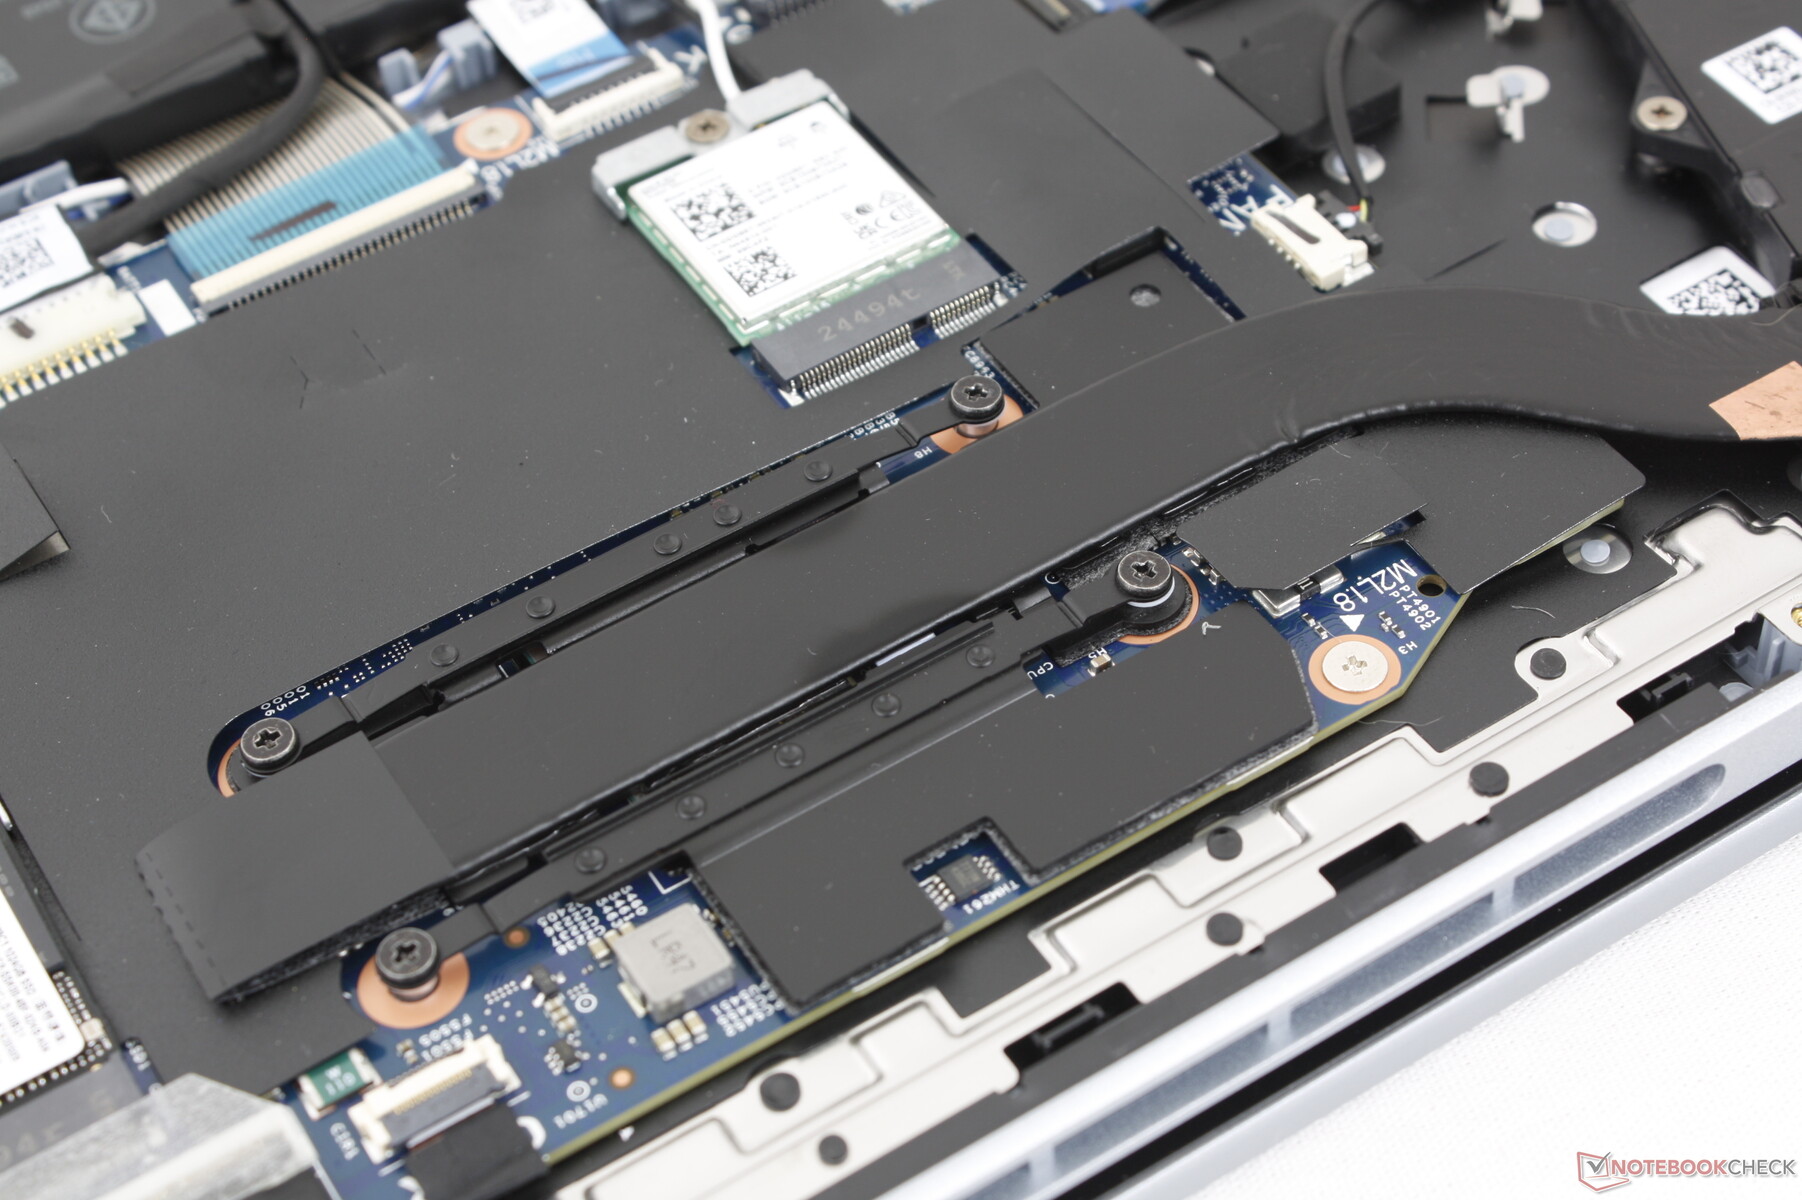
Maintenance
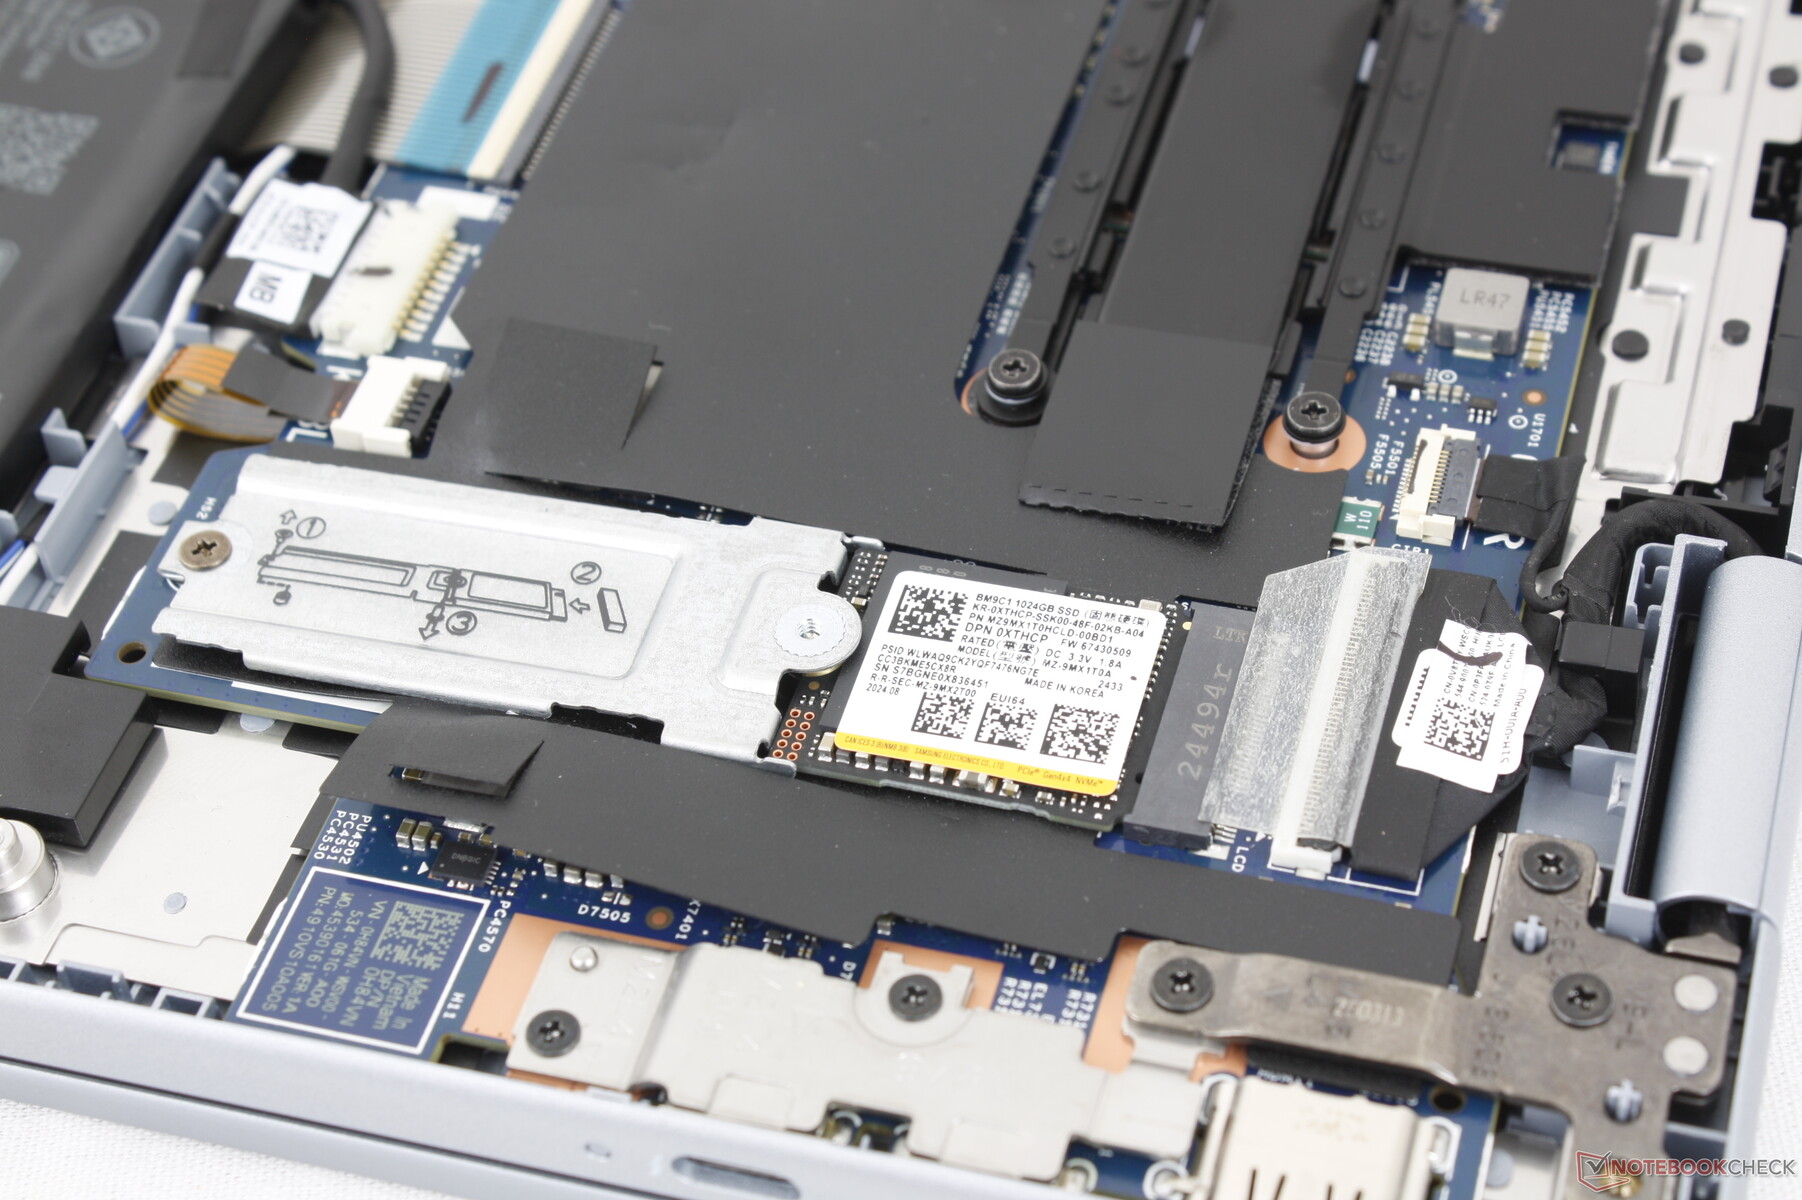
The bottom is secured by 8 Phillips screws for straightforward servicing. However, care and a sharp edge are highly recommended as the edges of the panel are more tightly latched to the base than on most other laptops. Once inside, users are greeted to no removable SODIMM modules and just a single M.2 2280 slot for storage.
The Dell 16 Plus shares many internal features with the Inspiron 16 Plus 7640 2-in-1 as shown by the comparison shots below.


Sustainability
The model utilizes recycled aluminum, steel, and ocean-bound plastic during manufacturing while the packaging is fully recyclable.
Accessories And Warranty
There are no extras in the box other than the AC adapter and paperwork. The usual one-year limited manufacturer warranty applies if purchased in the US.
Input Devices
Keyboard
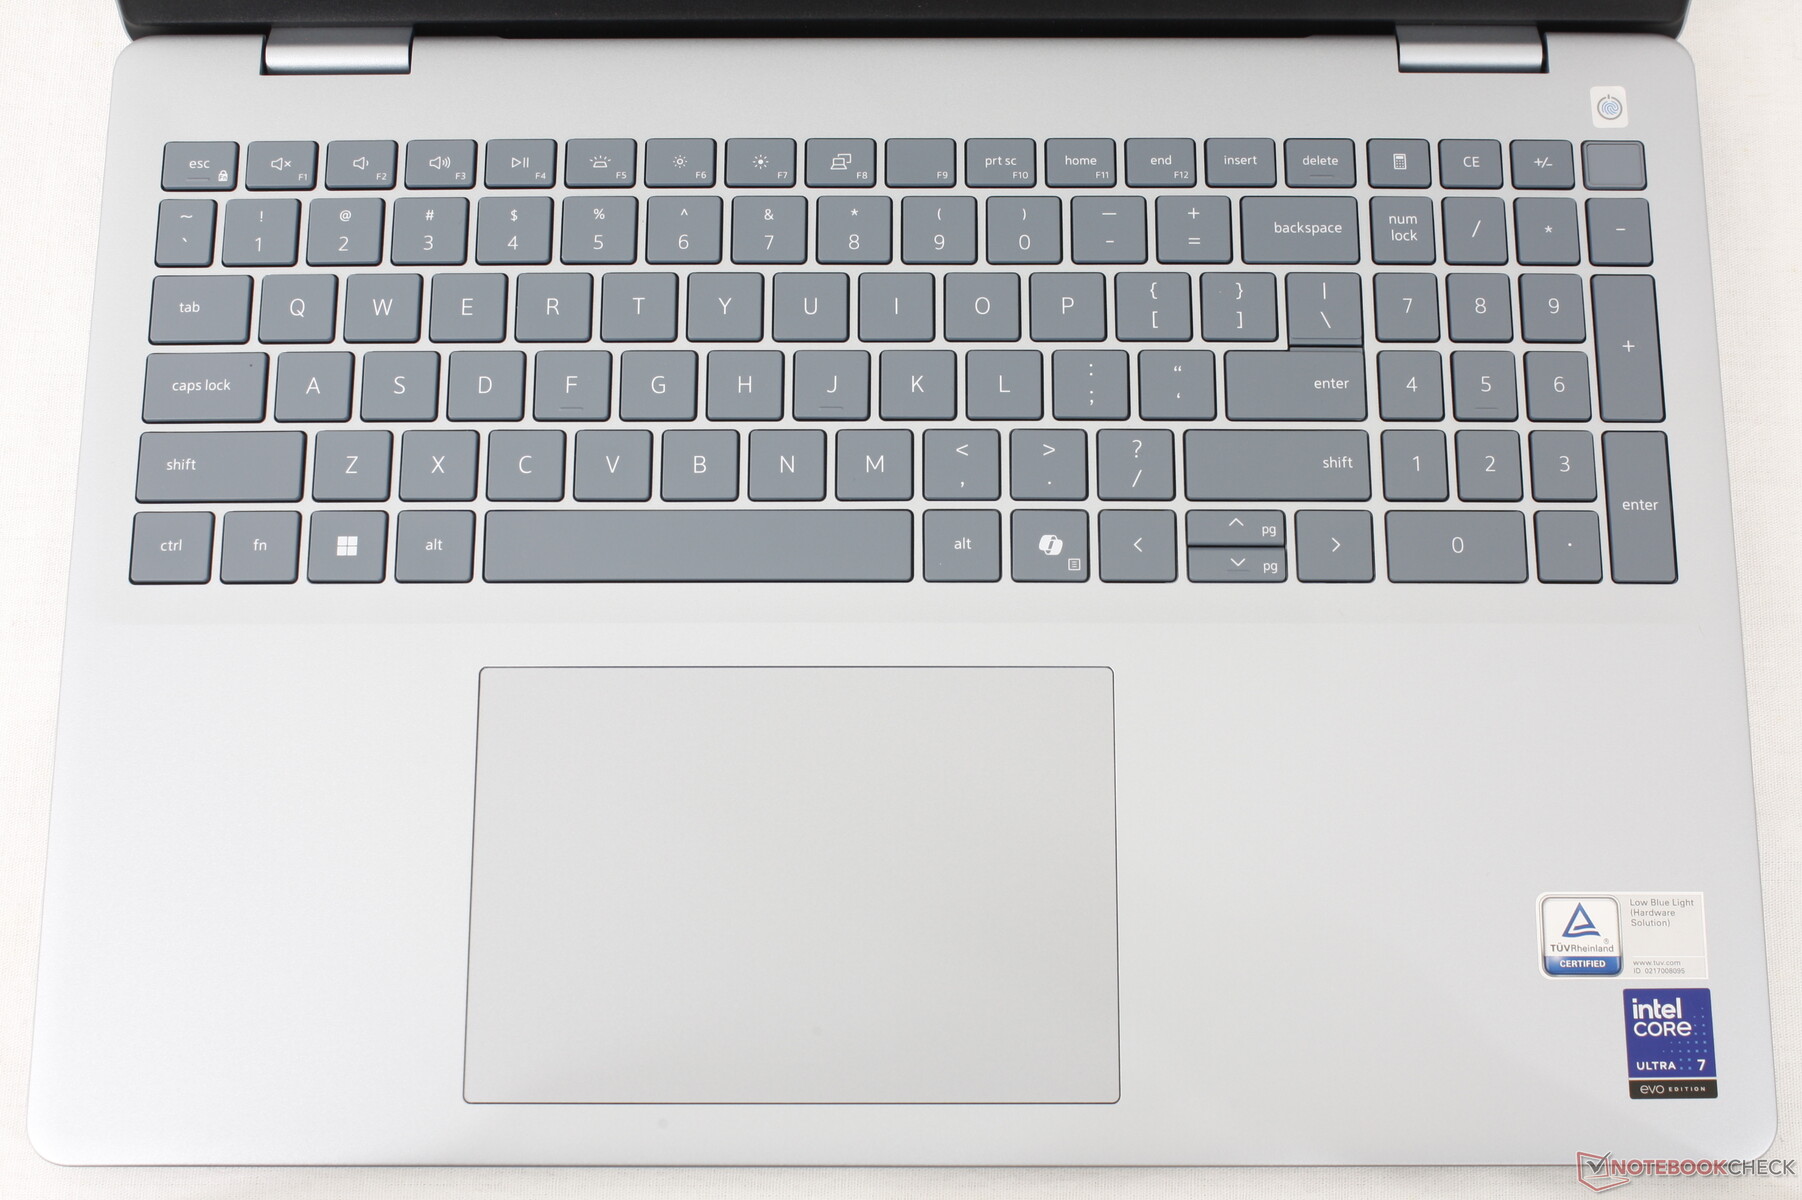
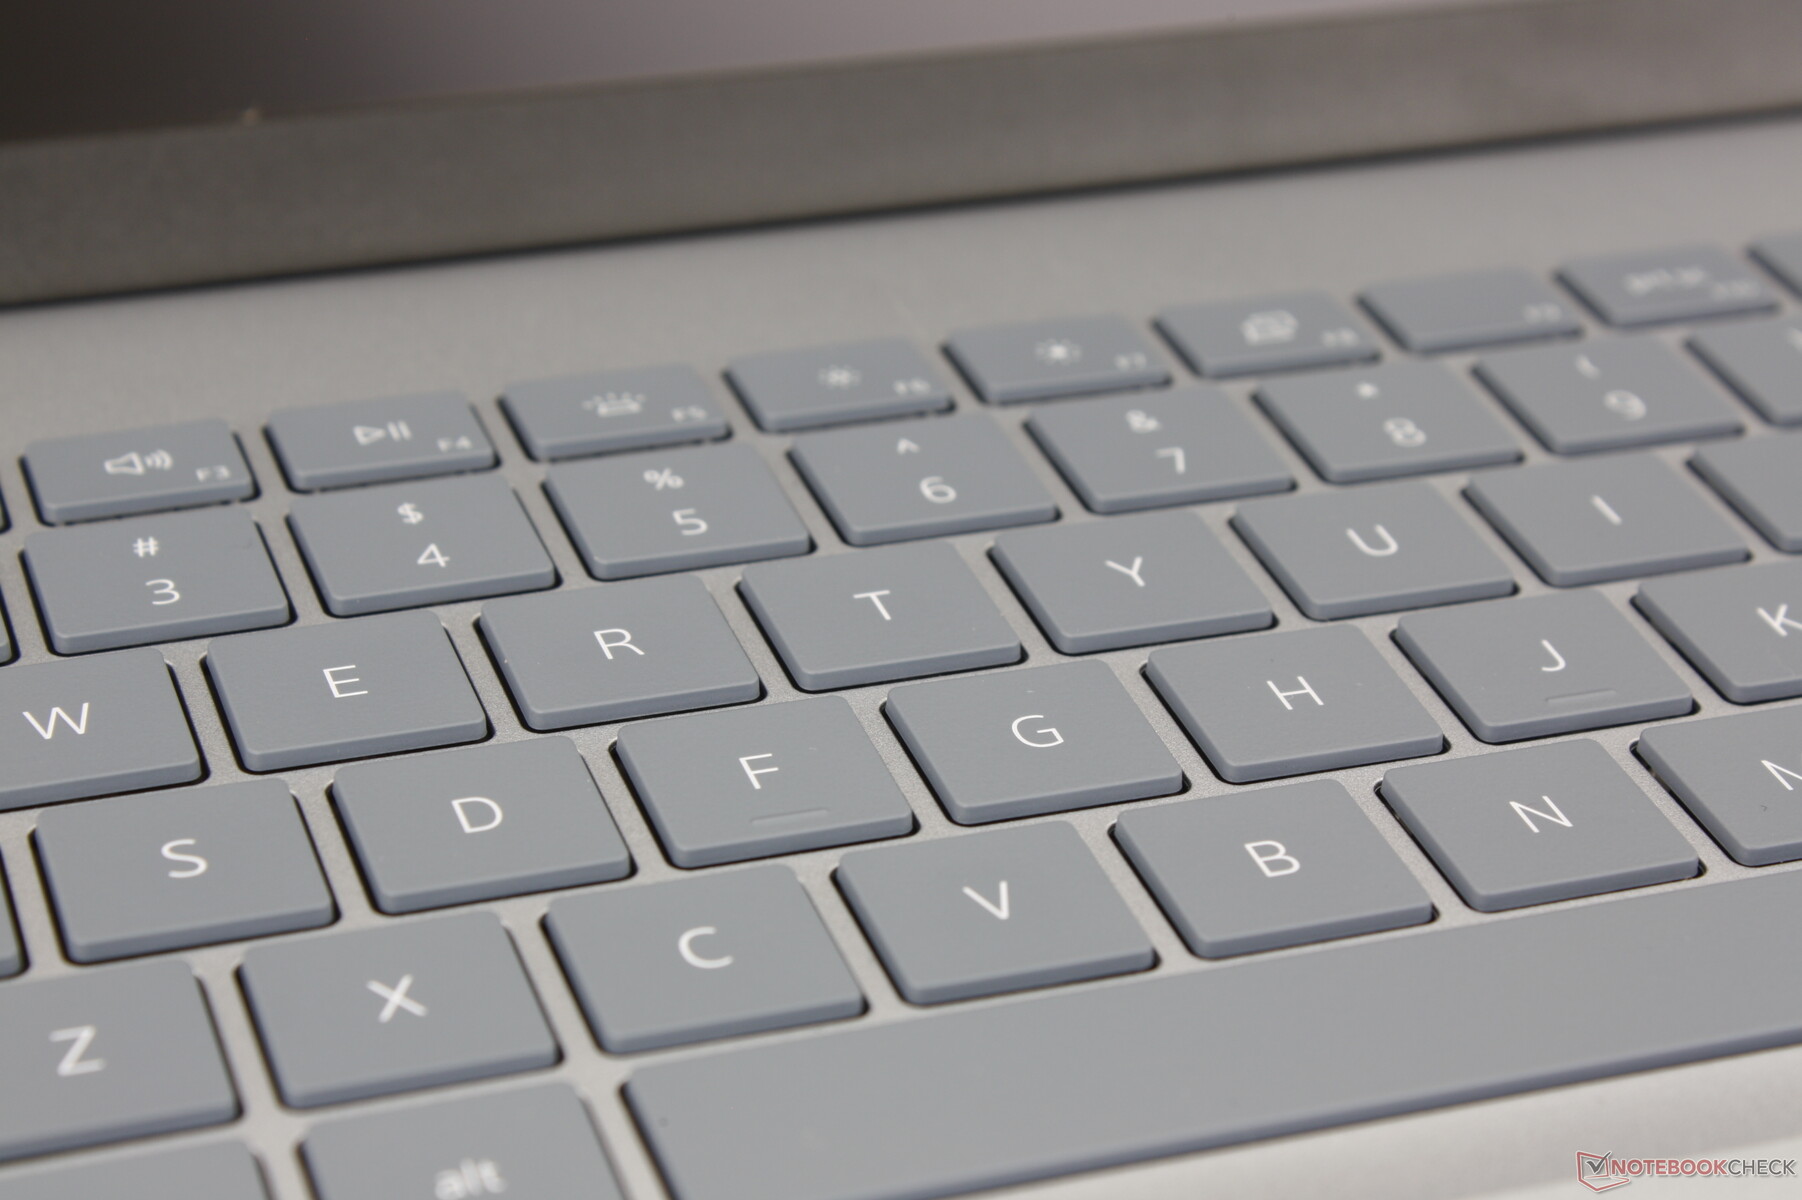
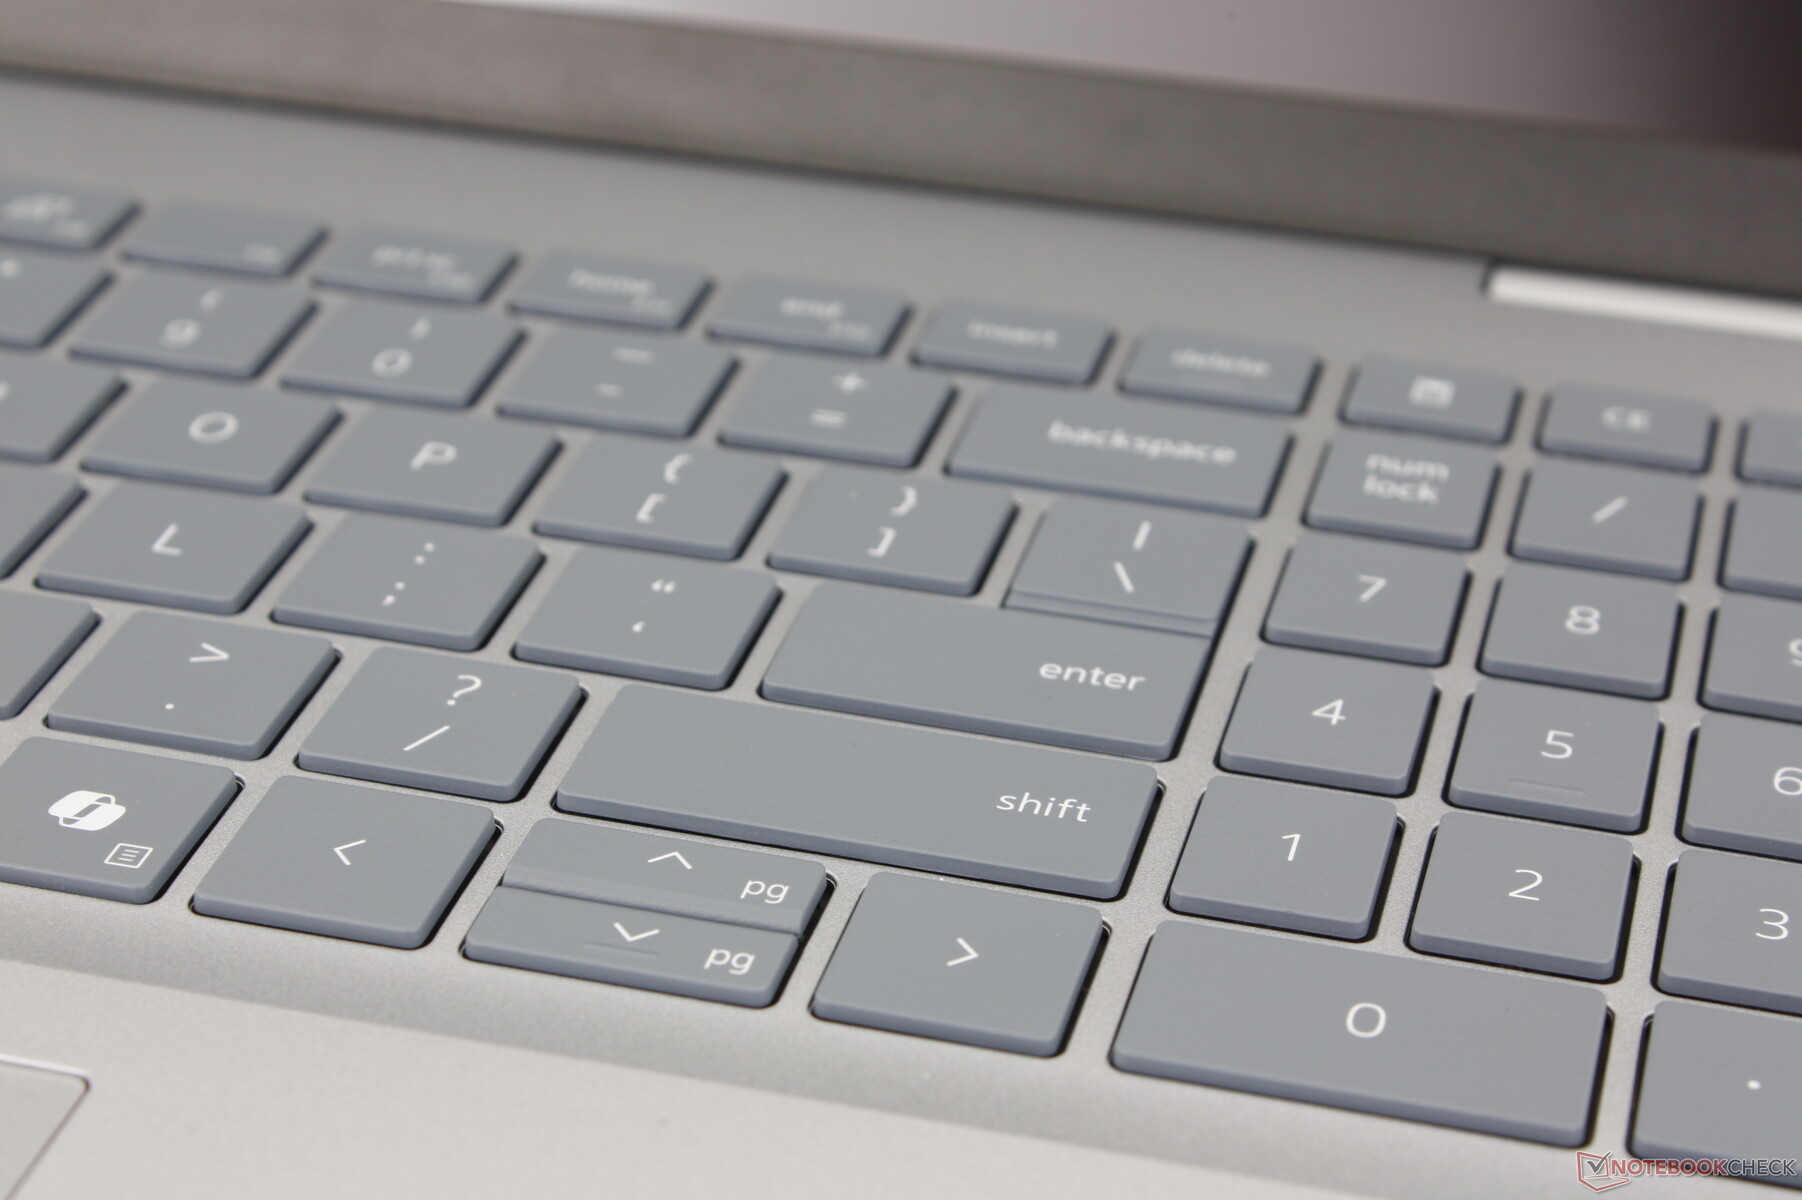
The Dell 16 Plus introduces an integrated numpad whereas this feature was missing on the Inspiron 16 Plus 7640 lineup. The typing experience is otherwise akin to older generation Inspiron models for better or worse. Key feedback is on the softer side but with a decently loud and clicky Space bar.
Touchpad
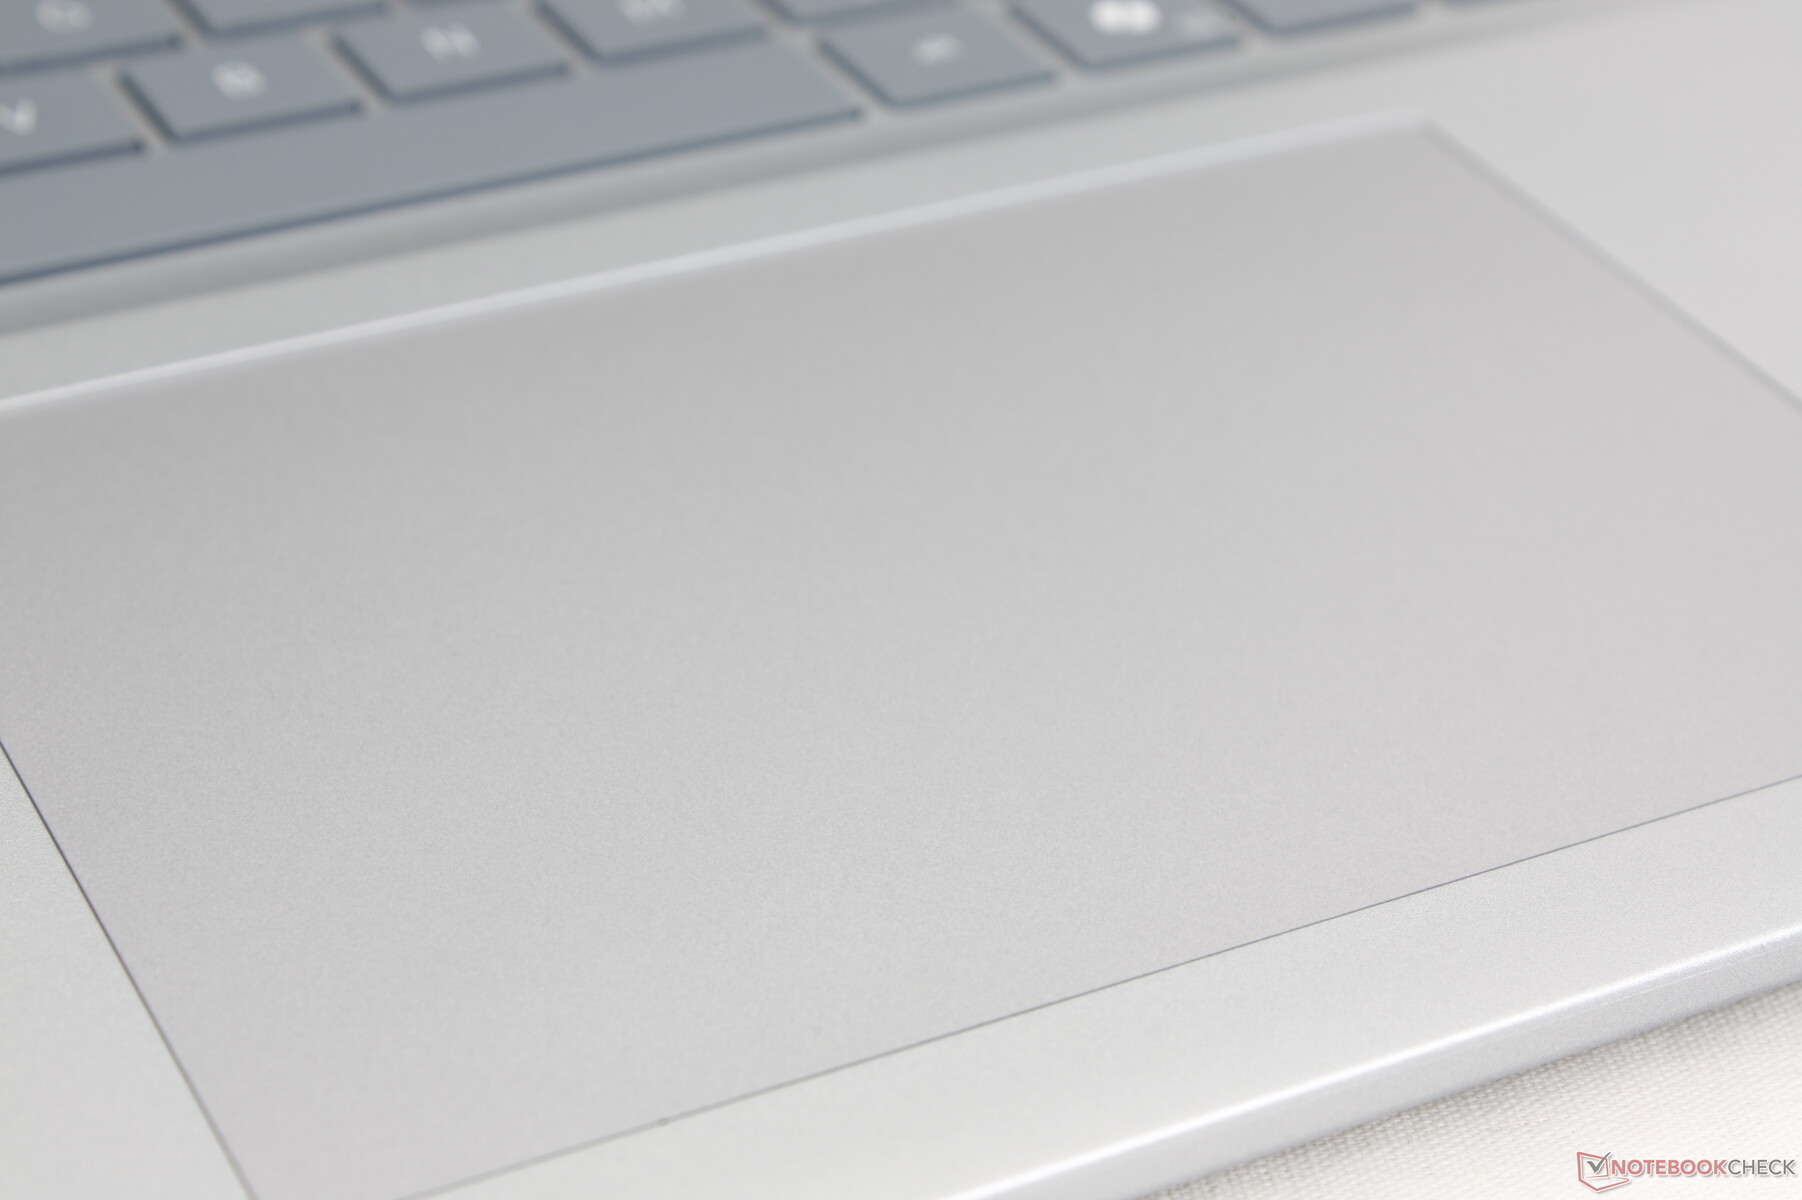
While the keyboard has expanded in functionality, the clickpad remains the same as on the Inspiron 16 Plus 7640 2-in-1 down to even the size (13.3 x 9 cm). It's large and spacious for comfortable cursor control and multi-touch inputs, but clicking on its surface requires more force than on most other laptops.
Display — 120 Hz and Full sRGB Colors
The Dell 16 Plus shares the same AU Optronics B160QAN IPS panel as found on the Inspiron 16 Plus 7640 for essentially the same viewing experience between them. Even so, we would have liked to see improvements to brightness and support for HDR.
The 90 Hz mini-LED configuration is more than likely the same panel as found on last year's Inspiron 16 7640 2-in-1.

| |||||||||||||||||||||||||
Brightness Distribution: 88 %
Center on Battery: 335.6 cd/m²
Contrast: 1525:1 (Black: 0.22 cd/m²)
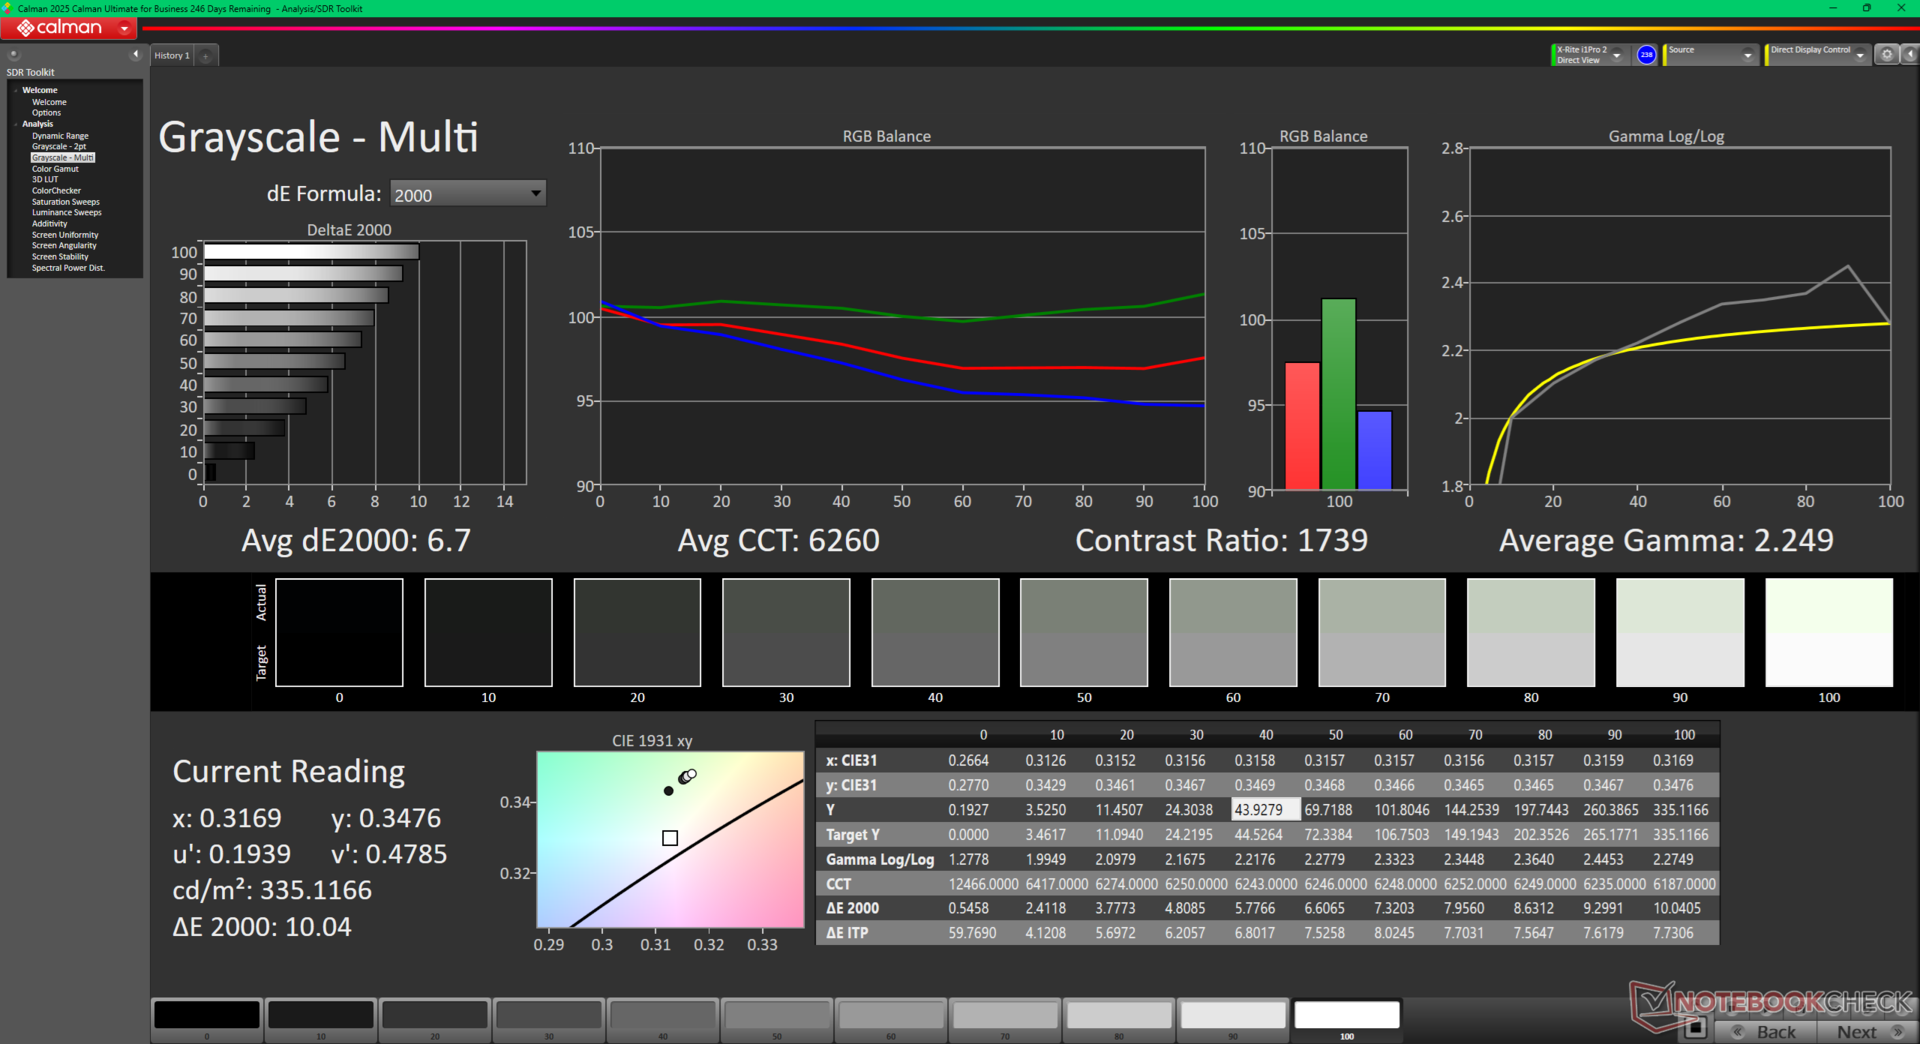
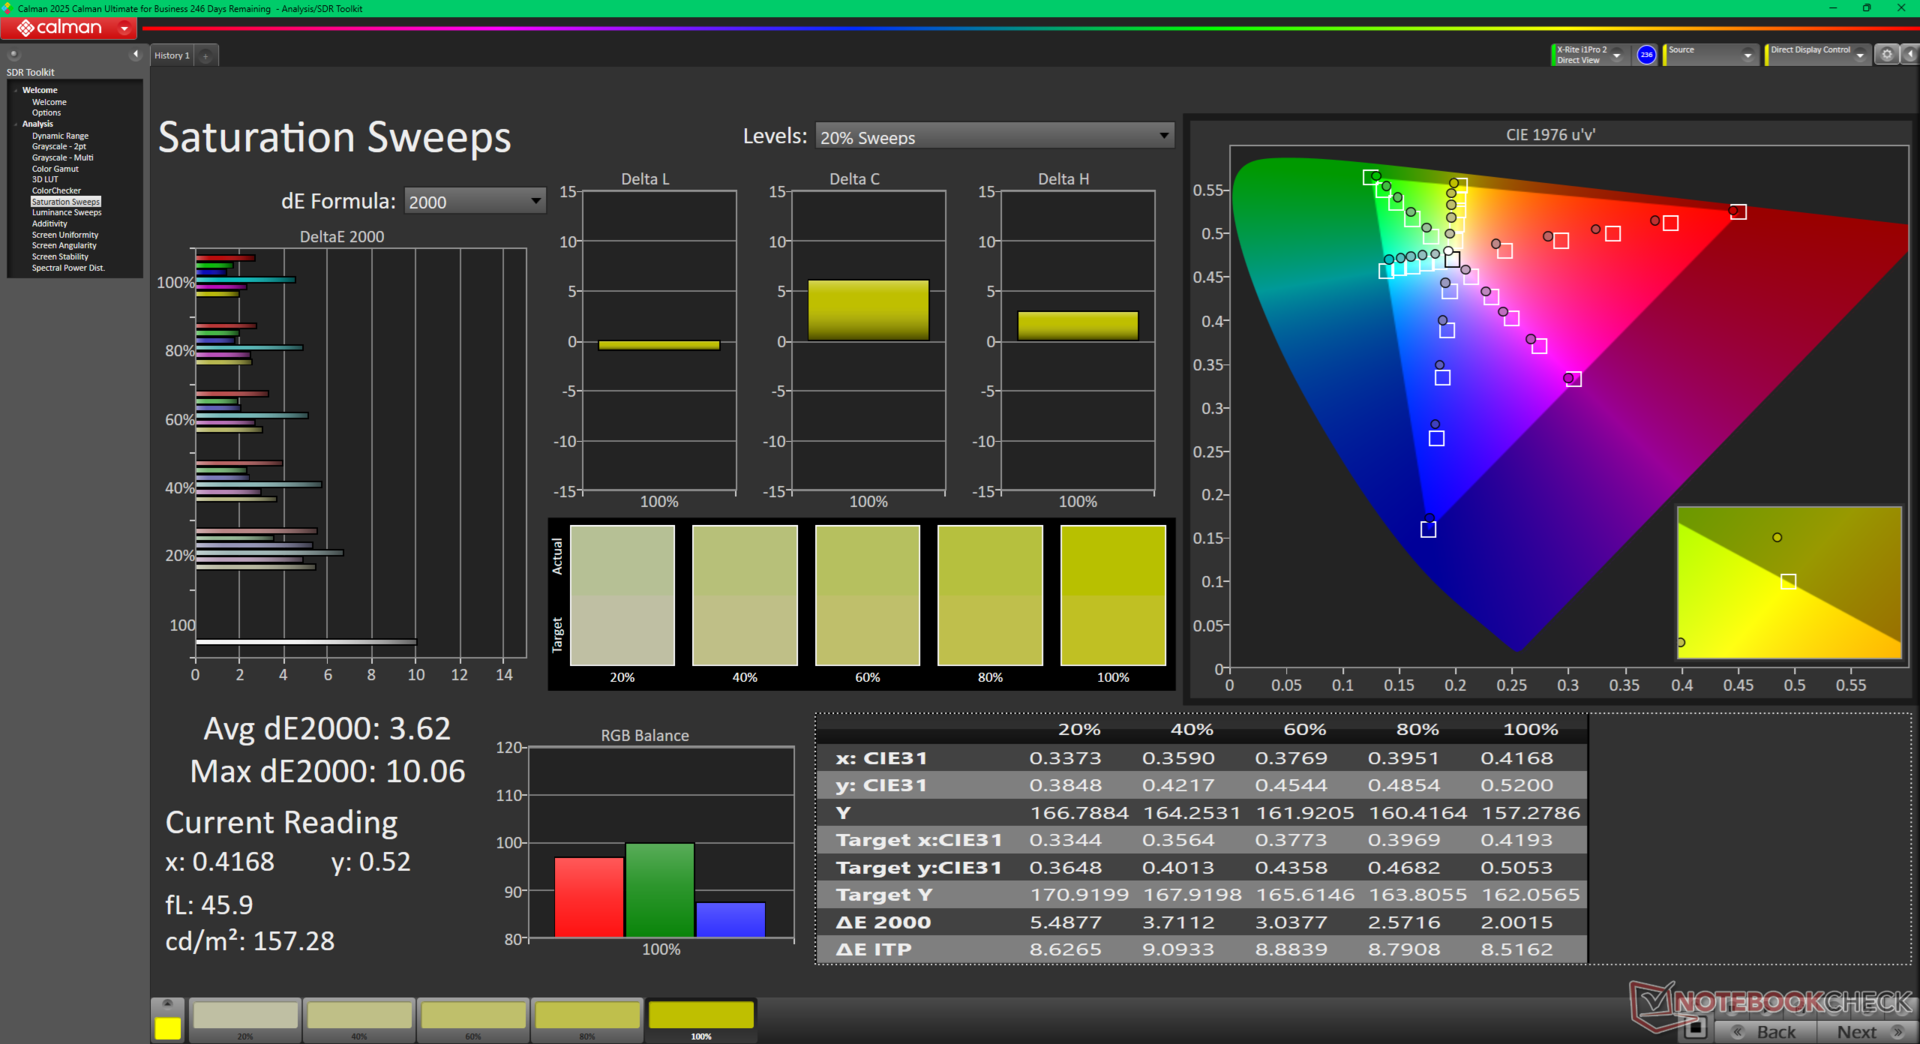
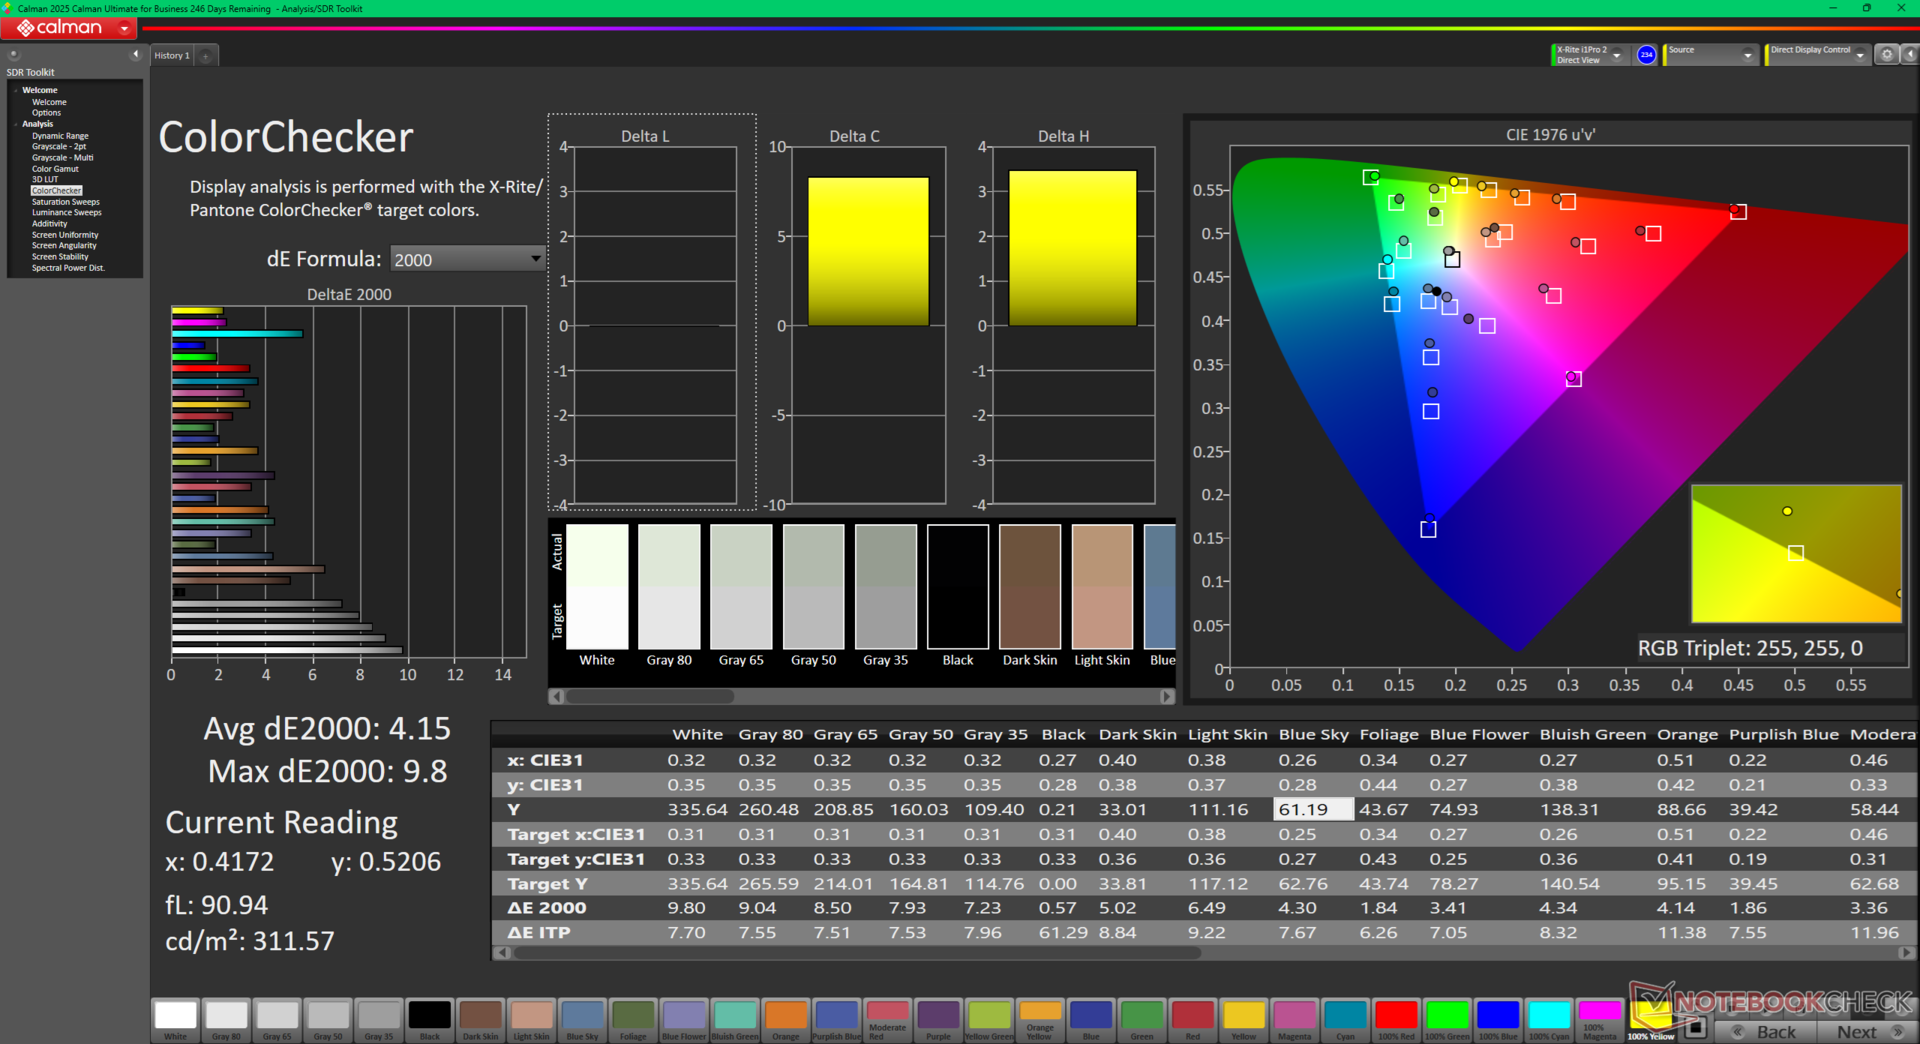
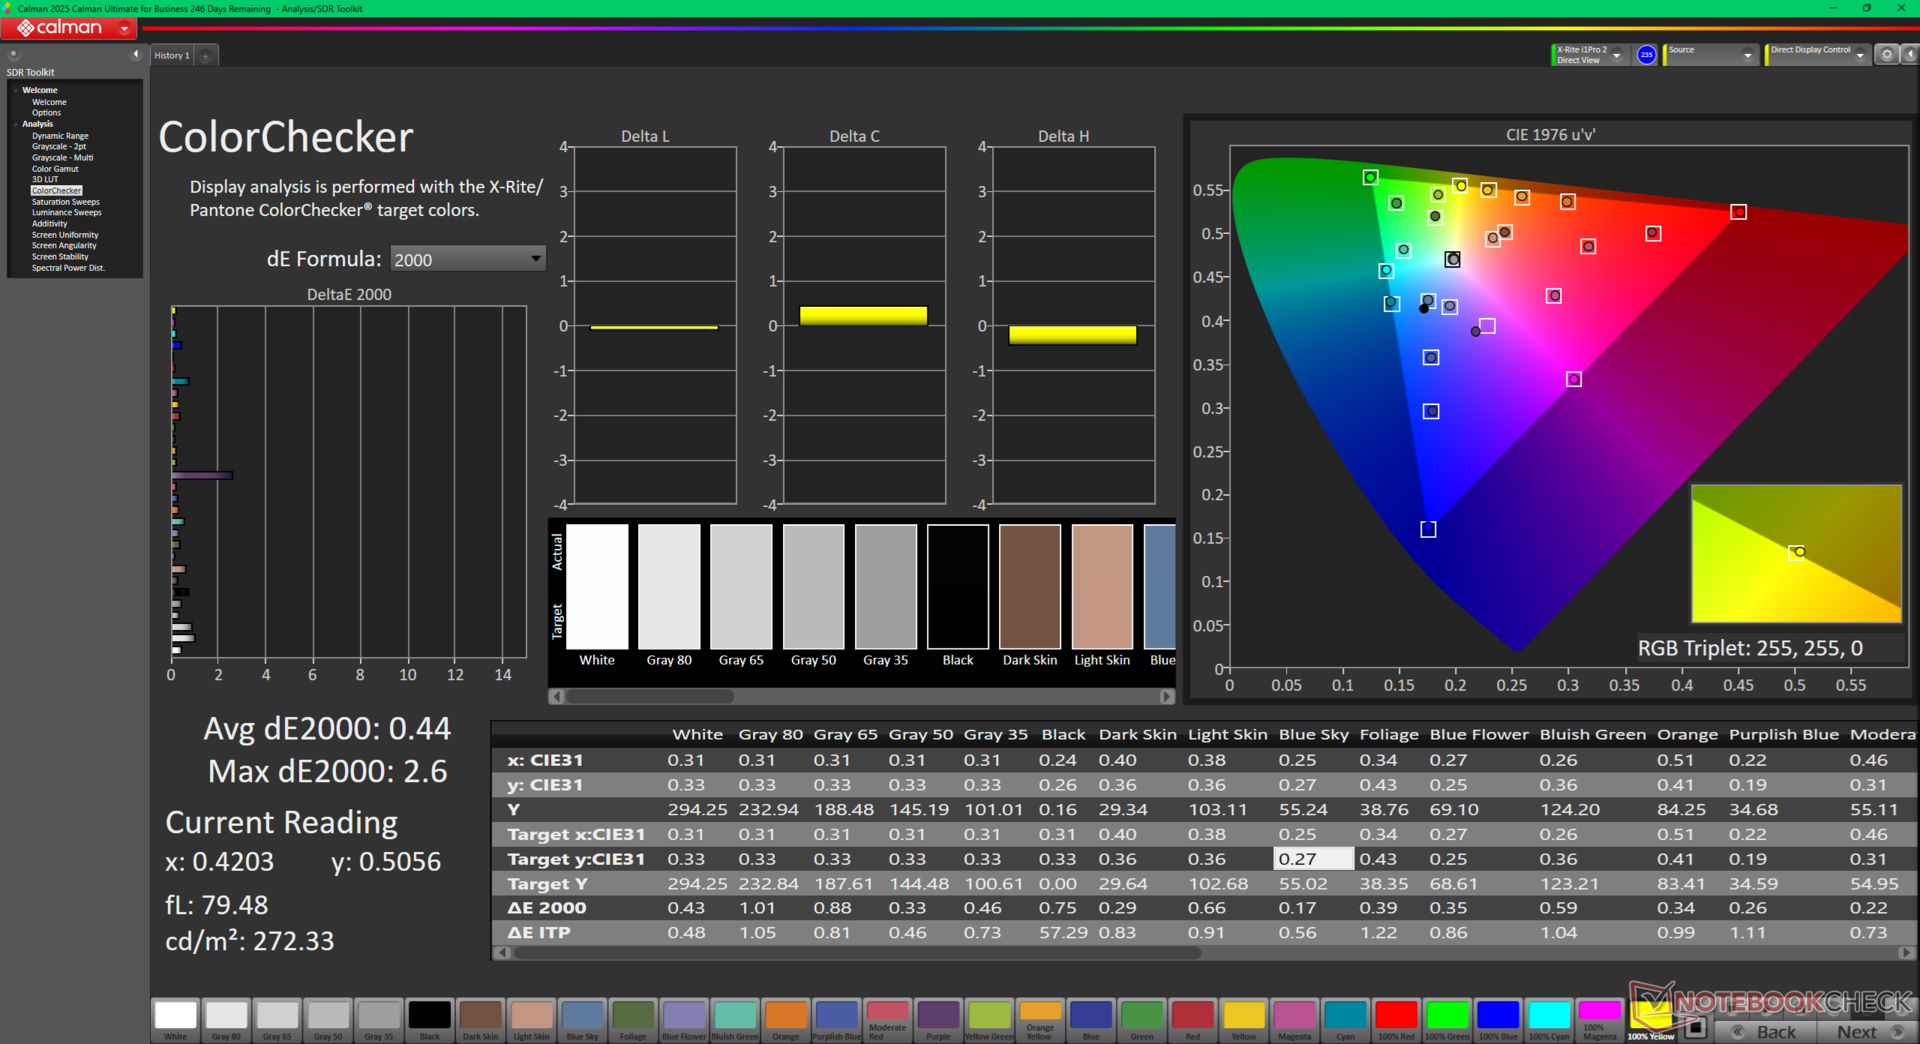
ΔE ColorChecker Calman: 4.15 | ∀{0.5-29.43 Ø4.73}
calibrated: 0.44
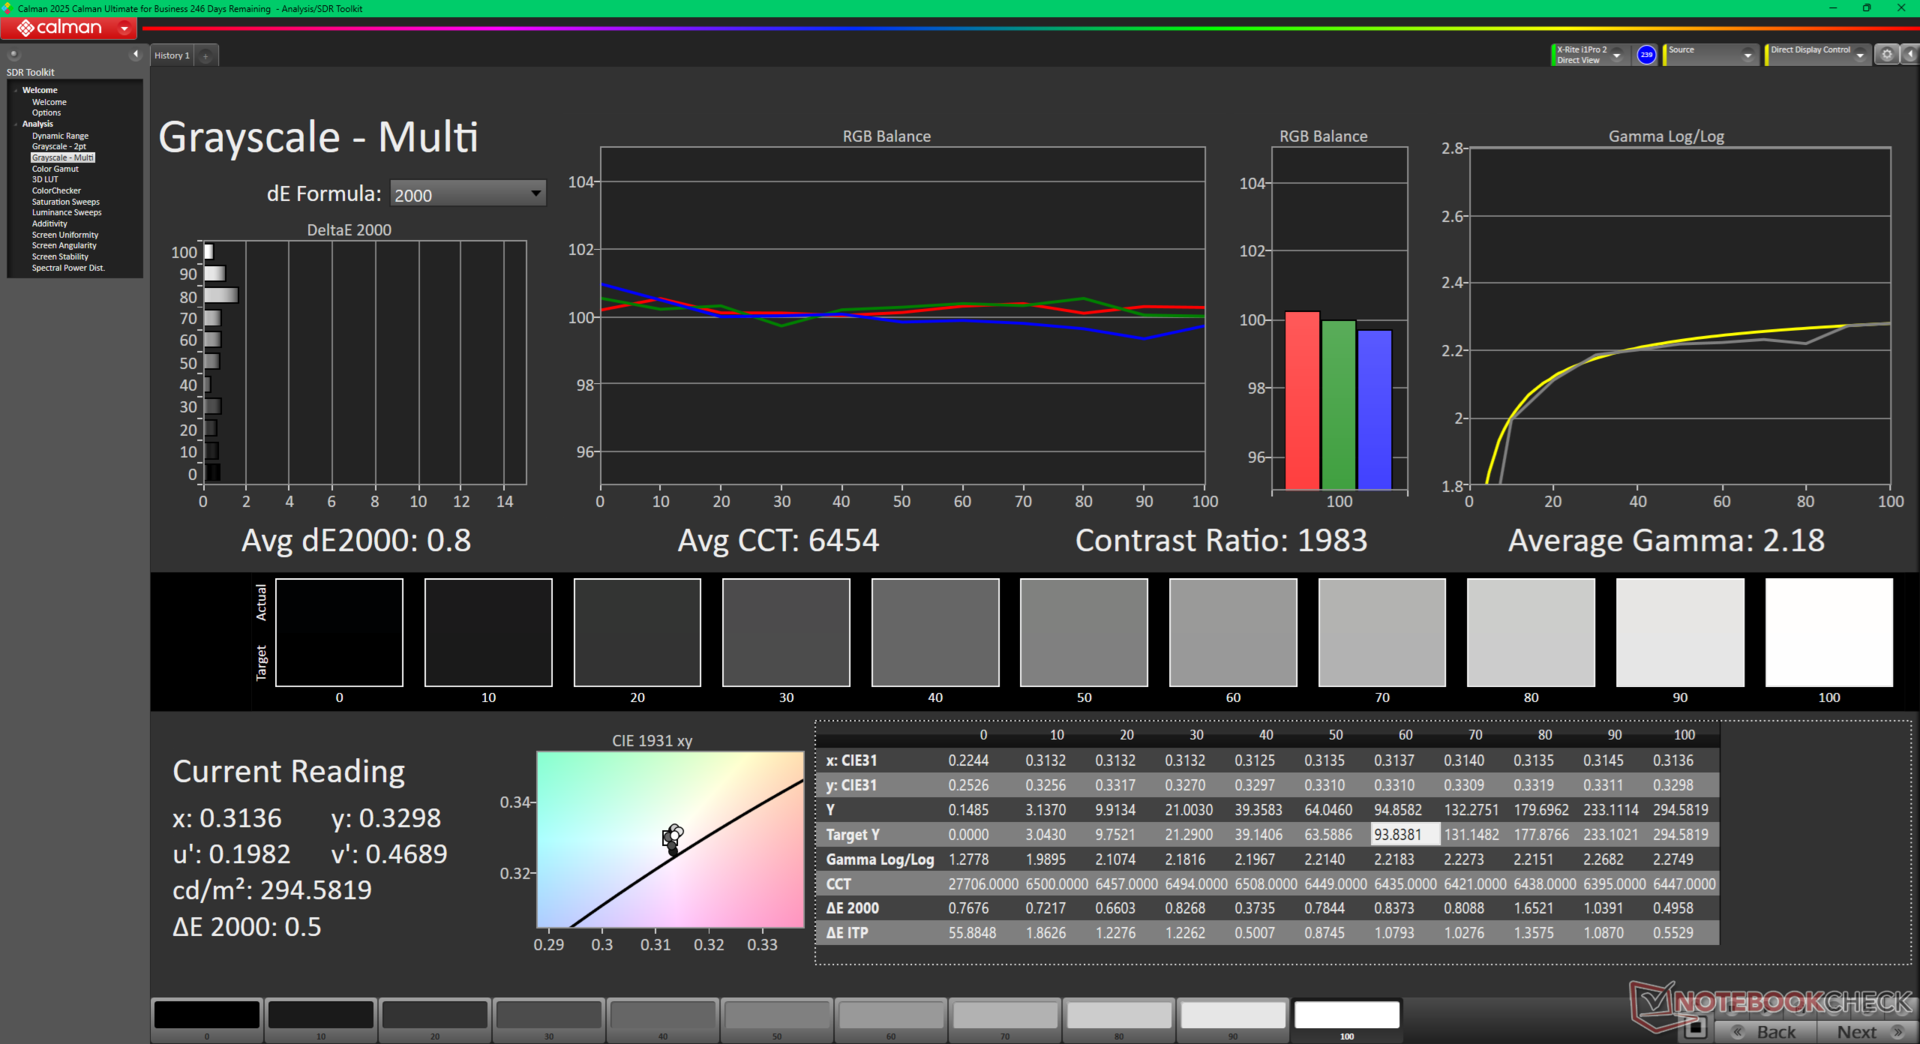
ΔE Greyscale Calman: 6.7 | ∀{0.09-98 Ø4.97}
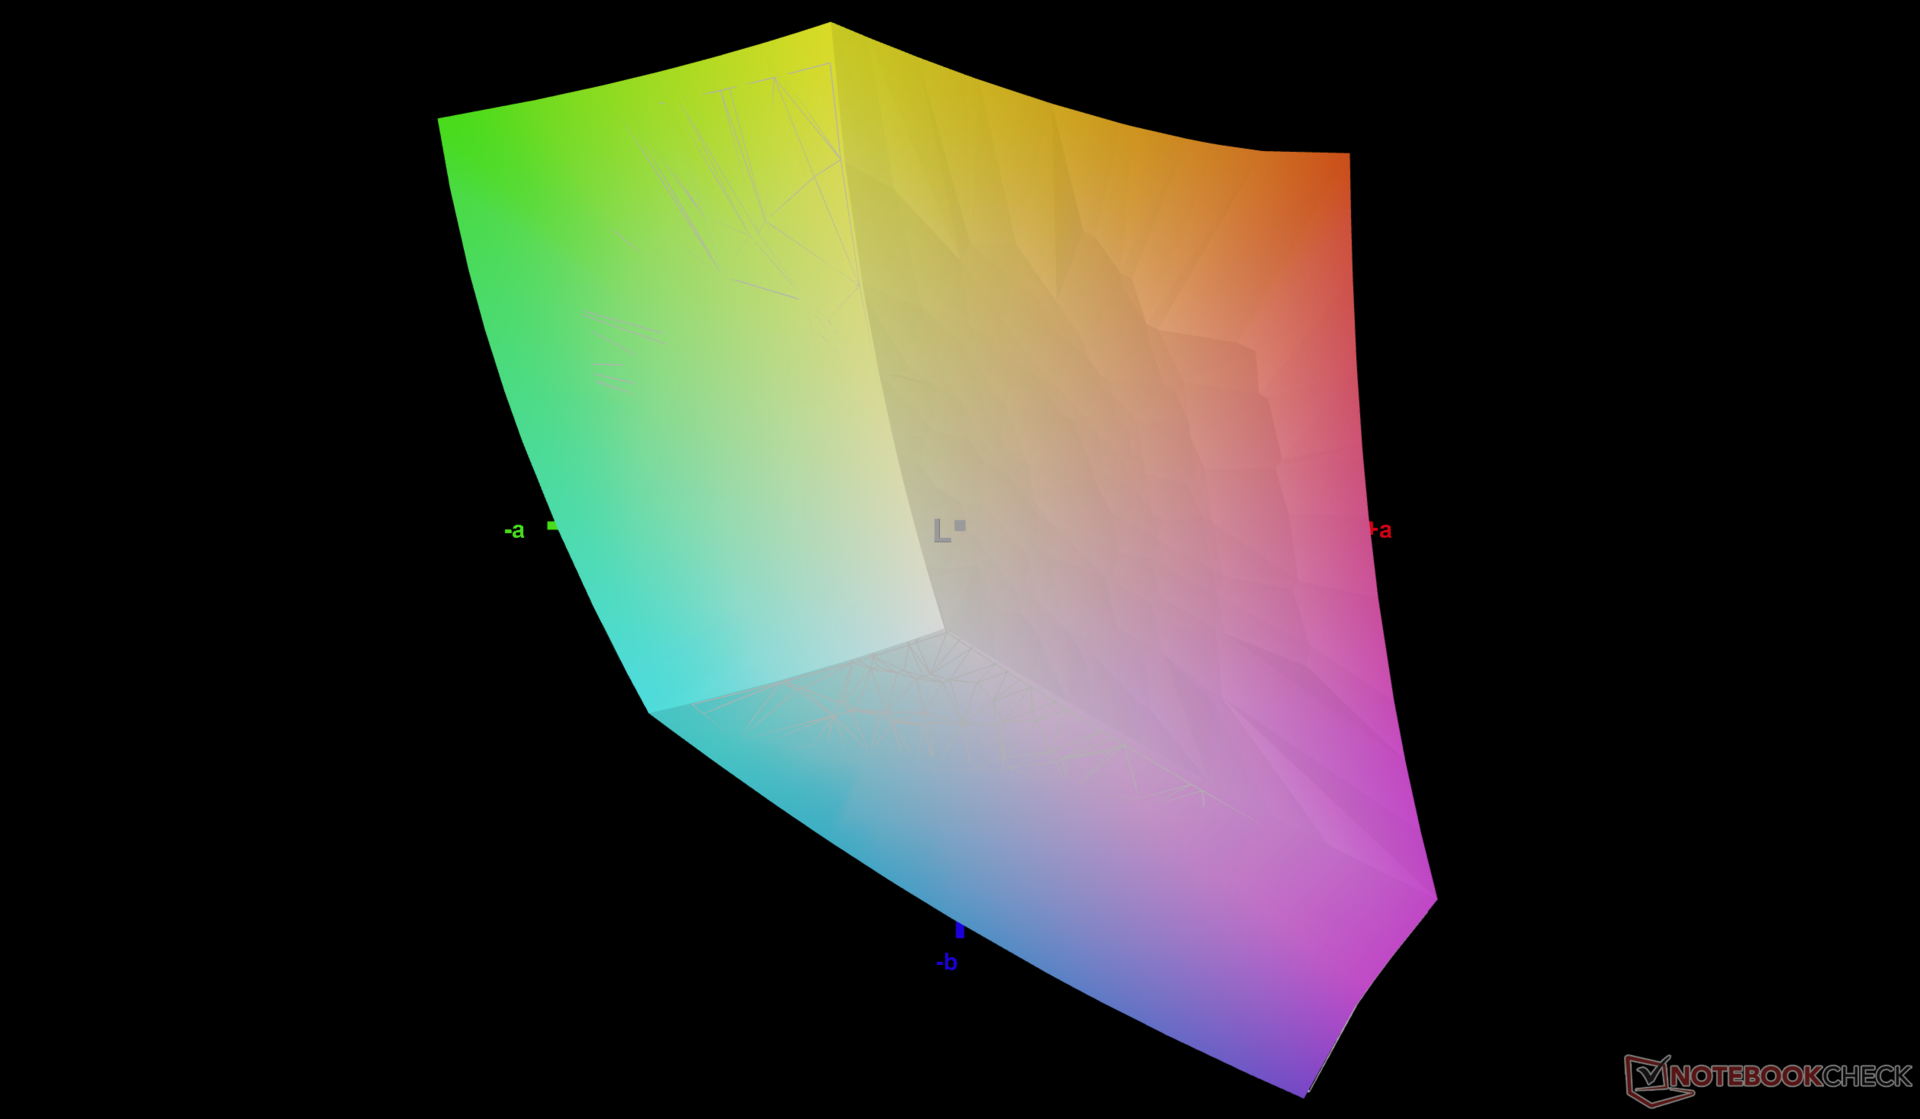
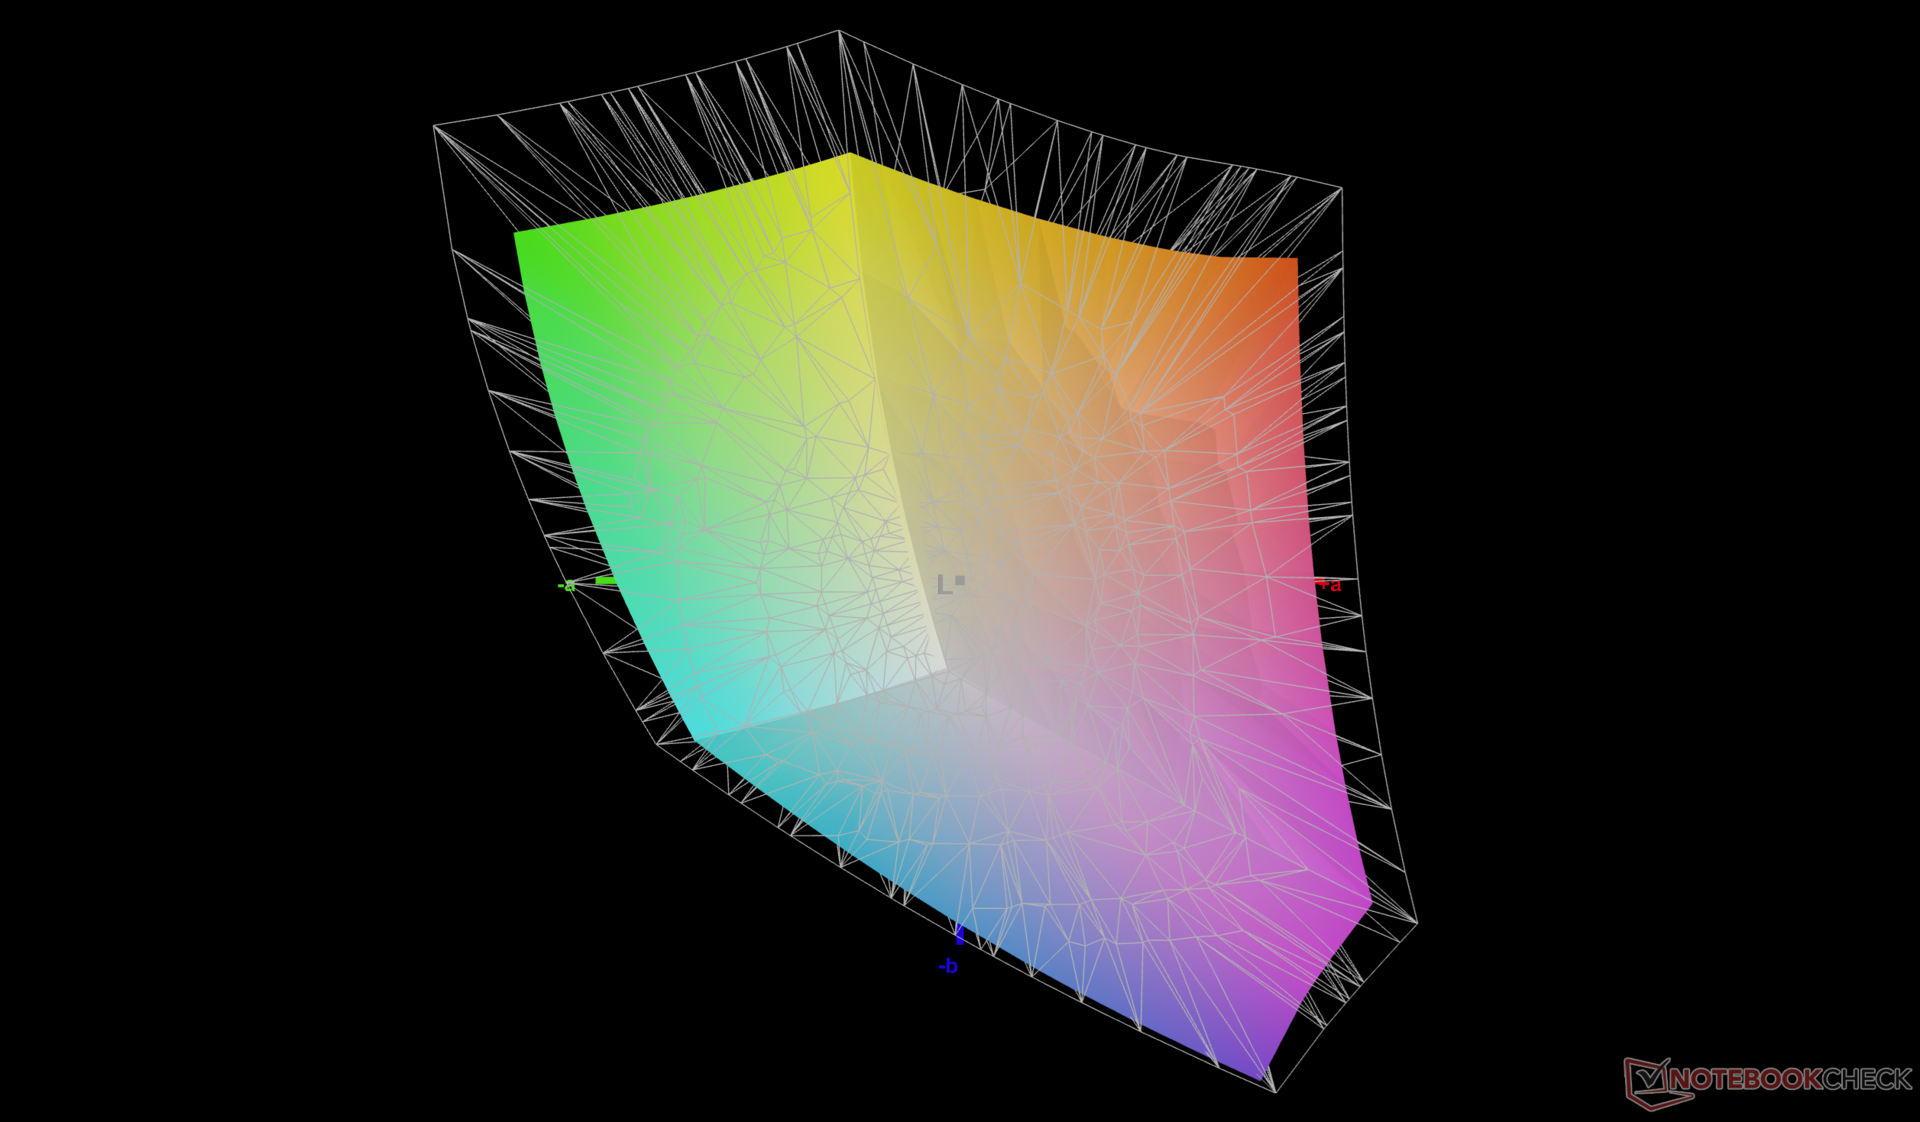
78.4% AdobeRGB 1998 (Argyll 3D)
99.8% sRGB (Argyll 3D)
76.6% Display P3 (Argyll 3D)
Gamma: 2.25
CCT: 6260 K
| Dell 16 Plus AU Optronics B160QAN, IPS, 2560x1600, 16", 120 Hz | Dell Inspiron 16 Plus 7640 AU Optronics B160QAN, IPS, 2560x1600, 16", 120 Hz | Acer Swift 16 AI SF16-51T-932H, Ultra 9 288V SDC41B6, OLED, 2880x1800, 16", 120 Hz | Lenovo ThinkBook 16 G7+ AMD LEN160-3.2K, IPS, 3200x2000, 16", 165 Hz | HP Pavilion Plus 16-ab0456tx AU Optronics AUOFDA4, IPS, 2560x1600, 16", 120 Hz | Asus Vivobook 16 M1606K B160UAN04.3 (AUOA5AB), IPS, 1920x1200, 16", 60 Hz | |
|---|---|---|---|---|---|---|
| Display | -1% | 17% | 12% | -2% | -50% | |
| Display P3 Coverage (%) | 76.6 | 76 -1% | 99.9 30% | 96.3 26% | 74.6 -3% | 36.8 -52% |
| sRGB Coverage (%) | 99.8 | 99.8 0% | 100 0% | 100 0% | 99 -1% | 55.3 -45% |
| AdobeRGB 1998 Coverage (%) | 78.4 | 76.7 -2% | 94.6 21% | 86.9 11% | 76.5 -2% | 38 -52% |
| Response Times | 24% | 54% | 66% | 72% | -1% | |
| Response Time Grey 50% / Grey 80% * (ms) | 32.8 ? | 25.6 ? 22% | 4.8 ? 85% | 13.9 ? 58% | 9.06 ? 72% | 36 ? -10% |
| Response Time Black / White * (ms) | 23.4 ? | 17.6 ? 25% | 18 ? 23% | 6.3 ? 73% | 6.7 ? 71% | 21.4 ? 9% |
| PWM Frequency (Hz) | 481 | |||||
| PWM Amplitude * (%) | 39 | |||||
| Screen | 0% | 195% | 16% | -23% | -128% | |
| Brightness middle (cd/m²) | 335.6 | 314.7 -6% | 425 27% | 422 26% | 403 20% | 326 -3% |
| Brightness (cd/m²) | 308 | 291 -6% | 421 37% | 403 31% | 394 28% | 303 -2% |
| Brightness Distribution (%) | 88 | 89 1% | 98 11% | 93 6% | 90 2% | 89 1% |
| Black Level * (cd/m²) | 0.22 | 0.28 -27% | 0.0219 90% | 0.3 -36% | 0.34 -55% | 0.24 -9% |
| Contrast (:1) | 1525 | 1124 -26% | 19406 1173% | 1407 -8% | 1185 -22% | 1358 -11% |
| Colorchecker dE 2000 * | 4.15 | 1.62 61% | 1.73 58% | 1.7 59% | 3.13 25% | 6.48 -56% |
| Colorchecker dE 2000 max. * | 9.8 | 2.94 70% | 3.82 61% | 3.4 65% | 6.14 37% | 19.42 -98% |
| Colorchecker dE 2000 calibrated * | 0.44 | 1.08 -145% | 0.7 -59% | 1.65 -275% | 4.92 -1018% | |
| Greyscale dE 2000 * | 6.7 | 1.3 81% | 0.09 99% | 2.4 64% | 4.5 33% | 3.85 43% |
| Gamma | 2.25 98% | 2.26 97% | 2.346 94% | 2.19 100% | 2.18 101% | 2.79 79% |
| CCT | 6260 104% | 6385 102% | 6432 101% | 6989 93% | 6261 104% | 6739 96% |
| Total Average (Program / Settings) | 8% /
3% | 89% /
132% | 31% /
23% | 16% /
-5% | -60% /
-93% |
* ... smaller is better
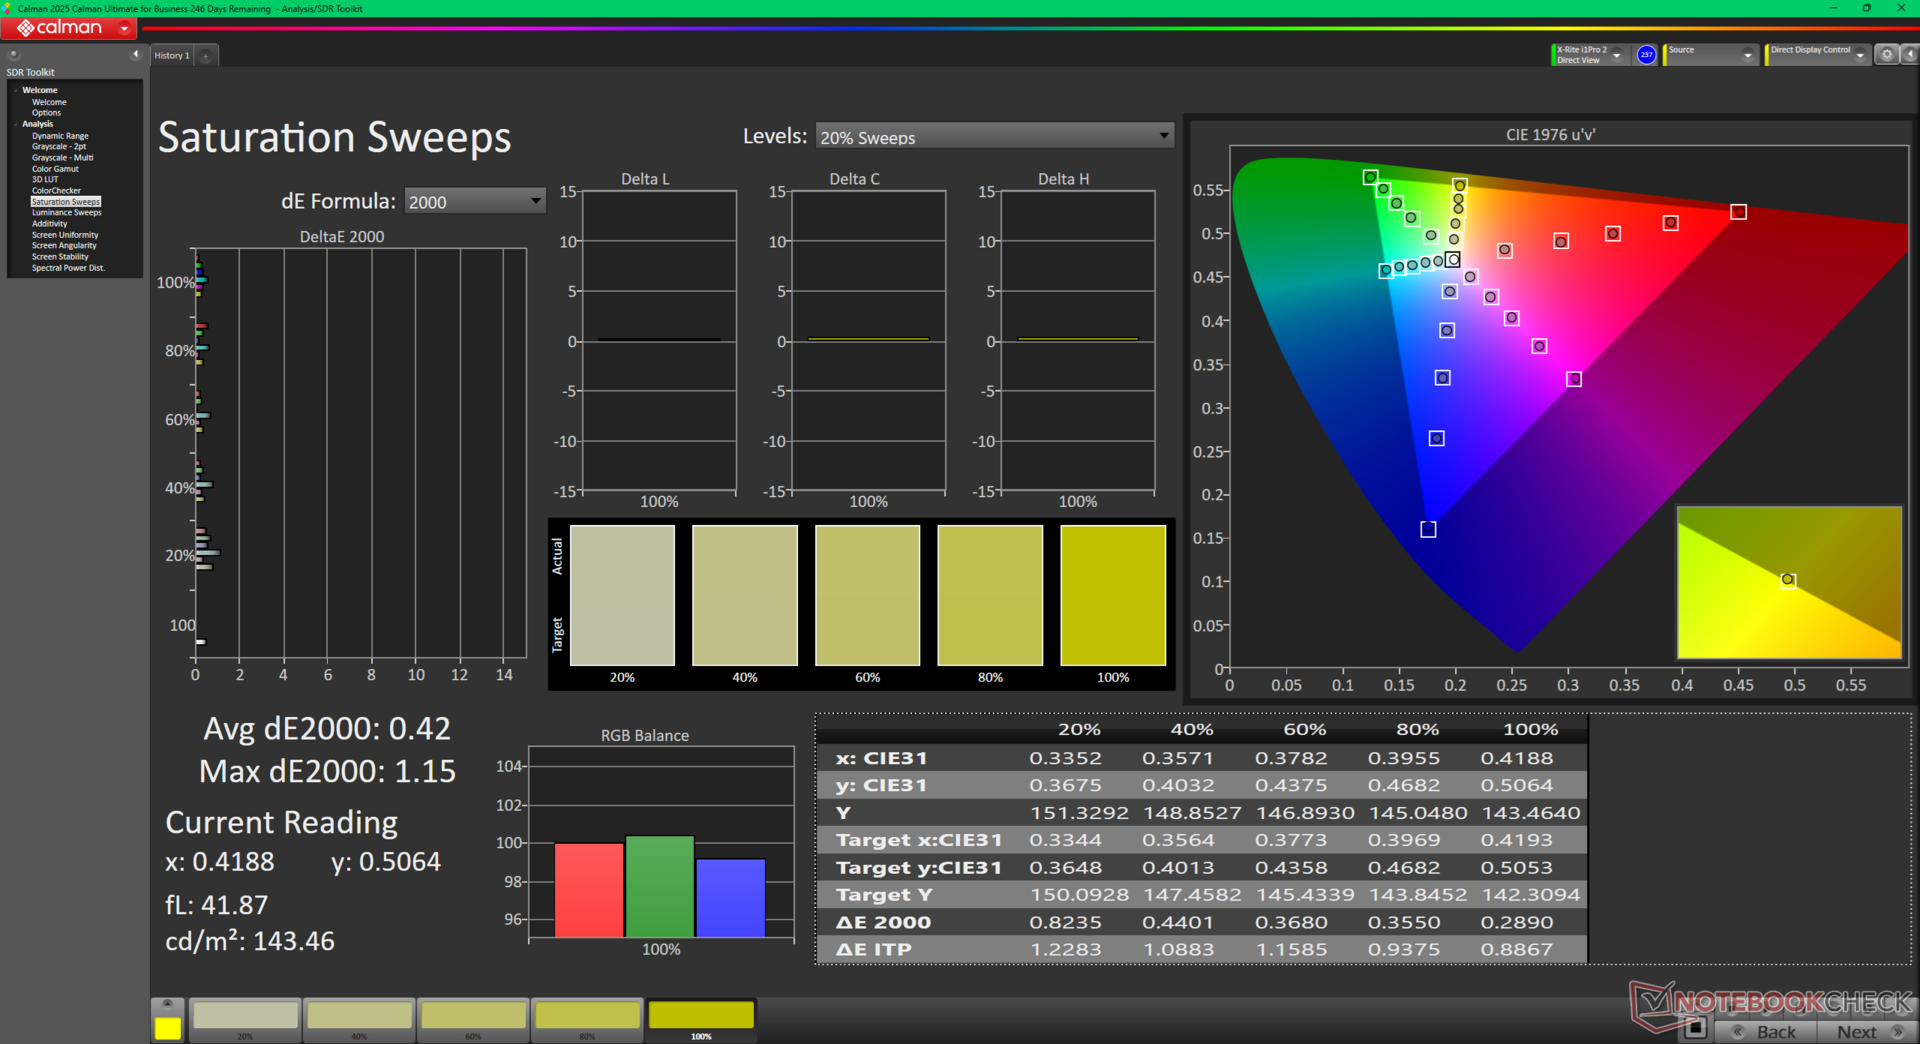
The display is not well calibrated out of the box which is common on most budget to midrange consumer laptops. Calibrating the display ourselves with an X-Rite colorimeter would greatly improve average grayscale and color deltaE values from 6.7 and 4.15 to just 0.8 and 0.44, respectively, to make better use of the full sRGB coverage. Our calibrated ICM profile is available to download above for free.
Display Response Times
| ↔ Response Time Black to White | ||
|---|---|---|
| 23.4 ms ... rise ↗ and fall ↘ combined | ↗ 11.6 ms rise | 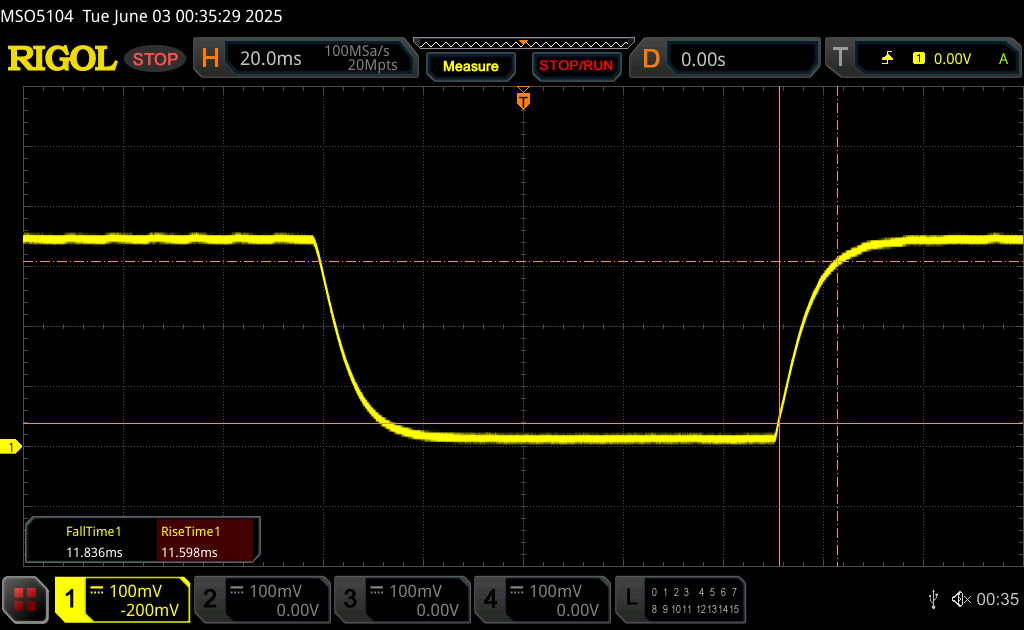 |
| ↘ 11.8 ms fall | ||
| The screen shows good response rates in our tests, but may be too slow for competitive gamers. In comparison, all tested devices range from 0.1 (minimum) to 240 (maximum) ms. » 54 % of all devices are better. This means that the measured response time is worse than the average of all tested devices (19.9 ms). | ||
| ↔ Response Time 50% Grey to 80% Grey | ||
| 32.8 ms ... rise ↗ and fall ↘ combined | ↗ 16.1 ms rise | 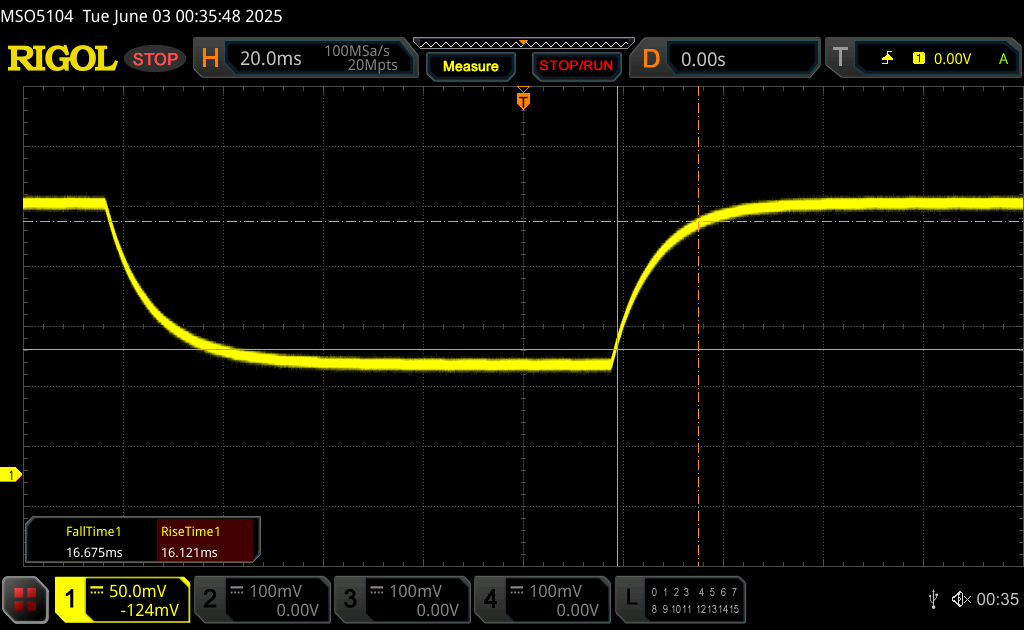 |
| ↘ 16.7 ms fall | ||
| The screen shows slow response rates in our tests and will be unsatisfactory for gamers. In comparison, all tested devices range from 0.165 (minimum) to 636 (maximum) ms. » 44 % of all devices are better. This means that the measured response time is similar to the average of all tested devices (31.1 ms). | ||
Screen Flickering / PWM (Pulse-Width Modulation)
| Screen flickering / PWM not detected |  | ||
In comparison: 52 % of all tested devices do not use PWM to dim the display. If PWM was detected, an average of 7791 (minimum: 5 - maximum: 343500) Hz was measured. | |||
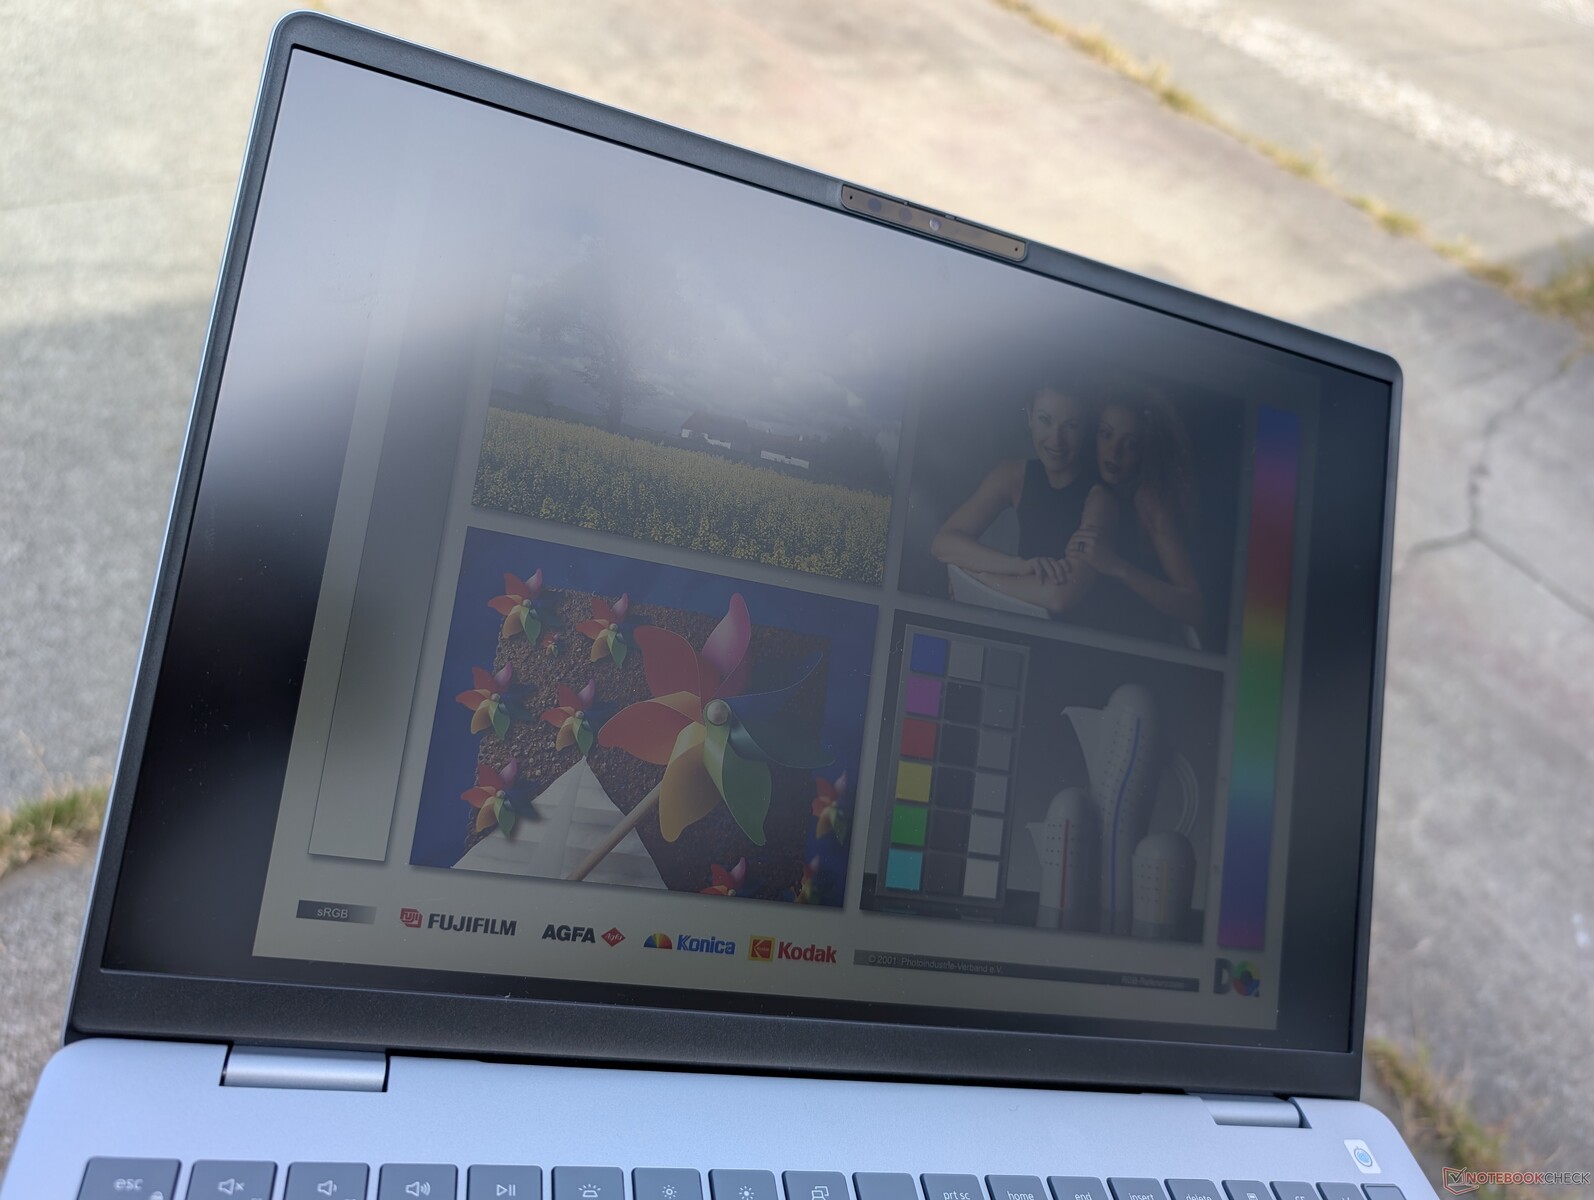
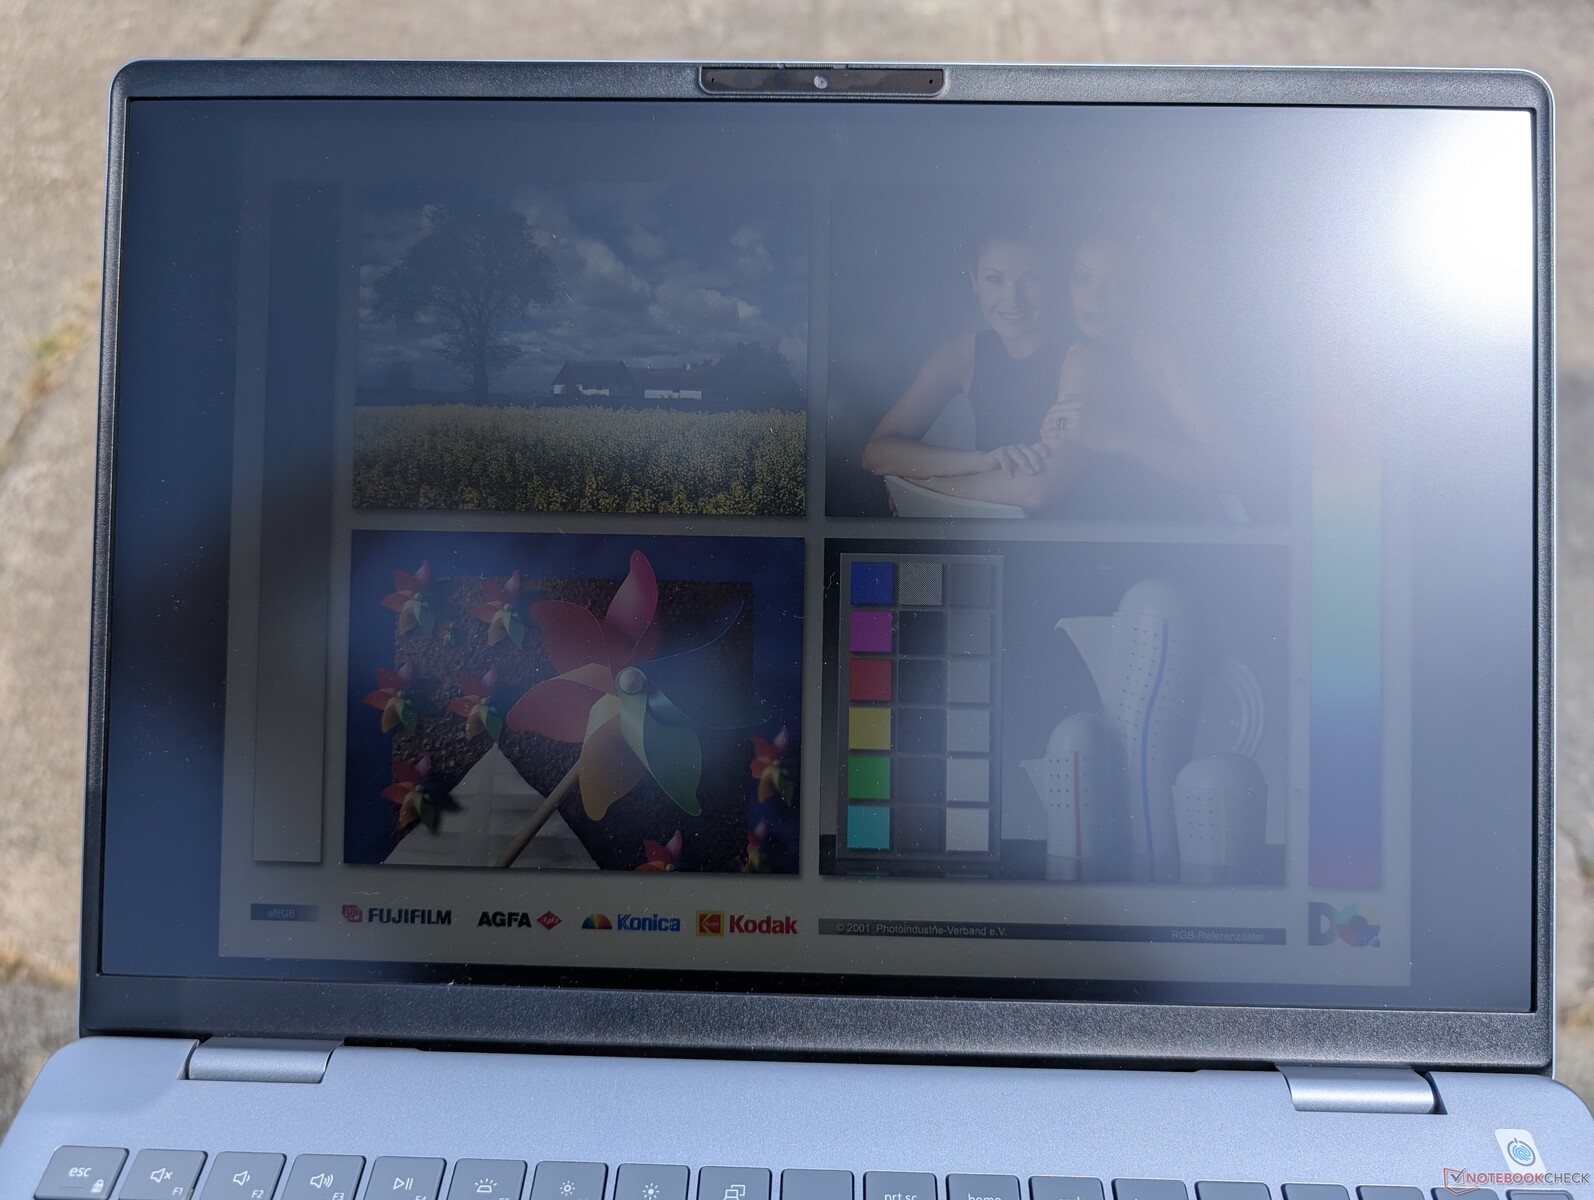
Outdoor visibility is poor as the display is not bright enough to overcome glare.

Performance — More Efficient With Faster Integrated Graphics


Testing Conditions
We set Dell Optimizer to Performance mode prior to running the benchmarks below. The Dell power profiles correlate with the default Windows power profiles and changing one profile will sync with the other.
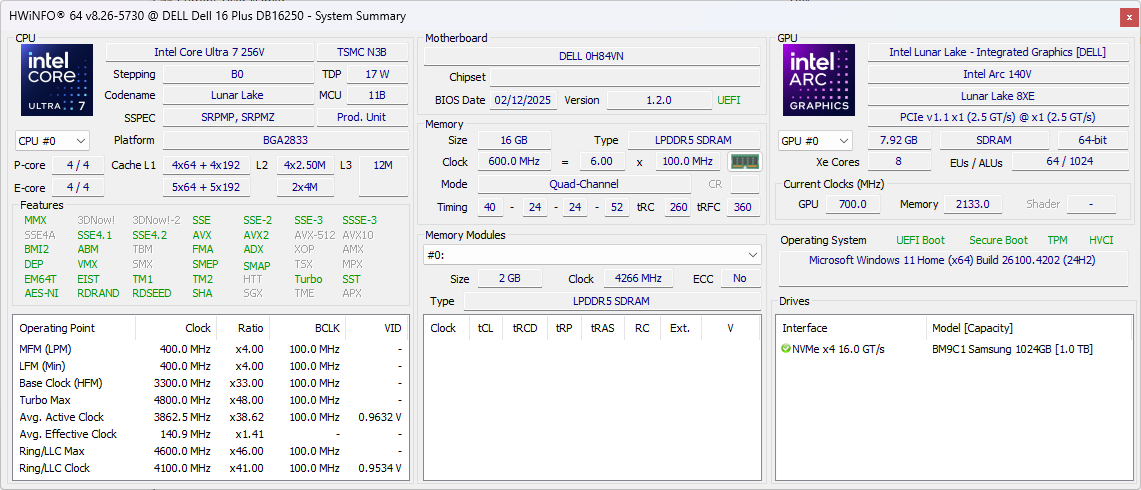
Processor
The Core Ultra 7 256V is all about efficiency while maintaining the raw processor performance levels of the previous generation Core Ultra 7 155U. Older models with Core H options are still significantly faster including the Inspiron 16 7640 2-in-1. Upgrading to the Core Ultra 9 288V configuration is expected to bring very minor gains of under 10 percent at best based on our time with the Acer Swift 16 AI.
Performance sustainability could be better as we're able to record a dip of 20 percent over time when running our CineBench R15 xT loop test as shown by the graph below.
Cinebench R15 Multi Loop
Cinebench R23: Multi Core | Single Core
Cinebench R20: CPU (Multi Core) | CPU (Single Core)
Cinebench R15: CPU Multi 64Bit | CPU Single 64Bit
Blender: v2.79 BMW27 CPU
7-Zip 18.03: 7z b 4 | 7z b 4 -mmt1
Geekbench 6.7: Multi-Core | Single-Core
Geekbench 5.5: Multi-Core | Single-Core
HWBOT x265 Benchmark v2.2: 4k Preset
LibreOffice : 20 Documents To PDF
R Benchmark 2.5: Overall mean
* ... smaller is better
AIDA64: FP32 Ray-Trace | FPU Julia | CPU SHA3 | CPU Queen | FPU SinJulia | FPU Mandel | CPU AES | CPU ZLib | FP64 Ray-Trace | CPU PhotoWorxx
| Performance rating | |
| Lenovo ThinkBook 16 G7+ AMD | |
| Asus Vivobook 16 M1606K | |
| HP Pavilion Plus 16-ab0456tx | |
| Dell Inspiron 16 Plus 7640 | |
| Acer Swift 16 AI SF16-51T-932H, Ultra 9 288V | |
| Average Intel Core Ultra 7 256V | |
| Dell 16 Plus | |
| AIDA64 / FP32 Ray-Trace | |
| Lenovo ThinkBook 16 G7+ AMD | |
| Asus Vivobook 16 M1606K | |
| HP Pavilion Plus 16-ab0456tx | |
| Dell Inspiron 16 Plus 7640 | |
| Acer Swift 16 AI SF16-51T-932H, Ultra 9 288V | |
| Average Intel Core Ultra 7 256V (10524 - 12898, n=7) | |
| Dell 16 Plus | |
| AIDA64 / FPU Julia | |
| Lenovo ThinkBook 16 G7+ AMD | |
| Asus Vivobook 16 M1606K | |
| HP Pavilion Plus 16-ab0456tx | |
| Dell Inspiron 16 Plus 7640 | |
| Acer Swift 16 AI SF16-51T-932H, Ultra 9 288V | |
| Average Intel Core Ultra 7 256V (52443 - 62522, n=7) | |
| Dell 16 Plus | |
| AIDA64 / CPU SHA3 | |
| Lenovo ThinkBook 16 G7+ AMD | |
| Asus Vivobook 16 M1606K | |
| HP Pavilion Plus 16-ab0456tx | |
| Dell Inspiron 16 Plus 7640 | |
| Acer Swift 16 AI SF16-51T-932H, Ultra 9 288V | |
| Average Intel Core Ultra 7 256V (2364 - 2915, n=7) | |
| Dell 16 Plus | |
| AIDA64 / CPU Queen | |
| HP Pavilion Plus 16-ab0456tx | |
| Dell Inspiron 16 Plus 7640 | |
| Lenovo ThinkBook 16 G7+ AMD | |
| Asus Vivobook 16 M1606K | |
| Acer Swift 16 AI SF16-51T-932H, Ultra 9 288V | |
| Average Intel Core Ultra 7 256V (49622 - 49794, n=6) | |
| Dell 16 Plus | |
| AIDA64 / FPU SinJulia | |
| Lenovo ThinkBook 16 G7+ AMD | |
| Asus Vivobook 16 M1606K | |
| Dell Inspiron 16 Plus 7640 | |
| HP Pavilion Plus 16-ab0456tx | |
| Average Intel Core Ultra 7 256V (4401 - 4434, n=7) | |
| Acer Swift 16 AI SF16-51T-932H, Ultra 9 288V | |
| Dell 16 Plus | |
| AIDA64 / FPU Mandel | |
| Lenovo ThinkBook 16 G7+ AMD | |
| Asus Vivobook 16 M1606K | |
| HP Pavilion Plus 16-ab0456tx | |
| Dell Inspiron 16 Plus 7640 | |
| Acer Swift 16 AI SF16-51T-932H, Ultra 9 288V | |
| Average Intel Core Ultra 7 256V (27382 - 33019, n=7) | |
| Dell 16 Plus | |
| AIDA64 / CPU AES | |
| Lenovo ThinkBook 16 G7+ AMD | |
| Dell Inspiron 16 Plus 7640 | |
| HP Pavilion Plus 16-ab0456tx | |
| Asus Vivobook 16 M1606K | |
| Average Intel Core Ultra 7 256V (38495 - 75938, n=7) | |
| Acer Swift 16 AI SF16-51T-932H, Ultra 9 288V | |
| Dell 16 Plus | |
| AIDA64 / CPU ZLib | |
| Lenovo ThinkBook 16 G7+ AMD | |
| Dell Inspiron 16 Plus 7640 | |
| Asus Vivobook 16 M1606K | |
| HP Pavilion Plus 16-ab0456tx | |
| Average Intel Core Ultra 7 256V (536 - 632, n=7) | |
| Acer Swift 16 AI SF16-51T-932H, Ultra 9 288V | |
| Dell 16 Plus | |
| AIDA64 / FP64 Ray-Trace | |
| Lenovo ThinkBook 16 G7+ AMD | |
| Asus Vivobook 16 M1606K | |
| HP Pavilion Plus 16-ab0456tx | |
| Dell Inspiron 16 Plus 7640 | |
| Acer Swift 16 AI SF16-51T-932H, Ultra 9 288V | |
| Average Intel Core Ultra 7 256V (5655 - 6878, n=7) | |
| Dell 16 Plus | |
| AIDA64 / CPU PhotoWorxx | |
| Acer Swift 16 AI SF16-51T-932H, Ultra 9 288V | |
| Average Intel Core Ultra 7 256V (49906 - 57060, n=7) | |
| Dell 16 Plus | |
| Lenovo ThinkBook 16 G7+ AMD | |
| HP Pavilion Plus 16-ab0456tx | |
| Dell Inspiron 16 Plus 7640 | |
| Asus Vivobook 16 M1606K | |
Stress Test
When running Prime95 stress, the CPU would boost to 3.2 GHz and 38 W lasting for about 20 seconds before reaching 83 C. It would then drop and stabilize at 2.5 GHz and 21 W in order to maintain a cooler core temperature of 74 C to represent limited Turbo Boost potential. This is also reflected in our CineBench R15 xT loop test as mentioned above.
When running Cyberpunk 2077 to represent typical gaming stress, the processor would again top out at 74 C to be significantly cooler than what we observed on the Inspiron 16 7640 2-in-1.
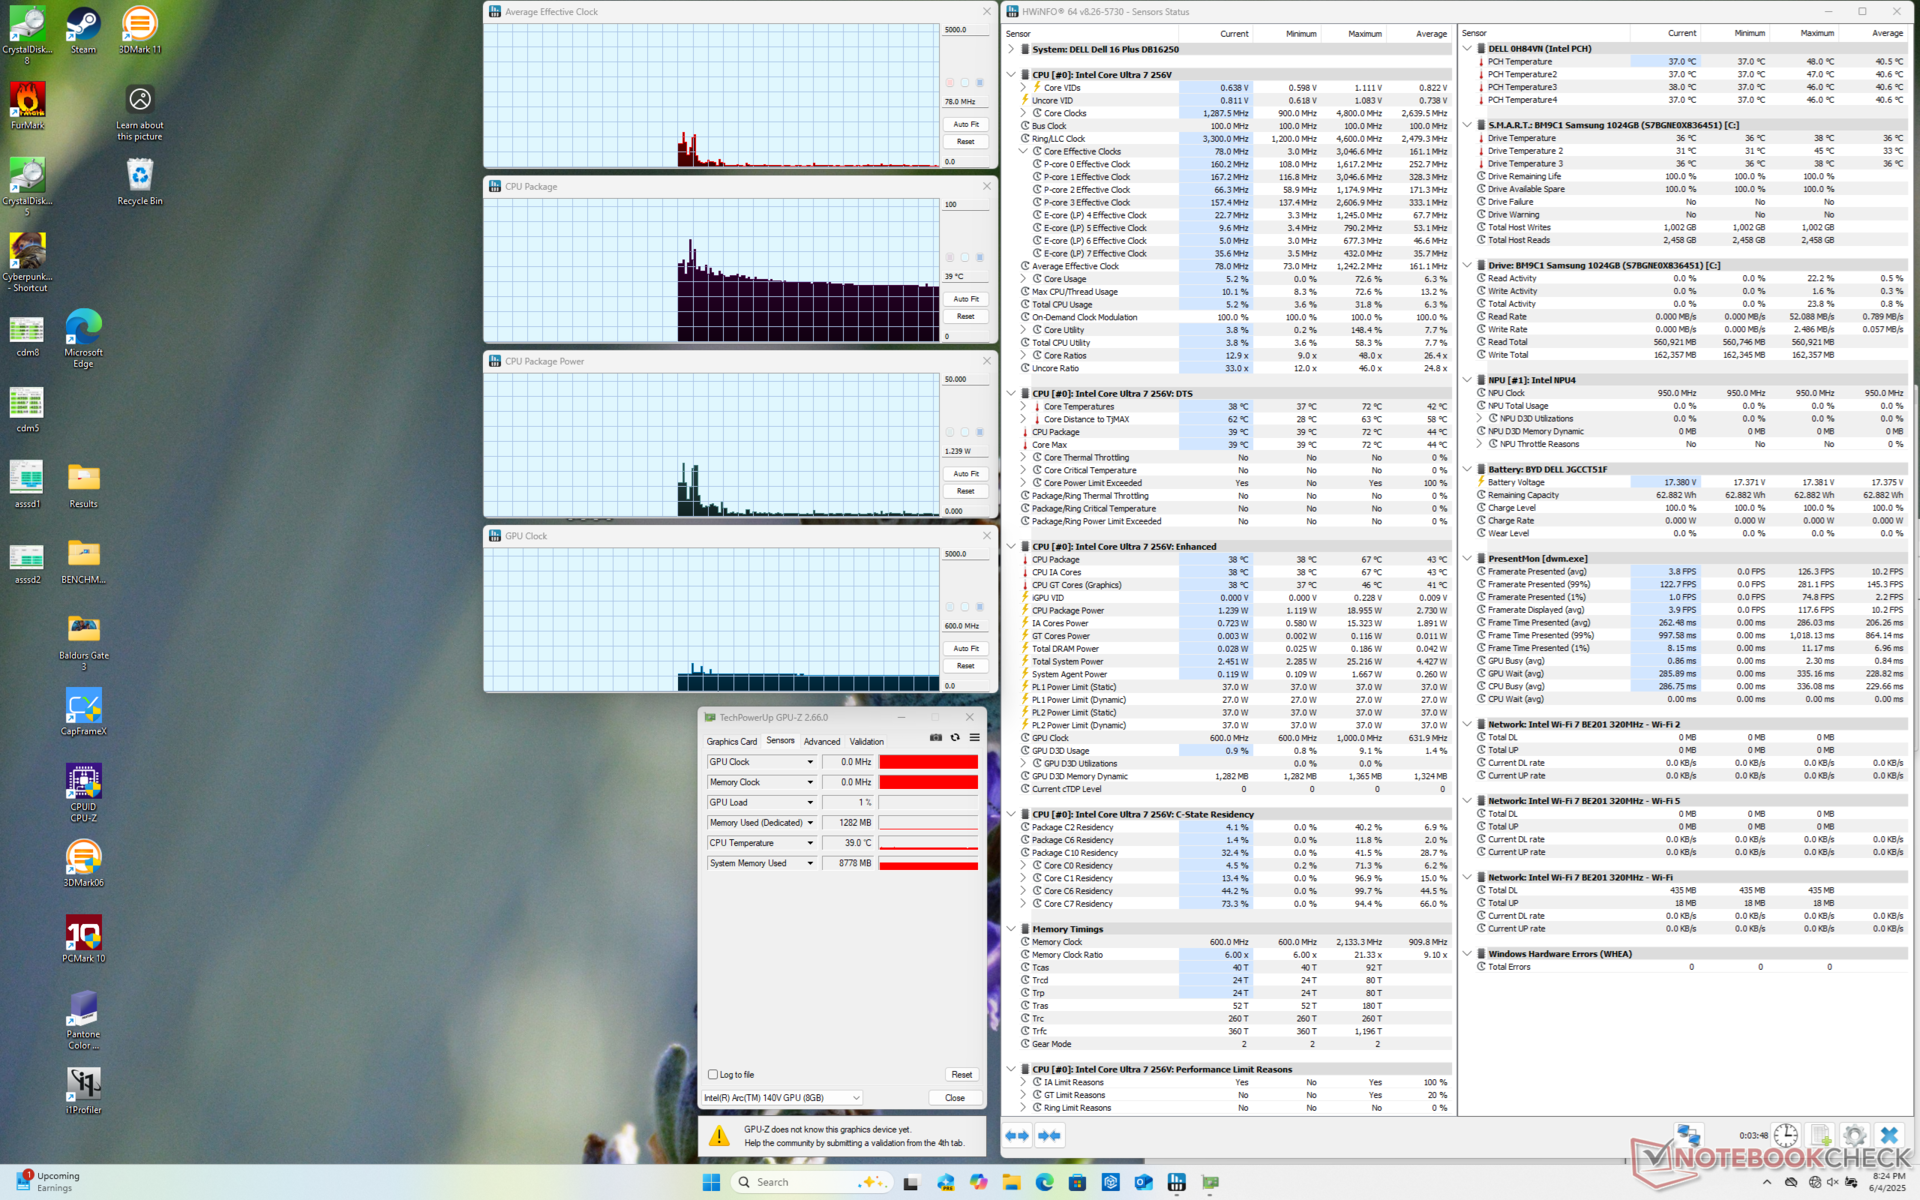
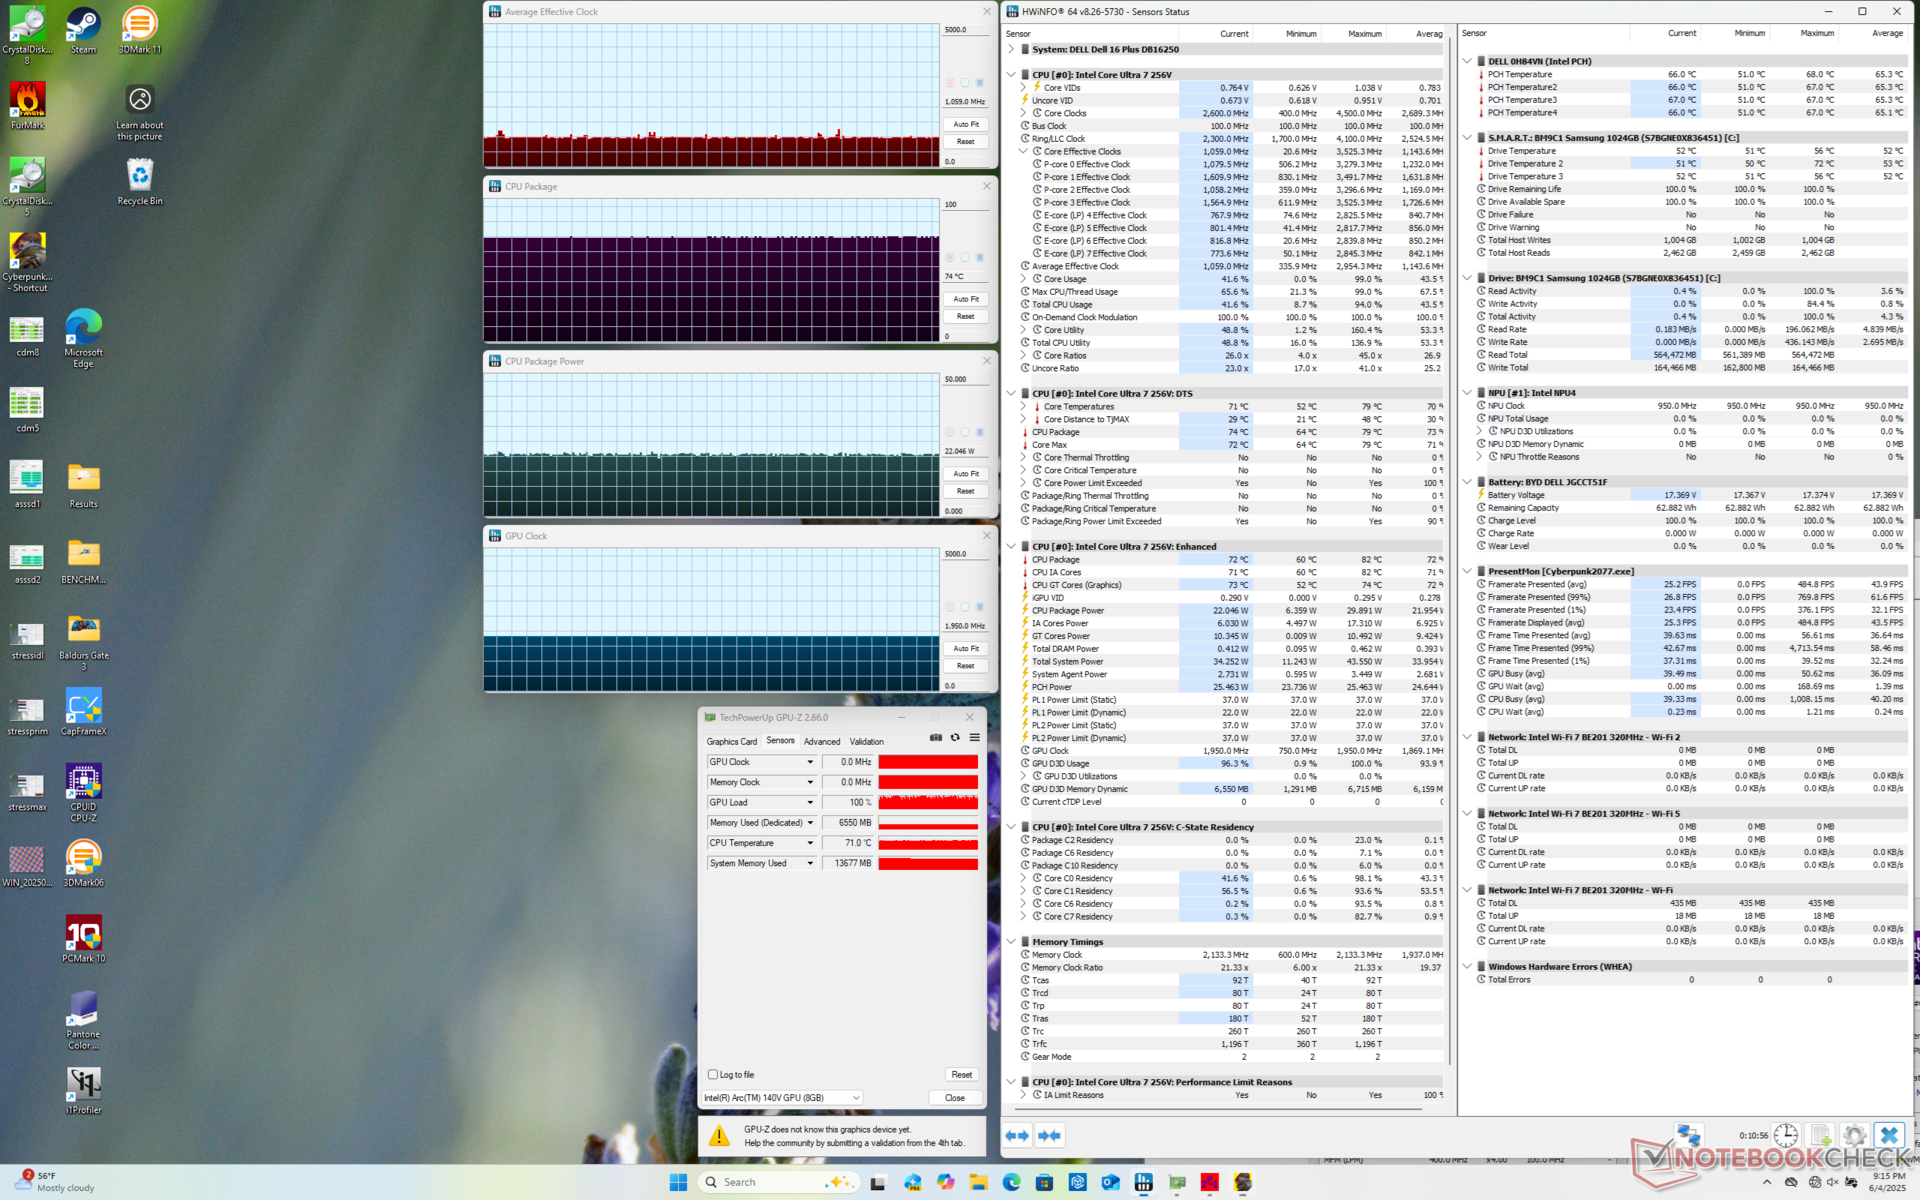
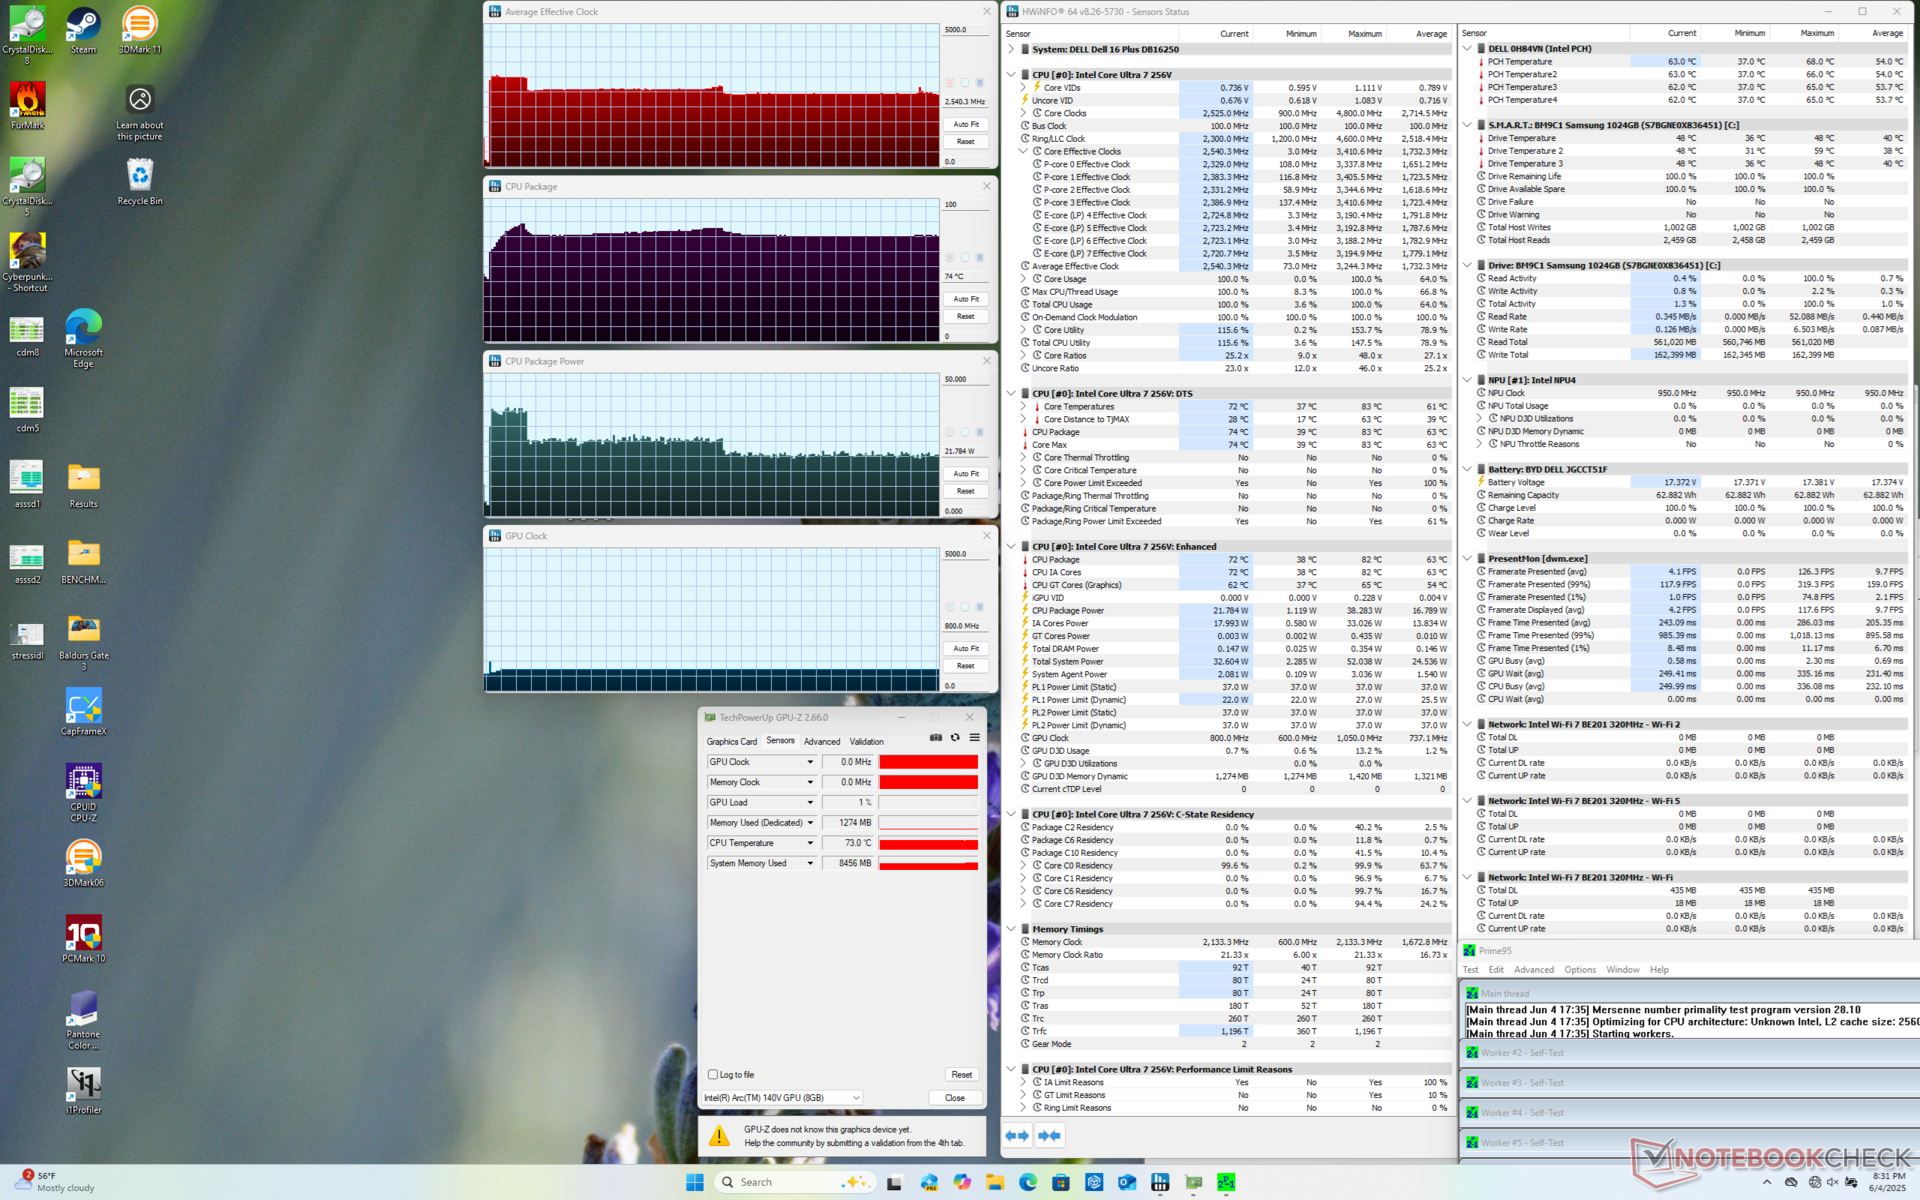
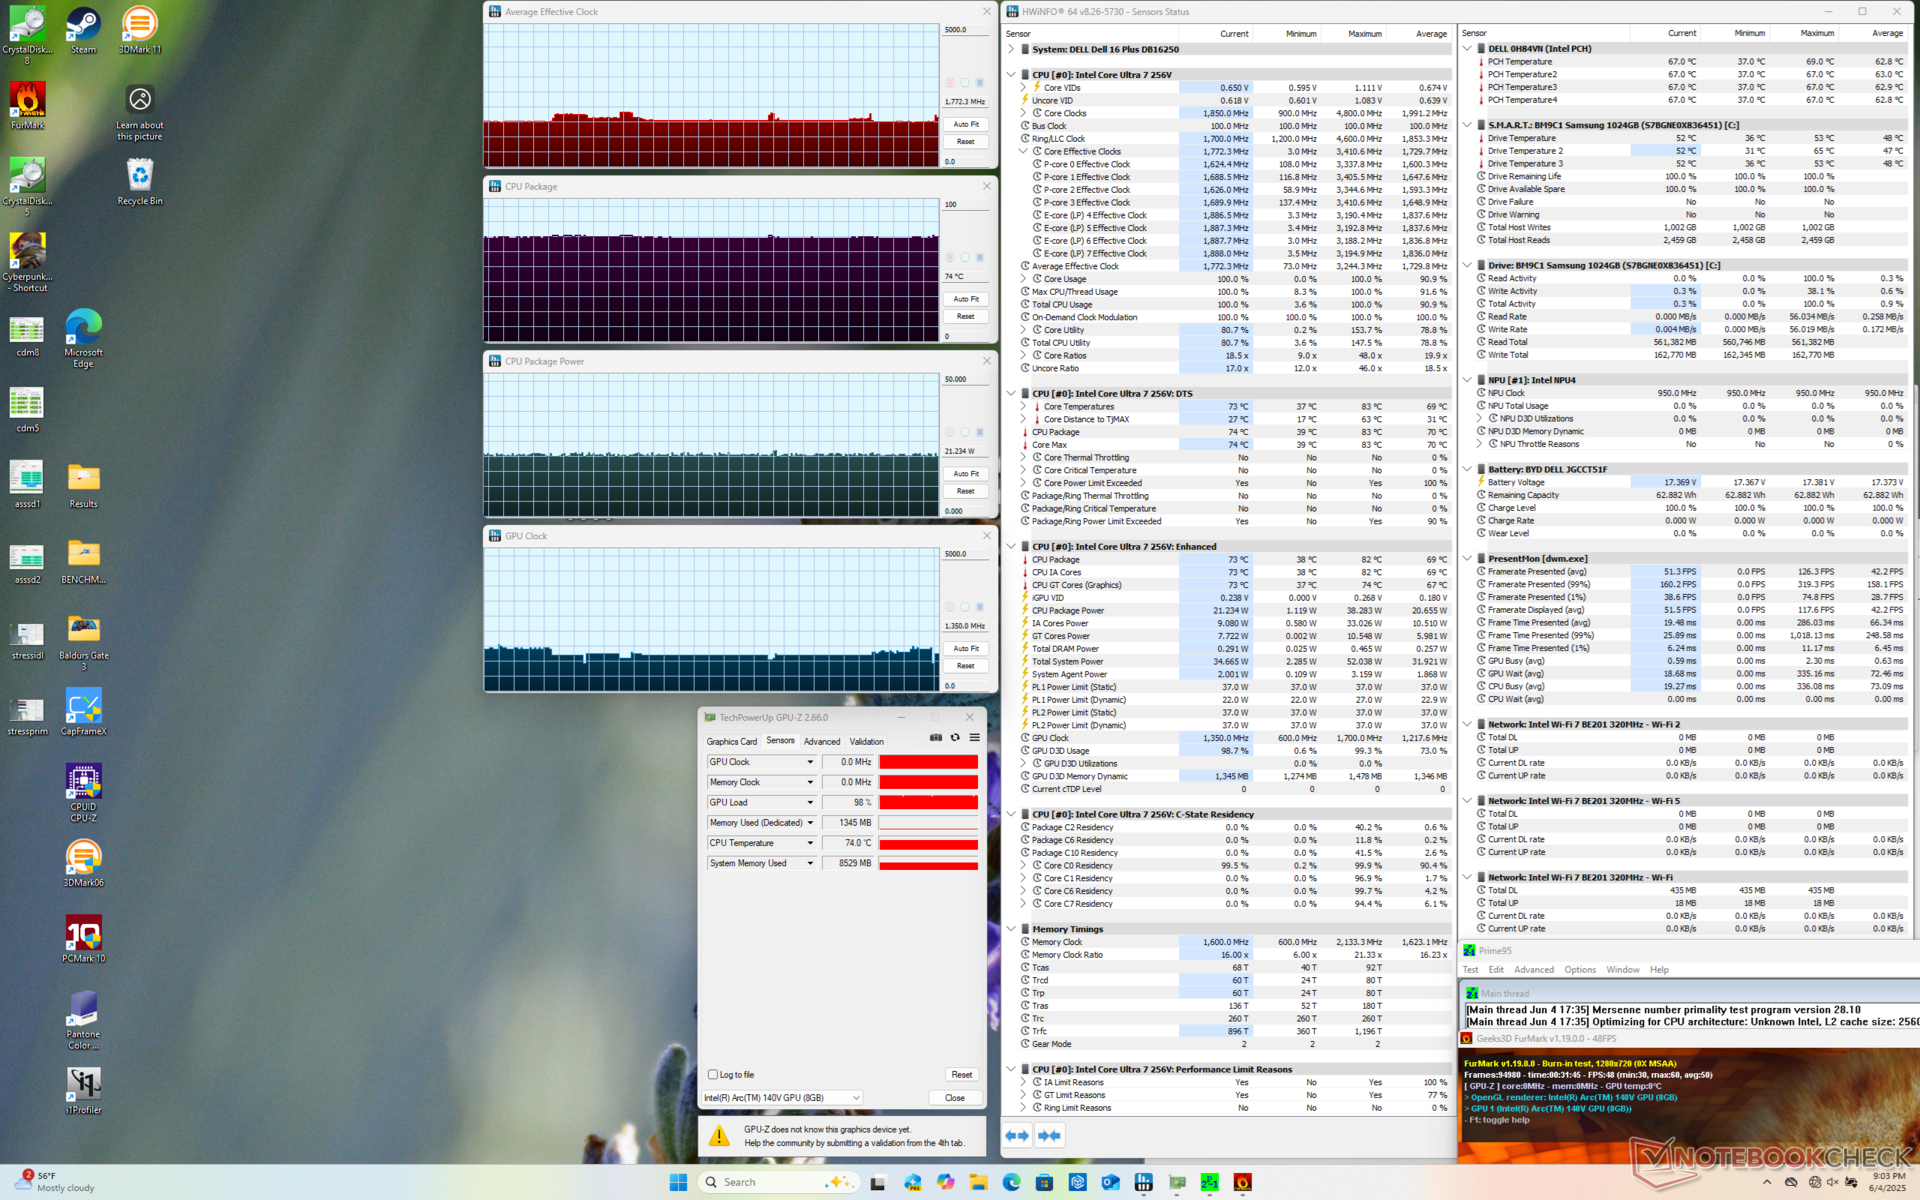
| Average CPU Clock (GHz) | GPU Clock (MHz) | Average CPU Temperature (°C) | |
| System Idle | -- | -- | 39 |
| Prime95 Stress | 2.5 | -- | 74 |
| Prime95 + FurMark Stress | 1.7 | 1350 | 74 |
| Cyberpunk 2077 Stress | 1.0 | 1950 | 74 |
System Performance
PCMark scores are comparable to competing 16-inch laptops including even those with faster H-series CPUs like the Asus Vivobook 16 M1606K. RAM performance is also excellent due to the on-package design of Lunar Lake.

PCMark 10: Score | Essentials | Productivity | Digital Content Creation
CrossMark: Overall | Productivity | Creativity | Responsiveness
WebXPRT 3: Overall
WebXPRT 4: Overall
Mozilla Kraken 1.1: Total
| Performance rating | |
| Lenovo ThinkBook 16 G7+ AMD | |
| Acer Swift 16 AI SF16-51T-932H, Ultra 9 288V | |
| Dell 16 Plus | |
| Average Intel Core Ultra 7 256V, Intel Arc Graphics 140V | |
| Asus Vivobook 16 M1606K | |
| HP Pavilion Plus 16-ab0456tx | |
| Dell Inspiron 16 Plus 7640 | |
| PCMark 10 / Score | |
| Lenovo ThinkBook 16 G7+ AMD | |
| Acer Swift 16 AI SF16-51T-932H, Ultra 9 288V | |
| Dell 16 Plus | |
| Average Intel Core Ultra 7 256V, Intel Arc Graphics 140V (6677 - 7702, n=7) | |
| Dell Inspiron 16 Plus 7640 | |
| Asus Vivobook 16 M1606K | |
| HP Pavilion Plus 16-ab0456tx | |
| PCMark 10 / Essentials | |
| Asus Vivobook 16 M1606K | |
| Lenovo ThinkBook 16 G7+ AMD | |
| Acer Swift 16 AI SF16-51T-932H, Ultra 9 288V | |
| Dell 16 Plus | |
| Dell Inspiron 16 Plus 7640 | |
| Average Intel Core Ultra 7 256V, Intel Arc Graphics 140V (9627 - 11365, n=7) | |
| HP Pavilion Plus 16-ab0456tx | |
| PCMark 10 / Productivity | |
| Lenovo ThinkBook 16 G7+ AMD | |
| Asus Vivobook 16 M1606K | |
| Average Intel Core Ultra 7 256V, Intel Arc Graphics 140V (8161 - 12672, n=7) | |
| Dell 16 Plus | |
| Acer Swift 16 AI SF16-51T-932H, Ultra 9 288V | |
| HP Pavilion Plus 16-ab0456tx | |
| Dell Inspiron 16 Plus 7640 | |
| PCMark 10 / Digital Content Creation | |
| Dell Inspiron 16 Plus 7640 | |
| Lenovo ThinkBook 16 G7+ AMD | |
| Acer Swift 16 AI SF16-51T-932H, Ultra 9 288V | |
| Dell 16 Plus | |
| Average Intel Core Ultra 7 256V, Intel Arc Graphics 140V (9481 - 10126, n=7) | |
| Asus Vivobook 16 M1606K | |
| HP Pavilion Plus 16-ab0456tx | |
| CrossMark / Overall | |
| HP Pavilion Plus 16-ab0456tx | |
| Lenovo ThinkBook 16 G7+ AMD | |
| Acer Swift 16 AI SF16-51T-932H, Ultra 9 288V | |
| Asus Vivobook 16 M1606K | |
| Average Intel Core Ultra 7 256V, Intel Arc Graphics 140V (1636 - 1736, n=7) | |
| Dell Inspiron 16 Plus 7640 | |
| Dell 16 Plus | |
| CrossMark / Productivity | |
| Acer Swift 16 AI SF16-51T-932H, Ultra 9 288V | |
| HP Pavilion Plus 16-ab0456tx | |
| Average Intel Core Ultra 7 256V, Intel Arc Graphics 140V (1563 - 1682, n=7) | |
| Asus Vivobook 16 M1606K | |
| Dell 16 Plus | |
| Lenovo ThinkBook 16 G7+ AMD | |
| Dell Inspiron 16 Plus 7640 | |
| CrossMark / Creativity | |
| Lenovo ThinkBook 16 G7+ AMD | |
| HP Pavilion Plus 16-ab0456tx | |
| Acer Swift 16 AI SF16-51T-932H, Ultra 9 288V | |
| Dell Inspiron 16 Plus 7640 | |
| Average Intel Core Ultra 7 256V, Intel Arc Graphics 140V (1862 - 1962, n=7) | |
| Dell 16 Plus | |
| Asus Vivobook 16 M1606K | |
| CrossMark / Responsiveness | |
| HP Pavilion Plus 16-ab0456tx | |
| Asus Vivobook 16 M1606K | |
| Lenovo ThinkBook 16 G7+ AMD | |
| Dell Inspiron 16 Plus 7640 | |
| Acer Swift 16 AI SF16-51T-932H, Ultra 9 288V | |
| Average Intel Core Ultra 7 256V, Intel Arc Graphics 140V (1215 - 1371, n=7) | |
| Dell 16 Plus | |
| WebXPRT 3 / Overall | |
| Lenovo ThinkBook 16 G7+ AMD | |
| Dell 16 Plus | |
| Acer Swift 16 AI SF16-51T-932H, Ultra 9 288V | |
| Average Intel Core Ultra 7 256V, Intel Arc Graphics 140V (243 - 310, n=7) | |
| Asus Vivobook 16 M1606K | |
| Dell Inspiron 16 Plus 7640 | |
| HP Pavilion Plus 16-ab0456tx | |
| WebXPRT 4 / Overall | |
| Average Intel Core Ultra 7 256V, Intel Arc Graphics 140V (282 - 286, n=7) | |
| Dell 16 Plus | |
| Acer Swift 16 AI SF16-51T-932H, Ultra 9 288V | |
| HP Pavilion Plus 16-ab0456tx | |
| Dell Inspiron 16 Plus 7640 | |
| Lenovo ThinkBook 16 G7+ AMD | |
| Asus Vivobook 16 M1606K | |
| Mozilla Kraken 1.1 / Total | |
| Dell Inspiron 16 Plus 7640 | |
| HP Pavilion Plus 16-ab0456tx | |
| Average Intel Core Ultra 7 256V, Intel Arc Graphics 140V (470 - 480, n=7) | |
| Dell 16 Plus | |
| Acer Swift 16 AI SF16-51T-932H, Ultra 9 288V | |
| Asus Vivobook 16 M1606K | |
| Lenovo ThinkBook 16 G7+ AMD | |
* ... smaller is better
| PCMark 10 Score | 7135 points | |
Help | ||
| AIDA64 / Memory Copy | |
| Acer Swift 16 AI SF16-51T-932H, Ultra 9 288V | |
| Average Intel Core Ultra 7 256V (99227 - 104459, n=7) | |
| Dell 16 Plus | |
| Lenovo ThinkBook 16 G7+ AMD | |
| HP Pavilion Plus 16-ab0456tx | |
| Dell Inspiron 16 Plus 7640 | |
| Asus Vivobook 16 M1606K | |
| AIDA64 / Memory Read | |
| Lenovo ThinkBook 16 G7+ AMD | |
| Dell 16 Plus | |
| Average Intel Core Ultra 7 256V (86352 - 89848, n=7) | |
| Acer Swift 16 AI SF16-51T-932H, Ultra 9 288V | |
| Dell Inspiron 16 Plus 7640 | |
| HP Pavilion Plus 16-ab0456tx | |
| Asus Vivobook 16 M1606K | |
| AIDA64 / Memory Write | |
| Dell 16 Plus | |
| Average Intel Core Ultra 7 256V (108692 - 117933, n=7) | |
| Acer Swift 16 AI SF16-51T-932H, Ultra 9 288V | |
| Lenovo ThinkBook 16 G7+ AMD | |
| HP Pavilion Plus 16-ab0456tx | |
| Dell Inspiron 16 Plus 7640 | |
| Asus Vivobook 16 M1606K | |
| AIDA64 / Memory Latency | |
| Dell Inspiron 16 Plus 7640 | |
| Lenovo ThinkBook 16 G7+ AMD | |
| Dell 16 Plus | |
| Average Intel Core Ultra 7 256V (96.1 - 99.6, n=7) | |
| Acer Swift 16 AI SF16-51T-932H, Ultra 9 288V | |
| HP Pavilion Plus 16-ab0456tx | |
| Asus Vivobook 16 M1606K | |
* ... smaller is better
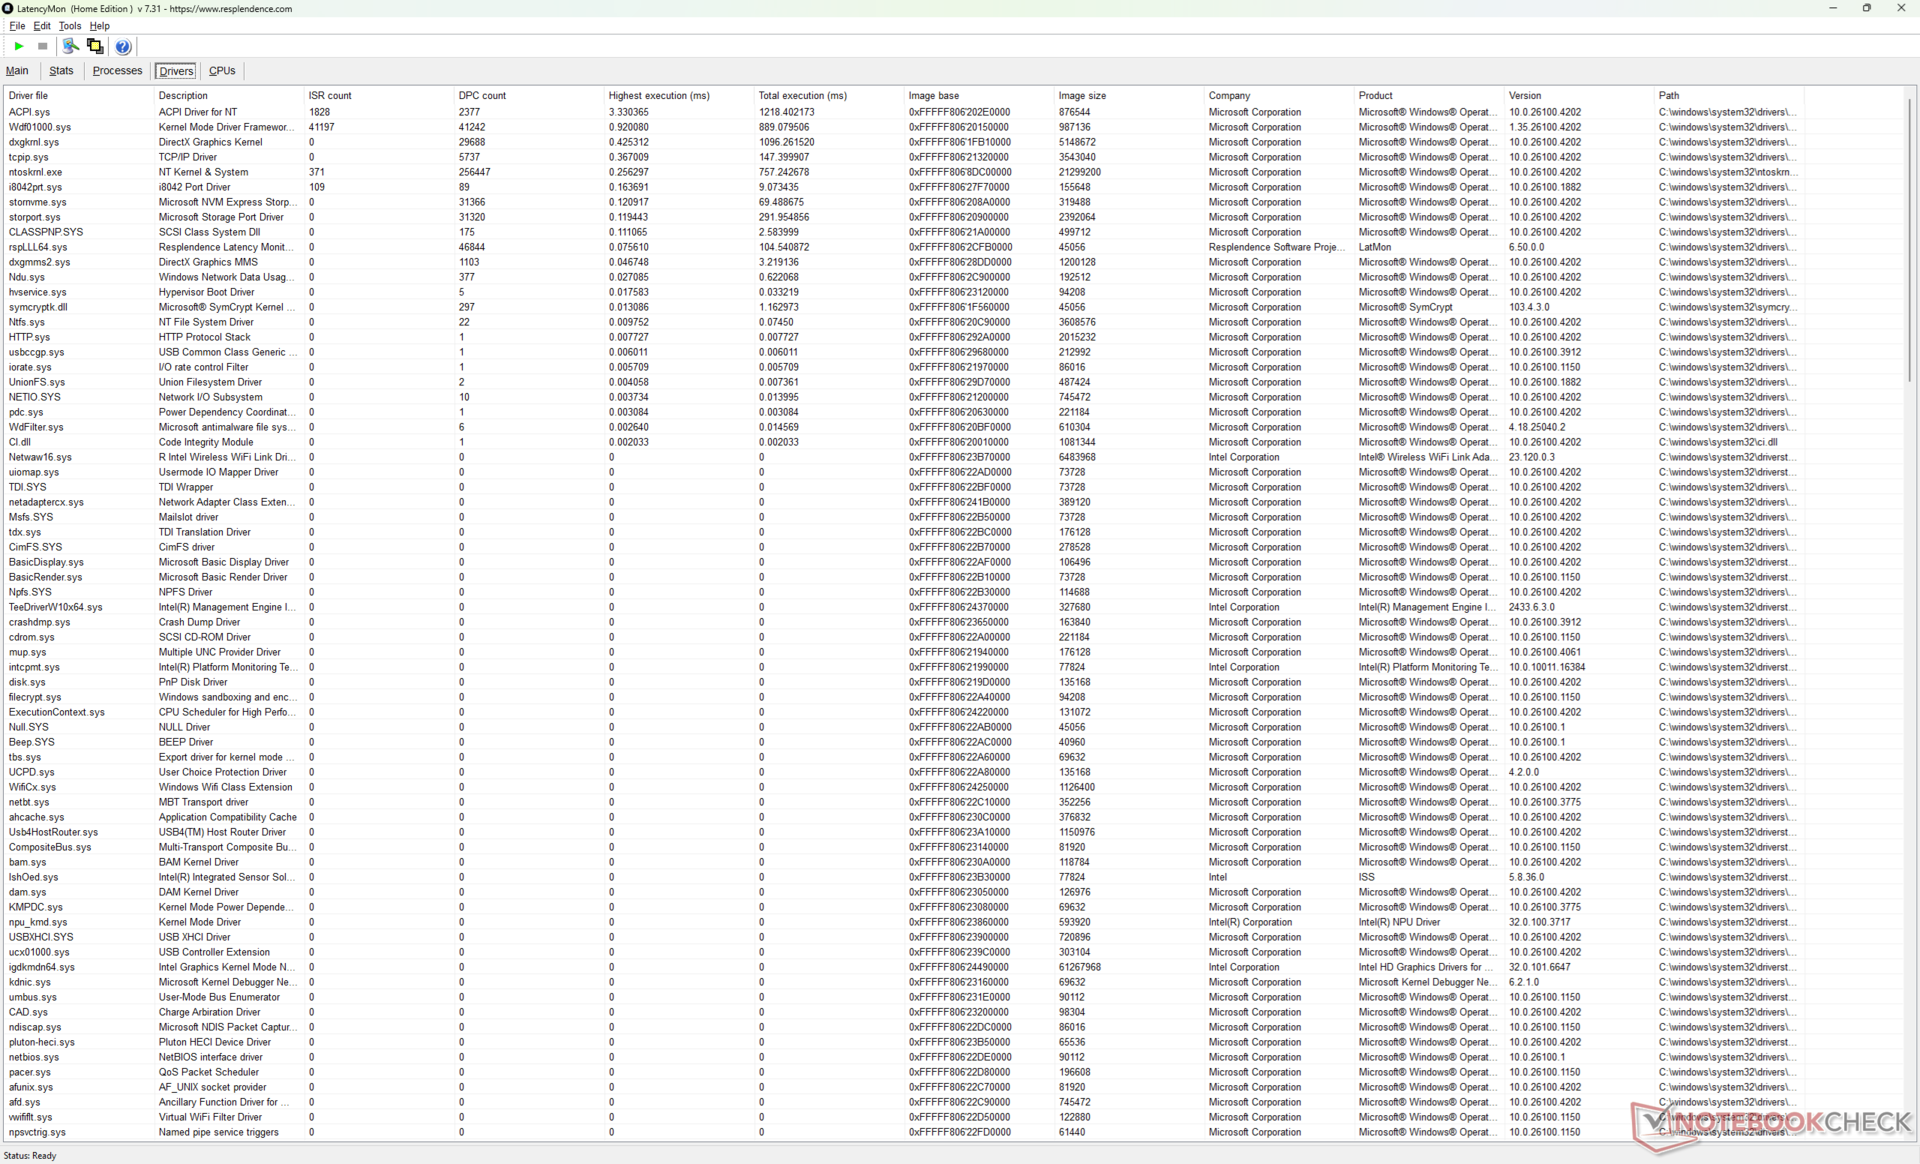
DPC Latency
LatencyMon reveals DPC issues when opening multiple browser tabs of our homepage. Strangely, GPU activity would cycle between 0 and 100 percent when playing 4K60 video whereas the GPU would be stable at ~40 percent on most other Lunar Lake laptops. There are otherwise no dropped frames recorded for a smooth 4K60 streaming experience.

| DPC Latencies / LatencyMon - interrupt to process latency (max), Web, Youtube, Prime95 | |
| HP Pavilion Plus 16-ab0456tx | |
| Dell 16 Plus | |
| Acer Swift 16 AI SF16-51T-932H, Ultra 9 288V | |
| Lenovo ThinkBook 16 G7+ AMD | |
| Asus Vivobook 16 M1606K | |
| Dell Inspiron 16 Plus 7640 | |
* ... smaller is better
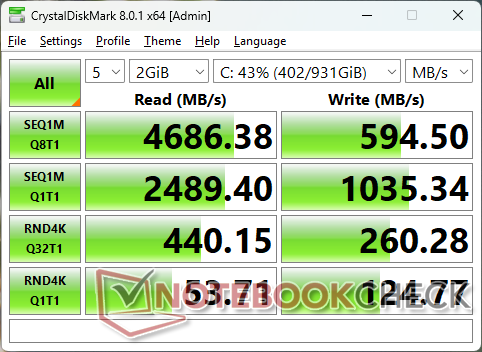
Storage Devices
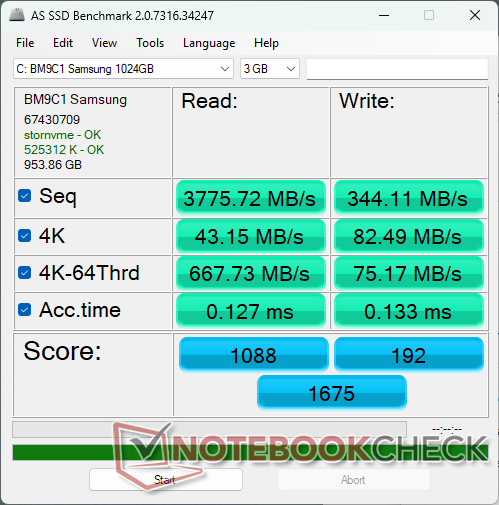
The Samsung BM9C1 is inferior to the Micron 2550 on last year's Inspiron 16 7640 2-in-1. Transfer rates are not as stable as they would fluctuate between 3600 MB/s and 4900 MB/s and even as low as 2200 MB/s during our DiskSpd loop test.

| Drive Performance rating - Percent | |
| HP Pavilion Plus 16-ab0456tx | |
| Asus Vivobook 16 M1606K | |
| Lenovo ThinkBook 16 G7+ AMD | |
| Dell Inspiron 16 Plus 7640 | |
| Acer Swift 16 AI SF16-51T-932H, Ultra 9 288V | |
| Dell 16 Plus | |
* ... smaller is better
Disk Throttling: DiskSpd Read Loop, Queue Depth 8
GPU Performance
The Arc 140V is a decent improvement over last year's Arc 8. In fact, the Dell 16 Plus runs most games consistently faster than last year's Inspiron 16 7640 2-in-1 by up to 25 percent even though the latter ships with a much faster Core-H CPU.
| Power Profile | Graphics Score | Physics Score | Combined Score |
| Performance mode | 9682 | 19037 | 3057 |
| Balanced mode | 8164 (-16%) | 16591 (-13%) | 2296 (-25%) |
| Battery Power | 8266 (-15%) | 16361 (-14%) | 2350 (-23%) |
Running on Balanced mode instead of performance mode impacts overall performance by quite the margin as shown by our Fire Strike results table above.
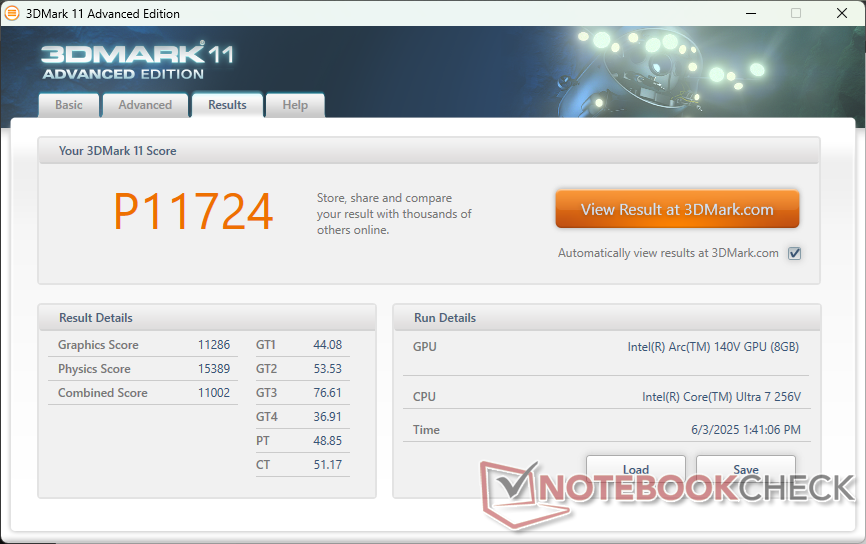


| 3DMark 11 Performance | 11724 points | |
| 3DMark Fire Strike Score | 8470 points | |
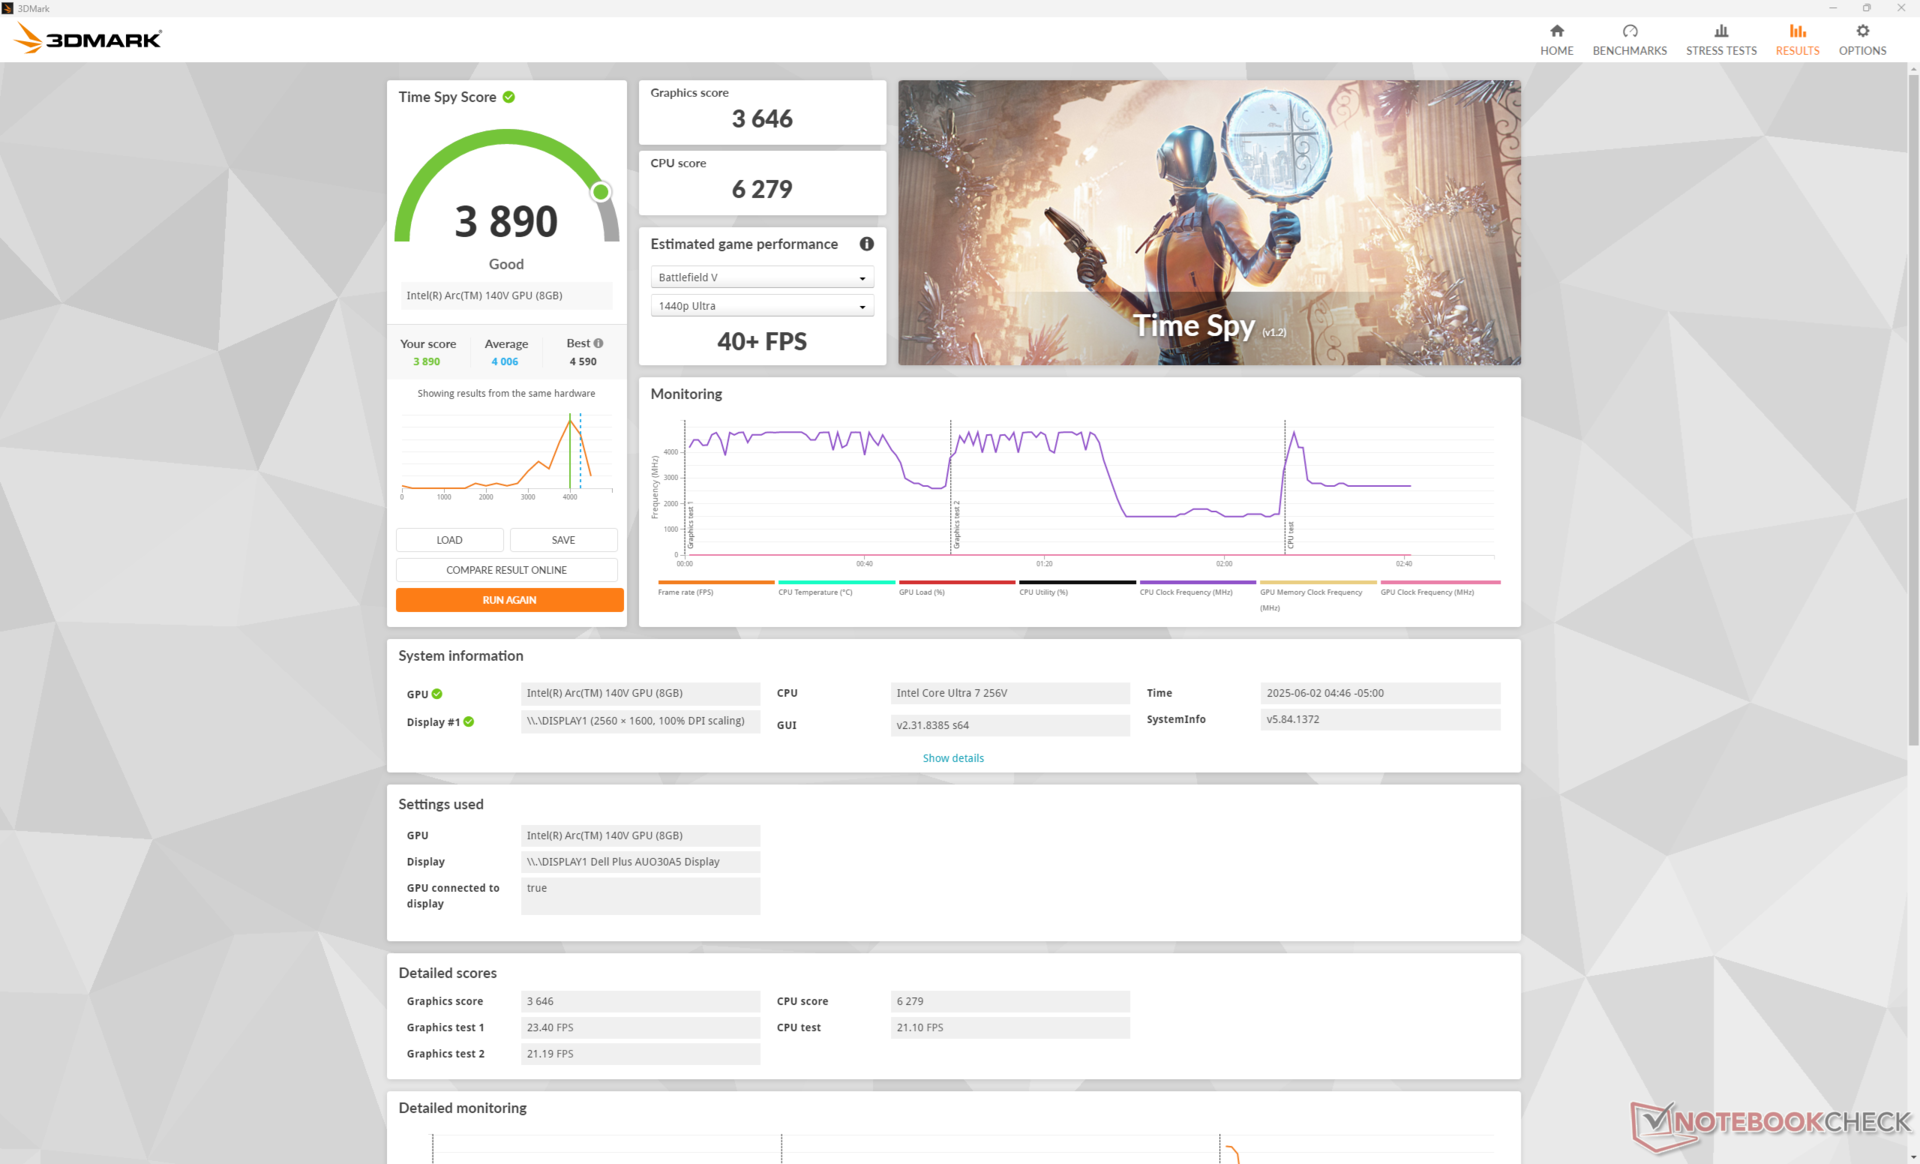
| 3DMark Time Spy Score | 3890 points | |
Help | ||
* ... smaller is better
Gaming Performance
Most titles run well on the system at native 1080p and low settings including Baldur's Gate 3. More demanding titles like Cyberpunk 2077, however, may need to drop down to 720p for a smoother experience.
| F1 24 | |
| 1920x1080 Low Preset AA:T AF:16x | |
| Average Intel Arc Graphics 140V (54 - 99, n=25) | |
| Dell 16 Plus | |
| Lenovo ThinkPad T16 Gen 3 21MN005XGE | |
| 1920x1080 Medium Preset AA:T AF:16x | |
| Average Intel Arc Graphics 140V (49.2 - 88.2, n=24) | |
| Dell 16 Plus | |
| Lenovo ThinkPad T16 Gen 3 21MN005XGE | |
| 1920x1080 High Preset AA:T AF:16x | |
| Average Intel Arc Graphics 140V (34.4 - 66.4, n=27) | |
| Dell 16 Plus | |
| LG Gram Pro 16Z90TS-G.AU89G | |
| Lenovo ThinkPad T16 Gen 3 21MN005XGE | |
| 1920x1080 Ultra High Preset AA:T AF:16x | |
| Dell 16 Plus | |
| Average Intel Arc Graphics 140V (14.6 - 22, n=25) | |
| Lenovo ThinkPad T16 Gen 3 21MN005XGE | |
Cyberpunk 2077 ultra FPS Chart
| low | med. | high | ultra | |
|---|---|---|---|---|
| Dota 2 Reborn (2015) | 98.3 | 70.3 | 71.1 | 71.9 |
| Final Fantasy XV Benchmark (2018) | 80.5 | 45.7 | 33.3 | |
| X-Plane 11.11 (2018) | 51.2 | 39.7 | 35.7 | |
| Strange Brigade (2018) | 205 | 81 | 68 | 56.9 |
| Baldur's Gate 3 (2023) | 38.1 | 31 | 27.7 | 27 |
| Cyberpunk 2077 (2023) | 44.2 | 35.2 | 24.7 | 24.1 |
| F1 24 (2024) | 75.3 | 70.7 | 55.3 | 18.8 |
Emissions
System Noise
The internal fan is generally lethargic in response to loads meaning that it ramps up slowly when launching or running more demanding applications. This is good as it takes longer before fan noise becomes more noticeable during heavy usage. After awhile, however, the system reaches a similar maximum level to most other 16-inch multimedia laptops including the Acer Swift 16 AI or Asus Vivobook 16.


Noise level
| Idle |
| 23.5 / 23.5 / 23.5 dB(A) |
| Load |
| 31.9 / 46.9 dB(A) |
 | ||
30 dB silent 40 dB(A) audible 50 dB(A) loud |
||
min: | ||
| Dell 16 Plus Arc 140V, Core Ultra 7 256V, Samsung BM9C1 1024GB | Dell Inspiron 16 Plus 7640 GeForce RTX 4060 Laptop GPU, Ultra 7 155H, SK hynix BC901 HFS001TEJ4X164N | Acer Swift 16 AI SF16-51T-932H, Ultra 9 288V Arc 140V, Core Ultra 9 288V, Western Digital PC SN5000S SDEQNSJ-1T00 | Lenovo ThinkBook 16 G7+ AMD Radeon 880M, Ryzen AI 9 365, Samsung PM9C1a MZAL81T0HDLB | HP Pavilion Plus 16-ab0456tx GeForce RTX 3050 6GB Laptop GPU, i7-13700H, WDC PC SN810 1TB | Asus Vivobook 16 M1606K Radeon 860M, Ryzen AI 7 350, Micron 2500 1TB MTFDKBA1T0QGN | |
|---|---|---|---|---|---|---|
| Noise | -2% | -6% | -2% | -0% | 2% | |
| off / environment * (dB) | 23.4 | 23.8 -2% | 25.8 -10% | 24.5 -5% | 22.22 5% | 23 2% |
| Idle Minimum * (dB) | 23.5 | 24.2 -3% | 25.8 -10% | 24.5 -4% | 22.22 5% | 23 2% |
| Idle Average * (dB) | 23.5 | 24.2 -3% | 25.8 -10% | 24.5 -4% | 22.22 5% | 23 2% |
| Idle Maximum * (dB) | 23.5 | 24.2 -3% | 26.7 -14% | 25.9 -10% | 22.22 5% | 24.67 -5% |
| Load Average * (dB) | 31.9 | 28.9 9% | 36.2 -13% | 42.03 -32% | 31.72 1% | |
| Cyberpunk 2077 ultra * (dB) | 42.6 | 44.4 -4% | 40.1 6% | 41.53 3% | ||
| Load Maximum * (dB) | 46.9 | 51 -9% | 41.1 12% | 40.1 14% | 42.1 10% | 42.51 9% |
| Witcher 3 ultra * (dB) | 51 | 42.1 |
* ... smaller is better
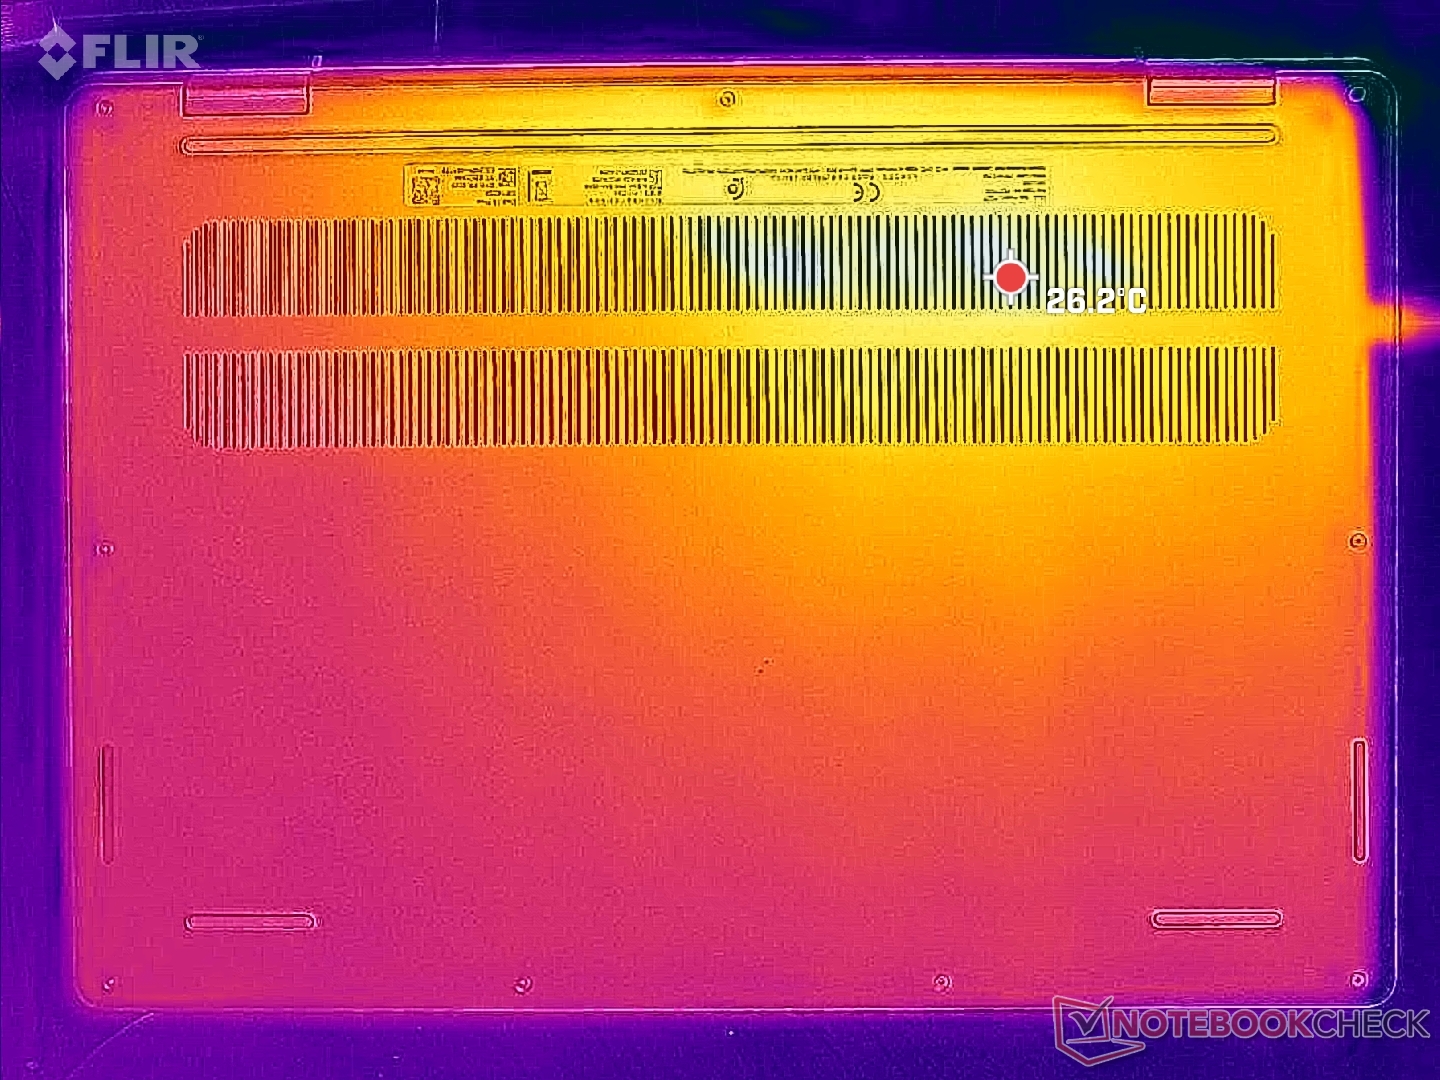
Temperature
Surface temperatures are noticeably cooler when compared to the outgoing Inspiron 16 7640 series due largely to the processor changes. Hot spots top out at the low 40 C range instead of the higher 40 C range.
The system is clearly not designed for gamers as the WASD region can become much warmer than the rest of the keyboard as shown by the temperature maps below.

(±) The maximum temperature on the upper side is 40.6 °C / 105 F, compared to the average of 36.8 °C / 98 F, ranging from 21 to 71 °C for the class Multimedia.
(±) The bottom heats up to a maximum of 40 °C / 104 F, compared to the average of 39.1 °C / 102 F
(+) In idle usage, the average temperature for the upper side is 27.2 °C / 81 F, compared to the device average of 31.3 °C / 88 F.
(+) The palmrests and touchpad are cooler than skin temperature with a maximum of 25.8 °C / 78.4 F and are therefore cool to the touch.
(+) The average temperature of the palmrest area of similar devices was 28.7 °C / 83.7 F (+2.9 °C / 5.3 F).


| Dell 16 Plus Intel Core Ultra 7 256V, Intel Arc Graphics 140V | Dell Inspiron 16 Plus 7640 Intel Core Ultra 7 155H, NVIDIA GeForce RTX 4060 Laptop GPU | Acer Swift 16 AI SF16-51T-932H, Ultra 9 288V Intel Core Ultra 9 288V, Intel Arc Graphics 140V | Lenovo ThinkBook 16 G7+ AMD AMD Ryzen AI 9 365, AMD Radeon 880M | HP Pavilion Plus 16-ab0456tx Intel Core i7-13700H, NVIDIA GeForce RTX 3050 6GB Laptop GPU | Asus Vivobook 16 M1606K AMD Ryzen AI 7 350, AMD Radeon 860M | |
|---|---|---|---|---|---|---|
| Heat | -9% | 7% | 9% | -24% | 0% | |
| Maximum Upper Side * (°C) | 40.6 | 43.4 -7% | 37.9 7% | 38.2 6% | 49.6 -22% | 48 -18% |
| Maximum Bottom * (°C) | 40 | 41.6 -4% | 31.5 21% | 37.9 5% | 45.8 -15% | 51 -27% |
| Idle Upper Side * (°C) | 29.2 | 32.8 -12% | 28.3 3% | 25.4 13% | 39.2 -34% | 22 25% |
| Idle Bottom * (°C) | 28.6 | 32.4 -13% | 29.7 -4% | 25.7 10% | 35.4 -24% | 23 20% |
* ... smaller is better
Speakers
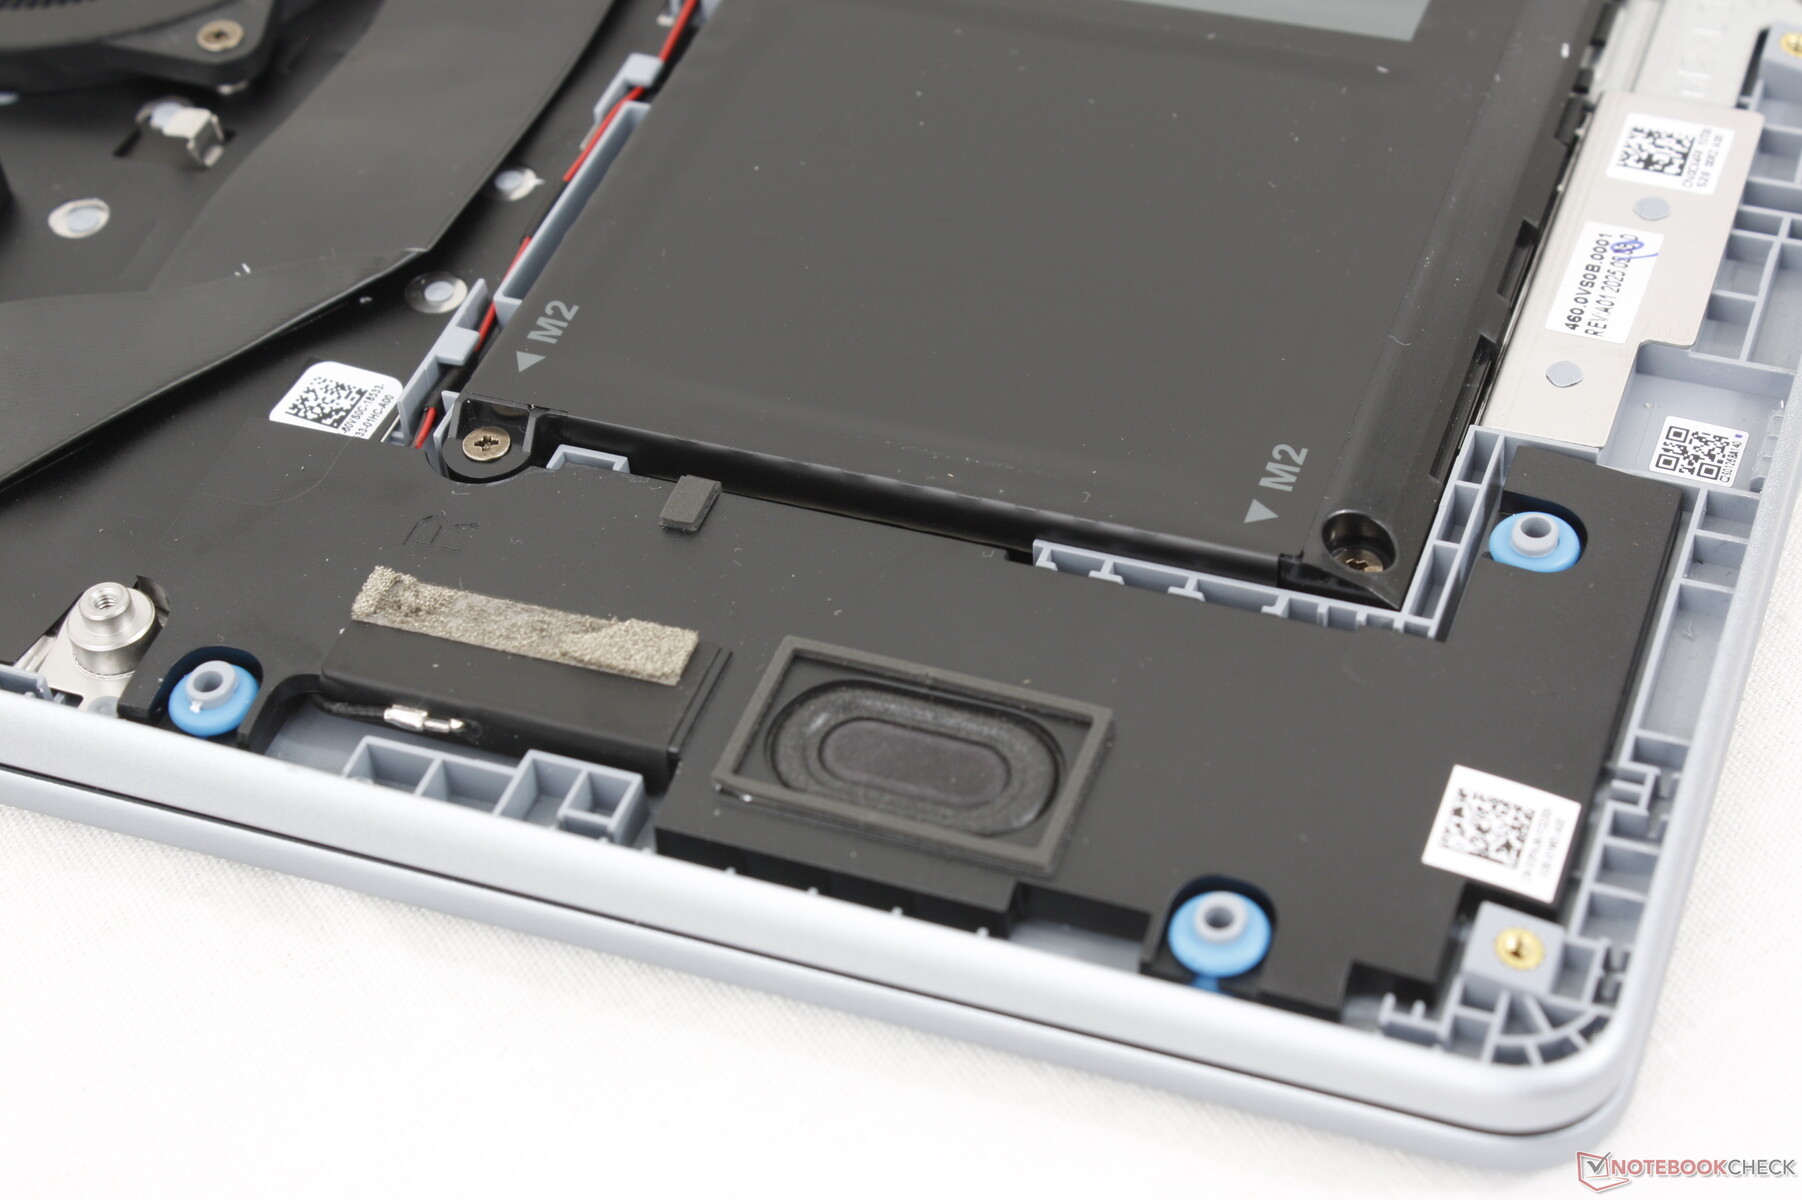
Dell 16 Plus audio analysis
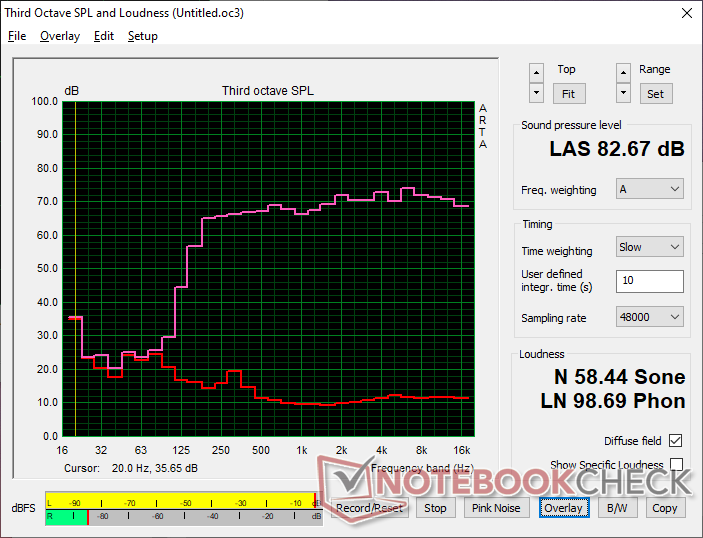
(+) | speakers can play relatively loud (82.7 dB)
Bass 100 - 315 Hz
(±) | reduced bass - on average 14.1% lower than median
(±) | linearity of bass is average (11.8% delta to prev. frequency)
Mids 400 - 2000 Hz
(+) | balanced mids - only 1.6% away from median
(+) | mids are linear (2.4% delta to prev. frequency)
Highs 2 - 16 kHz
(+) | balanced highs - only 2.9% away from median
(+) | highs are linear (3.3% delta to prev. frequency)
Overall 100 - 16.000 Hz
(+) | overall sound is linear (10% difference to median)
Compared to same class
» 13% of all tested devices in this class were better, 2% similar, 84% worse
» The best had a delta of 5%, average was 17%, worst was 45%
Compared to all devices tested
» 4% of all tested devices were better, 1% similar, 94% worse
» The best had a delta of 4%, average was 24%, worst was 134%
Apple MacBook Pro 16 2021 M1 Pro audio analysis
(+) | speakers can play relatively loud (84.7 dB)
Bass 100 - 315 Hz
(+) | good bass - only 3.8% away from median
(+) | bass is linear (5.2% delta to prev. frequency)
Mids 400 - 2000 Hz
(+) | balanced mids - only 1.3% away from median
(+) | mids are linear (2.1% delta to prev. frequency)
Highs 2 - 16 kHz
(+) | balanced highs - only 1.9% away from median
(+) | highs are linear (2.7% delta to prev. frequency)
Overall 100 - 16.000 Hz
(+) | overall sound is linear (4.6% difference to median)
Compared to same class
» 0% of all tested devices in this class were better, 0% similar, 100% worse
» The best had a delta of 5%, average was 17%, worst was 45%
Compared to all devices tested
» 0% of all tested devices were better, 0% similar, 100% worse
» The best had a delta of 4%, average was 24%, worst was 134%
Energy Management
Power Consumption — Improved Performance-Per-Watt
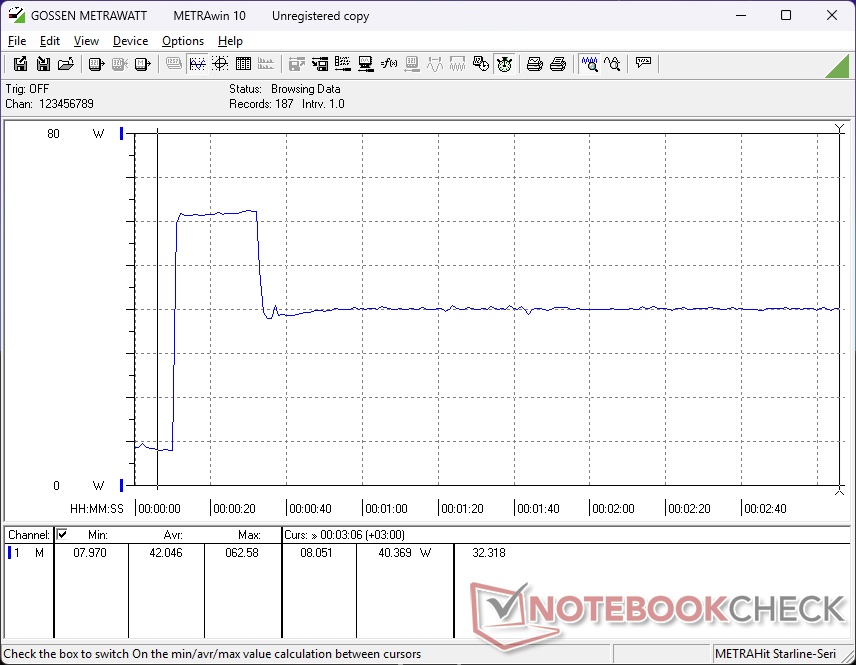
Overall consumption is quite low for a 16-inch laptop due to the lack of an H-series CPU, discrete GPU, or OLED options all of which are much more demanding than our V-series CPU, integrated GPU, and IPS panel. Most notably, the system draws only 41 W when running Cyberpunk 2077 compared to 67 W on the Inspiron 16 7640 2-in-1 even though our Dell 16 Plus can run the game roughly 25 percent faster.
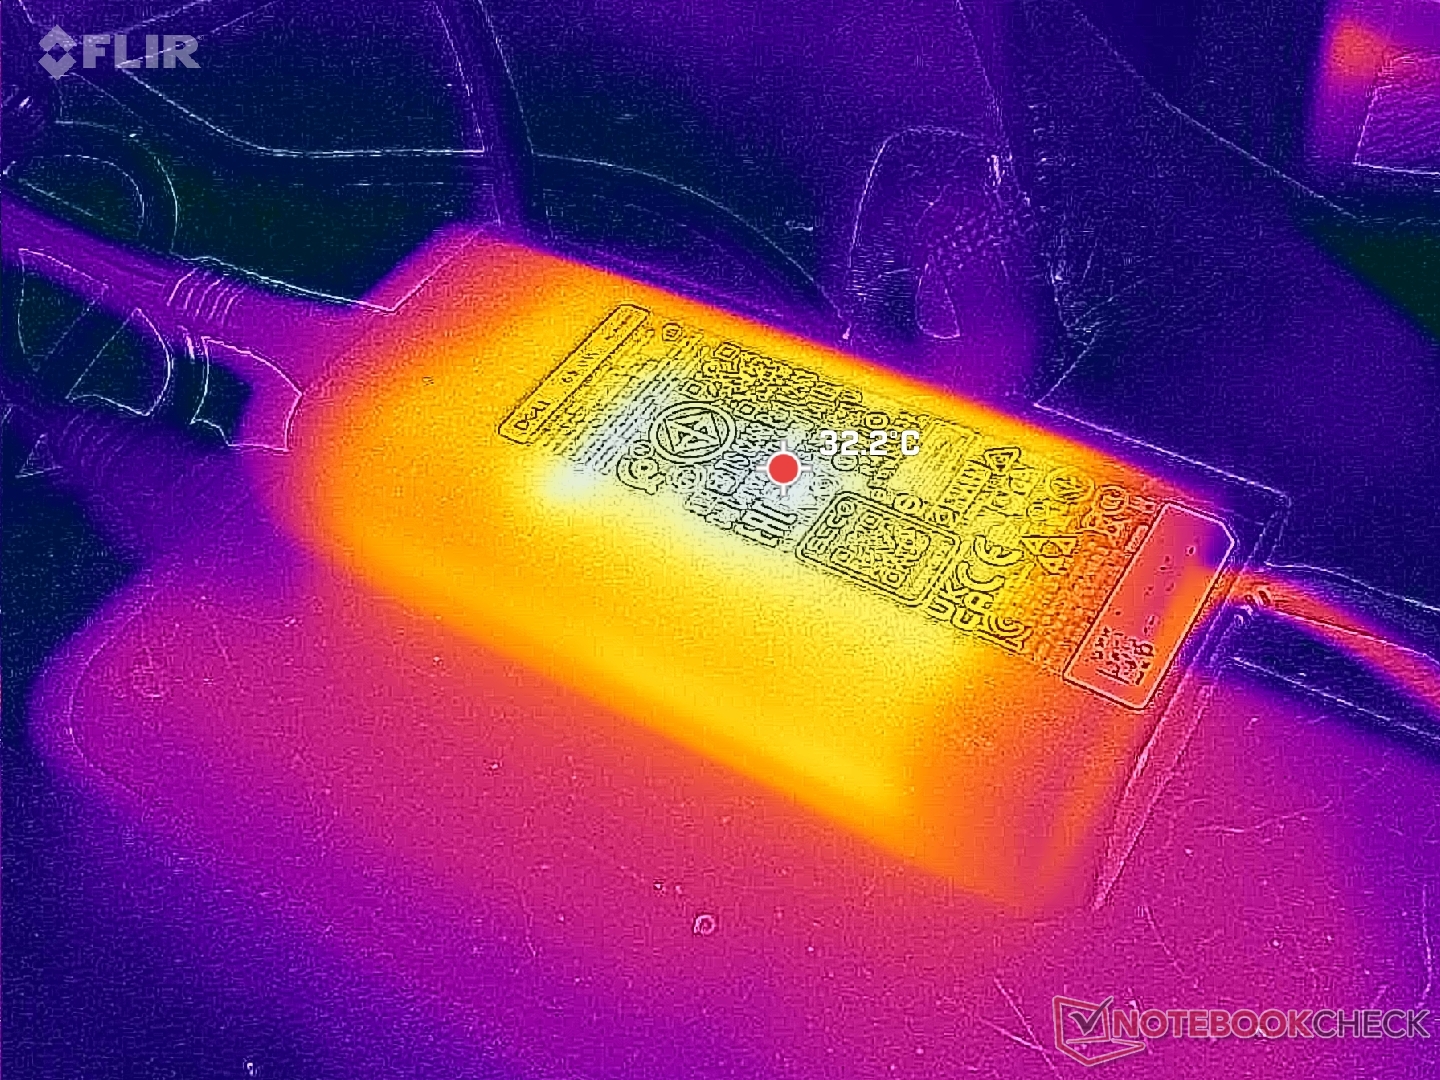
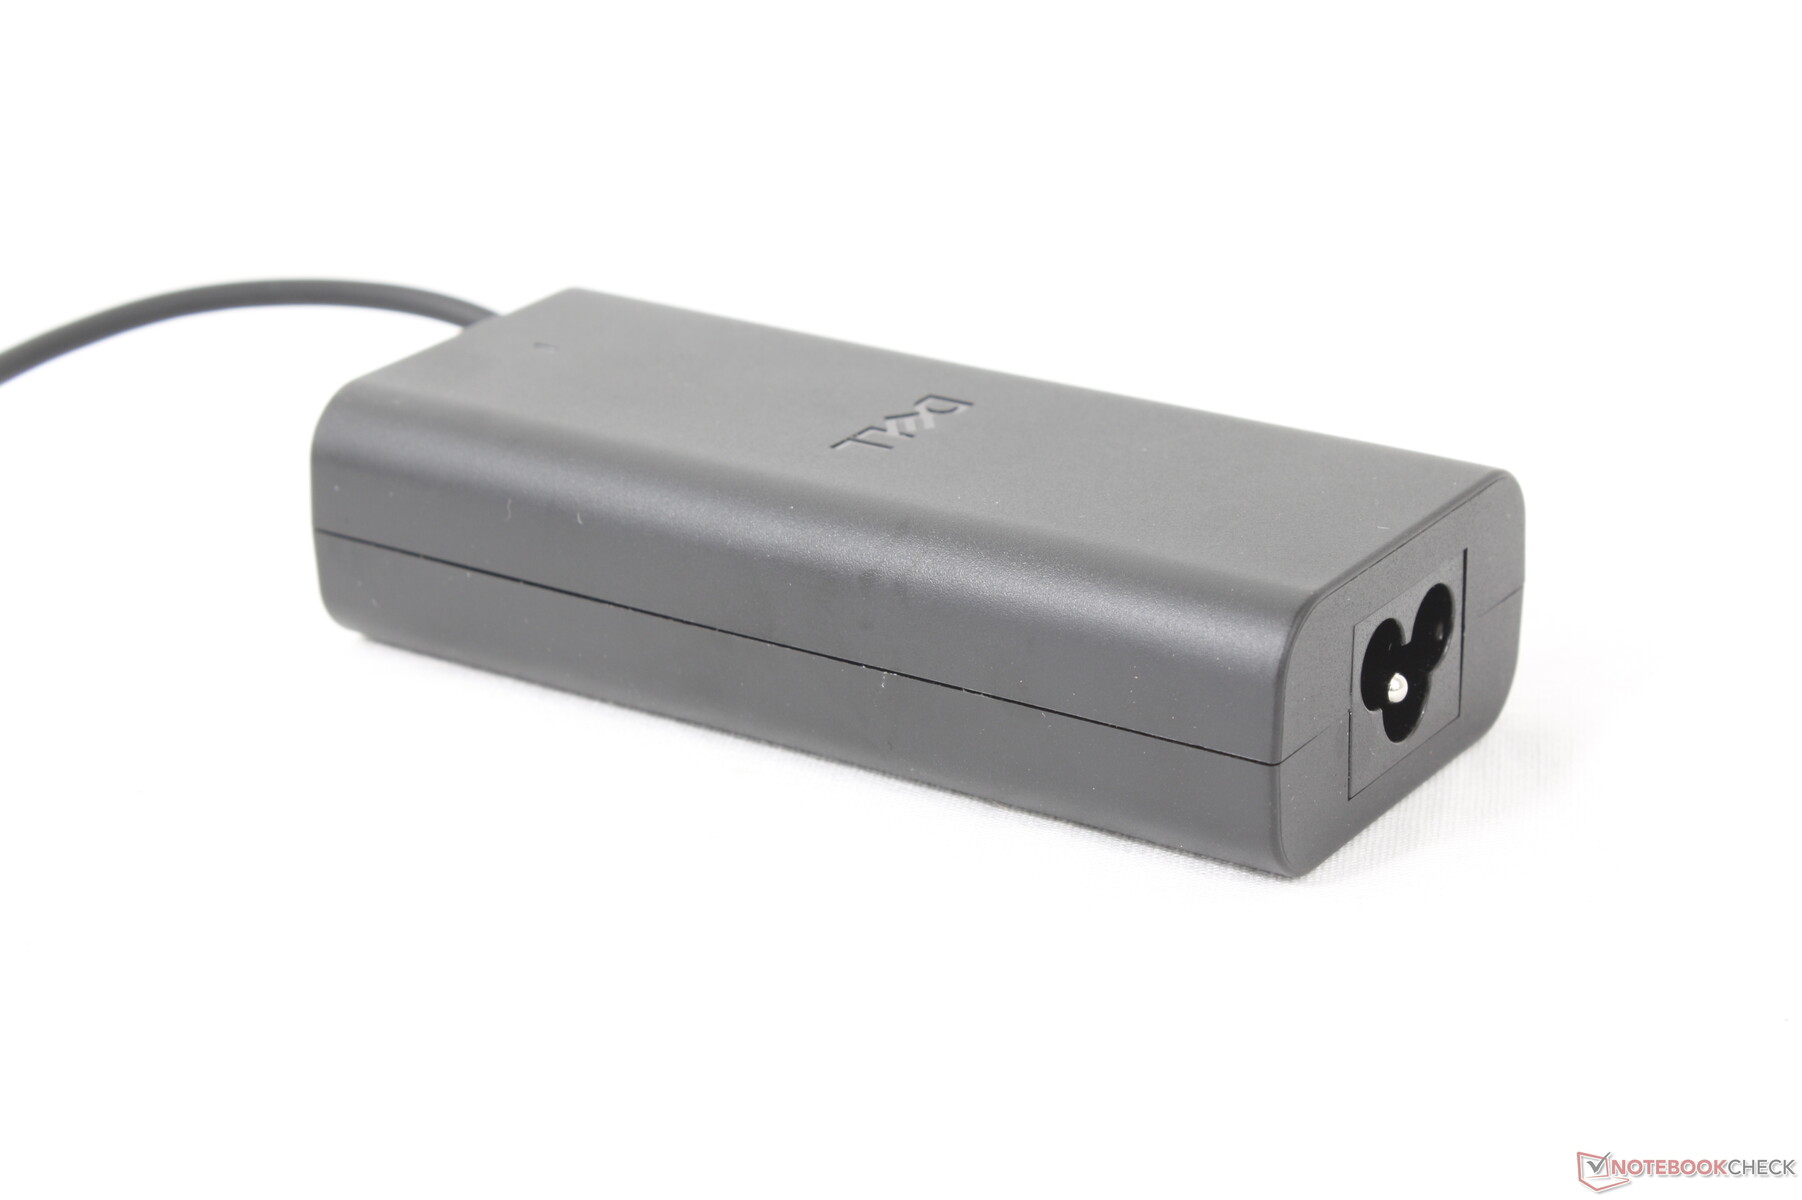
We're able to record a temporary maximum draw of 62 W from the small-medium (~11.2 x 5 x 2.8 cm) 65 W USB-C AC adapter.


| Off / Standby | |
| Idle | |
| Load |
|
Key:
min: | |
| Dell 16 Plus Core Ultra 7 256V, Arc 140V, Samsung BM9C1 1024GB, IPS, 2560x1600, 16" | Dell Inspiron 16 Plus 7640 Ultra 7 155H, GeForce RTX 4060 Laptop GPU, SK hynix BC901 HFS001TEJ4X164N, IPS, 2560x1600, 16" | Acer Swift 16 AI SF16-51T-932H, Ultra 9 288V Core Ultra 9 288V, Arc 140V, Western Digital PC SN5000S SDEQNSJ-1T00, OLED, 2880x1800, 16" | Lenovo ThinkBook 16 G7+ AMD Ryzen AI 9 365, Radeon 880M, Samsung PM9C1a MZAL81T0HDLB, IPS, 3200x2000, 16" | HP Pavilion Plus 16-ab0456tx i7-13700H, GeForce RTX 3050 6GB Laptop GPU, WDC PC SN810 1TB, IPS, 2560x1600, 16" | Asus Vivobook 16 M1606K Ryzen AI 7 350, Radeon 860M, Micron 2500 1TB MTFDKBA1T0QGN, IPS, 1920x1200, 16" | |
|---|---|---|---|---|---|---|
| Power Consumption | -64% | -22% | -93% | -60% | -36% | |
| Idle Minimum * (Watt) | 3.4 | 4.2 -24% | 5.7 -68% | 6.4 -88% | 3.3 3% | 4.7 -38% |
| Idle Average * (Watt) | 6.9 | 6.9 -0% | 7.4 -7% | 14.1 -104% | 7.3 -6% | 8.2 -19% |
| Idle Maximum * (Watt) | 7.4 | 15.2 -105% | 7.9 -7% | 14.3 -93% | 14.24 -92% | 9 -22% |
| Load Average * (Watt) | 41.7 | 70.4 -69% | 83.4 -100% | 91.7 -120% | 59 -41% | |
| Cyberpunk 2077 ultra external monitor * (Watt) | 38 | 77.5 -104% | 58 -53% | |||
| Cyberpunk 2077 ultra * (Watt) | 41.4 | 49.8 -20% | 79.8 -93% | 65 -57% | ||
| Load Maximum * (Watt) | 62 | 137.4 -122% | 65.41 -6% | 102.9 -66% | 115.8 -87% | 74 -19% |
| Witcher 3 ultra * (Watt) | 115.9 | 96.2 |
* ... smaller is better
Power Consumption Cyberpunk / Stress Test
Power Consumption external Monitor
Battery Life
Runtimes are very long as to be expected from such a Lunar Lake-powered laptop. WLAN battery life is just over 14 hours to be even longer than Inspiron 16 Plus 7640 despite the fact that the Dell 16 Plus carries a 30 percent smaller battery pack.
| Dell 16 Plus Core Ultra 7 256V, Arc 140V, 64 Wh | Dell Inspiron 16 Plus 7640 Ultra 7 155H, GeForce RTX 4060 Laptop GPU, 90 Wh | Acer Swift 16 AI SF16-51T-932H, Ultra 9 288V Core Ultra 9 288V, Arc 140V, 70 Wh | Lenovo ThinkBook 16 G7+ AMD Ryzen AI 9 365, Radeon 880M, 85 Wh | HP Pavilion Plus 16-ab0456tx i7-13700H, GeForce RTX 3050 6GB Laptop GPU, 68 Wh | Asus Vivobook 16 M1606K Ryzen AI 7 350, Radeon 860M, 42 Wh | |
|---|---|---|---|---|---|---|
| Battery runtime | -6% | -6% | -23% | -26% | -52% | |
| WiFi v1.3 (h) | 14.1 | 13.3 -6% | 13.2 -6% | 10.8 -23% | 10.4 -26% | 6.8 -52% |
| H.264 (h) | 13.9 | 12 | 6.8 | |||
| Load (h) | 1.1 |
Notebookcheck Rating
Dell 16 Plus
- 06/06/2025 v8
Allen Ngo
 Total Sustainability Score:
 Potential Competitors in Comparison
Image | Model / Review | Price | Weight | Height | Display |
|---|---|---|---|---|---|
1. 81.8%  | Dell 16 Plus Intel Core Ultra 7 256V ⎘ Intel Arc Graphics 140V ⎘ 16 GB Memory, 1024 GB SSD | Amazon: List Price: 1150 USD | 1.8 kg | 16.99 mm | 16.00" 2560x1600 189 PPI IPS |
2. 83.4%  | Dell Inspiron 16 Plus 7640 Intel Core Ultra 7 155H ⎘ NVIDIA GeForce RTX 4060 Laptop GPU ⎘ 16 GB Memory, 1024 GB SSD | Amazon: List Price: 1300 USD | 2.2 kg | 19.9 mm | 16.00" 2560x1600 189 PPI IPS |
3. 85.3%  | Acer Swift 16 AI SF16-51T-932H, Ultra 9 288V Intel Core Ultra 9 288V ⎘ Intel Arc Graphics 140V ⎘ 32 GB Memory, 1024 GB SSD | Amazon: | 1.5 kg | 15.95 mm | 16.00" 2880x1800 212 PPI OLED |
4. 86.6%  | Lenovo ThinkBook 16 G7+ AMD AMD Ryzen AI 9 365 ⎘ AMD Radeon 880M ⎘ 32 GB Memory, 1024 GB SSD | Amazon: 1. $999.95 Lenovo ThinkBook 16 G7 Busin... 2. $1,199.99 Lenovo ThinkBook 16 G7 Busin... 3. $749.99 Lenovo ThinkBook 16 Gen 7 Bu... List Price: 1399€ | 1.9 kg | 16.9 mm | 16.00" 3200x2000 236 PPI IPS |
5. 88.7% v7 (old)  | HP Pavilion Plus 16-ab0456tx Intel Core i7-13700H ⎘ NVIDIA GeForce RTX 3050 6GB Laptop GPU ⎘ 16 GB Memory, 1024 GB SSD | Amazon: 1. $779.99 HP Pavilion Plus 16 inch Lap... 2. $34.00 Laptop Right Fan for HP Pavi... 3. $66.00 Laptop LCD Bezel for HP Pavi... List Price: 1350 USD | 1.9 kg | 19.9 mm | 16.00" 2560x1600 189 PPI IPS |
6. 77.6%  | Asus Vivobook 16 M1606K AMD Ryzen AI 7 350 ⎘ AMD Radeon 860M ⎘ 16 GB Memory, 1024 GB SSD | Amazon: 1. $879.99 ASUS Vivobook S16 Laptop, Co... 2. $751.74 ASUS Vivobook 16 Laptop, Cop... 3. $619.99 ASUS Vivobook 16 Laptop, Cop... | 1.9 kg | 19.9 mm | 16.00" 1920x1200 142 PPI IPS |
Transparency
The selection of devices to be reviewed is made by our editorial team. The test sample was provided to the author as a loan by the manufacturer or retailer for the purpose of this review. The lender had no influence on this review, nor did the manufacturer receive a copy of this review before publication. There was no obligation to publish this review. As an independent media company, Notebookcheck is not subjected to the authority of manufacturers, retailers or publishers.
This is how Notebookcheck is testing
Every year, Notebookcheck independently reviews hundreds of laptops and smartphones using standardized procedures to ensure that all results are comparable. We have continuously developed our test methods for around 20 years and set industry standards in the process. In our test labs, high-quality measuring equipment is utilized by experienced technicians and editors. These tests involve a multi-stage validation process. Our complex rating system is based on hundreds of well-founded measurements and benchmarks, which maintains objectivity. Further information on our test methods can be found here.
