Verdict — Leaner And Lighter With Some Compromises
The Dell 16 Plus 2-in-1 is both an upgrade and a downgrade over last year's Inspiron 16 7640 2-in-1. It's slightly lighter and thinner with much faster graphics performance than before which may benefit travelers, casual gamers, or GPU-accelerated tasks.
Some of the year-over-year changes may not be for everyone. The move from Core Ultra-H to Core Ultra-V processors in particular has reduced raw processing power by quite the margin. Meanwhile, the rearranged ports are arguably for the worse as both USB-C ports are now packed closely together which affects docking ergonomics. Battery capacity has also been cut significantly to the point where battery life is shorter than on the Inspiron 16 7640 2-in-1 even though the older system ships with the faster Core Ultra-H CPU.
Balanced users who can appreciate the integrated numpad and relatively fast iGPU may prefer the newer Dell 16 Plus 2-in-1. Otherwise, power users who rely on raw CPU horsepower may still want the older Inspiron 16 7640 2-in-1 especially since both models share the exact same panels for an identical viewing experience.
Pros
Cons
Price and Availability
Dell is now shipping the Dell 16 Plus 2-in-1 starting at $950 with an IPS panel or $1500 with mini-LED.
- $999.99Dell 16 Plus 2-in-1 Business Laptop, 16" FHD+ Touchscreen, Intel Core Ultra 7 256V(8 Cores, up to 4.8 GHz) Intel Arc Graphics, 16GB DDR5, 512GB SSD, Backlit, Windows 11 Home, with SVT Stylus Pen Hub
- $1,079.99Dell 16 Plus AI Business 2-in-1 Laptop 16.0 Inch Touch WQXGA Display (Intel Ultra 7-256V, 16GB LPDDR5X, 1TB M.2 SSD, Intel Arc 140V, Fingerprint, Bluetooth 5.4, Backlit KB, Wi-Fi 7, Win11P)
- $1,169.99Dell 16 Plus 2-in-1 Business Laptop, 16" FHD+ Touchscreen, Intel Core Ultra 7 256V(8 Cores, up to 4.8 GHz) Intel Arc Graphics, 16GB DDR5, 1TB SSD, Backlit, Windows 11 Pro, with SVT Stylus Pen Hub
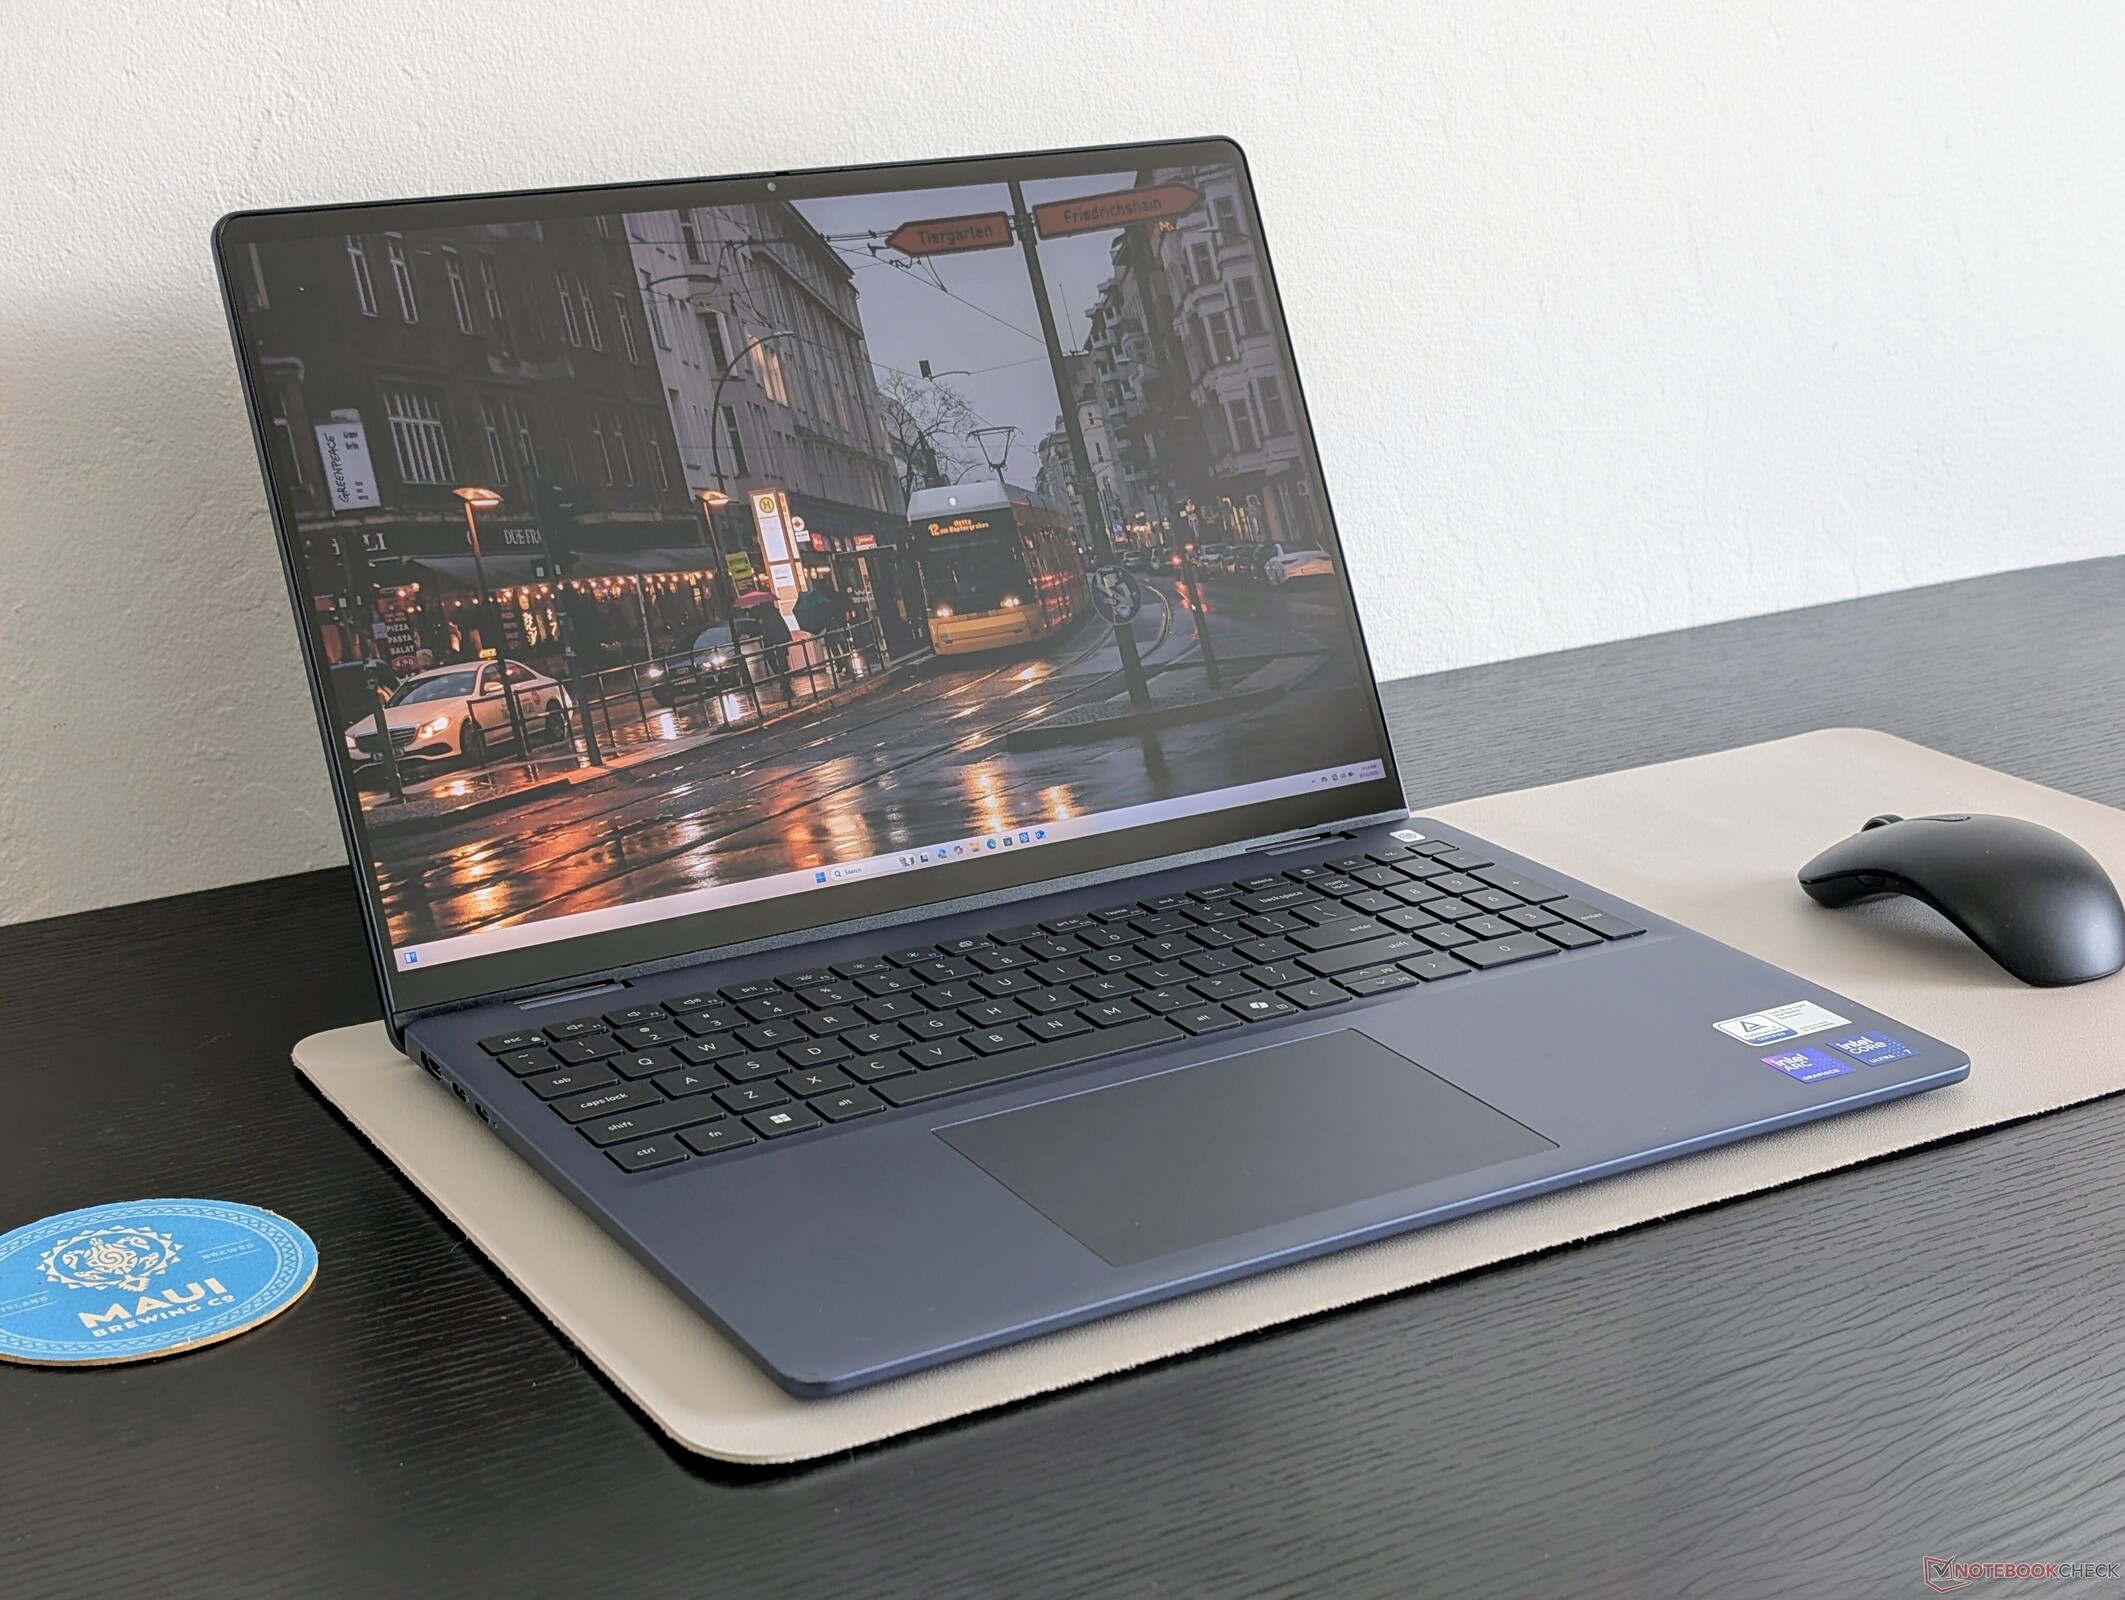
The Dell 16 Plus 2-in-1 is the convertible version of the Dell 16 Plus clamshell and the direct successor to the 2024 Inspiron 16 7640 2-in-1. It represents the start of a new generation of mainstream laptops designed to replace the outgoing Inspiron naming convention of old.
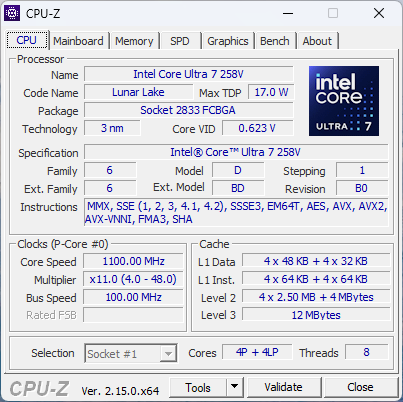
Our test unit is a middle configuration with the Core Ultra 7 256V CPU and 2.5K 90 Hz Mini-LED touchscreen for approximately 1400 USD. Lower-end SKUs may come with a more traditional FHD IPS touchscreen while higher-end SKUs ship with the Core Ultra 9 288V instead.
Competitors to the Dell 16 Plus 2-in-1 include other 16-inch multimedia convertibles like the HP Envy x360 2-in-1 16, Lenovo Yoga 7 2-in-1 16ILL10, or Samsung Galaxy Book5 Pro 360.
More Dell reviews:
Specifications
Case
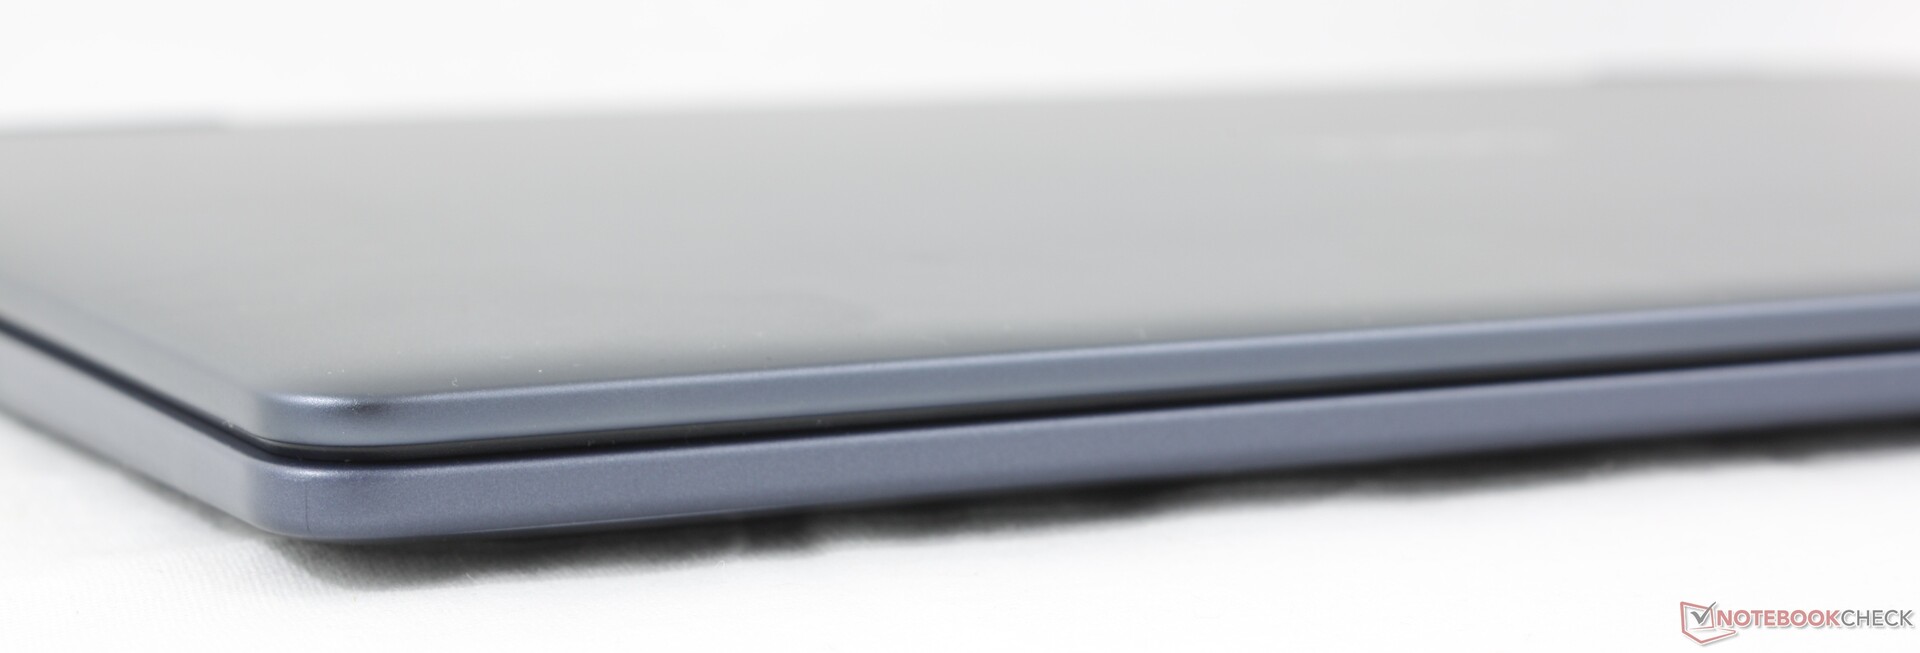
The case iterates on the Inspiron 16 7640 2-in-1 while using similar aluminum and plastic materials for that familiar "Inspiron" feel and quality. Dimensions and weight are subsequently almost identical between the two models save for the ever-so-slightly thinner profile of the newer model.

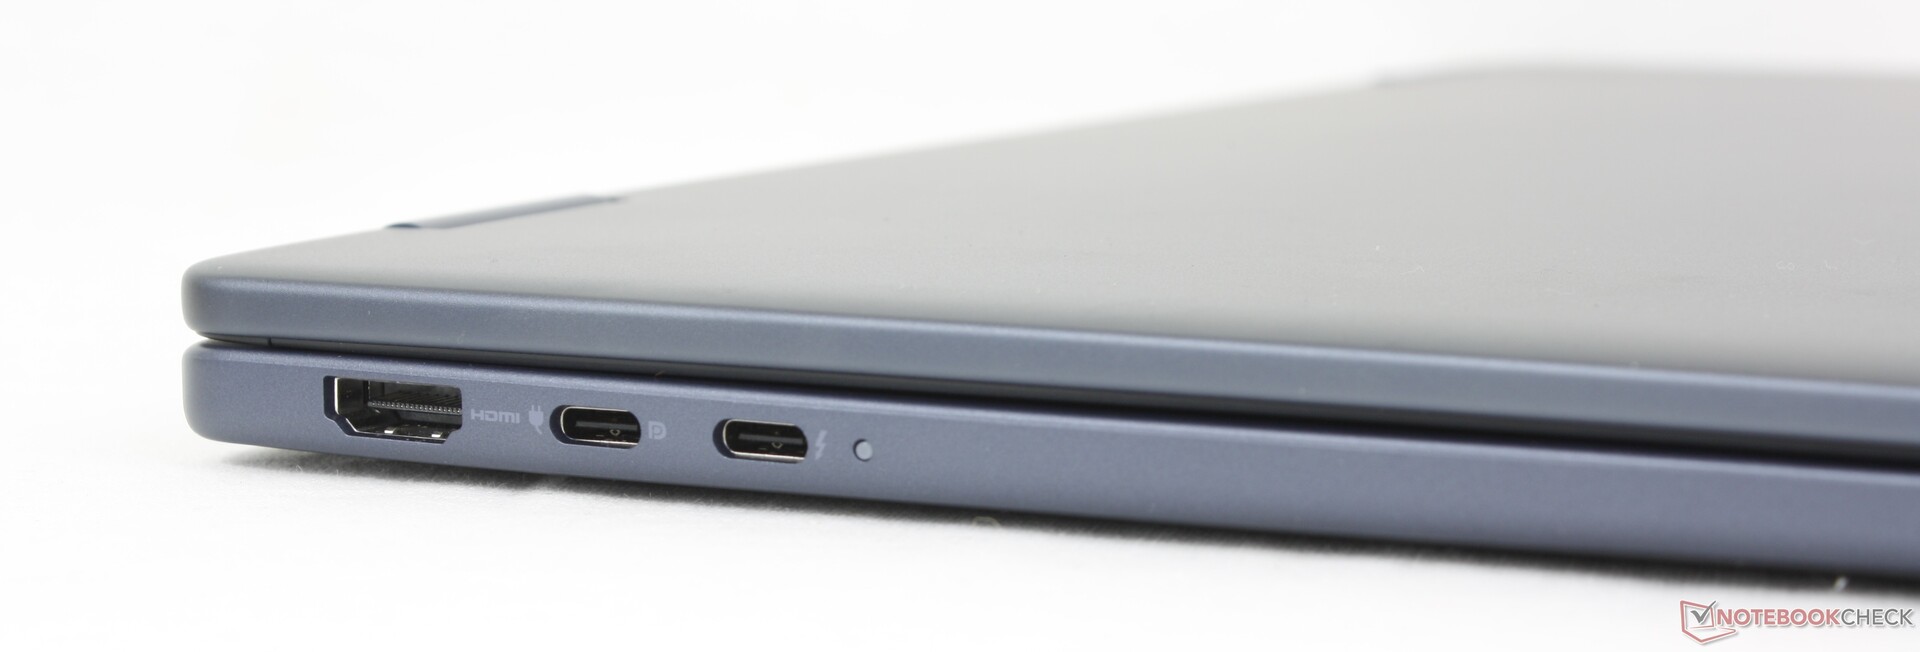
Connectivity
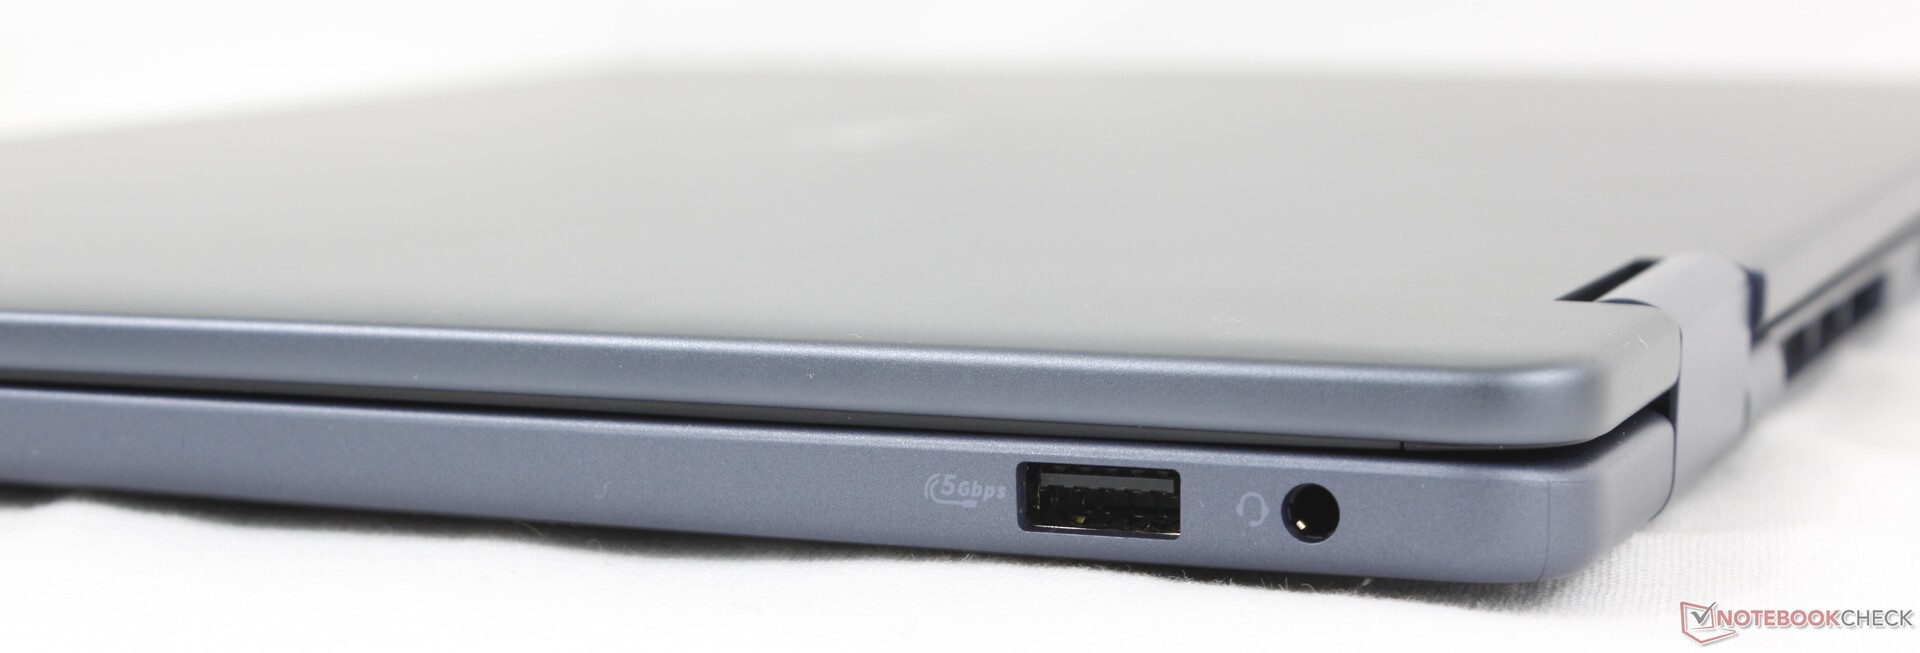
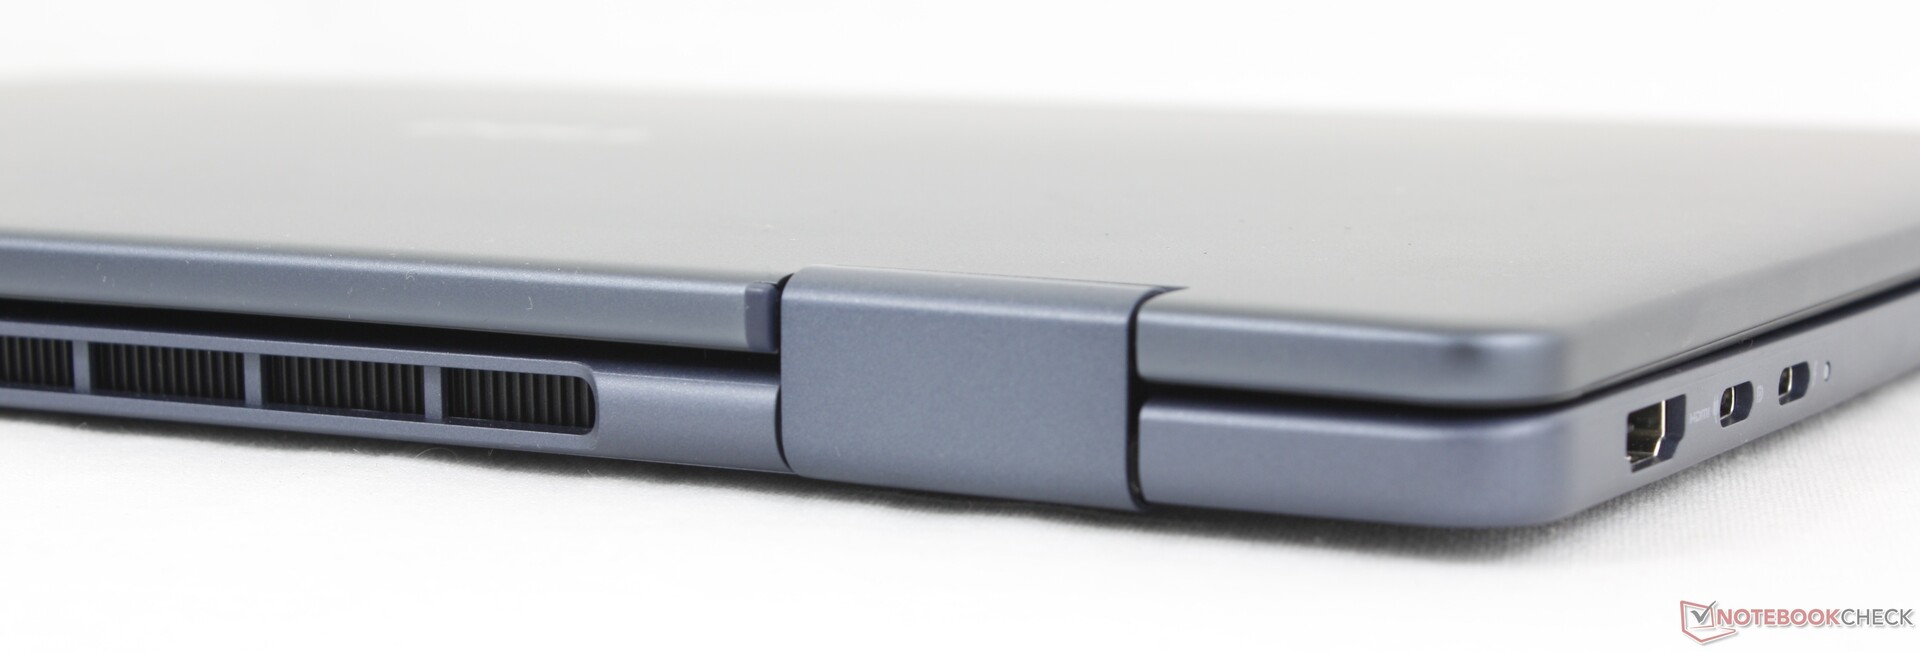
Port options are identical to last year's Inspiron albeit with one important difference: the omission of an integrated SD card reader. The two USB-C ports have also been rearranged arguably for the worse as you can no longer charge the system along its right edge.
Communication
Webcam
A 2 MP webcam comes standard with physical shutter and no IR.


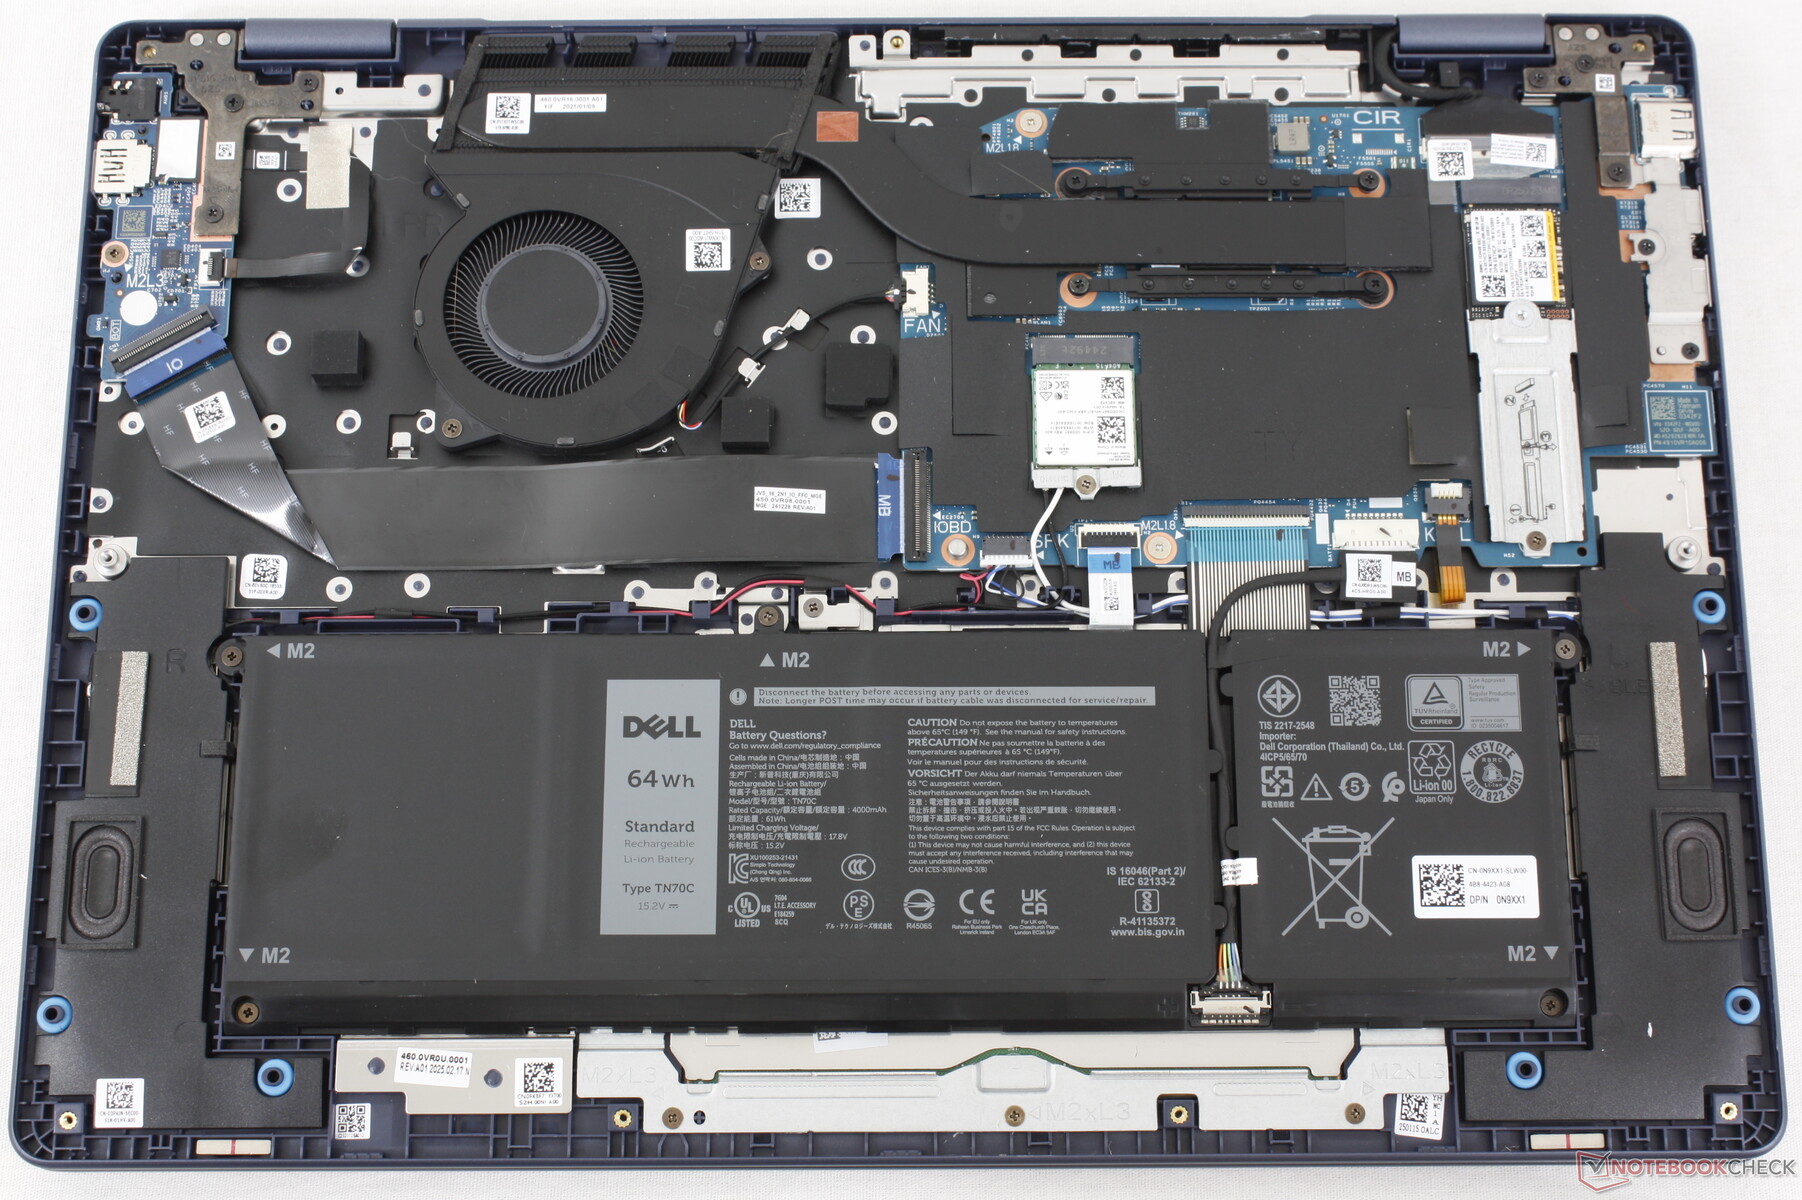
Maintenance

Sustainability
Dell does not explicit label any recycled materials used during the manufacturing of the Dell 16 Plus 2-in-1. The packaging uses no plastic for easier recycling.
Accessories And Warranty
The retail box includes the AC adapter and paperwork. The usual one-year manufacturer warranty applies if purchased in the US.
Input Devices
Keyboard And Touchpad
The keyboard and clickpad are 1:1 with the Dell 16 Plus clamshell for an identical experience. It's an upgrade in terms of producitivty over last year's Inspiron 16 7640 2-in-1 which favored large speaker grilles over an integrated numpad.
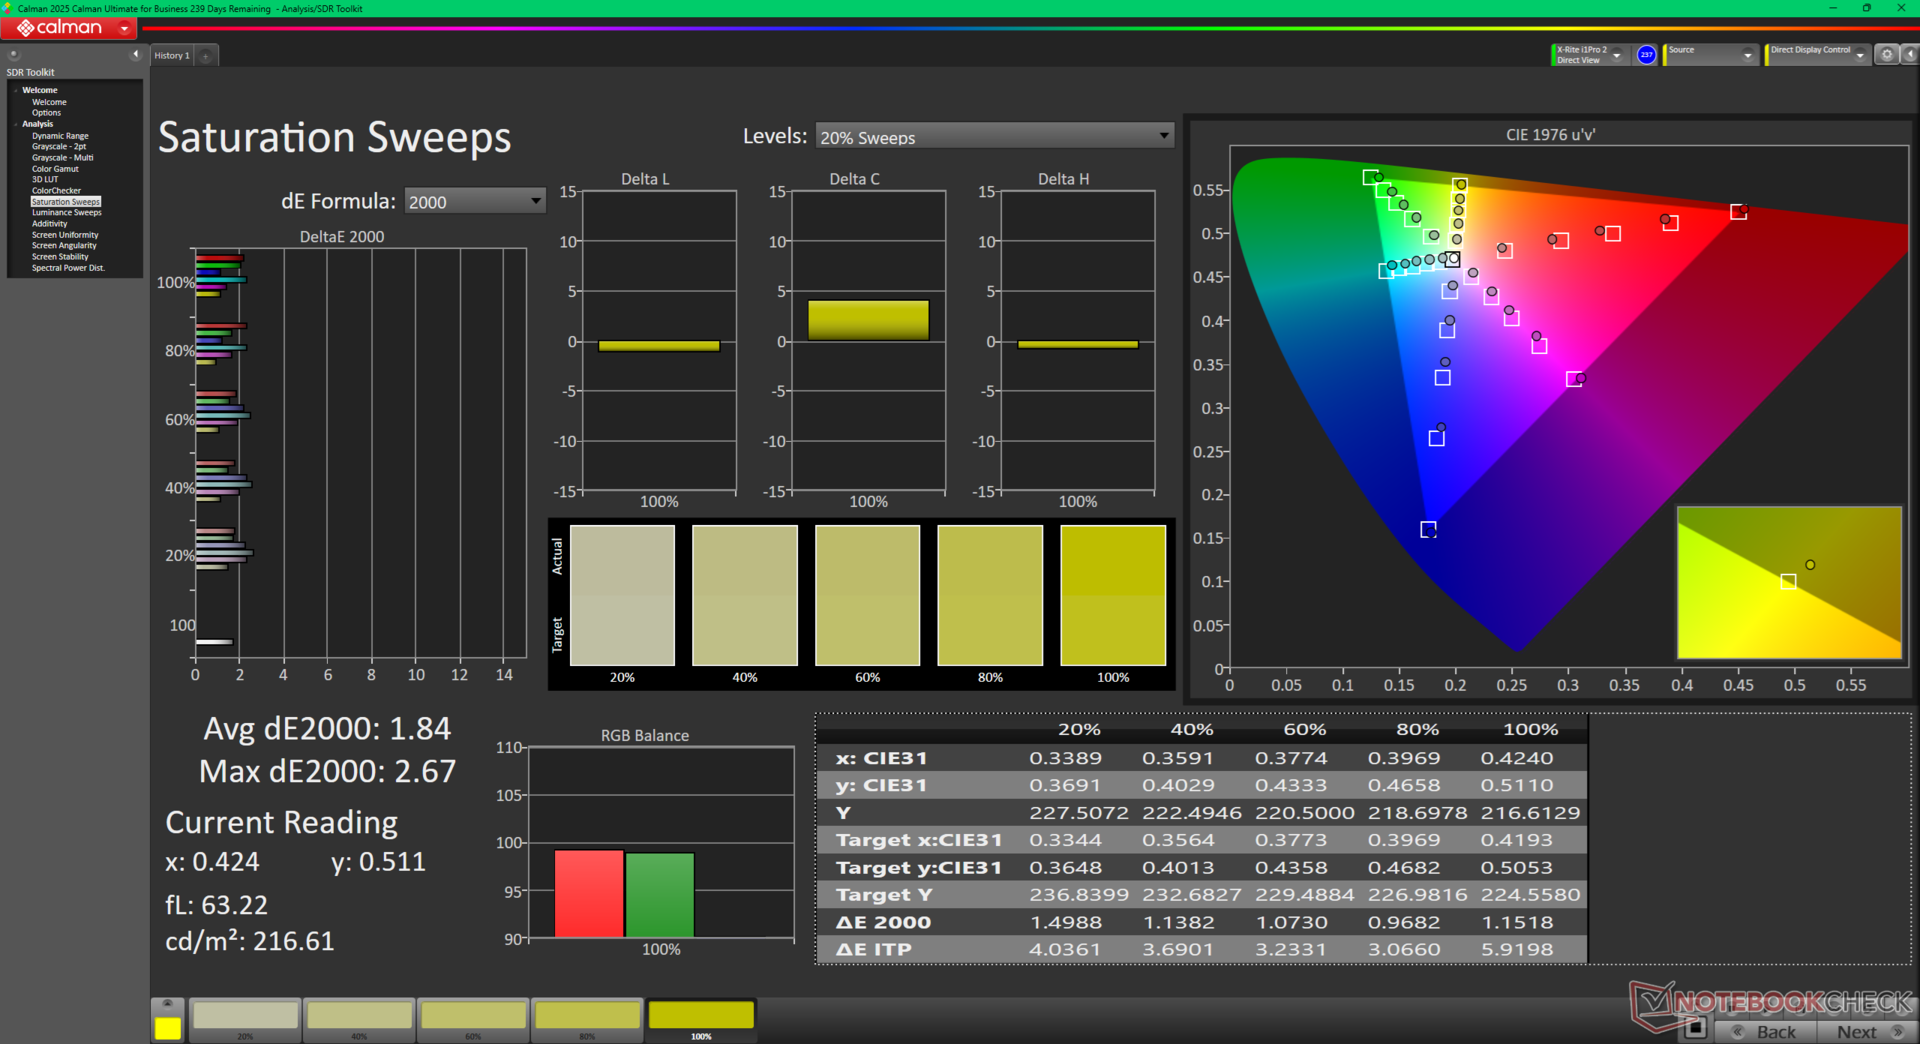
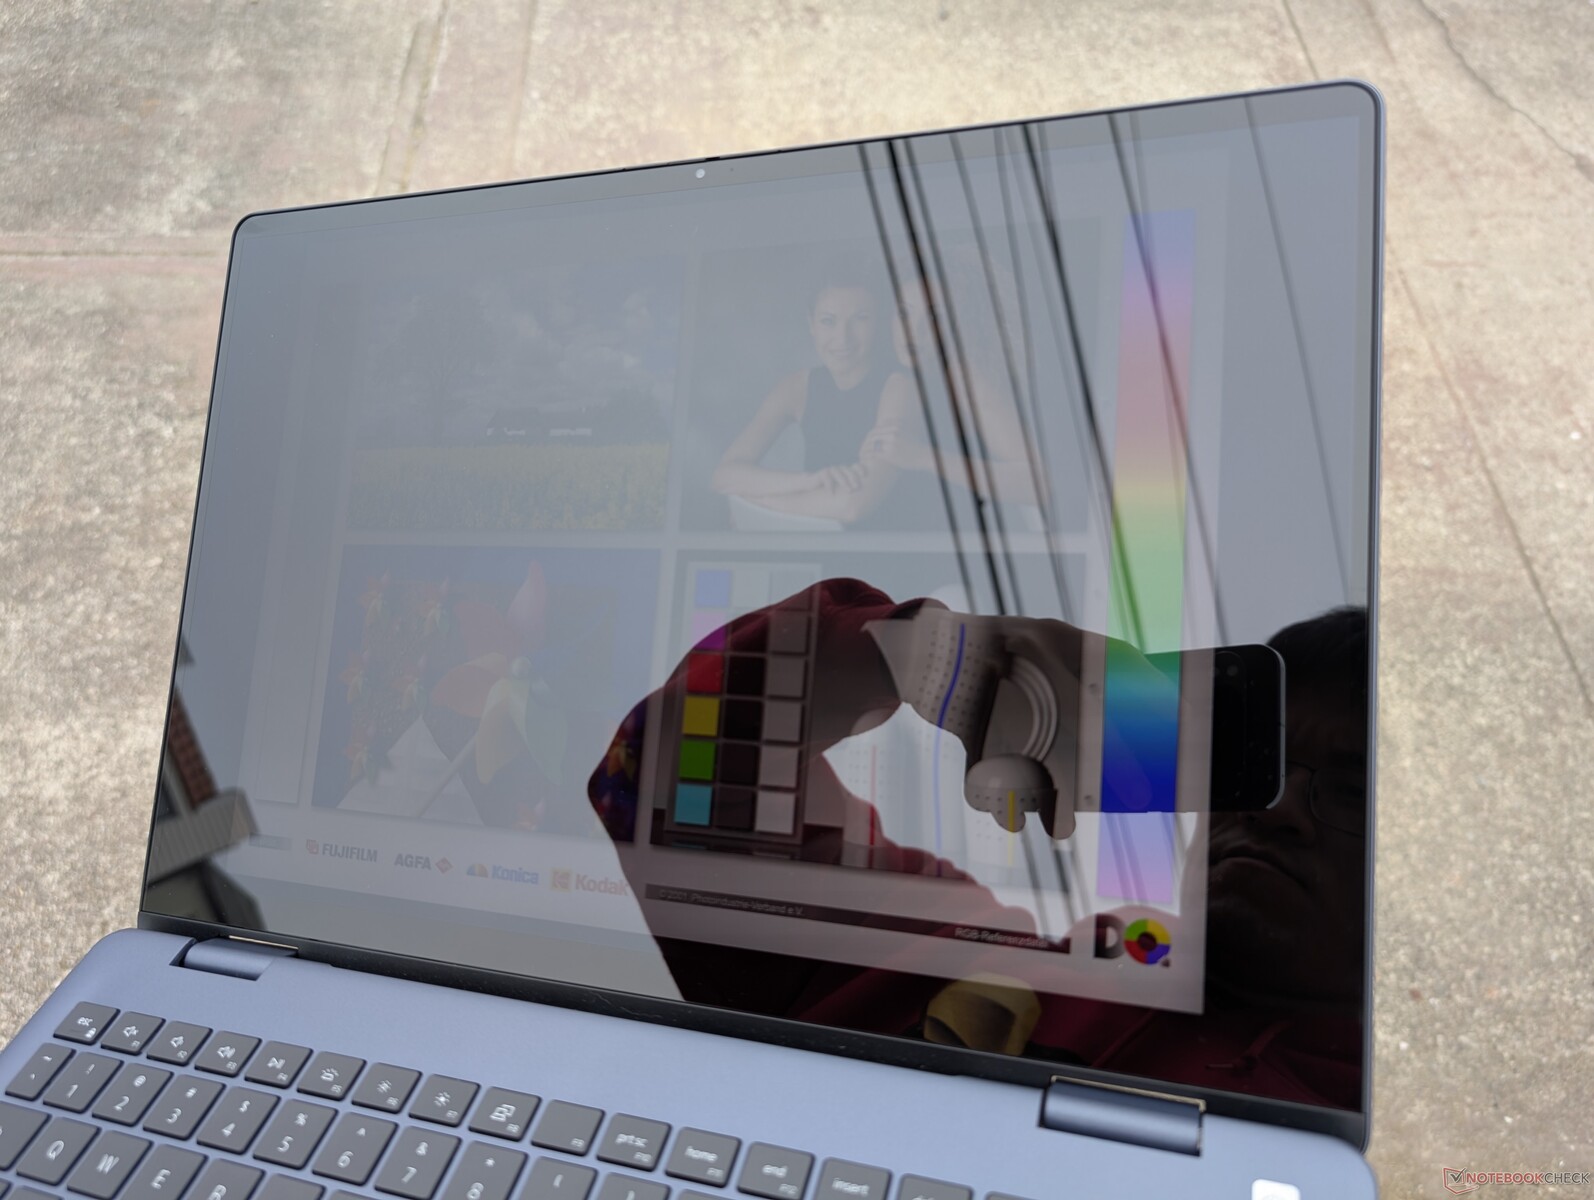
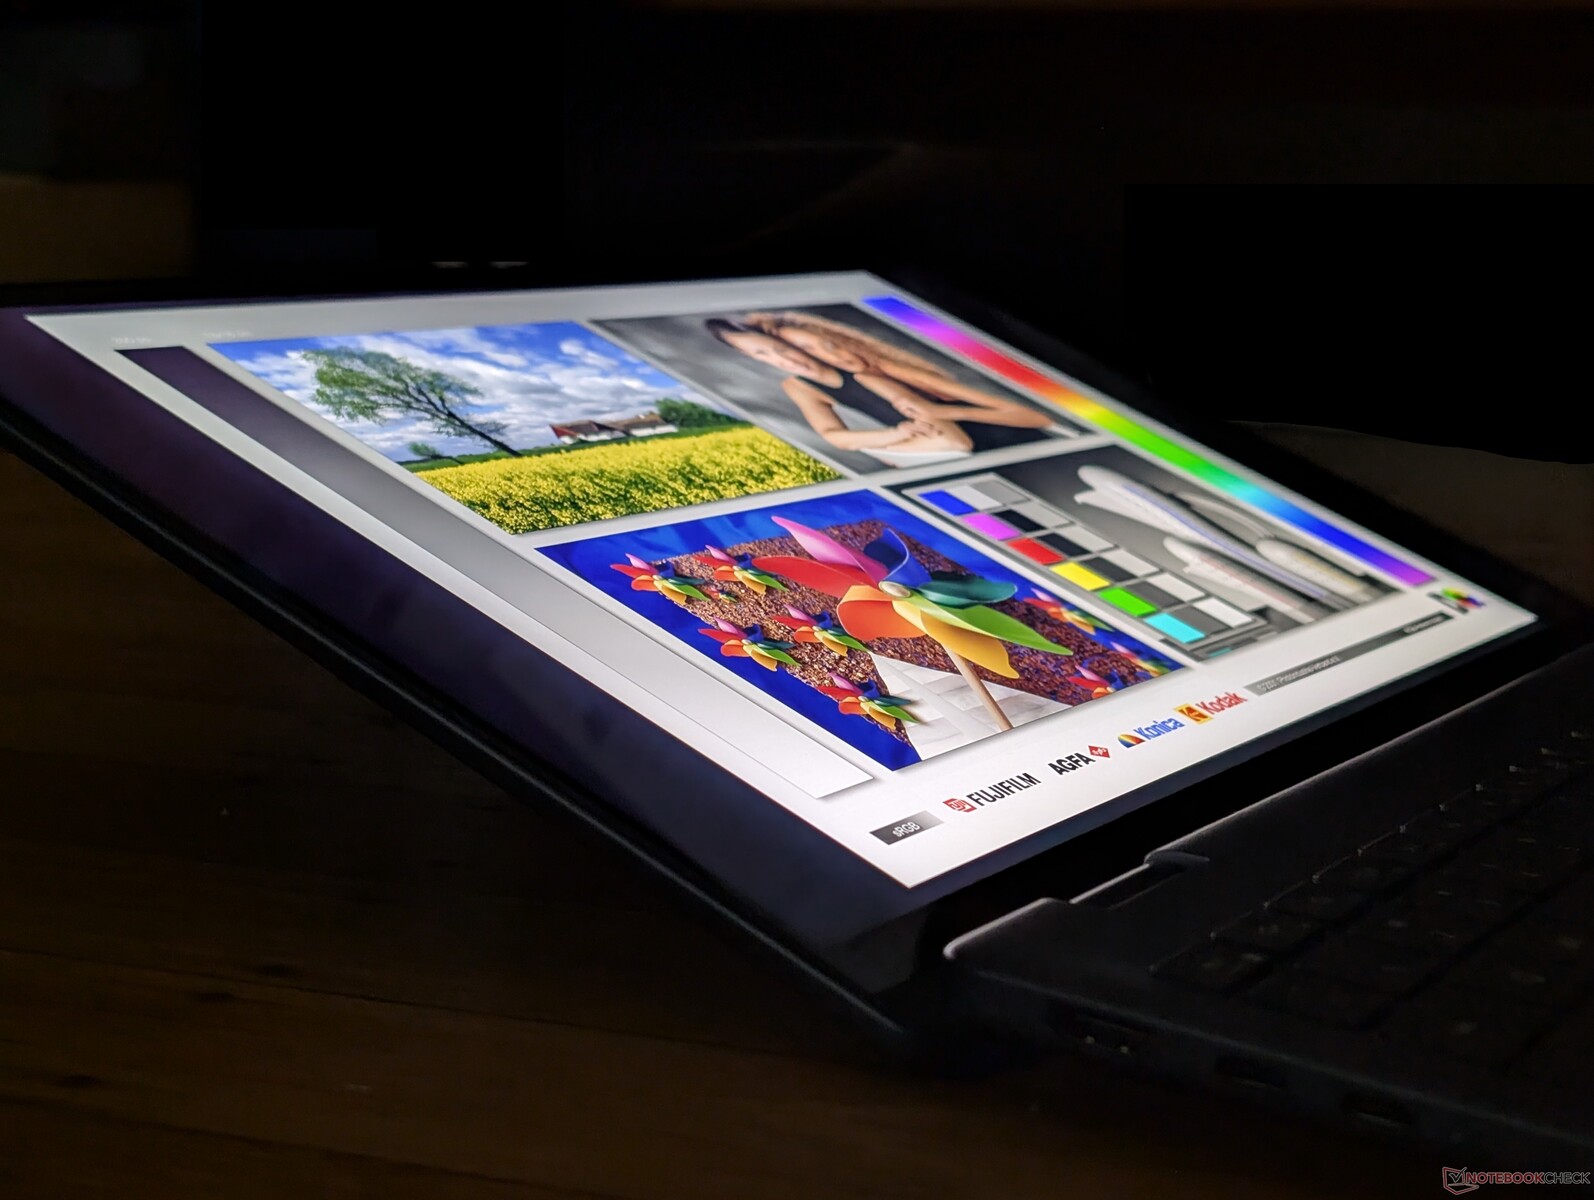
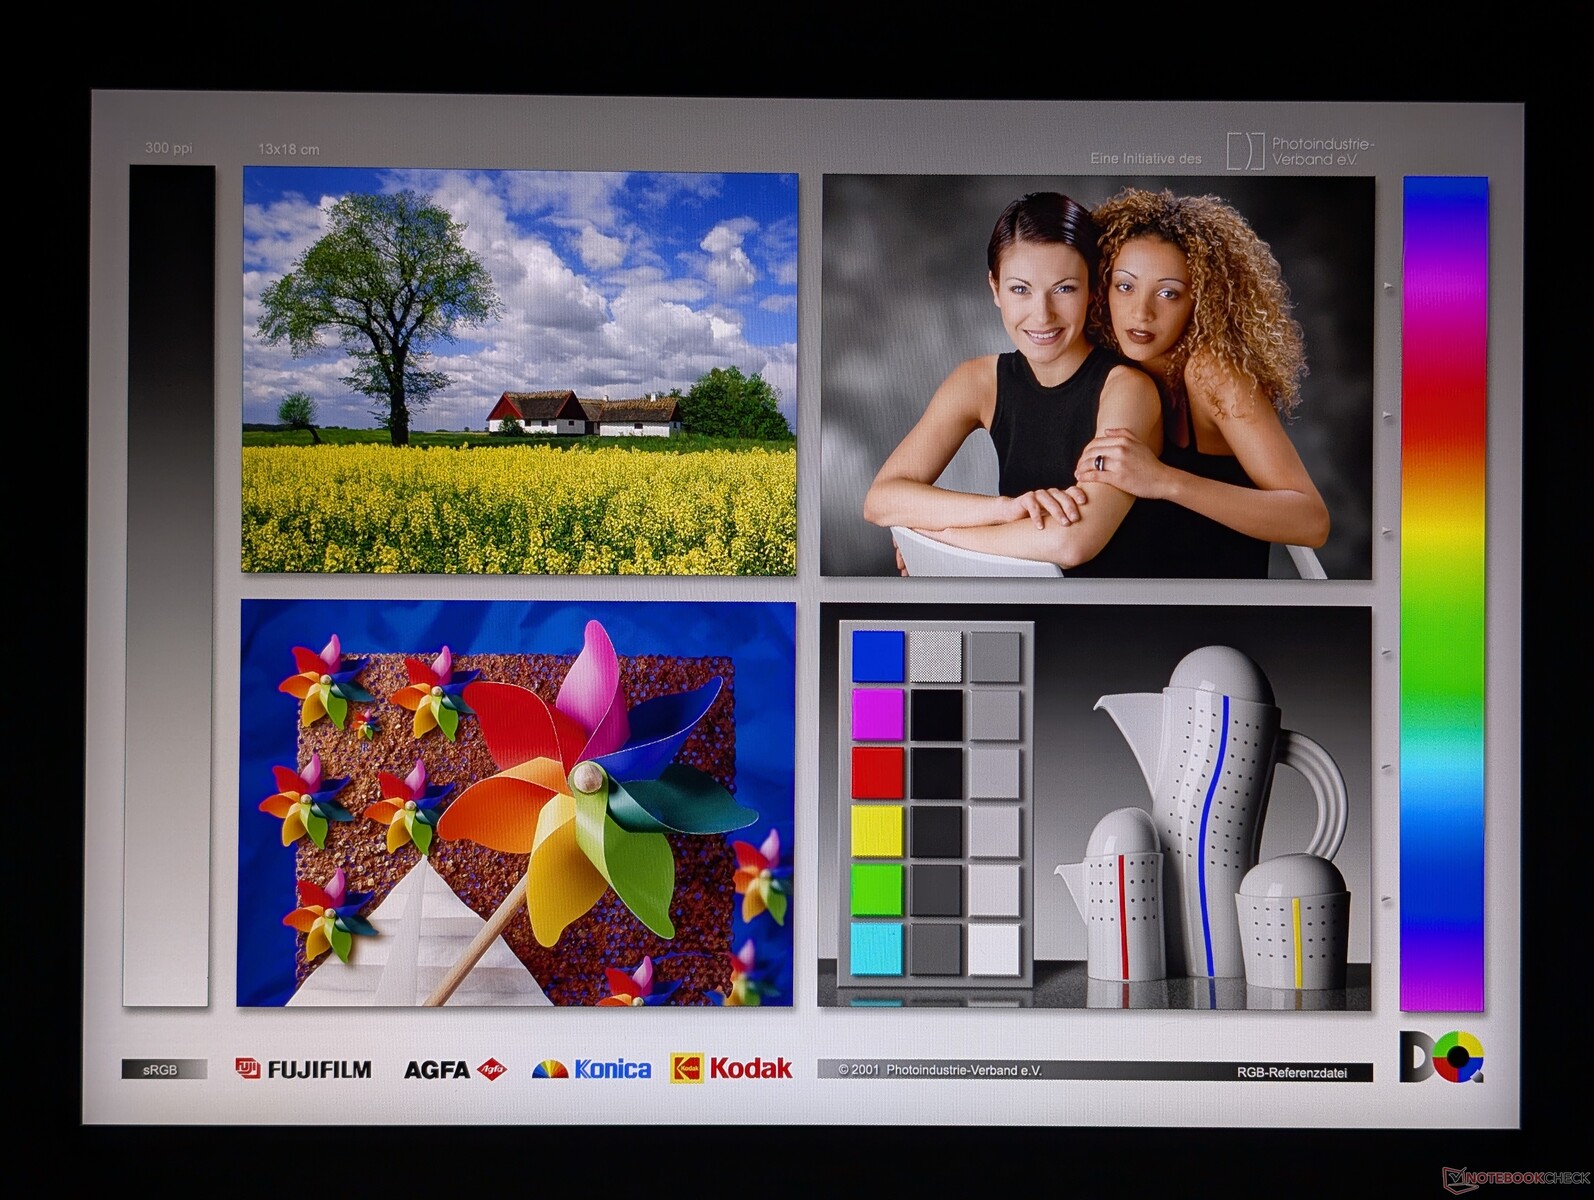
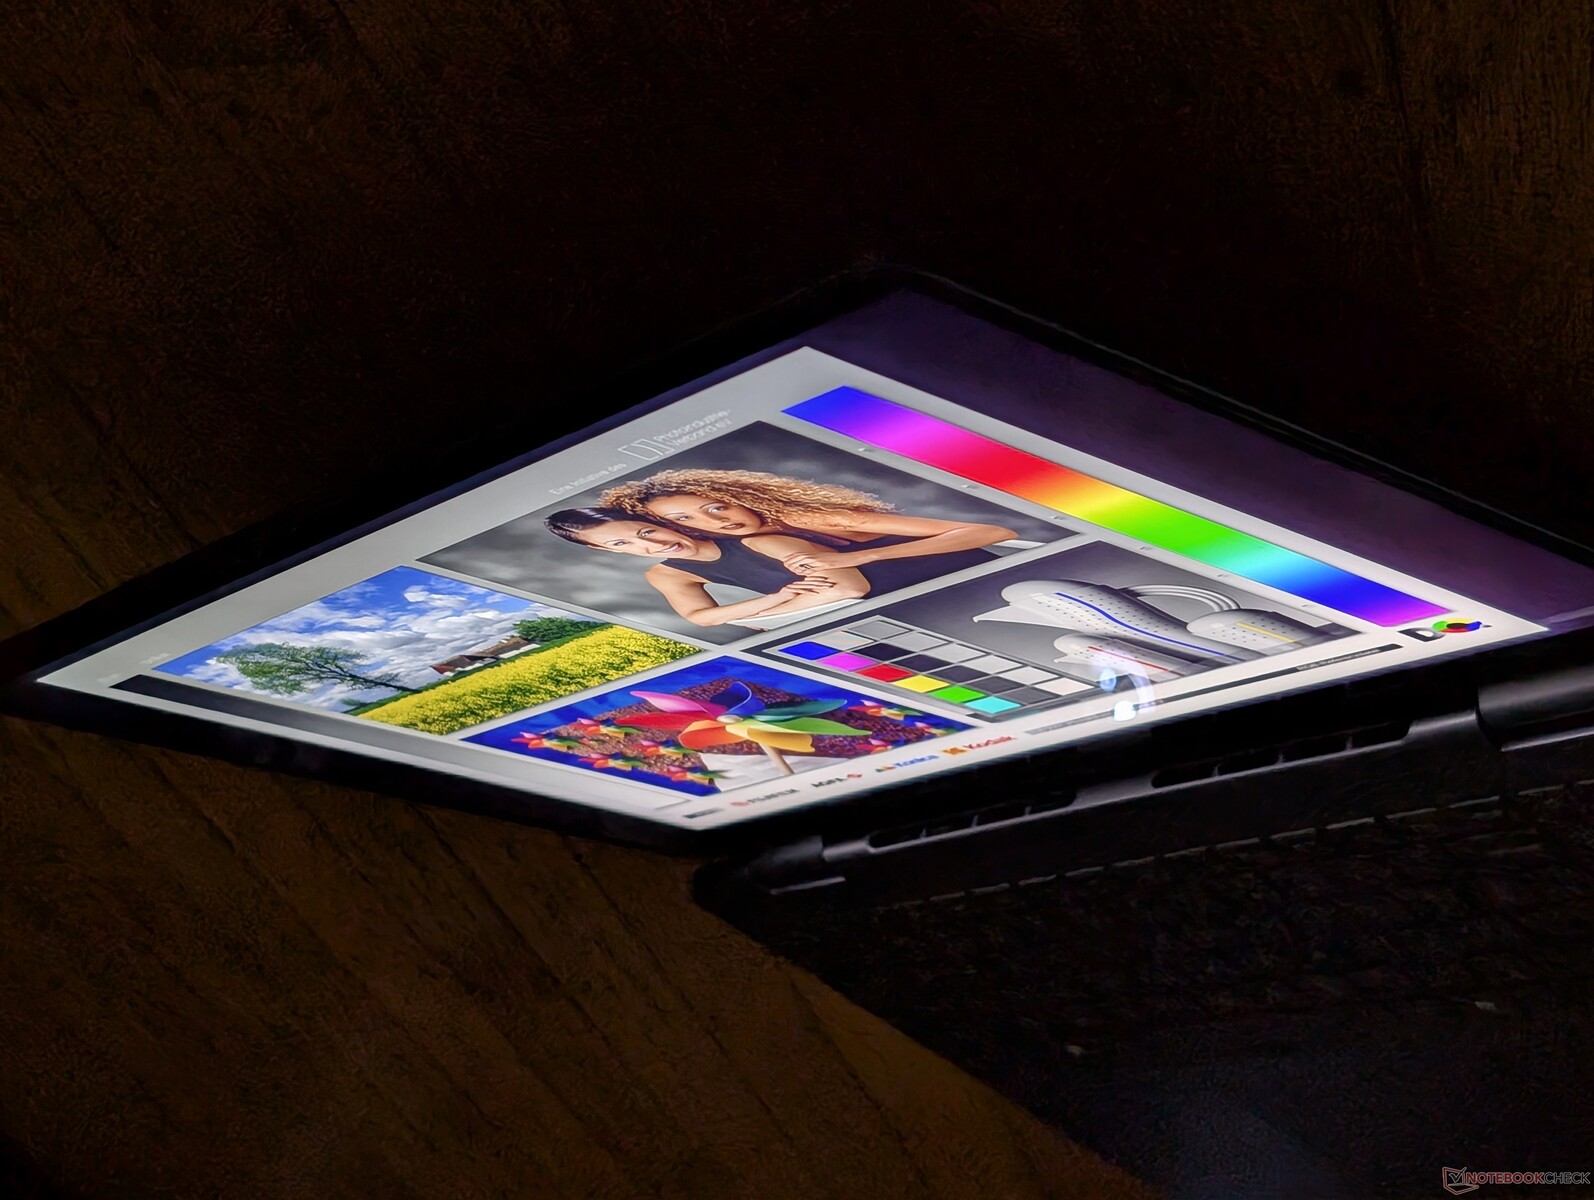
Display

The system utilizes the exact same AU Optronics B160QAT mini-LED panel as found on last year's Inspiron 16 7640 2-in-1 for the same viewing experience between the two models. Mini-LED panels are usually brighter and with deeper colors than most IPS panels for better HDR support, but they may exhibit halo effects and weaker black levels that aren't otherwise present on OLED panels.
Maximum brightness can reach 642 nits when HDR is enabled or 432 nits when on the default SDR mode.


| |||||||||||||||||||||||||
Brightness Distribution: 97 %
Center on Battery: 432.1 cd/m²
Contrast: ∞:1 (Black: 0 cd/m²)
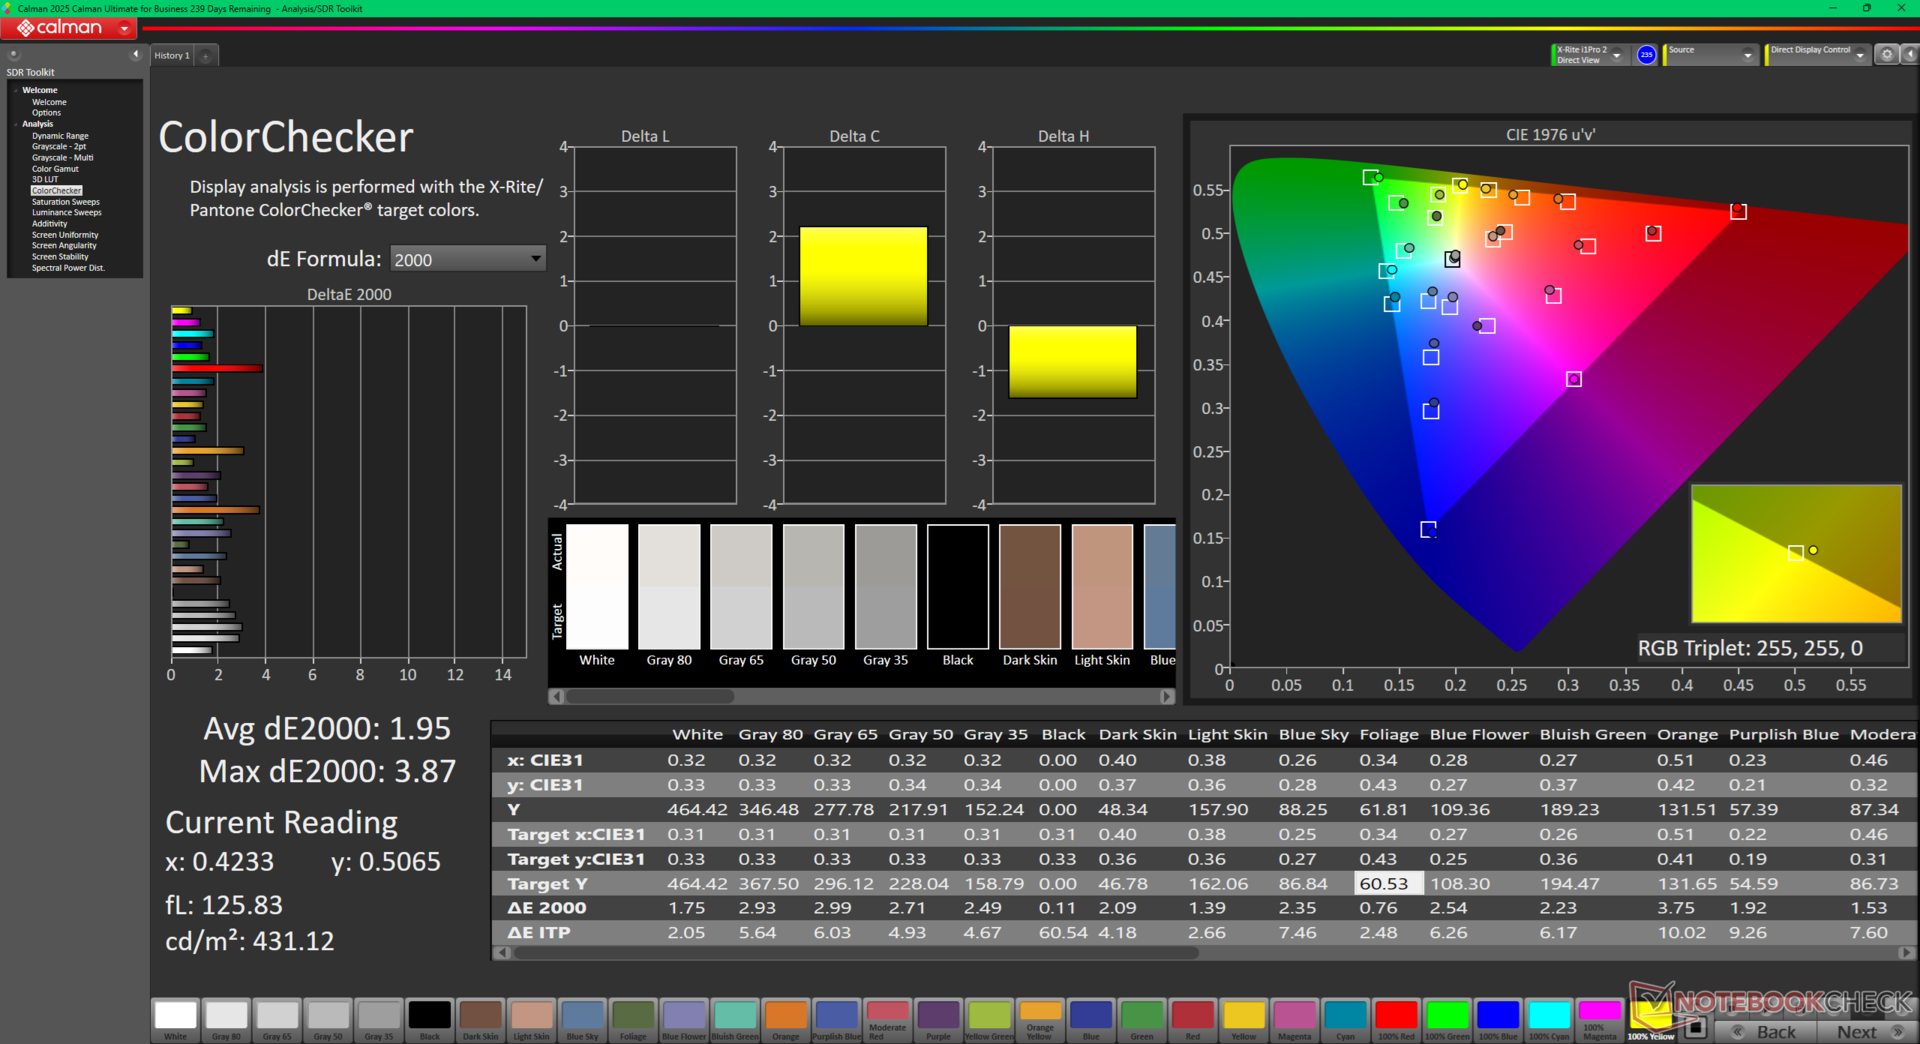
ΔE ColorChecker Calman: 1.95 | ∀{0.5-29.43 Ø4.72}
calibrated: 1.16
ΔE Greyscale Calman: 2 | ∀{0.09-98 Ø4.97}
94.2% AdobeRGB 1998 (Argyll 3D)
100% sRGB (Argyll 3D)
99.5% Display P3 (Argyll 3D)
Gamma: 2.3
CCT: 6222 K
| Dell 16 Plus 2-in-1 AU Optronics B160QAT, Mini-LED, 2560x1600, 16", 90 Hz | Dell Inspiron 16 7640 2-in-1 AU Optronics B160QAT, Mini-LED, 2560x1600, 16", 90 Hz | Lenovo Yoga 7 2-in-1 16ILL10 LEN160WUM, IPS, 1920x1200, 16", 60 Hz | Samsung Galaxy Book5 Pro 360 ATNA60CL09-0, OLED, 2880x1800, 16", 120 Hz | MSI Summit A16 AI Plus A3HMTG AU Optronics B16QAN02.N, IPS, 2560x1600, 16", 165 Hz | HP Envy x360 2-in-1 16-ad0097nr Samsung SDC41A6, OLED, 2880x1800, 16", 120 Hz | |
|---|---|---|---|---|---|---|
| Display | -1% | -53% | 1% | -4% | 1% | |
| Display P3 Coverage (%) | 99.5 | 99.4 0% | 39.7 -60% | 99.9 0% | 96.8 -3% | 99.6 0% |
| sRGB Coverage (%) | 100 | 100 0% | 57.9 -42% | 100 0% | 99.8 0% | 100 0% |
| AdobeRGB 1998 Coverage (%) | 94.2 | 92.5 -2% | 41 -56% | 96.6 3% | 84.7 -10% | 96.5 2% |
| Response Times | 32% | 50% | 73% | 80% | 98% | |
| Response Time Grey 50% / Grey 80% * (ms) | 48.8 ? | 15.4 ? 68% | 30 ? 39% | 0.48 ? 99% | 12.9 ? 74% | 0.8 ? 98% |
| Response Time Black / White * (ms) | 57.6 ? | 60.6 ? -5% | 22.5 ? 61% | 0.64 ? 99% | 8.9 ? 85% | 0.89 ? 98% |
| PWM Frequency (Hz) | 2807 ? | 2753.7 ? | 240 ? | 491.8 ? | ||
| PWM Amplitude * (%) | 50 | 40 20% | ||||
| Screen | -49% | -169% | 16% | -22% | -19% | |
| Brightness middle (cd/m²) | 432.1 | 413 -4% | 317.9 -26% | 387 -10% | 475.4 10% | 399.4 -8% |
| Brightness (cd/m²) | 426 | 409 -4% | 304 -29% | 392 -8% | 440 3% | 405 -5% |
| Brightness Distribution (%) | 97 | 97 0% | 90 -7% | 98 1% | 89 -8% | 98 1% |
| Black Level * (cd/m²) | 0.14 | 0.25 | 0.36 | |||
| Colorchecker dE 2000 * | 1.95 | 3.48 -78% | 7.39 -279% | 1 49% | 2.99 -53% | 4.05 -108% |
| Colorchecker dE 2000 max. * | 3.87 | 6.97 -80% | 21.43 -454% | 1.9 51% | 7.64 -97% | 6.69 -73% |
| Colorchecker dE 2000 calibrated * | 1.16 | 3.06 -164% | 0.74 36% | 1.02 12% | ||
| Greyscale dE 2000 * | 2 | 4.5 -125% | 6.5 -225% | 1.7 15% | 2.9 -45% | 1.1 45% |
| Gamma | 2.3 96% | 2.15 102% | 2.22 99% | 2.25 98% | 2.31 95% | 2.27 97% |
| CCT | 6222 104% | 6446 101% | 6140 106% | 6325 103% | 6472 100% | 6419 101% |
| Contrast (:1) | 2950 | 1272 | 1321 | |||
| Total Average (Program / Settings) | -6% /
-21% | -57% /
-104% | 30% /
27% | 18% /
-1% | 27% /
5% |
* ... smaller is better


Display Response Times
| ↔ Response Time Black to White | ||
|---|---|---|
| 57.6 ms ... rise ↗ and fall ↘ combined | ↗ 50.4 ms rise | 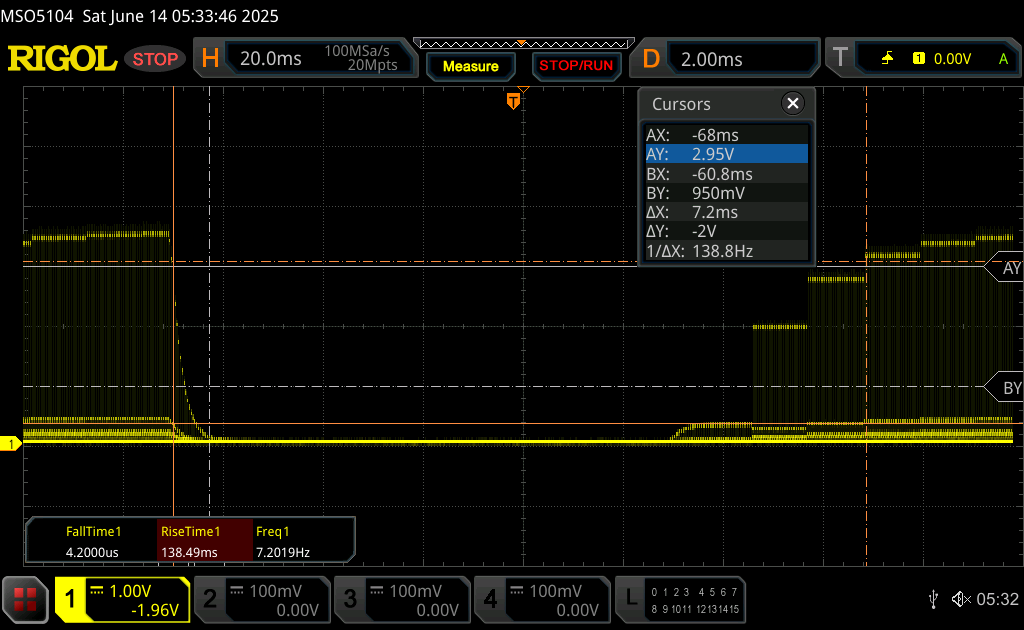 |
| ↘ 7.2 ms fall | ||
| The screen shows slow response rates in our tests and will be unsatisfactory for gamers. In comparison, all tested devices range from 0.1 (minimum) to 240 (maximum) ms. » 99 % of all devices are better. This means that the measured response time is worse than the average of all tested devices (19.8 ms). | ||
| ↔ Response Time 50% Grey to 80% Grey | ||
| 48.8 ms ... rise ↗ and fall ↘ combined | ↗ 33.6 ms rise |  |
| ↘ 15.2 ms fall | ||
| The screen shows slow response rates in our tests and will be unsatisfactory for gamers. In comparison, all tested devices range from 0.165 (minimum) to 636 (maximum) ms. » 84 % of all devices are better. This means that the measured response time is worse than the average of all tested devices (31 ms). | ||
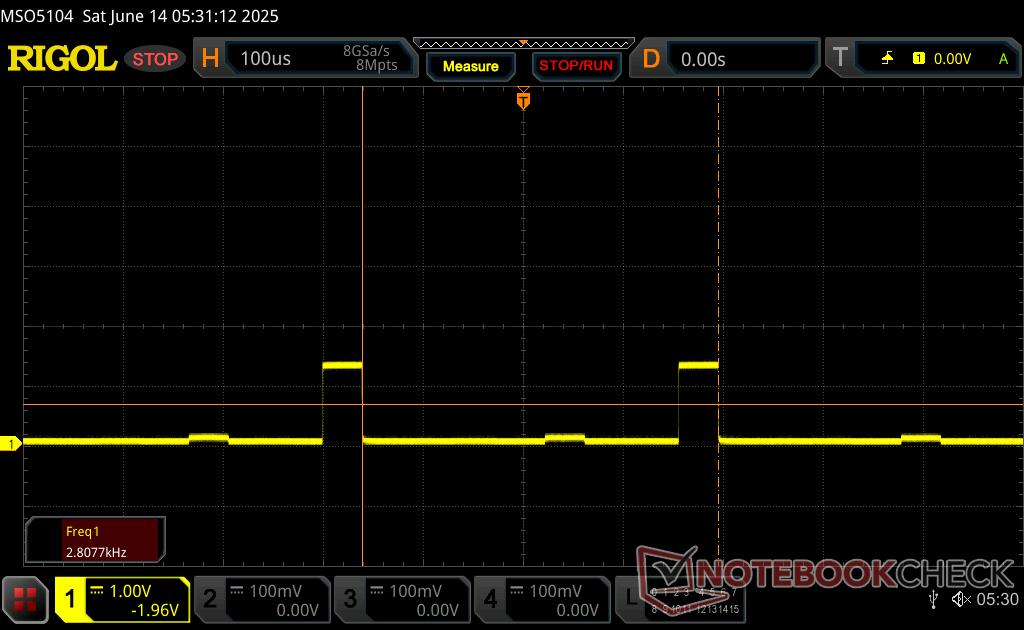
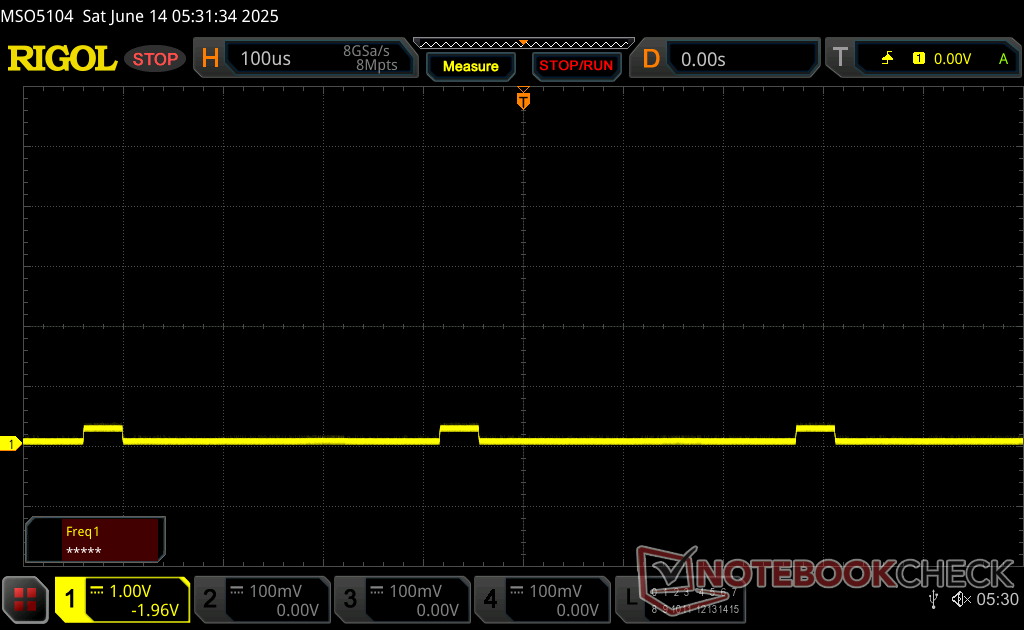
Screen Flickering / PWM (Pulse-Width Modulation)
| Screen flickering / PWM detected | 2807 Hz Amplitude: 50 % | ≤ 100 % brightness setting | 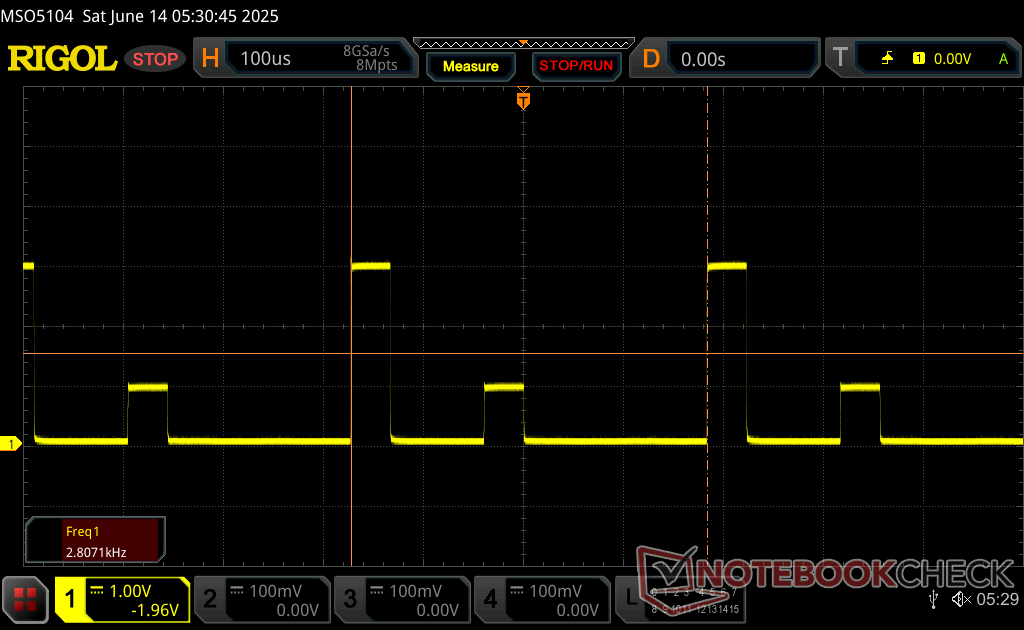 |
The display backlight flickers at 2807 Hz (worst case, e.g., utilizing PWM) Flickering detected at a brightness setting of 100 % and below. There should be no flickering or PWM above this brightness setting. The frequency of 2807 Hz is quite high, so most users sensitive to PWM should not notice any flickering. In comparison: 52 % of all tested devices do not use PWM to dim the display. If PWM was detected, an average of 7763 (minimum: 5 - maximum: 343500) Hz was measured. | |||


Performance


Testing Conditions
We set Dell Optimizer to Performance mode prior to running the benchmarks below.
Processor
The Core Ultra 7 256V emphasizes performance-per-watt over raw performance and so it offers very little over the last generation Core Ultra 7 155U or even the Core i7-1355U if users don't utilize the integrated NPU. Perhaps most notably, upgrading to the more expensive Core Ultra 9 288V configuration is only expected to boost performance by a measly 5 percent at best based on our time with the Acer Swift 16 AI. The Core Ultra 7 155H in last year's Inspiron 16 7640 2-in-1 is roughly 1.5x faster than our Core Ultra 256V.
Cinebench R15 Multi Loop
Cinebench R23: Multi Core | Single Core
Cinebench R20: CPU (Multi Core) | CPU (Single Core)
Cinebench R15: CPU Multi 64Bit | CPU Single 64Bit
Blender: v2.79 BMW27 CPU
7-Zip 18.03: 7z b 4 | 7z b 4 -mmt1
Geekbench 6.7: Multi-Core | Single-Core
Geekbench 5.5: Multi-Core | Single-Core
HWBOT x265 Benchmark v2.2: 4k Preset
LibreOffice : 20 Documents To PDF
R Benchmark 2.5: Overall mean
* ... smaller is better
AIDA64: FP32 Ray-Trace | FPU Julia | CPU SHA3 | CPU Queen | FPU SinJulia | FPU Mandel | CPU AES | CPU ZLib | FP64 Ray-Trace | CPU PhotoWorxx
| Performance rating | |
| MSI Summit A16 AI Plus A3HMTG | |
| HP Envy x360 2-in-1 16-ad0097nr | |
| Dell Inspiron 16 7640 2-in-1 | |
| Dell 16 Plus 2-in-1 | |
| Lenovo Yoga 7 2-in-1 16ILL10 | |
| Average Intel Core Ultra 7 258V | |
| Samsung Galaxy Book5 Pro 360 | |
| AIDA64 / FP32 Ray-Trace | |
| MSI Summit A16 AI Plus A3HMTG | |
| HP Envy x360 2-in-1 16-ad0097nr | |
| Dell Inspiron 16 7640 2-in-1 | |
| Dell 16 Plus 2-in-1 | |
| Samsung Galaxy Book5 Pro 360 | |
| Lenovo Yoga 7 2-in-1 16ILL10 | |
| Average Intel Core Ultra 7 258V (8454 - 12781, n=26) | |
| AIDA64 / FPU Julia | |
| MSI Summit A16 AI Plus A3HMTG | |
| HP Envy x360 2-in-1 16-ad0097nr | |
| Dell Inspiron 16 7640 2-in-1 | |
| Samsung Galaxy Book5 Pro 360 | |
| Lenovo Yoga 7 2-in-1 16ILL10 | |
| Dell 16 Plus 2-in-1 | |
| Average Intel Core Ultra 7 258V (40875 - 63401, n=26) | |
| AIDA64 / CPU SHA3 | |
| MSI Summit A16 AI Plus A3HMTG | |
| HP Envy x360 2-in-1 16-ad0097nr | |
| Dell Inspiron 16 7640 2-in-1 | |
| Lenovo Yoga 7 2-in-1 16ILL10 | |
| Average Intel Core Ultra 7 258V (1930 - 2817, n=26) | |
| Samsung Galaxy Book5 Pro 360 | |
| Dell 16 Plus 2-in-1 | |
| AIDA64 / CPU Queen | |
| HP Envy x360 2-in-1 16-ad0097nr | |
| MSI Summit A16 AI Plus A3HMTG | |
| Dell Inspiron 16 7640 2-in-1 | |
| Dell 16 Plus 2-in-1 | |
| Lenovo Yoga 7 2-in-1 16ILL10 | |
| Average Intel Core Ultra 7 258V (48816 - 49818, n=24) | |
| Samsung Galaxy Book5 Pro 360 | |
| AIDA64 / FPU SinJulia | |
| MSI Summit A16 AI Plus A3HMTG | |
| HP Envy x360 2-in-1 16-ad0097nr | |
| Dell Inspiron 16 7640 2-in-1 | |
| Lenovo Yoga 7 2-in-1 16ILL10 | |
| Dell 16 Plus 2-in-1 | |
| Average Intel Core Ultra 7 258V (3817 - 4440, n=26) | |
| Samsung Galaxy Book5 Pro 360 | |
| AIDA64 / FPU Mandel | |
| MSI Summit A16 AI Plus A3HMTG | |
| HP Envy x360 2-in-1 16-ad0097nr | |
| Dell Inspiron 16 7640 2-in-1 | |
| Samsung Galaxy Book5 Pro 360 | |
| Lenovo Yoga 7 2-in-1 16ILL10 | |
| Dell 16 Plus 2-in-1 | |
| Average Intel Core Ultra 7 258V (21670 - 33565, n=26) | |
| AIDA64 / CPU AES | |
| Dell Inspiron 16 7640 2-in-1 | |
| HP Envy x360 2-in-1 16-ad0097nr | |
| MSI Summit A16 AI Plus A3HMTG | |
| Dell 16 Plus 2-in-1 | |
| Lenovo Yoga 7 2-in-1 16ILL10 | |
| Average Intel Core Ultra 7 258V (30957 - 40753, n=26) | |
| Samsung Galaxy Book5 Pro 360 | |
| AIDA64 / CPU ZLib | |
| MSI Summit A16 AI Plus A3HMTG | |
| Dell Inspiron 16 7640 2-in-1 | |
| HP Envy x360 2-in-1 16-ad0097nr | |
| Lenovo Yoga 7 2-in-1 16ILL10 | |
| Dell 16 Plus 2-in-1 | |
| Average Intel Core Ultra 7 258V (422 - 632, n=26) | |
| Samsung Galaxy Book5 Pro 360 | |
| AIDA64 / FP64 Ray-Trace | |
| MSI Summit A16 AI Plus A3HMTG | |
| HP Envy x360 2-in-1 16-ad0097nr | |
| Dell Inspiron 16 7640 2-in-1 | |
| Samsung Galaxy Book5 Pro 360 | |
| Dell 16 Plus 2-in-1 | |
| Lenovo Yoga 7 2-in-1 16ILL10 | |
| Average Intel Core Ultra 7 258V (4258 - 6930, n=26) | |
| AIDA64 / CPU PhotoWorxx | |
| Dell 16 Plus 2-in-1 | |
| Average Intel Core Ultra 7 258V (44223 - 59245, n=26) | |
| Lenovo Yoga 7 2-in-1 16ILL10 | |
| MSI Summit A16 AI Plus A3HMTG | |
| Samsung Galaxy Book5 Pro 360 | |
| Dell Inspiron 16 7640 2-in-1 | |
| HP Envy x360 2-in-1 16-ad0097nr | |
System Performance
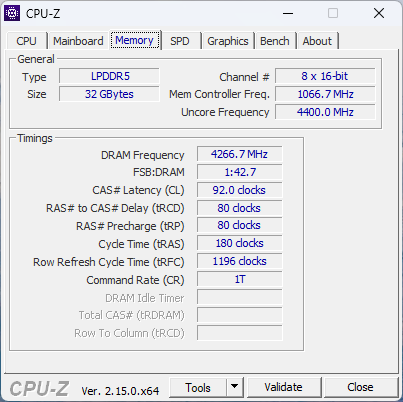
PCMark 10 results are slightly but consistently lower than on the Lenovo Yoga 7 2-in-1 16ILL10. RAM performance is otherwise very fast due to the on-die architecture of Lunar Lake.

PCMark 10: Score | Essentials | Productivity | Digital Content Creation
CrossMark: Overall | Productivity | Creativity | Responsiveness
WebXPRT 3: Overall
WebXPRT 4: Overall
Mozilla Kraken 1.1: Total
| Performance rating | |
| MSI Summit A16 AI Plus A3HMTG | |
| Lenovo Yoga 7 2-in-1 16ILL10 | |
| Dell Inspiron 16 7640 2-in-1 | |
| Dell 16 Plus 2-in-1 | |
| Average Intel Core Ultra 7 258V, Intel Arc Graphics 140V | |
| HP Envy x360 2-in-1 16-ad0097nr | |
| Samsung Galaxy Book5 Pro 360 | |
| PCMark 10 / Score | |
| MSI Summit A16 AI Plus A3HMTG | |
| Lenovo Yoga 7 2-in-1 16ILL10 | |
| Dell Inspiron 16 7640 2-in-1 | |
| HP Envy x360 2-in-1 16-ad0097nr | |
| Average Intel Core Ultra 7 258V, Intel Arc Graphics 140V (6265 - 7420, n=23) | |
| Dell 16 Plus 2-in-1 | |
| Samsung Galaxy Book5 Pro 360 | |
| PCMark 10 / Essentials | |
| Lenovo Yoga 7 2-in-1 16ILL10 | |
| MSI Summit A16 AI Plus A3HMTG | |
| Dell Inspiron 16 7640 2-in-1 | |
| HP Envy x360 2-in-1 16-ad0097nr | |
| Average Intel Core Ultra 7 258V, Intel Arc Graphics 140V (9295 - 11467, n=23) | |
| Dell 16 Plus 2-in-1 | |
| Samsung Galaxy Book5 Pro 360 | |
| PCMark 10 / Productivity | |
| HP Envy x360 2-in-1 16-ad0097nr | |
| MSI Summit A16 AI Plus A3HMTG | |
| Lenovo Yoga 7 2-in-1 16ILL10 | |
| Average Intel Core Ultra 7 258V, Intel Arc Graphics 140V (7357 - 13600, n=23) | |
| Samsung Galaxy Book5 Pro 360 | |
| Dell Inspiron 16 7640 2-in-1 | |
| Dell 16 Plus 2-in-1 | |
| PCMark 10 / Digital Content Creation | |
| MSI Summit A16 AI Plus A3HMTG | |
| Lenovo Yoga 7 2-in-1 16ILL10 | |
| Dell Inspiron 16 7640 2-in-1 | |
| Average Intel Core Ultra 7 258V, Intel Arc Graphics 140V (8160 - 10308, n=23) | |
| Dell 16 Plus 2-in-1 | |
| Samsung Galaxy Book5 Pro 360 | |
| HP Envy x360 2-in-1 16-ad0097nr | |
| CrossMark / Overall | |
| MSI Summit A16 AI Plus A3HMTG | |
| Lenovo Yoga 7 2-in-1 16ILL10 | |
| Dell Inspiron 16 7640 2-in-1 | |
| Dell 16 Plus 2-in-1 | |
| Average Intel Core Ultra 7 258V, Intel Arc Graphics 140V (1275 - 1742, n=22) | |
| HP Envy x360 2-in-1 16-ad0097nr | |
| Samsung Galaxy Book5 Pro 360 | |
| CrossMark / Productivity | |
| Lenovo Yoga 7 2-in-1 16ILL10 | |
| Dell Inspiron 16 7640 2-in-1 | |
| Dell 16 Plus 2-in-1 | |
| HP Envy x360 2-in-1 16-ad0097nr | |
| Average Intel Core Ultra 7 258V, Intel Arc Graphics 140V (1267 - 1684, n=22) | |
| MSI Summit A16 AI Plus A3HMTG | |
| Samsung Galaxy Book5 Pro 360 | |
| CrossMark / Creativity | |
| MSI Summit A16 AI Plus A3HMTG | |
| Lenovo Yoga 7 2-in-1 16ILL10 | |
| Dell Inspiron 16 7640 2-in-1 | |
| Dell 16 Plus 2-in-1 | |
| Average Intel Core Ultra 7 258V, Intel Arc Graphics 140V (1393 - 1977, n=22) | |
| HP Envy x360 2-in-1 16-ad0097nr | |
| Samsung Galaxy Book5 Pro 360 | |
| CrossMark / Responsiveness | |
| Dell Inspiron 16 7640 2-in-1 | |
| MSI Summit A16 AI Plus A3HMTG | |
| HP Envy x360 2-in-1 16-ad0097nr | |
| Lenovo Yoga 7 2-in-1 16ILL10 | |
| Samsung Galaxy Book5 Pro 360 | |
| Average Intel Core Ultra 7 258V, Intel Arc Graphics 140V (999 - 1411, n=22) | |
| Dell 16 Plus 2-in-1 | |
| WebXPRT 3 / Overall | |
| MSI Summit A16 AI Plus A3HMTG | |
| Lenovo Yoga 7 2-in-1 16ILL10 | |
| HP Envy x360 2-in-1 16-ad0097nr | |
| Dell 16 Plus 2-in-1 | |
| Dell Inspiron 16 7640 2-in-1 | |
| Average Intel Core Ultra 7 258V, Intel Arc Graphics 140V (219 - 317, n=22) | |
| Samsung Galaxy Book5 Pro 360 | |
| WebXPRT 4 / Overall | |
| Lenovo Yoga 7 2-in-1 16ILL10 | |
| Dell 16 Plus 2-in-1 | |
| Average Intel Core Ultra 7 258V, Intel Arc Graphics 140V (199.5 - 291, n=22) | |
| MSI Summit A16 AI Plus A3HMTG | |
| Samsung Galaxy Book5 Pro 360 | |
| Dell Inspiron 16 7640 2-in-1 | |
| HP Envy x360 2-in-1 16-ad0097nr | |
| Mozilla Kraken 1.1 / Total | |
| HP Envy x360 2-in-1 16-ad0097nr | |
| Dell Inspiron 16 7640 2-in-1 | |
| Samsung Galaxy Book5 Pro 360 | |
| Average Intel Core Ultra 7 258V, Intel Arc Graphics 140V (468 - 559, n=24) | |
| Dell 16 Plus 2-in-1 | |
| Lenovo Yoga 7 2-in-1 16ILL10 | |
| MSI Summit A16 AI Plus A3HMTG | |
* ... smaller is better
| PCMark 10 Score | 6766 points | |
Help | ||
| AIDA64 / Memory Copy | |
| Average Intel Core Ultra 7 258V (104408 - 114336, n=24) | |
| Dell 16 Plus 2-in-1 | |
| Samsung Galaxy Book5 Pro 360 | |
| Lenovo Yoga 7 2-in-1 16ILL10 | |
| MSI Summit A16 AI Plus A3HMTG | |
| Dell Inspiron 16 7640 2-in-1 | |
| HP Envy x360 2-in-1 16-ad0097nr | |
| AIDA64 / Memory Read | |
| MSI Summit A16 AI Plus A3HMTG | |
| Lenovo Yoga 7 2-in-1 16ILL10 | |
| Dell 16 Plus 2-in-1 | |
| Average Intel Core Ultra 7 258V (82846 - 89417, n=24) | |
| Samsung Galaxy Book5 Pro 360 | |
| Dell Inspiron 16 7640 2-in-1 | |
| HP Envy x360 2-in-1 16-ad0097nr | |
| AIDA64 / Memory Write | |
| Lenovo Yoga 7 2-in-1 16ILL10 | |
| Dell 16 Plus 2-in-1 | |
| Average Intel Core Ultra 7 258V (108824 - 117989, n=24) | |
| Samsung Galaxy Book5 Pro 360 | |
| MSI Summit A16 AI Plus A3HMTG | |
| HP Envy x360 2-in-1 16-ad0097nr | |
| Dell Inspiron 16 7640 2-in-1 | |
| AIDA64 / Memory Latency | |
| Dell Inspiron 16 7640 2-in-1 | |
| HP Envy x360 2-in-1 16-ad0097nr | |
| MSI Summit A16 AI Plus A3HMTG | |
| Dell 16 Plus 2-in-1 | |
| Lenovo Yoga 7 2-in-1 16ILL10 | |
| Average Intel Core Ultra 7 258V (95 - 101.7, n=24) | |
| Samsung Galaxy Book5 Pro 360 | |
* ... smaller is better
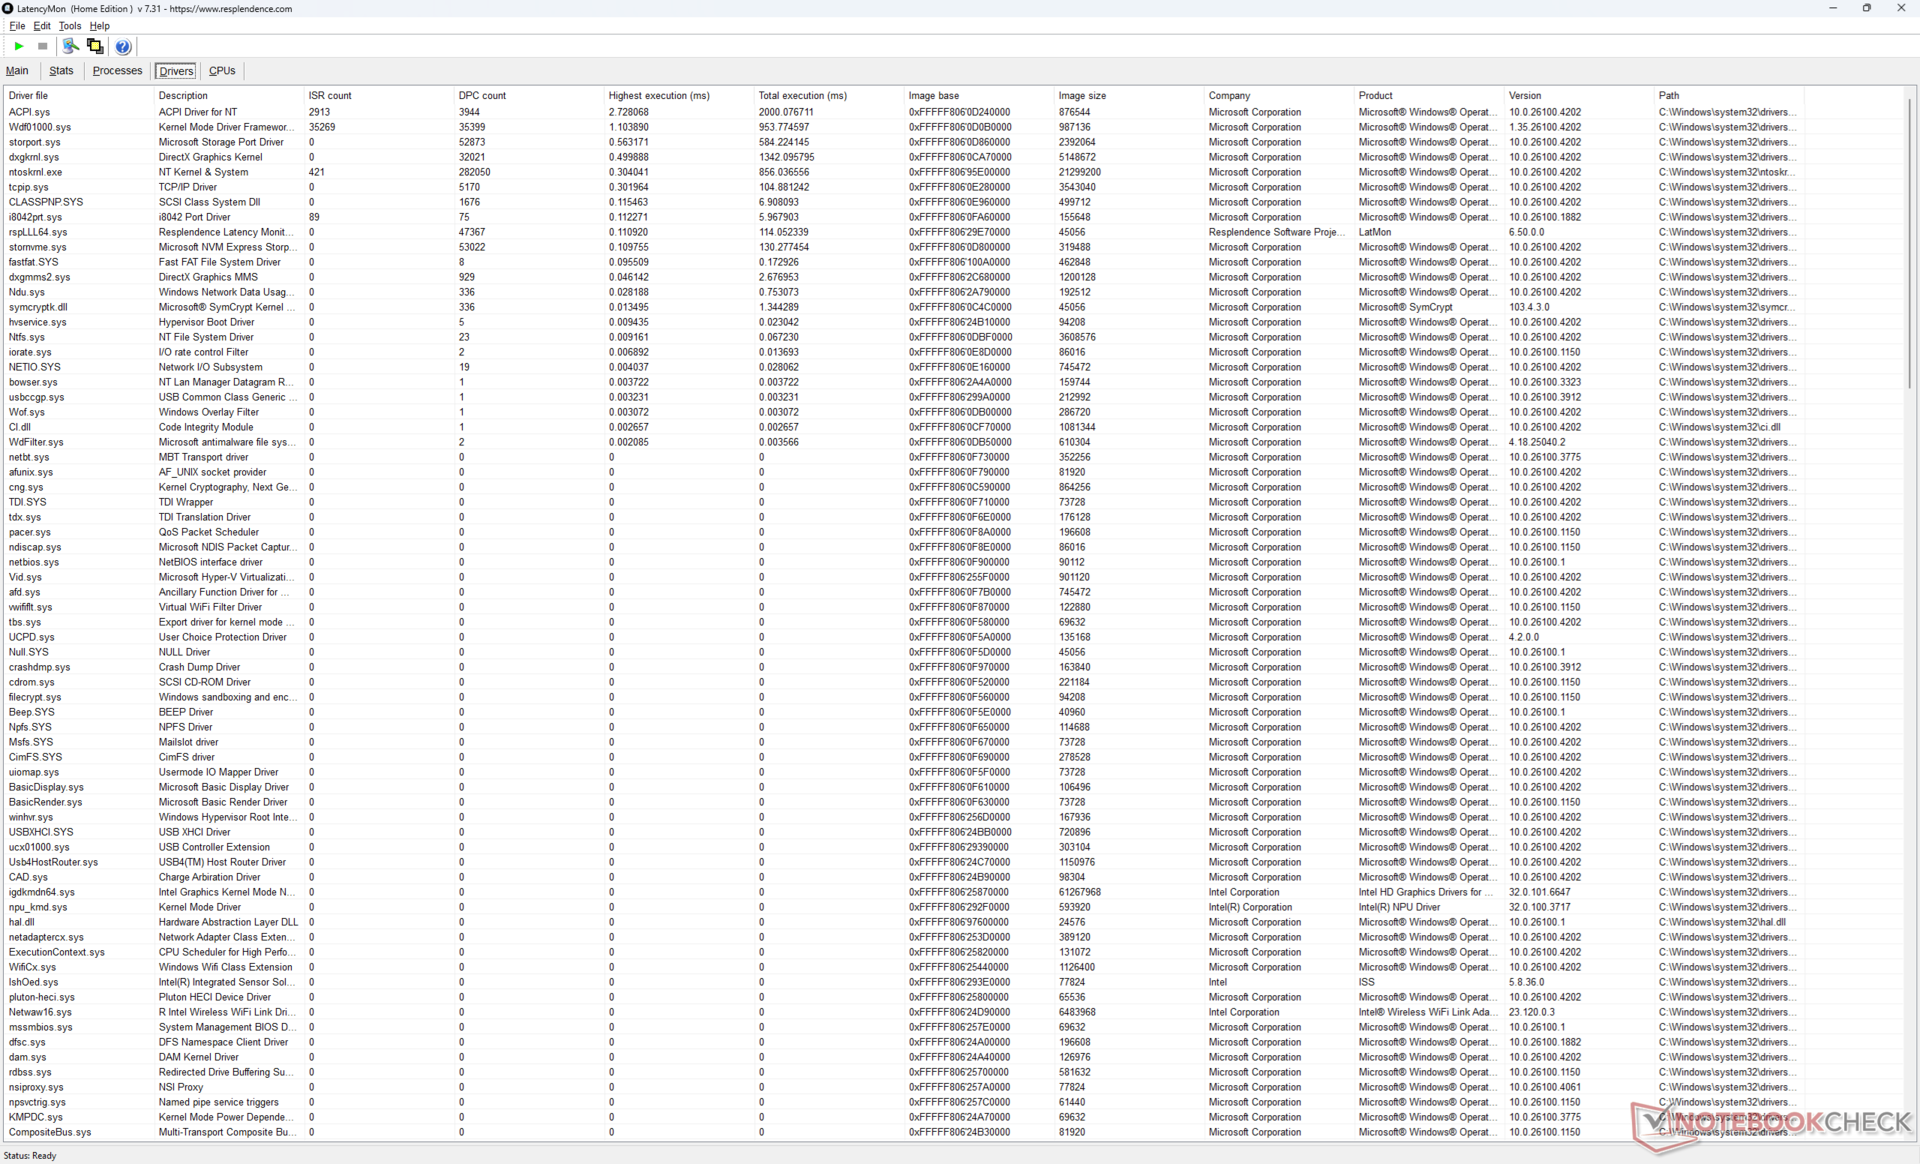
DPC Latency
LatencyMon shows minor DPC issues when opening multiple browser tabs of our homepage. 4K video playback at 60 Hz is otherwise perfect with no dropped frames recorded.

| DPC Latencies / LatencyMon - interrupt to process latency (max), Web, Youtube, Prime95 | |
| MSI Summit A16 AI Plus A3HMTG | |
| Dell 16 Plus 2-in-1 | |
| HP Envy x360 2-in-1 16-ad0097nr | |
| Dell Inspiron 16 7640 2-in-1 | |
| Samsung Galaxy Book5 Pro 360 | |
| Lenovo Yoga 7 2-in-1 16ILL10 | |
* ... smaller is better
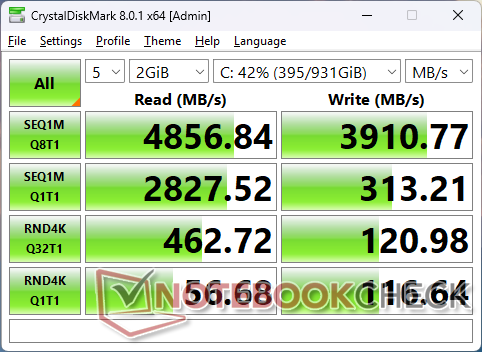
Storage Devices
Not only is the Samsung BM9C1 PCIe4 NVMe SSD slower than the Micron 2550 in last year's model, it tends to throttle as well. Transfer rates would cycle between 3400 MB/s and 4700 MB/s compared to the steadier ~5000 MB/s on the Inspiron 16 7640 2-in-1 when running our DiskSpd loop test as shown by the graph below.


| Drive Performance rating - Percent | |
| Samsung Galaxy Book5 Pro 360 | |
| Dell Inspiron 16 7640 2-in-1 | |
| Lenovo Yoga 7 2-in-1 16ILL10 | |
| MSI Summit A16 AI Plus A3HMTG | |
| Dell 16 Plus 2-in-1 | |
| HP Envy x360 2-in-1 16-ad0097nr | |
* ... smaller is better
Disk Throttling: DiskSpd Read Loop, Queue Depth 8
GPU Performance
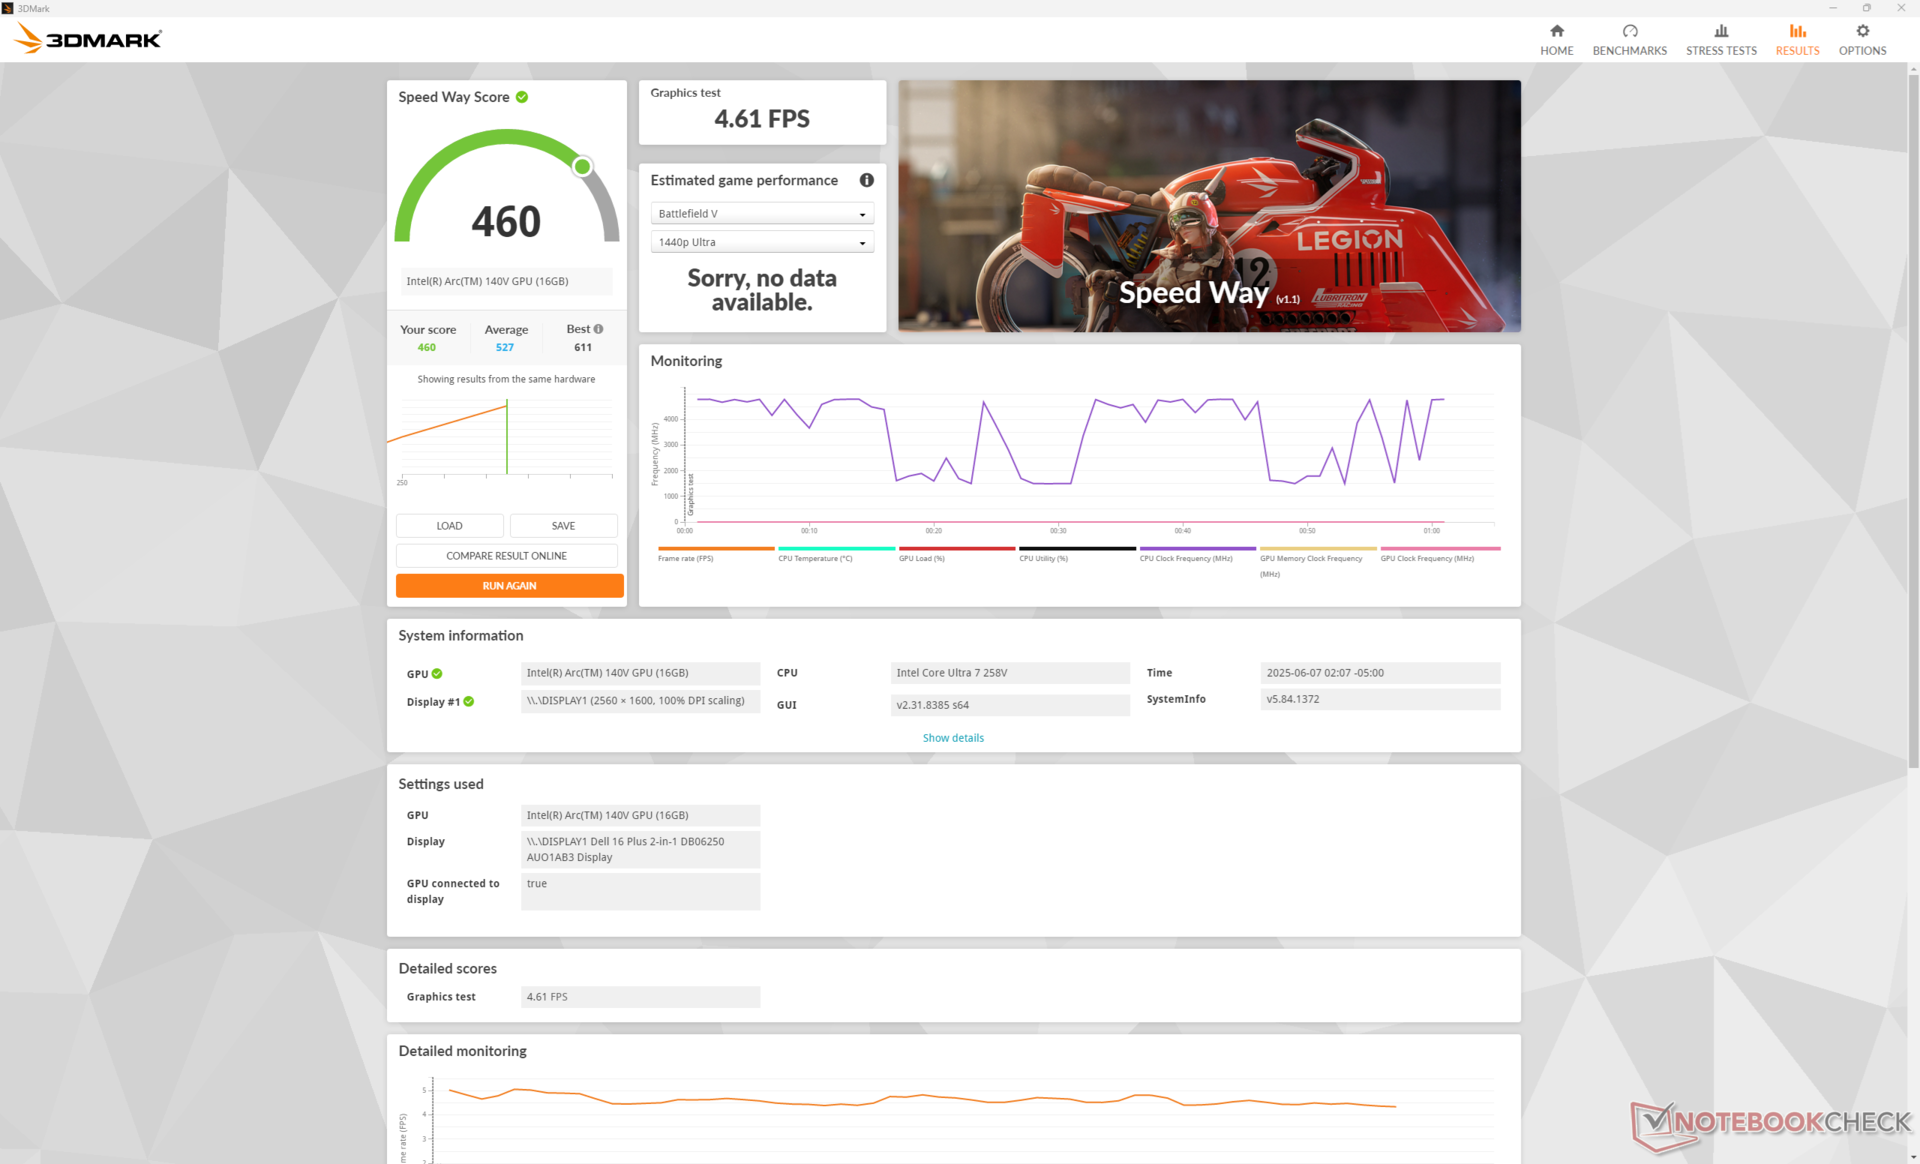
Whereas the Core Ultra 7 258V is slower than the Core Ultra 7 255H in last year's Inspiron when it comes to processor performance, the opposite is true when comparing the Arc 140V to the Arc 8. The Dell 16 Plus 2-in-1 is able to run demanding games like Final Fantasy XV or Cyberpunk 2077 anywhere between 35 to 50 percent faster despite the slower processor performance.
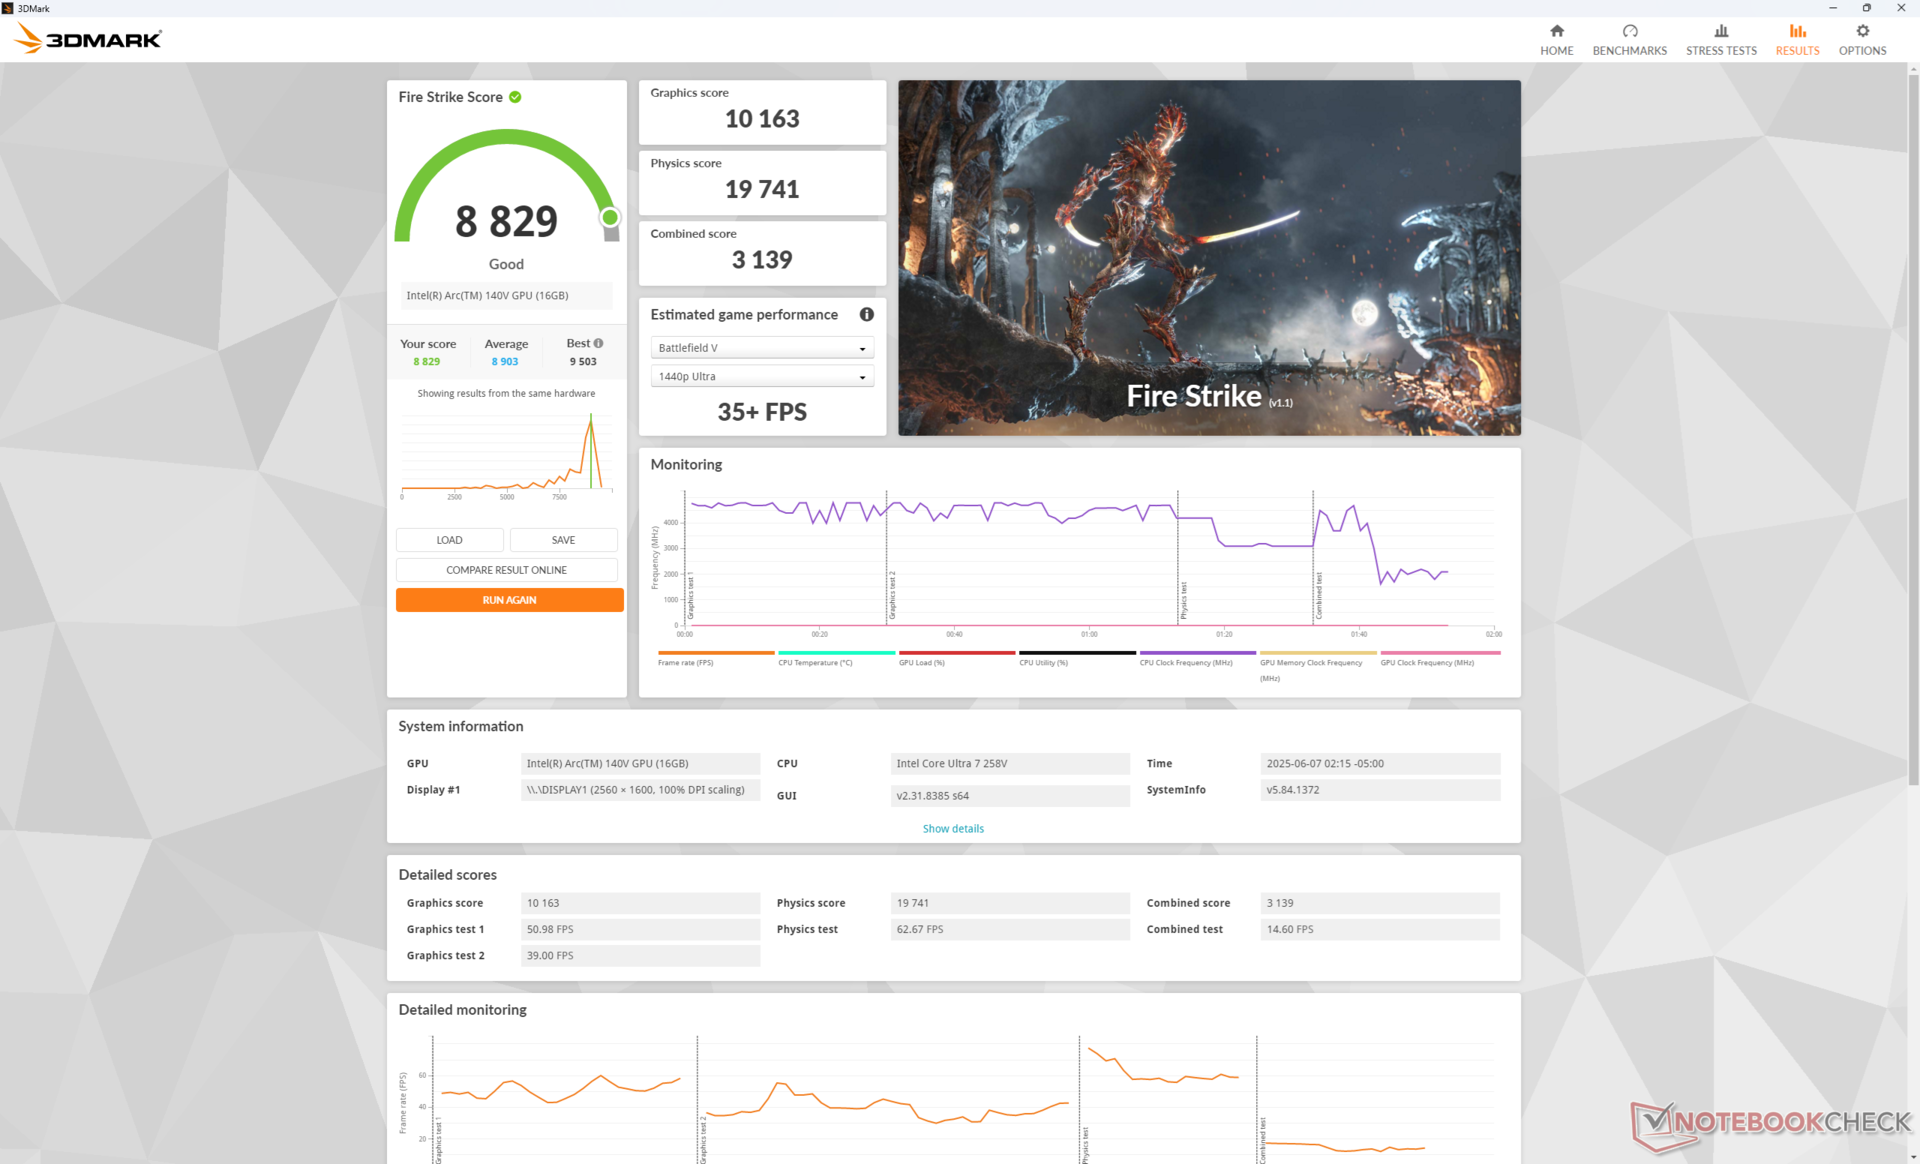
| Power Profile | Graphics Score | Physics Score | Combined Score |
| Performance Mode | 10163 | 19741 | 3139 |
| Balanced Mode | 8556 (-16%) | 16859 (-15%) | 2576 (-18%) |
| Battery Power | 9568 (-6%) | 16911 (-14%) | 2651 (-16%) |
Performance dips by roughly 15 percent if running on Balanced mode instead of Performance mode as shown by our Fire Strike results table above.
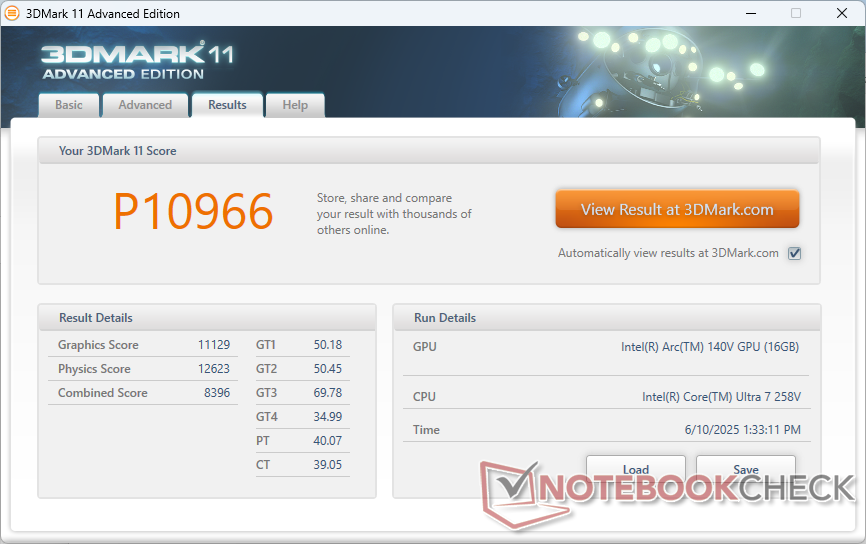
| 3DMark 11 Performance | 10966 points | |
| 3DMark Fire Strike Score | 8829 points | |
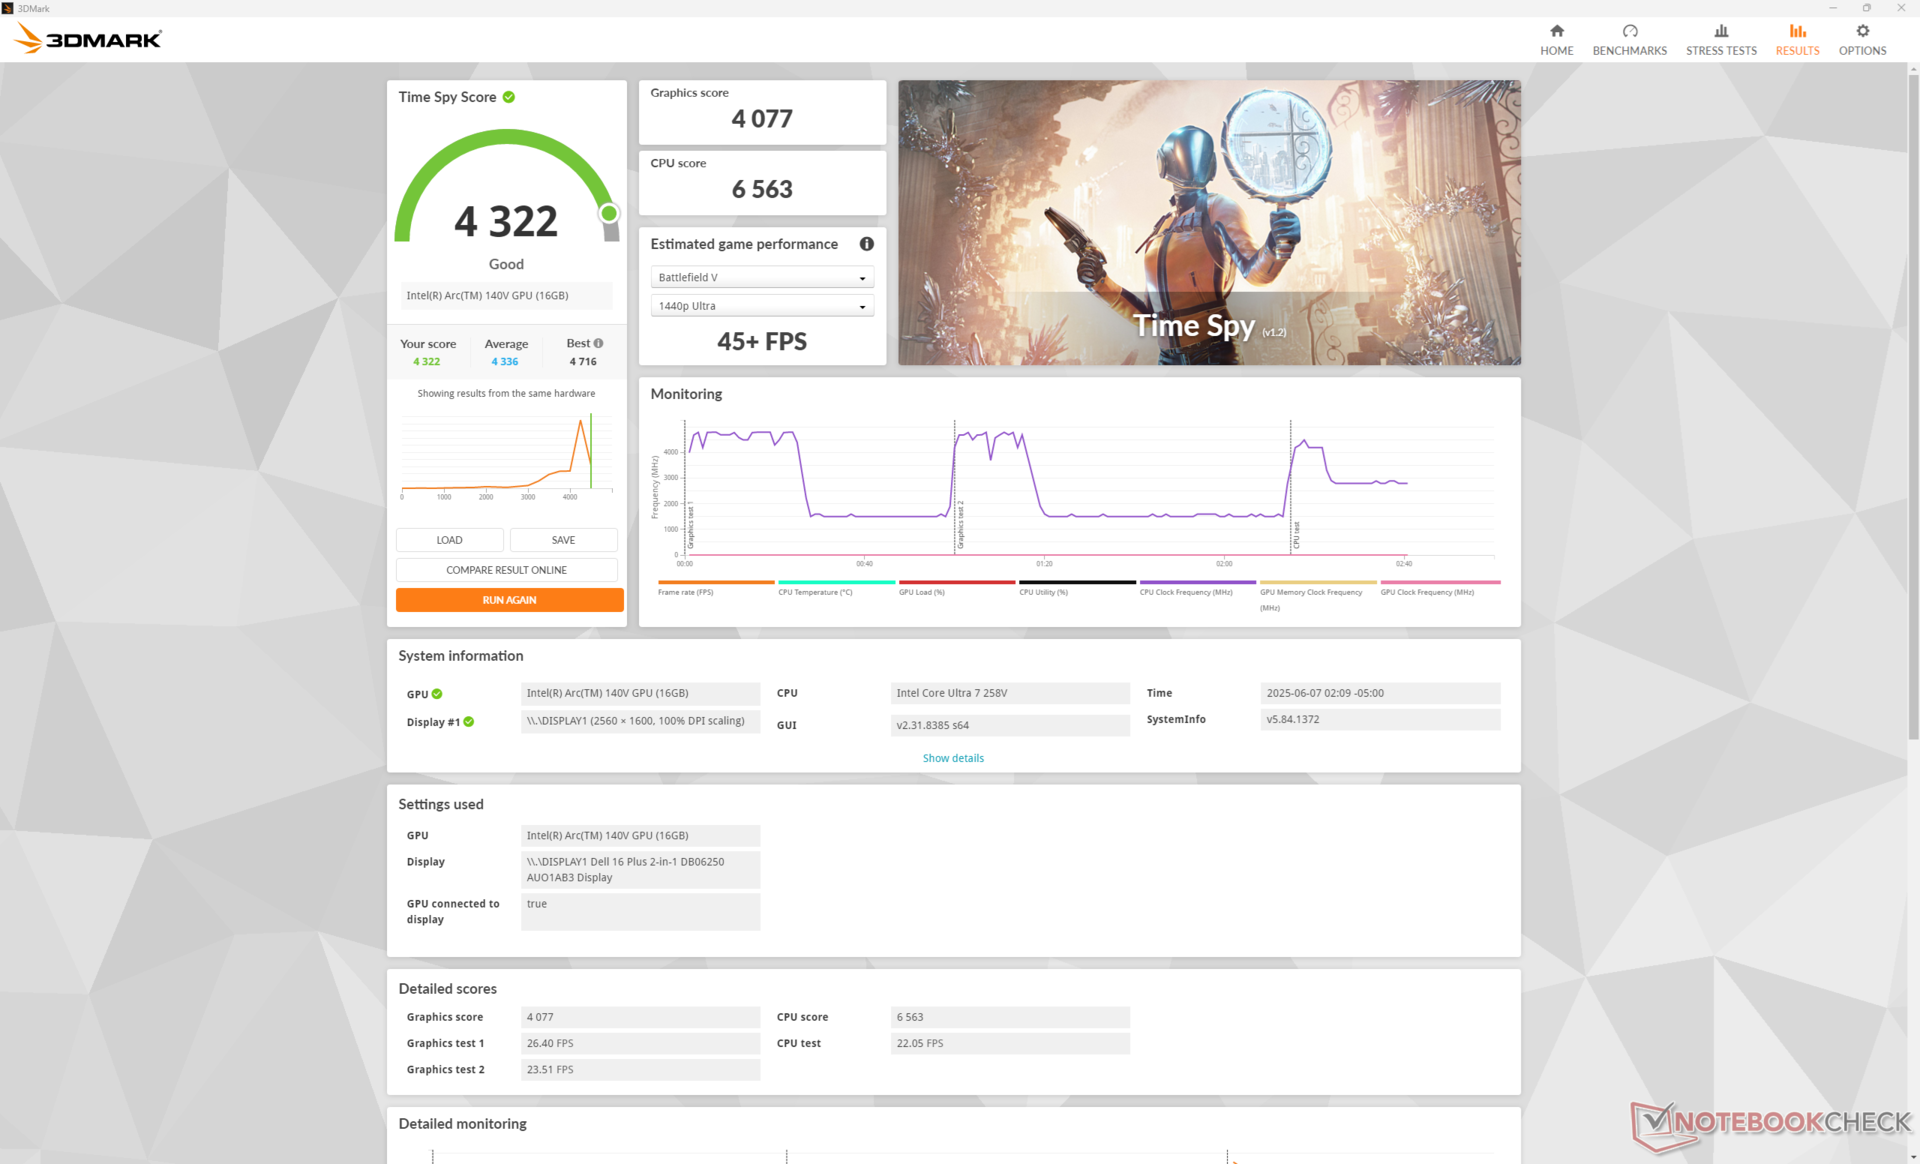
| 3DMark Time Spy Score | 4322 points | |
Help | ||
* ... smaller is better
| F1 24 | |
| 1920x1080 Low Preset AA:T AF:16x | |
| Lenovo Yoga 7 2-in-1 16ILL10 | |
| Dell 16 Plus 2-in-1 | |
| Average Intel Arc Graphics 140V (54 - 99, n=25) | |
| Lenovo ThinkPad T16 Gen 3 21MN005XGE | |
| 1920x1080 Medium Preset AA:T AF:16x | |
| Lenovo Yoga 7 2-in-1 16ILL10 | |
| Dell 16 Plus 2-in-1 | |
| Average Intel Arc Graphics 140V (49.2 - 88.2, n=24) | |
| Lenovo ThinkPad T16 Gen 3 21MN005XGE | |
| 1920x1080 High Preset AA:T AF:16x | |
| Dell 16 Plus 2-in-1 | |
| Lenovo Yoga 7 2-in-1 16ILL10 | |
| Average Intel Arc Graphics 140V (34.4 - 66.4, n=27) | |
| Lenovo ThinkPad T16 Gen 3 21MN005XGE | |
| 1920x1080 Ultra High Preset AA:T AF:16x | |
| Lenovo Yoga 7 2-in-1 16ILL10 | |
| Dell 16 Plus 2-in-1 | |
| Average Intel Arc Graphics 140V (14.6 - 22, n=25) | |
| Lenovo ThinkPad T16 Gen 3 21MN005XGE | |
Cyberpunk 2077 ultra FPS Chart
| low | med. | high | ultra | |
|---|---|---|---|---|
| Dota 2 Reborn (2015) | 105.1 | 88.2 | 87.7 | 86 |
| Final Fantasy XV Benchmark (2018) | 83.5 | 48.2 | 35.4 | |
| X-Plane 11.11 (2018) | 46.7 | 37.9 | 31.2 | |
| Strange Brigade (2018) | 228 | 70 | 61 | 54.7 |
| Baldur's Gate 3 (2023) | 42.4 | 35.4 | 31.4 | 31 |
| Cyberpunk 2077 (2023) | 47.7 | 38.8 | 32.9 | 29 |
| F1 24 (2024) | 84.4 | 77.4 | 60.4 | 19.7 |
Emissions
System Noise
Fan noise floor and ceiling are essentially unchanged from what we observed on last year's model despite the CPU and iGPU performance differences. However, the fan in the Dell 16 Plus 2-in-1 is more slow to react to onscreen loads and so the system can remain quieter for longer before higher RPMs are needed.
Noise level
| Idle |
| 23 / 23 / 24.7 dB(A) |
| Load |
| 32.5 / 45.6 dB(A) |
 | ||
30 dB silent 40 dB(A) audible 50 dB(A) loud |
||
min: | ||
| Dell 16 Plus 2-in-1 Arc 140V, Core Ultra 7 258V, Samsung BM9C1 1024GB | Dell Inspiron 16 7640 2-in-1 Arc 8-Core, Ultra 7 155H, Micron 2550 1TB | Lenovo Yoga 7 2-in-1 16ILL10 Arc 140V, Core Ultra 7 256V, WD PC SN7100S SDFPMSL-512G-1101 | Samsung Galaxy Book5 Pro 360 Arc 130V, Core Ultra 5 226V, Samsung PM9B1 512GB MZVL4512HBLU | MSI Summit A16 AI Plus A3HMTG Radeon 880M, Ryzen AI 9 365, Samsung PM9C1 MZVL81T0HELB-00BTW | HP Envy x360 2-in-1 16-ad0097nr Radeon 780M, R7 8840HS, KIOXIA BG5 KBG50ZNV1T02 | |
|---|---|---|---|---|---|---|
| Noise | -6% | -3% | 3% | -12% | 7% | |
| off / environment * (dB) | 23.2 | 22.9 1% | 23.3 -0% | 23.6 -2% | 23.8 -3% | 22.9 1% |
| Idle Minimum * (dB) | 23 | 22.9 -0% | 23.3 -1% | 23.6 -3% | 25 -9% | 23 -0% |
| Idle Average * (dB) | 23 | 22.9 -0% | 23.3 -1% | 23.6 -3% | 25 -9% | 23 -0% |
| Idle Maximum * (dB) | 24.7 | 25 -1% | 25.7 -4% | 23.6 4% | 29.5 -19% | 23 7% |
| Load Average * (dB) | 32.5 | 45.1 -39% | 40.2 -24% | 29.4 10% | 37.5 -15% | 23.8 27% |
| Cyberpunk 2077 ultra * (dB) | 42.6 | 44.9 -5% | 41.6 2% | 40.6 5% | 46.5 -9% | |
| Load Maximum * (dB) | 45.6 | 44.9 2% | 41.6 9% | 40.6 11% | 56.1 -23% | 43.8 4% |
| Witcher 3 ultra * (dB) | 43.8 |
* ... smaller is better
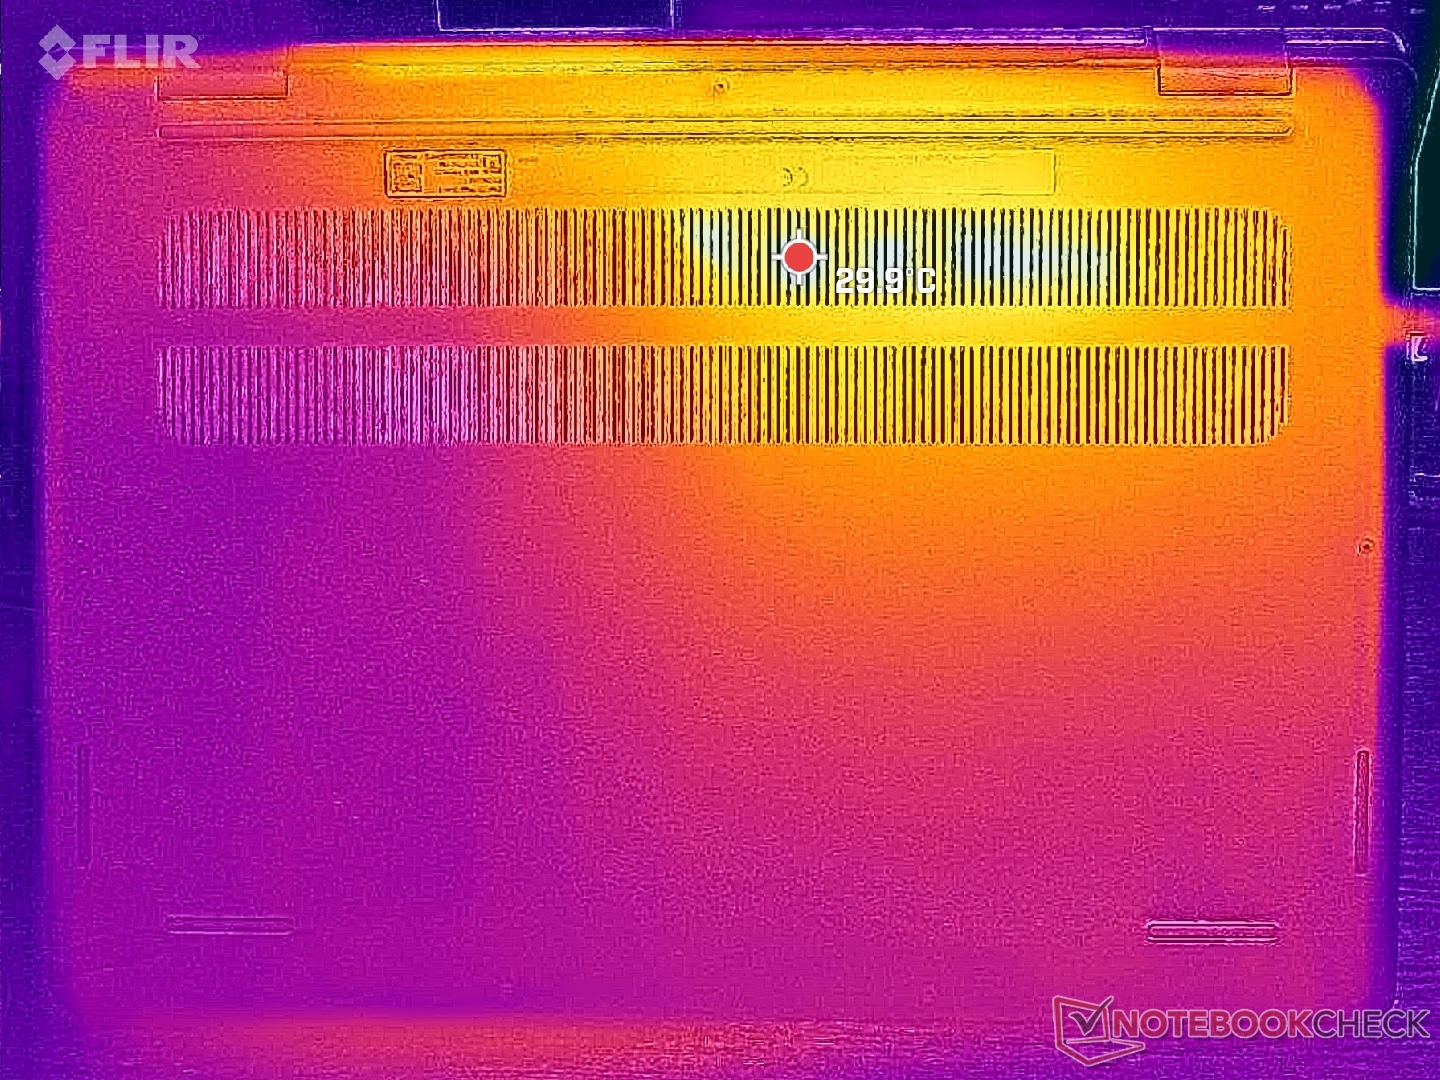
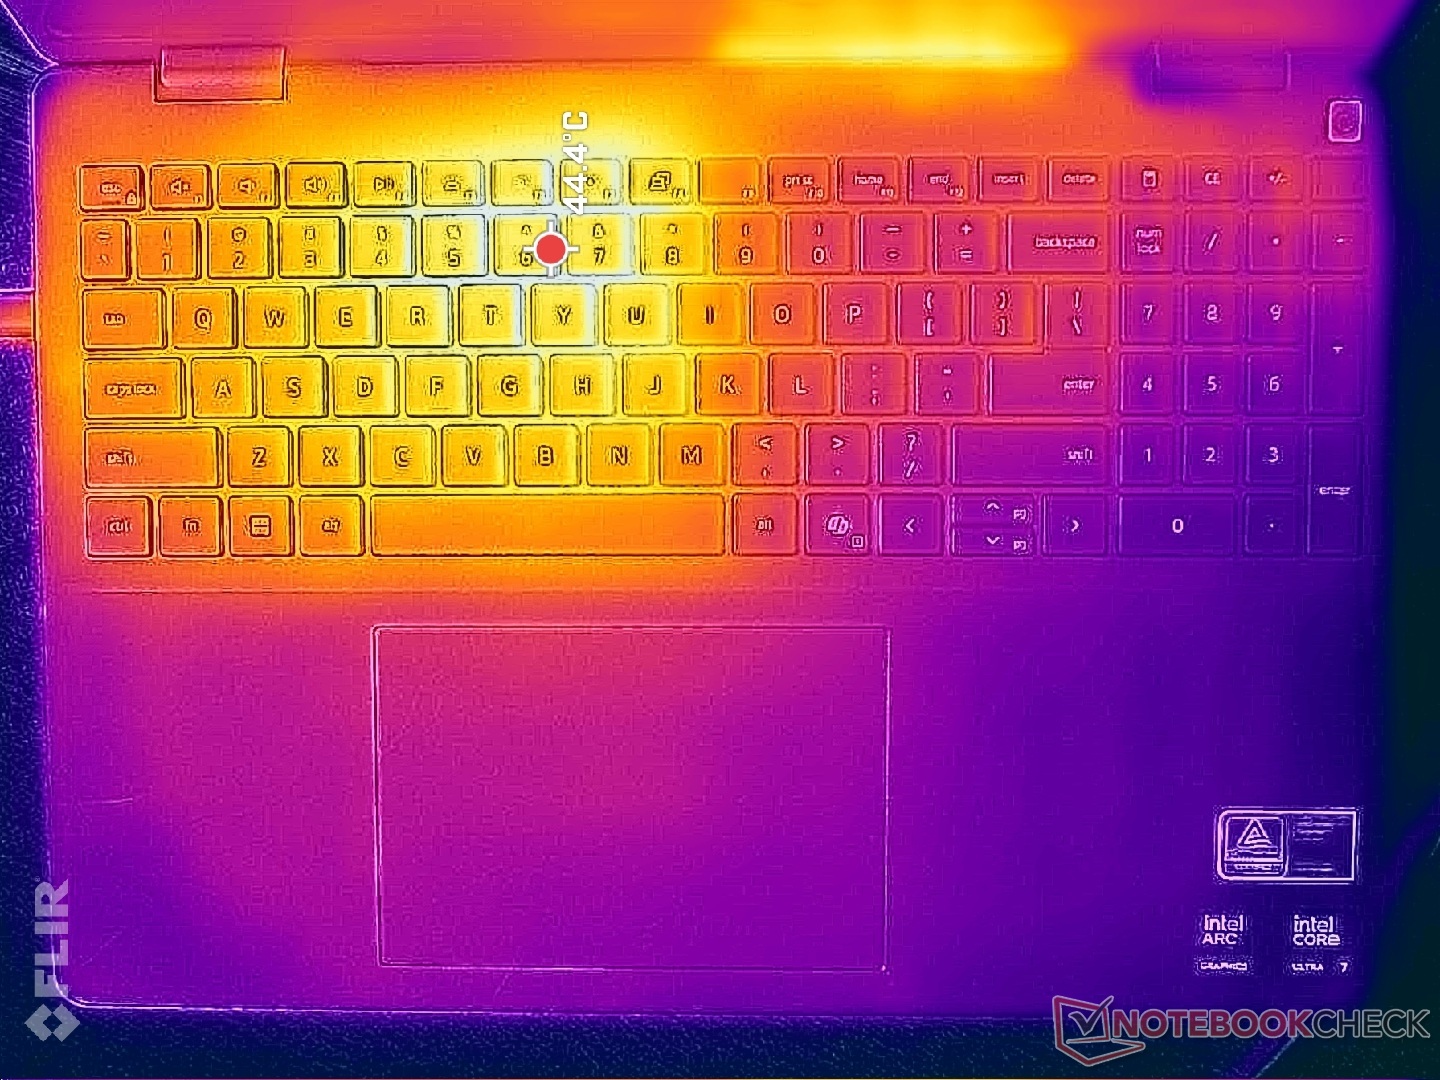
Temperature
Surface temperature hot spots can reach just over 44 C and 39 C on the keyboard deck and bottom panel, respectively, which is just slightly warmer than what we recorded on the competing Lenovo Yoga 7 2-in-1 16ILL10.
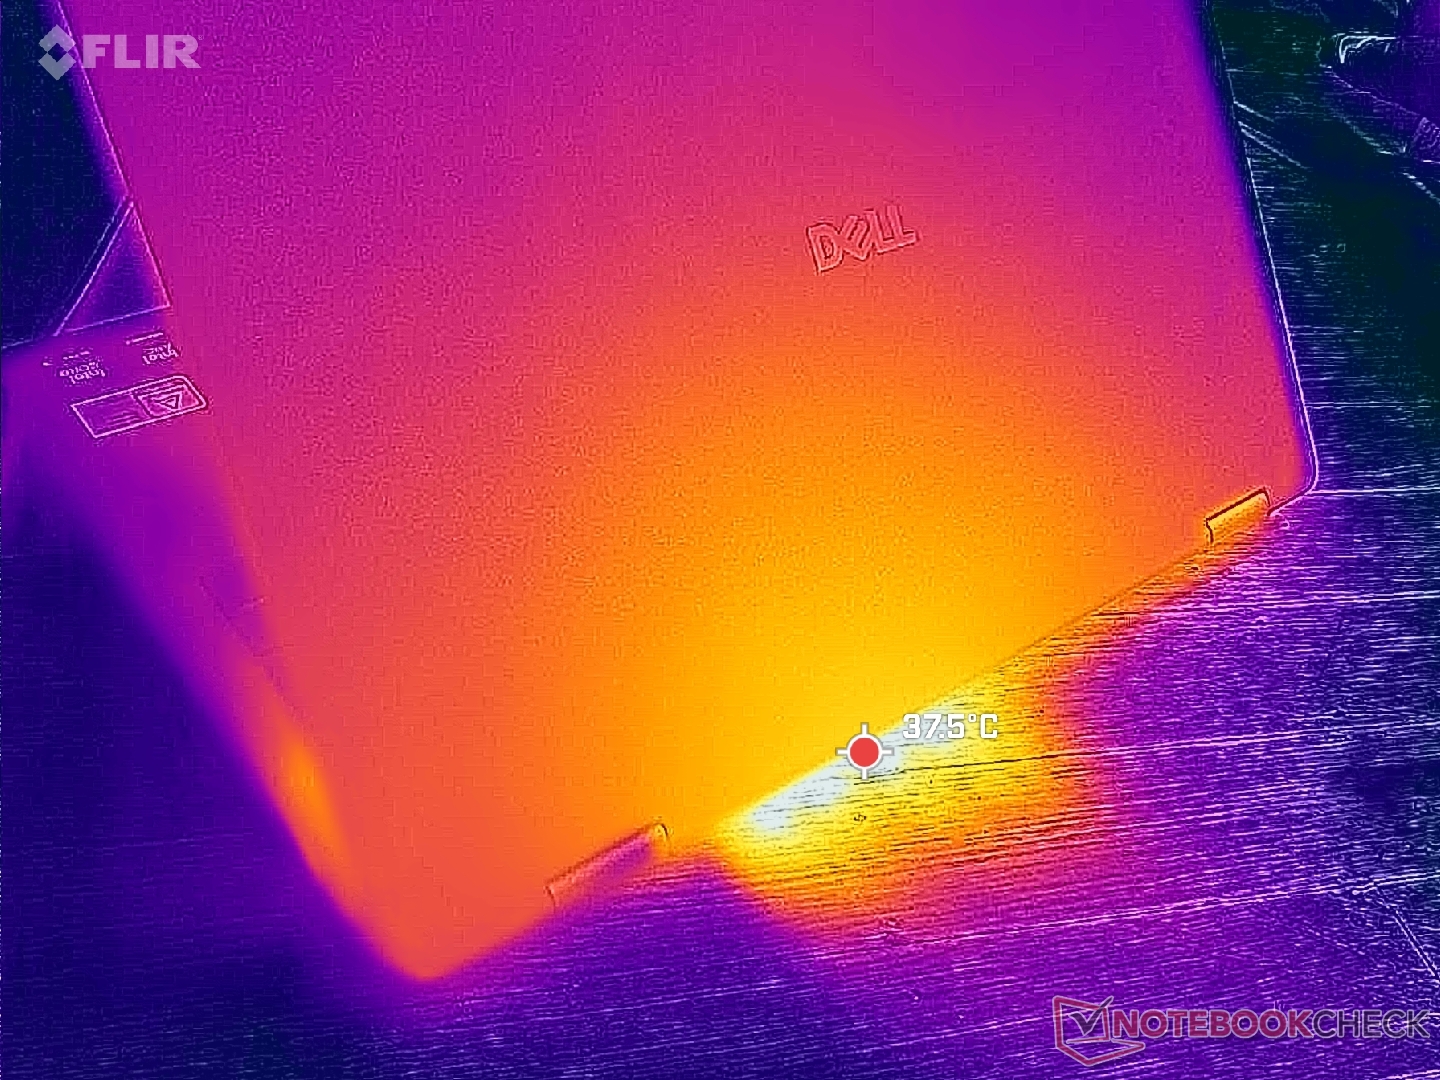

(±) The maximum temperature on the upper side is 44 °C / 111 F, compared to the average of 35.4 °C / 96 F, ranging from 19.6 to 60 °C for the class Convertible.
(+) The bottom heats up to a maximum of 39.4 °C / 103 F, compared to the average of 36.9 °C / 98 F
(+) In idle usage, the average temperature for the upper side is 28.7 °C / 84 F, compared to the device average of 30.3 °C / 87 F.
(+) The palmrests and touchpad are cooler than skin temperature with a maximum of 26.8 °C / 80.2 F and are therefore cool to the touch.
(±) The average temperature of the palmrest area of similar devices was 28 °C / 82.4 F (+1.2 °C / 2.2 F).


| Dell 16 Plus 2-in-1 Intel Core Ultra 7 258V, Intel Arc Graphics 140V | Dell Inspiron 16 7640 2-in-1 Intel Core Ultra 7 155H, Intel Arc 8-Core iGPU | Lenovo Yoga 7 2-in-1 16ILL10 Intel Core Ultra 7 256V, Intel Arc Graphics 140V | Samsung Galaxy Book5 Pro 360 Intel Core Ultra 5 226V, Intel Arc Graphics 130V | MSI Summit A16 AI Plus A3HMTG AMD Ryzen AI 9 365, AMD Radeon 880M | HP Envy x360 2-in-1 16-ad0097nr AMD Ryzen 7 8840HS, AMD Radeon 780M | |
|---|---|---|---|---|---|---|
| Heat | -4% | 12% | 12% | -3% | 4% | |
| Maximum Upper Side * (°C) | 44 | 46.8 -6% | 42.6 3% | 40.9 7% | 52.8 -20% | 42.6 3% |
| Maximum Bottom * (°C) | 39.4 | 45.6 -16% | 36.8 7% | 45.1 -14% | 42 -7% | 47.8 -21% |
| Idle Upper Side * (°C) | 31.8 | 32.2 -1% | 26.4 17% | 23.8 25% | 30.6 4% | 27.4 14% |
| Idle Bottom * (°C) | 34.2 | 31.4 8% | 26.6 22% | 23.5 31% | 29.6 13% | 27.8 19% |
* ... smaller is better
Stress Test
When initiating Prime95 stress, the CPU would boost to 3.4 GHz and 38 W until hitting 93 C several seconds later. Thereafter, performance would drop to 2.5 GHz and 22 W in order to maintain a cooler core temperature of 72 C. This is cooler by almost 15 C when compared to the Inspiron 16 7640 2-in-1 under similar conditions, but keep in mind that the Dell 16 Plus 2-in-1 ships with a slower processor as well.
Core temperature when running Cyberpunk 2077 to represent typical gaming loads would also be significantly cooler than on last year's Inspiron while offering better gaming performance.
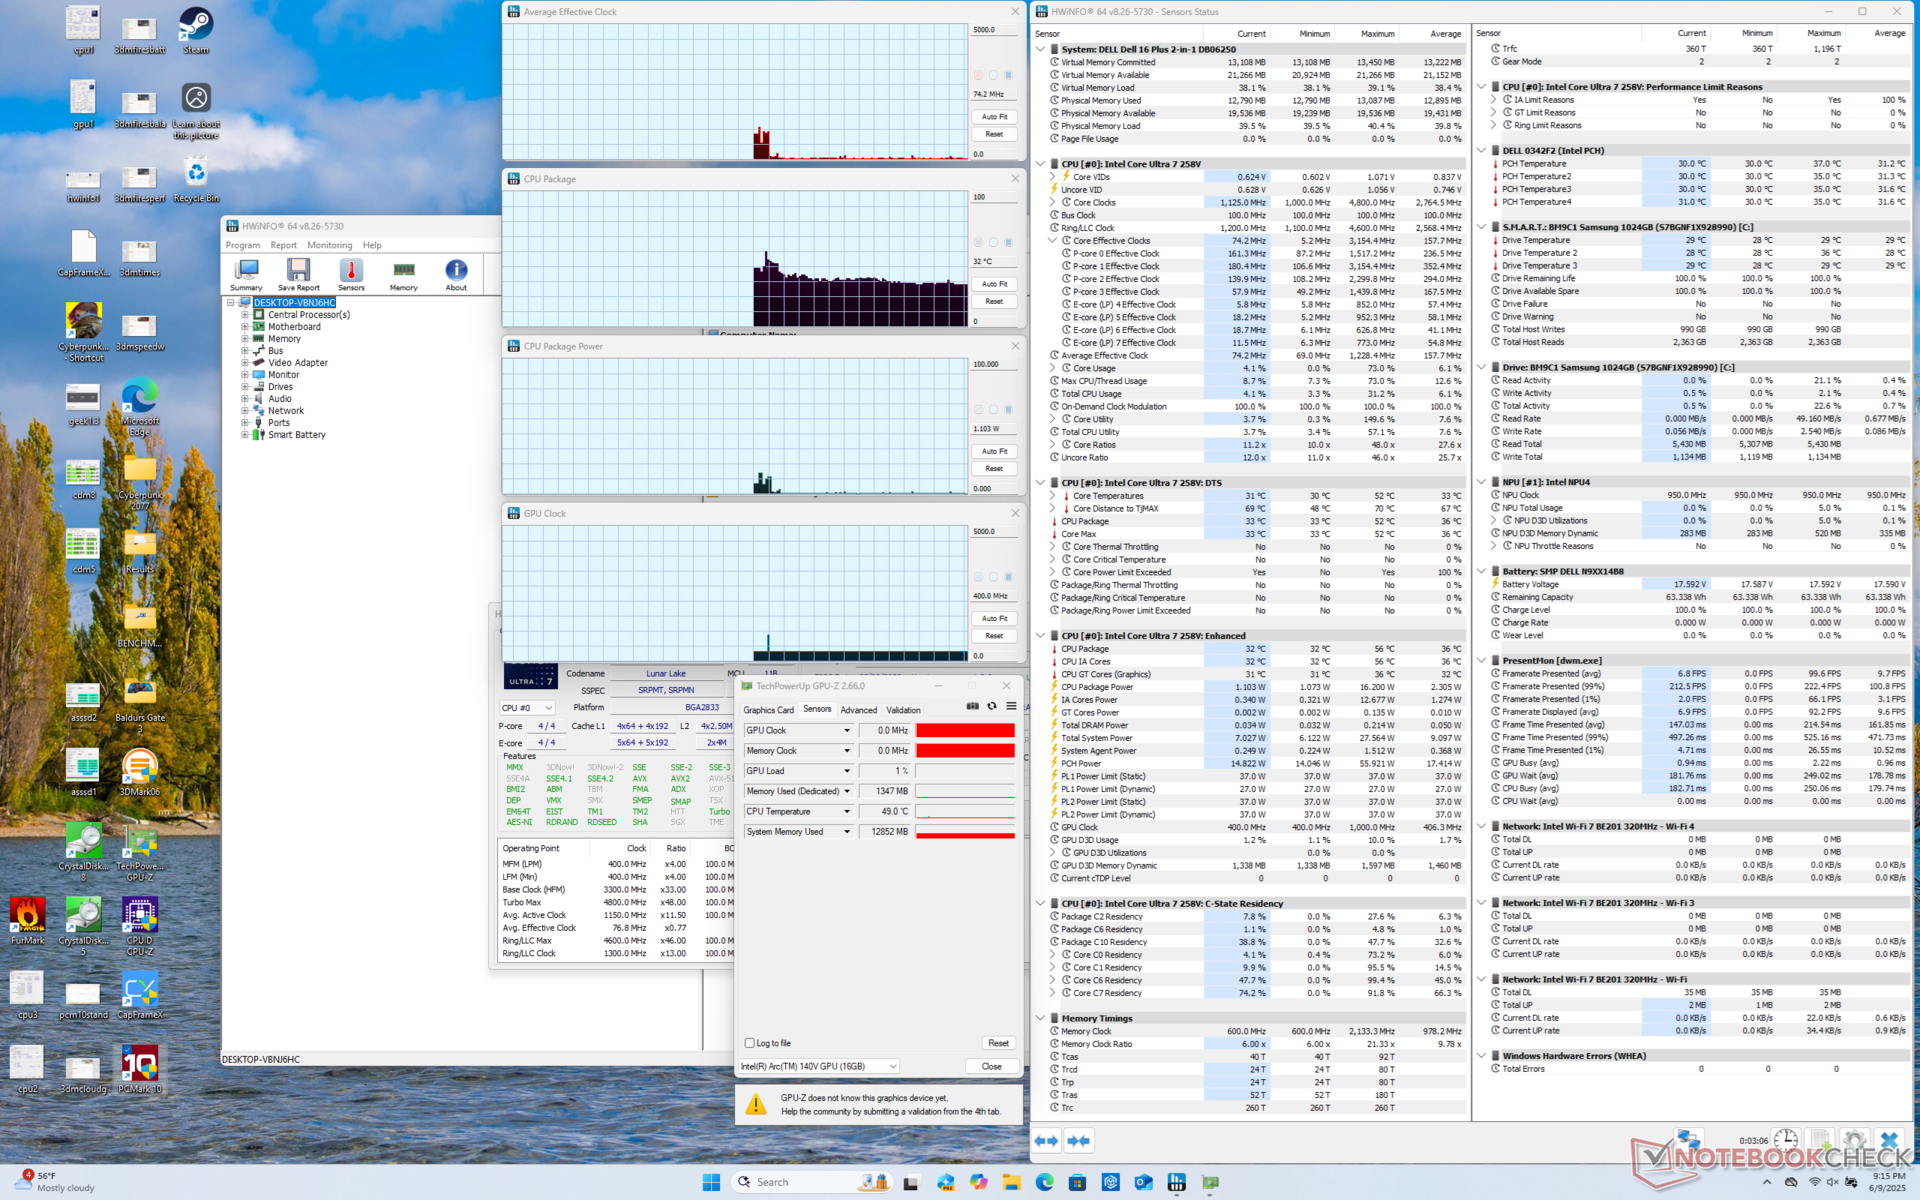
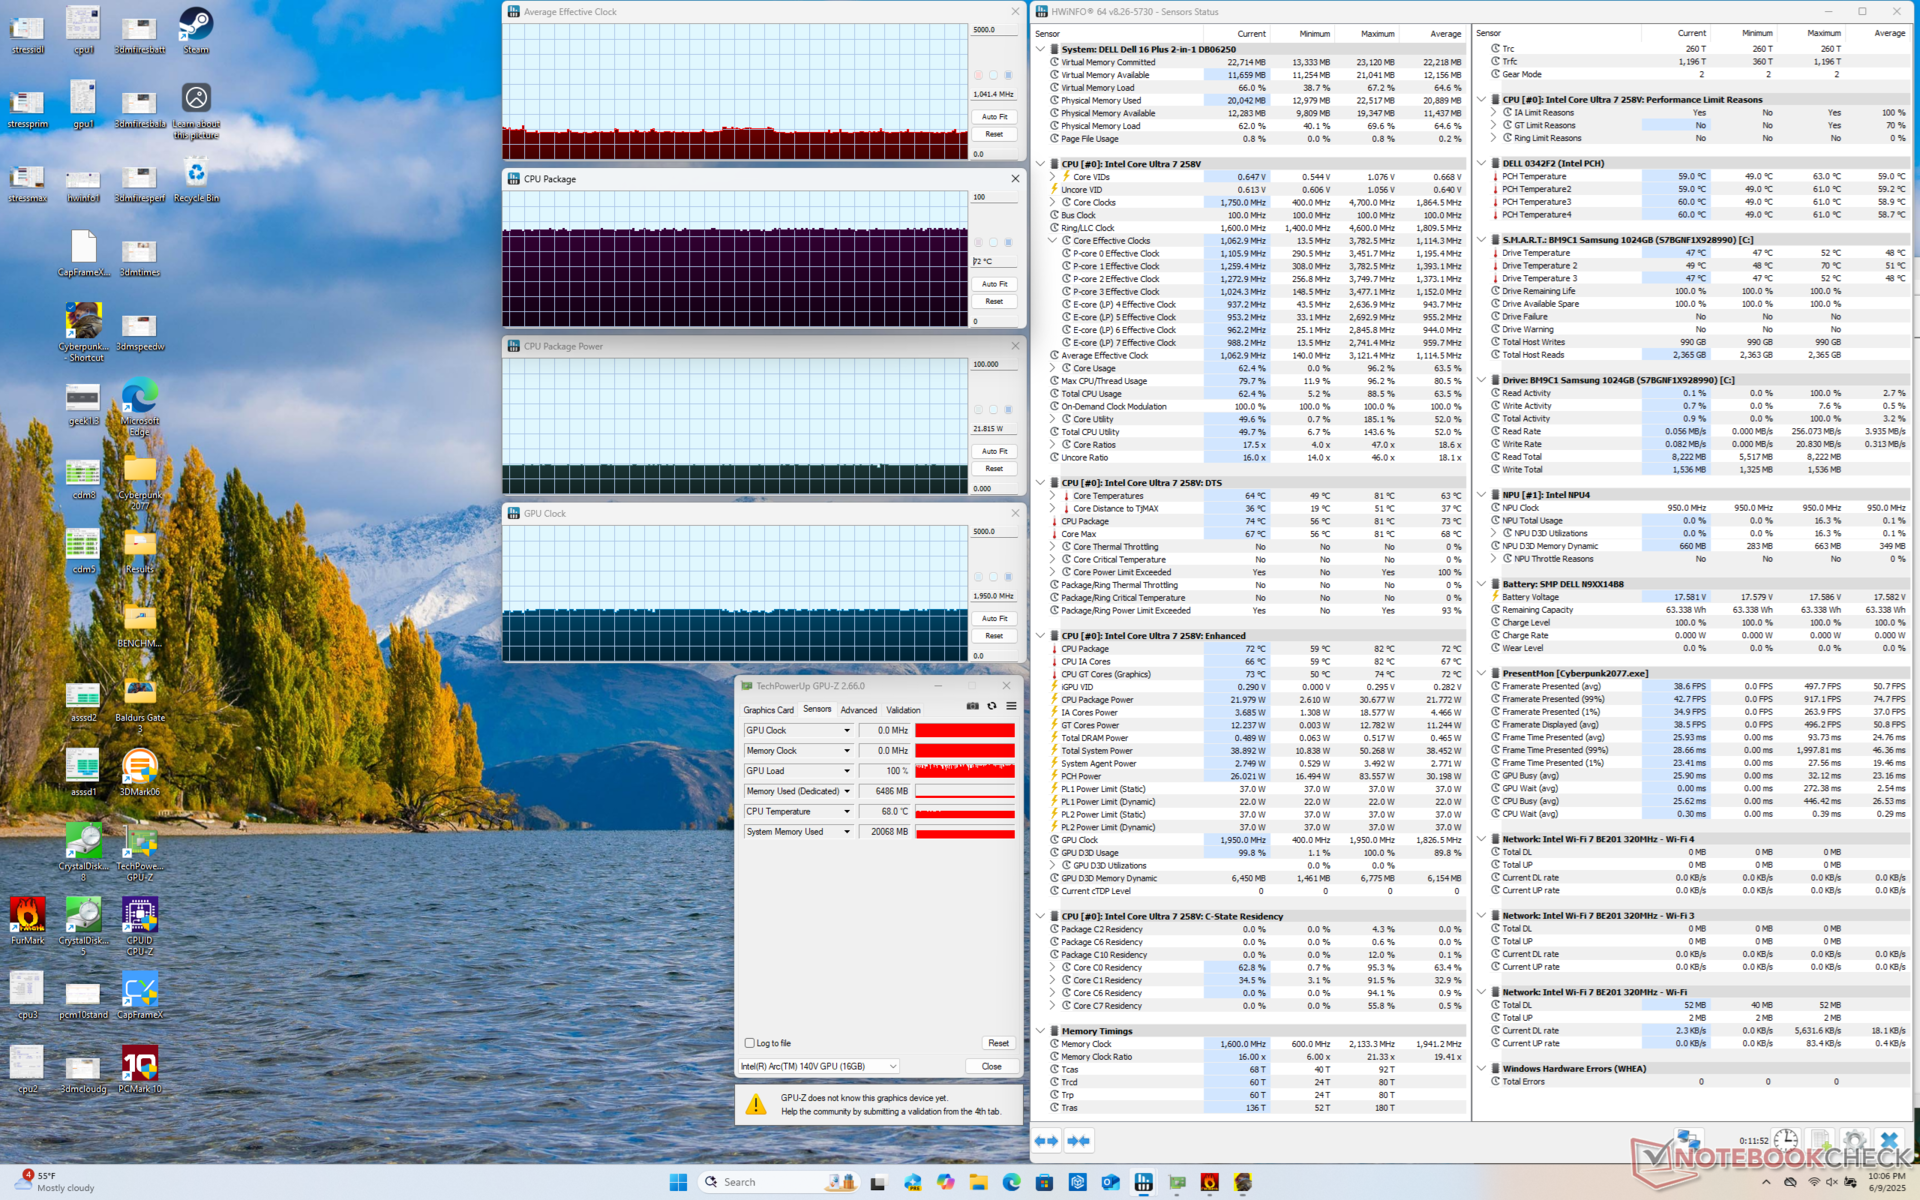
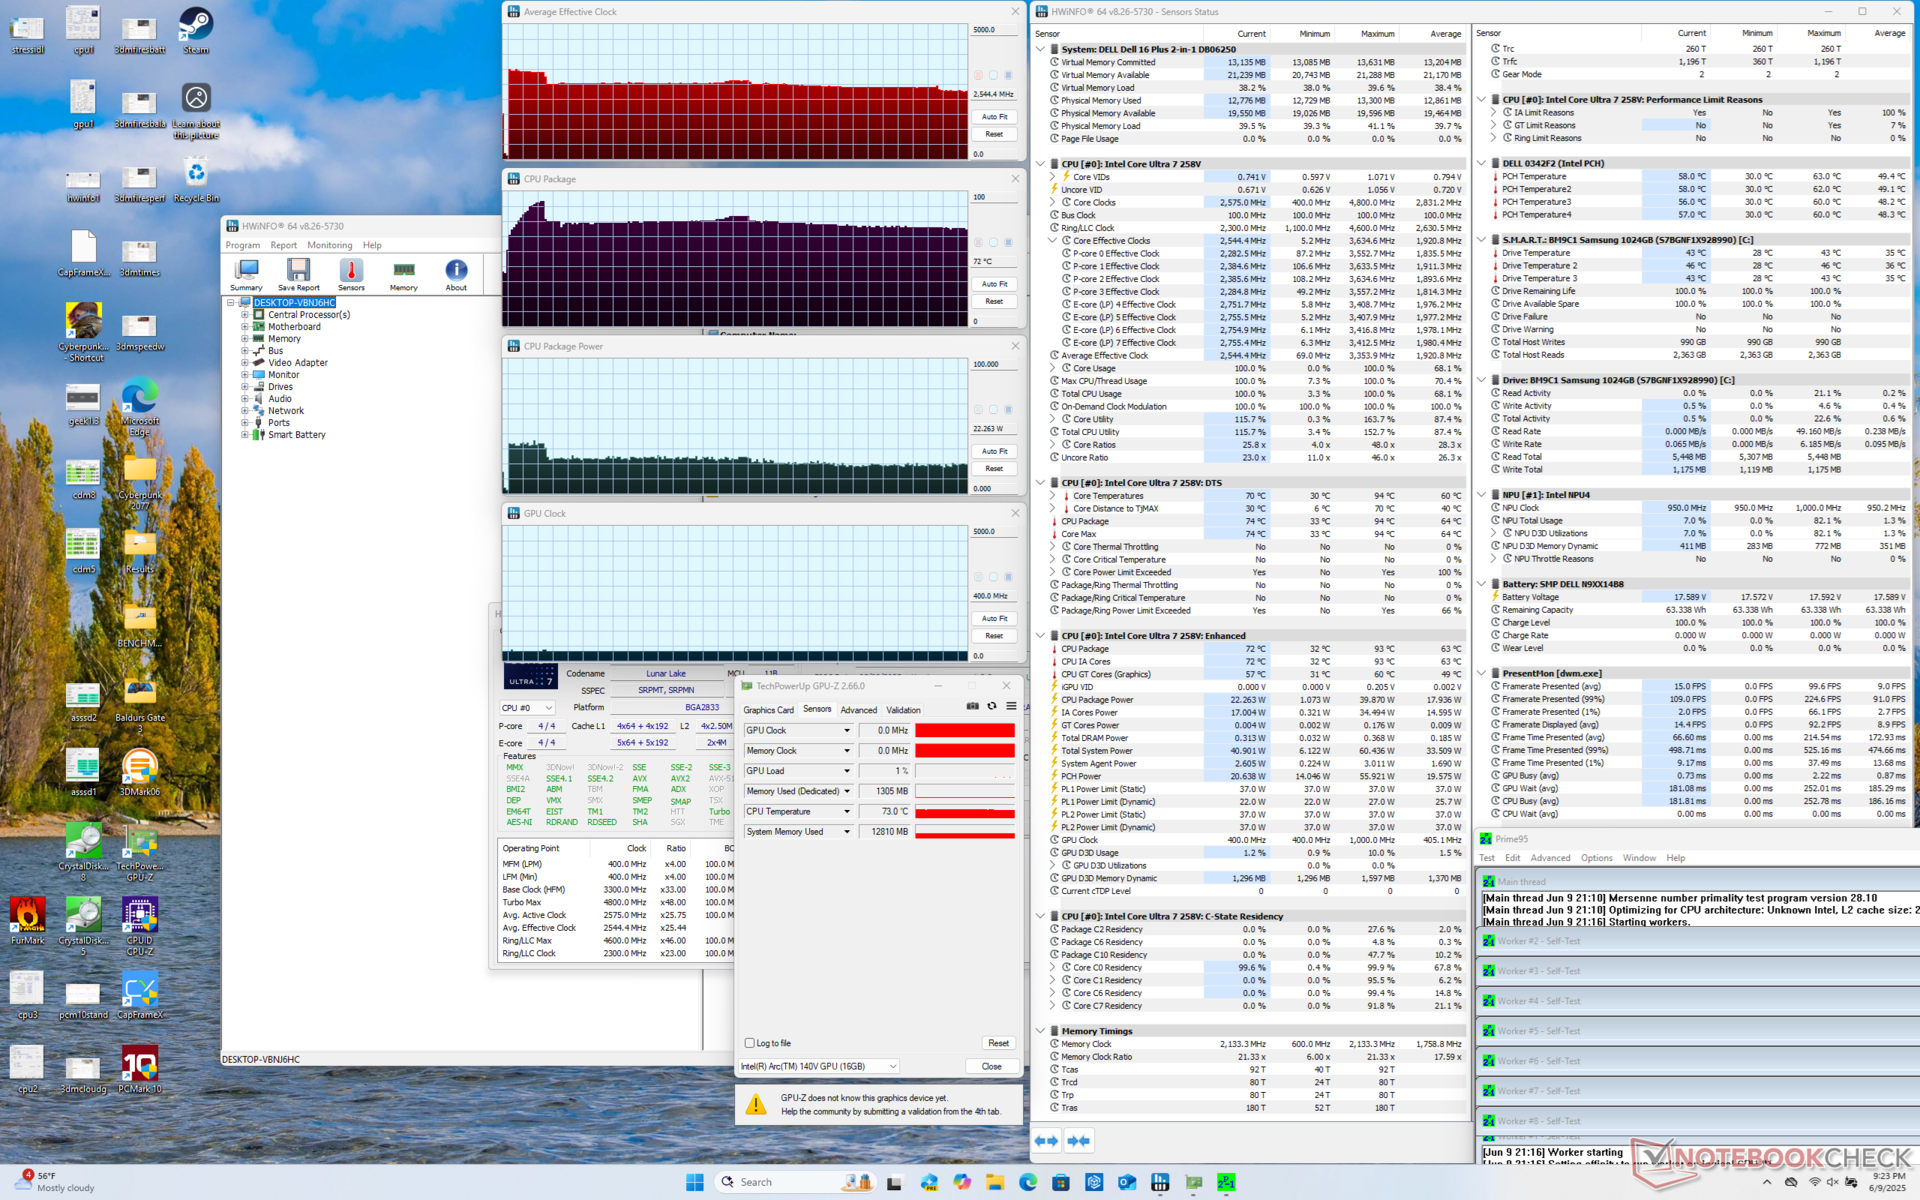
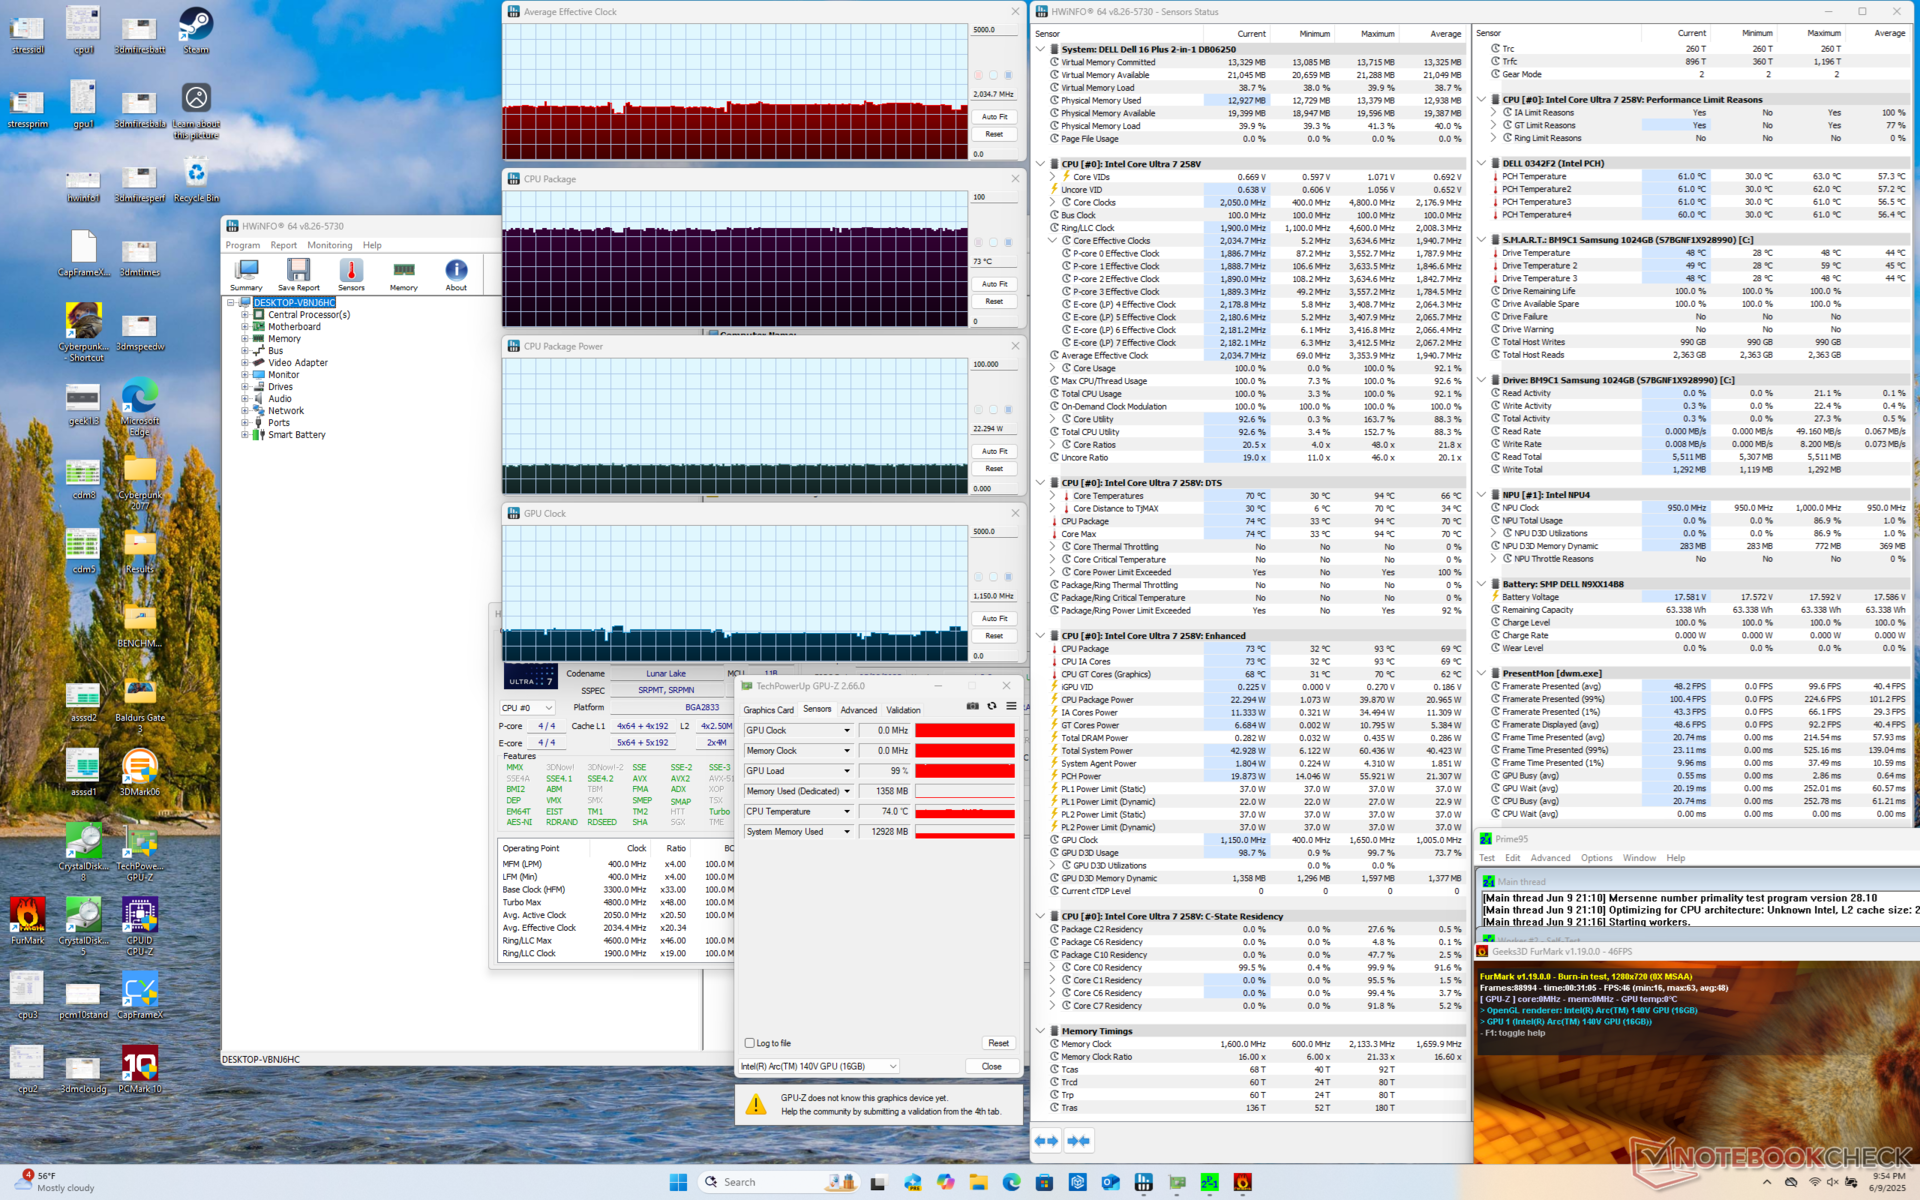
| Average CPU Clock (GHz) | GPU Clock (MHz) | Average CPU Temperature (°C) | |
| System Idle | -- | -- | 32 |
| Prime95 Stress | 2.5 | 400 | 72 |
| Prime95 + FurMark Stress | 2.0 | 1150 | 73 |
| Cyberpunk 2077 Stress | 1.0 | 1950 | 72 |
Speakers
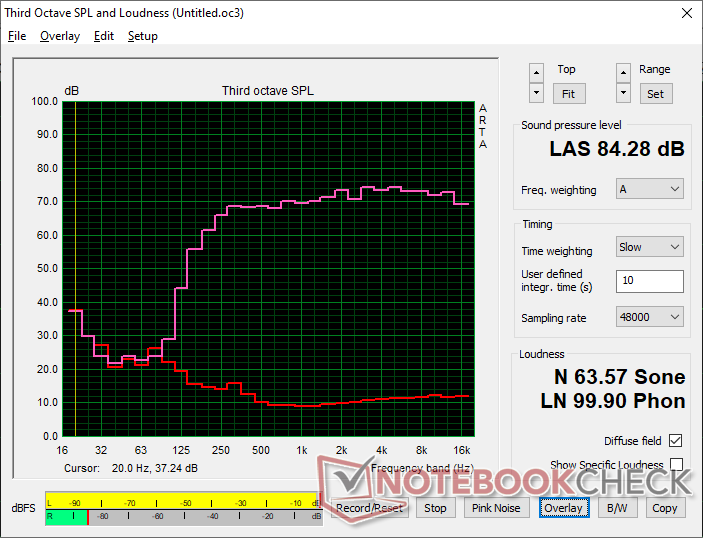
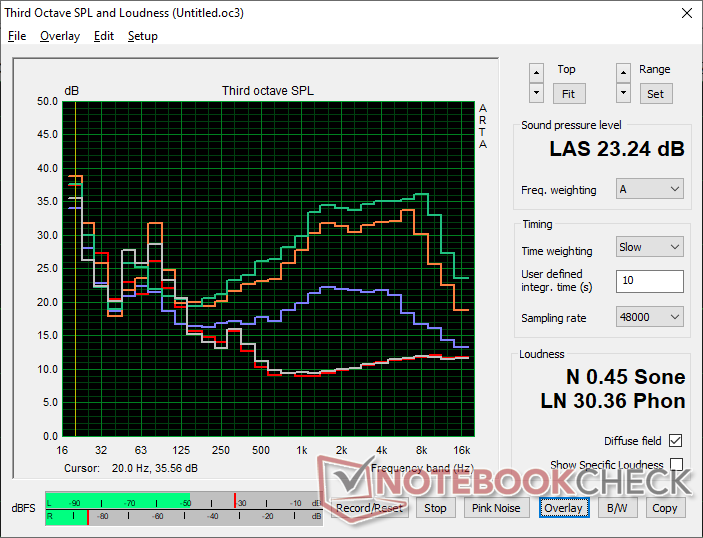
Dell 16 Plus 2-in-1 audio analysis
(+) | speakers can play relatively loud (82.5 dB)
Bass 100 - 315 Hz
(-) | nearly no bass - on average 16.2% lower than median
(±) | linearity of bass is average (12.1% delta to prev. frequency)
Mids 400 - 2000 Hz
(+) | balanced mids - only 0.8% away from median
(+) | mids are linear (1.8% delta to prev. frequency)
Highs 2 - 16 kHz
(+) | balanced highs - only 2.4% away from median
(+) | highs are linear (2.9% delta to prev. frequency)
Overall 100 - 16.000 Hz
(+) | overall sound is linear (10.5% difference to median)
Compared to same class
» 7% of all tested devices in this class were better, 2% similar, 91% worse
» The best had a delta of 6%, average was 20%, worst was 57%
Compared to all devices tested
» 5% of all tested devices were better, 1% similar, 93% worse
» The best had a delta of 4%, average was 24%, worst was 134%
Apple MacBook Pro 16 2021 M1 Pro audio analysis
(+) | speakers can play relatively loud (84.7 dB)
Bass 100 - 315 Hz
(+) | good bass - only 3.8% away from median
(+) | bass is linear (5.2% delta to prev. frequency)
Mids 400 - 2000 Hz
(+) | balanced mids - only 1.3% away from median
(+) | mids are linear (2.1% delta to prev. frequency)
Highs 2 - 16 kHz
(+) | balanced highs - only 1.9% away from median
(+) | highs are linear (2.7% delta to prev. frequency)
Overall 100 - 16.000 Hz
(+) | overall sound is linear (4.6% difference to median)
Compared to same class
» 0% of all tested devices in this class were better, 0% similar, 100% worse
» The best had a delta of 5%, average was 17%, worst was 45%
Compared to all devices tested
» 0% of all tested devices were better, 0% similar, 100% worse
» The best had a delta of 4%, average was 24%, worst was 134%
Energy Management
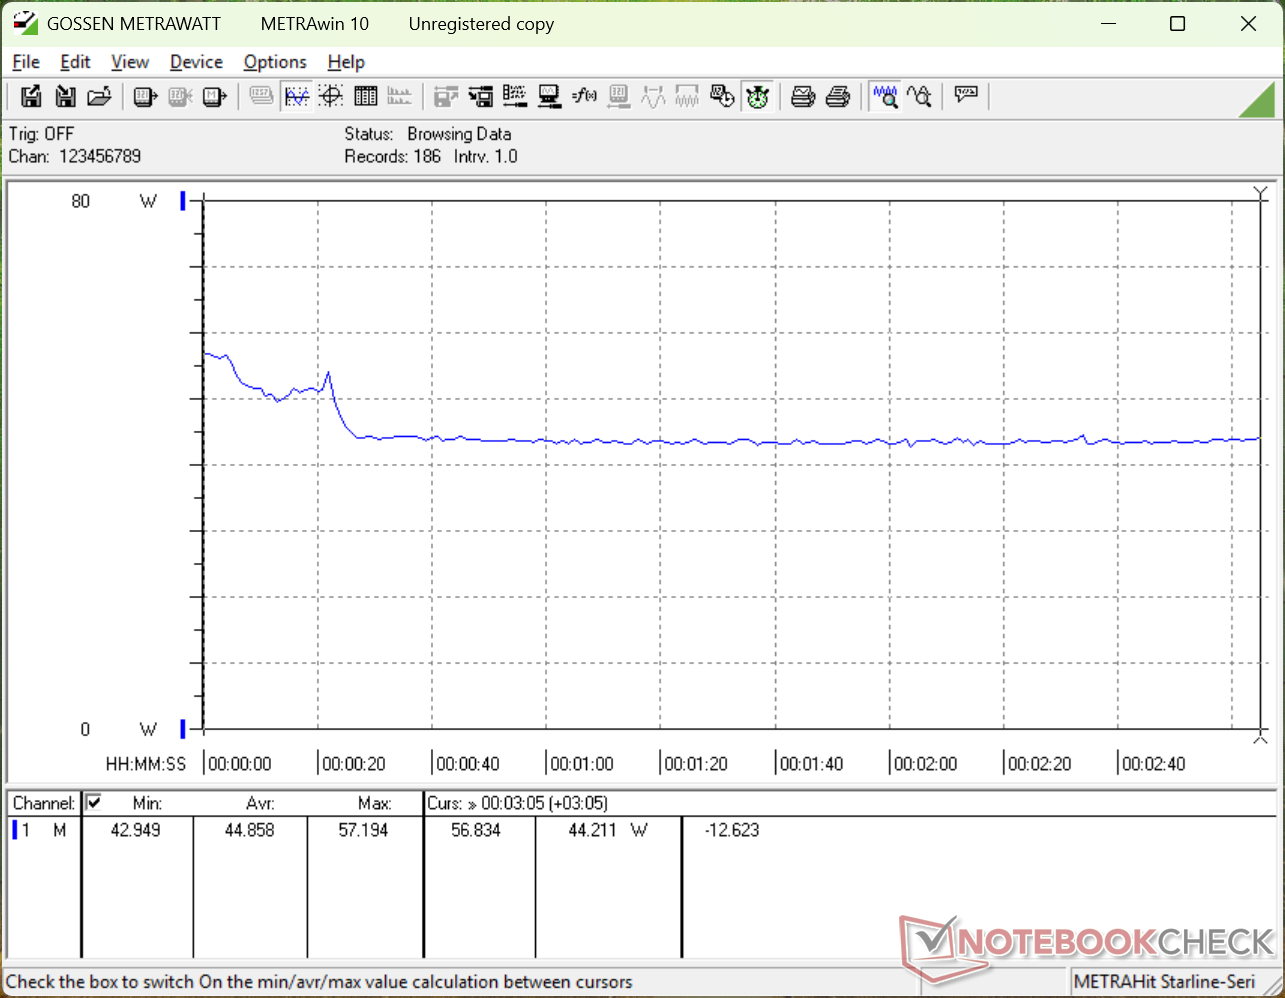
Power Consumption
Consumption when idling is similar to what we recorded on last year's Inspiron 16 7640 2-in-1 since they share more than a few similar components. When running more demanding loads, however, the Dell 16 Plus 2-in-1 requires much less power since the Core Ultra 7 258V is slower and more efficient than the Core Ultra 7 155H.
We're able to measure a maximum consumption of 67 W from the small (~11 x 5 x 2.8 cm) 65 W USB-C AC adapter.


| Off / Standby | |
| Idle | |
| Load |
|
Key:
min: | |
| Dell 16 Plus 2-in-1 Core Ultra 7 258V, Arc 140V, Samsung BM9C1 1024GB, Mini-LED, 2560x1600, 16" | Dell Inspiron 16 7640 2-in-1 Ultra 7 155H, Arc 8-Core, Micron 2550 1TB, Mini-LED, 2560x1600, 16" | Lenovo Yoga 7 2-in-1 16ILL10 Core Ultra 7 256V, Arc 140V, WD PC SN7100S SDFPMSL-512G-1101, IPS, 1920x1200, 16" | Samsung Galaxy Book5 Pro 360 Core Ultra 5 226V, Arc 130V, Samsung PM9B1 512GB MZVL4512HBLU, OLED, 2880x1800, 16" | MSI Summit A16 AI Plus A3HMTG Ryzen AI 9 365, Radeon 880M, Samsung PM9C1 MZVL81T0HELB-00BTW, IPS, 2560x1600, 16" | HP Envy x360 2-in-1 16-ad0097nr R7 8840HS, Radeon 780M, KIOXIA BG5 KBG50ZNV1T02, OLED, 2880x1800, 16" | |
|---|---|---|---|---|---|---|
| Power Consumption | -30% | 17% | 19% | -16% | 12% | |
| Idle Minimum * (Watt) | 7 | 6.1 13% | 4.2 40% | 5.3 24% | 5.4 23% | 5 29% |
| Idle Average * (Watt) | 13.2 | 13.5 -2% | 8.3 37% | 6.7 49% | 11 17% | 6.2 53% |
| Idle Maximum * (Watt) | 13.4 | 13.8 -3% | 9.5 29% | 7.3 46% | 11.2 16% | 14.7 -10% |
| Load Average * (Watt) | 43.9 | 63.6 -45% | 40.3 8% | 37.6 14% | 76.6 -74% | 49.9 -14% |
| Cyberpunk 2077 ultra external monitor * (Watt) | 40.7 | 64.6 -59% | 40.8 -0% | 42.8 -5% | 49.2 -21% | |
| Cyberpunk 2077 ultra * (Watt) | 44.9 | 67 -49% | 47.4 -6% | 44.6 1% | 61.1 -36% | |
| Load Maximum * (Watt) | 67.8 | 109.7 -62% | 59 13% | 64.1 5% | 91.8 -35% | 65 4% |
| Witcher 3 ultra * (Watt) | 54.5 |
* ... smaller is better
Power Consumption Cyberpunk / Stress Test
Power Consumption external Monitor
Battery Life
Battery capacity is smaller than on last year's Inspiron 16 7640 2-in-1 which negatively impacts WLAN runtime but just over two hours.
| Dell 16 Plus 2-in-1 Core Ultra 7 258V, Arc 140V, 64 Wh | Dell Inspiron 16 7640 2-in-1 Ultra 7 155H, Arc 8-Core, 90 Wh | Lenovo Yoga 7 2-in-1 16ILL10 Core Ultra 7 256V, Arc 140V, 70 Wh | Samsung Galaxy Book5 Pro 360 Core Ultra 5 226V, Arc 130V, 76 Wh | MSI Summit A16 AI Plus A3HMTG Ryzen AI 9 365, Radeon 880M, 82 Wh | HP Envy x360 2-in-1 16-ad0097nr R7 8840HS, Radeon 780M, 68 Wh | |
|---|---|---|---|---|---|---|
| Battery runtime | 28% | 125% | 21% | 2% | -13% | |
| WiFi v1.3 (h) | 8.9 | 11.4 28% | 20 125% | 10.8 21% | 9.1 2% | 7.7 -13% |
| Reader / Idle (h) | 21.8 | 15.6 | ||||
| Load (h) | 1.6 | 2.1 | 1.9 | |||
| H.264 (h) | 19.7 |
Notebookcheck Rating
Dell 16 Plus 2-in-1
- 06/14/2025 v8
Allen Ngo
 Total Sustainability Score:
 Potential Competitors in Comparison
Image | Model / Review | Price | Weight | Height | Display |
|---|---|---|---|---|---|
1. 83.5%  | Dell 16 Plus 2-in-1 Intel Core Ultra 7 258V ⎘ Intel Arc Graphics 140V ⎘ 32 GB Memory, 1024 GB SSD | Amazon: $1,149.99 List Price: 1500 USD | 2 kg | 16.99 mm | 16.00" 2560x1600 189 PPI Mini-LED |
2. 82.1%  | Dell Inspiron 16 7640 2-in-1 Intel Core Ultra 7 155H ⎘ Intel Arc 8-Core iGPU ⎘ 16 GB Memory, 1024 GB SSD | Amazon: List Price: 1000 USD | 2.1 kg | 18.99 mm | 16.00" 2560x1600 189 PPI Mini-LED |
3. 84.3%  | Lenovo Yoga 7 2-in-1 16ILL10 Intel Core Ultra 7 256V ⎘ Intel Arc Graphics 140V ⎘ 16 GB Memory, 512 GB SSD | Amazon: List Price: 1000 USD | 1.9 kg | 15.85 mm | 16.00" 1920x1200 142 PPI IPS |
4. 85.9%  | Samsung Galaxy Book5 Pro 360 Intel Core Ultra 5 226V ⎘ Intel Arc Graphics 130V ⎘ 16 GB Memory, 512 GB SSD | Amazon: List Price: 1799€ | 1.7 kg | 12.8 mm | 16.00" 2880x1800 212 PPI OLED |
5. 81.9%  | MSI Summit A16 AI Plus A3HMTG AMD Ryzen AI 9 365 ⎘ AMD Radeon 880M ⎘ 32 GB Memory, 1024 GB SSD | Amazon: List Price: 1600 USD | 2.1 kg | 16.85 mm | 16.00" 2560x1600 189 PPI IPS |
6. 87.2% v7 (old)  | HP Envy x360 2-in-1 16-ad0097nr AMD Ryzen 7 8840HS ⎘ AMD Radeon 780M ⎘ 16 GB Memory, 1024 GB SSD | Amazon: 1. $256.99 Replacement for HP Envy x360... 2. $135.99 LCDOLED Replacement for HP E... 3. $749.00 HP Envy 2-in-1 16" 2K Touch-... List Price: 1300 USD | 1.8 kg | 18.3 mm | 16.00" 2880x1800 212 PPI OLED |
Transparency
The selection of devices to be reviewed is made by our editorial team. The test sample was provided to the author as a loan by the manufacturer or retailer for the purpose of this review. The lender had no influence on this review, nor did the manufacturer receive a copy of this review before publication. There was no obligation to publish this review. As an independent media company, Notebookcheck is not subjected to the authority of manufacturers, retailers or publishers.
This is how Notebookcheck is testing
Every year, Notebookcheck independently reviews hundreds of laptops and smartphones using standardized procedures to ensure that all results are comparable. We have continuously developed our test methods for around 20 years and set industry standards in the process. In our test labs, high-quality measuring equipment is utilized by experienced technicians and editors. These tests involve a multi-stage validation process. Our complex rating system is based on hundreds of well-founded measurements and benchmarks, which maintains objectivity. Further information on our test methods can be found here.
