HP Envy x360 2-in-1 16 review: Ryzen 7 8840HS beats Core Ultra 7 155U

The Envy series is HP's midrange family sitting in between the less expensive Pavilion series and pricier flagship Spectre series. In this case, the new Envy x360 16 can be seen as the affordable version of the Spectre x360 16 but with stronger options and more luxurious features than the Pavilion x360 15.
Our test unit in review comes with the AMD Ryzen 7 8840HS CPU, integrated Radeon 780M graphics, and 120 Hz 1800p OLED touchscreen for approximately $1300 USD retail. Intel versions are also available with the 14th gen Core Ultra 5 125U or Ultra 7 155U and 1200p IPS touchscreen, but all configurations come with integrated graphics only. This latest Envy x360 16 design effectively replaces last year's Envy x360 15.
Competitors include other 16-inch multimedia laptops like the Lenovo Yoga 7 2-in-1 16IML9, Samsung Galaxy Book4 Pro 360, or LG Gram 2-in-1 16.
More HP reviews:
Potential Competitors in Comparison
Rating | Date | Model | Weight | Height | Size | Resolution | Price |
|---|---|---|---|---|---|---|---|
| 87.2 % v7 (old) | 05 / 2024 | HP Envy x360 2-in-1 16-ad0097nr R7 8840HS, Radeon 780M | 1.8 kg | 18.3 mm | 16.00" | 2880x1800 | |
| 86.9 % v7 (old) | 09 / 2022 | HP Envy 16 h0112nr i7-12700H, GeForce RTX 3060 Laptop GPU | 2.3 kg | 19.8 mm | 16.00" | 3840x2400 | |
| 91.1 % v7 (old) | 03 / 2024 | HP Spectre x360 16 RTX 4050 Ultra 7 155H, GeForce RTX 4050 Laptop GPU | 2 kg | 19.8 mm | 16.00" | 2880x1800 | |
| 86.7 % v7 (old) | 04 / 2024 | Lenovo Yoga 7 2-in-1 16IML9 Ultra 5 125U, Graphics 4-Core iGPU (Arrow Lake) | 2.1 kg | 16.99 mm | 16.00" | 1920x1200 | |
| 87.8 % v7 (old) | 03 / 2024 | Samsung Galaxy Book4 Pro 360 Ultra 5 125H, Arc 7-Core | 1.7 kg | 13 mm | 16.00" | 2880x1800 | |
| 85.8 % v7 (old) | 11 / 2023 | LG Gram 2in1 16 16T90R - G.AA78G i7-1360P, Iris Xe G7 96EUs | 1.5 kg | 17.2 mm | 16.00" | 2560x1600 |
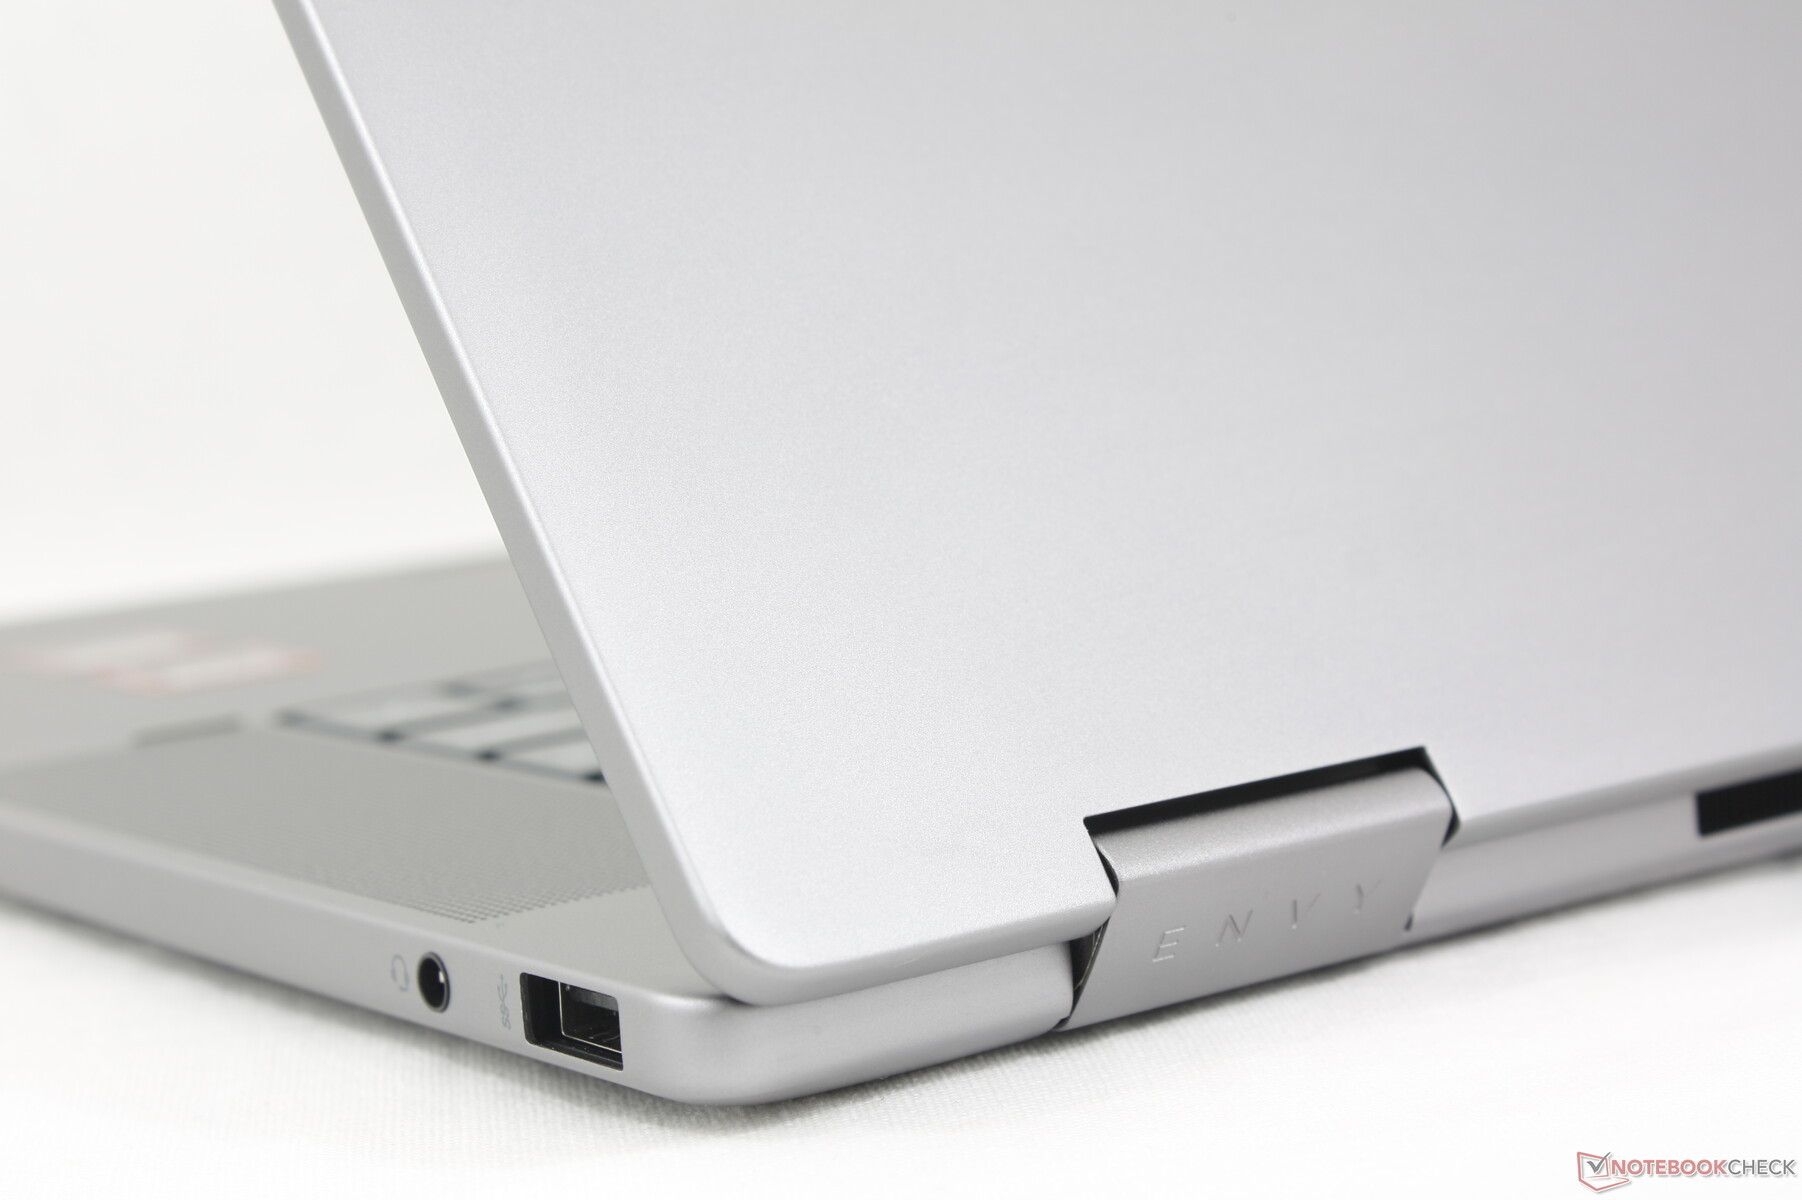
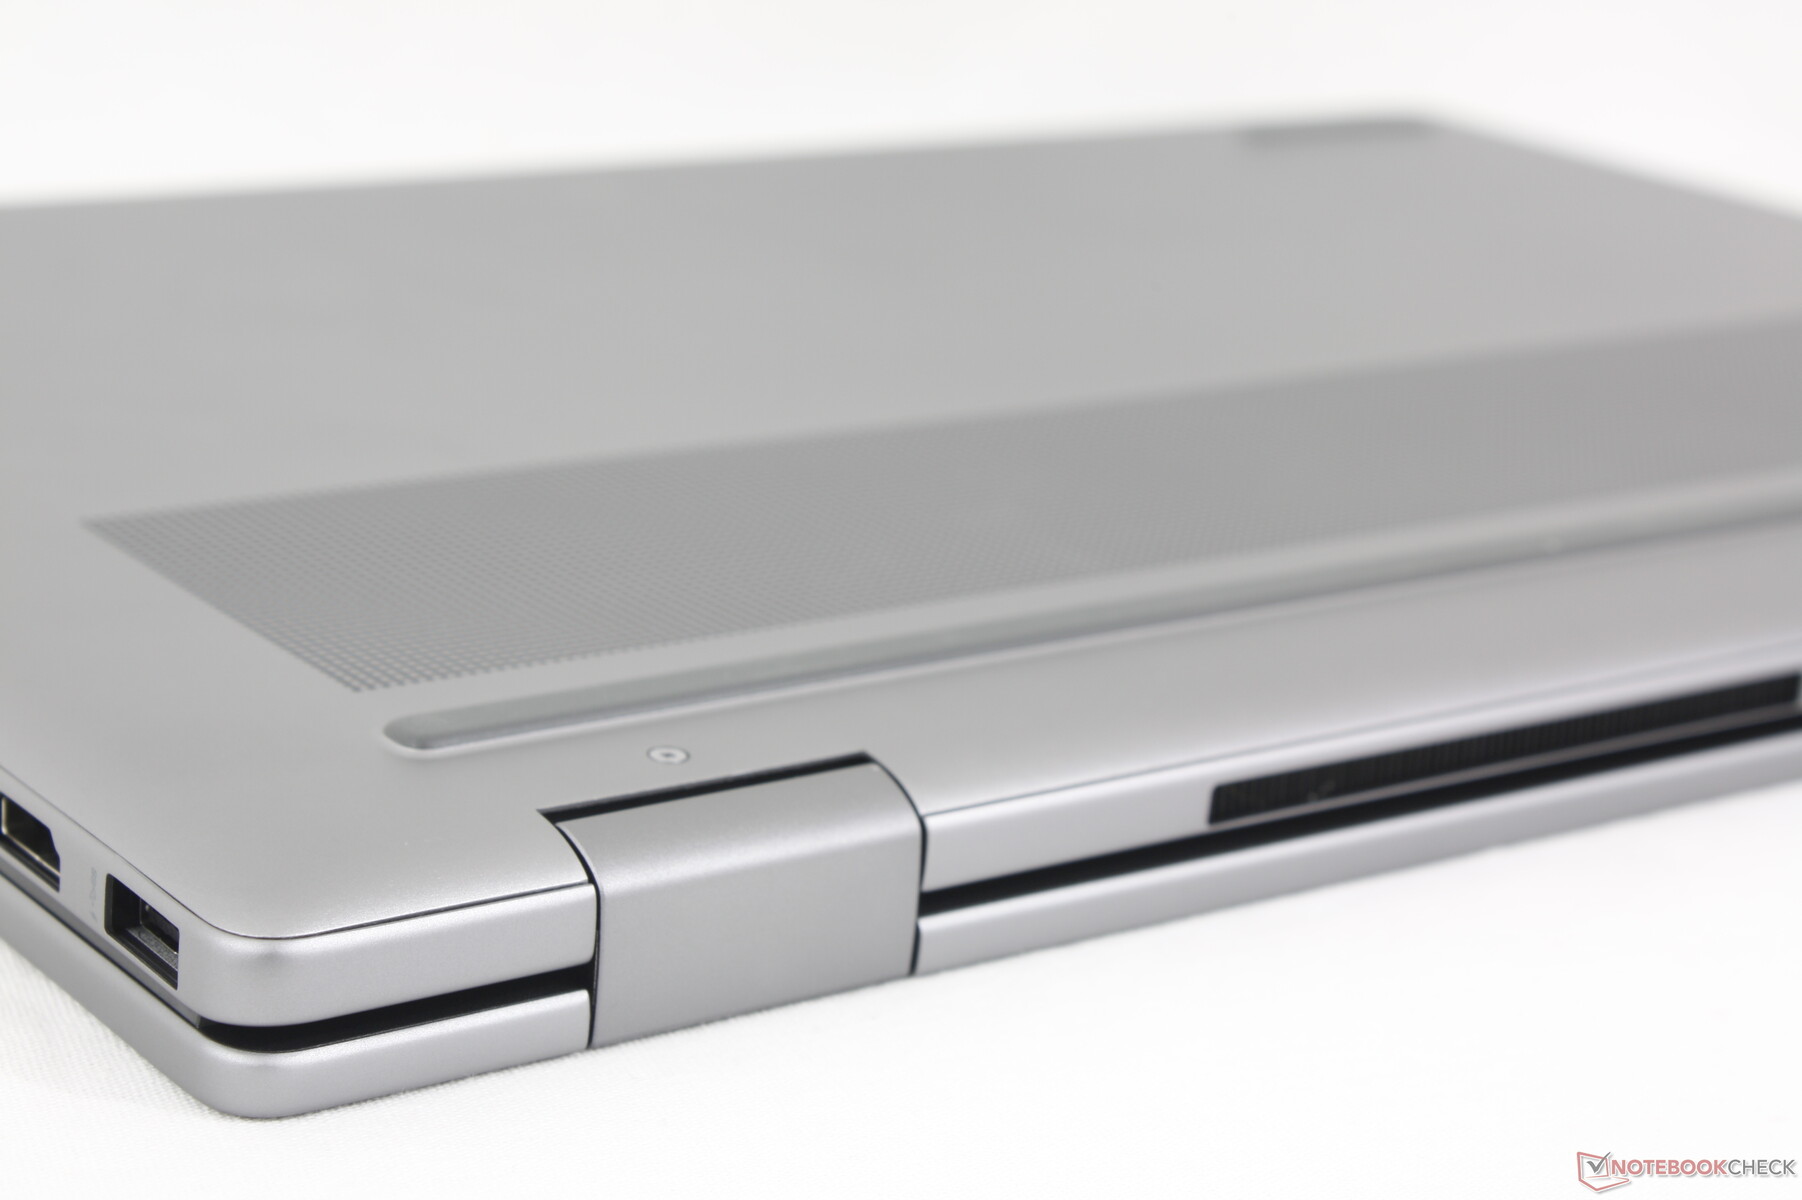
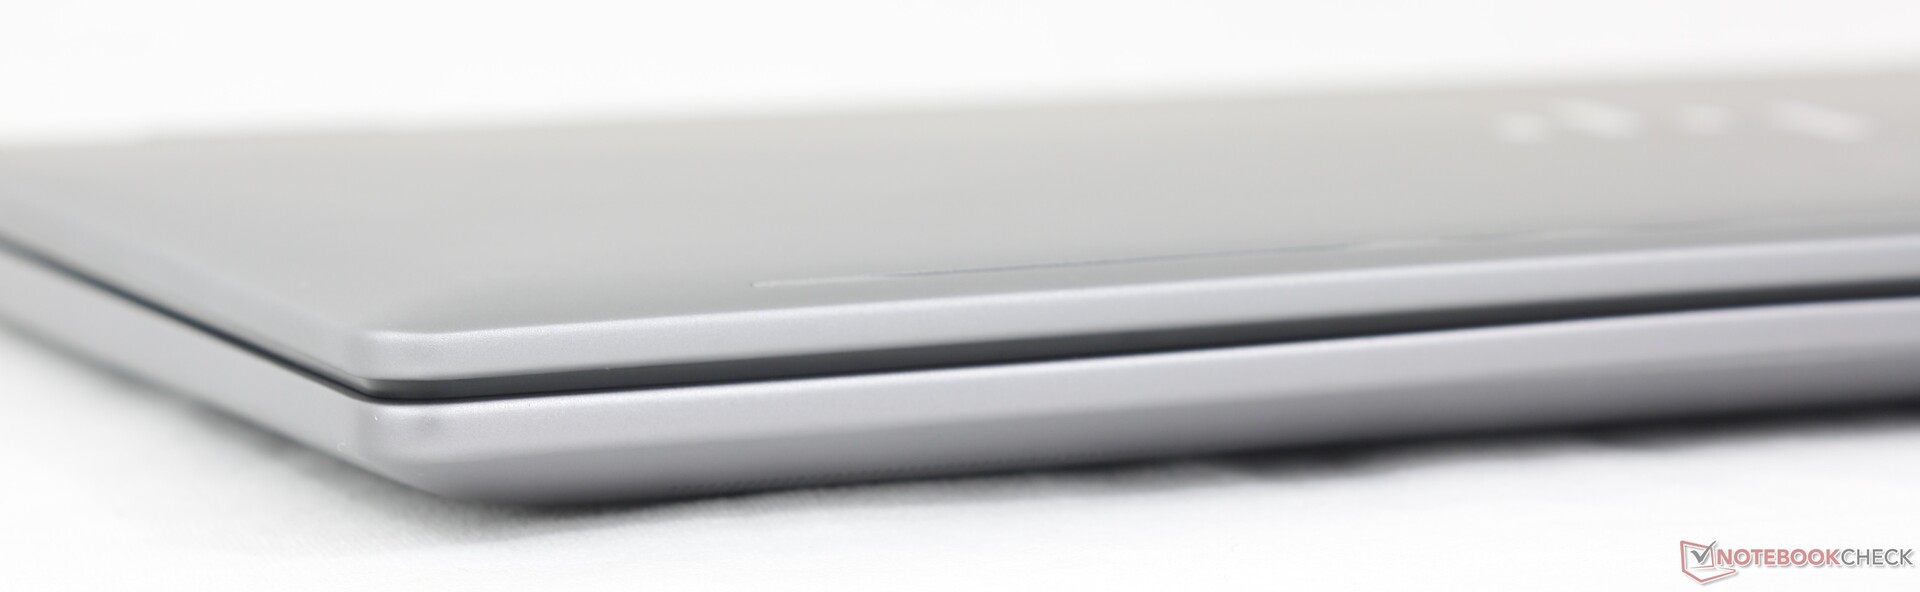
Case — Smooth Silver
The skeleton consists of similar aluminum materials and plastic keys as on the Envy x360 15 for a similar look and feel. Surfaces are rigid and of high quality even if they don't appear as luxurious as a Spectre design. The chassis yields slightly more than on the Spectre when applying pressure down the keyboard center or when attempting to twist the base, but it's not noticeably any worse or better than the Yoga 7 2-in-1 16IML9.
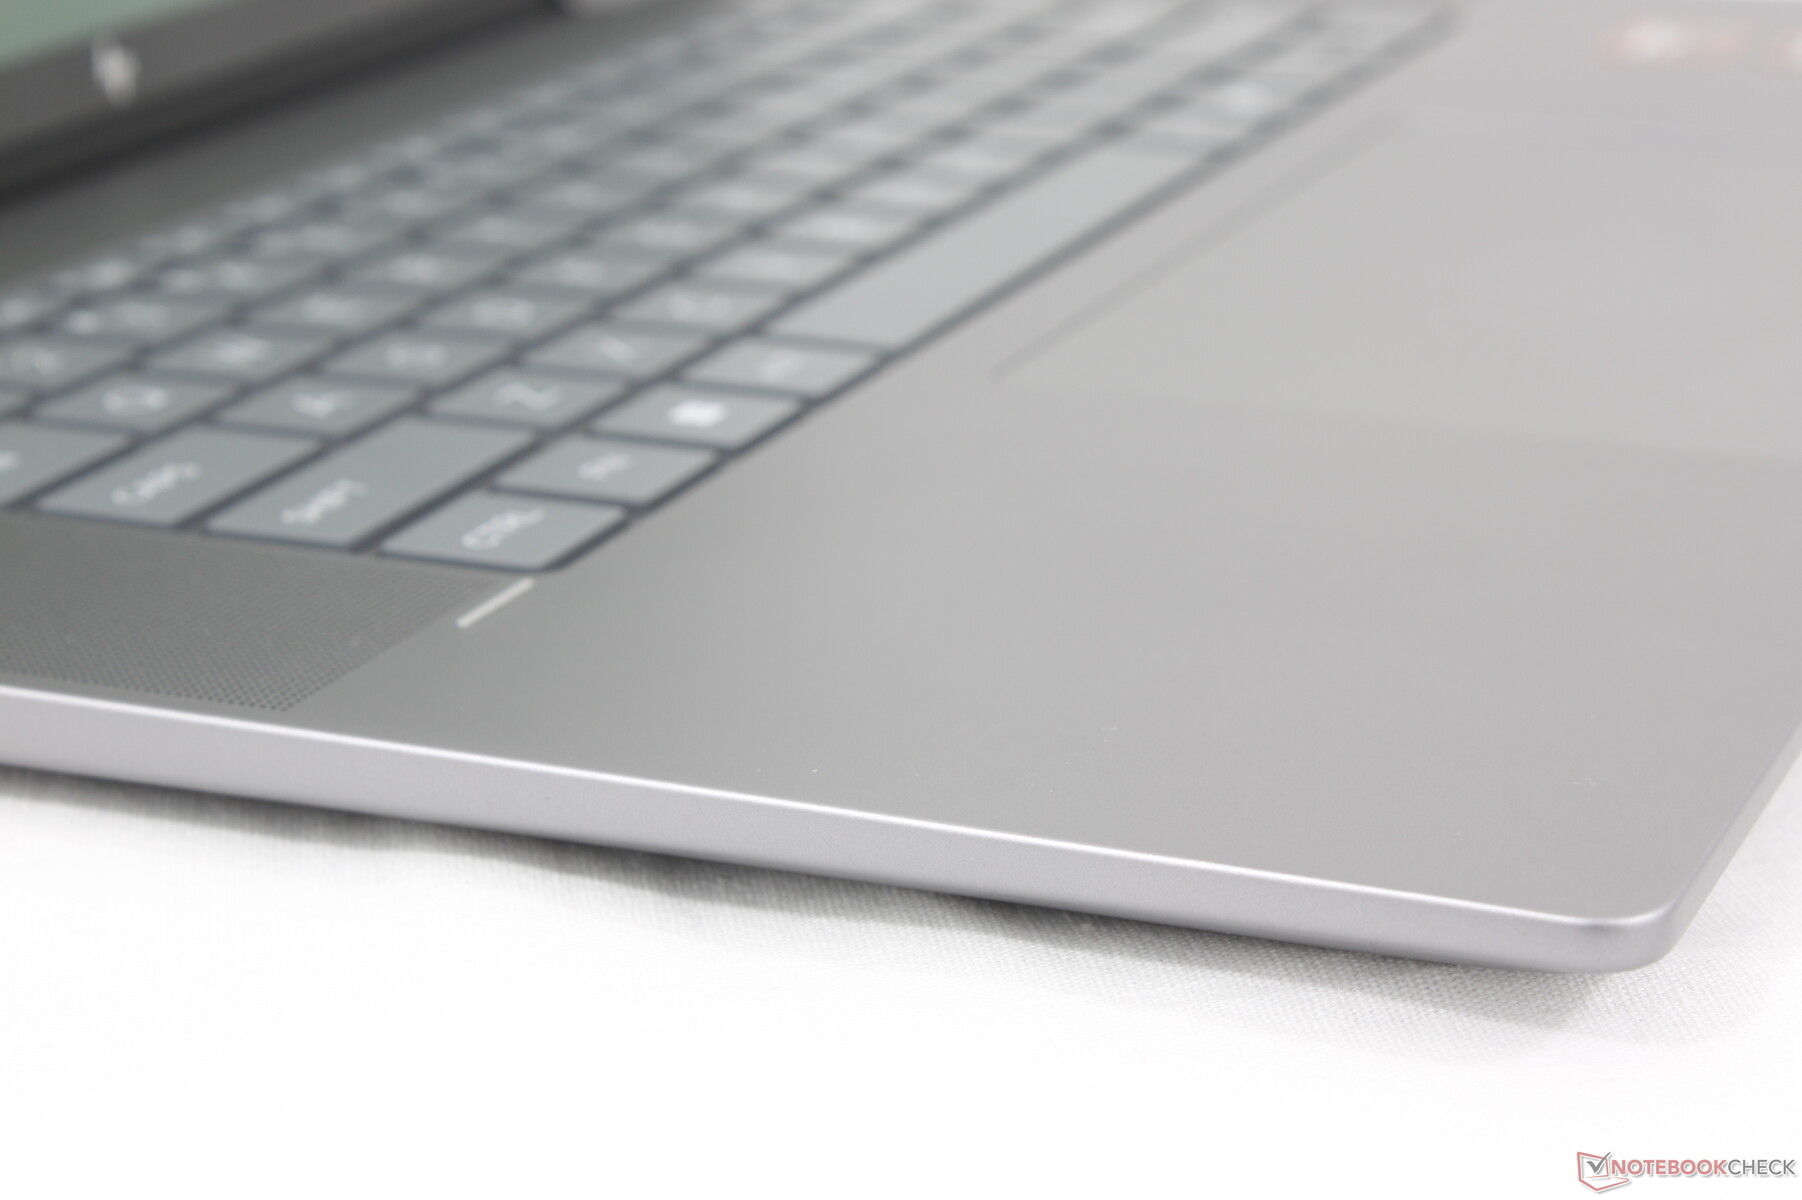
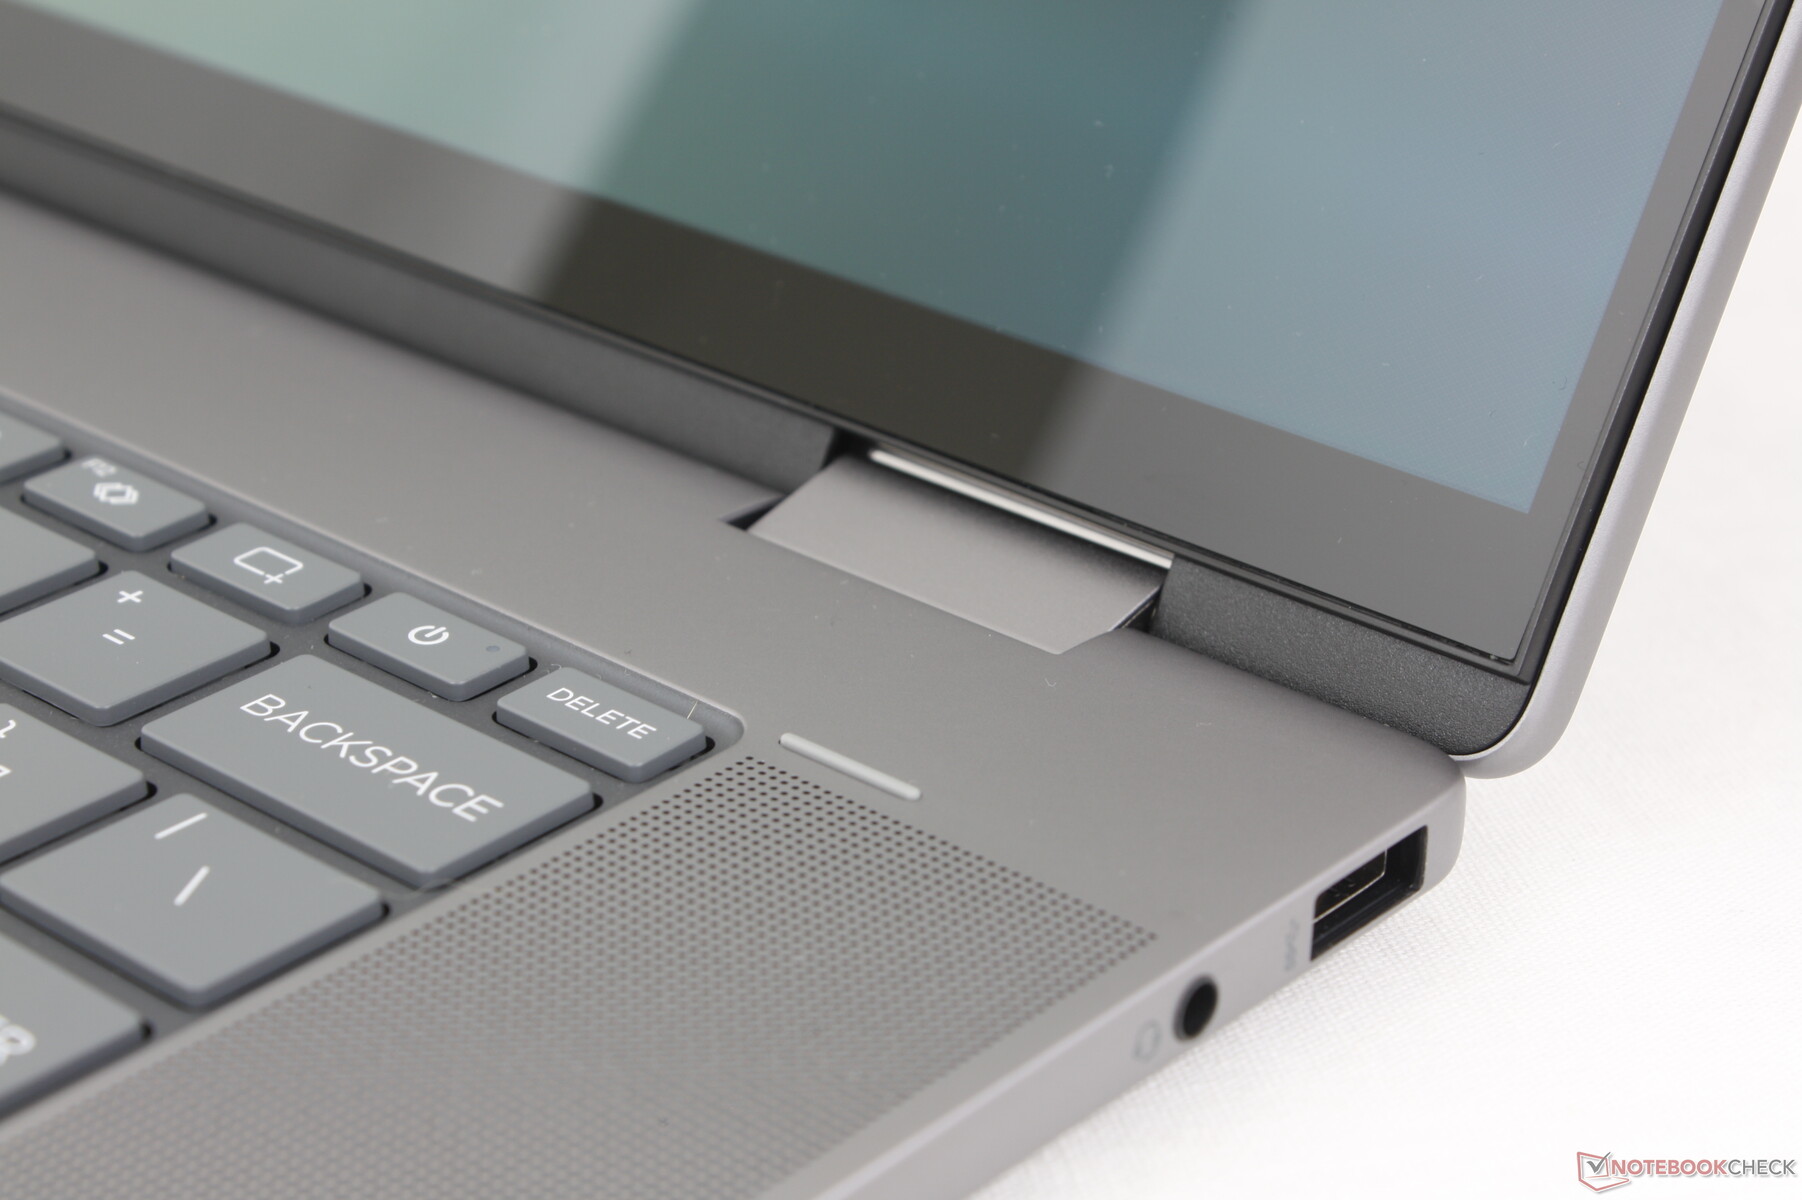
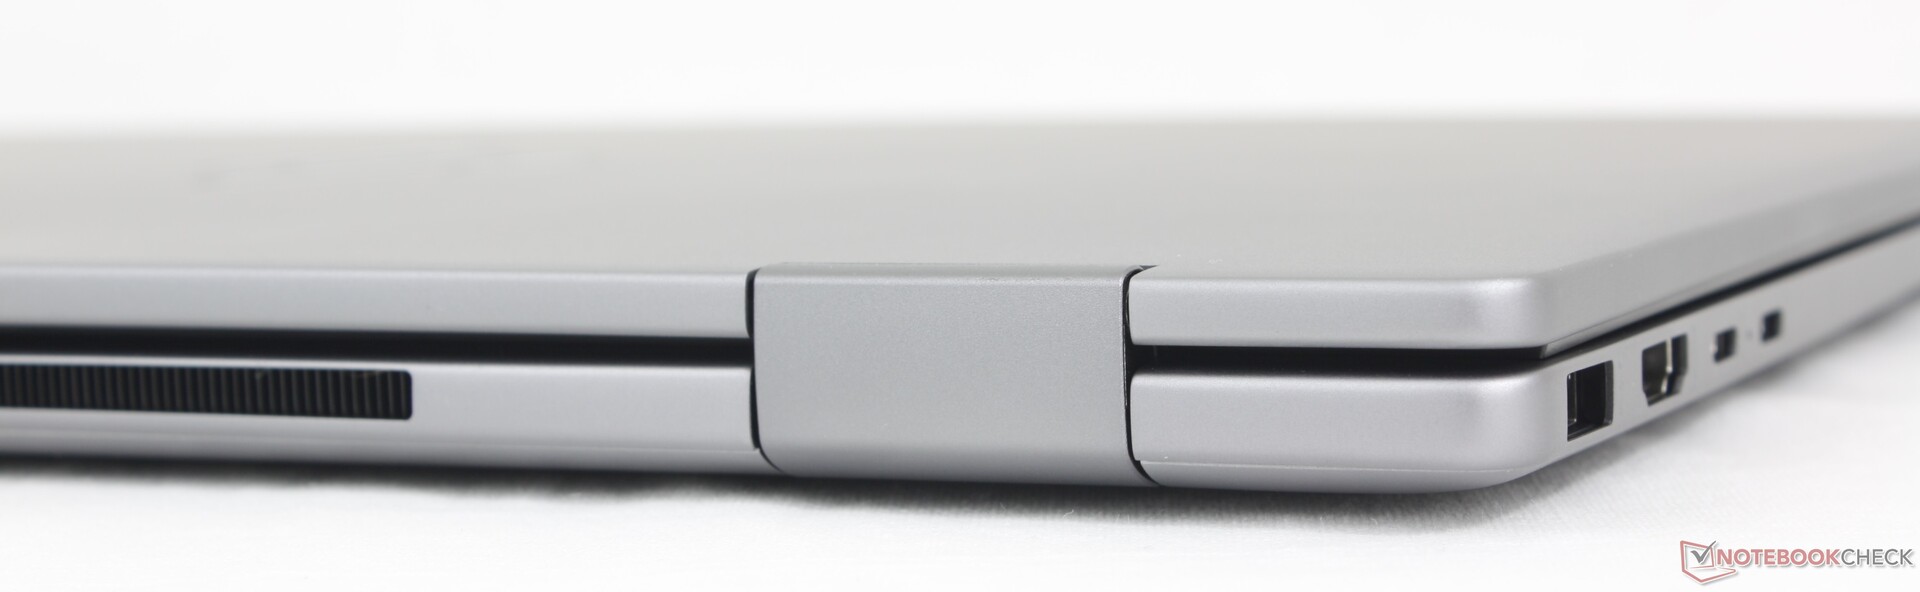
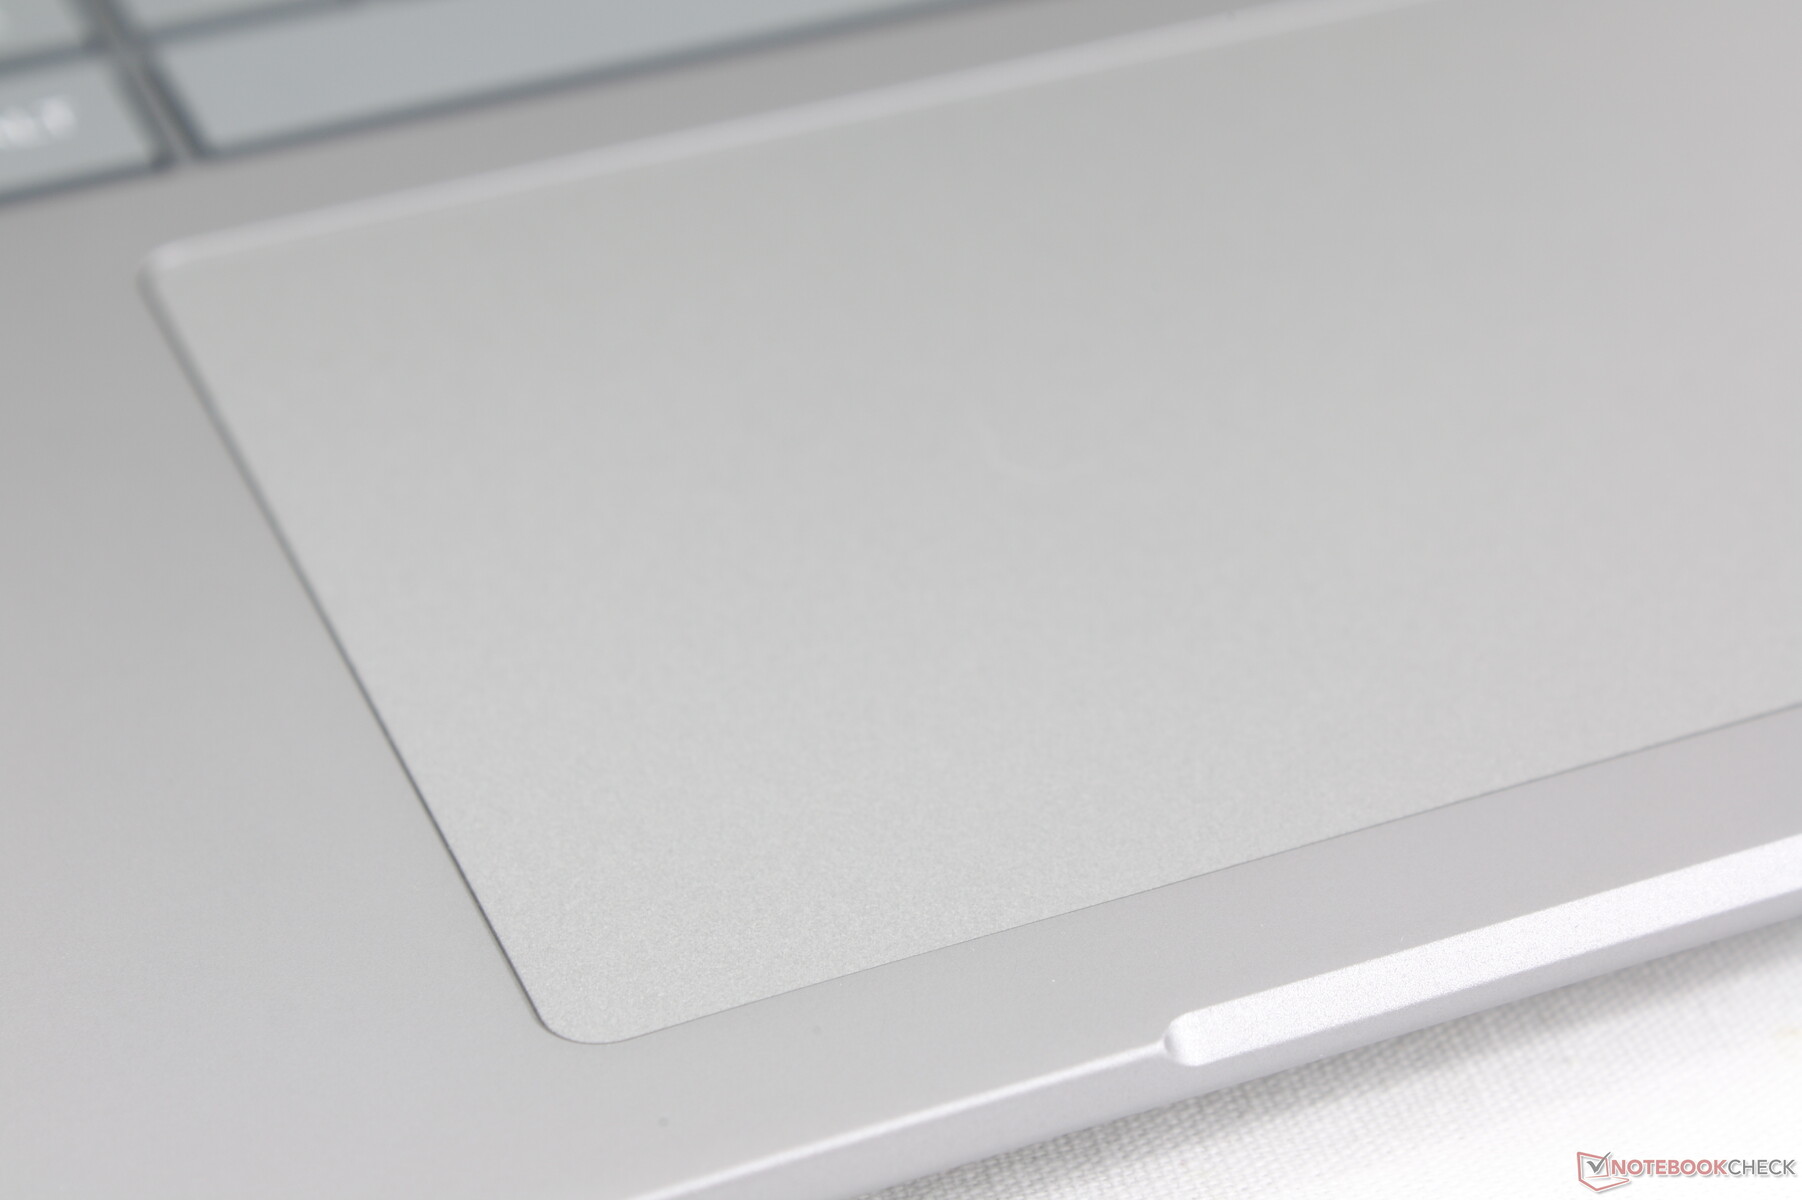
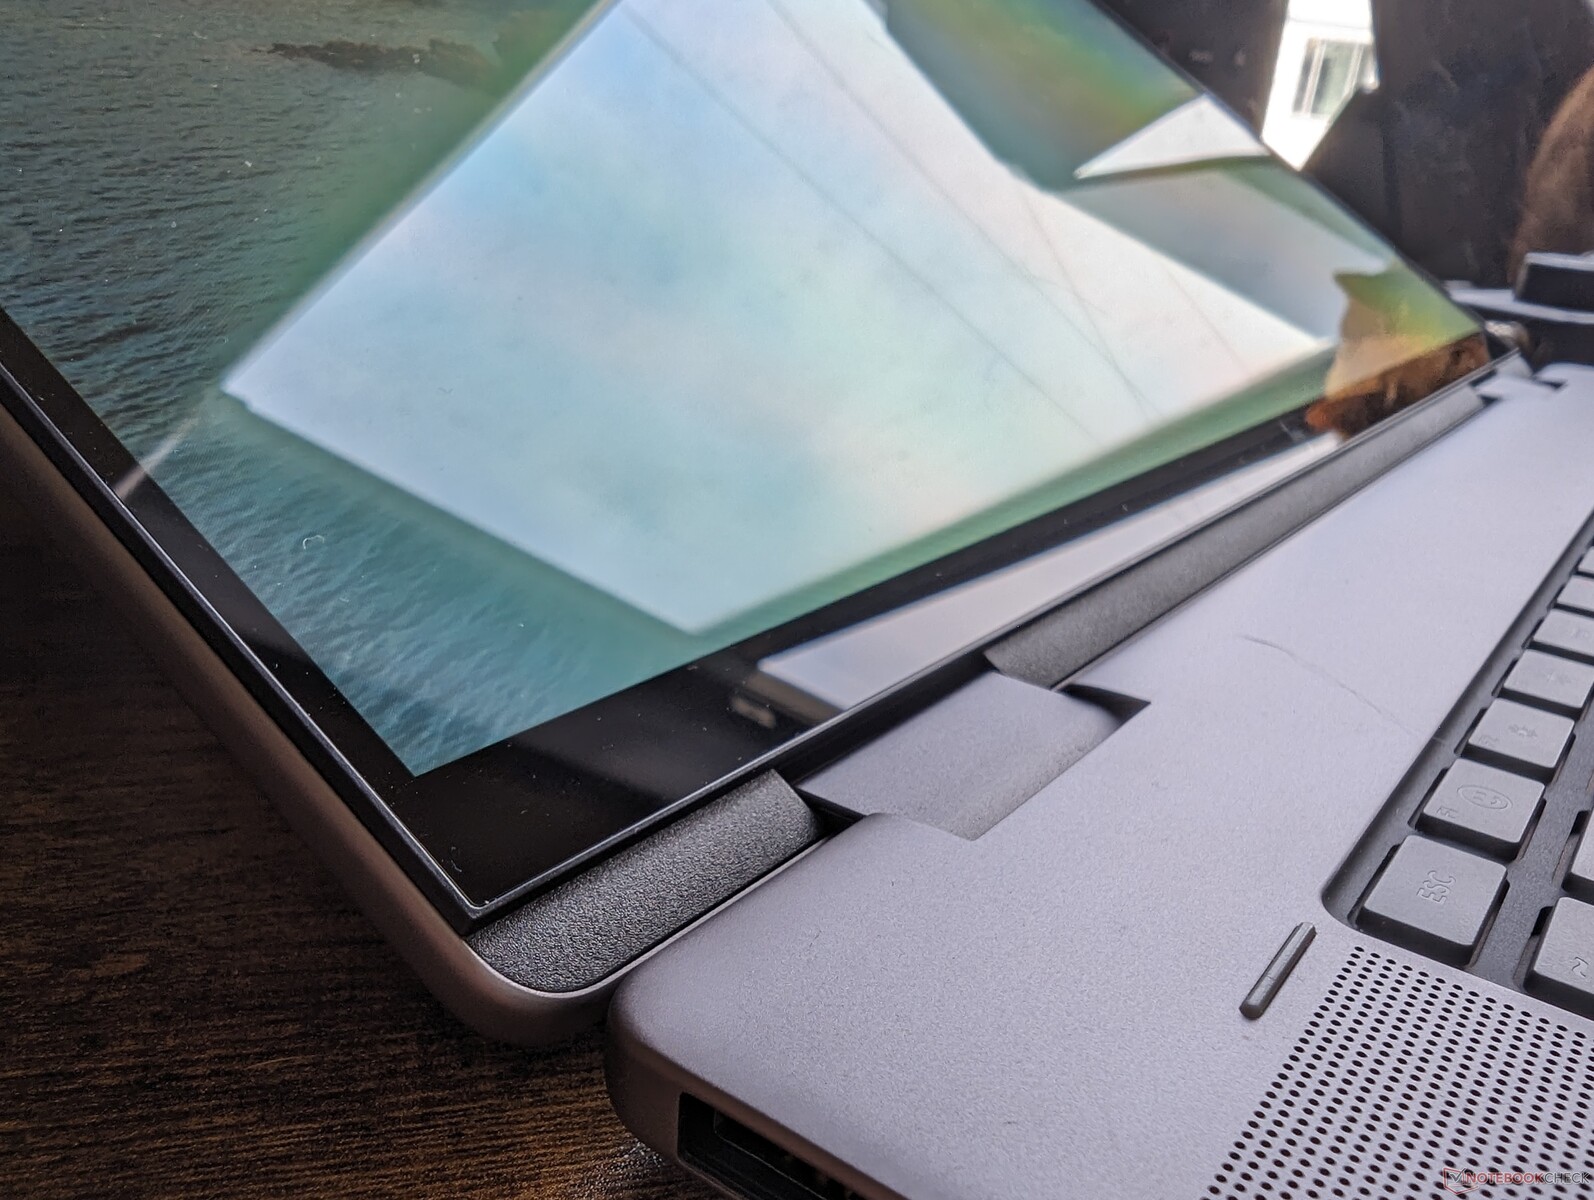
A notable difference between the Envy x360 16 and its smaller siblings is the keyboard deck which now sits lower than the surrounding speaker grilles and palm rests whereas the keyboard decks on the Envy x360 15 or Spectre x360 16 sit higher. The new aesthetic makes the Envy x360 16 design appear more "MacBook Pro-like" at first glance.
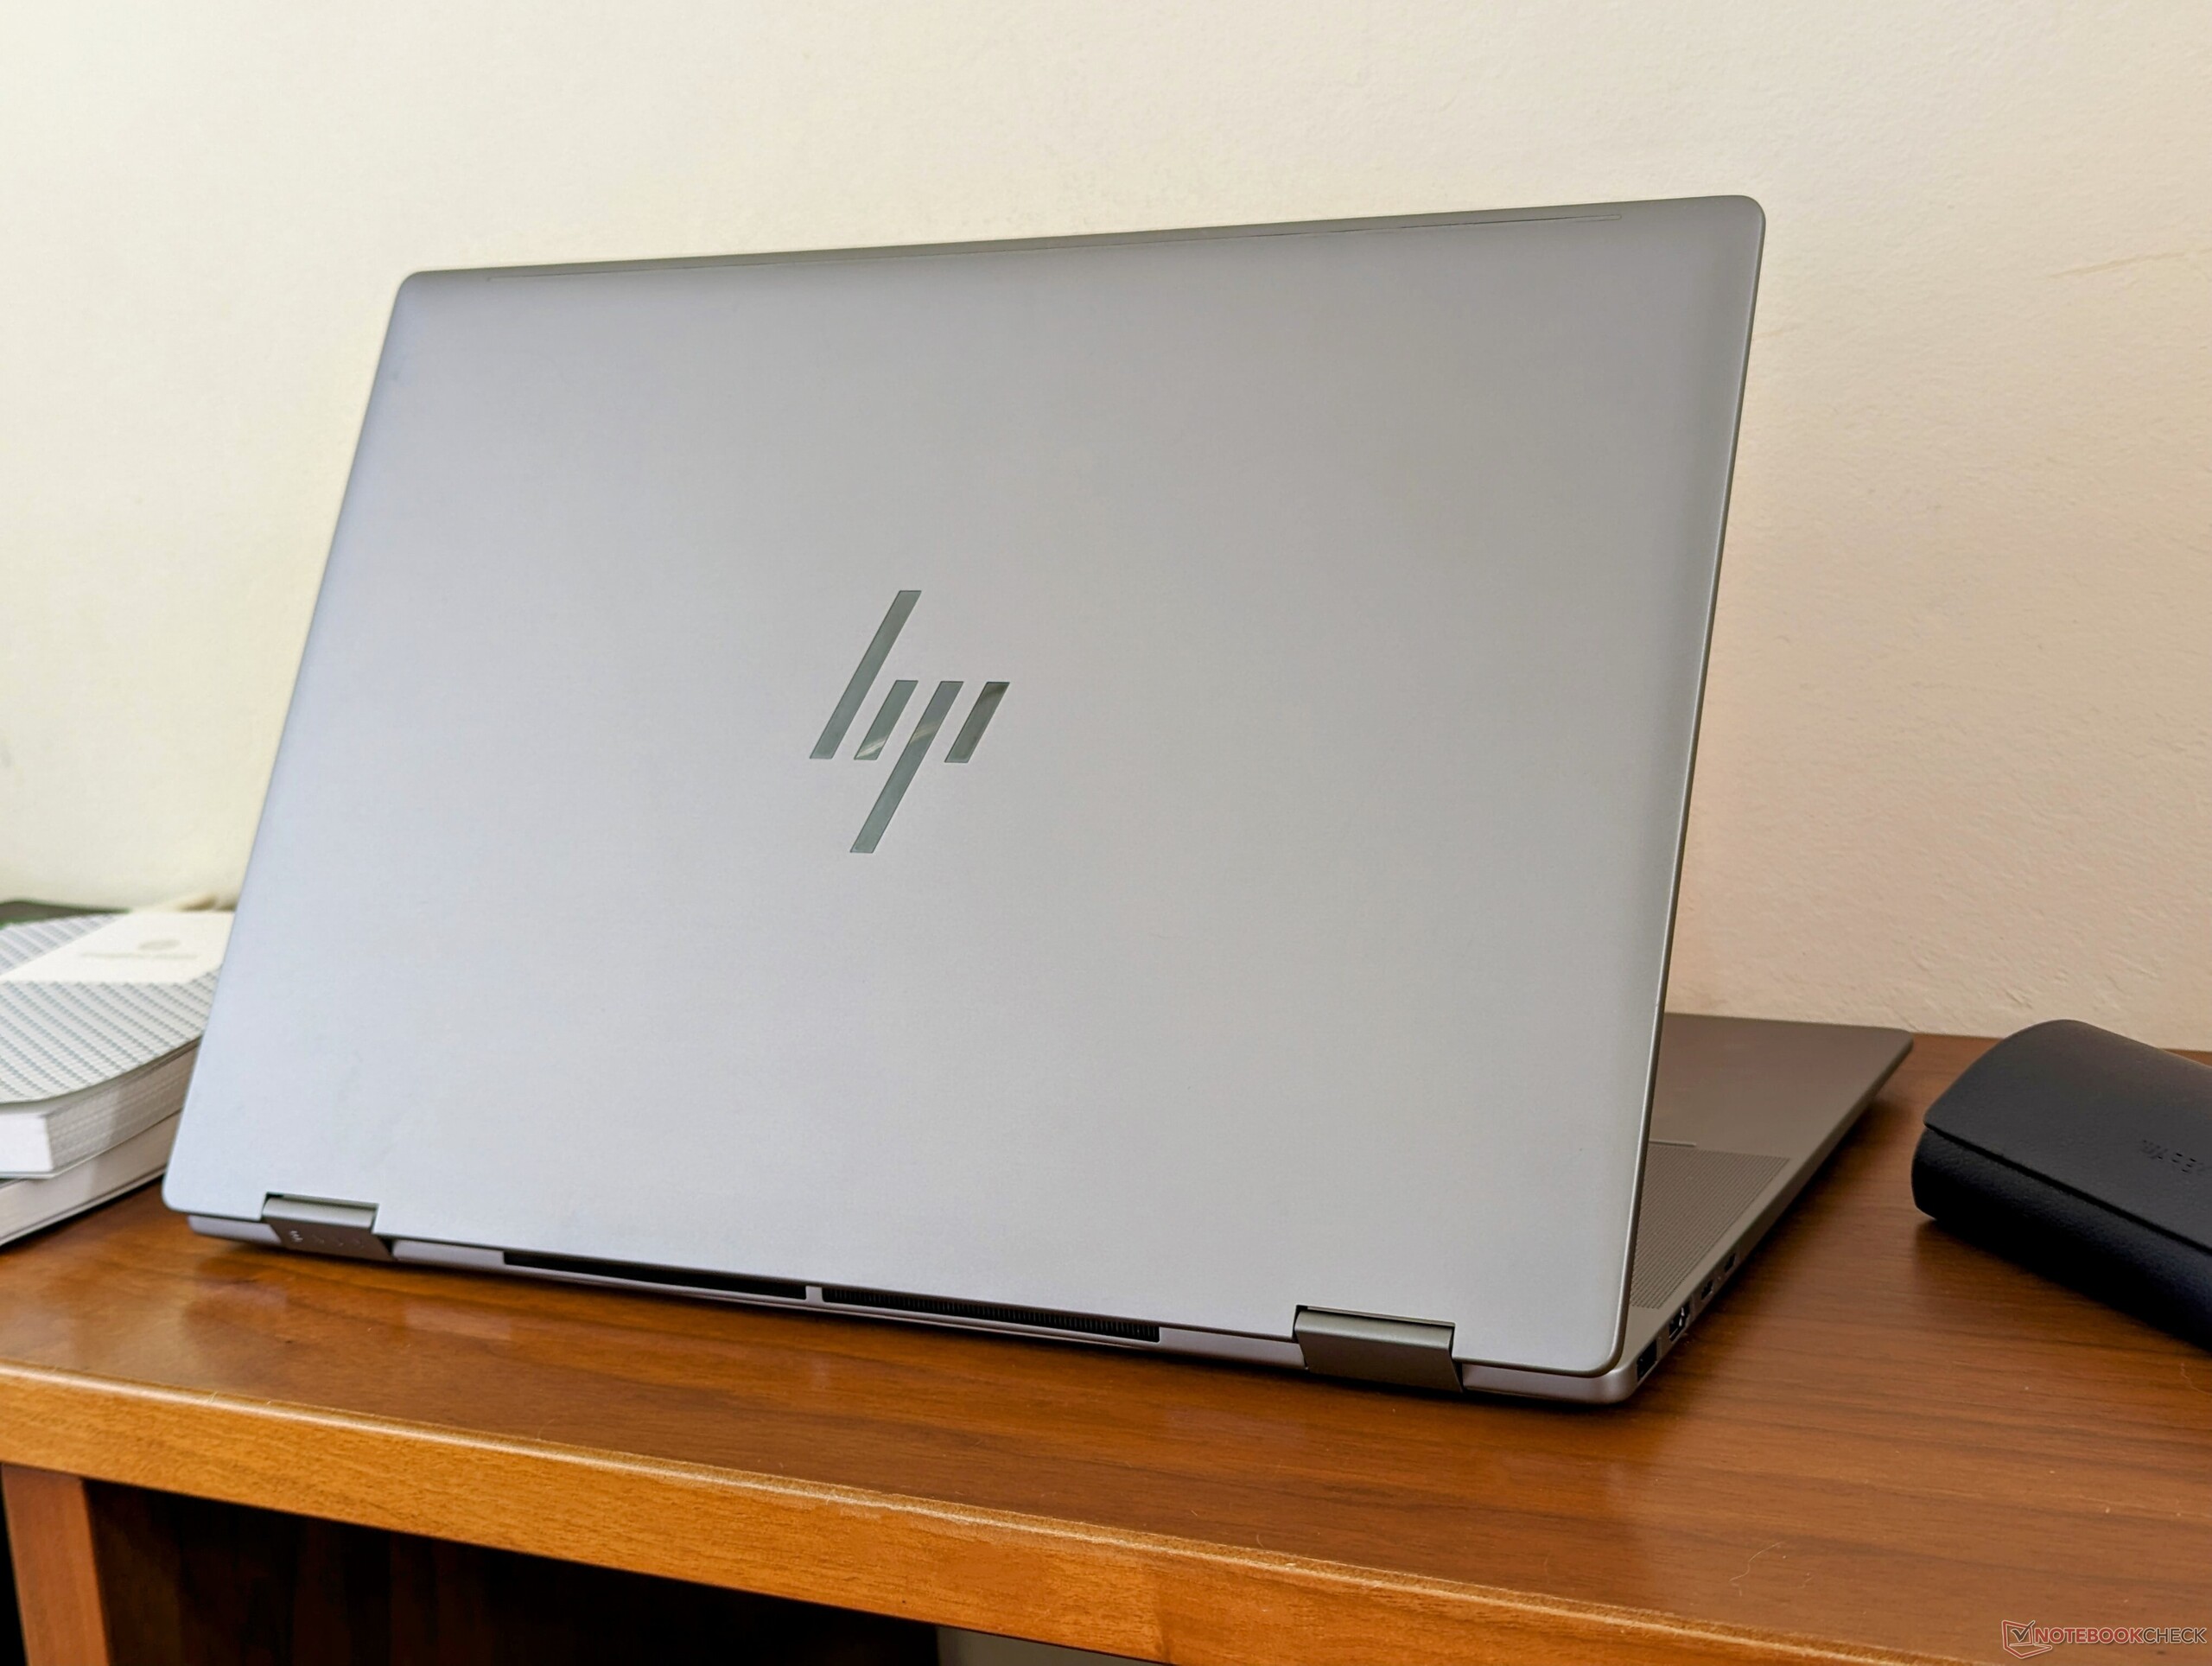
The new model is both thicker and larger than the outgoing Envy x360 15 while weight remains roughly the same. Perhaps most notably, the Envy x360 16 is nearly identical in to its more expensive Specture x360 16 in all three dimensions meaning that it's not any less travel-friendly despite their price differences.
Strangely, there is only one color option for the new Envy convertible regardless of configuration. In comparison, smaller Envy x360 models have an alternative Nightfall Black Aluminum color to accompany the usual Silver color. Multi-color options would have helped to visually distinguish between the Intel and AMD SKUs of the Envy x360 16 series.
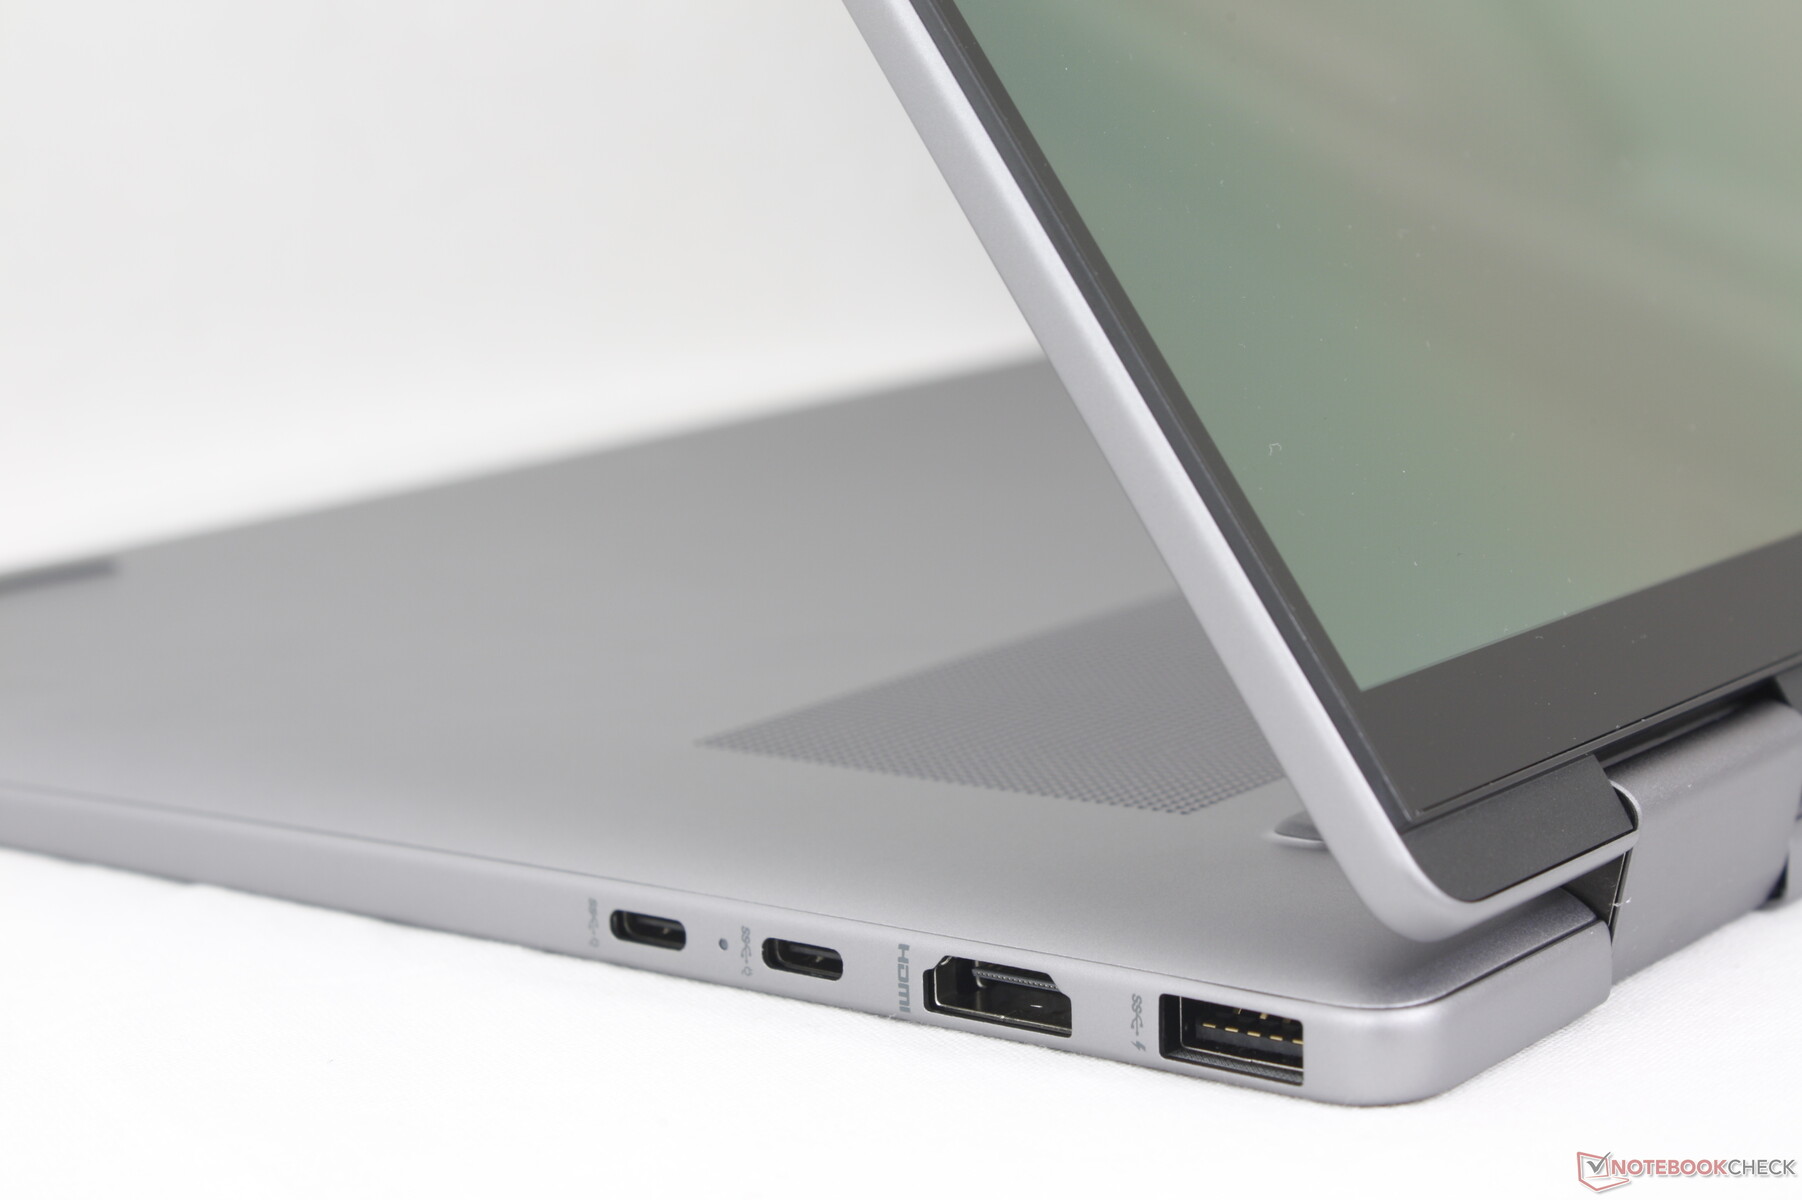
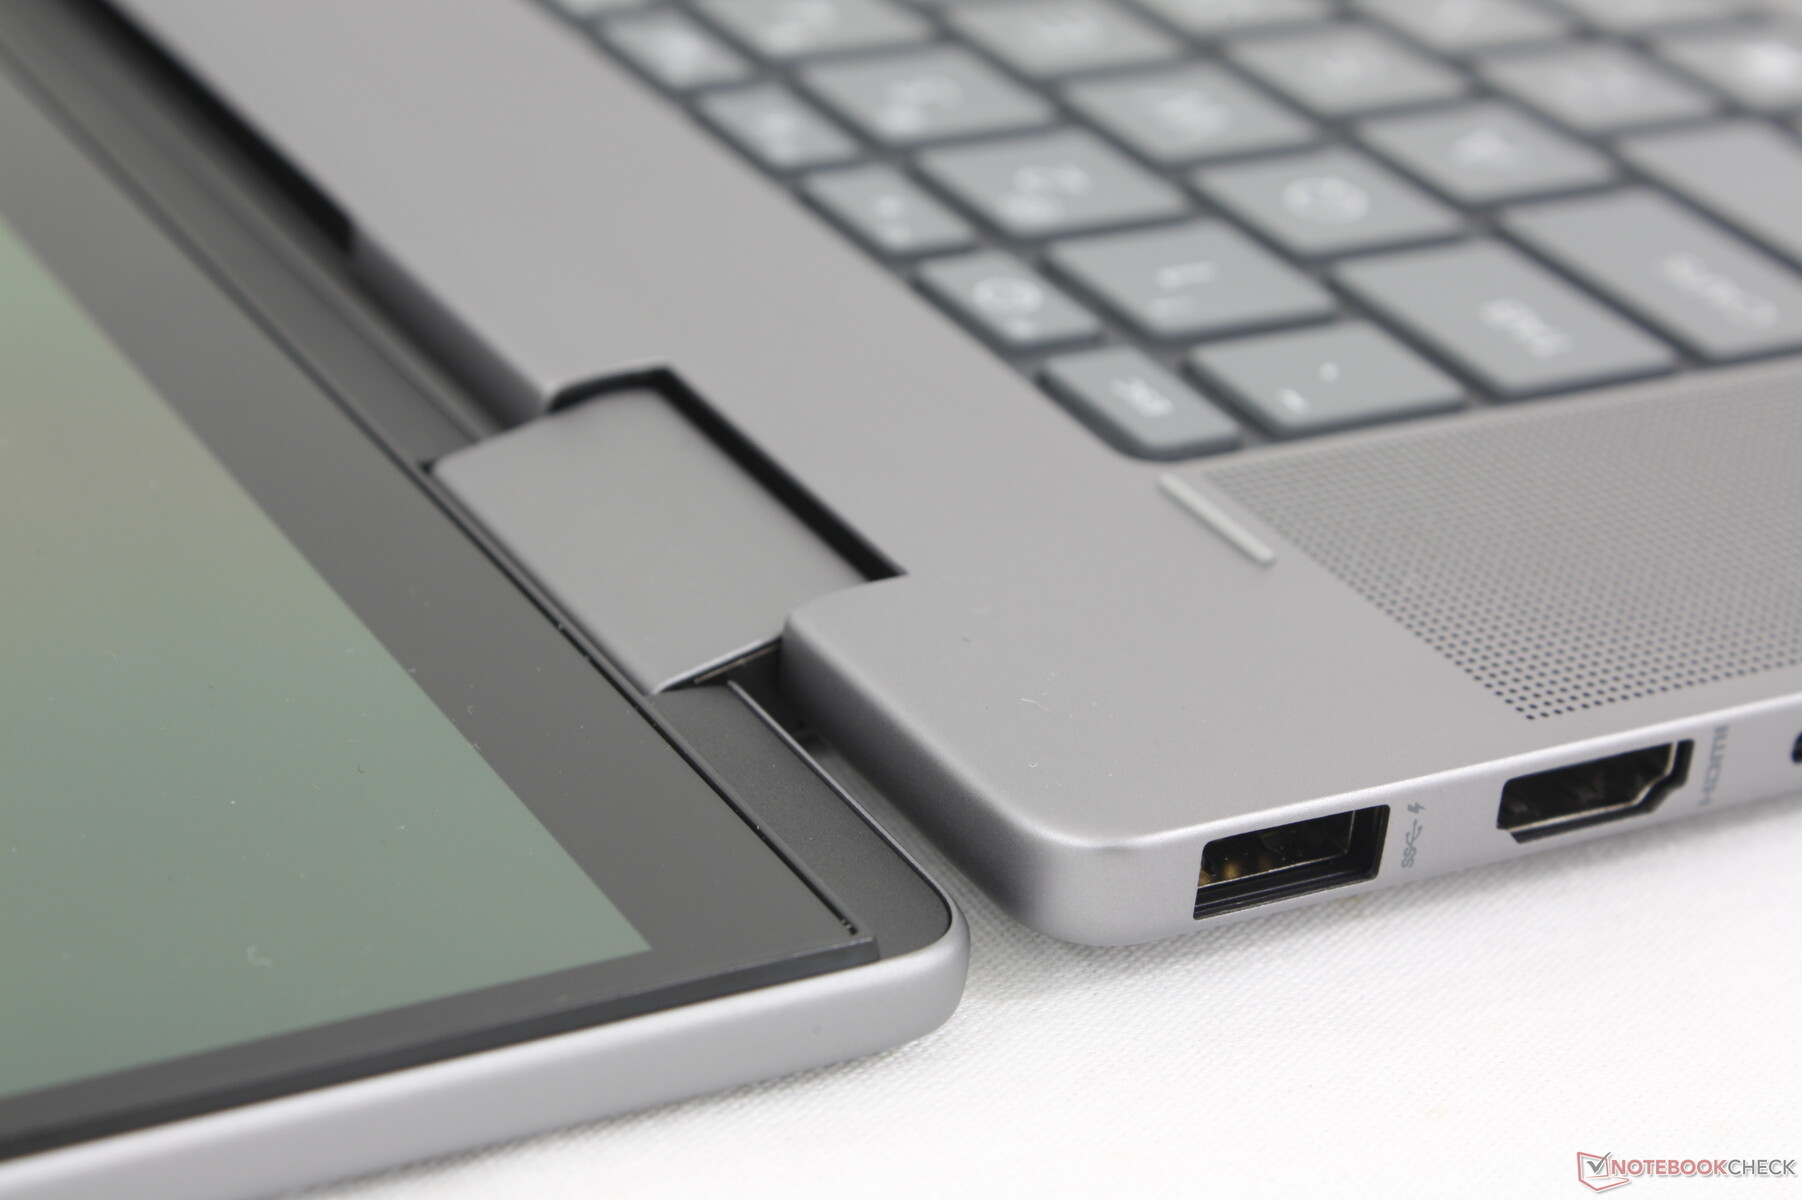
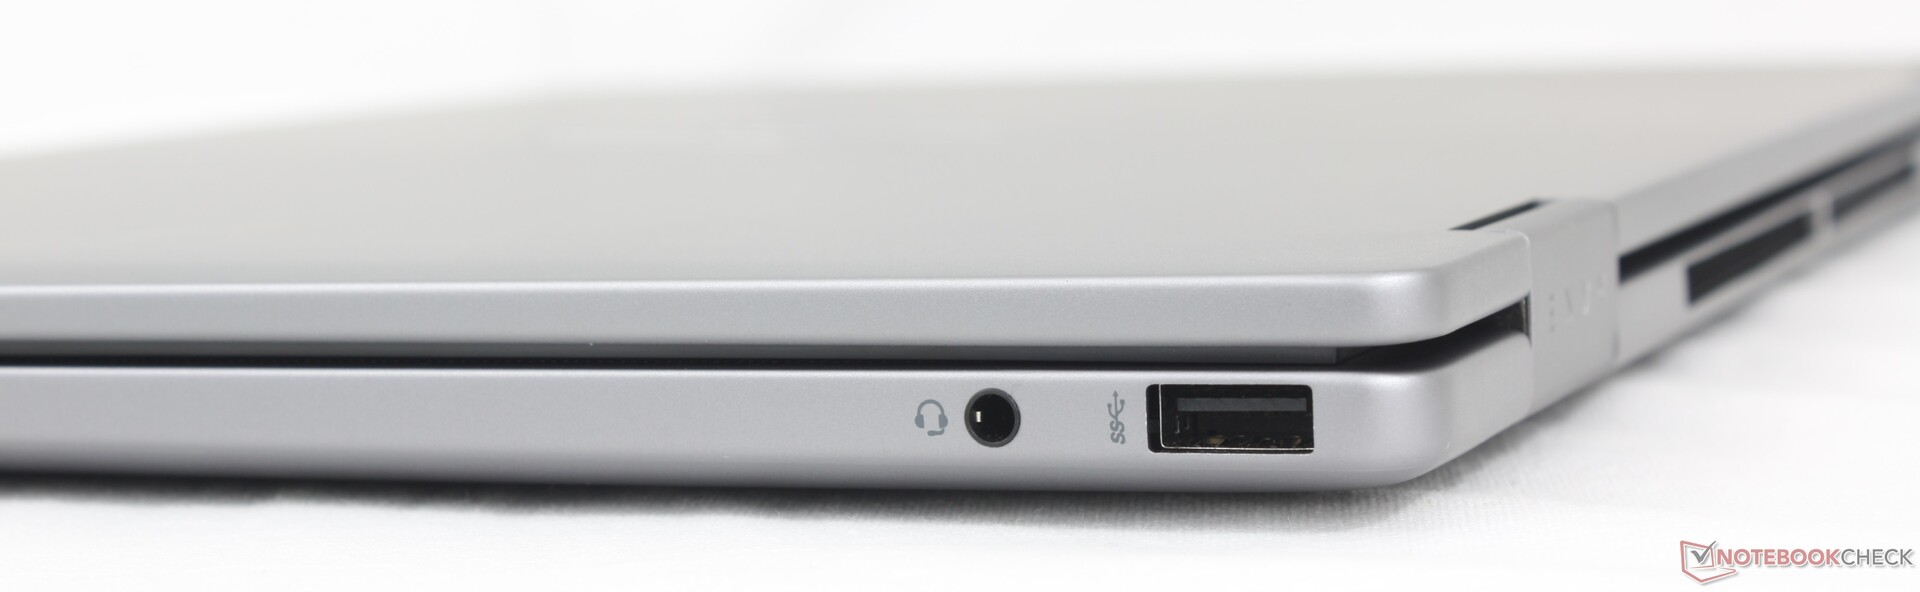
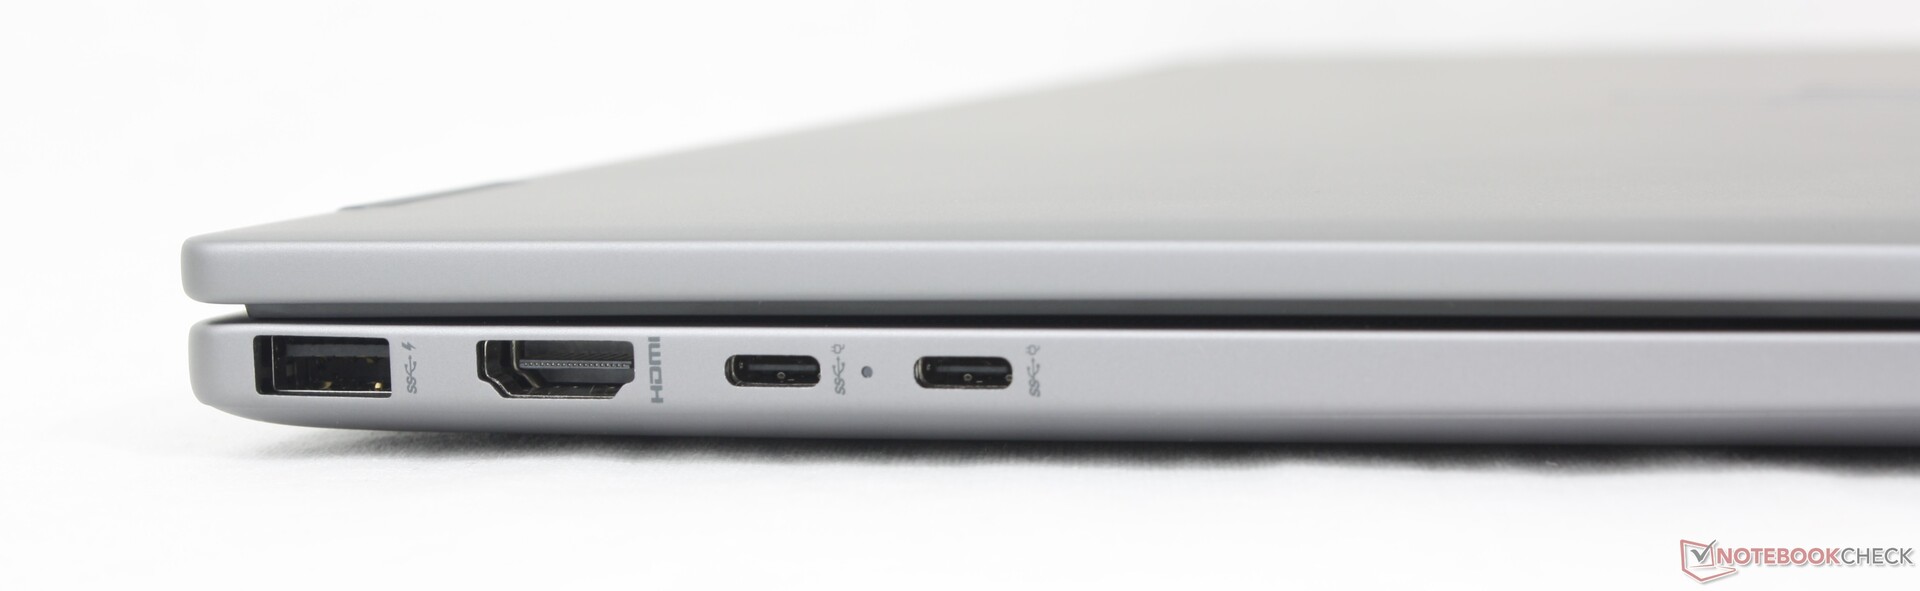
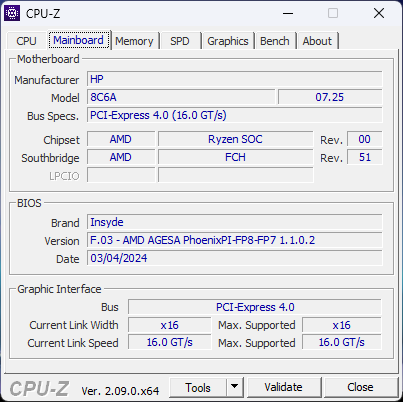
Connectivity — No Thunderbolt Or USB4 For AMD
All ports have returned from the 2023 Envy x360 15 minus the SD card reader. For a multimedia laptop this large, the lack of an integrated card reader is disappointing for photographers who rely on it for transferring media.
USB4 and Thunderbolt are unfortunately not supported on the new Envy as the two USB-C ports are each 10 Gbps only. Instead, users will have to consider the Intel version of the Envy x360 16 or upgrade to the Spectre x360 16 series for Thunderbolt compatibility.
Communication
The MediaTek MT7922 comes standard for Wi-Fi 6E and Bluetooth 5.3 connectivity. We experienced excellent transfer rates and no connectivity issues during both our Wi-Fi 6 and Wi-Fi 6E tests.
Webcam
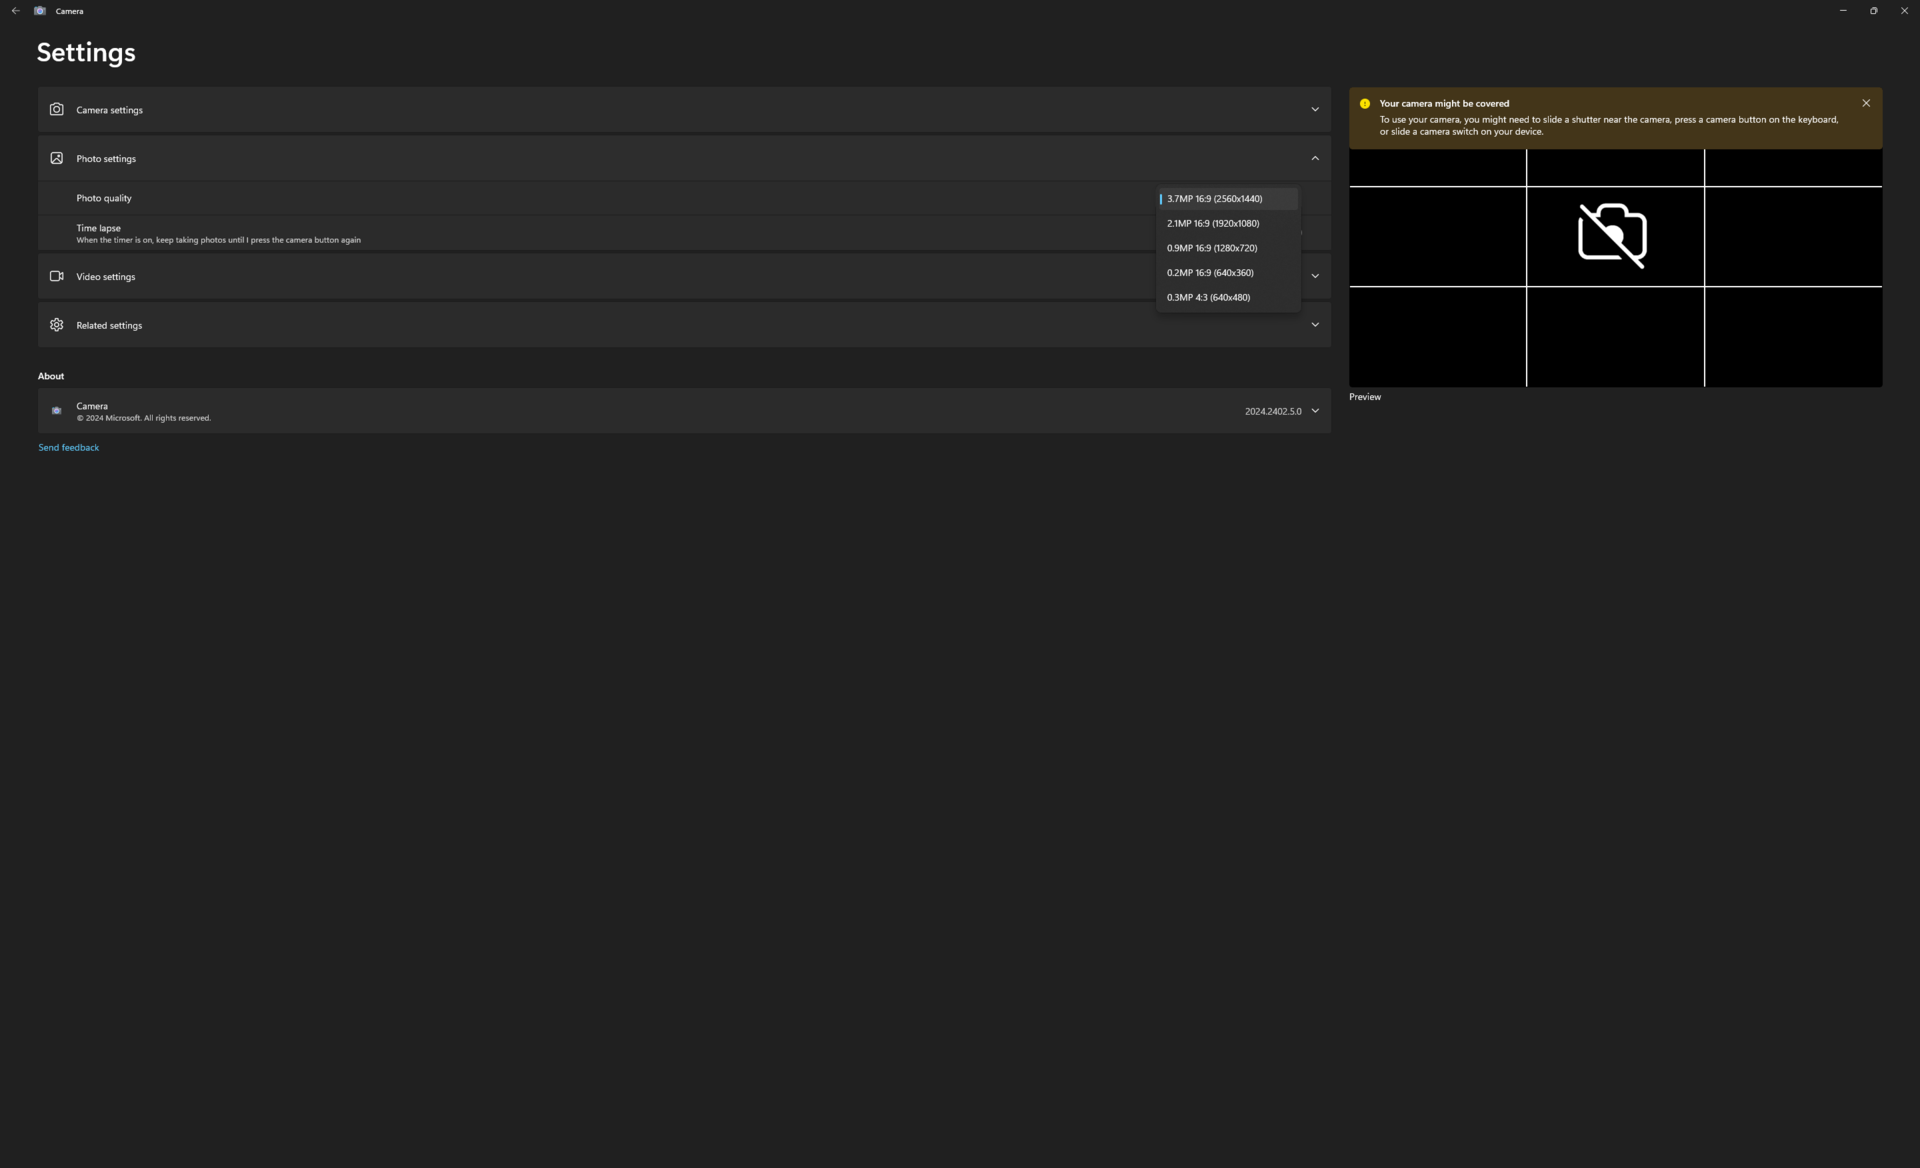
While HP advertises a 5 MP webcam, the Windows camera app only allows up to 3.7 MP as shown by the screenshot to the right. We've reached out to HP to see if this is working as intended or if a bug could be involved.
Both IR and a physical privacy shutter come standard.


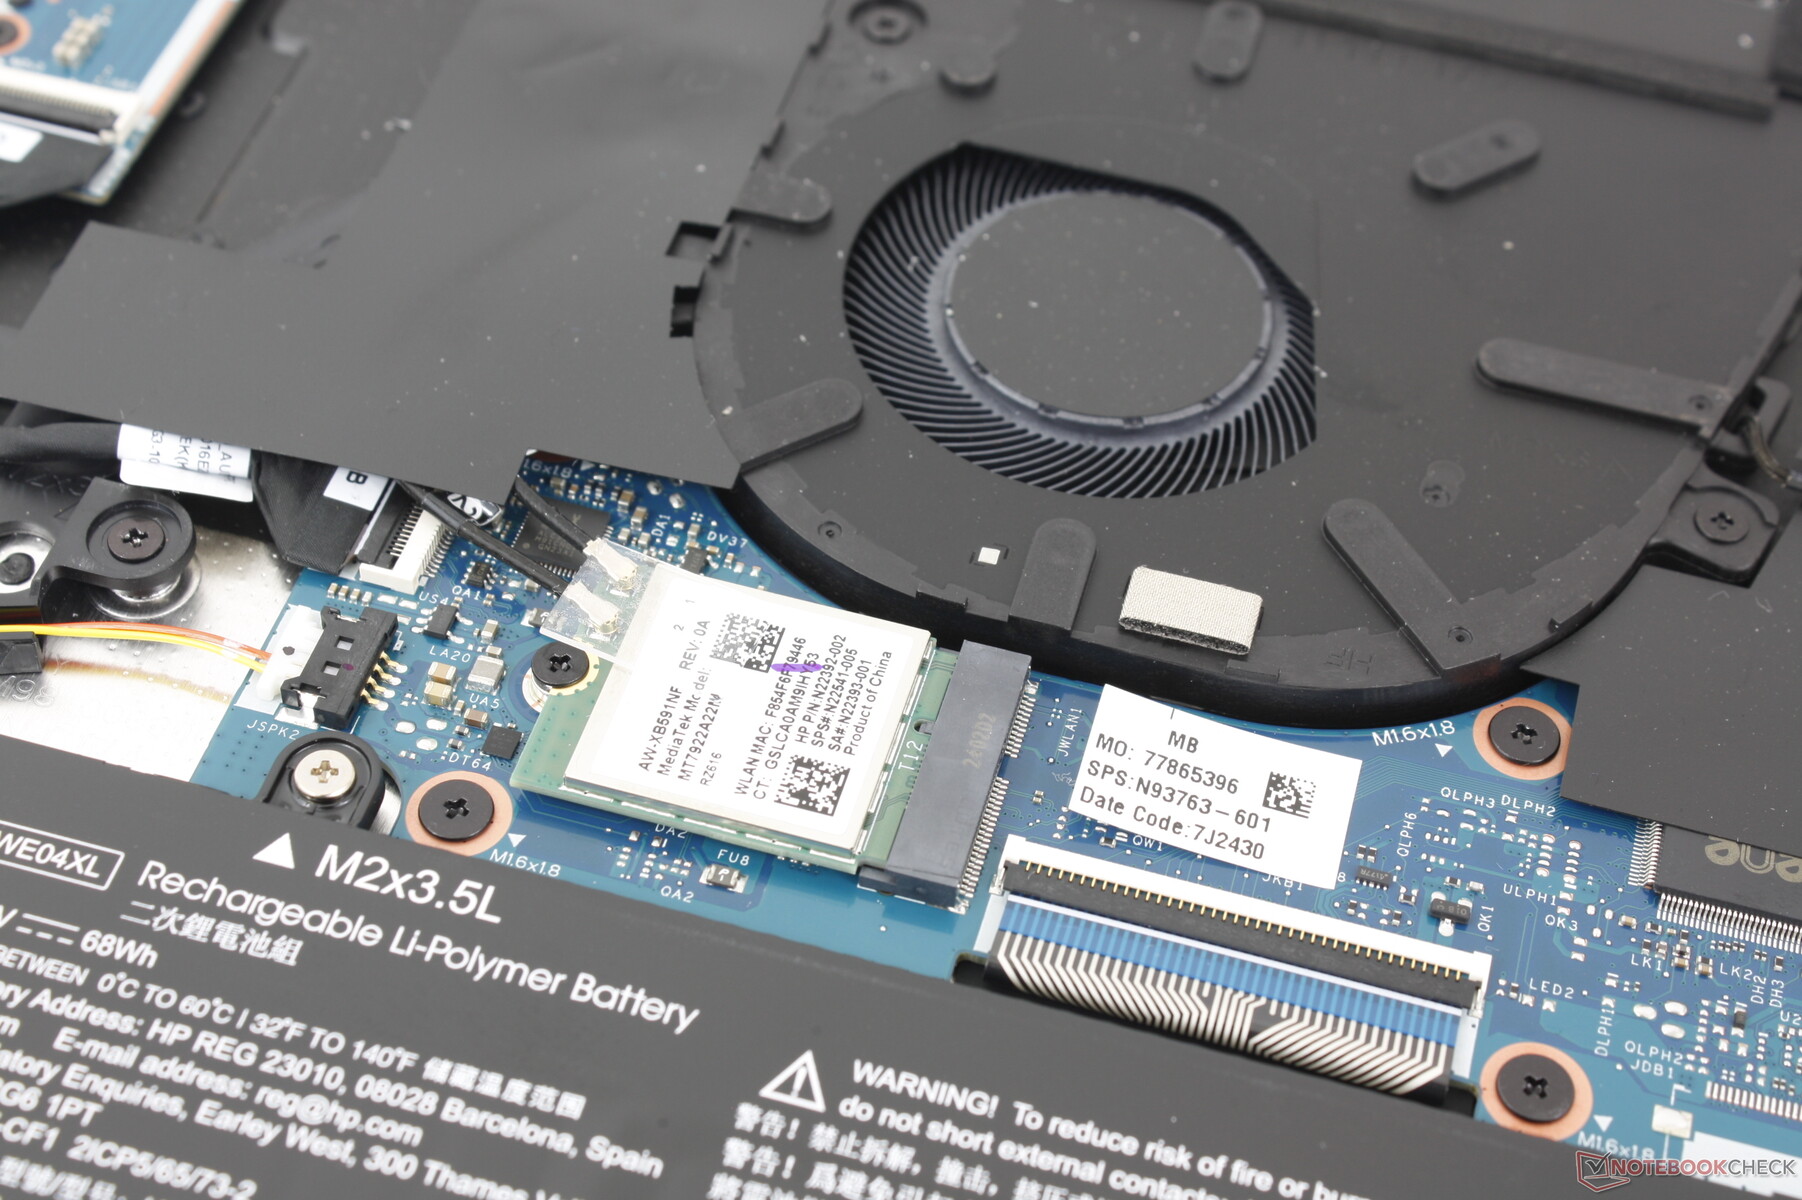
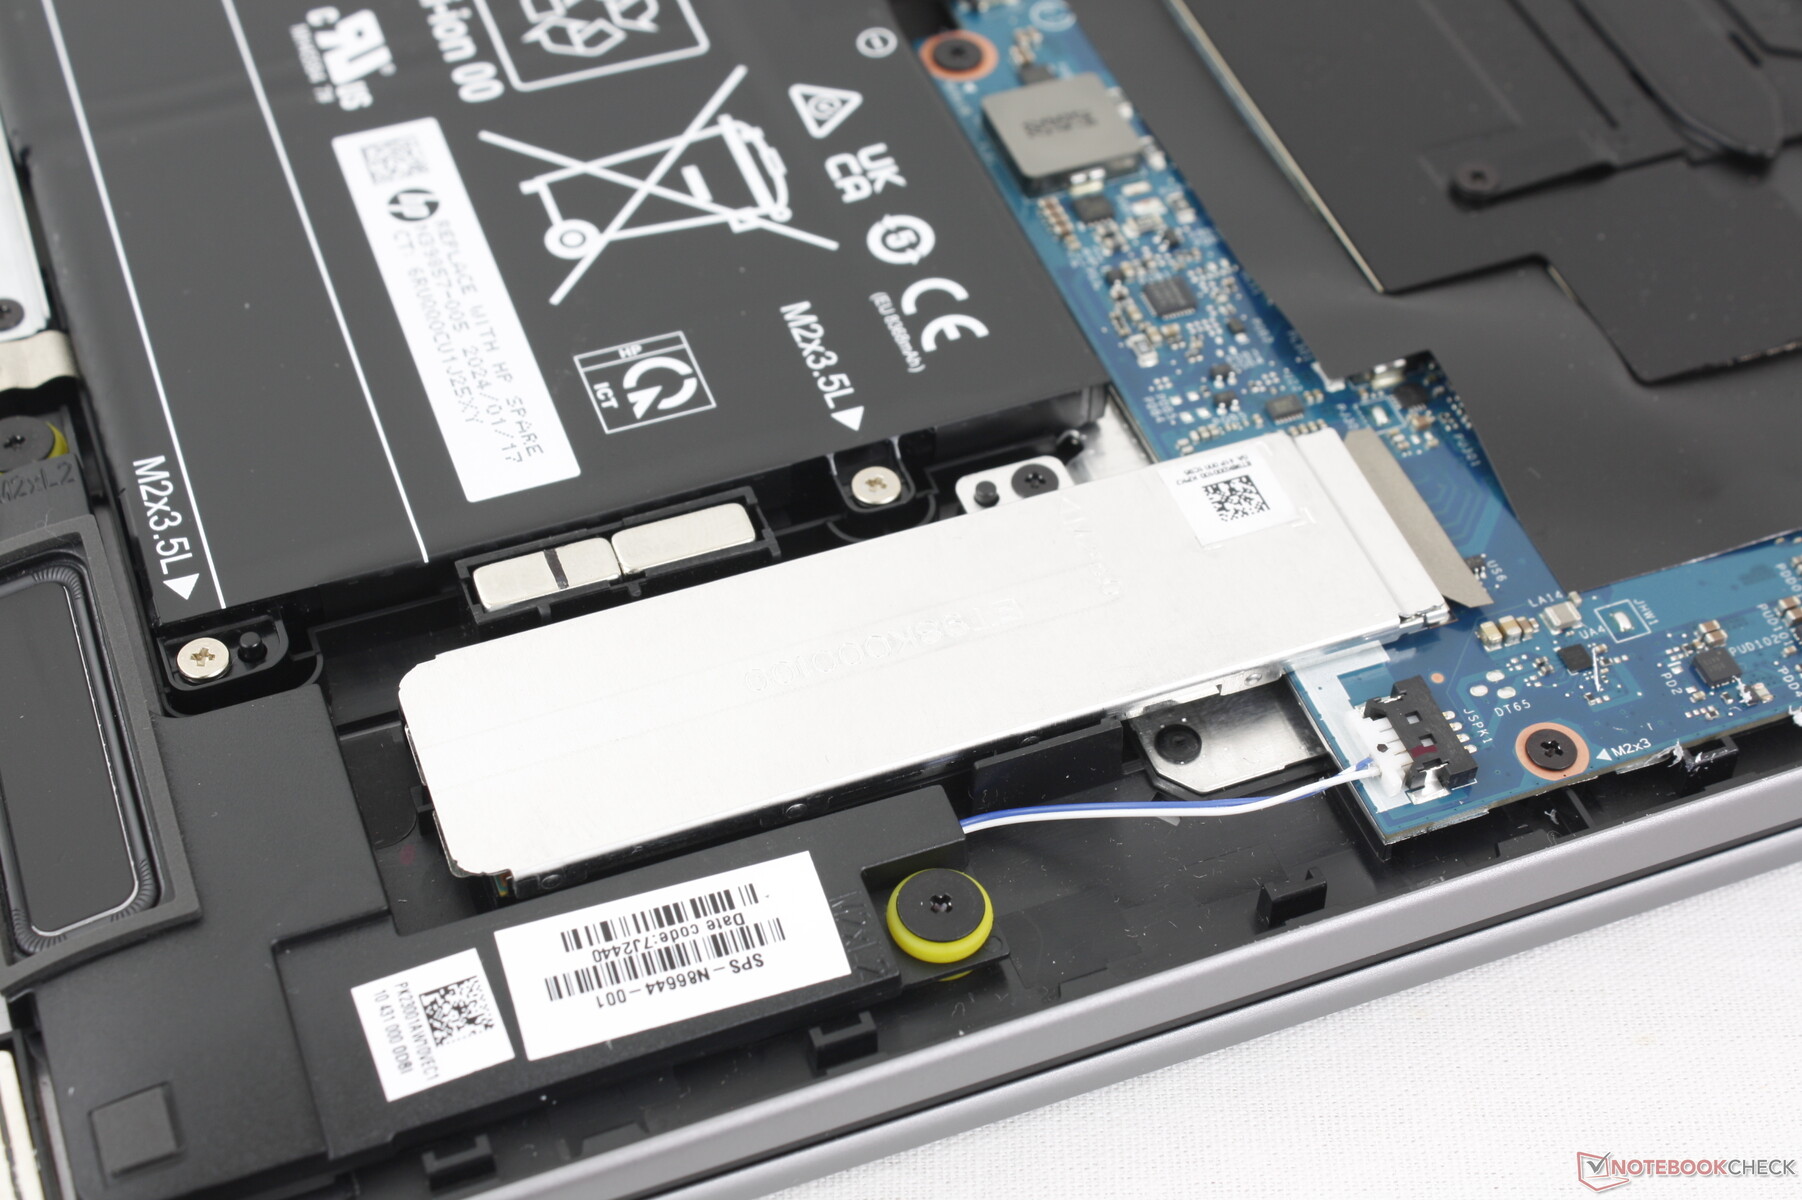
Maintenance
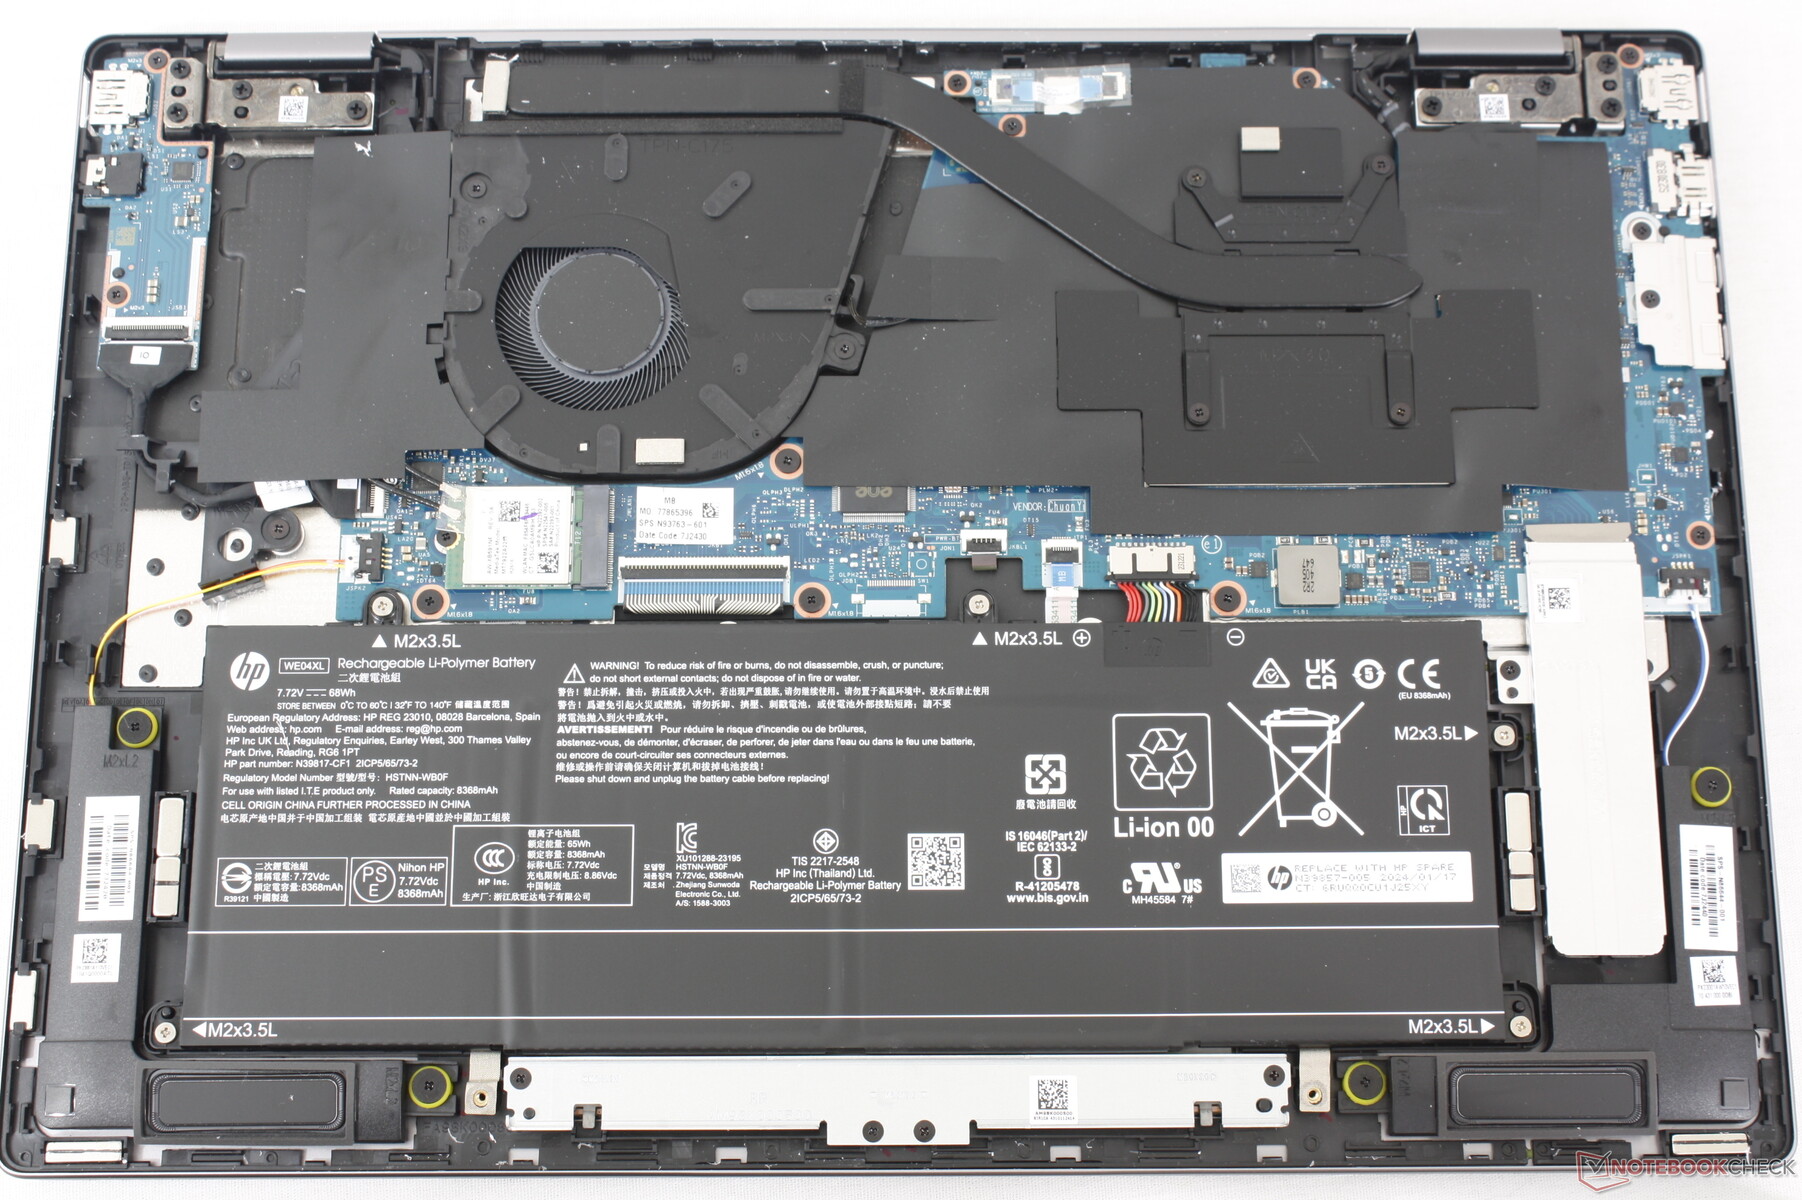
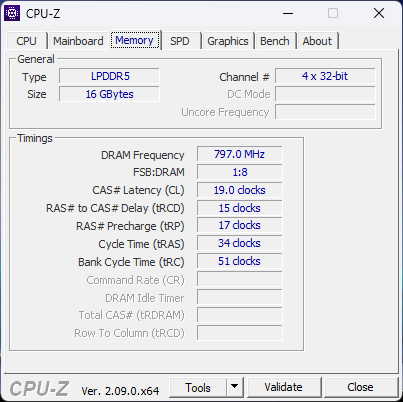
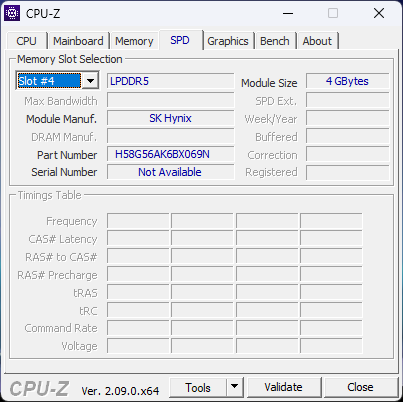
The bottom panel is secured by just four Torx screws. Removing it, however, is a whole other story as the edges are sharp and extremely tight to make servicing more difficult than it needs to be. We experienced this exact same problem on the Envy x360 15 to suggest that HP hadn't bothered to improve this aspect for the Envy x360 16 design. There's not much to upgrade once inside as RAM is soldered, anyway.
Accessories And Warranty
An active stylus pen is optional. The standard one-year limited manufacturer warranty applies if purchased in the US.
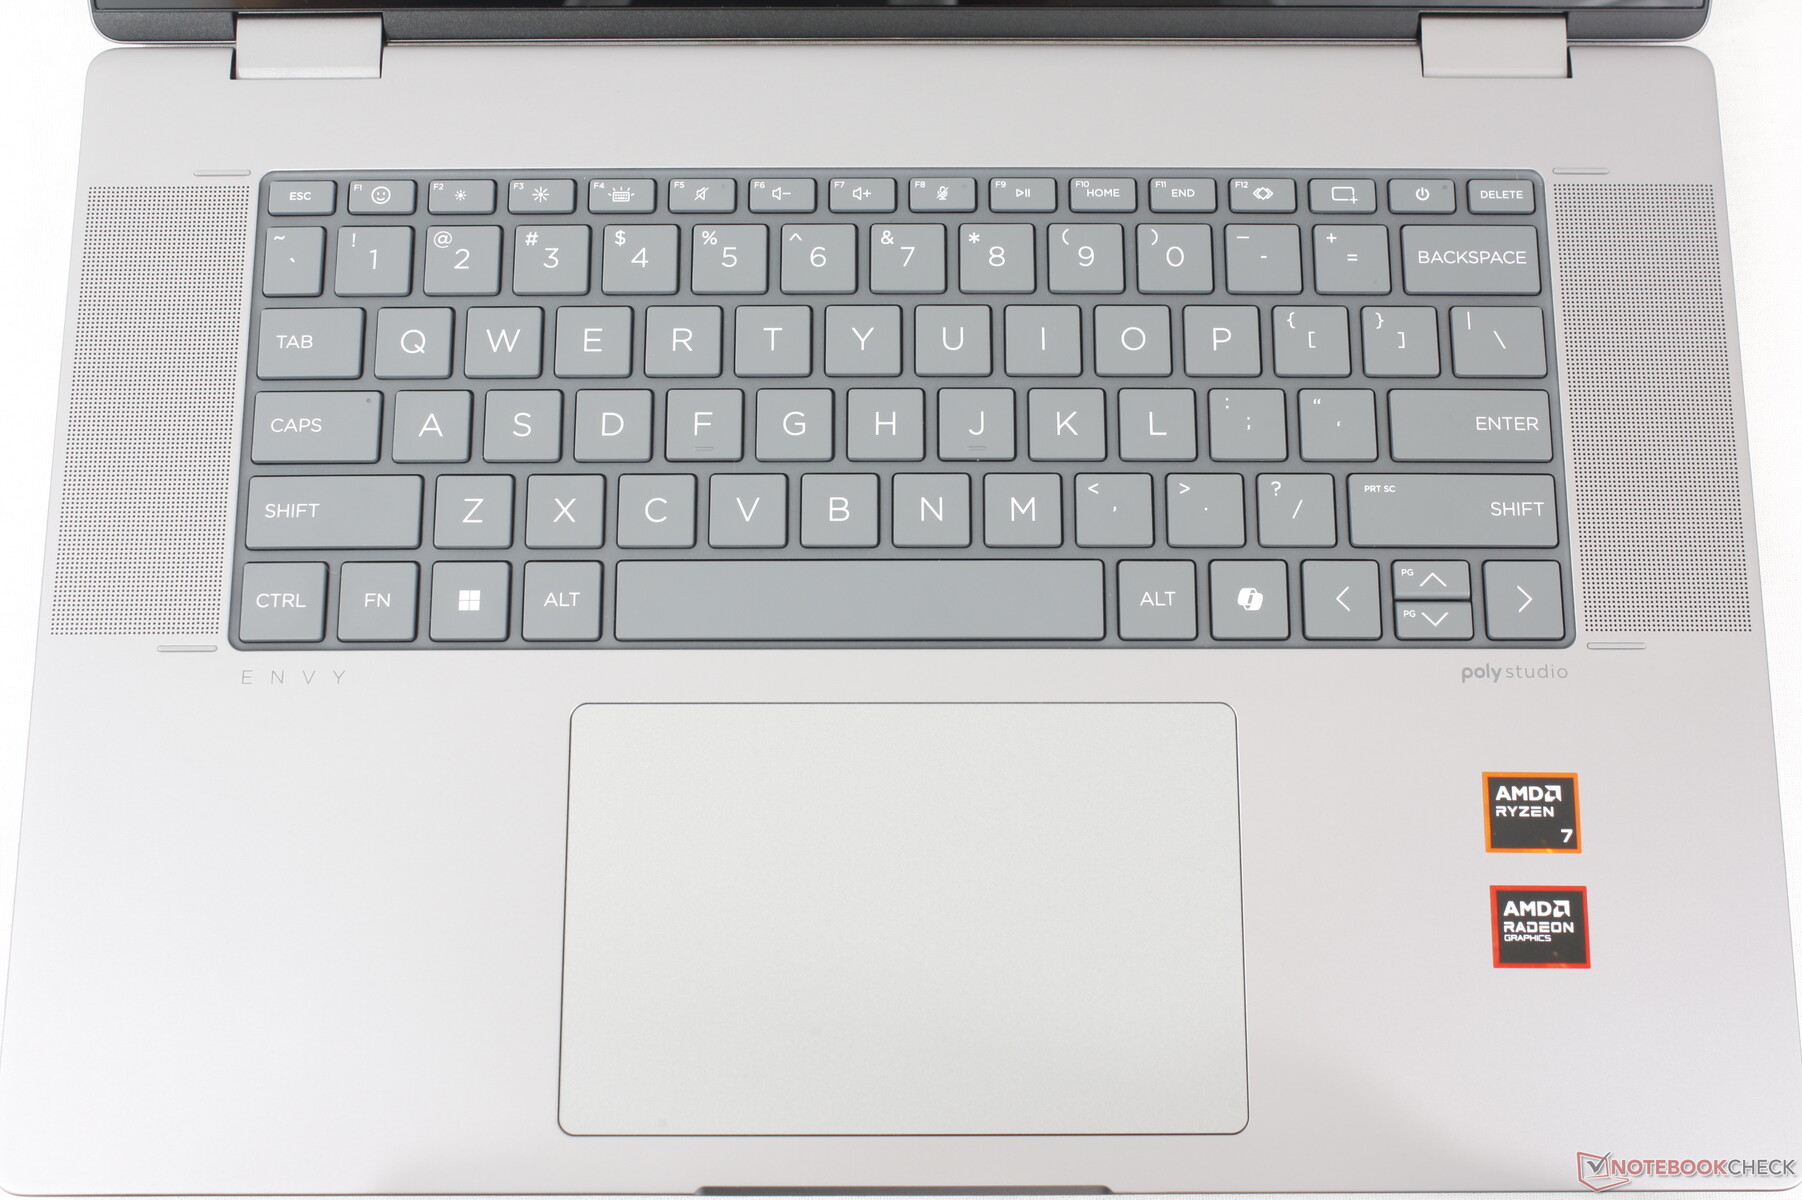
Input Devices — Spacious And Comfy
Keyboard
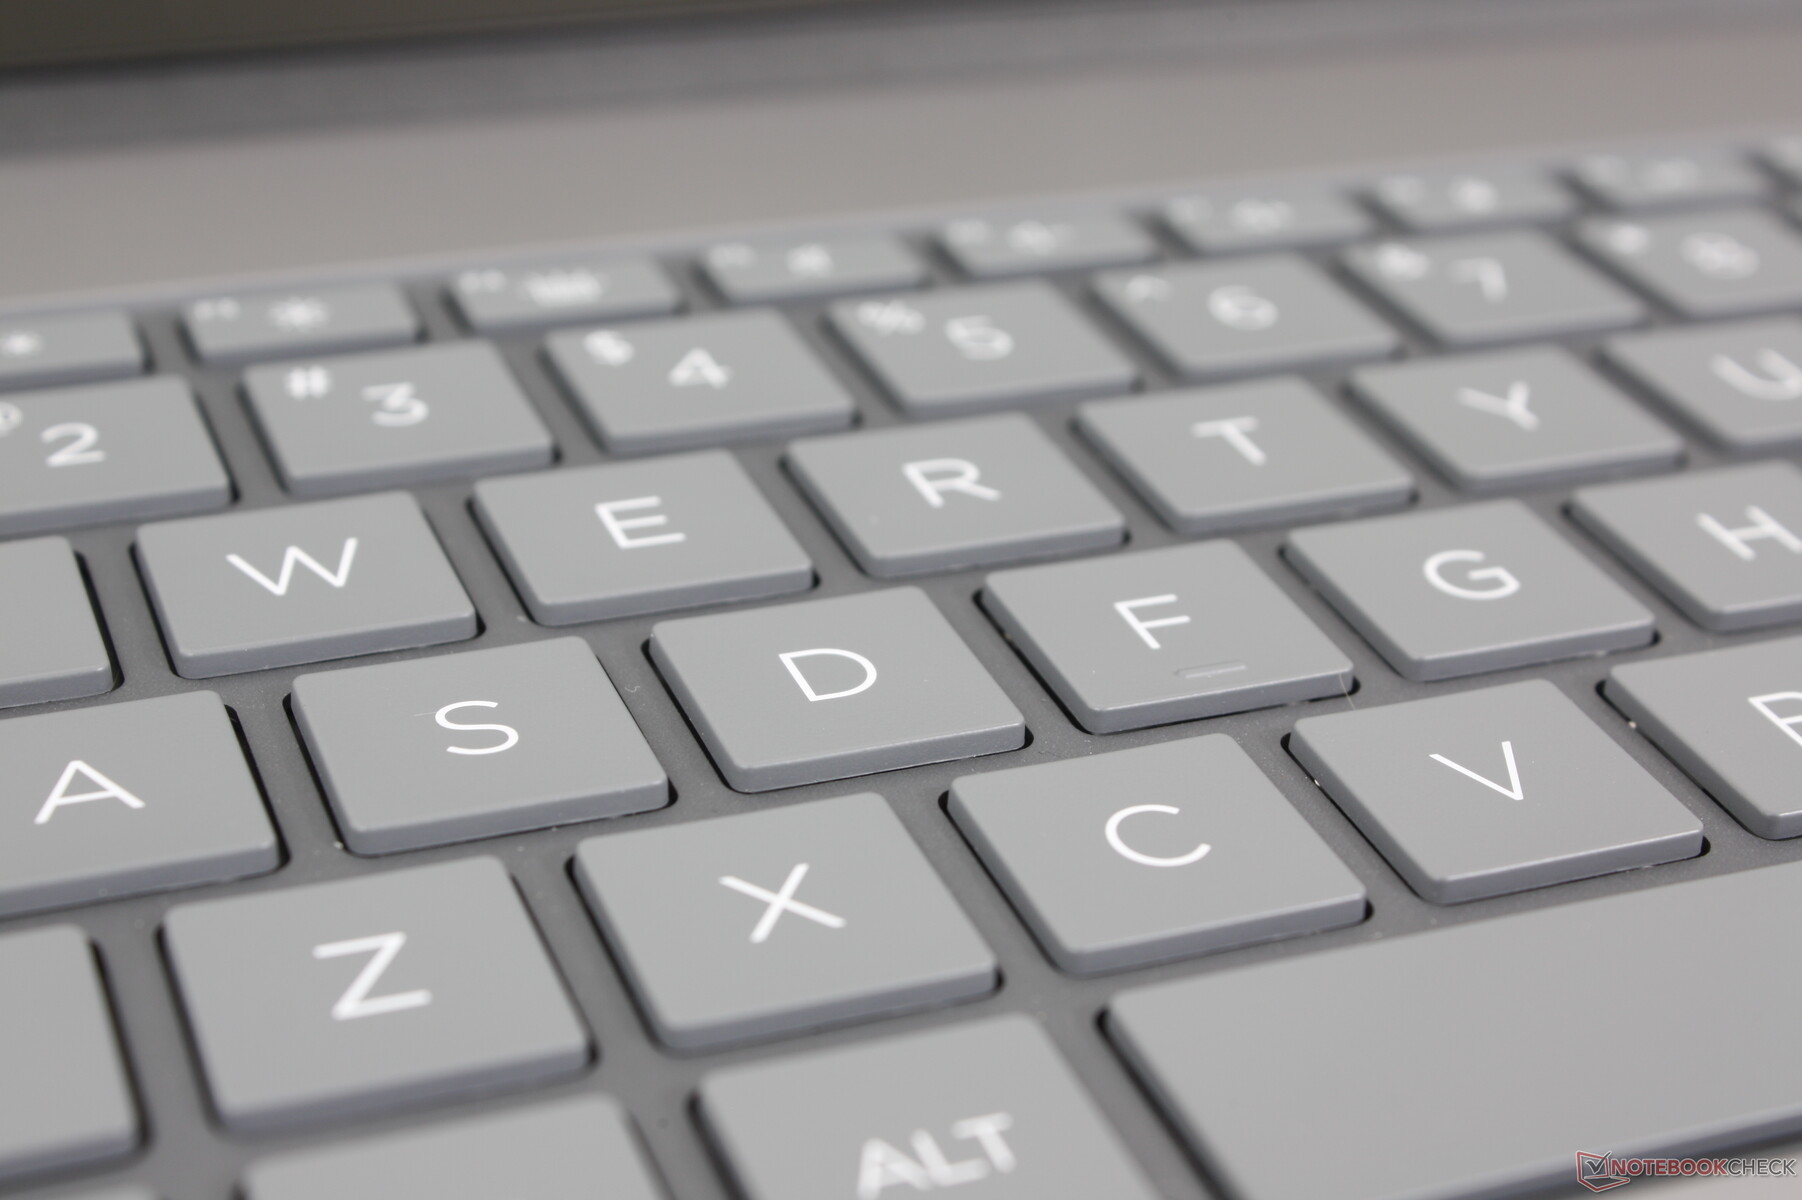
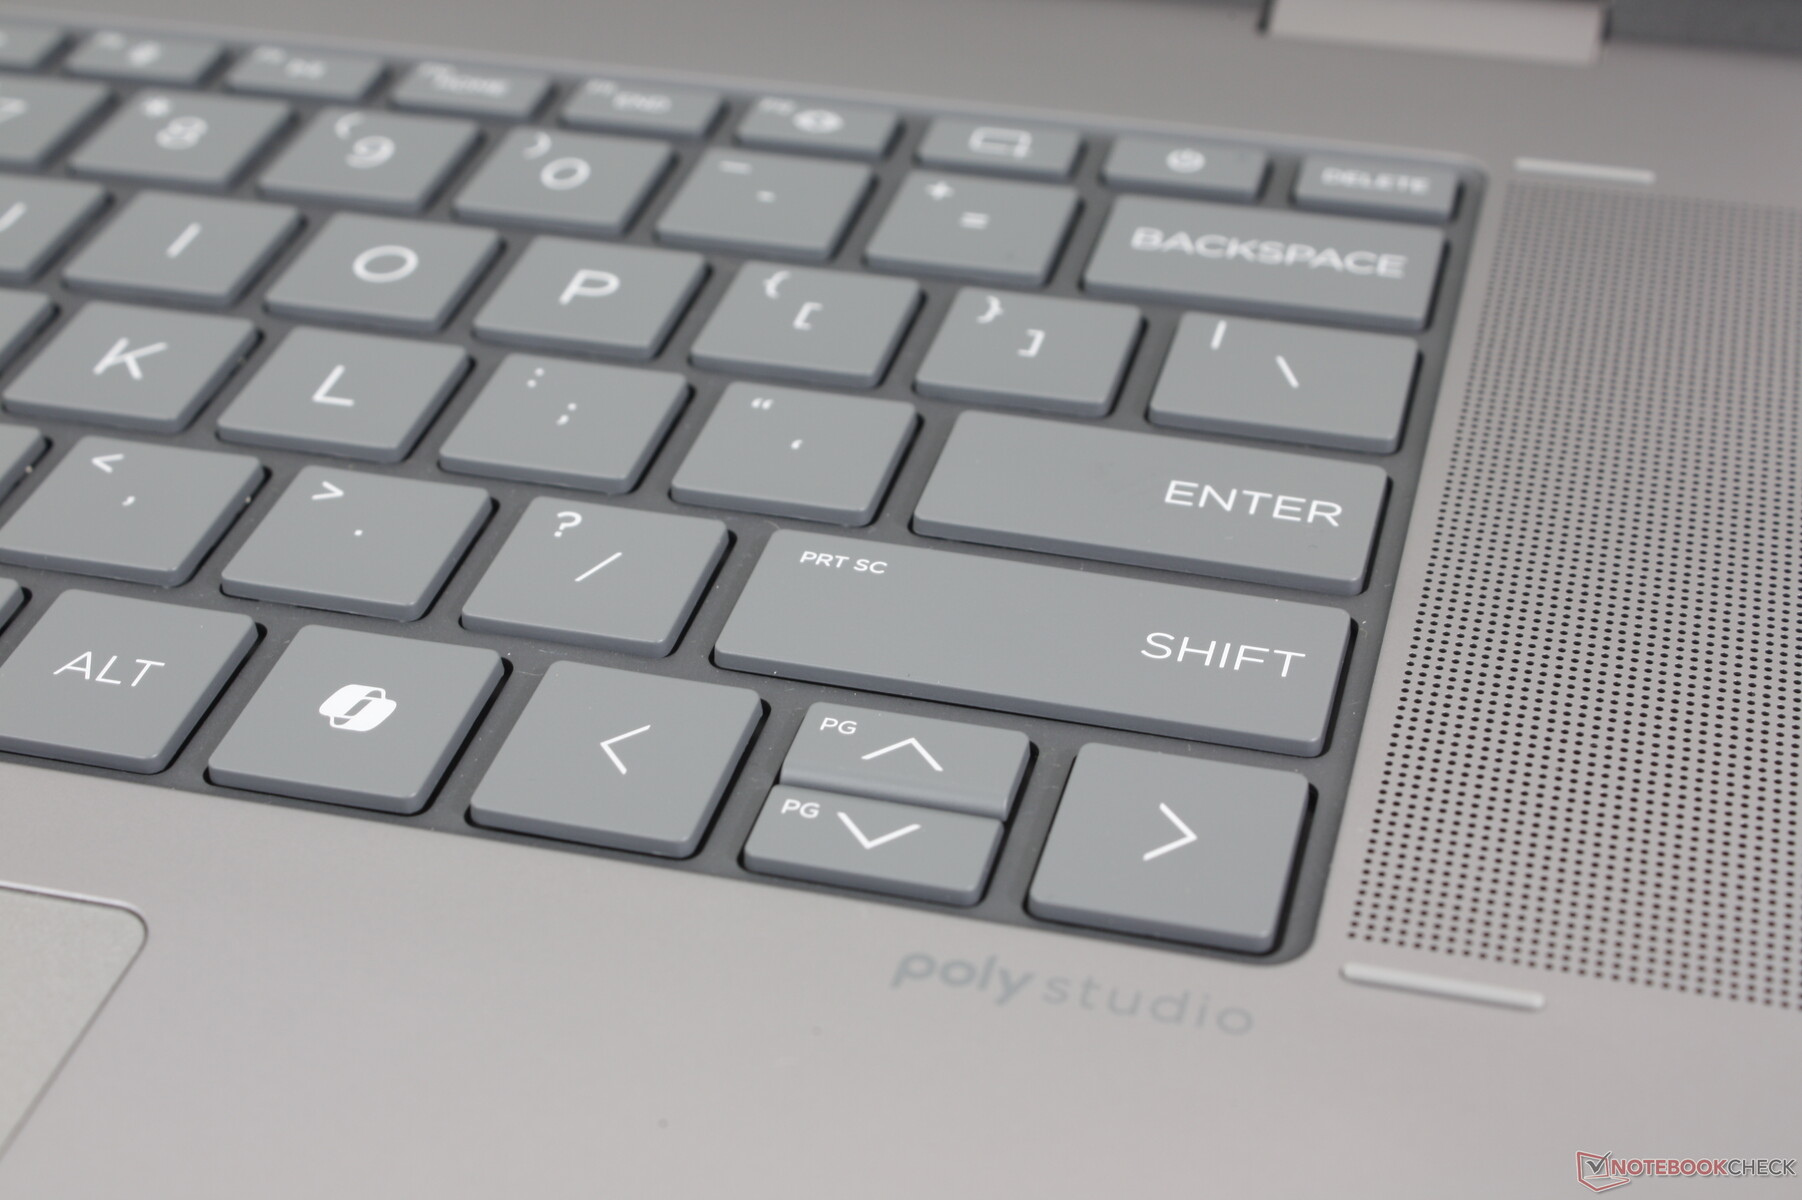
Key layout has changed from the Envy x360 15. The dedicated column of keys along the right edge (PgDn, PgUp, End, etc.) has been removed and its functions have now merged with the rest of the keyboard. This change makes the layout more visually on par with the Spectre x360 16 albeit without the fingerprint reader.
The typing experience is otherwise excellent and comparable to a Spectre with crisper feedback than on competing VivoBook or IdeaPad models. The GIF and customizable keys in particular are worthy mentions as most other multimedia laptops don't include such features.
Touchpad
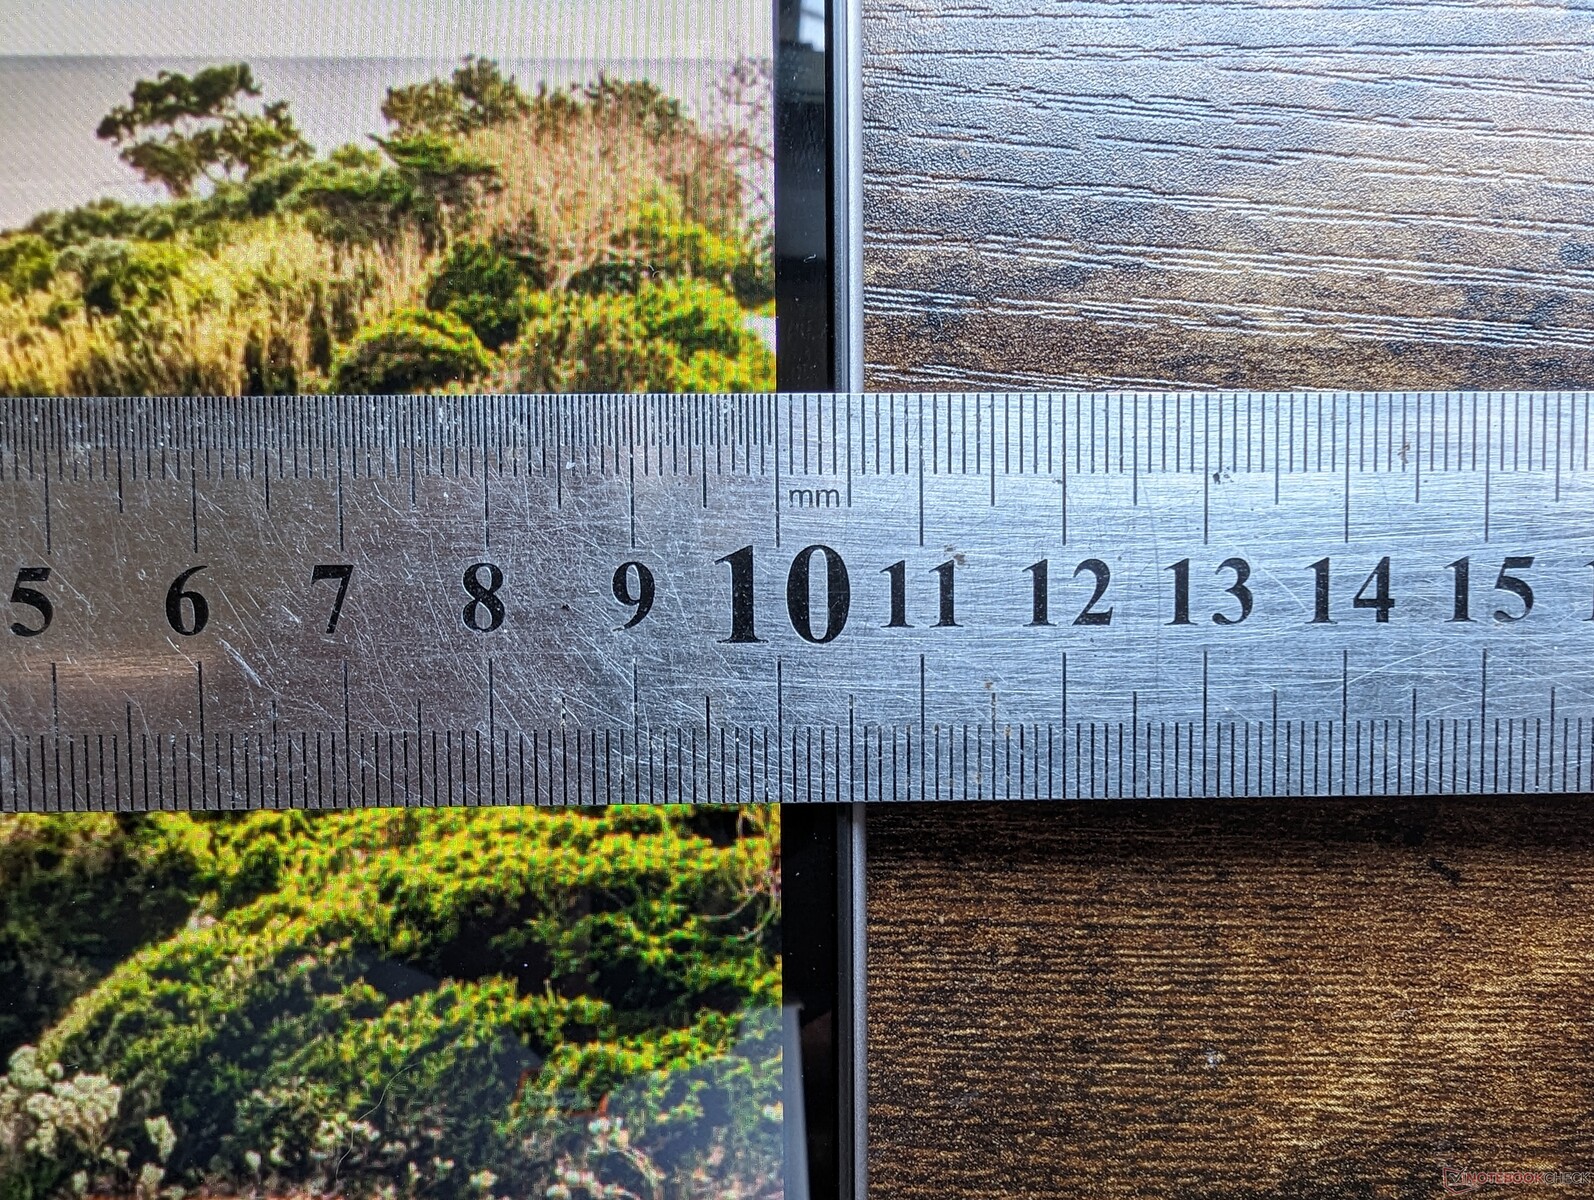
The clickpad is smaller than the one on the Spectre x360 16 (13.5 x 8.8 cm vs. 16 x 10 cm). Even so, it still feels spacious and sufficiently large even for a 16-inch form factor. Traction is smooth with only a bit of sticking when gliding at slower speeds while feedback when clicking is a bit soft and could have been firmer.
Display — High-End OLED For A Midrange Price
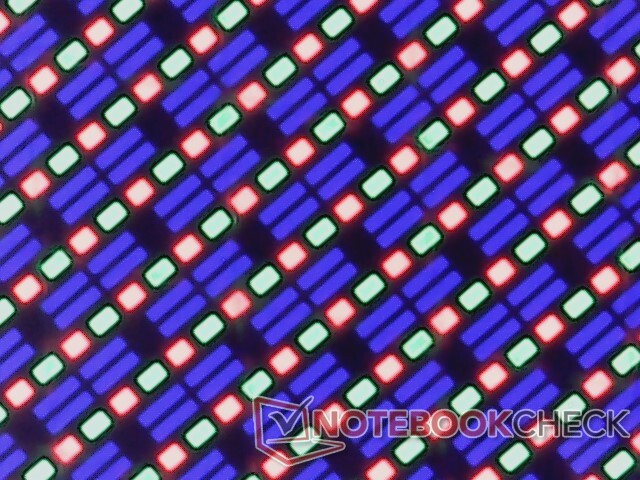
HP deploys the same Samsung SDC41A6 OLED panel for both the Envy x360 16 and Spectre x360 16 even though the latter is much more expensive. The visual experience is therefore identical between the two models down to their 100% DCI-P3 colors, fast response times, 120 Hz refresh rate, 400-nit maximum brightness, and even OLED DC dimming technology. This is a high-end display for a midrange laptop which puts the Envy x360 16 a step above other similarly-priced alternatives.
The display can be as bright as 616 nits when HDR is enabled. Otherwise, SDR content is limited to ~400 nits.
The 120 Hz display does not support variable refresh rate and so it instead offers two fixed refresh rate options: 48 Hz and 120 Hz. There is no 60 Hz selection unlike on most other panels.
| |||||||||||||||||||||||||
Brightness Distribution: 98 %
Center on Battery: 399.4 cd/m²
Contrast: ∞:1 (Black: 0 cd/m²)
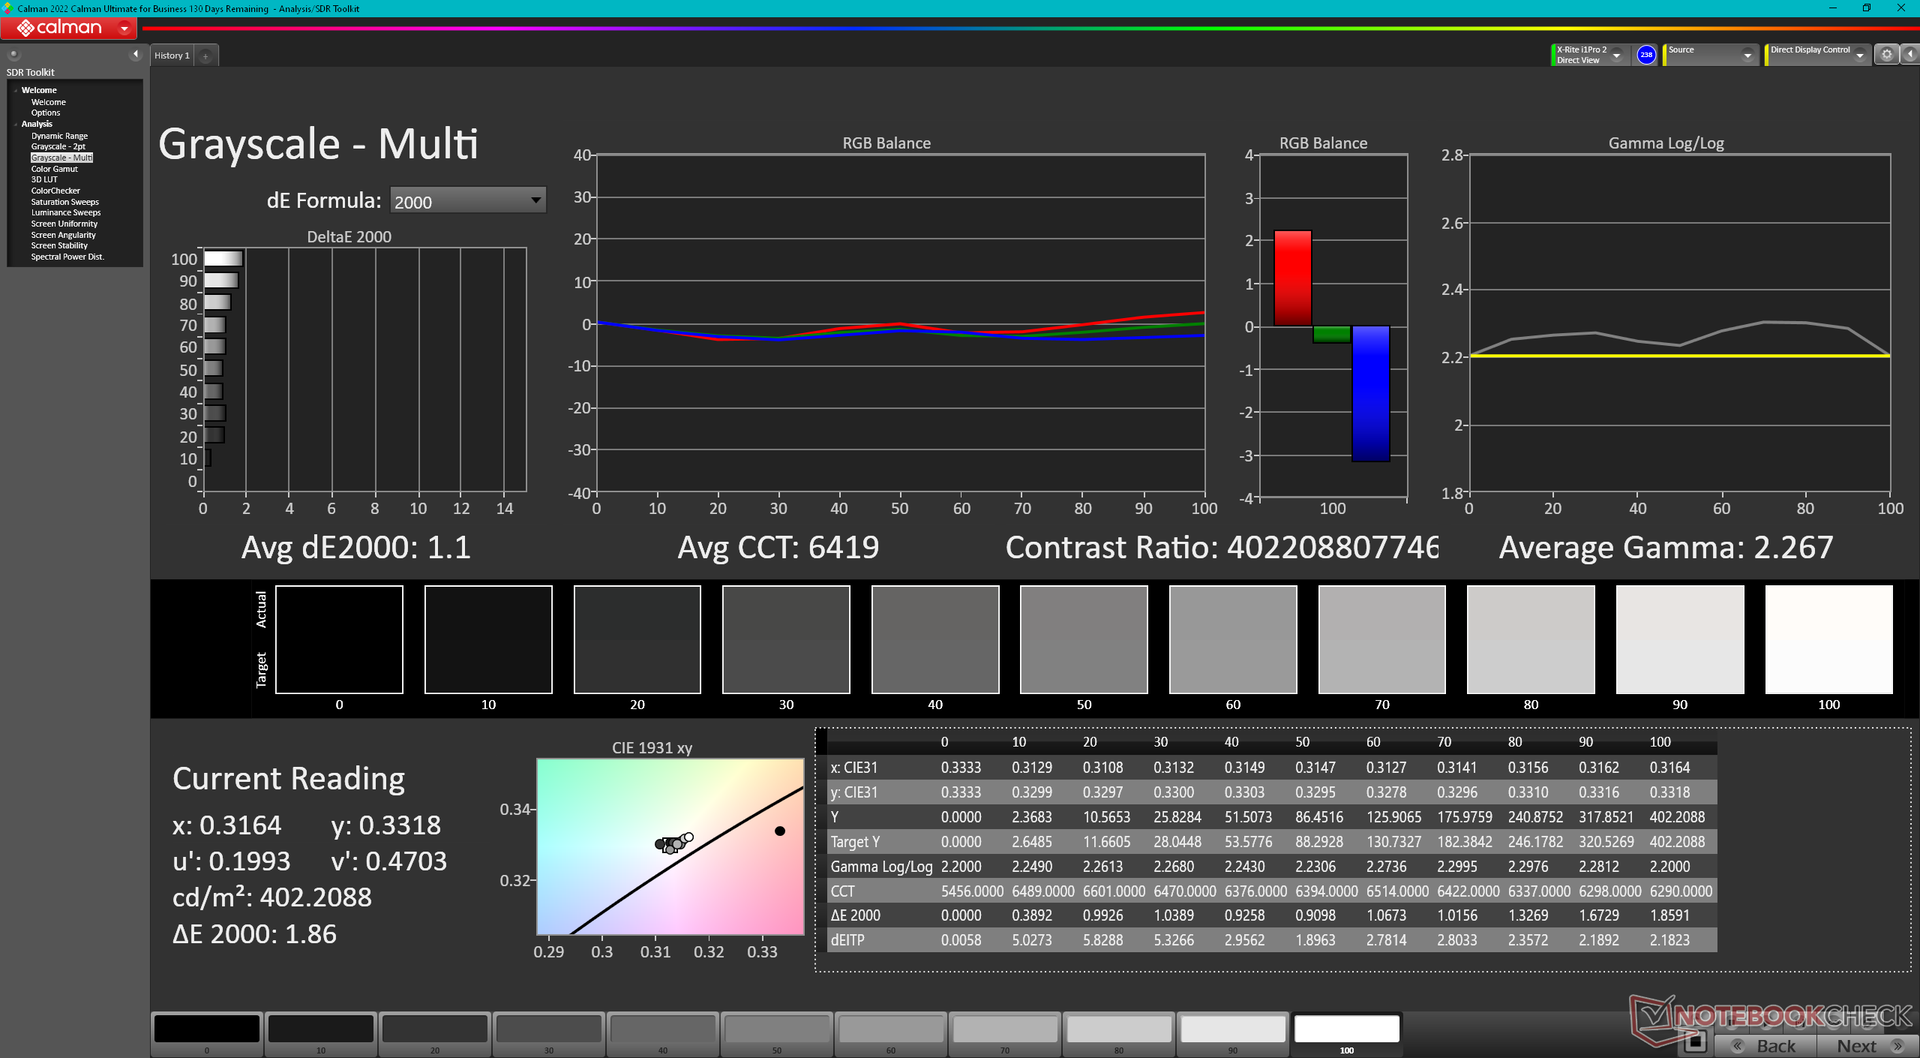
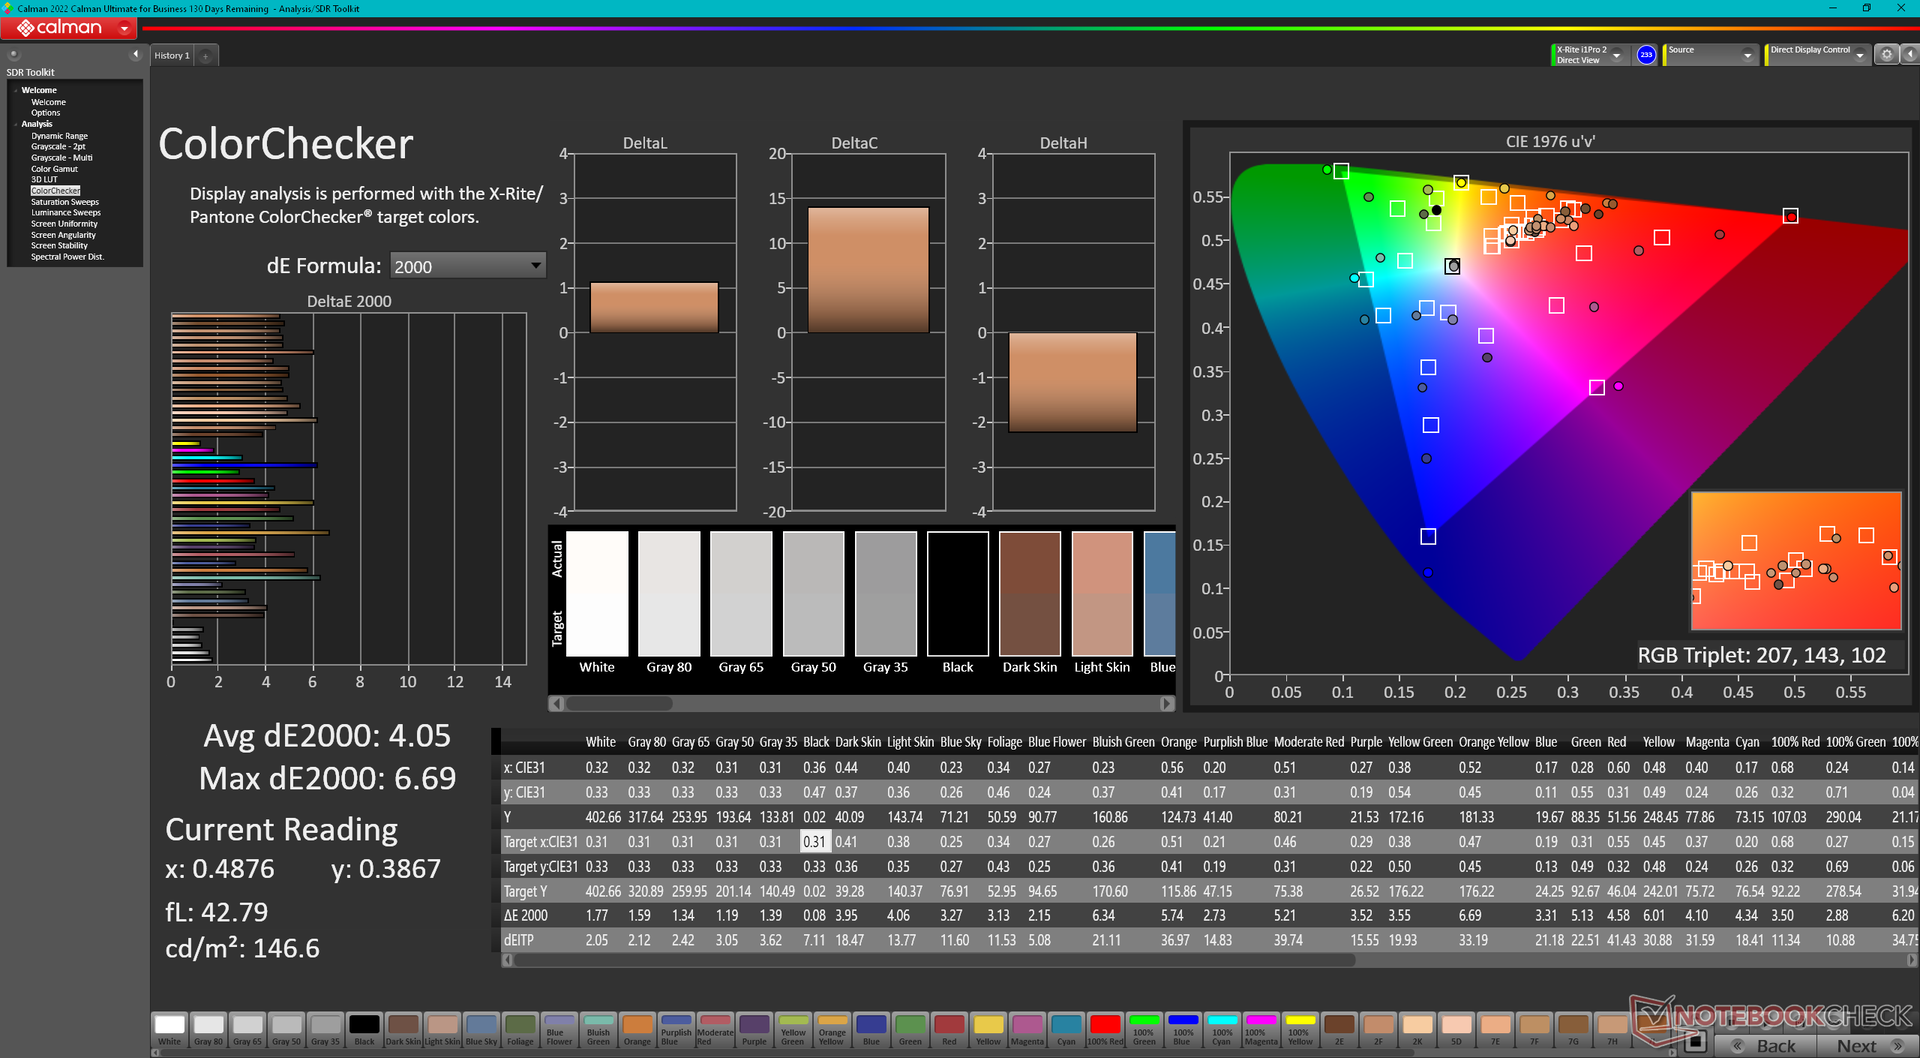
ΔE ColorChecker Calman: 4.05 | ∀{0.5-29.43 Ø4.72}
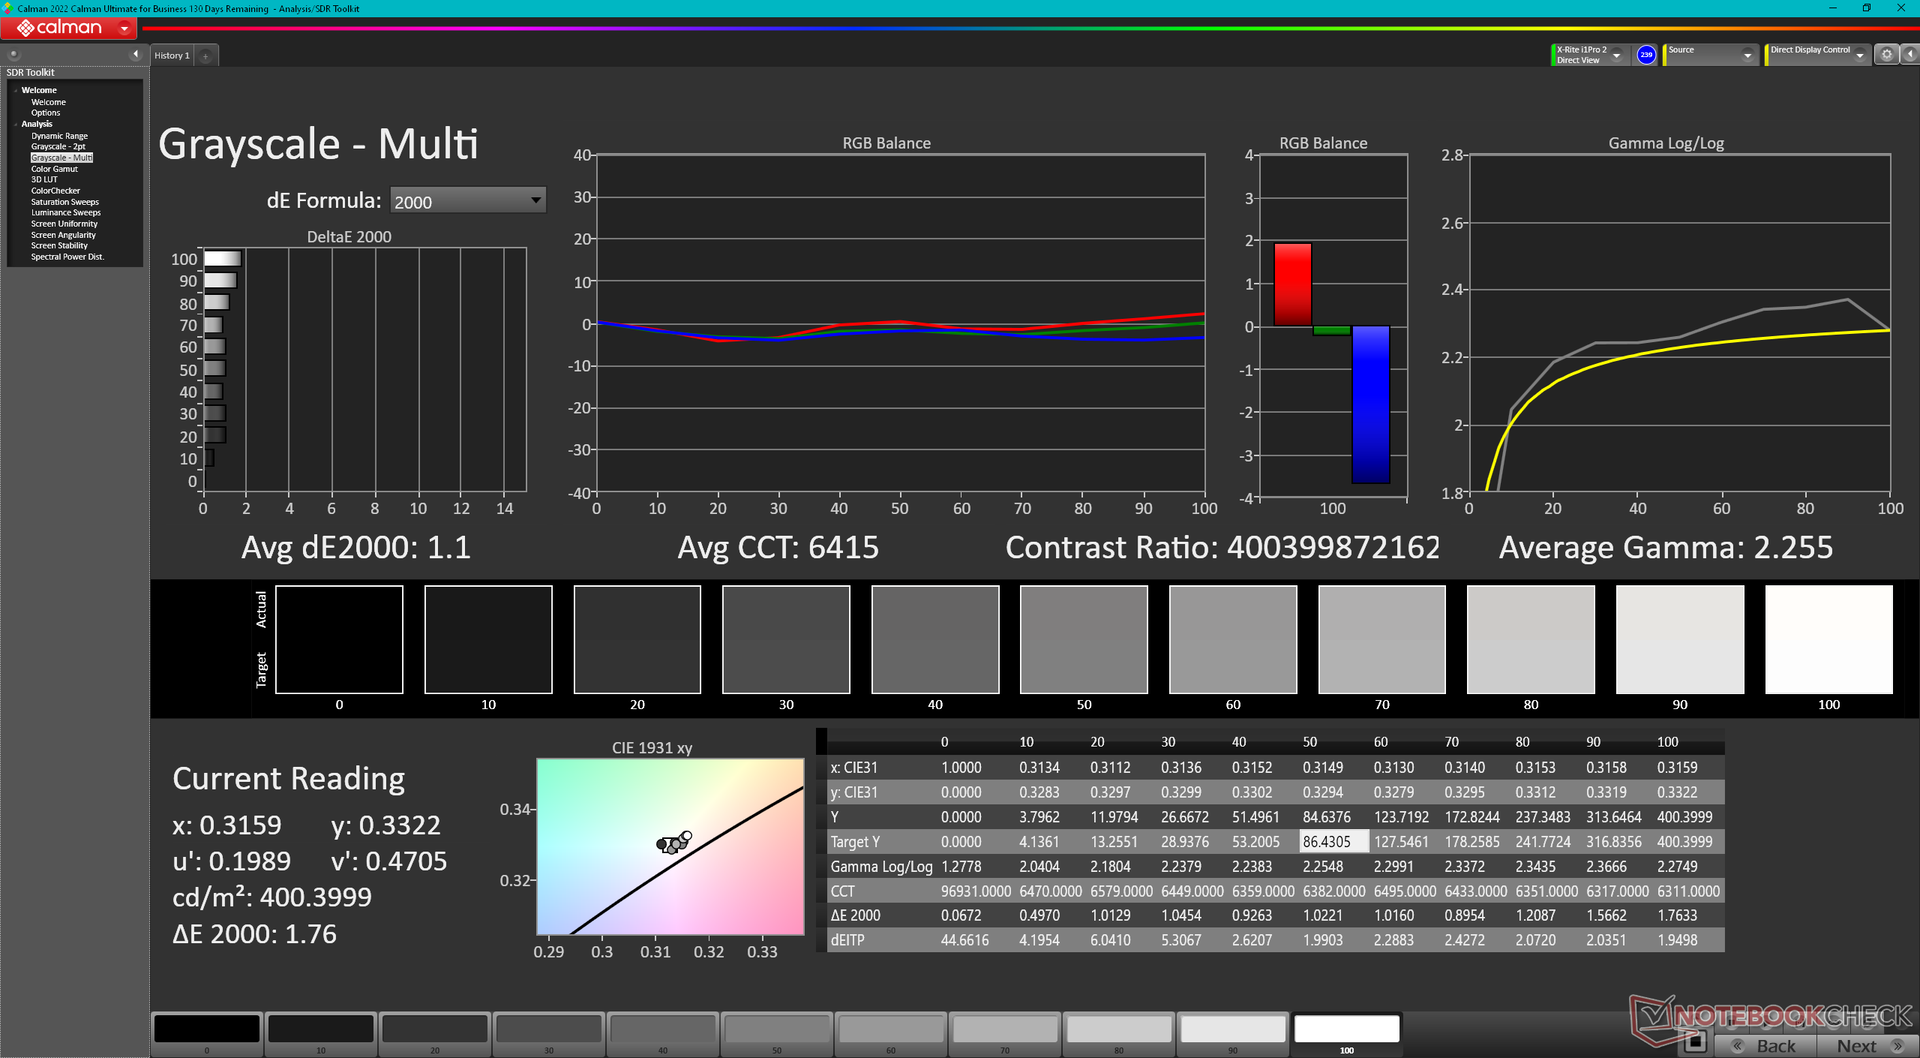
calibrated: 1.02
ΔE Greyscale Calman: 1.1 | ∀{0.09-98 Ø4.97}
96.5% AdobeRGB 1998 (Argyll 3D)
100% sRGB (Argyll 3D)
99.6% Display P3 (Argyll 3D)
Gamma: 2.27
CCT: 6419 K
| HP Envy x360 2-in-1 16-ad0097nr Samsung SDC41A6, OLED, 2880x1800, 16" | HP Envy 16 h0112nr Samsung SDC4174, OLED, 3840x2400, 16" | HP Spectre x360 16 RTX 4050 Samsung SDC41A6, OLED, 2880x1800, 16" | Lenovo Yoga 7 2-in-1 16IML9 LEN160FHD, IPS, 1920x1200, 16" | Samsung Galaxy Book4 Pro 360 ATNA60CL09-0, OLED, 2880x1800, 16" | LG Gram 2in1 16 16T90R - G.AA78G LP160WQ1-SPB2, IPS, 2560x1600, 16" | |
|---|---|---|---|---|---|---|
| Display | -3% | 0% | -51% | 0% | -5% | |
| Display P3 Coverage (%) | 99.6 | 99.3 0% | 99.6 0% | 40.9 -59% | 99.9 0% | 96.5 -3% |
| sRGB Coverage (%) | 100 | 100 0% | 100 0% | 61.4 -39% | 100 0% | 99.9 0% |
| AdobeRGB 1998 Coverage (%) | 96.5 | 88 -9% | 96.7 0% | 42.3 -56% | 96.6 0% | 84.6 -12% |
| Response Times | -132% | 3% | -3131% | 32% | -3502% | |
| Response Time Grey 50% / Grey 80% * (ms) | 0.8 ? | 2 ? -150% | 0.78 ? 2% | 32.1 ? -3913% | 0.49 ? 39% | 38.4 ? -4700% |
| Response Time Black / White * (ms) | 0.89 ? | 1.9 ? -113% | 0.86 ? 3% | 21.8 ? -2349% | 0.67 ? 25% | 21.4 ? -2304% |
| PWM Frequency (Hz) | 491.8 ? | 240.4 ? | 480 ? | 240 ? | ||
| Screen | 3% | -8% | -84% | 14% | -68% | |
| Brightness middle (cd/m²) | 399.4 | 328.8 -18% | 385.2 -4% | 313.3 -22% | 387 -3% | 329 -18% |
| Brightness (cd/m²) | 405 | 332 -18% | 387 -4% | 294 -27% | 392 -3% | 310 -23% |
| Brightness Distribution (%) | 98 | 97 -1% | 99 1% | 82 -16% | 98 0% | 88 -10% |
| Black Level * (cd/m²) | 0.35 | 0.39 | ||||
| Colorchecker dE 2000 * | 4.05 | 1.53 62% | 1.73 57% | 4.41 -9% | 1 75% | 3.52 13% |
| Colorchecker dE 2000 max. * | 6.69 | 6.04 10% | 3.95 41% | 15.75 -135% | 1.9 72% | 6.96 -4% |
| Colorchecker dE 2000 calibrated * | 1.02 | 1.84 -80% | 1.15 -13% | |||
| Greyscale dE 2000 * | 1.1 | 1.3 -18% | 2.6 -136% | 4.4 -300% | 1.7 -55% | 5.75 -423% |
| Gamma | 2.27 97% | 2.18 101% | 2.17 101% | 2.3 96% | 2.25 98% | 2.137 103% |
| CCT | 6419 101% | 6362 102% | 6133 106% | 7395 88% | 6325 103% | 7584 86% |
| Contrast (:1) | 895 | 844 | ||||
| Total Average (Program / Settings) | -44% /
-23% | -2% /
-4% | -1089% /
-584% | 15% /
14% | -1192% /
-625% |
* ... smaller is better
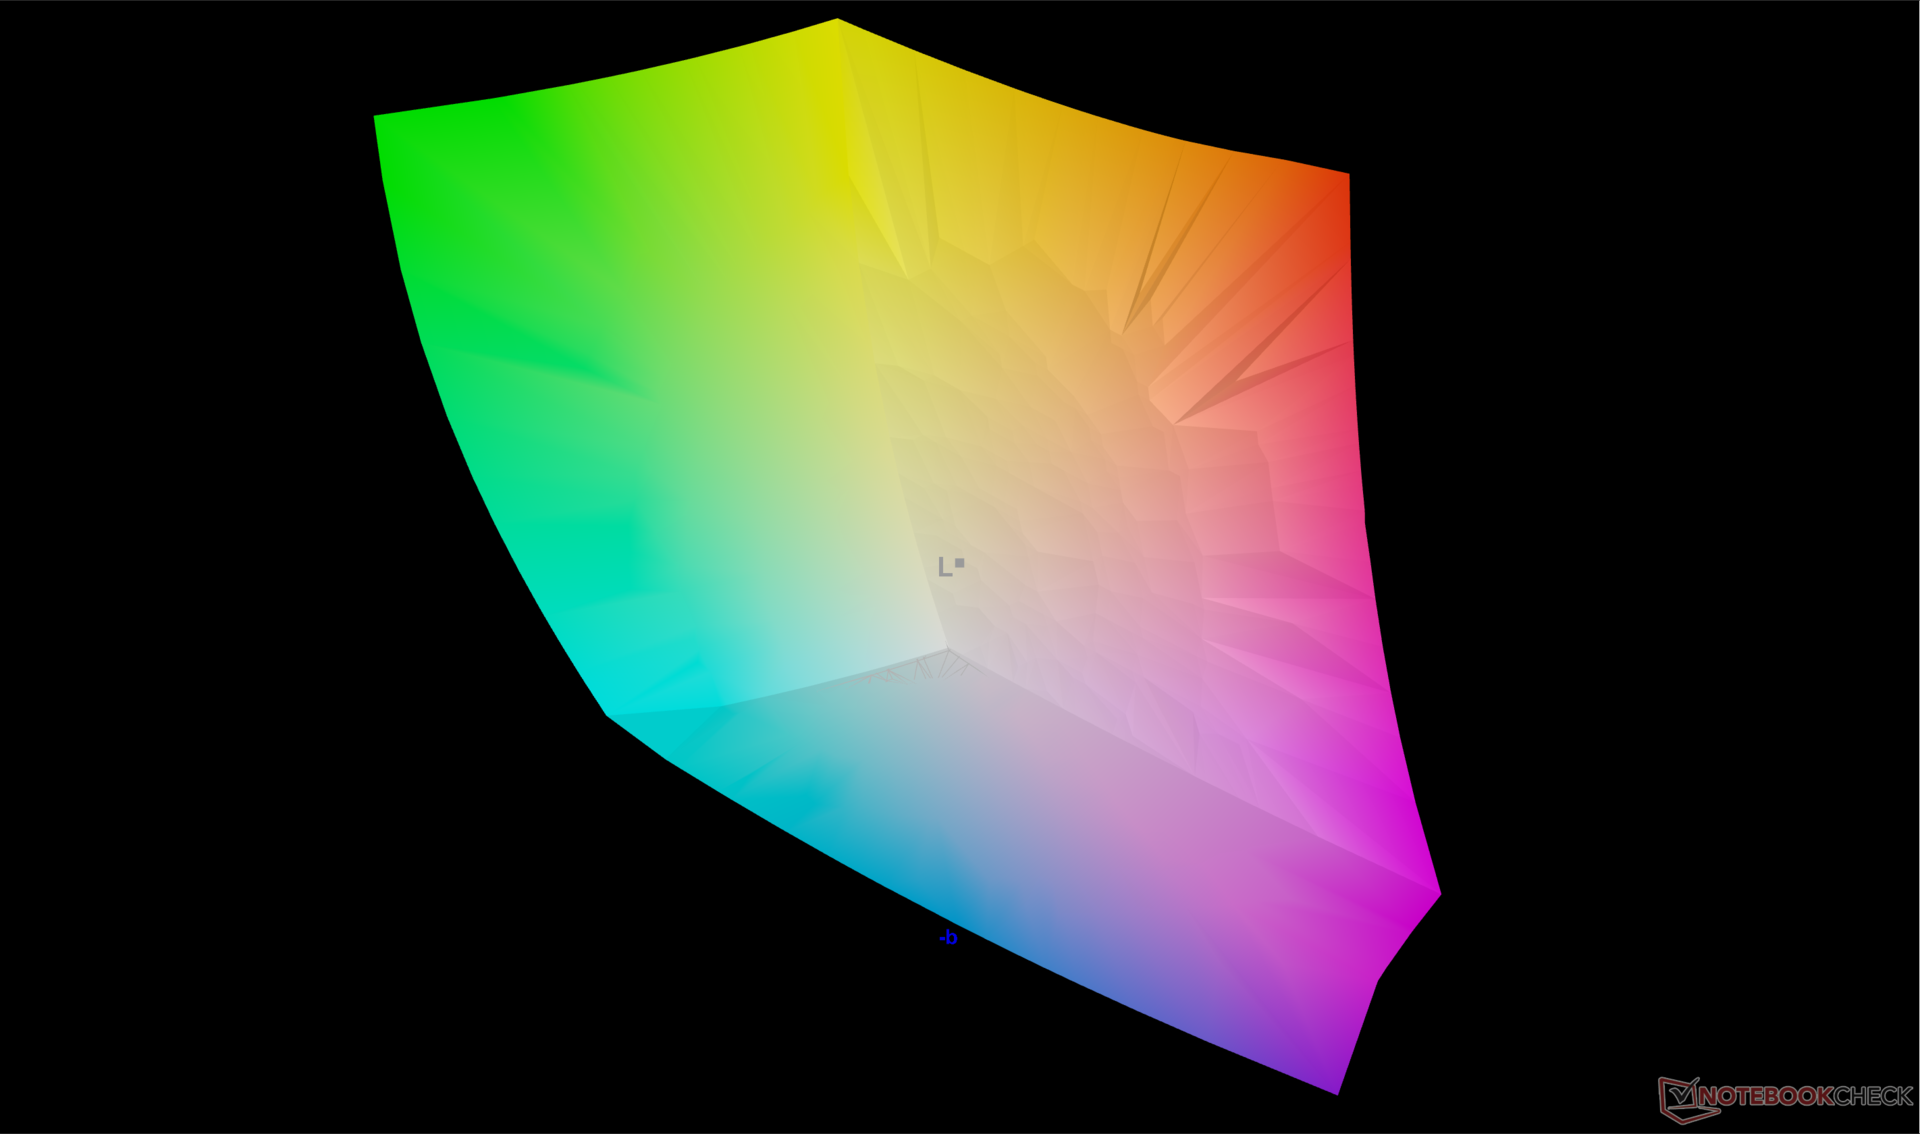
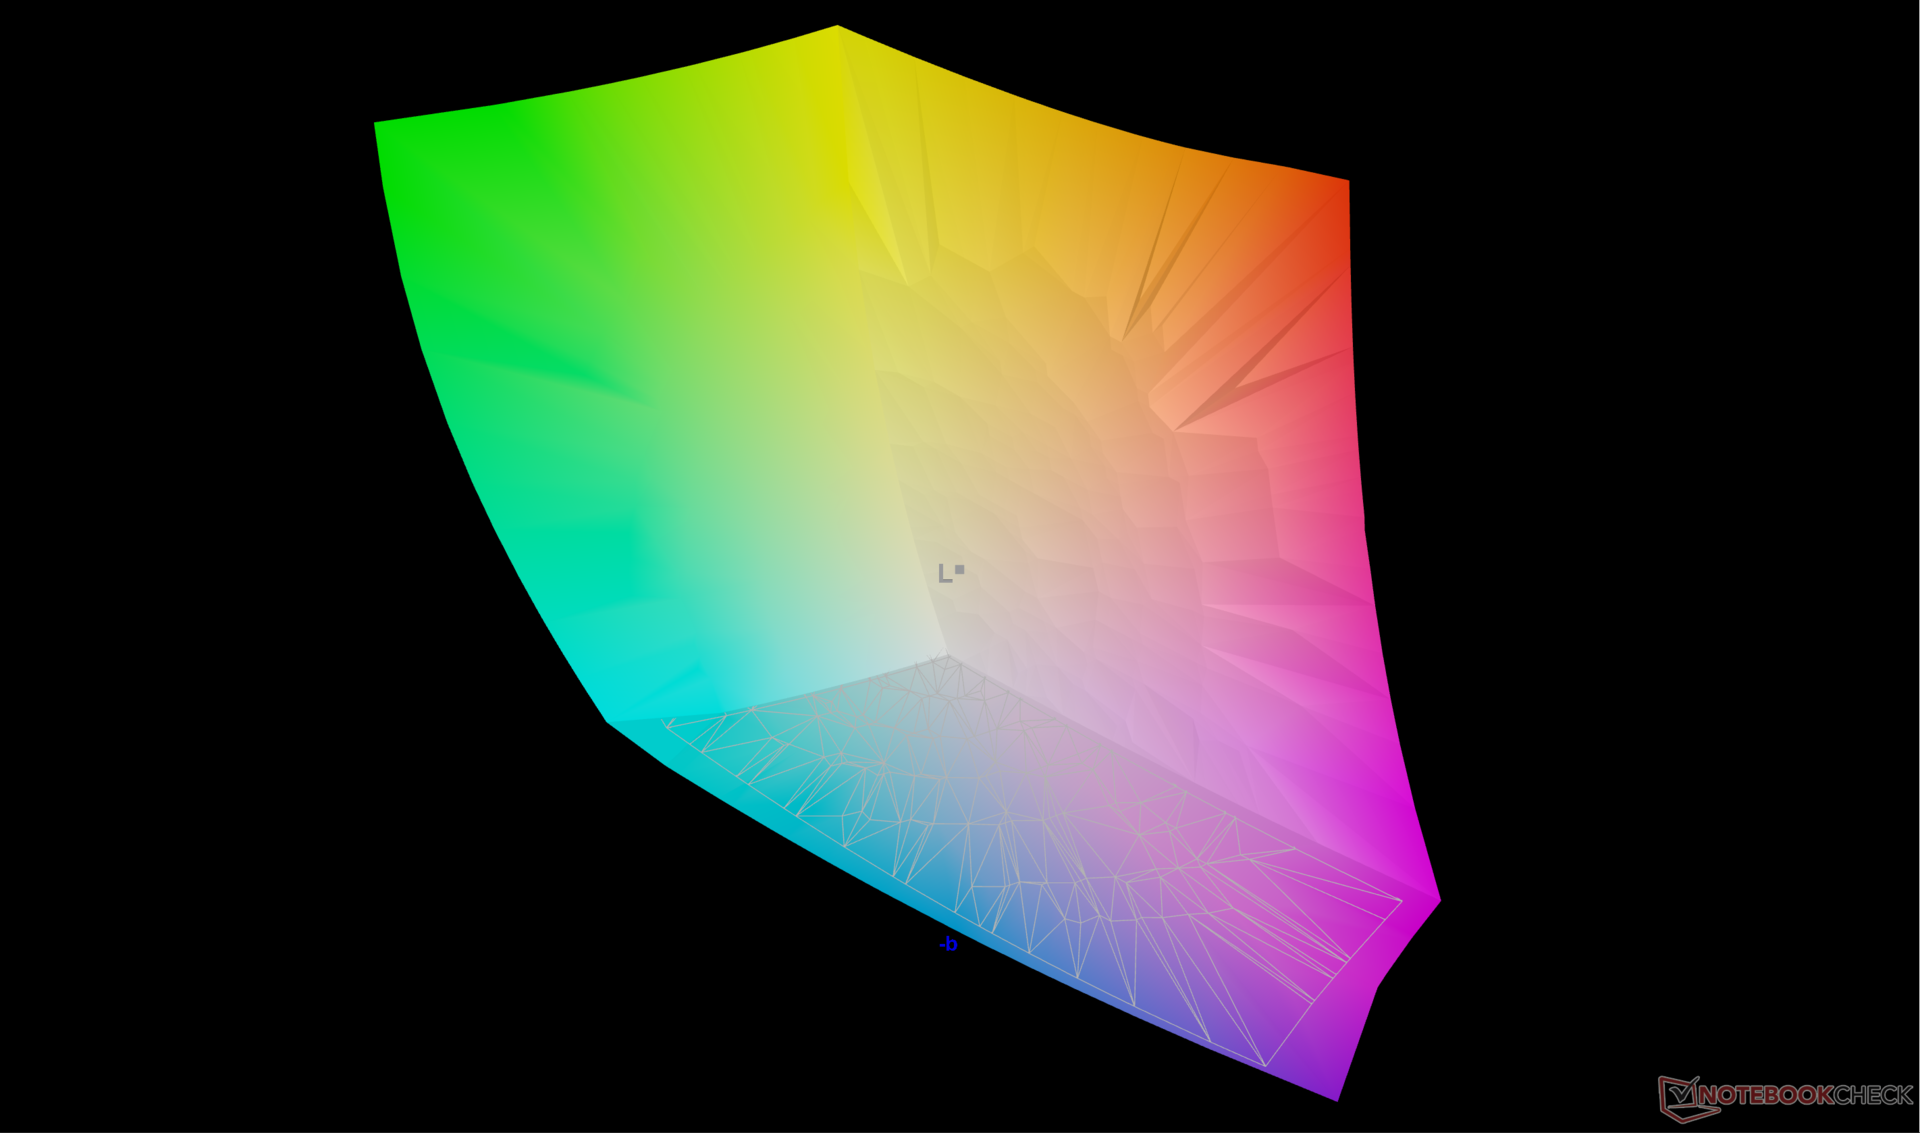
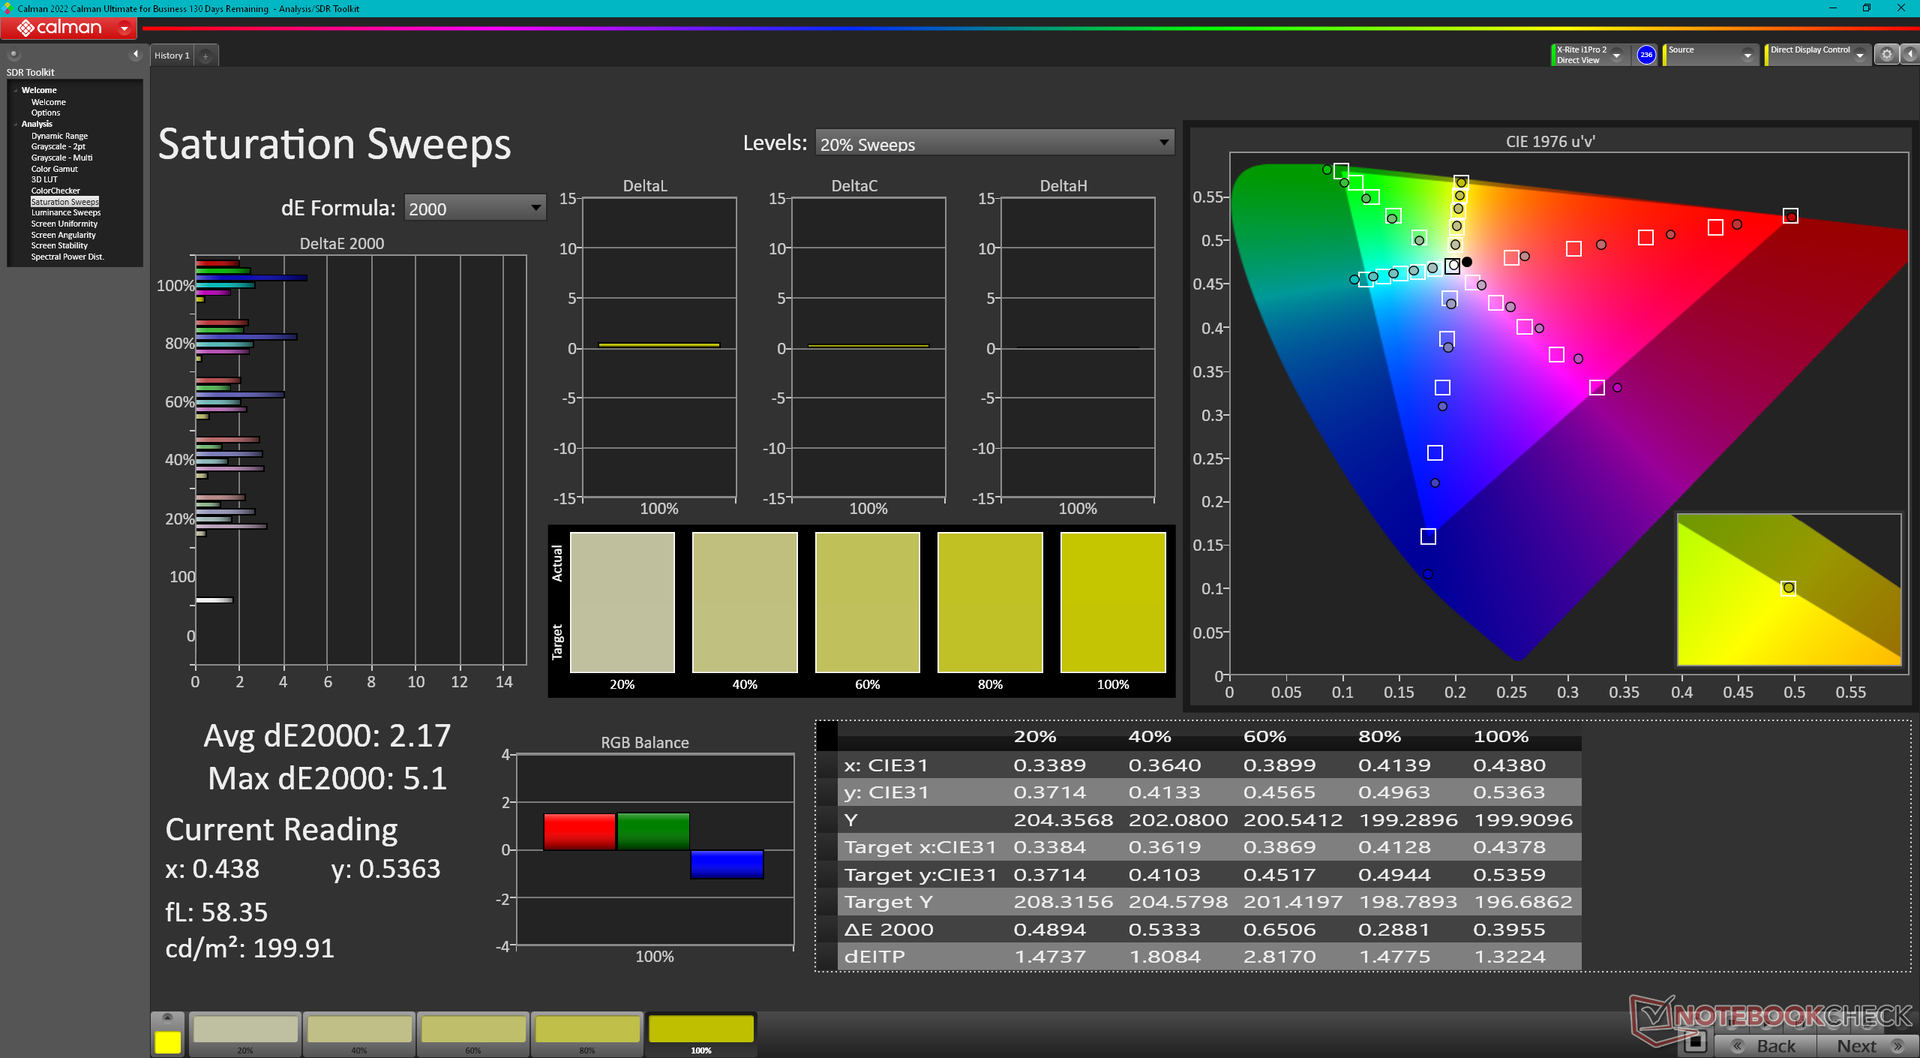
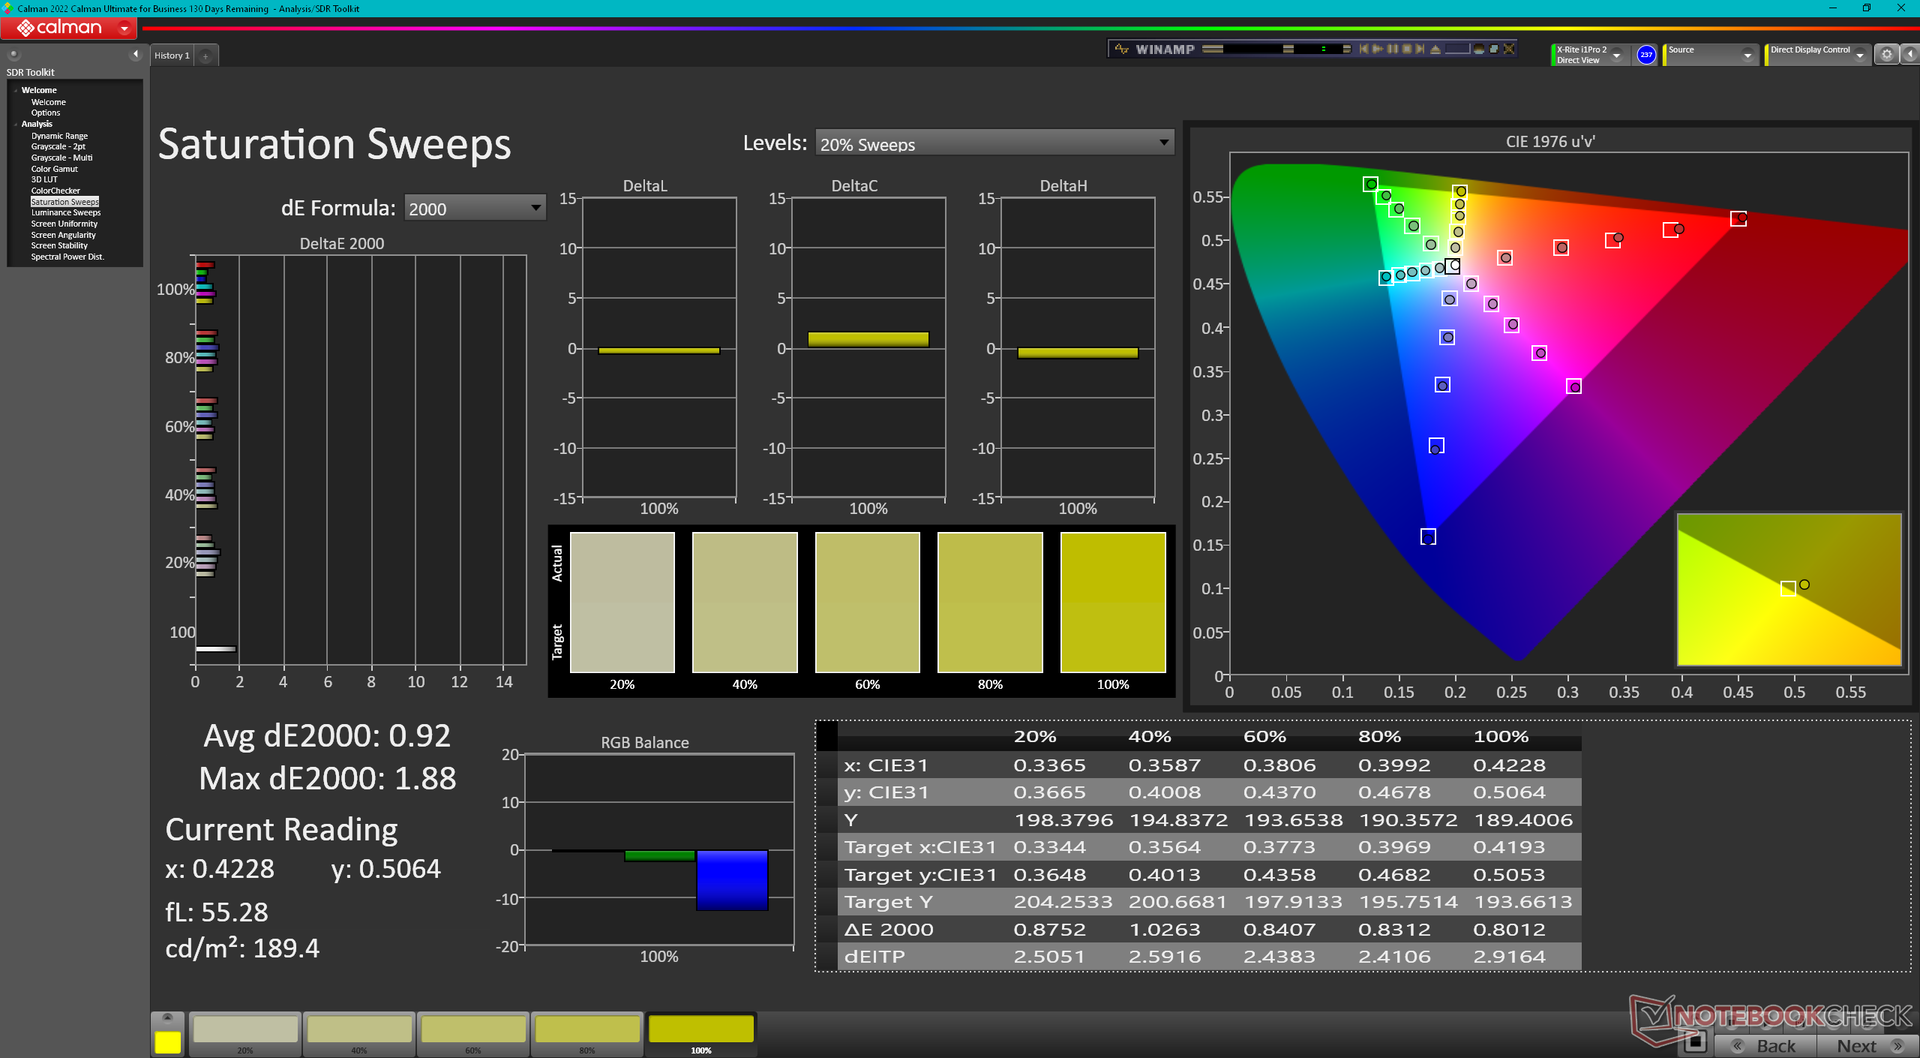
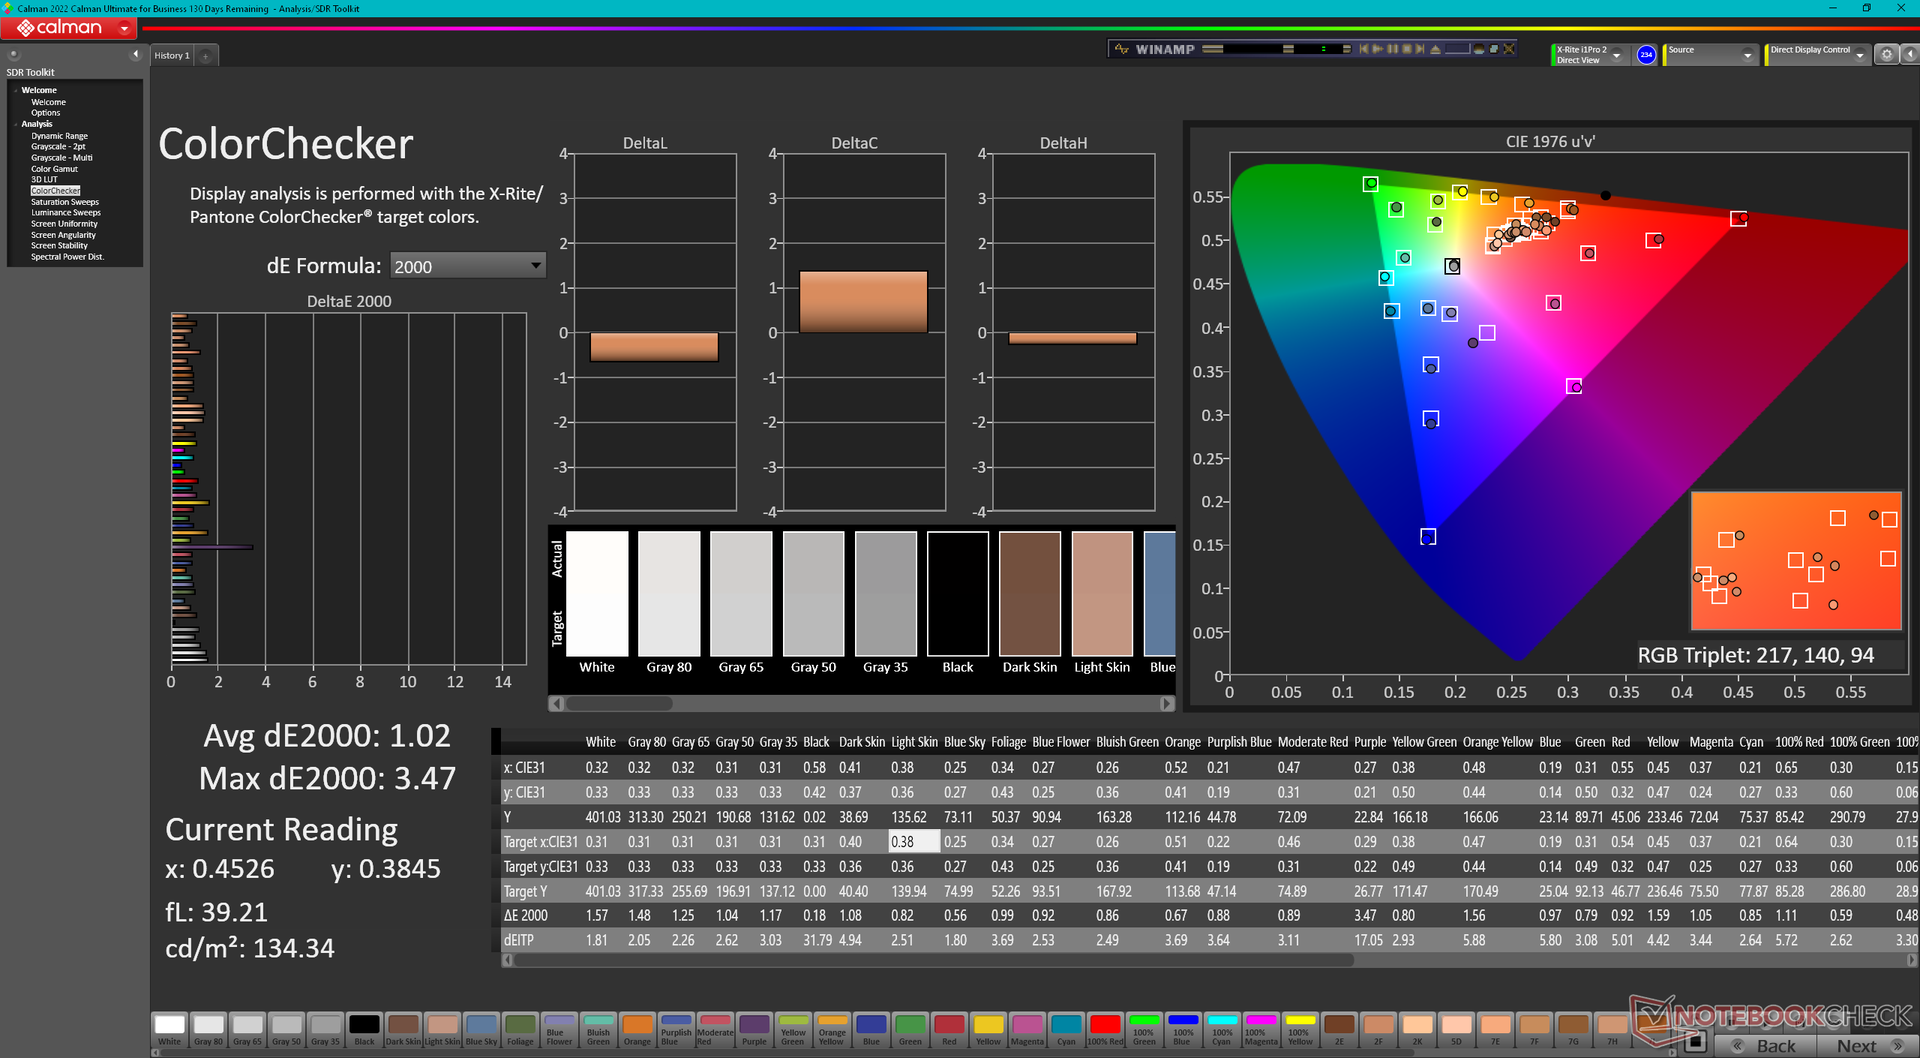
The display is well-calibrated against the P3 standard with average out-of-the-box grayscale and color deltaE values of just 1.1 and 4.05, respectively.
Display Response Times
| ↔ Response Time Black to White | ||
|---|---|---|
| 0.89 ms ... rise ↗ and fall ↘ combined | ↗ 0.42 ms rise | 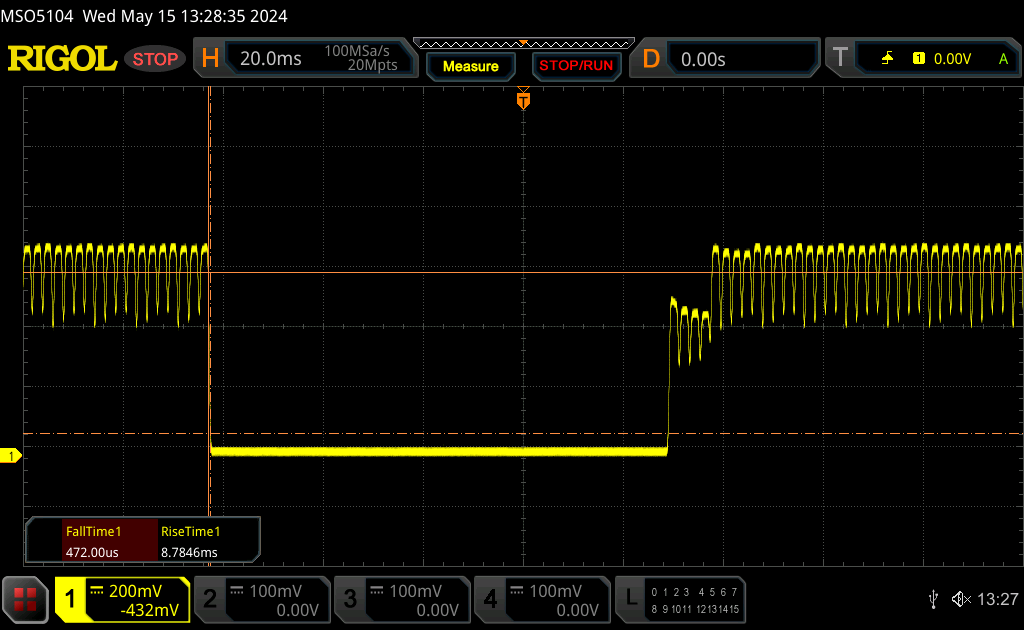 |
| ↘ 0.47 ms fall | ||
| The screen shows very fast response rates in our tests and should be very well suited for fast-paced gaming. In comparison, all tested devices range from 0.1 (minimum) to 240 (maximum) ms. » 3 % of all devices are better. This means that the measured response time is better than the average of all tested devices (19.8 ms). | ||
| ↔ Response Time 50% Grey to 80% Grey | ||
| 0.8 ms ... rise ↗ and fall ↘ combined | ↗ 0.45 ms rise | 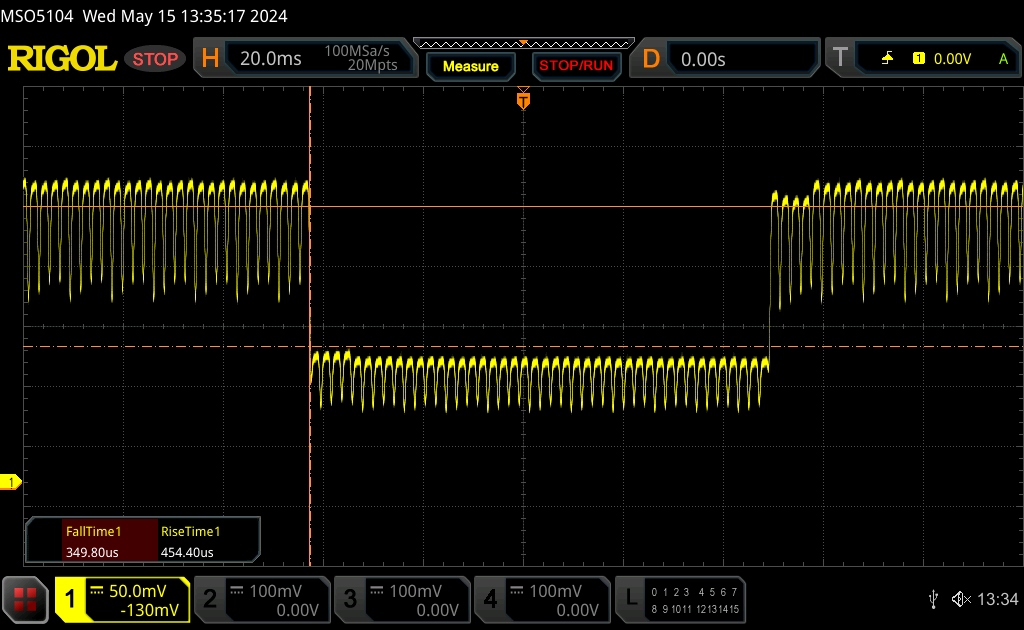 |
| ↘ 0.35 ms fall | ||
| The screen shows very fast response rates in our tests and should be very well suited for fast-paced gaming. In comparison, all tested devices range from 0.165 (minimum) to 636 (maximum) ms. » 3 % of all devices are better. This means that the measured response time is better than the average of all tested devices (31 ms). | ||
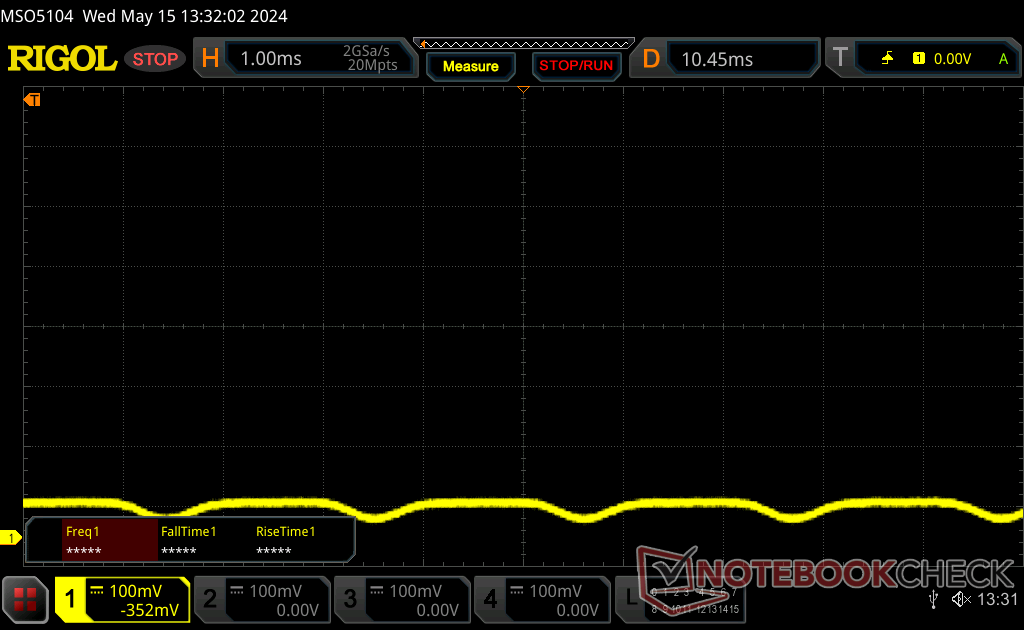
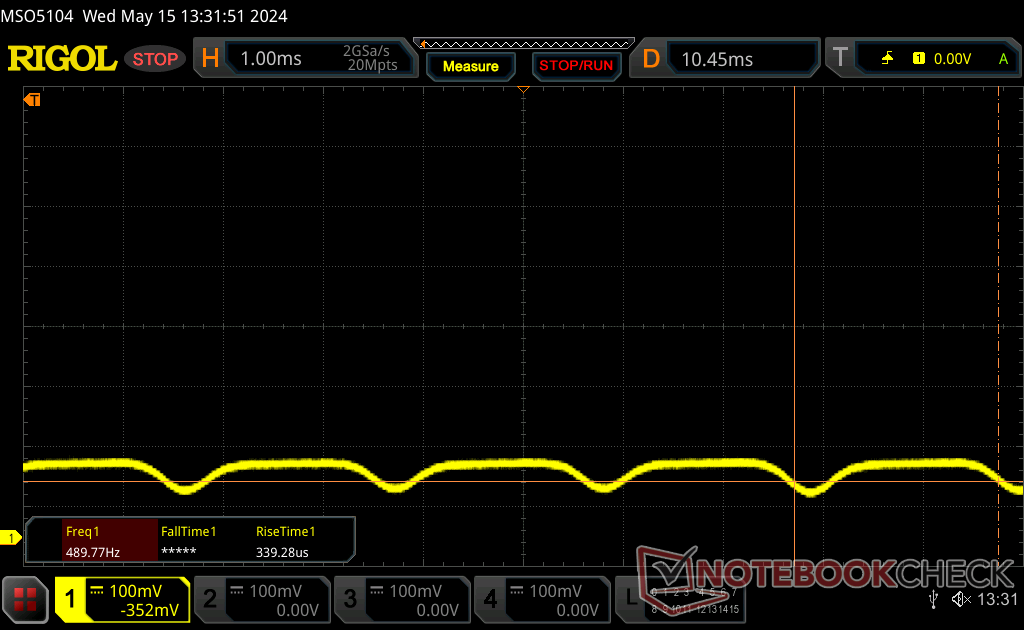
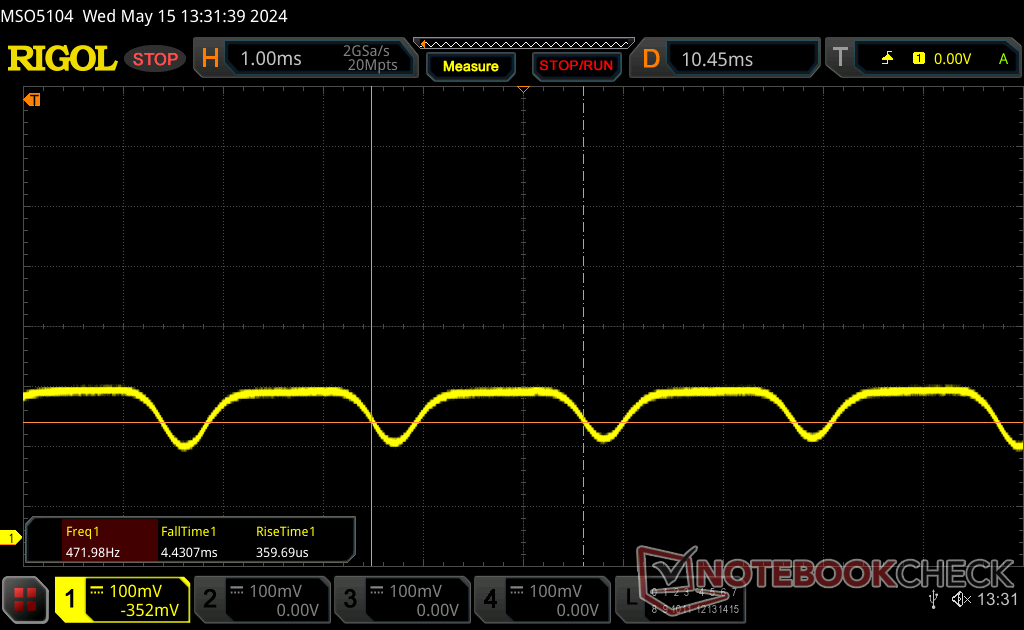
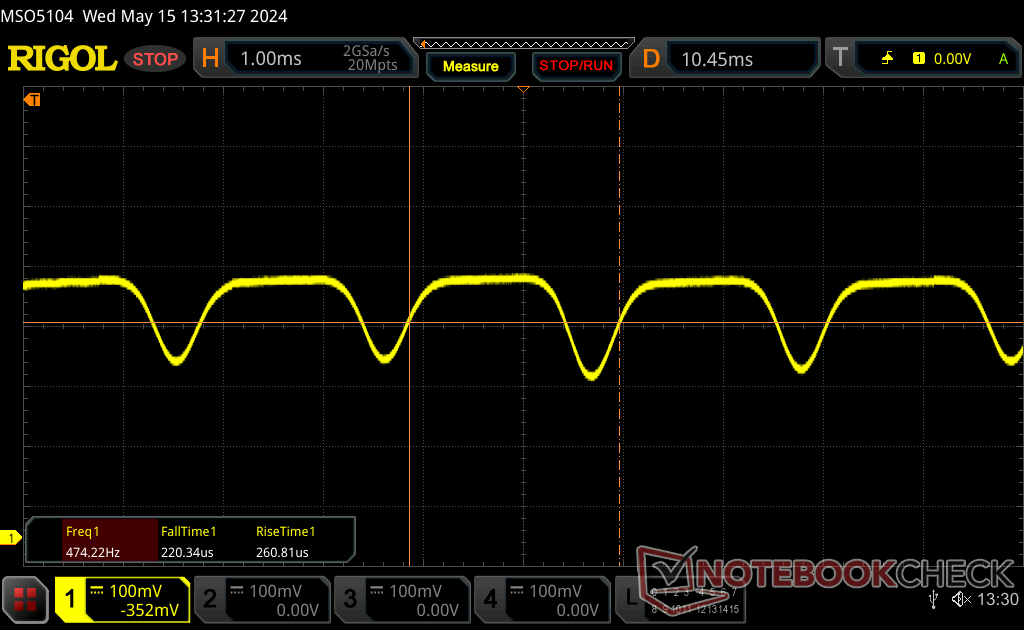
Screen Flickering / PWM (Pulse-Width Modulation)
| Screen flickering / PWM detected | 491.8 Hz | ≤ 100 % brightness setting | 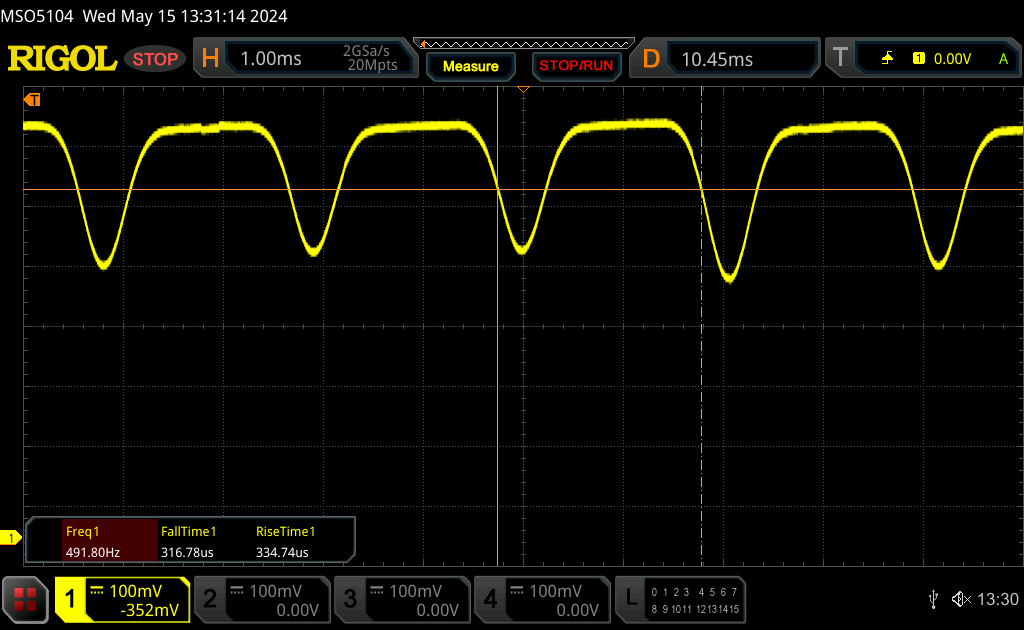 |
The display backlight flickers at 491.8 Hz (worst case, e.g., utilizing PWM) Flickering detected at a brightness setting of 100 % and below. There should be no flickering or PWM above this brightness setting. The frequency of 491.8 Hz is relatively high, so most users sensitive to PWM should not notice any flickering. However, there are reports that some users are still sensitive to PWM at 500 Hz and above, so be aware. In comparison: 52 % of all tested devices do not use PWM to dim the display. If PWM was detected, an average of 7750 (minimum: 5 - maximum: 343500) Hz was measured. | |||
Pulse-width modulation is present on all brightness levels including the maximum setting. Its frequency would stay constant 492 Hz throughout the entire brightness range whereas most other OLED panels may change between two different frequencies depending on the brightness level. This is because HP utilizes DC dimming whereas most other OLED panels simply cycle the backlight instead to control brightness.
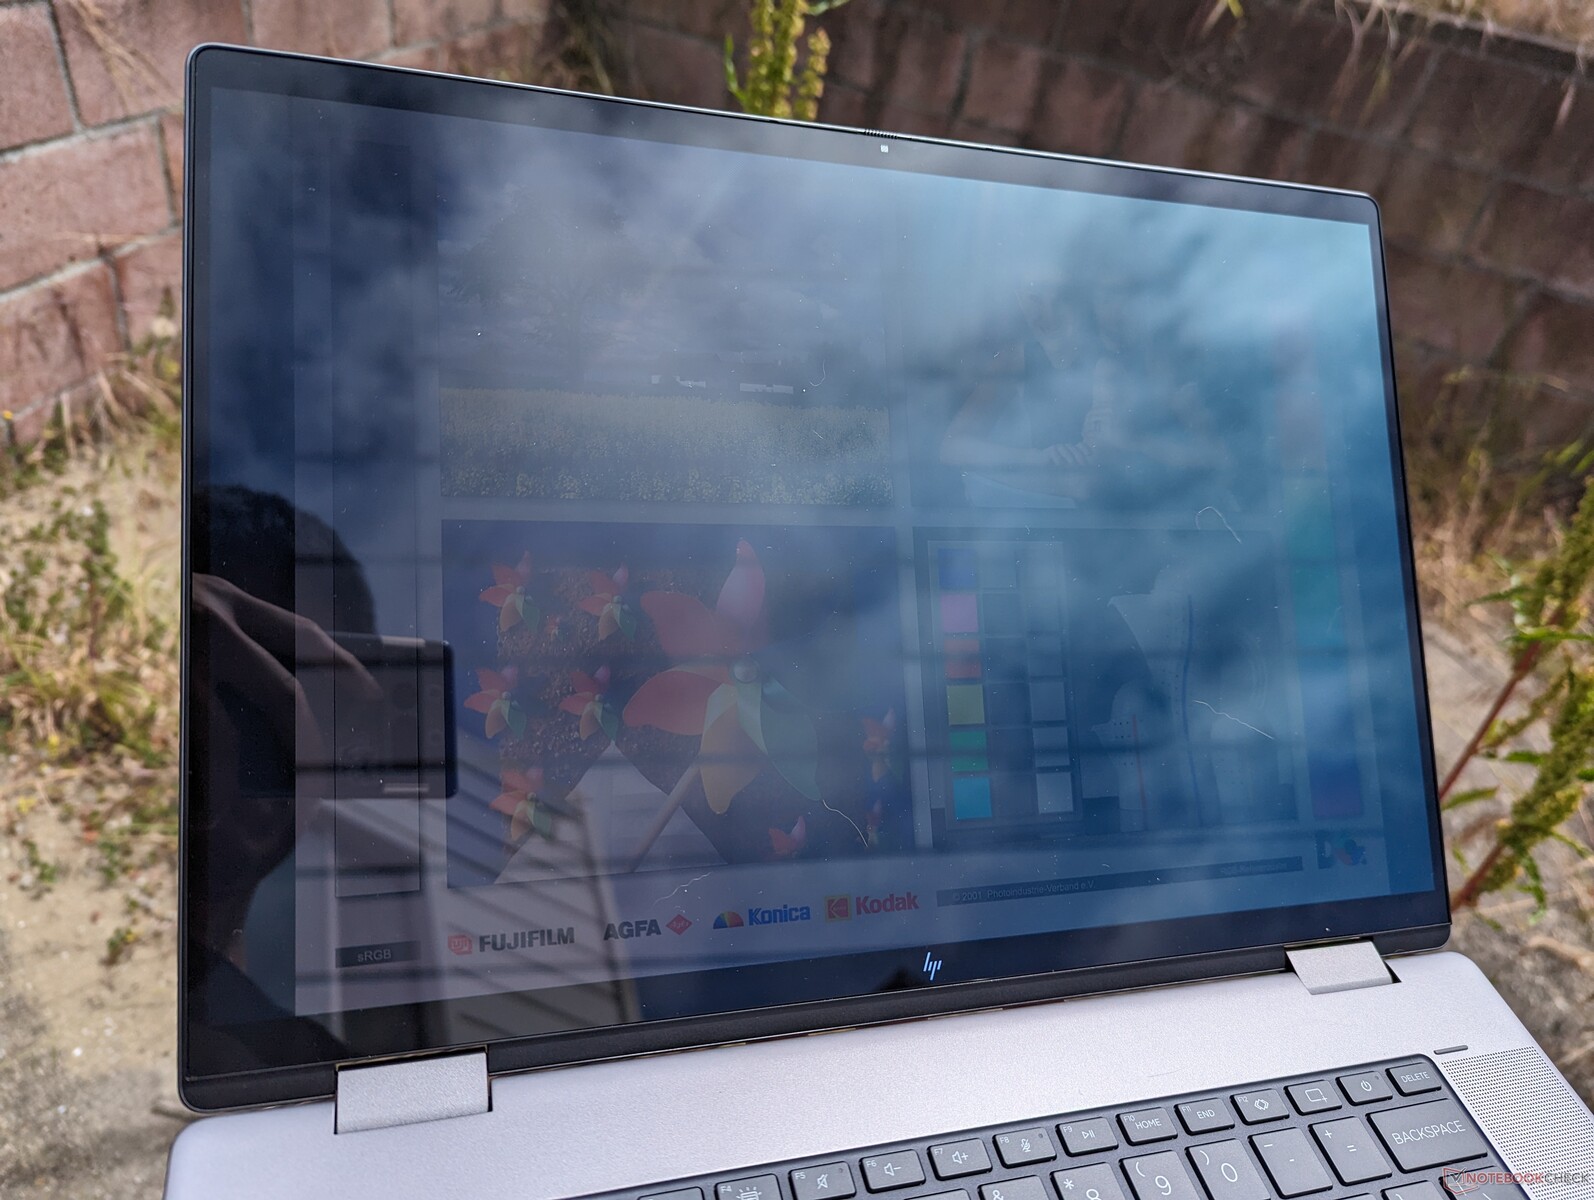
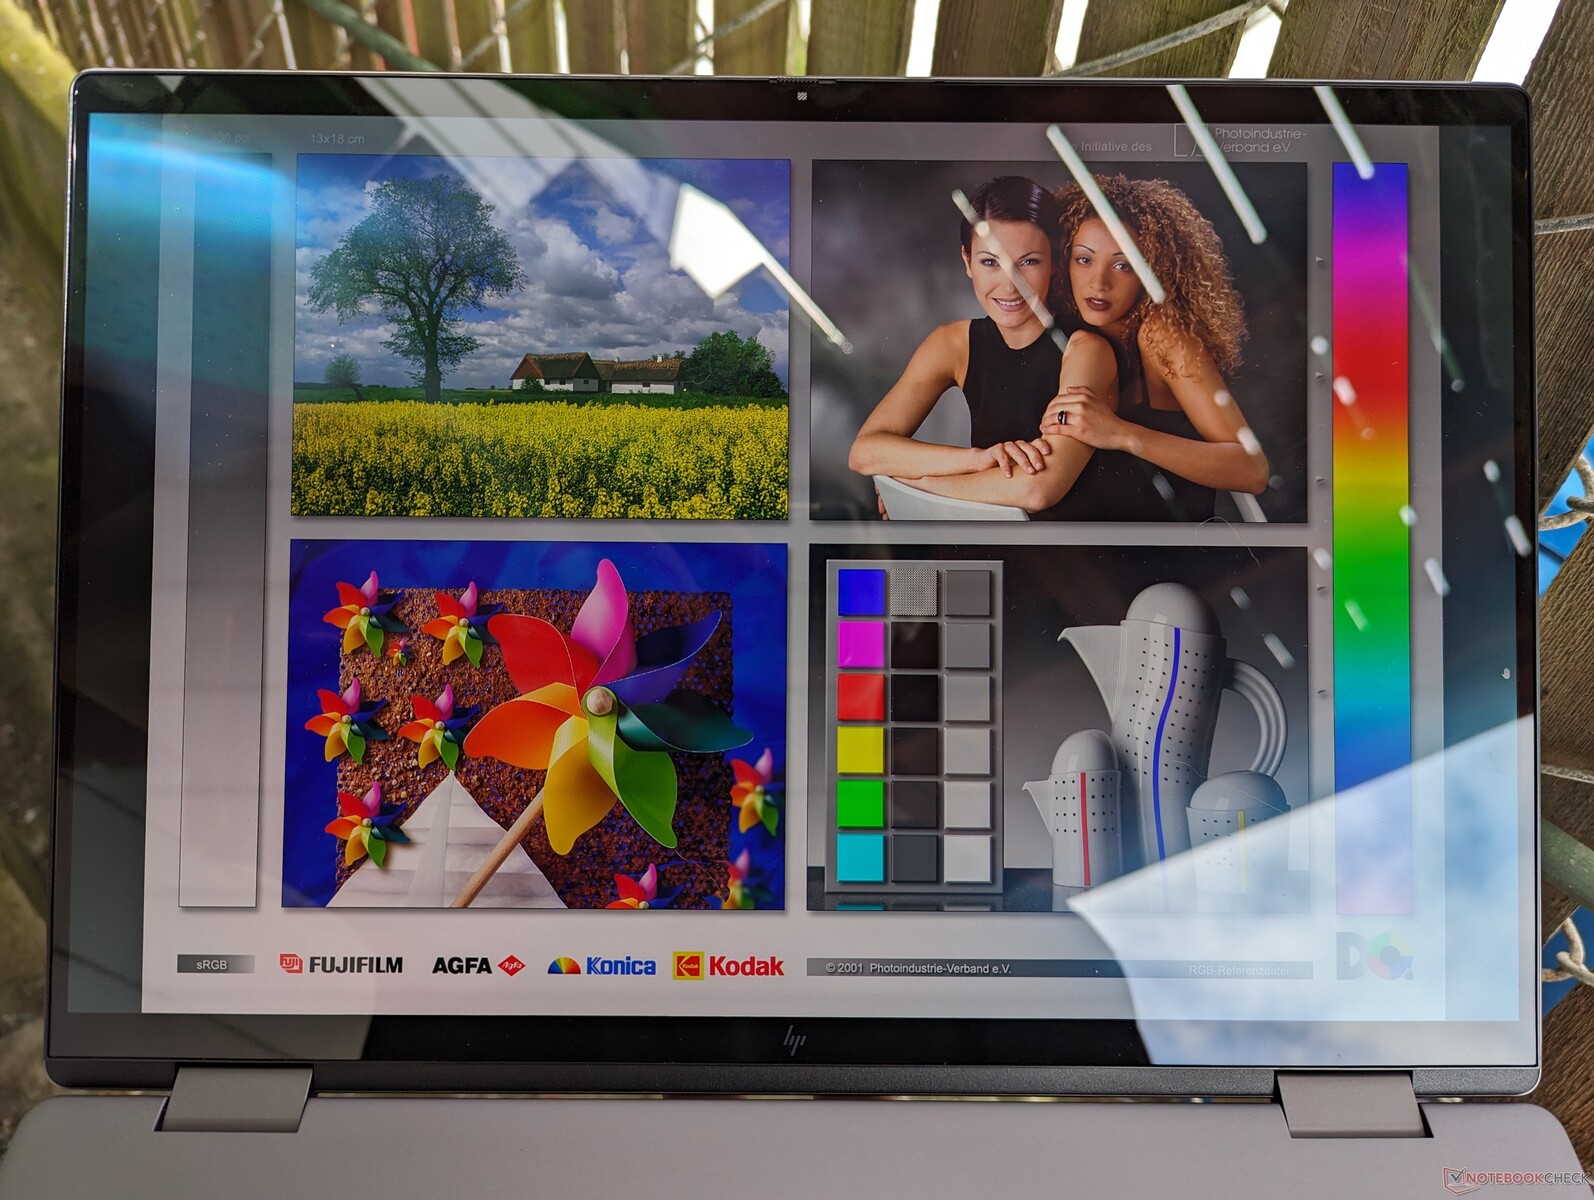
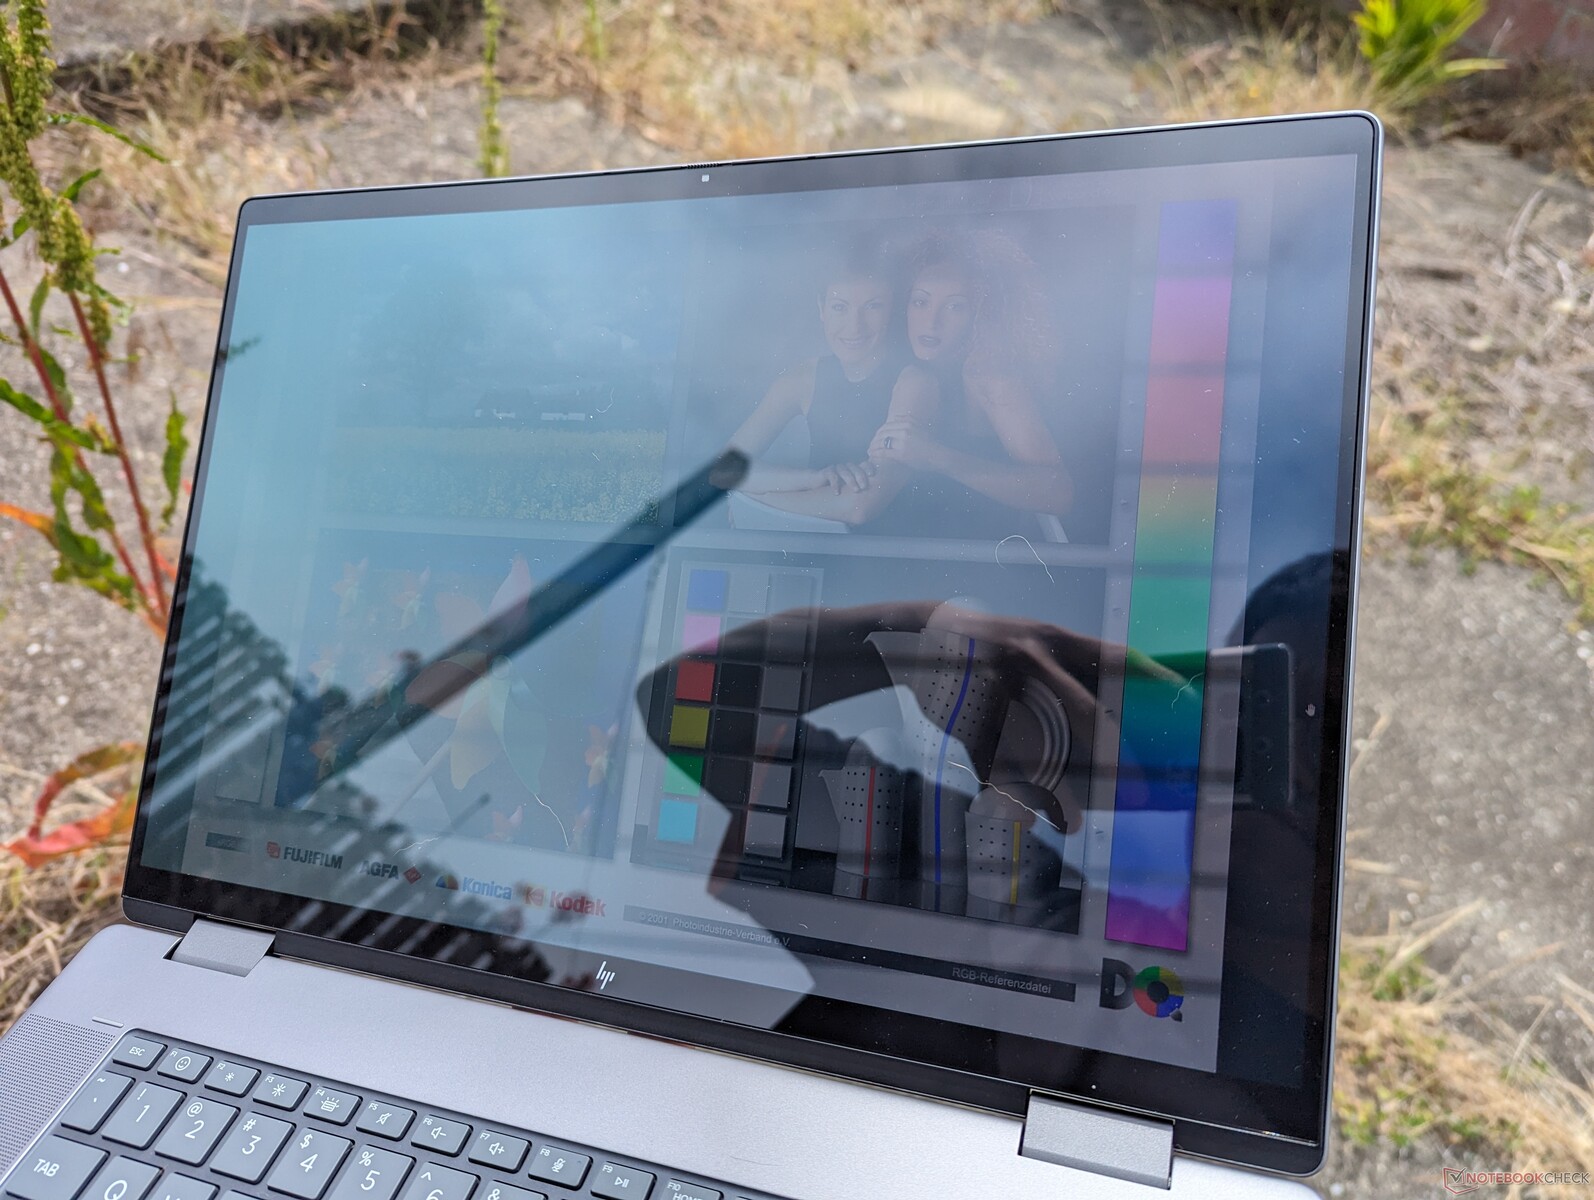
Glare on the glossy display is almost unavoidable if working outdoors. The backlight is not powerful enough to overcome ambient lighting, but the glare can still be reduced to more viewable levels if under shade.

Performance — Ryzen 7 8840HS Not Necessarily Better Than The Ryzen 7 7840HS
Testing Conditions
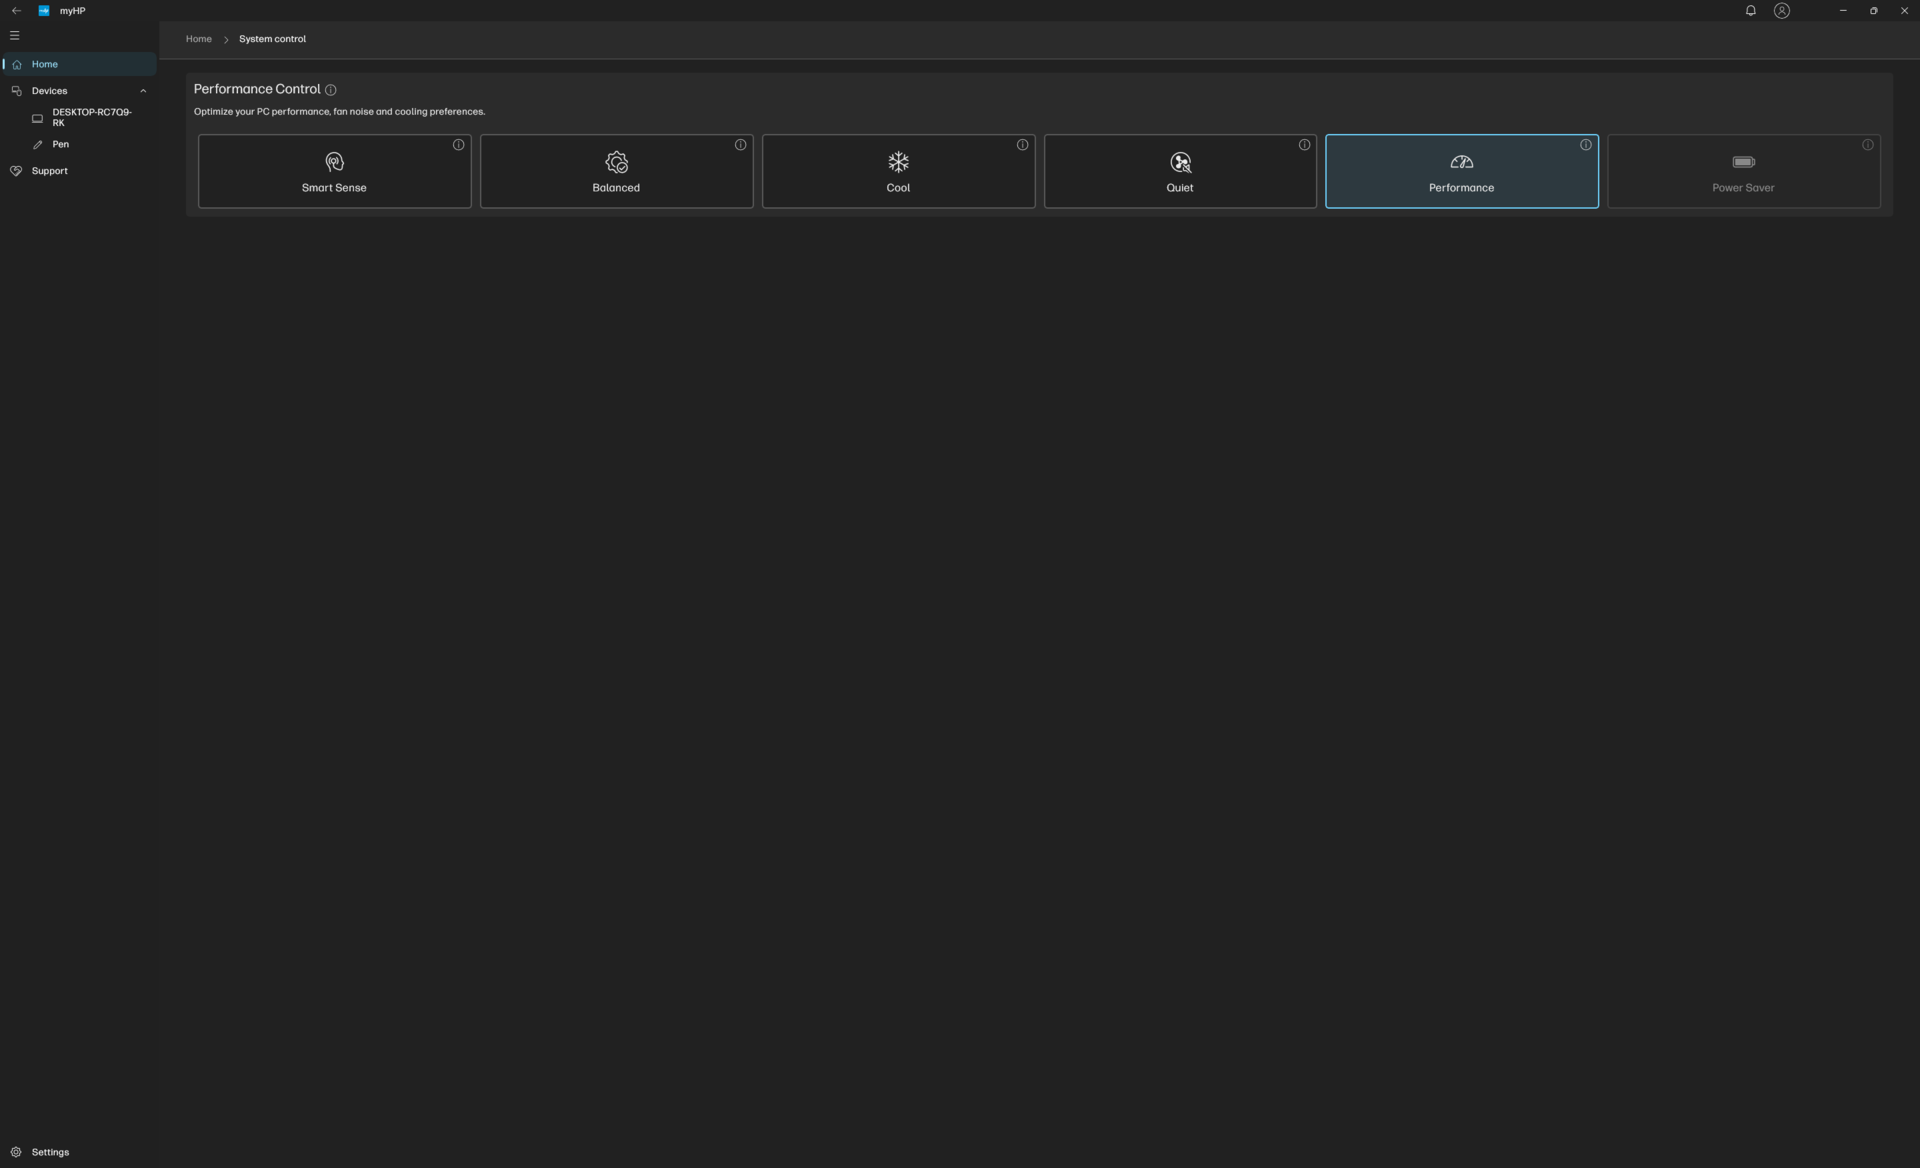
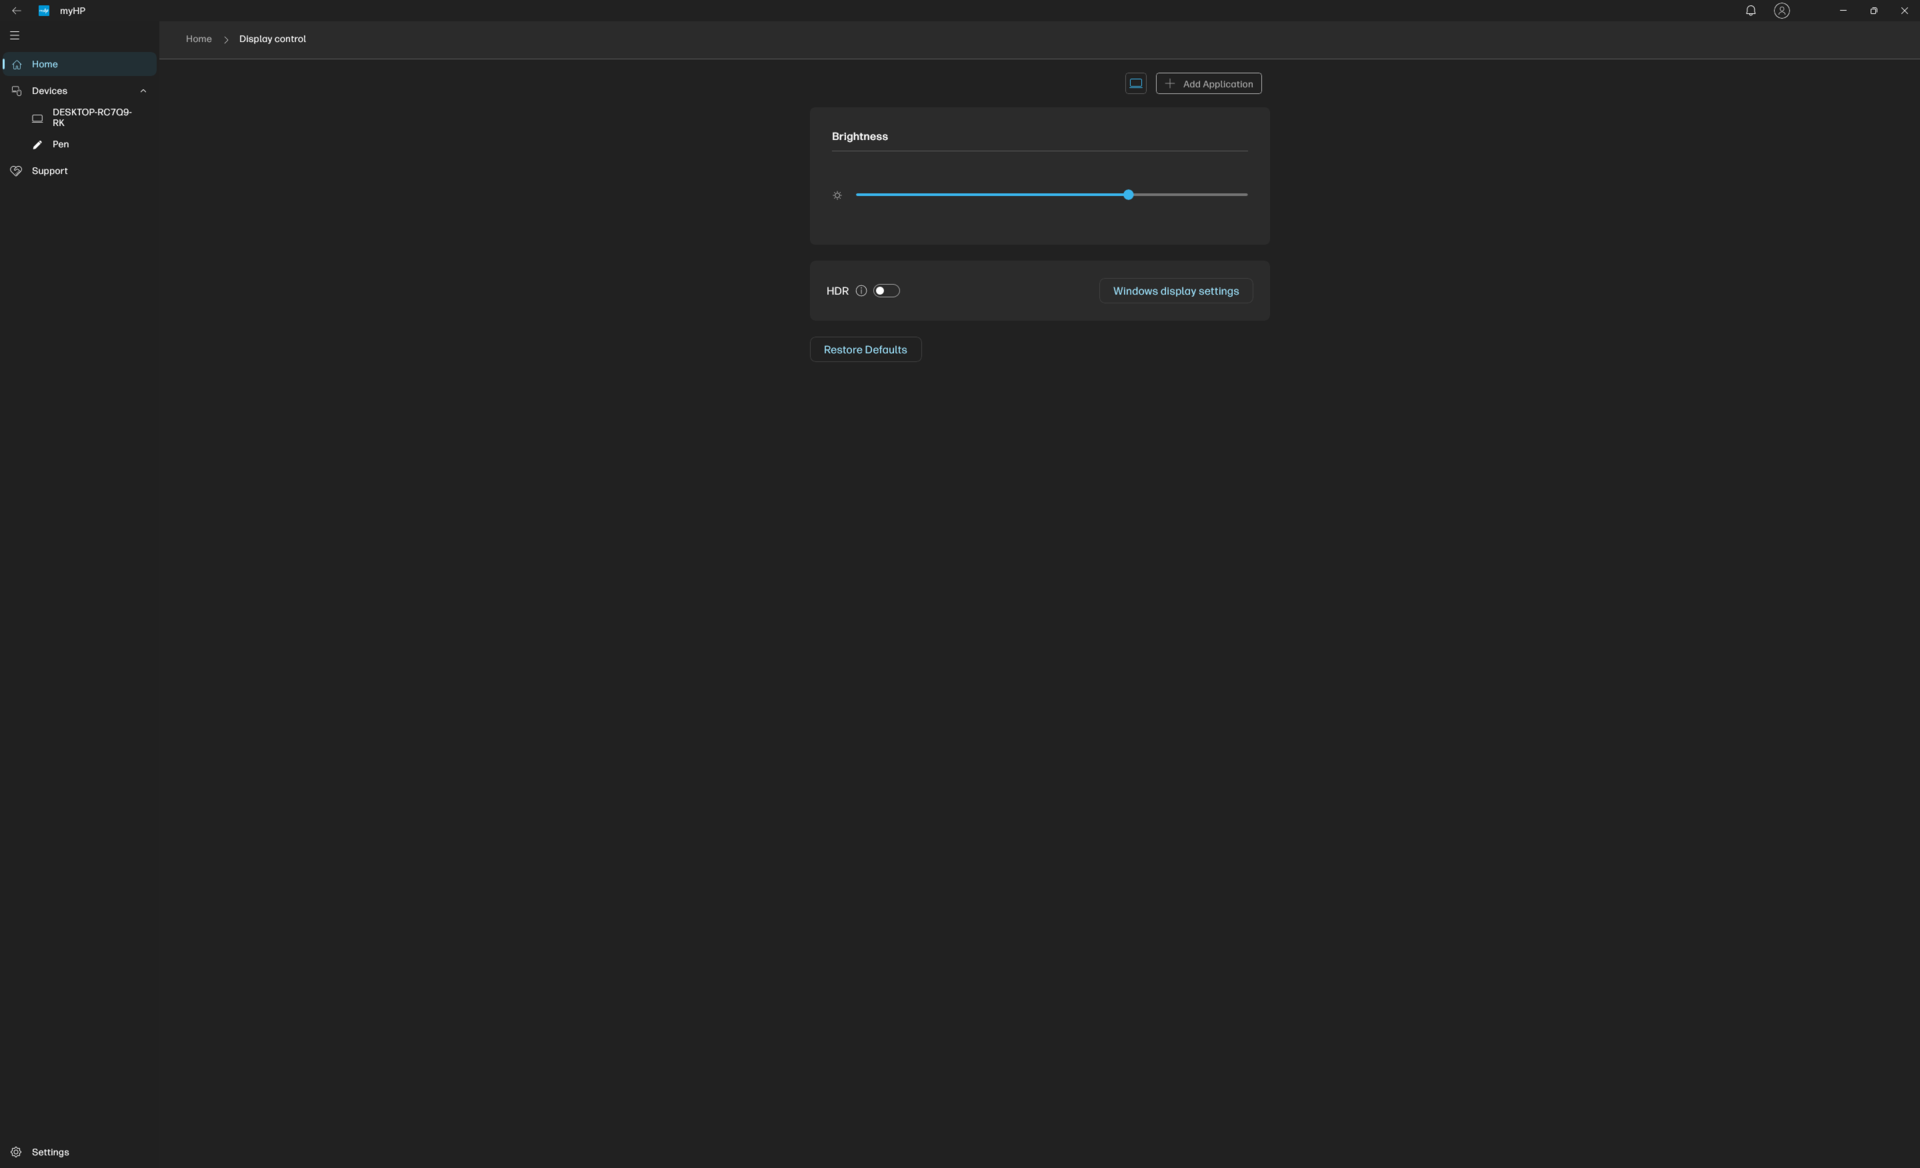
We set both MyHP and Windows to Performance mode prior to running the benchmarks below. Annoyingly, adjusting the power profile through Windows does not automatically change the power profile on MyHP and vice versa. Dell laptops allow you to conveniently sync different sets of power profiles in comparison.
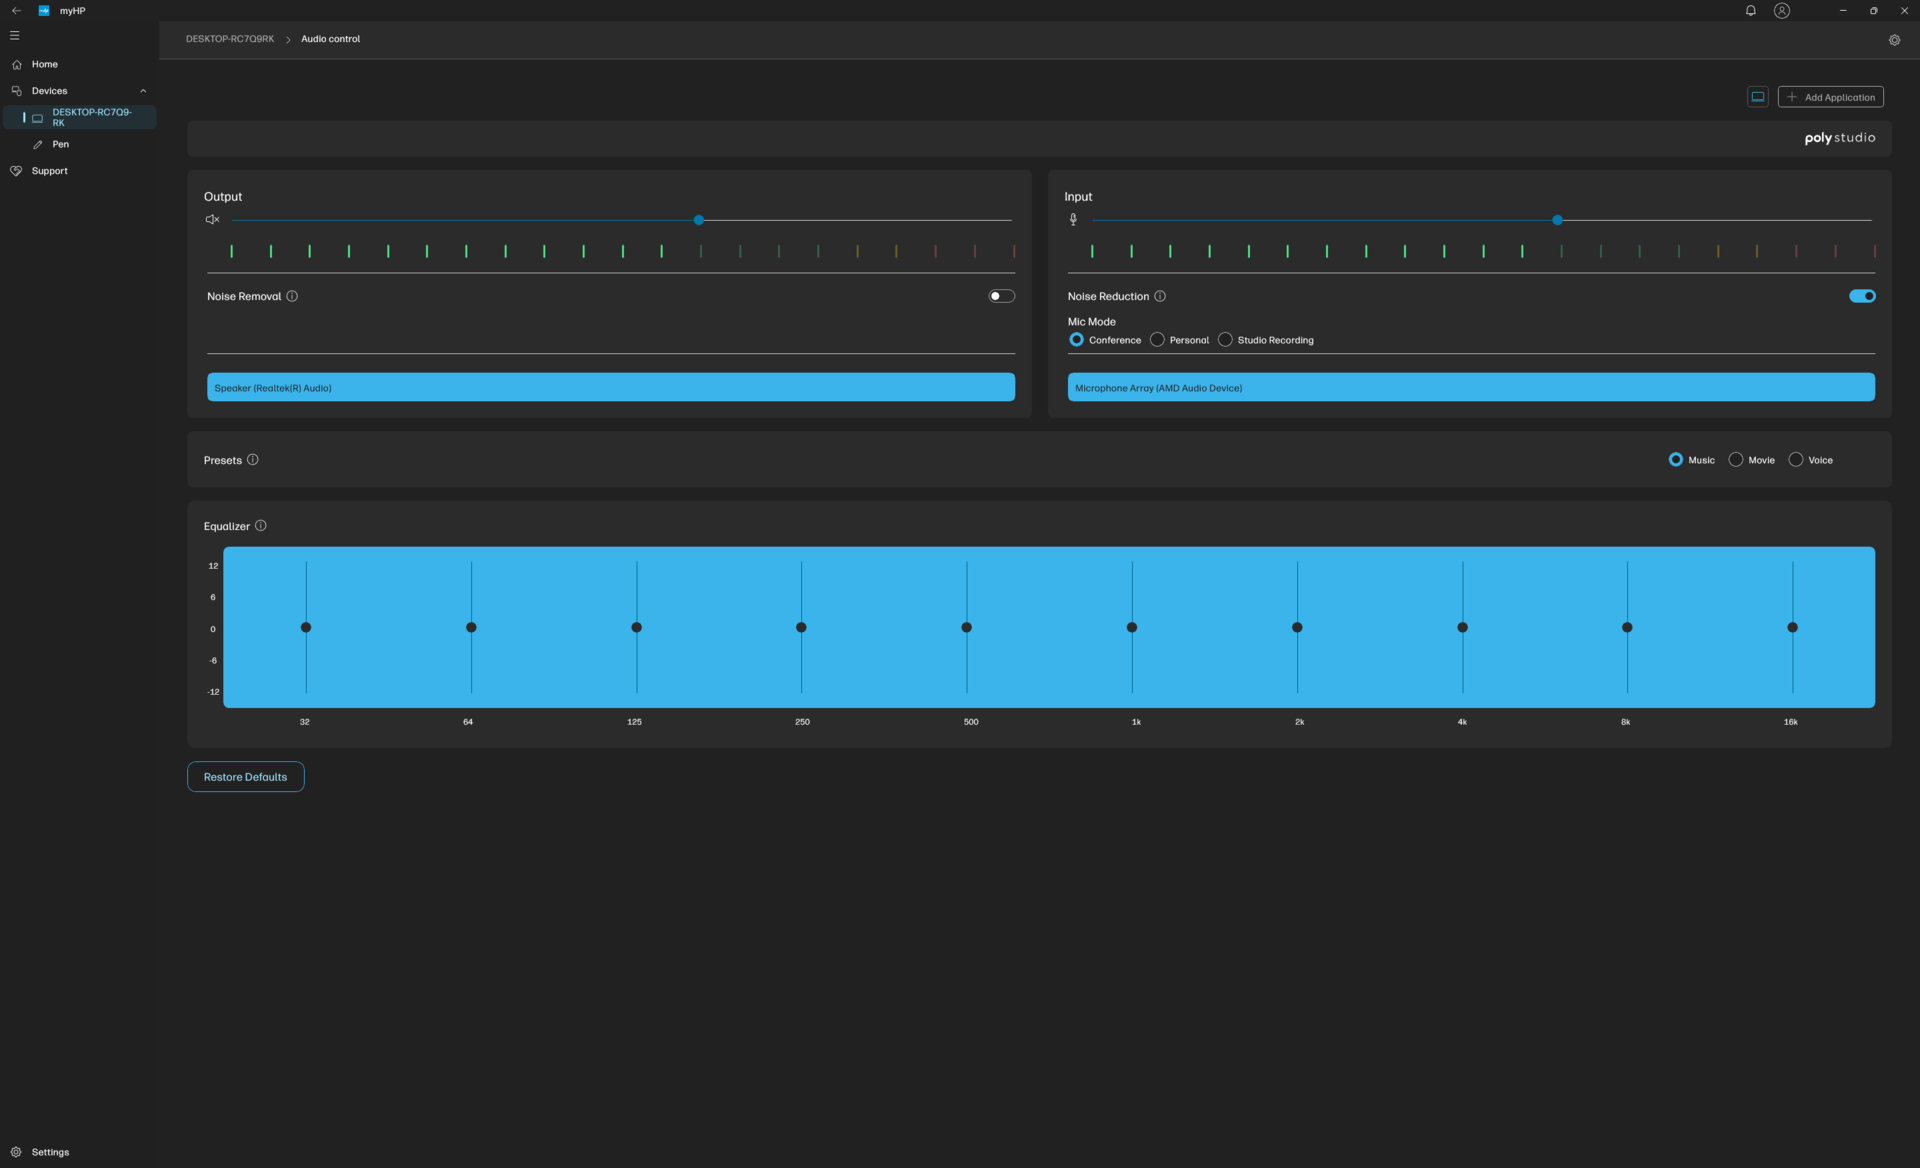
The MyHP software can certainly use some more work in terms of responsiveness and features. The app itself launches very slowly and the display options pale in comparison to the options available on Asus ZenBook/VivoBook OLED models where users can adjust the color temperature, blue light level, screensaver, color range, and more.

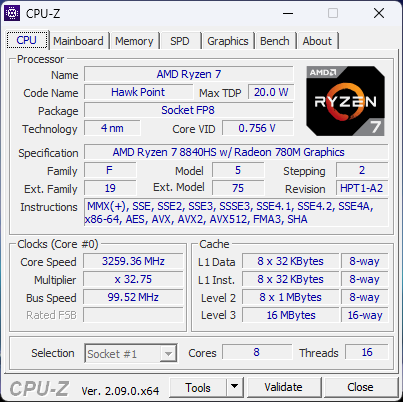
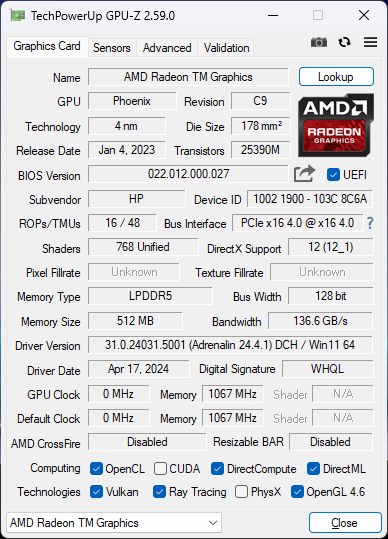
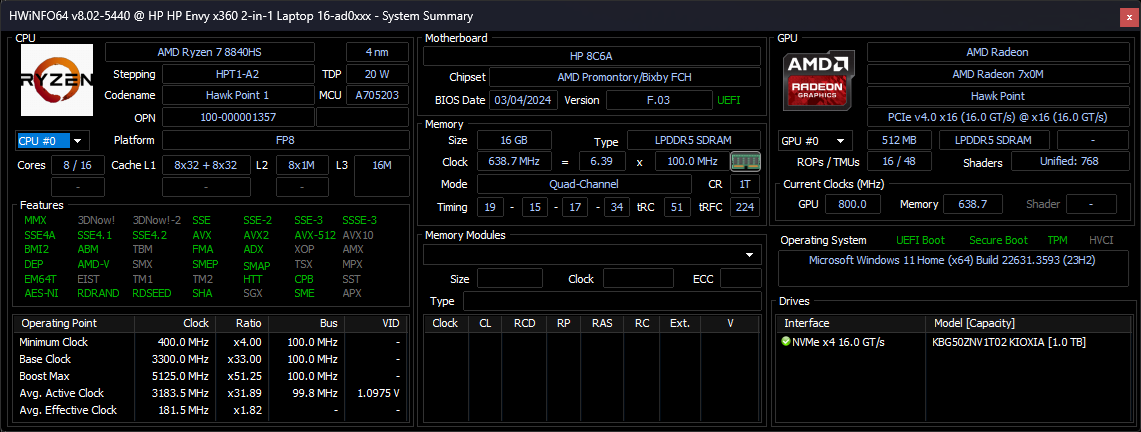
Processor
The Ryzen 7 8840HS replaces last year's Ryzen 7 7840HS which was a gaming-class mobile CPU found on high-performance laptops like the Lenovo Legion Slim 7 16. Much like on the Intel Meteor Lake series, the new AMD CPU integrates an NPU to accelerate local AI applications which are expected to become commonplace by next year.
Unfortunately, raw multi-thread performance is slower than the older Ryzen 7 7840HS by about 15 to 20 percent which is not insignificant. A similar deficit was observed on the latest Asus Zenbook 14 as well which also ships with the same CPU as our HP. The deficit can be attributed to the lower TDP range of the new CPU (20 to 30 W vs. 35 to 54 W) and the "shoehorned" NPU which occupies valuable die space that would have otherwise been reserved for non-AI functions. Overall performance is therefore closer to the 12th gen Core i7-12700H as found on the 2022 Envy 16 clamshell.
The Ryzen 7 8840HS isn't slow by any means as it still outperforms the Intel Core Ultra 5 125U and Ultra 7 155U Envy x360 16 variants by 35 to 40 percent each. To really make the most of the AMD CPU, however, you'll want to run local AI tasks when they become more available.
Cinebench R15 Multi Loop
Cinebench R23: Multi Core | Single Core
Cinebench R20: CPU (Multi Core) | CPU (Single Core)
Cinebench R15: CPU Multi 64Bit | CPU Single 64Bit
Blender: v2.79 BMW27 CPU
7-Zip 18.03: 7z b 4 | 7z b 4 -mmt1
Geekbench 6.7: Multi-Core | Single-Core
Geekbench 5.5: Multi-Core | Single-Core
HWBOT x265 Benchmark v2.2: 4k Preset
LibreOffice : 20 Documents To PDF
R Benchmark 2.5: Overall mean
* ... smaller is better
AIDA64: FP32 Ray-Trace | FPU Julia | CPU SHA3 | CPU Queen | FPU SinJulia | FPU Mandel | CPU AES | CPU ZLib | FP64 Ray-Trace | CPU PhotoWorxx
| Performance rating | |
| Average AMD Ryzen 7 8840HS | |
| HP Envy x360 2-in-1 16-ad0097nr | |
| HP Spectre x360 16 RTX 4050 | |
| HP Envy 16 h0112nr | |
| LG Gram 2in1 16 16T90R - G.AA78G | |
| Samsung Galaxy Book4 Pro 360 | |
| Lenovo Yoga 7 2-in-1 16IML9 | |
| AIDA64 / FPU Julia | |
| Average AMD Ryzen 7 8840HS (71472 - 93550, n=5) | |
| HP Envy x360 2-in-1 16-ad0097nr | |
| HP Spectre x360 16 RTX 4050 | |
| HP Envy 16 h0112nr | |
| LG Gram 2in1 16 16T90R - G.AA78G | |
| Lenovo Yoga 7 2-in-1 16IML9 | |
| Samsung Galaxy Book4 Pro 360 | |
| AIDA64 / CPU SHA3 | |
| Average AMD Ryzen 7 8840HS (3559 - 4132, n=5) | |
| HP Envy x360 2-in-1 16-ad0097nr | |
| HP Spectre x360 16 RTX 4050 | |
| HP Envy 16 h0112nr | |
| LG Gram 2in1 16 16T90R - G.AA78G | |
| Lenovo Yoga 7 2-in-1 16IML9 | |
| Samsung Galaxy Book4 Pro 360 | |
| AIDA64 / CPU Queen | |
| HP Envy x360 2-in-1 16-ad0097nr | |
| Average AMD Ryzen 7 8840HS (90515 - 111581, n=5) | |
| HP Envy 16 h0112nr | |
| LG Gram 2in1 16 16T90R - G.AA78G | |
| HP Spectre x360 16 RTX 4050 | |
| Samsung Galaxy Book4 Pro 360 | |
| Lenovo Yoga 7 2-in-1 16IML9 | |
| AIDA64 / FPU SinJulia | |
| Average AMD Ryzen 7 8840HS (12168 - 13731, n=5) | |
| HP Envy x360 2-in-1 16-ad0097nr | |
| HP Spectre x360 16 RTX 4050 | |
| HP Envy 16 h0112nr | |
| Samsung Galaxy Book4 Pro 360 | |
| LG Gram 2in1 16 16T90R - G.AA78G | |
| Lenovo Yoga 7 2-in-1 16IML9 | |
| AIDA64 / FPU Mandel | |
| Average AMD Ryzen 7 8840HS (38404 - 49687, n=5) | |
| HP Envy x360 2-in-1 16-ad0097nr | |
| HP Spectre x360 16 RTX 4050 | |
| HP Envy 16 h0112nr | |
| LG Gram 2in1 16 16T90R - G.AA78G | |
| Lenovo Yoga 7 2-in-1 16IML9 | |
| Samsung Galaxy Book4 Pro 360 | |
| AIDA64 / CPU AES | |
| HP Envy 16 h0112nr | |
| LG Gram 2in1 16 16T90R - G.AA78G | |
| HP Envy x360 2-in-1 16-ad0097nr | |
| HP Spectre x360 16 RTX 4050 | |
| Average AMD Ryzen 7 8840HS (60328 - 76247, n=5) | |
| Lenovo Yoga 7 2-in-1 16IML9 | |
| Samsung Galaxy Book4 Pro 360 | |
| AIDA64 / CPU ZLib | |
| HP Spectre x360 16 RTX 4050 | |
| HP Envy x360 2-in-1 16-ad0097nr | |
| HP Envy 16 h0112nr | |
| Average AMD Ryzen 7 8840HS (468 - 930, n=5) | |
| LG Gram 2in1 16 16T90R - G.AA78G | |
| Lenovo Yoga 7 2-in-1 16IML9 | |
| Samsung Galaxy Book4 Pro 360 | |
| AIDA64 / FP64 Ray-Trace | |
| Average AMD Ryzen 7 8840HS (9368 - 11880, n=5) | |
| HP Envy x360 2-in-1 16-ad0097nr | |
| HP Spectre x360 16 RTX 4050 | |
| HP Envy 16 h0112nr | |
| LG Gram 2in1 16 16T90R - G.AA78G | |
| Samsung Galaxy Book4 Pro 360 | |
| Lenovo Yoga 7 2-in-1 16IML9 | |
| AIDA64 / CPU PhotoWorxx | |
| HP Spectre x360 16 RTX 4050 | |
| Lenovo Yoga 7 2-in-1 16IML9 | |
| Samsung Galaxy Book4 Pro 360 | |
| LG Gram 2in1 16 16T90R - G.AA78G | |
| HP Envy 16 h0112nr | |
| Average AMD Ryzen 7 8840HS (31491 - 35861, n=5) | |
| HP Envy x360 2-in-1 16-ad0097nr | |
Stress Test

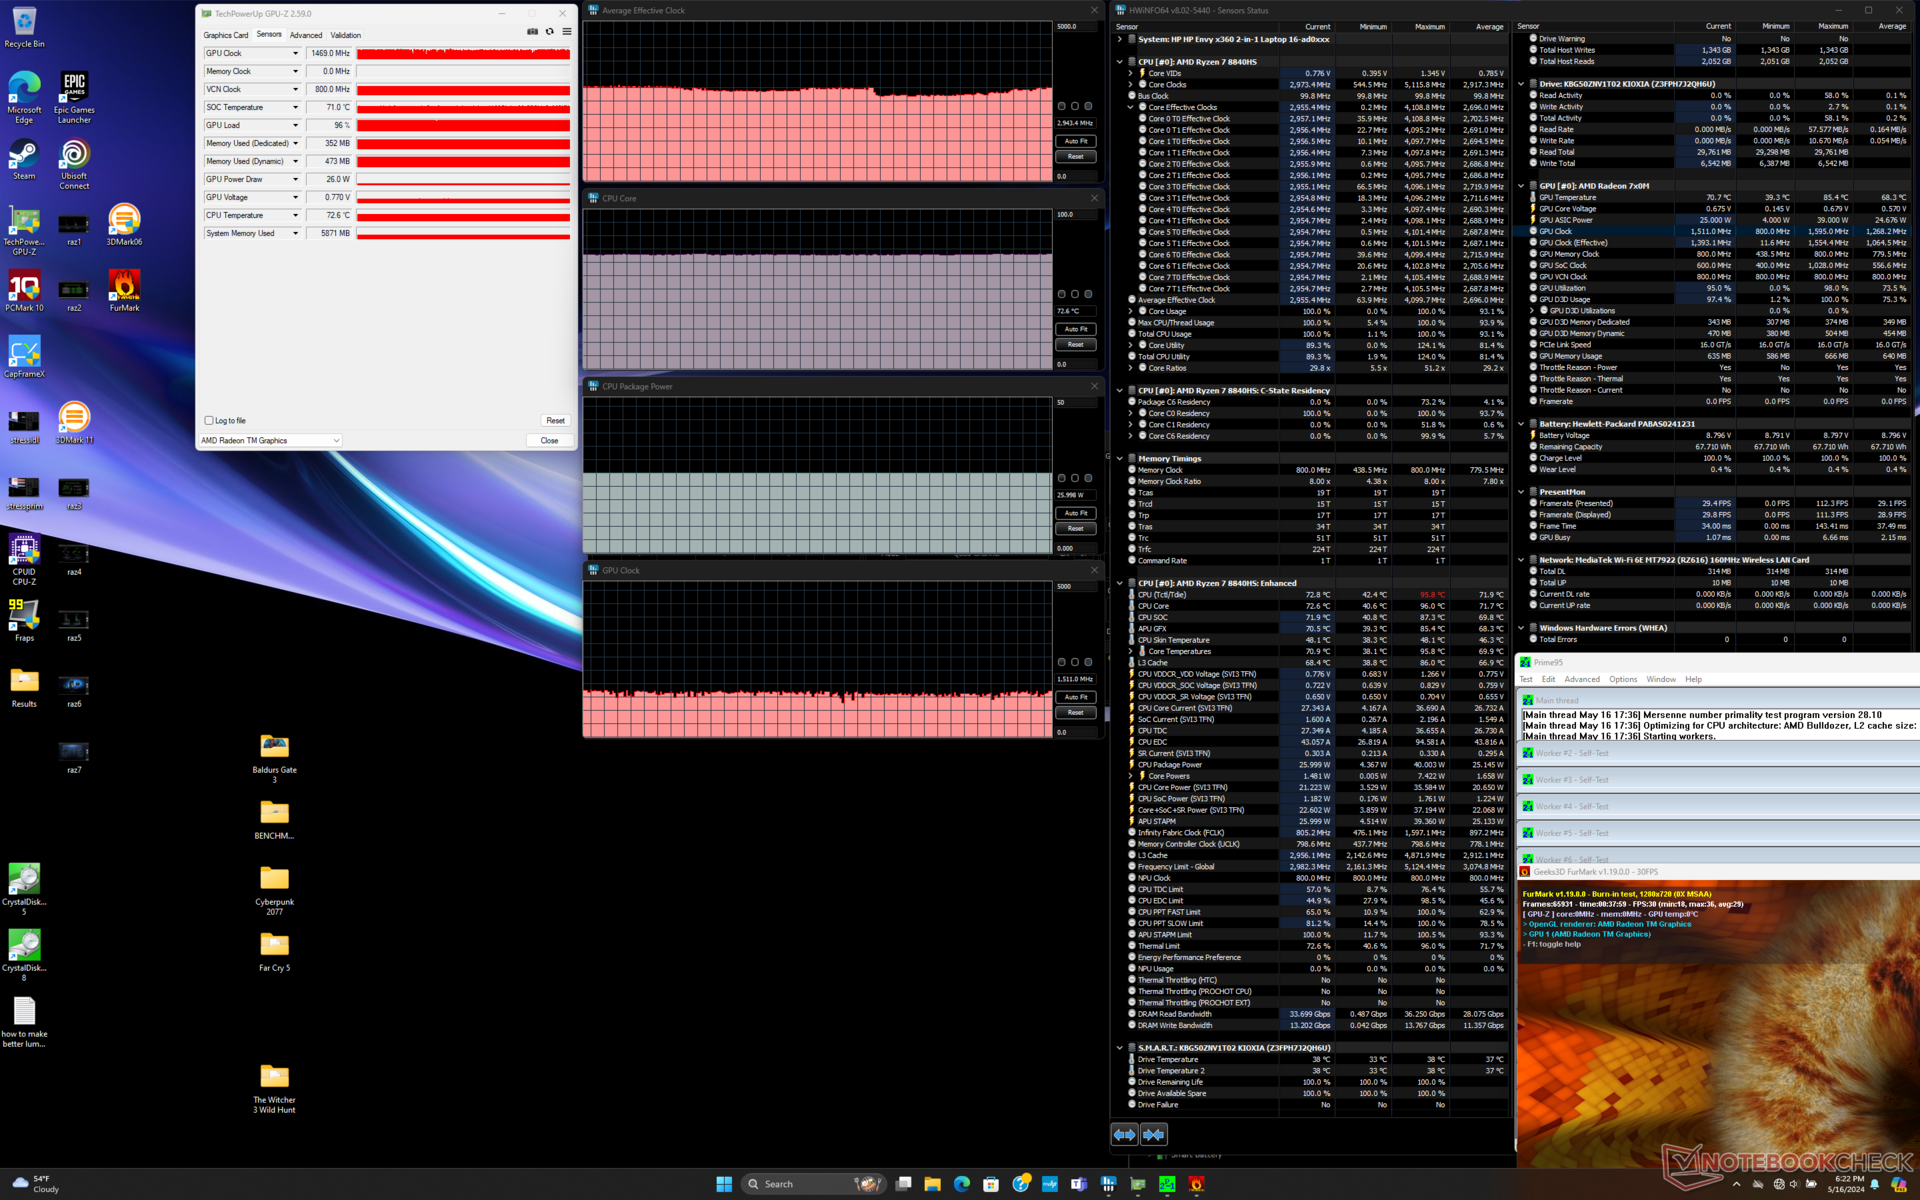
Running Prime95 causes the CPU to spike to 4.1 GHz and 40 W for only the first couple of seconds before falling to 3.4 GHz and 32 W. After several minutes, this would fall further to 3.1 GHz and 26 W to suggest limited Turbo Core sustainability. The Intel Core Ultra 7 CPU in the Spectre x360 16 would stabilize at the same temperature as our AMD-powered Envy x360 16 at 76 C perhaps by coincidence.
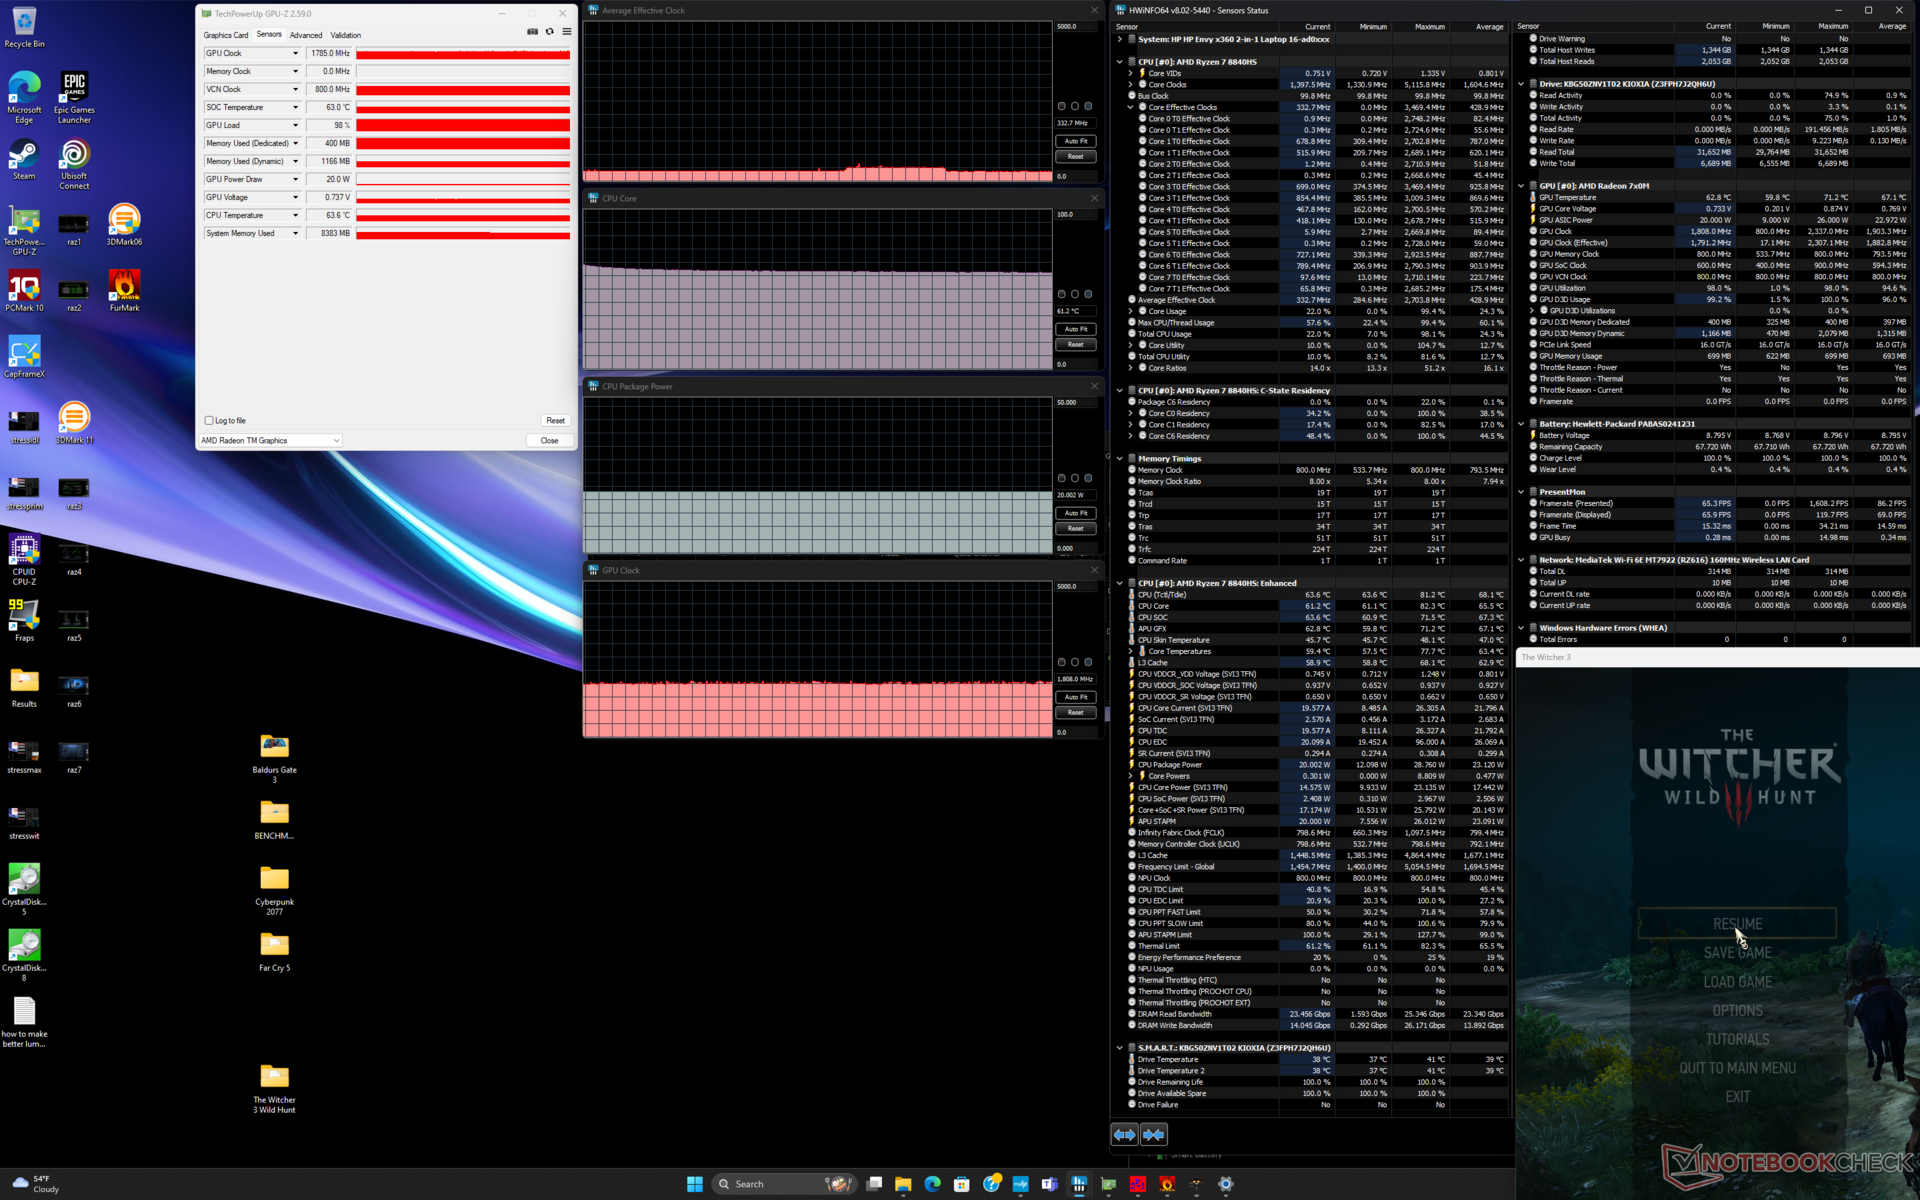
Running Witcher 3 on Performance mode would result in a stable CPU temperature and GPU clock rate of 68 C and 2180 MHz, respectively, compared to just 61 C and 1785 MHz when on Balanced mode. The differences align with our Fire Strike results and Fan noise observations between the two power profiles. CPU package power is affected as well from 26 W on Performance mode to 20 W on Balanced mode.
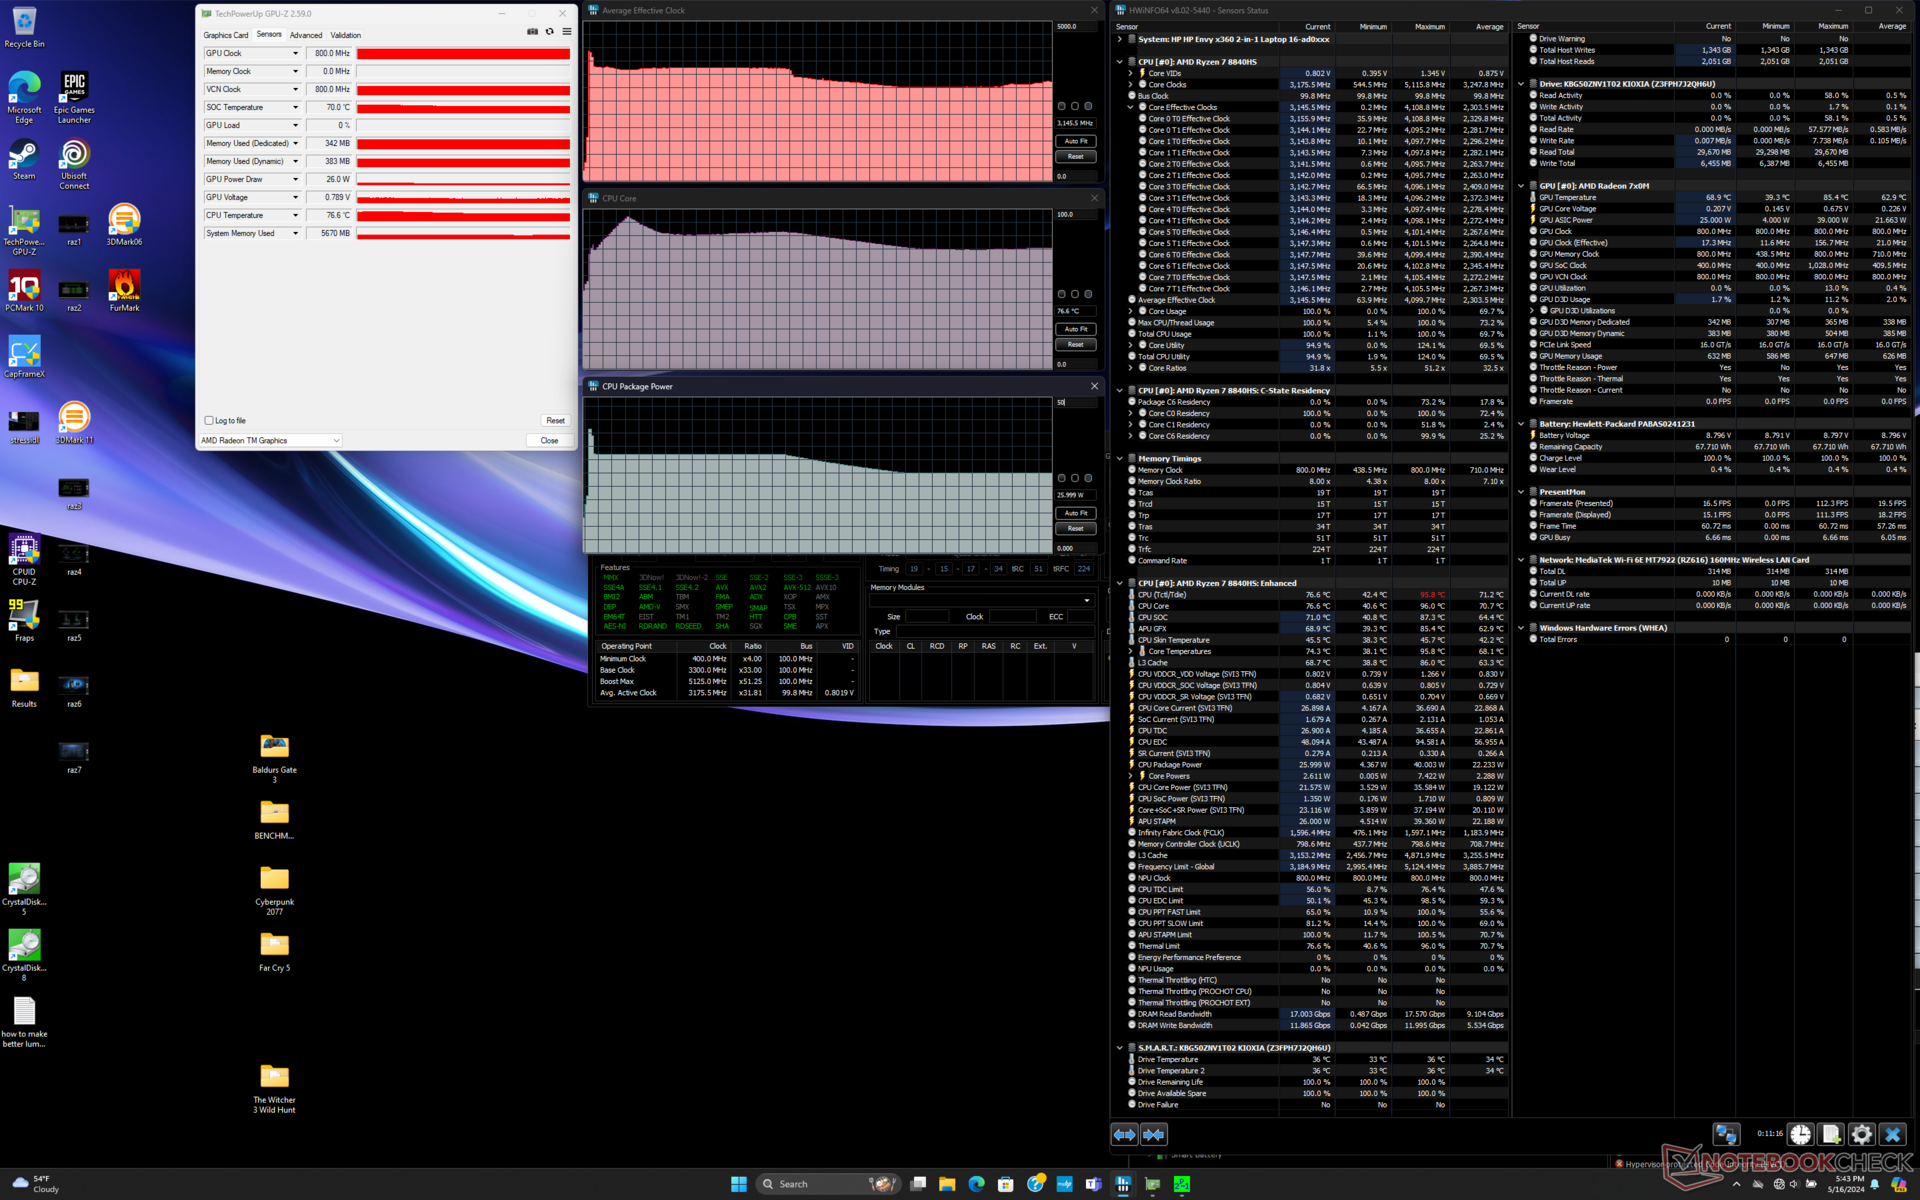
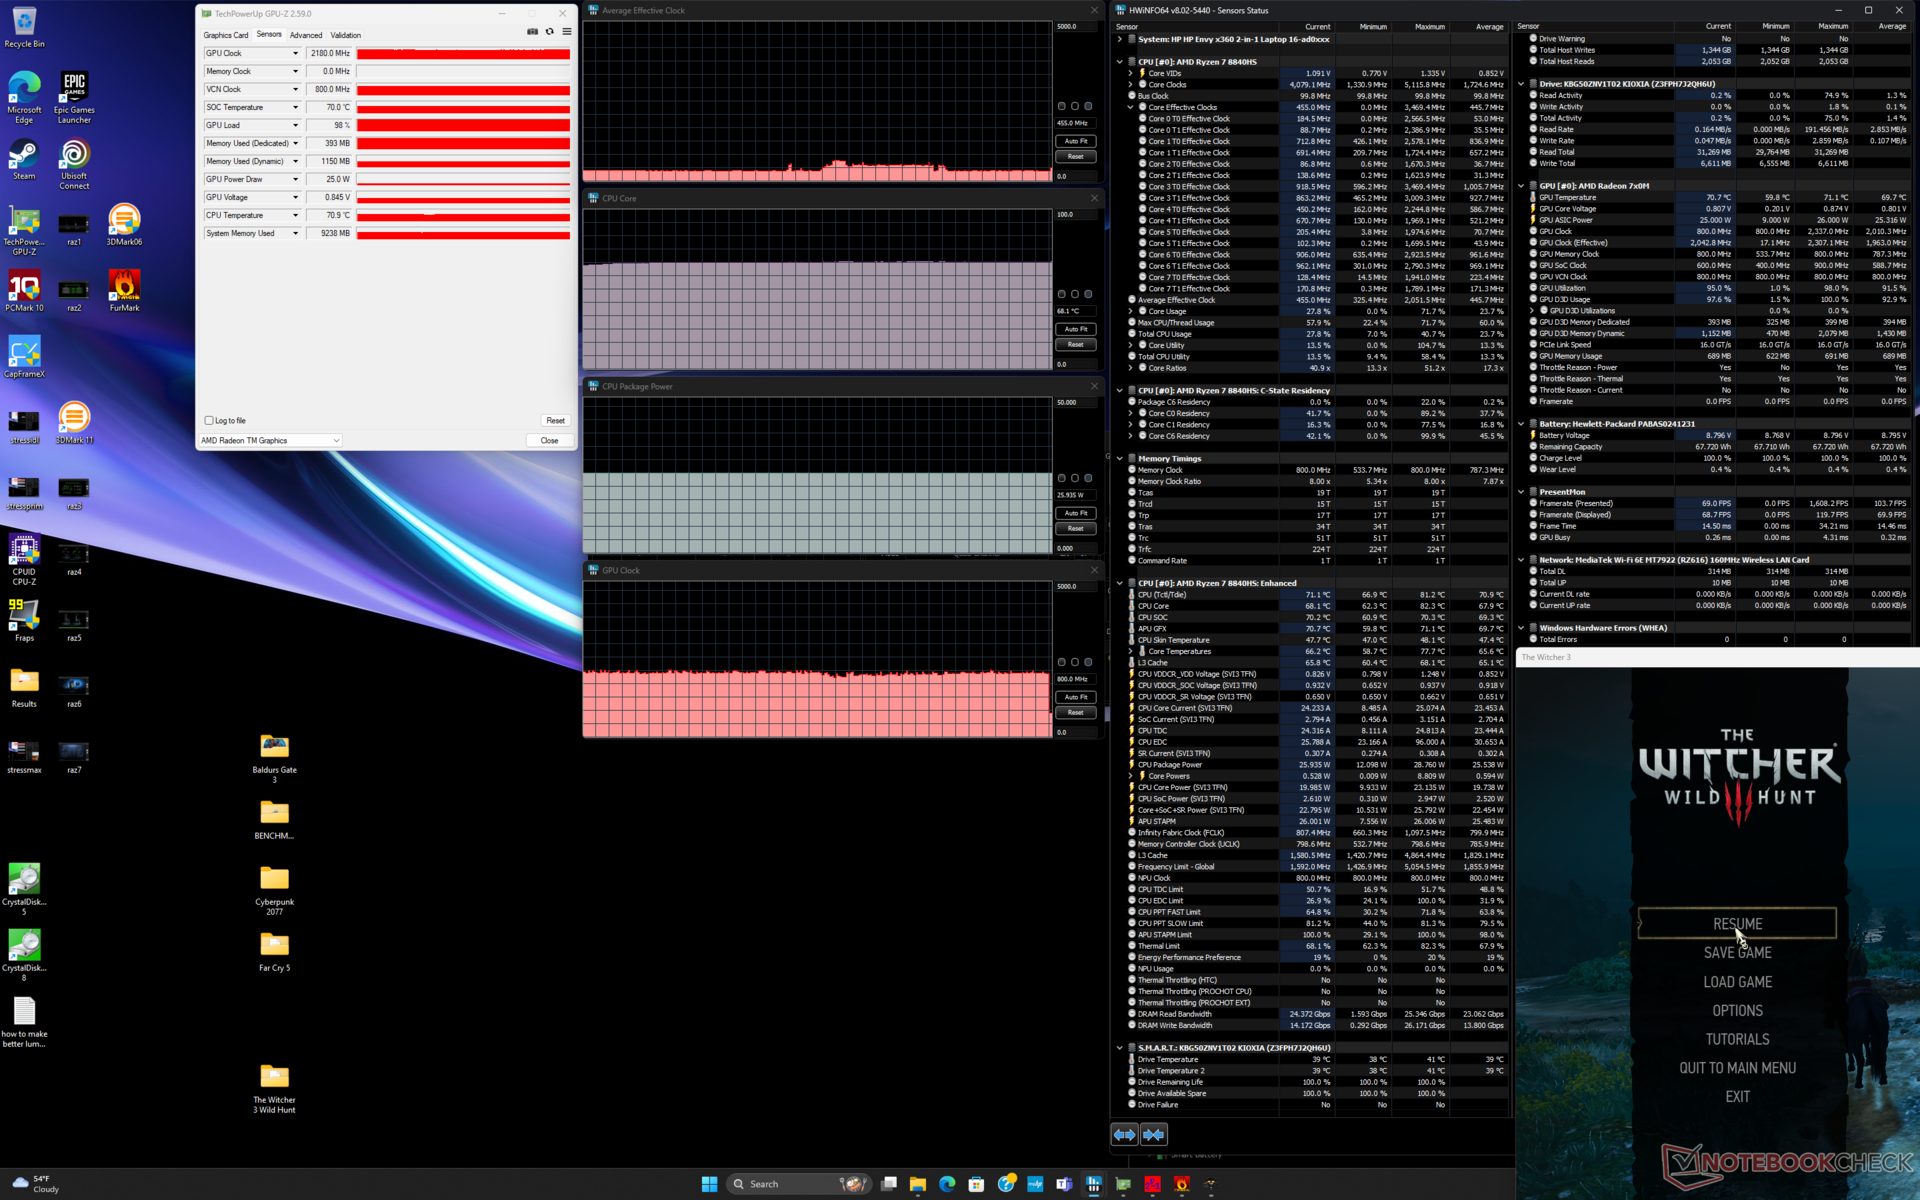
| Average CPU Clock (GHz) | GPU Clock (MHz) | Average CPU Temperature (°C) | |
| System Idle | -- | -- | 42 |
| Prime95 Stress | 3.1 | -- | 77 |
| Prime95 + FurMark Stress | 2.9 | 1469 | 73 |
| Witcher 3 Stress (Balanced mode) | ~0.3 | 1785 | 61 |
| Witcher 3 Stress (Performance mode) | ~0.5 | 2180 | 68 |
System Performance
PCMark scores are well ahead of last year's Envy x360 15 especially in the Productivity and Digital Content Creation subtests where raw CPU and GPU power really matter. The Envy x360 16 scores in between the Envy x360 15 and Spectre x360 16 on average.

CrossMark: Overall | Productivity | Creativity | Responsiveness
WebXPRT 3: Overall
WebXPRT 4: Overall
Mozilla Kraken 1.1: Total
| PCMark 10 / Score | |
| HP Envy 16 h0112nr | |
| Average AMD Ryzen 7 8840HS, AMD Radeon 780M (6775 - 7213, n=5) | |
| HP Envy x360 2-in-1 16-ad0097nr | |
| HP Spectre x360 16 RTX 4050 | |
| Samsung Galaxy Book4 Pro 360 | |
| Lenovo Yoga 7 2-in-1 16IML9 | |
| LG Gram 2in1 16 16T90R - G.AA78G | |
| PCMark 10 / Essentials | |
| HP Envy 16 h0112nr | |
| LG Gram 2in1 16 16T90R - G.AA78G | |
| Lenovo Yoga 7 2-in-1 16IML9 | |
| Average AMD Ryzen 7 8840HS, AMD Radeon 780M (10178 - 11449, n=5) | |
| Samsung Galaxy Book4 Pro 360 | |
| HP Envy x360 2-in-1 16-ad0097nr | |
| HP Spectre x360 16 RTX 4050 | |
| PCMark 10 / Productivity | |
| Average AMD Ryzen 7 8840HS, AMD Radeon 780M (9706 - 10449, n=5) | |
| HP Envy x360 2-in-1 16-ad0097nr | |
| HP Spectre x360 16 RTX 4050 | |
| HP Envy 16 h0112nr | |
| Samsung Galaxy Book4 Pro 360 | |
| Lenovo Yoga 7 2-in-1 16IML9 | |
| LG Gram 2in1 16 16T90R - G.AA78G | |
| PCMark 10 / Digital Content Creation | |
| HP Envy 16 h0112nr | |
| Average AMD Ryzen 7 8840HS, AMD Radeon 780M (8519 - 9163, n=5) | |
| HP Envy x360 2-in-1 16-ad0097nr | |
| HP Spectre x360 16 RTX 4050 | |
| Samsung Galaxy Book4 Pro 360 | |
| LG Gram 2in1 16 16T90R - G.AA78G | |
| Lenovo Yoga 7 2-in-1 16IML9 | |
| CrossMark / Overall | |
| HP Envy 16 h0112nr | |
| Average AMD Ryzen 7 8840HS, AMD Radeon 780M (1643 - 1698, n=5) | |
| Lenovo Yoga 7 2-in-1 16IML9 | |
| HP Envy x360 2-in-1 16-ad0097nr | |
| Samsung Galaxy Book4 Pro 360 | |
| HP Spectre x360 16 RTX 4050 | |
| LG Gram 2in1 16 16T90R - G.AA78G | |
| CrossMark / Productivity | |
| HP Envy 16 h0112nr | |
| Average AMD Ryzen 7 8840HS, AMD Radeon 780M (1605 - 1666, n=5) | |
| HP Envy x360 2-in-1 16-ad0097nr | |
| Samsung Galaxy Book4 Pro 360 | |
| LG Gram 2in1 16 16T90R - G.AA78G | |
| HP Spectre x360 16 RTX 4050 | |
| Lenovo Yoga 7 2-in-1 16IML9 | |
| CrossMark / Creativity | |
| HP Envy 16 h0112nr | |
| HP Spectre x360 16 RTX 4050 | |
| Average AMD Ryzen 7 8840HS, AMD Radeon 780M (1739 - 1863, n=5) | |
| HP Envy x360 2-in-1 16-ad0097nr | |
| Samsung Galaxy Book4 Pro 360 | |
| LG Gram 2in1 16 16T90R - G.AA78G | |
| Lenovo Yoga 7 2-in-1 16IML9 | |
| CrossMark / Responsiveness | |
| HP Envy 16 h0112nr | |
| LG Gram 2in1 16 16T90R - G.AA78G | |
| Samsung Galaxy Book4 Pro 360 | |
| Average AMD Ryzen 7 8840HS, AMD Radeon 780M (1334 - 1498, n=5) | |
| HP Envy x360 2-in-1 16-ad0097nr | |
| HP Spectre x360 16 RTX 4050 | |
| Lenovo Yoga 7 2-in-1 16IML9 | |
| WebXPRT 3 / Overall | |
| Average AMD Ryzen 7 8840HS, AMD Radeon 780M (297 - 440, n=5) | |
| HP Envy 16 h0112nr | |
| HP Envy x360 2-in-1 16-ad0097nr | |
| HP Spectre x360 16 RTX 4050 | |
| Samsung Galaxy Book4 Pro 360 | |
| LG Gram 2in1 16 16T90R - G.AA78G | |
| Lenovo Yoga 7 2-in-1 16IML9 | |
| WebXPRT 4 / Overall | |
| HP Envy 16 h0112nr | |
| HP Spectre x360 16 RTX 4050 | |
| Average AMD Ryzen 7 8840HS, AMD Radeon 780M (246 - 257, n=5) | |
| HP Envy x360 2-in-1 16-ad0097nr | |
| Samsung Galaxy Book4 Pro 360 | |
| Lenovo Yoga 7 2-in-1 16IML9 | |
| Mozilla Kraken 1.1 / Total | |
| LG Gram 2in1 16 16T90R - G.AA78G | |
| Lenovo Yoga 7 2-in-1 16IML9 | |
| Samsung Galaxy Book4 Pro 360 | |
| HP Envy x360 2-in-1 16-ad0097nr | |
| HP Spectre x360 16 RTX 4050 | |
| Average AMD Ryzen 7 8840HS, AMD Radeon 780M (518 - 563, n=5) | |
| HP Envy 16 h0112nr | |
* ... smaller is better
| PCMark 10 Score | 6958 points | |
Help | ||
| AIDA64 / Memory Copy | |
| Samsung Galaxy Book4 Pro 360 | |
| HP Spectre x360 16 RTX 4050 | |
| Lenovo Yoga 7 2-in-1 16IML9 | |
| HP Envy x360 2-in-1 16-ad0097nr | |
| Average AMD Ryzen 7 8840HS (62098 - 76766, n=5) | |
| LG Gram 2in1 16 16T90R - G.AA78G | |
| HP Envy 16 h0112nr | |
| AIDA64 / Memory Read | |
| HP Spectre x360 16 RTX 4050 | |
| Samsung Galaxy Book4 Pro 360 | |
| HP Envy 16 h0112nr | |
| Lenovo Yoga 7 2-in-1 16IML9 | |
| Average AMD Ryzen 7 8840HS (50273 - 61739, n=5) | |
| LG Gram 2in1 16 16T90R - G.AA78G | |
| HP Envy x360 2-in-1 16-ad0097nr | |
| AIDA64 / Memory Write | |
| HP Spectre x360 16 RTX 4050 | |
| HP Envy x360 2-in-1 16-ad0097nr | |
| Average AMD Ryzen 7 8840HS (78025 - 107658, n=5) | |
| LG Gram 2in1 16 16T90R - G.AA78G | |
| Samsung Galaxy Book4 Pro 360 | |
| Lenovo Yoga 7 2-in-1 16IML9 | |
| HP Envy 16 h0112nr | |
| AIDA64 / Memory Latency | |
| Lenovo Yoga 7 2-in-1 16IML9 | |
| HP Spectre x360 16 RTX 4050 | |
| Samsung Galaxy Book4 Pro 360 | |
| HP Envy x360 2-in-1 16-ad0097nr | |
| LG Gram 2in1 16 16T90R - G.AA78G | |
| Average AMD Ryzen 7 8840HS (91 - 122.4, n=5) | |
| HP Envy 16 h0112nr | |
* ... smaller is better
DPC Latency
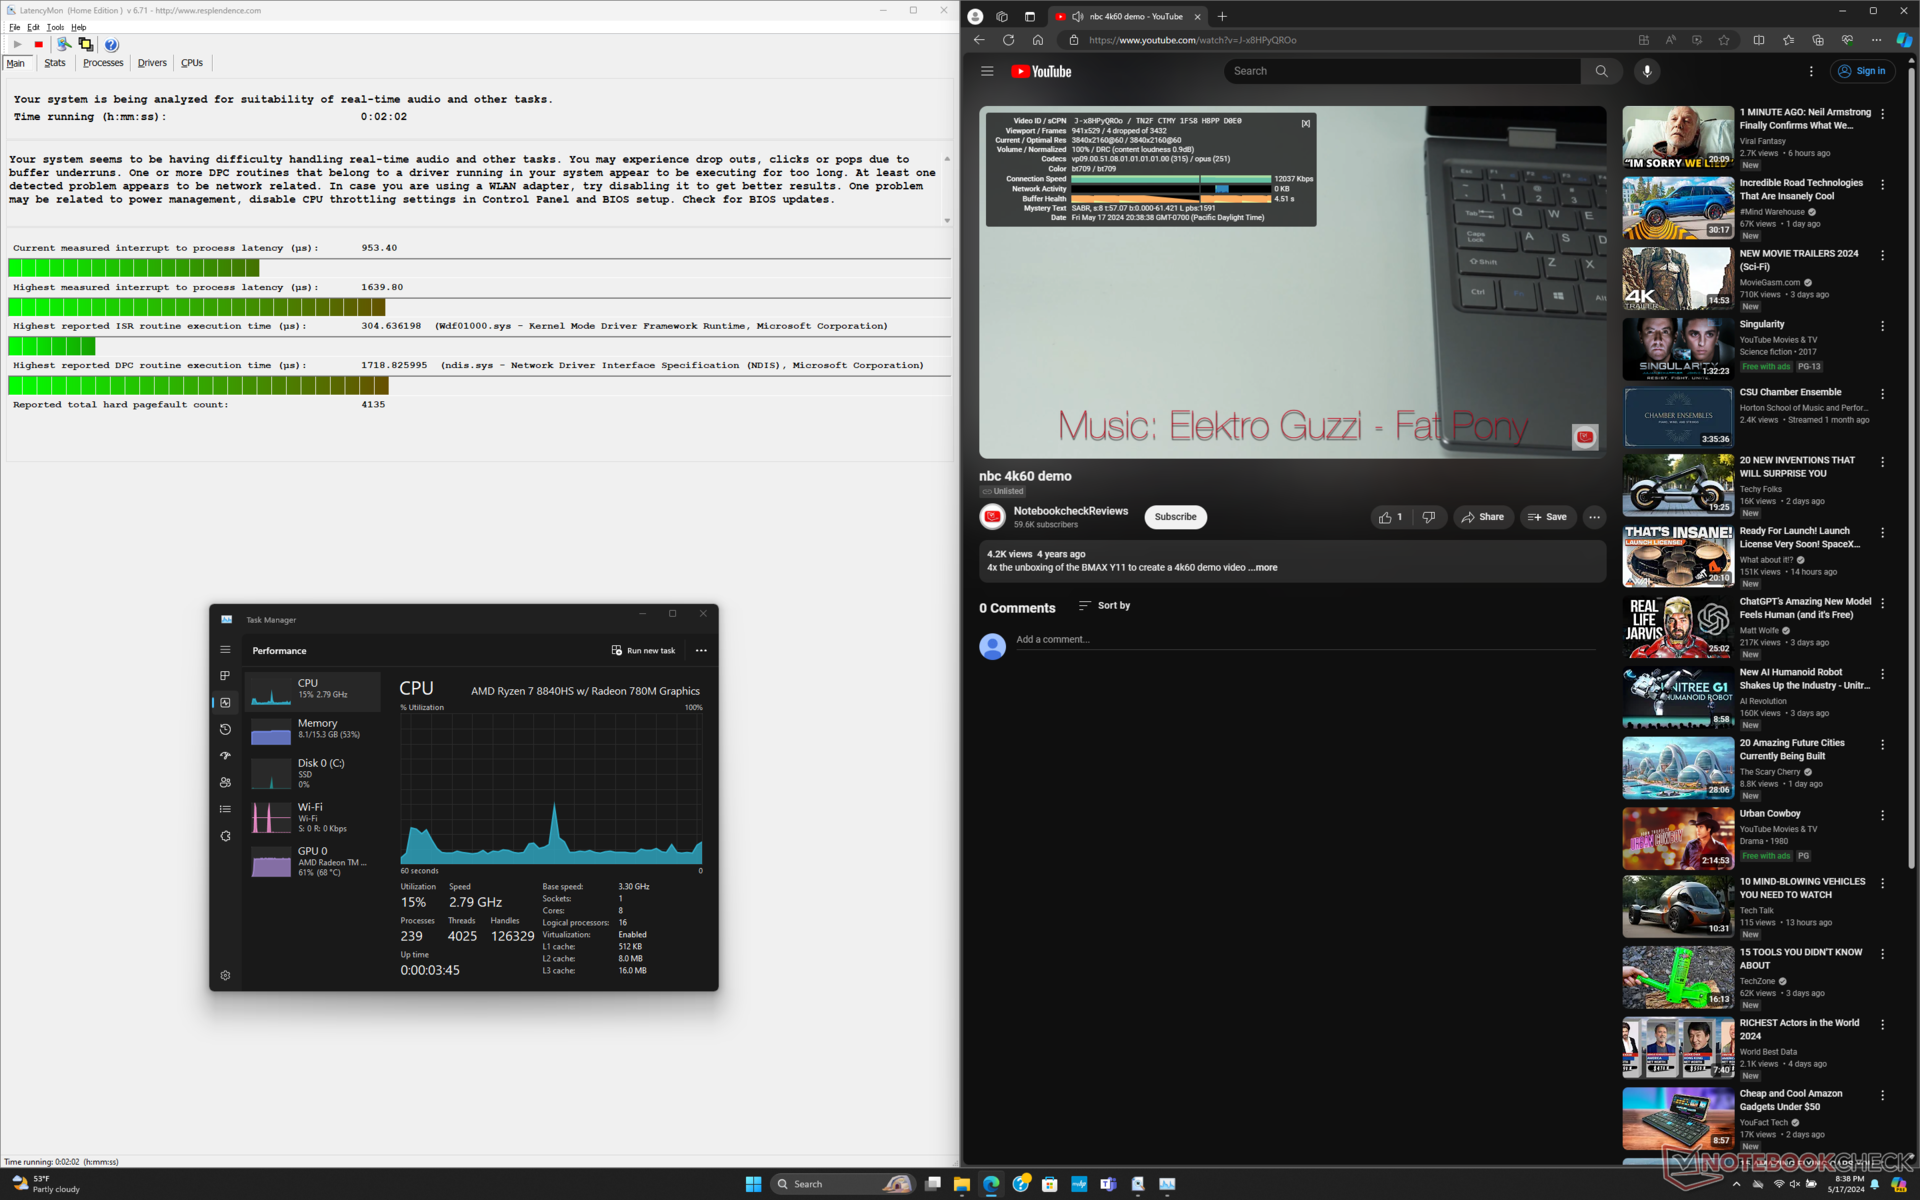
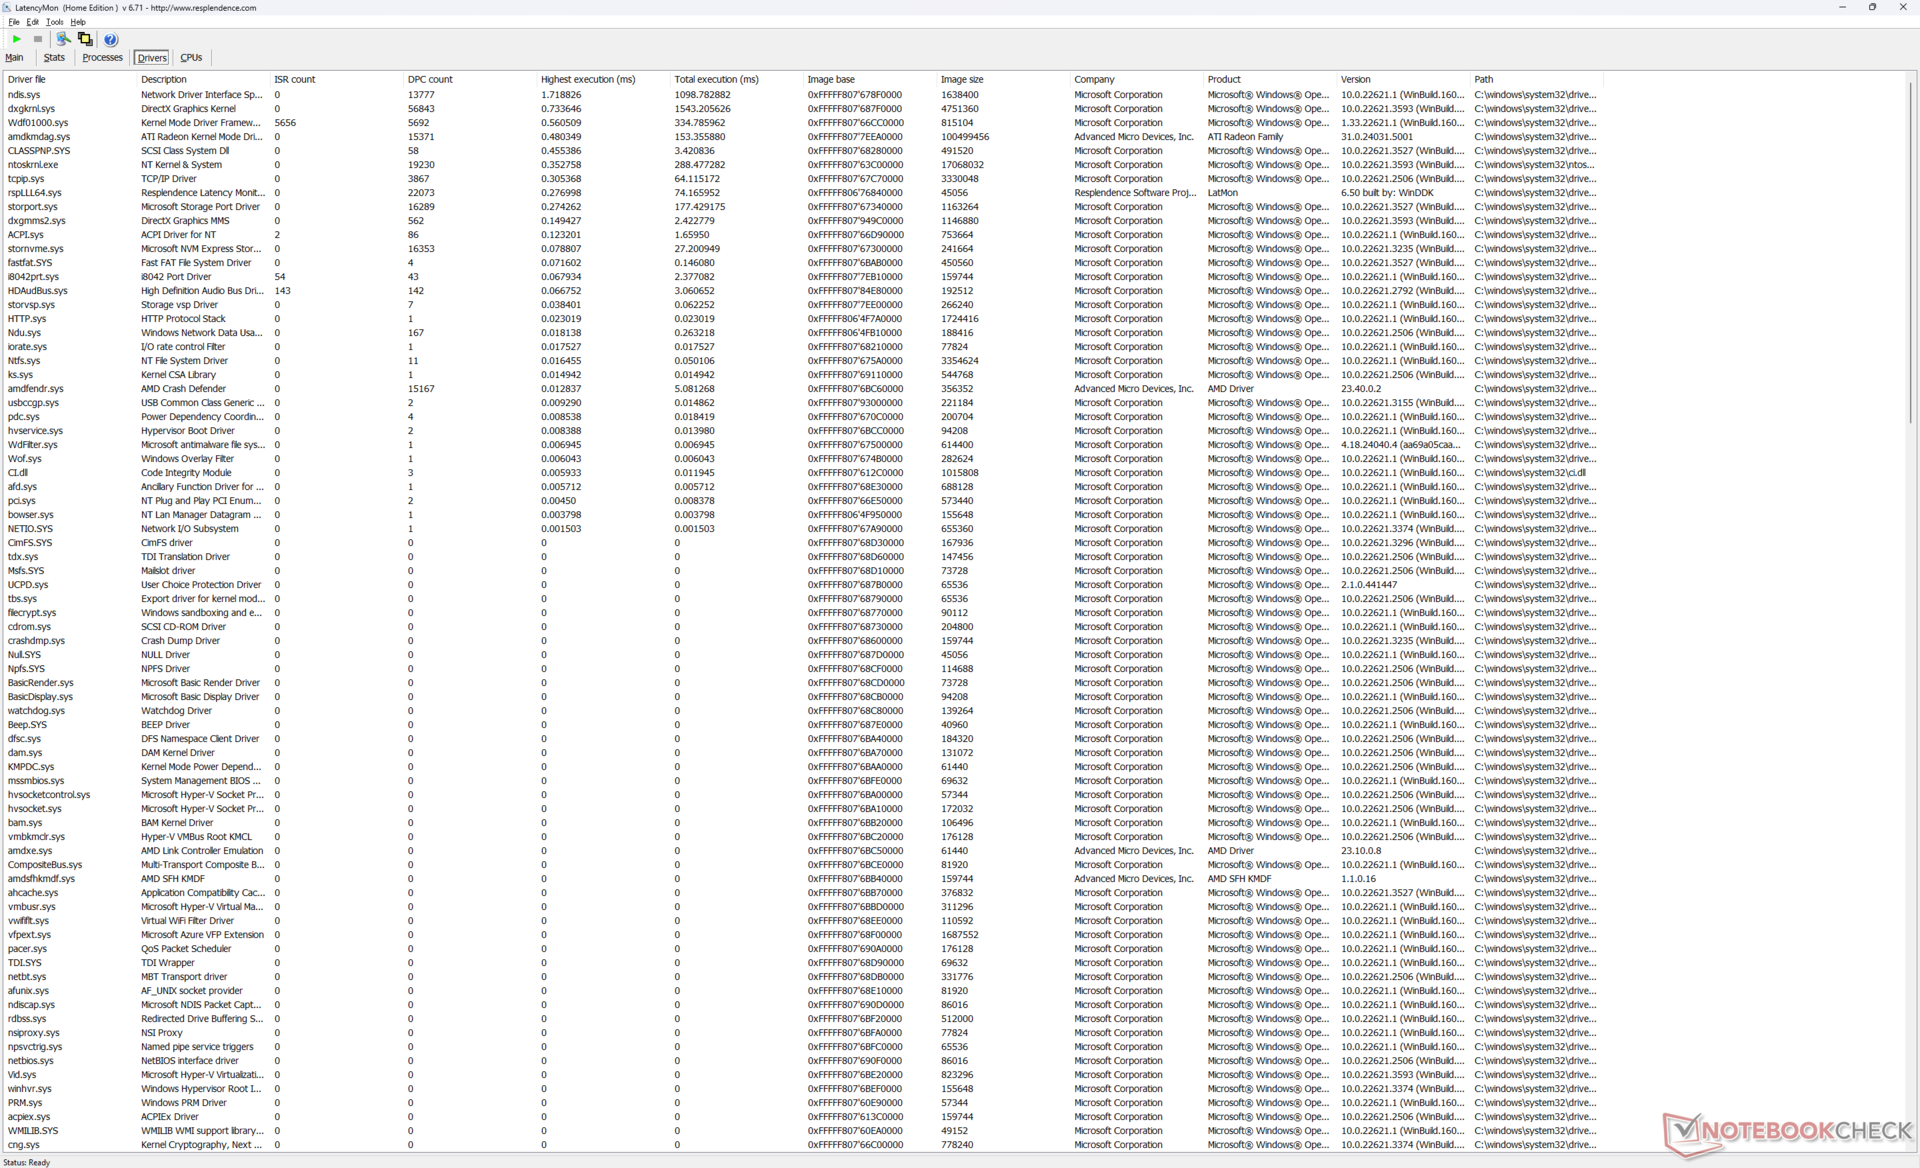
LatencyMon reveals minor DPC issues when opening multiple tabs of our homepage. 4K60 video playback is imperfect as well with 4 dropped frames recorded over the span of 60 seconds. Though the frame skips are not frequent enough to be noticeable, there should ideally be no skips at all.
| DPC Latencies / LatencyMon - interrupt to process latency (max), Web, Youtube, Prime95 | |
| LG Gram 2in1 16 16T90R - G.AA78G | |
| Samsung Galaxy Book4 Pro 360 | |
| HP Spectre x360 16 RTX 4050 | |
| HP Envy x360 2-in-1 16-ad0097nr | |
| HP Envy 16 h0112nr | |
| Lenovo Yoga 7 2-in-1 16IML9 | |
* ... smaller is better
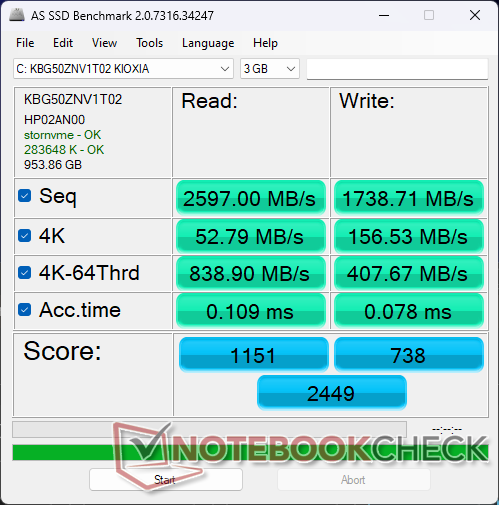
Storage Devices
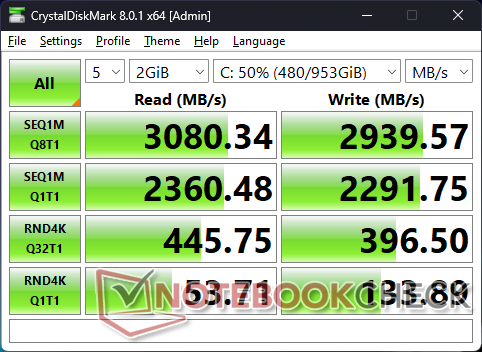
Our unit ships with the Kioxia KBG50ZNV1T02 which is a budget 2280 PCIe4 x4 NVMe SSD with sequential read and write rates of up to 3500 MB/s and 2900 MB/s, respectively, compared to 7000 MB/s on higher-end drives like the Samsung PM9A1 series. Transfer rates drop slightly when stressed, but performance is otherwise good for a midrange system.

| Drive Performance rating - Percent | |
| LG Gram 2in1 16 16T90R - G.AA78G | |
| HP Envy 16 h0112nr | |
| Samsung Galaxy Book4 Pro 360 | |
| HP Spectre x360 16 RTX 4050 | |
| HP Envy x360 2-in-1 16-ad0097nr | |
| Lenovo Yoga 7 2-in-1 16IML9 | |
* ... smaller is better
Disk Throttling: DiskSpd Read Loop, Queue Depth 8
GPU Performance
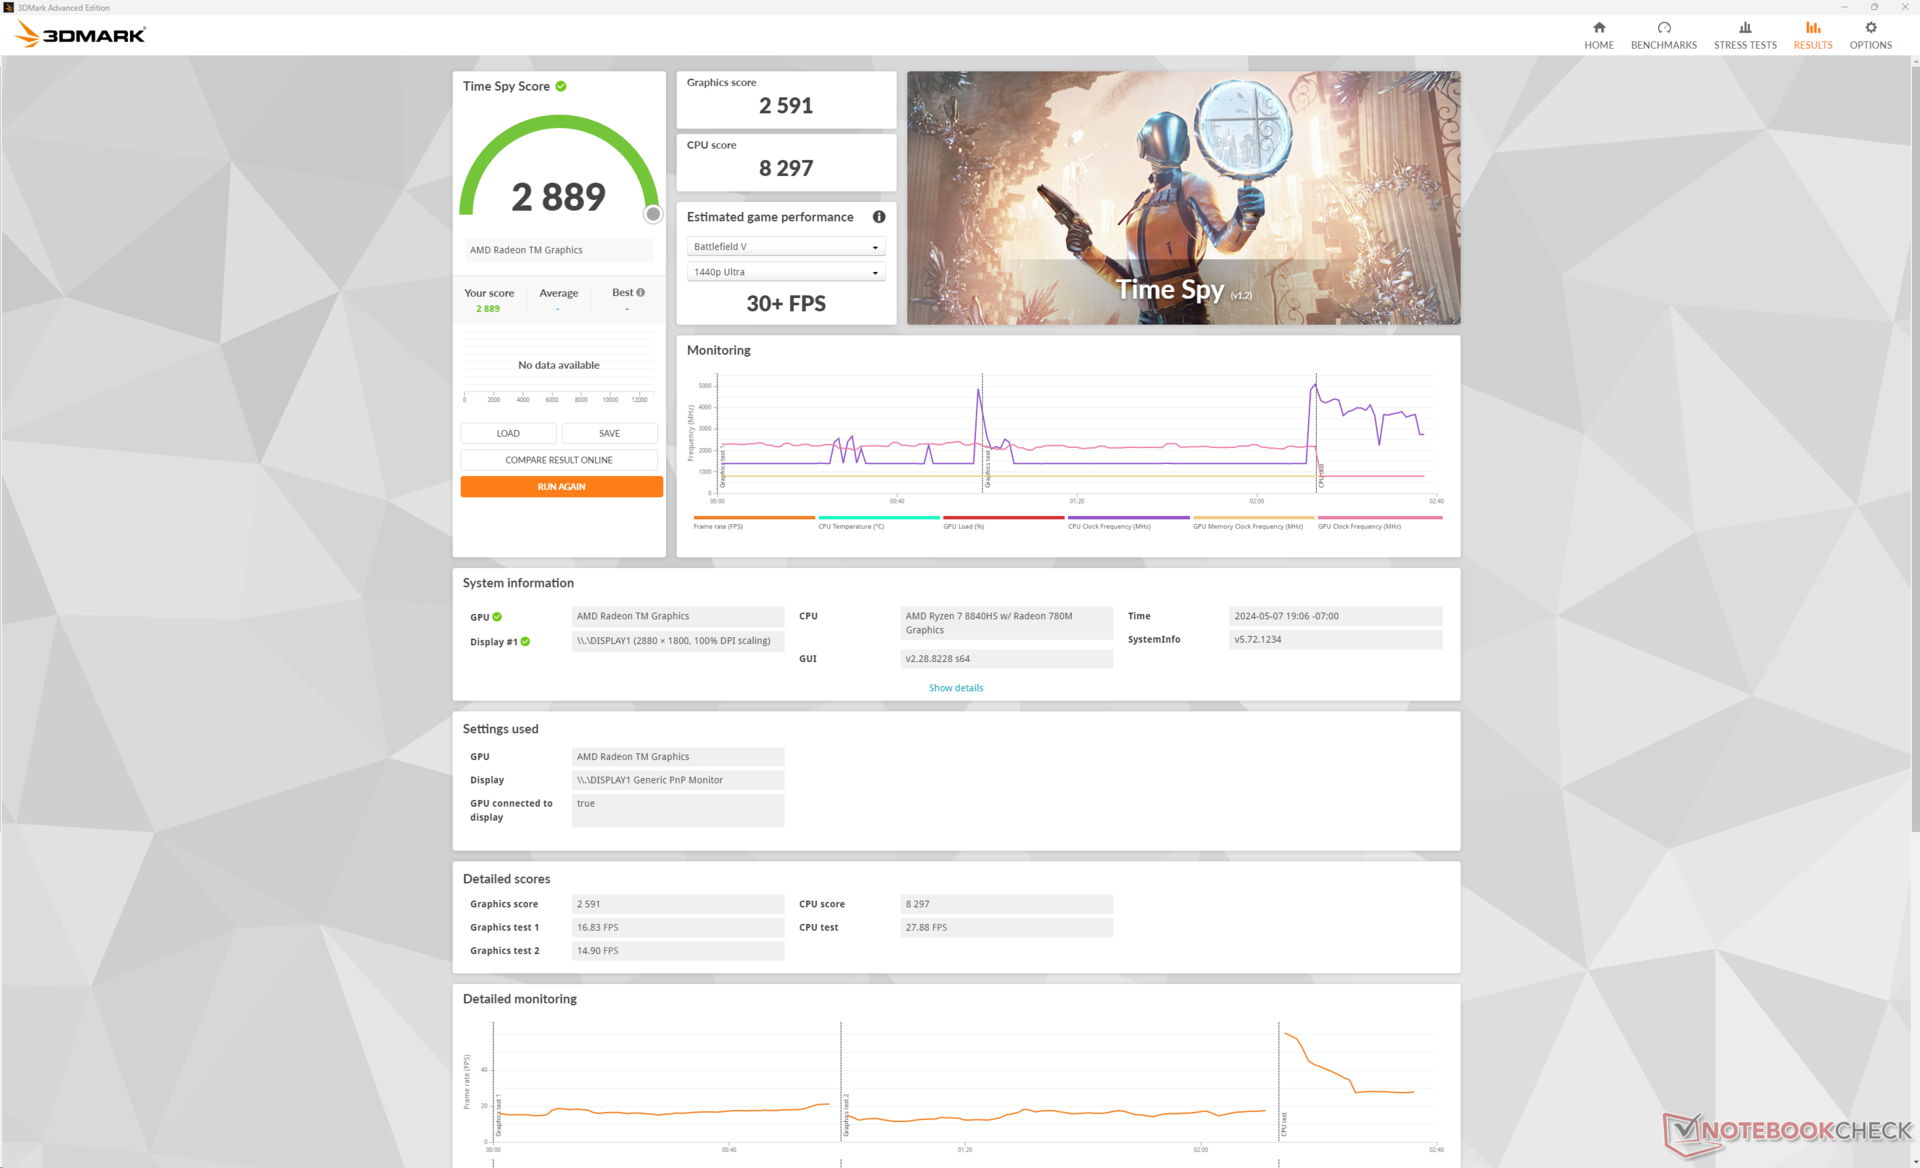
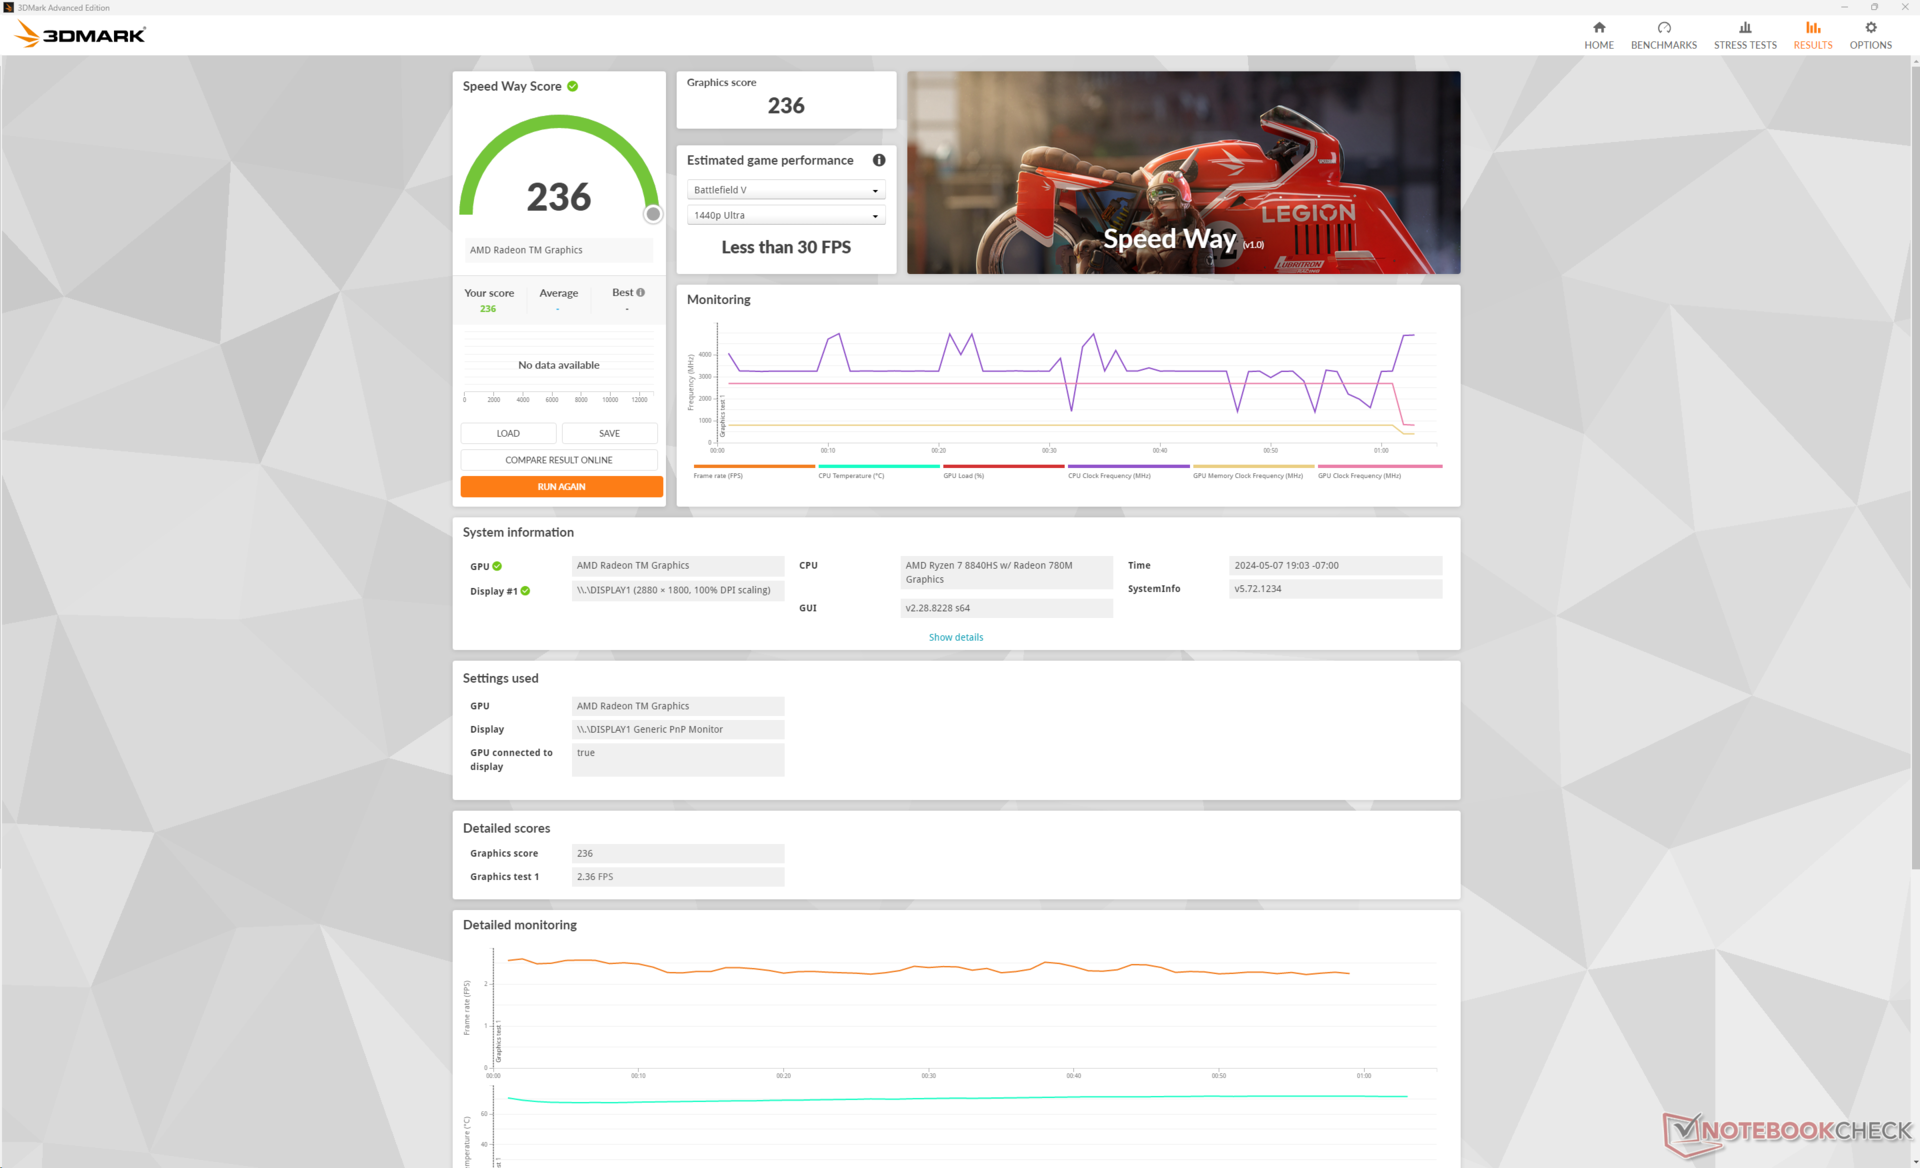
The Radeon 780M is still a beast of an integrated GPU even after Intel answered back with the competing Arc 8. 3DMark results show it to be most similar to the Arc 7 but well ahead of the older Iris Xe 96 EUs.
Opting for the Intel version of the Envy x360 16 will entail a significant decline in graphics performance. This is because the Intel versions ship with Core Ultra U-series CPUs instead of the Core Ultra H-series. Arc 7 and Arc 8 graphics are available only on Core Ultra H CPUs whereas the integrated GPU in the Core Ultra U-series performs more like the Iris Xe 96 EUs.
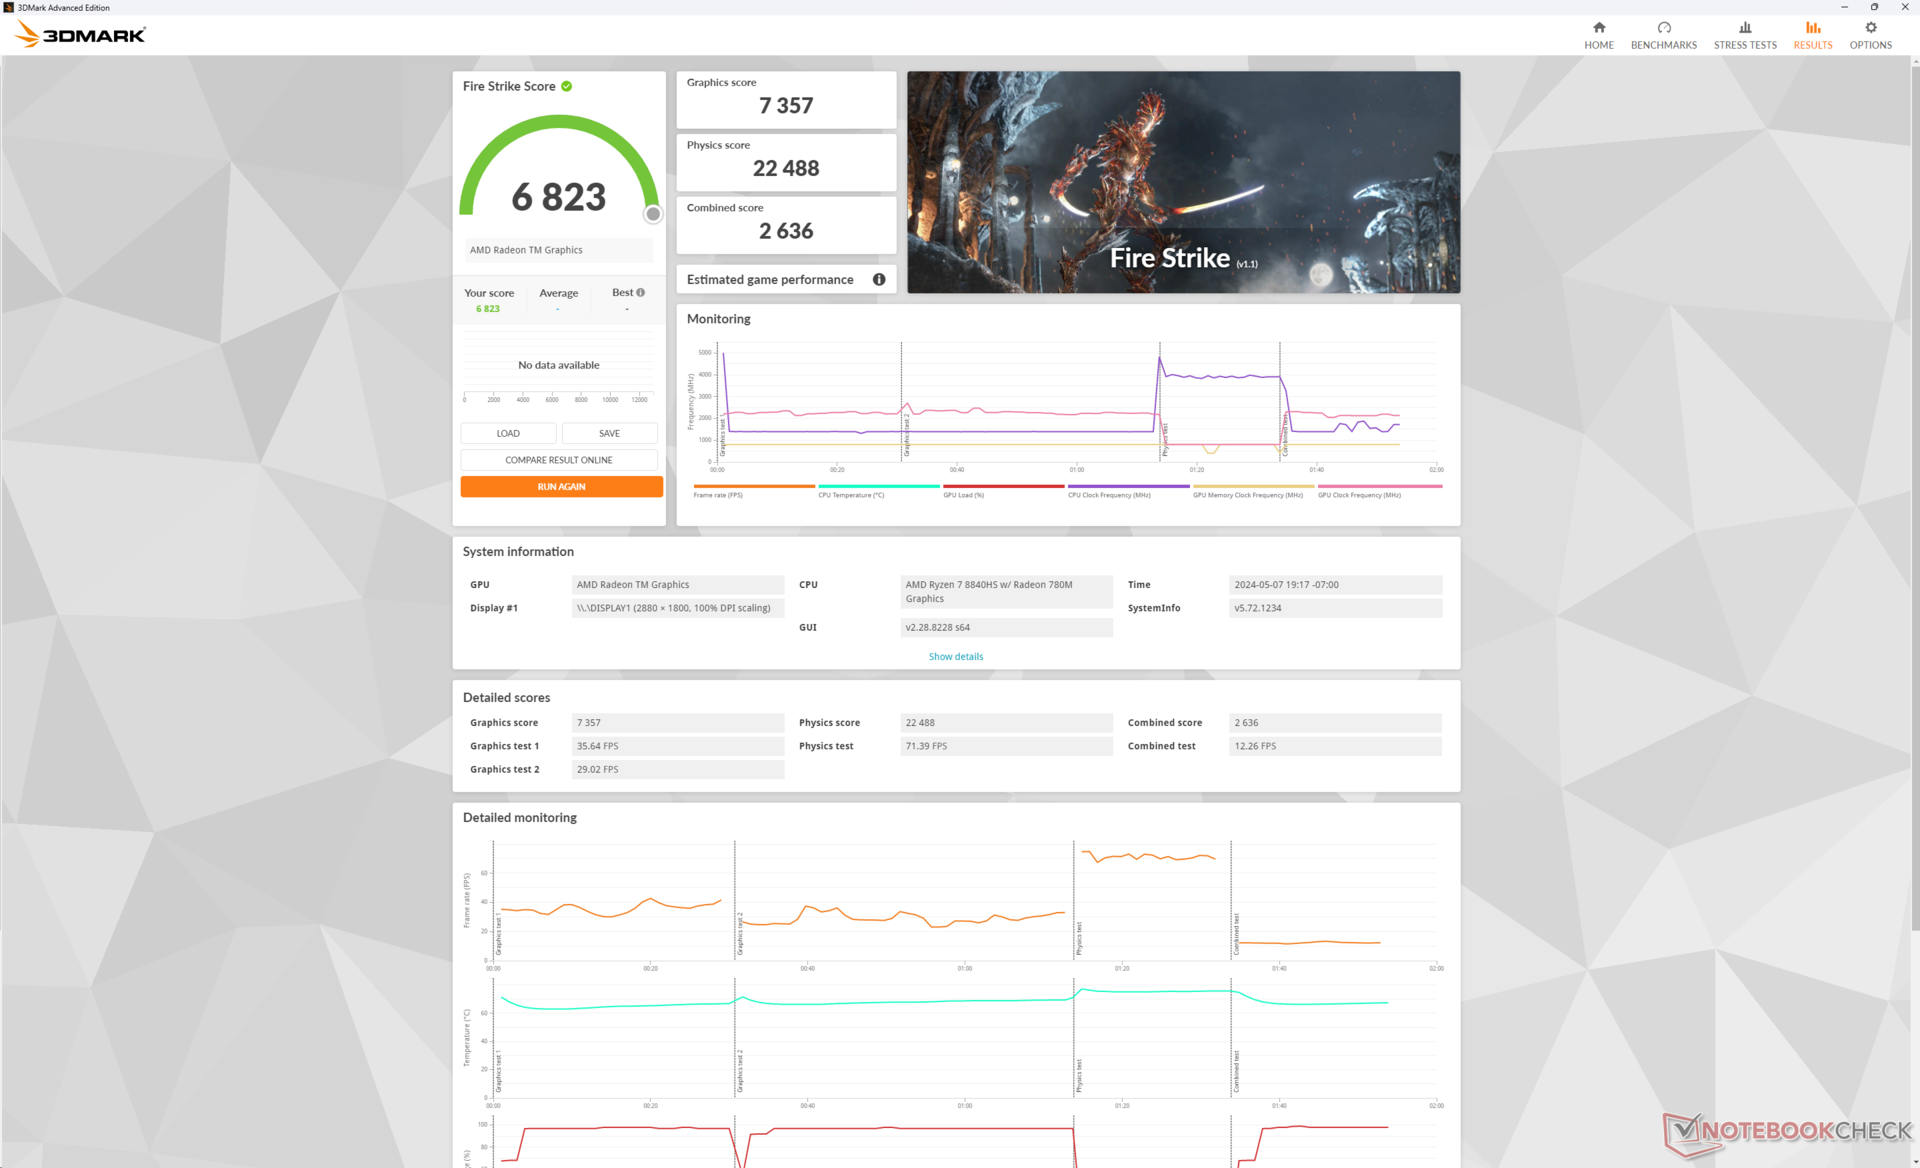
| Power Profile | Graphics Score | Physics Score | Combined Score |
| Performance Mode | 7357 | 22488 | 2636 |
| Balanced Mode | 6957 (-5%) | 20442 (-9%) | 2509 (-5%) |
| Battery Power | 4651 (-37%) | 18788 (-17%) | 1902 (-28%) |
Running on Balanced mode impacts performance by up to 10 percent according to our Fire Strike table above. Fan RPM becomes noticeably more lethargic when set to Balanced mode to accompany the slower performance.
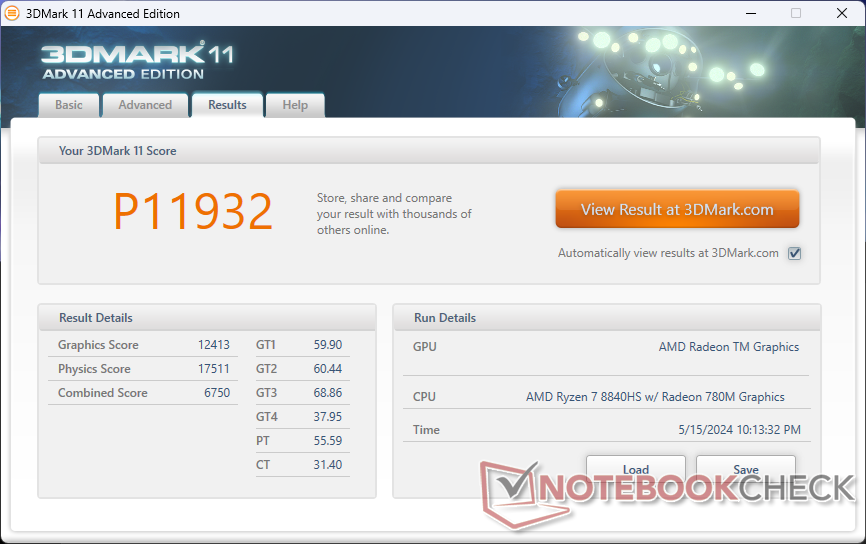
| 3DMark 11 Performance | 11932 points | |
| 3DMark Cloud Gate Standard Score | 32533 points | |
| 3DMark Fire Strike Score | 6823 points | |
| 3DMark Time Spy Score | 2889 points | |
Help | ||
* ... smaller is better
Unfortunately, performance in games is consistently slower than the average laptop in our database equipped with the same Radeon 780M GPU even when set to Performance mode. This is likely due to the overall slower raw processor performance of the Ryzen 7 8840HS when compared to last year's Ryzen 7 7840HS creating more CPU-bound scenarios.
| The Witcher 3 - 1920x1080 Ultra Graphics & Postprocessing (HBAO+) | |
| HP Spectre x360 16 RTX 4050 | |
| HP Envy x360 2-in-1 16-ad0097nr | |
| Samsung Galaxy Book4 Pro 360 | |
| HP Envy x360 15-fe0072ng | |
| Lenovo Yoga 7 2-in-1 16IML9 | |
| LG Gram 2in1 16 16T90R - G.AA78G | |
| Final Fantasy XV Benchmark - 1920x1080 High Quality | |
| HP Spectre x360 16 RTX 4050 | |
| HP Envy x360 2-in-1 16-ad0097nr | |
| Samsung Galaxy Book4 Pro 360 | |
| LG Gram 2in1 16 16T90R - G.AA78G | |
| HP Envy x360 15-fe0072ng | |
| Lenovo Yoga 7 2-in-1 16IML9 | |
| Strange Brigade - 1920x1080 ultra AA:ultra AF:16 | |
| HP Spectre x360 16 RTX 4050 | |
| HP Envy x360 2-in-1 16-ad0097nr | |
| Samsung Galaxy Book4 Pro 360 | |
| Lenovo Yoga 7 2-in-1 16IML9 | |
| LG Gram 2in1 16 16T90R - G.AA78G | |
| HP Envy x360 15-fe0072ng | |
| Dota 2 Reborn - 1920x1080 ultra (3/3) best looking | |
| HP Spectre x360 16 RTX 4050 | |
| HP Envy x360 2-in-1 16-ad0097nr | |
| LG Gram 2in1 16 16T90R - G.AA78G | |
| Samsung Galaxy Book4 Pro 360 | |
| Lenovo Yoga 7 2-in-1 16IML9 | |
| HP Envy x360 15-fe0072ng | |
| X-Plane 11.11 - 1920x1080 high (fps_test=3) | |
| HP Spectre x360 16 RTX 4050 | |
| LG Gram 2in1 16 16T90R - G.AA78G | |
| Samsung Galaxy Book4 Pro 360 | |
| HP Envy x360 15-fe0072ng | |
| HP Envy x360 2-in-1 16-ad0097nr | |
| Lenovo Yoga 7 2-in-1 16IML9 | |
| Far Cry 5 - 1920x1080 Ultra Preset AA:T | |
| HP Spectre x360 16 RTX 4050 | |
| HP Envy x360 2-in-1 16-ad0097nr | |
| LG Gram 2in1 16 16T90R - G.AA78G | |
| Lenovo Yoga 7 2-in-1 16IML9 | |
| Baldur's Gate 3 | |
| 1280x720 Low Preset AA:SM | |
| Average AMD Radeon 780M (30.7 - 67.6, n=34) | |
| HP Envy x360 2-in-1 16-ad0097nr | |
| Lenovo Yoga 7 2-in-1 16IML9 | |
| 1920x1080 Low Preset AA:SM | |
| Dell XPS 16 9640 | |
| HP Spectre x360 16 RTX 4050 | |
| Average AMD Radeon 780M (20.2 - 44.1, n=47) | |
| HP Envy x360 2-in-1 16-ad0097nr | |
| Lenovo Yoga 7 2-in-1 16IML9 | |
| 1920x1080 Medium Preset AA:T | |
| Dell XPS 16 9640 | |
| HP Spectre x360 16 RTX 4050 | |
| HP Envy x360 2-in-1 16-ad0097nr | |
| Average AMD Radeon 780M (15.7 - 36.8, n=50) | |
| 1920x1080 High Preset AA:T | |
| Dell XPS 16 9640 | |
| HP Spectre x360 16 RTX 4050 | |
| Average AMD Radeon 780M (13.3 - 30.6, n=50) | |
| HP Envy x360 2-in-1 16-ad0097nr | |
| 1920x1080 Ultra Preset AA:T | |
| Dell XPS 16 9640 | |
| HP Spectre x360 16 RTX 4050 | |
| Average AMD Radeon 780M (12.8 - 29.6, n=49) | |
| HP Envy x360 2-in-1 16-ad0097nr | |
Witcher 3 FPS Chart
| low | med. | high | ultra | |
|---|---|---|---|---|
| The Witcher 3 (2015) | 129.2 | 47.6 | 28.8 | |
| Dota 2 Reborn (2015) | 123.7 | 103.7 | 73 | 65.4 |
| Final Fantasy XV Benchmark (2018) | 64.5 | 34.1 | 25.2 | |
| X-Plane 11.11 (2018) | 47.8 | 33.9 | 27.9 | |
| Far Cry 5 (2018) | 63 | 36 | 33 | 31 |
| Strange Brigade (2018) | 138.2 | 60.3 | 50.2 | 42.2 |
| Tiny Tina's Wonderlands (2022) | 49.8 | 38 | 24 | 19.5 |
| F1 22 (2022) | 70.2 | 60 | 46 | 12 |
| Baldur's Gate 3 (2023) | 35 | 28.5 | 22.6 | 22.2 |
| Cyberpunk 2077 (2023) | 35.5 | 27.8 | 22.1 | 19.1 |
Emissions — Low Lows With High Highs
System Noise
Fan RPM and behavior are tied closely to the power profile selected. If on Balanced mode, the fan tends to run noticeably quieter and for longer periods before needing to ramp up. Fan noise when running 3DMark 06, for example, would remain at 23.8 dB(A) throughout the first benchmark scene whereas it would jump to 28 dB(A) if set to Performance mode. It's recommended to put MyHP on Balanced mode to limit fan pulsing when running undemanding tasks like web browsing or video streaming.
We're able to record a maximum noise level of almost 44 dB(A) when running Witcher 3 on Performance mode. This makes the Envy x360 16 one of the loudest 16-inch convertibles by several decibels when running demanding loads.
Noise level
| Idle |
| 23 / 23 / 23 dB(A) |
| Load |
| 23.8 / 43.8 dB(A) |
 | ||
30 dB silent 40 dB(A) audible 50 dB(A) loud |
||
min: | ||
| HP Envy x360 2-in-1 16-ad0097nr Radeon 780M, R7 8840HS, KIOXIA BG5 KBG50ZNV1T02 | HP Envy 16 h0112nr GeForce RTX 3060 Laptop GPU, i7-12700H, Micron 3400 1TB MTFDKBA1T0TFH | HP Spectre x360 16 RTX 4050 GeForce RTX 4050 Laptop GPU, Ultra 7 155H, SK hynix PC801 HFS001TEJ9X101N | Lenovo Yoga 7 2-in-1 16IML9 Graphics 4-Core iGPU (Arrow Lake), Ultra 5 125U, SK hynix HFS512GEJ4X112N | Samsung Galaxy Book4 Pro 360 Arc 7-Core, Ultra 5 125H, Samsung PM9B1 512GB MZVL4512HBLU | LG Gram 2in1 16 16T90R - G.AA78G Iris Xe G7 96EUs, i7-1360P, Samsung PM9A1 MZVL21T0HCLR | |
|---|---|---|---|---|---|---|
| Noise | -20% | 3% | 1% | -8% | -7% | |
| off / environment * (dB) | 22.9 | 22.8 -0% | 23.3 -2% | 22.8 -0% | 24.1 -5% | 25.1 -10% |
| Idle Minimum * (dB) | 23 | 22.9 -0% | 23.6 -3% | 22.8 1% | 24.1 -5% | 25.1 -9% |
| Idle Average * (dB) | 23 | 22.9 -0% | 23.6 -3% | 22.8 1% | 24.1 -5% | 25.1 -9% |
| Idle Maximum * (dB) | 23 | 30.5 -33% | 23.6 -3% | 22.8 1% | 26.4 -15% | 26.1 -13% |
| Load Average * (dB) | 23.8 | 41.4 -74% | 29.2 -23% | 30.8 -29% | 35.2 -48% | 31.4 -32% |
| Witcher 3 ultra * (dB) | 43.8 | 51.1 -17% | 32.1 27% | 31 29% | 38.5 12% | 41.1 6% |
| Load Maximum * (dB) | 43.8 | 51.4 -17% | 32.1 27% | 40.8 7% | 39.2 11% | 36.6 16% |
* ... smaller is better
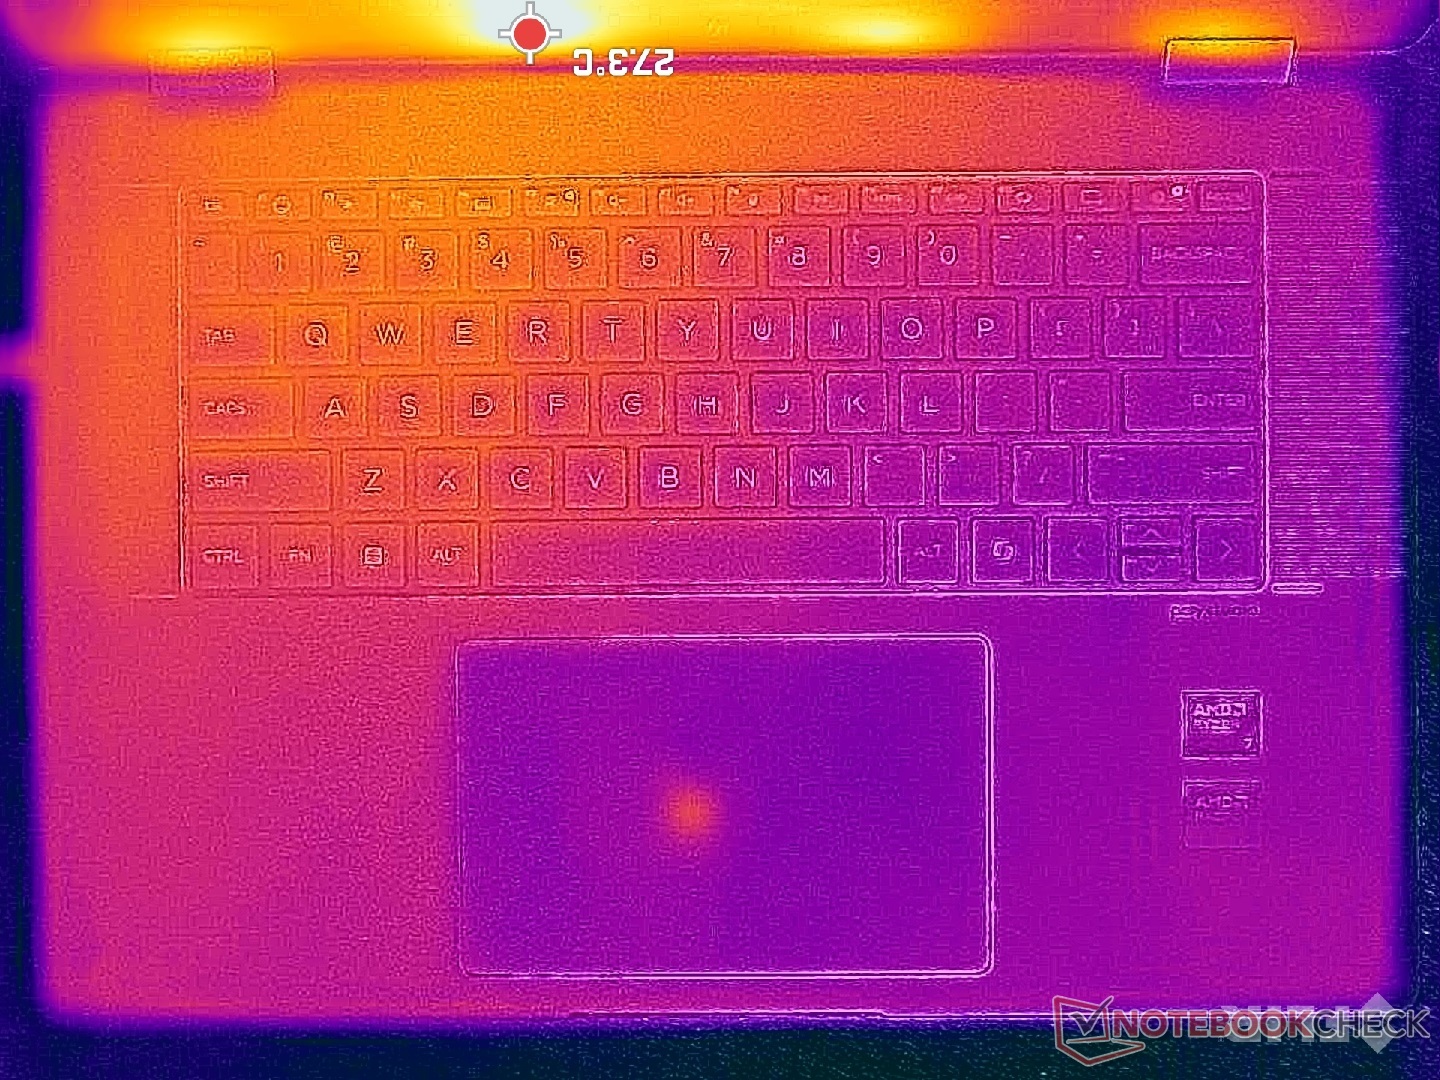
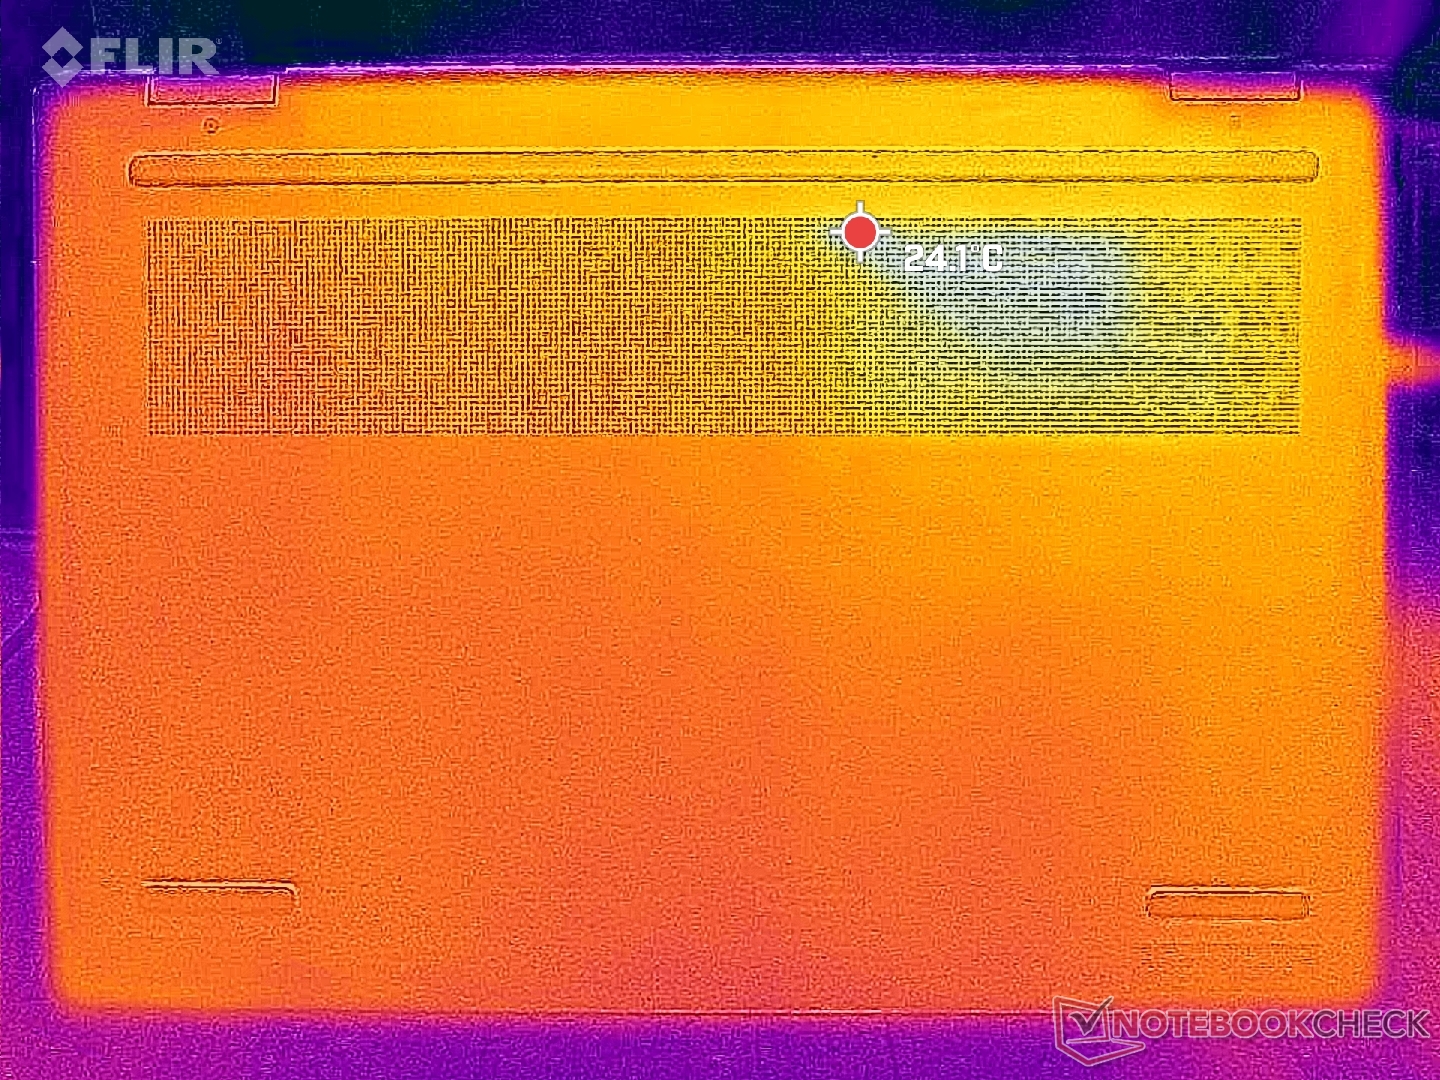
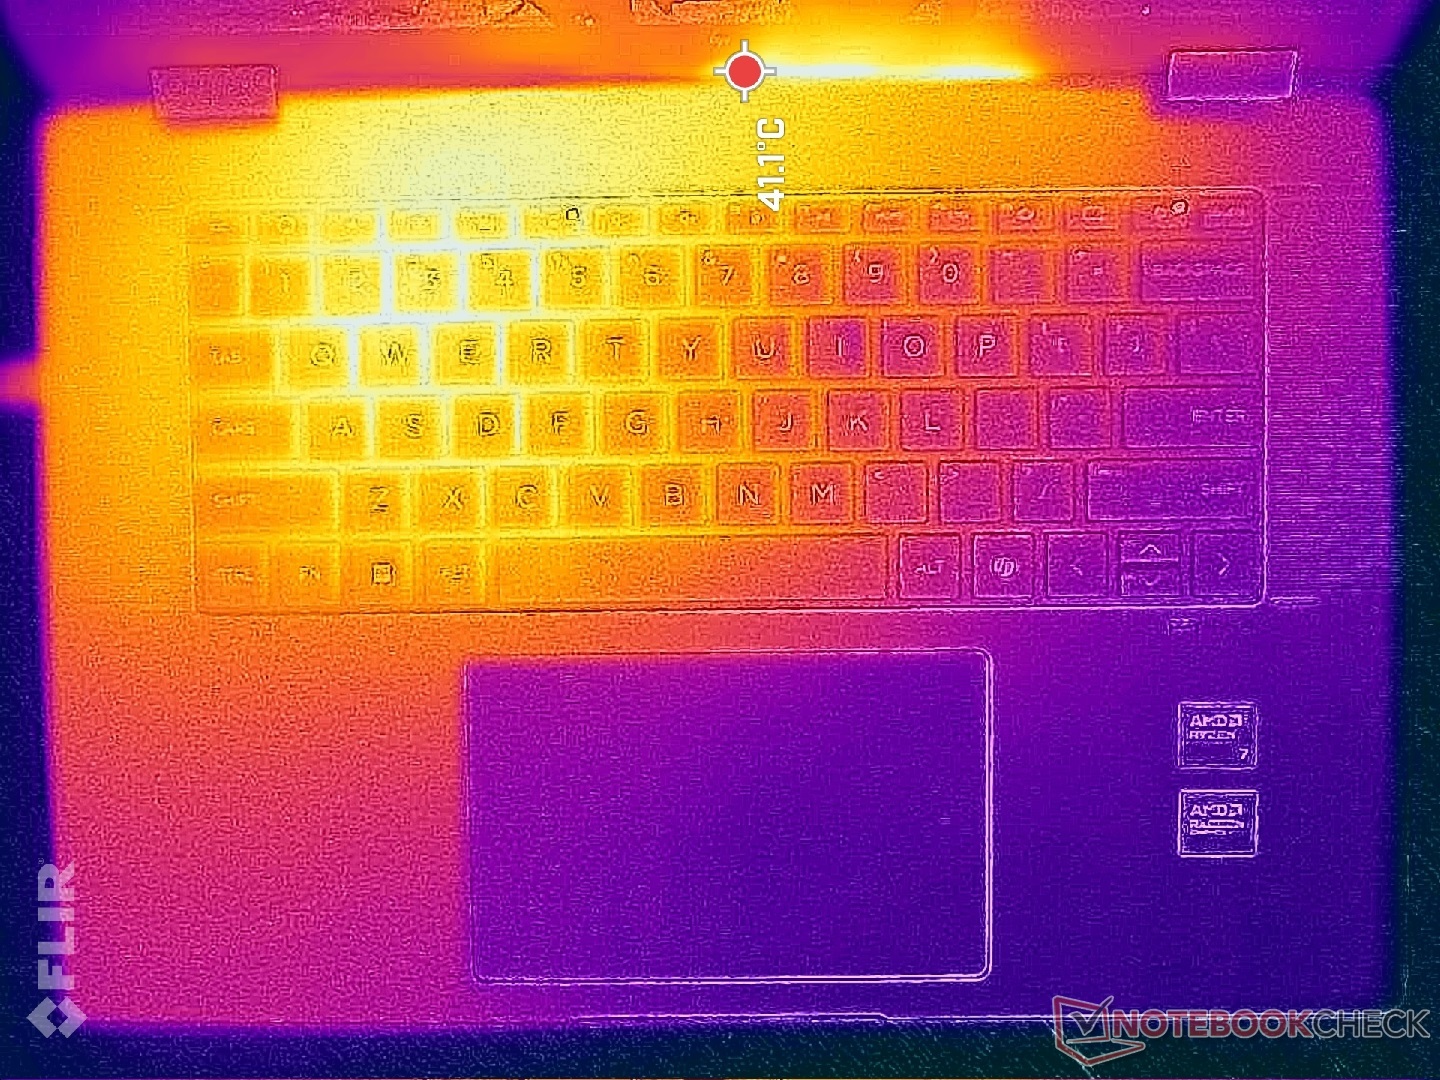
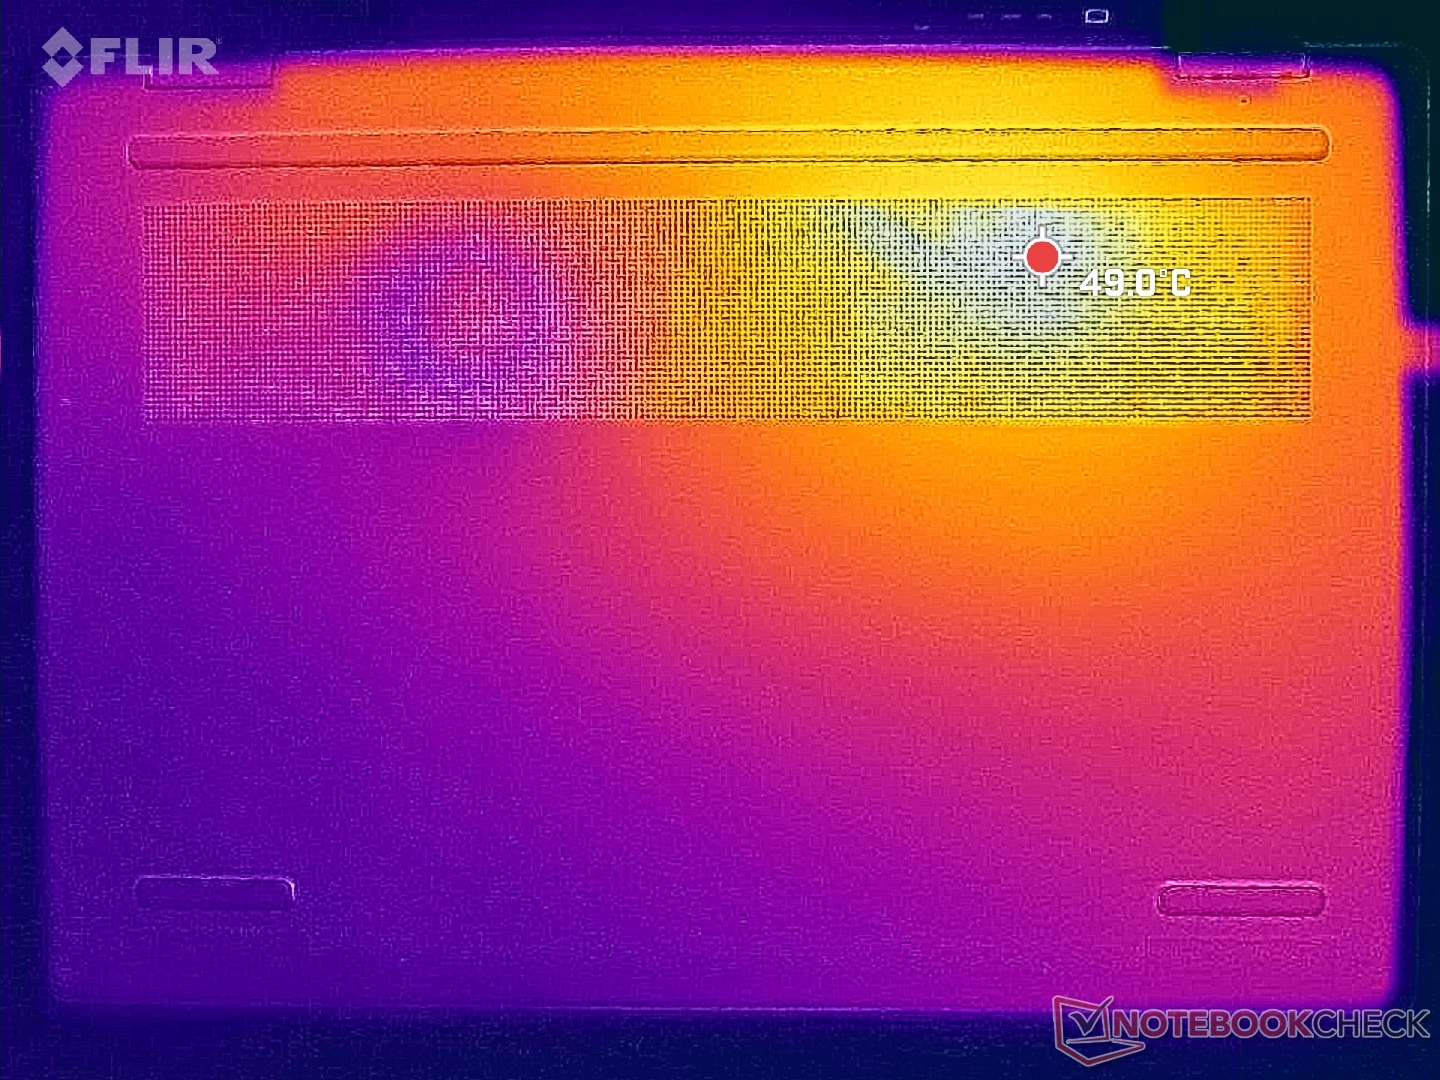
Temperature
Hot spots near the WASD keys can be as warm as 41 C compared to 38 C or just 36 C on the slower Core U-powered Yoga 7 2-in-1 16IML9 or Envy x360 15. The left palm rest in particular can be noticeably warmer than the right when under load, but the heat thankfully never becomes too uncomfortable.
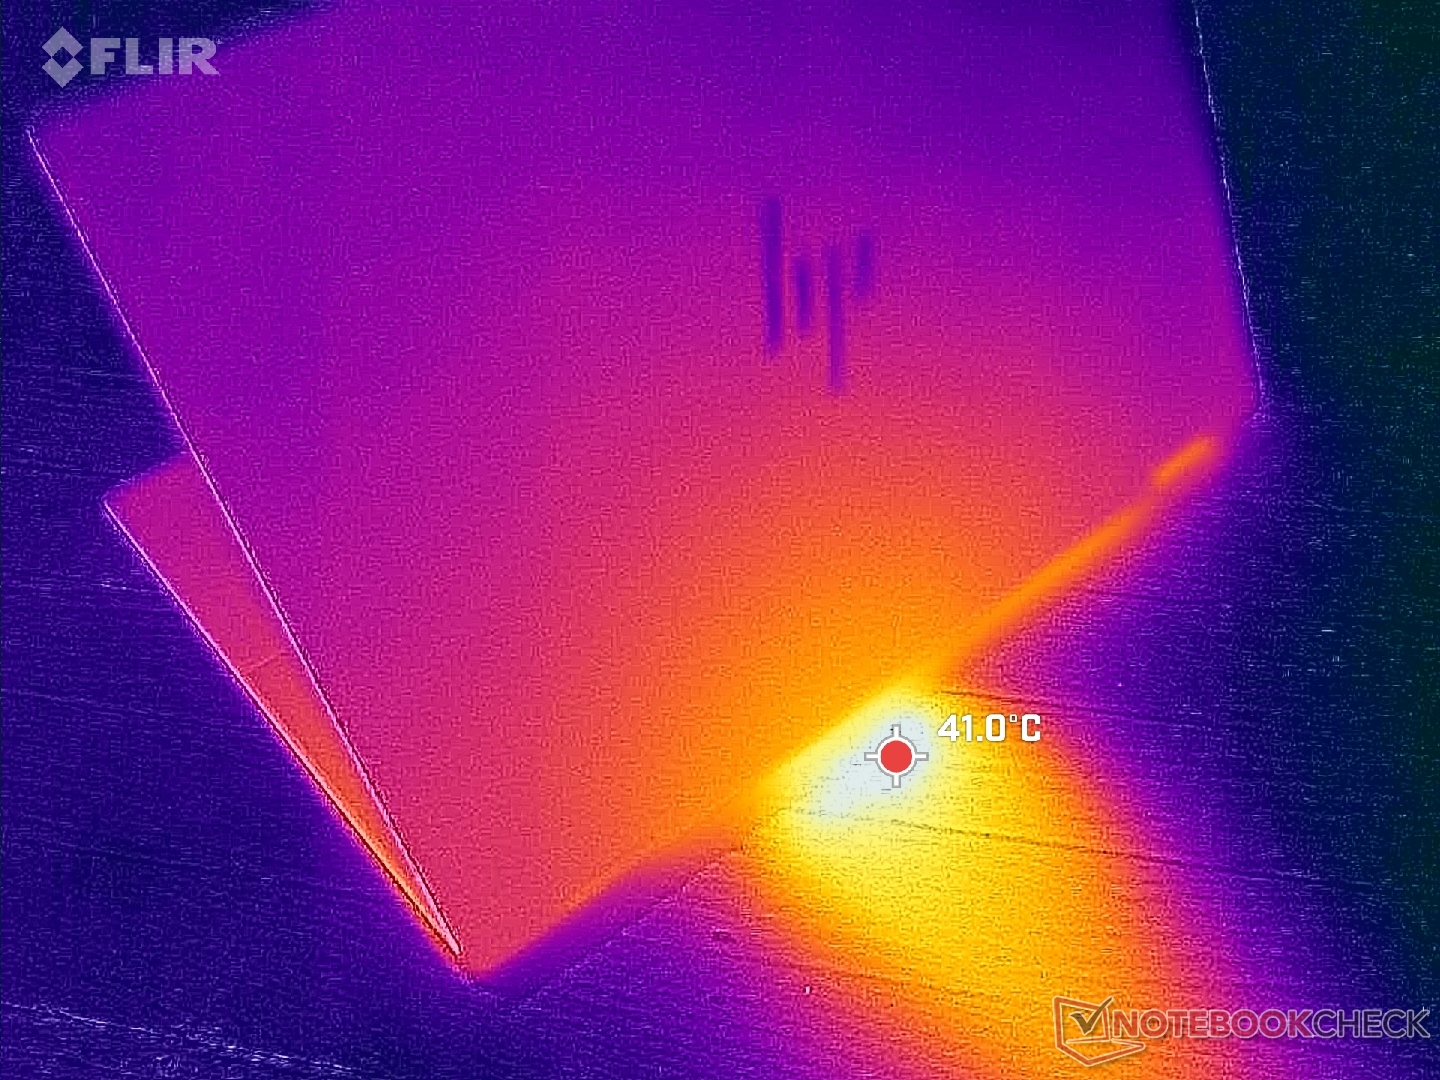
(±) The maximum temperature on the upper side is 42.6 °C / 109 F, compared to the average of 35.4 °C / 96 F, ranging from 19.6 to 60 °C for the class Convertible.
(-) The bottom heats up to a maximum of 47.8 °C / 118 F, compared to the average of 36.9 °C / 98 F
(+) In idle usage, the average temperature for the upper side is 26.5 °C / 80 F, compared to the device average of 30.3 °C / 87 F.
(+) The palmrests and touchpad are reaching skin temperature as a maximum (32.4 °C / 90.3 F) and are therefore not hot.
(-) The average temperature of the palmrest area of similar devices was 28 °C / 82.4 F (-4.4 °C / -7.9 F).
| HP Envy x360 2-in-1 16-ad0097nr AMD Ryzen 7 8840HS, AMD Radeon 780M | HP Envy 16 h0112nr Intel Core i7-12700H, NVIDIA GeForce RTX 3060 Laptop GPU | HP Spectre x360 16 RTX 4050 Intel Core Ultra 7 155H, NVIDIA GeForce RTX 4050 Laptop GPU | Lenovo Yoga 7 2-in-1 16IML9 Intel Core Ultra 5 125U, Intel Graphics 4-Core iGPU (Meteor / Arrow Lake) | Samsung Galaxy Book4 Pro 360 Intel Core Ultra 5 125H, Intel Arc 7-Core iGPU | LG Gram 2in1 16 16T90R - G.AA78G Intel Core i7-1360P, Intel Iris Xe Graphics G7 96EUs | |
|---|---|---|---|---|---|---|
| Heat | -10% | 1% | 10% | 11% | -20% | |
| Maximum Upper Side * (°C) | 42.6 | 45.2 -6% | 39.6 7% | 37.8 11% | 38.6 9% | 55 -29% |
| Maximum Bottom * (°C) | 47.8 | 44 8% | 39.2 18% | 38.8 19% | 39.2 18% | 55.4 -16% |
| Idle Upper Side * (°C) | 27.4 | 33.6 -23% | 29 -6% | 25.4 7% | 25.2 8% | 34.9 -27% |
| Idle Bottom * (°C) | 27.8 | 32.6 -17% | 31.6 -14% | 26.8 4% | 25.7 8% | 30 -8% |
* ... smaller is better
Speakers

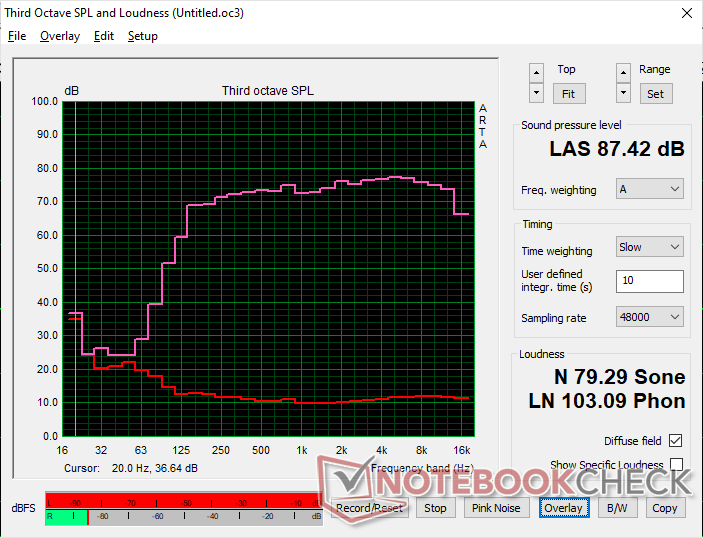
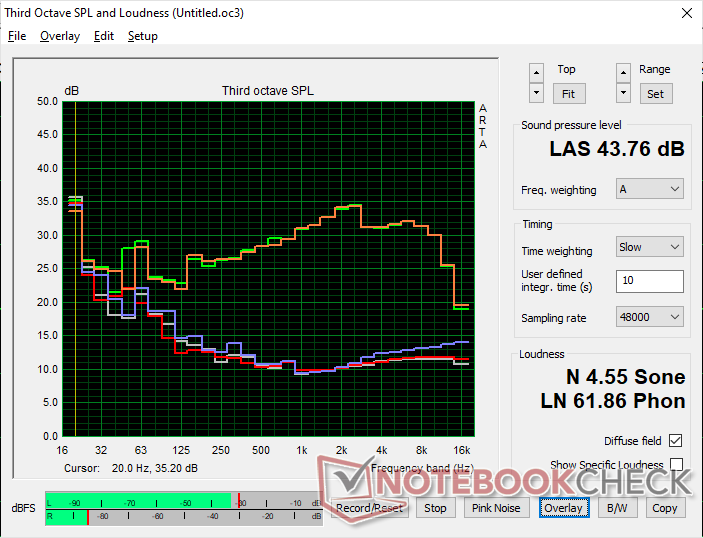
HP Envy x360 2-in-1 16-ad0097nr audio analysis
(+) | speakers can play relatively loud (87.4 dB)
Bass 100 - 315 Hz
(±) | reduced bass - on average 8.3% lower than median
(±) | linearity of bass is average (8.7% delta to prev. frequency)
Mids 400 - 2000 Hz
(+) | balanced mids - only 1% away from median
(+) | mids are linear (1.9% delta to prev. frequency)
Highs 2 - 16 kHz
(+) | balanced highs - only 2.5% away from median
(+) | highs are linear (1.2% delta to prev. frequency)
Overall 100 - 16.000 Hz
(+) | overall sound is linear (6.5% difference to median)
Compared to same class
» 0% of all tested devices in this class were better, 0% similar, 99% worse
» The best had a delta of 6%, average was 20%, worst was 57%
Compared to all devices tested
» 1% of all tested devices were better, 0% similar, 99% worse
» The best had a delta of 4%, average was 23%, worst was 134%
Apple MacBook Pro 16 2021 M1 Pro audio analysis
(+) | speakers can play relatively loud (84.7 dB)
Bass 100 - 315 Hz
(+) | good bass - only 3.8% away from median
(+) | bass is linear (5.2% delta to prev. frequency)
Mids 400 - 2000 Hz
(+) | balanced mids - only 1.3% away from median
(+) | mids are linear (2.1% delta to prev. frequency)
Highs 2 - 16 kHz
(+) | balanced highs - only 1.9% away from median
(+) | highs are linear (2.7% delta to prev. frequency)
Overall 100 - 16.000 Hz
(+) | overall sound is linear (4.6% difference to median)
Compared to same class
» 0% of all tested devices in this class were better, 0% similar, 100% worse
» The best had a delta of 5%, average was 17%, worst was 45%
Compared to all devices tested
» 0% of all tested devices were better, 0% similar, 100% worse
» The best had a delta of 4%, average was 23%, worst was 134%
Energy Management
Power Consumption
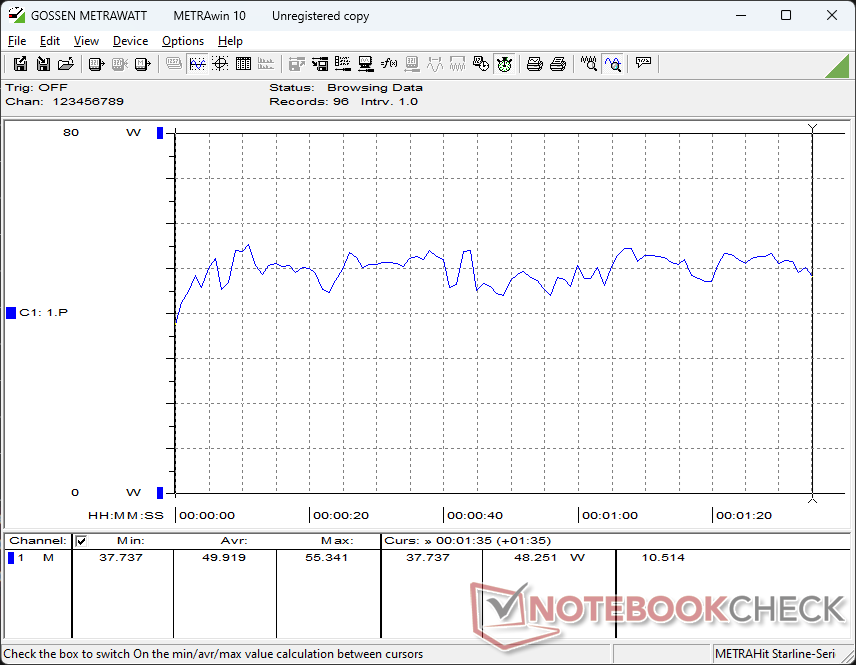
Idling on desktop demands between 5 W and 15 W which is almost half that of the Spectre x360 16 due to the lack of a dedicated GPU on the Envy model. You'll nevertheless want to limit screen time with white backgrounds as white demands more power on OLED than IPS; we're able to measure a difference of 9 W on our Envy when displaying an all-black screen versus an all-white screen when both are on maximum brightness.
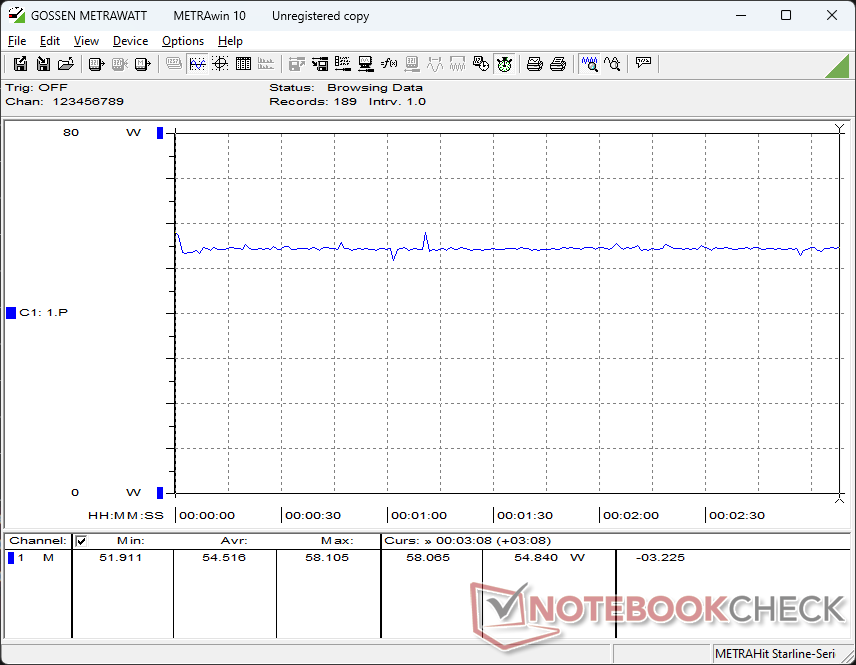
Running Witcher 3 consumes 55 W compared to 47 W on the Samsung Galaxy Book4 Pro 16 or 54 W on the IdeaPad Pro 6 16 each equipped with the competing Arc 8. Performance-per-watt is still very good and generally neck-to-neck with the newest Intel alternatives despite the AMD solution being almost two years old.
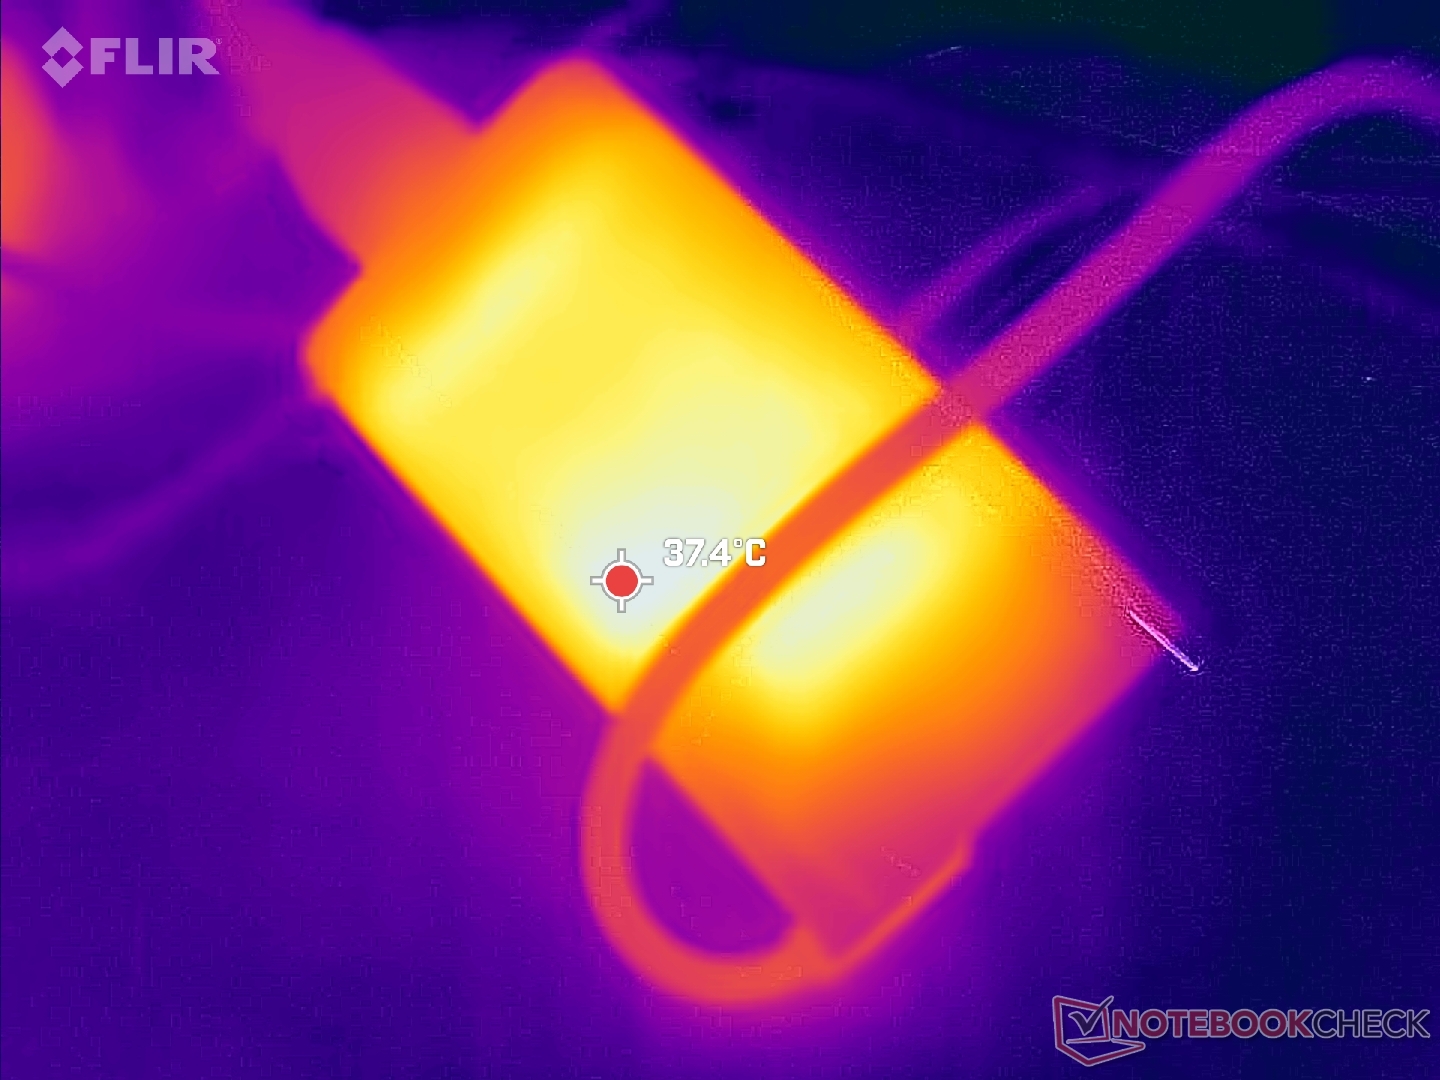
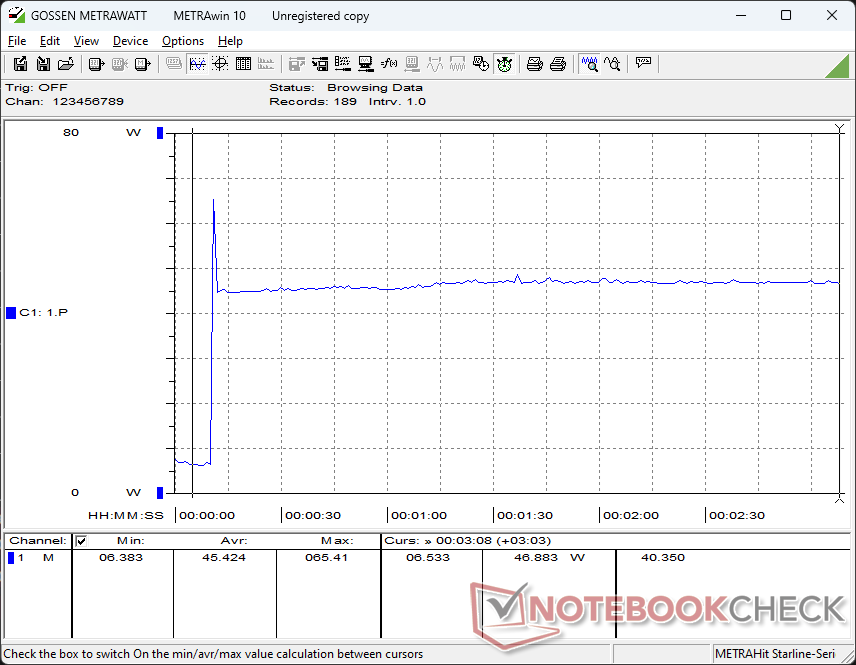
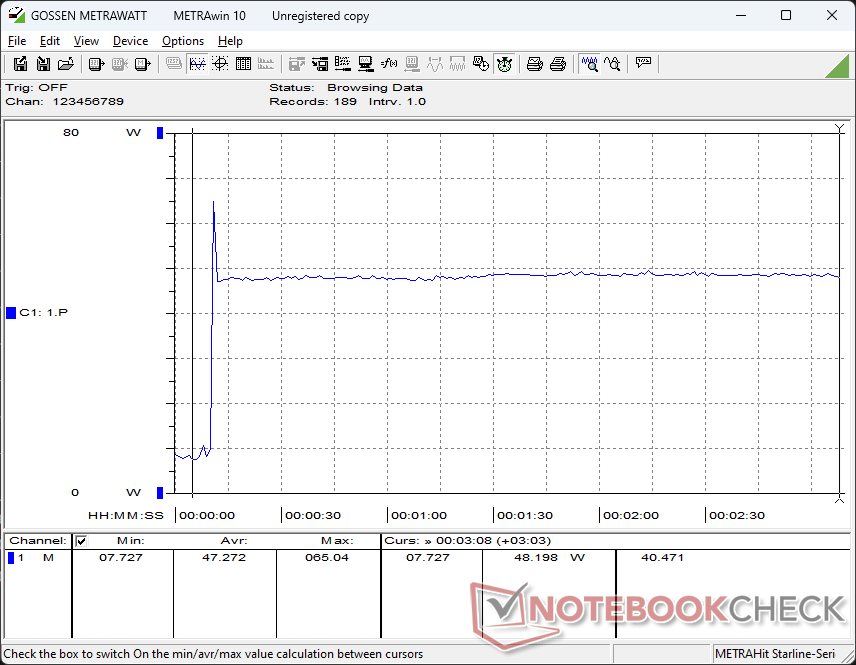
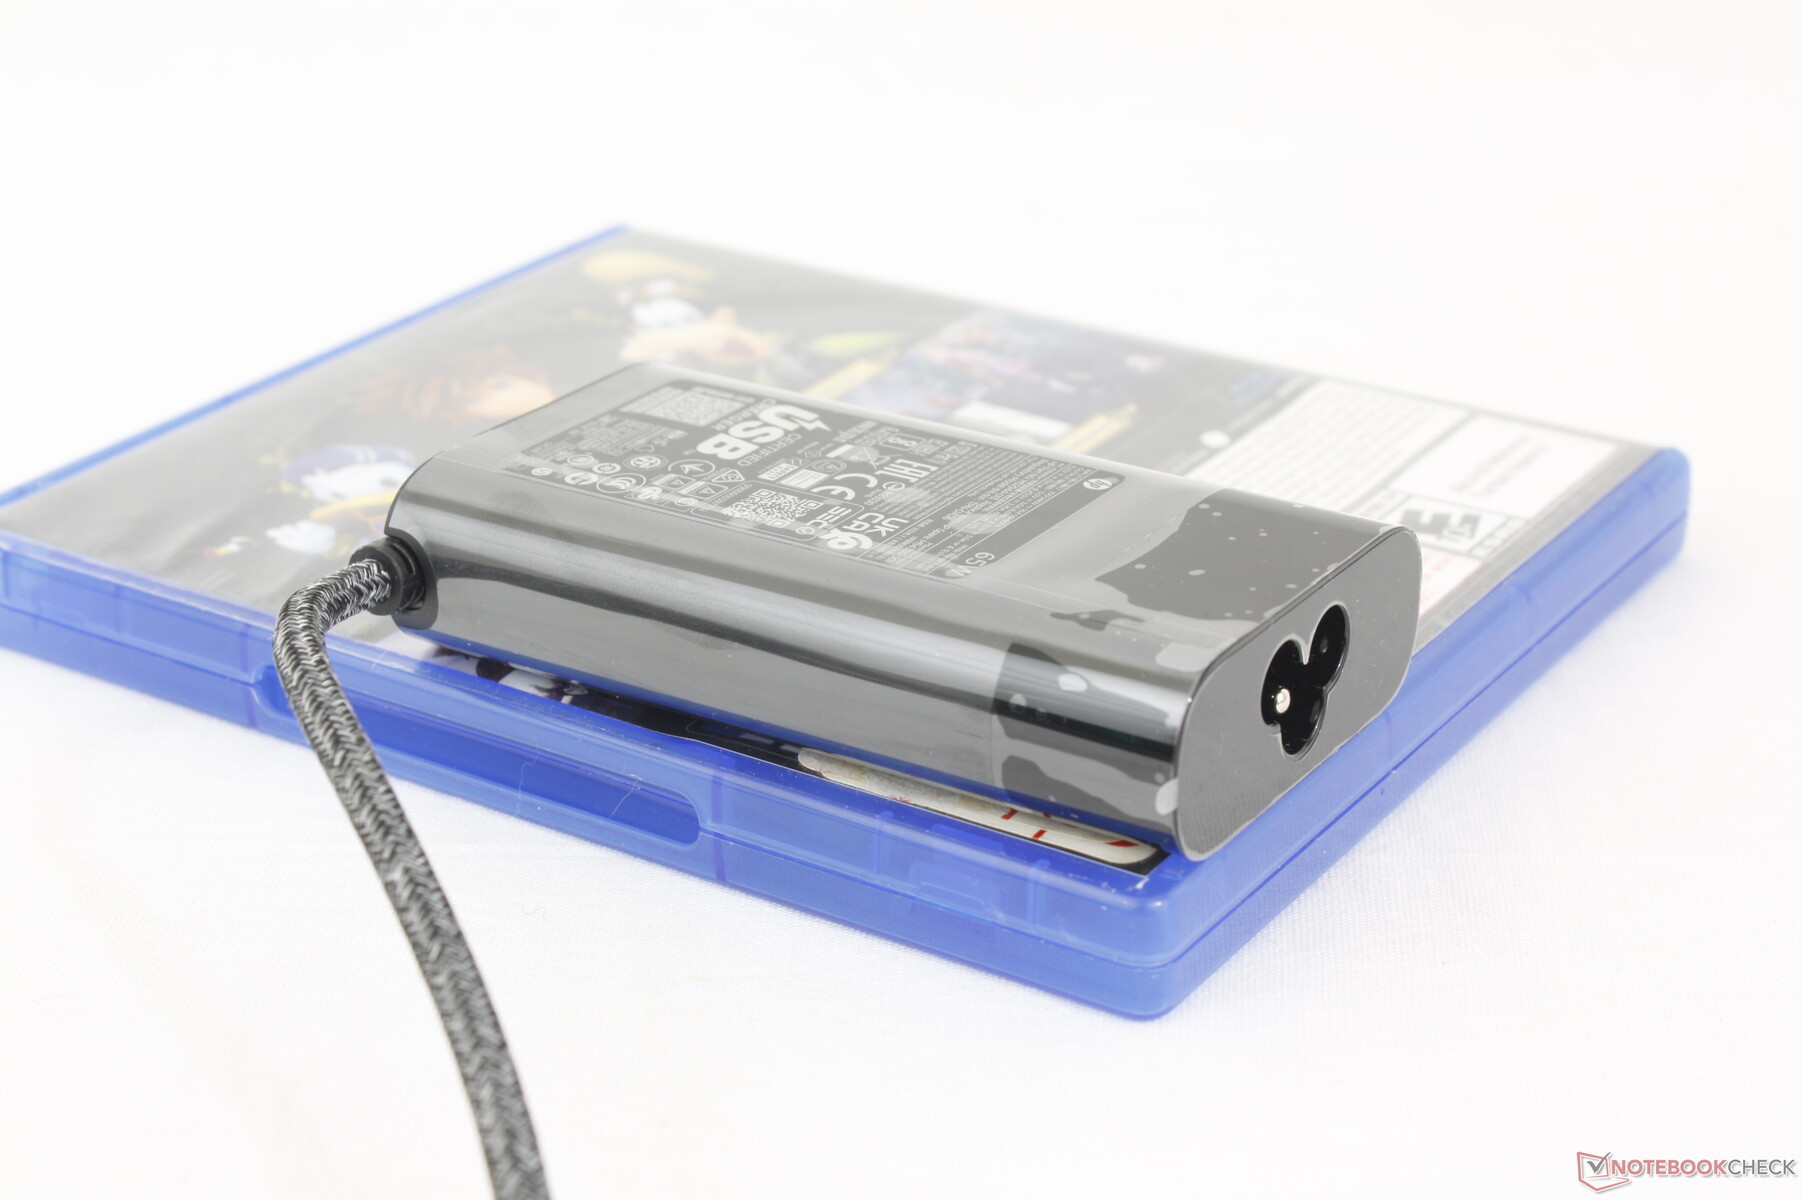
We're able to measure a temporary maximum draw of 66 W from the small (~9.6 x 5.5 x 2.2 cm) 65 W USB-C AC adapter when running extreme loads as shown by the screenshots below.
| Off / Standby | |
| Idle | |
| Load |
|
Key:
min: | |
| HP Envy x360 2-in-1 16-ad0097nr R7 8840HS, Radeon 780M, KIOXIA BG5 KBG50ZNV1T02, OLED, 2880x1800, 16" | HP Envy 16 h0112nr i7-12700H, GeForce RTX 3060 Laptop GPU, Micron 3400 1TB MTFDKBA1T0TFH, OLED, 3840x2400, 16" | HP Spectre x360 16 RTX 4050 Ultra 7 155H, GeForce RTX 4050 Laptop GPU, SK hynix PC801 HFS001TEJ9X101N, OLED, 2880x1800, 16" | Lenovo Yoga 7 2-in-1 16IML9 Ultra 5 125U, Graphics 4-Core iGPU (Arrow Lake), SK hynix HFS512GEJ4X112N, IPS, 1920x1200, 16" | Samsung Galaxy Book4 Pro 360 Ultra 5 125H, Arc 7-Core, Samsung PM9B1 512GB MZVL4512HBLU, OLED, 2880x1800, 16" | LG Gram 2in1 16 16T90R - G.AA78G i7-1360P, Iris Xe G7 96EUs, Samsung PM9A1 MZVL21T0HCLR, IPS, 2560x1600, 16" | |
|---|---|---|---|---|---|---|
| Power Consumption | -128% | -77% | 18% | 18% | -1% | |
| Idle Minimum * (Watt) | 5 | 10 -100% | 5.8 -16% | 3 40% | 3 40% | 5.5 -10% |
| Idle Average * (Watt) | 6.2 | 10.9 -76% | 12.3 -98% | 8.5 -37% | 6.3 -2% | 7.2 -16% |
| Idle Maximum * (Watt) | 14.7 | 27.8 -89% | 33.9 -131% | 8.9 39% | 6.5 56% | 12.9 12% |
| Load Average * (Watt) | 49.9 | 116.4 -133% | 83.3 -67% | 41.1 18% | 49.3 1% | 55 -10% |
| Witcher 3 ultra * (Watt) | 54.5 | 133.7 -145% | 89.1 -63% | 30.7 44% | 45.9 16% | 47 14% |
| Load Maximum * (Watt) | 65 | 209.8 -223% | 120.8 -86% | 64.6 1% | 65.5 -1% | 63.6 2% |
* ... smaller is better
Power Consumption Witcher 3 / Stresstest
Power Consumption external Monitor
Battery Life
Battery capacity is smaller than on most other 16-inch laptops which, when combined with the demanding OLED touchscreen, leads to shorter runtimes overall. We're able to squeeze 7.5 hours of real-world browsing from the Envy before automatic shutdown compared to over an hour or two hours longer on the Samsung Galaxy Book4 Pro 360 or Spectre x360 16. Battery life is still pretty good nonetheless so long as owners don't expect MacBook-level uptime.
Charging from empty to full capacity with the included AC adapter takes about 90 minutes.
| HP Envy x360 2-in-1 16-ad0097nr R7 8840HS, Radeon 780M, 68 Wh | HP Envy 16 h0112nr i7-12700H, GeForce RTX 3060 Laptop GPU, 83 Wh | HP Spectre x360 16 RTX 4050 Ultra 7 155H, GeForce RTX 4050 Laptop GPU, 83 Wh | Lenovo Yoga 7 2-in-1 16IML9 Ultra 5 125U, Graphics 4-Core iGPU (Arrow Lake), 71 Wh | Samsung Galaxy Book4 Pro 360 Ultra 5 125H, Arc 7-Core, 76 Wh | LG Gram 2in1 16 16T90R - G.AA78G i7-1360P, Iris Xe G7 96EUs, 80 Wh | |
|---|---|---|---|---|---|---|
| Battery runtime | 0% | 43% | 60% | 8% | 30% | |
| Reader / Idle (h) | 15.6 | 17.8 14% | ||||
| WiFi v1.3 (h) | 7.7 | 7.9 3% | 11 43% | 12.3 60% | 8.9 16% | 11.9 55% |
| Load (h) | 1.9 | 1.6 -16% | 1.9 0% | 2 5% | ||
| H.264 (h) | 14.7 |
Pros
Cons
Verdict — Spectre Experience For Less
HP currently offers two consumer-level 16-inch convertibles: the midrange Envy x360 16 and high-end Spectre x360 16. Surprisingly, the Envy is lighter than the Spectre while sporting the exact same OLED touchscreen and nearly the same dimensions. The user experiences between the two models are therefore much closer than expected despite their wide price differences.
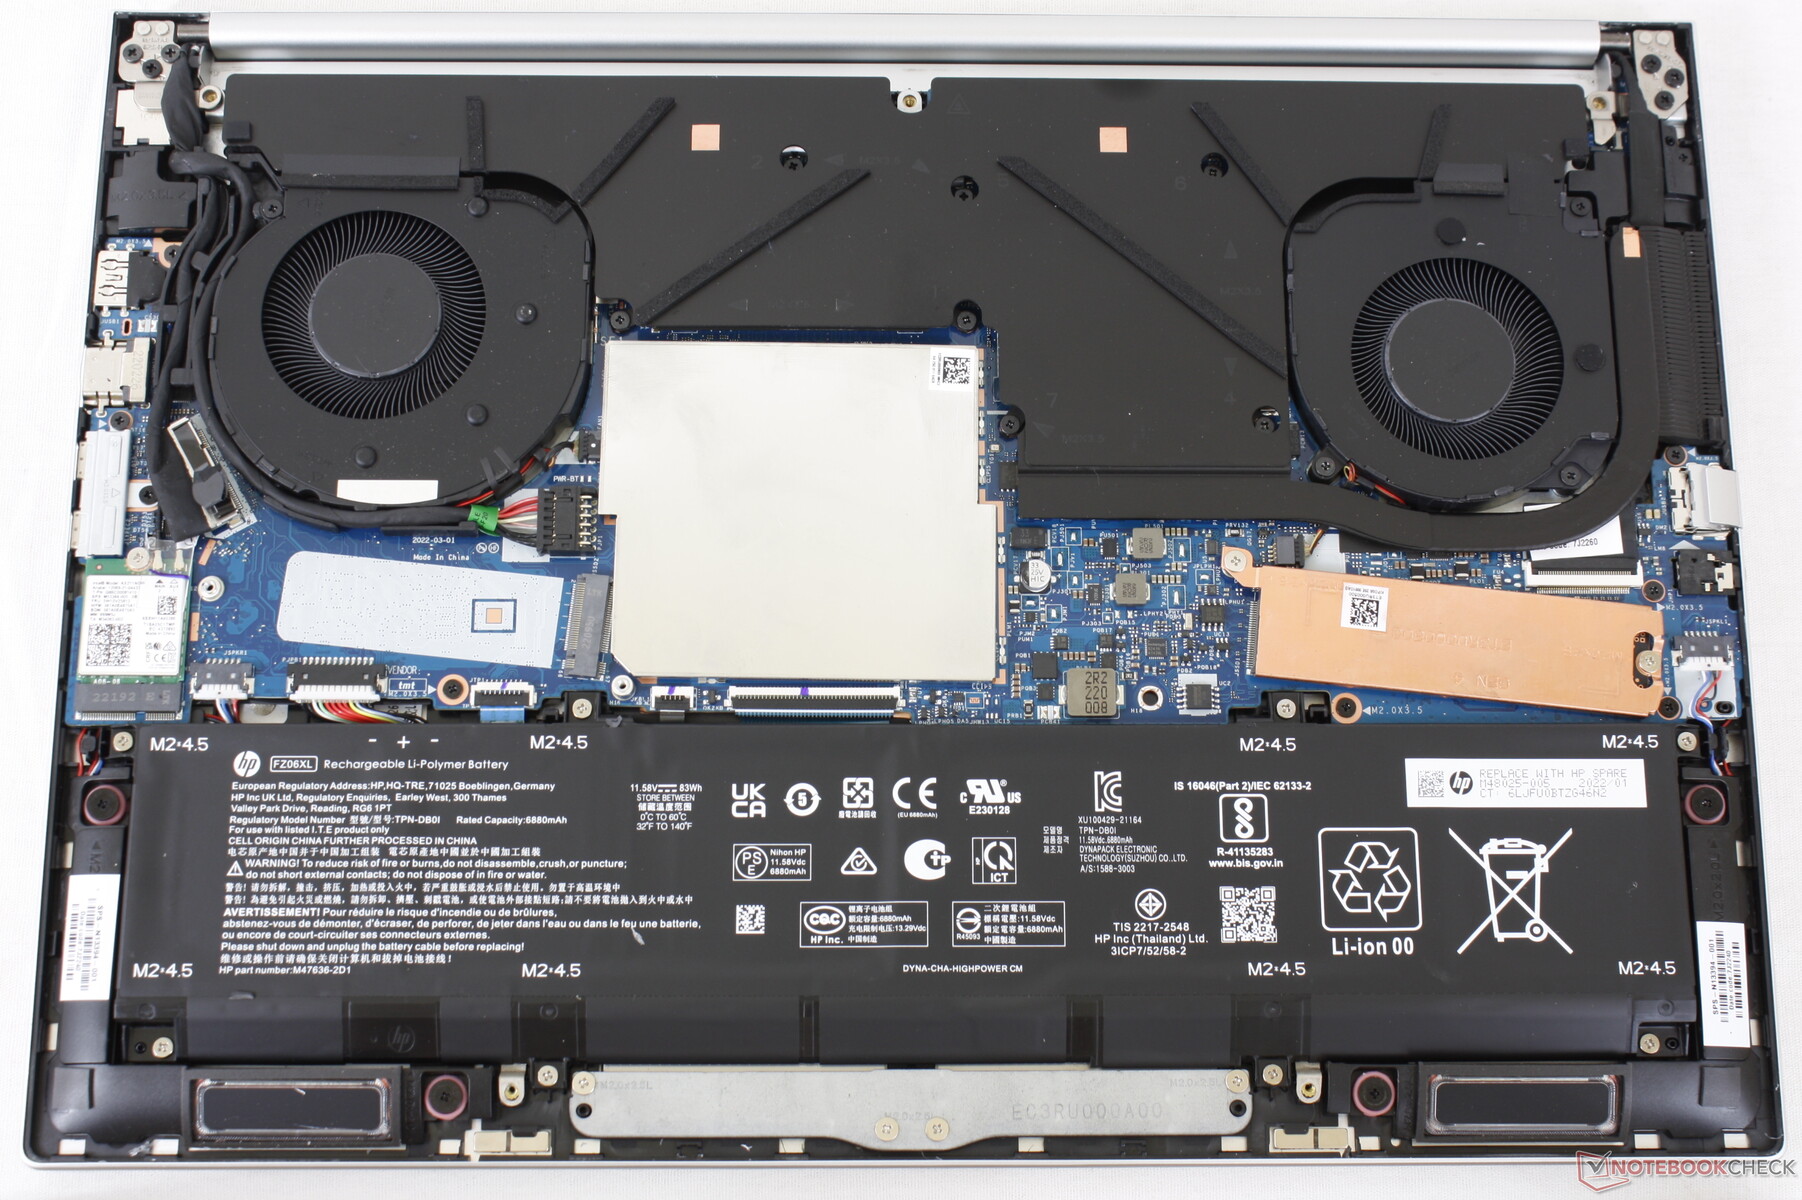
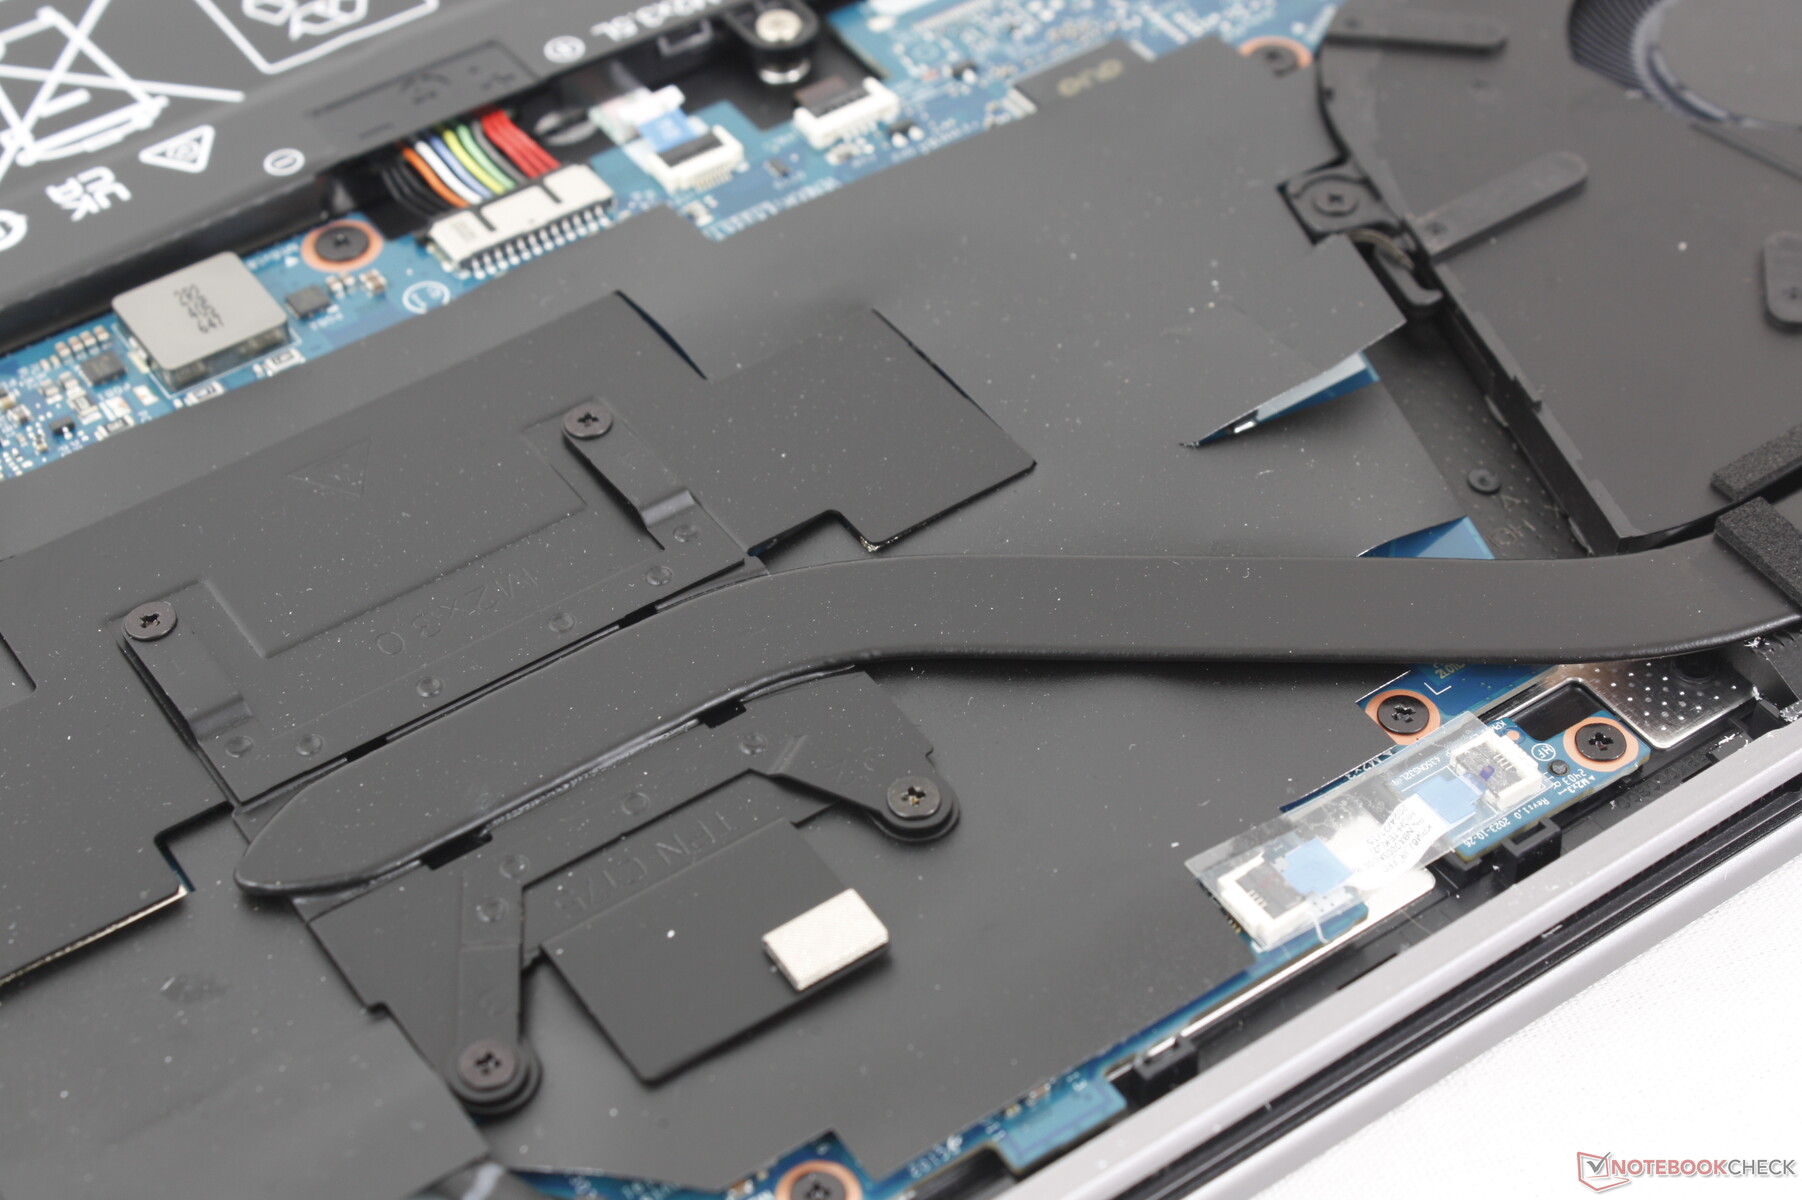
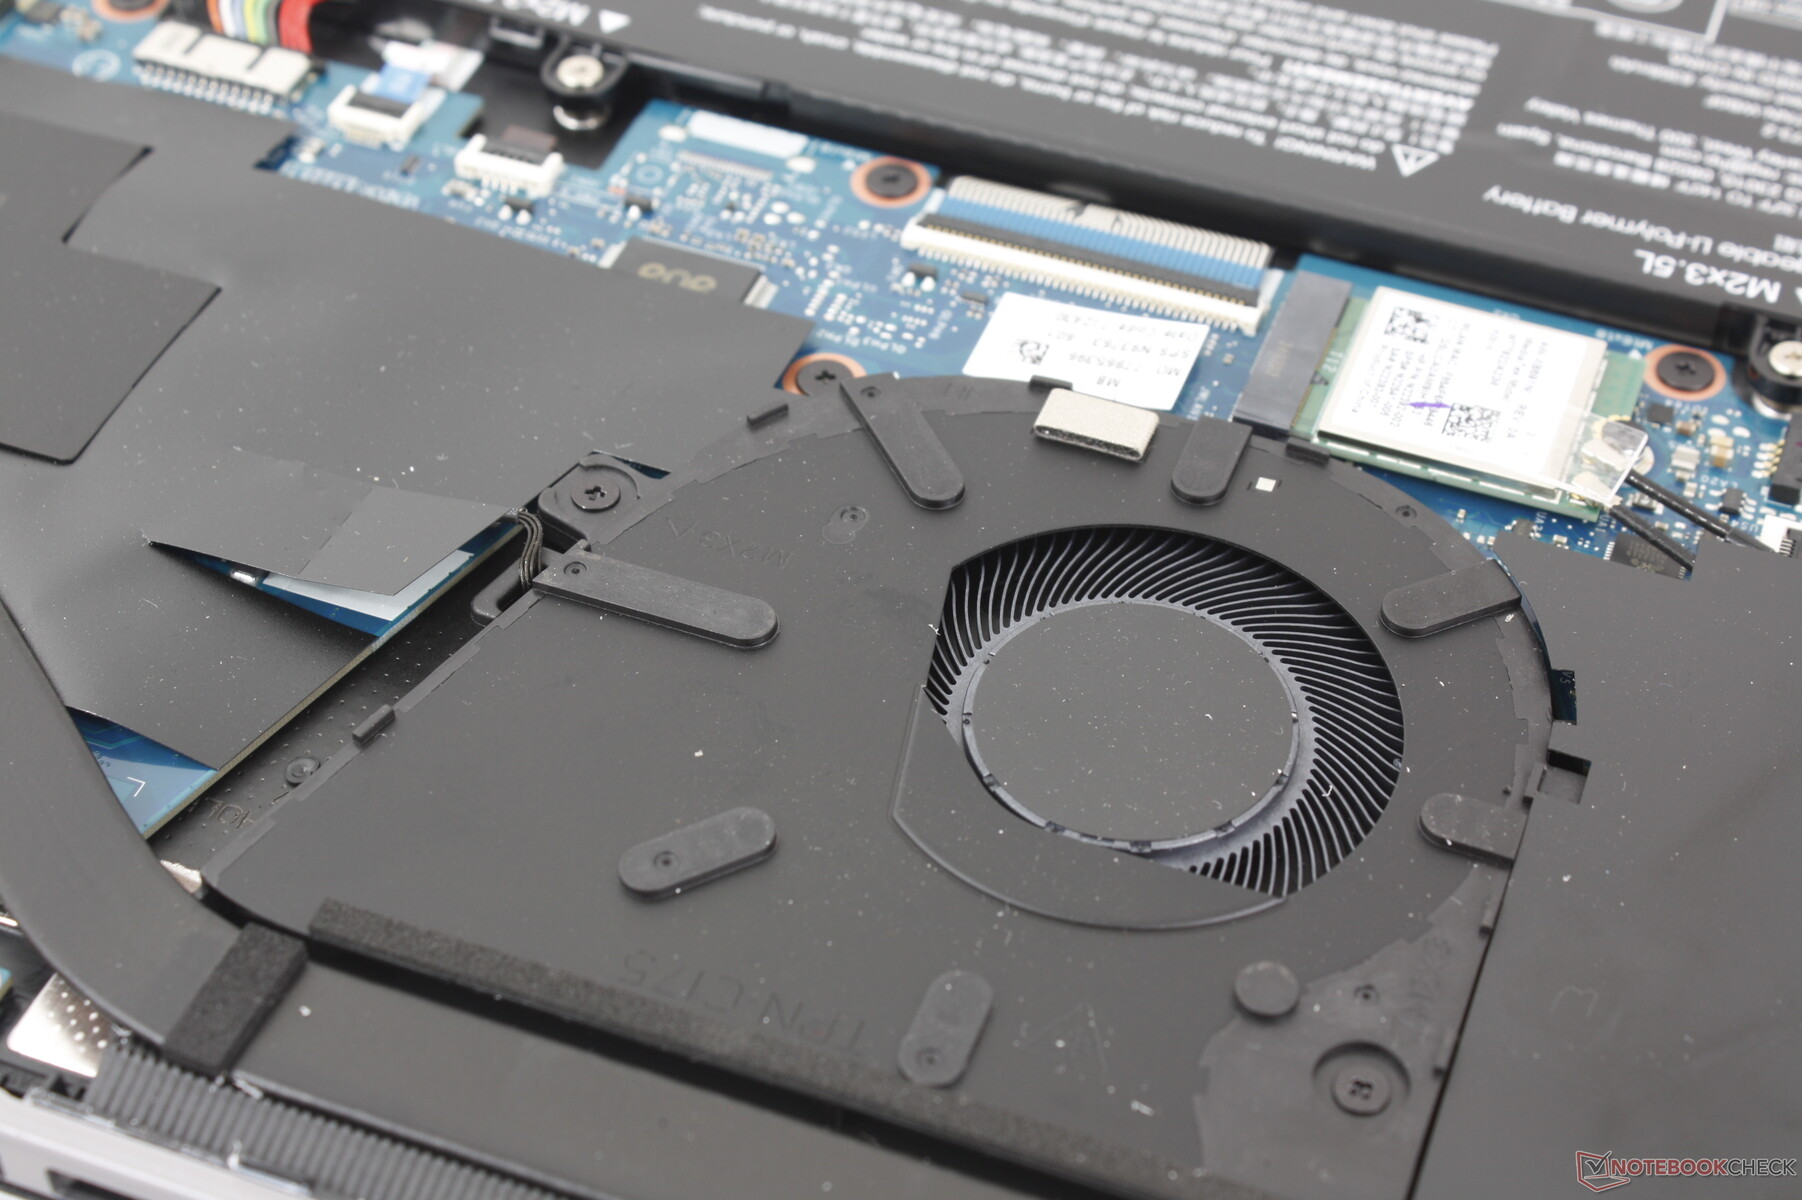
There are still a handful of reasons to prefer the pricier Spectre x360 16 aside from the more luxurious design. The Envy x360 16 has a smaller battery pack, no dedicated GPU, and a lower resolution webcam. It also tends to run louder under load due to having just one internal fan instead of two. The Asus VivoBook Pro 16 is a decent alternative to the Envy x360 16 since it includes OLED, a dGPU for faster performance, and a bigger battery at around the same price, but owners would lose the 2-in-1 form factor.
The AI-ready HP Envy x360 16 comes in both Intel and AMD flavors and with very similar features as the more expensive Spectre x360 16. Though the AMD versions are notably faster than Intel, they lack USB4 and Thunderbolt support for more limited docking capabilities.
We also have to credit the model for offering both Intel Meteor Lake-U and AMD Hawk Point-HS CPU options which is not common on other laptops. The AMD versions are unquestionably faster in terms of raw processor performance and even integrated graphics performance. However, users who value Thunderbolt will have no choice but to side with Intel and deal with the slower processor. It's unfortunate then that the AMD versions do not support USB4 which would have made them more easily recommendable over the Intel-based Envy options.
Price and Availability
HP is now shipping the Envy x360 16 as reviewed with the Ryzen 7 8840HS, 16 GB RAM, and 1 TB SSD for $1300 USD.
HP Envy x360 2-in-1 16-ad0097nr
- 05/22/2024 v7 (old)
Allen Ngo
Transparency
The selection of devices to be reviewed is made by our editorial team. The test sample was provided to the author as a loan by the manufacturer or retailer for the purpose of this review. The lender had no influence on this review, nor did the manufacturer receive a copy of this review before publication. There was no obligation to publish this review. As an independent media company, Notebookcheck is not subjected to the authority of manufacturers, retailers or publishers.
This is how Notebookcheck is testing
Every year, Notebookcheck independently reviews hundreds of laptops and smartphones using standardized procedures to ensure that all results are comparable. We have continuously developed our test methods for around 20 years and set industry standards in the process. In our test labs, high-quality measuring equipment is utilized by experienced technicians and editors. These tests involve a multi-stage validation process. Our complex rating system is based on hundreds of well-founded measurements and benchmarks, which maintains objectivity. Further information on our test methods can be found here.
Price comparison
