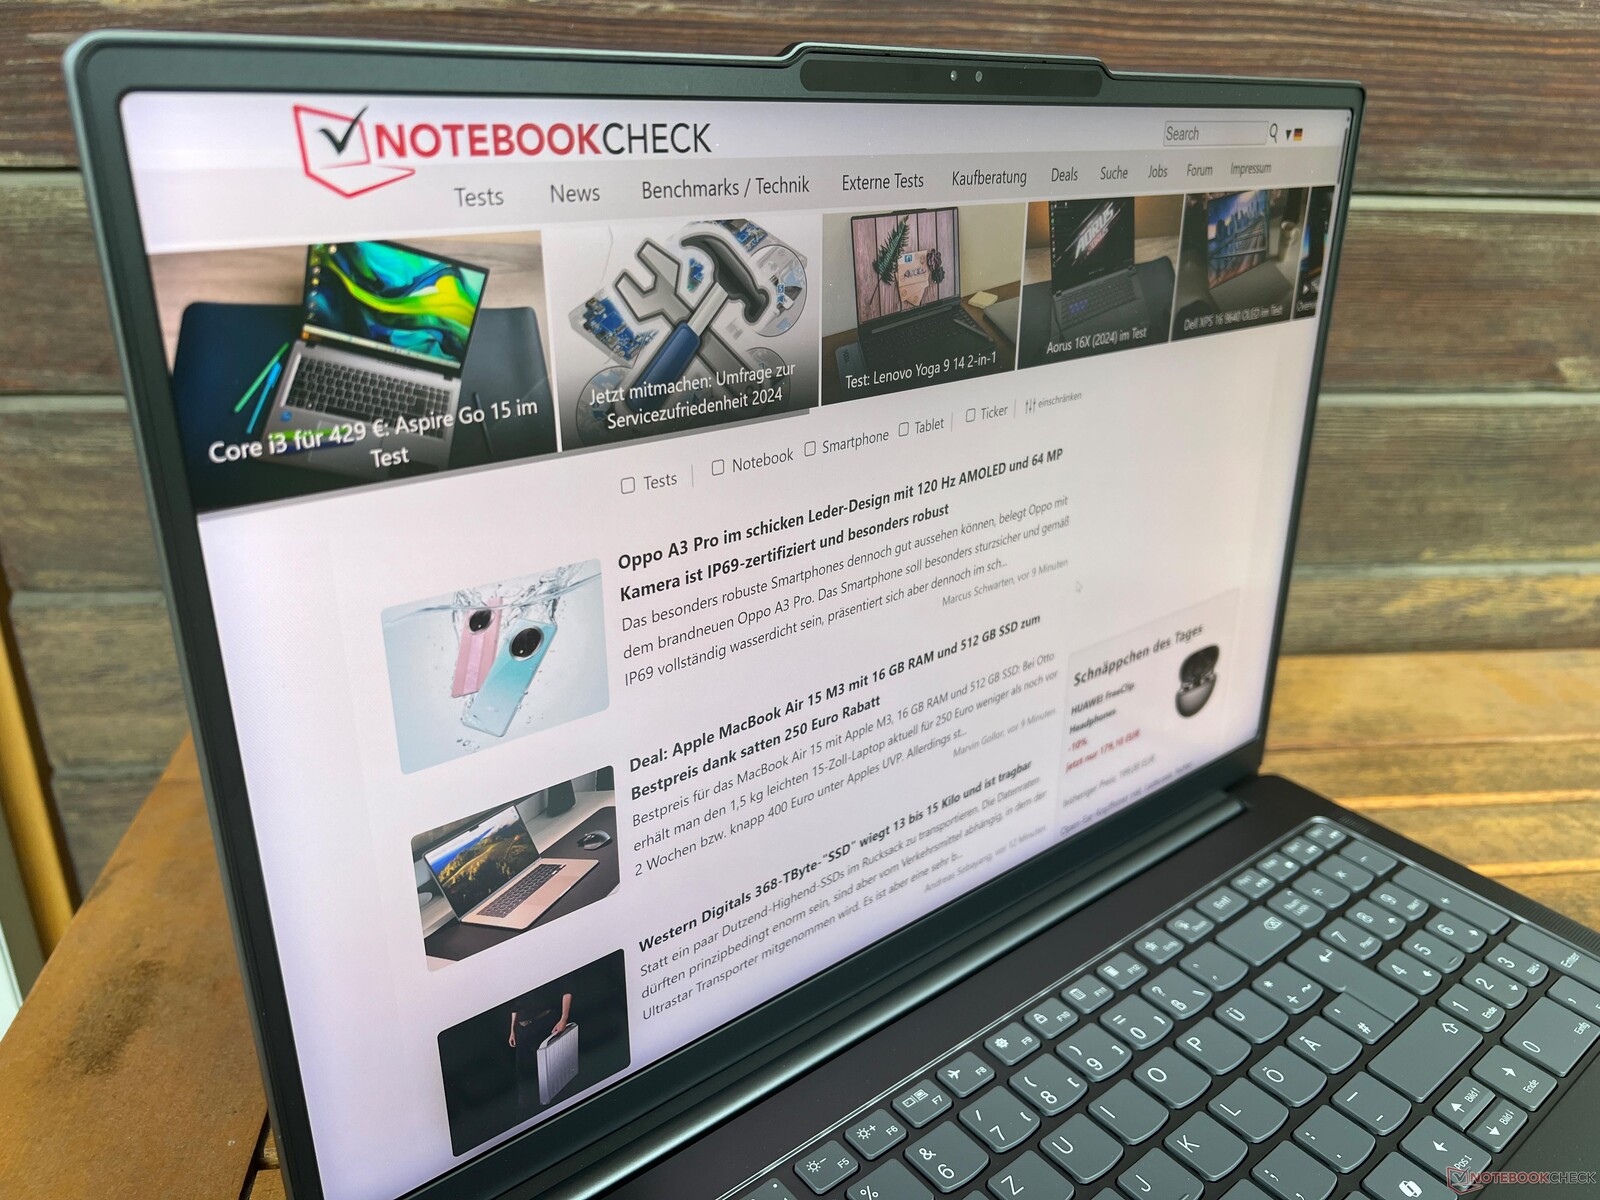
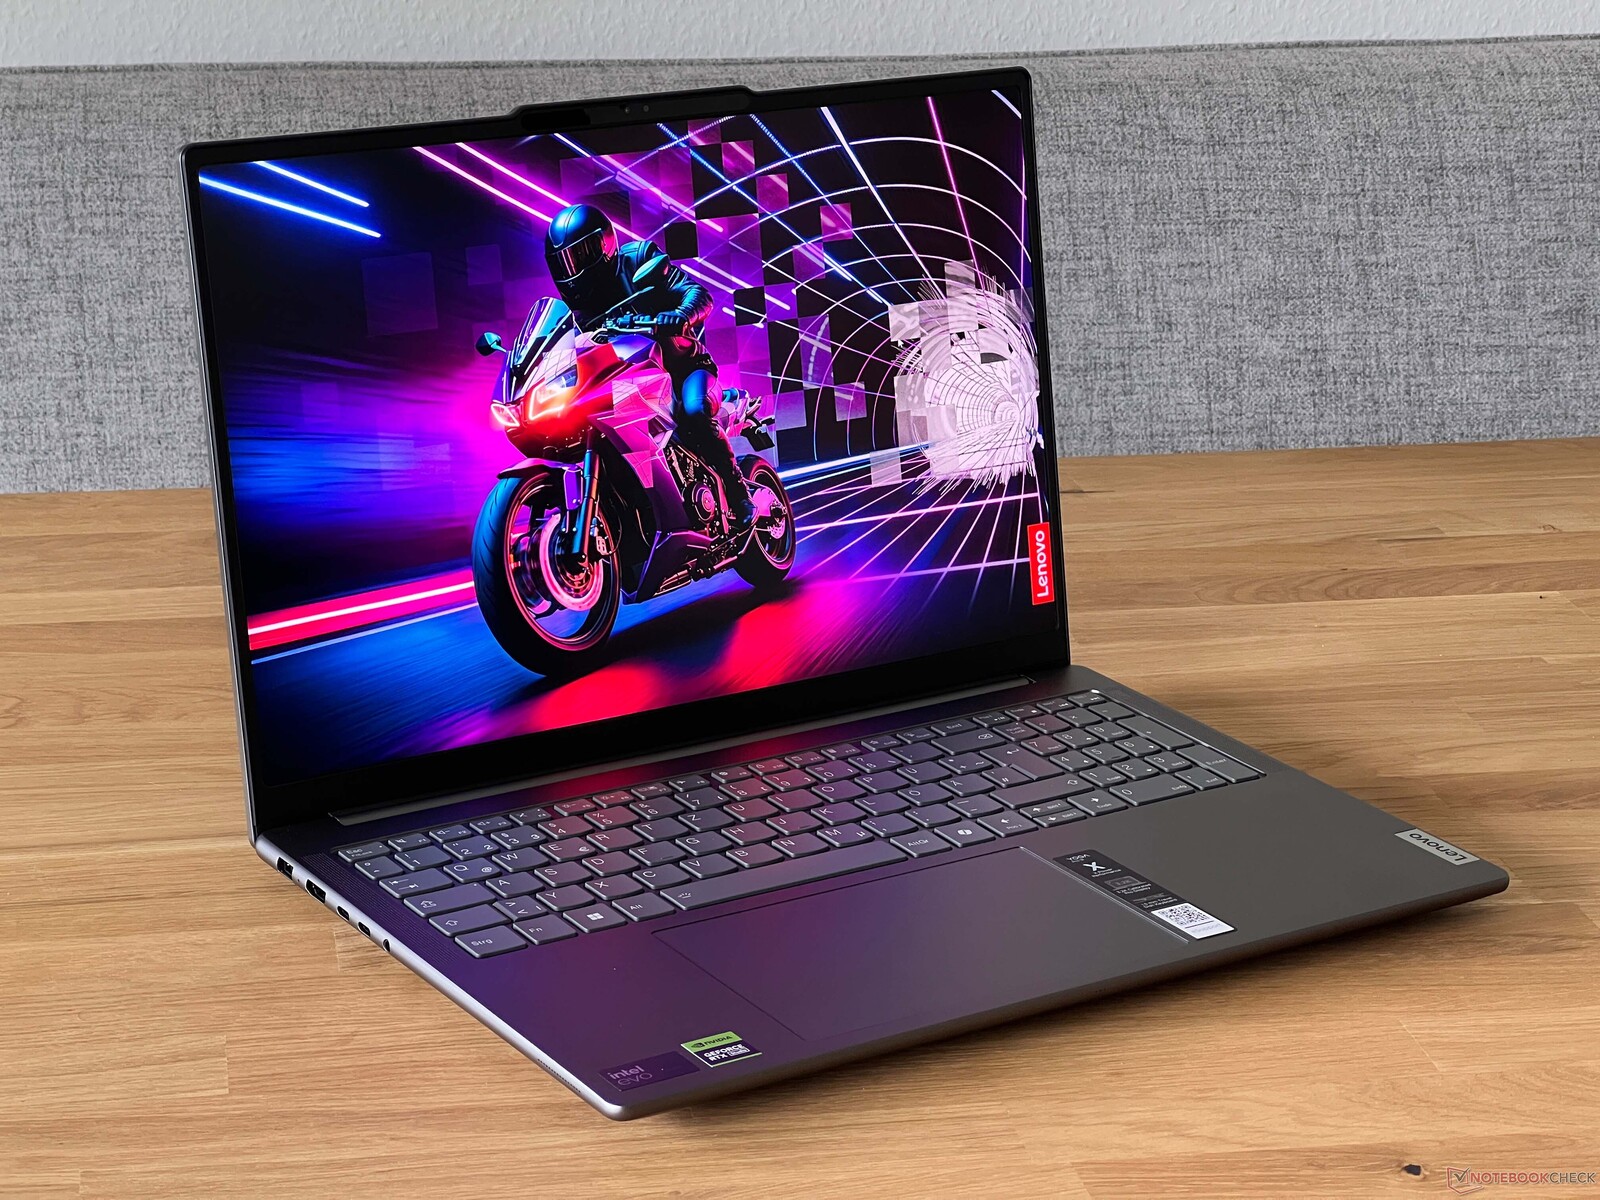
Lenovo Yoga Pro 9i 16 G9 laptop review: MiniLED with 1200 nits and Core Ultra 9
The Yoga Pro 9i 16 is Lenovo's best consumer multimedia laptop. With its high-resolution mini LED panel and good performance, it was one of the best multimedia devices in 2023. For the new G9 model, there have been some changes, including an up-to-date Meteor Lake processor from Intel and the switch from a reflective to a matte mini LED panel, which can get extremely bright at up to 1200 nits. The graphics cards are the GeForce RTX 4000 models up to the RTX 4070 Laptop with a 100 watt TGP.
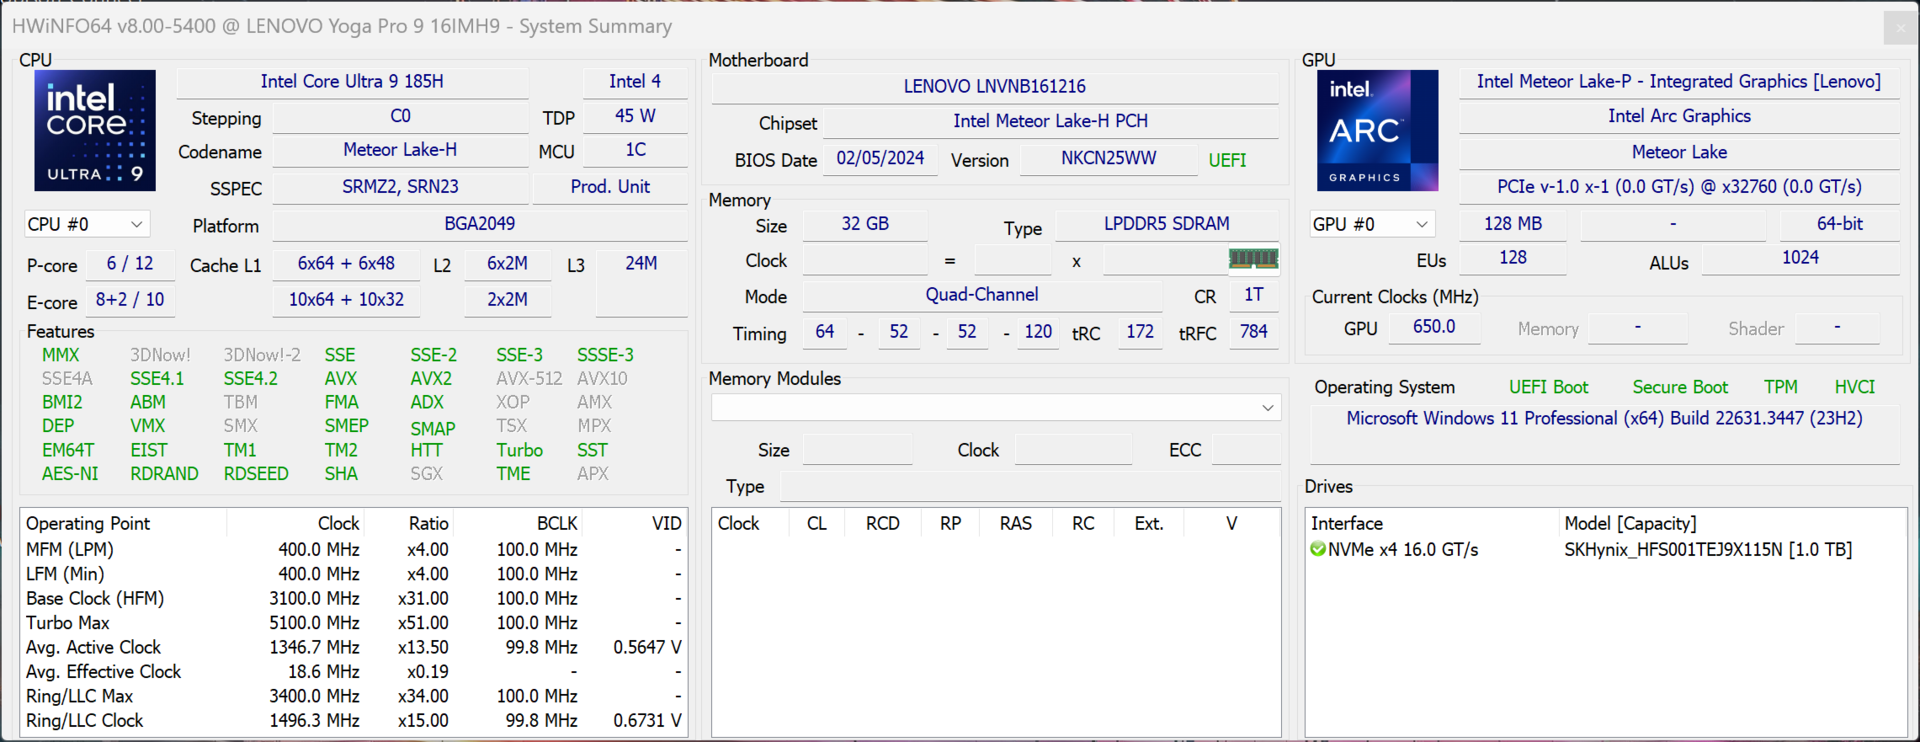
Our test device (with the model number 83DN006HGE) is the high-end variant for EUR 2700 (around $2875) and contains the Core Ultra 9 185H and GeForce RTX 4070 Laptop as well as 32 GB RAM, a 1 TB SSD and the bright mini LED panel. The weaker model with the Core Ultra 7 155H and GeForce RTX 4060 Laptop is available for EUR 2300 ($2450), but the rest of the hardware is identical.
Possible competitors in comparison
Rating | Date | Model | Weight | Height | Size | Resolution | Price |
|---|---|---|---|---|---|---|---|
| 88.7 % v7 (old) | 04 / 2024 | Lenovo Yoga Pro 9 16IMH9 Ultra 9 185H, GeForce RTX 4070 Laptop GPU | 2.1 kg | 18.3 mm | 16.00" | 3200x2000 | |
| 88.6 % v7 (old) | 04 / 2024 | Dell XPS 16 9640 Ultra 7 155H, GeForce RTX 4070 Laptop GPU | 2.3 kg | 18.7 mm | 16.30" | 3840x2400 | |
| 90 % v7 (old) | 03 / 2024 | Honor MagicBook Pro 16 2024 Ultra 7 155H, GeForce RTX 4060 Laptop GPU | 1.9 kg | 17.9 mm | 16.00" | 3072x1920 | |
| 90.4 % v7 (old) | 03 / 2024 | Samsung Galaxy Book4 Ultra Ultra 7 155H, GeForce RTX 4050 Laptop GPU | 1.8 kg | 17 mm | 16.00" | 2880x1800 | |
| 89.6 % v7 (old) | 01 / 2024 | Framework Laptop 16 R9 7940HS, Radeon RX 7700S | 2.4 kg | 20.95 mm | 16.00" | 2560x1600 | |
| 88.6 % v7 (old) | 07 / 2023 | Schenker VISION 16 Pro (M23) i7-13700H, GeForce RTX 4070 Laptop GPU | 1.6 kg | 17.1 mm | 16.00" | 2560x1600 |
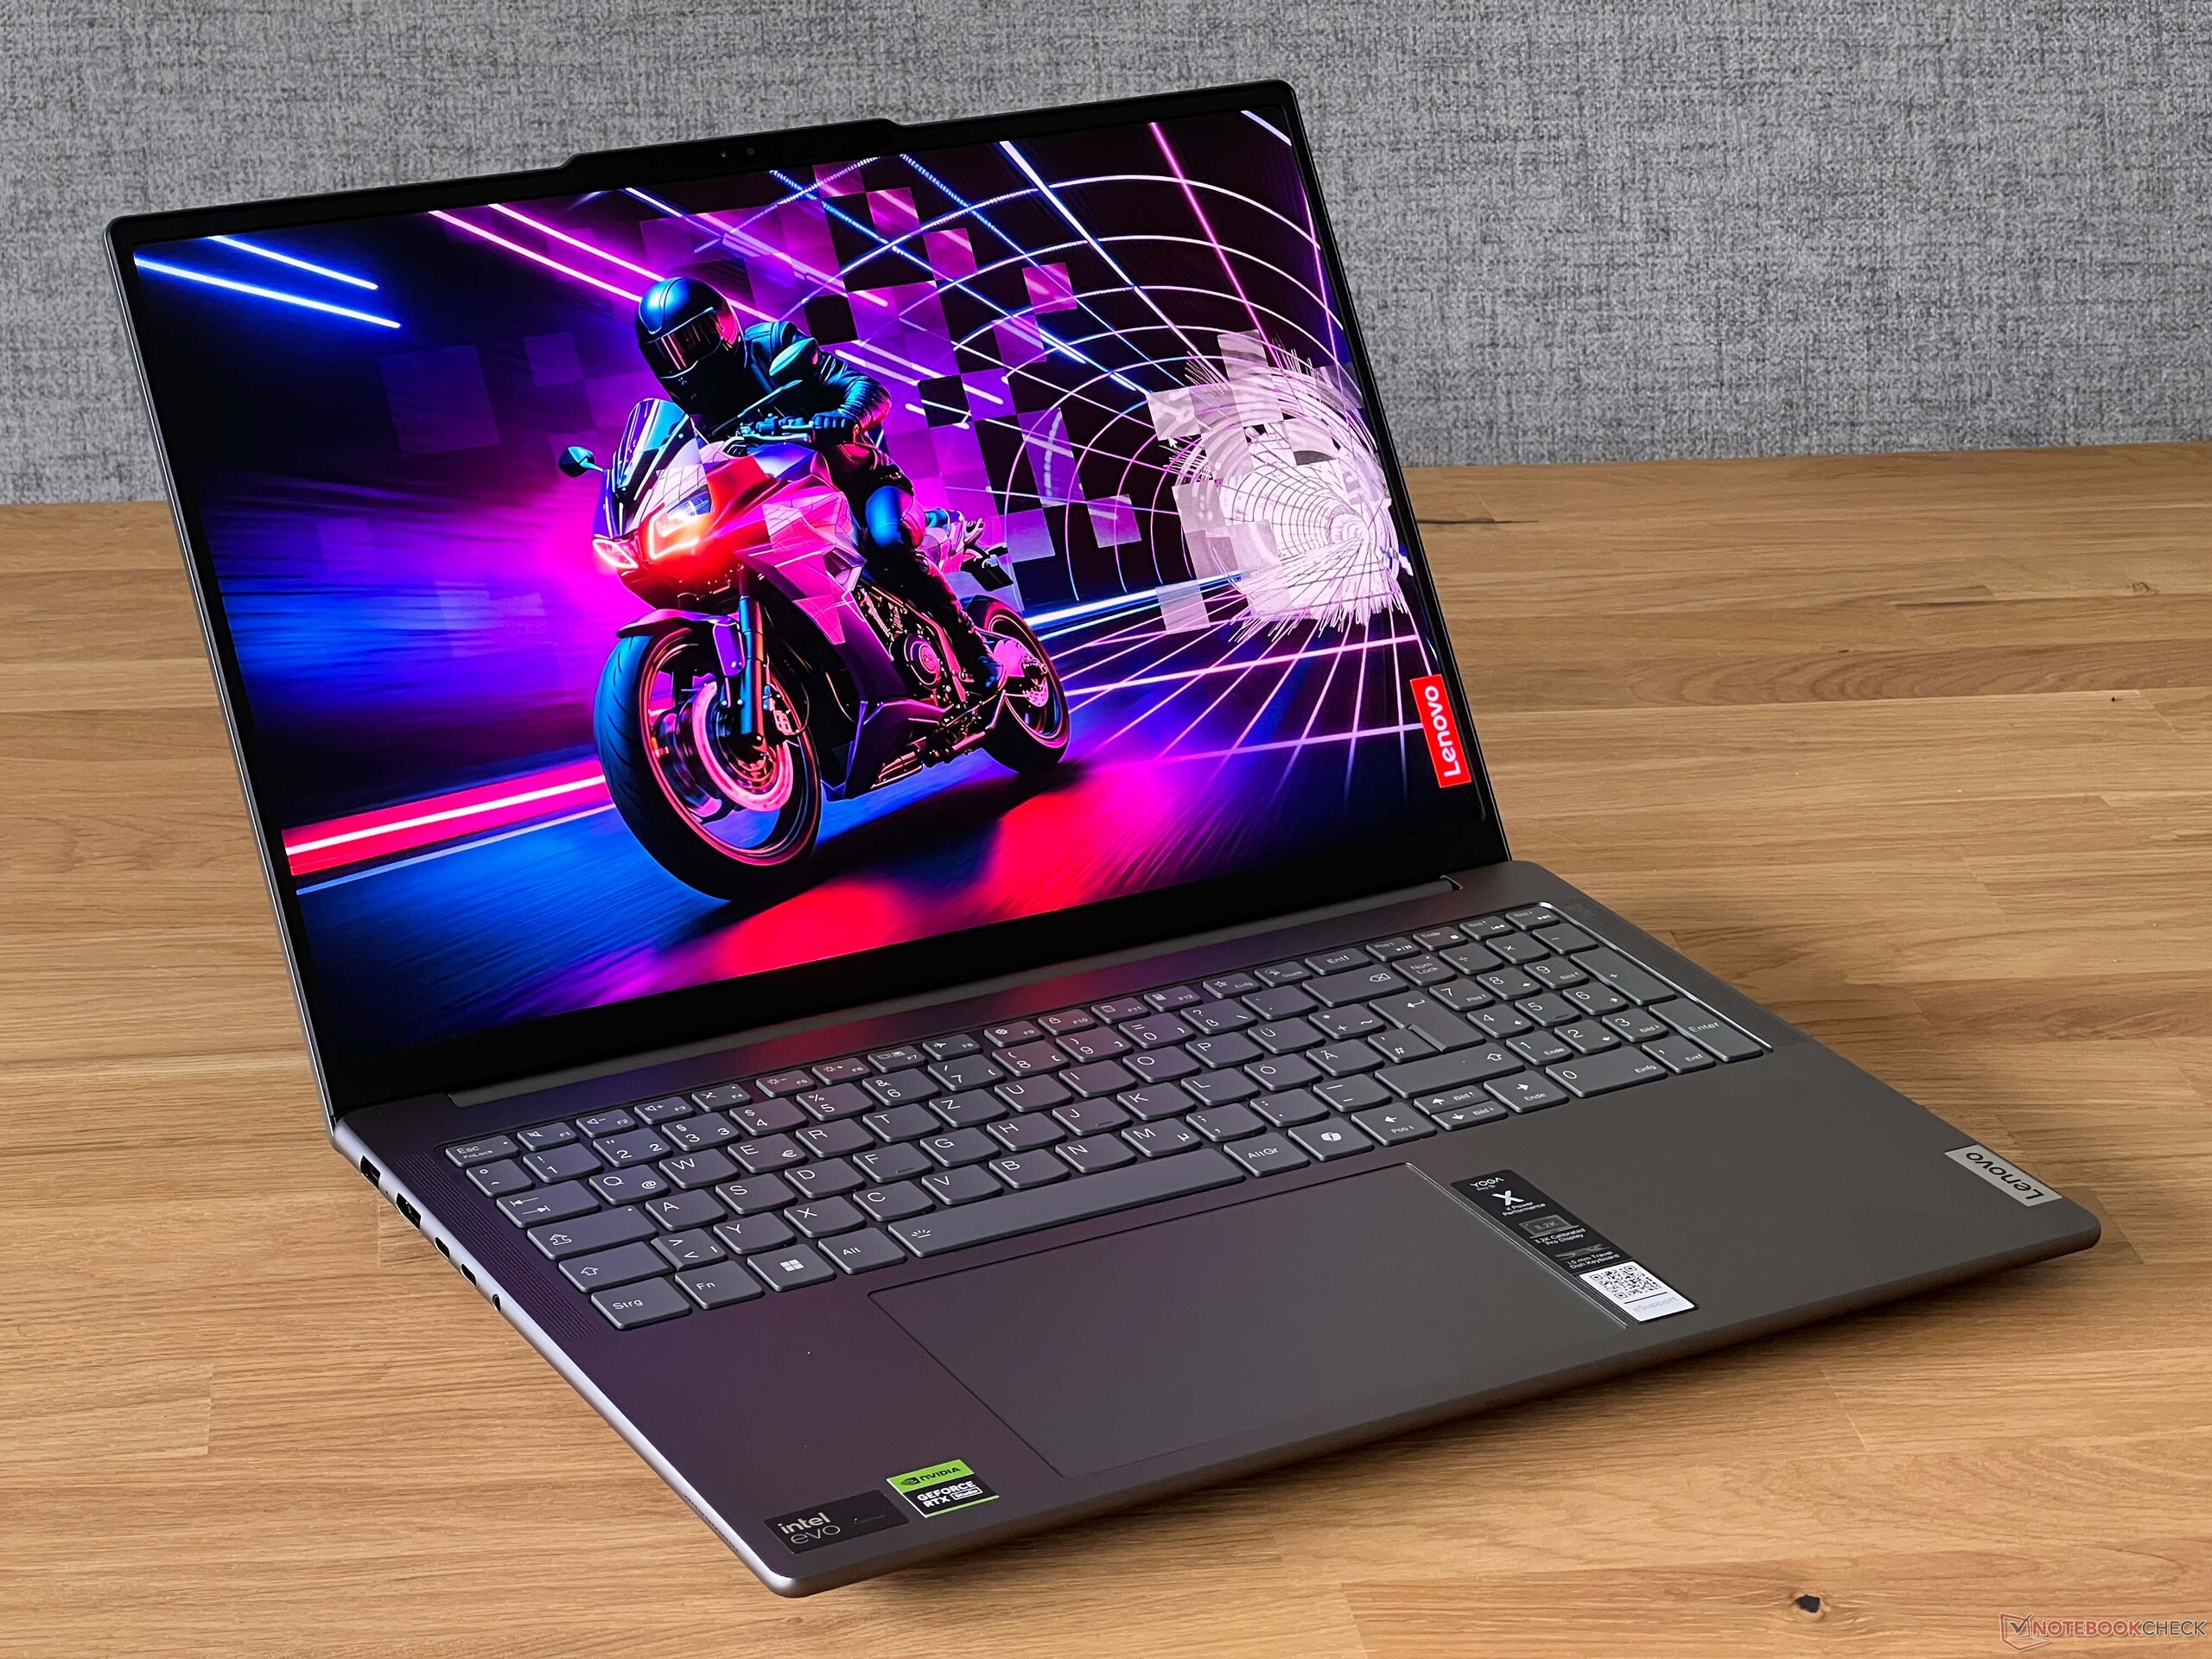
Casing - Aluminum and thin baseplate
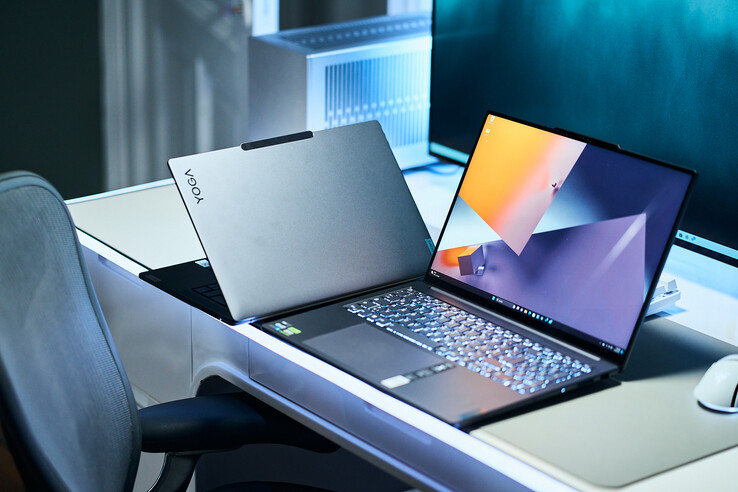
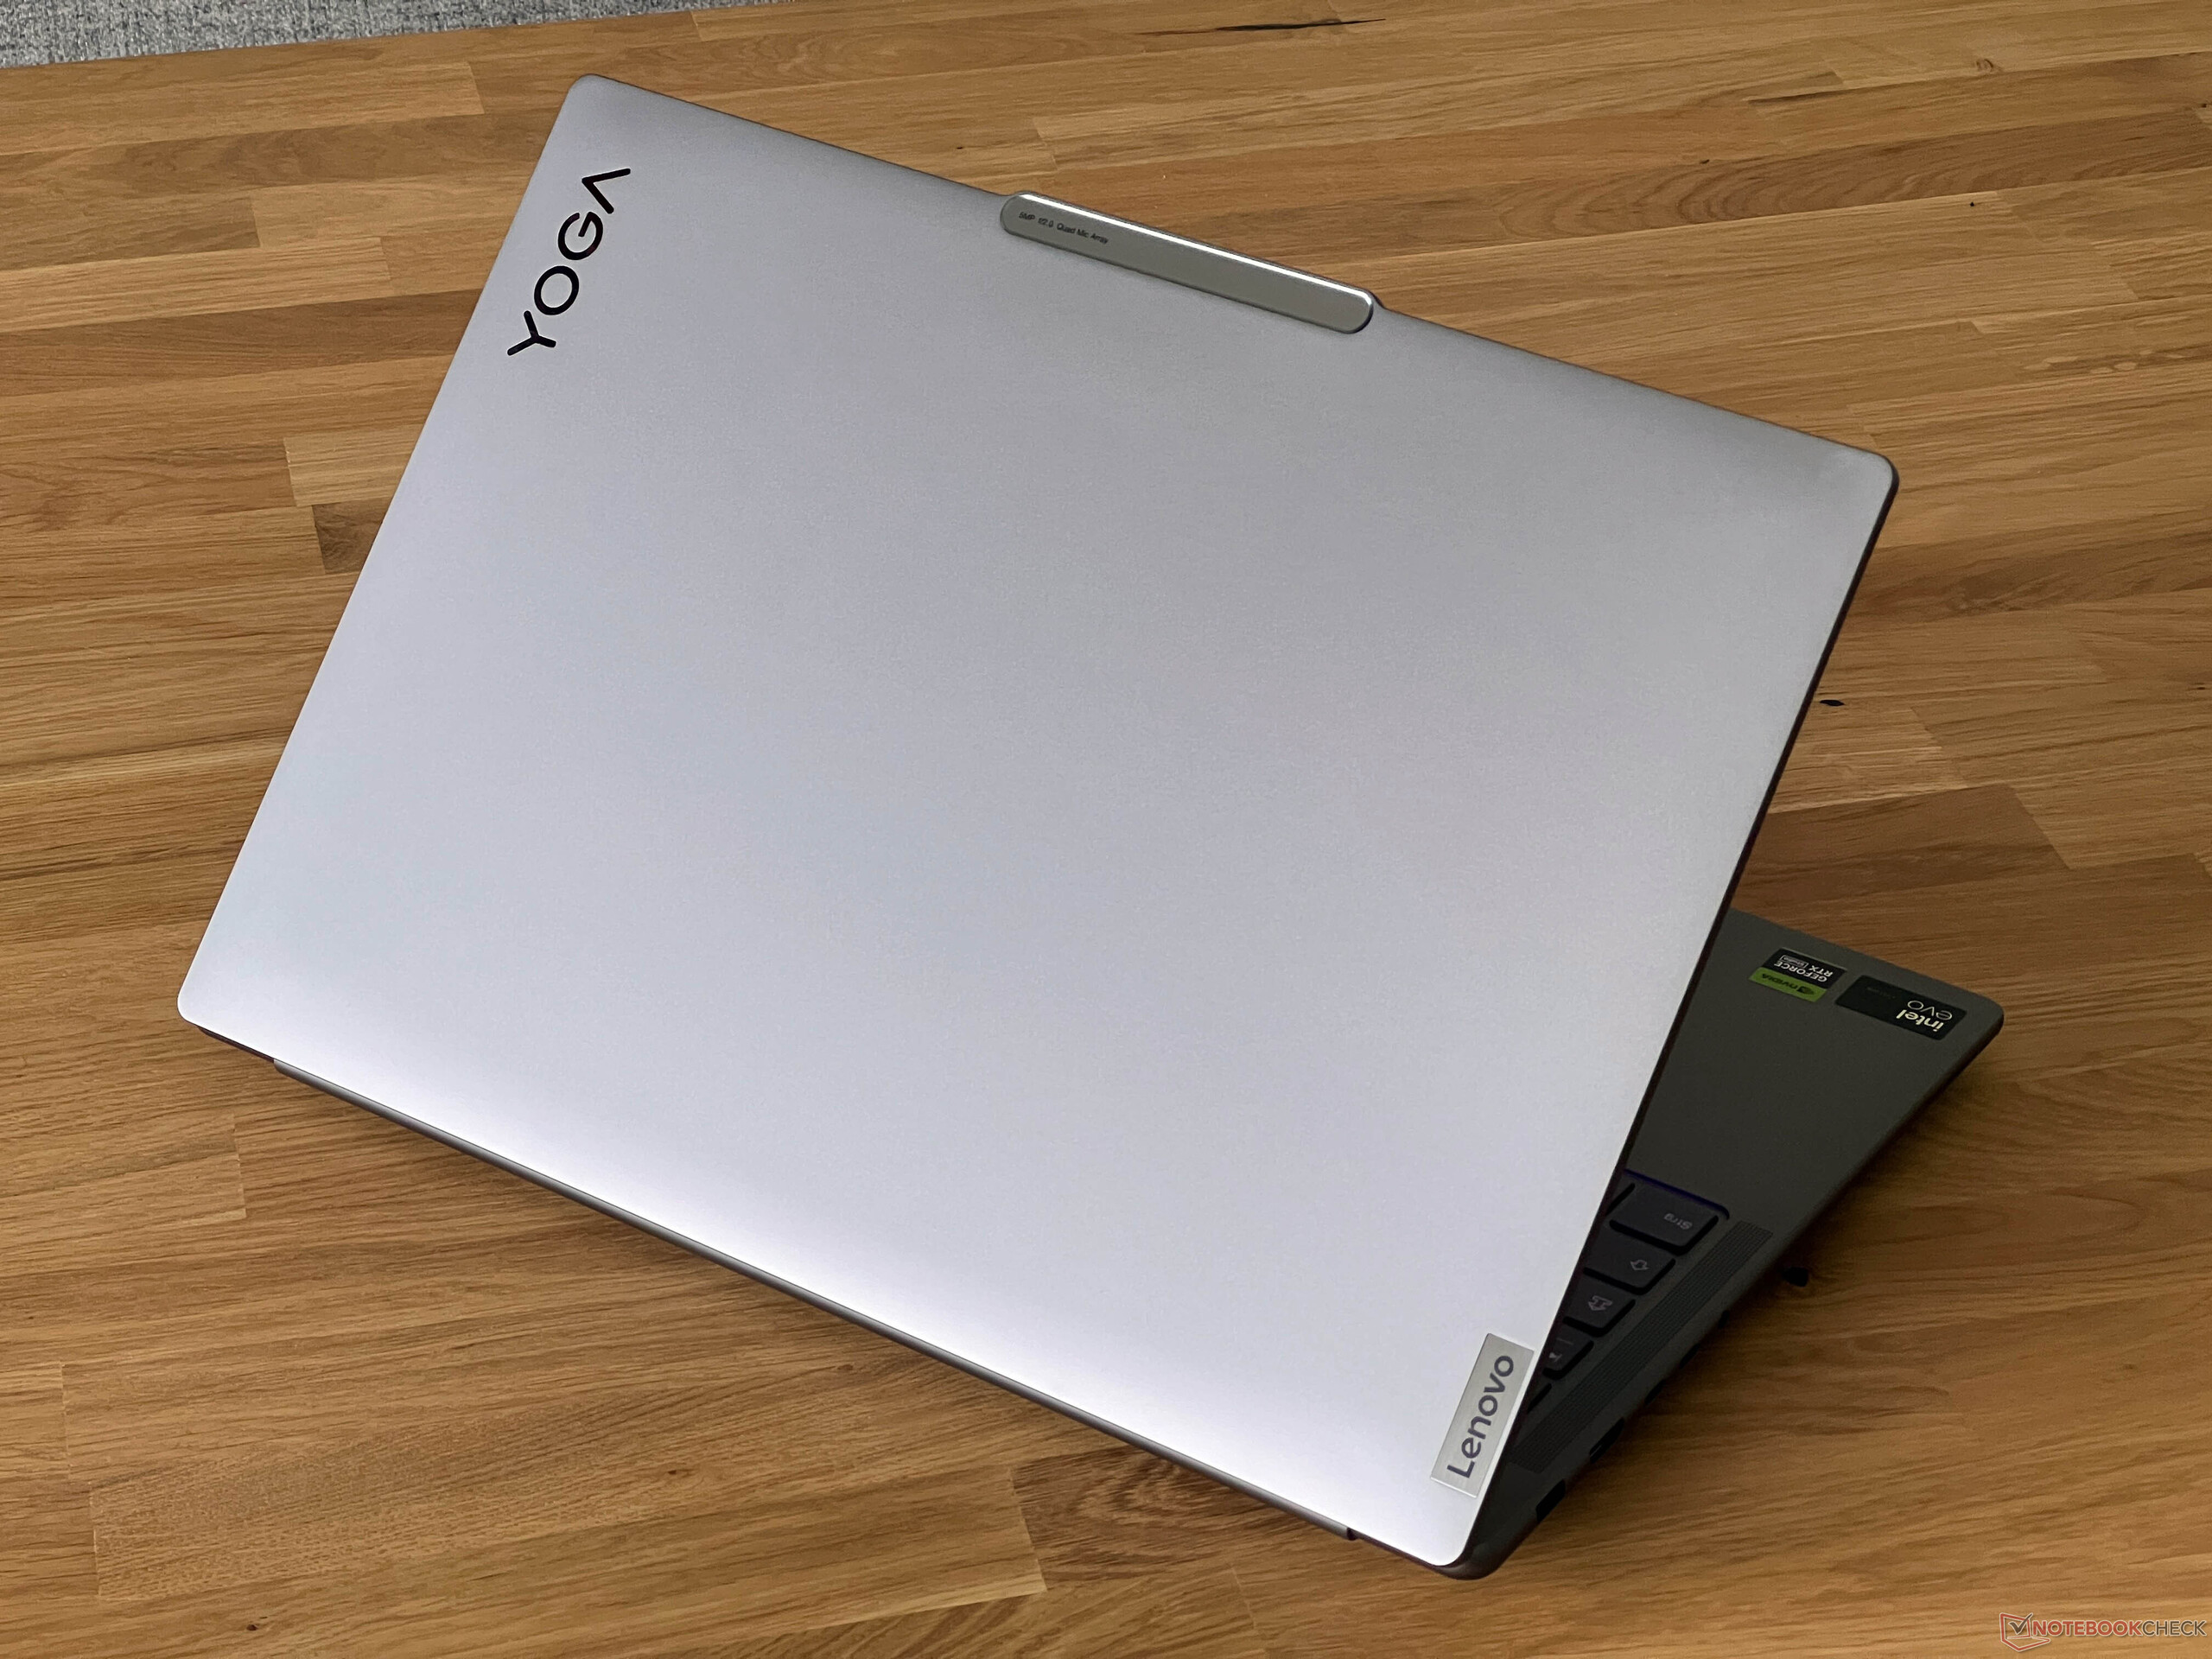
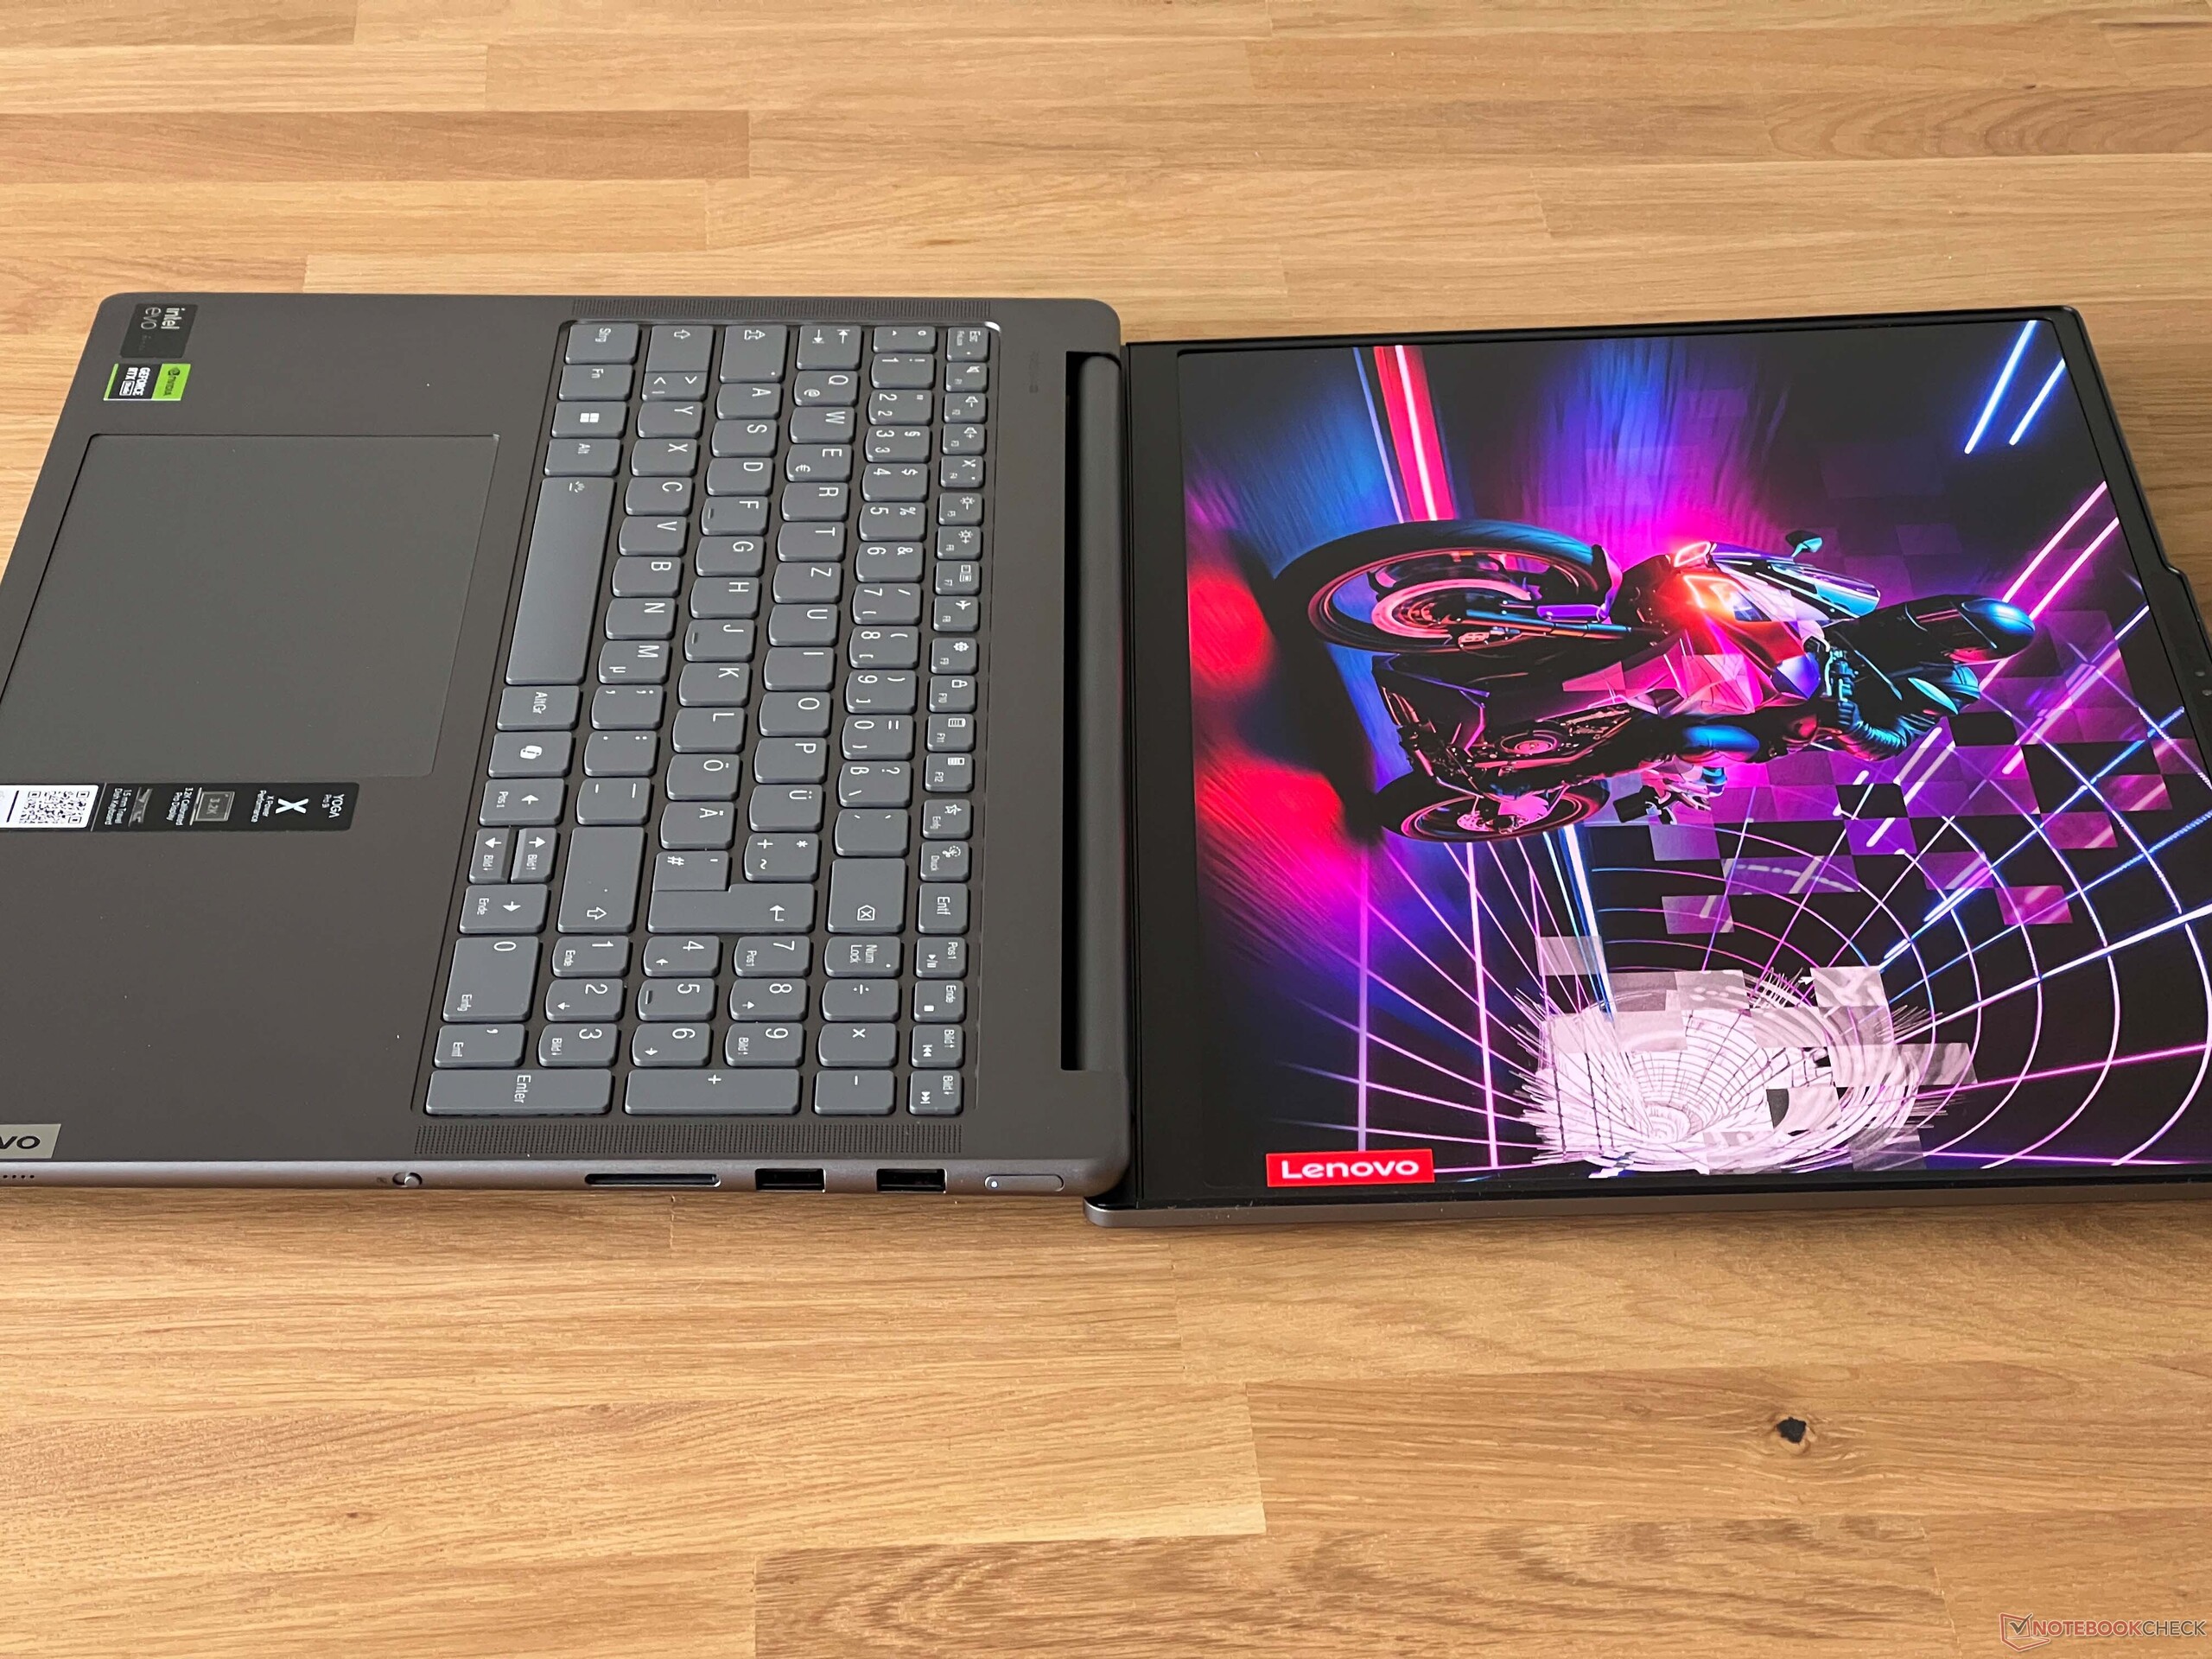
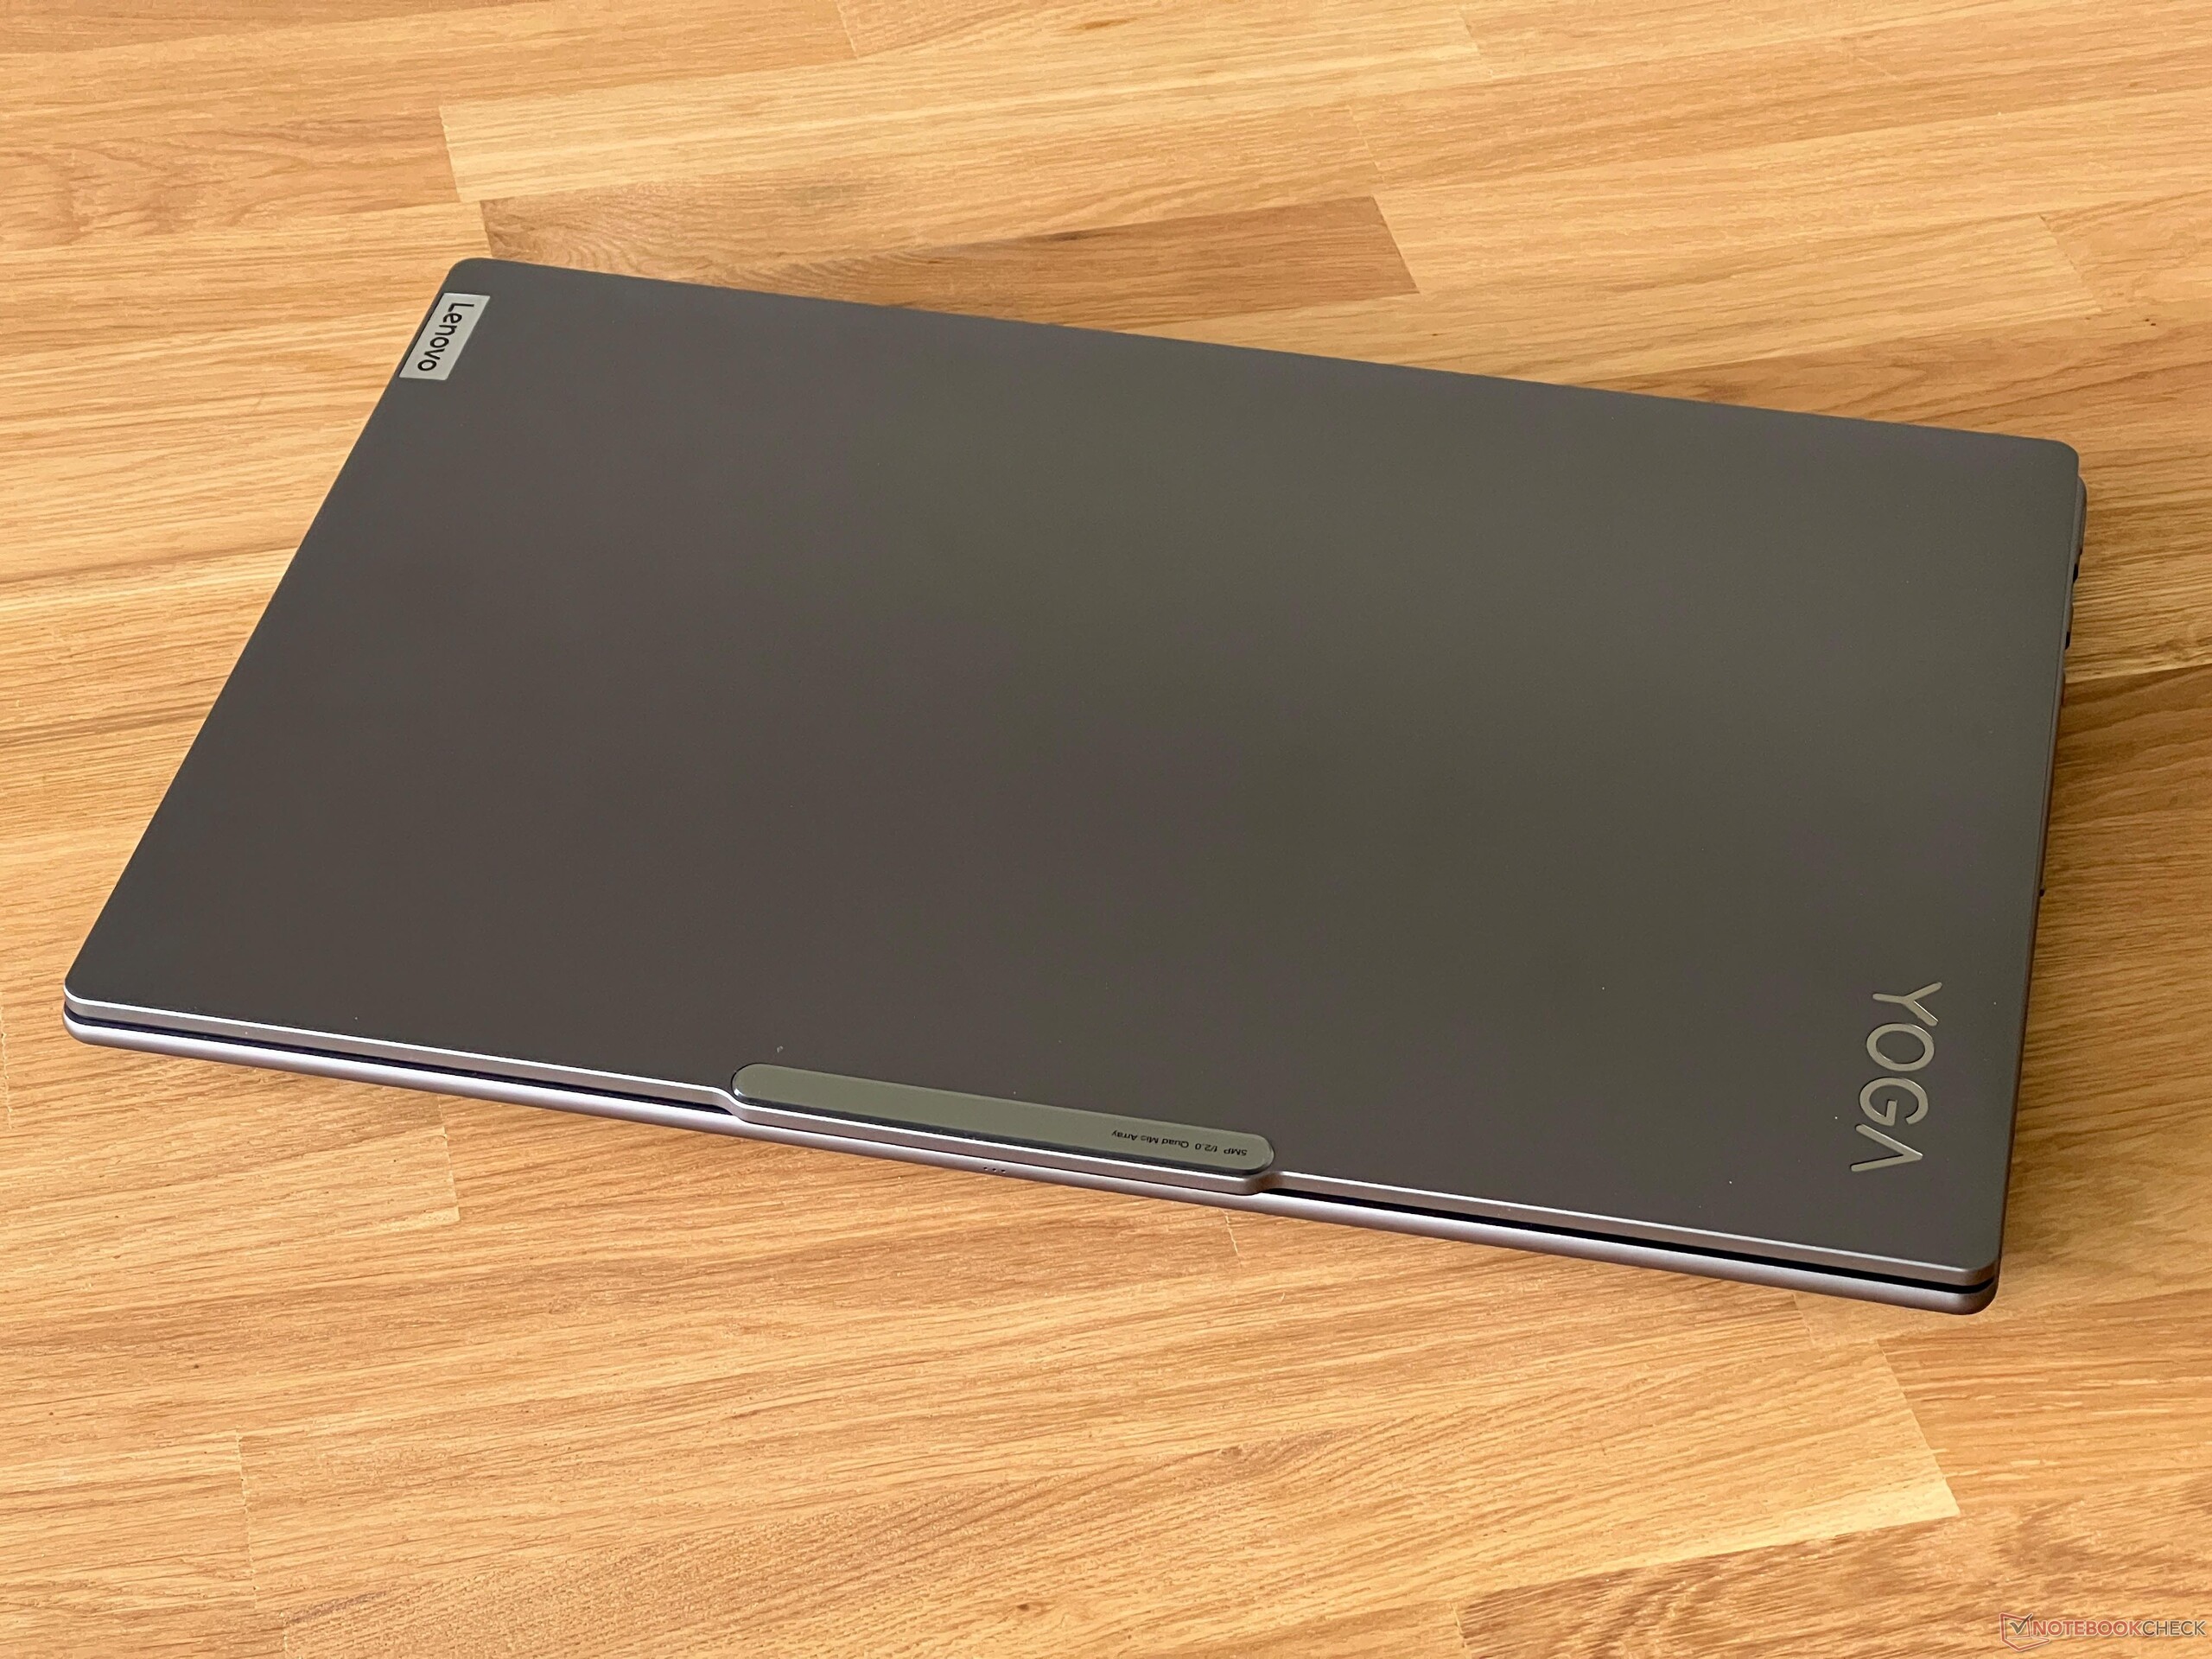
The case design remains unchanged from the old model and the aluminum case in dark gray (alternatively in turquoise) looks good, but there is not much of a visual difference to the current IdeaPad Pro 16. The design looks modern; only the large camera hump disturbs the impression somewhat.
In terms of quality, the test device gives a good impression overall. Only the still very thin base plate emits occasional creaking noises. However, the base unit itself is very stable and only the middle area yields slightly when subject to pressure. The screen lid is a little more flexible, but we were unable to elicit any image distortions. The hinges are well adjusted and the maximum opening angle is 180 degrees.

At a weight of just over 2 kg, the Yoga Pro falls in the midfield, but takes up a slightly larger footprint than the new Dell XPS 16, for example. The 170-watt power supply weighs 566 grams.
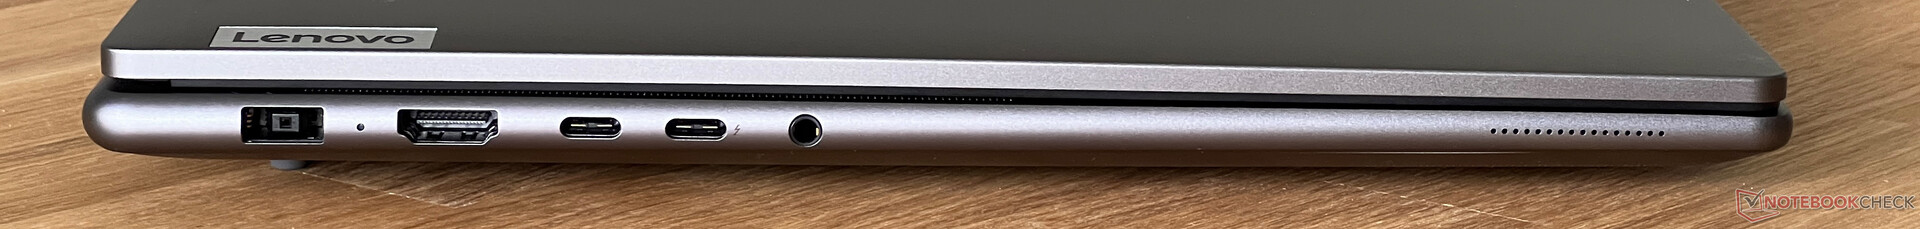
Equipment - Thunderbolt 4 & HDMI 2.1
While last year's model still had limitations with the HDMI port, a modern HDMI 2.1 port is now on board. Thunderbolt 4 and sufficient USB ports are also available. All video outputs are connected via the iGPU, so the GeForce GPU does not have to run all the time when using an external monitor, which reduces power consumption.

SD card reader
The card reader on the right-hand side offers an average transfer rate of 80-90 MB/s in conjunction with our reference card (Angelbird AV Pro V60). Inserted cards protrude about 1.5 cm from the case.
| SD Card Reader | |
| average JPG Copy Test (av. of 3 runs) | |
| Dell XPS 16 9640 (Angelbird AV Pro V60) | |
| Average of class Multimedia (23 - 531, n=37, last 2 years) | |
| Samsung Galaxy Book4 Ultra (Angelbird AV Pro V60) | |
| Lenovo Yoga Pro 9 16IMH9 (Angelbird AV Pro V60) | |
| Lenovo Yoga Pro 9 16-IRP G8 (Angelibird AV Pro V60) | |
| Schenker VISION 16 Pro (M23) (Angelbird AV Pro V60) | |
| maximum AS SSD Seq Read Test (1GB) | |
| Dell XPS 16 9640 (Angelbird AV Pro V60) | |
| Average of class Multimedia (37.3 - 1455, n=36, last 2 years) | |
| Lenovo Yoga Pro 9 16IMH9 (Angelbird AV Pro V60) | |
| Samsung Galaxy Book4 Ultra (Angelbird AV Pro V60) | |
| Lenovo Yoga Pro 9 16-IRP G8 (Angelibird AV Pro V60) | |
| Schenker VISION 16 Pro (M23) (Angelbird AV Pro V60) | |
Communication
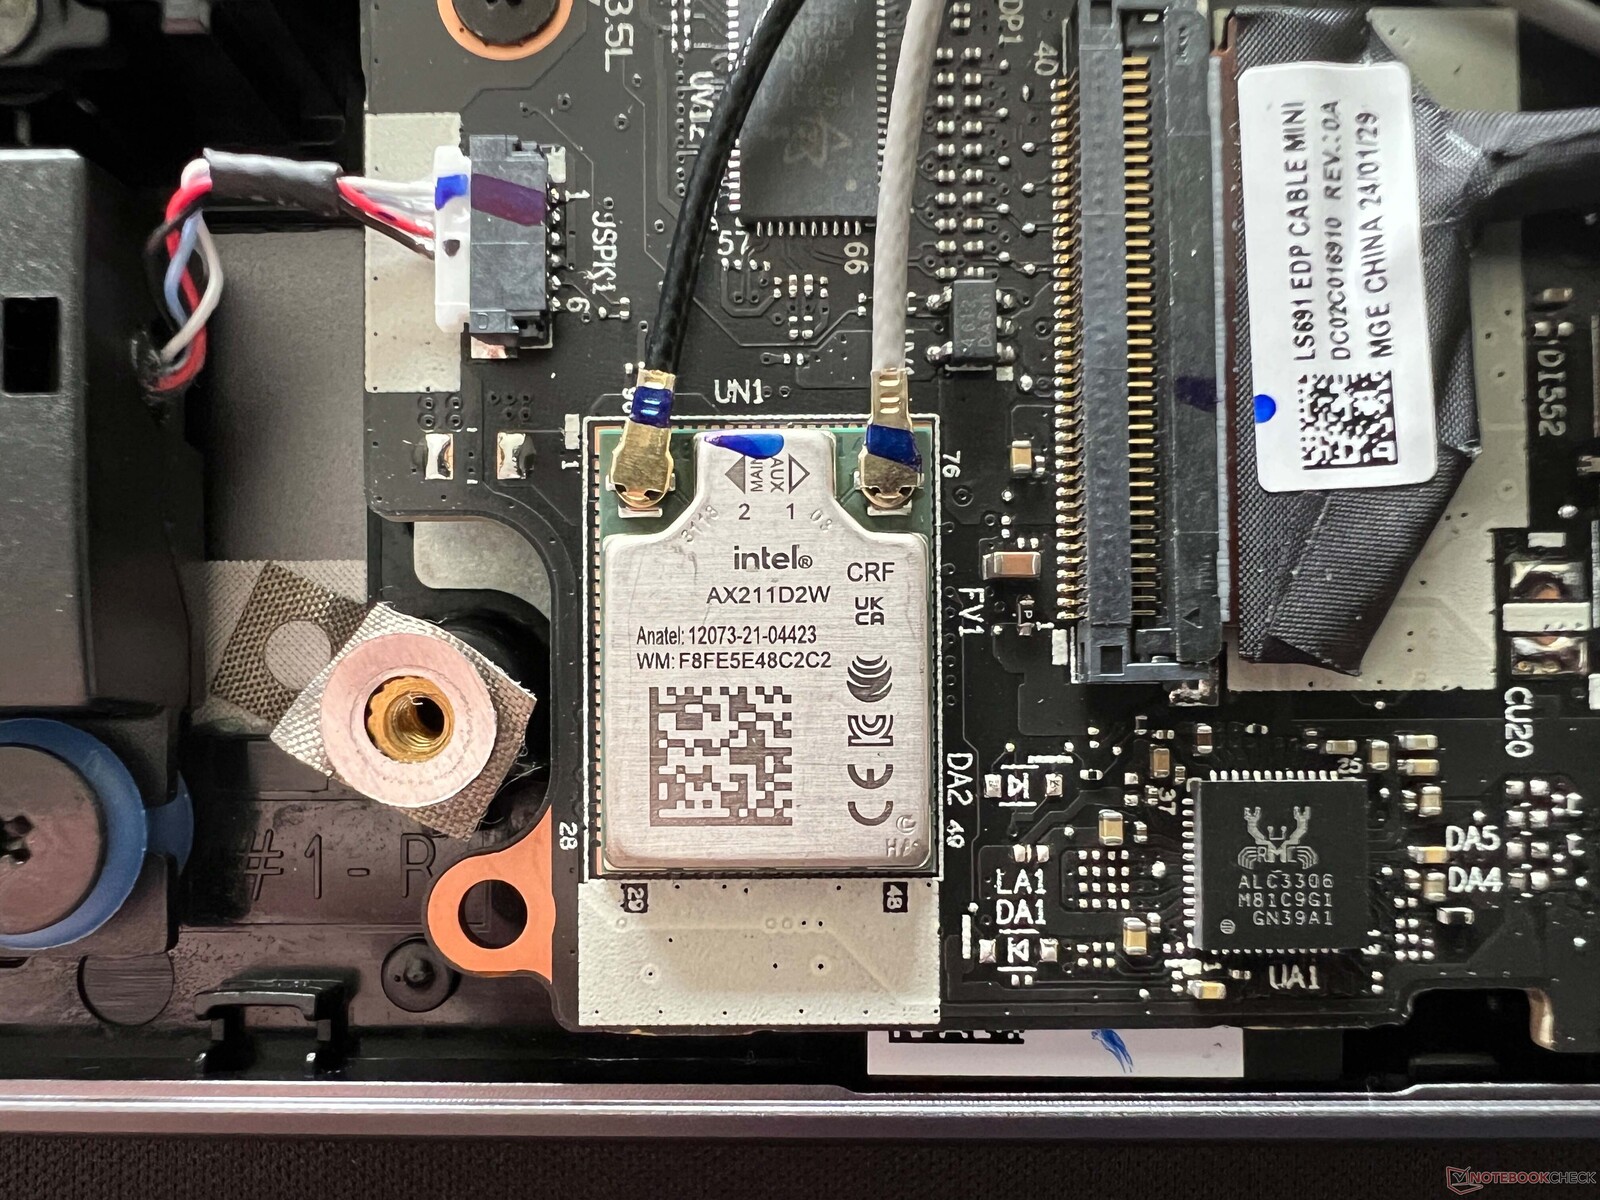
The AX211 WLAN module from Intel is soldered and supports WiFi 6E as well as Bluetooth 5.3. We had no issues with WLAN stability in our tests and the transfer rates were very good overall in conjunction with our reference router from Asus. Lenovo does not include a WiFi 7 module.
| Networking | |
| Lenovo Yoga Pro 9 16IMH9 | |
| iperf3 transmit AXE11000 | |
| iperf3 receive AXE11000 | |
| Dell XPS 16 9640 | |
| iperf3 transmit AXE11000 | |
| iperf3 receive AXE11000 | |
| Honor MagicBook Pro 16 2024 | |
| iperf3 transmit AXE11000 | |
| iperf3 receive AXE11000 | |
| Samsung Galaxy Book4 Ultra | |
| iperf3 transmit AXE11000 | |
| iperf3 receive AXE11000 | |
| Framework Laptop 16 | |
| iperf3 transmit AXE11000 | |
| iperf3 receive AXE11000 | |
| iperf3 transmit AXE11000 6GHz | |
| iperf3 receive AXE11000 6GHz | |
| Schenker VISION 16 Pro (M23) | |
| iperf3 transmit AXE11000 | |
| iperf3 receive AXE11000 | |
| Lenovo Yoga Pro 9 16-IRP G8 | |
| iperf3 transmit AXE11000 | |
| iperf3 receive AXE11000 | |
Webcam
The 5 MP camera offers decent image quality and there is also an IR sensor for facial recognition via Windows Hello. In conjunction with the processor's NPU, certain studio effects (blur, head tracking, etc.) are available directly in Windows and independently of the app. The webcam has an electronic shutter with a button on the right-hand side of the case.


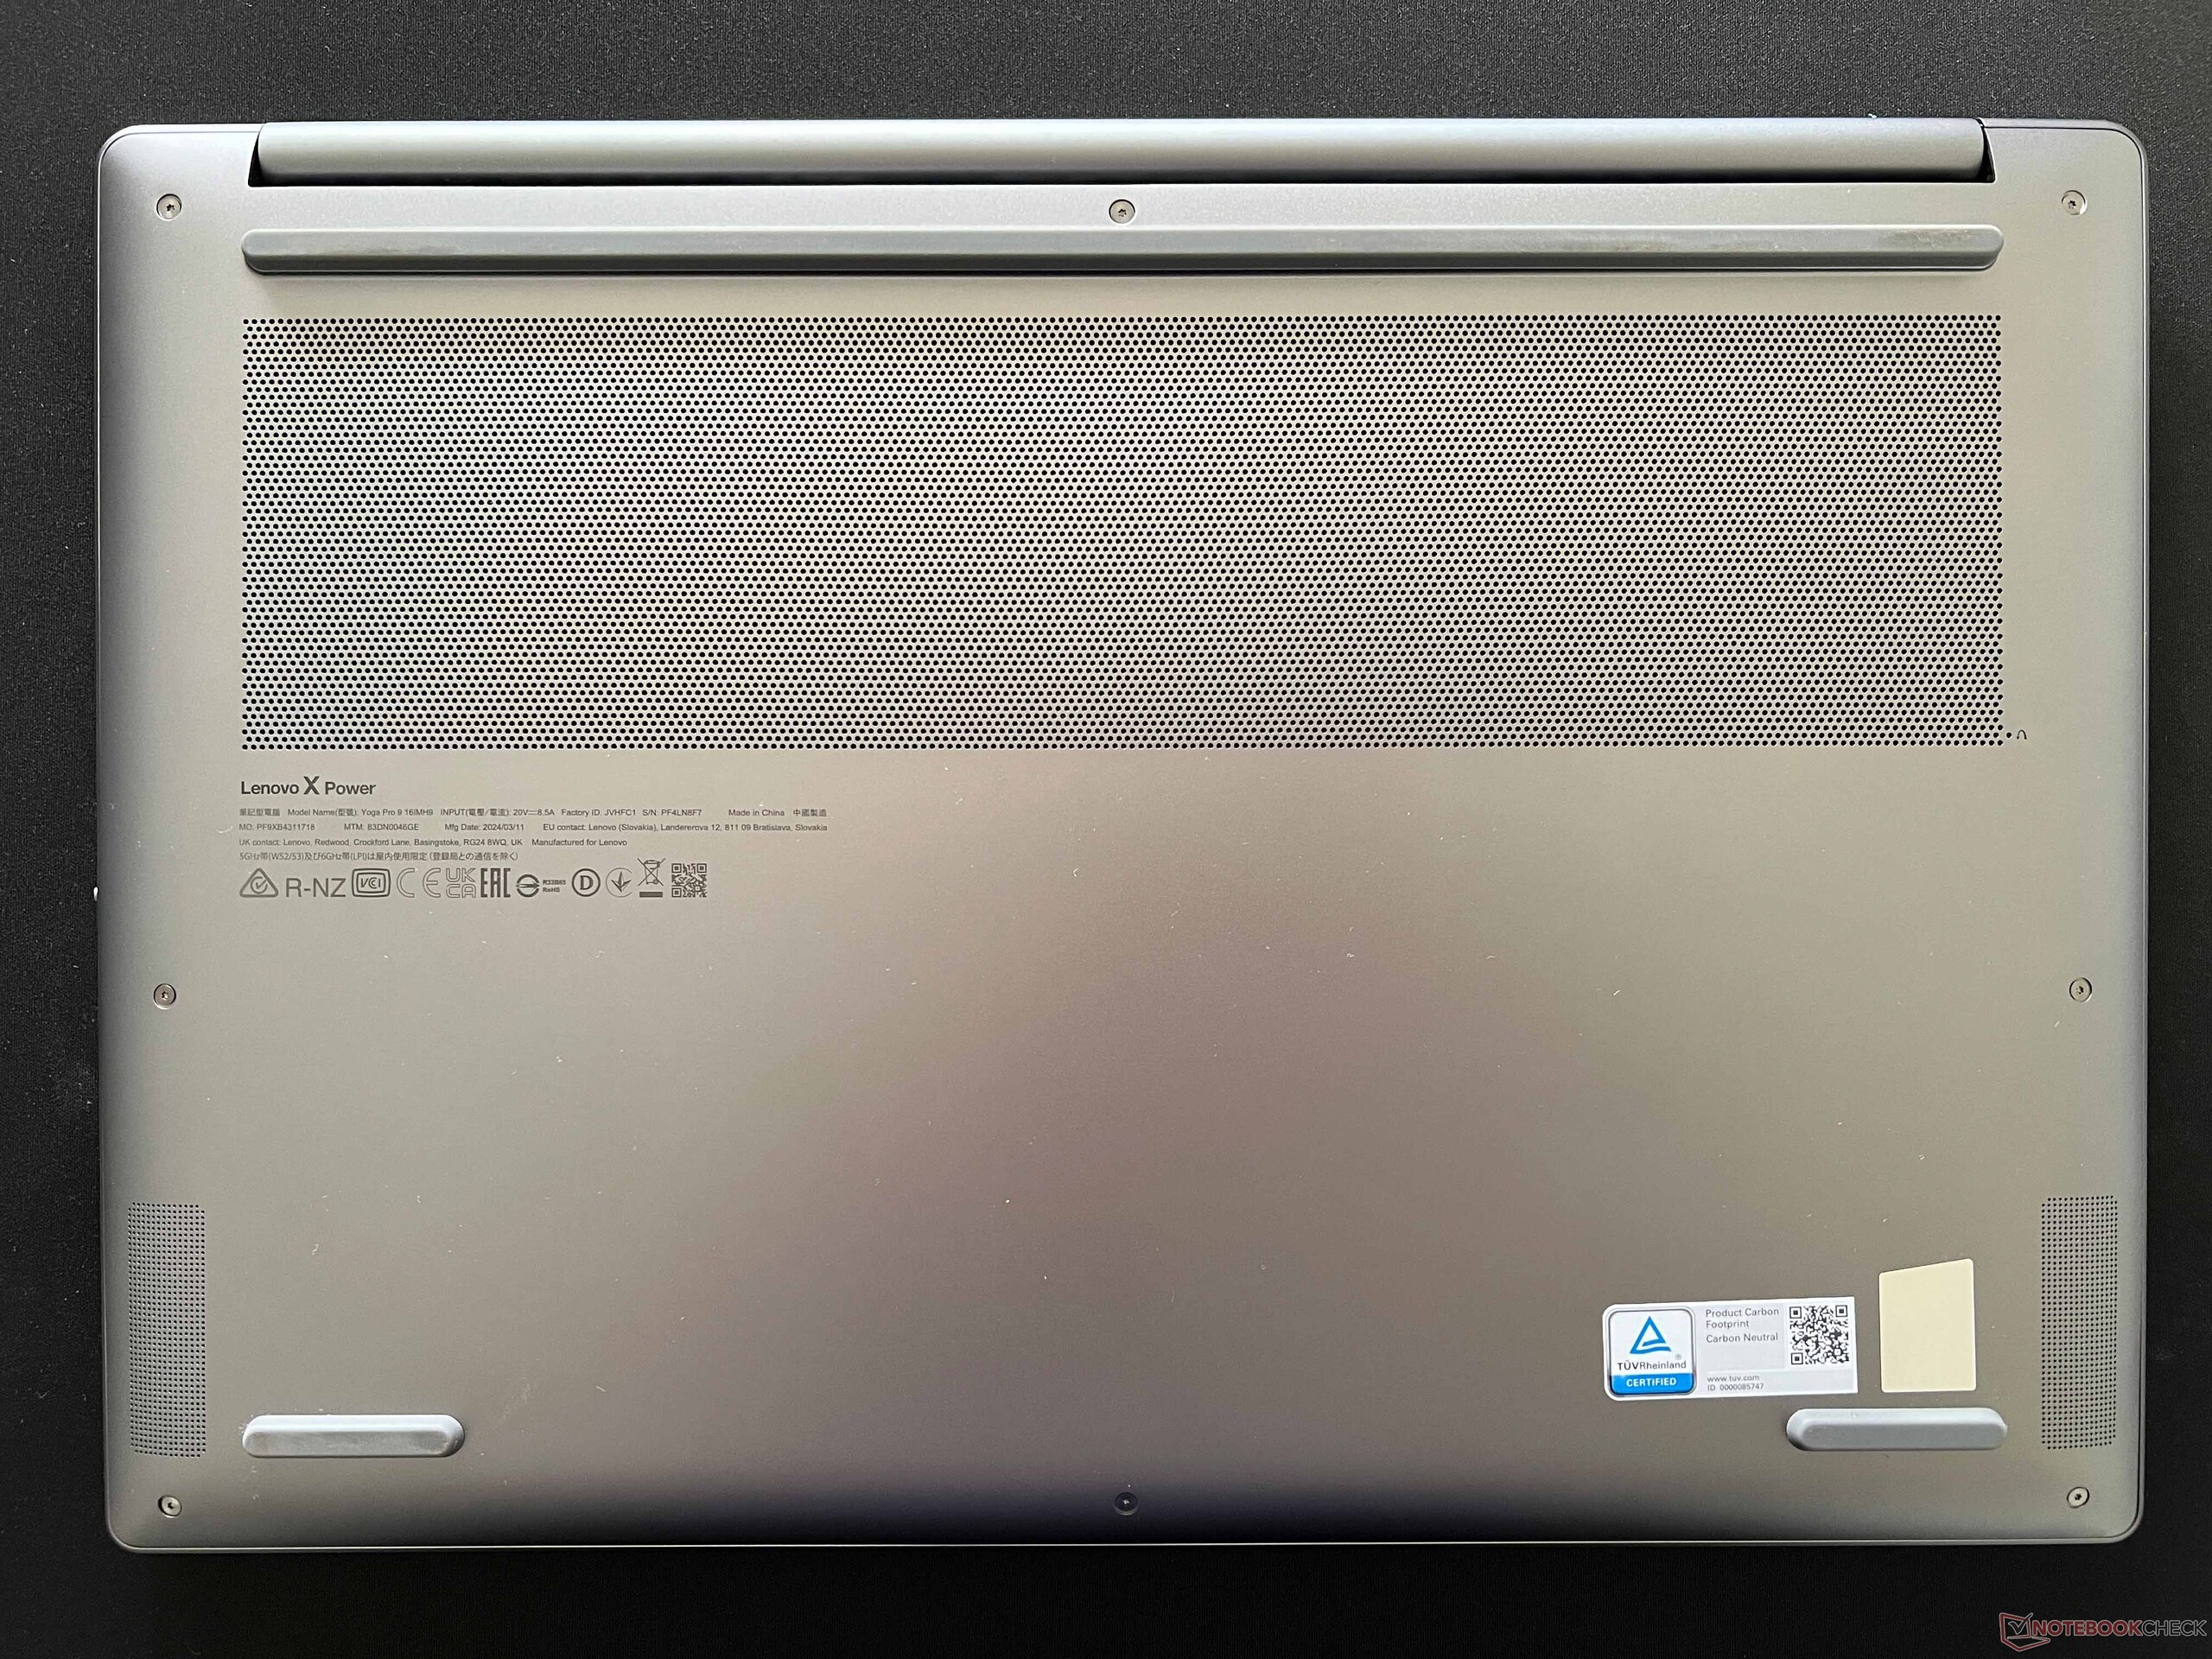
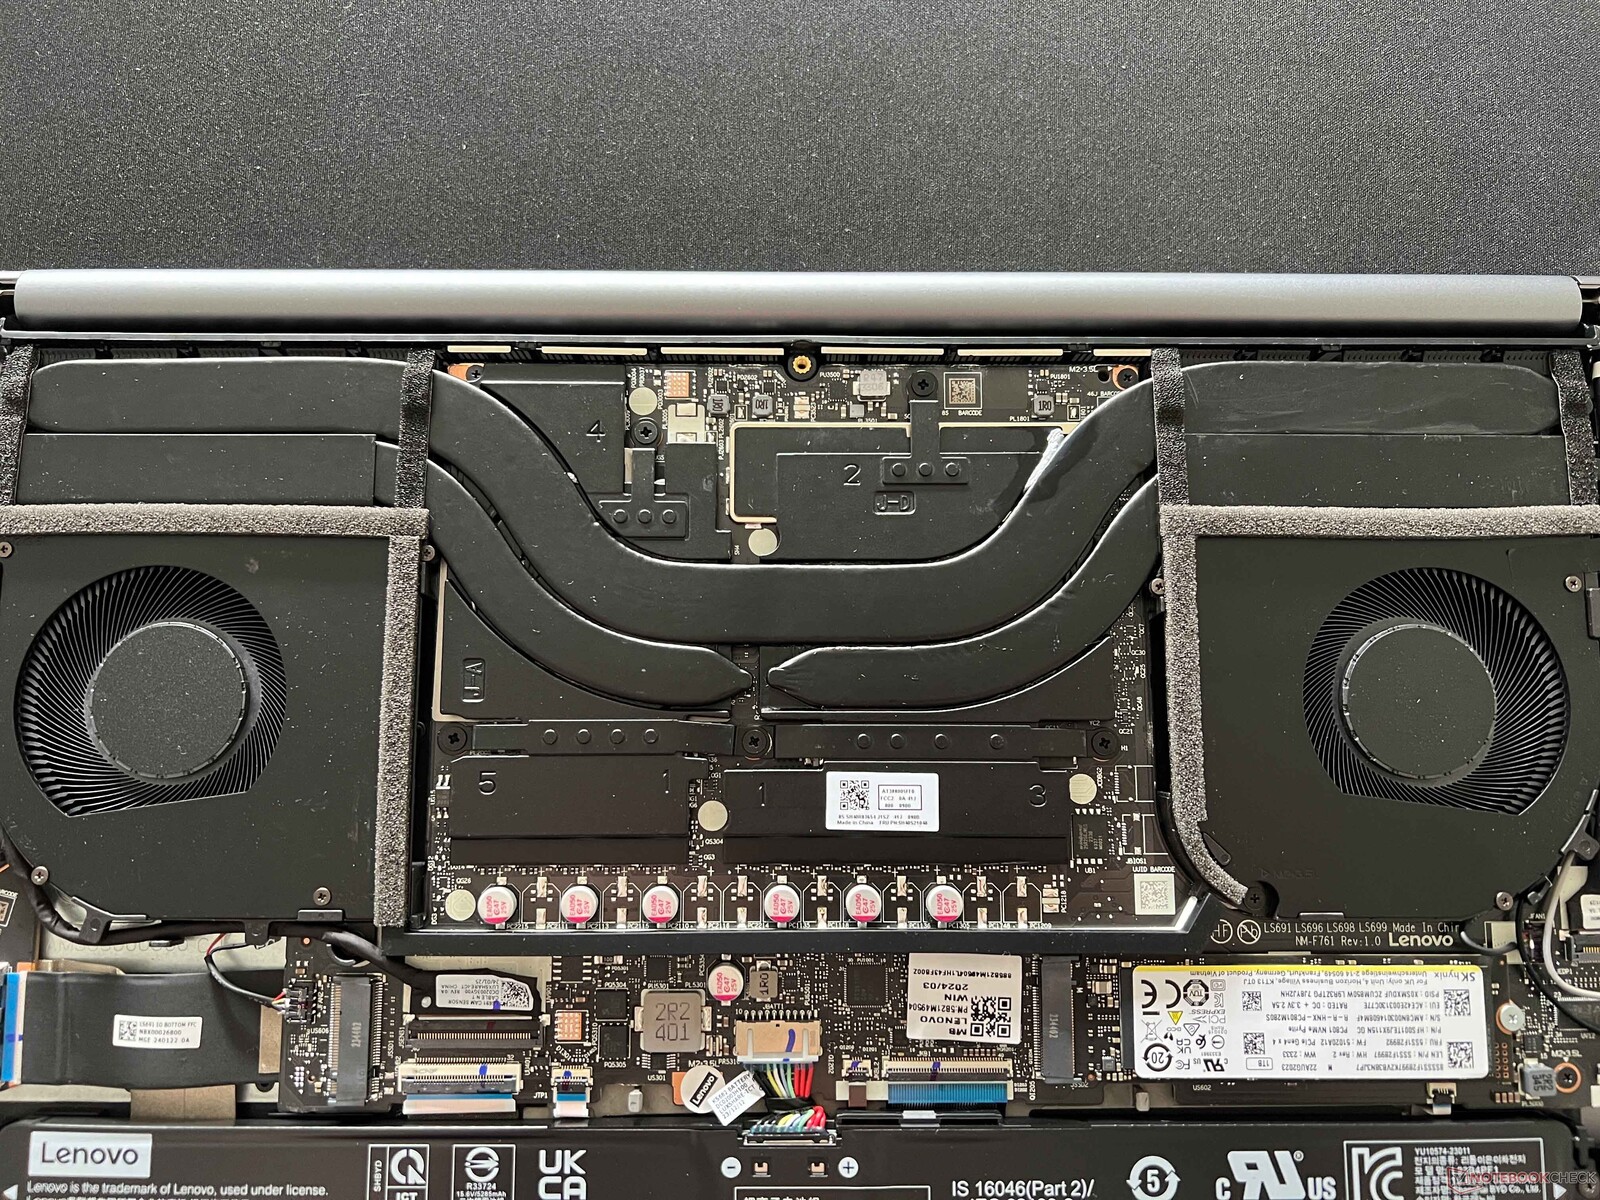
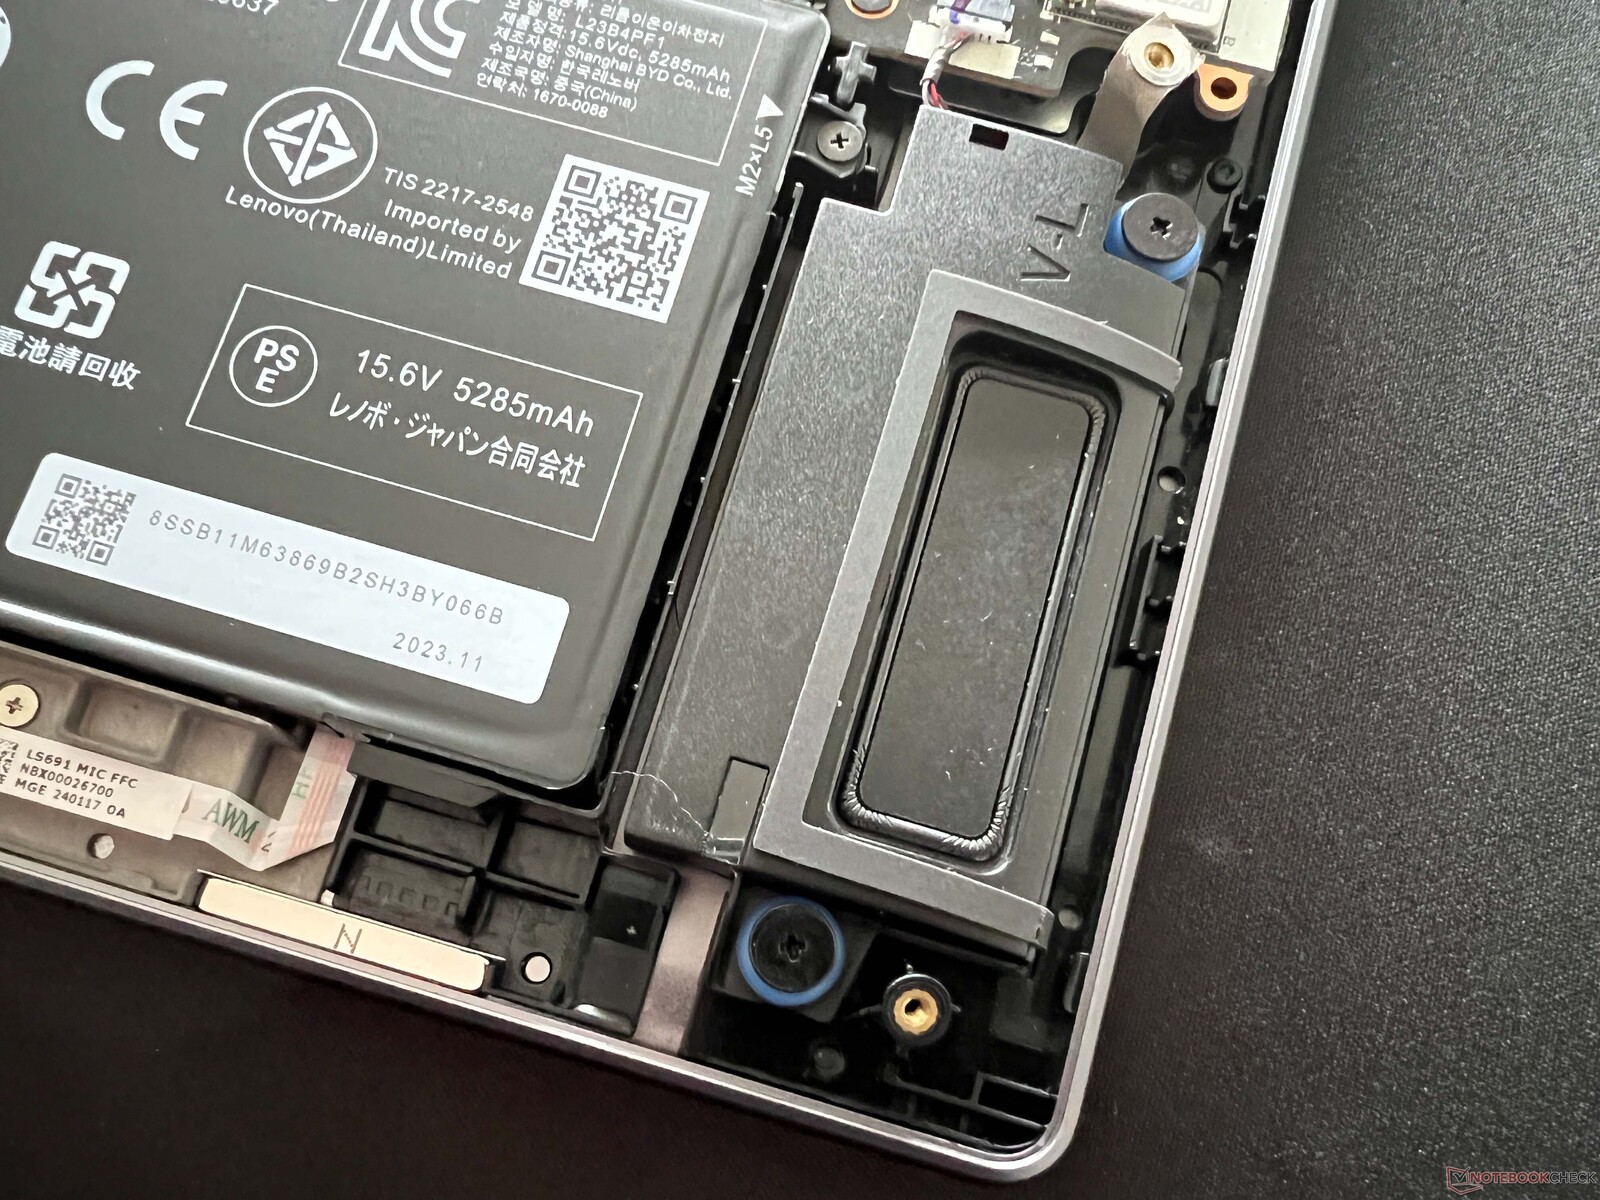
Maintenance
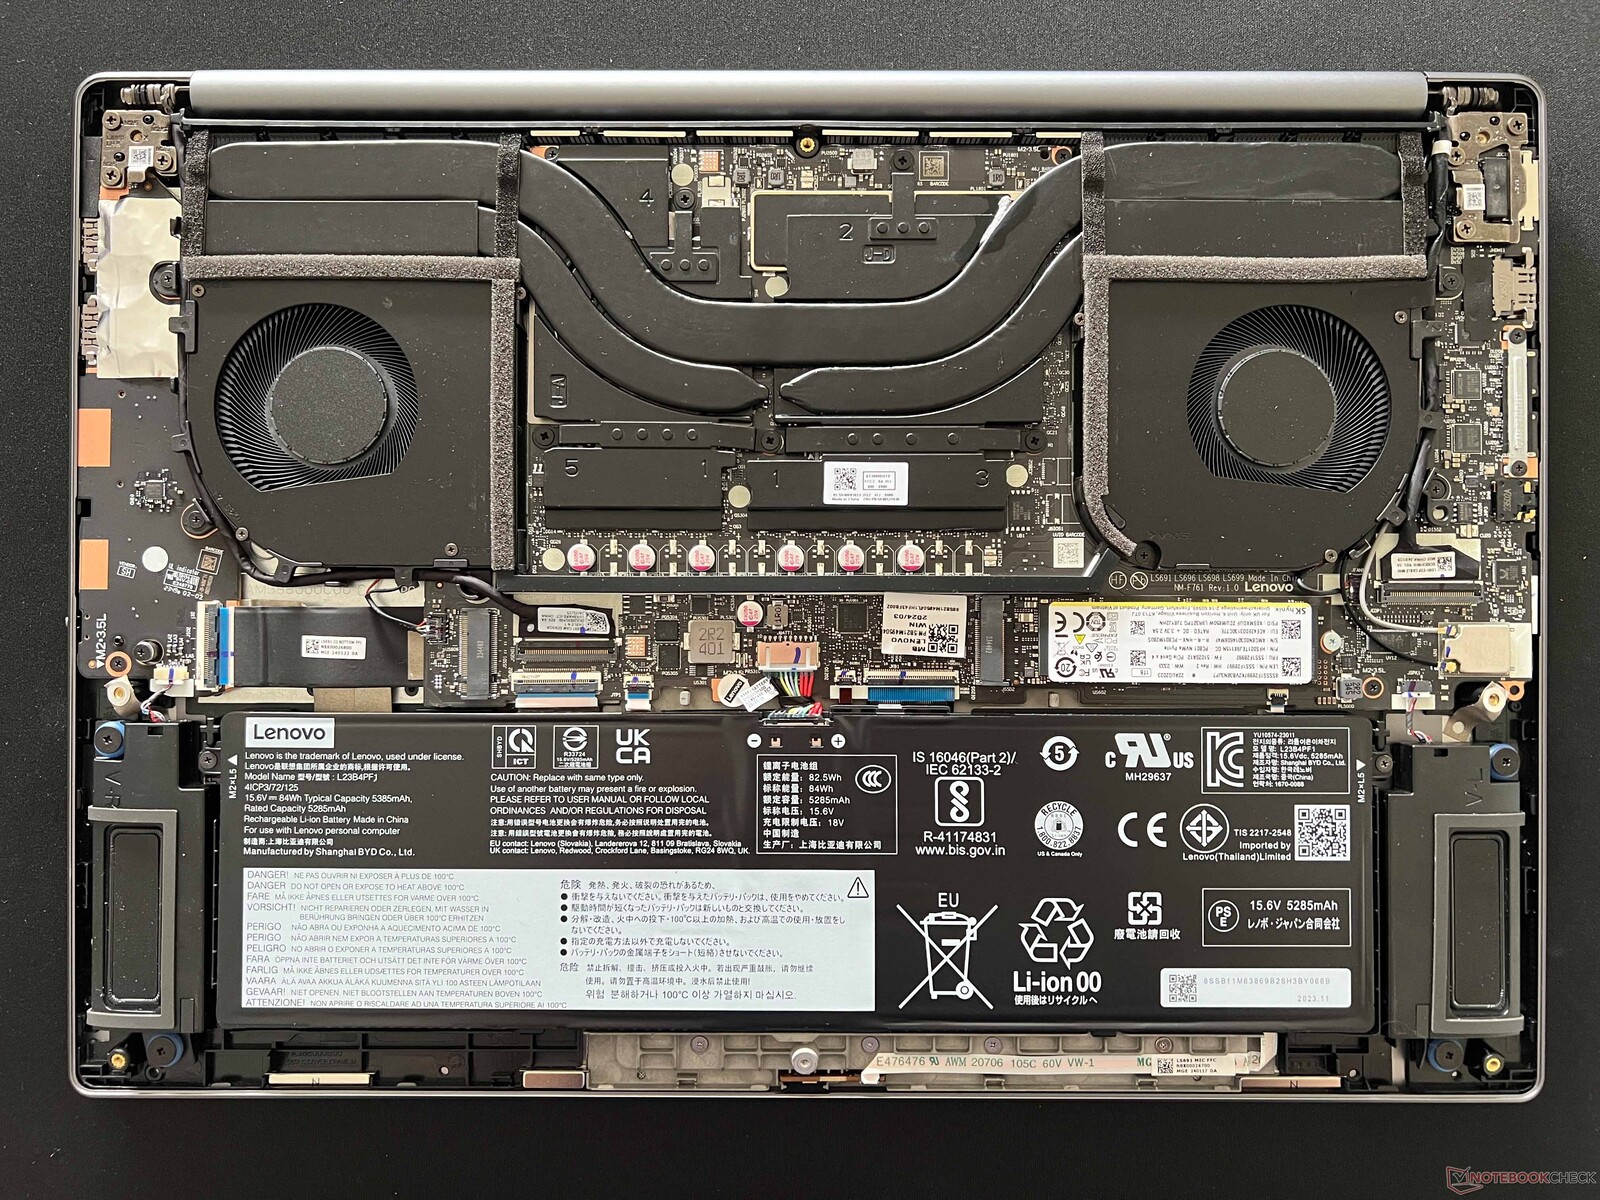
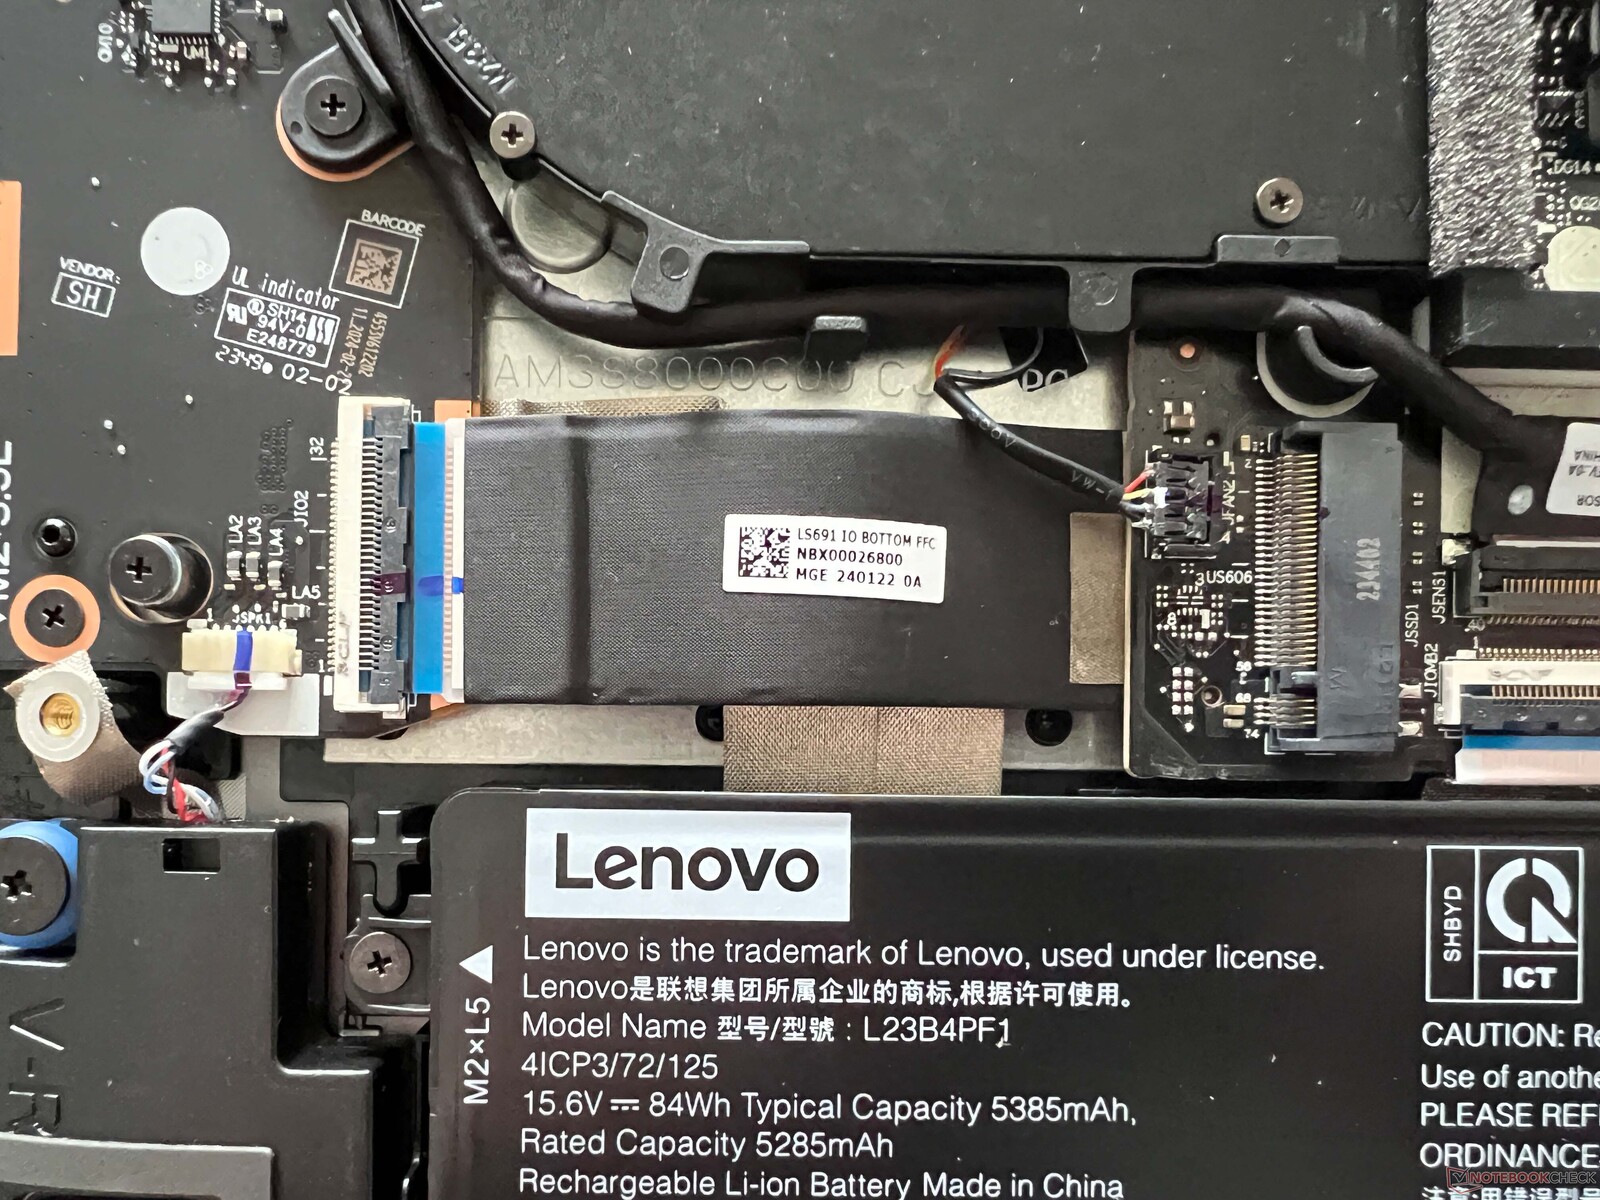
The bottom cover is secured with Torx screws (T5) and is easy to remove. Inside, the layout has changed compared to the old model, partly in order to make space for a larger battery. The RAM and WLAN module are still soldered. There are still two slots for M.2 2280 SSDs and you can both clean the fans and replace the battery (if necessary).
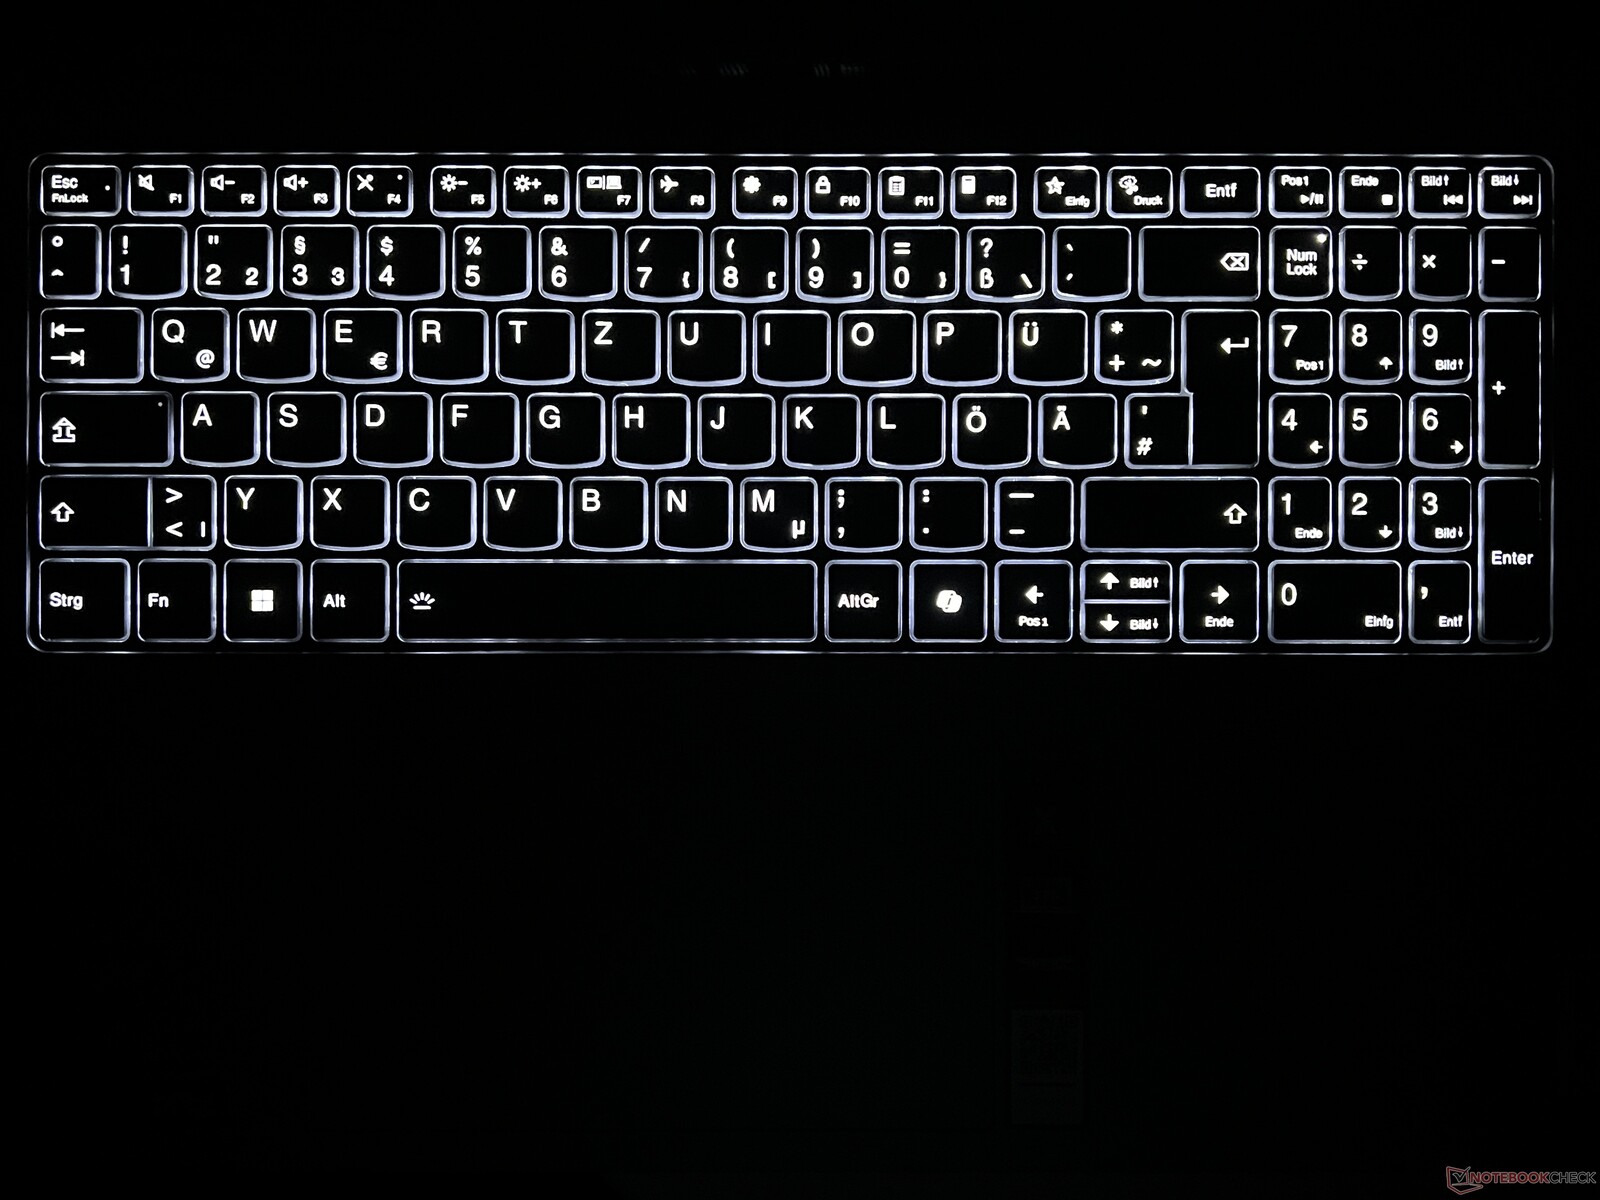
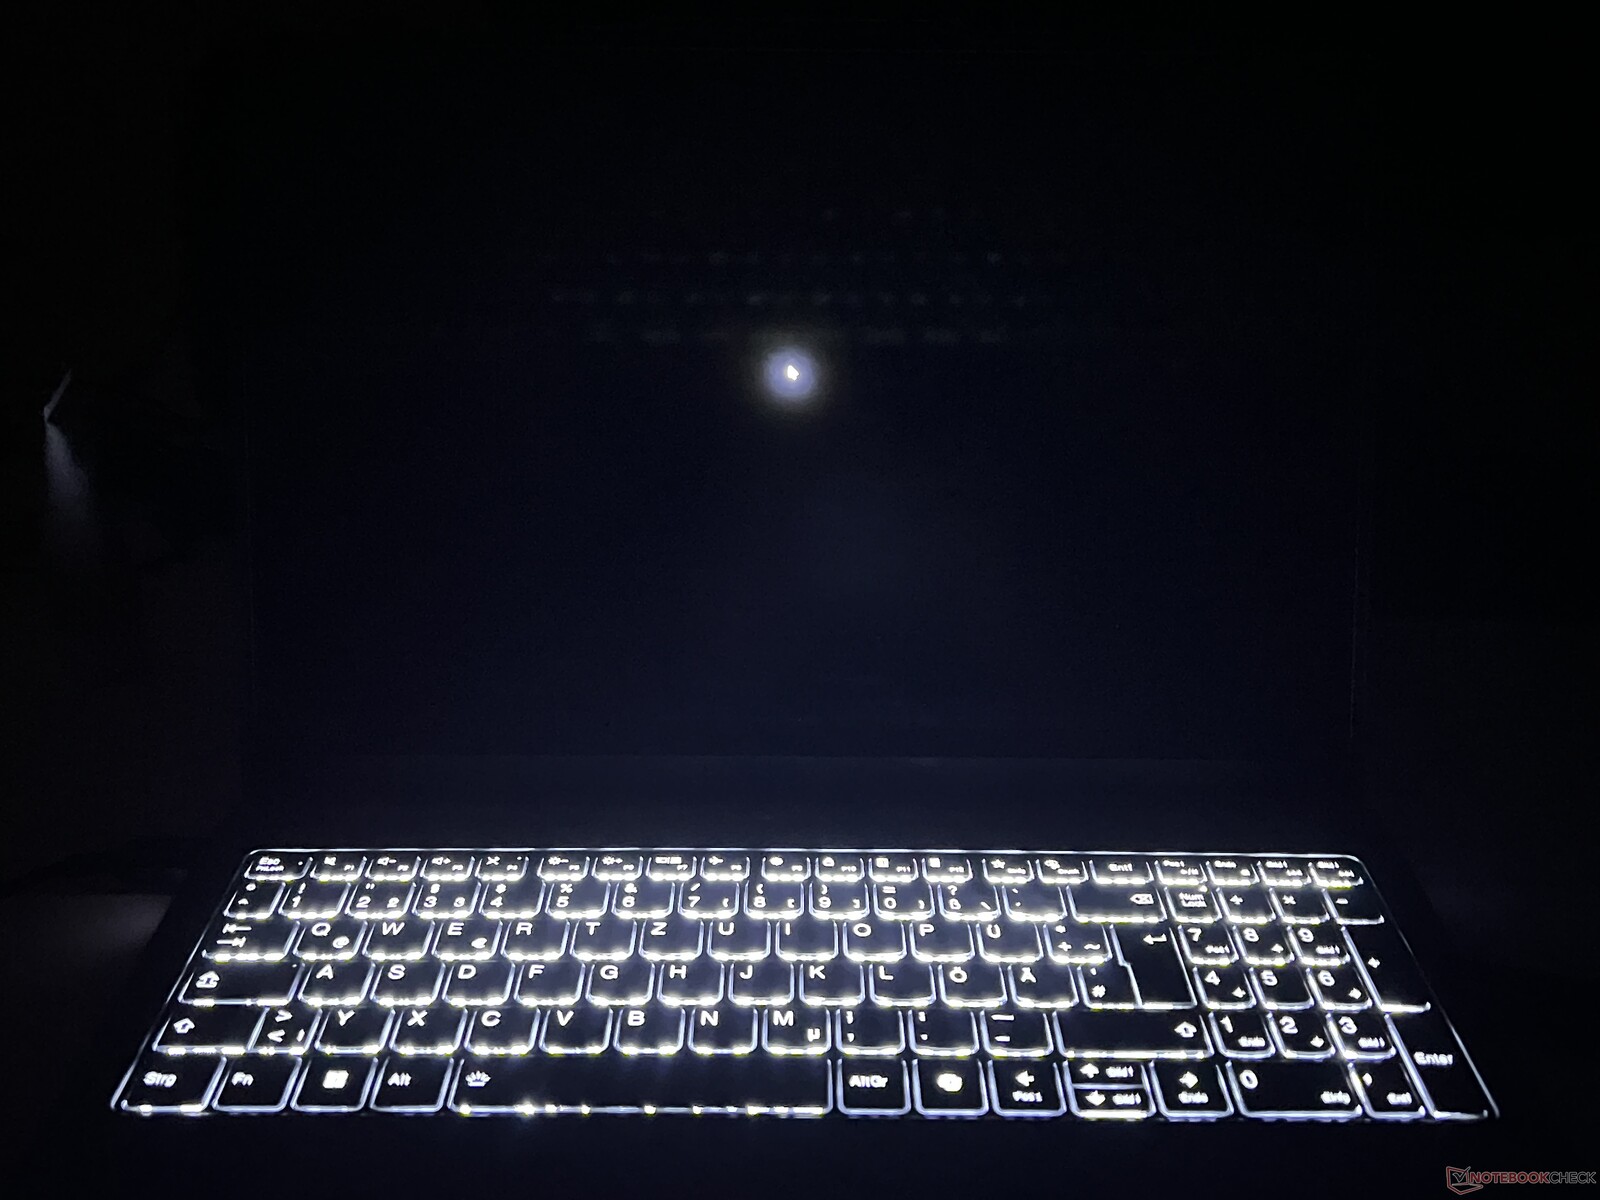
Input devices - 1.5 mm stroke and numpad
The input devices remain unchanged apart from the new Copilot key (instead of the right Ctrl key). The comfortable keyboard offers sufficiently long travel (1.5 mm) and long texts can be typed up without issue. The two-stage white illumination is activated automatically via a sensor.
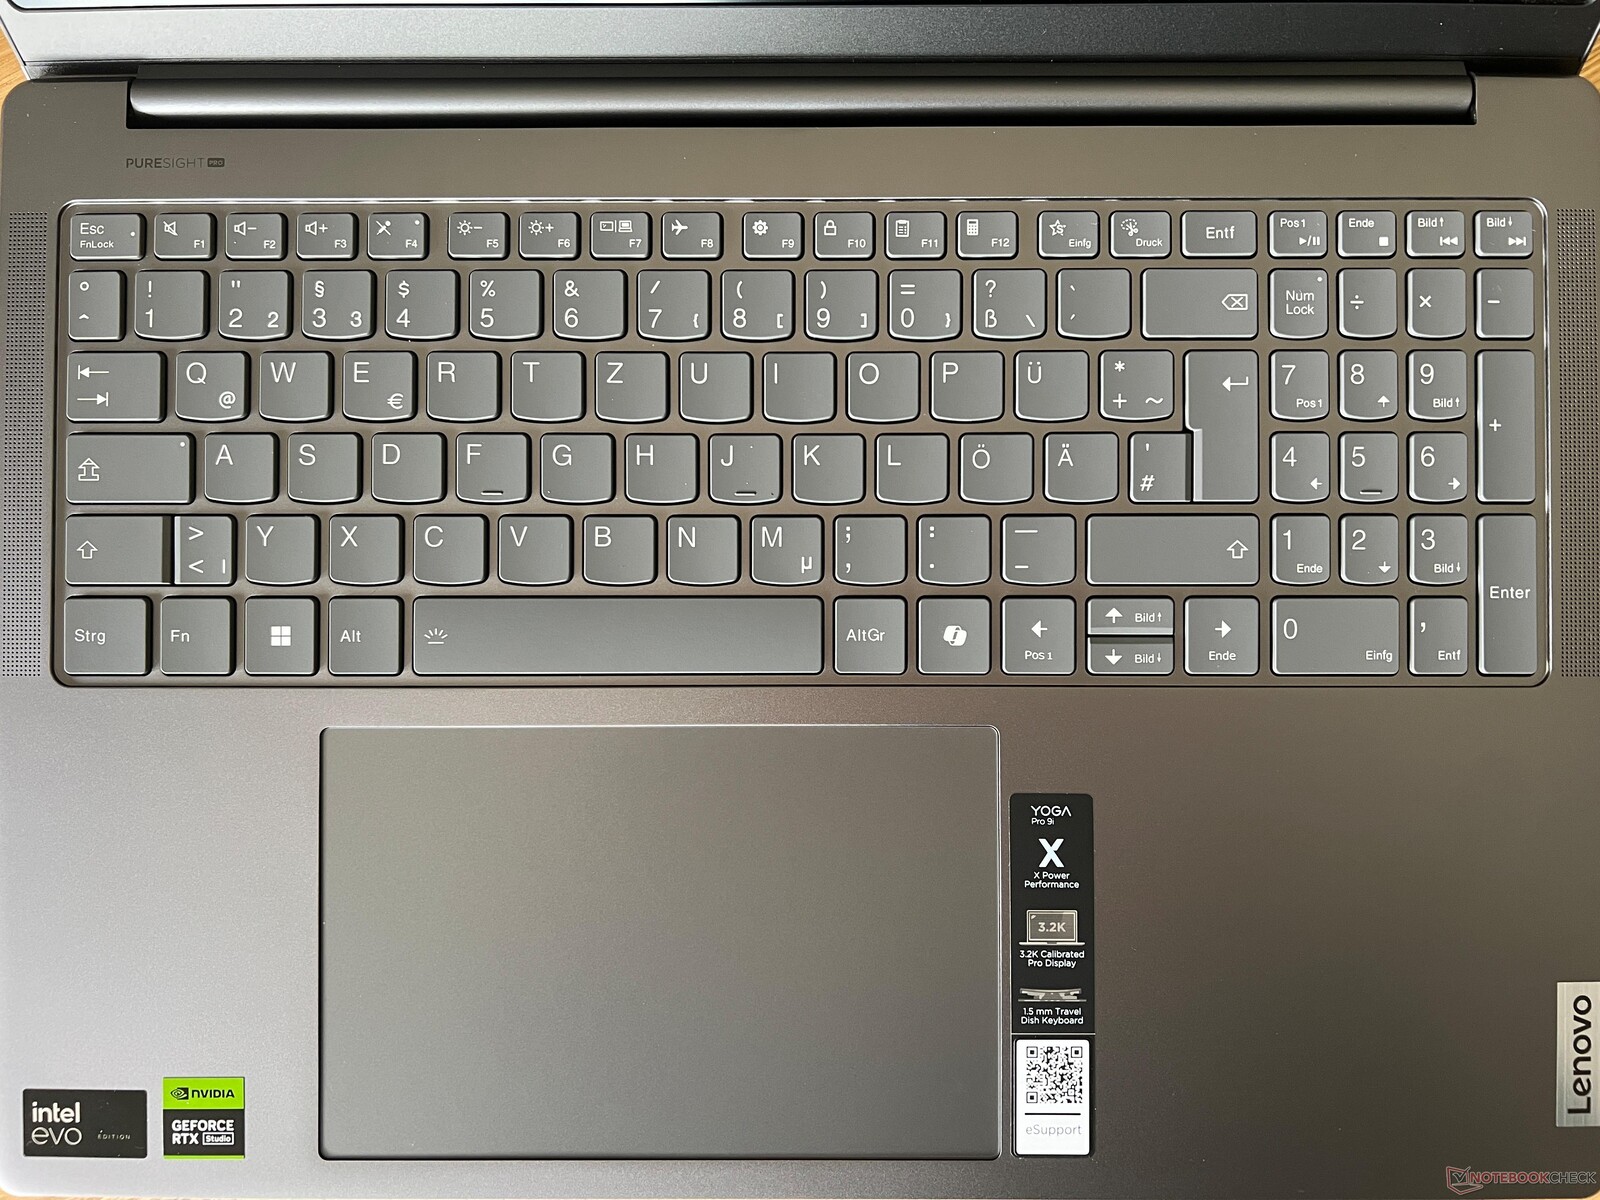
The size of the clickpad remains unchanged at 15 x 9.5 cm, but Lenovo appears to have taken our criticism on board and revised the mechanics. While the clicks on the old model sounded loud and cheap, the click noises are now much more muffled and make a very high-quality impression. As always, the gliding properties are excellent. Overall, there are absolutely no issues with the usability of the clickpad.
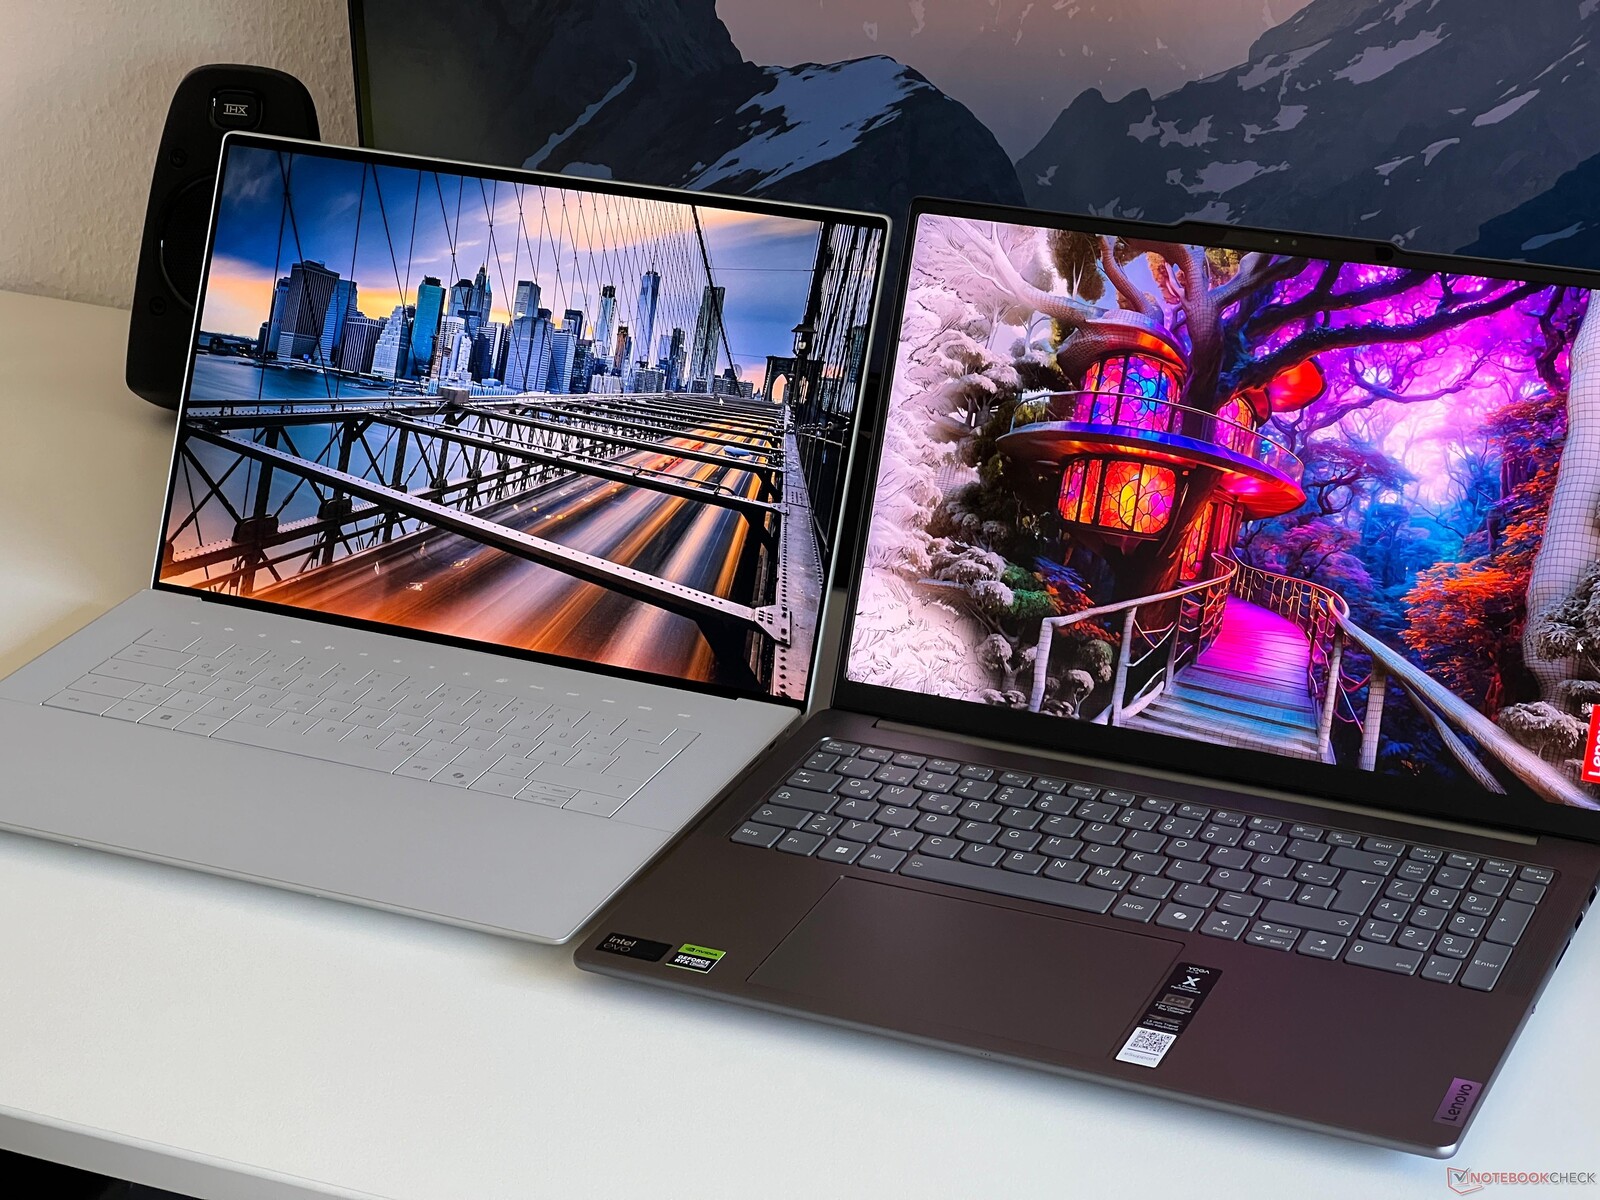
Display - Matte mini LED panel
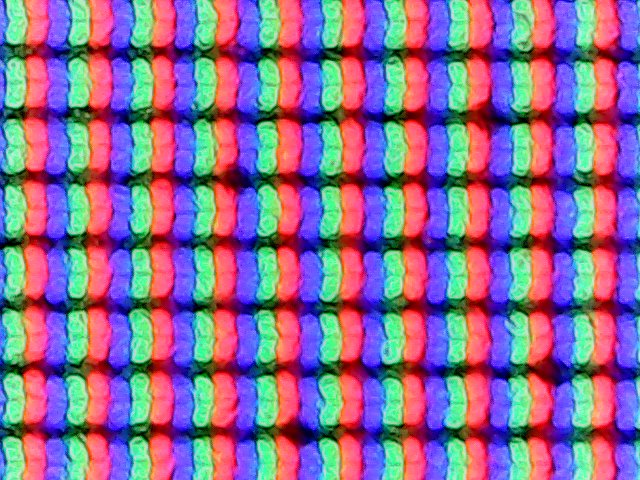
Lenovo offers various panels for the Yoga Pro 9i 16 G9 and our test device has the matte mini-LED screen with a resolution of 3200 x 2000. The glossy & touchscreen variant, which we tested on the predecessor, is still available. Movements are very fluid thanks to the high refresh rate and colors appear very vivid. Even bright surfaces do not appear grainy despite the matte display. The mini LED panel flickers at a constant frequency of 4800 Hz, which should not be a problem for the vast majority of users. The response times are slightly slower than the old model, but there was no ghosting in everyday use.
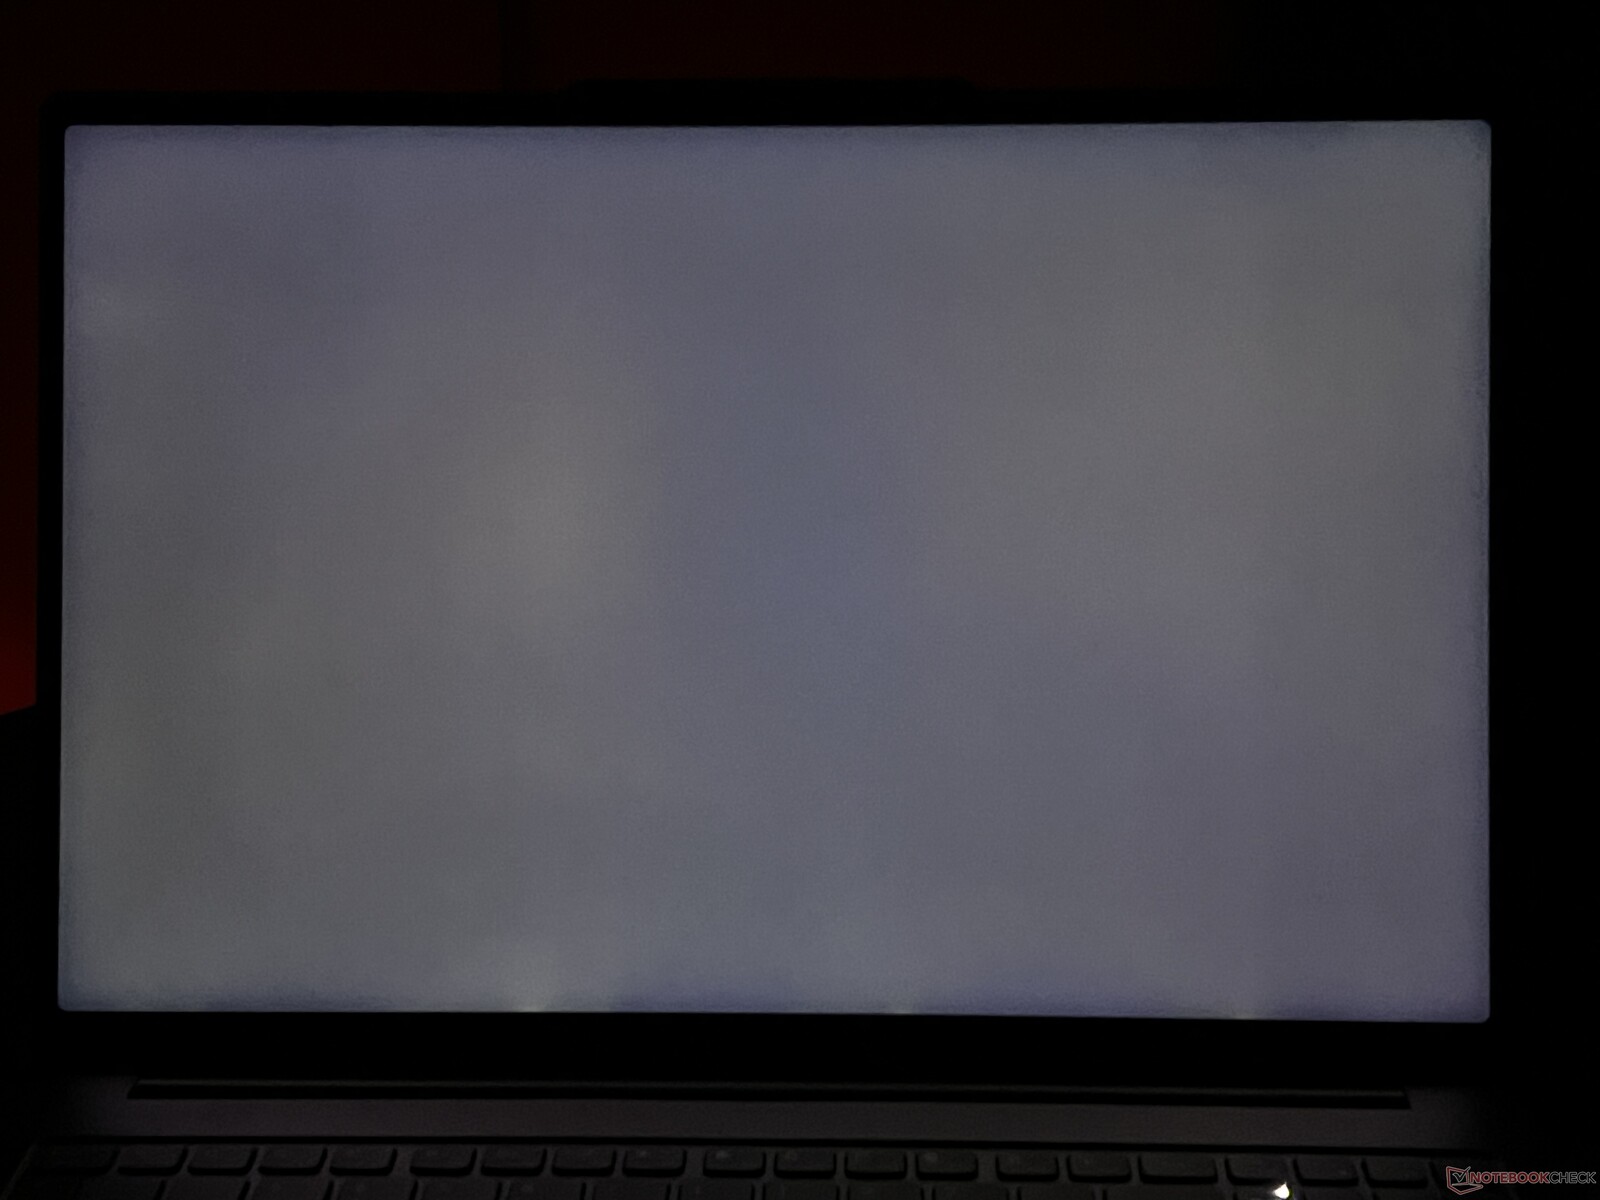
The mini LED panel behaves differently than you might expect. In SDR mode, the panel functions like a regular IPS screen and black is not completely black here. The average brightness is a very good 670 cd/m² and the black level is low at 0.22 cd/m², which results in a maximum contrast ratio of just under 3000:1.
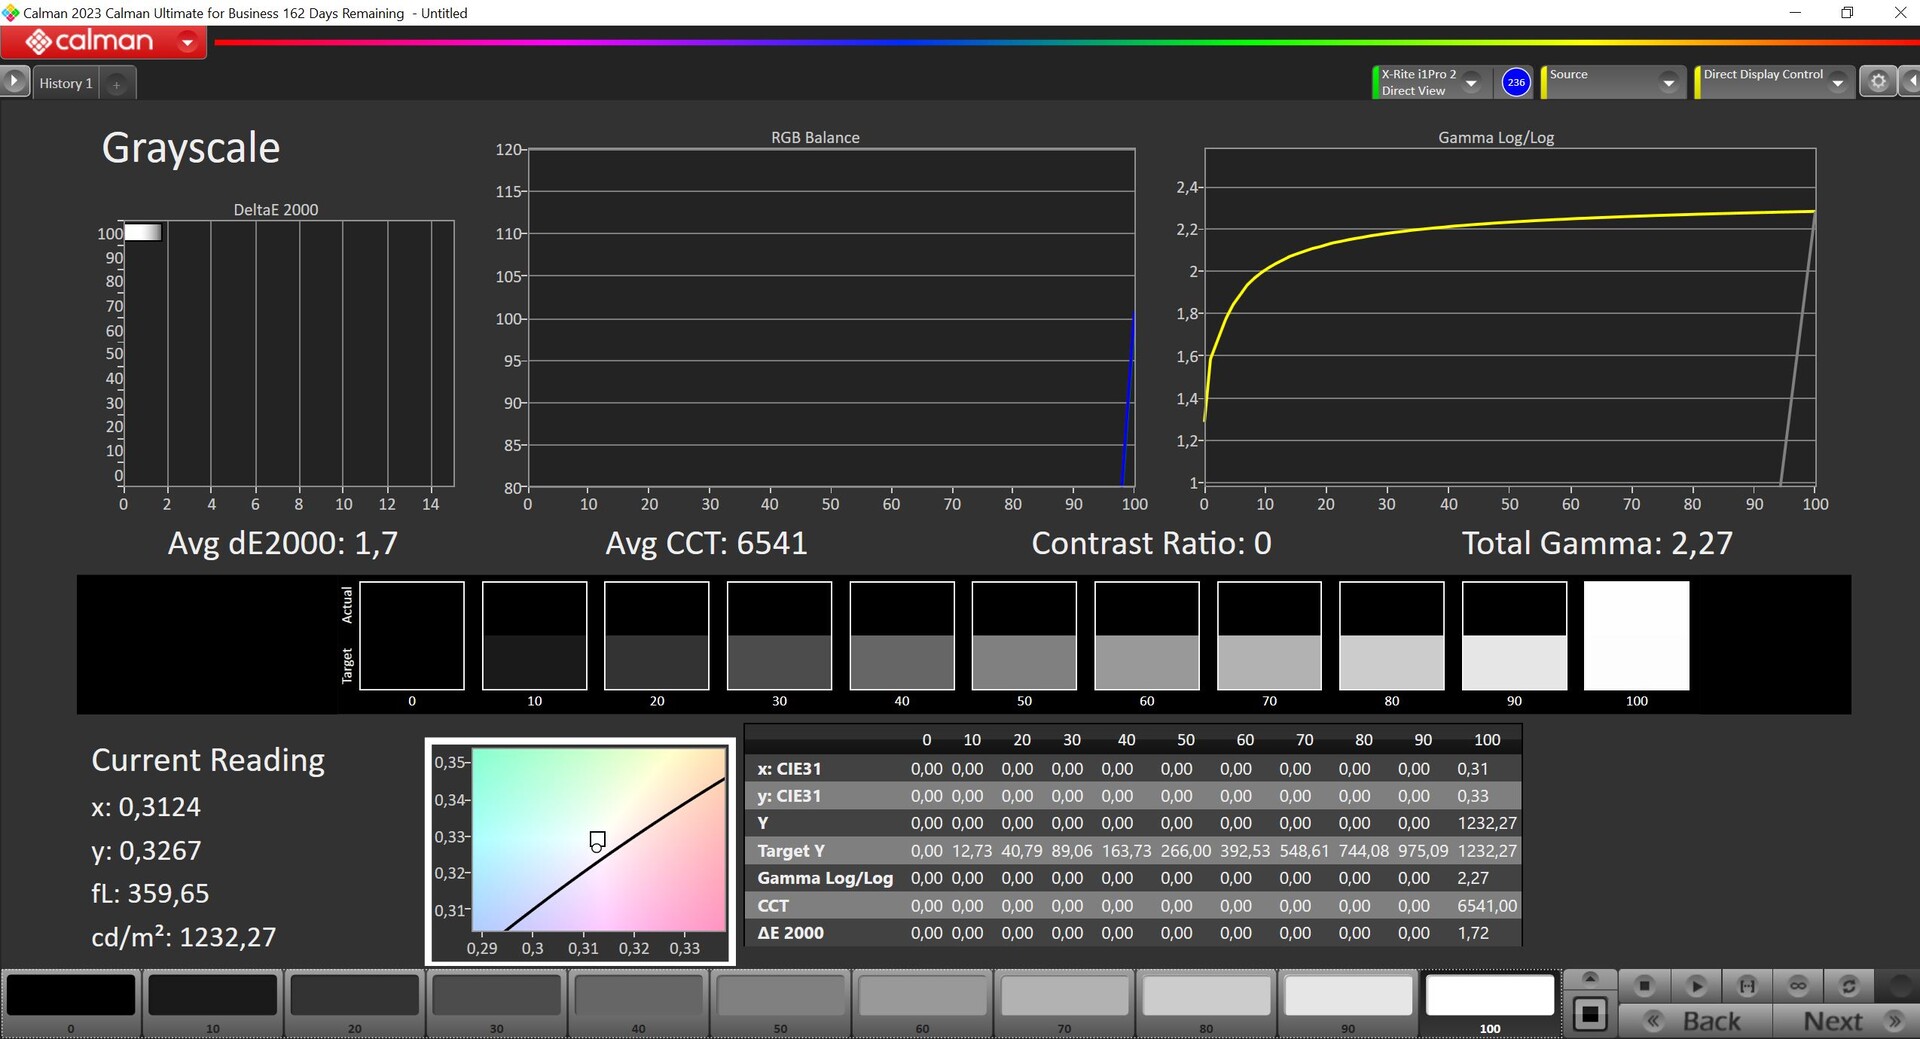
Only when HDR mode is activated does the panel switch to local dimming and black is now really black, although there are also visible halo effects with bright objects on dark backgrounds. The maximum HDR brightness is 1230 cd/m², both on small image sections and on an almost completely white image. This is exemplary, but Windows' HDR implementation is still problematic: HDR mode has to be manually activated and it is not suitable for continuous operation, as normal SDR content (such as the Windows desktop) then appears significantly paler than in SDR mode.
| |||||||||||||||||||||||||
Brightness Distribution: 93 %
Center on Battery: 651 cd/m²
Contrast: 2959:1 (Black: 0.22 cd/m²)
ΔE ColorChecker Calman: 1.9 | ∀{0.5-29.43 Ø4.71}
calibrated: 0.6
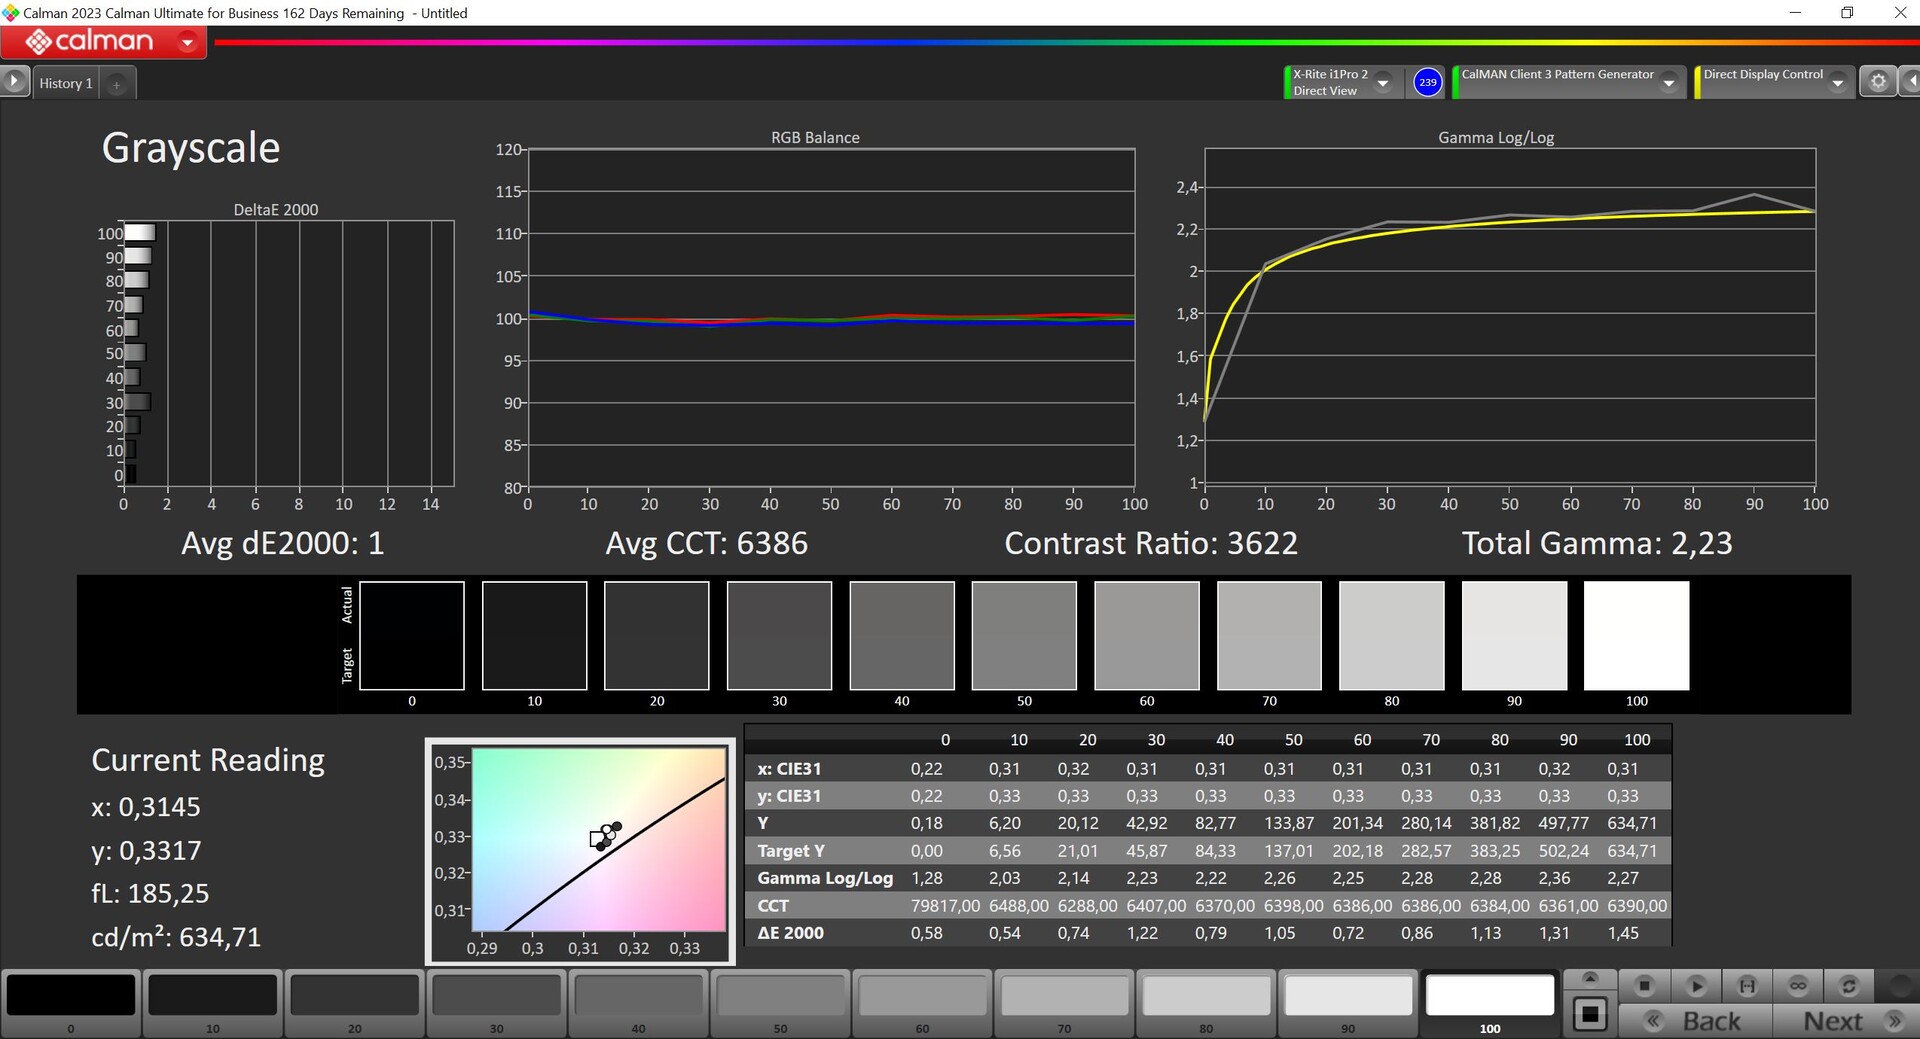
ΔE Greyscale Calman: 3 | ∀{0.09-98 Ø4.96}
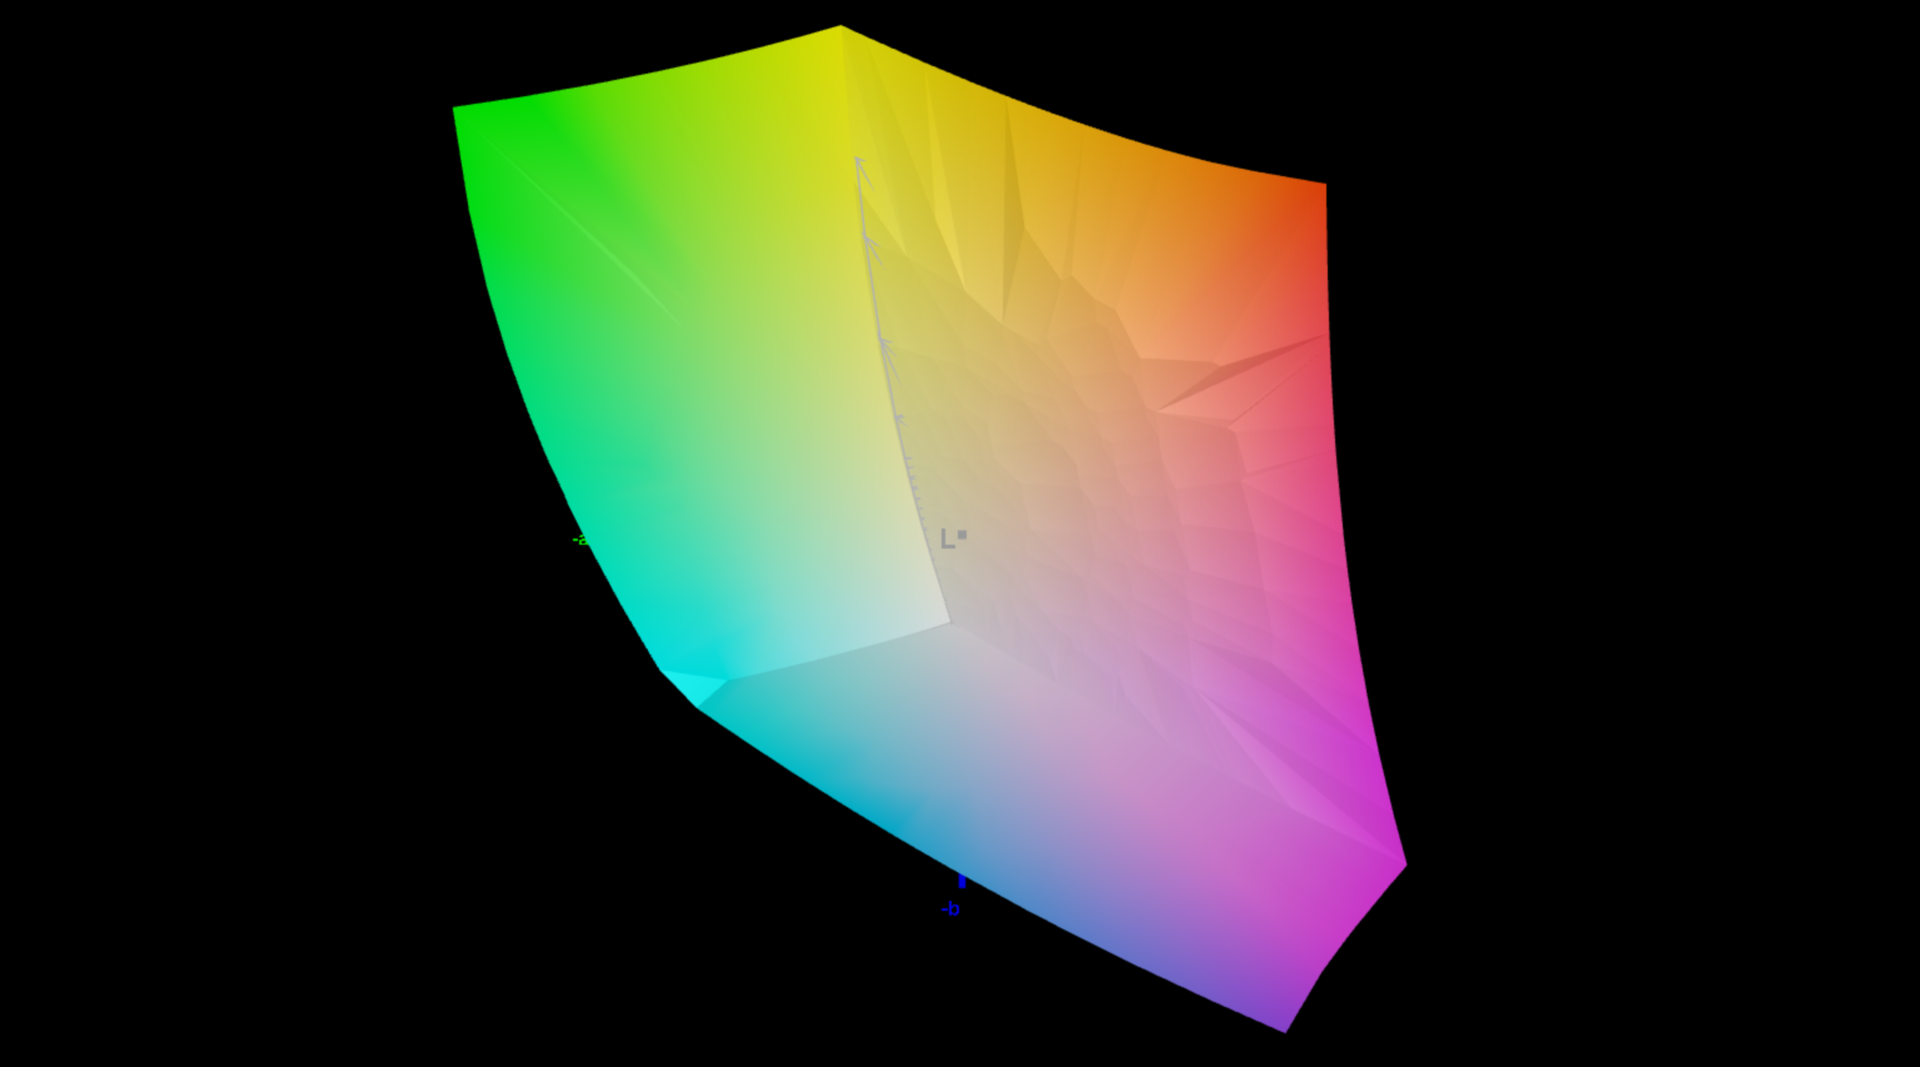
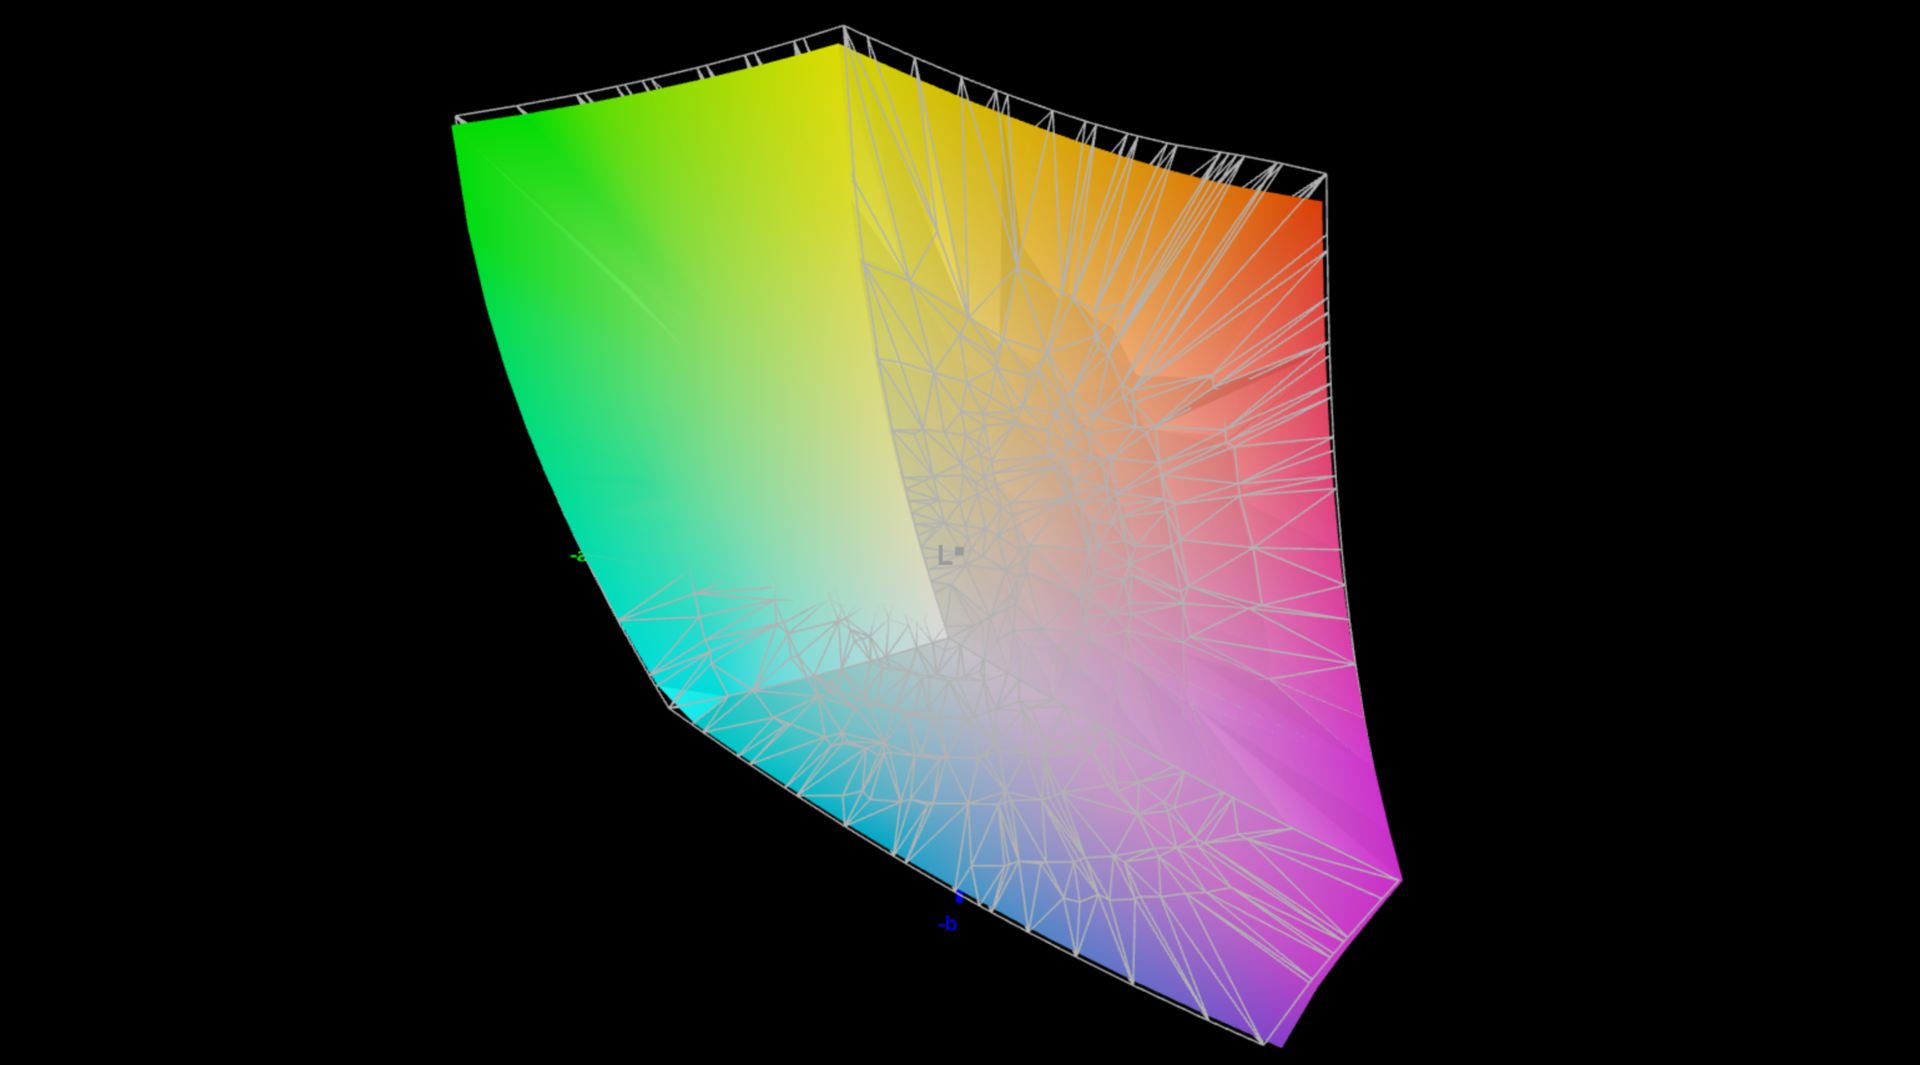
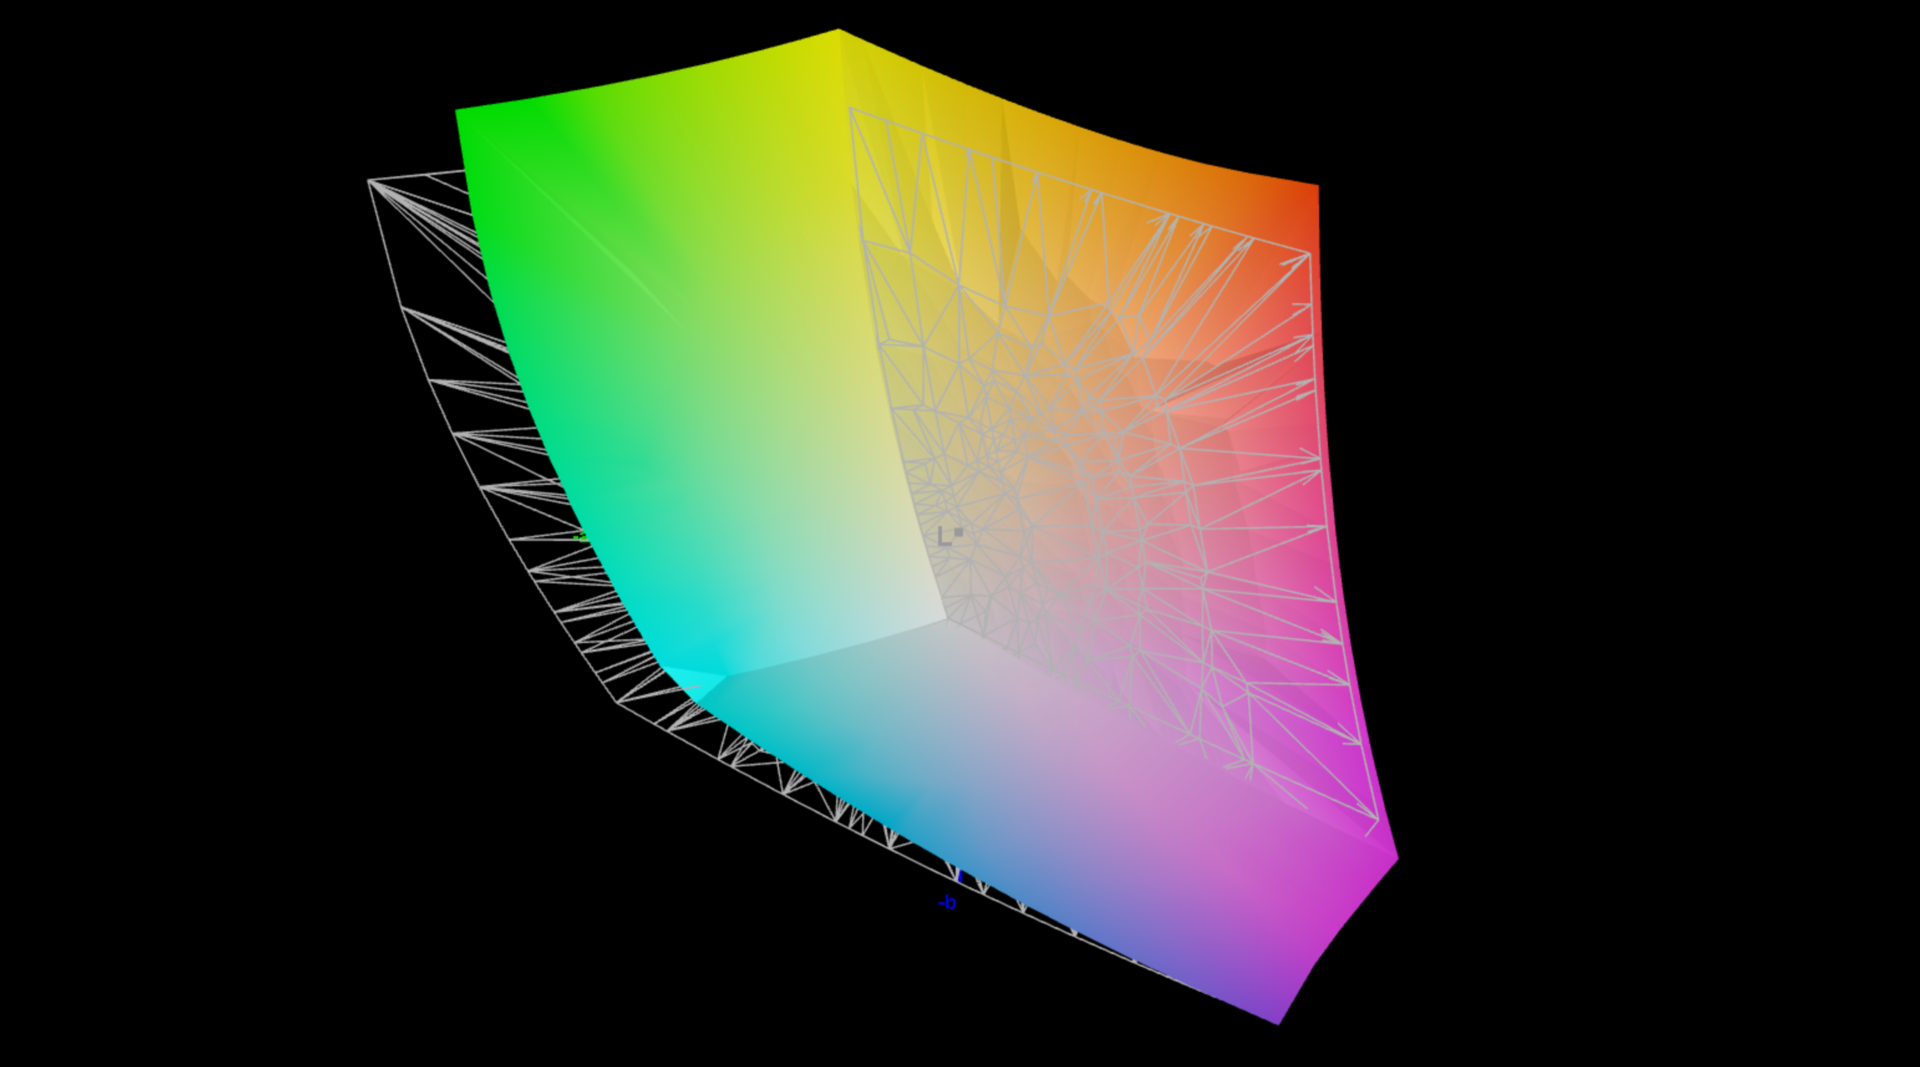
86.6% AdobeRGB 1998 (Argyll 3D)
99.9% sRGB (Argyll 3D)
97% Display P3 (Argyll 3D)
Gamma: 2.18
CCT: 6738 K
| Lenovo Yoga Pro 9 16IMH9 LEN160-3.2K, Mini-LED, 3200x2000, 16" | Dell XPS 16 9640 SDC4196, OLED, 3840x2400, 16.3" | Honor MagicBook Pro 16 2024 TL160MDMP01, IPS, 3072x1920, 16" | Samsung Galaxy Book4 Ultra ATNA60CL07-0, OLED, 2880x1800, 16" | Framework Laptop 16 2560x1600, 16" | Schenker VISION 16 Pro (M23) NE160QDM-NZ1, IPS, 2560x1600, 16" | Lenovo Yoga Pro 9 16-IRP G8 LEN160-3.2K, Mini-LED, 3200x2000, 16" | |
|---|---|---|---|---|---|---|---|
| Display | 1% | 2% | 1% | 0% | -16% | 3% | |
| Display P3 Coverage (%) | 97 | 98.3 1% | 98.8 2% | 98.6 2% | 97.7 1% | 68.8 -29% | 97 0% |
| sRGB Coverage (%) | 99.9 | 100 0% | 100 0% | 99.9 0% | 99.7 0% | 98.8 -1% | 99.8 0% |
| AdobeRGB 1998 Coverage (%) | 86.6 | 87.8 1% | 89.1 3% | 88.5 2% | 87 0% | 70 -19% | 95.1 10% |
| Response Times | 96% | 70% | 97% | 34% | 45% | 42% | |
| Response Time Grey 50% / Grey 80% * (ms) | 22.2 ? | 0.82 ? 96% | 6.3 ? 72% | 0.54 ? 98% | 14.6 ? 34% | 13.7 ? 38% | 14 ? 37% |
| Response Time Black / White * (ms) | 17 ? | 0.85 ? 95% | 5.6 ? 67% | 0.69 ? 96% | 11.3 ? 34% | 8.1 ? 52% | 9.2 ? 46% |
| PWM Frequency (Hz) | 4840 ? | 360 ? | 240 ? | 5800 ? | |||
| Screen | -11% | -30% | 3% | -23% | -57% | 11% | |
| Brightness middle (cd/m²) | 651 | 366 -44% | 551 -15% | 390 -40% | 504.8 -22% | 384 -41% | 539 -17% |
| Brightness (cd/m²) | 673 | 367 -45% | 524 -22% | 393 -42% | 490 -27% | 371 -45% | 546 -19% |
| Brightness Distribution (%) | 93 | 96 3% | 91 -2% | 98 5% | 84 -10% | 88 -5% | 96 3% |
| Black Level * (cd/m²) | 0.22 | 0.52 -136% | 0.41 -86% | 0.3 -36% | 0.18 18% | ||
| Contrast (:1) | 2959 | 1060 -64% | 1231 -58% | 1280 -57% | 2994 1% | ||
| Colorchecker dE 2000 * | 1.9 | 1.3 32% | 1.7 11% | 1.4 26% | 1.23 35% | 3.4 -79% | 1.4 26% |
| Colorchecker dE 2000 max. * | 4.2 | 3.6 14% | 4.1 2% | 2.7 36% | 3.74 11% | 9.2 -119% | 2.1 50% |
| Colorchecker dE 2000 calibrated * | 0.6 | 1 -67% | 1 -67% | 1.1 -83% | 1.3 -117% | ||
| Greyscale dE 2000 * | 3 | 2.2 27% | 2.4 20% | 2.1 30% | 2 33% | 3.4 -13% | 2.2 27% |
| Gamma | 2.18 101% | 2.14 103% | 2.2 100% | 2.27 97% | 2.22 99% | 2.16 102% | 2.19 100% |
| CCT | 6738 96% | 6680 97% | 6842 95% | 6431 101% | 6670 97% | 7462 87% | 6479 100% |
| Total Average (Program / Settings) | 29% /
9% | 14% /
-9% | 34% /
19% | 4% /
-10% | -9% /
-34% | 19% /
14% |
* ... smaller is better
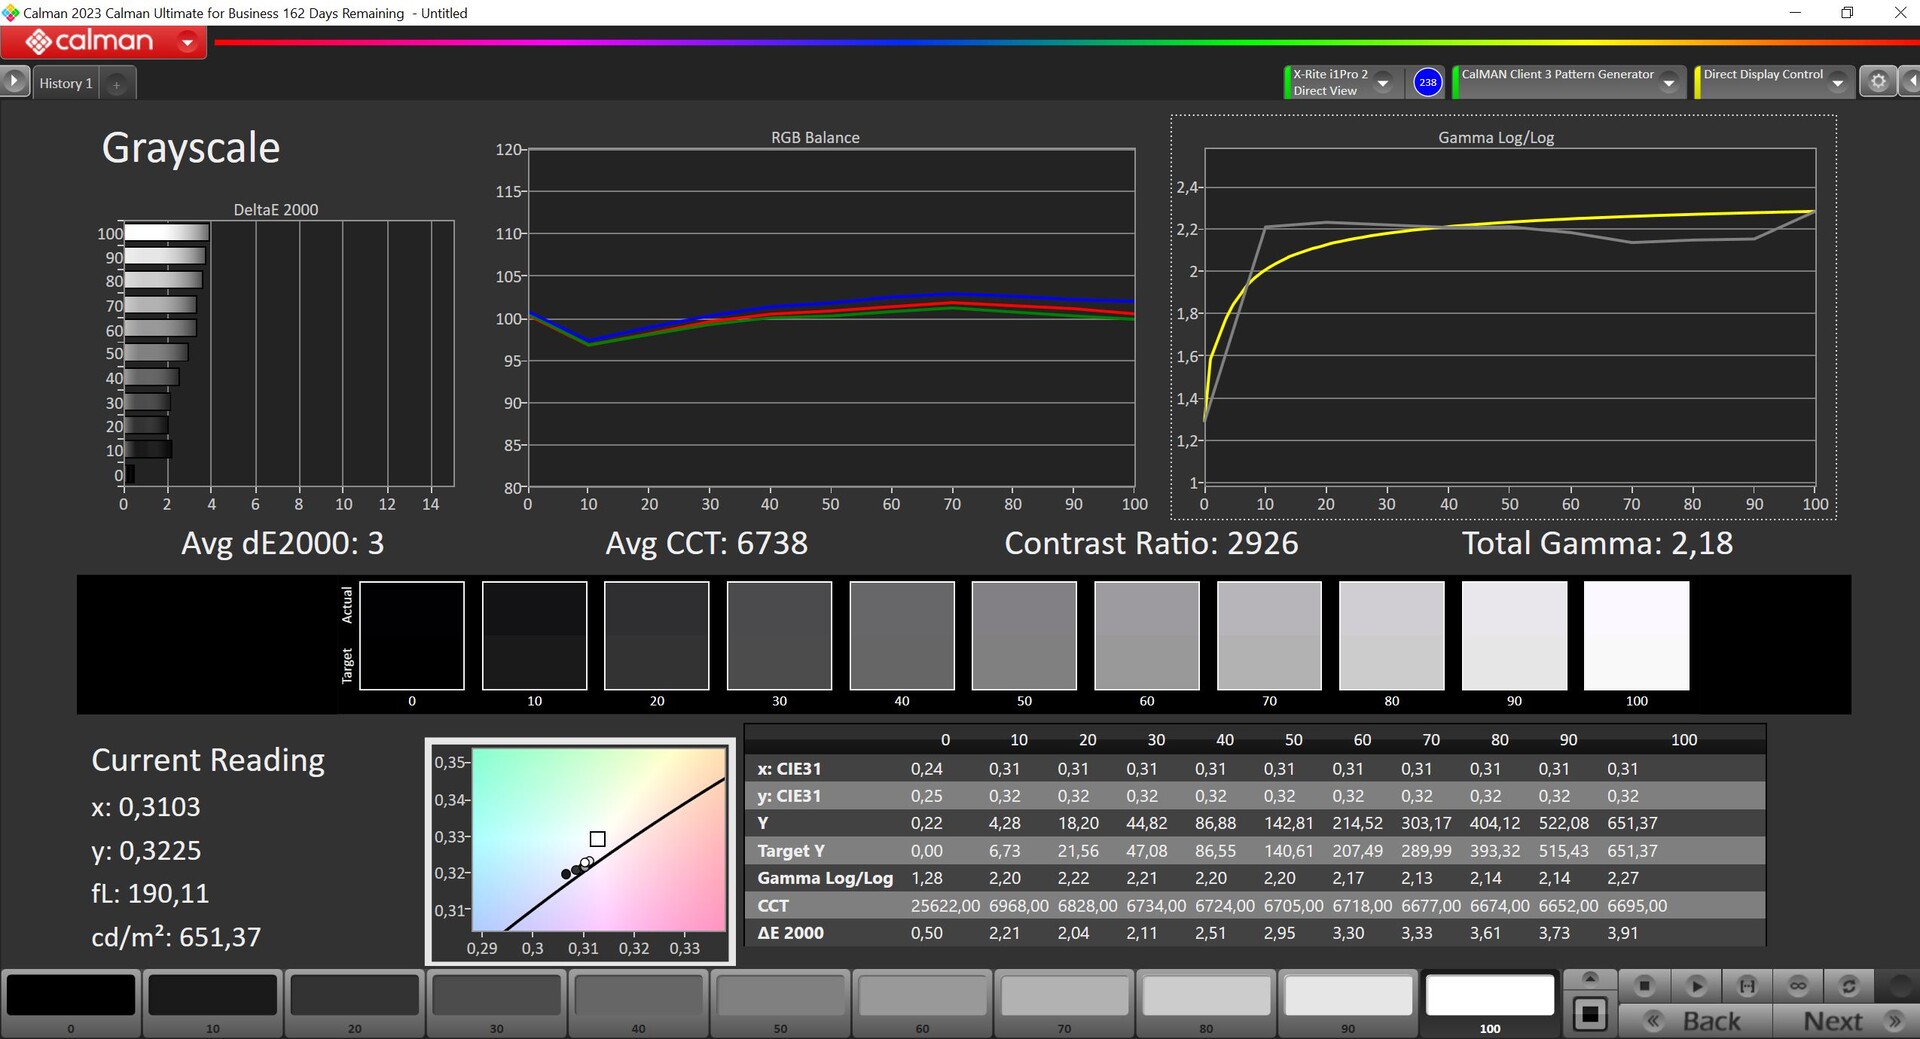
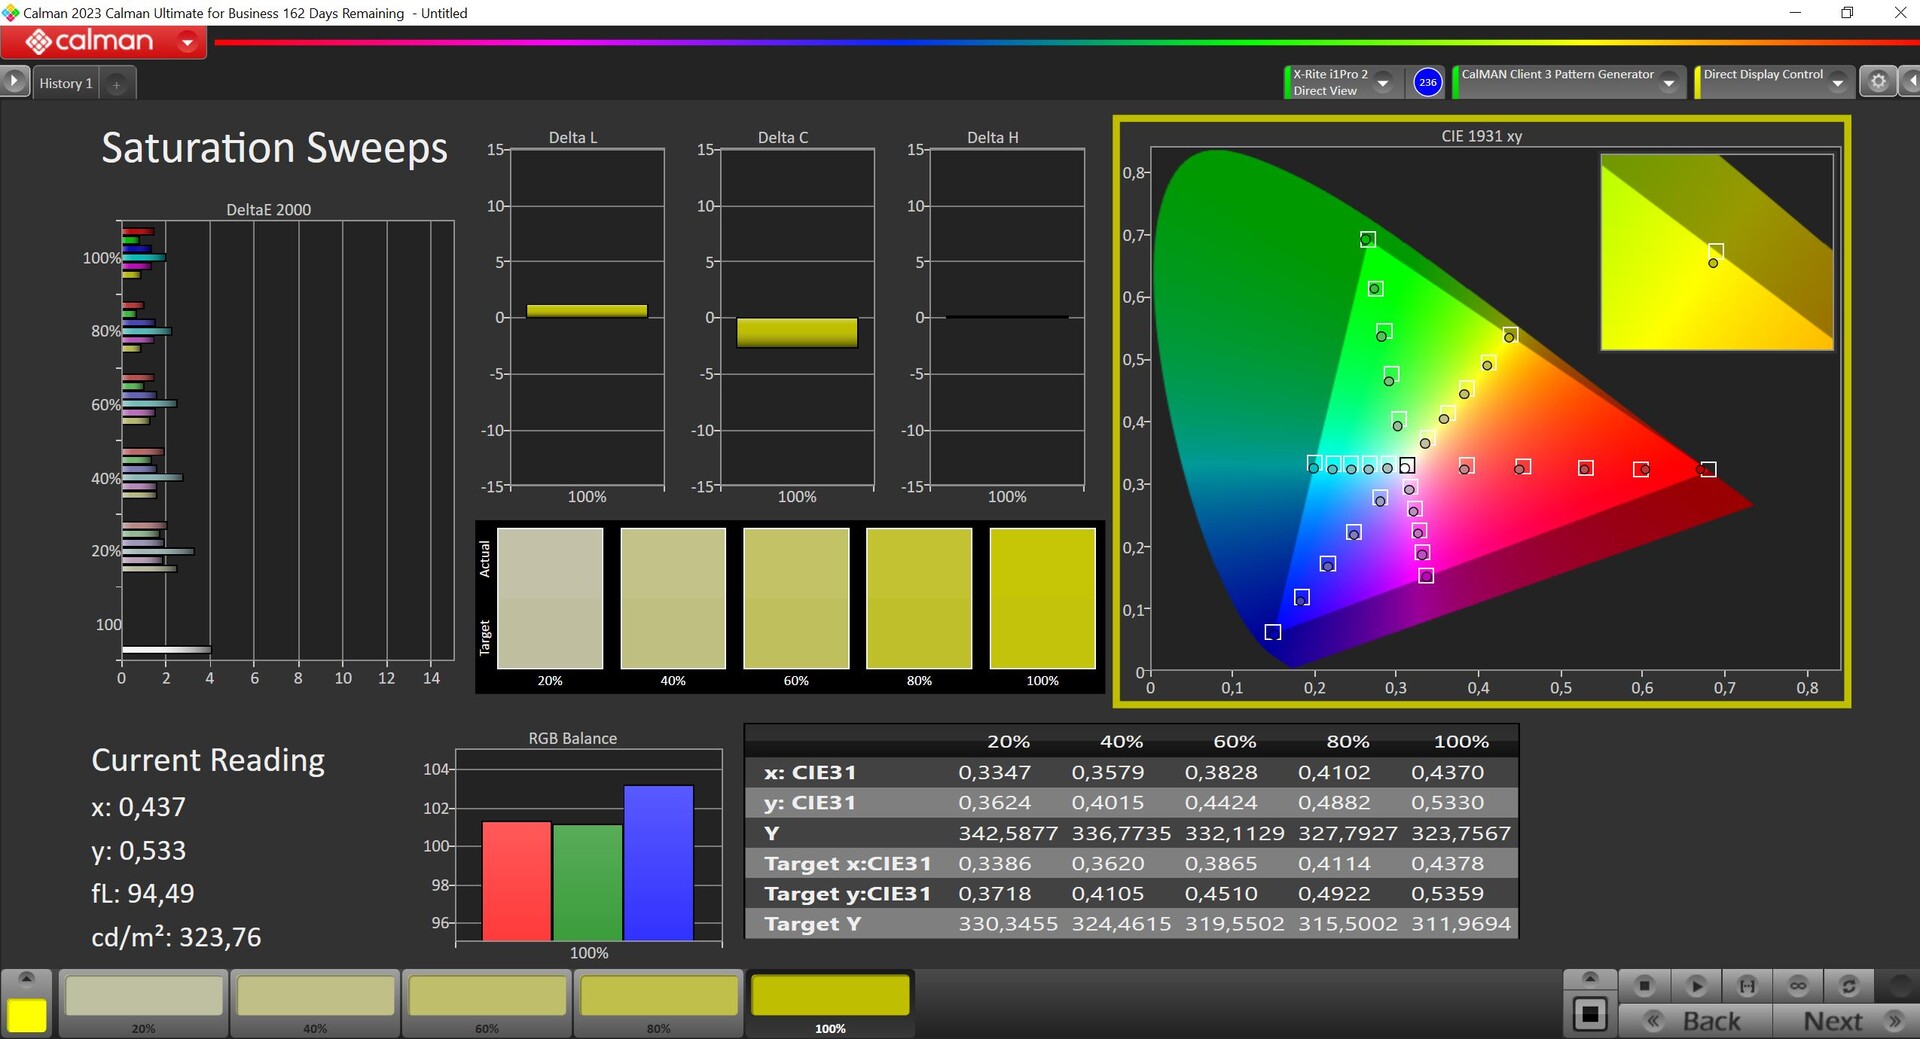
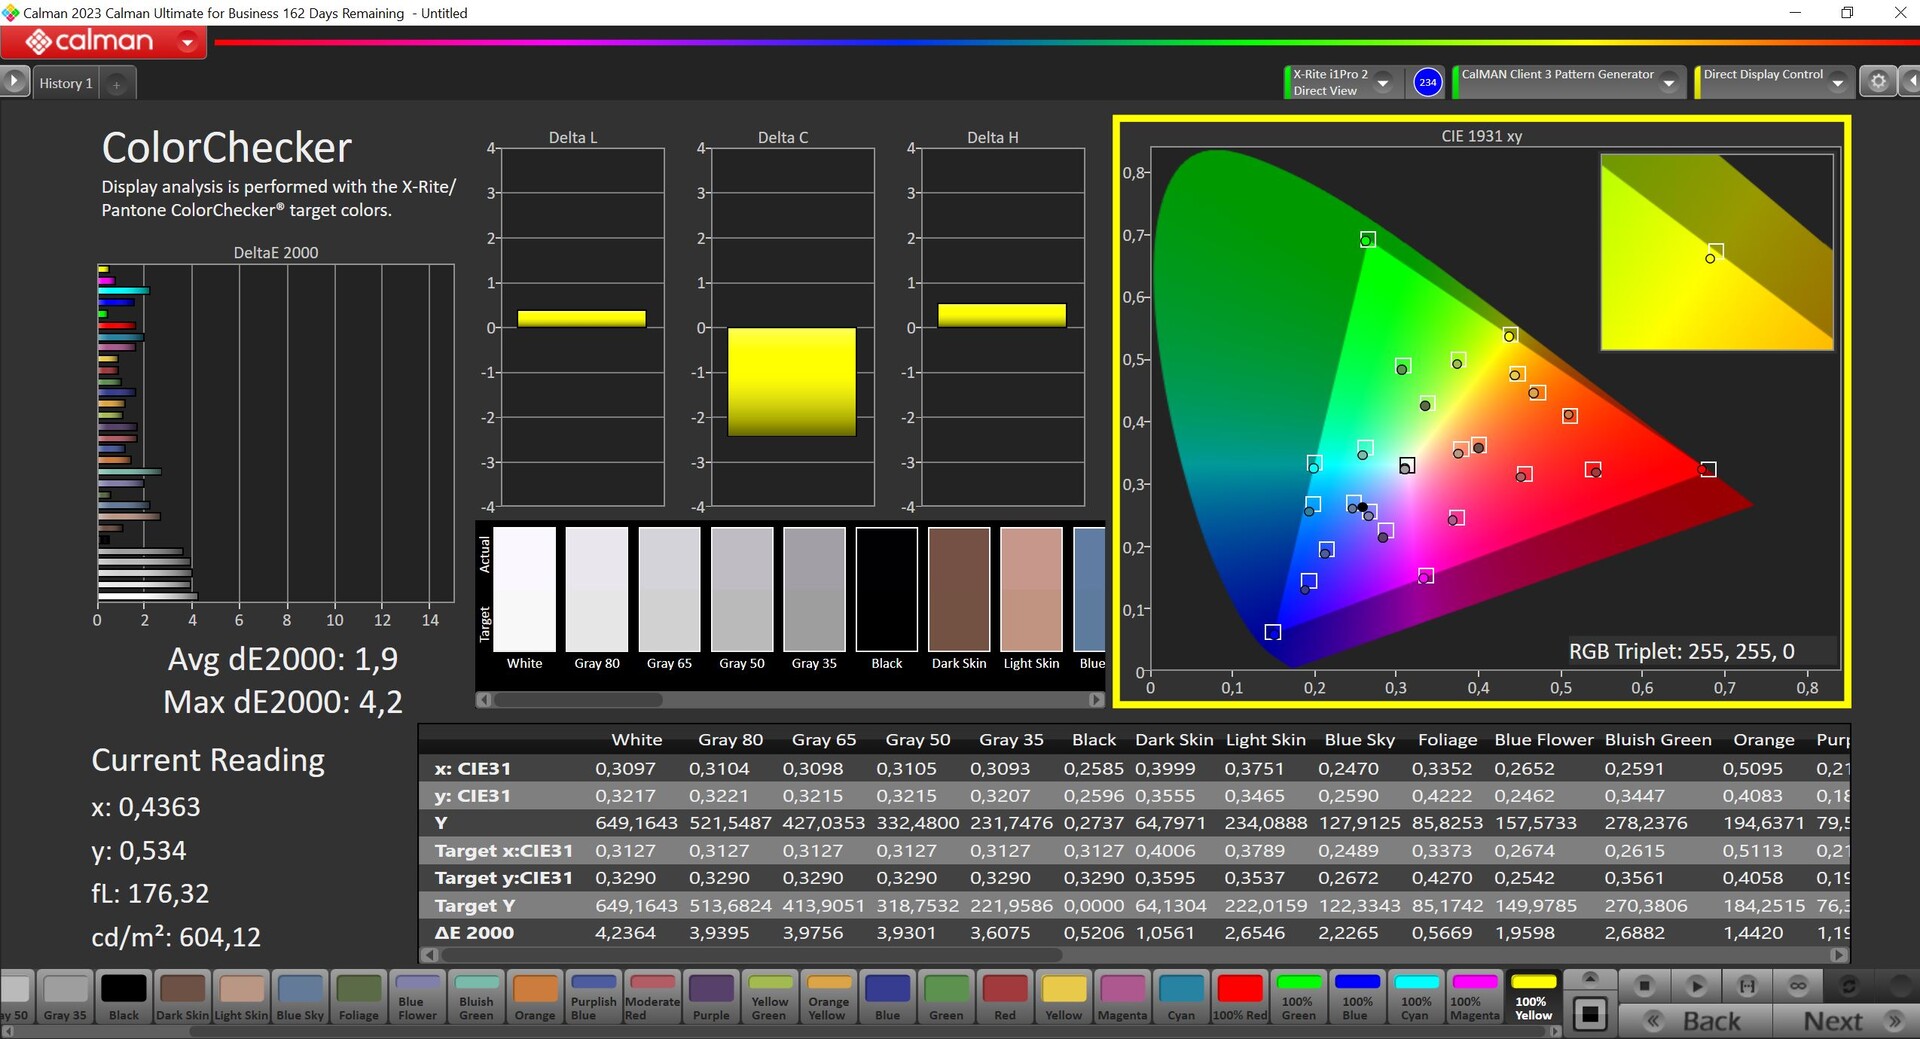
We analyzed the panel using professional CalMAN software (X-Rite i1 Pro 2) and we were surprised that the Lenovo Vantage software no longer provides color profiles for the different color spaces. Lenovo still advertises AdobeRGB, but the only profile available is the P3 color space. The reason for this restriction is unclear, but it is definitely annoying. The display is already quite decent out of the box, but we were able to significantly improve picture quality with our own calibration (profile available for free download above).


Display Response Times
| ↔ Response Time Black to White | ||
|---|---|---|
| 17 ms ... rise ↗ and fall ↘ combined | ↗ 8.2 ms rise | 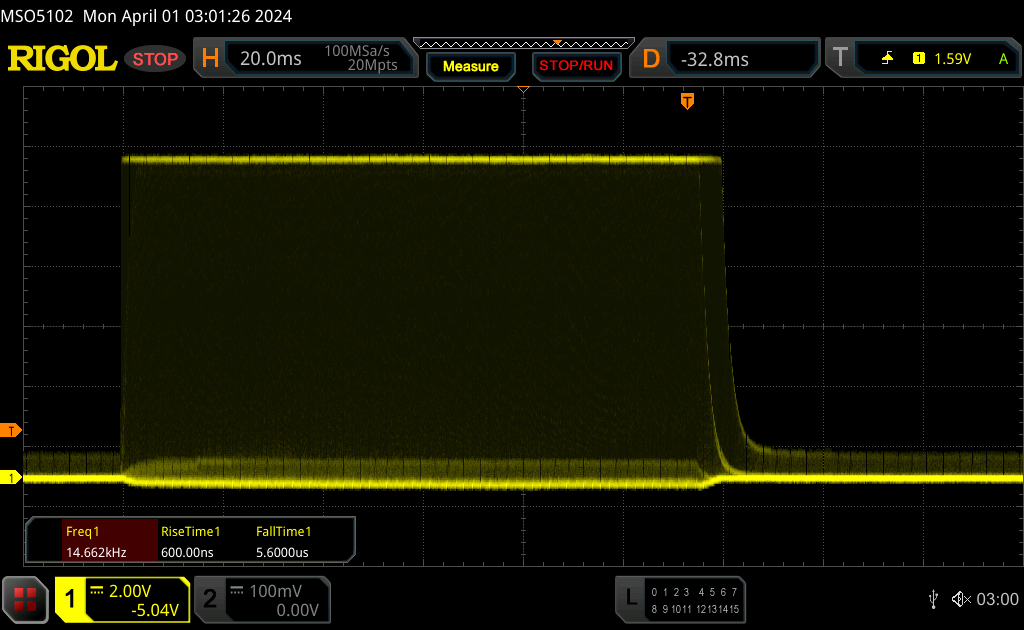 |
| ↘ 8.8 ms fall | ||
| The screen shows good response rates in our tests, but may be too slow for competitive gamers. In comparison, all tested devices range from 0.1 (minimum) to 240 (maximum) ms. » 39 % of all devices are better. This means that the measured response time is better than the average of all tested devices (19.8 ms). | ||
| ↔ Response Time 50% Grey to 80% Grey | ||
| 22.2 ms ... rise ↗ and fall ↘ combined | ↗ 9.6 ms rise | 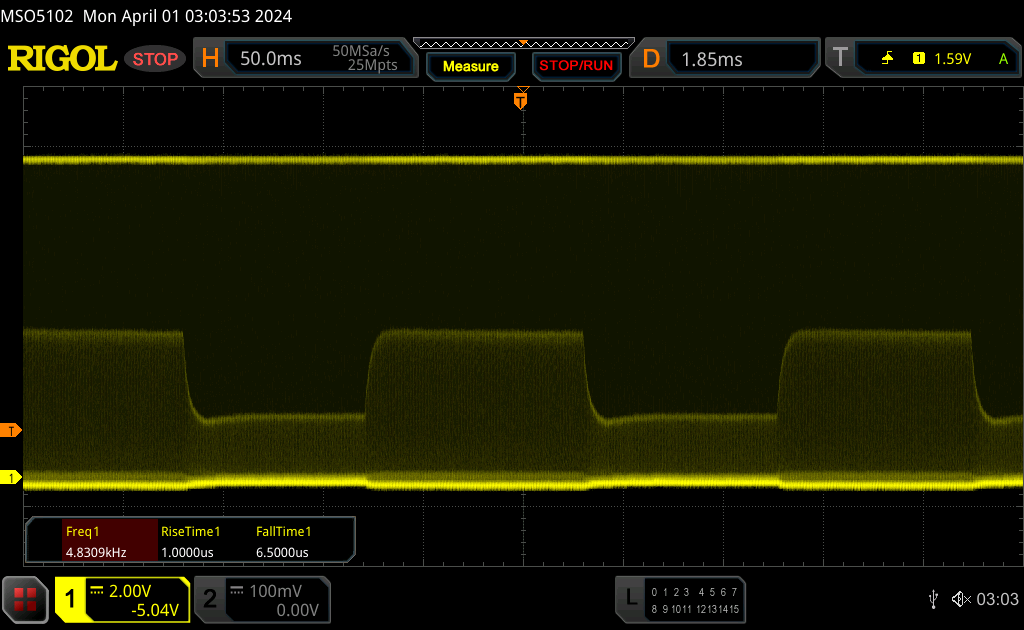 |
| ↘ 12.6 ms fall | ||
| The screen shows good response rates in our tests, but may be too slow for competitive gamers. In comparison, all tested devices range from 0.165 (minimum) to 636 (maximum) ms. » 34 % of all devices are better. This means that the measured response time is better than the average of all tested devices (31 ms). | ||
Screen Flickering / PWM (Pulse-Width Modulation)
| Screen flickering / PWM detected | 4840 Hz | ≤ 100 % brightness setting | 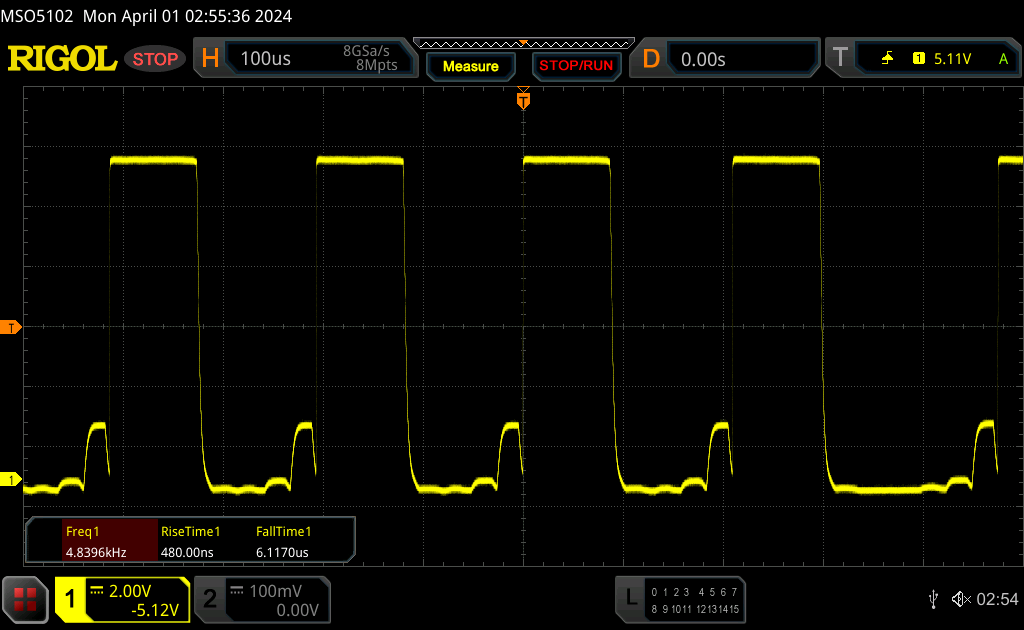 |
The display backlight flickers at 4840 Hz (worst case, e.g., utilizing PWM) Flickering detected at a brightness setting of 100 % and below. There should be no flickering or PWM above this brightness setting. The frequency of 4840 Hz is quite high, so most users sensitive to PWM should not notice any flickering. In comparison: 52 % of all tested devices do not use PWM to dim the display. If PWM was detected, an average of 7754 (minimum: 5 - maximum: 343500) Hz was measured. | |||
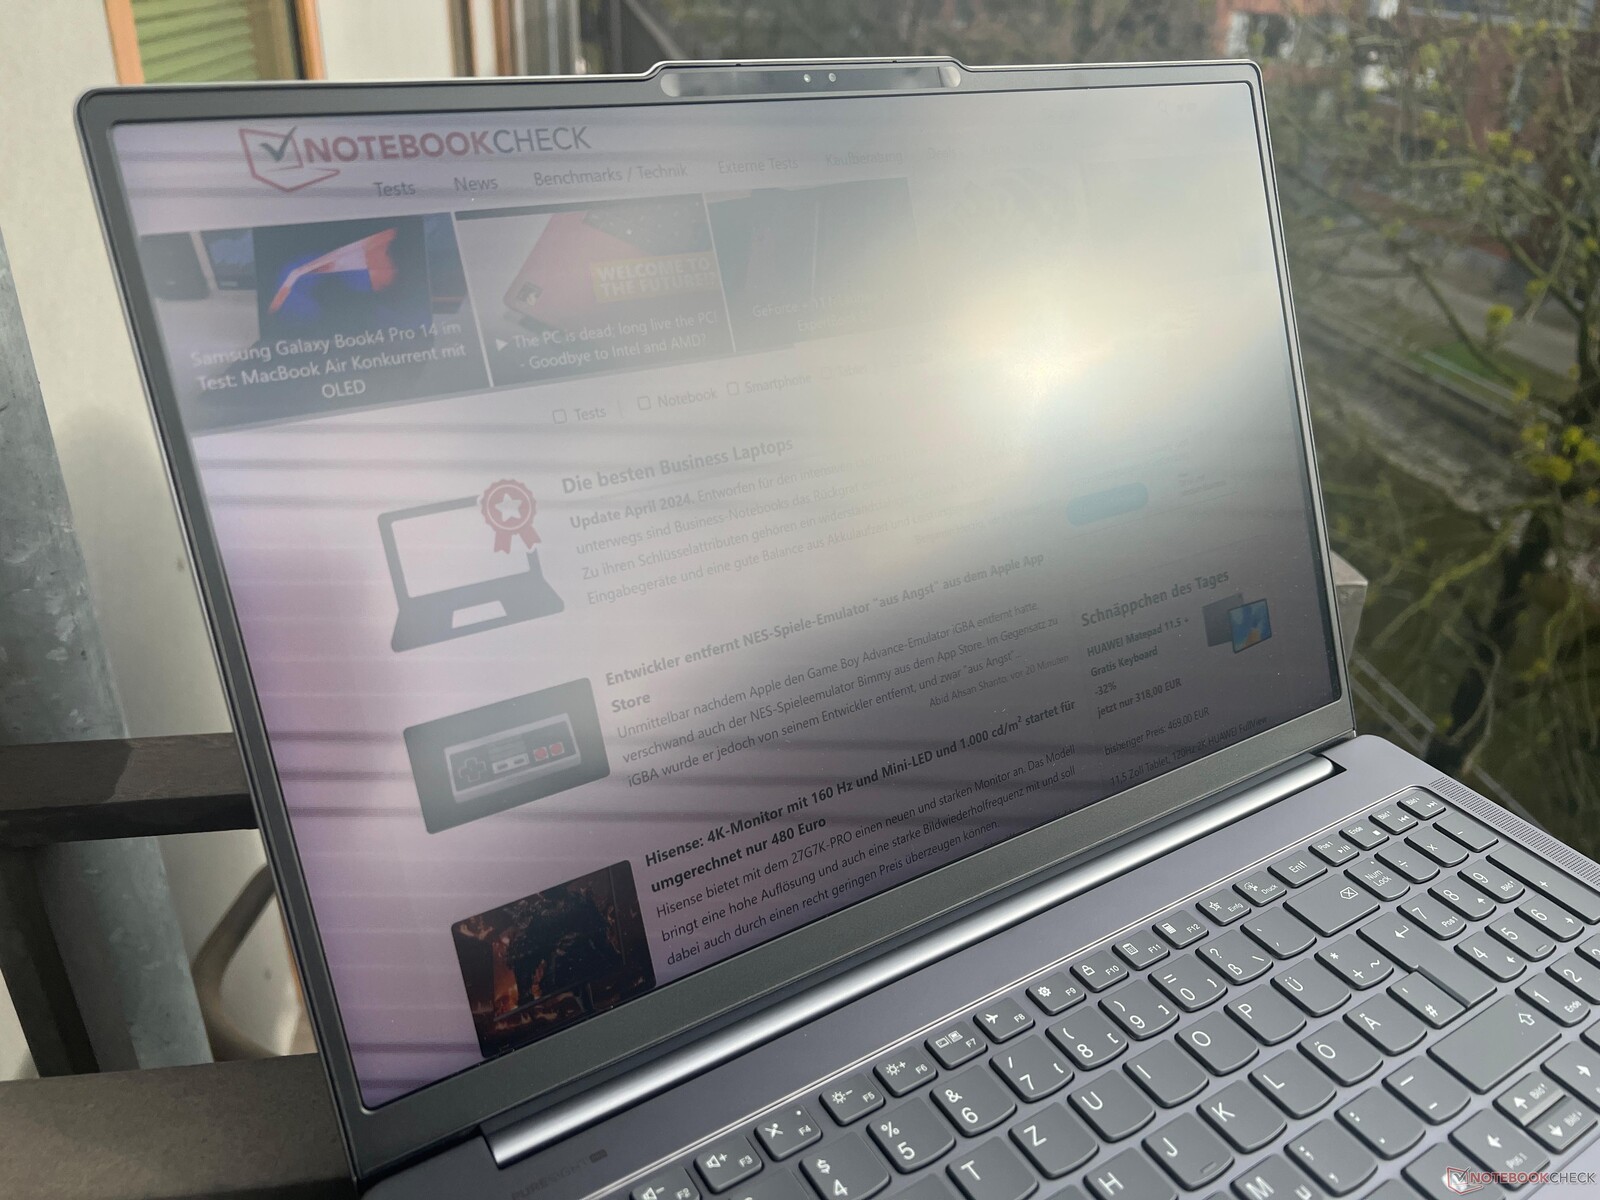
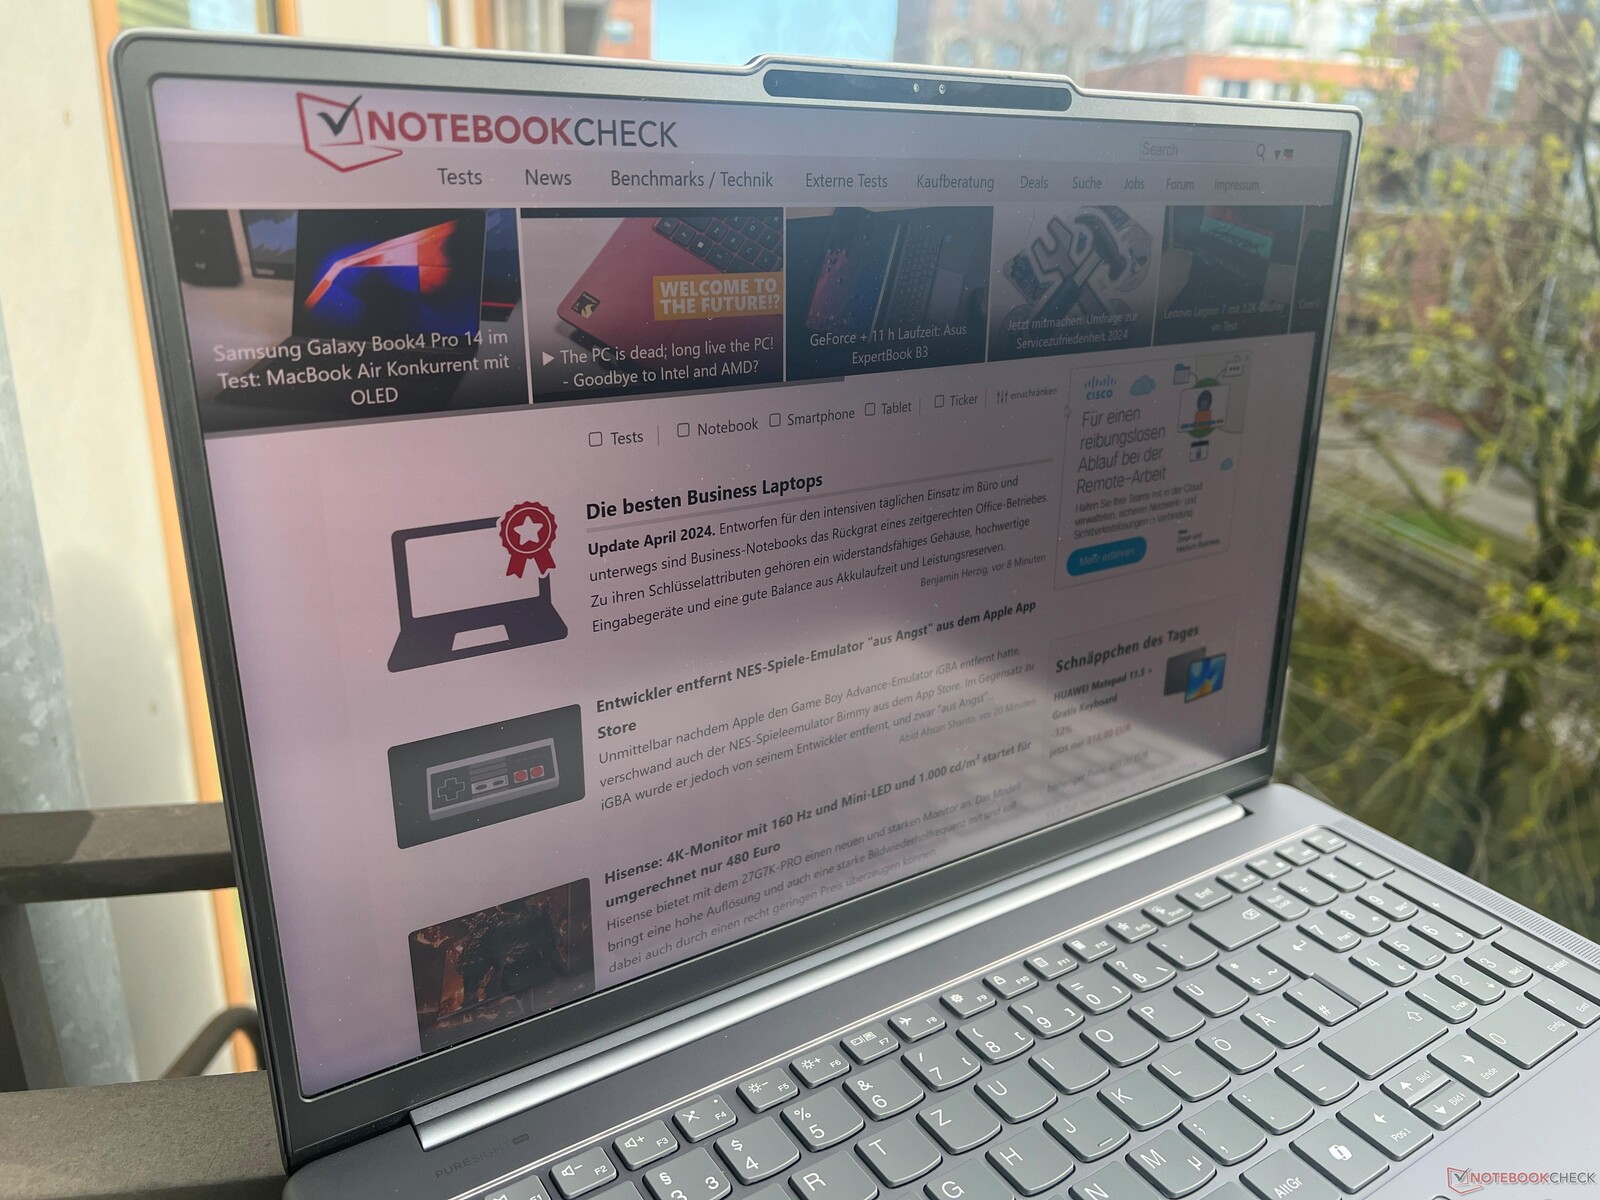
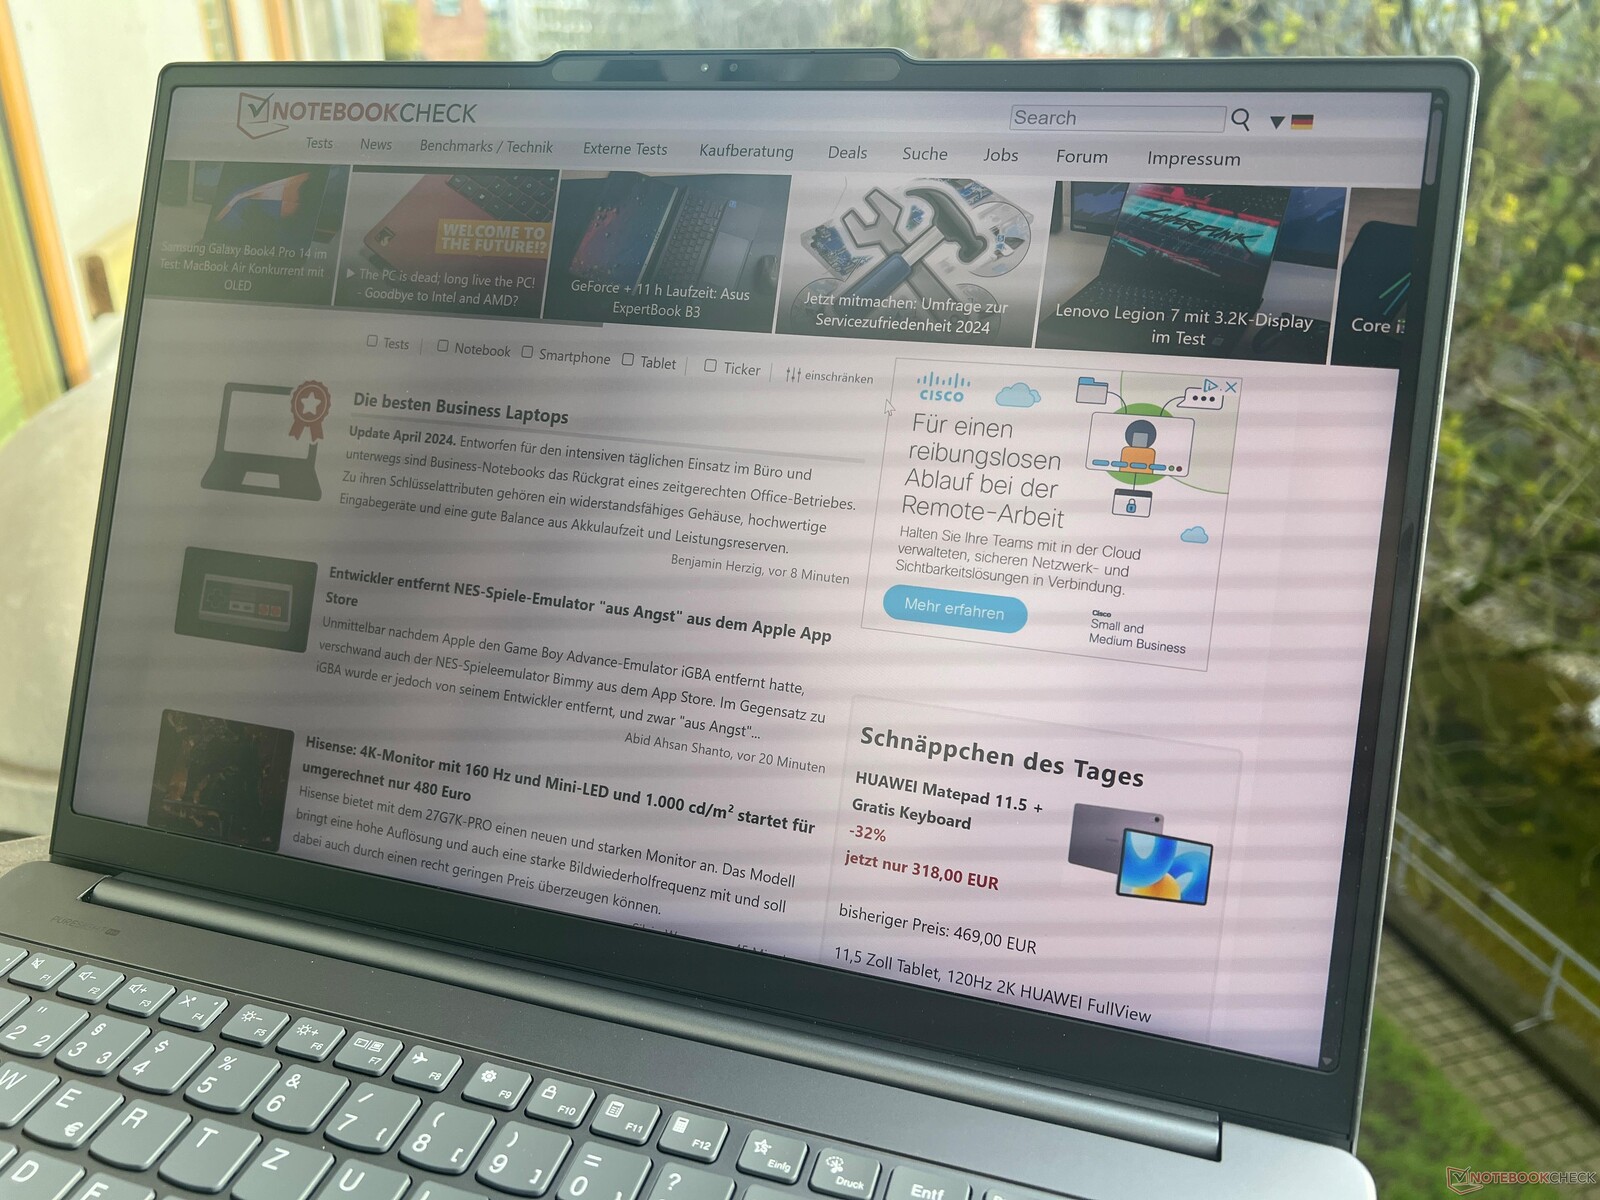
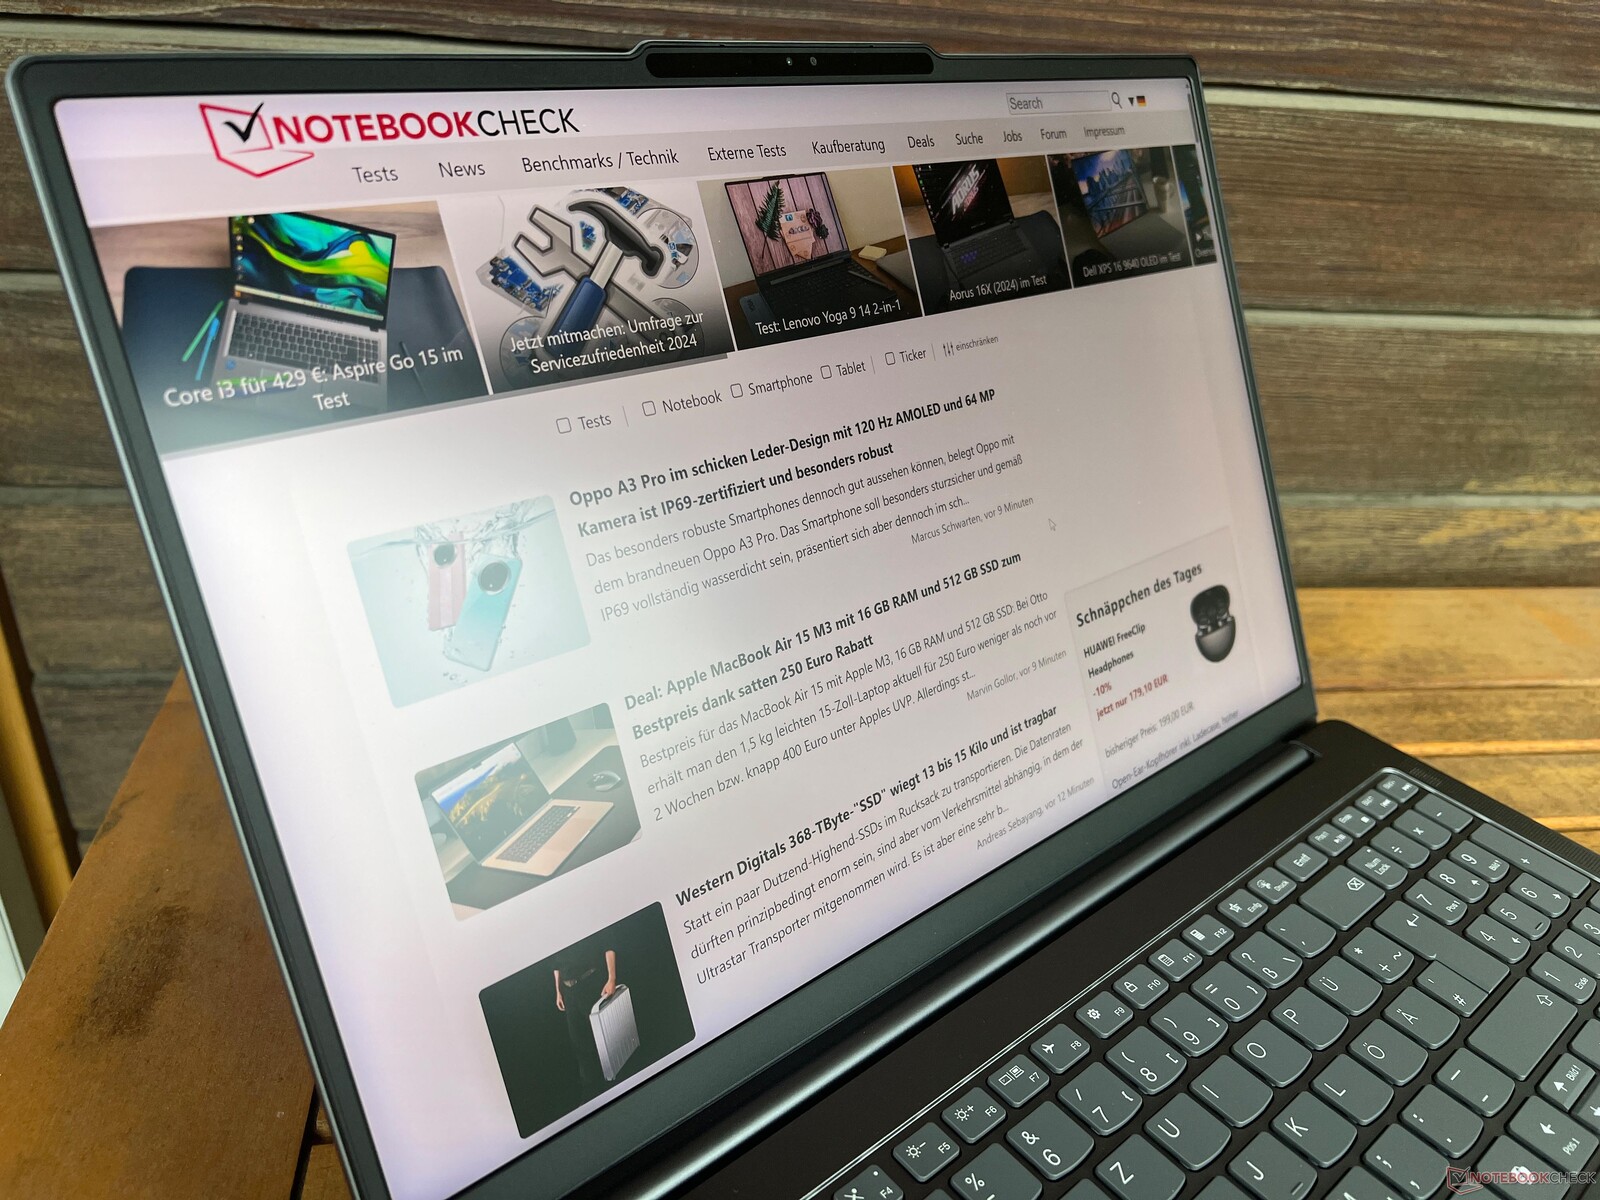

The matte version of the mini LED panel naturally performs better outdoors than the reflective touchscreen. If you avoid reflections from direct light sources, the device can also be used in very bright environments without issue. The viewing angle stability also gives no cause for criticism.

Performance - RTX 4070 Laptop with Advanced Optimus
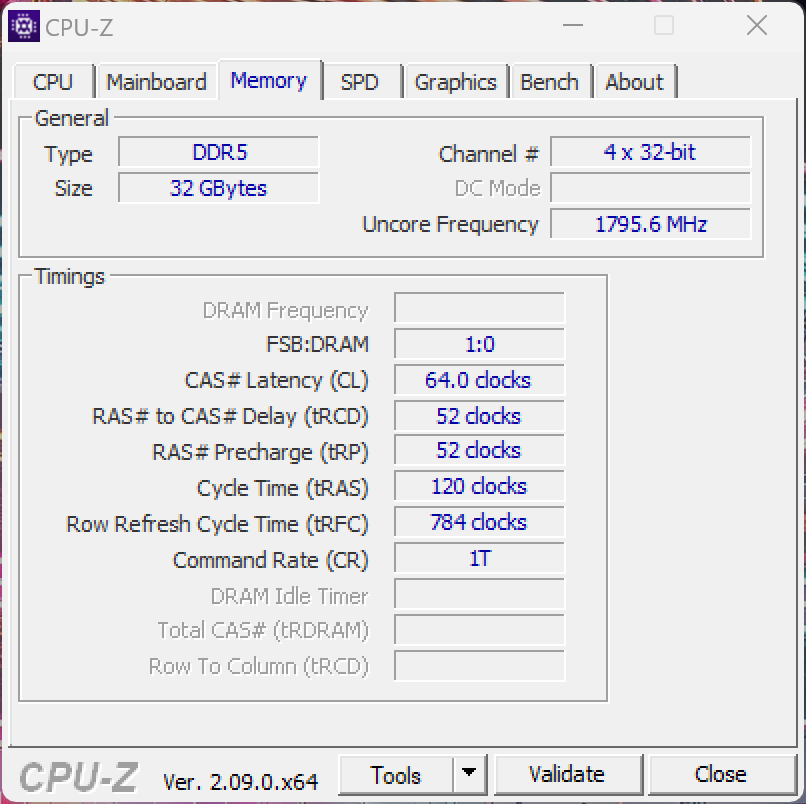
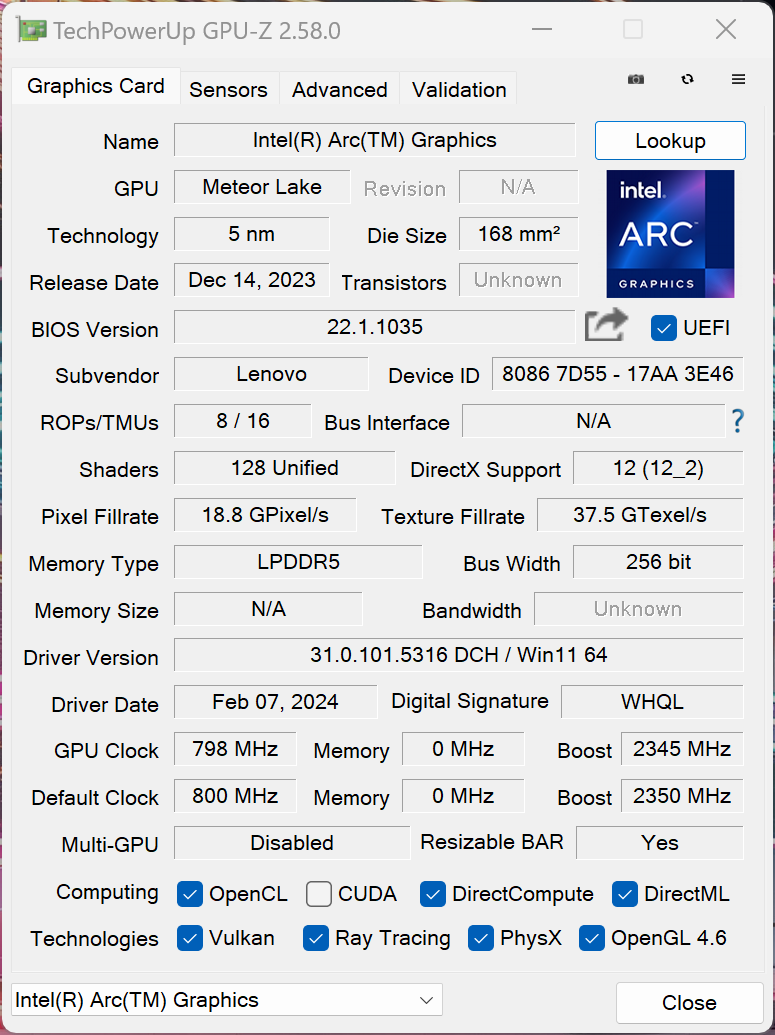
Lenovo offers the Yoga Pro 9i 16 G9 exclusively with the new Meteor Lake processors from Intel (Core Ultra 7 or 9) and the two GeForce RTX 4060/4070 Laptop models. 32 GB of RAM (LPDDR5x-7467) comes as standard, but the amount of RAM can be doubled to 64 GB for EUR 130 (around $140) when choosing the Core Ultra 9 185H.
Testing conditions
Lenovo offers various energy profiles and we have summarized the corresponding TDP/TGP values in the following table. We carried out the benchmarks and measurements in Performance mode.
| Energy profile | CPU load | CB R23 Multi | GPU load | Time Spy Graphics | Cyberpunk 2077 QHD Ultra |
Max. fan volume |
|---|---|---|---|---|---|---|
| Battery | 40 -> 30 watts | 12,824 points | 22 watts | 2,655 points | 10.3 FPS | 30.9 dB(A) |
| Auto | 78 -> 65 watts | 18,849 points | 65 watts | 10,032 points | 38.6 FPS | 44.9 dB(A) |
| Performance | 115 -> 80 watts | 19,851 points | 100 watts | 12,181 points | 47.8 FPS | 53.9 dB(A) |
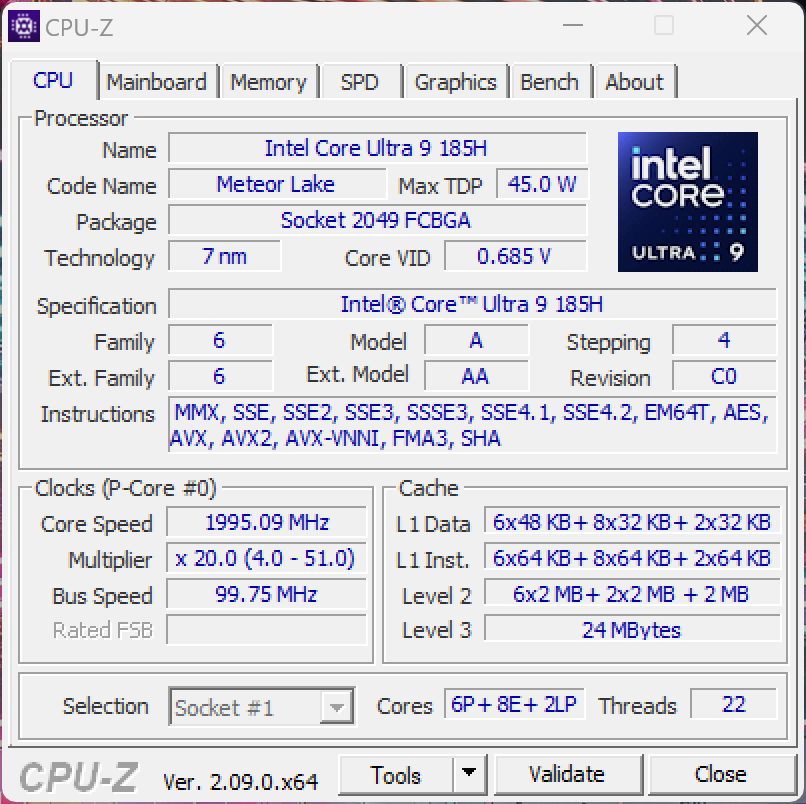
Processor - Core Ultra 9 185H
The Core Ultra 9 185H is the successor to the Core i9-13900H and offers 16 cores (22 threads). Compared to the Core Ultra 7 155H, the 185H achieves a higher maximum clock rate of up to 5.1 GHz. Thanks to the high power limits, performance is very good, but you can also see that multi-core performance is only marginally better than the old Raptor Lake chips. On average, the Core Ultra 9 is just 2% ahead of the predecessor's Core i7-13705H in all CPU benchmarks. Performance also remains very stable under sustained load.
In battery mode, the processor can consume a maximum of 80 watts, which is why the performance here is only slightly lower than in mains operation. Further CPU benchmarks are available in our tech section.
Cinebench R15 Multi Sustained Load
Cinebench R23: Multi Core | Single Core
Cinebench R20: CPU (Multi Core) | CPU (Single Core)
Cinebench R15: CPU Multi 64Bit | CPU Single 64Bit
Blender: v2.79 BMW27 CPU
7-Zip 18.03: 7z b 4 | 7z b 4 -mmt1
Geekbench 6.7: Multi-Core | Single-Core
Geekbench 5.5: Multi-Core | Single-Core
HWBOT x265 Benchmark v2.2: 4k Preset
LibreOffice : 20 Documents To PDF
R Benchmark 2.5: Overall mean
| CPU Performance rating | |
| Lenovo Yoga Pro 9 16IMH9 | |
| Lenovo Yoga Pro 9 16-IRP G8 | |
| Framework Laptop 16 | |
| Honor MagicBook Pro 16 2024 | |
| Dell XPS 16 9640 | |
| Average of class Multimedia | |
| Average Intel Core Ultra 9 185H | |
| Samsung Galaxy Book4 Ultra | |
| Schenker VISION 16 Pro (M23) -2! | |
| Cinebench R23 / Multi Core | |
| Lenovo Yoga Pro 9 16IMH9 | |
| Lenovo Yoga Pro 9 16-IRP G8 | |
| Honor MagicBook Pro 16 2024 | |
| Dell XPS 16 9640 | |
| Average Intel Core Ultra 9 185H (11072 - 19851, n=21) | |
| Average of class Multimedia (4861 - 33362, n=74, last 2 years) | |
| Framework Laptop 16 | |
| Samsung Galaxy Book4 Ultra | |
| Schenker VISION 16 Pro (M23) | |
| Cinebench R23 / Single Core | |
| Average of class Multimedia (1128 - 2459, n=66, last 2 years) | |
| Lenovo Yoga Pro 9 16IMH9 | |
| Schenker VISION 16 Pro (M23) | |
| Lenovo Yoga Pro 9 16-IRP G8 | |
| Dell XPS 16 9640 | |
| Samsung Galaxy Book4 Ultra | |
| Average Intel Core Ultra 9 185H (1166 - 1912, n=21) | |
| Honor MagicBook Pro 16 2024 | |
| Framework Laptop 16 | |
| Cinebench R20 / CPU (Multi Core) | |
| Lenovo Yoga Pro 9 16IMH9 | |
| Lenovo Yoga Pro 9 16-IRP G8 | |
| Honor MagicBook Pro 16 2024 | |
| Dell XPS 16 9640 | |
| Average Intel Core Ultra 9 185H (4198 - 7651, n=21) | |
| Framework Laptop 16 | |
| Average of class Multimedia (1887 - 12912, n=57, last 2 years) | |
| Samsung Galaxy Book4 Ultra | |
| Schenker VISION 16 Pro (M23) | |
| Cinebench R20 / CPU (Single Core) | |
| Lenovo Yoga Pro 9 16IMH9 | |
| Lenovo Yoga Pro 9 16-IRP G8 | |
| Average of class Multimedia (425 - 853, n=57, last 2 years) | |
| Schenker VISION 16 Pro (M23) | |
| Samsung Galaxy Book4 Ultra | |
| Honor MagicBook Pro 16 2024 | |
| Average Intel Core Ultra 9 185H (442 - 735, n=21) | |
| Framework Laptop 16 | |
| Dell XPS 16 9640 | |
| Cinebench R15 / CPU Multi 64Bit | |
| Lenovo Yoga Pro 9 16IMH9 | |
| Lenovo Yoga Pro 9 16-IRP G8 | |
| Honor MagicBook Pro 16 2024 | |
| Dell XPS 16 9640 | |
| Average Intel Core Ultra 9 185H (1582 - 3165, n=23) | |
| Framework Laptop 16 | |
| Average of class Multimedia (856 - 5224, n=61, last 2 years) | |
| Samsung Galaxy Book4 Ultra | |
| Schenker VISION 16 Pro (M23) | |
| Cinebench R15 / CPU Single 64Bit | |
| Average of class Multimedia (184.8 - 326, n=59, last 2 years) | |
| Lenovo Yoga Pro 9 16IMH9 | |
| Framework Laptop 16 | |
| Schenker VISION 16 Pro (M23) | |
| Lenovo Yoga Pro 9 16-IRP G8 | |
| Honor MagicBook Pro 16 2024 | |
| Average Intel Core Ultra 9 185H (191.9 - 281, n=21) | |
| Dell XPS 16 9640 | |
| Samsung Galaxy Book4 Ultra | |
| Blender / v2.79 BMW27 CPU | |
| Average of class Multimedia (100 - 557, n=58, last 2 years) | |
| Schenker VISION 16 Pro (M23) | |
| Samsung Galaxy Book4 Ultra | |
| Average Intel Core Ultra 9 185H (163 - 285, n=21) | |
| Framework Laptop 16 | |
| Honor MagicBook Pro 16 2024 | |
| Dell XPS 16 9640 | |
| Lenovo Yoga Pro 9 16-IRP G8 | |
| Lenovo Yoga Pro 9 16IMH9 | |
| 7-Zip 18.03 / 7z b 4 | |
| Lenovo Yoga Pro 9 16-IRP G8 | |
| Lenovo Yoga Pro 9 16IMH9 | |
| Framework Laptop 16 | |
| Dell XPS 16 9640 | |
| Honor MagicBook Pro 16 2024 | |
| Average Intel Core Ultra 9 185H (51289 - 76331, n=21) | |
| Samsung Galaxy Book4 Ultra | |
| Schenker VISION 16 Pro (M23) | |
| Average of class Multimedia (26062 - 130368, n=55, last 2 years) | |
| 7-Zip 18.03 / 7z b 4 -mmt1 | |
| Framework Laptop 16 | |
| Schenker VISION 16 Pro (M23) | |
| Lenovo Yoga Pro 9 16-IRP G8 | |
| Average of class Multimedia (3666 - 7545, n=56, last 2 years) | |
| Lenovo Yoga Pro 9 16IMH9 | |
| Samsung Galaxy Book4 Ultra | |
| Honor MagicBook Pro 16 2024 | |
| Dell XPS 16 9640 | |
| Average Intel Core Ultra 9 185H (4199 - 5781, n=21) | |
| Geekbench 6.7 / Multi-Core | |
| Average of class Multimedia (4983 - 29415, n=69, last 2 years) | |
| Lenovo Yoga Pro 9 16-IRP G8 | |
| Lenovo Yoga Pro 9 16IMH9 | |
| Dell XPS 16 9640 | |
| Average Intel Core Ultra 9 185H (9140 - 14540, n=21) | |
| Framework Laptop 16 | |
| Honor MagicBook Pro 16 2024 | |
| Samsung Galaxy Book4 Ultra | |
| Geekbench 6.7 / Single-Core | |
| Average of class Multimedia (1534 - 4335, n=68, last 2 years) | |
| Framework Laptop 16 | |
| Lenovo Yoga Pro 9 16-IRP G8 | |
| Lenovo Yoga Pro 9 16IMH9 | |
| Honor MagicBook Pro 16 2024 | |
| Samsung Galaxy Book4 Ultra | |
| Dell XPS 16 9640 | |
| Average Intel Core Ultra 9 185H (1490 - 2573, n=21) | |
| Geekbench 5.5 / Multi-Core | |
| Lenovo Yoga Pro 9 16-IRP G8 | |
| Lenovo Yoga Pro 9 16IMH9 | |
| Dell XPS 16 9640 | |
| Honor MagicBook Pro 16 2024 | |
| Average Intel Core Ultra 9 185H (9330 - 14230, n=21) | |
| Average of class Multimedia (4652 - 20422, n=56, last 2 years) | |
| Samsung Galaxy Book4 Ultra | |
| Framework Laptop 16 | |
| Schenker VISION 16 Pro (M23) | |
| Geekbench 5.5 / Single-Core | |
| Average of class Multimedia (805 - 2974, n=56, last 2 years) | |
| Framework Laptop 16 | |
| Lenovo Yoga Pro 9 16IMH9 | |
| Schenker VISION 16 Pro (M23) | |
| Samsung Galaxy Book4 Ultra | |
| Honor MagicBook Pro 16 2024 | |
| Lenovo Yoga Pro 9 16-IRP G8 | |
| Dell XPS 16 9640 | |
| Average Intel Core Ultra 9 185H (986 - 1902, n=21) | |
| HWBOT x265 Benchmark v2.2 / 4k Preset | |
| Lenovo Yoga Pro 9 16IMH9 | |
| Lenovo Yoga Pro 9 16-IRP G8 | |
| Framework Laptop 16 | |
| Dell XPS 16 9640 | |
| Honor MagicBook Pro 16 2024 | |
| Average Intel Core Ultra 9 185H (13.7 - 22.7, n=21) | |
| Average of class Multimedia (5.26 - 36.1, n=56, last 2 years) | |
| Samsung Galaxy Book4 Ultra | |
| Schenker VISION 16 Pro (M23) | |
| LibreOffice / 20 Documents To PDF | |
| Average of class Multimedia (23.9 - 146.7, n=57, last 2 years) | |
| Lenovo Yoga Pro 9 16-IRP G8 | |
| Schenker VISION 16 Pro (M23) | |
| Average Intel Core Ultra 9 185H (34.5 - 73.5, n=21) | |
| Honor MagicBook Pro 16 2024 | |
| Samsung Galaxy Book4 Ultra | |
| Dell XPS 16 9640 | |
| Framework Laptop 16 | |
| Lenovo Yoga Pro 9 16IMH9 | |
| R Benchmark 2.5 / Overall mean | |
| Dell XPS 16 9640 | |
| Average Intel Core Ultra 9 185H (0.4313 - 0.759, n=22) | |
| Samsung Galaxy Book4 Ultra | |
| Average of class Multimedia (0.3604 - 0.947, n=56, last 2 years) | |
| Honor MagicBook Pro 16 2024 | |
| Lenovo Yoga Pro 9 16-IRP G8 | |
| Framework Laptop 16 | |
| Lenovo Yoga Pro 9 16IMH9 | |
| Schenker VISION 16 Pro (M23) | |
* ... smaller is better
AIDA64: FP32 Ray-Trace | FPU Julia | CPU SHA3 | CPU Queen | FPU SinJulia | FPU Mandel | CPU AES | CPU ZLib | FP64 Ray-Trace | CPU PhotoWorxx
| Performance rating | |
| Framework Laptop 16 | |
| Lenovo Yoga Pro 9 16IMH9 | |
| Honor MagicBook Pro 16 2024 | |
| Lenovo Yoga Pro 9 16-IRP G8 | |
| Dell XPS 16 9640 | |
| Average Intel Core Ultra 9 185H | |
| Average of class Multimedia | |
| Samsung Galaxy Book4 Ultra | |
| Schenker VISION 16 Pro (M23) | |
| AIDA64 / FP32 Ray-Trace | |
| Framework Laptop 16 | |
| Lenovo Yoga Pro 9 16IMH9 | |
| Lenovo Yoga Pro 9 16-IRP G8 | |
| Average of class Multimedia (2214 - 50388, n=53, last 2 years) | |
| Honor MagicBook Pro 16 2024 | |
| Dell XPS 16 9640 | |
| Average Intel Core Ultra 9 185H (9220 - 18676, n=22) | |
| Samsung Galaxy Book4 Ultra | |
| Schenker VISION 16 Pro (M23) | |
| AIDA64 / FPU Julia | |
| Framework Laptop 16 | |
| Lenovo Yoga Pro 9 16IMH9 | |
| Honor MagicBook Pro 16 2024 | |
| Lenovo Yoga Pro 9 16-IRP G8 | |
| Dell XPS 16 9640 | |
| Average Intel Core Ultra 9 185H (48865 - 96463, n=22) | |
| Average of class Multimedia (12867 - 201874, n=54, last 2 years) | |
| Samsung Galaxy Book4 Ultra | |
| Schenker VISION 16 Pro (M23) | |
| AIDA64 / CPU SHA3 | |
| Framework Laptop 16 | |
| Honor MagicBook Pro 16 2024 | |
| Lenovo Yoga Pro 9 16IMH9 | |
| Lenovo Yoga Pro 9 16-IRP G8 | |
| Dell XPS 16 9640 | |
| Average of class Multimedia (626 - 8623, n=54, last 2 years) | |
| Average Intel Core Ultra 9 185H (2394 - 4534, n=22) | |
| Samsung Galaxy Book4 Ultra | |
| Schenker VISION 16 Pro (M23) | |
| AIDA64 / CPU Queen | |
| Framework Laptop 16 | |
| Lenovo Yoga Pro 9 16-IRP G8 | |
| Schenker VISION 16 Pro (M23) | |
| Lenovo Yoga Pro 9 16IMH9 | |
| Dell XPS 16 9640 | |
| Average Intel Core Ultra 9 185H (66785 - 95241, n=21) | |
| Samsung Galaxy Book4 Ultra | |
| Honor MagicBook Pro 16 2024 | |
| Average of class Multimedia (13483 - 181505, n=41, last 2 years) | |
| AIDA64 / FPU SinJulia | |
| Framework Laptop 16 | |
| Lenovo Yoga Pro 9 16IMH9 | |
| Lenovo Yoga Pro 9 16-IRP G8 | |
| Honor MagicBook Pro 16 2024 | |
| Dell XPS 16 9640 | |
| Average Intel Core Ultra 9 185H (7255 - 11392, n=22) | |
| Samsung Galaxy Book4 Ultra | |
| Schenker VISION 16 Pro (M23) | |
| Average of class Multimedia (886 - 28794, n=54, last 2 years) | |
| AIDA64 / FPU Mandel | |
| Framework Laptop 16 | |
| Lenovo Yoga Pro 9 16IMH9 | |
| Dell XPS 16 9640 | |
| Honor MagicBook Pro 16 2024 | |
| Average of class Multimedia (6395 - 105740, n=53, last 2 years) | |
| Lenovo Yoga Pro 9 16-IRP G8 | |
| Average Intel Core Ultra 9 185H (24004 - 48020, n=22) | |
| Samsung Galaxy Book4 Ultra | |
| Schenker VISION 16 Pro (M23) | |
| AIDA64 / CPU AES | |
| Framework Laptop 16 | |
| Honor MagicBook Pro 16 2024 | |
| Lenovo Yoga Pro 9 16IMH9 | |
| Average Intel Core Ultra 9 185H (53116 - 154066, n=22) | |
| Lenovo Yoga Pro 9 16-IRP G8 | |
| Dell XPS 16 9640 | |
| Samsung Galaxy Book4 Ultra | |
| Schenker VISION 16 Pro (M23) | |
| Average of class Multimedia (8171 - 126790, n=54, last 2 years) | |
| AIDA64 / CPU ZLib | |
| Lenovo Yoga Pro 9 16IMH9 | |
| Honor MagicBook Pro 16 2024 | |
| Lenovo Yoga Pro 9 16-IRP G8 | |
| Dell XPS 16 9640 | |
| Average Intel Core Ultra 9 185H (678 - 1341, n=22) | |
| Average of class Multimedia (143.8 - 2022, n=54, last 2 years) | |
| Samsung Galaxy Book4 Ultra | |
| Schenker VISION 16 Pro (M23) | |
| Framework Laptop 16 | |
| AIDA64 / FP64 Ray-Trace | |
| Framework Laptop 16 | |
| Lenovo Yoga Pro 9 16IMH9 | |
| Average of class Multimedia (1014 - 26875, n=54, last 2 years) | |
| Lenovo Yoga Pro 9 16-IRP G8 | |
| Dell XPS 16 9640 | |
| Honor MagicBook Pro 16 2024 | |
| Average Intel Core Ultra 9 185H (4428 - 10078, n=22) | |
| Schenker VISION 16 Pro (M23) | |
| Samsung Galaxy Book4 Ultra | |
| AIDA64 / CPU PhotoWorxx | |
| Lenovo Yoga Pro 9 16IMH9 | |
| Lenovo Yoga Pro 9 16-IRP G8 | |
| Dell XPS 16 9640 | |
| Samsung Galaxy Book4 Ultra | |
| Average of class Multimedia (8187 - 88154, n=54, last 2 years) | |
| Average Intel Core Ultra 9 185H (44547 - 53918, n=22) | |
| Honor MagicBook Pro 16 2024 | |
| Schenker VISION 16 Pro (M23) | |
| Framework Laptop 16 | |
System performance
The results in the synthetic benchmarks are good and the Yoga Pro 9i 16 is a very fast device in everyday use. There is only a short delay when switching to the dedicated graphics card, but this is normal for devices with Advanced Optimus. No other problems were detected during system performance testing.
CrossMark: Overall | Productivity | Creativity | Responsiveness
WebXPRT 3: Overall
WebXPRT 4: Overall
Mozilla Kraken 1.1: Total
| PCMark 10 / Score | |
| Framework Laptop 16 | |
| Average of class Multimedia (4325 - 10386, n=52, last 2 years) | |
| Average Intel Core Ultra 9 185H, NVIDIA GeForce RTX 4070 Laptop GPU (7443 - 7761, n=4) | |
| Lenovo Yoga Pro 9 16IMH9 | |
| Schenker VISION 16 Pro (M23) | |
| Lenovo Yoga Pro 9 16-IRP G8 | |
| Dell XPS 16 9640 | |
| Samsung Galaxy Book4 Ultra | |
| Honor MagicBook Pro 16 2024 | |
| PCMark 10 / Essentials | |
| Framework Laptop 16 | |
| Lenovo Yoga Pro 9 16IMH9 | |
| Lenovo Yoga Pro 9 16-IRP G8 | |
| Schenker VISION 16 Pro (M23) | |
| Average of class Multimedia (8025 - 11664, n=51, last 2 years) | |
| Average Intel Core Ultra 9 185H, NVIDIA GeForce RTX 4070 Laptop GPU (9728 - 11133, n=4) | |
| Samsung Galaxy Book4 Ultra | |
| Dell XPS 16 9640 | |
| Honor MagicBook Pro 16 2024 | |
| PCMark 10 / Productivity | |
| Average of class Multimedia (7323 - 18233, n=51, last 2 years) | |
| Framework Laptop 16 | |
| Schenker VISION 16 Pro (M23) | |
| Average Intel Core Ultra 9 185H, NVIDIA GeForce RTX 4070 Laptop GPU (9067 - 9555, n=4) | |
| Dell XPS 16 9640 | |
| Samsung Galaxy Book4 Ultra | |
| Lenovo Yoga Pro 9 16IMH9 | |
| Lenovo Yoga Pro 9 16-IRP G8 | |
| Honor MagicBook Pro 16 2024 | |
| PCMark 10 / Digital Content Creation | |
| Framework Laptop 16 | |
| Average Intel Core Ultra 9 185H, NVIDIA GeForce RTX 4070 Laptop GPU (11369 - 13194, n=4) | |
| Lenovo Yoga Pro 9 16IMH9 | |
| Lenovo Yoga Pro 9 16-IRP G8 | |
| Schenker VISION 16 Pro (M23) | |
| Honor MagicBook Pro 16 2024 | |
| Average of class Multimedia (3651 - 16240, n=51, last 2 years) | |
| Dell XPS 16 9640 | |
| Samsung Galaxy Book4 Ultra | |
| CrossMark / Overall | |
| Schenker VISION 16 Pro (M23) | |
| Average of class Multimedia (866 - 2728, n=60, last 2 years) | |
| Dell XPS 16 9640 | |
| Lenovo Yoga Pro 9 16-IRP G8 | |
| Average Intel Core Ultra 9 185H, NVIDIA GeForce RTX 4070 Laptop GPU (1663 - 1917, n=3) | |
| Samsung Galaxy Book4 Ultra | |
| Honor MagicBook Pro 16 2024 | |
| Lenovo Yoga Pro 9 16IMH9 | |
| Framework Laptop 16 | |
| CrossMark / Productivity | |
| Schenker VISION 16 Pro (M23) | |
| Average of class Multimedia (931 - 2489, n=60, last 2 years) | |
| Dell XPS 16 9640 | |
| Lenovo Yoga Pro 9 16-IRP G8 | |
| Average Intel Core Ultra 9 185H, NVIDIA GeForce RTX 4070 Laptop GPU (1573 - 1849, n=3) | |
| Honor MagicBook Pro 16 2024 | |
| Samsung Galaxy Book4 Ultra | |
| Lenovo Yoga Pro 9 16IMH9 | |
| Framework Laptop 16 | |
| CrossMark / Creativity | |
| Average of class Multimedia (907 - 3465, n=60, last 2 years) | |
| Lenovo Yoga Pro 9 16-IRP G8 | |
| Dell XPS 16 9640 | |
| Schenker VISION 16 Pro (M23) | |
| Lenovo Yoga Pro 9 16IMH9 | |
| Average Intel Core Ultra 9 185H, NVIDIA GeForce RTX 4070 Laptop GPU (1872 - 2008, n=3) | |
| Samsung Galaxy Book4 Ultra | |
| Framework Laptop 16 | |
| Honor MagicBook Pro 16 2024 | |
| CrossMark / Responsiveness | |
| Schenker VISION 16 Pro (M23) | |
| Dell XPS 16 9640 | |
| Honor MagicBook Pro 16 2024 | |
| Lenovo Yoga Pro 9 16-IRP G8 | |
| Average Intel Core Ultra 9 185H, NVIDIA GeForce RTX 4070 Laptop GPU (1338 - 1856, n=3) | |
| Average of class Multimedia (605 - 2024, n=60, last 2 years) | |
| Samsung Galaxy Book4 Ultra | |
| Framework Laptop 16 | |
| Lenovo Yoga Pro 9 16IMH9 | |
| WebXPRT 3 / Overall | |
| Framework Laptop 16 | |
| Average of class Multimedia (136.4 - 596, n=63, last 2 years) | |
| Schenker VISION 16 Pro (M23) | |
| Lenovo Yoga Pro 9 16-IRP G8 | |
| Lenovo Yoga Pro 9 16IMH9 | |
| Honor MagicBook Pro 16 2024 | |
| Dell XPS 16 9640 | |
| Samsung Galaxy Book4 Ultra | |
| Average Intel Core Ultra 9 185H, NVIDIA GeForce RTX 4070 Laptop GPU (240 - 295, n=5) | |
| WebXPRT 4 / Overall | |
| Average of class Multimedia (167.3 - 402, n=65, last 2 years) | |
| Schenker VISION 16 Pro (M23) | |
| Lenovo Yoga Pro 9 16IMH9 | |
| Framework Laptop 16 | |
| Lenovo Yoga Pro 9 16-IRP G8 | |
| Honor MagicBook Pro 16 2024 | |
| Samsung Galaxy Book4 Ultra | |
| Average Intel Core Ultra 9 185H, NVIDIA GeForce RTX 4070 Laptop GPU (248 - 268, n=5) | |
| Dell XPS 16 9640 | |
| Mozilla Kraken 1.1 / Total | |
| Average Intel Core Ultra 9 185H, NVIDIA GeForce RTX 4070 Laptop GPU (494 - 549, n=5) | |
| Honor MagicBook Pro 16 2024 | |
| Lenovo Yoga Pro 9 16-IRP G8 | |
| Schenker VISION 16 Pro (M23) | |
| Lenovo Yoga Pro 9 16IMH9 | |
| Framework Laptop 16 | |
| Average of class Multimedia (228 - 835, n=66, last 2 years) | |
| Samsung Galaxy Book4 Ultra | |
* ... smaller is better
| PCMark 10 Score | 7547 points | |
Help | ||
| AIDA64 / Memory Copy | |
| Lenovo Yoga Pro 9 16IMH9 | |
| Dell XPS 16 9640 | |
| Samsung Galaxy Book4 Ultra | |
| Average Intel Core Ultra 9 185H (69929 - 95718, n=22) | |
| Honor MagicBook Pro 16 2024 | |
| Average of class Multimedia (11299 - 132135, n=54, last 2 years) | |
| Framework Laptop 16 | |
| Lenovo Yoga Pro 9 16-IRP G8 | |
| Schenker VISION 16 Pro (M23) | |
| AIDA64 / Memory Read | |
| Samsung Galaxy Book4 Ultra | |
| Lenovo Yoga Pro 9 16IMH9 | |
| Dell XPS 16 9640 | |
| Average of class Multimedia (11624 - 174586, n=54, last 2 years) | |
| Average Intel Core Ultra 9 185H (64619 - 87768, n=22) | |
| Lenovo Yoga Pro 9 16-IRP G8 | |
| Honor MagicBook Pro 16 2024 | |
| Schenker VISION 16 Pro (M23) | |
| Framework Laptop 16 | |
| AIDA64 / Memory Write | |
| Lenovo Yoga Pro 9 16-IRP G8 | |
| Framework Laptop 16 | |
| Average of class Multimedia (11755 - 134998, n=54, last 2 years) | |
| Honor MagicBook Pro 16 2024 | |
| Samsung Galaxy Book4 Ultra | |
| Lenovo Yoga Pro 9 16IMH9 | |
| Dell XPS 16 9640 | |
| Average Intel Core Ultra 9 185H (51114 - 93871, n=22) | |
| Schenker VISION 16 Pro (M23) | |
| AIDA64 / Memory Latency | |
| Average Intel Core Ultra 9 185H (121.4 - 259, n=22) | |
| Honor MagicBook Pro 16 2024 | |
| Samsung Galaxy Book4 Ultra | |
| Dell XPS 16 9640 | |
| Lenovo Yoga Pro 9 16IMH9 | |
| Average of class Multimedia (7 - 535, n=53, last 2 years) | |
| Lenovo Yoga Pro 9 16-IRP G8 | |
| Framework Laptop 16 | |
| Schenker VISION 16 Pro (M23) | |
* ... smaller is better
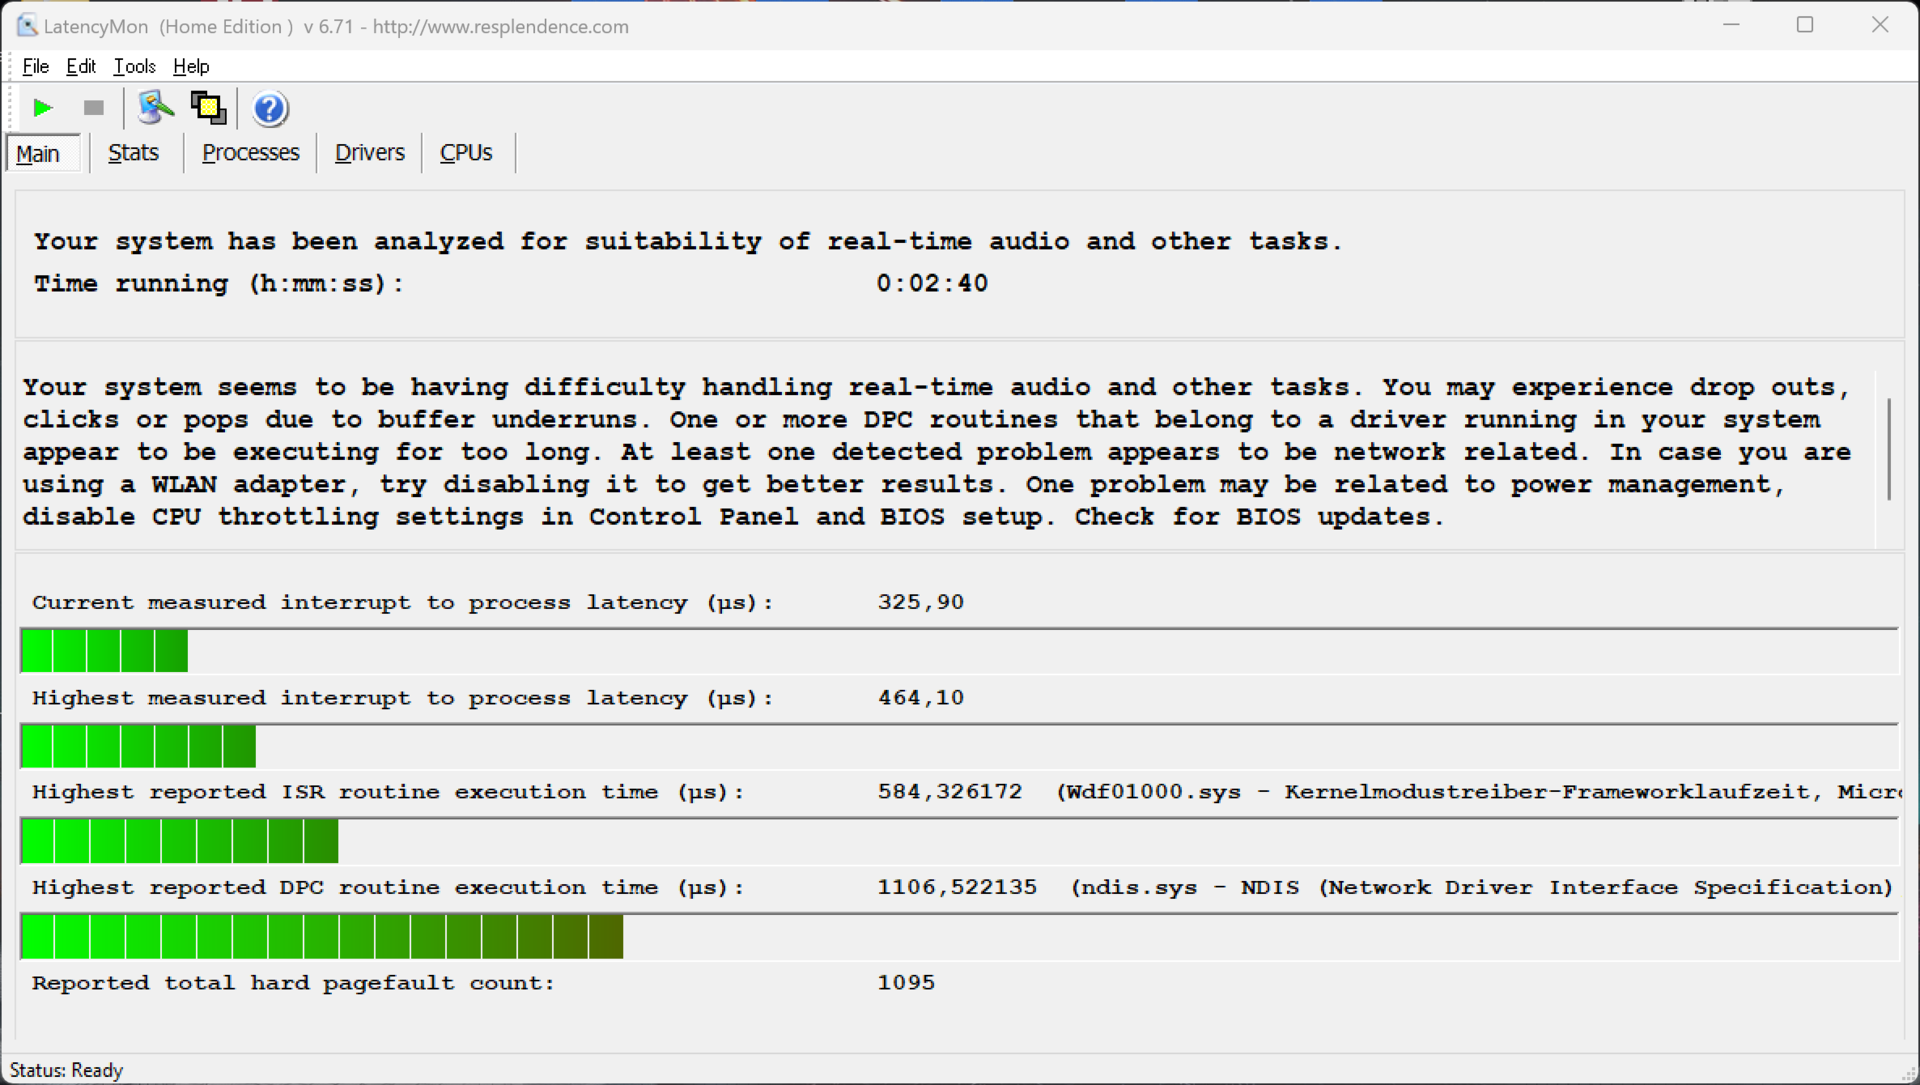
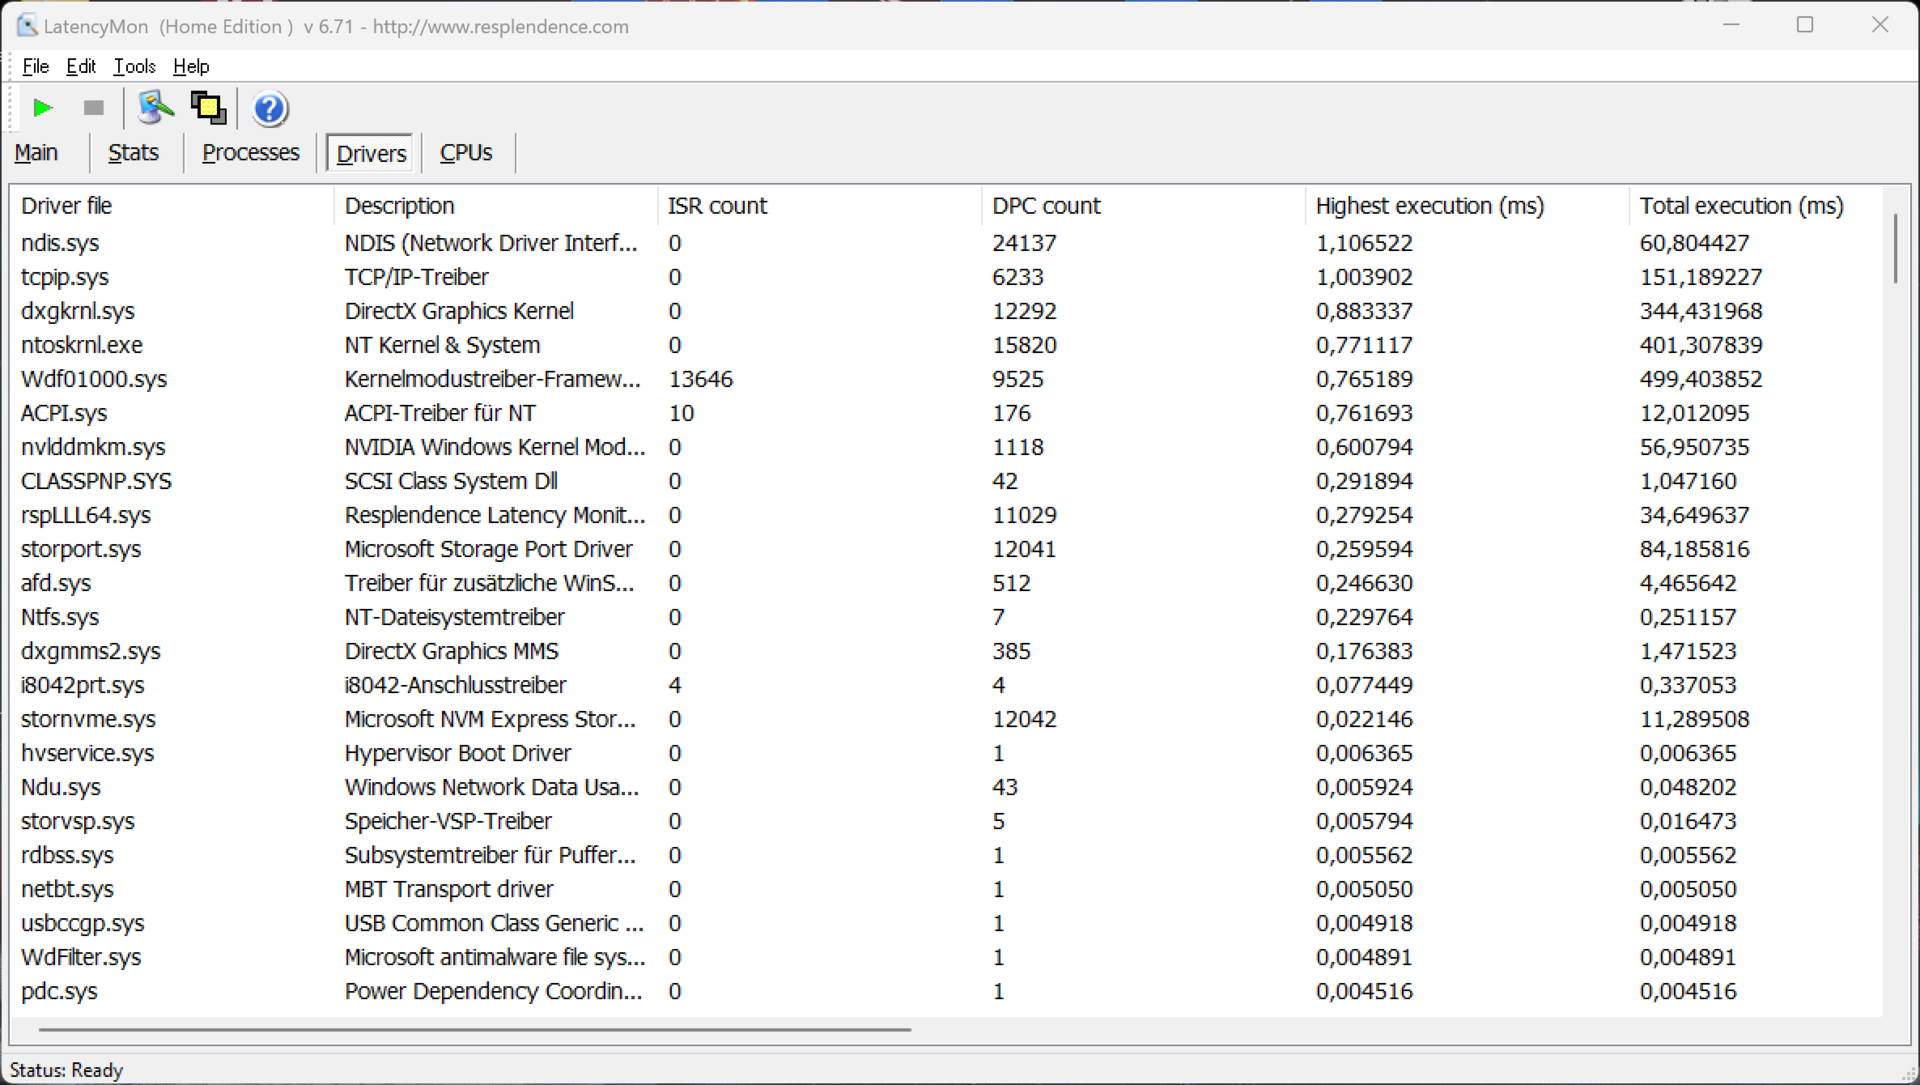
DPC latency
In our standardized latency test (web browsing, 4K YouTube playback, CPU load), our test device with its current BIOS version has no trouble running real-time audio applications. Although one driver struggles a little, the important "interrupt-to-process-latency" value is very low.
| DPC Latencies / LatencyMon - interrupt to process latency (max), Web, Youtube, Prime95 | |
| Lenovo Yoga Pro 9 16-IRP G8 | |
| Honor MagicBook Pro 16 2024 | |
| Framework Laptop 16 | |
| Dell XPS 16 9640 | |
| Schenker VISION 16 Pro (M23) | |
| Samsung Galaxy Book4 Ultra | |
| Lenovo Yoga Pro 9 16IMH9 | |
* ... smaller is better
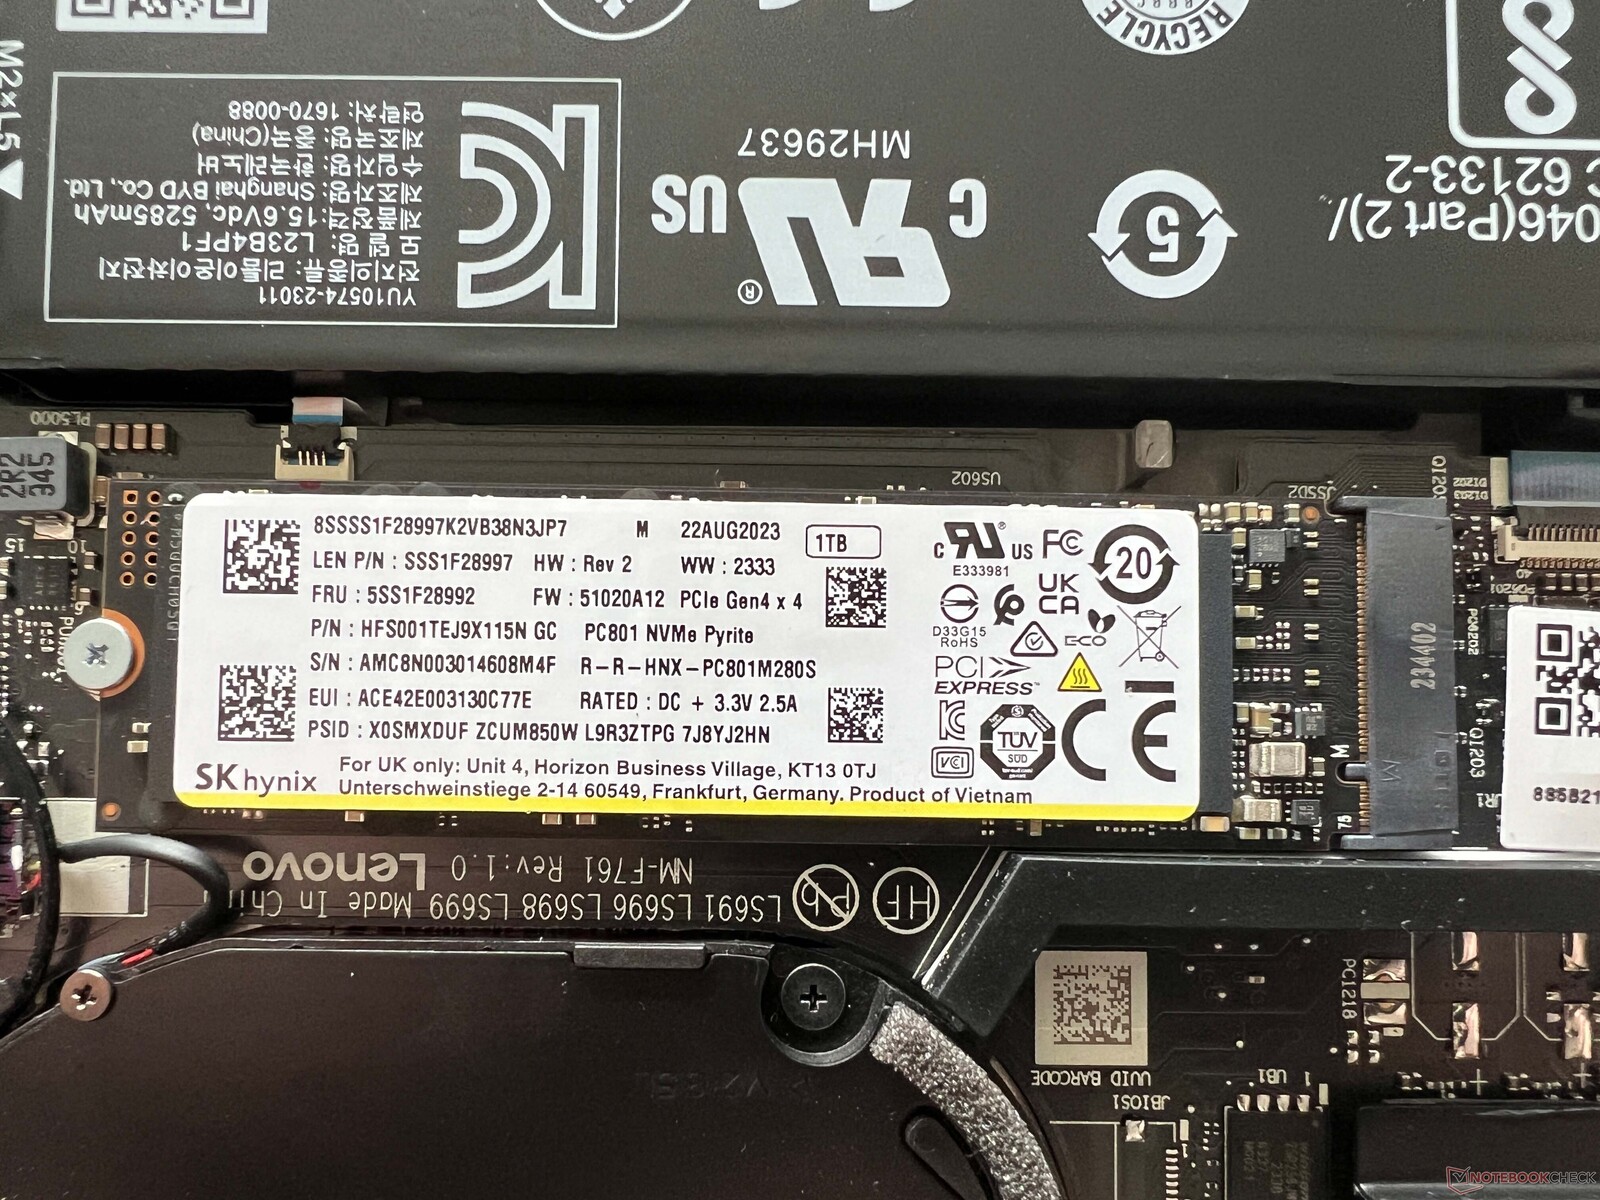
Storage devices
Lenovo installed a 1 TB PCIe 4.0 SSD from SK Hynix in our test device, of which 877 GB is available upon starting up for the first time. The benchmark results are only average, but this won't be a problem in everyday use. At least performance remains stable under sustained load. The Yoga Pro also offers a second slot for a PCIe 4.0 SSD. Further SSD benchmarks are listed here.

* ... smaller is better
Sustained Read Performance: DiskSpd Read Loop, Queue Depth 8
Graphics card
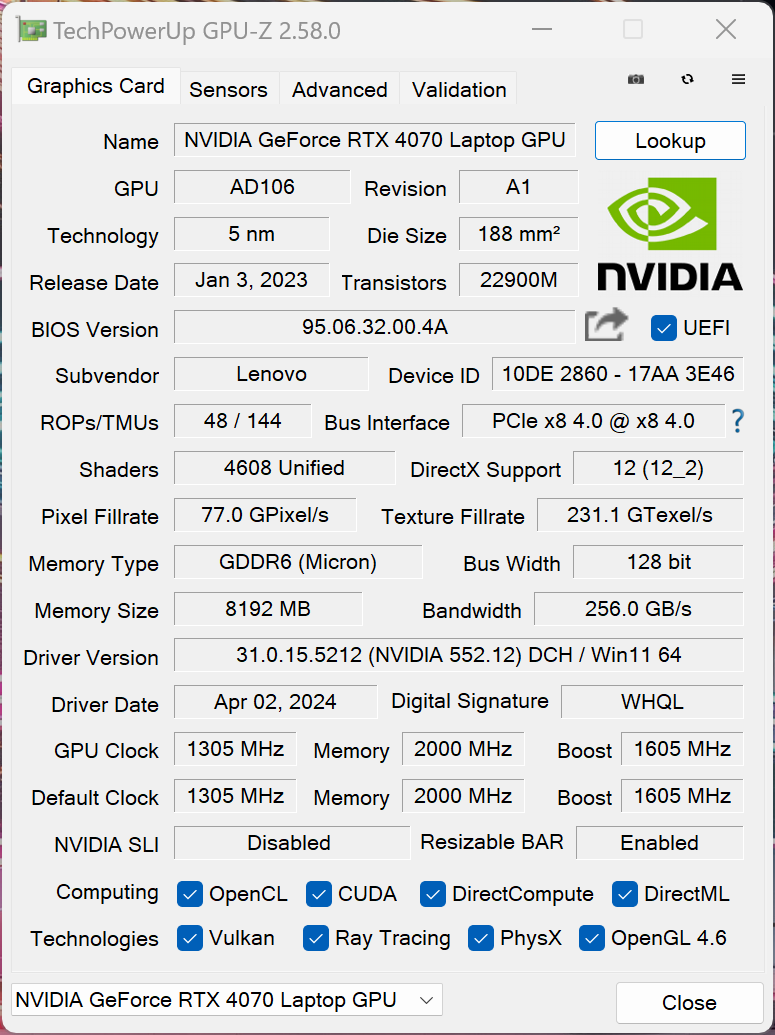
Nothing has changed in terms of dedicated graphics cards, as the Yoga Pro is still available with the Nvidia GeForce RTX 4060 Laptop or RTX 4070 Laptop. However, Advanced Optimus is now integrated for graphics switching, which was not the case in the old model. The faster RTX 4070 Laptop with a TGP of 100 watts is installed in our test device and the benchmark results are very good overall. The graphics card can also be optionally overclocked.
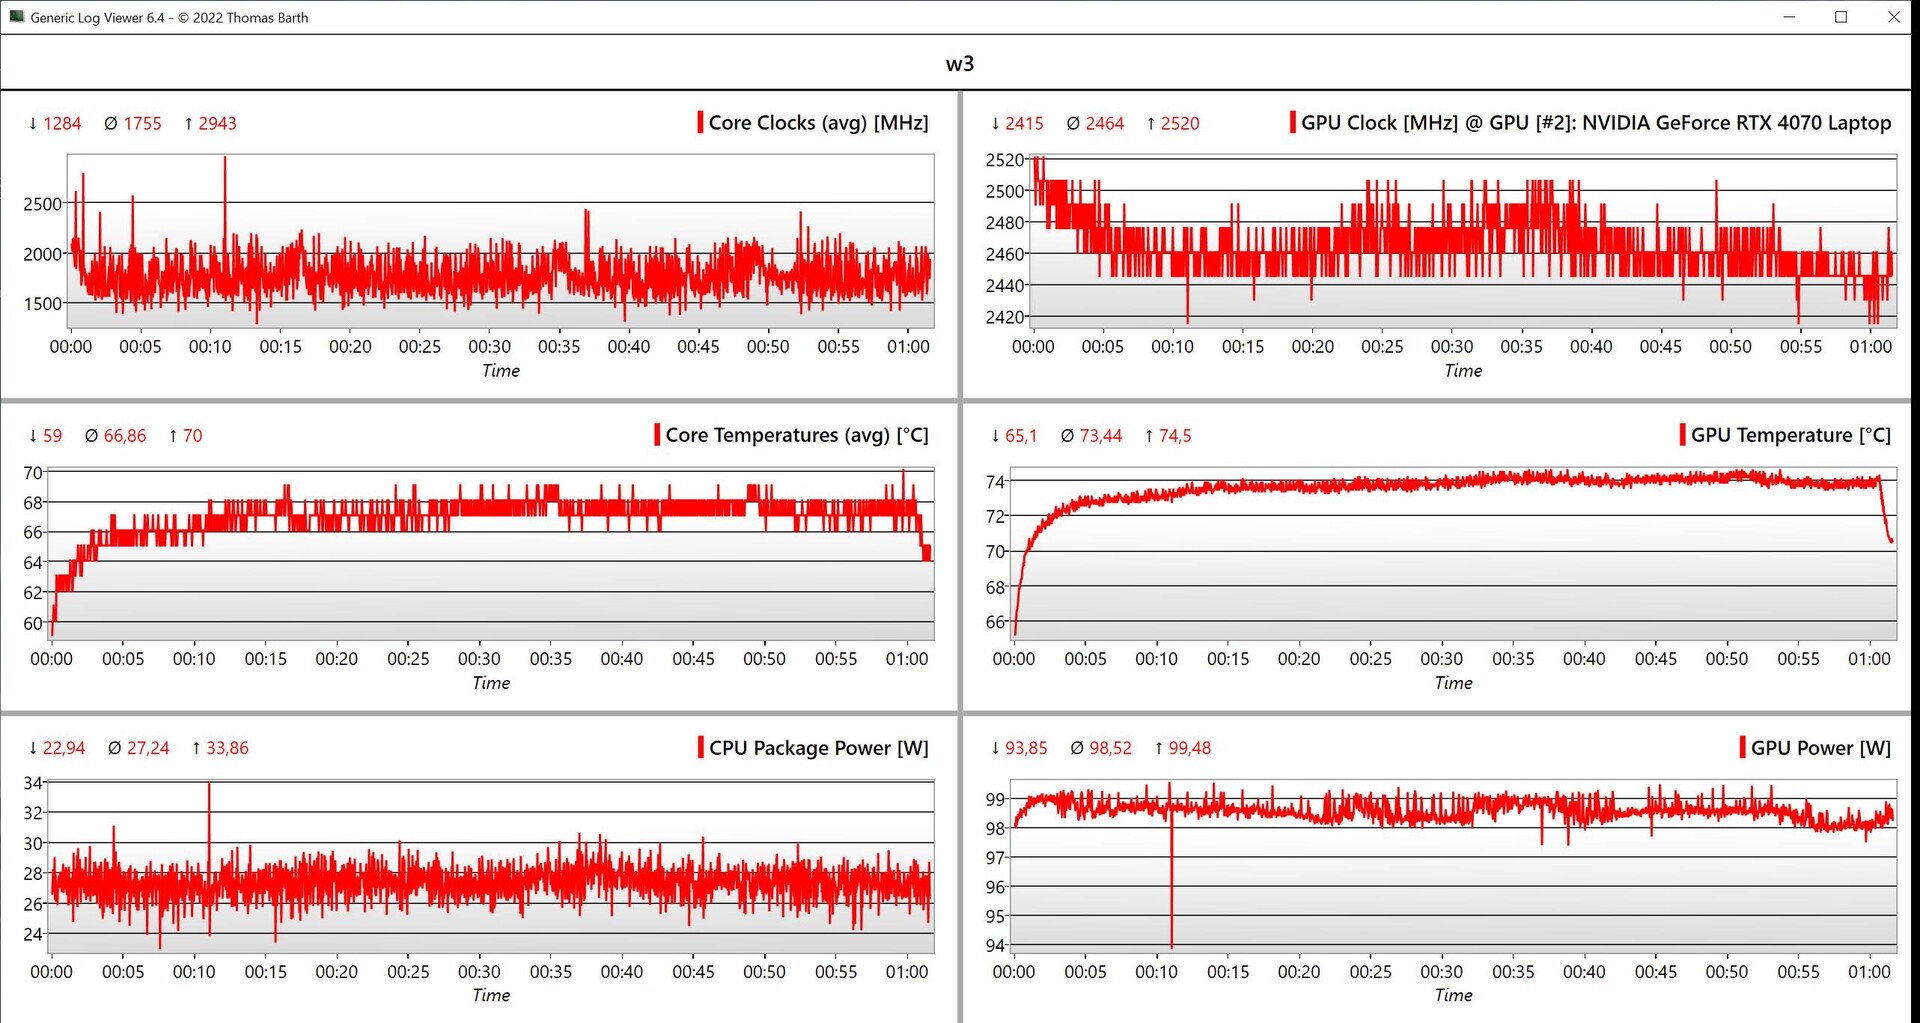
The Yoga also cuts a fine figure in the gaming benchmarks and even modern titles can be played at maximum details in QHD resolution without issue, and performance remains completely stable during long gaming sessions.
In battery mode, the graphics card has a maximum of 65 watts at its disposal, which is why the performance here is around 18% lower. Further GPU benchmarks are listed in our tech section.
| 3DMark 11 Performance | 34118 points | |
| 3DMark Fire Strike Score | 26981 points | |
| 3DMark Time Spy Score | 12105 points | |
Help | ||
| Blender / v3.3 Classroom OPTIX/RTX | |
| Average of class Multimedia (12 - 105, n=22, last 2 years) | |
| Samsung Galaxy Book4 Ultra | |
| Lenovo Yoga Pro 9 16-IRP G8 | |
| Schenker VISION 16 Pro (M23) | |
| Honor MagicBook Pro 16 2024 | |
| Average NVIDIA GeForce RTX 4070 Laptop GPU (18 - 30, n=68) | |
| Dell XPS 16 9640 | |
| Lenovo Yoga Pro 9 16IMH9 | |
| Blender / v3.3 Classroom CUDA | |
| Average of class Multimedia (20 - 186, n=22, last 2 years) | |
| Samsung Galaxy Book4 Ultra | |
| Lenovo Yoga Pro 9 16-IRP G8 | |
| Honor MagicBook Pro 16 2024 | |
| Dell XPS 16 9640 | |
| Schenker VISION 16 Pro (M23) | |
| Average NVIDIA GeForce RTX 4070 Laptop GPU (32 - 50, n=67) | |
| Lenovo Yoga Pro 9 16IMH9 | |
| Blender / v3.3 Classroom CPU | |
| Average of class Multimedia (134.5 - 1042, n=62, last 2 years) | |
| Schenker VISION 16 Pro (M23) | |
| Samsung Galaxy Book4 Ultra | |
| Honor MagicBook Pro 16 2024 | |
| Framework Laptop 16 | |
| Lenovo Yoga Pro 9 16-IRP G8 | |
| Dell XPS 16 9640 | |
| Average NVIDIA GeForce RTX 4070 Laptop GPU (158 - 440, n=67) | |
| Lenovo Yoga Pro 9 16IMH9 | |
* ... smaller is better
| The Witcher 3 - 1920x1080 Ultra Graphics & Postprocessing (HBAO+) | |
| Lenovo Yoga Pro 9 16IMH9 | |
| Schenker VISION 16 Pro (M23) | |
| Lenovo Yoga Pro 9 16-IRP G8 | |
| Dell XPS 16 9640 | |
| Framework Laptop 16 | |
| Honor MagicBook Pro 16 2024 | |
| Average of class Multimedia (11 - 121, n=7, last 2 years) | |
| Samsung Galaxy Book4 Ultra | |
| Horizon Forbidden West | |
| 1920x1080 Very High Preset AA:T | |
| Lenovo Yoga Pro 9 16IMH9 | |
| Average NVIDIA GeForce RTX 4070 Laptop GPU (53.2 - 76.7, n=10) | |
| Dell XPS 16 9640 | |
| Average of class Multimedia (12.4 - 64.4, n=2, last 2 years) | |
| 2560x1440 Very High Preset AA:T | |
| Lenovo Yoga Pro 9 16IMH9 | |
| Average NVIDIA GeForce RTX 4070 Laptop GPU (40.3 - 59.1, n=9) | |
| Average of class Multimedia (n=1last 2 years) | |
| Dell XPS 16 9640 | |
Witcher 3 FPS chart
| low | med. | high | ultra | QHD | |
|---|---|---|---|---|---|
| GTA V (2015) | 171.4 | 110.9 | 90.4 | ||
| The Witcher 3 (2015) | 242 | 107.8 | 89 | ||
| Dota 2 Reborn (2015) | 171.7 | 155.7 | 148.1 | 139 | |
| Final Fantasy XV Benchmark (2018) | 189.6 | 156.2 | 115.7 | 85.6 | |
| X-Plane 11.11 (2018) | 133.9 | 118.7 | 90.5 | ||
| Far Cry 5 (2018) | 156 | 133 | 130 | 116 | 109 |
| Strange Brigade (2018) | 418 | 300 | 244 | 213 | 139 |
| F1 23 (2023) | 229 | 239 | 209 | 68.9 | 44 |
| Baldur's Gate 3 (2023) | 166.3 | 136.6 | 119.9 | 117.7 | 79.8 |
| Cyberpunk 2077 (2023) | 129.6 | 106.8 | 90.5 | 76.9 | 47.8 |
| Horizon Forbidden West (2024) | 110.5 | 104.2 | 75.4 | 65.4 | 56.1 |
Emissions - Loud fans, top speakers
Noise
In idle mode and under low load, the fans remain deactivated or barely audible in most cases. Under load, however, it quickly becomes loud, both in Auto and Performance mode. We have summarized the results for the various energy profiles in the following table. In battery mode, the device remains very quiet at all times, but performance is massively reduced and is no longer sufficient for gaming. No electronic noises such as coil whine were detected on our test device
| Energy profile | 3DMark 06 | Witcher 3 | Cyberpunk 2077 | Stress test |
|---|---|---|---|---|
| Battery | 29.5 dB(A) | 29.5 dB(A) | 29.5 dB(A) | 30.9 dB(A) |
| Auto | 44.9 dB(A) | 44.9 dB(A) | 44.9 dB(A) | 44.9 dB(A) |
| Performance | 48.1 dB(A) | 49.7 dB(A) | 49.7 dB(A) | 53.9 dB(A) |
Noise level
| Idle |
| 24.3 / 24.3 / 25.8 dB(A) |
| Load |
| 48.1 / 53.9 dB(A) |
 | ||
30 dB silent 40 dB(A) audible 50 dB(A) loud |
||
min: | ||
| Lenovo Yoga Pro 9 16IMH9 GeForce RTX 4070 Laptop GPU, Ultra 9 185H, SK Hynix HFS001TEJ9X115N | Dell XPS 16 9640 GeForce RTX 4070 Laptop GPU, Ultra 7 155H, Kioxia XG8 KXG80ZNV1T02 | Honor MagicBook Pro 16 2024 GeForce RTX 4060 Laptop GPU, Ultra 7 155H, WD PC SN740 SDDPNQD-1T00 | Samsung Galaxy Book4 Ultra GeForce RTX 4050 Laptop GPU, Ultra 7 155H, Samsung PM9A1 MZVL2512HCJQ | Framework Laptop 16 Radeon RX 7700S, R9 7940HS, WDC PC SN810 1TB | Schenker VISION 16 Pro (M23) GeForce RTX 4070 Laptop GPU, i7-13700H, Samsung 990 Pro 1 TB | Lenovo Yoga Pro 9 16-IRP G8 GeForce RTX 4060 Laptop GPU, i7-13705H, Samsung PM9A1 MZVL21T0HCLR | |
|---|---|---|---|---|---|---|---|
| Noise | 2% | 10% | 9% | 7% | -7% | -0% | |
| off / environment * (dB) | 24.3 | 24.5 -1% | 24 1% | 24.2 -0% | 23.8 2% | 25.9 -7% | 24.7 -2% |
| Idle Minimum * (dB) | 24.3 | 24.5 -1% | 24 1% | 24.2 -0% | 23.9 2% | 25.9 -7% | 24.7 -2% |
| Idle Average * (dB) | 24.3 | 24.5 -1% | 24 1% | 24.2 -0% | 23.9 2% | 25.9 -7% | 26.2 -8% |
| Idle Maximum * (dB) | 25.8 | 27.5 -7% | 27.2 -5% | 24.2 6% | 23.9 7% | 32 -24% | 26.2 -2% |
| Load Average * (dB) | 48.1 | 39.6 18% | 29 40% | 37.9 21% | 28.5 41% | 47.2 2% | 39.7 17% |
| Witcher 3 ultra * (dB) | 49.7 | 49.7 -0% | 42.1 15% | 41.7 16% | 51.9 -4% | 53.1 -7% | 53.2 -7% |
| Load Maximum * (dB) | 53.9 | 49.7 8% | 45 17% | 41.7 23% | 53.7 -0% | 53.1 1% | 53.2 1% |
* ... smaller is better
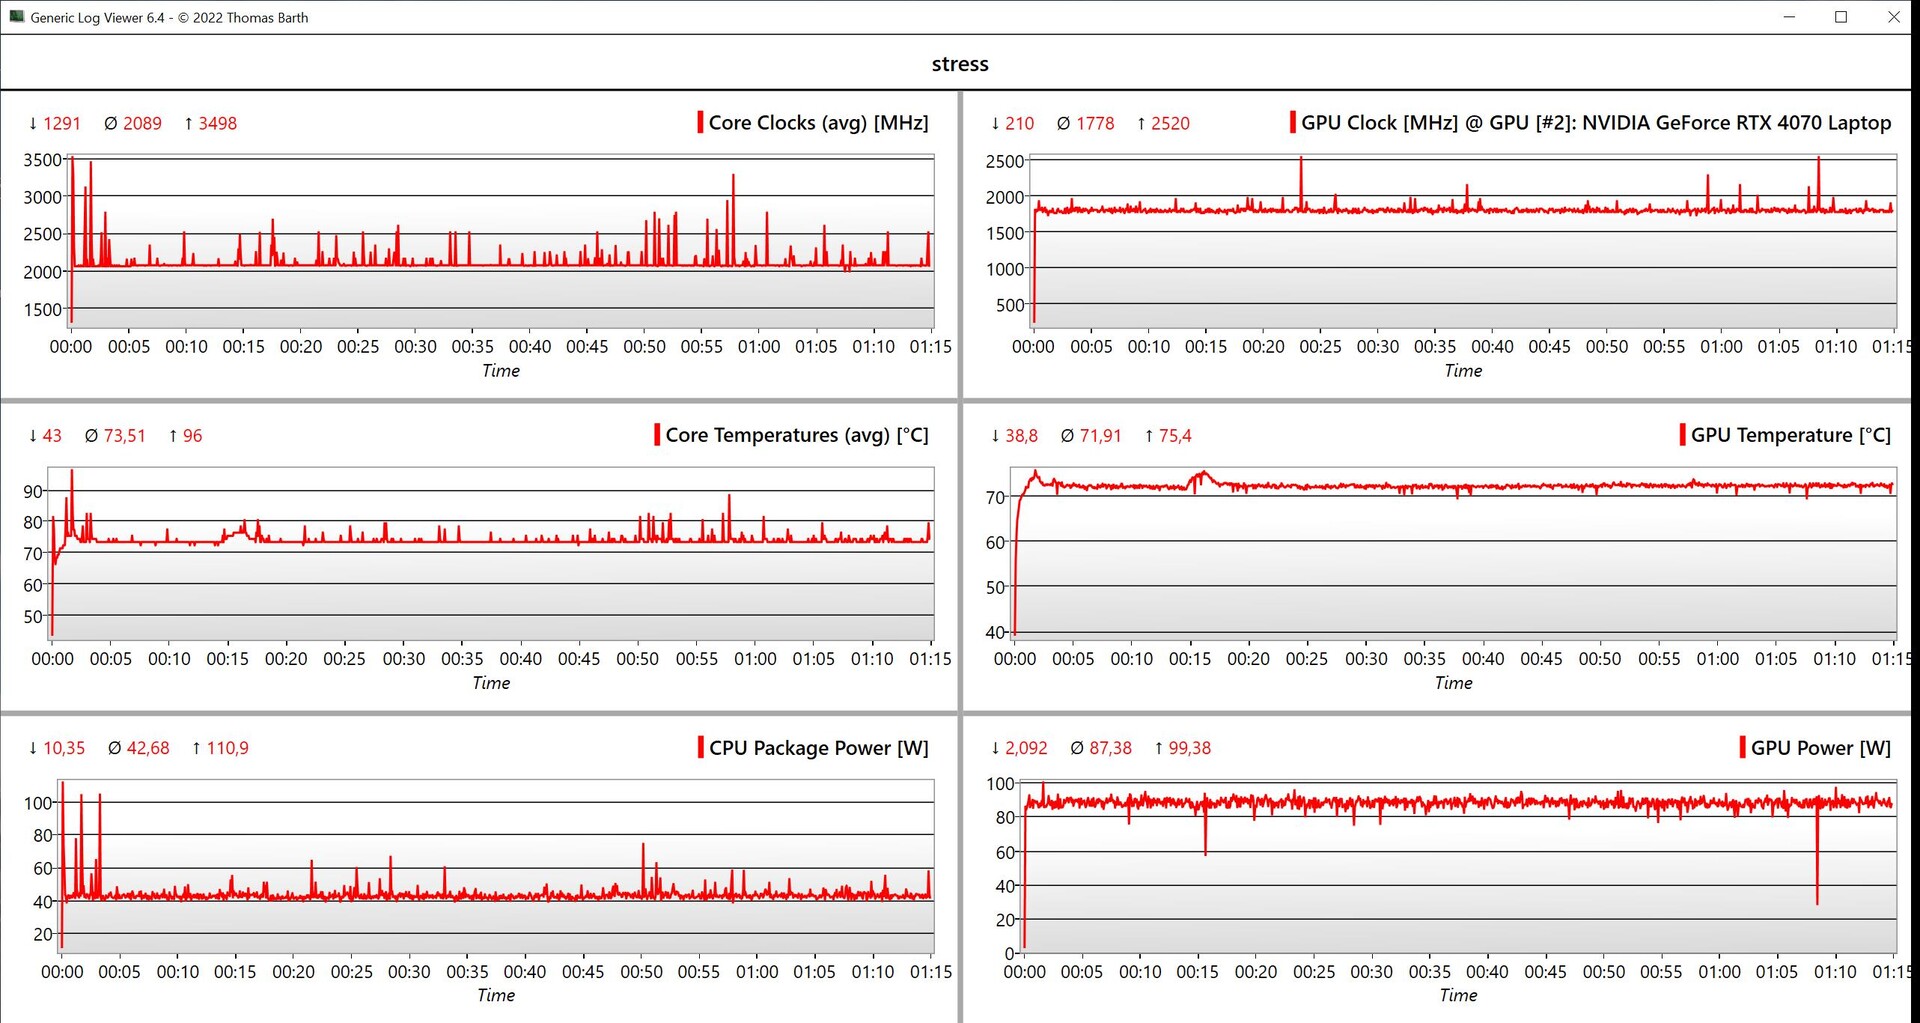
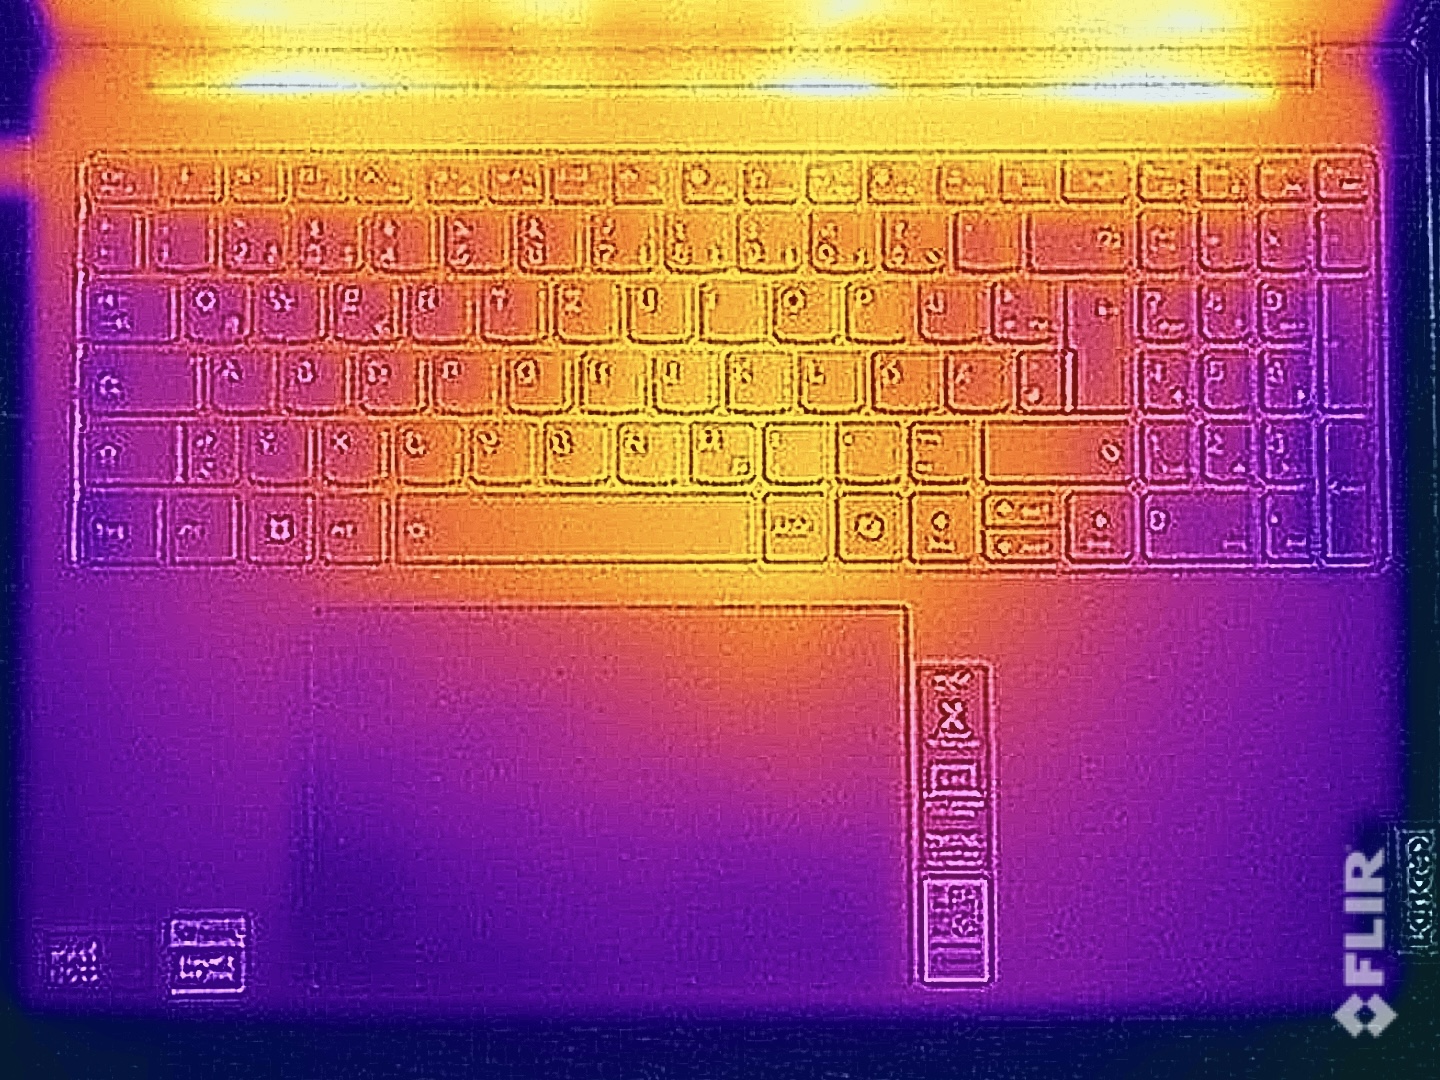
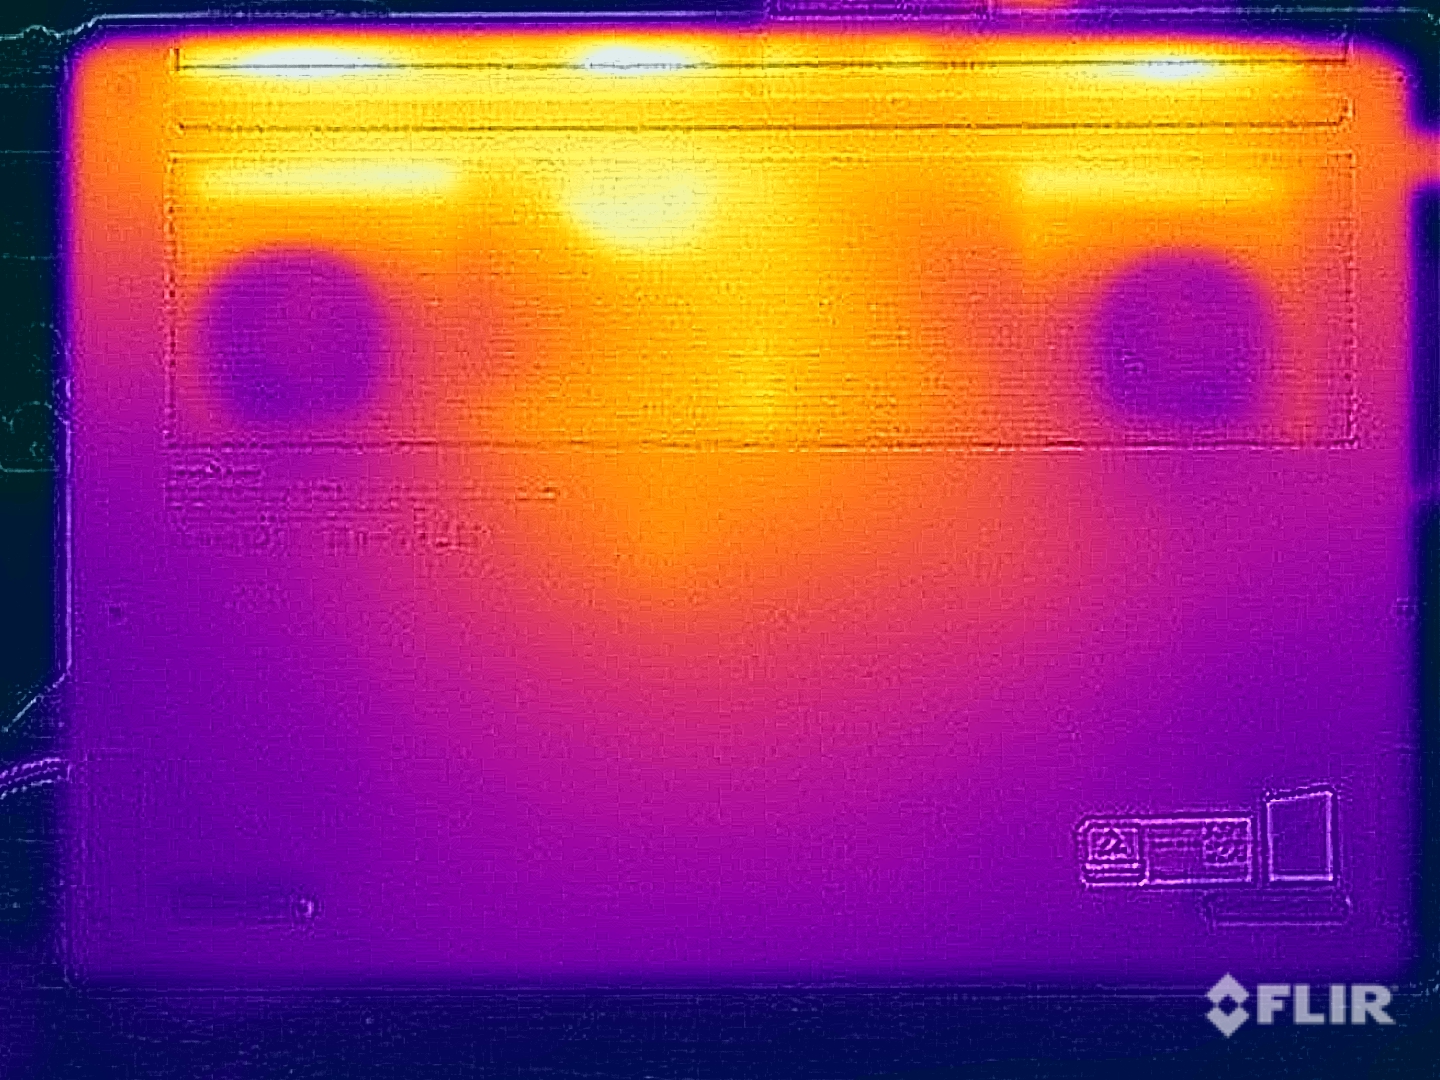
Temperature
The chassis remains pleasantly cool during simple tasks and the maximum temperature is also slightly lower under load. Nevertheless, users are likely to notice the above 45 °C hotspot on the underside, so placing the device on the thighs is not recommended here. Both the keyboard and the base unit remain significantly cooler. In the stress test with combined CPU/GPU load, the graphics card operates constantly at around 87 watts and the processor at 42 watts. This is solid performance overall.
(±) The maximum temperature on the upper side is 41.7 °C / 107 F, compared to the average of 36.8 °C / 98 F, ranging from 21 to 71 °C for the class Multimedia.
(-) The bottom heats up to a maximum of 46.3 °C / 115 F, compared to the average of 39.1 °C / 102 F
(+) In idle usage, the average temperature for the upper side is 25.5 °C / 78 F, compared to the device average of 31.3 °C / 88 F.
(±) Playing The Witcher 3, the average temperature for the upper side is 35.4 °C / 96 F, compared to the device average of 31.3 °C / 88 F.
(+) The palmrests and touchpad are cooler than skin temperature with a maximum of 31 °C / 87.8 F and are therefore cool to the touch.
(-) The average temperature of the palmrest area of similar devices was 28.7 °C / 83.7 F (-2.3 °C / -4.1 F).
| Lenovo Yoga Pro 9 16IMH9 Intel Core Ultra 9 185H, NVIDIA GeForce RTX 4070 Laptop GPU | Dell XPS 16 9640 Intel Core Ultra 7 155H, NVIDIA GeForce RTX 4070 Laptop GPU | Honor MagicBook Pro 16 2024 Intel Core Ultra 7 155H, NVIDIA GeForce RTX 4060 Laptop GPU | Samsung Galaxy Book4 Ultra Intel Core Ultra 7 155H, NVIDIA GeForce RTX 4050 Laptop GPU | Framework Laptop 16 AMD Ryzen 9 7940HS, AMD Radeon RX 7700S | Schenker VISION 16 Pro (M23) Intel Core i7-13700H, NVIDIA GeForce RTX 4070 Laptop GPU | Lenovo Yoga Pro 9 16-IRP G8 Intel Core i7-13705H, NVIDIA GeForce RTX 4060 Laptop GPU | |
|---|---|---|---|---|---|---|---|
| Heat | 4% | 9% | 10% | -3% | -7% | -3% | |
| Maximum Upper Side * (°C) | 41.7 | 39.4 6% | 39.7 5% | 38.5 8% | 42.4 -2% | 46.7 -12% | 41.6 -0% |
| Maximum Bottom * (°C) | 46.3 | 36.9 20% | 42.9 7% | 41.2 11% | 40.8 12% | 54.1 -17% | 50 -8% |
| Idle Upper Side * (°C) | 26.2 | 28.2 -8% | 23.7 10% | 23.5 10% | 31.4 -20% | 26.5 -1% | 26.8 -2% |
| Idle Bottom * (°C) | 27.2 | 27.4 -1% | 23.5 14% | 24.1 11% | 27.8 -2% | 26.8 1% | 27.9 -3% |
* ... smaller is better
Speakers
The sound system with the 6 modules is still one of the best models in the multimedia segment and outperforms many of its competitors. You can do without external speakers in many cases, but you won't benefit from the speakers when gaming due to the loud fans. A headset is recommended here.
Lenovo Yoga Pro 9 16IMH9 audio analysis
(+) | speakers can play relatively loud (84.5 dB)
Bass 100 - 315 Hz
(±) | reduced bass - on average 7% lower than median
(±) | linearity of bass is average (7.2% delta to prev. frequency)
Mids 400 - 2000 Hz
(+) | balanced mids - only 3.9% away from median
(+) | mids are linear (4.5% delta to prev. frequency)
Highs 2 - 16 kHz
(+) | balanced highs - only 2.8% away from median
(+) | highs are linear (3.2% delta to prev. frequency)
Overall 100 - 16.000 Hz
(+) | overall sound is linear (8.8% difference to median)
Compared to same class
» 11% of all tested devices in this class were better, 2% similar, 87% worse
» The best had a delta of 5%, average was 17%, worst was 45%
Compared to all devices tested
» 3% of all tested devices were better, 1% similar, 97% worse
» The best had a delta of 4%, average was 23%, worst was 134%
Dell XPS 16 9640 audio analysis
(+) | speakers can play relatively loud (83.4 dB)
Bass 100 - 315 Hz
(±) | reduced bass - on average 11.2% lower than median
(±) | linearity of bass is average (8.9% delta to prev. frequency)
Mids 400 - 2000 Hz
(+) | balanced mids - only 4.5% away from median
(+) | mids are linear (3% delta to prev. frequency)
Highs 2 - 16 kHz
(+) | balanced highs - only 1.4% away from median
(+) | highs are linear (2% delta to prev. frequency)
Overall 100 - 16.000 Hz
(+) | overall sound is linear (10% difference to median)
Compared to same class
» 13% of all tested devices in this class were better, 2% similar, 84% worse
» The best had a delta of 5%, average was 17%, worst was 45%
Compared to all devices tested
» 4% of all tested devices were better, 1% similar, 94% worse
» The best had a delta of 4%, average was 23%, worst was 134%
Honor MagicBook Pro 16 2024 audio analysis
(±) | speaker loudness is average but good (81.3 dB)
Bass 100 - 315 Hz
(±) | reduced bass - on average 6.8% lower than median
(±) | linearity of bass is average (9% delta to prev. frequency)
Mids 400 - 2000 Hz
(+) | balanced mids - only 2.1% away from median
(+) | mids are linear (5.2% delta to prev. frequency)
Highs 2 - 16 kHz
(+) | balanced highs - only 2.1% away from median
(+) | highs are linear (6.5% delta to prev. frequency)
Overall 100 - 16.000 Hz
(+) | overall sound is linear (8.7% difference to median)
Compared to same class
» 11% of all tested devices in this class were better, 2% similar, 87% worse
» The best had a delta of 5%, average was 17%, worst was 45%
Compared to all devices tested
» 3% of all tested devices were better, 1% similar, 97% worse
» The best had a delta of 4%, average was 23%, worst was 134%
Samsung Galaxy Book4 Ultra audio analysis
(+) | speakers can play relatively loud (85 dB)
Bass 100 - 315 Hz
(±) | reduced bass - on average 14.4% lower than median
(±) | linearity of bass is average (11.3% delta to prev. frequency)
Mids 400 - 2000 Hz
(+) | balanced mids - only 3.4% away from median
(+) | mids are linear (3.4% delta to prev. frequency)
Highs 2 - 16 kHz
(+) | balanced highs - only 3% away from median
(+) | highs are linear (5.6% delta to prev. frequency)
Overall 100 - 16.000 Hz
(+) | overall sound is linear (11.5% difference to median)
Compared to same class
» 18% of all tested devices in this class were better, 4% similar, 78% worse
» The best had a delta of 5%, average was 17%, worst was 45%
Compared to all devices tested
» 8% of all tested devices were better, 2% similar, 90% worse
» The best had a delta of 4%, average was 23%, worst was 134%
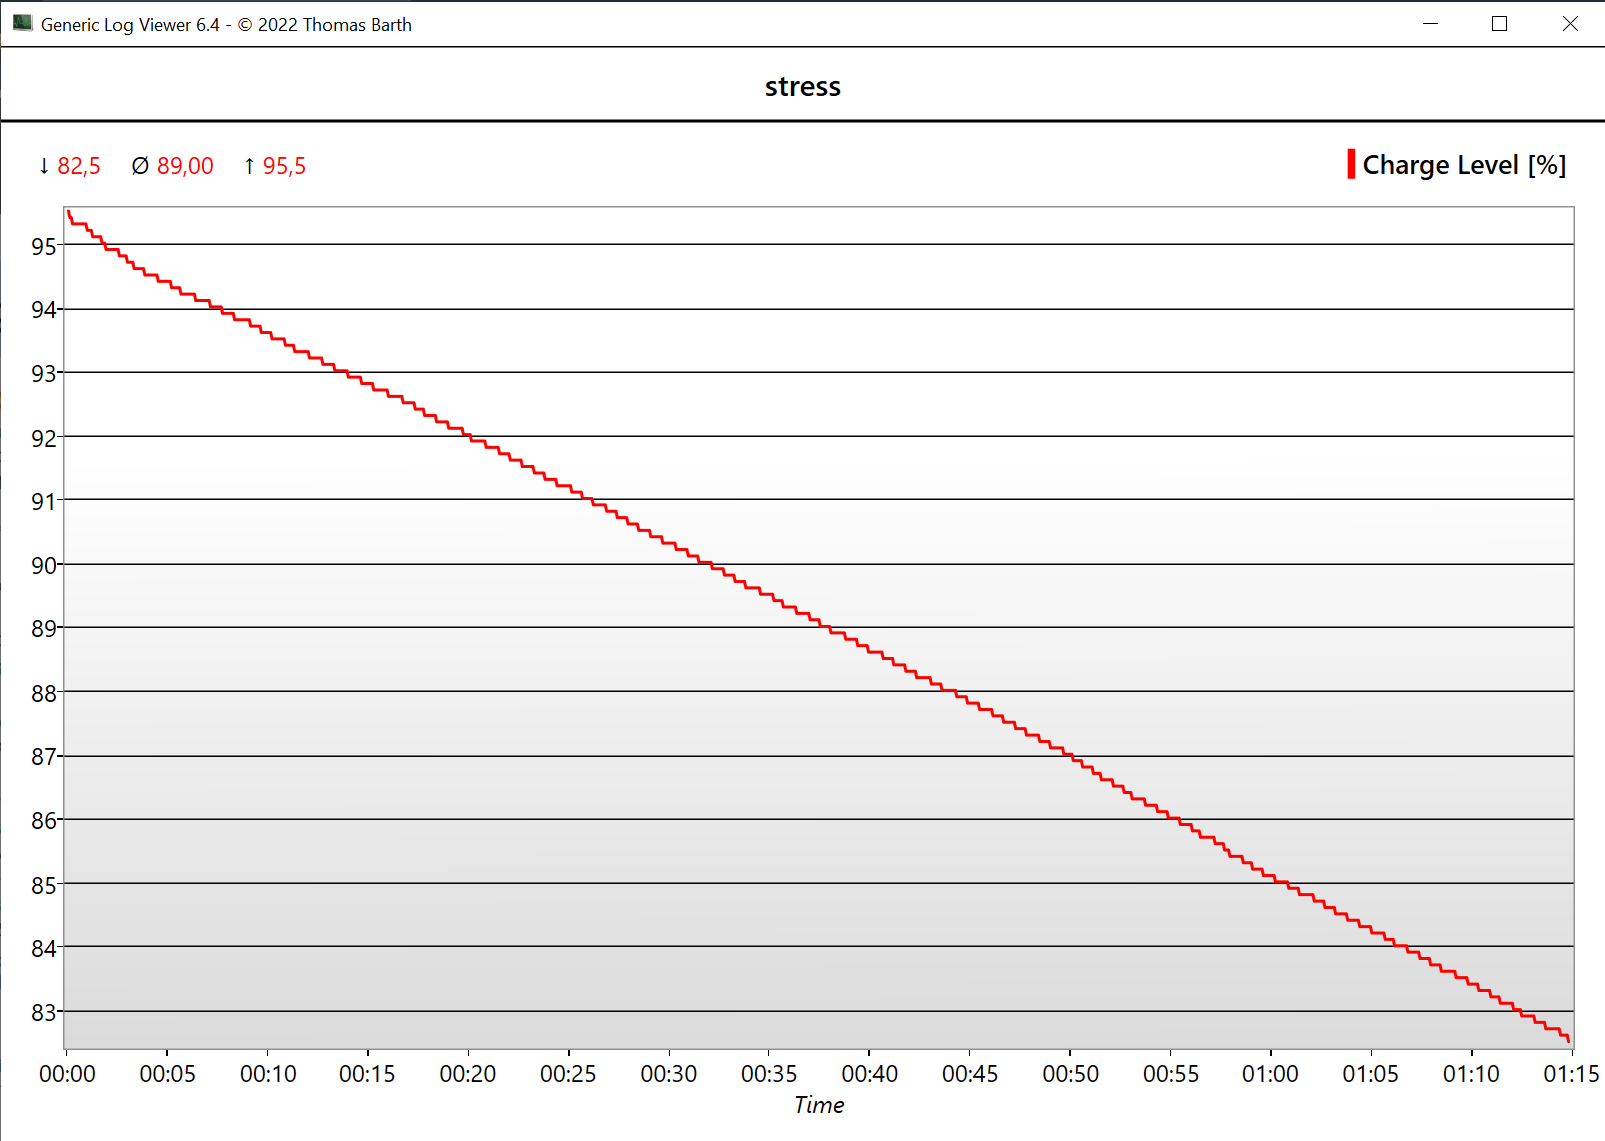
Energy management - Larger battery, longer runtimes
Power consumption
There are no significant changes in the consumption measurements compared to the predecessor. However, there is another problem here: the supplied 170 watt power supply does not sufficiently cover the maximum consumption and the device has to tap into the battery. And not just briefly, but constantly, which can be clearly seen in the chart below. During stress testing, the battery capacity drops by 12% in 75 minutes. Although our stress test is the worst-case scenario and not all customers will use Performance mode, this is clearly a problem and Lenovo is cutting corners here. The Yoga Pro 9i 16 should have been delivered with at least a 200-watt power supply.

| Off / Standby | |
| Idle | |
| Load |
|
Key:
min: | |
| Lenovo Yoga Pro 9 16IMH9 Ultra 9 185H, GeForce RTX 4070 Laptop GPU, SK Hynix HFS001TEJ9X115N, Mini-LED, 3200x2000, 16" | Dell XPS 16 9640 Ultra 7 155H, GeForce RTX 4070 Laptop GPU, Kioxia XG8 KXG80ZNV1T02, OLED, 3840x2400, 16.3" | Honor MagicBook Pro 16 2024 Ultra 7 155H, GeForce RTX 4060 Laptop GPU, WD PC SN740 SDDPNQD-1T00, IPS, 3072x1920, 16" | Samsung Galaxy Book4 Ultra Ultra 7 155H, GeForce RTX 4050 Laptop GPU, Samsung PM9A1 MZVL2512HCJQ, OLED, 2880x1800, 16" | Framework Laptop 16 R9 7940HS, Radeon RX 7700S, WDC PC SN810 1TB, , 2560x1600, 16" | Schenker VISION 16 Pro (M23) i7-13700H, GeForce RTX 4070 Laptop GPU, Samsung 990 Pro 1 TB, IPS, 2560x1600, 16" | Lenovo Yoga Pro 9 16-IRP G8 i7-13705H, GeForce RTX 4060 Laptop GPU, Samsung PM9A1 MZVL21T0HCLR, Mini-LED, 3200x2000, 16" | Average NVIDIA GeForce RTX 4070 Laptop GPU | Average of class Multimedia | |
|---|---|---|---|---|---|---|---|---|---|
| Power Consumption | 32% | 21% | 47% | 8% | 22% | -1% | -10% | 42% | |
| Idle Minimum * (Watt) | 10.3 | 7.7 25% | 5.2 50% | 4.8 53% | 9.5 8% | 8.6 17% | 10.9 -6% | 13.2 ? -28% | 5.66 ? 45% |
| Idle Average * (Watt) | 21.9 | 10.3 53% | 14.4 34% | 7.5 66% | 17 22% | 12 45% | 22.6 -3% | 18.2 ? 17% | 10.2 ? 53% |
| Idle Maximum * (Watt) | 22.4 | 10.6 53% | 15.4 31% | 7.9 65% | 17.2 23% | 12.4 45% | 23.5 -5% | 24.6 ? -10% | 12.5 ? 44% |
| Load Average * (Watt) | 96.9 | 76.5 21% | 105.4 -9% | 79.3 18% | 96.2 1% | 80 17% | 84.6 13% | 97 ? -0% | 65.2 ? 33% |
| Witcher 3 ultra * (Watt) | 159.6 | 126.4 21% | 107.6 33% | 79.2 50% | 171.9 -8% | 147.7 7% | 159.5 -0% | ||
| Load Maximum * (Watt) | 173.8 | 138.5 20% | 195.2 -12% | 125 28% | 175.7 -1% | 173.1 -0% | 177.3 -2% | 221 ? -27% | 113.5 ? 35% |
* ... smaller is better
Power consumption Witcher 3 / Stress test
Power consumption with an external monitor
Battery life
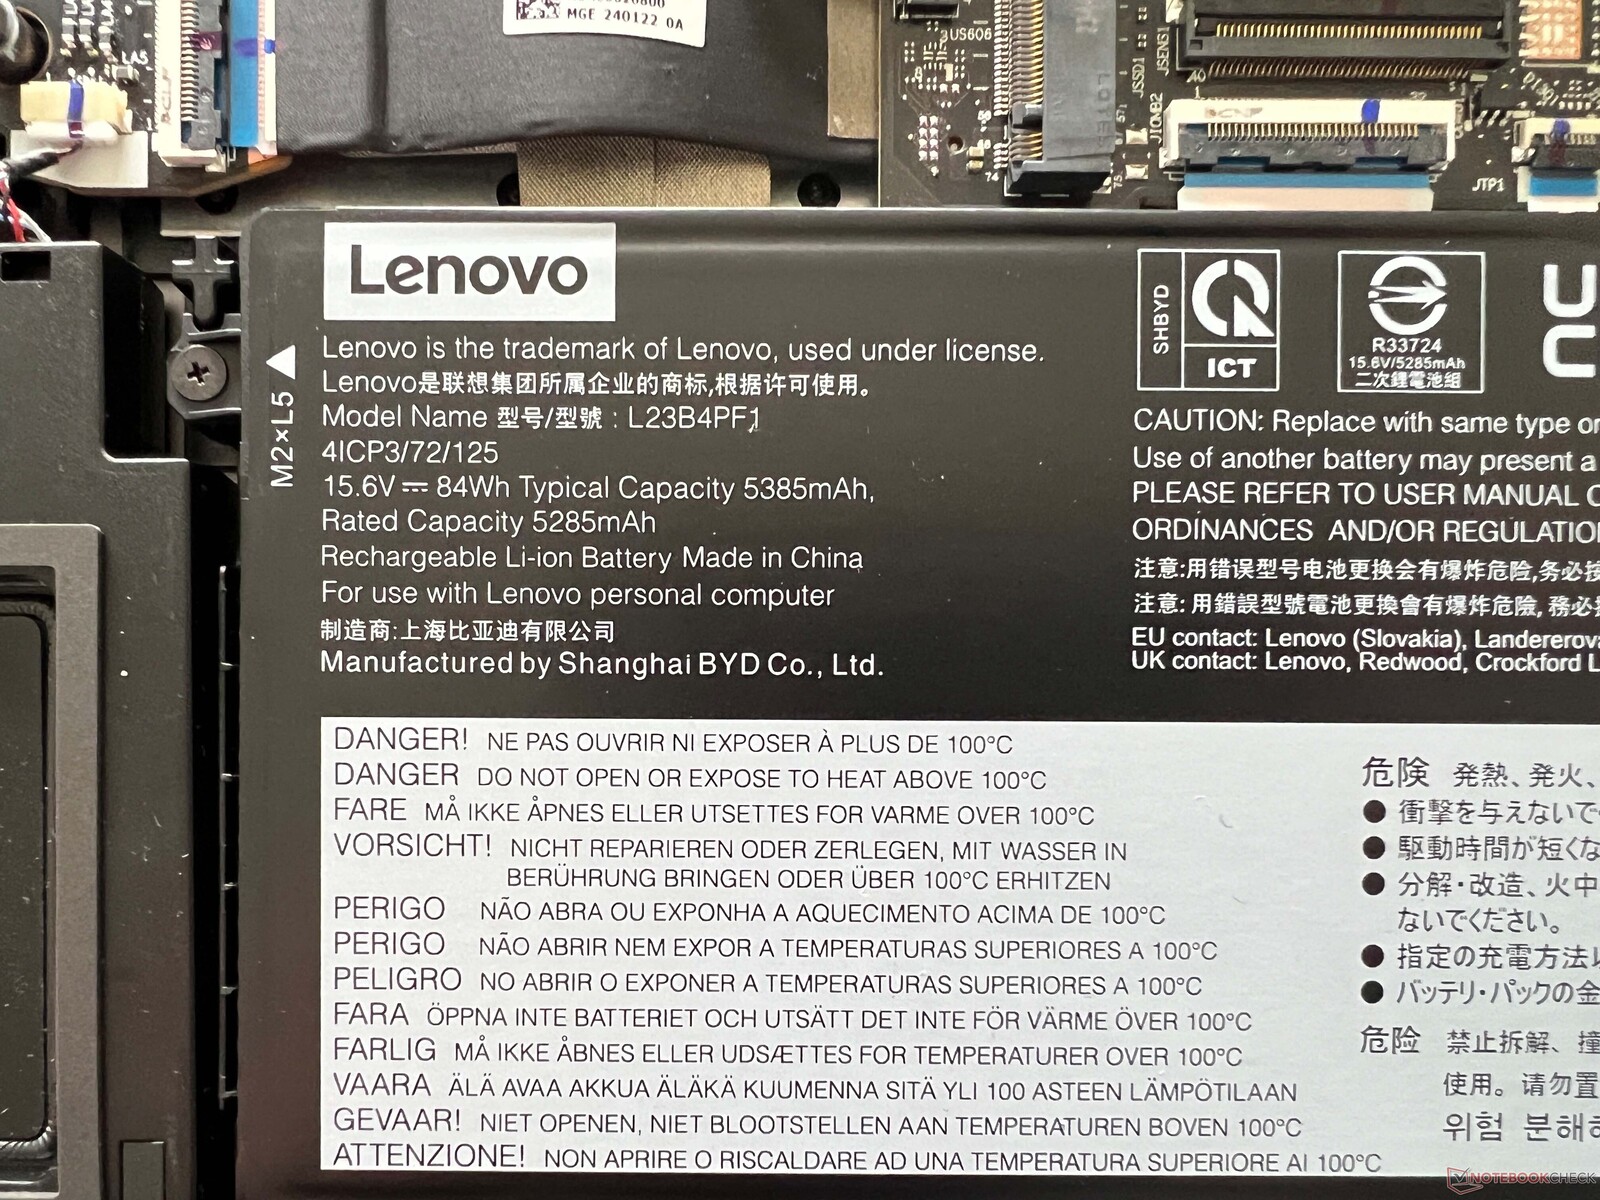
Battery life was not one of the strengths of the old model, which was also due to the very bright display. Lenovo has thus increased the battery capacity from 75 to 84 watts for its new G9 model, which has improved runtimes. With an adjusted brightness of 150 cd/m² in particular, the new Yoga performs better, even if the competitors often still have an advantage. In the WLAN test, we measured 8:46 hours at 60 Hz (~7.5 hours at 165 Hz), but just 4.5 hours at full SDR brightness and 60 Hz (4:10 hours at 165 Hz). In the video test, it is a very good 11.5 hours, but an HDR video at full brightness runs for just 2:40 hours and under full load it ends after 73 minutes. A full charge takes 96 minutes with the device switched on.
| Lenovo Yoga Pro 9 16IMH9 Ultra 9 185H, GeForce RTX 4070 Laptop GPU, 84 Wh | Dell XPS 16 9640 Ultra 7 155H, GeForce RTX 4070 Laptop GPU, 99.5 Wh | Honor MagicBook Pro 16 2024 Ultra 7 155H, GeForce RTX 4060 Laptop GPU, 75 Wh | Samsung Galaxy Book4 Ultra Ultra 7 155H, GeForce RTX 4050 Laptop GPU, 76 Wh | Framework Laptop 16 R9 7940HS, Radeon RX 7700S, 85 Wh | Schenker VISION 16 Pro (M23) i7-13700H, GeForce RTX 4070 Laptop GPU, 80 Wh | Lenovo Yoga Pro 9 16-IRP G8 i7-13705H, GeForce RTX 4060 Laptop GPU, 75 Wh | Average of class Multimedia | |
|---|---|---|---|---|---|---|---|---|
| Battery runtime | 29% | 12% | 29% | 14% | -12% | -35% | 42% | |
| H.264 (h) | 11.5 | 16.5 43% | 13.1 14% | 17.9 56% | 7.8 -32% | 7.5 -35% | 17.1 ? 49% | |
| WiFi v1.3 (h) | 8.8 | 10.5 19% | 12.2 39% | 10.9 24% | 9.1 3% | 7.8 -11% | 6.4 -27% | 12.2 ? 39% |
| Load (h) | 1.2 | 1.5 25% | 1 -17% | 1.3 8% | 1.5 25% | 1.3 8% | 0.7 -42% | 1.664 ? 39% |
Pros
Cons
Verdict - Yoga Pro 9i 16 G9 not only with improvements

Lenovo has improved its Yoga Pro 9i 16 G9 multimedia notebook in number of areas. A modern HDMI port is installed, Advanced Optimus is on board and the mechanics of the ClickPad have been improved. Moreover, the battery is now larger and the runtimes slightly better, but if you max out the brightness of the mini LED panel, you shouldn't expect miracles.
In terms of performance, the Yoga continues to perform very well, but the new Core Ultra 9 185H does not offer any real performance advantage over the old Raptor Lake chips. Gaming performance is solid and the matte mini-LED screen looks very good, especially with HDR content. The problem, however, is that Lenovo no longer offers color profiles for sRGB and AdobeRGB, which was the case with the old model.
Lenovo once again offers a very good multimedia notebook in the Yoga Pro 9 16 G9 with fast components and an extremely bright mini LED panel. However, there are also disadvantages such as the loud fans, the rather weak power supply and the short battery runtimes when the display brightness is maxed out.
The cooling still gets very loud under load and the inadequate power supply is also problematic, as the Yoga has to constantly tap into the battery under prolonged load. All in all, however, the positive aspects outweigh the negatives and the Yoga hardly has any competitors in the Windows segment in regard to its mini-LED panel. The OLED panels are nowhere near as bright, but Windows' poor HDR implementation remains a problem. Nevertheless, the Yoga Pro still clearly outperforms other multimedia competitors such as the new Dell XPS 16 9640, especially in terms of performance.
Price and availability
The new Yoga Pro 9 16 G9 can be configured and ordered directly from Lenovo, with the base model starting at just under $1500.
Lenovo Yoga Pro 9 16IMH9
- 04/20/2024 v7 (old)
Andreas Osthoff
Transparency
The selection of devices to be reviewed is made by our editorial team. The test sample was provided to the author as a loan by the manufacturer or retailer for the purpose of this review. The lender had no influence on this review, nor did the manufacturer receive a copy of this review before publication. There was no obligation to publish this review. As an independent media company, Notebookcheck is not subjected to the authority of manufacturers, retailers or publishers.
This is how Notebookcheck is testing
Every year, Notebookcheck independently reviews hundreds of laptops and smartphones using standardized procedures to ensure that all results are comparable. We have continuously developed our test methods for around 20 years and set industry standards in the process. In our test labs, high-quality measuring equipment is utilized by experienced technicians and editors. These tests involve a multi-stage validation process. Our complex rating system is based on hundreds of well-founded measurements and benchmarks, which maintains objectivity. Further information on our test methods can be found here.
Price comparison

