Schenker Vision 16 Pro 2023 review: 1.6 kg light and powerful package with RTX 4070 Laptop
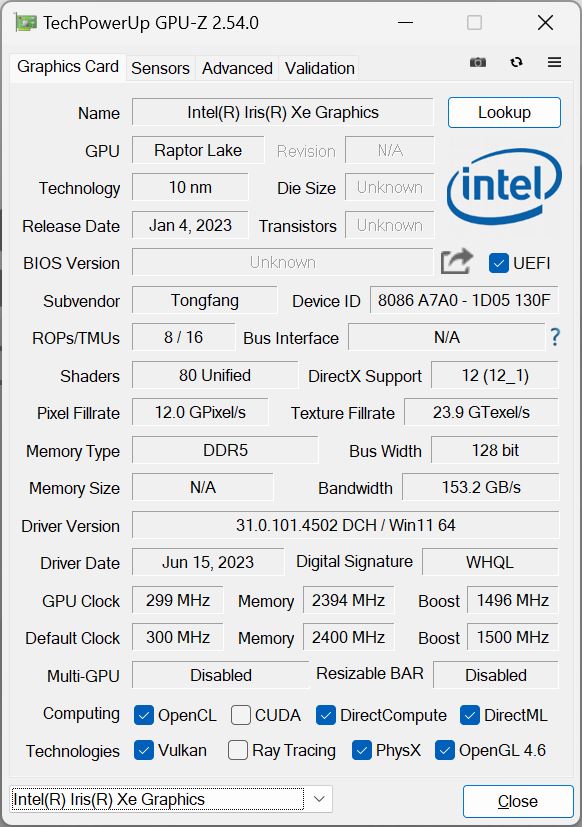
Schenker has updated the Vision 16 Pro for 2023, again offering an extremely light 16-inch laptop with a very high performance. The processor was upgraded to Intel's current Core i7-13700H Raptor Lake chip, and as graphics card, you can either choose the new GeForce RTX 4060 Laptop or the RTX 4070 Laptop, each with a maximum TGP of 95 watts. In addition to those two updates, there are also some improvements in the cooling system (new fans), and besides the processor, the GPU now also uses liquid metal cooling for optimal heat transfer.
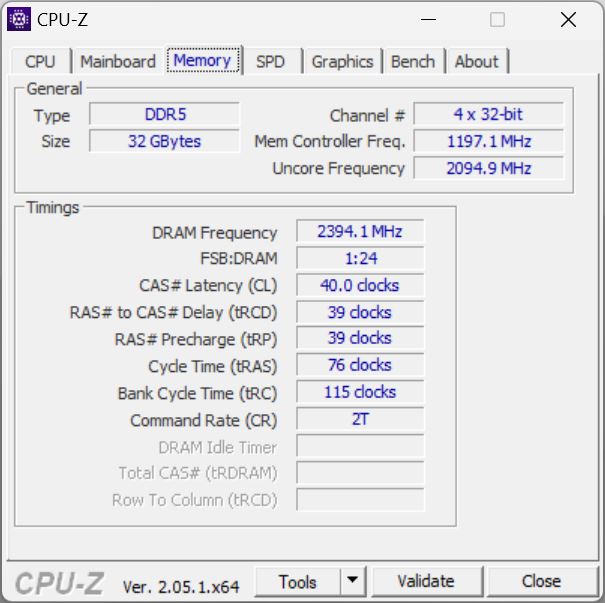
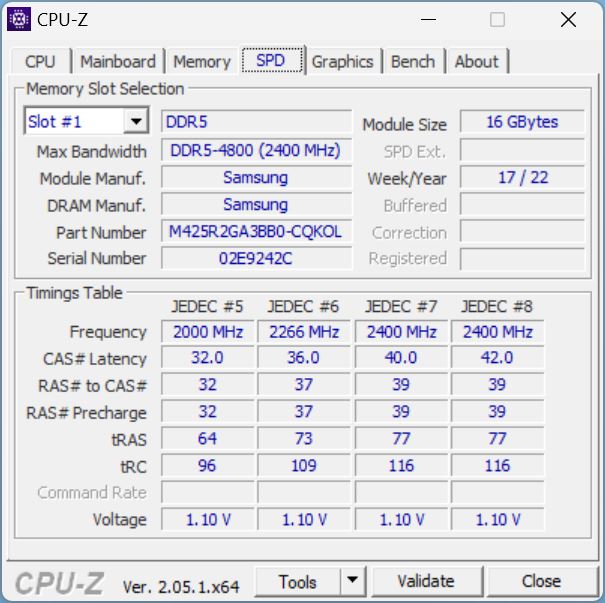
The price of the new model with the Core i7-13700H, GeForce RTX 4060 Laptop, 16 GB of RAM, and a 500-GB SSD starts from 2,099 Euros (~$2361). Our test configuration with the faster RTX 4070 Laptop, 32 GB of RAM, and a 1-TB SSD as well as Windows 11 preinstalled costs around 2,600 Euros (~$2,924), which also corresponds to the price of the predecessor.
Possible Competitors in Comparison
Rating | Date | Model | Weight | Height | Size | Resolution | Price |
|---|---|---|---|---|---|---|---|
| 88.6 % v7 (old) | 07 / 2023 | Schenker VISION 16 Pro (M23) i7-13700H, GeForce RTX 4070 Laptop GPU | 1.6 kg | 17.1 mm | 16.00" | 2560x1600 | |
| 88.8 % v7 (old) | 05 / 2023 | Samsung Galaxy Book3 Ultra 16, i9-13900H RTX 4070 i9-13900H, GeForce RTX 4070 Laptop GPU | 1.8 kg | 16.8 mm | 16.00" | 2880x1800 | |
| 88.8 % v7 (old) | 07 / 2023 | MSI Stealth 16 Studio A13VG i7-13700H, GeForce RTX 4070 Laptop GPU | 2 kg | 19.95 mm | 16.00" | 2560x1600 | |
| 90.3 % v7 (old) | 04 / 2023 | Dell XPS 15 9530 RTX 4070 i7-13700H, GeForce RTX 4070 Laptop GPU | 1.9 kg | 18 mm | 15.60" | 3456x2160 | |
| 86.1 % v7 (old) | 06 / 2023 | Asus ProArt Studiobook 16 OLED H7604 i9-13980HX, GeForce RTX 4070 Laptop GPU | 2.4 kg | 23.9 mm | 16.00" | 3200x2000 | |
| 93.7 % v7 (old) | 03 / 2023 | Apple MacBook Pro 16 2023 M2 Max M2 Max, M2 Max 38-Core GPU | 2.2 kg | 16.8 mm | 16.20" | 3456x2234 |
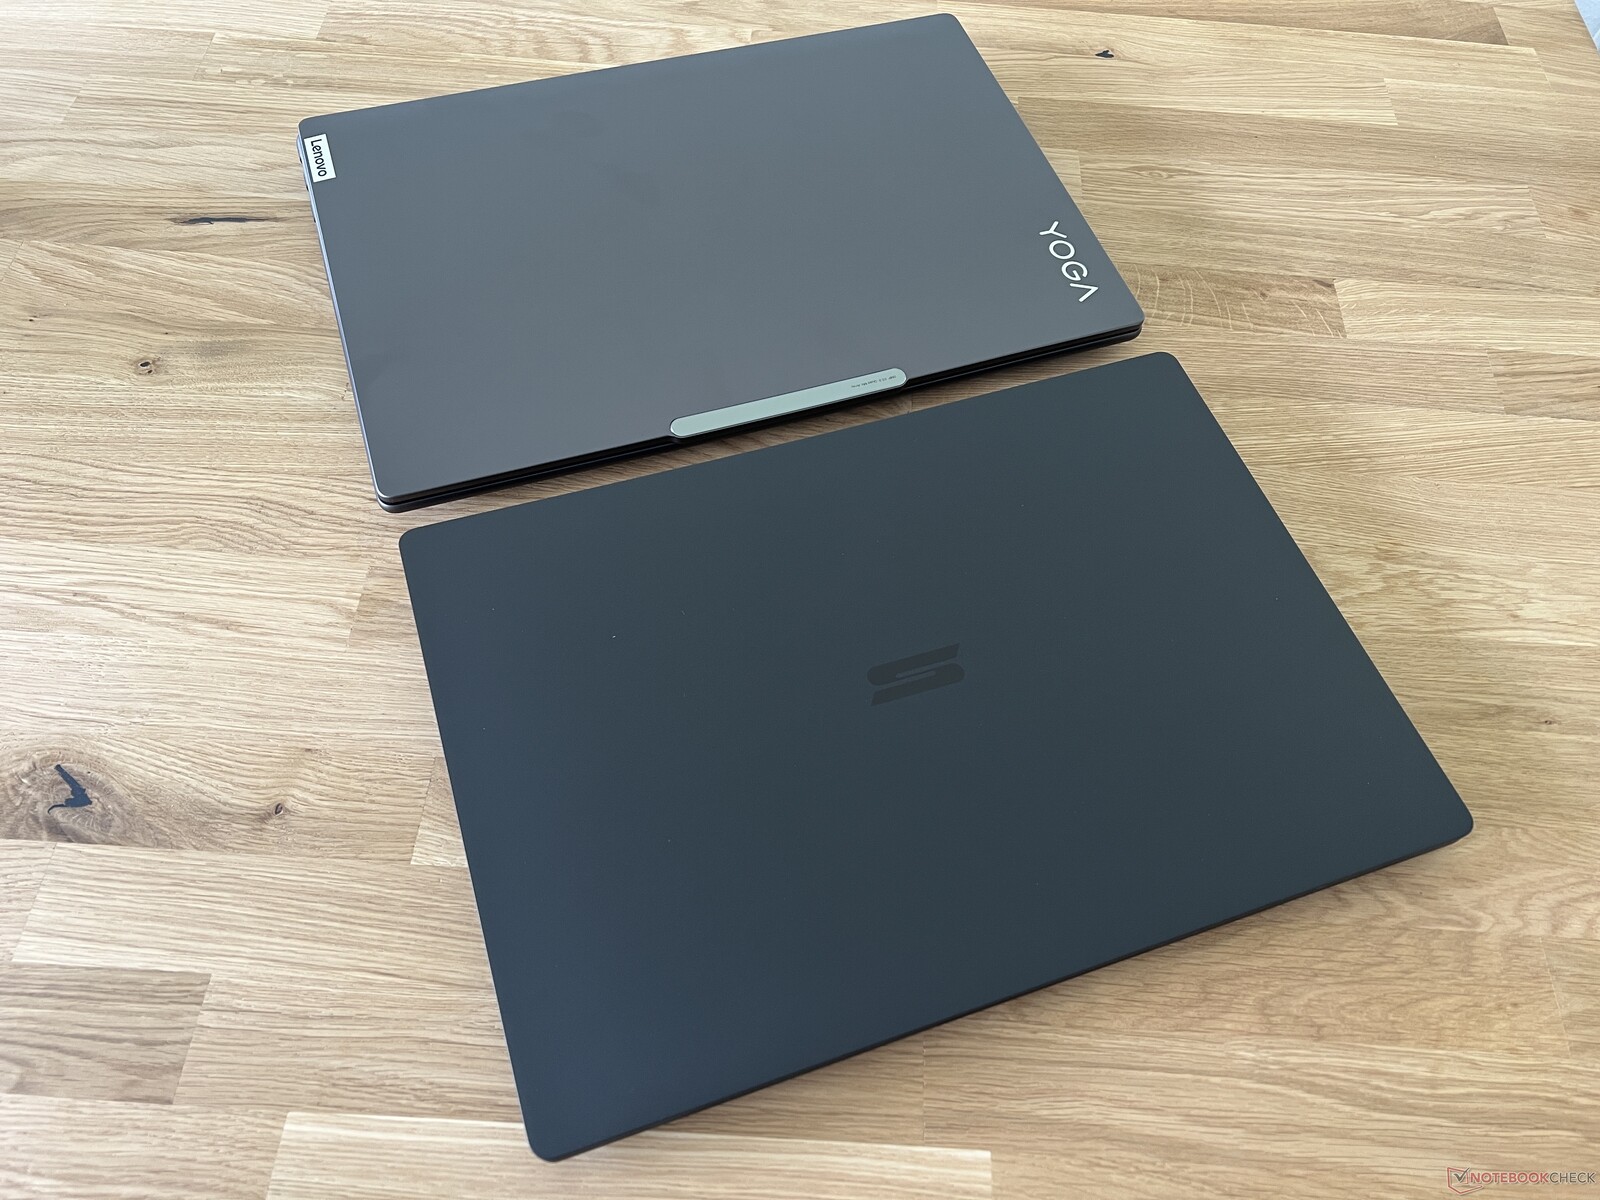
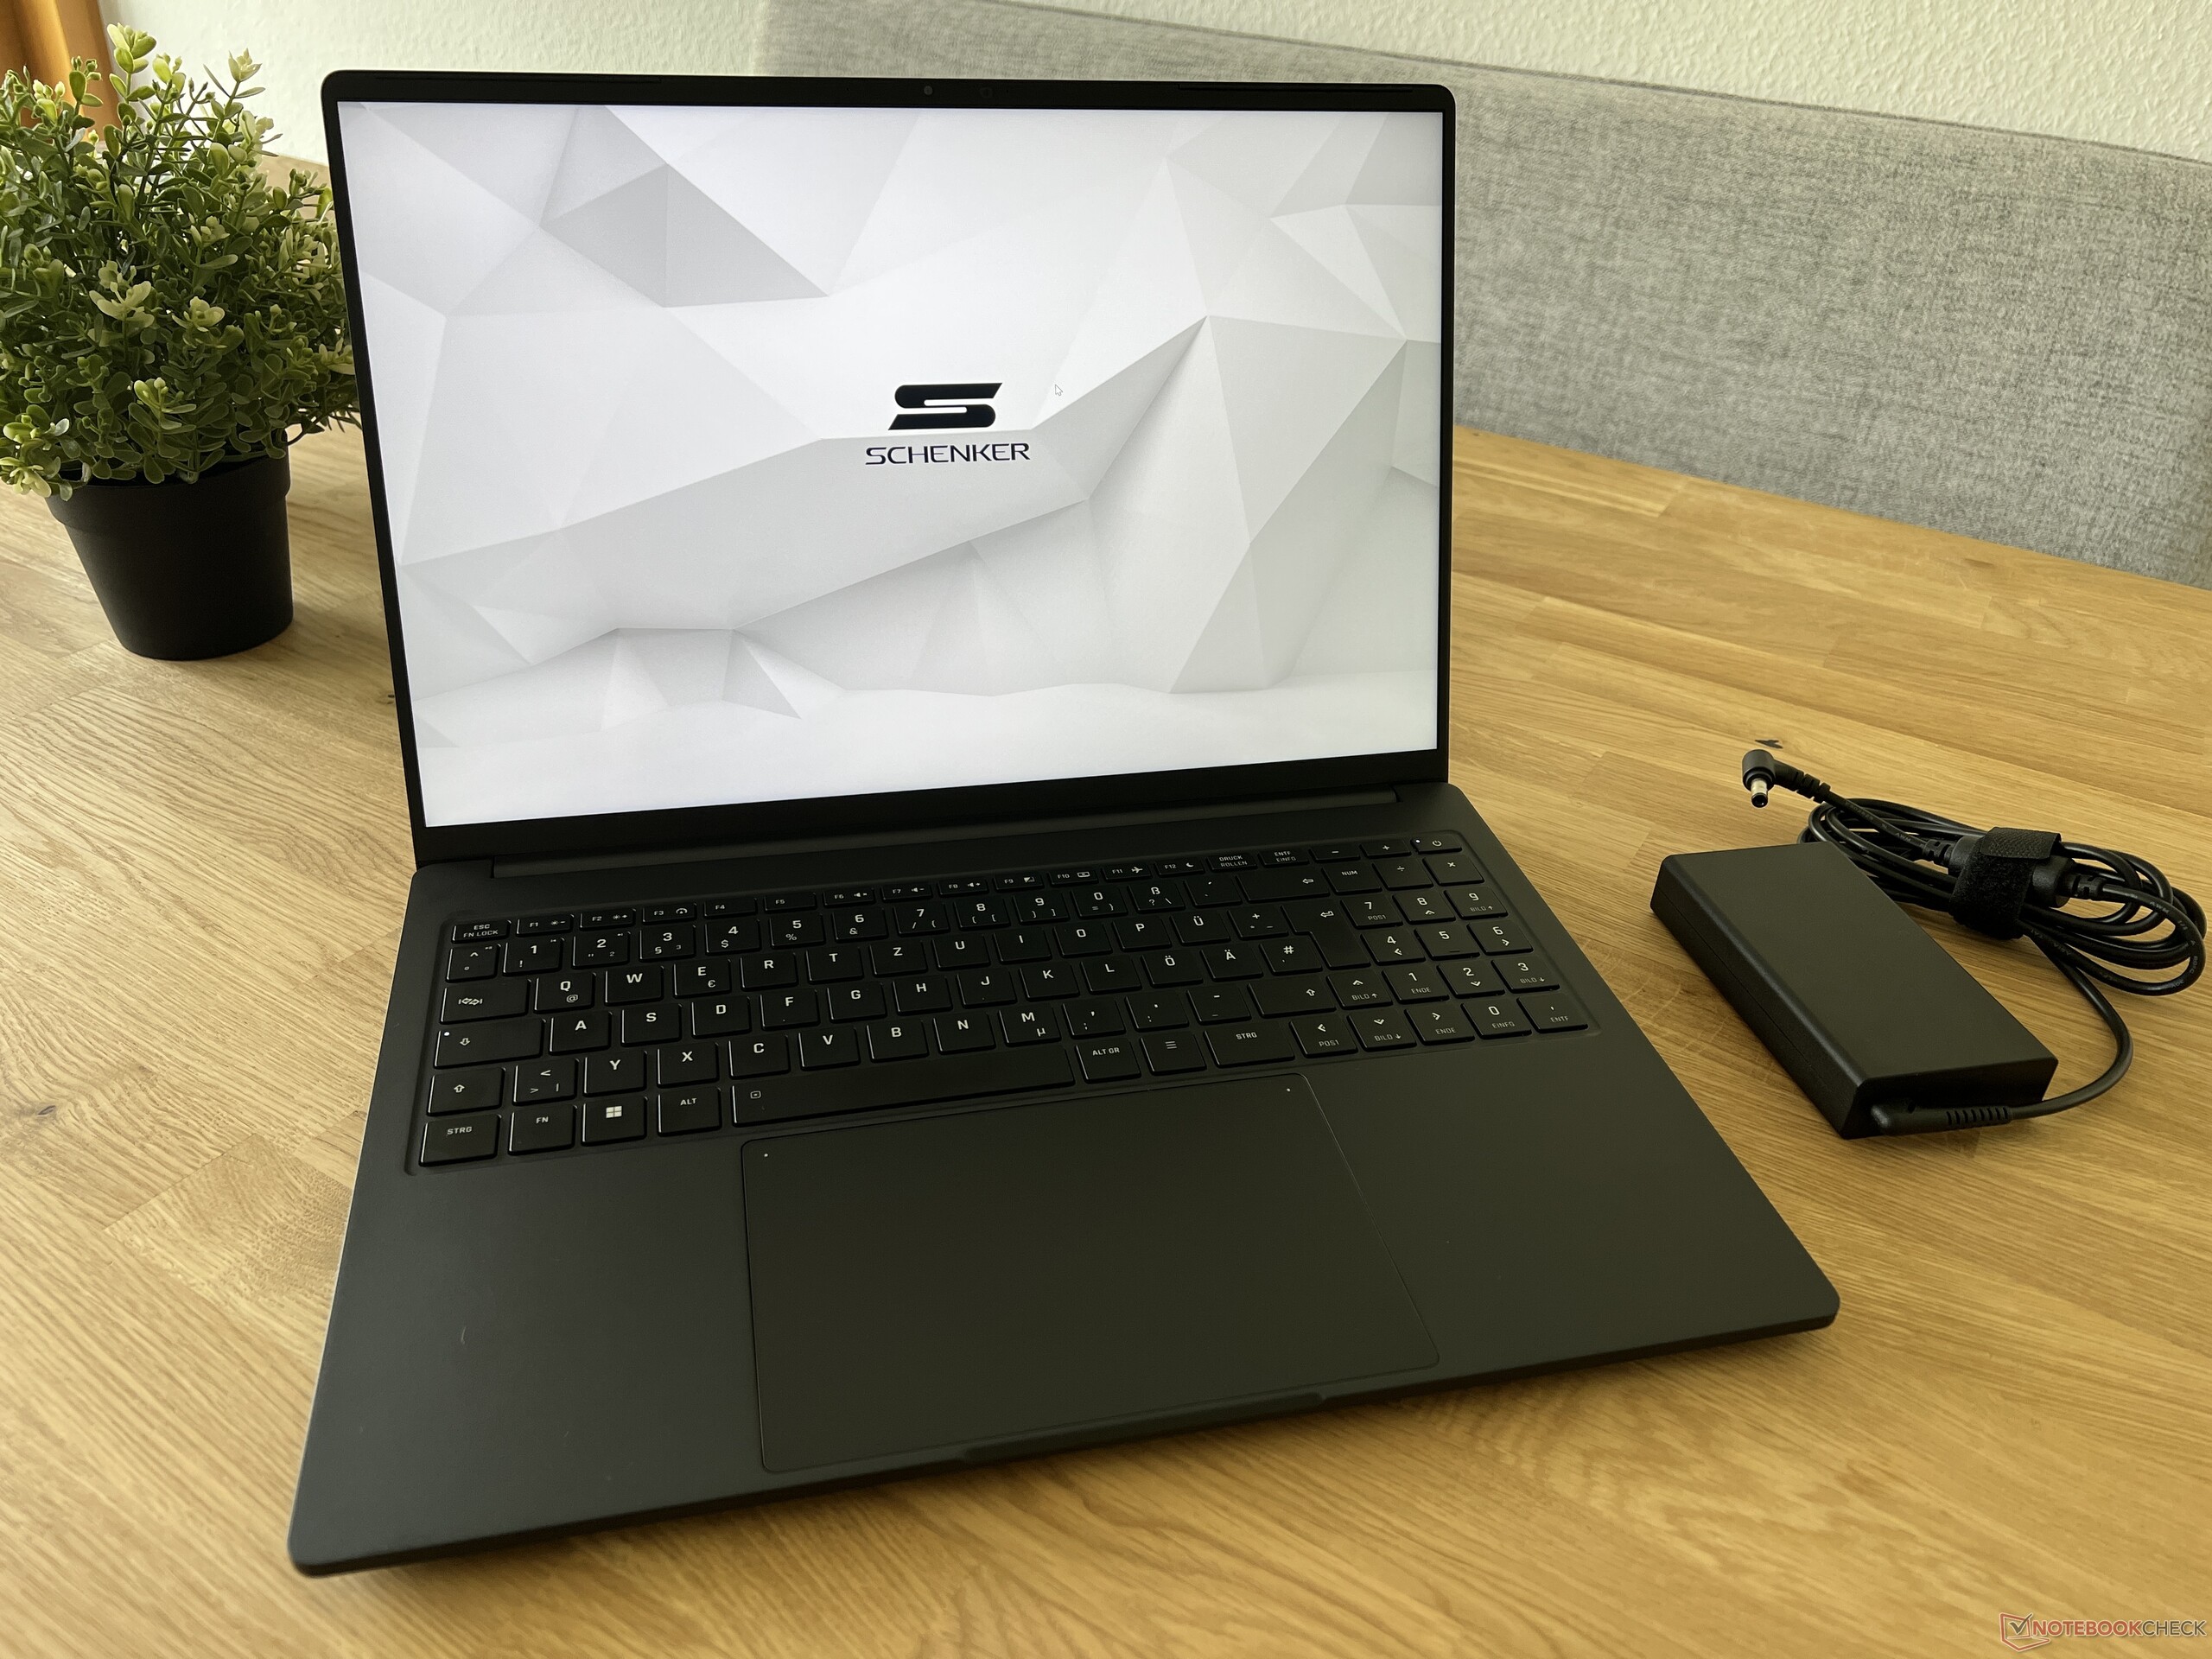
Case - Light 1.6 kg (~3.5 lb) magnesium case
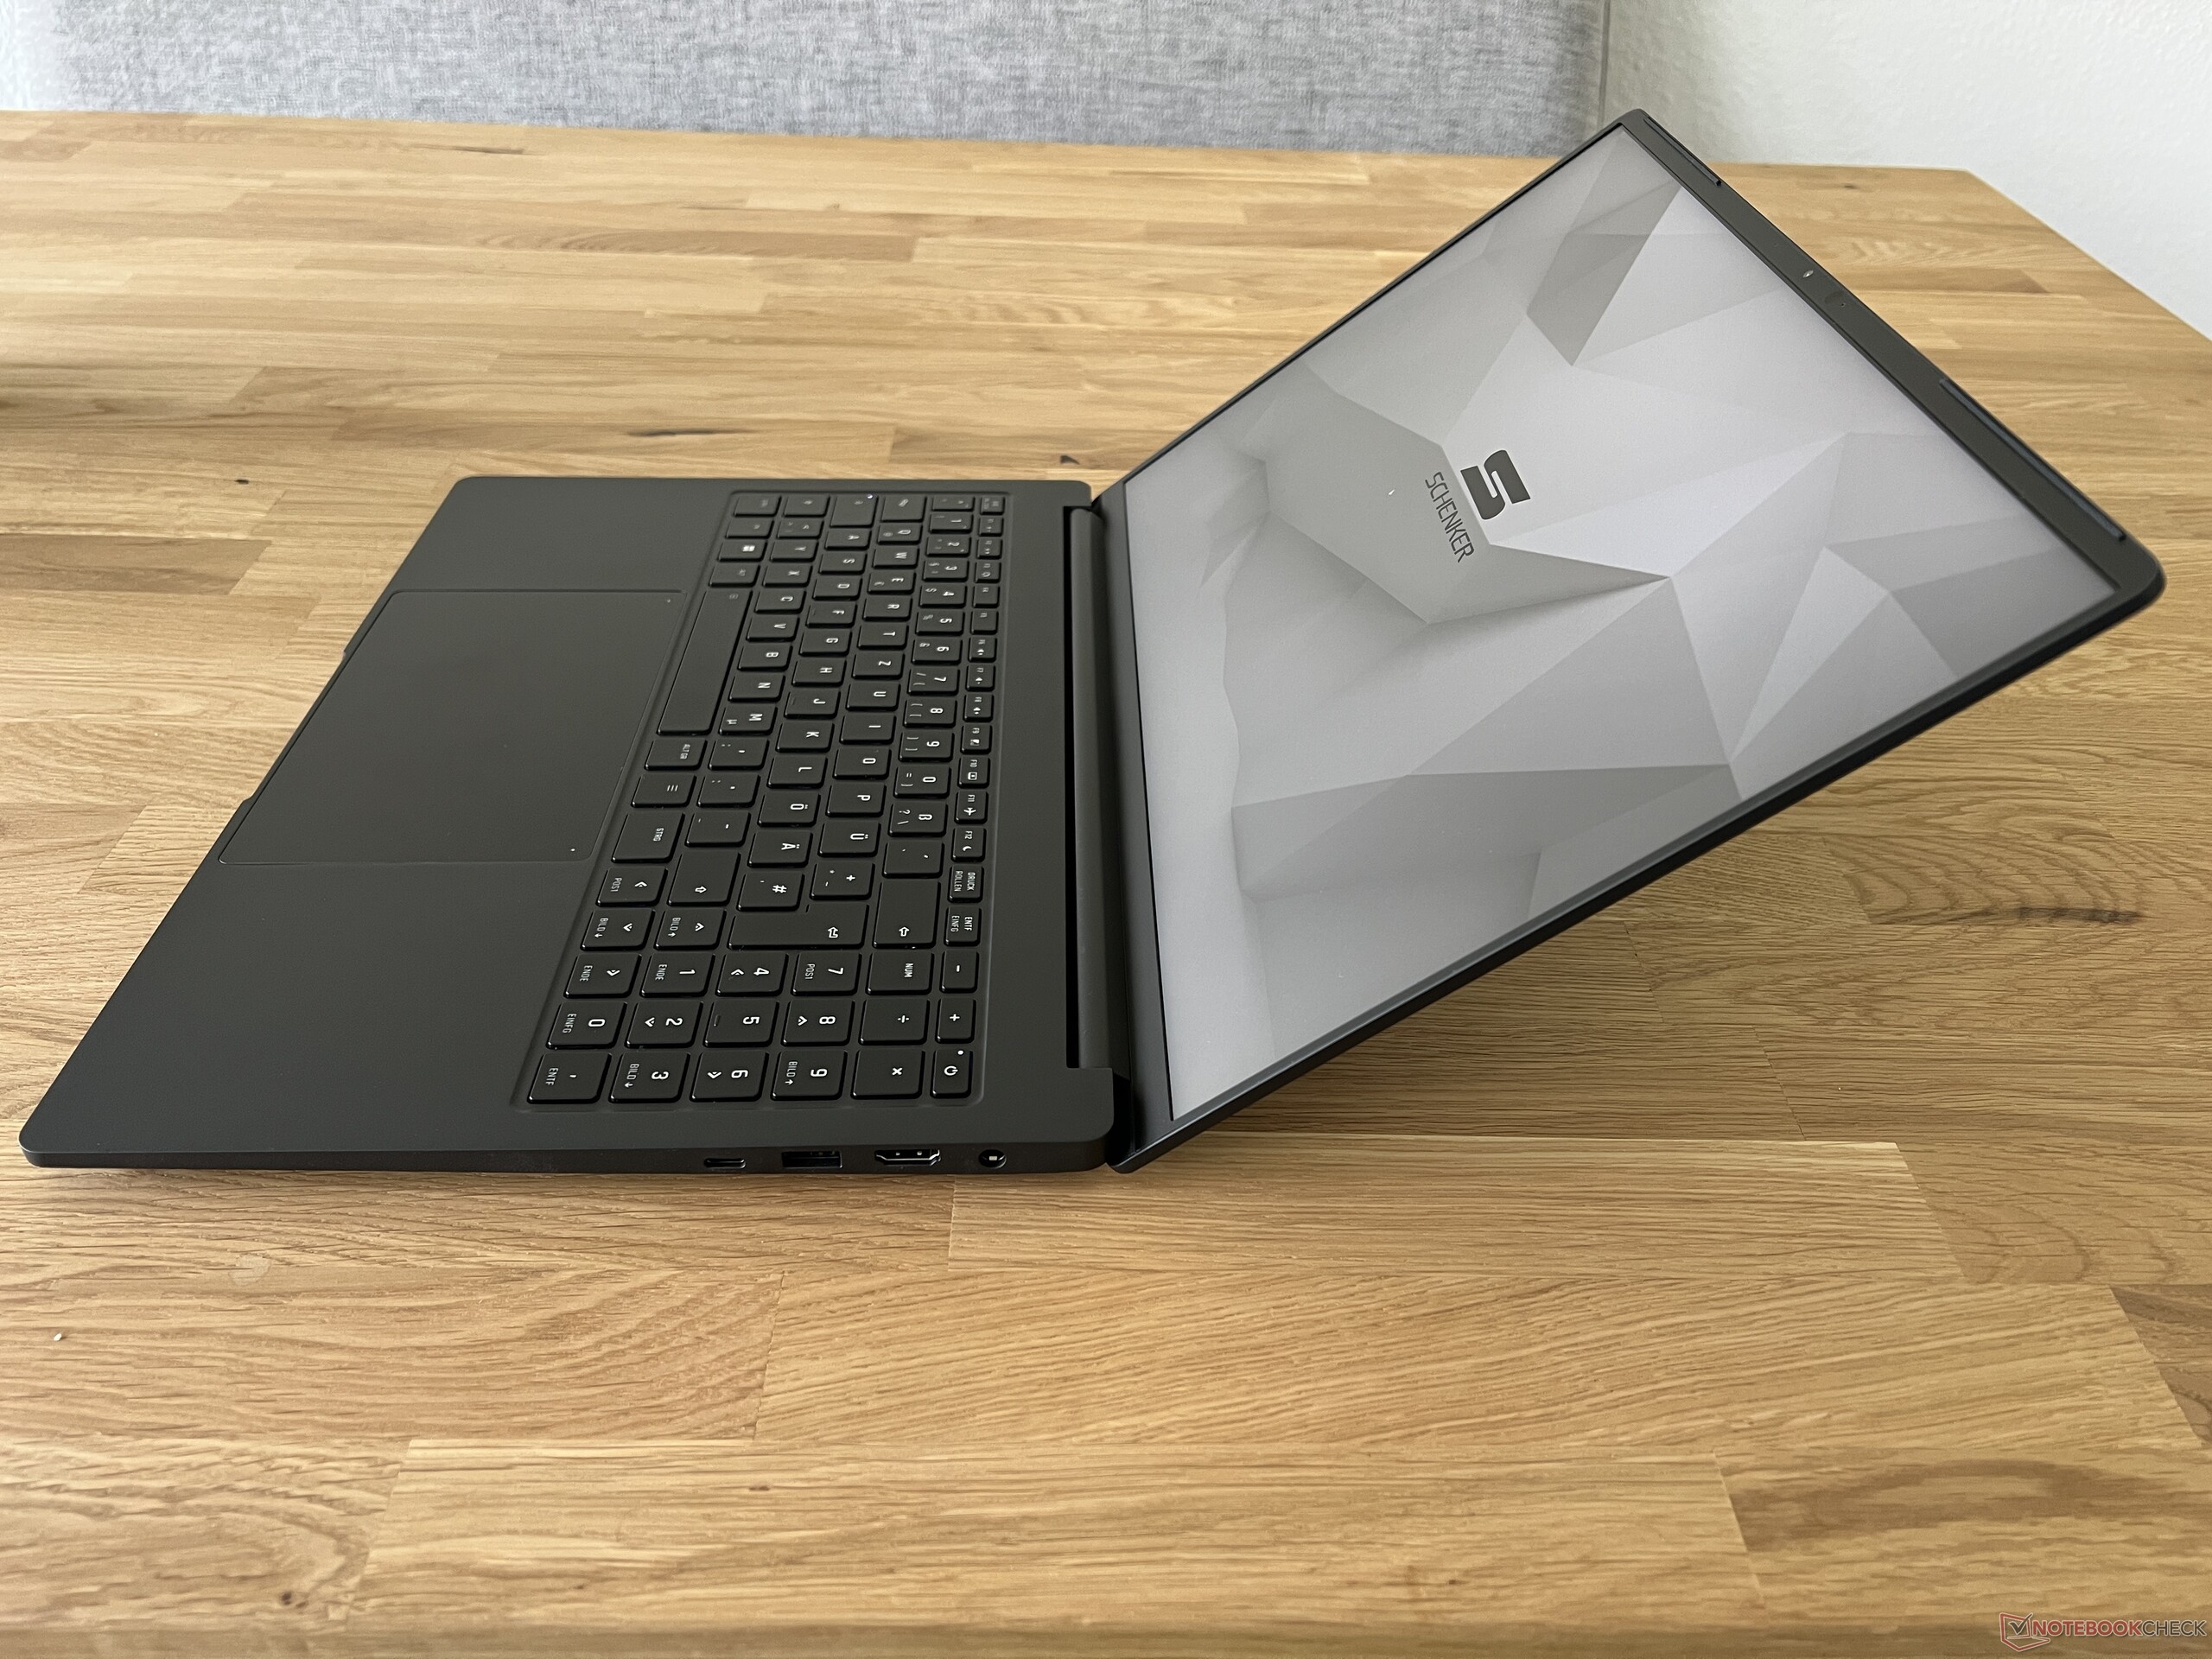
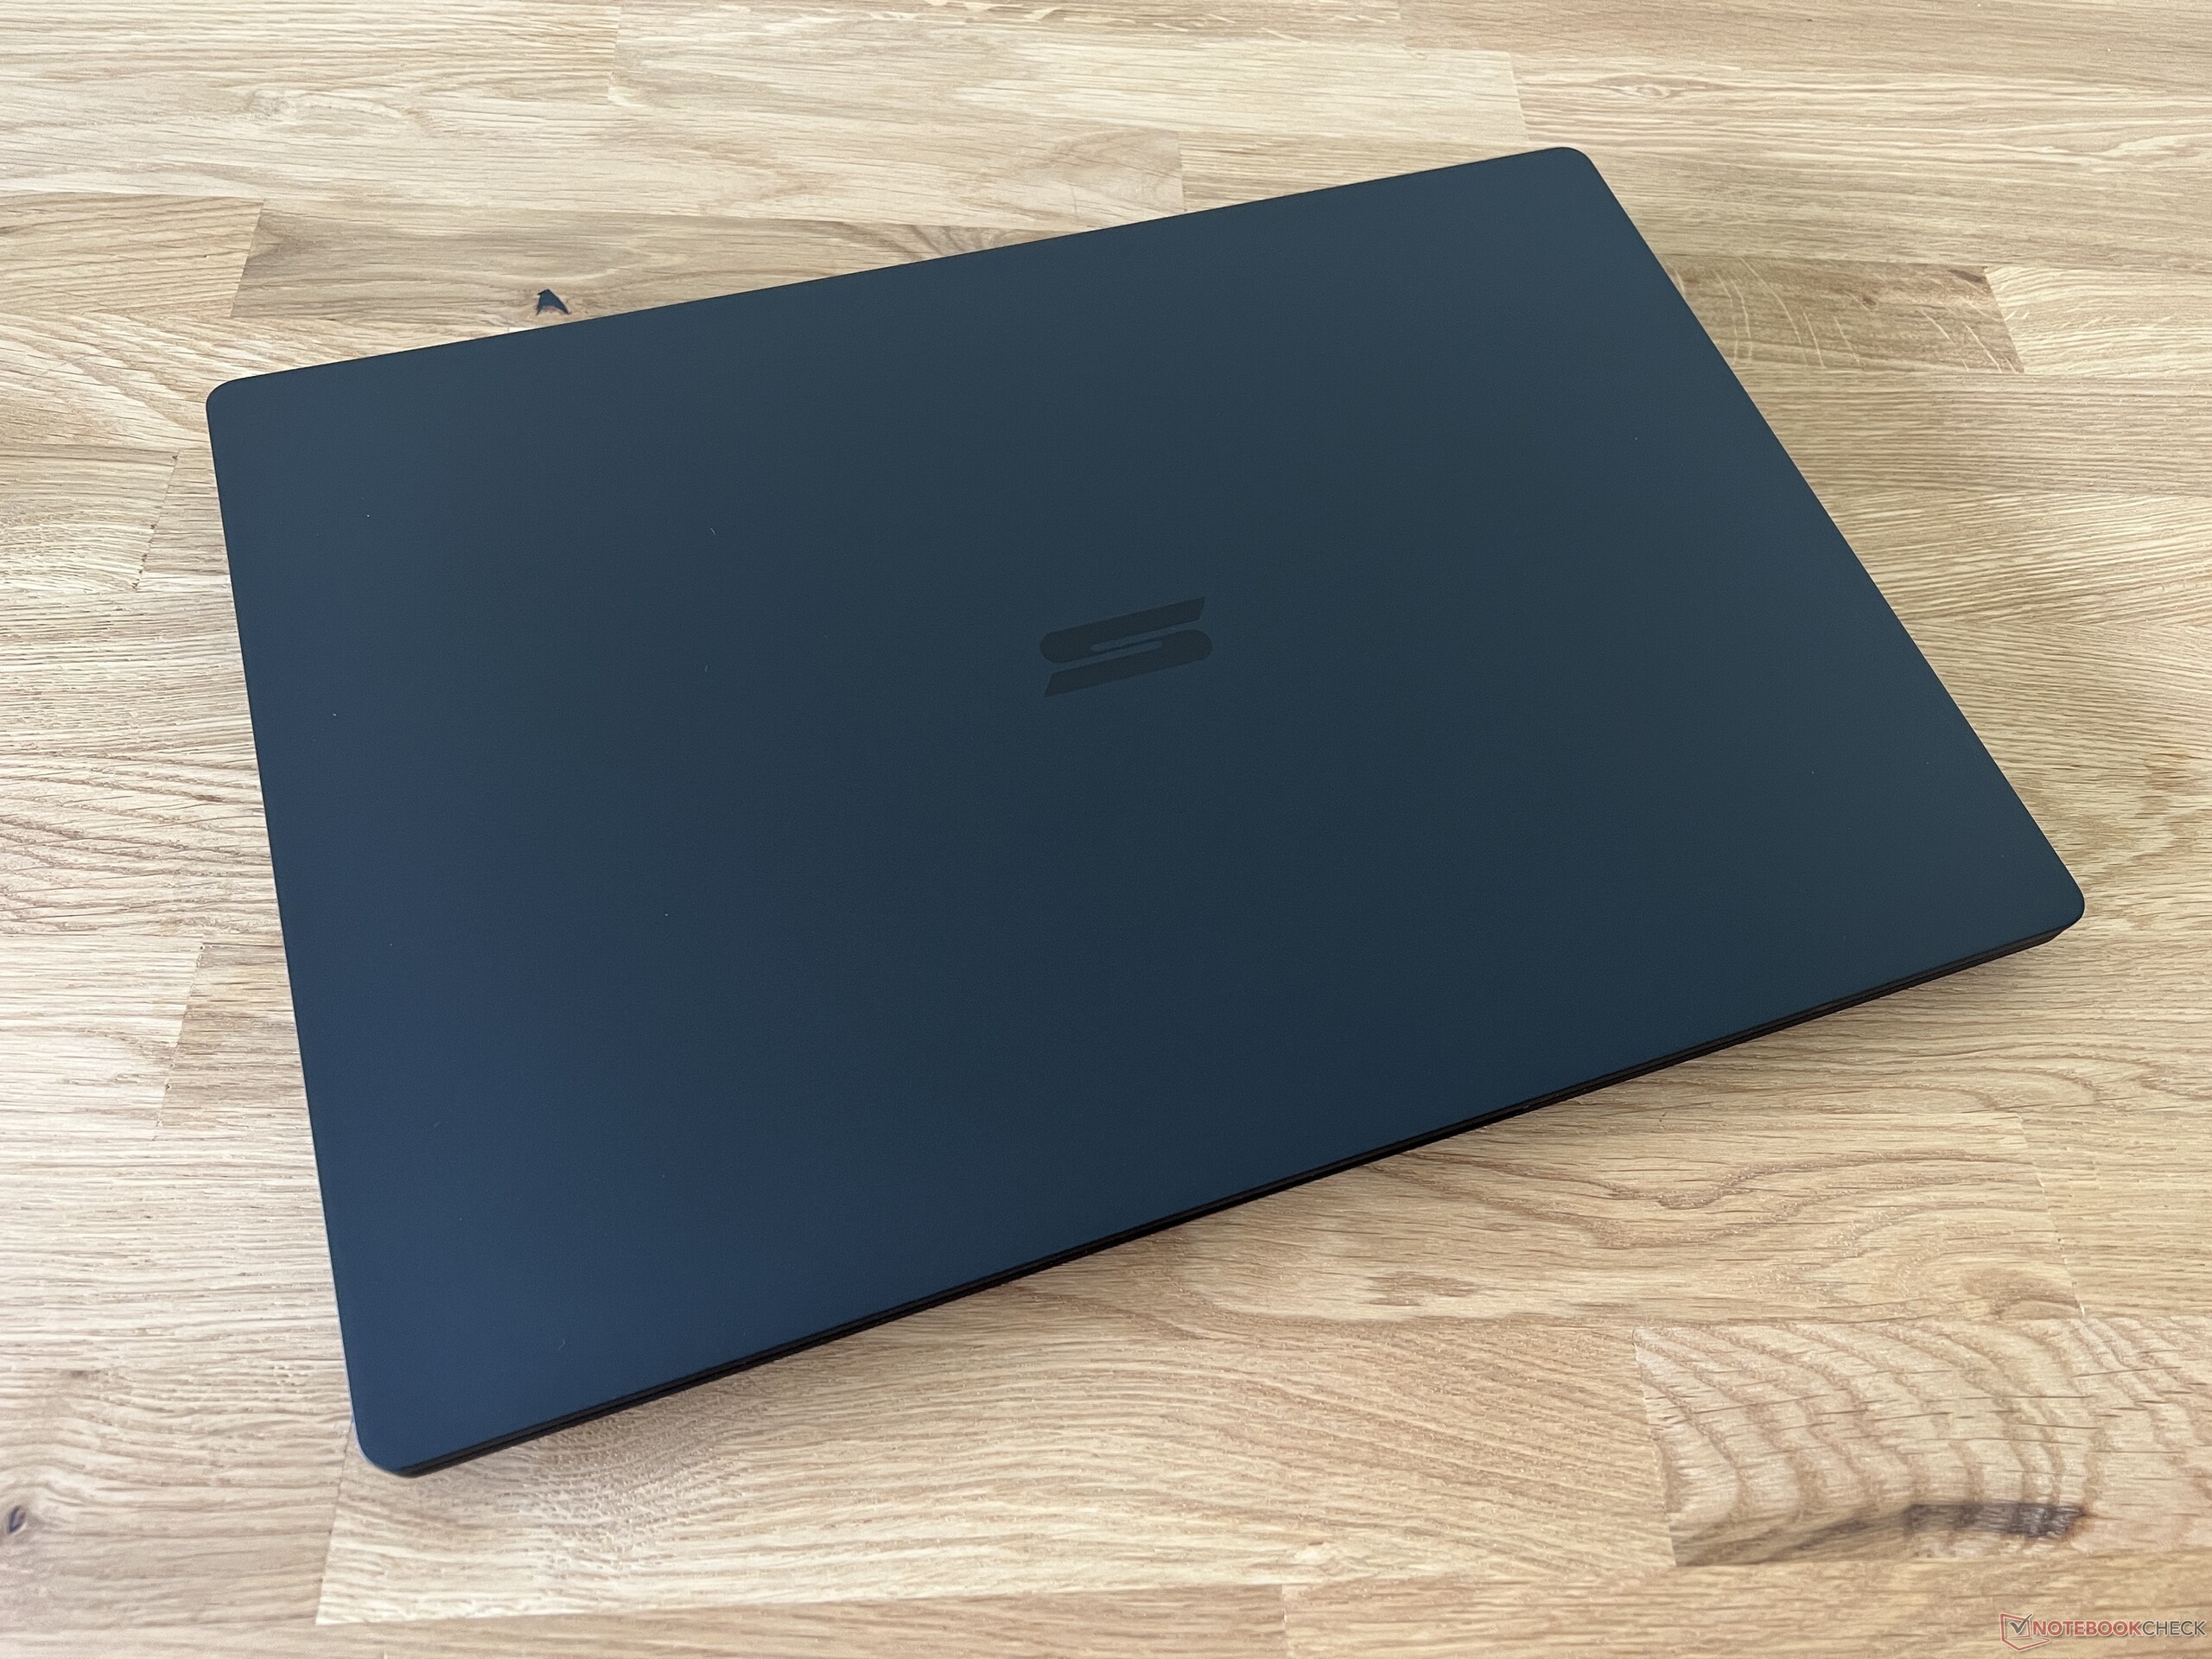
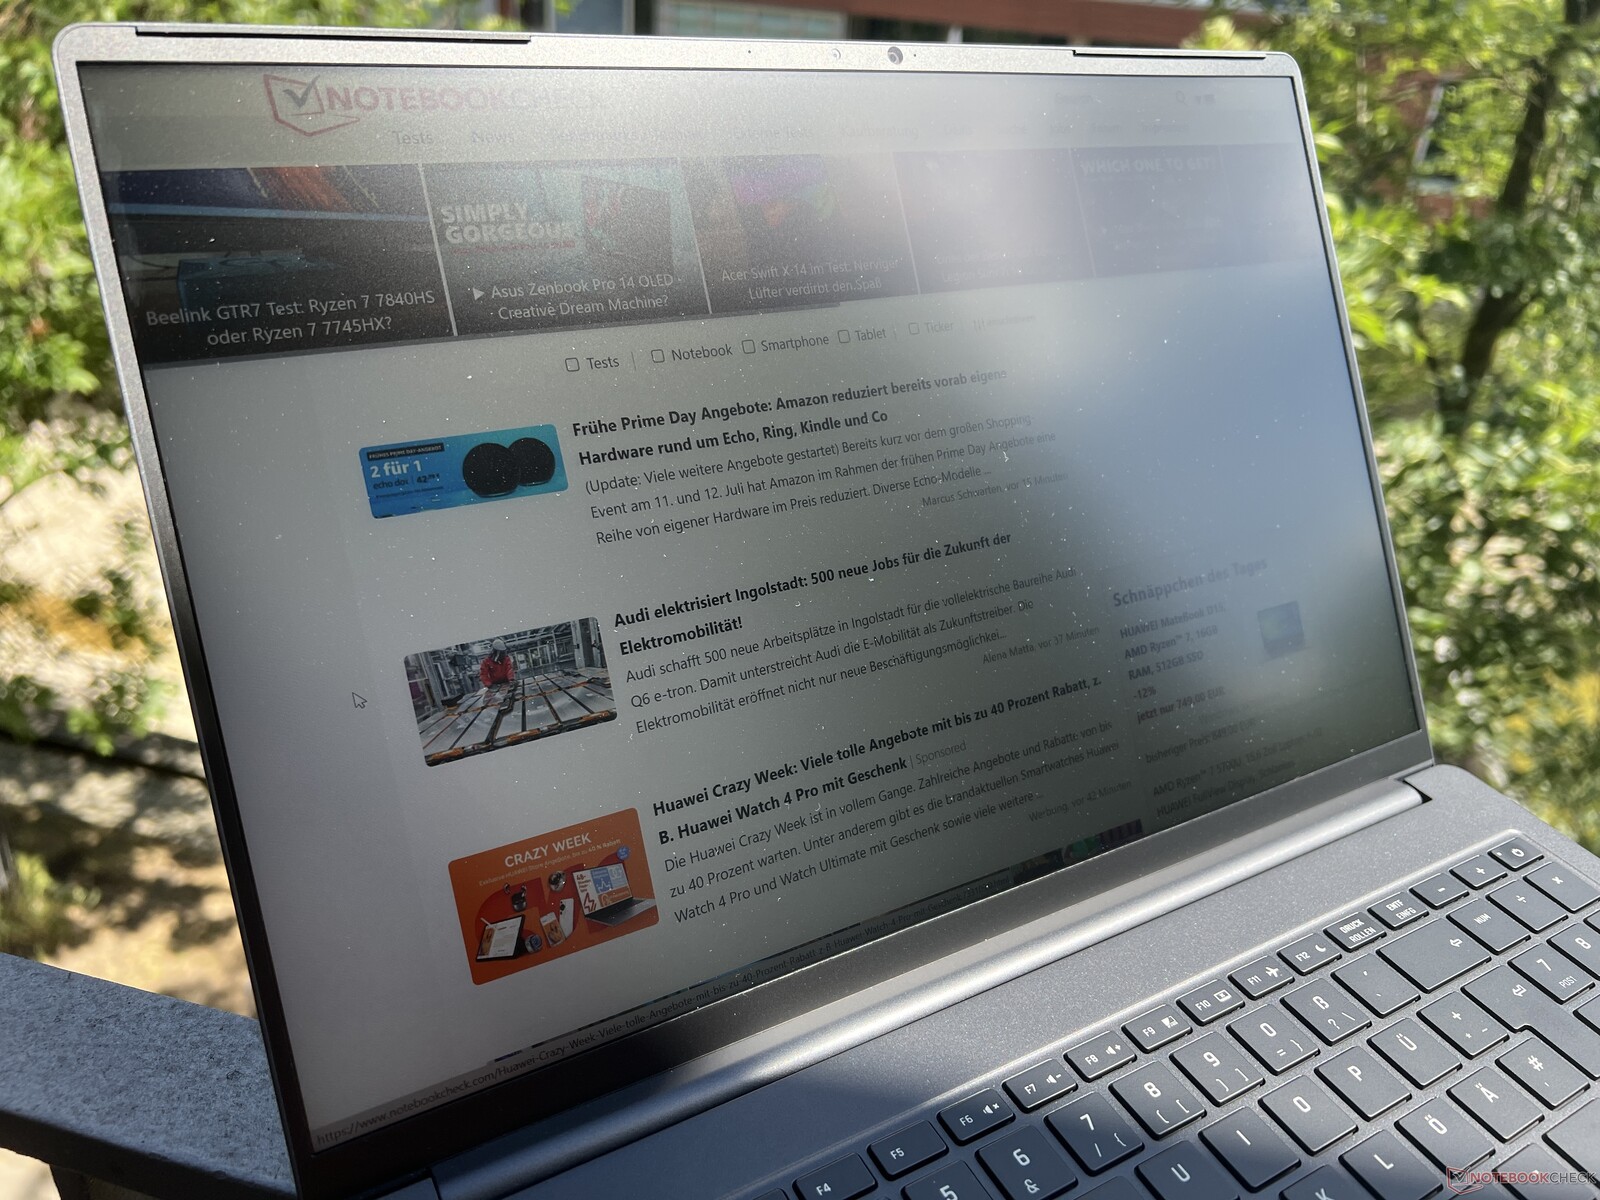
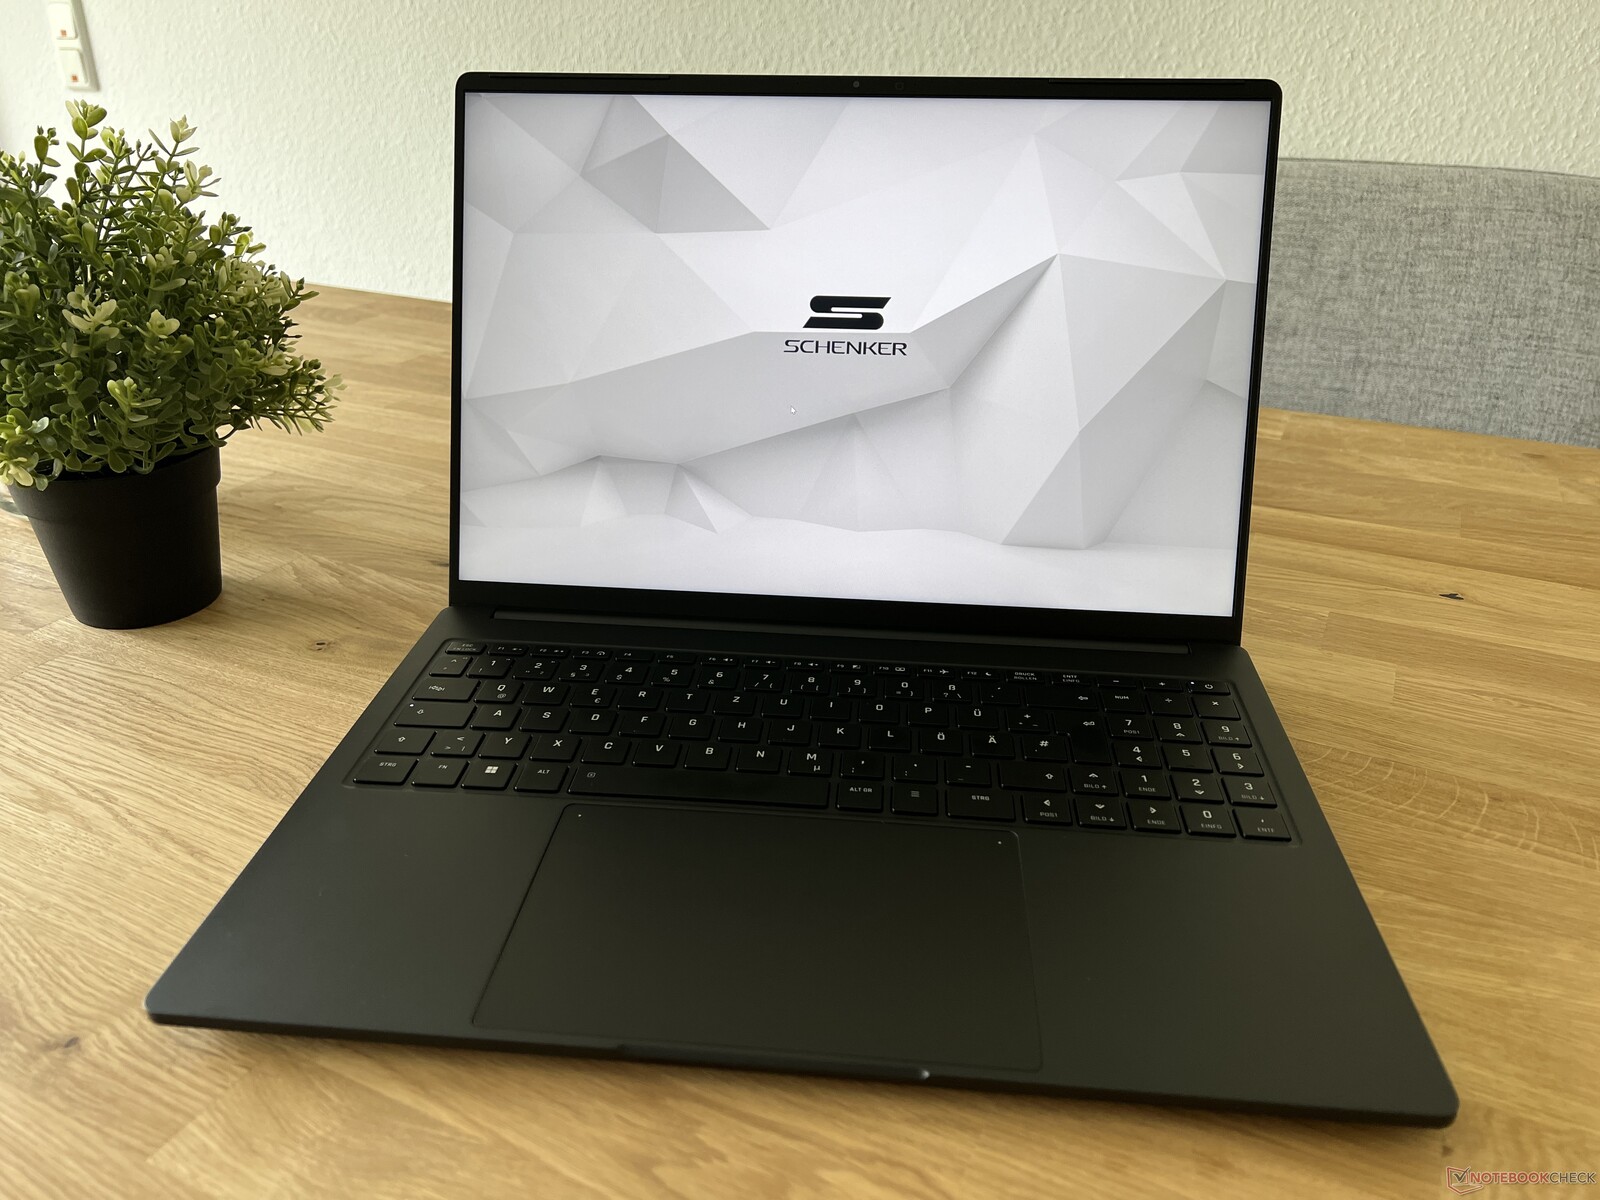
Since last year, Schenker hasn't changed anything in the case, and this time we have the black version in our test. Lacking any contrasts, it looks much more inconspicuous than the silver version. At merely 1.6 kg (~3.5 lb), the magnesium case (base unit and display lid) continues to be extremely light for a fast 16-inch laptop. The base unit is very robust, and only the center of the keyboard can be pressed down minimally, without this causing any problems in everyday operation. The thin display lid is slightly more flexible, and the hinges continue to allow some visible wobbling.
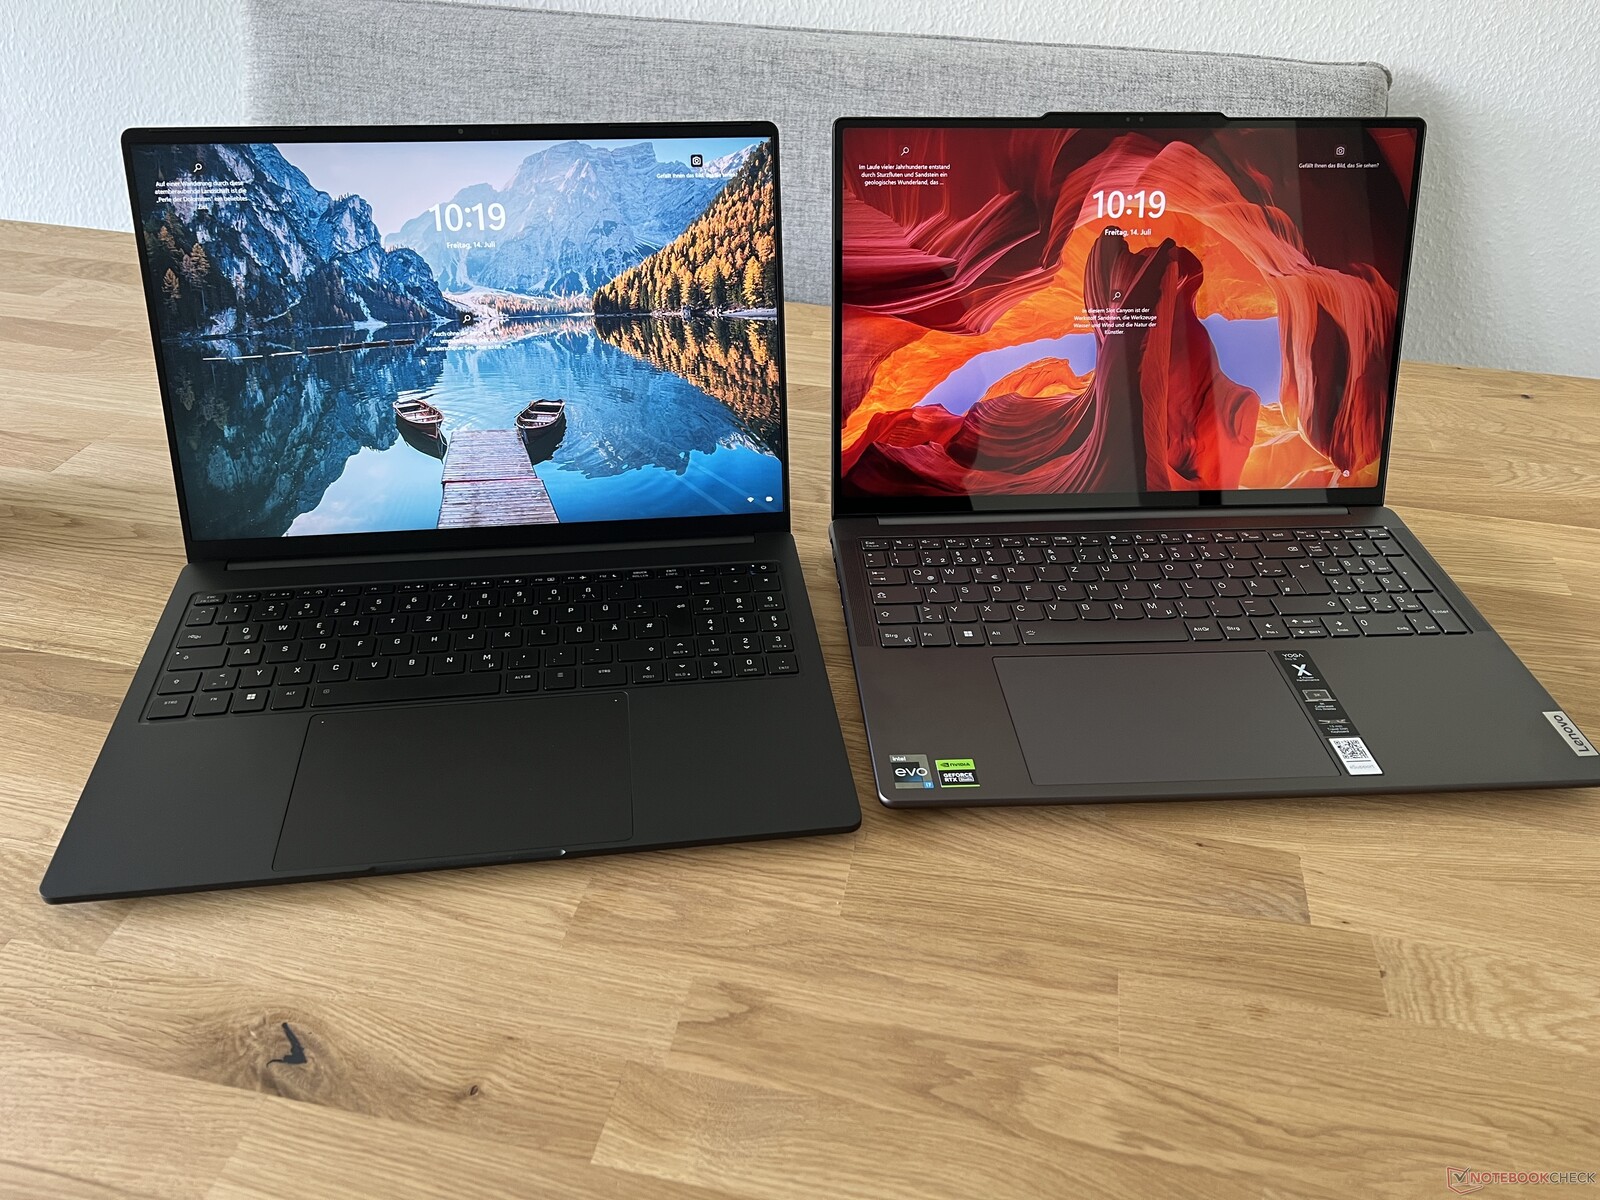
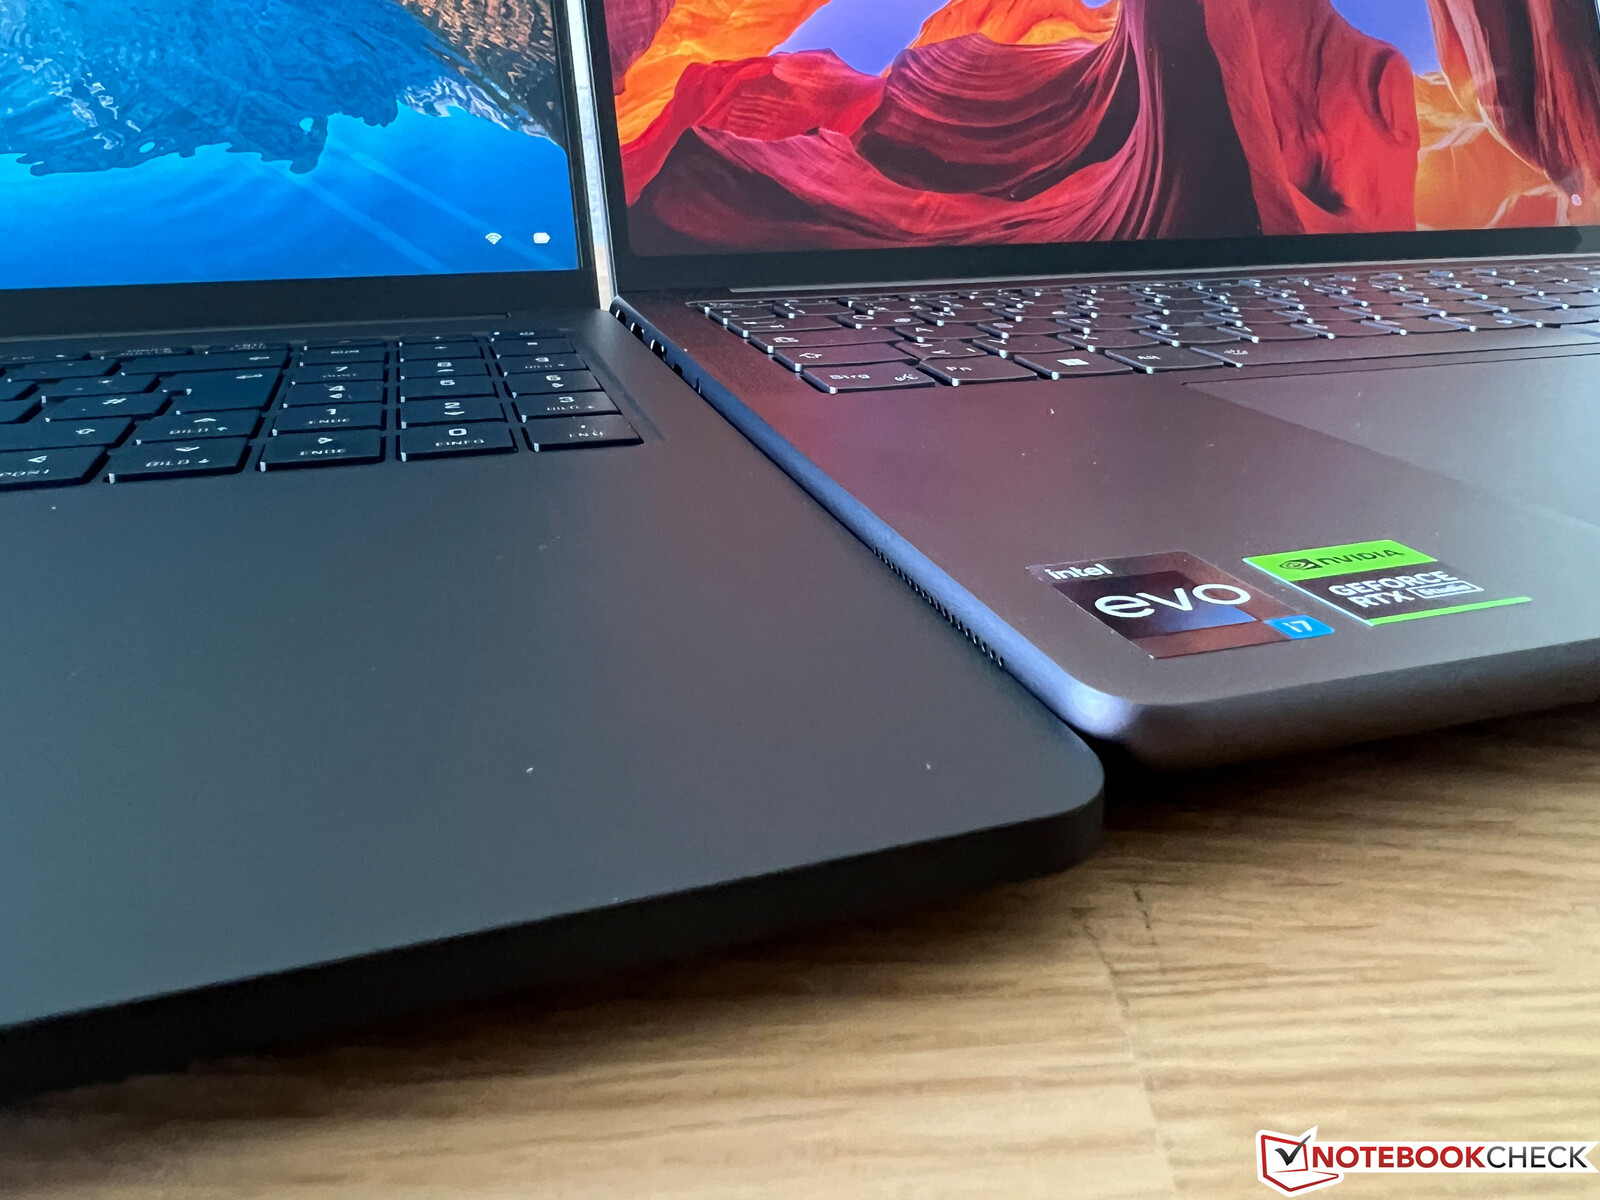
In the size comparison, the Vision 16 Pro is also the most compact and at the same time lightest laptop by far. We also took a few comparison pictures with the new Lenovo Yoga Pro 9 16, which we are also currently testing. Their footprints are practically identical, but you can see the difference in the height particularly of the base unit.
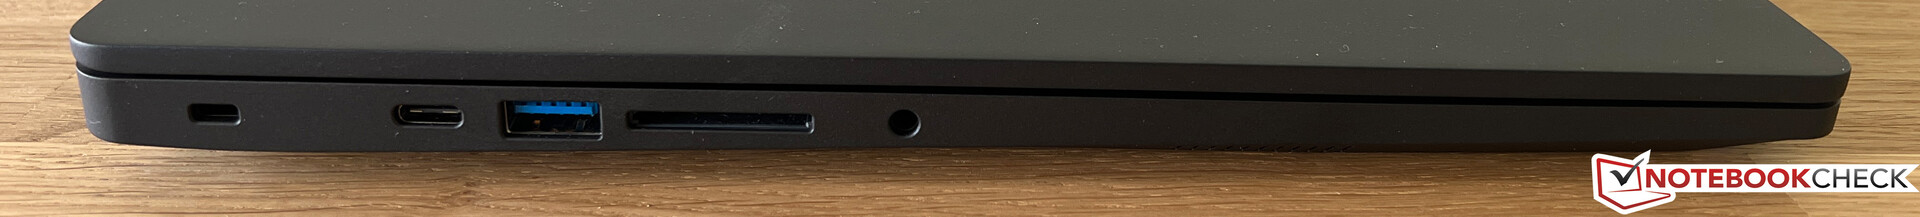
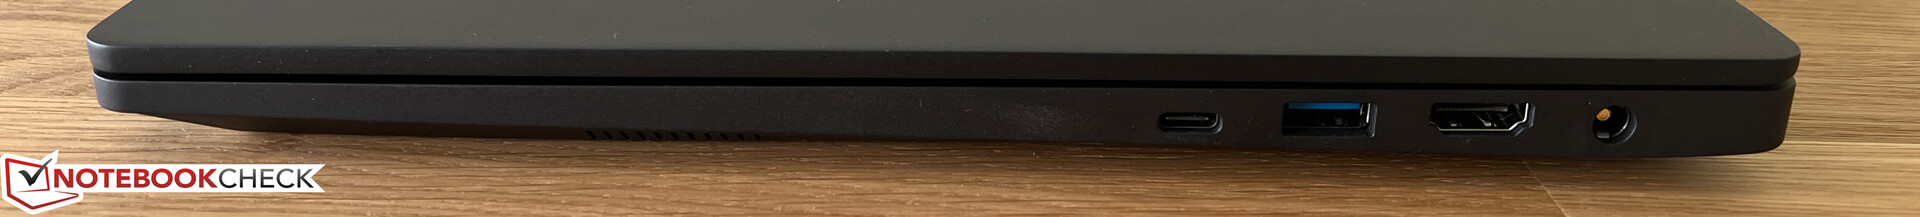
Equipment - Thunderbolt and Card Reader
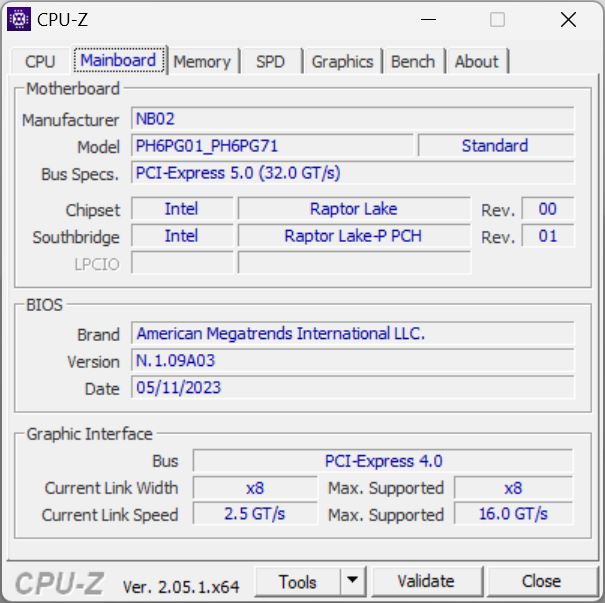
Despite its slim case, the Vision 16 Pro offers all the important connections including Thunderbolt 4 and 2x USB-A, making adapters unnecessary in practice. The connections are distributed over both sides and are placed in the rear area. On the road, you can also charge the laptop via USB-C (min. 65 watts, max. 100 watts). Compared to that of last year's model, the card reader has become significantly slower, which we tested with two SD cards. You also have to accept some slight compromises in the WLAN module, since the antenna configuration of the Vision 16 Pro doesn't support 6-GHz networks (Wi-Fi 6E). The AX201 module from Intel continues to be used (Wi-Fi 6), and the transfer rates are very good. The 1080p webcam creates decent recordings in reasonable light conditions. In addition, there is also an IR module for face recognition via Windows Hello.
| SD Card Reader | |
| average JPG Copy Test (av. of 3 runs) | |
| Apple MacBook Pro 16 2023 M2 Max (Angelbird AV Pro V60) | |
| MSI Stealth 16 Studio A13VG | |
| Dell XPS 15 9530 RTX 4070 (Toshiba Exceria Pro SDXC 64 GB UHS-II) | |
| Average of class Multimedia (23 - 531, n=43, last 2 years) | |
| Schenker Vision 16 Pro RTX 3070 Ti (AV Pro V60) | |
| Samsung Galaxy Book3 Ultra 16, i9-13900H RTX 4070 (AV Pro SD microSD 128 GB V60) | |
| Asus ProArt Studiobook 16 OLED H7604 (Angelibird AV Pro V60) | |
| Schenker VISION 16 Pro (M23) (Angelbird AV Pro V60) | |
| maximum AS SSD Seq Read Test (1GB) | |
| Apple MacBook Pro 16 2023 M2 Max (Angelbird AV Pro V60) | |
| Average of class Multimedia (27.9 - 1455, n=42, last 2 years) | |
| Dell XPS 15 9530 RTX 4070 (Toshiba Exceria Pro SDXC 64 GB UHS-II) | |
| MSI Stealth 16 Studio A13VG | |
| Samsung Galaxy Book3 Ultra 16, i9-13900H RTX 4070 (AV Pro SD microSD 128 GB V60) | |
| Asus ProArt Studiobook 16 OLED H7604 (Angelibird AV Pro V60) | |
| Schenker Vision 16 Pro RTX 3070 Ti (AV Pro V60) | |
| Schenker VISION 16 Pro (M23) (Angelbird AV Pro V60) | |
| Networking | |
| Schenker VISION 16 Pro (M23) | |
| iperf3 transmit AXE11000 | |
| iperf3 receive AXE11000 | |
| Samsung Galaxy Book3 Ultra 16, i9-13900H RTX 4070 | |
| iperf3 transmit AXE11000 | |
| iperf3 receive AXE11000 | |
| iperf3 transmit AXE11000 6GHz | |
| iperf3 receive AXE11000 6GHz | |
| MSI Stealth 16 Studio A13VG | |
| iperf3 transmit AXE11000 | |
| iperf3 receive AXE11000 | |
| iperf3 transmit AXE11000 6GHz | |
| iperf3 receive AXE11000 6GHz | |
| Dell XPS 15 9530 RTX 4070 | |
| iperf3 transmit AXE11000 | |
| iperf3 receive AXE11000 | |
| Asus ProArt Studiobook 16 OLED H7604 | |
| iperf3 transmit AXE11000 | |
| iperf3 receive AXE11000 | |
| Apple MacBook Pro 16 2023 M2 Max | |
| iperf3 transmit AXE11000 6GHz | |
| iperf3 receive AXE11000 6GHz | |
| Schenker Vision 16 Pro RTX 3070 Ti | |
| iperf3 transmit AXE11000 | |
| iperf3 receive AXE11000 | |

 GeForce RTX 4070 Laptop GPU, i7-13700H, Samsung 990 Pro 1 TB")
 GeForce RTX 4070 Laptop GPU, i7-13700H, Samsung 990 Pro 1 TB")
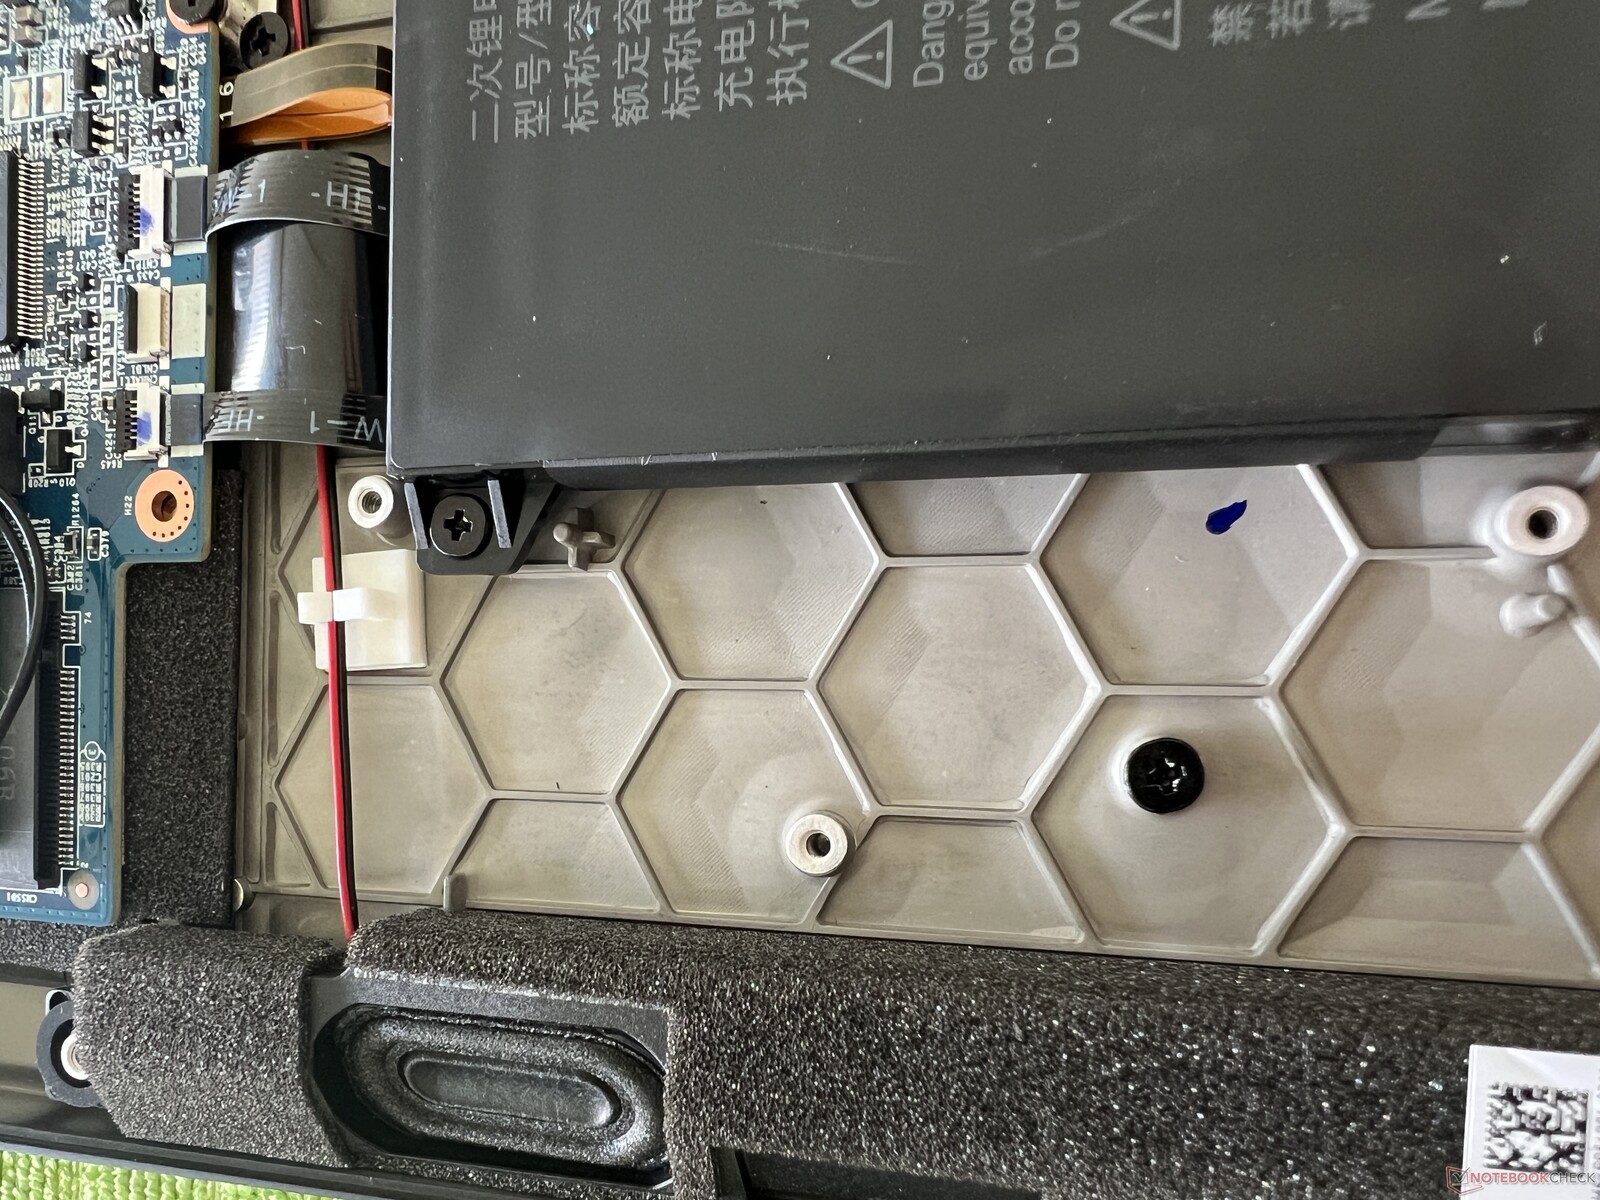
Maintenance
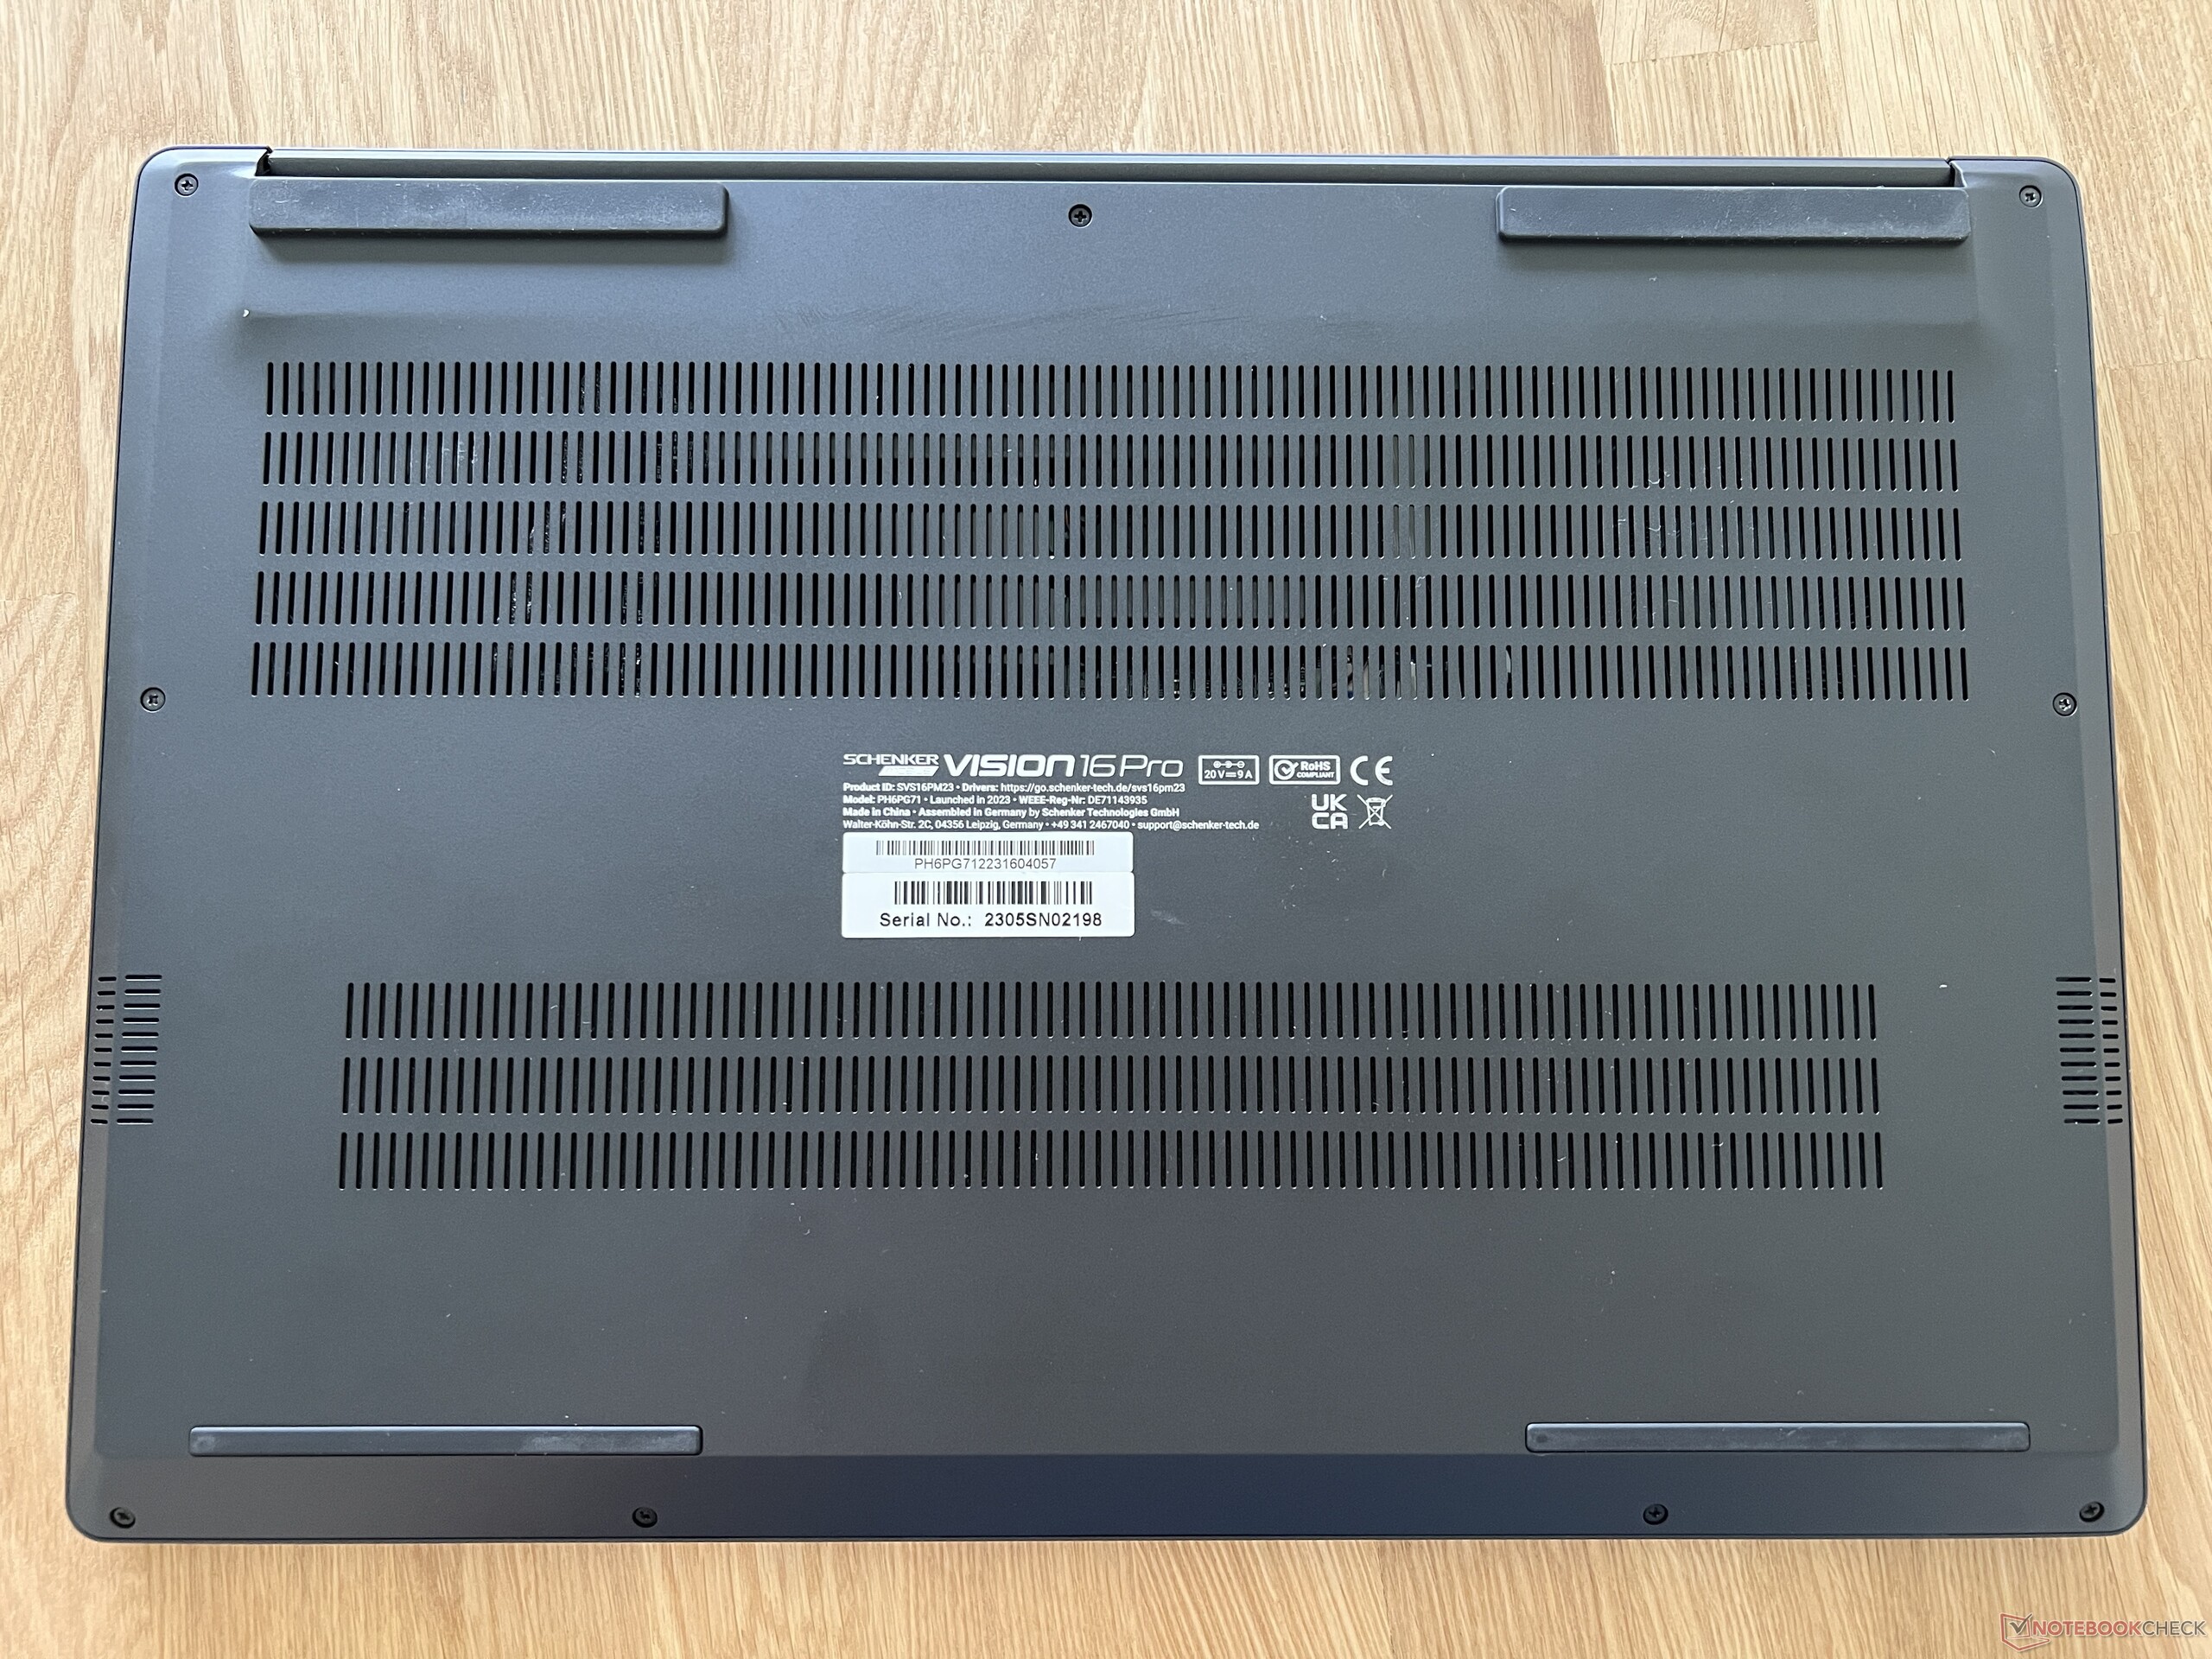
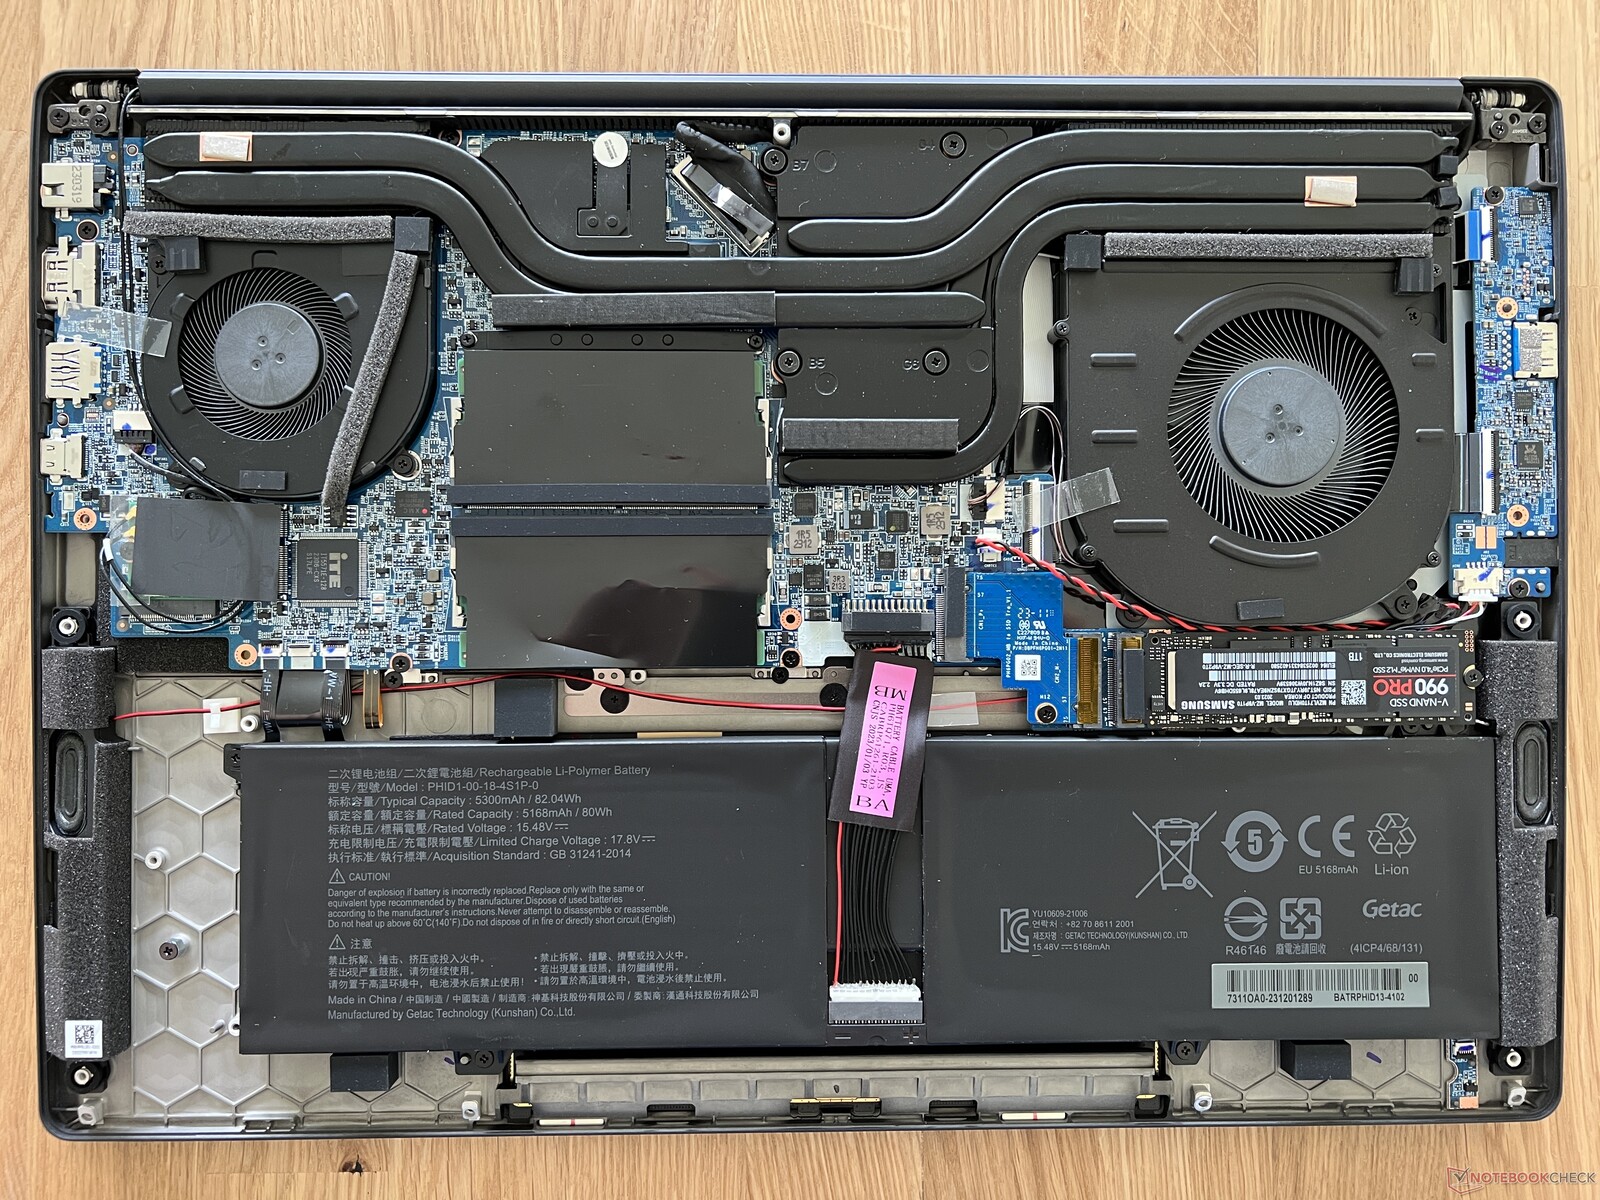
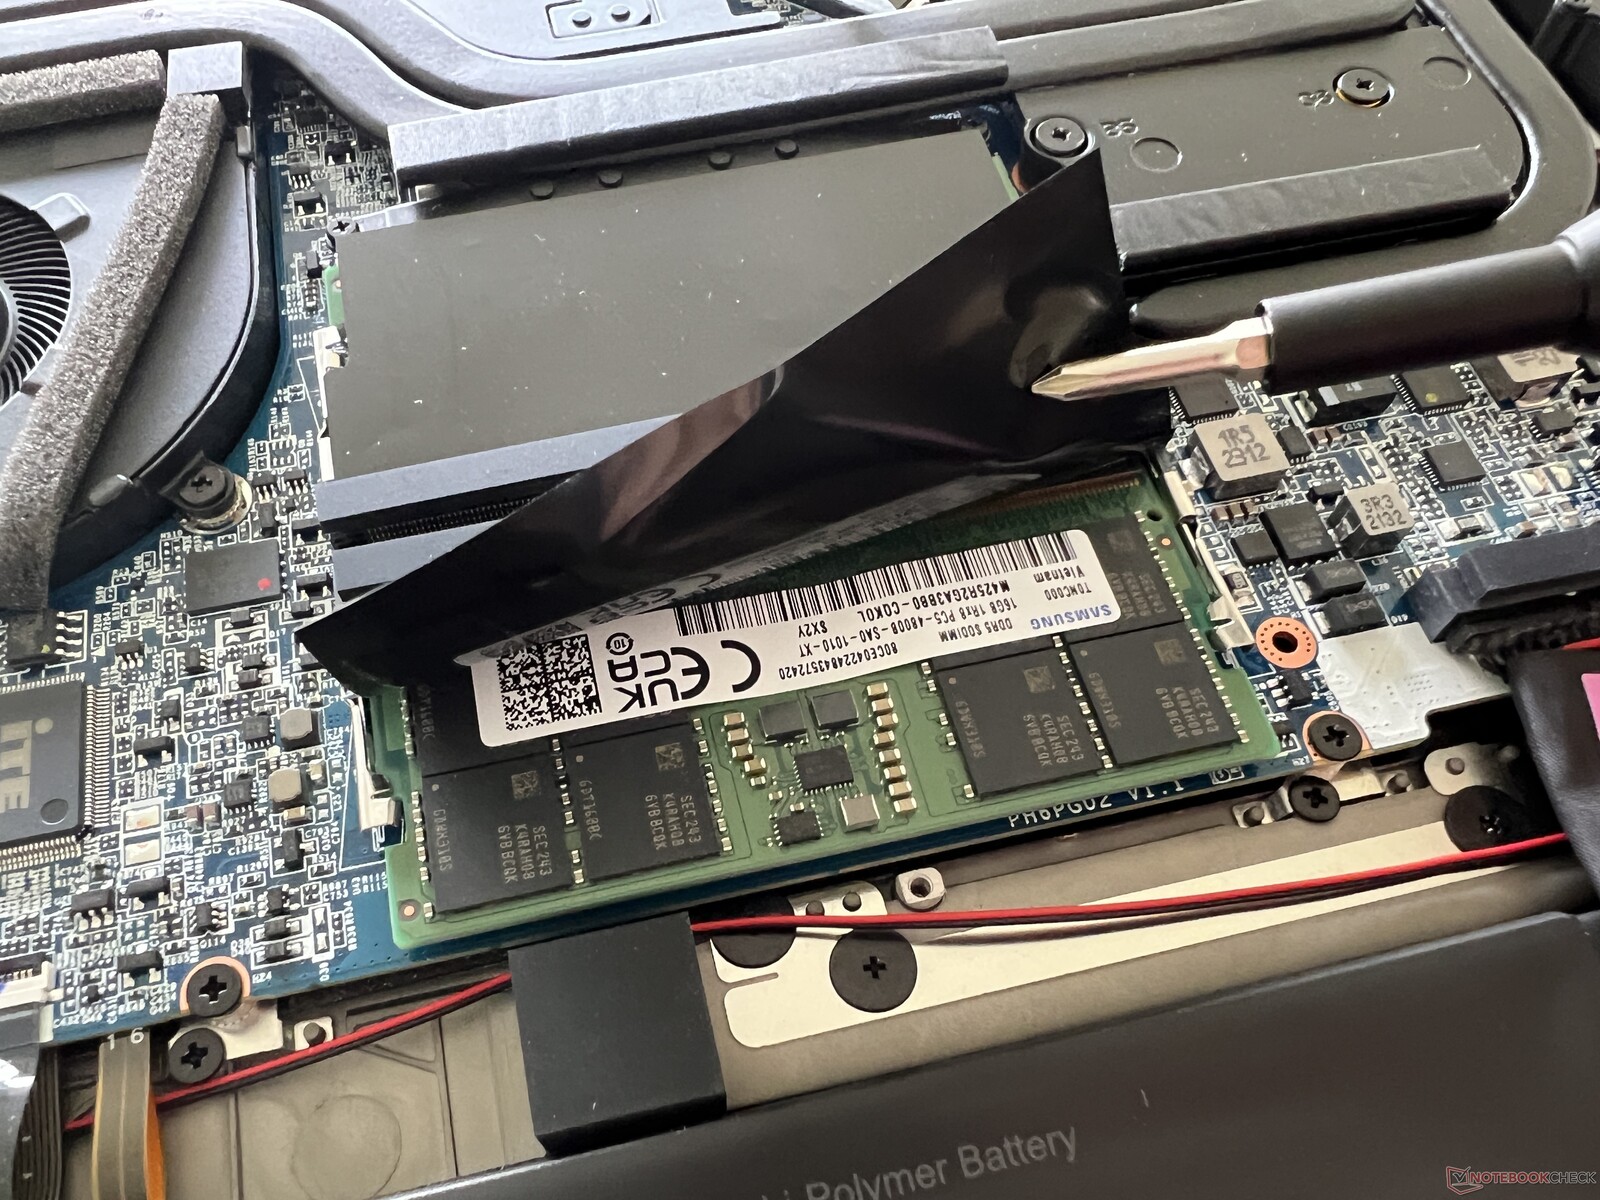
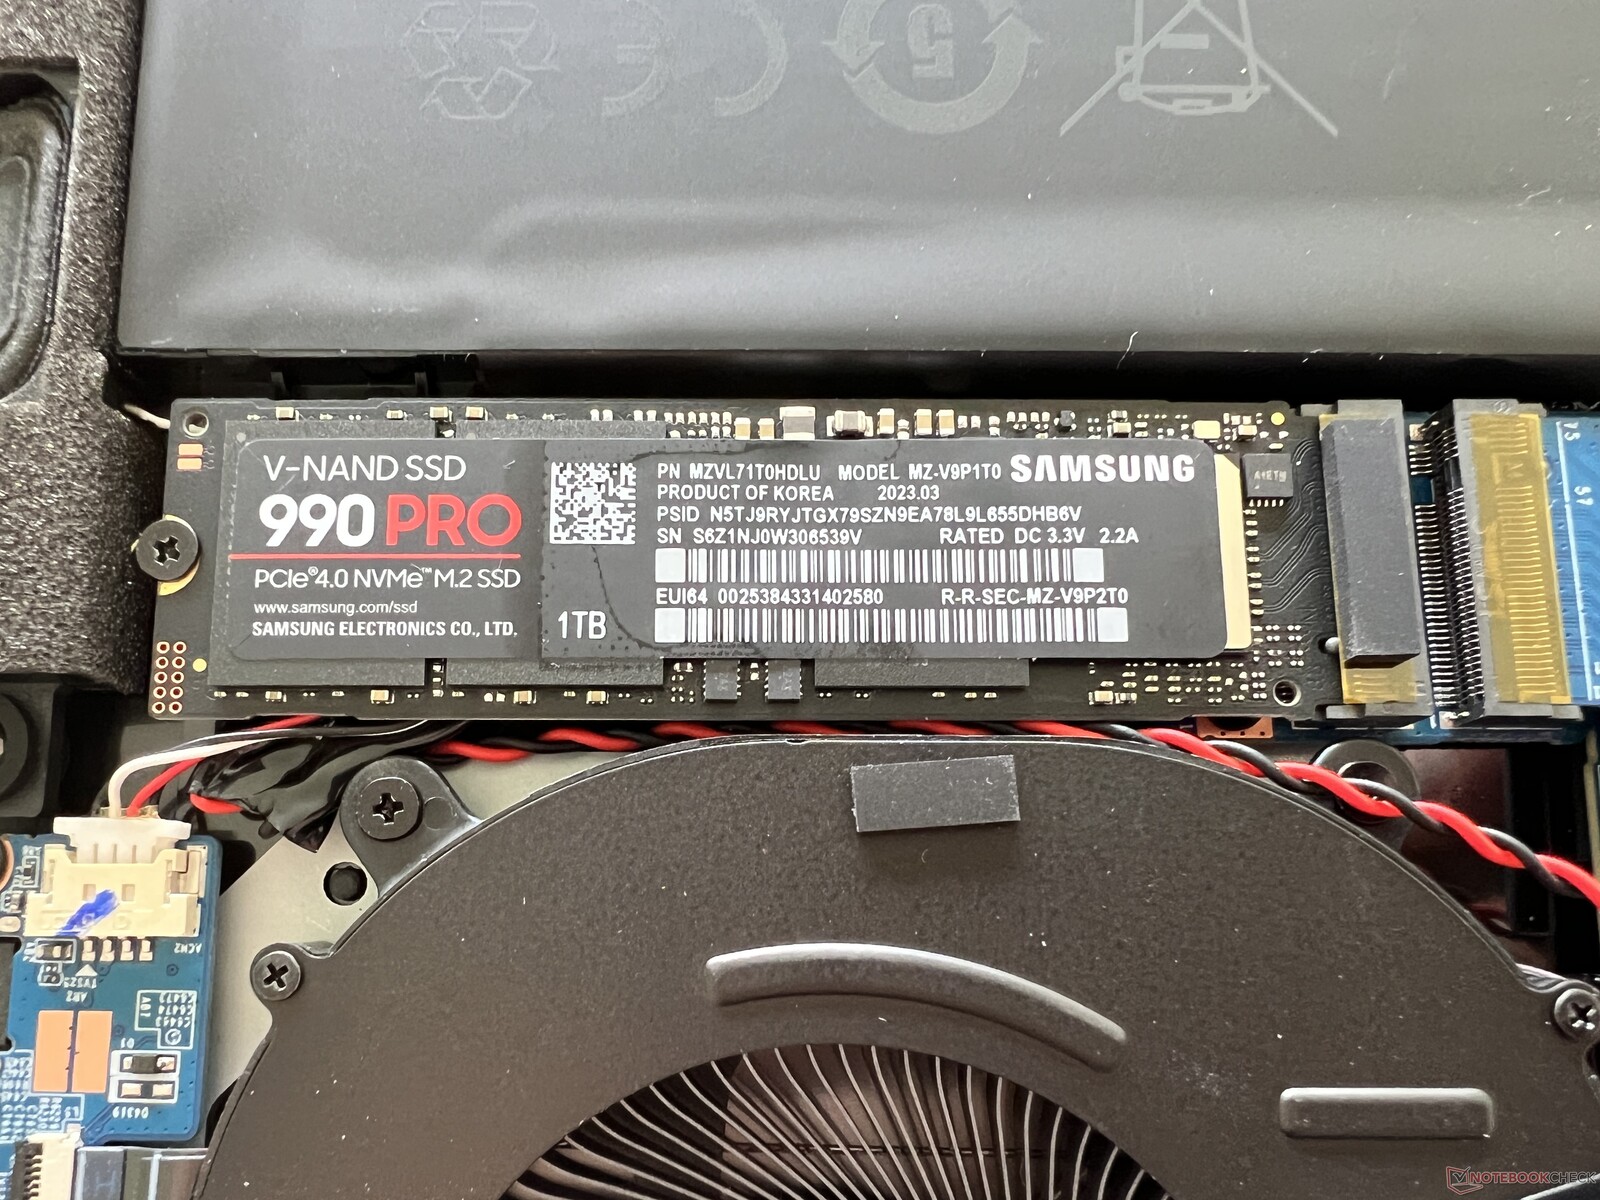
The bottom of the case is secured with some regular Phillips screws and can be easily removed. Inside, you can see that other than a slight change in the positioning of the heat pipes, the configuration is basically identical. The users have access to the two fans, the SO-DIMM slots, and the two slots for the M.2 2280 SSDs, with only a single-sided second SSD being supported.
Input Devices - Large ClickPad and number block
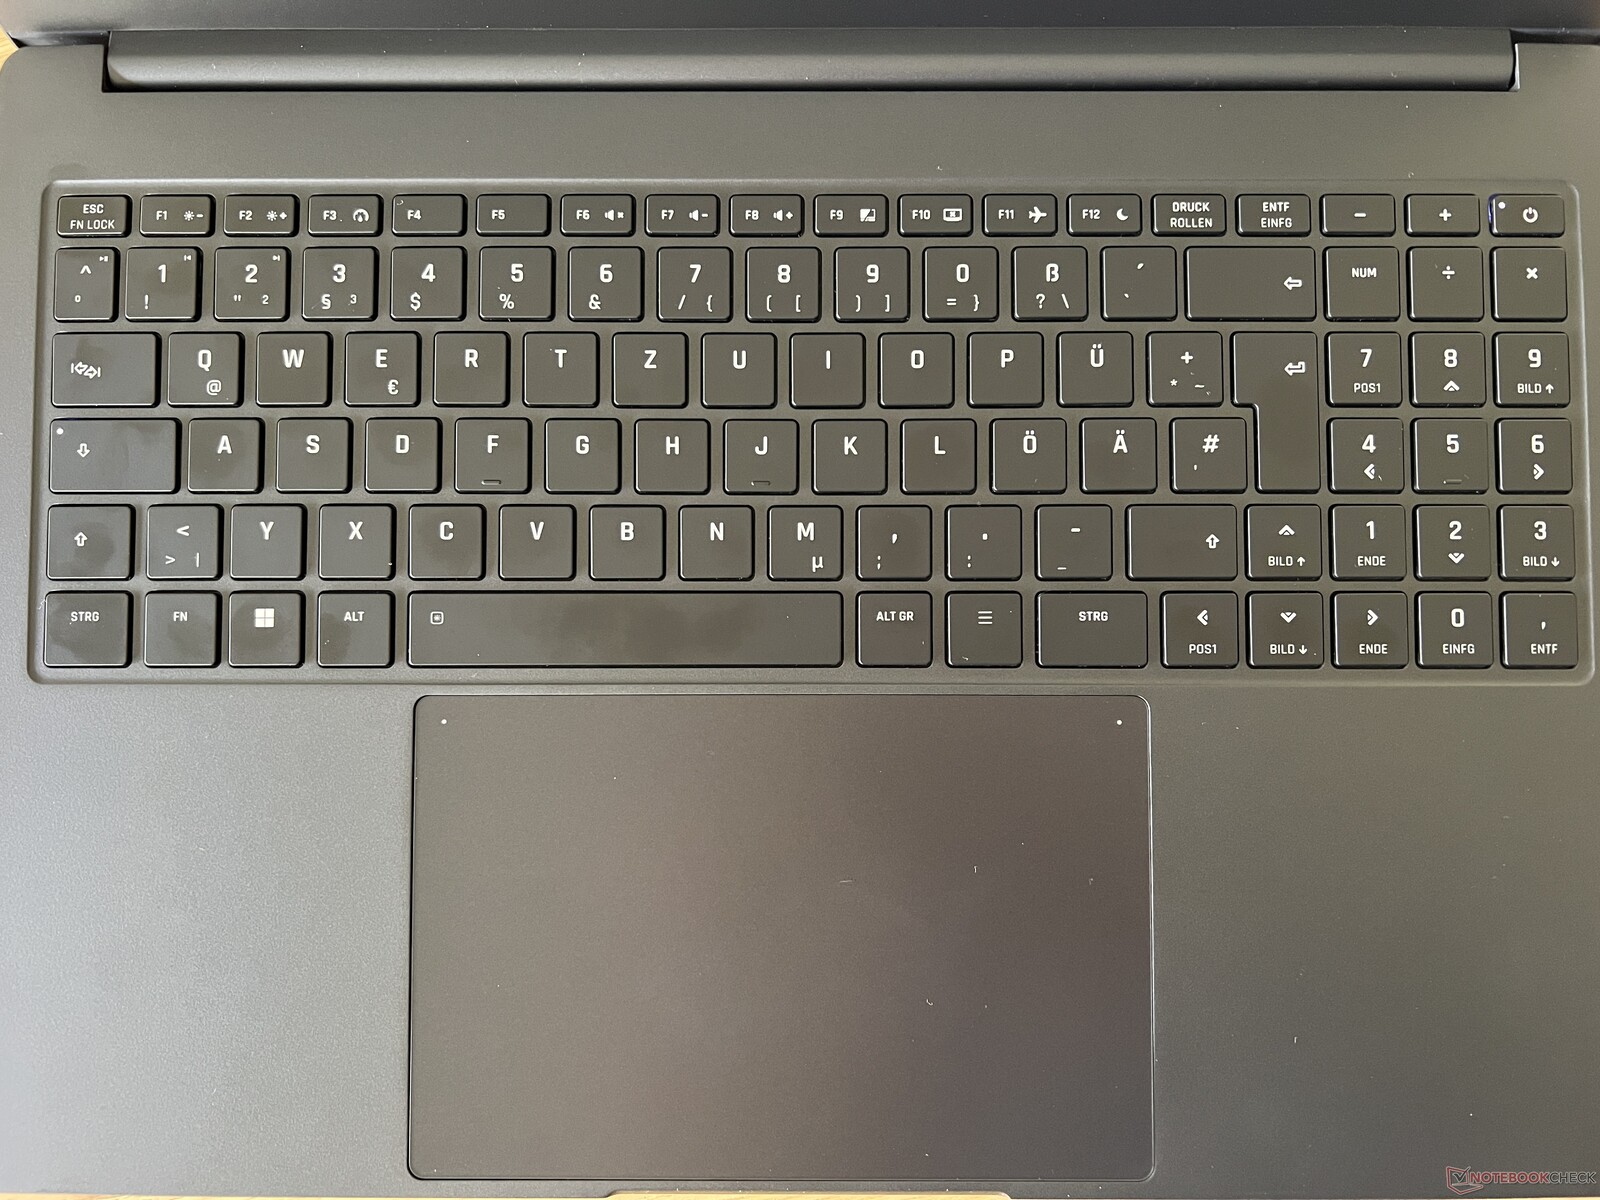
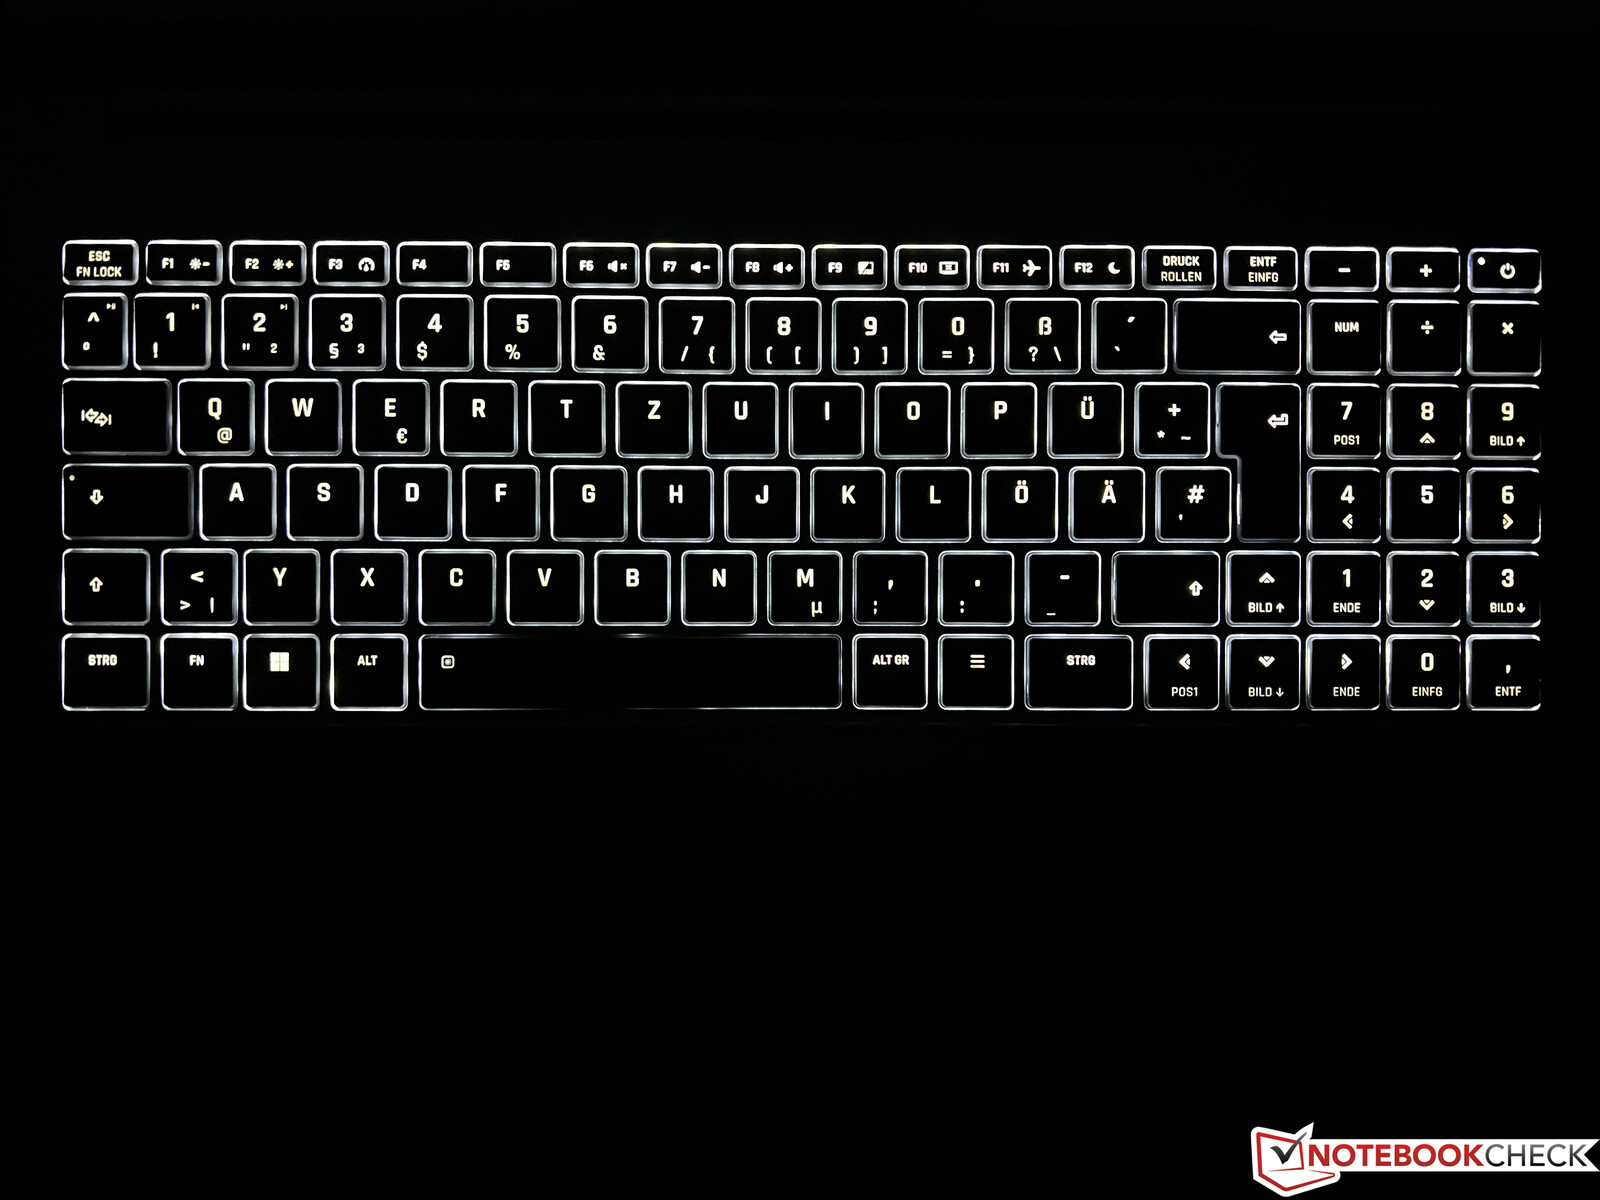
The full-size keyboard offers a dedicated number block including large arrow keys, but that also means that there is no additional Enter key and the size of the Shift key is reduced. Overall, the keyboard is very accurate and comfortable and key strokes are also comfortably quiet, with only the Space and Enter keys being slightly louder. In darker surroundings, the white, two-step keyboard illumination is helpful. The huge glass ClickPad (15.4 x 10 cm, ~6 x 4 in) can be operated easily and offers a lot of space for gestures and cursor movements. Only the clicking noises are a bit loud.
Display - WQHD panel with 240 Hz
The display has remained unchanged and continues to be a matte WQHD panel with a 2,560 x 1,600 Pixel resolution and refresh rate of 240 Hz. The subjective image impression is very good, since even bright areas are displayed without any graininess. The brightness of the panel (NE160QDM-NZ1) is specified as 350 cd/m², and our panel even slightly surpasses this at an average of 370 cd/m². The black value is a decent 0.3 cd/m², leading to a good contrast ratio of more than 1,200:1.
The 240 Hz refresh rate creates a very smooth impression with movements, and the response times are also fast. Light halos are only visible in dark images at full brightness, but this won't be a problem in practical operation. PWM is not used.
| |||||||||||||||||||||||||
Brightness Distribution: 88 %
Center on Battery: 384 cd/m²
Contrast: 1280:1 (Black: 0.3 cd/m²)
ΔE ColorChecker Calman: 3.4 | ∀{0.5-29.43 Ø4.72}
calibrated: 1.3
ΔE Greyscale Calman: 3.4 | ∀{0.09-98 Ø4.97}
70% AdobeRGB 1998 (Argyll 3D)
98.8% sRGB (Argyll 3D)
68.8% Display P3 (Argyll 3D)
Gamma: 2.16
CCT: 7462 K
| Schenker VISION 16 Pro (M23) NE160QDM-NZ1, IPS, 2560x1600, 16" | Samsung Galaxy Book3 Ultra 16, i9-13900H RTX 4070 Samsung SDC4185 ATNA60CL03-0, OLED / AMOLED, 2880x1800, 16" | MSI Stealth 16 Studio A13VG AUO26A9, IPS, 2560x1600, 16" | Dell XPS 15 9530 RTX 4070 Samsung 156XG01, OLED, 3456x2160, 15.6" | Asus ProArt Studiobook 16 OLED H7604 ATNA60BX01-1, OLED, 3200x2000, 16" | Apple MacBook Pro 16 2023 M2 Max Mini-LED, 3456x2234, 16.2" | Schenker Vision 16 Pro RTX 3070 Ti N160QDM-NZ1, IPS, 2560x1600, 16" | |
|---|---|---|---|---|---|---|---|
| Display | 26% | 21% | 29% | 25% | 24% | -1% | |
| Display P3 Coverage (%) | 68.8 | 95.3 39% | 96.4 40% | 99.8 45% | 99.6 45% | 99 44% | 68.7 0% |
| sRGB Coverage (%) | 98.8 | 99.1 0% | 99.7 1% | 100 1% | 100 1% | 100 1% | 96.7 -2% |
| AdobeRGB 1998 Coverage (%) | 70 | 97.4 39% | 84.8 21% | 98.4 41% | 89.4 28% | 88.5 26% | 70 0% |
| Response Times | 80% | 50% | 82% | 93% | -486% | -5% | |
| Response Time Grey 50% / Grey 80% * (ms) | 13.7 ? | 2 ? 85% | 4.4 ? 68% | 1.68 ? 88% | 0.59 ? 96% | 80.5 ? -488% | 14.3 ? -4% |
| Response Time Black / White * (ms) | 8.1 ? | 2 ? 75% | 5.6 ? 31% | 1.94 ? 76% | 0.79 ? 90% | 47.2 ? -483% | 8.6 ? -6% |
| PWM Frequency (Hz) | 250 ? | 239 | 240 ? | 14880 ? | |||
| Screen | 21% | -16% | 0% | 159% | 4950% | -14% | |
| Brightness middle (cd/m²) | 384 | 403 5% | 424 10% | 389.5 1% | 349 -9% | 504 31% | 364 -5% |
| Brightness (cd/m²) | 371 | 408 10% | 411 11% | 392 6% | 350 -6% | 487 31% | 347 -6% |
| Brightness Distribution (%) | 88 | 98 11% | 88 0% | 98 11% | 95 8% | 94 7% | 89 1% |
| Black Level * (cd/m²) | 0.3 | 0.37 -23% | 0.02 93% | 0.001 100% | 0.3 -0% | ||
| Contrast (:1) | 1280 | 1146 -10% | 17450 1263% | 504000 39275% | 1213 -5% | ||
| Colorchecker dE 2000 * | 3.4 | 2.63 23% | 3.04 11% | 4.95 -46% | 2.1 38% | 1.5 56% | 3.3 3% |
| Colorchecker dE 2000 max. * | 9.2 | 4.07 56% | 7.5 18% | 8.65 6% | 5.5 40% | 3.3 64% | 6.6 28% |
| Colorchecker dE 2000 calibrated * | 1.3 | 3.04 -134% | 1.53 -18% | 2.1 -62% | 2.5 -92% | ||
| Greyscale dE 2000 * | 3.4 | 2.69 21% | 4.34 -28% | 2 41% | 1.2 65% | 2.1 38% | 5.2 -53% |
| Gamma | 2.16 102% | 2.48 89% | 2.32 95% | 2.27 97% | 2.19 100% | 2.25 98% | 2.14 103% |
| CCT | 7462 87% | 6907 94% | 6952 93% | 6265 104% | 6545 99% | 6882 94% | 6331 103% |
| Total Average (Program / Settings) | 42% /
33% | 18% /
1% | 37% /
21% | 92% /
121% | 1496% /
2977% | -7% /
-10% |
* ... smaller is better
We measure the panel in the state of delivery with the professional CalMAN software. It has a significant blue tint, and the color temperature is also too cool. Schenker offers the download of a calibrated profile in the Control Center, and it is then downloaded automatically using the serial number. While this improves the situation and also eliminates the color tint, it also reduces the maximum brightness slightly by around 30 cd/m². This isn't really a perfect solution, as we will see shortly, but those who are unable to calibrate their panel (or download our calibrated profile from the link above) will still get a noticeable improvement here.

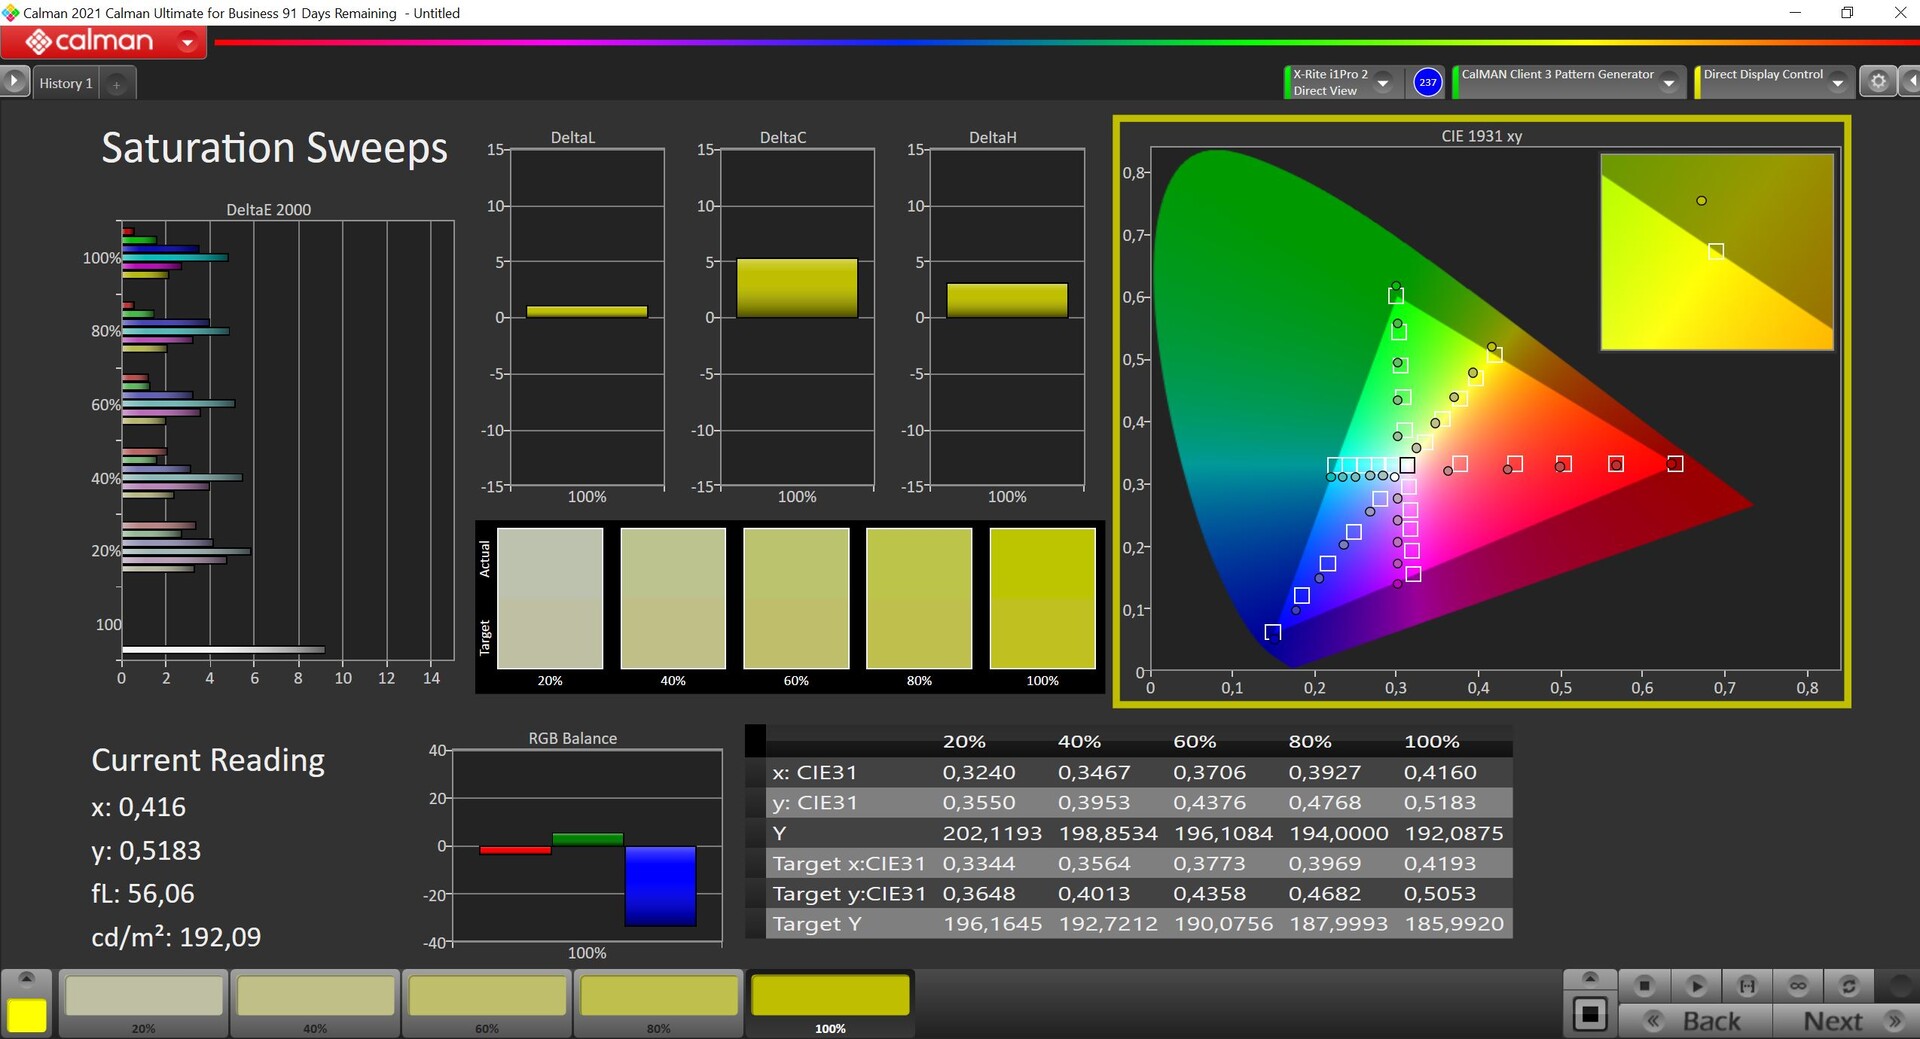
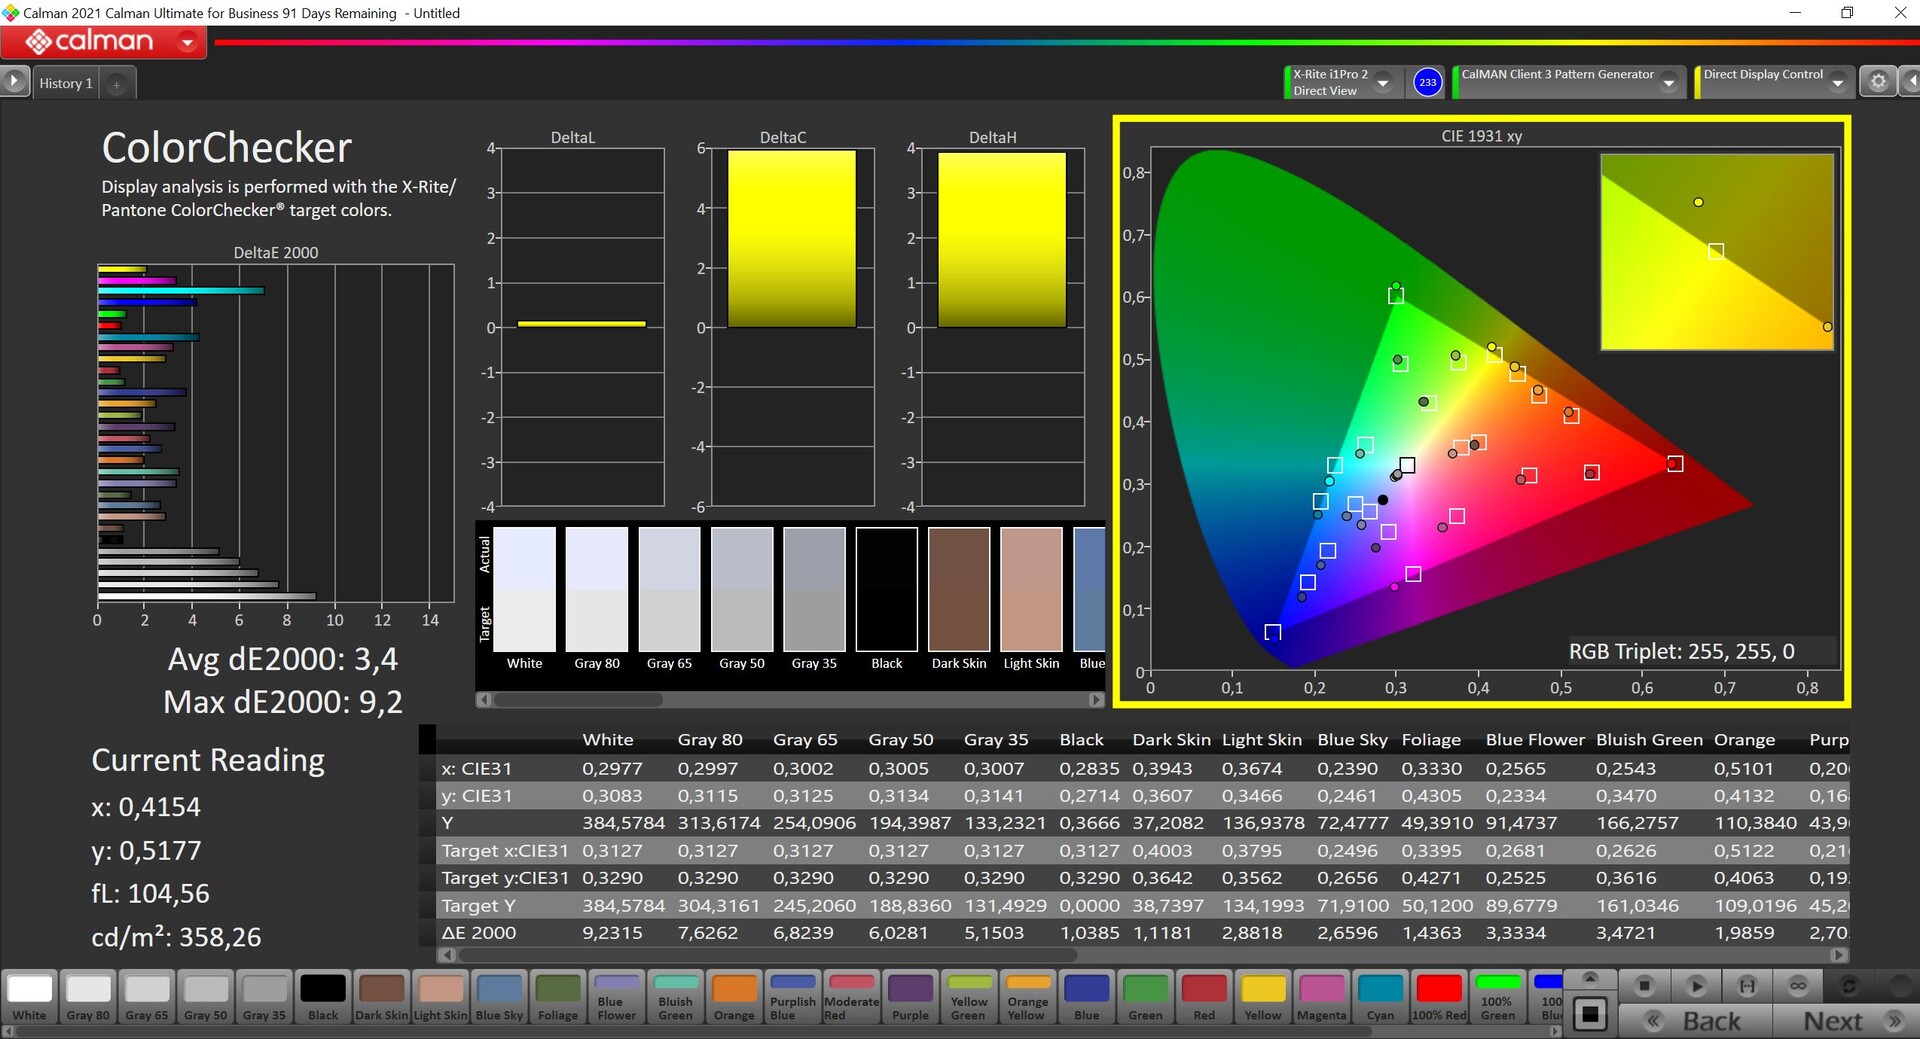

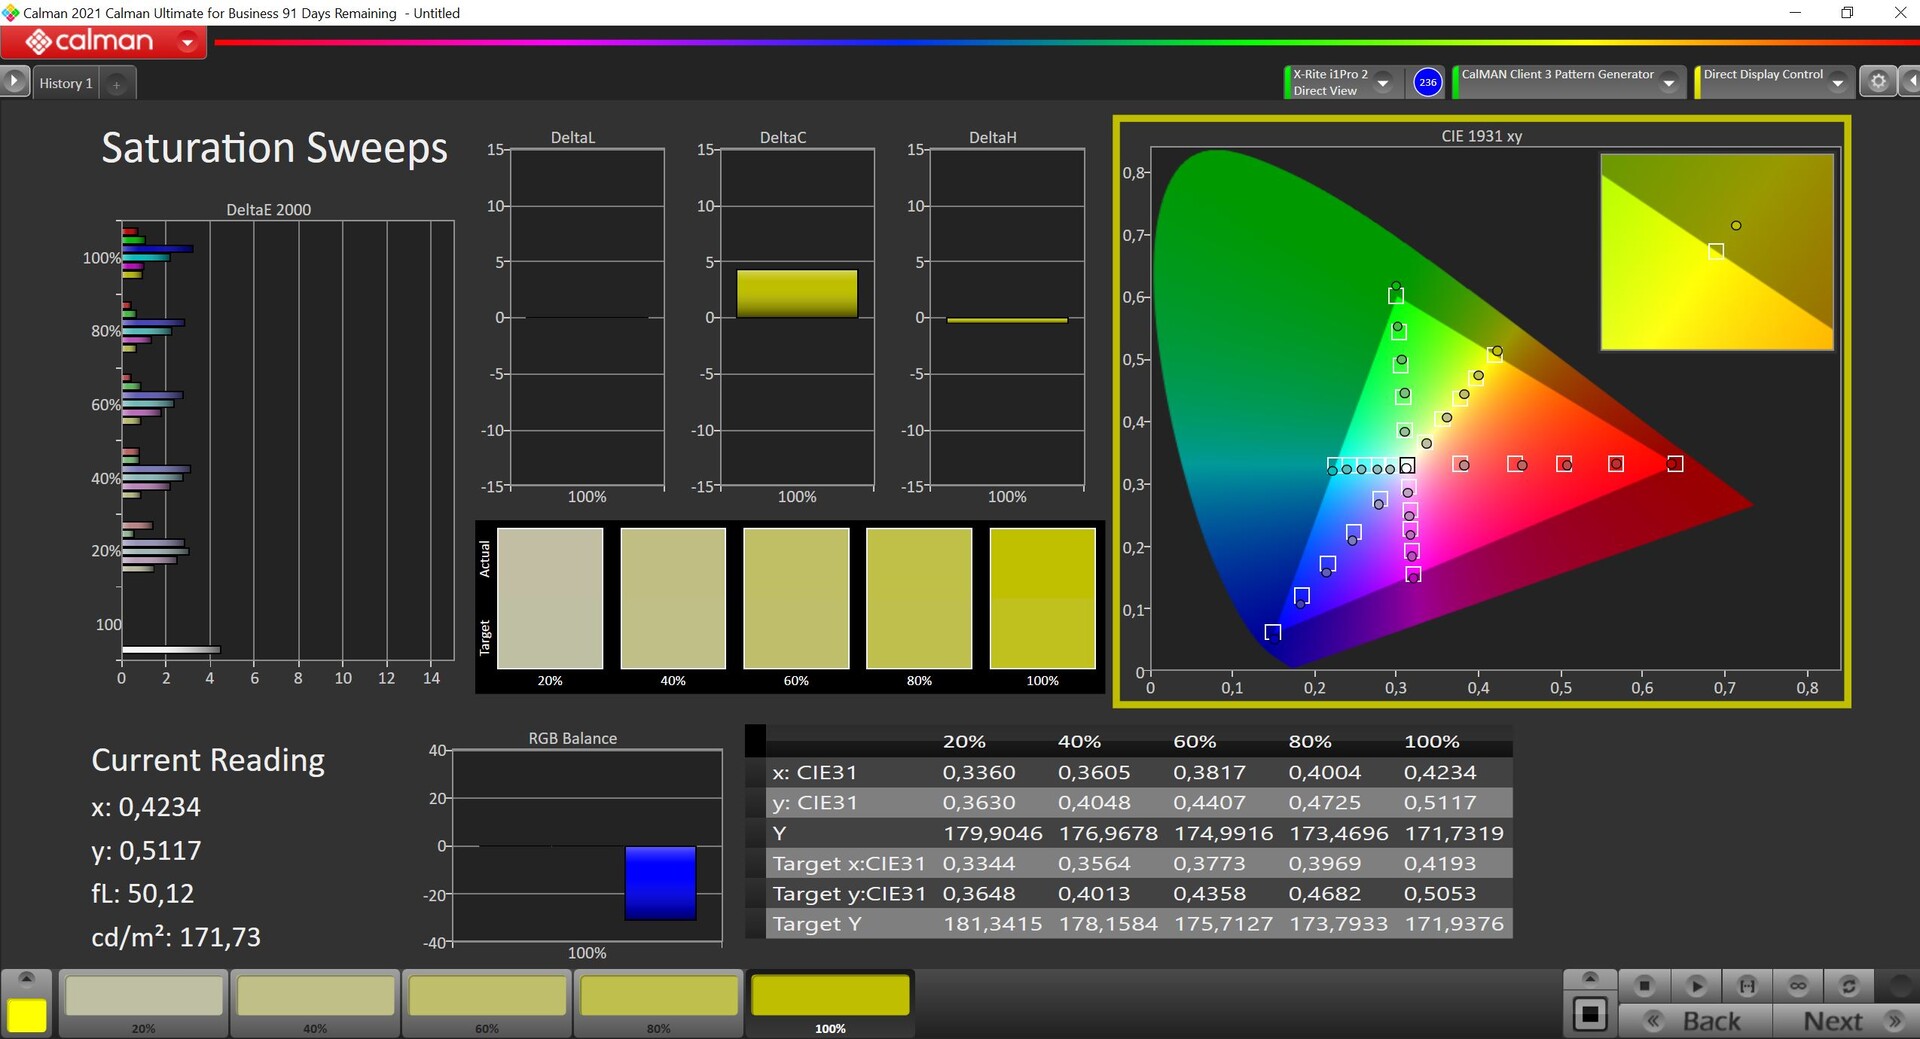

Using our own calibration, we are able to improve the display further, with the grayscale now being at reference level and particularly the color deviations being even lower. However, there are still some outliers in the blue color tones where the deviations are minimally above the important target limit of 3. But overall, the panel is still quite suited for image processing in the small sRGB color space that is practically covered completely.


Display Response Times
| ↔ Response Time Black to White | ||
|---|---|---|
| 8.1 ms ... rise ↗ and fall ↘ combined | ↗ 3.8 ms rise | 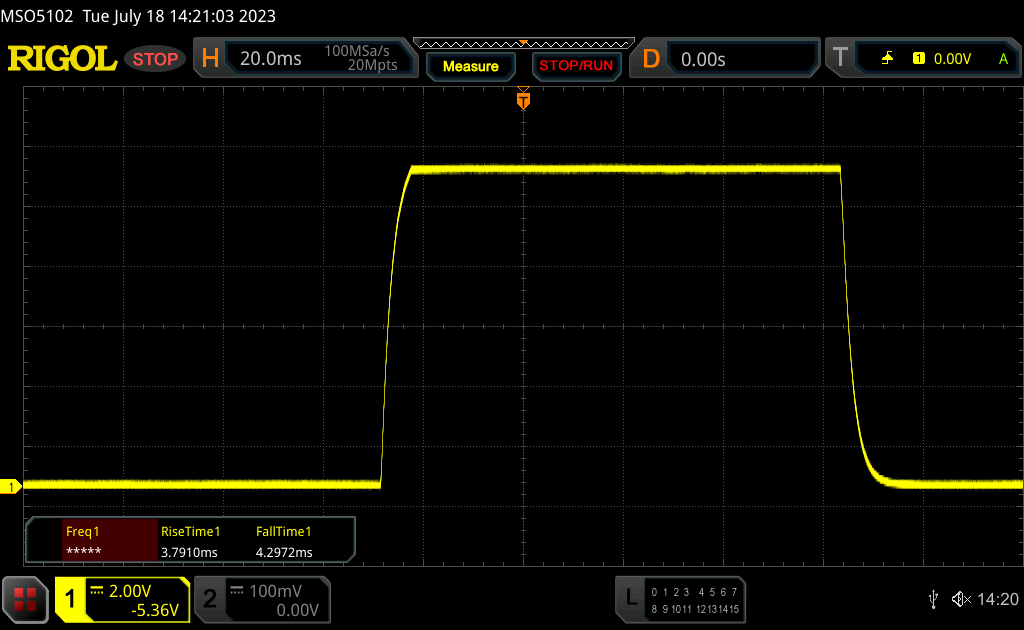 |
| ↘ 4.3 ms fall | ||
| The screen shows fast response rates in our tests and should be suited for gaming. In comparison, all tested devices range from 0.1 (minimum) to 240 (maximum) ms. » 23 % of all devices are better. This means that the measured response time is better than the average of all tested devices (19.8 ms). | ||
| ↔ Response Time 50% Grey to 80% Grey | ||
| 13.7 ms ... rise ↗ and fall ↘ combined | ↗ 6.7 ms rise | 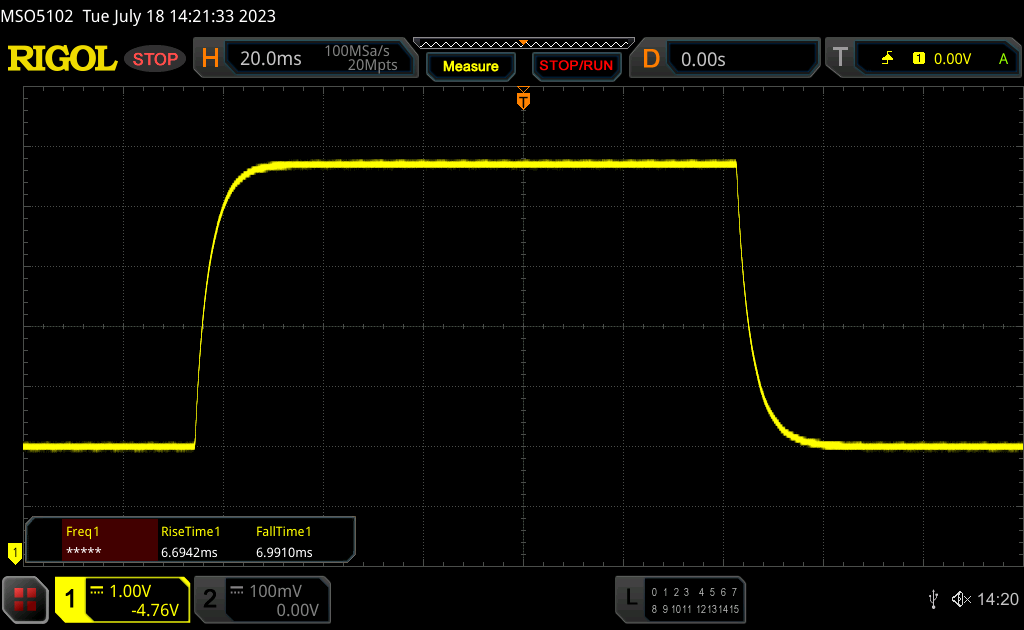 |
| ↘ 7 ms fall | ||
| The screen shows good response rates in our tests, but may be too slow for competitive gamers. In comparison, all tested devices range from 0.165 (minimum) to 636 (maximum) ms. » 27 % of all devices are better. This means that the measured response time is better than the average of all tested devices (31 ms). | ||
Screen Flickering / PWM (Pulse-Width Modulation)
| Screen flickering / PWM not detected | 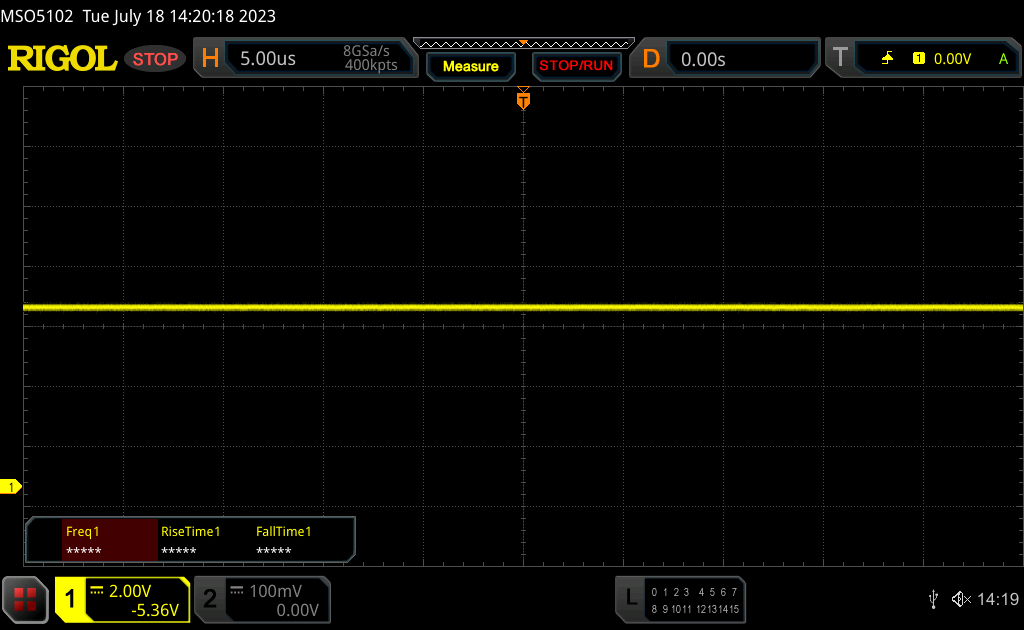 | ||
In comparison: 52 % of all tested devices do not use PWM to dim the display. If PWM was detected, an average of 7763 (minimum: 5 - maximum: 343500) Hz was measured. | |||
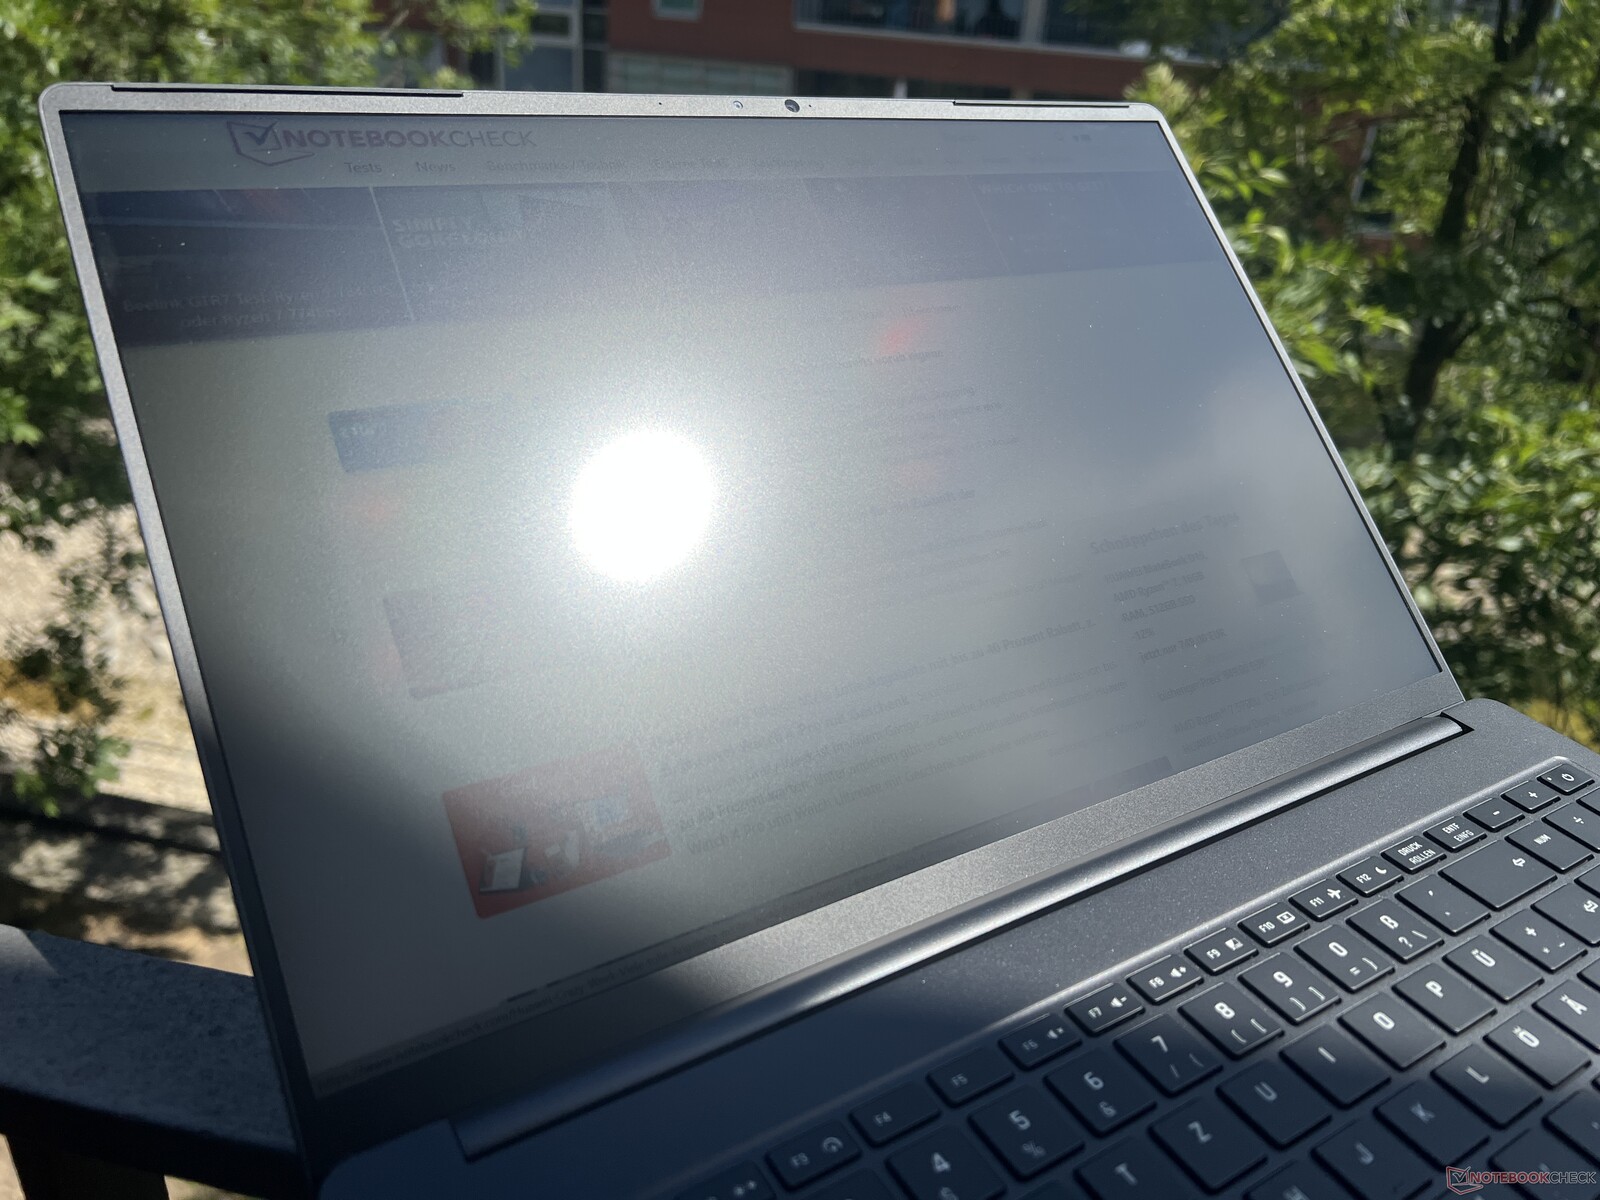

As long as you avoid reflections of direct light sources, the Vision 16 Pro can also be used in bright surroundings without any problems. The viewing angle stability is good overall, but there is visible brightening and reduced contrast when looking from an angle above.

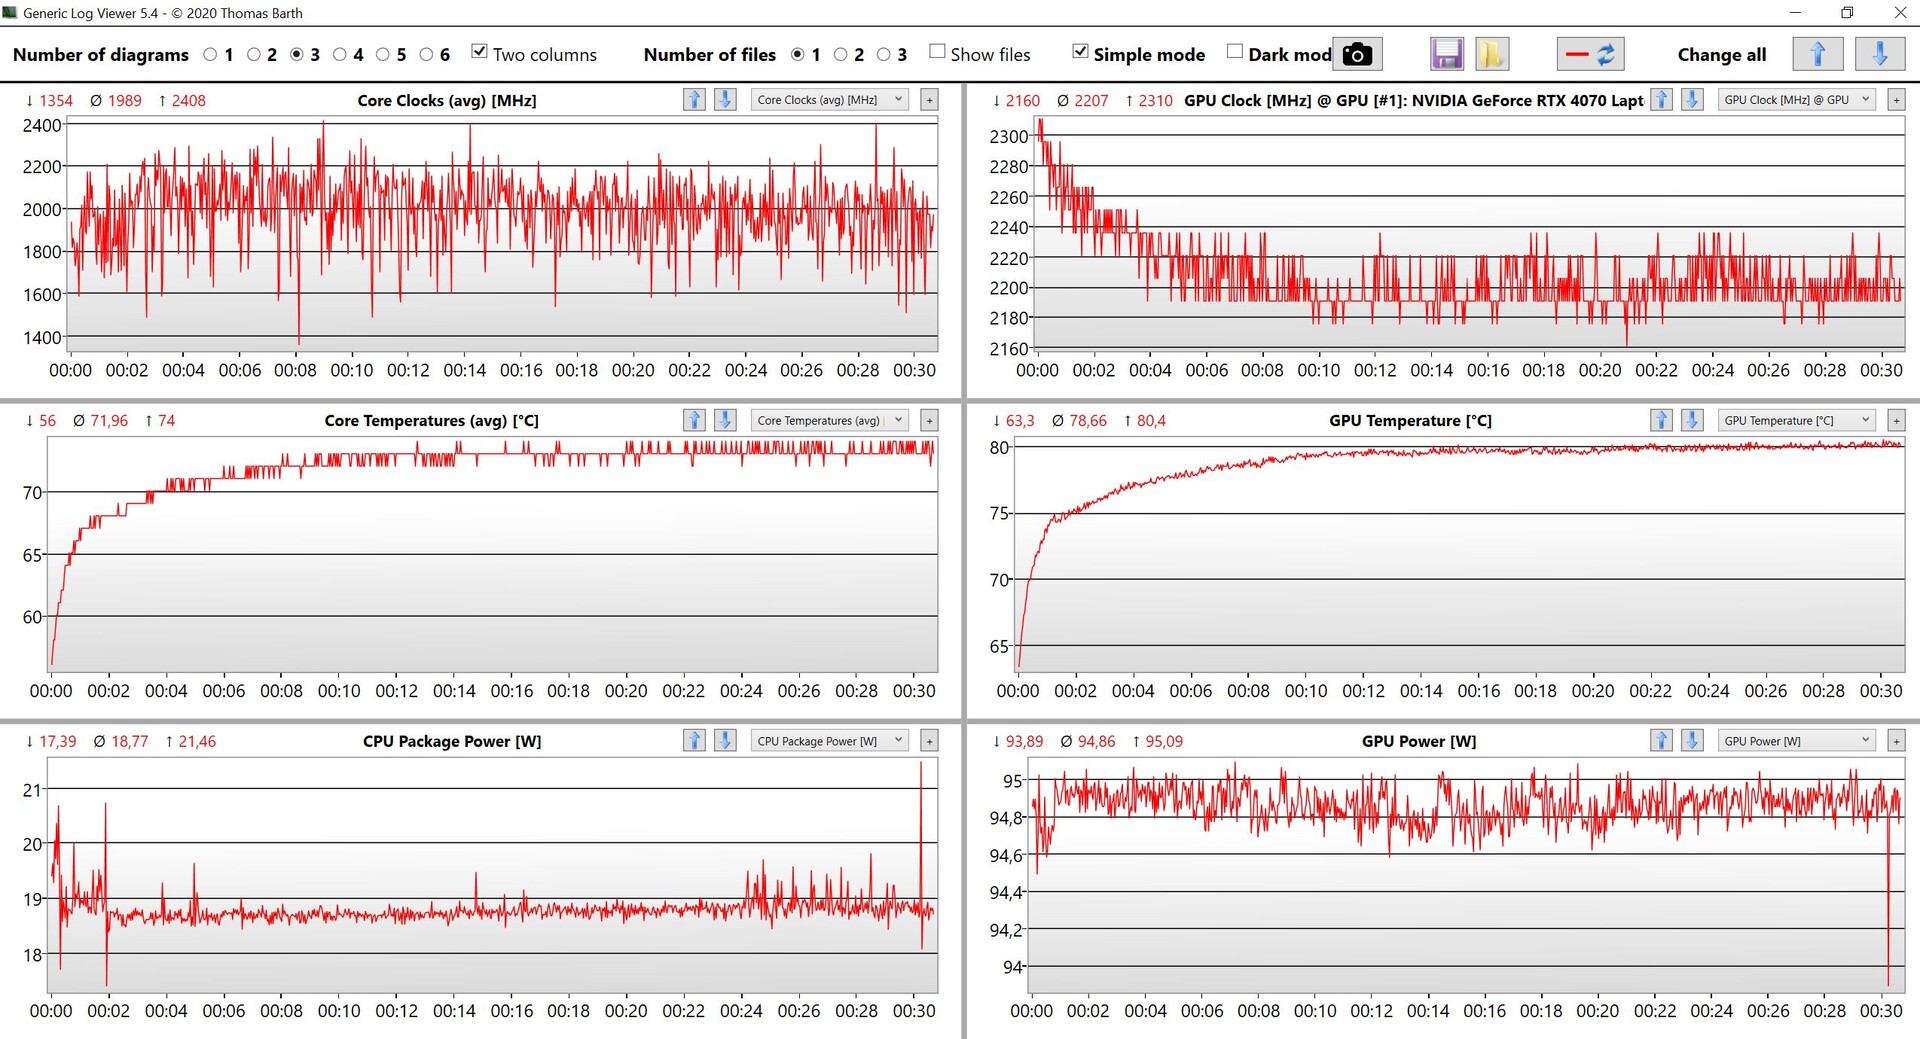
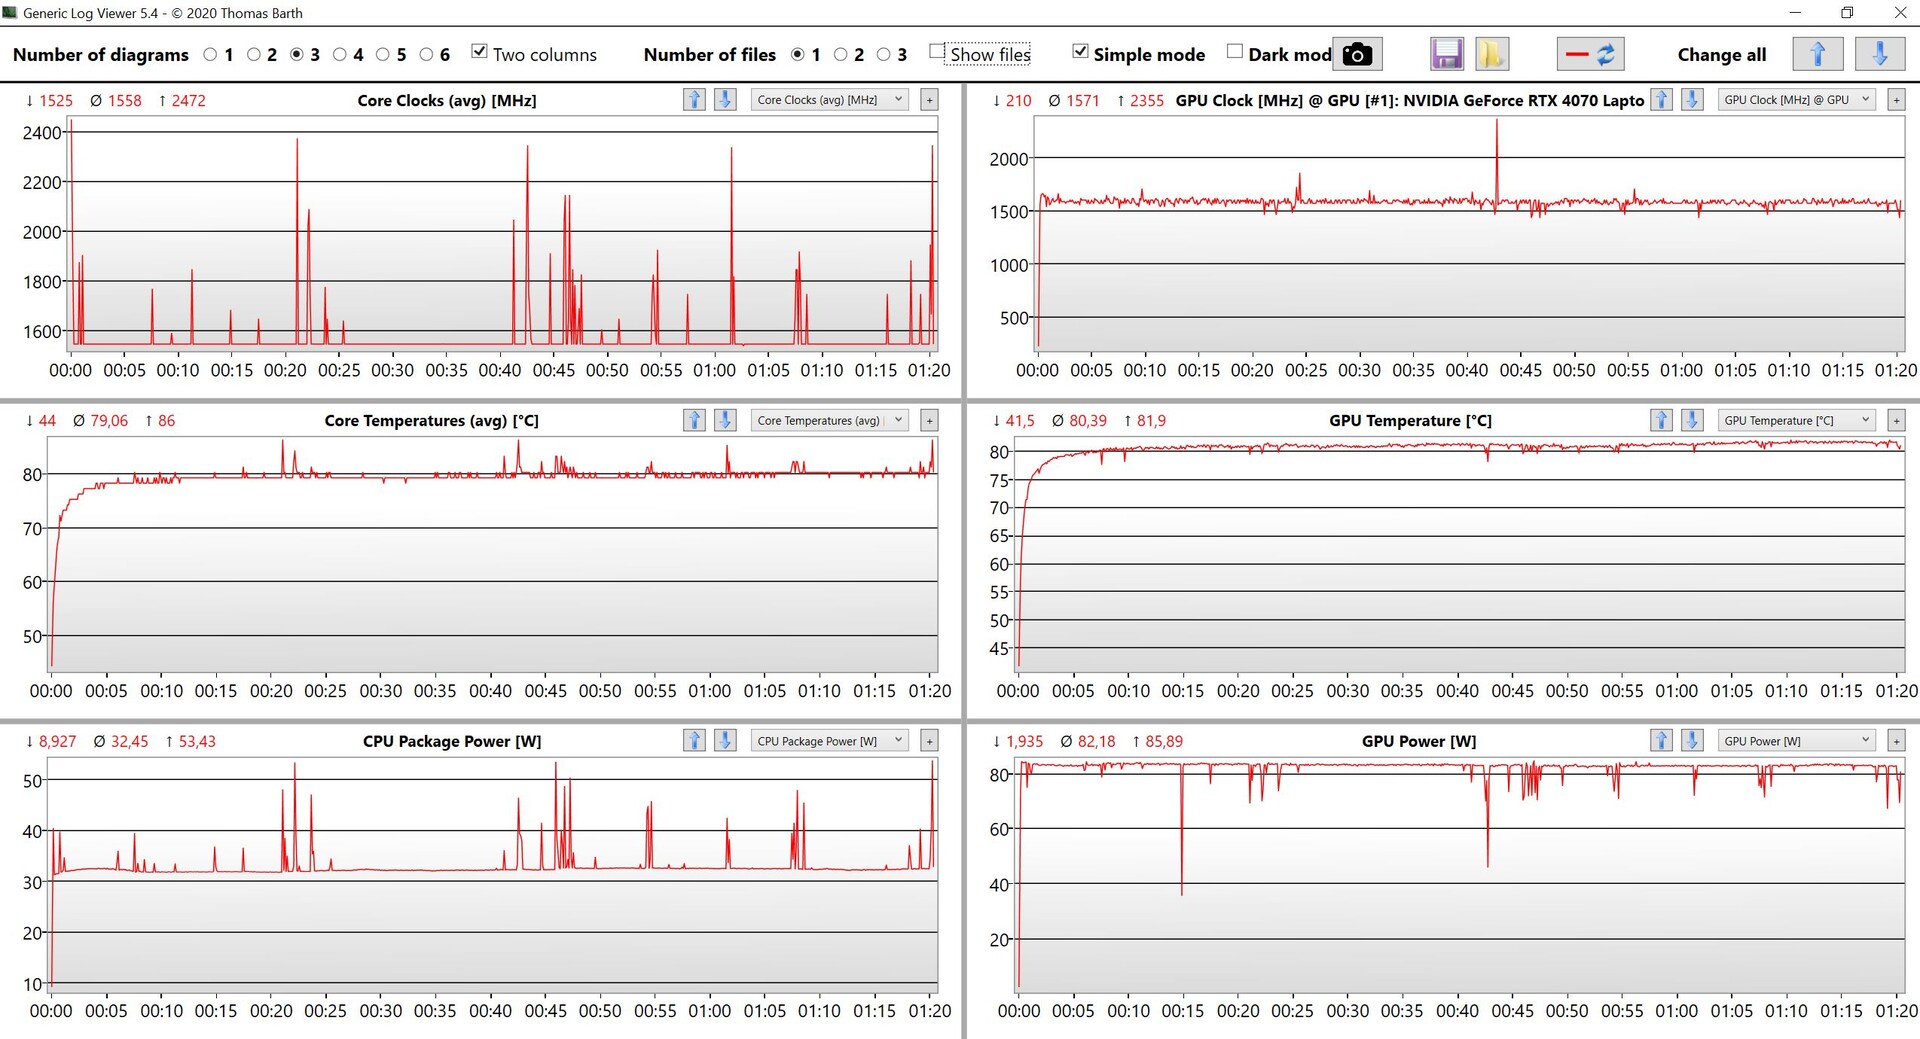
Performance - RTX 4070 Laptop with 95 watts
Test Conditions
Schenker offers various power profiles in the Control Center, but in contrast to the predecessor, there is no manual profile anymore, which would allow you to configure the TDP limits of the processor. We again ran the benchmarks and measurements in the Enthusiast Performance mode, which sets the TDP values of the processor at 60/45 watts (or 55/35 watts when the dGPU is activated). The GPU is able to consume 95 watts (70W TGP + 25W Dynamic Boost) here, and in the Enthusiast Balanced mode it is 85 watts (60 + 25W).
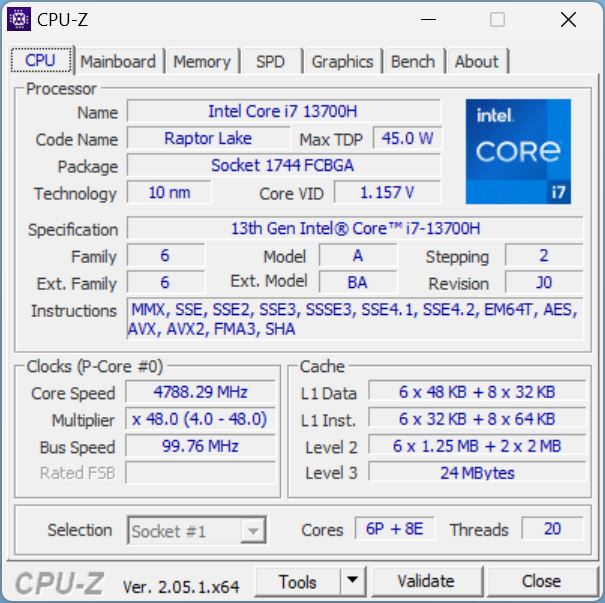
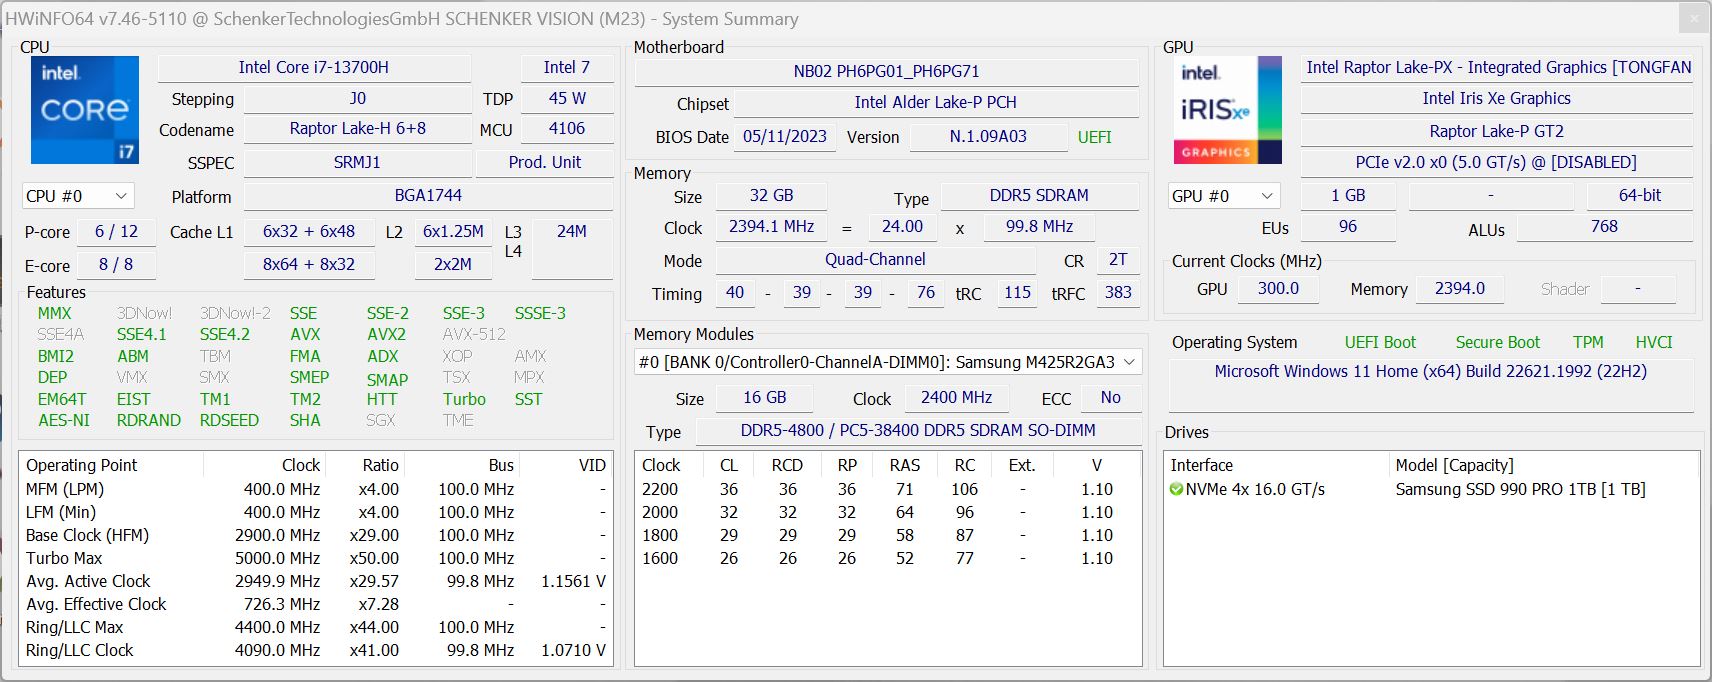
Processor - Core i7-13700H
The Core i7-13700H from Intel's current Raptor Lake generation is the direct successor to the Core i7-12700H, and there are no changes besides some slight increases in the maximum clock speeds. The Vision 16 Pro is one of the few devices without extremely high power limits of more than 100 watts. This has some advantages in everyday operation, since the temperatures don't shoot up that high as quickly, and there is also not such a steep performance drop under constant load. On the other hand, the multi-core performance under short load is also lower than that of the competitors and only slightly higher than in the older model. In Turbo mode, the old model was even significantly faster. In battery operation, the power consumption is limited to 36 watts, causing the multi-core performance to drop by 20% without a charger. You can find additional CPU benchmarks in our technical section.
Cinebench R15 Multi Constant Load Test
Cinebench R23: Multi Core | Single Core
Cinebench R20: CPU (Multi Core) | CPU (Single Core)
Cinebench R15: CPU Multi 64Bit | CPU Single 64Bit
Blender: v2.79 BMW27 CPU
7-Zip 18.03: 7z b 4 | 7z b 4 -mmt1
Geekbench 5.5: Multi-Core | Single-Core
HWBOT x265 Benchmark v2.2: 4k Preset
LibreOffice : 20 Documents To PDF
R Benchmark 2.5: Overall mean
| CPU Performance rating | |
| Asus ProArt Studiobook 16 OLED H7604 | |
| MSI Stealth 16 Studio A13VG | |
| Apple MacBook Pro 16 2023 M2 Max -6! | |
| Dell XPS 15 9530 RTX 4070 | |
| Average of class Multimedia | |
| Schenker VISION 16 Pro (M23) | |
| Average Intel Core i7-13700H | |
| Schenker Vision 16 Pro RTX 3070 Ti | |
| Samsung Galaxy Book3 Ultra 16, i9-13900H RTX 4070 | |
| Cinebench R23 / Multi Core | |
| Asus ProArt Studiobook 16 OLED H7604 | |
| MSI Stealth 16 Studio A13VG | |
| Average of class Multimedia (4861 - 33362, n=80, last 2 years) | |
| Dell XPS 15 9530 RTX 4070 | |
| Average Intel Core i7-13700H (5890 - 20034, n=29) | |
| Apple MacBook Pro 16 2023 M2 Max | |
| Schenker VISION 16 Pro (M23) | |
| Samsung Galaxy Book3 Ultra 16, i9-13900H RTX 4070 | |
| Schenker Vision 16 Pro RTX 3070 Ti | |
| Cinebench R23 / Single Core | |
| Asus ProArt Studiobook 16 OLED H7604 | |
| Average of class Multimedia (1128 - 2459, n=72, last 2 years) | |
| Schenker VISION 16 Pro (M23) | |
| MSI Stealth 16 Studio A13VG | |
| Dell XPS 15 9530 RTX 4070 | |
| Schenker Vision 16 Pro RTX 3070 Ti | |
| Average Intel Core i7-13700H (1323 - 1914, n=29) | |
| Apple MacBook Pro 16 2023 M2 Max | |
| Samsung Galaxy Book3 Ultra 16, i9-13900H RTX 4070 | |
| Cinebench R20 / CPU (Multi Core) | |
| Asus ProArt Studiobook 16 OLED H7604 | |
| MSI Stealth 16 Studio A13VG | |
| Average of class Multimedia (1887 - 12912, n=63, last 2 years) | |
| Dell XPS 15 9530 RTX 4070 | |
| Average Intel Core i7-13700H (2322 - 7674, n=29) | |
| Schenker VISION 16 Pro (M23) | |
| Schenker Vision 16 Pro RTX 3070 Ti | |
| Samsung Galaxy Book3 Ultra 16, i9-13900H RTX 4070 | |
| Apple MacBook Pro 16 2023 M2 Max | |
| Cinebench R20 / CPU (Single Core) | |
| Asus ProArt Studiobook 16 OLED H7604 | |
| Schenker VISION 16 Pro (M23) | |
| Average of class Multimedia (425 - 853, n=63, last 2 years) | |
| MSI Stealth 16 Studio A13VG | |
| Schenker Vision 16 Pro RTX 3070 Ti | |
| Dell XPS 15 9530 RTX 4070 | |
| Average Intel Core i7-13700H (508 - 741, n=29) | |
| Apple MacBook Pro 16 2023 M2 Max | |
| Samsung Galaxy Book3 Ultra 16, i9-13900H RTX 4070 | |
| Cinebench R15 / CPU Multi 64Bit | |
| Asus ProArt Studiobook 16 OLED H7604 | |
| MSI Stealth 16 Studio A13VG | |
| Schenker Vision 16 Pro RTX 3070 Ti | |
| Schenker Vision 16 Pro RTX 3070 Ti | |
| Dell XPS 15 9530 RTX 4070 | |
| Average of class Multimedia (856 - 5224, n=67, last 2 years) | |
| Average Intel Core i7-13700H (905 - 2982, n=29) | |
| Schenker VISION 16 Pro (M23) | |
| Samsung Galaxy Book3 Ultra 16, i9-13900H RTX 4070 | |
| Apple MacBook Pro 16 2023 M2 Max | |
| Cinebench R15 / CPU Single 64Bit | |
| Asus ProArt Studiobook 16 OLED H7604 | |
| Average of class Multimedia (184.8 - 326, n=65, last 2 years) | |
| Schenker VISION 16 Pro (M23) | |
| MSI Stealth 16 Studio A13VG | |
| Dell XPS 15 9530 RTX 4070 | |
| Schenker Vision 16 Pro RTX 3070 Ti | |
| Average Intel Core i7-13700H (213 - 278, n=29) | |
| Apple MacBook Pro 16 2023 M2 Max | |
| Samsung Galaxy Book3 Ultra 16, i9-13900H RTX 4070 | |
| Blender / v2.79 BMW27 CPU | |
| Schenker Vision 16 Pro RTX 3070 Ti | |
| Average of class Multimedia (100 - 557, n=64, last 2 years) | |
| Samsung Galaxy Book3 Ultra 16, i9-13900H RTX 4070 | |
| Average Intel Core i7-13700H (169 - 555, n=29) | |
| Schenker VISION 16 Pro (M23) | |
| Dell XPS 15 9530 RTX 4070 | |
| MSI Stealth 16 Studio A13VG | |
| Asus ProArt Studiobook 16 OLED H7604 | |
| 7-Zip 18.03 / 7z b 4 | |
| Asus ProArt Studiobook 16 OLED H7604 | |
| MSI Stealth 16 Studio A13VG | |
| Schenker VISION 16 Pro (M23) | |
| Average Intel Core i7-13700H (27322 - 76344, n=29) | |
| Dell XPS 15 9530 RTX 4070 | |
| Average of class Multimedia (26062 - 130368, n=61, last 2 years) | |
| Schenker Vision 16 Pro RTX 3070 Ti | |
| Samsung Galaxy Book3 Ultra 16, i9-13900H RTX 4070 | |
| 7-Zip 18.03 / 7z b 4 -mmt1 | |
| Asus ProArt Studiobook 16 OLED H7604 | |
| Schenker VISION 16 Pro (M23) | |
| MSI Stealth 16 Studio A13VG | |
| Dell XPS 15 9530 RTX 4070 | |
| Average of class Multimedia (3666 - 7545, n=62, last 2 years) | |
| Average Intel Core i7-13700H (4825 - 6238, n=29) | |
| Schenker Vision 16 Pro RTX 3070 Ti | |
| Samsung Galaxy Book3 Ultra 16, i9-13900H RTX 4070 | |
| Geekbench 5.5 / Multi-Core | |
| Asus ProArt Studiobook 16 OLED H7604 | |
| Apple MacBook Pro 16 2023 M2 Max | |
| Dell XPS 15 9530 RTX 4070 | |
| MSI Stealth 16 Studio A13VG | |
| Average of class Multimedia (4652 - 20422, n=61, last 2 years) | |
| Schenker VISION 16 Pro (M23) | |
| Average Intel Core i7-13700H (6165 - 14215, n=29) | |
| Schenker Vision 16 Pro RTX 3070 Ti | |
| Samsung Galaxy Book3 Ultra 16, i9-13900H RTX 4070 | |
| Geekbench 5.5 / Single-Core | |
| Asus ProArt Studiobook 16 OLED H7604 | |
| Apple MacBook Pro 16 2023 M2 Max | |
| Average of class Multimedia (805 - 2974, n=61, last 2 years) | |
| Dell XPS 15 9530 RTX 4070 | |
| Schenker VISION 16 Pro (M23) | |
| MSI Stealth 16 Studio A13VG | |
| Schenker Vision 16 Pro RTX 3070 Ti | |
| Average Intel Core i7-13700H (1362 - 1919, n=29) | |
| Samsung Galaxy Book3 Ultra 16, i9-13900H RTX 4070 | |
| HWBOT x265 Benchmark v2.2 / 4k Preset | |
| Asus ProArt Studiobook 16 OLED H7604 | |
| MSI Stealth 16 Studio A13VG | |
| Average of class Multimedia (5.26 - 36.1, n=62, last 2 years) | |
| Dell XPS 15 9530 RTX 4070 | |
| Schenker VISION 16 Pro (M23) | |
| Average Intel Core i7-13700H (6.72 - 21.2, n=29) | |
| Samsung Galaxy Book3 Ultra 16, i9-13900H RTX 4070 | |
| Schenker Vision 16 Pro RTX 3070 Ti | |
| LibreOffice / 20 Documents To PDF | |
| Samsung Galaxy Book3 Ultra 16, i9-13900H RTX 4070 | |
| MSI Stealth 16 Studio A13VG | |
| Average of class Multimedia (23.9 - 146.7, n=63, last 2 years) | |
| Average Intel Core i7-13700H (31.3 - 62.4, n=29) | |
| Schenker VISION 16 Pro (M23) | |
| Asus ProArt Studiobook 16 OLED H7604 | |
| Dell XPS 15 9530 RTX 4070 | |
| Schenker Vision 16 Pro RTX 3070 Ti | |
| R Benchmark 2.5 / Overall mean | |
| Samsung Galaxy Book3 Ultra 16, i9-13900H RTX 4070 | |
| Average of class Multimedia (0.3604 - 0.947, n=62, last 2 years) | |
| Average Intel Core i7-13700H (0.4308 - 0.607, n=29) | |
| Schenker Vision 16 Pro RTX 3070 Ti | |
| MSI Stealth 16 Studio A13VG | |
| Dell XPS 15 9530 RTX 4070 | |
| Schenker VISION 16 Pro (M23) | |
| Asus ProArt Studiobook 16 OLED H7604 | |
* ... smaller is better
AIDA64: FP32 Ray-Trace | FPU Julia | CPU SHA3 | CPU Queen | FPU SinJulia | FPU Mandel | CPU AES | CPU ZLib | FP64 Ray-Trace | CPU PhotoWorxx
| Performance rating | |
| Asus ProArt Studiobook 16 OLED H7604 | |
| MSI Stealth 16 Studio A13VG | |
| Average of class Multimedia | |
| Schenker VISION 16 Pro (M23) | |
| Dell XPS 15 9530 RTX 4070 | |
| Average Intel Core i7-13700H | |
| Samsung Galaxy Book3 Ultra 16, i9-13900H RTX 4070 | |
| Schenker Vision 16 Pro RTX 3070 Ti | |
| AIDA64 / FP32 Ray-Trace | |
| Asus ProArt Studiobook 16 OLED H7604 | |
| MSI Stealth 16 Studio A13VG | |
| Average of class Multimedia (2214 - 50388, n=59, last 2 years) | |
| Samsung Galaxy Book3 Ultra 16, i9-13900H RTX 4070 | |
| Dell XPS 15 9530 RTX 4070 | |
| Average Intel Core i7-13700H (4986 - 18908, n=29) | |
| Schenker VISION 16 Pro (M23) | |
| Schenker Vision 16 Pro RTX 3070 Ti | |
| AIDA64 / FPU Julia | |
| Asus ProArt Studiobook 16 OLED H7604 | |
| Average of class Multimedia (12867 - 201874, n=60, last 2 years) | |
| MSI Stealth 16 Studio A13VG | |
| Schenker VISION 16 Pro (M23) | |
| Average Intel Core i7-13700H (25360 - 92359, n=29) | |
| Dell XPS 15 9530 RTX 4070 | |
| Schenker Vision 16 Pro RTX 3070 Ti | |
| Samsung Galaxy Book3 Ultra 16, i9-13900H RTX 4070 | |
| AIDA64 / CPU SHA3 | |
| Asus ProArt Studiobook 16 OLED H7604 | |
| MSI Stealth 16 Studio A13VG | |
| Average of class Multimedia (626 - 8623, n=60, last 2 years) | |
| Samsung Galaxy Book3 Ultra 16, i9-13900H RTX 4070 | |
| Average Intel Core i7-13700H (1339 - 4224, n=29) | |
| Schenker VISION 16 Pro (M23) | |
| Dell XPS 15 9530 RTX 4070 | |
| Schenker Vision 16 Pro RTX 3070 Ti | |
| AIDA64 / CPU Queen | |
| Asus ProArt Studiobook 16 OLED H7604 | |
| MSI Stealth 16 Studio A13VG | |
| Dell XPS 15 9530 RTX 4070 | |
| Schenker VISION 16 Pro (M23) | |
| Average Intel Core i7-13700H (59324 - 107159, n=29) | |
| Schenker Vision 16 Pro RTX 3070 Ti | |
| Samsung Galaxy Book3 Ultra 16, i9-13900H RTX 4070 | |
| Average of class Multimedia (13483 - 181505, n=47, last 2 years) | |
| AIDA64 / FPU SinJulia | |
| Asus ProArt Studiobook 16 OLED H7604 | |
| MSI Stealth 16 Studio A13VG | |
| Schenker VISION 16 Pro (M23) | |
| Average of class Multimedia (886 - 28794, n=60, last 2 years) | |
| Average Intel Core i7-13700H (4800 - 11050, n=29) | |
| Dell XPS 15 9530 RTX 4070 | |
| Schenker Vision 16 Pro RTX 3070 Ti | |
| Samsung Galaxy Book3 Ultra 16, i9-13900H RTX 4070 | |
| AIDA64 / FPU Mandel | |
| Asus ProArt Studiobook 16 OLED H7604 | |
| MSI Stealth 16 Studio A13VG | |
| Average of class Multimedia (6395 - 105740, n=59, last 2 years) | |
| Samsung Galaxy Book3 Ultra 16, i9-13900H RTX 4070 | |
| Average Intel Core i7-13700H (12321 - 45118, n=29) | |
| Dell XPS 15 9530 RTX 4070 | |
| Schenker VISION 16 Pro (M23) | |
| Schenker Vision 16 Pro RTX 3070 Ti | |
| AIDA64 / CPU AES | |
| Asus ProArt Studiobook 16 OLED H7604 | |
| MSI Stealth 16 Studio A13VG | |
| Average Intel Core i7-13700H (28769 - 151254, n=29) | |
| Schenker VISION 16 Pro (M23) | |
| Average of class Multimedia (8171 - 126790, n=60, last 2 years) | |
| Dell XPS 15 9530 RTX 4070 | |
| Schenker Vision 16 Pro RTX 3070 Ti | |
| Samsung Galaxy Book3 Ultra 16, i9-13900H RTX 4070 | |
| AIDA64 / CPU ZLib | |
| Asus ProArt Studiobook 16 OLED H7604 | |
| MSI Stealth 16 Studio A13VG | |
| Samsung Galaxy Book3 Ultra 16, i9-13900H RTX 4070 | |
| Average of class Multimedia (143.8 - 2022, n=60, last 2 years) | |
| Schenker VISION 16 Pro (M23) | |
| Average Intel Core i7-13700H (389 - 1215, n=29) | |
| Dell XPS 15 9530 RTX 4070 | |
| Schenker Vision 16 Pro RTX 3070 Ti | |
| AIDA64 / FP64 Ray-Trace | |
| Asus ProArt Studiobook 16 OLED H7604 | |
| MSI Stealth 16 Studio A13VG | |
| Average of class Multimedia (1014 - 26875, n=60, last 2 years) | |
| Dell XPS 15 9530 RTX 4070 | |
| Average Intel Core i7-13700H (2540 - 10135, n=29) | |
| Schenker VISION 16 Pro (M23) | |
| Schenker Vision 16 Pro RTX 3070 Ti | |
| Samsung Galaxy Book3 Ultra 16, i9-13900H RTX 4070 | |
| AIDA64 / CPU PhotoWorxx | |
| Average of class Multimedia (8187 - 88154, n=60, last 2 years) | |
| Asus ProArt Studiobook 16 OLED H7604 | |
| Samsung Galaxy Book3 Ultra 16, i9-13900H RTX 4070 | |
| MSI Stealth 16 Studio A13VG | |
| Schenker VISION 16 Pro (M23) | |
| Dell XPS 15 9530 RTX 4070 | |
| Schenker Vision 16 Pro RTX 3070 Ti | |
| Average Intel Core i7-13700H (12872 - 52727, n=29) | |
System Performance
The test results in the synthetic benchmarks are very good, but the comparison devices are very close and there won't be any noticeable differences in everyday operation. Those are all simply very responsive computers with modern components. We did not encounter any stability problems during our tests.
CrossMark: Overall | Productivity | Creativity | Responsiveness
| PCMark 10 / Score | |
| Average of class Multimedia (4325 - 10386, n=57, last 2 years) | |
| Asus ProArt Studiobook 16 OLED H7604 | |
| Average Intel Core i7-13700H, NVIDIA GeForce RTX 4070 Laptop GPU (7158 - 7956, n=8) | |
| Schenker VISION 16 Pro (M23) | |
| MSI Stealth 16 Studio A13VG | |
| Dell XPS 15 9530 RTX 4070 | |
| Samsung Galaxy Book3 Ultra 16, i9-13900H RTX 4070 | |
| PCMark 10 / Essentials | |
| Dell XPS 15 9530 RTX 4070 | |
| Asus ProArt Studiobook 16 OLED H7604 | |
| Schenker VISION 16 Pro (M23) | |
| Average Intel Core i7-13700H, NVIDIA GeForce RTX 4070 Laptop GPU (10252 - 11449, n=8) | |
| MSI Stealth 16 Studio A13VG | |
| Average of class Multimedia (8025 - 11664, n=56, last 2 years) | |
| Samsung Galaxy Book3 Ultra 16, i9-13900H RTX 4070 | |
| PCMark 10 / Productivity | |
| Average of class Multimedia (7323 - 18233, n=56, last 2 years) | |
| Asus ProArt Studiobook 16 OLED H7604 | |
| Schenker VISION 16 Pro (M23) | |
| Average Intel Core i7-13700H, NVIDIA GeForce RTX 4070 Laptop GPU (8501 - 10769, n=8) | |
| MSI Stealth 16 Studio A13VG | |
| Dell XPS 15 9530 RTX 4070 | |
| Samsung Galaxy Book3 Ultra 16, i9-13900H RTX 4070 | |
| PCMark 10 / Digital Content Creation | |
| Average Intel Core i7-13700H, NVIDIA GeForce RTX 4070 Laptop GPU (10358 - 12908, n=8) | |
| MSI Stealth 16 Studio A13VG | |
| Schenker VISION 16 Pro (M23) | |
| Dell XPS 15 9530 RTX 4070 | |
| Asus ProArt Studiobook 16 OLED H7604 | |
| Average of class Multimedia (3651 - 16240, n=56, last 2 years) | |
| Samsung Galaxy Book3 Ultra 16, i9-13900H RTX 4070 | |
| CrossMark / Overall | |
| Asus ProArt Studiobook 16 OLED H7604 | |
| Apple MacBook Pro 16 2023 M2 Max | |
| Schenker VISION 16 Pro (M23) | |
| Dell XPS 15 9530 RTX 4070 | |
| Average Intel Core i7-13700H, NVIDIA GeForce RTX 4070 Laptop GPU (1768 - 2073, n=6) | |
| Average of class Multimedia (866 - 2728, n=66, last 2 years) | |
| MSI Stealth 16 Studio A13VG | |
| Schenker Vision 16 Pro RTX 3070 Ti | |
| Samsung Galaxy Book3 Ultra 16, i9-13900H RTX 4070 | |
| CrossMark / Productivity | |
| Asus ProArt Studiobook 16 OLED H7604 | |
| Schenker VISION 16 Pro (M23) | |
| Average Intel Core i7-13700H, NVIDIA GeForce RTX 4070 Laptop GPU (1645 - 2006, n=6) | |
| Dell XPS 15 9530 RTX 4070 | |
| Average of class Multimedia (931 - 2489, n=66, last 2 years) | |
| MSI Stealth 16 Studio A13VG | |
| Apple MacBook Pro 16 2023 M2 Max | |
| Schenker Vision 16 Pro RTX 3070 Ti | |
| Samsung Galaxy Book3 Ultra 16, i9-13900H RTX 4070 | |
| CrossMark / Creativity | |
| Apple MacBook Pro 16 2023 M2 Max | |
| Asus ProArt Studiobook 16 OLED H7604 | |
| Dell XPS 15 9530 RTX 4070 | |
| Average of class Multimedia (907 - 3465, n=66, last 2 years) | |
| Average Intel Core i7-13700H, NVIDIA GeForce RTX 4070 Laptop GPU (1936 - 2137, n=6) | |
| Schenker VISION 16 Pro (M23) | |
| MSI Stealth 16 Studio A13VG | |
| Schenker Vision 16 Pro RTX 3070 Ti | |
| Samsung Galaxy Book3 Ultra 16, i9-13900H RTX 4070 | |
| CrossMark / Responsiveness | |
| Asus ProArt Studiobook 16 OLED H7604 | |
| Schenker VISION 16 Pro (M23) | |
| Average Intel Core i7-13700H, NVIDIA GeForce RTX 4070 Laptop GPU (1451 - 2202, n=6) | |
| MSI Stealth 16 Studio A13VG | |
| Dell XPS 15 9530 RTX 4070 | |
| Average of class Multimedia (605 - 2024, n=66, last 2 years) | |
| Apple MacBook Pro 16 2023 M2 Max | |
| Schenker Vision 16 Pro RTX 3070 Ti | |
| Samsung Galaxy Book3 Ultra 16, i9-13900H RTX 4070 | |
| PCMark 10 Score | 7368 points | |
Help | ||
| AIDA64 / Memory Copy | |
| Average of class Multimedia (11299 - 132135, n=60, last 2 years) | |
| Asus ProArt Studiobook 16 OLED H7604 | |
| Samsung Galaxy Book3 Ultra 16, i9-13900H RTX 4070 | |
| MSI Stealth 16 Studio A13VG | |
| Dell XPS 15 9530 RTX 4070 | |
| Schenker VISION 16 Pro (M23) | |
| Schenker Vision 16 Pro RTX 3070 Ti | |
| Average Intel Core i7-13700H (24334 - 78081, n=29) | |
| AIDA64 / Memory Read | |
| Average of class Multimedia (11624 - 174586, n=60, last 2 years) | |
| Asus ProArt Studiobook 16 OLED H7604 | |
| MSI Stealth 16 Studio A13VG | |
| Schenker VISION 16 Pro (M23) | |
| Samsung Galaxy Book3 Ultra 16, i9-13900H RTX 4070 | |
| Dell XPS 15 9530 RTX 4070 | |
| Schenker Vision 16 Pro RTX 3070 Ti | |
| Average Intel Core i7-13700H (23681 - 79656, n=29) | |
| AIDA64 / Memory Write | |
| Samsung Galaxy Book3 Ultra 16, i9-13900H RTX 4070 | |
| Average of class Multimedia (11755 - 134998, n=60, last 2 years) | |
| Asus ProArt Studiobook 16 OLED H7604 | |
| MSI Stealth 16 Studio A13VG | |
| Average Intel Core i7-13700H (22986 - 99898, n=29) | |
| Dell XPS 15 9530 RTX 4070 | |
| Schenker VISION 16 Pro (M23) | |
| Schenker Vision 16 Pro RTX 3070 Ti | |
| AIDA64 / Memory Latency | |
| Average of class Multimedia (7 - 535, n=59, last 2 years) | |
| Samsung Galaxy Book3 Ultra 16, i9-13900H RTX 4070 | |
| Average Intel Core i7-13700H (82.4 - 136.8, n=29) | |
| Schenker Vision 16 Pro RTX 3070 Ti | |
| MSI Stealth 16 Studio A13VG | |
| Dell XPS 15 9530 RTX 4070 | |
| Asus ProArt Studiobook 16 OLED H7604 | |
| Schenker VISION 16 Pro (M23) | |
* ... smaller is better
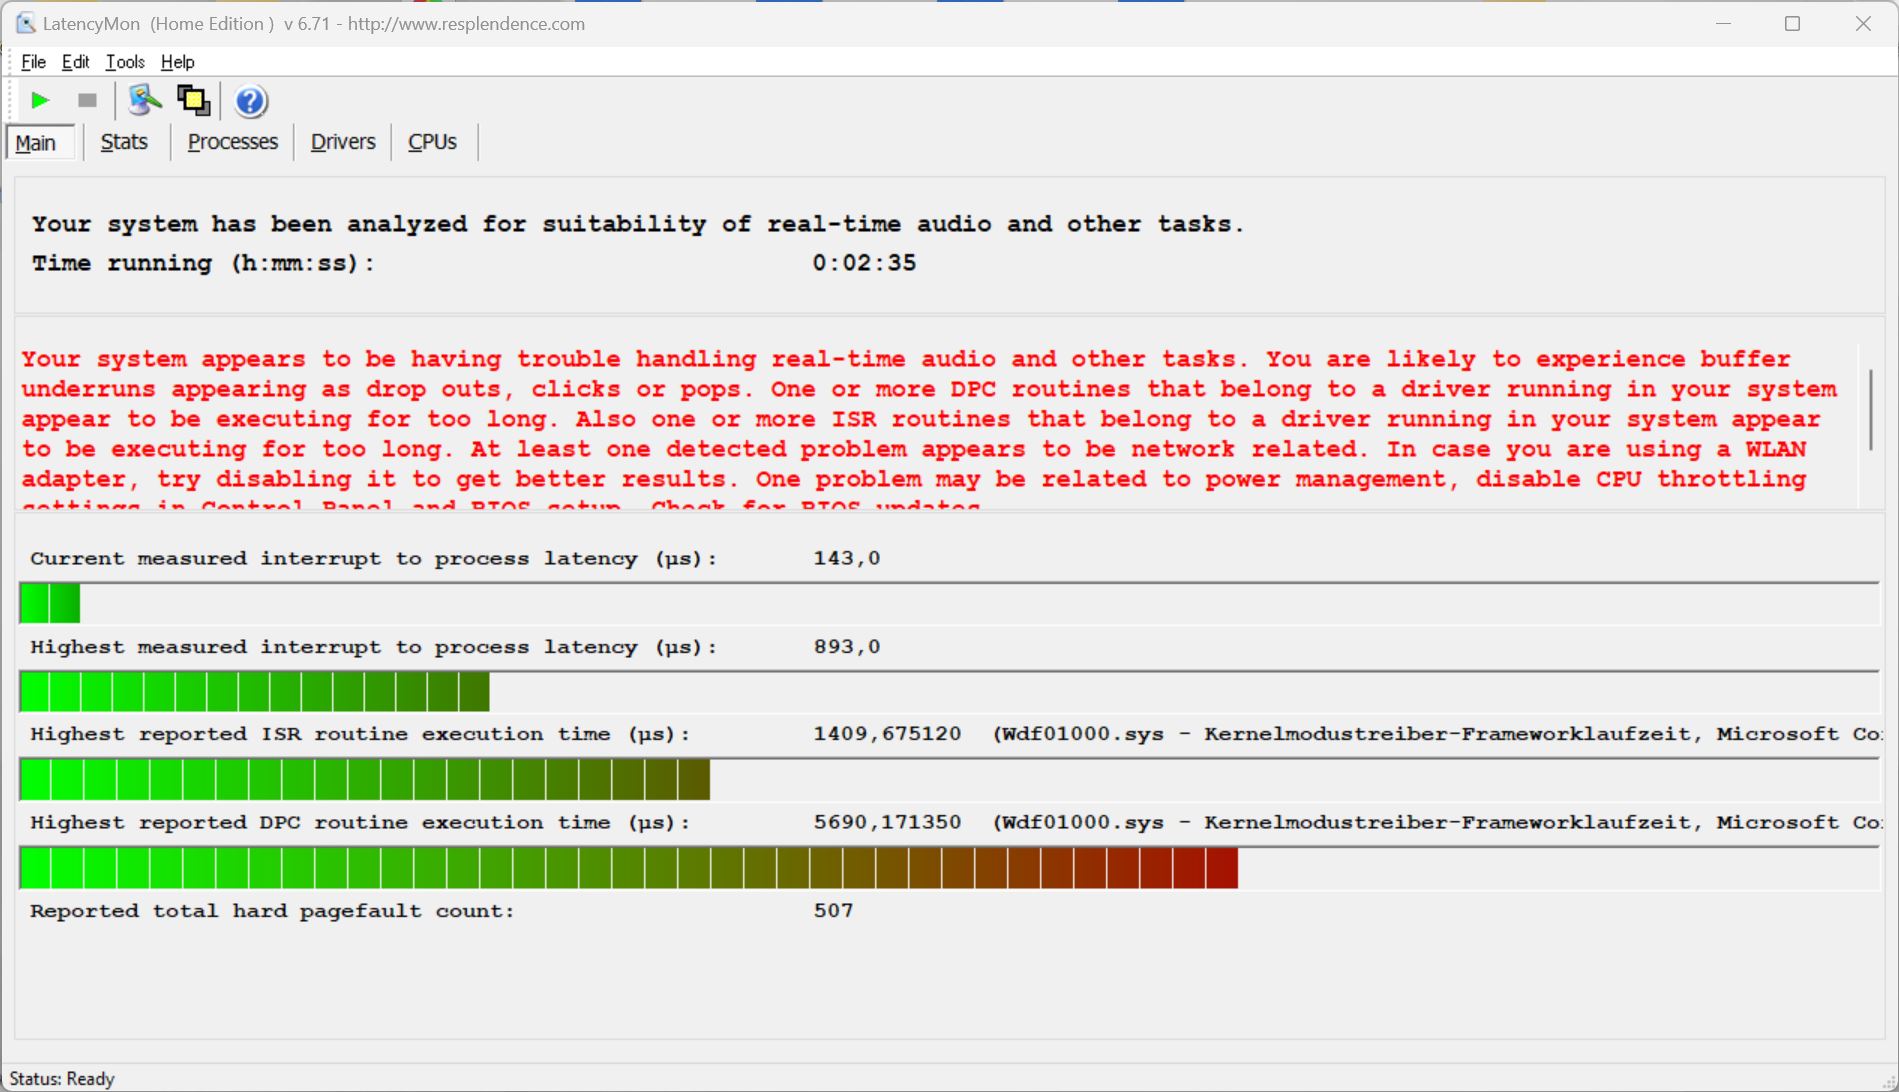
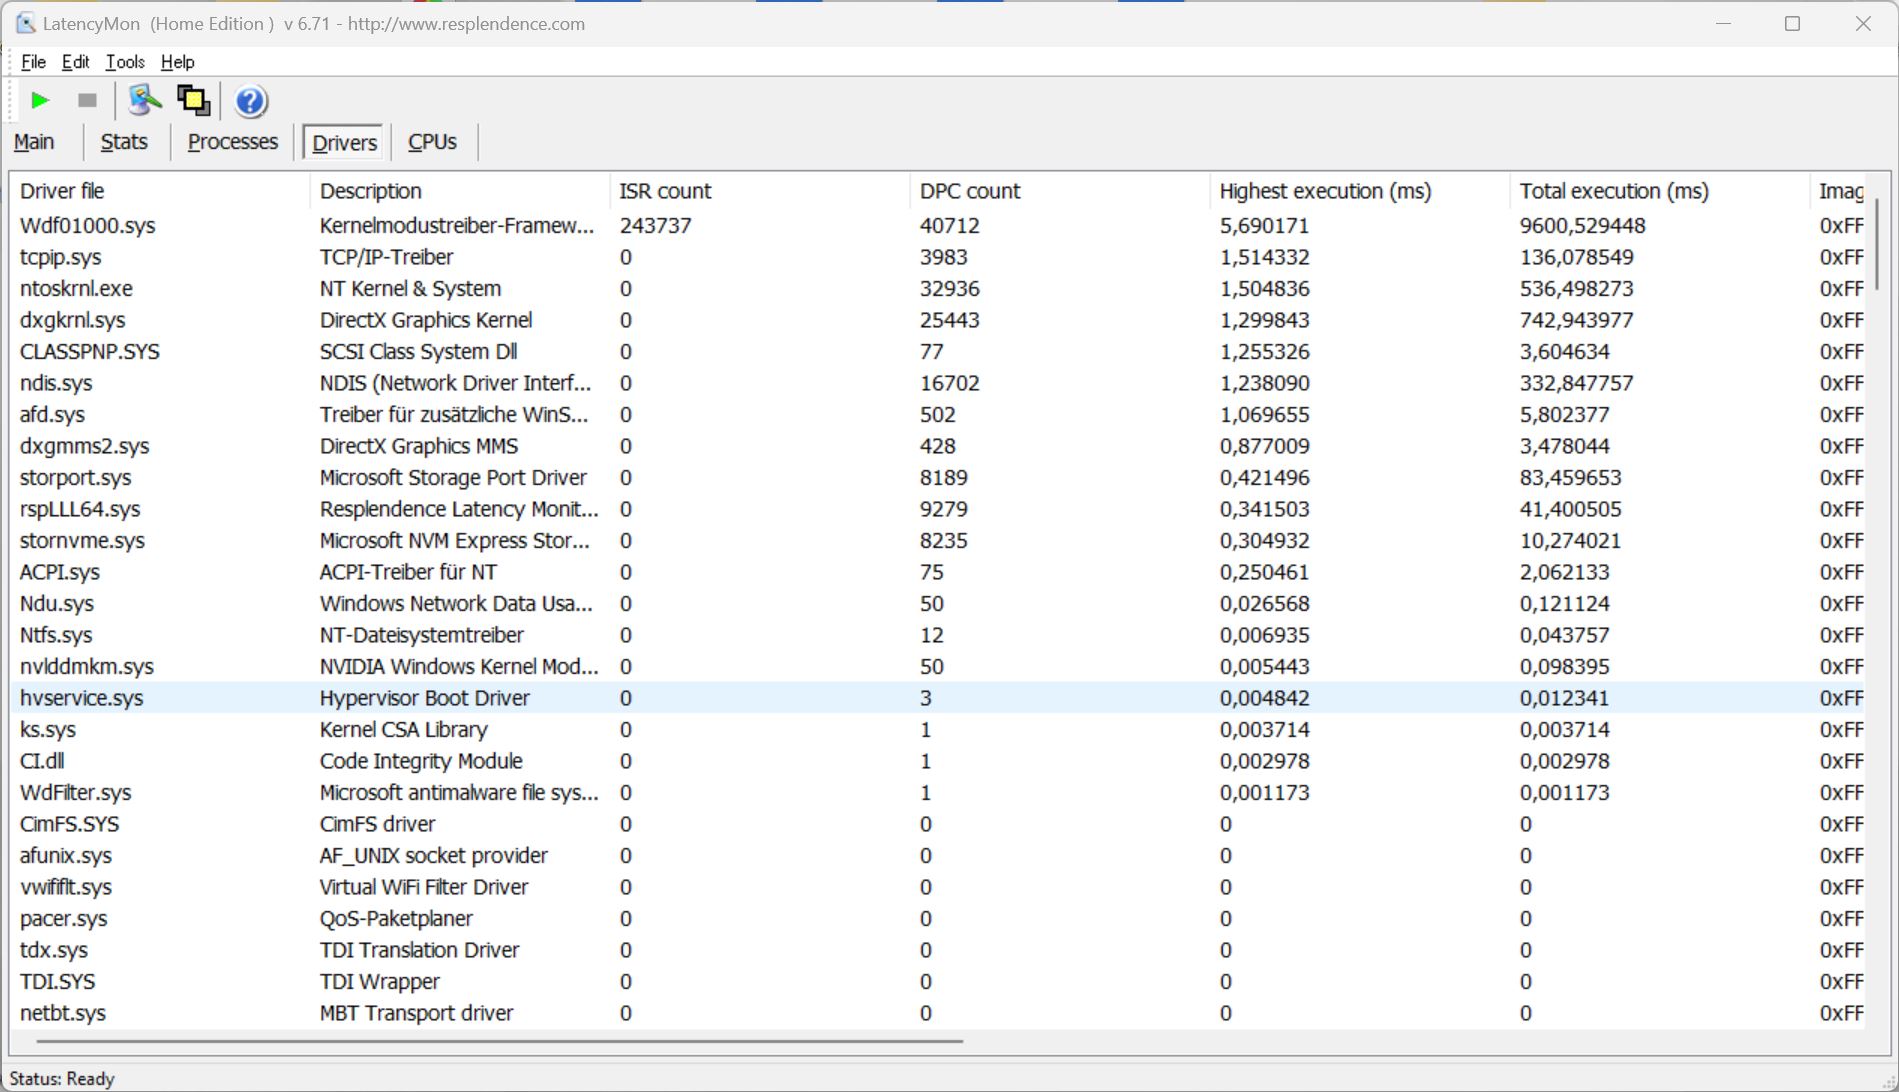
DPC Latencies
In our standardized latency test (with surfing the Internet, 4K YouTube reproduction, and CPU load), with the current BIOS version at the time of the test, our test unit shows some slight limitations for using it in real-time audio applications.
| DPC Latencies / LatencyMon - interrupt to process latency (max), Web, Youtube, Prime95 | |
| MSI Stealth 16 Studio A13VG | |
| Samsung Galaxy Book3 Ultra 16, i9-13900H RTX 4070 | |
| Asus ProArt Studiobook 16 OLED H7604 | |
| Dell XPS 15 9530 RTX 4070 | |
| Schenker VISION 16 Pro (M23) | |
| Schenker Vision 16 Pro RTX 3070 Ti | |
* ... smaller is better
Storage Solution
The Vision 16 Pro offers two fast PCIe 4.0 slots for SSDs, with the second slot next to the battery only being able to take a single-sided SSD. Our test unit uses the 1-TB version of the Samsung 990 Pro, and after the first startup, 870 GB of storage are still available to the user. The transfer rates of the SSD are very high, and the performance also remains completely stable even after longer loads, which is by no means a given with current high performance SSDs. You can find additional SSD benchmarks here.

* ... smaller is better
Disk Throttling: DiskSpd Read Loop, Queue Depth 8
Graphics Card - RTX 4070 Laptop
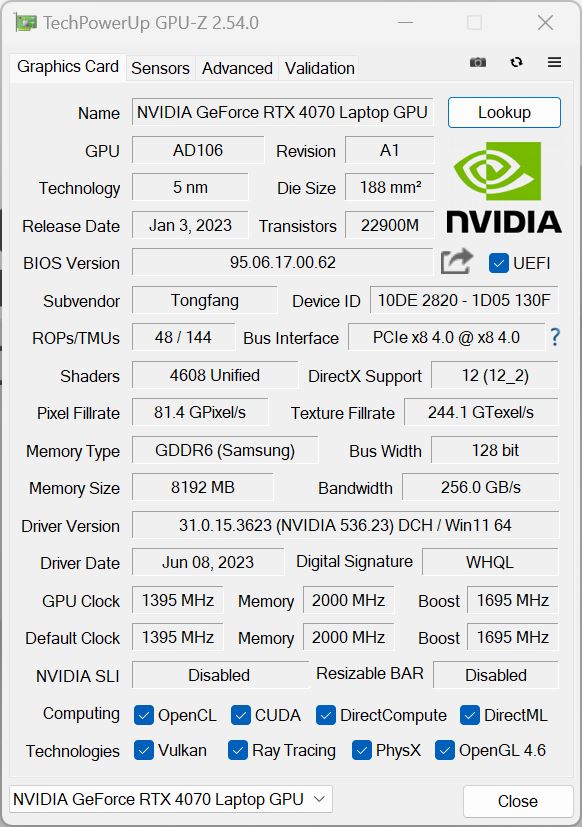
As already in last year's model, a current Nvidia GPU with a maximum TGP of 95 watts is used (70W TGP + 25W Dynamic Boost from the CPU), but this year, the new RTX 4070 Laptop is used. However, the RTX 4080 Laptop, which is the direct successor of the RTX 3080 in last year's model, is not offered anymore. There is no MUX switch in the multimedia laptop, so graphics switching happens regularly via Optimus.
At a maximum of 95 watts, this is a fast version of the RTX 4070 Laptop, since this is close to the 105-Watt maximum the 4070 generally consumes when gaming. Only in some synthetic tests such as FurMark, the consumption can be higher, but this doesn't play any role in practice. You can also see this easily in the 3DMarks, where the Schenker Vision 16 Pro practically ends up at the same level with the ProArt Studiobook 16 that specifies a TGP of 130 watts for the RTX 4070 Laptop. Compared to last year's Vision 16 Pro with the RTX 3070 Ti, there is a speed increase of around 25-30%.
Our test unit passes the Time Spy stress test at 98.2% without any problems, but the power consumption of the GPU is throttled to 36 watts in battery operation. Without a charger, the GPU performance therefore turns out about 40% lower. You can find additional GPU benchmarks here.
| 3DMark 11 Performance | 32729 points | |
| 3DMark Fire Strike Score | 24151 points | |
| 3DMark Time Spy Score | 11566 points | |
Help | ||
| Blender / v3.3 Classroom METAL | |
| Apple MacBook Pro 16 2023 M2 Max | |
| Average of class Multimedia (17.8 - 68, n=5, last 2 years) | |
| Blender / v3.3 Classroom OPTIX/RTX | |
| Average of class Multimedia (12 - 105, n=24, last 2 years) | |
| Dell XPS 15 9530 RTX 4070 | |
| Schenker Vision 16 Pro RTX 3070 Ti | |
| Samsung Galaxy Book3 Ultra 16, i9-13900H RTX 4070 | |
| MSI Stealth 16 Studio A13VG | |
| Schenker VISION 16 Pro (M23) | |
| Asus ProArt Studiobook 16 OLED H7604 | |
| Average NVIDIA GeForce RTX 4070 Laptop GPU (18 - 30, n=68) | |
| Blender / v3.3 Classroom CUDA | |
| Average of class Multimedia (20 - 186, n=24, last 2 years) | |
| Dell XPS 15 9530 RTX 4070 | |
| Schenker Vision 16 Pro RTX 3070 Ti | |
| Samsung Galaxy Book3 Ultra 16, i9-13900H RTX 4070 | |
| MSI Stealth 16 Studio A13VG | |
| Asus ProArt Studiobook 16 OLED H7604 | |
| Schenker VISION 16 Pro (M23) | |
| Average NVIDIA GeForce RTX 4070 Laptop GPU (32 - 50, n=67) | |
| Blender / v3.3 Classroom CPU | |
| Schenker Vision 16 Pro RTX 3070 Ti | |
| Samsung Galaxy Book3 Ultra 16, i9-13900H RTX 4070 | |
| Average of class Multimedia (134.5 - 1042, n=66, last 2 years) | |
| Schenker VISION 16 Pro (M23) | |
| Dell XPS 15 9530 RTX 4070 | |
| Apple MacBook Pro 16 2023 M2 Max | |
| MSI Stealth 16 Studio A13VG | |
| Average NVIDIA GeForce RTX 4070 Laptop GPU (158 - 440, n=67) | |
| Asus ProArt Studiobook 16 OLED H7604 | |
* ... smaller is better
Gaming Performance
The comparatively low CPU performance can have a negative effect on the gaming performance, since at times the Vision 16 Pro performance drops here, compared to that of other laptops with the RTX 4070 Laptop. But basically, the performance is completely sufficient to also play modern games such as Cyberpunk 2077 or Star Wars: Jedi Survivor smoothly in QHD resolution, and it also remains stable during longer gaming sessions.
| The Witcher 3 - 1920x1080 Ultra Graphics & Postprocessing (HBAO+) | |
| MSI Stealth 16 Studio A13VG | |
| Asus ProArt Studiobook 16 OLED H7604 | |
| Schenker VISION 16 Pro (M23) | |
| Schenker Vision 16 Pro RTX 3070 Ti | |
| Samsung Galaxy Book3 Ultra 16, i9-13900H RTX 4070 | |
| Dell XPS 15 9530 RTX 4070 | |
| Average of class Multimedia (11 - 121, n=11, last 2 years) | |
The Witcher 3 FPS Chart
| low | med. | high | ultra | QHD | |
|---|---|---|---|---|---|
| GTA V (2015) | 170 | 156.9 | 96.5 | 80.6 | |
| The Witcher 3 (2015) | 226 | 105.4 | |||
| Dota 2 Reborn (2015) | 178.4 | 161.3 | 152.4 | 143.8 | |
| Final Fantasy XV Benchmark (2018) | 175.3 | 143.2 | 109 | 81.6 | |
| X-Plane 11.11 (2018) | 154.8 | 138.4 | 109.7 | ||
| Far Cry 5 (2018) | 168 | 134 | 127 | 120 | 108 |
| Strange Brigade (2018) | 362 | 270 | 223 | 196.7 | 131.6 |
| F1 2021 (2021) | 339 | 276 | 234 | 133.1 | 104.3 |
| Cyberpunk 2077 1.6 (2022) | 106 | 102 | 101 | 82 | 52 |
| F1 22 (2022) | 220 | 183 | 72.6 | 47 | |
| Star Wars Jedi Survivor (2023) | 84 | 76 | 72 | 67 | 44 |
Emissions - Noisy fans at full power
Noise Emissions
You can configure in the BIOS whether the two fans should run constantly at a low speed or not, which has the advantage that peak loads can be handled better. Although this option was activated in our test unit, the fans stood still in many cases, even in the fastest performance mode. The fans only become clearly audible under load, when the GPU plays a larger role due to the higher power consumption. At about 53 dB(A) when gaming and in the stress test, the Vision 16 Pro actually now gets about as loud as the predecessor in Turbo mode. We list the measurements of the different modes in the following table:
| Application | Silent | Performance Balanced | Performance Enthusiast |
|---|---|---|---|
| 3DMark 06 | 37.7 dB(A) | 47.2 dB(A) | 47.2 dB(A) |
| Witcher 3 | 37.7 dB(A) | 49.9 dB(A) | 53.1 dB(A) |
| Stress test | 40.6 dB(A) | 49.9 dB(A) | 53.1 dB(A) |
Particularly in everyday operation and also with some older or not as demanding games, it is worth switching to Silent mode (either via the Control Center or using the F3 key), since the performance will still be sufficient and the fans then remain significantly quieter at about 38 to 40 dB(A). We did not notice any other electronic noises in our test unit.
Noise level
| Idle |
| 25.9 / 25.9 / 32 dB(A) |
| Load |
| 47.2 / 53.1 dB(A) |
 | ||
30 dB silent 40 dB(A) audible 50 dB(A) loud |
||
min: | ||
| Schenker VISION 16 Pro (M23) GeForce RTX 4070 Laptop GPU, i7-13700H, Samsung 990 Pro 1 TB | Samsung Galaxy Book3 Ultra 16, i9-13900H RTX 4070 GeForce RTX 4070 Laptop GPU, i9-13900H, Samsung PM9A1 MZVL21T0HCLR | MSI Stealth 16 Studio A13VG GeForce RTX 4070 Laptop GPU, i7-13700H, Micron 3400 2TB MTFDKBA2T0TFH | Dell XPS 15 9530 RTX 4070 GeForce RTX 4070 Laptop GPU, i7-13700H, SK hynix PC801 HFS001TEJ9X101N | Asus ProArt Studiobook 16 OLED H7604 GeForce RTX 4070 Laptop GPU, i9-13980HX, Phison EM2804TBMTCB47 | Apple MacBook Pro 16 2023 M2 Max M2 Max 38-Core GPU, M2 Max, Apple SSD AP2048Z | Schenker Vision 16 Pro RTX 3070 Ti GeForce RTX 3070 Ti Laptop GPU, i7-12700H, Samsung SSD 980 Pro 1TB MZ-V8P1T0BW | |
|---|---|---|---|---|---|---|---|
| Noise | 6% | 13% | 20% | 4% | 18% | 11% | |
| off / environment * (dB) | 25.9 | 25.2 3% | 24 7% | 23.1 11% | 24.5 5% | 23.9 8% | 22.9 12% |
| Idle Minimum * (dB) | 25.9 | 25.2 3% | 24 7% | 23.1 11% | 24.5 5% | 23.9 8% | 24.3 6% |
| Idle Average * (dB) | 25.9 | 25.2 3% | 24 7% | 23.1 11% | 24.5 5% | 23.9 8% | 24.3 6% |
| Idle Maximum * (dB) | 32 | 31.3 2% | 24 25% | 24.2 24% | 24.5 23% | 23.9 25% | 24.3 24% |
| Load Average * (dB) | 47.2 | 38.8 18% | 34.81 26% | 27.1 43% | 47.6 -1% | 36.6 22% | 38.5 18% |
| Witcher 3 ultra * (dB) | 53.1 | 44.05 17% | 40.1 24% | 55.9 -5% | 35.1 34% | 51 4% | |
| Load Maximum * (dB) | 53.1 | 51.2 4% | 51.57 3% | 44.6 16% | 56.7 -7% | 43.2 19% | 51 4% |
* ... smaller is better
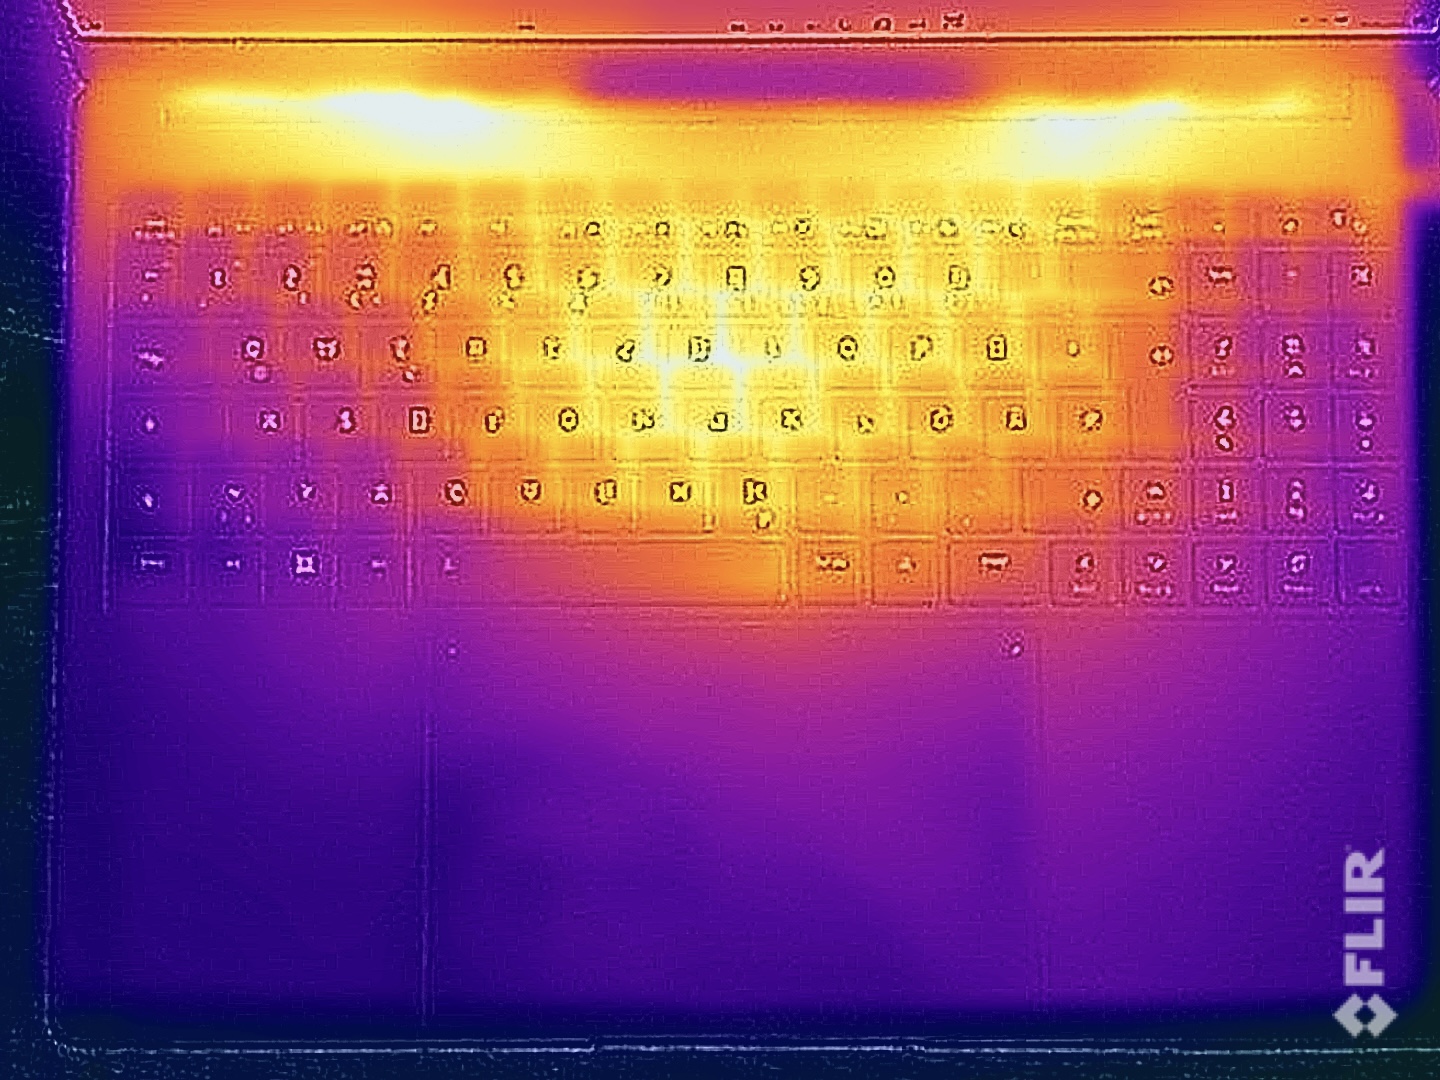
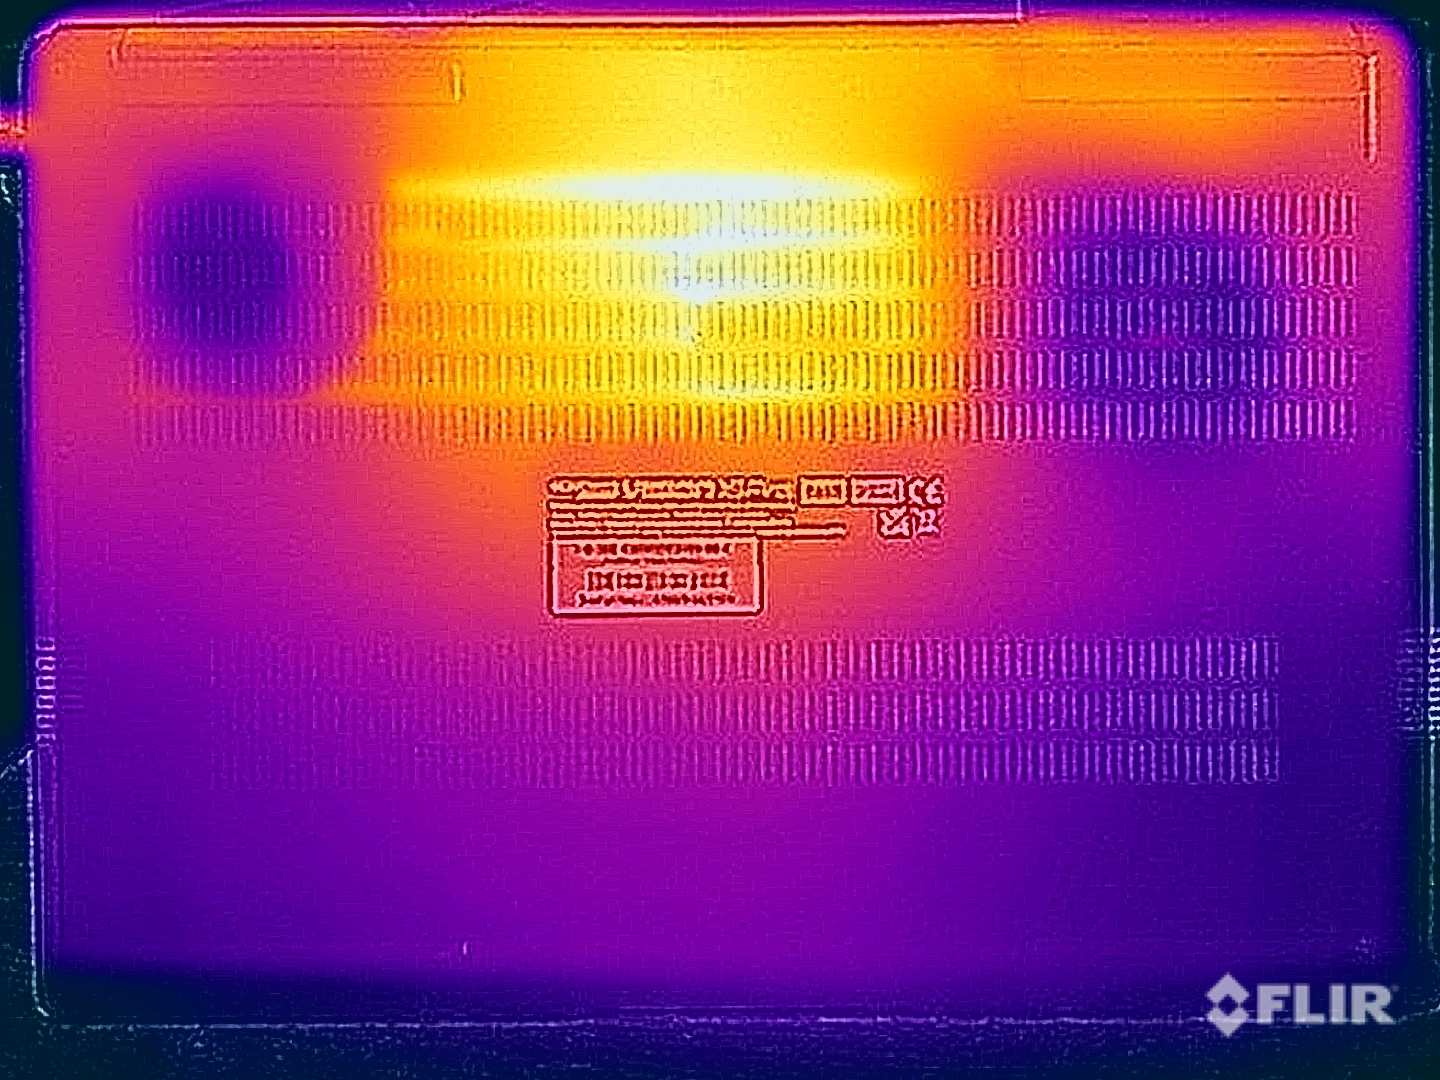
Temperatures
While there are no temperature problems in everyday operation, you shouldn't place the device on your lap when gaming or under high load for the components. In the extreme case, we measure temperatures higher than 50 °C (122 °F) in the cental area at the bottom. The central area of the keyboard also warms up to more than 45 °C (113 °F), which becomes noticeable while typing. But the typical WASD keys remain significantly cooler, which helps during gaming. The considerably more compact charger only gets marginally warmer than that of the old model, and there are no problems with a maximum temperature of 44 °C (111 °F).
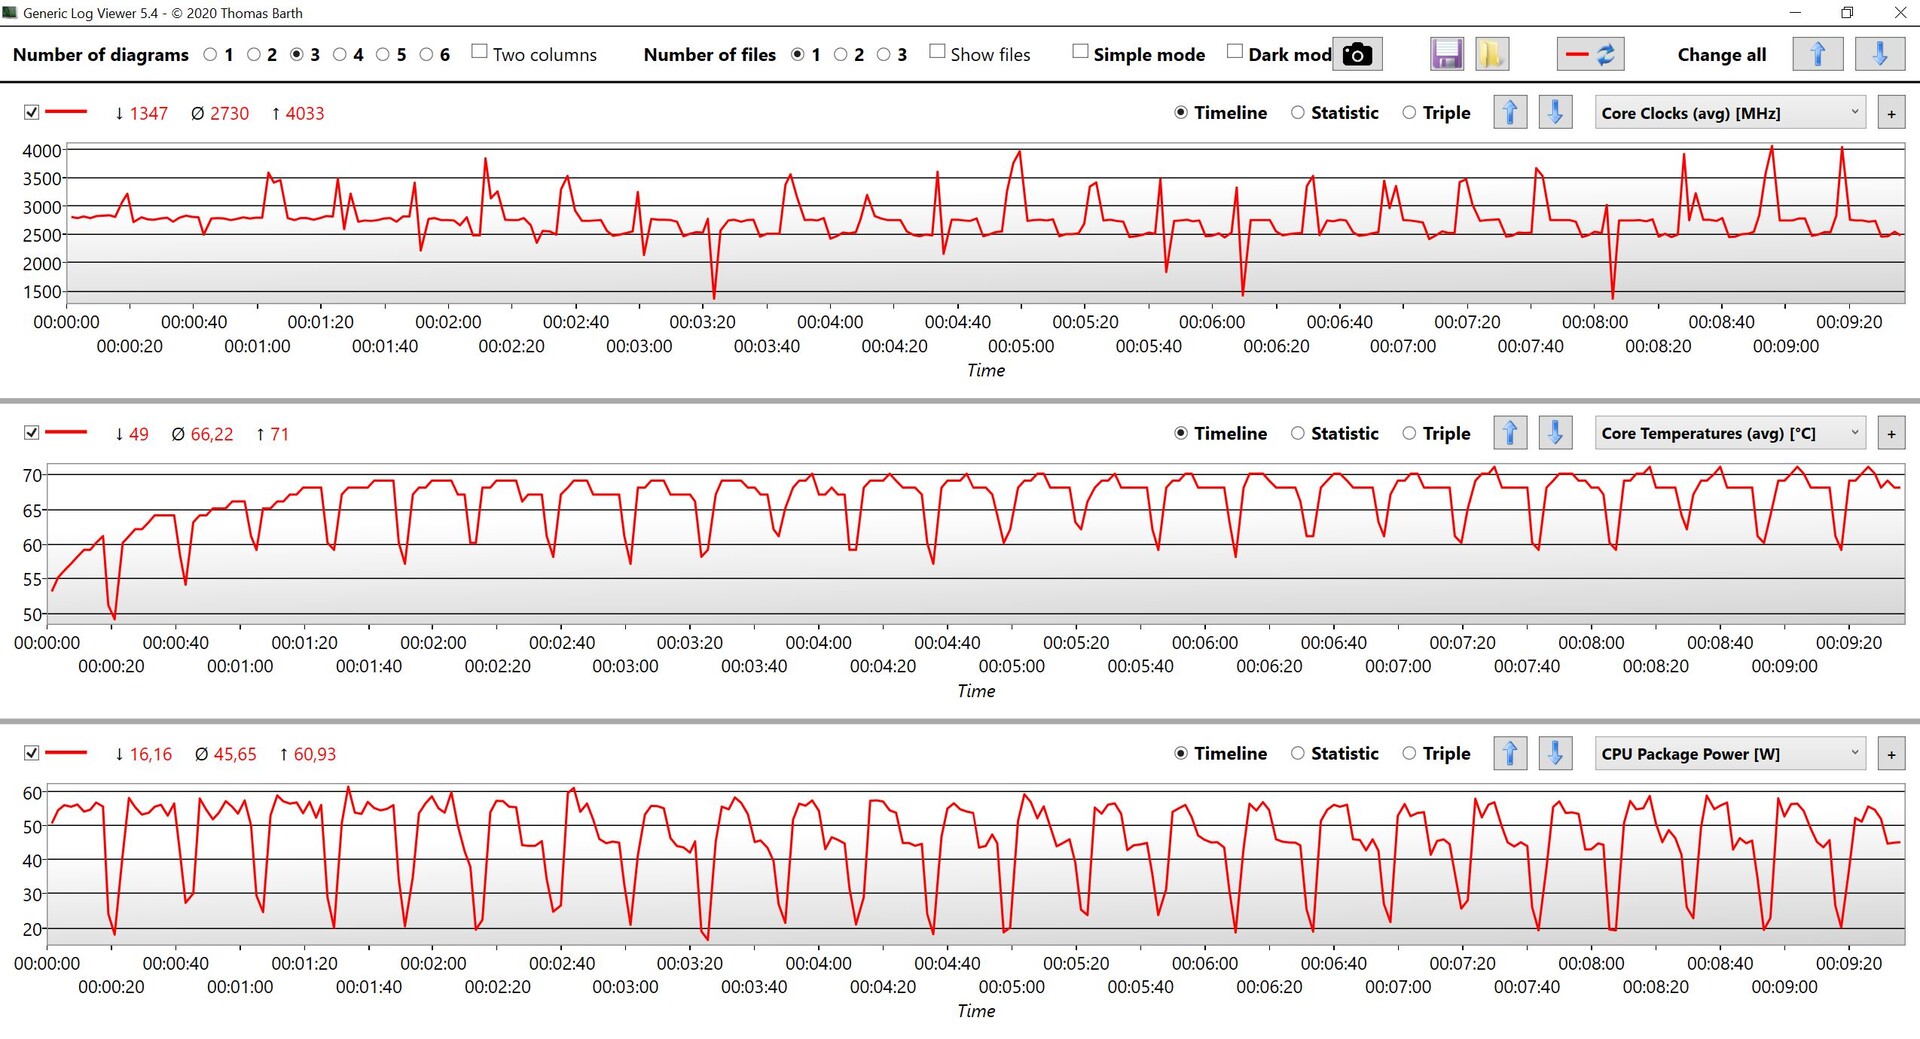
During the stress test, the graphics card is prioritized since it runs stably at around 82 watts. The processor, on the other hand, quickly levels out at about ~32 watts. Overall, this is a decent result for such a slim device.
(-) The maximum temperature on the upper side is 46.7 °C / 116 F, compared to the average of 36.8 °C / 98 F, ranging from 21 to 71 °C for the class Multimedia.
(-) The bottom heats up to a maximum of 54.1 °C / 129 F, compared to the average of 39.1 °C / 102 F
(+) In idle usage, the average temperature for the upper side is 24.7 °C / 76 F, compared to the device average of 31.3 °C / 88 F.
(±) Playing The Witcher 3, the average temperature for the upper side is 37.7 °C / 100 F, compared to the device average of 31.3 °C / 88 F.
(+) The palmrests and touchpad are cooler than skin temperature with a maximum of 28 °C / 82.4 F and are therefore cool to the touch.
(±) The average temperature of the palmrest area of similar devices was 28.7 °C / 83.7 F (+0.7 °C / 1.3 F).
| Schenker VISION 16 Pro (M23) Intel Core i7-13700H, NVIDIA GeForce RTX 4070 Laptop GPU | Samsung Galaxy Book3 Ultra 16, i9-13900H RTX 4070 Intel Core i9-13900H, NVIDIA GeForce RTX 4070 Laptop GPU | MSI Stealth 16 Studio A13VG Intel Core i7-13700H, NVIDIA GeForce RTX 4070 Laptop GPU | Dell XPS 15 9530 RTX 4070 Intel Core i7-13700H, NVIDIA GeForce RTX 4070 Laptop GPU | Asus ProArt Studiobook 16 OLED H7604 Intel Core i9-13980HX, NVIDIA GeForce RTX 4070 Laptop GPU | Apple MacBook Pro 16 2023 M2 Max Apple M2 Max, Apple M2 Max 38-Core GPU | Schenker Vision 16 Pro RTX 3070 Ti Intel Core i7-12700H, NVIDIA GeForce RTX 3070 Ti Laptop GPU | |
|---|---|---|---|---|---|---|---|
| Heat | -10% | -32% | -8% | -9% | 15% | 1% | |
| Maximum Upper Side * (°C) | 46.7 | 45.9 2% | 60 -28% | 45.6 2% | 44.1 6% | 44.2 5% | 50.8 -9% |
| Maximum Bottom * (°C) | 54.1 | 50.9 6% | 61 -13% | 42 22% | 48 11% | 42.9 21% | 46.3 14% |
| Idle Upper Side * (°C) | 26.5 | 31.6 -19% | 38.2 -44% | 34.4 -30% | 32.7 -23% | 22.4 15% | 27.2 -3% |
| Idle Bottom * (°C) | 26.8 | 34.2 -28% | 37.7 -41% | 33.2 -24% | 34.9 -30% | 22.3 17% | 26.6 1% |
* ... smaller is better
Speakers
Nothing has changed in the speaker system, and particularly the high frequencies are very accurate. Overall, the performance is also decent here, but the Vision 16 Pro is still unable to reach the excellent performance of the MacBook Pro 16.
Schenker VISION 16 Pro (M23) audio analysis
(±) | speaker loudness is average but good (77.6 dB)
Bass 100 - 315 Hz
(±) | reduced bass - on average 14.7% lower than median
(-) | bass is not linear (15% delta to prev. frequency)
Mids 400 - 2000 Hz
(+) | balanced mids - only 3.1% away from median
(+) | mids are linear (4.6% delta to prev. frequency)
Highs 2 - 16 kHz
(+) | balanced highs - only 1.3% away from median
(+) | highs are linear (4.1% delta to prev. frequency)
Overall 100 - 16.000 Hz
(+) | overall sound is linear (13.1% difference to median)
Compared to same class
» 26% of all tested devices in this class were better, 5% similar, 69% worse
» The best had a delta of 5%, average was 17%, worst was 45%
Compared to all devices tested
» 13% of all tested devices were better, 3% similar, 84% worse
» The best had a delta of 4%, average was 24%, worst was 134%
Apple MacBook Pro 16 2023 M2 Max audio analysis
(+) | speakers can play relatively loud (86.1 dB)
Bass 100 - 315 Hz
(+) | good bass - only 3.9% away from median
(+) | bass is linear (5.7% delta to prev. frequency)
Mids 400 - 2000 Hz
(+) | balanced mids - only 1.2% away from median
(+) | mids are linear (1.5% delta to prev. frequency)
Highs 2 - 16 kHz
(+) | balanced highs - only 2.5% away from median
(+) | highs are linear (1.7% delta to prev. frequency)
Overall 100 - 16.000 Hz
(+) | overall sound is linear (4.9% difference to median)
Compared to same class
» 0% of all tested devices in this class were better, 0% similar, 99% worse
» The best had a delta of 5%, average was 17%, worst was 45%
Compared to all devices tested
» 0% of all tested devices were better, 0% similar, 100% worse
» The best had a delta of 4%, average was 24%, worst was 134%
Power Management - Improved battery life
Power Consumption
In our measurements of the consumption, the new 2023 model turns out slightly more efficient throughout, with only the maximum consumption of 173 watts being practically identical. But this value quickly drops to around 150 watts (also while gaming), so the included 180-Watt charger is sufficiently sized. By the way, not only is that significantly more compact now, but also much lighter (489 vs. 811 grams, 17.2 vs. 28.6 oz).
| Off / Standby | |
| Idle | |
| Load |
|
Key:
min: | |
| Schenker VISION 16 Pro (M23) i7-13700H, GeForce RTX 4070 Laptop GPU, Samsung 990 Pro 1 TB, IPS, 2560x1600, 16" | Samsung Galaxy Book3 Ultra 16, i9-13900H RTX 4070 i9-13900H, GeForce RTX 4070 Laptop GPU, Samsung PM9A1 MZVL21T0HCLR, OLED / AMOLED, 2880x1800, 16" | MSI Stealth 16 Studio A13VG i7-13700H, GeForce RTX 4070 Laptop GPU, Micron 3400 2TB MTFDKBA2T0TFH, IPS, 2560x1600, 16" | Dell XPS 15 9530 RTX 4070 i7-13700H, GeForce RTX 4070 Laptop GPU, SK hynix PC801 HFS001TEJ9X101N, OLED, 3456x2160, 15.6" | Asus ProArt Studiobook 16 OLED H7604 i9-13980HX, GeForce RTX 4070 Laptop GPU, Phison EM2804TBMTCB47, OLED, 3200x2000, 16" | Apple MacBook Pro 16 2023 M2 Max M2 Max, M2 Max 38-Core GPU, Apple SSD AP2048Z, Mini-LED, 3456x2234, 16.2" | Schenker Vision 16 Pro RTX 3070 Ti i7-12700H, GeForce RTX 3070 Ti Laptop GPU, Samsung SSD 980 Pro 1TB MZ-V8P1T0BW, IPS, 2560x1600, 16" | Average NVIDIA GeForce RTX 4070 Laptop GPU | Average of class Multimedia | |
|---|---|---|---|---|---|---|---|---|---|
| Power Consumption | 28% | -28% | -38% | -53% | -3% | -12% | -50% | 21% | |
| Idle Minimum * (Watt) | 8.6 | 4.3 50% | 11 -28% | 20 -133% | 12.8 -49% | 5.2 40% | 9 -5% | 13.2 ? -53% | 5.65 ? 34% |
| Idle Average * (Watt) | 12 | 4.6 62% | 18 -50% | 20.7 -73% | 19.9 -66% | 16.5 -38% | 13.3 -11% | 18.2 ? -52% | 10 ? 17% |
| Idle Maximum * (Watt) | 12.4 | 11.4 8% | 19 -53% | 22.4 -81% | 20.3 -64% | 16.8 -35% | 14.3 -15% | 24.6 ? -98% | 12.3 ? 1% |
| Load Average * (Watt) | 80 | 97 -21% | 91 -14% | 77.1 4% | 131.4 -64% | 113 -41% | 107 -34% | 97 ? -21% | 65.1 ? 19% |
| Witcher 3 ultra * (Watt) | 147.7 | 100.9 32% | 130 12% | 95.4 35% | 196.5 -33% | 92 38% | 155.2 -5% | ||
| Load Maximum * (Watt) | 173.1 | 107 38% | 228 -32% | 133.4 23% | 246.8 -43% | 145 16% | 172 1% | 221 ? -28% | 112.5 ? 35% |
* ... smaller is better
Power Consumption The Witcher 3 / Stress Test
Power Consumption With External Monitor
Battery Life
Corresponding to the slightly more efficient consumption values, the battery life also turns out slightly better. At an adjusted brightness of 150 cd/m² (corresponding to 39% of the maximum brightness of our test unit), our WLAN test runs for slightly longer than 7.5 hours with both 60 or 240 Hz, making the Vision 16 Pro 2023 significantly more competitive. Only the MacBook Pro 16 plays in a different league, lasting almost 15 hours here. The video test at 150 cd/m² also runs for almost 8 hours.
At the maximum display brightness, the refresh rate does make a difference, since the WLAN test at 240 Hz runs for barely 6 hours, while it is still more than 7 hours at 60 Hz. We would like it, if as in the smaller Vision 14, Schenker could also offer a version of the Vision 16 Pro with a larger battery, dropping the secondary M.2 slot.
| Schenker VISION 16 Pro (M23) i7-13700H, GeForce RTX 4070 Laptop GPU, 80 Wh | Samsung Galaxy Book3 Ultra 16, i9-13900H RTX 4070 i9-13900H, GeForce RTX 4070 Laptop GPU, 76 Wh | MSI Stealth 16 Studio A13VG i7-13700H, GeForce RTX 4070 Laptop GPU, 99.9 Wh | Dell XPS 15 9530 RTX 4070 i7-13700H, GeForce RTX 4070 Laptop GPU, 86 Wh | Asus ProArt Studiobook 16 OLED H7604 i9-13980HX, GeForce RTX 4070 Laptop GPU, 90 Wh | Apple MacBook Pro 16 2023 M2 Max M2 Max, M2 Max 38-Core GPU, 99.6 Wh | Schenker Vision 16 Pro RTX 3070 Ti i7-12700H, GeForce RTX 3070 Ti Laptop GPU, 80 Wh | Average of class Multimedia | |
|---|---|---|---|---|---|---|---|---|
| Battery runtime | -4% | 28% | 9% | -22% | 72% | -15% | 63% | |
| H.264 (h) | 7.8 | 9 15% | 7.7 -1% | 6 -23% | 18.7 140% | 6.1 -22% | 16.2 ? 108% | |
| WiFi v1.3 (h) | 7.8 | 8 3% | 7.8 0% | 8 3% | 5.6 -28% | 14.8 90% | 6 -23% | 12 ? 54% |
| Load (h) | 1.3 | 0.9 -31% | 2.4 85% | 1.5 15% | 1.1 -15% | 1.1 -15% | 1.3 0% | 1.669 ? 28% |
Pros
Cons
Verdict - Vision 16 Pro continues to be impressively light and slim
While the new 2023 model of the Vision 16 Pro includes the expected updates with an Intel Raptor Lake processor and the new Nvidia GeForce RTX 4070 Laptop, there are also some additional adjustments in the power profiles. The Vision 16 Pro is one of the rare cases, where the 45-Watt processor also really runs at that value without the short-term power limit being absurdly high. This means that the performance remains fairly constant and the temperatures don't jump up as quickly, but at the same time the performance is also slightly lower particularly in short benchmarks. However, this doesn't really play any role in everyday operation. On the other hand, we don't really understand why Schenker removed the manual or Turbo mode that allowed you to adjust the TDP values of the CPU. In the previous model, this also allowed you to further increase the CPU performance noticeably.
At the same maximum TGP of 95 watts, the new GeForce RTX 4070 Laptop delivers about 25-30% more performance than the old RTX 3070 Ti, but there is no direct successor to the old RTX 3080. Other than that, there are few reasons for complaint about the performance overall, and the transfer rates of the fast PCIe 4.0 SSD also remain constant. We don't understand why there is now a significantly slower card reader, though.
The Schenker Vision 16 Pro offers a lot of performance in a very slim and light case also in the 2023 version. Despite that, there are no compromises in the connections or maintenance options.
The matte IPS display with 240 Hz subjectively delivers a good image quality, and with the included calibrated profile from Schenker you can also remedy the color tint, but the low color space coverage and lack of HDR support are still disadvantages. But at least PWM is not used.
The display options are also the largest advantages of the competitors, which often offer OLED or MiniLED panels. Whether this is always better (keyword: PWM) is questionable, but the subjective image impression is slightly better and there are advantages in the color space and HDR. The pure CPU performance (multi-core) is also often better with the competitors, but particularly in the graphics performance, the Vision 16 Pro doesn't have to hide behind the Asus ProArt Studiobook 16 or MSI Stealth 16 Studio comparison devices. Particularly the Dell XPS 15 with the 50-Watt version of the RTX 4070 Laptop falls behind significantly in this regard.
Price and Availability
The new Vision 16 Pro M23 can be configured at Bestware starting from 2,099 Euros (~$2,361). For our test configuration with upgrades to the RTX 4070 Laptop and more RAM and SSD storage, you have to pay about 2,600 Euros (~$2,924).
Schenker VISION 16 Pro (M23)
- 07/18/2023 v7 (old)
Andreas Osthoff
Transparency
The selection of devices to be reviewed is made by our editorial team. The test sample was provided to the author as a loan by the manufacturer or retailer for the purpose of this review. The lender had no influence on this review, nor did the manufacturer receive a copy of this review before publication. There was no obligation to publish this review. As an independent media company, Notebookcheck is not subjected to the authority of manufacturers, retailers or publishers.
This is how Notebookcheck is testing
Every year, Notebookcheck independently reviews hundreds of laptops and smartphones using standardized procedures to ensure that all results are comparable. We have continuously developed our test methods for around 20 years and set industry standards in the process. In our test labs, high-quality measuring equipment is utilized by experienced technicians and editors. These tests involve a multi-stage validation process. Our complex rating system is based on hundreds of well-founded measurements and benchmarks, which maintains objectivity. Further information on our test methods can be found here.
Price comparison

