Schenker Vision 16 Pro Laptop Review - Lightweight 16-inch Ultrabook with RTX 3070 Ti

The Schenker Vision 14 launched last year is a very lightweight 14-inch Ultrabook that combines a light magnesium chassis with plenty of ports, a high-resolution display as well as an optional GeForce GPU. This concept is now also available in a 16-inch form factor called the Vision 16 & Vision 16 Pro. Both models use the same case as well as a modern Intel Alder Lake processor (Core i7-12700H) and the differences are limited to the display, the RAM (DDR4 vs. DDR5) and the dGPU selection. The regular Vision 16 is equipped with a 90 Hz panel and is either available as an iGPU model or with the optional GeForce RTX 3050 Ti (65W), while the Pro unit gets a 240 Hz screen and comes with the GeForce RTX 3060 by default. It is possible to upgrade to the RTX 3070 Ti and the RTX 3080 (95W versions).
Today we review the Schenker Vision 16 Pro with 32 GB RAM, a 1 TB PCIe 4.0 SSD as well as the GeForce RTX 3070 Ti for 2561 Euros. The base model with the RTX 3060, 16 GB RAM and 500 GB SSD starts at 1899 Euros. We will also have a look at the regular Vision 16 with the RTX 3050 Ti soon. We classify the Vision 16 Pro as a multimedia laptop, but thanks to the powerful GPUs, it can also be a contender for slim gaming laptops (like the Lenovo Legion Slim 7, for example). If you prefer Linux, there is also the similarly constructed Tuxedo InfinityBook Pro 16 Gen7 in the Max Performance edition (up to the RTX 3070 Ti) starting from 2069 Euros.
Potential Competitors
Rating | Date | Model | Weight | Height | Size | Resolution | Price |
|---|---|---|---|---|---|---|---|
| 87.8 % v7 (old) | 11 / 2022 | Schenker Vision 16 Pro RTX 3070 Ti i7-12700H, GeForce RTX 3070 Ti Laptop GPU | 1.7 kg | 17.1 mm | 16.00" | 2560x1600 | |
| 93.2 % v7 (old) | 11 / 2021 | Apple MacBook Pro 16 2021 M1 Pro M1 Pro, M1 Pro 16-Core GPU | 2.2 kg | 16.8 mm | 16.20" | 3456x2234 | |
| 87.9 % v7 (old) | 11 / 2022 | Lenovo Legion Slim 7-16IAH 82TF004YGE i7-12700H, GeForce RTX 3060 Laptop GPU | 2.2 kg | 16.9 mm | 16.00" | 2560x1600 | |
| 87.9 % v7 (old) | 10 / 2022 | Lenovo ThinkBook 16p G3 ARH R9 6900HX, GeForce RTX 3060 Laptop GPU | 2.1 kg | 19.5 mm | 16.00" | 2560x1600 | |
| 86.9 % v7 (old) | 09 / 2022 | HP Envy 16 h0112nr i7-12700H, GeForce RTX 3060 Laptop GPU | 2.3 kg | 19.8 mm | 16.00" | 3840x2400 |
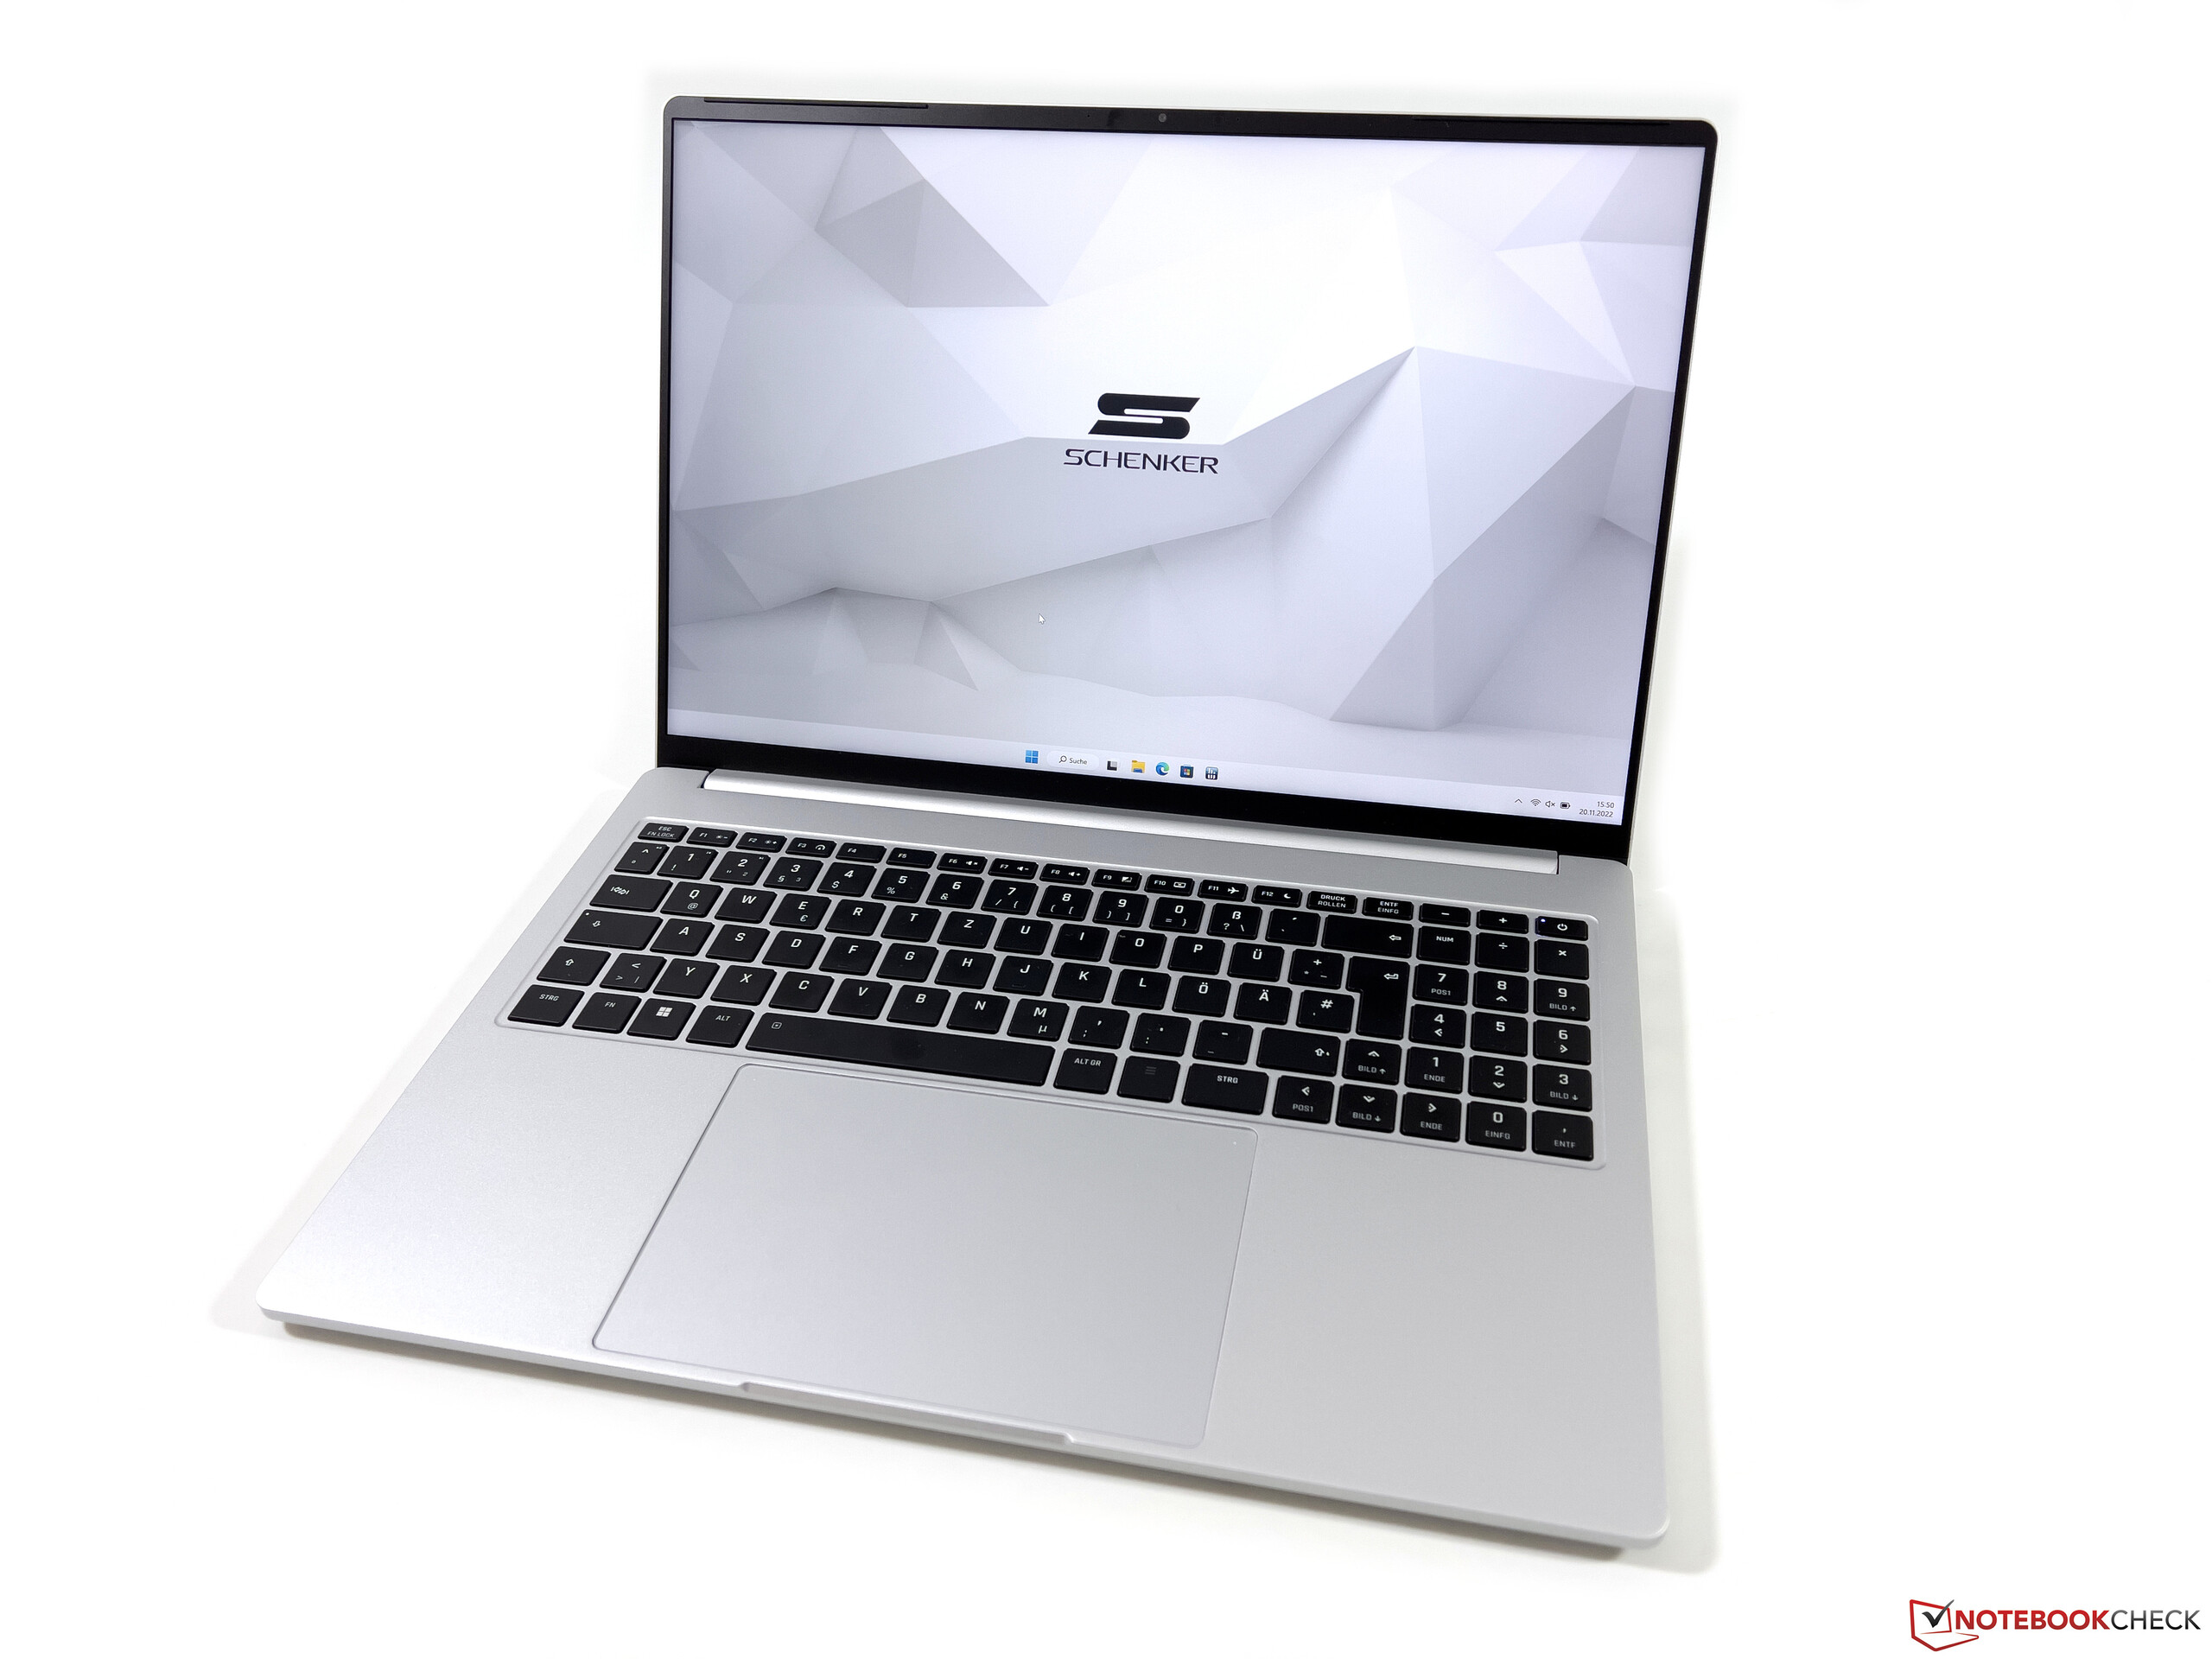
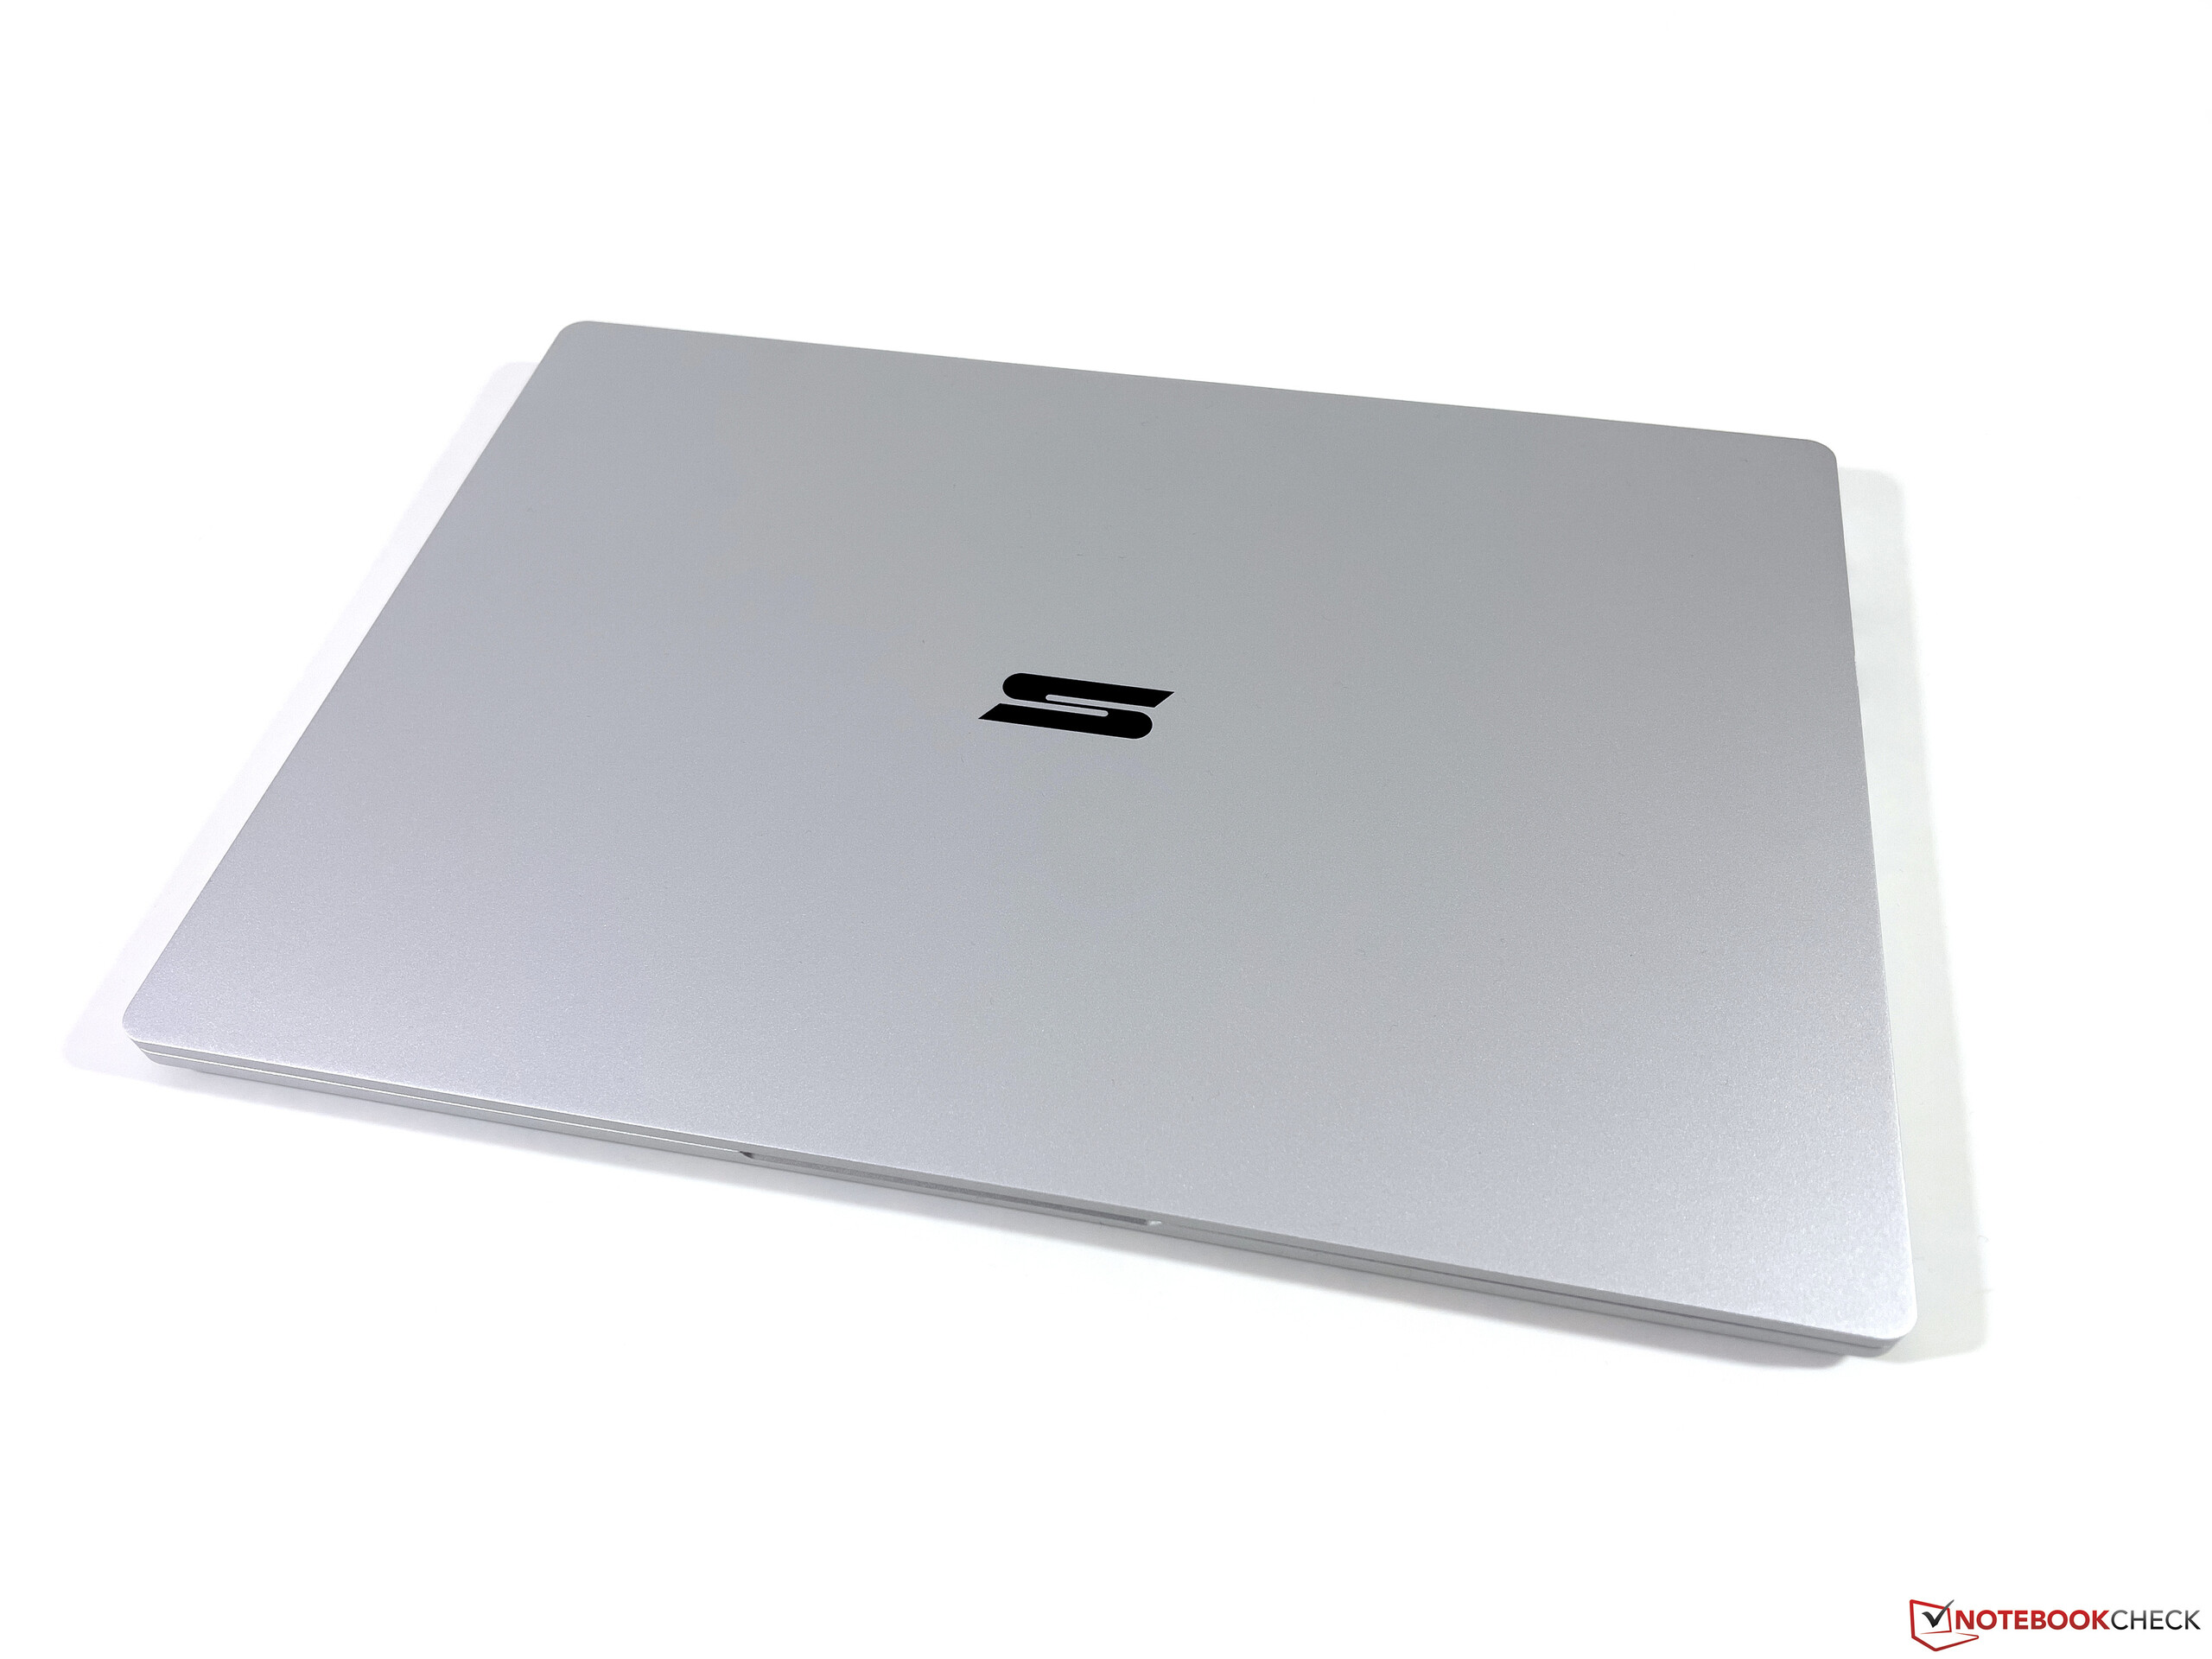
Case - Vision 16 Pro with magnesium chassis
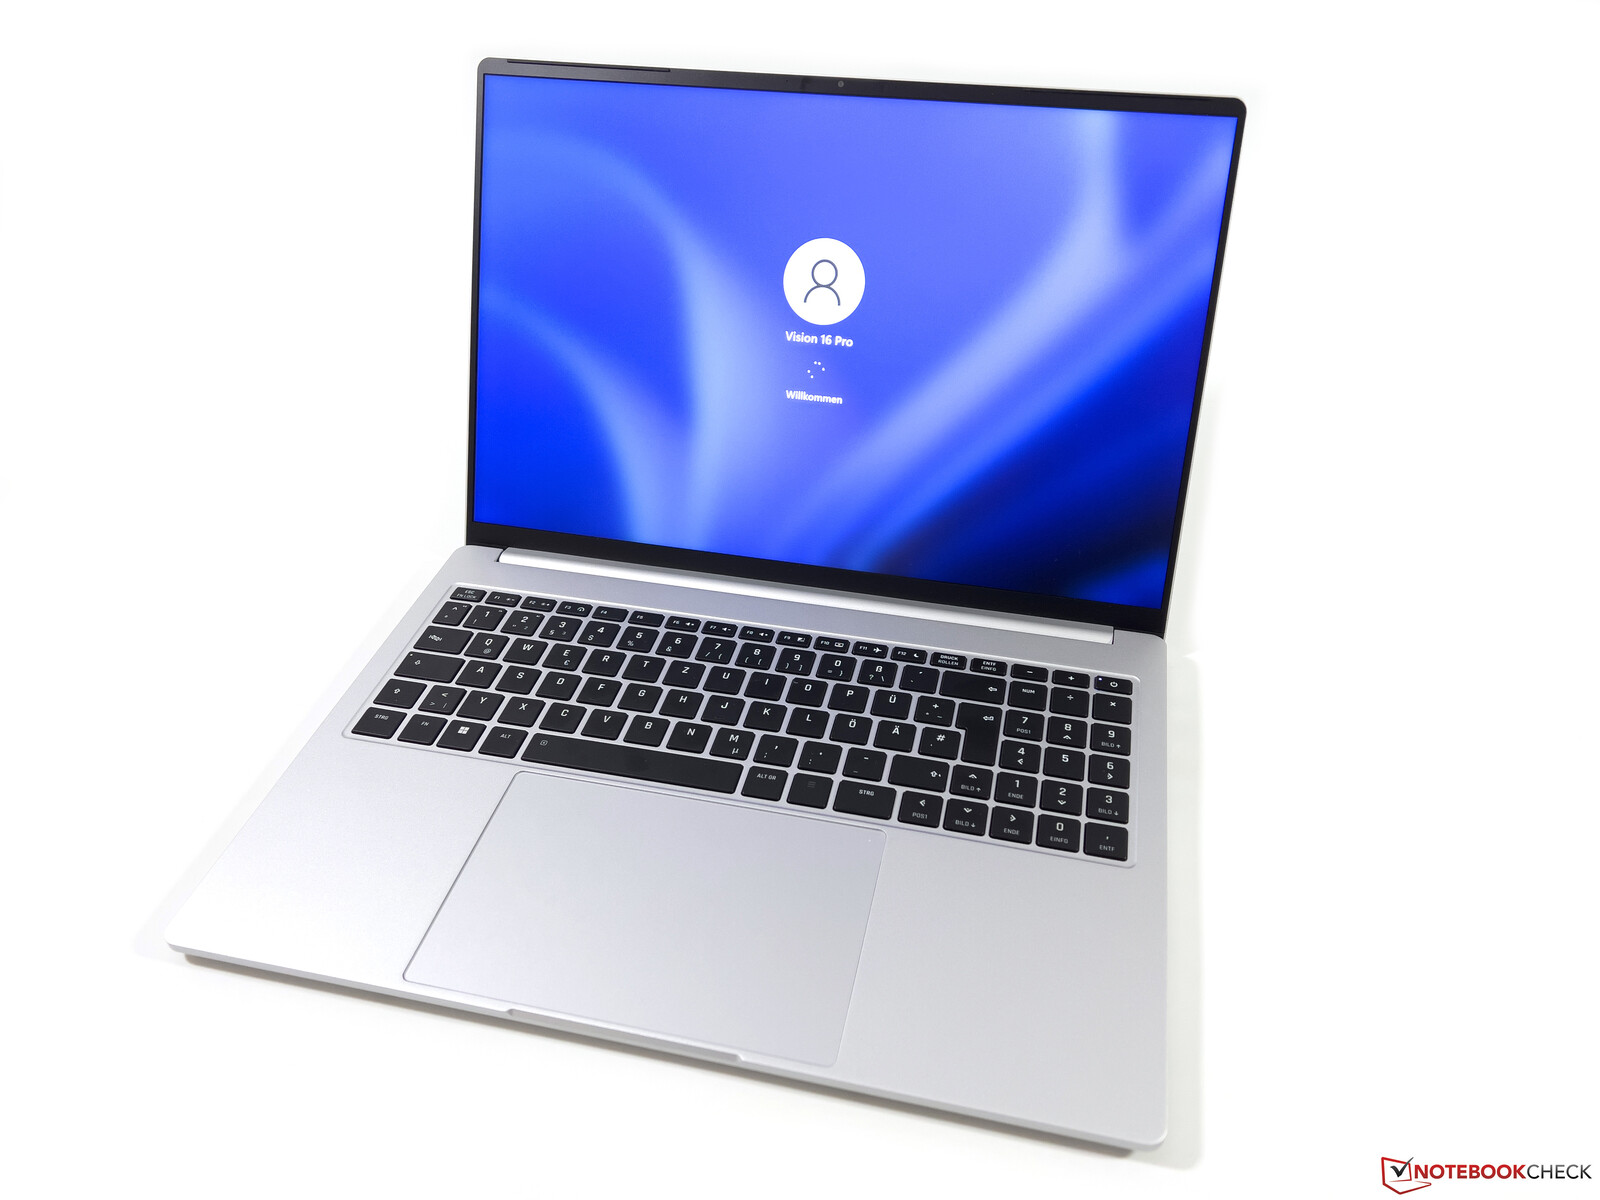
The design of the new Vision 16 Pro does not differ from the smaller Vision 14, the inconspicuous chassis (either in silver or black) is just a bit bigger. Schenker also uses the same materials with a magnesium alloy for the base unit and the lid, while the display frame is made of plastic. The bezels at the side are very narrow at 4 mm, which results in a screen-to-body ratio of 85 %.
The 16-inch device leaves a good impression in terms of quality with a sturdy base unit that only flexes slightly in the center of the keyboard, but there are no creaking sounds. The lid is very thin and we can provoke slight picture distortions with concentrated pressure from the back, even though this should not be an issue during regular use. Like on the smaller Vision 14 we are not completely happy with the display hinges, because there is some wobbling and the maximum opening angle is also limited to 140 degrees.
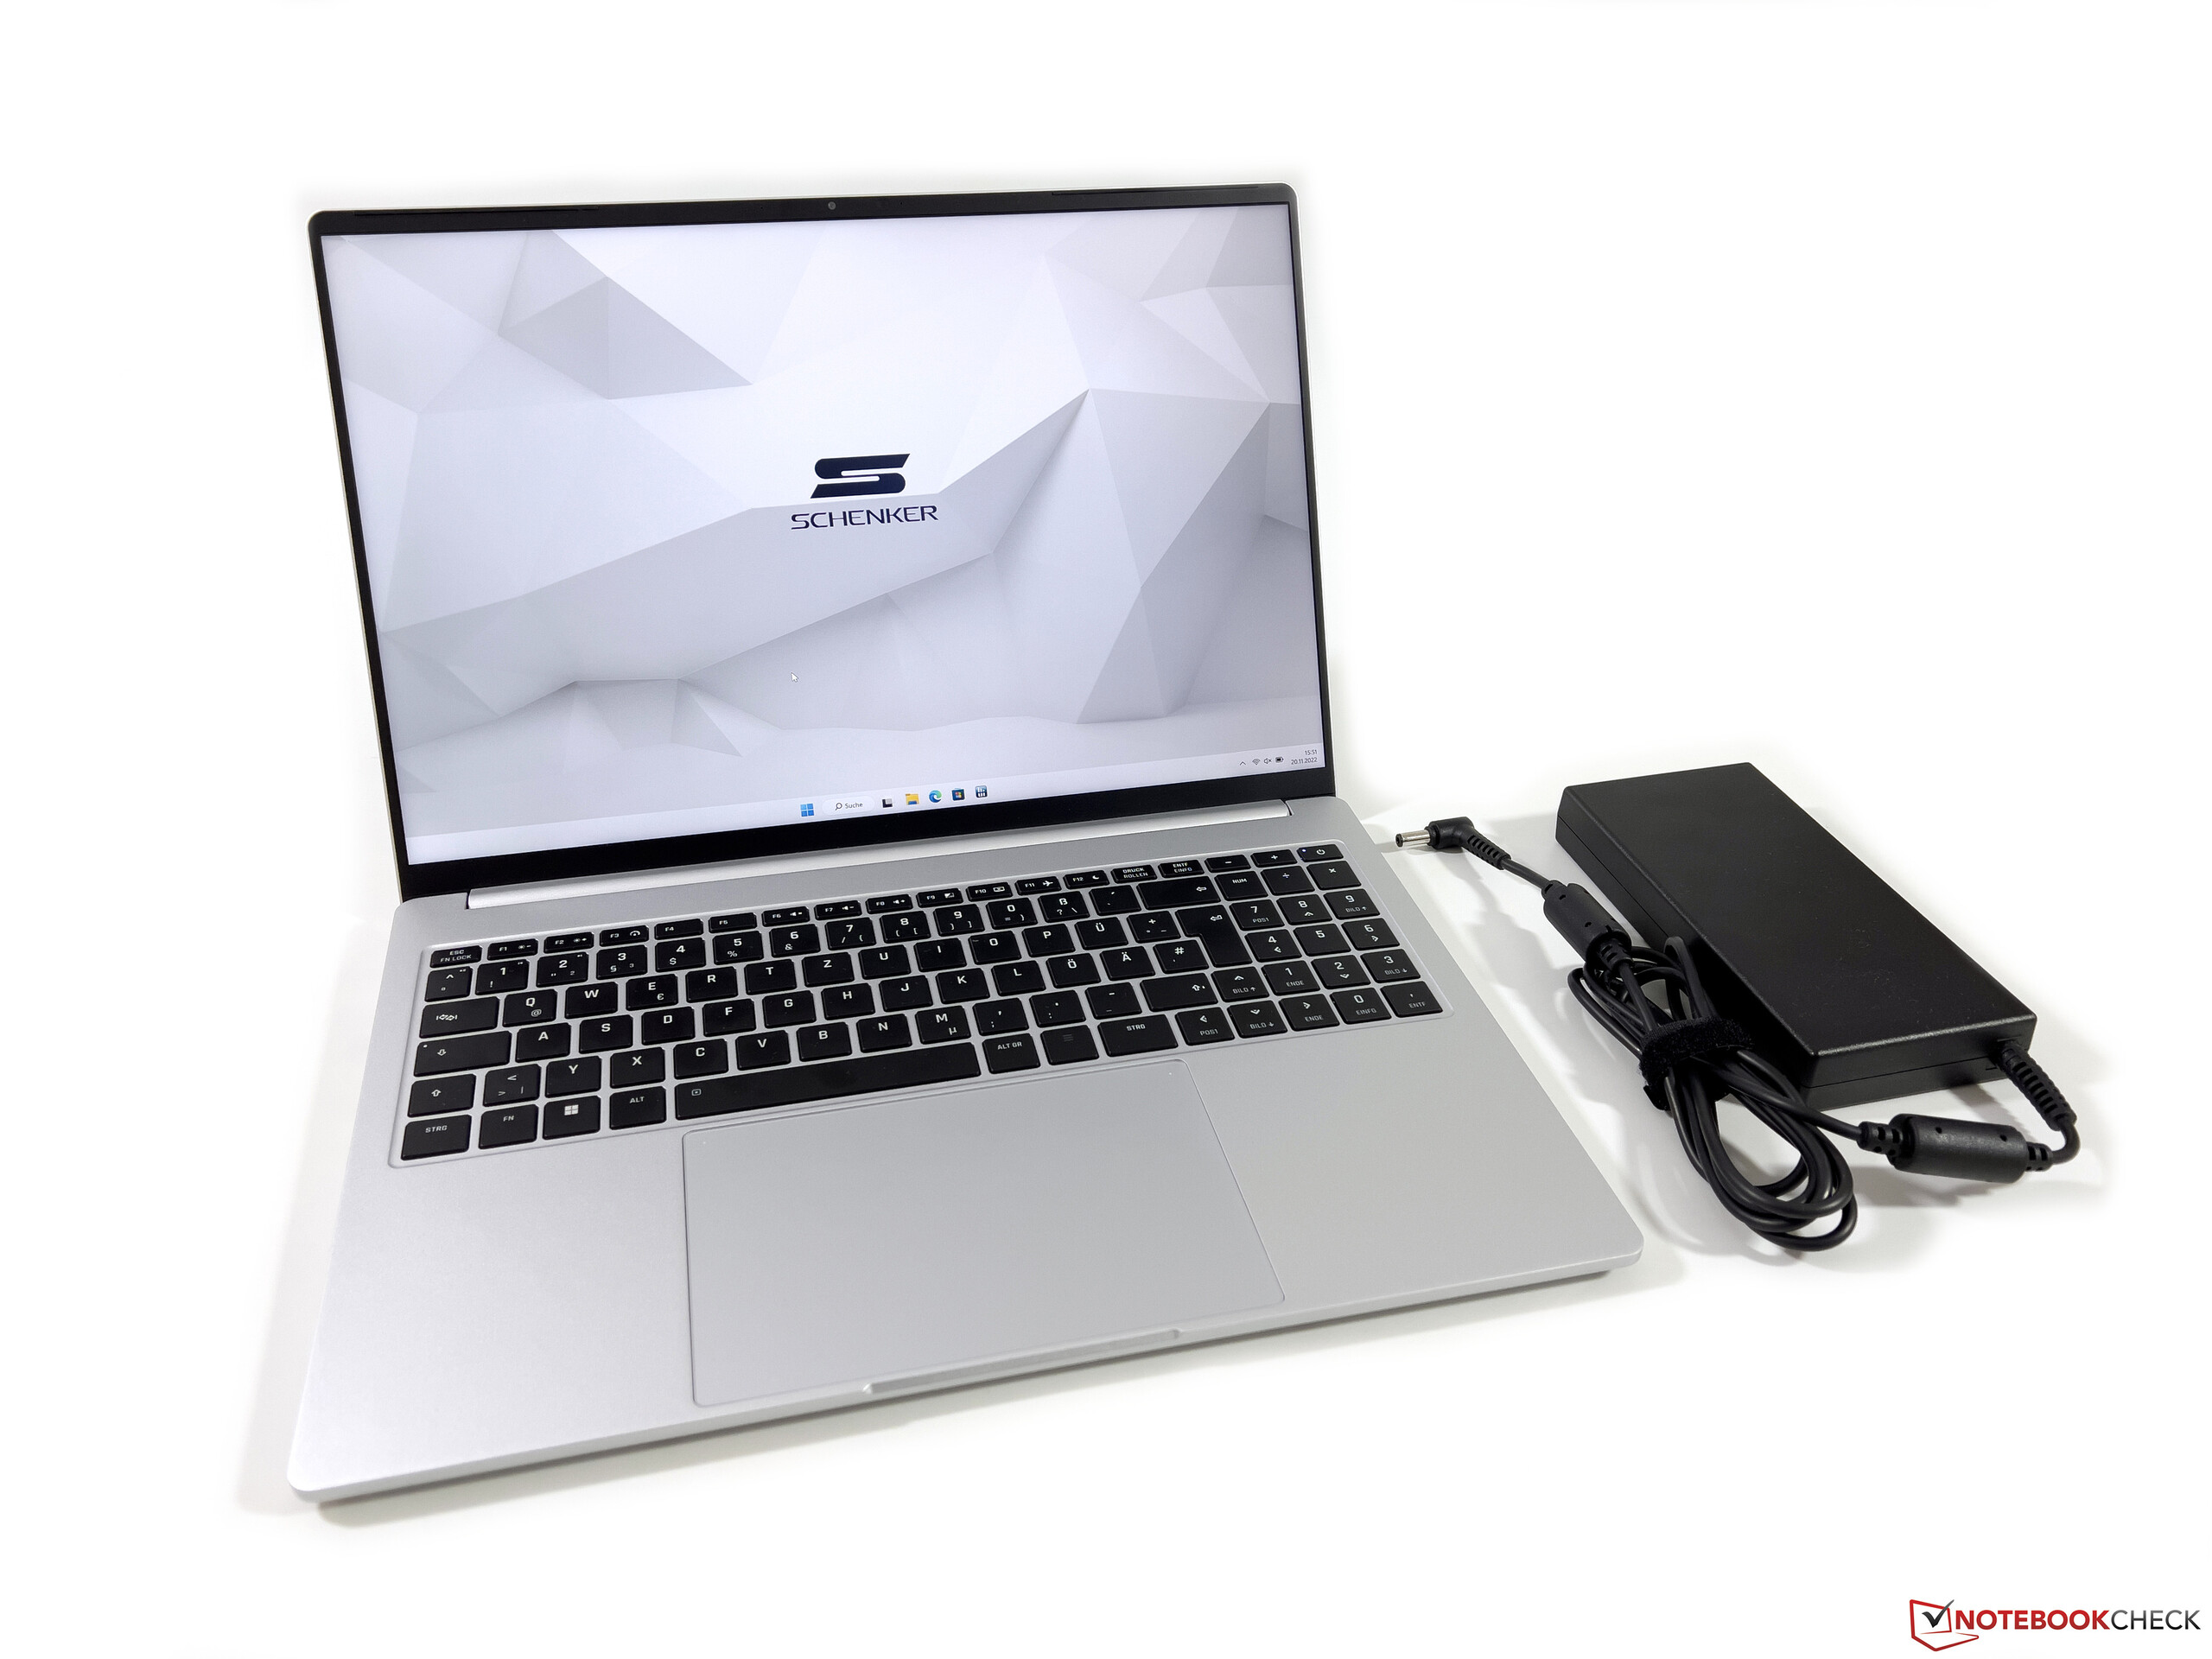
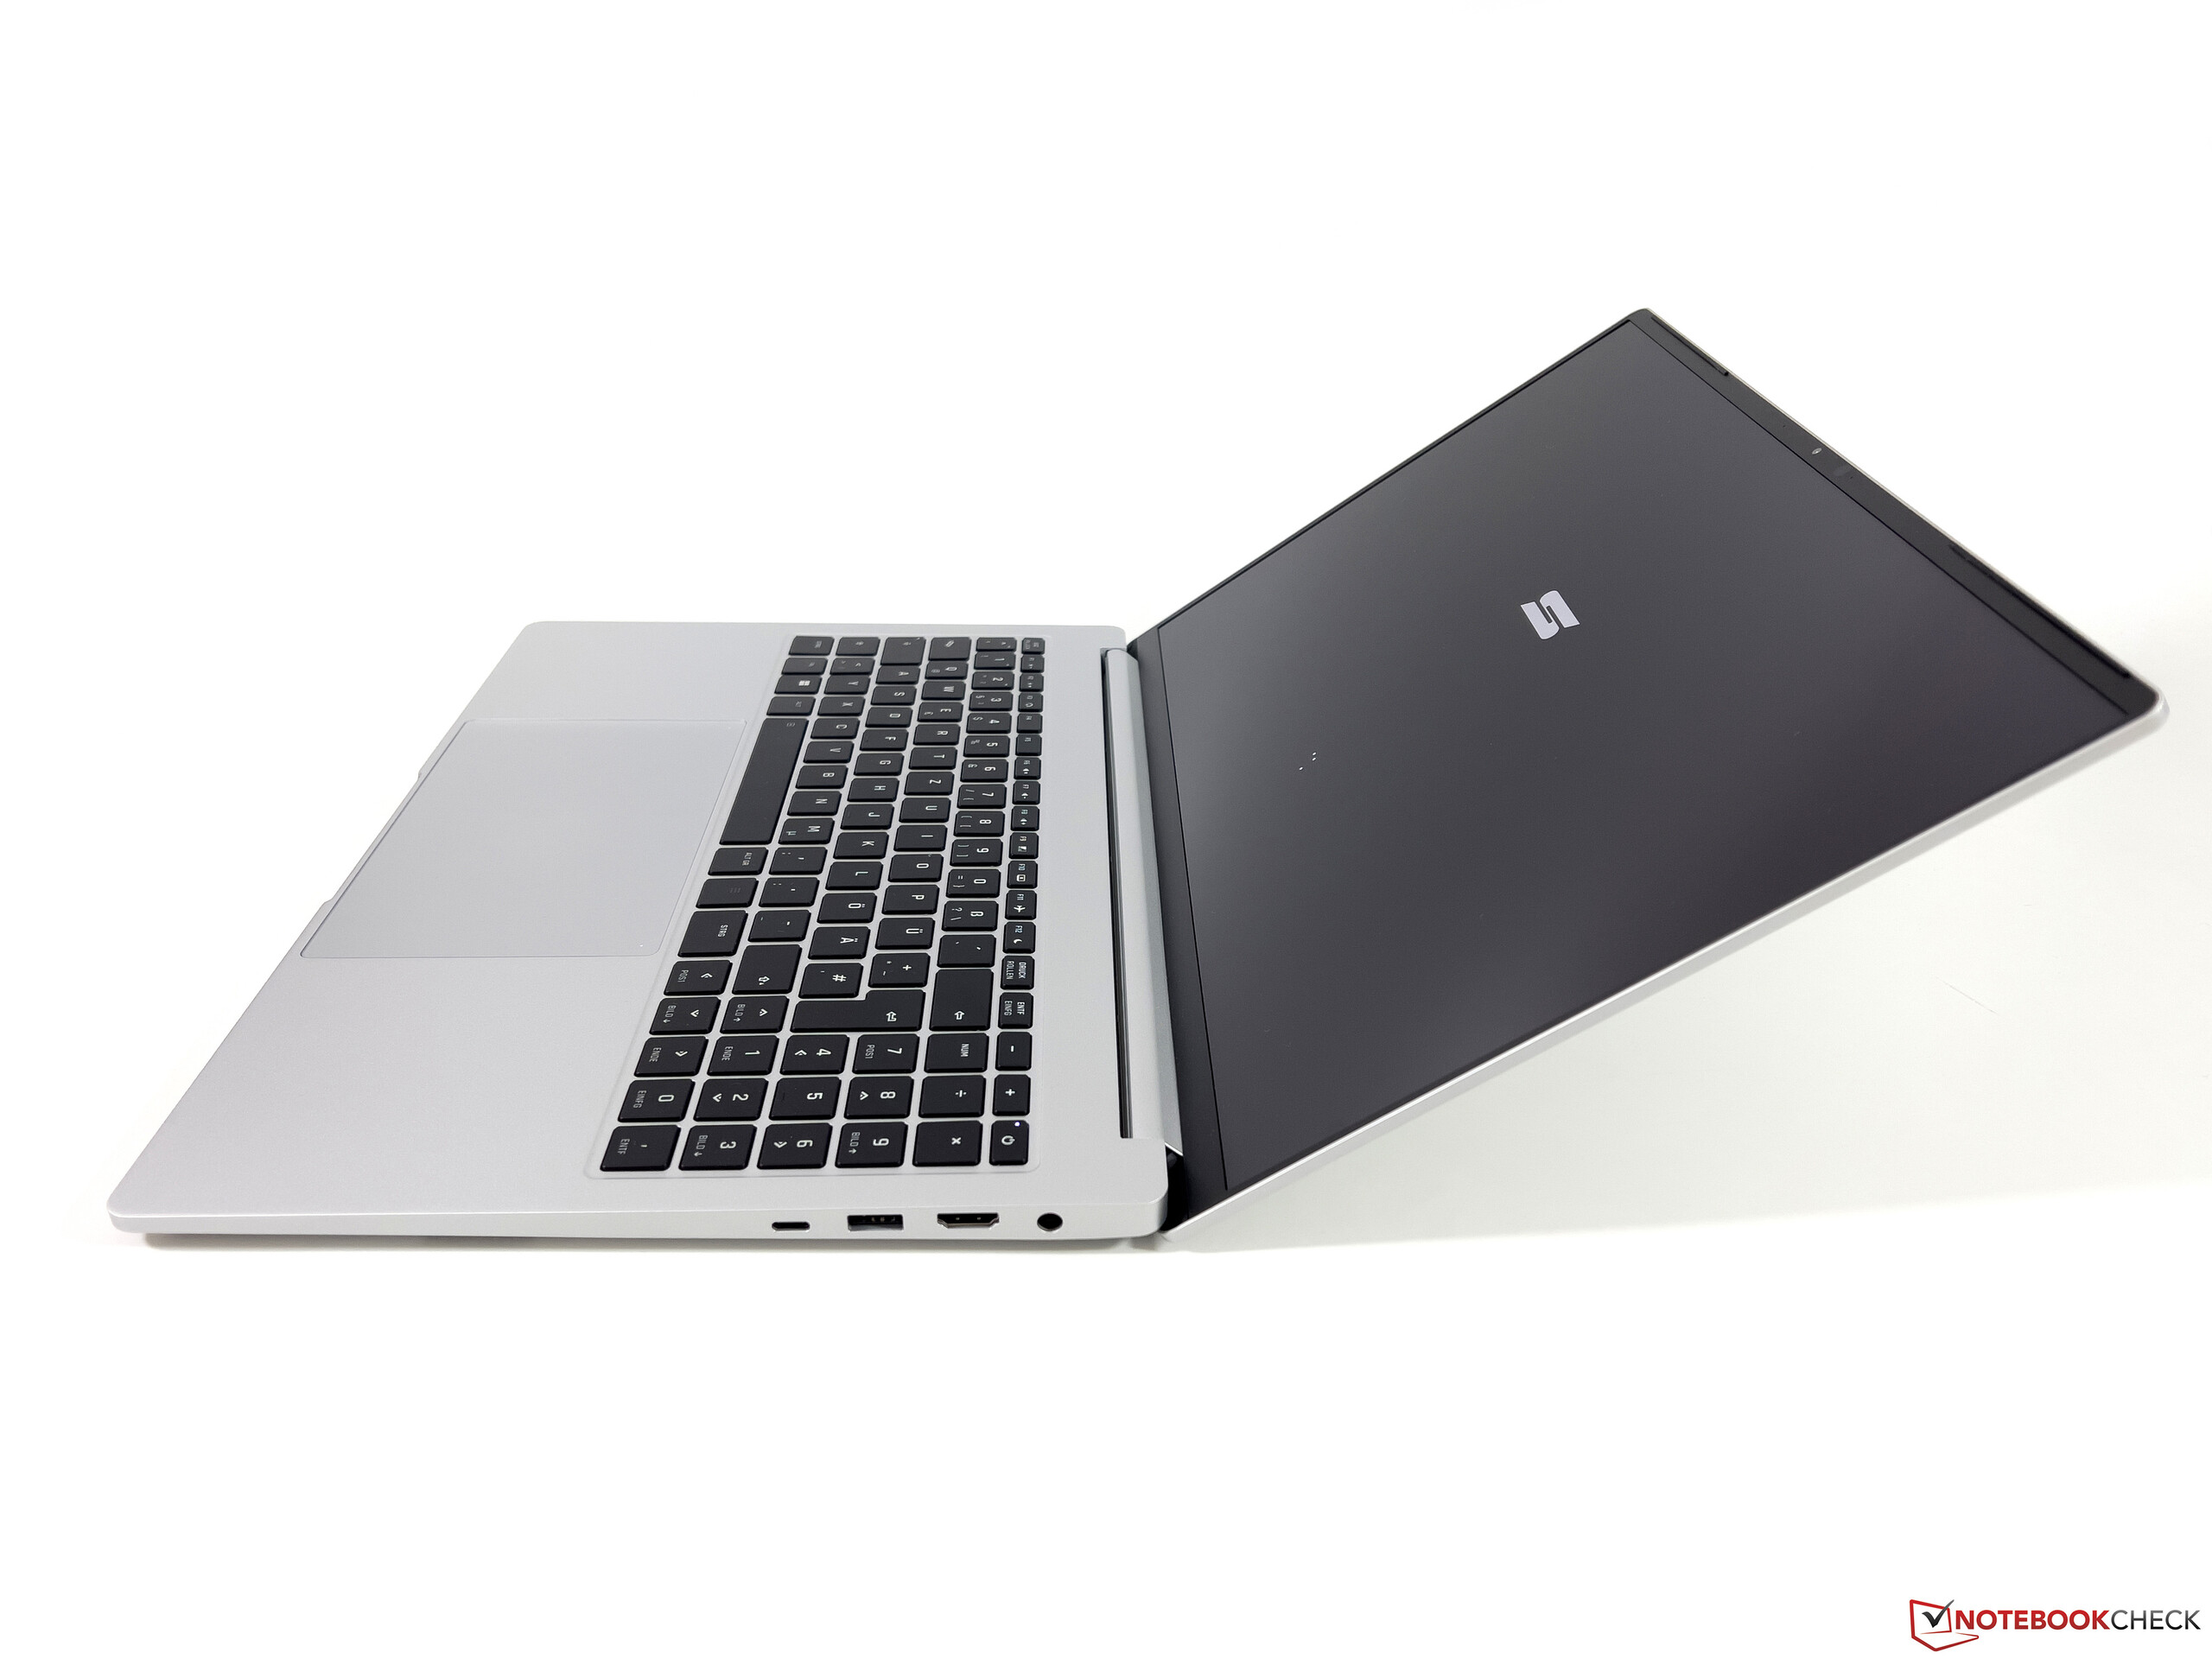
Our spec with the RTX 3070 Ti is the heaviest version of the Vision 16 Pro, even though a weight of 1.651 kg for a powerful 16-inch machine can hardly be called heavy. This means the Vision 16 Pro is around 500 grams lighter than the majority of multimedia or slim gaming laptops. The device also feels very light and compact when you use it, but the 180W power adapter is pretty heavy at more than 800 grams.
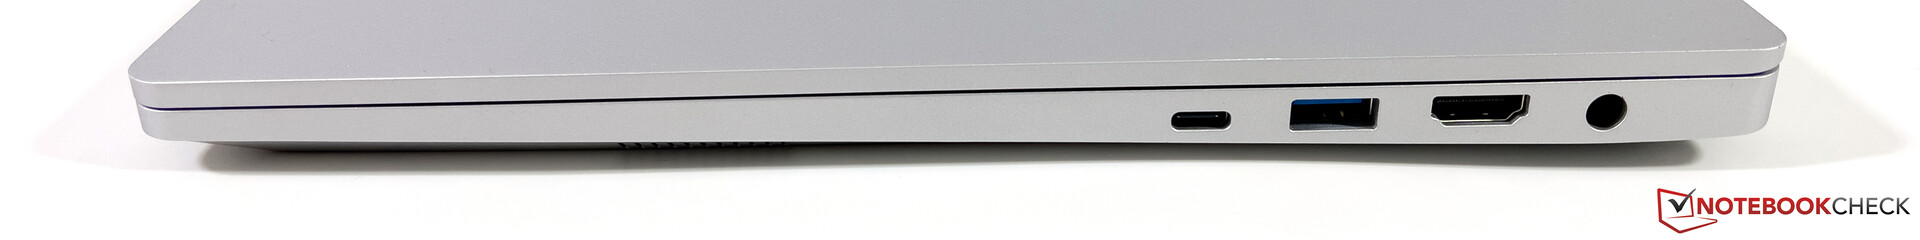
Connectivity - Plenty of ports, but no Wi-Fi 6E
Schenker continues the trend of the Vision 14 and includes plenty of ports including a full-size card reader. In addition to Thunderbolt 4 there is also an HDMI 2.1 output and you can charge the battery via USB-C (up to 100W), even though you will not be able to utilize the full performance of the components in this case. However, it can still be very handy when you are on the road. The video outputs via USB-C (DisplayPort ALT mode) are attached via Nvidia Optimus, but the HDMI output is directly connected to the GeForce GPU. This can improve the gaming performance attached to an external display, but also results in higher consumption figures.
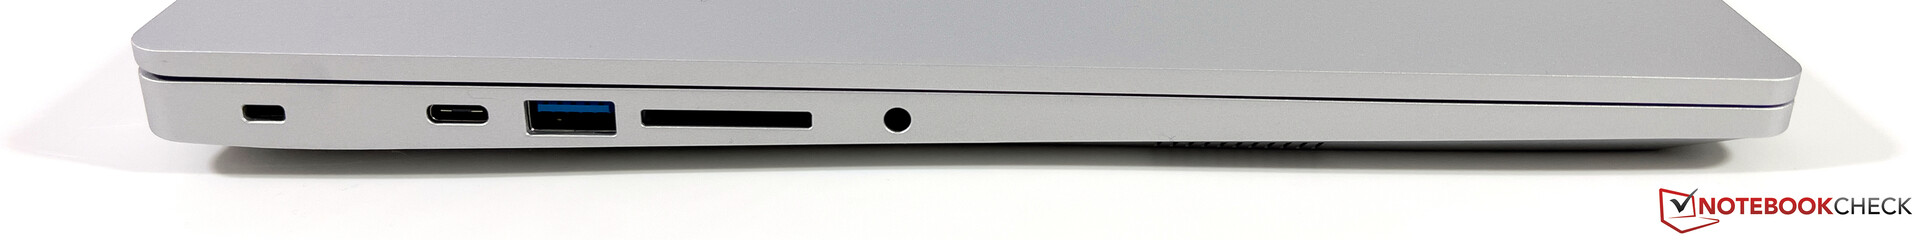
SD Card Reader
The card reader on the left side manages average transfer rates of ~80 MB/s with our reference card (Angelbird AV Pro V60). The reader is not suited to accommodate permanently since inserted cards will protrude by about 2 cm.
| SD Card Reader | |
| average JPG Copy Test (av. of 3 runs) | |
| Average of class Multimedia (23 - 531, n=36, last 2 years) | |
| Apple MacBook Pro 16 2021 M1 Pro (Angelbird AV Pro V60) | |
| Schenker Vision 16 Pro RTX 3070 Ti (AV Pro V60) | |
| Lenovo ThinkBook 16p G3 ARH (AV PRO microSD 128 GB V60) | |
| Lenovo Legion Slim 7-16IAH 82TF004YGE | |
| HP Envy 16 h0112nr (AV Pro SD microSD 128 GB V60) | |
| maximum AS SSD Seq Read Test (1GB) | |
| Average of class Multimedia (37.3 - 1455, n=35, last 2 years) | |
| Lenovo Legion Slim 7-16IAH 82TF004YGE | |
| Lenovo ThinkBook 16p G3 ARH (AV PRO microSD 128 GB V60) | |
| HP Envy 16 h0112nr (AV Pro SD microSD 128 GB V60) | |
| Schenker Vision 16 Pro RTX 3070 Ti (AV Pro V60) | |
Communication
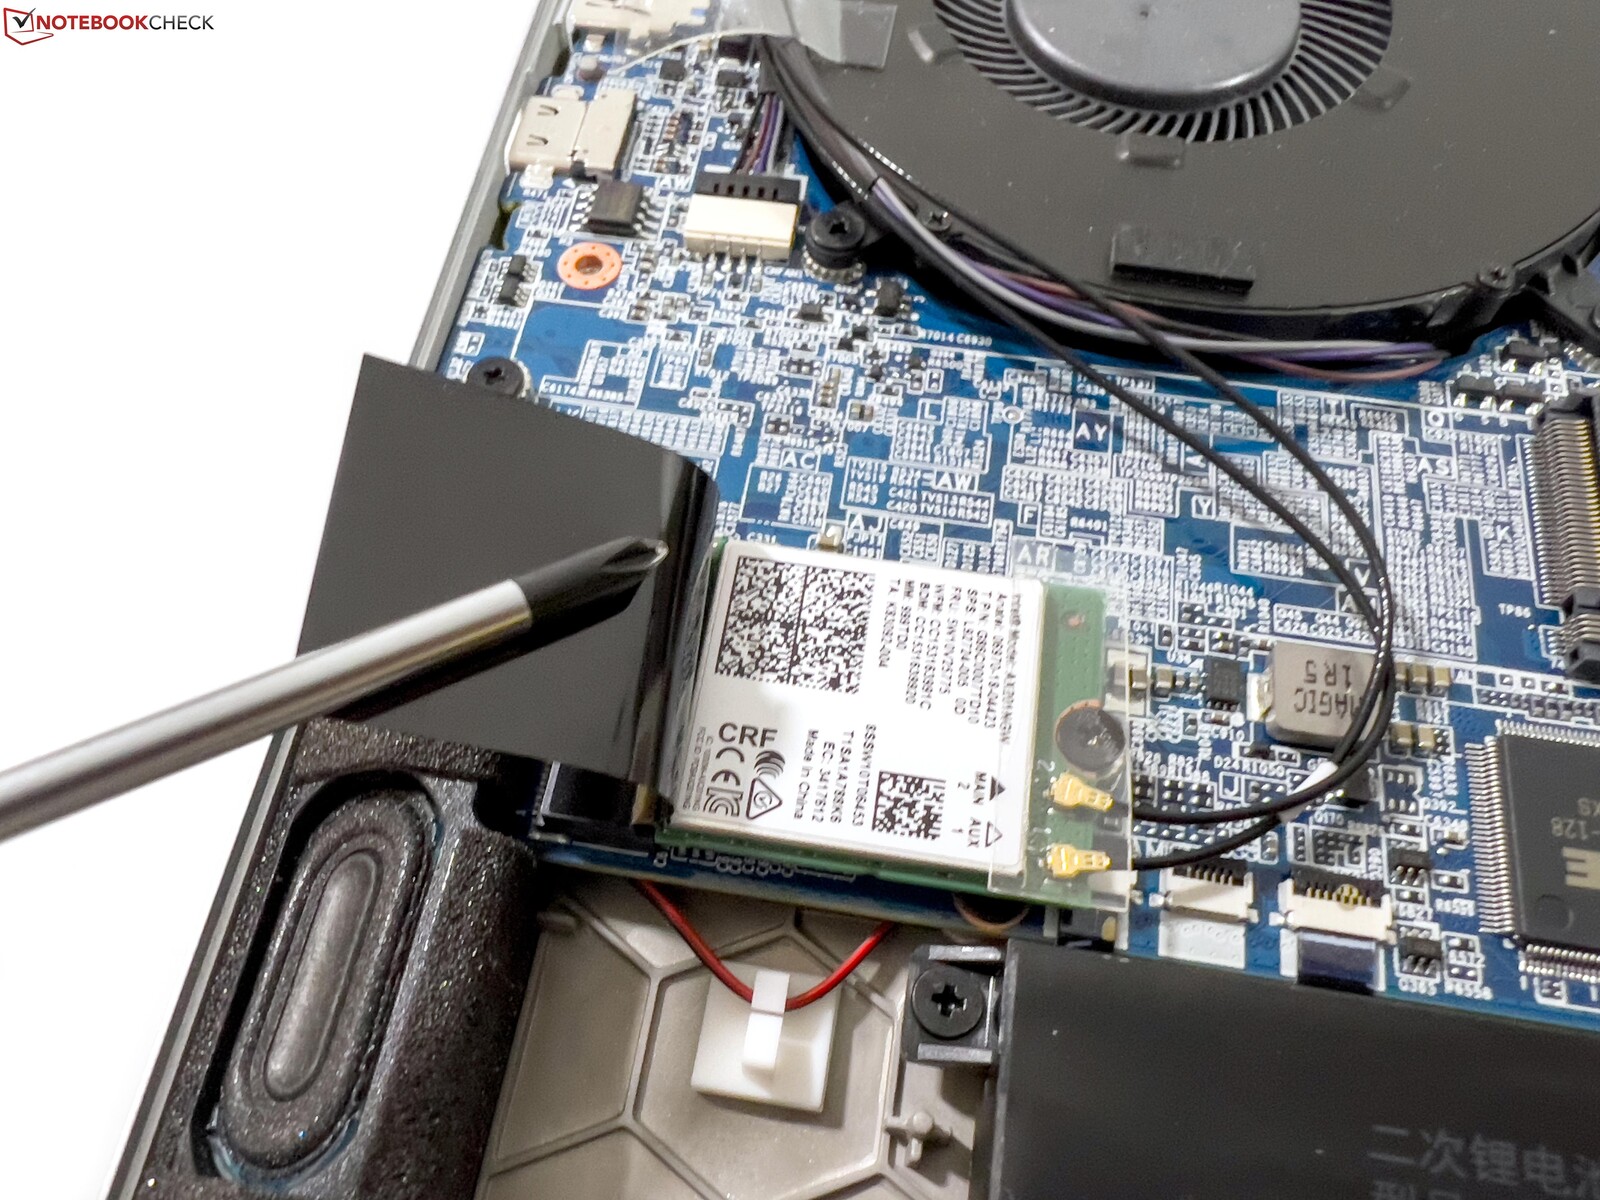
The antenna configuration of the Vision 16 Pro does not support 6 GHz networks (Wi-Fi 6E), so Schenker does not offer a corresponding module. Intel’s AX201 card in our review unit still supports the Wi-Fi 6 standard and manages very high and stable transfer rates in our Wi-Fi test with the reference router from Asus.
| Networking | |
| Schenker Vision 16 Pro RTX 3070 Ti | |
| iperf3 receive AXE11000 | |
| iperf3 transmit AXE11000 | |
| Apple MacBook Pro 16 2021 M1 Pro | |
| iperf3 transmit AX12 | |
| iperf3 receive AX12 | |
| iperf3 receive AXE11000 | |
| iperf3 transmit AXE11000 | |
| Lenovo Legion Slim 7-16IAH 82TF004YGE | |
| iperf3 receive AXE11000 | |
| iperf3 transmit AXE11000 | |
| Lenovo ThinkBook 16p G3 ARH | |
| iperf3 receive AXE11000 | |
| iperf3 transmit AXE11000 | |
| HP Envy 16 h0112nr | |
| iperf3 receive AXE11000 6GHz | |
| iperf3 transmit AXE11000 6GHz | |
Webcam
Schenker includes a 1080p webcam in the top bezel, which is supported by an additional IR webcam (for facial recognition). The quality of the pictures is okay in good lighting conditions.


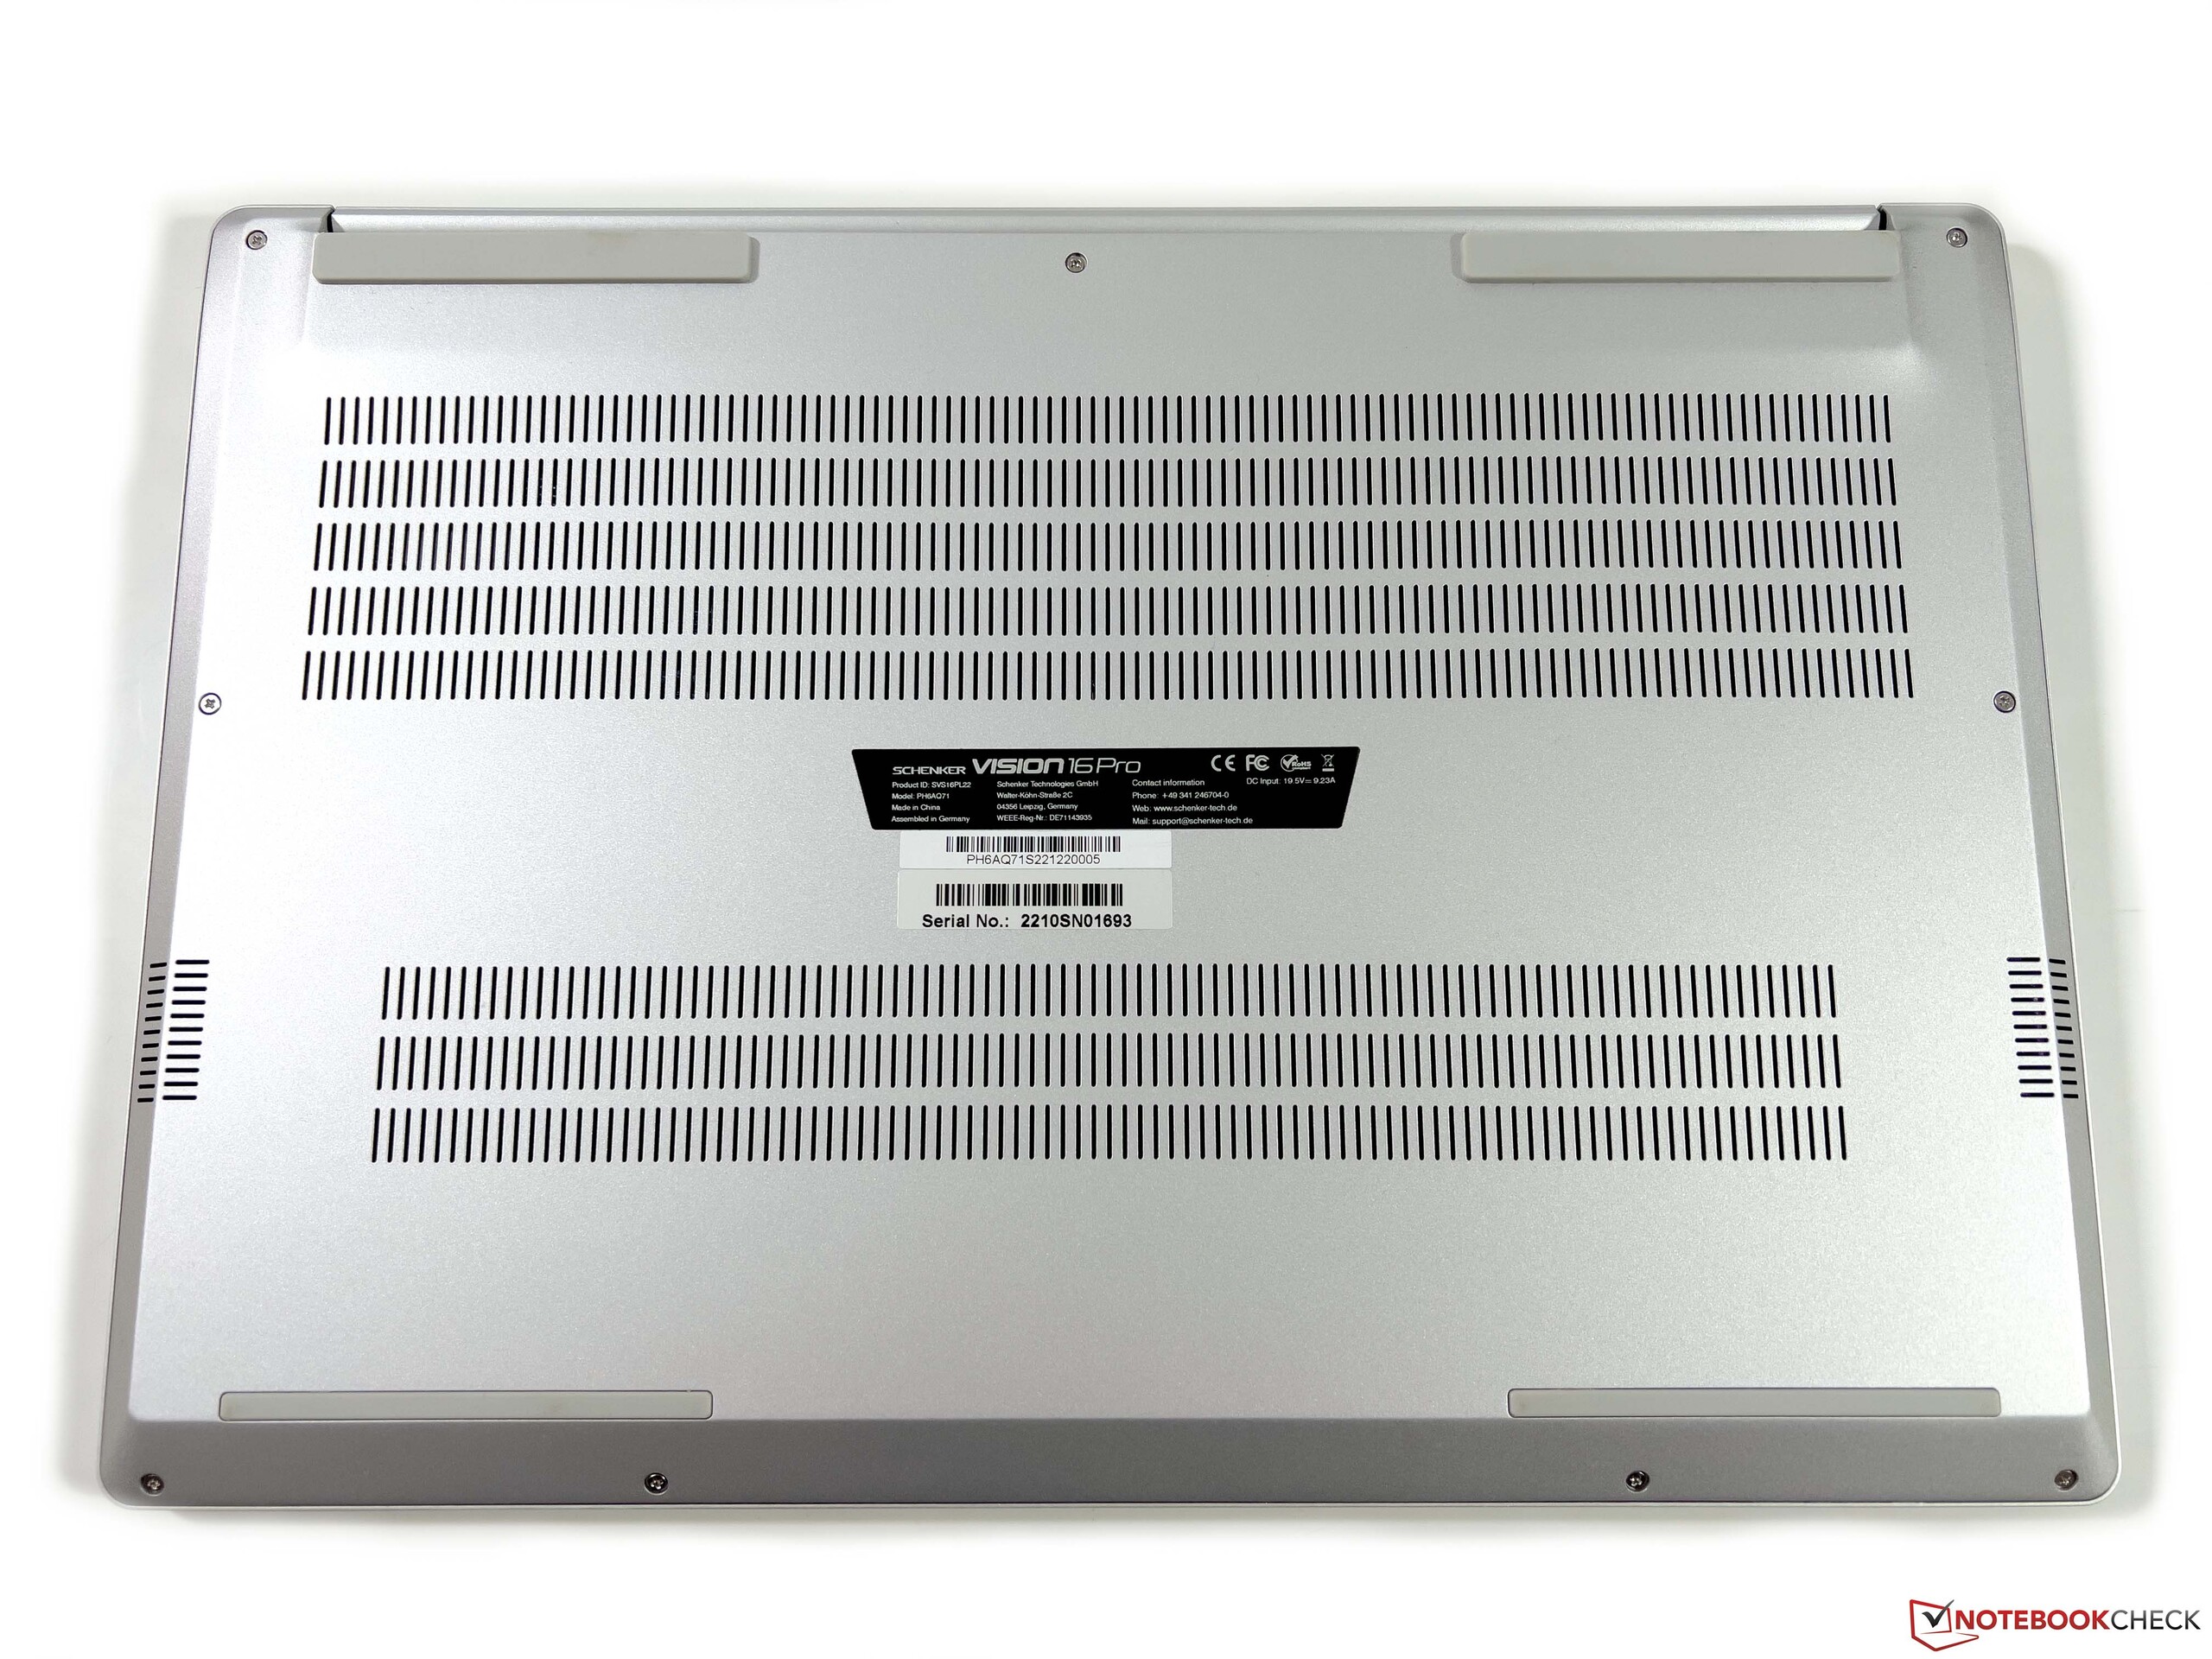
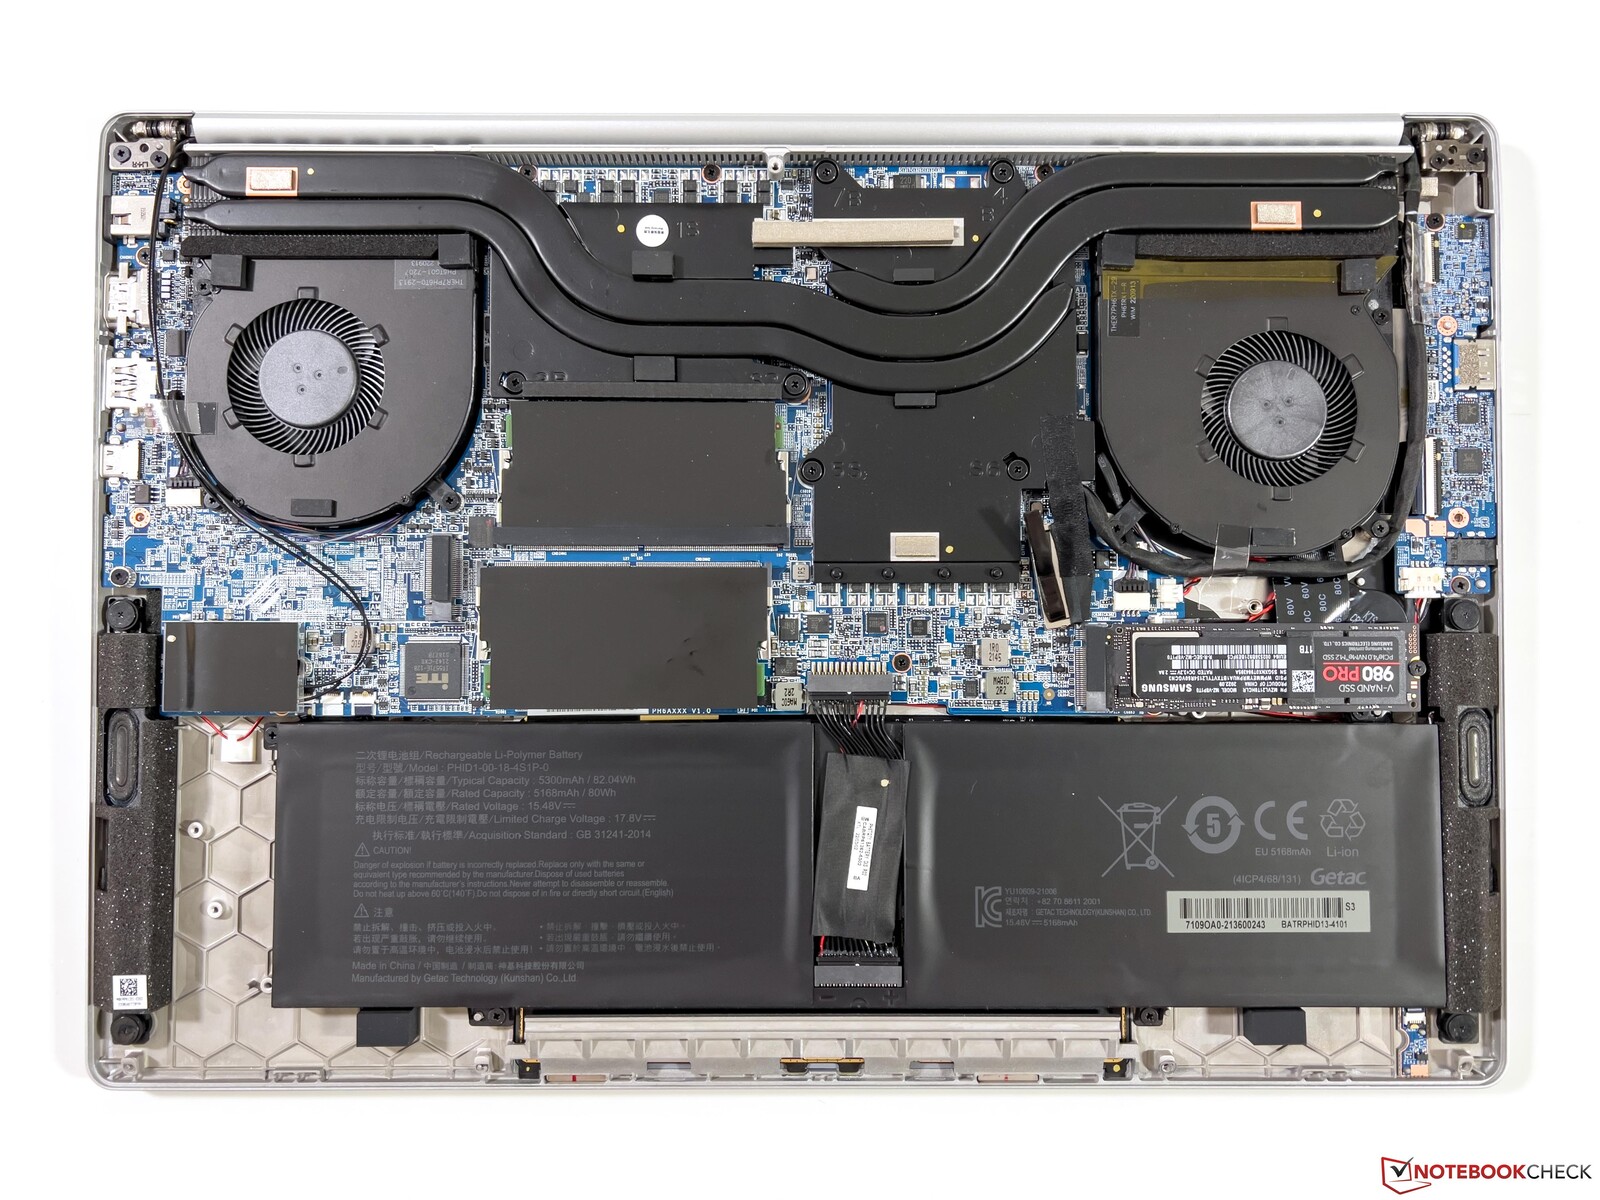
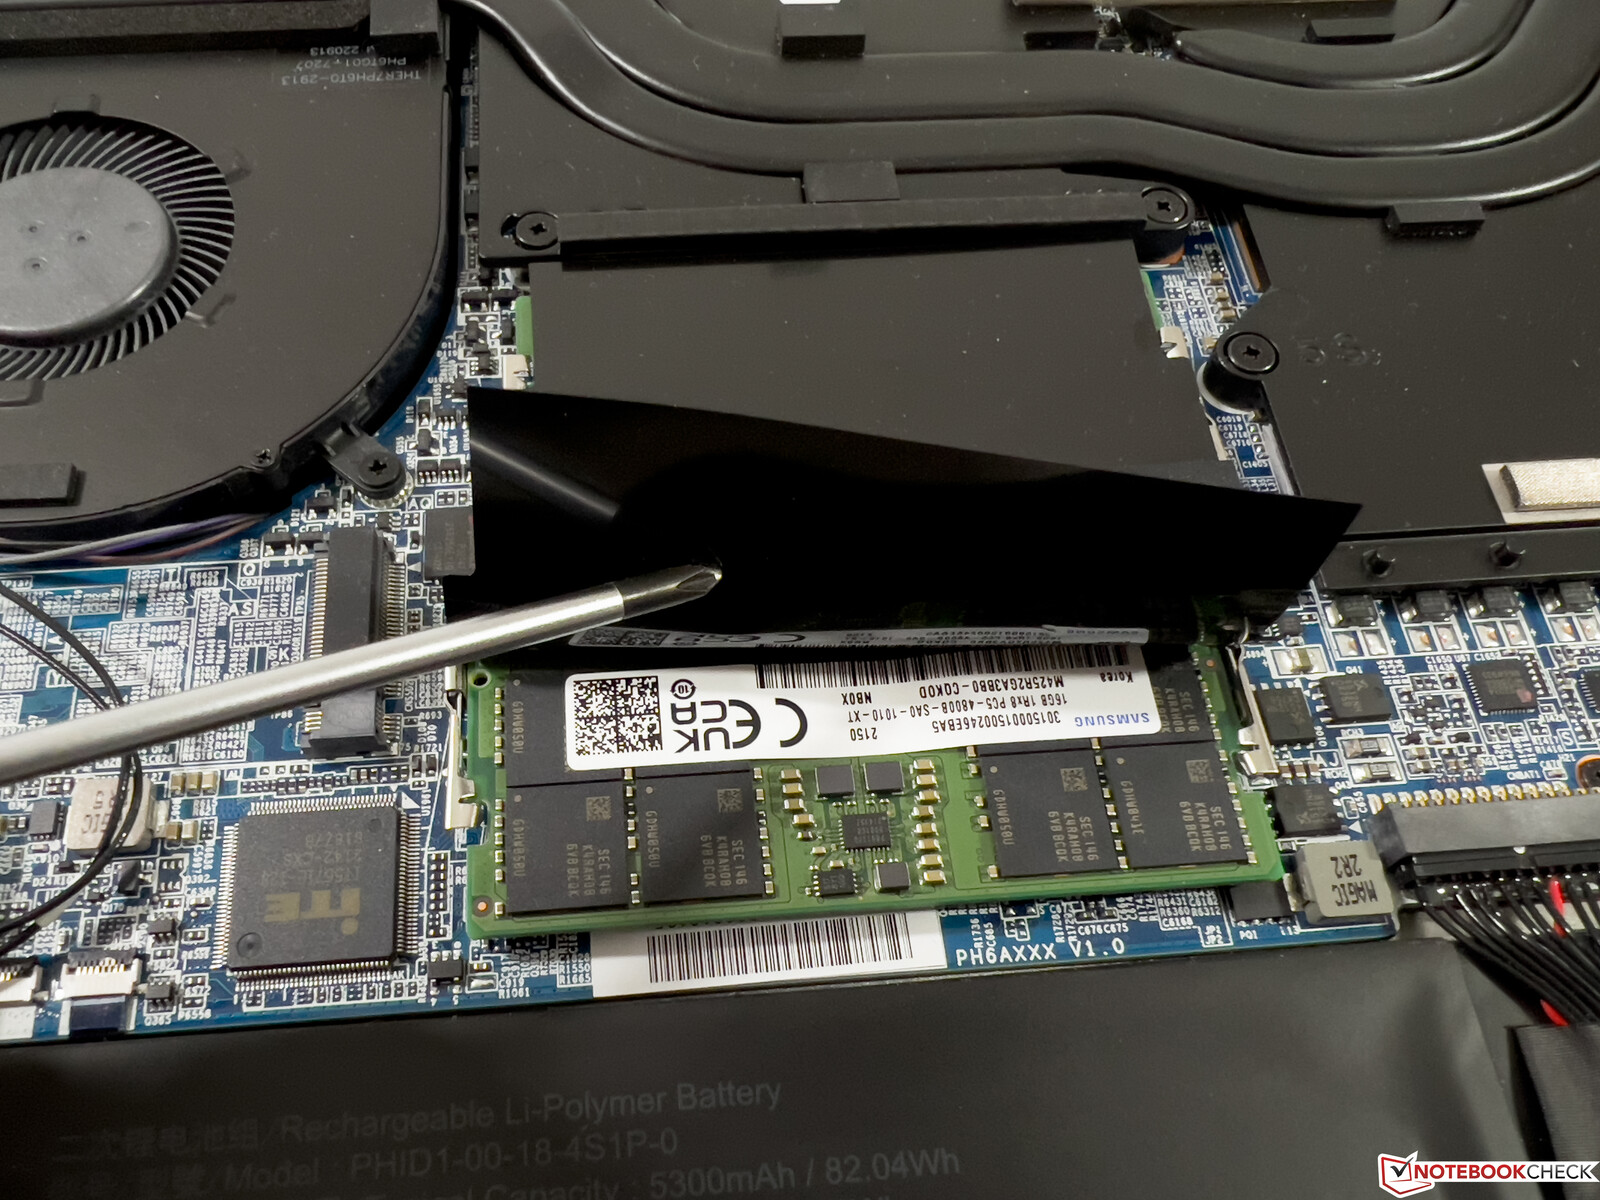
Maintenance
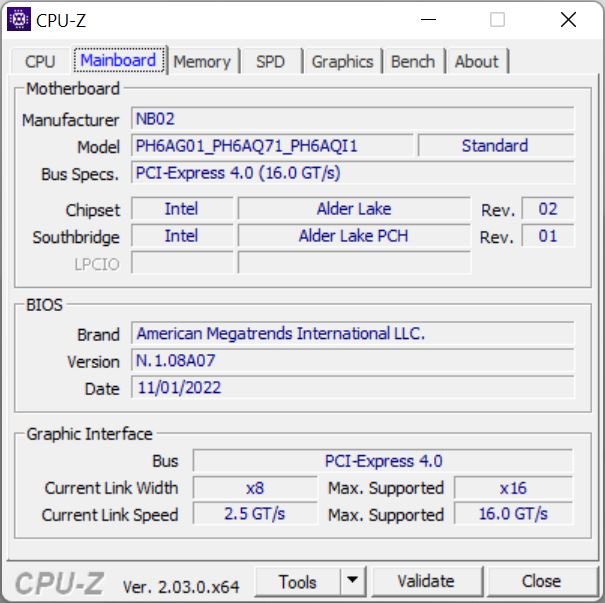
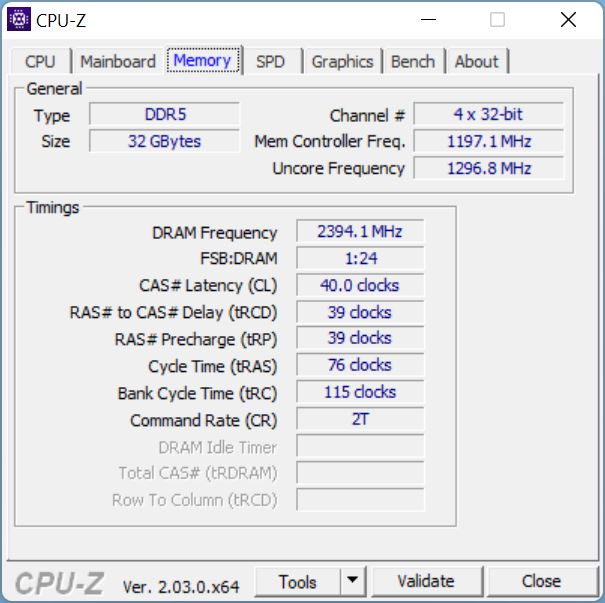
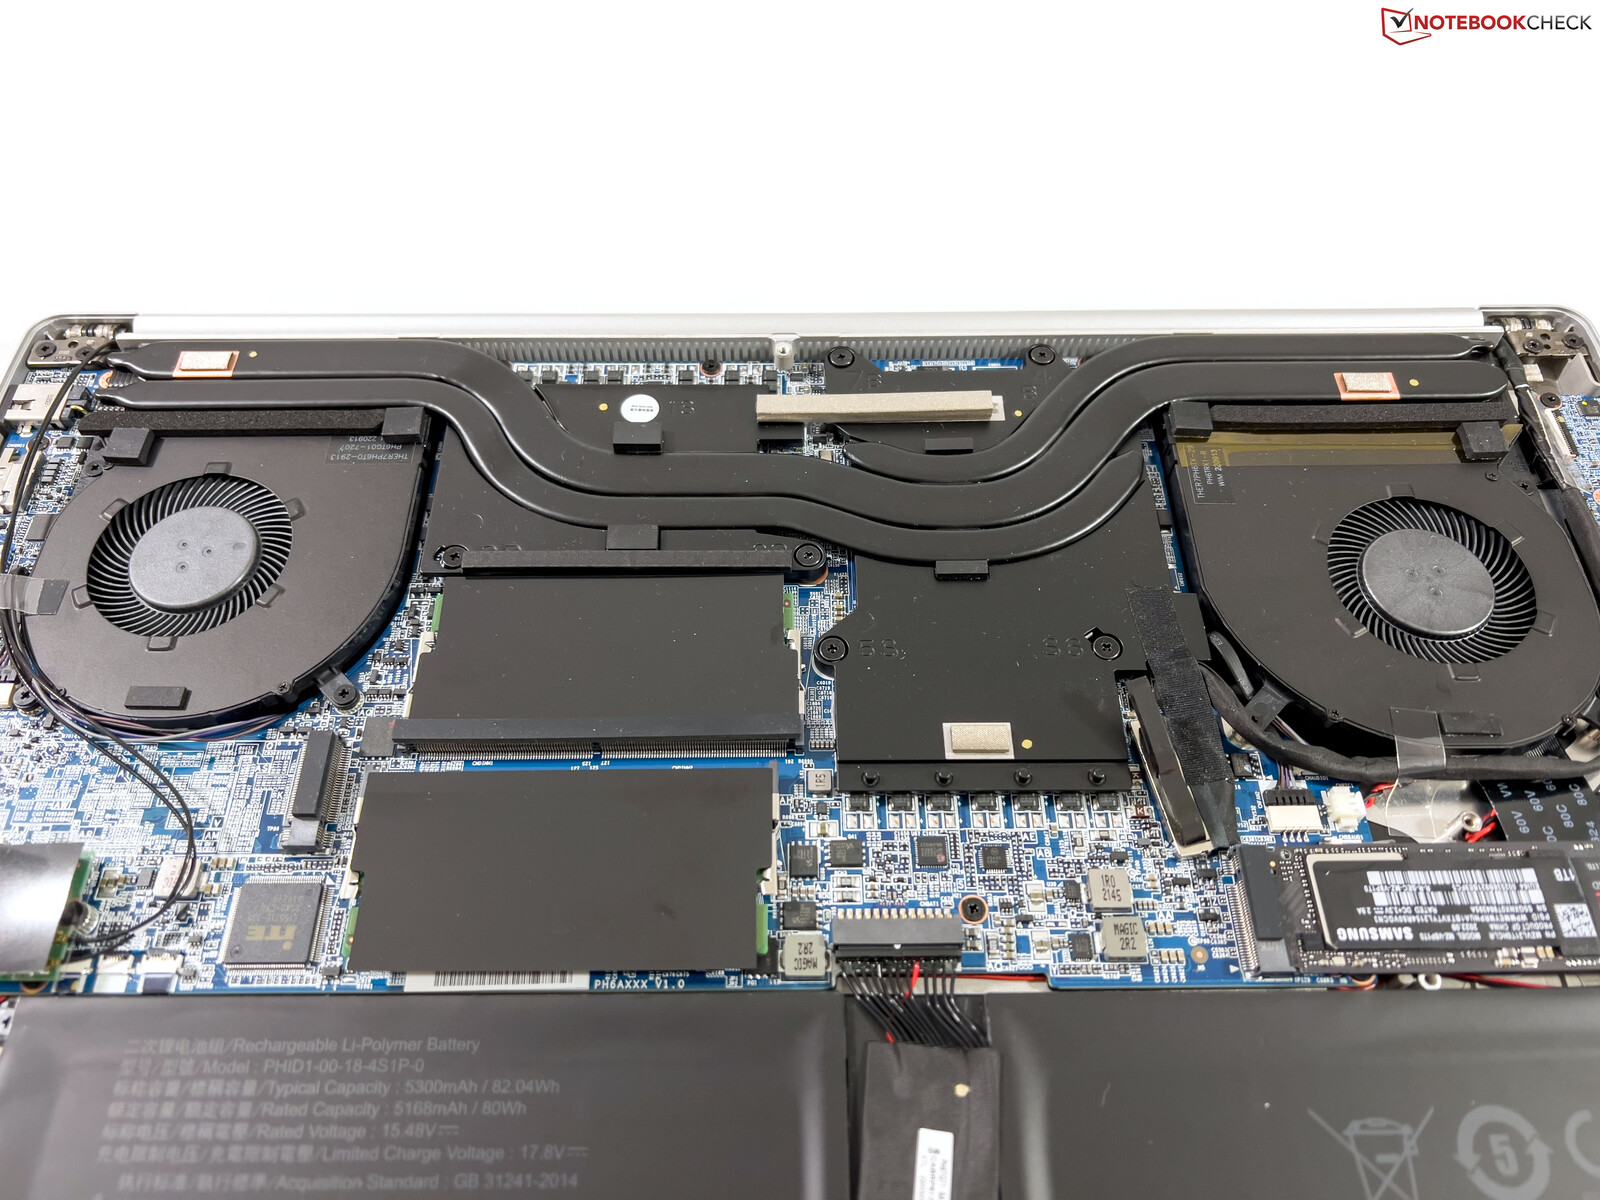
The lower bottom panel is secured by regular Philips screws and is very easy to remove. In addition to the two fans, you can access two SODIMM RAM slots as well as two fast PCIe-4.0 slots for M.2-SSDs. You can also replace the Wi-Fi module and the battery is screwed. It does not get much better in a compact device.
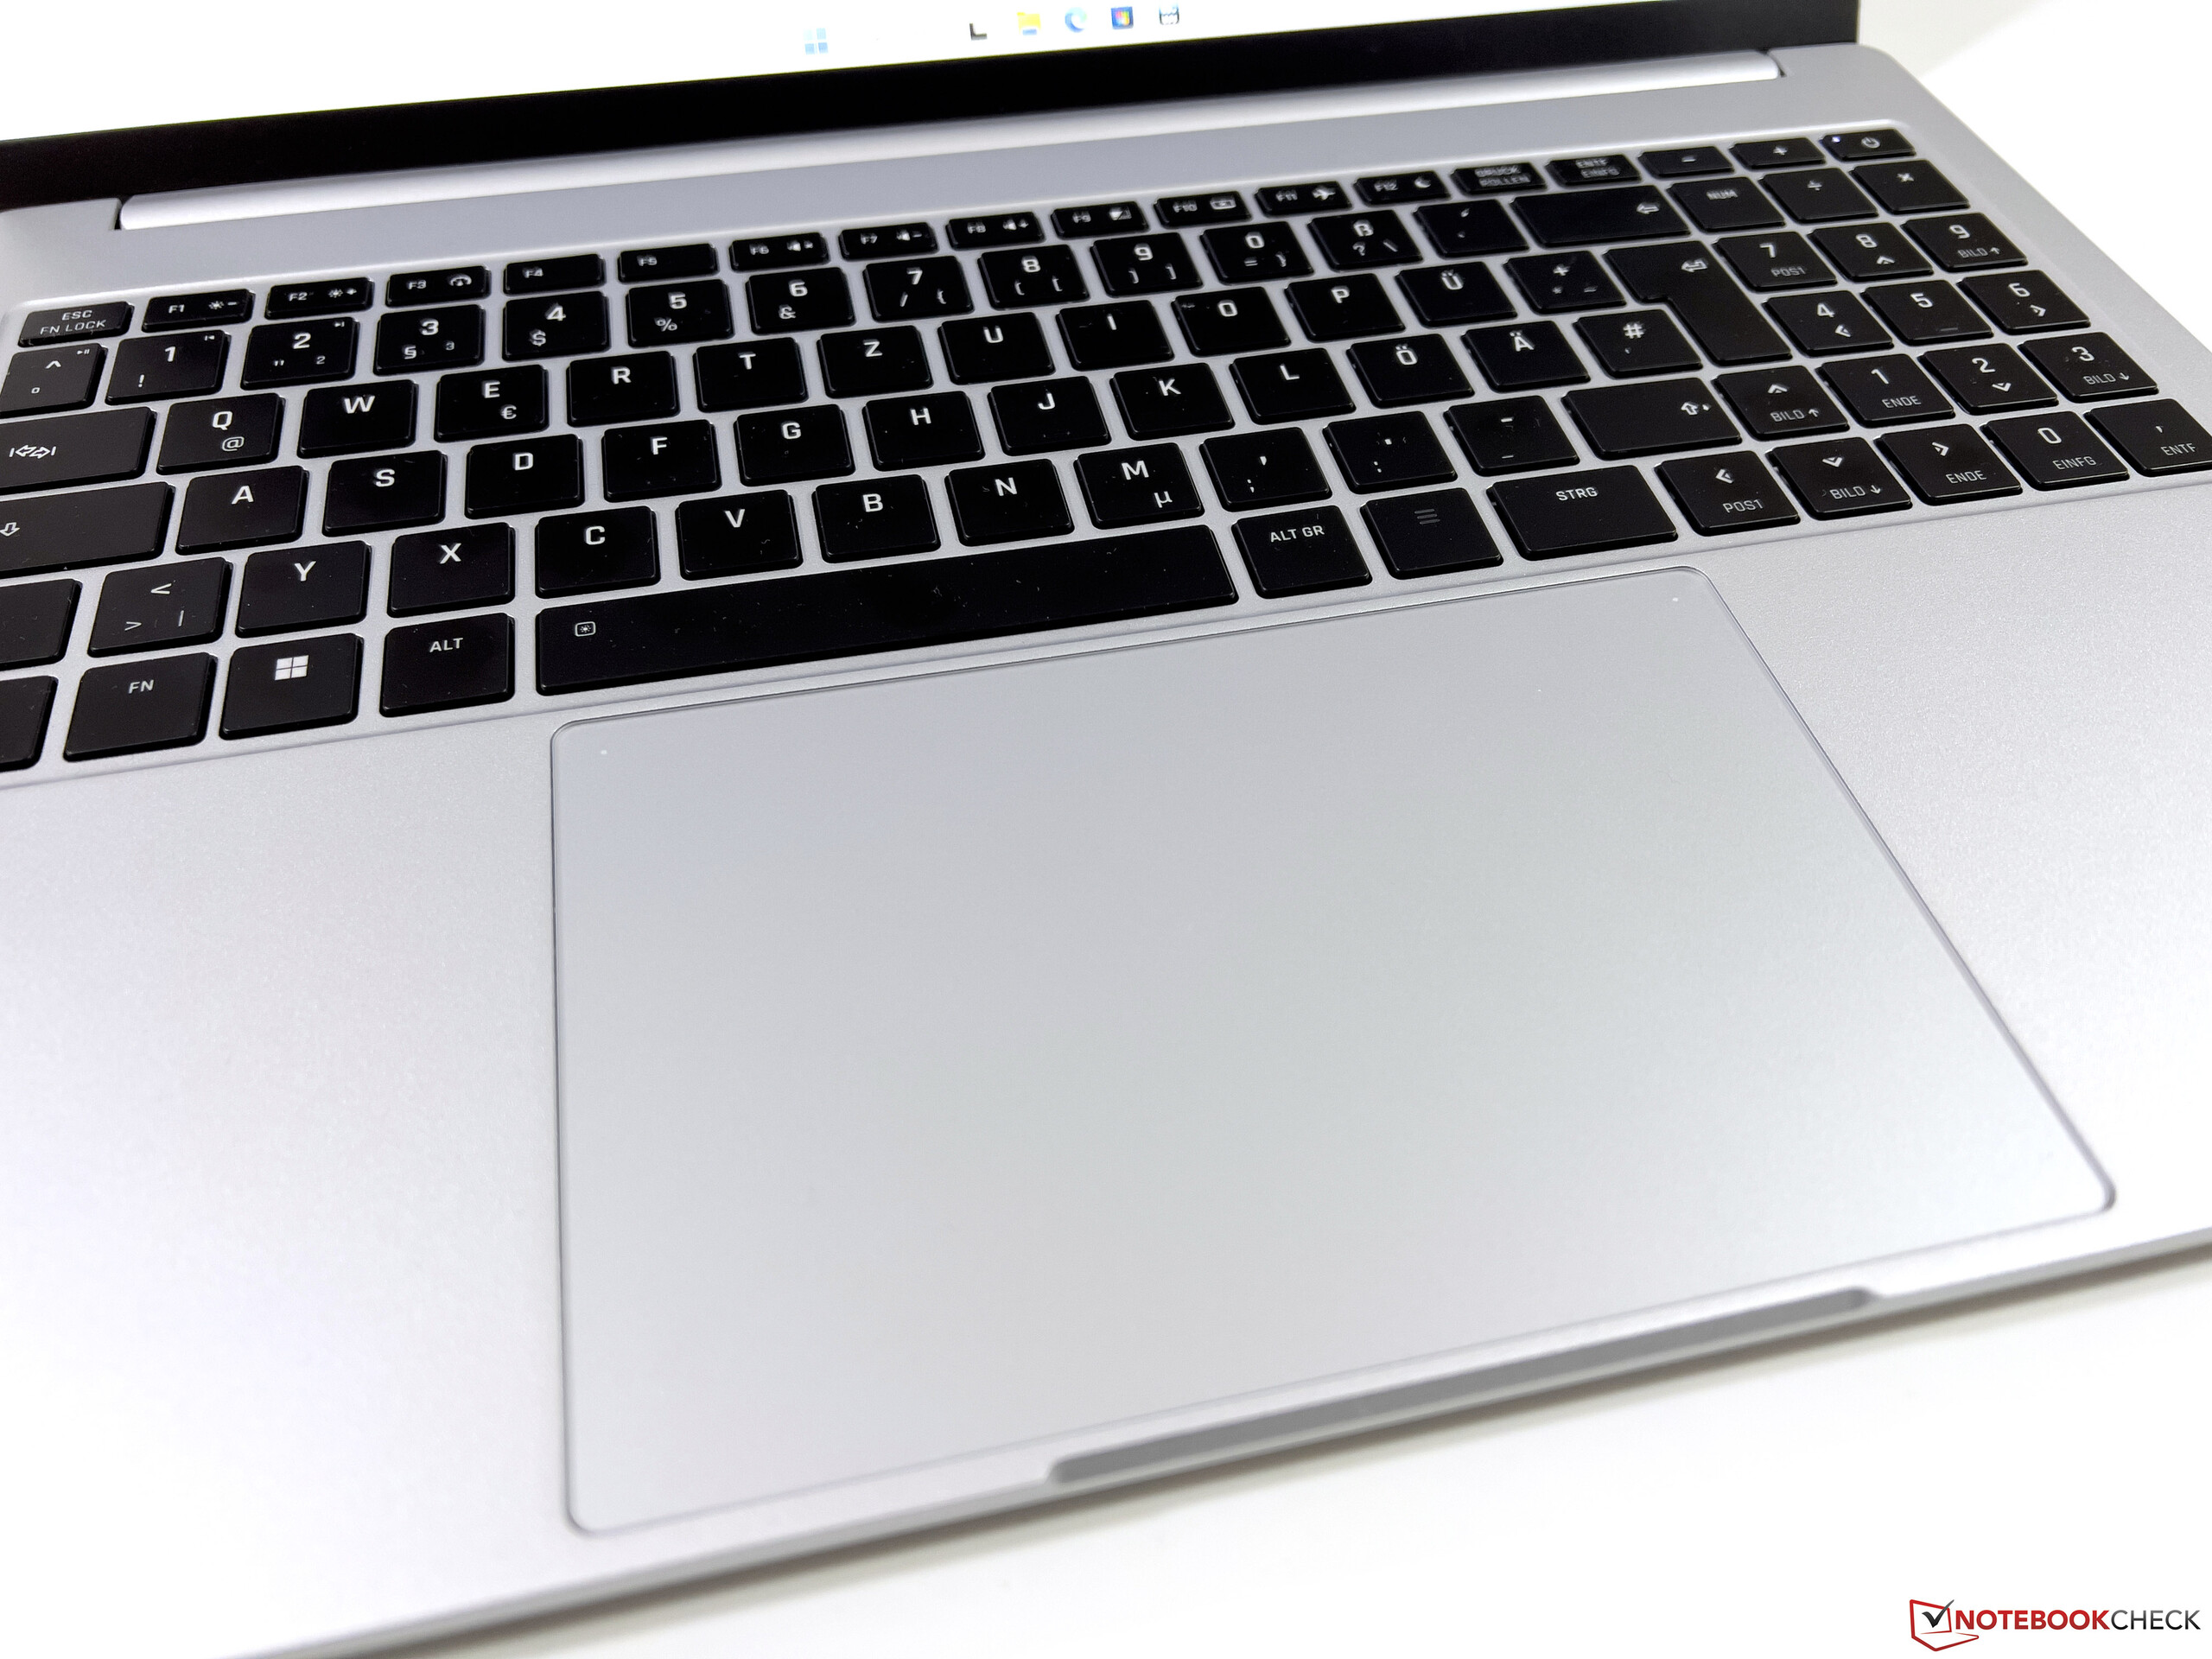
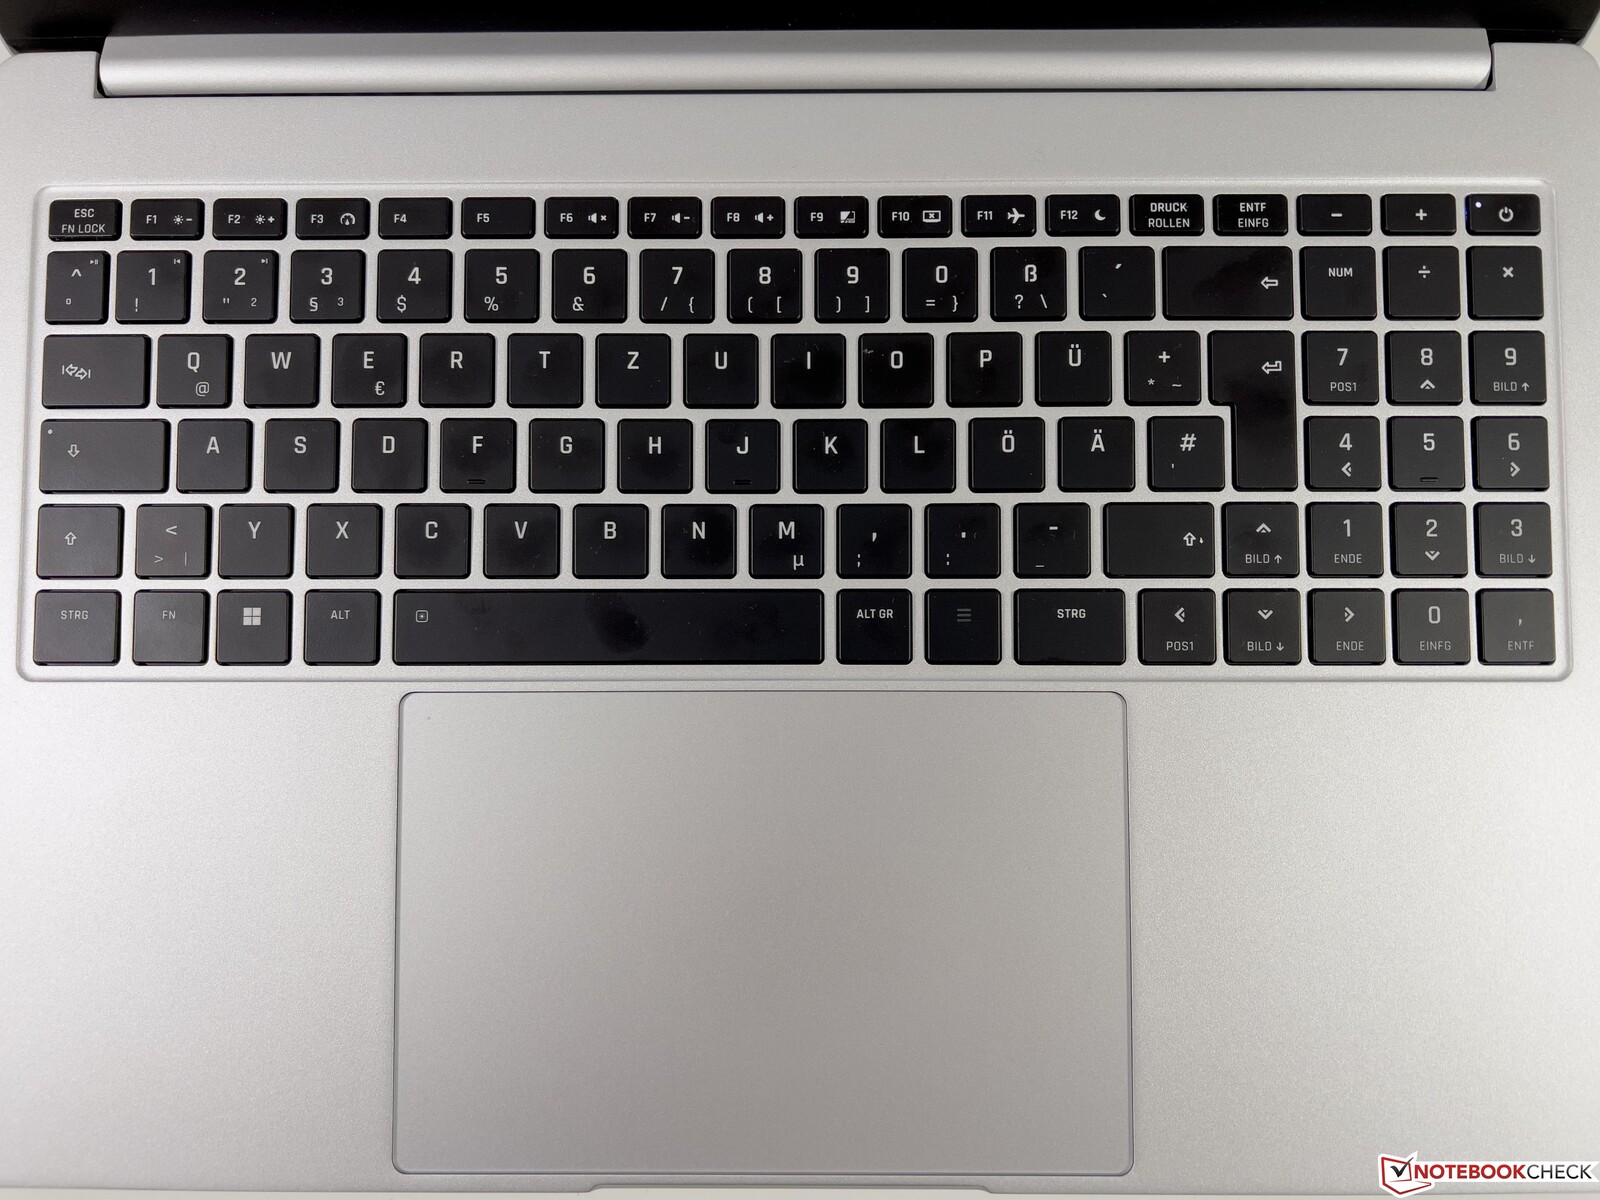
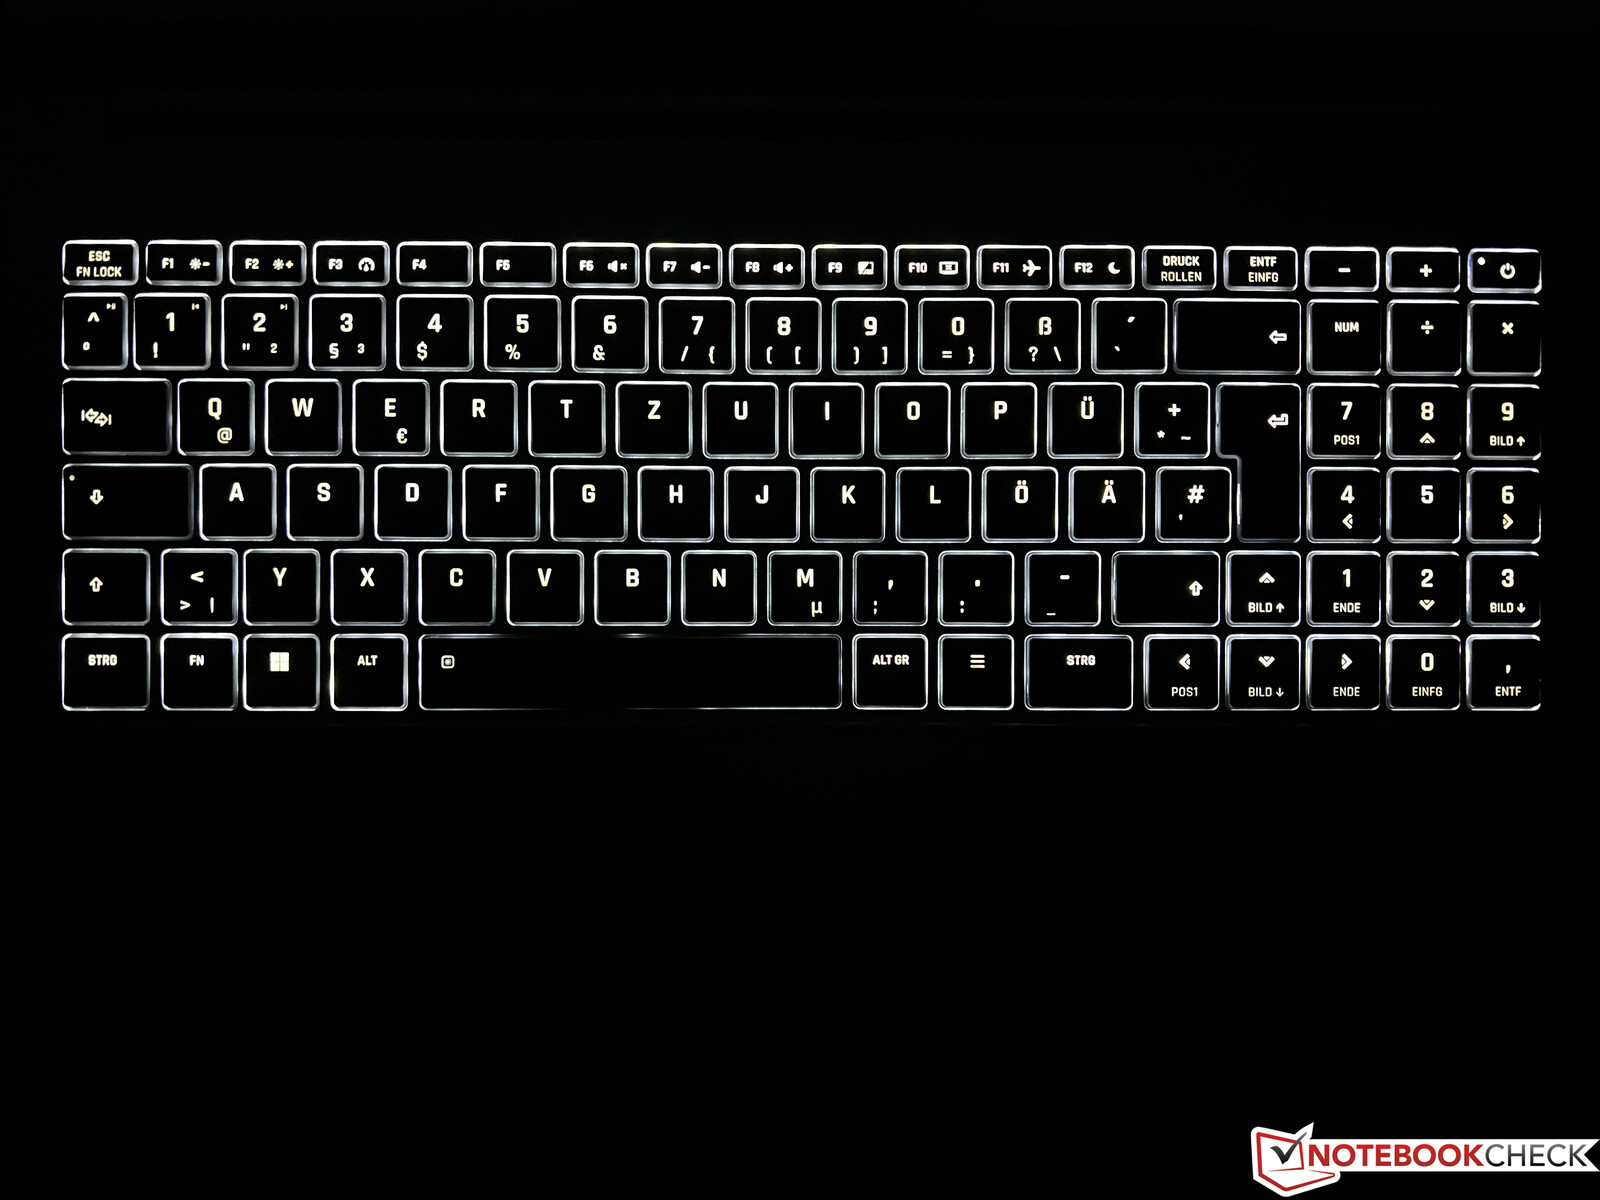
Input Devices - Vision 16 with huge clickpad
The black keyboard offers a nice contrast to the silver chassis color and includes a full-size numpad as well as a two-stage background illumination (white). The manufacturer decided to include full-size arrow keys, but this means the numpad does not offer a secondary return key. Page-up/page-down are also limited to secondary functions via arrow keys.
The keyboard is precise and the key strokes are very quiet except for the larger return key and space bar, which are noticeably louder. Schenker does not specify the key travel, but the overall typing experience is very comfortable and even longer texts are no problem.
The highlight is definitely the huge clickpad with 15.4 x 10 cm. It works really well and offers good gliding capabilities, but the clicking sounds (when you really press the lower half) are pretty loud. It is easy to deactivate the pad via double-tap in the upper left corner, which is indicated by a small LED. This makes sense, when you play games with an external mouse.
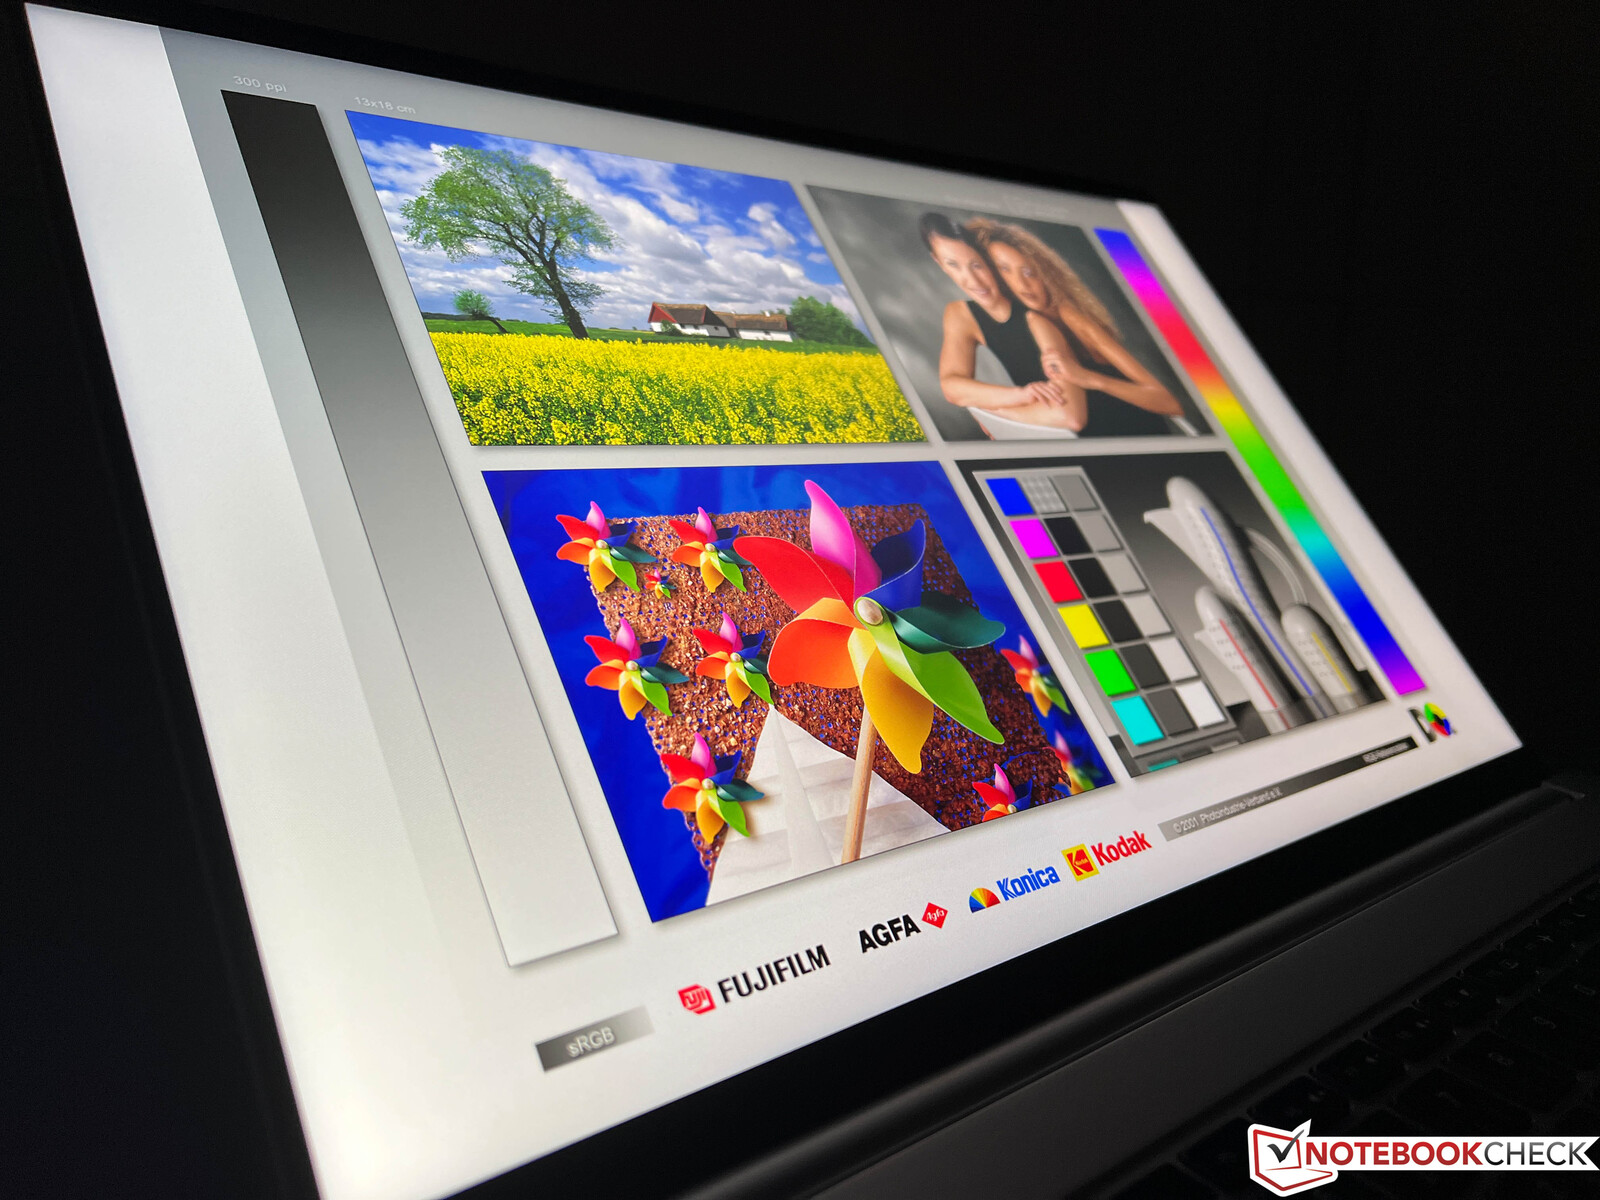
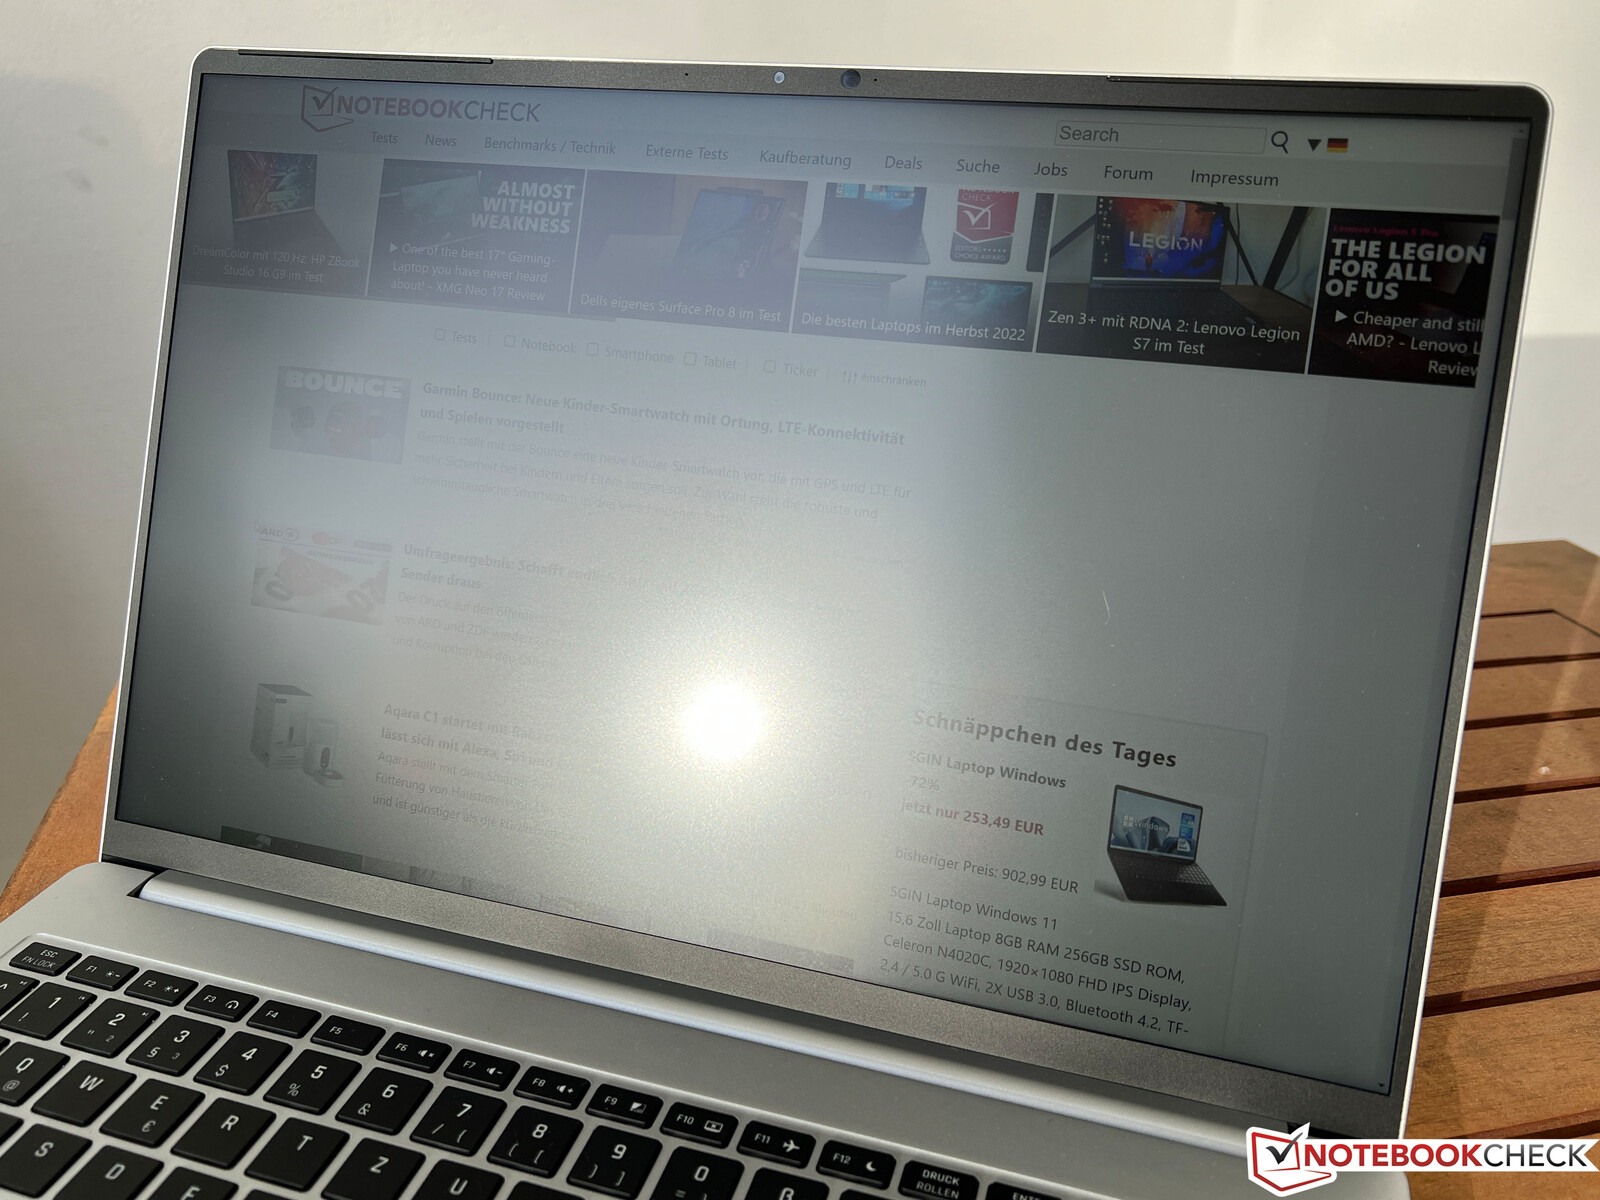
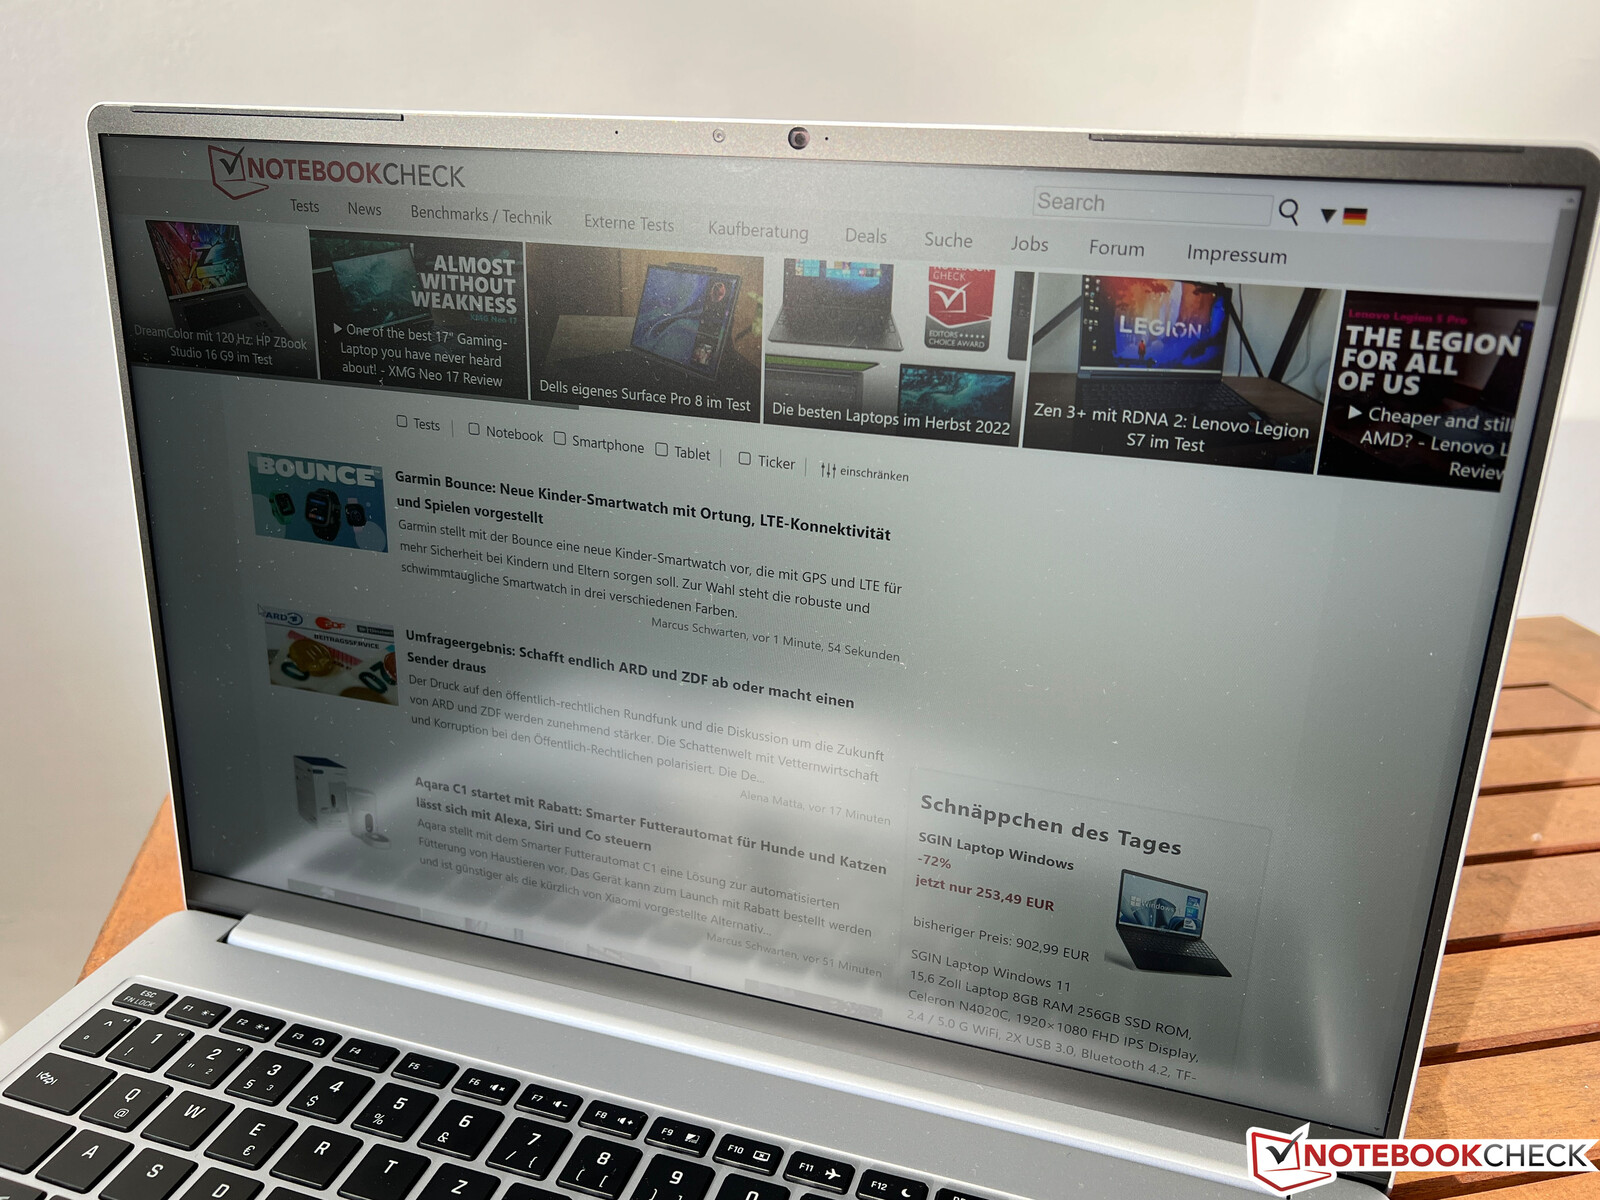
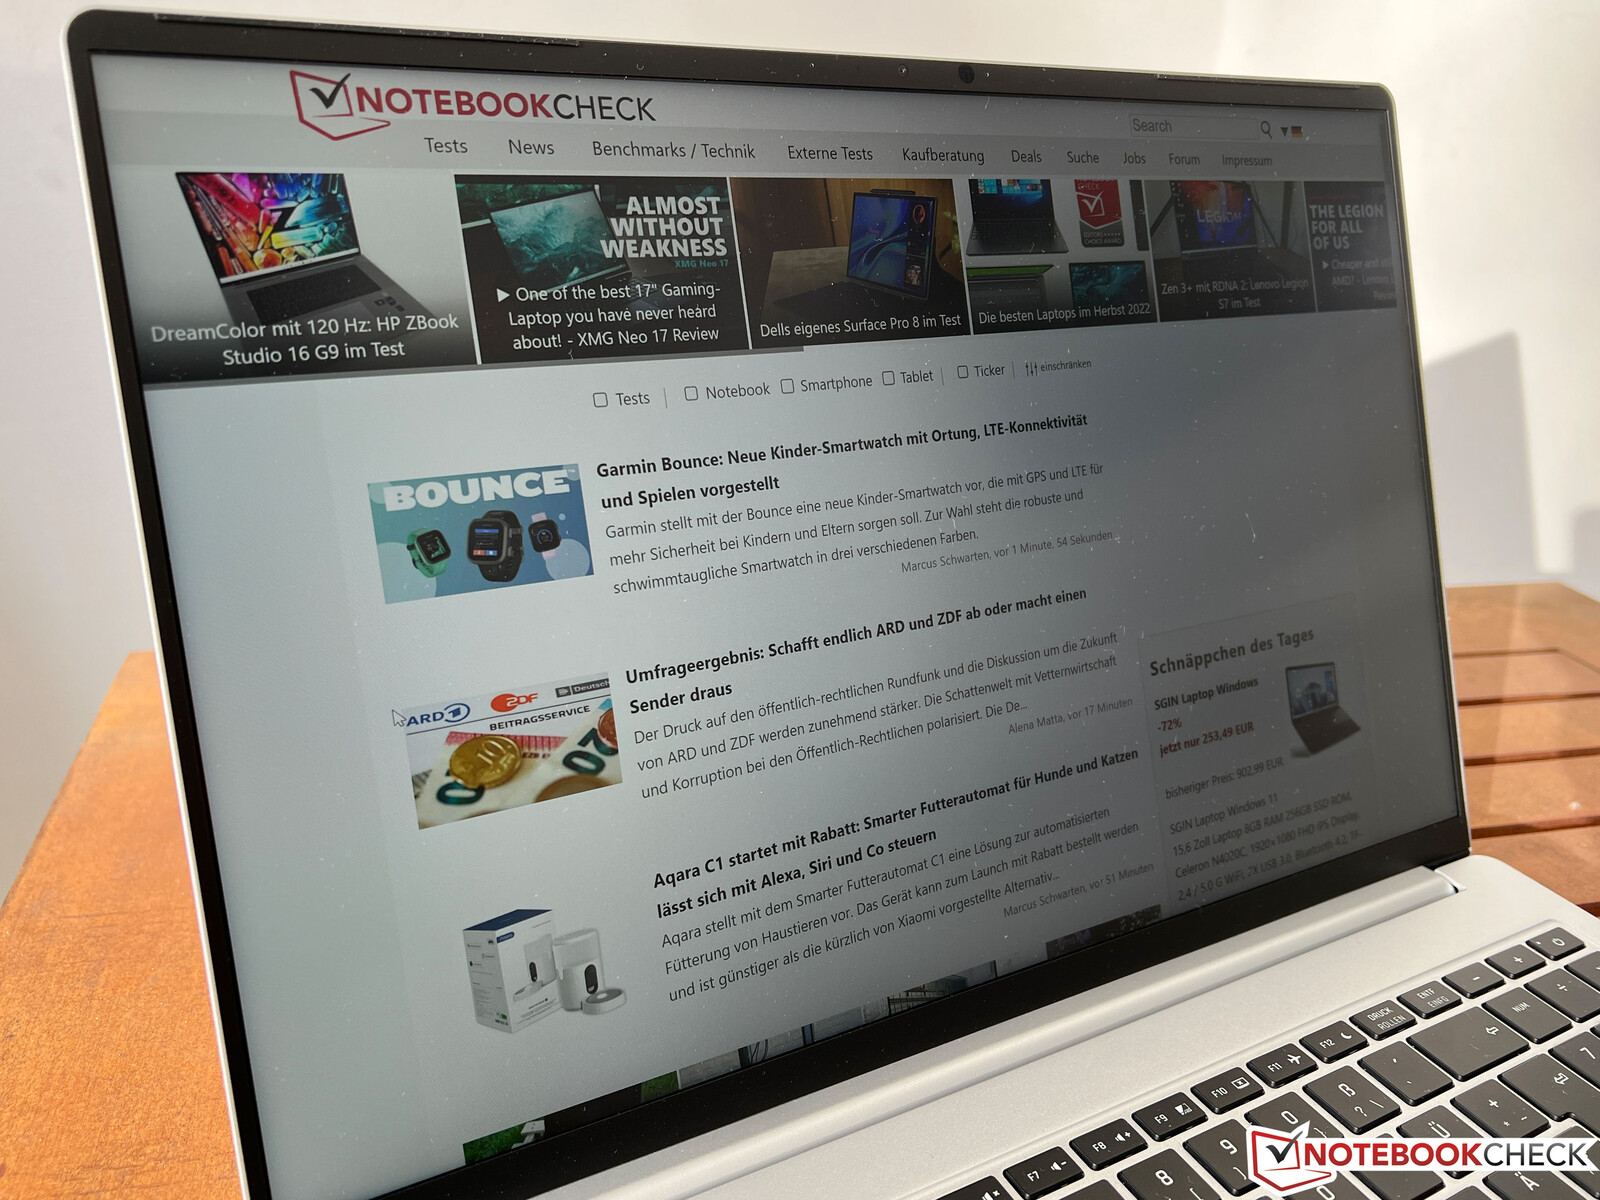
Display - Schenker uses matte IPS panel with 240 Hz
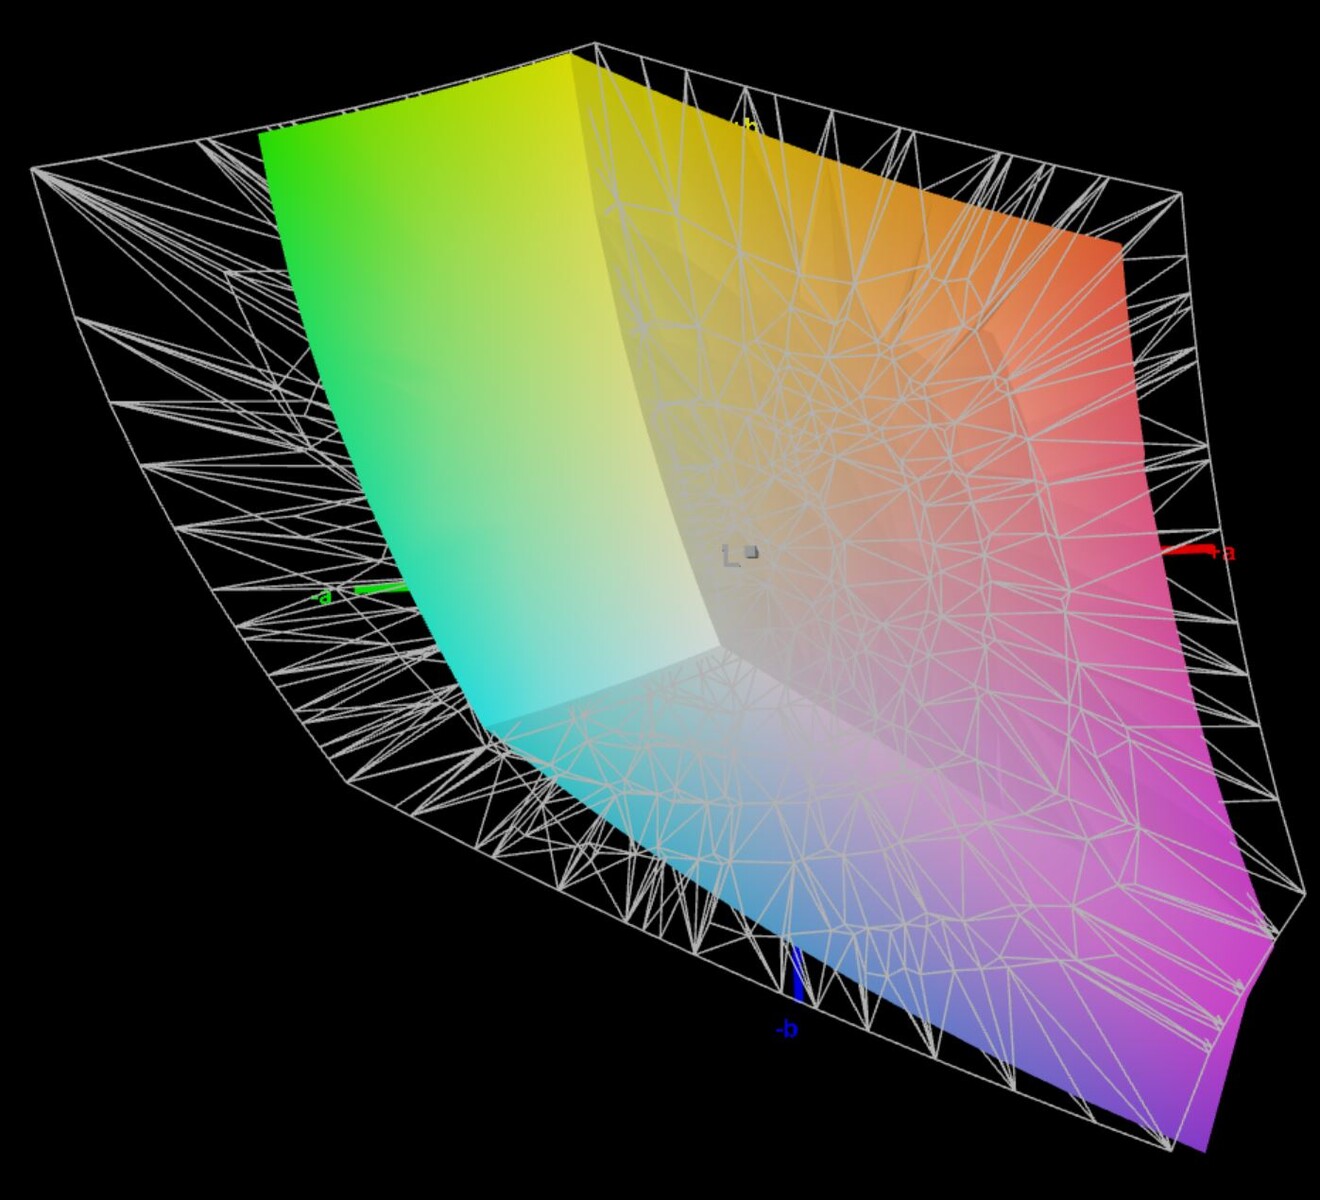
Schenker only offers the Vision 16 Pro with a matte WQHD panel from BOE (NE160QDM-NZ1, 2560 x 1600 pixels), which also supports 240 Hz. The subjective picture impression is very good, because contents are crisp and bright surfaces are not grainy. Colors also look good, but OLED screens, for example, offer richer colors.
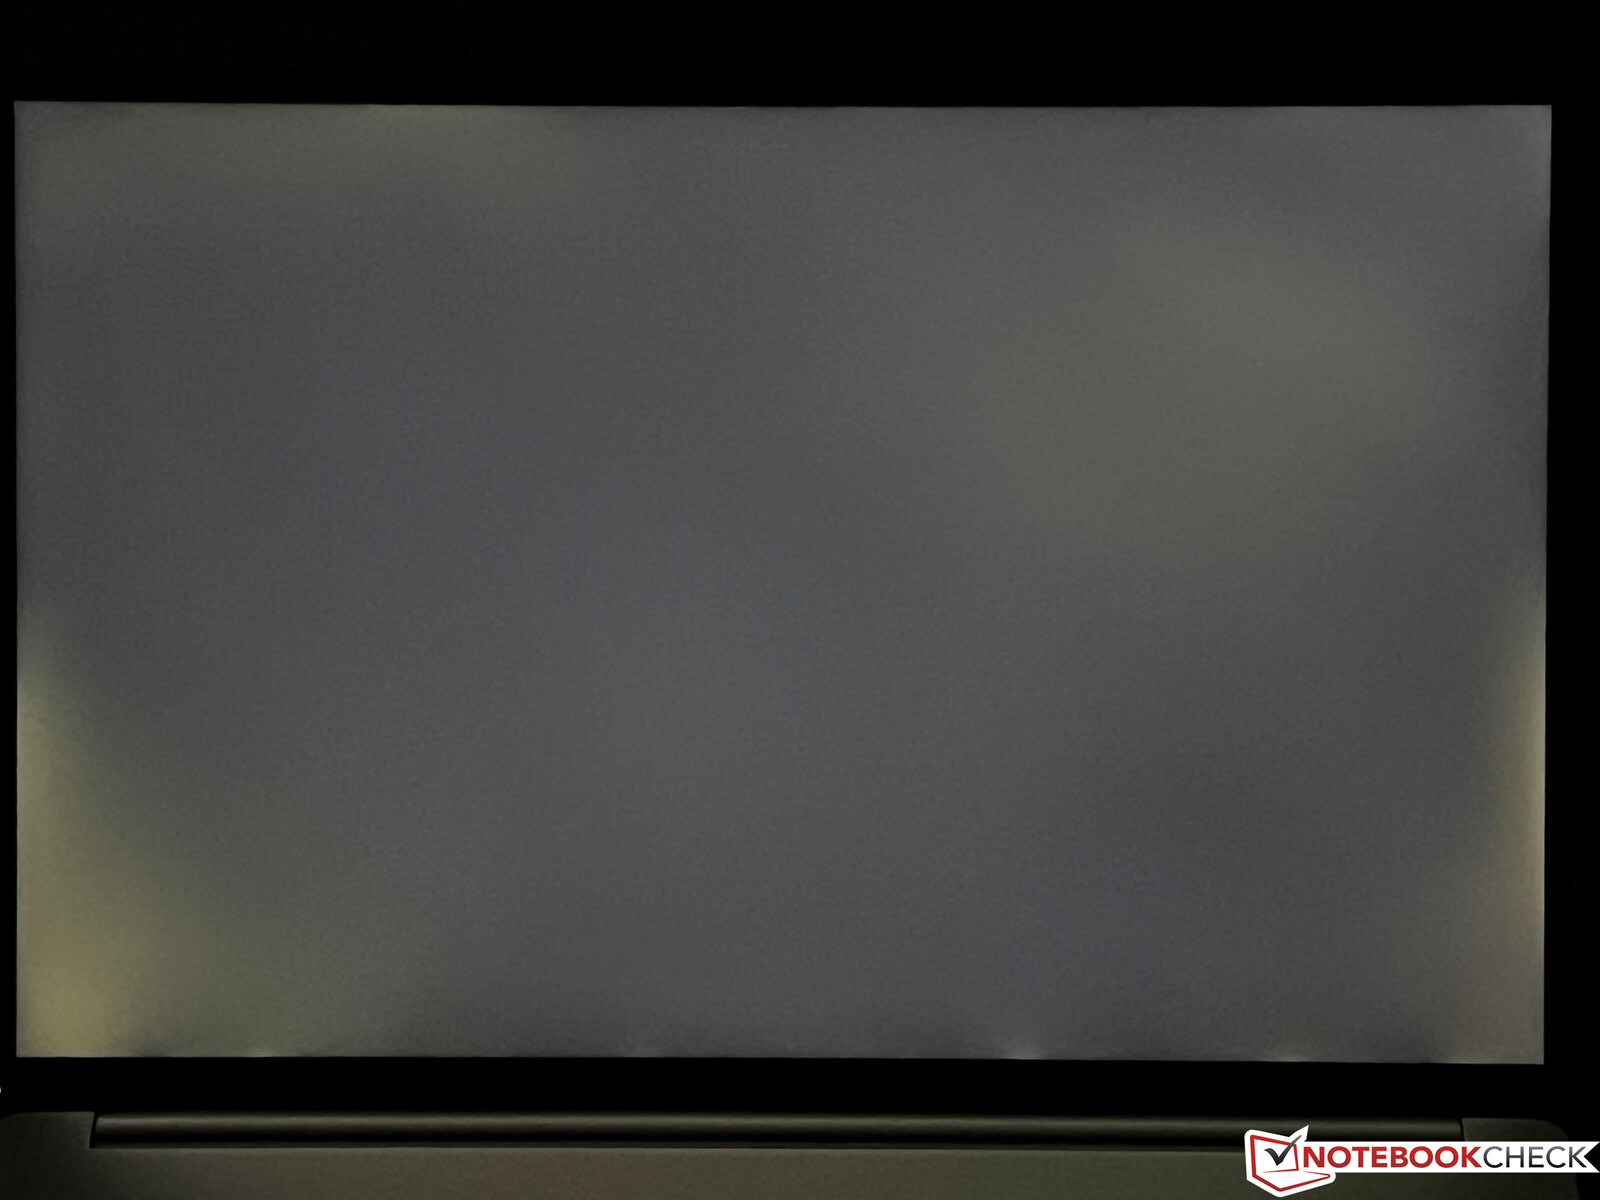
Schenker advertises a brightness of 350 nits and we can confirm that. The black value is still okay at 0.3, which results in a contrast ratio of more than 1200:1. Response times are fast, there is no PWM, and the viewing angle stability of the IPS panel is good. There is visible screen-bleeding at high brightness values, which is particularly noticeable when you watch videos with black bars.

| |||||||||||||||||||||||||
Brightness Distribution: 89 %
Center on Battery: 364 cd/m²
Contrast: 1213:1 (Black: 0.3 cd/m²)
ΔE ColorChecker Calman: 3.3 | ∀{0.5-29.43 Ø4.71}
calibrated: 2.5
ΔE Greyscale Calman: 5.2 | ∀{0.09-98 Ø4.96}
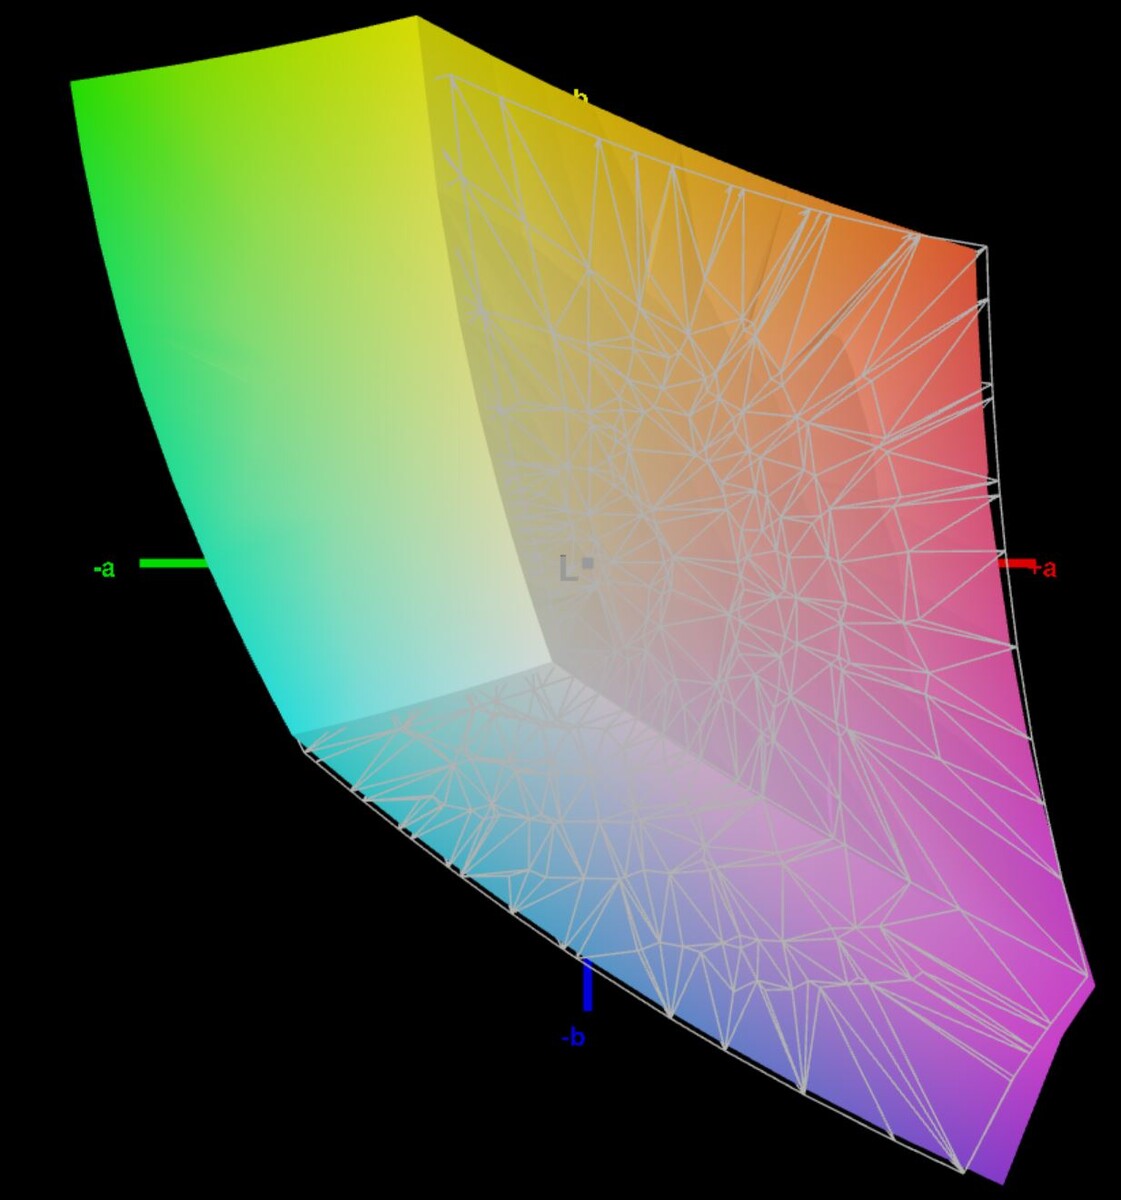
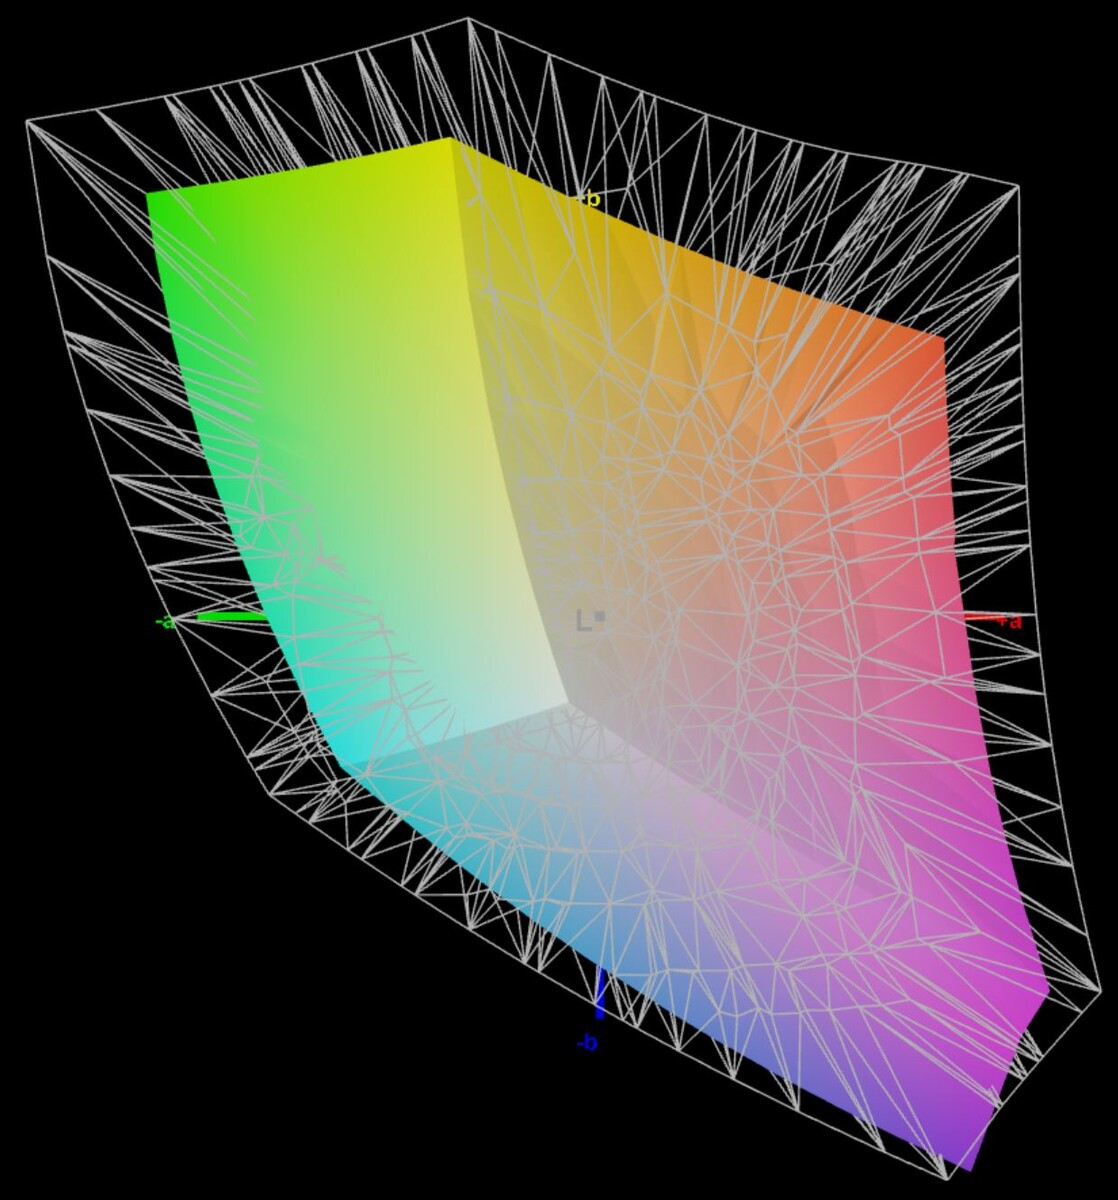
70% AdobeRGB 1998 (Argyll 3D)
96.7% sRGB (Argyll 3D)
68.7% Display P3 (Argyll 3D)
Gamma: 2.14
CCT: 6331 K
| Schenker Vision 16 Pro RTX 3070 Ti N160QDM-NZ1, IPS, 2560x1600, 16" | Apple MacBook Pro 16 2021 M1 Pro Liquid Retina XDR, Mini-LED, 3456x2234, 16.2" | Lenovo Legion Slim 7-16IAH 82TF004YGE MNG007DA1-G , IPS LED, 2560x1600, 16" | Lenovo ThinkBook 16p G3 ARH BOE CQ NE160QDM-NY1, IPS, 2560x1600, 16" | HP Envy 16 h0112nr Samsung SDC4174, OLED, 3840x2400, 16" | |
|---|---|---|---|---|---|
| Display | 24% | 3% | 2% | 25% | |
| Display P3 Coverage (%) | 68.7 | 99.1 44% | 70.5 3% | 69.8 2% | 99.3 45% |
| sRGB Coverage (%) | 96.7 | 100 3% | 99.1 2% | 98.2 2% | 100 3% |
| AdobeRGB 1998 Coverage (%) | 70 | 88 26% | 72.8 4% | 71.4 2% | 88 26% |
| Response Times | -582% | 18% | -20% | 82% | |
| Response Time Grey 50% / Grey 80% * (ms) | 14.3 ? | 42.8 ? -199% | 12 ? 16% | 15.6 ? -9% | 2 ? 86% |
| Response Time Black / White * (ms) | 8.6 ? | 91.6 ? -965% | 7 ? 19% | 11.2 ? -30% | 1.9 ? 78% |
| PWM Frequency (Hz) | 14880 | 240.4 ? | |||
| Screen | 297% | 23% | 22% | 22% | |
| Brightness middle (cd/m²) | 364 | 514 41% | 523 44% | 532.8 46% | 328.8 -10% |
| Brightness (cd/m²) | 347 | 497 43% | 494 42% | 519 50% | 332 -4% |
| Brightness Distribution (%) | 89 | 95 7% | 90 1% | 94 6% | 97 9% |
| Black Level * (cd/m²) | 0.3 | 0.02 93% | 0.4 -33% | 0.55 -83% | |
| Contrast (:1) | 1213 | 25700 2019% | 1308 8% | 969 -20% | |
| Colorchecker dE 2000 * | 3.3 | 1.4 58% | 2.6 21% | 1.32 60% | 1.53 54% |
| Colorchecker dE 2000 max. * | 6.6 | 2.8 58% | 5 24% | 3.97 40% | 6.04 8% |
| Colorchecker dE 2000 calibrated * | 2.5 | 1 60% | 1.59 36% | ||
| Greyscale dE 2000 * | 5.2 | 2.3 56% | 3.3 37% | 1.8 65% | 1.3 75% |
| Gamma | 2.14 103% | 2.27 97% | 2.17 101% | 2.64 83% | 2.18 101% |
| CCT | 6331 103% | 6792 96% | 6013 108% | 6761 96% | 6362 102% |
| Total Average (Program / Settings) | -87% /
99% | 15% /
18% | 1% /
12% | 43% /
34% |
* ... smaller is better
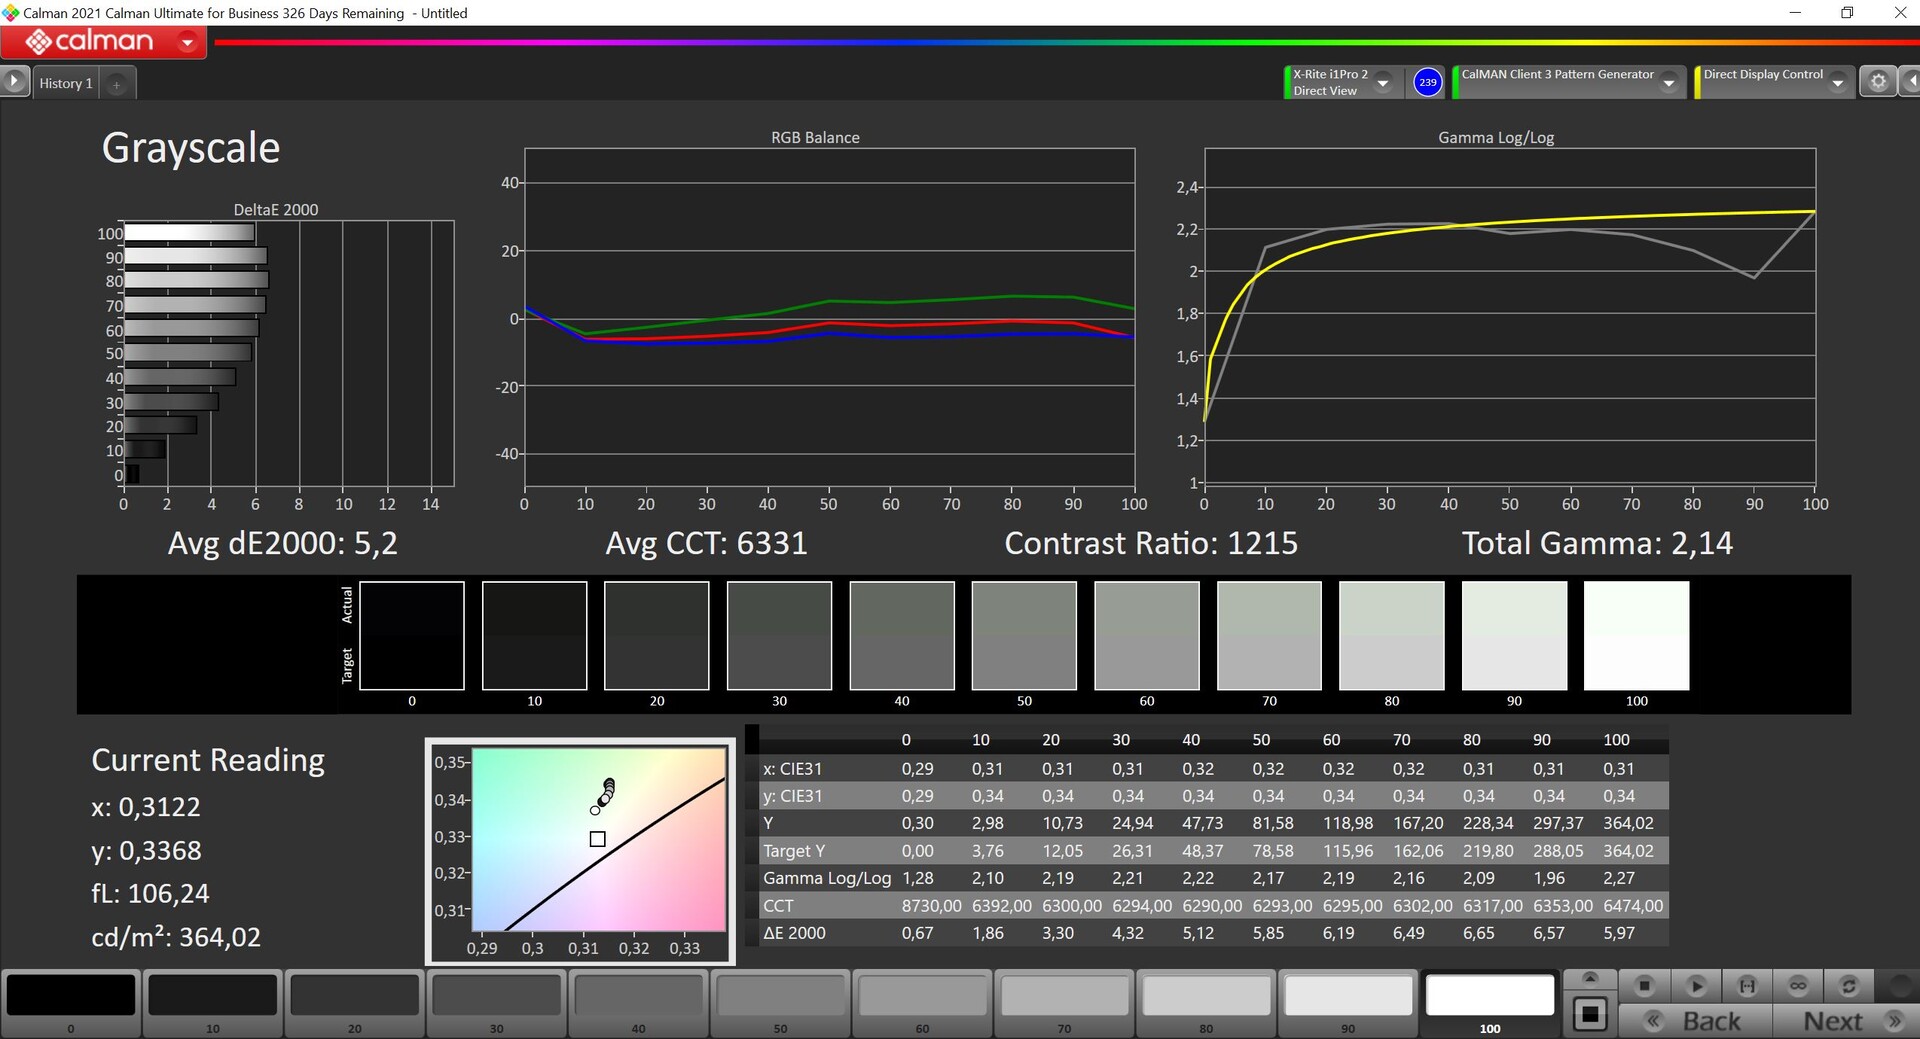
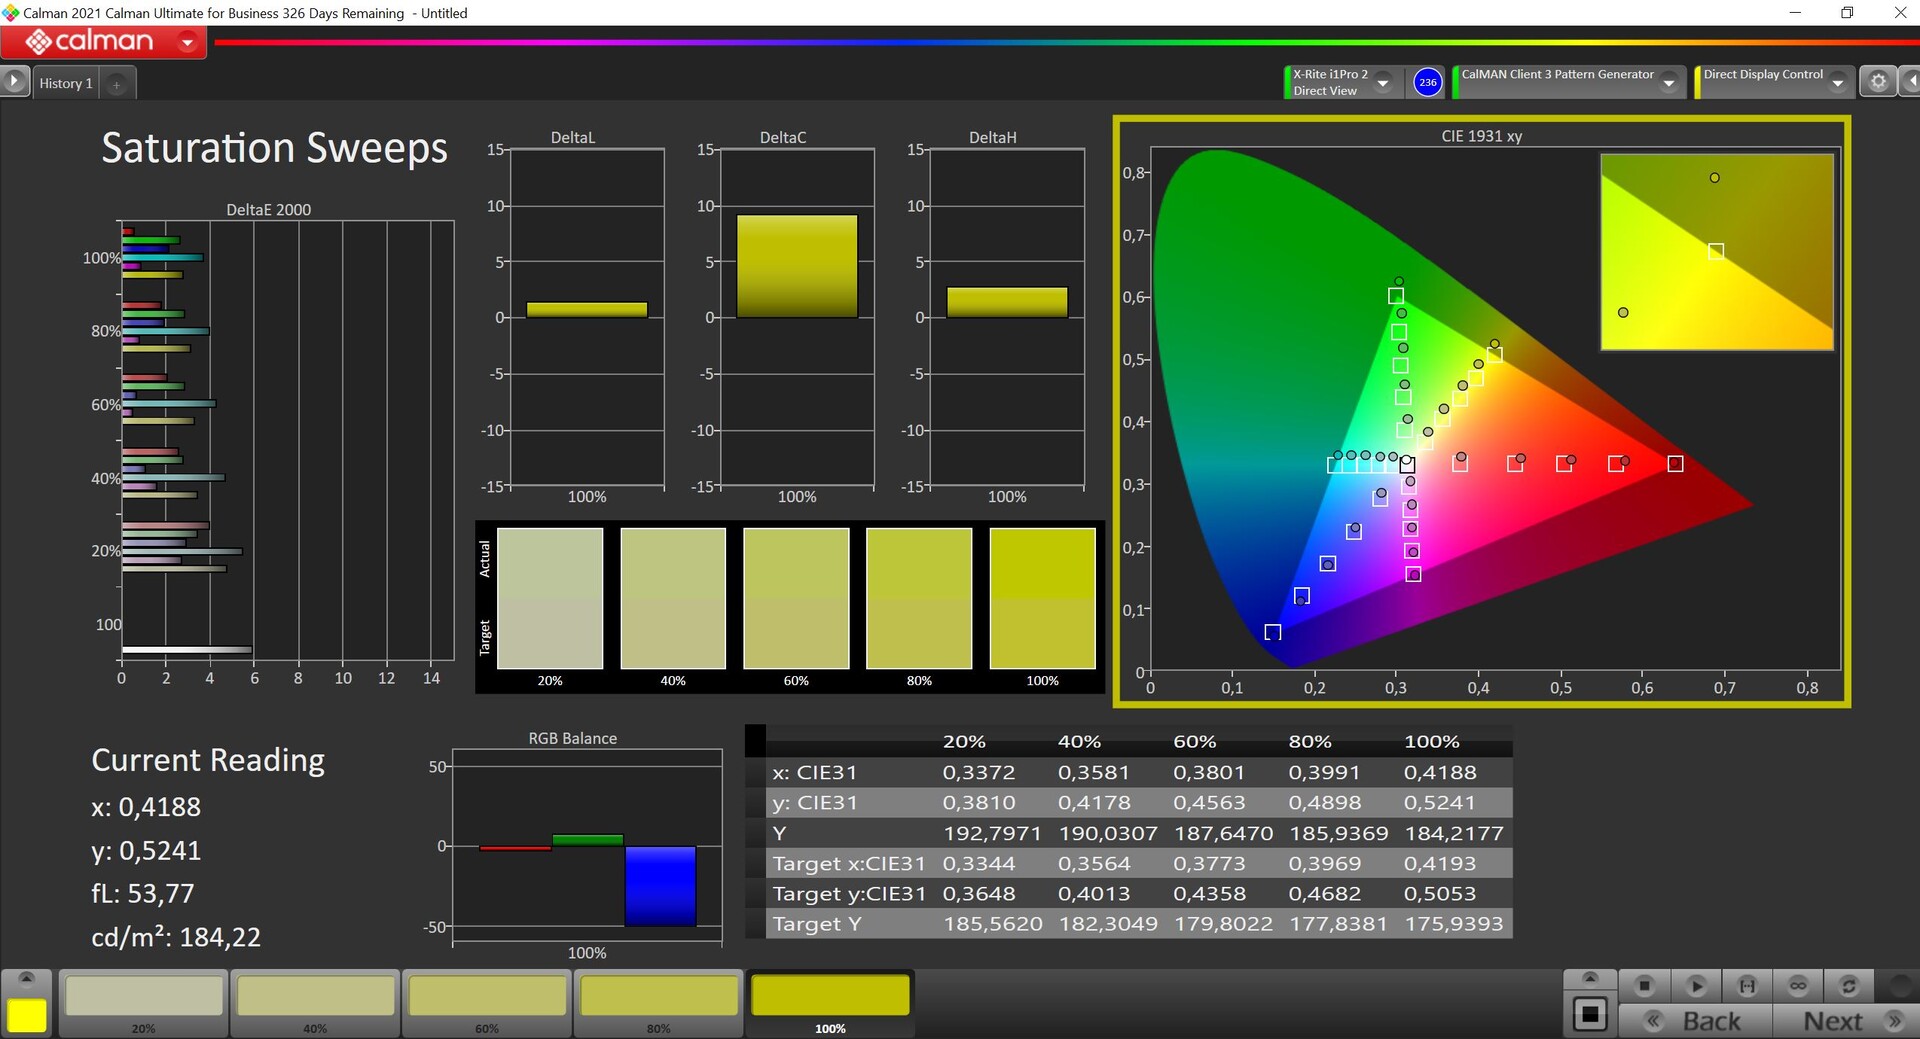
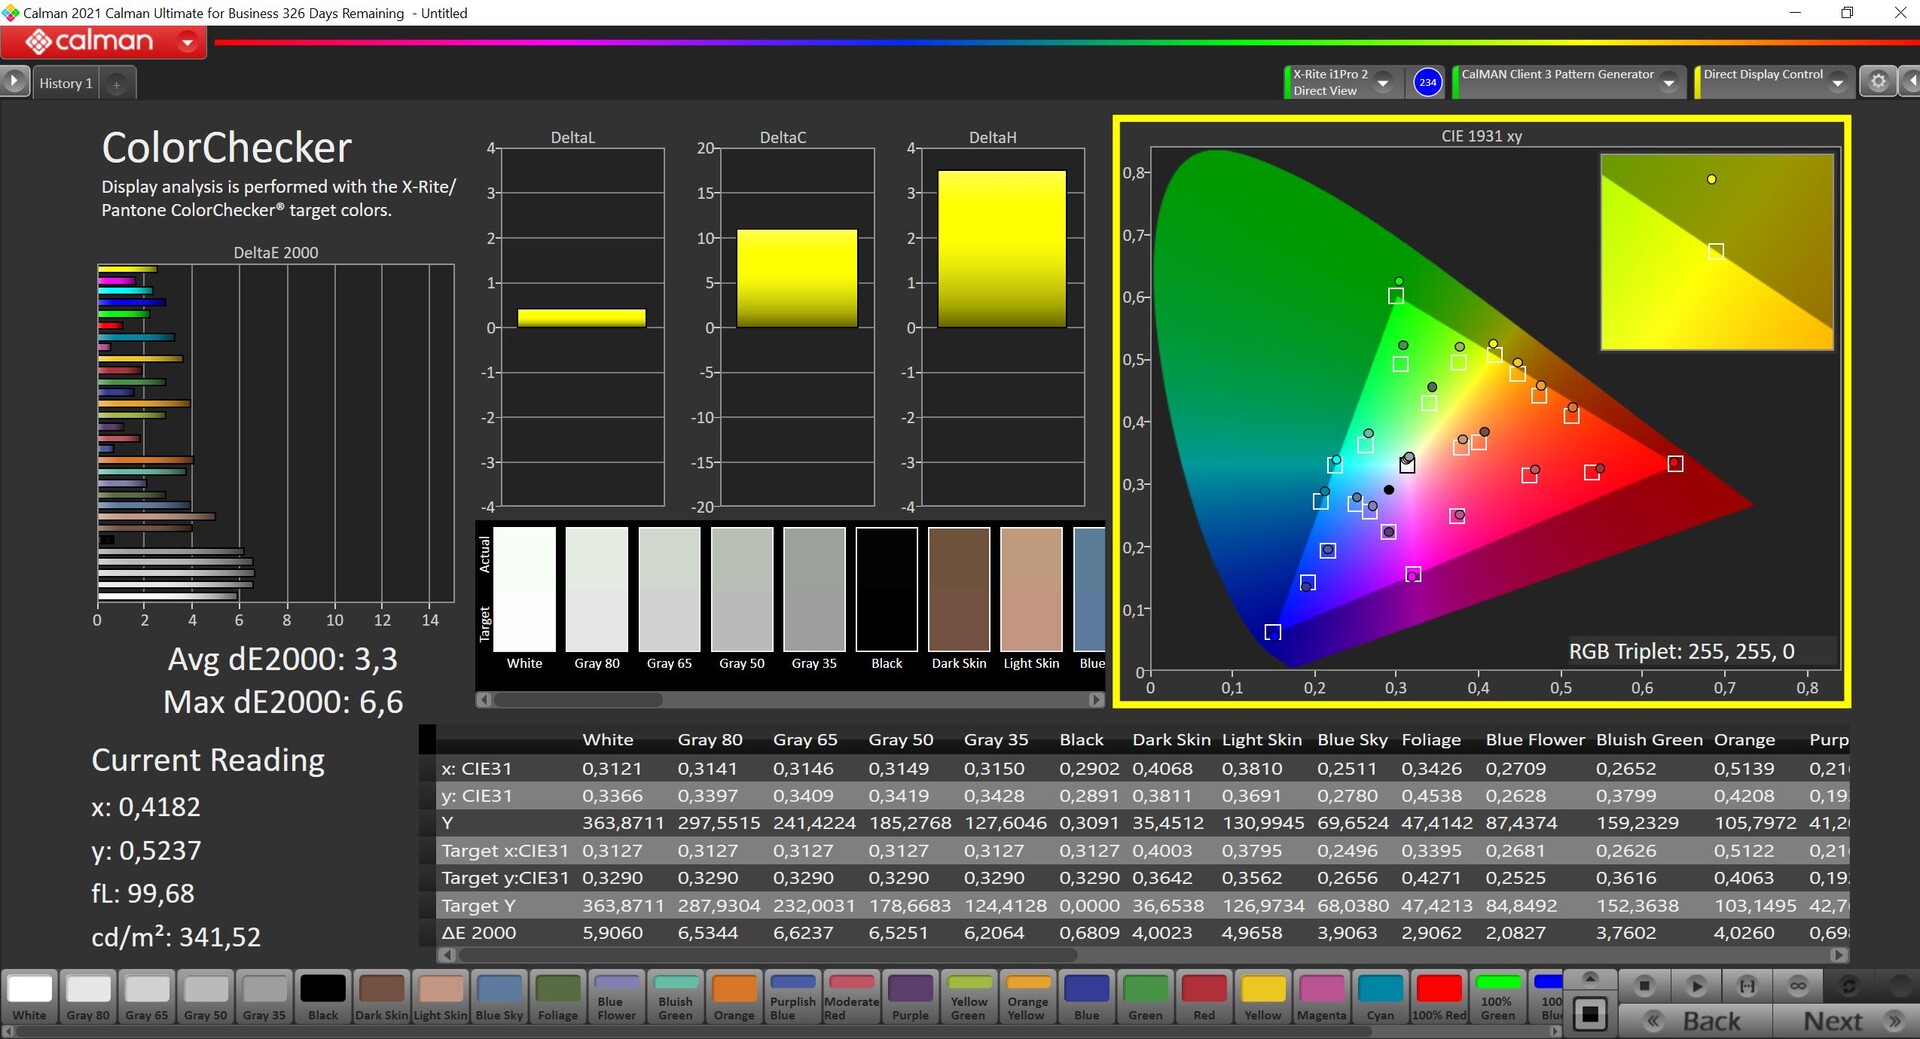
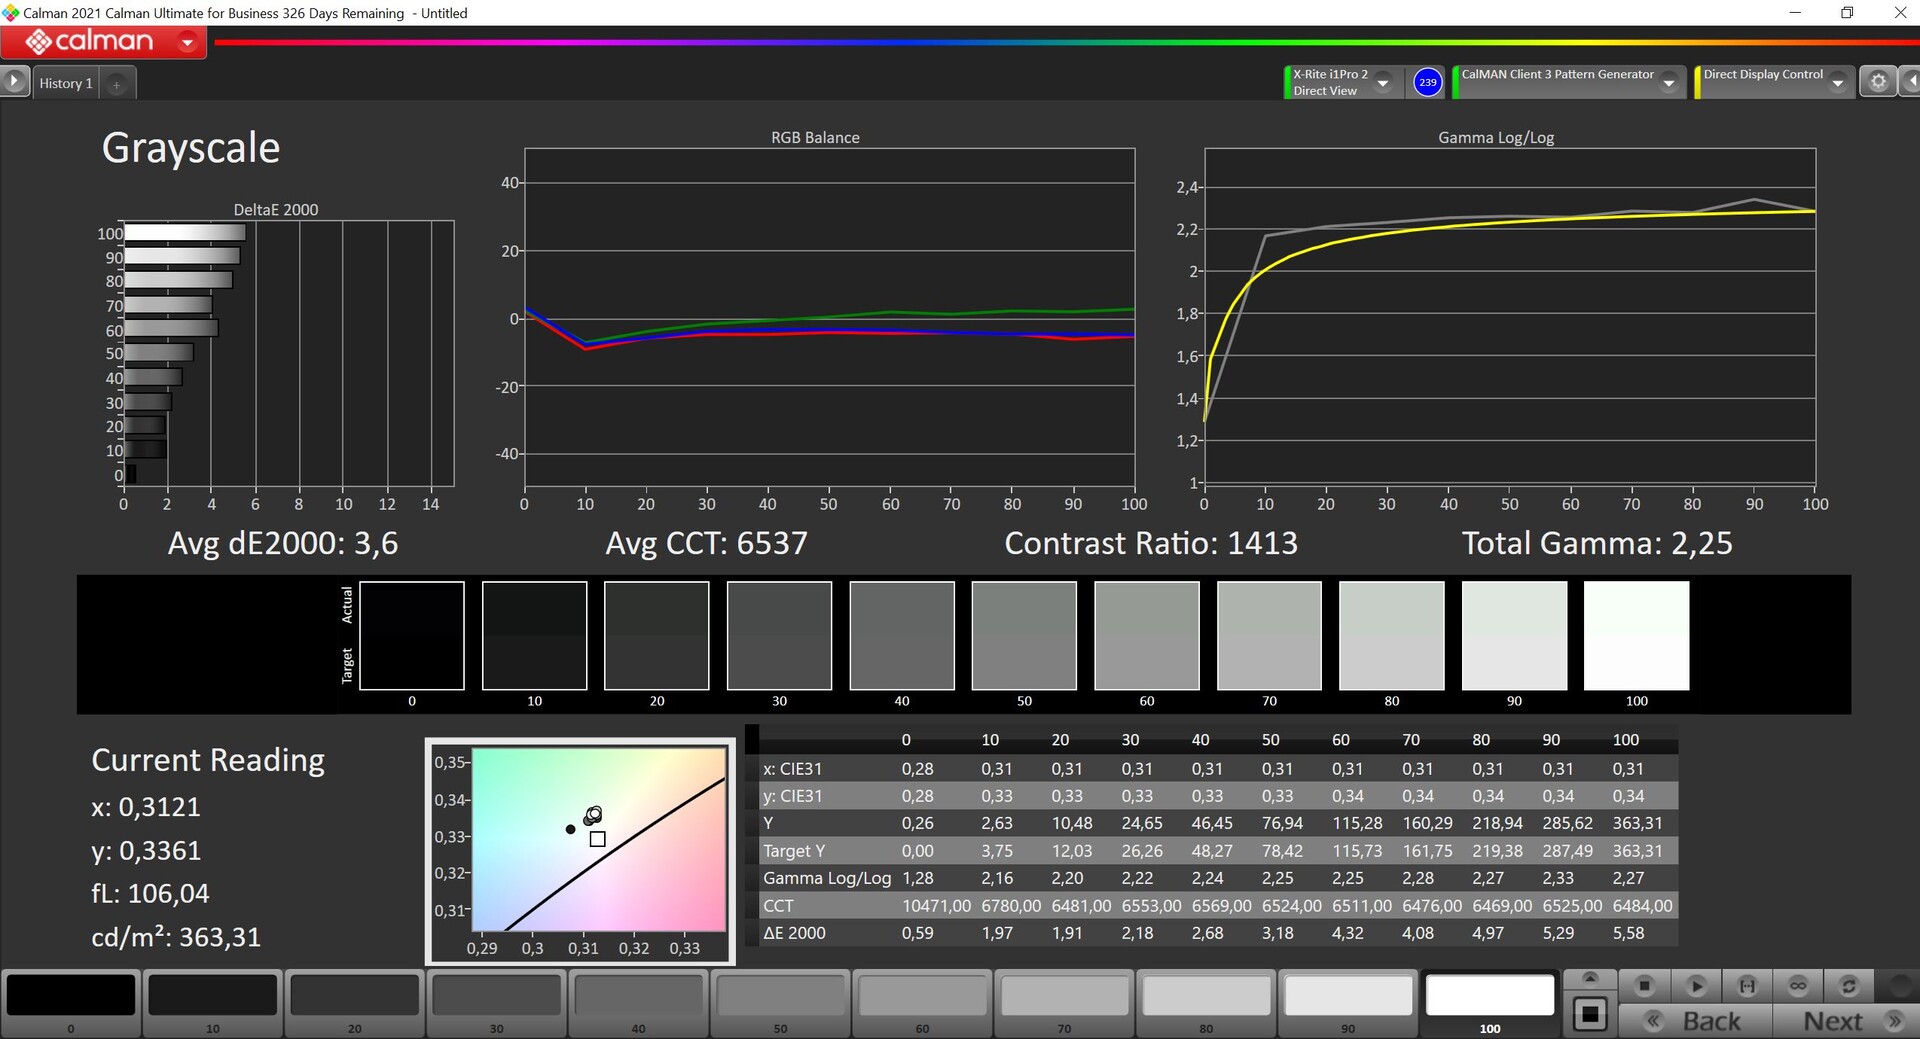
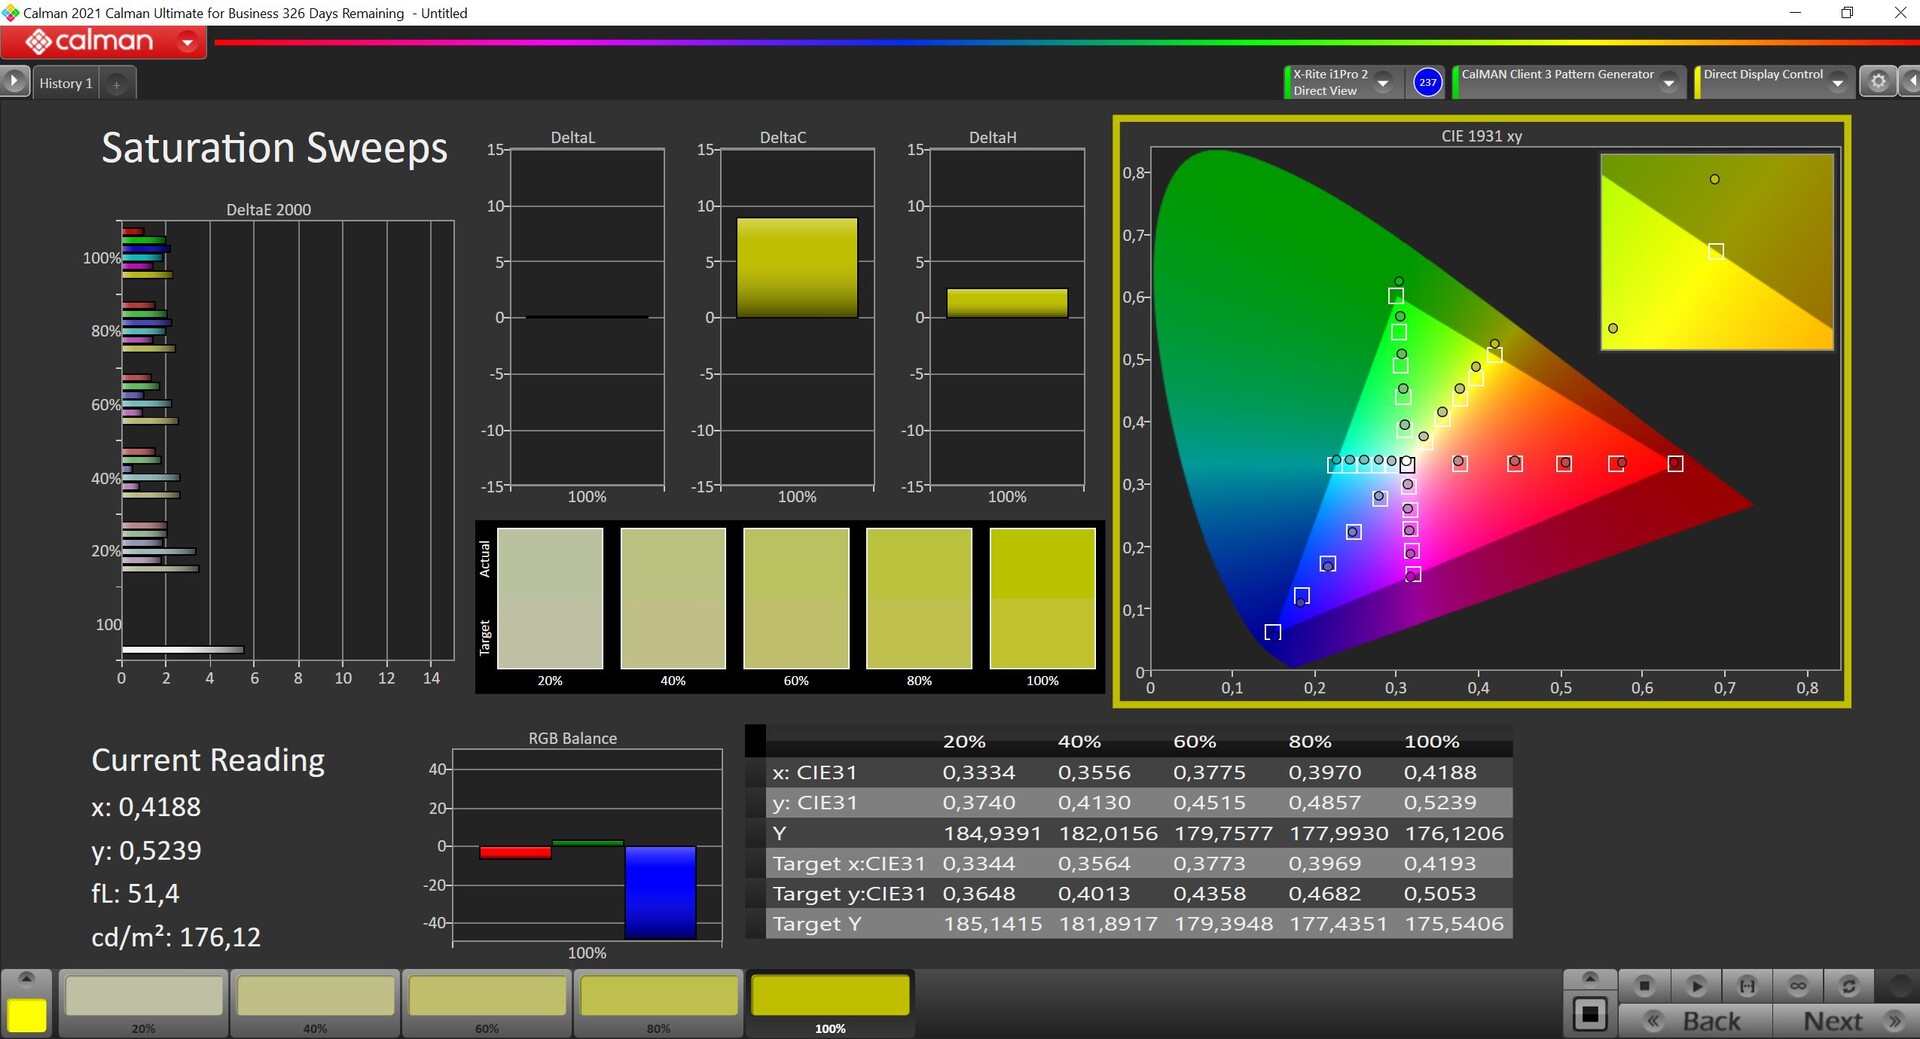
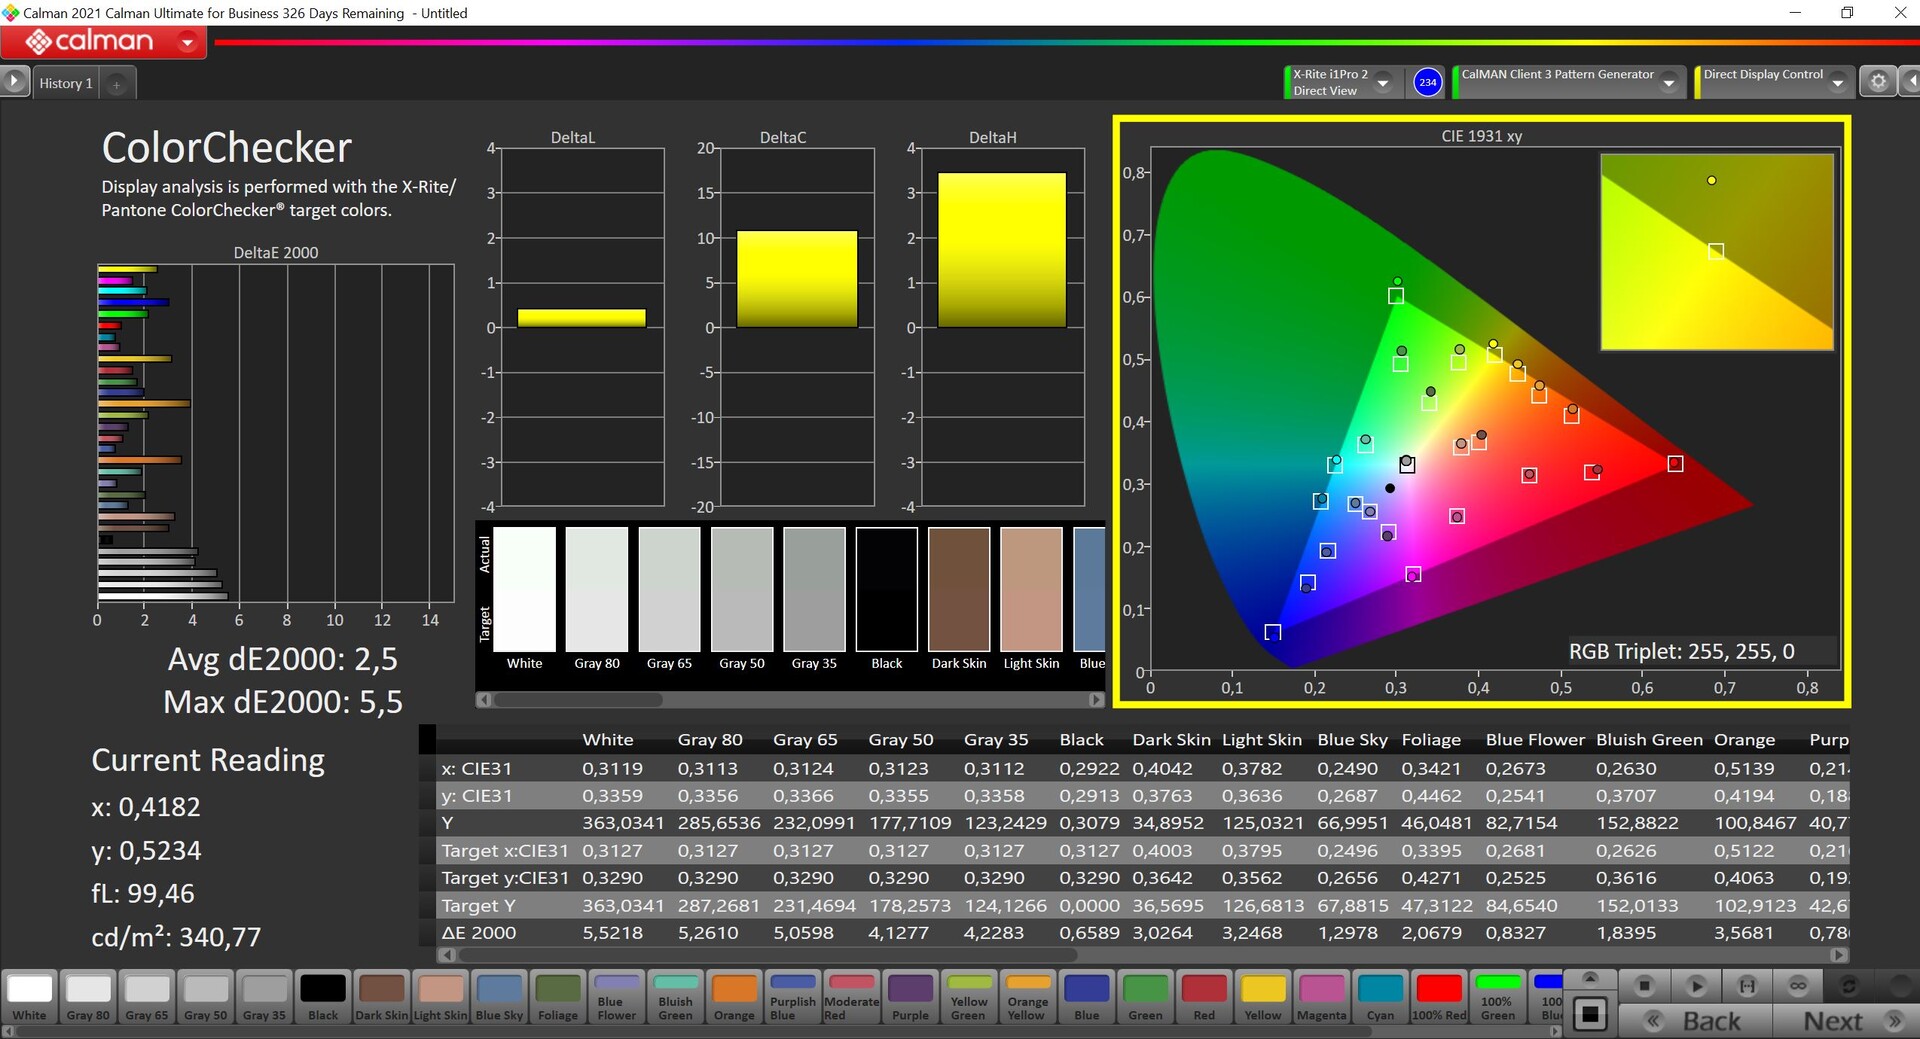
We tested the panel with the professional CalMAN software (X-Rite i1 Pro 2) and there is a slight green hue out of the box in combination with a slightly too warm color temperature. We also see some colors with a deviation above 3. Our own calibration (profile can be downloaded for free in the box above) improves the performance, but some colors still have a DeltaE-2000-deviation of more than 3 compared to the sRGB reference color space. The panel covers the small sRGB reference almost completely.
The focus of the 240 Hz display is oriented towards gaming, but considering the price and the general orientation of the device, we would have preferred another option (more precise colors, extended gamut, HDR, and lower frequency).
Display Response Times
| ↔ Response Time Black to White | ||
|---|---|---|
| 8.6 ms ... rise ↗ and fall ↘ combined | ↗ 3.9 ms rise | 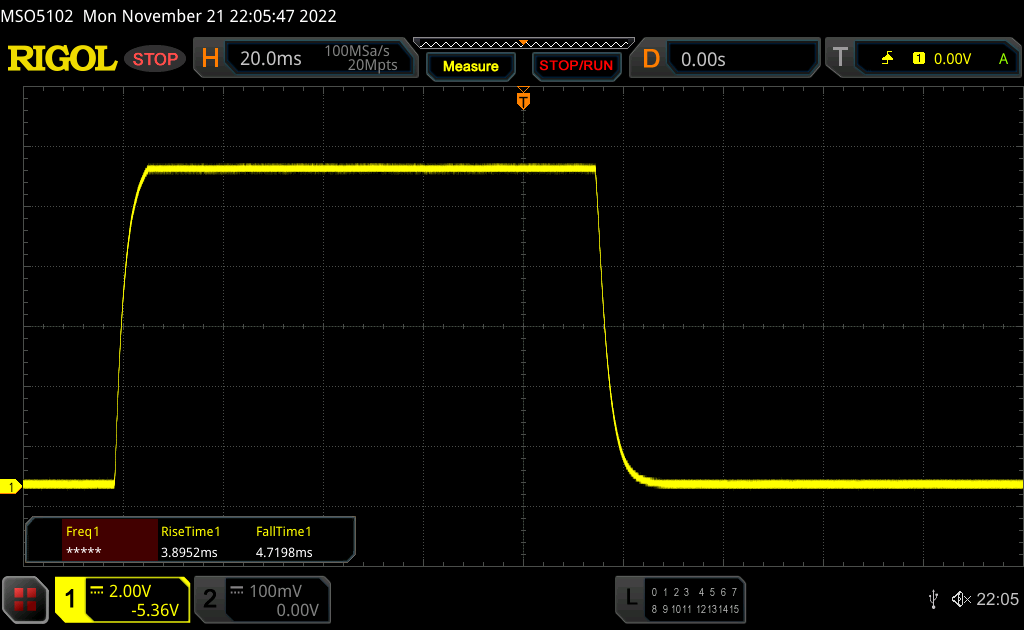 |
| ↘ 4.7 ms fall | ||
| The screen shows fast response rates in our tests and should be suited for gaming. In comparison, all tested devices range from 0.1 (minimum) to 240 (maximum) ms. » 24 % of all devices are better. This means that the measured response time is better than the average of all tested devices (19.8 ms). | ||
| ↔ Response Time 50% Grey to 80% Grey | ||
| 14.3 ms ... rise ↗ and fall ↘ combined | ↗ 6.8 ms rise | 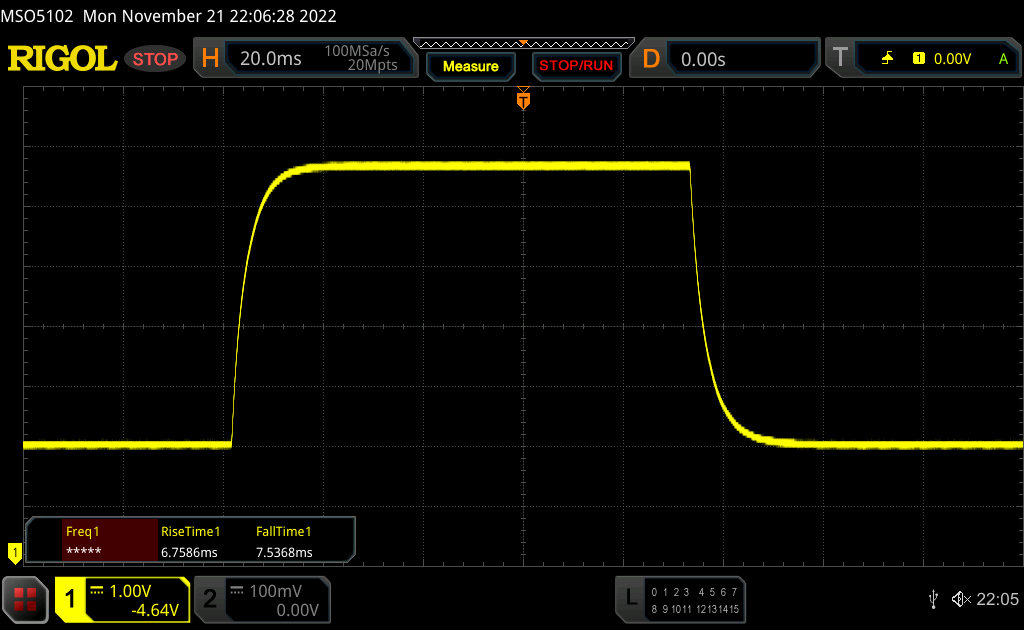 |
| ↘ 7.5 ms fall | ||
| The screen shows good response rates in our tests, but may be too slow for competitive gamers. In comparison, all tested devices range from 0.165 (minimum) to 636 (maximum) ms. » 28 % of all devices are better. This means that the measured response time is better than the average of all tested devices (30.9 ms). | ||
Screen Flickering / PWM (Pulse-Width Modulation)
| Screen flickering / PWM not detected | 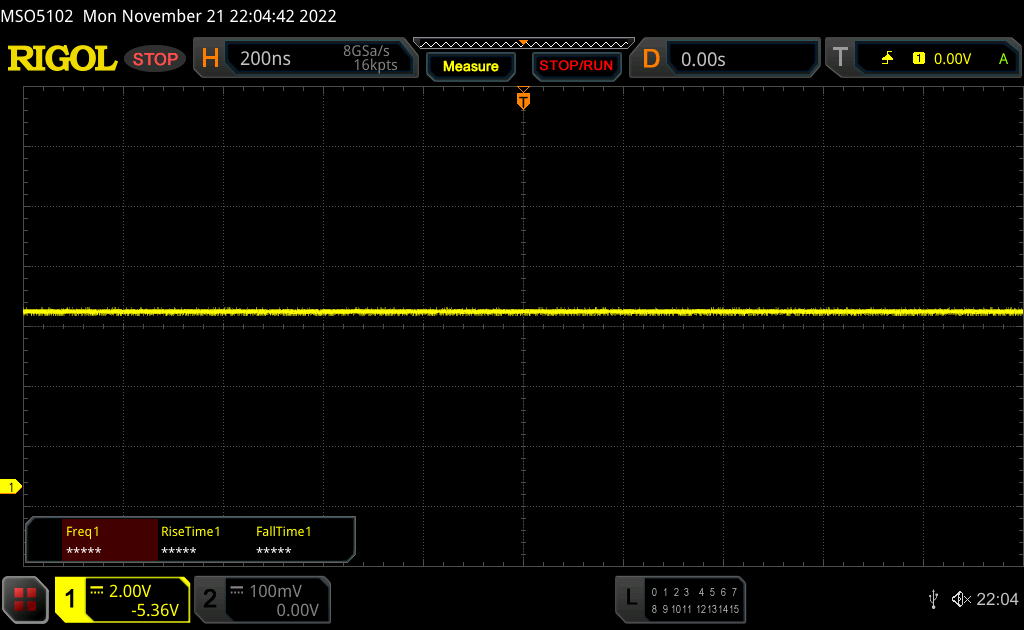 | ||
In comparison: 52 % of all tested devices do not use PWM to dim the display. If PWM was detected, an average of 7744 (minimum: 5 - maximum: 343500) Hz was measured. | |||
The matte screen surface helps to find a suitable position in bright environments, but the display should be brighter for a really comfortable working experience outdoors.
Performance - Vision 16 Pro with Alder Lake
Review Settings
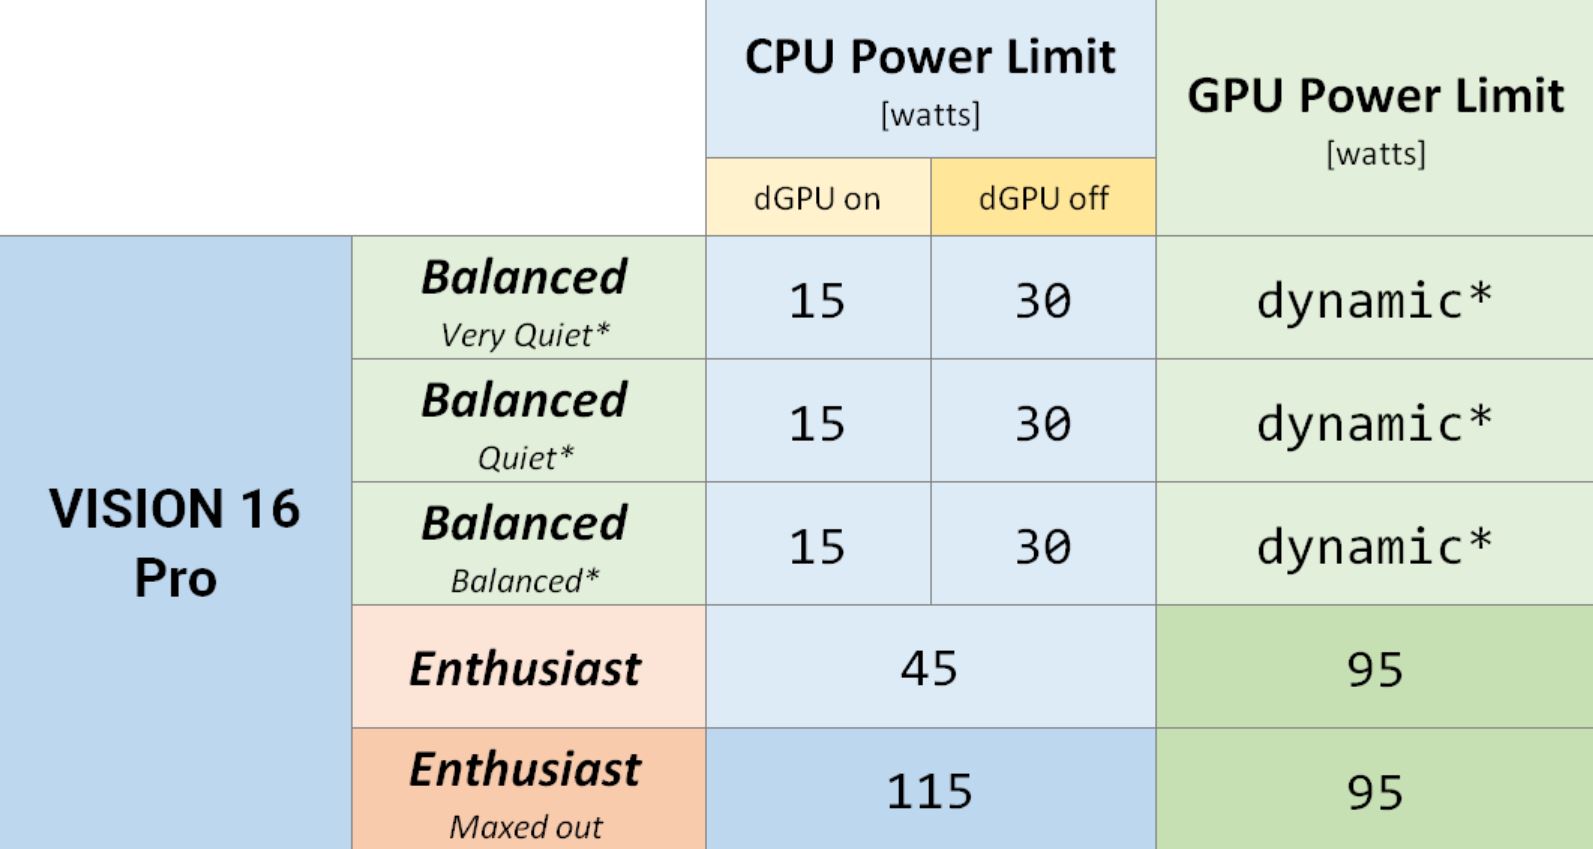
Schenker’s Vision 16 Pro offers different power profiles and there are manual controls for the CPU and GPU in the control center. We cannot test all modes, but we want to mention that Schenker offers comprehensive information about the profiles and the performance results. Based on our findings, we can confirm the numbers. The GPU consumption is dynamically controlled via Nvidia’s Whisper Mode technology when you use the Balanced mode.
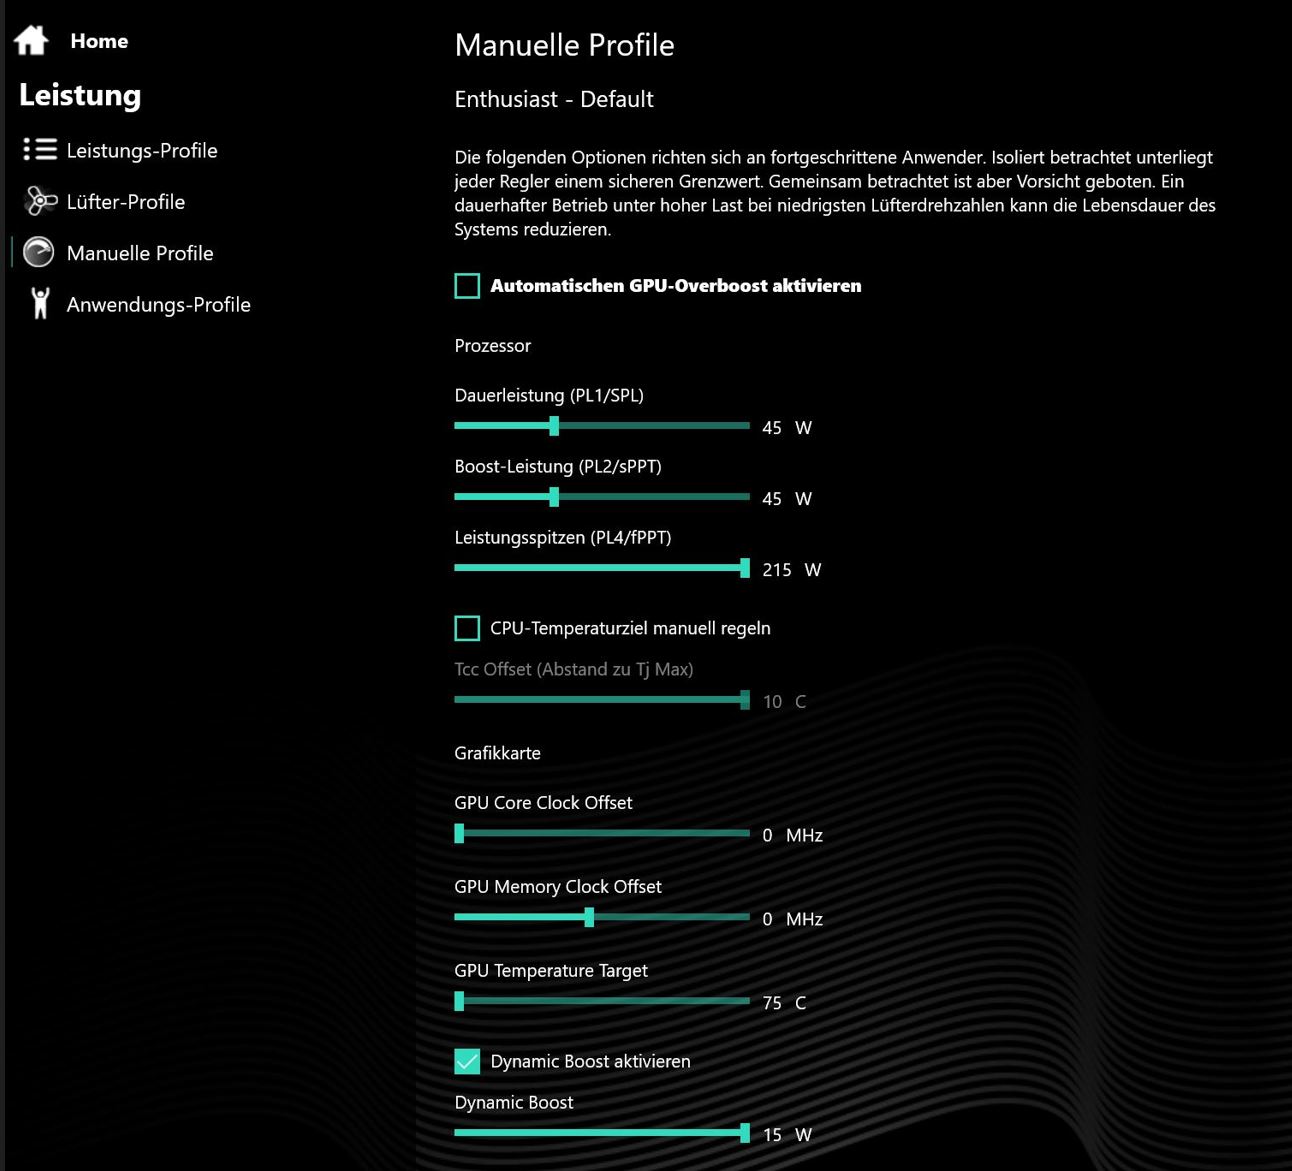
We use the Enthusiast (Default) profile for the review, but we will also have a look at other profiles in some sections. To switch between the profiles, you can either use the Control Center of the F3 key (even though this is limited to the main profiles).
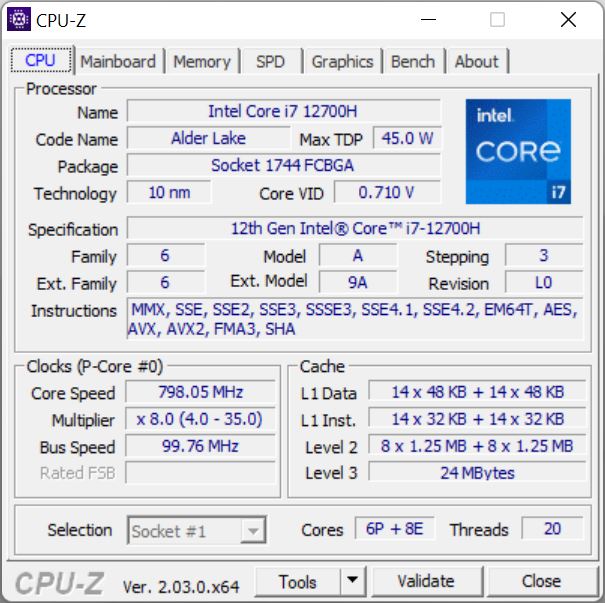
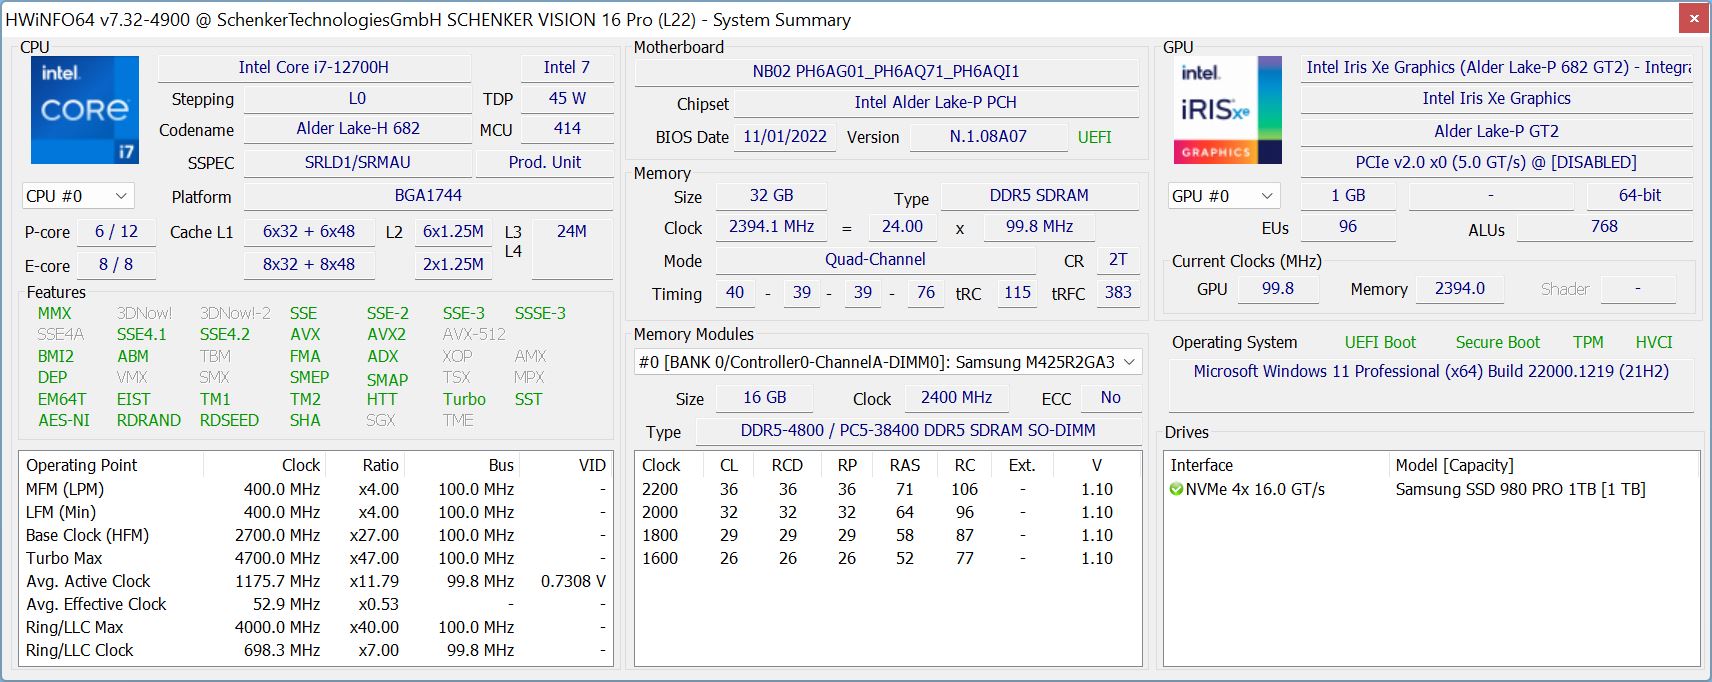
Processor - Core i7-12700H
The Vision 16 Pro is only shipped with the Intel Core i7-12700H (Alder Lake 12th Gen), which offers 6 performance cores and 8 efficiency cores. The performance can vary significantly depending on the TDP values and Schenker decided to limit the processor to 45W by default. This avoids unwanted fan activity in everyday scenarios, but the performance is already very good in standard applications. If you need more CPU performance, you can just increase the power limits manually all the way up to 115W, which is utilized by the system. However, the fan noise will be louder as well (38.5 vs. 44.4 dB(A)).
Cinebench R15 Multi Loop
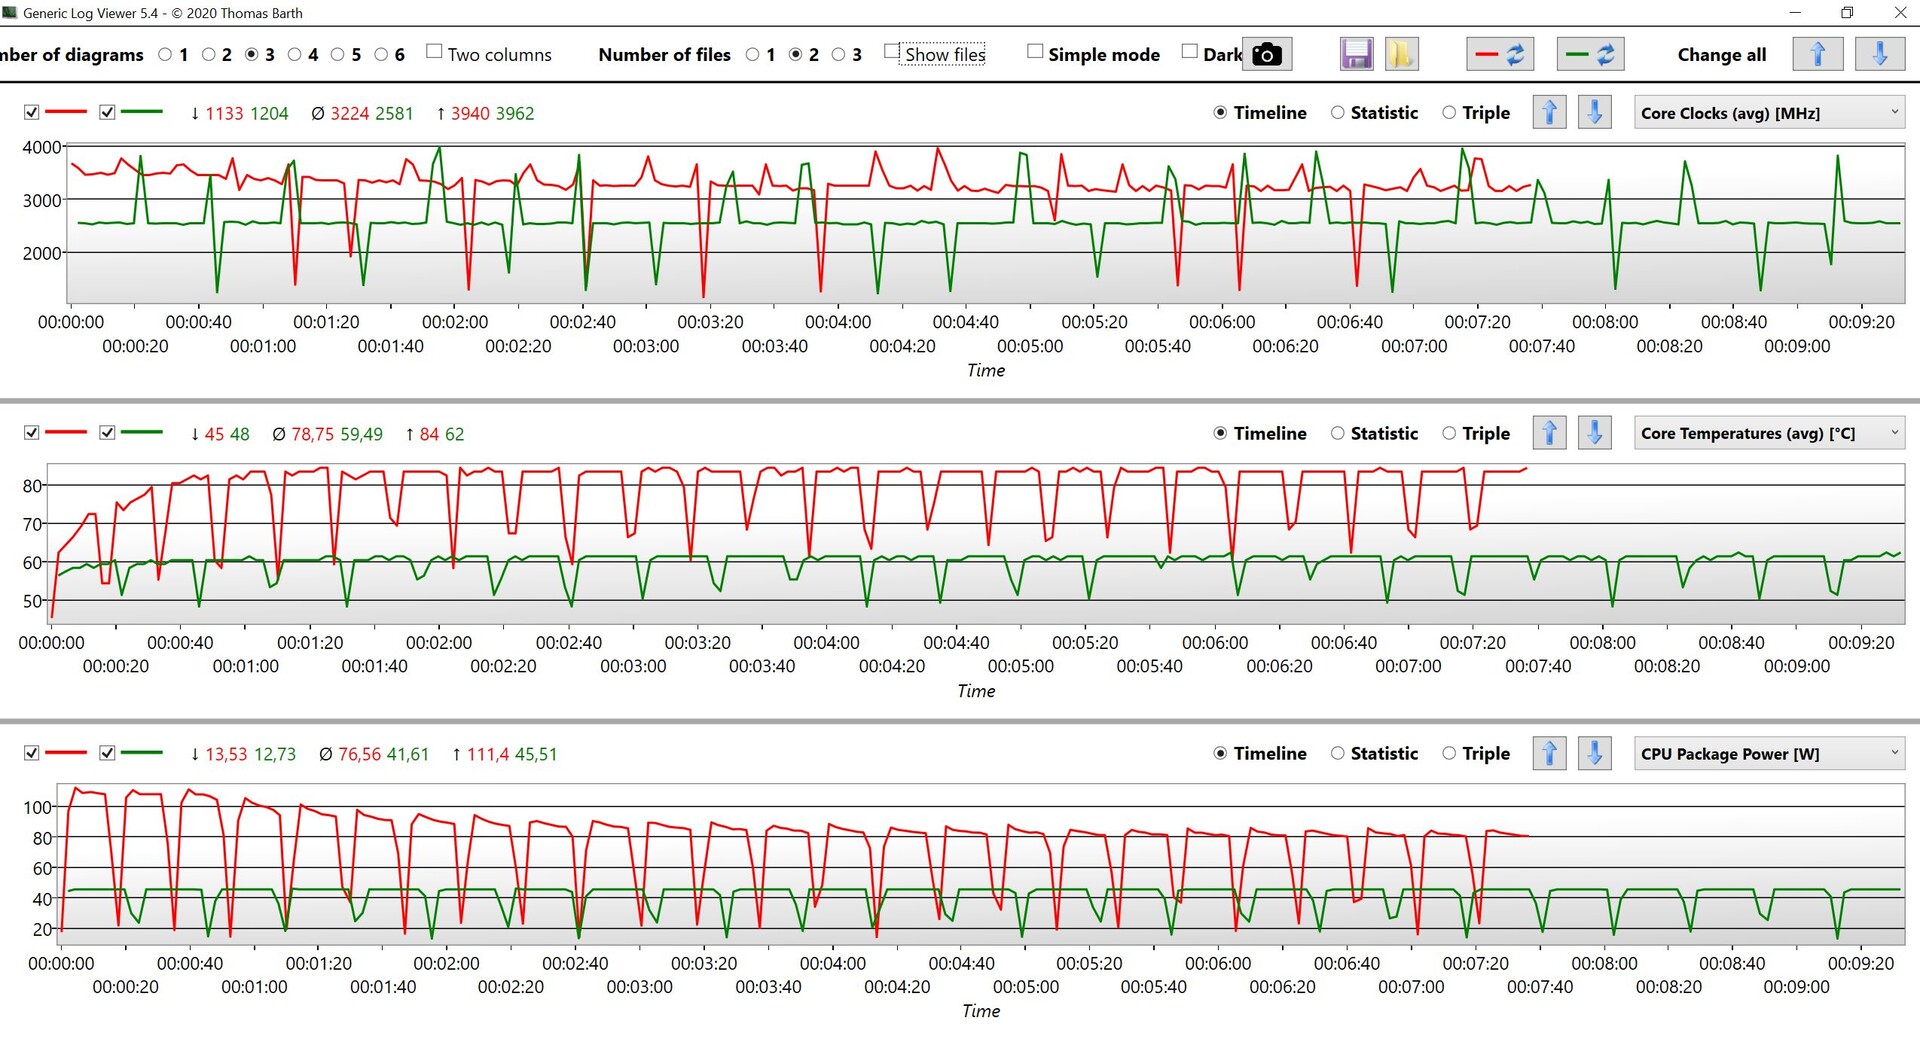
Our analysis of the Cinebench loop clearly shows that the CPU can easily maintain 45W and still has plenty of headroom. The CPU manages to stay above 100W for a while with increased power limits, and even maintains more than 80W for sustained workloads, so the test device is one of the fastest models within our comparison group. The single-core performance is great in both scenarios.
The CPU is limited to 25W on battery though, which means the performance takes a noticeable hit (-35% compared to 45W). More CPU benchmarks are listed in our Tech section.
Cinebench R23: Multi Core | Single Core
Cinebench R20: CPU (Multi Core) | CPU (Single Core)
Cinebench R15: CPU Multi 64Bit | CPU Single 64Bit
Blender: v2.79 BMW27 CPU
7-Zip 18.03: 7z b 4 | 7z b 4 -mmt1
Geekbench 5.5: Multi-Core | Single-Core
HWBOT x265 Benchmark v2.2: 4k Preset
LibreOffice : 20 Documents To PDF
R Benchmark 2.5: Overall mean
| CPU Performance rating | |
| Lenovo Legion Slim 7-16IAH 82TF004YGE | |
| Average of class Multimedia | |
| Average Intel Core i7-12700H | |
| HP Envy 16 h0112nr | |
| Schenker Vision 16 Pro RTX 3070 Ti | |
| Apple MacBook Pro 16 2021 M1 Pro -5! | |
| Lenovo ThinkBook 16p G3 ARH | |
| Cinebench R23 / Multi Core | |
| Lenovo Legion Slim 7-16IAH 82TF004YGE | |
| Average of class Multimedia (4861 - 33362, n=65, last 2 years) | |
| Average Intel Core i7-12700H (4032 - 19330, n=64) | |
| Lenovo ThinkBook 16p G3 ARH | |
| HP Envy 16 h0112nr | |
| Schenker Vision 16 Pro RTX 3070 Ti | |
| Apple MacBook Pro 16 2021 M1 Pro | |
| Cinebench R23 / Single Core | |
| Average of class Multimedia (1128 - 2459, n=64, last 2 years) | |
| Schenker Vision 16 Pro RTX 3070 Ti | |
| HP Envy 16 h0112nr | |
| Average Intel Core i7-12700H (778 - 1826, n=63) | |
| Lenovo Legion Slim 7-16IAH 82TF004YGE | |
| Lenovo ThinkBook 16p G3 ARH | |
| Apple MacBook Pro 16 2021 M1 Pro | |
| Cinebench R20 / CPU (Multi Core) | |
| Lenovo Legion Slim 7-16IAH 82TF004YGE | |
| Average of class Multimedia (1887 - 12912, n=56, last 2 years) | |
| Average Intel Core i7-12700H (1576 - 7407, n=64) | |
| Lenovo ThinkBook 16p G3 ARH | |
| HP Envy 16 h0112nr | |
| Schenker Vision 16 Pro RTX 3070 Ti | |
| Apple MacBook Pro 16 2021 M1 Pro | |
| Cinebench R20 / CPU (Single Core) | |
| Average of class Multimedia (425 - 853, n=56, last 2 years) | |
| Schenker Vision 16 Pro RTX 3070 Ti | |
| HP Envy 16 h0112nr | |
| Average Intel Core i7-12700H (300 - 704, n=64) | |
| Lenovo Legion Slim 7-16IAH 82TF004YGE | |
| Lenovo ThinkBook 16p G3 ARH | |
| Apple MacBook Pro 16 2021 M1 Pro | |
| Cinebench R15 / CPU Multi 64Bit | |
| Lenovo Legion Slim 7-16IAH 82TF004YGE | |
| Schenker Vision 16 Pro RTX 3070 Ti (Turbo) | |
| Schenker Vision 16 Pro RTX 3070 Ti | |
| Average of class Multimedia (856 - 5224, n=60, last 2 years) | |
| HP Envy 16 h0112nr | |
| Average Intel Core i7-12700H (1379 - 2916, n=70) | |
| Lenovo ThinkBook 16p G3 ARH | |
| Apple MacBook Pro 16 2021 M1 Pro | |
| Cinebench R15 / CPU Single 64Bit | |
| Average of class Multimedia (184.8 - 326, n=58, last 2 years) | |
| Schenker Vision 16 Pro RTX 3070 Ti | |
| HP Envy 16 h0112nr | |
| Lenovo Legion Slim 7-16IAH 82TF004YGE | |
| Average Intel Core i7-12700H (113 - 263, n=65) | |
| Lenovo ThinkBook 16p G3 ARH | |
| Apple MacBook Pro 16 2021 M1 Pro | |
| Blender / v2.79 BMW27 CPU | |
| Schenker Vision 16 Pro RTX 3070 Ti | |
| Average of class Multimedia (100 - 557, n=57, last 2 years) | |
| HP Envy 16 h0112nr | |
| Lenovo ThinkBook 16p G3 ARH | |
| Average Intel Core i7-12700H (168 - 732, n=63) | |
| Apple MacBook Pro 16 2021 M1 Pro (Blender 3.0 Beta M1) | |
| Lenovo Legion Slim 7-16IAH 82TF004YGE | |
| 7-Zip 18.03 / 7z b 4 | |
| Lenovo Legion Slim 7-16IAH 82TF004YGE | |
| Average Intel Core i7-12700H (22844 - 73067, n=63) | |
| Average of class Multimedia (26062 - 130368, n=54, last 2 years) | |
| Lenovo ThinkBook 16p G3 ARH | |
| HP Envy 16 h0112nr | |
| Schenker Vision 16 Pro RTX 3070 Ti | |
| 7-Zip 18.03 / 7z b 4 -mmt1 | |
| Average of class Multimedia (3666 - 7545, n=55, last 2 years) | |
| Schenker Vision 16 Pro RTX 3070 Ti | |
| HP Envy 16 h0112nr | |
| Average Intel Core i7-12700H (2743 - 5972, n=63) | |
| Lenovo Legion Slim 7-16IAH 82TF004YGE | |
| Lenovo ThinkBook 16p G3 ARH | |
| Geekbench 5.5 / Multi-Core | |
| Average of class Multimedia (4652 - 20422, n=55, last 2 years) | |
| HP Envy 16 h0112nr | |
| Lenovo Legion Slim 7-16IAH 82TF004YGE | |
| Apple MacBook Pro 16 2021 M1 Pro | |
| Average Intel Core i7-12700H (5144 - 13745, n=64) | |
| Schenker Vision 16 Pro RTX 3070 Ti | |
| Lenovo ThinkBook 16p G3 ARH | |
| Geekbench 5.5 / Single-Core | |
| Average of class Multimedia (805 - 2974, n=55, last 2 years) | |
| Schenker Vision 16 Pro RTX 3070 Ti | |
| HP Envy 16 h0112nr | |
| Apple MacBook Pro 16 2021 M1 Pro | |
| Average Intel Core i7-12700H (803 - 1851, n=64) | |
| Lenovo Legion Slim 7-16IAH 82TF004YGE | |
| Lenovo ThinkBook 16p G3 ARH | |
| HWBOT x265 Benchmark v2.2 / 4k Preset | |
| Lenovo Legion Slim 7-16IAH 82TF004YGE | |
| Average of class Multimedia (5.26 - 36.1, n=55, last 2 years) | |
| Lenovo ThinkBook 16p G3 ARH | |
| Average Intel Core i7-12700H (4.67 - 21.8, n=64) | |
| HP Envy 16 h0112nr | |
| Schenker Vision 16 Pro RTX 3070 Ti | |
| LibreOffice / 20 Documents To PDF | |
| Lenovo ThinkBook 16p G3 ARH | |
| Average of class Multimedia (23.9 - 146.7, n=56, last 2 years) | |
| Average Intel Core i7-12700H (34.2 - 95.3, n=63) | |
| HP Envy 16 h0112nr | |
| Schenker Vision 16 Pro RTX 3070 Ti | |
| Lenovo Legion Slim 7-16IAH 82TF004YGE | |
| R Benchmark 2.5 / Overall mean | |
| Lenovo ThinkBook 16p G3 ARH | |
| Average Intel Core i7-12700H (0.4441 - 1.052, n=63) | |
| Lenovo Legion Slim 7-16IAH 82TF004YGE | |
| Average of class Multimedia (0.3604 - 0.947, n=55, last 2 years) | |
| HP Envy 16 h0112nr | |
| Schenker Vision 16 Pro RTX 3070 Ti | |
* ... smaller is better
AIDA64: FP32 Ray-Trace | FPU Julia | CPU SHA3 | CPU Queen | FPU SinJulia | FPU Mandel | CPU AES | CPU ZLib | FP64 Ray-Trace | CPU PhotoWorxx
| Performance rating | |
| Lenovo Legion Slim 7-16IAH 82TF004YGE | |
| Lenovo ThinkBook 16p G3 ARH | |
| Average of class Multimedia | |
| HP Envy 16 h0112nr | |
| Schenker Vision 16 Pro RTX 3070 Ti | |
| Average Intel Core i7-12700H | |
| AIDA64 / FP32 Ray-Trace | |
| Average of class Multimedia (2214 - 50388, n=53, last 2 years) | |
| Lenovo Legion Slim 7-16IAH 82TF004YGE | |
| Lenovo ThinkBook 16p G3 ARH | |
| Schenker Vision 16 Pro RTX 3070 Ti | |
| HP Envy 16 h0112nr | |
| Average Intel Core i7-12700H (2585 - 17957, n=64) | |
| AIDA64 / FPU Julia | |
| Lenovo ThinkBook 16p G3 ARH | |
| Lenovo Legion Slim 7-16IAH 82TF004YGE | |
| Average of class Multimedia (12867 - 201874, n=53, last 2 years) | |
| Schenker Vision 16 Pro RTX 3070 Ti | |
| HP Envy 16 h0112nr | |
| Average Intel Core i7-12700H (12439 - 90760, n=64) | |
| AIDA64 / CPU SHA3 | |
| Lenovo Legion Slim 7-16IAH 82TF004YGE | |
| Average of class Multimedia (626 - 8623, n=53, last 2 years) | |
| Lenovo ThinkBook 16p G3 ARH | |
| Average Intel Core i7-12700H (833 - 4242, n=64) | |
| Schenker Vision 16 Pro RTX 3070 Ti | |
| HP Envy 16 h0112nr | |
| AIDA64 / CPU Queen | |
| Lenovo Legion Slim 7-16IAH 82TF004YGE | |
| Lenovo ThinkBook 16p G3 ARH | |
| HP Envy 16 h0112nr | |
| Average Intel Core i7-12700H (57923 - 103202, n=63) | |
| Schenker Vision 16 Pro RTX 3070 Ti | |
| Average of class Multimedia (13483 - 181505, n=40, last 2 years) | |
| AIDA64 / FPU SinJulia | |
| Lenovo ThinkBook 16p G3 ARH | |
| Lenovo Legion Slim 7-16IAH 82TF004YGE | |
| Average Intel Core i7-12700H (3249 - 9939, n=64) | |
| Average of class Multimedia (886 - 28794, n=53, last 2 years) | |
| Schenker Vision 16 Pro RTX 3070 Ti | |
| HP Envy 16 h0112nr | |
| AIDA64 / FPU Mandel | |
| Lenovo ThinkBook 16p G3 ARH | |
| Average of class Multimedia (6395 - 105740, n=53, last 2 years) | |
| Lenovo Legion Slim 7-16IAH 82TF004YGE | |
| Schenker Vision 16 Pro RTX 3070 Ti | |
| HP Envy 16 h0112nr | |
| Average Intel Core i7-12700H (7135 - 44760, n=64) | |
| AIDA64 / CPU AES | |
| Lenovo Legion Slim 7-16IAH 82TF004YGE | |
| HP Envy 16 h0112nr | |
| Average Intel Core i7-12700H (31839 - 144360, n=64) | |
| Average of class Multimedia (8171 - 126790, n=53, last 2 years) | |
| Schenker Vision 16 Pro RTX 3070 Ti | |
| Lenovo ThinkBook 16p G3 ARH | |
| AIDA64 / CPU ZLib | |
| Lenovo Legion Slim 7-16IAH 82TF004YGE | |
| Average Intel Core i7-12700H (305 - 1171, n=64) | |
| Average of class Multimedia (143.8 - 2022, n=53, last 2 years) | |
| Lenovo ThinkBook 16p G3 ARH | |
| Schenker Vision 16 Pro RTX 3070 Ti | |
| HP Envy 16 h0112nr | |
| AIDA64 / FP64 Ray-Trace | |
| Average of class Multimedia (1014 - 26875, n=53, last 2 years) | |
| Lenovo Legion Slim 7-16IAH 82TF004YGE | |
| Lenovo ThinkBook 16p G3 ARH | |
| Schenker Vision 16 Pro RTX 3070 Ti | |
| HP Envy 16 h0112nr | |
| Average Intel Core i7-12700H (1437 - 9692, n=64) | |
| AIDA64 / CPU PhotoWorxx | |
| Average of class Multimedia (8187 - 88154, n=53, last 2 years) | |
| Schenker Vision 16 Pro RTX 3070 Ti | |
| HP Envy 16 h0112nr | |
| Lenovo Legion Slim 7-16IAH 82TF004YGE | |
| Average Intel Core i7-12700H (12863 - 52207, n=64) | |
| Lenovo ThinkBook 16p G3 ARH | |
System Performance
The Vision 16 Pro is a very responsive system and we did not notice any problems during our review period. However, the synthetic PCMark 10 crashed repeatedly, so we cannot offer any scores. The decent result in the CrossMark benchmark confirms our subjective performance impression.
| CrossMark / Overall | |
| Average of class Multimedia (866 - 2728, n=59, last 2 years) | |
| Lenovo Legion Slim 7-16IAH 82TF004YGE | |
| HP Envy 16 h0112nr | |
| Average Intel Core i7-12700H, NVIDIA GeForce RTX 3070 Ti Laptop GPU (974 - 2000, n=12) | |
| Schenker Vision 16 Pro RTX 3070 Ti | |
| Apple MacBook Pro 16 2021 M1 Pro | |
| Lenovo ThinkBook 16p G3 ARH | |
| CrossMark / Productivity | |
| Lenovo Legion Slim 7-16IAH 82TF004YGE | |
| Average of class Multimedia (931 - 2489, n=59, last 2 years) | |
| Average Intel Core i7-12700H, NVIDIA GeForce RTX 3070 Ti Laptop GPU (907 - 1962, n=12) | |
| HP Envy 16 h0112nr | |
| Schenker Vision 16 Pro RTX 3070 Ti | |
| Lenovo ThinkBook 16p G3 ARH | |
| Apple MacBook Pro 16 2021 M1 Pro | |
| CrossMark / Creativity | |
| Average of class Multimedia (907 - 3465, n=59, last 2 years) | |
| Apple MacBook Pro 16 2021 M1 Pro | |
| HP Envy 16 h0112nr | |
| Lenovo Legion Slim 7-16IAH 82TF004YGE | |
| Average Intel Core i7-12700H, NVIDIA GeForce RTX 3070 Ti Laptop GPU (1027 - 2057, n=12) | |
| Schenker Vision 16 Pro RTX 3070 Ti | |
| Lenovo ThinkBook 16p G3 ARH | |
| CrossMark / Responsiveness | |
| Average Intel Core i7-12700H, NVIDIA GeForce RTX 3070 Ti Laptop GPU (1029 - 2142, n=12) | |
| Lenovo Legion Slim 7-16IAH 82TF004YGE | |
| HP Envy 16 h0112nr | |
| Average of class Multimedia (605 - 2024, n=59, last 2 years) | |
| Schenker Vision 16 Pro RTX 3070 Ti | |
| Lenovo ThinkBook 16p G3 ARH | |
| Apple MacBook Pro 16 2021 M1 Pro | |
» No benchmarks for this notebook found!
| AIDA64 / Memory Copy | |
| Average of class Multimedia (11299 - 132135, n=53, last 2 years) | |
| Schenker Vision 16 Pro RTX 3070 Ti | |
| HP Envy 16 h0112nr | |
| Average Intel Core i7-12700H (25615 - 80511, n=64) | |
| Lenovo ThinkBook 16p G3 ARH | |
| Lenovo Legion Slim 7-16IAH 82TF004YGE | |
| AIDA64 / Memory Read | |
| Average of class Multimedia (11624 - 174586, n=53, last 2 years) | |
| HP Envy 16 h0112nr | |
| Schenker Vision 16 Pro RTX 3070 Ti | |
| Lenovo Legion Slim 7-16IAH 82TF004YGE | |
| Average Intel Core i7-12700H (25586 - 79442, n=64) | |
| Lenovo ThinkBook 16p G3 ARH | |
| AIDA64 / Memory Write | |
| Average of class Multimedia (11755 - 134998, n=53, last 2 years) | |
| Schenker Vision 16 Pro RTX 3070 Ti | |
| HP Envy 16 h0112nr | |
| Lenovo Legion Slim 7-16IAH 82TF004YGE | |
| Average Intel Core i7-12700H (23679 - 88660, n=64) | |
| Lenovo ThinkBook 16p G3 ARH | |
| AIDA64 / Memory Latency | |
| Average of class Multimedia (7 - 535, n=52, last 2 years) | |
| Lenovo ThinkBook 16p G3 ARH | |
| Lenovo Legion Slim 7-16IAH 82TF004YGE | |
| Schenker Vision 16 Pro RTX 3070 Ti | |
| HP Envy 16 h0112nr | |
| Average Intel Core i7-12700H (76.2 - 133.9, n=62) | |
* ... smaller is better
DPC Latency
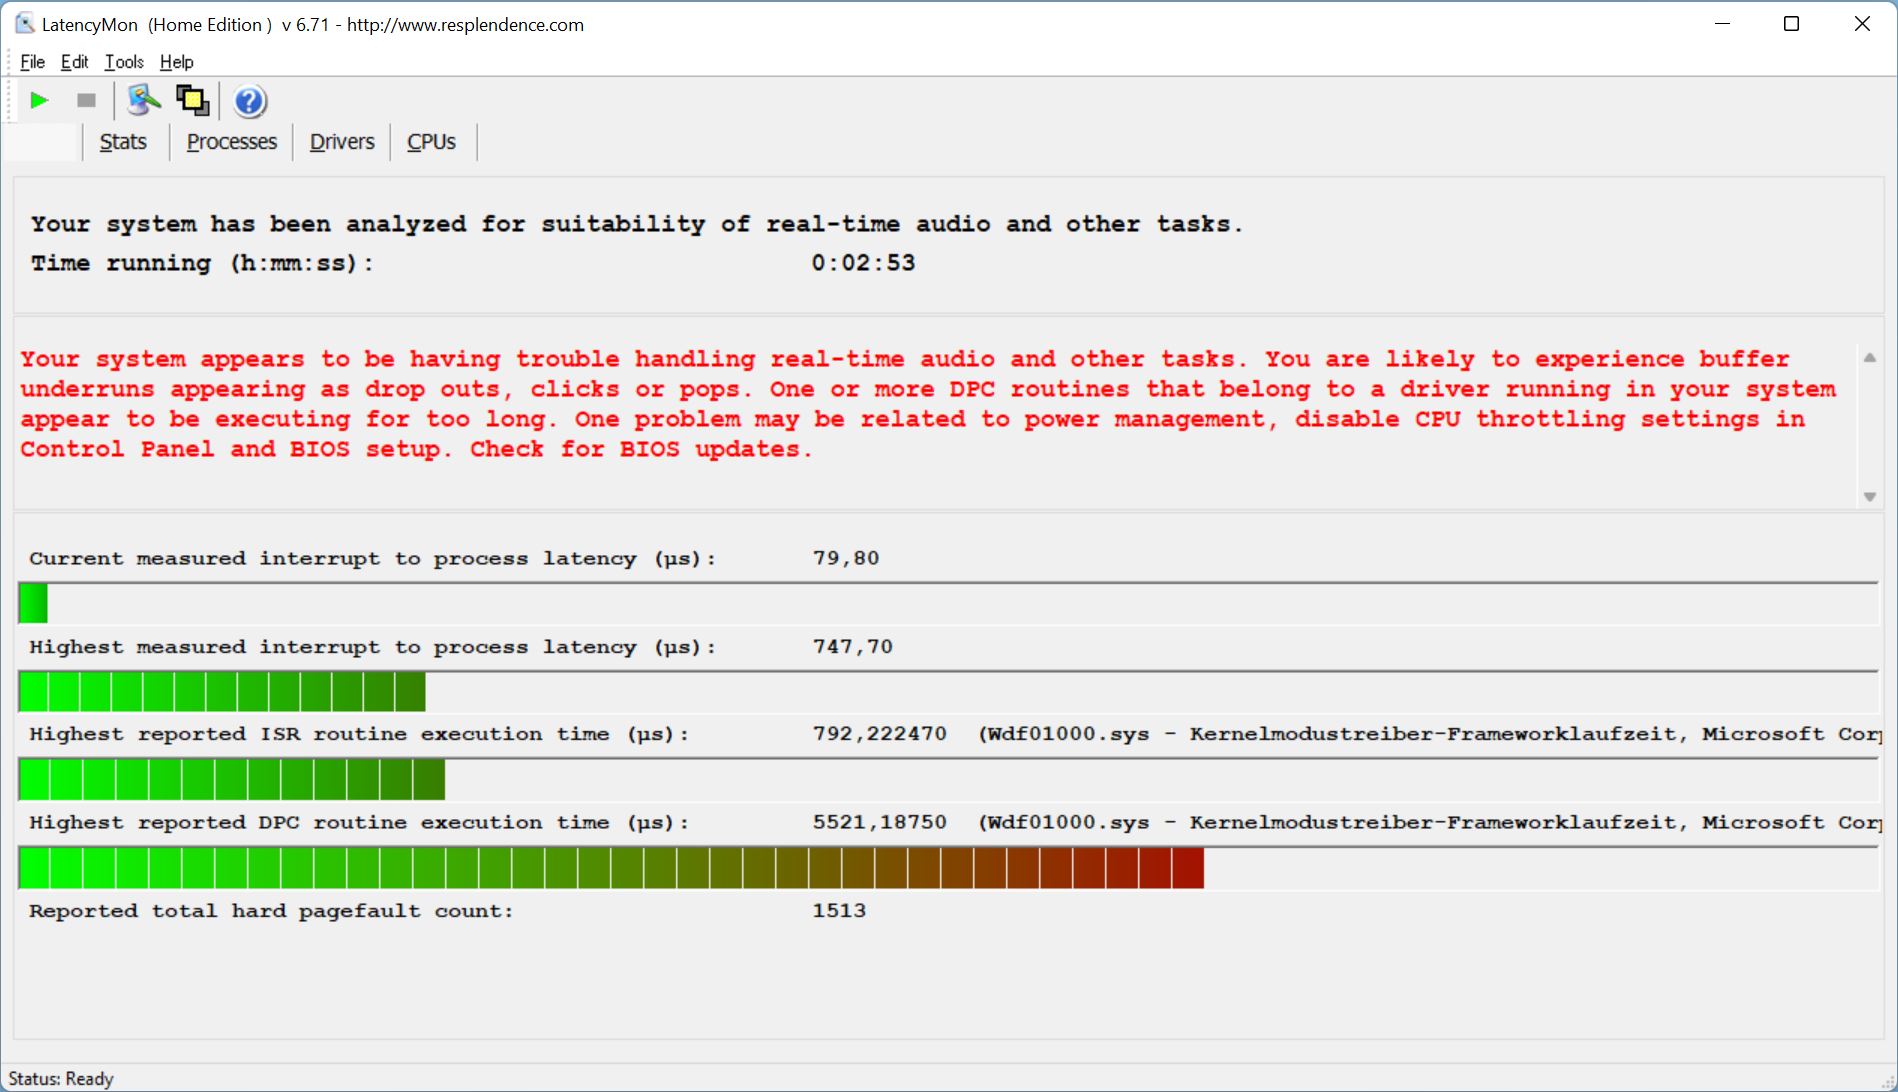
Our standardized latency test (web browsing, 4K YouTube playback, CPU load) shows that the Vision 16 Pro with the current BIOS version does not have general issues (no critical values for interrupt to process latency), but one driver shows a big spike.
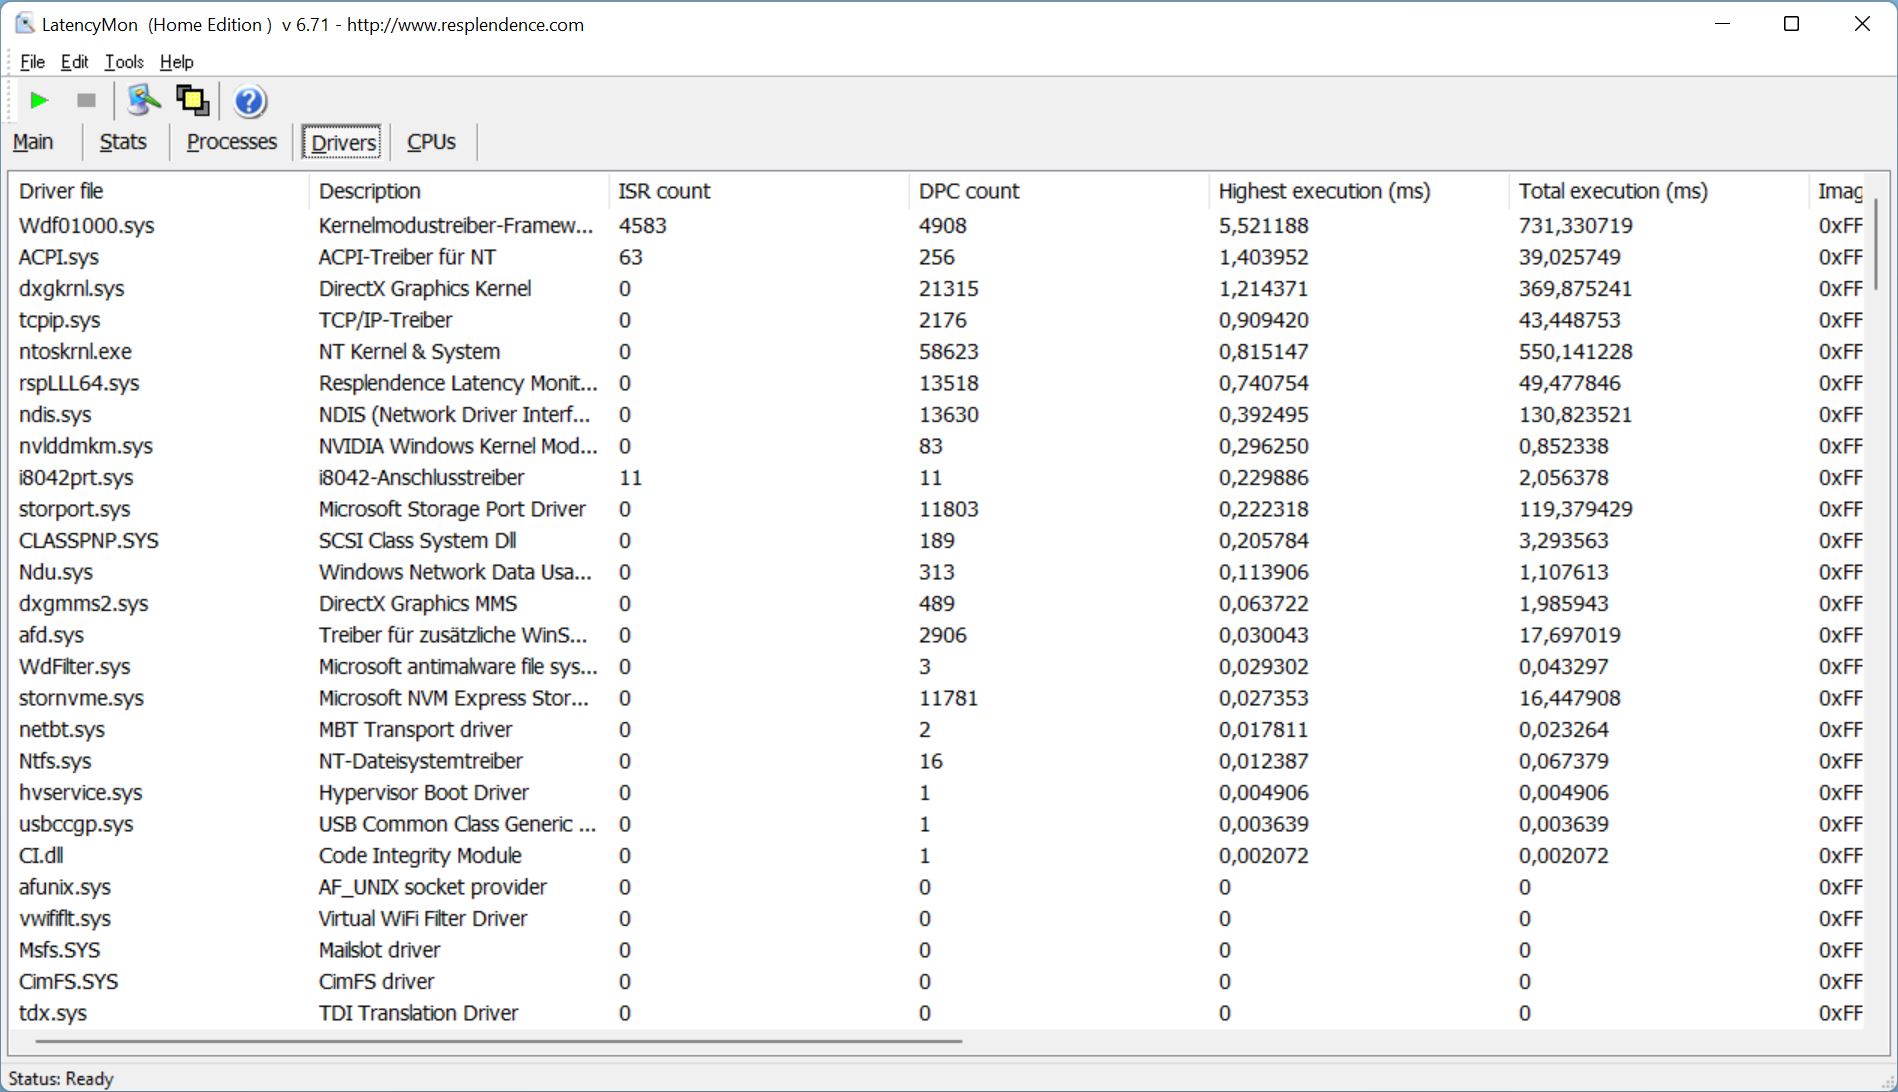
| DPC Latencies / LatencyMon - interrupt to process latency (max), Web, Youtube, Prime95 | |
| Lenovo ThinkBook 16p G3 ARH | |
| HP Envy 16 h0112nr | |
| Schenker Vision 16 Pro RTX 3070 Ti | |
| Lenovo Legion Slim 7-16IAH 82TF004YGE | |
* ... smaller is better
Storage Devices
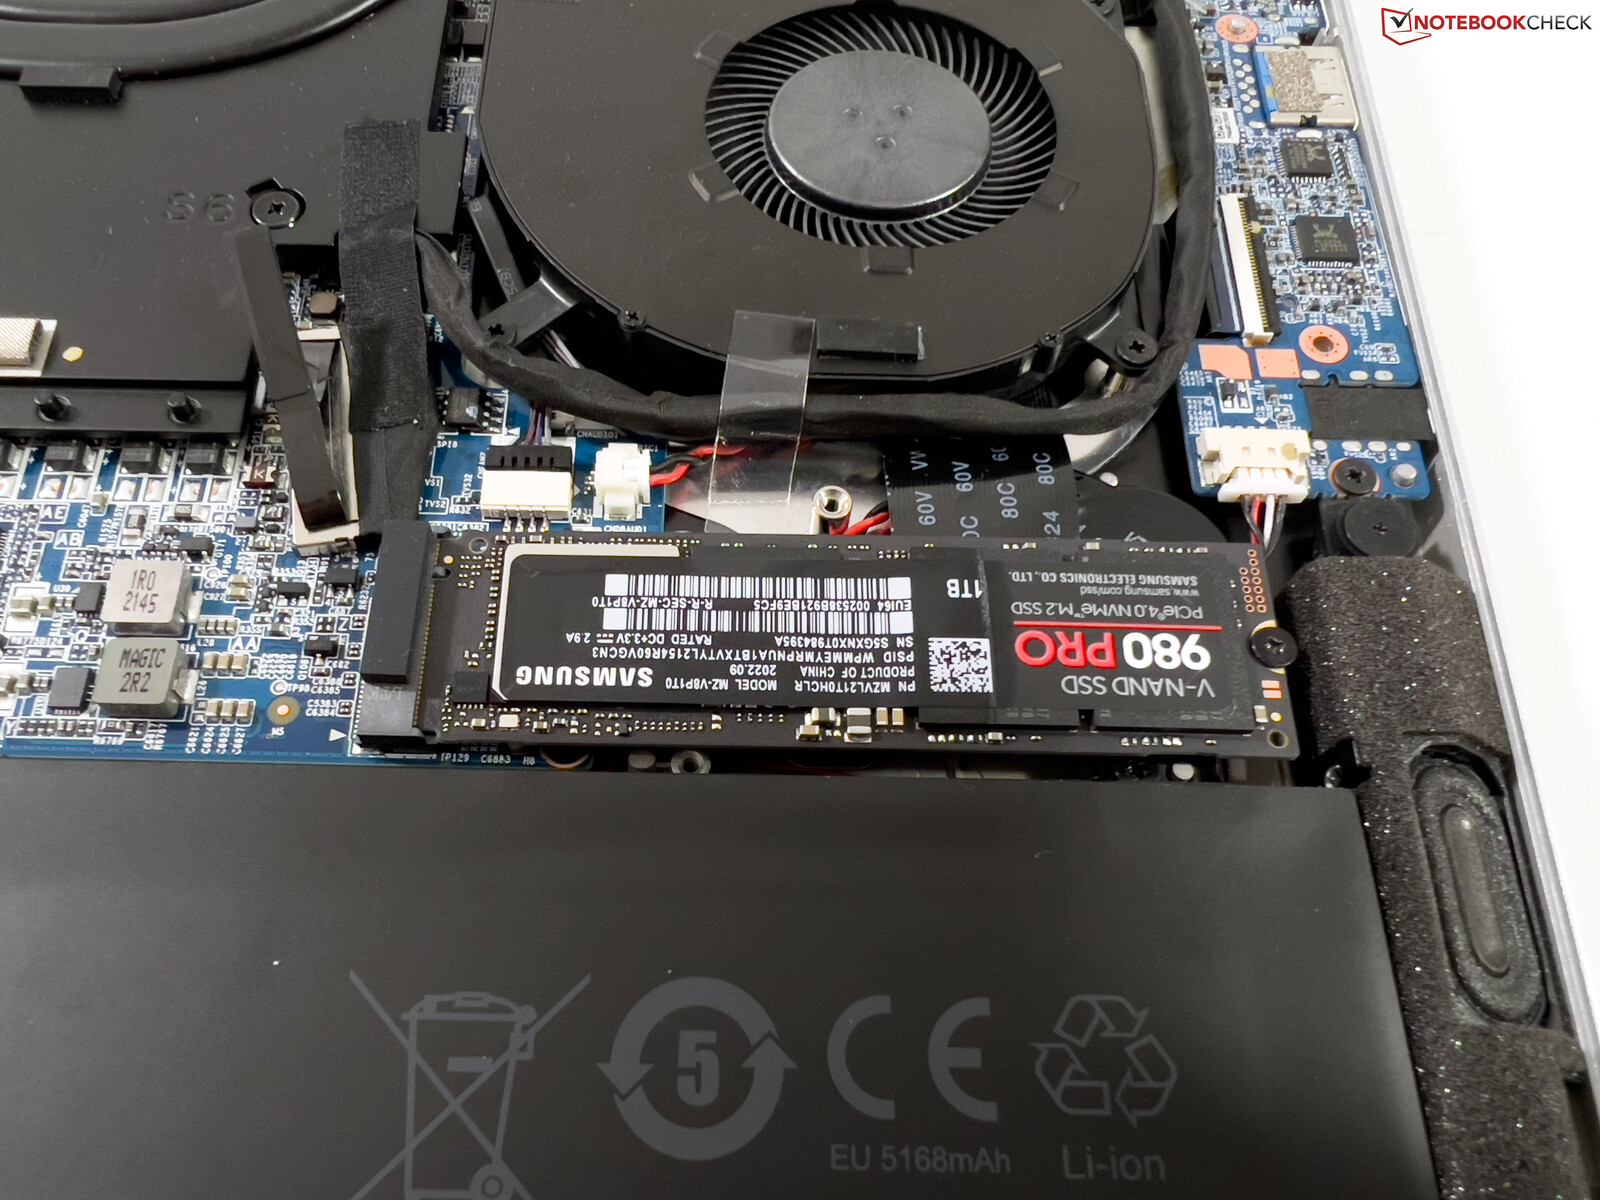
The Vision 16 Pro offers two fast PCIe-4.0 slots, which can accommodate two-sided SSDs. Our review unit is equipped with the fast Samsung 980 Pro with a storage capacity of 1 TB (865 GB are available for the user after the initial set-up). Transfer rates are very high, but more important is that the performance can be maintained by the Vision 16 Pro under sustained workloads. More SSD benchmarks are available here.

* ... smaller is better
Disk Throttling: DiskSpd Read Loop, Queue Depth 8
GPU Performance - RTX 3070 Ti
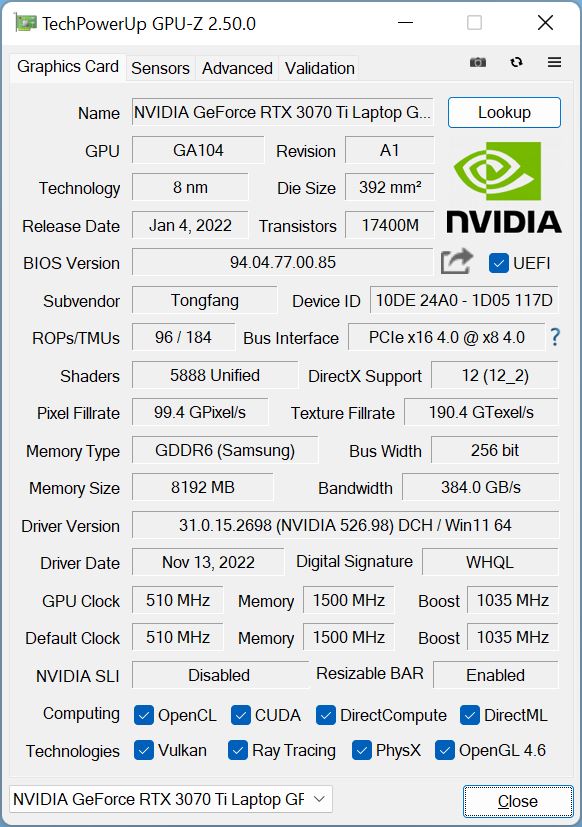
Our review unit is equipped with the dedicated Nvidia GeForce RTX 3070 Ti with 8 GB GDDR6-VRAM. It is the 70W version, but the GPU can also use up to 25W from the CPU (Dynamic Boost 2.0), so the maximum TGP is 95W. This means it is not one of the fastest versions, but it is still a decent value considering the chassis size.
The synthetic benchmarks show that the GPU is around 10-15% slower than the average results for this GPU in our database since the RTX 3070 Ti is primarily used in fast and bulky gaming laptops, but the Vision 16 Pro is still ahead of the other competitors with the RTX 3060. It is also impressive that the GPU performance is very stable. The Time Spy stress test is just not passed at 96.8%, but this minor performance reduction is not noticeable in practice.
The GPU consumption is limited to 35W on battery power, which results in a massive performance deficit of 80%. Please see our Tech section for more GPU benchmarks.
| 3DMark 11 Performance | 27642 points | |
| 3DMark Fire Strike Score | 21451 points | |
| 3DMark Time Spy Score | 9259 points | |
Help | ||
| Blender / v3.3 Classroom OPTIX/RTX | |
| HP Envy 16 h0112nr | |
| Average of class Multimedia (12 - 105, n=21, last 2 years) | |
| Lenovo ThinkBook 16p G3 ARH | |
| Lenovo Legion Slim 7-16IAH 82TF004YGE | |
| Schenker Vision 16 Pro RTX 3070 Ti | |
| Average NVIDIA GeForce RTX 3070 Ti Laptop GPU (22 - 30, n=15) | |
| Blender / v3.3 Classroom CUDA | |
| HP Envy 16 h0112nr | |
| Average of class Multimedia (20 - 186, n=21, last 2 years) | |
| Lenovo ThinkBook 16p G3 ARH | |
| Lenovo Legion Slim 7-16IAH 82TF004YGE | |
| Schenker Vision 16 Pro RTX 3070 Ti | |
| Average NVIDIA GeForce RTX 3070 Ti Laptop GPU (36 - 46, n=16) | |
| Blender / v3.3 Classroom CPU | |
| HP Envy 16 h0112nr | |
| Schenker Vision 16 Pro RTX 3070 Ti | |
| Lenovo ThinkBook 16p G3 ARH | |
| Average of class Multimedia (134.5 - 1042, n=61, last 2 years) | |
| Average NVIDIA GeForce RTX 3070 Ti Laptop GPU (285 - 459, n=16) | |
| Lenovo Legion Slim 7-16IAH 82TF004YGE | |
* ... smaller is better
Gaming Performance
The Vision 16 Pro does not offer a MUX switch to deactivate the iGPU when you use the internal screen. This only works via HDMI, which is directly attached to the Nvidia GPU. The gaming performance confirms the synthetic results and the review unit is ahead of the rivals with the GeForce RTX 3060 (and obviously many other multimedia laptops with the RTX 3050 Ti), but it is not the fastest version of the RTX 3070 Ti.
| Performance rating - Percent | |
| Schenker Vision 16 Pro RTX 3070 Ti | |
| HP Envy 16 h0112nr | |
| Lenovo Legion Slim 7-16IAH 82TF004YGE | |
| Lenovo ThinkBook 16p G3 ARH | |
| Average of class Multimedia | |
| The Witcher 3 - 1920x1080 Ultra Graphics & Postprocessing (HBAO+) | |
| Schenker Vision 16 Pro RTX 3070 Ti | |
| HP Envy 16 h0112nr | |
| Lenovo Legion Slim 7-16IAH 82TF004YGE | |
| Lenovo ThinkBook 16p G3 ARH | |
| Average of class Multimedia (11 - 107, n=5, last 2 years) | |
| GTA V - 1920x1080 Highest AA:4xMSAA + FX AF:16x | |
| Schenker Vision 16 Pro RTX 3070 Ti | |
| HP Envy 16 h0112nr | |
| Lenovo Legion Slim 7-16IAH 82TF004YGE | |
| Lenovo ThinkBook 16p G3 ARH | |
| Average of class Multimedia (7.92 - 141.6, n=53, last 2 years) | |
| Final Fantasy XV Benchmark - 1920x1080 High Quality | |
| Schenker Vision 16 Pro RTX 3070 Ti | |
| HP Envy 16 h0112nr | |
| Lenovo ThinkBook 16p G3 ARH | |
| Lenovo Legion Slim 7-16IAH 82TF004YGE | |
| Average of class Multimedia (7.61 - 144.4, n=56, last 2 years) | |
| Strange Brigade - 1920x1080 ultra AA:ultra AF:16 | |
| Schenker Vision 16 Pro RTX 3070 Ti | |
| HP Envy 16 h0112nr | |
| Lenovo ThinkBook 16p G3 ARH | |
| Lenovo Legion Slim 7-16IAH 82TF004YGE | |
| Average of class Multimedia (13.3 - 303, n=55, last 2 years) | |
| Dota 2 Reborn - 1920x1080 ultra (3/3) best looking | |
| Schenker Vision 16 Pro RTX 3070 Ti | |
| Lenovo Legion Slim 7-16IAH 82TF004YGE | |
| HP Envy 16 h0112nr | |
| Lenovo ThinkBook 16p G3 ARH | |
| Average of class Multimedia (29 - 179.9, n=57, last 2 years) | |
| X-Plane 11.11 - 1920x1080 high (fps_test=3) | |
| Lenovo Legion Slim 7-16IAH 82TF004YGE | |
| HP Envy 16 h0112nr | |
| Schenker Vision 16 Pro RTX 3070 Ti | |
| Lenovo ThinkBook 16p G3 ARH | |
| Average of class Multimedia (16.9 - 141.1, n=53, last 2 years) | |
The gaming performance of the Vision 16 Pro is usually sufficient for the maximum details in the native resolution, even when you play demanding titles. The performance is also stable during longer gaming session, which is also shown by our Witcher 3 test. More gaming benchmarks are listed here.
| The Witcher 3 | |
| 1920x1080 High Graphics & Postprocessing (Nvidia HairWorks Off) | |
| Average NVIDIA GeForce RTX 3070 Ti Laptop GPU (139.7 - 226, n=27) | |
| Schenker Vision 16 Pro RTX 3070 Ti | |
| HP Envy 16 h0112nr | |
| Lenovo Legion Slim 7-16IAH 82TF004YGE | |
| Lenovo ThinkBook 16p G3 ARH | |
| Average of class Multimedia (22 - 157, n=5, last 2 years) | |
| 1920x1080 Ultra Graphics & Postprocessing (HBAO+) | |
| Average NVIDIA GeForce RTX 3070 Ti Laptop GPU (76.8 - 124.1, n=39) | |
| Schenker Vision 16 Pro RTX 3070 Ti | |
| HP Envy 16 h0112nr | |
| Lenovo Legion Slim 7-16IAH 82TF004YGE | |
| Lenovo ThinkBook 16p G3 ARH | |
| Average of class Multimedia (11 - 107, n=5, last 2 years) | |
| Cyberpunk 2077 1.6 | |
| 2560x1440 Ultra Preset | |
| Average NVIDIA GeForce RTX 3070 Ti Laptop GPU (40 - 62, n=10) | |
| Schenker Vision 16 Pro RTX 3070 Ti | |
| Lenovo ThinkBook 16p G3 ARH | |
| 1920x1080 Ultra Preset | |
| Average NVIDIA GeForce RTX 3070 Ti Laptop GPU (48.5 - 104, n=13) | |
| Schenker Vision 16 Pro RTX 3070 Ti | |
| HP Envy 16 h0112nr | |
| Lenovo ThinkBook 16p G3 ARH | |
| F1 22 | |
| 2560x1440 Ultra High Preset AA:T AF:16x | |
| Average NVIDIA GeForce RTX 3070 Ti Laptop GPU (36.8 - 50.5, n=7) | |
| Schenker Vision 16 Pro RTX 3070 Ti | |
| 1920x1080 Ultra High Preset AA:T AF:16x | |
| Average NVIDIA GeForce RTX 3070 Ti Laptop GPU (58.1 - 80, n=8) | |
| Schenker Vision 16 Pro RTX 3070 Ti | |
| Average of class Multimedia (11 - 54.1, n=7, last 2 years) | |
| Far Cry 5 | |
| 2560x1440 Ultra Preset AA:T | |
| Average NVIDIA GeForce RTX 3070 Ti Laptop GPU (77 - 111, n=15) | |
| Schenker Vision 16 Pro RTX 3070 Ti | |
| Average of class Multimedia (45 - 106, n=3, last 2 years) | |
| 1920x1080 Ultra Preset AA:T | |
| Average NVIDIA GeForce RTX 3070 Ti Laptop GPU (91 - 138, n=25) | |
| Schenker Vision 16 Pro RTX 3070 Ti | |
| Average of class Multimedia (17 - 145, n=14, last 2 years) | |
Witcher 3 FPS chart
| low | med. | high | ultra | QHD | |
|---|---|---|---|---|---|
| GTA V (2015) | 185.9 | 182.1 | 173.5 | 110.1 | 88.8 |
| The Witcher 3 (2015) | 385 | 267 | 172 | 84.9 | |
| Dota 2 Reborn (2015) | 178 | 164.7 | 155.4 | 146.7 | |
| Final Fantasy XV Benchmark (2018) | 183.6 | 117.7 | 91.4 | 67 | |
| X-Plane 11.11 (2018) | 143.2 | 125 | 101 | ||
| Far Cry 5 (2018) | 159 | 131 | 121 | 114 | 92 |
| Strange Brigade (2018) | 405 | 229 | 186.1 | 162.6 | 119.3 |
| F1 2021 (2021) | 332 | 231 | 194.4 | 109.1 | 82.2 |
| Cyberpunk 2077 1.6 (2022) | 105 | 93 | 77 | 64 | 40 |
| F1 22 (2022) | 209 | 205 | 157.3 | 58.1 | 36.8 |
Emissions - Good fan control
System noise
A slim device with powerful components is always a challenge for the fans and the fan control. The two fans of the Vision 16 Pro are always active, even while idling, but they are not audible at a regular distance. The advantage of this solution is that there is no pulsating in short peak load scenarios, so the device is very quiet in everyday situations. The decision to limit the CPU to 45W also pays off, because we only measured 38.5 dB(A) under full multi-core load instead of 44.4 dB(A) in Turbo mode with maximum power limits. During gaming and under full load you should expect 51 dB(A) after a couple of minutes. We only measure up to 38.5 dB(A) in the Balanced power profile, so it might be worth checking the gaming performance in this mode.
The Turbo mode with full CPU performance will result in 53.4 dB(A) during our stress test, which also corresponds with the Fan Boost mode. After the load period is over, the fans will rotate at 38.5 dB(A) for a couple of minutes. We did not hear any other electronic sounds.
Noise level
| Idle |
| 24.3 / 24.3 / 24.3 dB(A) |
| Load |
| 38.5 / 51 dB(A) |
 | ||
30 dB silent 40 dB(A) audible 50 dB(A) loud |
||
min: | ||
| Schenker Vision 16 Pro RTX 3070 Ti GeForce RTX 3070 Ti Laptop GPU, i7-12700H, Samsung SSD 980 Pro 1TB MZ-V8P1T0BW | Apple MacBook Pro 16 2021 M1 Pro M1 Pro 16-Core GPU, M1 Pro, Apple SSD AP1024R | Lenovo Legion Slim 7-16IAH 82TF004YGE GeForce RTX 3060 Laptop GPU, i7-12700H, SK Hynix HFS001TEJ9X115N | Lenovo ThinkBook 16p G3 ARH GeForce RTX 3060 Laptop GPU, R9 6900HX, Micron 3400 1TB MTFDKBA1T0TFH | HP Envy 16 h0112nr GeForce RTX 3060 Laptop GPU, i7-12700H, Micron 3400 1TB MTFDKBA1T0TFH | |
|---|---|---|---|---|---|
| Noise | 8% | -0% | 7% | -3% | |
| off / environment * (dB) | 22.9 | 24.7 -8% | 23 -0% | 22.7 1% | 22.8 -0% |
| Idle Minimum * (dB) | 24.3 | 24.7 -2% | 23 5% | 23.1 5% | 22.9 6% |
| Idle Average * (dB) | 24.3 | 24.7 -2% | 23 5% | 23.2 5% | 22.9 6% |
| Idle Maximum * (dB) | 24.3 | 24.7 -2% | 23 5% | 23.6 3% | 30.5 -26% |
| Load Average * (dB) | 38.5 | 26.1 32% | 43.7 -14% | 30.6 21% | 41.4 -8% |
| Witcher 3 ultra * (dB) | 51 | 51.7 -1% | 47.6 7% | 51.1 -0% | |
| Load Maximum * (dB) | 51 | 37.4 27% | 52 -2% | 47.5 7% | 51.4 -1% |
* ... smaller is better
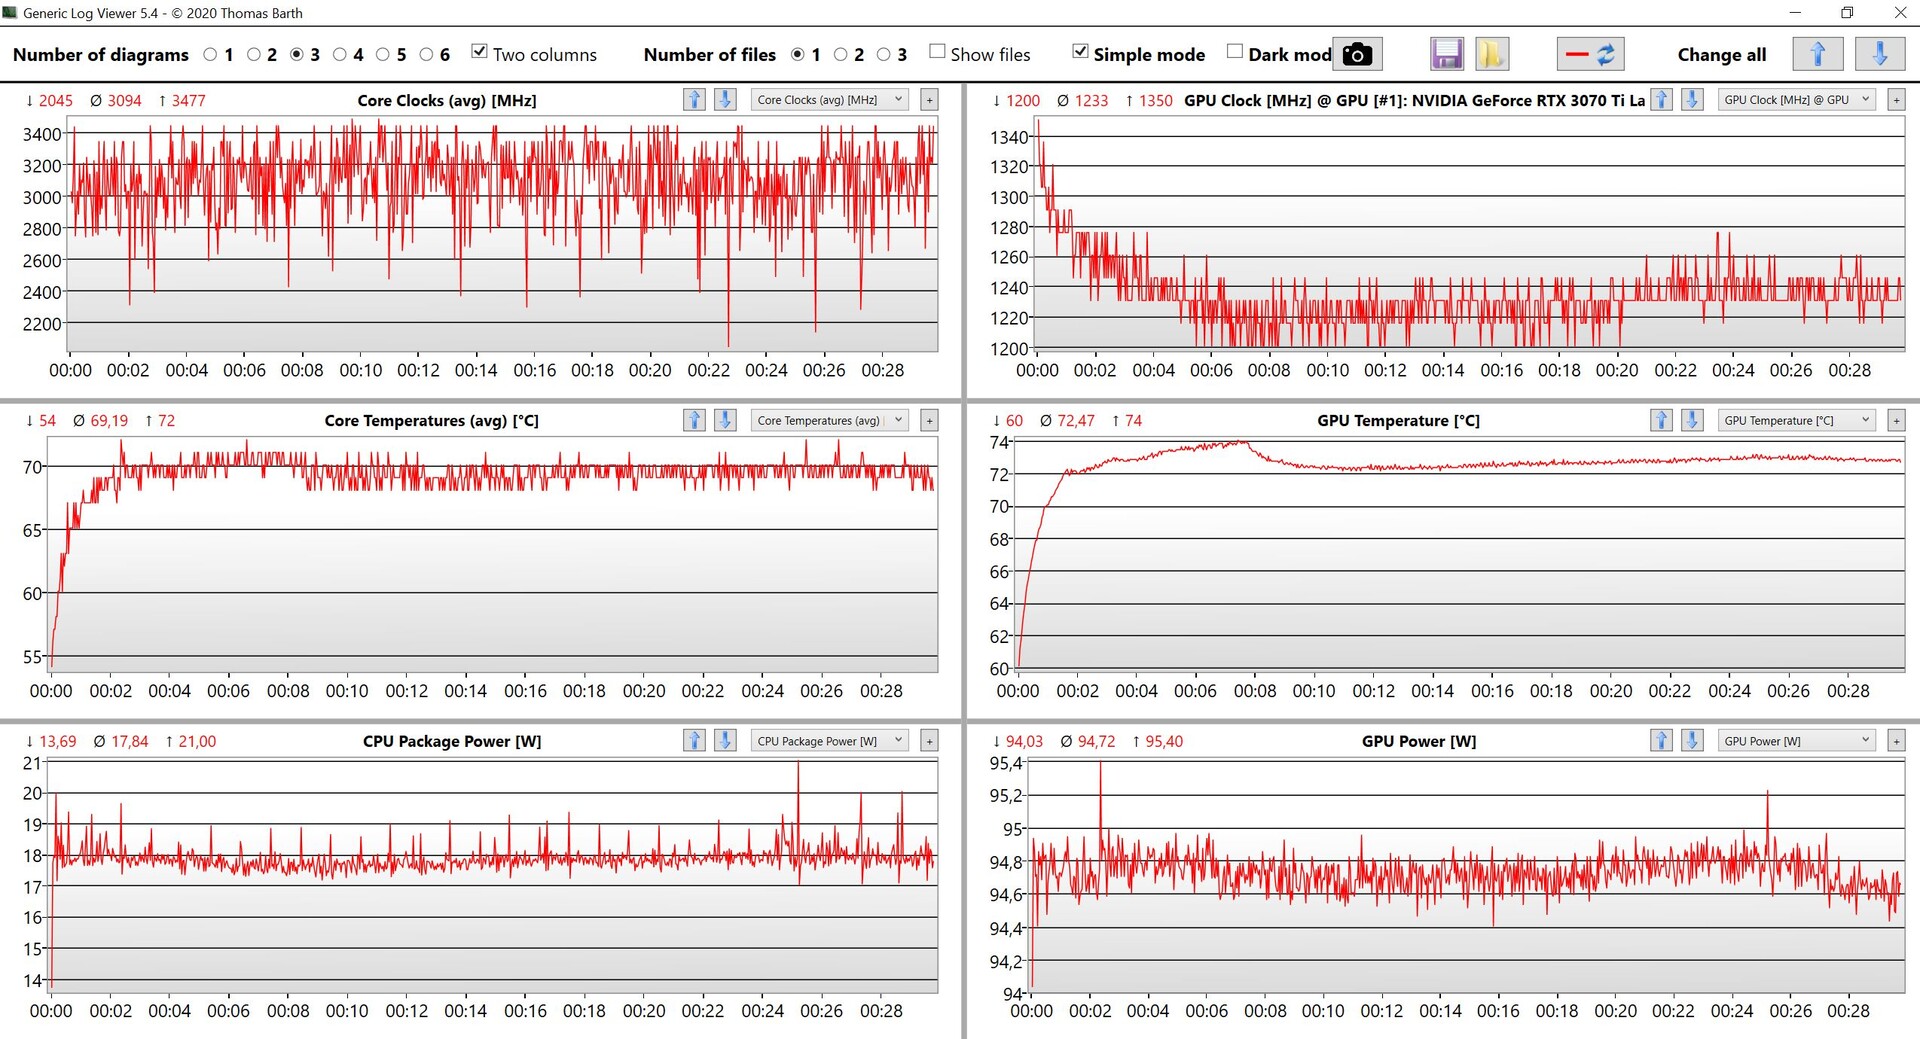
Temperature
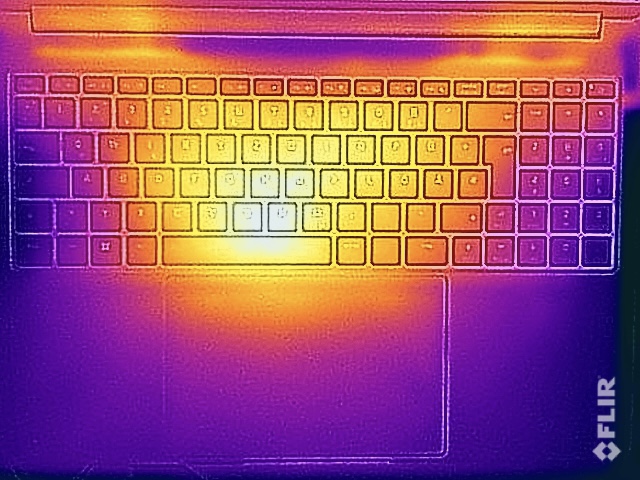
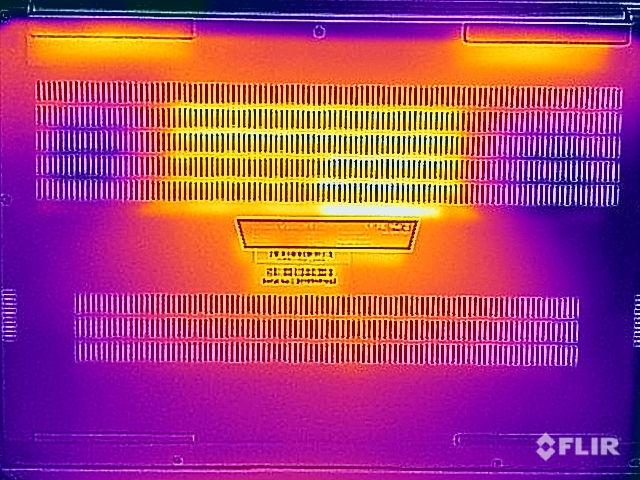
The Vision 16 Pro has no temperature problems or hot spots while idling and during light workloads, which is also a benefit of the constantly spinning fans. However, it gets warm under load or when you play games. The bottom of the base unit is still okay at up to 46 °C and you could still put it on your lap, but the center keyboard area warms up to more than 50 °C, which is clearly noticeable and already a bit unpleasant. This is fortunately not a big issue when you play games (where you mainly use the WASD and surrounding keys).
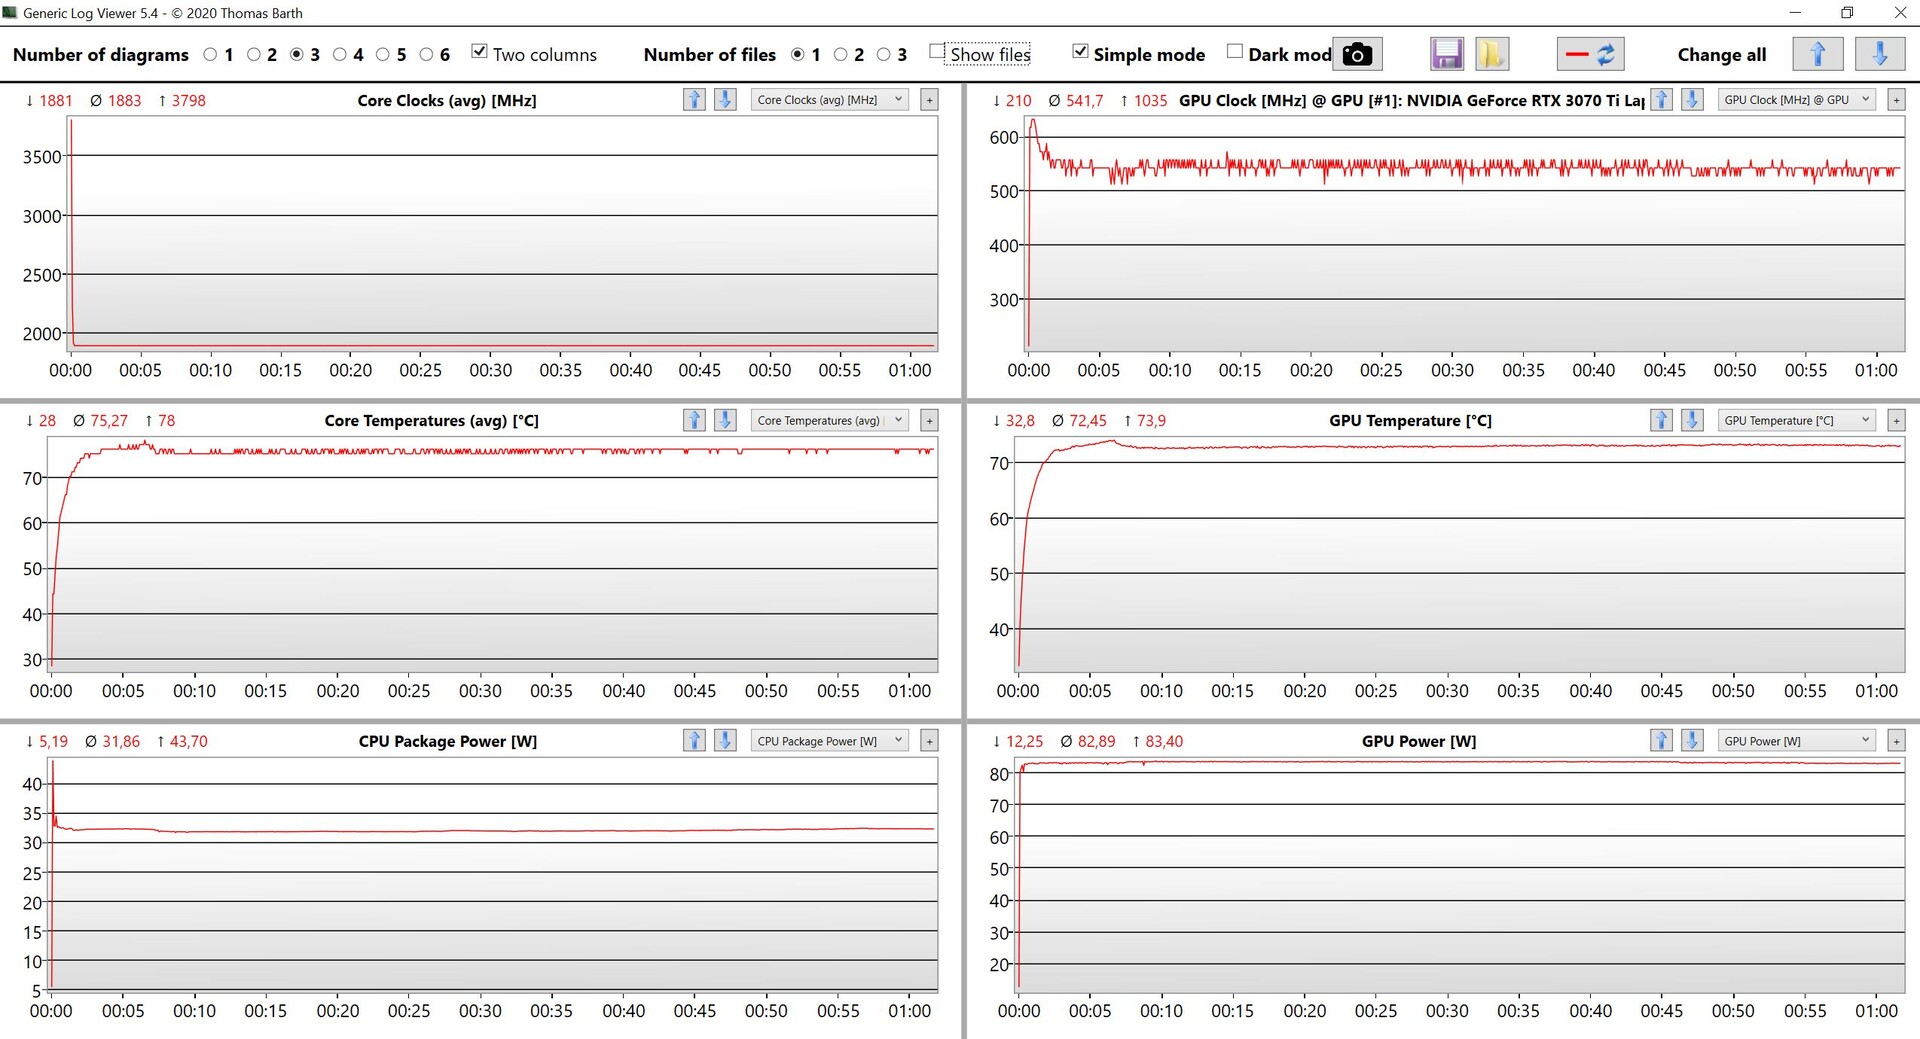
Our stress test shows that the GPU is preferred by the system with a steady consumption of more than 80W, while the processor quickly levels off at ~32W. All in all, a decent result and we did not notice a performance deficit immediately after the stress test.
(-) The maximum temperature on the upper side is 50.8 °C / 123 F, compared to the average of 36.8 °C / 98 F, ranging from 21 to 71 °C for the class Multimedia.
(-) The bottom heats up to a maximum of 46.3 °C / 115 F, compared to the average of 39.1 °C / 102 F
(+) In idle usage, the average temperature for the upper side is 25.5 °C / 78 F, compared to the device average of 31.3 °C / 88 F.
(-) Playing The Witcher 3, the average temperature for the upper side is 39.4 °C / 103 F, compared to the device average of 31.3 °C / 88 F.
(+) The palmrests and touchpad are cooler than skin temperature with a maximum of 29.8 °C / 85.6 F and are therefore cool to the touch.
(±) The average temperature of the palmrest area of similar devices was 28.7 °C / 83.7 F (-1.1 °C / -1.9 F).
| Schenker Vision 16 Pro RTX 3070 Ti Intel Core i7-12700H, NVIDIA GeForce RTX 3070 Ti Laptop GPU | Apple MacBook Pro 16 2021 M1 Pro Apple M1 Pro, Apple M1 Pro 16-Core GPU | Lenovo Legion Slim 7-16IAH 82TF004YGE Intel Core i7-12700H, NVIDIA GeForce RTX 3060 Laptop GPU | Lenovo ThinkBook 16p G3 ARH AMD Ryzen 9 6900HX, NVIDIA GeForce RTX 3060 Laptop GPU | HP Envy 16 h0112nr Intel Core i7-12700H, NVIDIA GeForce RTX 3060 Laptop GPU | |
|---|---|---|---|---|---|
| Heat | 14% | -22% | -11% | -8% | |
| Maximum Upper Side * (°C) | 50.8 | 41 19% | 48.3 5% | 48.2 5% | 45.2 11% |
| Maximum Bottom * (°C) | 46.3 | 39 16% | 55.3 -19% | 49.6 -7% | 44 5% |
| Idle Upper Side * (°C) | 27.2 | 24 12% | 35.7 -31% | 31.8 -17% | 33.6 -24% |
| Idle Bottom * (°C) | 26.6 | 24 10% | 37.6 -41% | 33.6 -26% | 32.6 -23% |
* ... smaller is better
Speakers
There are two stereo speakers, which offer a decent sound experience with precise high tones, but the system lacks some punch, and the Vision 16 Pro cannot keep up with excellent sound systems like on the MacBook Pro 16, for example. The preloaded Nahimic software offers multiple presets and you should activate the software, otherwise the sound will be worse and quieter.
Schenker Vision 16 Pro RTX 3070 Ti audio analysis
(±) | speaker loudness is average but good (77.6 dB)
Bass 100 - 315 Hz
(-) | nearly no bass - on average 17.9% lower than median
(±) | linearity of bass is average (12.2% delta to prev. frequency)
Mids 400 - 2000 Hz
(+) | balanced mids - only 3.3% away from median
(+) | mids are linear (4.9% delta to prev. frequency)
Highs 2 - 16 kHz
(+) | balanced highs - only 2.8% away from median
(+) | highs are linear (5.1% delta to prev. frequency)
Overall 100 - 16.000 Hz
(±) | linearity of overall sound is average (15.1% difference to median)
Compared to same class
» 36% of all tested devices in this class were better, 4% similar, 60% worse
» The best had a delta of 5%, average was 17%, worst was 45%
Compared to all devices tested
» 21% of all tested devices were better, 4% similar, 75% worse
» The best had a delta of 4%, average was 23%, worst was 134%
Apple MacBook Pro 16 2021 M1 Pro audio analysis
(+) | speakers can play relatively loud (84.7 dB)
Bass 100 - 315 Hz
(+) | good bass - only 3.8% away from median
(+) | bass is linear (5.2% delta to prev. frequency)
Mids 400 - 2000 Hz
(+) | balanced mids - only 1.3% away from median
(+) | mids are linear (2.1% delta to prev. frequency)
Highs 2 - 16 kHz
(+) | balanced highs - only 1.9% away from median
(+) | highs are linear (2.7% delta to prev. frequency)
Overall 100 - 16.000 Hz
(+) | overall sound is linear (4.6% difference to median)
Compared to same class
» 0% of all tested devices in this class were better, 0% similar, 100% worse
» The best had a delta of 5%, average was 17%, worst was 45%
Compared to all devices tested
» 0% of all tested devices were better, 0% similar, 100% worse
» The best had a delta of 4%, average was 23%, worst was 134%
Energy Management - 240 Hz mode consumes more power
Power Consumption
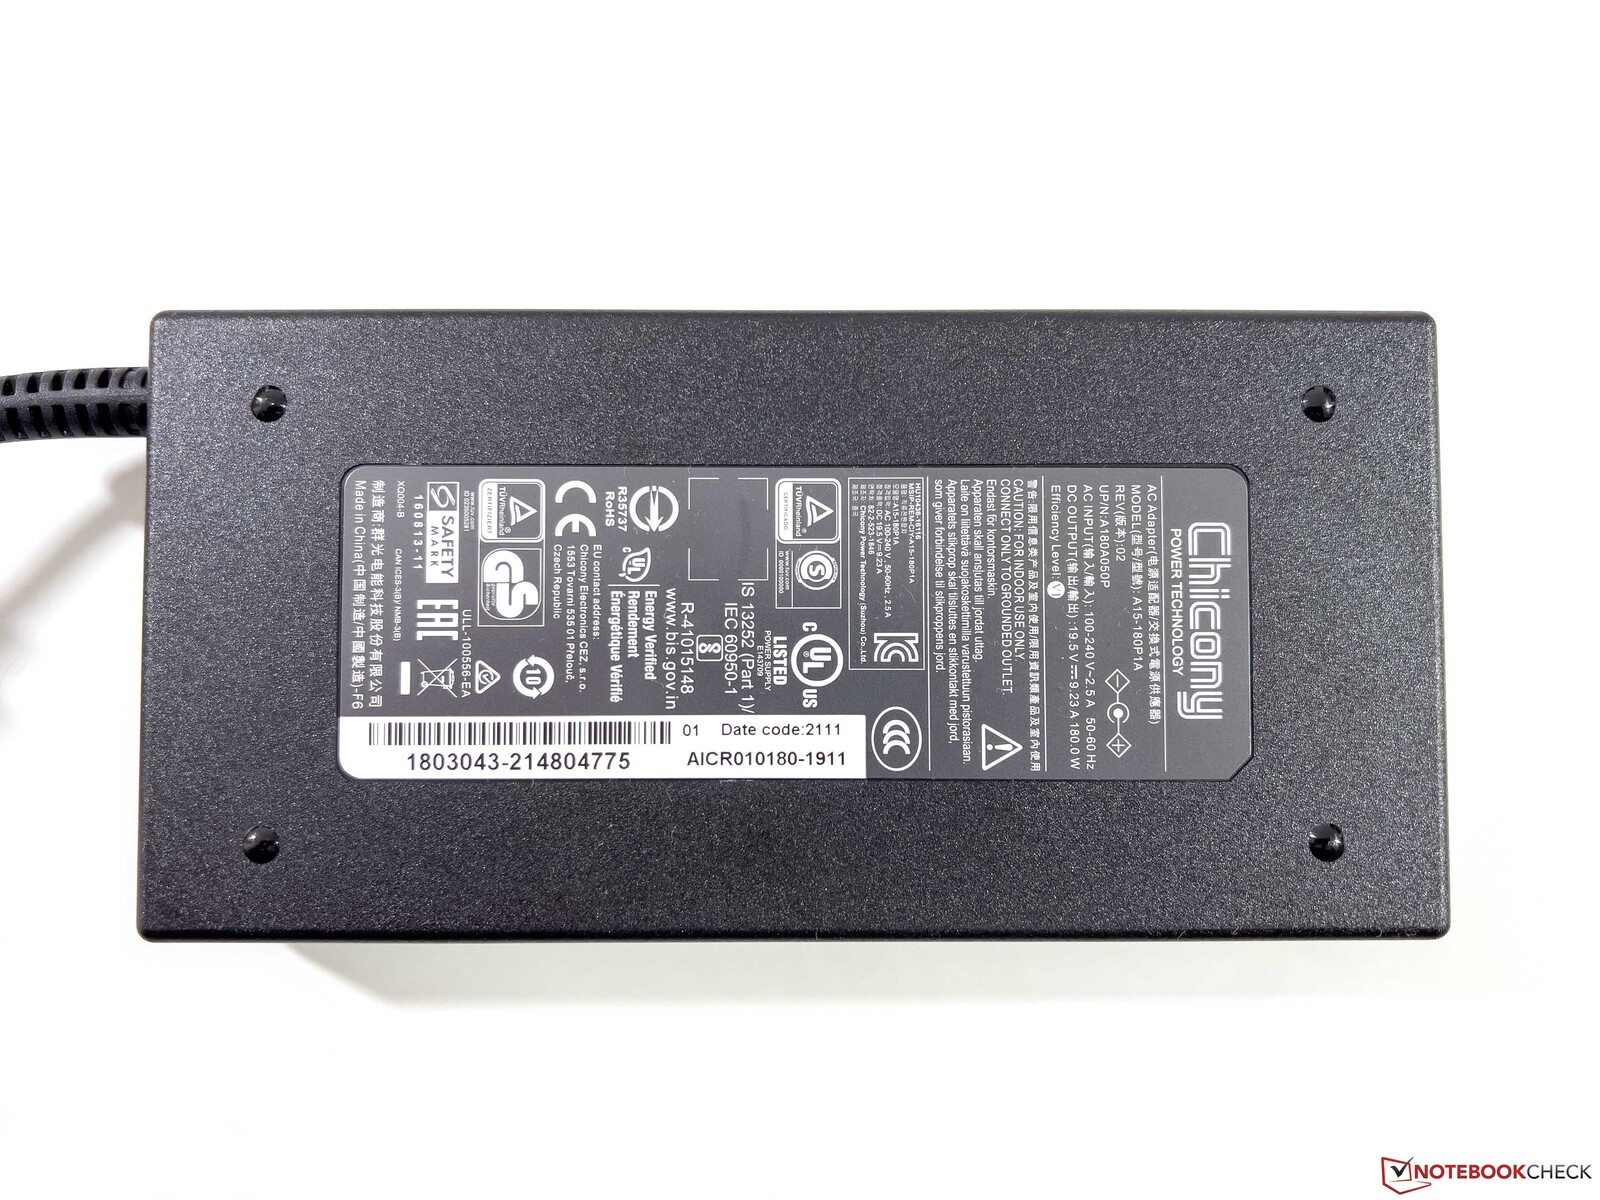
We measure up to 14.3W while idling with 240 Hz activated compared to 11.8W in the 60 Hz mode, so it pays off to reduce the frequency on battery power. Our stress test results in a maximum consumption of 172W and still 160W at the end of the stress test, which should also be expected while gaming. The provided 180W power adapter is therefore sufficient and it still has some headroom to charge the battery in these situations.
| Off / Standby | |
| Idle | |
| Load |
|
Key:
min: | |
| Schenker Vision 16 Pro RTX 3070 Ti i7-12700H, GeForce RTX 3070 Ti Laptop GPU, Samsung SSD 980 Pro 1TB MZ-V8P1T0BW, IPS, 2560x1600, 16" | Apple MacBook Pro 16 2021 M1 Pro M1 Pro, M1 Pro 16-Core GPU, Apple SSD AP1024R, Mini-LED, 3456x2234, 16.2" | Lenovo Legion Slim 7-16IAH 82TF004YGE i7-12700H, GeForce RTX 3060 Laptop GPU, SK Hynix HFS001TEJ9X115N, IPS LED, 2560x1600, 16" | Lenovo ThinkBook 16p G3 ARH R9 6900HX, GeForce RTX 3060 Laptop GPU, Micron 3400 1TB MTFDKBA1T0TFH, IPS, 2560x1600, 16" | HP Envy 16 h0112nr i7-12700H, GeForce RTX 3060 Laptop GPU, Micron 3400 1TB MTFDKBA1T0TFH, OLED, 3840x2400, 16" | Average NVIDIA GeForce RTX 3070 Ti Laptop GPU | Average of class Multimedia | |
|---|---|---|---|---|---|---|---|
| Power Consumption | 24% | -27% | -12% | -17% | -51% | 30% | |
| Idle Minimum * (Watt) | 9 | 5 44% | 13.3 -48% | 10.3 -14% | 10 -11% | 14.2 ? -58% | 5.62 ? 38% |
| Idle Average * (Watt) | 13.3 | 15.1 -14% | 17.5 -32% | 16 -20% | 10.9 18% | 19.9 ? -50% | 10.2 ? 23% |
| Idle Maximum * (Watt) | 14.3 | 15.5 -8% | 18.4 -29% | 24 -68% | 27.8 -94% | 26.2 ? -83% | 12.5 ? 13% |
| Load Average * (Watt) | 107 | 54 50% | 122.8 -15% | 85.4 20% | 116.4 -9% | 125.8 ? -18% | 65 ? 39% |
| Witcher 3 ultra * (Watt) | 155.2 | 154.7 -0% | 132.2 15% | 133.7 14% | |||
| Load Maximum * (Watt) | 172 | 90 48% | 232.6 -35% | 181.9 -6% | 209.8 -22% | 248 ? -44% | 111.9 ? 35% |
* ... smaller is better
Power consumption Witcher 3 / stress test
Power consumption external screen (USB-C)
Battery Runtime
The 80 Wh battery in the Vision 16 Pro does not manage extremely long runtimes since the power consumption is just too high. We determine a runtime of around 6 hours in the 240 Hz both in our Wi-Fi and video test at 150 nits (41 % of the maximum brightness) and 5 hours in the Wi-Fi test at full brightness. The 60 Hz mode increases the runtime by around 1.5 hours at 150 nits.
A full recharge of the battery takes 107 minutes when the device is turned on; 80% of the capacity is available after about 50 minutes.
| Schenker Vision 16 Pro RTX 3070 Ti i7-12700H, GeForce RTX 3070 Ti Laptop GPU, 80 Wh | Apple MacBook Pro 16 2021 M1 Pro M1 Pro, M1 Pro 16-Core GPU, 99.6 Wh | Lenovo Legion Slim 7-16IAH 82TF004YGE i7-12700H, GeForce RTX 3060 Laptop GPU, 99.99 Wh | Lenovo ThinkBook 16p G3 ARH R9 6900HX, GeForce RTX 3060 Laptop GPU, 71 Wh | HP Envy 16 h0112nr i7-12700H, GeForce RTX 3060 Laptop GPU, 83 Wh | Average of class Multimedia | |
|---|---|---|---|---|---|---|
| Battery runtime | 185% | 14% | 8% | 28% | 102% | |
| H.264 (h) | 6.1 | 17.5 187% | 9.5 56% | 16.8 ? 175% | ||
| WiFi v1.3 (h) | 6 | 16.9 182% | 5.2 -13% | 6.5 8% | 7.9 32% | 12.3 ? 105% |
| Load (h) | 1.3 | 1.3 0% | 1.6 23% | 1.645 ? 27% | ||
| Witcher 3 ultra (h) | 1.5 |
Pros
Cons
Verdict - Vision 16 Pro convinces with high performance figures
Schenker continues the concept of the Vision 14 with the new Vision 16 Pro and offers a lightweight 16-inch laptop with compact dimensions, which also offers plenty of ports and powerful components. Models with fast GPUs like the GeForce RTX 3070 Ti offer much more GPU performance compared to most other multimedia laptops, which are usually limited to the RTX 3050 Ti or 3060. The performance of the components (CPU, GPU & SSD) is also stable under sustained workloads, which is not a matter of course considering the slim and light chassis.
There are more advantages like the good maintenance options, because you can change the Wi-Fi module and access two SODIMM slots as well as two M.2-2280 slots for SSDs. We also like the input devices, especially the giant touchpad. The WQHD panel with 240 Hz is mostly oriented towards gamers, but only covers the sRGB gamut and there are still some color deviations even after our own calibration. Considering the multimedia classification and the high price, it would have been nice to get an option for another display. The subjective picture quality of the matte screen is still very good and there is no PWM flickering.
The Schenker Vision 16 Pro offers a very convincing overall package, which combines a compact and lightweight 16-inch cassis with good maintenance options, plenty of ports, and powerful components.
Unfortunately, the new 16-inch model also shares some weaknesses with the smaller 14-inch Vision 14, including the slightly wobbly display hinges and the antenna configuration, which does not support the latest 6 GHz networks (Wi-Fi 6E). The surface temperatures and the fan noise is also high when you really stress the hardware (during gaming, for example), but the heat has to be dissipated from the slim chassis.
The Vision 16 Pro is much lighter, yet more powerful than the immediate rivals. Depending on the usage scenario there will be better alternatives, like the MacBook Pro 16 with its superior Mini-LED display and the unrestricted performance on battery power (but you should consider the more expensive M1 Max model for comparable GPU performance). Compared to lightweight gaming laptops like the Lenovo Legion Slim 7 or the multimedia laptop HP Envy 16, the Schenker performs very well overall.
Price and Availability
You can configure the Vision 16 Pro on bestware.com starting from 1.899 Euros.
Schenker Vision 16 Pro RTX 3070 Ti
- 11/24/2022 v7 (old)
Andreas Osthoff
Price comparison
