Core i7-13700HX performance debut: Uniwill GM6PX7X IDX laptop review

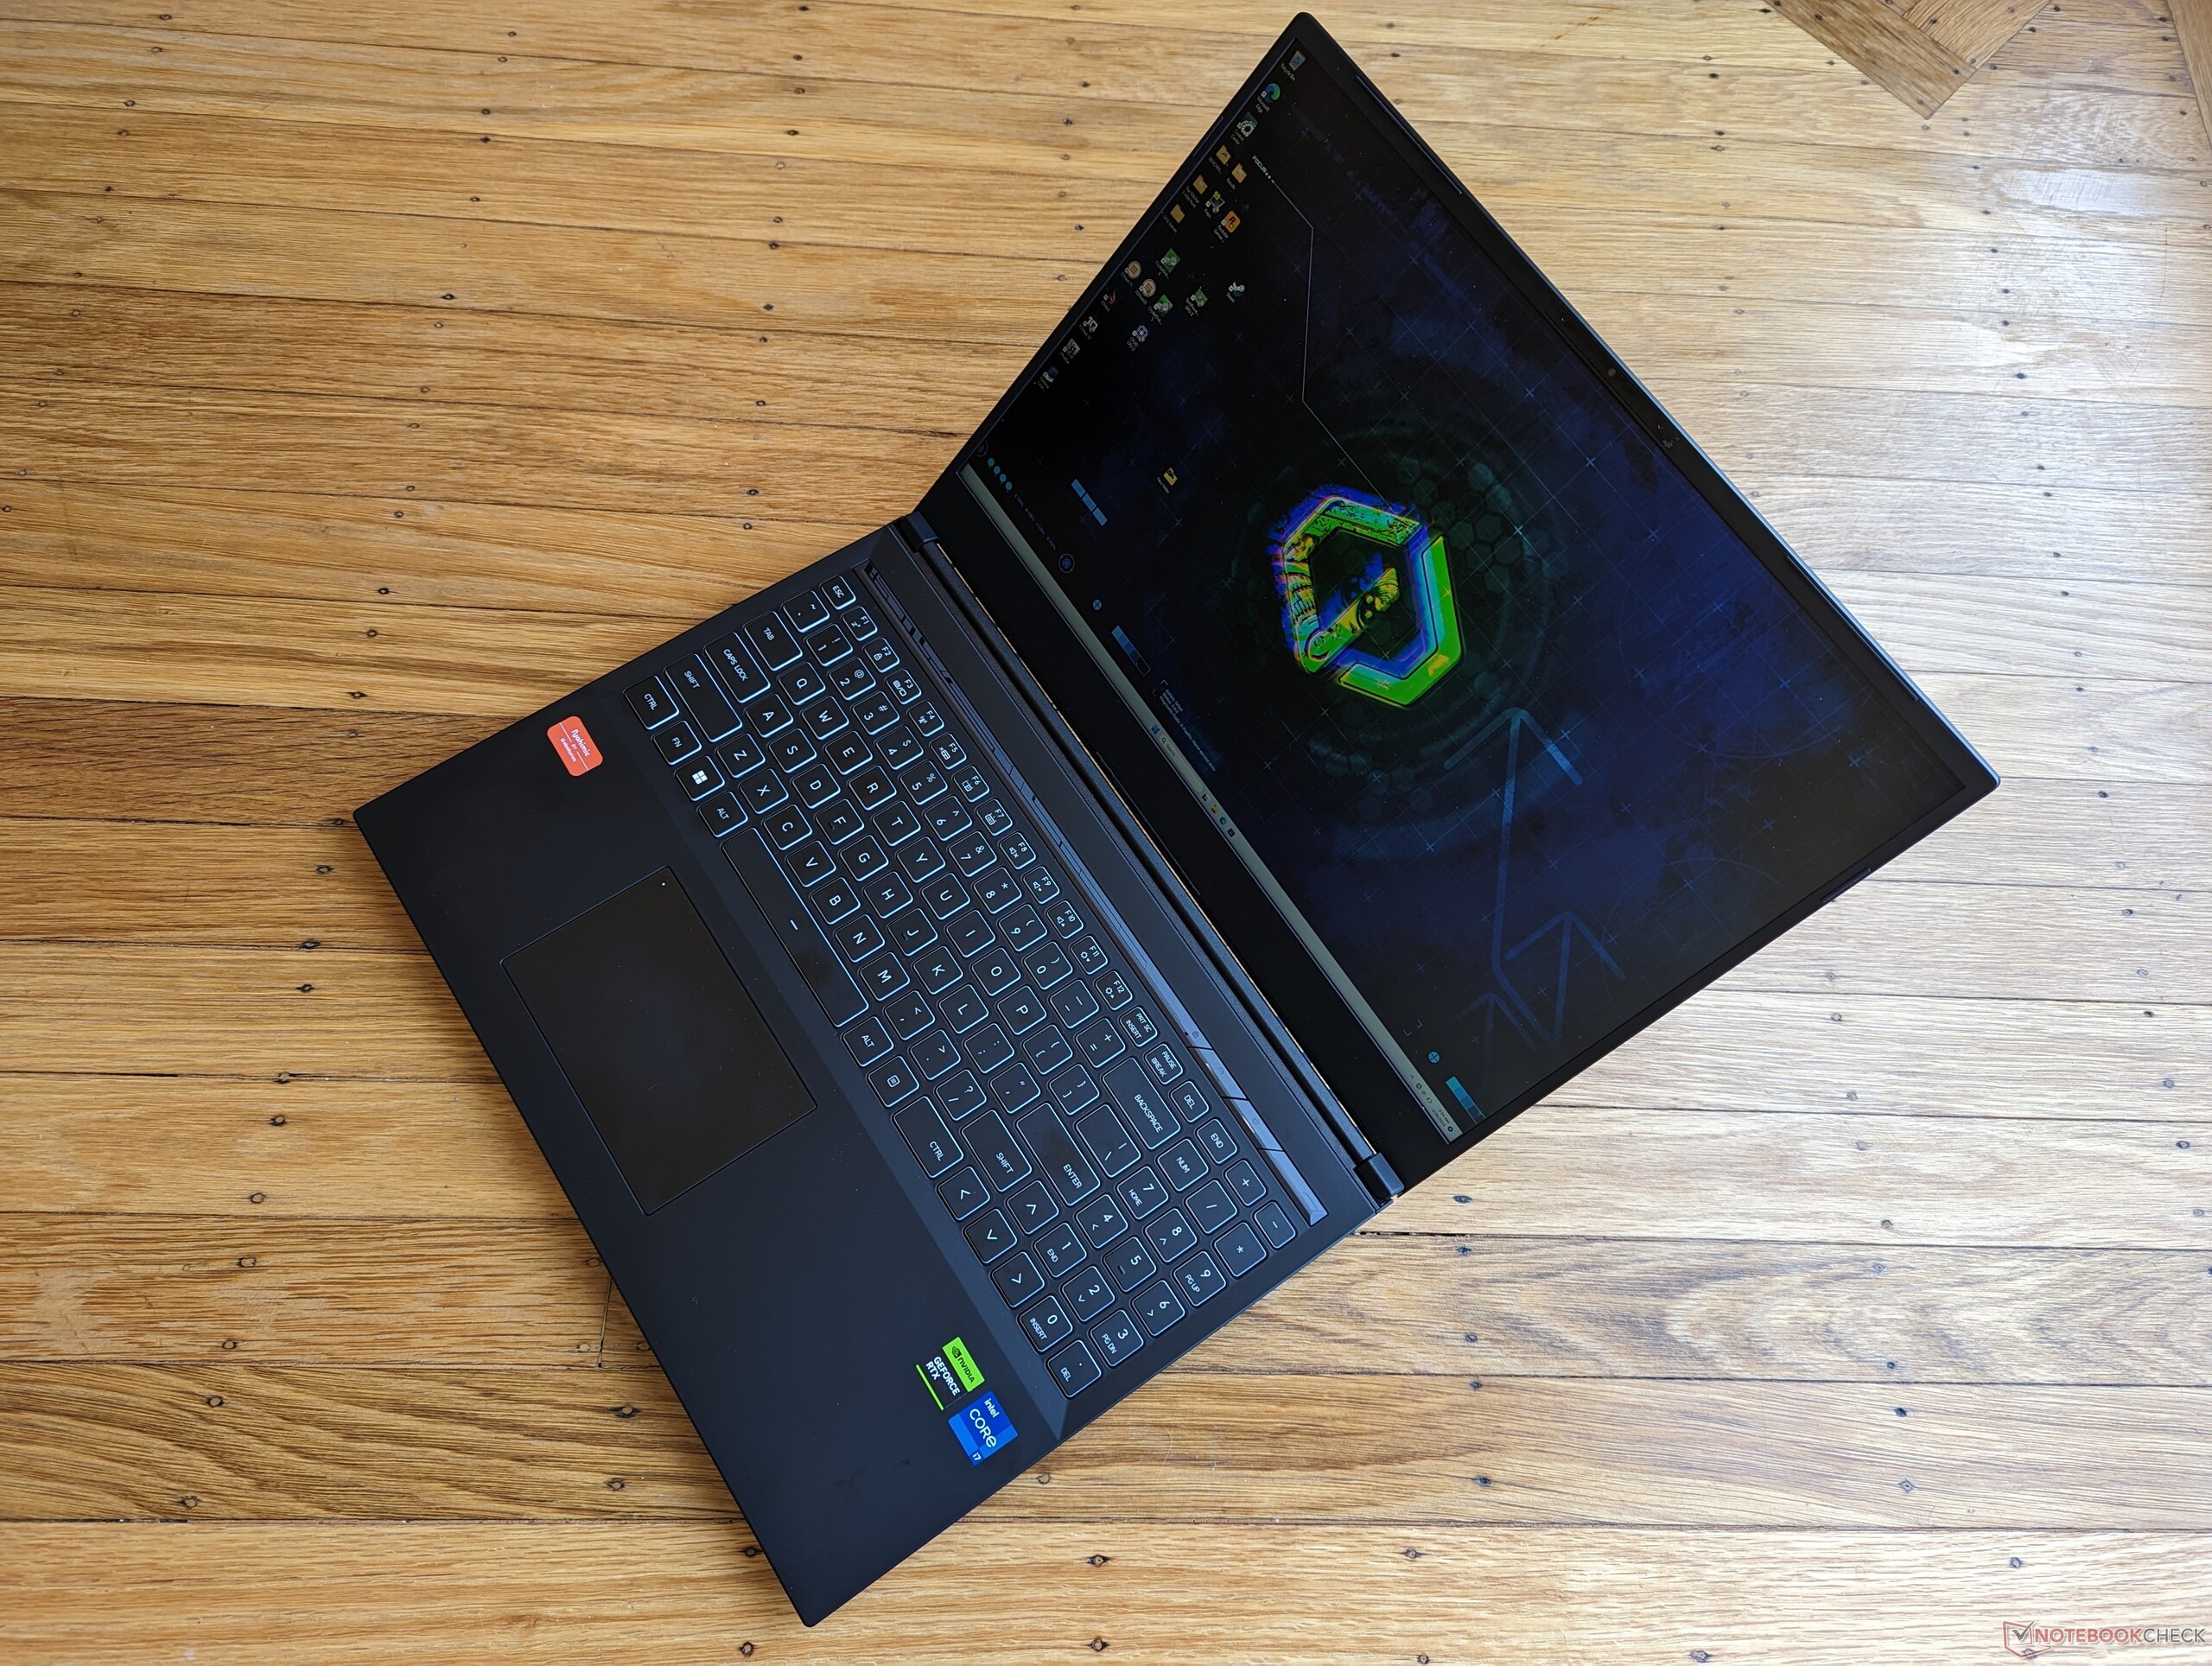
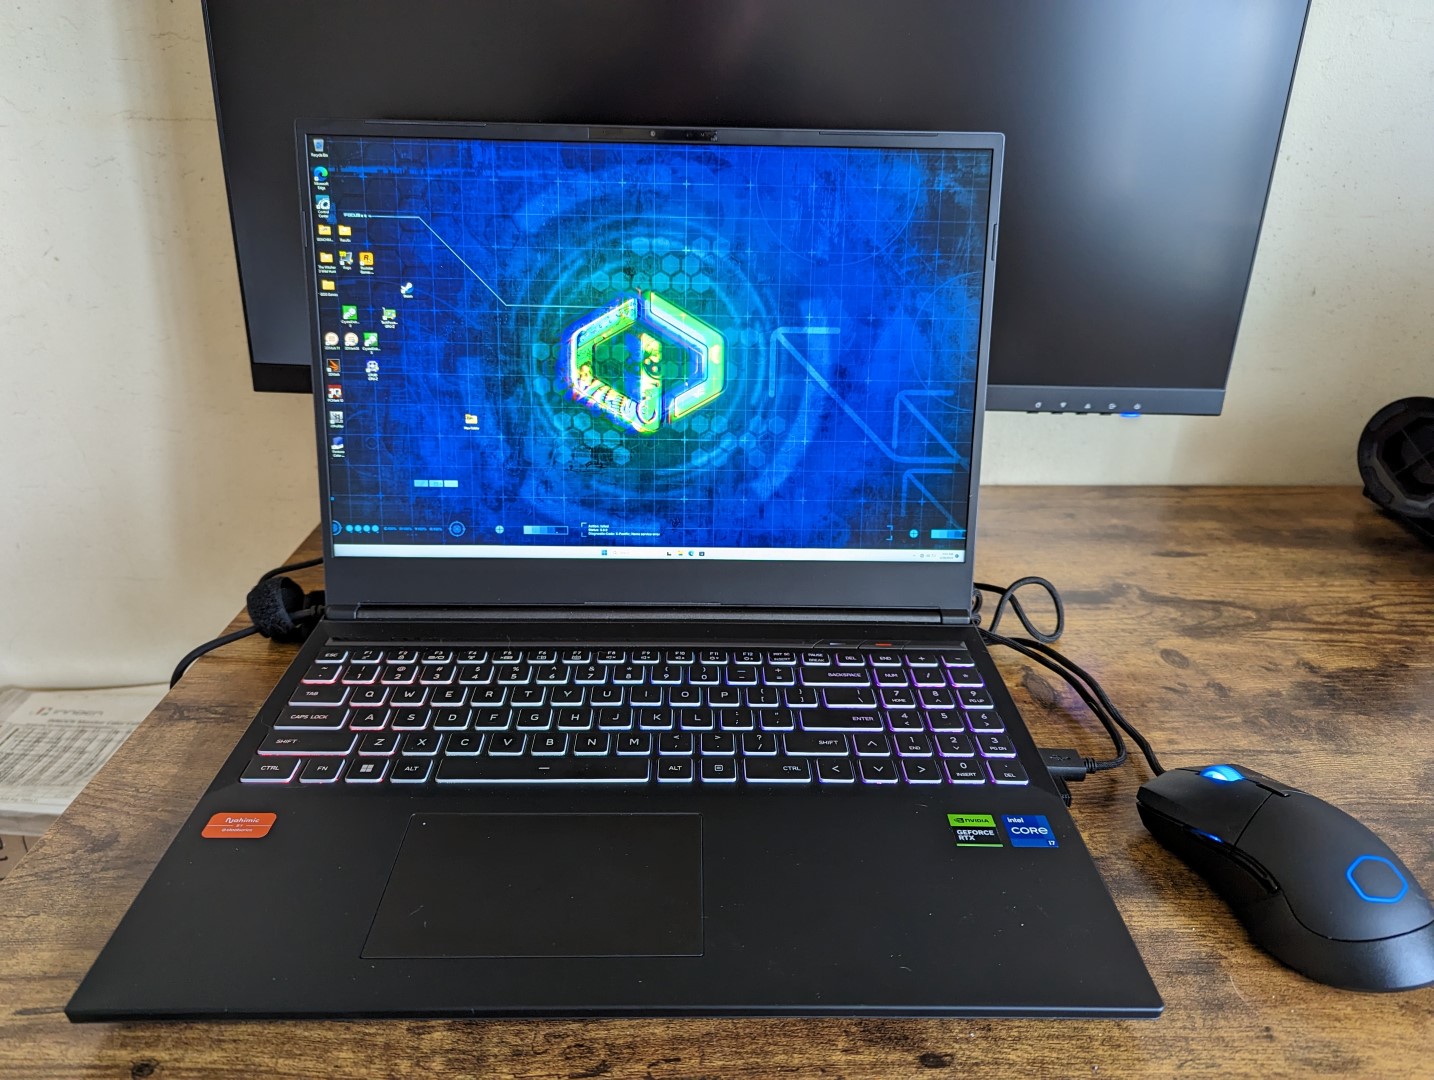
The Uniwill GM6PX7X is a 16-inch white label gaming laptop design known in some markets as the Schenker XMG Neo 16 E23. It is a newer model revealed at CES 2023 alongside the mobile 13th gen Raptor Lake-H series and mobile Ada Lovelace GeForce RTX 40 series.
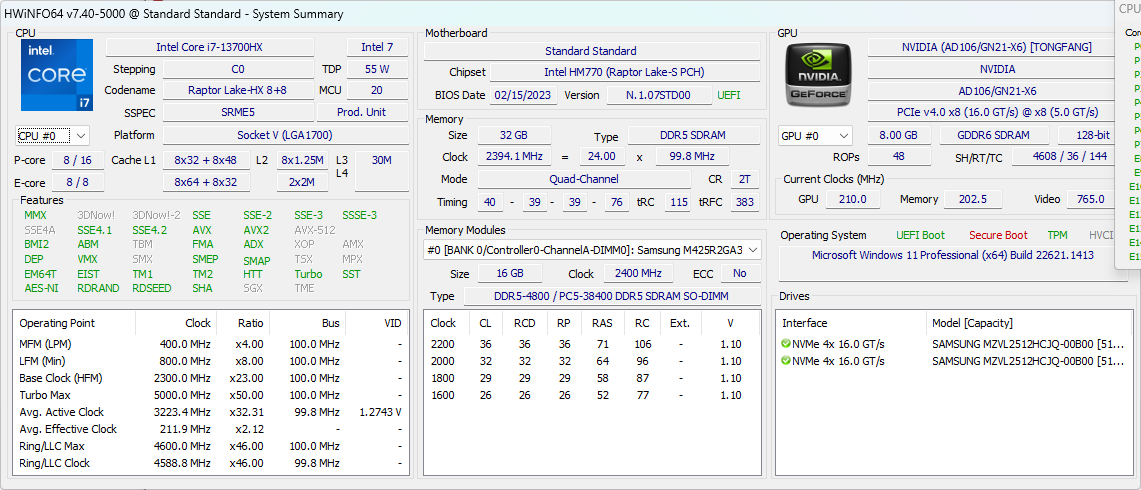
Like most other Uniwill or Schenker models, the GM6PX7X is highly configurable with CPU options up to the Core i9-13900HX and GPU options ranging from to the mobile GeForce RTX 4060 up to the 4090. Our specific review unit is a midrange configuration equipped with the Core i7-13700HX and RTX 4070.
See our full review on the RTX 4090-powered Schenker XMG Neo 16 E23 for more information on the chassis and as our RTX 4070-powered Uniwill GM6PX7X utilizes the same design. There are, however, several physical differences between them that we will note below.
More Uniwill/Schenker reviews:
Potential Competitors in Comparison
Rating | Date | Model | Weight | Height | Size | Resolution | Price |
|---|---|---|---|---|---|---|---|
| 88.2 % v7 (old) | 03 / 2023 | Uniwill GM6PX7X RTX 4070 i7-13700HX, GeForce RTX 4070 Laptop GPU | 2.2 kg | 22 mm | 16.00" | 2560x1600 | |
| 87.7 % v7 (old) | 04 / 2023 | Schenker XMG Neo 16 E23 i9-13900HX, GeForce RTX 4090 Laptop GPU | 2.5 kg | 29.9 mm | 16.00" | 2560x1600 | |
| 88.4 % v7 (old) | 03 / 2023 | Asus ROG Strix G16 G614JZ i9-13980HX, GeForce RTX 4080 Laptop GPU | 2.4 kg | 30.4 mm | 16.00" | 2560x1600 | |
| 89.4 % v7 (old) | 02 / 2023 | Lenovo Legion Pro 7 16IRX8H i9-13900HX, GeForce RTX 4080 Laptop GPU | 2.7 kg | 26 mm | 16.00" | 2560x1600 | |
| 86.2 % v7 (old) | 03 / 2023 | Gigabyte AERO 16 OLED BSF i9-13900H, GeForce RTX 4070 Laptop GPU | 2.1 kg | 18 mm | 16.00" | 3840x2400 | |
| 91.2 % v7 (old) | 02 / 2023 | Razer Blade 16 Early 2023 i9-13950HX, GeForce RTX 4080 Laptop GPU | 2.4 kg | 21.99 mm | 16.00" | 2560x1600 |
Case
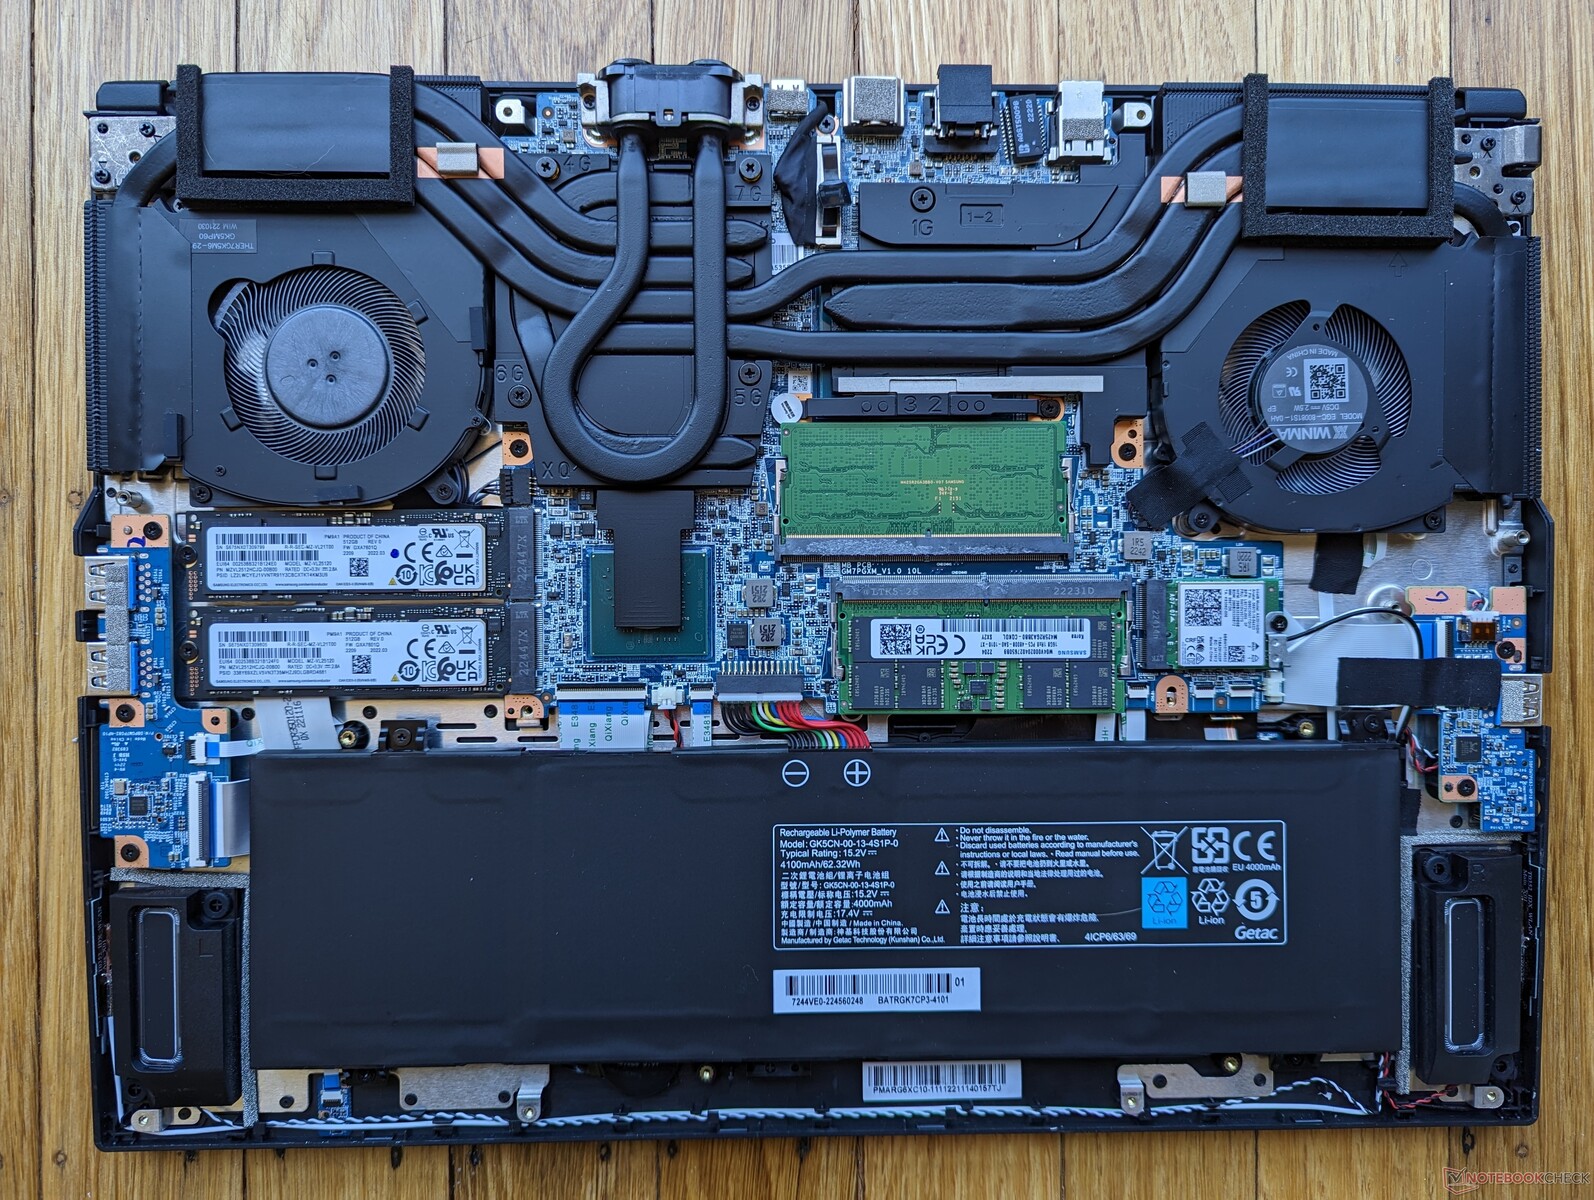
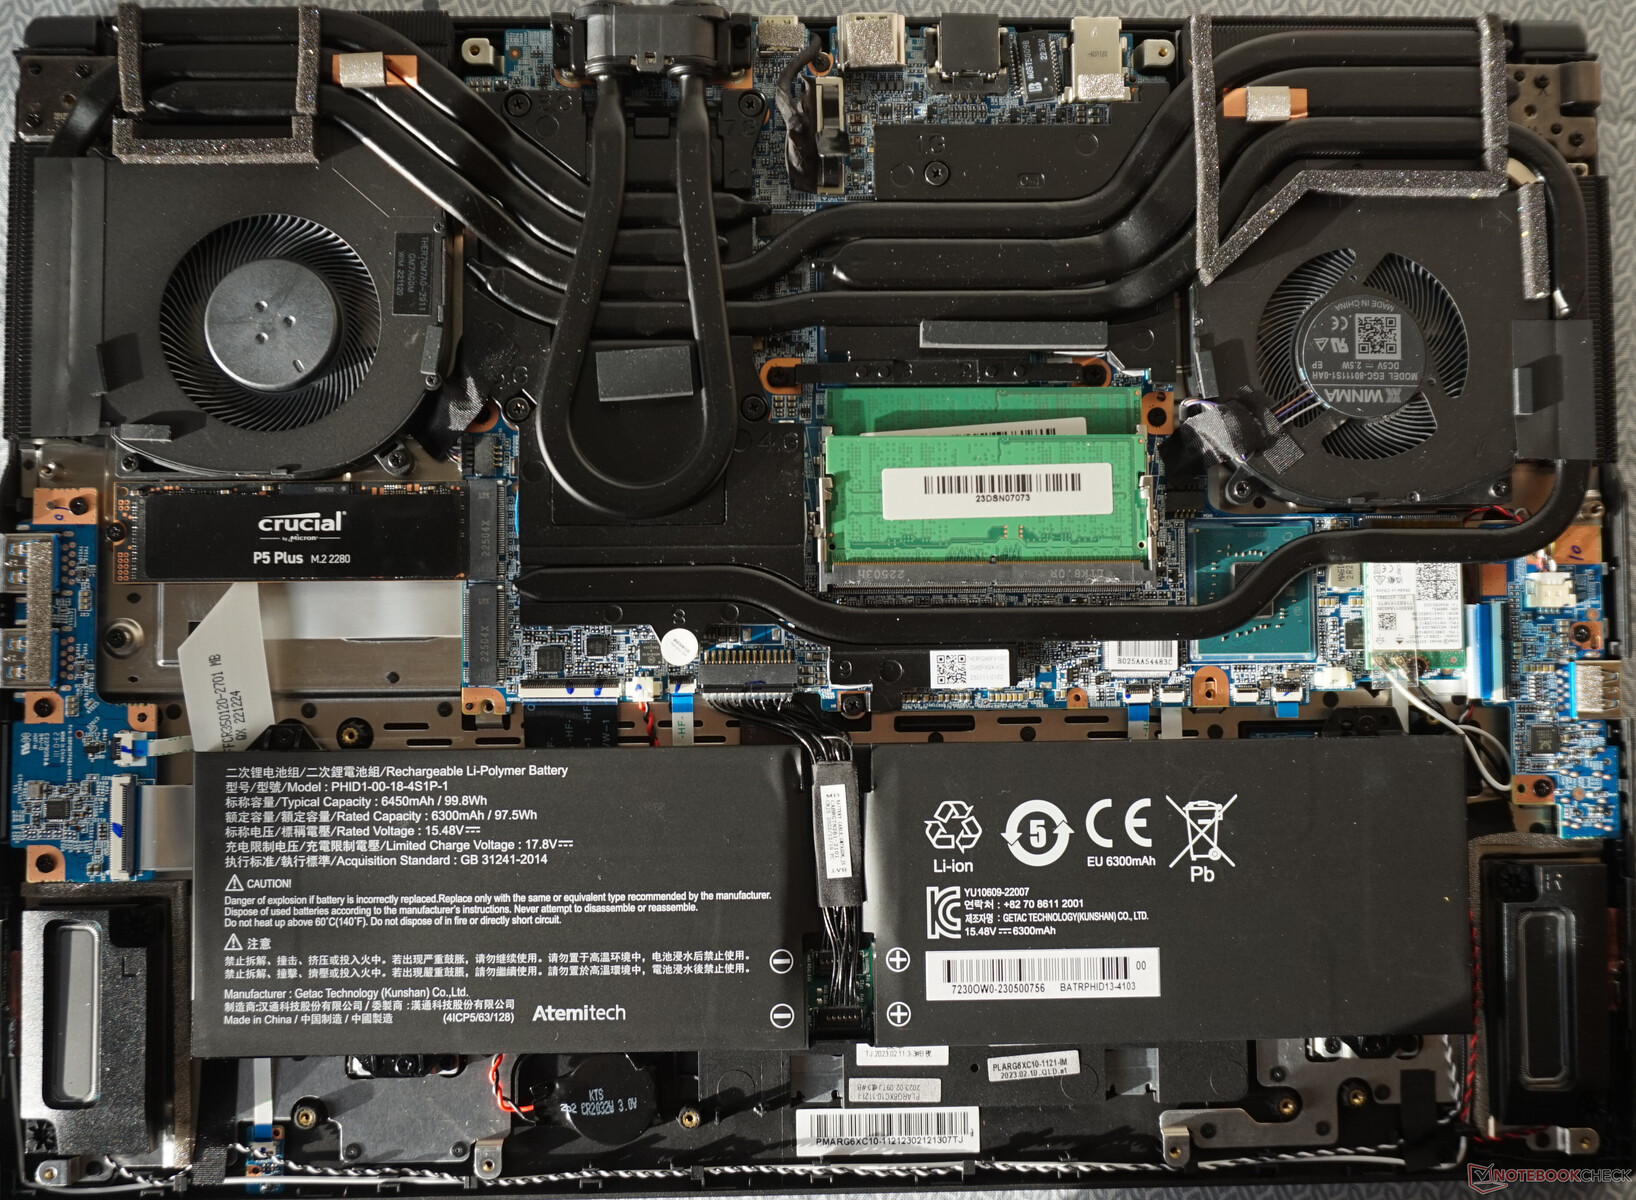
There are two chassis versions of the Schenker XMG Neo 16: one thinner build for all RTX 4060 and 4070 configurations and one thicker build for all RTX 4080 and 4090 configurations. The mobile RTX 4080/4090 GPUs are more power-hungry than the mobile RTX 4060/4070 and so they demand a larger chassis size. Major differences between the two versions include:
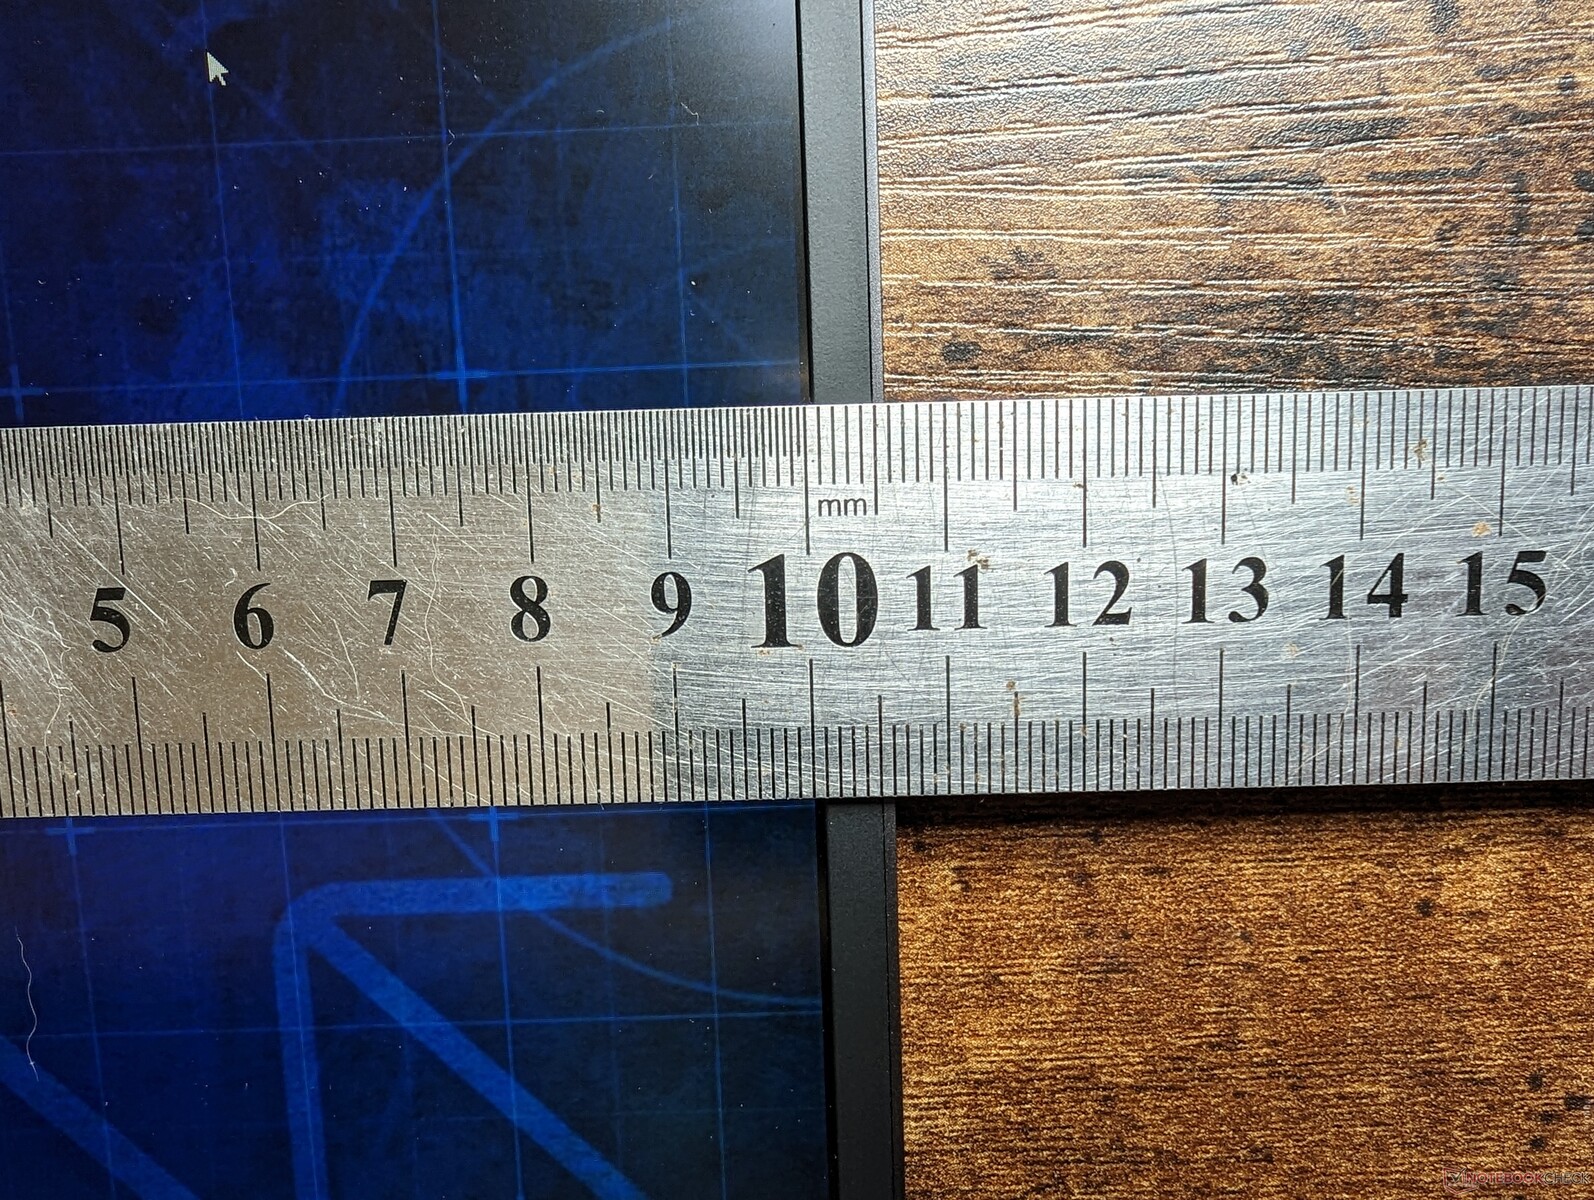
- Thickness: 22 mm vs. 26.1 mm
- Weight: 2.2 kg vs. 2.5 kg
- Battery capacity: 62 Wh vs. 99 Wh
- Webcam: 1 MP vs. 2 MP
- AC adapter: 280 W vs. 330 W
Both builds otherwise share the same keyboard options (membrane or Cherry MX mechanical), clickpad, ports, display and chassis materials.
SD Card Reader
| SD Card Reader | |
| average JPG Copy Test (av. of 3 runs) | |
| Gigabyte AERO 16 OLED BSF | |
| Razer Blade 16 Early 2023 (AV PRO microSD 128 GB V60) | |
| Schenker XMG Neo 16 E23 (AV PRO microSD 128 GB V60) | |
| Uniwill GM6PX7X RTX 4070 (AV PRO microSD 128 GB V60) | |
| maximum AS SSD Seq Read Test (1GB) | |
| Razer Blade 16 Early 2023 (AV PRO microSD 128 GB V60) | |
| Gigabyte AERO 16 OLED BSF | |
| Uniwill GM6PX7X RTX 4070 (AV PRO microSD 128 GB V60) | |
| Schenker XMG Neo 16 E23 (AV PRO microSD 128 GB V60) | |
Communication
| Networking | |
| iperf3 transmit AXE11000 | |
| Schenker XMG Neo 16 E23 | |
| Lenovo Legion Pro 7 16IRX8H | |
| Asus ROG Strix G16 G614JZ | |
| Razer Blade 16 Early 2023 | |
| Uniwill GM6PX7X RTX 4070 | |
| iperf3 receive AXE11000 | |
| Schenker XMG Neo 16 E23 | |
| Lenovo Legion Pro 7 16IRX8H | |
| Asus ROG Strix G16 G614JZ | |
| Razer Blade 16 Early 2023 | |
| Uniwill GM6PX7X RTX 4070 | |
| iperf3 transmit AXE11000 6GHz | |
| Gigabyte AERO 16 OLED BSF | |
| Razer Blade 16 Early 2023 | |
| iperf3 receive AXE11000 6GHz | |
| Gigabyte AERO 16 OLED BSF | |
| Razer Blade 16 Early 2023 | |
Webcam


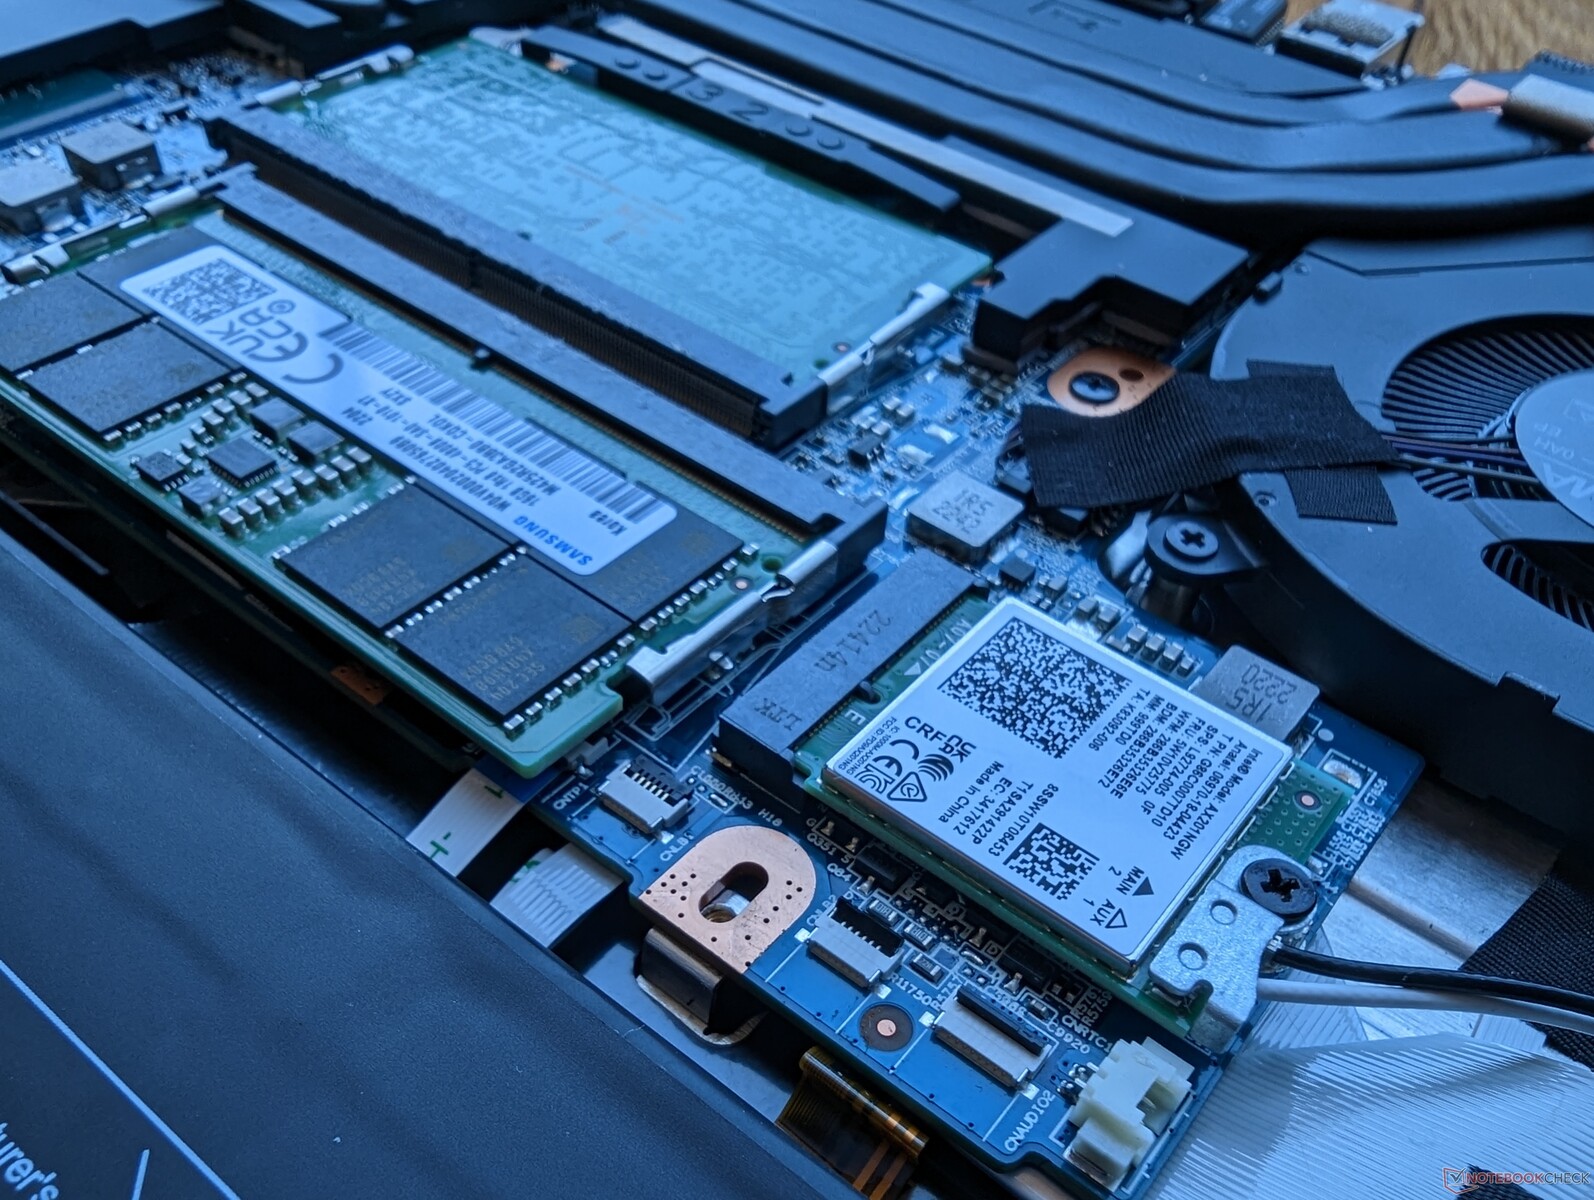
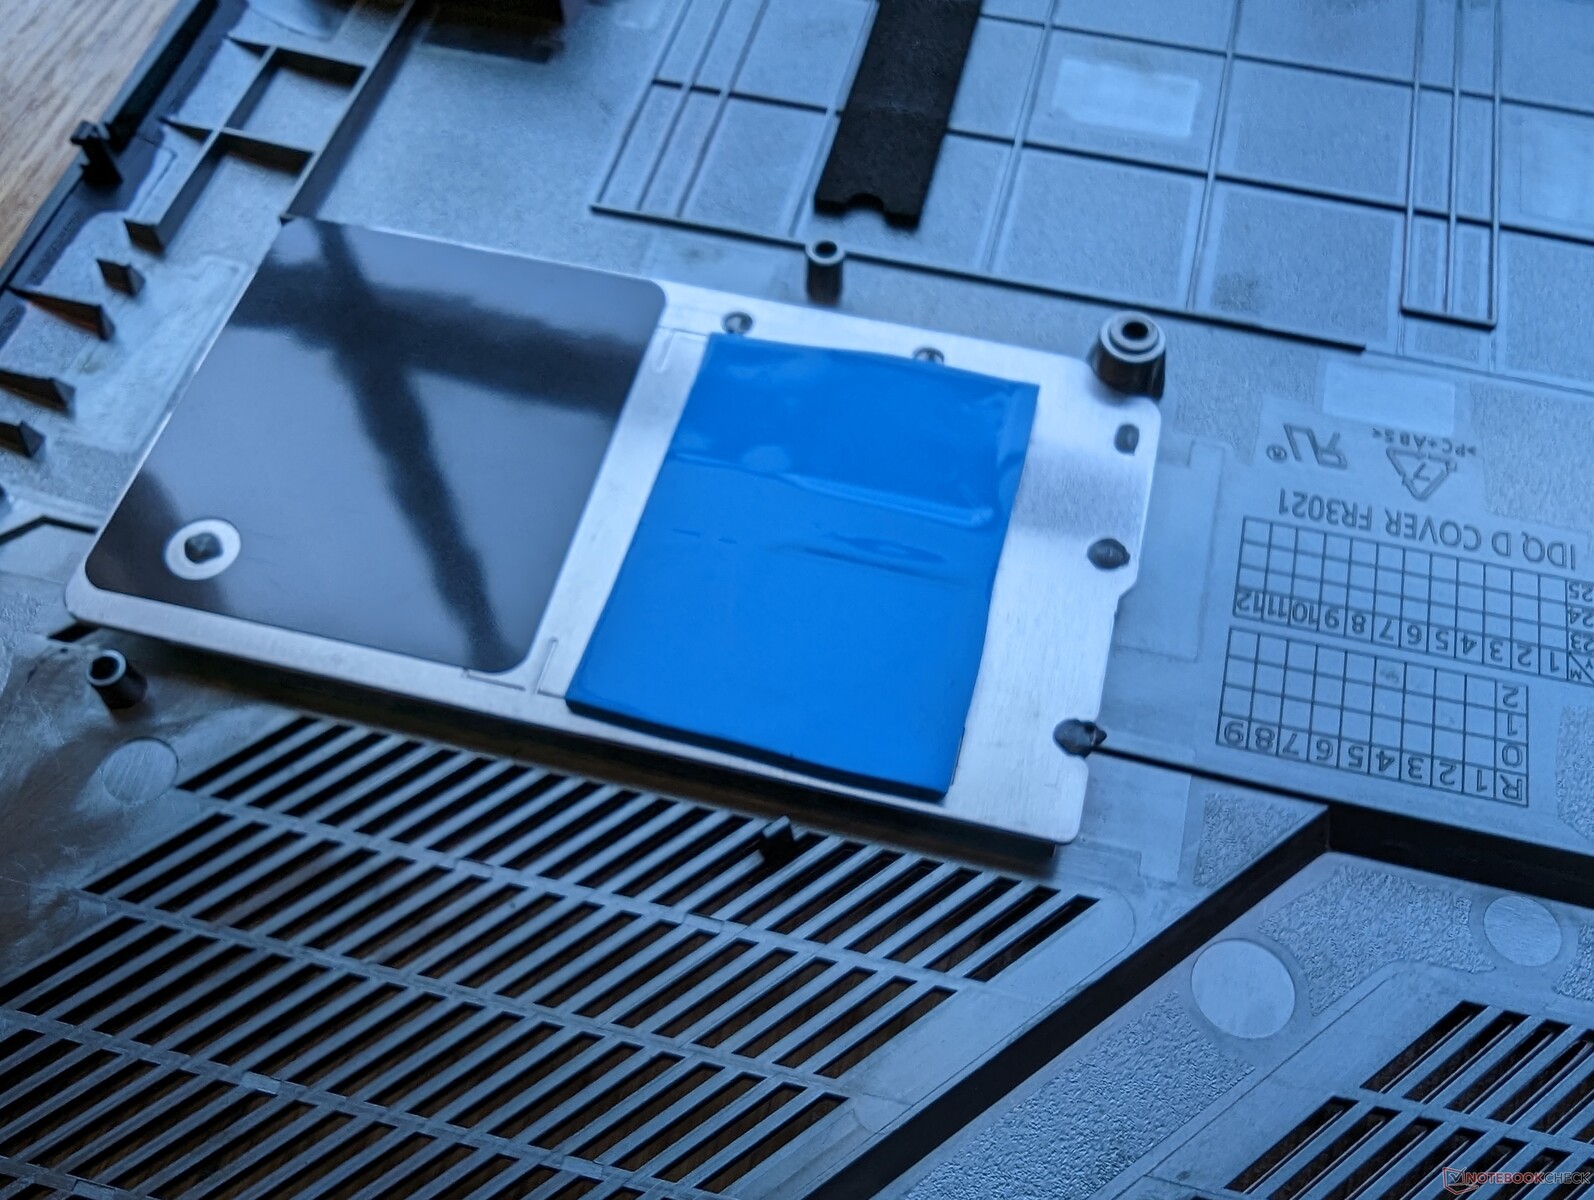
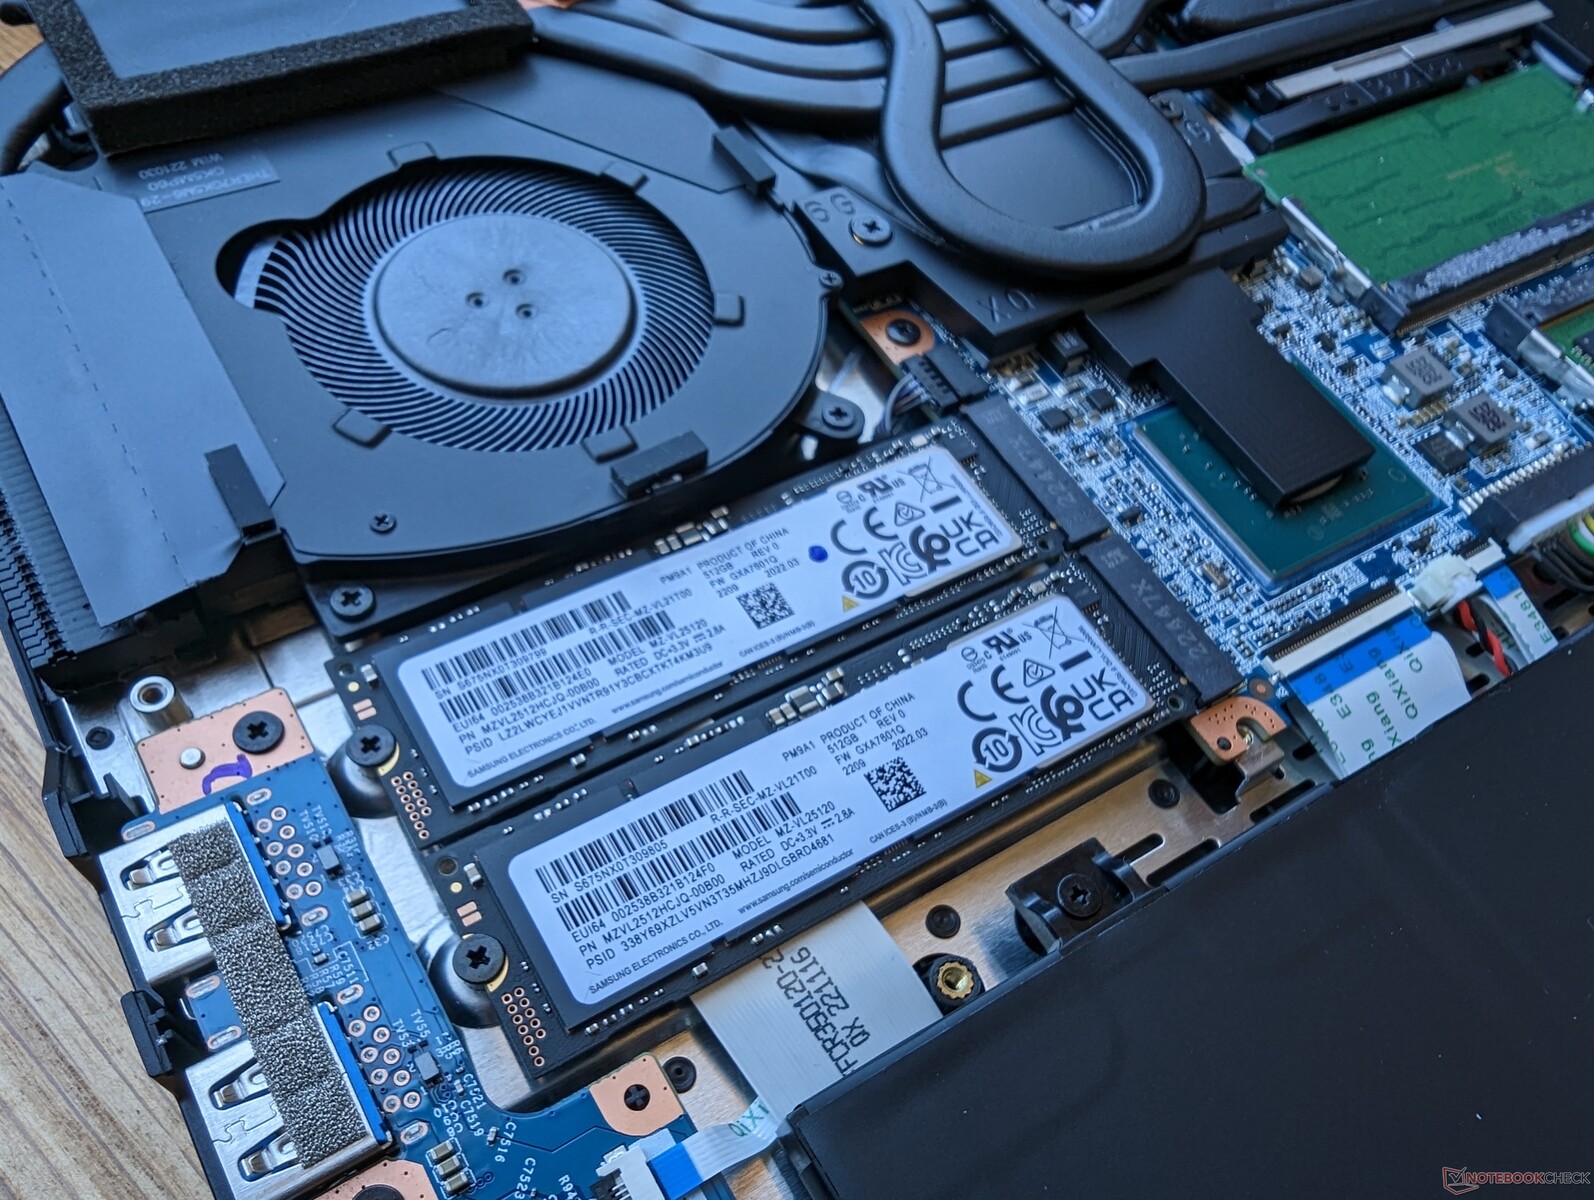
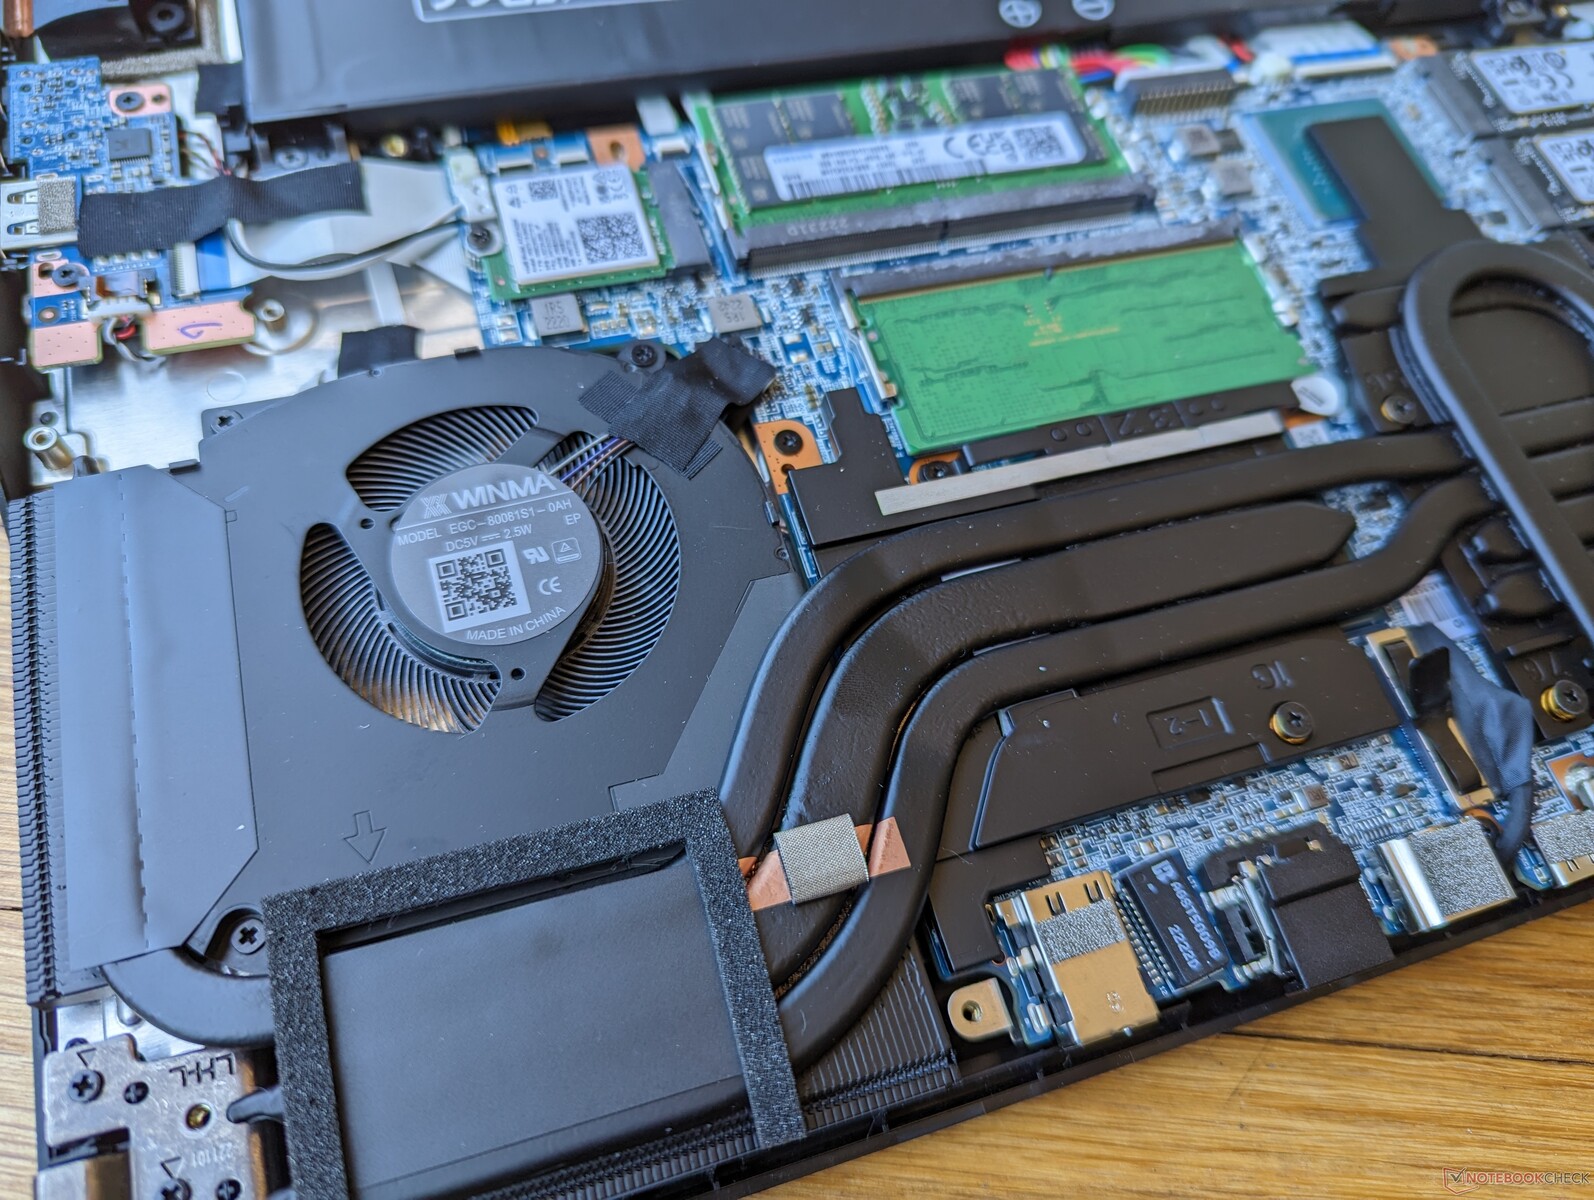
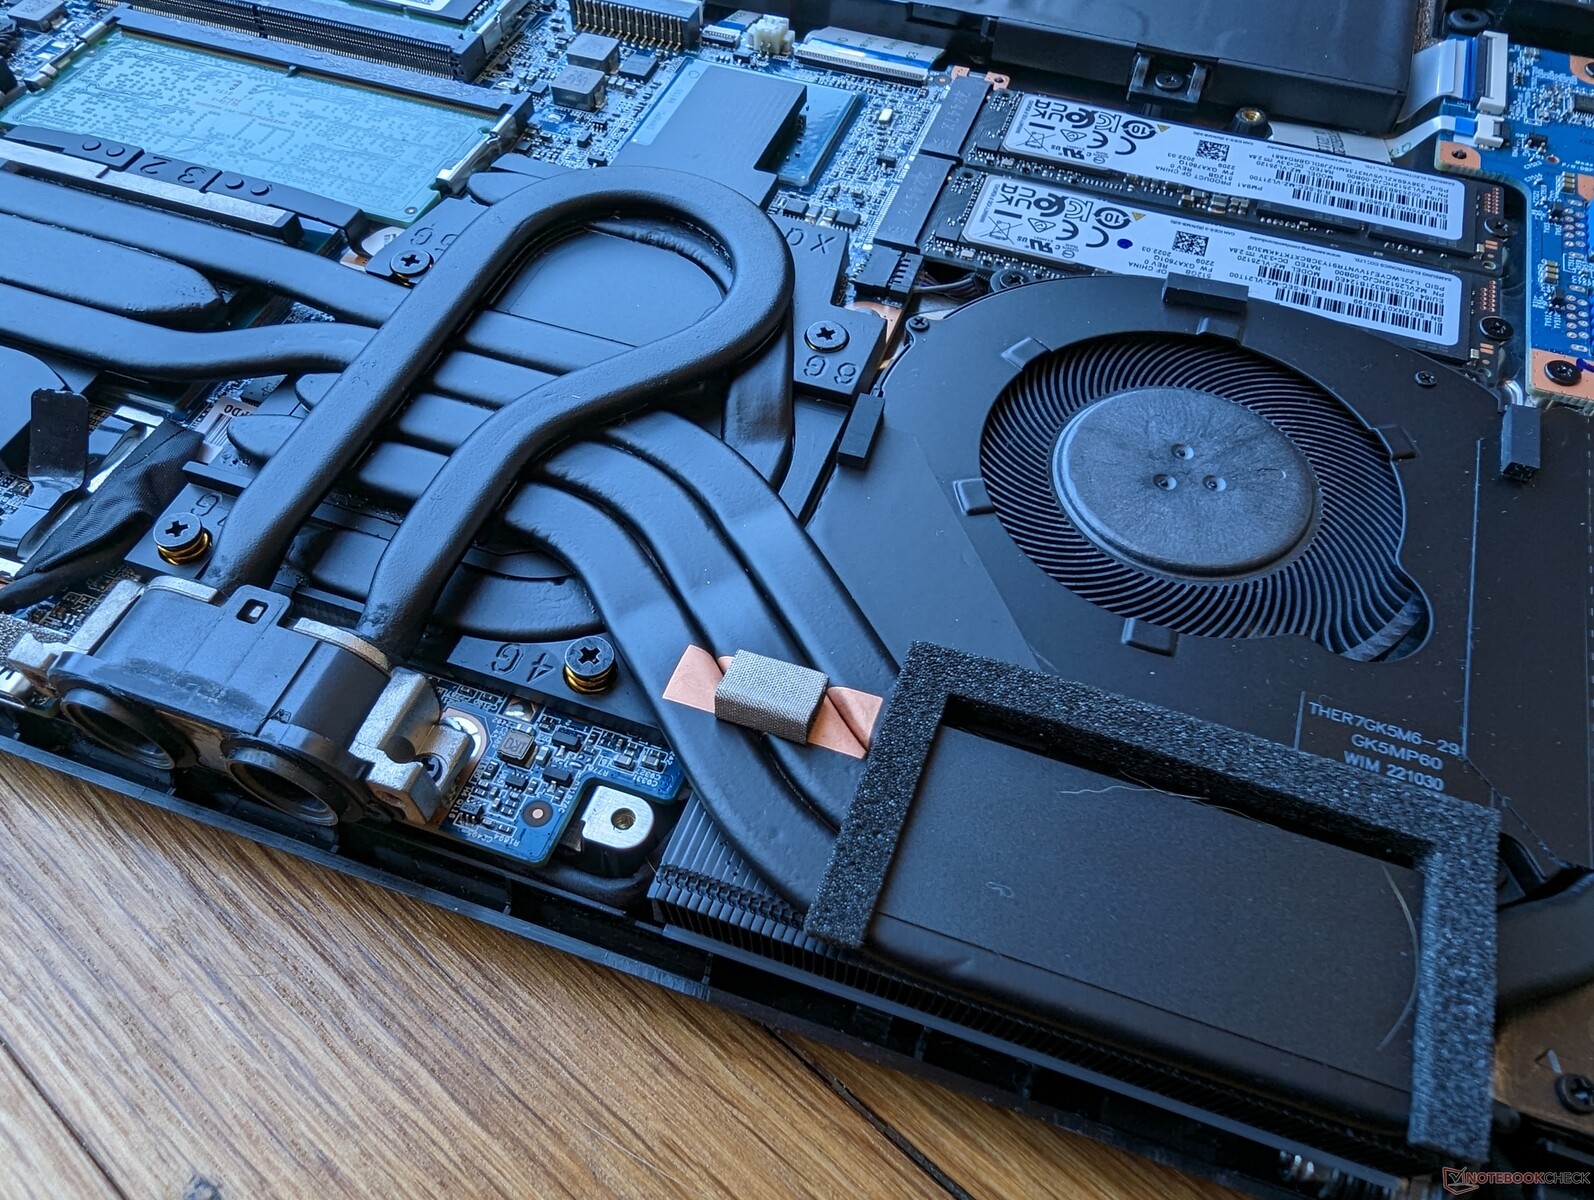
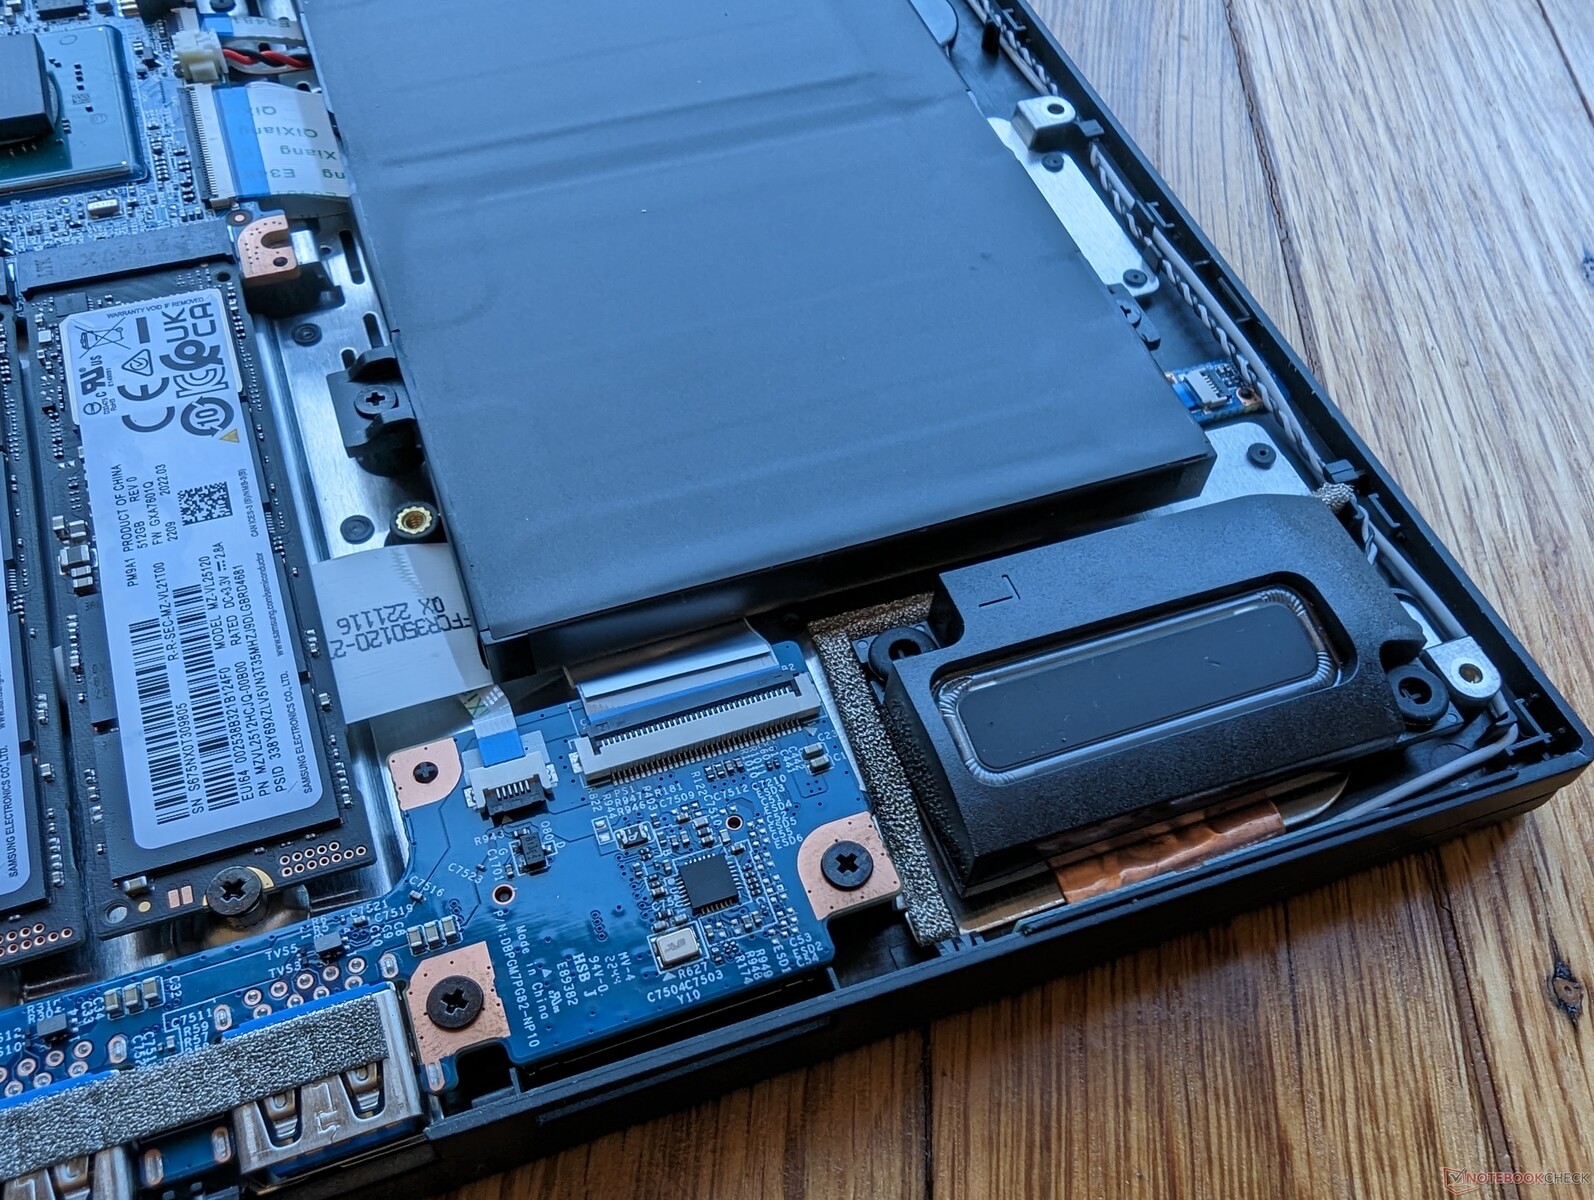
Maintenance
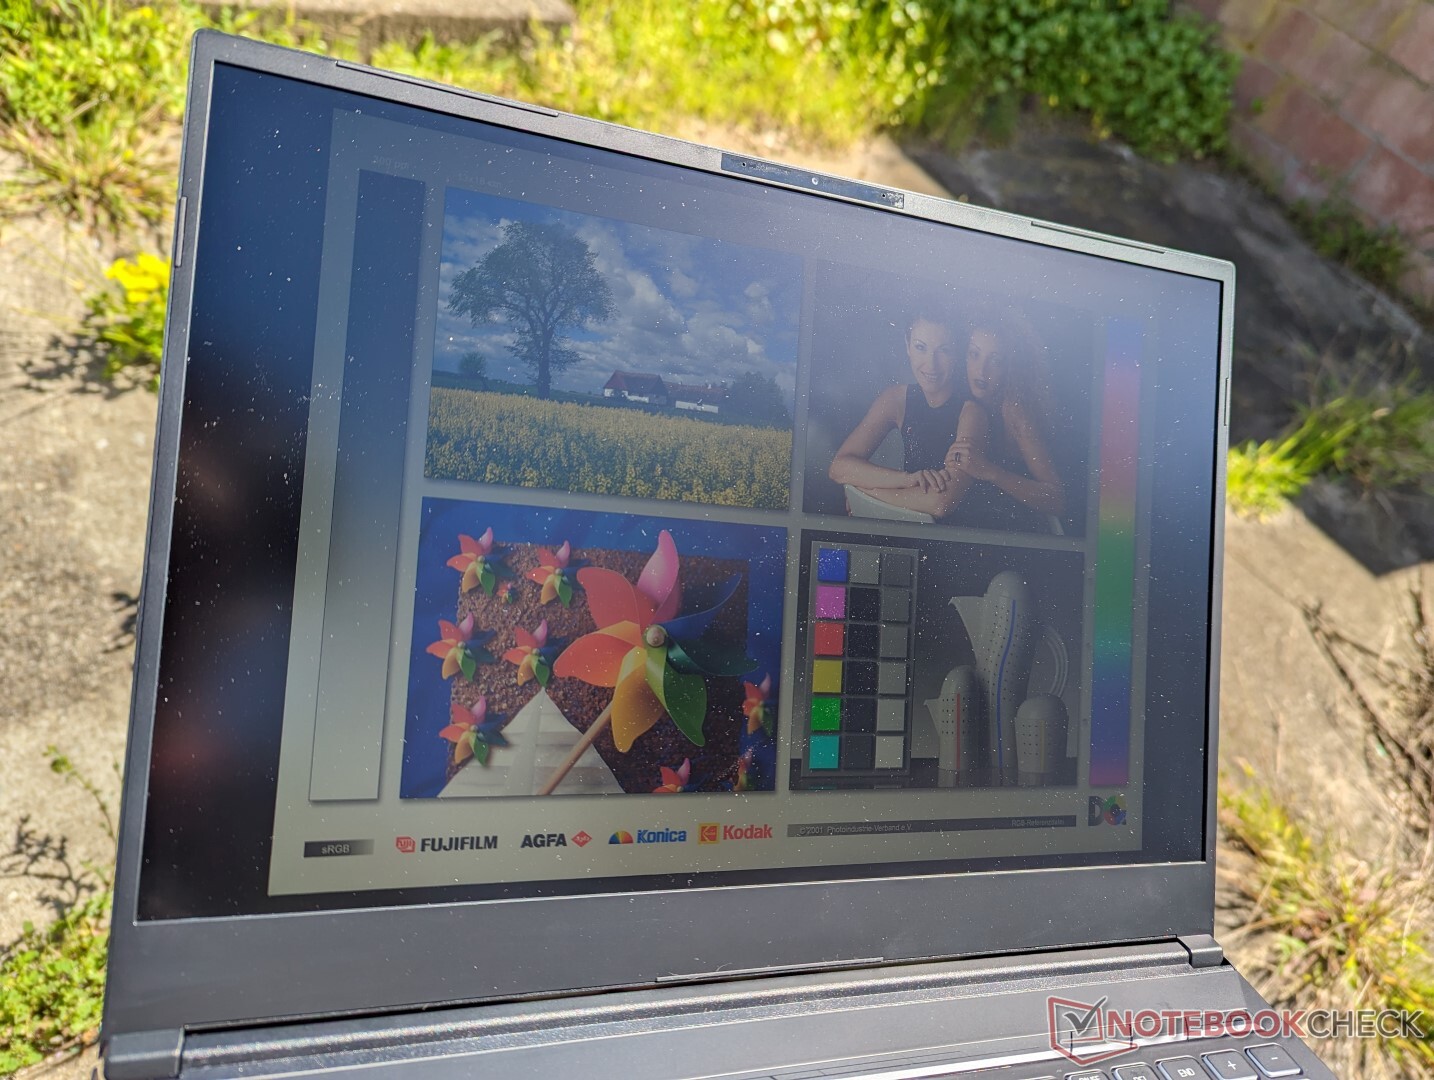
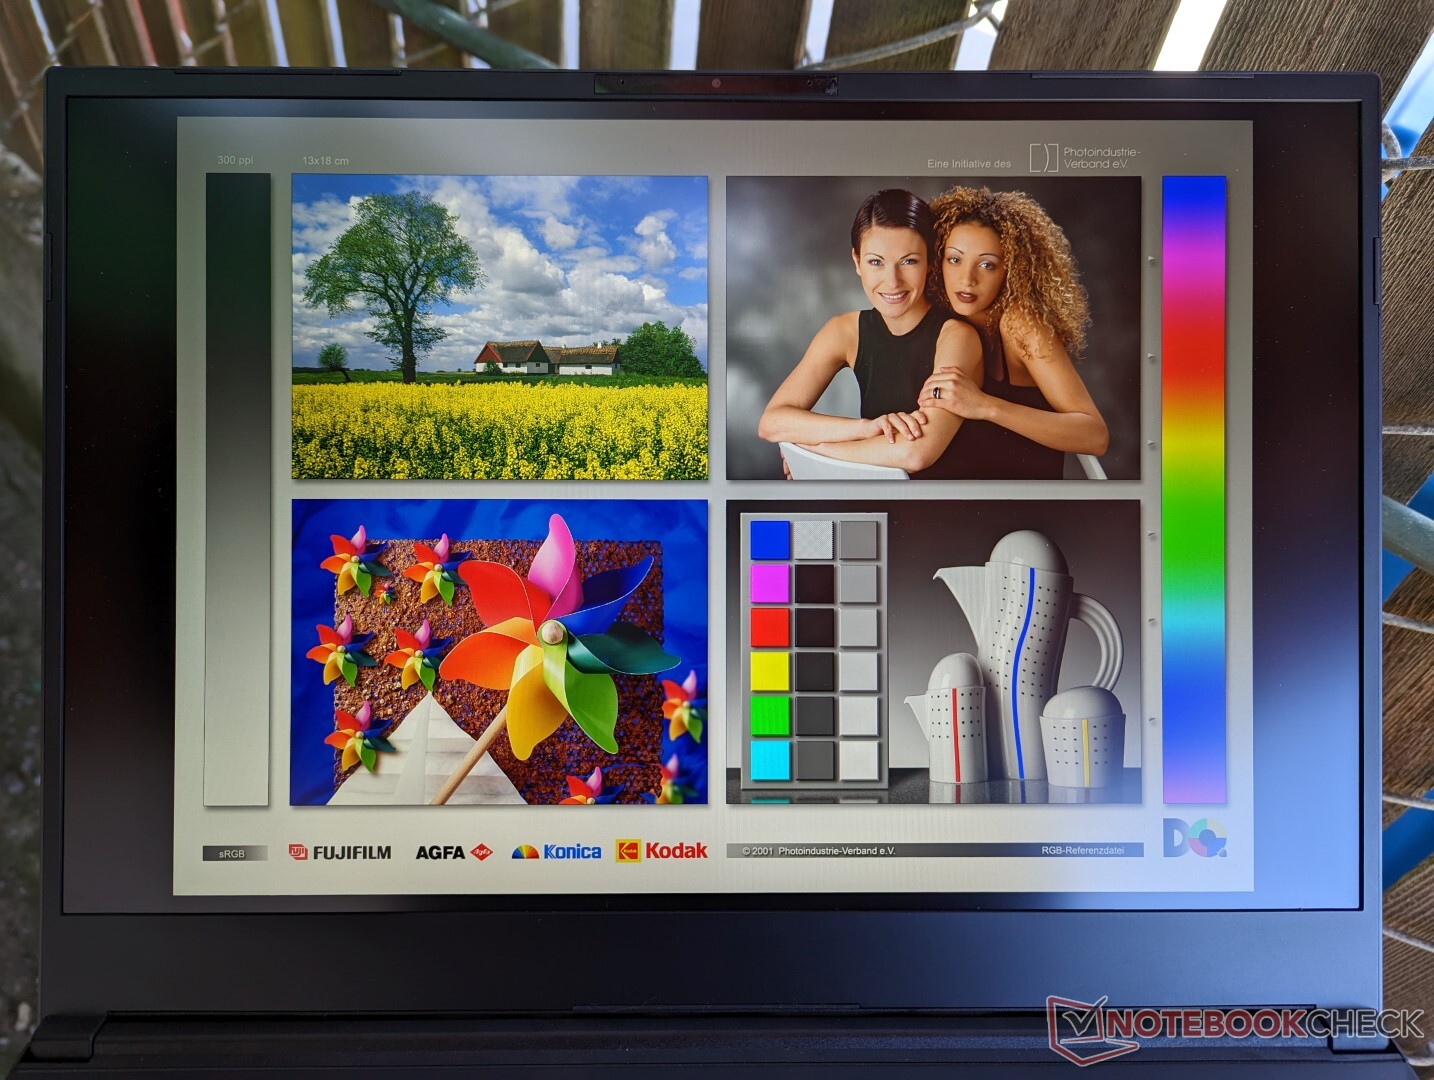
Display
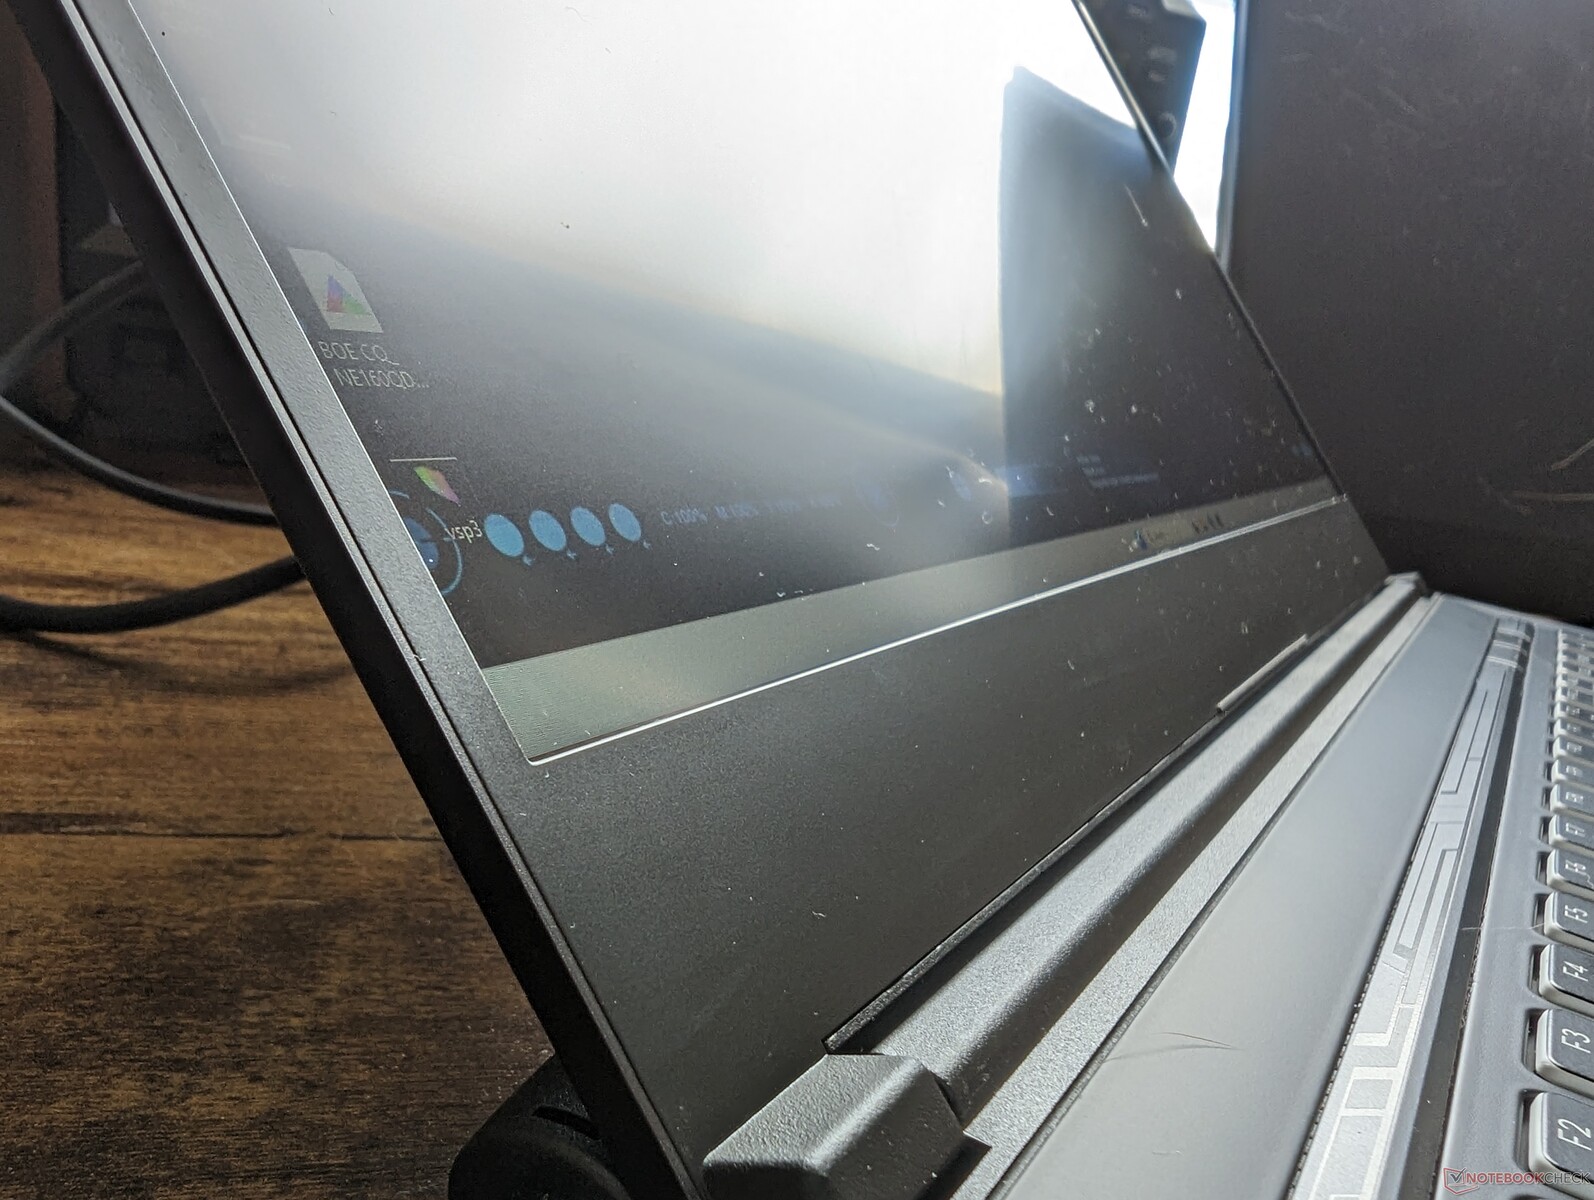
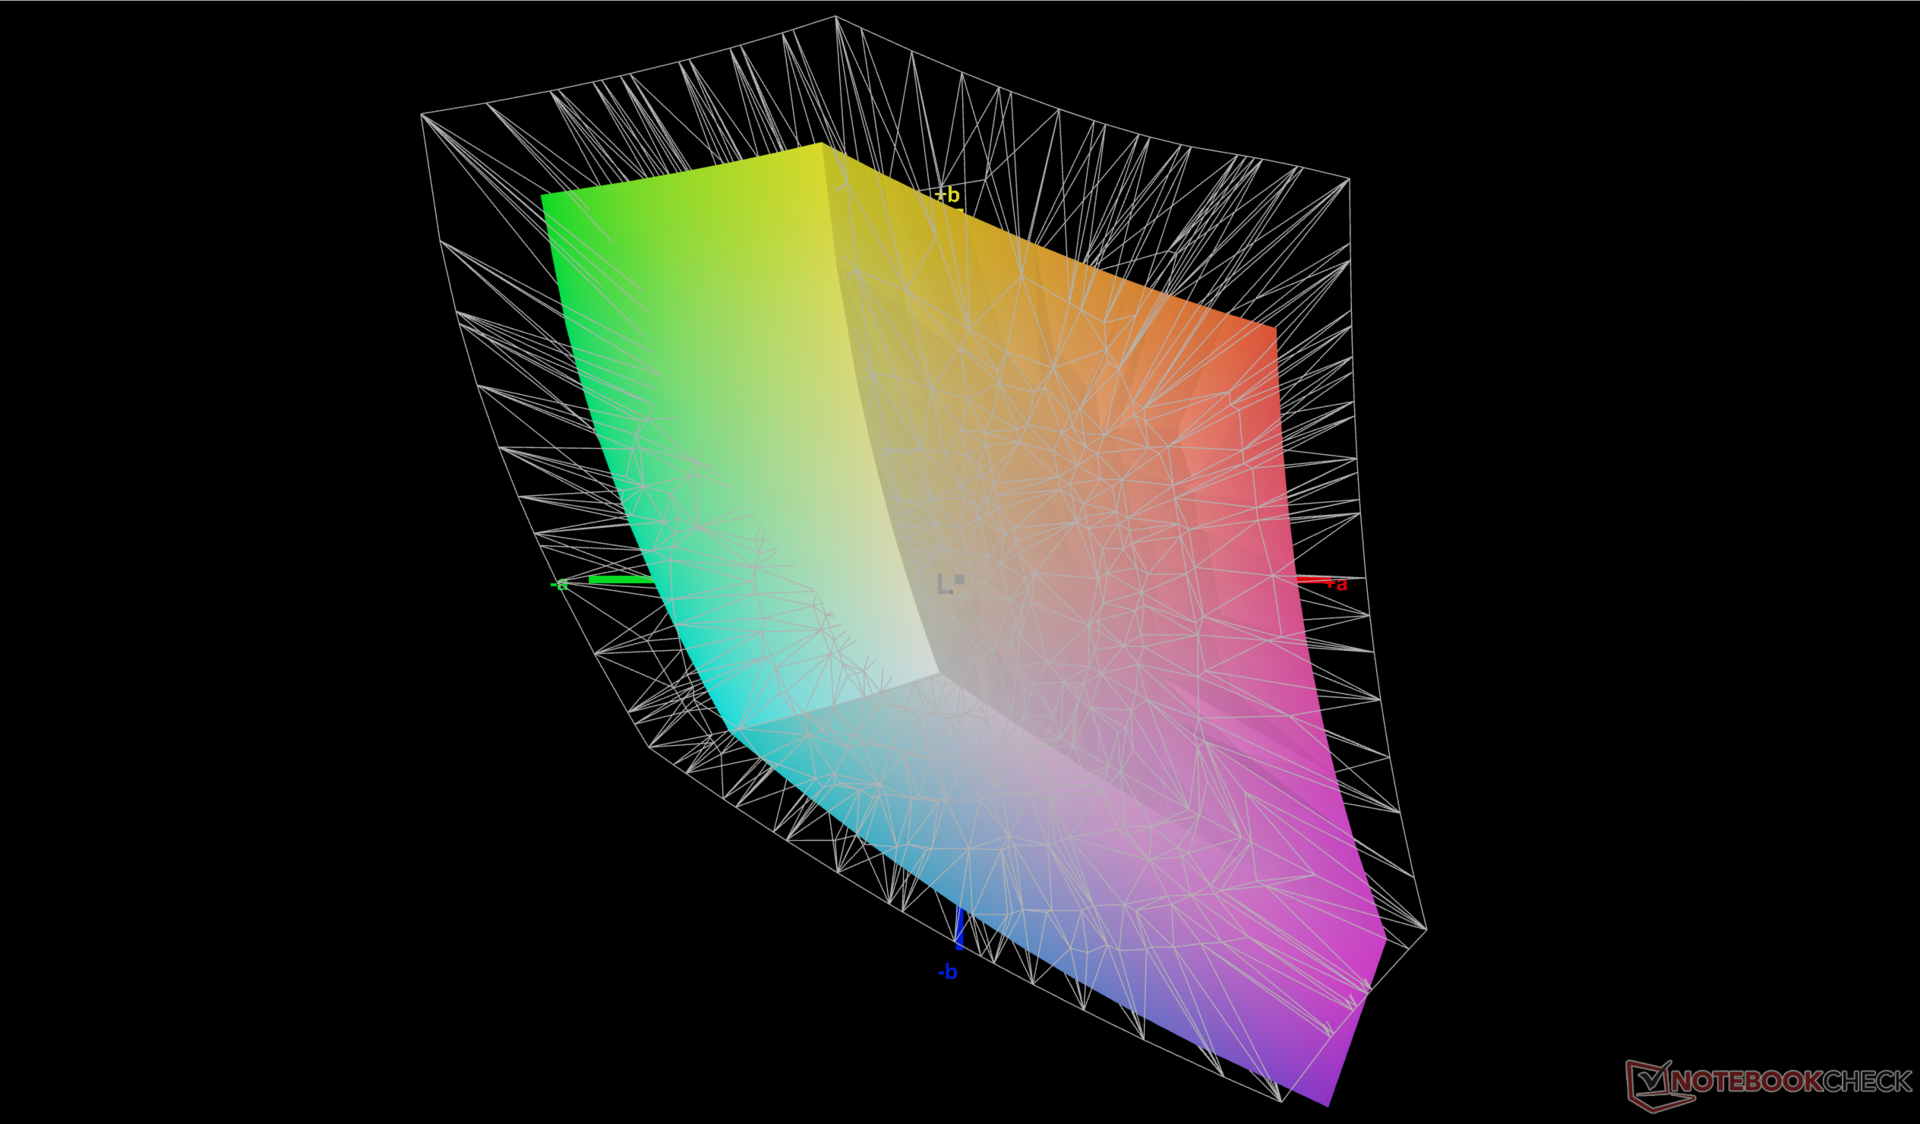
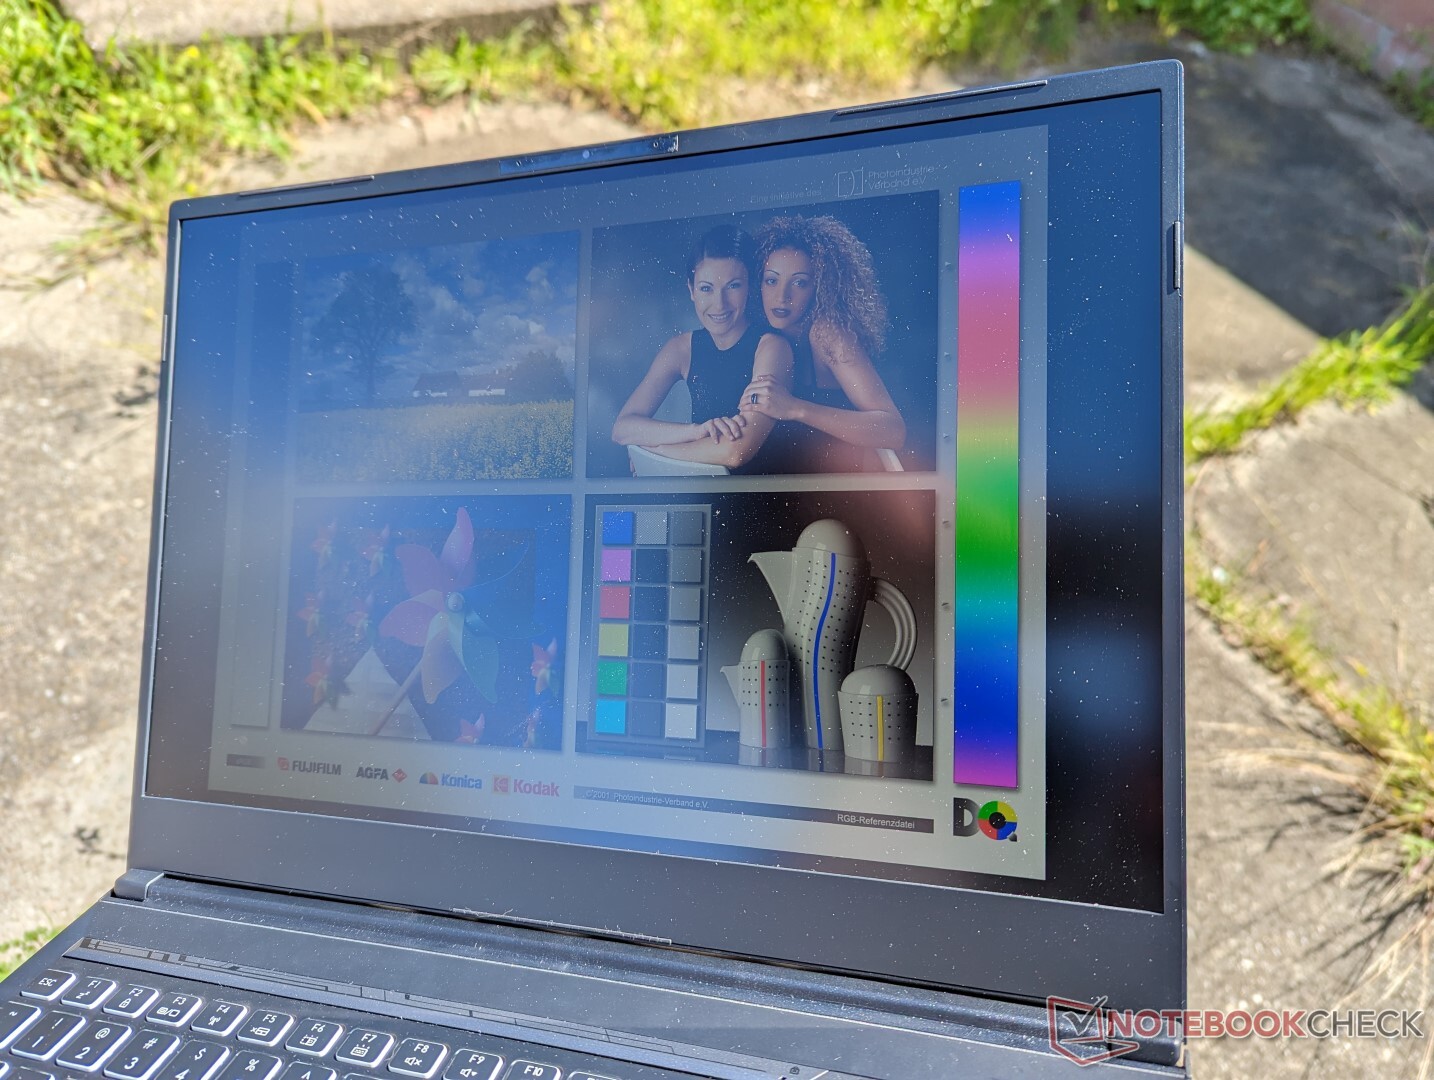
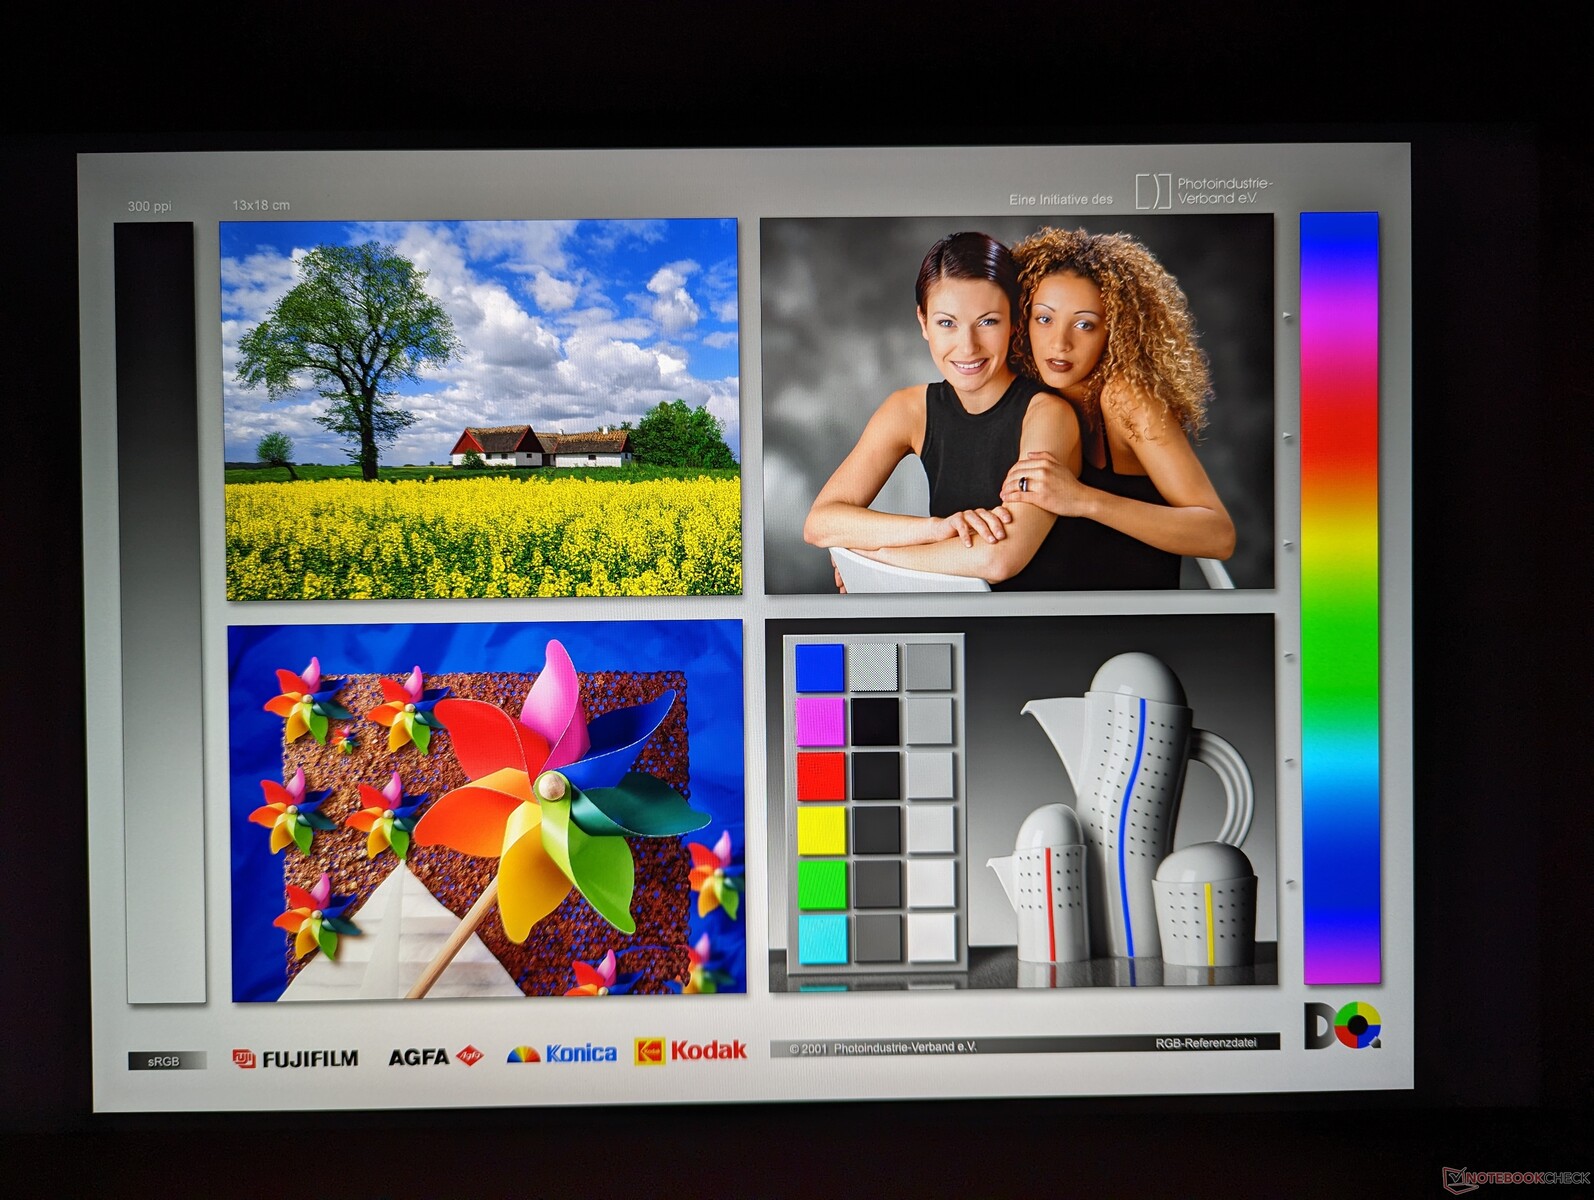
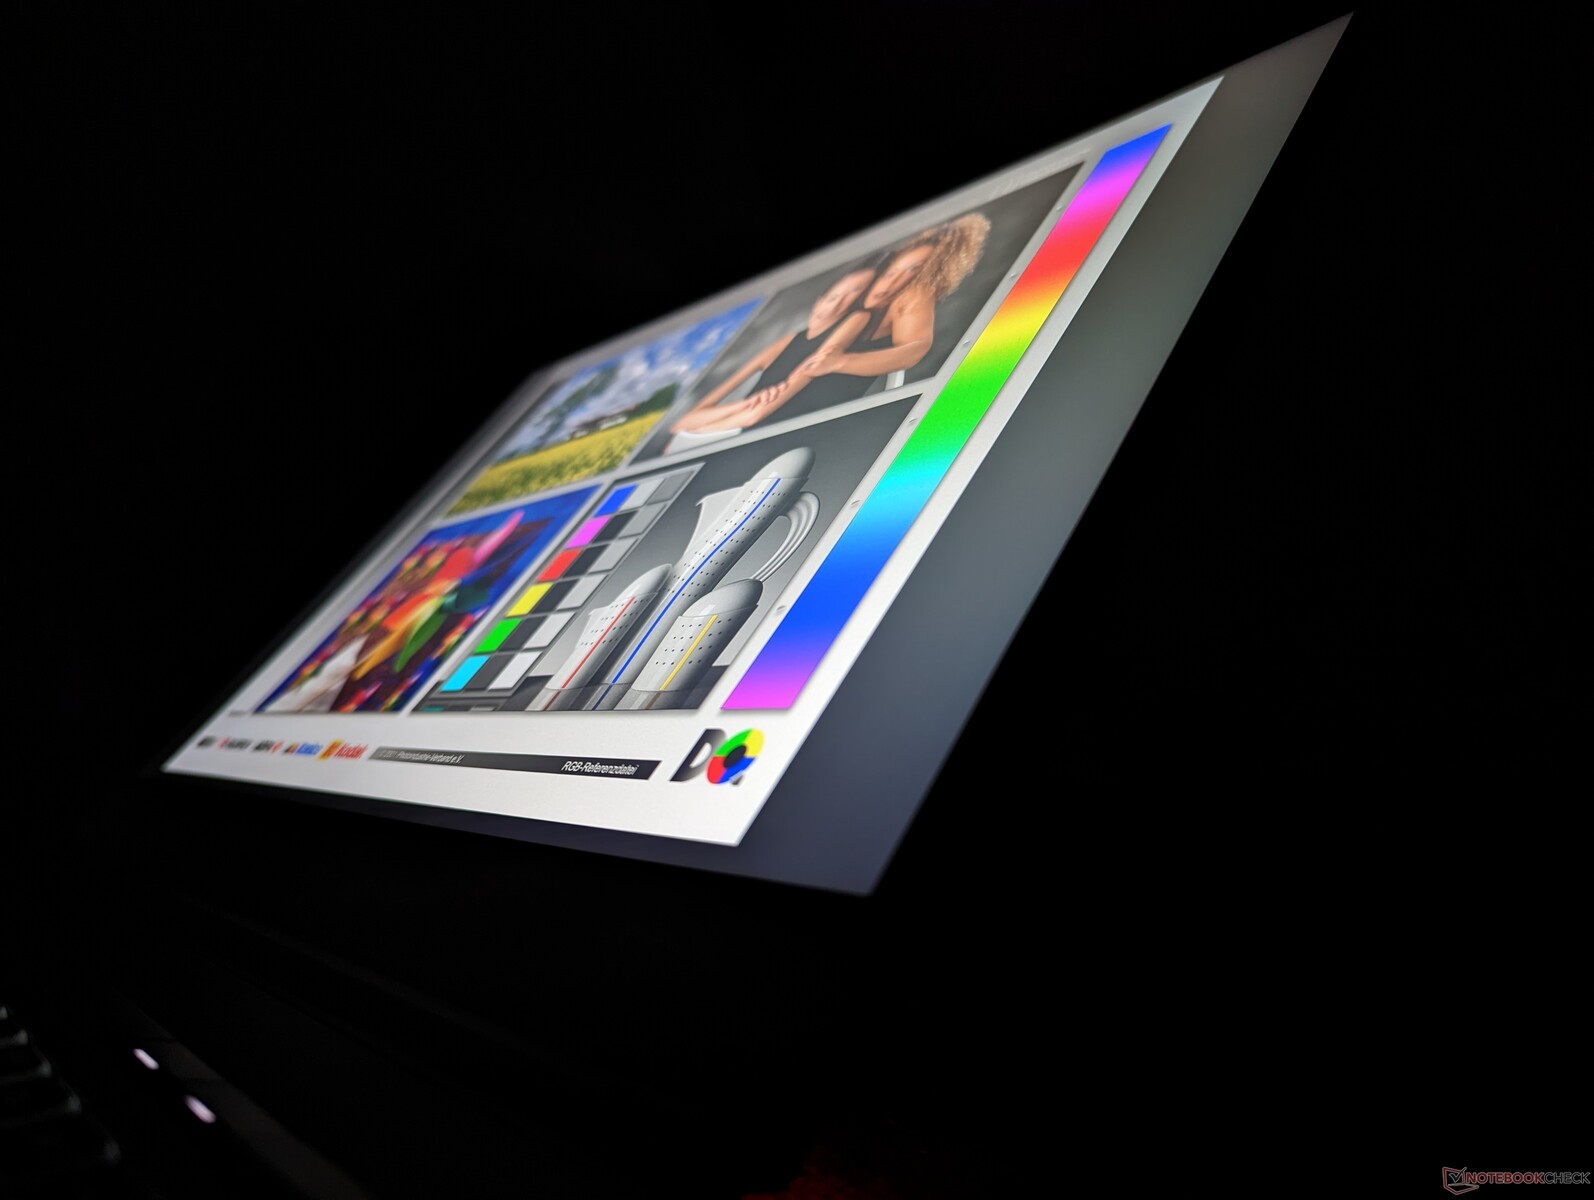
There are no second display options for this particular chassis design and so our Uniwill utilizes the same BOE NE160QDM-NZ1 IPS panel as found on the RTX 4090-powered Schenker Neo 16. The panel is notable for its fast 240 Hz refresh rate and >95 percent sRGB coverage. Nonetheless, competing laptops like the Asus ROG Strix G16 or Gigabyte AERO 16 OLED offer even deeper colors and faster response times that hardcore gamers or graphics editors can appreciate.

| |||||||||||||||||||||||||
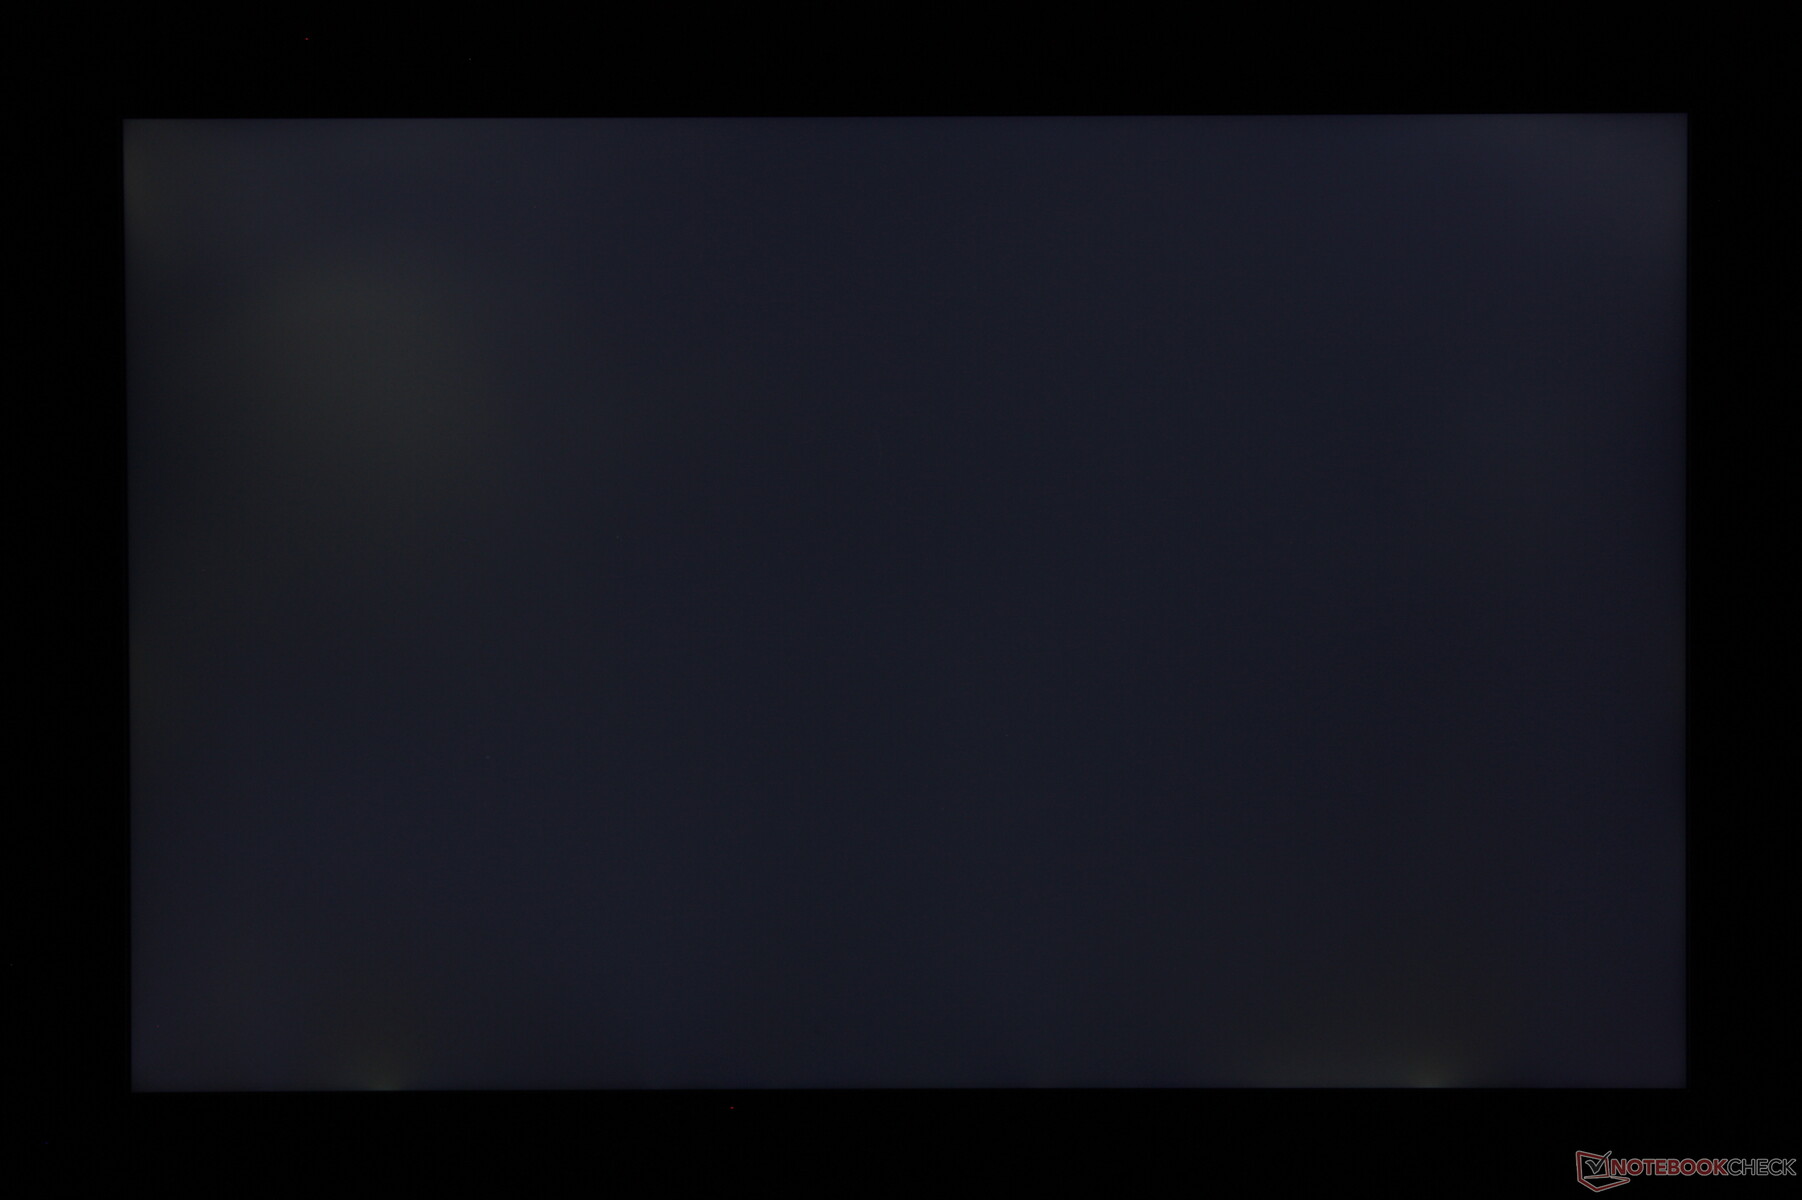
Brightness Distribution: 89 %
Center on Battery: 338.6 cd/m²
Contrast: 1058:1 (Black: 0.32 cd/m²)
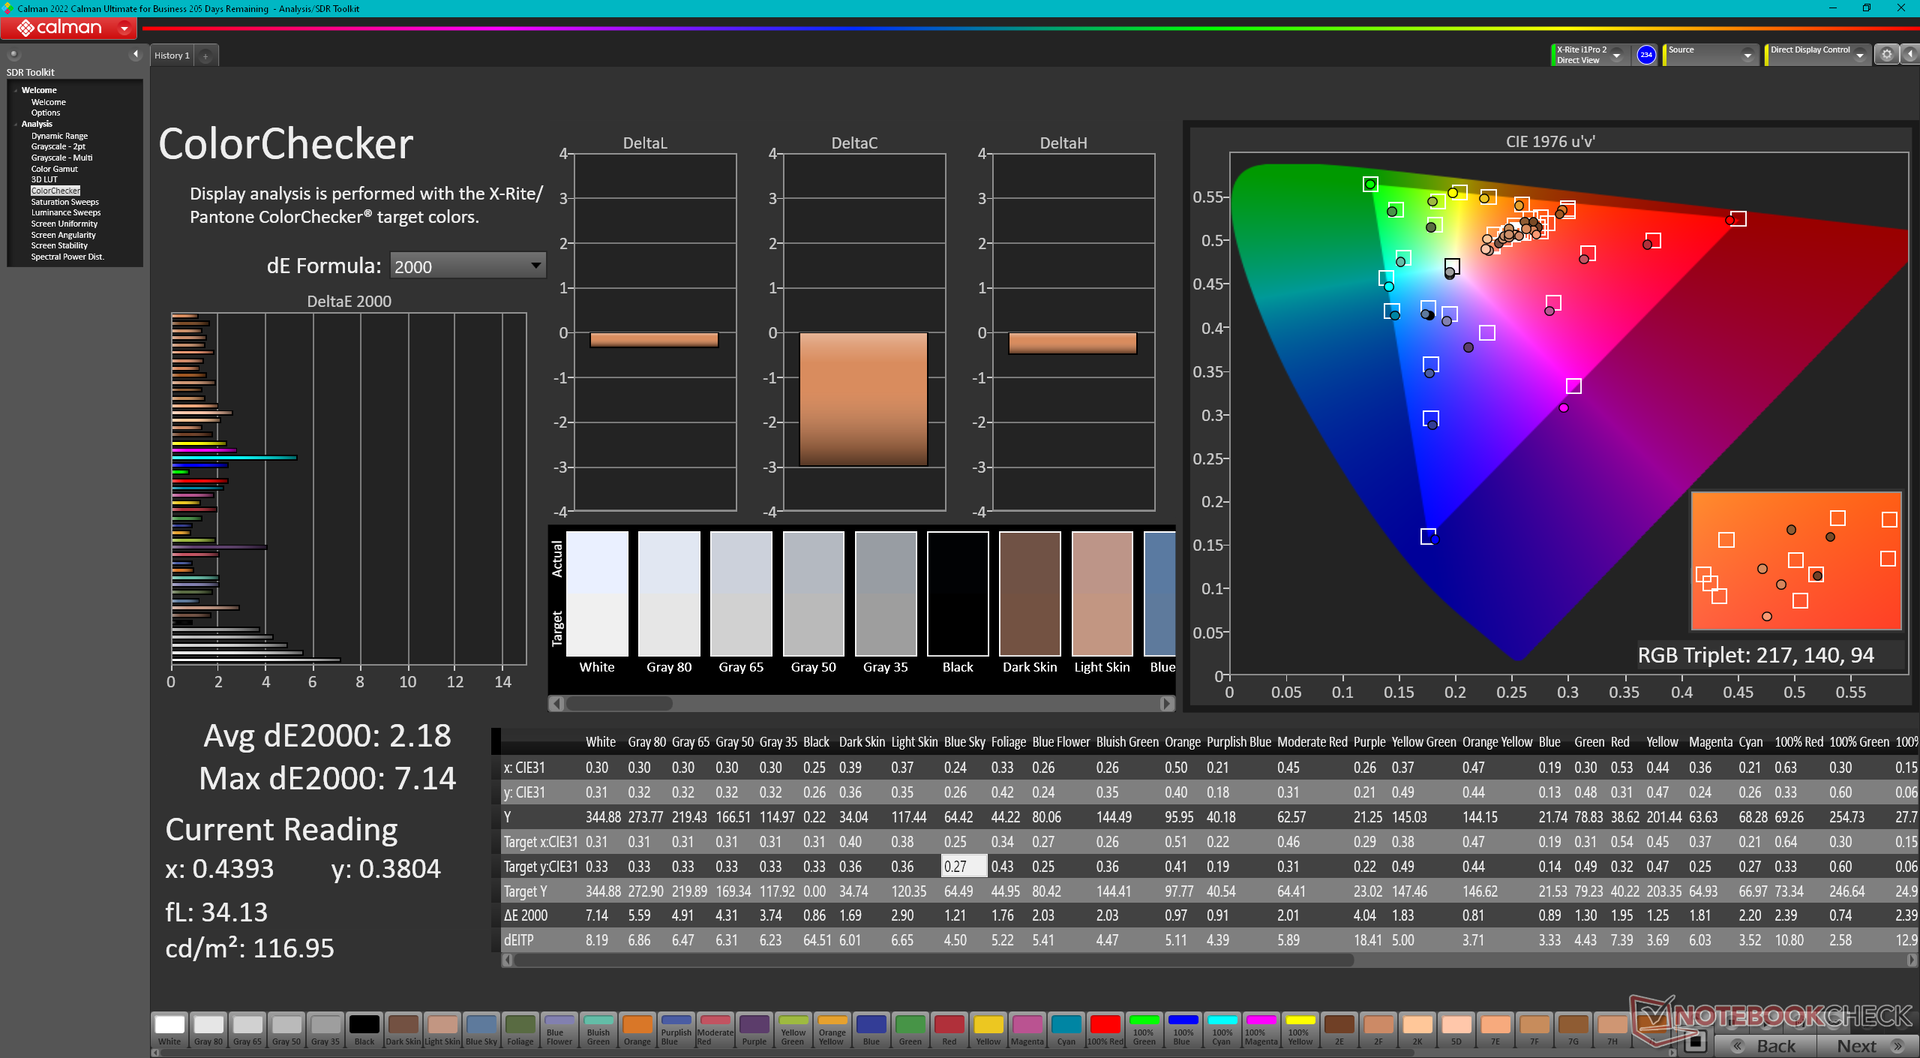
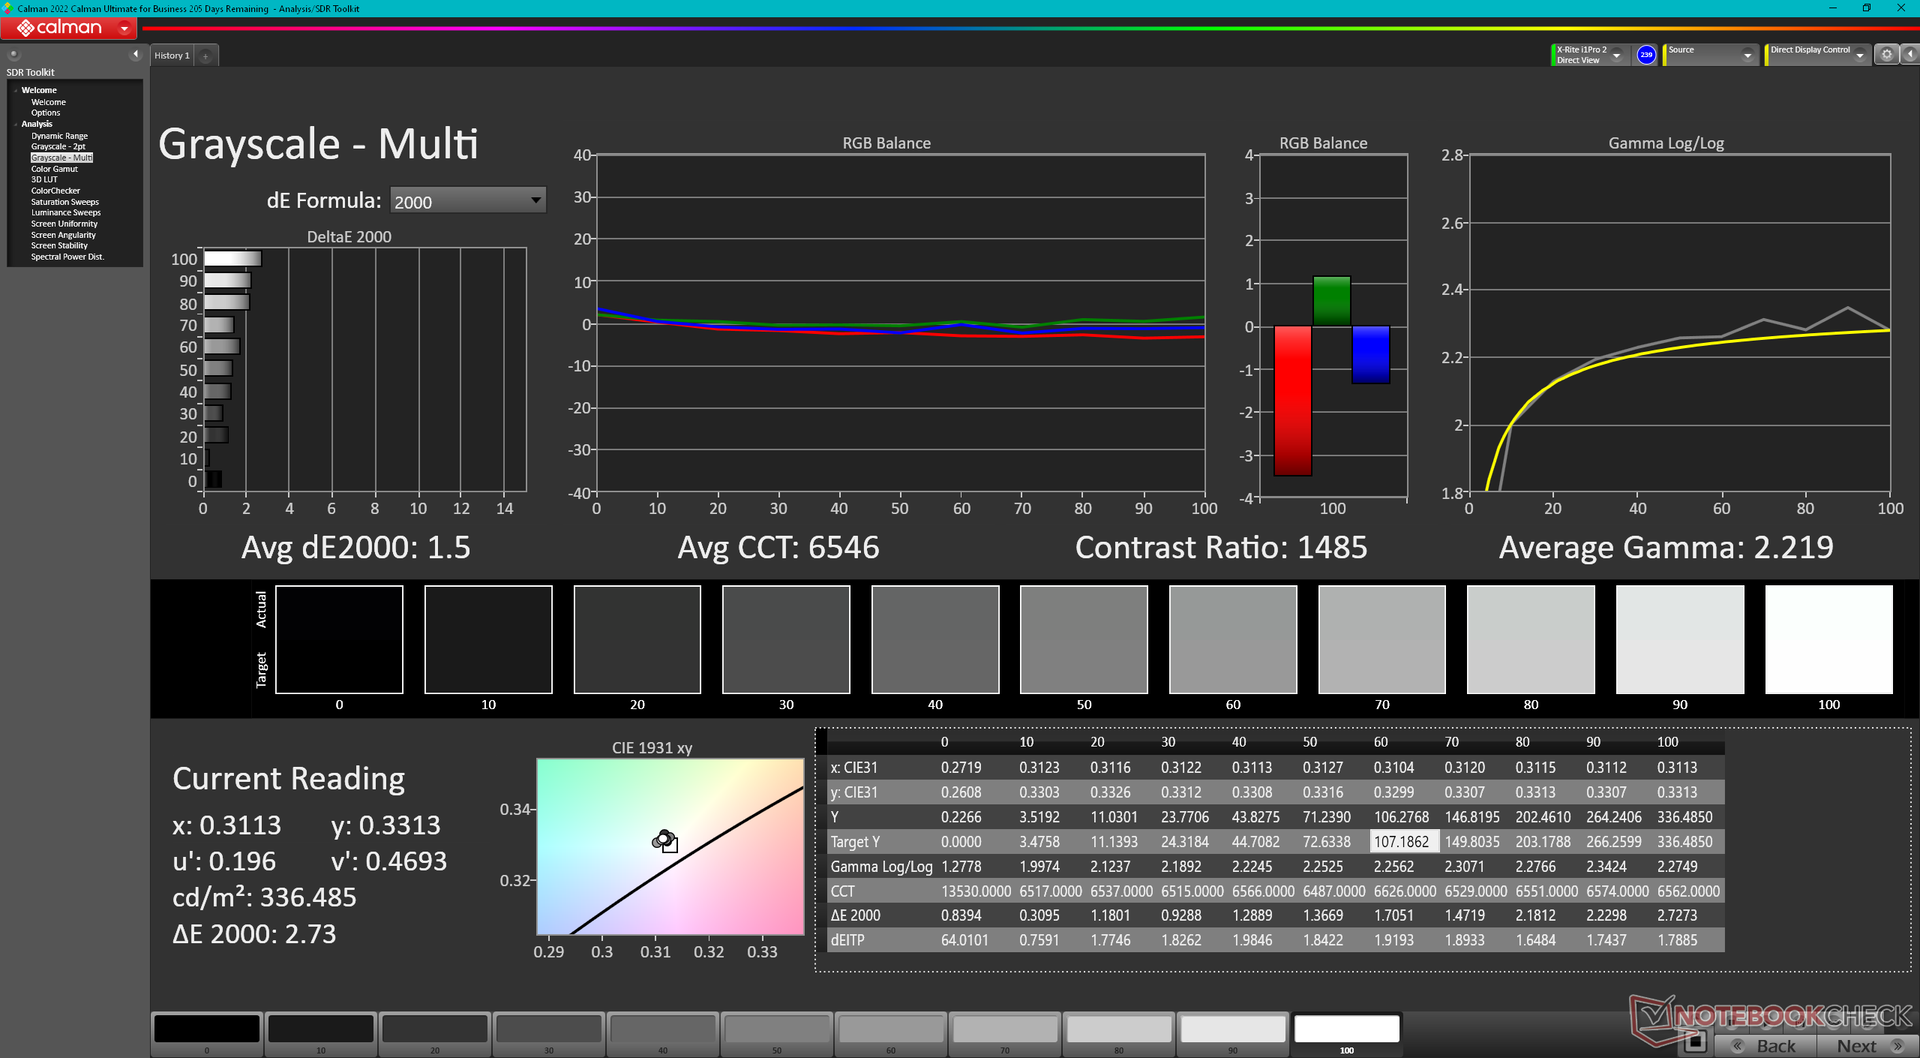
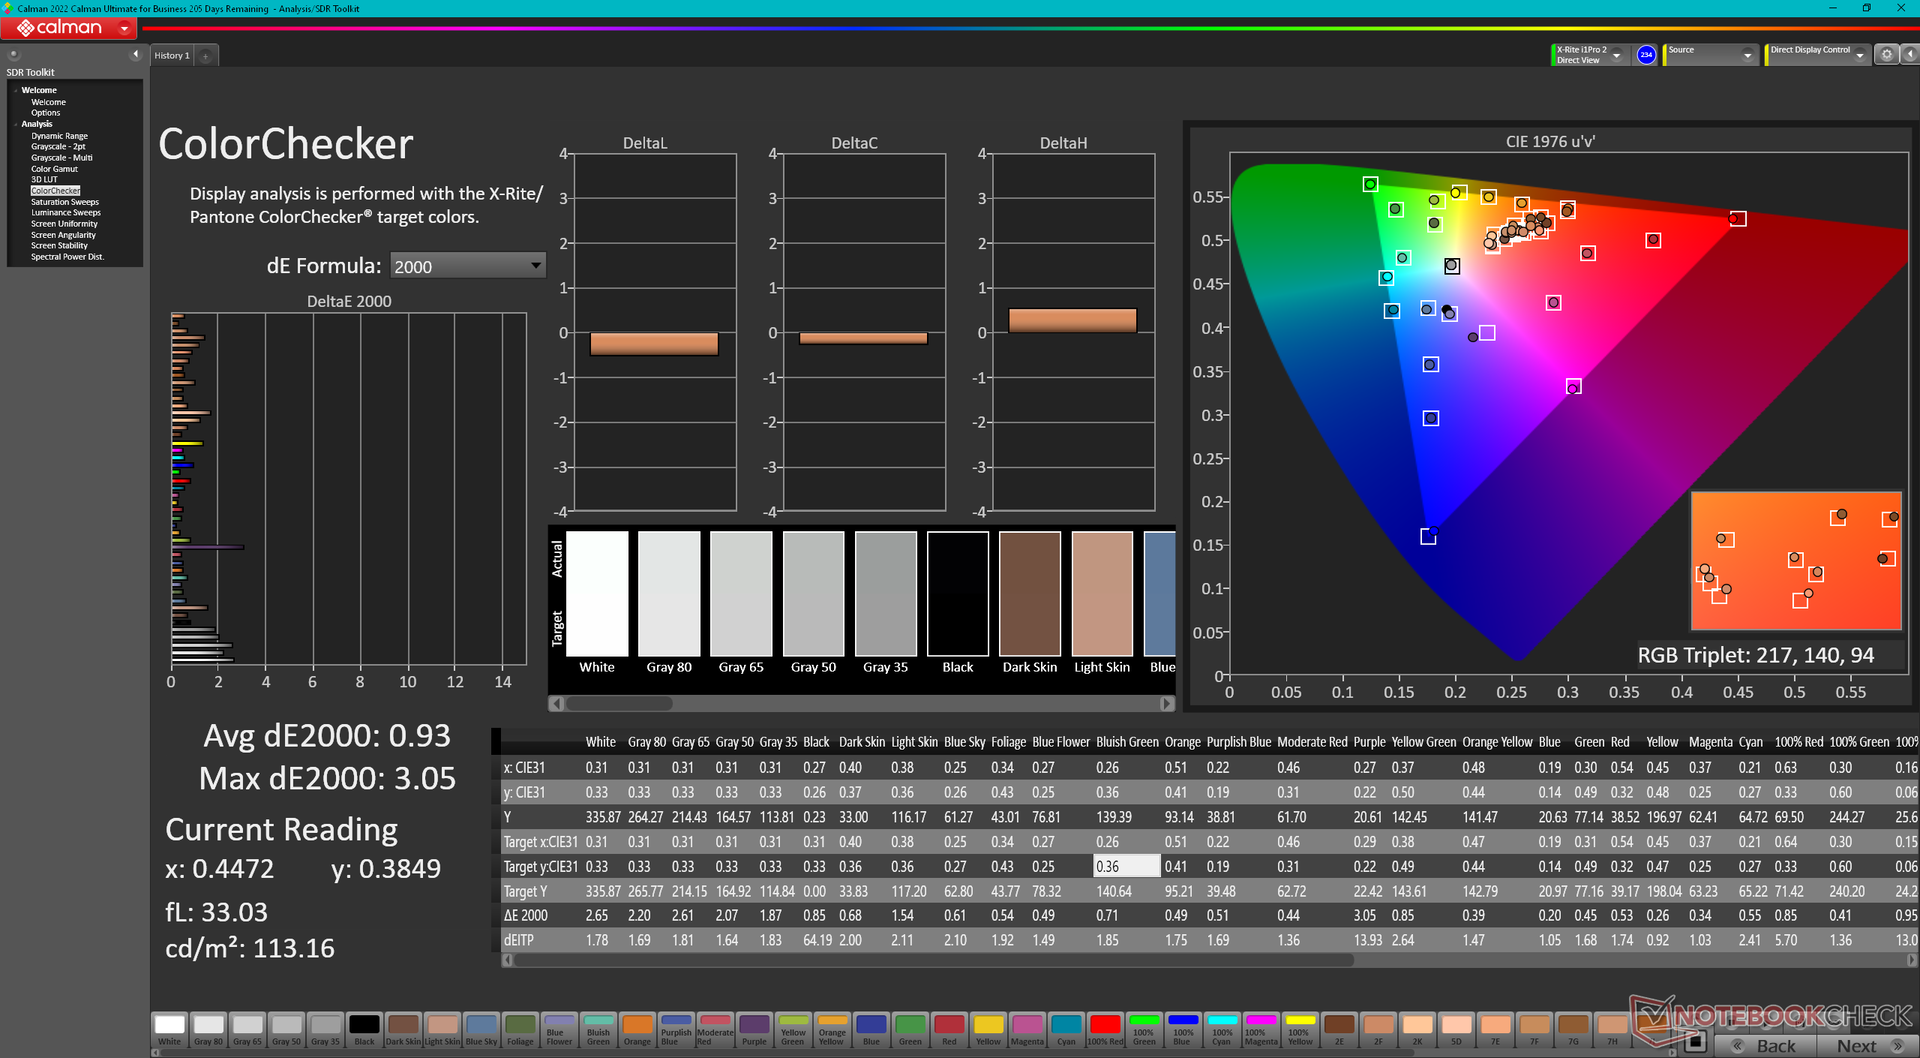
ΔE ColorChecker Calman: 2.18 | ∀{0.5-29.43 Ø4.75}
calibrated: 0.93
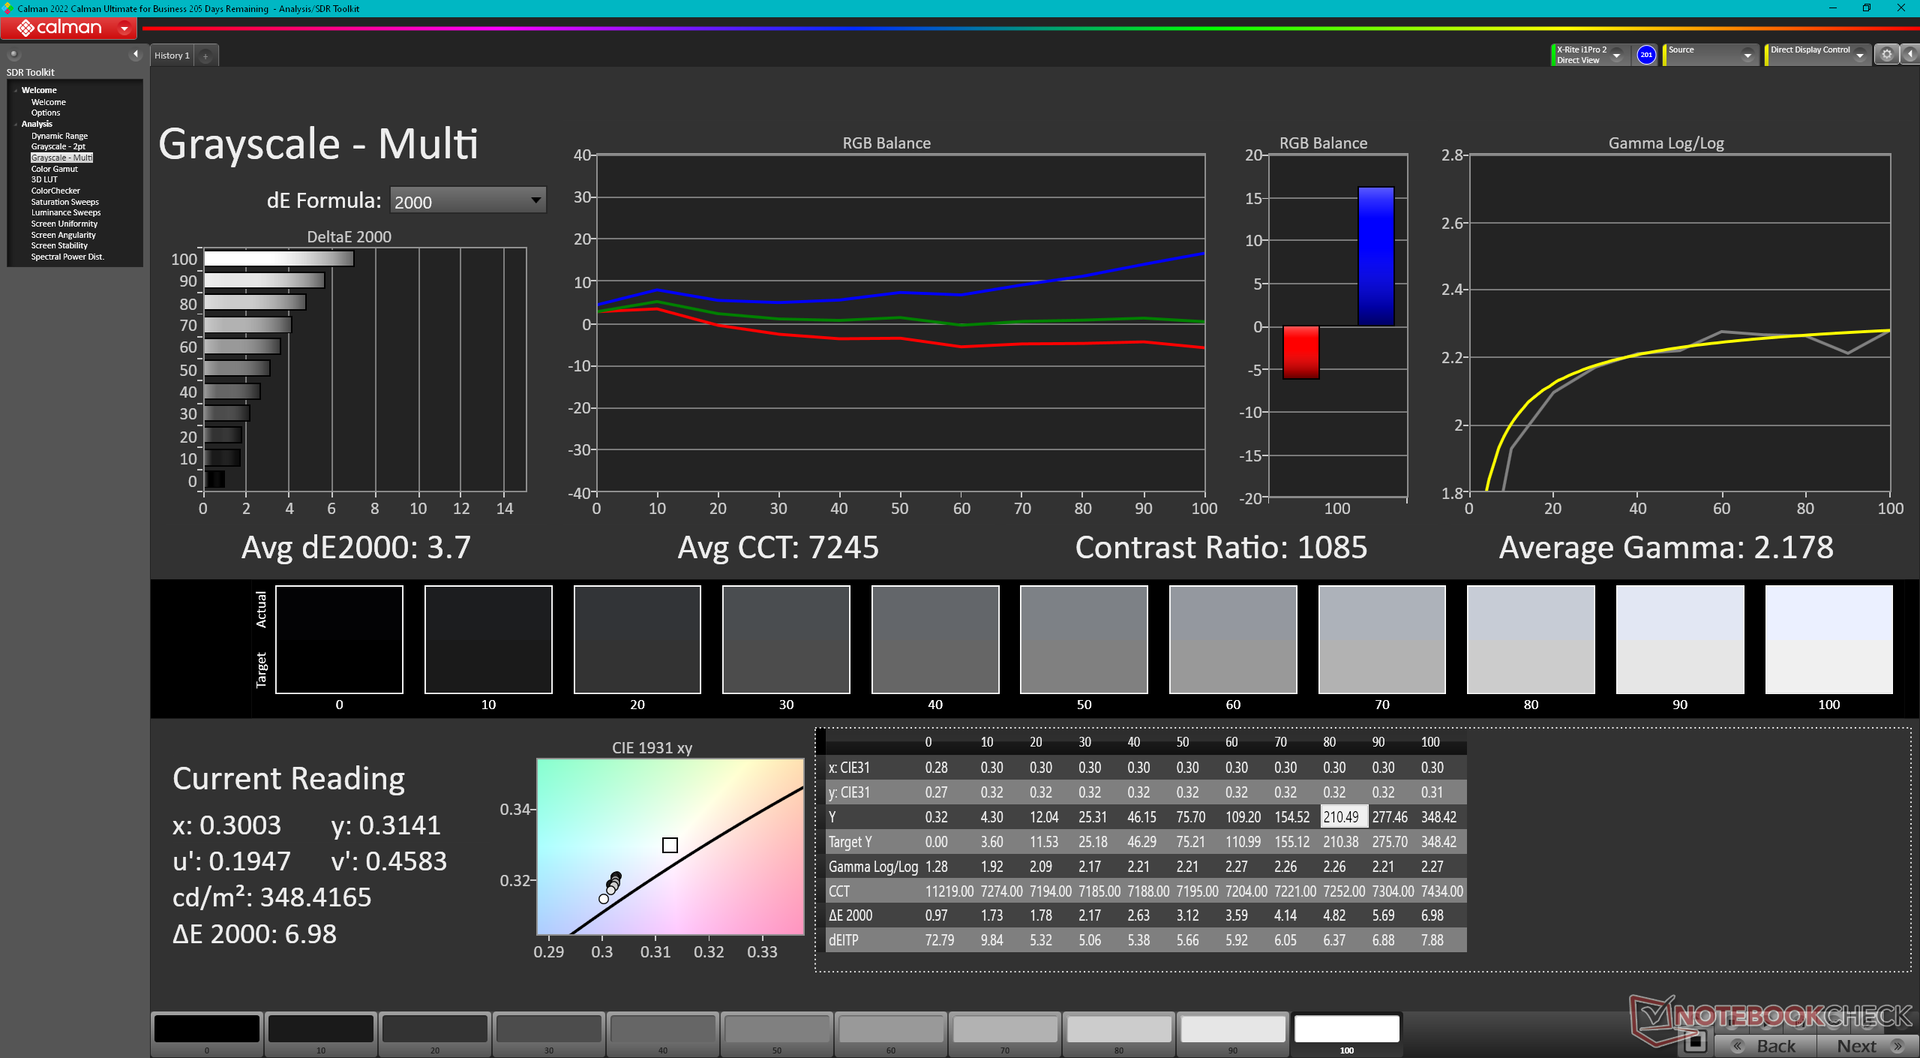
ΔE Greyscale Calman: 3.7 | ∀{0.09-98 Ø5}
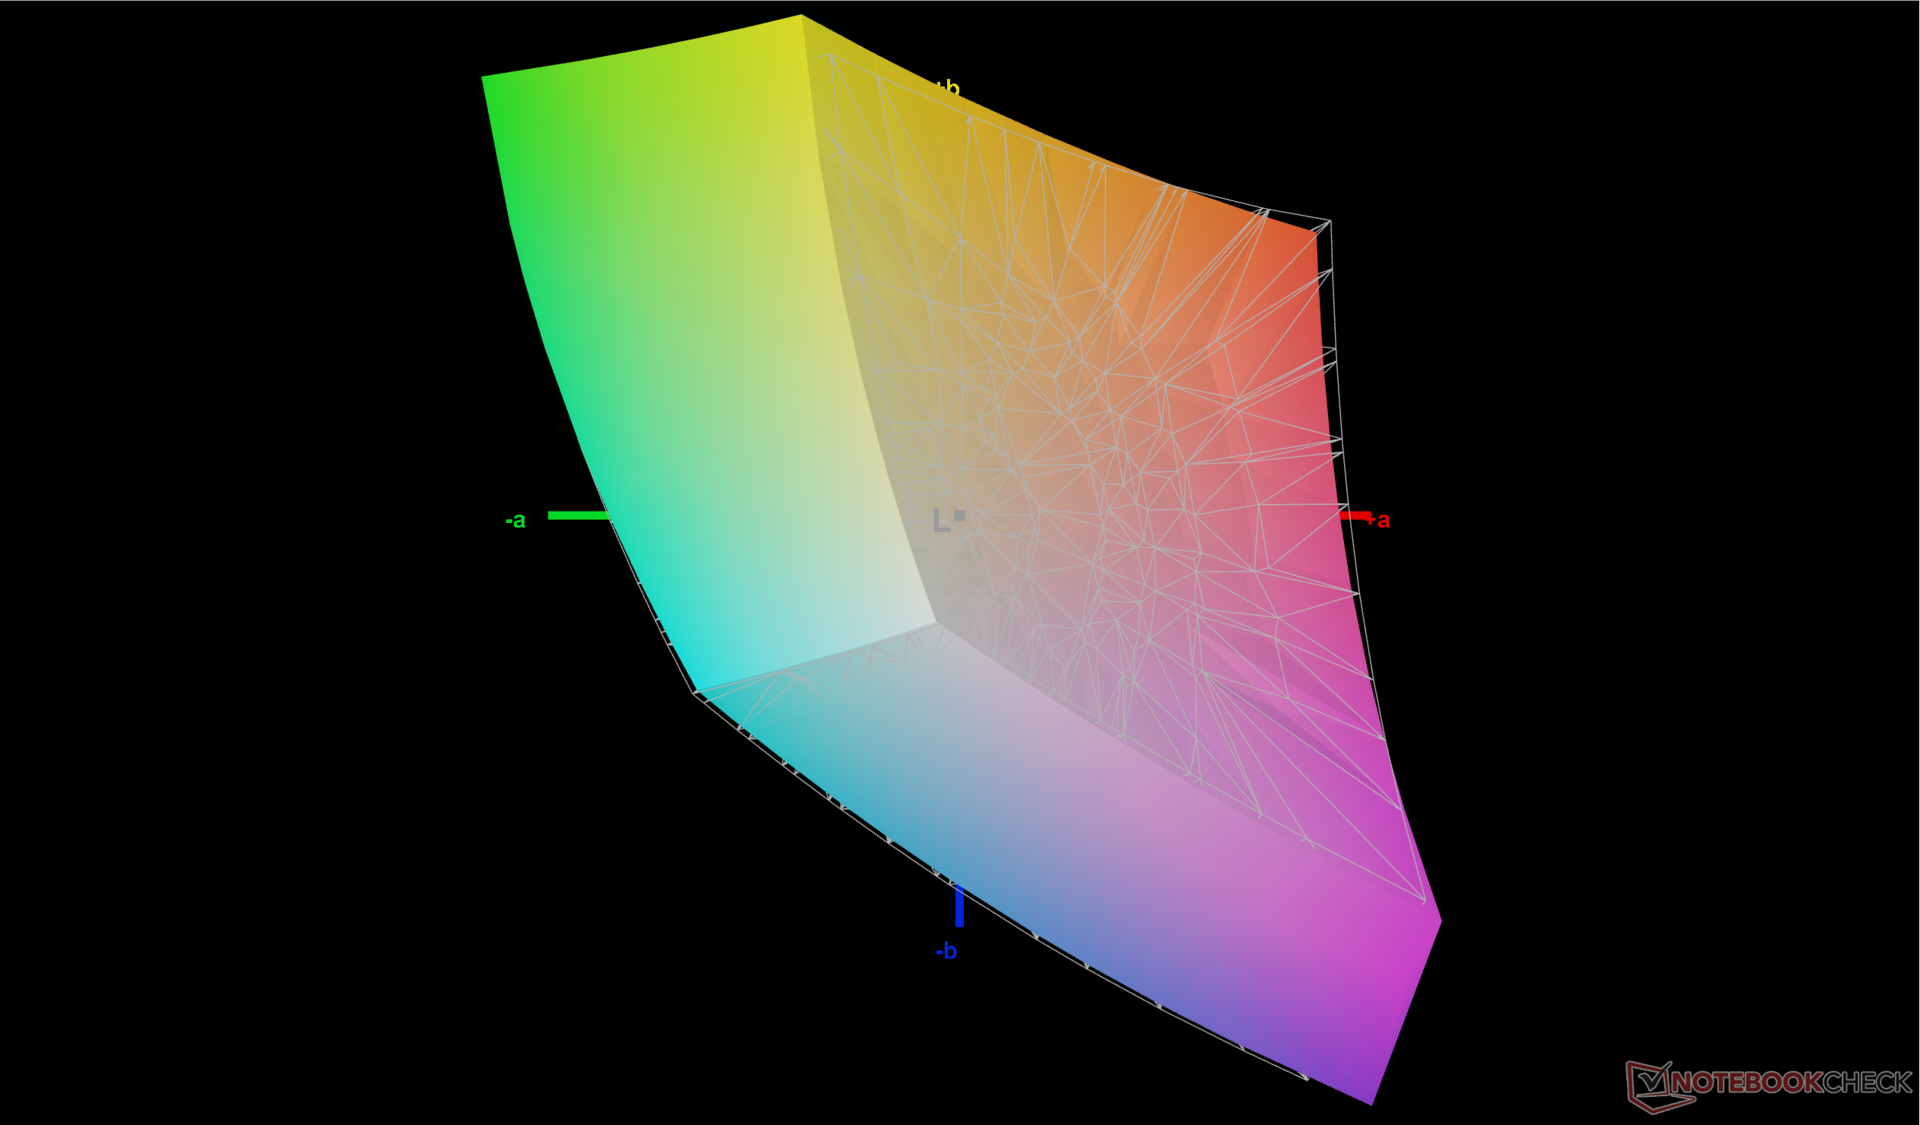
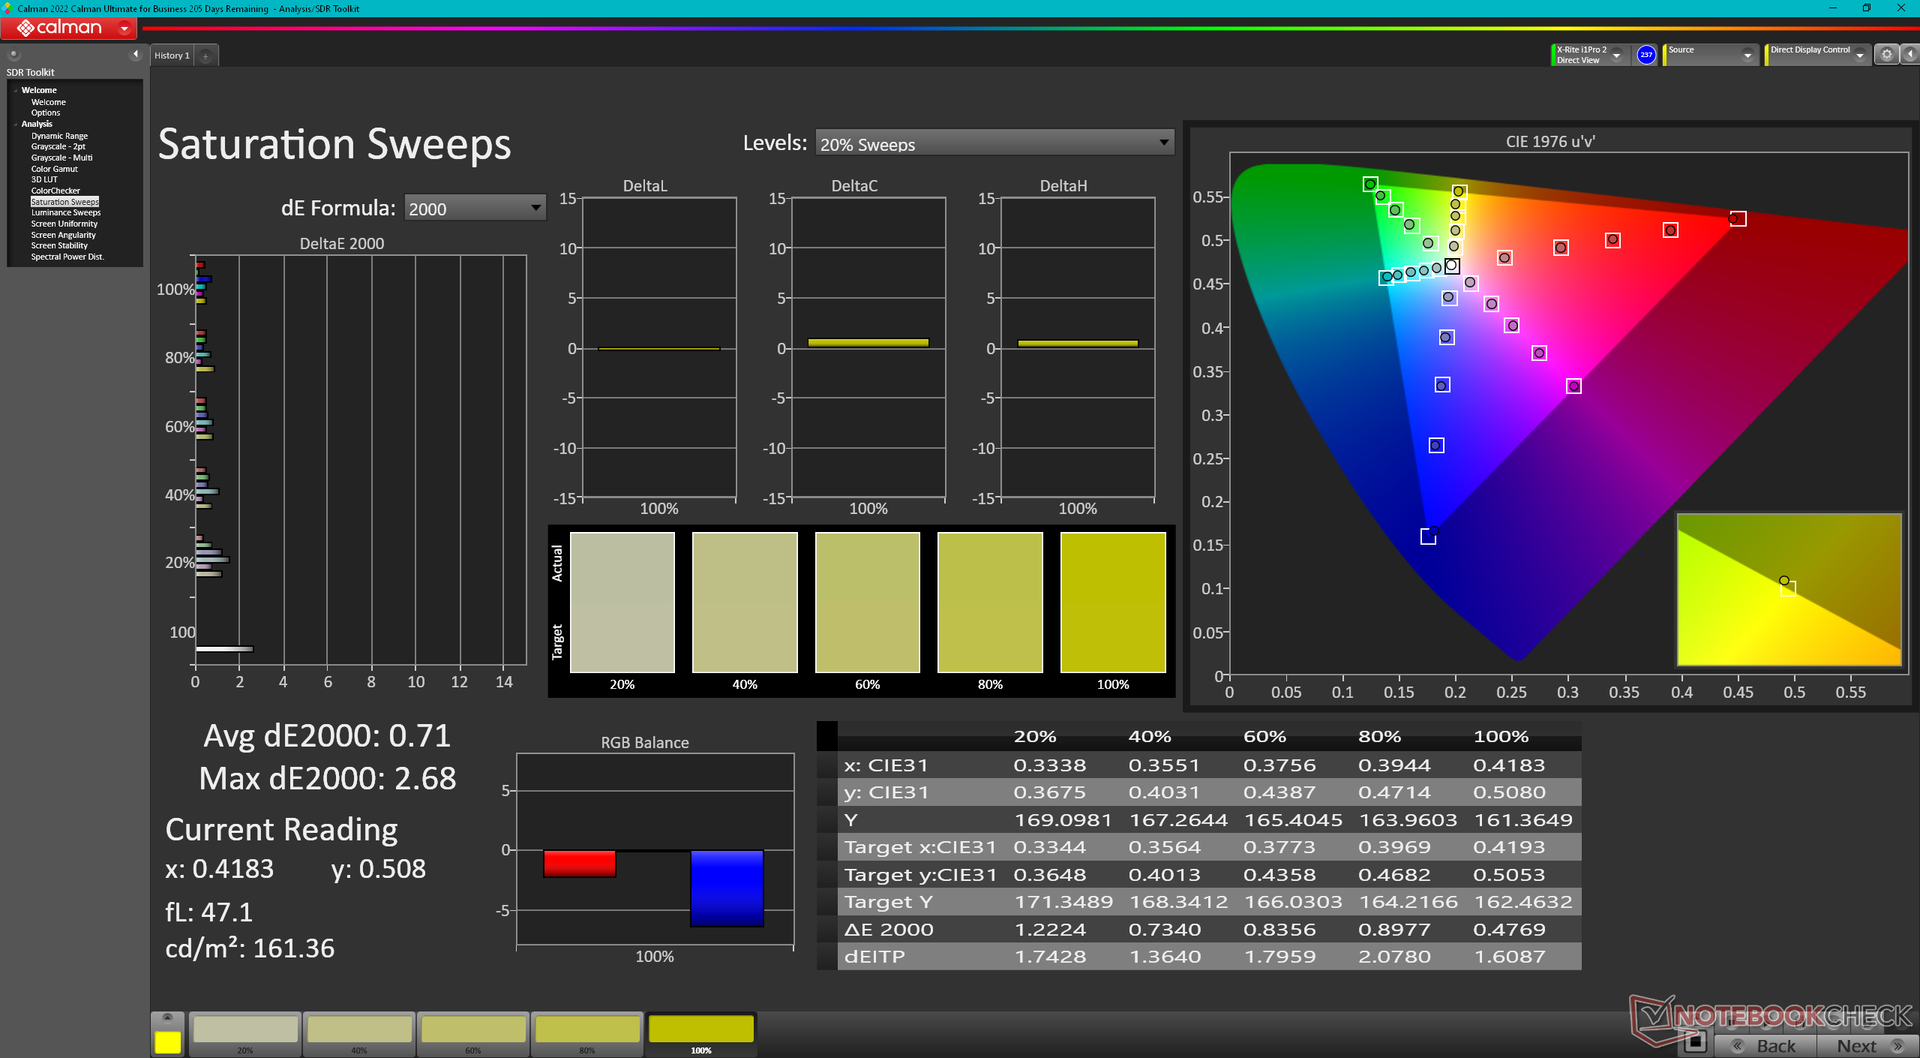
68.6% AdobeRGB 1998 (Argyll 3D)
96.4% sRGB (Argyll 3D)
67.5% Display P3 (Argyll 3D)
Gamma: 2.18
CCT: 7245 K
| Uniwill GM6PX7X RTX 4070 BOE CQ NE160QDM-NZ1, IPS, 2560x1600, 16" | Schenker XMG Neo 16 E23 BOE0AF0 NE160QDM-NZ1, IPS, 2560x1600, 16" | Asus ROG Strix G16 G614JZ TL160ADMP03-0, IPS, 2560x1600, 16" | Lenovo Legion Pro 7 16IRX8H MNG007DA2-3 (CSO1628), IPS, 2560x1600, 16" | Gigabyte AERO 16 OLED BSF Samsung SDC4191 (ATNA60YV09-0, OLED, 3840x2400, 16" | Razer Blade 16 Early 2023 CSOT T3 MNG007DA4-1, IPS, 2560x1600, 16" | |
|---|---|---|---|---|---|---|
| Display | 0% | 24% | 3% | 31% | 27% | |
| Display P3 Coverage (%) | 67.5 | 67.3 0% | 97 44% | 69.1 2% | 99.9 48% | 98.5 46% |
| sRGB Coverage (%) | 96.4 | 96.7 0% | 99.9 4% | 99.7 3% | 100 4% | 100 4% |
| AdobeRGB 1998 Coverage (%) | 68.6 | 68.9 0% | 84.9 24% | 71.2 4% | 96.4 41% | 89.7 31% |
| Response Times | -2% | 47% | 21% | 82% | 13% | |
| Response Time Grey 50% / Grey 80% * (ms) | 12.6 ? | 14.5 ? -15% | 5.1 ? 60% | 12.3 ? 2% | 2 ? 84% | 6.6 ? 48% |
| Response Time Black / White * (ms) | 9.8 ? | 8.6 ? 12% | 6.6 ? 33% | 5.9 ? 40% | 1.98 ? 80% | 12 ? -22% |
| PWM Frequency (Hz) | 60 | |||||
| Screen | 9% | 16% | 33% | 142% | 8% | |
| Brightness middle (cd/m²) | 338.6 | 372 10% | 470 39% | 511 51% | 389.97 15% | 456.8 35% |
| Brightness (cd/m²) | 328 | 349 6% | 459 40% | 469 43% | 395 20% | 437 33% |
| Brightness Distribution (%) | 89 | 88 -1% | 93 4% | 86 -3% | 97 9% | 83 -7% |
| Black Level * (cd/m²) | 0.32 | 0.32 -0% | 0.42 -31% | 0.4 -25% | 0.03 91% | 0.35 -9% |
| Contrast (:1) | 1058 | 1163 10% | 1119 6% | 1278 21% | 12999 1129% | 1305 23% |
| Colorchecker dE 2000 * | 2.18 | 2.06 6% | 1.86 15% | 0.95 56% | 2 8% | 3.7 -70% |
| Colorchecker dE 2000 max. * | 7.14 | 3 58% | 3.87 46% | 2.07 71% | 4.1 43% | 6.42 10% |
| Colorchecker dE 2000 calibrated * | 0.93 | 1.5 -61% | 0.93 -0% | 0.91 2% | 1.68 -81% | 0.66 29% |
| Greyscale dE 2000 * | 3.7 | 1.9 49% | 2.7 27% | 0.6 84% | 2.23 40% | 2.6 30% |
| Gamma | 2.18 101% | 2.312 95% | 2.246 98% | 2.176 101% | 2.41 91% | 2.3 96% |
| CCT | 7245 90% | 6747 96% | 6711 97% | 6545 99% | 6323 103% | 6108 106% |
| Total Average (Program / Settings) | 2% /
5% | 29% /
22% | 19% /
25% | 85% /
109% | 16% /
13% |
* ... smaller is better
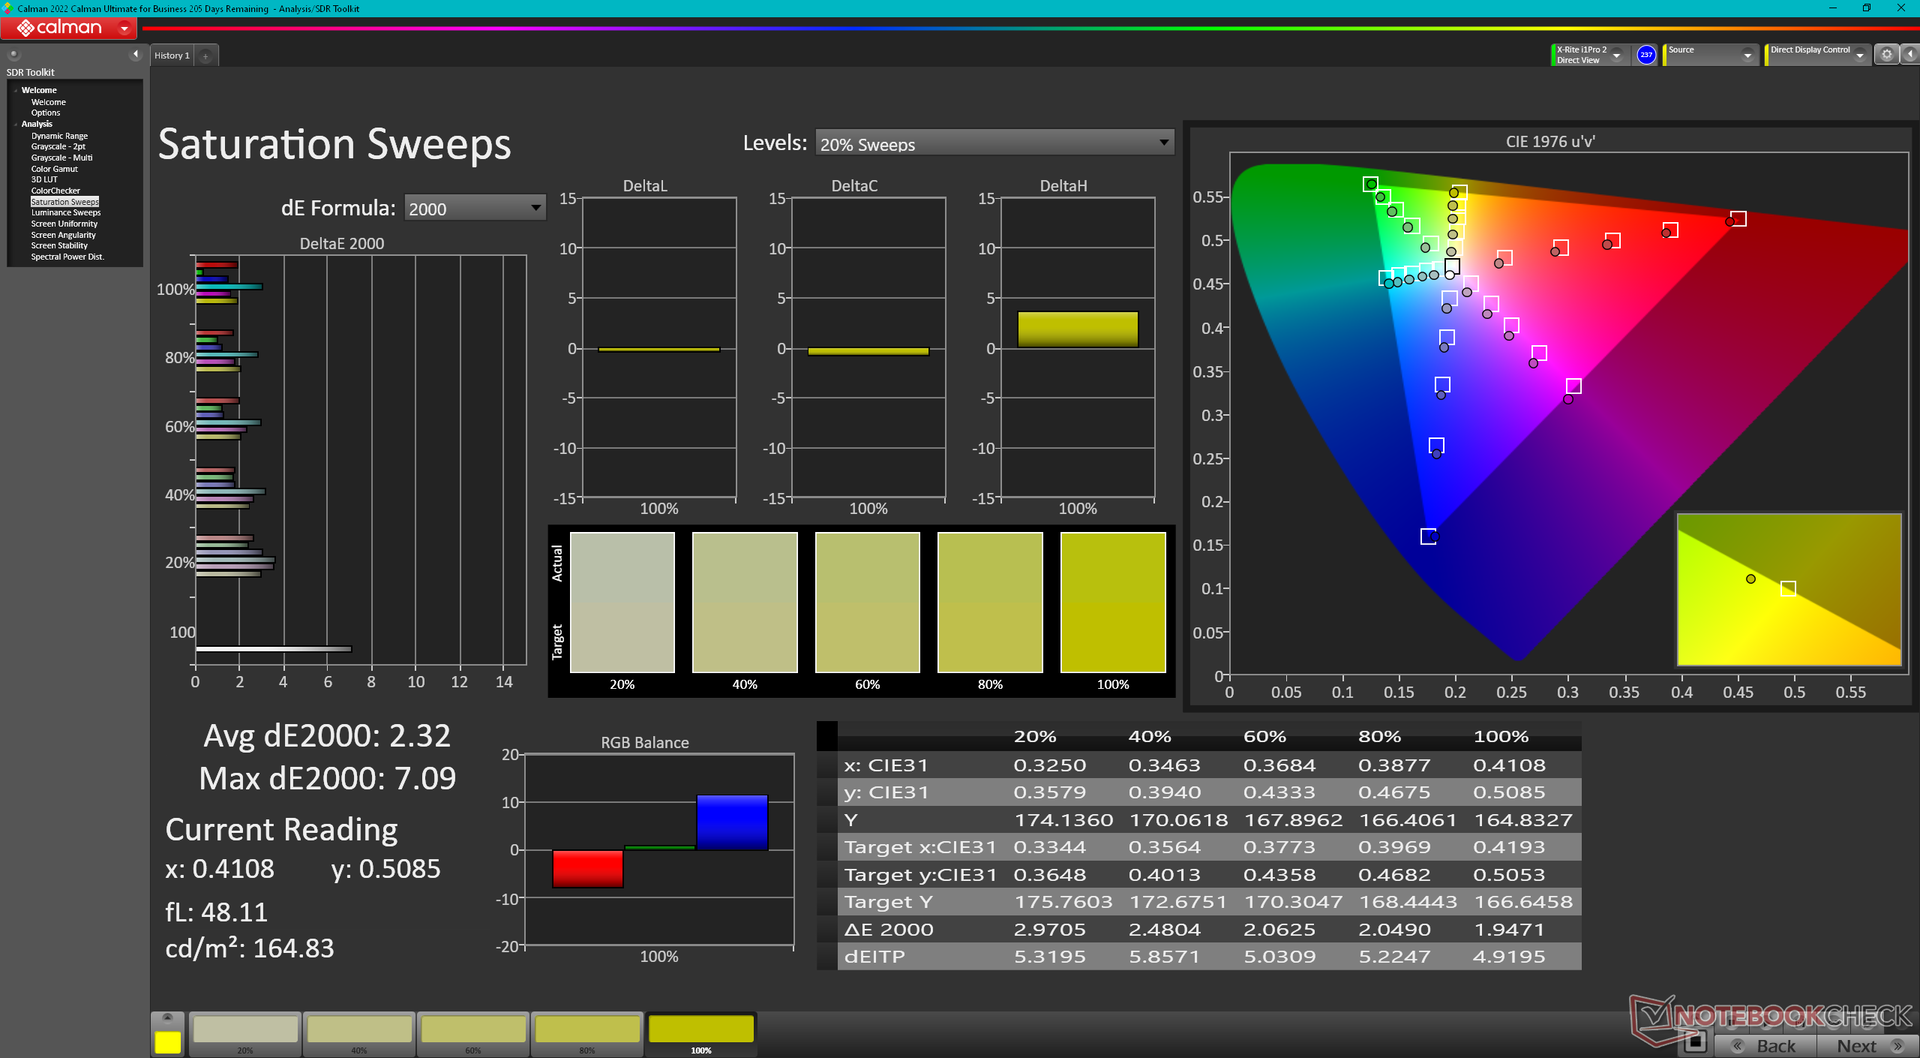
The display is decently calibrated out of the box with average grayscale and color deltaE values of 3.7 and 2.18, respectively. Color temperature is slightly on the cool side, however, which our own X-Rite calibration addresses. Users can apply our calibrated ICM profile above to get more accurate colors out of the Uniwill.
Display Response Times
| ↔ Response Time Black to White | ||
|---|---|---|
| 9.8 ms ... rise ↗ and fall ↘ combined | ↗ 5.1 ms rise | 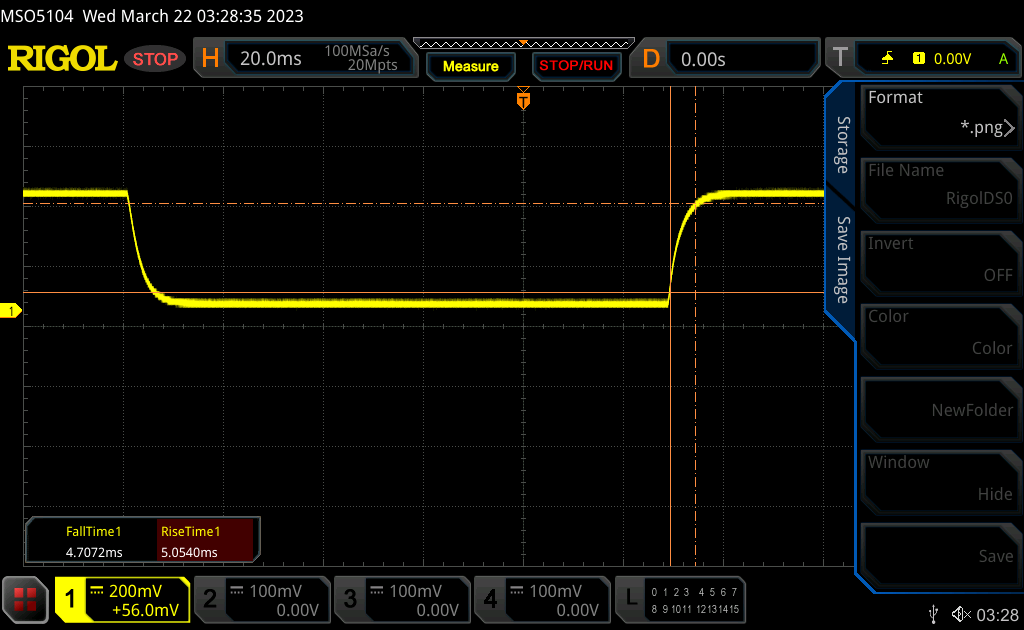 |
| ↘ 4.7 ms fall | ||
| The screen shows fast response rates in our tests and should be suited for gaming. In comparison, all tested devices range from 0.1 (minimum) to 240 (maximum) ms. » 26 % of all devices are better. This means that the measured response time is better than the average of all tested devices (20.1 ms). | ||
| ↔ Response Time 50% Grey to 80% Grey | ||
| 12.6 ms ... rise ↗ and fall ↘ combined | ↗ 6.3 ms rise | 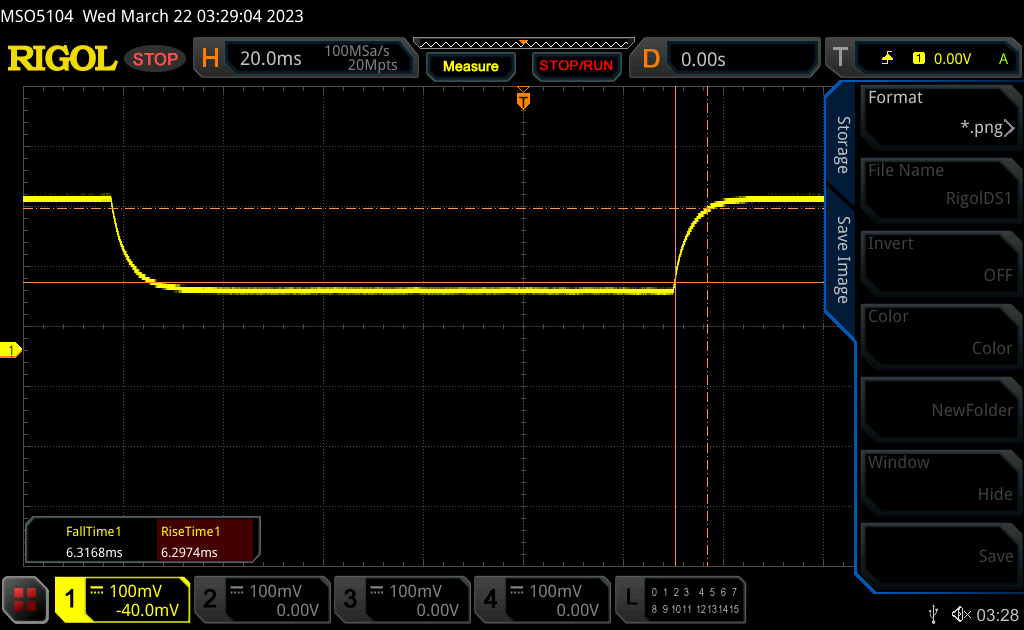 |
| ↘ 6.3 ms fall | ||
| The screen shows good response rates in our tests, but may be too slow for competitive gamers. In comparison, all tested devices range from 0.165 (minimum) to 636 (maximum) ms. » 25 % of all devices are better. This means that the measured response time is better than the average of all tested devices (31.4 ms). | ||
Screen Flickering / PWM (Pulse-Width Modulation)
| Screen flickering / PWM not detected | 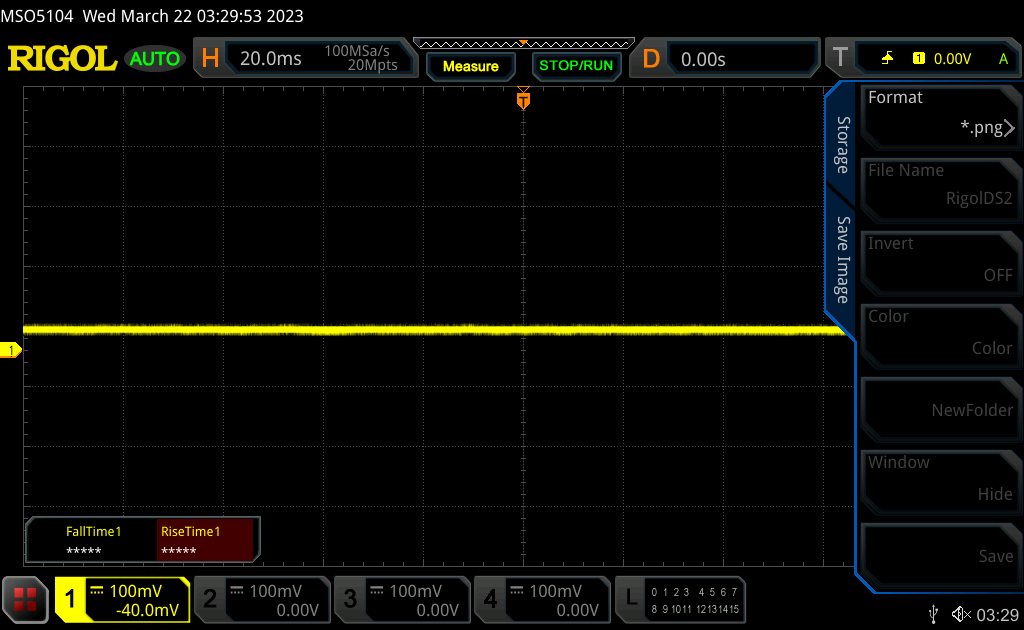 | ||
In comparison: 53 % of all tested devices do not use PWM to dim the display. If PWM was detected, an average of 7986 (minimum: 5 - maximum: 343500) Hz was measured. | |||

Performance
Testing Conditions
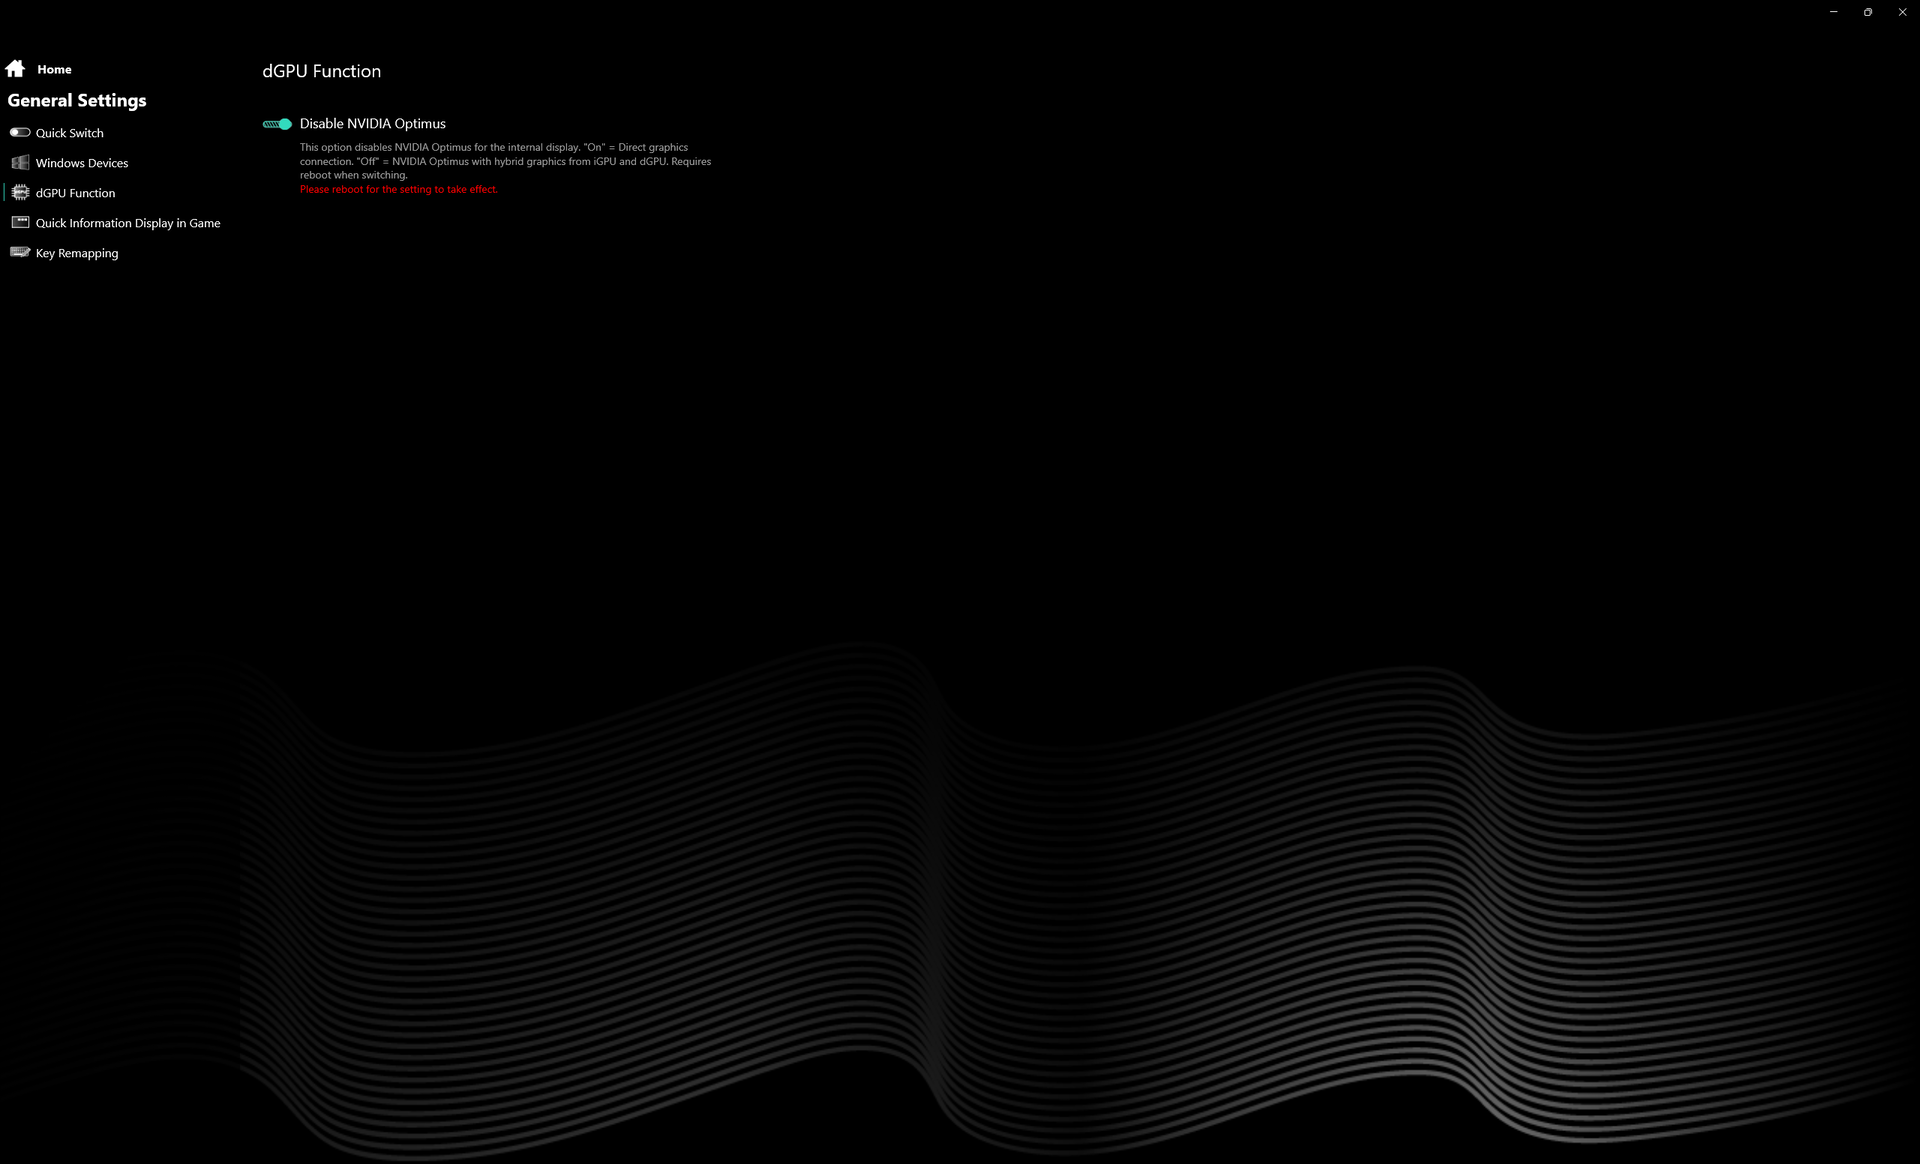
We set our unit to Turbo mode via the pre-installed Control Center software with Optimus turned off prior to running any benchmarks below. The system does not support Advanced Optimus meaning a reboot is required when switching between the discrete GPU and Optimus. Users are encouraged to become familiar with the pre-installed Control Center software as it is the hub for adjusting performance profiles, Optimus, and more.
G-Sync is not supported on the internal display.


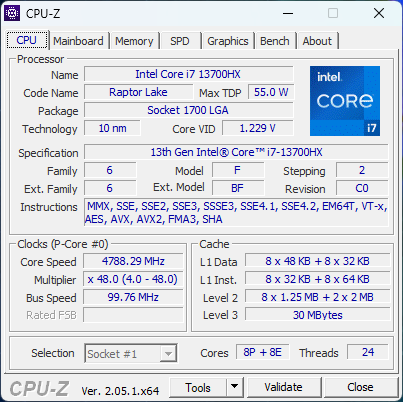
Processor
We can finally see how the upper midrange Core i7-13700HX CPU scales after having testing several enthusiast gaming laptops with 13th gen Core i9 processors. Benchmarks show it to be roughly 25 percent faster than the previous generation 12th gen Core i7-12700H commonly found on most mid-range to higher-end gaming laptops of 2022. Upgrading to the Core i9-13900HX configuration is expected to boost performance quite significantly by 35 percent.
Overall performance is far ahead of any mobile Zen 3+ CPU while the latest Zen 4 Ryzen 9 7945HX is still the faster processor by 20 to 50 percent. Performance stability is excellent with no major clock rate fluctuations when stressed.
More technical details and benchmark comparisons about the Core i7-13700HX can be found on our dedicated page here.
Cinebench R15 Multi Loop
Cinebench R23: Multi Core | Single Core
Cinebench R20: CPU (Multi Core) | CPU (Single Core)
Cinebench R15: CPU Multi 64Bit | CPU Single 64Bit
Blender: v2.79 BMW27 CPU
7-Zip 18.03: 7z b 4 | 7z b 4 -mmt1
Geekbench 5.5: Multi-Core | Single-Core
HWBOT x265 Benchmark v2.2: 4k Preset
LibreOffice : 20 Documents To PDF
R Benchmark 2.5: Overall mean
* ... smaller is better
AIDA64: FP32 Ray-Trace | FPU Julia | CPU SHA3 | CPU Queen | FPU SinJulia | FPU Mandel | CPU AES | CPU ZLib | FP64 Ray-Trace | CPU PhotoWorxx
| Performance rating | |
| Lenovo Legion Pro 7 16IRX8H | |
| Asus ROG Strix G16 G614JZ | |
| Schenker XMG Neo 16 E23 | |
| Razer Blade 16 Early 2023 | |
| Uniwill GM6PX7X RTX 4070 | |
| Gigabyte AERO 16 OLED BSF | |
| Average Intel Core i7-13700HX | |
| AIDA64 / FP32 Ray-Trace | |
| Asus ROG Strix G16 G614JZ | |
| Lenovo Legion Pro 7 16IRX8H | |
| Razer Blade 16 Early 2023 | |
| Razer Blade 16 Early 2023 | |
| Razer Blade 16 Early 2023 | |
| Schenker XMG Neo 16 E23 | |
| Uniwill GM6PX7X RTX 4070 | |
| Average Intel Core i7-13700HX (14261 - 21999, n=11) | |
| Gigabyte AERO 16 OLED BSF | |
| AIDA64 / CPU Queen | |
| Asus ROG Strix G16 G614JZ | |
| Schenker XMG Neo 16 E23 | |
| Razer Blade 16 Early 2023 | |
| Razer Blade 16 Early 2023 | |
| Lenovo Legion Pro 7 16IRX8H | |
| Uniwill GM6PX7X RTX 4070 | |
| Average Intel Core i7-13700HX (86532 - 114717, n=11) | |
| Gigabyte AERO 16 OLED BSF | |
| AIDA64 / FP64 Ray-Trace | |
| Lenovo Legion Pro 7 16IRX8H | |
| Asus ROG Strix G16 G614JZ | |
| Razer Blade 16 Early 2023 | |
| Razer Blade 16 Early 2023 | |
| Razer Blade 16 Early 2023 | |
| Schenker XMG Neo 16 E23 | |
| Uniwill GM6PX7X RTX 4070 | |
| Average Intel Core i7-13700HX (7728 - 11837, n=11) | |
| Gigabyte AERO 16 OLED BSF | |
| AIDA64 / CPU PhotoWorxx | |
| Razer Blade 16 Early 2023 | |
| Razer Blade 16 Early 2023 | |
| Razer Blade 16 Early 2023 | |
| Schenker XMG Neo 16 E23 | |
| Lenovo Legion Pro 7 16IRX8H | |
| Gigabyte AERO 16 OLED BSF | |
| Uniwill GM6PX7X RTX 4070 | |
| Asus ROG Strix G16 G614JZ | |
| Average Intel Core i7-13700HX (19678 - 42415, n=11) | |
System Performance
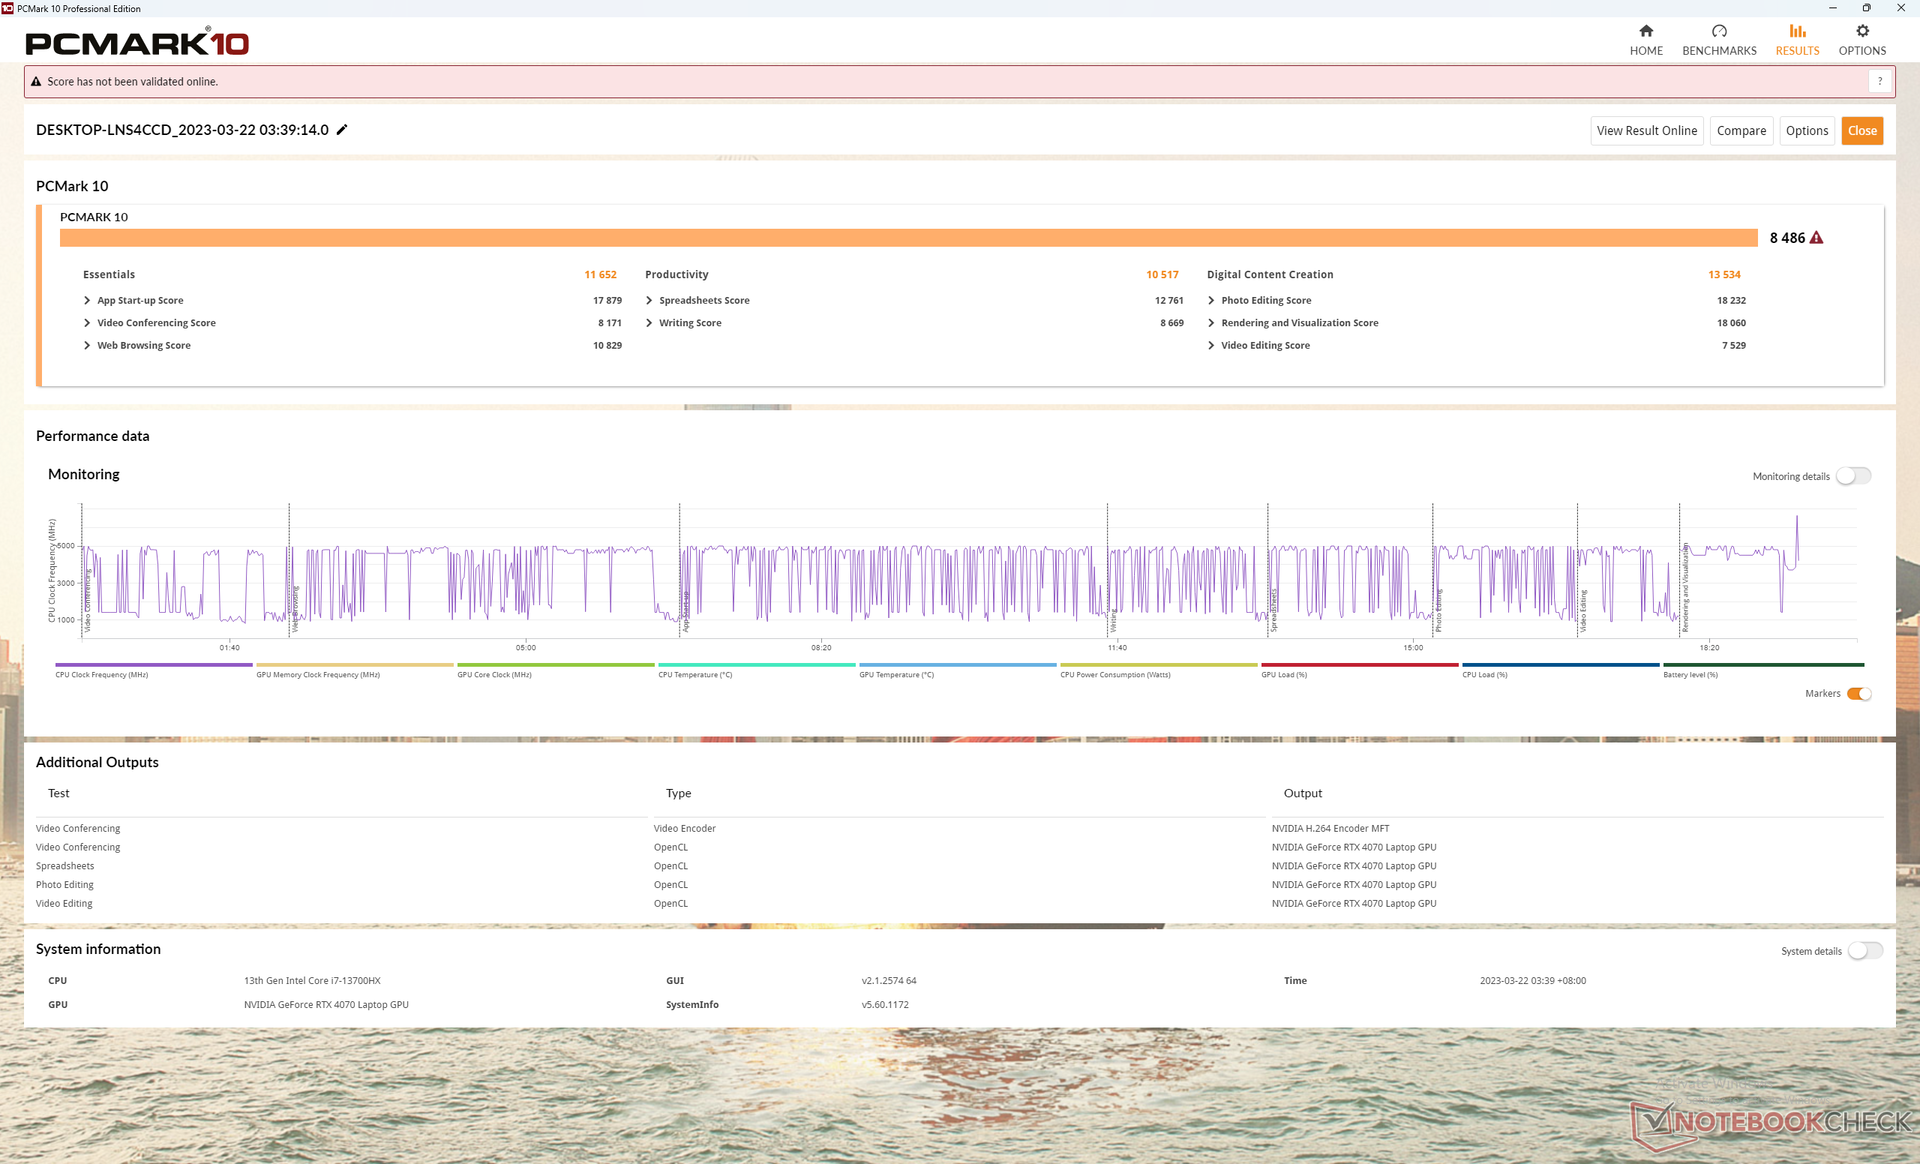
PCMark results are comparable to other high-end gaming laptops running on 13th gen Core CPUs and GeForce 40 GPUs like the Gigabyte AERO 16 or Razer Blade 16. Scores are consistently ahead of the Schenker XMG Neo 15 running on older Zen 3+ and GeForce 30 hardware.
CrossMark: Overall | Productivity | Creativity | Responsiveness
| PCMark 10 / Score | |
| Uniwill GM6PX7X RTX 4070 | |
| Schenker XMG Neo 16 E23 | |
| Gigabyte AERO 16 OLED BSF | |
| Razer Blade 16 Early 2023 | |
| Lenovo Legion Pro 7 16IRX8H | |
| Asus ROG Strix G16 G614JZ | |
| PCMark 10 / Essentials | |
| Asus ROG Strix G16 G614JZ | |
| Lenovo Legion Pro 7 16IRX8H | |
| Uniwill GM6PX7X RTX 4070 | |
| Gigabyte AERO 16 OLED BSF | |
| Razer Blade 16 Early 2023 | |
| Schenker XMG Neo 16 E23 | |
| PCMark 10 / Productivity | |
| Lenovo Legion Pro 7 16IRX8H | |
| Uniwill GM6PX7X RTX 4070 | |
| Schenker XMG Neo 16 E23 | |
| Gigabyte AERO 16 OLED BSF | |
| Razer Blade 16 Early 2023 | |
| Asus ROG Strix G16 G614JZ | |
| PCMark 10 / Digital Content Creation | |
| Schenker XMG Neo 16 E23 | |
| Razer Blade 16 Early 2023 | |
| Gigabyte AERO 16 OLED BSF | |
| Uniwill GM6PX7X RTX 4070 | |
| Asus ROG Strix G16 G614JZ | |
| Lenovo Legion Pro 7 16IRX8H | |
| CrossMark / Overall | |
| Asus ROG Strix G16 G614JZ | |
| Schenker XMG Neo 16 E23 | |
| Uniwill GM6PX7X RTX 4070 | |
| Gigabyte AERO 16 OLED BSF | |
| Razer Blade 16 Early 2023 | |
| CrossMark / Productivity | |
| Asus ROG Strix G16 G614JZ | |
| Schenker XMG Neo 16 E23 | |
| Uniwill GM6PX7X RTX 4070 | |
| Gigabyte AERO 16 OLED BSF | |
| Razer Blade 16 Early 2023 | |
| CrossMark / Creativity | |
| Schenker XMG Neo 16 E23 | |
| Asus ROG Strix G16 G614JZ | |
| Uniwill GM6PX7X RTX 4070 | |
| Gigabyte AERO 16 OLED BSF | |
| Razer Blade 16 Early 2023 | |
| CrossMark / Responsiveness | |
| Asus ROG Strix G16 G614JZ | |
| Gigabyte AERO 16 OLED BSF | |
| Uniwill GM6PX7X RTX 4070 | |
| Schenker XMG Neo 16 E23 | |
| Razer Blade 16 Early 2023 | |
| PCMark 10 Score | 8486 points | |
Help | ||
| AIDA64 / Memory Latency | |
| Razer Blade 16 Early 2023 | |
| Razer Blade 16 Early 2023 | |
| Razer Blade 16 Early 2023 | |
| Gigabyte AERO 16 OLED BSF | |
| Asus ROG Strix G16 G614JZ | |
| Uniwill GM6PX7X RTX 4070 | |
| Average Intel Core i7-13700HX (81.5 - 97.9, n=11) | |
| Schenker XMG Neo 16 E23 | |
| Lenovo Legion Pro 7 16IRX8H | |
* ... smaller is better
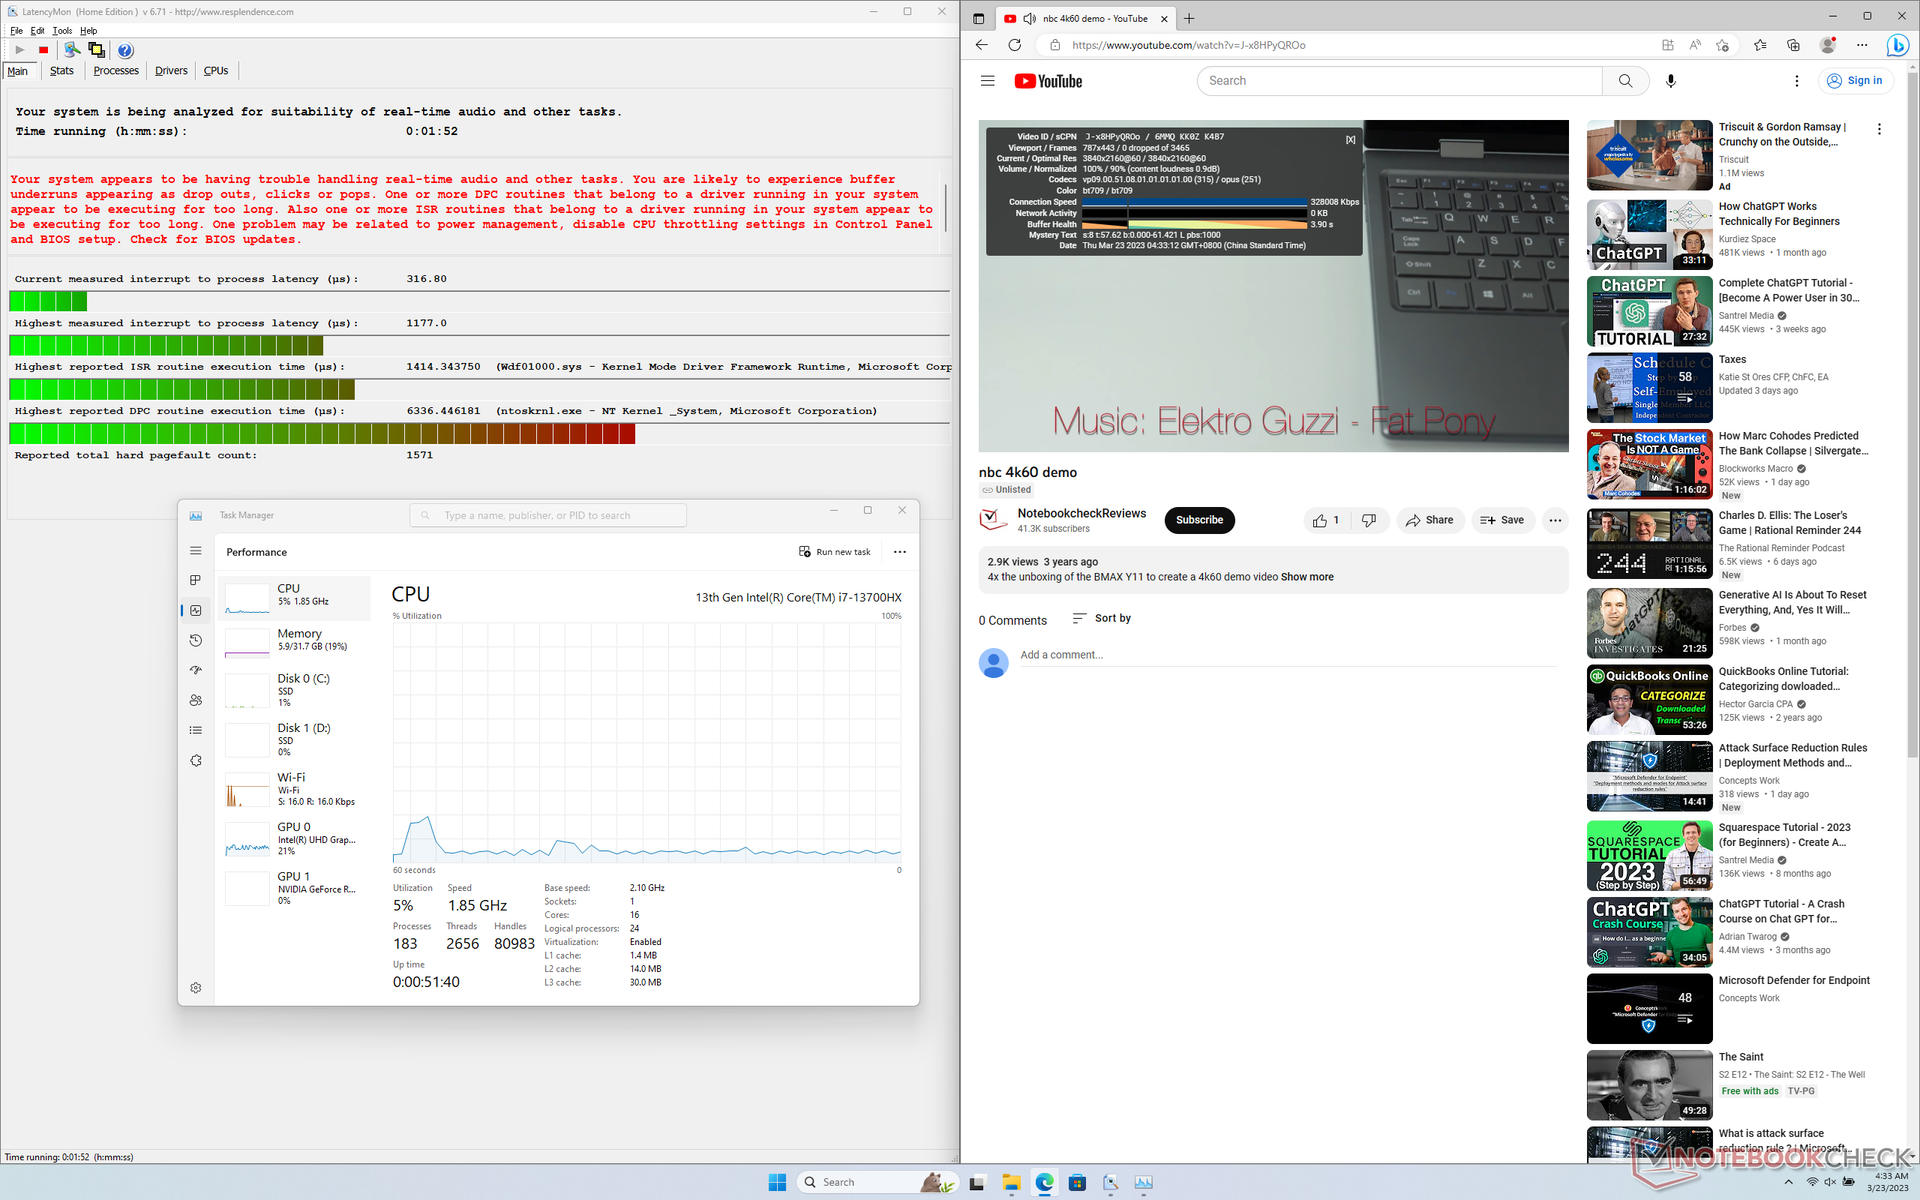
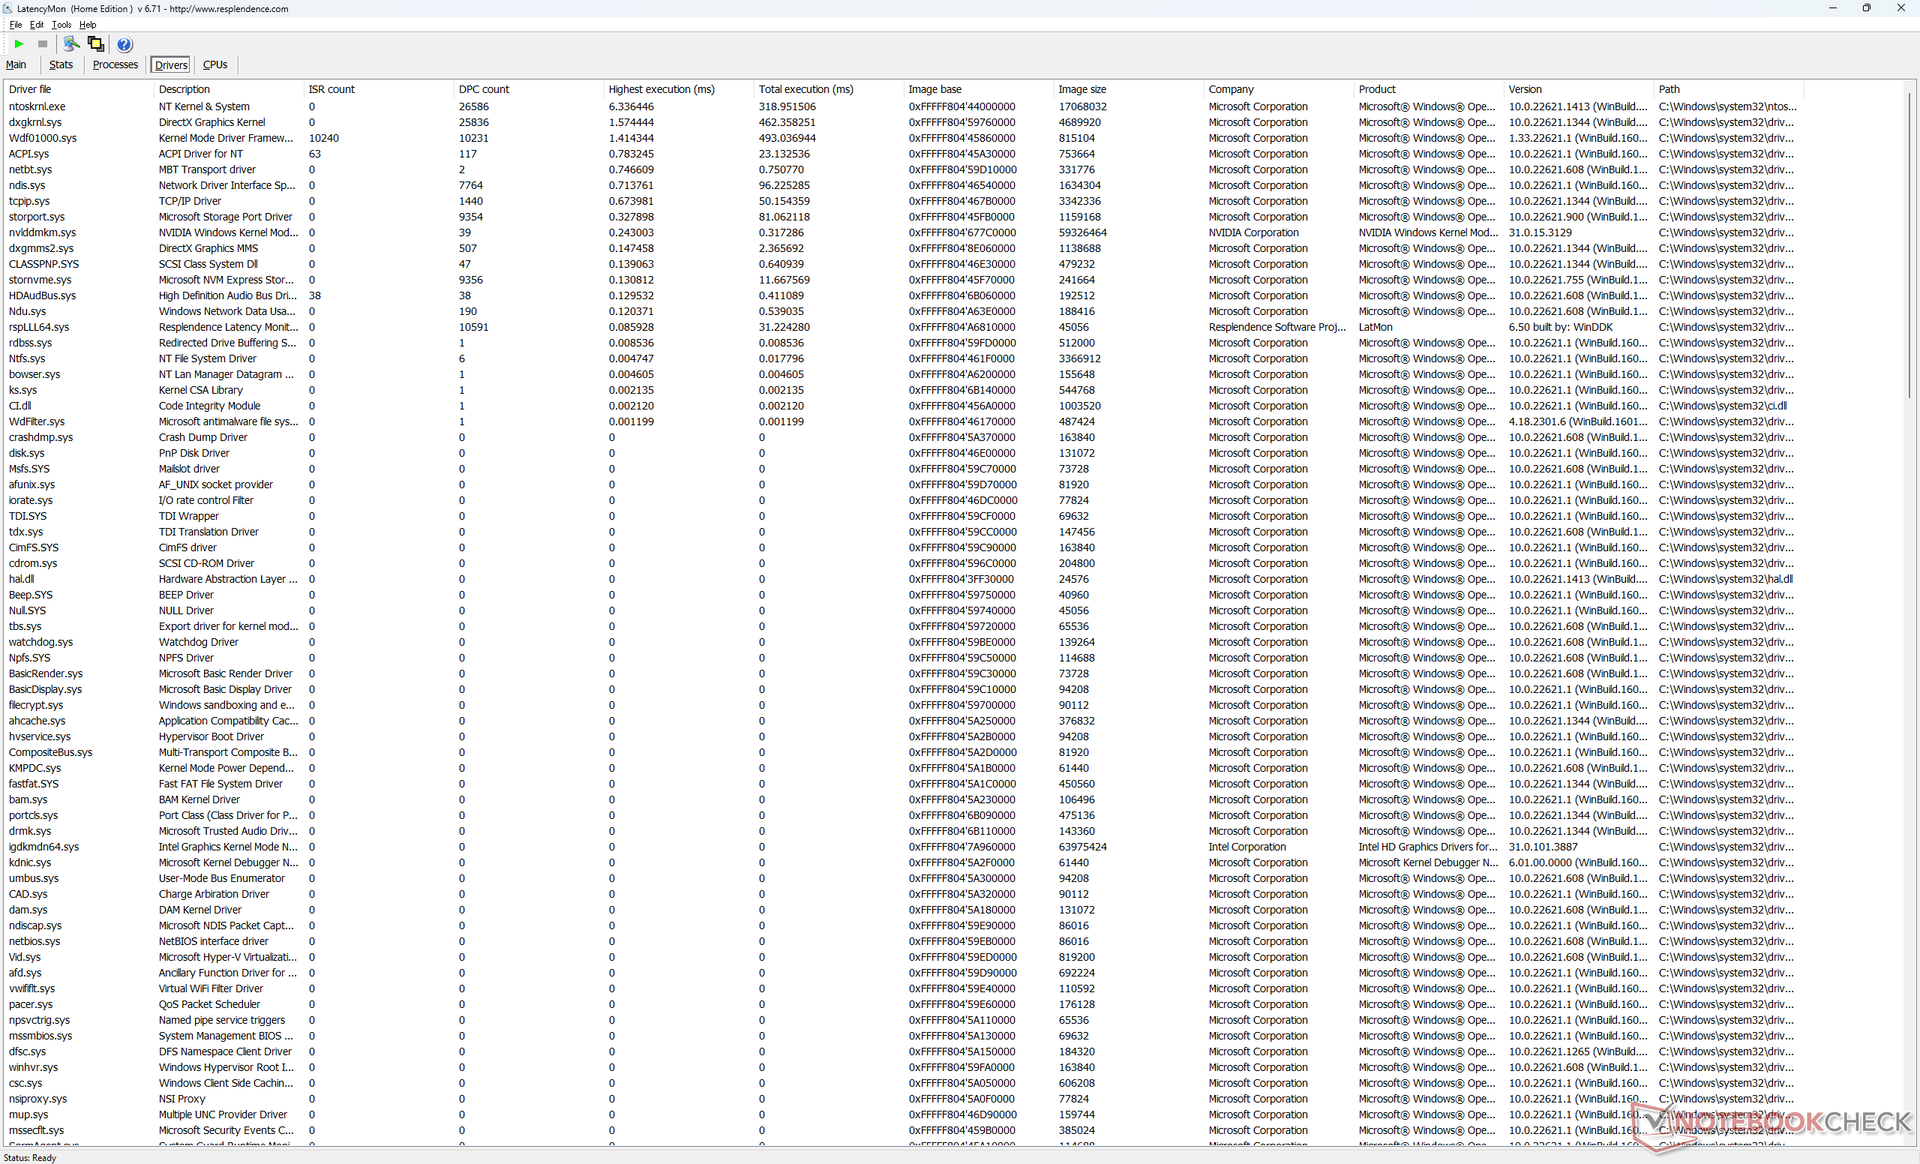
DPC Latency
LatencyMon reveals DPC issues when opening multiple browser tabs on our homepage. 4K video playback at 60 FPS is otherwise perfect with low CPU and GPU utilization and no dropped frames.
| DPC Latencies / LatencyMon - interrupt to process latency (max), Web, Youtube, Prime95 | |
| Schenker XMG Neo 16 E23 | |
| Asus ROG Strix G16 G614JZ | |
| Razer Blade 16 Early 2023 | |
| Uniwill GM6PX7X RTX 4070 | |
| Gigabyte AERO 16 OLED BSF | |
| Lenovo Legion Pro 7 16IRX8H | |
* ... smaller is better
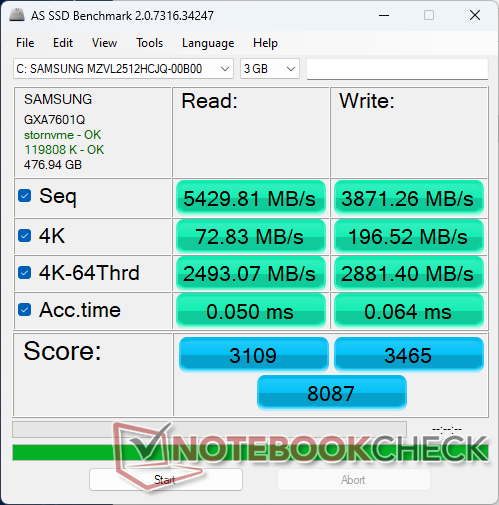
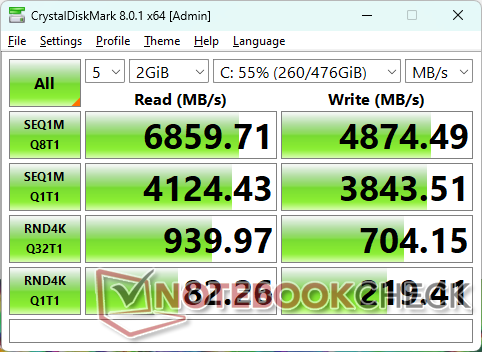
Storage Devices
Our test unit ships with a PCIe4 x4 Samsung PM9A1 MZVL2512HCJQ NVMe SSD supporting sequential read rates of 6700 MB/s. The fast rates are sustainable as well with no performance dips when stressed.

| Drive Performance rating - Percent | |
| Lenovo Legion Pro 7 16IRX8H | |
| Uniwill GM6PX7X RTX 4070 | |
| Gigabyte AERO 16 OLED BSF | |
| Razer Blade 16 Early 2023 | |
| Asus ROG Strix G16 G614JZ | |
| Schenker XMG Neo 16 E23 | |
* ... smaller is better
Disk Throttling: DiskSpd Read Loop, Queue Depth 8
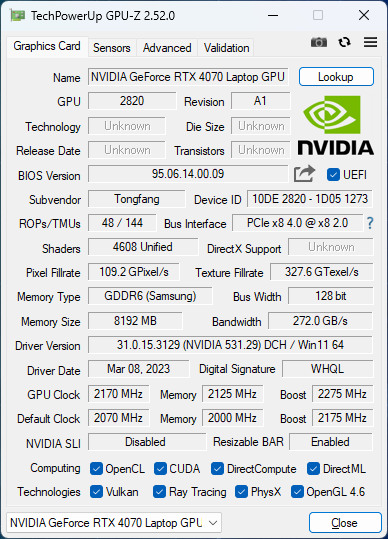
GPU Performance
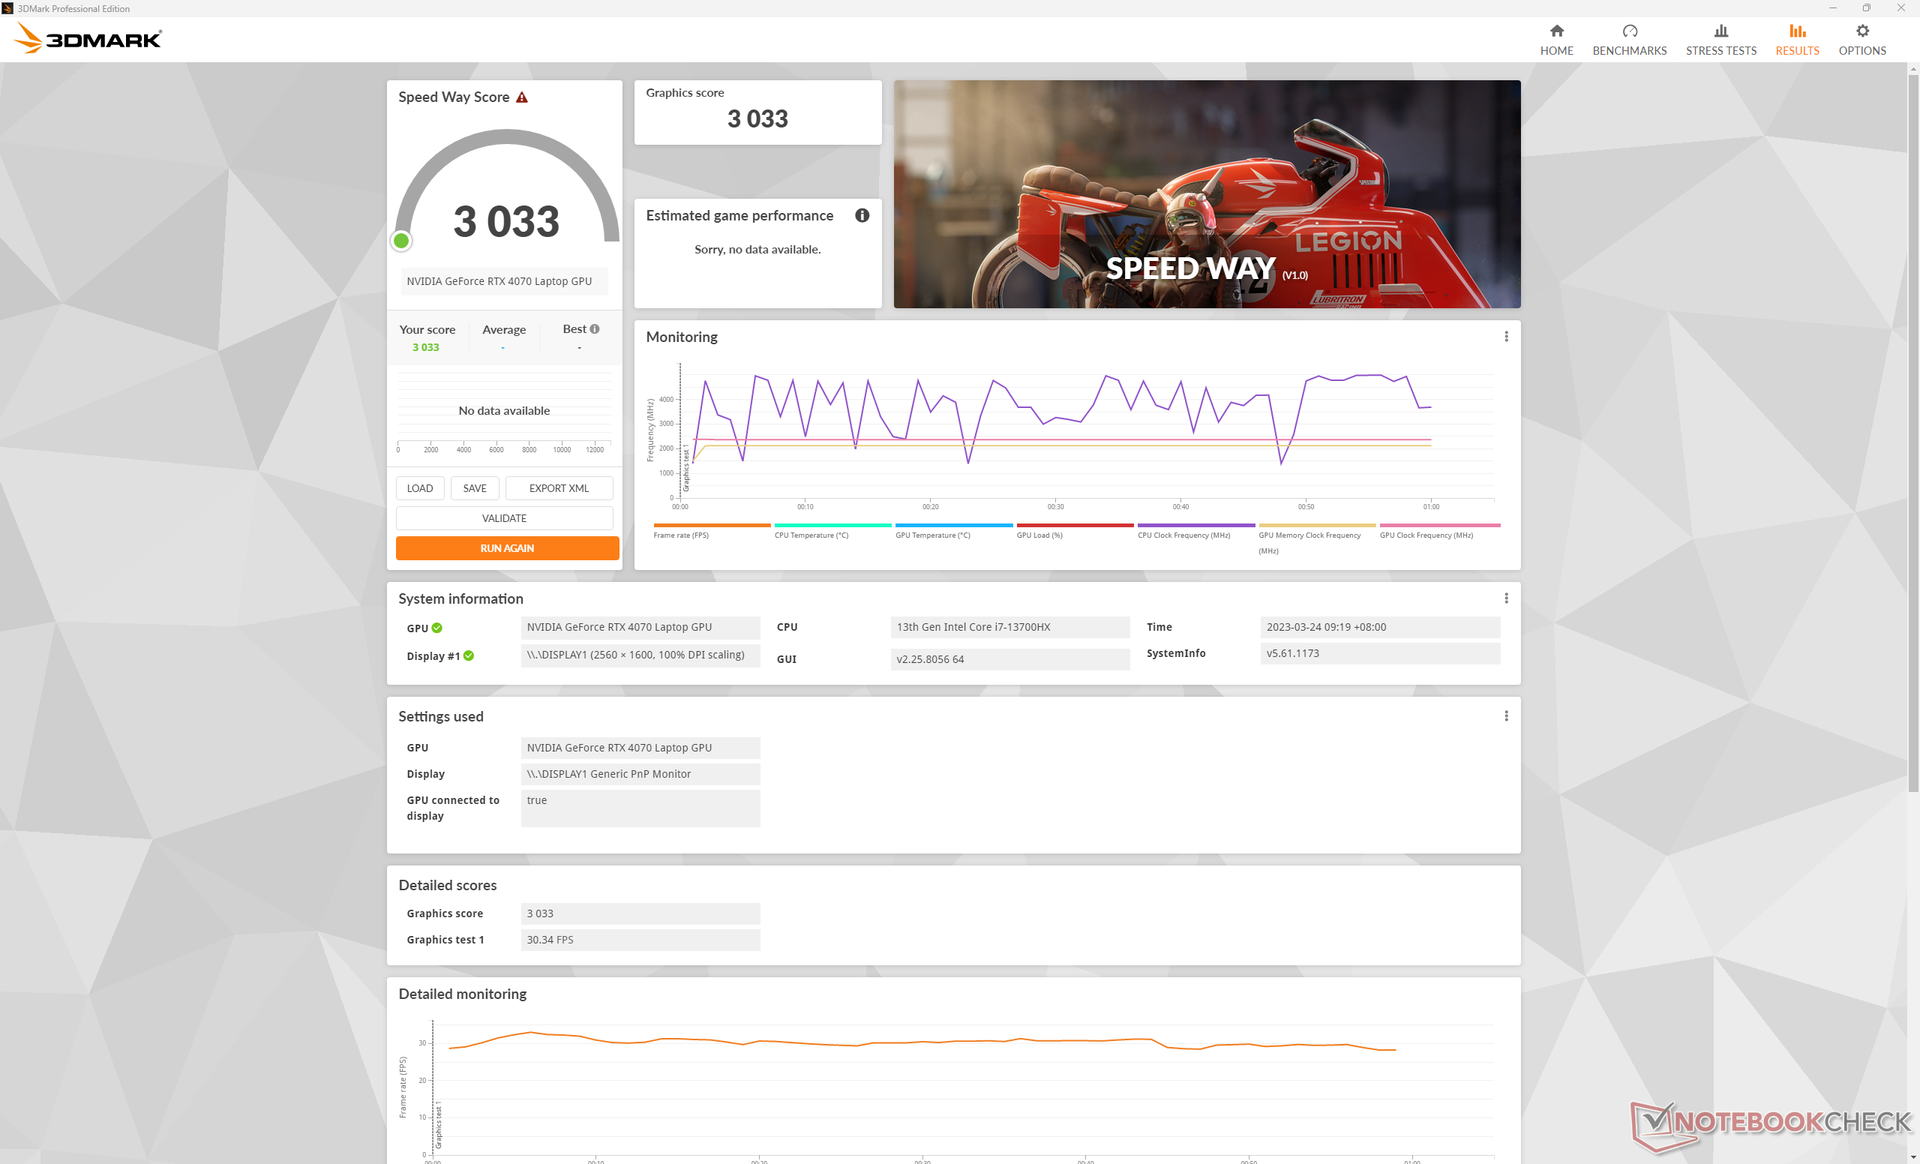
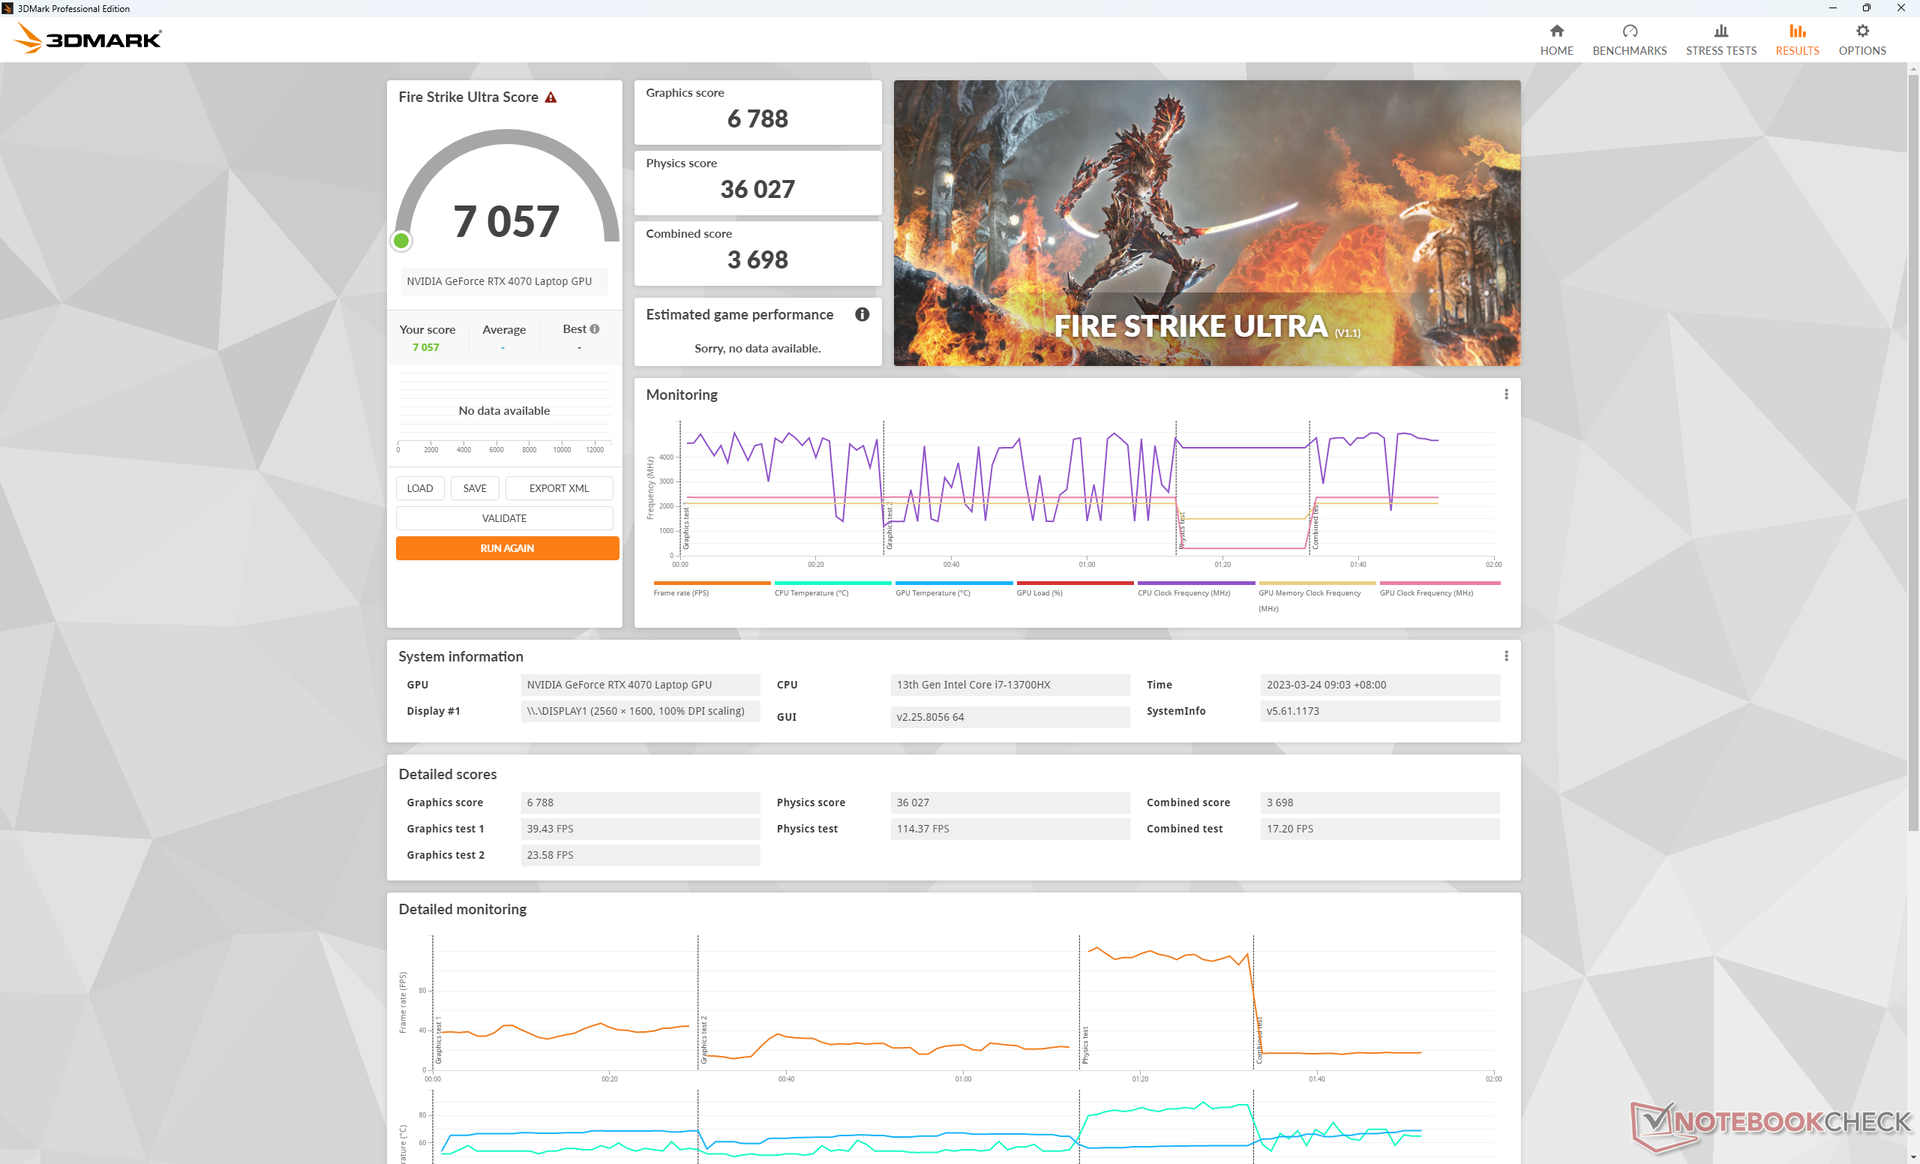
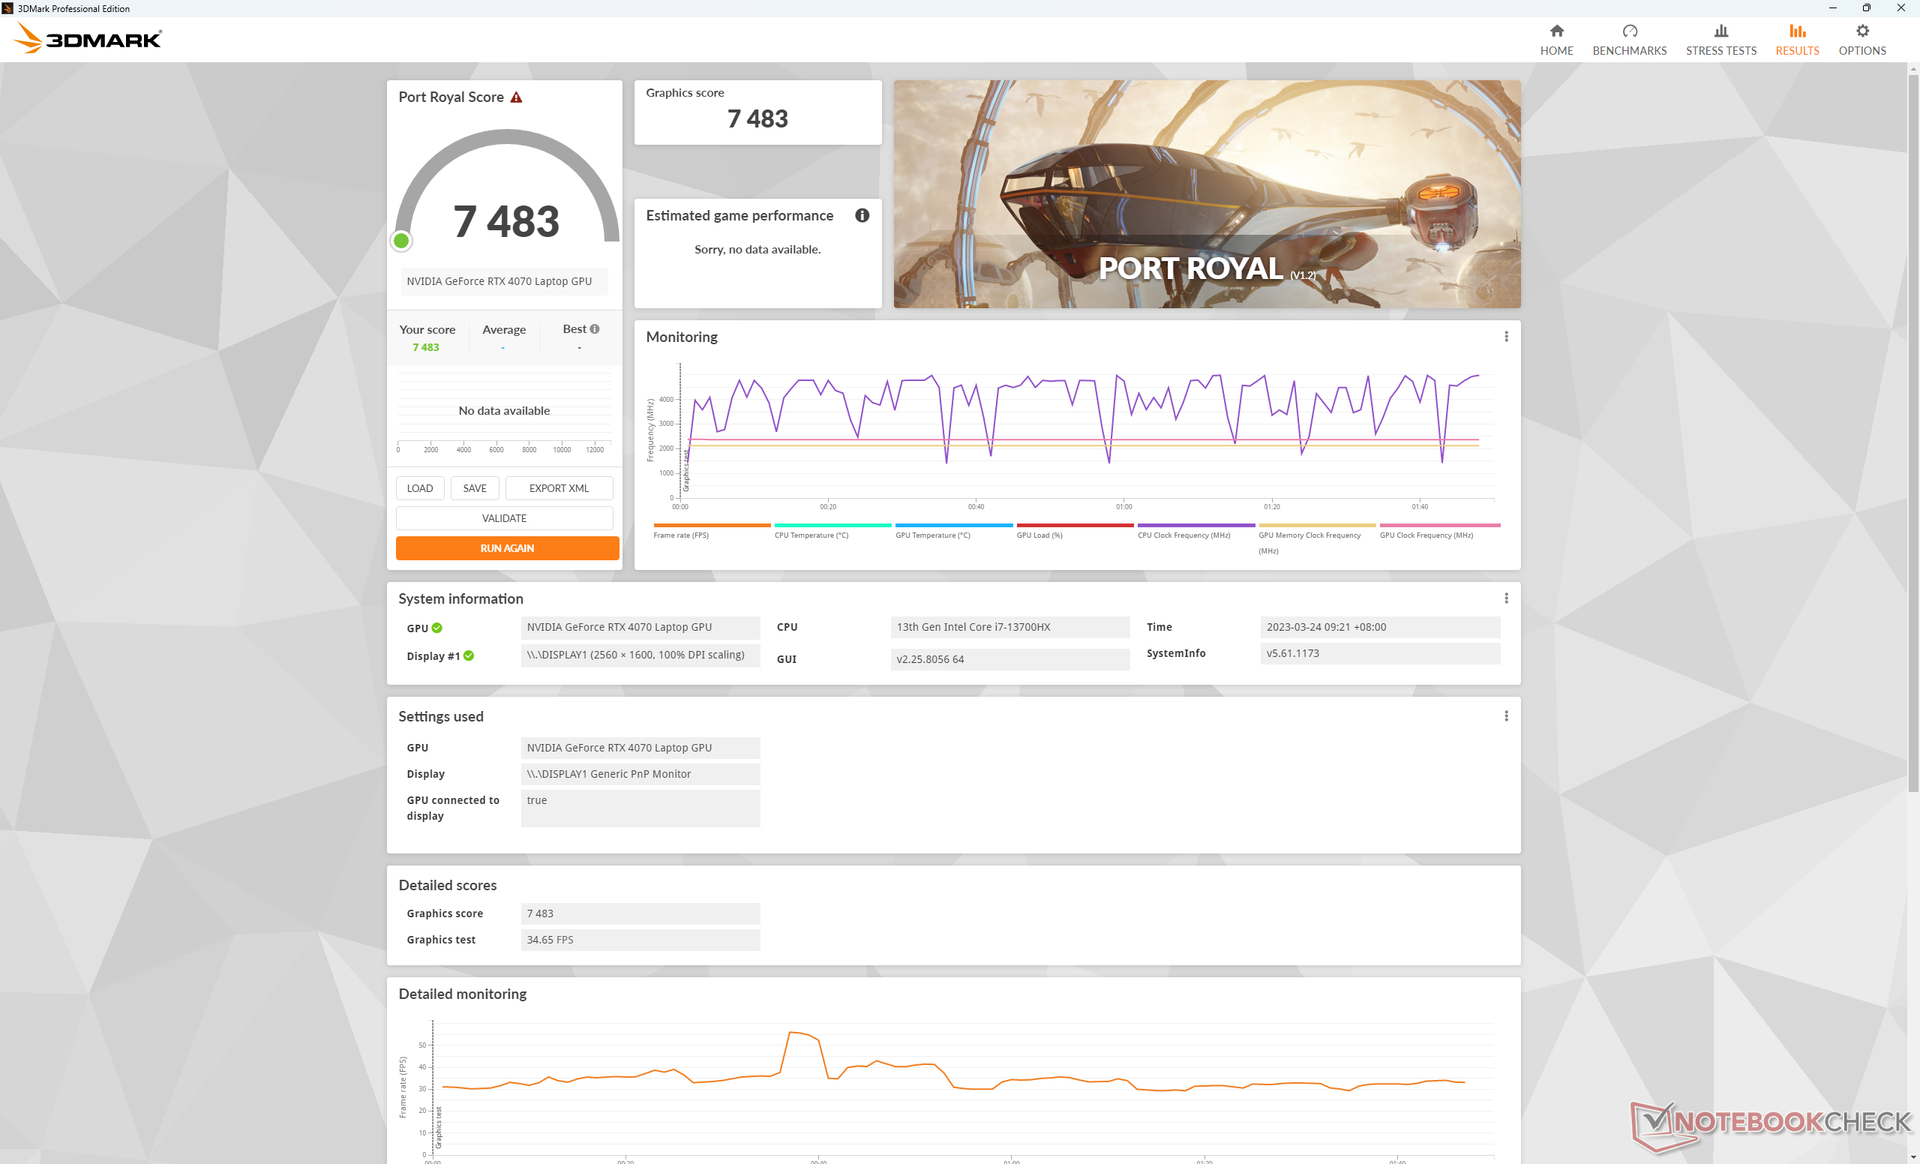
After having tested a handful of GeForce RTX 4060, 4070, 4080 and 4090 laptops thus far, the expected performance differences between them are becoming clear. In regards to the 140 W mobile RTX 4070, users can expect it to perform 15 to 20 percent faster than the mobile RTX 4060 or roughly 30 to 35 percent slower than the 175 W mobile RTX 4080. Thus, the performance gap between the mobile RTX 4070 and mobile RTX 4080 is much greater than the gap between the mobile RTX 4060 and RTX 4070. This may be Nvidia's way to encourage potential buyers to consider the higher-end 4080 or 4090 configurations instead.
Upgrading from the mobile RTX 4070 to the 175 W mobile RTX 4090 option increases raw performance by about 55 to 80 percent. Extremely demanding games at 4K like Cyberpunk 2077 or F1 22 do not run well on the mobile RTX 4070 unless if DLSS or frame generation are supported.
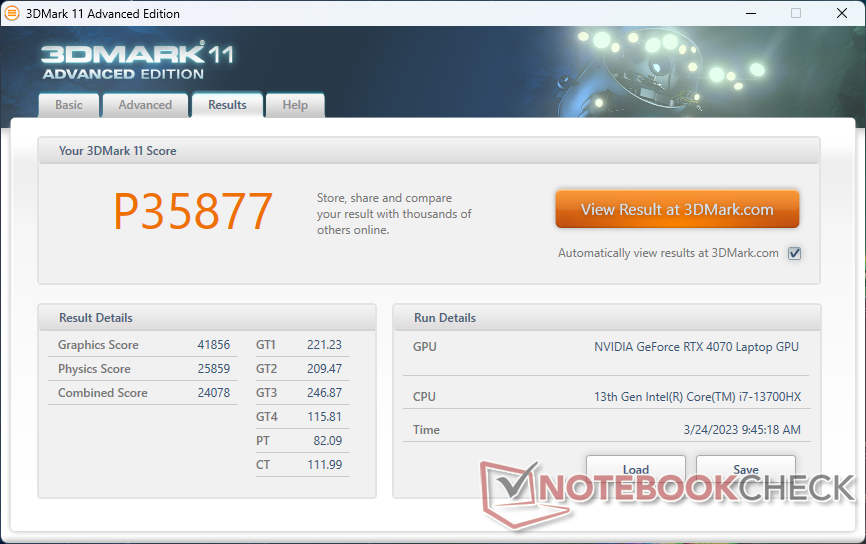
| 3DMark 11 Performance | 35877 points | |
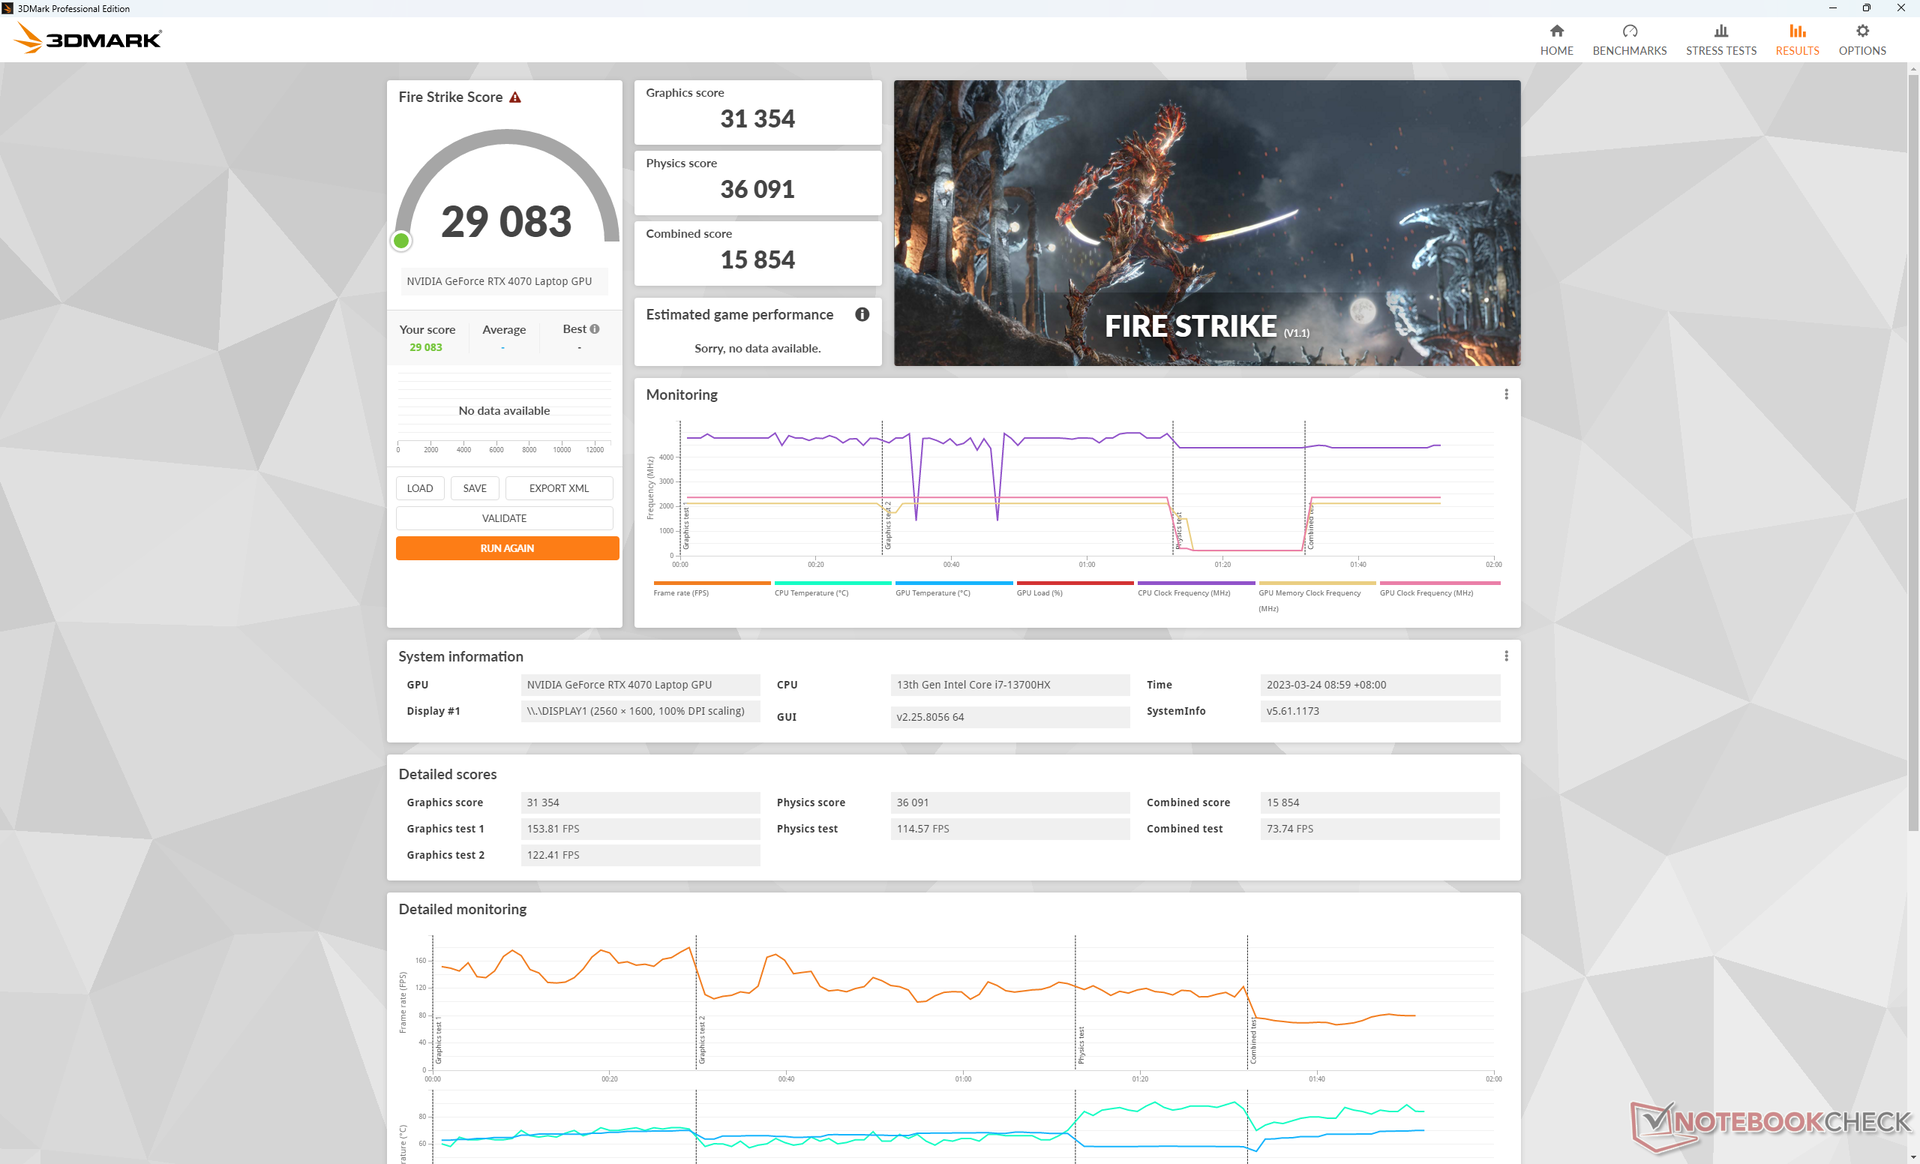
| 3DMark Fire Strike Score | 29083 points | |
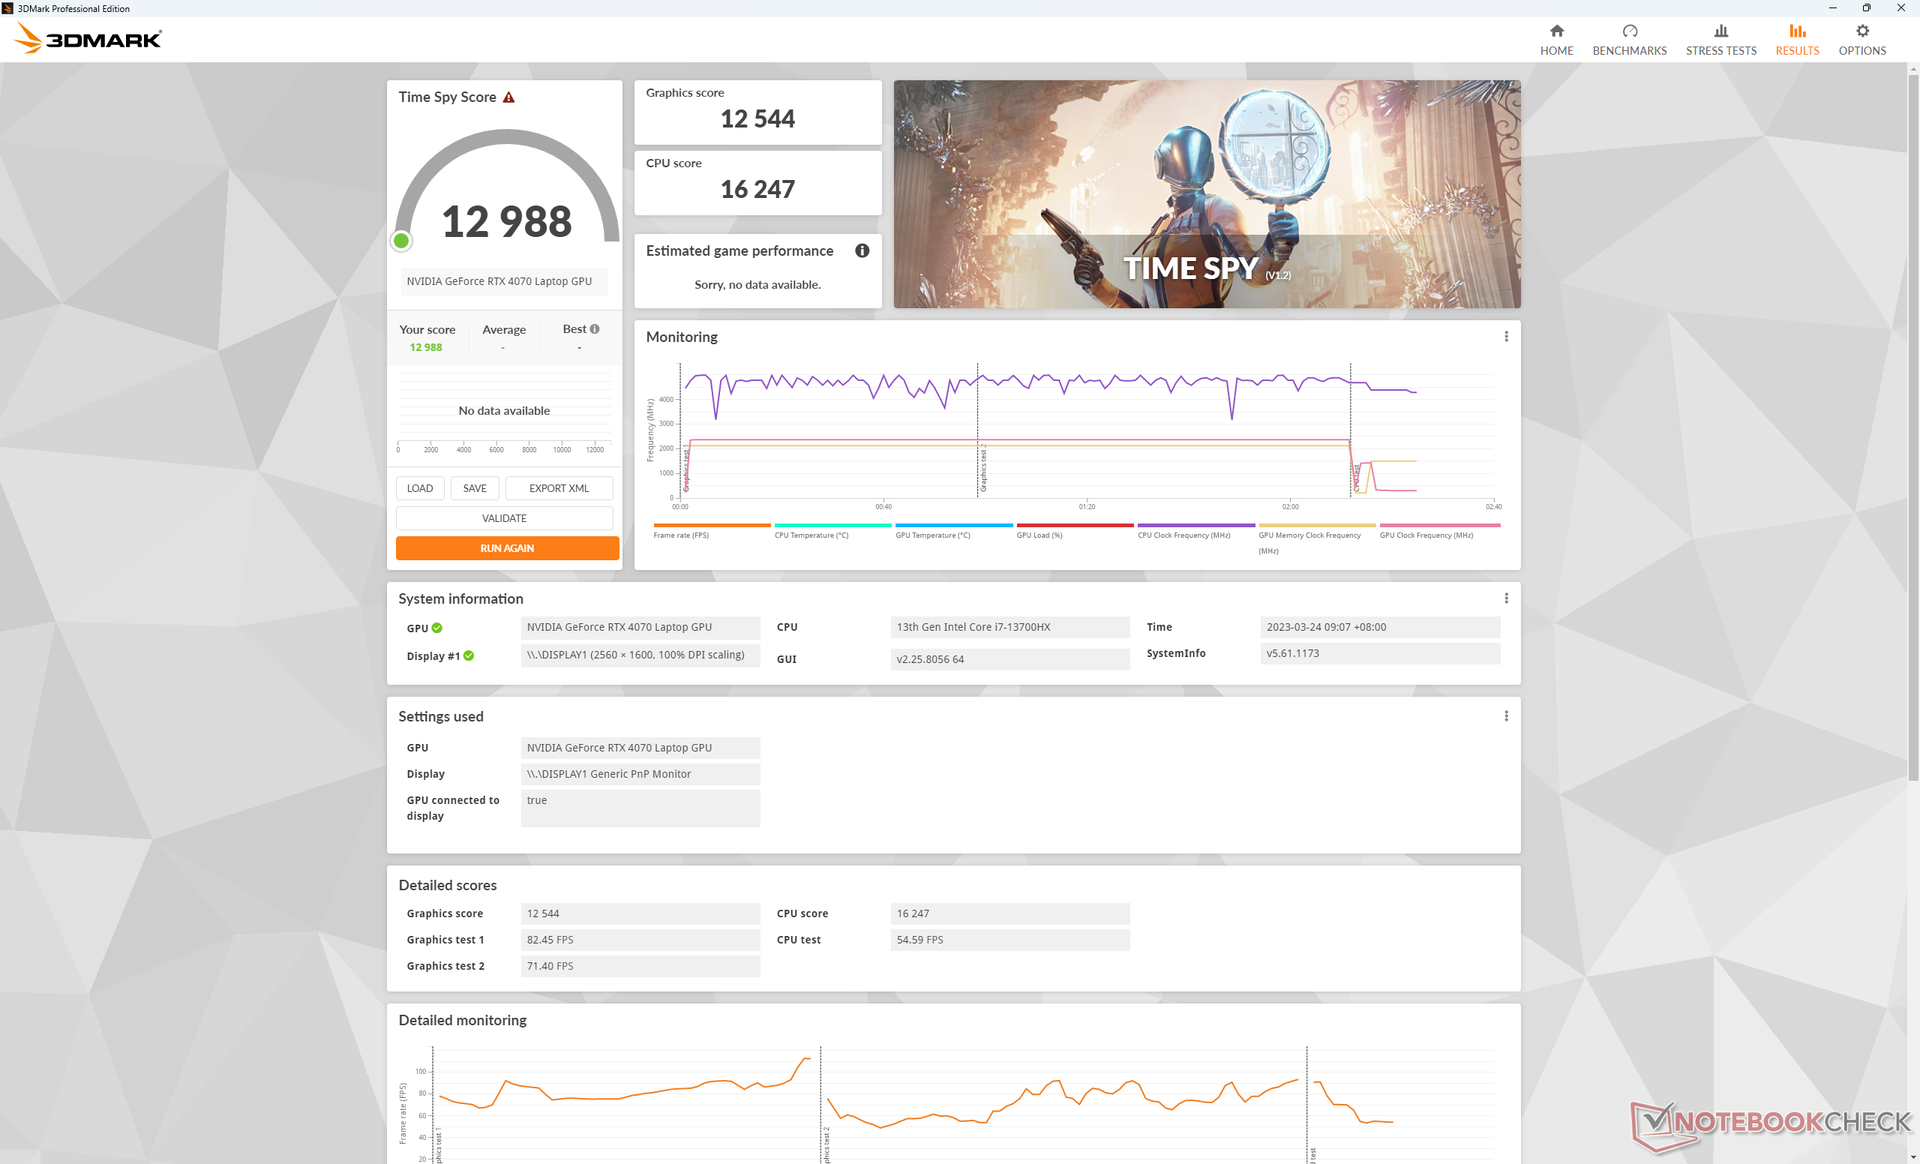
| 3DMark Time Spy Score | 12988 points | |
Help | ||
* ... smaller is better
Witcher 3 FPS Chart
| low | med. | high | ultra | QHD | 4K | |
|---|---|---|---|---|---|---|
| GTA V (2015) | 187 | 186.9 | 183.1 | 124.8 | 93.1 | 93.6 |
| The Witcher 3 (2015) | 606.3 | 430.3 | 260.5 | 123.2 | 78.8 | |
| Dota 2 Reborn (2015) | 213 | 187.9 | 187.2 | 170.2 | 146.6 | |
| Final Fantasy XV Benchmark (2018) | 227 | 177.3 | 121.2 | 88.6 | 48.8 | |
| X-Plane 11.11 (2018) | 189.4 | 165.6 | 129.2 | 109.2 | ||
| Strange Brigade (2018) | 567 | 332 | 255 | 217 | 143.3 | 75.3 |
| Cyberpunk 2077 1.6 (2022) | 182.8 | 152.9 | 115.1 | 93.6 | 55.6 | 24.4 |
| F1 22 (2022) | 310 | 306 | 231 | 83.1 | 53.8 | 26.5 |
Emissions
System Noise
Fan noise is dependent on the power profile and GPU setting. If on discrete GPU mode, for example, fan noise would be a steady 29 dB(A) when idling on desktop against a silent background of 22.4 dB(A). In comparison, fan noise would be much quieter at just 22.9 dB(A) if on Optimus mode. You'll therefore want to keep the system in Optimus mode for undemanding tasks like web browsing or video streaming.
Running Witcher 3 on Performance mode with the dGPU active would result in a fan noise of just under 49 dB(A) which is quieter than on many other 16-inch gaming laptops including the thicker RTX 4090-powered Neo 16 or Lenovo Legion Pro 7 16. Nonetheless, fan noise can still reach an even louder 55 dB(A) if the title is much more demanding.
Noise level
| Idle |
| 22.9 / 29 / 29 dB(A) |
| Load |
| 40.2 / 55 dB(A) |
 | ||
30 dB silent 40 dB(A) audible 50 dB(A) loud |
||
min: | ||
| Uniwill GM6PX7X RTX 4070 GeForce RTX 4070 Laptop GPU, i7-13700HX, Samsung PM9A1 MZVL2512HCJQ | Schenker XMG Neo 16 E23 GeForce RTX 4090 Laptop GPU, i9-13900HX, Crucial P5 Plus 1TB CT1000P5PSSD8 | Asus ROG Strix G16 G614JZ GeForce RTX 4080 Laptop GPU, i9-13980HX, WD PC SN560 SDDPNQE-1T00 | Lenovo Legion Pro 7 16IRX8H GeForce RTX 4080 Laptop GPU, i9-13900HX, Samsung PM9A1 MZVL21T0HCLR | Gigabyte AERO 16 OLED BSF GeForce RTX 4070 Laptop GPU, i9-13900H, Gigabyte AG470S1TB-SI B10 | Razer Blade 16 Early 2023 GeForce RTX 4080 Laptop GPU, i9-13950HX, SSSTC CA6-8D1024 | |
|---|---|---|---|---|---|---|
| Noise | -25% | -6% | -10% | -6% | 6% | |
| off / environment * (dB) | 22.4 | 25 -12% | 25 -12% | 24 -7% | 23 -3% | 23 -3% |
| Idle Minimum * (dB) | 22.9 | 31 -35% | 26 -14% | 26 -14% | 23 -0% | 23 -0% |
| Idle Average * (dB) | 29 | 33 -14% | 28 3% | 28 3% | 23 21% | 23 21% |
| Idle Maximum * (dB) | 29 | 42 -45% | 30 -3% | 34 -17% | 33.64 -16% | 23.6 19% |
| Load Average * (dB) | 40.2 | 58 -44% | 48 -19% | 47 -17% | 51.49 -28% | 39 3% |
| Witcher 3 ultra * (dB) | 48.7 | 57 -17% | 49 -1% | 55 -13% | 55.27 -13% | 51.6 -6% |
| Load Maximum * (dB) | 55 | 59 -7% | 52 5% | 56 -2% | 55.24 -0% | 51.3 7% |
* ... smaller is better
Temperature
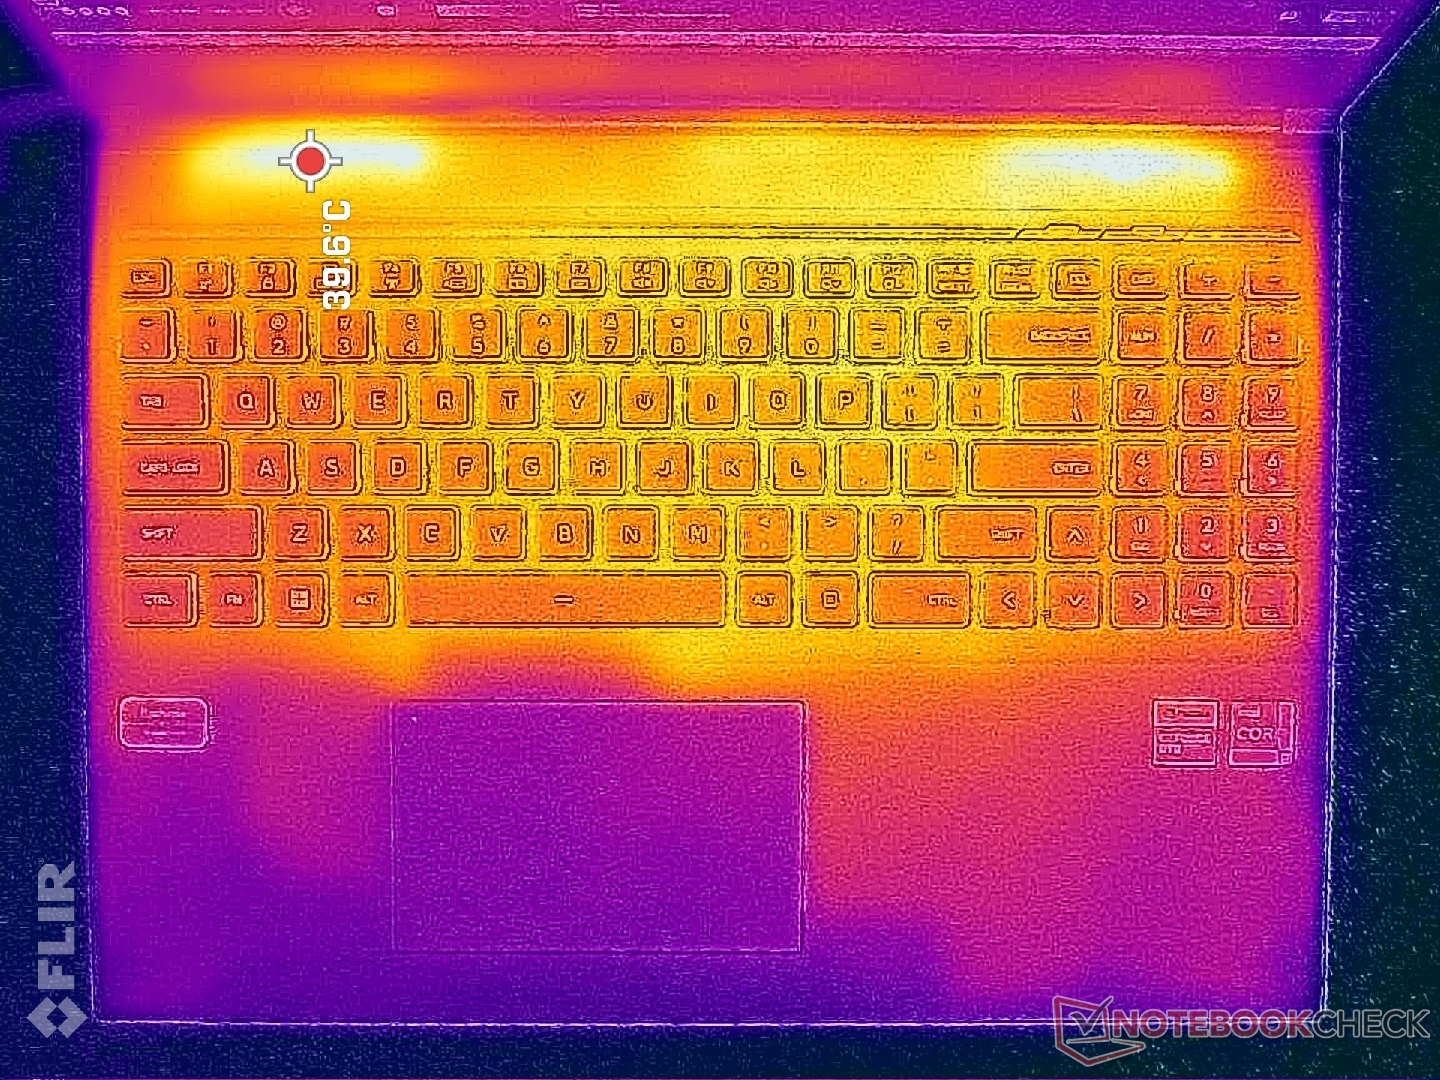
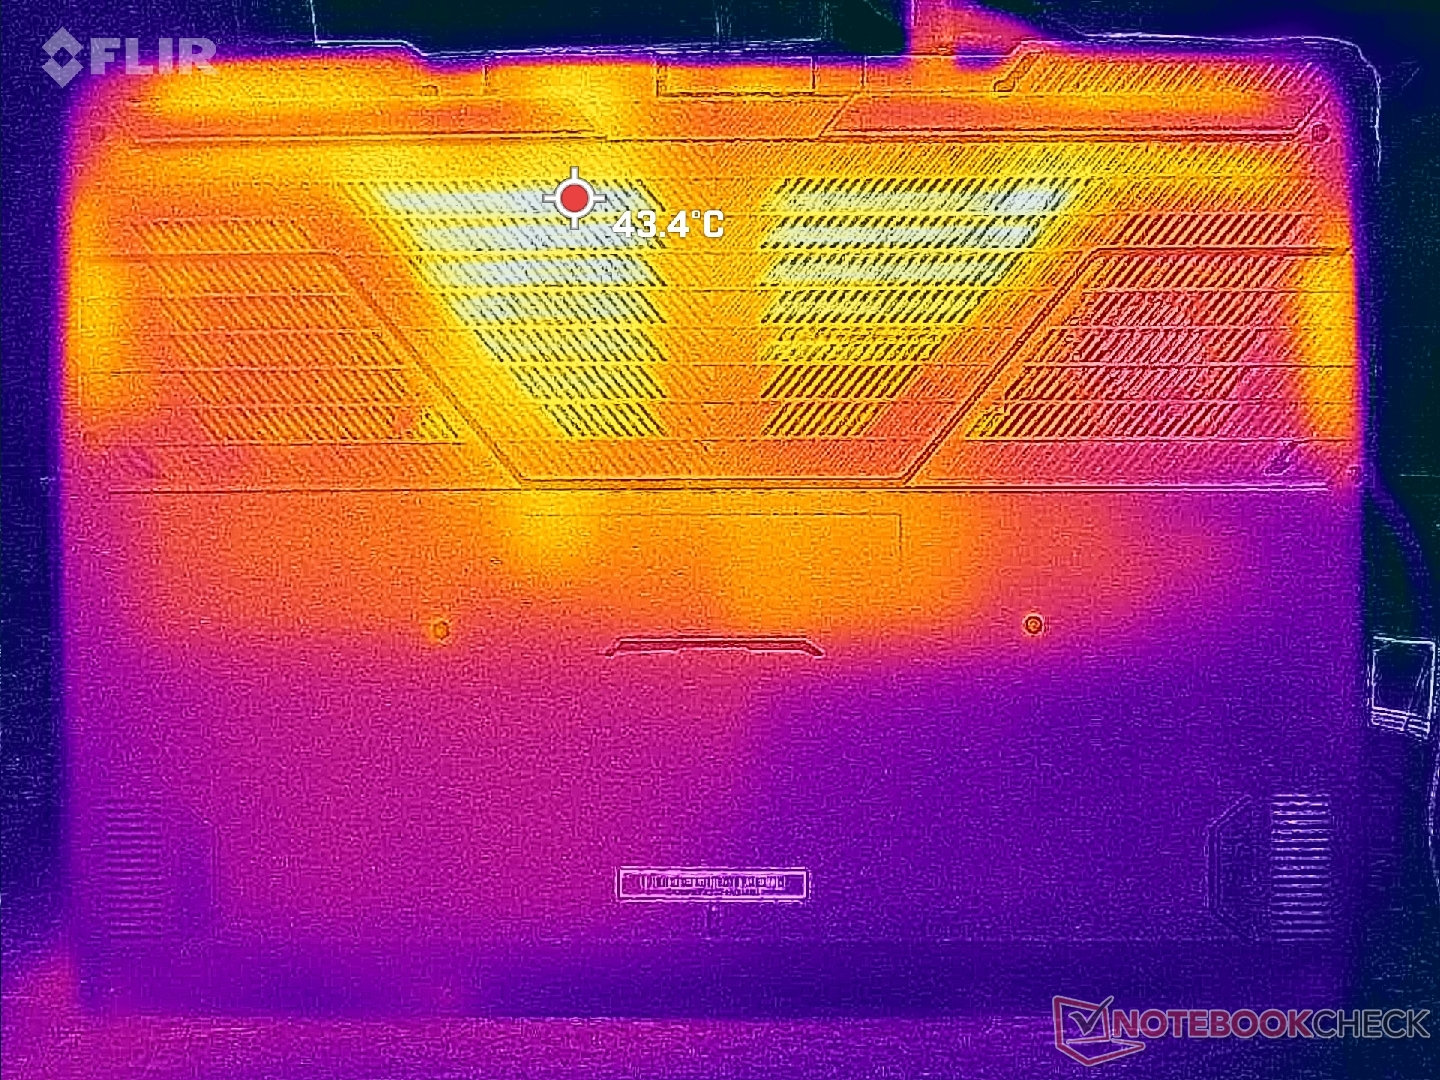
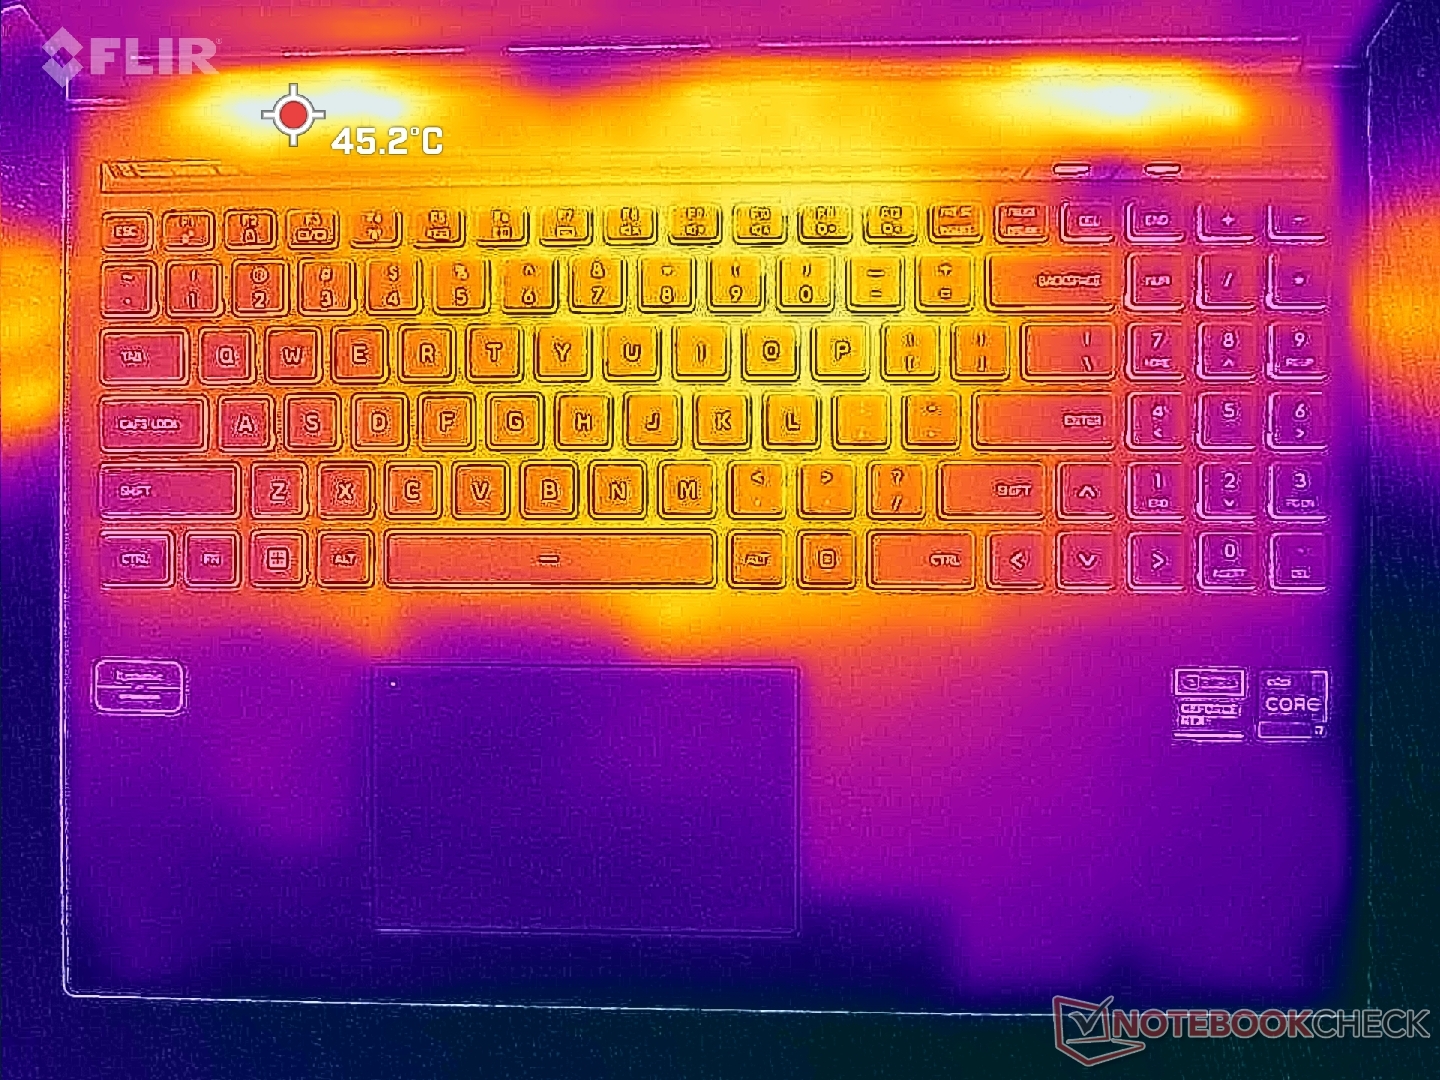
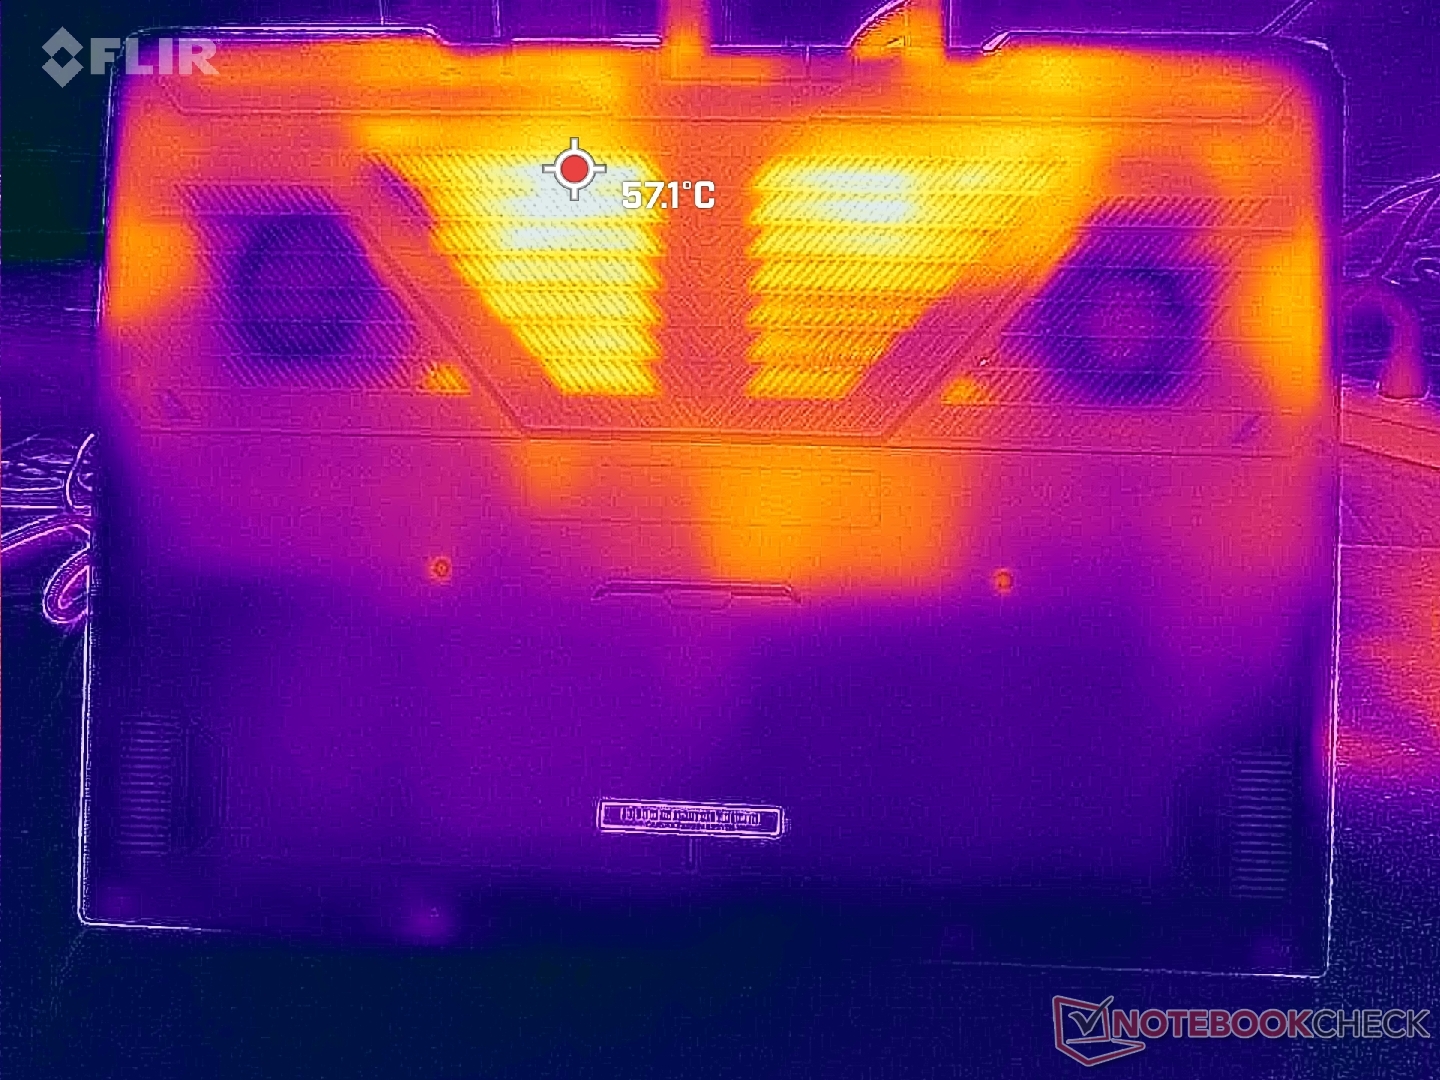
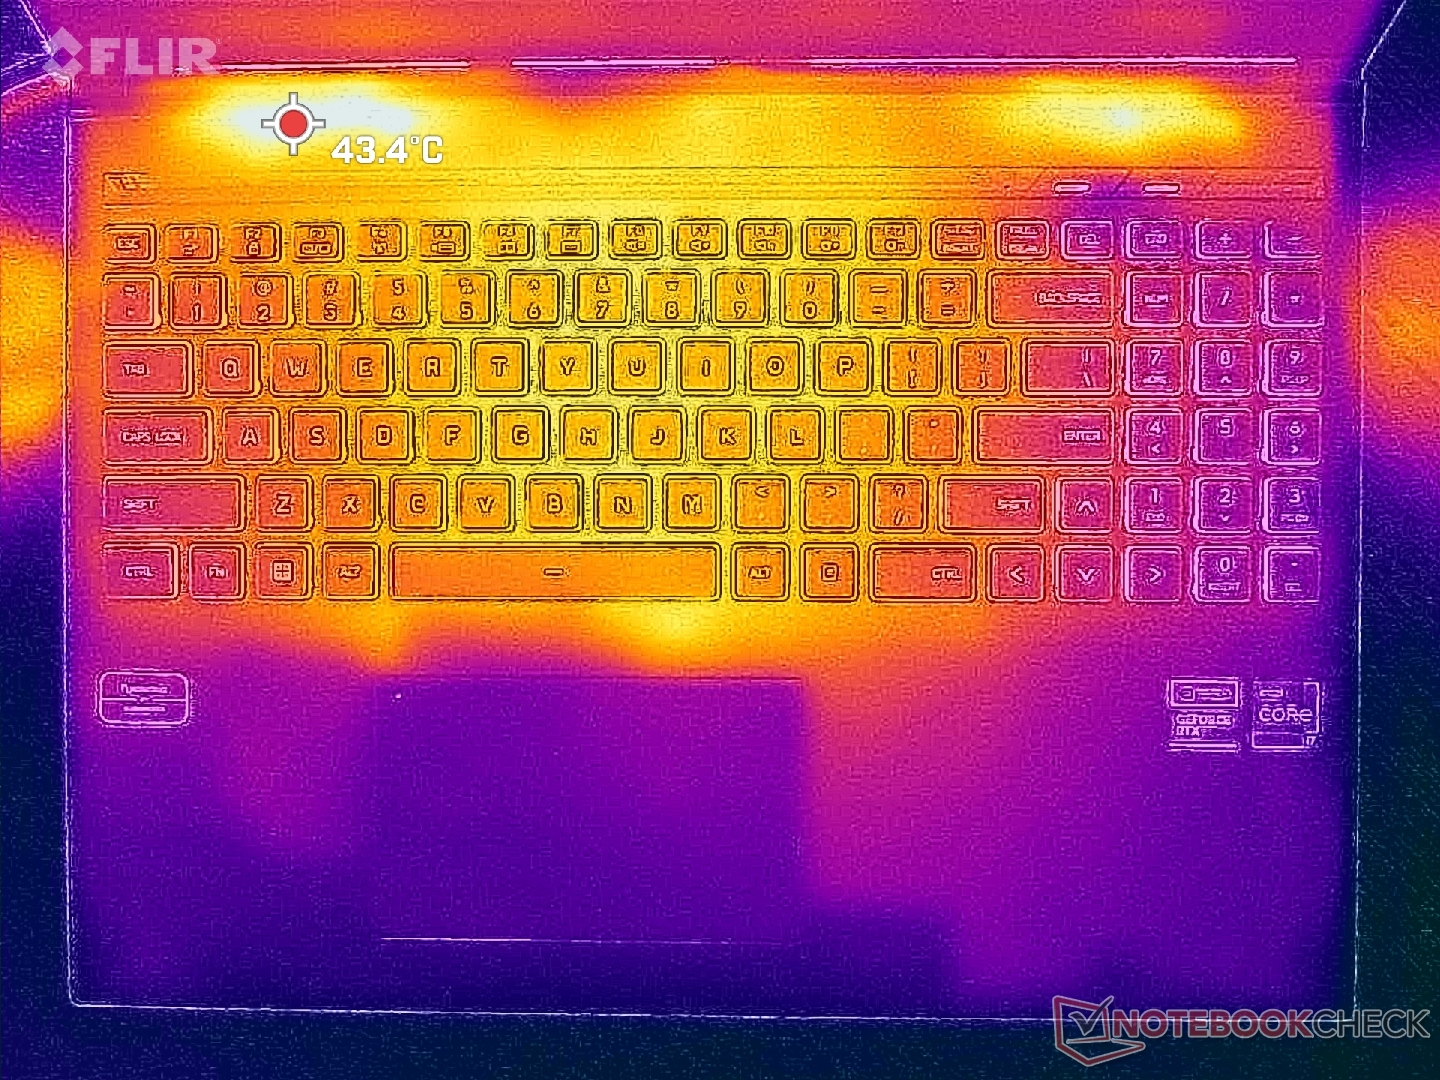
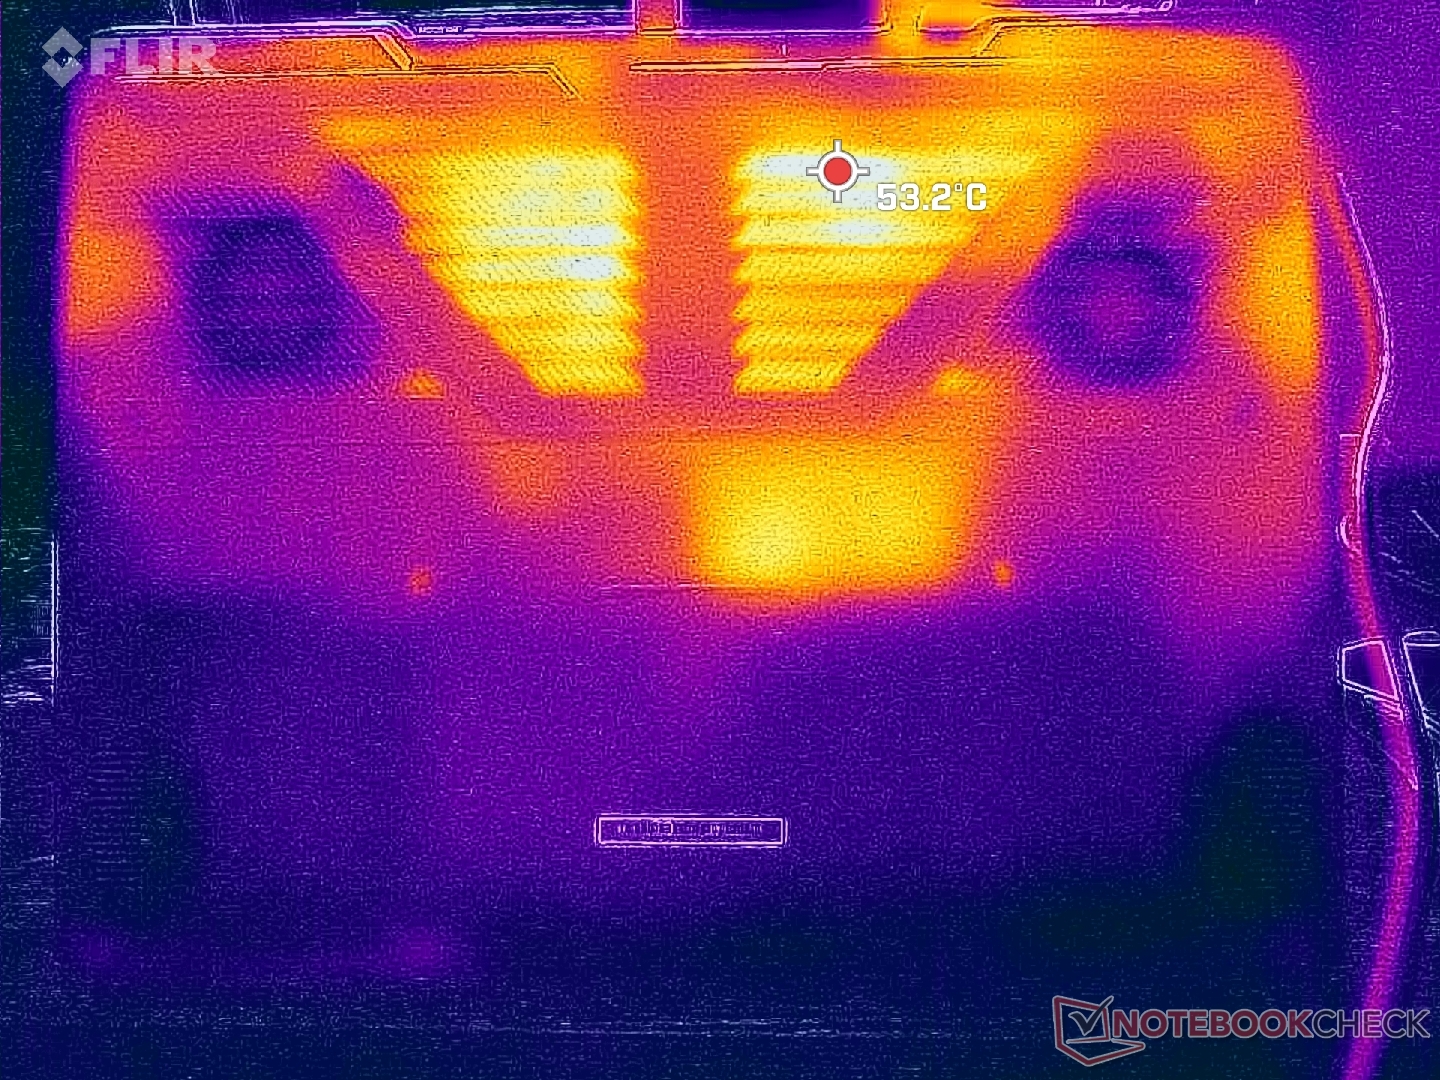
Surface temperatures when gaming are relatively cool when compared to other 16-inch gaming laptops. The Asus ROG Strix G16, for example, can reach over 54 C whereas the hot spots on the Uniwill top out at 40 C on the top and 45 C on the bottom. Temperatures are cooler than on the RTX 4090-powered Neo 16 by a few degrees C as well when under similar gaming loads.
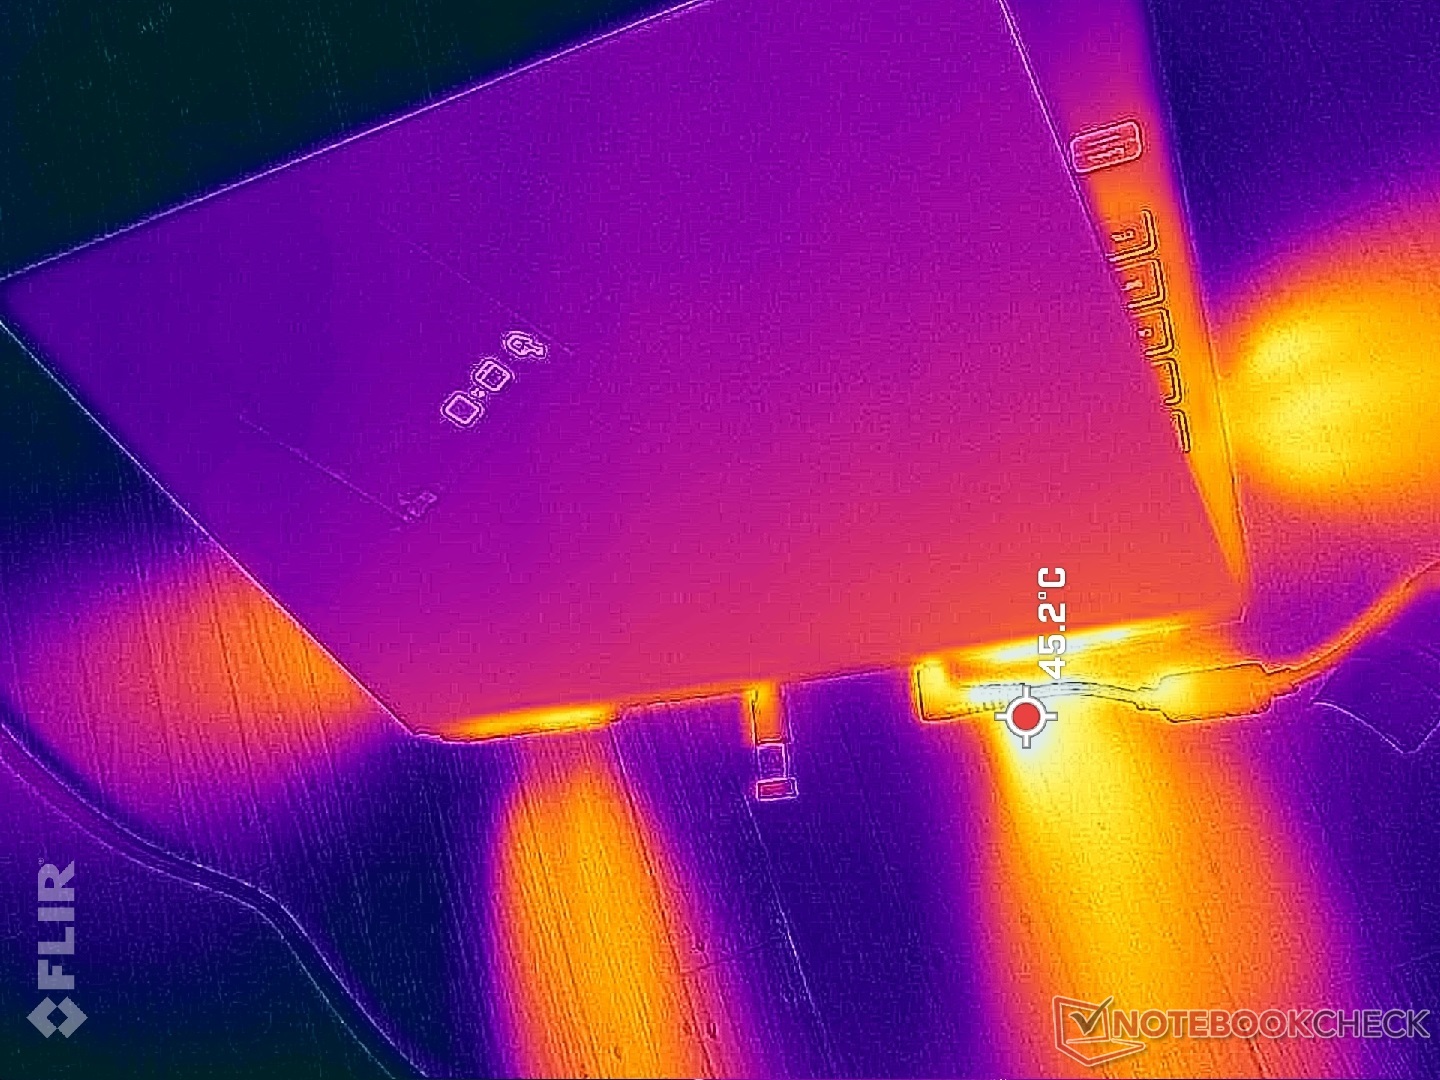
(+) The maximum temperature on the upper side is 38.2 °C / 101 F, compared to the average of 40.4 °C / 105 F, ranging from 21.2 to 68.8 °C for the class Gaming.
(±) The bottom heats up to a maximum of 45 °C / 113 F, compared to the average of 43.3 °C / 110 F
(+) In idle usage, the average temperature for the upper side is 28.9 °C / 84 F, compared to the device average of 33.9 °C / 93 F.
(±) Playing The Witcher 3, the average temperature for the upper side is 32.7 °C / 91 F, compared to the device average of 33.9 °C / 93 F.
(+) The palmrests and touchpad are cooler than skin temperature with a maximum of 26.4 °C / 79.5 F and are therefore cool to the touch.
(+) The average temperature of the palmrest area of similar devices was 28.8 °C / 83.8 F (+2.4 °C / 4.3 F).
| Uniwill GM6PX7X RTX 4070 Intel Core i7-13700HX, NVIDIA GeForce RTX 4070 Laptop GPU | Schenker XMG Neo 16 E23 Intel Core i9-13900HX, NVIDIA GeForce RTX 4090 Laptop GPU | Asus ROG Strix G16 G614JZ Intel Core i9-13980HX, NVIDIA GeForce RTX 4080 Laptop GPU | Lenovo Legion Pro 7 16IRX8H Intel Core i9-13900HX, NVIDIA GeForce RTX 4080 Laptop GPU | Gigabyte AERO 16 OLED BSF Intel Core i9-13900H, NVIDIA GeForce RTX 4070 Laptop GPU | Razer Blade 16 Early 2023 Intel Core i9-13950HX, NVIDIA GeForce RTX 4080 Laptop GPU | |
|---|---|---|---|---|---|---|
| Heat | 2% | -8% | -9% | 16% | 9% | |
| Maximum Upper Side * (°C) | 38.2 | 50 -31% | 54 -41% | 48 -26% | 41 -7% | 40 -5% |
| Maximum Bottom * (°C) | 45 | 51 -13% | 55 -22% | 49 -9% | 47 -4% | 37.6 16% |
| Idle Upper Side * (°C) | 33.6 | 28 17% | 29 14% | 40 -19% | 23 32% | 32.4 4% |
| Idle Bottom * (°C) | 39.6 | 26 34% | 33 17% | 33 17% | 23 42% | 31.4 21% |
* ... smaller is better
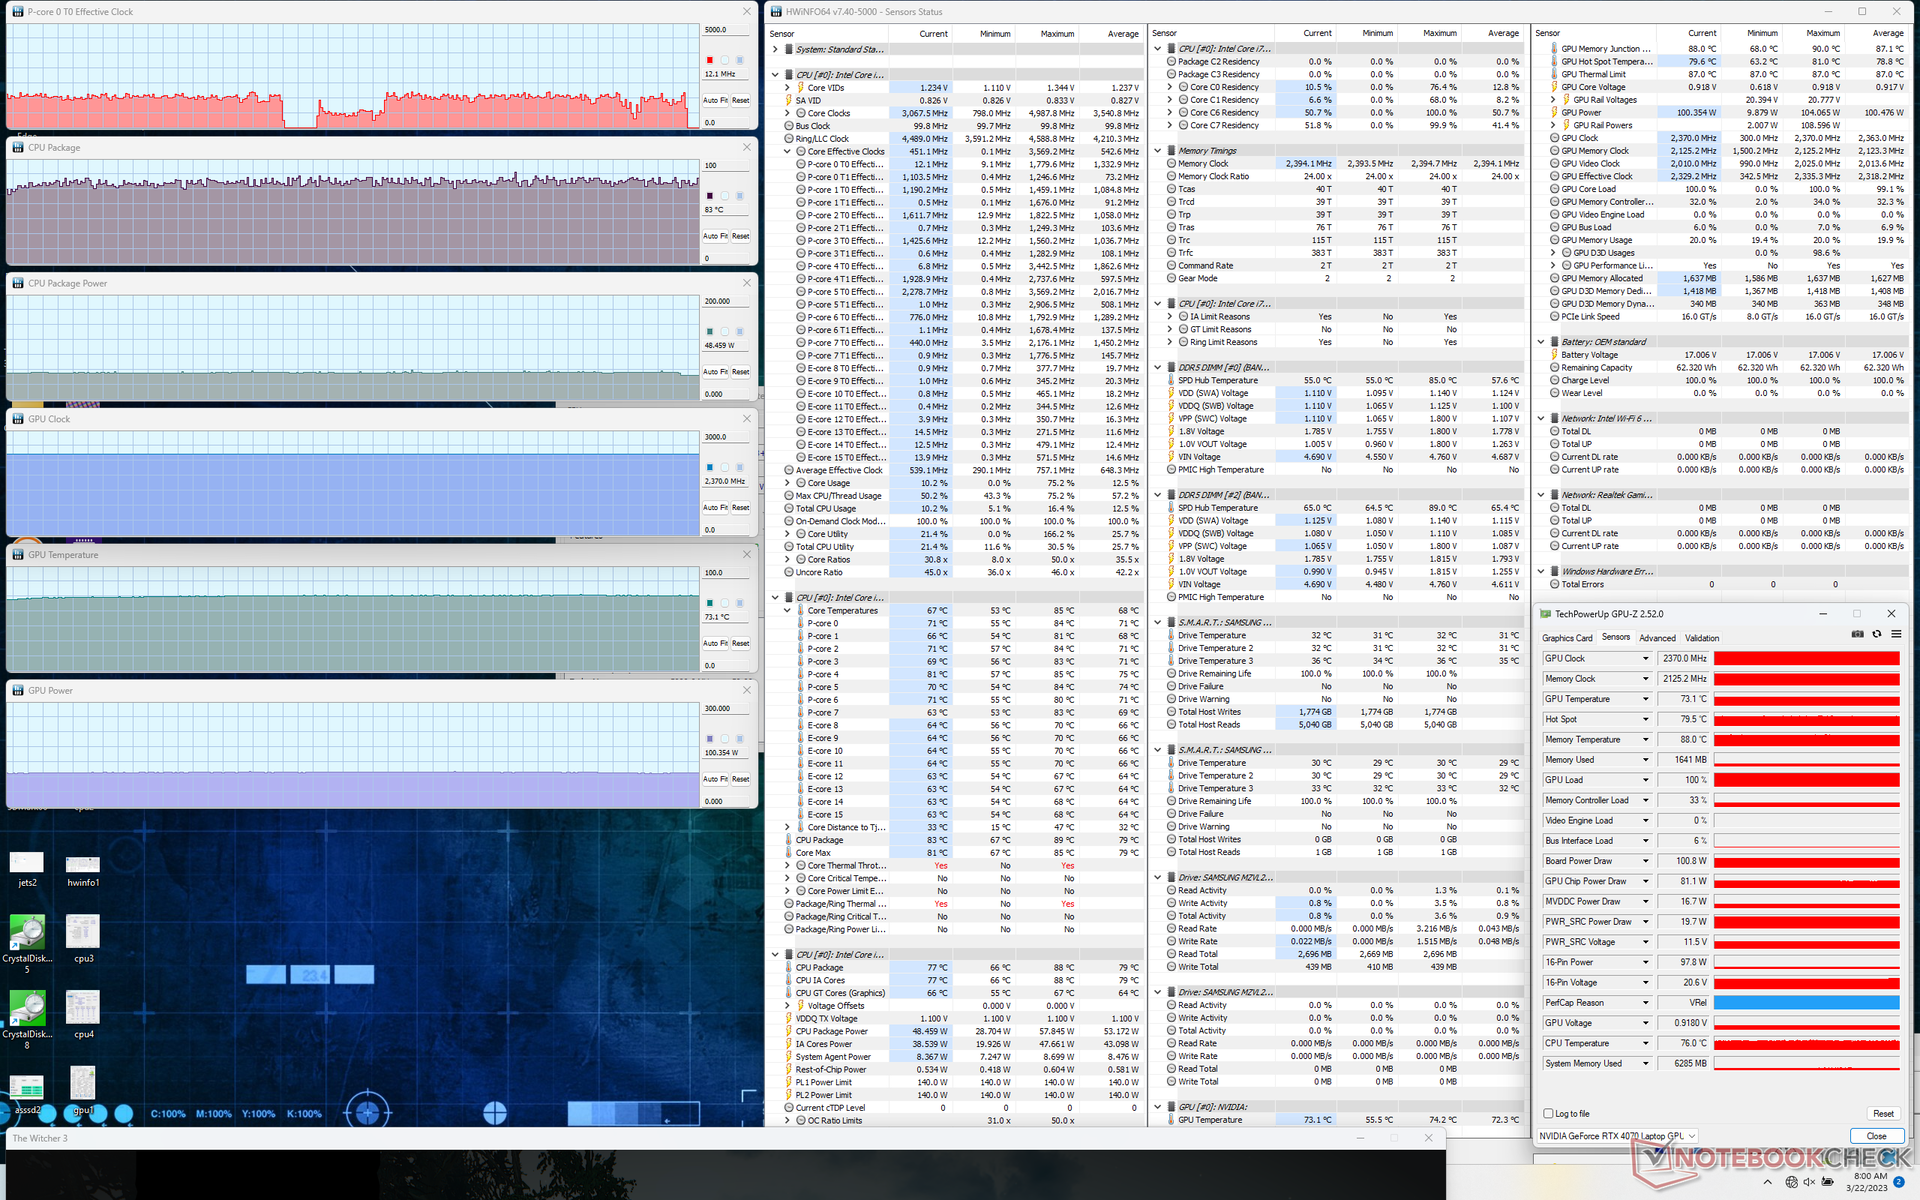
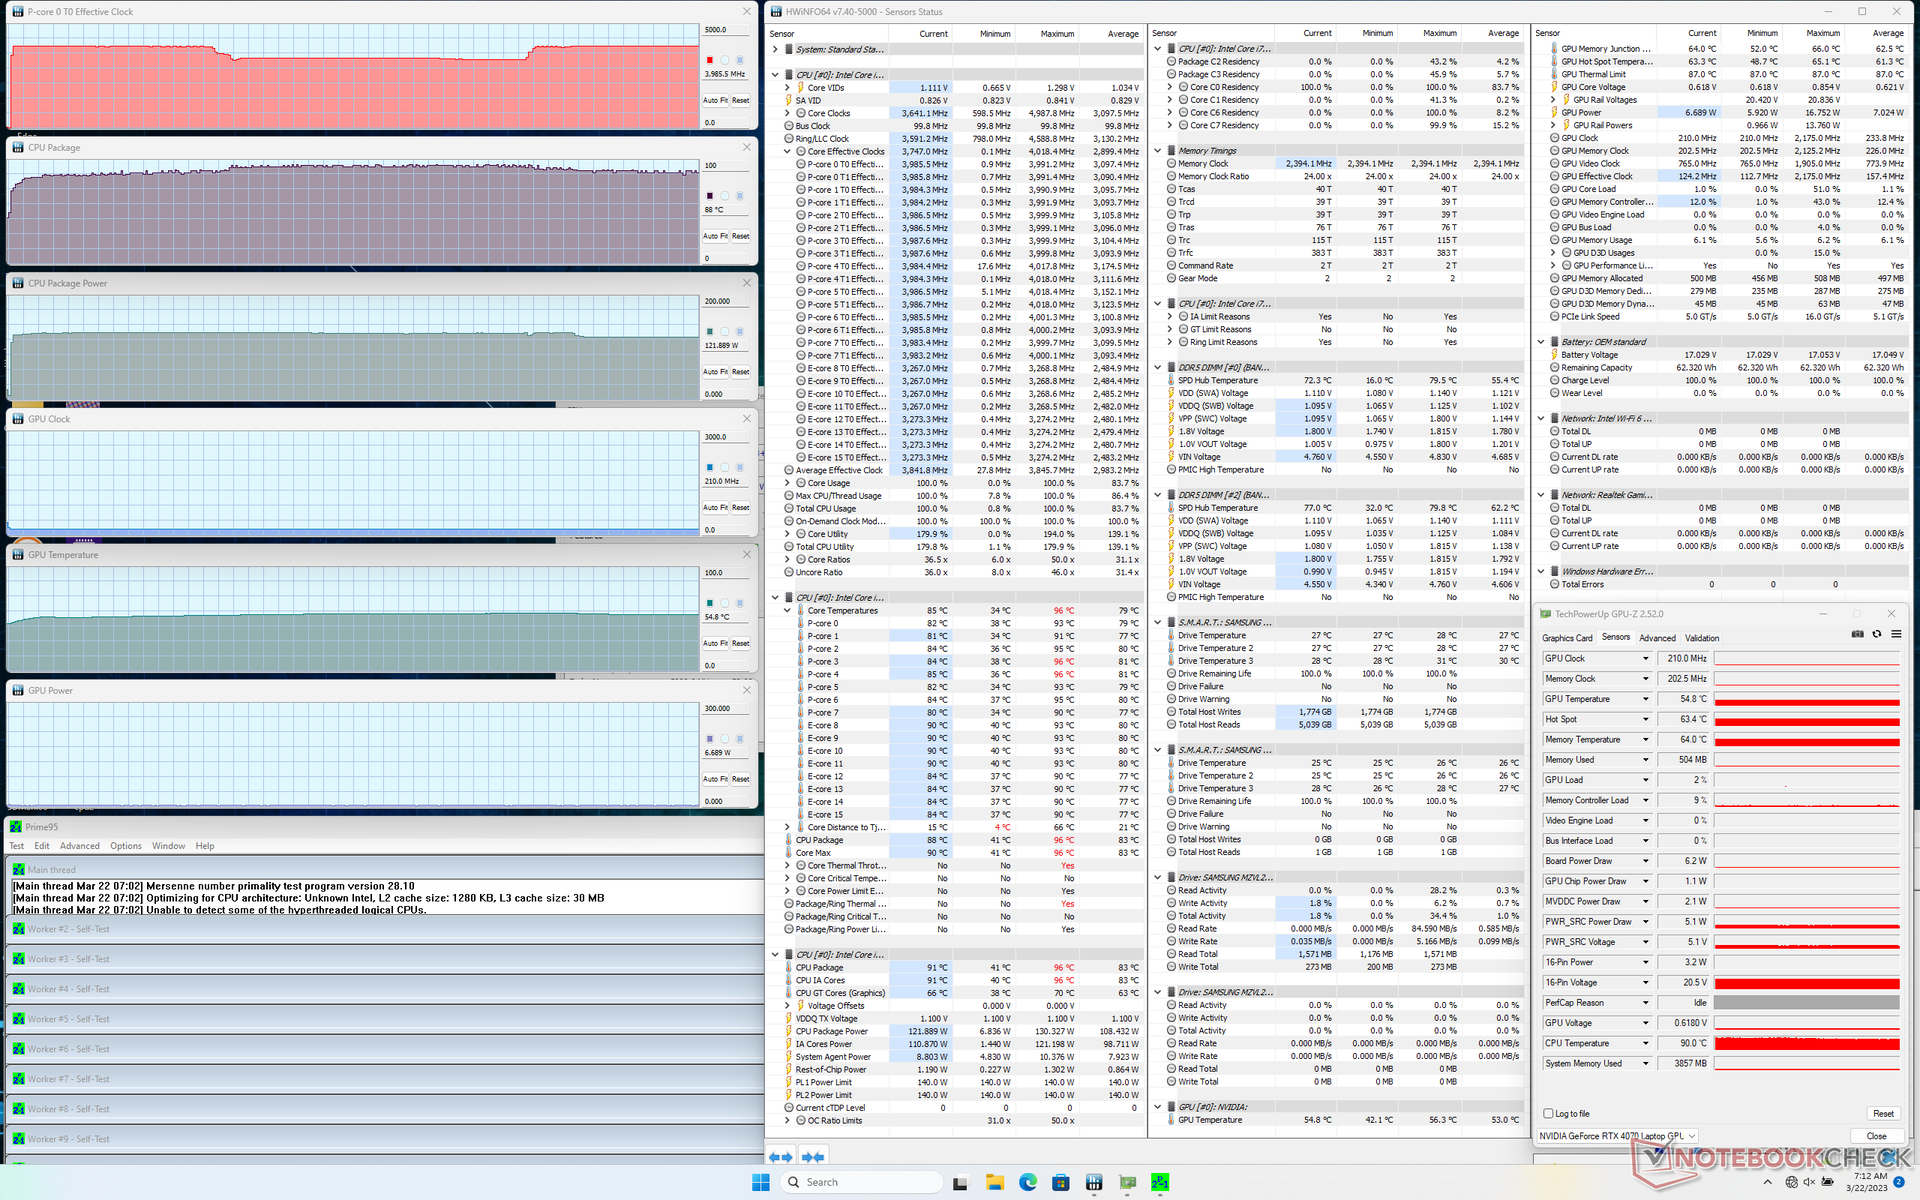
Stress Test
When stressed under Prime95, the CPU would boost to 4 GHz and 130 W for the first few minutes only. Thereafter, clock rates and board power draw would dip to 3.4 GHz and 122 W, respectively. Core temperature would hover around 90 C which is very warm even for a gaming laptop. Running this same test on the Razer Blade 16, for example, would result in a CPU temperature much closer to 80 C.
CPU and GPU temperature when running Witcher 3 would stabilize at 83 C and 73 C, respectively, compared to 78 C each on the Blade 16. GPU board power draw would stabilize at just 100 W compared to its 140 W TGP rating.
Running on battery power limits performance as expected. A Fire Strike test on batteries would return Physics and Graphics scores of 9314 and 11777 points, respectively, compared to 36091 and 31354 points when on mains.
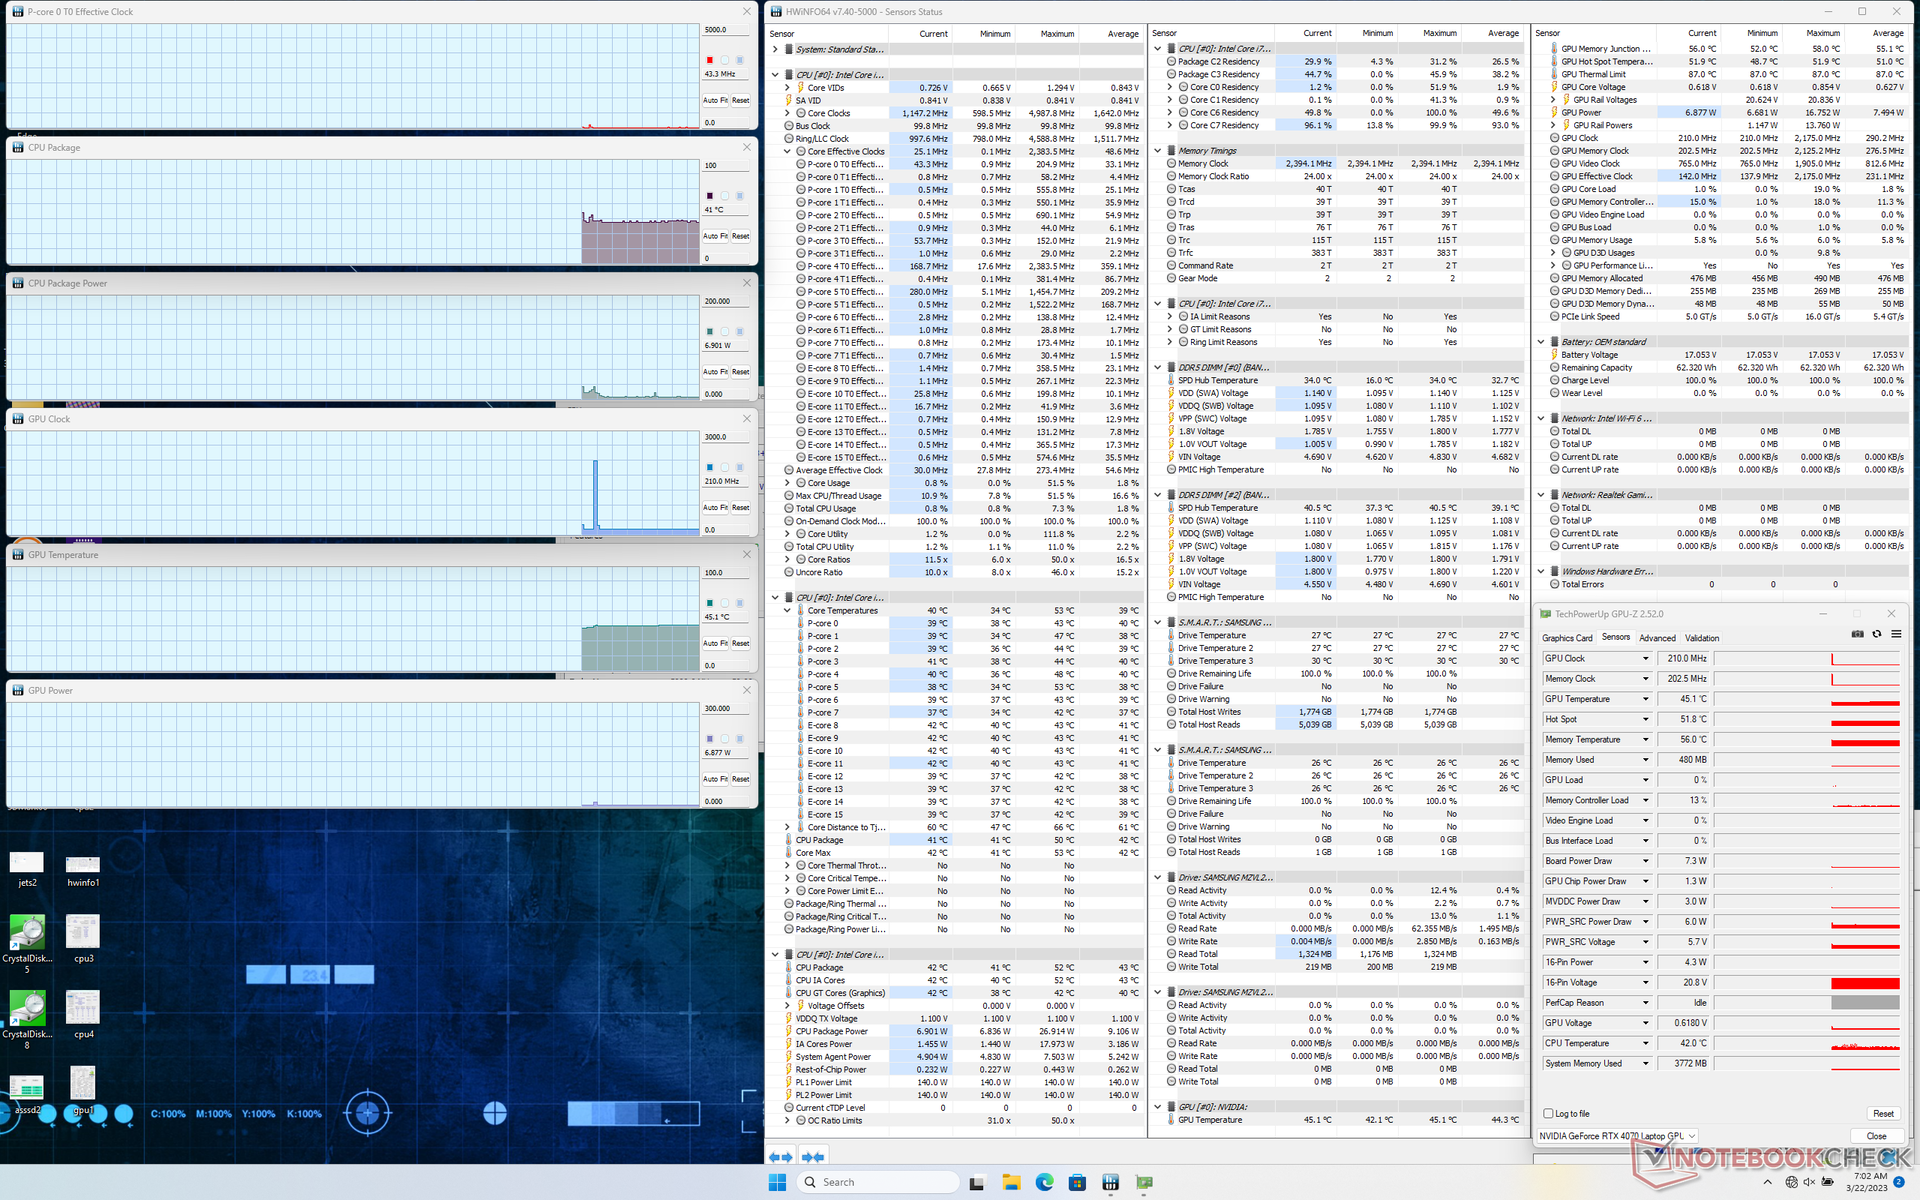
| CPU Clock (GHz) | GPU Clock (MHz) | Average CPU Temperature (°C) | Average GPU Temperature (°C) | |
| System Idle | -- | -- | 41 | 45 |
| Prime95 Stress | 3.4 - 4.0 | -- | 89 | 55 |
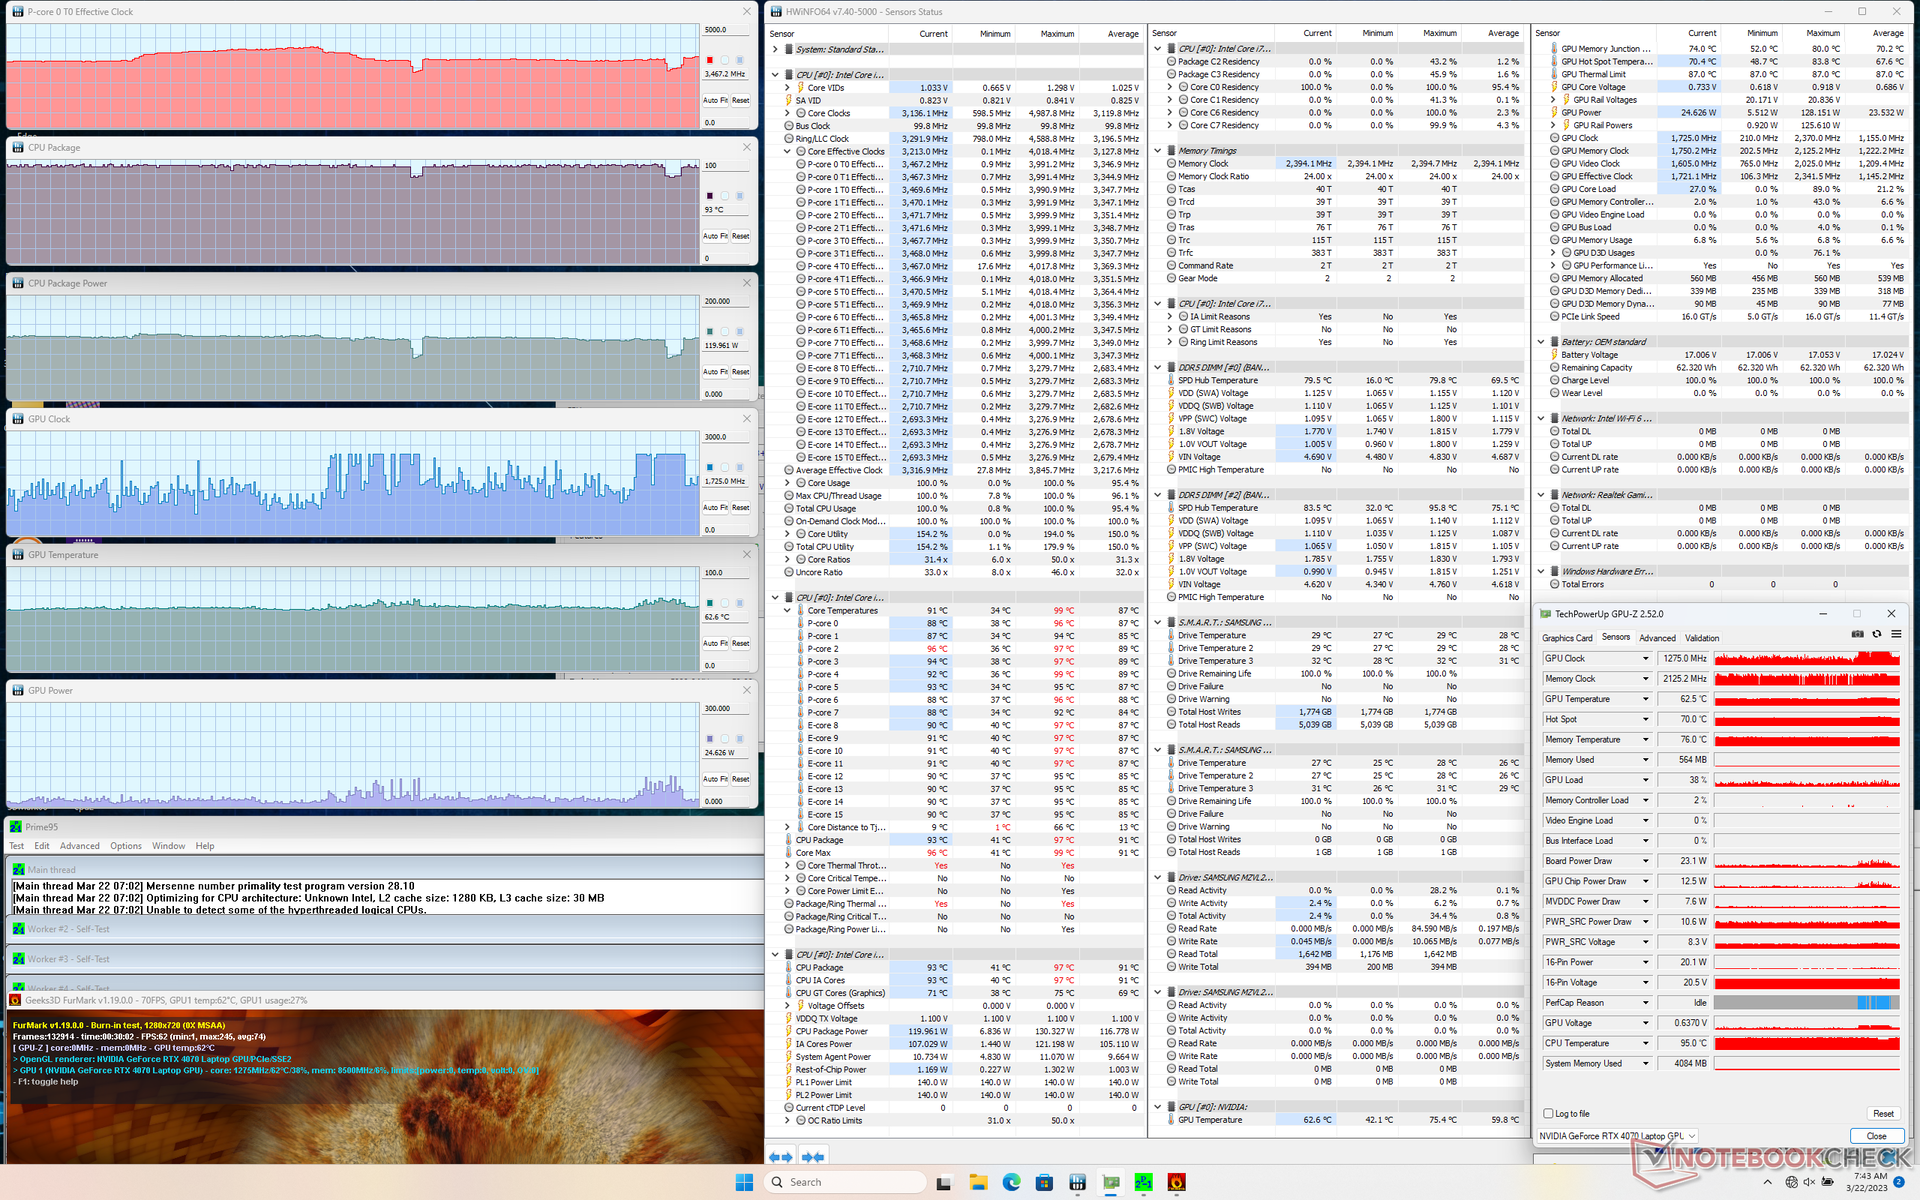
| Prime95 + FurMark Stress | ~3.5 | 1275 - 2350 | 93 | 63 |
| Witcher 3 Stress | ~1450 | 2370 | 83 | 73 |
Speakers
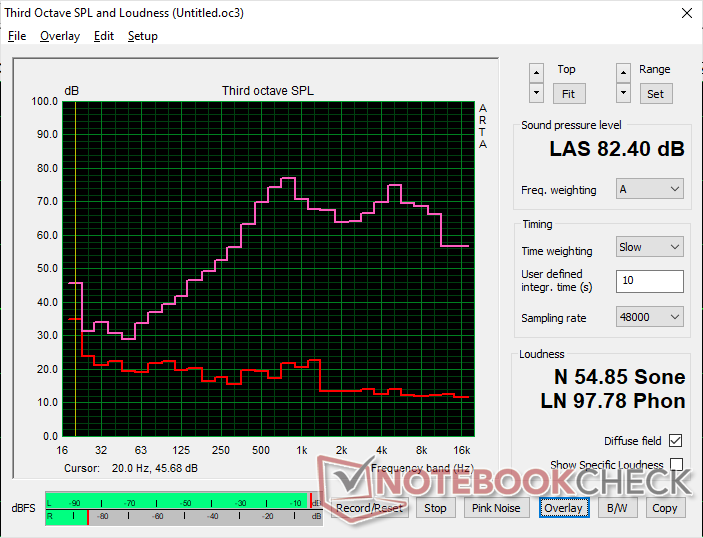
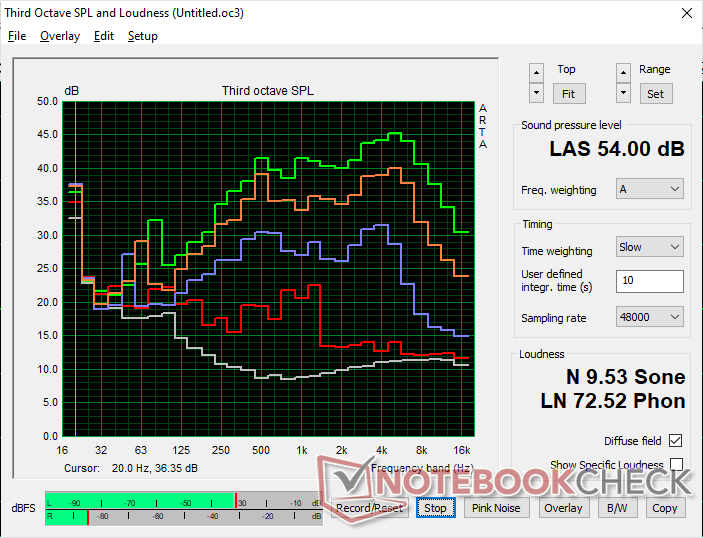
Uniwill GM6PX7X RTX 4070 audio analysis
(+) | speakers can play relatively loud (82.4 dB)
Bass 100 - 315 Hz
(-) | nearly no bass - on average 18.6% lower than median
(+) | bass is linear (6.4% delta to prev. frequency)
Mids 400 - 2000 Hz
(+) | balanced mids - only 4.4% away from median
(±) | linearity of mids is average (8.4% delta to prev. frequency)
Highs 2 - 16 kHz
(+) | balanced highs - only 2.9% away from median
(+) | highs are linear (5.5% delta to prev. frequency)
Overall 100 - 16.000 Hz
(±) | linearity of overall sound is average (16.8% difference to median)
Compared to same class
» 43% of all tested devices in this class were better, 11% similar, 46% worse
» The best had a delta of 6%, average was 18%, worst was 132%
Compared to all devices tested
» 29% of all tested devices were better, 7% similar, 64% worse
» The best had a delta of 4%, average was 24%, worst was 134%
Apple MacBook Pro 16 2021 M1 Pro audio analysis
(+) | speakers can play relatively loud (84.7 dB)
Bass 100 - 315 Hz
(+) | good bass - only 3.8% away from median
(+) | bass is linear (5.2% delta to prev. frequency)
Mids 400 - 2000 Hz
(+) | balanced mids - only 1.3% away from median
(+) | mids are linear (2.1% delta to prev. frequency)
Highs 2 - 16 kHz
(+) | balanced highs - only 1.9% away from median
(+) | highs are linear (2.7% delta to prev. frequency)
Overall 100 - 16.000 Hz
(+) | overall sound is linear (4.6% difference to median)
Compared to same class
» 0% of all tested devices in this class were better, 0% similar, 100% worse
» The best had a delta of 5%, average was 17%, worst was 45%
Compared to all devices tested
» 0% of all tested devices were better, 0% similar, 100% worse
» The best had a delta of 4%, average was 24%, worst was 134%
Energy Management
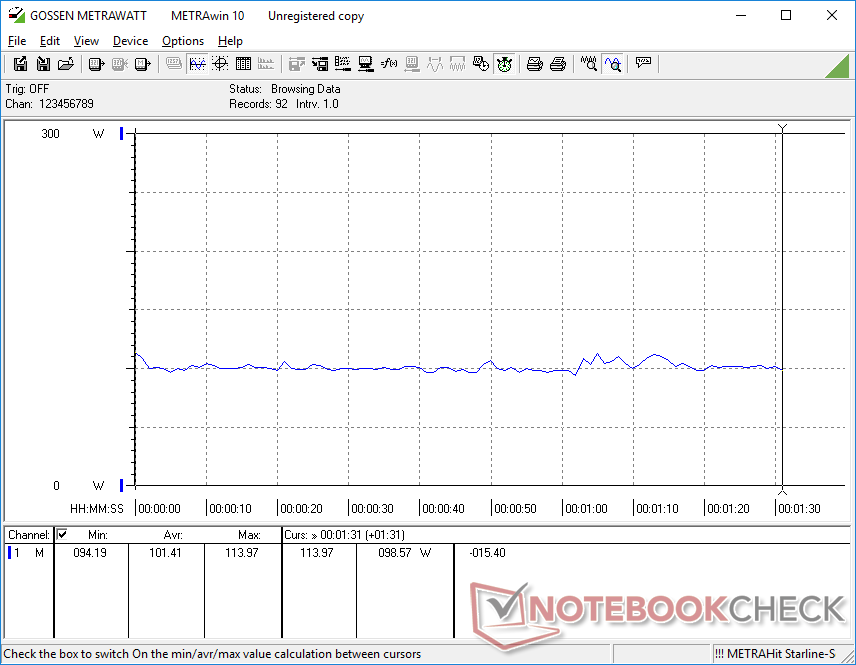
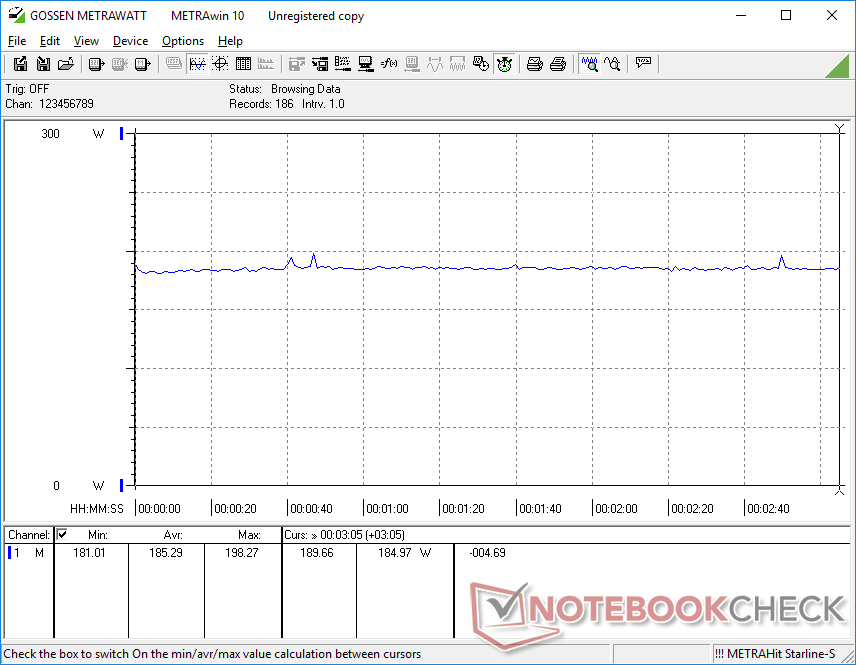
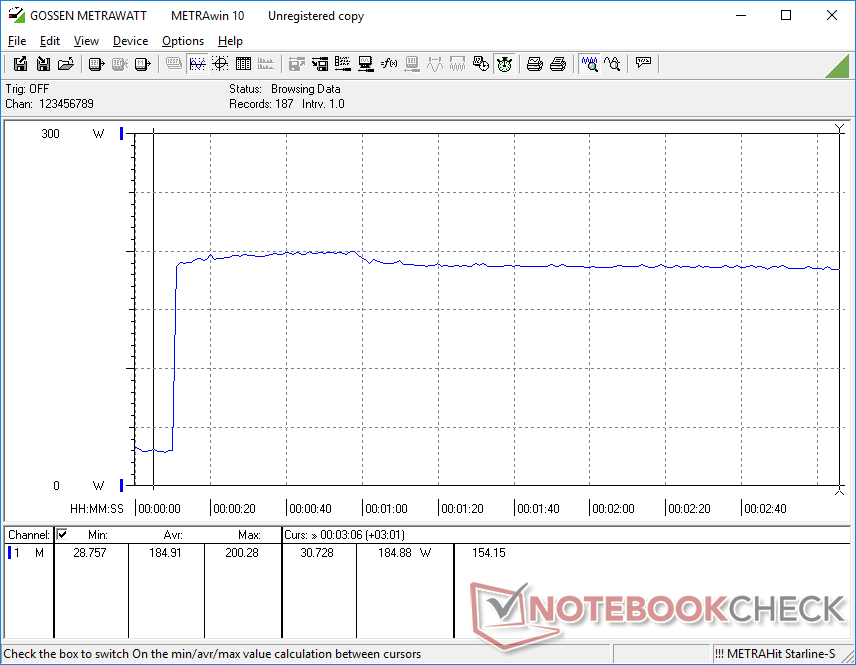
Power Consumption
Power consumption should be less than the faster RTX 4090-equipped Neo 16 in all cases, but this is strangely not true. Idling on desktop would demand between 12 W and 32 W compared to just 8 W and 28 W on the RTX 4090-powered Neo 16. We double-checked our power profiles and brightness settings but the results would not improve.
Running higher loads like games draws 24 to 37 percent less power than the Neo 16. The mobile RTX 4070 is about 35 to 45 percent slower than the mobile RTX 4090 and so the lower consumption is not unexpected.
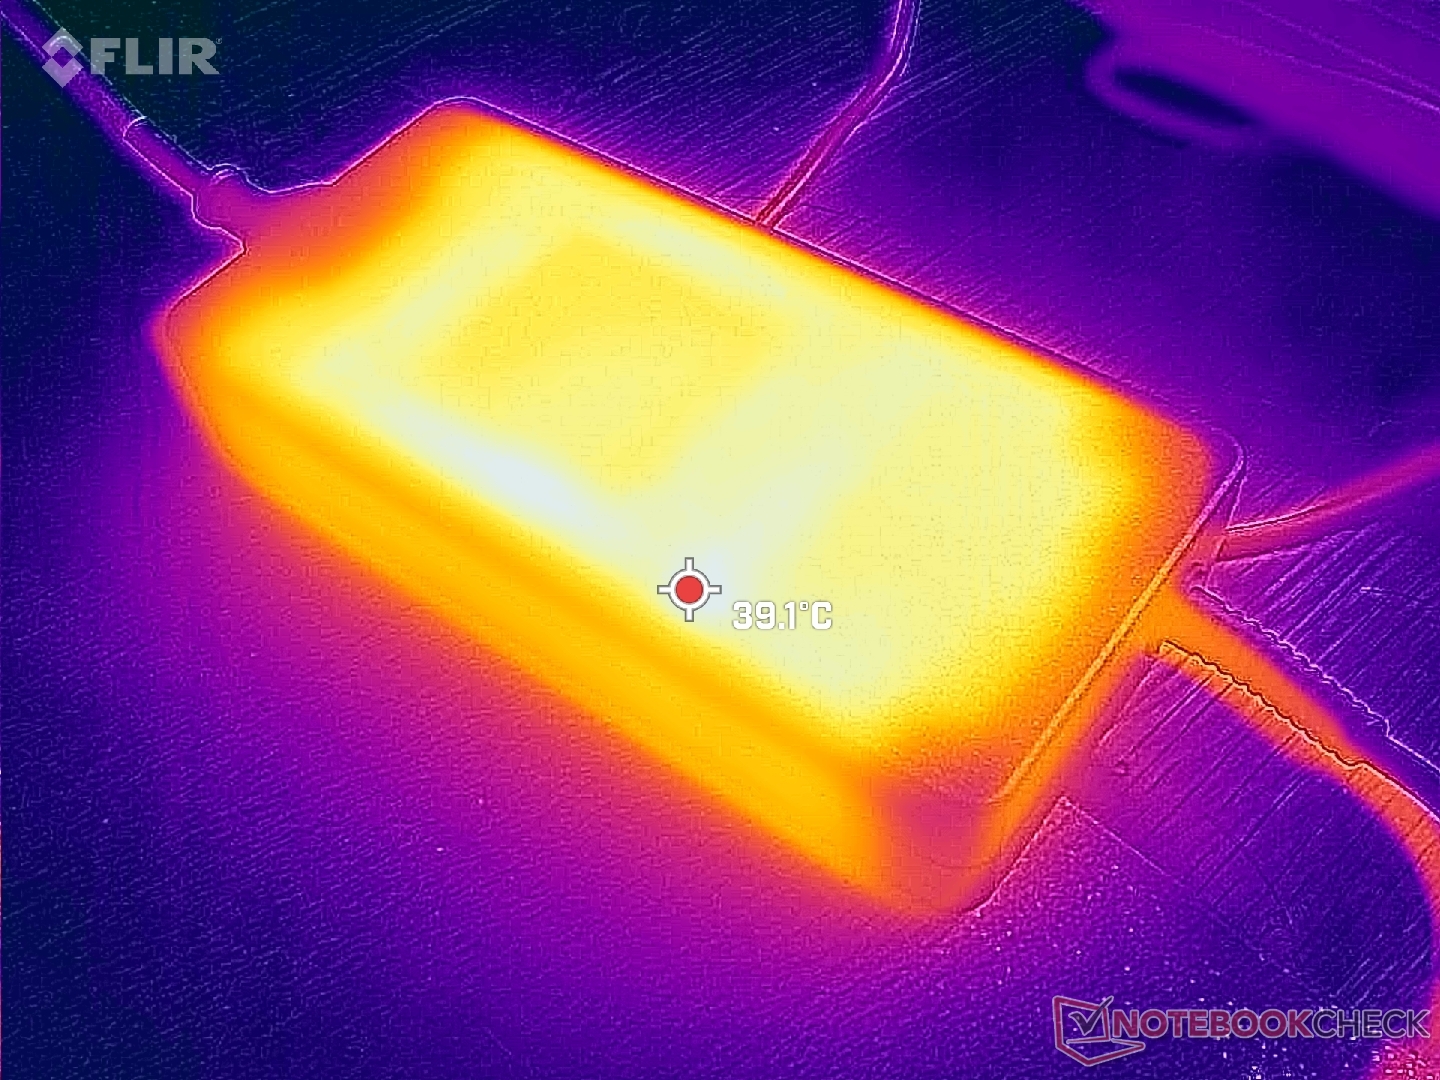
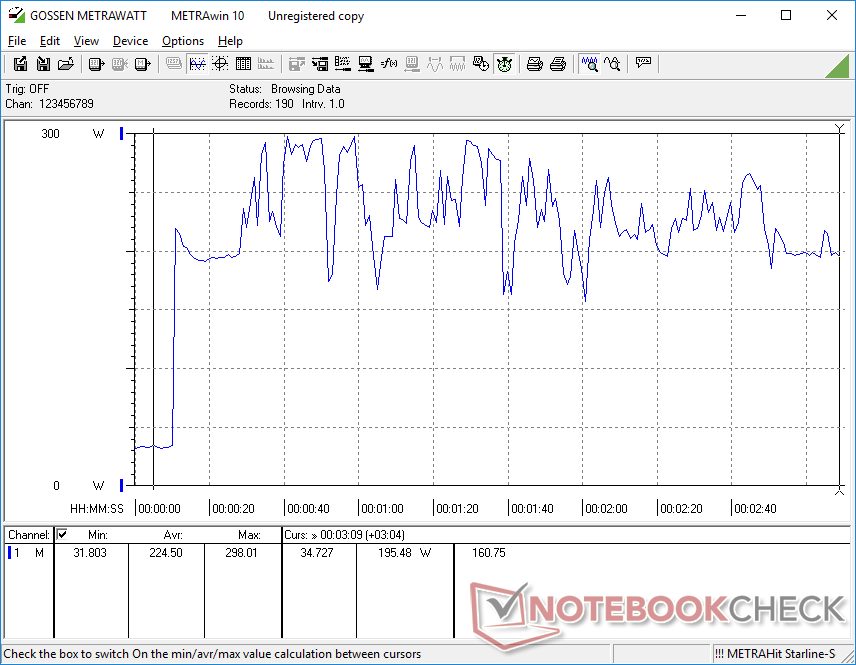
Running Prime95 and FurMark simultaneously would cause consumption to cycle heavily from as low as 167 W up to 298 W even though the large (~18 x 8.4 x 3.5 cm) AC adapter is rated for 280 W. Consumption would be much more stable when repeating this test on the RTX 4090-equipped Neo 16 as shown by the comparison chart below.
| Off / Standby | |
| Idle | |
| Load |
|
Key:
min: | |
| Uniwill GM6PX7X RTX 4070 i7-13700HX, GeForce RTX 4070 Laptop GPU, Samsung PM9A1 MZVL2512HCJQ, IPS, 2560x1600, 16" | Schenker XMG Neo 16 E23 i9-13900HX, GeForce RTX 4090 Laptop GPU, Crucial P5 Plus 1TB CT1000P5PSSD8, IPS, 2560x1600, 16" | Asus ROG Strix G16 G614JZ i9-13980HX, GeForce RTX 4080 Laptop GPU, WD PC SN560 SDDPNQE-1T00, IPS, 2560x1600, 16" | Lenovo Legion Pro 7 16IRX8H i9-13900HX, GeForce RTX 4080 Laptop GPU, Samsung PM9A1 MZVL21T0HCLR, IPS, 2560x1600, 16" | Gigabyte AERO 16 OLED BSF i9-13900H, GeForce RTX 4070 Laptop GPU, Gigabyte AG470S1TB-SI B10, OLED, 3840x2400, 16" | Razer Blade 16 Early 2023 i9-13950HX, GeForce RTX 4080 Laptop GPU, SSSTC CA6-8D1024, IPS, 2560x1600, 16" | |
|---|---|---|---|---|---|---|
| Power Consumption | -13% | -5% | -26% | 19% | -25% | |
| Idle Minimum * (Watt) | 12.6 | 8 37% | 10 21% | 18 -43% | 11.8 6% | 15.2 -21% |
| Idle Average * (Watt) | 17.7 | 18 -2% | 16 10% | 24 -36% | 16.1 9% | 22.8 -29% |
| Idle Maximum * (Watt) | 31.8 | 28 12% | 27 15% | 32 -1% | 17 47% | 49.8 -57% |
| Load Average * (Watt) | 101.4 | 133 -31% | 129 -27% | 130 -28% | 100.6 1% | 121.2 -20% |
| Witcher 3 ultra * (Watt) | 185.3 | 294 -59% | 247 -33% | 260 -40% | 158 15% | 242 -31% |
| Load Maximum * (Watt) | 298 | 399 -34% | 342 -15% | 320 -7% | 192 36% | 273.7 8% |
* ... smaller is better
Power Consumption Witcher 3 / Stresstest
Power Consumption external Monitor
Battery Life
Battery capacity is one-third smaller than on the RTX 4090-powered Neo 16 for a shorter WLAN battery life of about 4 hours. Most other 16-inch gaming laptops have larger battery capacities and runtimes in comparison.
Charging from empty to full capacity takes just under two hours. None of our USB-C chargers are able to recharge the laptop.
| Uniwill GM6PX7X RTX 4070 i7-13700HX, GeForce RTX 4070 Laptop GPU, 62 Wh | Schenker XMG Neo 16 E23 i9-13900HX, GeForce RTX 4090 Laptop GPU, 99 Wh | Asus ROG Strix G16 G614JZ i9-13980HX, GeForce RTX 4080 Laptop GPU, 90 Wh | Lenovo Legion Pro 7 16IRX8H i9-13900HX, GeForce RTX 4080 Laptop GPU, 99.9 Wh | Gigabyte AERO 16 OLED BSF i9-13900H, GeForce RTX 4070 Laptop GPU, 88 Wh | Razer Blade 16 Early 2023 i9-13950HX, GeForce RTX 4080 Laptop GPU, 95.2 Wh | |
|---|---|---|---|---|---|---|
| Battery runtime | 68% | 142% | 27% | 88% | 53% | |
| WiFi v1.3 (h) | 4 | 6.7 68% | 9.7 142% | 5.1 27% | 7.5 88% | 6.1 53% |
| H.264 (h) | 5.8 | 7.4 | ||||
| Witcher 3 ultra (h) | 1.4 | |||||
| Load (h) | 1.1 | 2.1 | 2.1 | 1.4 | ||
| Reader / Idle (h) | 6.4 | 8.9 |
Pros
Cons
Verdict
The Uniwill GM6PX7X is a solid 16-inch gaming laptop even if it doesn't excel in any particular category. The system is lightweight, for example, but the Gigabyte Aero 16 is lighter still. Color coverage approaches 100 percent sRGB, but even deeper P3 colors are available on the Asus ROG Strix G16 or Razer Blade 16. Graphics performance is great for the size, but the lack of Advanced Optimus or G-Sync support on the internal monitor is a thorn to the experience. Zone-based RGB backlighting is supported, but per-key RGB lighting is tied to an optional Cherry mechanical upgrade. Meanwhile, configuring with the faster GeForce RTX 4080 or 4090 entails a thicker and heavier chassis which negates one of the key benefits of the Uniwill GM6PX7X design. There are no notable weaknesses or standout features to the Uniwill which gives it a sense of consistency that some gamers might appreciate.
The Uniwill GM6PX7X is a no-frills gaming laptop that's above average in most every category, but it lacks the oomph or eye-catching feature to help stand out from the crowd.
We can still commend the model for its full-size numpad and arrow keys and rare support for an optional external water cooler. These same keyboard keys tend to be smaller and more cramped on other gaming laptops. Enthusiasts may want to consider the higher-end RTX 4080 or 4090 SKUs to better exploit the optional water cooling.
Price and Availability
The Uniwill GM6PX7X is now shipping under several different names and prices depending on the region. Schenker, for example, offers the chassis under the brand name XMG Neo 16.
Uniwill GM6PX7X RTX 4070
- 03/28/2023 v7 (old)
Allen Ngo
Transparency
The selection of devices to be reviewed is made by our editorial team. The test sample was provided to the author as a loan by the manufacturer or retailer for the purpose of this review. The lender had no influence on this review, nor did the manufacturer receive a copy of this review before publication. There was no obligation to publish this review. As an independent media company, Notebookcheck is not subjected to the authority of manufacturers, retailers or publishers.
This is how Notebookcheck is testing
Every year, Notebookcheck independently reviews hundreds of laptops and smartphones using standardized procedures to ensure that all results are comparable. We have continuously developed our test methods for around 20 years and set industry standards in the process. In our test labs, high-quality measuring equipment is utilized by experienced technicians and editors. These tests involve a multi-stage validation process. Our complex rating system is based on hundreds of well-founded measurements and benchmarks, which maintains objectivity. Further information on our test methods can be found here.
Price comparison
