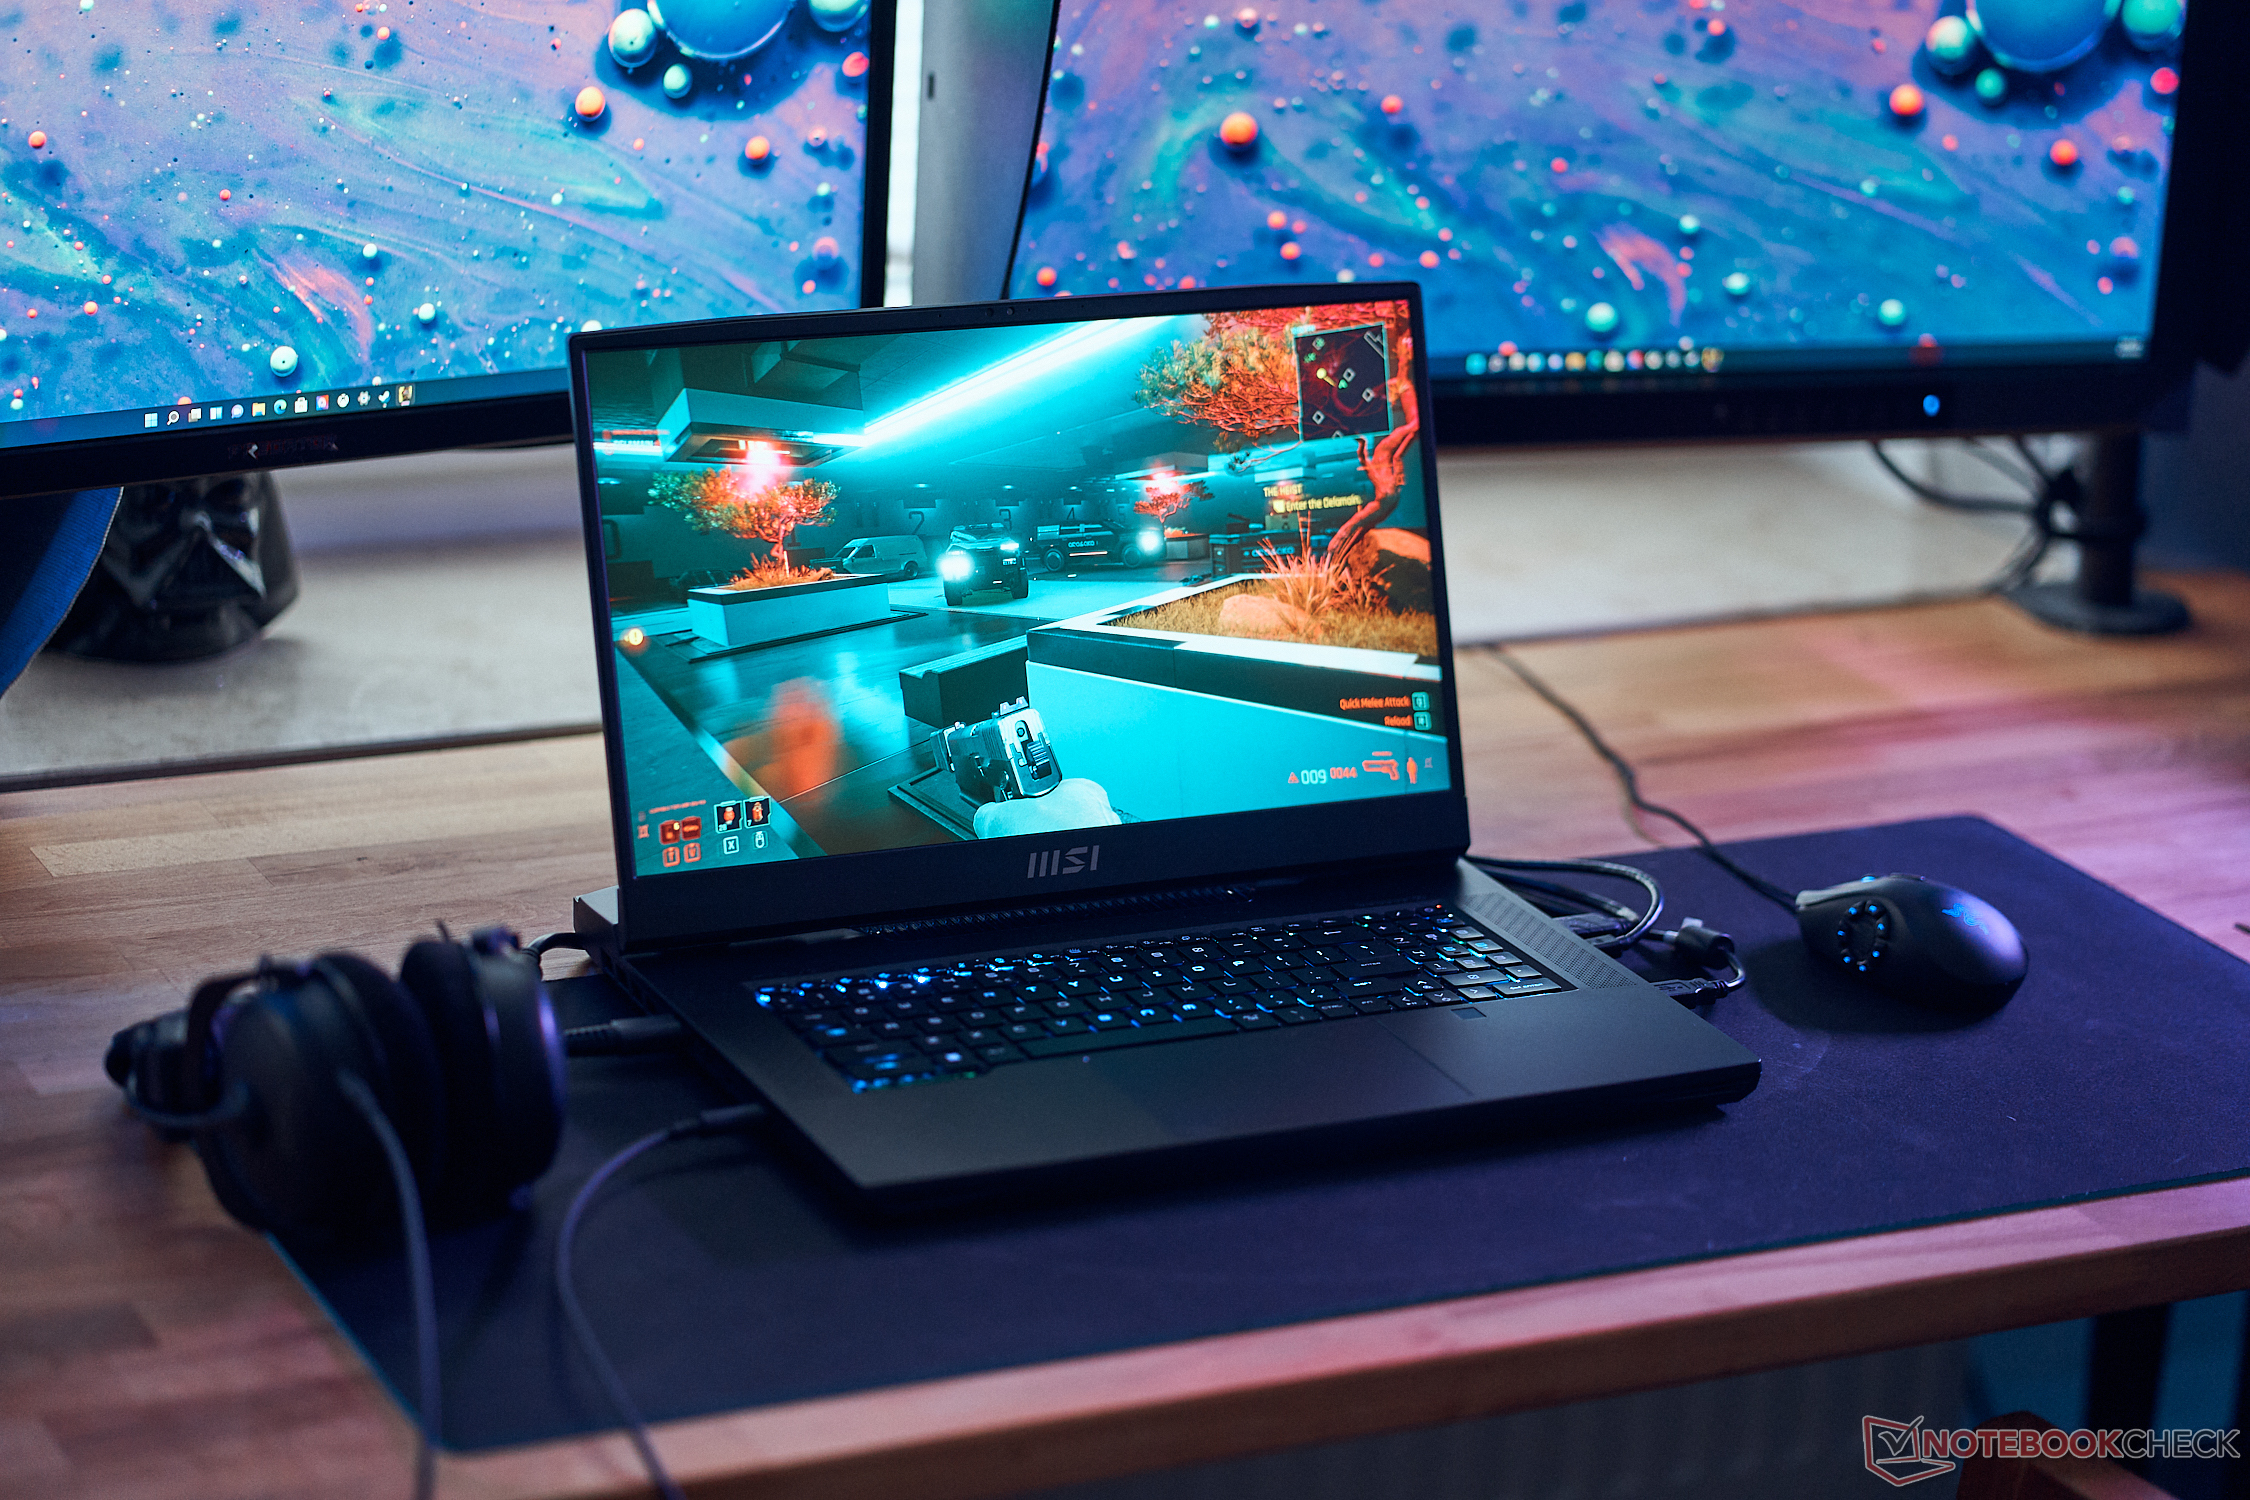
MSI Titan GT77 12UHS Laptop Review: Alder Lake-HX poster child with unhindered desktop-class performance
The MSI Titan has been the company's flagship lineup till the Intel 10th gen-powered Titan GT76 series in 2020. In the 11th gen, MSI chose to limit its flagship offering to the GE76 Raider 11UH. The GE76 Raider gets an Alder Lake upgrade in 2022 as well with the GE76 Raider 12U. However, Intel's introduction of the Alder Lake-HX platform meant that MSI now has an incentive to revive the iconic Titan-class of laptops.
This year's MSI Titan GT77 12U Series seeks to be a holistic package that offers almost everything that an enthusiast gamer would wish for. Desktop-class CPU? Check. Maxed-out memory? Check. The fastest GPU possible? Check. All the storage you can fill up? Check. A Cherry MX mechanical keyboard? Check. A high refresh-rate display? Check and double check.
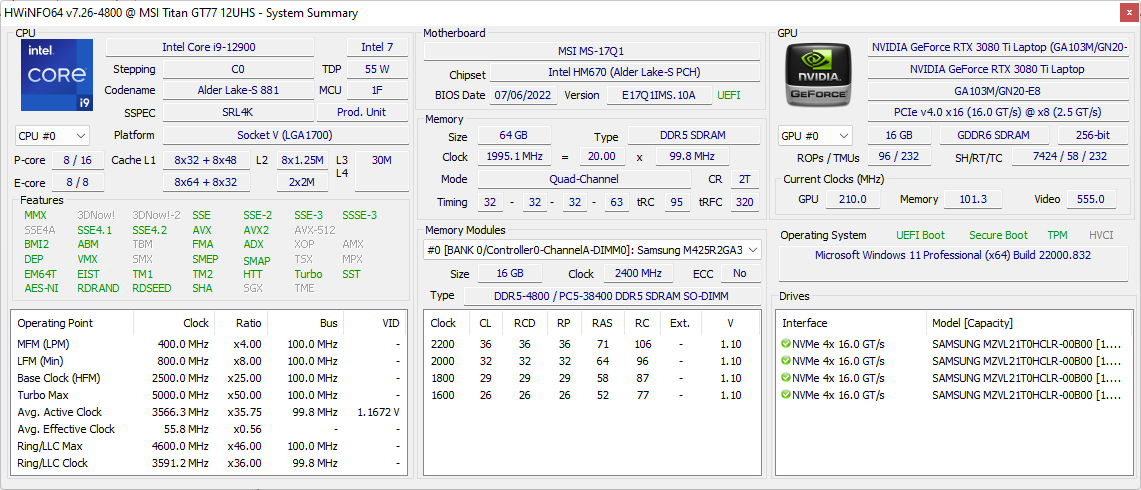
Though MSI has officially unveiled the HX lineup in India, these laptops are yet to be made available in retail in the country at the time of writing. Our MSI Titan GT77 12UHS review sample was provided by Intel India and is powered by the Core i9-12900HX, 64 GB DDR5-4800 RAM, a 175 W RTX 3080 Ti Laptop GPU, 4x 1 TB Samsung PM9A1 NVMe SSDs, a 17.3-inch 360 Hz FHD panel, and a 99.9 WHr battery. According to Intel, this configuration will set you back by about US$4,999 (converted actual approx. ₹3,96,617).
There's also a more affordable model of the Titan GT77 featuring a Core i7-12800HX and an RTX 3070 Ti Laptop GPU for about US$3,100. Our FHD 360 Hz model is not yet available online on MSI or Amazon and all currently available configurations make use of a 120 Hz UHD screen, a review of which will follow soon.
In this review, we set to evaluate the MSI Titan GT77 and see how Intel's new desktop-class Alder Lake-HX processors aid in the iconic Titan's revival and the experience of using what is potentially the most powerful gaming laptop on the market.
Potential Competitors in Comparison
Rating | Date | Model | Weight | Height | Size | Resolution | Price |
|---|---|---|---|---|---|---|---|
| 88.3 % v7 (old) | 08 / 2022 | MSI Titan GT77 12UHS i9-12900HX, GeForce RTX 3080 Ti Laptop GPU | 3.3 kg | 23 mm | 17.30" | 1920x1080 | |
| 83.7 % v7 (old) | 08 / 2022 | Aorus 17X XES i9-12900HX, GeForce RTX 3070 Ti Laptop GPU | 2.7 kg | 30 mm | 17.30" | 1920x1080 | |
| 86.8 % v7 (old) | 07 / 2022 | MSI Raider GE77 HX 12UHS i9-12900HX, GeForce RTX 3080 Ti Laptop GPU | 3.1 kg | 25.9 mm | 17.30" | 3840x2160 | |
| 87.7 % v7 (old) | 07 / 2022 | MSI GE67 HX 12UGS i7-12800HX, GeForce RTX 3070 Ti Laptop GPU | 2.5 kg | 23.4 mm | 15.60" | 1920x1080 | |
| 88.2 % v7 (old) | 05 / 2022 | Asus ROG Zephyrus Duo 16 GX650RX R9 6900HX, GeForce RTX 3080 Ti Laptop GPU | 2.6 kg | 20.5 mm | 16.00" | 3840x2400 | |
| 89.2 % v7 (old) | 05 / 2022 | Alienware x17 R2 P48E i9-12900HK, GeForce RTX 3080 Ti Laptop GPU | 3.1 kg | 20.9 mm | 17.30" | 1920x1080 | |
| 84.7 % v7 (old) | 03 / 2022 | Gigabyte Aero 16 YE5 i9-12900HK, GeForce RTX 3080 Ti Laptop GPU | 2.3 kg | 22.4 mm | 16.00" | 3840x2400 | |
| 87.5 % v7 (old) | 01 / 2022 | MSI GE76 Raider i9-12900HK, GeForce RTX 3080 Ti Laptop GPU | 3 kg | 26 mm | 17.30" | 1920x1080 |
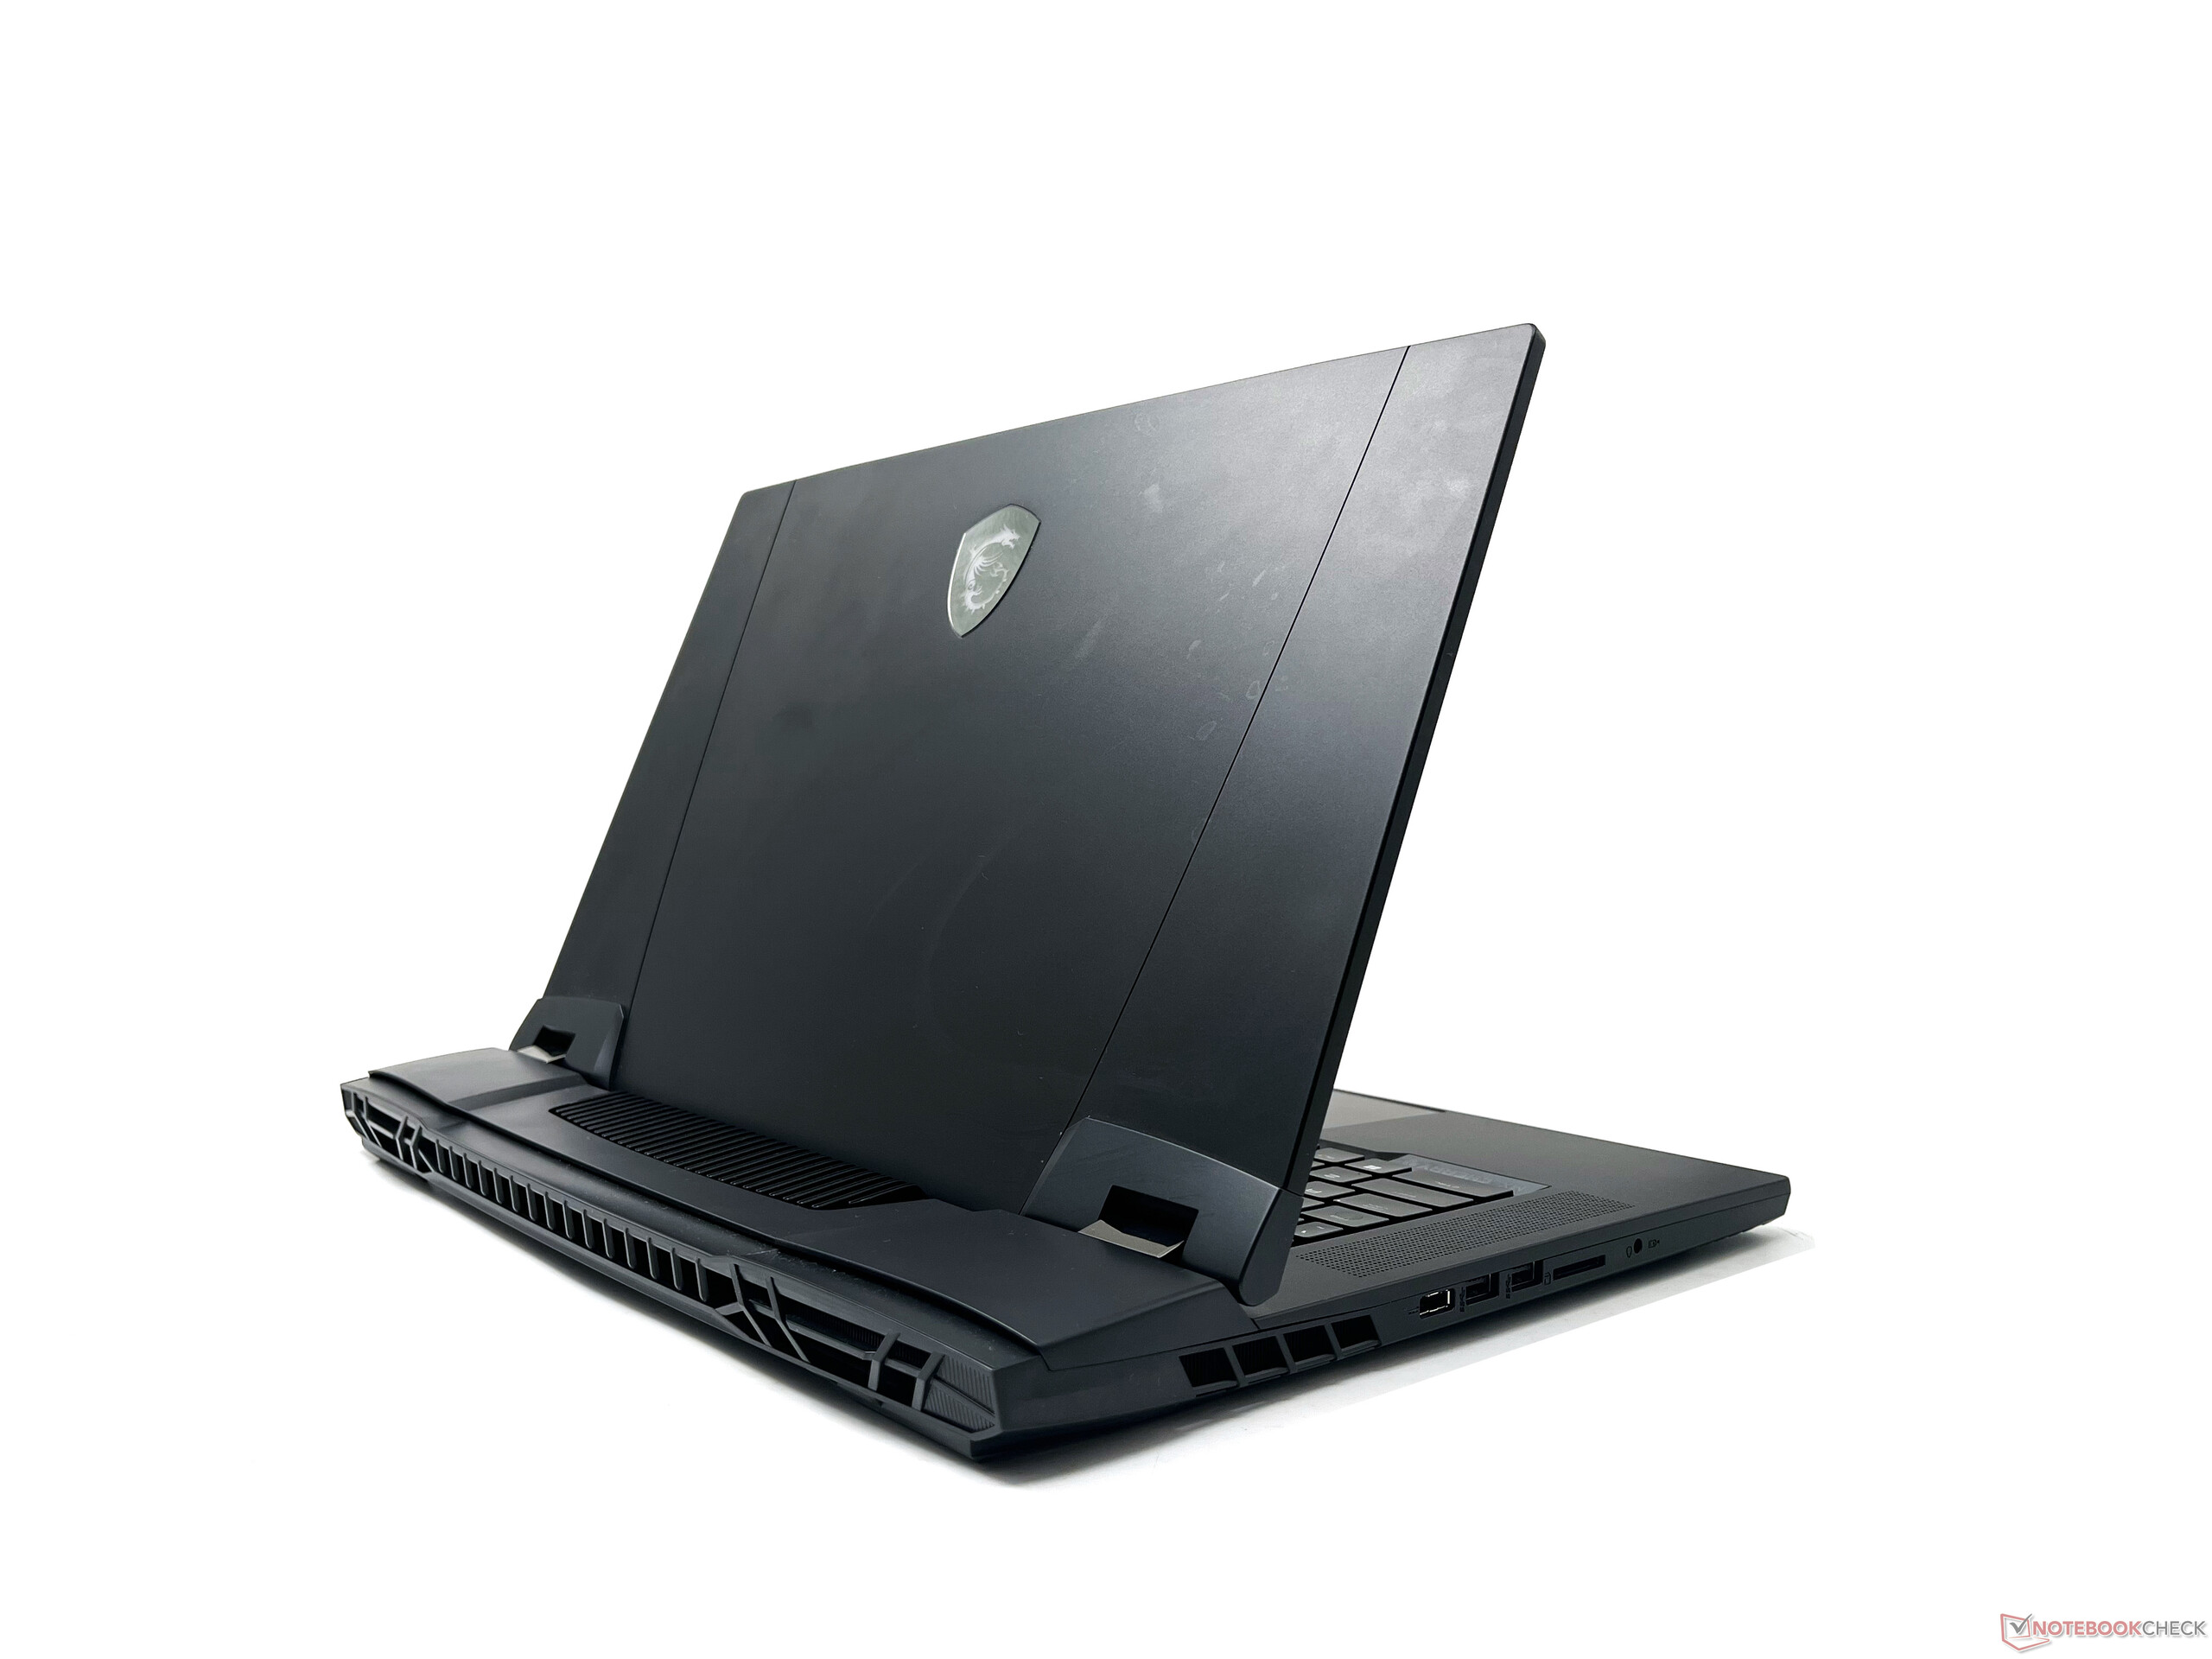
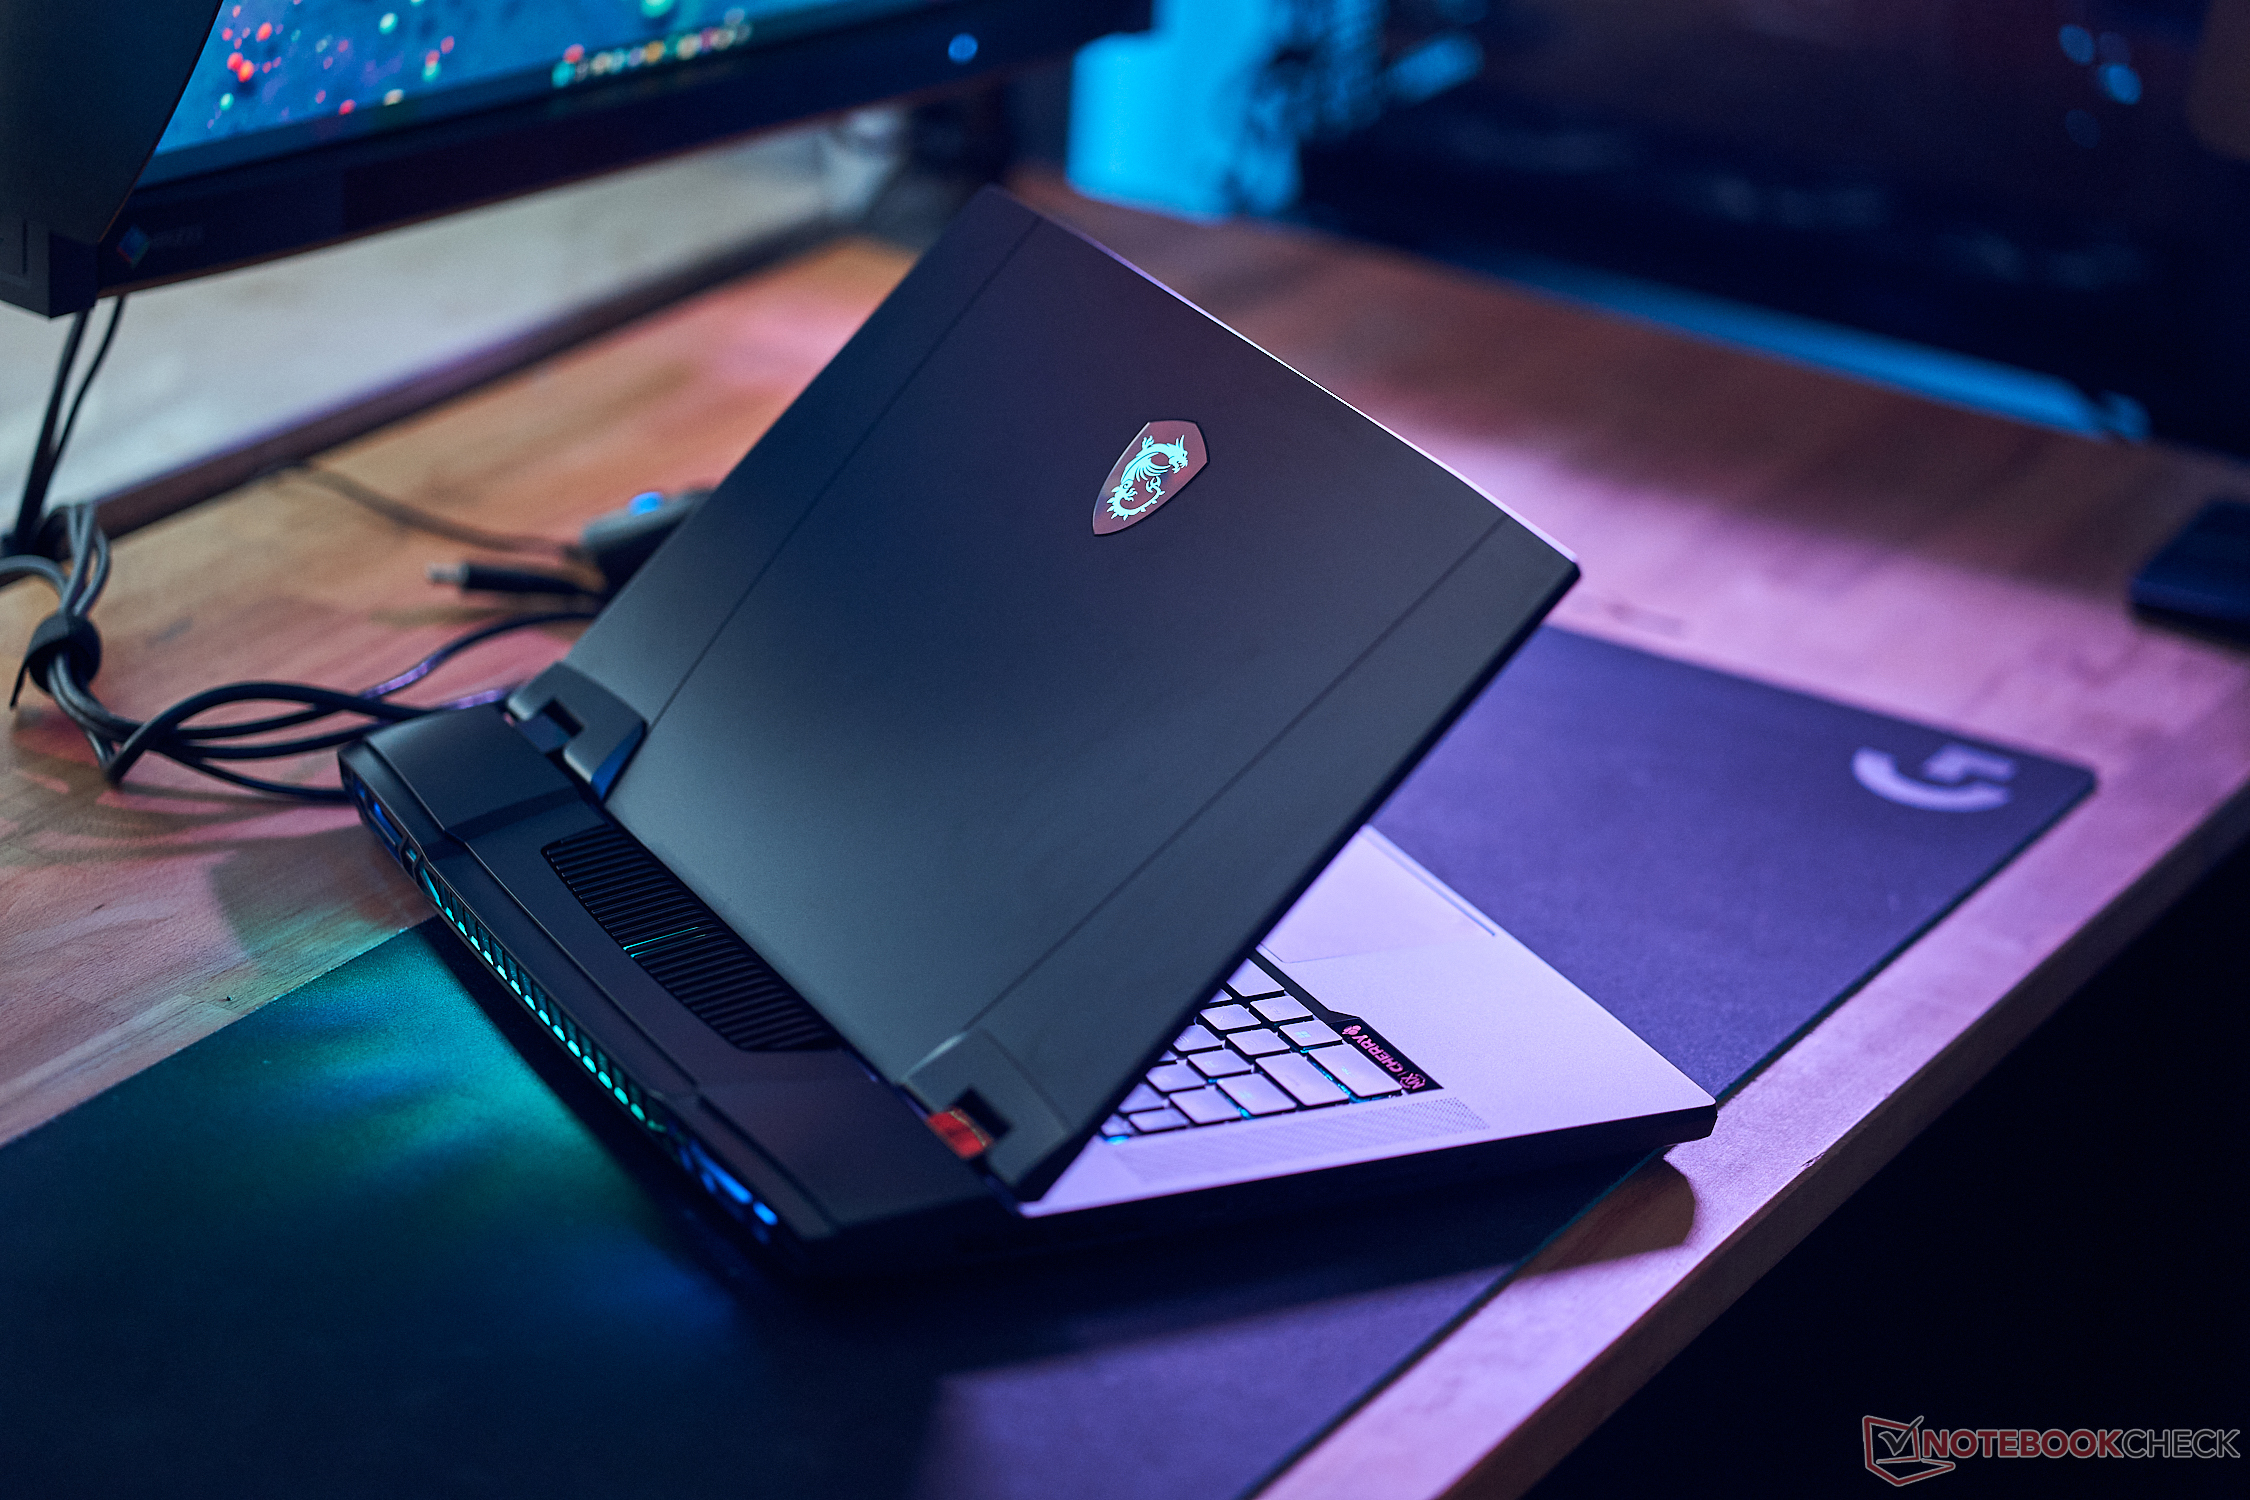
Case: Significantly slimmer than the Titan GT76
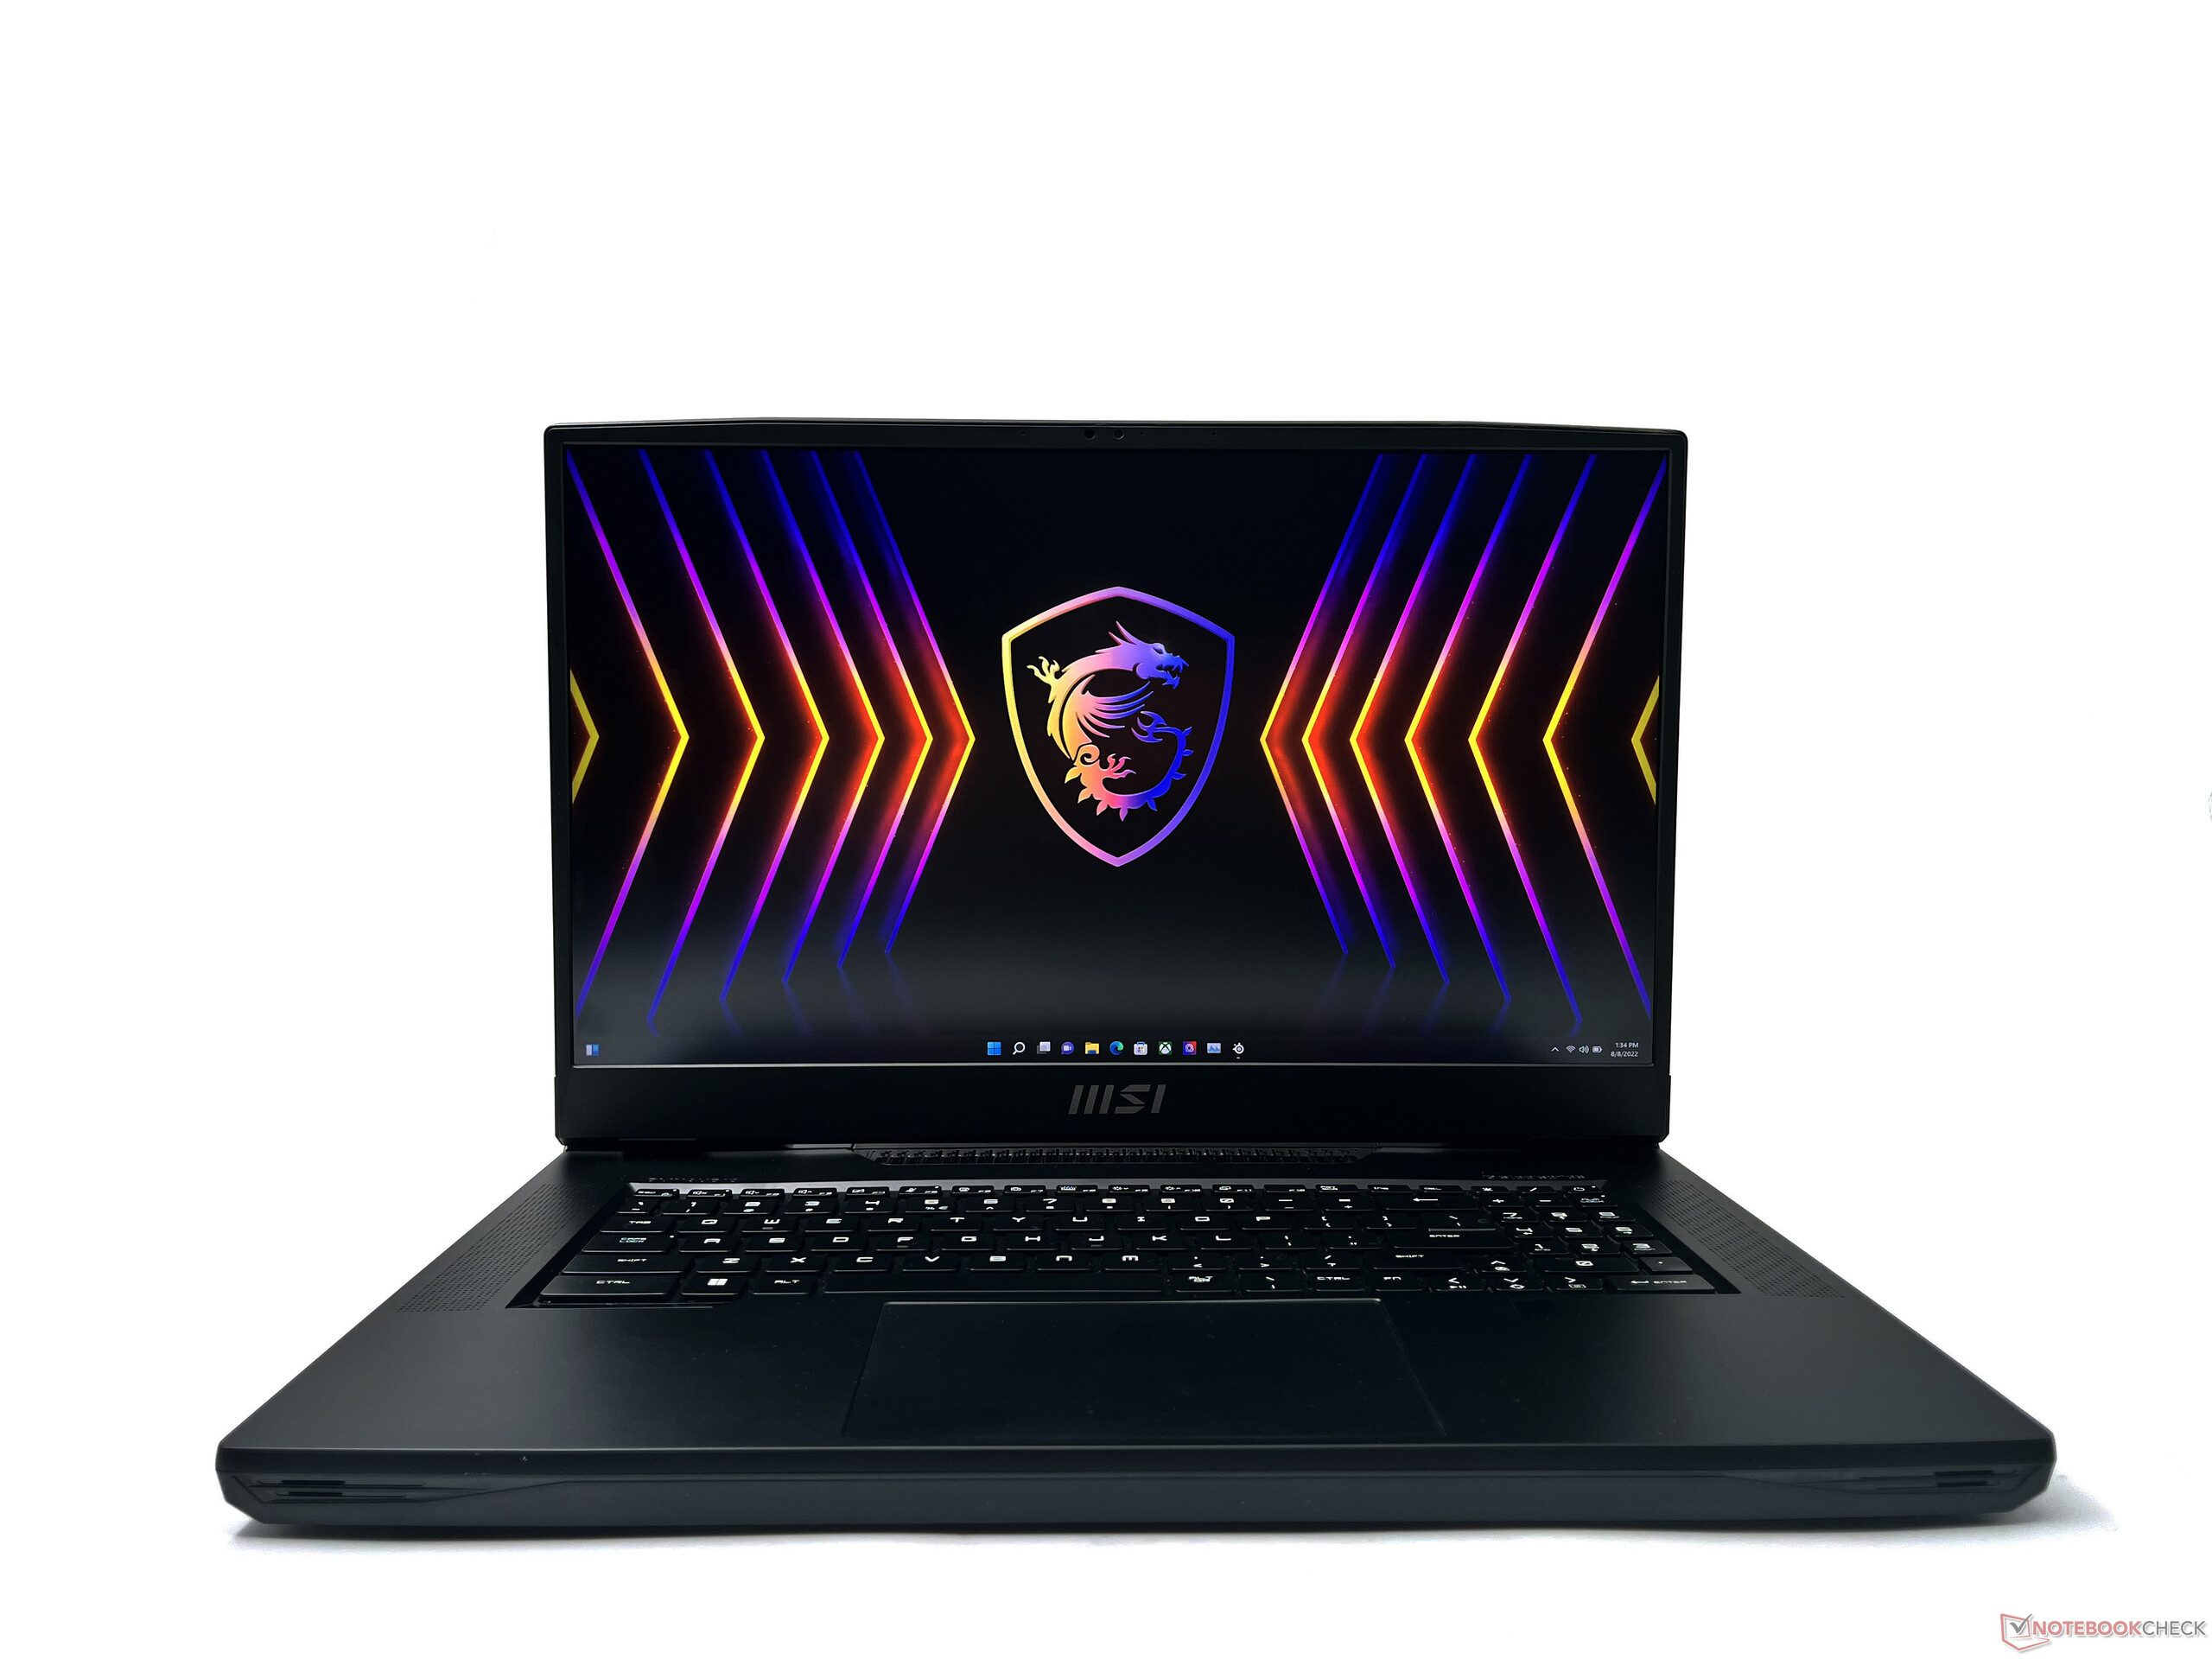
The Titan GT77 does carry over elements of the older Titan GT76's design language but with some notable changes. The laptop sports an all-black design that is only 23 mm thick compared to the Titan GT76's 42 mm thickness. MSI packs most of the processing and cooling wizardry towards the rear protrusion of the chassis, so it does give some scope for the manufacturer to reduce the overall thickness.
The chassis is primarily plastic but feels premium-enough and helps keep the device's weight in check. The aesthetic is quite pleasing for an enthusiast gaming laptop without too much of a gamer eccentricity at first glance. Be prepared to wipe your fingerprints often, though.
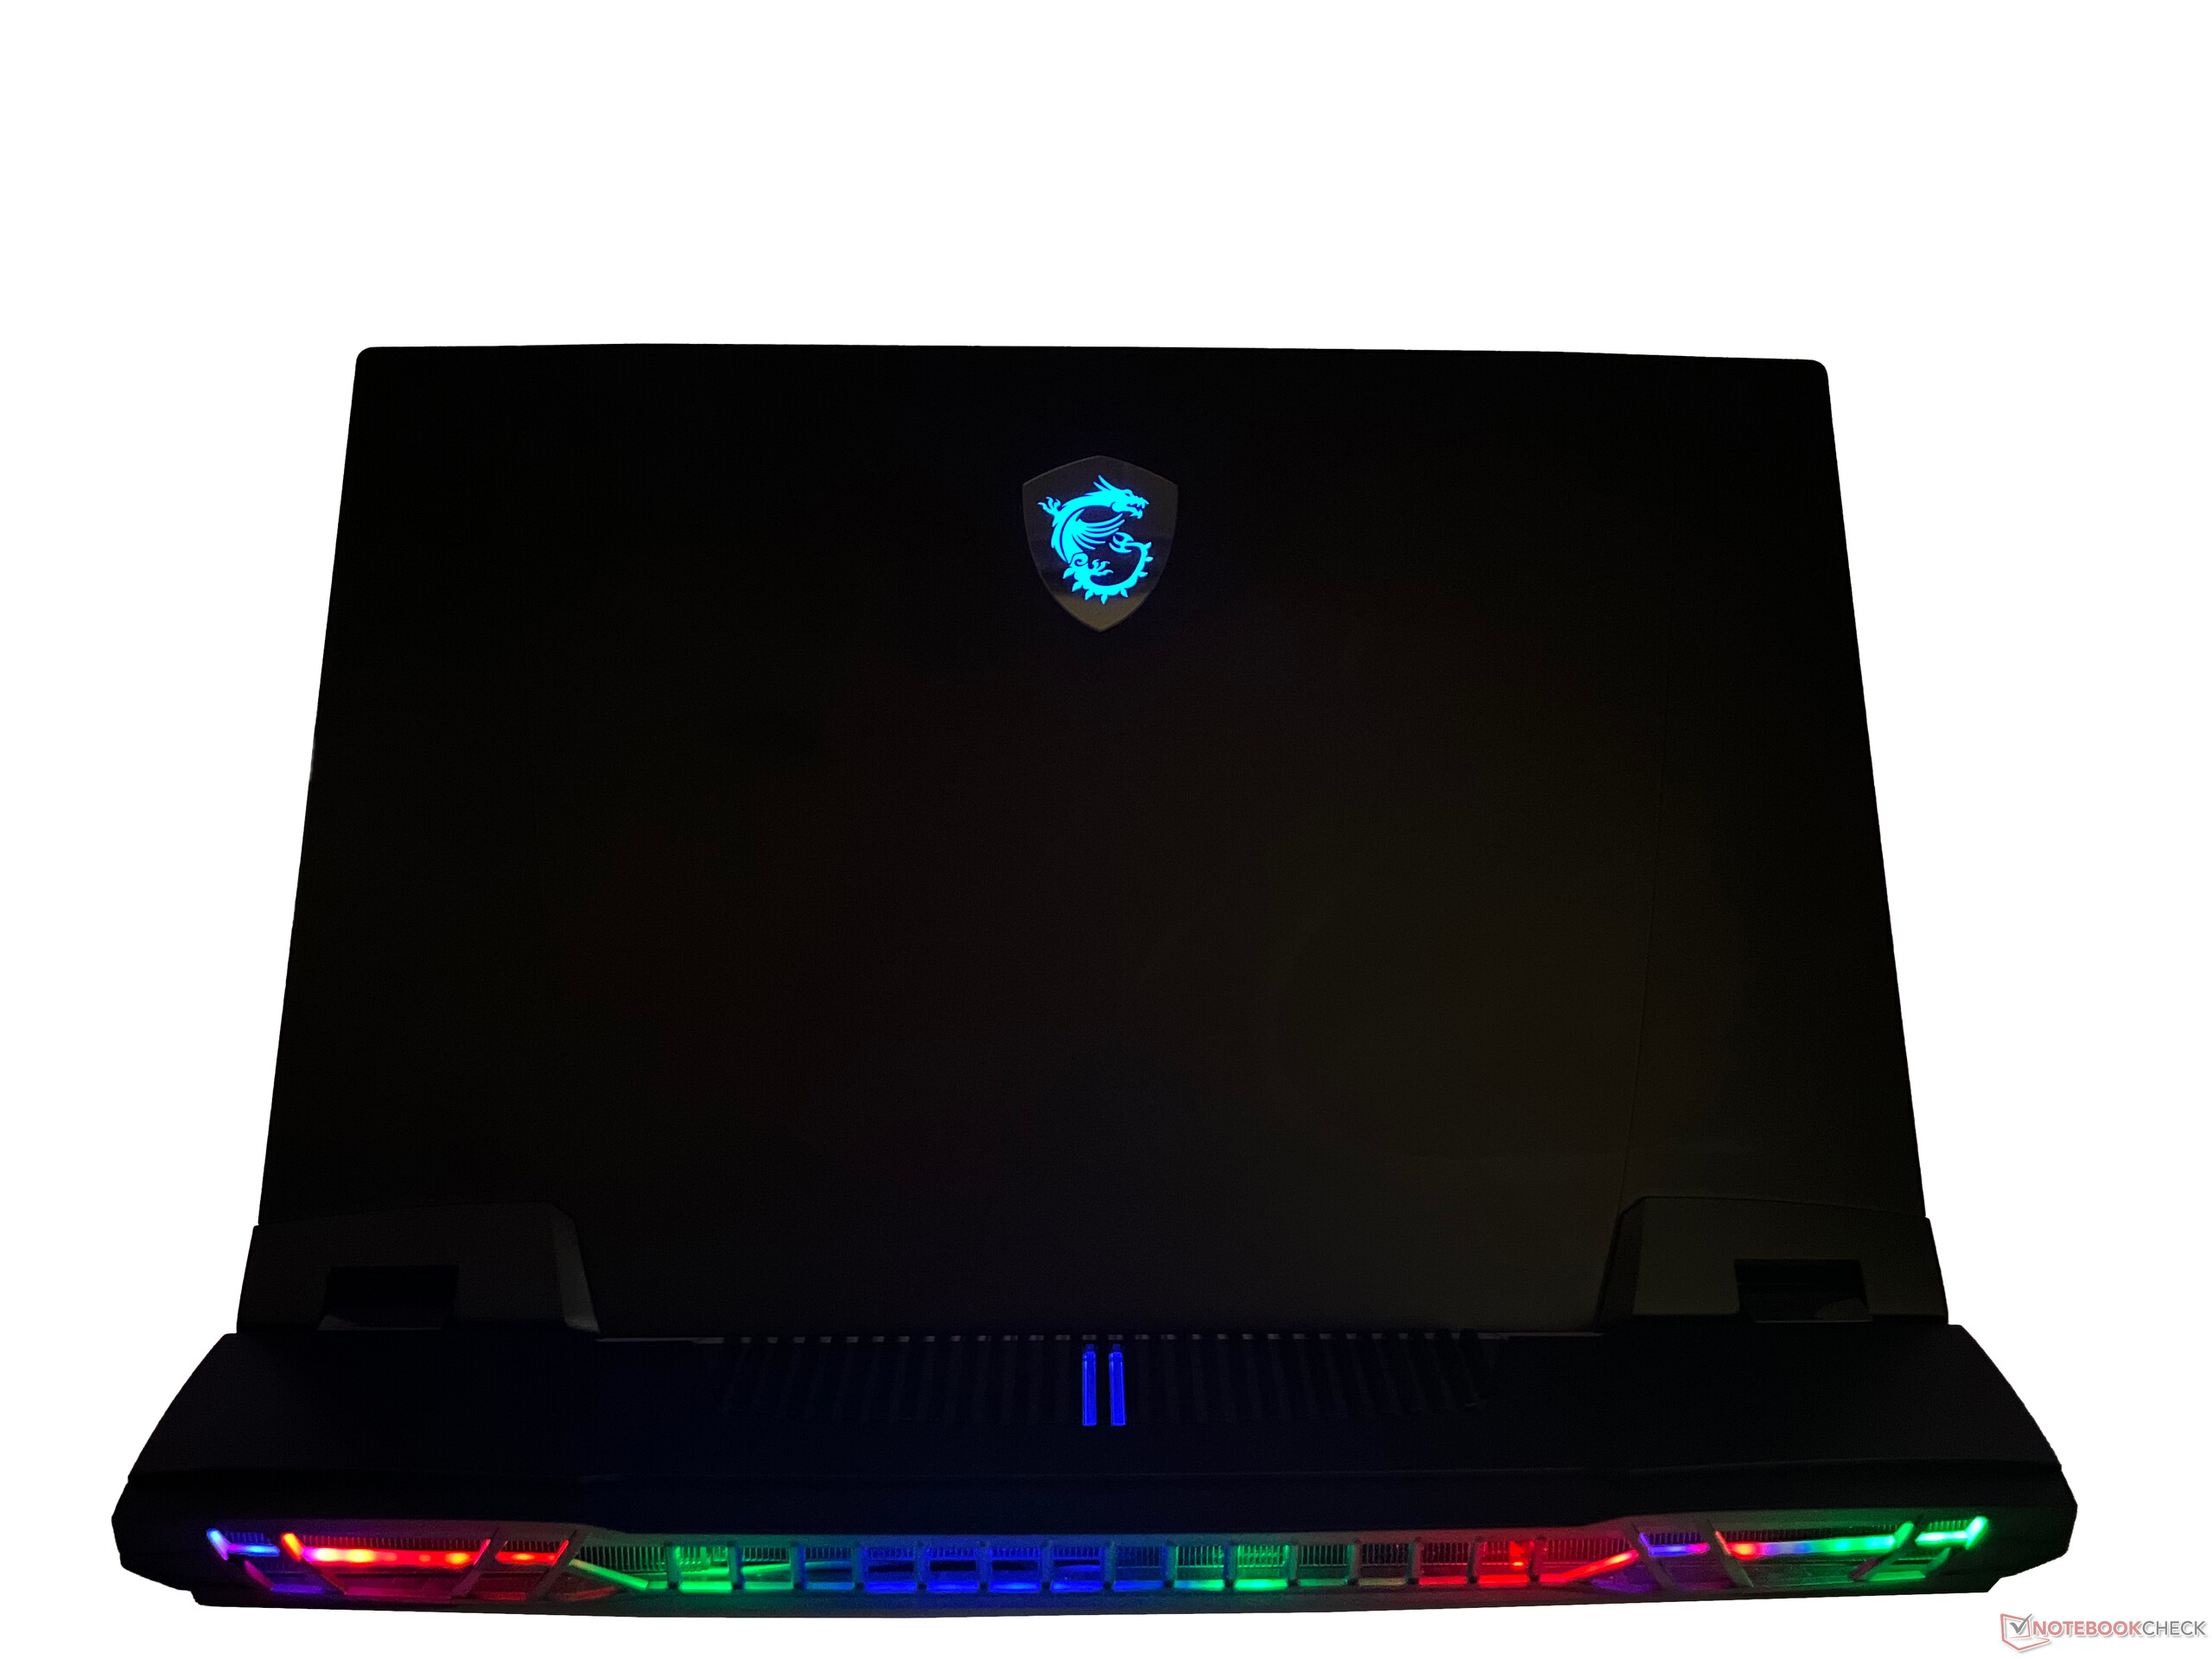
The display lid cover gets an aluminum finish and now has an MSI logo that shines in glorious RGB. The lid can be opened with one finger without the device sliding. There is some flex observed with both the lid and the keyboard deck, but it is not apparent in regular use.
Unlike the GE76 Raider, there is no RGB light bar on the front. Instead, MSI has fitted about 27 RGB LEDs at the rear exhaust vents. There's also a short, parallel RGB strip on the rear intake vents just behind the display. Two more exhausts are present, each on either side of the laptop.
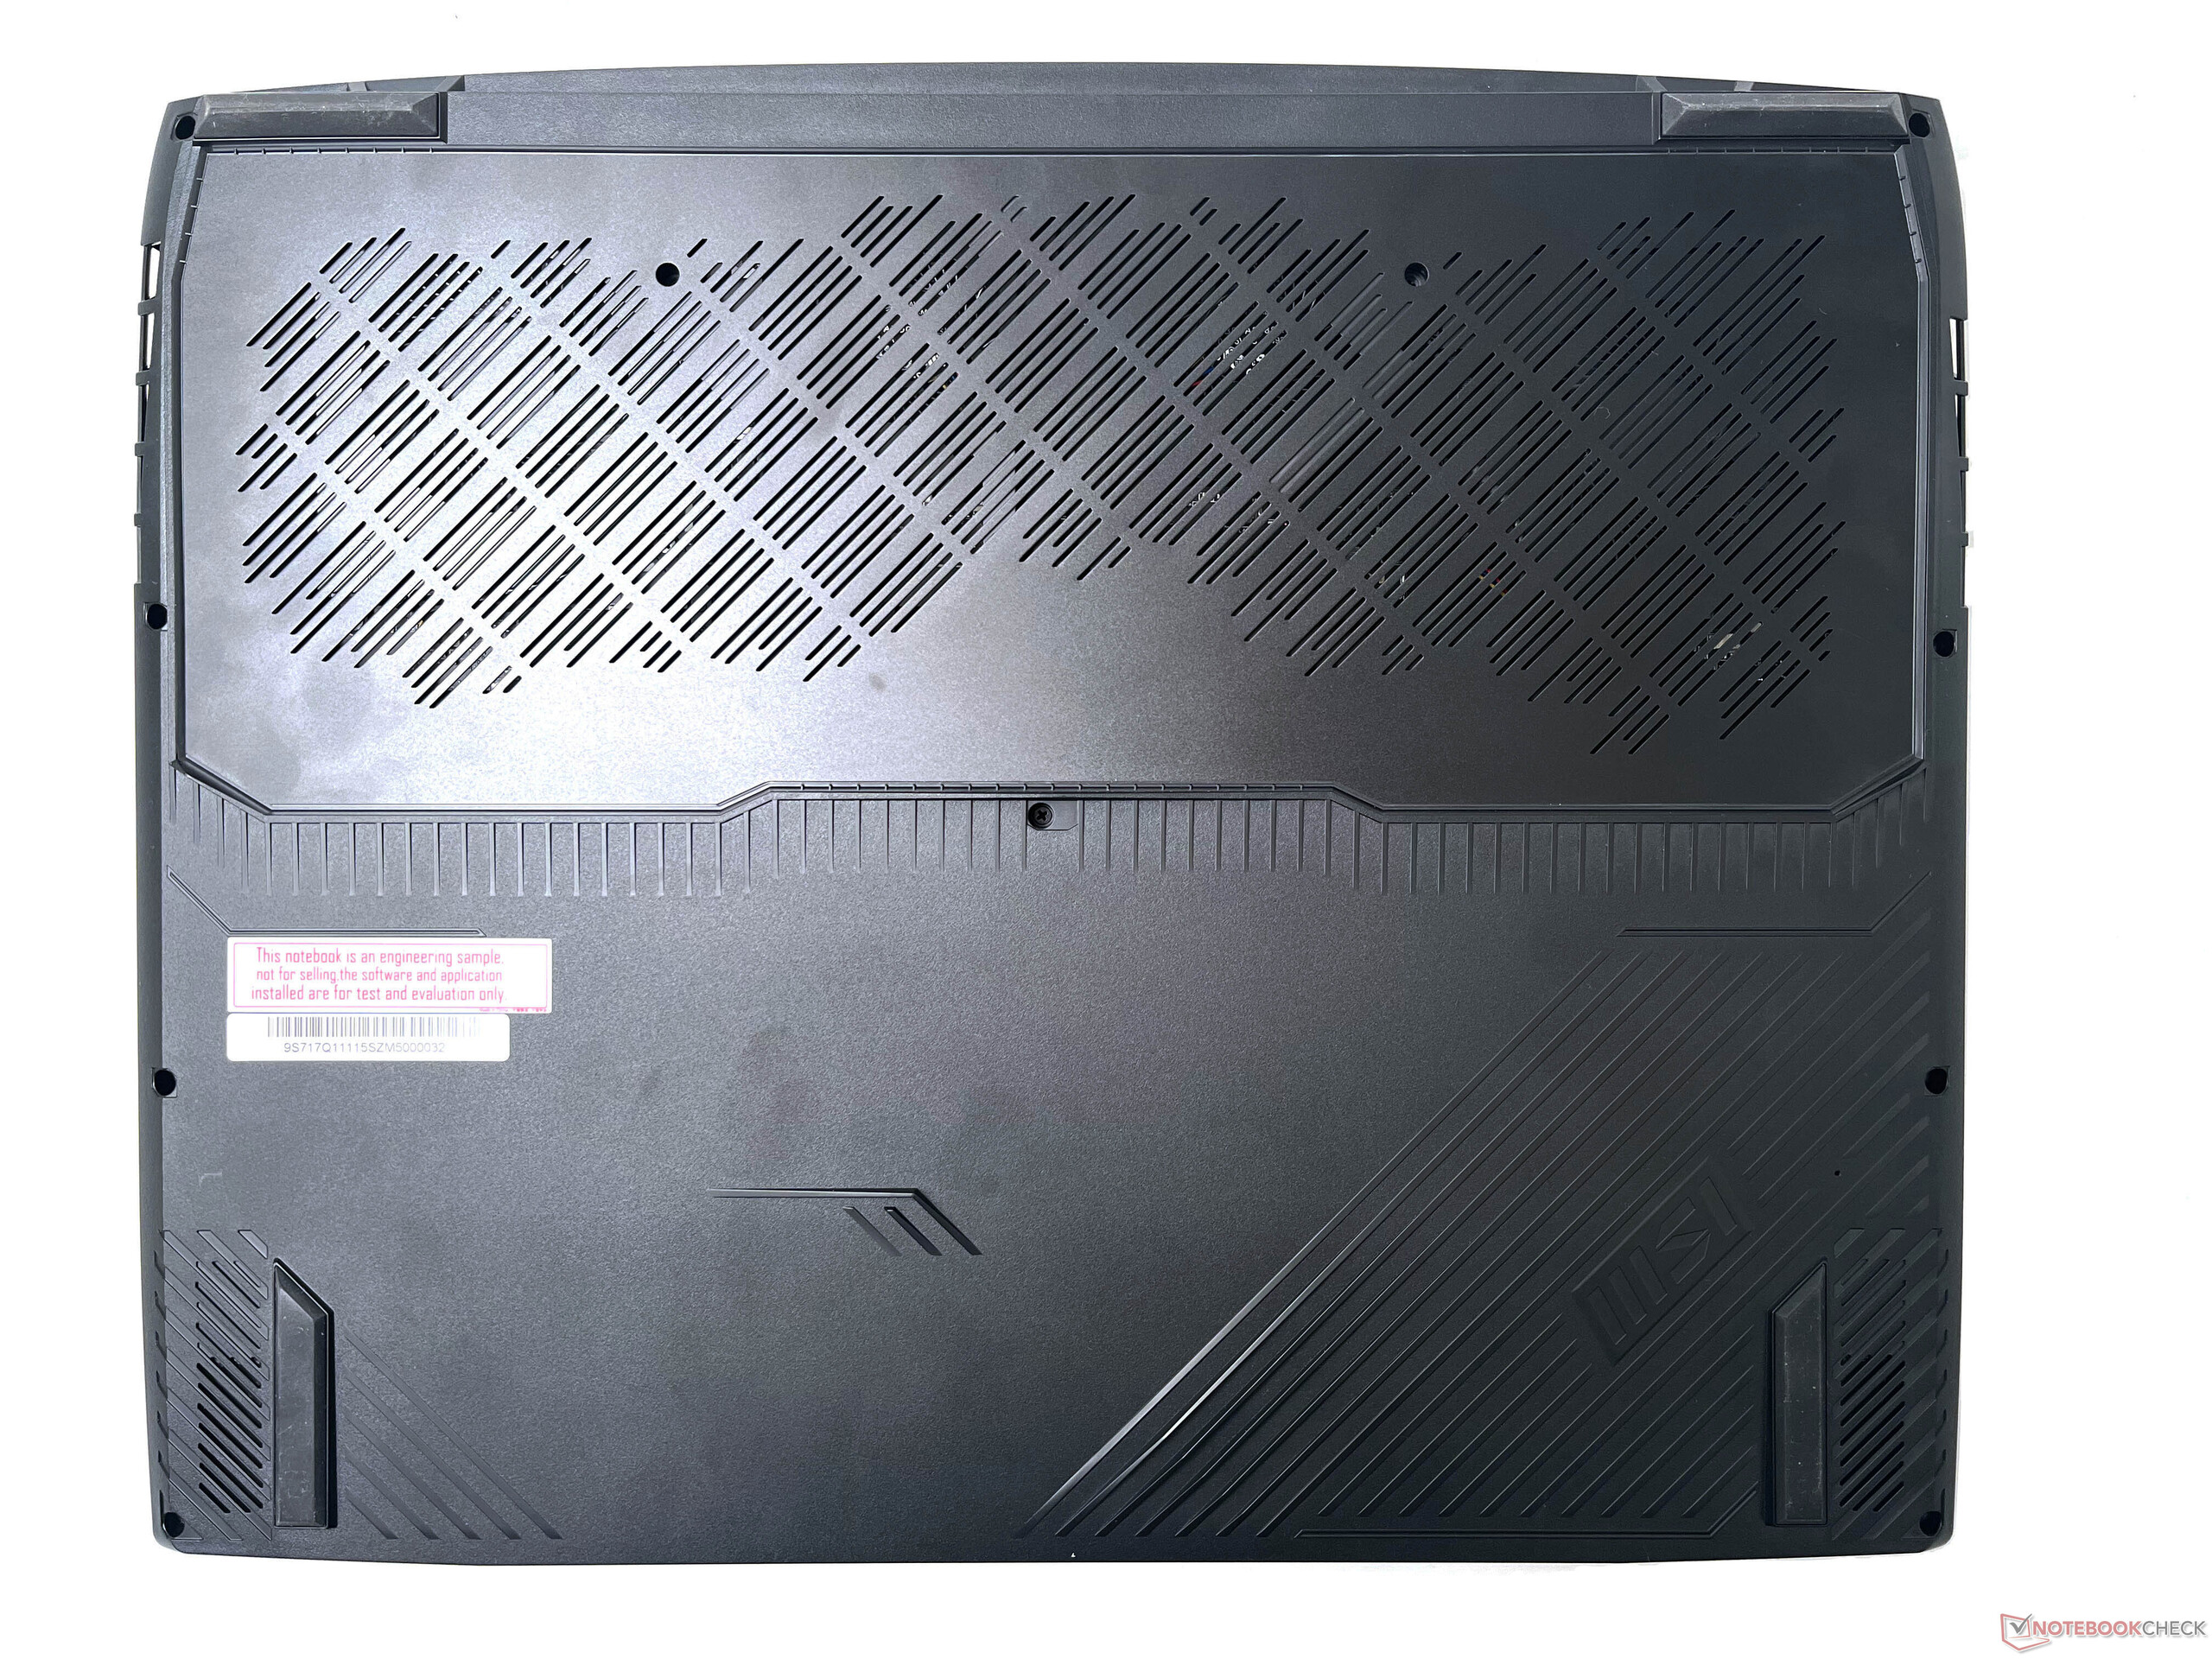
The bottom panel is probably the weakest part of the chassis and its construction seems subpar compared to the rest of the casing. This can probably be overlooked considering that you won't be interacting with the bottom cover as often. It does, however, offer a good number of air intake vents.
Overall, the MSI Titan GT77 sports a solid construction with welcome portability improvements compared to previous Titans.
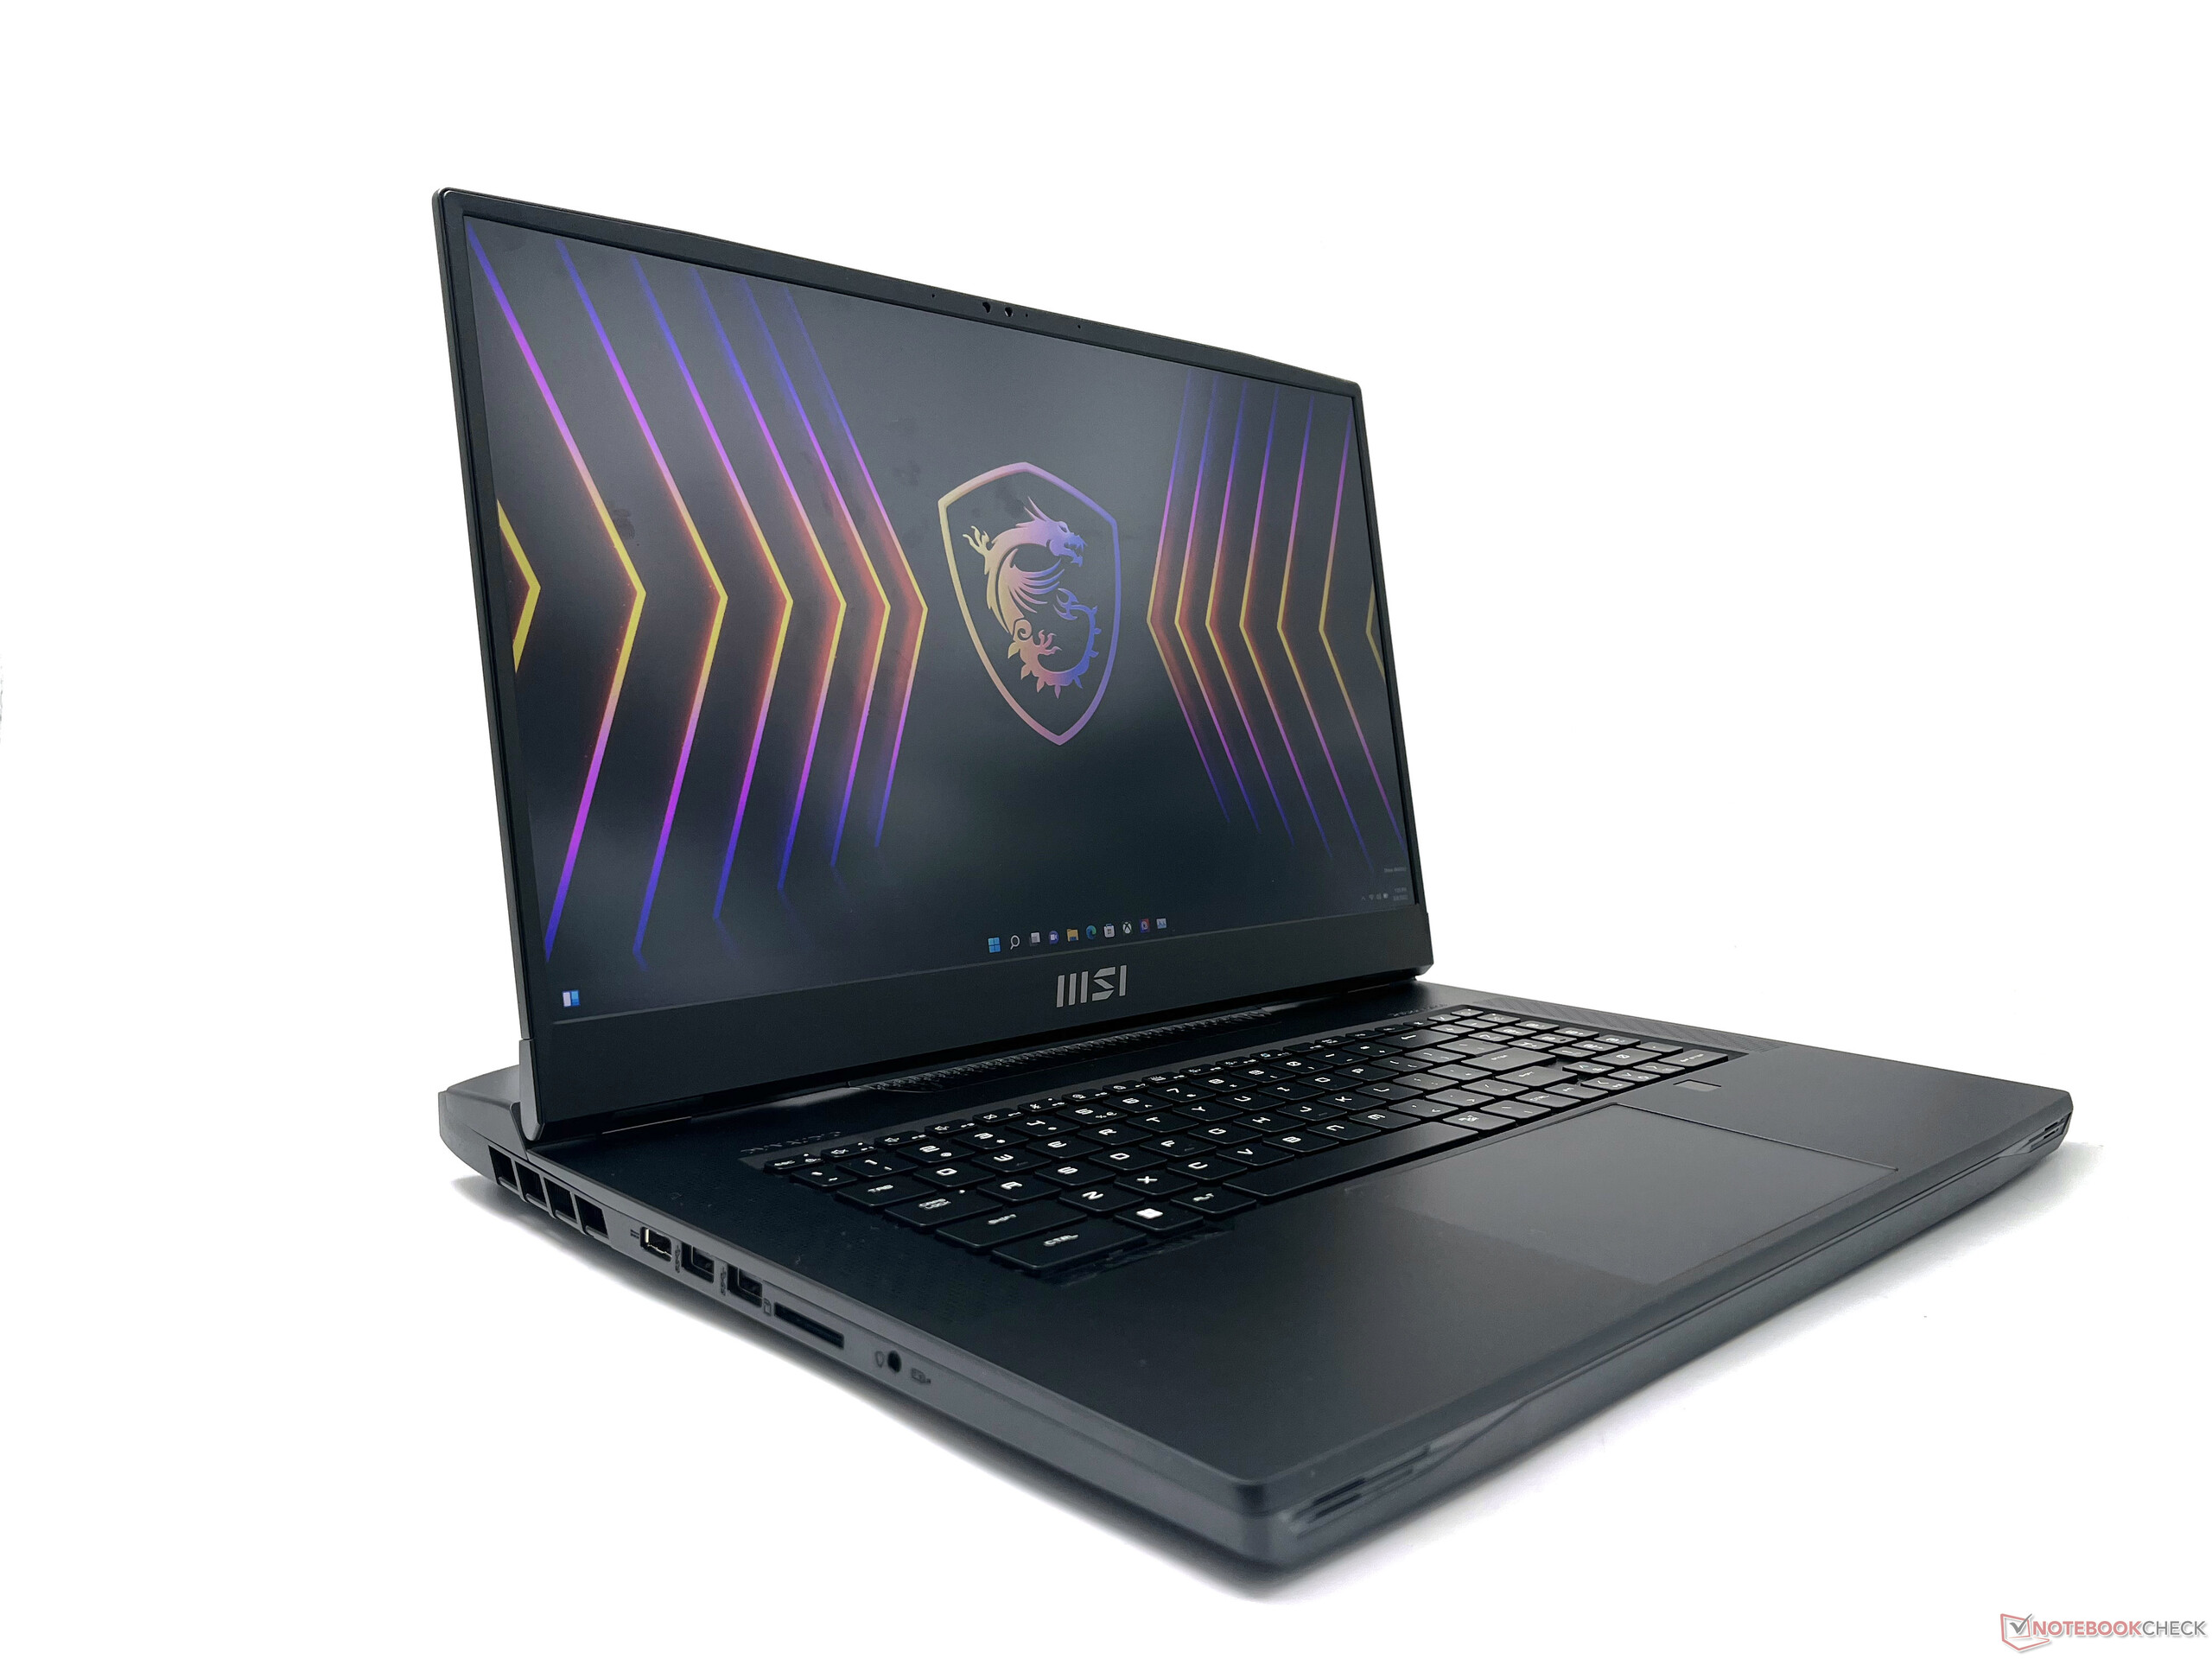
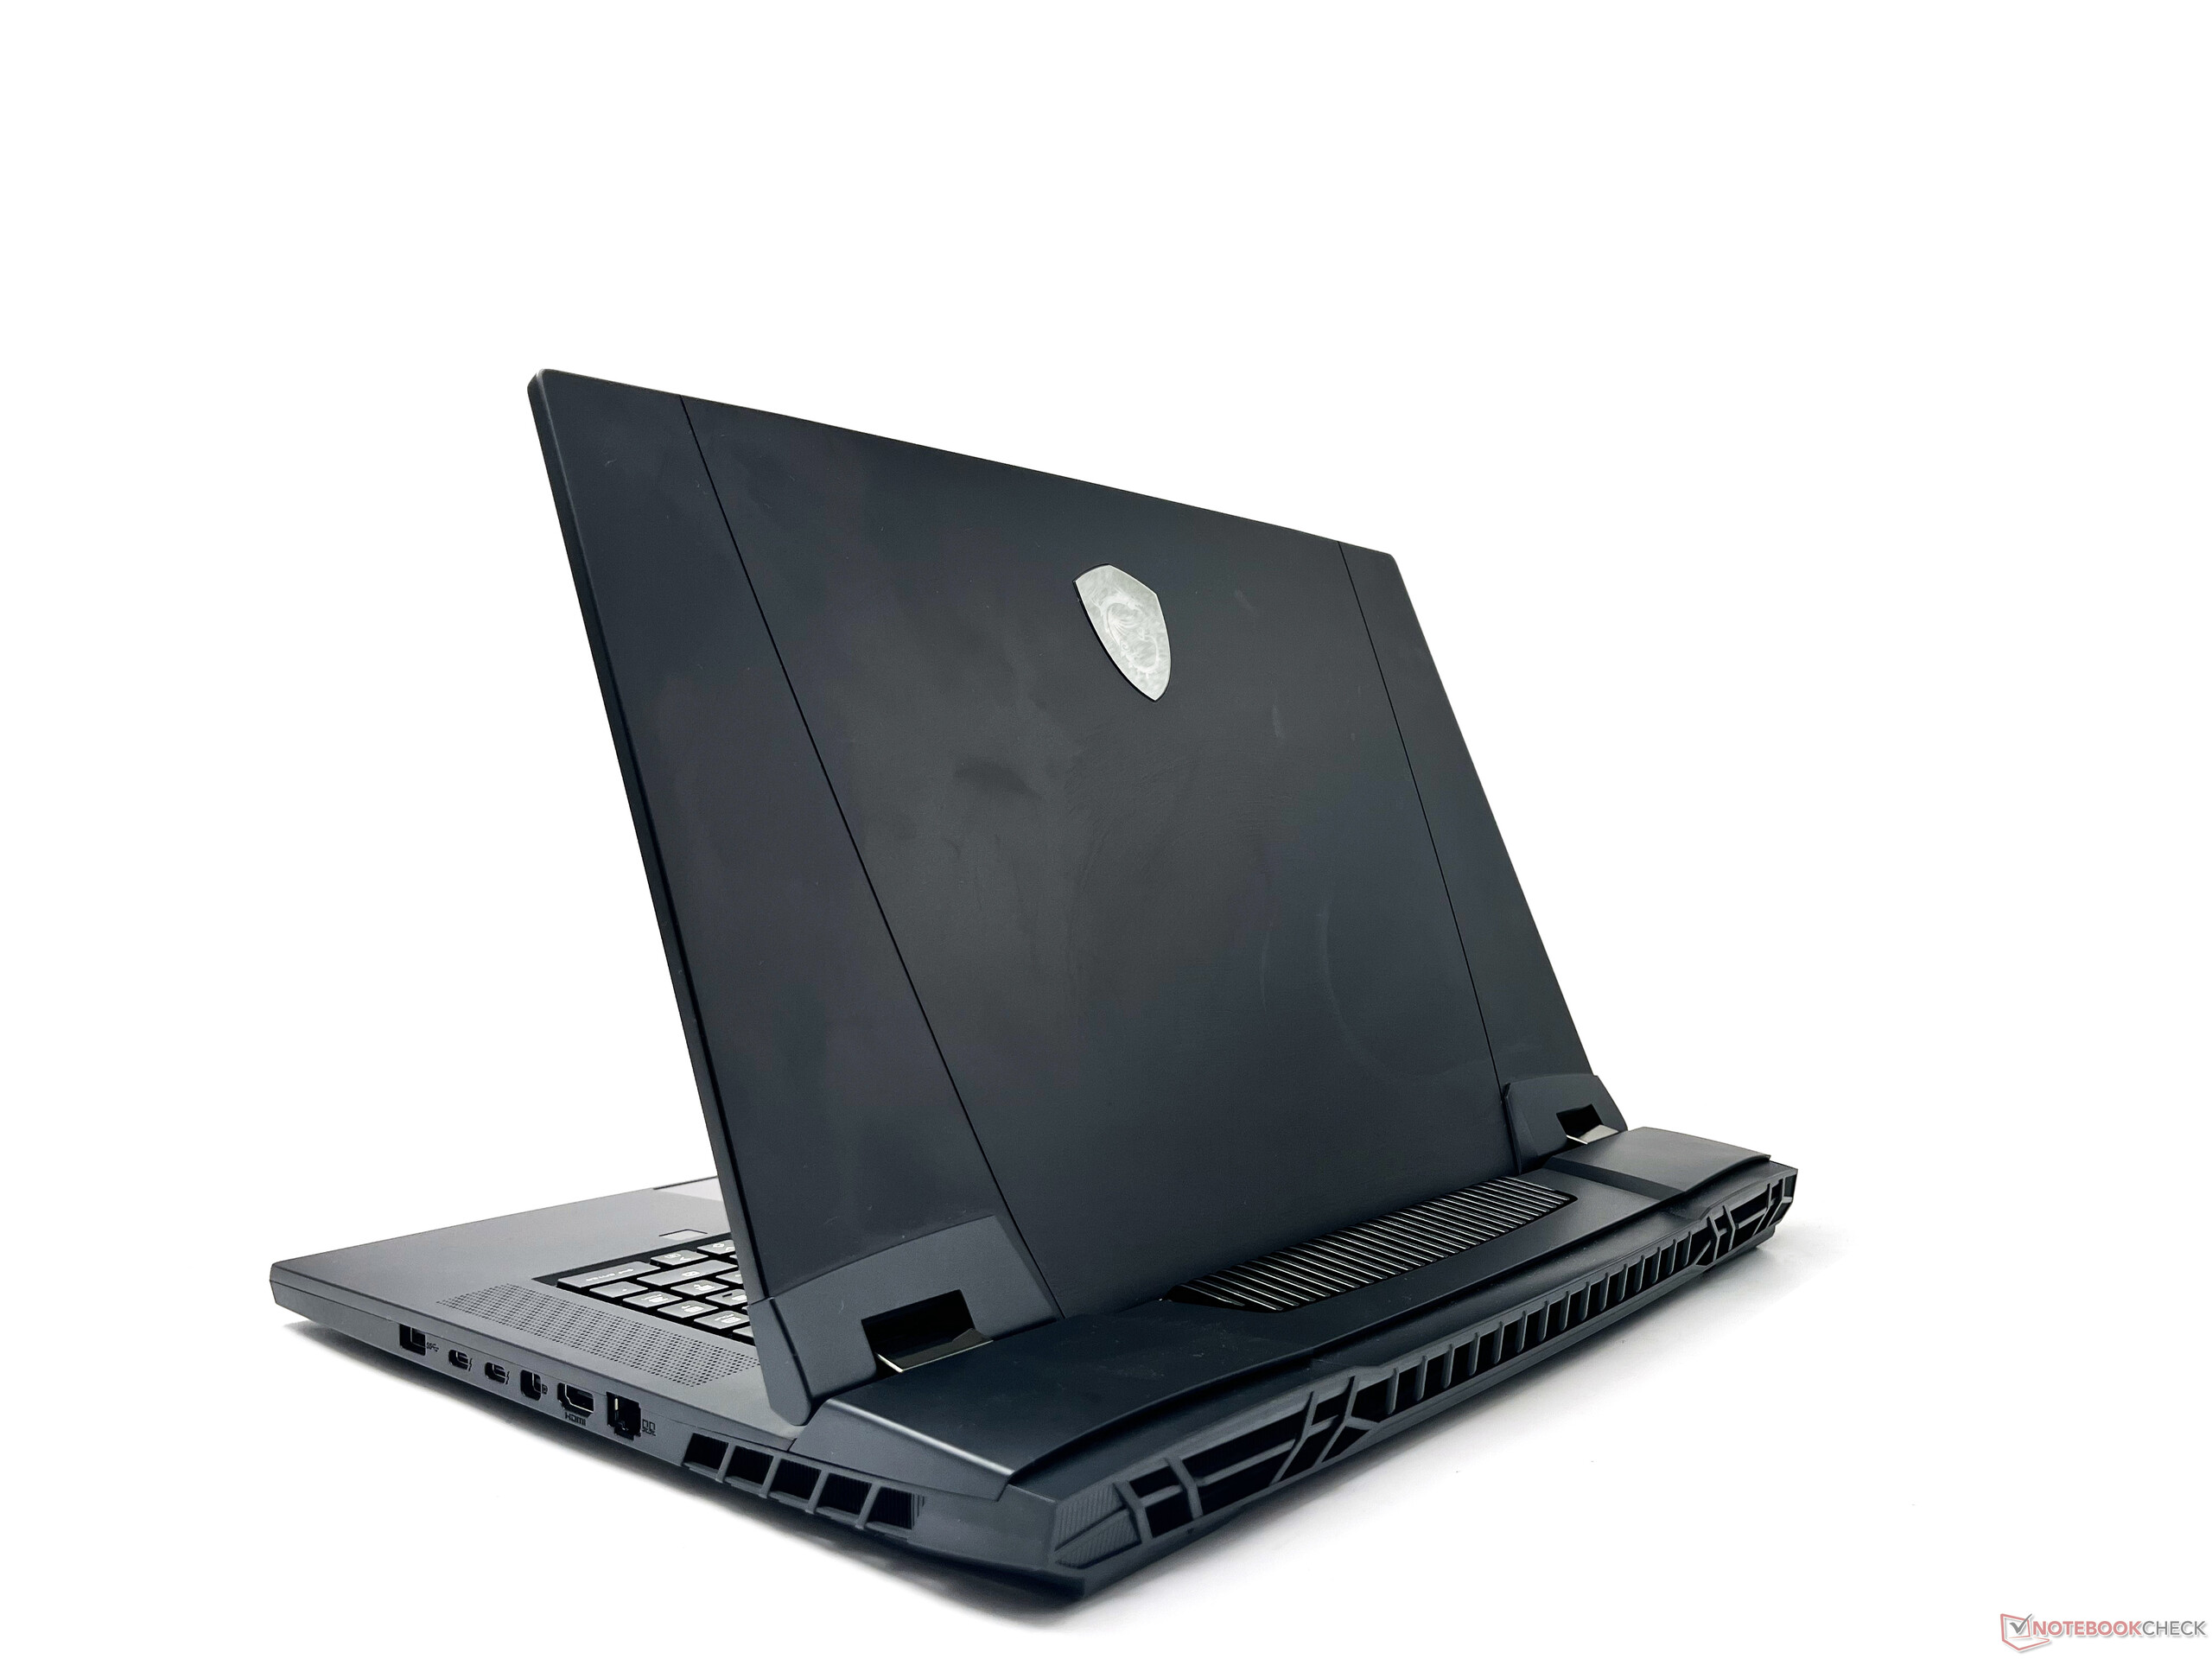
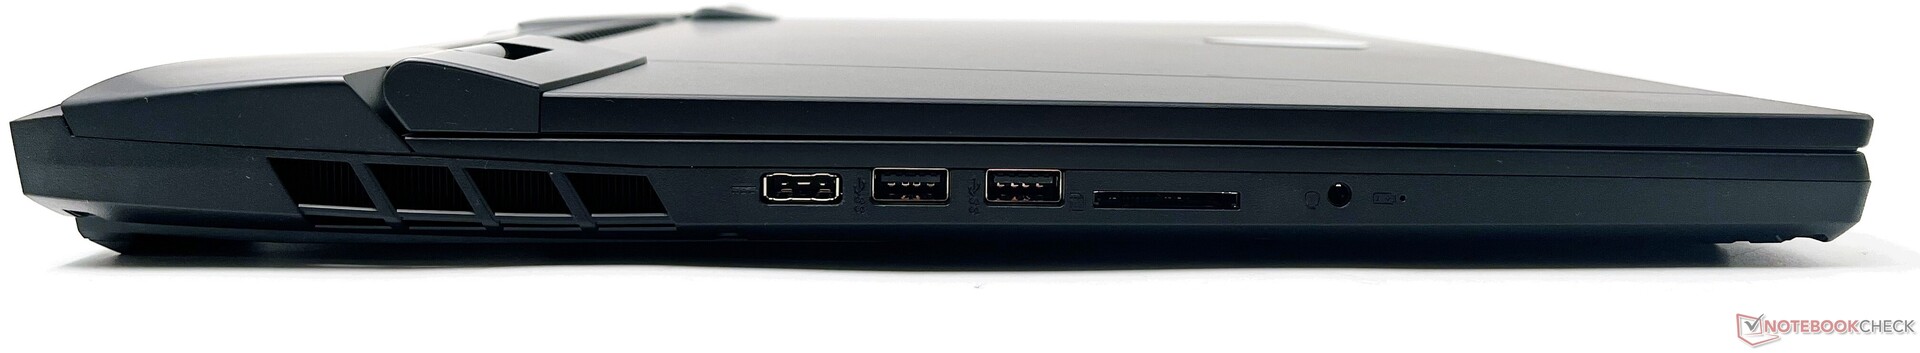
Connectivity: Adequate ports selection with full-size SD card reader and Wi-Fi 6E
The Titan GT77 offers a slightly different but adequate port selection compared to the Titan GT76. Moreover, it implements the latest connectivity standards you would expect to find in an enthusiast gaming laptop in 2022.
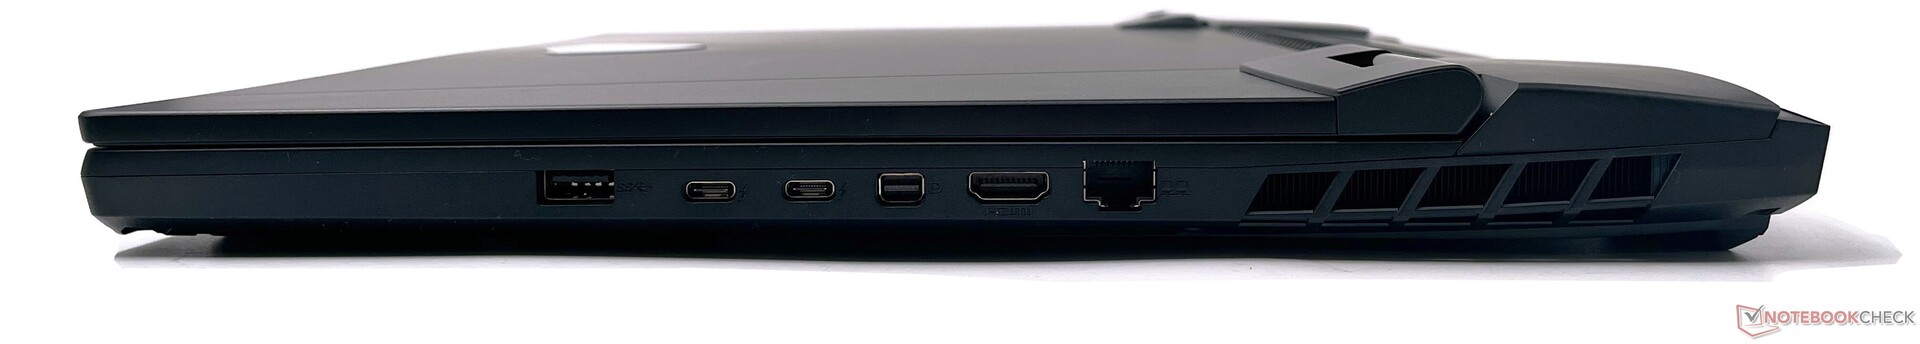
Towards the left, we have MSI's proprietary DC-in port, 2x USB 3.2 Gen2 Type-A ports, a full-size UHS-III SD Express card reader, and a combo audio jack. There is no separate microphone-in port offered this time. On the right, we have another USB 3.2 Gen2 Type-A port, 2x Thunderbolt 4 ports, a mini-DisplayPort-out, HDMI-out that supports up to 4K 120 Hz or 8K 60 Hz, and a 2.5 GbE RJ-45 port.
The ports are conveniently placed and do not hinder peripheral connectivity. There is no Kensington lock slot available.

SD Card Reader
The Titan GT77 finally offers a full-size SD card slot, which is a welcome development. The card reader is perceivably faster than the one in the Raider GE77 HX 12UHS but trails behind others in the competition.
| SD Card Reader | |
| average JPG Copy Test (av. of 3 runs) | |
| Alienware x17 R2 P48E (AV Pro V60) | |
| Asus ROG Zephyrus Duo 16 GX650RX (AV PRO microSD 128 GB V60) | |
| Average of class Gaming (20.9 - 210, n=54, last 2 years) | |
| MSI GE67 HX 12UGS (Toshiba Exceria Pro SDXC 64 GB UHS-II) | |
| MSI GE76 Raider (AV PRO microSD 128 GB V60) | |
| MSI Titan GT77 12UHS (AV PRO microSD 128 GB V60) | |
| MSI Raider GE77 HX 12UHS (AV PRO microSD 128 GB V60) | |
| maximum AS SSD Seq Read Test (1GB) | |
| Alienware x17 R2 P48E (AV Pro V60) | |
| Asus ROG Zephyrus Duo 16 GX650RX (AV PRO microSD 128 GB V60) | |
| Average of class Gaming (25.5 - 261, n=51, last 2 years) | |
| MSI Titan GT77 12UHS (AV PRO microSD 128 GB V60) | |
| MSI GE67 HX 12UGS (Toshiba Exceria Pro SDXC 64 GB UHS-II) | |
Communication
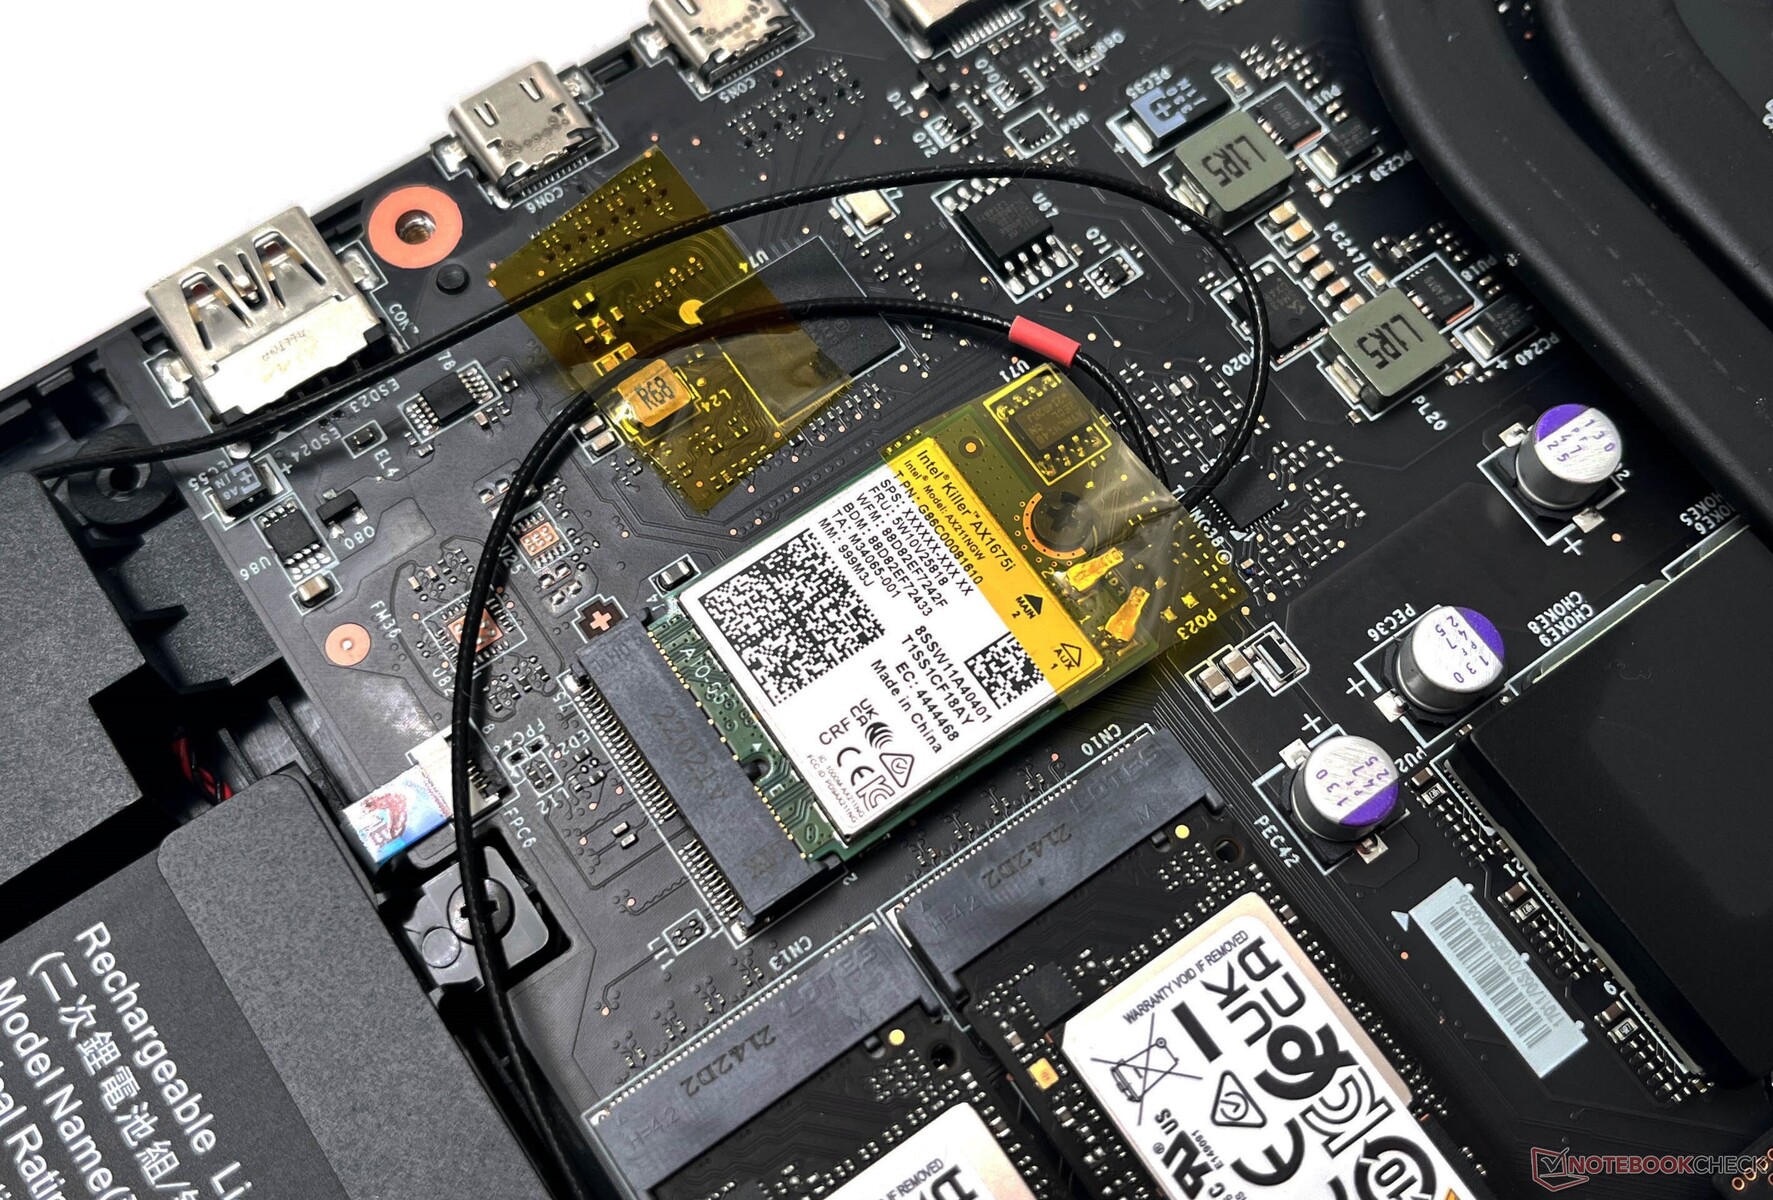
Our Titan GT77 unit came fitted with a Killer Wi-Fi 6E AX1675i WLAN card. Wi-Fi performance is generally above class average in both the 5 GHz and 6 GHz bands with minimal dips in throughput when tested with our reference Asus ROG Rapture GT-AXE11000 router.
We observed that the AX1675i's 6 GHz performance does not seem to offer any tangible benefit over 5 GHz in terms of average throughput. However, if you do have a 6E-capable router, using this band may help with increased peak throughput rates.
Webcam
It's not unusual to find abysmal webcams in gaming laptops, but the Titan GT77's 720p shooter performs rather poorly for a 2022 device. A much-improved FHD webcam is available in the GE76 Raider 12U.
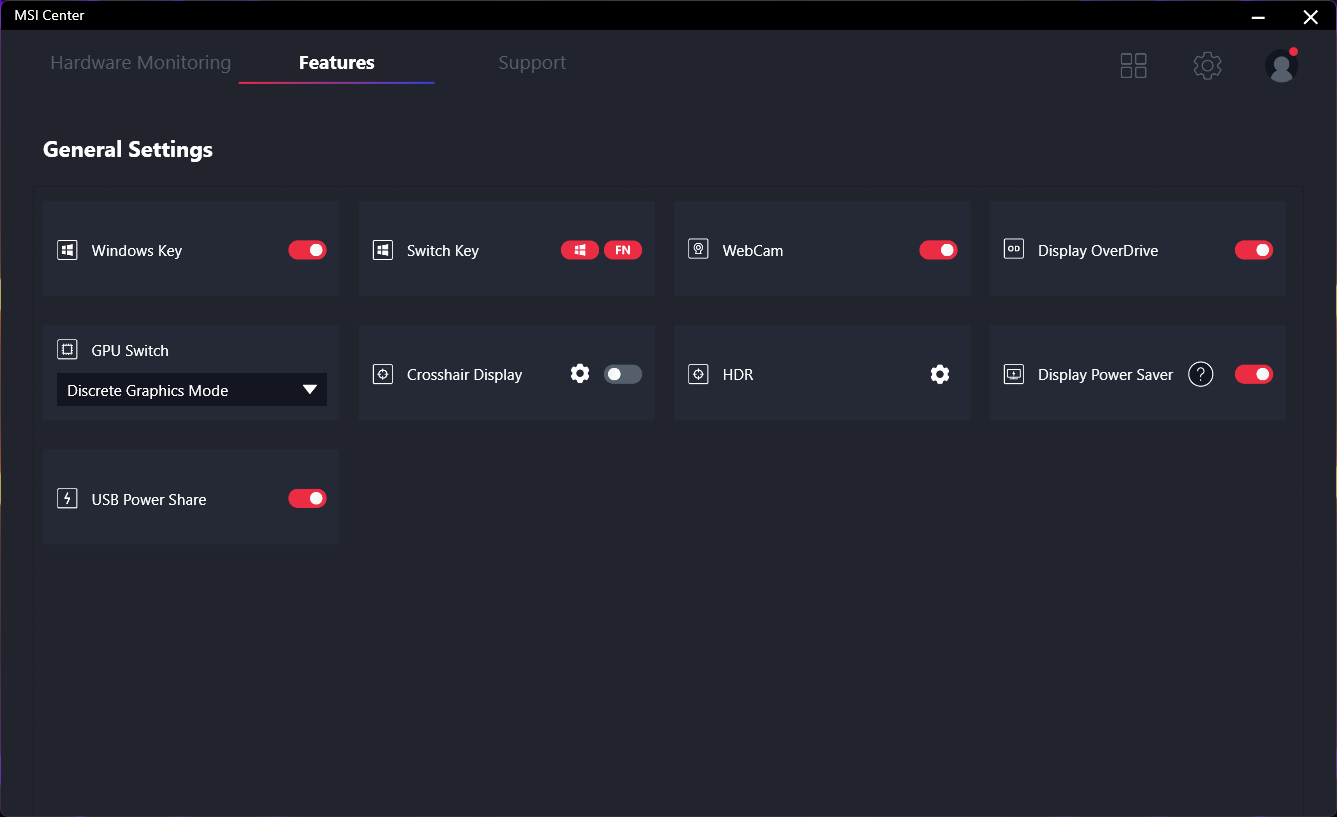
As evident in our ColorChecker Passport and test chart images below, color accuracy is rather poor with lots of noise and an overall lack of sharpness even under bright ambient light. There is no physical privacy shutter available, but the webcam can be toggled on/off using a keyboard shortcut or via MSI Center.


Security
The Titan GT77 offers both IR camera and fingerprint-based biometrics compatible with Windows Hello, which is a rarity in gaming laptops. Both forms of biometrics are easy to enroll and are quite fast and responsive.
Additionally, a TPM 2.0 module is also present.
Accessories
Since this is a custom unit seeded by Intel, we did not find any additional accessories in the box apart from the massive 330 W power brick.
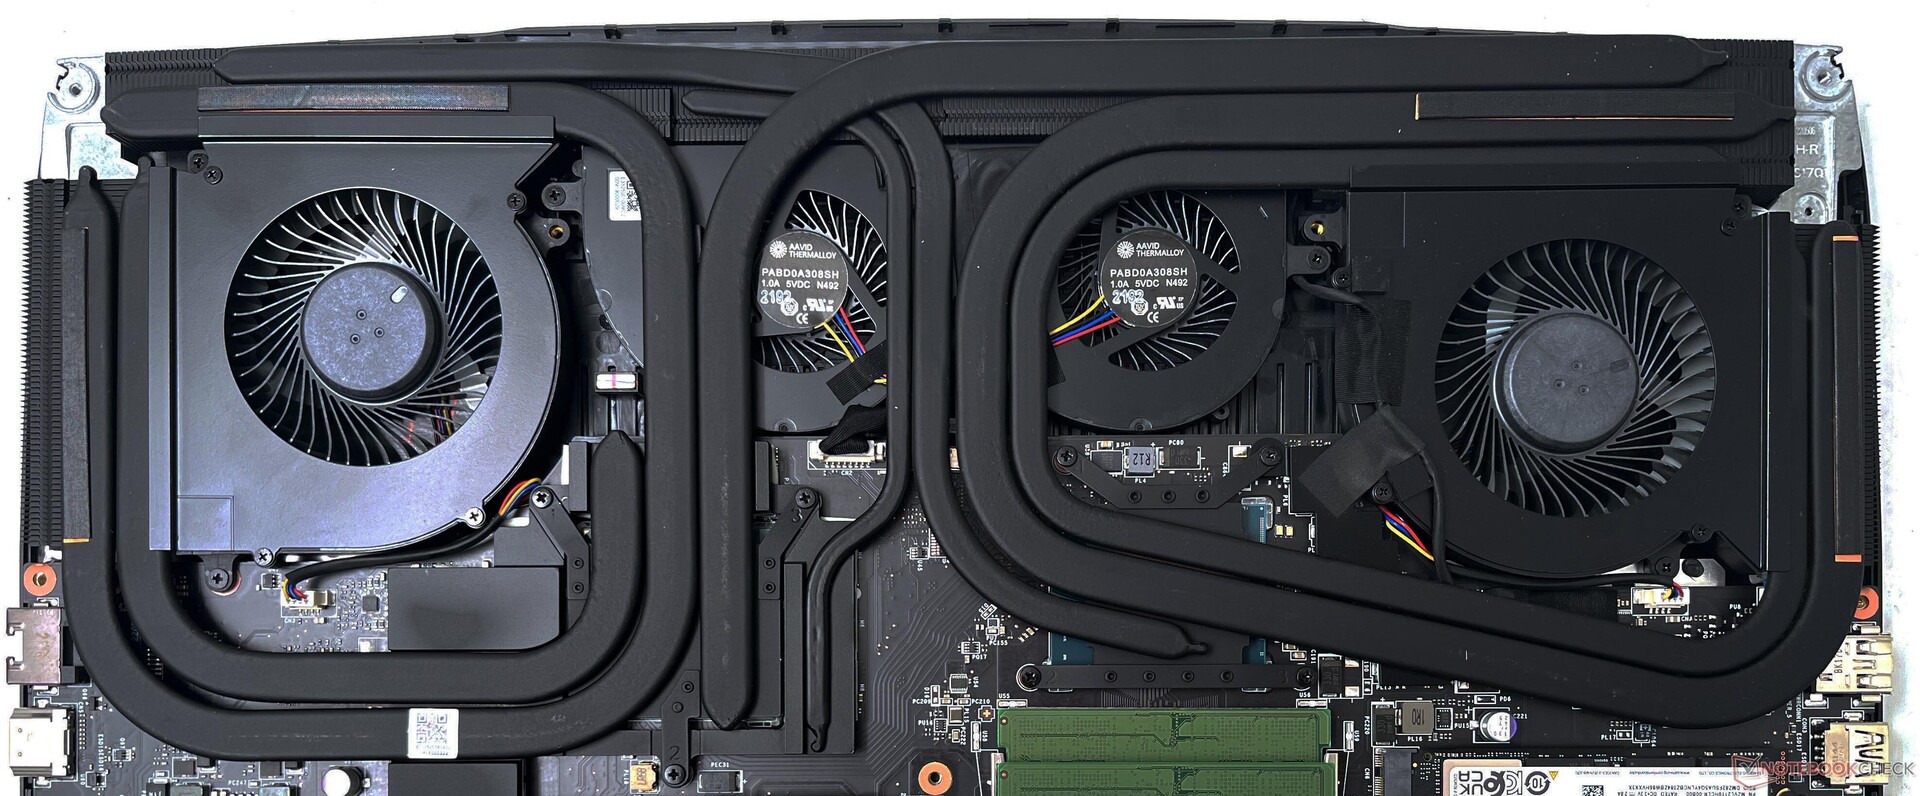
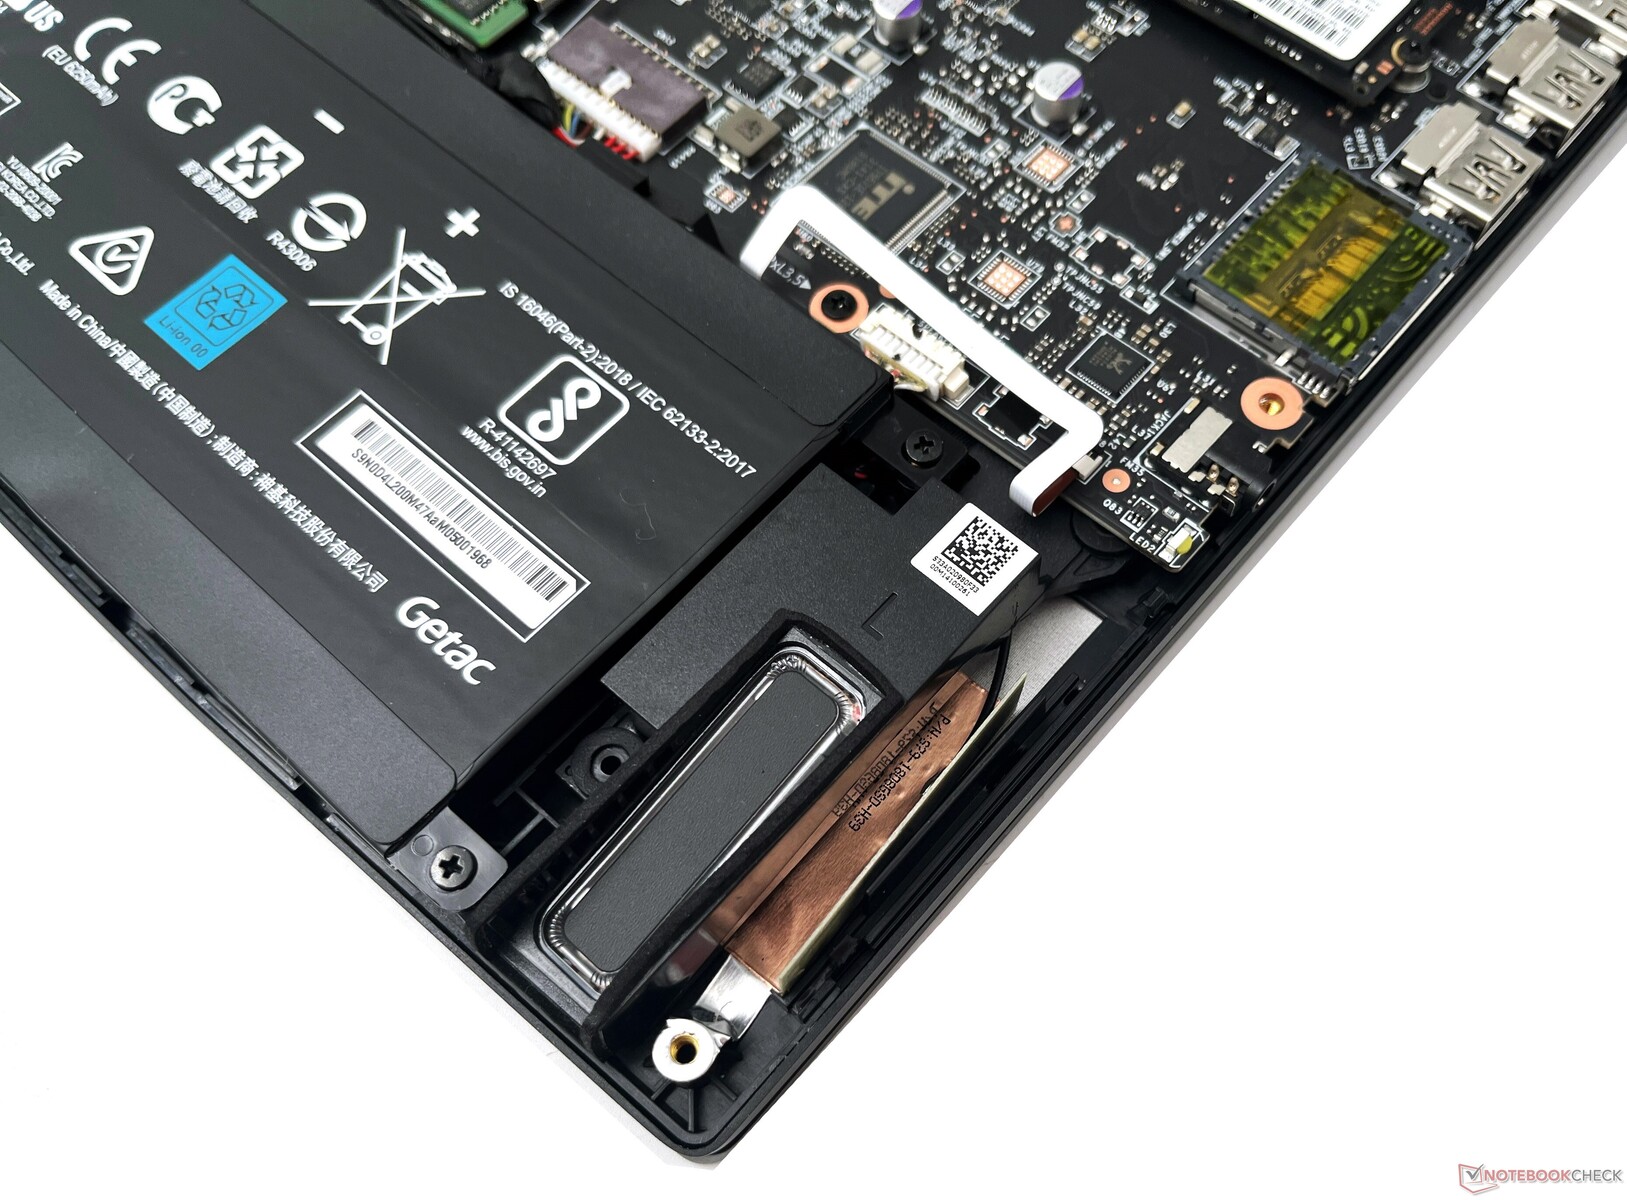
Maintenance
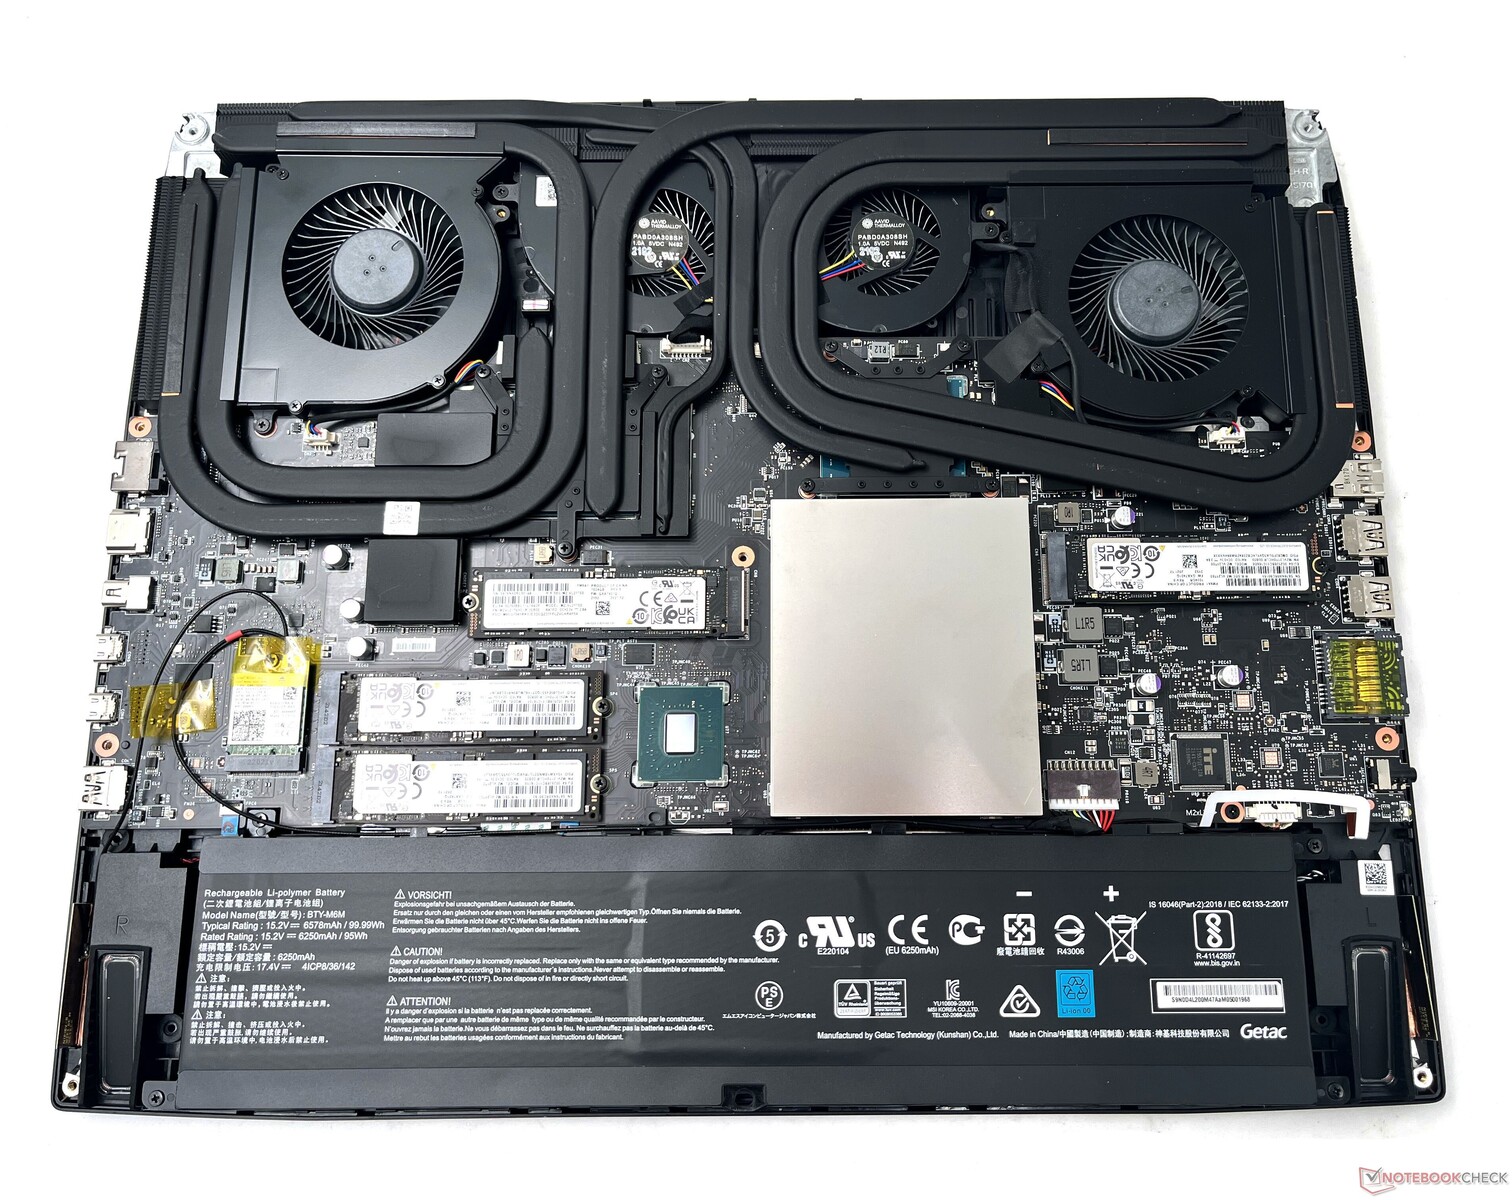
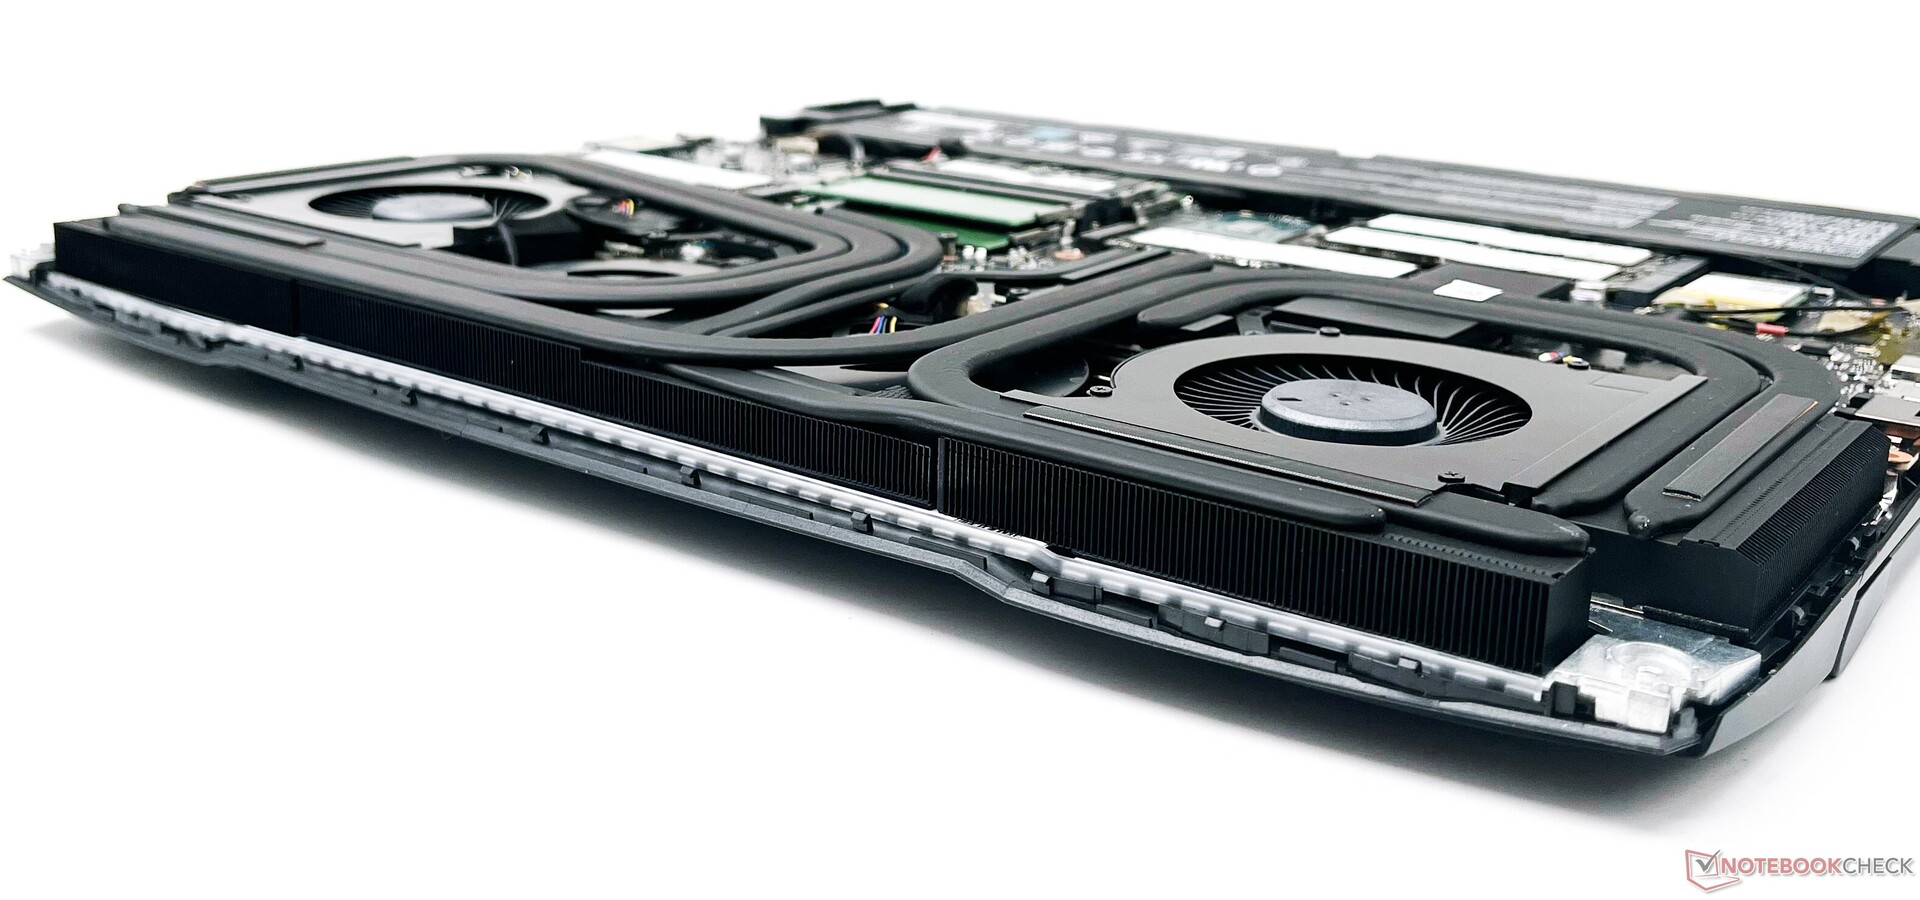
There is no maintenance hatch provided. The bottom panel can be opened after removing 11 PH1 screws, but it does take some effort to fully pry it open from the rest of the chassis.
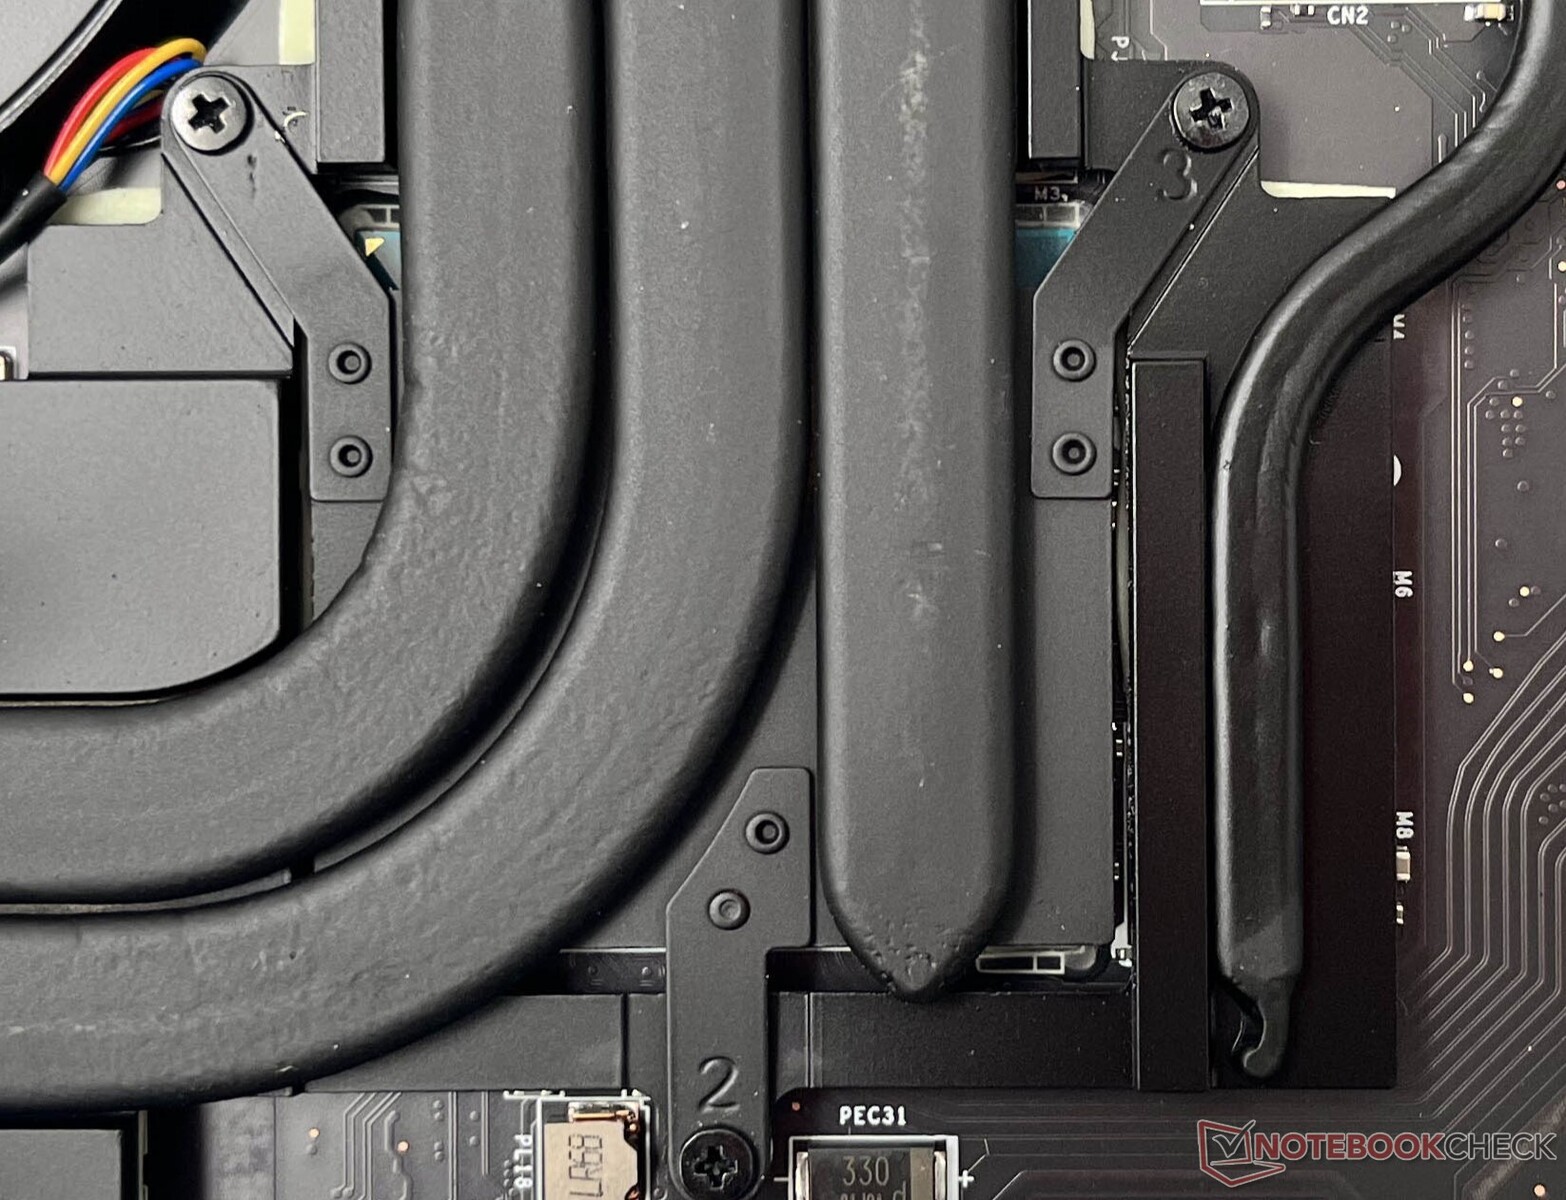
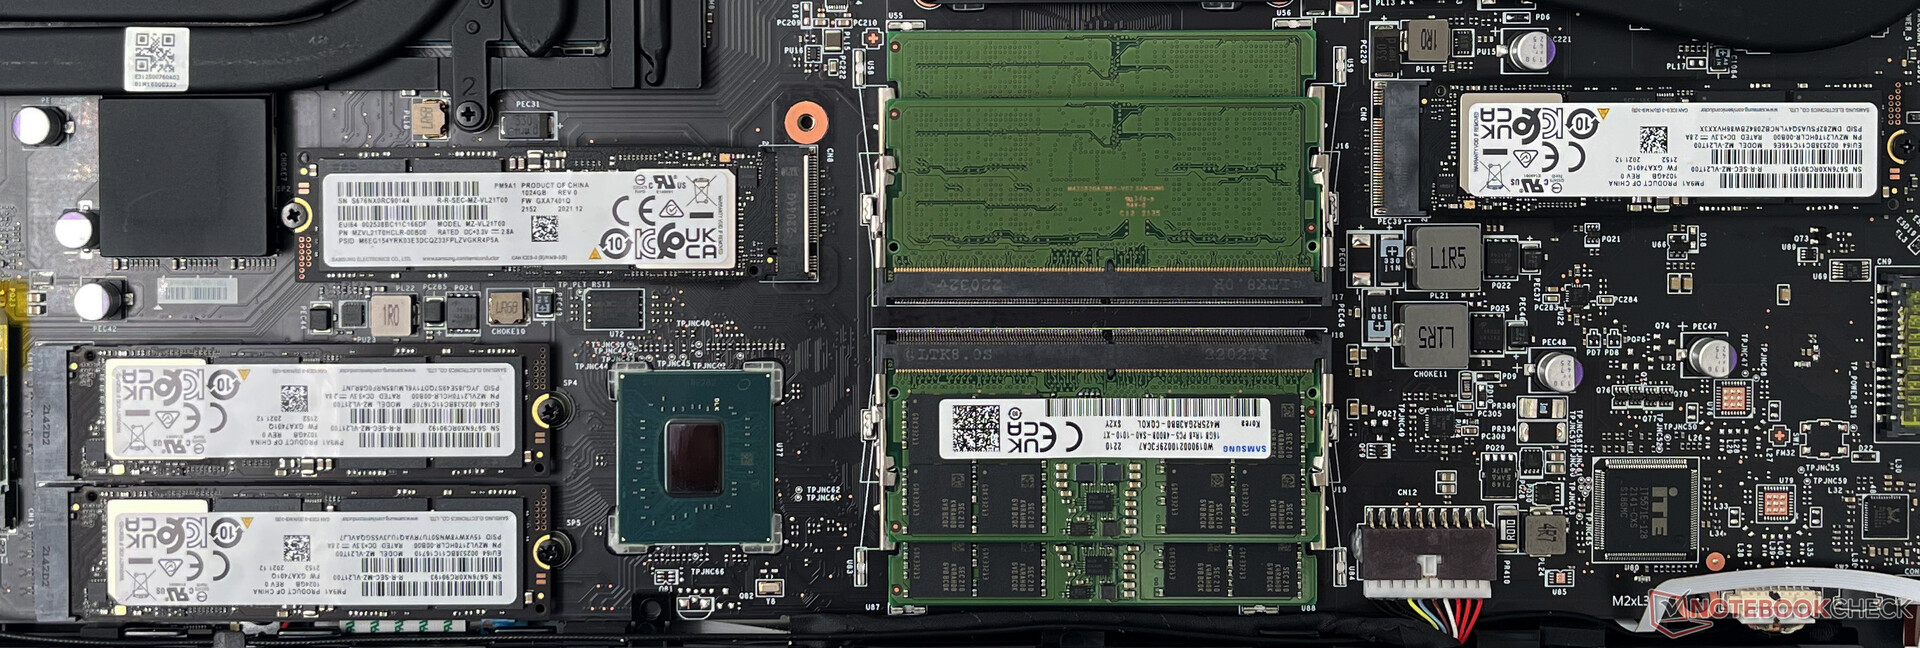
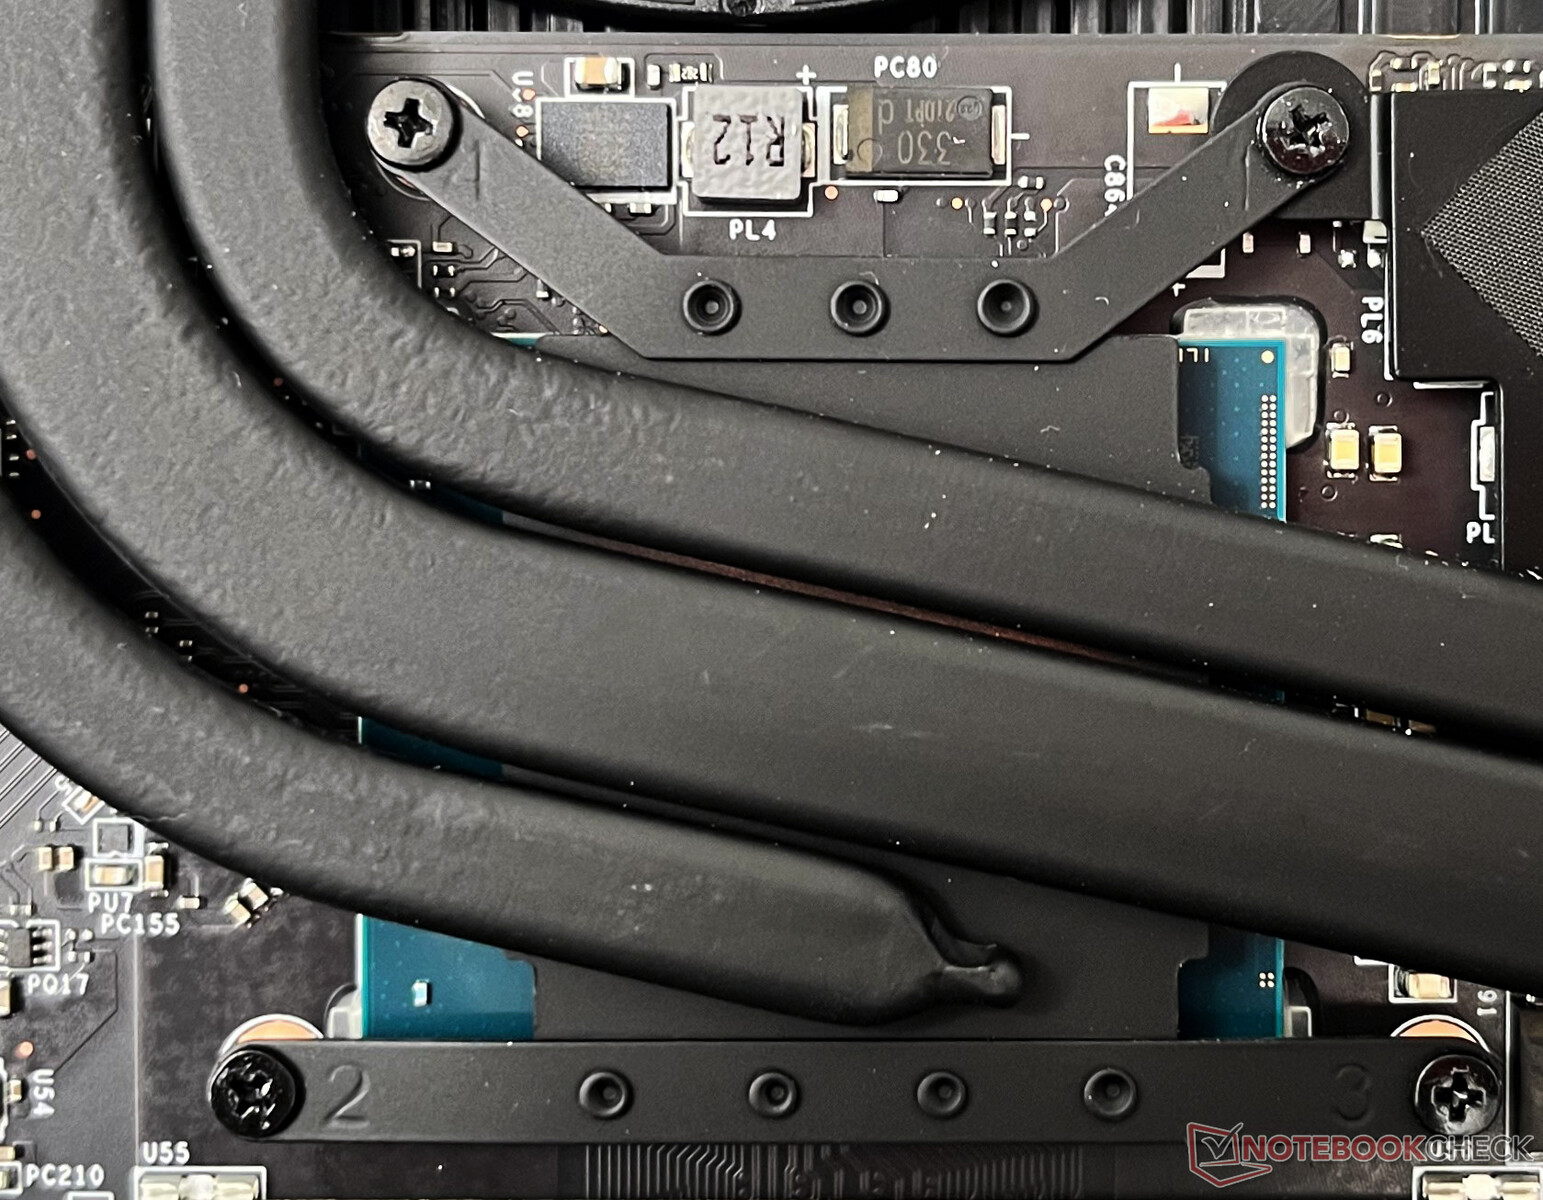
Inside, we find quite a busy arrangement of parts. In true Titan style, the cooling system is massive with four fans, seven heatpipes, and six exhausts.
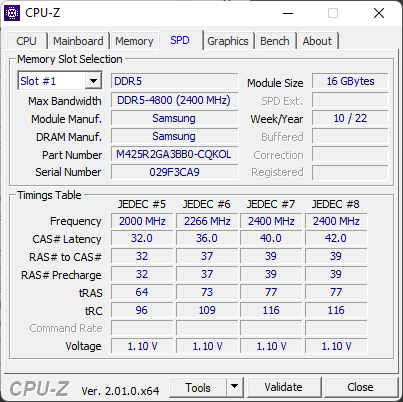
All four SSD slots in our unit came occupied with 1 TB PCIe Gen4 NVMe drives. Four sticks of 16 GB DDR5-4800 memory each are present below the aluminum cover — you can cram up to 128 GB of DDR5-4800 memory in here.
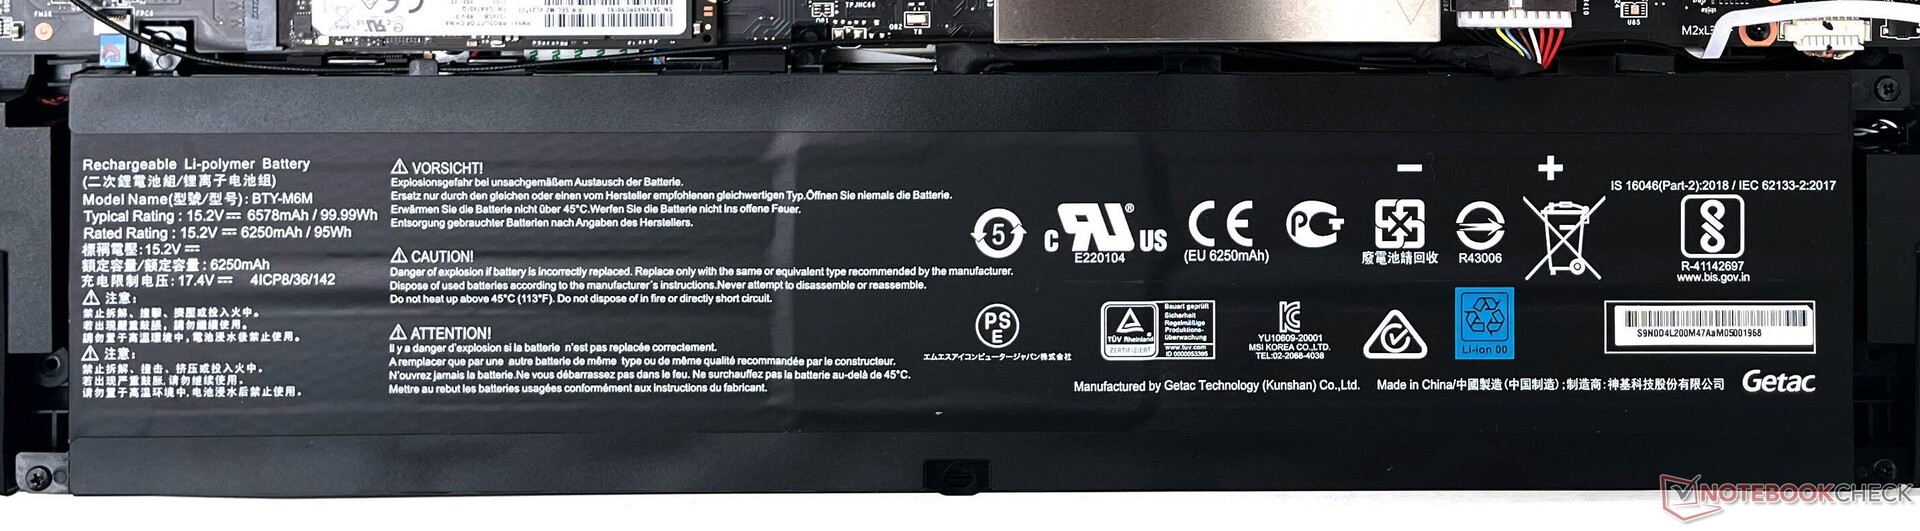
The 99.9 WHr battery can be removed for replacement. The Killer AX1675i WLAN card, NVMe SSDs, and DDR5 memory can all be upgraded.
Warranty
Depending on the region, MSI offers a standard one-year warranty or two-year warranty for its gaming laptops along with global travel insurance. Since ours is a custom unit, it did not come with any warranty information.
Input Devices: Delightful Cherry MX keyboard and large touchpad
Keyboard
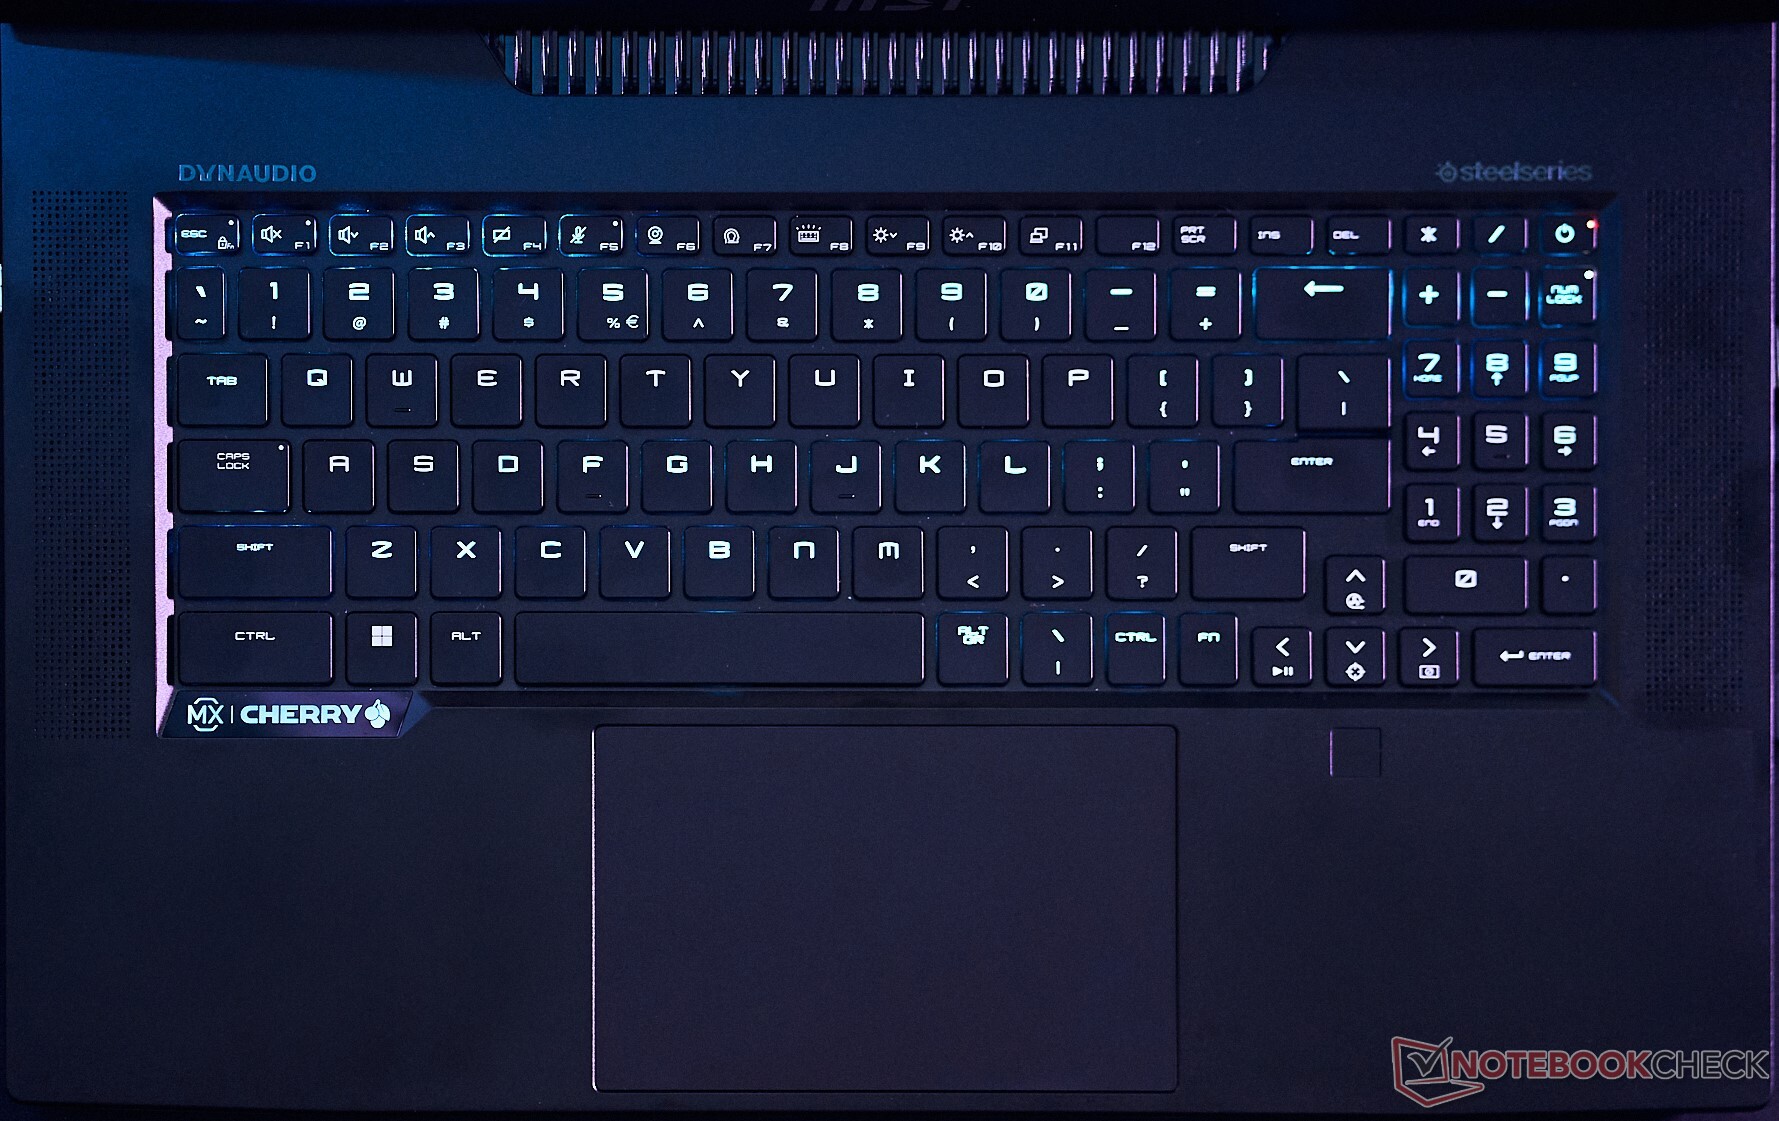
The SteelSeries keyboard with Cherry MX Ultra Low Profile mechanical switches presents a great typing experience with excellent tactile feedback, fast response, and a crisp typing sound. All keys can be individually lit, and the SteelSeries GG software allows configuring all kinds of RGB lighting effects and macro shortcuts.
However, only the main typing area uses Cherry MX mechanical keys. The function keys, arrow keys, and the numpad all seem to make do with conventional membrane switches. The location of the Fn key might take some time getting used to if you are new to MSI laptops. Pressing the Fn key lights up the additional functions alone on the F1-F12 keys, which helps with easy legibility in dark environments.
The Home, End, Page Up, and Page Down keys are available only on the numpad and require disengaging the Num Lock if you wish to use them. The arrow keys are of decent size, but the lack of mechanical keys here is a bummer if you are into racing games. It is important that the keyboard area is kept relatively clean as dust or food particles can easily get lodged under the keys and pose issues with actuation.
Touchpad
The touchpad is a step-up from what we had seen in the Titan GT76. It now sports a buttonless design and measures 13 x 8.2 cm, thus enabling effortless gliding.
The touchpad clicks relatively effortlessly and supports Windows Precision gestures.
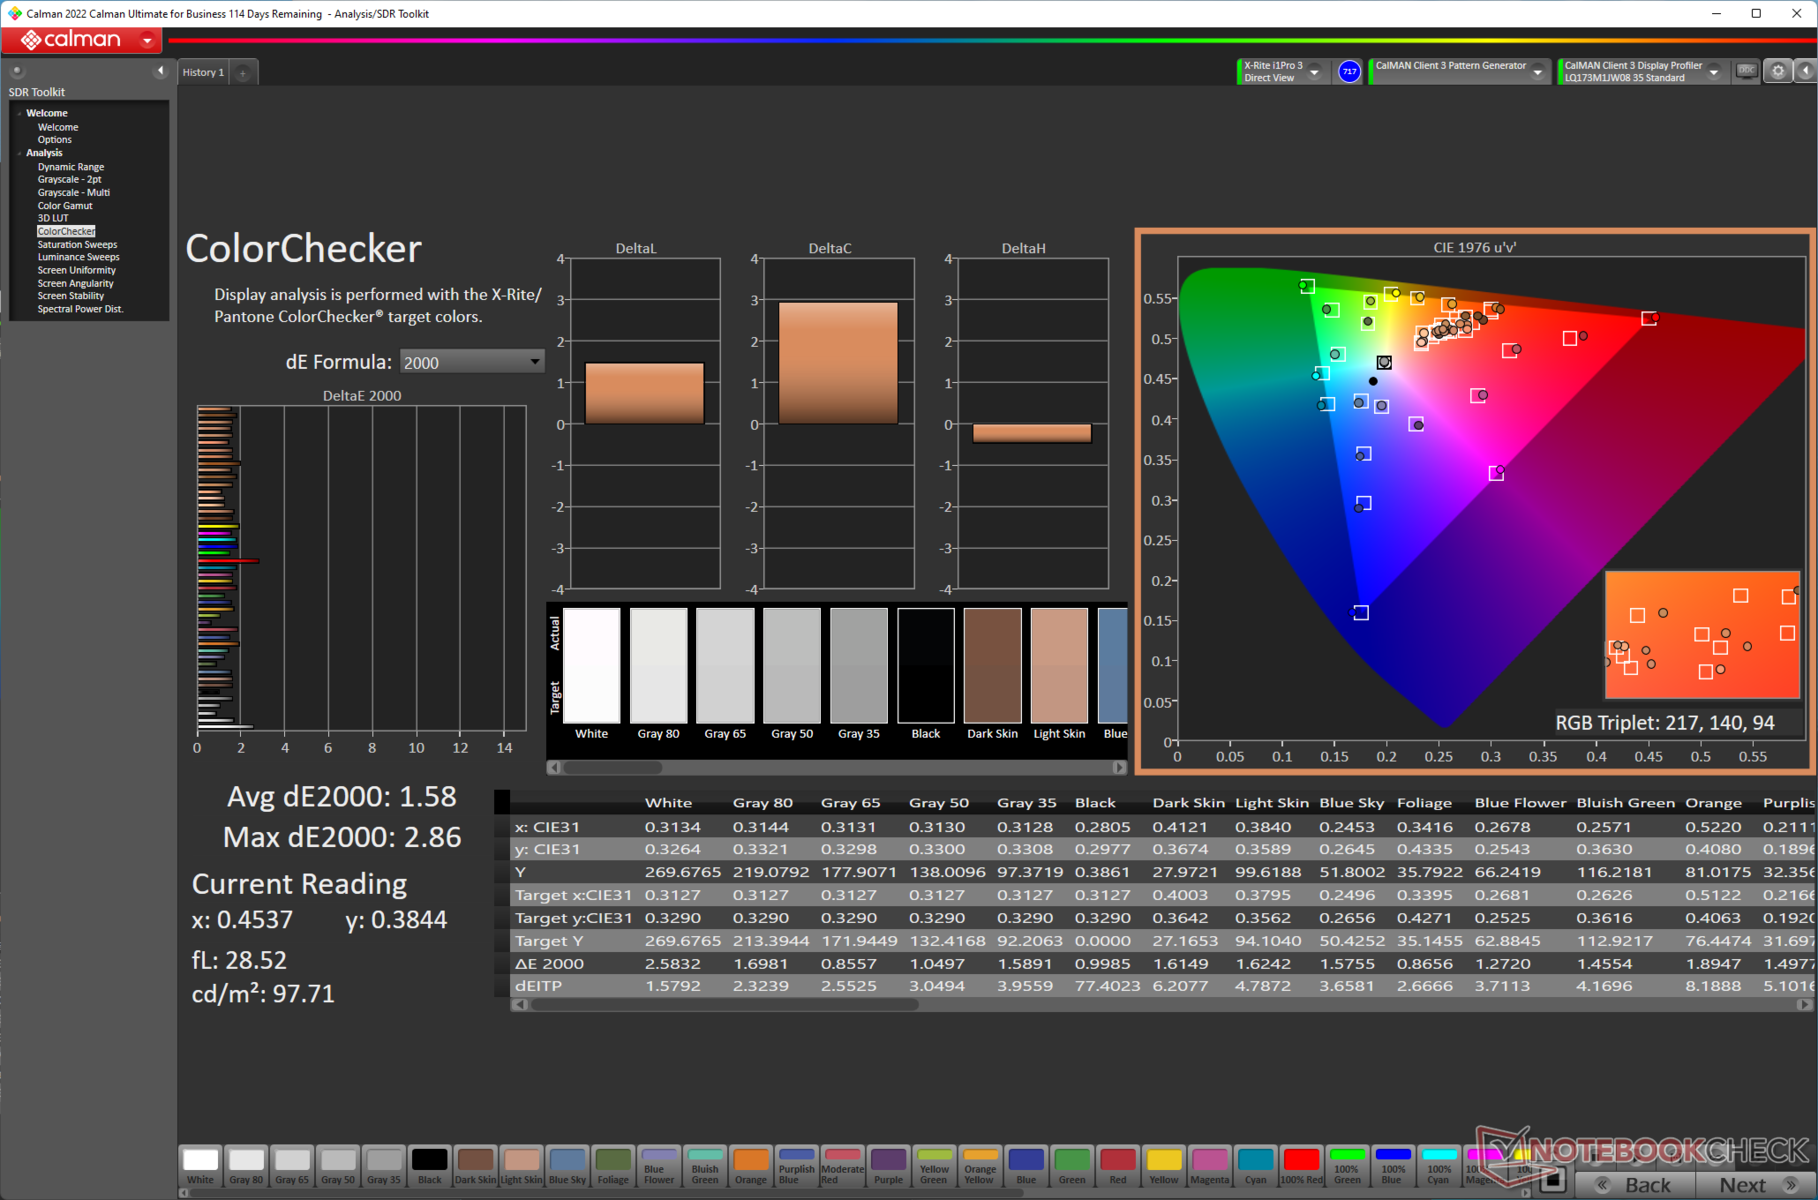
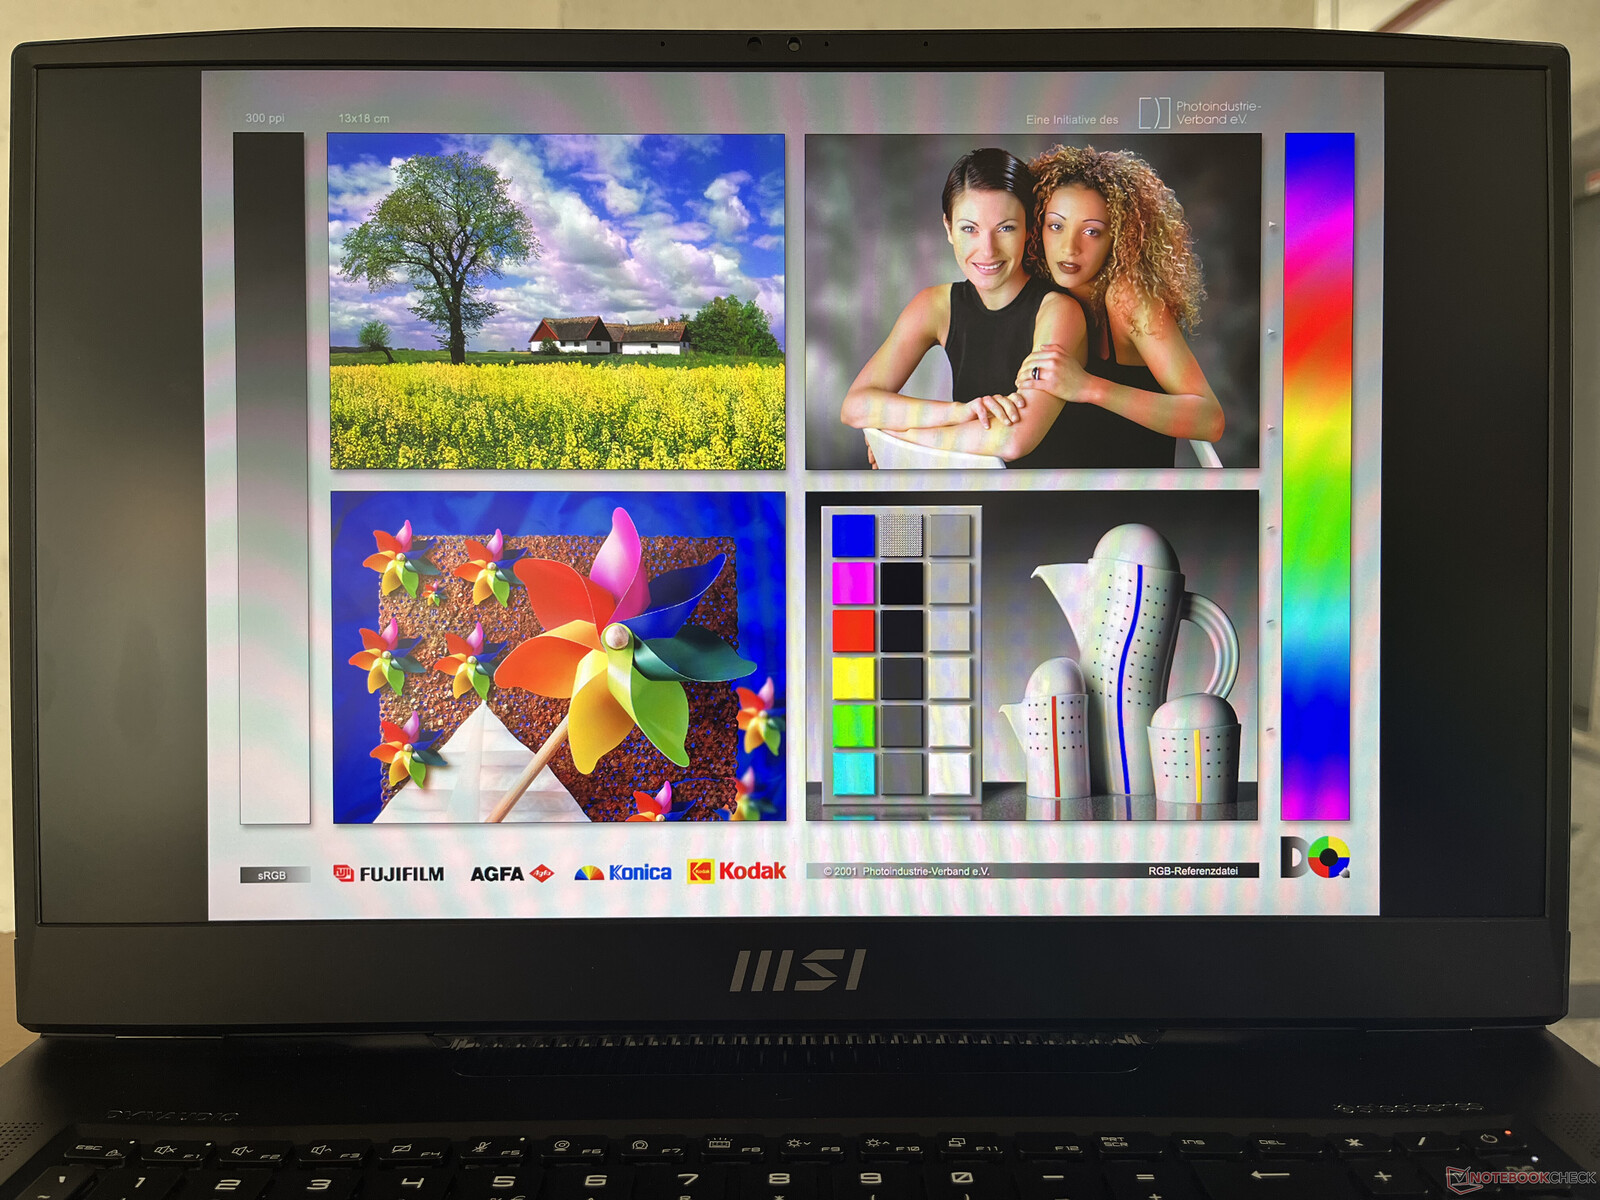
Display: 360 Hz FHD panel with low response times and buggy color software
Our Titan GT77 unit came equipped with a 360 Hz FHD panel. The Titan GT77 can currently be configured only with a 120 Hz UHD panel, but it is likely that the company will also offer a 360 Hz FHD option down the line.
This display does not offer any form of HDR or G-Sync support. At the time of testing, True Color only supported sRGB and a few other blue light reduction tweaks. Now, MSI has updated the app to include AdobeRGB and Display P3 color spaces as well.
That being said, using True Color on this laptop can be a bit irksome. There is a bug in the app that does not allow it to play well with the latest Intel iGPU drivers. Updating the Intel graphics drivers whitewashes all colors and makes the entire display look extremely unpleasant. Thankfully, MSI acknowledges the issue and directs you to a link for remediation. Basically, all you need to do is to downgrade the Intel iGPU drivers to an older version. In our testing, we found version 30.0.101.1994 to work just fine. Switching from MSHybrid to discrete graphics mode is another workaround.
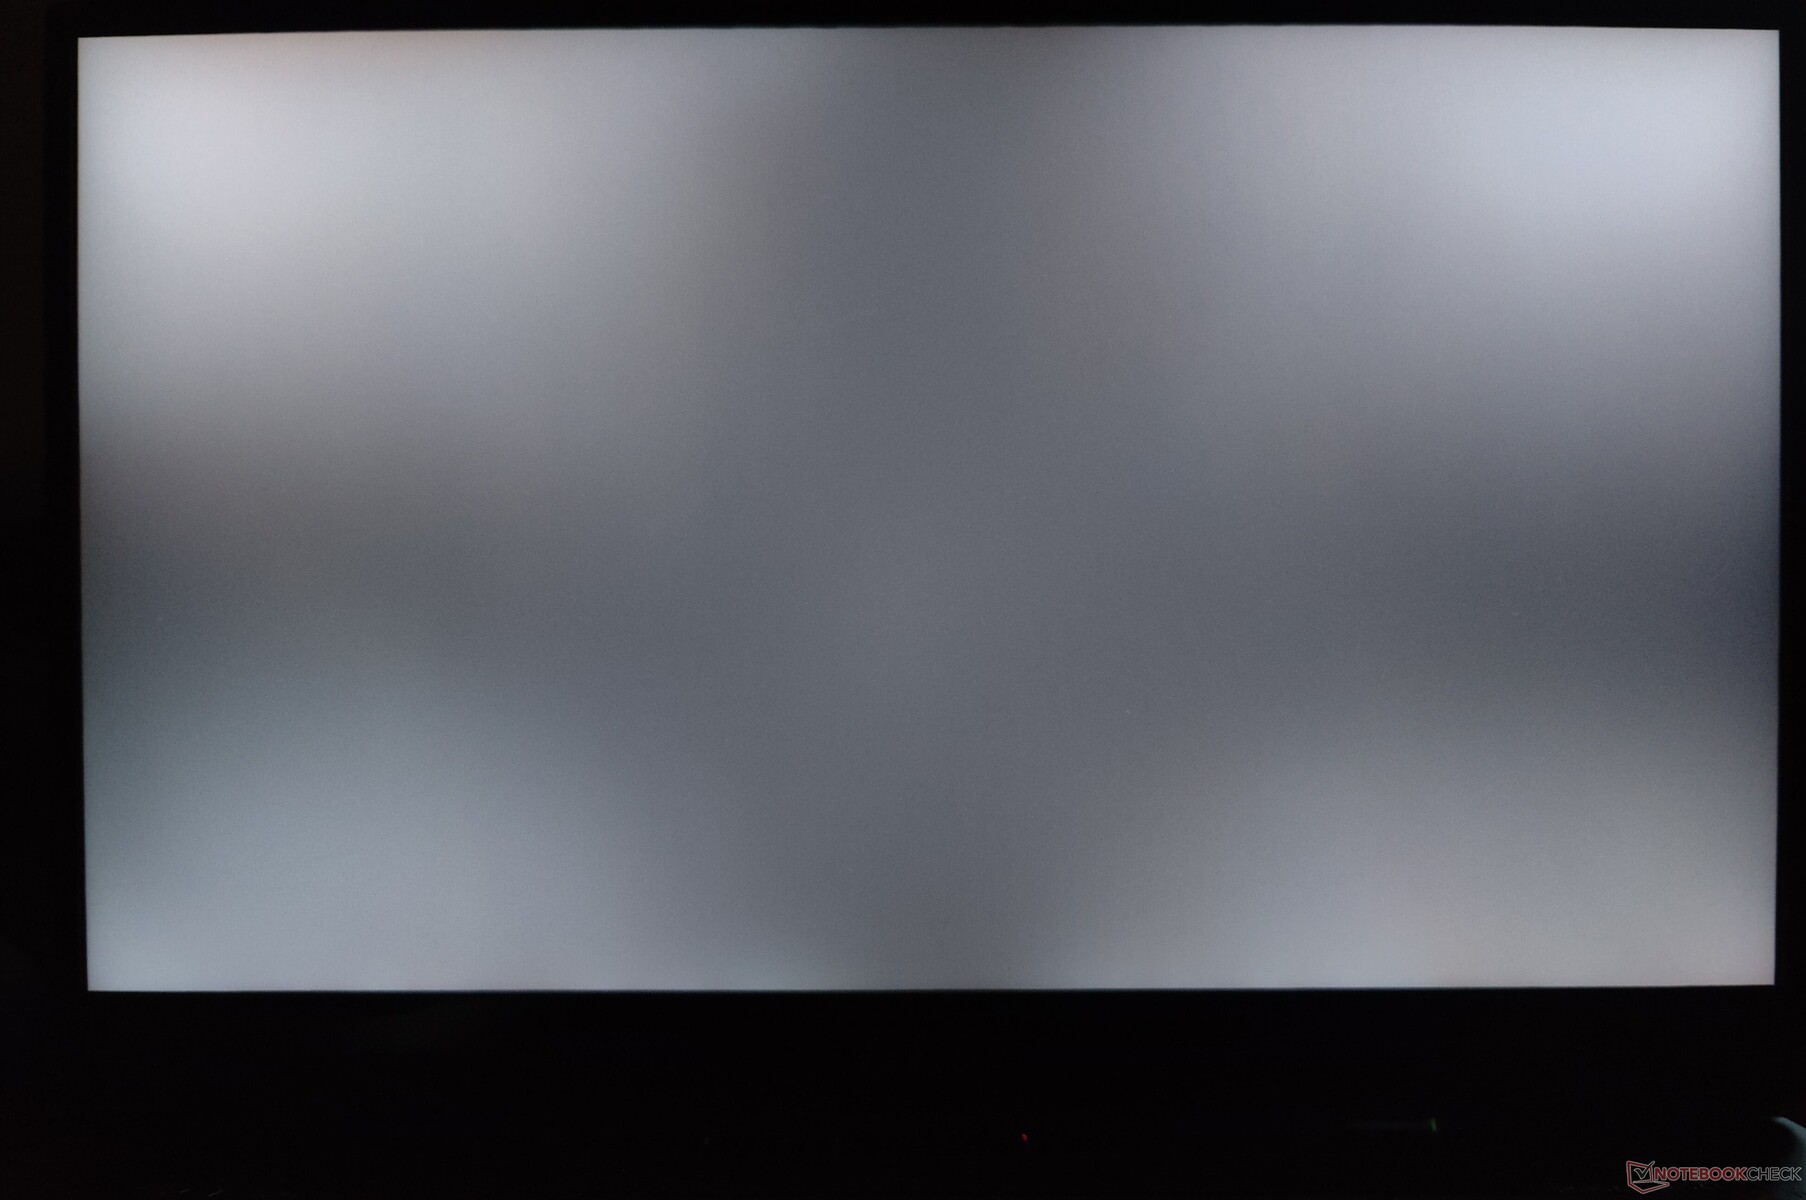
Individual pixel sizes seem rather large given that this is just a 127 PPI display. We observed light bleeding at the corners under long exposure.
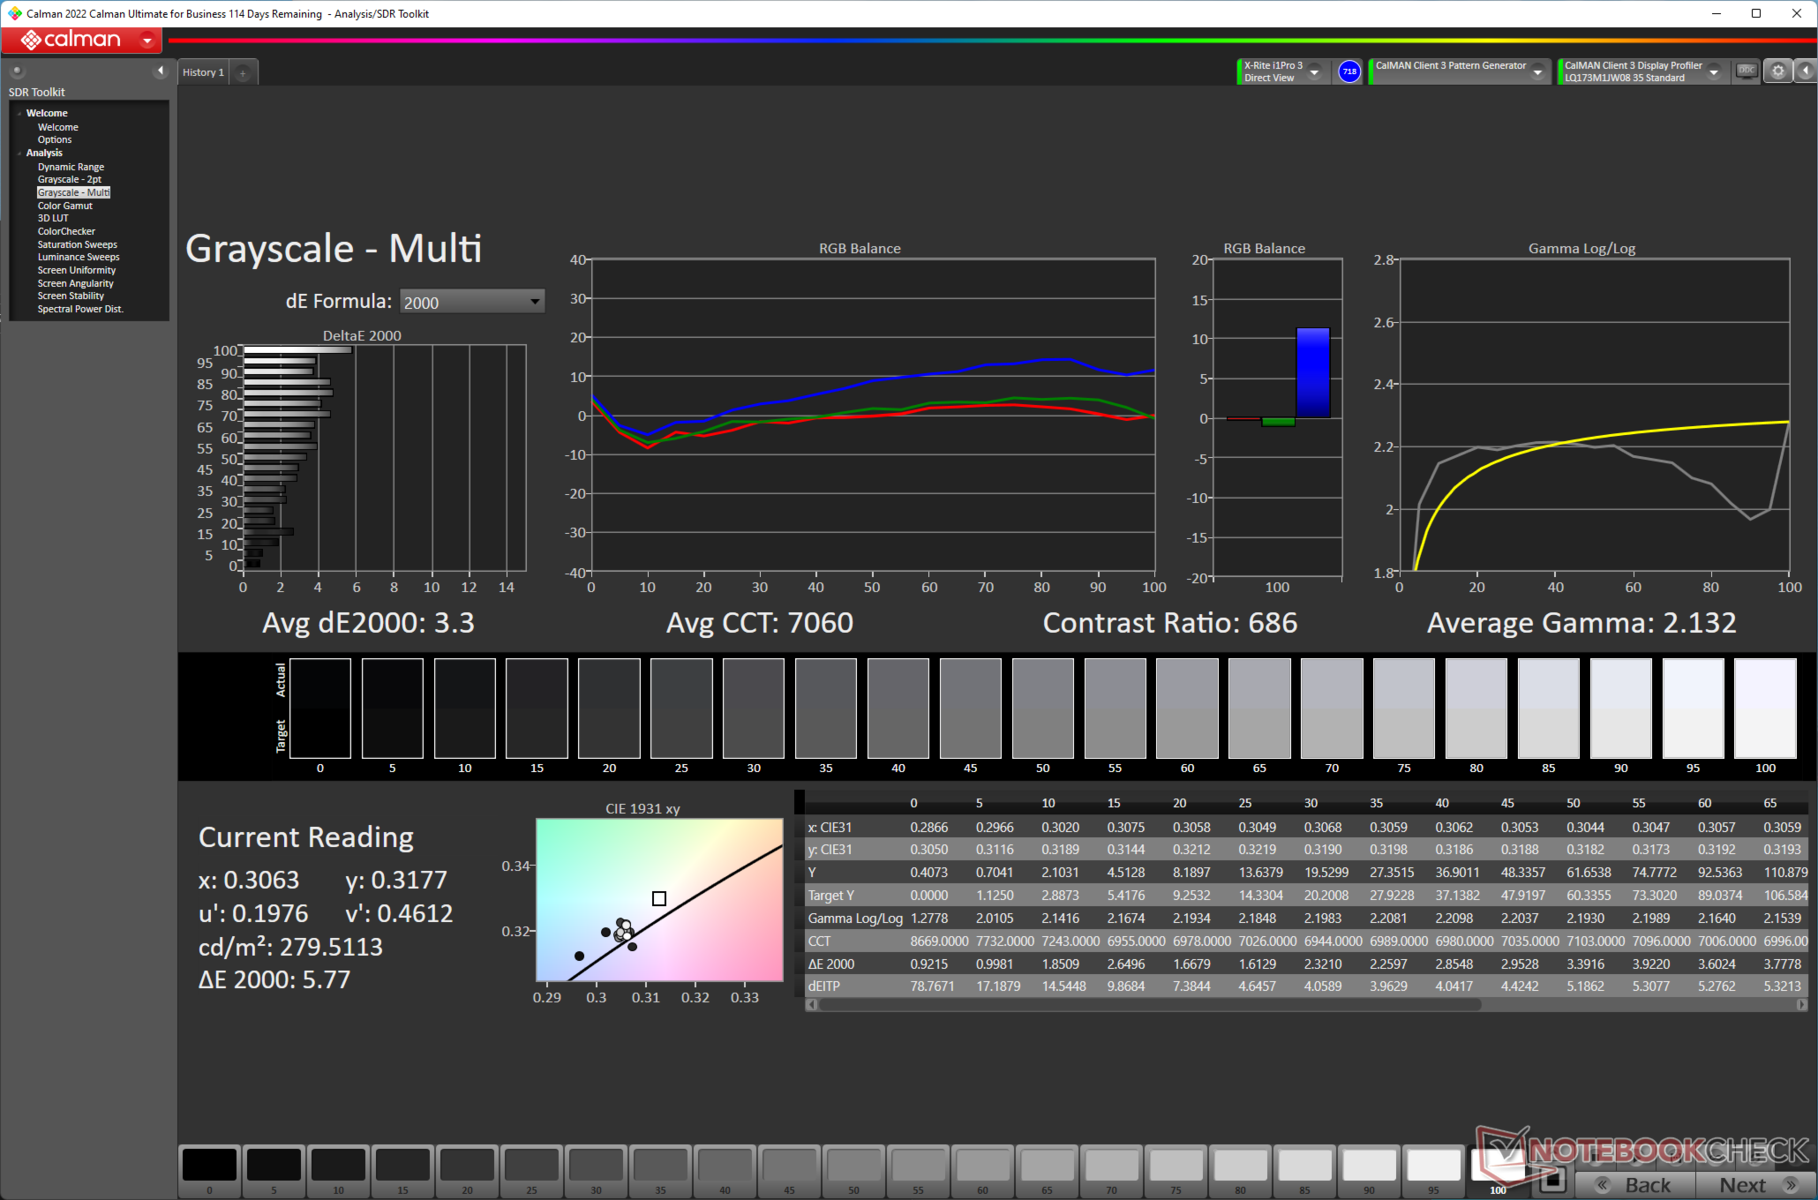
Brightness distribution is decent at 79%, but the contrast ratio of 700:1 is just about average. Subjectively, the Titan GT77's display offers a decent viewing experience if your primary use case is gaming.

| |||||||||||||||||||||||||
Brightness Distribution: 79 %
Center on Battery: 280 cd/m²
Contrast: 700:1 (Black: 0.4 cd/m²)
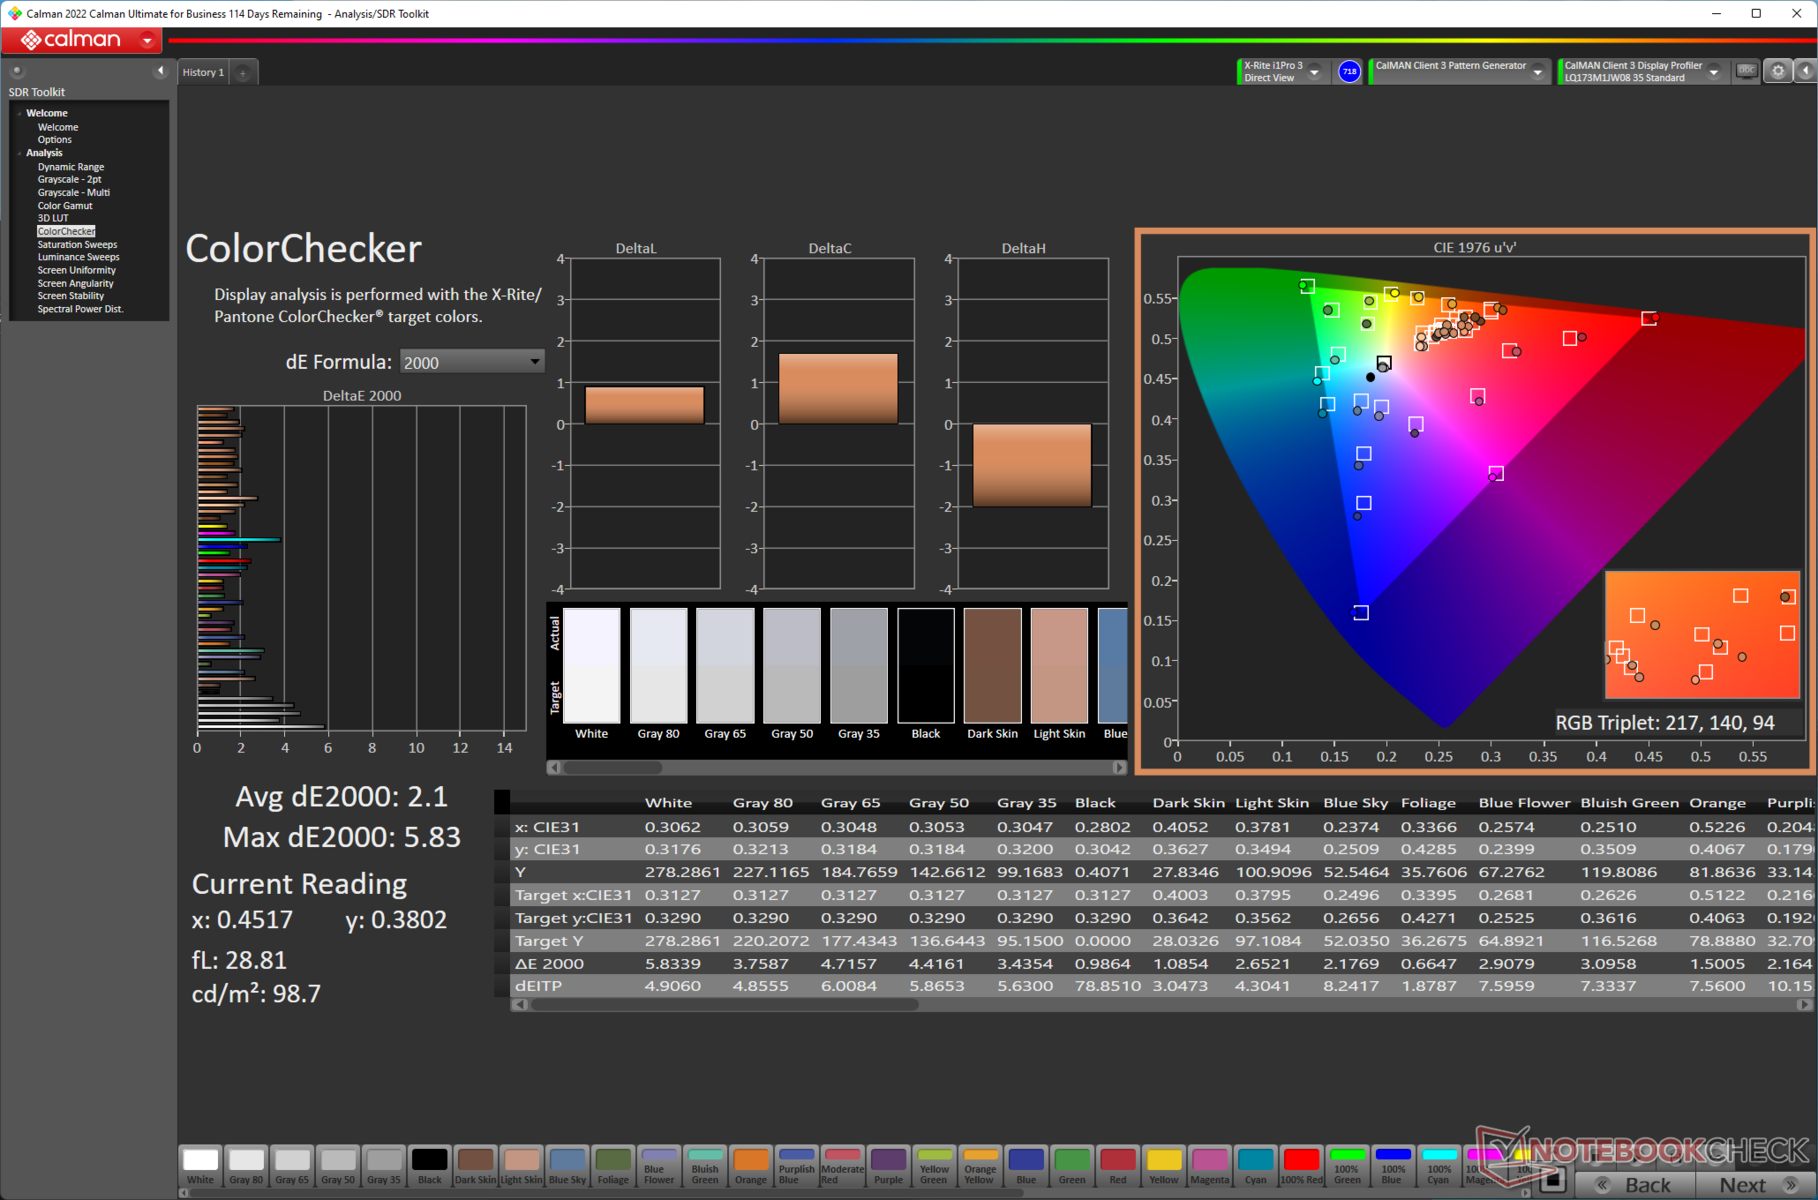
ΔE ColorChecker Calman: 2.1 | ∀{0.5-29.43 Ø4.71}
calibrated: 1.58
ΔE Greyscale Calman: 3.3 | ∀{0.09-98 Ø4.96}
73% AdobeRGB 1998 (Argyll 3D)
98.9% sRGB (Argyll 3D)
70.8% Display P3 (Argyll 3D)
Gamma: 2.13
CCT: 7060 K
| MSI Titan GT77 12UHS Sharp SHP1544 LQ173M1JW08, IPS-Level, 1920x1080, 17.3" | MSI Titan GT77 12UHS AU Optronics B173ZAN06.1, IPS, 3840x2160, 17.3" | Aorus 17X XES Sharp SHP1563, IPS, 1920x1080, 17.3" | MSI Raider GE77 HX 12UHS AU Optronics B173ZAN06.1, IPS, 3840x2160, 17.3" | MSI GE67 HX 12UGS Samsung ATNA562P02-0, OLED, 1920x1080, 15.6" | Asus ROG Zephyrus Duo 16 GX650RX BOE NE160QAM-NX1, IPS-Level, 3840x2400, 16" | Alienware x17 R2 P48E AU Optronics B173HAN, IPS, 1920x1080, 17.3" | MSI GE76 Raider AU Optronics B173HAN05.4 (AUOE295), IPS-Level, 1920x1080, 17.3" | |
|---|---|---|---|---|---|---|---|---|
| Display | 19% | -1% | 18% | -2% | 19% | 7% | -9% | |
| Display P3 Coverage (%) | 70.8 | 97 37% | 70.1 -1% | 96.6 36% | 71.7 1% | 98 38% | 79.2 12% | 63.1 -11% |
| sRGB Coverage (%) | 98.9 | 99.8 1% | 99.9 1% | 99.8 1% | 89.7 -9% | 99.9 1% | 99.8 1% | 94 -5% |
| AdobeRGB 1998 Coverage (%) | 73 | 86.2 18% | 71.9 -2% | 85.8 18% | 75.2 3% | 86.3 18% | 79.6 9% | 65.2 -11% |
| Response Times | -35% | -11% | -49% | 92% | -194% | -192% | -84% | |
| Response Time Grey 50% / Grey 80% * (ms) | 3.03 ? | 5.2 ? -72% | 3.4 ? -12% | 5.8 ? -91% | 0.25 ? 92% | 14.6 ? -382% | 12.4 ? -309% | 5.6 ? -85% |
| Response Time Black / White * (ms) | 5.28 ? | 5.1 ? 3% | 5.8 ? -10% | 5.6 ? -6% | 0.4 ? 92% | 5.6 ? -6% | 9.2 ? -74% | 9.6 ? -82% |
| PWM Frequency (Hz) | 480.4 ? | |||||||
| Screen | 10% | -18% | -1% | -13% | 9% | 11% | 33% | |
| Brightness middle (cd/m²) | 280 | 418 49% | 278 -1% | 381 36% | 356.1 27% | 459 64% | 365.4 31% | 290 4% |
| Brightness (cd/m²) | 275 | 401 46% | 273 -1% | 371 35% | 358 30% | 434 58% | 344 25% | 290 5% |
| Brightness Distribution (%) | 79 | 91 15% | 79 0% | 84 6% | 99 25% | 88 11% | 85 8% | 96 22% |
| Black Level * (cd/m²) | 0.4 | 0.48 -20% | 0.26 35% | 0.52 -30% | 0.44 -10% | 0.29 28% | 0.23 43% | |
| Contrast (:1) | 700 | 871 24% | 1069 53% | 733 5% | 1043 49% | 1260 80% | 1261 80% | |
| Colorchecker dE 2000 * | 2.1 | 2.47 -18% | 3.96 -89% | 4.83 -130% | 2.97 -41% | 3.17 -51% | 1.59 24% | |
| Colorchecker dE 2000 max. * | 5.83 | 7.81 -34% | 10.78 -85% | 7.94 -36% | 8.13 -39% | 7.69 -32% | 3.17 46% | |
| Colorchecker dE 2000 calibrated * | 1.58 | 0.66 58% | 1.07 32% | 2.53 -60% | 1.03 35% | 0.51 68% | 0.87 45% | |
| Greyscale dE 2000 * | 3.3 | 4.4 -33% | 6.8 -106% | 3.1 6% | 4.9 -48% | 5.3 -61% | 2.5 24% | |
| Gamma | 2.13 103% | 2.129 103% | 2.224 99% | 2.2 100% | 2.235 98% | 2.18 101% | 2.253 98% | |
| CCT | 7060 92% | 7197 90% | 7651 85% | 5938 109% | 6775 96% | 5879 111% | 6640 98% | |
| Total Average (Program / Settings) | -2% /
5% | -10% /
-13% | -11% /
-5% | 26% /
9% | -55% /
-18% | -58% /
-19% | -20% /
7% |
* ... smaller is better
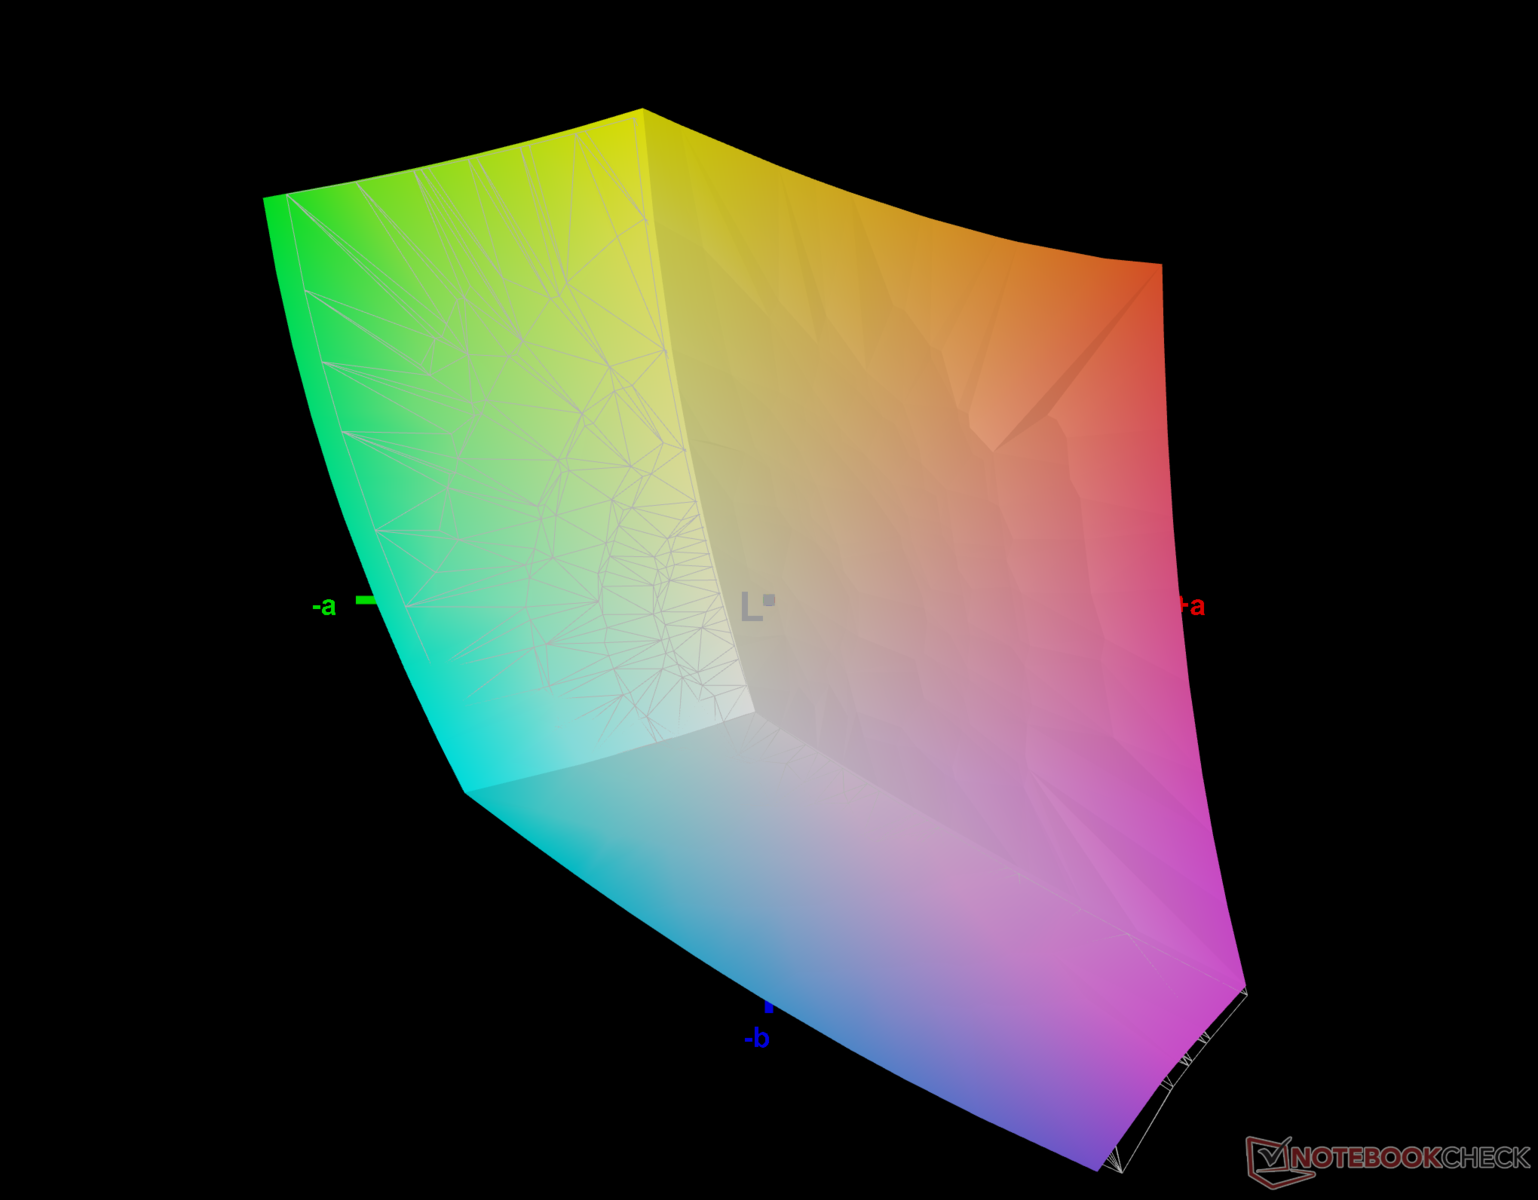
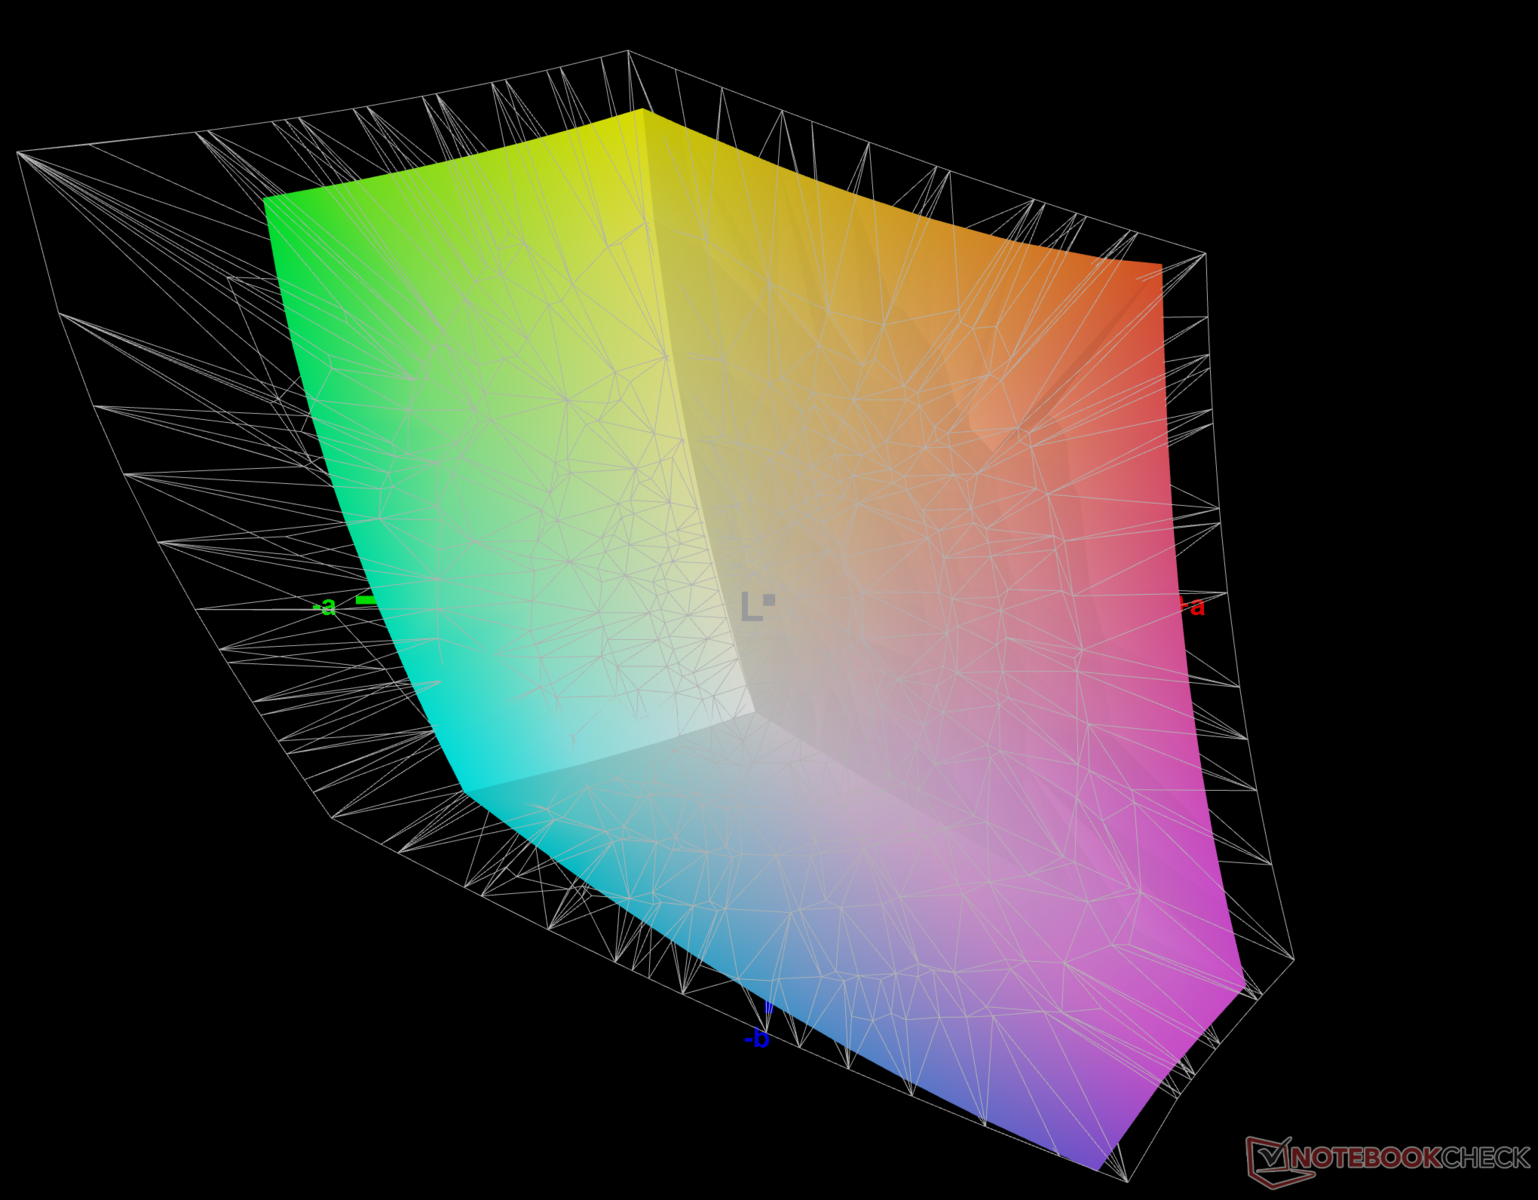
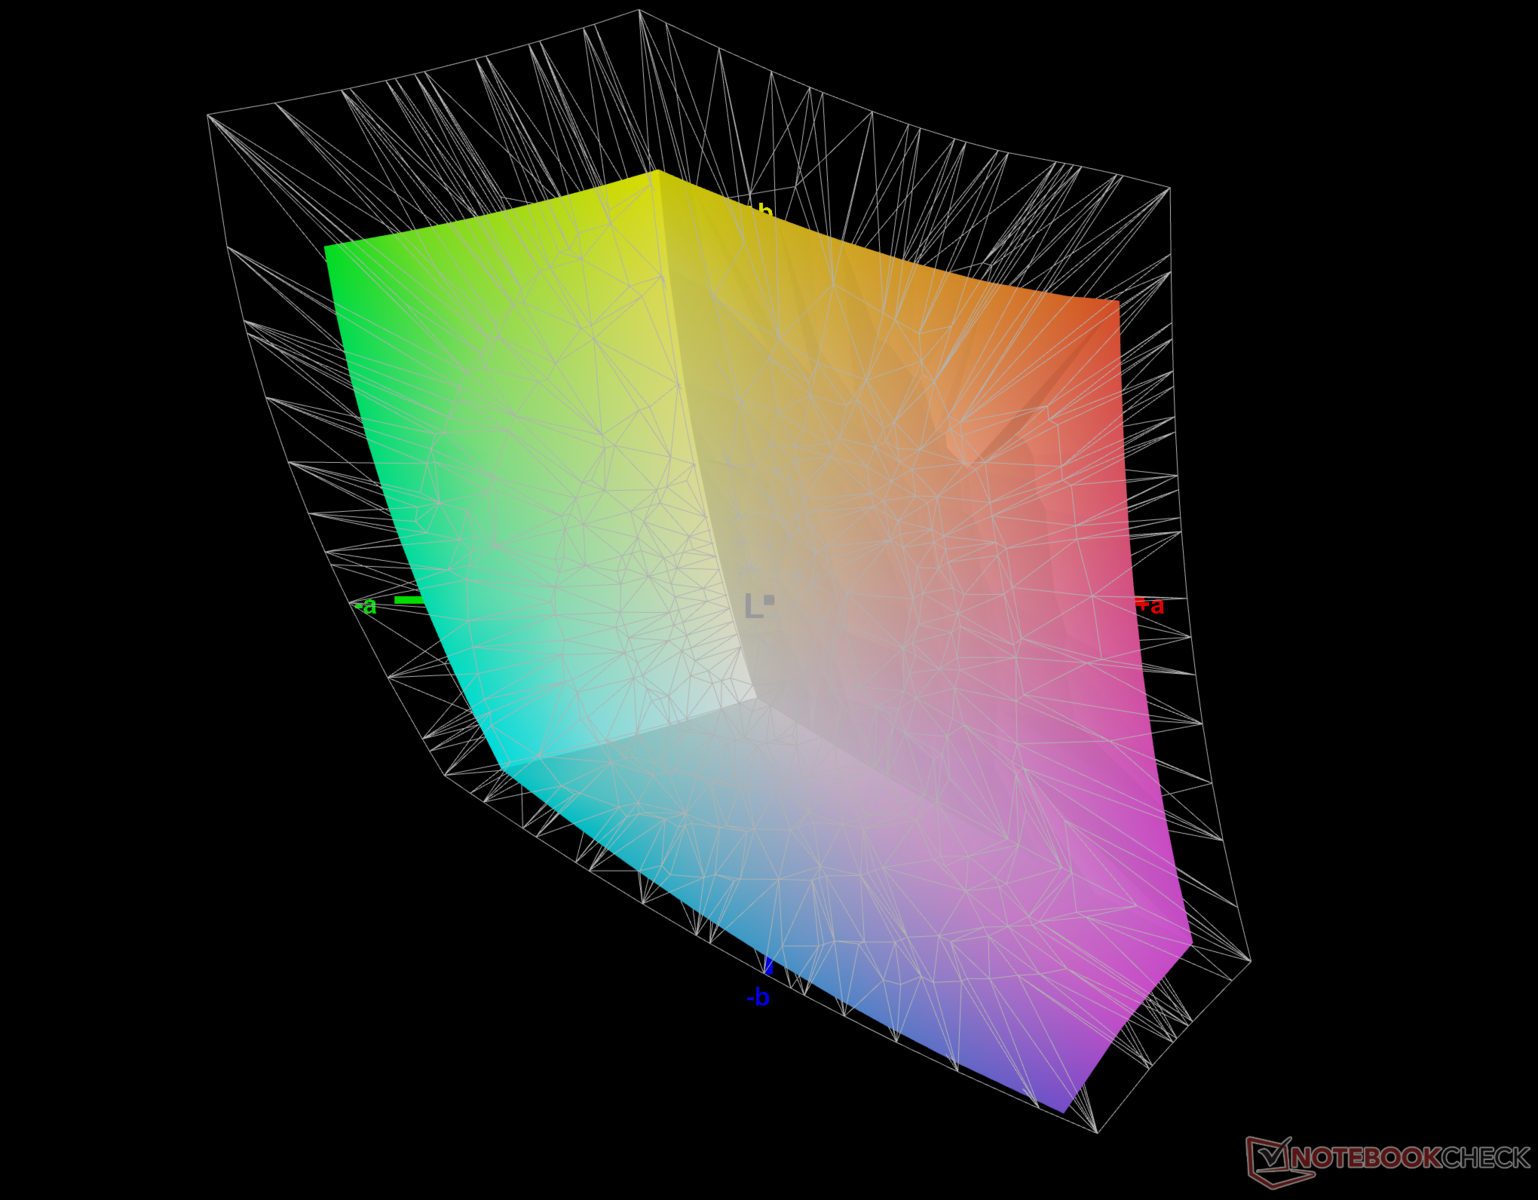
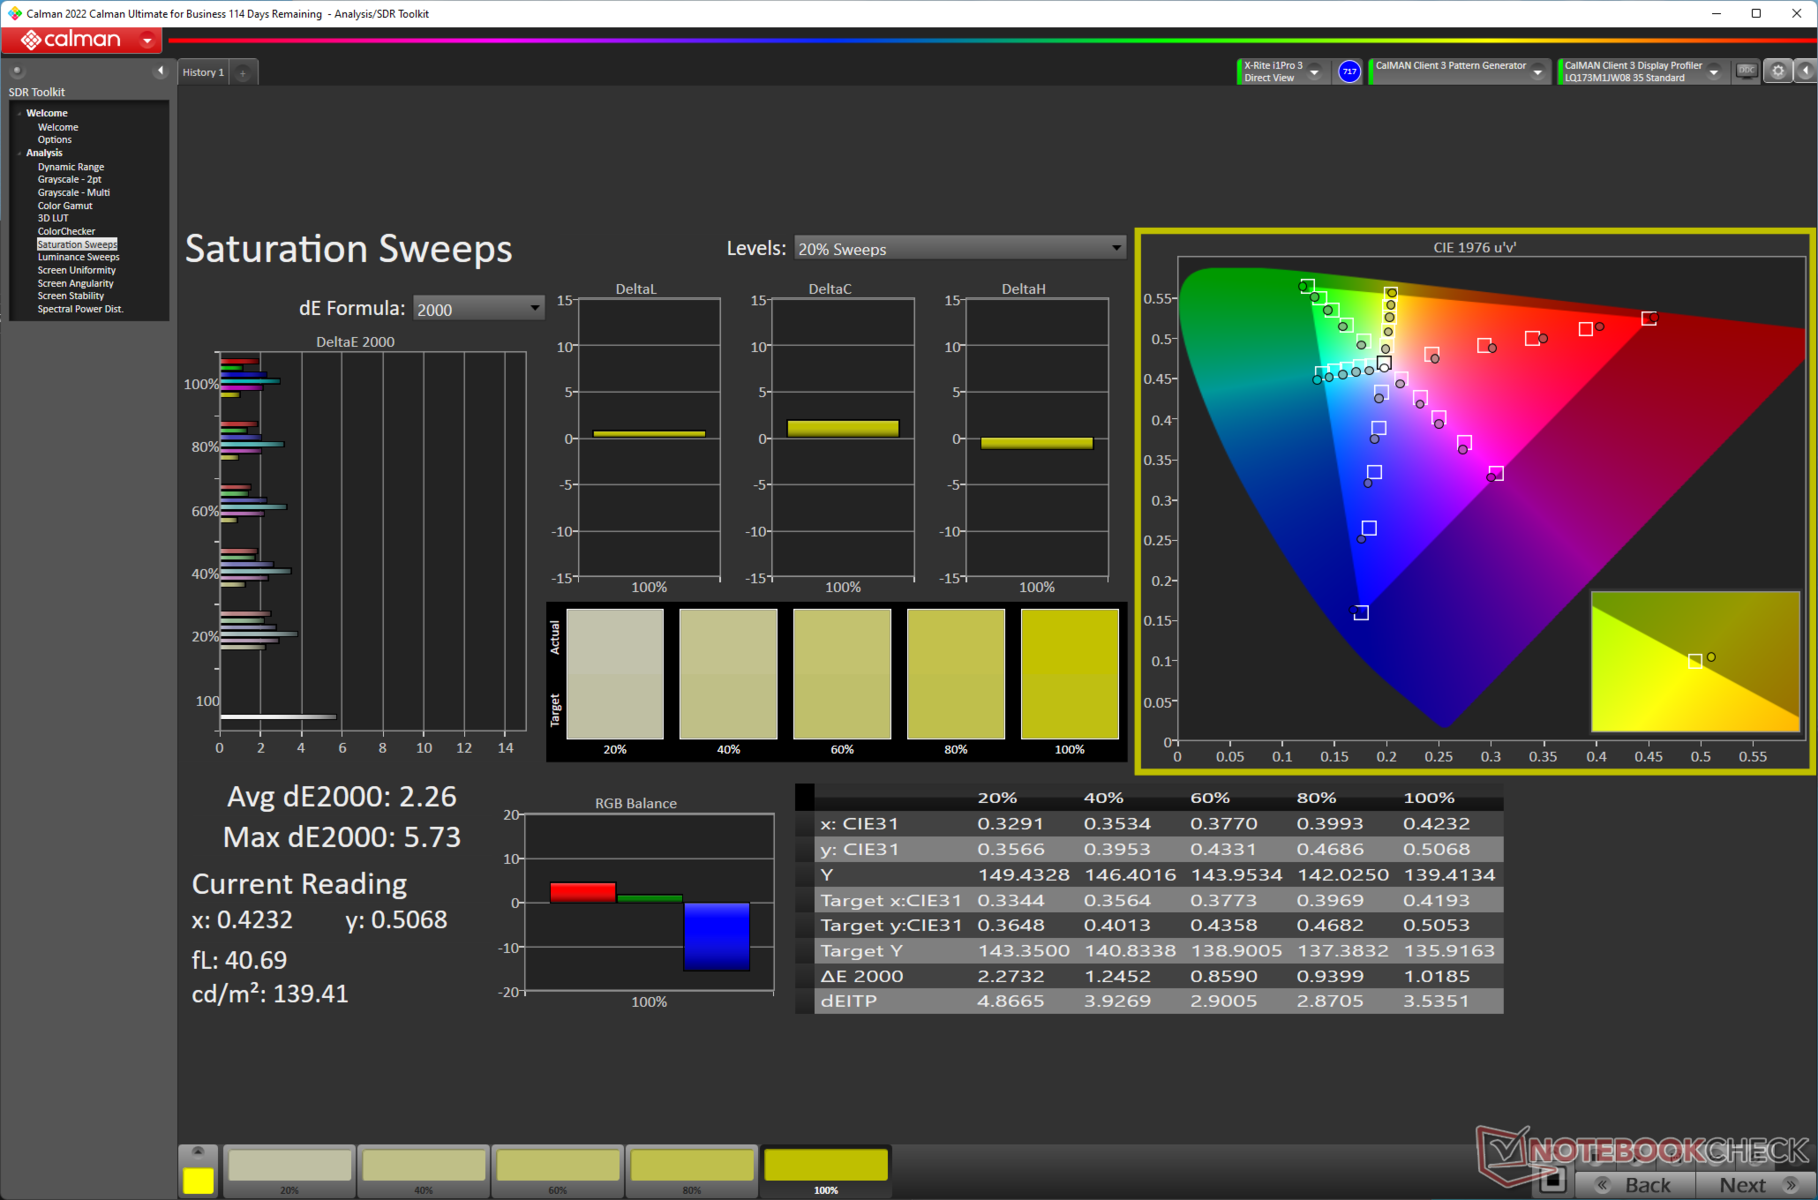
Since the Titan GT77 is aimed primarily at enthusiast gamers, the color space coverage does not really elicit any exuberance. The sRGB gamut coverage of 98.9% is good and 73% of AdobeRGB should still bode well for non-professional content creation. The SKU with a UHD panel offers vastly improved AdobeRGB and Display P3 coverages.
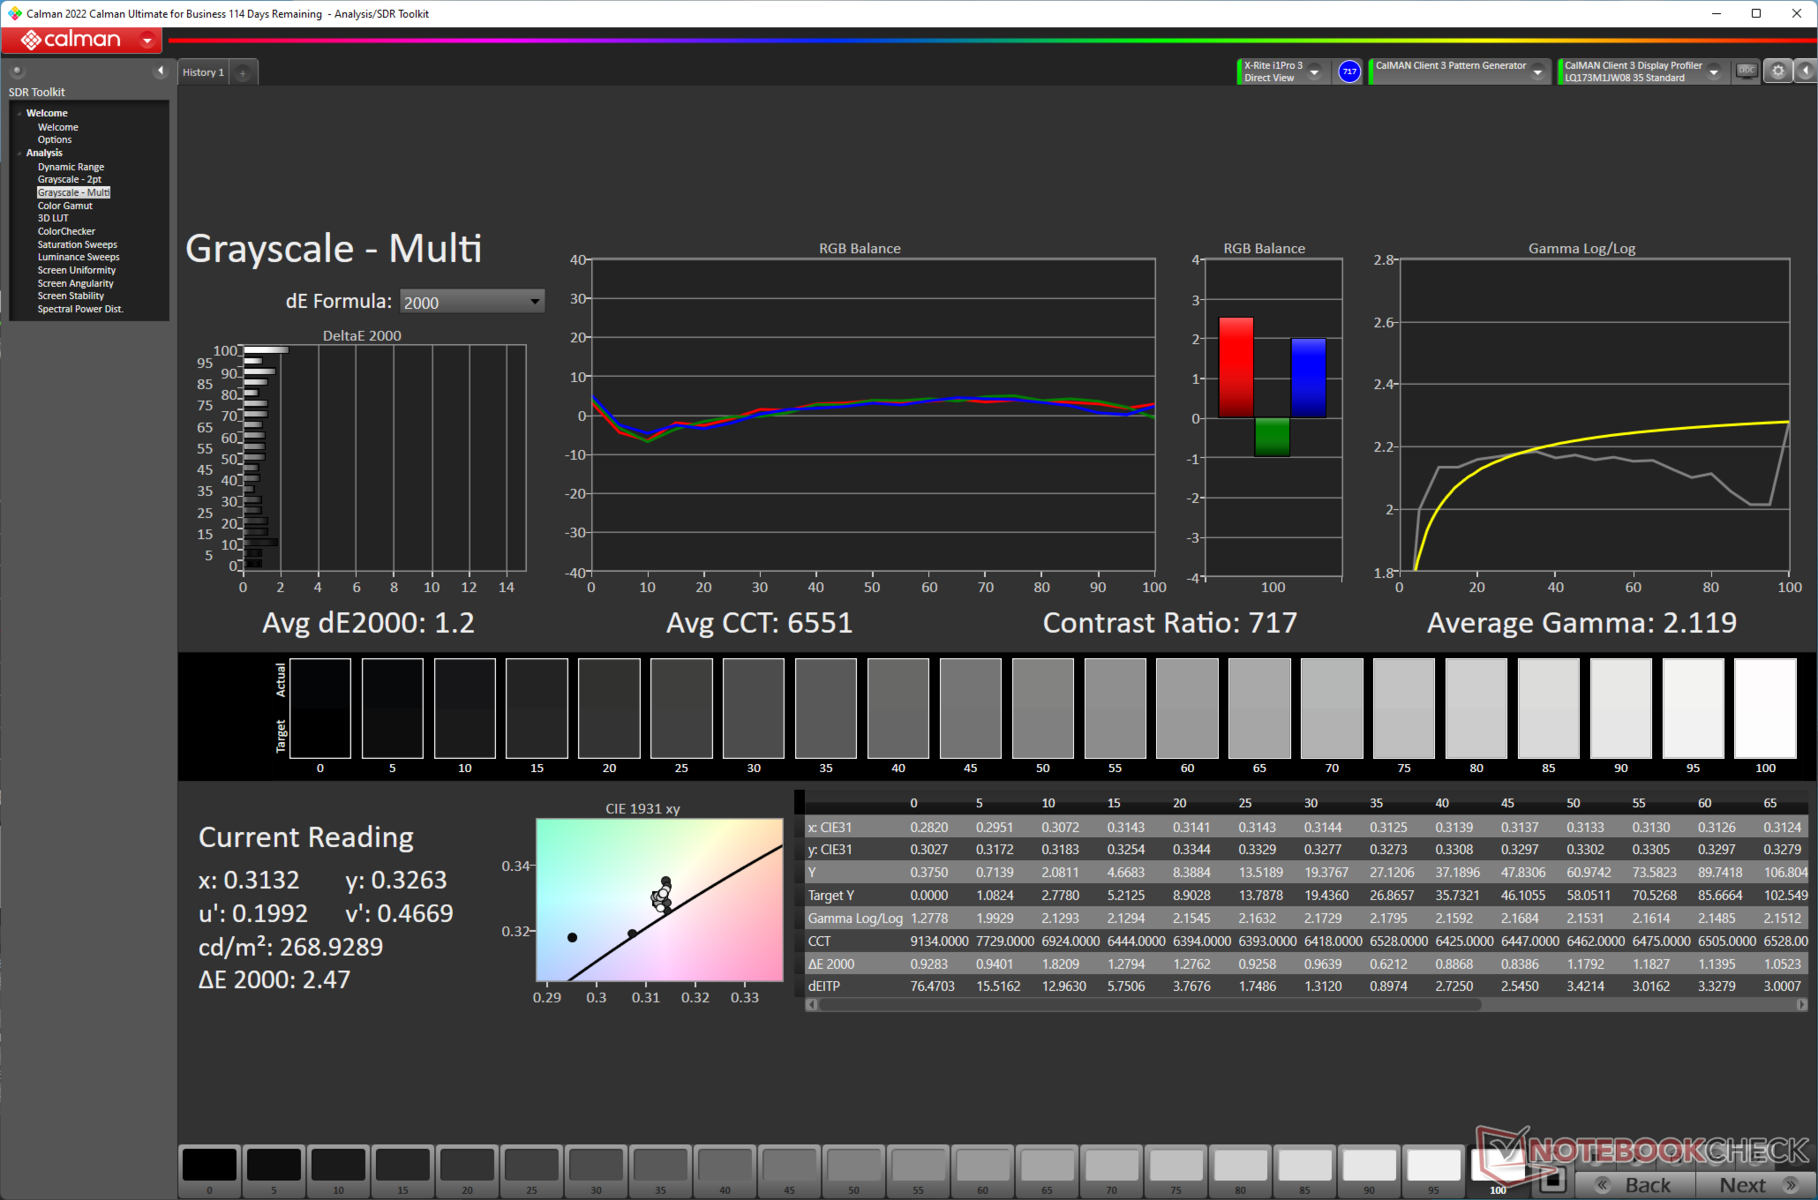
Color accuracy is not too shabby out-of-the-box with an average grayscale Delta E of 3.3 and an average ColorChecker Delta E of 2.1. We could further tighten the average grayscale Delta E to 1.2 and the average ColorChecker Delta E to 1.58 with our standardized color calibration routine using the X-rite i1Basic Pro 3 spectrophotometer and the Calman Calibration Software from Portrait Displays.
Our calibrated ICC file can be downloaded from the link above.

The Titan GT77's Sharp SHP1544 panel offers very good response times. It obviously cannot match the ultra-low response times offered by the Raider GE67 HX 12UGS's Samsung OLED panel, but it is on par with the competition.
Display Response Times
| ↔ Response Time Black to White | ||
|---|---|---|
| 5.28 ms ... rise ↗ and fall ↘ combined | ↗ 2.32 ms rise | 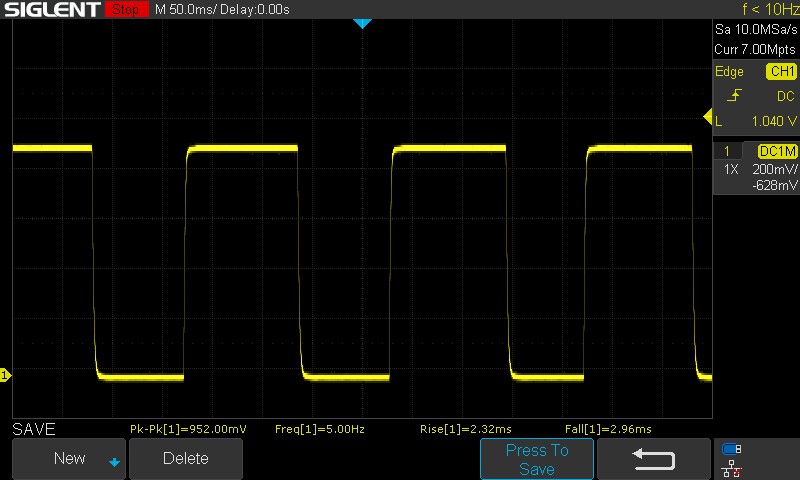 |
| ↘ 2.96 ms fall | ||
| The screen shows very fast response rates in our tests and should be very well suited for fast-paced gaming. In comparison, all tested devices range from 0.1 (minimum) to 240 (maximum) ms. » 18 % of all devices are better. This means that the measured response time is better than the average of all tested devices (19.8 ms). | ||
| ↔ Response Time 50% Grey to 80% Grey | ||
| 3.03 ms ... rise ↗ and fall ↘ combined | ↗ 1.28 ms rise | 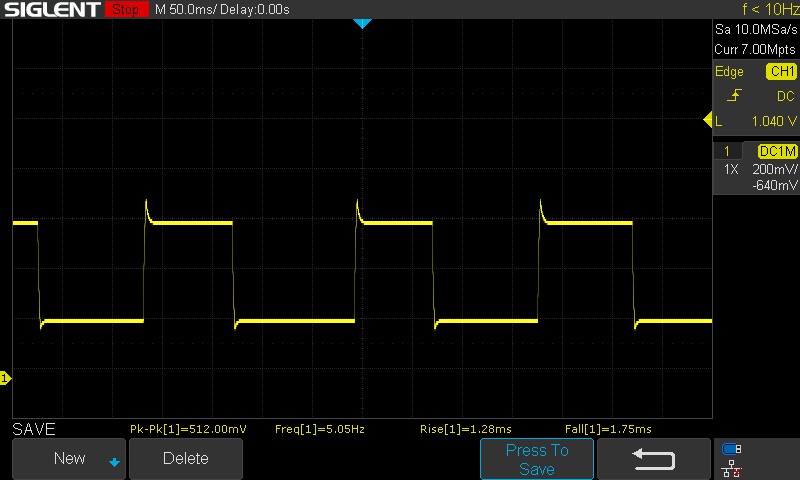 |
| ↘ 1.75 ms fall | ||
| The screen shows very fast response rates in our tests and should be very well suited for fast-paced gaming. In comparison, all tested devices range from 0.165 (minimum) to 636 (maximum) ms. » 13 % of all devices are better. This means that the measured response time is better than the average of all tested devices (30.9 ms). | ||
We noted a combined 5.28 ms while transitioning from 100% black to 100% white. The panel uses overdrive by default as evident from the "horn" in the oscilloscope pattern. This results in a fast 3.03 ms 50% grey to 80% grey response time.
We observed that this value can rise to 9.73 ms with overdrive off.
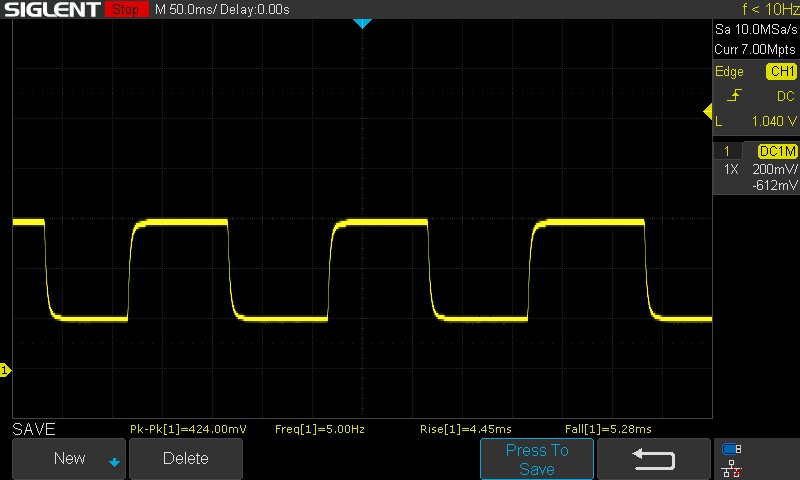
Screen Flickering / PWM (Pulse-Width Modulation)
| Screen flickering / PWM not detected | ≤ 100 % brightness setting | 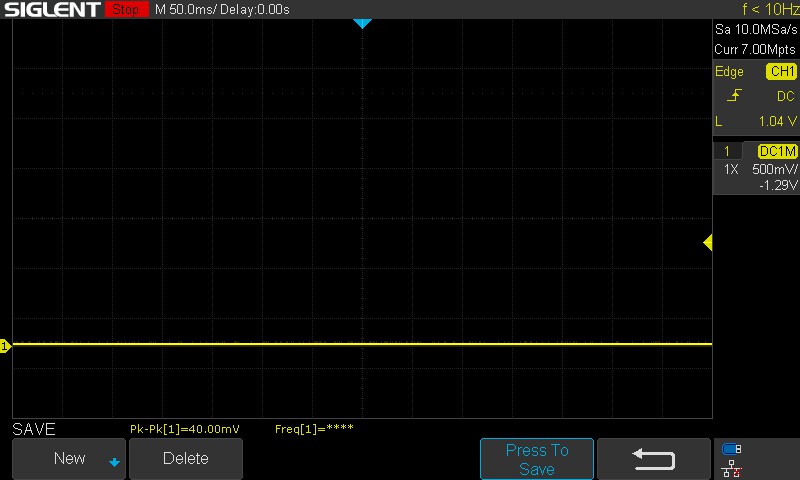 | |
In comparison: 52 % of all tested devices do not use PWM to dim the display. If PWM was detected, an average of 7748 (minimum: 5 - maximum: 343500) Hz was measured. | |||
We did not observe any PWM flickering across all tested brightness levels, so those long gaming marathons should not cause much eye strain.
For more information, refer to our article "Why Pulse Width Modulation (PWM) is such a headache", and also check out our PWM Ranking Table for PWM frequency comparison across all reviewed devices.
Outdoor viewing is manageable as long as there's not too much sunlight falling directly on the display. We observed loss of brightness and color information at extreme viewing angles.


Performance: Chart-topping Core i9-12900HX and RTX 3080 Ti combo
Our test Titan GT77 12UHS unit is powered by the Intel Core i9-12900HX processor and a 175 w Nvidia GeForce RTX 3080 Ti Laptop GPU. There's also a Titan GT77 12UGS SKU powered by the Core i9-12900HX but with a 150 W RTX 3070 Ti Laptop GPU. MSI is also offering a Titan GT77 powered by the Core i7-12800HX and the RTX 3070 Ti Laptop GPU.
Testing Conditions
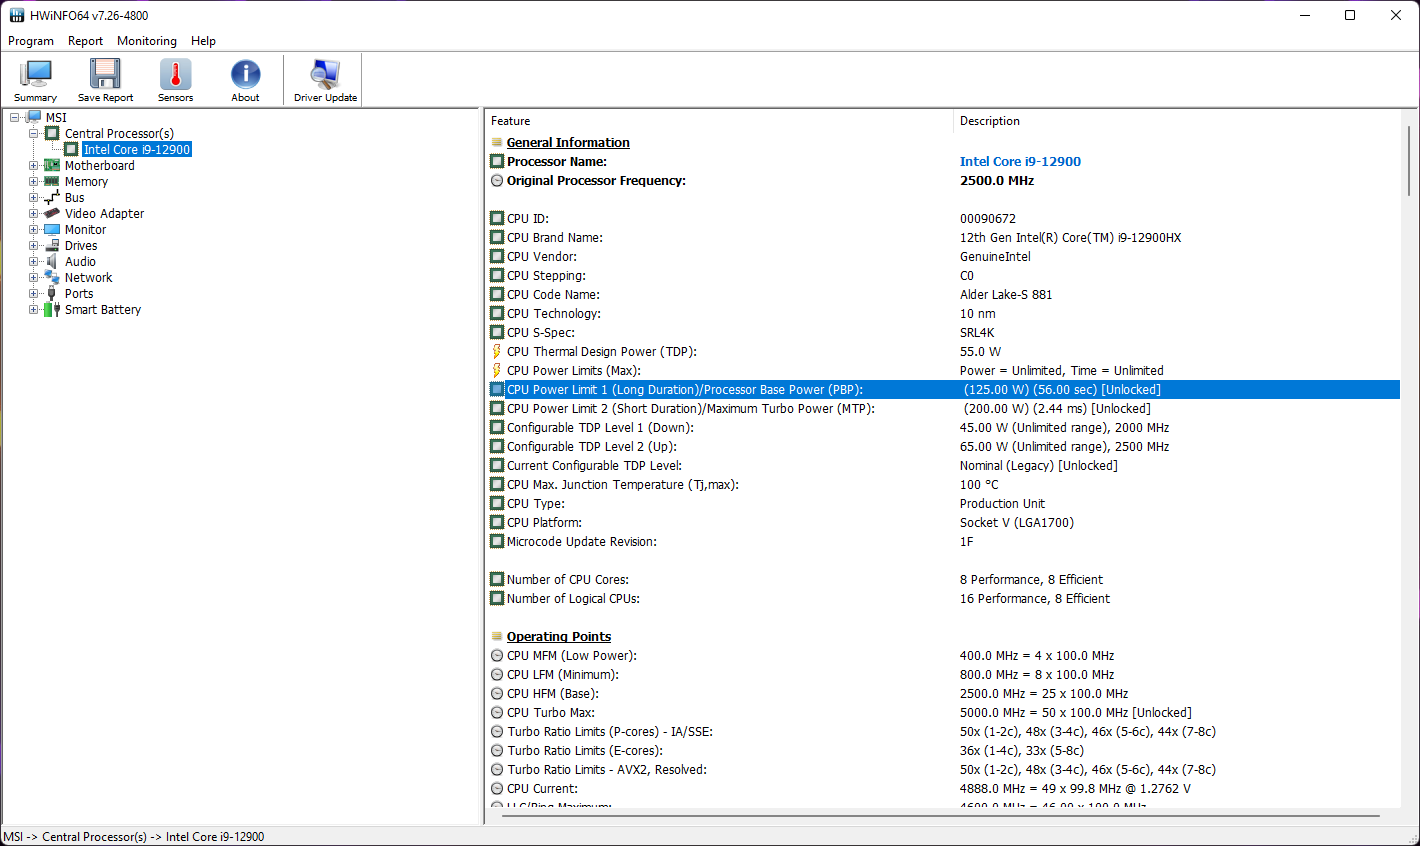
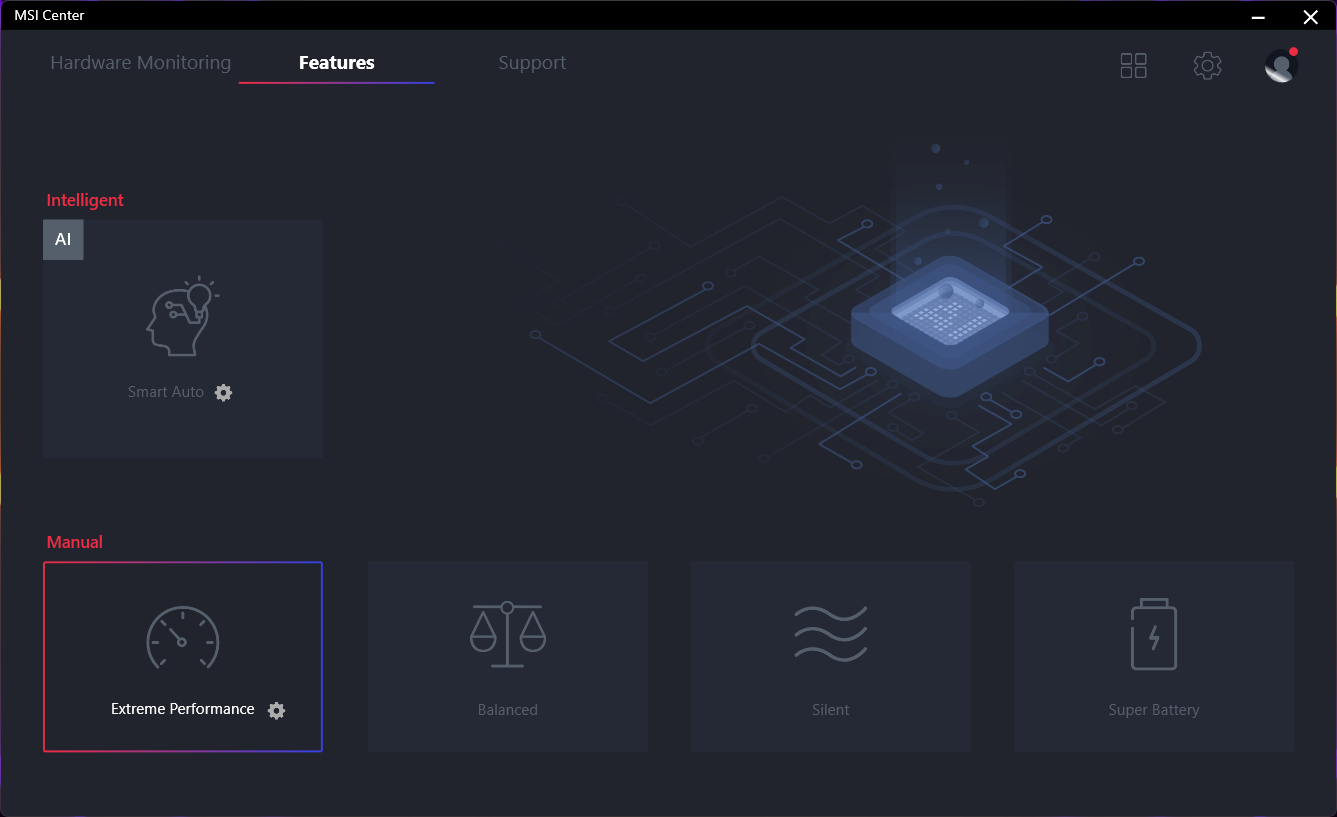
As is standard for MSI laptops, the MSI Center app is the go-to place for all kinds of performance adjustments. Given the nature of the beast, we chose to go with the Extreme Performance profile that allows the Core i9-12900HX to operate at a PL1 (processor base power) of 125 W and a PL2 (maximum turbo power) of 200 W.
MSI Center allows MUX switching between MSHybrid and discrete GPU modes. We went with the discrete GPU option so to allow the RTX 3080 Ti to fully flex its muscles. There is no Advanced Optimus available, so you will have to restart the laptop each time the MUX is manually changed.
The choice of performance modes has a significant impact on noise levels as we shall see shortly.
The table below illustrates how the PL1 (processor base power) and PL2 (maximum turbo power) vary in different performance modes. The Balanced and Extreme Performance modes are similar for the most part, though the latter allows for a higher PL1.
While the Balanced profile should suffice for most tasks including gaming, we recommend opting for the Extreme Performance mode to extract the maximum possible juice from the processor.
| Performance Mode | PL1 (PBP) / Tau | PL2 (MTP) / Tau |
|---|---|---|
| Silent | 30 W / 56 s | 30 W / 2.44 ms |
| Balanced | 100 W / 56 s | 200 W / 2.44 ms |
| Extreme Performance | 125 W / 56 s | 200 W / 2.44 ms |
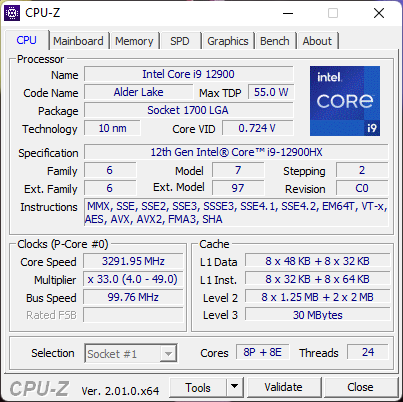
Processor
The Core i9-12900HX is a 16-core 24-thread Alder Lake-HX part with 8P cores and 8E cores. Alder Lake-HX is essentially a mobile version of desktop Alder Lake-S in a BGA socket. This is also the first mobile platform to offer PCIe Gen5 support.
The Core i9-12900HX comes unlocked and you can actually enter MSI's hidden BIOS controls (press Right Shift + Right Ctrl + Left Alt + F2) to undervolt or overclock the CPU. However, the stock power settings already max out the available thermal headroom as evident from the stress tests below.
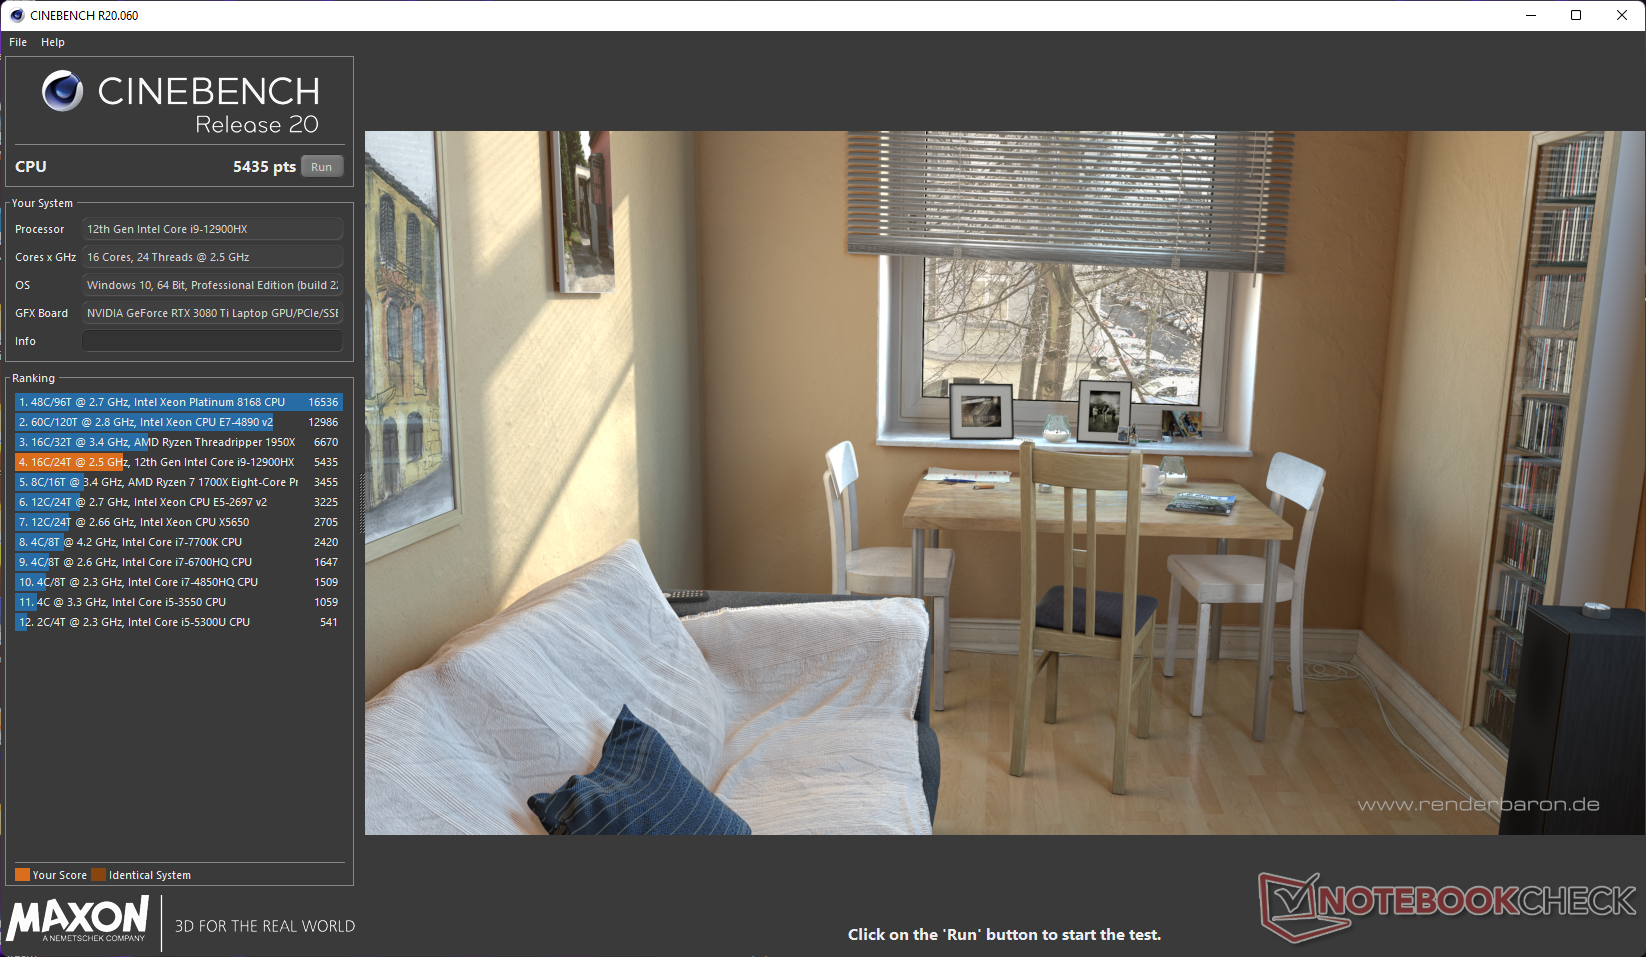
In terms of overall CPU performance, the Titan GT77 tops the chart matched only by the Raider GE77 HX 12 UHS. We find that the Core i9-12900HX is not too far behind the average desktop Core i9-12900K in most CPU tests.
MSI's Cooler Boost Titan is able to ensure that the Core i9-12900HX does not throttle under load as evidenced by consistent performance in the Cinebench R15 multi-core loop test.
Cinebench R15 Multi Loop
The following graph illustrates how important CPU parameters vary during a Cinebench R15 multi-core loop test. Though the Titan GT77's Core i9-12900HX is configured to operate at up to 200 W PL2, we find that the peak value is about 165 W. The P-cores can boost up to 4.8 GHz while the E-cores operate at the 3.5 GHz mark.
We noticed a bug in the MSI Center app that always reverts the profile to Extreme Performance whenever a CPU-bound benchmark such as Cinebench is launched. This limited our ability to run the same loop in other performance profiles, such as Balanced, Silent, or Super Battery. Hopefully, MSI can fix this in a future software update.
The Core i9-12900HX in the Aorus 17X XES ties with that of the Titan GT77 in single-core tests but trails behind in multi-core. This is likely due to the lower power limits in the Aorus notebook. The Core i7-12800HX in the Raider GE67 HX 12UGS is right on the Core i9-12900HX's heels with just single-digit percentage performance deltas in most CPU tests.
The Core i7-12800HX-powered Titan GT77 SKU could, therefore, be a wise investment if you are looking to save some cash with negligible performance sacrifice.
Multi-core performance drops by about 37.2% on battery.
Cinebench R23: Multi Core | Single Core
Cinebench R20: CPU (Multi Core) | CPU (Single Core)
Cinebench R15: CPU Multi 64Bit | CPU Single 64Bit
Blender: v2.79 BMW27 CPU
7-Zip 18.03: 7z b 4 | 7z b 4 -mmt1
Geekbench 5.5: Multi-Core | Single-Core
HWBOT x265 Benchmark v2.2: 4k Preset
LibreOffice : 20 Documents To PDF
R Benchmark 2.5: Overall mean
| CPU Performance rating | |
| Average Intel Core i9-12900K | |
| Average of class Gaming | |
| MSI Titan GT77 12UHS | |
| MSI Raider GE77 HX 12UHS | |
| Average Intel Core i9-12900HX | |
| MSI GE67 HX 12UGS | |
| Aorus 17X XES | |
| MSI GE76 Raider | |
| Alienware x17 R2 P48E | |
| Gigabyte Aero 16 YE5 | |
| Asus ROG Zephyrus Duo 16 GX650RX | |
| Cinebench R23 / Multi Core | |
| Average of class Gaming (10488 - 42661, n=104, last 2 years) | |
| Average Intel Core i9-12900K (25245 - 27005, n=2) | |
| MSI Raider GE77 HX 12UHS | |
| MSI Titan GT77 12UHS | |
| Average Intel Core i9-12900HX (18337 - 23482, n=8) | |
| MSI GE67 HX 12UGS | |
| Alienware x17 R2 P48E | |
| Aorus 17X XES | |
| MSI GE76 Raider | |
| Gigabyte Aero 16 YE5 | |
| Asus ROG Zephyrus Duo 16 GX650RX | |
| Cinebench R23 / Single Core | |
| Average of class Gaming (1601 - 2415, n=104, last 2 years) | |
| Average Intel Core i9-12900K (1998 - 2011, n=2) | |
| Gigabyte Aero 16 YE5 | |
| Aorus 17X XES | |
| Average Intel Core i9-12900HX (1897 - 1936, n=8) | |
| MSI Titan GT77 12UHS | |
| MSI GE76 Raider | |
| MSI Raider GE77 HX 12UHS | |
| Alienware x17 R2 P48E | |
| MSI GE67 HX 12UGS | |
| Asus ROG Zephyrus Duo 16 GX650RX | |
| Cinebench R20 / CPU (Multi Core) | |
| Average of class Gaming (4029 - 16433, n=103, last 2 years) | |
| Average Intel Core i9-12900K (9630 - 10240, n=2) | |
| MSI Raider GE77 HX 12UHS | |
| MSI Titan GT77 12UHS | |
| Average Intel Core i9-12900HX (7037 - 9042, n=8) | |
| MSI GE67 HX 12UGS | |
| Alienware x17 R2 P48E | |
| Aorus 17X XES | |
| Gigabyte Aero 16 YE5 | |
| MSI GE76 Raider | |
| Asus ROG Zephyrus Duo 16 GX650RX | |
| Cinebench R20 / CPU (Single Core) | |
| Average of class Gaming (622 - 913, n=103, last 2 years) | |
| Average Intel Core i9-12900K (766 - 777, n=2) | |
| MSI Raider GE77 HX 12UHS | |
| Aorus 17X XES | |
| MSI Titan GT77 12UHS | |
| Average Intel Core i9-12900HX (728 - 745, n=8) | |
| MSI GE76 Raider | |
| Alienware x17 R2 P48E | |
| Gigabyte Aero 16 YE5 | |
| MSI GE67 HX 12UGS | |
| Asus ROG Zephyrus Duo 16 GX650RX | |
| Cinebench R15 / CPU Multi 64Bit | |
| Average of class Gaming (1578 - 6330, n=102, last 2 years) | |
| Average Intel Core i9-12900K (3473 - 4102, n=3) | |
| MSI Titan GT77 12UHS | |
| MSI Raider GE77 HX 12UHS | |
| Average Intel Core i9-12900HX (2830 - 3652, n=8) | |
| MSI GE67 HX 12UGS | |
| Alienware x17 R2 P48E | |
| MSI GE76 Raider | |
| Aorus 17X XES | |
| Gigabyte Aero 16 YE5 | |
| Asus ROG Zephyrus Duo 16 GX650RX | |
| Cinebench R15 / CPU Single 64Bit | |
| Average of class Gaming (188.8 - 350, n=103, last 2 years) | |
| Average Intel Core i9-12900K (286 - 292, n=3) | |
| MSI Raider GE77 HX 12UHS | |
| Gigabyte Aero 16 YE5 | |
| MSI Titan GT77 12UHS | |
| Average Intel Core i9-12900HX (274 - 282, n=8) | |
| Aorus 17X XES | |
| MSI GE76 Raider | |
| Alienware x17 R2 P48E | |
| MSI GE67 HX 12UGS | |
| Asus ROG Zephyrus Duo 16 GX650RX | |
| Blender / v2.79 BMW27 CPU | |
| Asus ROG Zephyrus Duo 16 GX650RX | |
| Aorus 17X XES | |
| Gigabyte Aero 16 YE5 | |
| MSI GE76 Raider | |
| Alienware x17 R2 P48E | |
| Average Intel Core i9-12900HX (144 - 201, n=8) | |
| MSI GE67 HX 12UGS | |
| MSI Raider GE77 HX 12UHS | |
| Average of class Gaming (79 - 330, n=101, last 2 years) | |
| MSI Titan GT77 12UHS | |
| Average Intel Core i9-12900K (121.1 - 128.3, n=2) | |
| 7-Zip 18.03 / 7z b 4 | |
| Average Intel Core i9-12900K (96960 - 97671, n=2) | |
| Average of class Gaming (33491 - 148086, n=102, last 2 years) | |
| MSI Raider GE77 HX 12UHS | |
| MSI Titan GT77 12UHS | |
| Average Intel Core i9-12900HX (69778 - 88128, n=7) | |
| MSI GE67 HX 12UGS | |
| MSI GE76 Raider | |
| Aorus 17X XES | |
| Alienware x17 R2 P48E | |
| Gigabyte Aero 16 YE5 | |
| Asus ROG Zephyrus Duo 16 GX650RX | |
| 7-Zip 18.03 / 7z b 4 -mmt1 | |
| Average Intel Core i9-12900K (6571 - 6580, n=2) | |
| Average of class Gaming (4824 - 7436, n=102, last 2 years) | |
| MSI Raider GE77 HX 12UHS | |
| Aorus 17X XES | |
| Average Intel Core i9-12900HX (6165 - 6358, n=7) | |
| MSI Titan GT77 12UHS | |
| Gigabyte Aero 16 YE5 | |
| MSI GE76 Raider | |
| Alienware x17 R2 P48E | |
| Asus ROG Zephyrus Duo 16 GX650RX | |
| MSI GE67 HX 12UGS | |
| Geekbench 5.5 / Multi-Core | |
| Average Intel Core i9-12900K (17698 - 17854, n=2) | |
| Average of class Gaming (6460 - 28263, n=102, last 2 years) | |
| MSI Raider GE77 HX 12UHS | |
| MSI Titan GT77 12UHS | |
| Average Intel Core i9-12900HX (15116 - 16925, n=8) | |
| Aorus 17X XES | |
| MSI GE67 HX 12UGS | |
| Gigabyte Aero 16 YE5 | |
| Alienware x17 R2 P48E | |
| MSI GE76 Raider | |
| Asus ROG Zephyrus Duo 16 GX650RX | |
| Geekbench 5.5 / Single-Core | |
| Average of class Gaming (1403 - 2474, n=102, last 2 years) | |
| Average Intel Core i9-12900K (1969 - 2042, n=2) | |
| MSI Raider GE77 HX 12UHS | |
| MSI Titan GT77 12UHS | |
| MSI GE76 Raider | |
| Average Intel Core i9-12900HX (1874 - 1949, n=8) | |
| Aorus 17X XES | |
| Alienware x17 R2 P48E | |
| Gigabyte Aero 16 YE5 | |
| MSI GE67 HX 12UGS | |
| Asus ROG Zephyrus Duo 16 GX650RX | |
| HWBOT x265 Benchmark v2.2 / 4k Preset | |
| Average Intel Core i9-12900K (29 - 30, n=2) | |
| Average of class Gaming (11.5 - 44.4, n=102, last 2 years) | |
| MSI Raider GE77 HX 12UHS | |
| MSI Titan GT77 12UHS | |
| Average Intel Core i9-12900HX (19.6 - 26.6, n=7) | |
| MSI GE67 HX 12UGS | |
| Alienware x17 R2 P48E | |
| MSI GE76 Raider | |
| Aorus 17X XES | |
| Gigabyte Aero 16 YE5 | |
| Asus ROG Zephyrus Duo 16 GX650RX | |
| LibreOffice / 20 Documents To PDF | |
| Average of class Gaming (33.2 - 88.8, n=102, last 2 years) | |
| Asus ROG Zephyrus Duo 16 GX650RX | |
| MSI Raider GE77 HX 12UHS | |
| MSI GE67 HX 12UGS | |
| Alienware x17 R2 P48E | |
| Average Intel Core i9-12900K (38.1 - 40.6, n=2) | |
| Gigabyte Aero 16 YE5 | |
| MSI Titan GT77 12UHS | |
| MSI GE76 Raider | |
| Aorus 17X XES | |
| Average Intel Core i9-12900HX (33.6 - 42.4, n=7) | |
| R Benchmark 2.5 / Overall mean | |
| Asus ROG Zephyrus Duo 16 GX650RX | |
| MSI GE67 HX 12UGS | |
| Alienware x17 R2 P48E | |
| MSI GE76 Raider | |
| MSI Raider GE77 HX 12UHS | |
| Average of class Gaming (0.3439 - 0.59, n=102, last 2 years) | |
| Average Intel Core i9-12900HX (0.4159 - 0.4242, n=7) | |
| MSI Titan GT77 12UHS | |
| Aorus 17X XES | |
| Gigabyte Aero 16 YE5 | |
| Average Intel Core i9-12900K (0.3946 - 0.4216, n=2) | |
* ... smaller is better
AIDA64: FP32 Ray-Trace | FPU Julia | CPU SHA3 | CPU Queen | FPU SinJulia | FPU Mandel | CPU AES | CPU ZLib | FP64 Ray-Trace | CPU PhotoWorxx
| Performance rating | |
| Average of class Gaming | |
| MSI Raider GE77 HX 12UHS | |
| MSI Titan GT77 12UHS | |
| Average Intel Core i9-12900HX | |
| Average Intel Core i9-12900K | |
| Asus ROG Zephyrus Duo 16 GX650RX | |
| Aorus 17X XES | |
| MSI GE67 HX 12UGS | |
| Alienware x17 R2 P48E | |
| MSI GE76 Raider | |
| Gigabyte Aero 16 YE5 | |
| AIDA64 / FP32 Ray-Trace | |
| Average of class Gaming (10227 - 85542, n=102, last 2 years) | |
| MSI Titan GT77 12UHS | |
| MSI Raider GE77 HX 12UHS | |
| Average Intel Core i9-12900HX (11535 - 22183, n=7) | |
| Asus ROG Zephyrus Duo 16 GX650RX | |
| Aorus 17X XES | |
| Average Intel Core i9-12900K (12739 - 13345, n=3) | |
| MSI GE67 HX 12UGS | |
| Alienware x17 R2 P48E | |
| MSI GE76 Raider | |
| Gigabyte Aero 16 YE5 | |
| AIDA64 / FPU Julia | |
| Average of class Gaming (51376 - 372155, n=102, last 2 years) | |
| MSI Raider GE77 HX 12UHS | |
| MSI Titan GT77 12UHS | |
| Asus ROG Zephyrus Duo 16 GX650RX | |
| Average Intel Core i9-12900HX (52916 - 110093, n=7) | |
| Aorus 17X XES | |
| Average Intel Core i9-12900K (58406 - 59419, n=3) | |
| MSI GE67 HX 12UGS | |
| Alienware x17 R2 P48E | |
| MSI GE76 Raider | |
| Gigabyte Aero 16 YE5 | |
| AIDA64 / CPU SHA3 | |
| Average of class Gaming (2180 - 10115, n=102, last 2 years) | |
| MSI Raider GE77 HX 12UHS | |
| Average Intel Core i9-12900K (4796 - 5127, n=3) | |
| MSI Titan GT77 12UHS | |
| Average Intel Core i9-12900HX (3559 - 5123, n=7) | |
| MSI GE67 HX 12UGS | |
| Aorus 17X XES | |
| Asus ROG Zephyrus Duo 16 GX650RX | |
| Alienware x17 R2 P48E | |
| MSI GE76 Raider | |
| Gigabyte Aero 16 YE5 | |
| AIDA64 / CPU Queen | |
| Average of class Gaming (49785 - 173351, n=86, last 2 years) | |
| Average Intel Core i9-12900K (112066 - 112694, n=3) | |
| Alienware x17 R2 P48E | |
| Gigabyte Aero 16 YE5 | |
| MSI GE76 Raider | |
| Asus ROG Zephyrus Duo 16 GX650RX | |
| Aorus 17X XES | |
| MSI Titan GT77 12UHS | |
| Average Intel Core i9-12900HX (101029 - 104457, n=7) | |
| MSI Raider GE77 HX 12UHS | |
| MSI GE67 HX 12UGS | |
| AIDA64 / FPU SinJulia | |
| Average of class Gaming (4424 - 33636, n=102, last 2 years) | |
| Average Intel Core i9-12900K (14590 - 14664, n=3) | |
| MSI Titan GT77 12UHS | |
| Asus ROG Zephyrus Duo 16 GX650RX | |
| MSI Raider GE77 HX 12UHS | |
| Average Intel Core i9-12900HX (10475 - 13062, n=7) | |
| MSI GE67 HX 12UGS | |
| Aorus 17X XES | |
| Alienware x17 R2 P48E | |
| MSI GE76 Raider | |
| Gigabyte Aero 16 YE5 | |
| AIDA64 / FPU Mandel | |
| Average of class Gaming (25115 - 196829, n=102, last 2 years) | |
| Asus ROG Zephyrus Duo 16 GX650RX | |
| MSI Titan GT77 12UHS | |
| MSI Raider GE77 HX 12UHS | |
| Average Intel Core i9-12900HX (31779 - 53628, n=7) | |
| Aorus 17X XES | |
| Average Intel Core i9-12900K (35801 - 39323, n=3) | |
| MSI GE67 HX 12UGS | |
| Alienware x17 R2 P48E | |
| MSI GE76 Raider | |
| Gigabyte Aero 16 YE5 | |
| AIDA64 / CPU AES | |
| MSI Raider GE77 HX 12UHS | |
| MSI Titan GT77 12UHS | |
| Average Intel Core i9-12900HX (125268 - 183146, n=7) | |
| Asus ROG Zephyrus Duo 16 GX650RX | |
| Aorus 17X XES | |
| Average Intel Core i9-12900K (94062 - 140055, n=3) | |
| MSI GE67 HX 12UGS | |
| Average of class Gaming (39258 - 247074, n=102, last 2 years) | |
| Alienware x17 R2 P48E | |
| MSI GE76 Raider | |
| Gigabyte Aero 16 YE5 | |
| AIDA64 / CPU ZLib | |
| Average of class Gaming (574 - 2531, n=102, last 2 years) | |
| Average Intel Core i9-12900K (1537 - 1608, n=3) | |
| MSI Raider GE77 HX 12UHS | |
| MSI Titan GT77 12UHS | |
| MSI GE67 HX 12UGS | |
| Average Intel Core i9-12900HX (990 - 1408, n=7) | |
| Alienware x17 R2 P48E | |
| MSI GE76 Raider | |
| Aorus 17X XES | |
| Gigabyte Aero 16 YE5 | |
| Asus ROG Zephyrus Duo 16 GX650RX | |
| AIDA64 / FP64 Ray-Trace | |
| Average of class Gaming (5509 - 45446, n=102, last 2 years) | |
| MSI Titan GT77 12UHS | |
| MSI Raider GE77 HX 12UHS | |
| Average Intel Core i9-12900HX (6663 - 11913, n=7) | |
| Asus ROG Zephyrus Duo 16 GX650RX | |
| Aorus 17X XES | |
| Average Intel Core i9-12900K (7586 - 8283, n=3) | |
| MSI GE67 HX 12UGS | |
| Alienware x17 R2 P48E | |
| MSI GE76 Raider | |
| Gigabyte Aero 16 YE5 | |
| AIDA64 / CPU PhotoWorxx | |
| MSI Raider GE77 HX 12UHS | |
| Average of class Gaming (12271 - 89891, n=102, last 2 years) | |
| Average Intel Core i9-12900K (33311 - 49236, n=3) | |
| Average Intel Core i9-12900HX (40239 - 47710, n=7) | |
| MSI Titan GT77 12UHS | |
| Aorus 17X XES | |
| MSI GE76 Raider | |
| Gigabyte Aero 16 YE5 | |
| Alienware x17 R2 P48E | |
| MSI GE67 HX 12UGS | |
| Asus ROG Zephyrus Duo 16 GX650RX | |
Check out our dedicated Intel Core i9-12900HX page for more information and benchmark comparisons.
System Performance
Overall system performance is on expected lines for a laptop with such powerful guts. Memory read/write speeds, however, seem to have taken a hit in comparison with the Raider GE77 HX 12UHS. Otherwise, we did not notice any issues in daily productivity or web browsing tasks.
CrossMark: Overall | Productivity | Creativity | Responsiveness
| PCMark 10 / Score | |
| Average of class Gaming (5828 - 12414, n=93, last 2 years) | |
| MSI Titan GT77 12UHS | |
| Alienware x17 R2 P48E | |
| MSI GE67 HX 12UGS | |
| MSI GE76 Raider | |
| Average Intel Core i9-12900HX, NVIDIA GeForce RTX 3080 Ti Laptop GPU (6812 - 8636, n=6) | |
| Aorus 17X XES | |
| Gigabyte Aero 16 YE5 | |
| MSI Raider GE77 HX 12UHS | |
| Asus ROG Zephyrus Duo 16 GX650RX | |
| PCMark 10 / Essentials | |
| Alienware x17 R2 P48E | |
| MSI Titan GT77 12UHS | |
| Gigabyte Aero 16 YE5 | |
| MSI GE67 HX 12UGS | |
| MSI GE76 Raider | |
| Average of class Gaming (8810 - 11935, n=97, last 2 years) | |
| Average Intel Core i9-12900HX, NVIDIA GeForce RTX 3080 Ti Laptop GPU (9598 - 11192, n=6) | |
| Aorus 17X XES | |
| MSI Raider GE77 HX 12UHS | |
| Asus ROG Zephyrus Duo 16 GX650RX | |
| PCMark 10 / Productivity | |
| Average of class Gaming (6845 - 25323, n=95, last 2 years) | |
| Average Intel Core i9-12900HX, NVIDIA GeForce RTX 3080 Ti Laptop GPU (9365 - 10932, n=6) | |
| Aorus 17X XES | |
| MSI Titan GT77 12UHS | |
| Alienware x17 R2 P48E | |
| MSI GE76 Raider | |
| Gigabyte Aero 16 YE5 | |
| MSI GE67 HX 12UGS | |
| MSI Raider GE77 HX 12UHS | |
| Asus ROG Zephyrus Duo 16 GX650RX | |
| PCMark 10 / Digital Content Creation | |
| Average of class Gaming (7602 - 19954, n=95, last 2 years) | |
| MSI Titan GT77 12UHS | |
| Alienware x17 R2 P48E | |
| MSI GE76 Raider | |
| MSI GE67 HX 12UGS | |
| Average Intel Core i9-12900HX, NVIDIA GeForce RTX 3080 Ti Laptop GPU (9543 - 14291, n=6) | |
| Aorus 17X XES | |
| Gigabyte Aero 16 YE5 | |
| MSI Raider GE77 HX 12UHS | |
| Asus ROG Zephyrus Duo 16 GX650RX | |
| CrossMark / Overall | |
| MSI Raider GE77 HX 12UHS | |
| Aorus 17X XES | |
| Average Intel Core i9-12900HX, NVIDIA GeForce RTX 3080 Ti Laptop GPU (2108 - 2170, n=5) | |
| Gigabyte Aero 16 YE5 | |
| MSI Titan GT77 12UHS | |
| Average of class Gaming (1366 - 2409, n=94, last 2 years) | |
| MSI GE67 HX 12UGS | |
| Alienware x17 R2 P48E | |
| Asus ROG Zephyrus Duo 16 GX650RX | |
| CrossMark / Productivity | |
| MSI Raider GE77 HX 12UHS | |
| Gigabyte Aero 16 YE5 | |
| Aorus 17X XES | |
| Average Intel Core i9-12900HX, NVIDIA GeForce RTX 3080 Ti Laptop GPU (1978 - 2047, n=5) | |
| MSI Titan GT77 12UHS | |
| MSI GE67 HX 12UGS | |
| Average of class Gaming (1386 - 2254, n=94, last 2 years) | |
| Alienware x17 R2 P48E | |
| Asus ROG Zephyrus Duo 16 GX650RX | |
| CrossMark / Creativity | |
| MSI Raider GE77 HX 12UHS | |
| Average Intel Core i9-12900HX, NVIDIA GeForce RTX 3080 Ti Laptop GPU (2288 - 2366, n=5) | |
| Aorus 17X XES | |
| MSI Titan GT77 12UHS | |
| Average of class Gaming (1343 - 2786, n=94, last 2 years) | |
| Gigabyte Aero 16 YE5 | |
| Alienware x17 R2 P48E | |
| MSI GE67 HX 12UGS | |
| Asus ROG Zephyrus Duo 16 GX650RX | |
| CrossMark / Responsiveness | |
| Gigabyte Aero 16 YE5 | |
| Aorus 17X XES | |
| MSI Raider GE77 HX 12UHS | |
| Average Intel Core i9-12900HX, NVIDIA GeForce RTX 3080 Ti Laptop GPU (1991 - 2090, n=5) | |
| MSI Titan GT77 12UHS | |
| MSI GE67 HX 12UGS | |
| Asus ROG Zephyrus Duo 16 GX650RX | |
| Average of class Gaming (1226 - 2334, n=94, last 2 years) | |
| Alienware x17 R2 P48E | |
| PCMark 8 Home Score Accelerated v2 | 6253 points | |
| PCMark 8 Creative Score Accelerated v2 | 10390 points | |
| PCMark 8 Work Score Accelerated v2 | 7085 points | |
| PCMark 10 Score | 8203 points | |
Help | ||
| AIDA64 / Memory Copy | |
| Average of class Gaming (21750 - 129946, n=102, last 2 years) | |
| MSI Raider GE77 HX 12UHS | |
| Average Intel Core i9-12900HX (62852 - 70863, n=7) | |
| MSI Titan GT77 12UHS | |
| Aorus 17X XES | |
| MSI GE76 Raider | |
| Gigabyte Aero 16 YE5 | |
| Alienware x17 R2 P48E | |
| Asus ROG Zephyrus Duo 16 GX650RX | |
| MSI GE67 HX 12UGS | |
| AIDA64 / Memory Read | |
| Average of class Gaming (22956 - 118858, n=102, last 2 years) | |
| MSI Raider GE77 HX 12UHS | |
| Aorus 17X XES | |
| Average Intel Core i9-12900HX (62140 - 72930, n=7) | |
| Gigabyte Aero 16 YE5 | |
| MSI GE76 Raider | |
| MSI Titan GT77 12UHS | |
| MSI GE67 HX 12UGS | |
| Alienware x17 R2 P48E | |
| Asus ROG Zephyrus Duo 16 GX650RX | |
| AIDA64 / Memory Write | |
| Average of class Gaming (22297 - 135096, n=102, last 2 years) | |
| MSI Raider GE77 HX 12UHS | |
| MSI GE76 Raider | |
| Average Intel Core i9-12900HX (60001 - 68782, n=7) | |
| Gigabyte Aero 16 YE5 | |
| MSI Titan GT77 12UHS | |
| Aorus 17X XES | |
| MSI GE67 HX 12UGS | |
| Asus ROG Zephyrus Duo 16 GX650RX | |
| Alienware x17 R2 P48E | |
| AIDA64 / Memory Latency | |
| Average of class Gaming (75.3 - 165.4, n=102, last 2 years) | |
| Alienware x17 R2 P48E | |
| MSI GE67 HX 12UGS | |
| MSI GE76 Raider | |
| Asus ROG Zephyrus Duo 16 GX650RX | |
| Gigabyte Aero 16 YE5 | |
| MSI Titan GT77 12UHS | |
| Average Intel Core i9-12900HX (83.9 - 93.4, n=7) | |
| Aorus 17X XES | |
| MSI Raider GE77 HX 12UHS | |
* ... smaller is better
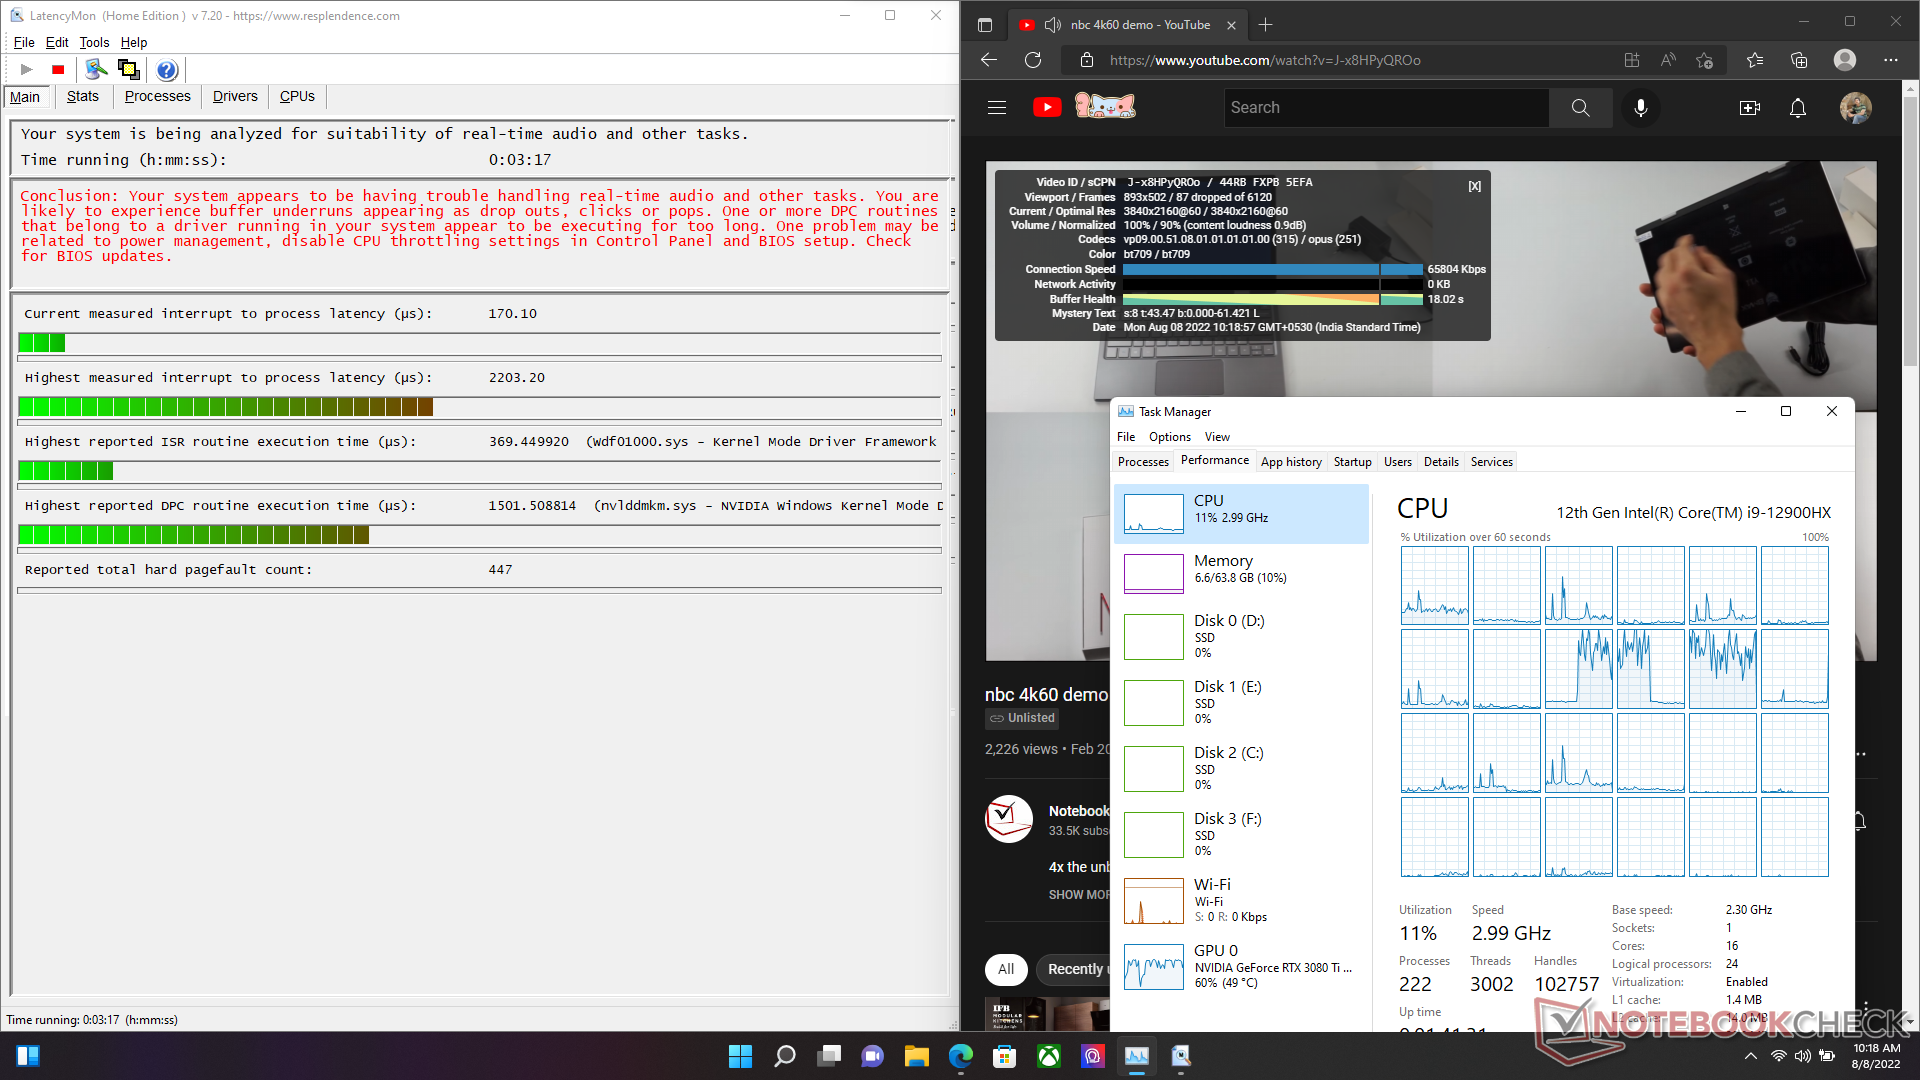
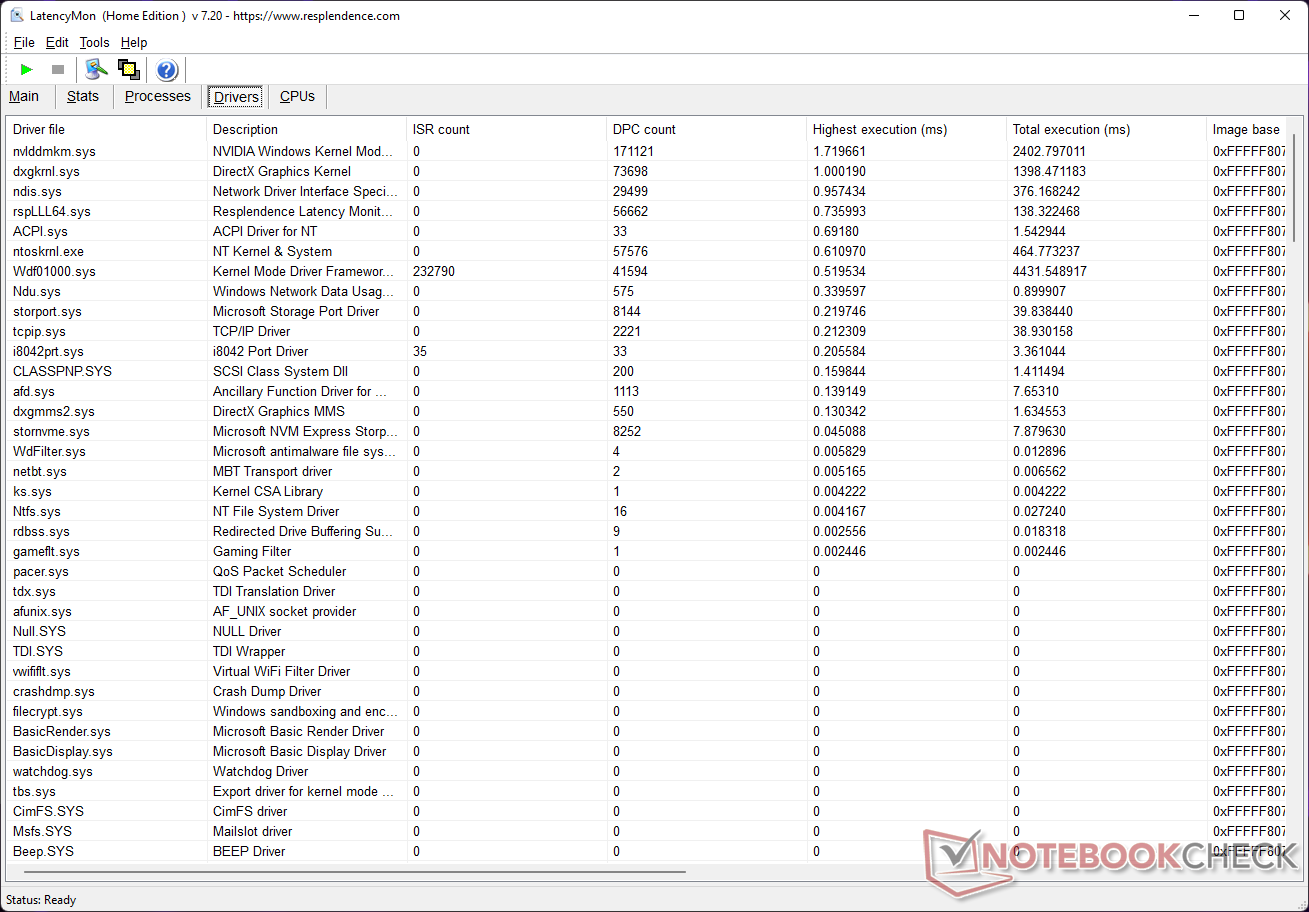
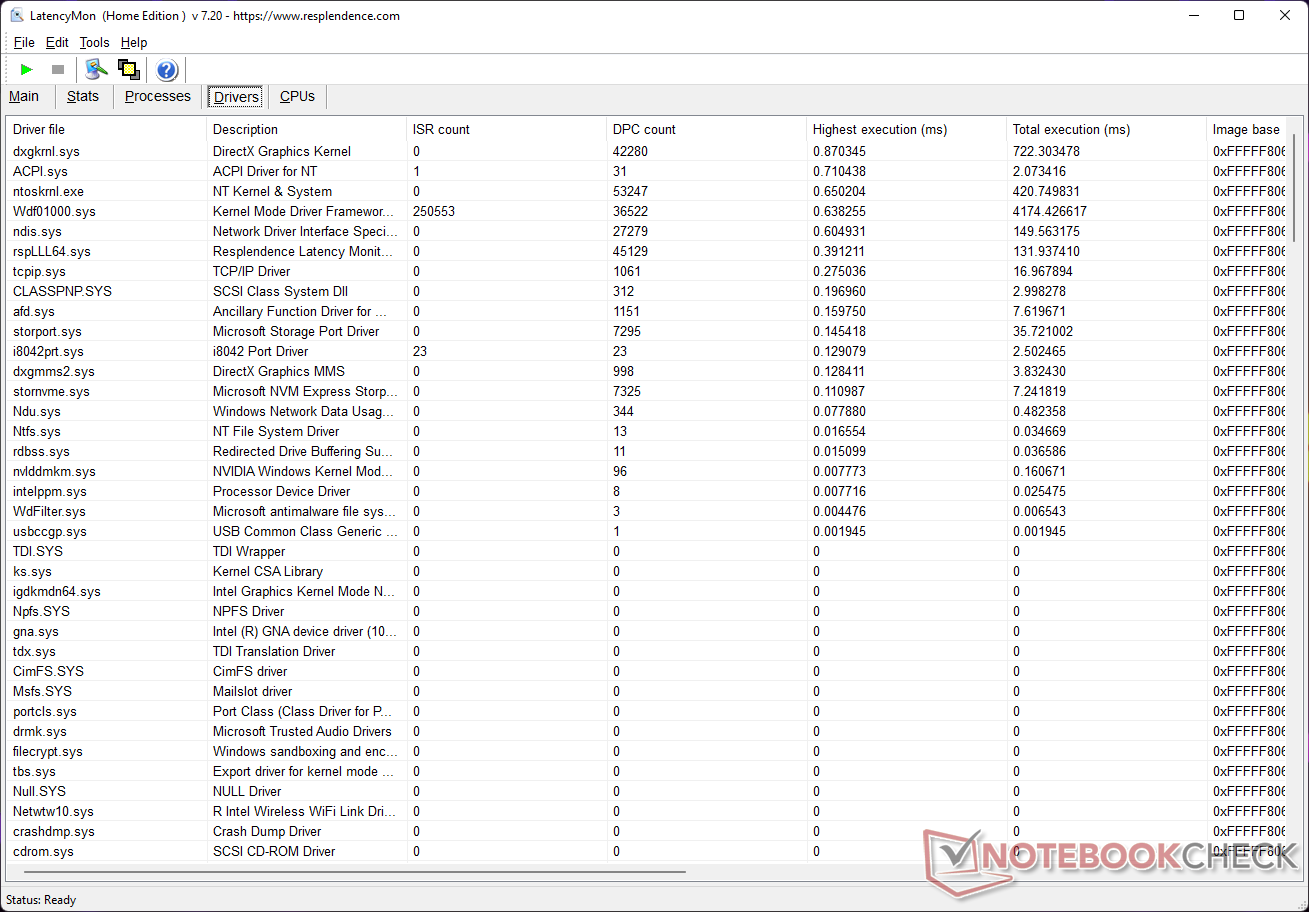
DPC Latency
The MSI Titan GT77 suffers from high DPC latency issues when run in dGPU mode due to high execution times of the Nvidia driver. Switching to MSHybrid mode improves the DPC latency considerably, though you might still want to fine tune some of the performance settings if you are into real-time audio/video workflows.
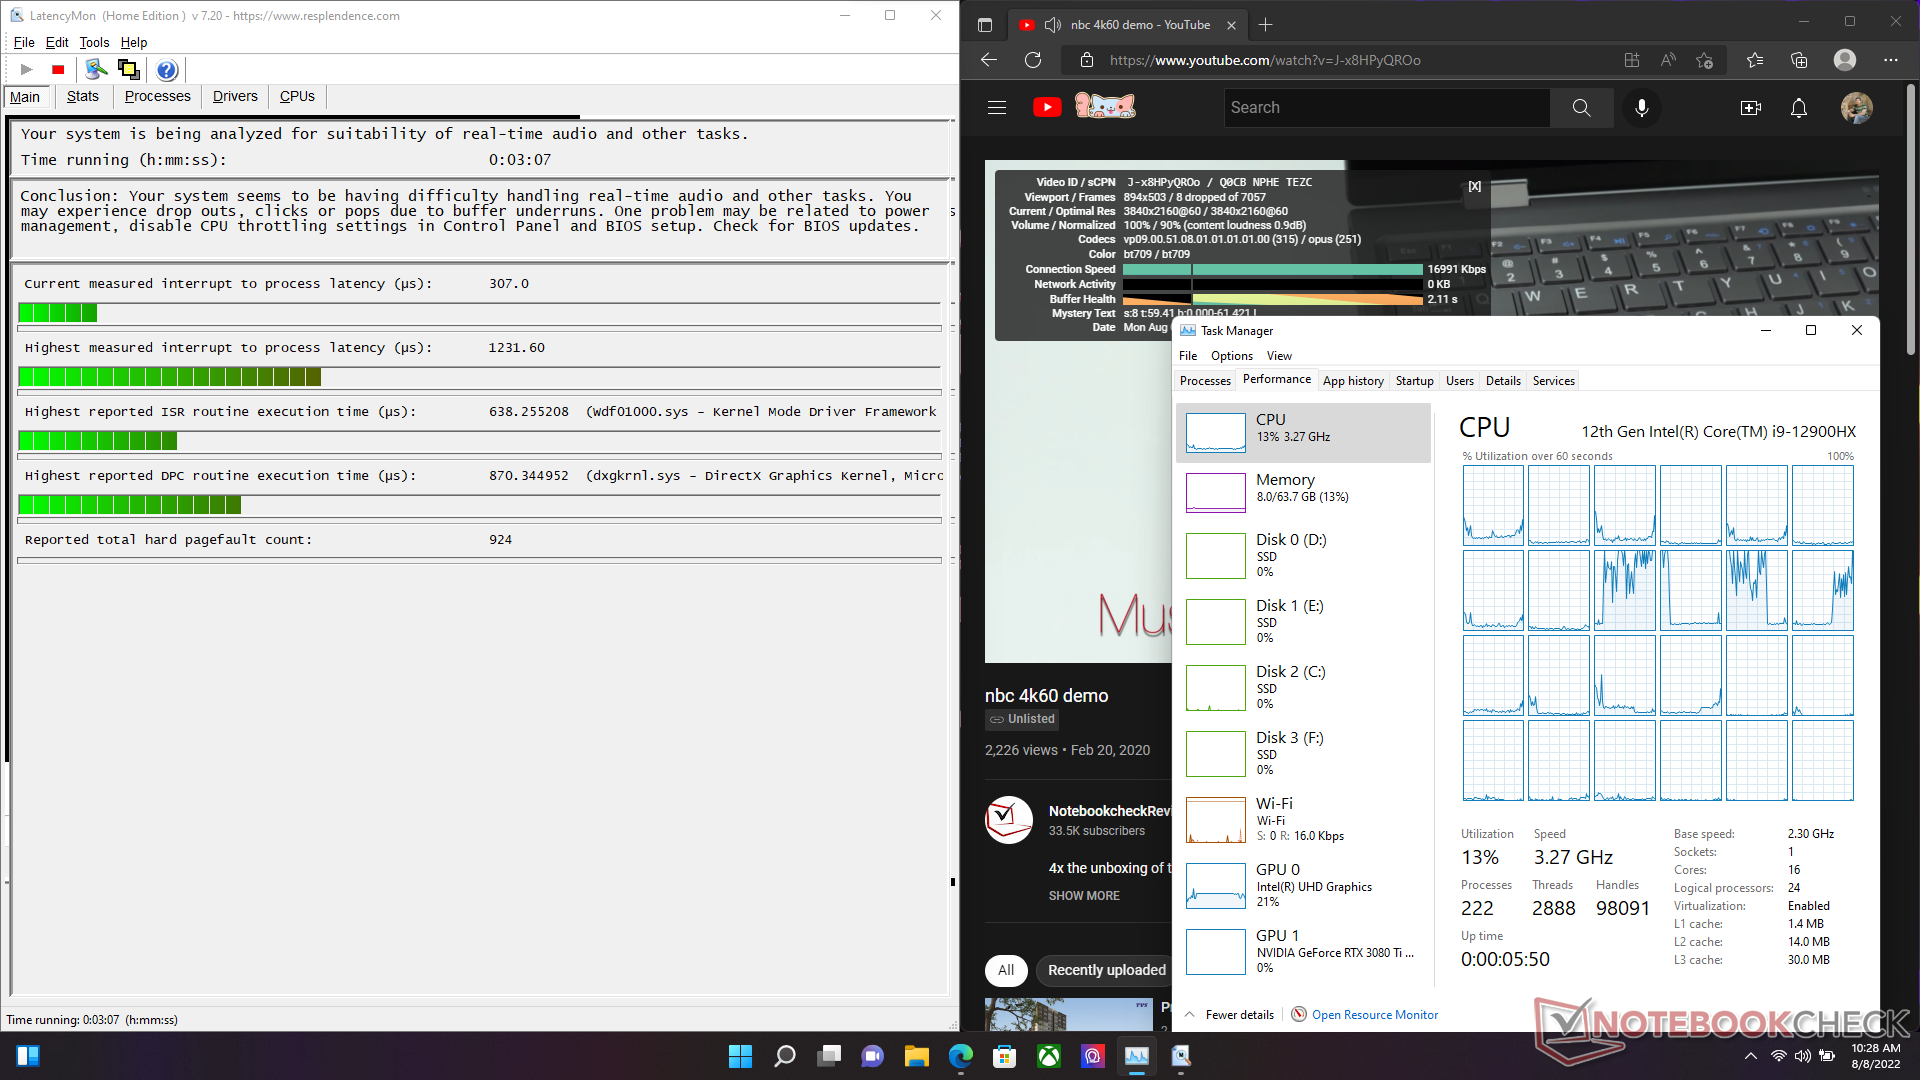
| DPC Latencies / LatencyMon - interrupt to process latency (max), Web, Youtube, Prime95 | |
| MSI Titan GT77 12UHS (dGPU) | |
| MSI Titan GT77 12UHS (MSHybrid) | |
| MSI GE67 HX 12UGS (Edge 103.0.1264.37) | |
| MSI Raider GE77 HX 12UHS | |
| MSI GE76 Raider | |
| Aorus 17X XES | |
| Alienware x17 R2 P48E (Edge 101.0.1210.32) | |
| Gigabyte Aero 16 YE5 | |
| Asus ROG Zephyrus Duo 16 GX650RX | |
* ... smaller is better
Our DPC Latency Ranking page provides more latency comparisons across reviewed devices.
Storage Devices
The storage subsystem is one area that MSI could have done better. It does use Samsung's high-end PM9A1 NVMe SSDs — we've got four of them in our unit — but the lack of any kind of thermal solution on these drives severely impedes their performance.
In the initial benchmark runs, we observed poor sequential read/write performance on all drives except the D:\ drive. It was only in subsequent runs that we could acheive some parity in the performance of all installed drives.
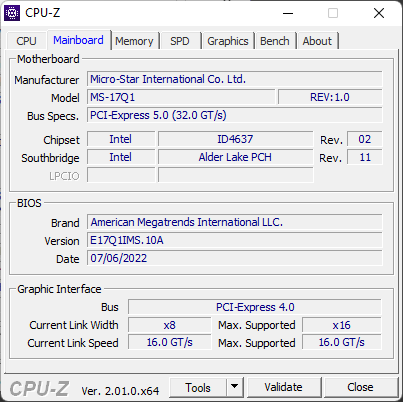
The first M.2 slot is PCIe Gen5 compatible, which is a good thing to have if you plan on transitioning to the next generation of storage down the line. This and the second M.2 slot, which is PCIe Gen4, connect directly to the CPU. There are two other M.2 PCIe Gen4 slots available and these connect to the chipset.
There is no scope for installing additional 2.5-inch SATA drives.

* ... smaller is better
Due to lack of an effective thermal solution either on the drive or on the bottom panel, we often experienced severe performance drops in read/write benchmarks. The Samsung PM9A1 is unable to maintain good sustained read speeds as seen in our DiskSpd Read Loop test at a queue depth of 8.
Disk Throttling: DiskSpd Read Loop, Queue Depth 8
Check out our dedicated SSD and HDD Benchmarks page for more storage device comparisons.
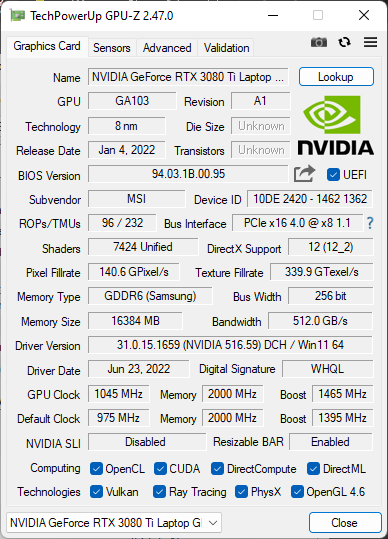
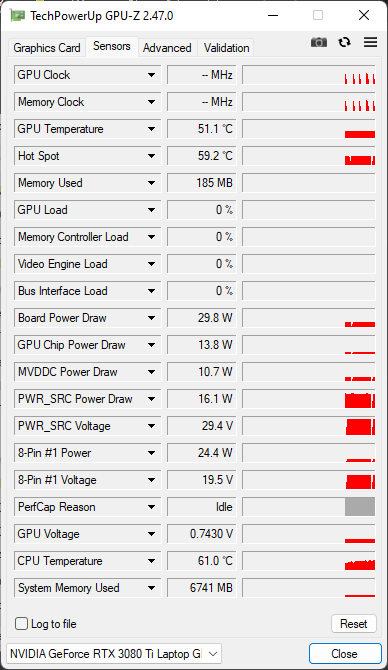
GPU Performance
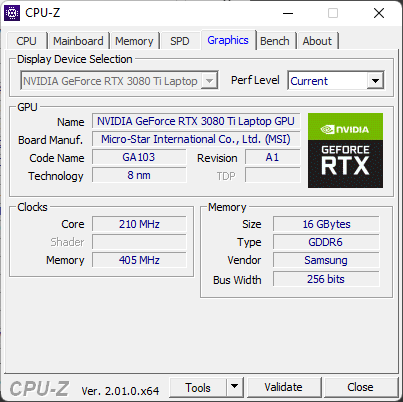
Our Titan GT77 test unit features a 175 W RTX 3080 Ti Laptop GPU. MSI or Intel do not explicitly specify the Dynamic Boost for this GPU, but we assume it would be 15 W.
Overall 3DMark performance ties with other RTX 3080 Ti-powered laptops in the comparison. The RTX 3080 Ti in the Gigabyte Aero 16 YE5 is about 26% slower overall in 3DMark owing to the low 105 W TGP.

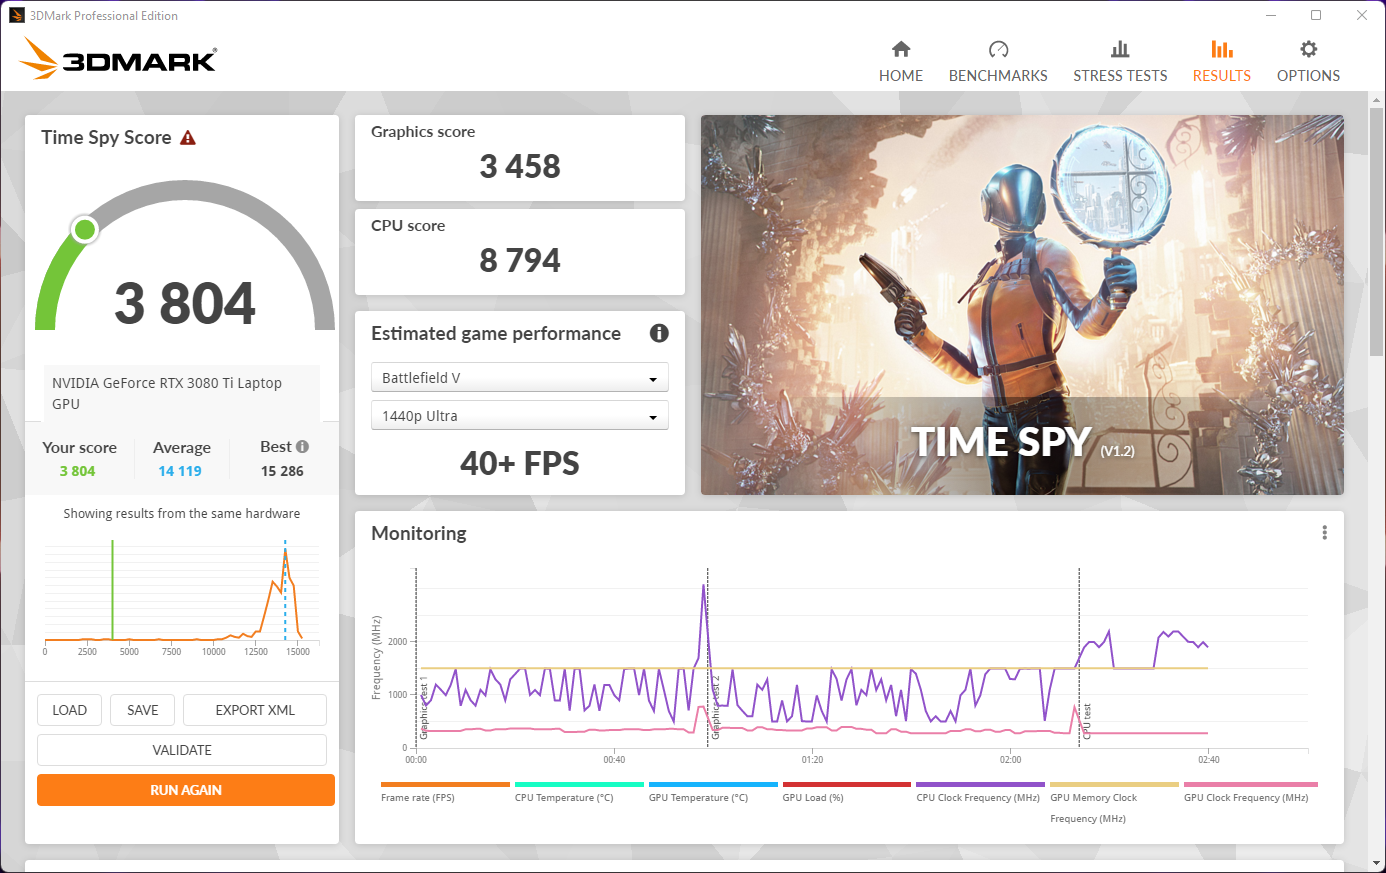
GPU performance takes a nose dive on battery power with up to a 75% performance loss in Time Spy Graphics. According to 3DMark, the reduced score still corresponds to about 40+ fps in Battlefield V at 1440p Ultra.
Disconnecting the mains also reduces the display refresh rate from 360 Hz to 60 Hz.
| 3DMark 11 Performance | 36141 points | |
| 3DMark Ice Storm Standard Score | 290945 points | |
| 3DMark Cloud Gate Standard Score | 65134 points | |
| 3DMark Fire Strike Score | 30196 points | |
| 3DMark Fire Strike Extreme Score | 16347 points | |
| 3DMark Time Spy Score | 13618 points | |
Help | ||
Gaming Performance
The Titan GT77 tops the charts in most games we've tested and usually ties with the Raider GE77 HX 12UHS. The RTX 3080 Ti is capable of running a good number of modern titles at 4K Ultra with frame rates often exceeding 60 fps. Ray tracing performance is decent, but you will want to enable DLSS for higher frame rates.
| F1 2021 | |
| 1920x1080 Medium Preset AA:T AF:16x | |
| MSI Titan GT77 12UHS | |
| MSI GE76 Raider | |
| Average NVIDIA GeForce RTX 3080 Ti Laptop GPU (207 - 401, n=17) | |
| Asus ROG Zephyrus Duo 16 GX650RX | |
| MSI Raider GE77 HX 12UHS | |
| Gigabyte Aero 16 YE5 | |
| 1920x1080 High Preset AA:T AF:16x | |
| MSI Titan GT77 12UHS | |
| MSI GE76 Raider | |
| Average NVIDIA GeForce RTX 3080 Ti Laptop GPU (182.1 - 316, n=17) | |
| Asus ROG Zephyrus Duo 16 GX650RX | |
| MSI Raider GE77 HX 12UHS | |
| Gigabyte Aero 16 YE5 | |
| 1920x1080 Ultra High Preset + Raytracing AA:T AF:16x | |
| MSI Titan GT77 12UHS | |
| MSI GE76 Raider | |
| MSI Raider GE77 HX 12UHS | |
| Asus ROG Zephyrus Duo 16 GX650RX | |
| Average NVIDIA GeForce RTX 3080 Ti Laptop GPU (30.2 - 160.6, n=30) | |
| Gigabyte Aero 16 YE5 | |
The Witcher 3 FPS chart
Frame rates in The Witcher 3 at 1080p Ultra with the character remaining stationary for the duration of the test are fairly consistent and show no perceivable signs of throttling.
| low | med. | high | ultra | |
|---|---|---|---|---|
| GTA V (2015) | 187.1 | 186.8 | 182.7 | 131.8 |
| The Witcher 3 (2015) | 543 | 411 | 260 | 129.3 |
| Dota 2 Reborn (2015) | 204.5 | 184.5 | 179.8 | 170.5 |
| Final Fantasy XV Benchmark (2018) | 222 | 189.3 | 137.6 | |
| X-Plane 11.11 (2018) | 184 | 160.4 | 123.8 | |
| Far Cry 5 (2018) | 192 | 173 | 164 | 153 |
| Strange Brigade (2018) | 535 | 313 | 248 | 219 |
| Watch Dogs Legion (2020) | 141.4 | 134.1 | 121.4 | 84 |
| F1 2021 (2021) | 404 | 383 | 302 | 158.2 |
| Cyberpunk 2077 1.6 (2022) | 169.8 | 150.3 | 120.5 | 99.4 |
| F1 22 (2022) | 226 | 227 | 196.5 | 79.8 |
Refer to our dedicated Nvidia GeForce RTX 3080 Ti Laptop GPU and game benchmark pages for more information and gaming comparisons.
Emissions: With great power comes great noise and heat
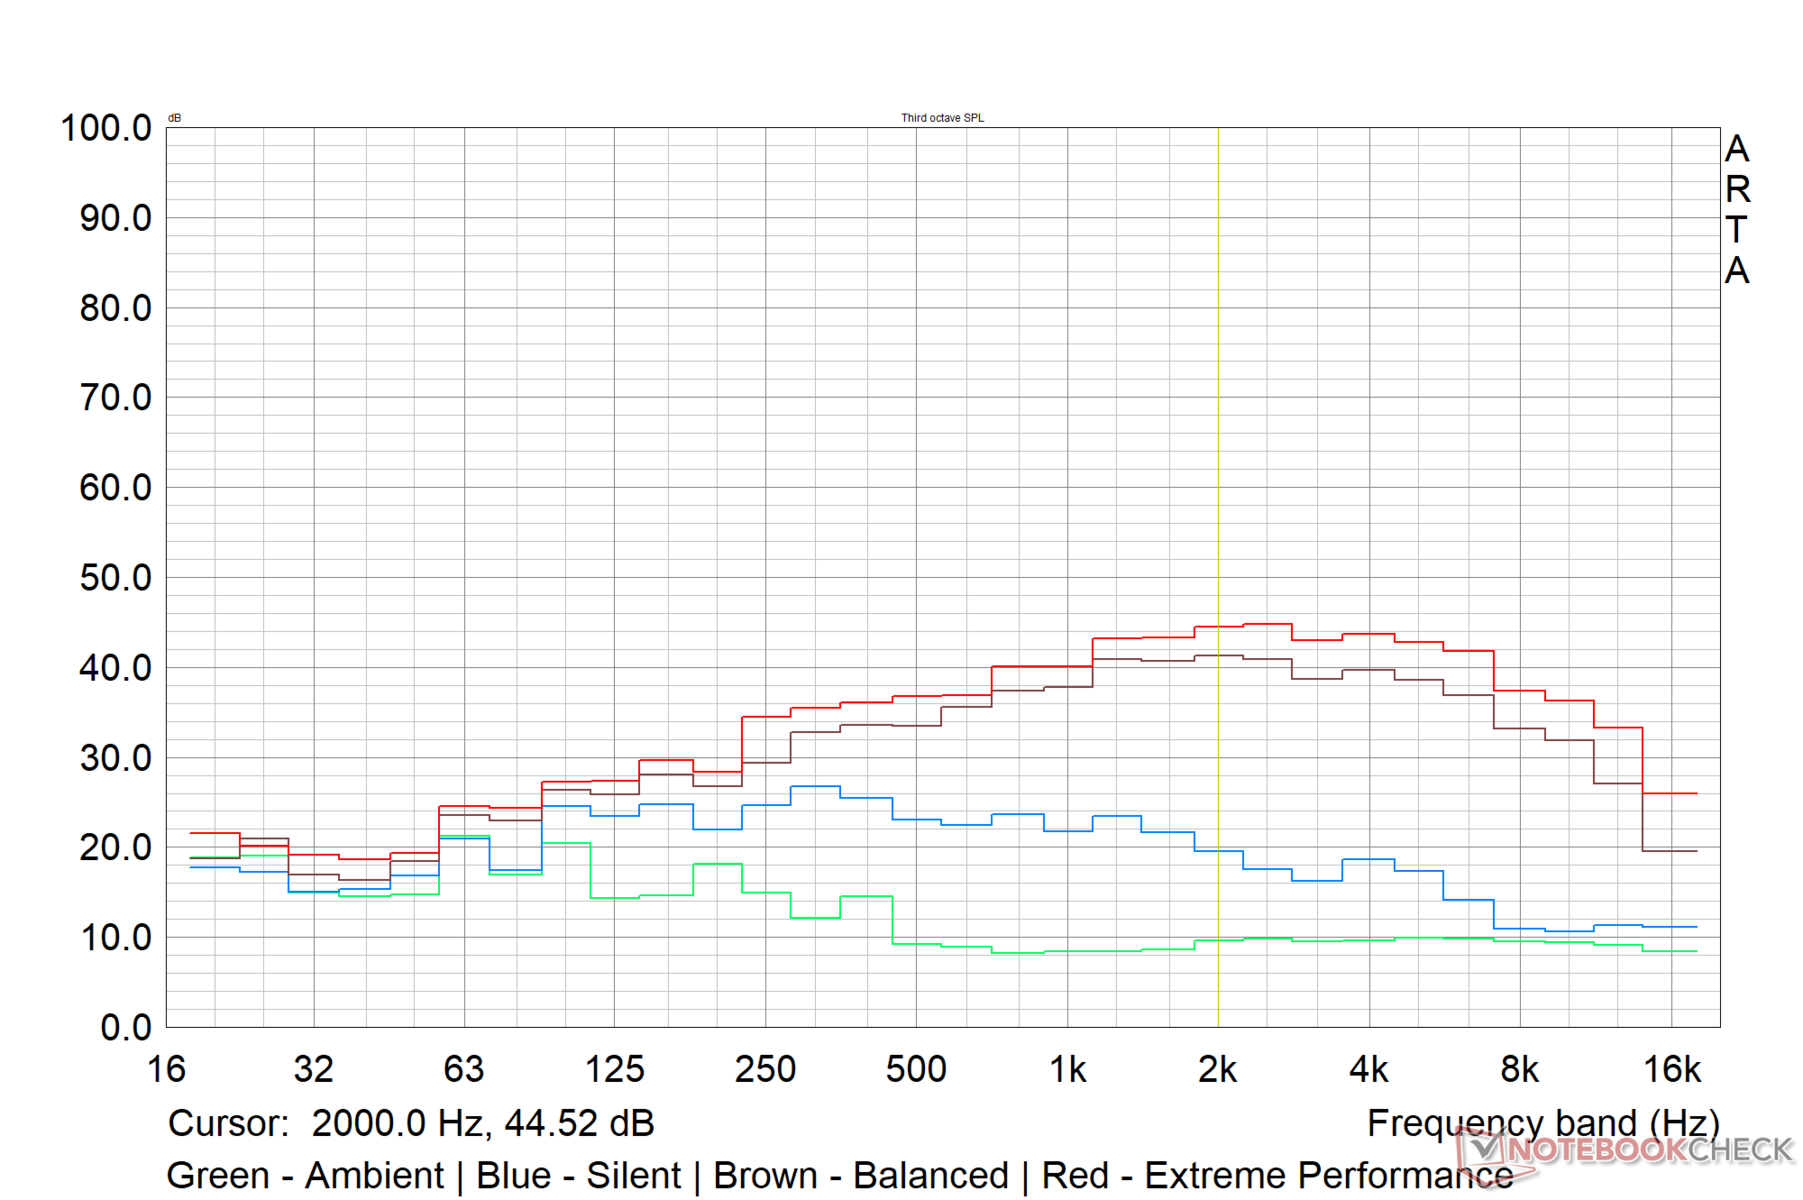
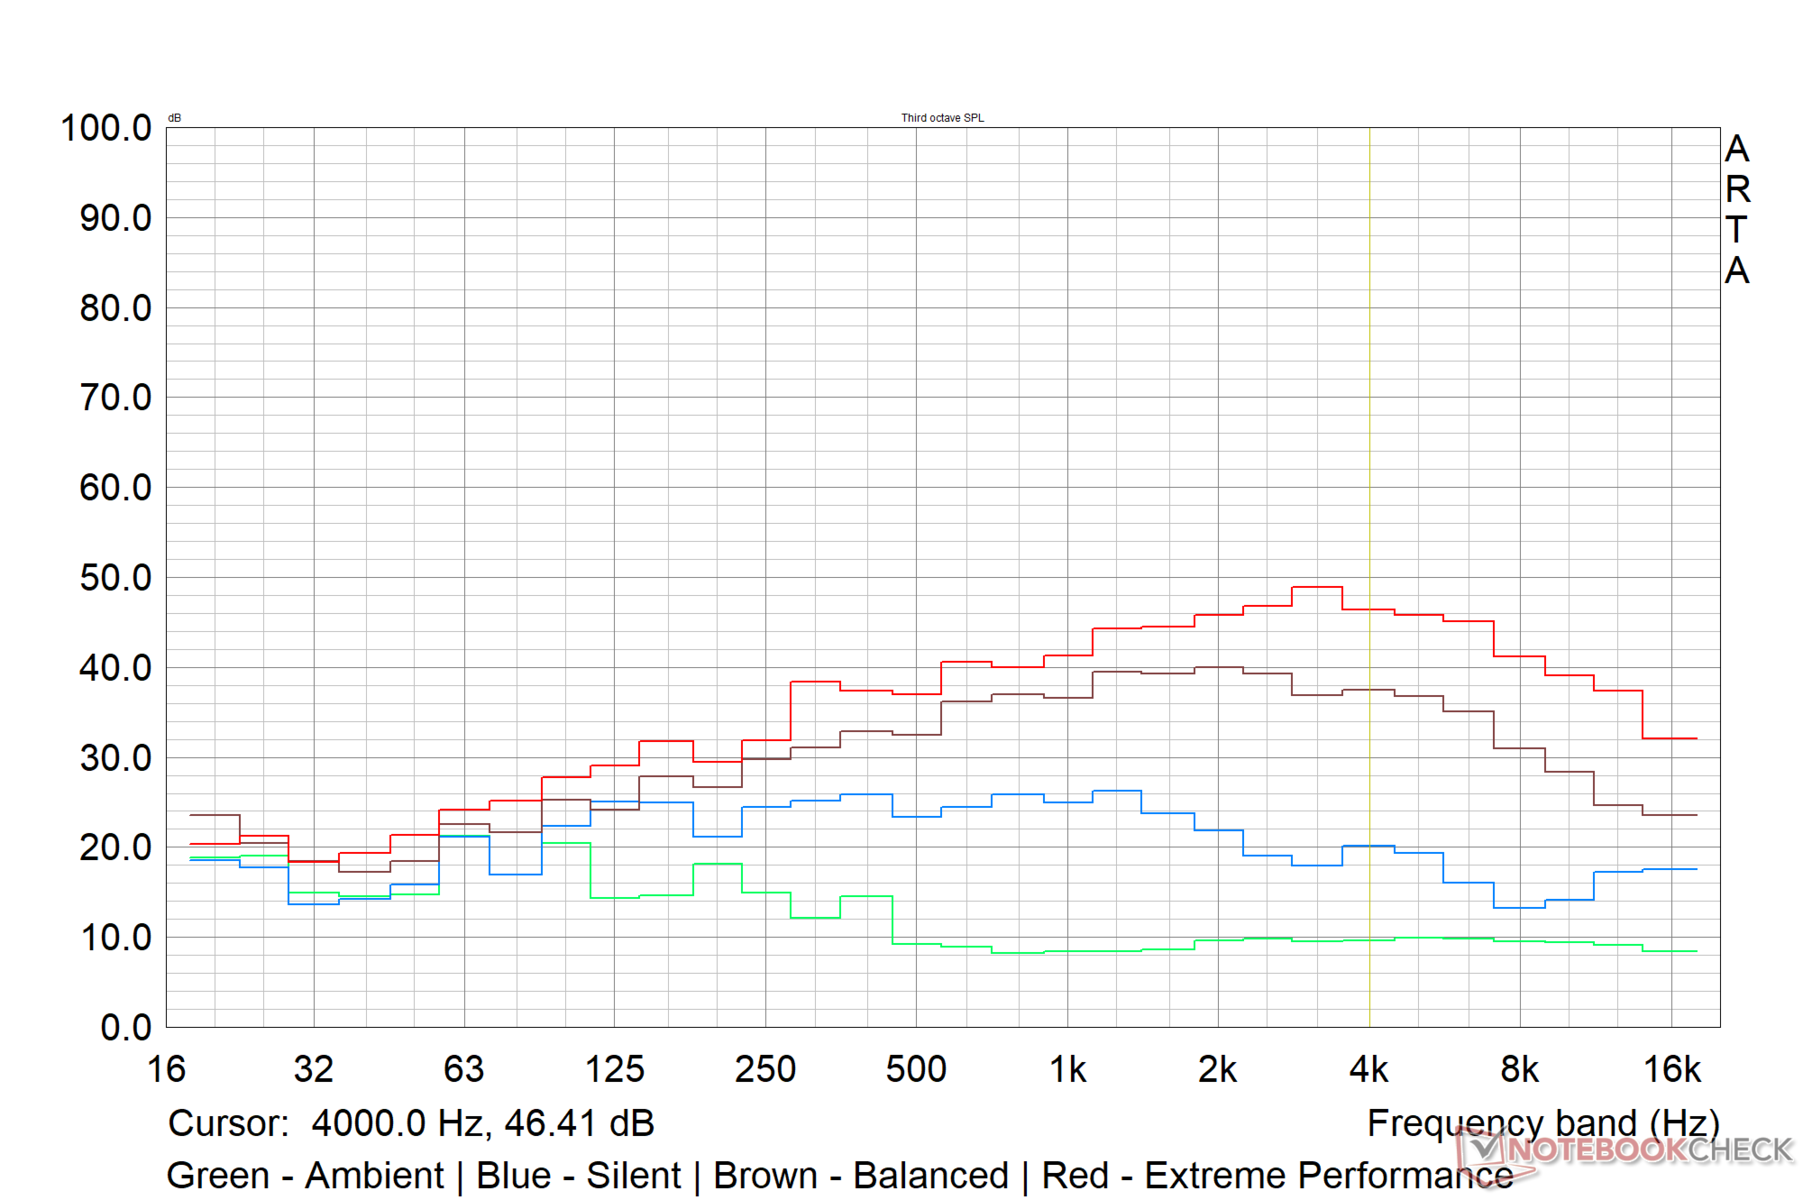
System Noise
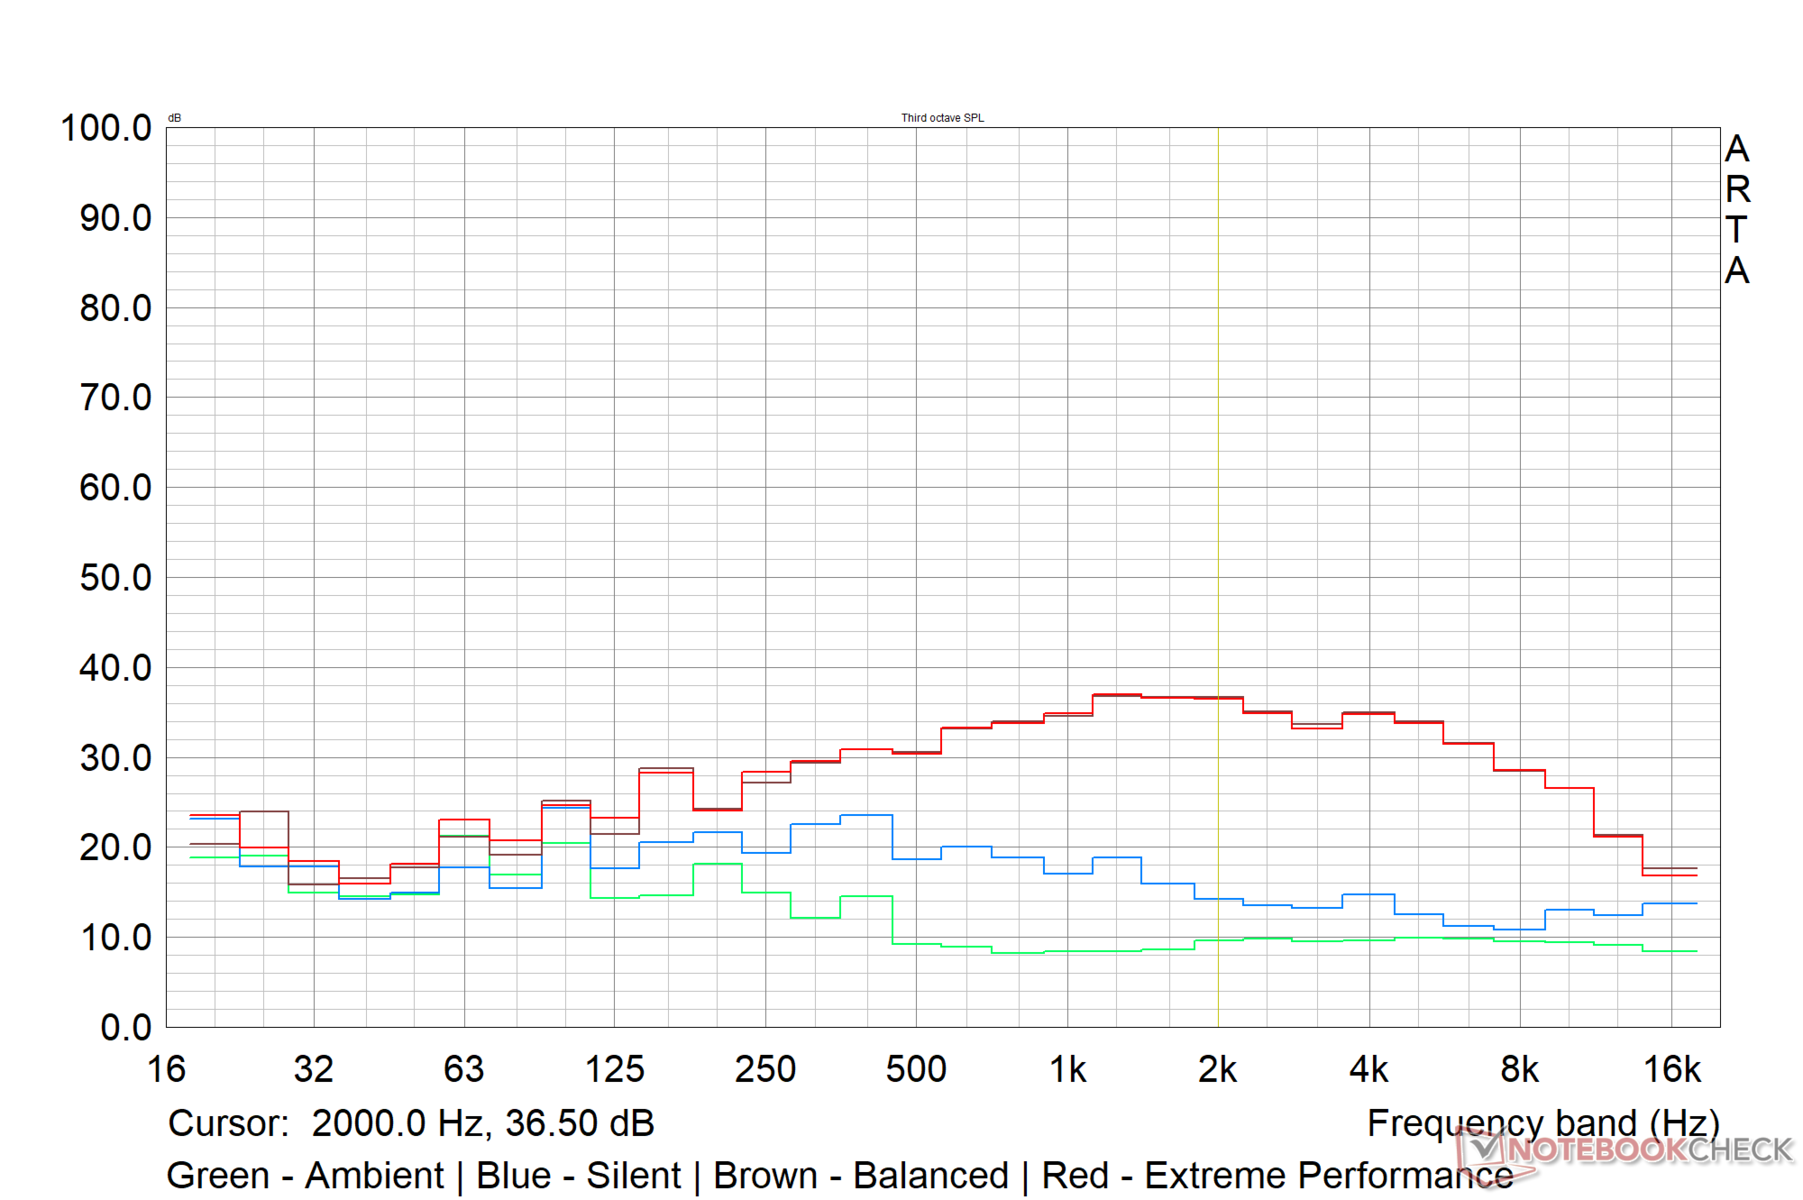
Top-of-the line internals combined with the massive cooling system means that the Titan GT77 can rev up its engines like no other, especially in the Extreme Performance mode. That being said, the laptop is relatively silent in idle across all tested performance modes.
The Balanced and Extreme Performance modes are quite similar save for a 25 W lesser PL1 in the former. Therefore, we observe that the noise profile under various loads in both these performance modes to be more or less similar. Nevertheless, MSI seems to have capped the noise emission in the Balanced profile at about 50 dB(A) while the fans can get a bit louder up to 57 dB(A) in the Extreme Performance profile.
If you prefer a quieter operating profile for less-demanding tasks, consider using the Silent profile in which fan noise is just under the 35 dB(A) mark.
Noise level
| Idle |
| 24.53 / 24.53 / 24.53 dB(A) |
| Load |
| 46.25 / 54.25 dB(A) |
 | ||
30 dB silent 40 dB(A) audible 50 dB(A) loud |
||
min: | ||
| MSI Titan GT77 12UHS Intel Core i9-12900HX, NVIDIA GeForce RTX 3080 Ti Laptop GPU | Aorus 17X XES Intel Core i9-12900HX, NVIDIA GeForce RTX 3070 Ti Laptop GPU | MSI Raider GE77 HX 12UHS Intel Core i9-12900HX, NVIDIA GeForce RTX 3080 Ti Laptop GPU | MSI GE67 HX 12UGS Intel Core i7-12800HX, NVIDIA GeForce RTX 3070 Ti Laptop GPU | Alienware x17 R2 P48E Intel Core i9-12900HK, NVIDIA GeForce RTX 3080 Ti Laptop GPU | |
|---|---|---|---|---|---|
| Noise | -18% | -23% | 2% | 8% | |
| off / environment * (dB) | 21.9 | 26 -19% | 26 -19% | 22.7 -4% | 22.7 -4% |
| Idle Minimum * (dB) | 24.53 | 28 -14% | 26 -6% | 22.9 7% | 23.1 6% |
| Idle Average * (dB) | 24.53 | 32 -30% | 34 -39% | 22.9 7% | 23.1 6% |
| Idle Maximum * (dB) | 24.53 | 38 -55% | 46 -88% | 22.9 7% | 23.1 6% |
| Load Average * (dB) | 46.25 | 53 -15% | 50 -8% | 44.4 4% | 31.9 31% |
| Witcher 3 ultra * (dB) | 56.86 | 54 5% | 55 3% | 55.7 2% | 52.5 8% |
| Load Maximum * (dB) | 54.25 | 55 -1% | 57 -5% | 57.4 -6% | 52.5 3% |
* ... smaller is better
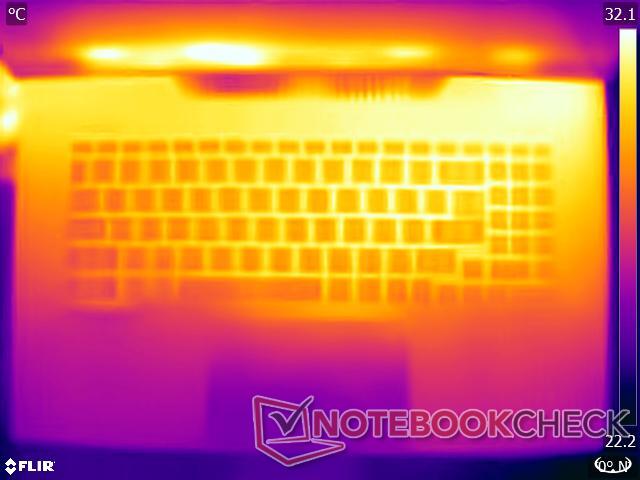
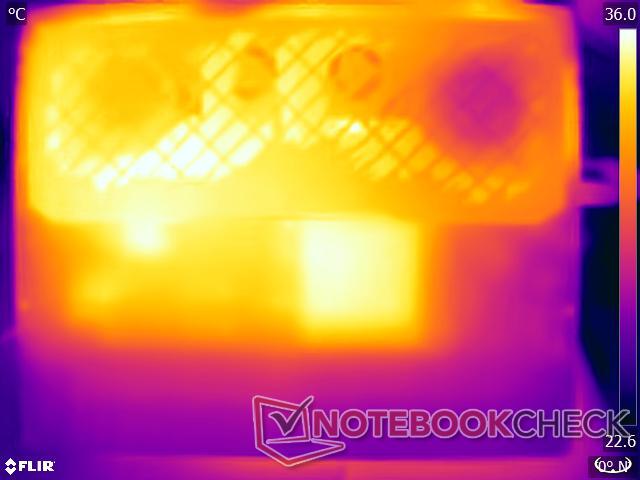
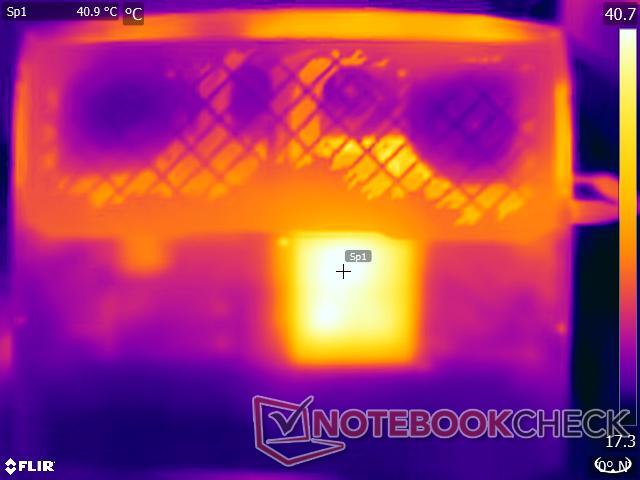
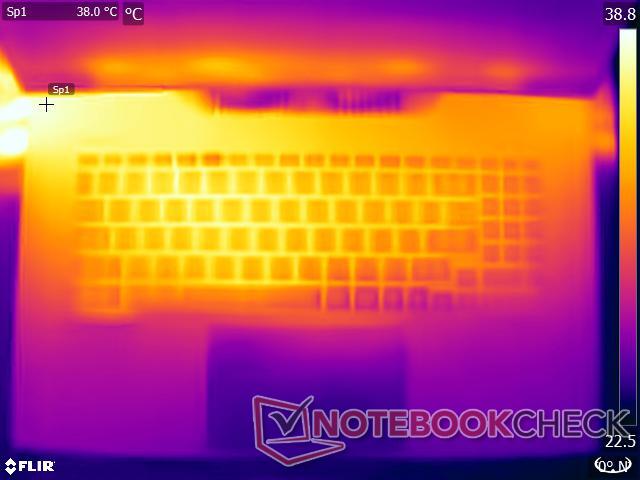
Temperature
Surface temperatures are definitely on the higher side despite the robust cooling system. We recorded a maximum of 40.8 °C on the upper side and 52.4 °C on the bottom under maximum load of Prime95 and FurMark running together.
Stressing with The Witcher 3 at 1080p Ultra results in temperature hotspots of 47 °C and 47.6 °C on the top and bottom, respectively. The palm rest and touchpad areas remain relatively cool even under stress.
(±) The maximum temperature on the upper side is 40.8 °C / 105 F, compared to the average of 40.4 °C / 105 F, ranging from 21.2 to 68.8 °C for the class Gaming.
(-) The bottom heats up to a maximum of 52.4 °C / 126 F, compared to the average of 43.2 °C / 110 F
(±) In idle usage, the average temperature for the upper side is 32 °C / 90 F, compared to the device average of 33.9 °C / 93 F.
(-) Playing The Witcher 3, the average temperature for the upper side is 40.4 °C / 105 F, compared to the device average of 33.9 °C / 93 F.
(+) The palmrests and touchpad are reaching skin temperature as a maximum (33.4 °C / 92.1 F) and are therefore not hot.
(-) The average temperature of the palmrest area of similar devices was 28.8 °C / 83.8 F (-4.6 °C / -8.3 F).
Given its weight, the Titan GT77 is not something you would use on a lap. Though our stress tests represent extreme scenarios, we would still recommend using the Silent or Balanced performance modes to ensure surface temperatures are within tolerable limits.


| MSI Titan GT77 12UHS Intel Core i9-12900HX, NVIDIA GeForce RTX 3080 Ti Laptop GPU | Aorus 17X XES Intel Core i9-12900HX, NVIDIA GeForce RTX 3070 Ti Laptop GPU | MSI Raider GE77 HX 12UHS Intel Core i9-12900HX, NVIDIA GeForce RTX 3080 Ti Laptop GPU | MSI GE67 HX 12UGS Intel Core i7-12800HX, NVIDIA GeForce RTX 3070 Ti Laptop GPU | Alienware x17 R2 P48E Intel Core i9-12900HK, NVIDIA GeForce RTX 3080 Ti Laptop GPU | |
|---|---|---|---|---|---|
| Heat | -13% | -16% | 20% | 8% | |
| Maximum Upper Side * (°C) | 40.8 | 54 -32% | 53 -30% | 34.4 16% | 49.6 -22% |
| Maximum Bottom * (°C) | 52.4 | 58 -11% | 58 -11% | 42 20% | 42.4 19% |
| Idle Upper Side * (°C) | 34.6 | 37 -7% | 38 -10% | 24 31% | 29.2 16% |
| Idle Bottom * (°C) | 38.4 | 39 -2% | 43 -12% | 33.2 14% | 32 17% |
* ... smaller is better
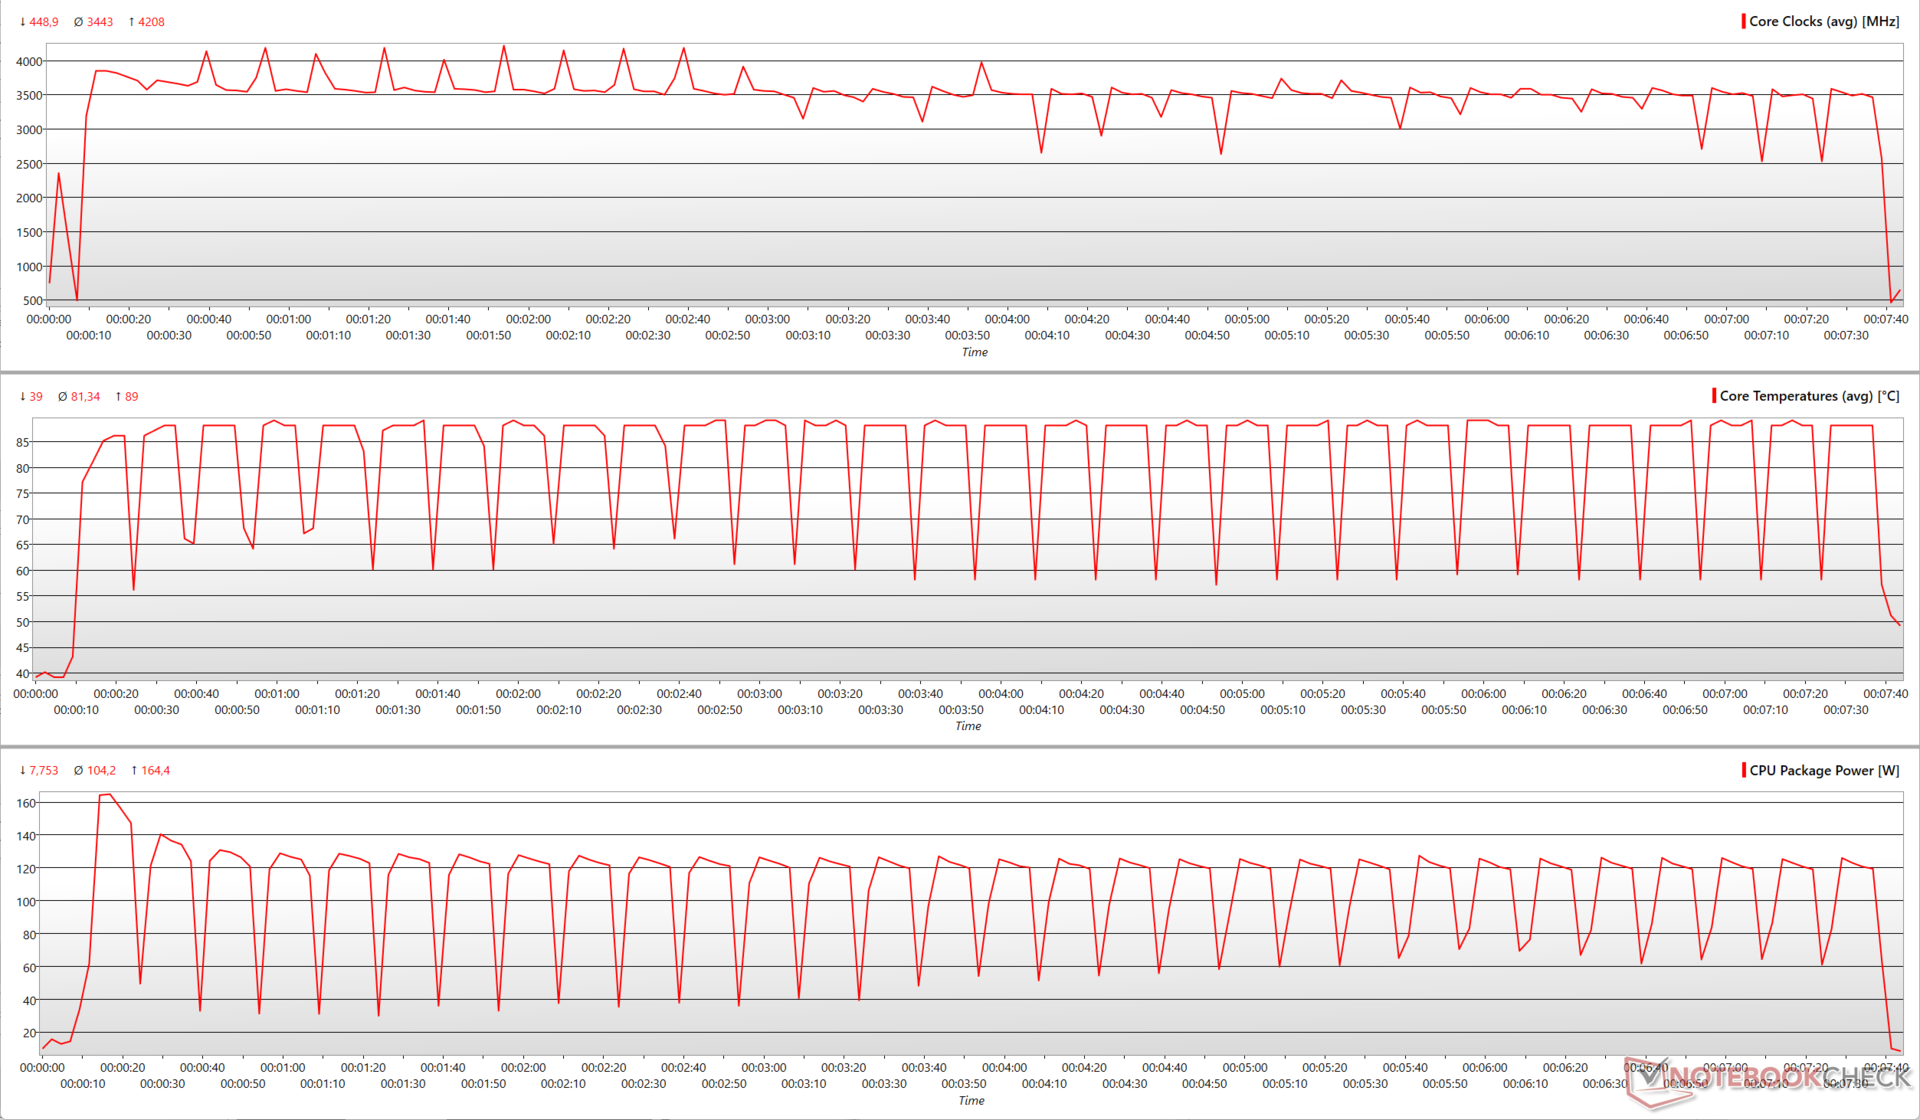
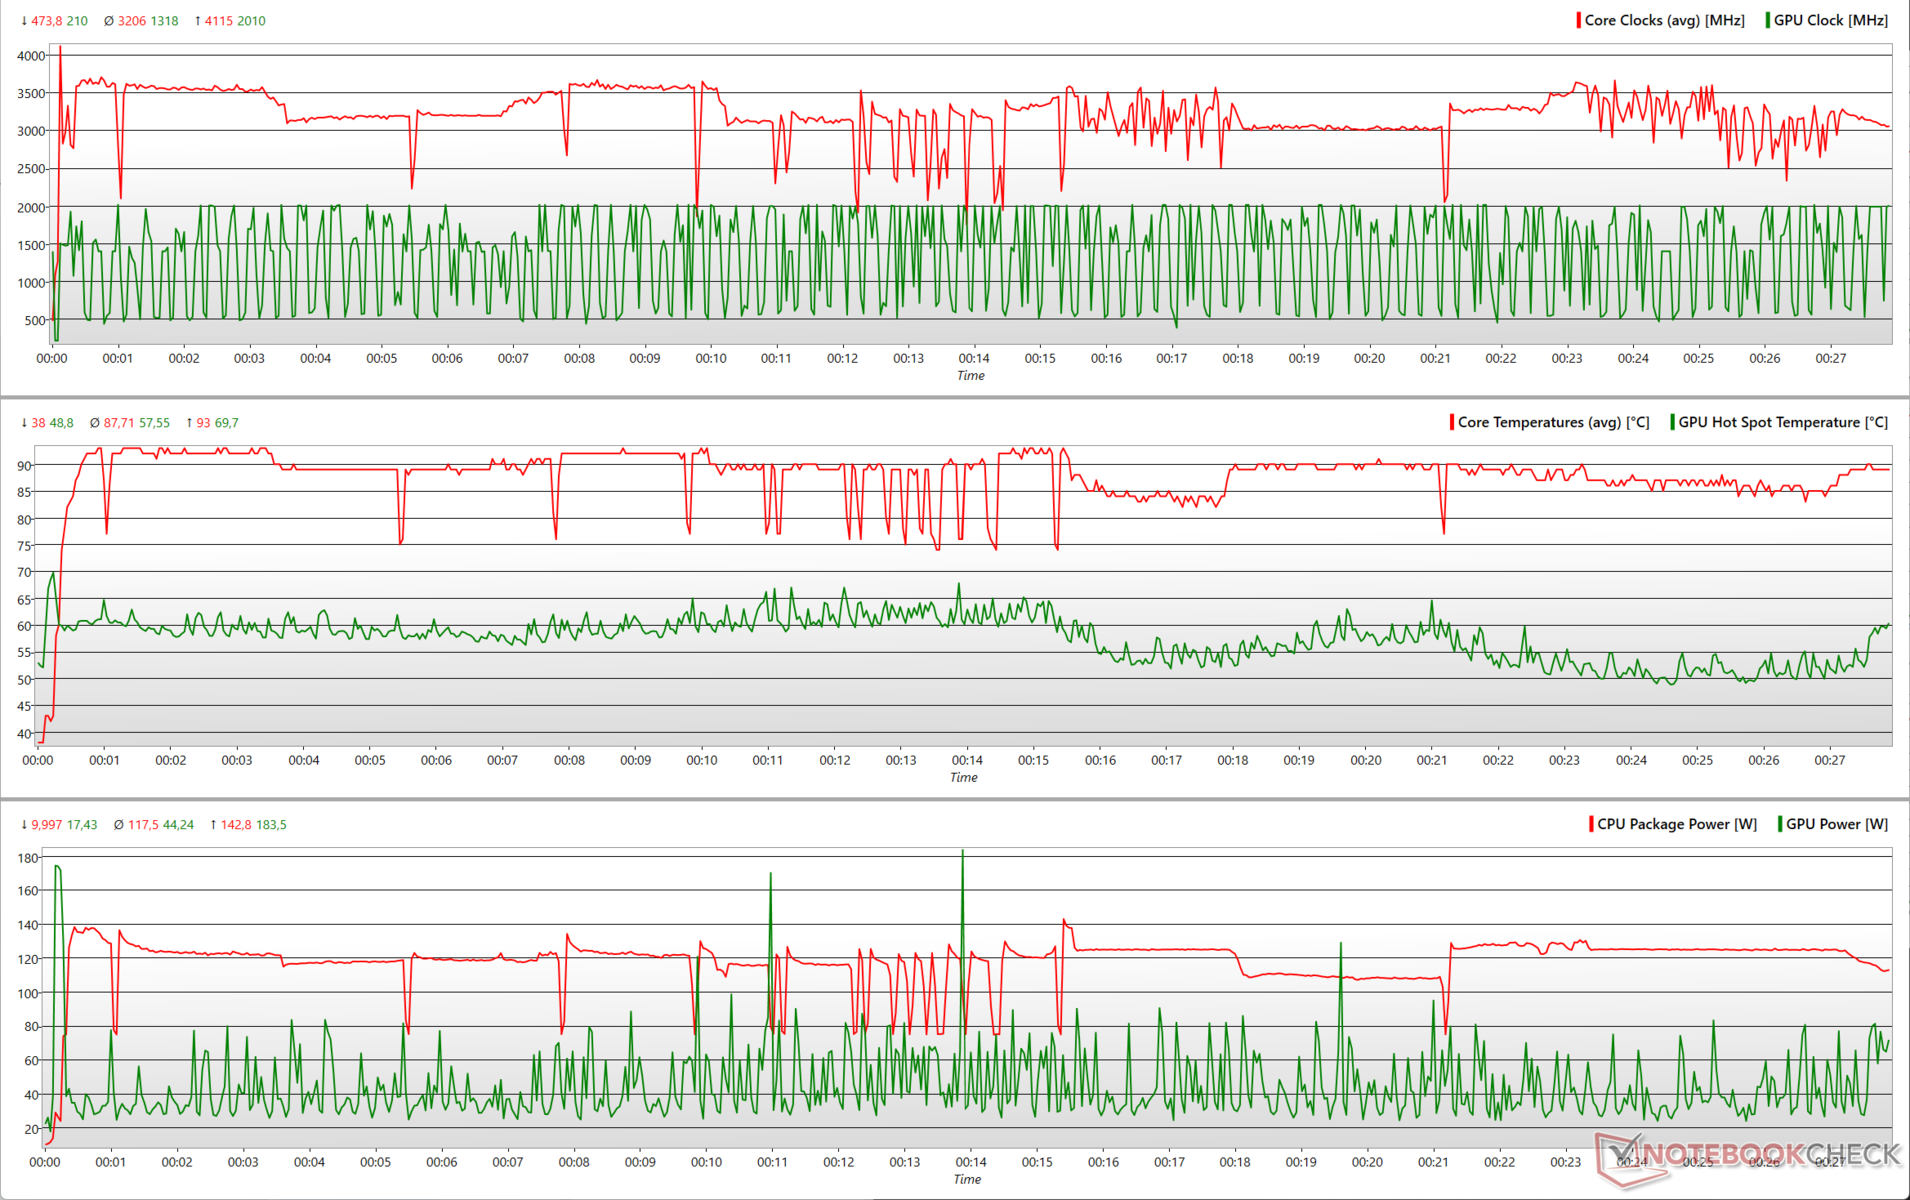
Stress Test
Stressing the Titan GT77 with Prime95 running in-place FFTs sees the Core i9-12900HX spiking up to 4.1 GHz at about 155 W, but we observe the clocks settling down between 3 GHz and 3.5 GHz at 120 W about four minutes into the test.
According to MSI, the Titan GT77 uses MSI OverBoost for a combined 250 W load (75 W CPU + 175 W GPU) from both the CPU and the GPU depending on the scenario. The addition of FurMark to Prime95 sees the CPU clock initially peaking to 4.1 GHz at about 140 W and thereafter oscillating between 3 GHz and 3.5 GHz at 120 W. The RTX 3080 Ti Laptop GPU shows inconsistent clocks in this workload coinciding with fluctuating power.
We see the GPU coming close to 175 W TGP at the start of the run but is able to use only about 80-90 W for the major duration of the test. At times, we do see spikes up to 185 W but that causes the CPU TDP to drop to 75 W. GPU clocks during the combined Prime95 and FurMark stress are not stable and keep oscillating between base and boost clocks regularly in order to accommodate the power requirements of the CPU.
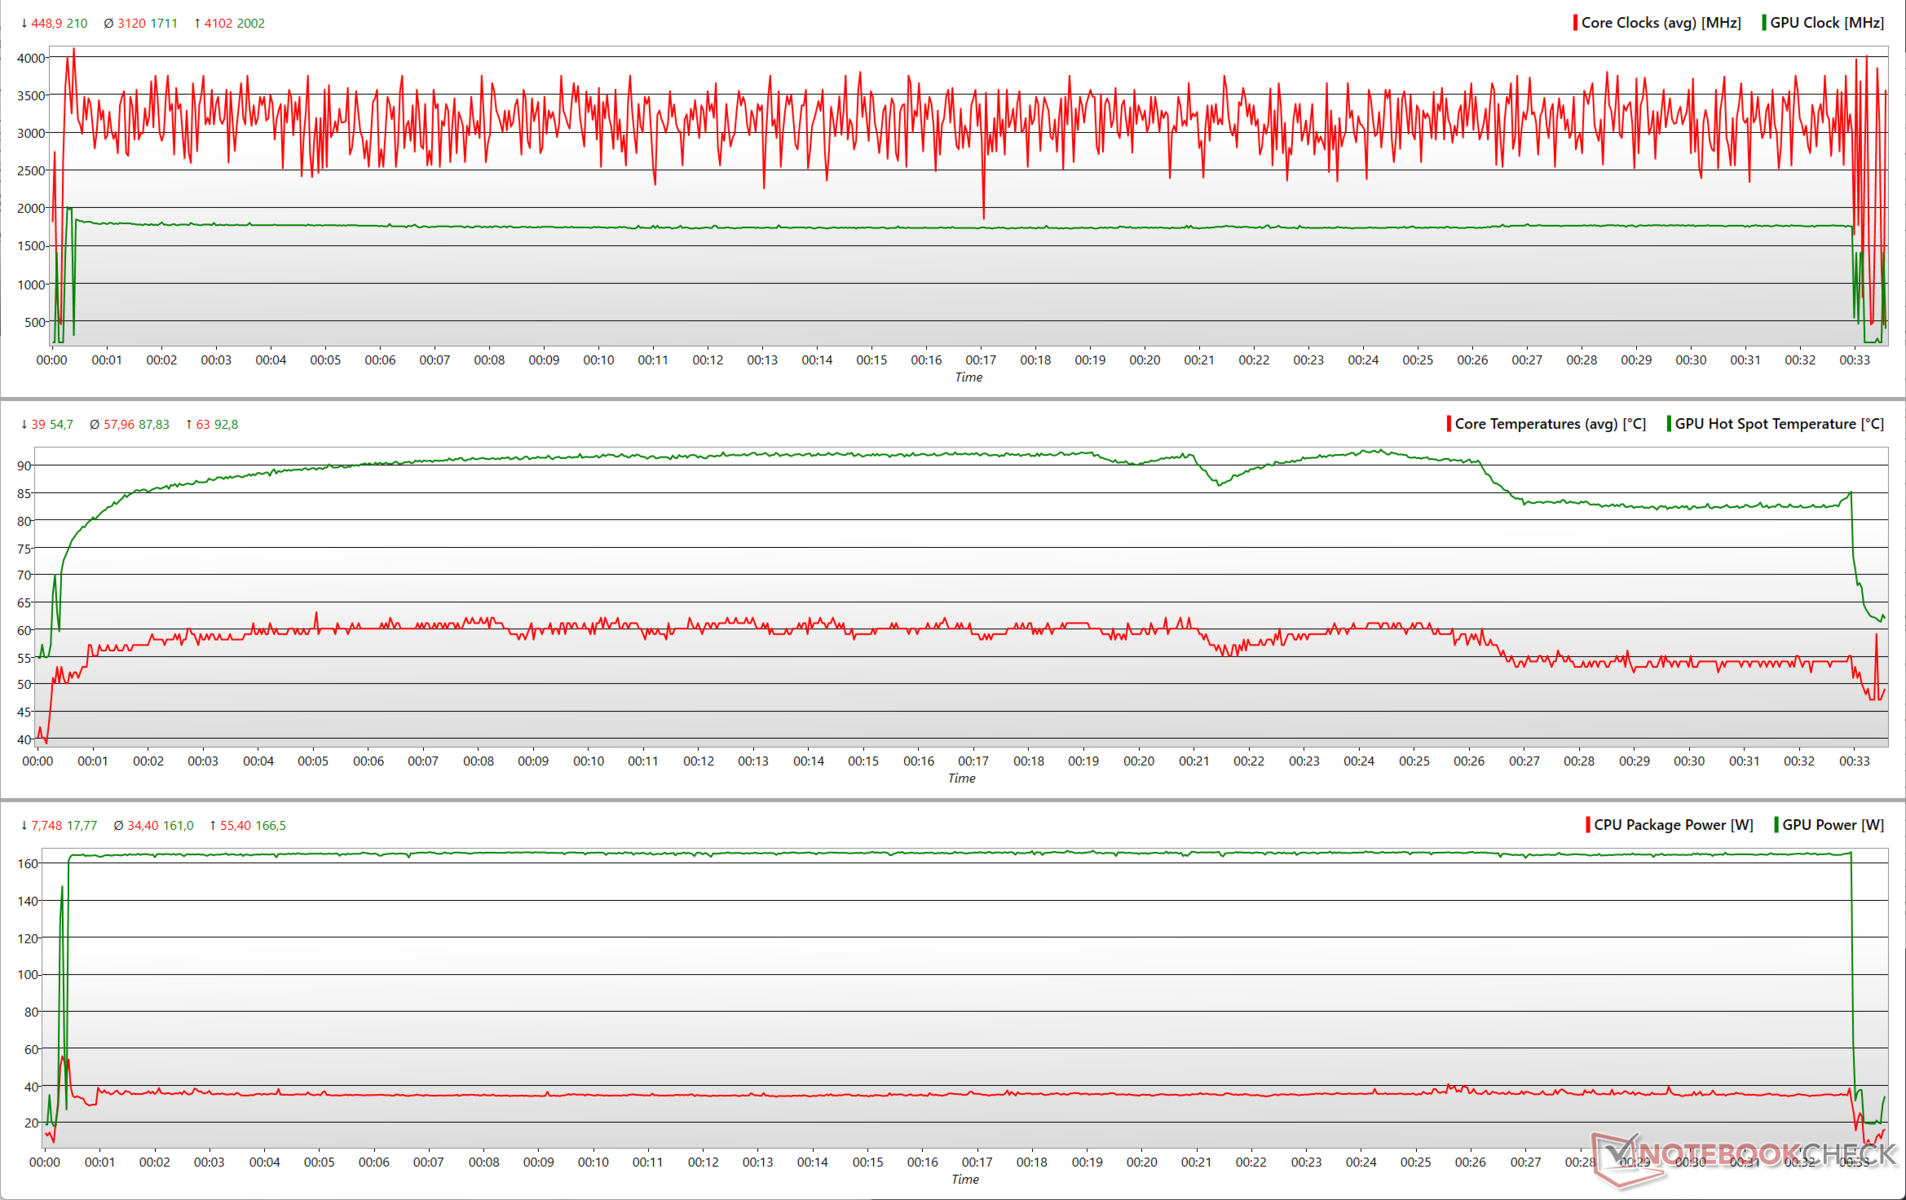
Running The Witcher 3 at 1080p Ultra presents a more real-world stress scenario with a much more predictable performance. Though the CPU clocks are relatively unstable, we find the RTX 3080 Ti to clock a consistent 1.8 GHz clock at 165 W after an initial high of 2 GHz. The CPU TDP does not go beyond 35 W during this test resulting in a combined load of 200 W.
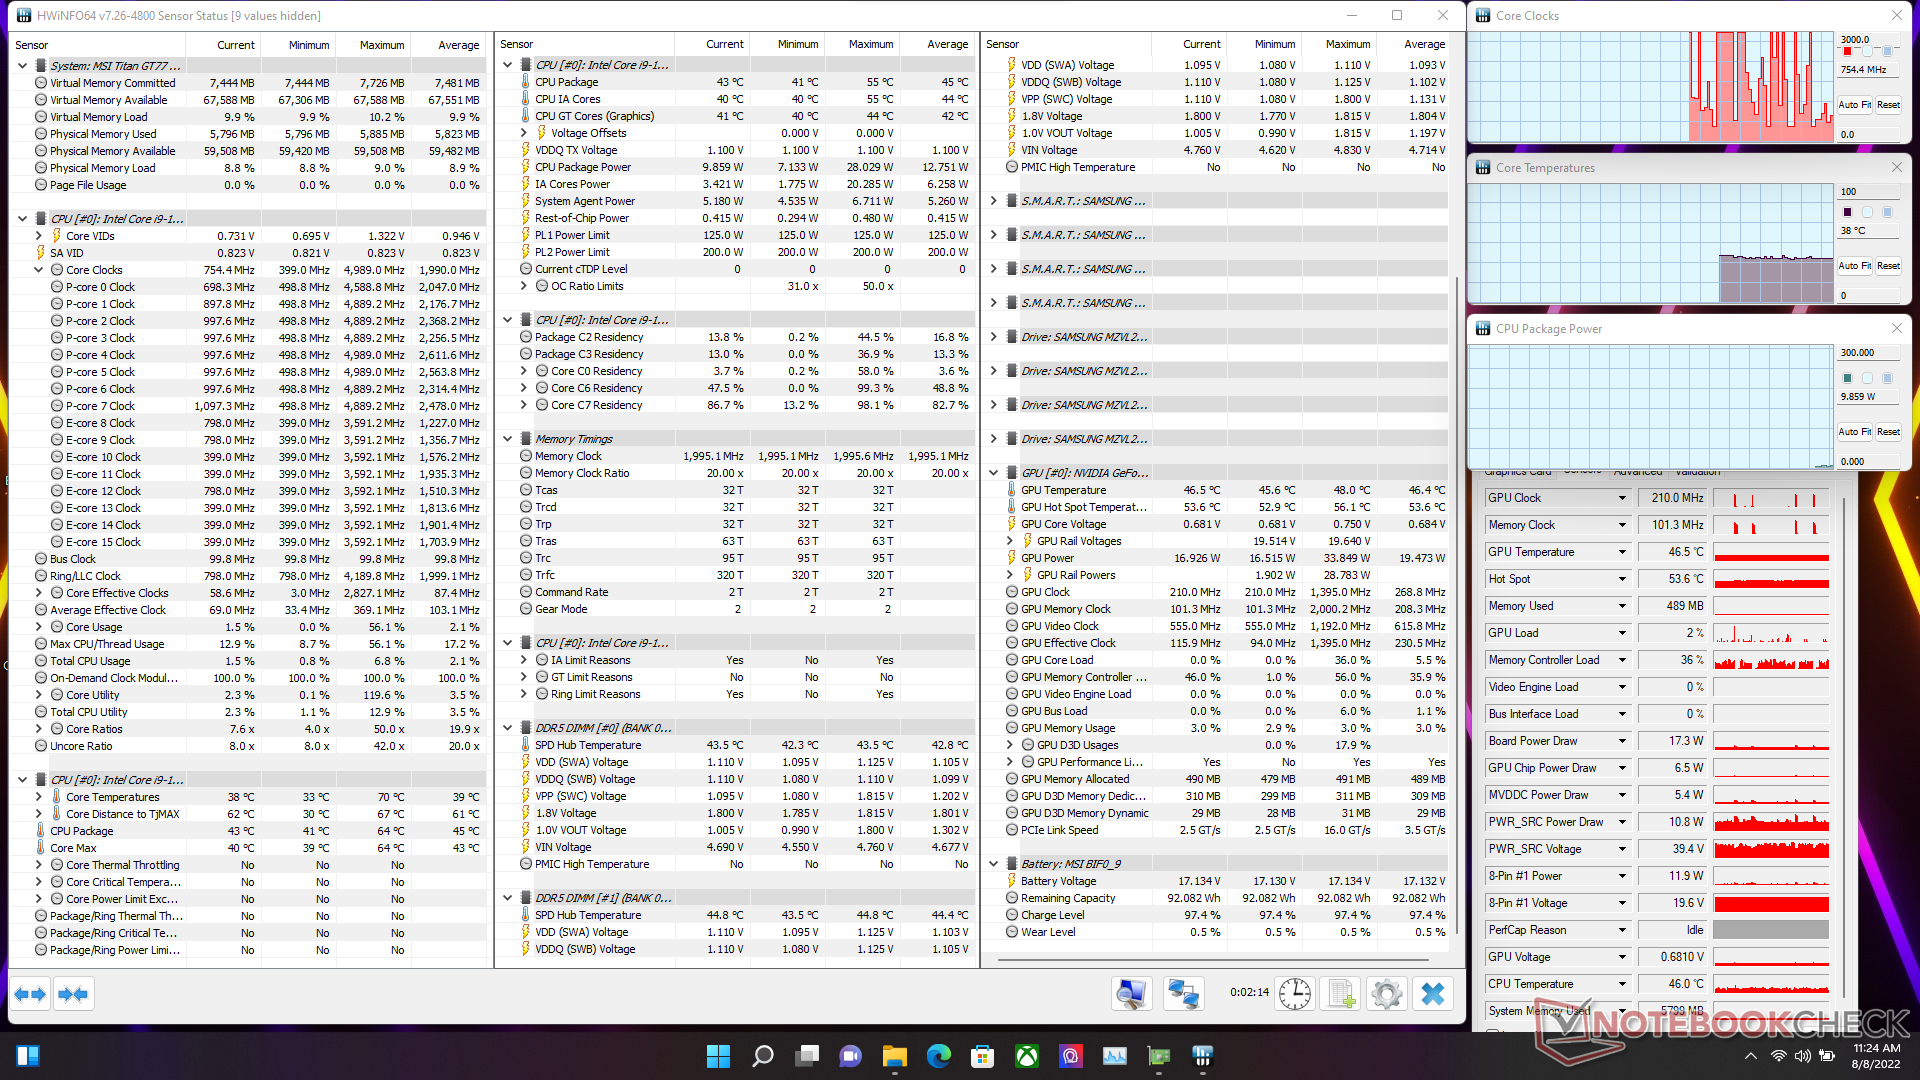
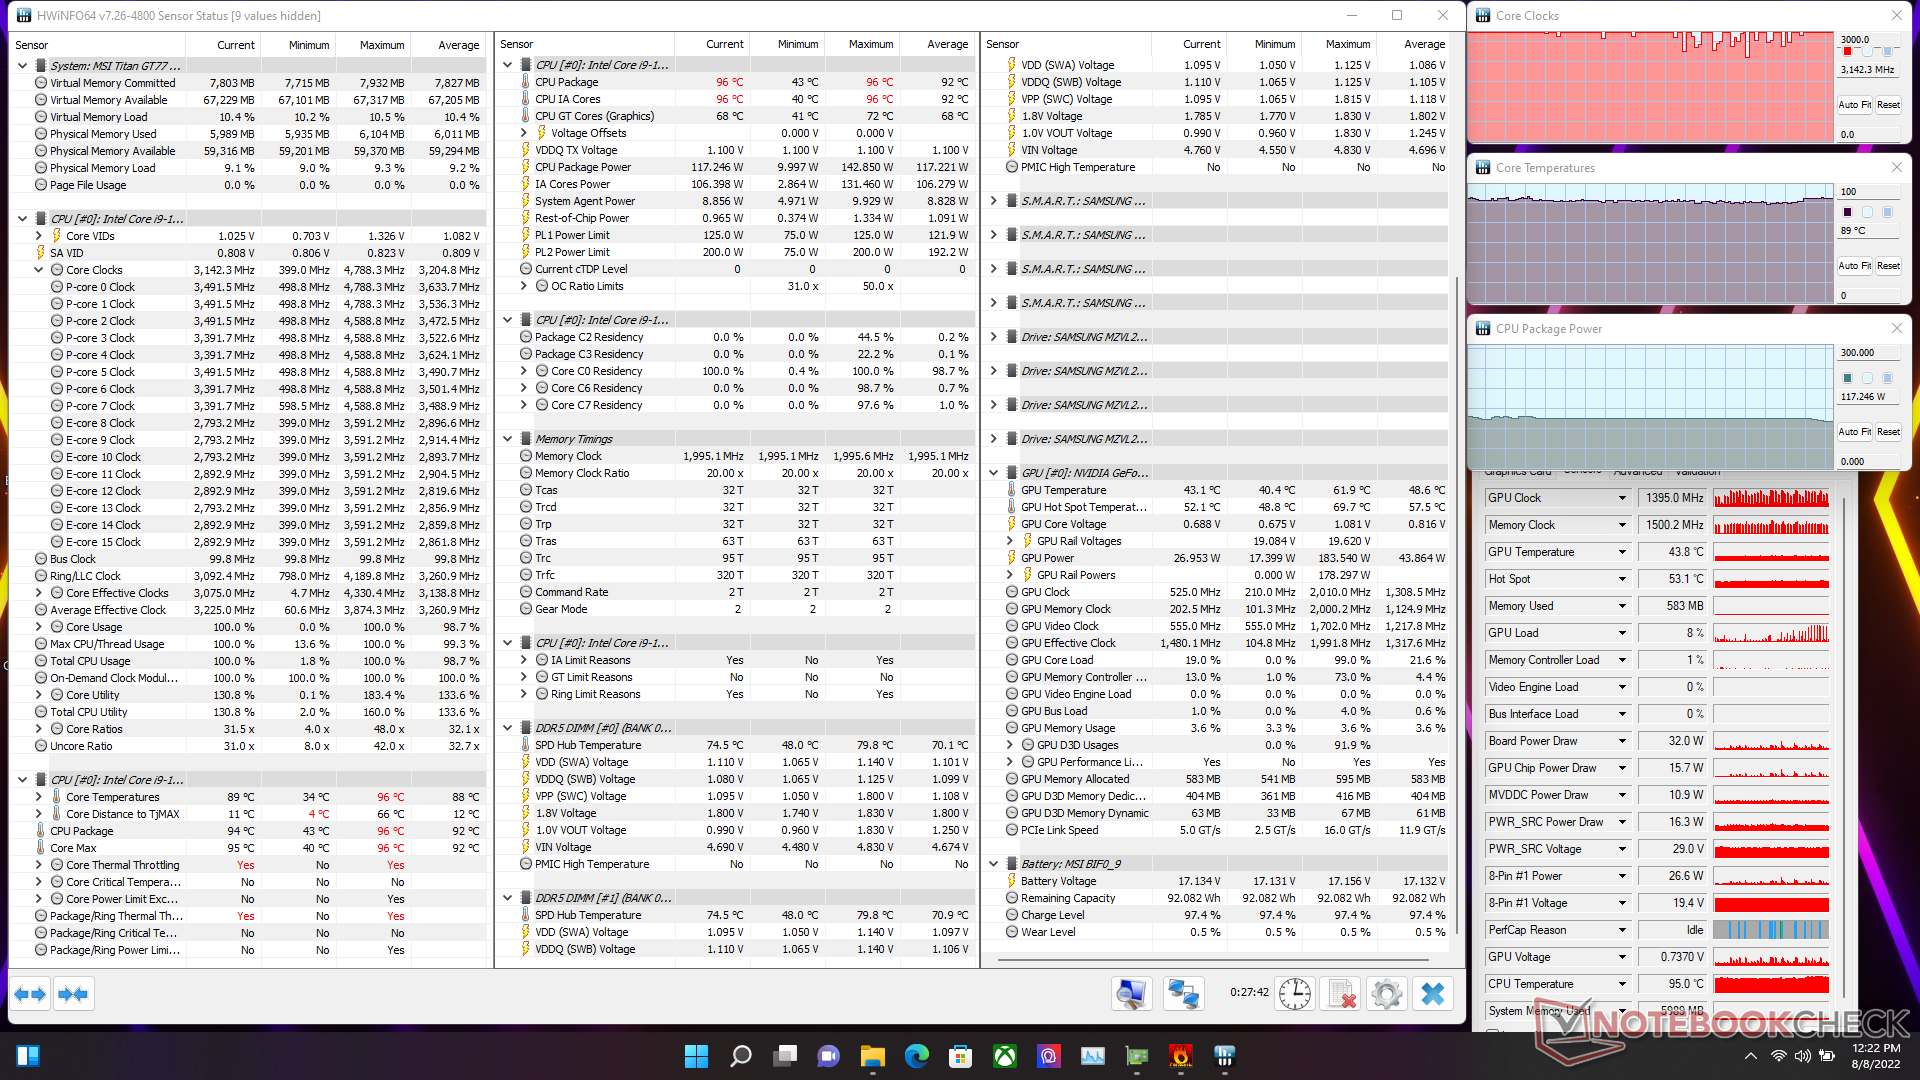
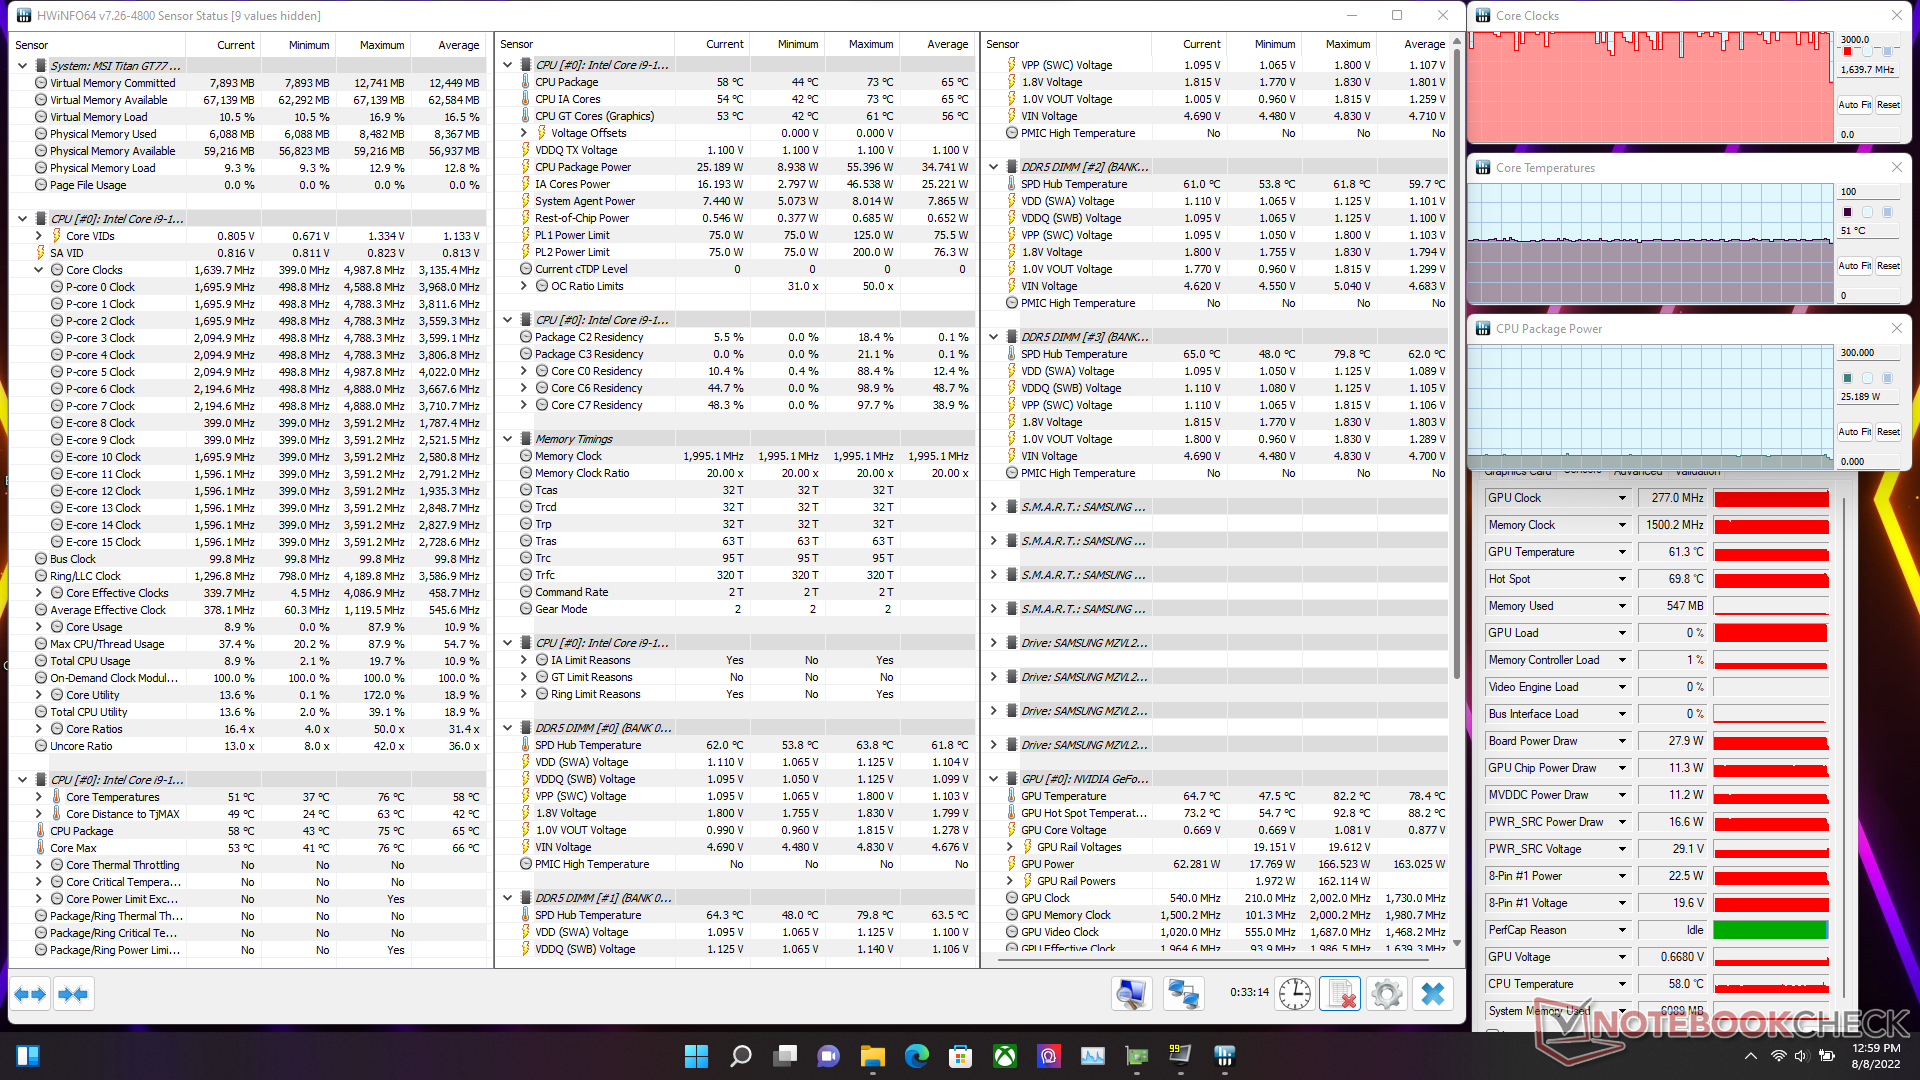
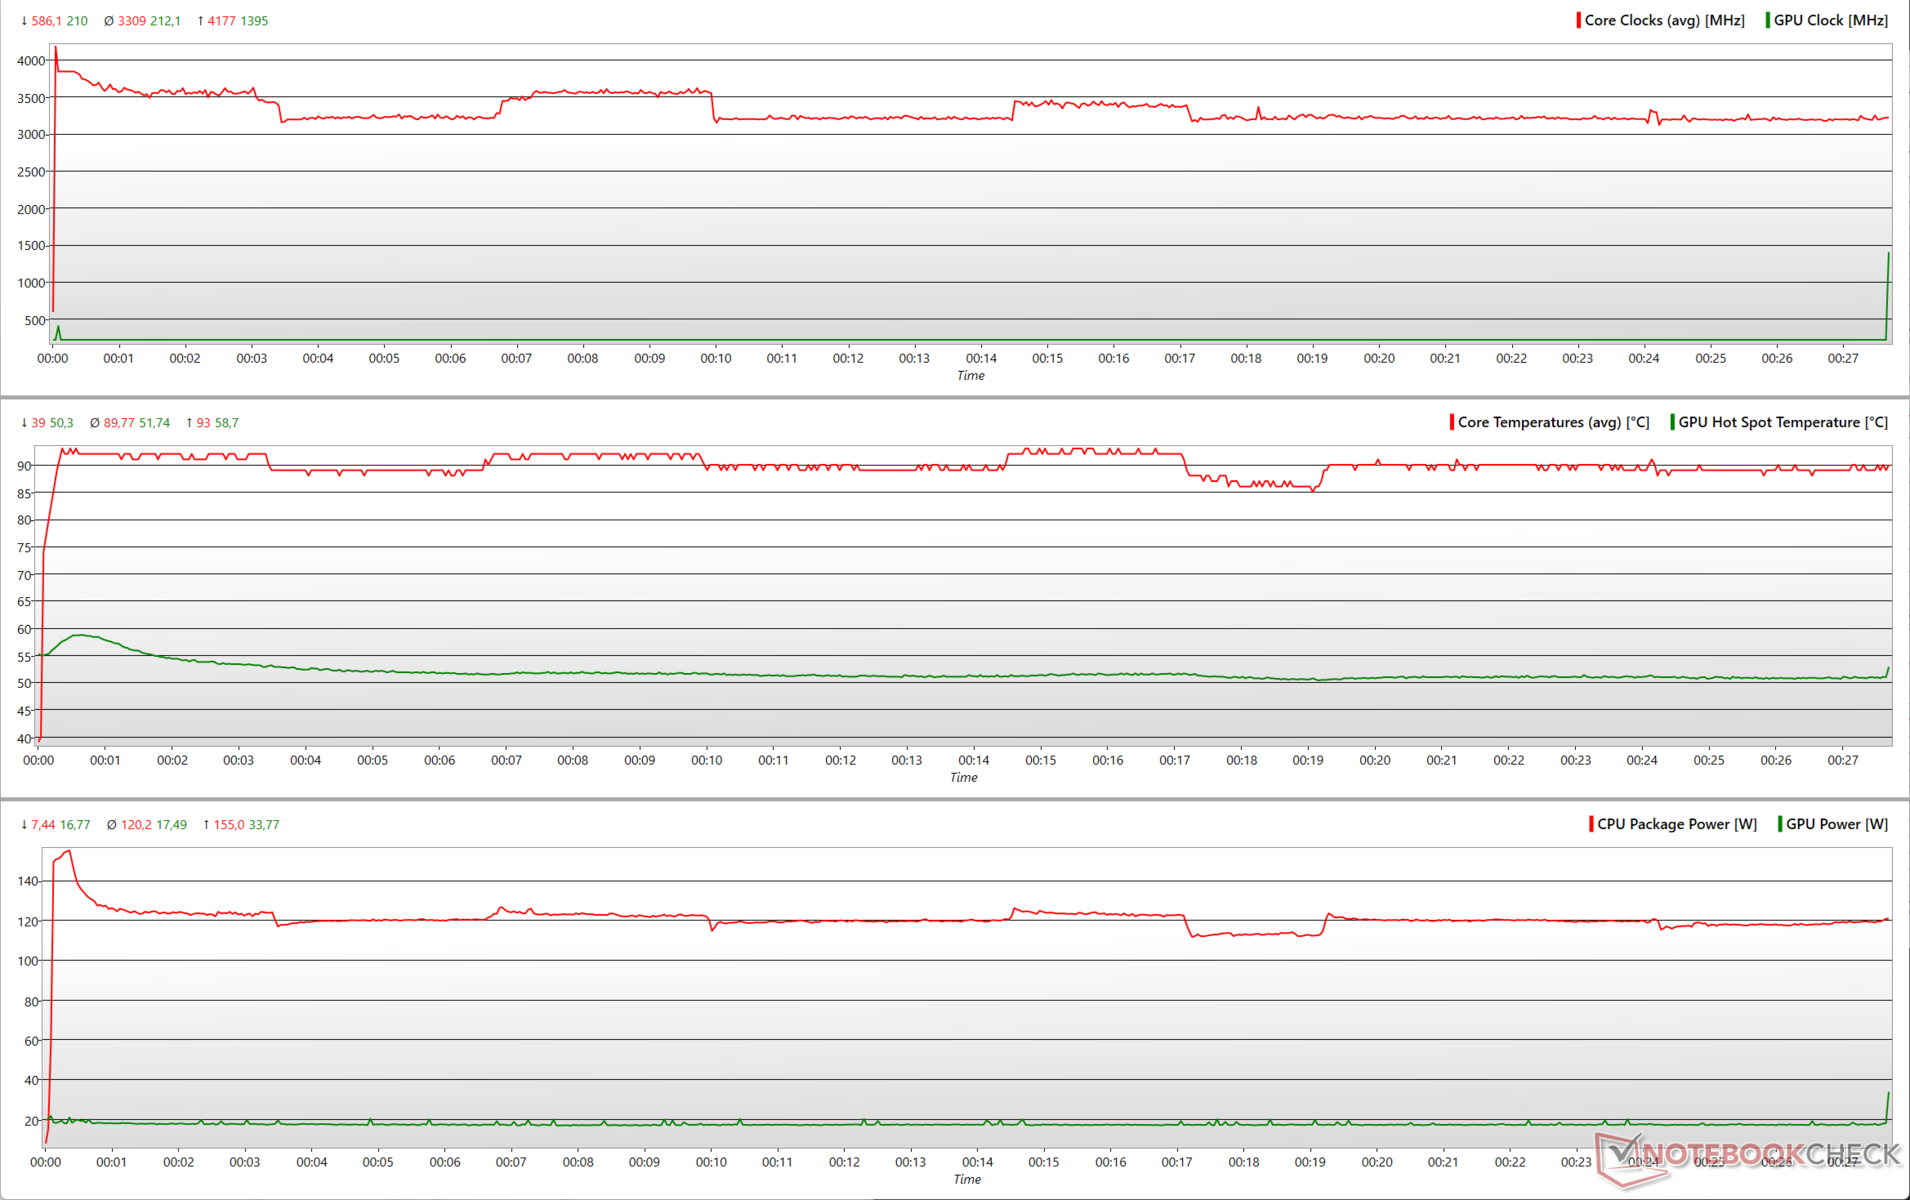
| Stress Test | CPU Clock (GHz) | GPU Clock (MHz) | Average CPU Temperature (°C) | Average GPU Temperature (°C) |
| System Idle | 0.75 | 210 | 39 | 46.4 |
| Prime95 | 3.2 | 210 | 85 | 42.1 |
| Prime95 + FurMark | 3.1 | 1,395 | 88 | 48.6 |
| The Witcher 3 | 1.6 | 1,964.6 | 58 | 78.4 |
Speakers
The Titan GT77 comes with a quad-speaker setup with two 2 W woofers and two 2 W speakers. Sound quality is loud at 83.4 dB(A) and is enough to fill a mid-sized room without much distortion at high volumes.
The relatively large chassis ensures that the passive radiators have enough room to produce a decent bass response. The Titan GT77 shines in reproducing the mids and highs well. Subjectively, the audio quality is more than passable for most use cases.
Gamers will be able to get the maximum out of available audio hardware with a good pair of headphones. However, audiophiles will find the lack of a dedicated mic/line-in jack a tad bit disappointing.
MSI does not offer Dolby Atmos certification for the Titan GT77, but the included Nahimic app offers lots of customization options.
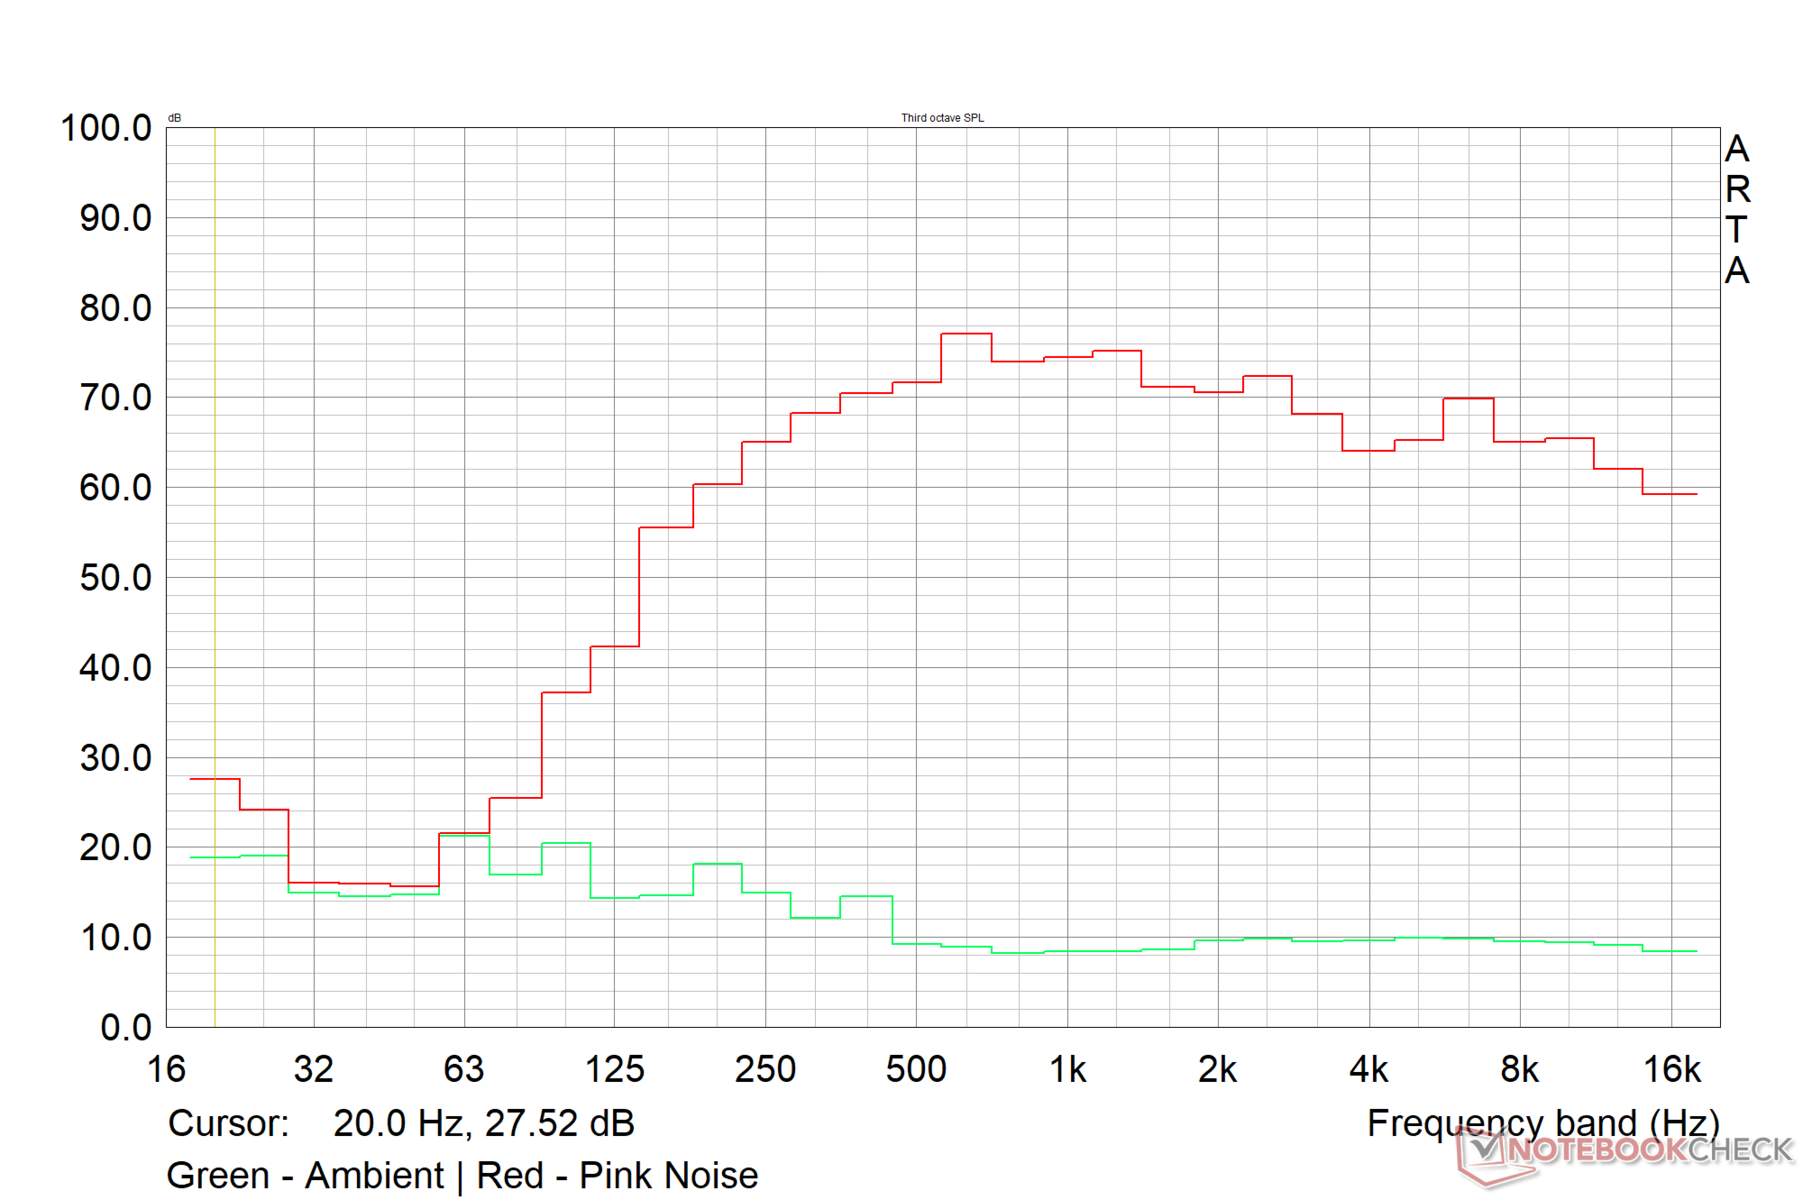
MSI Titan GT77 12UHS audio analysis
(+) | speakers can play relatively loud (83.4 dB)
Bass 100 - 315 Hz
(-) | nearly no bass - on average 71.8% lower than median
(+) | bass is linear (0% delta to prev. frequency)
Mids 400 - 2000 Hz
(-) | nearly no mids - on average 71.8% lower than median
(+) | mids are linear (0% delta to prev. frequency)
Highs 2 - 16 kHz
(-) | nearly no highs - on average 71.8% lower than median
(+) | highs are linear (0% delta to prev. frequency)
Overall 100 - 16.000 Hz
(-) | overall sound is not linear (107.7% difference to median)
Compared to same class
» 100% of all tested devices in this class were better, 0% similar, 0% worse
» The best had a delta of 6%, average was 18%, worst was 132%
Compared to all devices tested
» 96% of all tested devices were better, 0% similar, 4% worse
» The best had a delta of 4%, average was 23%, worst was 134%
Apple MacBook Pro 16 2021 M1 Pro audio analysis
(+) | speakers can play relatively loud (84.7 dB)
Bass 100 - 315 Hz
(+) | good bass - only 3.8% away from median
(+) | bass is linear (5.2% delta to prev. frequency)
Mids 400 - 2000 Hz
(+) | balanced mids - only 1.3% away from median
(+) | mids are linear (2.1% delta to prev. frequency)
Highs 2 - 16 kHz
(+) | balanced highs - only 1.9% away from median
(+) | highs are linear (2.7% delta to prev. frequency)
Overall 100 - 16.000 Hz
(+) | overall sound is linear (4.6% difference to median)
Compared to same class
» 0% of all tested devices in this class were better, 0% similar, 100% worse
» The best had a delta of 5%, average was 17%, worst was 45%
Compared to all devices tested
» 0% of all tested devices were better, 0% similar, 100% worse
» The best had a delta of 4%, average was 23%, worst was 134%
Energy Management: Inconsistent power draws at max load
Power Consumption
The supplied 330 W adapter is sufficient to power the Titan GT77 through demanding workloads. Idle and load power consumption is on the higher side, which isn't surprising given the meaty internals. Power draw under load is comparable with that of the Raider GE77 HX 12UHS.
A combined Prime95 and Furmark load shows highly oscillating power draws consistent with our previous observations during the stress test.
The Alienware x17 R2 with a Core i9-12900HK is about 8% less energy-efficient overall.
| Off / Standby | |
| Idle | |
| Load |
|
Key:
min: | |
| MSI Titan GT77 12UHS i9-12900HX, GeForce RTX 3080 Ti Laptop GPU, 1920x1080, | Aorus 17X XES i9-12900HX, GeForce RTX 3070 Ti Laptop GPU, 1920x1080, | MSI Raider GE77 HX 12UHS i9-12900HX, GeForce RTX 3080 Ti Laptop GPU, 3840x2160, | MSI GE67 HX 12UGS i7-12800HX, GeForce RTX 3070 Ti Laptop GPU, 1920x1080, | Asus ROG Zephyrus Duo 16 GX650RX R9 6900HX, GeForce RTX 3080 Ti Laptop GPU, 3840x2400, | Alienware x17 R2 P48E i9-12900HK, GeForce RTX 3080 Ti Laptop GPU, 1920x1080, | Average NVIDIA GeForce RTX 3080 Ti Laptop GPU | Average of class Gaming | |
|---|---|---|---|---|---|---|---|---|
| Power Consumption | 8% | 16% | 23% | 23% | -8% | 19% | 31% | |
| Idle Minimum * (Watt) | 30.21 | 18 40% | 13 57% | 16.1 47% | 19 37% | 24.1 20% | 17.2 ? 43% | 13.1 ? 57% |
| Idle Average * (Watt) | 32.42 | 28 14% | 19 41% | 17.1 47% | 24 26% | 28.5 12% | 23.3 ? 28% | 19 ? 41% |
| Idle Maximum * (Watt) | 33.7 | 36 -7% | 29 14% | 26.6 21% | 31 8% | 60 -78% | 30.8 ? 9% | 24.6 ? 27% |
| Load Average * (Watt) | 125.09 | 153 -22% | 143 -14% | 116.3 7% | 104 17% | 128.7 -3% | 121.2 ? 3% | 111.3 ? 11% |
| Witcher 3 ultra * (Watt) | 256 | 221 14% | 247 4% | 237 7% | 186.5 27% | 254 1% | ||
| Load Maximum * (Watt) | 321.88 | 290 10% | 352 -9% | 291.1 10% | 256 20% | 323 -0% | 276 ? 14% | 260 ? 19% |
* ... smaller is better
Power Consumption - The Witcher 3 / Stress test
Power Consumption - External monitor
Battery Life
As expected, run times away from the wall are just about average even with the maxed out 4-cell 99.9 WHr battery.
We clocked about 7 hours and 13 minutes during the H.264 1080p video loop test and close to 7 hours with our standardized Wi-Fi browsing script, both at 150 cd/m2 brightness. Therefore, prudent use at lower screen brightness running in Silent or Super Battery mode and with chassis RGB effects off can get you run times close to a typical workday.
Gaming on battery power is possible for just about 1.5 hours even with reduced screen brightness. All battery run time tests were performed in the MSHybrid mode at a 60 Hz refresh rate.
| MSI Titan GT77 12UHS i9-12900HX, GeForce RTX 3080 Ti Laptop GPU, 99.9 Wh | Aorus 17X XES i9-12900HX, GeForce RTX 3070 Ti Laptop GPU, 99 Wh | MSI Raider GE77 HX 12UHS i9-12900HX, GeForce RTX 3080 Ti Laptop GPU, 99.99 Wh | MSI GE67 HX 12UGS i7-12800HX, GeForce RTX 3070 Ti Laptop GPU, 99.9 Wh | Asus ROG Zephyrus Duo 16 GX650RX R9 6900HX, GeForce RTX 3080 Ti Laptop GPU, 90 Wh | Alienware x17 R2 P48E i9-12900HK, GeForce RTX 3080 Ti Laptop GPU, 87 Wh | Average of class Gaming | |
|---|---|---|---|---|---|---|---|
| Battery runtime | -28% | 4% | 16% | 4% | -57% | 8% | |
| H.264 (h) | 7.2 | 3.8 -47% | 6.5 -10% | 9.3 29% | 8.27 ? 15% | ||
| WiFi v1.3 (h) | 6.9 | 4.4 -36% | 5.4 -22% | 5.6 -19% | 7.8 13% | 2 -71% | 7.08 ? 3% |
| Witcher 3 ultra (h) | 1.5 | ||||||
| Load (h) | 1.4 | 1.4 0% | 2 43% | 2.1 50% | 1 -29% | 0.8 -43% | 1.496 ? 7% |
| Reader / Idle (h) | 9.8 | 8.4 | 12.5 | 3.9 | 7.84 ? |
Pros
Cons
Verdict: A grand, US$5,000 showcase for Alder Lake-HX
MSI has revived its iconic Titan lineup after a two-year hiatus, and the Titan GT77 does everything it possibly can to live up to the name. The redesigned chassis is now slimmer and offers better aesthetics than previous generation Titans. Though primarily made of plastic, the Titan GT77 still manages to feel premium and well-built.
Connectivity features are on par for the course for a 2022 flagship laptop. The 720p webcam is unbefitting for the asking price. The Cherry MX mechanical keyboard and the roomy touchpad are welcome additions in the Titan GT77.
The FHD panel in our unit, which is currently not available in retail, was average at best with mediocre brightness distribution and contrast ratio. However, it offers a 360 Hz refresh rate and low response times that should please competitive gamers. For all other purposes, we recommend opting for SKUs with a UHD panel.
The Core i9-12900HX and the 175 W RTX 3080 Ti Laptop GPU combination offers oodles of processing power for just about any workload you throw at it as long as you don't mind the high heat and noise emissions.
There aren't too many Alder Lake-HX laptops in the wild at the moment. But if you have deep pockets and need absolutely unhindered, top-of-the-line performance with looks to match, there are very few gaming laptops that can hold a candle to the MSI Titan GT77.
The Titan GT77 is not without some glaring shortcomings, though. MSI has some work cut out on the storage subsystem front — the SD card reader can surely use a speed bump and the NVMe drives definitely merit a capable thermal solution. Wi-Fi 6E performance also needs to be looked into. MSI's software suite needs some bug fixing as well, particularly MSI True Color. MSI's OverDrive functionality can also use some tweaking to ensure a more equitable power share between the CPU and GPU for consistent clocks and power draws.
Should you go out and get the Titan GT77 right away? This is a moot question if you are prepared to shell out five grand. However, the Titan GT77 has some able competition that can save you quite some dough. The Raider GE67 HX 12UGS with the Core i9-12800HX and RTX 3070 Ti, for example, often comes quite close to the top-spec Titan GT77 for half the price (US$2,500).
If a 360 Hz display is what you are after, the Alienware x17 R2 offers comparable performance although it features the Core i9-12900HK for US$3,900. The Aorus 17X XES does lag behind the Titan GT77 in overall CPU and GPU performance, but its US$2,999 price does merit a consideration. If features such as the mechanical keyboard and a plethora of NVMe slots are more important, you can still get the Titan GT77 with a Core i7-12800HX and an RTX 3070 Ti for close to US$3,100.
Price and Availability
Our test MSI Titan GT77 is a custom unit seeded directly by Intel, so there's no official pricing information available. However, Intel did tell us that this configuration comes close to about US$5,000.
Retail units of the Titan GT77 are slowly making their way worldwide. Presently, the Titan GT77 featuring the Core i9-12900HX, RTX 3080 Ti, 64 GB DDR5-4800 RAM, 2 TB NVMe SSD, and a 120 Hz UHD display is available for about US$5,361 from the official MSI Malaysian store.
Those in the US, can order a Titan GT77 12UHS-007 with Core i7-12800HX and RTX 3080 Ti for US$3,899. There's also a Titan GT77 12UHS-009 available with a Core i7-12800HX and RTX 3070 Ti for US$3,053.
MSI Titan GT77 12UHS
- 08/28/2022 v7 (old)
Vaidyanathan Subramaniam
Price comparison
