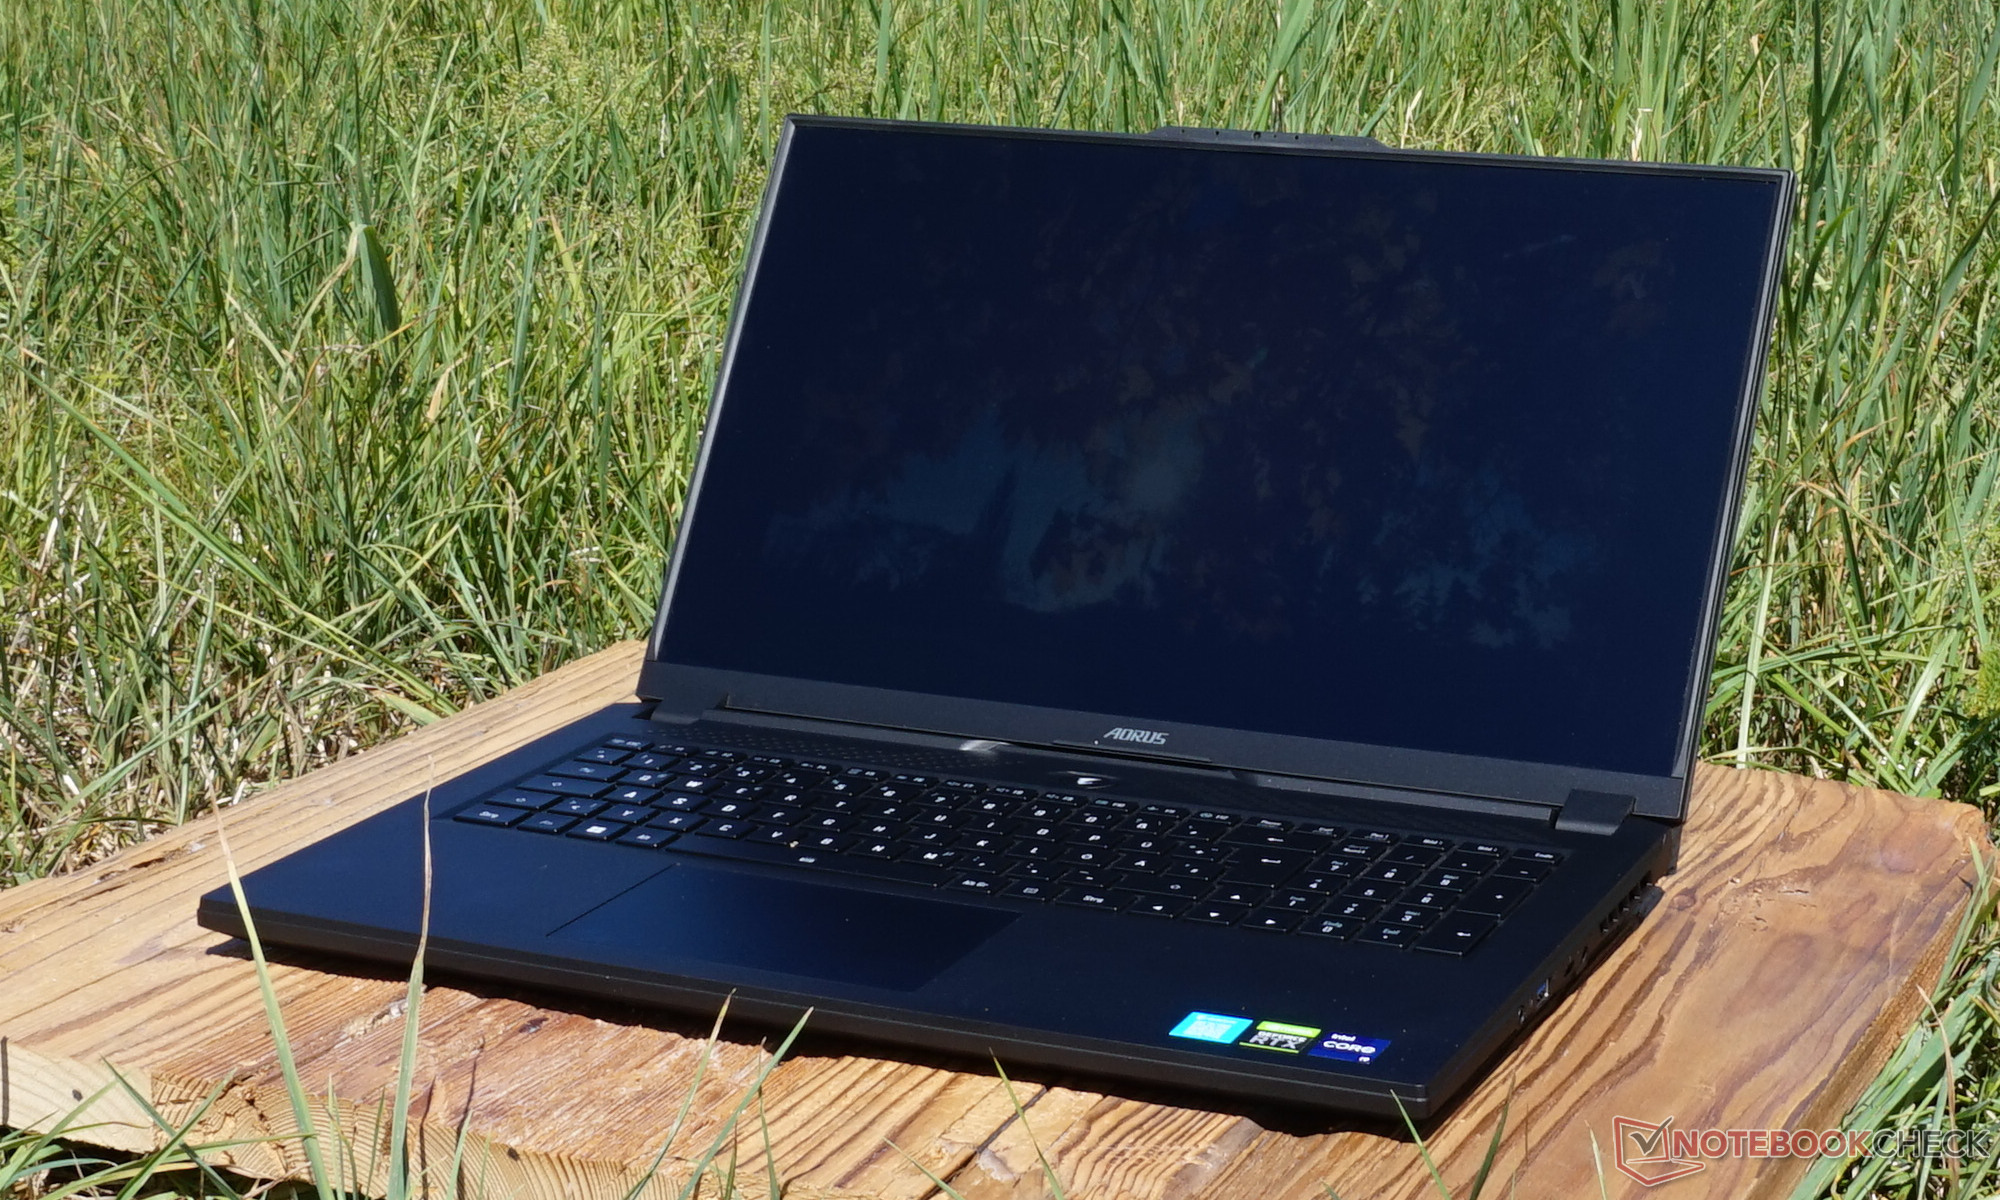
Aorus 17X XES review: Gaming laptop with an i9-12900HX offers top performance


With its most important key specifications, the laptop is predestined for gaming. Because of its 360-Hertz panel, the Aorus 17X is supposed to handle high frame rates particularly well. Considering the Intel i9-12900HX, which is currently the most powerful mobile processor of the Alder Lake class with its abundant 16 cores and an Nvidia GeForce RTX 3070 Ti, this doesn't seem an illusory goal at all. In addition, there is also a model with the Nvidia RTX 3080 Ti, which promises additional FPS and should be even slightly faster.
With so much performance, the competitors include correspondingly well-equipped gaming laptops such as the MSI GE67 HX 12 UGS or the Schenker XMG Pro 17 E22. Another interesting comparison should be with the externally identical Aorus 17 XE4, which combines the same graphics card with a slightly smaller CPU. You can also find additional details on the case, maintenance, or input devices in the review of the Aorus 17 XE4, since these sections are identical for the Aorus 17X.
Possible Competitors for Comparison
Rating | Date | Model | Weight | Height | Size | Resolution | Price |
|---|---|---|---|---|---|---|---|
| 83.7 % v7 (old) | 08 / 2022 | Aorus 17X XES i9-12900HX, GeForce RTX 3070 Ti Laptop GPU | 2.7 kg | 30 mm | 17.30" | 1920x1080 | |
| 86.3 % v7 (old) | 09 / 2022 | HP Omen 17-ck1075ng i7-12700H, GeForce RTX 3070 Ti Laptop GPU | 2.8 kg | 31 mm | 17.30" | 1920x1080 | |
| 87.7 % v7 (old) | 07 / 2022 | MSI GE67 HX 12UGS i7-12800HX, GeForce RTX 3070 Ti Laptop GPU | 2.5 kg | 23.4 mm | 15.60" | 1920x1080 | |
| 85.4 % v7 (old) | 07 / 2022 | Schenker XMG Pro 17 E22 i9-12900H, GeForce RTX 3080 Ti Laptop GPU | 2.8 kg | 27 mm | 17.30" | 2560x1440 | |
| 87.4 % v7 (old) | 06 / 2022 | MSI Raider GE66 12UHS i9-12900HK, GeForce RTX 3080 Ti Laptop GPU | 2.4 kg | 23.4 mm | 15.60" | 3840x2160 | |
| 88.2 % v7 (old) | 05 / 2022 | Asus ROG Zephyrus Duo 16 GX650RX R9 6900HX, GeForce RTX 3080 Ti Laptop GPU | 2.6 kg | 20.5 mm | 16.00" | 3840x2400 | |
| 85.2 % v7 (old) | 04 / 2022 | Aorus 17 XE4 i7-12700H, GeForce RTX 3070 Ti Laptop GPU | 2.6 kg | 27 mm | 17.30" | 1920x1080 |
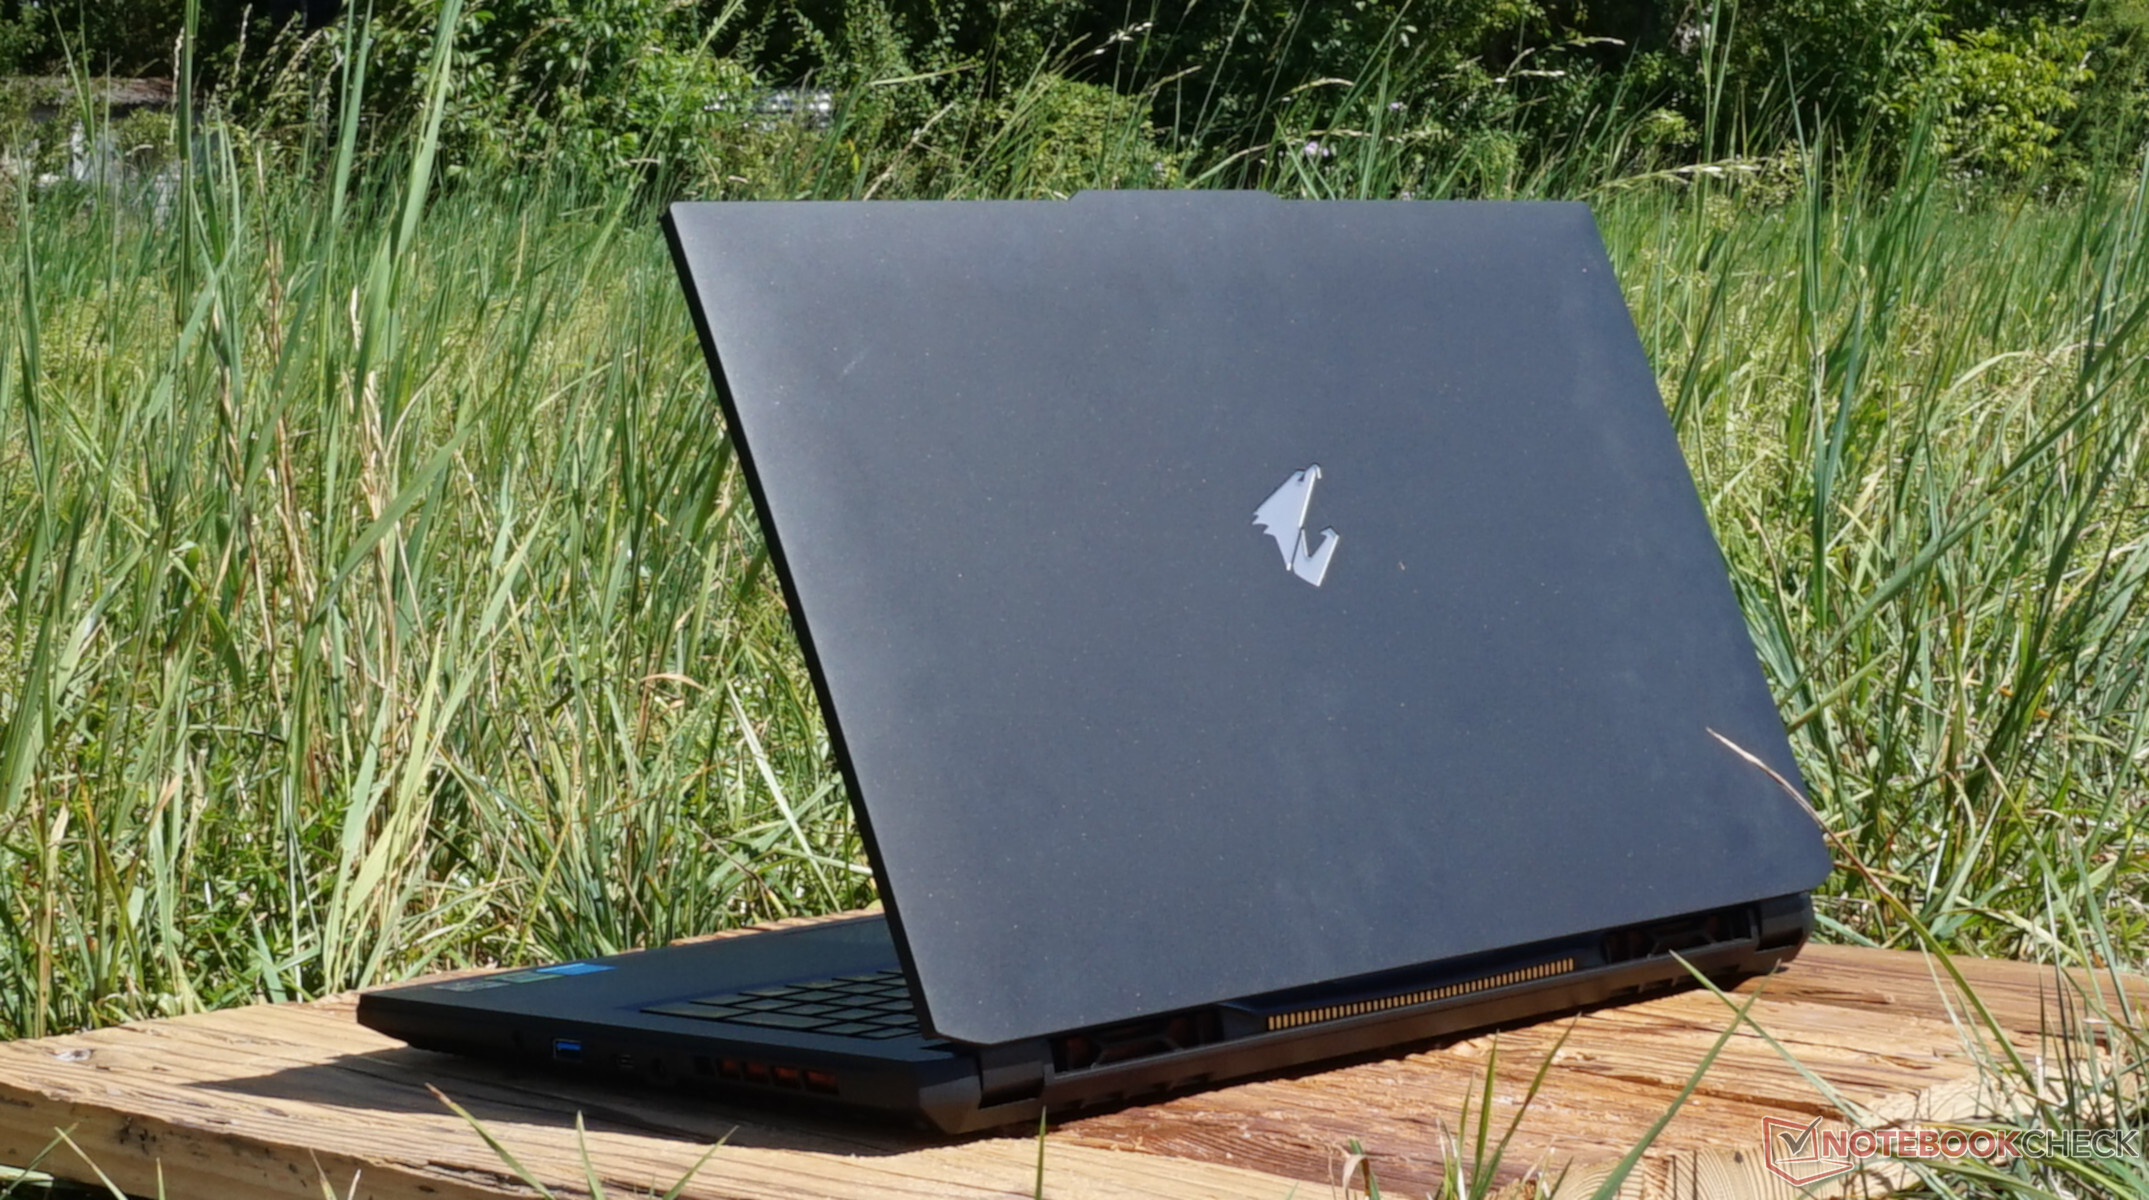
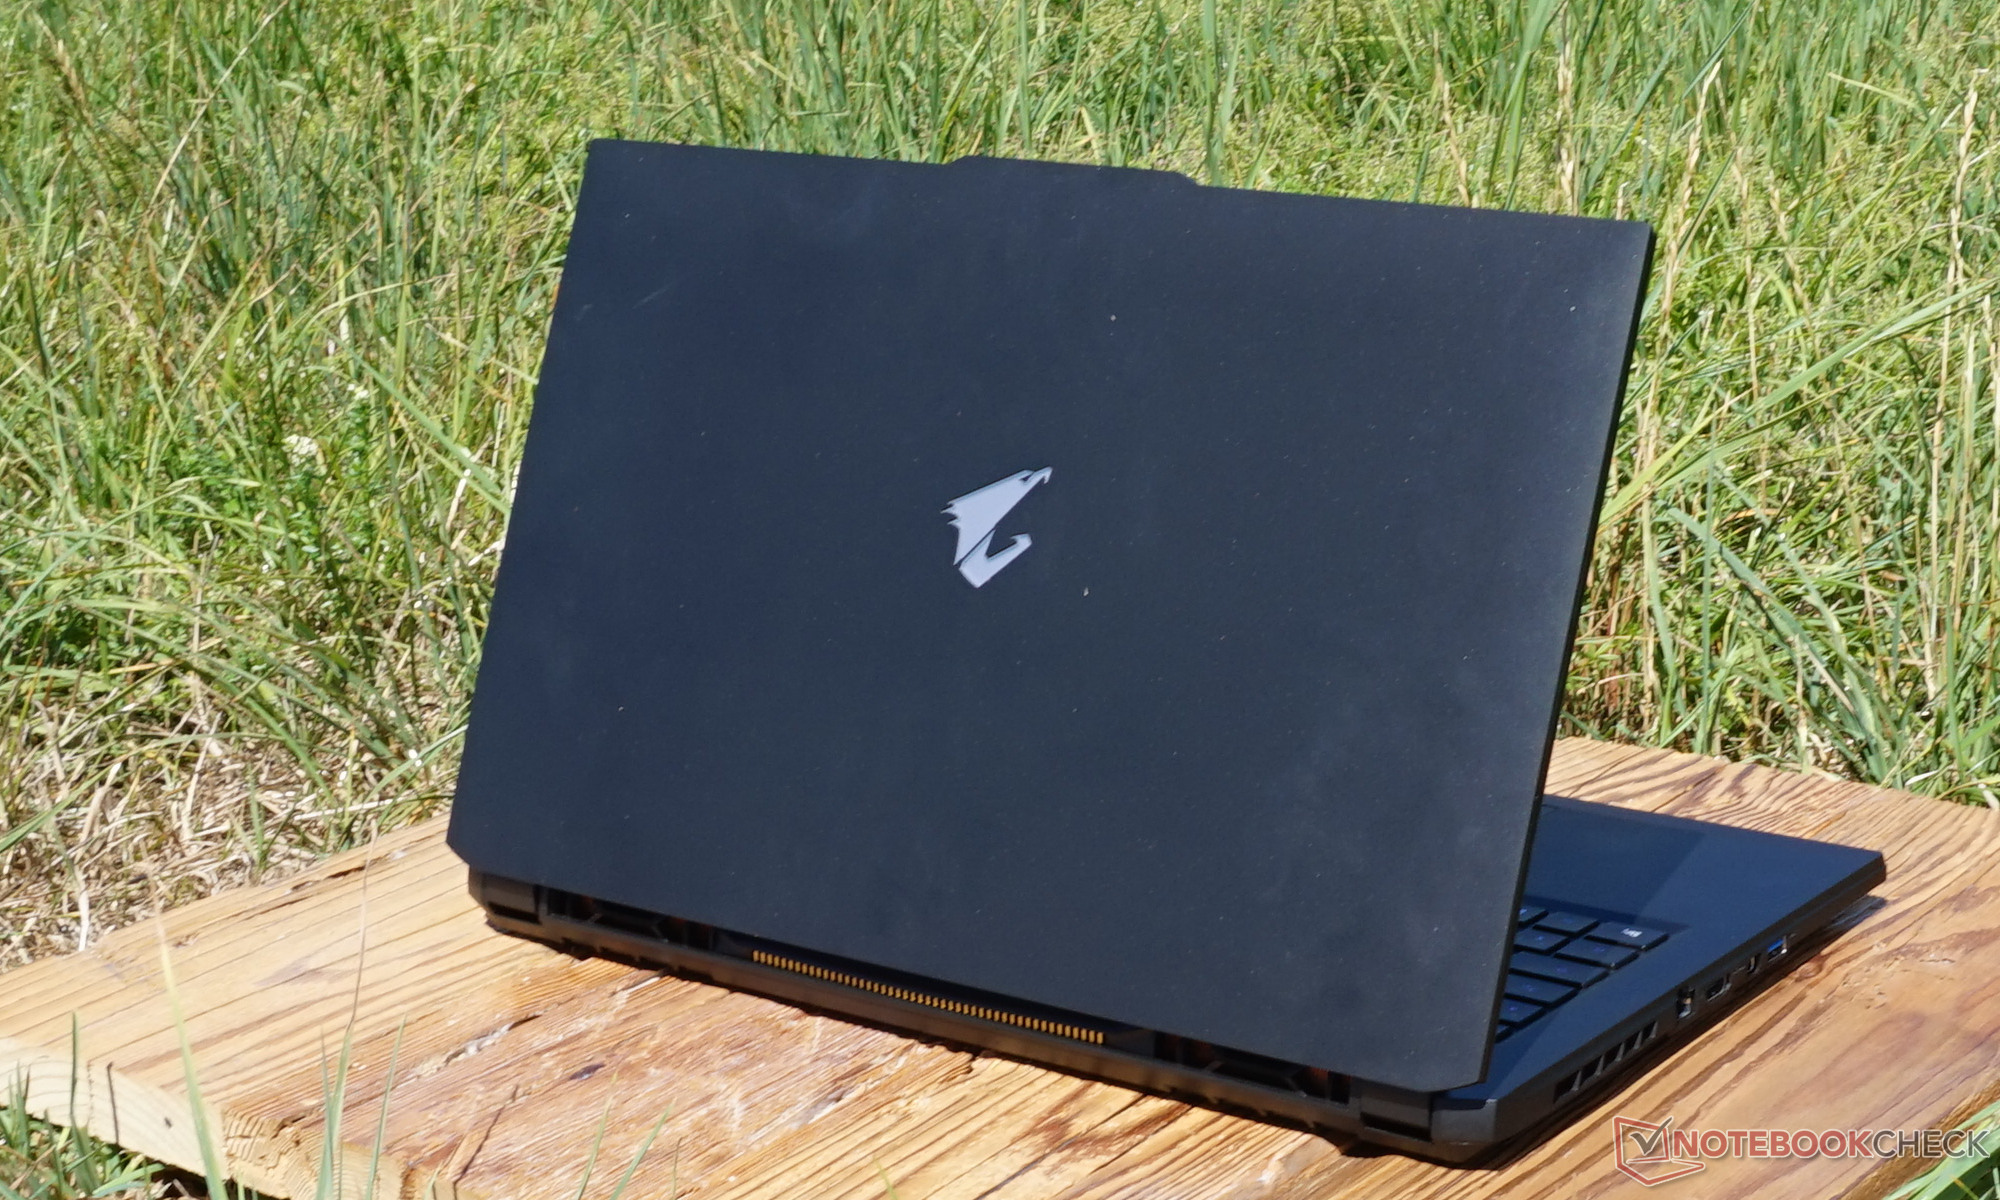
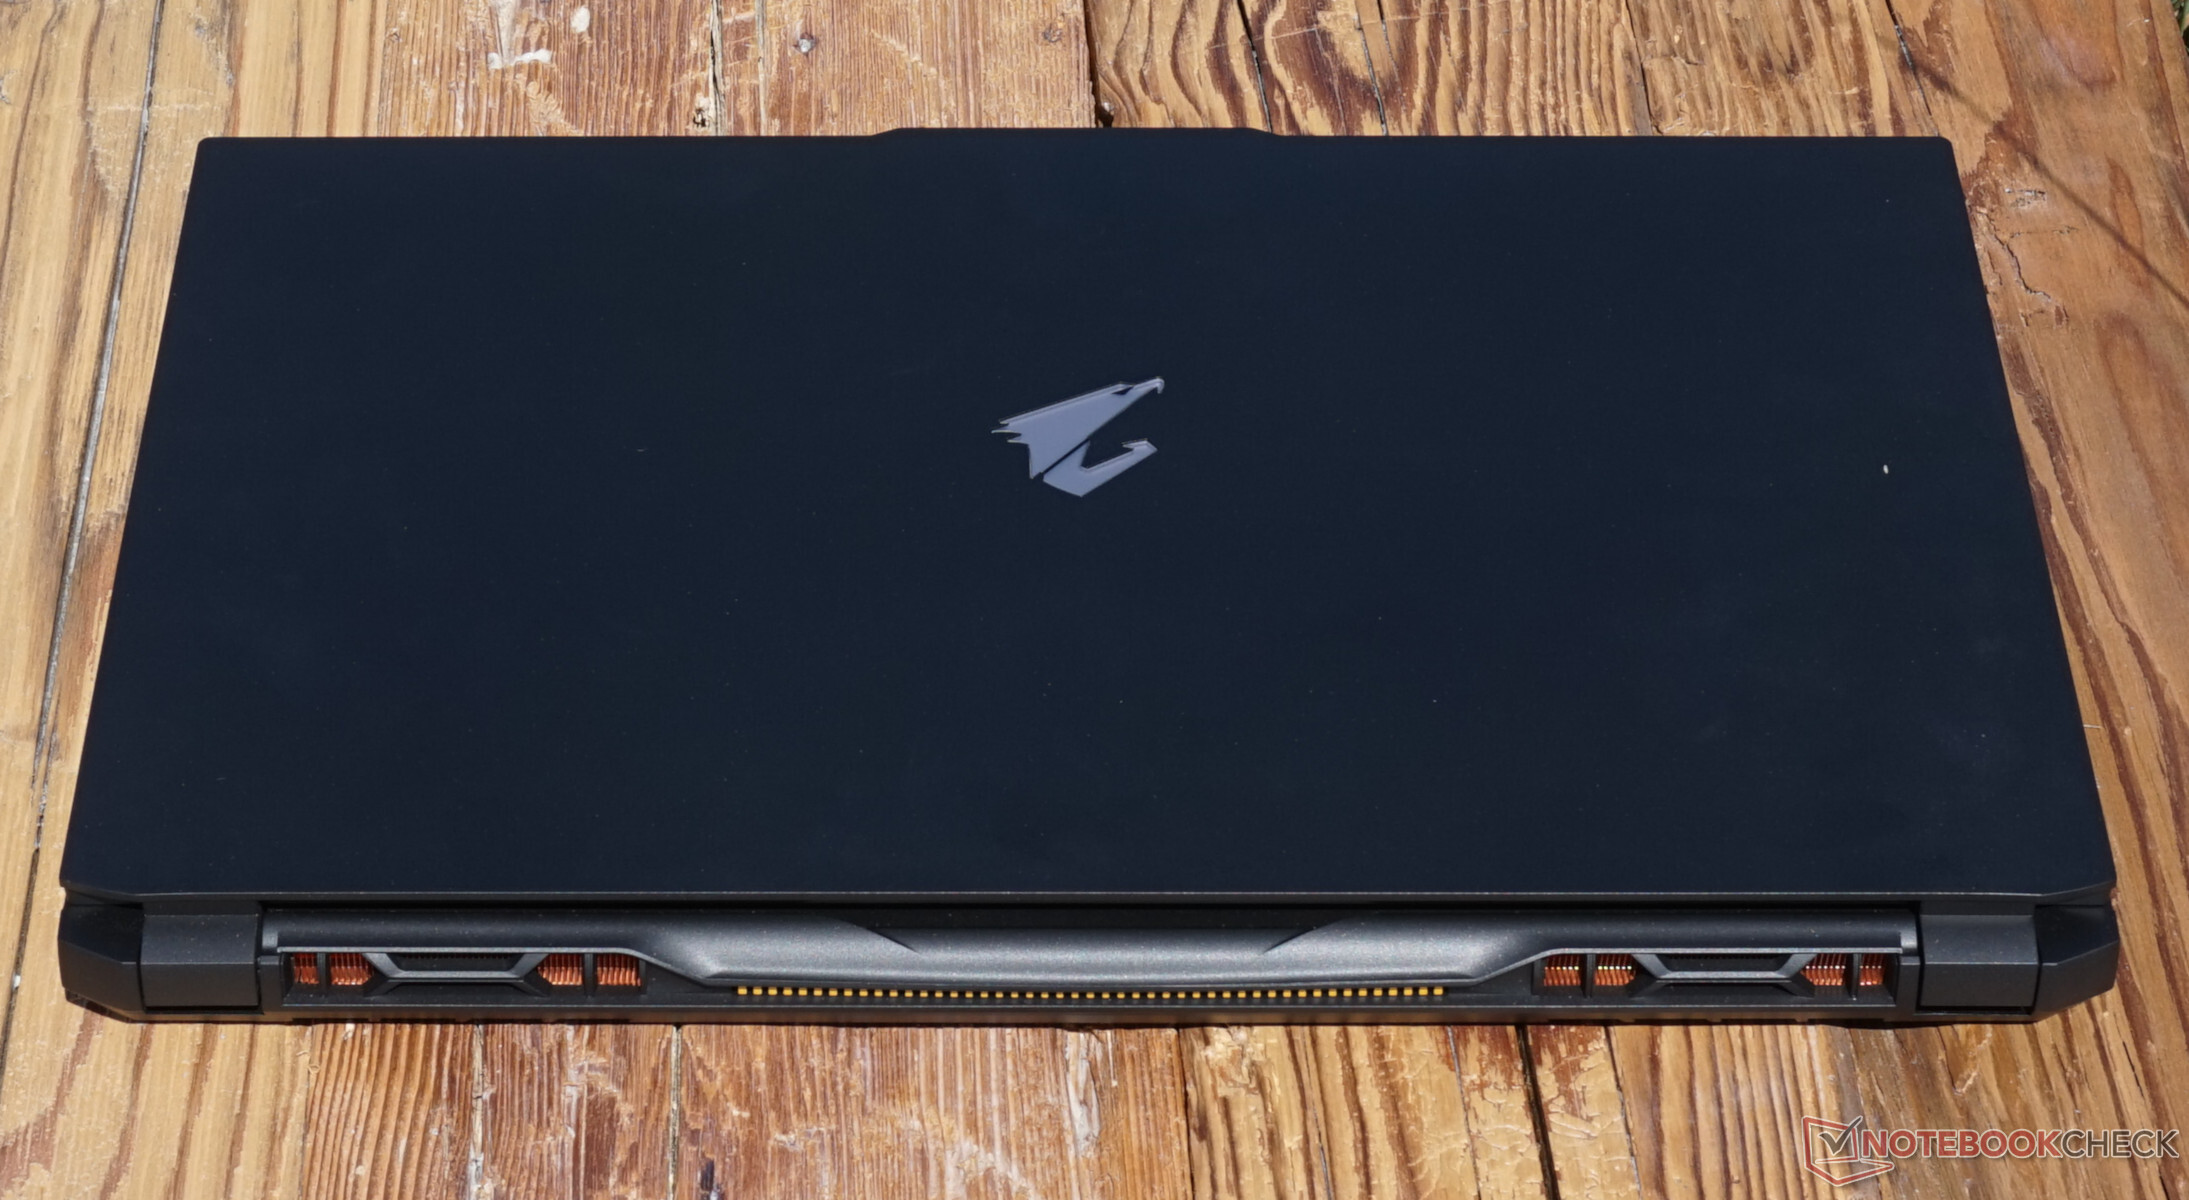
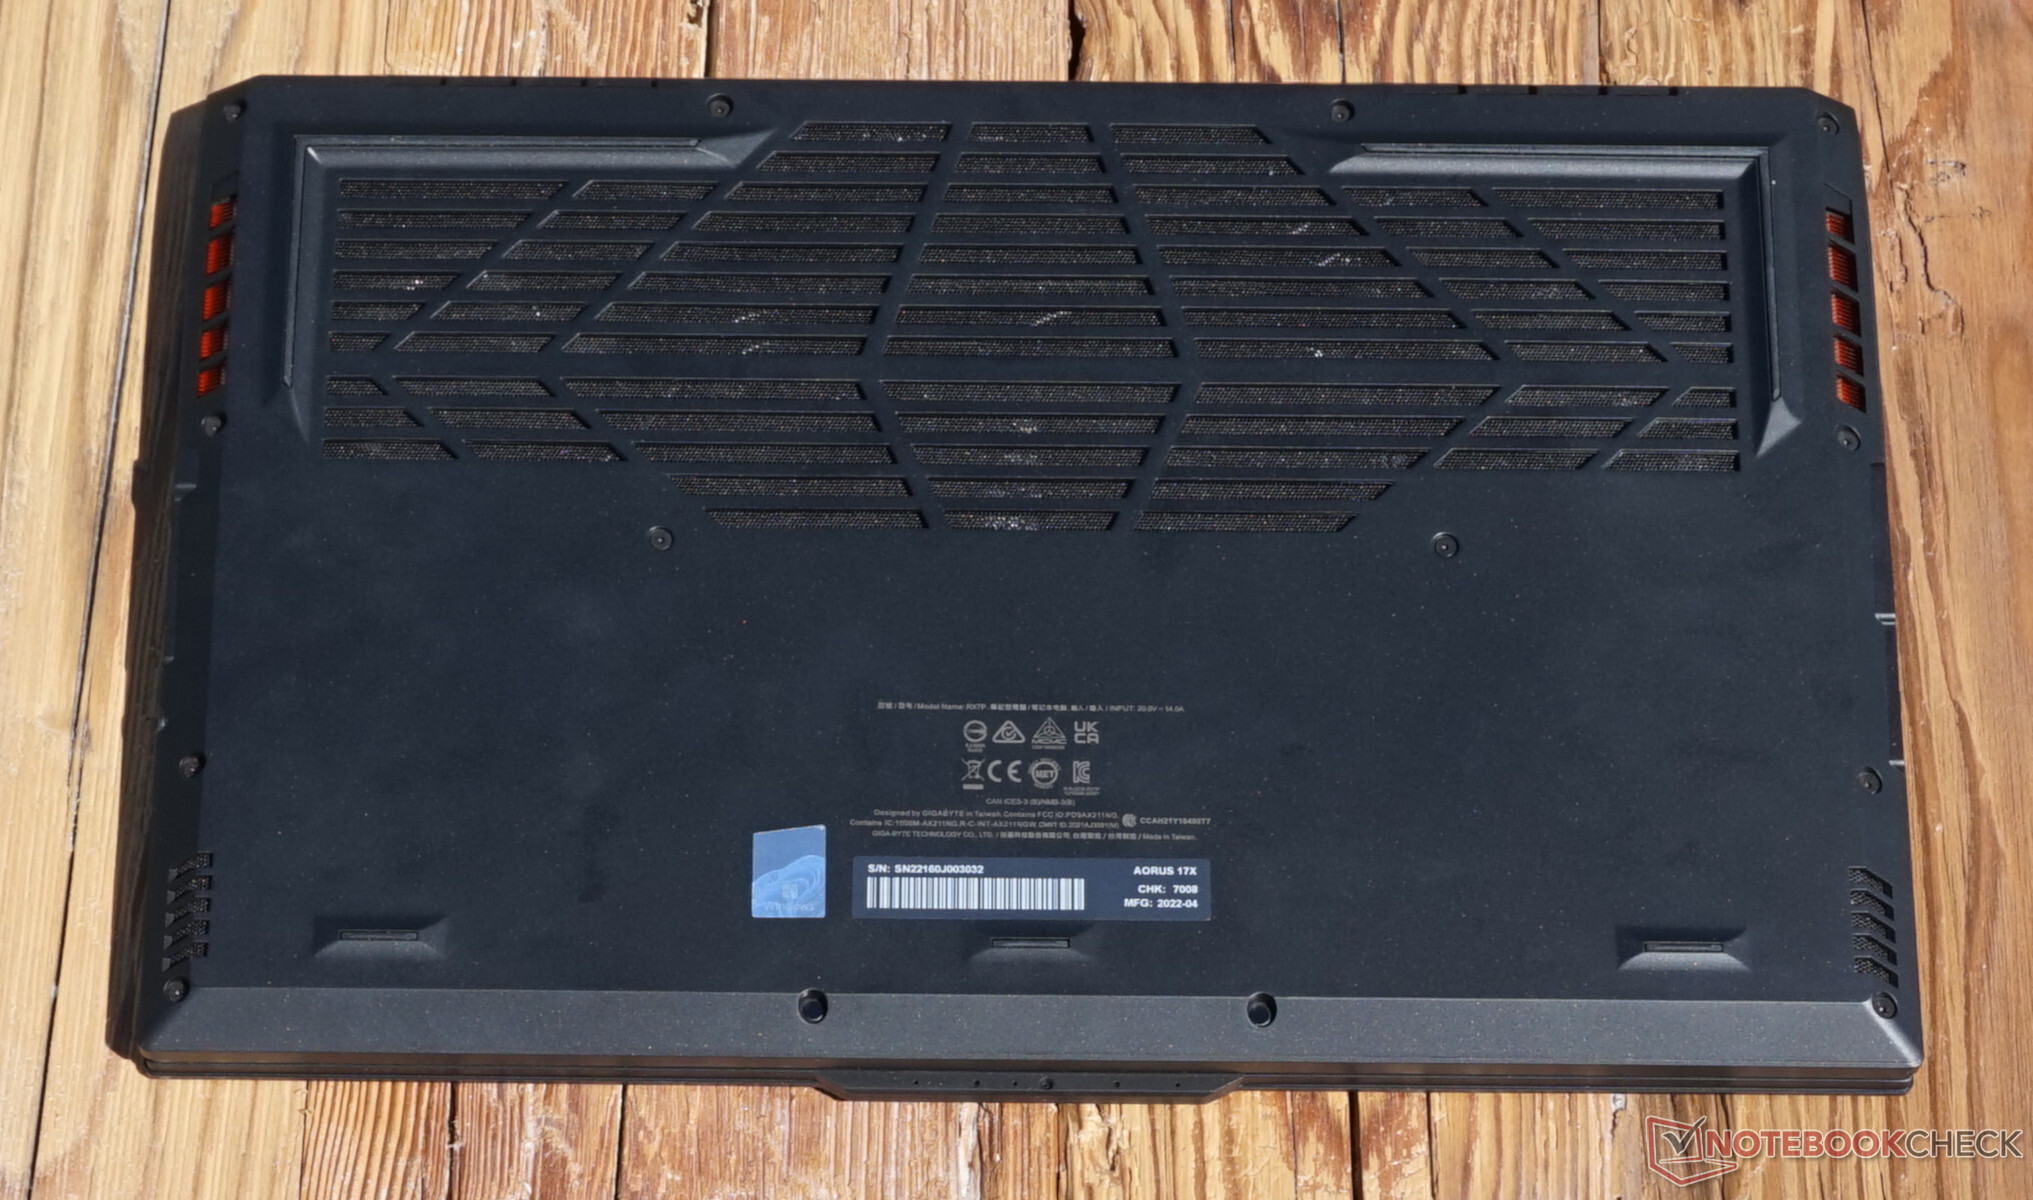
Case - Large cooling system and a lot of plastic in the Aorus 17X
Being large, heavy, and dominated by plastic, the case can be considered pragmatic at best. The display lid could have been a bit more robust, but overall, there are no annoying creaking noises, and you can also open the lid up to 130 degrees using a single hand without any trouble. Considering the heavy base, this is of course not surprising. The white, illuminated Aorus logo is attractive to look at.
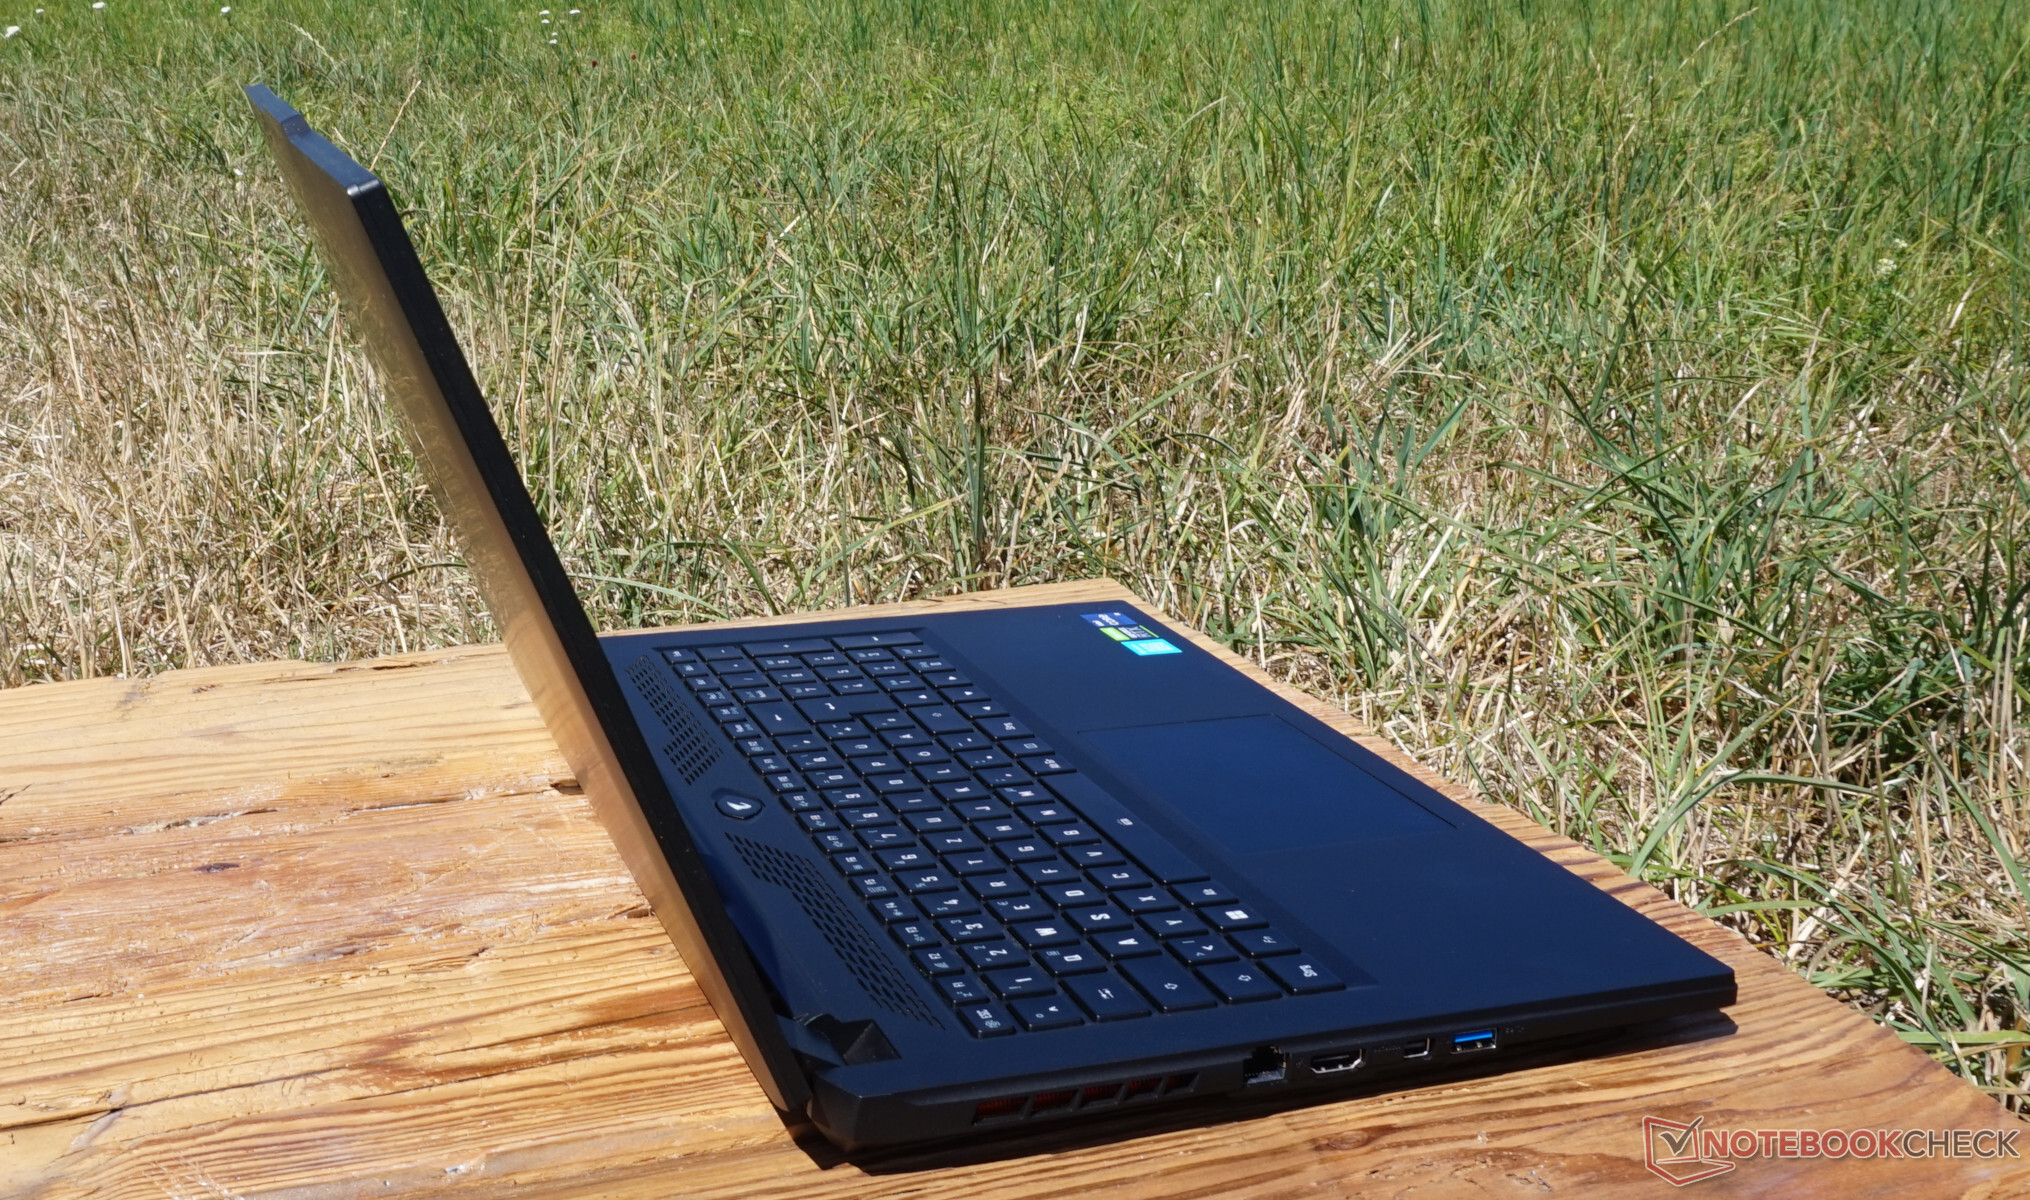
Equipment - Minimal but suitable for a gaming laptop
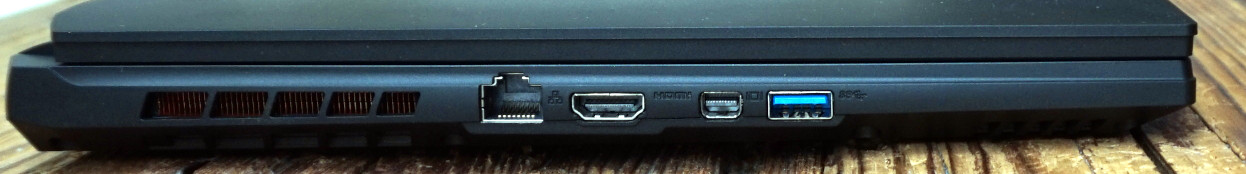
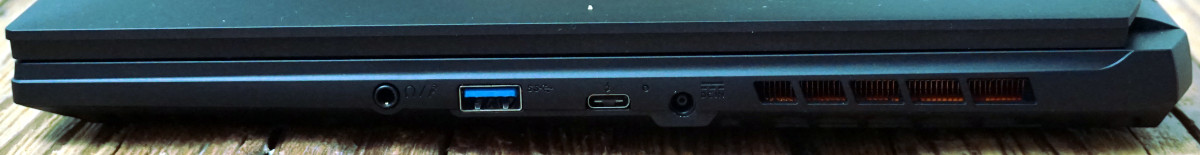
The amount of connections isn't really abundant. But at least, Thunderbolt 4 ensures fast data transfer. The 2.5-Gigabit LAN port offers a similar advantage, and not only creative professionals should be pleased with the three different video output ports.
Communications
The WLAN module, which slightly surpasses the average transmission rates of gaming laptops, also offers a high bandwidth. But with Wi-Fi 6E, the standard used here is also correspondingly powerful.
| Networking | |
| iperf3 receive AXE11000 6GHz | |
| Aorus 17X XES | |
| Average of class Gaming (975 - 1775, n=35, last 2 years) | |
| Average Intel Wi-Fi 6E AX211 (700 - 1857, n=226) | |
| MSI GE67 HX 12UGS | |
| iperf3 transmit AXE11000 6GHz | |
| Aorus 17X XES | |
| Average of class Gaming (723 - 1868, n=36, last 2 years) | |
| Average Intel Wi-Fi 6E AX211 (385 - 1851, n=226) | |
| MSI GE67 HX 12UGS | |
Webcam
As in the Aorus 17 XE4, the 17X XES also uses a simple HD camera. With its weak resolution, it is just barely suited for video calls. At least, the resulting image is easily recognizable even in bad light conditions, and the color deviations remain within limits.
On the other hand, the dual-array microphone turns out good. Recordings from various directions and distances are reproduced at almost the same volume. Unfortunately, the voices sound very tinny, but at least they are easily understandable.


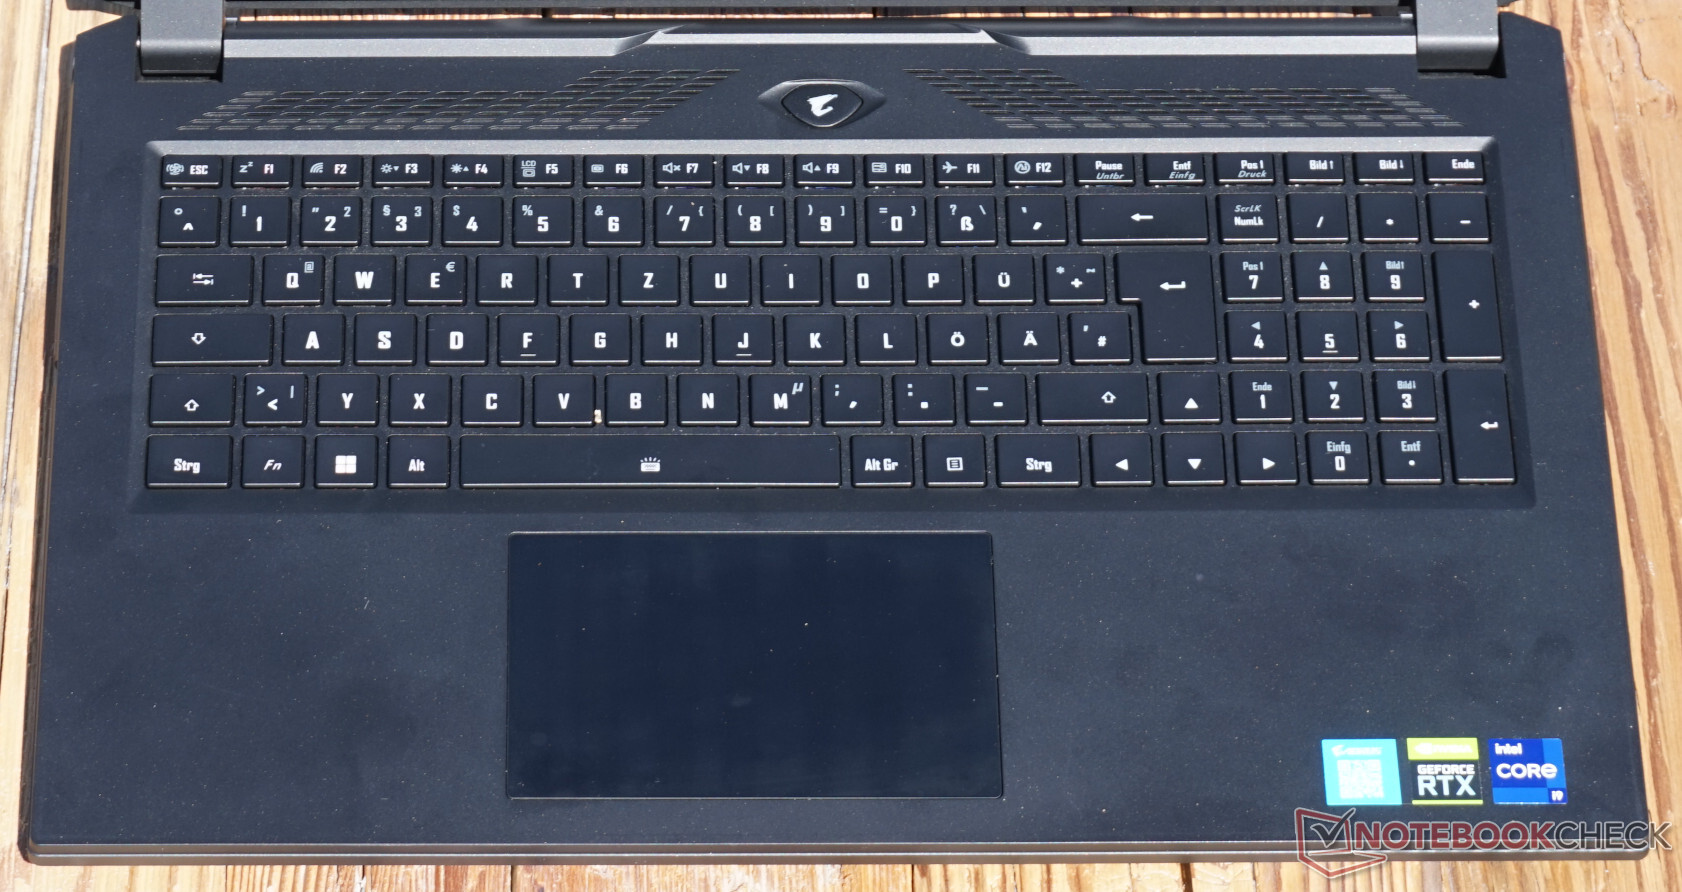
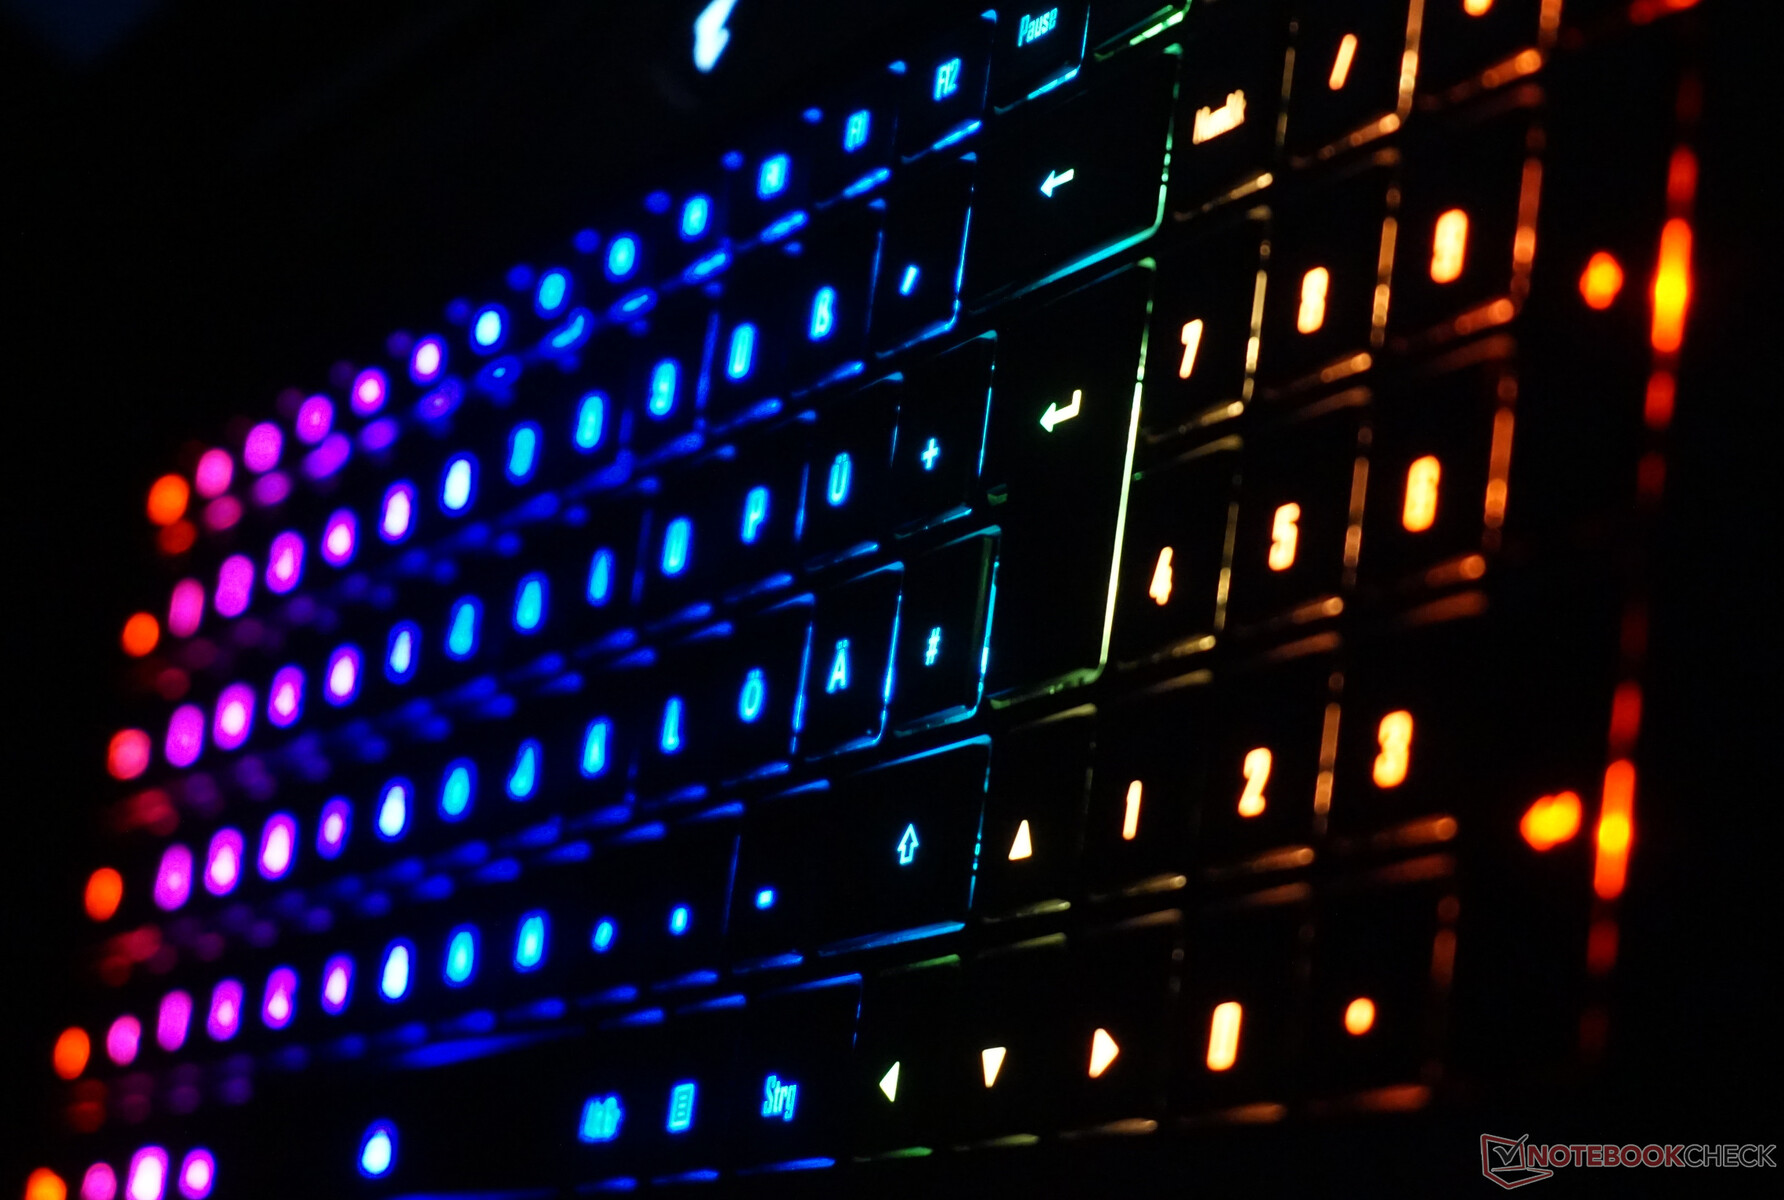
Input Devices - The gaming keyboard has a colorful illumination
The decent keyboard doesn't offer a large stroke but a comfortable resistance. The frame hardly bends. At least, with the freely configurable RGB illumination, a large selection of function keys, and the full-size number block, there are no reasons for complaint. However, we have to be careful, since the keyboard is minimally smaller than the standard, which can cause some irritation when typing.
Display - Fast but not bright

The large display with a 17.3-inch diagonal impresses particularly with its refresh rate of 360 Hz. The response times turn out correspondingly short. In addition, there is a decent contrast ratio of more than 1000:1. The high refresh rate is combined with a Full HD resolution.
What is less convincing is the brightness. Even on the desk, the average value of 270 cd/m² seems too low at times, and the illumination lacks power. Considering the weak background illumination, the screen bleeding remains within limits, and we only notice a light halo in the top right corner with extremely dark image content.
To enable the display to adjust automatically to the surroundings, Gigabyte equipped the Aorus 17X with a brightness sensor. While it works reliably, it activates a bit too often for our tastes. Merely creating some shadow by moving the hand in front of it, might lead to an adjustment of the brightness, which is also reported each time.
Nvidia Advanced Optimus, which runs in the background and limits the latencies to a minimum, ensures almost unnoticeable switching between the iGPU and gaming graphics card. This is especially practical for fast and competitive games, but also useful in general.
| |||||||||||||||||||||||||
Brightness Distribution: 79 %
Center on Battery: 278 cd/m²
Contrast: 1069:1 (Black: 0.26 cd/m²)
ΔE ColorChecker Calman: 3.96 | ∀{0.5-29.43 Ø4.72}
calibrated: 1.07
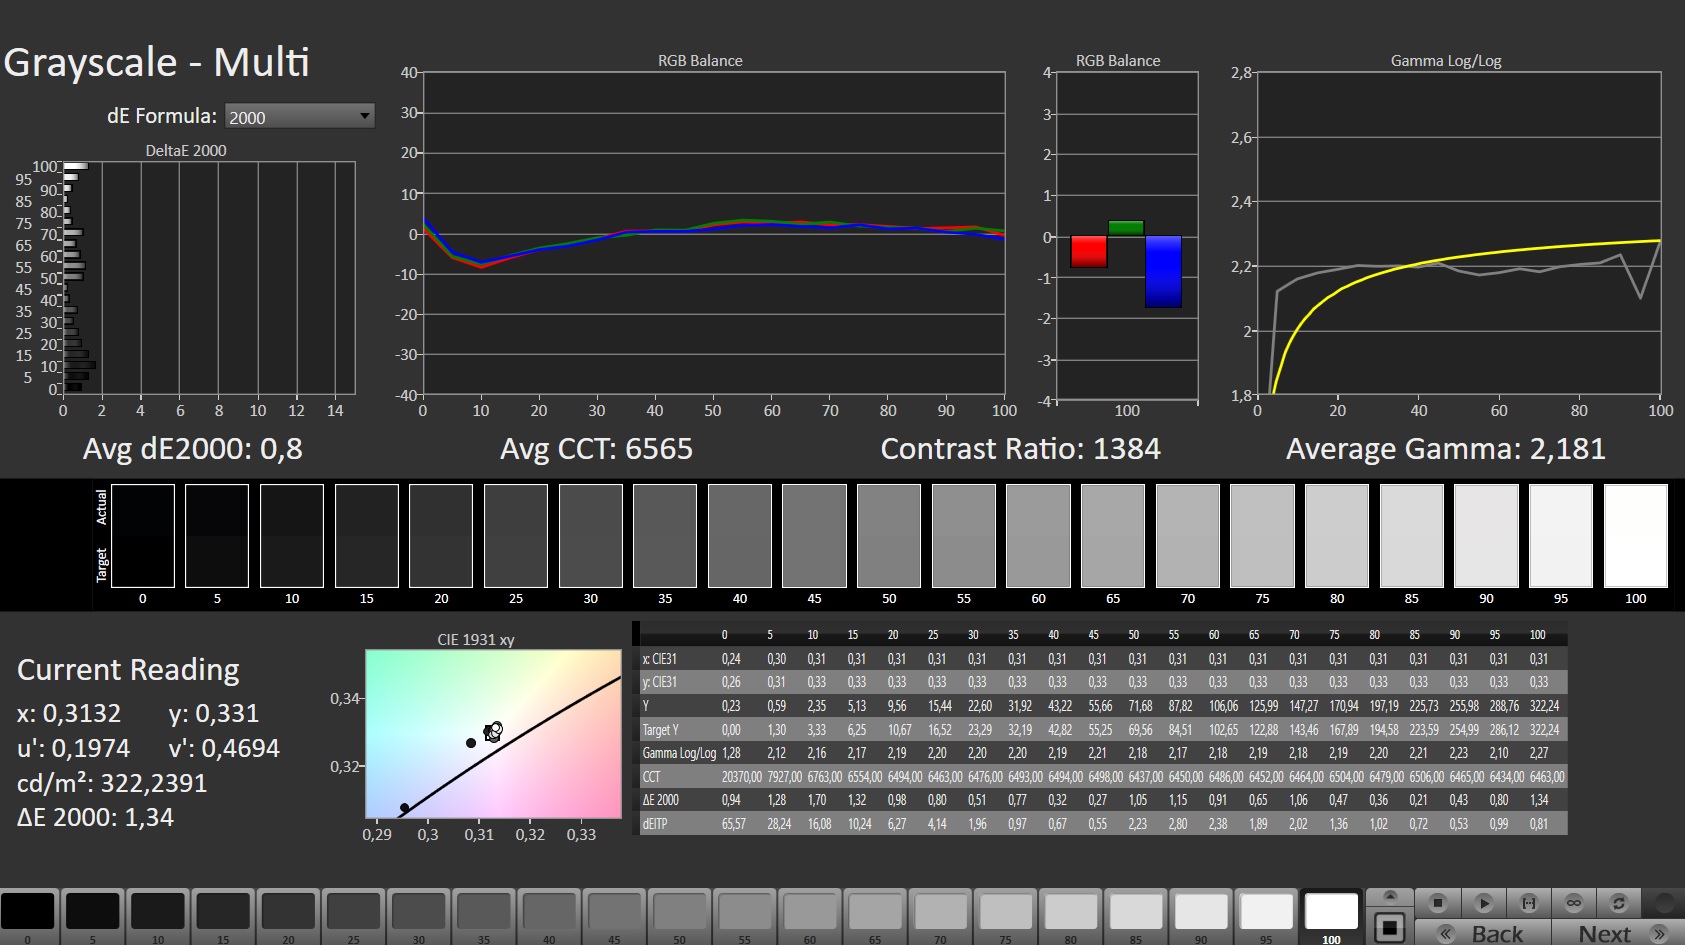
ΔE Greyscale Calman: 6.8 | ∀{0.09-98 Ø4.97}
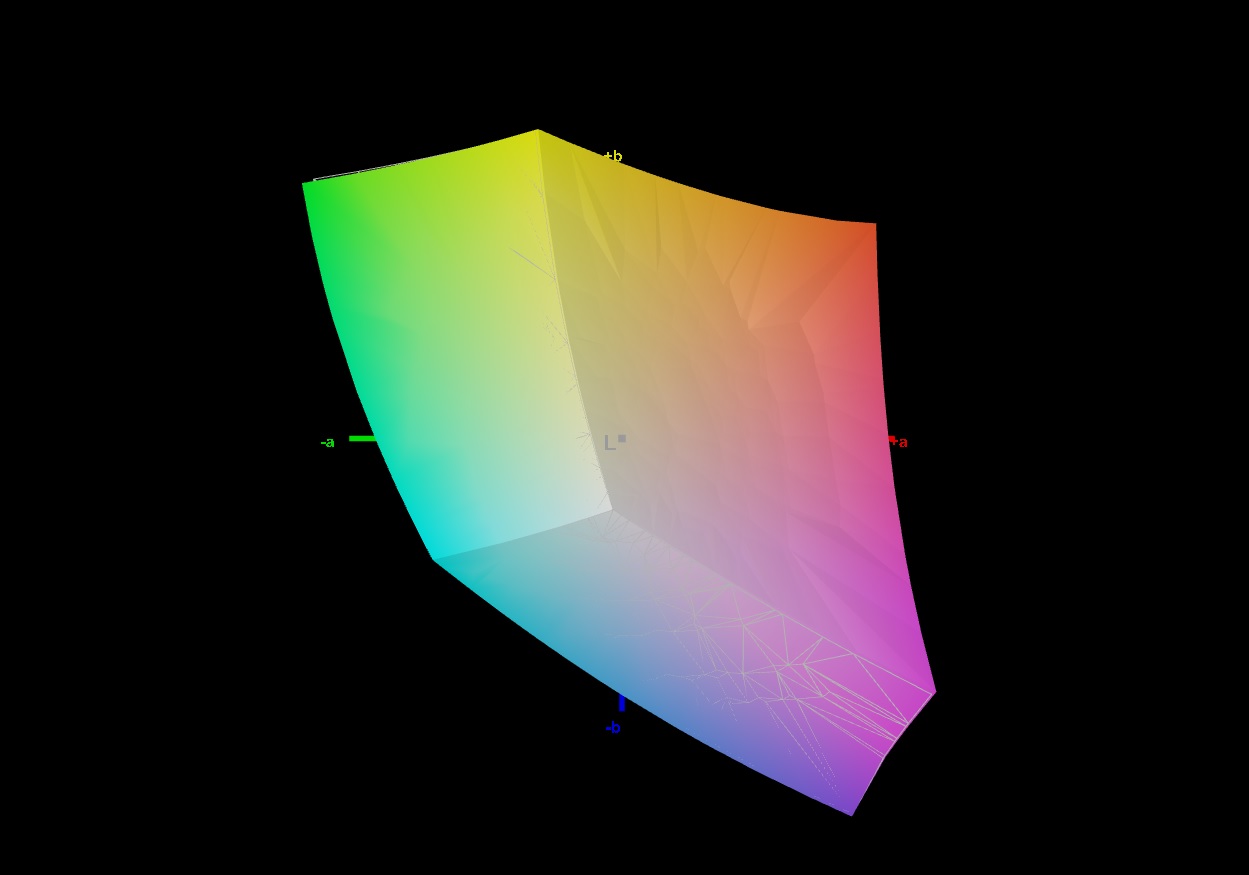
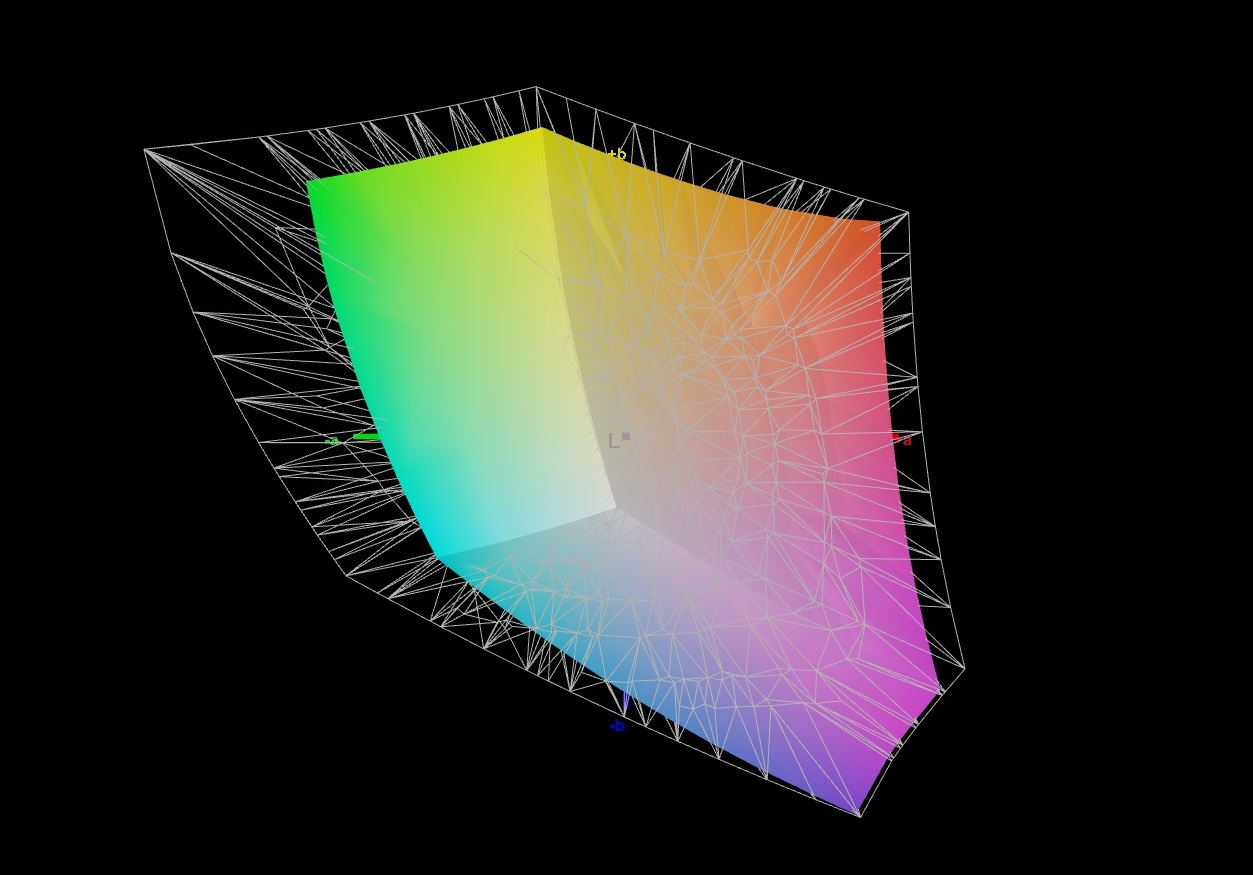
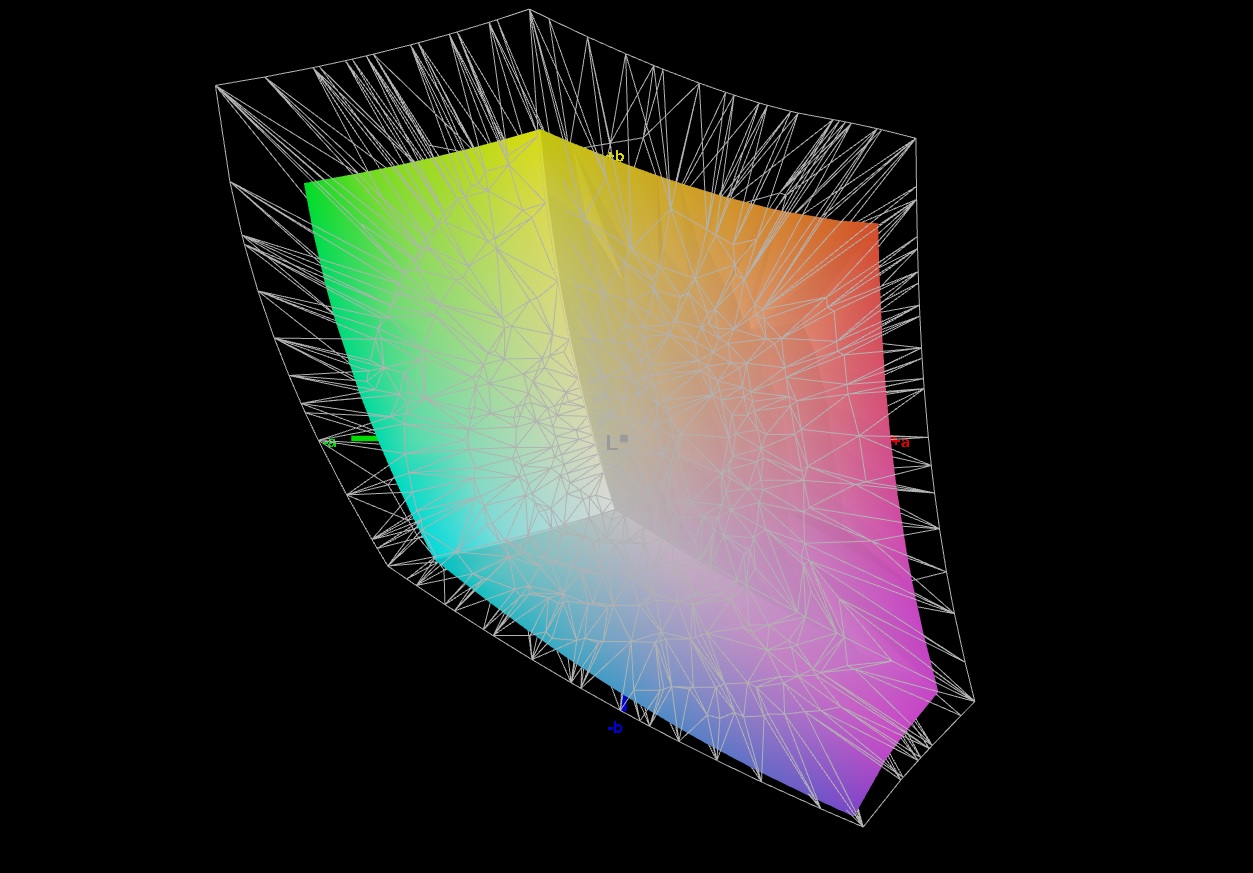
71.9% AdobeRGB 1998 (Argyll 3D)
99.9% sRGB (Argyll 3D)
70.1% Display P3 (Argyll 3D)
Gamma: 2.224
CCT: 7651 K
| Aorus 17X XES Sharp SHP1563, IPS, 1920x1080, 17.3" | HP Omen 17-ck1075ng BOE09EE, IPS, 1920x1080, 17.3" | MSI GE67 HX 12UGS Samsung ATNA562P02-0, OLED, 1920x1080, 15.6" | Schenker XMG Pro 17 E22 BOE099D, IPS, 2560x1440, 17.3" | MSI Raider GE66 12UHS AUO51EB, IPS, 3840x2160, 15.6" | Asus ROG Zephyrus Duo 16 GX650RX BOE NE160QAM-NX1, IPS-Level, 3840x2400, 16" | Aorus 17 XE4 Sharp LQ173M1JW12, IPS, 1920x1080, 17.3" | |
|---|---|---|---|---|---|---|---|
| Display | -14% | -1% | 19% | 15% | 20% | -1% | |
| Display P3 Coverage (%) | 70.1 | 59.03 -16% | 71.7 2% | 97.5 39% | 80.4 15% | 98 40% | 69 -2% |
| sRGB Coverage (%) | 99.9 | 87.46 -12% | 89.7 -10% | 99.9 0% | 98.4 -2% | 99.9 0% | 99.4 -1% |
| AdobeRGB 1998 Coverage (%) | 71.9 | 61.04 -15% | 75.2 5% | 85.2 18% | 94.7 32% | 86.3 20% | 71.2 -1% |
| Response Times | -192% | 93% | -38% | -287% | -163% | -220% | |
| Response Time Grey 50% / Grey 80% * (ms) | 3.4 ? | 14 ? -312% | 0.25 ? 93% | 5.4 ? -59% | 18.8 ? -453% | 14.6 ? -329% | 15.2 ? -347% |
| Response Time Black / White * (ms) | 5.8 ? | 10 ? -72% | 0.4 ? 93% | 6.8 ? -17% | 12.8 ? -121% | 5.6 ? 3% | 11.2 ? -93% |
| PWM Frequency (Hz) | 100 ? | 480.4 ? | |||||
| Screen | 8% | 24% | 20% | 18% | 16% | 21% | |
| Brightness middle (cd/m²) | 278 | 321 15% | 356.1 28% | 349 26% | 351 26% | 459 65% | 274 -1% |
| Brightness (cd/m²) | 273 | 302 11% | 358 31% | 319 17% | 347 27% | 434 59% | 267 -2% |
| Brightness Distribution (%) | 79 | 84 6% | 99 25% | 83 5% | 90 14% | 88 11% | 82 4% |
| Black Level * (cd/m²) | 0.26 | 0.41 -58% | 0.32 -23% | 0.35 -35% | 0.44 -69% | 0.25 4% | |
| Contrast (:1) | 1069 | 783 -27% | 1091 2% | 1003 -6% | 1043 -2% | 1096 3% | |
| Colorchecker dE 2000 * | 3.96 | 1.62 59% | 4.83 -22% | 2.5 37% | 2.54 36% | 2.97 25% | 2.07 48% |
| Colorchecker dE 2000 max. * | 10.78 | 4.08 62% | 7.94 26% | 6.87 36% | 8.36 22% | 8.13 25% | 4.89 55% |
| Colorchecker dE 2000 calibrated * | 1.07 | 1.93 -80% | 0.64 40% | 0.67 37% | 1.03 4% | 0.83 22% | |
| Greyscale dE 2000 * | 6.8 | 1.24 82% | 3.1 54% | 3.9 43% | 4.1 40% | 4.9 28% | 3 56% |
| Gamma | 2.224 99% | 2.41 91% | 2.2 100% | 2.09 105% | 2.089 105% | 2.235 98% | 2.207 100% |
| CCT | 7651 85% | 6261 104% | 5938 109% | 7192 90% | 7036 92% | 6775 96% | 6999 93% |
| Total Average (Program / Settings) | -66% /
-26% | 39% /
30% | 0% /
12% | -85% /
-26% | -42% /
-9% | -67% /
-18% |
* ... smaller is better
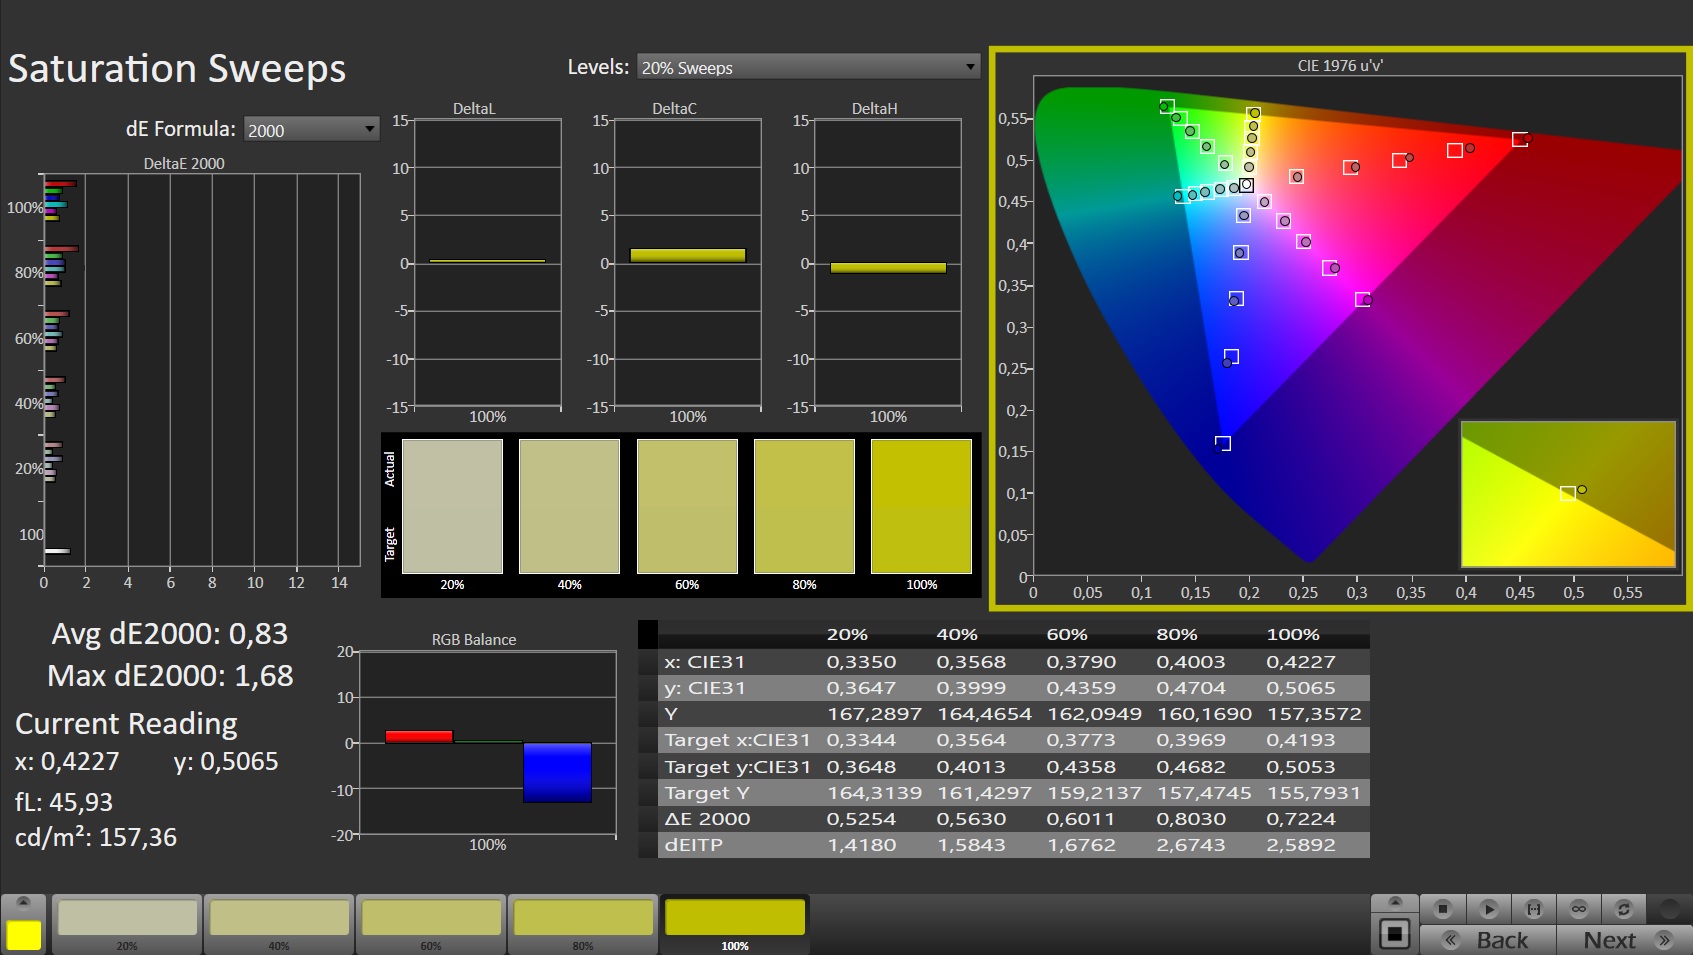
The color space coverage is optimally targeted for gaming. The sRGB color space can basically be reproduced completely. As expected, the display is only able to cover parts of the AdobeRGB or DCI-P3 color spaces, which are most used for processing media.
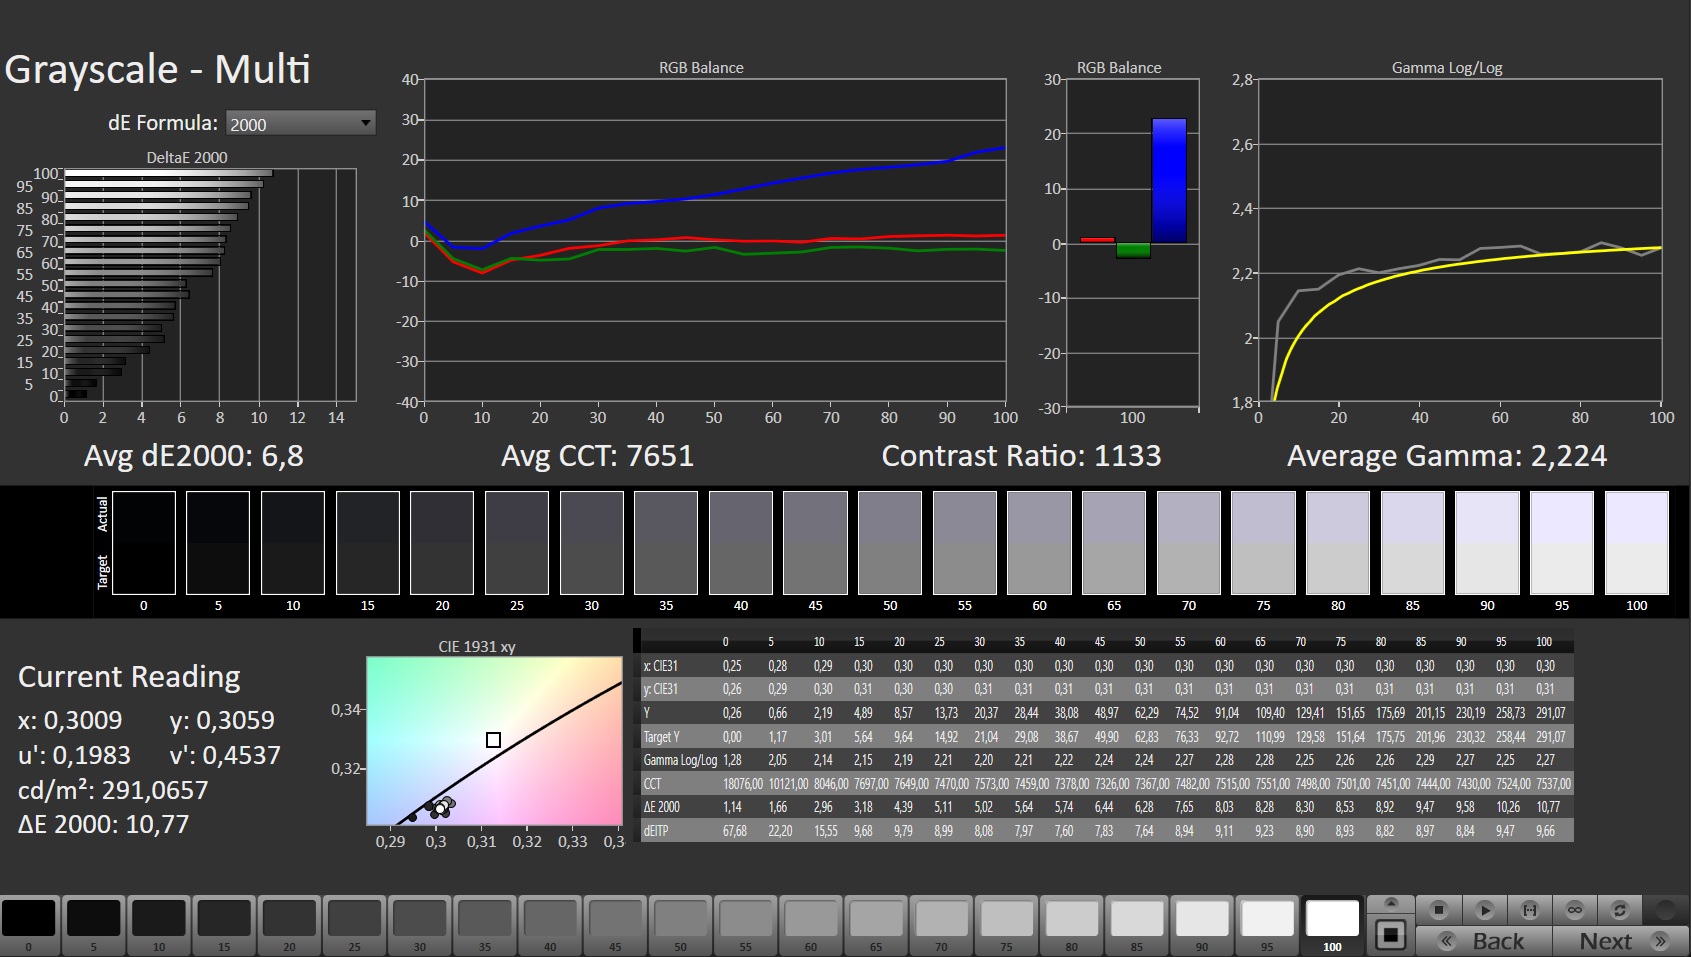
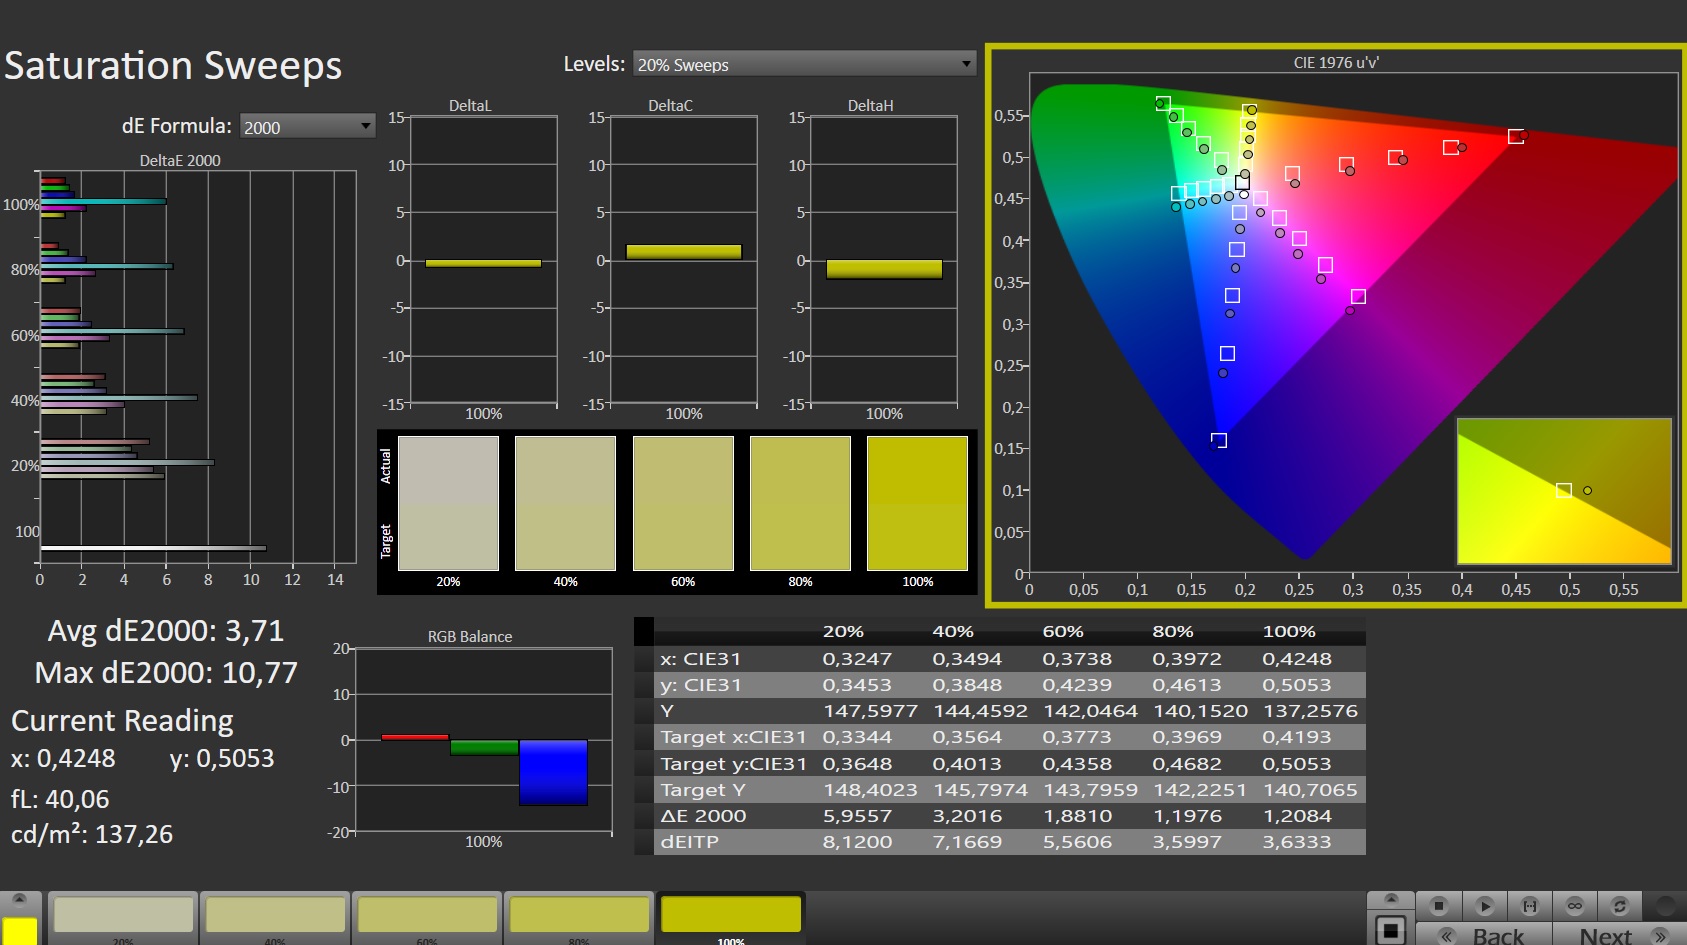
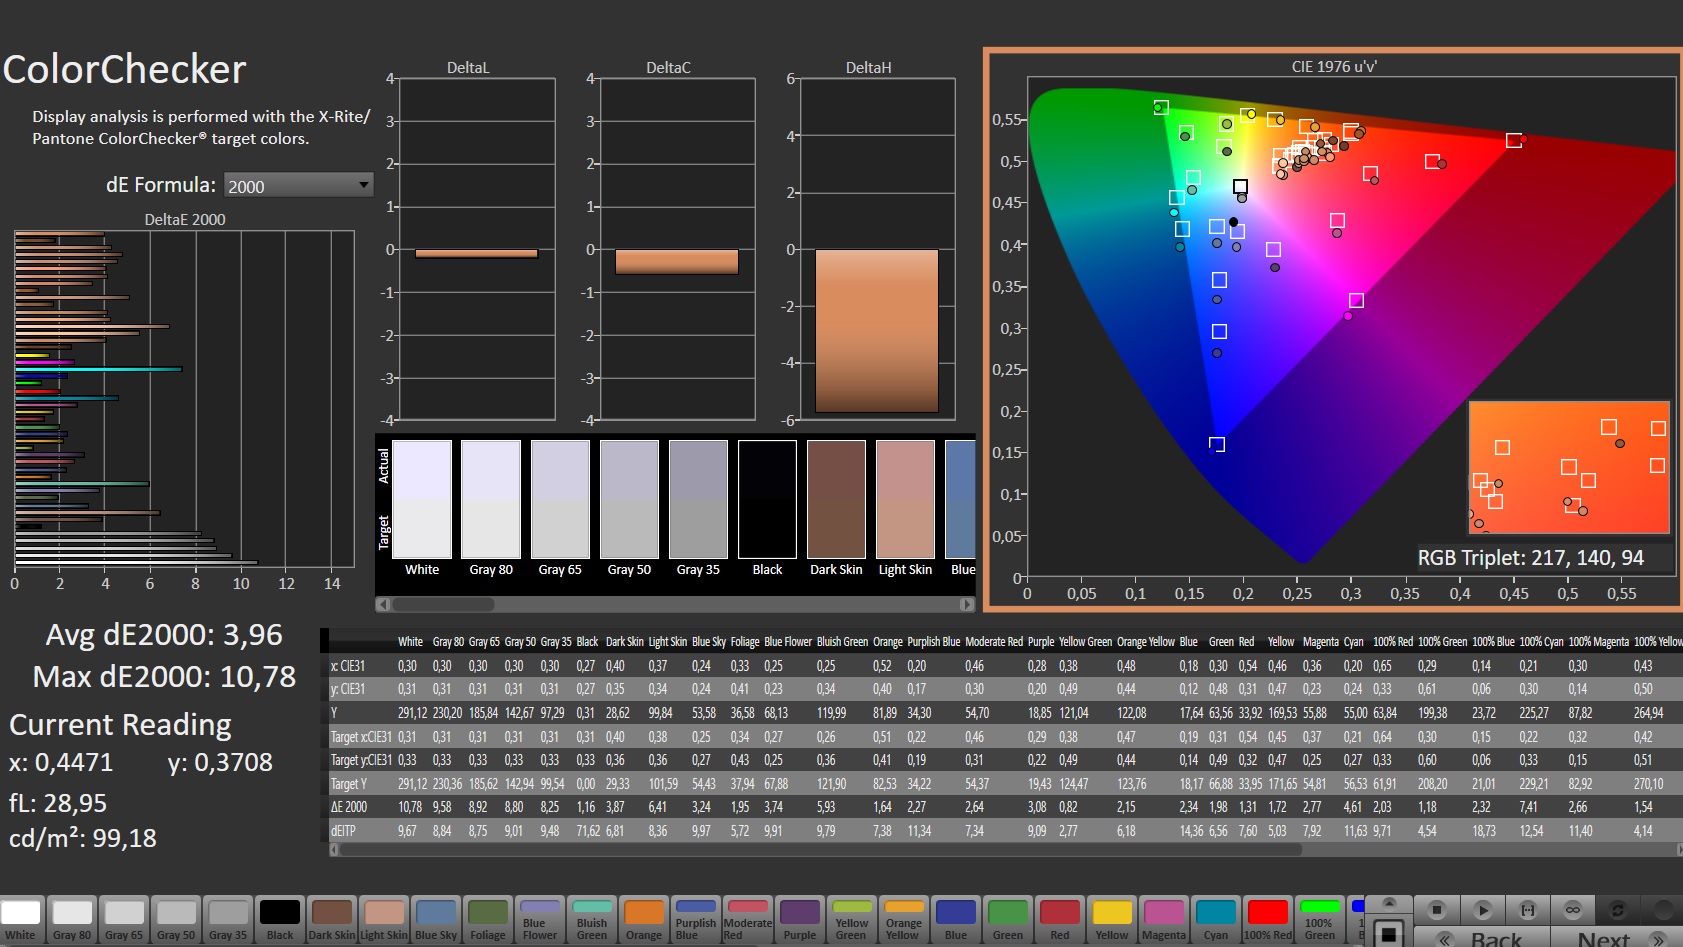
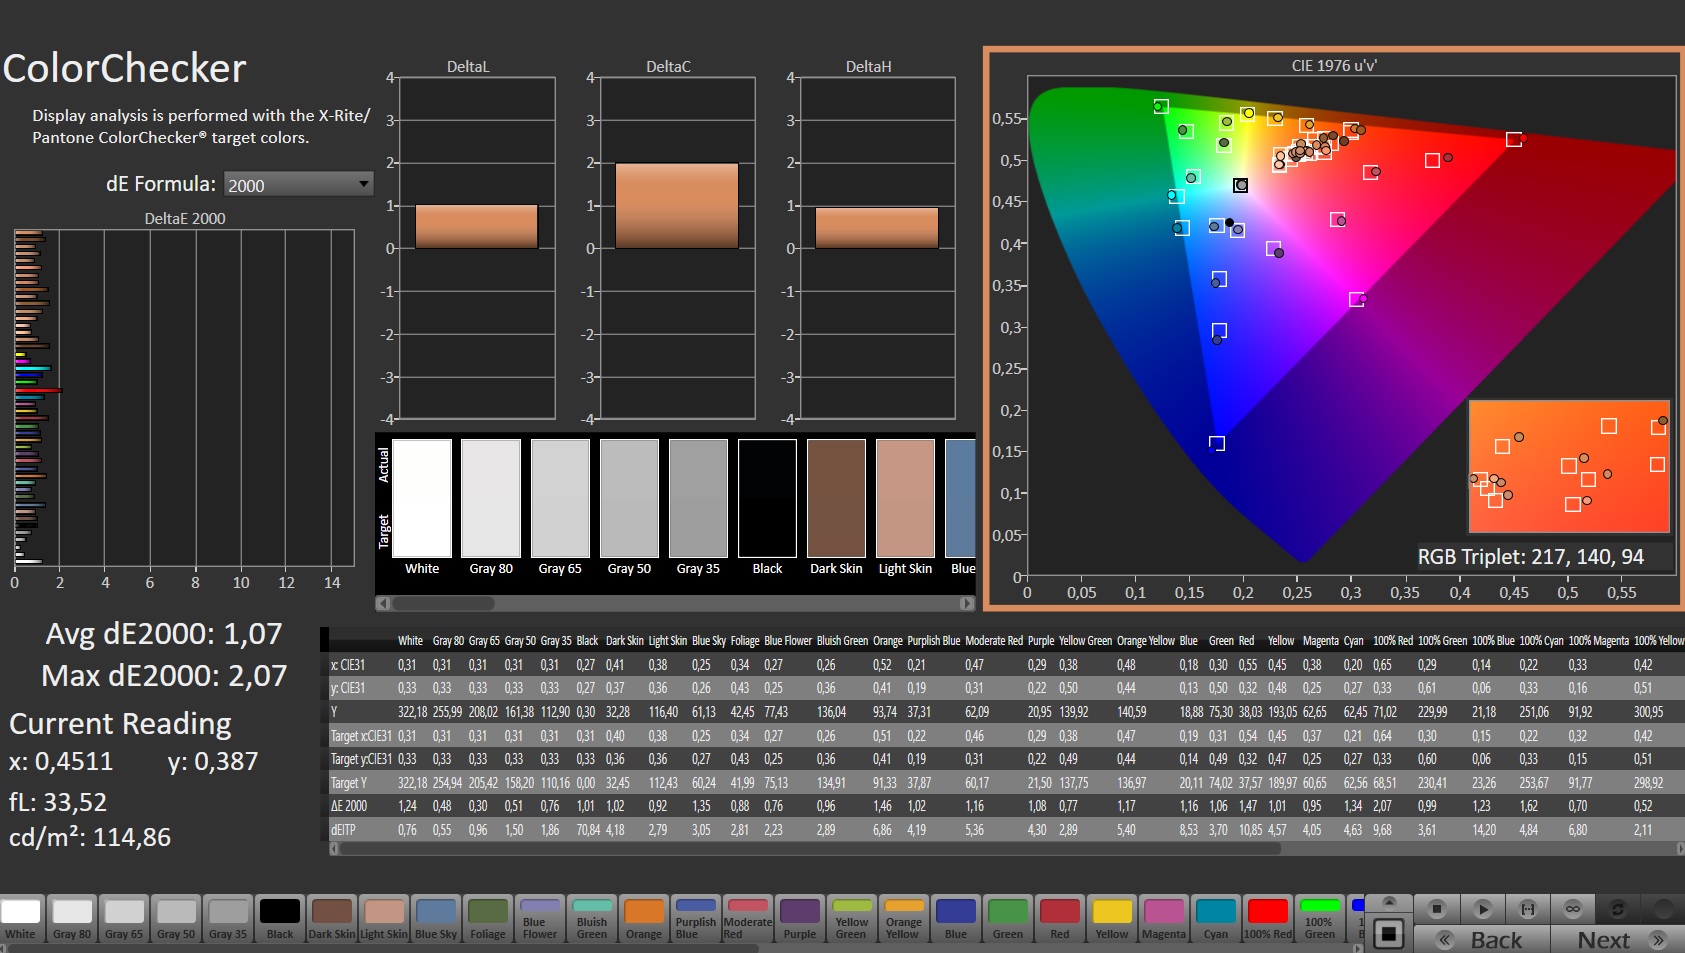
The color accuracy in the state of delivery can still be improved. However, you need trained eyes to be able to really notice the DeltaE of barely 4. After the calibration, we measure a DeltaE of only 1, which corresponds to an almost optimal color reproduction. You can download the associated color profile from the link above, at the bottom of the box with the panel values.
Display Response Times
| ↔ Response Time Black to White | ||
|---|---|---|
| 5.8 ms ... rise ↗ and fall ↘ combined | ↗ 2.5 ms rise | 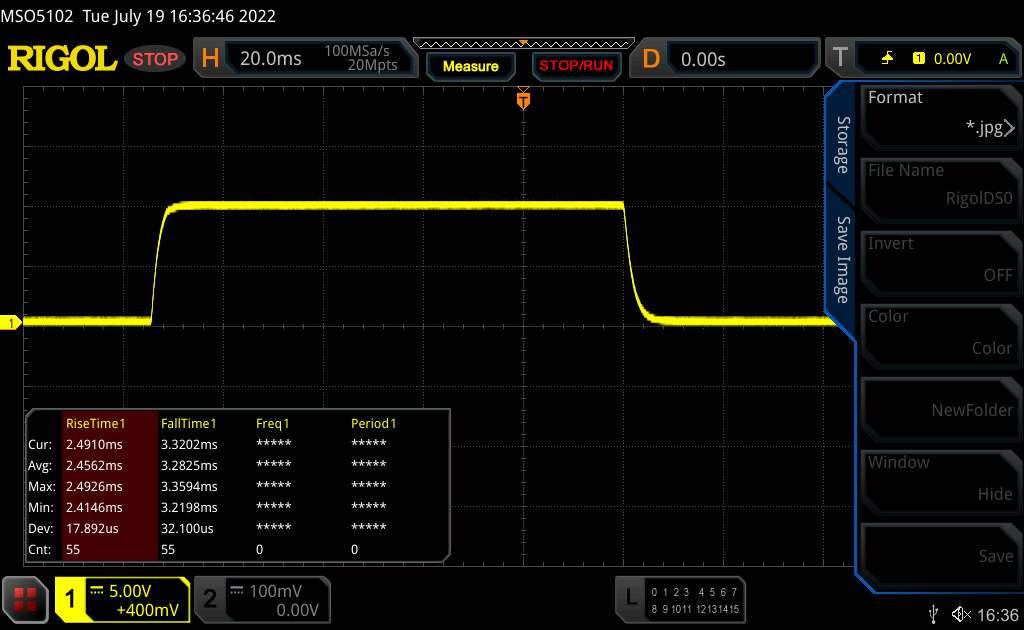 |
| ↘ 3.3 ms fall | ||
| The screen shows very fast response rates in our tests and should be very well suited for fast-paced gaming. In comparison, all tested devices range from 0.1 (minimum) to 240 (maximum) ms. » 18 % of all devices are better. This means that the measured response time is better than the average of all tested devices (19.8 ms). | ||
| ↔ Response Time 50% Grey to 80% Grey | ||
| 3.4 ms ... rise ↗ and fall ↘ combined | ↗ 1.4 ms rise | 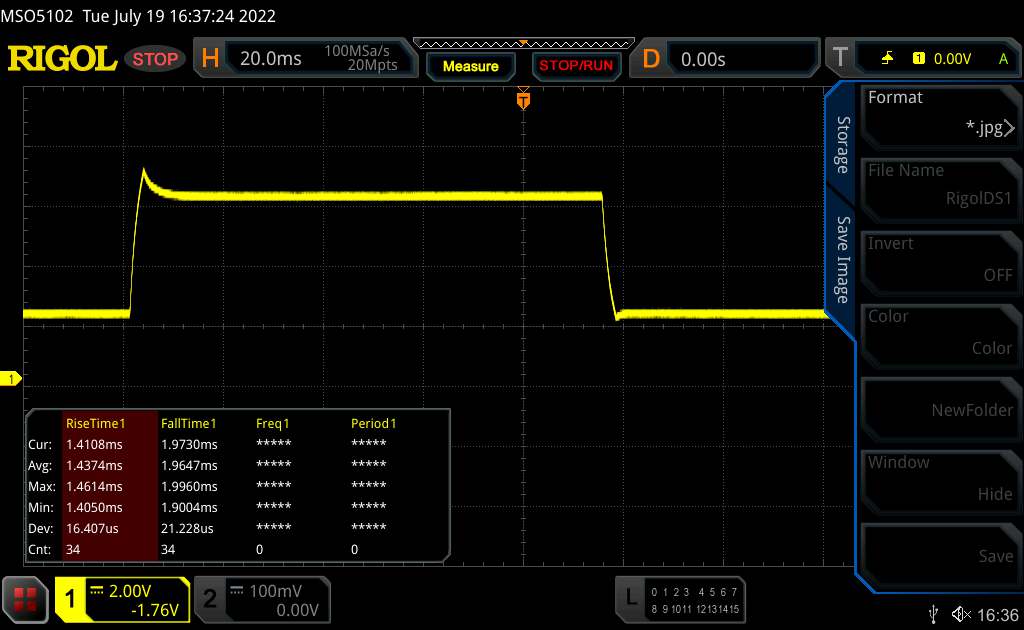 |
| ↘ 2 ms fall | ||
| The screen shows very fast response rates in our tests and should be very well suited for fast-paced gaming. In comparison, all tested devices range from 0.165 (minimum) to 636 (maximum) ms. » 14 % of all devices are better. This means that the measured response time is better than the average of all tested devices (31 ms). | ||
Screen Flickering / PWM (Pulse-Width Modulation)
| Screen flickering / PWM not detected | 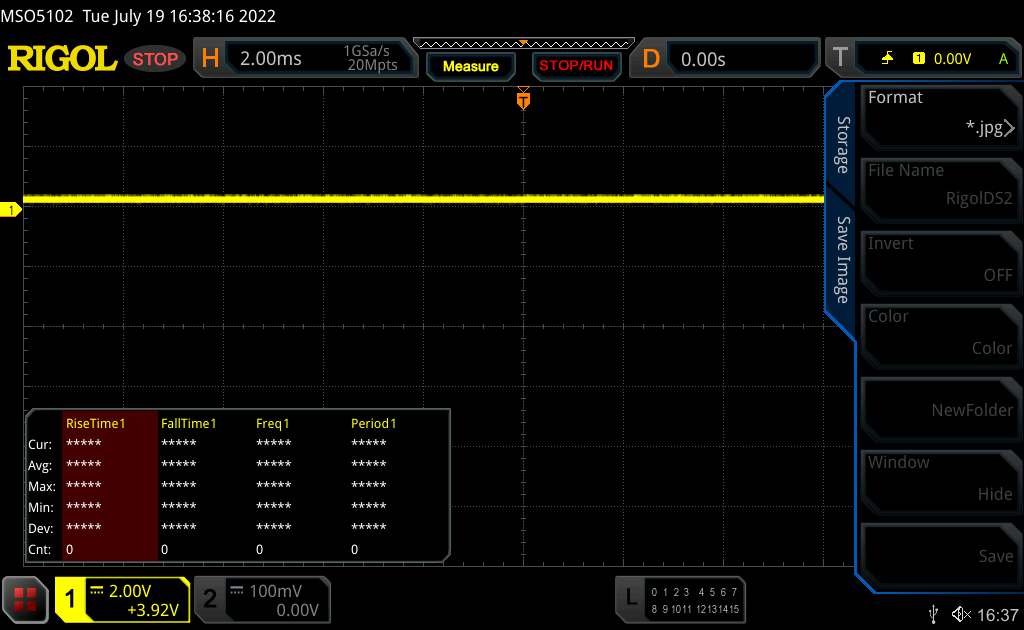 | ||
In comparison: 52 % of all tested devices do not use PWM to dim the display. If PWM was detected, an average of 7747 (minimum: 5 - maximum: 343500) Hz was measured. | |||
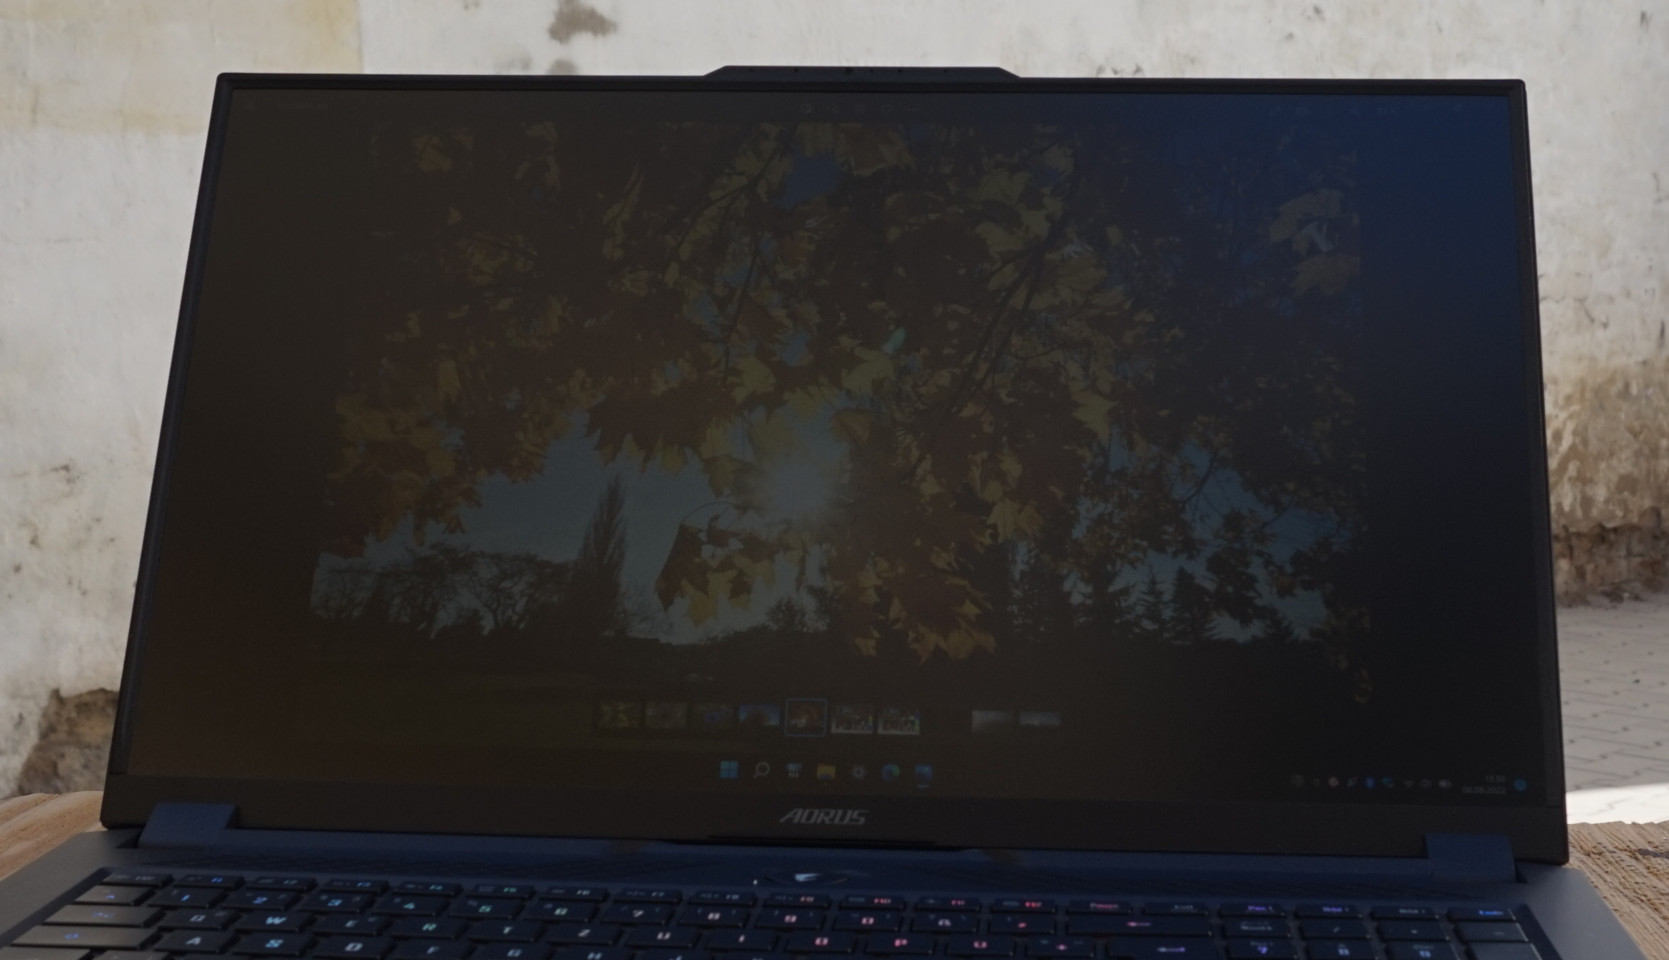
Using the Aorus 17X XES outdoors can hardly be recommended. In direct sunlight, you can hardly recognize anything anymore. Even in the shade or with light from the back, most colors will lack in brightness.
The laptop is still sufficient to use for web surfing or reading in a shady place. However, image processing or gaming can only be recommended indoors.
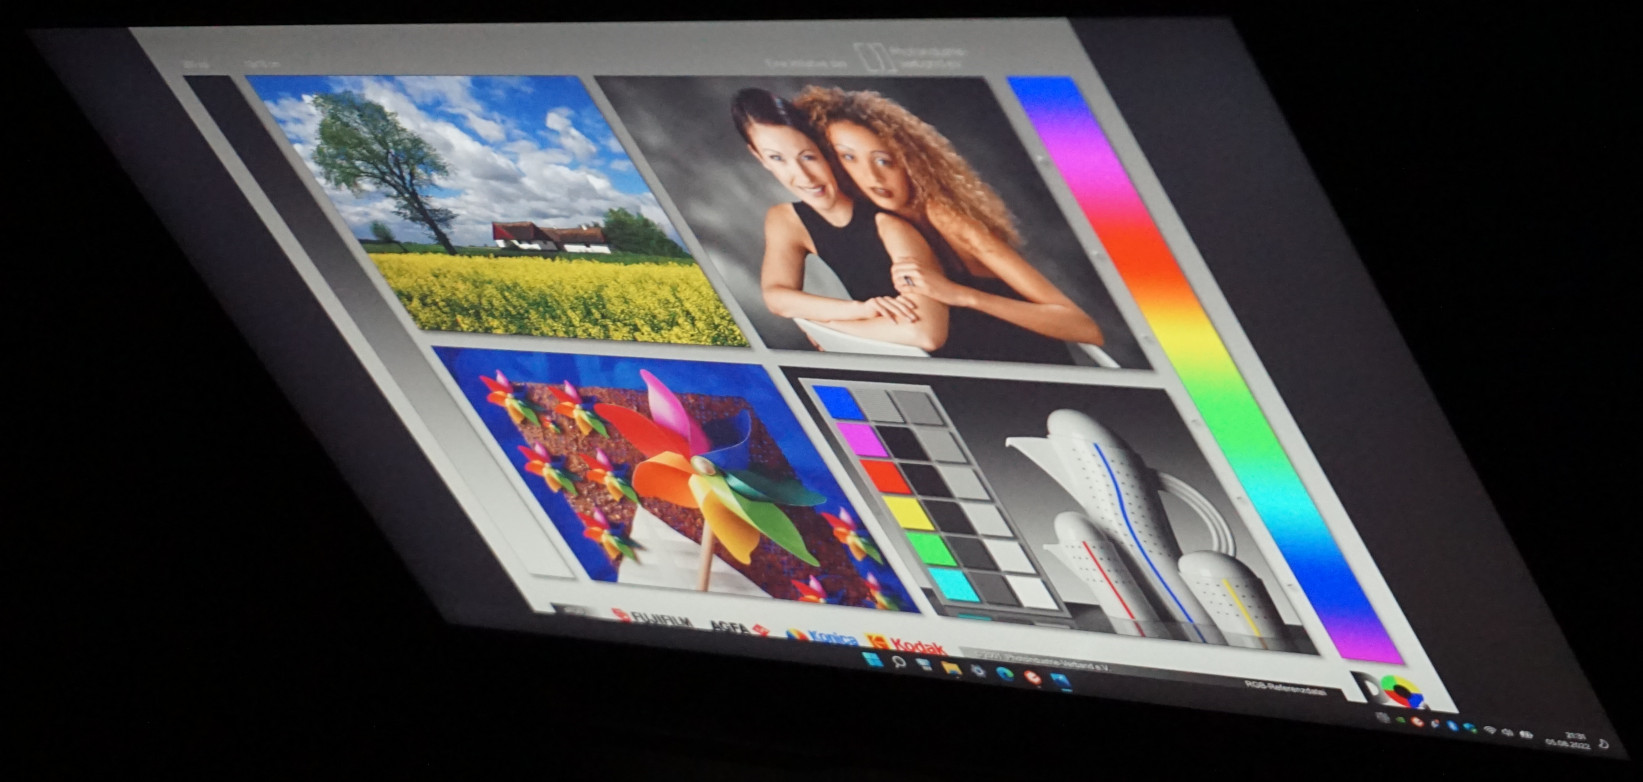
The viewing angle stability is without fault, but we don't expect anything else from an IPS panel. Even from a steep viewing angle of almost 90°, we do not observe any color changes. Although the brightness is reduced, this doesn't hinder recognition.


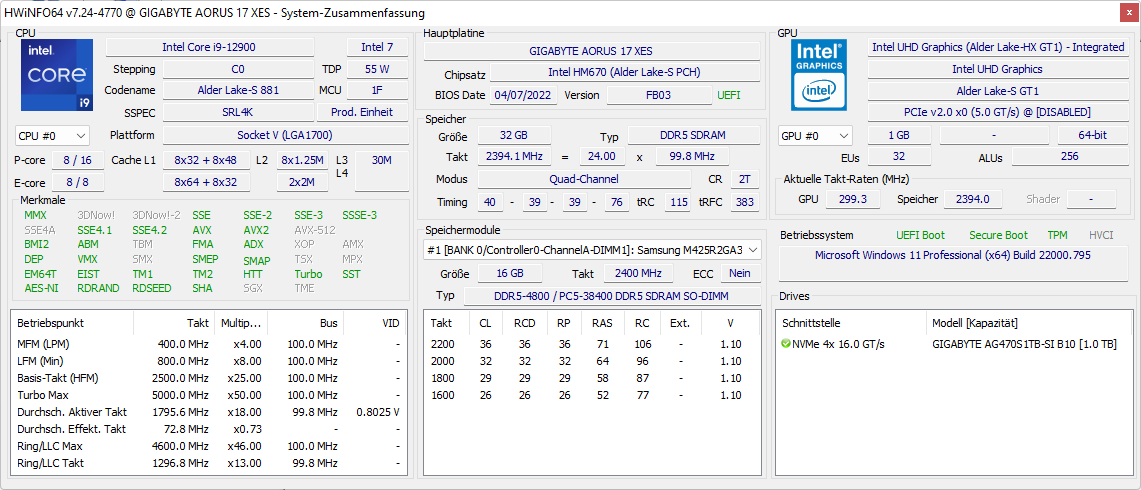
Performance - The i9 CPU dominates in the gaming laptop
The hardware equipment proves itself to be sufficient for the Full-HD resolution. All the current and most probably also many future games can be played smoothly on the gaming laptop without any compromises. If you can accept with less details, very high frame rates also become realistic and can be displayed optimally thanks to 360 Hz including variable refresh rates.
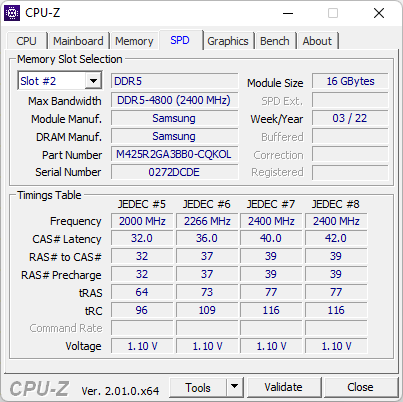
In addition, the extremely fast processor with a total of 24 threads in combination with 32 GB of DDR5 RAM also allow using it for demanding computations aside from graphical applications. The computing performance by no means needs to hide from a workstation.
Test Conditions
For all the tests, games, and benchmarks, as well as additional tasks from text and image processing to surfing the Internet, we used the automatic switching of the performance profiles in the Gigabyte Control Center, which is called "Ai Boost." Not only does this adjust the power limits of the CPU, but the color profiles and behavior of the fans or keyboard also change depending on the situation. The table below shows how much power is allocated for the processor.
Overall, the system works reliably, recognizes all the programs, and associates them with the corresponding modes. However, we found the very noticeable change between color profiles that always occurred with some delay a bit annoying. This was noticeable, for example, when closing the browser and starting a writing program that activates the creator mode.
While completely turning off the keyboard illumination when the power plug is pulled from the outlet seems consequent, it still isn't really practical in the evening hours.
Independent from the intelligent control, the performance profiles can also be adjusted individually up to the smallest details, in order to orient them on your own preferences. However, you then need to switch them manually. You can do this via button press, which is also the same way you can adjust the fan profile.
| Gaming Mode | Creator Mode | Turbo Mode | Meeting | Power Saving | |
|---|---|---|---|---|---|
| PL1 | 65 W | 86 W | 86 W | 15 W | 15 W |
| PL2 | 157 W | 157 W | 157 W | 30 W | 30 W |
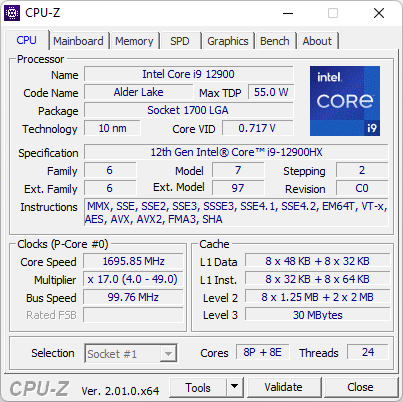
Processor
The Intel Core i9-12900HX offers 2 additional Performance cores compared to the i9-12900H. Together with 8 additional Efficiency cores, this results in the ability to handle a total of 24 threads, which becomes noticeable during intense tasks including multi-tasking.
Since only the P cores reach the maximum clock speed of 5.0 GHz, the HX chip offers the same on paper as a AMD Ryzen 9 6900HX in this regard. In the constant load test with Cinebench R15 and also the general CPU performance, it places significantly ahead of the AMD chip. Overall, the i9 leaves most of the competitors significantly behind in terms of the raw performance capabilities, which is not surprising when you consider its impressive equipment. The i9 processors with 6 P cores such as the i9-12900H are also left behind.
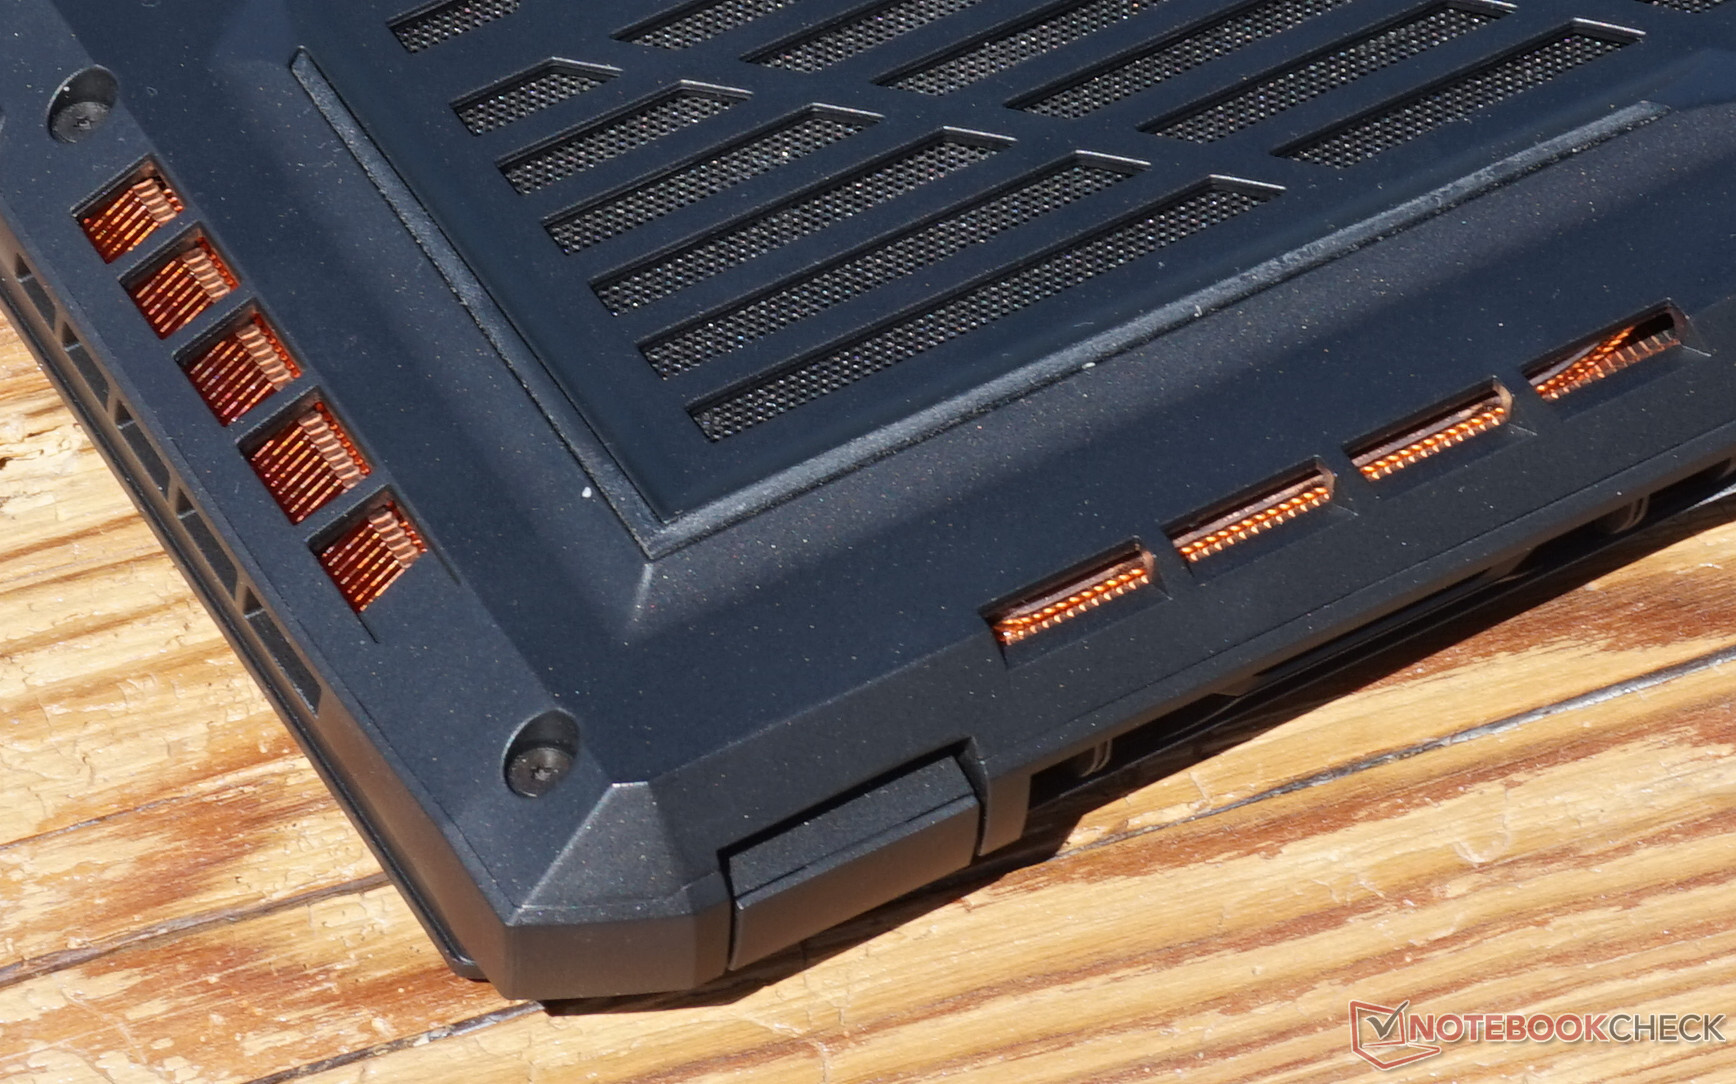
In addition, there is a very stable performance in the long run, which considering the high power consumption also points to a very well designed cooling system. After the first run of Cinebench R15, the value doesn't even drop by 4% in the long run. The cooling also represents the only visible external difference to the Aorus 17 XE4. Instead of the black painted cooling fins made from aluminum, you can see the copper of the heat pipes through the fan vent openings.
Our benchmark list provides an overview of the performance of various processors.
Cinebench R15 Multi Constant Load Test
Cinebench R23: Multi Core | Single Core
Cinebench R20: CPU (Multi Core) | CPU (Single Core)
Cinebench R15: CPU Multi 64Bit | CPU Single 64Bit
Blender: v2.79 BMW27 CPU
7-Zip 18.03: 7z b 4 | 7z b 4 -mmt1
Geekbench 5.5: Multi-Core | Single-Core
HWBOT x265 Benchmark v2.2: 4k Preset
LibreOffice : 20 Documents To PDF
R Benchmark 2.5: Overall mean
| CPU Performance rating | |
| Average of class Gaming | |
| Average Intel Core i9-12900HX | |
| MSI GE67 HX 12UGS | |
| Aorus 17X XES | |
| Schenker XMG Pro 17 E22 | |
| MSI Raider GE66 12UHS | |
| Aorus 17 XE4 | |
| HP Omen 17-ck1075ng | |
| Asus ROG Zephyrus Duo 16 GX650RX | |
| Cinebench R23 / Multi Core | |
| Average of class Gaming (10488 - 40970, n=106, last 2 years) | |
| Average Intel Core i9-12900HX (18337 - 23482, n=8) | |
| MSI GE67 HX 12UGS | |
| Aorus 17X XES | |
| Schenker XMG Pro 17 E22 | |
| MSI Raider GE66 12UHS | |
| Aorus 17 XE4 | |
| Asus ROG Zephyrus Duo 16 GX650RX | |
| HP Omen 17-ck1075ng | |
| Cinebench R23 / Single Core | |
| Average of class Gaming (1166 - 2387, n=106, last 2 years) | |
| Aorus 17X XES | |
| Average Intel Core i9-12900HX (1897 - 1936, n=8) | |
| Schenker XMG Pro 17 E22 | |
| MSI Raider GE66 12UHS | |
| MSI GE67 HX 12UGS | |
| Aorus 17 XE4 | |
| HP Omen 17-ck1075ng | |
| Asus ROG Zephyrus Duo 16 GX650RX | |
| Cinebench R20 / CPU (Multi Core) | |
| Average of class Gaming (4029 - 16108, n=105, last 2 years) | |
| Average Intel Core i9-12900HX (7037 - 9042, n=8) | |
| MSI GE67 HX 12UGS | |
| Aorus 17X XES | |
| Schenker XMG Pro 17 E22 | |
| MSI Raider GE66 12UHS | |
| Aorus 17 XE4 | |
| Asus ROG Zephyrus Duo 16 GX650RX | |
| HP Omen 17-ck1075ng | |
| Cinebench R20 / CPU (Single Core) | |
| Average of class Gaming (442 - 904, n=105, last 2 years) | |
| Aorus 17X XES | |
| Average Intel Core i9-12900HX (728 - 745, n=8) | |
| Schenker XMG Pro 17 E22 | |
| MSI Raider GE66 12UHS | |
| Aorus 17 XE4 | |
| HP Omen 17-ck1075ng | |
| MSI GE67 HX 12UGS | |
| Asus ROG Zephyrus Duo 16 GX650RX | |
| Cinebench R15 / CPU Multi 64Bit | |
| Average of class Gaming (1578 - 6271, n=104, last 2 years) | |
| Average Intel Core i9-12900HX (2830 - 3652, n=8) | |
| MSI GE67 HX 12UGS | |
| Aorus 17X XES | |
| Schenker XMG Pro 17 E22 | |
| Aorus 17 XE4 | |
| MSI Raider GE66 12UHS | |
| HP Omen 17-ck1075ng | |
| HP Omen 17-ck1075ng | |
| Asus ROG Zephyrus Duo 16 GX650RX | |
| Cinebench R15 / CPU Single 64Bit | |
| Average of class Gaming (188.8 - 344, n=105, last 2 years) | |
| Average Intel Core i9-12900HX (274 - 282, n=8) | |
| Aorus 17X XES | |
| Schenker XMG Pro 17 E22 | |
| MSI Raider GE66 12UHS | |
| Aorus 17 XE4 | |
| MSI GE67 HX 12UGS | |
| HP Omen 17-ck1075ng | |
| HP Omen 17-ck1075ng | |
| Asus ROG Zephyrus Duo 16 GX650RX | |
| Blender / v2.79 BMW27 CPU | |
| HP Omen 17-ck1075ng | |
| Aorus 17 XE4 | |
| Asus ROG Zephyrus Duo 16 GX650RX | |
| Aorus 17X XES | |
| MSI Raider GE66 12UHS | |
| Schenker XMG Pro 17 E22 | |
| Average Intel Core i9-12900HX (144 - 201, n=8) | |
| MSI GE67 HX 12UGS | |
| Average of class Gaming (80 - 330, n=103, last 2 years) | |
| 7-Zip 18.03 / 7z b 4 | |
| Average of class Gaming (33491 - 148086, n=104, last 2 years) | |
| Average Intel Core i9-12900HX (69778 - 88128, n=7) | |
| MSI GE67 HX 12UGS | |
| Aorus 17X XES | |
| MSI Raider GE66 12UHS | |
| Schenker XMG Pro 17 E22 | |
| Asus ROG Zephyrus Duo 16 GX650RX | |
| Aorus 17 XE4 | |
| HP Omen 17-ck1075ng | |
| 7-Zip 18.03 / 7z b 4 -mmt1 | |
| Average of class Gaming (4199 - 7436, n=104, last 2 years) | |
| Aorus 17X XES | |
| Average Intel Core i9-12900HX (6165 - 6358, n=7) | |
| Schenker XMG Pro 17 E22 | |
| MSI Raider GE66 12UHS | |
| Aorus 17 XE4 | |
| HP Omen 17-ck1075ng | |
| Asus ROG Zephyrus Duo 16 GX650RX | |
| MSI GE67 HX 12UGS | |
| Geekbench 5.5 / Multi-Core | |
| Average of class Gaming (6460 - 27010, n=104, last 2 years) | |
| Average Intel Core i9-12900HX (15116 - 16925, n=8) | |
| Aorus 17X XES | |
| MSI GE67 HX 12UGS | |
| MSI Raider GE66 12UHS | |
| Schenker XMG Pro 17 E22 | |
| Aorus 17 XE4 | |
| HP Omen 17-ck1075ng | |
| Asus ROG Zephyrus Duo 16 GX650RX | |
| Geekbench 5.5 / Single-Core | |
| Average of class Gaming (986 - 2474, n=104, last 2 years) | |
| Average Intel Core i9-12900HX (1874 - 1949, n=8) | |
| Aorus 17X XES | |
| MSI Raider GE66 12UHS | |
| Schenker XMG Pro 17 E22 | |
| Aorus 17 XE4 | |
| MSI GE67 HX 12UGS | |
| HP Omen 17-ck1075ng | |
| Asus ROG Zephyrus Duo 16 GX650RX | |
| HWBOT x265 Benchmark v2.2 / 4k Preset | |
| Average of class Gaming (11.5 - 44.3, n=104, last 2 years) | |
| Average Intel Core i9-12900HX (19.6 - 26.6, n=7) | |
| MSI GE67 HX 12UGS | |
| Aorus 17X XES | |
| Schenker XMG Pro 17 E22 | |
| MSI Raider GE66 12UHS | |
| Asus ROG Zephyrus Duo 16 GX650RX | |
| Aorus 17 XE4 | |
| HP Omen 17-ck1075ng | |
| LibreOffice / 20 Documents To PDF | |
| Average of class Gaming (33.2 - 88.8, n=104, last 2 years) | |
| Asus ROG Zephyrus Duo 16 GX650RX | |
| HP Omen 17-ck1075ng | |
| MSI GE67 HX 12UGS | |
| Schenker XMG Pro 17 E22 | |
| Aorus 17X XES | |
| Average Intel Core i9-12900HX (33.6 - 42.4, n=7) | |
| Aorus 17 XE4 | |
| MSI Raider GE66 12UHS | |
| R Benchmark 2.5 / Overall mean | |
| Asus ROG Zephyrus Duo 16 GX650RX | |
| HP Omen 17-ck1075ng | |
| MSI GE67 HX 12UGS | |
| Aorus 17 XE4 | |
| MSI Raider GE66 12UHS | |
| Schenker XMG Pro 17 E22 | |
| Average of class Gaming (0.3439 - 0.759, n=105, last 2 years) | |
| Average Intel Core i9-12900HX (0.4159 - 0.4242, n=7) | |
| Aorus 17X XES | |
* ... smaller is better
AIDA64: FP32 Ray-Trace | FPU Julia | CPU SHA3 | CPU Queen | FPU SinJulia | FPU Mandel | CPU AES | CPU ZLib | FP64 Ray-Trace | CPU PhotoWorxx
| Performance rating | |
| Average of class Gaming | |
| Average Intel Core i9-12900HX | |
| Asus ROG Zephyrus Duo 16 GX650RX | |
| Aorus 17X XES | |
| HP Omen 17-ck1075ng | |
| MSI GE67 HX 12UGS | |
| MSI Raider GE66 12UHS | |
| Schenker XMG Pro 17 E22 | |
| Aorus 17 XE4 | |
| AIDA64 / FP32 Ray-Trace | |
| Average of class Gaming (10227 - 85542, n=103, last 2 years) | |
| Average Intel Core i9-12900HX (11535 - 22183, n=7) | |
| Asus ROG Zephyrus Duo 16 GX650RX | |
| Aorus 17X XES | |
| HP Omen 17-ck1075ng | |
| MSI GE67 HX 12UGS | |
| Schenker XMG Pro 17 E22 | |
| MSI Raider GE66 12UHS | |
| Aorus 17 XE4 | |
| AIDA64 / FPU Julia | |
| Average of class Gaming (51376 - 238426, n=103, last 2 years) | |
| Asus ROG Zephyrus Duo 16 GX650RX | |
| Average Intel Core i9-12900HX (52916 - 110093, n=7) | |
| Aorus 17X XES | |
| HP Omen 17-ck1075ng | |
| MSI GE67 HX 12UGS | |
| MSI Raider GE66 12UHS | |
| Schenker XMG Pro 17 E22 | |
| Aorus 17 XE4 | |
| AIDA64 / CPU SHA3 | |
| Average of class Gaming (2180 - 9817, n=103, last 2 years) | |
| Average Intel Core i9-12900HX (3559 - 5123, n=7) | |
| MSI GE67 HX 12UGS | |
| HP Omen 17-ck1075ng | |
| Aorus 17X XES | |
| Asus ROG Zephyrus Duo 16 GX650RX | |
| Schenker XMG Pro 17 E22 | |
| MSI Raider GE66 12UHS | |
| Aorus 17 XE4 | |
| AIDA64 / CPU Queen | |
| Average of class Gaming (49785 - 173351, n=89, last 2 years) | |
| Schenker XMG Pro 17 E22 | |
| MSI Raider GE66 12UHS | |
| Asus ROG Zephyrus Duo 16 GX650RX | |
| Aorus 17X XES | |
| Average Intel Core i9-12900HX (101029 - 104457, n=7) | |
| HP Omen 17-ck1075ng | |
| Aorus 17 XE4 | |
| MSI GE67 HX 12UGS | |
| AIDA64 / FPU SinJulia | |
| Average of class Gaming (4424 - 33636, n=103, last 2 years) | |
| Asus ROG Zephyrus Duo 16 GX650RX | |
| Average Intel Core i9-12900HX (10475 - 13062, n=7) | |
| MSI GE67 HX 12UGS | |
| Aorus 17X XES | |
| Schenker XMG Pro 17 E22 | |
| MSI Raider GE66 12UHS | |
| HP Omen 17-ck1075ng | |
| Aorus 17 XE4 | |
| AIDA64 / FPU Mandel | |
| Average of class Gaming (25115 - 128721, n=103, last 2 years) | |
| Asus ROG Zephyrus Duo 16 GX650RX | |
| Average Intel Core i9-12900HX (31779 - 53628, n=7) | |
| Aorus 17X XES | |
| HP Omen 17-ck1075ng | |
| MSI GE67 HX 12UGS | |
| Schenker XMG Pro 17 E22 | |
| MSI Raider GE66 12UHS | |
| Aorus 17 XE4 | |
| AIDA64 / CPU AES | |
| Average Intel Core i9-12900HX (125268 - 183146, n=7) | |
| Asus ROG Zephyrus Duo 16 GX650RX | |
| HP Omen 17-ck1075ng | |
| Aorus 17X XES | |
| MSI GE67 HX 12UGS | |
| Average of class Gaming (39258 - 247074, n=103, last 2 years) | |
| Schenker XMG Pro 17 E22 | |
| MSI Raider GE66 12UHS | |
| Aorus 17 XE4 | |
| AIDA64 / CPU ZLib | |
| Average of class Gaming (574 - 2531, n=103, last 2 years) | |
| MSI GE67 HX 12UGS | |
| Average Intel Core i9-12900HX (990 - 1408, n=7) | |
| MSI Raider GE66 12UHS | |
| Schenker XMG Pro 17 E22 | |
| HP Omen 17-ck1075ng | |
| Aorus 17X XES | |
| Asus ROG Zephyrus Duo 16 GX650RX | |
| Aorus 17 XE4 | |
| AIDA64 / FP64 Ray-Trace | |
| Average of class Gaming (5509 - 45446, n=103, last 2 years) | |
| Average Intel Core i9-12900HX (6663 - 11913, n=7) | |
| Asus ROG Zephyrus Duo 16 GX650RX | |
| Aorus 17X XES | |
| HP Omen 17-ck1075ng | |
| MSI GE67 HX 12UGS | |
| Schenker XMG Pro 17 E22 | |
| MSI Raider GE66 12UHS | |
| Aorus 17 XE4 | |
| AIDA64 / CPU PhotoWorxx | |
| Average of class Gaming (12271 - 89891, n=103, last 2 years) | |
| Average Intel Core i9-12900HX (40239 - 47710, n=7) | |
| MSI Raider GE66 12UHS | |
| Aorus 17X XES | |
| HP Omen 17-ck1075ng | |
| MSI GE67 HX 12UGS | |
| Asus ROG Zephyrus Duo 16 GX650RX | |
| Schenker XMG Pro 17 E22 | |
| Aorus 17 XE4 | |
System Performance
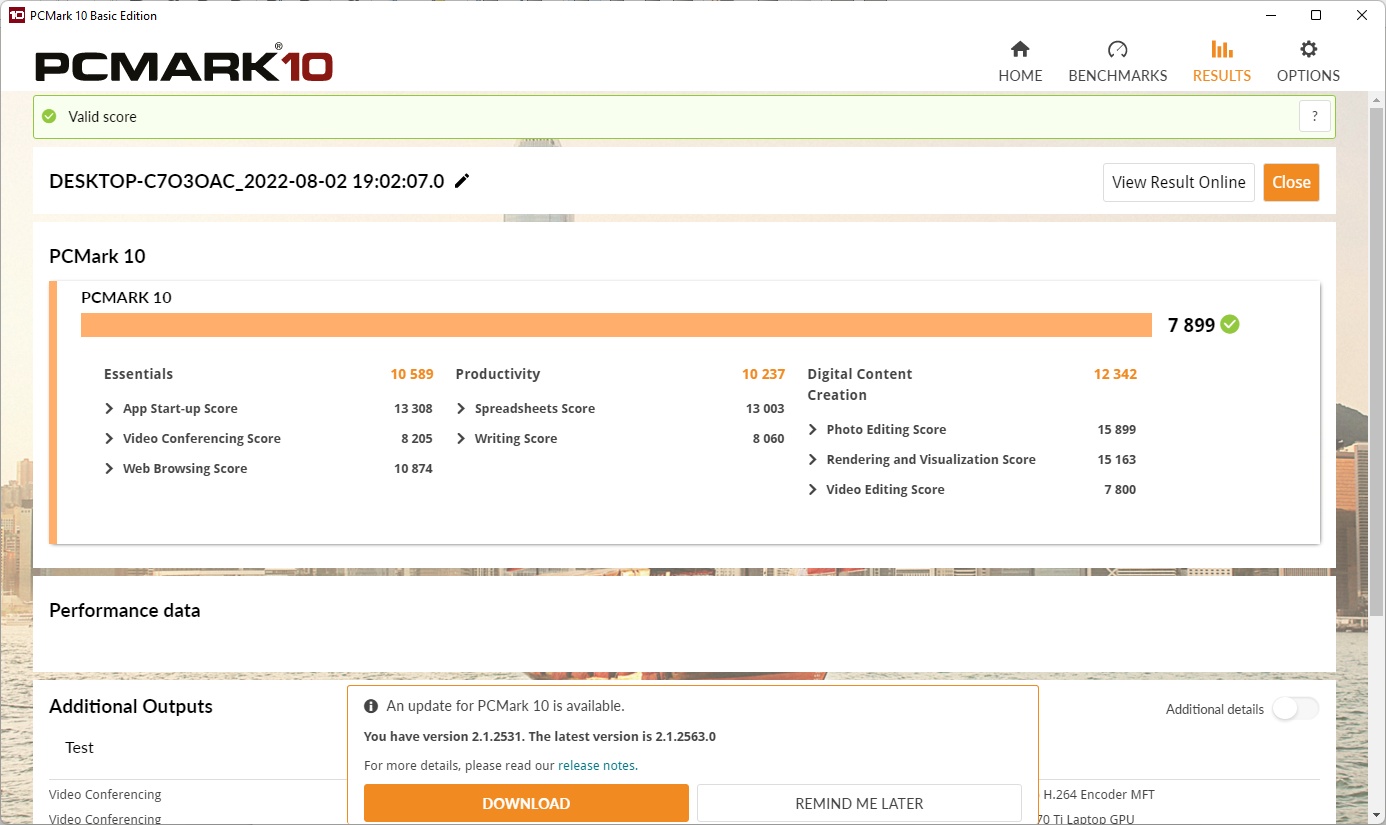
Considering the processor used, we almost expected the excellent performance of the Aorus 17X in terms of the system performance. The laptop is clearly able to move ahead of the average of gaming laptops we tested, in some parts even by more than 20%. It almost always places ahead of the Aorus 17 XE4, which is not very surprising considering the lower processor performance of that system. Only the MSI Raider GE66 12UHS with the overclocked Intel Core i9-12900HK is able to achieve even better values almost throughout.
The performance capabilities can be clearly felt during almost every application startup, and we can hardly, if at all, observe any delays. Even running several applications in parallel does not lead to any hindrances, which is also due to the large and fast working memory. The use of virtual scenarios therefore also appears completely realistic.
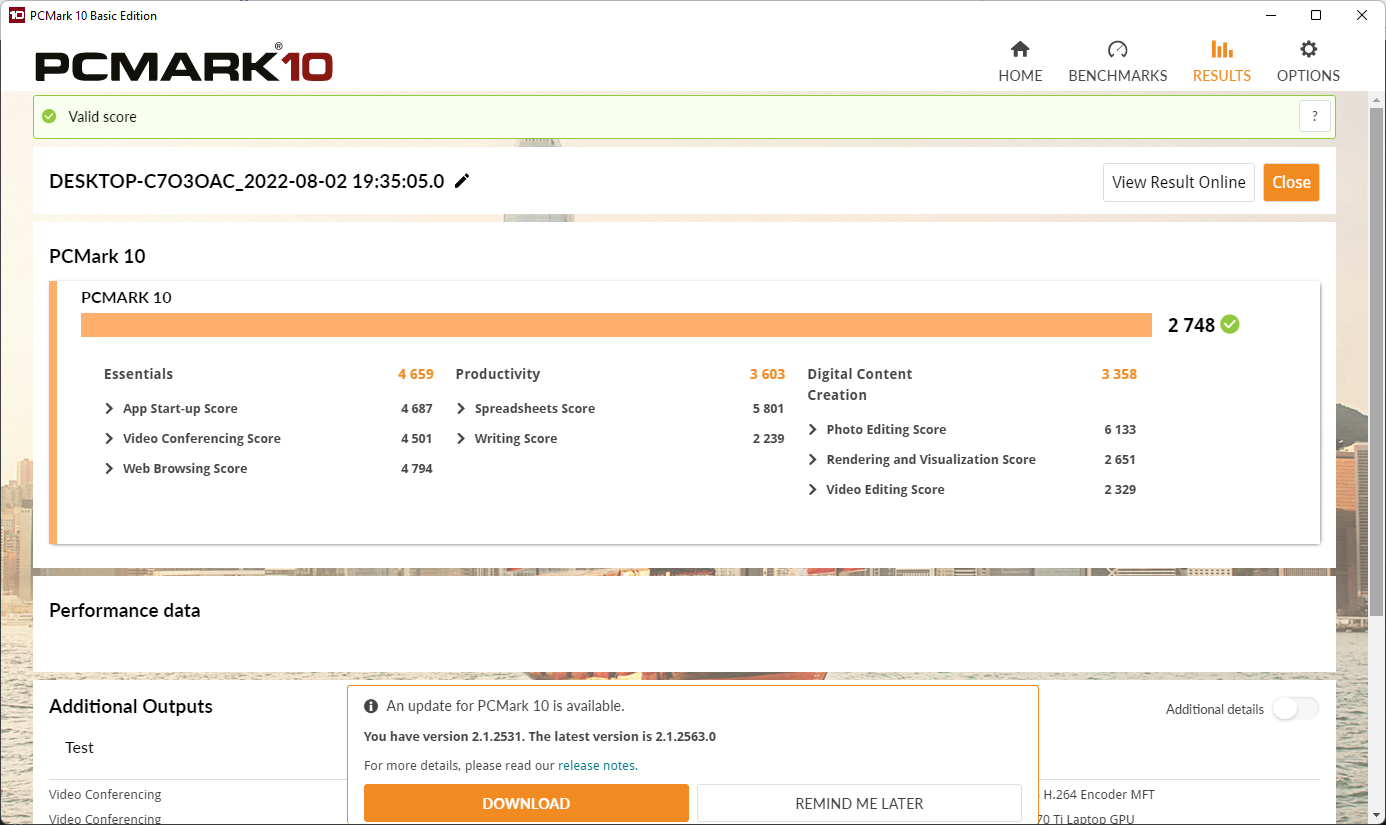
In battery operation, which forces using the Power Saving mode, not much is left of the high performance, and the result in PCMark10 then reaches only one third of the best value.
CrossMark: Overall | Productivity | Creativity | Responsiveness
| PCMark 10 / Score | |
| Average of class Gaming (5828 - 11730, n=92, last 2 years) | |
| MSI Raider GE66 12UHS | |
| MSI GE67 HX 12UGS | |
| Aorus 17X XES | |
| Average Intel Core i9-12900HX, NVIDIA GeForce RTX 3070 Ti Laptop GPU (n=1) | |
| Schenker XMG Pro 17 E22 | |
| Aorus 17 XE4 | |
| HP Omen 17-ck1075ng | |
| Asus ROG Zephyrus Duo 16 GX650RX | |
| PCMark 10 / Essentials | |
| MSI Raider GE66 12UHS | |
| MSI GE67 HX 12UGS | |
| Schenker XMG Pro 17 E22 | |
| Aorus 17 XE4 | |
| Average of class Gaming (8810 - 11935, n=96, last 2 years) | |
| HP Omen 17-ck1075ng | |
| Aorus 17X XES | |
| Average Intel Core i9-12900HX, NVIDIA GeForce RTX 3070 Ti Laptop GPU (n=1) | |
| Asus ROG Zephyrus Duo 16 GX650RX | |
| PCMark 10 / Productivity | |
| Average of class Gaming (6845 - 21327, n=94, last 2 years) | |
| MSI Raider GE66 12UHS | |
| Aorus 17X XES | |
| Average Intel Core i9-12900HX, NVIDIA GeForce RTX 3070 Ti Laptop GPU (n=1) | |
| Schenker XMG Pro 17 E22 | |
| MSI GE67 HX 12UGS | |
| Aorus 17 XE4 | |
| HP Omen 17-ck1075ng | |
| Asus ROG Zephyrus Duo 16 GX650RX | |
| PCMark 10 / Digital Content Creation | |
| Average of class Gaming (7602 - 19954, n=94, last 2 years) | |
| MSI GE67 HX 12UGS | |
| MSI Raider GE66 12UHS | |
| Aorus 17X XES | |
| Average Intel Core i9-12900HX, NVIDIA GeForce RTX 3070 Ti Laptop GPU (n=1) | |
| Schenker XMG Pro 17 E22 | |
| Aorus 17 XE4 | |
| HP Omen 17-ck1075ng | |
| Asus ROG Zephyrus Duo 16 GX650RX | |
| CrossMark / Overall | |
| Aorus 17X XES | |
| Average Intel Core i9-12900HX, NVIDIA GeForce RTX 3070 Ti Laptop GPU (n=1) | |
| Aorus 17 XE4 | |
| Average of class Gaming (1366 - 2409, n=93, last 2 years) | |
| MSI GE67 HX 12UGS | |
| HP Omen 17-ck1075ng | |
| Asus ROG Zephyrus Duo 16 GX650RX | |
| CrossMark / Productivity | |
| Aorus 17X XES | |
| Average Intel Core i9-12900HX, NVIDIA GeForce RTX 3070 Ti Laptop GPU (n=1) | |
| Aorus 17 XE4 | |
| MSI GE67 HX 12UGS | |
| Average of class Gaming (1386 - 2254, n=93, last 2 years) | |
| HP Omen 17-ck1075ng | |
| Asus ROG Zephyrus Duo 16 GX650RX | |
| CrossMark / Creativity | |
| Aorus 17X XES | |
| Average Intel Core i9-12900HX, NVIDIA GeForce RTX 3070 Ti Laptop GPU (n=1) | |
| Average of class Gaming (1343 - 2729, n=93, last 2 years) | |
| MSI GE67 HX 12UGS | |
| HP Omen 17-ck1075ng | |
| Aorus 17 XE4 | |
| Asus ROG Zephyrus Duo 16 GX650RX | |
| CrossMark / Responsiveness | |
| Aorus 17 XE4 | |
| Aorus 17X XES | |
| Average Intel Core i9-12900HX, NVIDIA GeForce RTX 3070 Ti Laptop GPU (n=1) | |
| MSI GE67 HX 12UGS | |
| Asus ROG Zephyrus Duo 16 GX650RX | |
| Average of class Gaming (1226 - 2334, n=93, last 2 years) | |
| HP Omen 17-ck1075ng | |
| PCMark 10 Score | 7899 points | |
Help | ||
| AIDA64 / Memory Copy | |
| Average of class Gaming (21750 - 129946, n=103, last 2 years) | |
| Average Intel Core i9-12900HX (62852 - 70863, n=7) | |
| MSI Raider GE66 12UHS | |
| Aorus 17X XES | |
| Asus ROG Zephyrus Duo 16 GX650RX | |
| HP Omen 17-ck1075ng | |
| MSI GE67 HX 12UGS | |
| Schenker XMG Pro 17 E22 | |
| Aorus 17 XE4 | |
| AIDA64 / Memory Read | |
| Average of class Gaming (22956 - 118858, n=103, last 2 years) | |
| Aorus 17X XES | |
| Average Intel Core i9-12900HX (62140 - 72930, n=7) | |
| MSI Raider GE66 12UHS | |
| HP Omen 17-ck1075ng | |
| MSI GE67 HX 12UGS | |
| Asus ROG Zephyrus Duo 16 GX650RX | |
| Aorus 17 XE4 | |
| Schenker XMG Pro 17 E22 | |
| AIDA64 / Memory Write | |
| Average of class Gaming (22297 - 135096, n=103, last 2 years) | |
| MSI Raider GE66 12UHS | |
| Average Intel Core i9-12900HX (60001 - 68782, n=7) | |
| Aorus 17X XES | |
| HP Omen 17-ck1075ng | |
| MSI GE67 HX 12UGS | |
| Asus ROG Zephyrus Duo 16 GX650RX | |
| Schenker XMG Pro 17 E22 | |
| Aorus 17 XE4 | |
| AIDA64 / Memory Latency | |
| Average of class Gaming (75.3 - 259, n=103, last 2 years) | |
| HP Omen 17-ck1075ng | |
| MSI GE67 HX 12UGS | |
| MSI Raider GE66 12UHS | |
| Asus ROG Zephyrus Duo 16 GX650RX | |
| Aorus 17 XE4 | |
| Schenker XMG Pro 17 E22 | |
| Average Intel Core i9-12900HX (83.9 - 93.4, n=7) | |
| Aorus 17X XES | |
* ... smaller is better
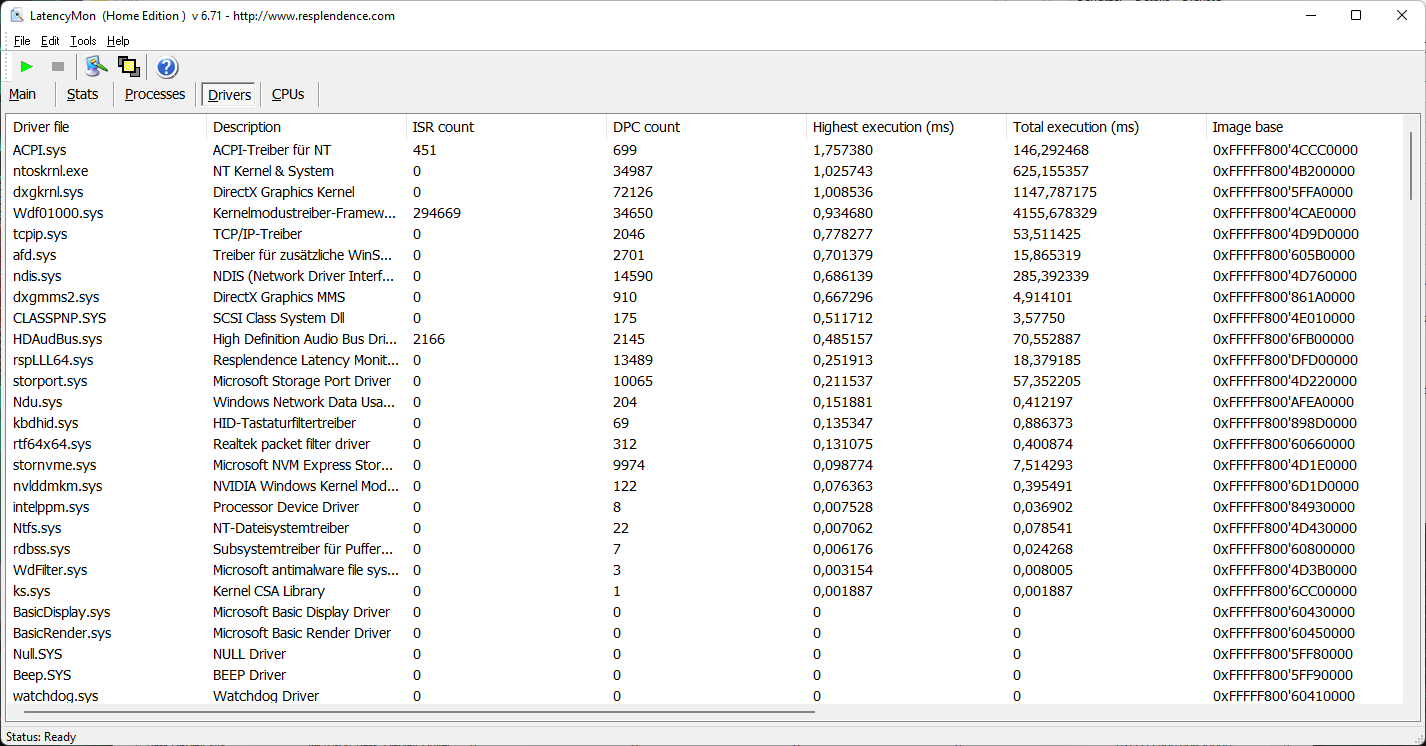
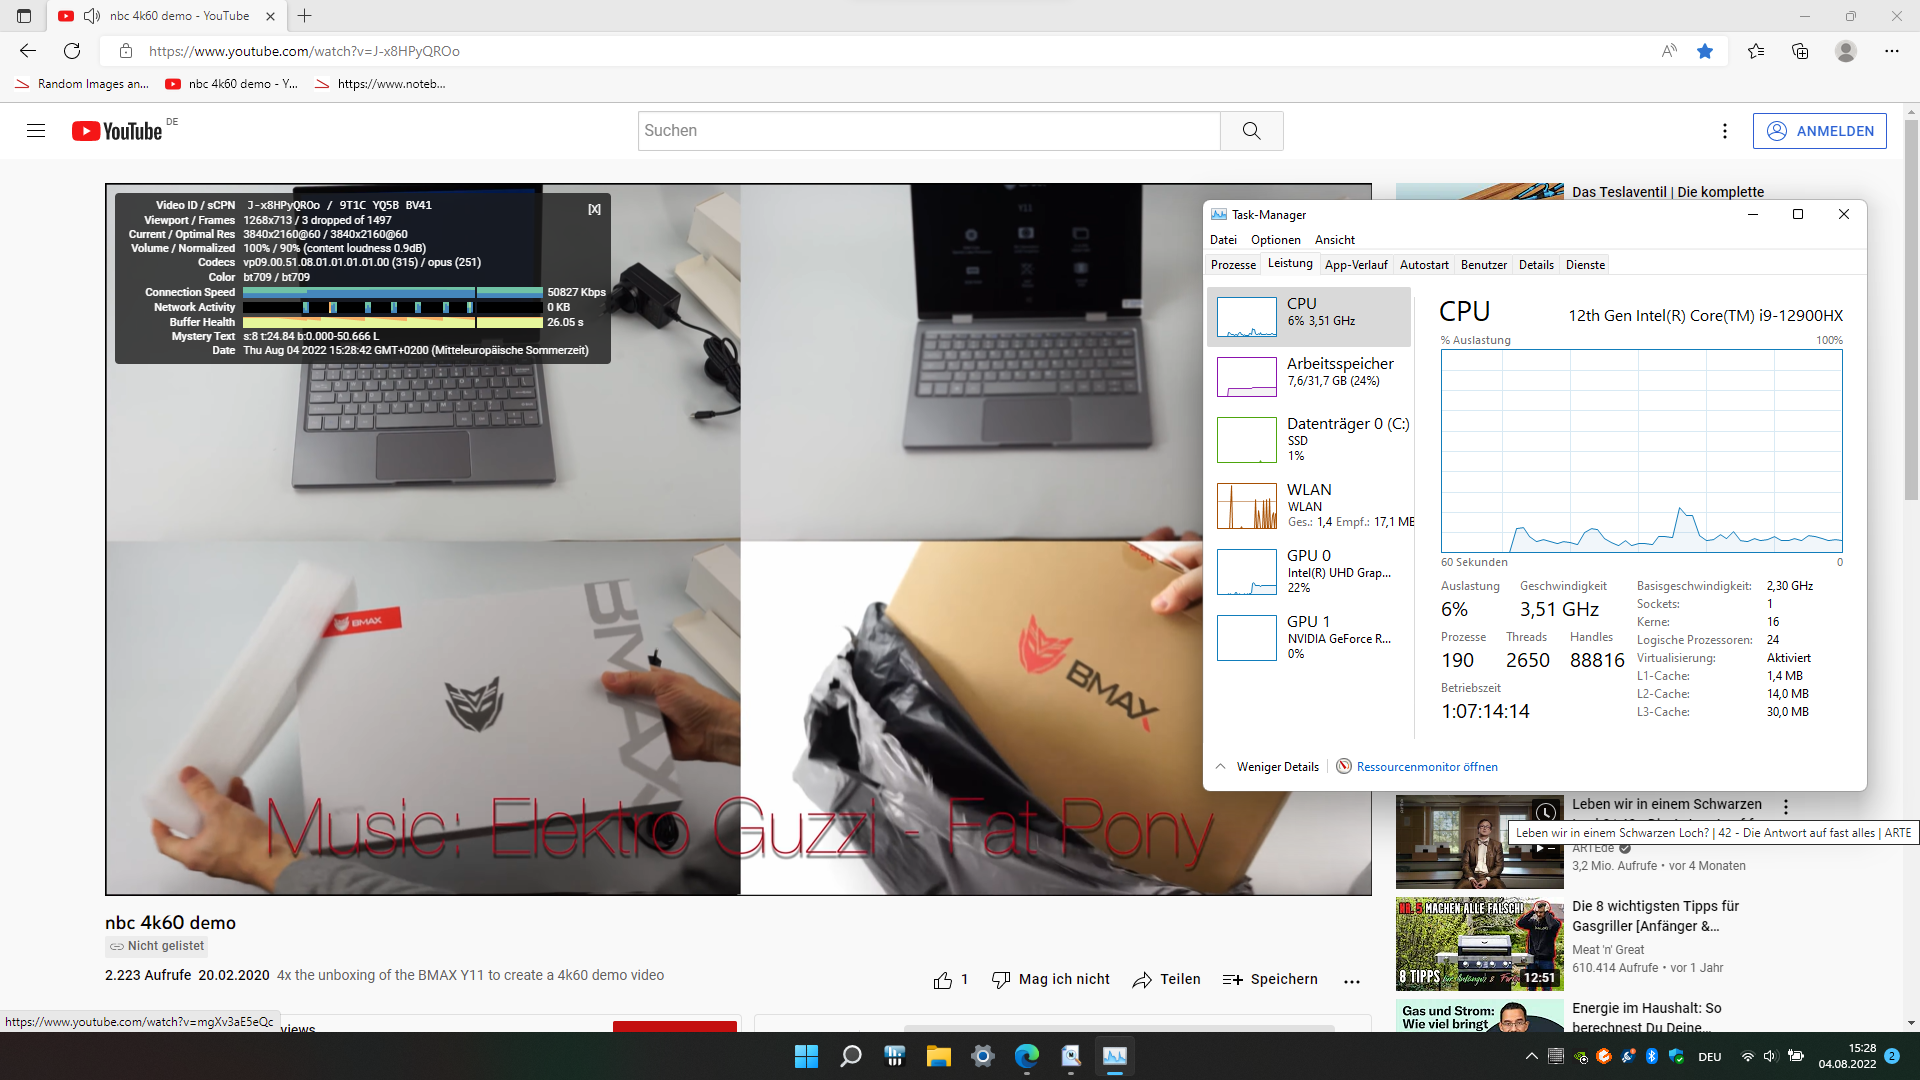
DPC Latencies
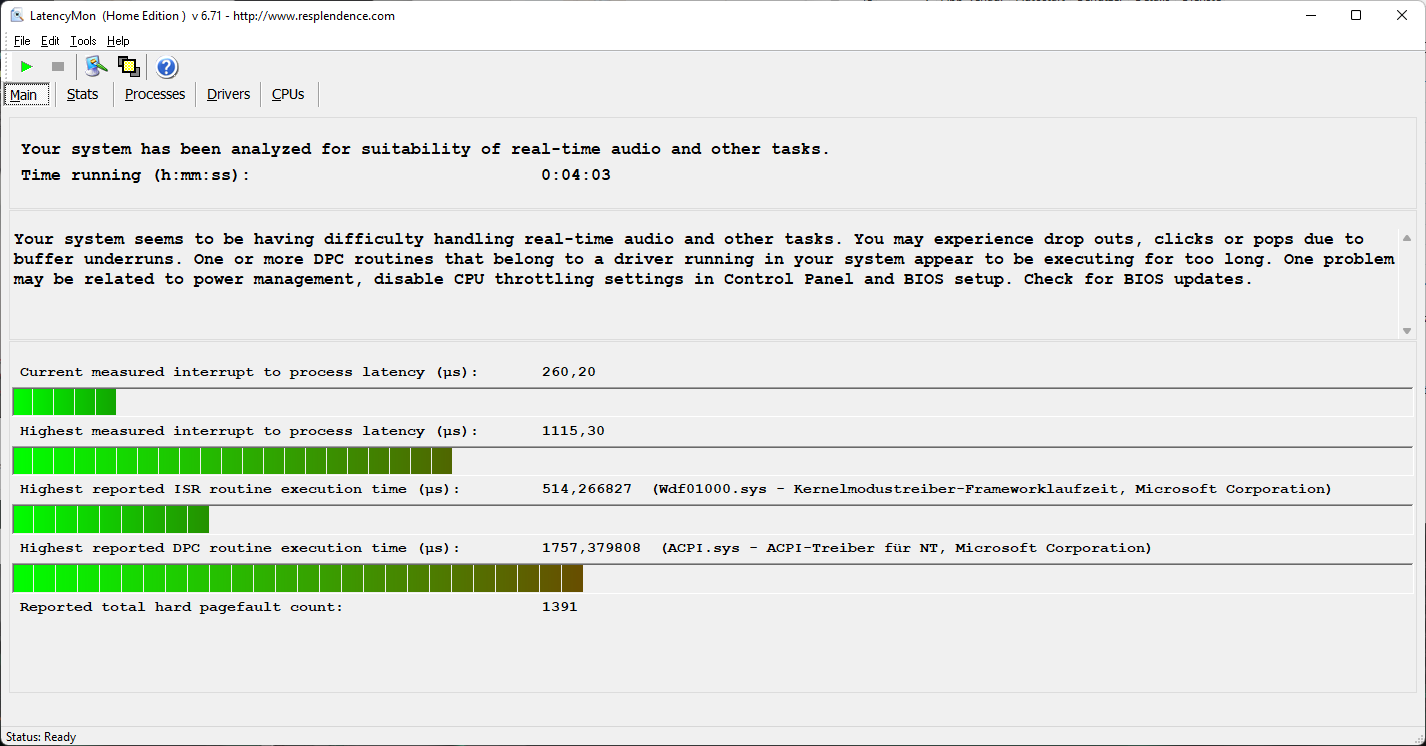
In the evaluation of latencies when running programs, the laptop is unable to impress us fully. To evaluate this, we open several pages in the default browser and then play a Youtube video in 4K resolution and run Prime95. This results in a maximum delay of barely more than 1 ms. This value is limited and in some instances significantly lower than those of the competitors. However, the Aorus 17X XES is still not suited for real-time audio and video processing with this.
The 4K video reproduction gives solid but not perfect results. The demand on the processor is not very high, and after completing the video, only 3 frames were dropped of a total of 3,500 single frames.
| DPC Latencies / LatencyMon - interrupt to process latency (max), Web, Youtube, Prime95 | |
| HP Omen 17-ck1075ng | |
| MSI Raider GE66 12UHS | |
| MSI GE67 HX 12UGS | |
| Aorus 17 XE4 | |
| Aorus 17X XES | |
| Schenker XMG Pro 17 E22 | |
| Asus ROG Zephyrus Duo 16 GX650RX | |
* ... smaller is better
Storage Solution
The Gigabyte M.2 SSD used does not show any weaknesses. Even during the load test, which is particularly meant to show whether the heat development is too high, the maximum performance remains constant. The capabilities of the PCIe 4.0 connection are used to the full extent.
Among the other competitors, the Schenker XMG Pro 17 E22 shows how things shouldn't be done, since there is throttling already after a short time period.

| Aorus 17X XES Gigabyte AG470S1TB-SI B10 | HP Omen 17-ck1075ng WDC PC SN810 1TB | MSI GE67 HX 12UGS Samsung PM9A1 MZVL21T0HCLR | Schenker XMG Pro 17 E22 Samsung SSD 980 Pro 1TB MZ-V8P1T0BW | MSI Raider GE66 12UHS Samsung PM9A1 MZVL22T0HBLB | Asus ROG Zephyrus Duo 16 GX650RX 2x Samsung SSD 980 Pro 2TB MZ-V8P2T0 (RAID 0) | Aorus 17 XE4 Gigabyte AG470S1TB-SI B10 | Average Gigabyte AG470S1TB-SI B10 | Average of class Gaming | |
|---|---|---|---|---|---|---|---|---|---|
| Drive Performance rating | |||||||||
| Percent (pt) | 76.7 | 55.3 -28% | 75.9 -1% | 73.4 -4% | 77.5 1% | 76.8 0% | 79.3 3% | 75 -2% | 61.9 -19% |
| DiskSpd | -25% | 3% | -4% | -2% | 24% | -6% | -6% | -14% | |
| seq read (MB/s) | 3871 | 3605 -7% | 3929 1% | 3141 -19% | 3813 -1% | 4903 27% | 3631 -6% | 3374 ? -13% | 3512 ? -9% |
| seq write (MB/s) | 4224 | 3593 -15% | 4063 -4% | 3391 -20% | 3838 -9% | 7889 87% | 2200 -48% | 3243 ? -23% | 3938 ? -7% |
| seq q8 t1 read (MB/s) | 6921 | 6799 -2% | 6683 -3% | 6766 -2% | 5358 -23% | 10557 53% | 7034 2% | 6976 ? 1% | 7451 ? 8% |
| seq q8 t1 write (MB/s) | 4852 | 5199 7% | 4985 3% | 4993 3% | 4951 2% | 9830 103% | 3611 -26% | 4350 ? -10% | 5905 ? 22% |
| 4k q1 t1 read (MB/s) | 74.1 | 77 4% | 93 26% | 67.2 -9% | 88.3 19% | 73.1 -1% | 88.8 20% | 75.4 ? 2% | 70.1 ? -5% |
| 4k q1 t1 write (MB/s) | 319 | 205 -36% | 275 -14% | 279 -13% | 273 -14% | 359 13% | 356 12% | 322 ? 1% | 195.9 ? -39% |
| 4k q32 t16 read (MB/s) | 3564 | 1274 -64% | 4176 17% | 4260 20% | 4068 14% | 2390 -33% | 3582 1% | 3564 ? 0% | 2279 ? -36% |
| 4k q32 t16 write (MB/s) | 3570 | 553 -85% | 3491 -2% | 3961 11% | 3478 -3% | 1542 -57% | 3604 1% | 3512 ? -2% | 1844 ? -48% |
| AS SSD | -25% | -21% | -6% | 1% | 0% | 7% | 0% | -27% | |
| Score Total (Points) | 9242 | 5693 -38% | 8980 -3% | 9047 -2% | 8959 -3% | 6635 -28% | 9279 0% | 8696 ? -6% | 6891 ? -25% |
| Score Read (Points) | 3629 | 1898 -48% | 3469 -4% | 3276 -10% | 3341 -8% | 2619 -28% | 3549 -2% | 3255 ? -10% | 2250 ? -38% |
| Score Write (Points) | 3877 | 2955 -24% | 3799 -2% | 4151 7% | 3977 3% | 2556 -34% | 3996 3% | 3859 ? 0% | 3562 ? -8% |
| Seq Read (MB/s) | 5715 | 5233.79 -8% | 5282.63 -8% | 4559 -20% | 5098.97 -11% | 5344.88 -6% | 5031 -12% | 5105 ? -11% | 5567 ? -3% |
| Seq Write (MB/s) | 3218 | 2355.42 -27% | 3975.65 24% | 3548 10% | 3667.77 14% | 7663.27 138% | 3162 -2% | 3302 ? 3% | 3949 ? 23% |
| 4K Read (MB/s) | 94.04 | 68.25 -27% | 86.37 -8% | 63.1 -33% | 84.06 -11% | 68.93 -27% | 108 15% | 91 ? -3% | 71 ? -25% |
| 4K Write (MB/s) | 256.3 | 224.32 -12% | 240.81 -6% | 254.1 -1% | 244.47 -5% | 328.69 28% | 308.6 20% | 286 ? 12% | 216 ? -16% |
| 4K-64 Read (MB/s) | 2963 | 1306.59 -56% | 2854.25 -4% | 2757 -7% | 2747.2 -7% | 2015.68 -32% | 2938 -1% | 2653 ? -10% | 1623 ? -45% |
| 4K-64 Write (MB/s) | 3299 | 2495.32 -24% | 3160.56 -4% | 3543 7% | 3365.94 2% | 1460.96 -56% | 3371 2% | 3242 ? -2% | 2952 ? -11% |
| Access Time Read * (ms) | 0.085 | 0.078 8% | 0.029 66% | 0.073 14% | 0.032 62% | 0.053 38% | 0.048 44% | 0.06282 ? 26% | 0.06402 ? 25% |
| Access Time Write * (ms) | 0.014 | 0.017 -21% | 0.054 -286% | 0.018 -29% | 0.018 -29% | 0.013 7% | 0.013 7% | 0.01364 ? 3% | 0.03815 ? -173% |
| Total Average (Program / Settings) | -26% /
-25% | -6% /
-11% | -5% /
-5% | 0% /
-0% | 8% /
10% | 1% /
2% | -3% /
-2% | -20% /
-21% |
* ... smaller is better
Constant Performance Reading: DiskSpd Read Loop, Queue Depth 8
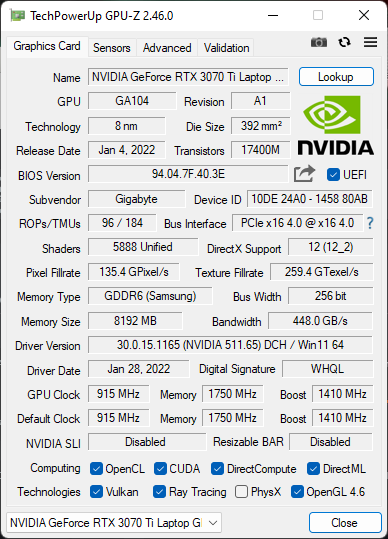
Graphics Card
The Aorus 17X provides the Nvidia GeForce RTX 3070 Ti graphics card with a maximum of 130 watts, with the possibility of taking 15 watts of that as "Dynamic Boost" for the CPU. In our various benchmarks, the gaming laptop performs close to the average value of the GPU used.
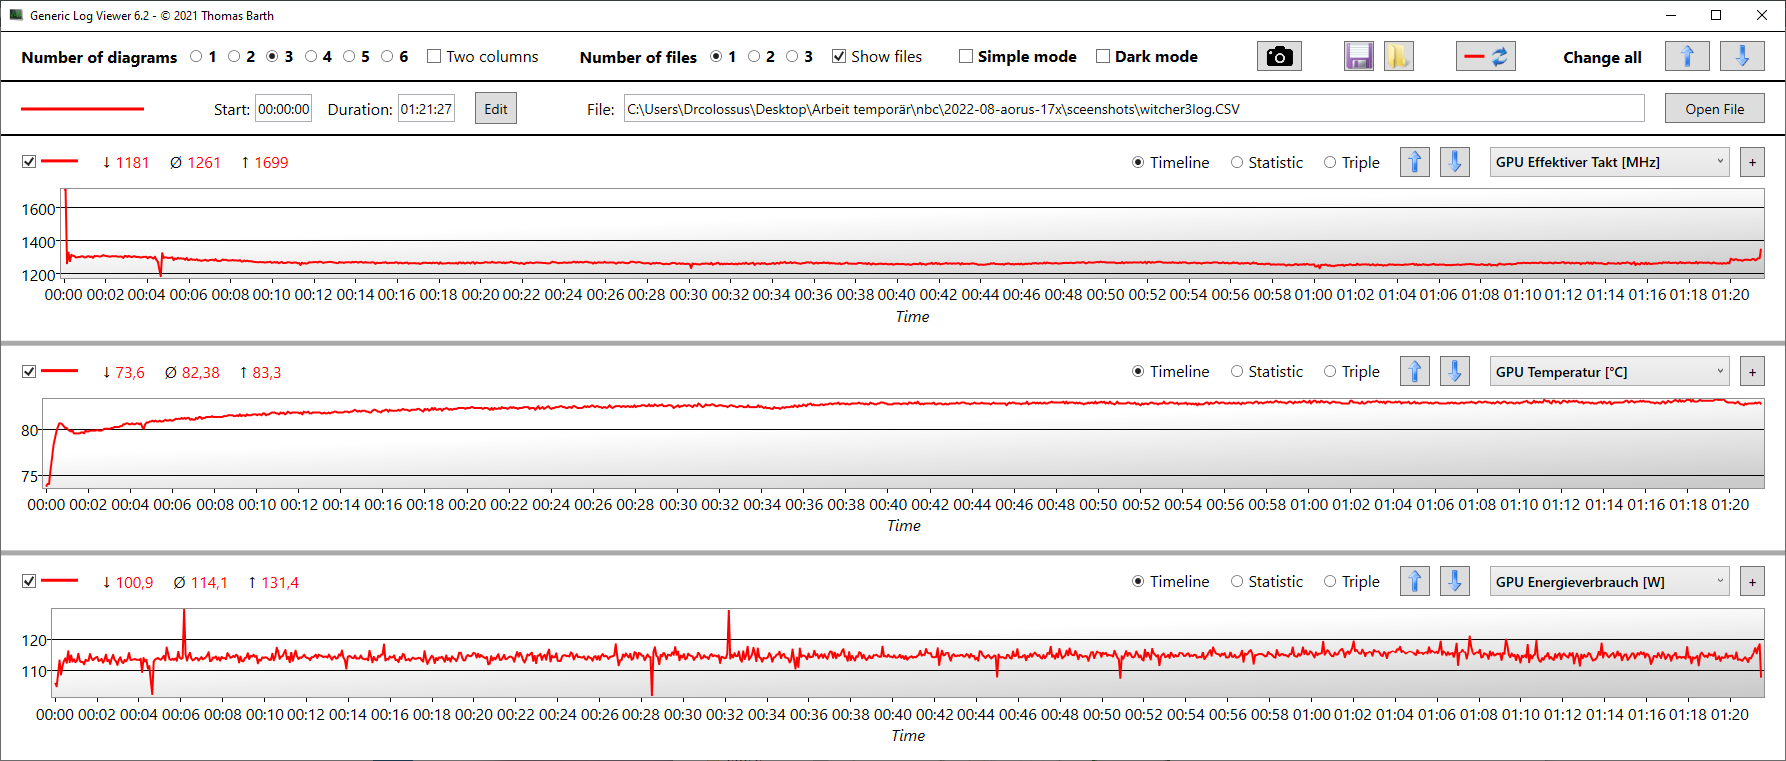
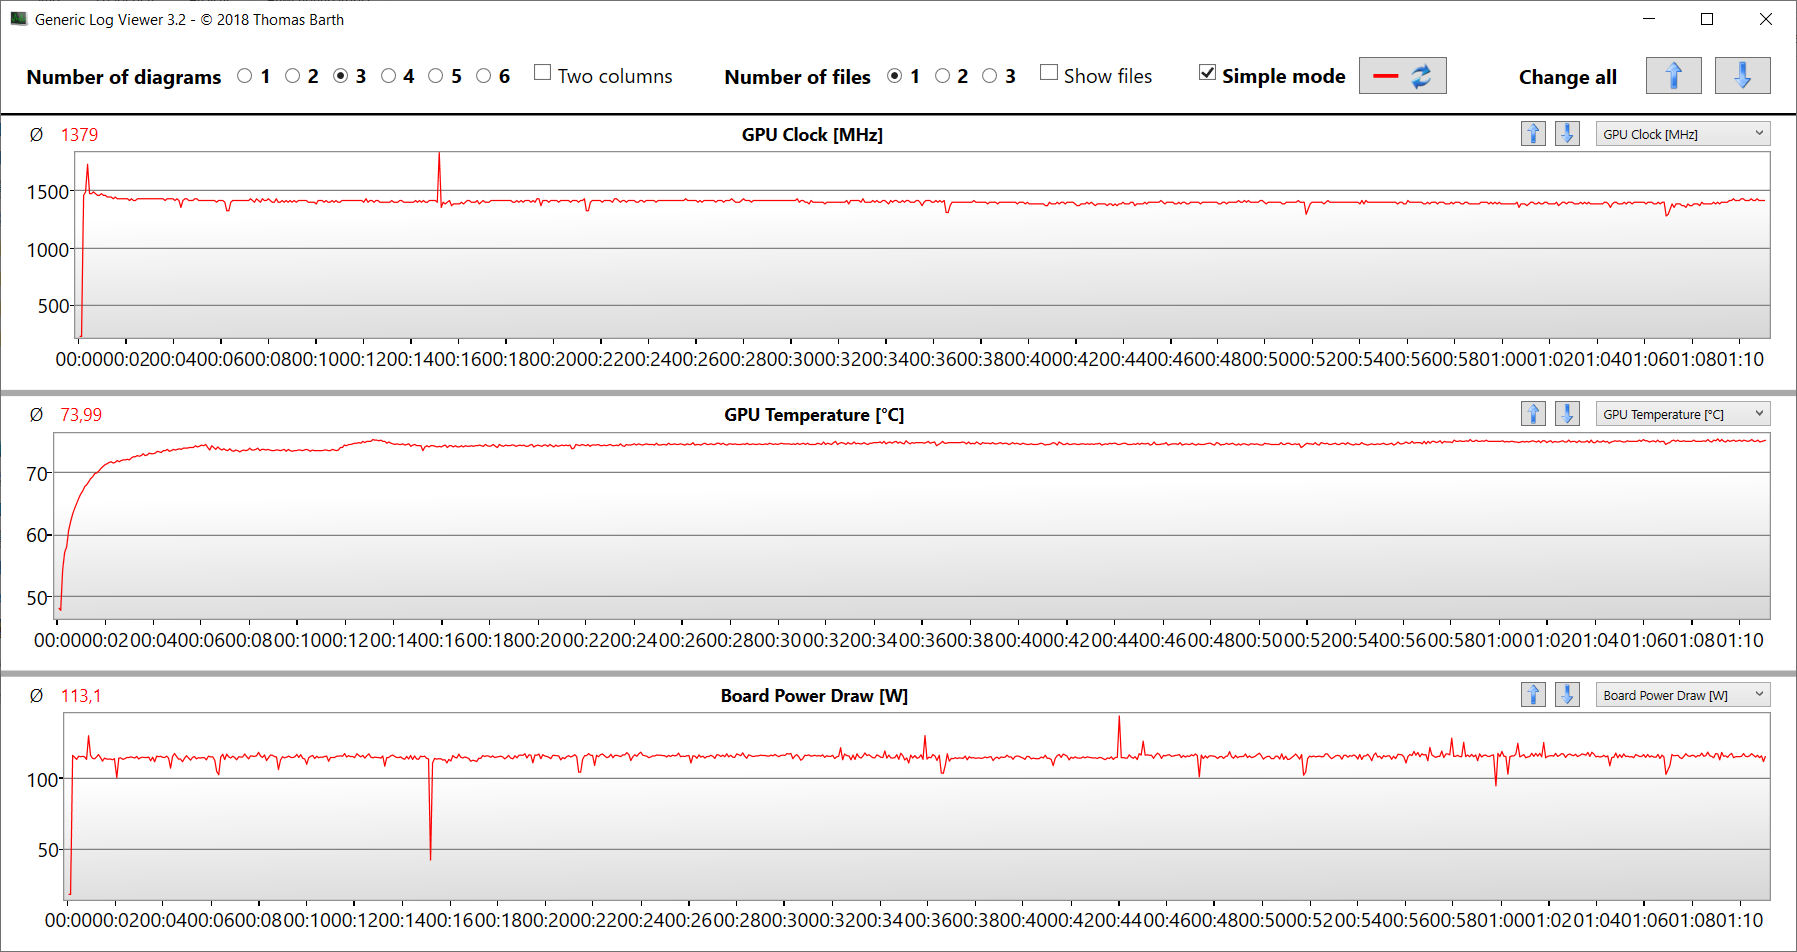
In the stress test with The Witcher 3, the performance also remains constant for longer time periods, which is an indication that the cooling system is sufficiently sized. However, it is conspicuous that the Aorus 17 XE4 with the smaller i7-12700H processor does better throughout here. A glance at the sensor values of HWiNFO shows that the GPU doesn't reach the same performance values, which can probably be traced back to the significantly higher power and cooling needs of the larger processor. This means that the maximum temperature of the GPU is reached considerably faster, leading to a lowering of the clock speed. The average values of the two charts below show this fairly well.
You can find additional benchmarks and comparisons to various graphics cards in our benchmark list.
| 3DMark 11 Performance | 29161 points | |
| 3DMark Cloud Gate Standard Score | 59273 points | |
| 3DMark Fire Strike Score | 23528 points | |
| 3DMark Time Spy Score | 10254 points | |
Help | ||
Gaming Performance
All the games we tested are able to maintain a frame rate beyond 60 FPS even at highest detail settings. This means that the Aorus 17X should be able to handle newer and demanding games well, even for the foreseeable future. Here, the Full-HD resolution also provides a pragmatic limitation of the required performance.
As already mentioned, the RTX 3070 Ti is unable to perform at its full potential. The MSI GE67 12UGS with the same GPU is clearly ahead in some areas here. The focus of the Gigabyte laptop is more on productivity.
The 360-Hz panel might only reach its full potential in some simpler games. However, it still strikes a good figure at 100 or more frames per second, since variable refresh rates are supported and the response times are extremely low.
| The Witcher 3 | |
| 1920x1080 High Graphics & Postprocessing (Nvidia HairWorks Off) | |
| Average of class Gaming (n=1last 2 years) | |
| MSI GE67 HX 12UGS | |
| MSI Raider GE66 12UHS | |
| Schenker XMG Pro 17 E22 | |
| HP Omen 17-ck1075ng | |
| Asus ROG Zephyrus Duo 16 GX650RX | |
| Average NVIDIA GeForce RTX 3070 Ti Laptop GPU (139.7 - 226, n=27) | |
| Aorus 17 XE4 | |
| Aorus 17X XES | |
| 1920x1080 Ultra Graphics & Postprocessing (HBAO+) | |
| Average of class Gaming (104.7 - 240, n=6, last 2 years) | |
| MSI GE67 HX 12UGS | |
| Schenker XMG Pro 17 E22 | |
| Asus ROG Zephyrus Duo 16 GX650RX | |
| MSI Raider GE66 12UHS | |
| HP Omen 17-ck1075ng | |
| Average NVIDIA GeForce RTX 3070 Ti Laptop GPU (76.8 - 124.1, n=39) | |
| Aorus 17 XE4 | |
| Aorus 17X XES | |
| Forza Horizon 5 | |
| 1920x1080 High Preset | |
| Schenker XMG Pro 17 E22 | |
| Aorus 17X XES | |
| Average NVIDIA GeForce RTX 3070 Ti Laptop GPU (122 - 130, n=3) | |
| Aorus 17 XE4 | |
| 1920x1080 Extreme Preset | |
| Schenker XMG Pro 17 E22 | |
| Aorus 17X XES | |
| Aorus 17 XE4 | |
| Average NVIDIA GeForce RTX 3070 Ti Laptop GPU (76 - 80, n=3) | |
| God of War | |
| 1920x1080 High Preset | |
| Aorus 17X XES | |
| Average NVIDIA GeForce RTX 3070 Ti Laptop GPU (76.6 - 92, n=5) | |
| Aorus 17 XE4 | |
| 1920x1080 Ultra Preset | |
| Aorus 17X XES | |
| Average NVIDIA GeForce RTX 3070 Ti Laptop GPU (55.1 - 64.3, n=5) | |
| Aorus 17 XE4 | |
| Elex 2 | |
| 1920x1080 High / On AA:FX AF:16x | |
| Schenker XMG Pro 17 E22 | |
| Average NVIDIA GeForce RTX 3070 Ti Laptop GPU (83 - 99.4, n=3) | |
| Aorus 17 XE4 | |
| Aorus 17X XES | |
| 1920x1080 Ultra / On AA:SM AF:16x | |
| Schenker XMG Pro 17 E22 | |
| Average NVIDIA GeForce RTX 3070 Ti Laptop GPU (75 - 89, n=3) | |
| Aorus 17 XE4 | |
| Aorus 17X XES | |
Aside from a short drop by 4%, the frame rate in our The Witcher 3 stress test remains almost constant at maximum details. This indicates a sufficient cooling performance, even under constant load.
You can see in the chart as well as in the fps values of the various games, that the Aorus 17 XE4 with the same graphics card and the i7-12700H always performs a few percentage points better. The graphics card has to share too many resources with the processor. However, this doesn't change the good overall impression in terms of the suitability for current games.
The Witcher 3 FPS Chart
| low | med. | high | ultra | |
|---|---|---|---|---|
| GTA V (2015) | 178.5 | 110.9 | ||
| The Witcher 3 (2015) | 158 | 93.7 | ||
| Dota 2 Reborn (2015) | 158.3 | 148 | ||
| Final Fantasy XV Benchmark (2018) | 94.7 | |||
| X-Plane 11.11 (2018) | 116.9 | |||
| Far Cry 5 (2018) | 144 | 135 | ||
| Strange Brigade (2018) | 184.7 | 163.2 | ||
| Forza Horizon 5 (2021) | 130 | 80 | ||
| God of War (2022) | 92 | 61 | ||
| Elex 2 (2022) | 83 | 75 |
Emissions - Aorus 17X with high cooling needs
Noise Emissions
Of course the fans get loud under load. Unfortunately, the noise volume surpasses that of the competitors in some cases significantly, but you usually also hear some whirring noises there.
What really stands out is the sudden revving up of the fan speed, sometimes even in battery operation. This becomes annoying under regular load such as web surfing, image processing, and running office programs. The fans keep revving up suddenly.
Apparently, Gigabyte already took note of how annoying this could become. The "Escape" key offers a second function to adjust the fan behavior with a button press, without having to make any other changes.
Noise level
| Idle |
| 28 / 32 / 38 dB(A) |
| Load |
| 53 / 55 dB(A) |
 | ||
30 dB silent 40 dB(A) audible 50 dB(A) loud |
||
min: | ||
| Aorus 17X XES GeForce RTX 3070 Ti Laptop GPU, i9-12900HX, Gigabyte AG470S1TB-SI B10 | HP Omen 17-ck1075ng GeForce RTX 3070 Ti Laptop GPU, i7-12700H, WDC PC SN810 1TB | MSI GE67 HX 12UGS GeForce RTX 3070 Ti Laptop GPU, i7-12800HX, Samsung PM9A1 MZVL21T0HCLR | Schenker XMG Pro 17 E22 GeForce RTX 3080 Ti Laptop GPU, i9-12900H, Samsung SSD 980 Pro 1TB MZ-V8P1T0BW | MSI Raider GE66 12UHS GeForce RTX 3080 Ti Laptop GPU, i9-12900HK, Samsung PM9A1 MZVL22T0HBLB | Asus ROG Zephyrus Duo 16 GX650RX GeForce RTX 3080 Ti Laptop GPU, R9 6900HX, 2x Samsung SSD 980 Pro 2TB MZ-V8P2T0 (RAID 0) | Aorus 17 XE4 GeForce RTX 3070 Ti Laptop GPU, i7-12700H, Gigabyte AG470S1TB-SI B10 | |
|---|---|---|---|---|---|---|---|
| Noise | 6% | 15% | -4% | 8% | 13% | 7% | |
| off / environment * (dB) | 26 | 25.4 2% | 22.7 13% | 26 -0% | 26 -0% | 26 -0% | 24 8% |
| Idle Minimum * (dB) | 28 | 28 -0% | 22.9 18% | 26 7% | 27 4% | 26 7% | 30 -7% |
| Idle Average * (dB) | 32 | 28 12% | 22.9 28% | 34 -6% | 30 6% | 27 16% | 31 3% |
| Idle Maximum * (dB) | 38 | 31.2 18% | 22.9 40% | 42 -11% | 39 -3% | 29 24% | 34 11% |
| Load Average * (dB) | 53 | 52.2 2% | 44.4 16% | 58 -9% | 45 15% | 41 23% | 44 17% |
| Witcher 3 ultra * (dB) | 54 | 52.2 3% | 55.7 -3% | 57 -6% | 45 17% | 48 11% | 51 6% |
| Load Maximum * (dB) | 55 | 52.2 5% | 57.4 -4% | 58 -5% | 47 15% | 50 9% | 49 11% |
* ... smaller is better
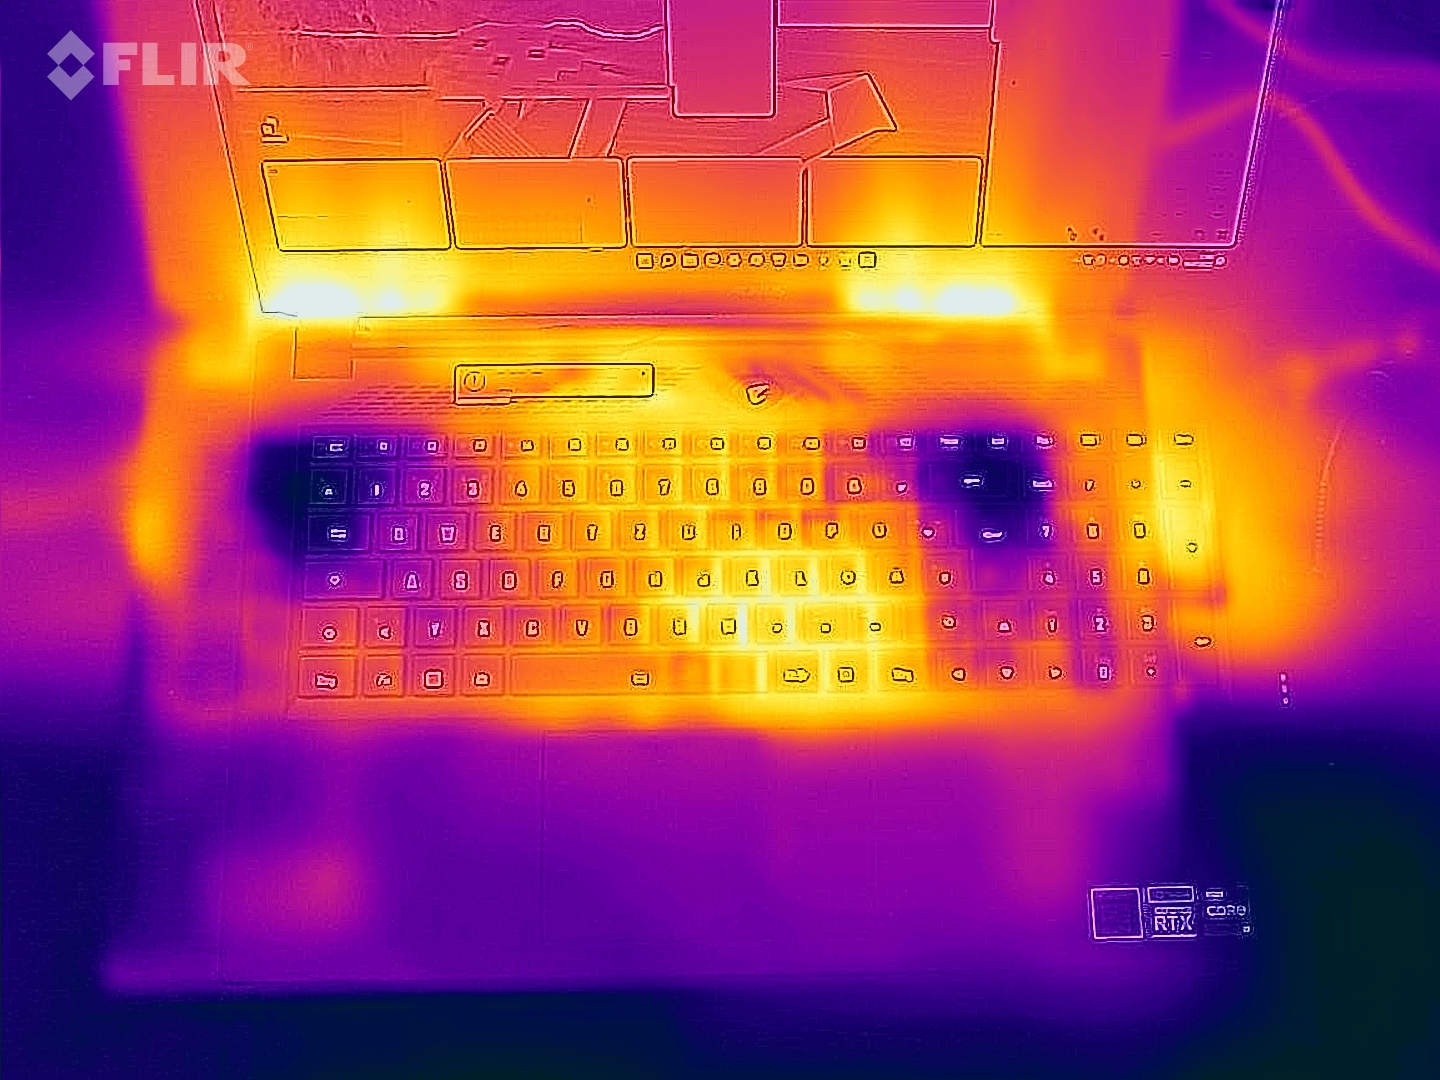
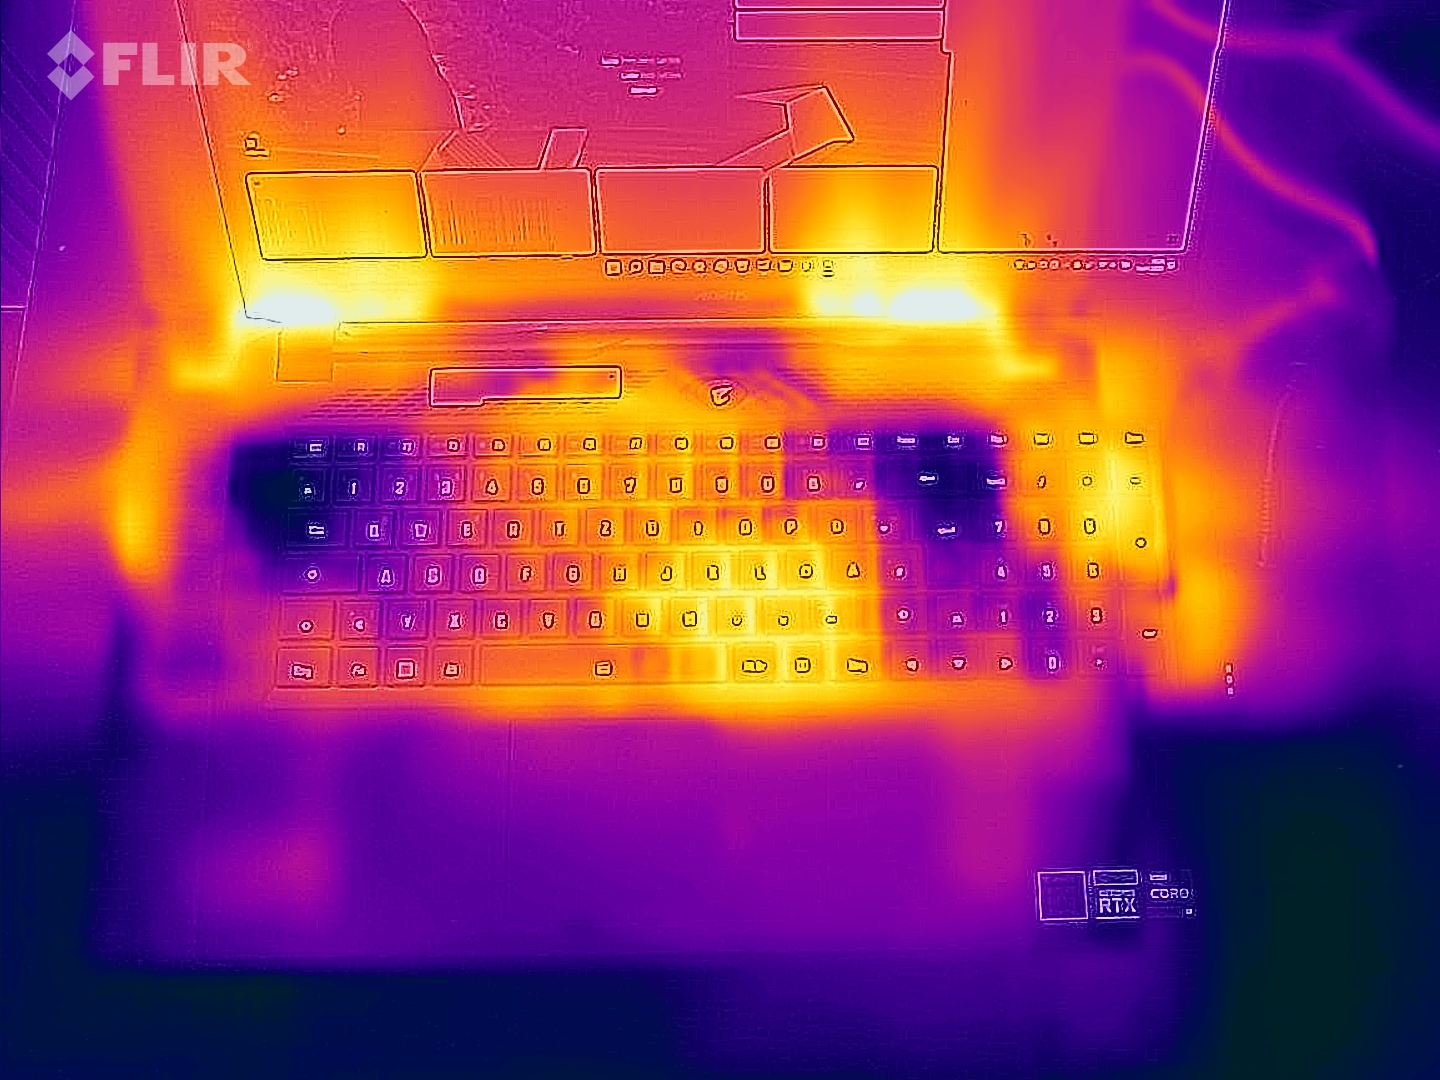
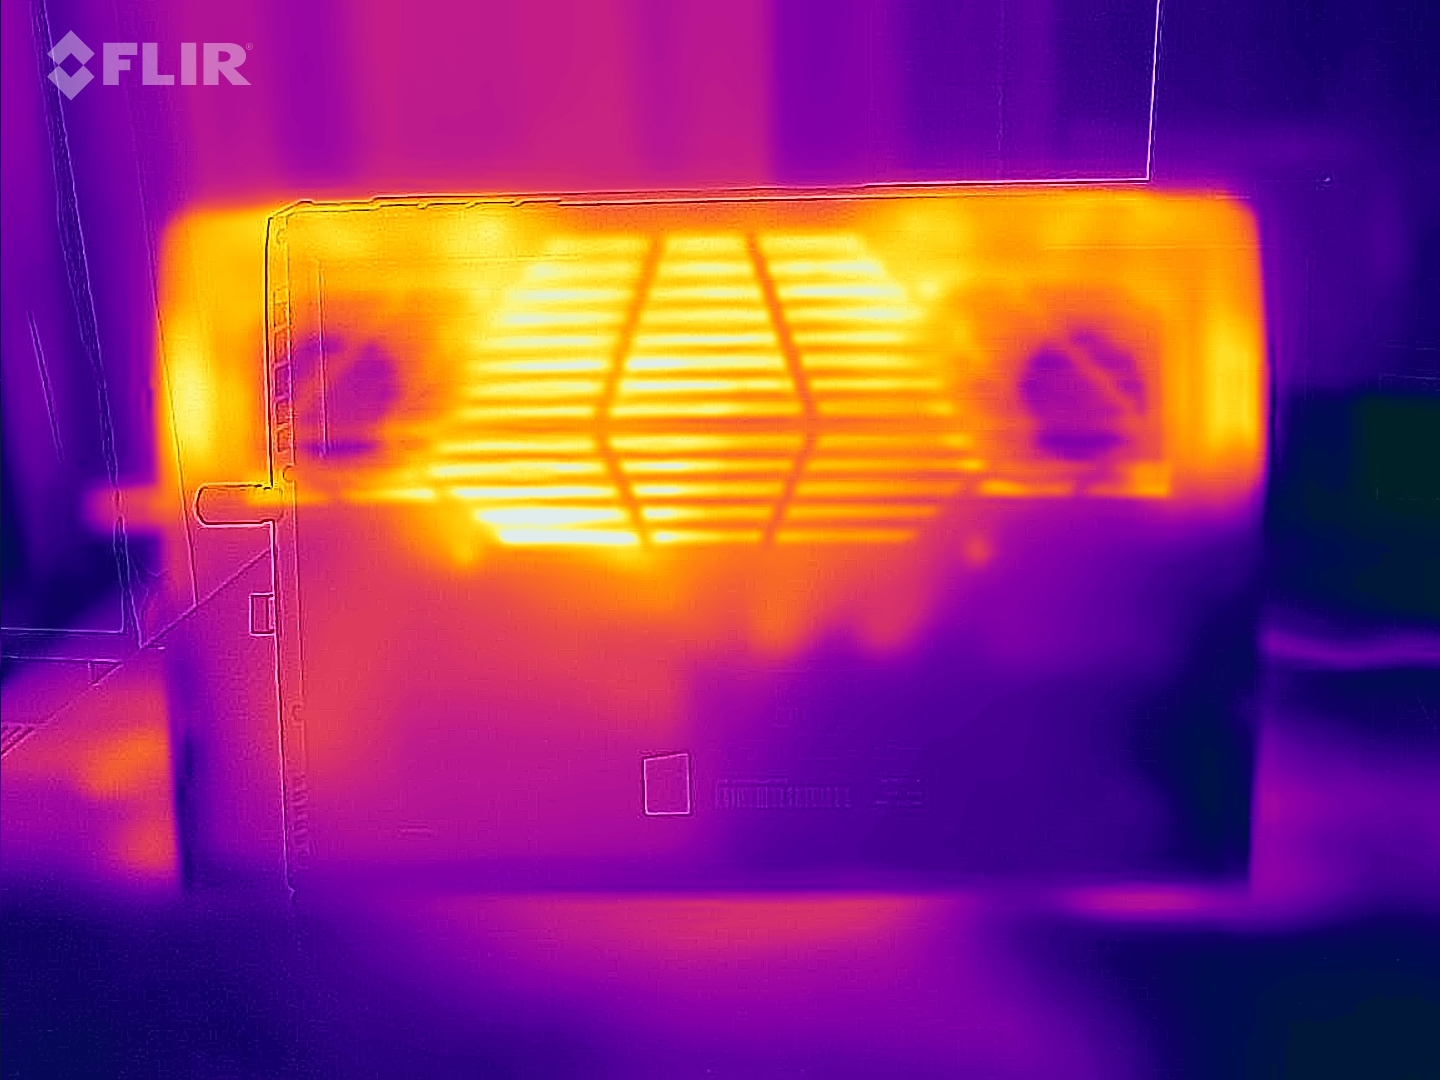
Temperatures
The heat development of the gaming laptop while gaming and even during the stress test doesn't get too extreme. The palm rests remain relatively cool. The heat development also stays within acceptable limits in the area of the keyboard, even if the keys warm up noticeably.
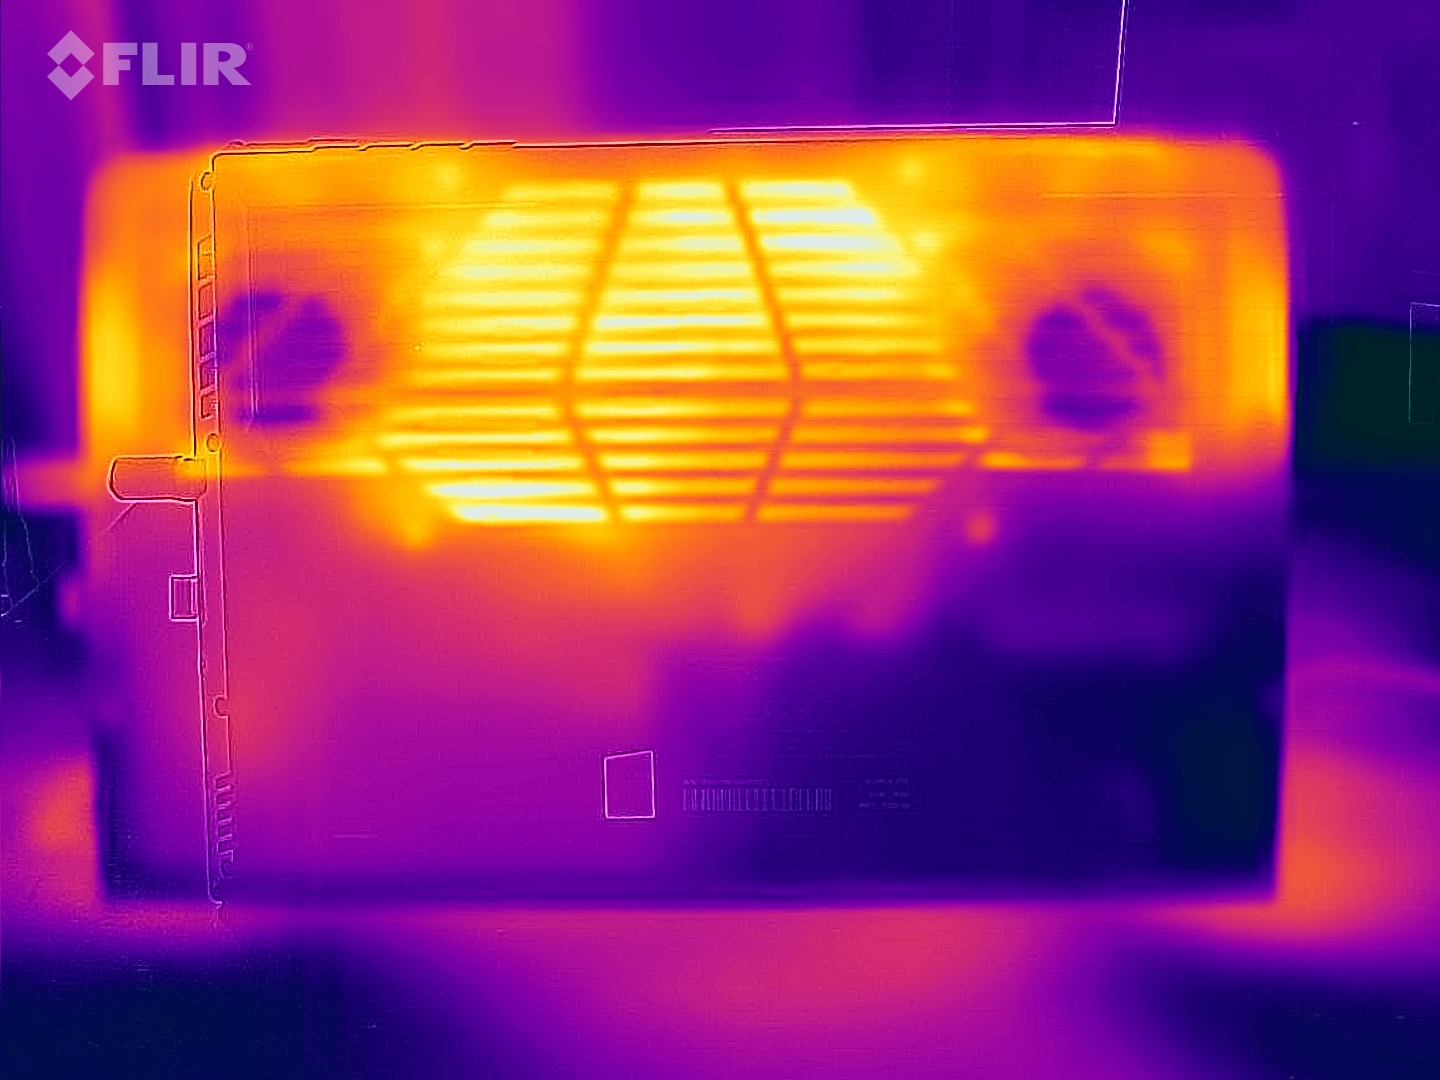
A large part of the heat is removed though the bottom, which becomes several degrees warmer than the top. We measure a maximum value of 65 °C (149 °F). This also means that you shouldn't use the Aorus 17X on a padded surface, but it is best placed on a solid surface like a desk.
(-) The maximum temperature on the upper side is 54 °C / 129 F, compared to the average of 40.4 °C / 105 F, ranging from 21.2 to 68.8 °C for the class Gaming.
(-) The bottom heats up to a maximum of 58 °C / 136 F, compared to the average of 43.2 °C / 110 F
(±) In idle usage, the average temperature for the upper side is 34.1 °C / 93 F, compared to the device average of 33.9 °C / 93 F.
(-) Playing The Witcher 3, the average temperature for the upper side is 45.2 °C / 113 F, compared to the device average of 33.9 °C / 93 F.
(-) The palmrests and touchpad can get very hot to the touch with a maximum of 41 °C / 105.8 F.
(-) The average temperature of the palmrest area of similar devices was 28.8 °C / 83.8 F (-12.2 °C / -22 F).
| Aorus 17X XES Intel Core i9-12900HX, NVIDIA GeForce RTX 3070 Ti Laptop GPU | HP Omen 17-ck1075ng Intel Core i7-12700H, NVIDIA GeForce RTX 3070 Ti Laptop GPU | MSI GE67 HX 12UGS Intel Core i7-12800HX, NVIDIA GeForce RTX 3070 Ti Laptop GPU | Schenker XMG Pro 17 E22 Intel Core i9-12900H, NVIDIA GeForce RTX 3080 Ti Laptop GPU | MSI Raider GE66 12UHS Intel Core i9-12900HK, NVIDIA GeForce RTX 3080 Ti Laptop GPU | Asus ROG Zephyrus Duo 16 GX650RX AMD Ryzen 9 6900HX, NVIDIA GeForce RTX 3080 Ti Laptop GPU | Aorus 17 XE4 Intel Core i7-12700H, NVIDIA GeForce RTX 3070 Ti Laptop GPU | |
|---|---|---|---|---|---|---|---|
| Heat | 18% | 29% | 2% | 4% | 14% | 11% | |
| Maximum Upper Side * (°C) | 54 | 31.3 42% | 34.4 36% | 56 -4% | 54 -0% | 45 17% | 50 7% |
| Maximum Bottom * (°C) | 58 | 43.3 25% | 42 28% | 60 -3% | 65 -12% | 50 14% | 58 -0% |
| Idle Upper Side * (°C) | 37 | 31.3 15% | 24 35% | 34 8% | 30 19% | 33 11% | 30 19% |
| Idle Bottom * (°C) | 39 | 43.3 -11% | 33.2 15% | 36 8% | 35 10% | 33 15% | 32 18% |
* ... smaller is better
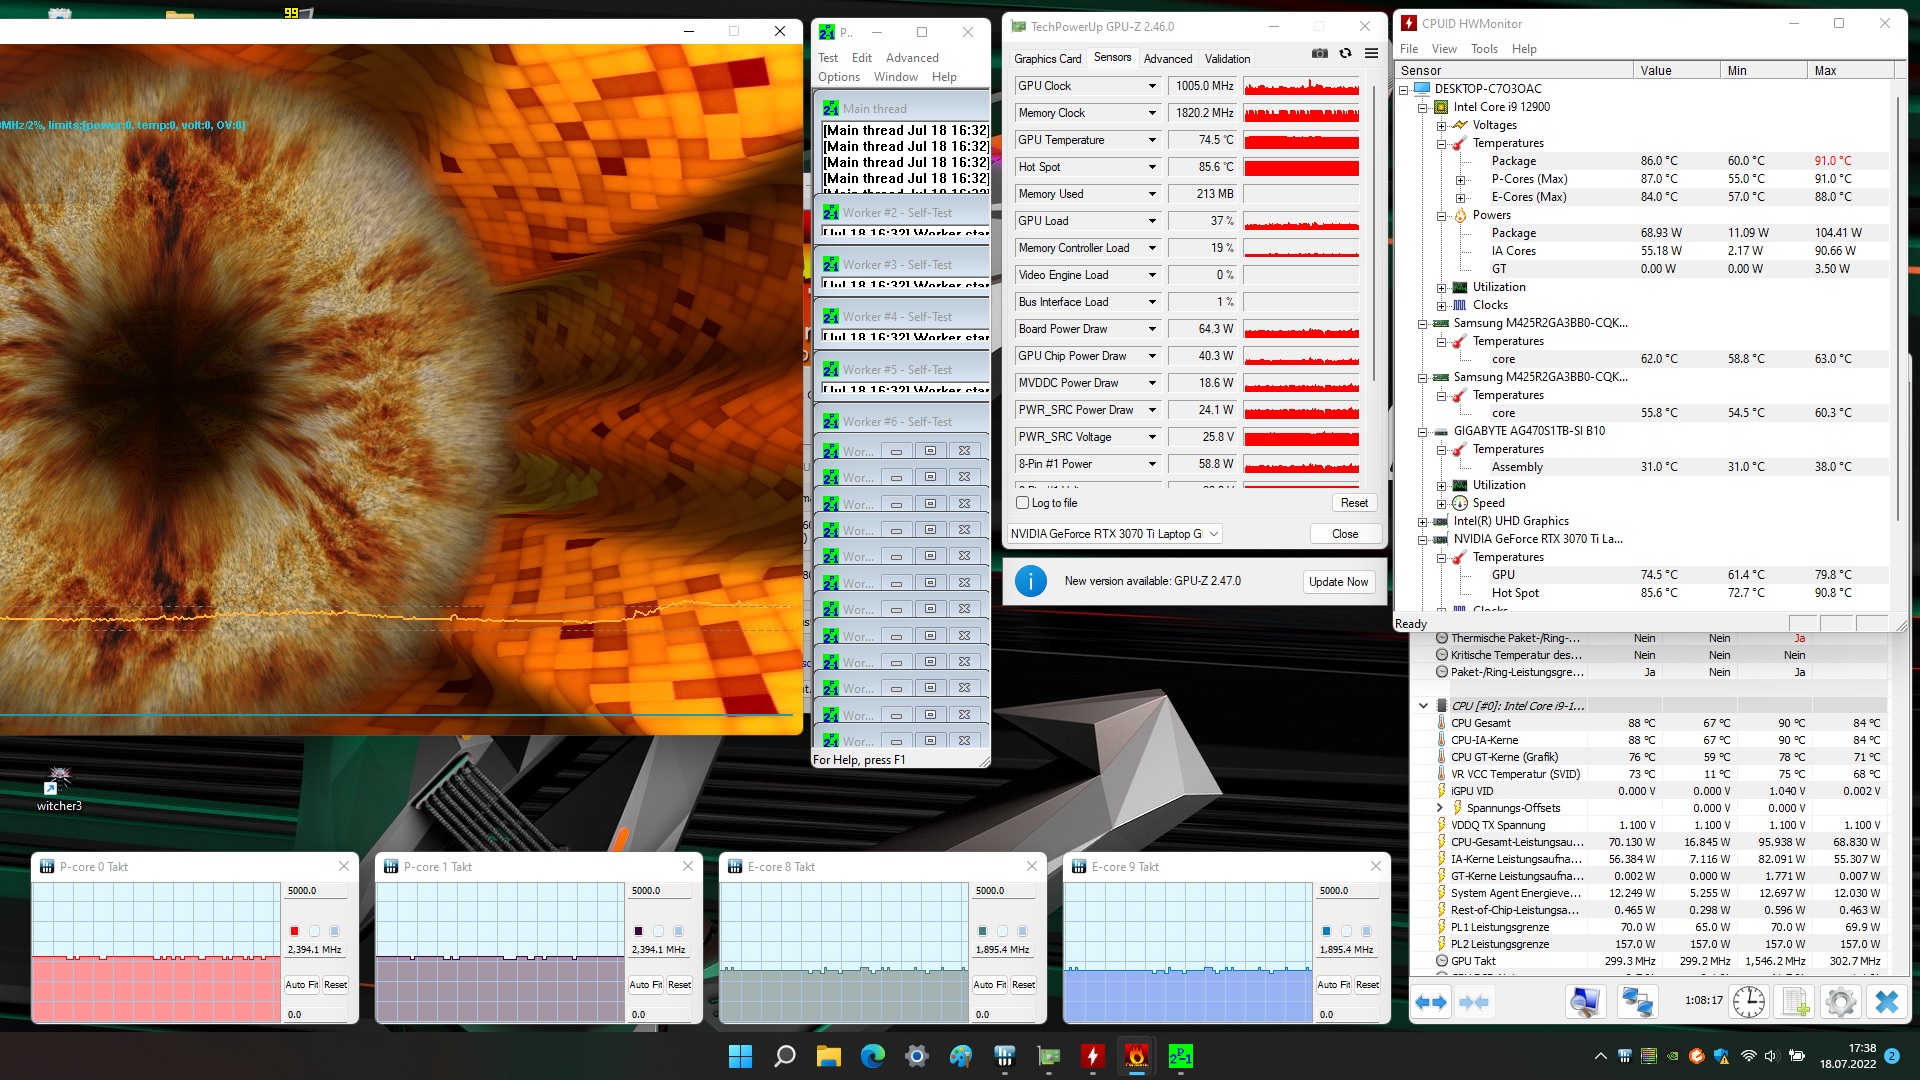
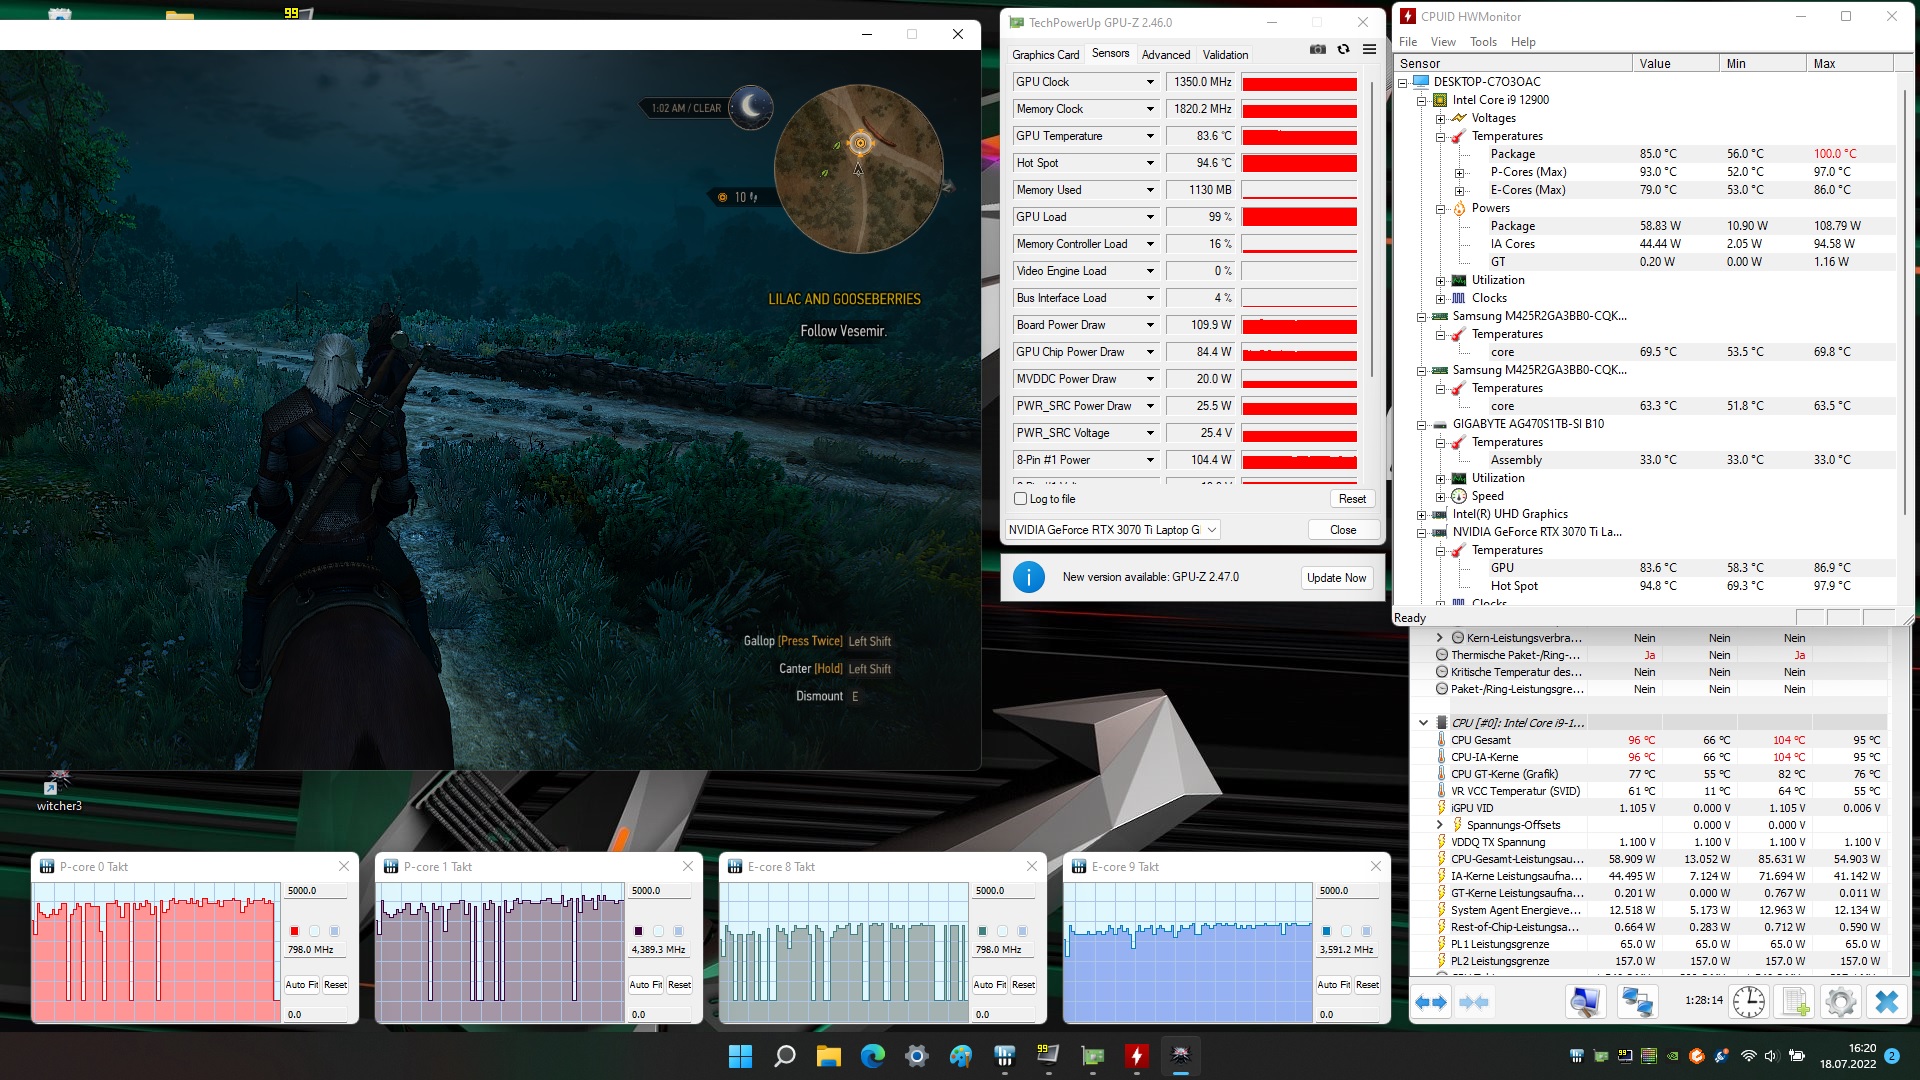
Stress Test
Under constant load, the i9-12900HX reaches up to 100 °C (212 °F). After that, the Aorus 17X always has to throttle its clock speed significantly. However, this is only the case if the graphics card is also under heavy load. This scenario with The Witcher 3 at maximum detail settings, which is displayed well, reveals the extremely high heat development of the power-hungry CPU.
Speakers
You can immediately see by looking at the bar chart below that the laptop lacks bass. The MacBook Pro 16 shows how this should look like. Unfortunately, you can clearly hear the difference with the corresponding music such as Electronic or Rock. The deep frequencies clearly lack power.
In contrast, voices and high frequencies in general are reproduced clearly and accurately. Music that emphasizes voices and all the content dominated by voice and dialog sounds convincing. For stereo speakers in a laptop, this is a good result.
Thanks to the headset port and various video ports, there are numerous additional options for external speakers.
Aorus 17X XES audio analysis
(+) | speakers can play relatively loud (85 dB)
Bass 100 - 315 Hz
(-) | nearly no bass - on average 27.6% lower than median
(±) | linearity of bass is average (11.8% delta to prev. frequency)
Mids 400 - 2000 Hz
(±) | higher mids - on average 5.1% higher than median
(+) | mids are linear (5.5% delta to prev. frequency)
Highs 2 - 16 kHz
(+) | balanced highs - only 3% away from median
(+) | highs are linear (6% delta to prev. frequency)
Overall 100 - 16.000 Hz
(±) | linearity of overall sound is average (19% difference to median)
Compared to same class
» 63% of all tested devices in this class were better, 8% similar, 29% worse
» The best had a delta of 6%, average was 18%, worst was 132%
Compared to all devices tested
» 45% of all tested devices were better, 7% similar, 48% worse
» The best had a delta of 4%, average was 23%, worst was 134%
Apple MacBook Pro 16 2021 M1 Pro audio analysis
(+) | speakers can play relatively loud (84.7 dB)
Bass 100 - 315 Hz
(+) | good bass - only 3.8% away from median
(+) | bass is linear (5.2% delta to prev. frequency)
Mids 400 - 2000 Hz
(+) | balanced mids - only 1.3% away from median
(+) | mids are linear (2.1% delta to prev. frequency)
Highs 2 - 16 kHz
(+) | balanced highs - only 1.9% away from median
(+) | highs are linear (2.7% delta to prev. frequency)
Overall 100 - 16.000 Hz
(+) | overall sound is linear (4.6% difference to median)
Compared to same class
» 0% of all tested devices in this class were better, 0% similar, 100% worse
» The best had a delta of 5%, average was 17%, worst was 45%
Compared to all devices tested
» 0% of all tested devices were better, 0% similar, 100% worse
» The best had a delta of 4%, average was 23%, worst was 134%
Power Management - A power-hungry 17-inch laptop
Power Consumption
As in other comparably equipped and powerful gaming laptops, the power consumption already turns out very high even without load. While a minimum of 18 watts is acceptable in comparison, it still seems too high if you consider that there are no running applications at all.
The average load consumption of more than 150 watts is significantly higher than that of the competitors. The i9-12900HX alone consumes 10 watts more than weaker CPUs. However, the power isn't really used effectively. In our The Witcher 3 stress test, the Aorus 17 XE4 does better and uses 10% less power for this as well.
With a top consumption of 290 watts, the 280-Watt power supply is still able to handle it.
| Off / Standby | |
| Idle | |
| Load |
|
Key:
min: | |
| Aorus 17X XES i9-12900HX, GeForce RTX 3070 Ti Laptop GPU | HP Omen 17-ck1075ng i7-12700H, GeForce RTX 3070 Ti Laptop GPU | Schenker XMG Pro 17 E22 i9-12900H, GeForce RTX 3080 Ti Laptop GPU | MSI Raider GE66 12UHS i9-12900HK, GeForce RTX 3080 Ti Laptop GPU | Asus ROG Zephyrus Duo 16 GX650RX R9 6900HX, GeForce RTX 3080 Ti Laptop GPU | Aorus 17 XE4 i7-12700H, GeForce RTX 3070 Ti Laptop GPU | Average NVIDIA GeForce RTX 3070 Ti Laptop GPU | Average of class Gaming | |
|---|---|---|---|---|---|---|---|---|
| Power Consumption | 24% | 21% | 21% | 14% | 12% | 22% | 26% | |
| Idle Minimum * (Watt) | 18 | 12.2 32% | 13 28% | 16 11% | 19 -6% | 20 -11% | 14.2 ? 21% | 13 ? 28% |
| Idle Average * (Watt) | 28 | 18 36% | 17 39% | 19 32% | 24 14% | 23 18% | 19.9 ? 29% | 18.7 ? 33% |
| Idle Maximum * (Watt) | 36 | 19.4 46% | 26 28% | 26 28% | 31 14% | 28 22% | 26.2 ? 27% | 24.3 ? 32% |
| Load Average * (Watt) | 153 | 128 16% | 120 22% | 110 28% | 104 32% | 120 22% | 125.8 ? 18% | 110.2 ? 28% |
| Witcher 3 ultra * (Watt) | 221 | 209 5% | 221 -0% | 202 9% | 186.5 16% | 196 11% | ||
| Load Maximum * (Watt) | 290 | 266 8% | 266 8% | 242 17% | 256 12% | 257 11% | 248 ? 14% | 258 ? 11% |
* ... smaller is better
Power Consumption The Witcher 3 / Stress Test
Power Consumption With External Monitor
Battery Life
It is not surprising that with the same battery capacity as in the Aorus 17 XE4, the more power-hungry processor in the Aorus 17X leads to a much worse battery life. Particularly while web surfing, the laptop is unconvincing despite there hardly being any load worth mention on the system. You have barely more than 4 hours to find another outlet again. Despite the Power Saving mode and limited brightness, the result is still below average, even though the battery stores almost 100 Wh.
The laptop is simply not designed for work in battery operation, so you should always keep the power supply within reach, even though it is by no means small.
| Aorus 17X XES i9-12900HX, GeForce RTX 3070 Ti Laptop GPU, 99 Wh | HP Omen 17-ck1075ng i7-12700H, GeForce RTX 3070 Ti Laptop GPU, 78 Wh | MSI GE67 HX 12UGS i7-12800HX, GeForce RTX 3070 Ti Laptop GPU, 99.9 Wh | Schenker XMG Pro 17 E22 i9-12900H, GeForce RTX 3080 Ti Laptop GPU, 80 Wh | Asus ROG Zephyrus Duo 16 GX650RX R9 6900HX, GeForce RTX 3080 Ti Laptop GPU, 90 Wh | Aorus 17 XE4 i7-12700H, GeForce RTX 3070 Ti Laptop GPU, 99 Wh | Average of class Gaming | |
|---|---|---|---|---|---|---|---|
| Battery runtime | 49% | 39% | 28% | 64% | 30% | 66% | |
| H.264 (h) | 3.8 | 4.6 21% | 9.3 145% | 6.1 61% | 8.64 ? 127% | ||
| WiFi v1.3 (h) | 4.4 | 6.2 41% | 5.6 27% | 6.8 55% | 7.8 77% | 5.1 16% | 7.15 ? 63% |
| Load (h) | 1.4 | 2.2 57% | 2.1 50% | 1.5 7% | 1 -29% | 1.6 14% | 1.502 ? 7% |
Pros
Cons
Verdict - Gaming and working with the Gigabyte laptop
The heart and highlight of the Aorus 17X XES is the processor. With the i9-12900HX, the laptop moves far ahead to the top in the CPU benchmarks, with a convincing performance during demanding tasks that it can easily also run in parallel. A lot of DDR5 RAM and the fast and capable M.2 SSD underline the high ambitions in terms of the system performance.
Despite the 360-Hertz monitor with full sRGB color space coverage and Nvidia Advanced Optimus for a correspondingly fast display, this is by no means a pure gaming laptop. At its suitable place on a desk with between one and three appropriate screens connected to its video ports, it is also able to prove its workstation qualities.
The 32 GB of working memory are well-suited for this, among other things. In addition, the processor appears too powerful and in too much need for cooling to be able to make full use of the graphics card performance, which can become quite a hindrance while gaming.
Not a pure gaming laptop, the Aorus 17X is similarly well equipped for demanding tasks and the occasional gaming at a high level.
It is not surprising that the laptop turns out rather weak in terms of the battery life and the noise and heat development. The powerful components demand clear compromises in terms of the mobility. However, we still would have expected more, considering the very large battery.
The connection equipment also could have turned out a bit more abundant. The 17-inch laptop would definitely offer sufficient space for this. In addition, the two USB-A connections still use the USB 3.0 standard with only 5 Gbit/s. On the other hand, Thunderbolt 4, 2.5-Gigbit LAN, as well as HDMI and DP somewhat make up for this.
But of course this doesn't change anything in the good system performance. If a laptop should work really fast and also display games in the best quality, everything for this is available here. But if gaming should be in the foreground, the Aorus 17 XE4 might be a better choice. The smaller processor decreases the price noticeably, without limiting the performance during gaming. You can find an even higher system performance at a correspondingly higher price in the MSI Raider GE66, for example.
Price and Availability
The Aorus 17X is listed at Gigabyte, and a similar Aorus 17 configuration with the Intel i9-12900H processor is available at BestBuy for $2999. You can find the Aorus 17 XE4 with i7-12700H, which performs better in the pure gaming performance, at Amazon for $1999.
Aorus 17X XES
- 08/17/2022 v7 (old)
Mario Petzold
Price comparison

