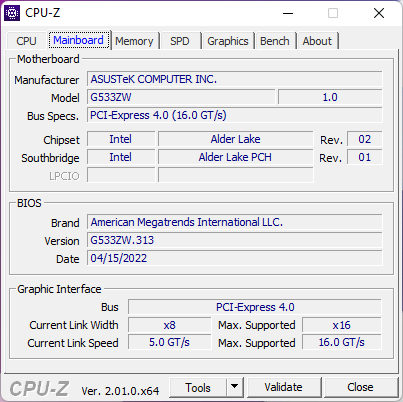
Asus ROG Strix Scar 15 G533ZW Laptop Review: 1440p 240 Hz gaming powerhouse with Alder Lake Core i9 and 150 W RTX 3070 Ti
The Asus ROG Strix series is one of the highly anticipated gaming laptop lineups to look out for at the start of each year. The ROG Strix Scar 15 (2022) was announced during CES 2022 with upgrades to Intel Alder Lake-H and graphics options up to the Nvidia GeForce RTX 3080 Ti Laptop GPU. Asus continues to carry forward the G533 nomenclature into 2022 but has made some changes to the branding.
While Asus completely switched over to AMD Ryzen 5000 series offerings with the ROG Strix Scar 15 in 2021, the company has now bifurcated the product line into distinct Intel Alder Lake and AMD Ryzen 6000 offerings.
In the 15.6-inch format, we have offerings such as our current test unit, the ROG Strix Scar 15 G533ZW. On the AMD side, Asus drops the "Scar" branding (along with the signature design and Keystone) with the Strix G15 G513 series being powered by CPU options up to a Ryzen 9 6900HX and up to a 150 W RTX 3080 Laptop GPU.
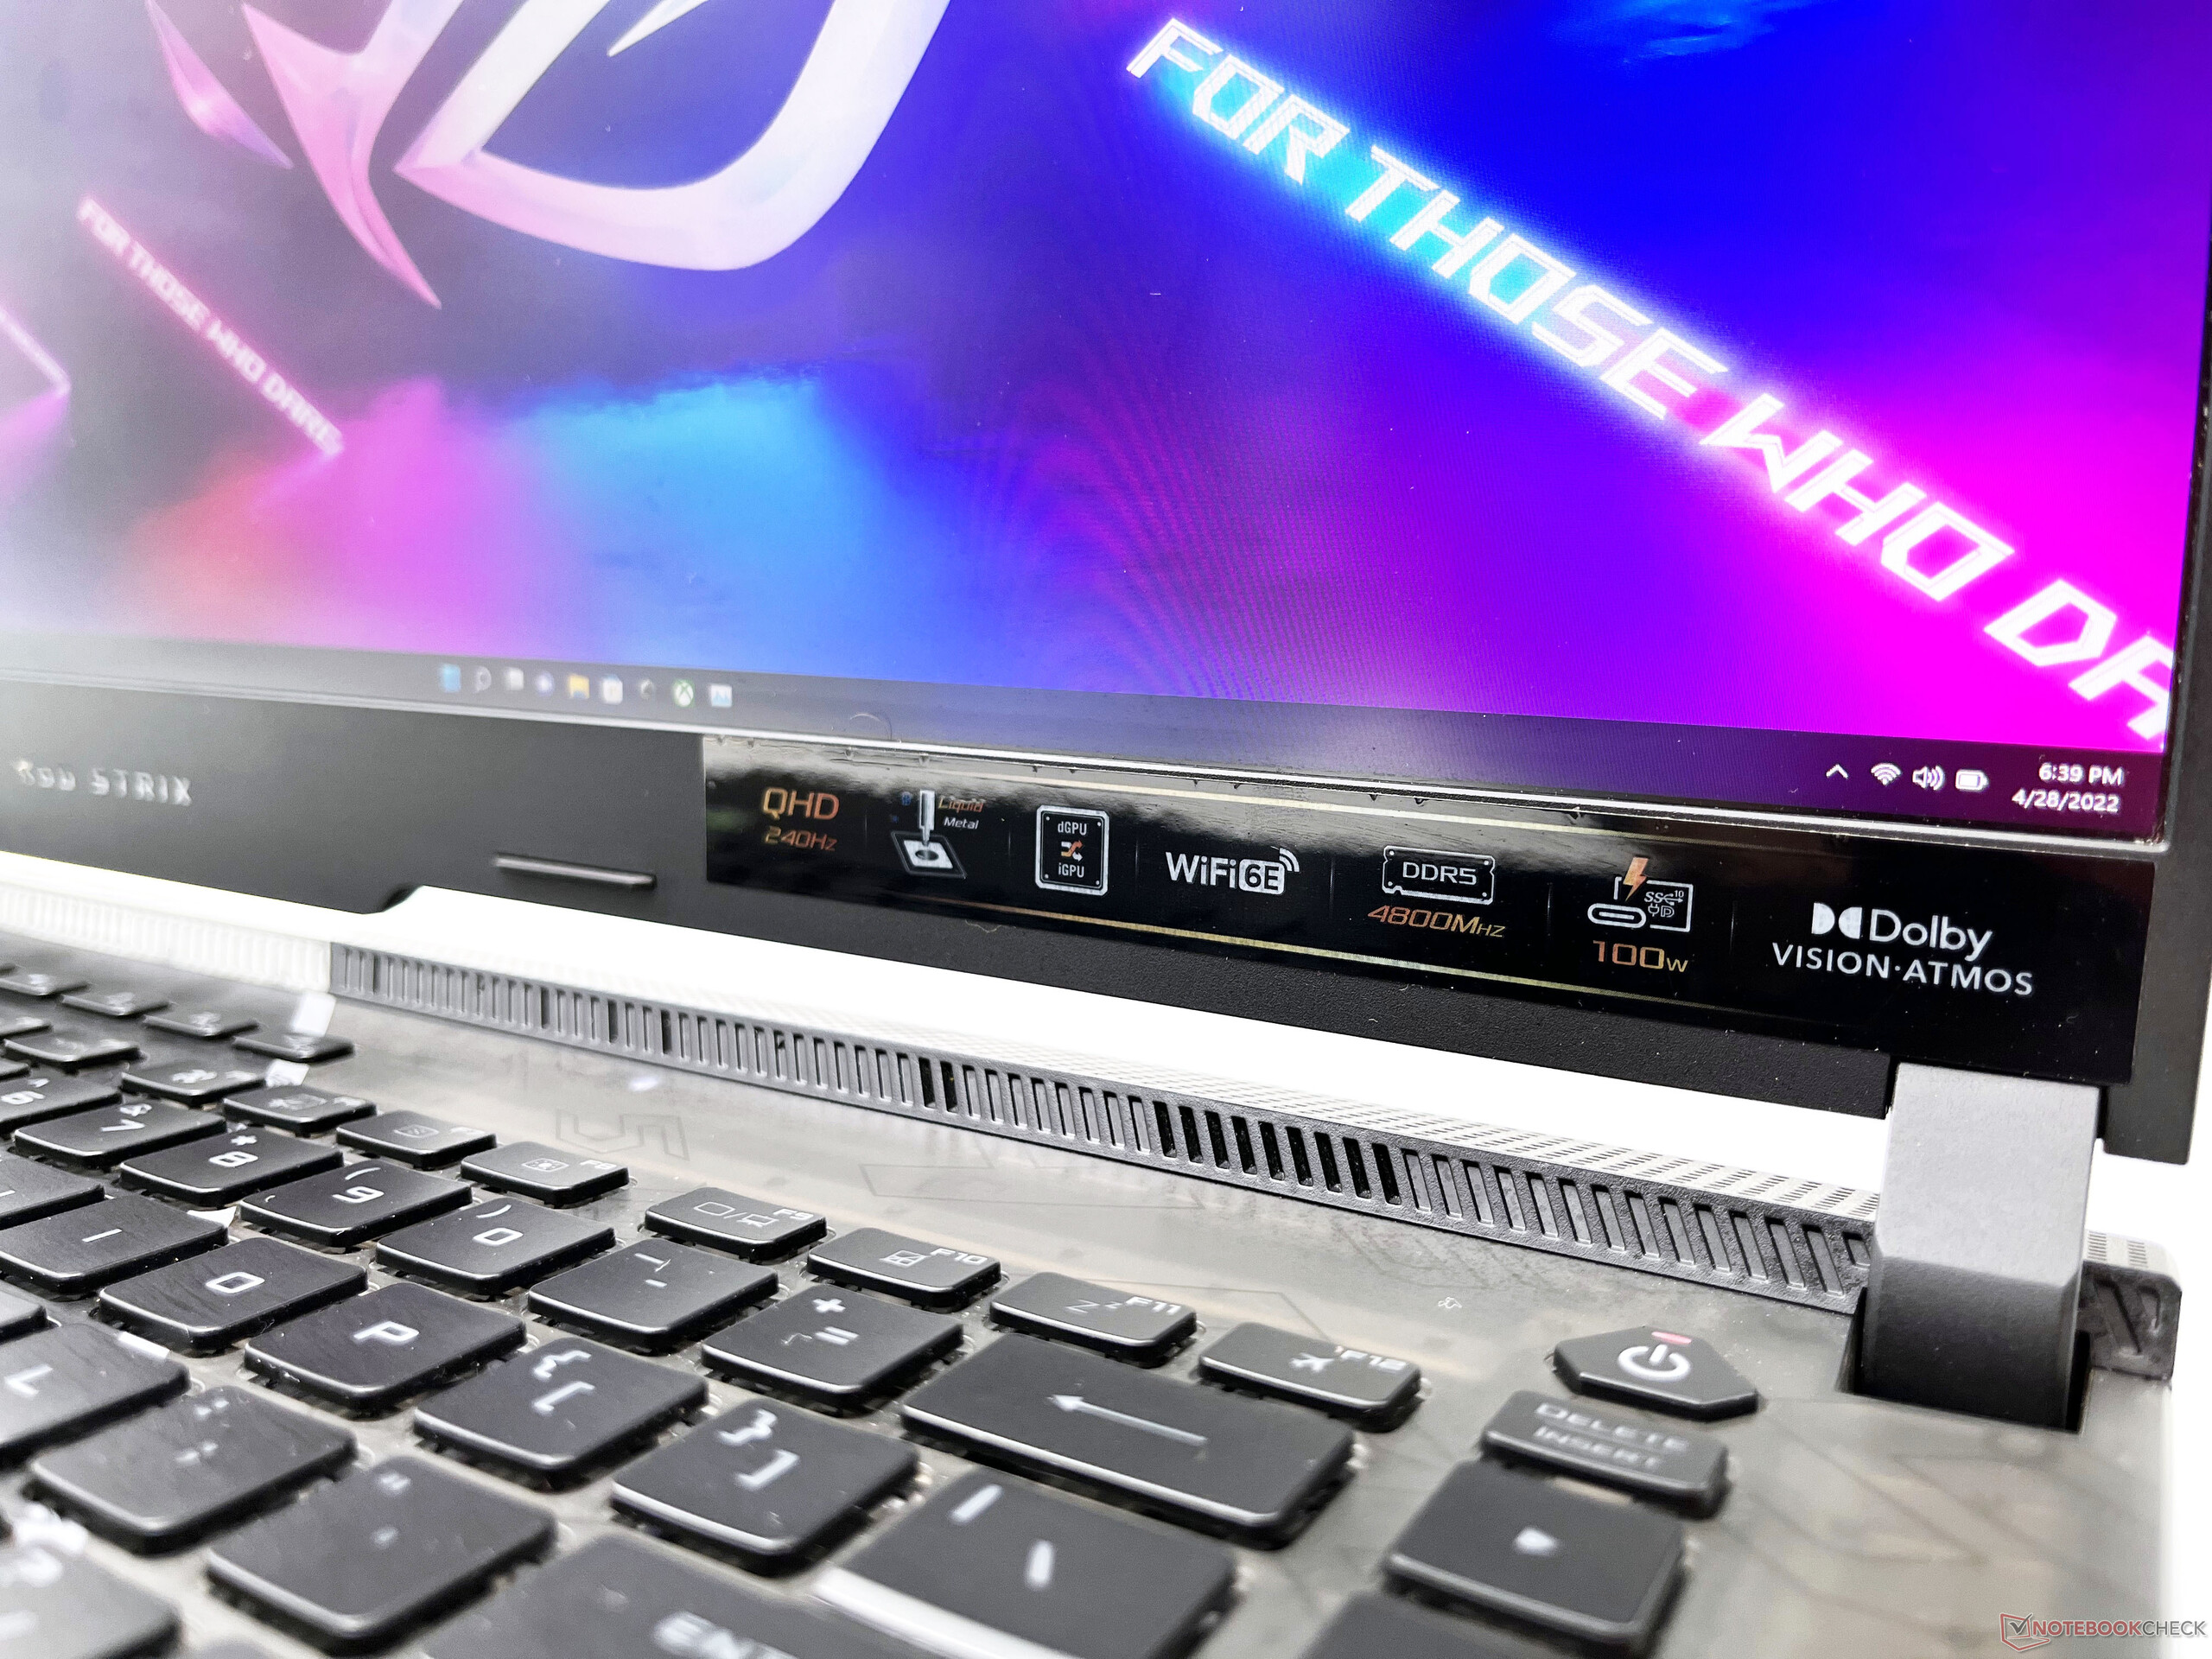
The ROG Strix Scar 15 G533ZW (2022) introduces some enticing new features to the lineup. All 2022 ROG laptops now come with a MUX switch that can be enabled within Armory Crate. We also get to see display options up to WQHD 240 Hz panels, DDR5-4800 memory, PCIe Gen 4 SSDs, faster USB ports, 2.5G LAN, and Wi-Fi 6E.
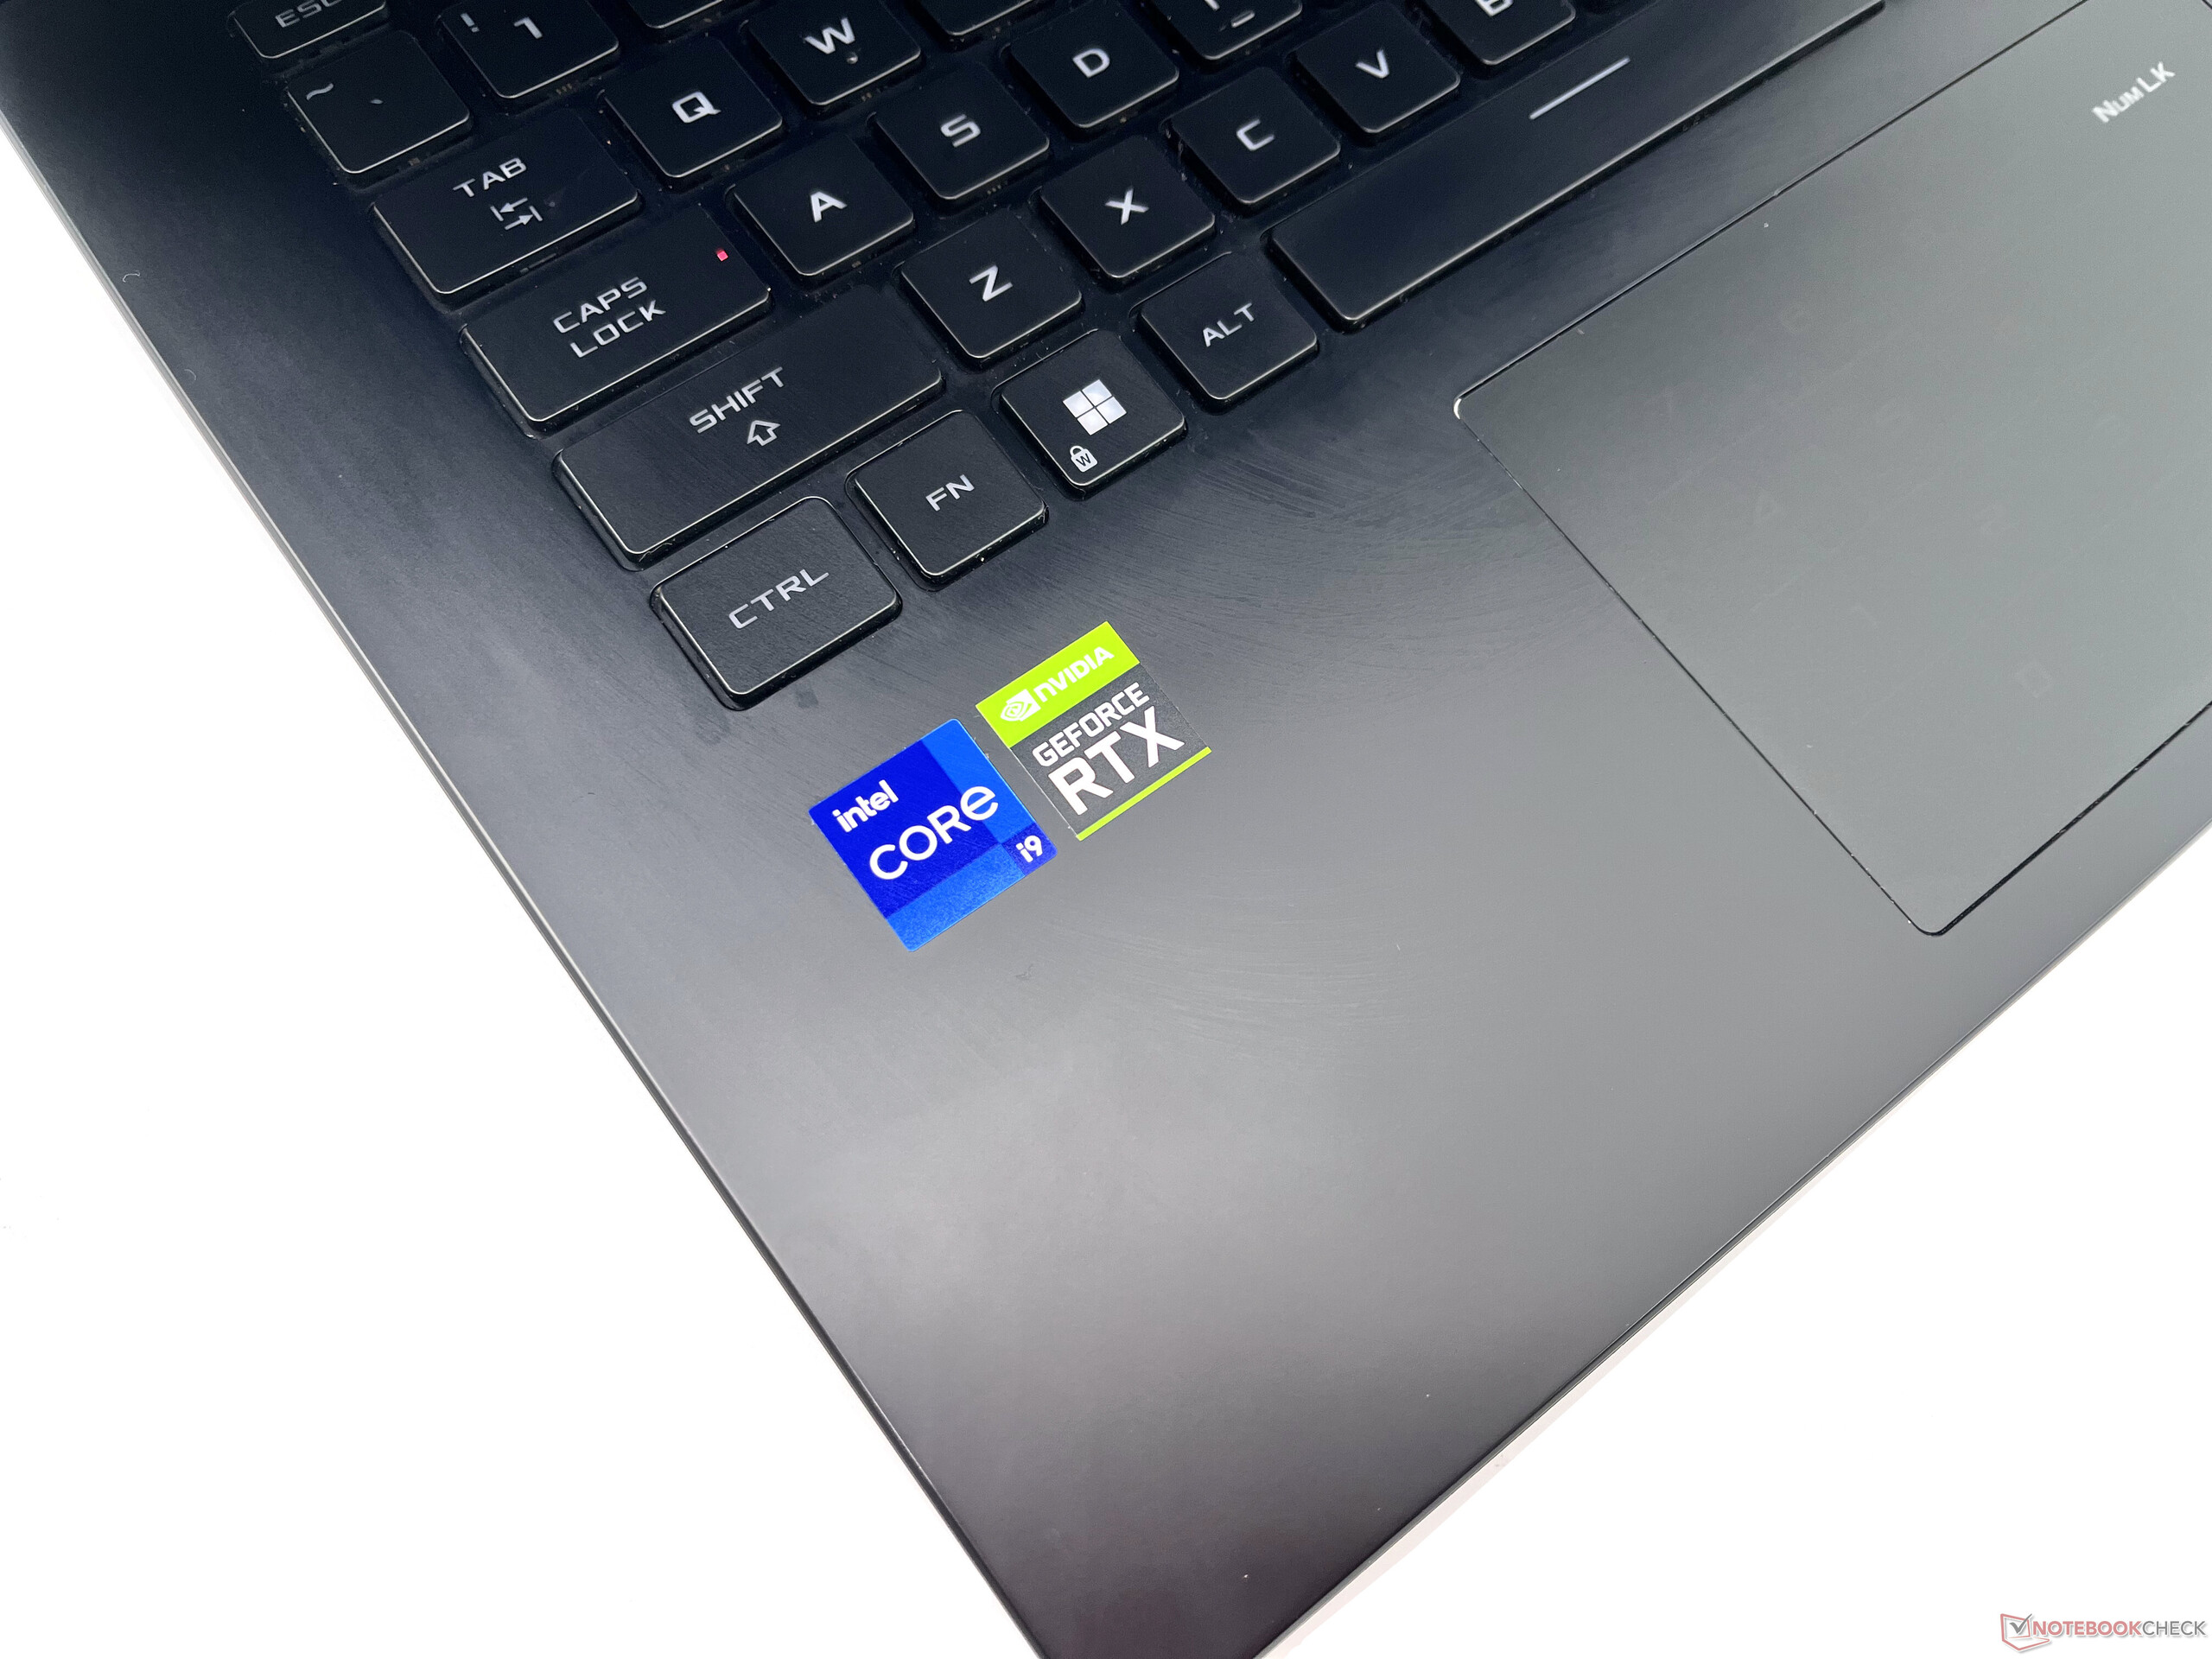
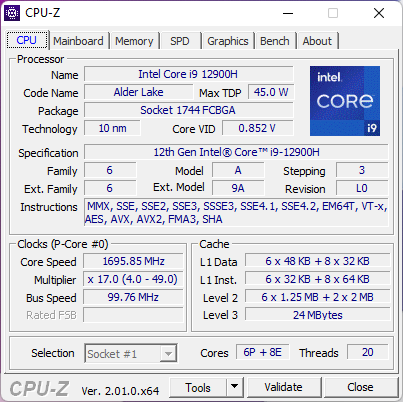
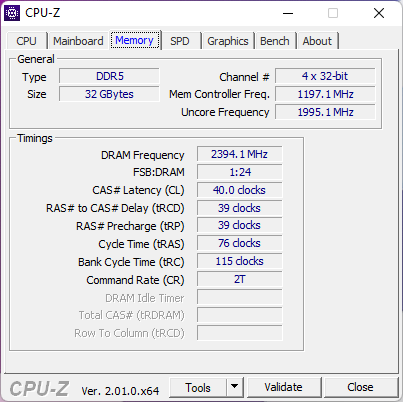
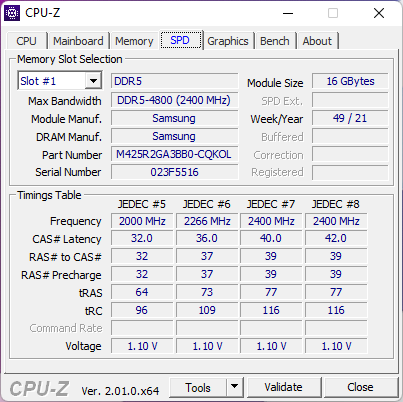
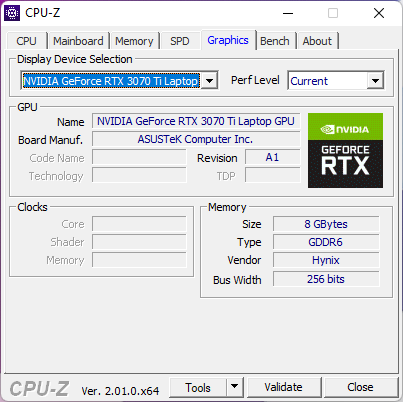
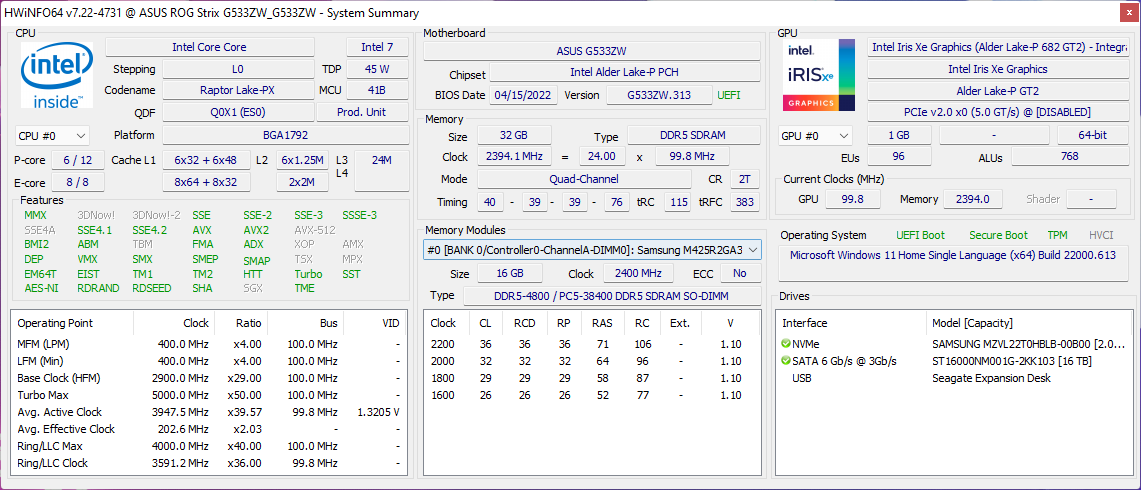
Our test ROG Strix Scar 15 G533ZW device is powered by the Core i9-12900H and a 150 W RTX 3070 Ti Laptop GPU. There's 32 GB DDR5-4800 RAM onboard along with a 2 TB Gen 4 NVMe SSD. This configuration will set you back by ₹2,64,990 (US$3,419).
In this review, we take the ROG Strix Scar 15 G533ZW for a spin and see if the new upgrades merit your consideration.
Potential Competitors in Comparison
Rating | Date | Model | Weight | Height | Size | Resolution | Price |
|---|---|---|---|---|---|---|---|
| 86.3 % v7 (old) | 05 / 2022 | Asus ROG Strix Scar 15 G533ZW-LN106WS i9-12900H, GeForce RTX 3070 Ti Laptop GPU | 2.3 kg | 27.2 mm | 15.60" | 2560x1440 | |
| 80.7 % v7 (old) | 04 / 2022 | MSI Pulse GL66 12UEK i9-12900H, GeForce RTX 3060 Laptop GPU | 2.3 kg | 25 mm | 15.60" | 1920x1080 | |
| 84.7 % v7 (old) | 03 / 2022 | Gigabyte Aero 16 YE5 i9-12900HK, GeForce RTX 3080 Ti Laptop GPU | 2.3 kg | 22.4 mm | 16.00" | 3840x2400 | |
| 86.9 % v7 (old) | 03 / 2022 | MSI Vector GP66 12UGS i9-12900H, GeForce RTX 3070 Ti Laptop GPU | 2.3 kg | 23.4 mm | 15.60" | 1920x1080 | |
| 87.4 % v7 (old) | 06 / 2022 | MSI Raider GE66 12UHS i9-12900HK, GeForce RTX 3080 Ti Laptop GPU | 2.4 kg | 23.4 mm | 15.60" | 3840x2160 | |
| 85.5 % v7 (old) | 05 / 2022 | HP Omen 16-b1090ng i7-12700H, GeForce RTX 3070 Ti Laptop GPU | 2.3 kg | 23 mm | 16.10" | 2560x1440 | |
| 88 % v7 (old) | 03 / 2022 | Lenovo Legion 5 Pro 16 G7 i7 RTX 3070Ti i7-12700H, GeForce RTX 3070 Ti Laptop GPU | 2.6 kg | 26.6 mm | 16.00" | 2560x1600 | |
| 89.4 % v7 (old) | 05 / 2022 | Razer Blade 14 Ryzen 9 6900HX R9 6900HX, GeForce RTX 3070 Ti Laptop GPU | 1.8 kg | 16.8 mm | 14.00" | 2560x1440 | |
| 86.7 % v7 (old) | 03 / 2022 | Asus ROG Zephyrus G14 GA402RK R9 6900HS, Radeon RX 6800S | 1.7 kg | 19.5 mm | 14.00" | 2560x1600 | |
| 89.1 % v7 (old) | 03 / 2022 | Razer Blade 15 2022 i7-12800H, GeForce RTX 3080 Ti Laptop GPU | 2.1 kg | 16.99 mm | 15.60" | 2560x1440 |
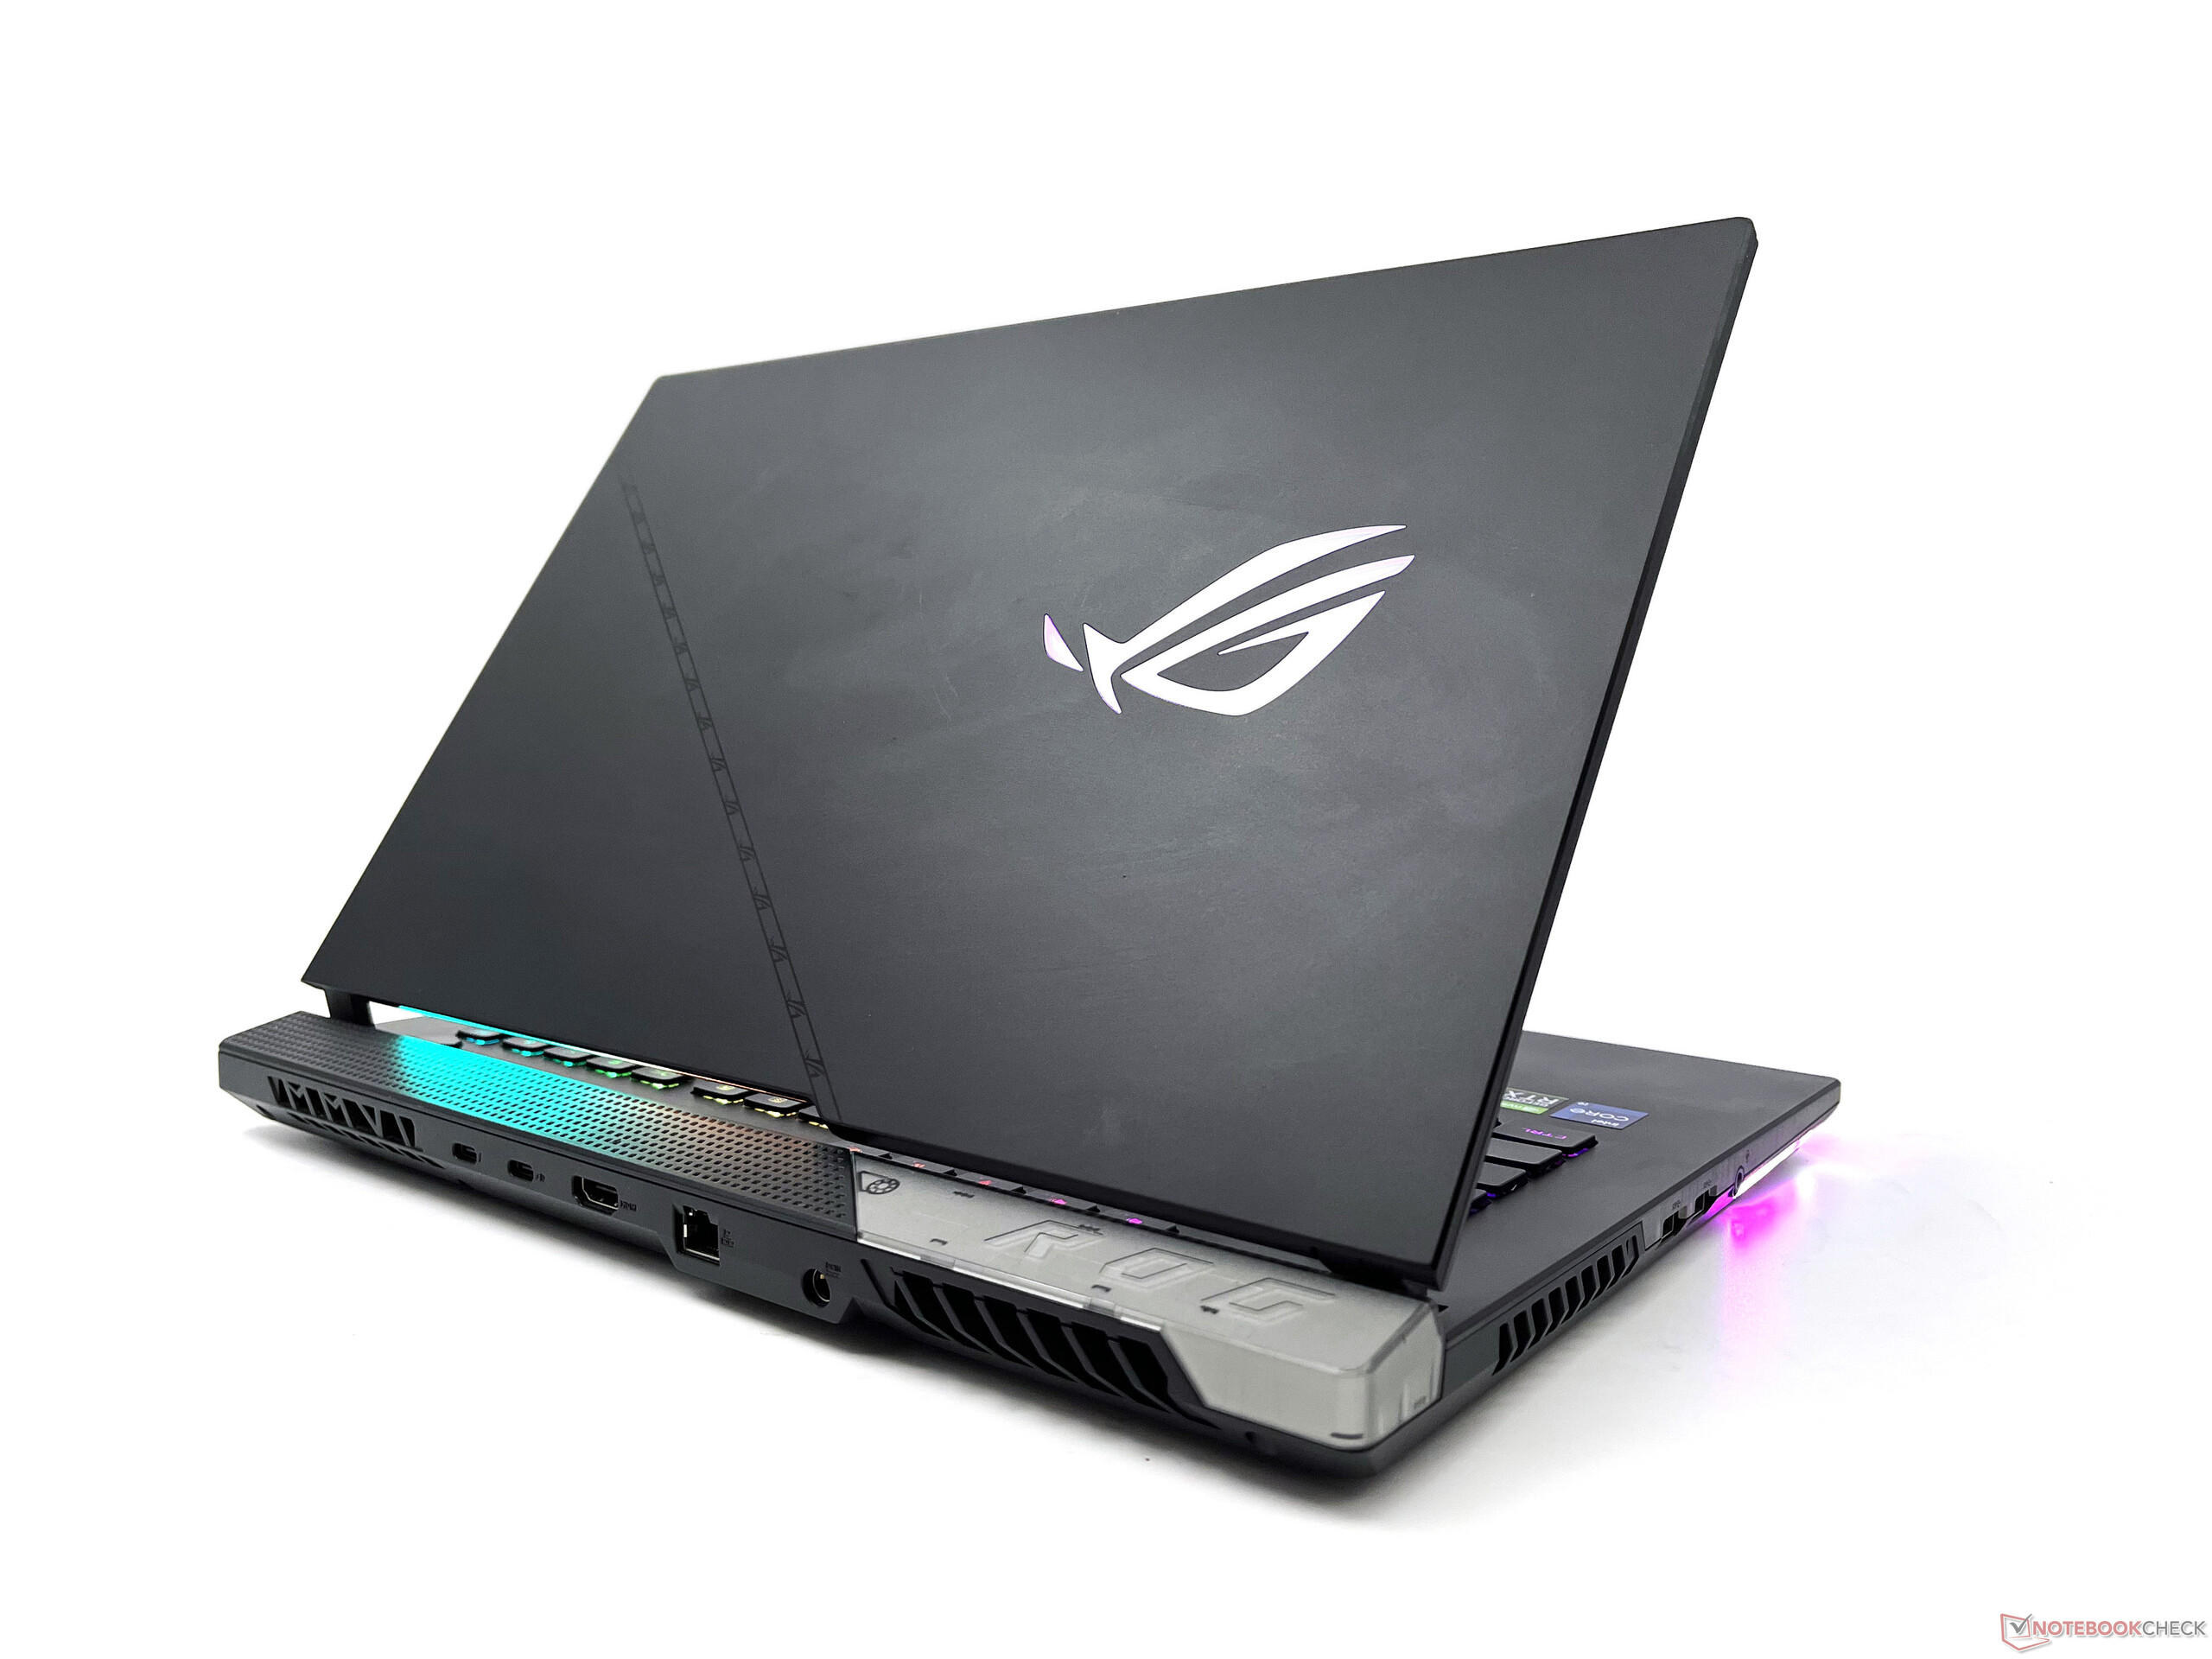
Case: Unchanged from last year
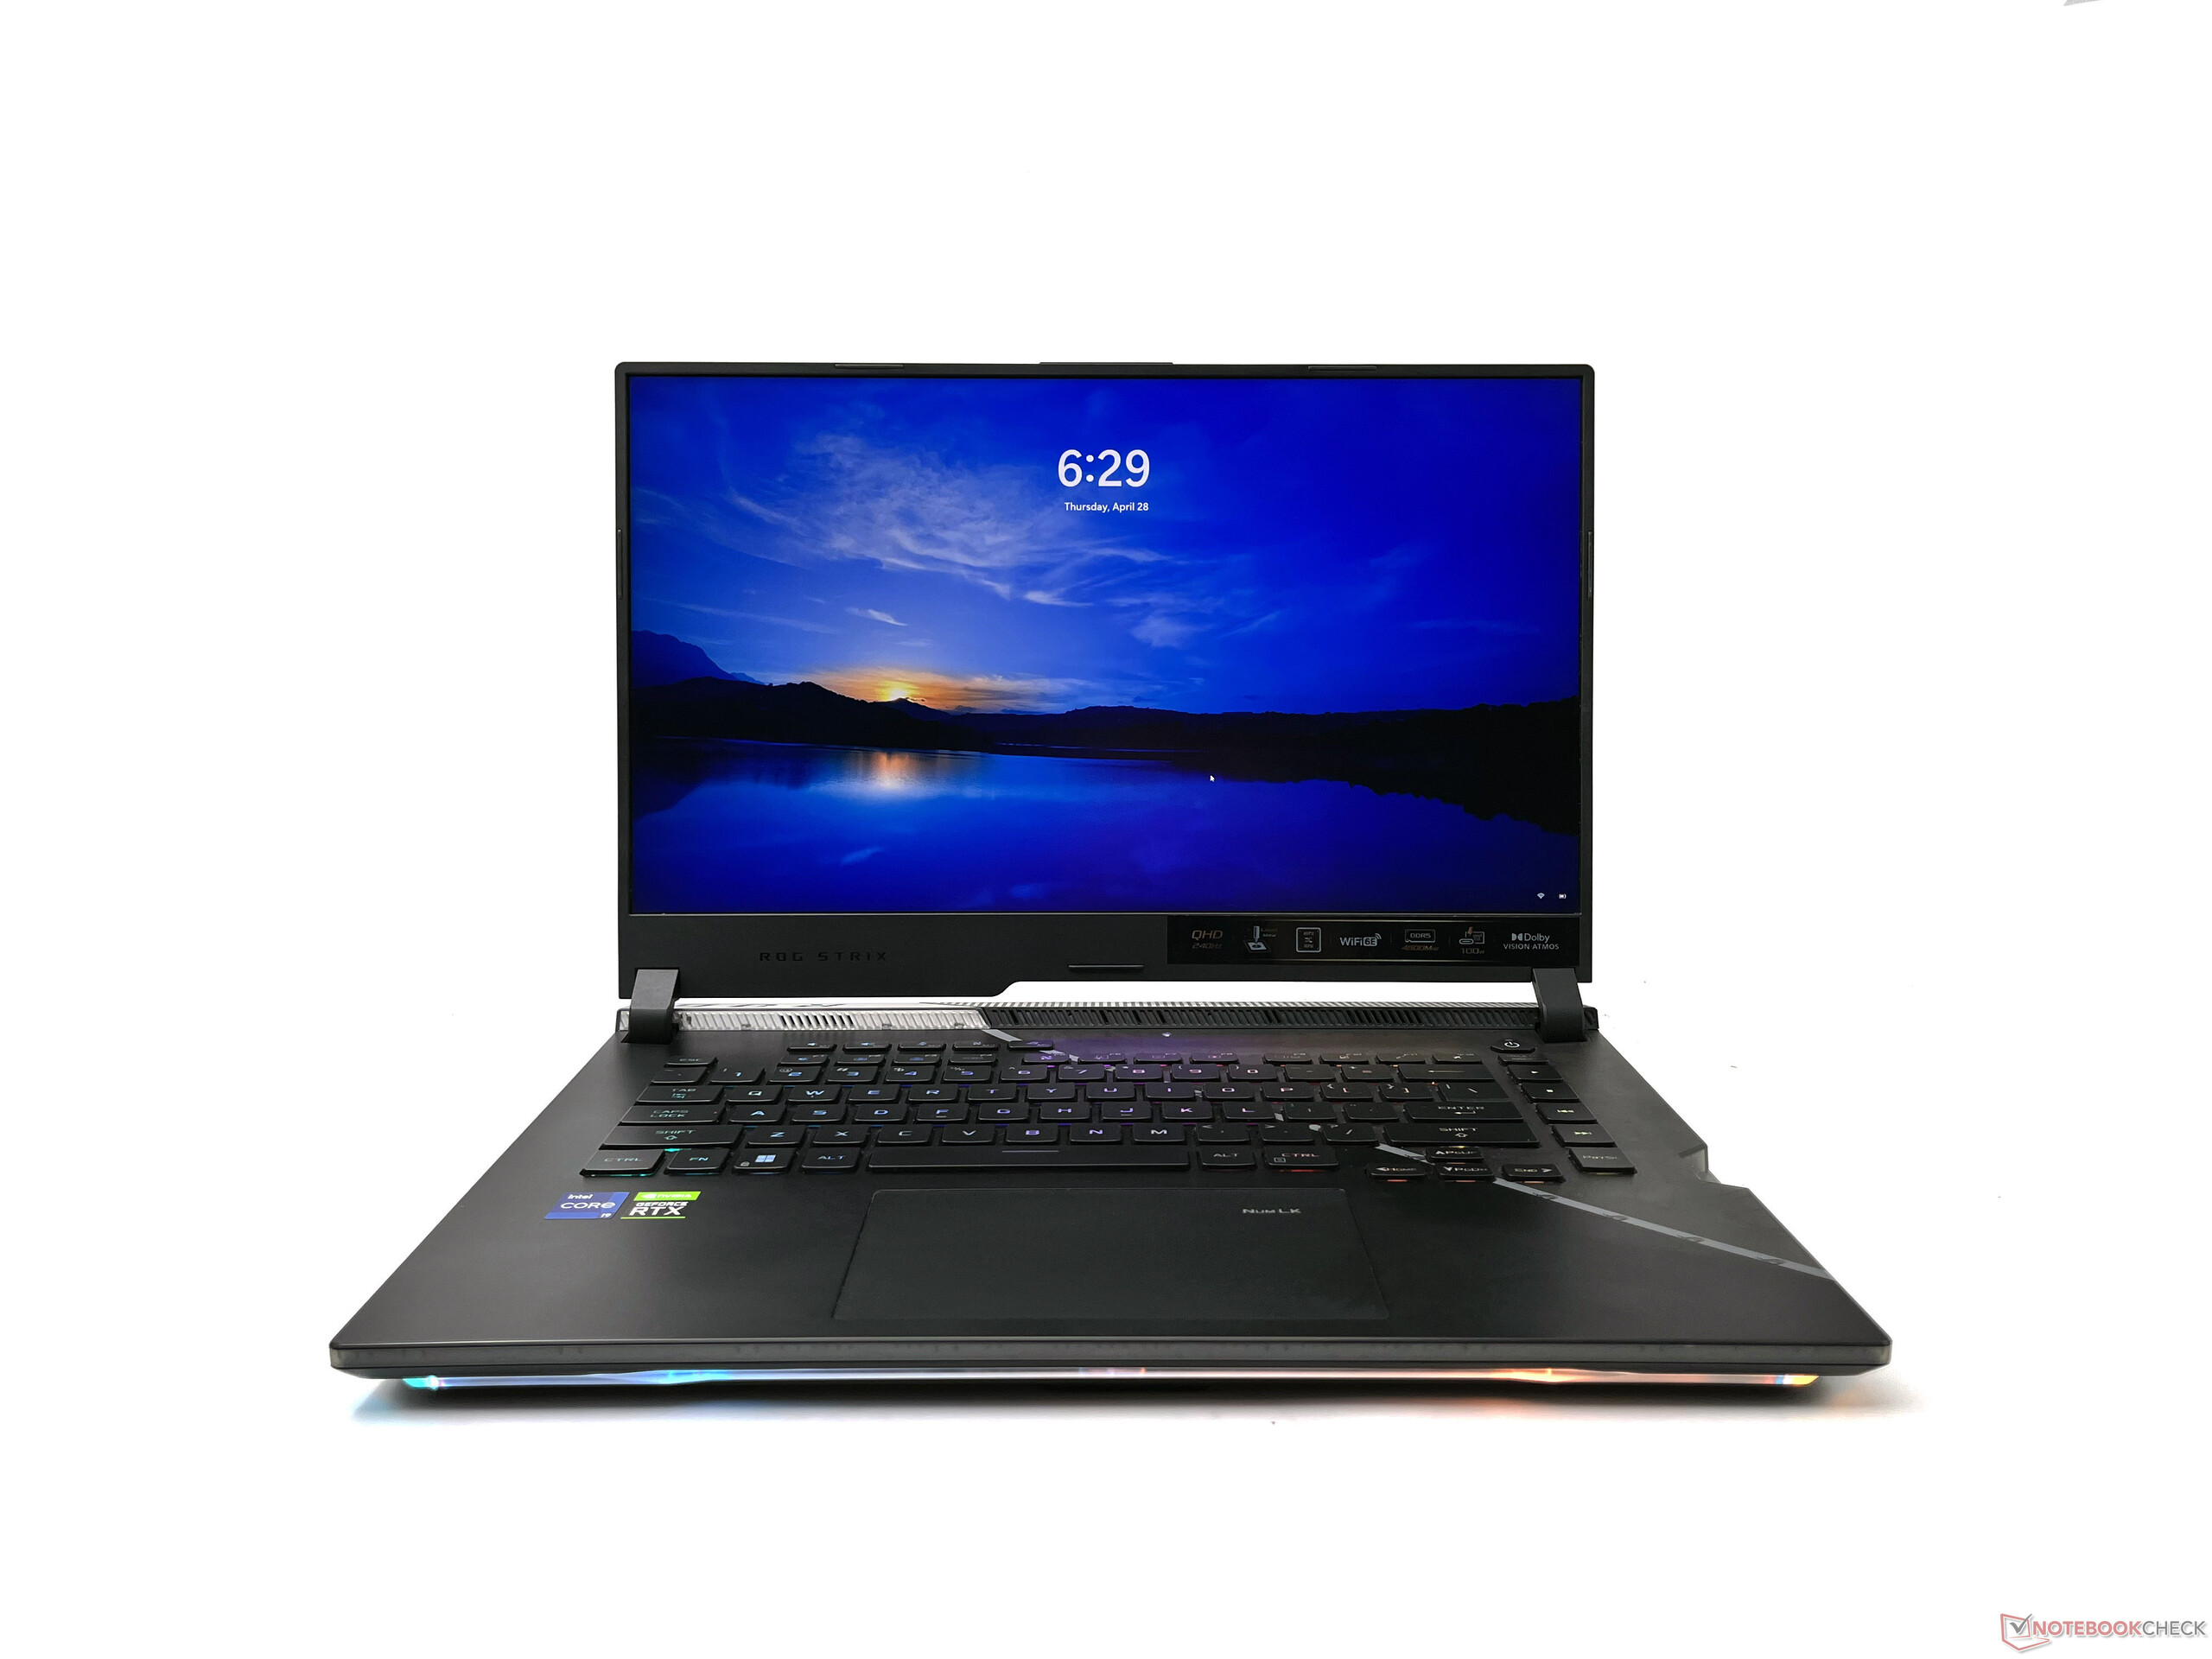
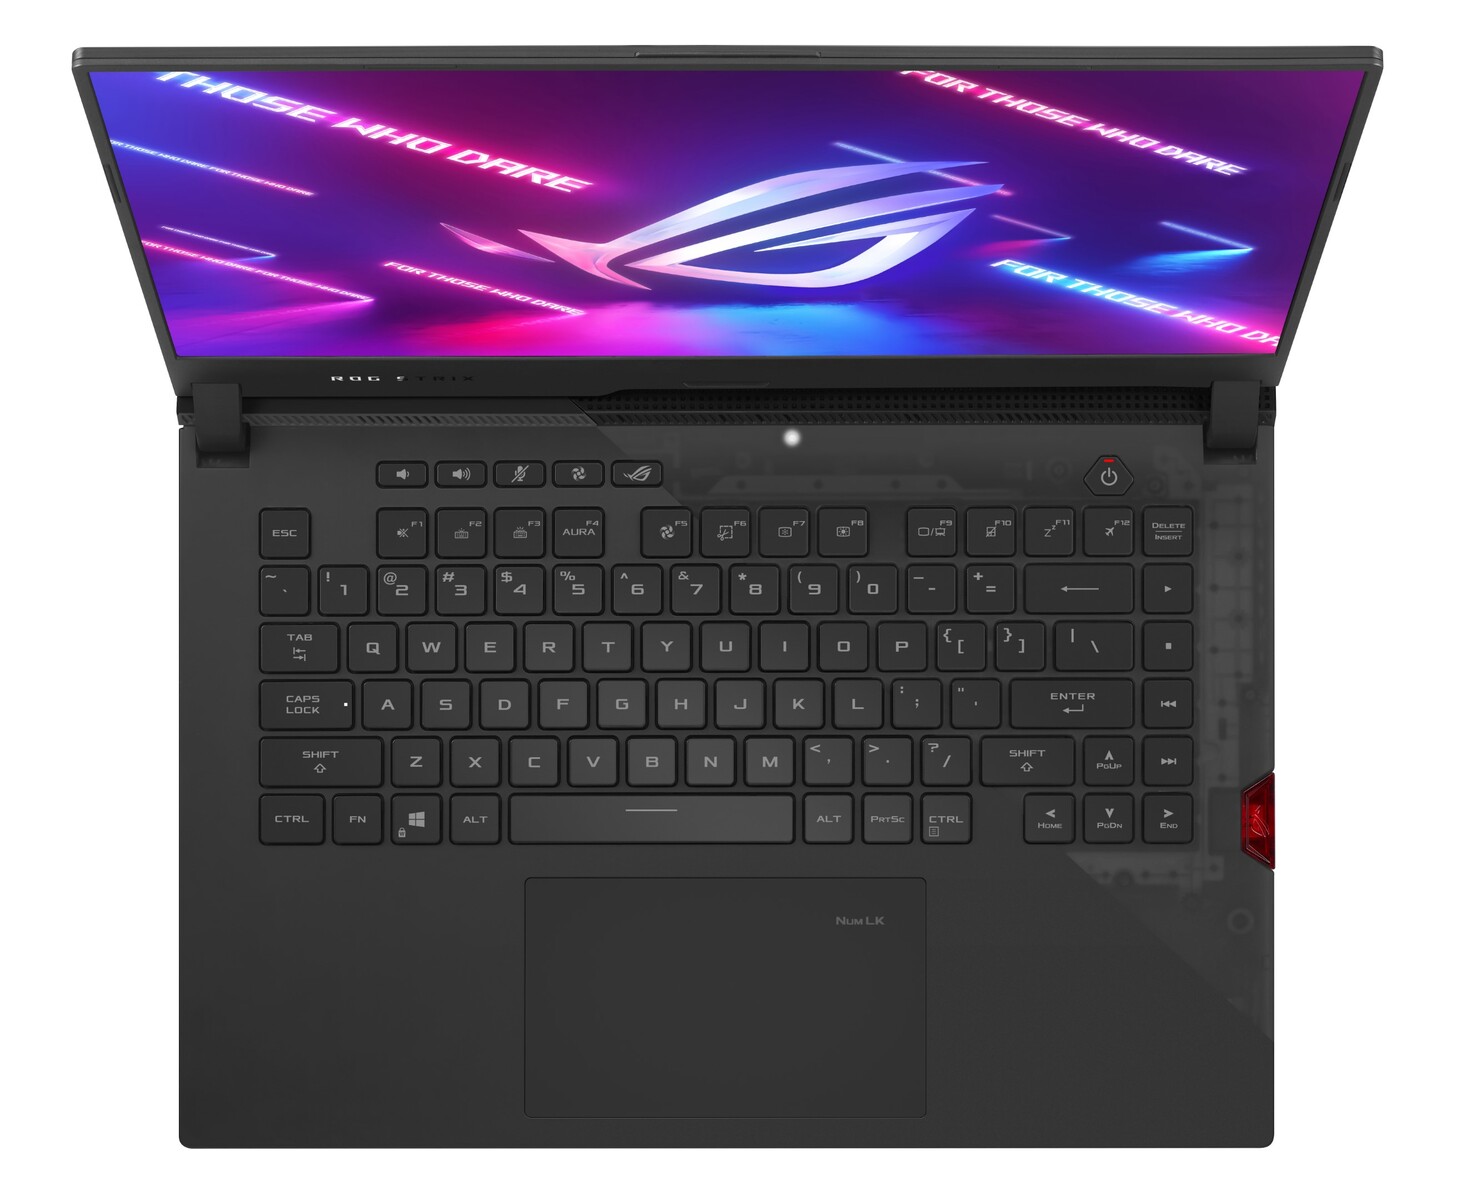
The ROG Strix Scar 15 G533ZW is virtually indistinguishable from last year's model in terms of design, dimensions, and weight. The main body is primarily made of plastic — it does not feel cheap or tacky, but it can quickly gather quite a few fingerprints and smudges.
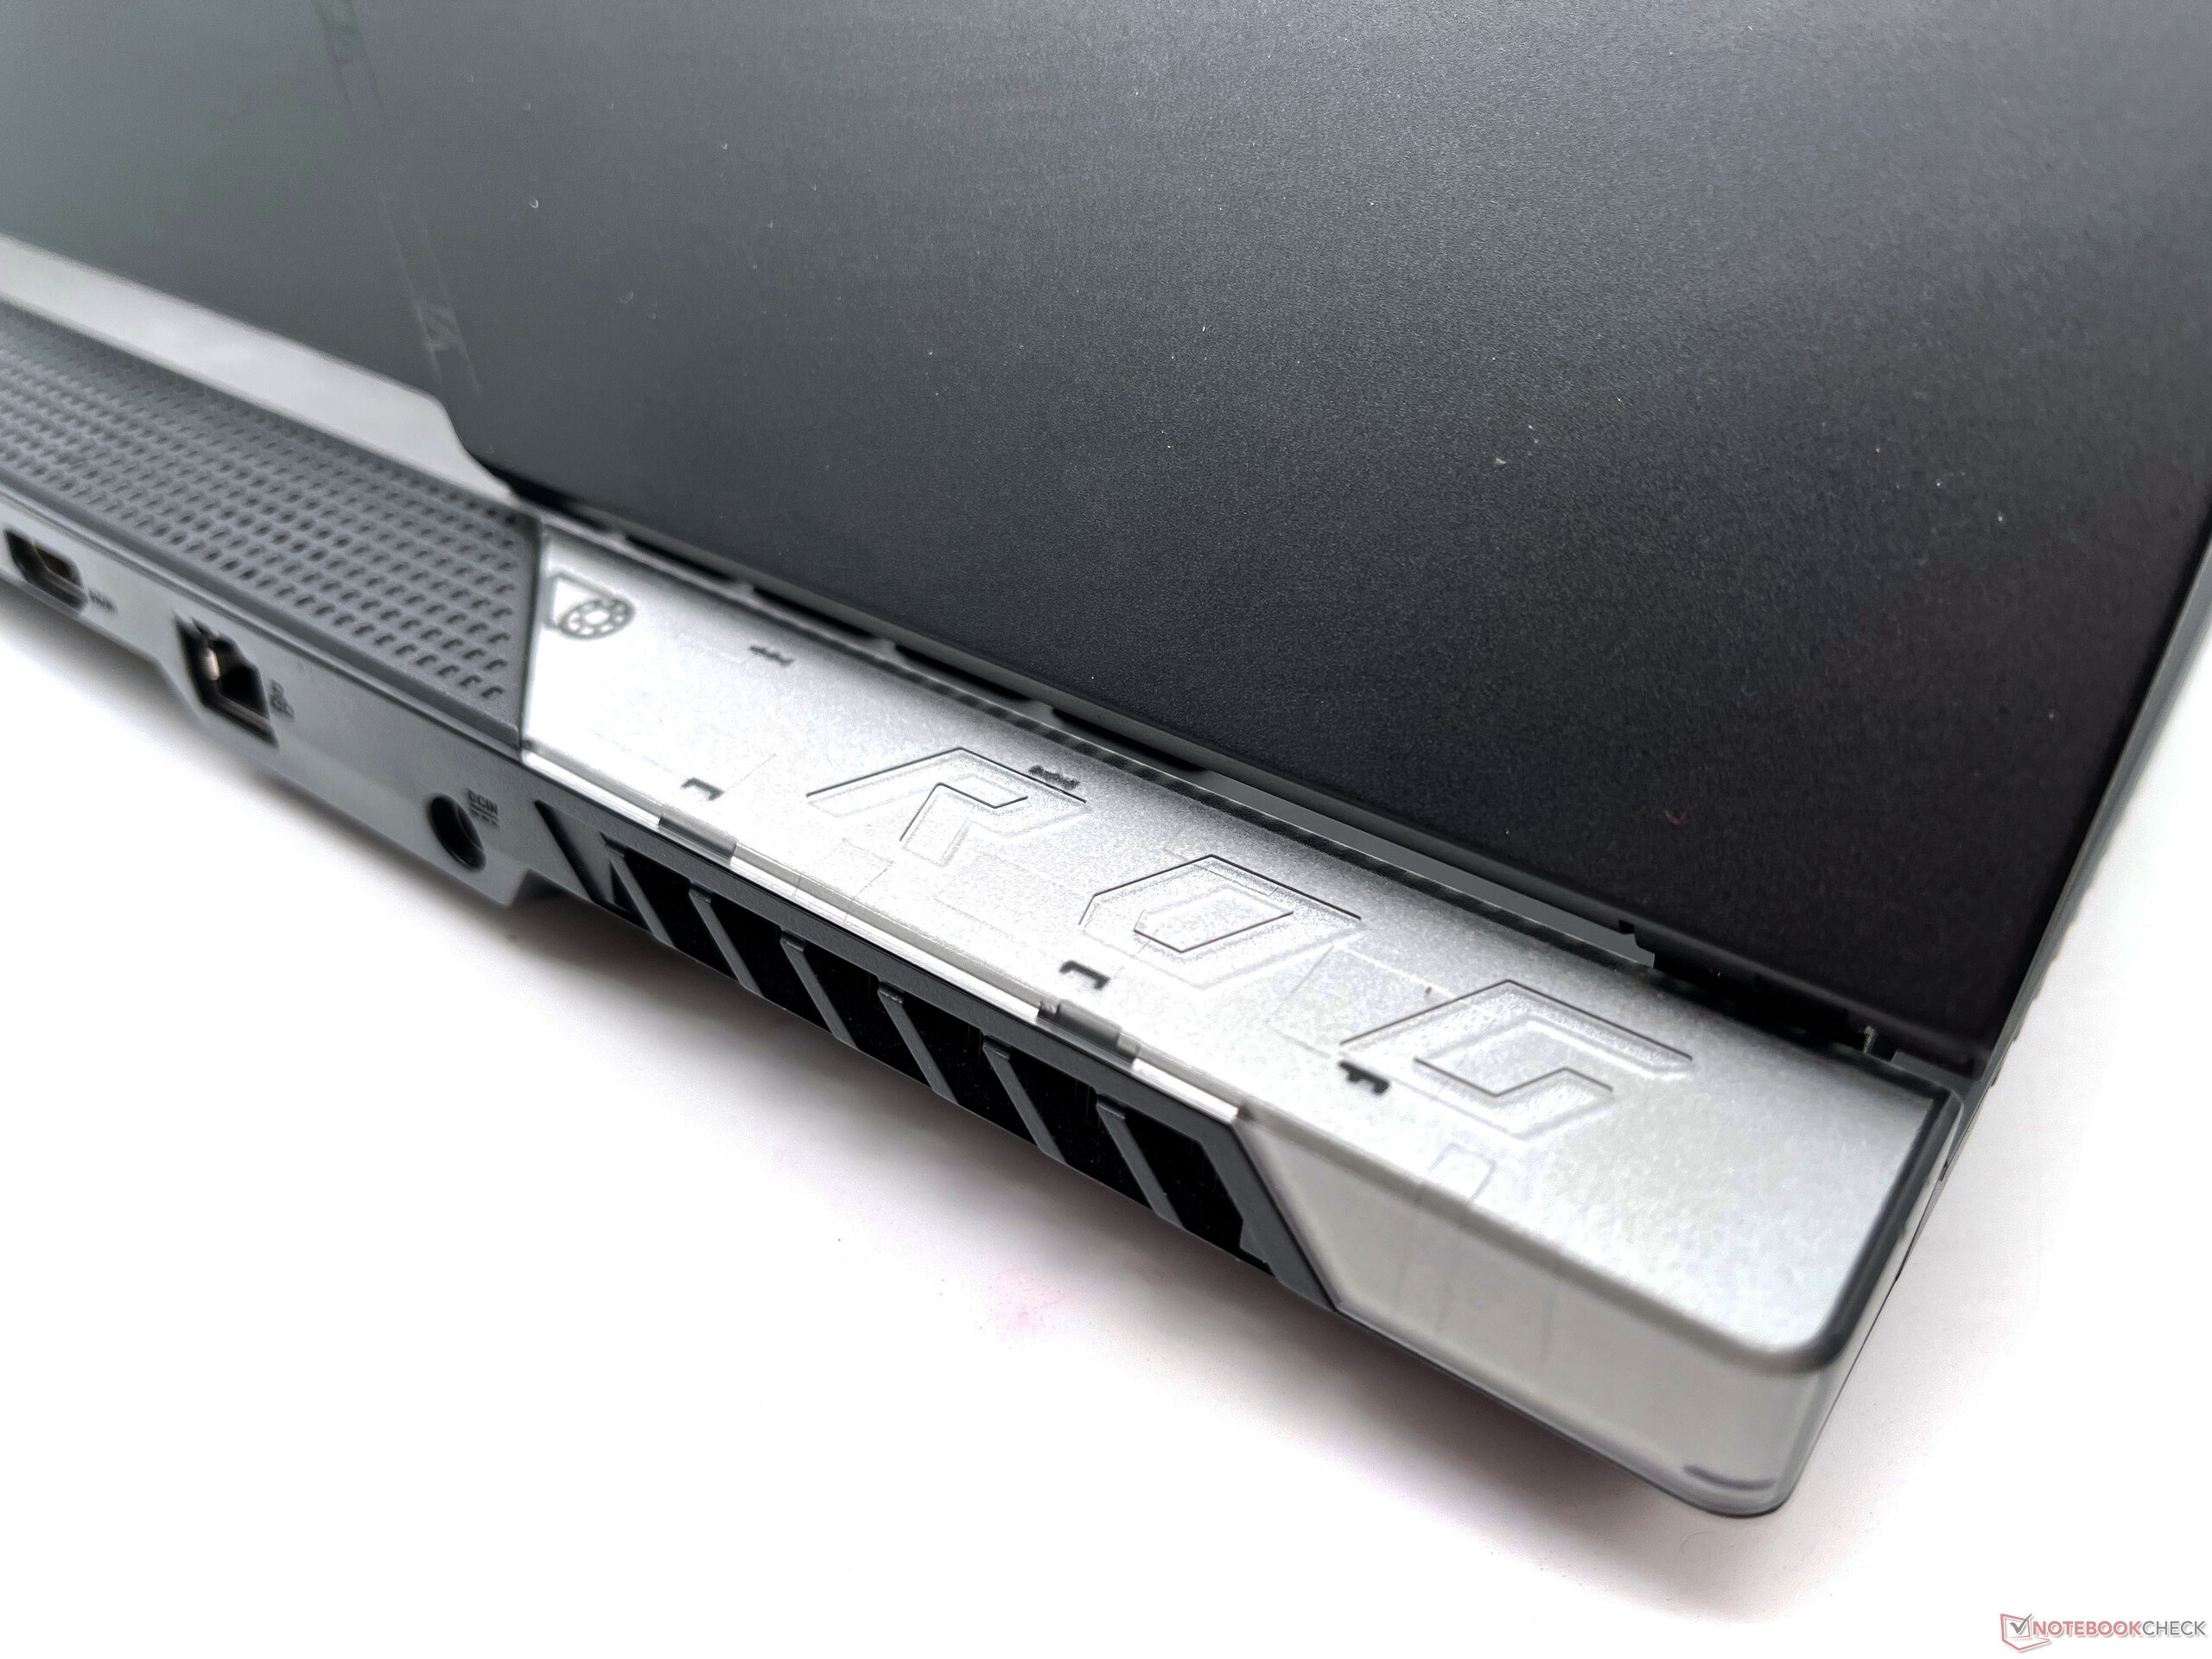
There is some flex noticeable in the keyboard deck if pressed hard but nothing concerning in particular. The right edge of the keyboard deck is translucent in signature Scar style, letting get a sneak peek at the innards.
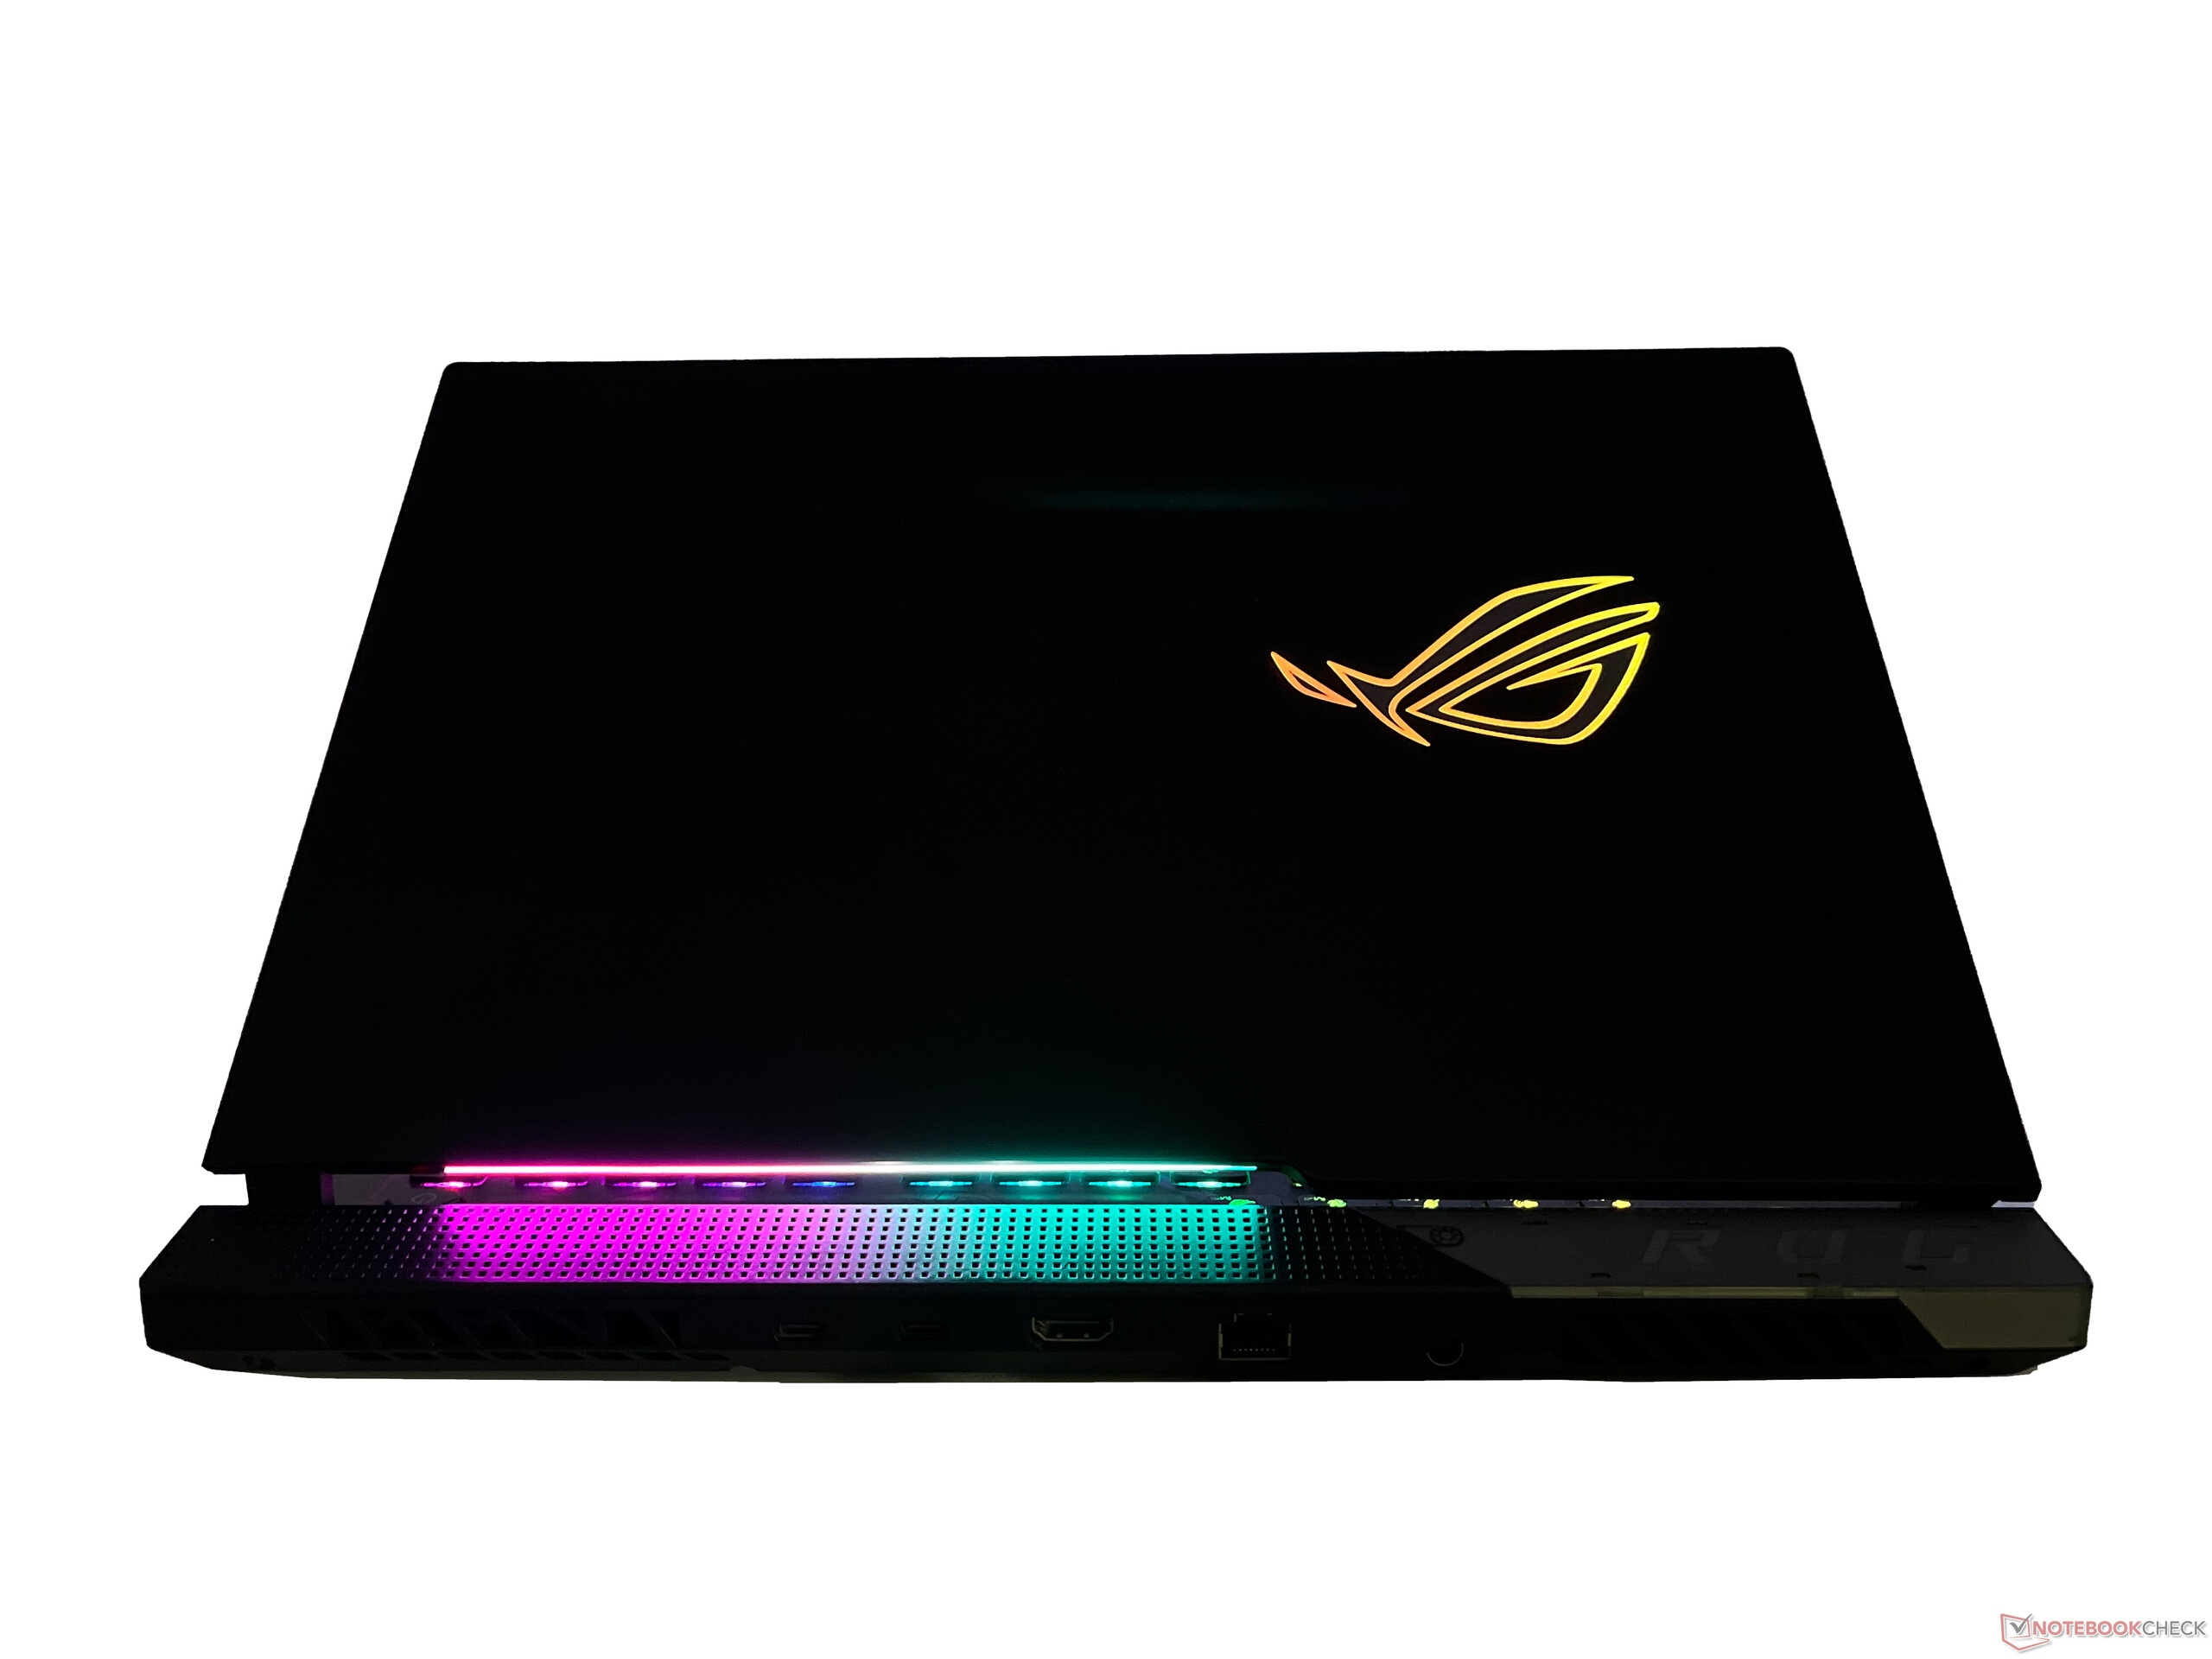
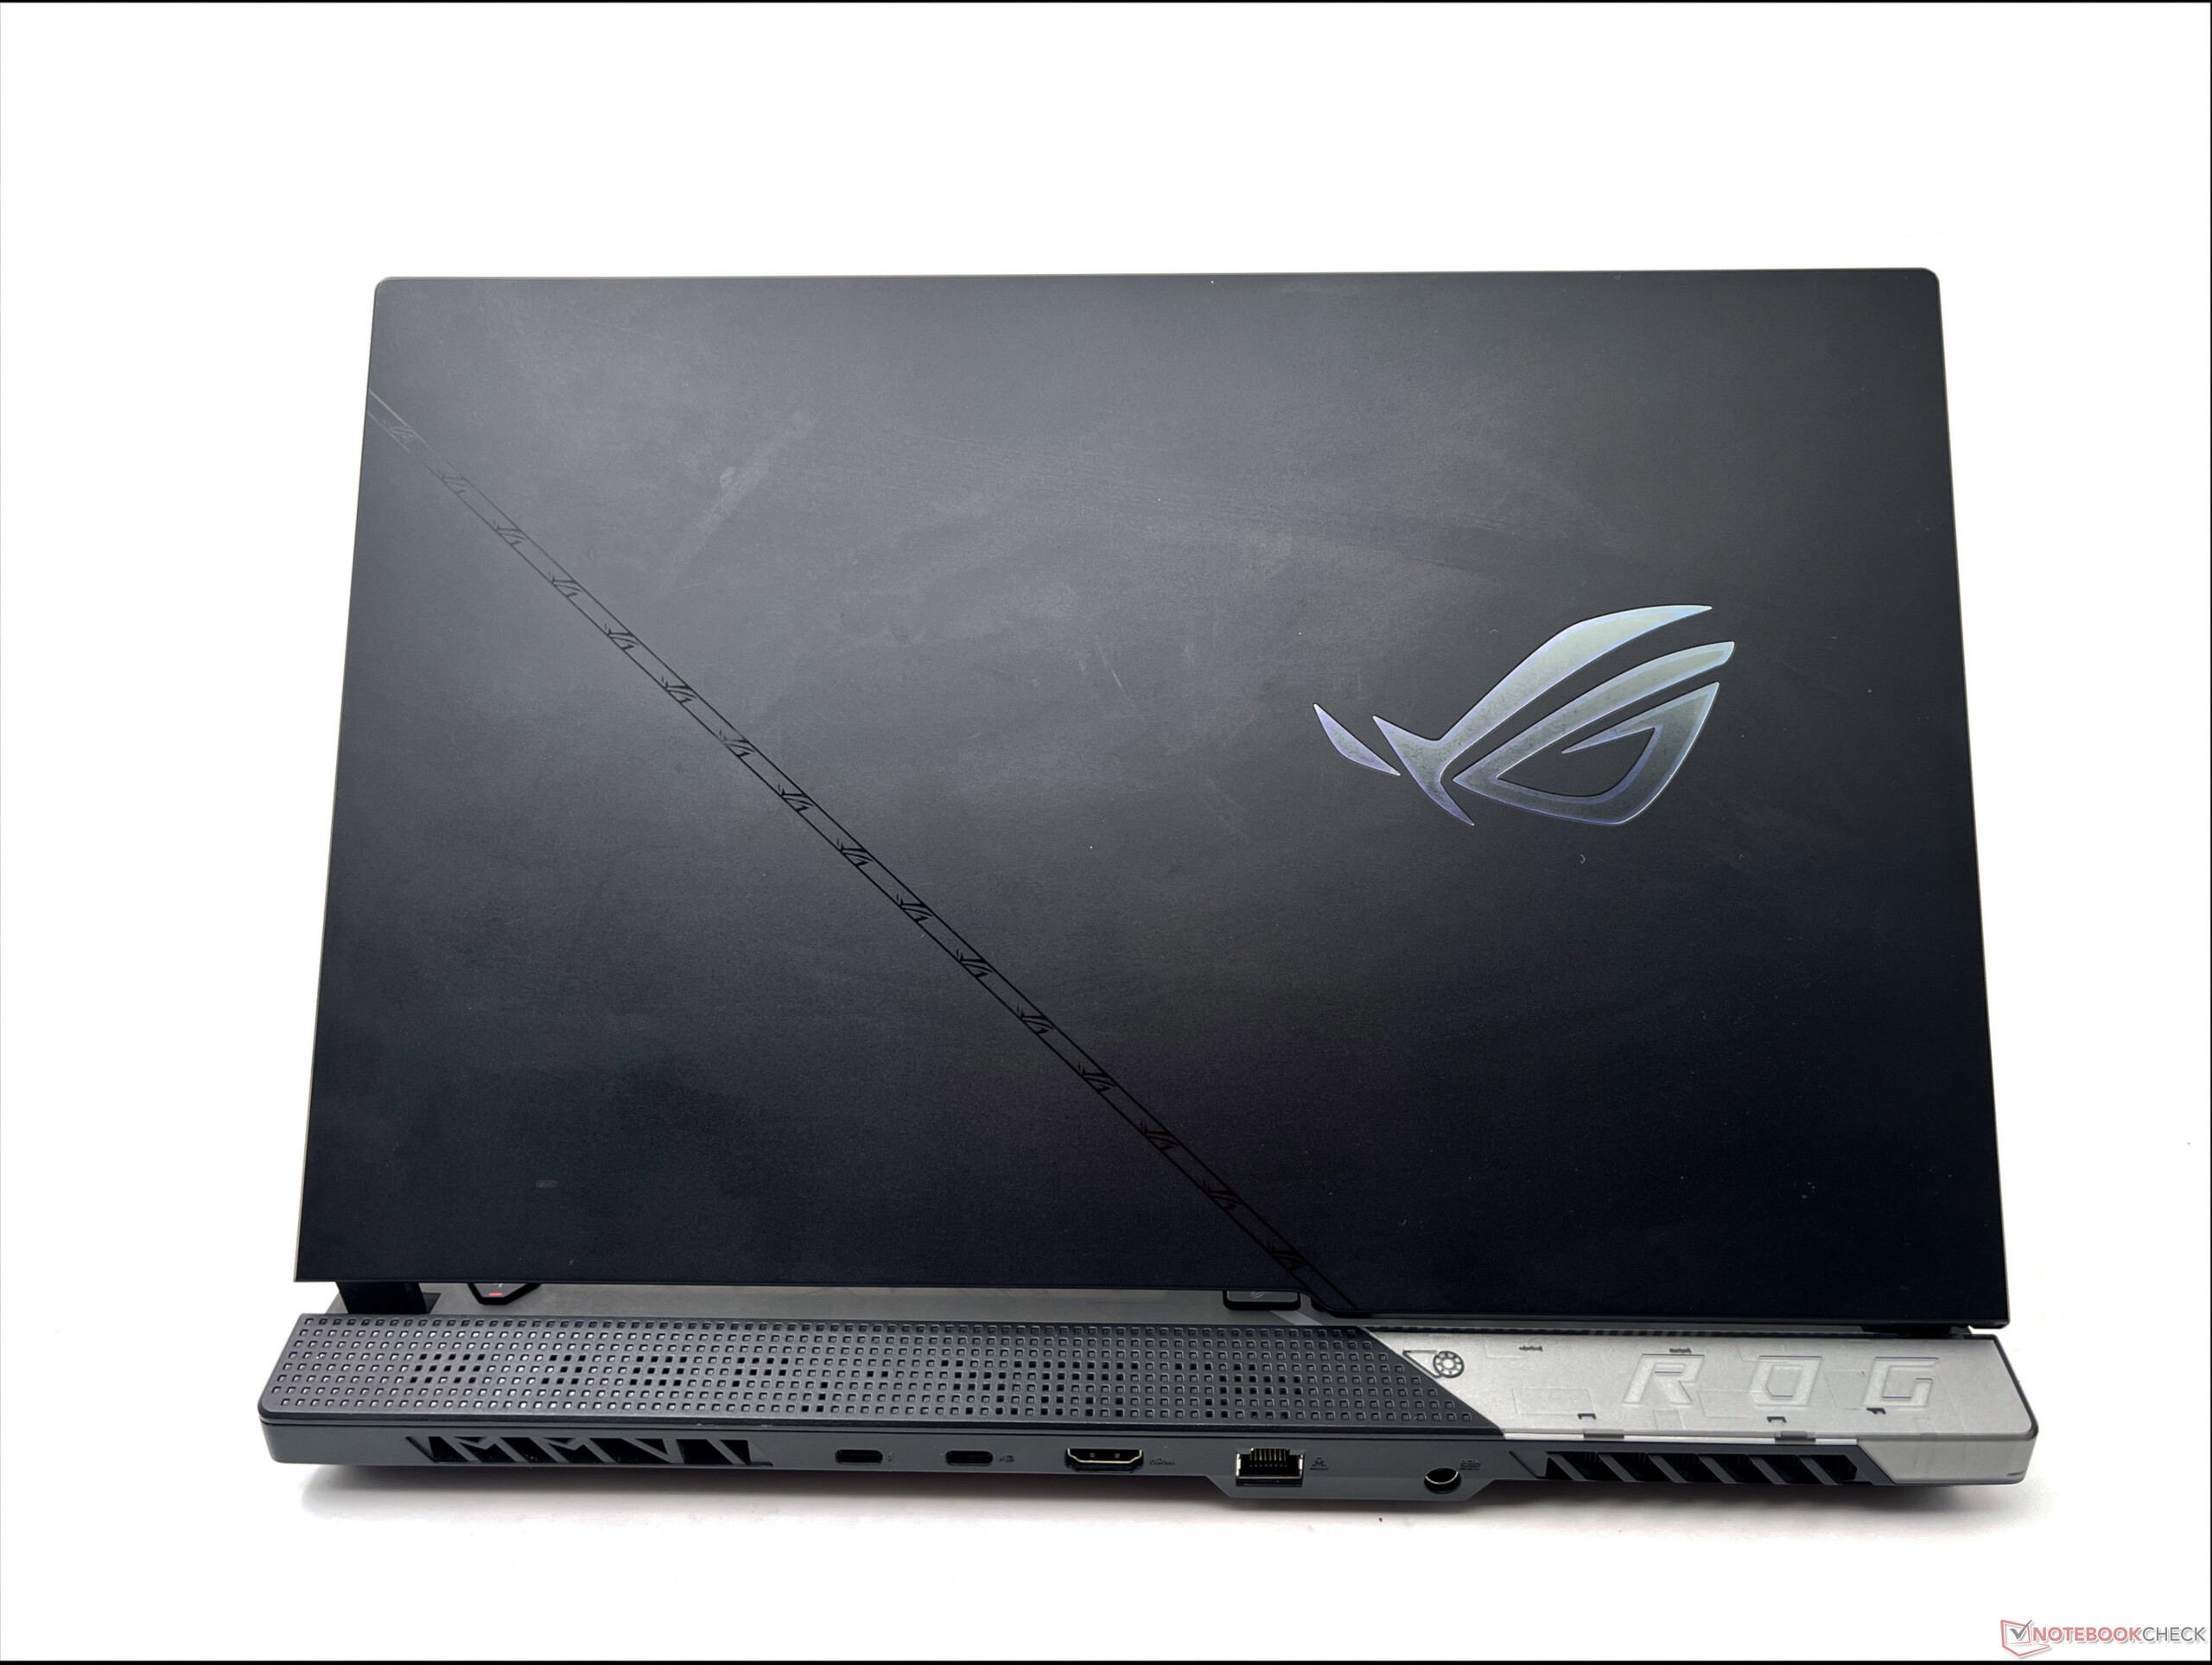
The lid cover is made of aluminum and can be opened with one finger, but it flexes a bit too much for our liking. The back of the lid sports the ROG logo, the outline of which gets some RGB love. There are also LEDs at the base of the display for some added bling. The lid can open only up to about 130°, which can be a bit of a hassle when using the device on the lap.
The base is rubberized for a firm grip. There's also some customizability on offer in the form of ROG Armor Caps — a couple of them come in the box, but you can 3D print custom ones if you like.
Overall, the Asus ROG Strix Scar 15 G533ZW's build quality is sturdy for the most part save for some flex in the keyboard and the lid.

Connectivity: Thunderbolt 4 and Wi-Fi 6E onboard
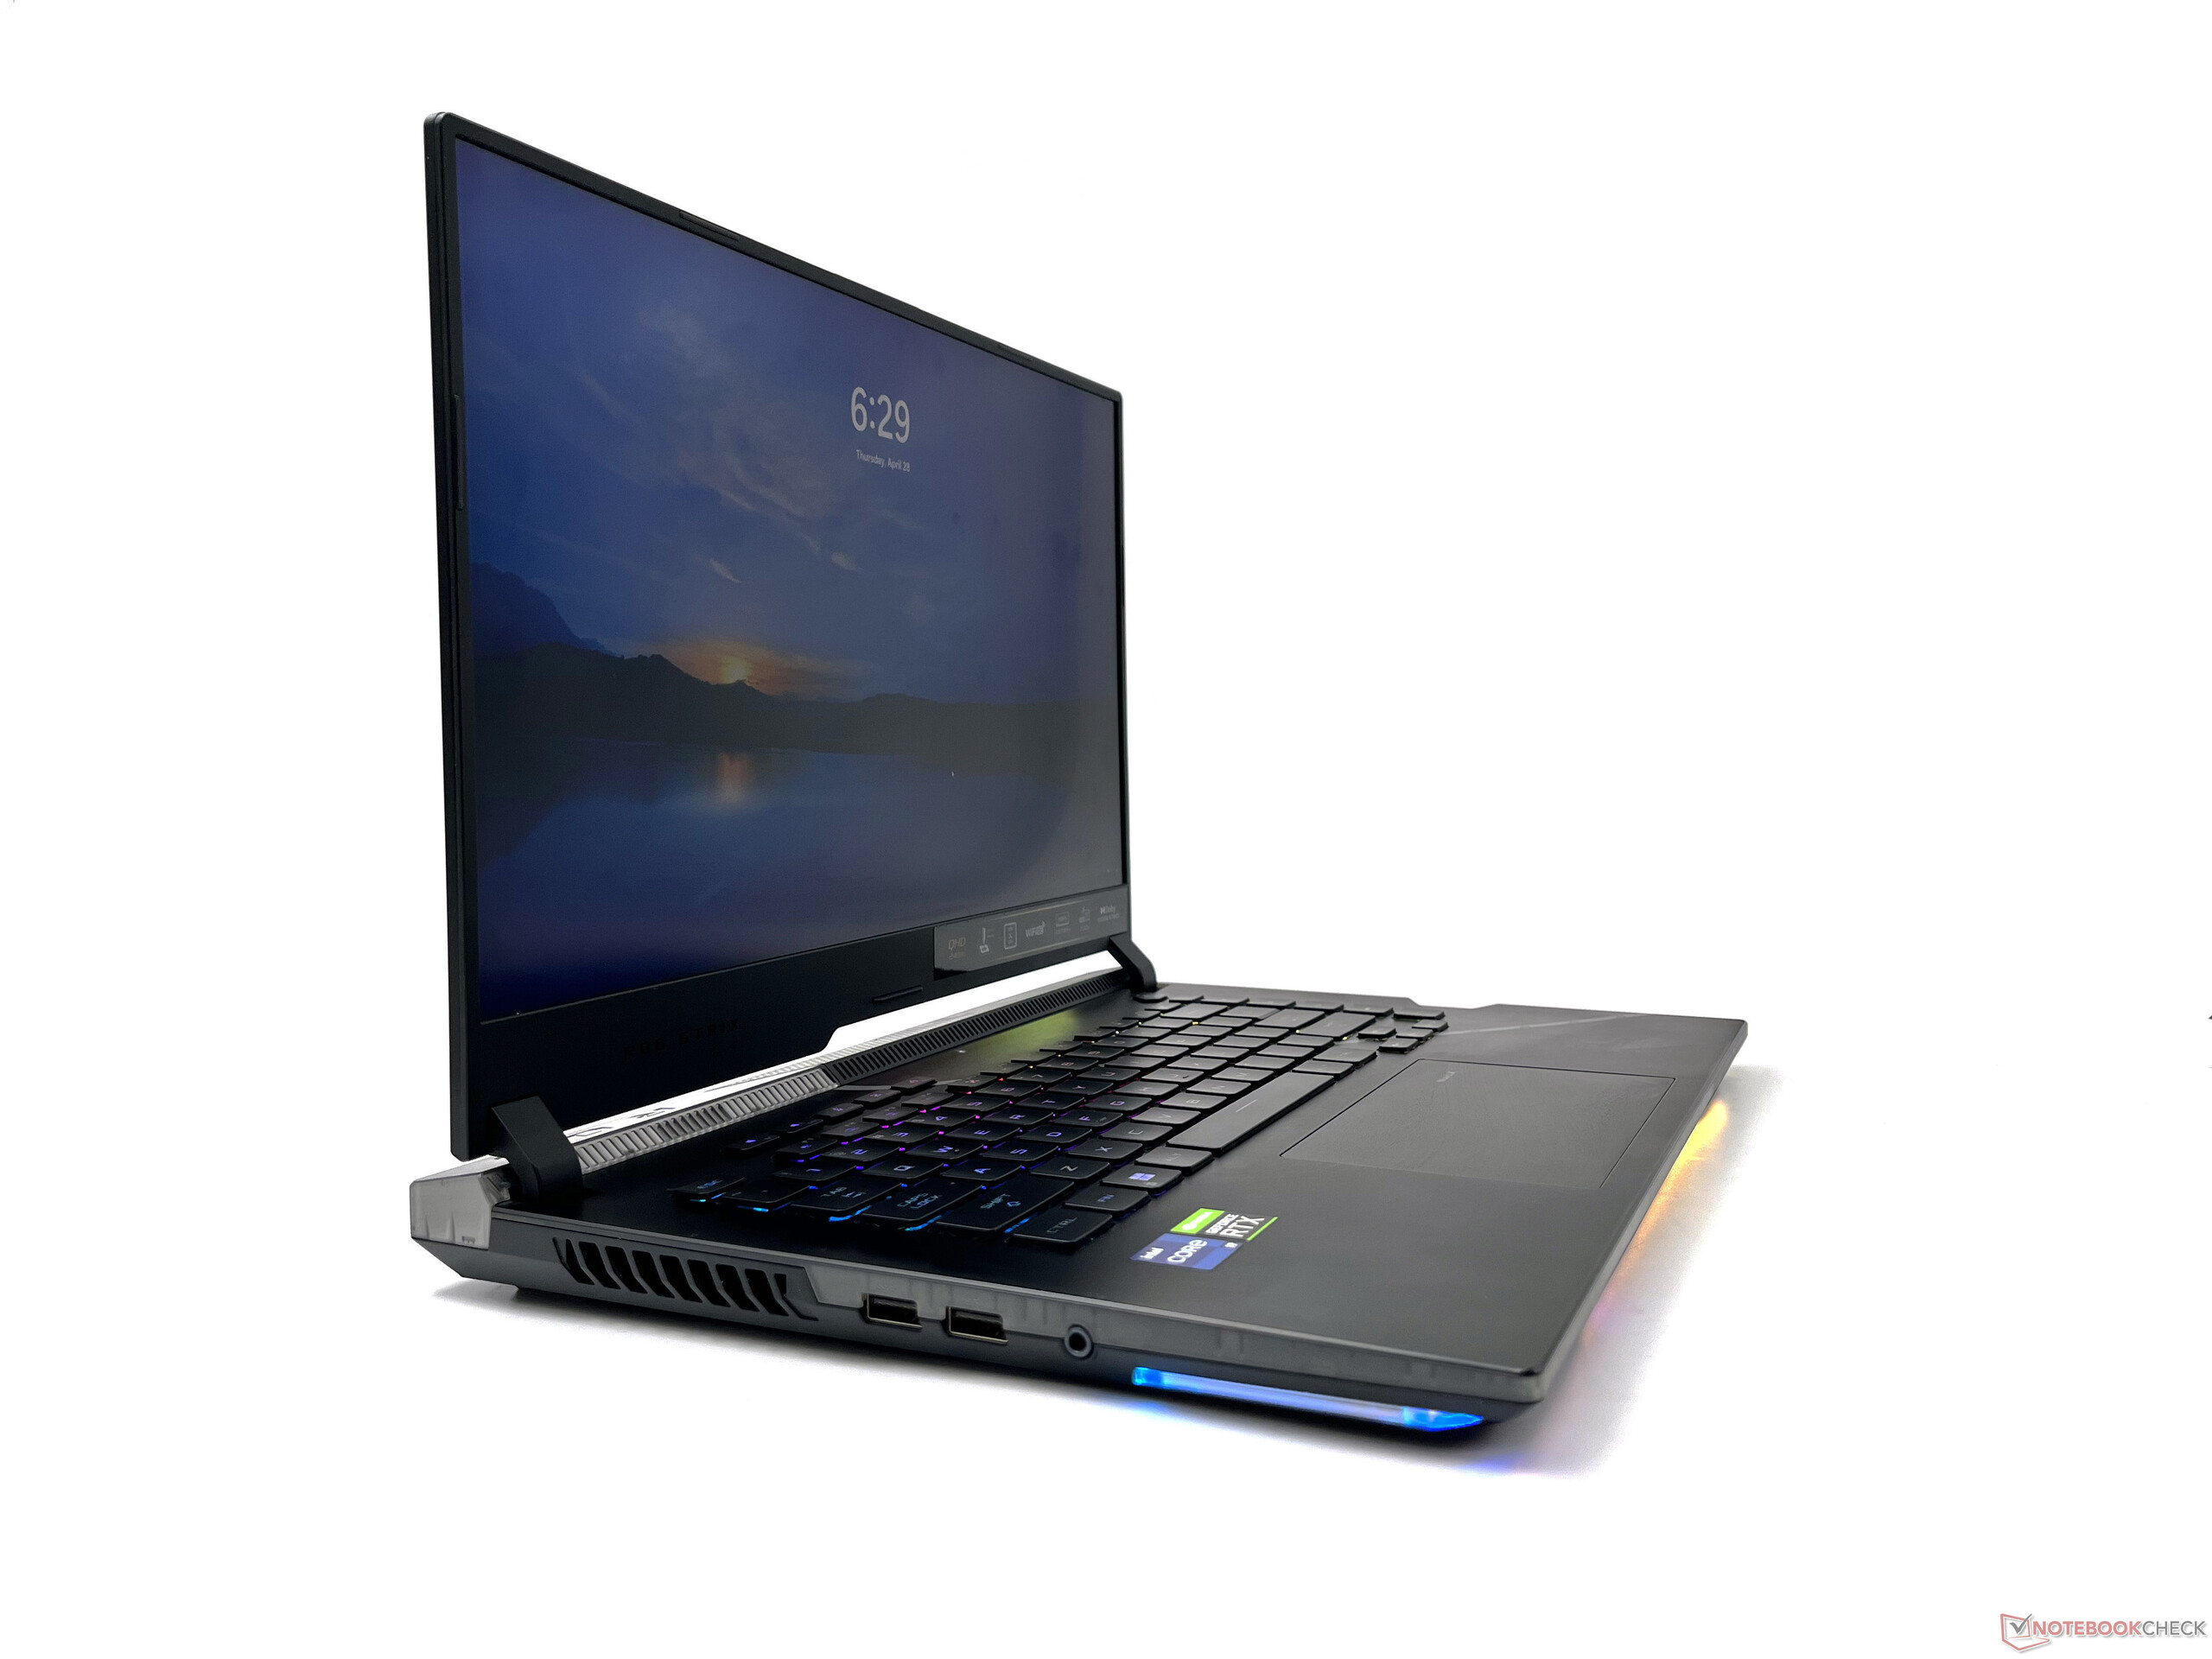
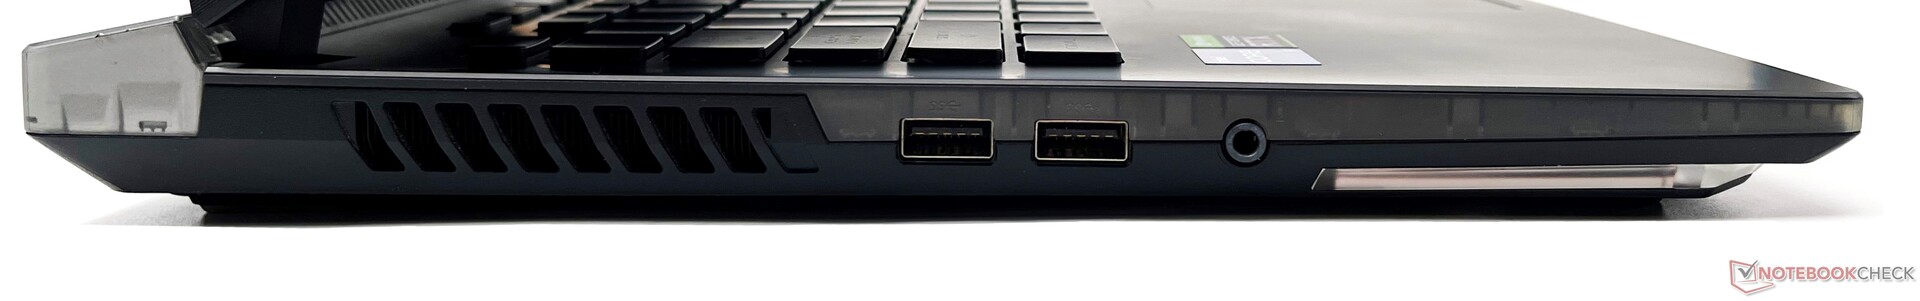
The ROG Strix Scar 15 G533 covers the essentials when it comes to I/O. On the left, there are two USB 3.2 Gen 1 Type-As and a combo audio jack while the right just has a slot for the ROG Keystone 2. The Keystone 2 is an NFC key that works with the Armory Crate app to apply various performance and RGB profiles and also to unlock a hidden Shadow Drive.
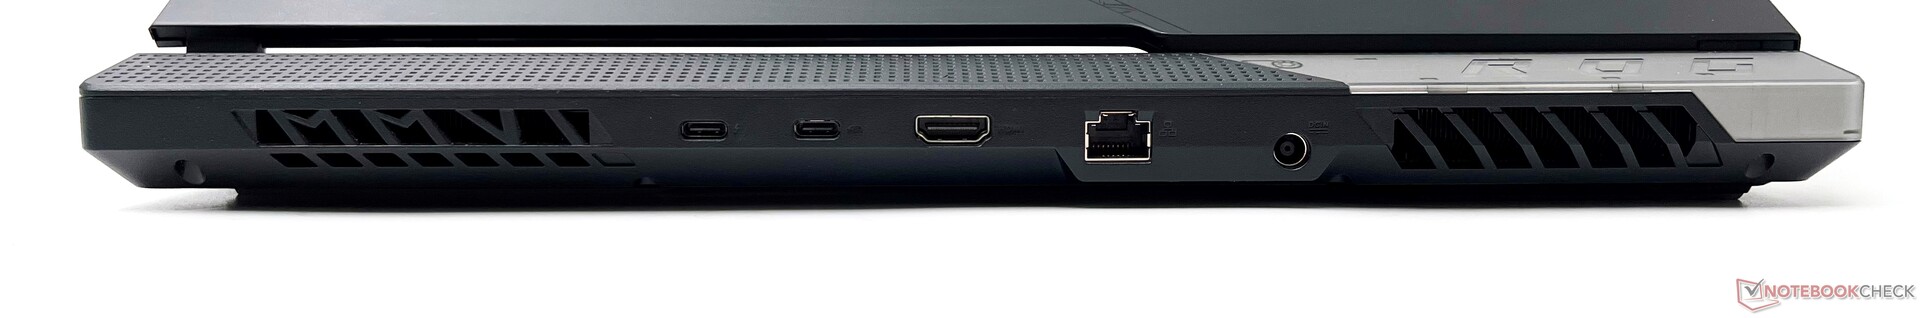
The majority of the ports are located towards the rear. These include a Thunderbolt 4 port, a USB 3.2 Gen2 Type-C that supports DisplayPort-out and Power Delivery, HDMI 2.1-out, a 2.5G Ethernet port, and DC power-in.
The port placement is convenient and does not hinder movements of an external mouse. Unfortunately, the Scar 15 does not offer an SD card slot or a Kensington lock slot.

Communication
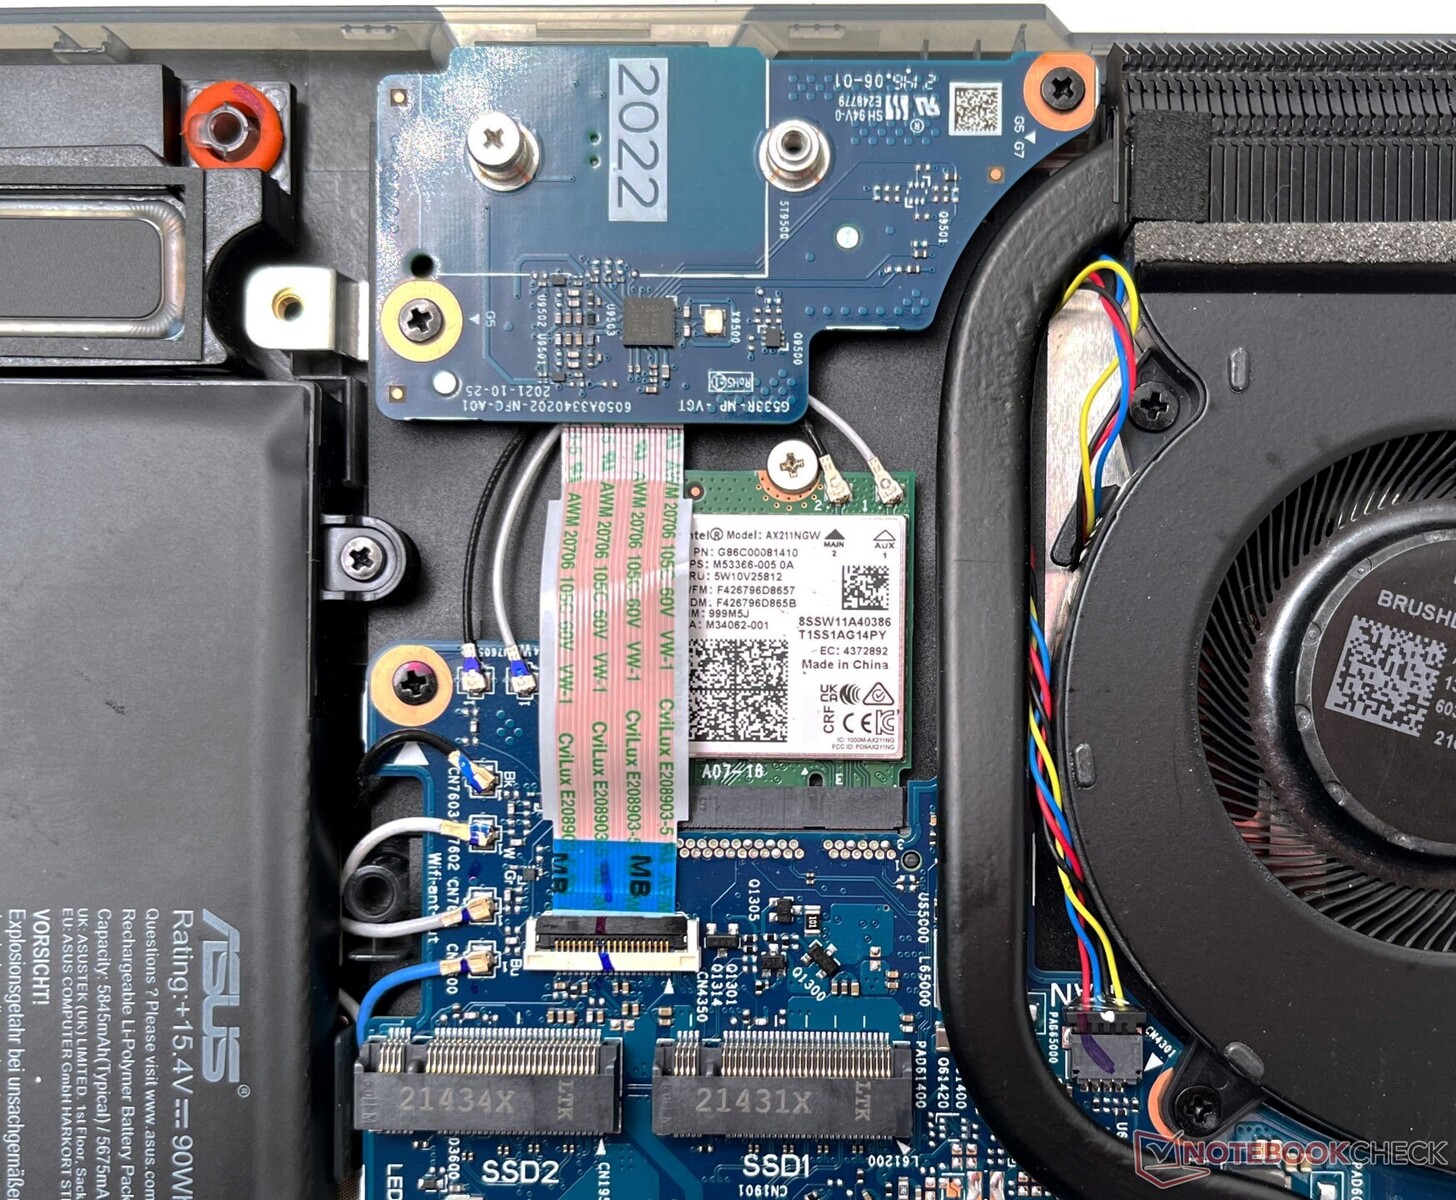
The ROG Strix Scar 15 offers Wi-Fi 6E connectivity via the Intel Wi-Fi 6E AX211 card. We have already seen several laptops featuring the AX211 chipset before, but the ROG Strix Scar 15 is likely to be the first laptop to launch in India that supports the new wireless standard.
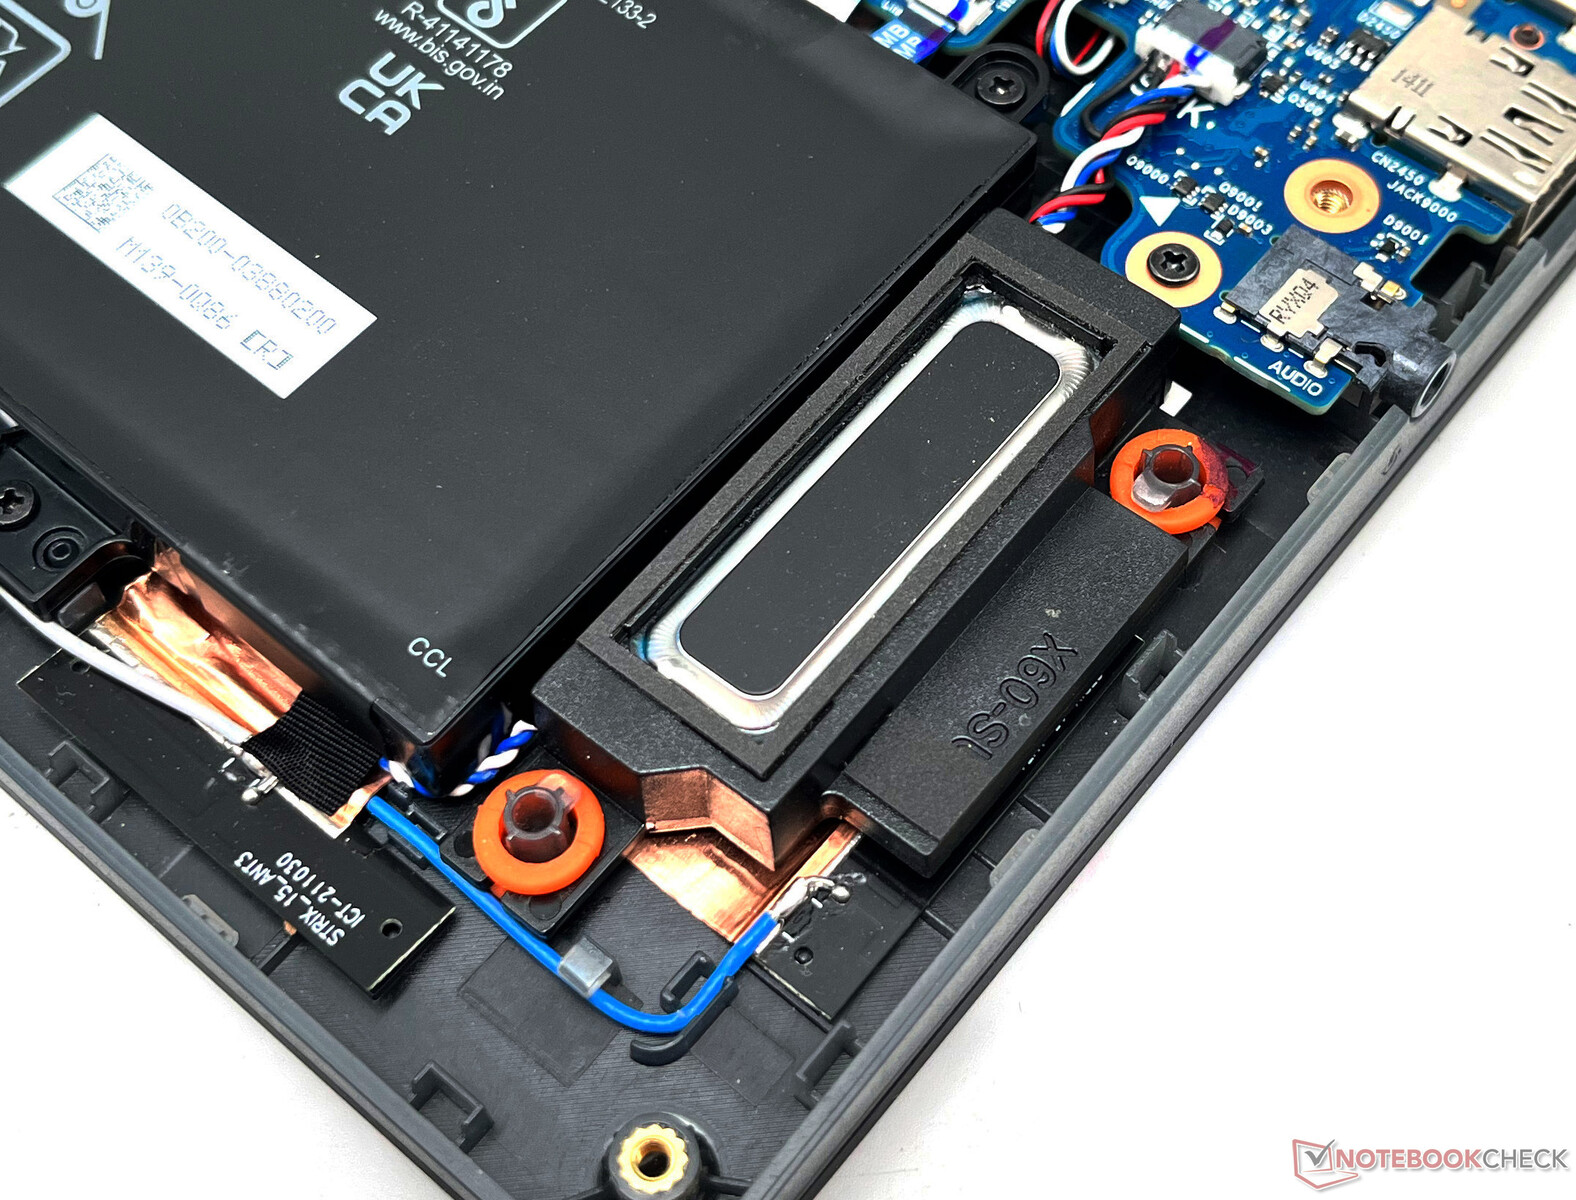
The Scar 15's Wi-Fi card can be swapped out if needed, but we are not really fans of its placement. The WLAN card is actually tucked under the primary M.2 SSD and requires removing the drive in order to access it for upgrades or replacement. You should also be careful with the data cable coming from the Keystone PCB that runs directly above the card.
Accordingly, we tested both Wi-Fi 5 GHz and Wi-Fi 6E performance with our reference Asus ROG Rapture GT-AXE11000 router at a distance of 1 m from the device in clear line of sight. Our test device shows up to 6% higher average receive speeds with 6E in the receive test and similar average throughput as 5 GHz in the transmit test. The 6E band also allows for higher maximum receive values close to 2 Gbit/s.
We did observe that it takes some time for the 6 GHz option to become available for connecting after freshly booting into Windows. No major dips in throughput were observed during testing.
Webcam
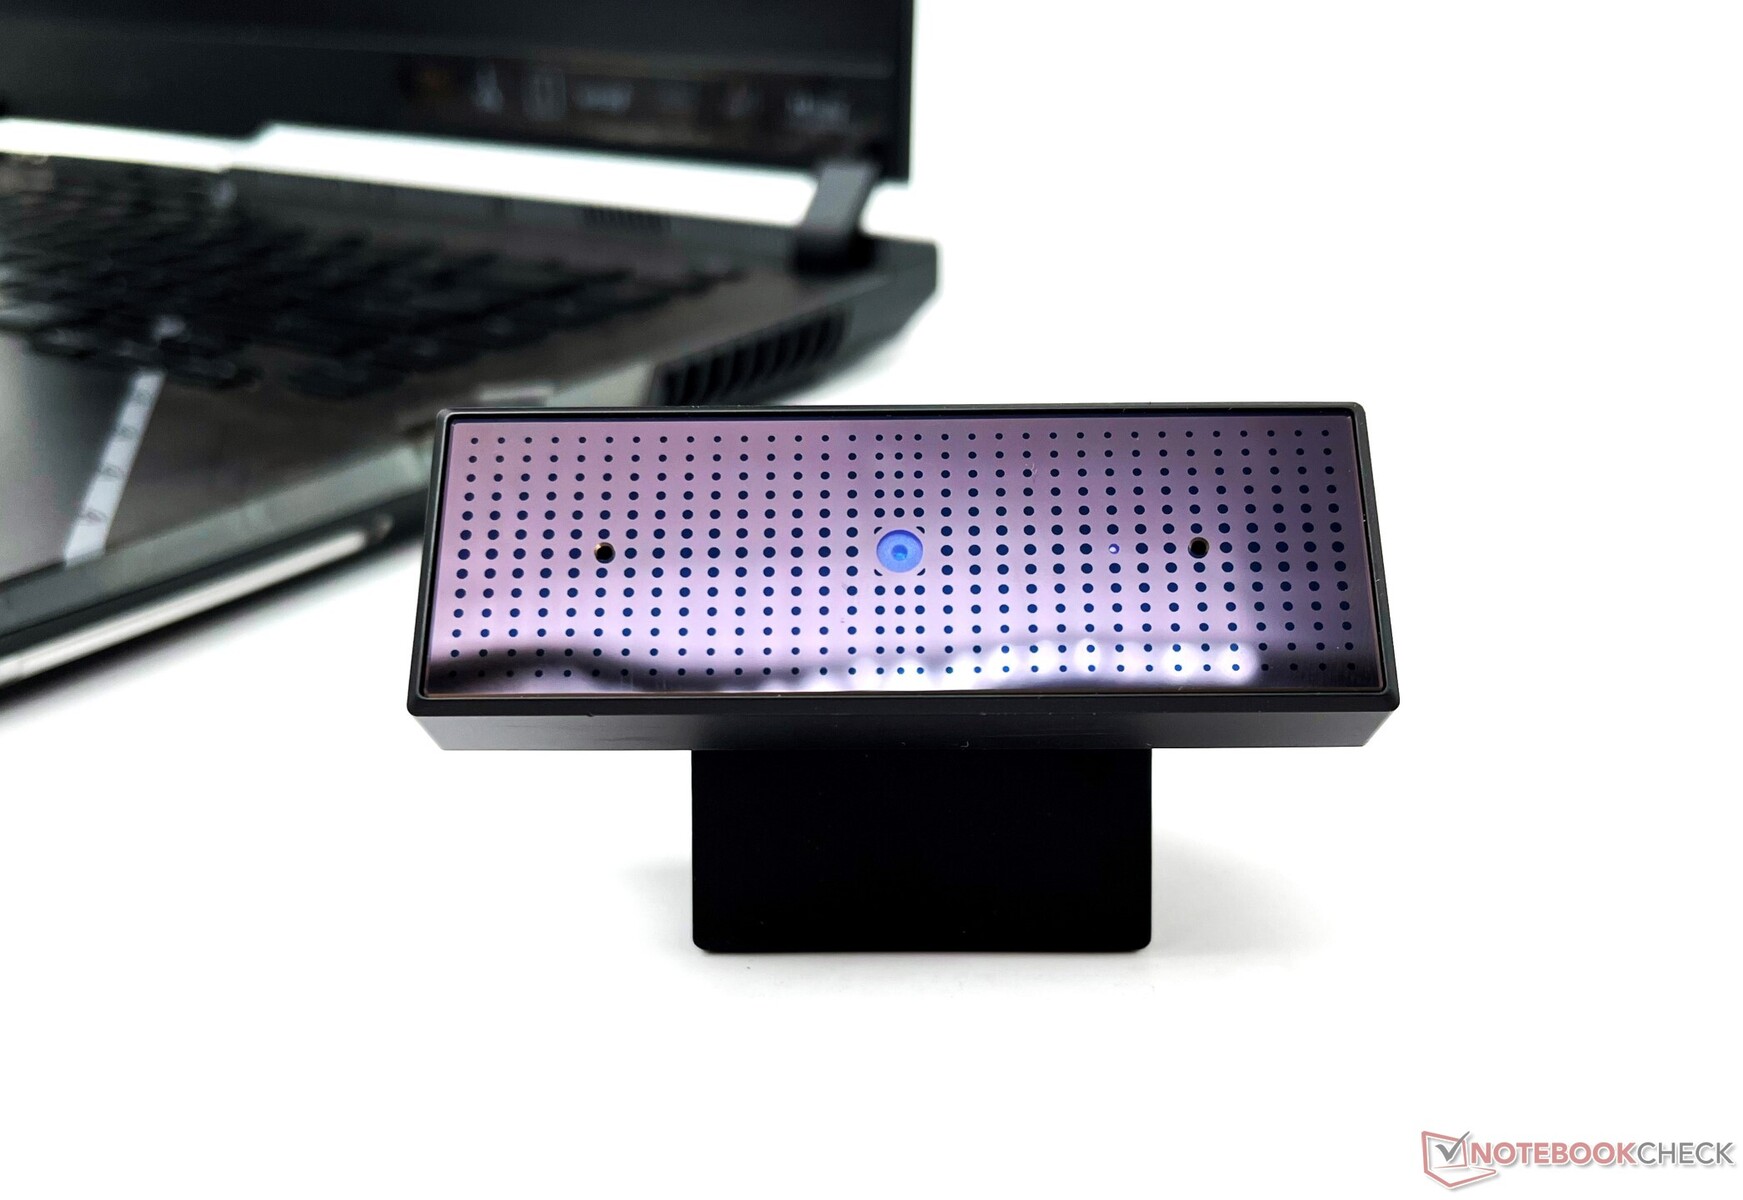
The ROG Strix Scar 15 does not feature a webcam. However, our review unit came with an external ROG Eye 1080p 60 fps webcam with built-in beamforming dual microphones. The webcam can be used on the desk or mounted on the Scar 15's top bezel.
The image quality from the ROG Eye is quite usable for the most part. The ROG Eye camera shows an average Delta E color accuracy of 15.12 with our ColorChecker Passport in a well-lit room, with the lowest Delta E values seen in the white and black patches.
The test chart shows decent detailing, but there is a lack of sharpness and clarity in the image. The ROG Eye webcam will set you back by about ₹5,800 (~US$75 or lower) if purchased separately.


Security
Since the ROG Strix Scar 15 is targeted at the gaming crowd, Asus has skimped on security features such as a fingerprint reader or an IR camera. There is a TPM 2.0 module present, however.
Accessories
The box contains the power adapter and the usual paperwork. You also get the ROG Keystone 2 key and two replaceable ROG Armor Caps. Our unit shipped with the ROG Eye external webcam, but some retail units may not be offered with one depending on the SKU and region.
Maintenance
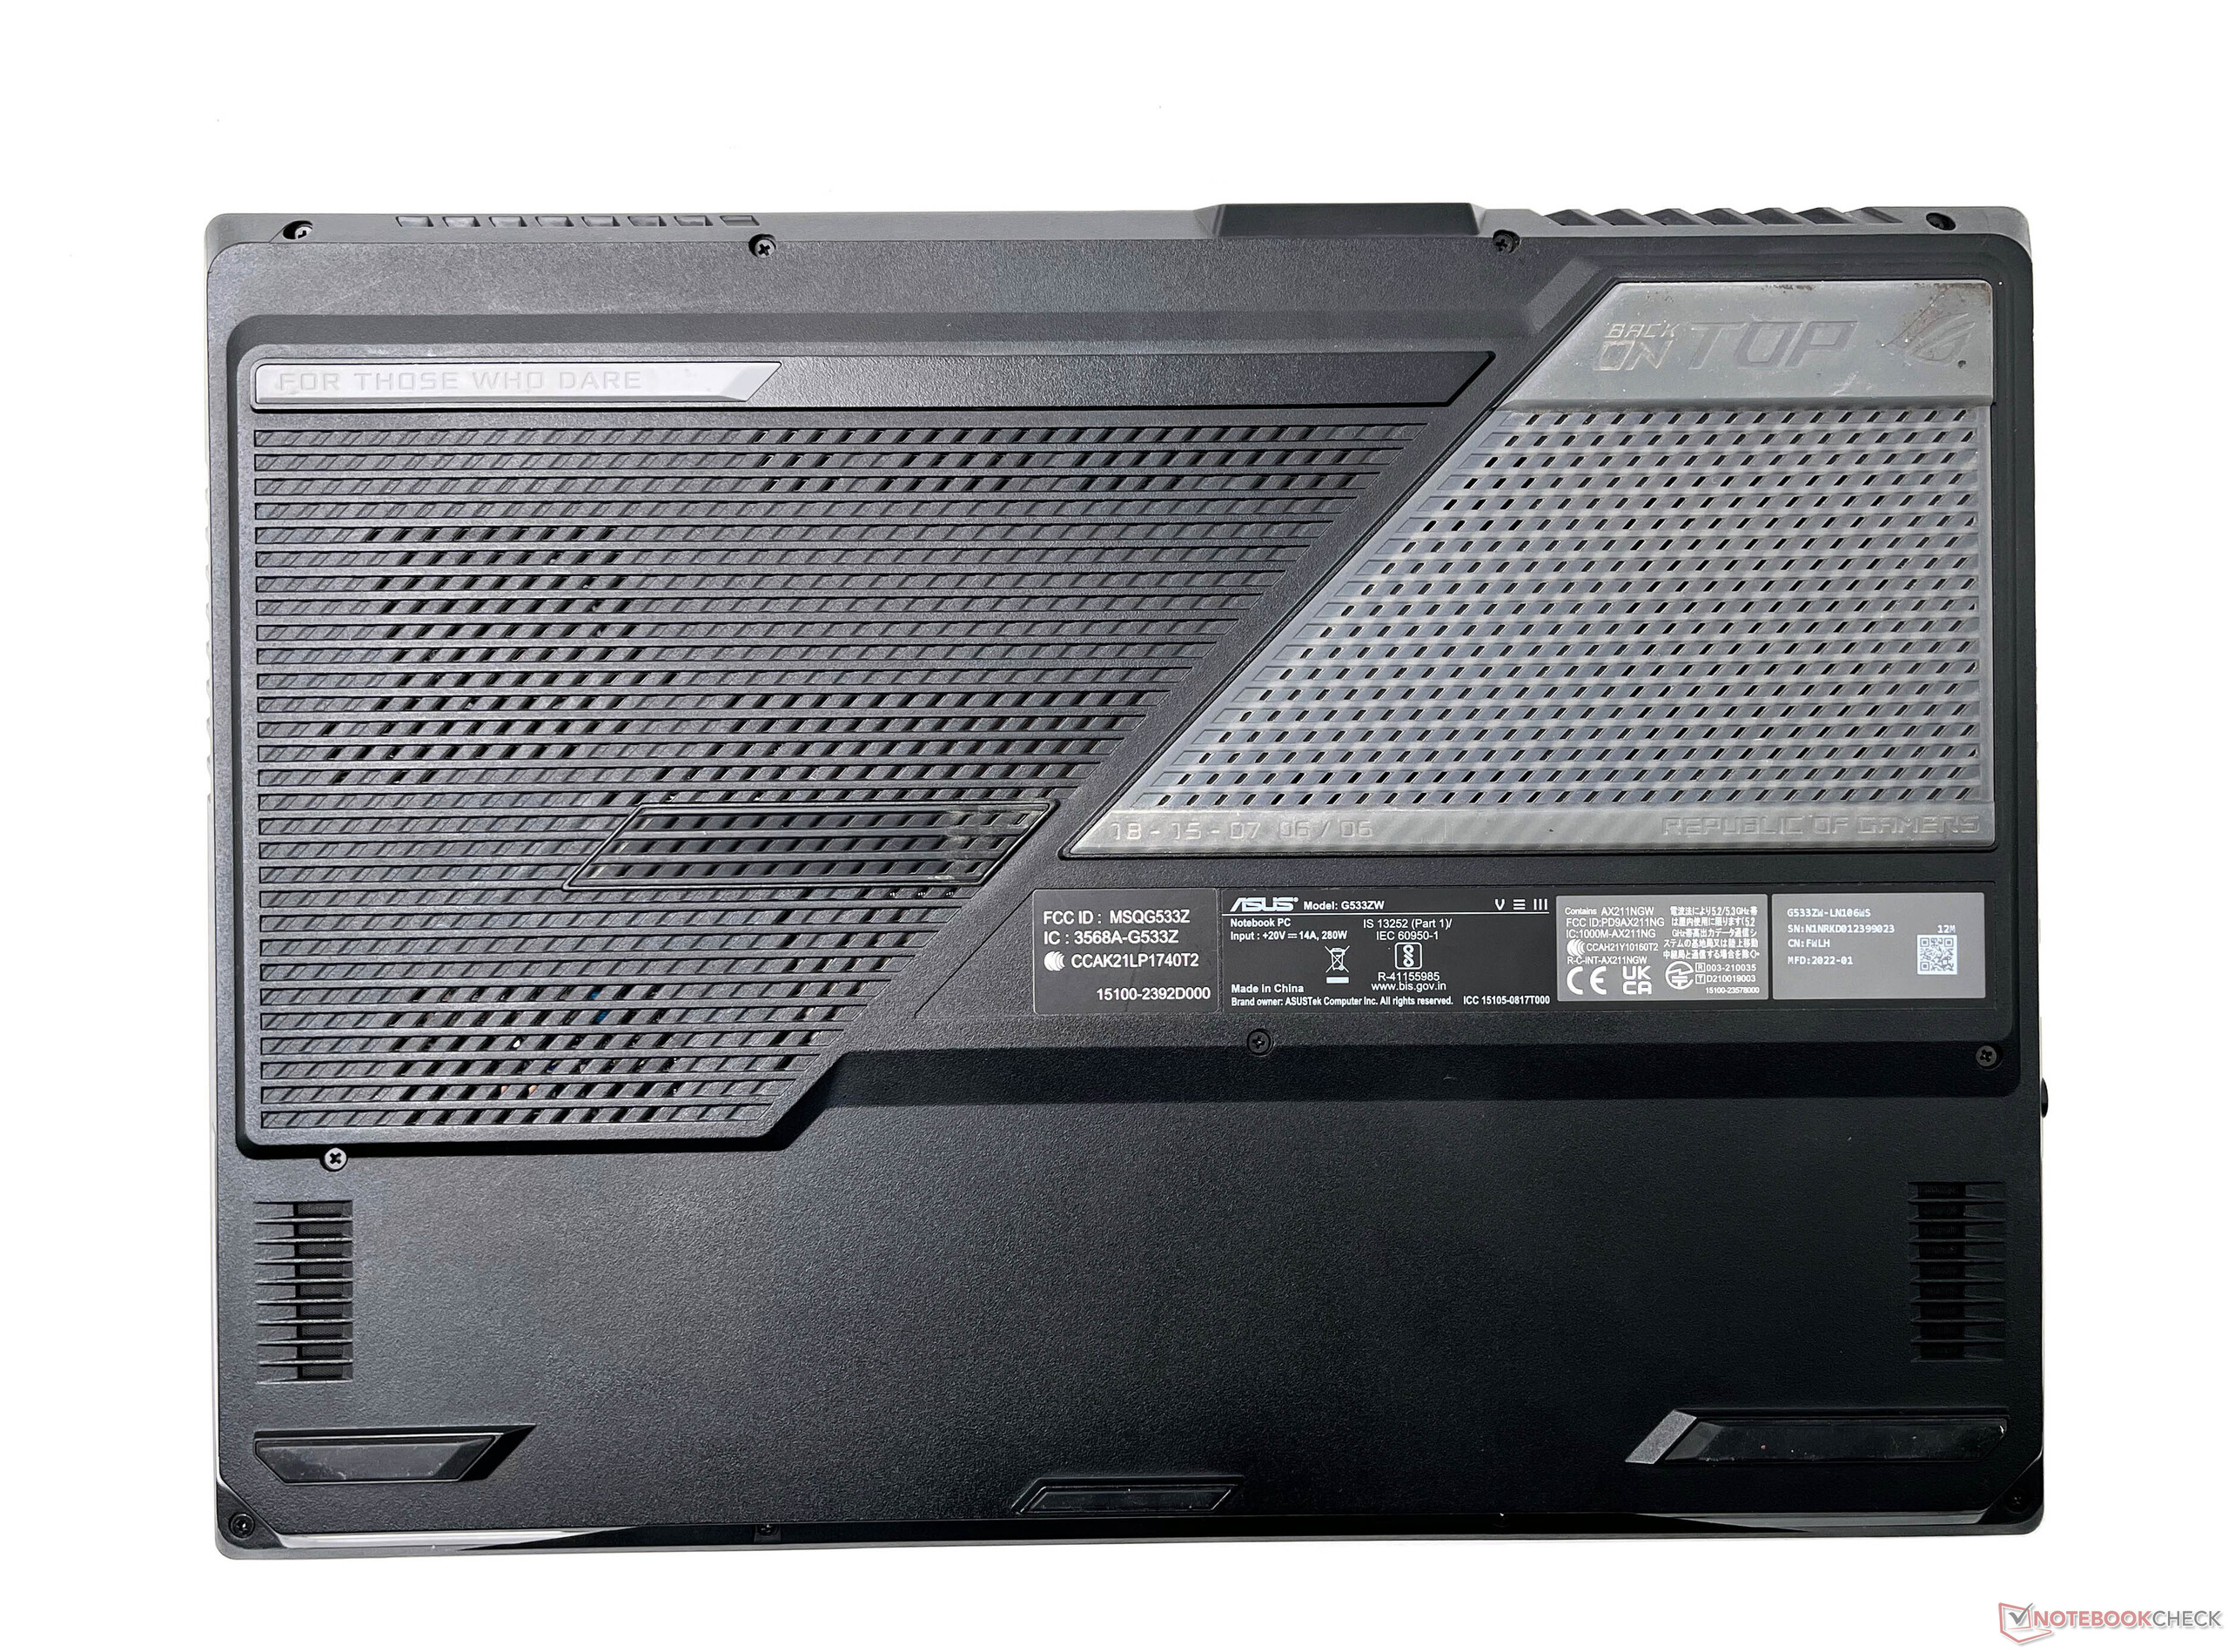
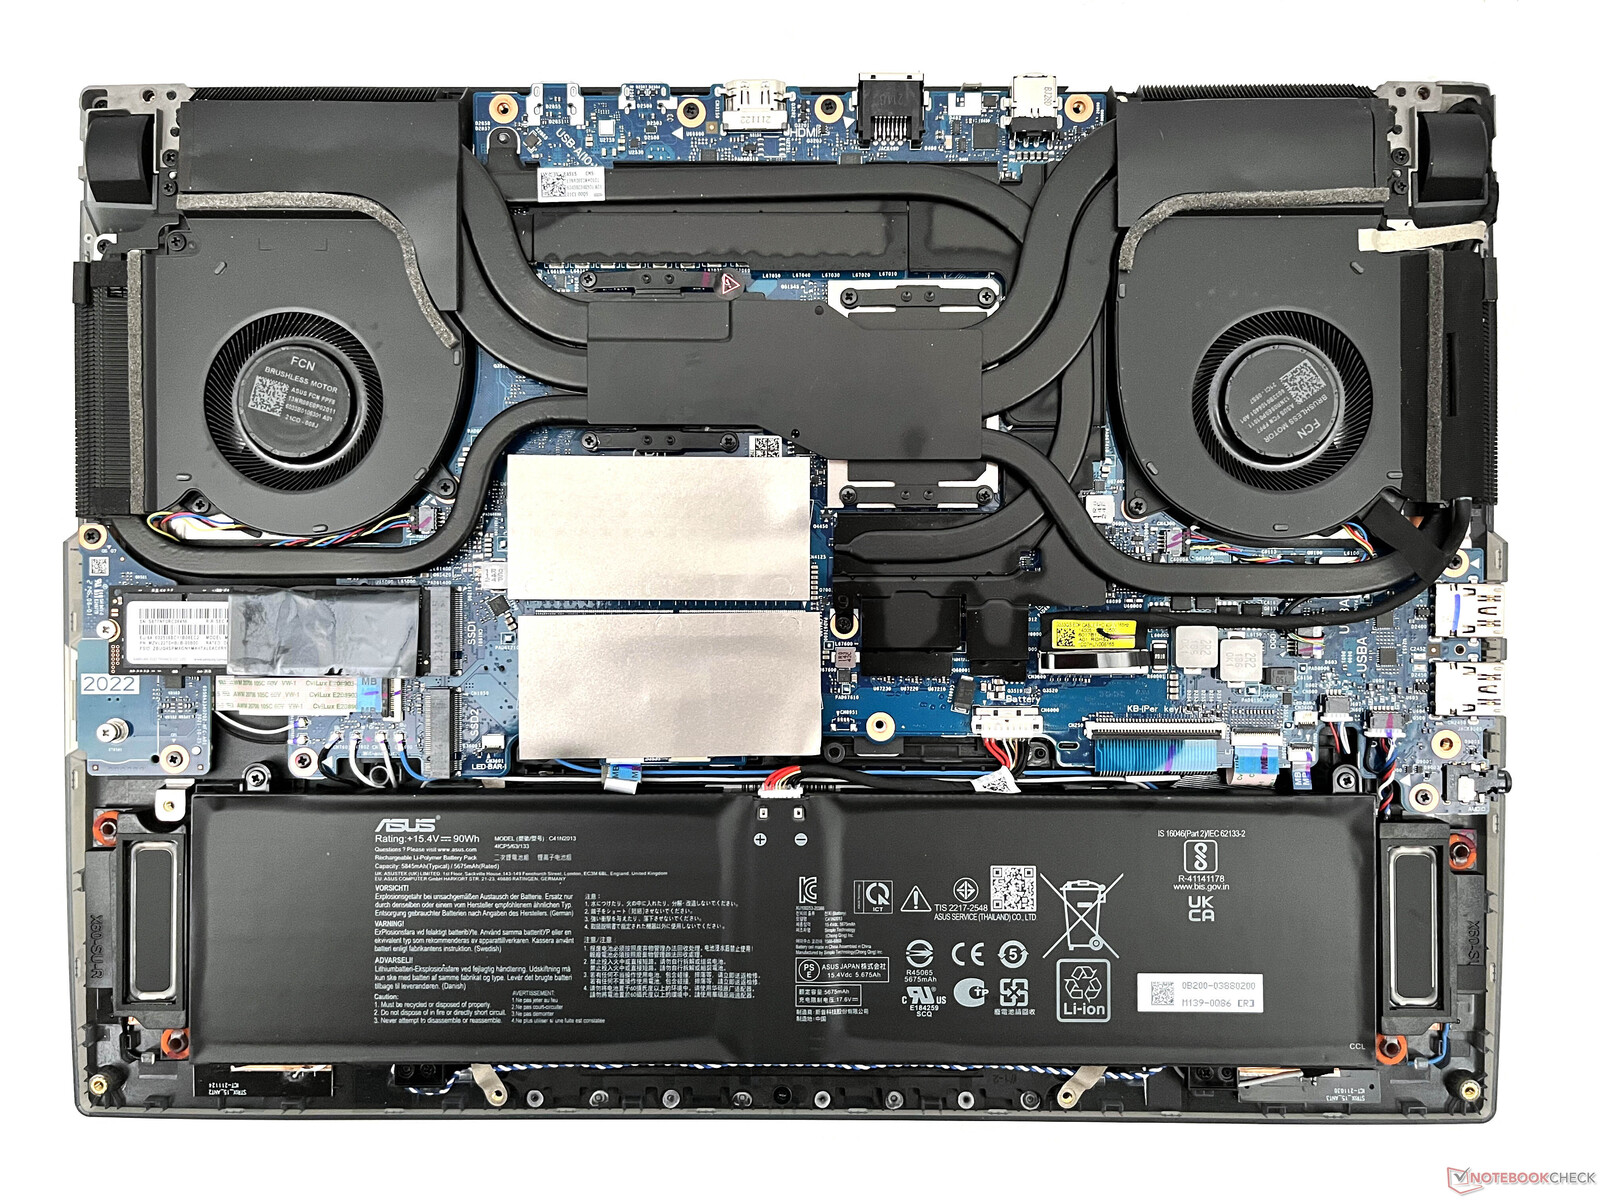
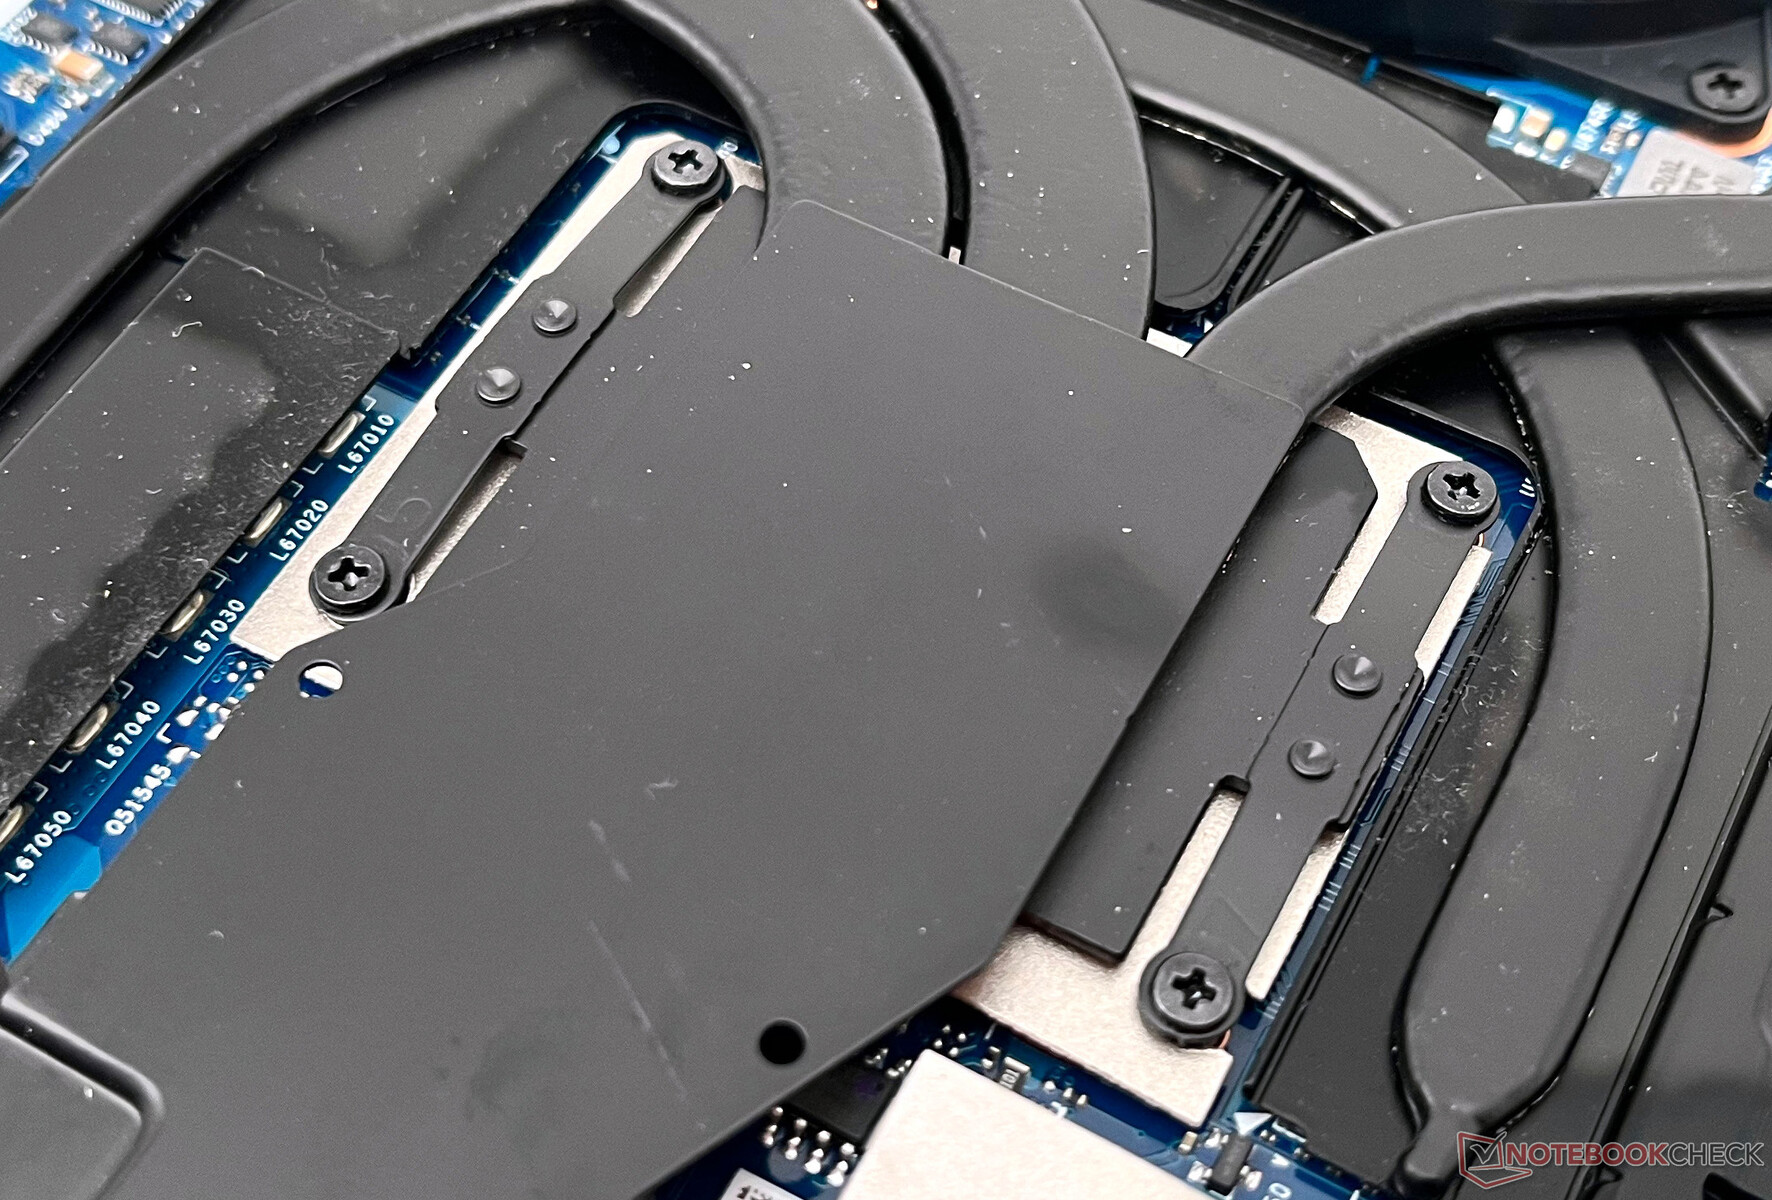
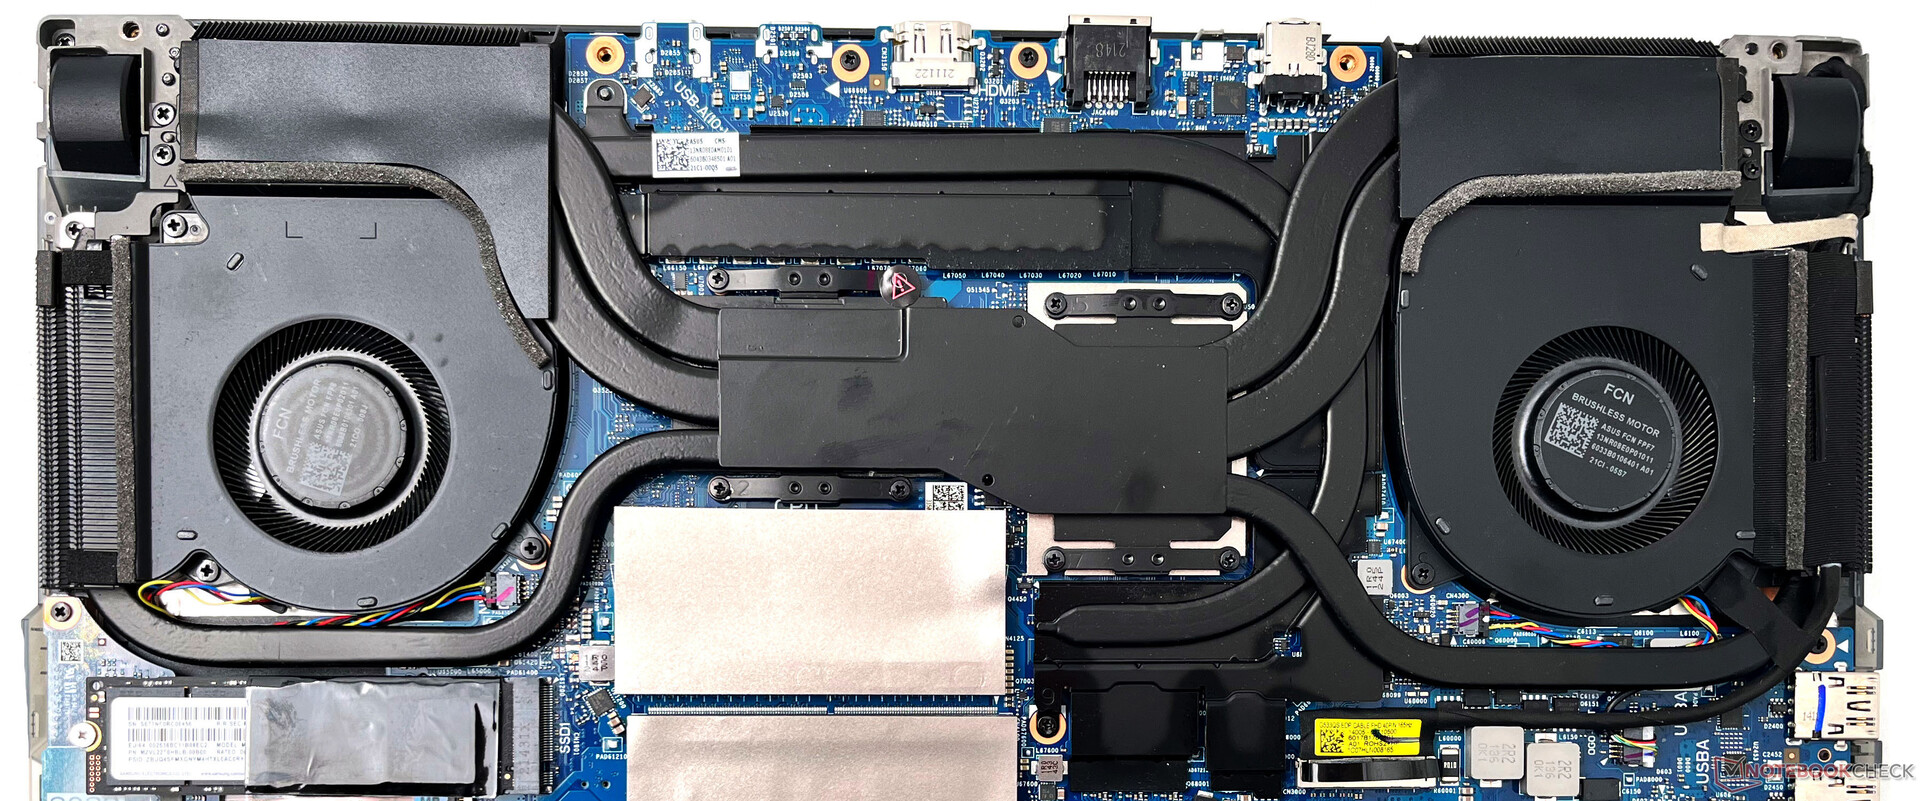
The bottom panel can be easily pried open after removing the 10 PH0 screws. However, one needs to be careful here as there are fragile ribbon cables that run from the bottom panel to the motherboard. These cables control the RGB light bar on the front edge of the bottom panel.
Having the chassis RGB strip in this location is not a good idea in our opinion as it complicates accessing the internals due to thin cables that can snap if you aren't careful while dislodging the bottom panel. The LEDs should have been part of the main chassis itself ideally like the MSI GE76 Raider, for example.
The innards do not throw up any particular surprises. You get swappable SO-DIMMs, M.2 SSDs, and WLAN card, a large 90 Whr battery, and a dual-fan eight-heat pipe cooling system.
Warranty
Asus offers a standard one-year warranty for the ROG Strix Scar 15 in India. Additional Premium Care warranty extensions can be purchased via the MyAsus app or from an Asus Store.
Indian buyers can currently avail Back to School offers for two and three-year warranty extensions and accidental damage protection across various Asus laptop portfolios, including the ROG series, within 15 days of purchase.
Input Devices: Back to membrane switches
Keyboard
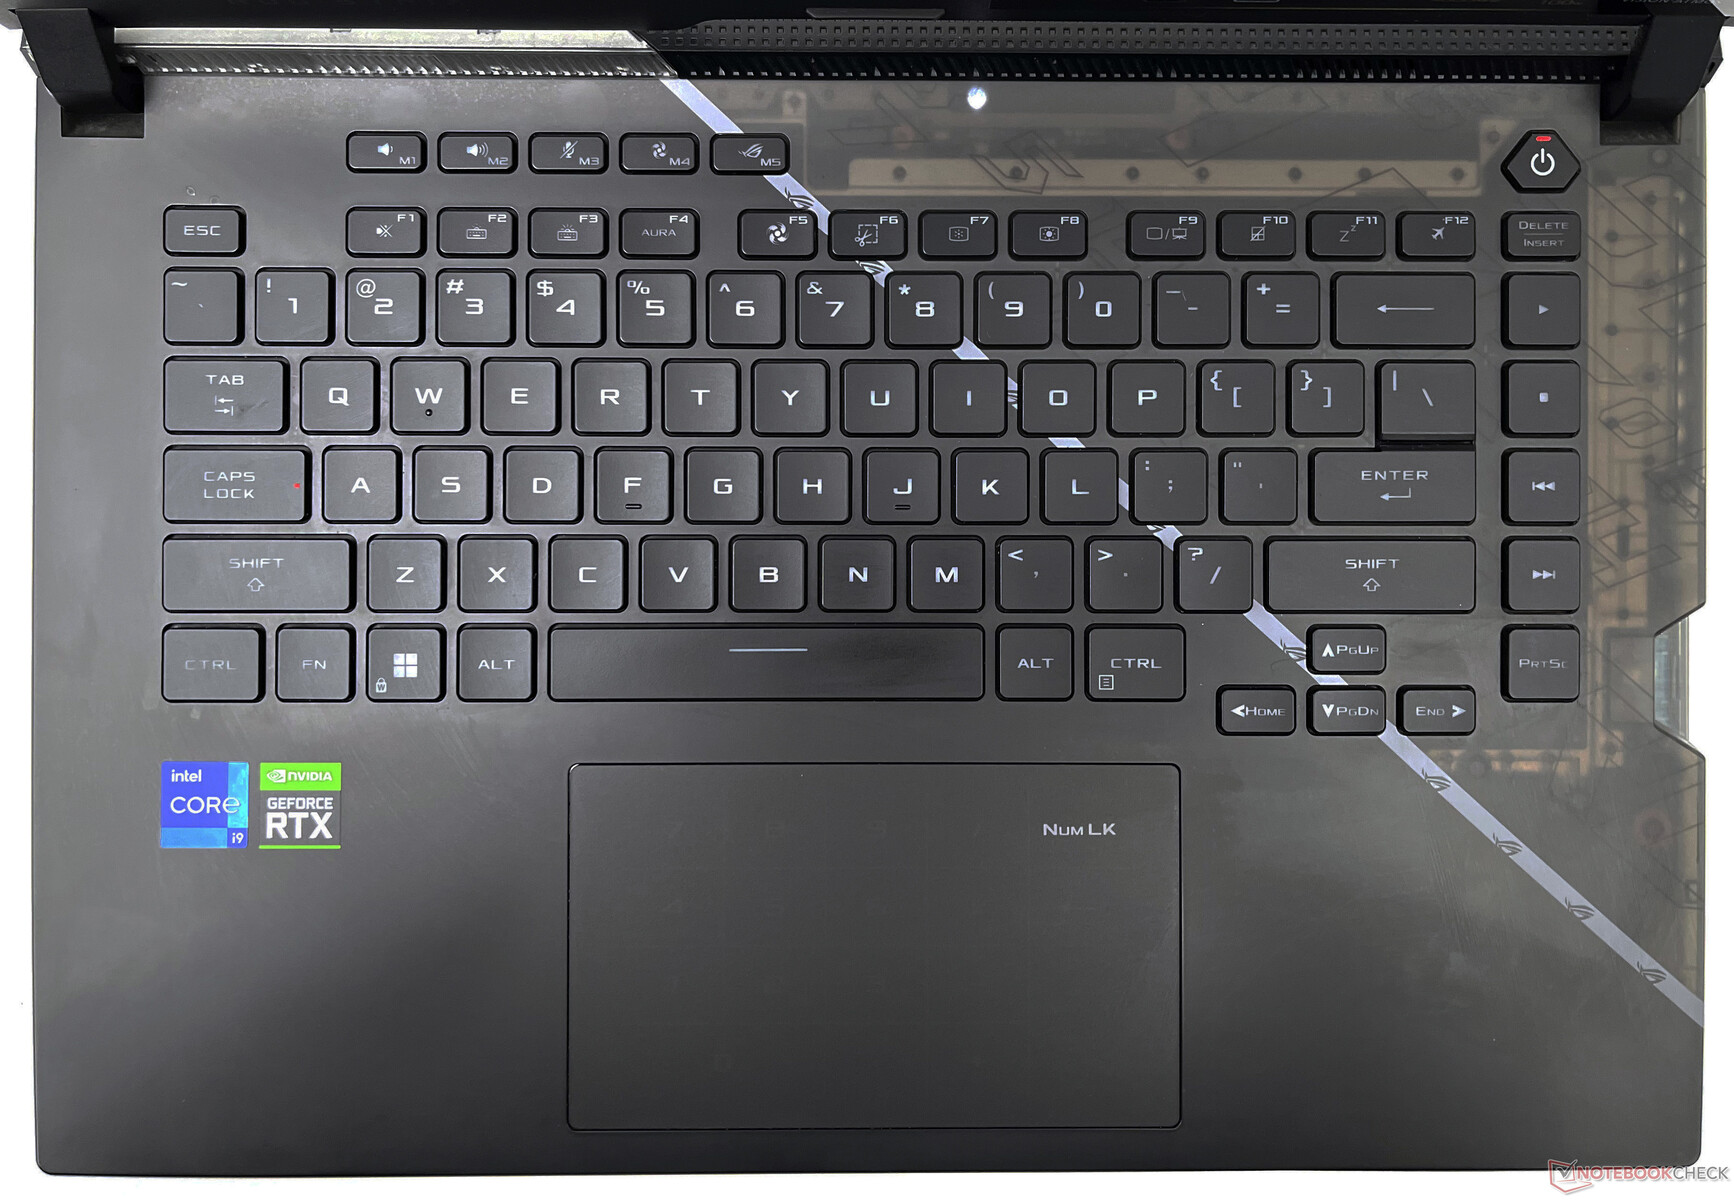
The matte keyboard deck is a smudge and grease magnet despite Asus's claims to the contrary. The 2021 ROG Strix Scar 15's keyboard featured opto-mechanical switches, but Asus has reverted to the classic membrane dome switch for this year's Scar 15. To compensate, Asus is using what it calls ROG Overstroke that registers a key press earlier in the stroke. The keys are adequately spaced and typing, in general, is quite comfortable with decent tactility.
The topmost row has quick shortcuts for volume, mic mute, fan speed, and the Armory Crate app. These keys can also be mapped to custom shortcuts and macros via Armory Crate. Arrow keys are smaller than we'd like but get the job done. Asus says there are small vents around the WASD keys to draw air into the chassis and prevent keyboard warm-up.
RGB brightness is more than adequate to enjoy various lighting effects via Aura Sync. All keys can be individually lit, but Asus likes to keep the F1-F12 lettering in the dark for some reason.
Touchpad
The 13 cm x 7.5 cm touchpad is roomy and offers smooth gliding. However, the clicks are shallow and somewhat loud for our taste. Gamers would be better off with a proper mouse.
There's a soft-touch toggle on the touchpad for a digital numeric keypad, which glows only in white.
Display: Dolby Vision with poor contrast ratio but improved response times
Asus essentially uses the same QHD IPS BOE panel as last year's in the new Scar 15 but with a slight revision in the model number and a 240 Hz refresh rate across all 15-inch and 17-inch SKUs.
The Scar 15's display supports Dolby Vision HDR and Adaptive Sync. We used the default "Bright" profile in the Dolby Vision settings for ensuing measurements.
The sub-pixel arrangement appears a bit fuzzy due to the matte coating. We observe significant backlight bleeding under long exposures.
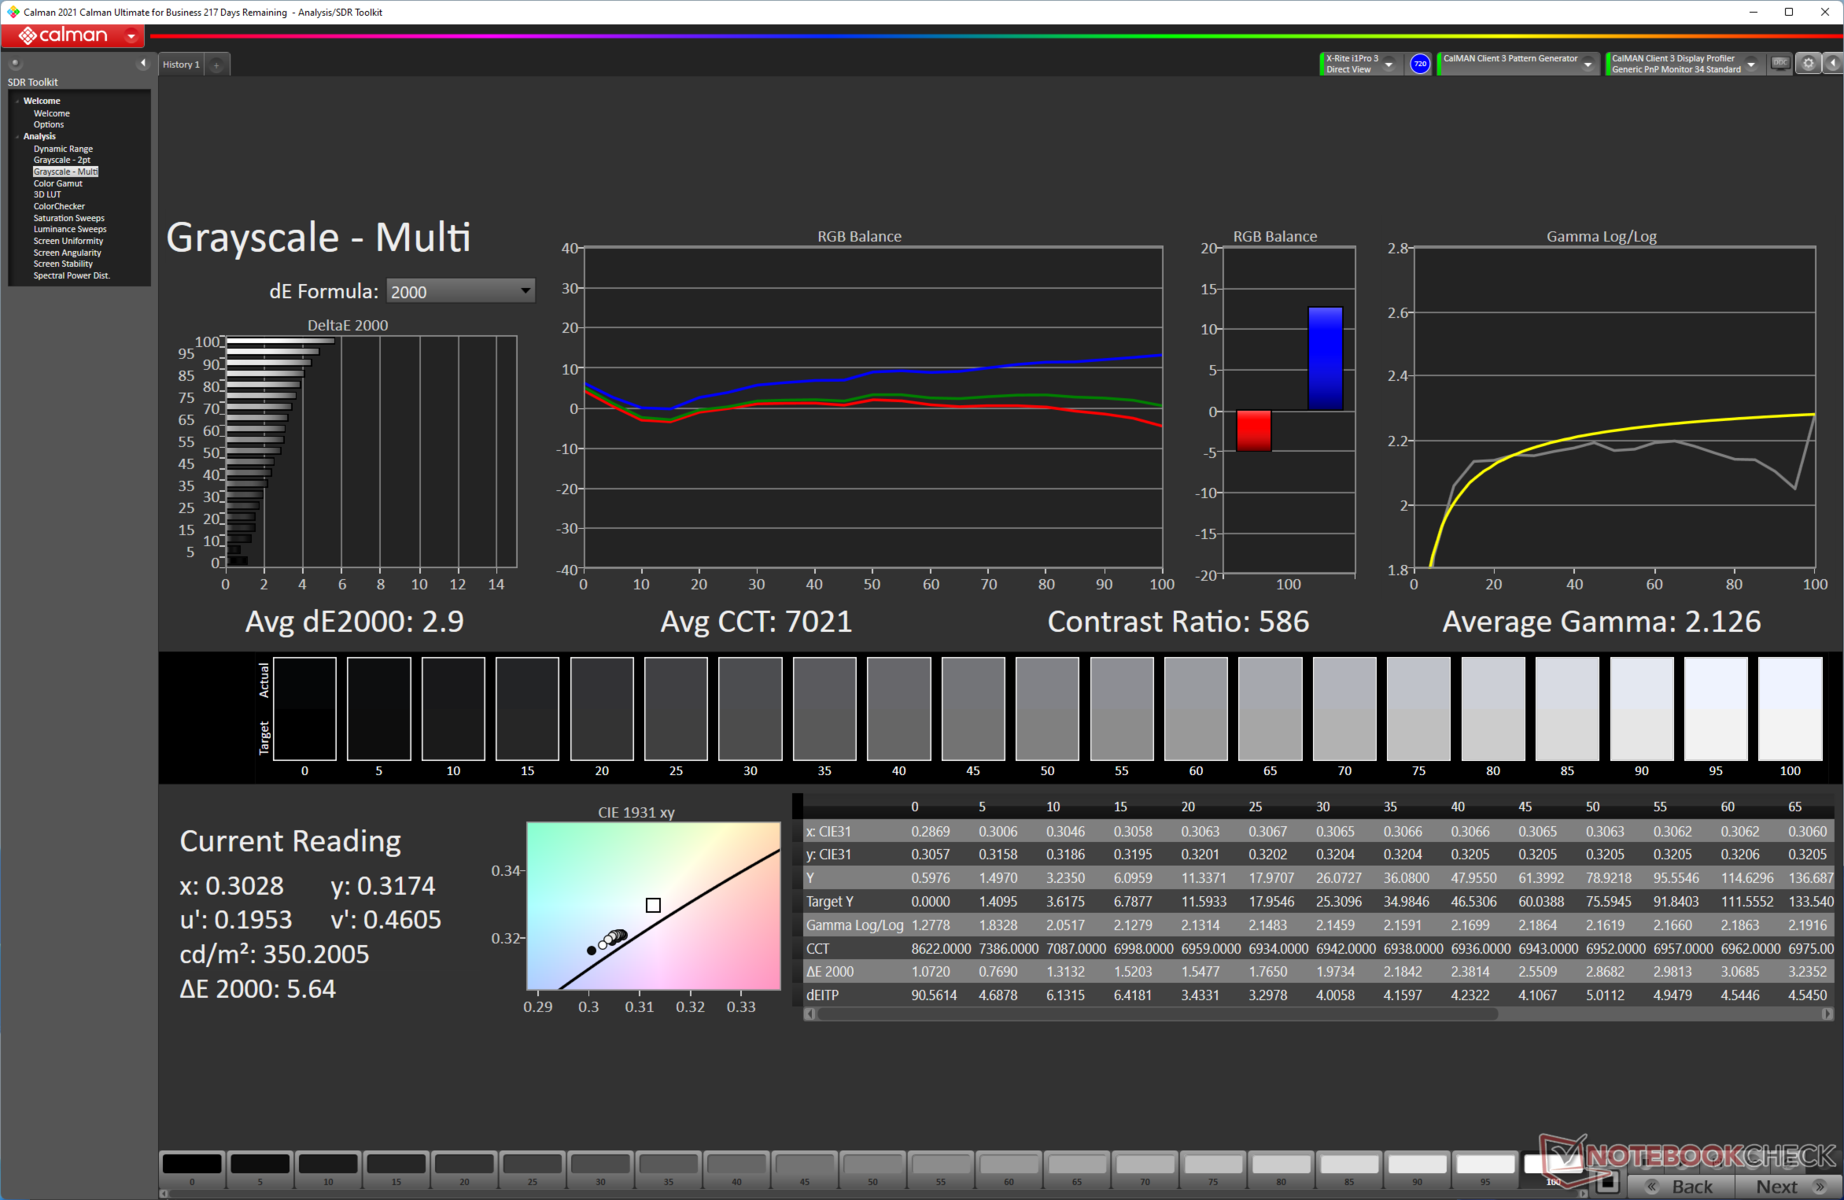
The brightness distribution is decent at 91%. However, the panel suffers from a poor contrast ratio of only 586:1. The overall subjective viewing experience is still pretty good for an IPS panel.


| |||||||||||||||||||||||||
Brightness Distribution: 91 %
Center on Battery: 346 cd/m²
Contrast: 586:1 (Black: 0.59 cd/m²)
ΔE ColorChecker Calman: 3.06 | ∀{0.5-29.43 Ø4.71}
calibrated: 2.57
84.5% AdobeRGB 1998 (Argyll 3D)
99.9% sRGB (Argyll 3D)
96.2% Display P3 (Argyll 3D)
Gamma: 2.12
CCT: 7021 K
| Asus ROG Strix Scar 15 G533ZW BOE CQ NE156QHM-NZ2, IPS-level, 2560x1440, 15.6" | MSI Pulse GL66 12UEK AU Optronics B156HAN08.4 (AUOAF90), IPS, 1920x1080, 15.6" | MSI Vector GP66 12UGS BOE NE156FHM-NZ3, IPS, 1920x1080, 15.6" | MSI Raider GE66 12UHS AUO51EB, IPS, 3840x2160, 15.6" | HP Omen 16-b1090ng BOE09E5, IPS, 2560x1440, 16.1" | Lenovo Legion 5 Pro 16 G7 i7 RTX 3070Ti NE160QDM-NY1, IPS, 2560x1600, 16" | Razer Blade 15 2022 Sharp LQ156T1JW03, IPS, 2560x1440, 15.6" | |
|---|---|---|---|---|---|---|---|
| Display | -51% | -14% | -2% | -14% | -16% | 2% | |
| Display P3 Coverage (%) | 96.2 | 39 -59% | 70.1 -27% | 80.4 -16% | 71 -26% | 68.7 -29% | 99.1 3% |
| sRGB Coverage (%) | 99.9 | 58.4 -42% | 99.5 0% | 98.4 -2% | 97.9 -2% | 97.6 -2% | 99.9 0% |
| AdobeRGB 1998 Coverage (%) | 84.5 | 40.3 -52% | 72.1 -15% | 94.7 12% | 73.3 -13% | 70.9 -16% | 86.8 3% |
| Response Times | -334% | -1% | -105% | -55% | -63% | -69% | |
| Response Time Grey 50% / Grey 80% * (ms) | 7.86 ? 4.21 ? | 38.8 ? -394% | 5.8 ? 26% | 18.8 ? -139% | 14.5 ? -84% | 17.6 ? -124% | 14.4 ? -83% |
| Response Time Black / White * (ms) | 7.5 ? | 28 ? -273% | 9.6 ? -28% | 12.8 ? -71% | 9.4 ? -25% | 7.6 ? -1% | 11.6 ? -55% |
| PWM Frequency (Hz) | |||||||
| Screen | 28% | 24% | 21% | 12% | 43% | 17% | |
| Brightness middle (cd/m²) | 346 | 248 -28% | 353.1 2% | 351 1% | 335 -3% | 502 45% | 286 -17% |
| Brightness (cd/m²) | 329 | 245 -26% | 325 -1% | 347 5% | 319 -3% | 491 49% | 271 -18% |
| Brightness Distribution (%) | 91 | 86 -5% | 85 -7% | 90 -1% | 90 -1% | 91 0% | 89 -2% |
| Black Level * (cd/m²) | 0.59 | 0.13 78% | 0.38 36% | 0.35 41% | 0.28 53% | 0.37 37% | 0.25 58% |
| Contrast (:1) | 586 | 1908 226% | 929 59% | 1003 71% | 1196 104% | 1357 132% | 1144 95% |
| Colorchecker dE 2000 * | 3.06 | 3.14 -3% | 2.24 27% | 2.54 17% | 4.38 -43% | 2.7 12% | 2.74 10% |
| Colorchecker dE 2000 max. * | 5.81 | 5.82 -0% | 5 14% | 8.36 -44% | 9.48 -63% | 4.5 23% | 5.21 10% |
| Colorchecker dE 2000 calibrated * | 2.57 | 3.14 -22% | 1.02 60% | 0.67 74% | 1.33 48% | 1.4 46% | 2.52 2% |
| Gamma | 2.12 104% | 2.49 88% | 2.24 98% | 2.089 105% | 2.103 105% | 2.44 90% | 2.2 100% |
| CCT | 7021 93% | 6468 100% | 6864 95% | 7036 92% | 6244 104% | 6326 103% | 6408 101% |
| Greyscale dE 2000 * | 1.2 | 4 | 4.1 | 7 | 2.7 | 1.1 | |
| Total Average (Program / Settings) | -119% /
-46% | 3% /
11% | -29% /
-4% | -19% /
-4% | -12% /
13% | -17% /
0% |
* ... smaller is better
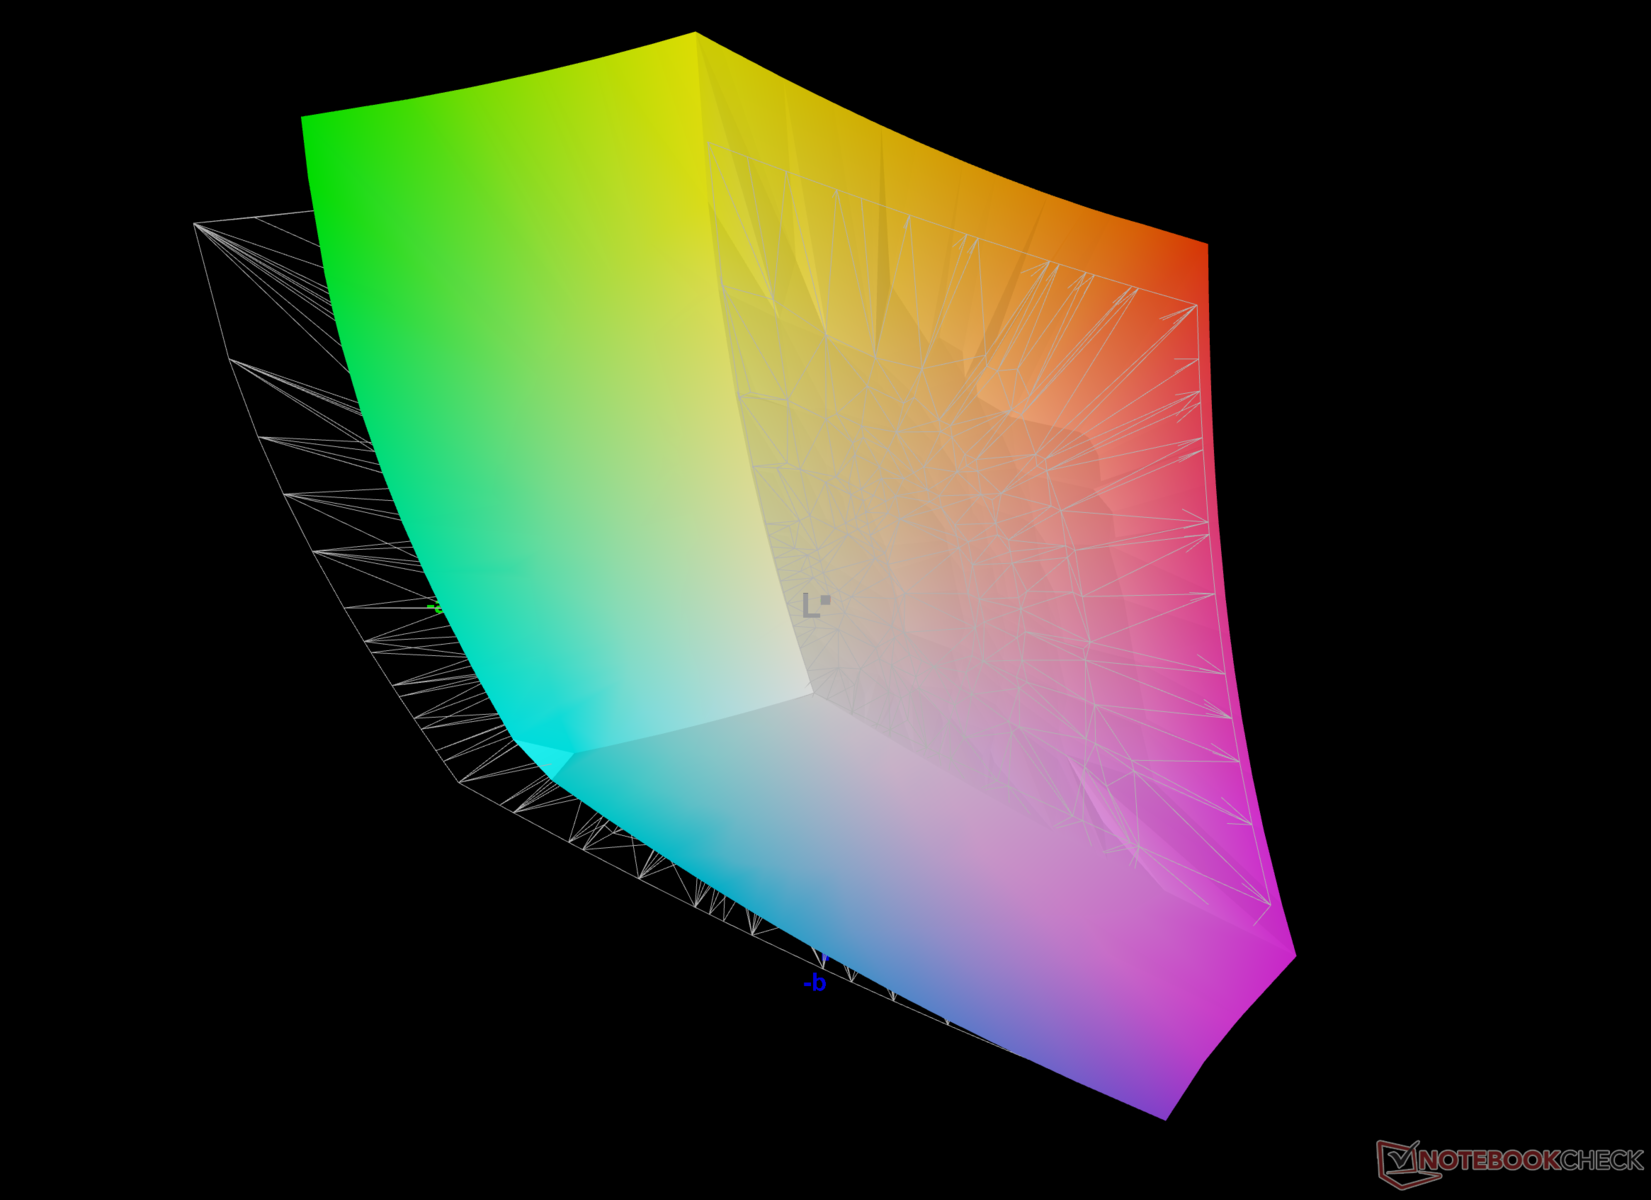
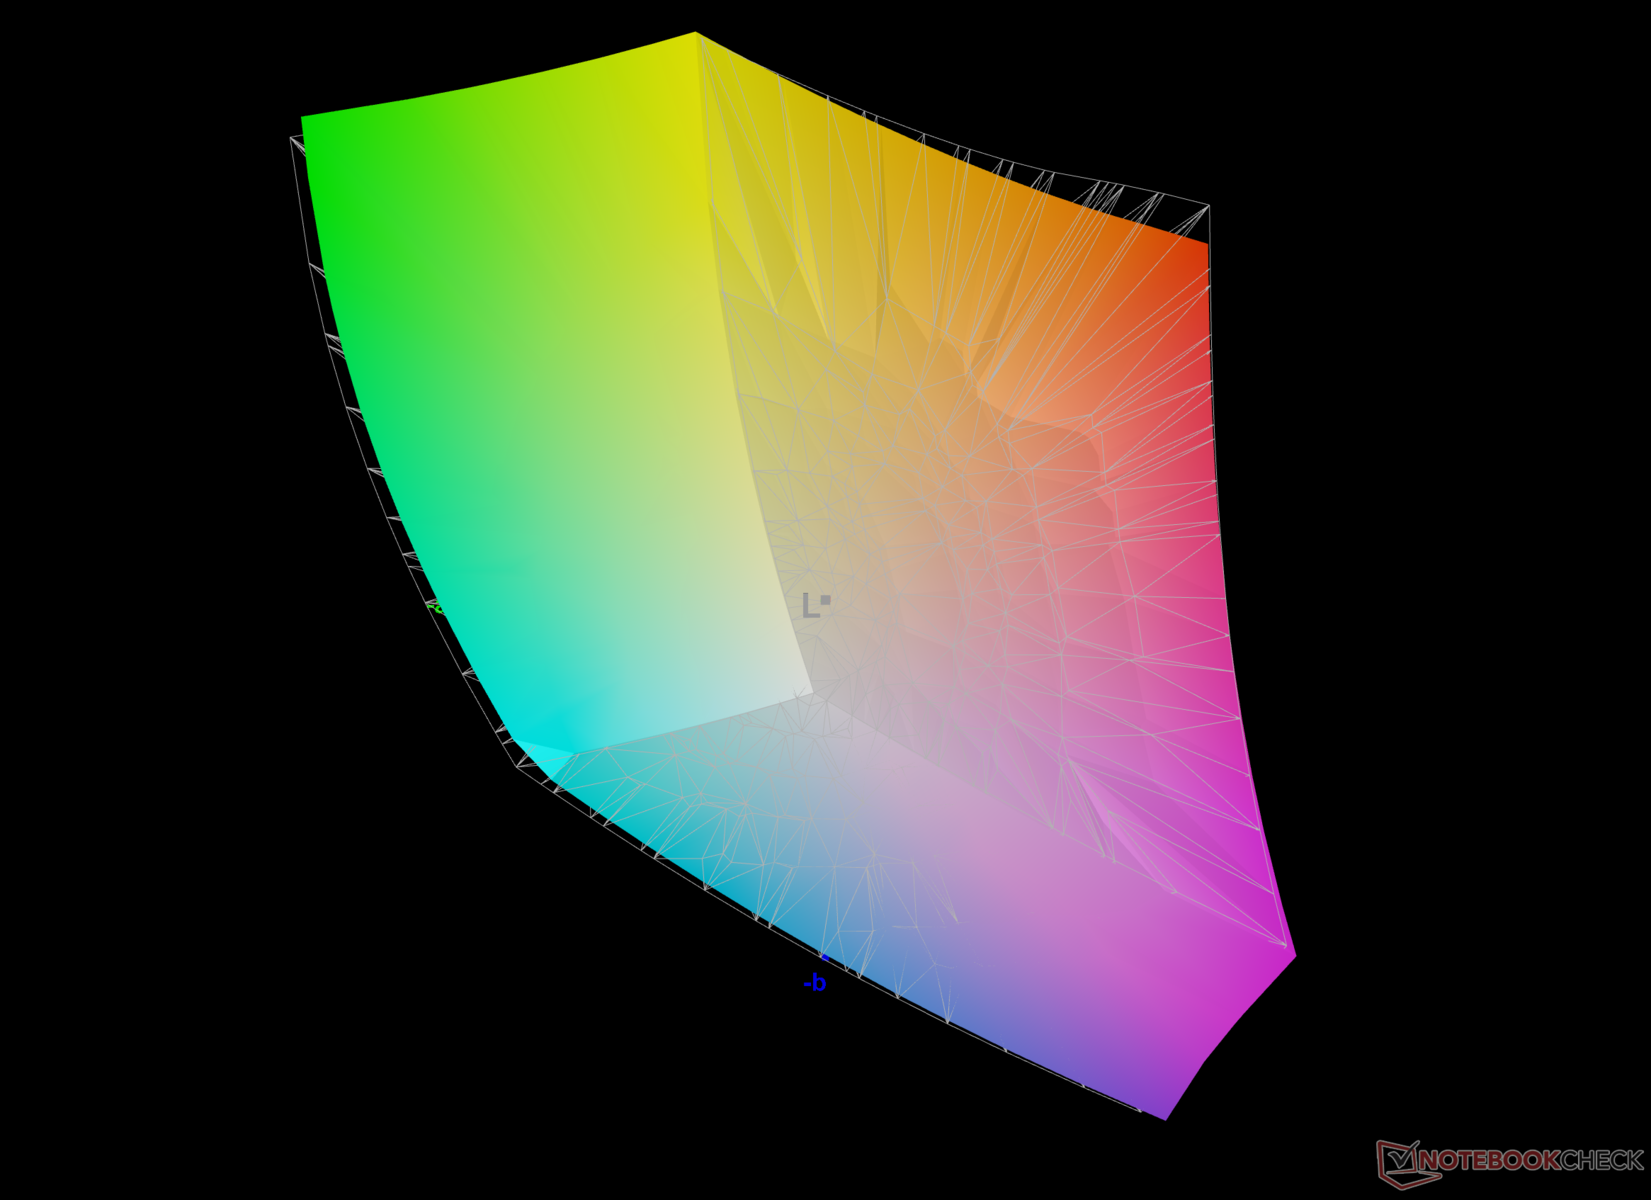
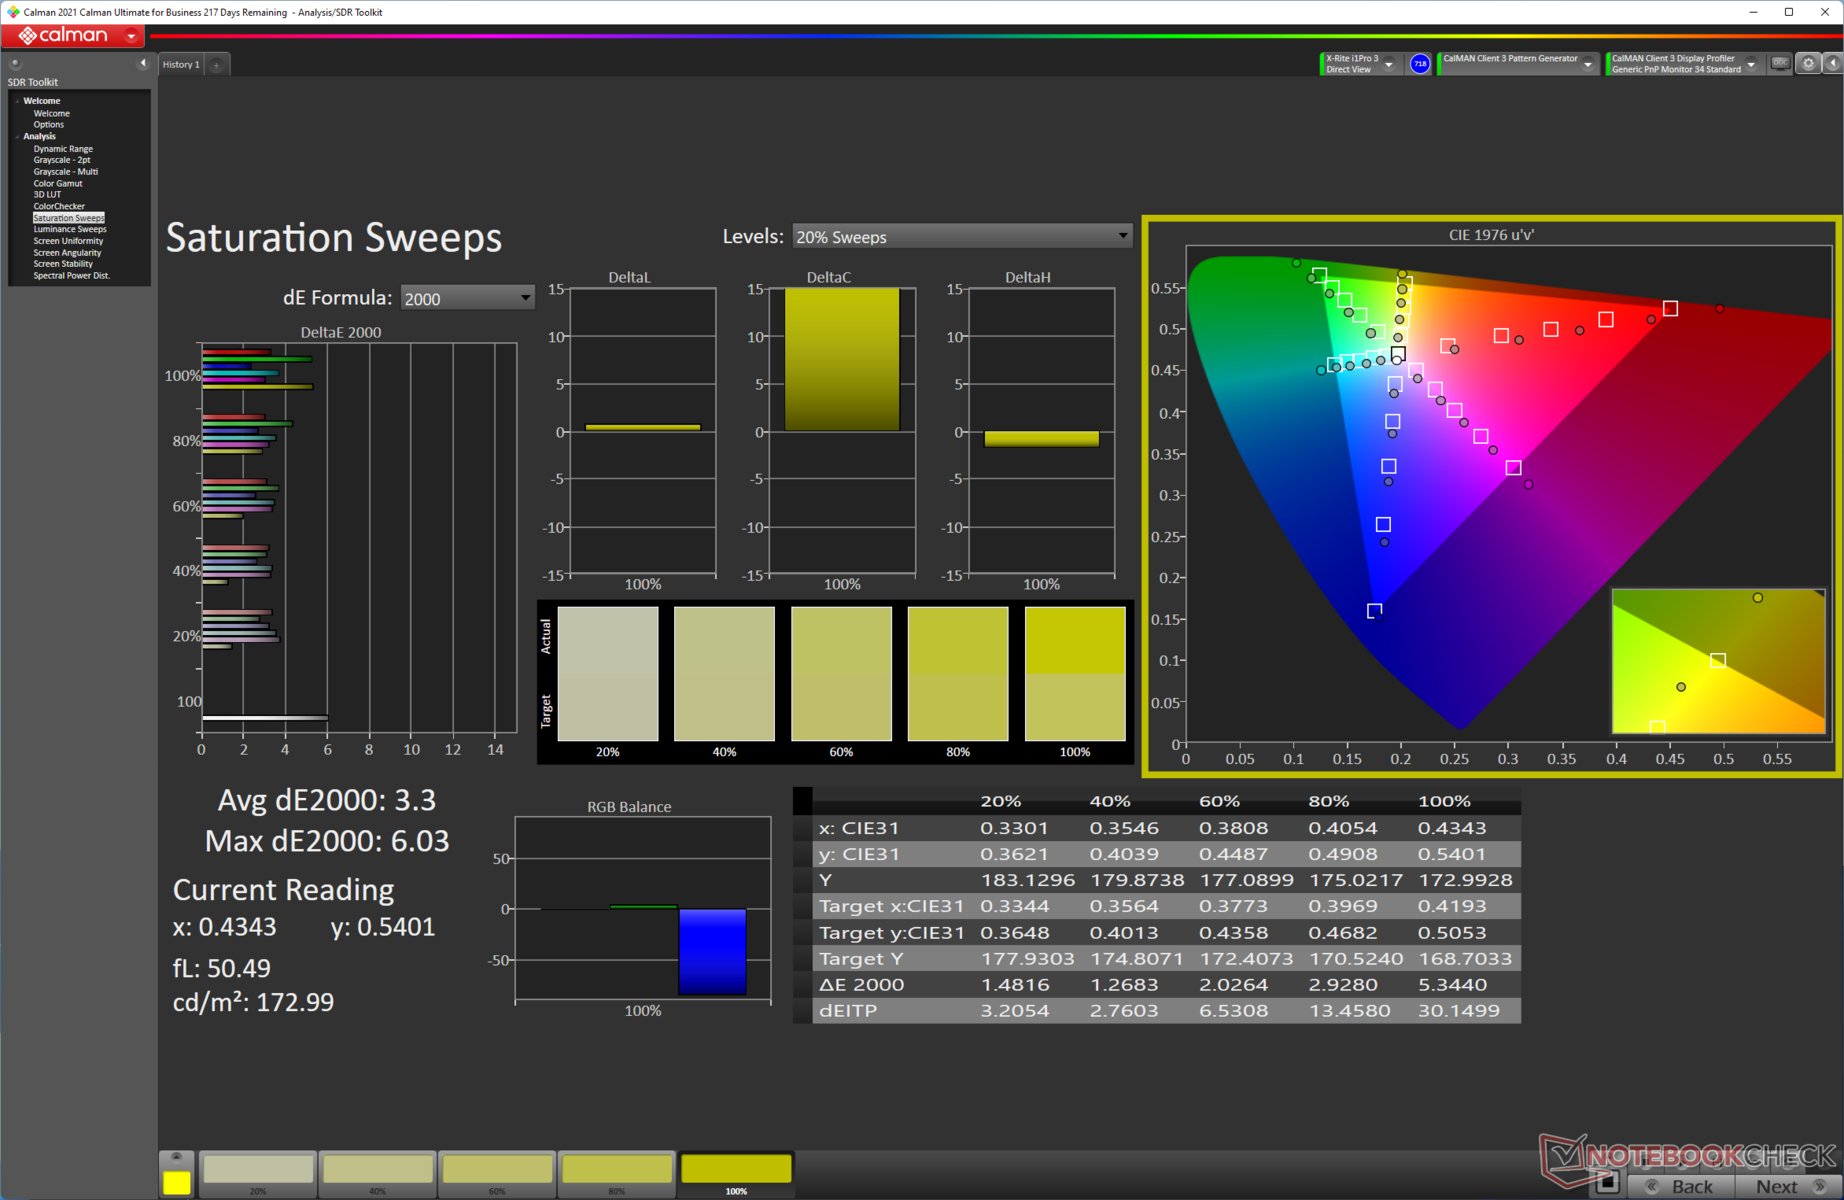
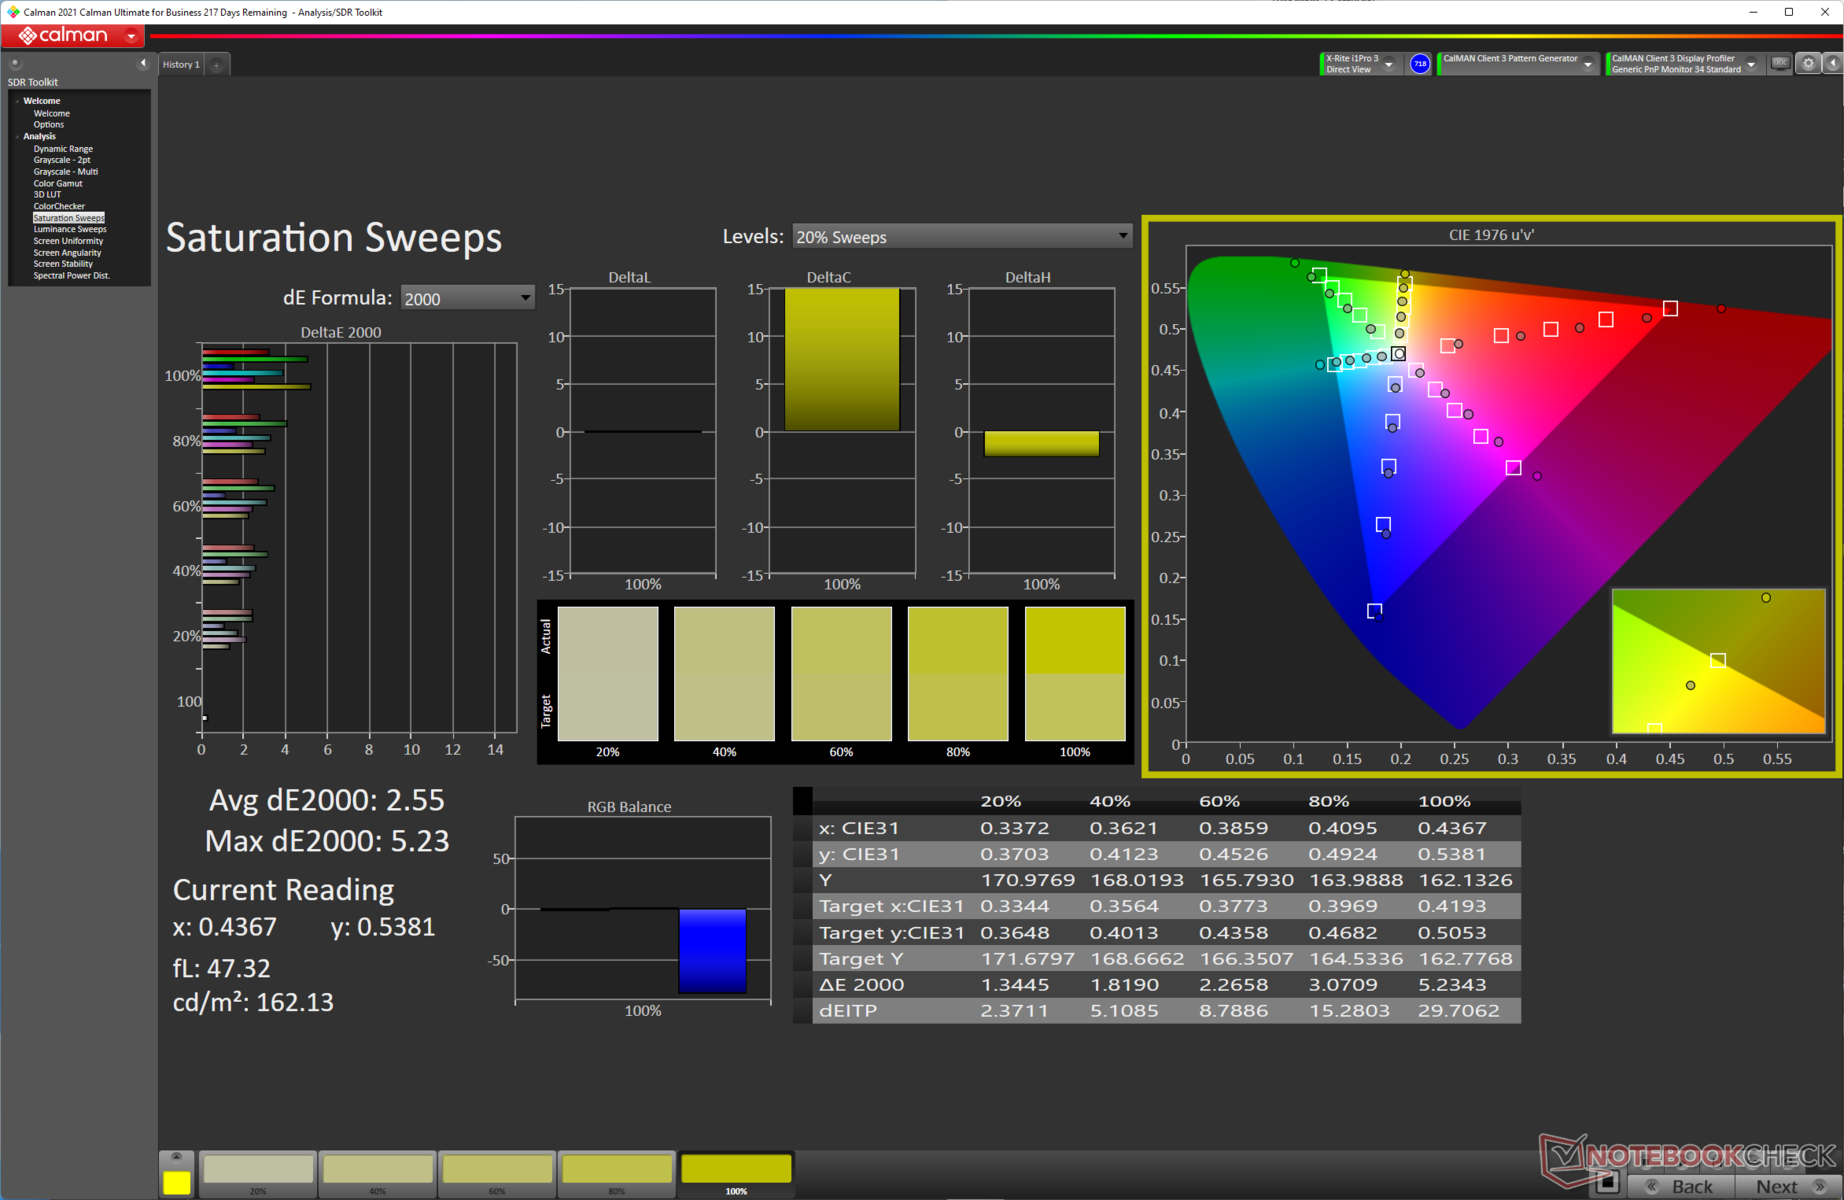
The ROG Strix Scar 15's display performs very well for a gaming laptop when it comes to color gamut coverage. The panel covers the complete sRGB spectrum and almost all of DCI-P3. AdobeRGB coverage is good too at nearly 85%, making the Scar 15's display quite amenable to professional photo and video editing workflows.
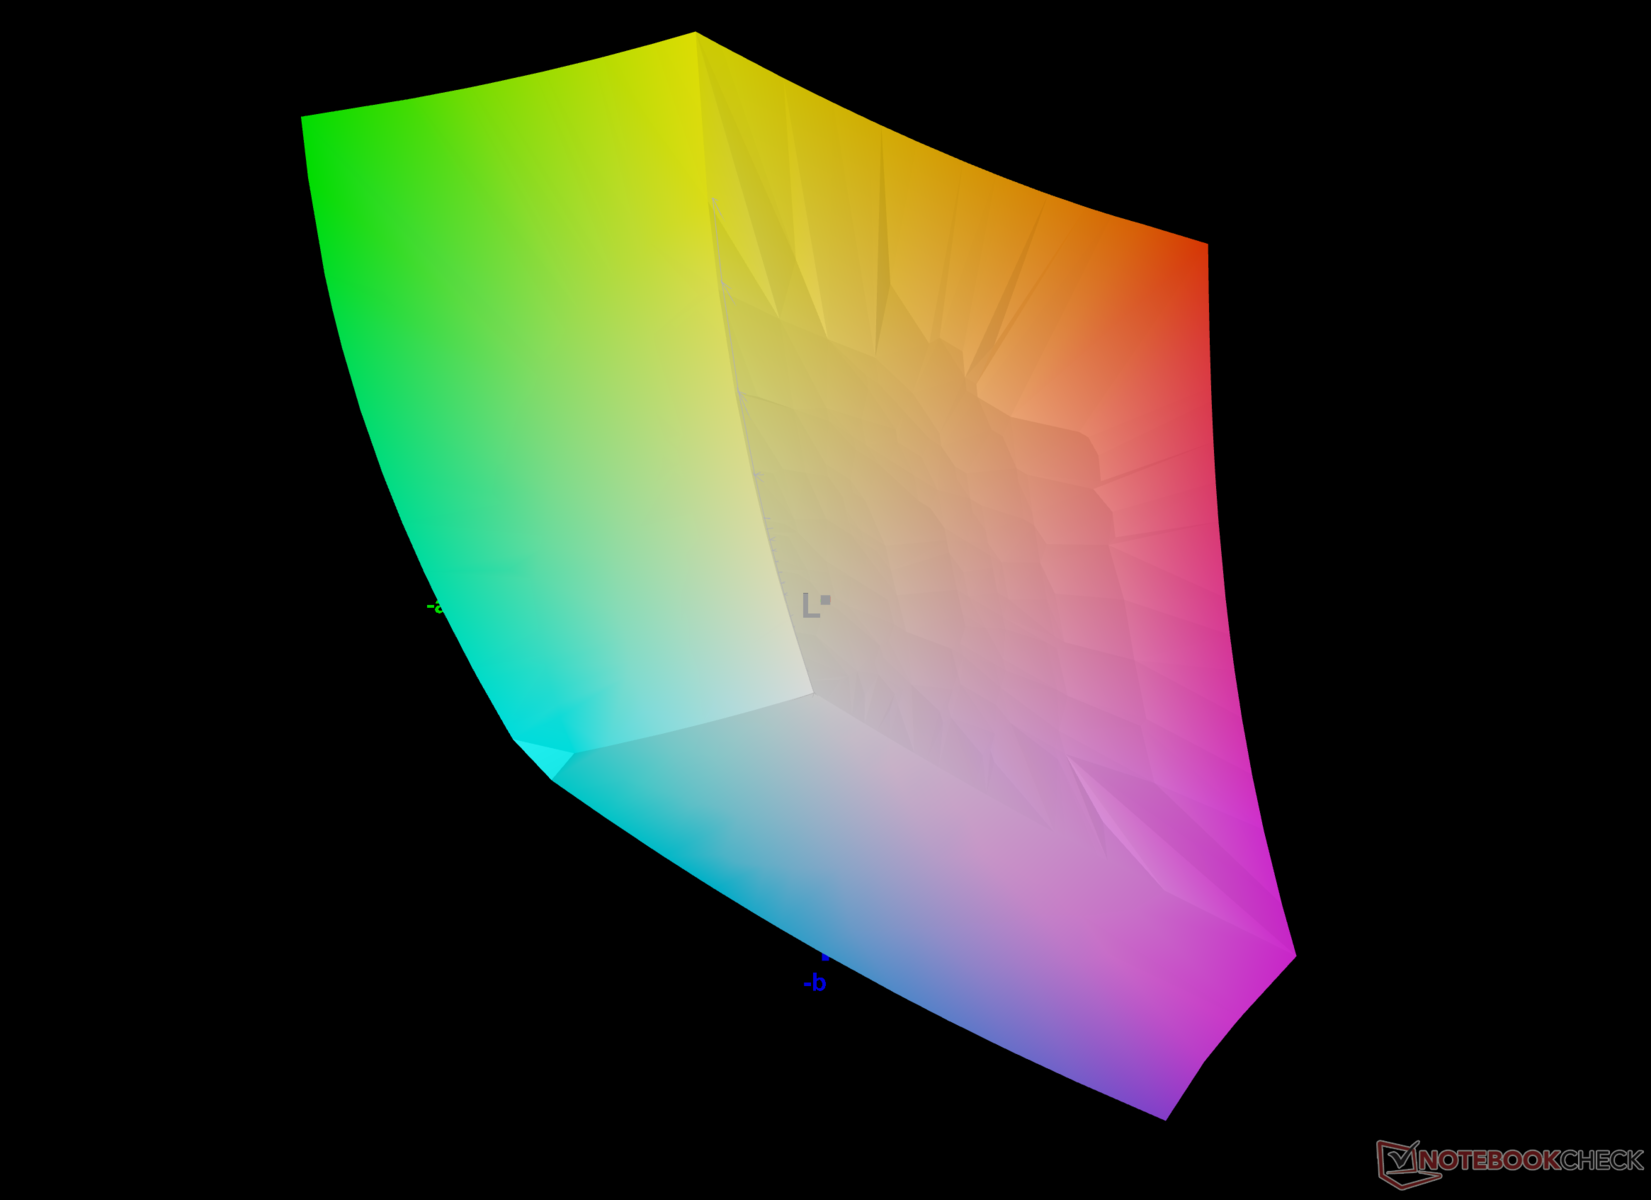
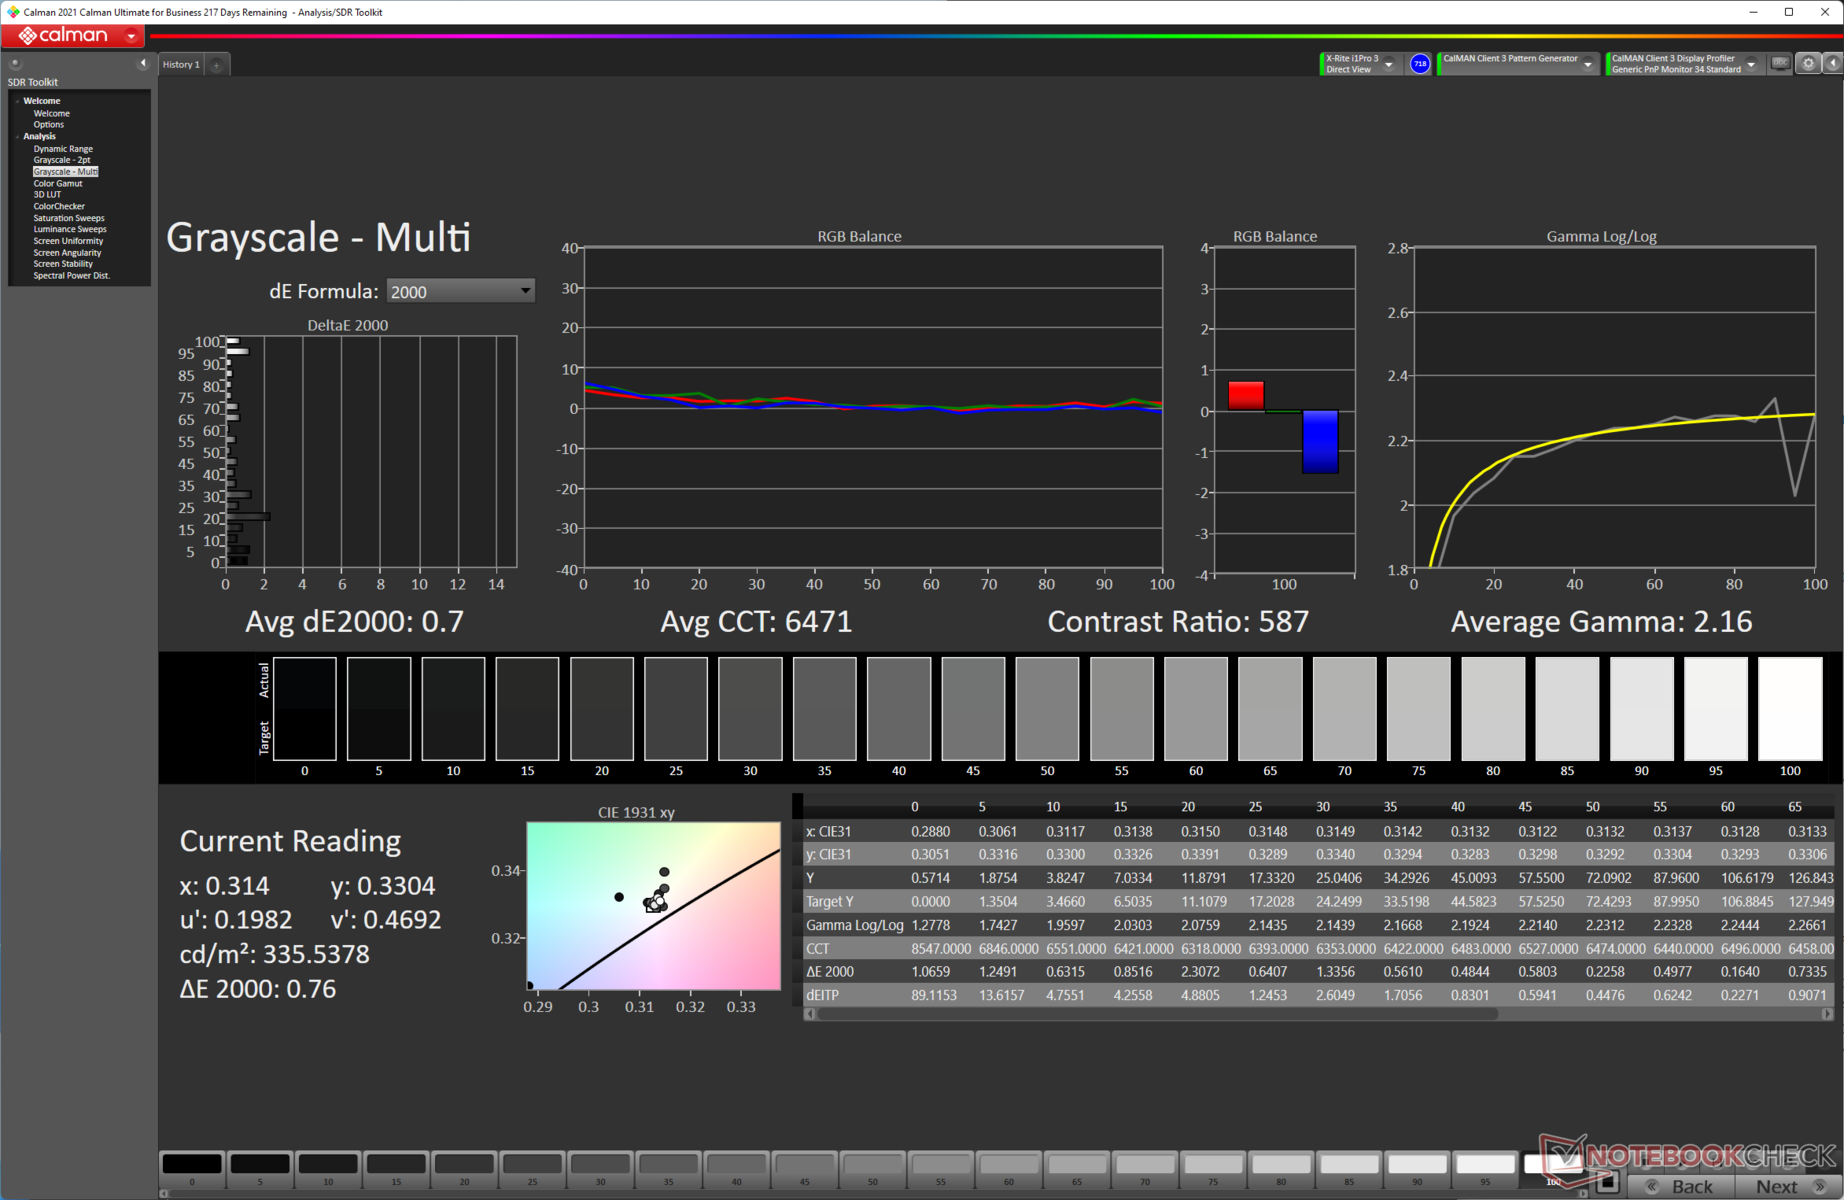
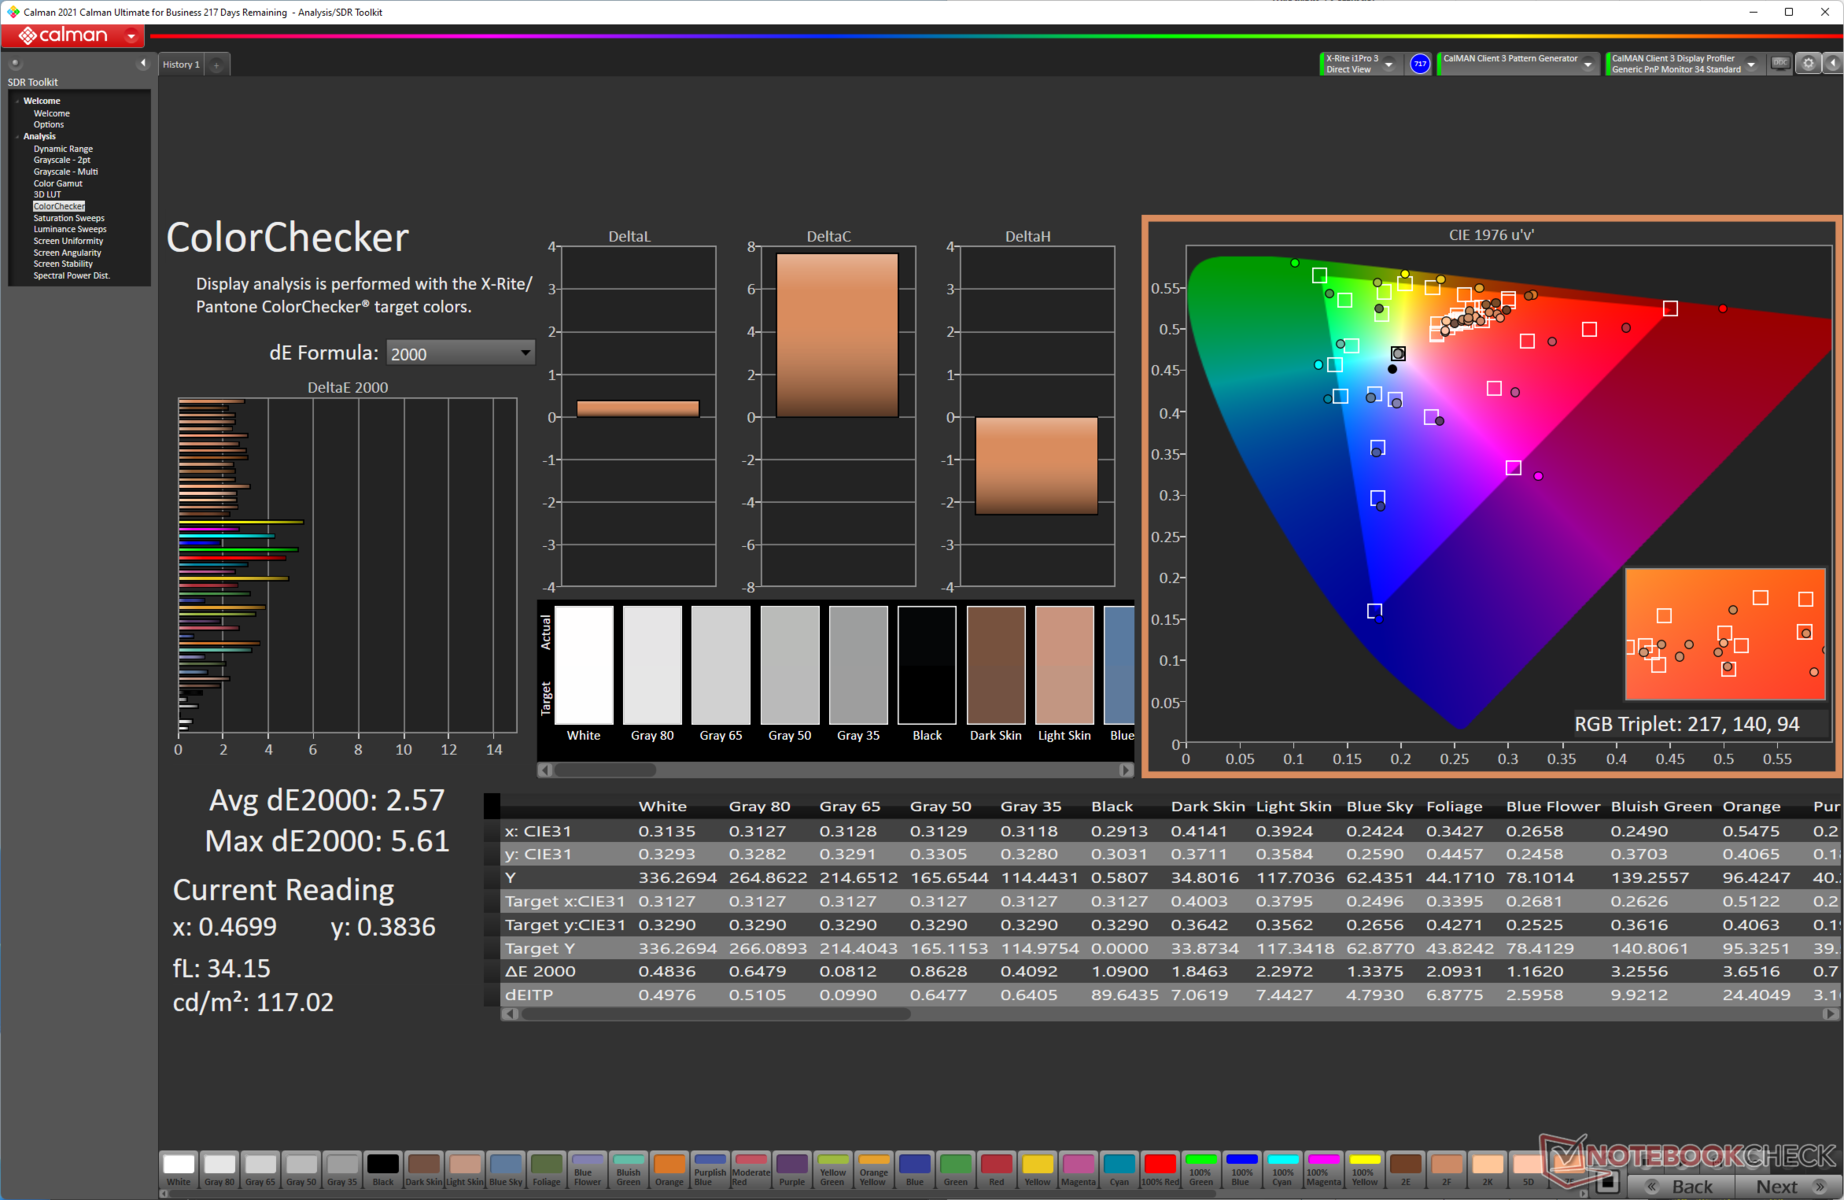
Color calibration out-of-the-box is already quite good with an average Delta E of 2.9 in Grayscale and 3.06 in ColorChecker Our calibration routine helps in further reducing the average Grayscale Delta E to 0.7 and the ColorChecker Delta E to 2.57. Higher deviations are seen in the red and blue parts of the color spectrum.
Our calibrated ICC file can be downloaded from the link above.

The BOE CQ NE156QHM-NZ2 panel seems to offer much improved response times than last year's variant, which should please gamers. We measured a combined 100% black to 100% white response time of 7.5 ms and a combined 50% grey to 80% grey response time of 4.21 ms.
Asus enables overdrive mode by default, which is reflected in the "horn" signal seen in the 50% grey to 80% grey data. Panel overdrive can be disabled in the Armory Crate app. This increases the grey-to-grey response times to 7.86 ms.
We did not observe any PWM or screen flickering across all brightness levels, so long-term use of this display should not cause any eye fatigue.
For more information, refer to our article "Why Pulse Width Modulation (PWM) is such a headache", and also check out our PWM ranking table for PWM frequency comparison across all reviewed devices.
Display Response Times
| ↔ Response Time Black to White | ||
|---|---|---|
| 7.5 ms ... rise ↗ and fall ↘ combined | ↗ 3.89 ms rise | 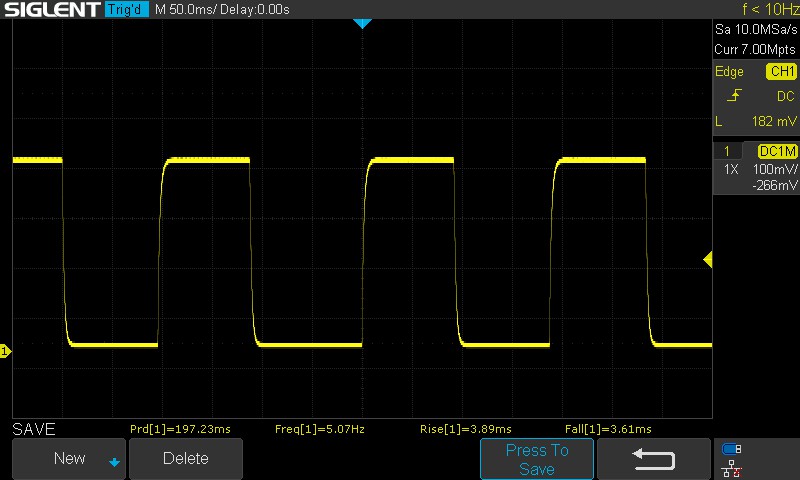 |
| ↘ 3.61 ms fall | ||
| The screen shows very fast response rates in our tests and should be very well suited for fast-paced gaming. In comparison, all tested devices range from 0.1 (minimum) to 240 (maximum) ms. » 22 % of all devices are better. This means that the measured response time is better than the average of all tested devices (19.8 ms). | ||
| ↔ Response Time 50% Grey to 80% Grey | ||
| 4.21 ms ... rise ↗ and fall ↘ combined | ↗ 1.98 ms rise | 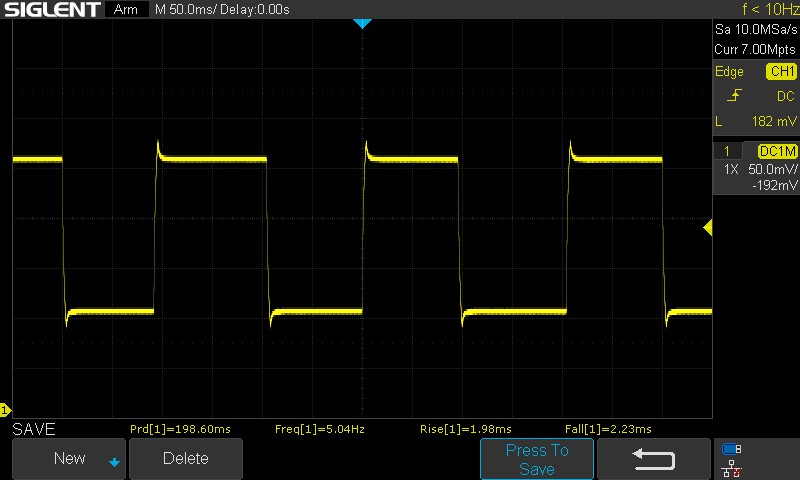 |
| ↘ 2.23 ms fall | ||
| The screen shows very fast response rates in our tests and should be very well suited for fast-paced gaming. In comparison, all tested devices range from 0.165 (minimum) to 636 (maximum) ms. » 16 % of all devices are better. This means that the measured response time is better than the average of all tested devices (31 ms). | ||
| ↔ Response Time 50% Grey to 80% Grey | ||
| 7.86 ms ... rise ↗ and fall ↘ combined | ↗ 4.02 ms rise | 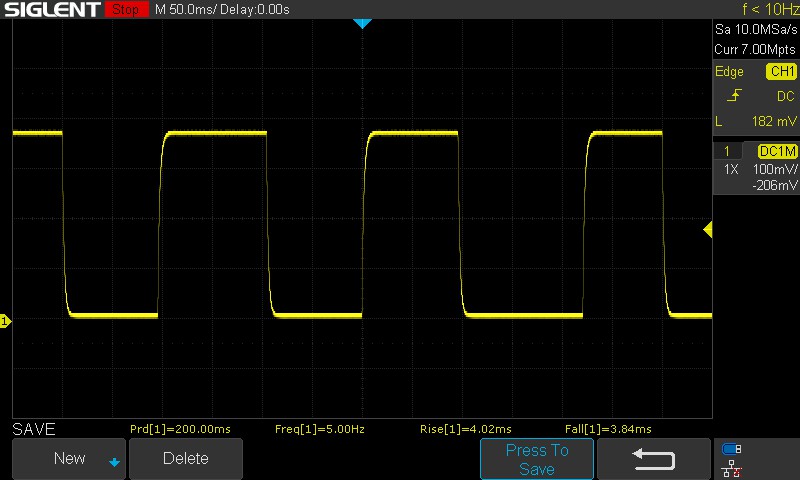 |
| ↘ 3.84 ms fall | ||
| The screen shows very fast response rates in our tests and should be very well suited for fast-paced gaming. In comparison, all tested devices range from 0.165 (minimum) to 636 (maximum) ms. » 21 % of all devices are better. This means that the measured response time is better than the average of all tested devices (31 ms). | ||
Screen Flickering / PWM (Pulse-Width Modulation)
| Screen flickering / PWM not detected | 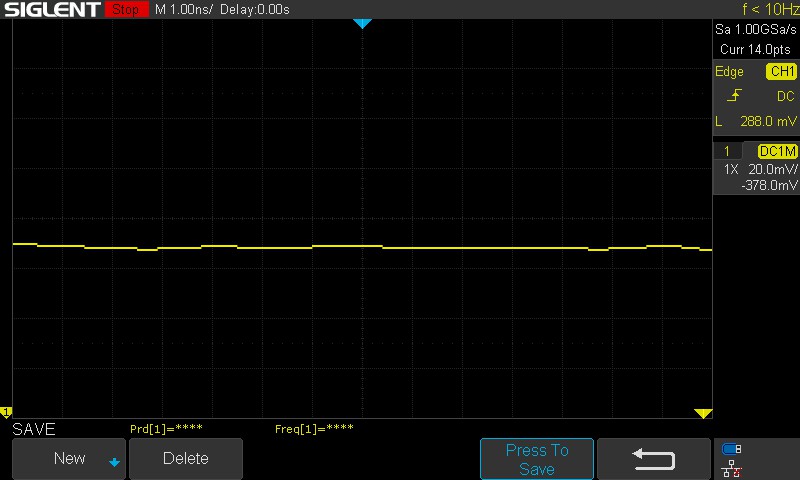 | ||
In comparison: 52 % of all tested devices do not use PWM to dim the display. If PWM was detected, an average of 7754 (minimum: 5 - maximum: 343500) Hz was measured. | |||
Outdoor viewing is decent as long as there is no harsh sunlight falling on the display. Viewing angles are wide, but we observe loss of brightness and color information when viewed from extreme angles.


Performance: Core i9-12900H gets wings at 135 W
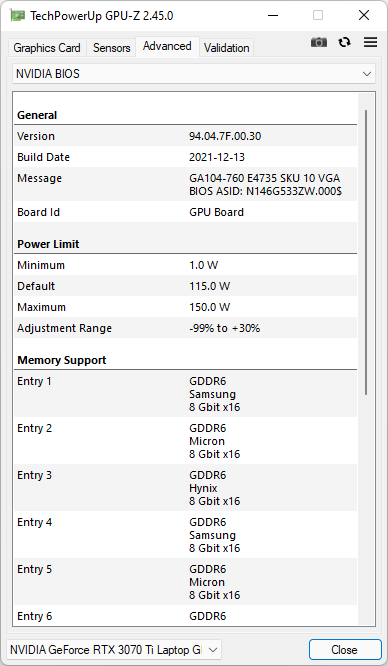
Asus has equipped our test ROG Strix Scar 15 unit with an Intel Core i9-12900H CPU and a 150 W Nvidia GeForce RTX 3070 Ti Laptop GPU.
Apparently, the Core i9-12900H with a liquid metal thermal interface material (TIM) is the de facto processor option on all 2022 Scar 15 SKUs, at least in India. GPU options, however, range from the 140 W RTX 3060 to the 150 W RTX 3080 Ti.
Testing Conditions
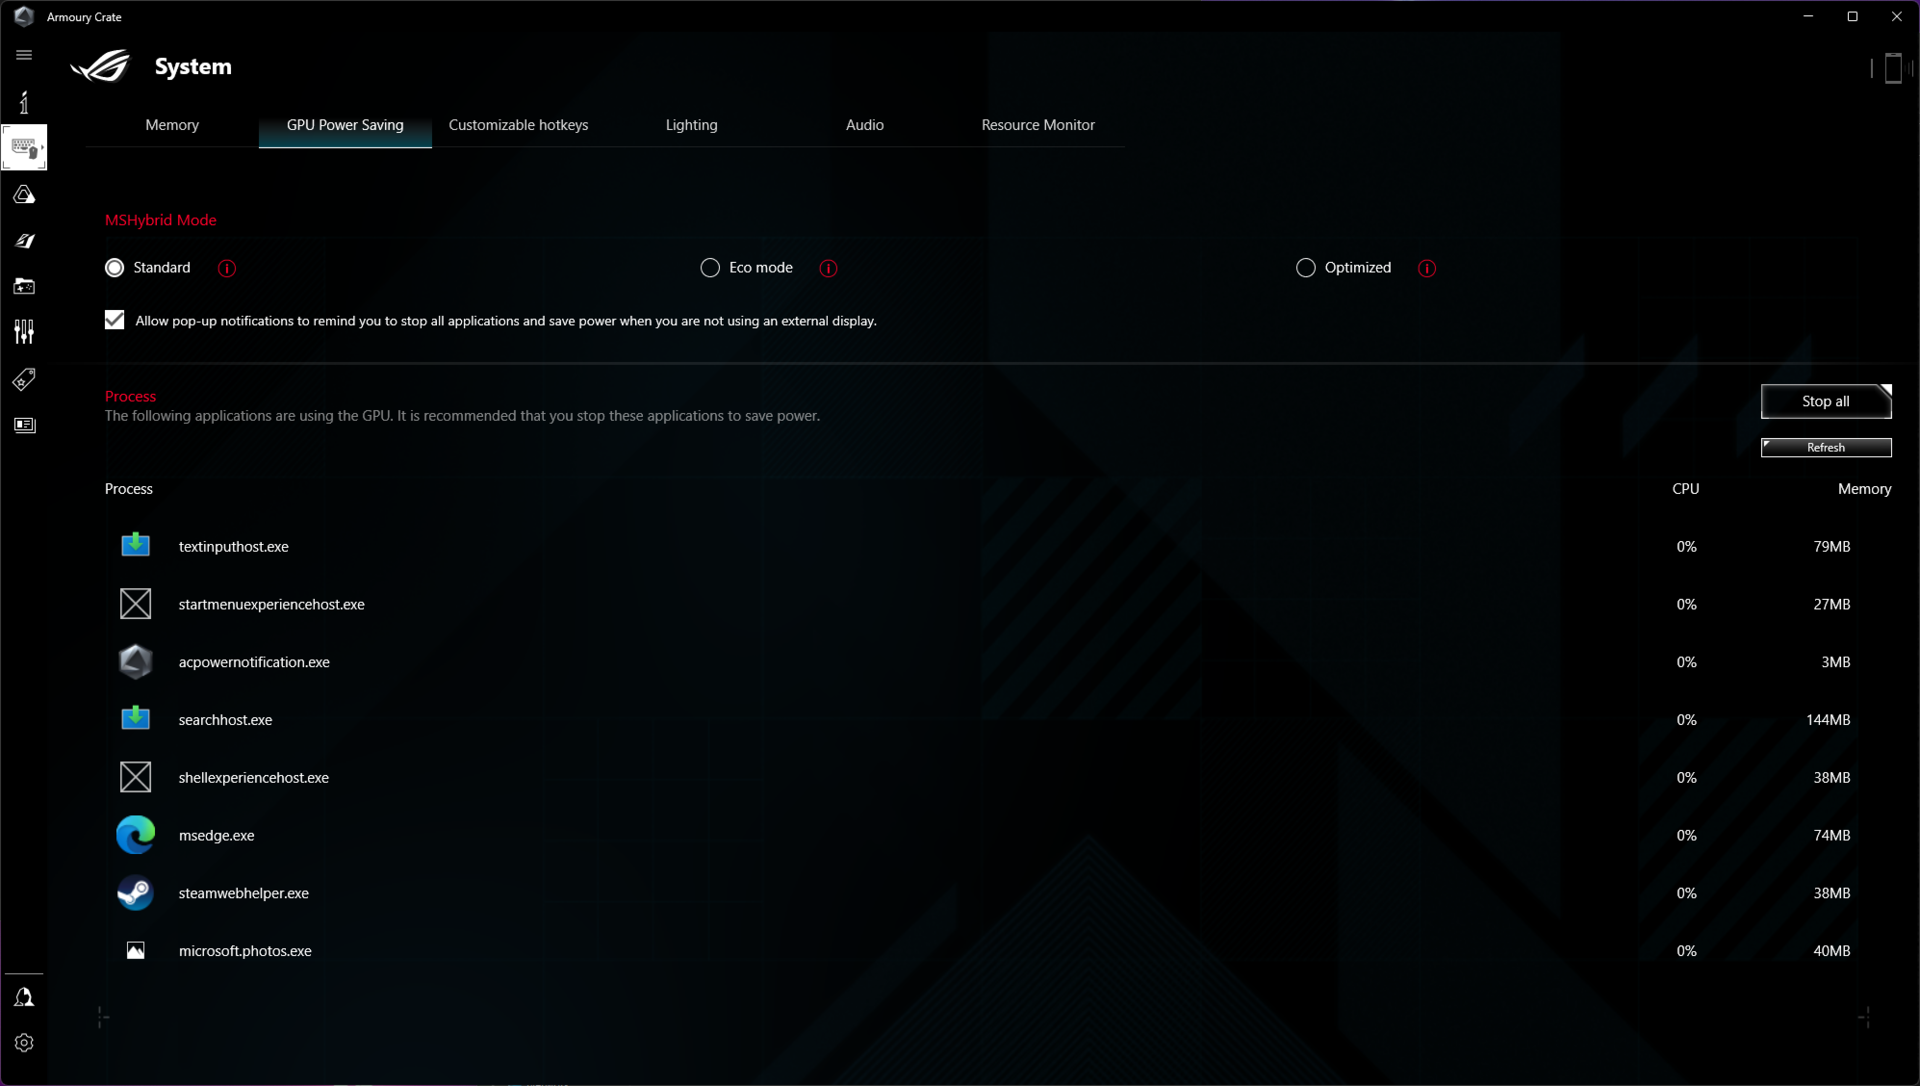
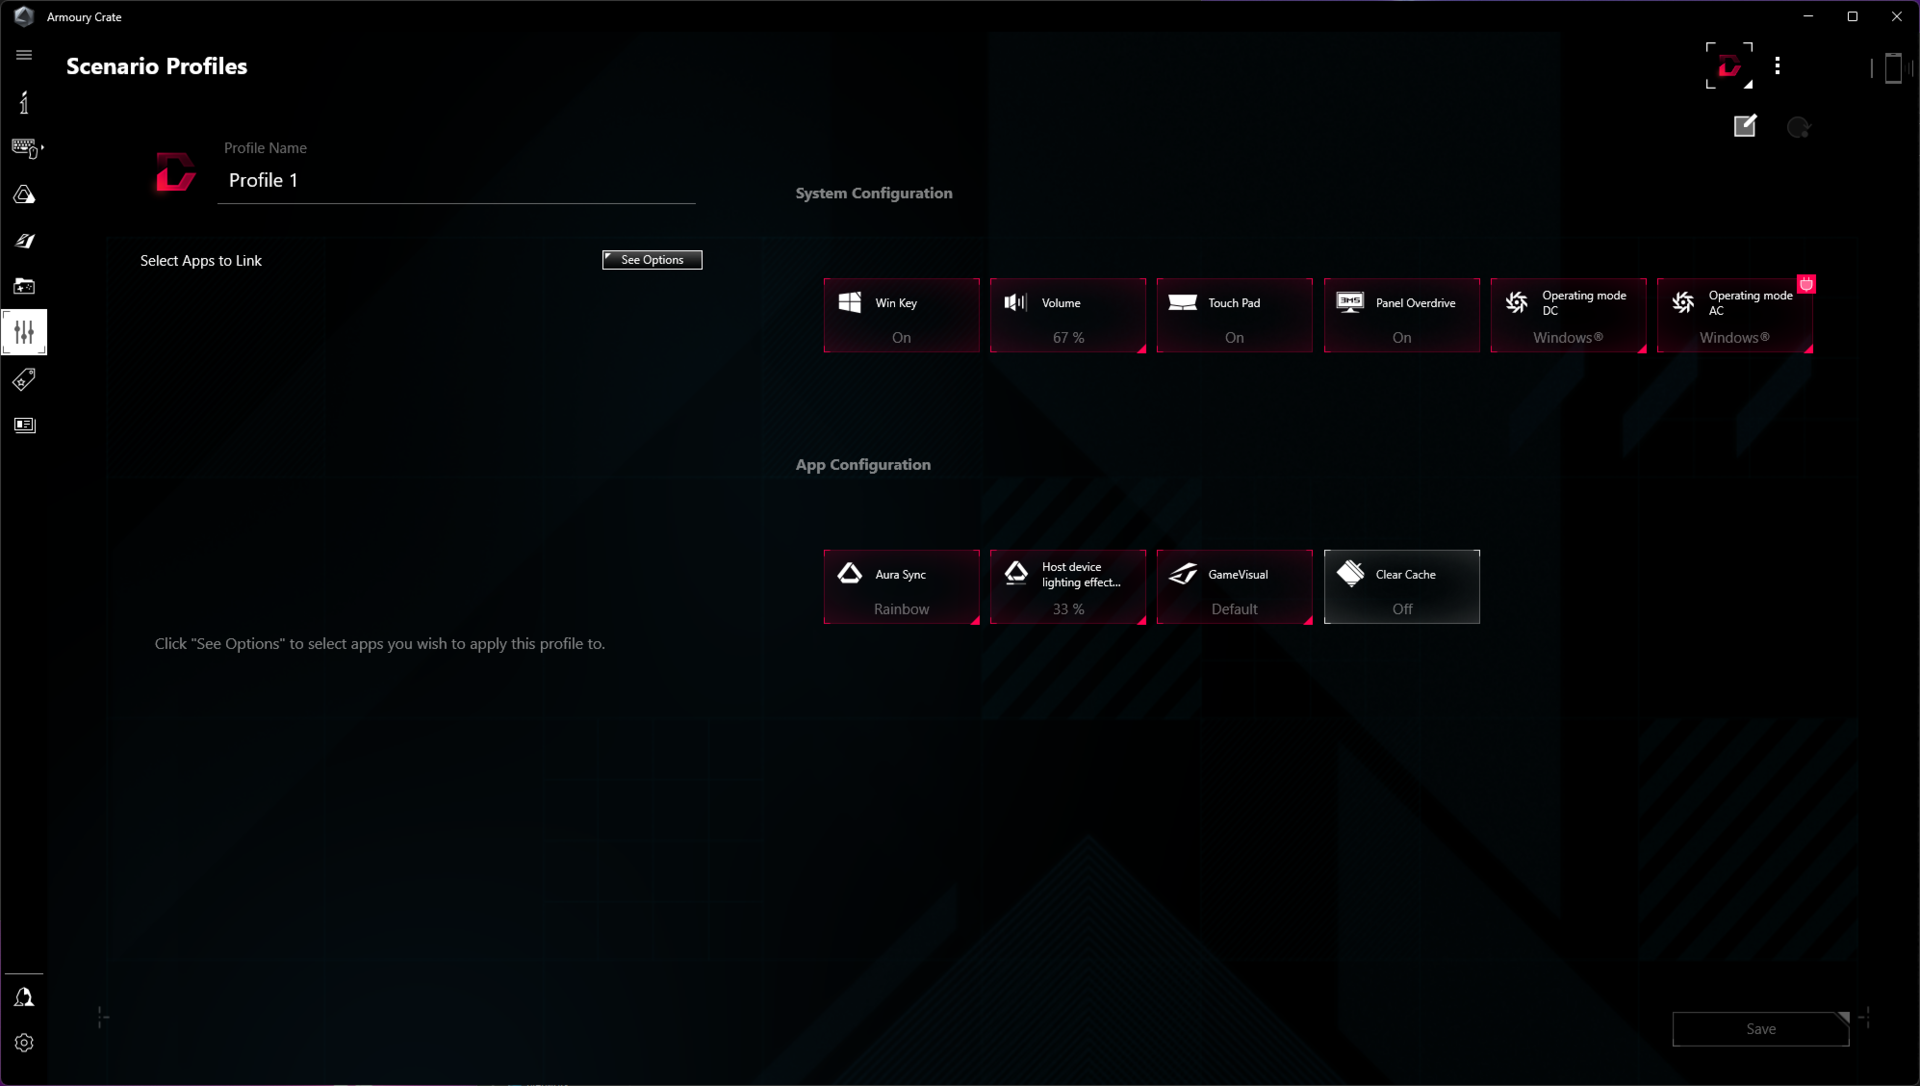
The Armory Crate app allows the selection of one of the three primary performance modes — Silent, Performance, and Turbo. You can also tune clock and fan settings manually in the Manual mode or simply let Windows power profiles take over with the Windows mode.
For the GPU, Asus allows choosing between the default MSHybrid mode and a MUX mode. The MUX switch allows routing the dGPU signal directly to the internal display bypassing the iGPU. This can afford a slight performance benefit, which we shall see in the GPU Performance section. However, for the sake of comparison, we used the standard MSHybrid mode as this is the default configuration.

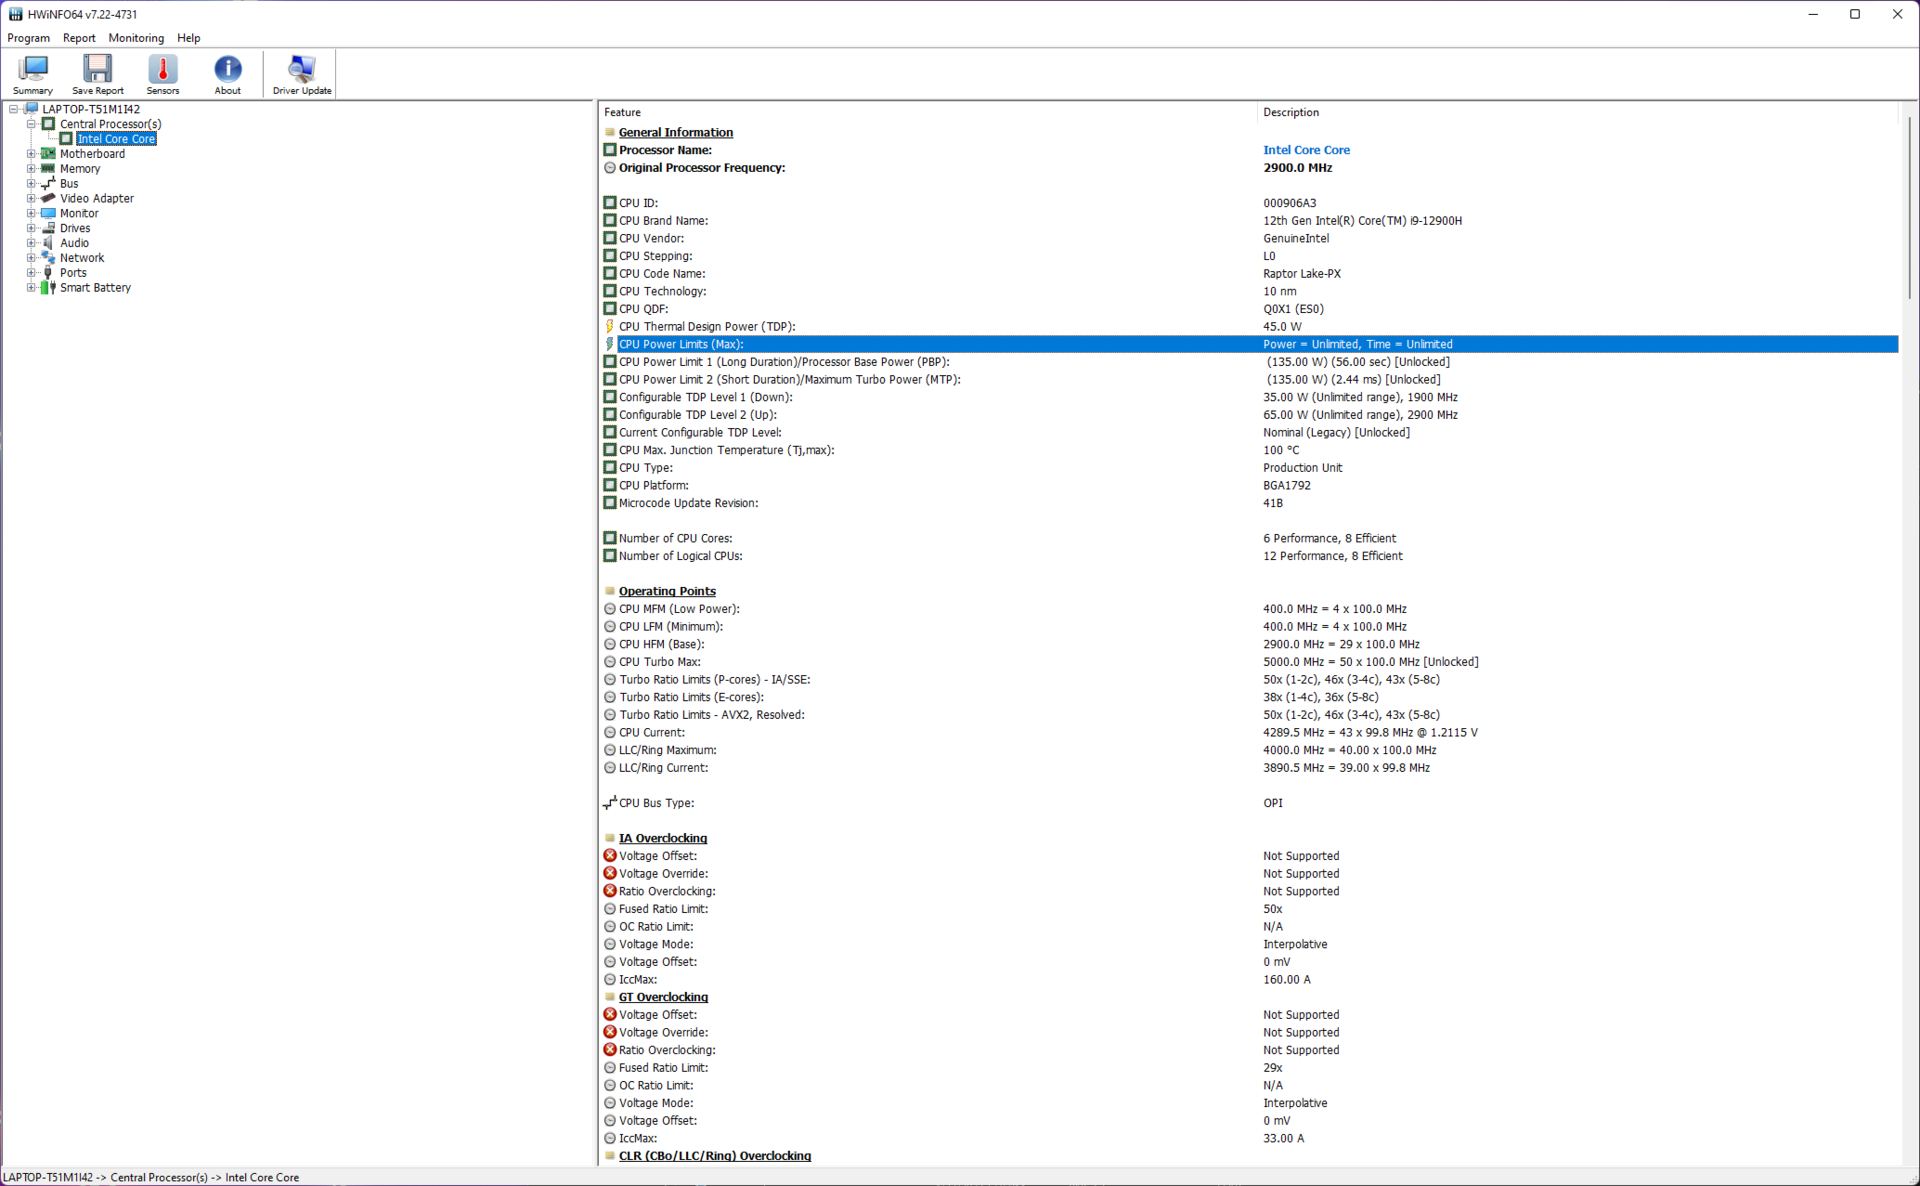
The table below illustrates how the PL1 and PL2 values change with each chosen power profile. We recommend going with the Turbo profile for heavy workloads and gaming if high fan noise levels are no issue.
| Performance Mode | PL1 / Tau | PL2 / Tau |
|---|---|---|
| Silent | 45 W / 56 s | 70 W / 2.44 ms |
| Performance | 80 W / 56 s | 90 W / 2.44 ms |
| Turbo | 135 W / 56 s | 135 W / 2.44 ms |
For our testing, we chose the Turbo mode as it allows the Core i9-12900H to fully flex its muscles with an unlocked 135 W PL1/PL2. Comparative data between various performance modes are provided wherever applicable.
Processor

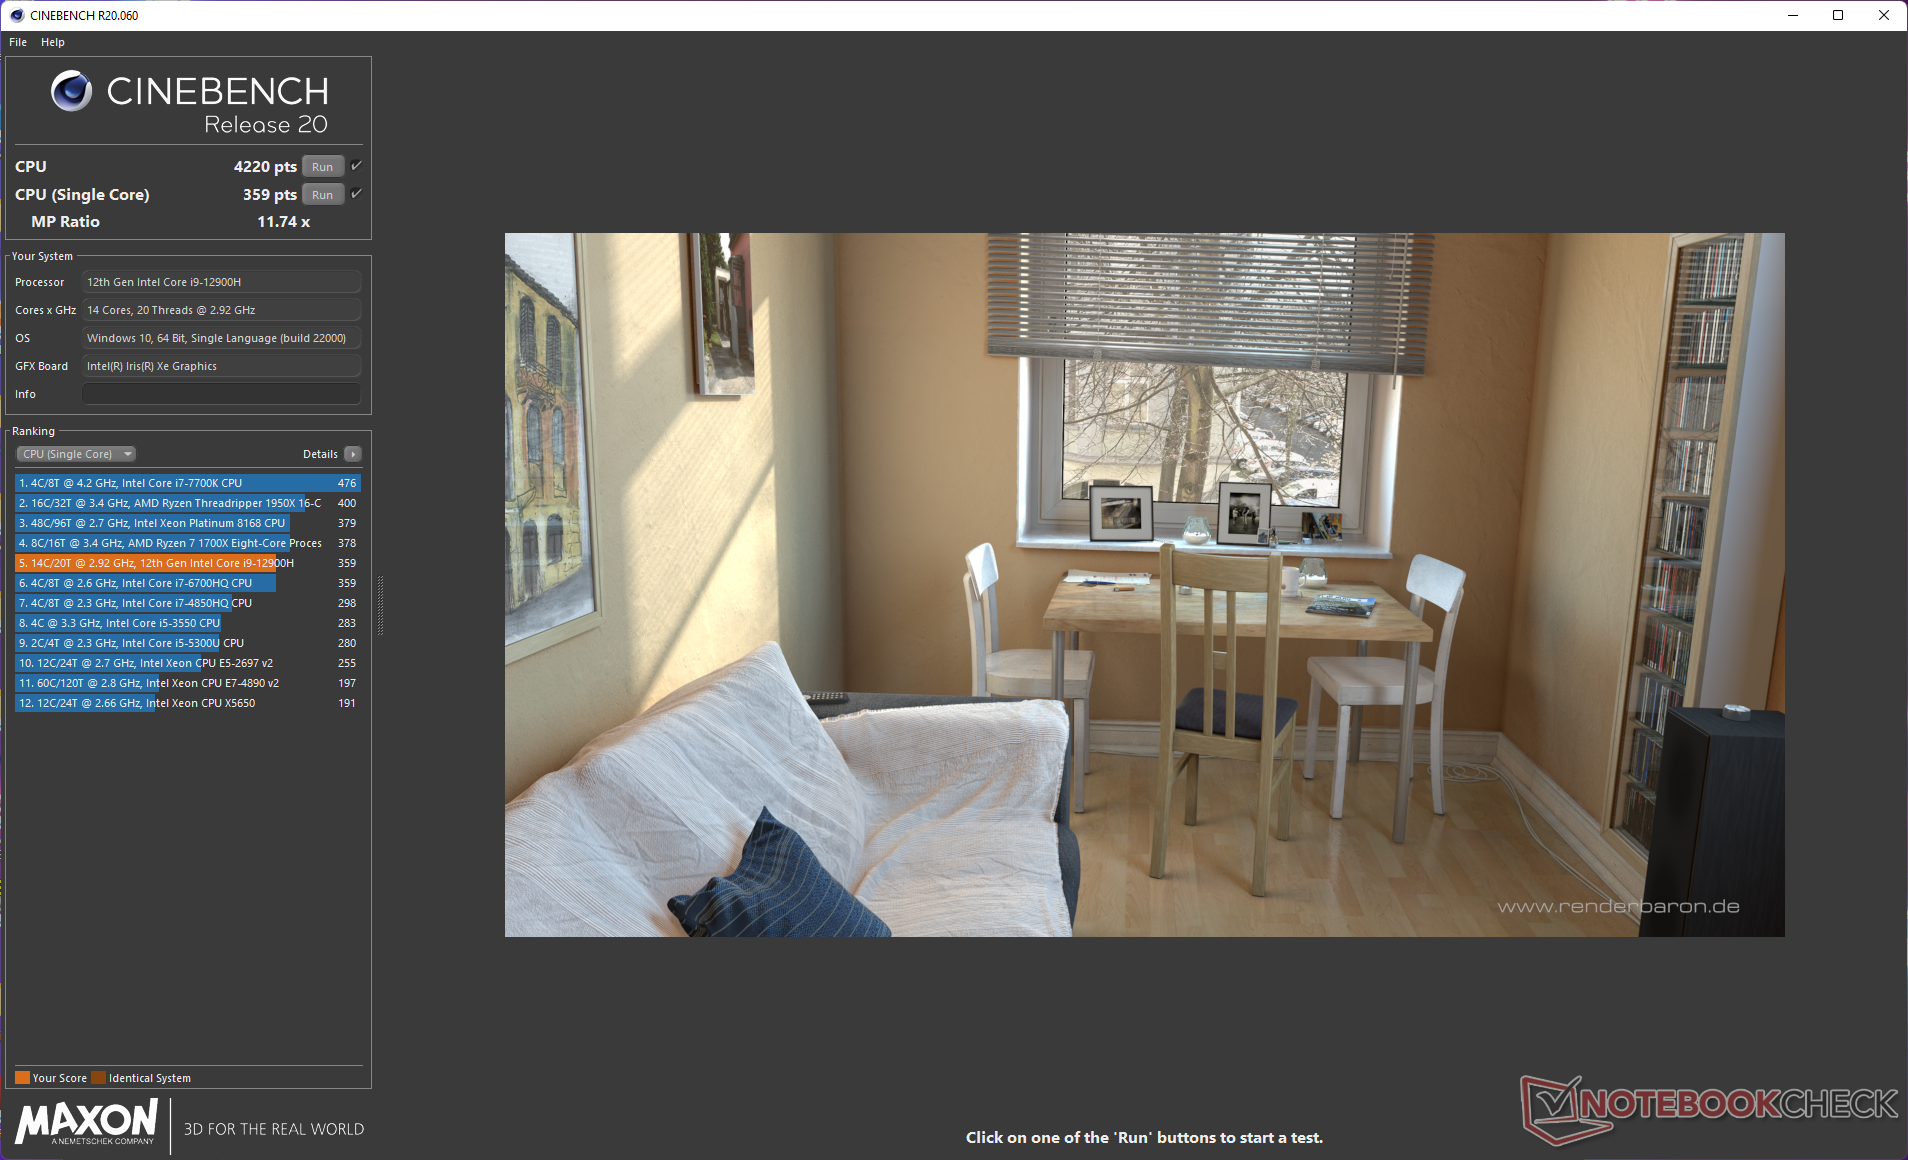
The Core i9-12900H is a 12th gen Alder Lake part with 14 cores (6P+8E) and 20 threads. Asus's implementation of a robust cooling system ensures that the Core i9-12900H is able to offer sustained performance without much throttling in the Cinebench R15 multi-core loop test.
Interestingly, we observe the Core i7-12700H in the Lenovo Legion 5i Pro 16 G7 to offer a slightly higher multi-core performance across the board. However, the Core i9-12900H does have the edge in single-core loads.
Cinebench R15 Multi Loop
The Core i9-12900H also seems to have a slight advantage over the Core i9-12900HK in the MSI Raider GE66 12UHS, but ties with the multiplier-unlocked Alder Lake chip in the Gigabyte Aero 16 YE5 in single-core Cinebench tests.
On battery, the ROG Strix Scar 15 switches to the Silent power plan. This results in a massive 40% reduction in multi-core performance and a 50% drop in single-core numbers in Cinebench R20.
Cinebench R23: Multi Core | Single Core
Cinebench R20: CPU (Multi Core) | CPU (Single Core)
Cinebench R15: CPU Multi 64Bit | CPU Single 64Bit
Blender: v2.79 BMW27 CPU
7-Zip 18.03: 7z b 4 | 7z b 4 -mmt1
Geekbench 5.5: Multi-Core | Single-Core
HWBOT x265 Benchmark v2.2: 4k Preset
LibreOffice : 20 Documents To PDF
R Benchmark 2.5: Overall mean
| CPU Performance rating | |
| Average of class Gaming | |
| Asus ROG Strix Scar 15 G533ZW-LN106WS | |
| Gigabyte Aero 16 YE5 | |
| Lenovo Legion 5 Pro 16 G7 i7 RTX 3070Ti | |
| MSI Pulse GL66 12UEK | |
| MSI Raider GE66 12UHS | |
| MSI Vector GP66 12UGS | |
| HP Omen 16-b1090ng | |
| Average Intel Core i9-12900H | |
| Razer Blade 15 2022 | |
| Razer Blade 14 Ryzen 9 6900HX | |
| Asus ROG Zephyrus G14 GA402RK | |
| Cinebench R23 / Multi Core | |
| Average of class Gaming (10488 - 42661, n=107, last 2 years) | |
| Lenovo Legion 5 Pro 16 G7 i7 RTX 3070Ti | |
| Asus ROG Strix Scar 15 G533ZW-LN106WS | |
| Gigabyte Aero 16 YE5 | |
| MSI Pulse GL66 12UEK | |
| MSI Vector GP66 12UGS | |
| MSI Raider GE66 12UHS | |
| HP Omen 16-b1090ng | |
| Average Intel Core i9-12900H (7359 - 19648, n=28) | |
| Razer Blade 15 2022 | |
| Razer Blade 14 Ryzen 9 6900HX | |
| Asus ROG Zephyrus G14 GA402RK | |
| Cinebench R23 / Single Core | |
| Average of class Gaming (1166 - 2415, n=107, last 2 years) | |
| Gigabyte Aero 16 YE5 | |
| Asus ROG Strix Scar 15 G533ZW-LN106WS | |
| MSI Pulse GL66 12UEK | |
| MSI Vector GP66 12UGS | |
| MSI Raider GE66 12UHS | |
| Average Intel Core i9-12900H (1634 - 1930, n=28) | |
| Lenovo Legion 5 Pro 16 G7 i7 RTX 3070Ti | |
| HP Omen 16-b1090ng | |
| Razer Blade 15 2022 | |
| Asus ROG Zephyrus G14 GA402RK | |
| Razer Blade 14 Ryzen 9 6900HX | |
| Cinebench R20 / CPU (Multi Core) | |
| Average of class Gaming (4029 - 16433, n=106, last 2 years) | |
| Lenovo Legion 5 Pro 16 G7 i7 RTX 3070Ti | |
| Asus ROG Strix Scar 15 G533ZW-LN106WS | |
| Gigabyte Aero 16 YE5 | |
| MSI Pulse GL66 12UEK | |
| MSI Vector GP66 12UGS | |
| MSI Raider GE66 12UHS | |
| HP Omen 16-b1090ng | |
| Razer Blade 15 2022 | |
| Average Intel Core i9-12900H (2681 - 7471, n=28) | |
| Razer Blade 14 Ryzen 9 6900HX | |
| Asus ROG Zephyrus G14 GA402RK | |
| Cinebench R20 / CPU (Single Core) | |
| Average of class Gaming (442 - 913, n=106, last 2 years) | |
| MSI Pulse GL66 12UEK | |
| MSI Vector GP66 12UGS | |
| Asus ROG Strix Scar 15 G533ZW-LN106WS | |
| MSI Raider GE66 12UHS | |
| Average Intel Core i9-12900H (624 - 738, n=28) | |
| Lenovo Legion 5 Pro 16 G7 i7 RTX 3070Ti | |
| HP Omen 16-b1090ng | |
| Razer Blade 15 2022 | |
| Gigabyte Aero 16 YE5 | |
| Asus ROG Zephyrus G14 GA402RK | |
| Razer Blade 14 Ryzen 9 6900HX | |
| Cinebench R15 / CPU Multi 64Bit | |
| Average of class Gaming (1578 - 6330, n=105, last 2 years) | |
| Asus ROG Strix Scar 15 G533ZW-LN106WS | |
| Lenovo Legion 5 Pro 16 G7 i7 RTX 3070Ti | |
| HP Omen 16-b1090ng | |
| Gigabyte Aero 16 YE5 | |
| MSI Pulse GL66 12UEK | |
| MSI Raider GE66 12UHS | |
| Average Intel Core i9-12900H (1395 - 3077, n=28) | |
| MSI Vector GP66 12UGS | |
| Razer Blade 14 Ryzen 9 6900HX | |
| Razer Blade 15 2022 | |
| Asus ROG Zephyrus G14 GA402RK | |
| Cinebench R15 / CPU Single 64Bit | |
| Average of class Gaming (188.8 - 350, n=106, last 2 years) | |
| Gigabyte Aero 16 YE5 | |
| MSI Pulse GL66 12UEK | |
| Asus ROG Strix Scar 15 G533ZW-LN106WS | |
| MSI Vector GP66 12UGS | |
| MSI Raider GE66 12UHS | |
| Lenovo Legion 5 Pro 16 G7 i7 RTX 3070Ti | |
| Average Intel Core i9-12900H (235 - 277, n=29) | |
| HP Omen 16-b1090ng | |
| Razer Blade 15 2022 | |
| Asus ROG Zephyrus G14 GA402RK | |
| Razer Blade 14 Ryzen 9 6900HX | |
| Blender / v2.79 BMW27 CPU | |
| Asus ROG Zephyrus G14 GA402RK | |
| Average Intel Core i9-12900H (160 - 451, n=28) | |
| Razer Blade 15 2022 | |
| Razer Blade 14 Ryzen 9 6900HX | |
| Gigabyte Aero 16 YE5 | |
| MSI Vector GP66 12UGS | |
| MSI Raider GE66 12UHS | |
| MSI Pulse GL66 12UEK | |
| HP Omen 16-b1090ng | |
| Asus ROG Strix Scar 15 G533ZW-LN106WS | |
| Lenovo Legion 5 Pro 16 G7 i7 RTX 3070Ti | |
| Average of class Gaming (79 - 330, n=104, last 2 years) | |
| 7-Zip 18.03 / 7z b 4 | |
| Average of class Gaming (33491 - 148086, n=105, last 2 years) | |
| HP Omen 16-b1090ng | |
| Lenovo Legion 5 Pro 16 G7 i7 RTX 3070Ti | |
| MSI Raider GE66 12UHS | |
| Gigabyte Aero 16 YE5 | |
| Asus ROG Strix Scar 15 G533ZW-LN106WS | |
| MSI Vector GP66 12UGS | |
| MSI Pulse GL66 12UEK | |
| Razer Blade 14 Ryzen 9 6900HX | |
| Razer Blade 15 2022 | |
| Average Intel Core i9-12900H (34684 - 76677, n=28) | |
| Asus ROG Zephyrus G14 GA402RK | |
| 7-Zip 18.03 / 7z b 4 -mmt1 | |
| Average of class Gaming (4199 - 7436, n=105, last 2 years) | |
| Gigabyte Aero 16 YE5 | |
| MSI Vector GP66 12UGS | |
| MSI Pulse GL66 12UEK | |
| MSI Raider GE66 12UHS | |
| Asus ROG Strix Scar 15 G533ZW-LN106WS | |
| HP Omen 16-b1090ng | |
| Asus ROG Zephyrus G14 GA402RK | |
| Average Intel Core i9-12900H (5302 - 6289, n=28) | |
| Razer Blade 14 Ryzen 9 6900HX | |
| Lenovo Legion 5 Pro 16 G7 i7 RTX 3070Ti | |
| Razer Blade 15 2022 | |
| Geekbench 5.5 / Multi-Core | |
| Average of class Gaming (6460 - 28263, n=105, last 2 years) | |
| Asus ROG Strix Scar 15 G533ZW-LN106WS | |
| Gigabyte Aero 16 YE5 | |
| MSI Raider GE66 12UHS | |
| HP Omen 16-b1090ng | |
| Lenovo Legion 5 Pro 16 G7 i7 RTX 3070Ti | |
| Razer Blade 15 2022 | |
| MSI Vector GP66 12UGS | |
| Average Intel Core i9-12900H (8519 - 14376, n=31) | |
| MSI Pulse GL66 12UEK | |
| Asus ROG Zephyrus G14 GA402RK | |
| Razer Blade 14 Ryzen 9 6900HX | |
| Geekbench 5.5 / Single-Core | |
| Average of class Gaming (986 - 2474, n=105, last 2 years) | |
| MSI Vector GP66 12UGS | |
| Gigabyte Aero 16 YE5 | |
| MSI Raider GE66 12UHS | |
| Asus ROG Strix Scar 15 G533ZW-LN106WS | |
| MSI Pulse GL66 12UEK | |
| HP Omen 16-b1090ng | |
| Average Intel Core i9-12900H (1631 - 1897, n=31) | |
| Razer Blade 15 2022 | |
| Lenovo Legion 5 Pro 16 G7 i7 RTX 3070Ti | |
| Asus ROG Zephyrus G14 GA402RK | |
| Razer Blade 14 Ryzen 9 6900HX | |
| HWBOT x265 Benchmark v2.2 / 4k Preset | |
| Average of class Gaming (11.5 - 44.4, n=105, last 2 years) | |
| Lenovo Legion 5 Pro 16 G7 i7 RTX 3070Ti | |
| Asus ROG Strix Scar 15 G533ZW-LN106WS | |
| HP Omen 16-b1090ng | |
| MSI Vector GP66 12UGS | |
| MSI Pulse GL66 12UEK | |
| MSI Raider GE66 12UHS | |
| Gigabyte Aero 16 YE5 | |
| Razer Blade 14 Ryzen 9 6900HX | |
| Razer Blade 15 2022 | |
| Average Intel Core i9-12900H (8.05 - 22.5, n=28) | |
| Asus ROG Zephyrus G14 GA402RK | |
| LibreOffice / 20 Documents To PDF | |
| Razer Blade 15 2022 | |
| Razer Blade 14 Ryzen 9 6900HX | |
| Average of class Gaming (33.2 - 88.8, n=105, last 2 years) | |
| Asus ROG Zephyrus G14 GA402RK | |
| Average Intel Core i9-12900H (36.8 - 59.8, n=28) | |
| Lenovo Legion 5 Pro 16 G7 i7 RTX 3070Ti | |
| MSI Pulse GL66 12UEK | |
| HP Omen 16-b1090ng | |
| MSI Vector GP66 12UGS | |
| Asus ROG Strix Scar 15 G533ZW-LN106WS | |
| Gigabyte Aero 16 YE5 | |
| MSI Raider GE66 12UHS | |
| R Benchmark 2.5 / Overall mean | |
| Razer Blade 14 Ryzen 9 6900HX | |
| Asus ROG Zephyrus G14 GA402RK | |
| Razer Blade 15 2022 | |
| Average Intel Core i9-12900H (0.4218 - 0.506, n=28) | |
| Lenovo Legion 5 Pro 16 G7 i7 RTX 3070Ti | |
| HP Omen 16-b1090ng | |
| MSI Raider GE66 12UHS | |
| Asus ROG Strix Scar 15 G533ZW-LN106WS | |
| Average of class Gaming (0.3439 - 0.759, n=106, last 2 years) | |
| MSI Pulse GL66 12UEK | |
| MSI Vector GP66 12UGS | |
| Gigabyte Aero 16 YE5 | |
* ... smaller is better
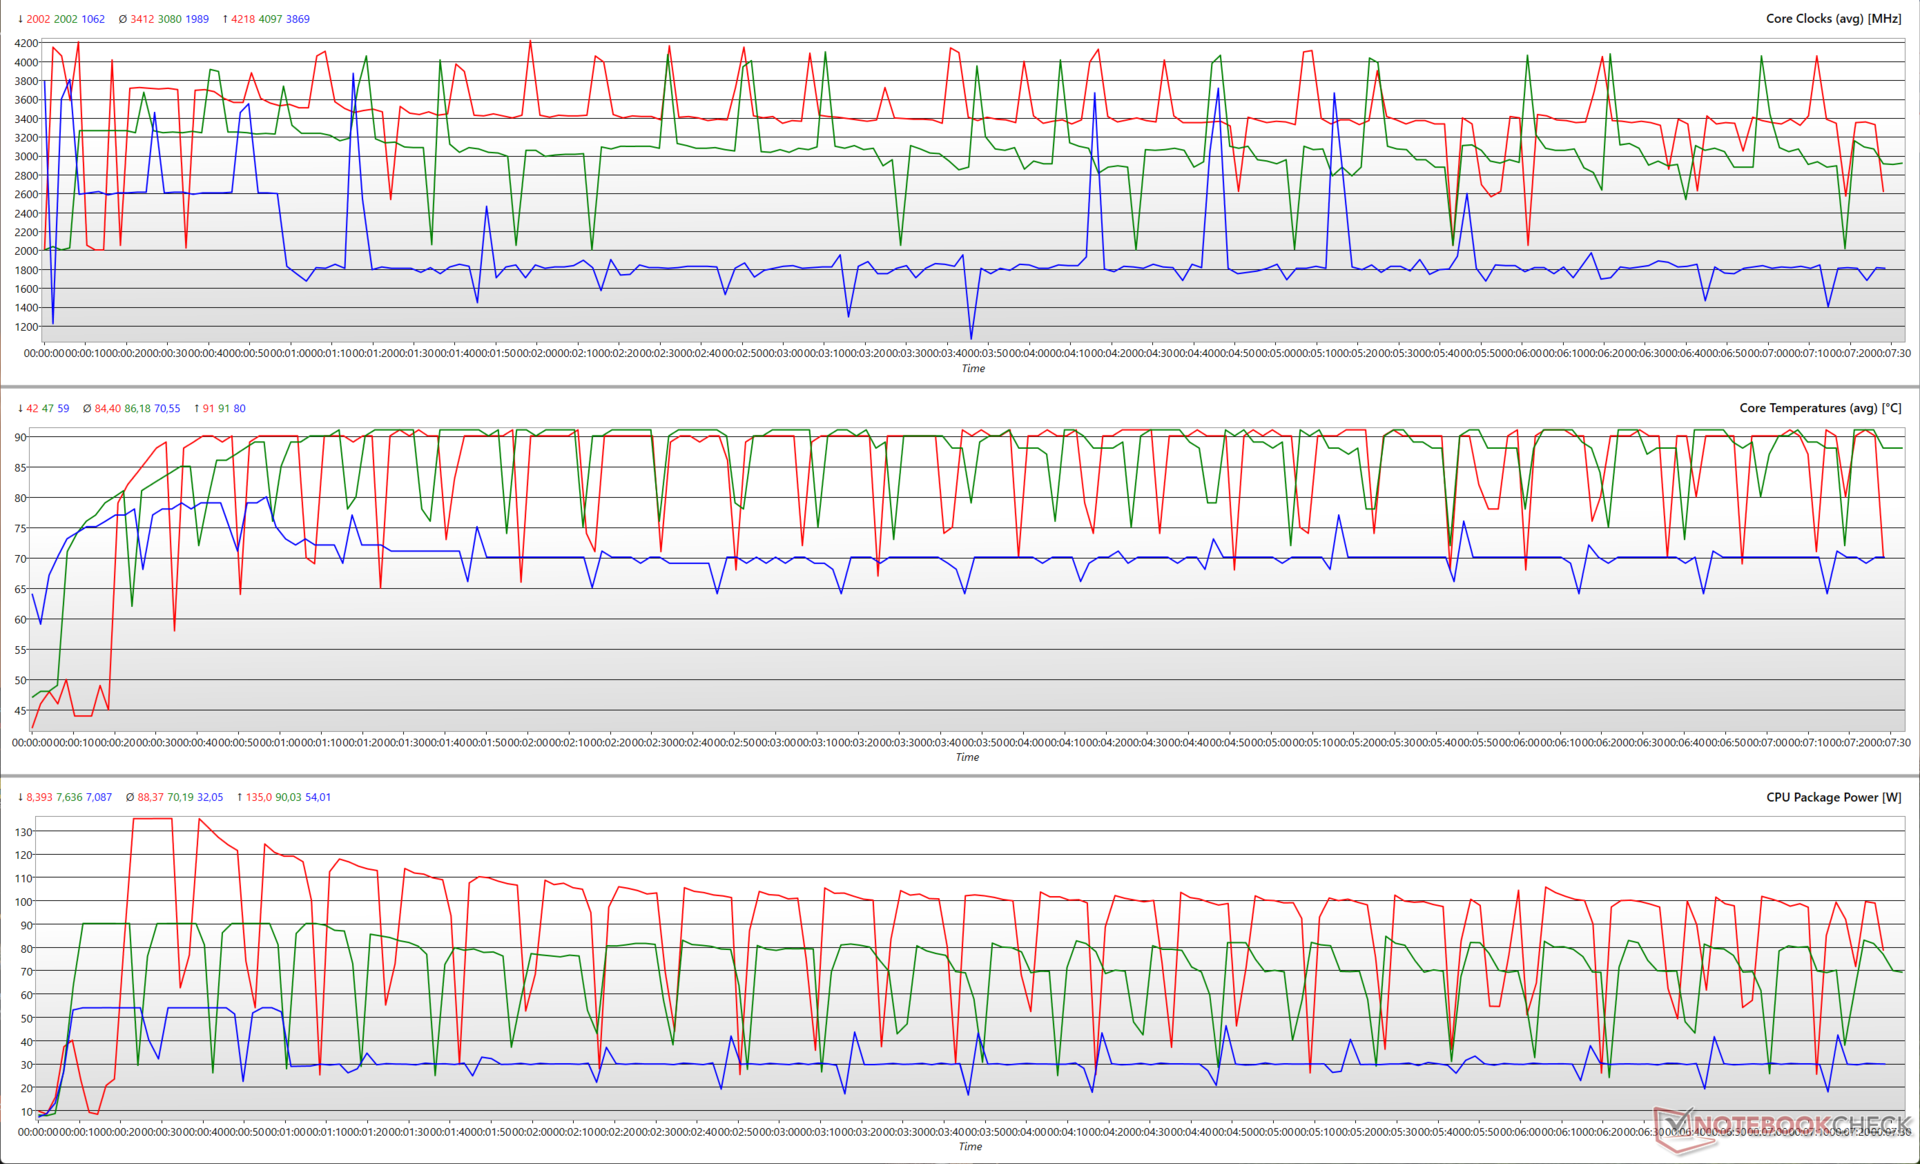
The following graph illustrates how different CPU parameters vary during a Cinebench R15 multi-core loop in each of the performance modes. Turbo allows the Core i9-12900H to use 135 W, but this does not last for more than 10 seconds. The CPU eventually settles at ~100 W for most of the loop. During this process, the average core temperatures hit 90 °C while clocks reach between 4.1 GHz to 4.2 GHz.
Performance mode sees 90 W of package power drawn initially but this settles at 80 W from the sixth loop onwards. The core temperatures reach 90 °C here as well, but the processor can touch 4 GHz+ only at a few intervals.
Silent mode starts off close to 60 W but settles near to the 30 W mark. As expected, this results in lower CPU clocks usually near the 2 GHz mark with occasional spikes to the 3.5 GHz mark. The temperatures in this mode are quite low at 70 °C.
AIDA64: FP32 Ray-Trace | FPU Julia | CPU SHA3 | CPU Queen | FPU SinJulia | FPU Mandel | CPU AES | CPU ZLib | FP64 Ray-Trace | CPU PhotoWorxx
| Performance rating | |
| Average of class Gaming | |
| Razer Blade 14 Ryzen 9 6900HX | |
| Asus ROG Zephyrus G14 GA402RK | |
| Asus ROG Strix Scar 15 G533ZW-LN106WS | |
| Lenovo Legion 5 Pro 16 G7 i7 RTX 3070Ti | |
| Average Intel Core i9-12900H | |
| MSI Raider GE66 12UHS | |
| Gigabyte Aero 16 YE5 | |
| MSI Pulse GL66 12UEK | |
| MSI Vector GP66 12UGS | |
| HP Omen 16-b1090ng | |
| Razer Blade 15 2022 | |
| AIDA64 / FP32 Ray-Trace | |
| Average of class Gaming (10227 - 85542, n=105, last 2 years) | |
| Razer Blade 14 Ryzen 9 6900HX | |
| Asus ROG Zephyrus G14 GA402RK | |
| Average Intel Core i9-12900H (4074 - 18289, n=29) | |
| Asus ROG Strix Scar 15 G533ZW-LN106WS | |
| Lenovo Legion 5 Pro 16 G7 i7 RTX 3070Ti | |
| MSI Pulse GL66 12UEK | |
| MSI Raider GE66 12UHS | |
| MSI Vector GP66 12UGS | |
| Gigabyte Aero 16 YE5 | |
| Razer Blade 15 2022 | |
| HP Omen 16-b1090ng | |
| AIDA64 / FPU SinJulia | |
| Average of class Gaming (4424 - 33636, n=105, last 2 years) | |
| Razer Blade 14 Ryzen 9 6900HX | |
| Asus ROG Zephyrus G14 GA402RK | |
| Asus ROG Strix Scar 15 G533ZW-LN106WS | |
| Lenovo Legion 5 Pro 16 G7 i7 RTX 3070Ti | |
| MSI Pulse GL66 12UEK | |
| MSI Vector GP66 12UGS | |
| Gigabyte Aero 16 YE5 | |
| MSI Raider GE66 12UHS | |
| HP Omen 16-b1090ng | |
| Razer Blade 15 2022 | |
| Average Intel Core i9-12900H (5709 - 10410, n=29) | |
| AIDA64 / FPU Mandel | |
| Average of class Gaming (25115 - 128721, n=105, last 2 years) | |
| Razer Blade 14 Ryzen 9 6900HX | |
| Asus ROG Zephyrus G14 GA402RK | |
| Average Intel Core i9-12900H (11257 - 45581, n=29) | |
| Lenovo Legion 5 Pro 16 G7 i7 RTX 3070Ti | |
| Asus ROG Strix Scar 15 G533ZW-LN106WS | |
| MSI Pulse GL66 12UEK | |
| MSI Raider GE66 12UHS | |
| MSI Vector GP66 12UGS | |
| Gigabyte Aero 16 YE5 | |
| Razer Blade 15 2022 | |
| HP Omen 16-b1090ng | |
| AIDA64 / CPU ZLib | |
| Average of class Gaming (574 - 2531, n=105, last 2 years) | |
| Asus ROG Strix Scar 15 G533ZW-LN106WS | |
| Lenovo Legion 5 Pro 16 G7 i7 RTX 3070Ti | |
| MSI Pulse GL66 12UEK | |
| MSI Vector GP66 12UGS | |
| MSI Raider GE66 12UHS | |
| Gigabyte Aero 16 YE5 | |
| HP Omen 16-b1090ng | |
| Razer Blade 15 2022 | |
| Average Intel Core i9-12900H (449 - 1193, n=29) | |
| Razer Blade 14 Ryzen 9 6900HX | |
| Asus ROG Zephyrus G14 GA402RK | |
| AIDA64 / FP64 Ray-Trace | |
| Average of class Gaming (5509 - 45446, n=105, last 2 years) | |
| Razer Blade 14 Ryzen 9 6900HX | |
| Asus ROG Zephyrus G14 GA402RK | |
| Average Intel Core i9-12900H (2235 - 10511, n=29) | |
| Lenovo Legion 5 Pro 16 G7 i7 RTX 3070Ti | |
| Asus ROG Strix Scar 15 G533ZW-LN106WS | |
| MSI Pulse GL66 12UEK | |
| MSI Raider GE66 12UHS | |
| MSI Vector GP66 12UGS | |
| Gigabyte Aero 16 YE5 | |
| HP Omen 16-b1090ng | |
| Razer Blade 15 2022 | |
| AIDA64 / CPU PhotoWorxx | |
| Average of class Gaming (12271 - 89891, n=105, last 2 years) | |
| Razer Blade 15 2022 | |
| HP Omen 16-b1090ng | |
| MSI Raider GE66 12UHS | |
| Asus ROG Strix Scar 15 G533ZW-LN106WS | |
| Gigabyte Aero 16 YE5 | |
| Average Intel Core i9-12900H (20960 - 48269, n=30) | |
| Lenovo Legion 5 Pro 16 G7 i7 RTX 3070Ti | |
| Asus ROG Zephyrus G14 GA402RK | |
| Razer Blade 14 Ryzen 9 6900HX | |
| MSI Vector GP66 12UGS | |
| MSI Pulse GL66 12UEK | |
Check out our dedicated Intel Core i9-12900H page for more benchmarks and performance comparisons.
System Performance
System performance is on expected lines and on par with similarly configured devices. We did not notice any hiccups in general productivity or web browsing tasks.
CrossMark: Overall | Productivity | Creativity | Responsiveness
| PCMark 10 / Score | |
| Average of class Gaming (5828 - 12414, n=93, last 2 years) | |
| MSI Raider GE66 12UHS | |
| MSI Vector GP66 12UGS | |
| Asus ROG Strix Scar 15 G533ZW-LN106WS | |
| Gigabyte Aero 16 YE5 | |
| Asus ROG Zephyrus G14 GA402RK | |
| Average Intel Core i9-12900H, NVIDIA GeForce RTX 3070 Ti Laptop GPU (7087 - 8072, n=6) | |
| Razer Blade 15 2022 | |
| Lenovo Legion 5 Pro 16 G7 i7 RTX 3070Ti | |
| Razer Blade 14 Ryzen 9 6900HX | |
| HP Omen 16-b1090ng | |
| MSI Pulse GL66 12UEK | |
| PCMark 10 / Essentials | |
| MSI Raider GE66 12UHS | |
| Gigabyte Aero 16 YE5 | |
| MSI Vector GP66 12UGS | |
| Razer Blade 14 Ryzen 9 6900HX | |
| Asus ROG Zephyrus G14 GA402RK | |
| Average Intel Core i9-12900H, NVIDIA GeForce RTX 3070 Ti Laptop GPU (10266 - 11663, n=6) | |
| Razer Blade 15 2022 | |
| Asus ROG Strix Scar 15 G533ZW-LN106WS | |
| Average of class Gaming (8810 - 11935, n=97, last 2 years) | |
| MSI Pulse GL66 12UEK | |
| HP Omen 16-b1090ng | |
| Lenovo Legion 5 Pro 16 G7 i7 RTX 3070Ti | |
| PCMark 10 / Productivity | |
| Average of class Gaming (6845 - 25323, n=95, last 2 years) | |
| Asus ROG Strix Scar 15 G533ZW-LN106WS | |
| MSI Raider GE66 12UHS | |
| Average Intel Core i9-12900H, NVIDIA GeForce RTX 3070 Ti Laptop GPU (9402 - 10742, n=6) | |
| MSI Vector GP66 12UGS | |
| Gigabyte Aero 16 YE5 | |
| Lenovo Legion 5 Pro 16 G7 i7 RTX 3070Ti | |
| Asus ROG Zephyrus G14 GA402RK | |
| MSI Pulse GL66 12UEK | |
| Razer Blade 15 2022 | |
| HP Omen 16-b1090ng | |
| Razer Blade 14 Ryzen 9 6900HX | |
| PCMark 10 / Digital Content Creation | |
| Average of class Gaming (7602 - 19954, n=95, last 2 years) | |
| MSI Raider GE66 12UHS | |
| MSI Vector GP66 12UGS | |
| Razer Blade 15 2022 | |
| Asus ROG Strix Scar 15 G533ZW-LN106WS | |
| Lenovo Legion 5 Pro 16 G7 i7 RTX 3070Ti | |
| Gigabyte Aero 16 YE5 | |
| Asus ROG Zephyrus G14 GA402RK | |
| Average Intel Core i9-12900H, NVIDIA GeForce RTX 3070 Ti Laptop GPU (10009 - 12541, n=6) | |
| HP Omen 16-b1090ng | |
| Razer Blade 14 Ryzen 9 6900HX | |
| MSI Pulse GL66 12UEK | |
| CrossMark / Overall | |
| Gigabyte Aero 16 YE5 | |
| MSI Pulse GL66 12UEK | |
| Asus ROG Strix Scar 15 G533ZW-LN106WS | |
| Average of class Gaming (1366 - 2409, n=94, last 2 years) | |
| Lenovo Legion 5 Pro 16 G7 i7 RTX 3070Ti | |
| Average Intel Core i9-12900H, NVIDIA GeForce RTX 3070 Ti Laptop GPU (1664 - 2044, n=6) | |
| CrossMark / Productivity | |
| MSI Pulse GL66 12UEK | |
| Gigabyte Aero 16 YE5 | |
| Asus ROG Strix Scar 15 G533ZW-LN106WS | |
| Lenovo Legion 5 Pro 16 G7 i7 RTX 3070Ti | |
| Average of class Gaming (1386 - 2254, n=94, last 2 years) | |
| Average Intel Core i9-12900H, NVIDIA GeForce RTX 3070 Ti Laptop GPU (1591 - 1968, n=6) | |
| CrossMark / Creativity | |
| Average of class Gaming (1343 - 2786, n=94, last 2 years) | |
| Gigabyte Aero 16 YE5 | |
| Asus ROG Strix Scar 15 G533ZW-LN106WS | |
| MSI Pulse GL66 12UEK | |
| Lenovo Legion 5 Pro 16 G7 i7 RTX 3070Ti | |
| Average Intel Core i9-12900H, NVIDIA GeForce RTX 3070 Ti Laptop GPU (1797 - 2148, n=6) | |
| CrossMark / Responsiveness | |
| MSI Pulse GL66 12UEK | |
| Gigabyte Aero 16 YE5 | |
| Asus ROG Strix Scar 15 G533ZW-LN106WS | |
| Lenovo Legion 5 Pro 16 G7 i7 RTX 3070Ti | |
| Average Intel Core i9-12900H, NVIDIA GeForce RTX 3070 Ti Laptop GPU (1514 - 2069, n=6) | |
| Average of class Gaming (1226 - 2334, n=94, last 2 years) | |
| PCMark 8 Home Score Accelerated v2 | 6245 points | |
| PCMark 8 Work Score Accelerated v2 | 6416 points | |
| PCMark 10 Score | 7904 points | |
Help | ||
| AIDA64 / Memory Copy | |
| Average of class Gaming (21750 - 129946, n=105, last 2 years) | |
| HP Omen 16-b1090ng | |
| MSI Raider GE66 12UHS | |
| Razer Blade 15 2022 | |
| Gigabyte Aero 16 YE5 | |
| Asus ROG Strix Scar 15 G533ZW-LN106WS | |
| Average Intel Core i9-12900H (34438 - 74264, n=29) | |
| Lenovo Legion 5 Pro 16 G7 i7 RTX 3070Ti | |
| Asus ROG Zephyrus G14 GA402RK | |
| Razer Blade 14 Ryzen 9 6900HX | |
| MSI Pulse GL66 12UEK | |
| MSI Vector GP66 12UGS | |
| AIDA64 / Memory Read | |
| Average of class Gaming (22956 - 118858, n=105, last 2 years) | |
| MSI Raider GE66 12UHS | |
| HP Omen 16-b1090ng | |
| Razer Blade 15 2022 | |
| Gigabyte Aero 16 YE5 | |
| Asus ROG Strix Scar 15 G533ZW-LN106WS | |
| Average Intel Core i9-12900H (36365 - 74642, n=29) | |
| Lenovo Legion 5 Pro 16 G7 i7 RTX 3070Ti | |
| Asus ROG Zephyrus G14 GA402RK | |
| Razer Blade 14 Ryzen 9 6900HX | |
| MSI Vector GP66 12UGS | |
| MSI Pulse GL66 12UEK | |
| AIDA64 / Memory Write | |
| Average of class Gaming (22297 - 135096, n=105, last 2 years) | |
| Razer Blade 15 2022 | |
| MSI Raider GE66 12UHS | |
| Asus ROG Strix Scar 15 G533ZW-LN106WS | |
| HP Omen 16-b1090ng | |
| Gigabyte Aero 16 YE5 | |
| Average Intel Core i9-12900H (32276 - 67858, n=29) | |
| Lenovo Legion 5 Pro 16 G7 i7 RTX 3070Ti | |
| Asus ROG Zephyrus G14 GA402RK | |
| Razer Blade 14 Ryzen 9 6900HX | |
| MSI Pulse GL66 12UEK | |
| MSI Vector GP66 12UGS | |
| AIDA64 / Memory Latency | |
| Average of class Gaming (75.3 - 259, n=105, last 2 years) | |
| Asus ROG Strix Scar 15 G533ZW-LN106WS | |
| Lenovo Legion 5 Pro 16 G7 i7 RTX 3070Ti | |
| MSI Raider GE66 12UHS | |
| MSI Pulse GL66 12UEK | |
| MSI Vector GP66 12UGS | |
| HP Omen 16-b1090ng | |
| Gigabyte Aero 16 YE5 | |
| Average Intel Core i9-12900H (74.7 - 118.1, n=28) | |
| Razer Blade 14 Ryzen 9 6900HX | |
| Asus ROG Zephyrus G14 GA402RK | |
| Razer Blade 15 2022 | |
* ... smaller is better
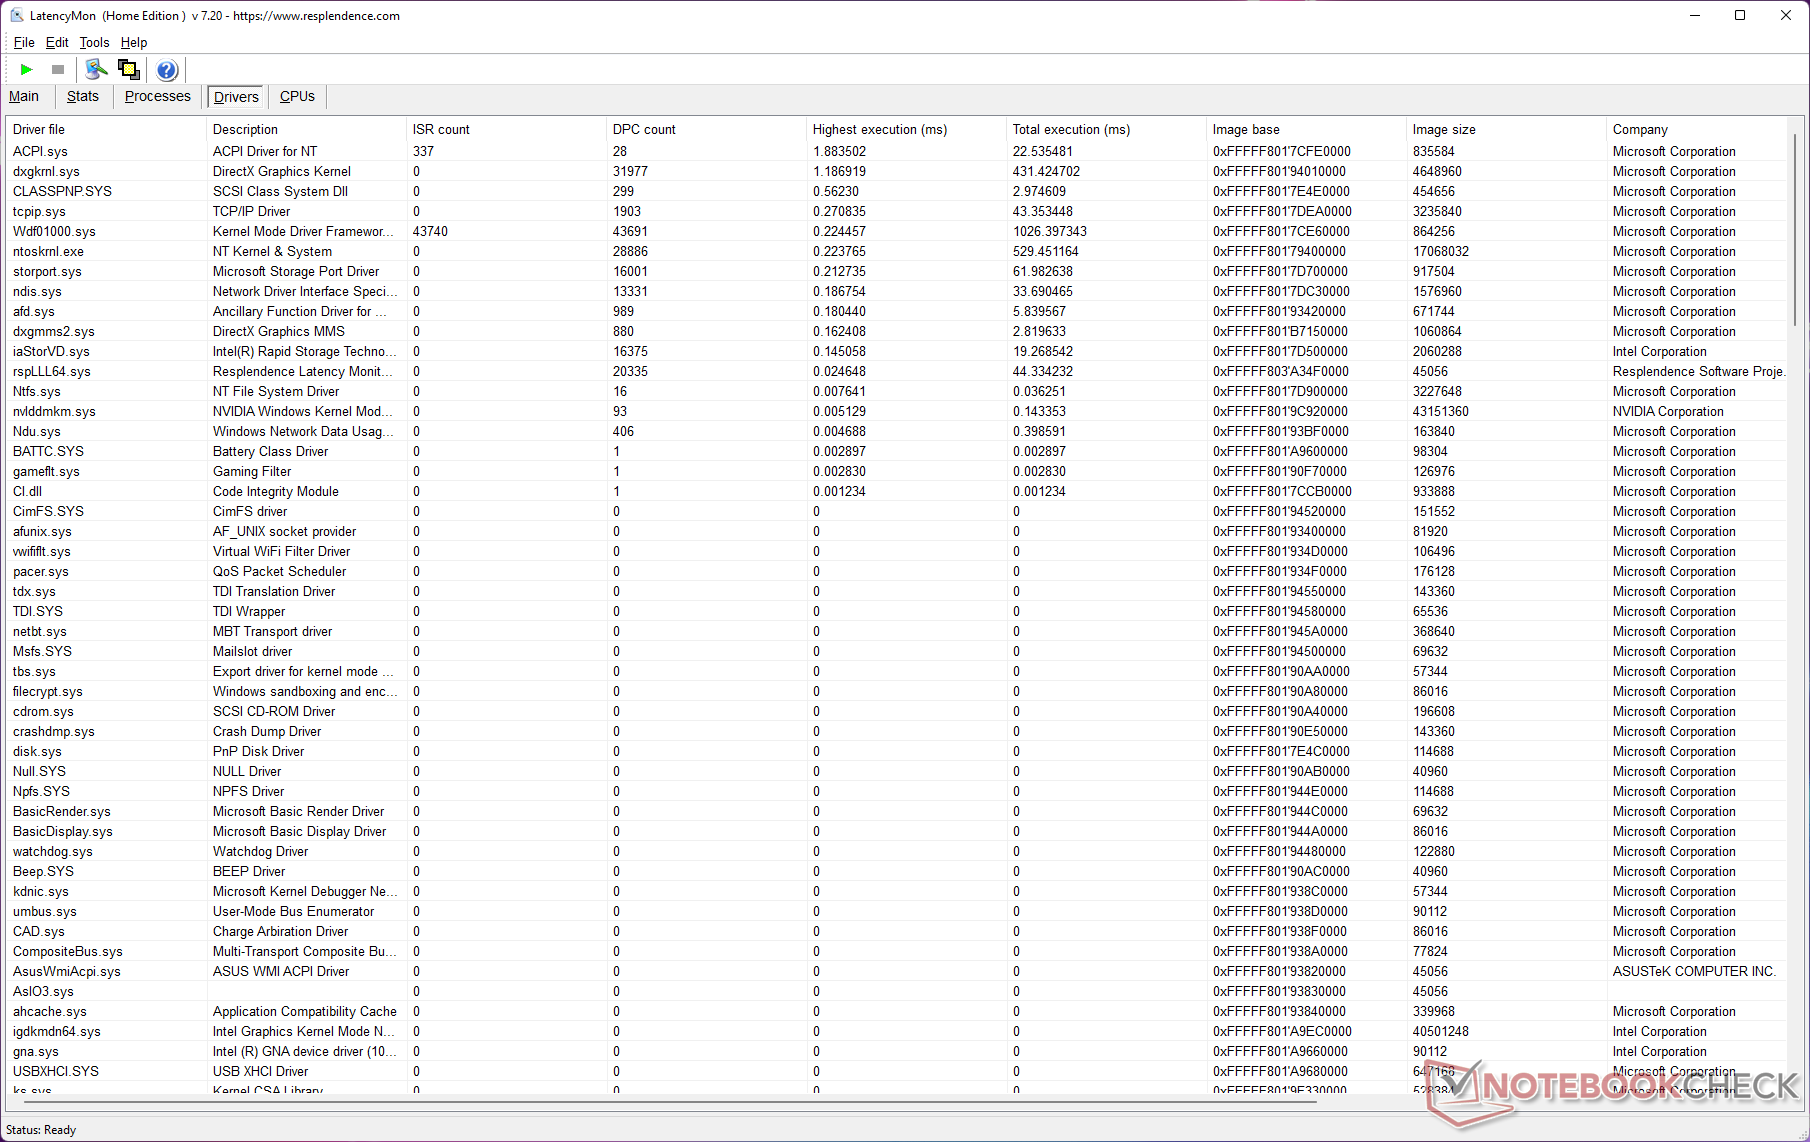
DPC Latency
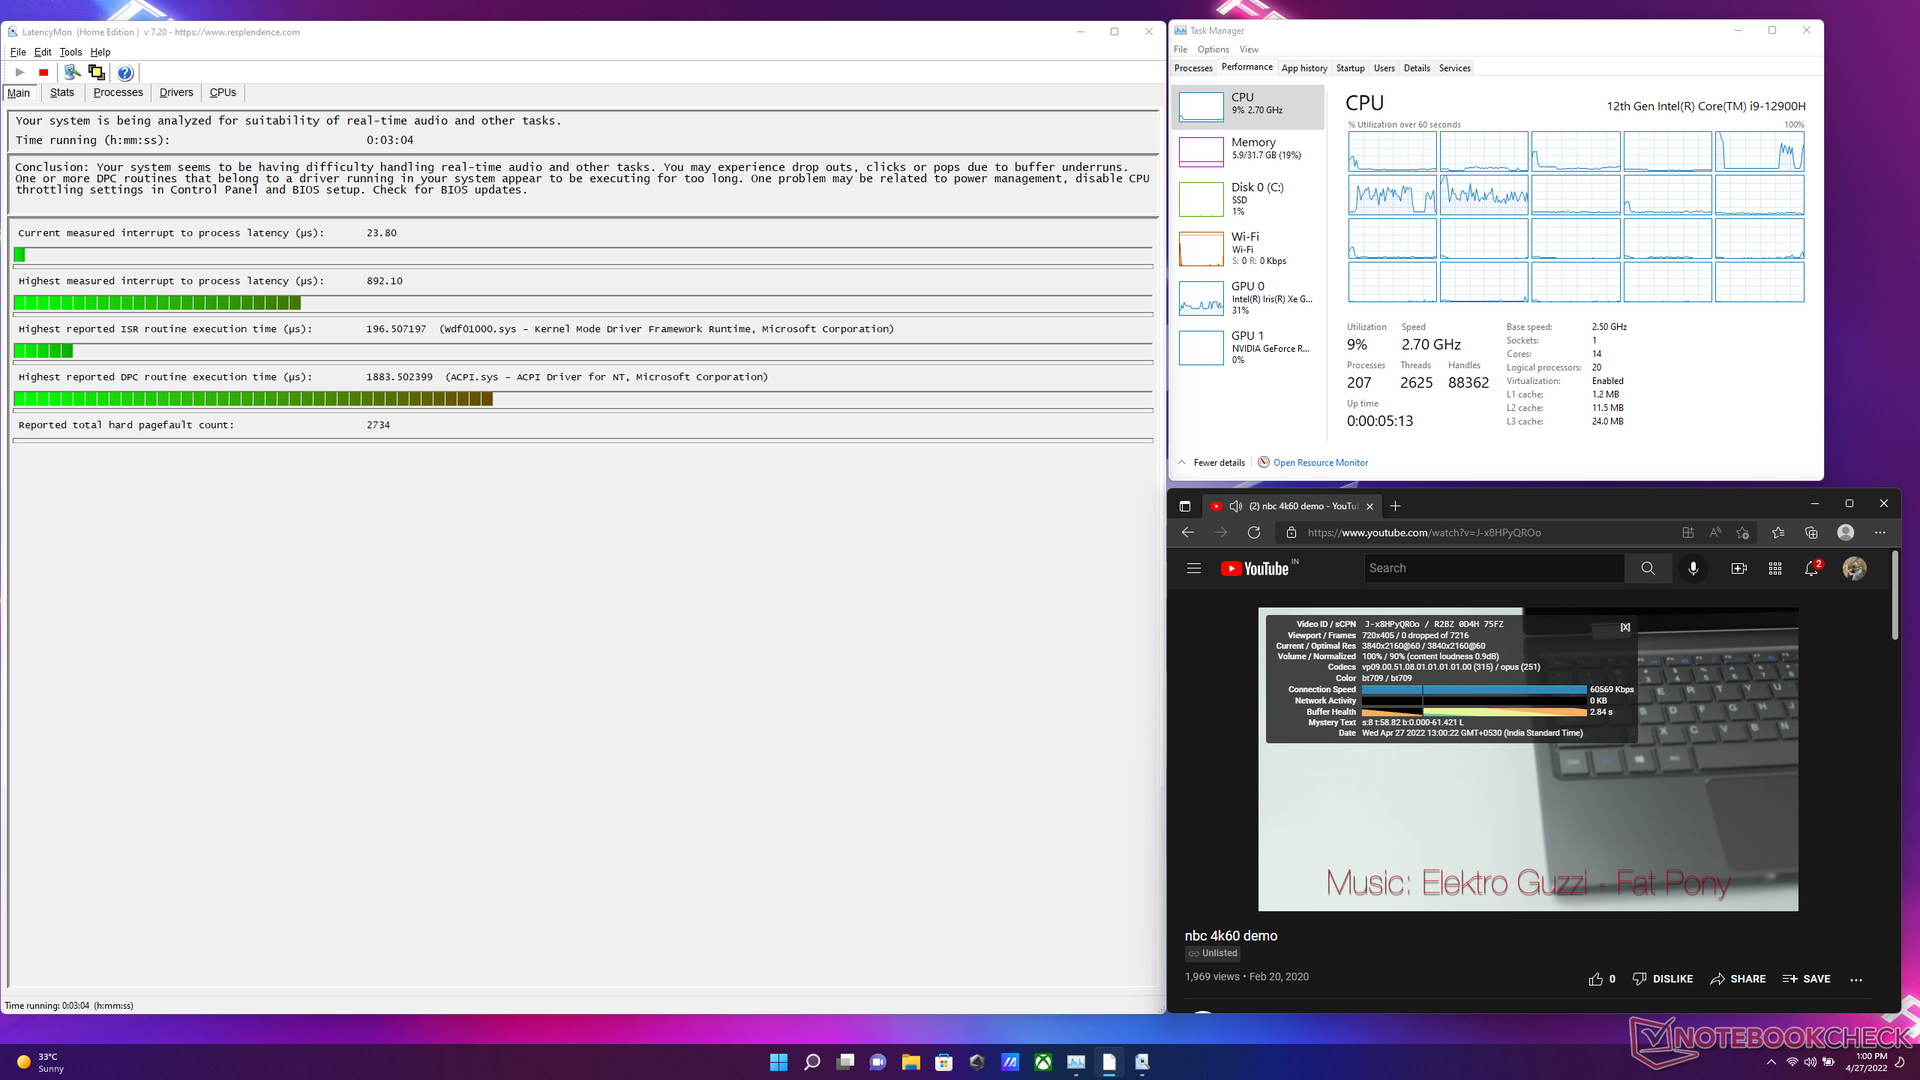
The Scar 15's measured DPC latency is lower than most of its competition. That being said, you may still run into potential hiccups when it comes to real-time audio and video workflows. The Windows power management component, ACPI.sys, seems to be the reason for the observed high DPC latency.
| DPC Latencies / LatencyMon - interrupt to process latency (max), Web, Youtube, Prime95 | |
| MSI Raider GE66 12UHS | |
| Asus ROG Zephyrus G14 GA402RK | |
| MSI Vector GP66 12UGS | |
| Razer Blade 15 2022 | |
| Razer Blade 14 Ryzen 9 6900HX | |
| MSI Pulse GL66 12UEK | |
| Asus ROG Strix Scar 15 G533ZW-LN106WS | |
| Lenovo Legion 5 Pro 16 G7 i7 RTX 3070Ti | |
| HP Omen 16-b1090ng | |
| Gigabyte Aero 16 YE5 | |
* ... smaller is better
Our dedicated DPC Latency Ranking page provides more latency comparisons across reviewed devices.
Storage Devices
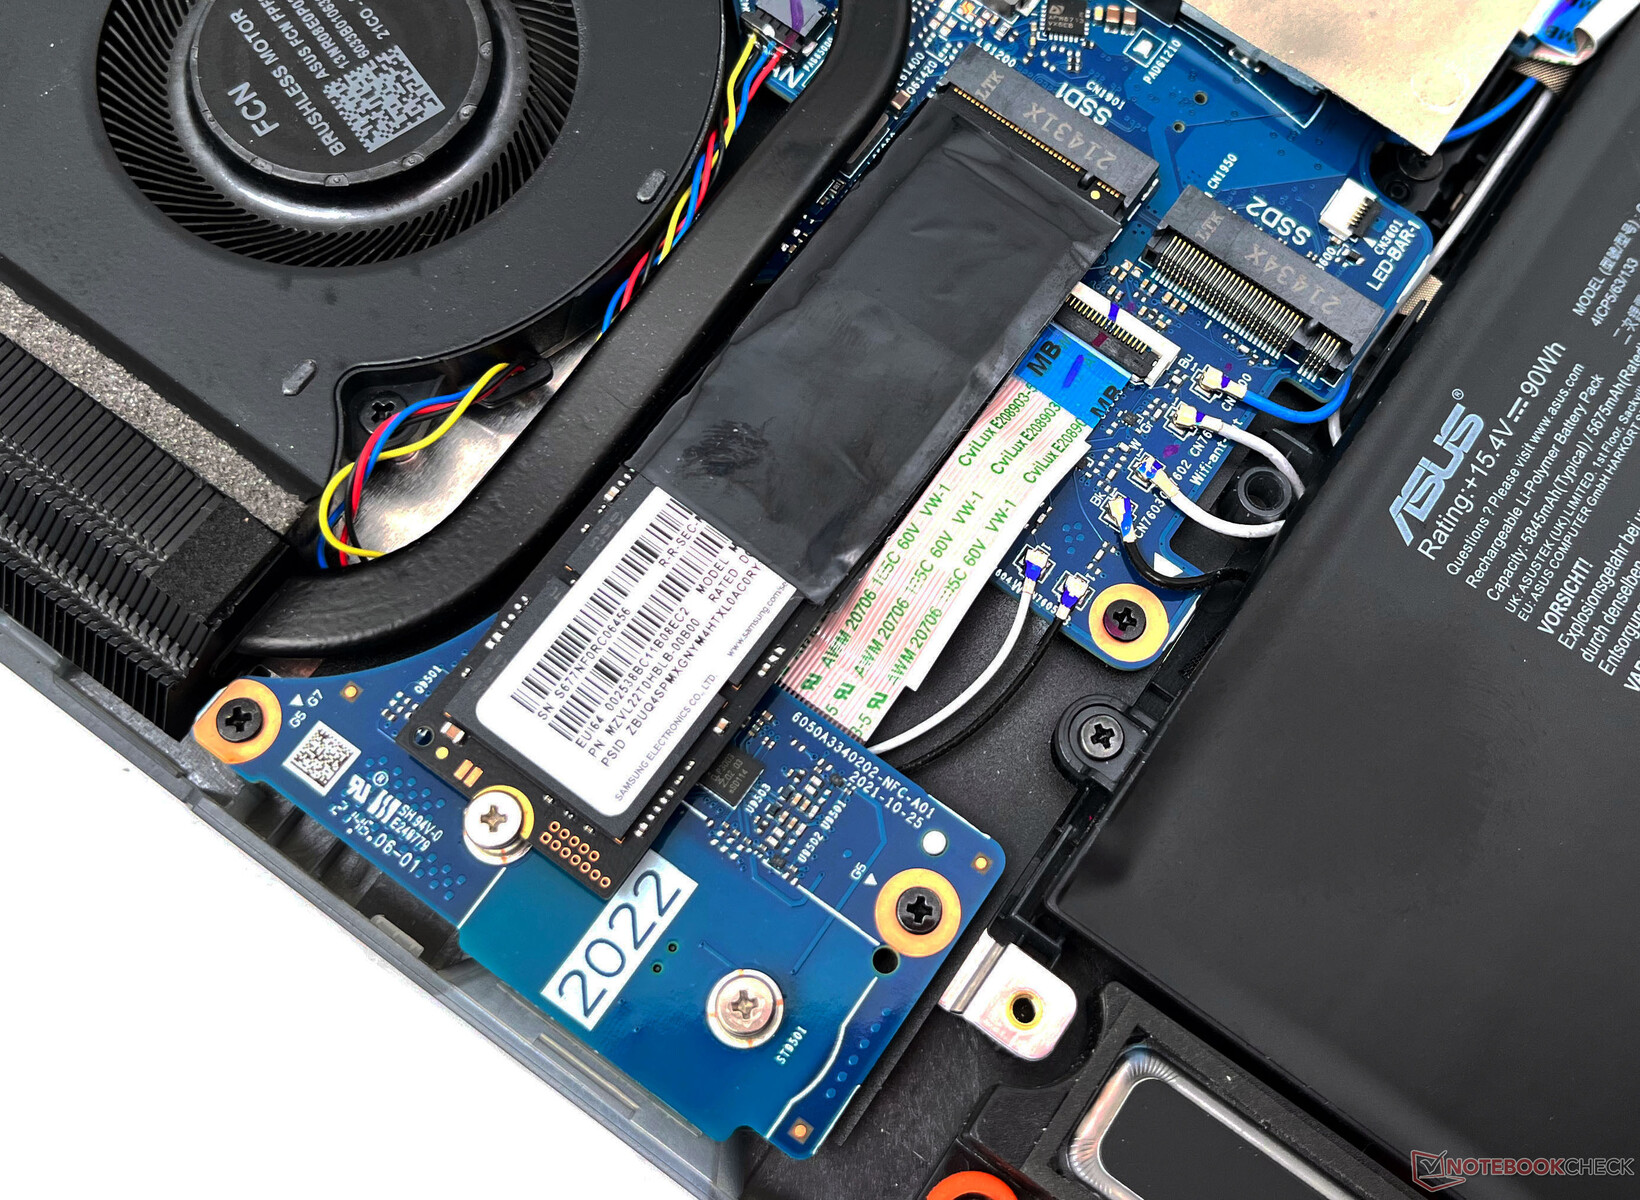
Our ROG Strix Scar 15 unit came with a 2 TB Samsung PM9A1 NVMe SSD. Its benchmark performance is comparable to other PM9A1-equipped laptops.
However, the drive throttles significantly after the sixth loop in DiskSpd sustained reads at a queue depth of 8 as there is no thermal solution provided either on the drive or on the bottom panel.
There is no scope for installing 2.5-inch SATA drives. Nevertheless, Asus provides a secondary M.2 slot for adding another NVMe storage expansion.

| Asus ROG Strix Scar 15 G533ZW Samsung PM9A1 MZVL22T0HBLB | MSI Pulse GL66 12UEK Micron 2450 512GB MTFDKBA512TFK | Gigabyte Aero 16 YE5 Phison ESR01TBMFCT | MSI Vector GP66 12UGS | MSI Raider GE66 12UHS Samsung PM9A1 MZVL22T0HBLB | HP Omen 16-b1090ng WDC PC SN810 1TB | Lenovo Legion 5 Pro 16 G7 i7 RTX 3070Ti Samsung PM9A1 MZVL21T0HCLR | Razer Blade 14 Ryzen 9 6900HX Samsung PM9A1 MZVL21T0HCLR | Asus ROG Zephyrus G14 GA402RK Micron 2450 1TB MTFDKBK1T0TFK | Razer Blade 15 2022 SSSTC CA6-8D1024 | Average Samsung PM9A1 MZVL22T0HBLB | Average of class Gaming | |
|---|---|---|---|---|---|---|---|---|---|---|---|---|
| Drive Performance rating | ||||||||||||
| Percent (pt) | 87.6 | 60.6 -31% | 89.4 2% | 62.8 -28% | 85.2 -3% | 67.3 -23% | 89.8 3% | 85.1 -3% | 64.2 -27% | 78.8 -10% | 76.2 -13% | 71.9 -18% |
| DiskSpd | -21% | 9% | -20% | 1% | -16% | 11% | 4% | -27% | -3% | -6% | -11% | |
| seq read (MB/s) | 2397 | 2038 -15% | 3819 59% | 2119 -12% | 3813 59% | 3928 64% | 4486 87% | 4352 82% | 2262 -6% | 4119 72% | 3903 ? 63% | 3556 ? 48% |
| seq write (MB/s) | 4488 | 3275 -27% | 4457 -1% | 3405 -24% | 3838 -14% | 4033 -10% | 4368 -3% | 4240 -6% | 3454 -23% | 4167 -7% | 4101 ? -9% | 3957 ? -12% |
| seq q8 t1 read (MB/s) | 7006 | 3613 -48% | 7028 0% | 3563 -49% | 5358 -24% | 6867 -2% | 6637 -5% | 6670 -5% | 3563 -49% | 6921 -1% | 7079 ? 1% | 7552 ? 8% |
| seq q8 t1 write (MB/s) | 5263 | 3351 -36% | 5004 -5% | 3448 -34% | 4951 -6% | 5412 3% | 4940 -6% | 4995 -5% | 3455 -34% | 4740 -10% | 5439 ? 3% | 5961 ? 13% |
| 4k q1 t1 read (MB/s) | 86.8 | 71.5 -18% | 88.7 2% | 69.5 -20% | 88.3 2% | 77.1 -11% | 97.4 12% | 79.8 -8% | 62.4 -28% | 79.6 -8% | 77.3 ? -11% | 70.3 ? -19% |
| 4k q1 t1 write (MB/s) | 294 | 421 43% | 373 27% | 408 39% | 273 -7% | 205 -30% | 274 -7% | 196.8 -33% | 249 -15% | 256 -13% | 212 ? -28% | 195.9 ? -33% |
| 4k q32 t16 read (MB/s) | 3975 | 1550 -61% | 3555 -11% | 1844 -54% | 4068 2% | 1528 -62% | 4158 5% | 4174 5% | 1841 -54% | 3184 -20% | 2860 ? -28% | 2264 ? -43% |
| 4k q32 t16 write (MB/s) | 3509 | 3249 -7% | 3612 3% | 3354 -4% | 3478 -1% | 585 -83% | 3544 1% | 3559 1% | 3364 -4% | 2141 -39% | 2177 ? -38% | 1832 ? -48% |
| AS SSD | -116% | -6% | -242% | -6% | -29% | -0% | -37% | -116% | -33% | -28% | -42% | |
| Score Total (Points) | 9031 | 4693 -48% | 9380 4% | 6130 -32% | 8959 -1% | 5985 -34% | 9094 1% | 9147 1% | 7568 -16% | 7659 -15% | 7177 ? -21% | 6872 ? -24% |
| Score Read (Points) | 3378 | 1878 -44% | 3634 8% | 2008 -41% | 3341 -1% | 1994 -41% | 3380 0% | 3439 2% | 2722 -19% | 3431 2% | 2615 ? -23% | 2248 ? -33% |
| Score Write (Points) | 3999 | 1837 -54% | 3991 0% | 3087 -23% | 3977 -1% | 3093 -23% | 4043 1% | 4026 1% | 3451 -14% | 2563 -36% | 3292 ? -18% | 3547 ? -11% |
| Seq Read (MB/s) | 5563.48 | 3127 -44% | 5588 0% | 3080 -45% | 5098.97 -8% | 5396.69 -3% | 5036 -9% | 5482.07 -1% | 3209 -42% | 5750 3% | 5454 ? -2% | 5591 ? 0% |
| Seq Write (MB/s) | 4045.87 | 2977 -26% | 3267 -19% | 2997 -26% | 3667.77 -9% | 2667.04 -34% | 3784 -6% | 4007.19 -1% | 3131 -23% | 4073 1% | 3968 ? -2% | 3972 ? -2% |
| 4K Read (MB/s) | 81.3 | 95.9 18% | 109.4 35% | 70 -14% | 84.06 3% | 73.81 -9% | 88.1 8% | 73.78 -9% | 77.7 -4% | 67.2 -17% | 72 ? -11% | 71.1 ? -13% |
| 4K Write (MB/s) | 248.96 | 363.5 46% | 321.6 29% | 352 41% | 244.47 -2% | 247.26 -1% | 240.4 -3% | 174.19 -30% | 218.3 -12% | 221.3 -11% | 195.9 ? -21% | 215 ? -14% |
| 4K-64 Read (MB/s) | 2740.24 | 1469 -46% | 2966 8% | 1630 -41% | 2747.2 0% | 1380.56 -50% | 2788 2% | 2816.7 3% | 2323 -15% | 2789 2% | 1998 ? -27% | 1618 ? -41% |
| 4K-64 Write (MB/s) | 3345.62 | 1175 -65% | 3342 0% | 2435 -27% | 3365.94 1% | 2579.14 -23% | 3424 2% | 3450.87 3% | 2920 -13% | 1934 -42% | 2700 ? -19% | 2935 ? -12% |
| Access Time Read * (ms) | 0.022 | 0.051 -132% | 0.056 -155% | 0.033 -50% | 0.032 -45% | 0.045 -105% | 0.02 9% | 0.035 -59% | 0.065 -195% | 0.023 -5% | 0.03461 ? -57% | 0.06364 ? -189% |
| Access Time Write * (ms) | 0.017 | 0.167 -882% | 0.012 29% | 0.425 -2400% | 0.018 -6% | 0.016 6% | 0.018 -6% | 0.07 -312% | 0.174 -924% | 0.058 -241% | 0.03473 ? -104% | 0.03794 ? -123% |
| Total Average (Program / Settings) | -56% /
-74% | 2% /
1% | -97% /
-142% | -3% /
-3% | -23% /
-24% | 5% /
4% | -12% /
-19% | -57% /
-76% | -15% /
-20% | -16% /
-18% | -24% /
-28% |
* ... smaller is better
Disk Throttling: DiskSpd Read Loop, Queue Depth 8
Refer to our SSD and HDD Benchmarks page for more storage device comparisons.
GPU Performance
Our ROG Strix Scar 15 unit features an Nvidia GeForce RTX 3070 Ti Laptop GPU with a total graphics power (TGP) of 150 W (125 W + 25 W Dynamic Boost).
Overall 3DMark performance is on par with a Radeon RX 6800S in the Asus ROG Zephyrus G14. Performance in 3DMark Fire Strike Graphics and 3DMark Time Spy Graphics trails by 5% and 12%, respectively when compared to the RTX 3080 Ti Laptop GPU in the MSI Raider GE66 12UHS.

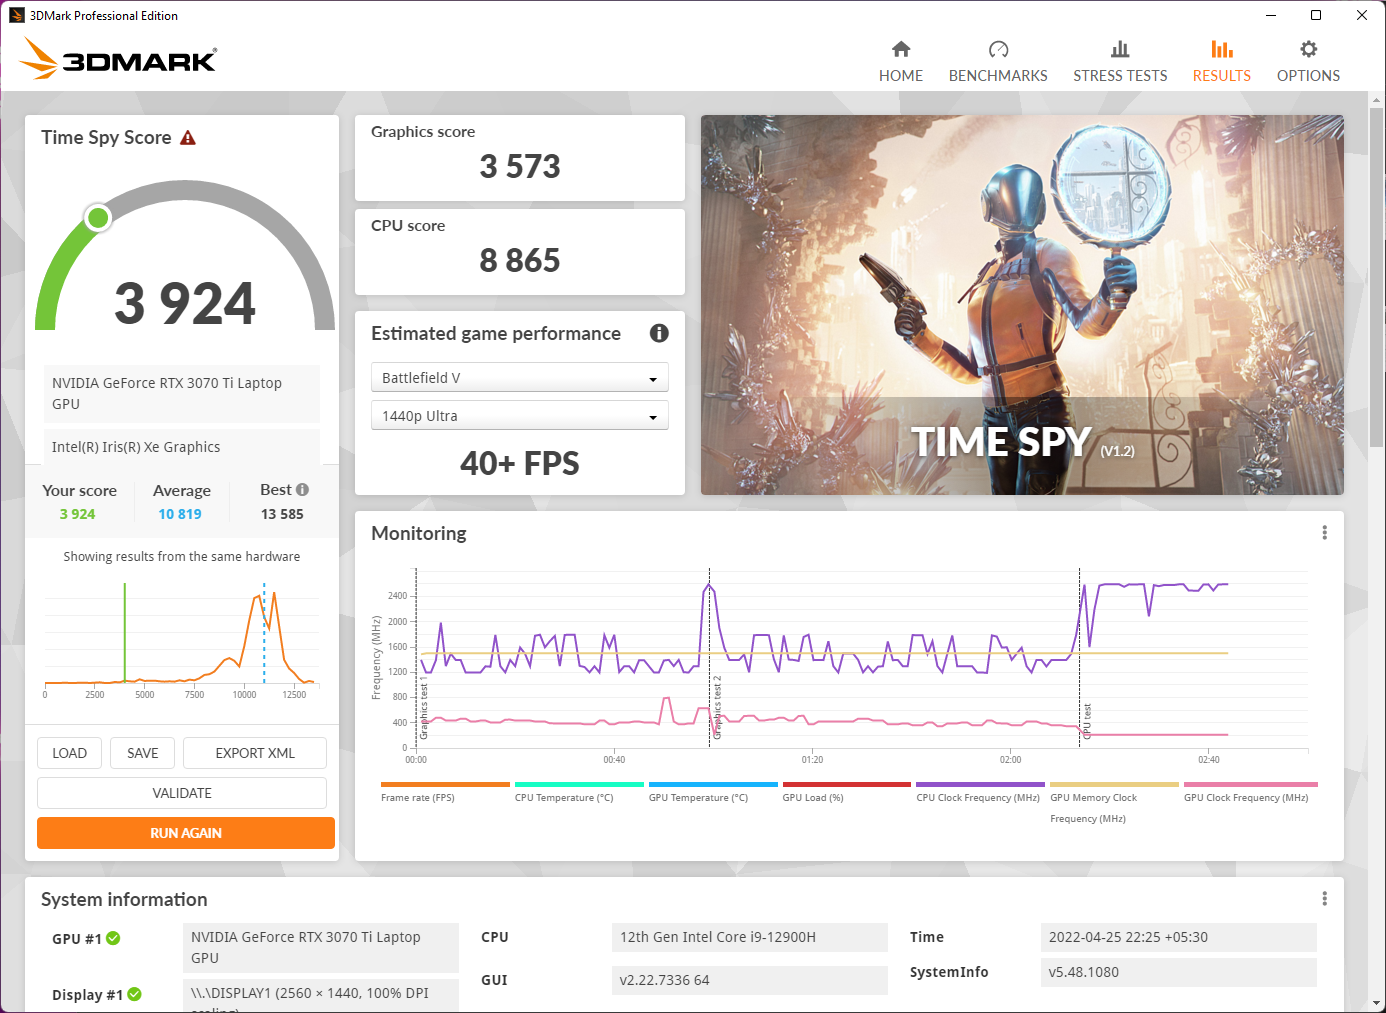
GPU performance takes a huge beating on battery power. We observed a 68% reduction in the Time Spy Graphics score. The notebook automatically switches to the Silent performance mode and the display refresh rate is lowered from 240 Hz to 60 Hz upon disconnecting the power adapter. According to 3DMark, the low scores on battery still correlate with a performance equivalent to 40+ fps in a title like Battlefield V at 1440p Ultra.
As mentioned earlier, Asus allows using a MUX switch via Armory Crate to bypass the iGPU. Asus claims up to a 9% performance benefit in doing so, but your mileage will vary depending on the game or graphic load.
The table below shows a comparison between standard MSHybrid and MUX modes in 3DMark Time Spy and Fire Strike graphics tests. Though we do see a slight advantage, the difference is well within the margin of error to be considered significant.
The dedicated MUX switch is still a nice feature to have nevertheless and can come in handy with real-world gaming, particularly to push more frames at 1080p.
| 3DMark Test | Standard MSHybrid | MUX Switch |
|---|---|---|
| Fire Strike Score | 24123 | 25390 (+1.1%) |
| Fire Strike Graphics | 29292 | 29811 (+1.77%) |
| Fire Strike Physics | 30624 | 30101 (-1.70%) |
| Time Spy Score | 11481 | 11724 (+2.11%) |
| Time Spy Graphics | 11197 | 11374 (+1.58%) |
| Time Spy CPU | 13413 | 14204 (+5.9%) |
| 3DMark 11 Performance | 34211 points | |
| 3DMark Ice Storm Standard Score | 118774 points | |
| 3DMark Cloud Gate Standard Score | 58464 points | |
| 3DMark Fire Strike Score | 24123 points | |
| 3DMark Fire Strike Extreme Score | 13949 points | |
| 3DMark Time Spy Score | 11481 points | |
Help | ||
Gaming Performance
Performance in tested games is on expected lines. The RTX 3070 Ti Laptop GPU is quite capable of 4K gaming on an external display at least at High settings if not at Ultra. QHD gaming is fully possible with all details cranked up to the max. Ray tracing does take a hit when compared to an RTX 3080 Ti Laptop GPU but playable frames should be achievable with DLSS in supported titles.
| The Witcher 3 | |
| 1920x1080 Ultra Graphics & Postprocessing (HBAO+) | |
| Average of class Gaming (104.7 - 240, n=7, last 2 years) | |
| MSI Vector GP66 12UGS | |
| Asus ROG Strix Scar 15 G533ZW-LN106WS | |
| MSI Raider GE66 12UHS | |
| Razer Blade 15 2022 | |
| Lenovo Legion 5 Pro 16 G7 i7 RTX 3070Ti | |
| Average NVIDIA GeForce RTX 3070 Ti Laptop GPU (76.8 - 124.1, n=39) | |
| HP Omen 16-b1090ng | |
| Razer Blade 14 Ryzen 9 6900HX | |
| Asus ROG Zephyrus G14 GA402RK | |
| Gigabyte Aero 16 YE5 | |
| MSI Pulse GL66 12UEK | |
| 3840x2160 High Graphics & Postprocessing (Nvidia HairWorks Off) | |
| Average of class Gaming (114 - 170.9, n=4, last 2 years) | |
| Asus ROG Strix Scar 15 G533ZW-LN106WS | |
| MSI Raider GE66 12UHS | |
| Average NVIDIA GeForce RTX 3070 Ti Laptop GPU (73.2 - 78, n=2) | |
| Gigabyte Aero 16 YE5 | |
| 3840x2160 Ultra Graphics & Postprocessing (HBAO+) | |
| Average of class Gaming (112.4 - 114.8, n=2, last 2 years) | |
| Asus ROG Strix Scar 15 G533ZW-LN106WS | |
| Average NVIDIA GeForce RTX 3070 Ti Laptop GPU (48.4 - 52.3, n=2) | |
| Gigabyte Aero 16 YE5 | |
| F1 2021 | |
| 1920x1080 Ultra High Preset + Raytracing AA:T AF:16x | |
| MSI Raider GE66 12UHS | |
| Asus ROG Strix Scar 15 G533ZW-LN106WS | |
| Lenovo Legion 5 Pro 16 G7 i7 RTX 3070Ti | |
| Asus ROG Zephyrus G14 GA402RK | |
| Average NVIDIA GeForce RTX 3070 Ti Laptop GPU (67.3 - 134.2, n=13) | |
| Gigabyte Aero 16 YE5 | |
| 2560x1440 Ultra High Preset + Raytracing AA:T AF:16x | |
| Lenovo Legion 5 Pro 16 G7 i7 RTX 3070Ti | |
| Asus ROG Strix Scar 15 G533ZW-LN106WS | |
| Gigabyte Aero 16 YE5 | |
| Average NVIDIA GeForce RTX 3070 Ti Laptop GPU (47.5 - 99.2, n=11) | |
| Asus ROG Zephyrus G14 GA402RK | |
| 3840x2160 Ultra High Preset + Raytracing AA:T AF:16x | |
| Asus ROG Strix Scar 15 G533ZW-LN106WS | |
| Average NVIDIA GeForce RTX 3070 Ti Laptop GPU (47 - 56.8, n=3) | |
| Gigabyte Aero 16 YE5 | |
| Asus ROG Zephyrus G14 GA402RK | |
| Assassin´s Creed Valhalla | |
| 1920x1080 Ultra High Preset | |
| Asus ROG Zephyrus G14 GA402RK | |
| MSI Raider GE66 12UHS | |
| Asus ROG Strix Scar 15 G533ZW-LN106WS | |
| Average NVIDIA GeForce RTX 3070 Ti Laptop GPU (73 - 80, n=4) | |
| 2560x1440 Ultra High Preset | |
| MSI Raider GE66 12UHS | |
| Asus ROG Zephyrus G14 GA402RK | |
| Asus ROG Strix Scar 15 G533ZW-LN106WS | |
| Average NVIDIA GeForce RTX 3070 Ti Laptop GPU (56 - 62, n=3) | |
| 3840x2160 Ultra High Preset | |
| MSI Raider GE66 12UHS | |
| Asus ROG Strix Scar 15 G533ZW-LN106WS | |
| Average NVIDIA GeForce RTX 3070 Ti Laptop GPU (35 - 37, n=2) | |
| Asus ROG Zephyrus G14 GA402RK | |
The Witcher 3 FPS Chart
Frame rates in The Witcher 3 stress test at 1080p Ultra hover between 103 to 113 fps and seem relatively stable for the most part.
| low | med. | high | ultra | QHD | 4K | |
|---|---|---|---|---|---|---|
| GTA V (2015) | 182.7 | 184.5 | 172.2 | 123.9 | 101.9 | 98 |
| The Witcher 3 (2015) | 441 | 251 | 209 | 111 | 78 | |
| Dota 2 Reborn (2015) | 187 | 173.3 | 164.8 | 158.4 | 130.2 | |
| Final Fantasy XV Benchmark (2018) | 202 | 129.7 | 95.7 | 72.2 | 43.9 | |
| Far Cry 5 (2018) | 160 | 143 | 138 | 130 | 107 | 61 |
| Strange Brigade (2018) | 519 | 274 | 235 | 196.2 | 148.5 | 87.9 |
| Assassin´s Creed Valhalla (2020) | 160 | 111 | 94 | 80 | 62 | 37 |
| F1 2021 (2021) | 405 | 317 | 238 | 134.2 | 98.4 | 56.8 |
| Cyberpunk 2077 1.6 (2022) | 140.3 | 114.6 | 89.5 | 76 | 46 | 24.6 |
Check out the Nvidia GeForce RTX 3070 Ti Laptop GPU and game benchmark pages for more information and performance comparisons.
Emissions: 150 W RTX 3070 Ti at the expense of high fan noise
System Noise
The ROG Strix Scar 15's dual fans are capable of keeping the laptop performing well under load. However, this comes at the expense of higher noise levels particularly in the Turbo performance mode.
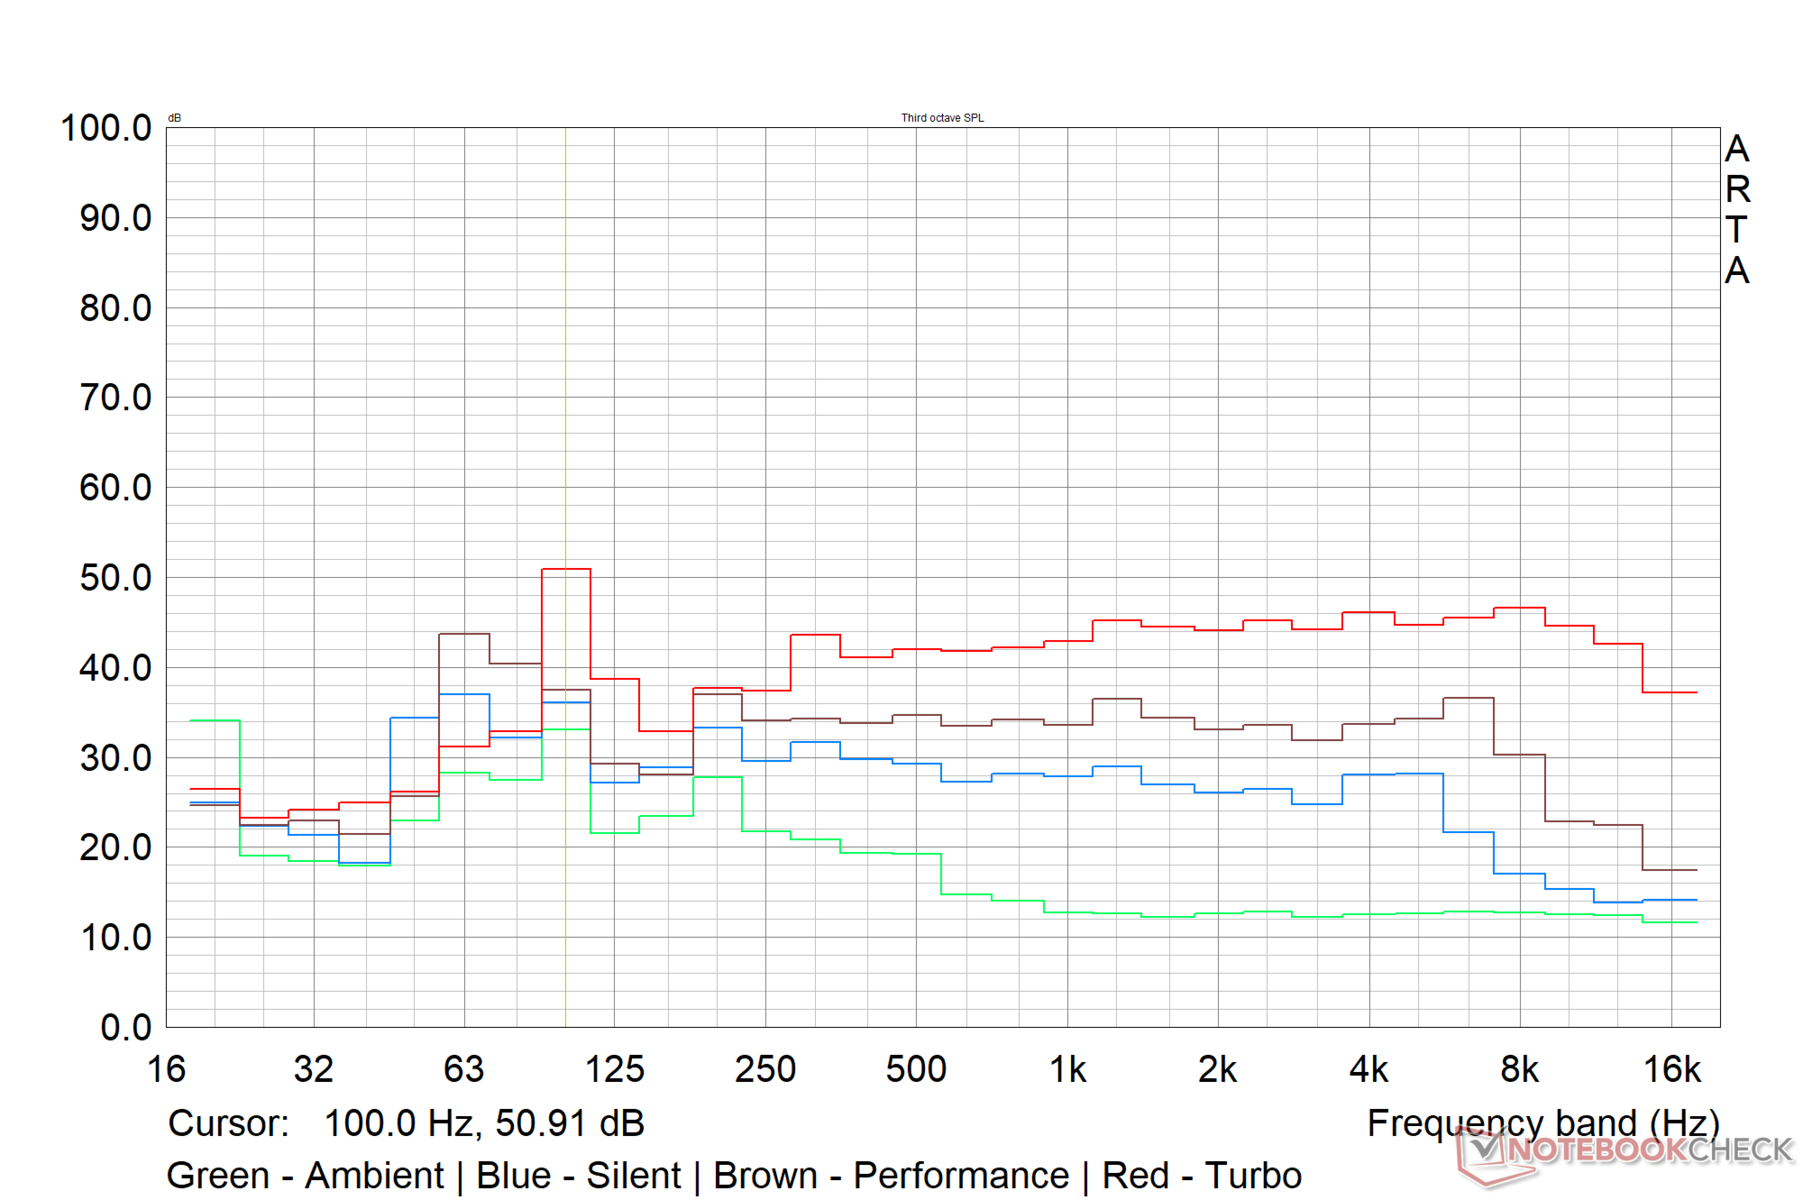
For measuring fan noise, we used the Earthworks M23R omnidirectional reference microphone connected to a Focusrite Scarlett 2i2 3rd gen USB audio interface and calibrated to a sound pressure level of 94 dB(A). The setup was placed at a fixed 15 cm distance from the laptop during recording.
Asus claims that the maximum operating noise under load in Turbo and Performance modes would be 48 dB(A), but we recorded fan noise levels up to 56.6 dB(A) in both max. load and The Witcher 3 Ultra stress scenarios. The idle noise levels were also on the higher side in Turbo but were around the 29 dB(A) mark in Silent and Performance modes.
We recorded 39.01 dB(A) as the maximum fan noise level under full load in the Silent profile.
Noise level
| Idle |
| 39.07 / 39.07 / 39.07 dB(A) |
| Load |
| 53.34 / 56.6 dB(A) |
 | ||
30 dB silent 40 dB(A) audible 50 dB(A) loud |
||
min: | ||


| Asus ROG Strix Scar 15 G533ZW Intel Core i9-12900H, NVIDIA GeForce RTX 3070 Ti Laptop GPU | MSI Raider GE66 12UHS Intel Core i9-12900HK, NVIDIA GeForce RTX 3080 Ti Laptop GPU | Lenovo Legion 5 Pro 16 G7 i7 RTX 3070Ti Intel Core i7-12700H, NVIDIA GeForce RTX 3070 Ti Laptop GPU | Asus ROG Zephyrus G14 GA402RK AMD Ryzen 9 6900HS, AMD Radeon RX 6800S | Razer Blade 15 2022 Intel Core i7-12800H, NVIDIA GeForce RTX 3080 Ti Laptop GPU | |
|---|---|---|---|---|---|
| Noise | 16% | 16% | 23% | 20% | |
| off / environment * (dB) | 26.86 | 26 3% | 24.6 8% | 24 11% | 25.4 5% |
| Idle Minimum * (dB) | 39.07 | 27 31% | 28.4 27% | 24 39% | 26.2 33% |
| Idle Average * (dB) | 39.07 | 30 23% | 28.4 27% | 26 33% | 26.2 33% |
| Idle Maximum * (dB) | 39.07 | 39 -0% | 28.4 27% | 31 21% | 28.4 27% |
| Load Average * (dB) | 53.34 | 45 16% | 49.4 7% | 45 16% | 44.7 16% |
| Witcher 3 ultra * (dB) | 56.6 | 45 20% | 49.4 13% | 43 24% | 44.7 21% |
| Load Maximum * (dB) | 56.6 | 47 17% | 54.7 3% | 45 20% | 51.9 8% |
* ... smaller is better
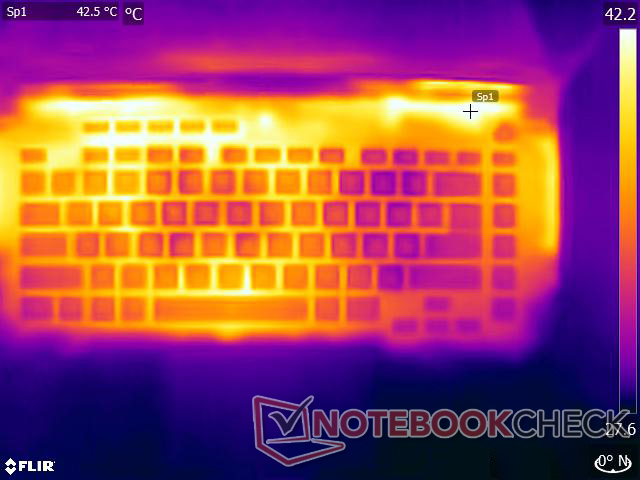
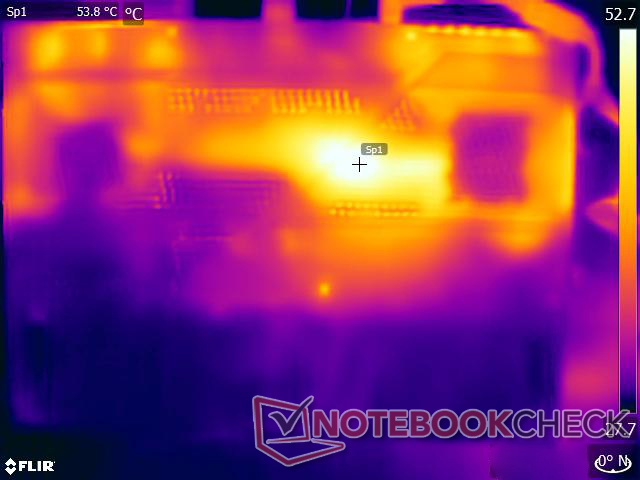
Temperature
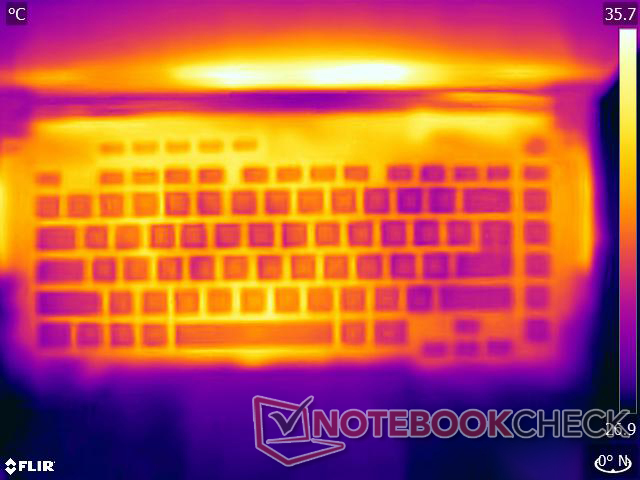
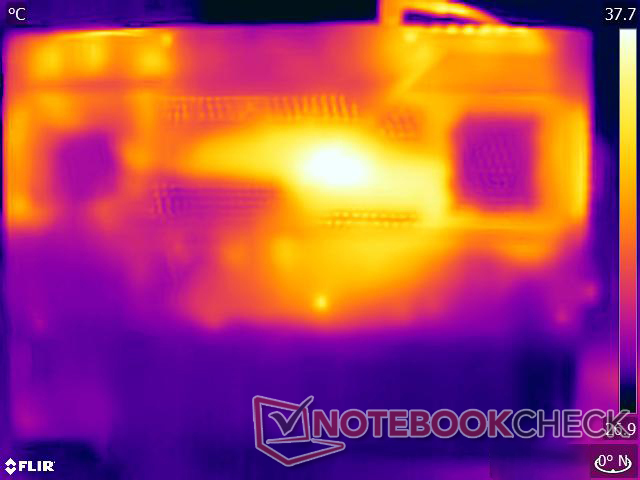
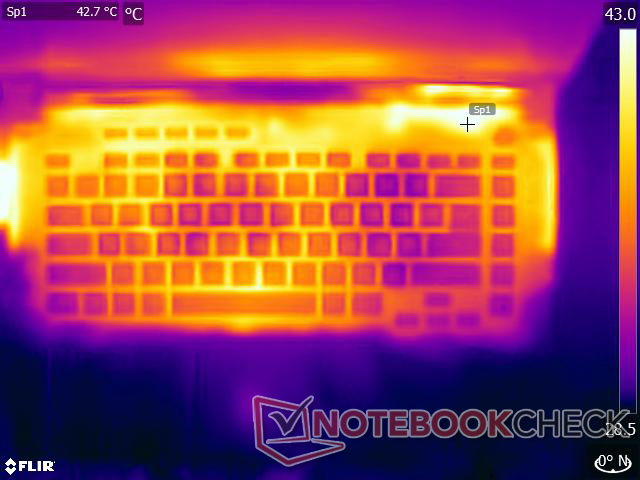
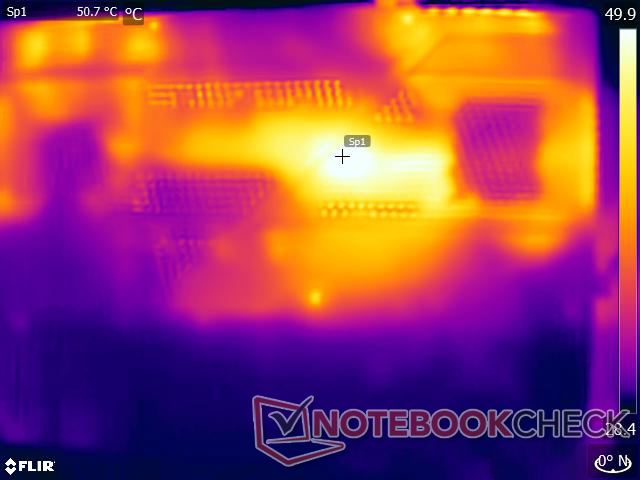
Even with a dual-fan and eight-heat pipe setup, surface temperatures can get high under load as is generally the norm when it comes to gaming laptops. We recorded a maximum of 42.6 °C on the top and 50.2 °C on the bottom surfaces under a combined Prime95 + FurMark load. With The Witcher 3, the top and bottom hotspots were 48.4 °C and 54.4 °C, respectively.
Despite higher surface temperatures elsewhere on the chassis, Asus does a good job of keeping the palm rest areas relatively cool. If you want to use the device on the lap, we recommend switching to the Silent profile and not stressing the device much.
(±) The maximum temperature on the upper side is 42.6 °C / 109 F, compared to the average of 40.4 °C / 105 F, ranging from 21.2 to 68.8 °C for the class Gaming.
(-) The bottom heats up to a maximum of 50.2 °C / 122 F, compared to the average of 43.2 °C / 110 F
(±) In idle usage, the average temperature for the upper side is 33.4 °C / 92 F, compared to the device average of 33.9 °C / 93 F.
(-) Playing The Witcher 3, the average temperature for the upper side is 41.3 °C / 106 F, compared to the device average of 33.9 °C / 93 F.
(+) The palmrests and touchpad are reaching skin temperature as a maximum (33.4 °C / 92.1 F) and are therefore not hot.
(-) The average temperature of the palmrest area of similar devices was 28.8 °C / 83.8 F (-4.6 °C / -8.3 F).
| Asus ROG Strix Scar 15 G533ZW Intel Core i9-12900H, NVIDIA GeForce RTX 3070 Ti Laptop GPU | MSI Raider GE66 12UHS Intel Core i9-12900HK, NVIDIA GeForce RTX 3080 Ti Laptop GPU | Lenovo Legion 5 Pro 16 G7 i7 RTX 3070Ti Intel Core i7-12700H, NVIDIA GeForce RTX 3070 Ti Laptop GPU | Asus ROG Zephyrus G14 GA402RK AMD Ryzen 9 6900HS, AMD Radeon RX 6800S | Razer Blade 15 2022 Intel Core i7-12800H, NVIDIA GeForce RTX 3080 Ti Laptop GPU | |
|---|---|---|---|---|---|
| Heat | -7% | 4% | -1% | -3% | |
| Maximum Upper Side * (°C) | 42.6 | 54 -27% | 45.3 -6% | 55 -29% | 50 -17% |
| Maximum Bottom * (°C) | 50.2 | 65 -29% | 61.2 -22% | 55 -10% | 47 6% |
| Idle Upper Side * (°C) | 36.2 | 30 17% | 28.6 21% | 30 17% | 37.4 -3% |
| Idle Bottom * (°C) | 40.2 | 35 13% | 31.4 22% | 32 20% | 38.4 4% |
* ... smaller is better
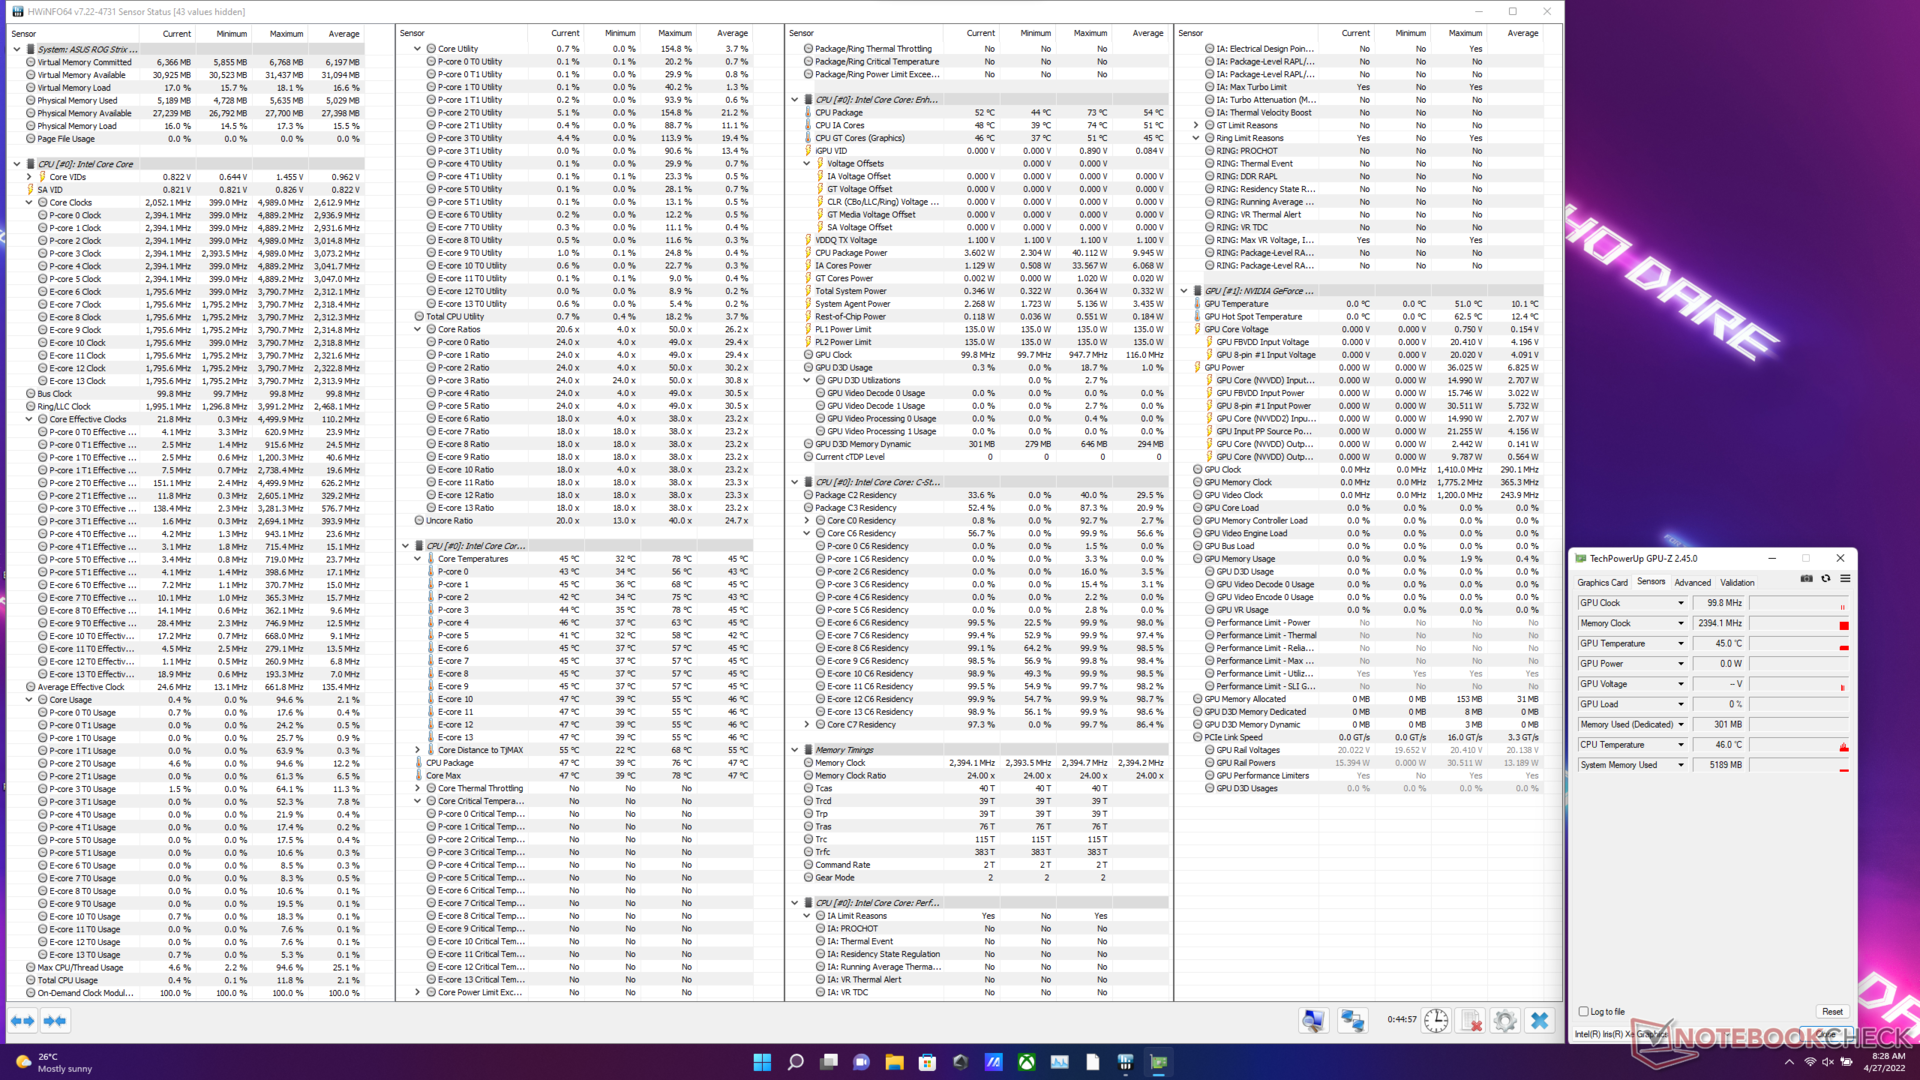
Stress Test
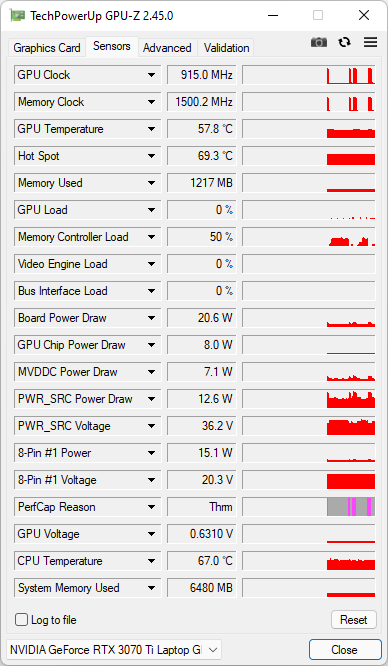
Stressing the Scar 15 in the Turbo profile reveals insights into how TDPs, temperatures, and clocks vary and how available power is distributed between the CPU and the GPU.
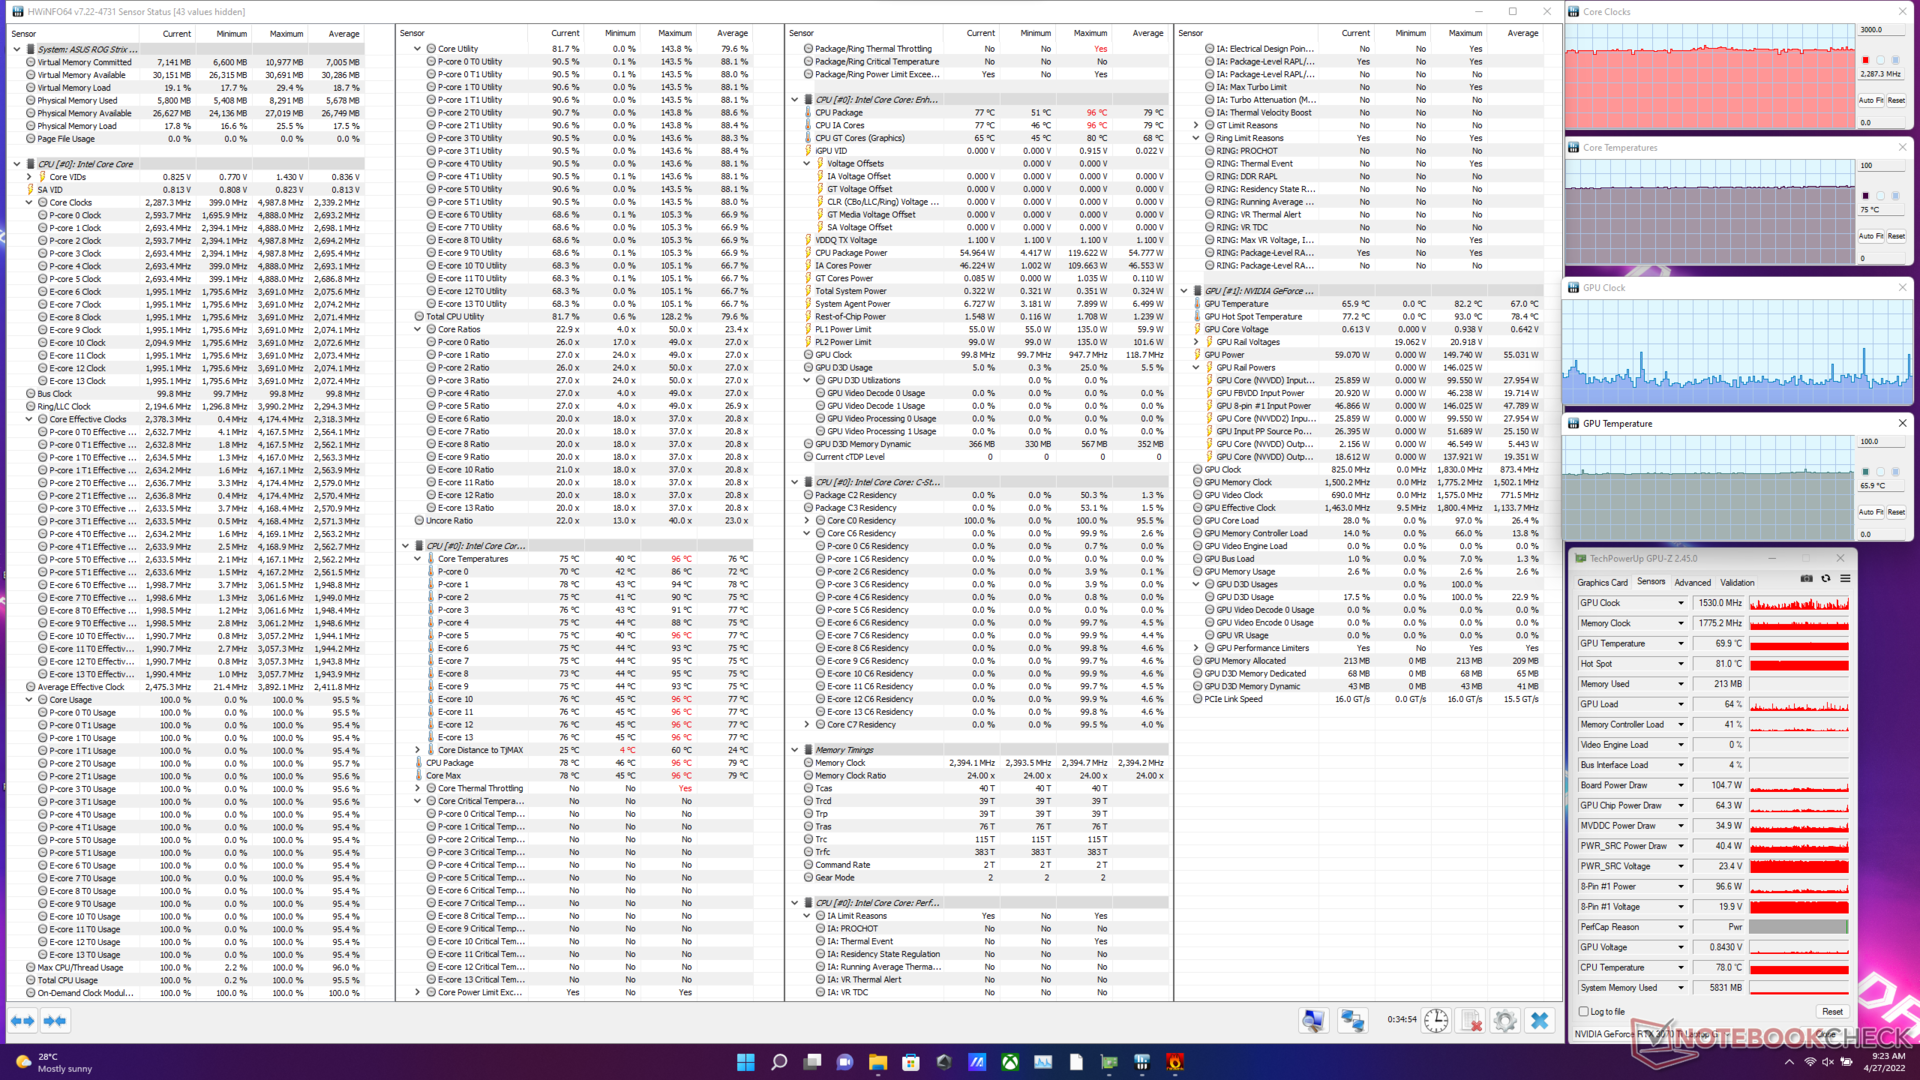
With Prime95 alone, we observe that the Core i9-12900H is able to draw 130 W for a short time before dropping down to 120 W and eventually settling between 100 to 110 W; we saw similar TDP utilization during the Cinebench R15 loop test above in Turbo mode. As a result, the CPU temperatures can sustain near the 90 °C mark with clocks being consistent at nearly 3.5 GHz.
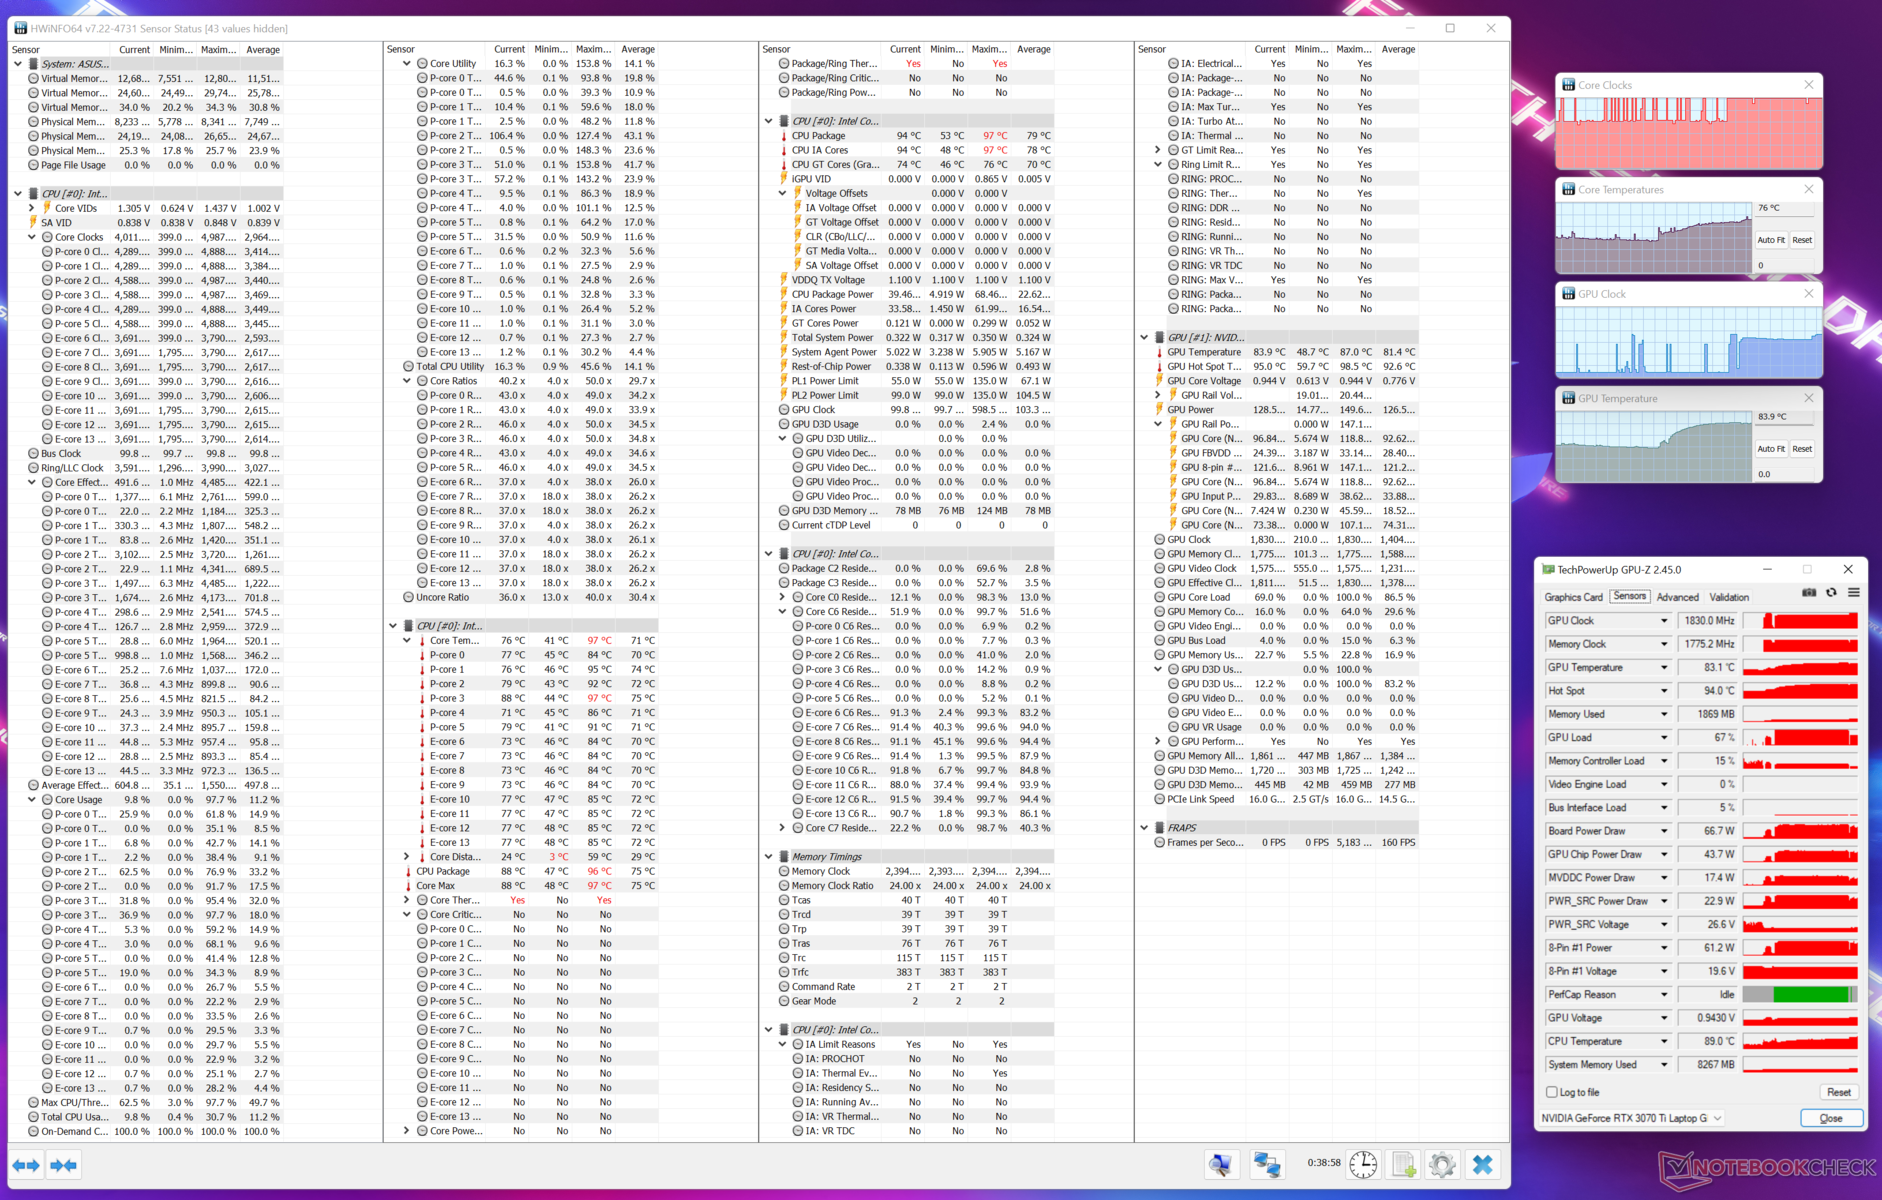
Adding FurMark to the mix brings the RTX 3070 Ti into action. The CPU TDP now drops just short of the 60 W mark leaving more thermal and power headroom for the GPU, allowing the latter to boost to just above the 1,500 MHz mark albeit only for a brief time.
The Witcher 3 presents a more real-world picture of how CPU and GPU metrics can change during gaming. Here, we also see Dynamic Boost coming into action with the RTX 3070 Ti now able to sustain fairly well between 140 W and 150 W TGP and boost clocks at 1,800 MHz. The Core i9-12900H settles for a 3 GHz clock at a much lesser TDP requirement of just about 25 W.
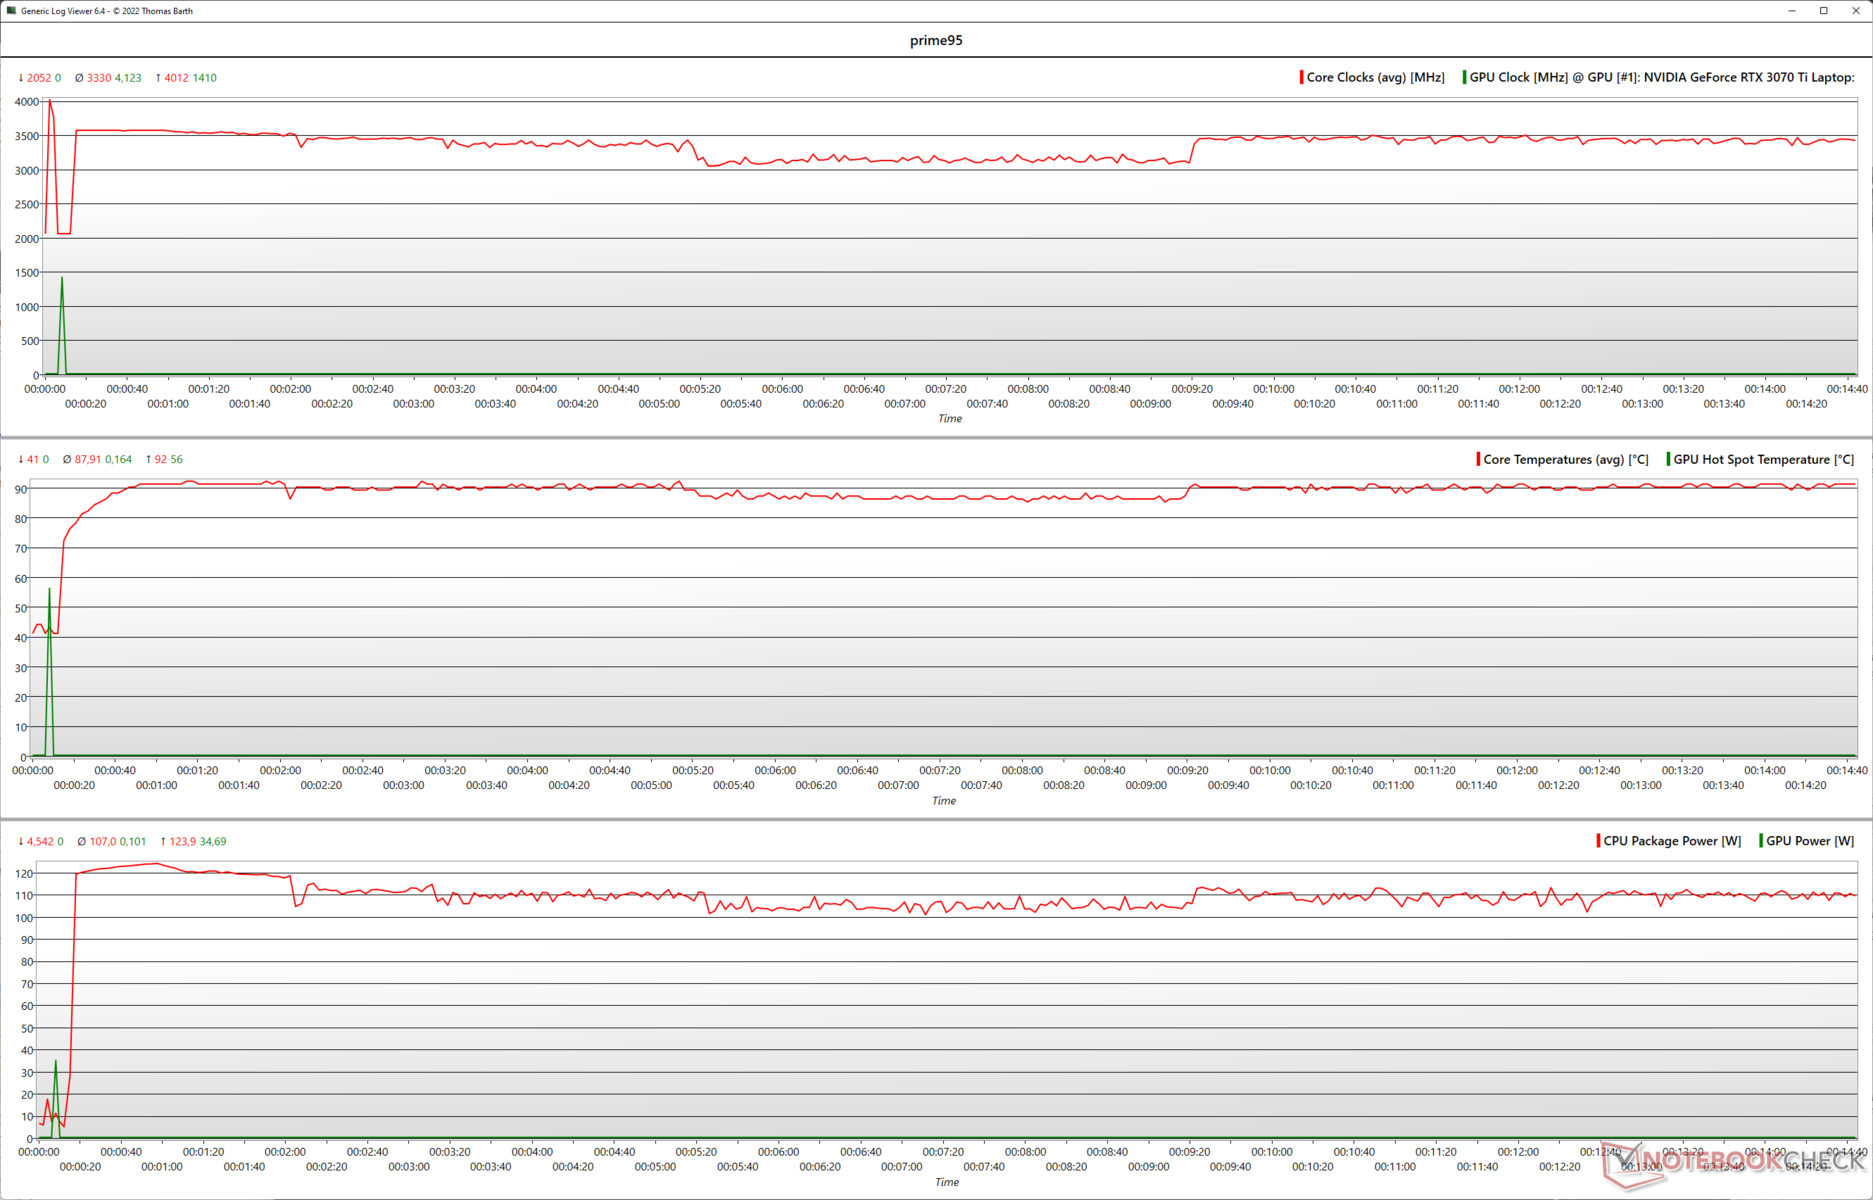
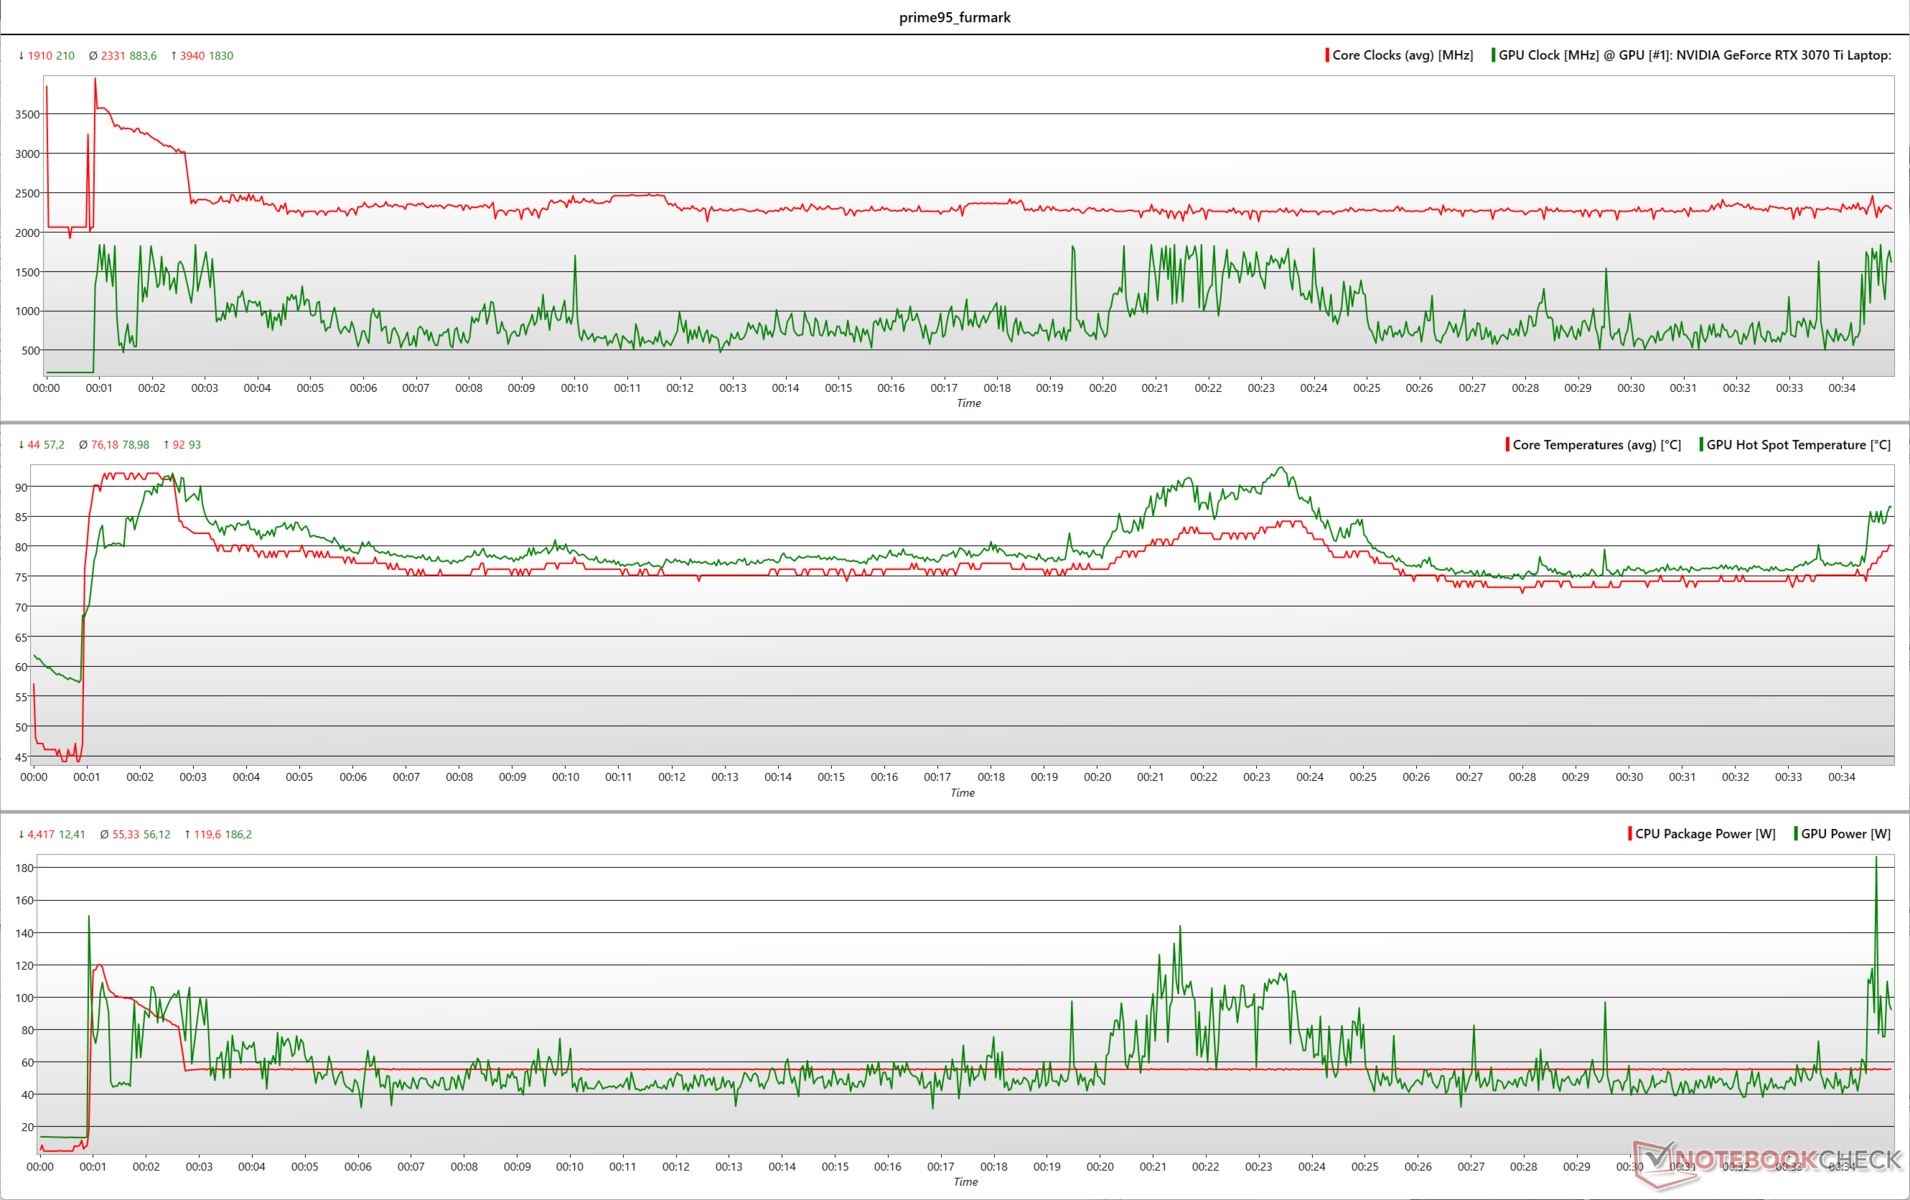
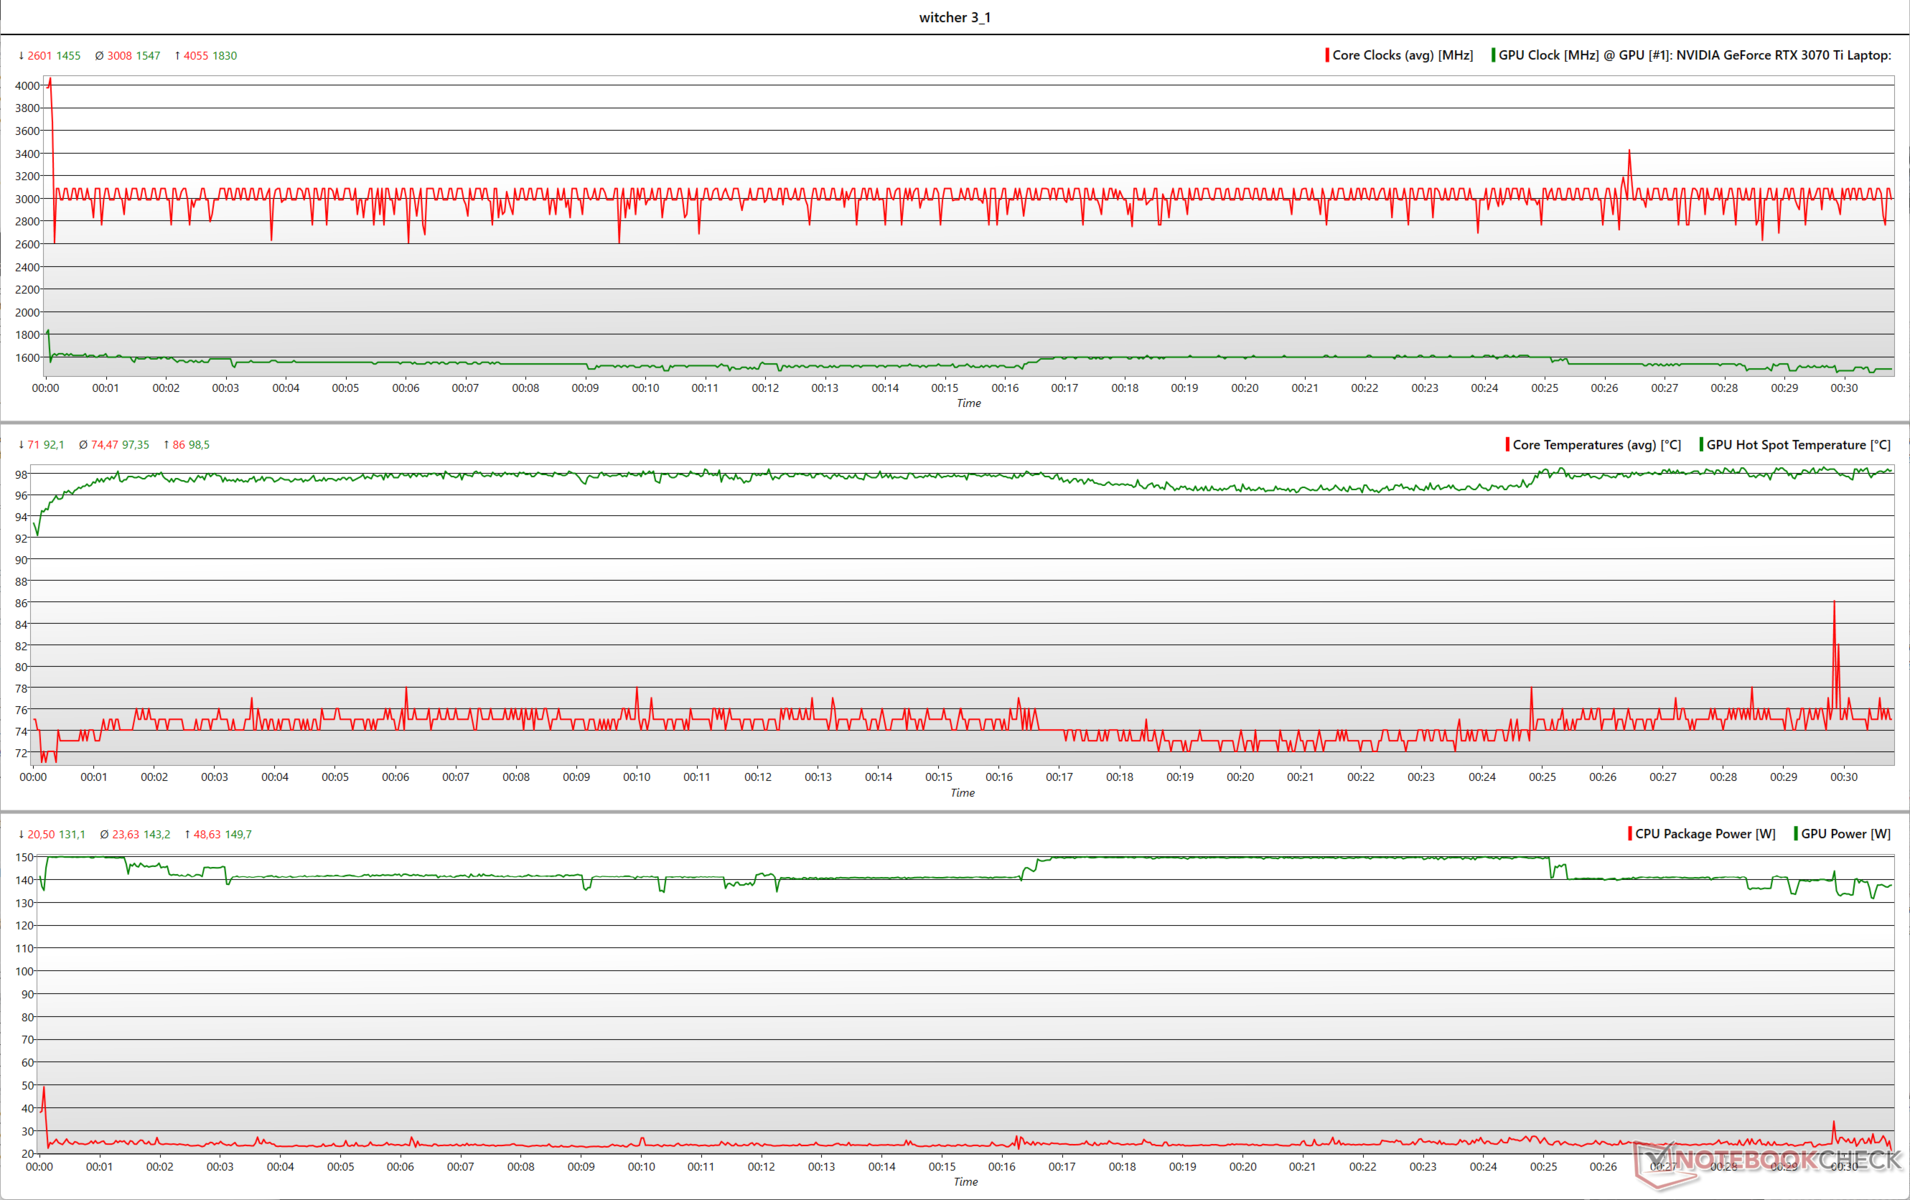
| Stress Test | CPU Clock (GHz) | GPU Clock (MHz) | Average CPU Temperature (°C) | Average GPU Temperature (°C) |
| System Idle | 2.05 | 99.8 | 45 | 45 |
| Prime95 | 3.49 | 99.8 | 87.9 | 44.8 |
| Prime95 + FurMark | 2.28 | 1,530 | 76 | 67 |
| The Witcher 3 | 4.0 | 1,830 | 71 | 81.4 |
Speakers
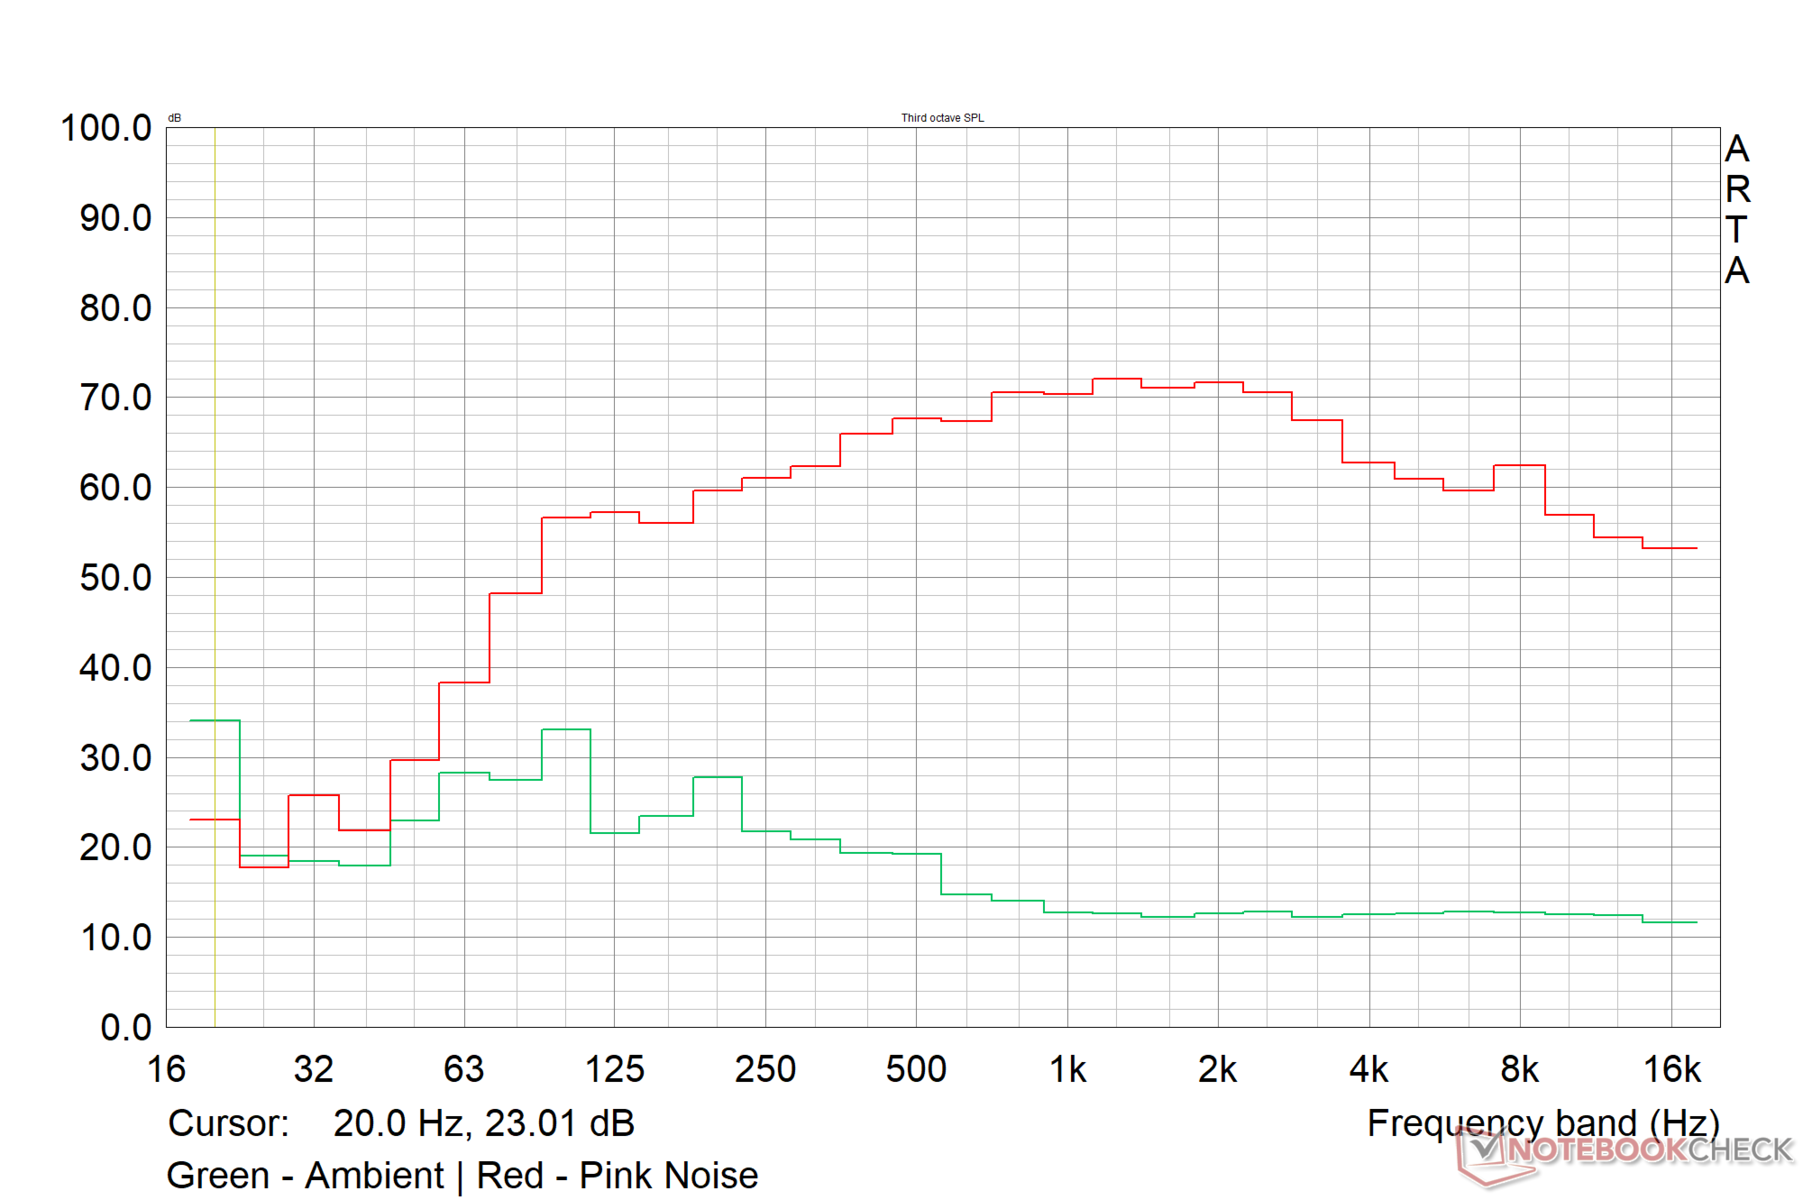
Asus does not actually mention the Scar 15's speaker power in its materials and just indicates that the laptop uses a quad-speaker system with Dolby Atmos and Smart Amp. Most likely, the speaker system is unchanged from the 2021 version, which had 2x 4 W downward firing speakers at the front and 2x 2W tweeters near the hinge area below the display. The speakers have a loudness of about 80.5 dB in a medium-sized closed room, which is decent.
The separation of the passively radiated woofers and the tweeters results in a decent bass response given the chassis constraints. The mids are linear and the highs, balanced. Subjectively, the ROG Strix Scar 15's audio quality is quite serviceable for most purposes. There is no perceivable distortion at higher volumes.
The speakers are certified for Dolby Atmos, and the official Dolby Access app comes pre-installed with fully enabled licenses for Dolby Atmos for Headphones and Dolby Atmos for built-in speakers. The app allows changing between various available sound profiles and creating up to three custom EQ presets.
Asus ROG Strix Scar 15 G533ZW-LN106WS audio analysis
(±) | speaker loudness is average but good (80.5 dB)
Bass 100 - 315 Hz
(+) | good bass - only 3.7% away from median
(+) | bass is linear (5.5% delta to prev. frequency)
Mids 400 - 2000 Hz
(±) | higher mids - on average 7.1% higher than median
(+) | mids are linear (3.1% delta to prev. frequency)
Highs 2 - 16 kHz
(+) | balanced highs - only 3.3% away from median
(+) | highs are linear (5.9% delta to prev. frequency)
Overall 100 - 16.000 Hz
(+) | overall sound is linear (12.2% difference to median)
Compared to same class
» 13% of all tested devices in this class were better, 4% similar, 83% worse
» The best had a delta of 6%, average was 18%, worst was 132%
Compared to all devices tested
» 10% of all tested devices were better, 3% similar, 88% worse
» The best had a delta of 4%, average was 23%, worst was 134%
Apple MacBook Pro 16 2021 M1 Pro audio analysis
(+) | speakers can play relatively loud (84.7 dB)
Bass 100 - 315 Hz
(+) | good bass - only 3.8% away from median
(+) | bass is linear (5.2% delta to prev. frequency)
Mids 400 - 2000 Hz
(+) | balanced mids - only 1.3% away from median
(+) | mids are linear (2.1% delta to prev. frequency)
Highs 2 - 16 kHz
(+) | balanced highs - only 1.9% away from median
(+) | highs are linear (2.7% delta to prev. frequency)
Overall 100 - 16.000 Hz
(+) | overall sound is linear (4.6% difference to median)
Compared to same class
» 0% of all tested devices in this class were better, 0% similar, 100% worse
» The best had a delta of 5%, average was 17%, worst was 45%
Compared to all devices tested
» 0% of all tested devices were better, 0% similar, 100% worse
» The best had a delta of 4%, average was 23%, worst was 134%
Energy Management: Core i9-12900H and RTX 3070 Ti combo can get demanding
Power Consumption
Asus supplies a 280 W power adapter with this year's Scar 15, and we see that the laptop is able to nearly maximize the power draw under maximum load. Overall energy consumption under load seems to be on the higher side given the powerful guts. Power draw during standby could have been lesser.
The Razer Blade 14 with a Ryzen 9 6900HX seems to be about 20% less economical overall mainly due to high idle power draws.
| Off / Standby | |
| Idle | |
| Load |
|
Key:
min: | |
| Asus ROG Strix Scar 15 G533ZW i9-12900H, GeForce RTX 3070 Ti Laptop GPU, Samsung PM9A1 MZVL22T0HBLB, IPS-level, 2560x1440, 15.6" | MSI Raider GE66 12UHS i9-12900HK, GeForce RTX 3080 Ti Laptop GPU, Samsung PM9A1 MZVL22T0HBLB, IPS, 3840x2160, 15.6" | Lenovo Legion 5 Pro 16 G7 i7 RTX 3070Ti i7-12700H, GeForce RTX 3070 Ti Laptop GPU, Samsung PM9A1 MZVL21T0HCLR, IPS, 2560x1600, 16" | Razer Blade 14 Ryzen 9 6900HX R9 6900HX, GeForce RTX 3070 Ti Laptop GPU, Samsung PM9A1 MZVL21T0HCLR, IPS, 2560x1440, 14" | Razer Blade 15 2022 i7-12800H, GeForce RTX 3080 Ti Laptop GPU, SSSTC CA6-8D1024, IPS, 2560x1440, 15.6" | Average NVIDIA GeForce RTX 3070 Ti Laptop GPU | Average of class Gaming | |
|---|---|---|---|---|---|---|---|
| Power Consumption | -31% | -10% | -20% | -99% | -36% | -28% | |
| Idle Minimum * (Watt) | 7.56 | 16 -112% | 8.6 -14% | 10.2 -35% | 33.2 -339% | 14.2 ? -88% | 13 ? -72% |
| Idle Average * (Watt) | 13.5 | 19 -41% | 17.6 -30% | 26 -93% | 36.4 -170% | 19.9 ? -47% | 19 ? -41% |
| Idle Maximum * (Watt) | 16.87 | 26 -54% | 18.5 -10% | 26.7 -58% | 37.6 -123% | 26.2 ? -55% | 24.6 ? -46% |
| Load Average * (Watt) | 128.9 | 110 15% | 110 15% | 89.3 31% | 116.7 9% | 125.8 ? 2% | 110.7 ? 14% |
| Witcher 3 ultra * (Watt) | 196.2 | 202 -3% | 227 -16% | 158.7 19% | 172 12% | ||
| Load Maximum * (Watt) | 274.86 | 242 12% | 294.6 -7% | 227.5 17% | 228.6 17% | 248 ? 10% | 259 ? 6% |
* ... smaller is better
Power Consumption - The Witcher 3 / Stress test
Power Consumption - External Monitor
Battery Life
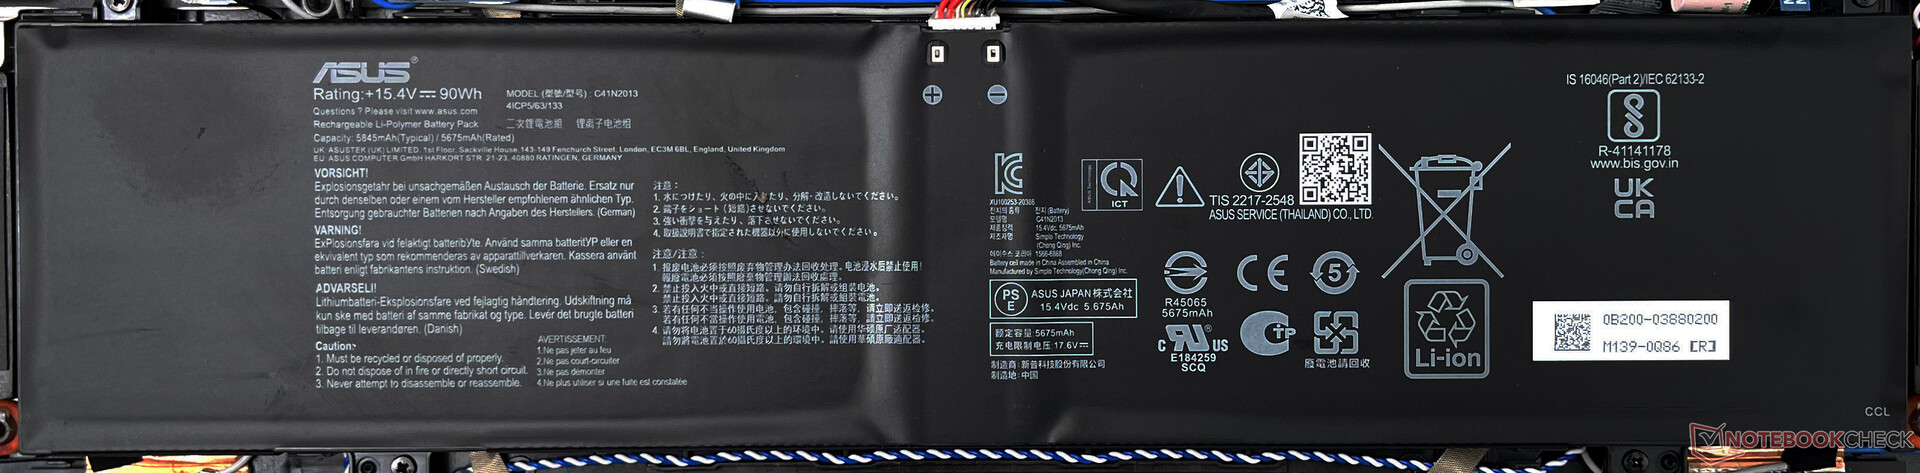
The ROG Strix Scar 15 features a 90 Whr 4S1P battery. Run times are decent given the powerful internals. Asus claims a video playback backup time of up to 10.5 hours — we clocked 8.5 hours with our H.264 1080p video loop.
Web browsing run times at reduced brightness with our standard script last for nearly 8.5 hours. Interestingly, both the AMD Ryzen 9-powered notebooks in the comparison — the Asus ROG Zephyrus G14 and the Razer Blade 14 — are able to afford about 70 minutes higher run time in this test despite sporting much smaller batteries.
Gaming on battery results in just 70 minutes of backup even at reduced brightness.
| Asus ROG Strix Scar 15 G533ZW i9-12900H, GeForce RTX 3070 Ti Laptop GPU, 90 Wh | MSI Raider GE66 12UHS i9-12900HK, GeForce RTX 3080 Ti Laptop GPU, 99 Wh | Lenovo Legion 5 Pro 16 G7 i7 RTX 3070Ti i7-12700H, GeForce RTX 3070 Ti Laptop GPU, 80 Wh | Asus ROG Zephyrus G14 GA402RK R9 6900HS, Radeon RX 6800S, 76 Wh | Razer Blade 14 Ryzen 9 6900HX R9 6900HX, GeForce RTX 3070 Ti Laptop GPU, 62 Wh | Razer Blade 15 2022 i7-12800H, GeForce RTX 3080 Ti Laptop GPU, 80 Wh | Average of class Gaming | |
|---|---|---|---|---|---|---|---|
| Battery runtime | 14% | -32% | 7% | 46% | -42% | 17% | |
| H.264 (h) | 8.5 | 7.1 -16% | 6.3 -26% | 8.32 ? -2% | |||
| WiFi v1.3 (h) | 8.4 | 5.7 -32% | 5.4 -36% | 9.5 13% | 9.5 13% | 4.9 -42% | 7.11 ? -15% |
| Witcher 3 ultra (h) | 1.2 | ||||||
| Load (h) | 0.9 | 1.7 89% | 0.6 -33% | 0.9 0% | 1.6 78% | 1.502 ? 67% | |
| Reader / Idle (h) | 18.1 | 12.2 | 8.27 ? |
Pros
Cons
Verdict: Brawny QHD gaming machine that delivers on most fronts
Asus continues to refine the ROG Strix Scar lineup with new upgrades. The Asus ROG Strix Scar 15 G533 (2022) offers almost everything you would expect from a gaming laptop at this price. The build quality is great, connectivity options are decent, and there is enough scope for internal upgrades as well. Certain SKUs in some regions may not ship with the external ROG Eye webcam, so keep that in mind.
Asus reverts to membrane switches for the keyboard — though not as "clickety" as the opto-mechanical ones we saw with last year's model, they still make for a decent typing and gaming experience. The lack of biometrics in any form is a downer.
Display characteristics seem good for general usage and gaming with QHD resolution, Dolby Vision support, decent color calibration, 240 Hz refresh, and fast response times. However, the measured black levels seem inadequate.
With unhindered connectivity, performance, and loads of customization possibilities, the Asus ROG Strix Scar 15 G533 definitely merits a top consideration if you are on the hunt for a capable QHD gaming laptop as long as you can put up with higher heat and noise emissions."
Asus allows both the Core i9-12900H and the RTX 3070 Ti to fully flex without much trouble. Adequate performance on the move can still be had with lower performance profiles, but the 90 Whr battery could have ideally lasted longer.
The ROG Strix Scar 15 is not without competition, though. The MSI Vector GP66 12UGS comes across as a capable contender, and its 1080p 360 Hz display might grab the attention of competitive gamers. The Lenovo Legion 5i Pro 16 with its Core i7-12700H manages to evoke surprise with its superlative CPU performance that surpasses even the Core i9-12900HK in some laptops.
The Scar 15's Core i9-12900H's performance is also head and shoulders above both Ryzen 9-powered contenders — the Asus ROG Zephyrus G14 and the Razer Blade 14 — although these Ryzen 6000 laptops have an advantage in terms of power consumption and battery life.
At ₹2,64,990 (US$3,419), the ROG Strix Scar 15's asking price is high in the Indian market, but you're getting a device that checks off almost all the required boxes and one that will let you play many current and upcoming games in QHD Ultra without breaking a sweat.
Price and Availability
The Asus ROG Strix Scar 15 G533 is available on Amazon India as well as on Amazon US for US$3,269. You can also get a cheaper Scar 15 G533 with a Core i9-12900H, RTX 3060, and FHD display for US$1,736.99 on BestBuy.
Asus ROG Strix Scar 15 G533ZW-LN106WS
- 05/31/2022 v7 (old)
Vaidyanathan Subramaniam
Price comparison
