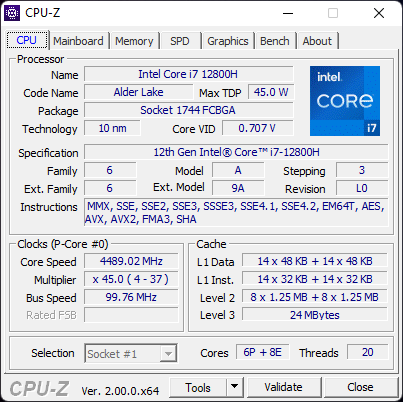
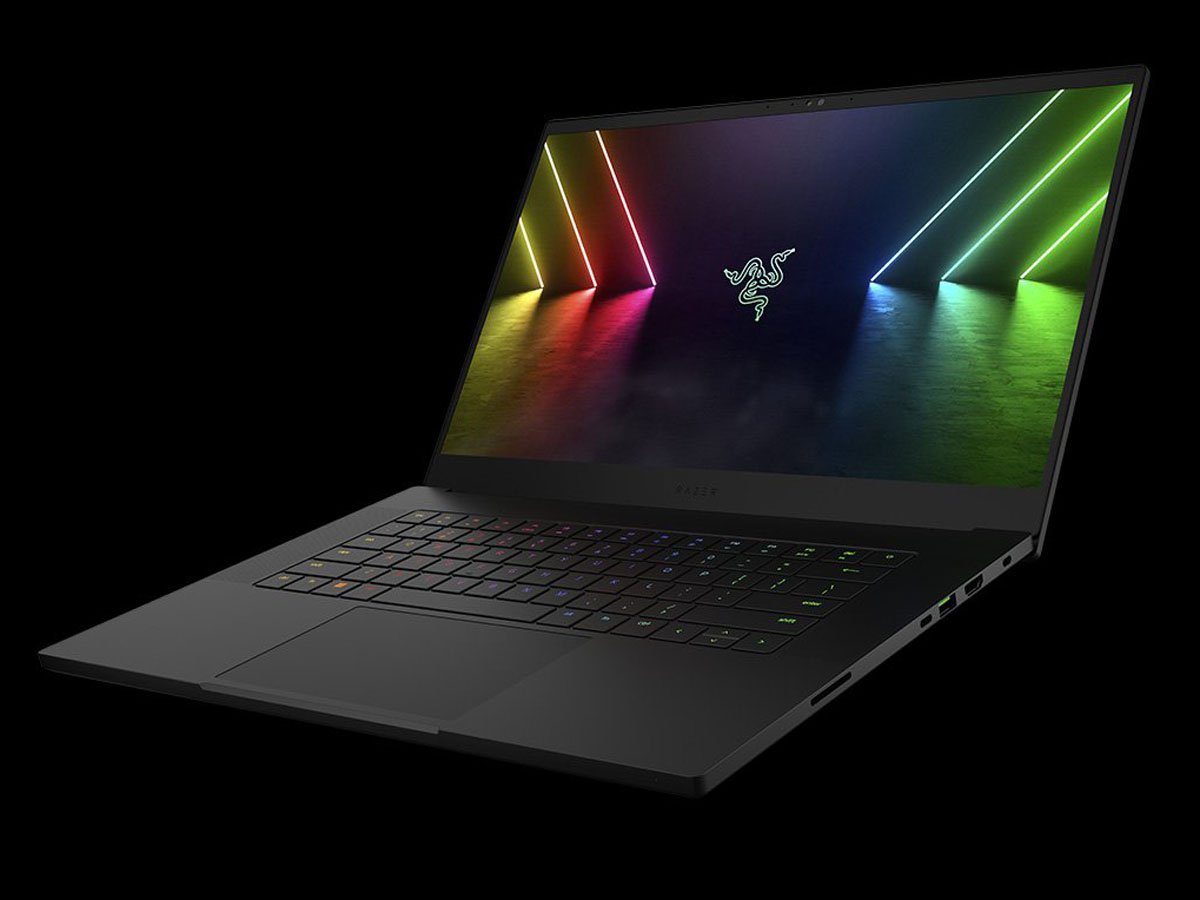
Intel Core i7-12800H debut: Razer Blade 15 laptop review
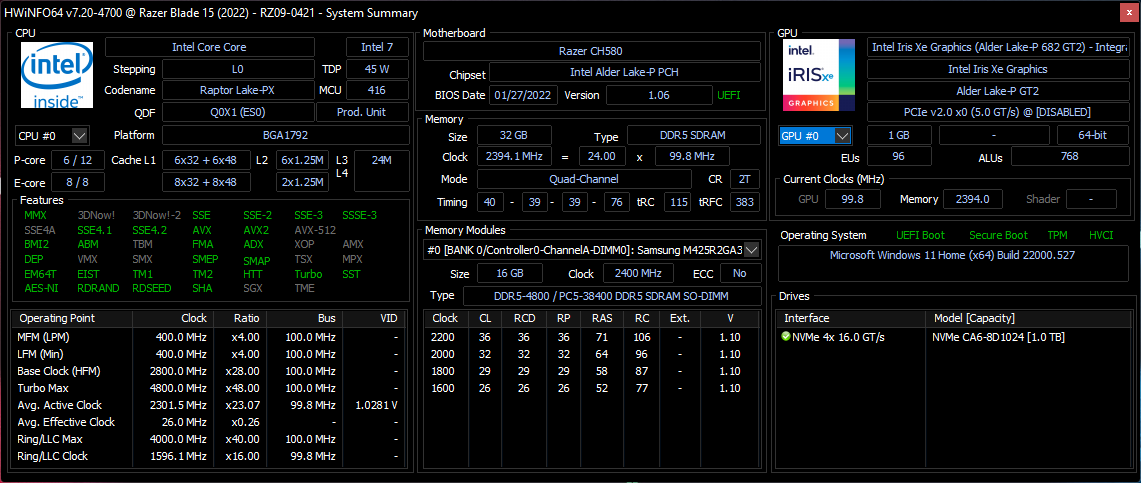
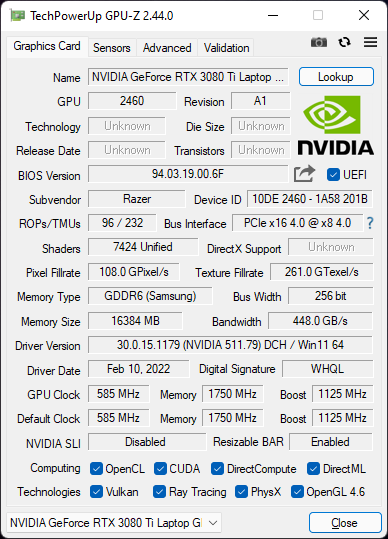
Razer has refreshed its Blade 15 series this year to include the latest Intel CPUs and Nvidia GPUs. In this case, the model is getting 12th gen Alder Lake-H Core i7-12800H and Core i9-12900H CPUs alongside the GeForce RTX 3070 Ti and 3080 Ti (110 W TGP) to replace the older 11th gen Core i7-11800H, Core i9-11900H, RTX 3070, and RTX 3080 (105 W TGP) options. This review will focus on the performance differences users can expect when upgrading from an older Razer Blade 15 to the latest 2022 configuration in review.
Alternatives to the Blade 15 include other ultrathin 15.6-inch gaming laptops like the Eurocom RX315, MSI GS66, ADATA XPG Xenia 15, or the Asus Zephyrus S series.
More Razer reviews:
Potential Competitors in Comparison
Rating | Date | Model | Weight | Height | Size | Resolution | Price |
|---|---|---|---|---|---|---|---|
| 89.1 % v7 (old) | 03 / 2022 | Razer Blade 15 2022 i7-12800H, GeForce RTX 3080 Ti Laptop GPU | 2.1 kg | 16.99 mm | 15.60" | 2560x1440 | |
| 87.5 % v7 (old) | 05 / 2021 | Razer Blade 15 Advanced Model Early 2021 i7-10875H, GeForce RTX 3080 Laptop GPU | 2 kg | 16.99 mm | 15.60" | 1920x1080 | |
| 85.9 % v7 (old) | 08 / 2020 | Razer Blade 15 RTX 2080 Super Max-Q i7-10875H, GeForce RTX 2080 Super Max-Q | 2.2 kg | 17.8 mm | 15.60" | 1920x1080 | |
v (old) | 03 / 2022 | Schenker XMG Neo 15 E22 (Early 2022, RTX 3080 Ti) i7-12700H, GeForce RTX 3080 Ti Laptop GPU | 2.2 kg | 26.6 mm | 15.60" | 2560x1440 | |
| 87.3 % v7 (old) | 10 / 2021 | ADATA XPG Xenia 15 i7-11800H, GeForce RTX 3070 Laptop GPU | 1.9 kg | 20.5 mm | 15.60" | 2560x1440 | |
| 83 % v7 (old) | 01 / 2022 | Eurocom Nightsky ARX315 R9 5900X, GeForce RTX 3070 Laptop GPU | 2.6 kg | 32.5 mm | 15.60" | 1920x1080 |
Case
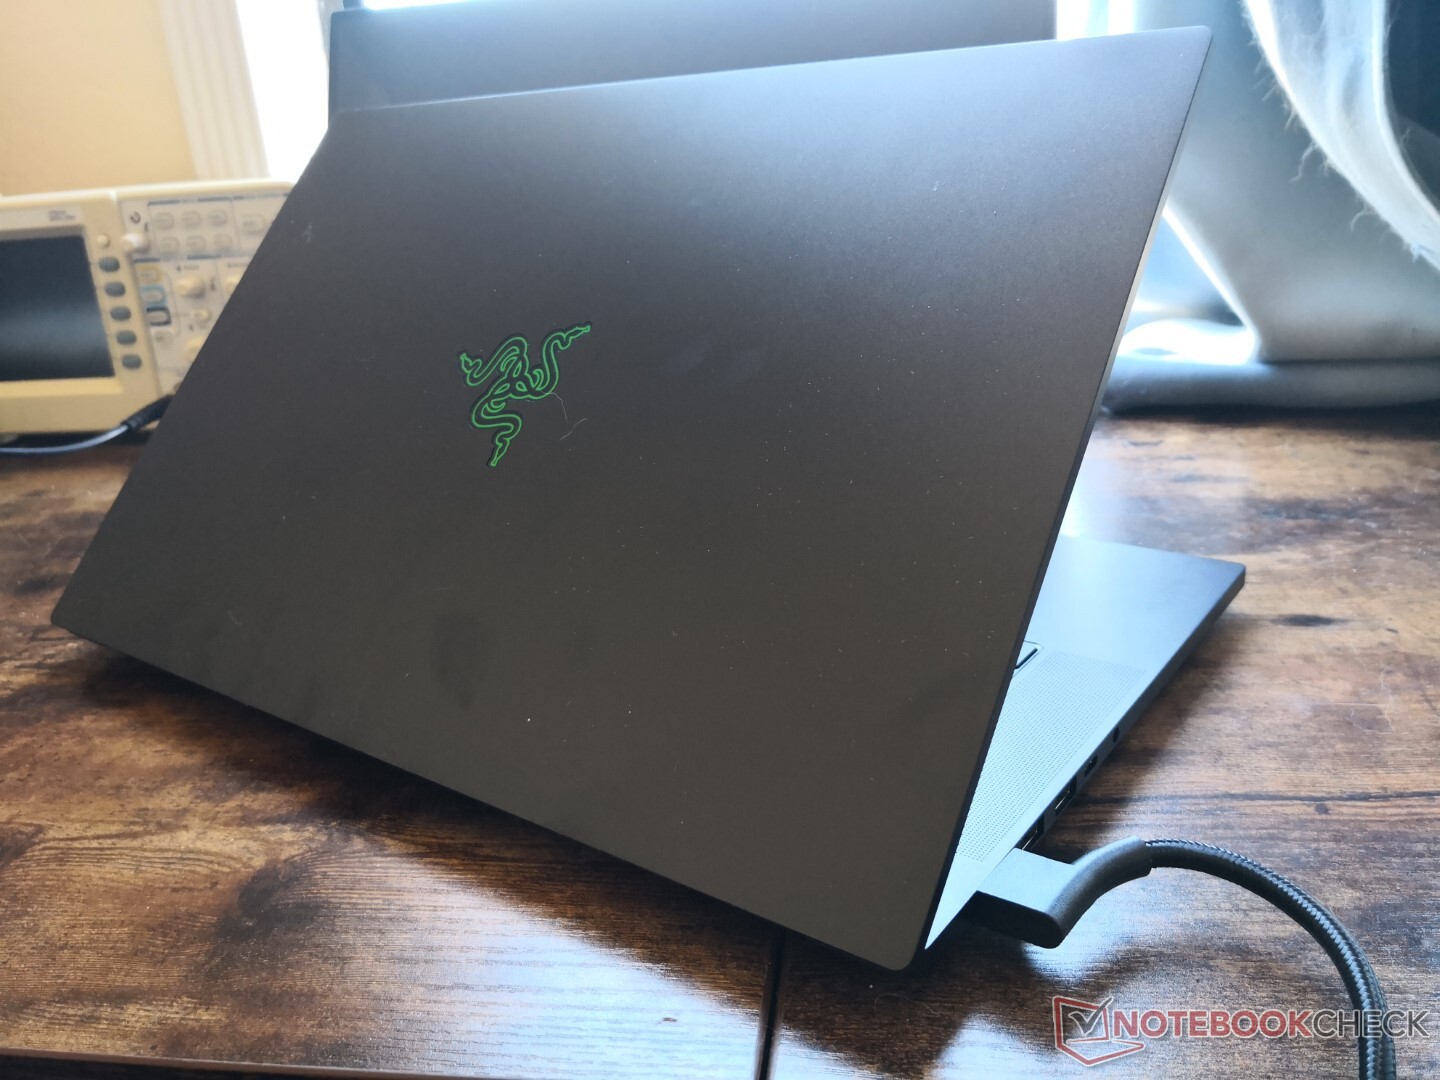
The chassis remains mostly identical to last year's Advanced Model and so there are no changes to the dimensions or feel of the system. If you've handled a Blade Stealth, Blade 14, Blade 15, or Blade Pro 17 in the past, then this latest 2022 will feel familiar.
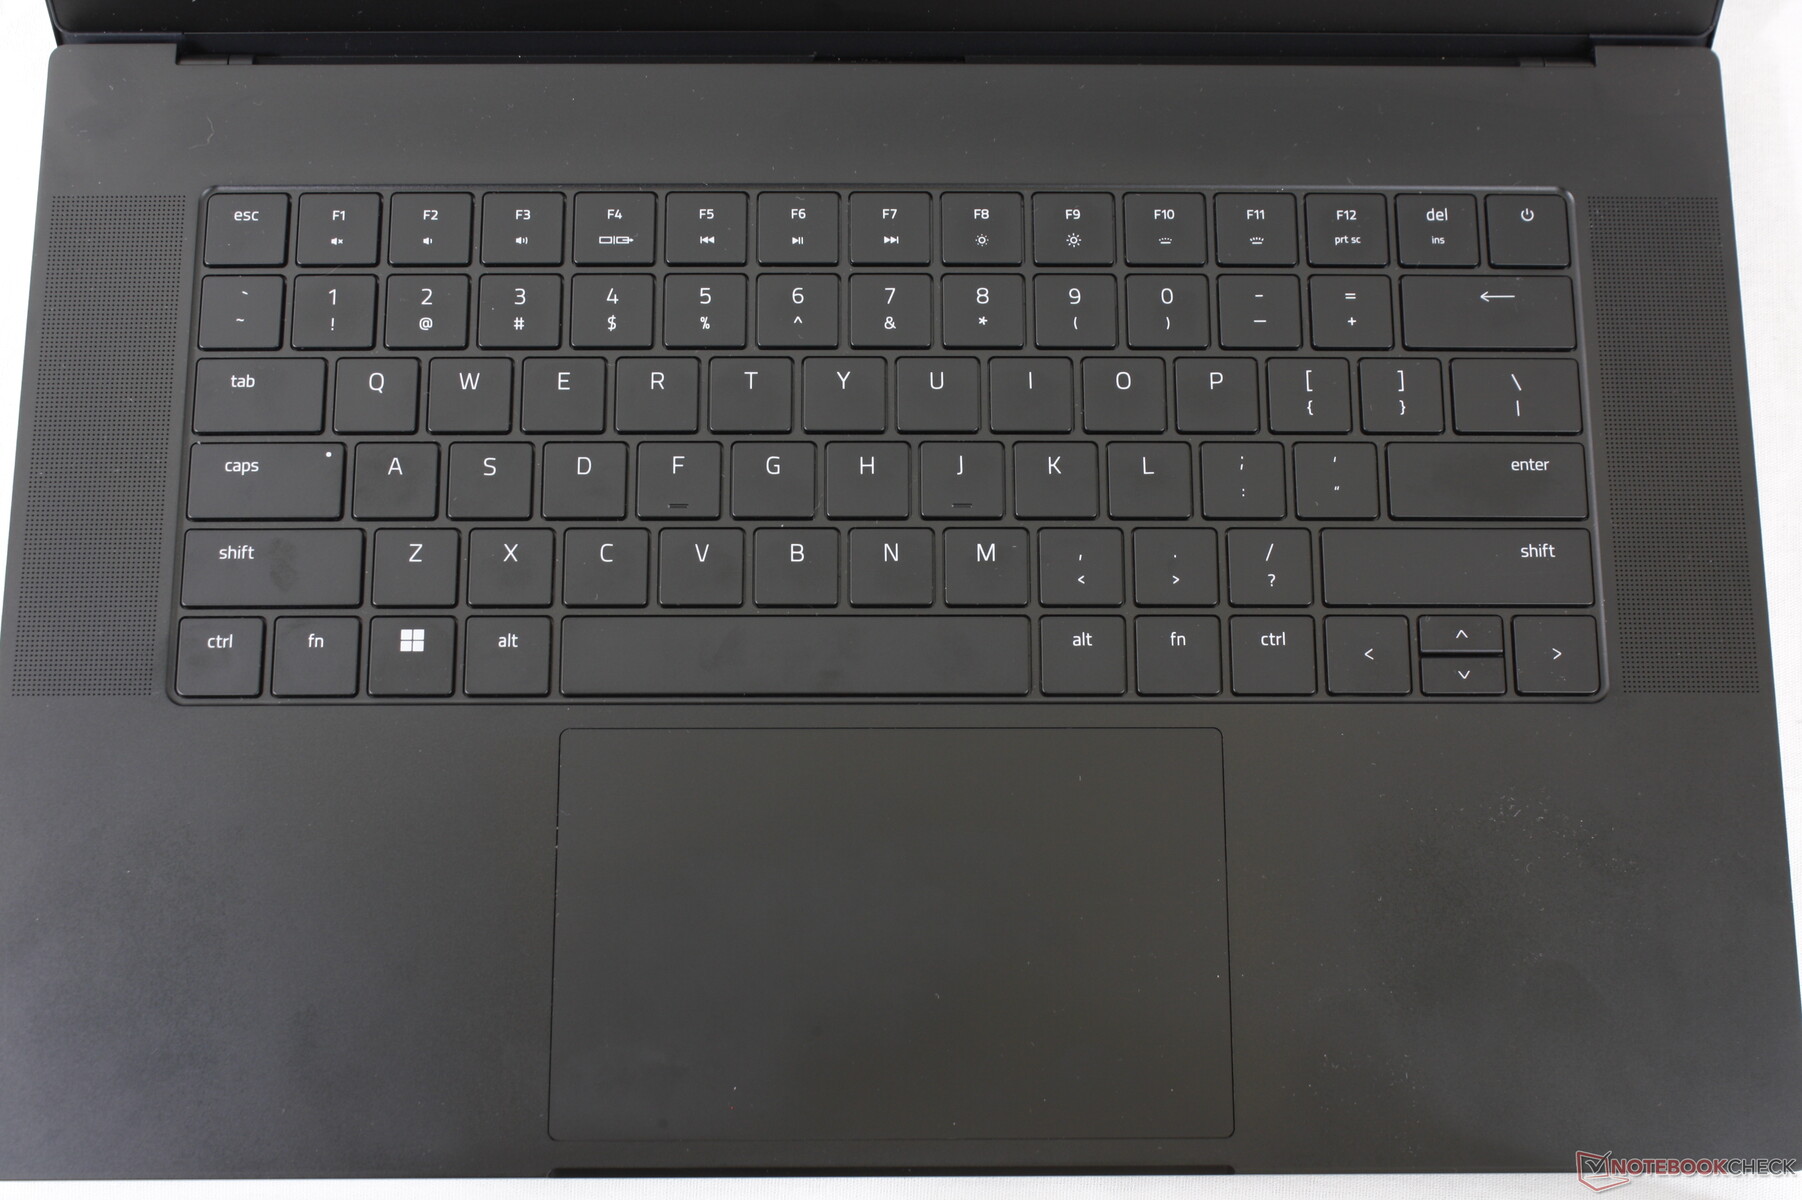
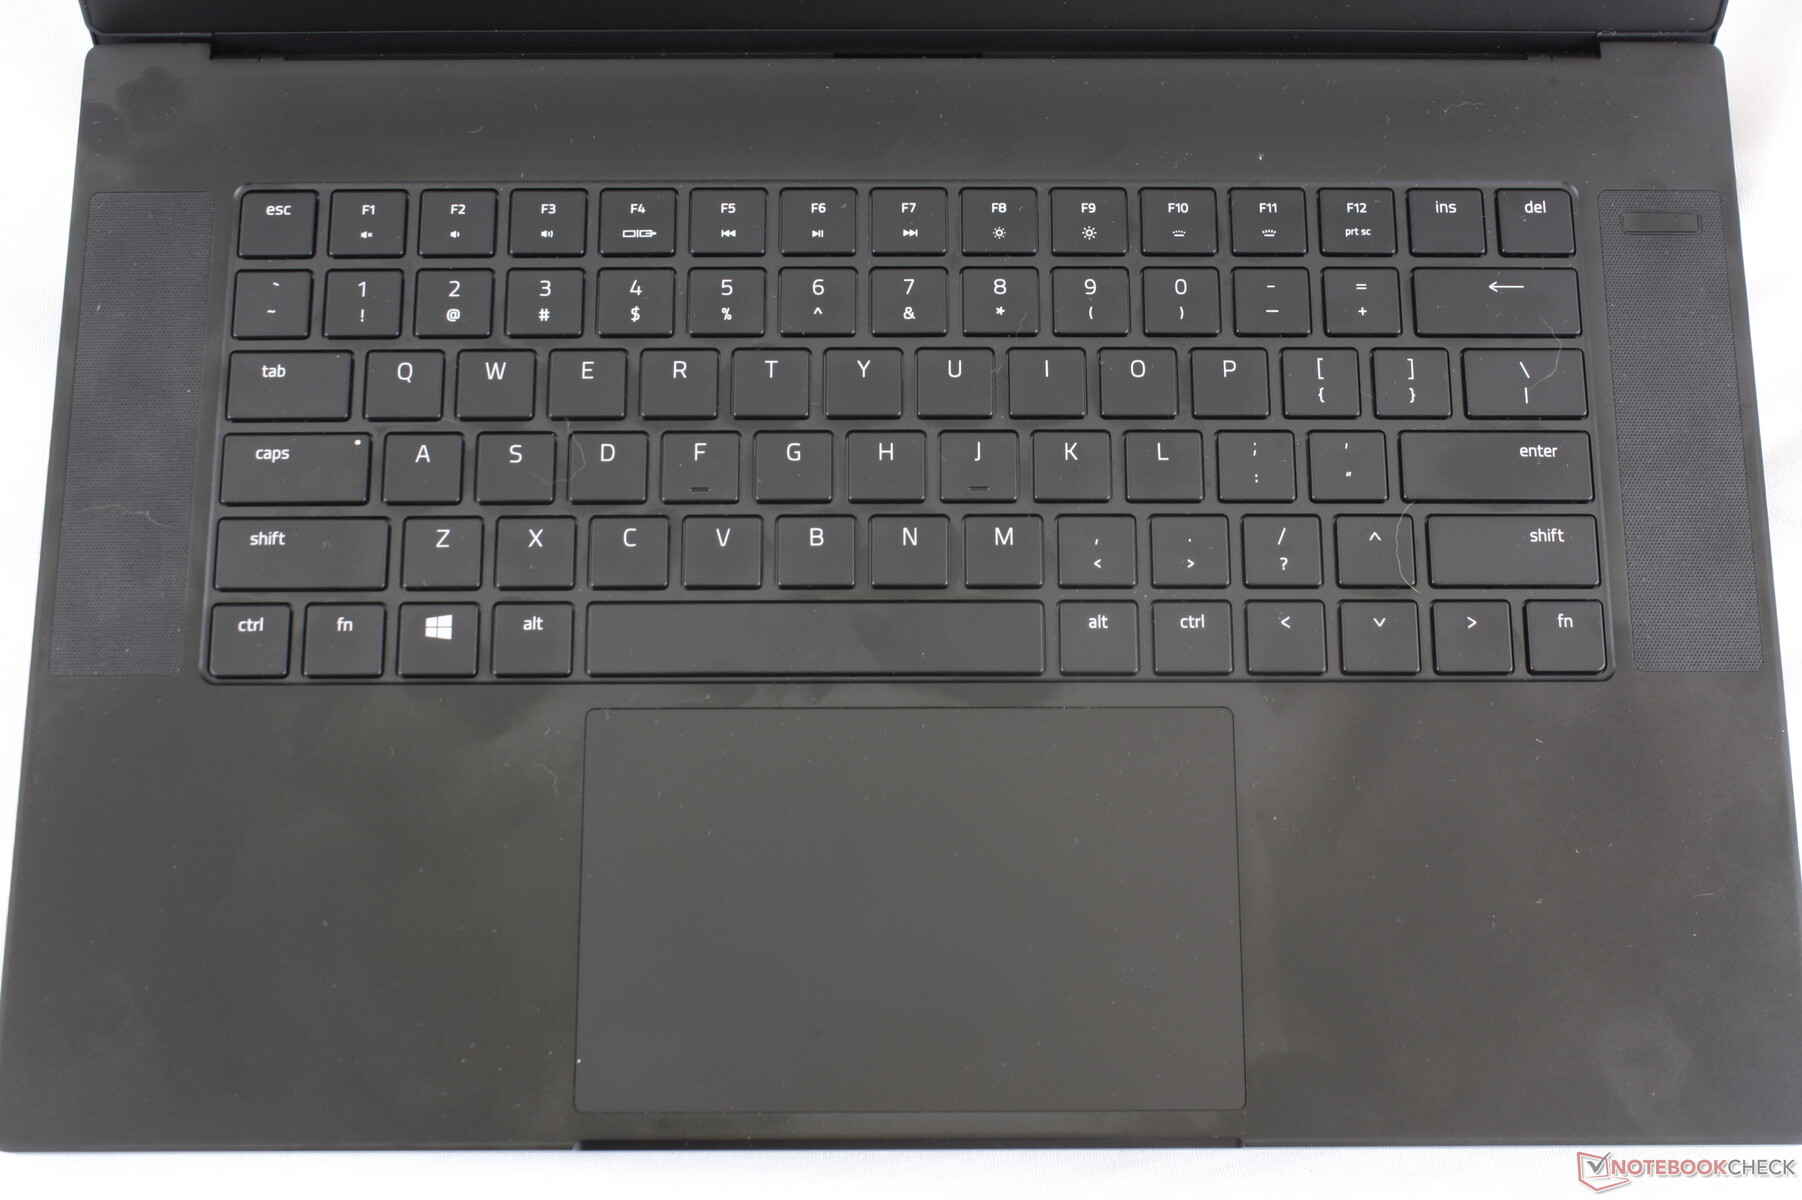
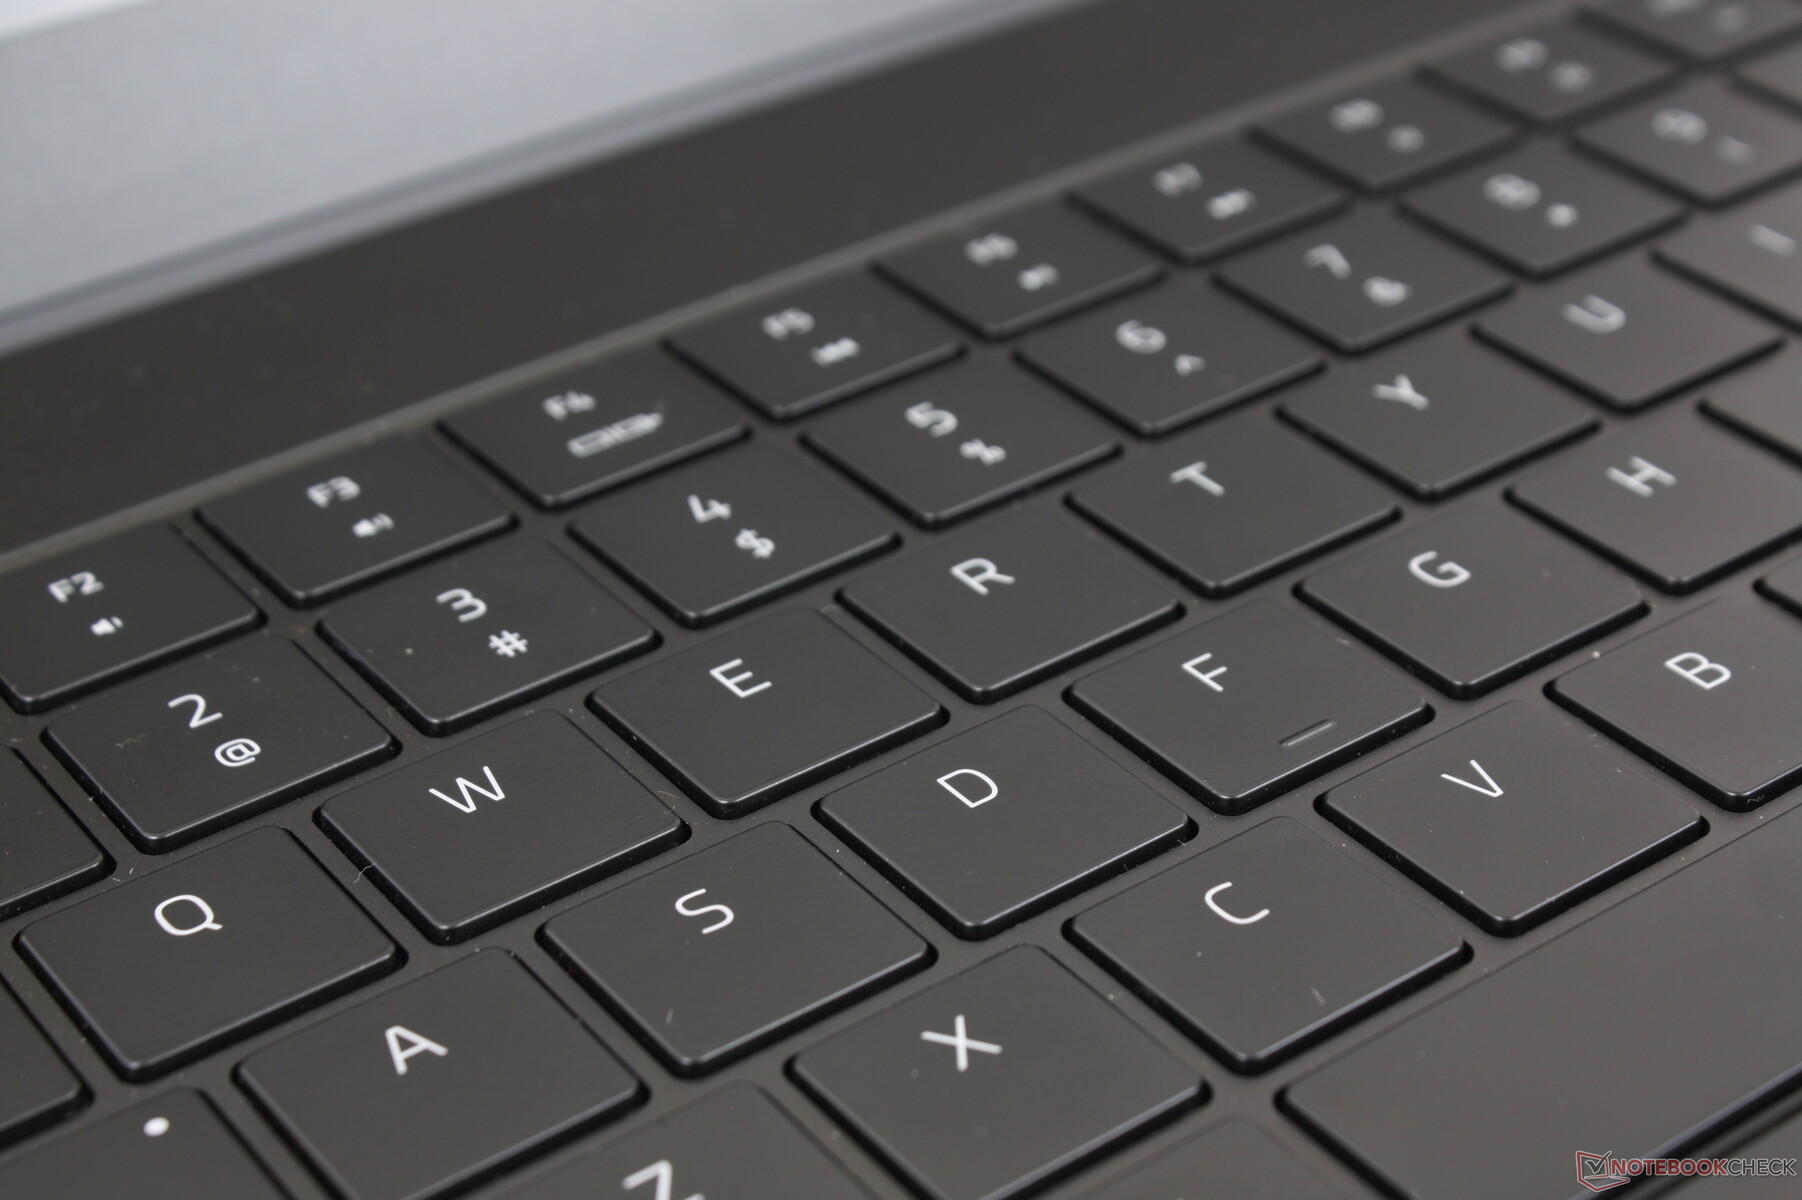
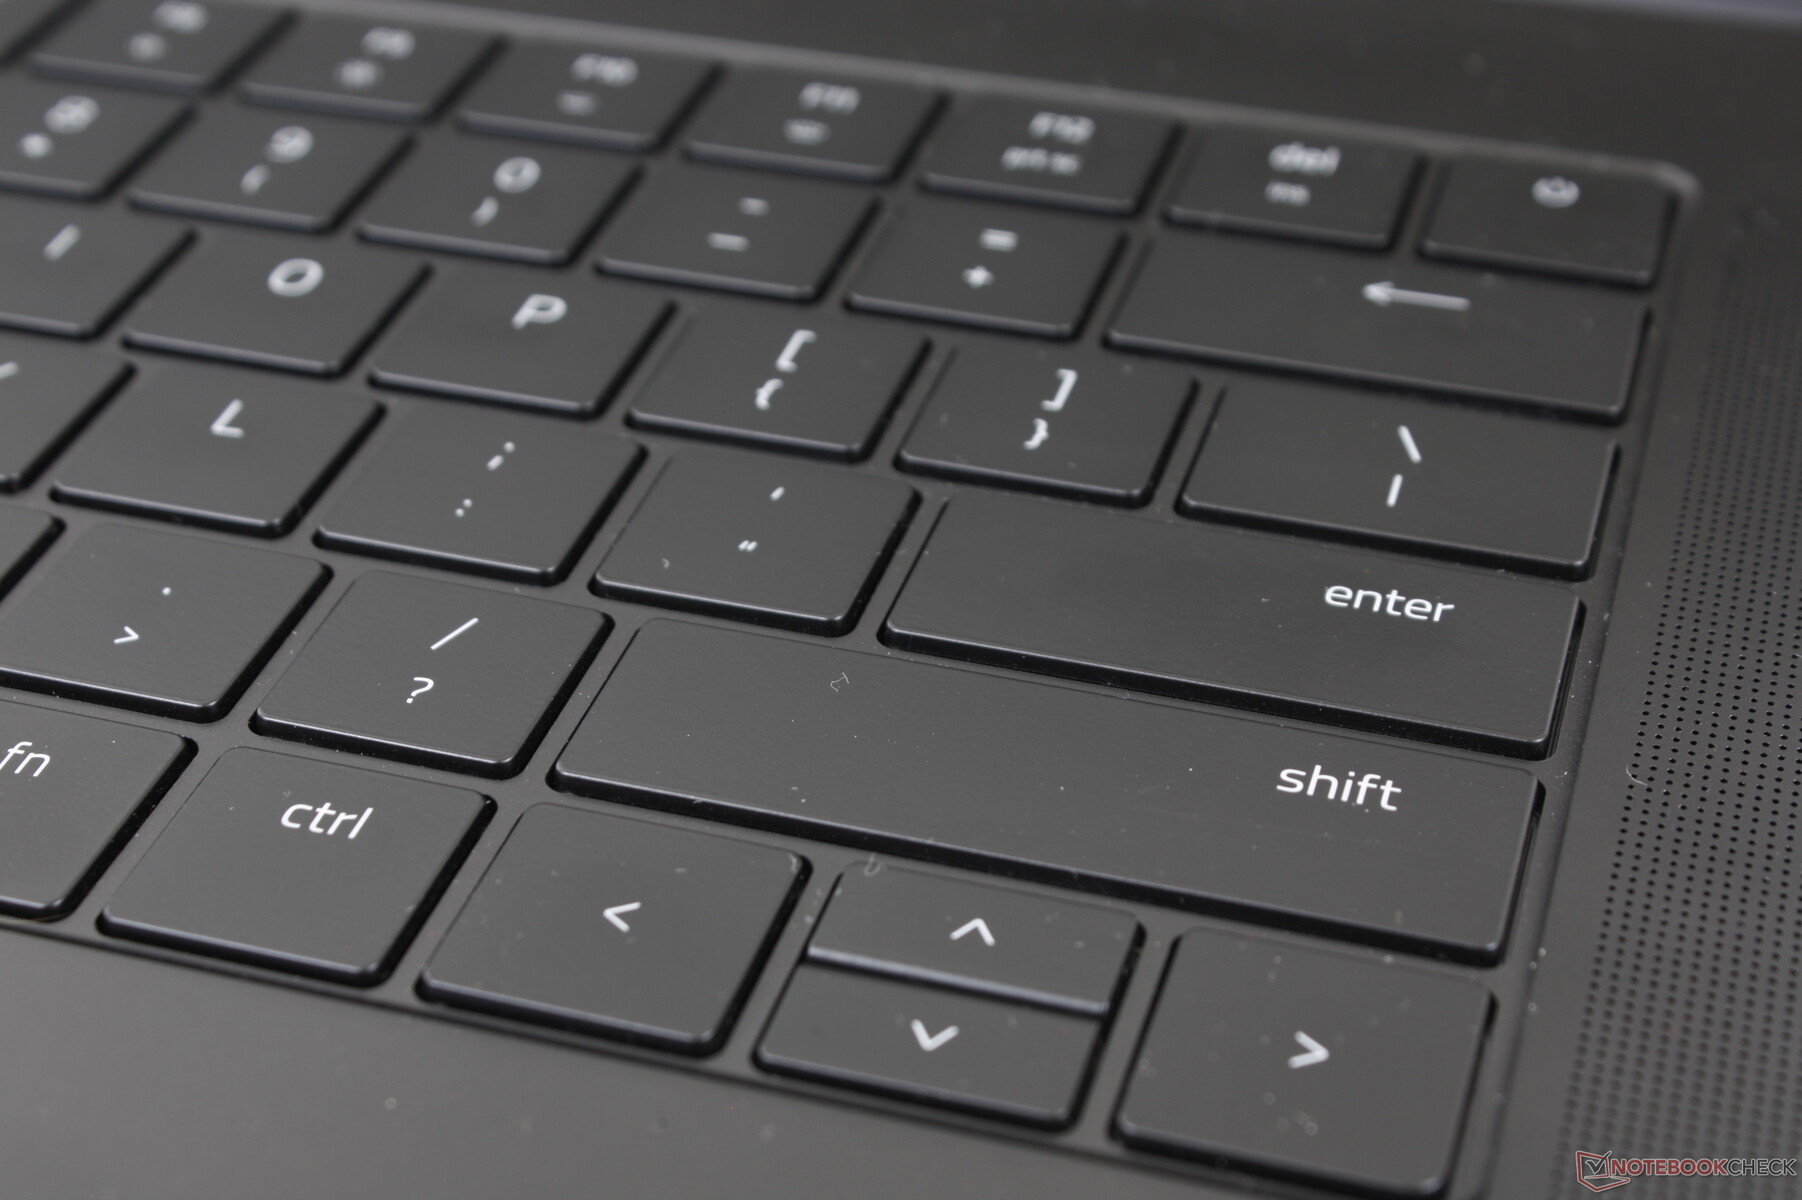
The only major physical change this year is to the keyboard keycaps which are now slightly larger than before. The Power button has also been relocated which doubles as an easy way to visually distinguish between the 2022 model from earlier models.
SD Card Reader
| SD Card Reader | |
| average JPG Copy Test (av. of 3 runs) | |
| Razer Blade 15 Advanced Model Early 2021 (AV PRO microSD 128 GB V60) | |
| Razer Blade 15 RTX 2080 Super Max-Q (Toshiba Exceria Pro SDXC 64 GB UHS-II) | |
| Razer Blade 15 2022 (Toshiba Exceria Pro SDXC 64 GB UHS-II) | |
| ADATA XPG Xenia 15 (AV Pro V60) | |
| Schenker XMG Neo 15 E22 (Early 2022, RTX 3080 Ti) | |
| Eurocom Nightsky ARX315 (AV Pro V60) | |
| maximum AS SSD Seq Read Test (1GB) | |
| Razer Blade 15 RTX 2080 Super Max-Q (Toshiba Exceria Pro SDXC 64 GB UHS-II) | |
| Razer Blade 15 Advanced Model Early 2021 (AV PRO microSD 128 GB V60) | |
| Razer Blade 15 2022 (Toshiba Exceria Pro SDXC 64 GB UHS-II) | |
| ADATA XPG Xenia 15 (AV Pro V60) | |
| Eurocom Nightsky ARX315 (AV Pro V60) | |
| Schenker XMG Neo 15 E22 (Early 2022, RTX 3080 Ti) | |
Communication
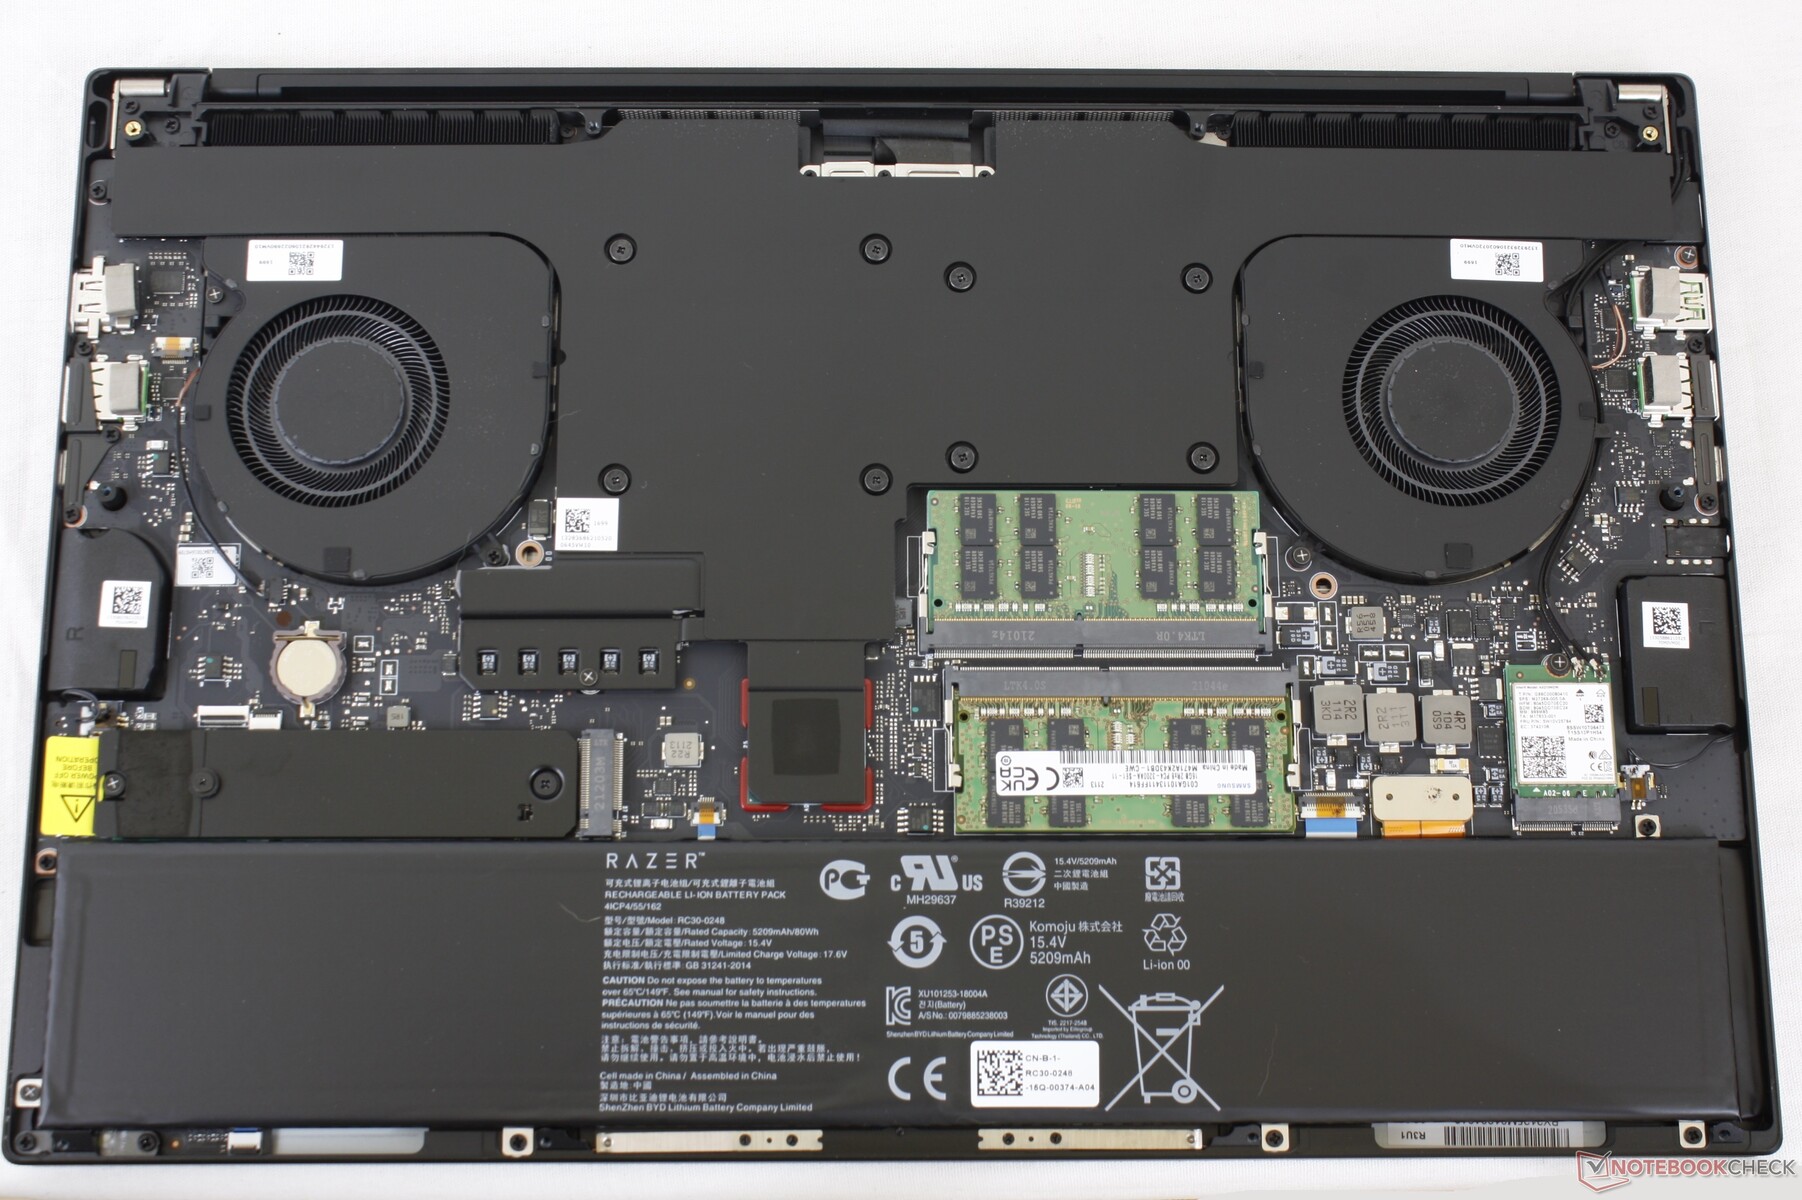
The WLAN module has been upgraded to the Killer AX1690i which is essentially the gaming version of the existing Intel Wi-Fi 6E AX210.
Webcam


Maintenance
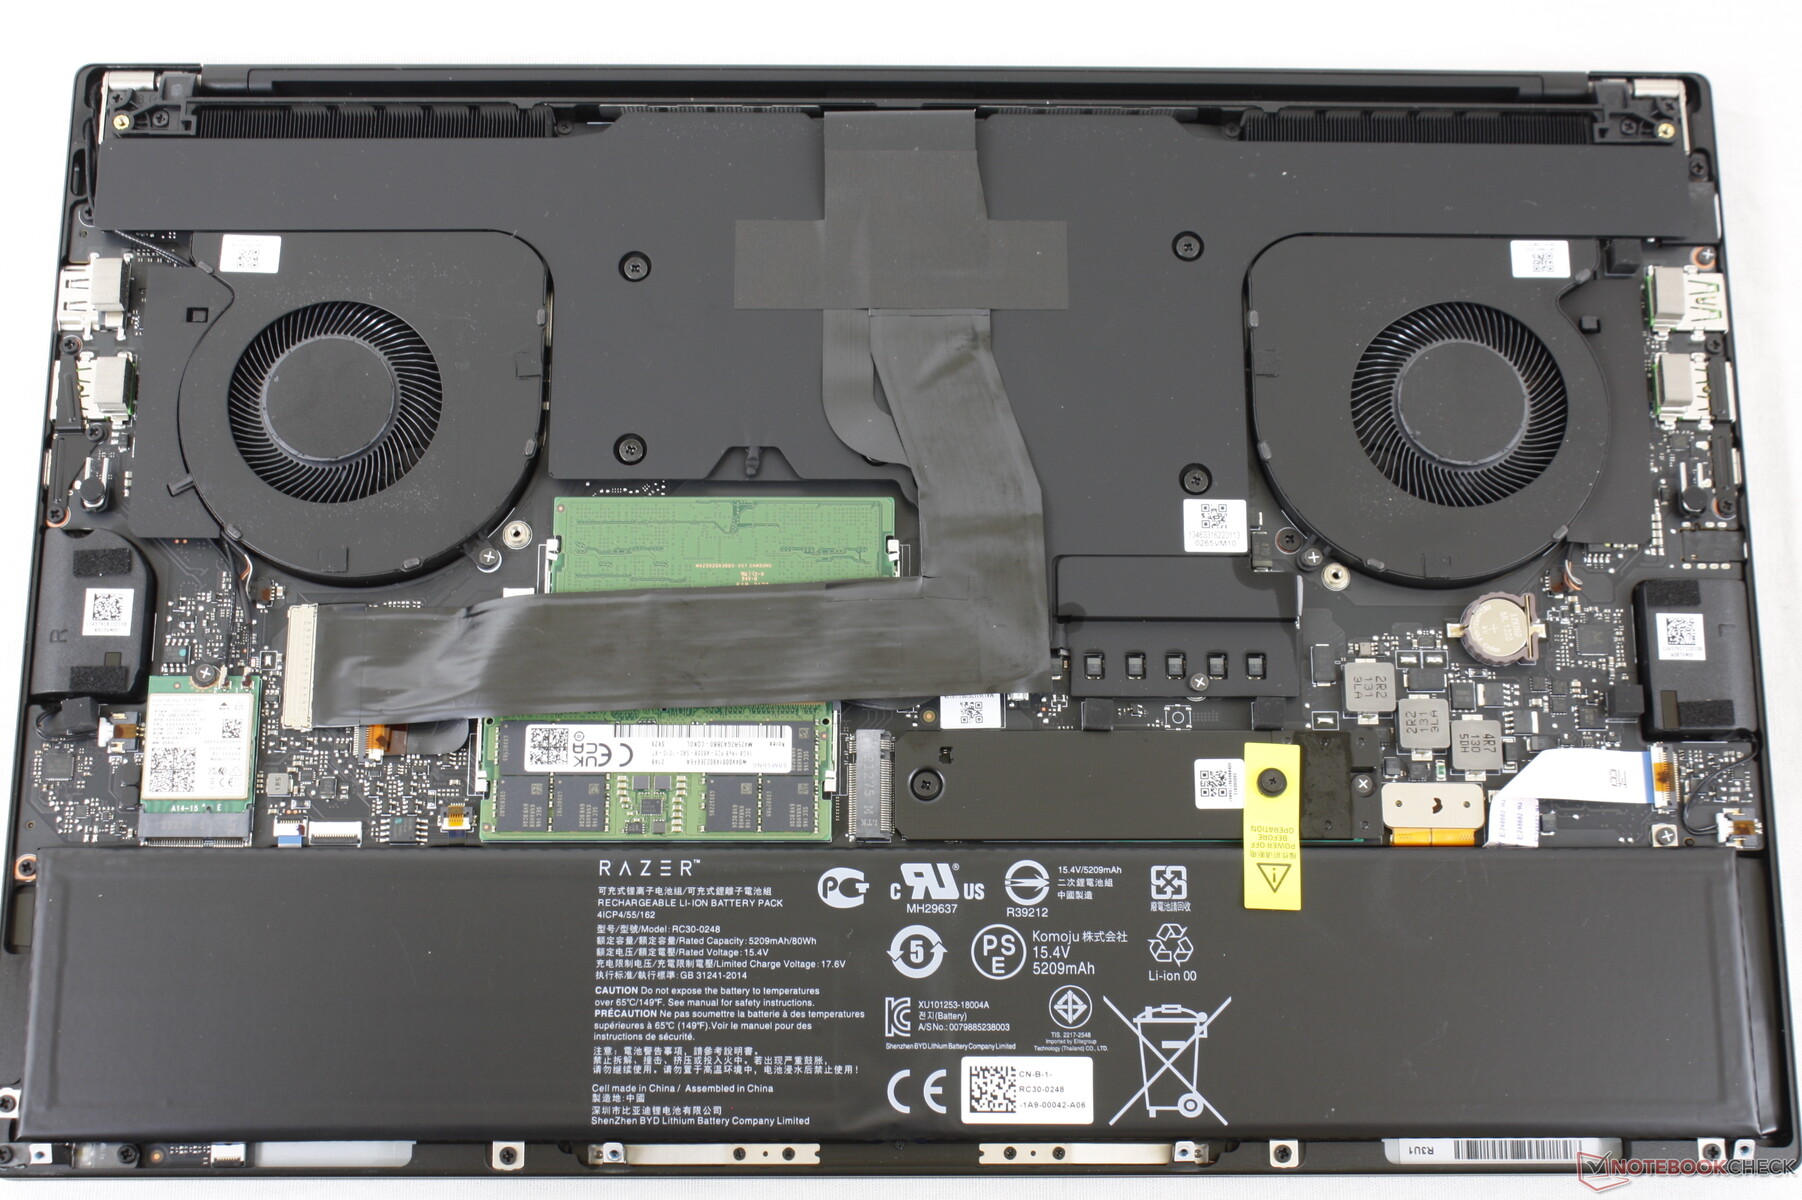
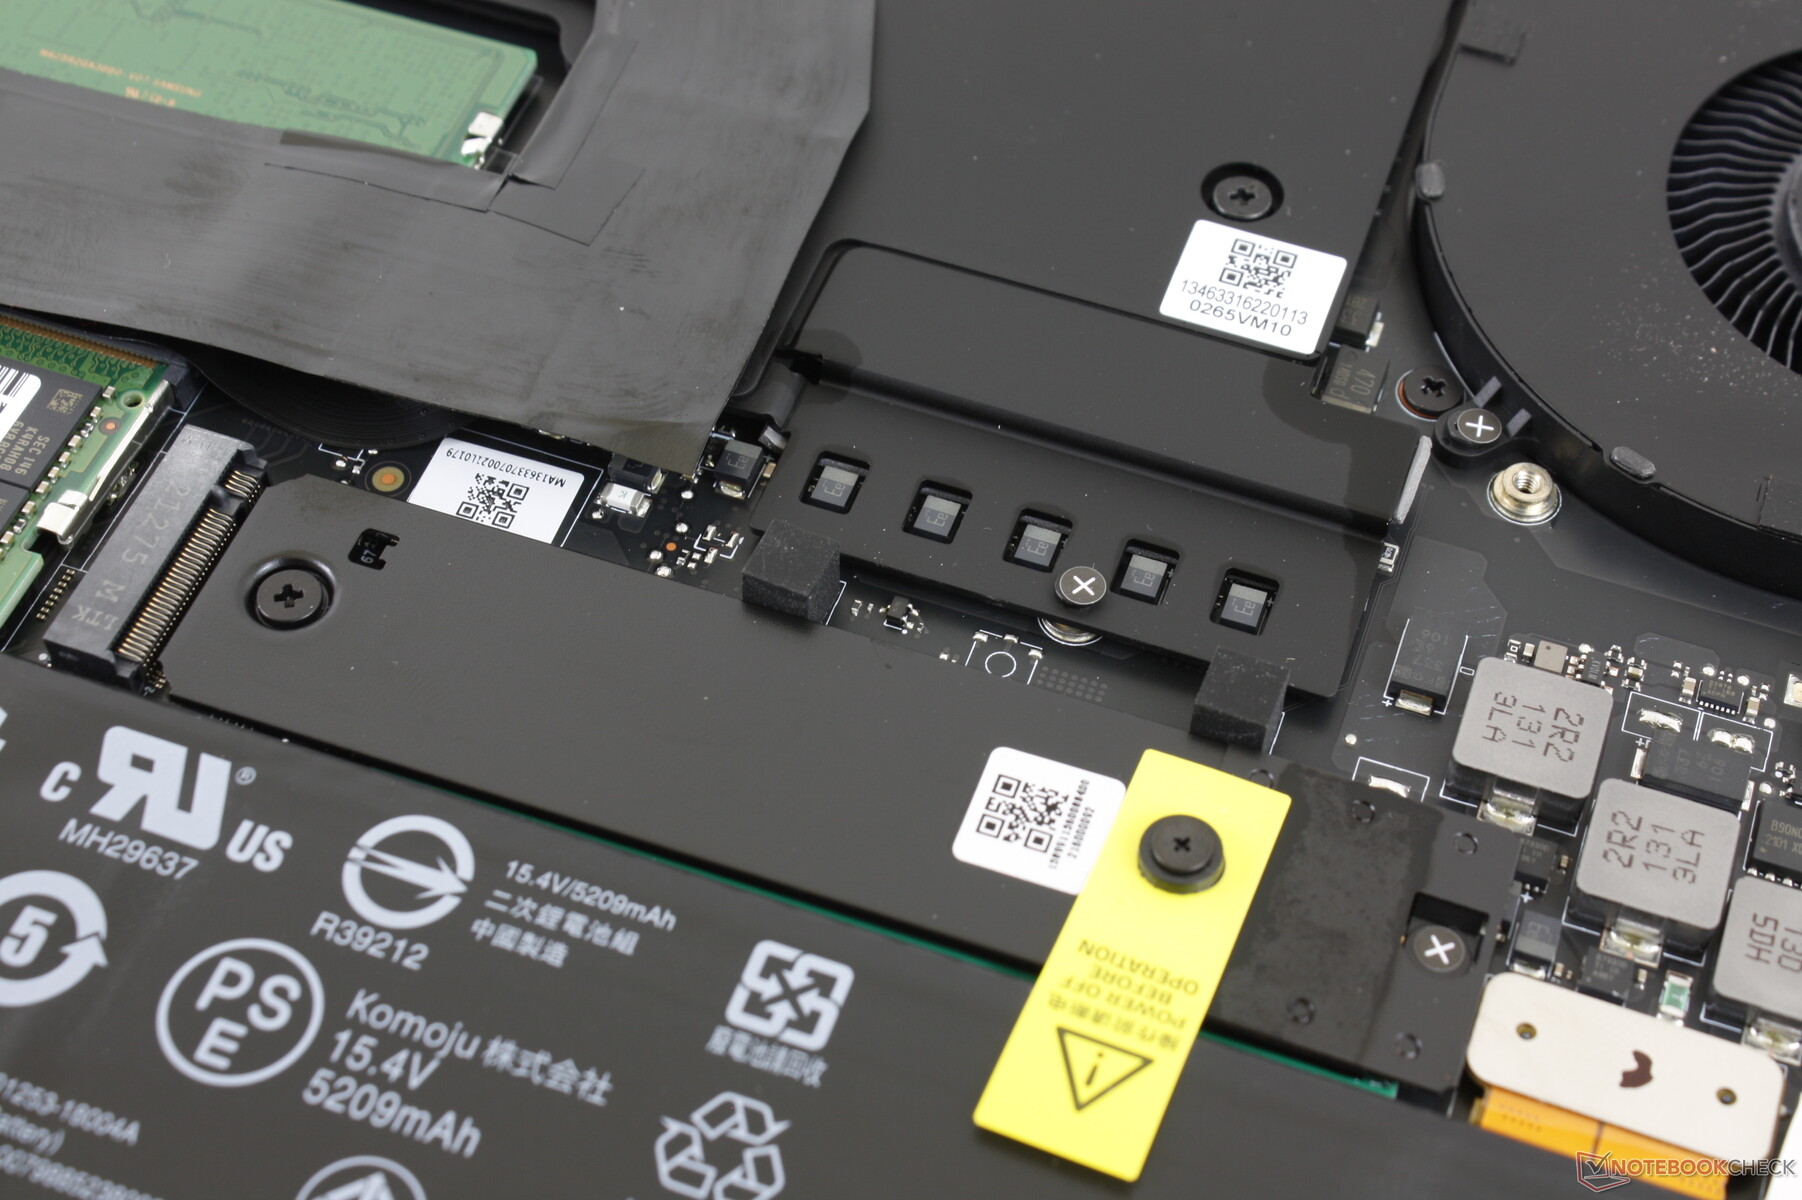
There are minor changes to the internals and fans when compared to last year's model as shown below. The 2x M.2 2280 PCIe4 slots, 2x SODIMM slots, and removable WLAN module remain.
Accessories and Warranty
There are no extras in the box other than the AC adapter and paperwork.
A base one-year warranty plus two-year battery warranty are included with every new purchase of a 12th gen Blade model. Note, however, that the two-year battery warranty does not currently apply to older Blade models.
Input Devices
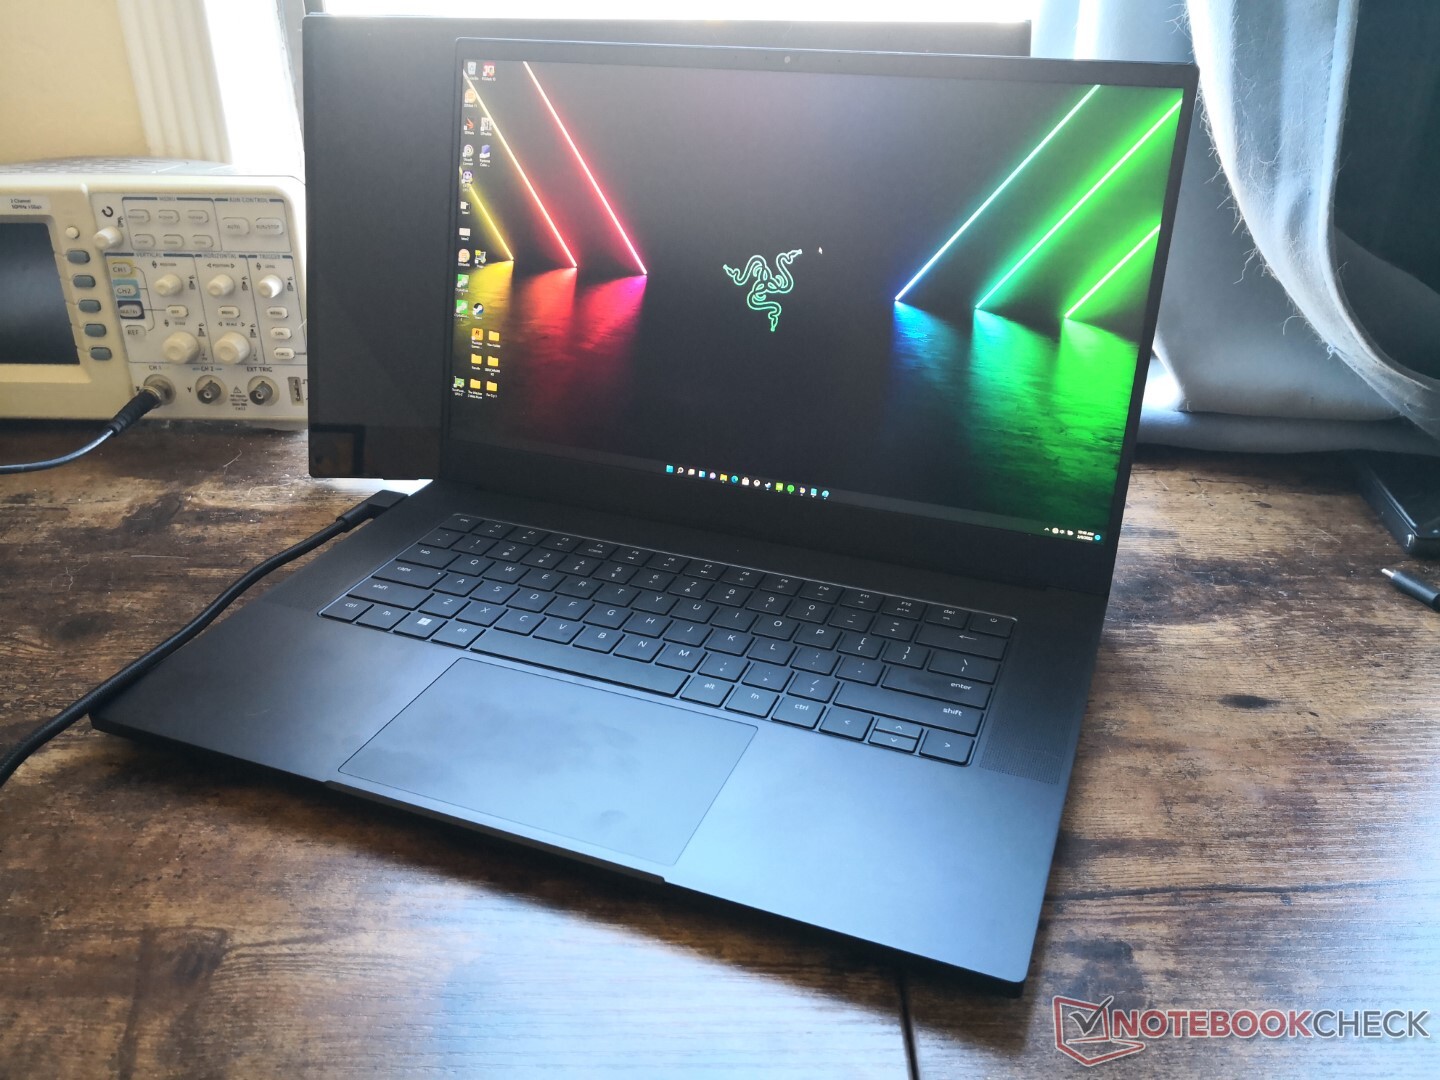
Though the large clickpad remains the same, Razer has upgraded the keyboard on the 2022 Blade 15 with slightly larger keycaps than on previous generation models to reduce typing errors. Consequently, the space between each key has been reduced. Travel and feedback are otherwise identical year-over-year.
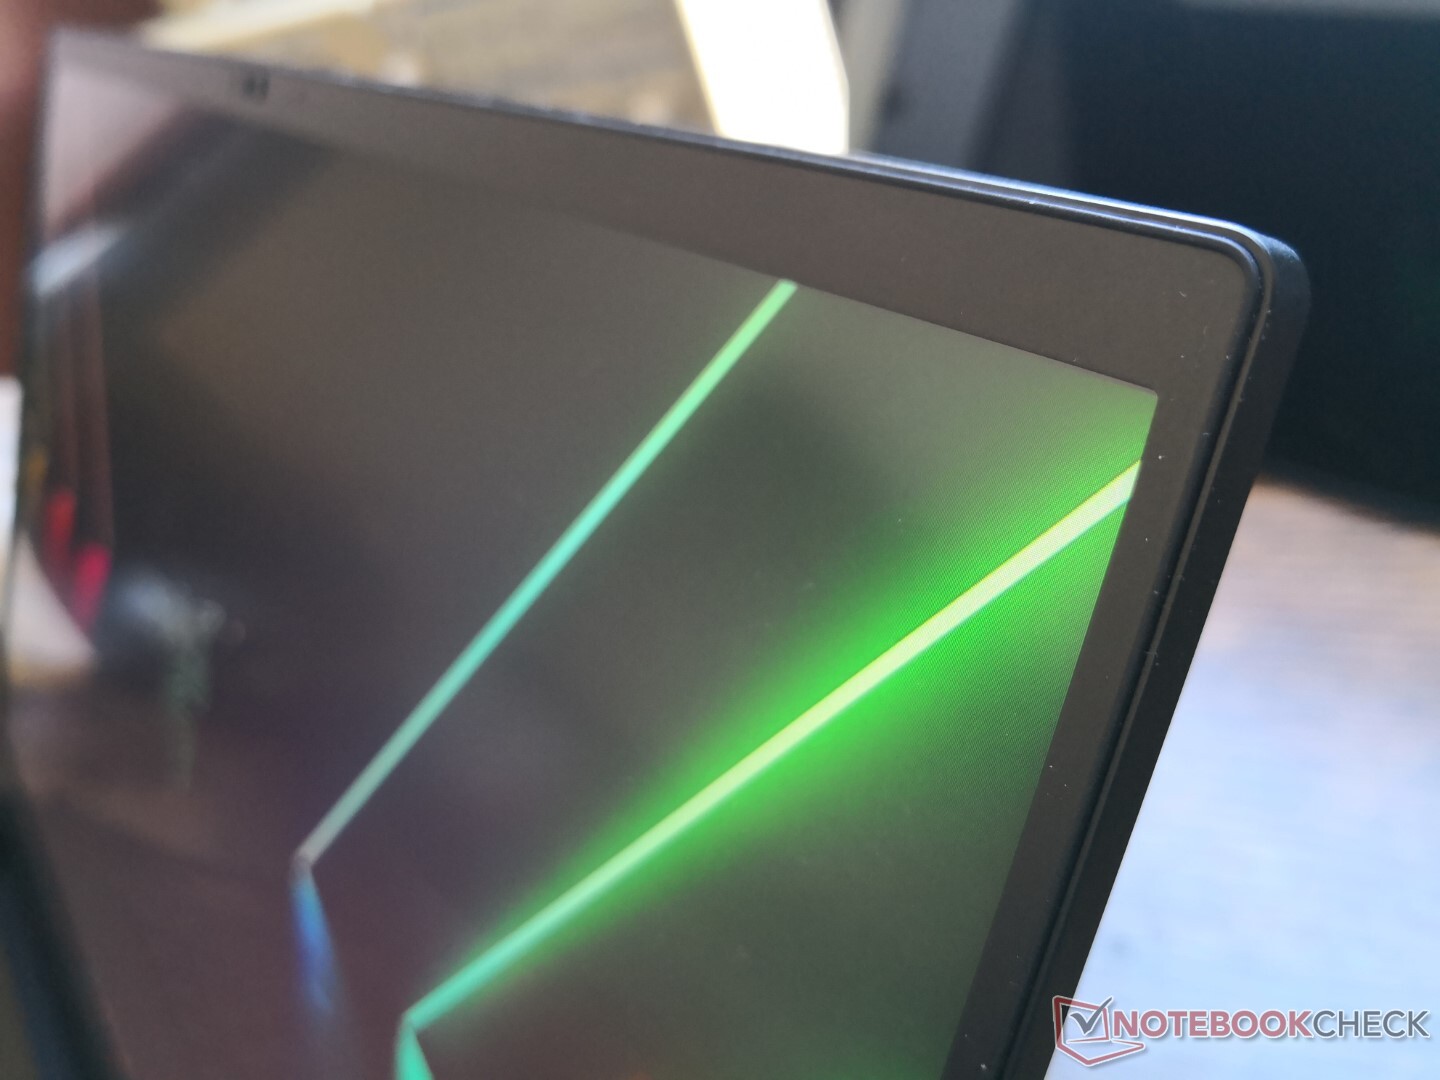
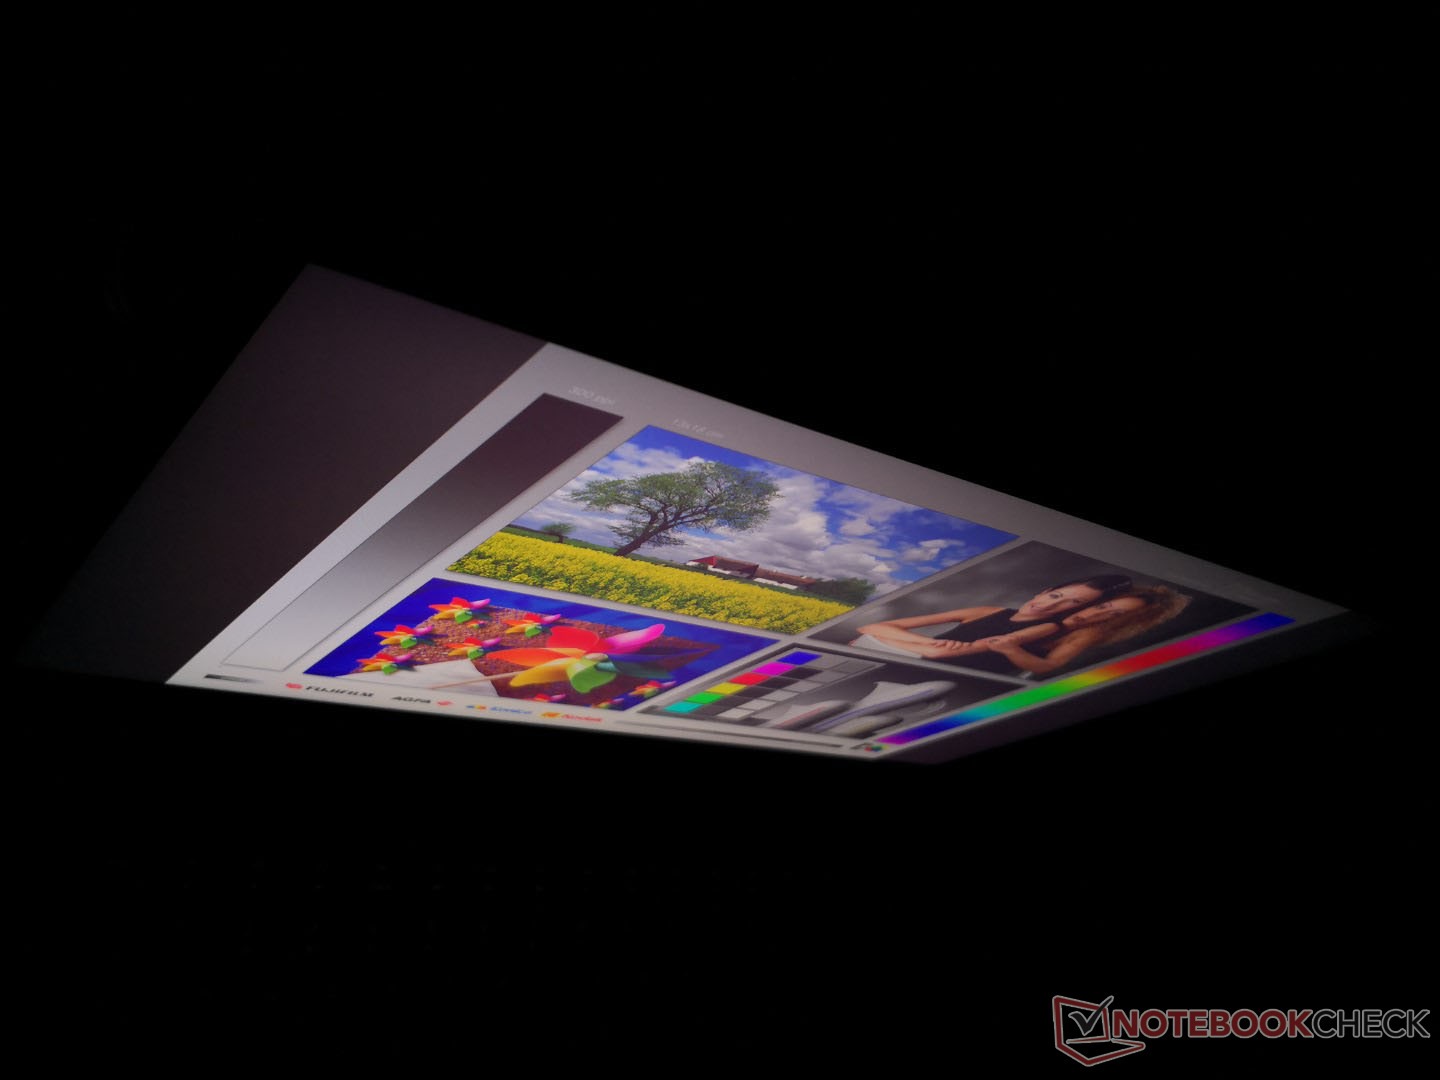
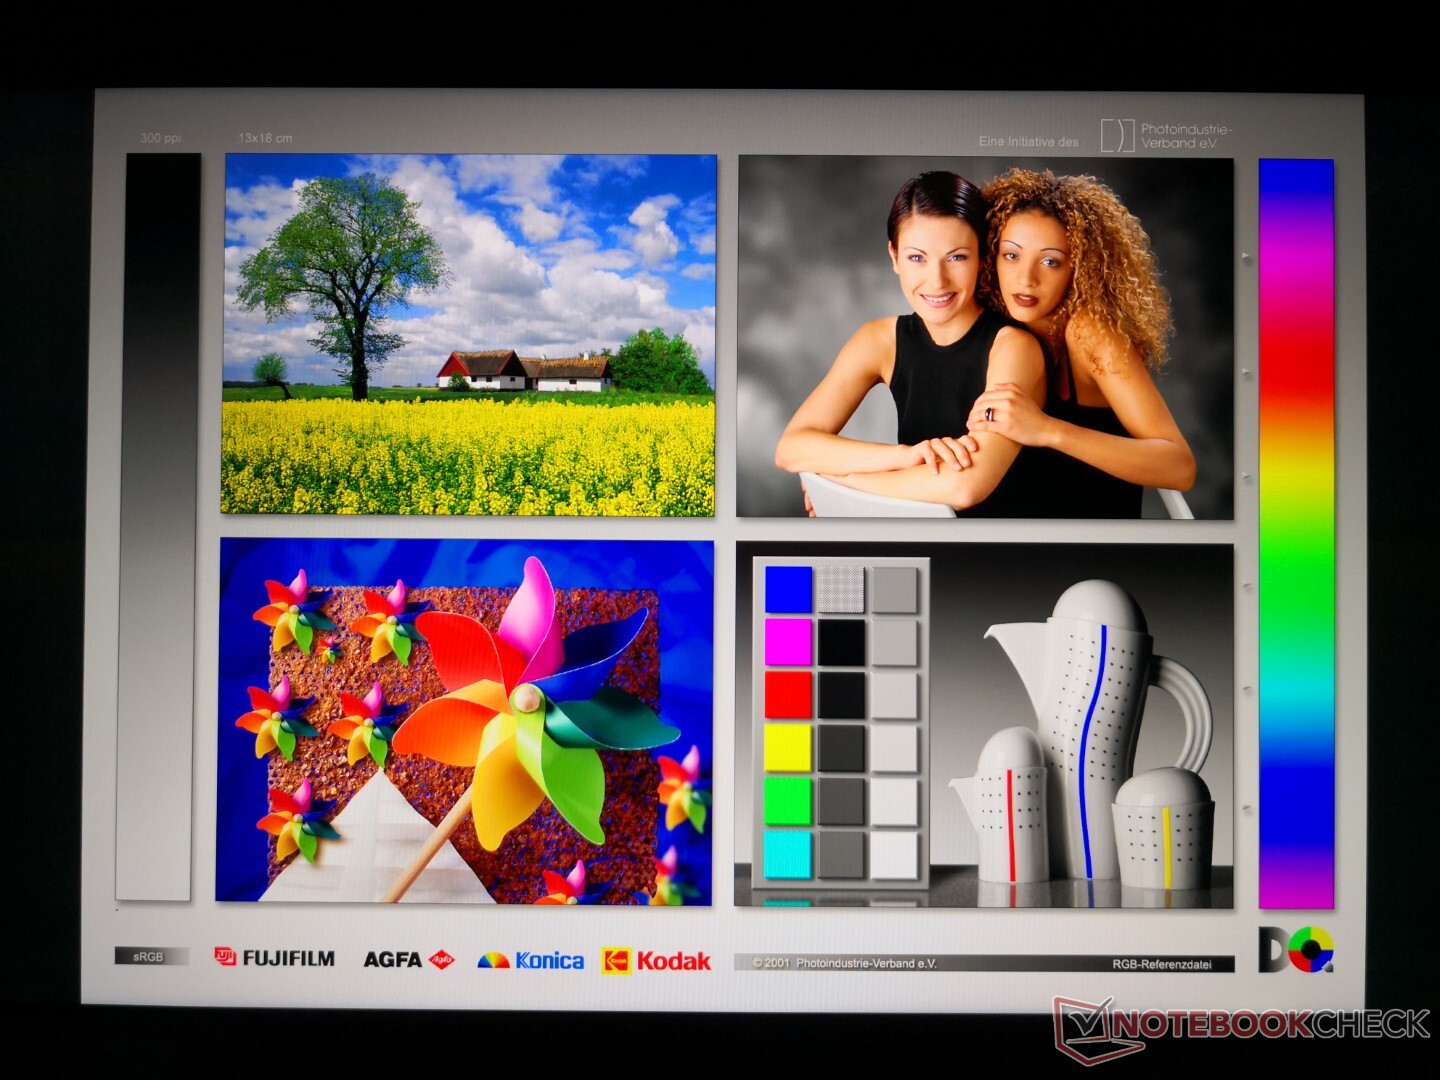
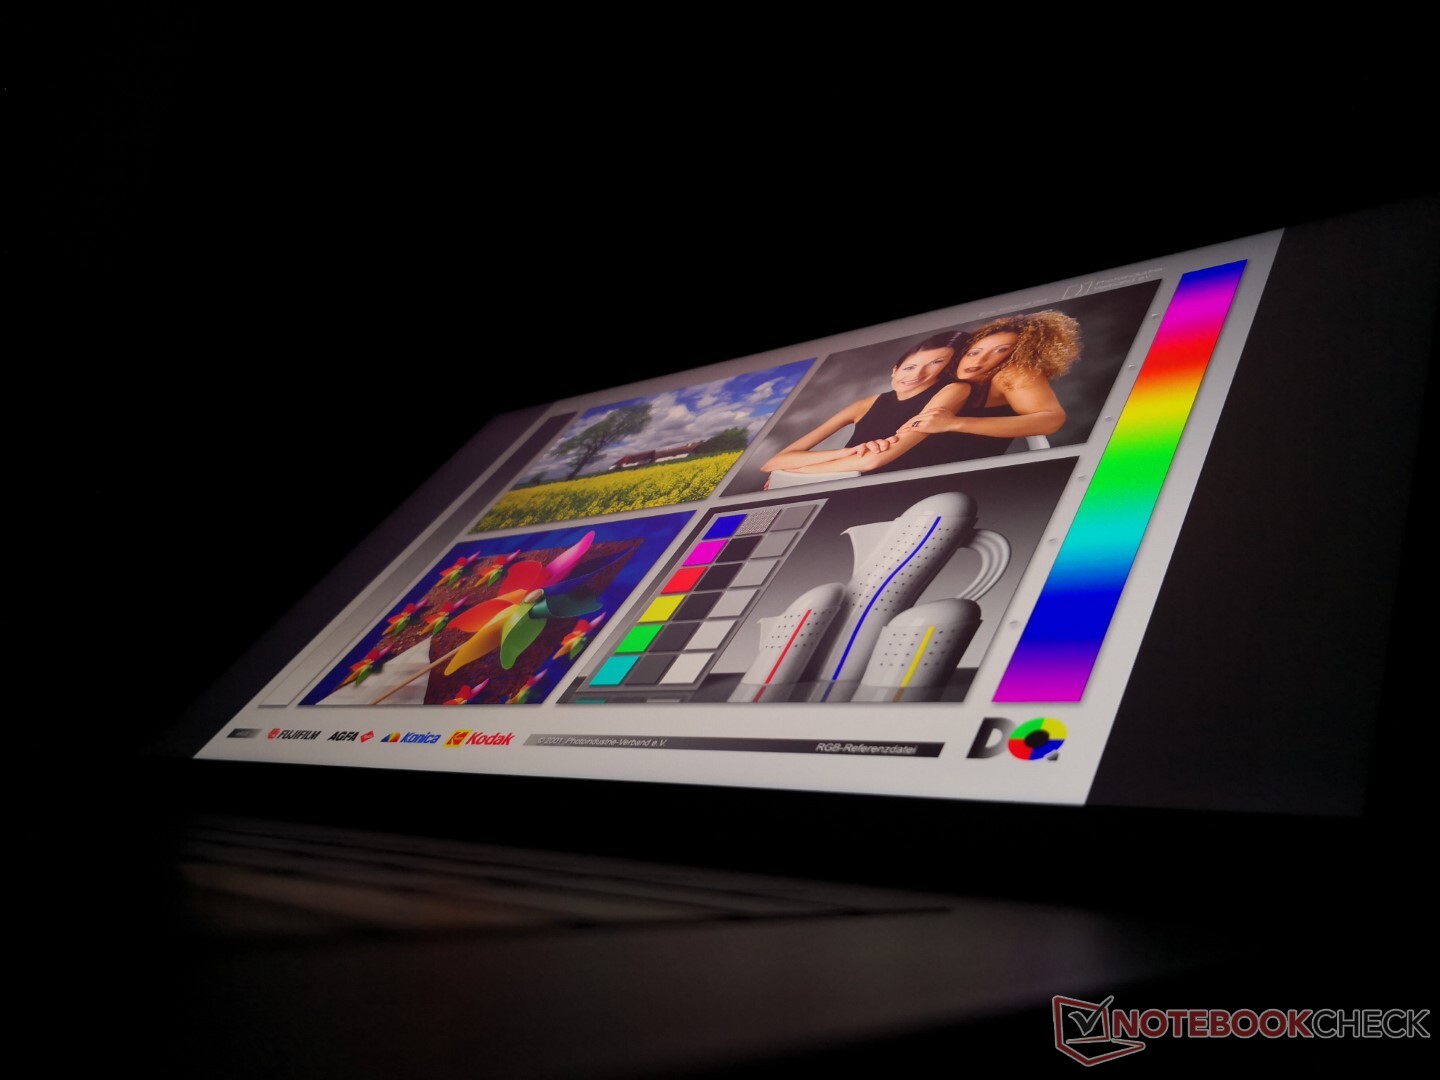
Display
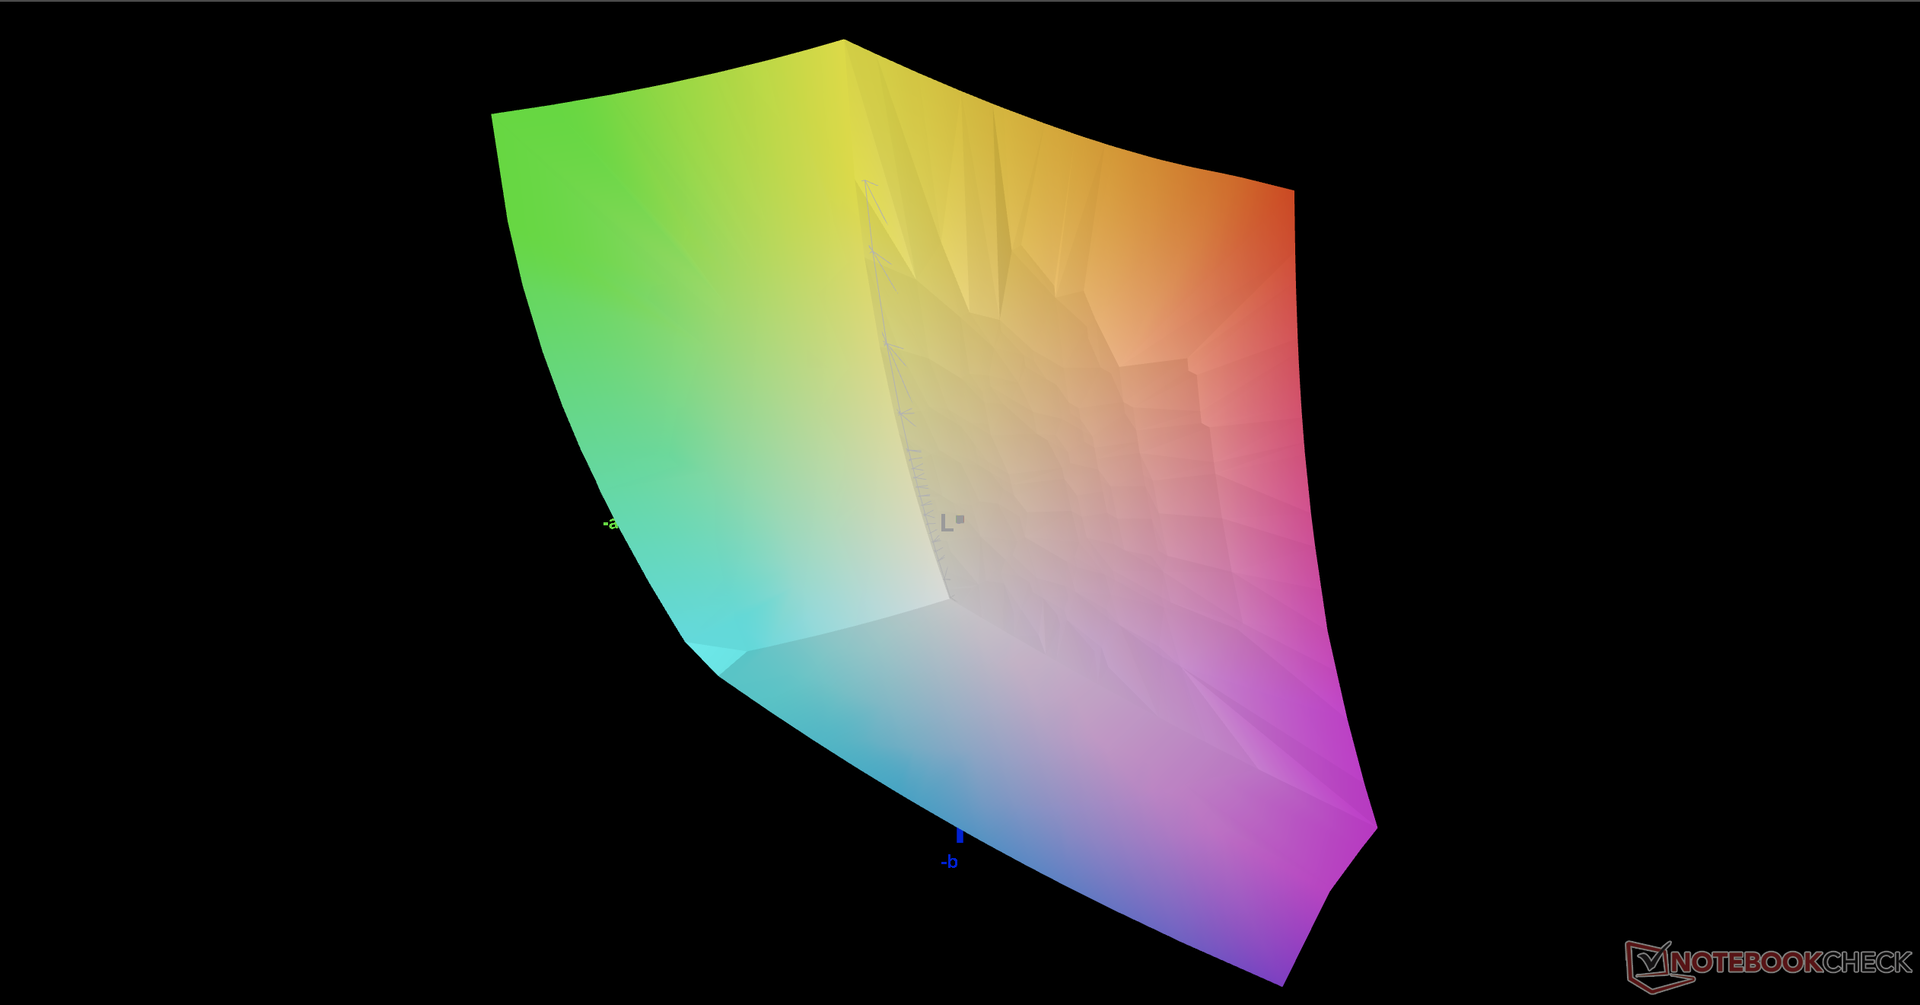
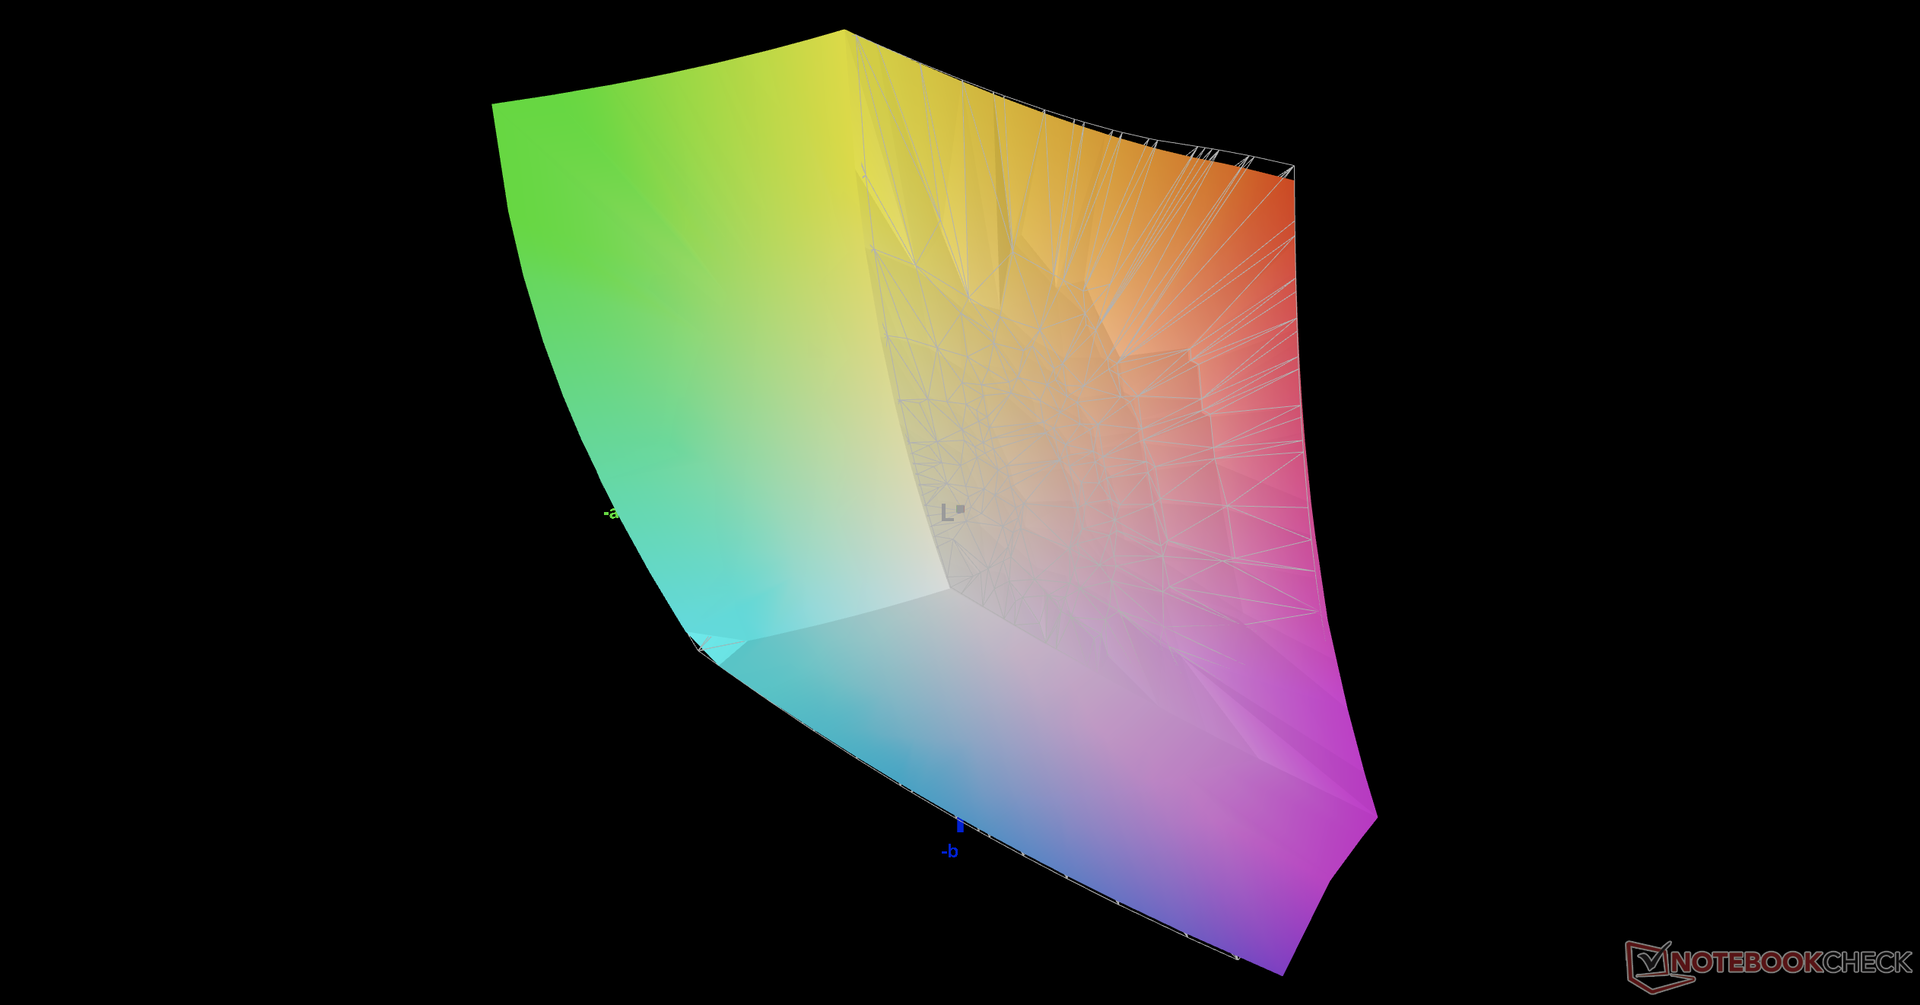
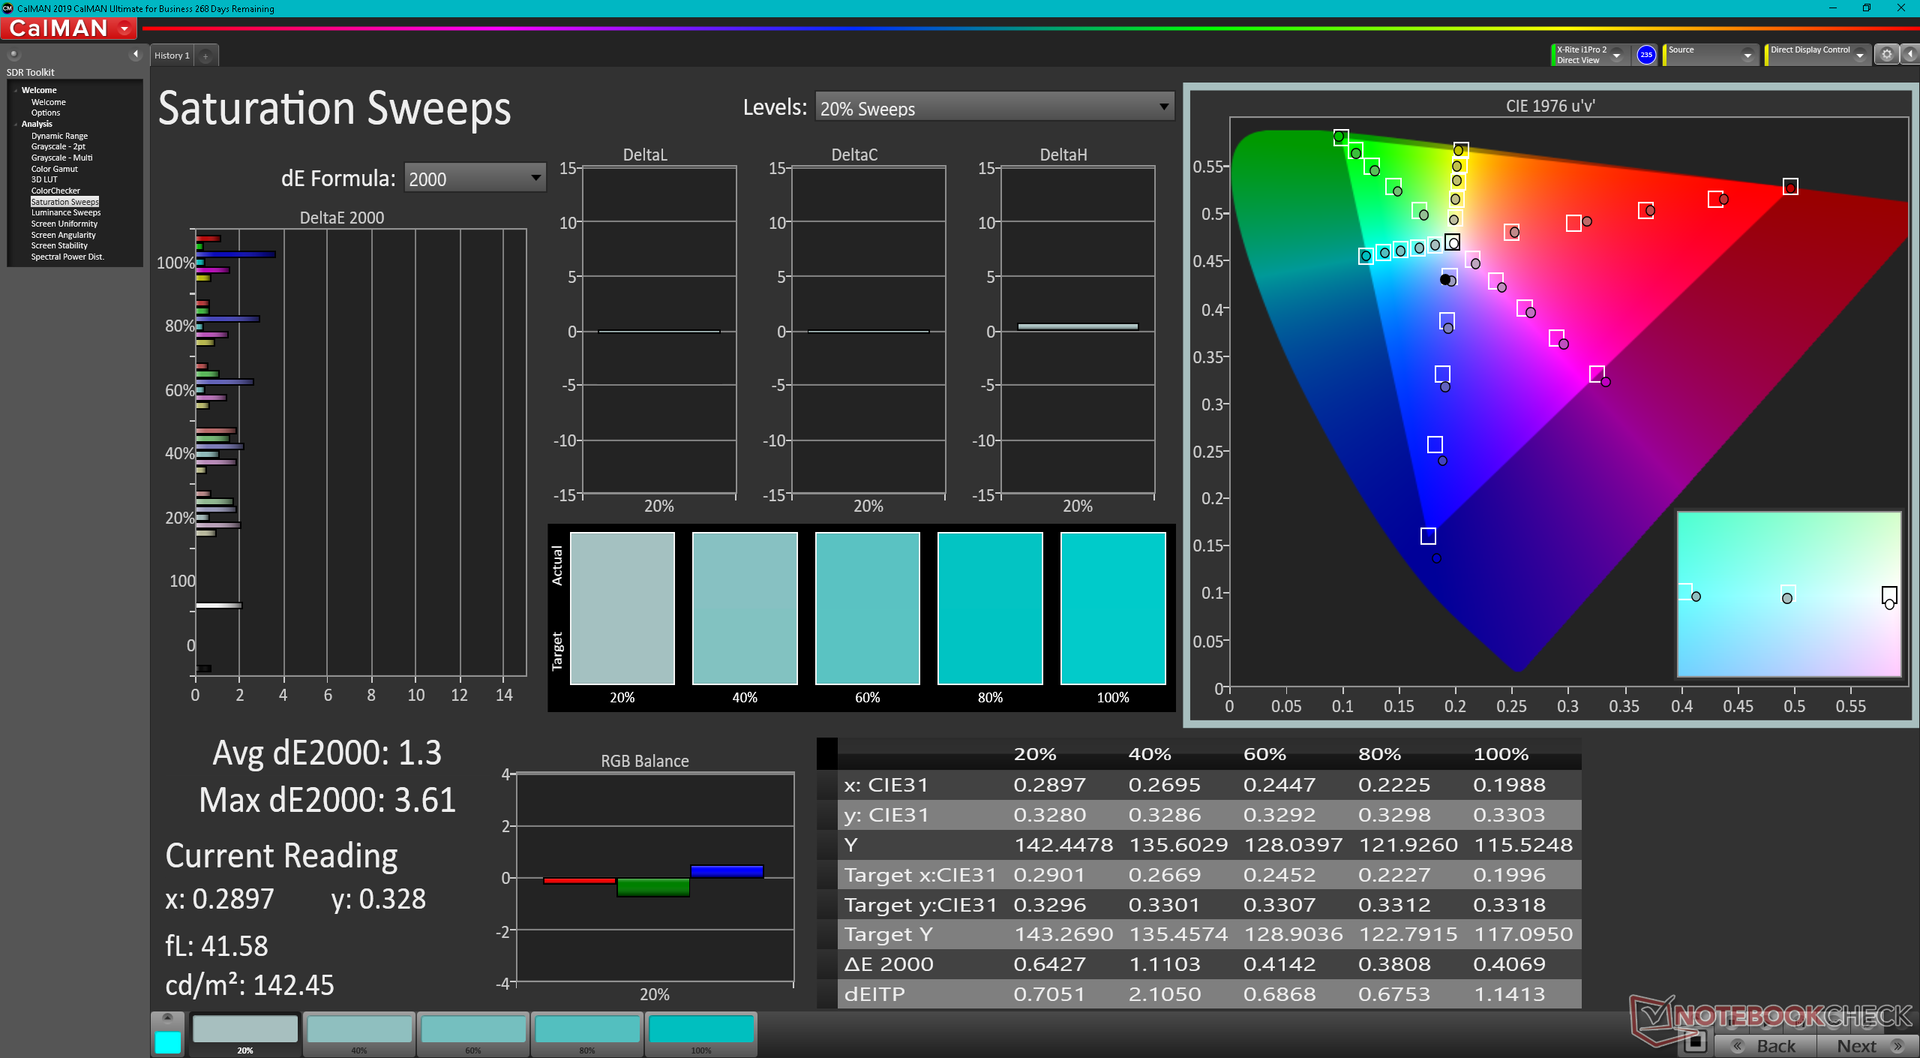
The Blade 15 is one of the few 15.6-inch laptops to come with a 240 Hz 1440p panel that covers the entire DCI-P3 standard. The 165 Hz 1440p panel on the Xenia 15, for example, covers all of sRGB but only 68 percent of P3. Black-white and gray-gray response times are also very good meaning that this panel can be used for both gaming and digital editing. In previous years, Blade 15 owners would have had to settle for 4K UHD options instead for the full DCI-P3 coverage.

| |||||||||||||||||||||||||
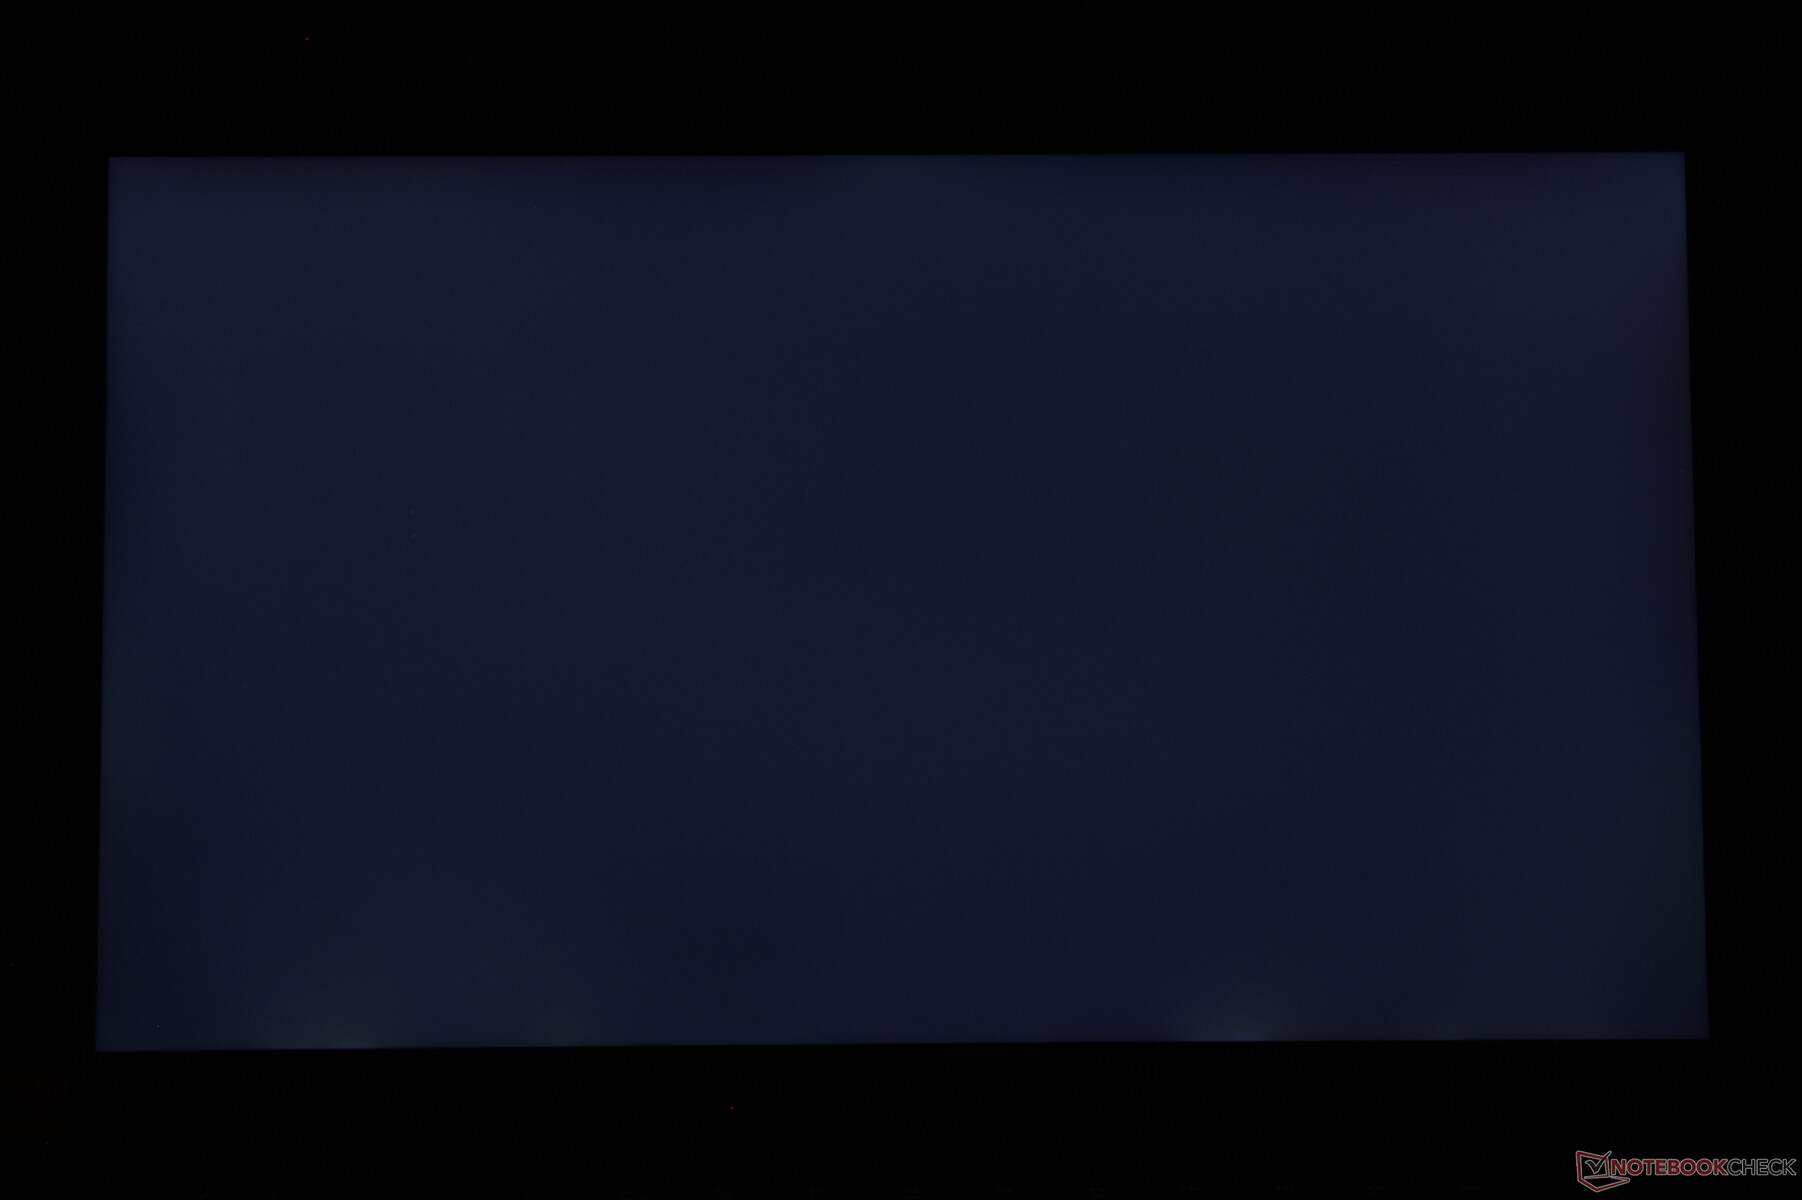
Brightness Distribution: 89 %
Center on Battery: 286 cd/m²
Contrast: 1144:1 (Black: 0.25 cd/m²)
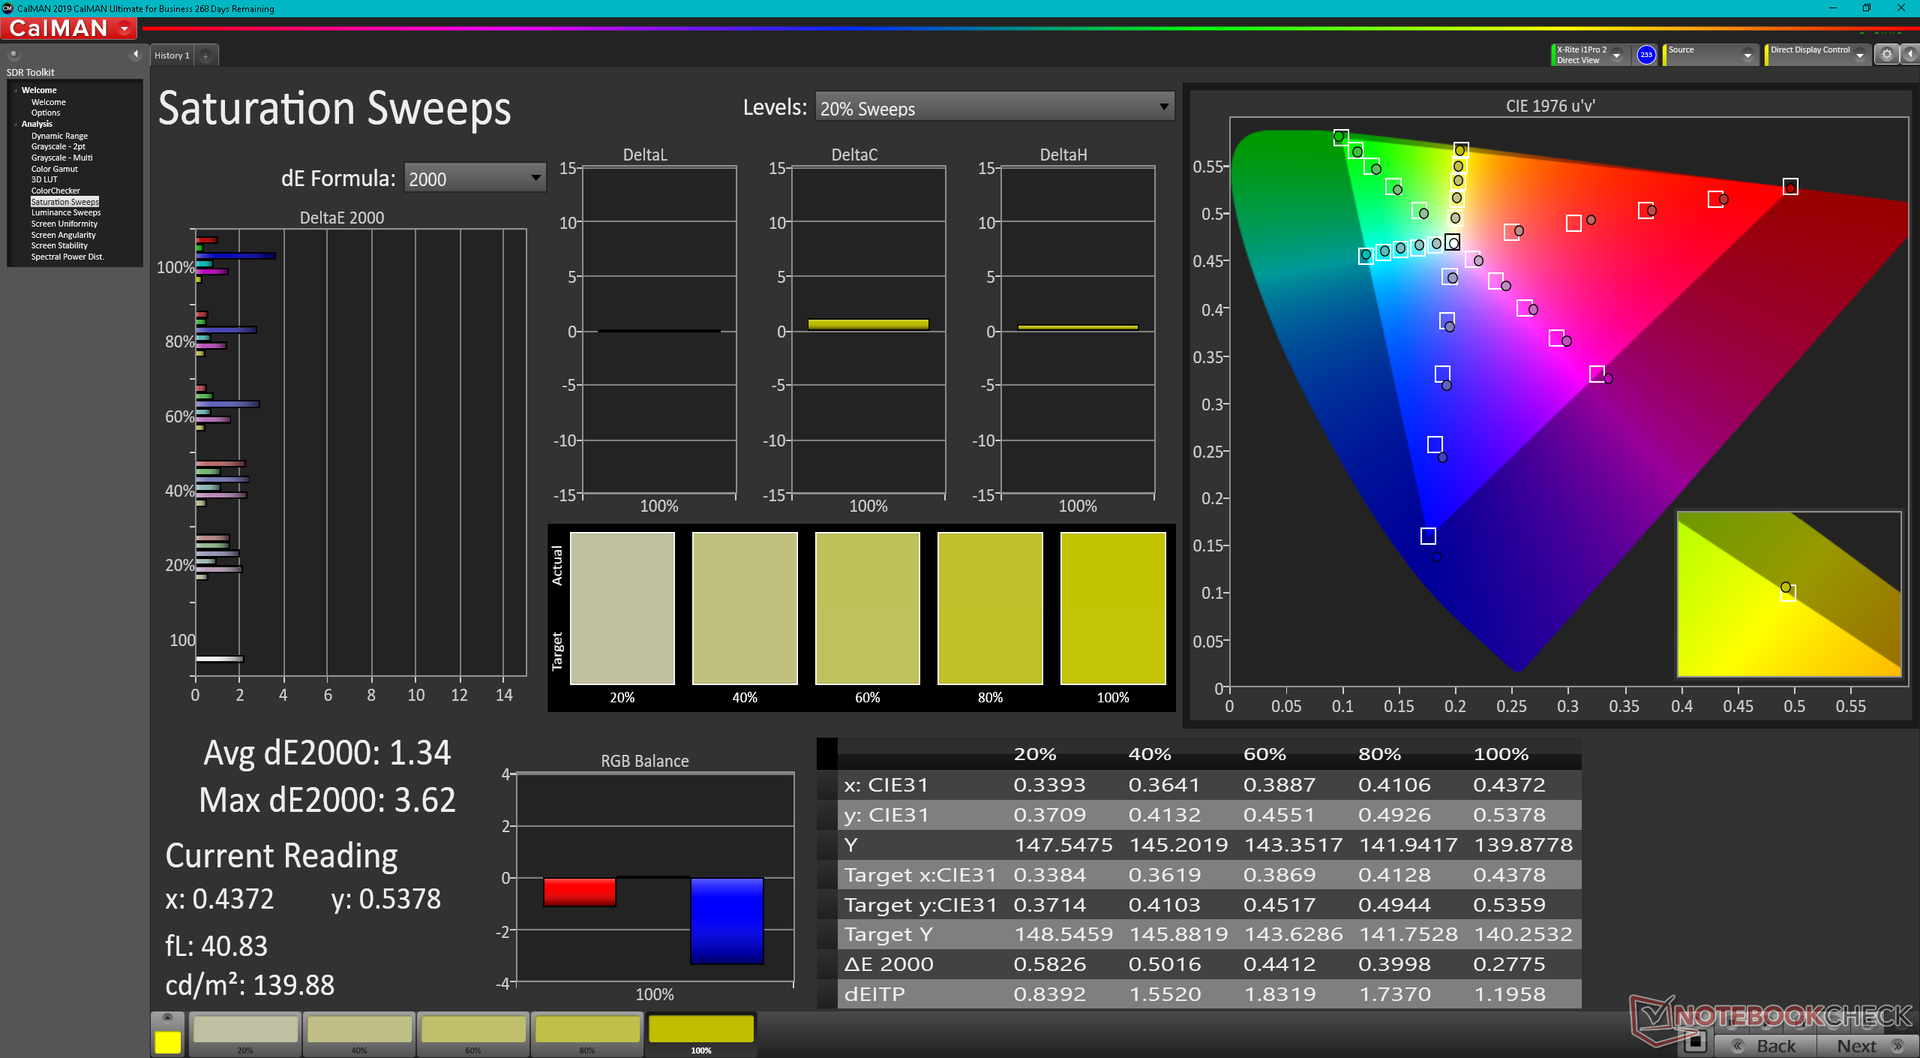
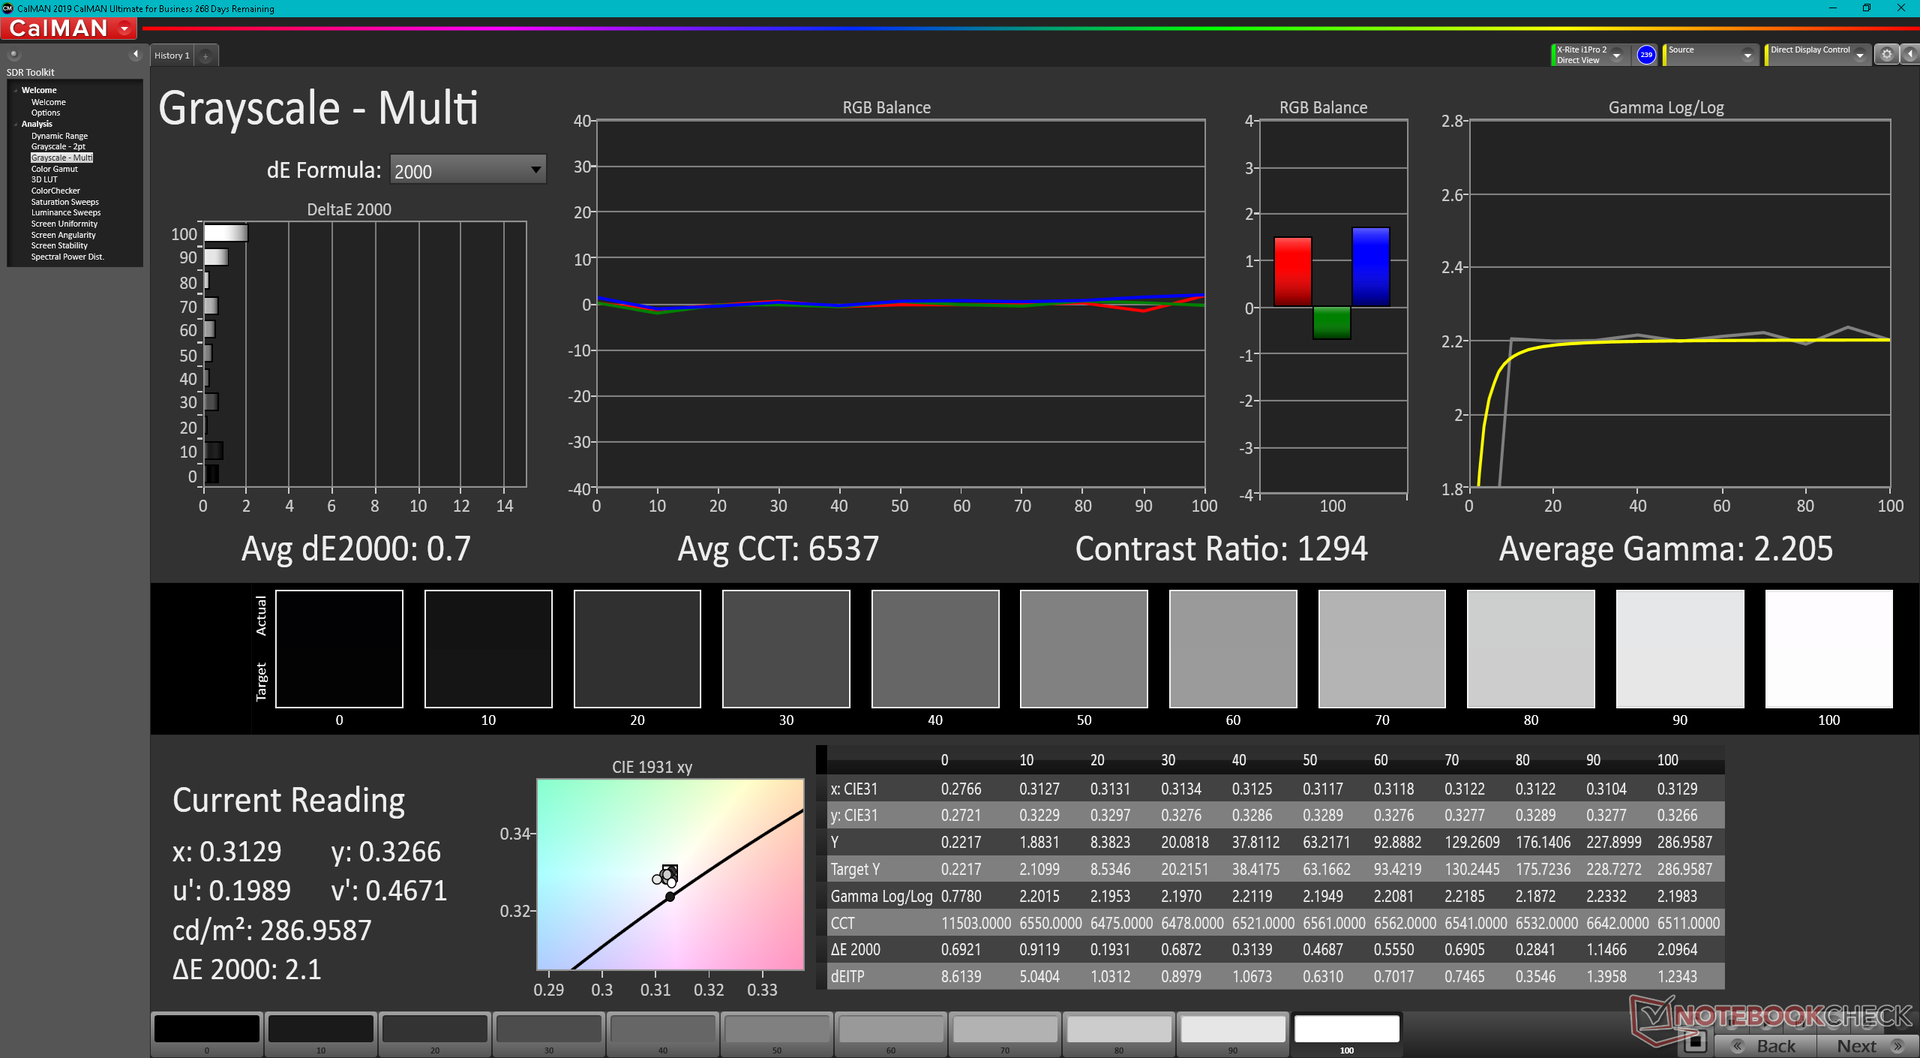
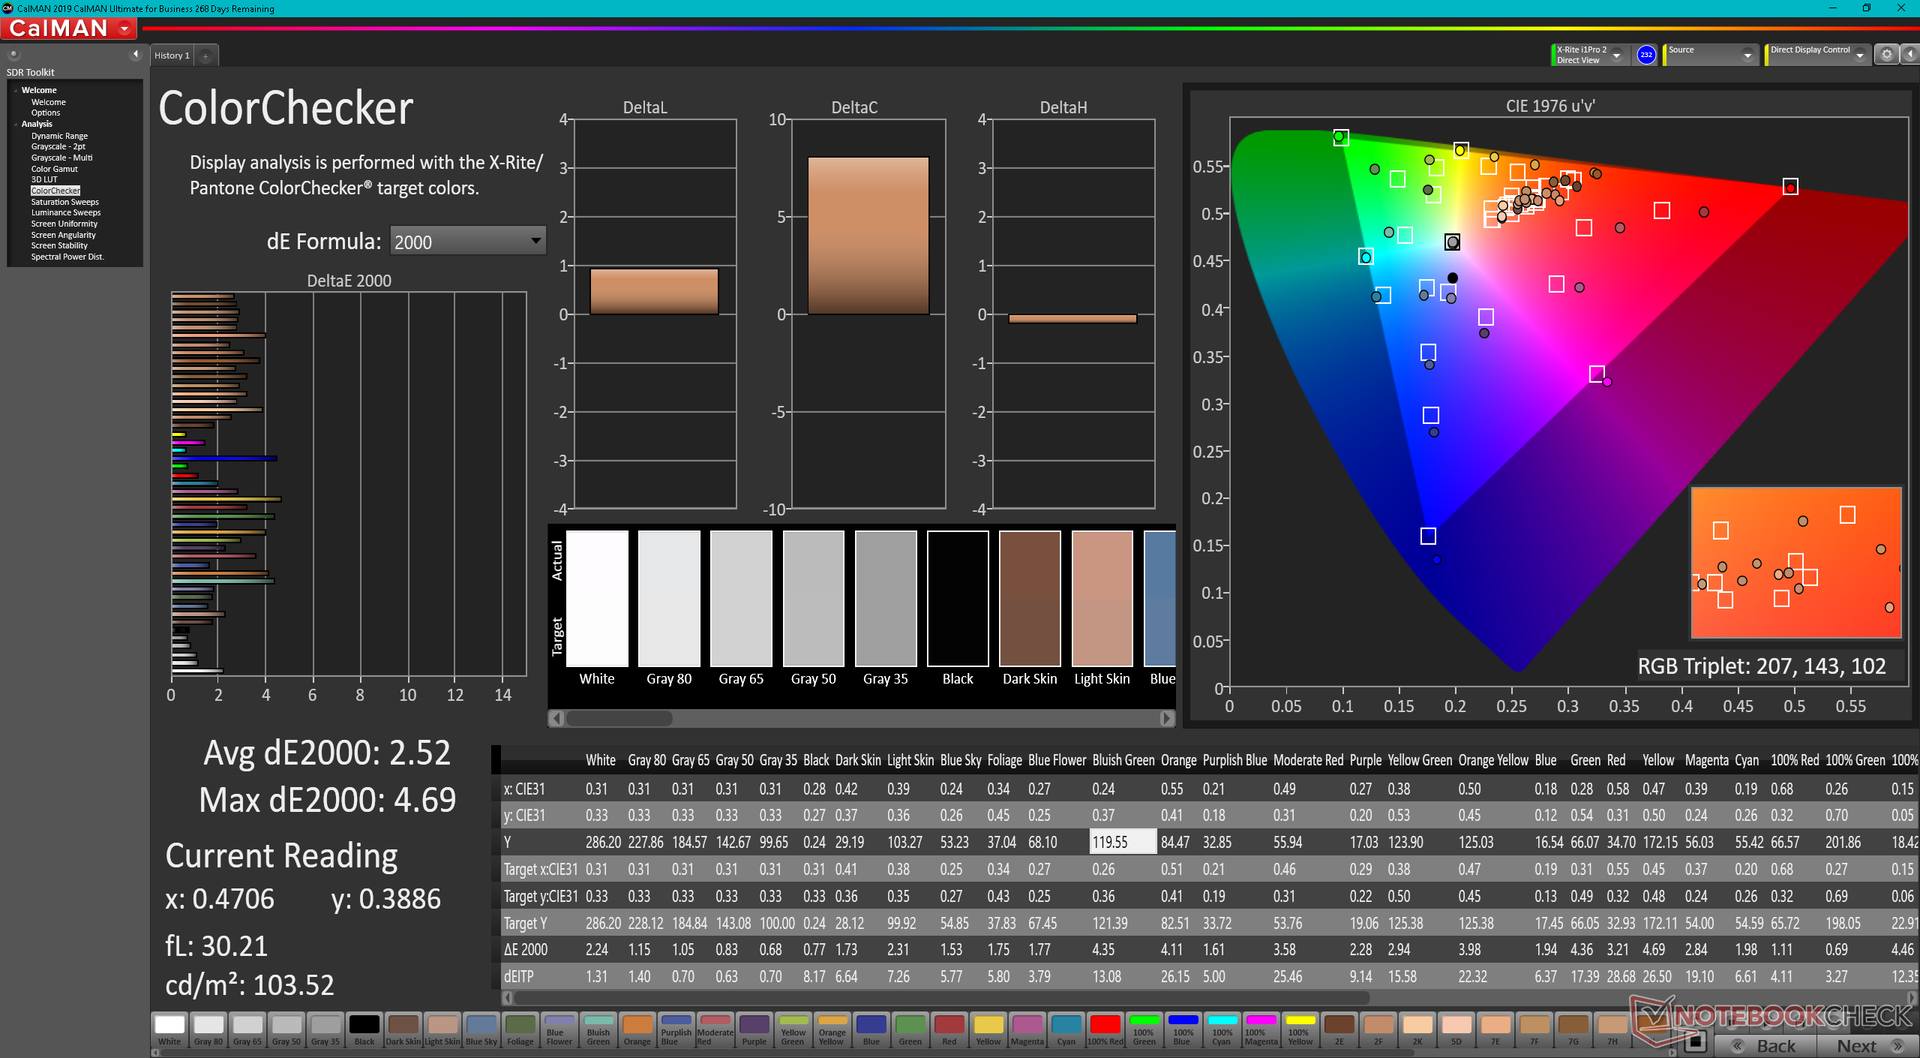
ΔE ColorChecker Calman: 2.74 | ∀{0.5-29.43 Ø4.72}
calibrated: 2.52
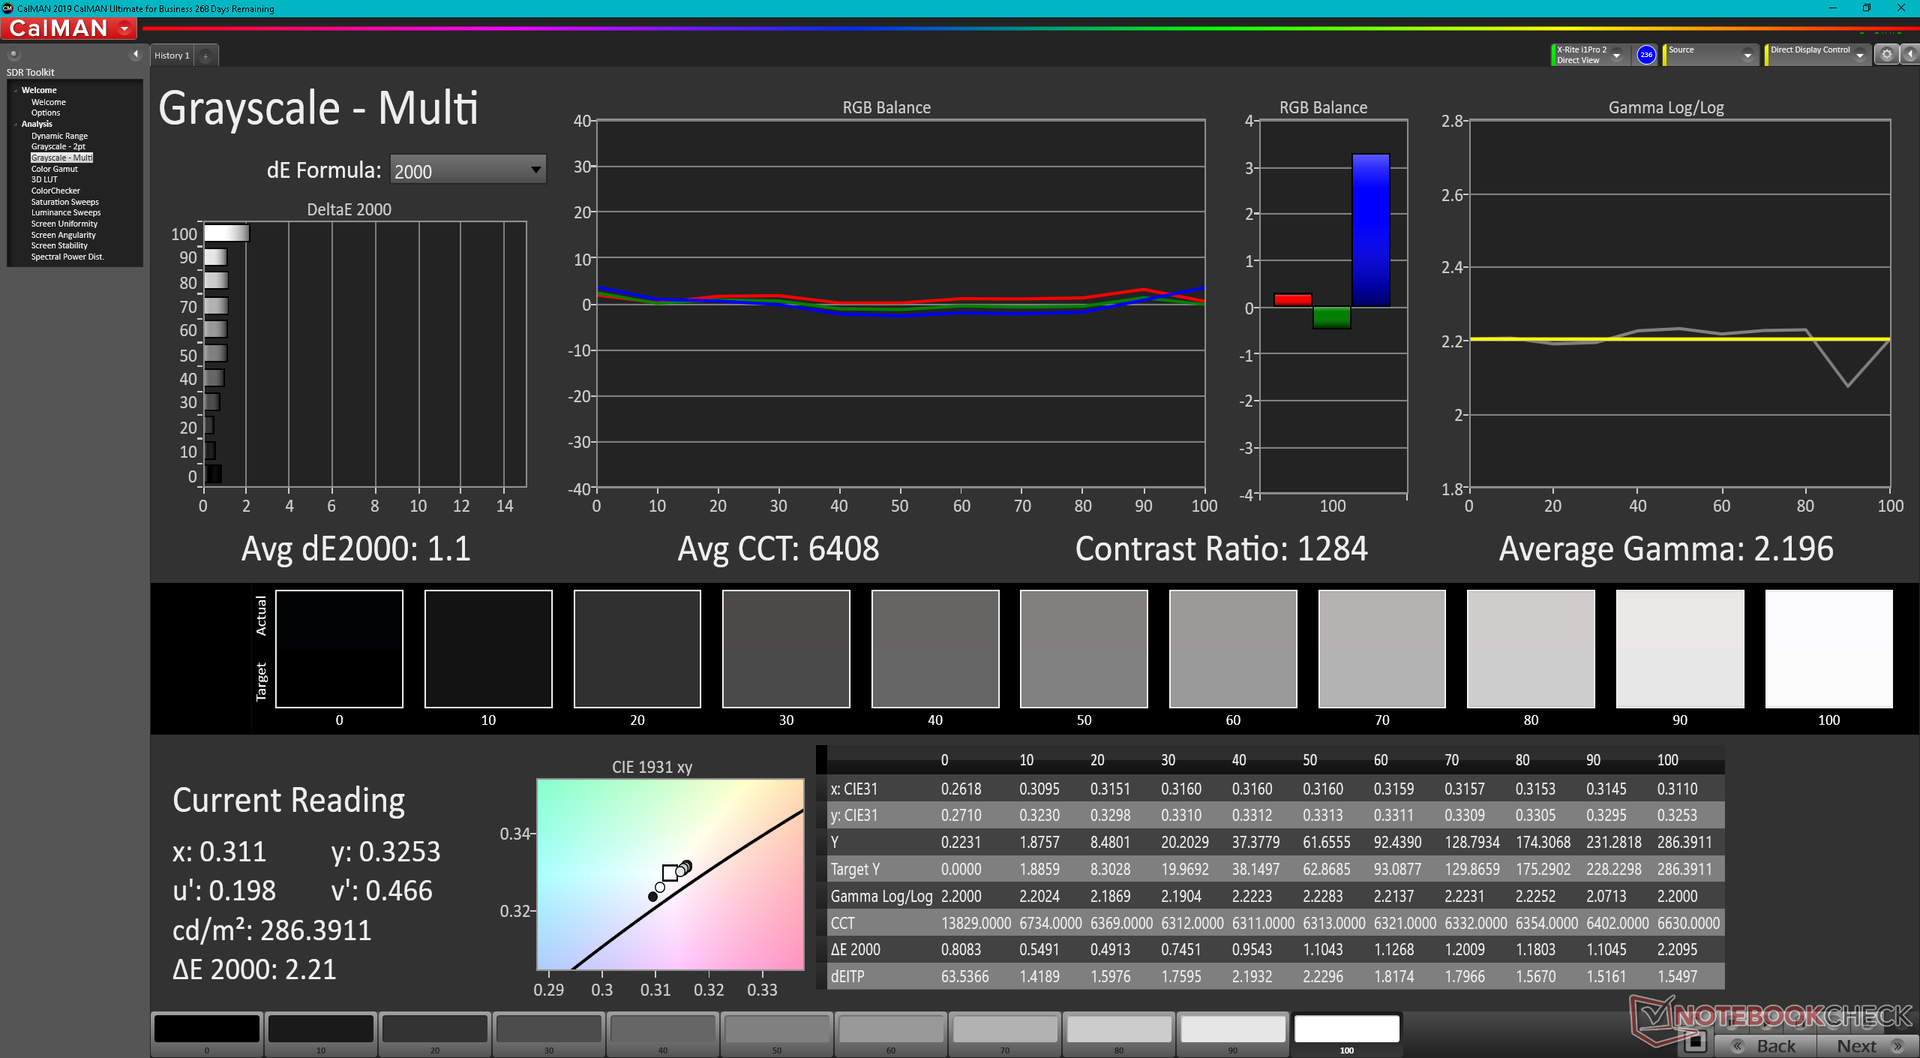
ΔE Greyscale Calman: 1.1 | ∀{0.09-98 Ø4.97}
86.8% AdobeRGB 1998 (Argyll 3D)
99.9% sRGB (Argyll 3D)
99.1% Display P3 (Argyll 3D)
Gamma: 2.2
CCT: 6408 K
| Razer Blade 15 2022 Sharp LQ156T1JW03, IPS, 2560x1440, 15.6" | Razer Blade 15 Advanced Model Early 2021 TL156VDXP02-0, IPS, 1920x1080, 15.6" | Razer Blade 15 RTX 2080 Super Max-Q AU Optronics B156HAN12.0, IPS, 1920x1080, 15.6" | Schenker XMG Neo 15 E22 (Early 2022, RTX 3080 Ti) BOE0A67 (BOE CQ NE156QHM-NZ1), IPS, 2560x1440, 15.6" | ADATA XPG Xenia 15 BOE CQ NE156QHM-NY2, IPS, 2560x1440, 15.6" | Eurocom Nightsky ARX315 Sharp LQ156M1JW03, IPS, 1920x1080, 15.6" | |
|---|---|---|---|---|---|---|
| Display | -20% | -16% | -18% | -15% | ||
| Display P3 Coverage (%) | 99.1 | 65.9 -34% | 70.2 -29% | 68.2 -31% | 67.9 -31% | |
| sRGB Coverage (%) | 99.9 | 96.4 -4% | 99 -1% | 98.1 -2% | 99.7 0% | |
| AdobeRGB 1998 Coverage (%) | 86.8 | 68 -22% | 71.4 -18% | 69.1 -20% | 73.7 -15% | |
| Response Times | -1% | 40% | 4% | 2% | -2% | |
| Response Time Grey 50% / Grey 80% * (ms) | 14.4 ? | 16 ? -11% | 6 ? 58% | 14.4 ? -0% | 13.6 ? 6% | 15.2 ? -6% |
| Response Time Black / White * (ms) | 11.6 ? | 10.4 ? 10% | 9 ? 22% | 10.8 ? 7% | 12 ? -3% | 11.2 ? 3% |
| PWM Frequency (Hz) | 23150 ? | |||||
| Screen | 20% | -6% | -28% | -62% | -38% | |
| Brightness middle (cd/m²) | 286 | 338 18% | 347 21% | 295 3% | 321.1 12% | 312.8 9% |
| Brightness (cd/m²) | 271 | 334 23% | 328 21% | 277 2% | 308 14% | 294 8% |
| Brightness Distribution (%) | 89 | 94 6% | 89 0% | 62 -30% | 82 -8% | 90 1% |
| Black Level * (cd/m²) | 0.25 | 0.24 4% | 0.285 -14% | 0.28 -12% | 0.38 -52% | 0.28 -12% |
| Contrast (:1) | 1144 | 1408 23% | 1218 6% | 1054 -8% | 845 -26% | 1117 -2% |
| Colorchecker dE 2000 * | 2.74 | 1.39 49% | 2.35 14% | 2.36 14% | 3.21 -17% | 2.96 -8% |
| Colorchecker dE 2000 max. * | 5.21 | 3.31 36% | 4.15 20% | 4.24 19% | 10.56 -103% | 6.23 -20% |
| Colorchecker dE 2000 calibrated * | 2.52 | 0.97 62% | 1.16 54% | 1.53 39% | ||
| Greyscale dE 2000 * | 1.1 | 1.6 -45% | 3.04 -176% | 3.43 -212% | 5.7 -418% | 4.2 -282% |
| Gamma | 2.2 100% | 2.291 96% | 2.35 94% | 2.44 90% | 2.09 105% | 2.32 95% |
| CCT | 6408 101% | 6626 98% | 6658 98% | 6266 104% | 7194 90% | 7145 91% |
| Color Space (Percent of AdobeRGB 1998) (%) | 68 | 65 | ||||
| Color Space (Percent of sRGB) (%) | 89 | 99 | ||||
| Total Average (Program / Settings) | -0% /
8% | 6% /
-2% | -12% /
-22% | -26% /
-44% | -18% /
-27% |
* ... smaller is better
The display is well-calibrated out of the box with average grayscale and color DeltaE values of just 1.1 and 2.74, respectively, against the DCI-P3 standard. Razer says it individually calibrates each panel at factory and our independent measurements with an X-Rite colorimeter can confirm the accurate colors and grayscale.

Display Response Times
| ↔ Response Time Black to White | ||
|---|---|---|
| 11.6 ms ... rise ↗ and fall ↘ combined | ↗ 5.6 ms rise | 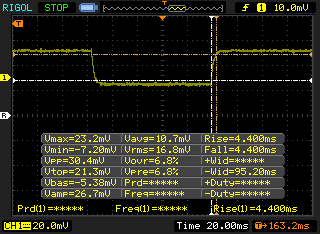 |
| ↘ 6 ms fall | ||
| The screen shows good response rates in our tests, but may be too slow for competitive gamers. In comparison, all tested devices range from 0.1 (minimum) to 240 (maximum) ms. » 31 % of all devices are better. This means that the measured response time is better than the average of all tested devices (19.8 ms). | ||
| ↔ Response Time 50% Grey to 80% Grey | ||
| 14.4 ms ... rise ↗ and fall ↘ combined | ↗ 6.8 ms rise | 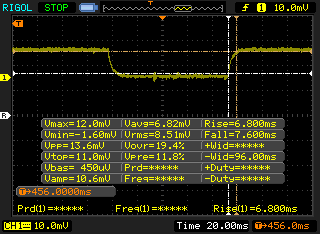 |
| ↘ 7.6 ms fall | ||
| The screen shows good response rates in our tests, but may be too slow for competitive gamers. In comparison, all tested devices range from 0.165 (minimum) to 636 (maximum) ms. » 28 % of all devices are better. This means that the measured response time is better than the average of all tested devices (31 ms). | ||
Screen Flickering / PWM (Pulse-Width Modulation)
| Screen flickering / PWM not detected | 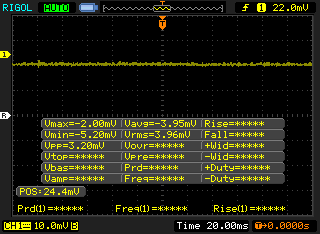 | ||
In comparison: 52 % of all tested devices do not use PWM to dim the display. If PWM was detected, an average of 7747 (minimum: 5 - maximum: 343500) Hz was measured. | |||
Performance
Testing Conditions
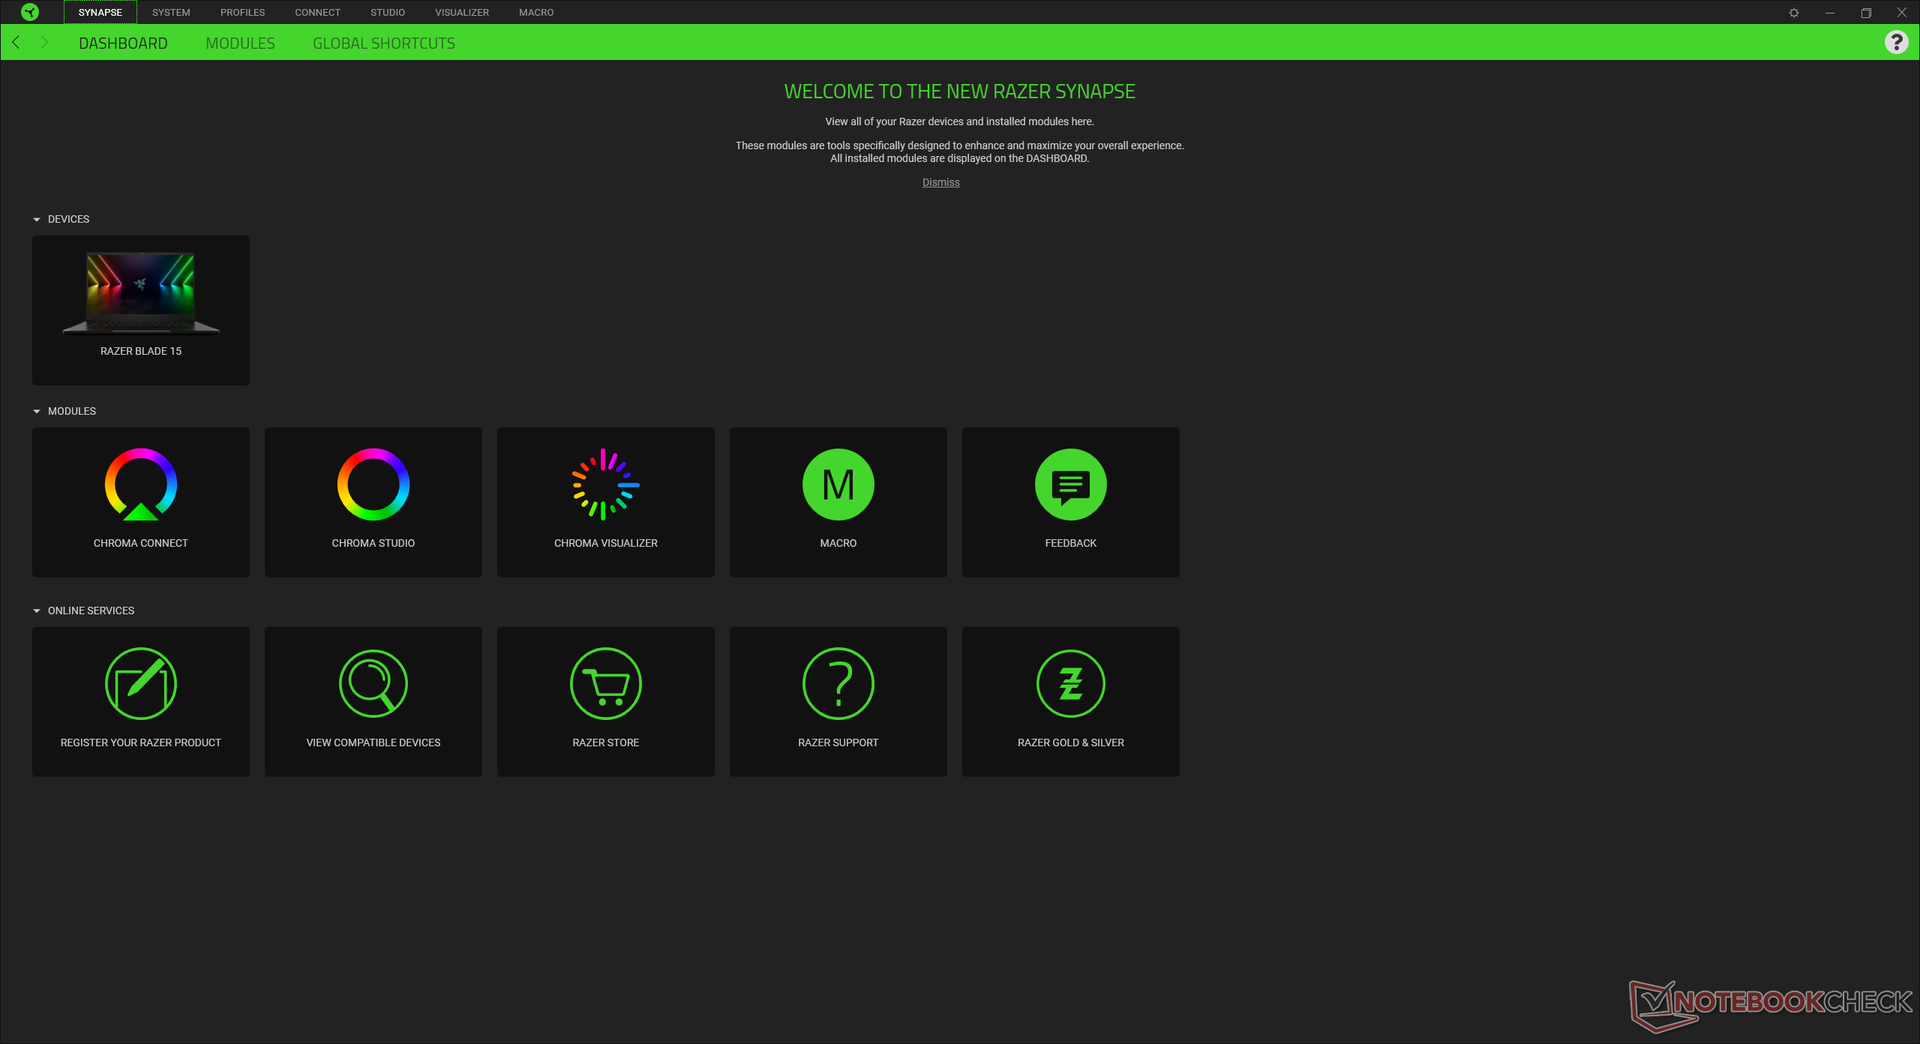
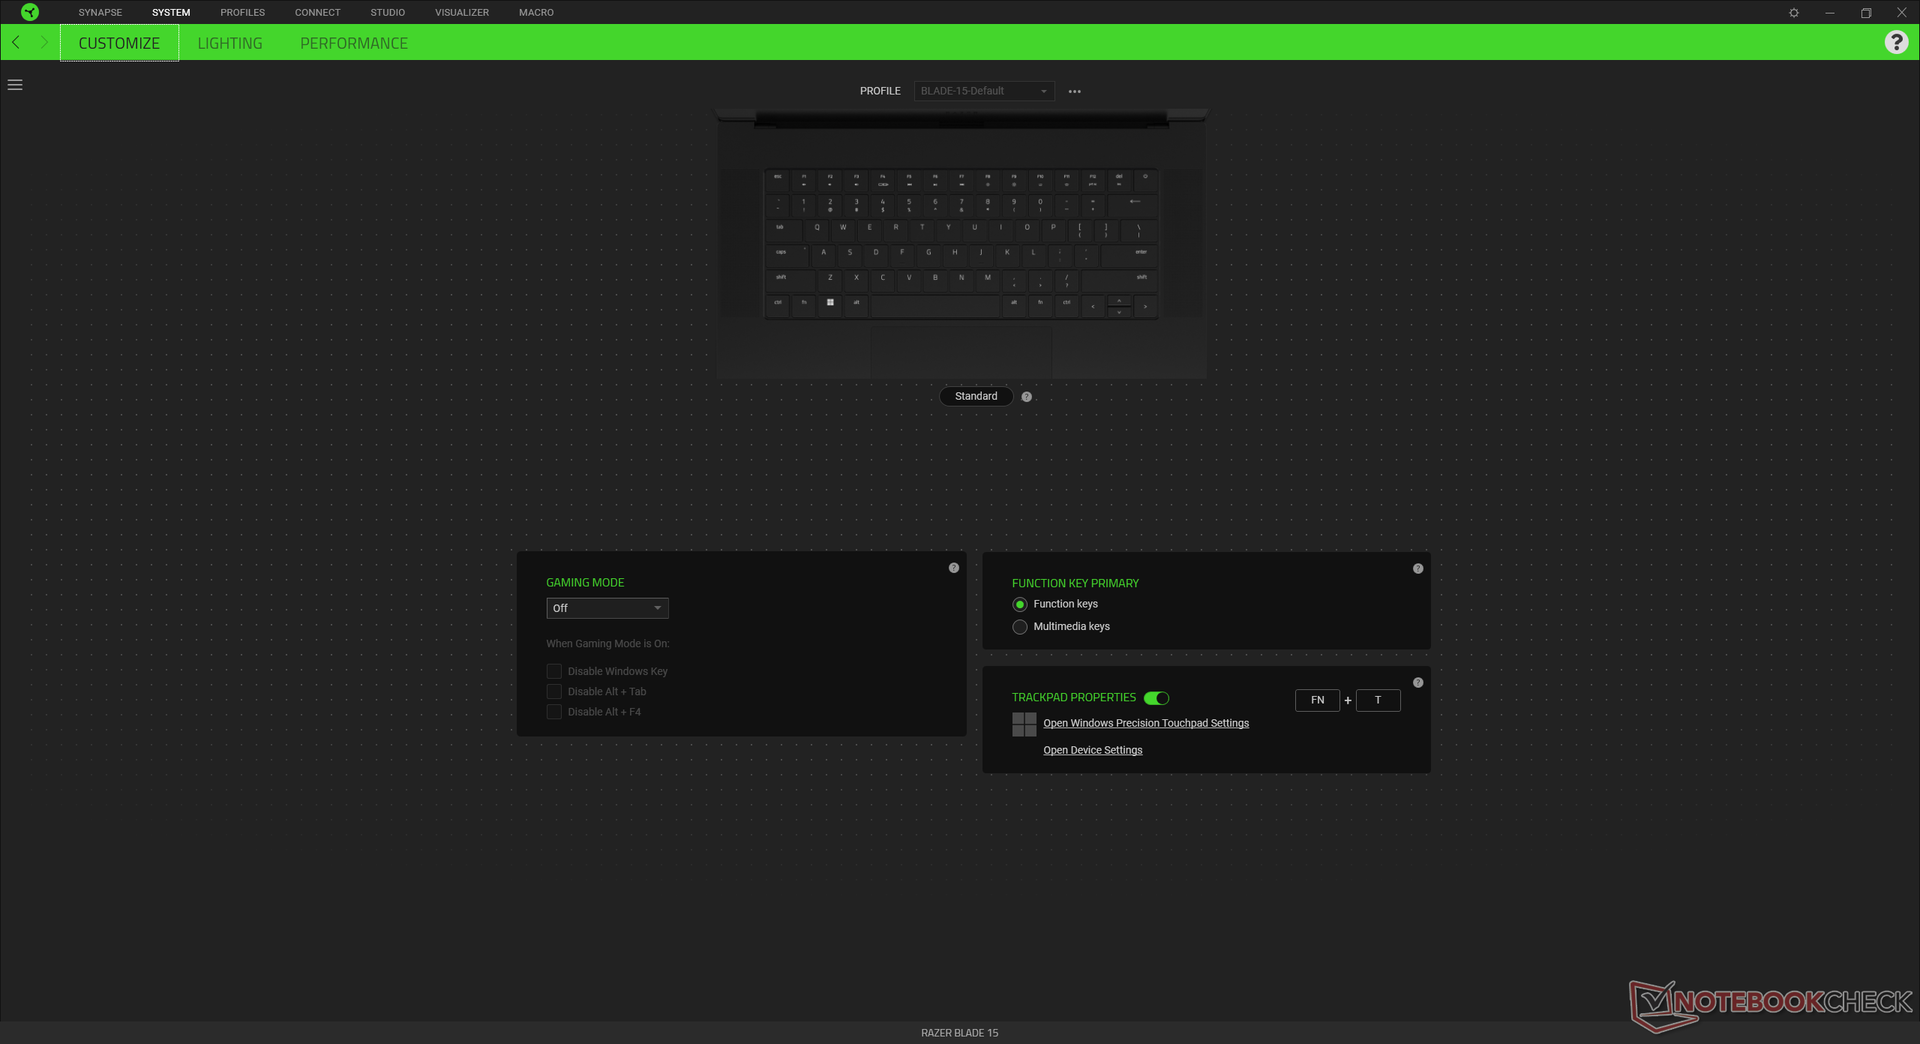
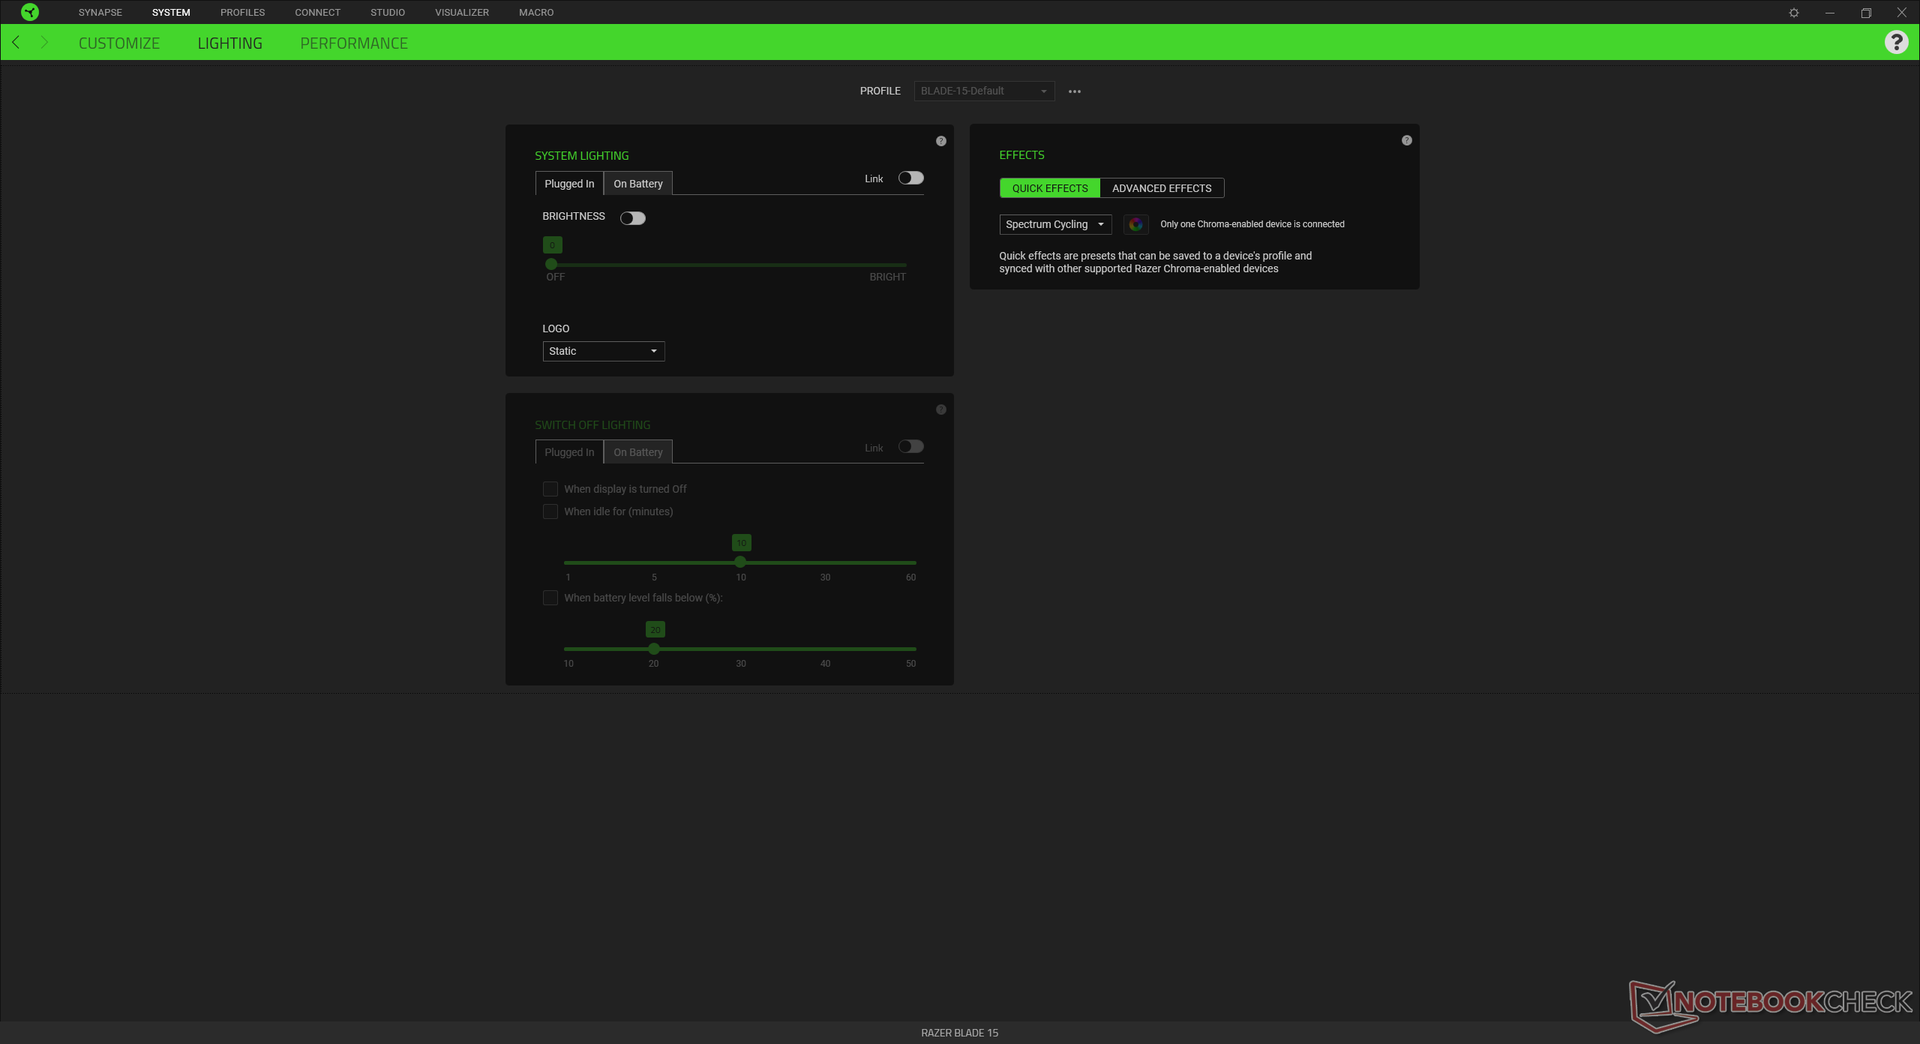
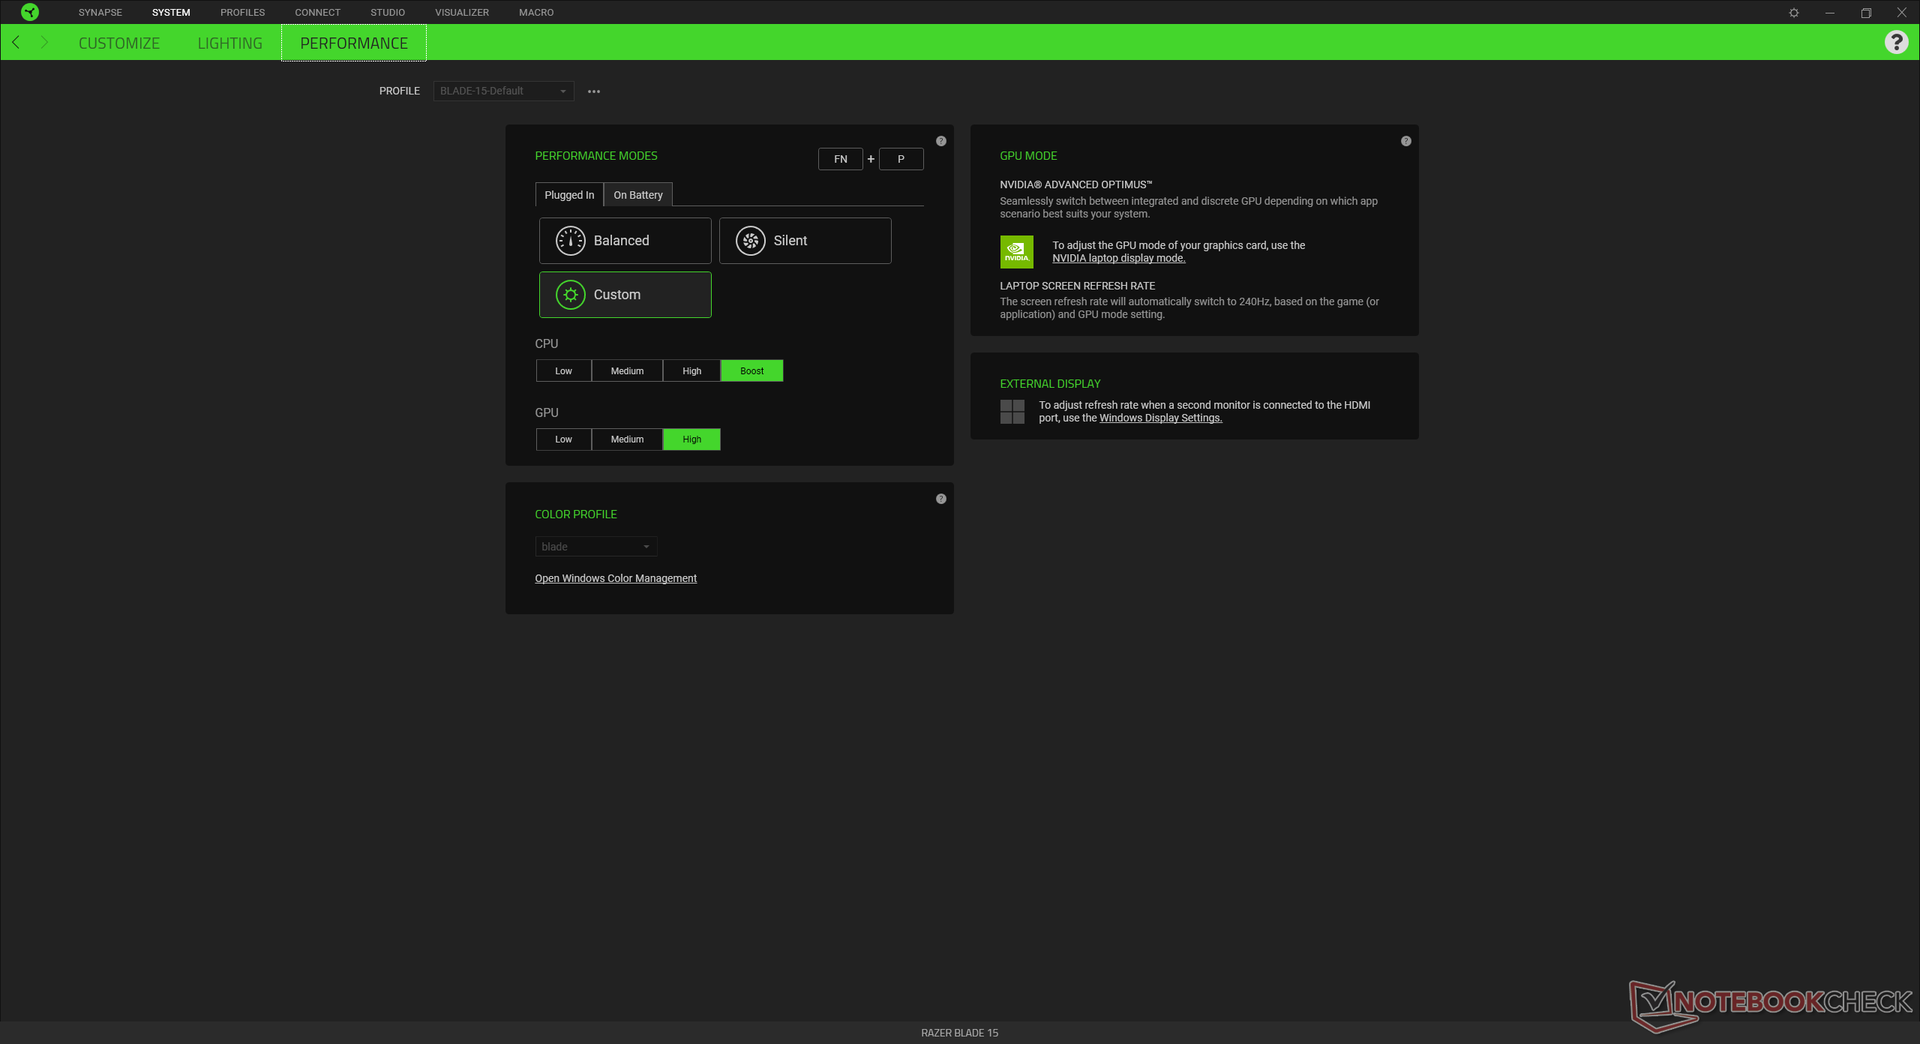
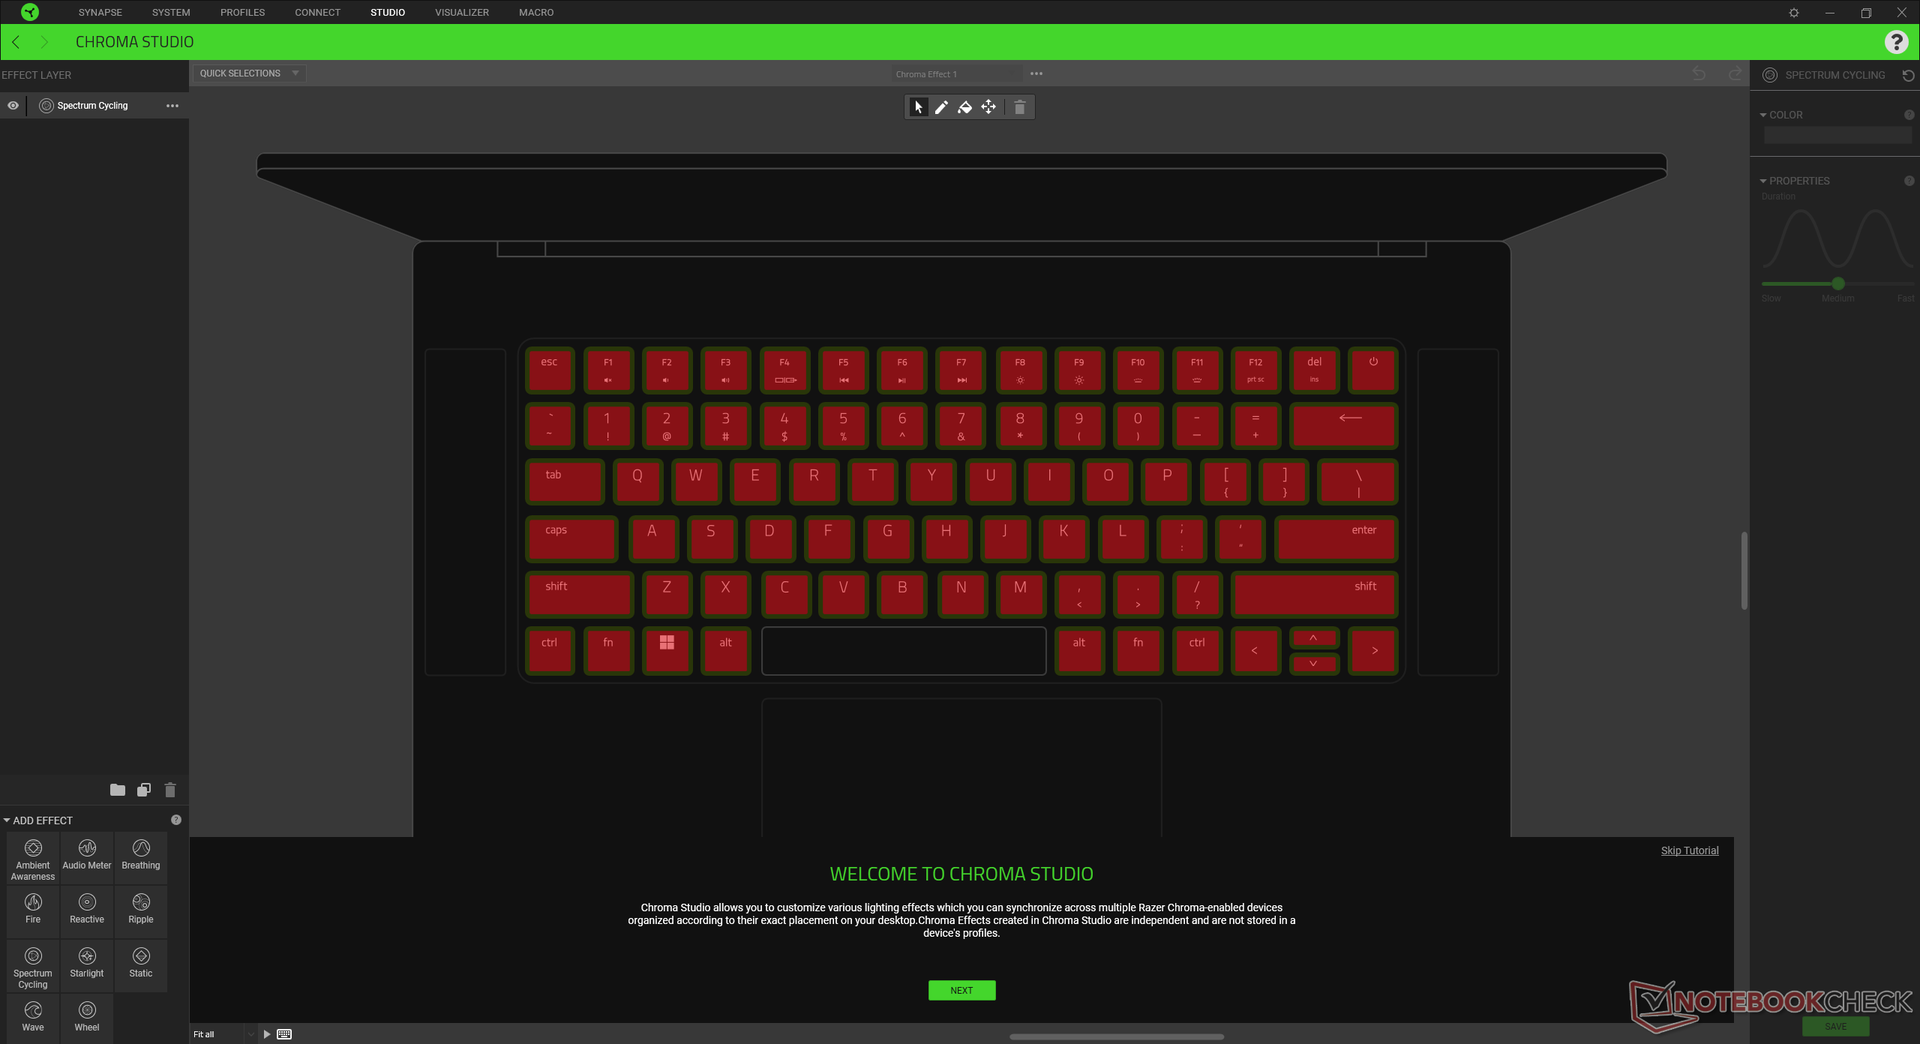
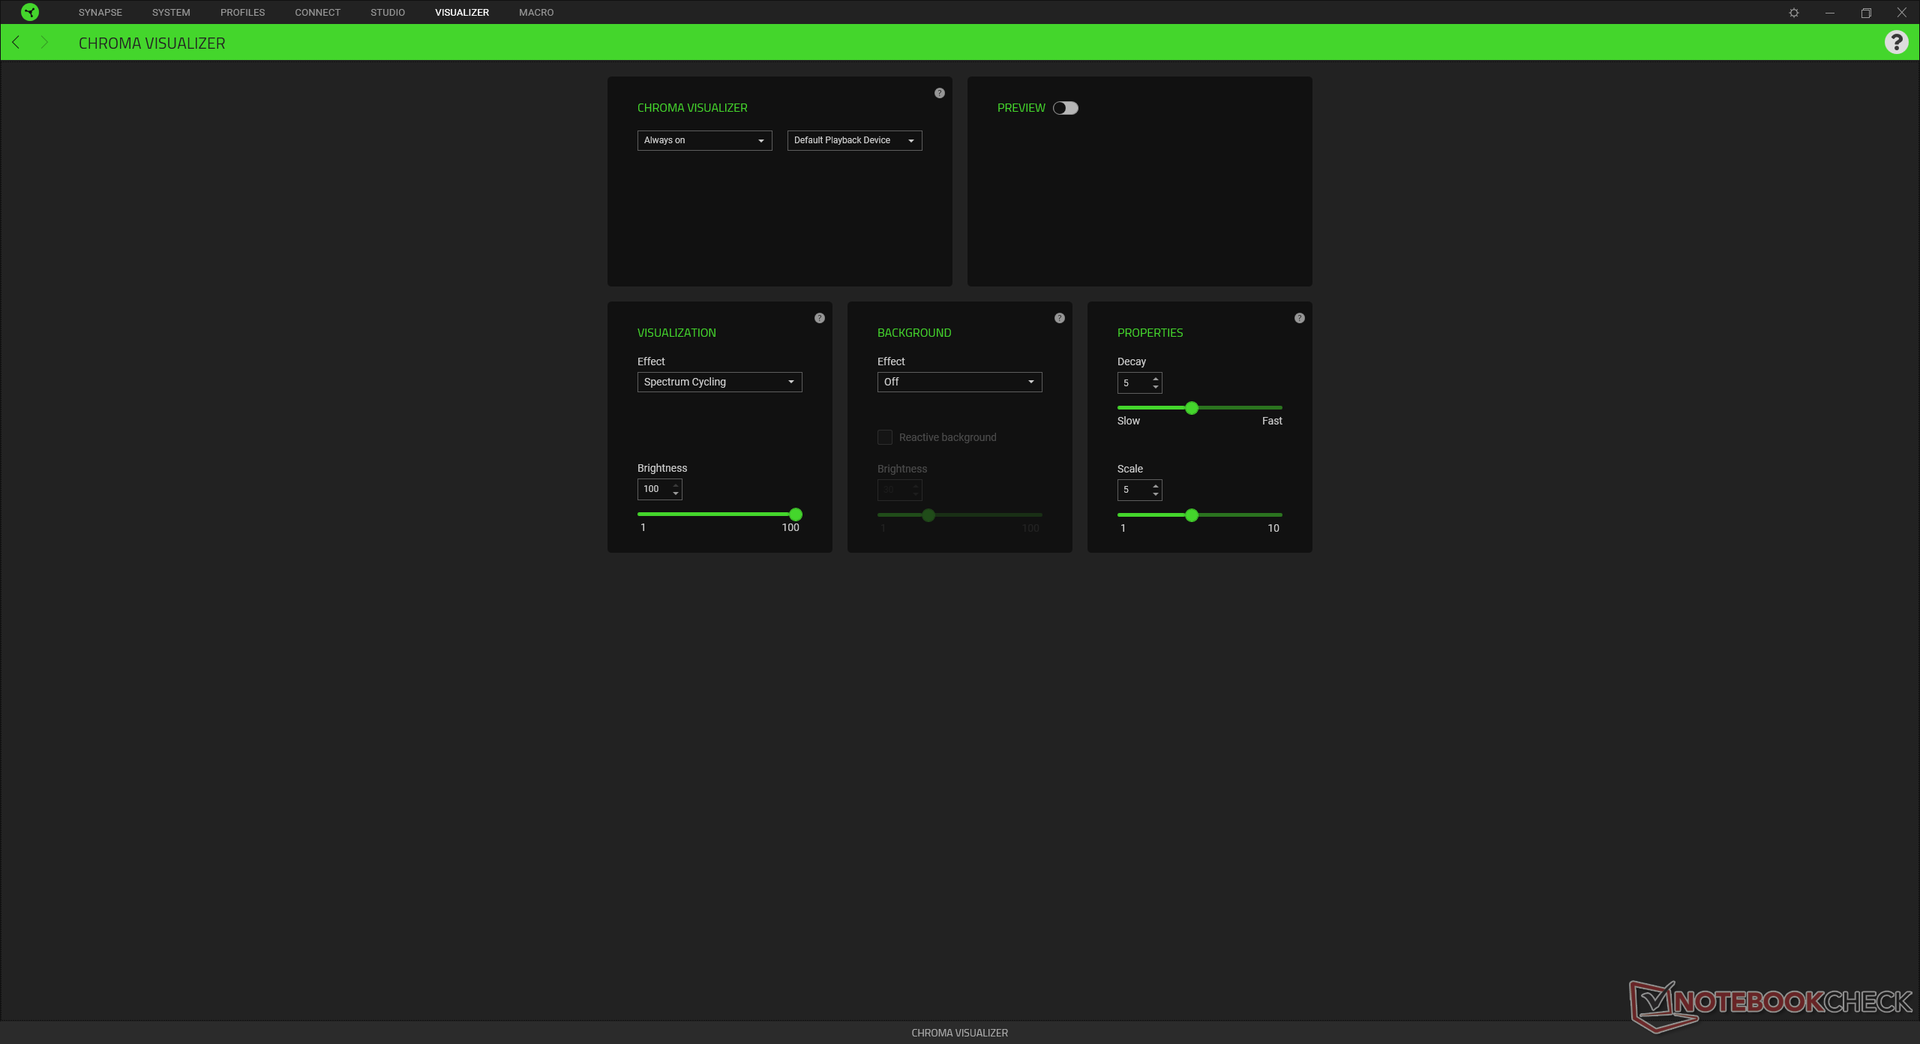
Our unit was set to Custom performance mode with CPU to Boost and GPU to High via the Razer Synapse software prior to running any performance benchmarks below for the highest possible scores. We also enabled the dGPU by disabling Optimus. It's highly recommended to become familiar with Razer Synapse as it is the software hub for controlling performance and features.
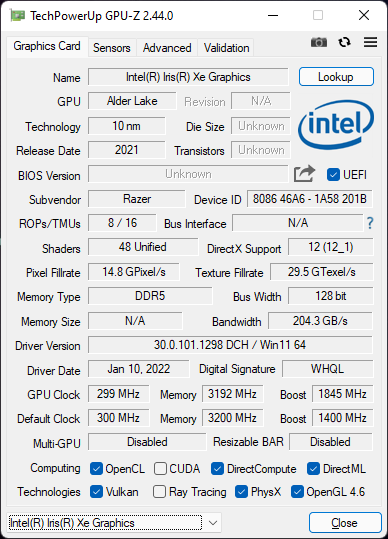
Users can switch between dGPU only or Nvidia Optimus (MUX) without needing to restart the system since the Blade 15 is one of the few gaming laptops to support Advanced Optimus or Optimus 2.0. Keep in mind that G-Sync for the internal display will only work when not in Optimus mode. Additionally, Thunderbolt 4 support will only be enabled when on Optimus mode much like on other laptops running on 12th gen Alder Lake-H CPUs.
Processor
The Core i7-12800H offers 20 percent faster single-thread and multi-thread performance over the last generation Core i7-11800H that it directly replaces. Upgrading to the Core i9-12900H SKU is expected to boost CPU performance by another 5 to 15 percent based on our experience with the MSI Vector GP66.
Cinebench R15 Multi Loop
Cinebench R23: Multi Core | Single Core
Cinebench R15: CPU Multi 64Bit | CPU Single 64Bit
Blender: v2.79 BMW27 CPU
7-Zip 18.03: 7z b 4 | 7z b 4 -mmt1
Geekbench 5.5: Multi-Core | Single-Core
HWBOT x265 Benchmark v2.2: 4k Preset
LibreOffice : 20 Documents To PDF
R Benchmark 2.5: Overall mean
| Cinebench R23 / Multi Core | |
| MSI Vector GP66 12UGS | |
| Razer Blade 15 2022 | |
| Average Intel Core i7-12800H (9777 - 16597, n=5) | |
| Razer Blade 14 Ryzen 9 RTX 3070 | |
| Razer Blade 15 Advanced (Mid 2021) | |
| MSI Alpha 15 B5EEK-008 | |
| Aorus 15P XC | |
| Lenovo Legion C7 15IMH05 82EH0030GE | |
| Razer Blade 15 Advanced Model Early 2021 | |
| Cinebench R23 / Single Core | |
| MSI Vector GP66 12UGS | |
| Average Intel Core i7-12800H (1796 - 1859, n=5) | |
| Razer Blade 15 2022 | |
| Razer Blade 15 Advanced (Mid 2021) | |
| MSI Alpha 15 B5EEK-008 | |
| Lenovo Legion C7 15IMH05 82EH0030GE | |
| Aorus 15P XC | |
| Razer Blade 14 Ryzen 9 RTX 3070 | |
| Razer Blade 15 Advanced Model Early 2021 | |
| Geekbench 5.5 / Multi-Core | |
| Razer Blade 15 2022 | |
| MSI Vector GP66 12UGS | |
| Average Intel Core i7-12800H (9607 - 12940, n=5) | |
| Asus ROG Zephyrus M16 GU603H | |
| MSI Alpha 15 B5EEK-008 | |
| Lenovo Legion C7 15IMH05 82EH0030GE | |
| Aorus 15P XC | |
| Asus ROG Zephyrus G15 GA502IU-ES76 | |
| Razer Blade 15 Advanced Model Early 2021 | |
| Geekbench 5.5 / Single-Core | |
| MSI Vector GP66 12UGS | |
| Average Intel Core i7-12800H (1739 - 1842, n=5) | |
| Razer Blade 15 2022 | |
| Asus ROG Zephyrus M16 GU603H | |
| MSI Alpha 15 B5EEK-008 | |
| Lenovo Legion C7 15IMH05 82EH0030GE | |
| Razer Blade 15 Advanced Model Early 2021 | |
| Aorus 15P XC | |
| Asus ROG Zephyrus G15 GA502IU-ES76 | |
* ... smaller is better
AIDA64: FP32 Ray-Trace | FPU Julia | CPU SHA3 | CPU Queen | FPU SinJulia | FPU Mandel | CPU AES | CPU ZLib | FP64 Ray-Trace | CPU PhotoWorxx
| Performance rating | |
| Eurocom Nightsky ARX315 | |
| Schenker XMG Neo 15 E22 (Early 2022, RTX 3080 Ti) | |
| Average Intel Core i7-12800H | |
| Razer Blade 15 2022 | |
| Razer Blade 15 RTX 2080 Super Max-Q | |
| Razer Blade 15 Advanced Model Early 2021 | |
| ADATA XPG Xenia 15 -9! | |
| AIDA64 / FP32 Ray-Trace | |
| Eurocom Nightsky ARX315 | |
| Schenker XMG Neo 15 E22 (Early 2022, RTX 3080 Ti) | |
| Razer Blade 15 RTX 2080 Super Max-Q | |
| Average Intel Core i7-12800H (5839 - 15206, n=5) | |
| Razer Blade 15 Advanced Model Early 2021 | |
| Razer Blade 15 2022 | |
| AIDA64 / FPU Julia | |
| Eurocom Nightsky ARX315 | |
| Razer Blade 15 RTX 2080 Super Max-Q | |
| Razer Blade 15 Advanced Model Early 2021 | |
| Average Intel Core i7-12800H (27801 - 80002, n=5) | |
| Schenker XMG Neo 15 E22 (Early 2022, RTX 3080 Ti) | |
| Razer Blade 15 2022 | |
| AIDA64 / CPU SHA3 | |
| Schenker XMG Neo 15 E22 (Early 2022, RTX 3080 Ti) | |
| Eurocom Nightsky ARX315 | |
| Average Intel Core i7-12800H (2013 - 3684, n=5) | |
| Razer Blade 15 2022 | |
| Razer Blade 15 RTX 2080 Super Max-Q | |
| Razer Blade 15 Advanced Model Early 2021 | |
| AIDA64 / CPU Queen | |
| Eurocom Nightsky ARX315 | |
| Schenker XMG Neo 15 E22 (Early 2022, RTX 3080 Ti) | |
| Average Intel Core i7-12800H (85965 - 108084, n=5) | |
| Razer Blade 15 2022 | |
| Razer Blade 15 RTX 2080 Super Max-Q | |
| Razer Blade 15 Advanced Model Early 2021 | |
| AIDA64 / FPU SinJulia | |
| Eurocom Nightsky ARX315 | |
| Schenker XMG Neo 15 E22 (Early 2022, RTX 3080 Ti) | |
| Razer Blade 15 2022 | |
| Average Intel Core i7-12800H (7027 - 9658, n=5) | |
| Razer Blade 15 RTX 2080 Super Max-Q | |
| Razer Blade 15 Advanced Model Early 2021 | |
| AIDA64 / FPU Mandel | |
| Eurocom Nightsky ARX315 | |
| Schenker XMG Neo 15 E22 (Early 2022, RTX 3080 Ti) | |
| Razer Blade 15 RTX 2080 Super Max-Q | |
| Average Intel Core i7-12800H (15765 - 38179, n=5) | |
| Razer Blade 15 Advanced Model Early 2021 | |
| Razer Blade 15 2022 | |
| AIDA64 / CPU AES | |
| Eurocom Nightsky ARX315 | |
| Schenker XMG Neo 15 E22 (Early 2022, RTX 3080 Ti) | |
| Average Intel Core i7-12800H (55371 - 73928, n=5) | |
| Razer Blade 15 2022 | |
| Razer Blade 15 RTX 2080 Super Max-Q | |
| Razer Blade 15 Advanced Model Early 2021 | |
| AIDA64 / FP64 Ray-Trace | |
| Eurocom Nightsky ARX315 | |
| Schenker XMG Neo 15 E22 (Early 2022, RTX 3080 Ti) | |
| Razer Blade 15 RTX 2080 Super Max-Q | |
| Average Intel Core i7-12800H (3257 - 8559, n=5) | |
| Razer Blade 15 Advanced Model Early 2021 | |
| Razer Blade 15 2022 | |
| AIDA64 / CPU PhotoWorxx | |
| Razer Blade 15 2022 | |
| Schenker XMG Neo 15 E22 (Early 2022, RTX 3080 Ti) | |
| Average Intel Core i7-12800H (31329 - 40992, n=5) | |
| Razer Blade 15 Advanced Model Early 2021 | |
| Eurocom Nightsky ARX315 | |
| Razer Blade 15 RTX 2080 Super Max-Q | |
System Performance
| PCMark 10 / Score | |
| Razer Blade 15 2022 | |
| Average Intel Core i7-12800H, NVIDIA GeForce RTX 3080 Ti Laptop GPU (7313 - 7744, n=3) | |
| Razer Blade 15 Advanced (Mid 2021) | |
| Razer Blade 17 RTX 3070 | |
| Razer Blade 14 Ryzen 9 RTX 3070 | |
| Razer Blade 15 RTX 2070 Super Max-Q | |
| Razer Blade Pro 17 2021 (QHD Touch) | |
| Razer Blade 15 Base Edition 2021, i7-10750H RTX 3060 | |
| Razer Blade 15 Advanced Model Early 2021 | |
| PCMark 10 / Essentials | |
| Razer Blade 15 Advanced (Mid 2021) | |
| Razer Blade 17 RTX 3070 | |
| Razer Blade 15 2022 | |
| Average Intel Core i7-12800H, NVIDIA GeForce RTX 3080 Ti Laptop GPU (10597 - 10814, n=3) | |
| Razer Blade 14 Ryzen 9 RTX 3070 | |
| Razer Blade 15 RTX 2070 Super Max-Q | |
| Razer Blade 15 Base Edition 2021, i7-10750H RTX 3060 | |
| Razer Blade Pro 17 2021 (QHD Touch) | |
| Razer Blade 15 Advanced Model Early 2021 | |
| PCMark 10 / Productivity | |
| Razer Blade 15 2022 | |
| Average Intel Core i7-12800H, NVIDIA GeForce RTX 3080 Ti Laptop GPU (9470 - 9675, n=3) | |
| Razer Blade 14 Ryzen 9 RTX 3070 | |
| Razer Blade 17 RTX 3070 | |
| Razer Blade 15 Advanced (Mid 2021) | |
| Razer Blade 15 RTX 2070 Super Max-Q | |
| Razer Blade Pro 17 2021 (QHD Touch) | |
| Razer Blade 15 Advanced Model Early 2021 | |
| Razer Blade 15 Base Edition 2021, i7-10750H RTX 3060 | |
| PCMark 10 / Digital Content Creation | |
| Razer Blade 15 2022 | |
| Average Intel Core i7-12800H, NVIDIA GeForce RTX 3080 Ti Laptop GPU (10351 - 12306, n=3) | |
| Razer Blade 15 Advanced (Mid 2021) | |
| Razer Blade 17 RTX 3070 | |
| Razer Blade 15 RTX 2070 Super Max-Q | |
| Razer Blade 14 Ryzen 9 RTX 3070 | |
| Razer Blade Pro 17 2021 (QHD Touch) | |
| Razer Blade 15 Base Edition 2021, i7-10750H RTX 3060 | |
| Razer Blade 15 Advanced Model Early 2021 | |
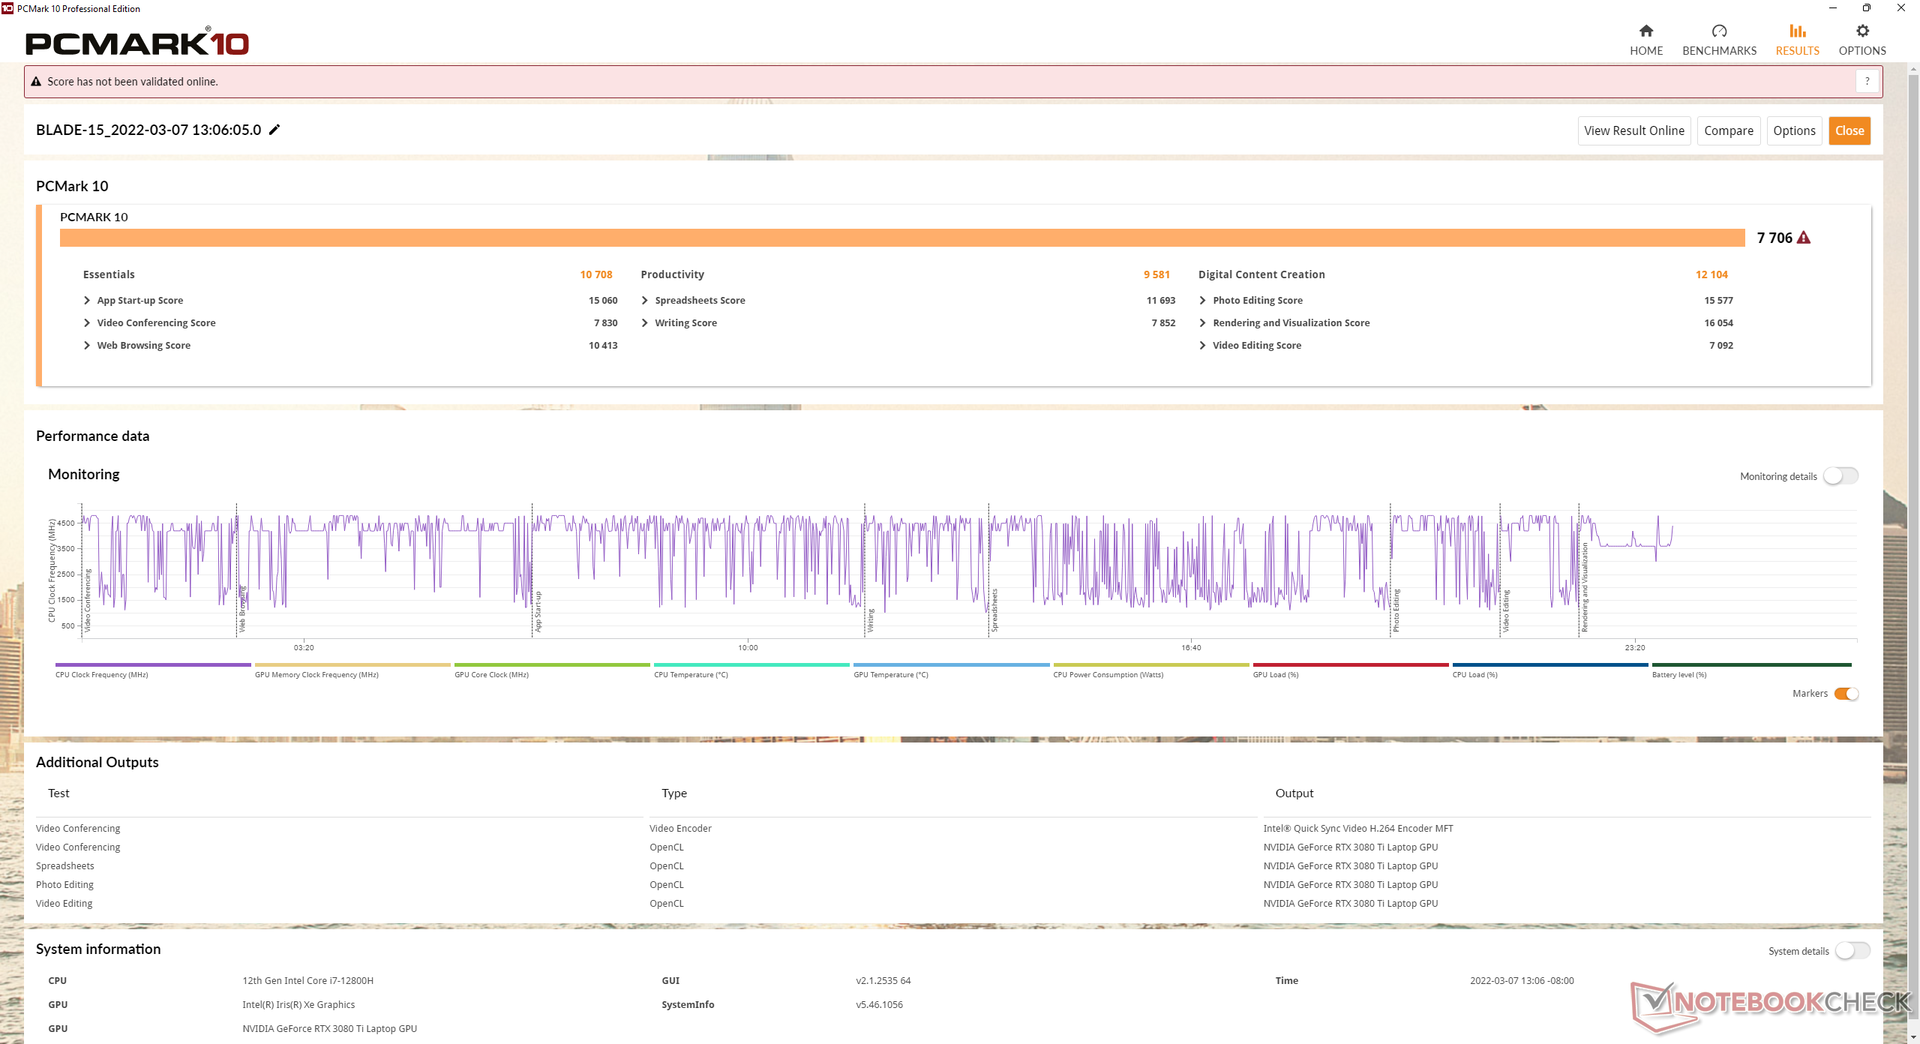
| PCMark 10 Score | 7706 points | |
Help | ||
| AIDA64 / Memory Copy | |
| Schenker XMG Neo 15 E22 (Early 2022, RTX 3080 Ti) | |
| Razer Blade 15 2022 | |
| Average Intel Core i7-12800H (48643 - 62522, n=5) | |
| Eurocom Nightsky ARX315 | |
| Razer Blade 15 Advanced Model Early 2021 | |
| Razer Blade 15 RTX 2080 Super Max-Q | |
| AIDA64 / Memory Read | |
| Schenker XMG Neo 15 E22 (Early 2022, RTX 3080 Ti) | |
| Razer Blade 15 2022 | |
| Average Intel Core i7-12800H (56629 - 66199, n=5) | |
| Eurocom Nightsky ARX315 | |
| Razer Blade 15 Advanced Model Early 2021 | |
| Razer Blade 15 RTX 2080 Super Max-Q | |
| AIDA64 / Memory Write | |
| Razer Blade 15 2022 | |
| Schenker XMG Neo 15 E22 (Early 2022, RTX 3080 Ti) | |
| Average Intel Core i7-12800H (50923 - 66074, n=5) | |
| Eurocom Nightsky ARX315 | |
| Razer Blade 15 Advanced Model Early 2021 | |
| Razer Blade 15 RTX 2080 Super Max-Q | |
| AIDA64 / Memory Latency | |
| Eurocom Nightsky ARX315 | |
| Razer Blade 15 Advanced Model Early 2021 | |
| Razer Blade 15 RTX 2080 Super Max-Q | |
| Average Intel Core i7-12800H (89.3 - 95.2, n=5) | |
| ADATA XPG Xenia 15 | |
| Schenker XMG Neo 15 E22 (Early 2022, RTX 3080 Ti) | |
| Razer Blade 15 2022 | |
* ... smaller is better
DPC Latency
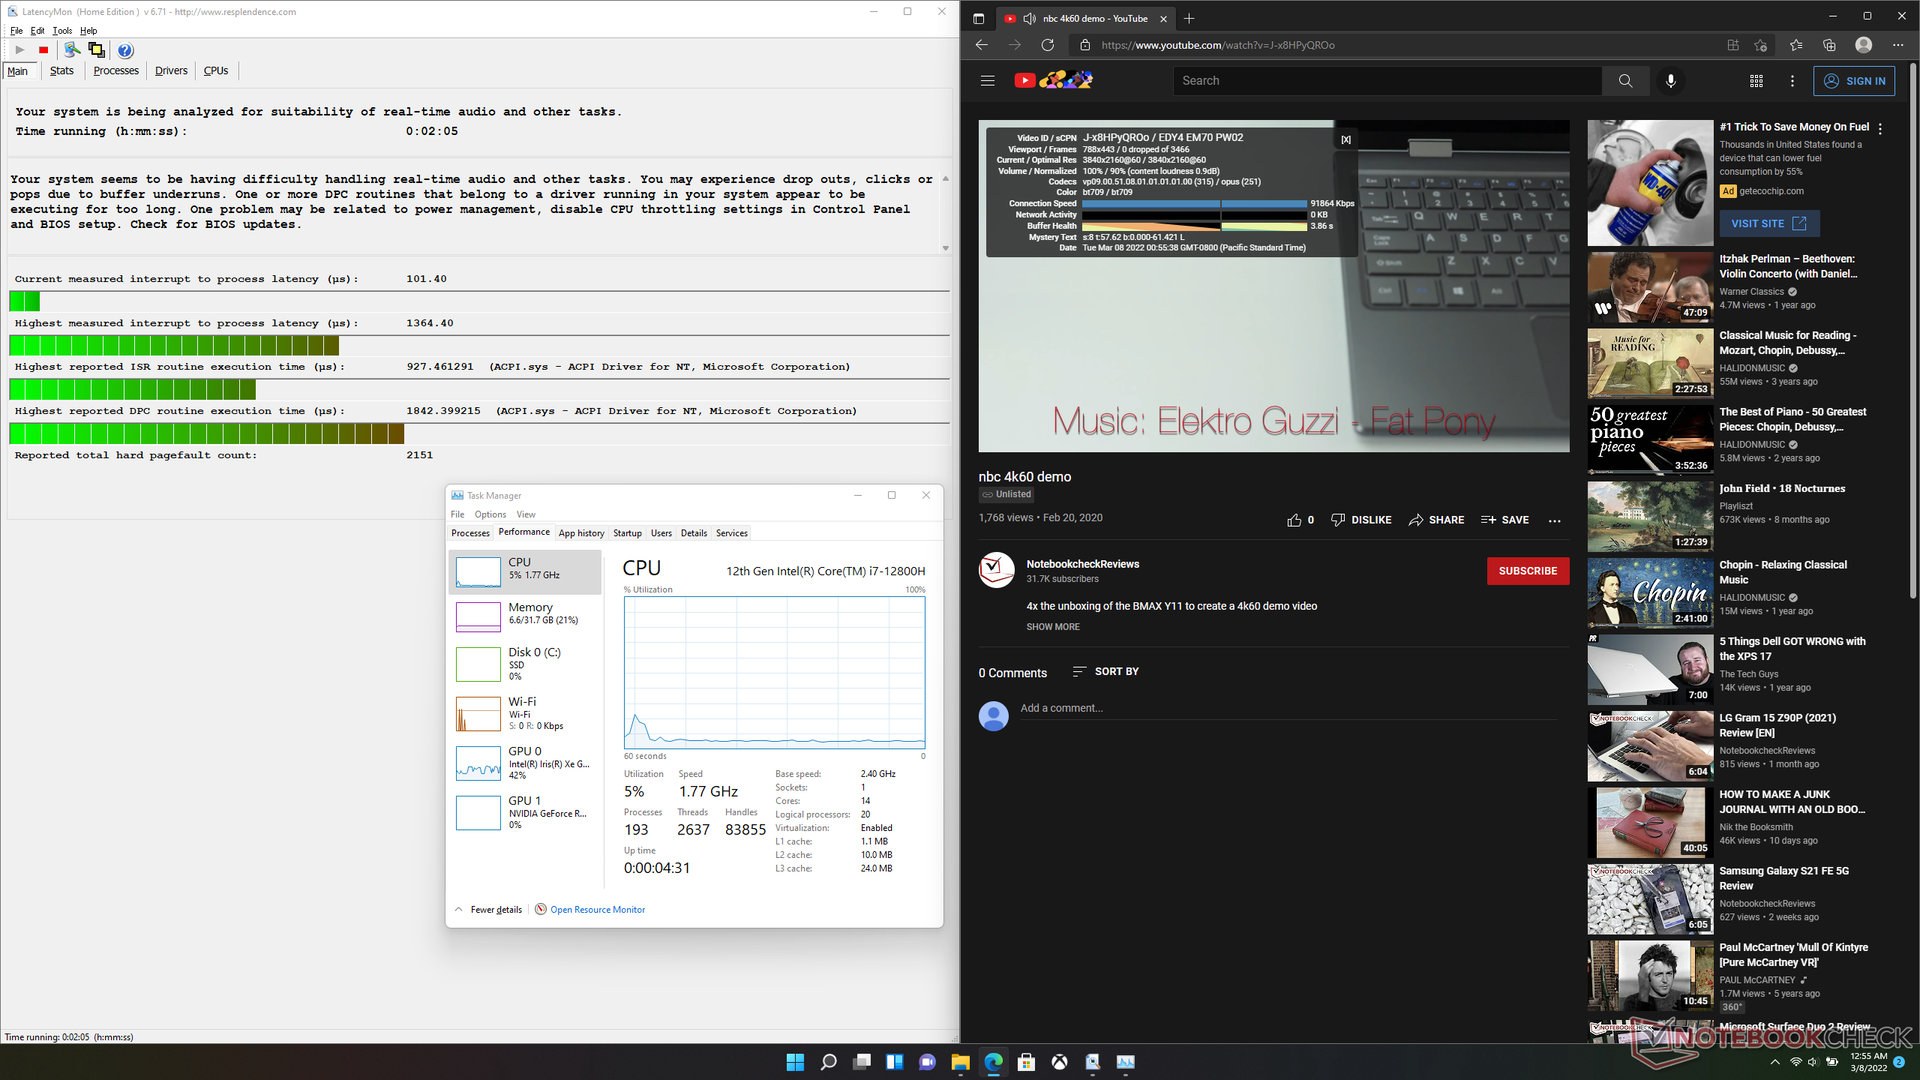
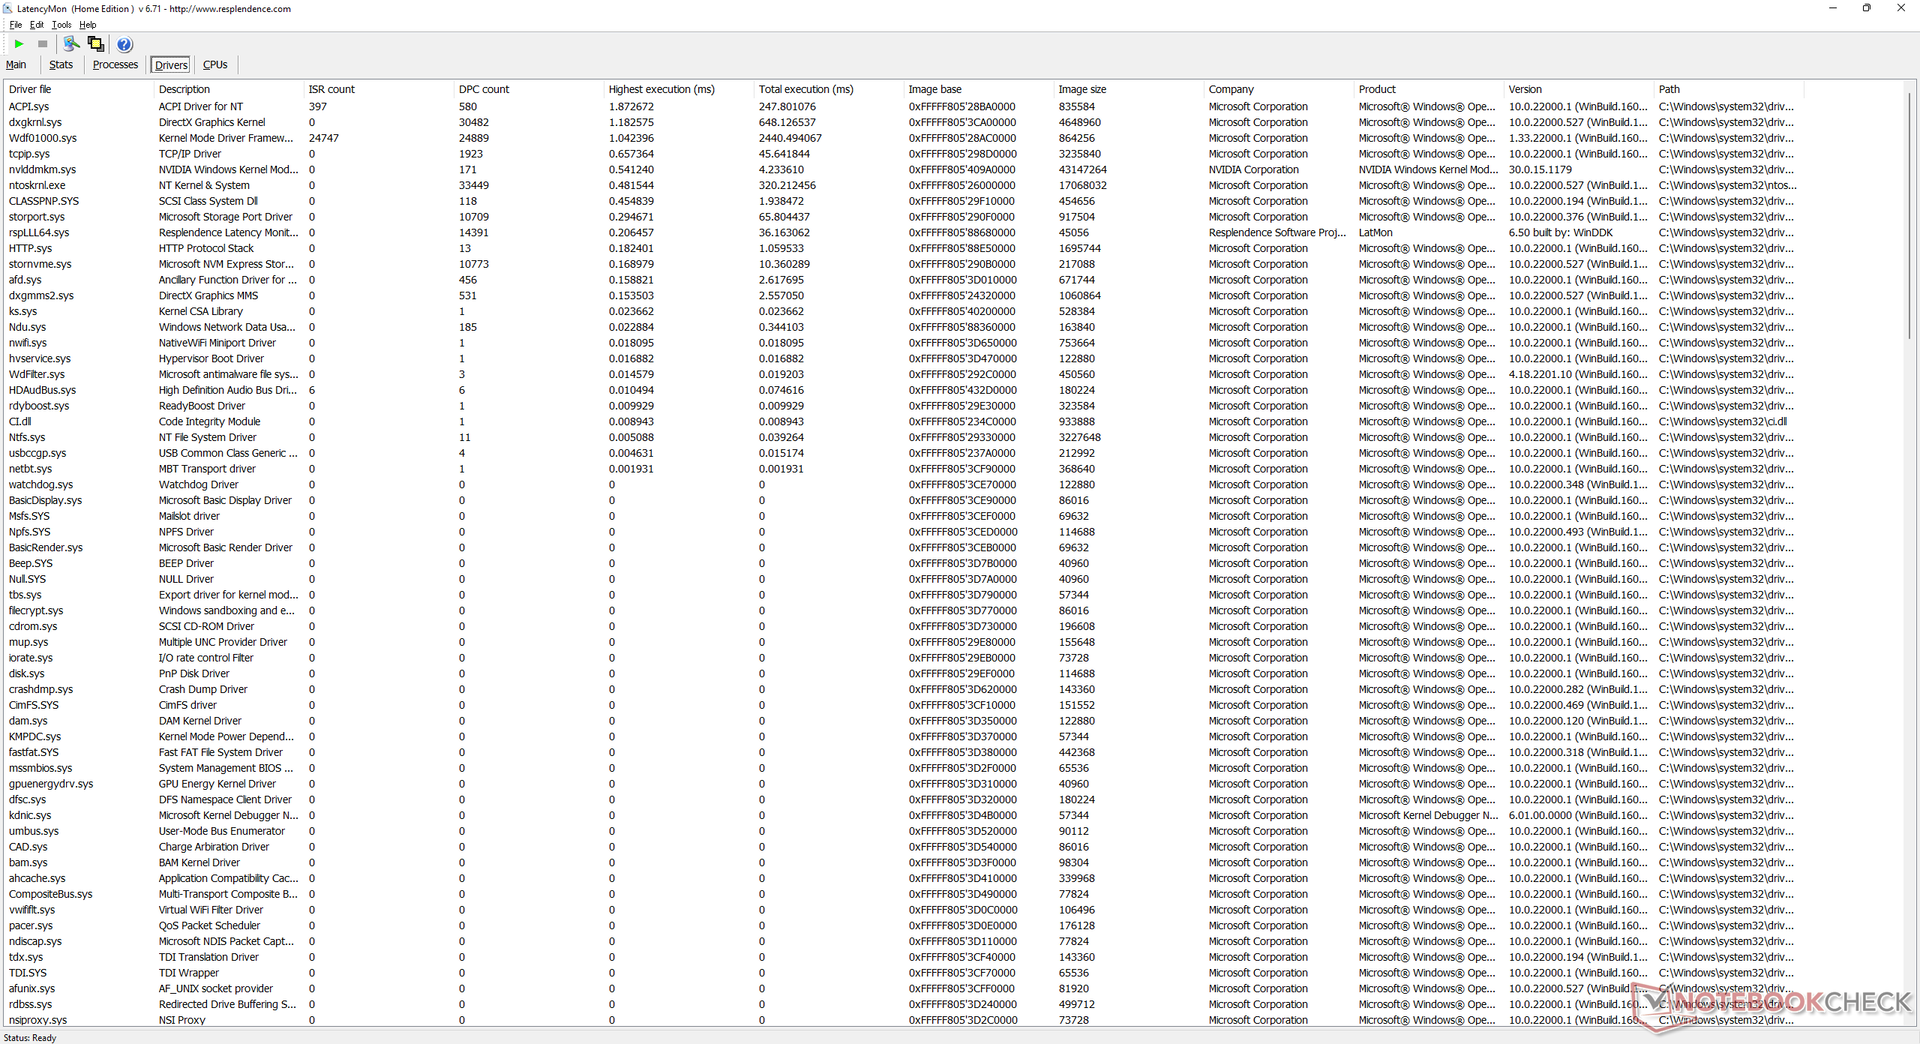
LatencyMon shows DPC issues when opening multiple browser tabs on our homepage. 4K video playback at 60 FPS is otherwise smooth and with no dropped frames when on Optimus mode.
| DPC Latencies / LatencyMon - interrupt to process latency (max), Web, Youtube, Prime95 | |
| ADATA XPG Xenia 15 | |
| Razer Blade 15 2022 | |
| Schenker XMG Neo 15 E22 (Early 2022, RTX 3080 Ti) | |
| Razer Blade 15 RTX 2080 Super Max-Q | |
| Razer Blade 15 Advanced Model Early 2021 | |
| Eurocom Nightsky ARX315 | |
* ... smaller is better
Storage Devices
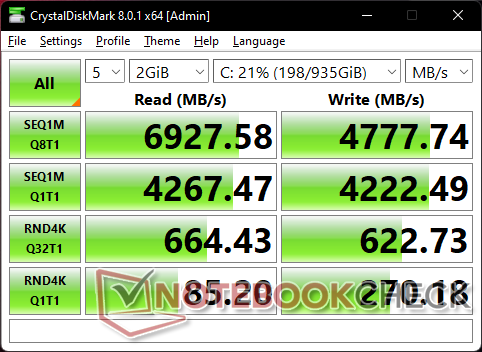
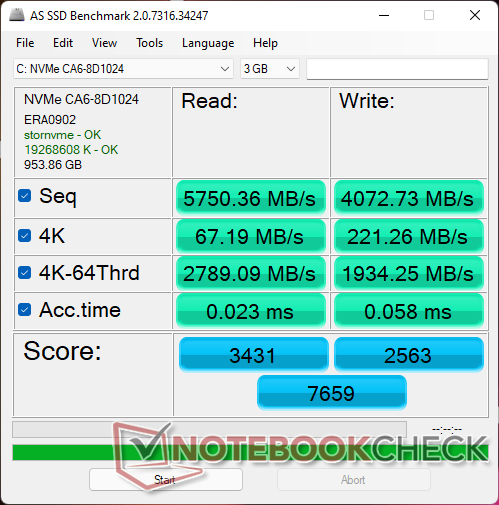
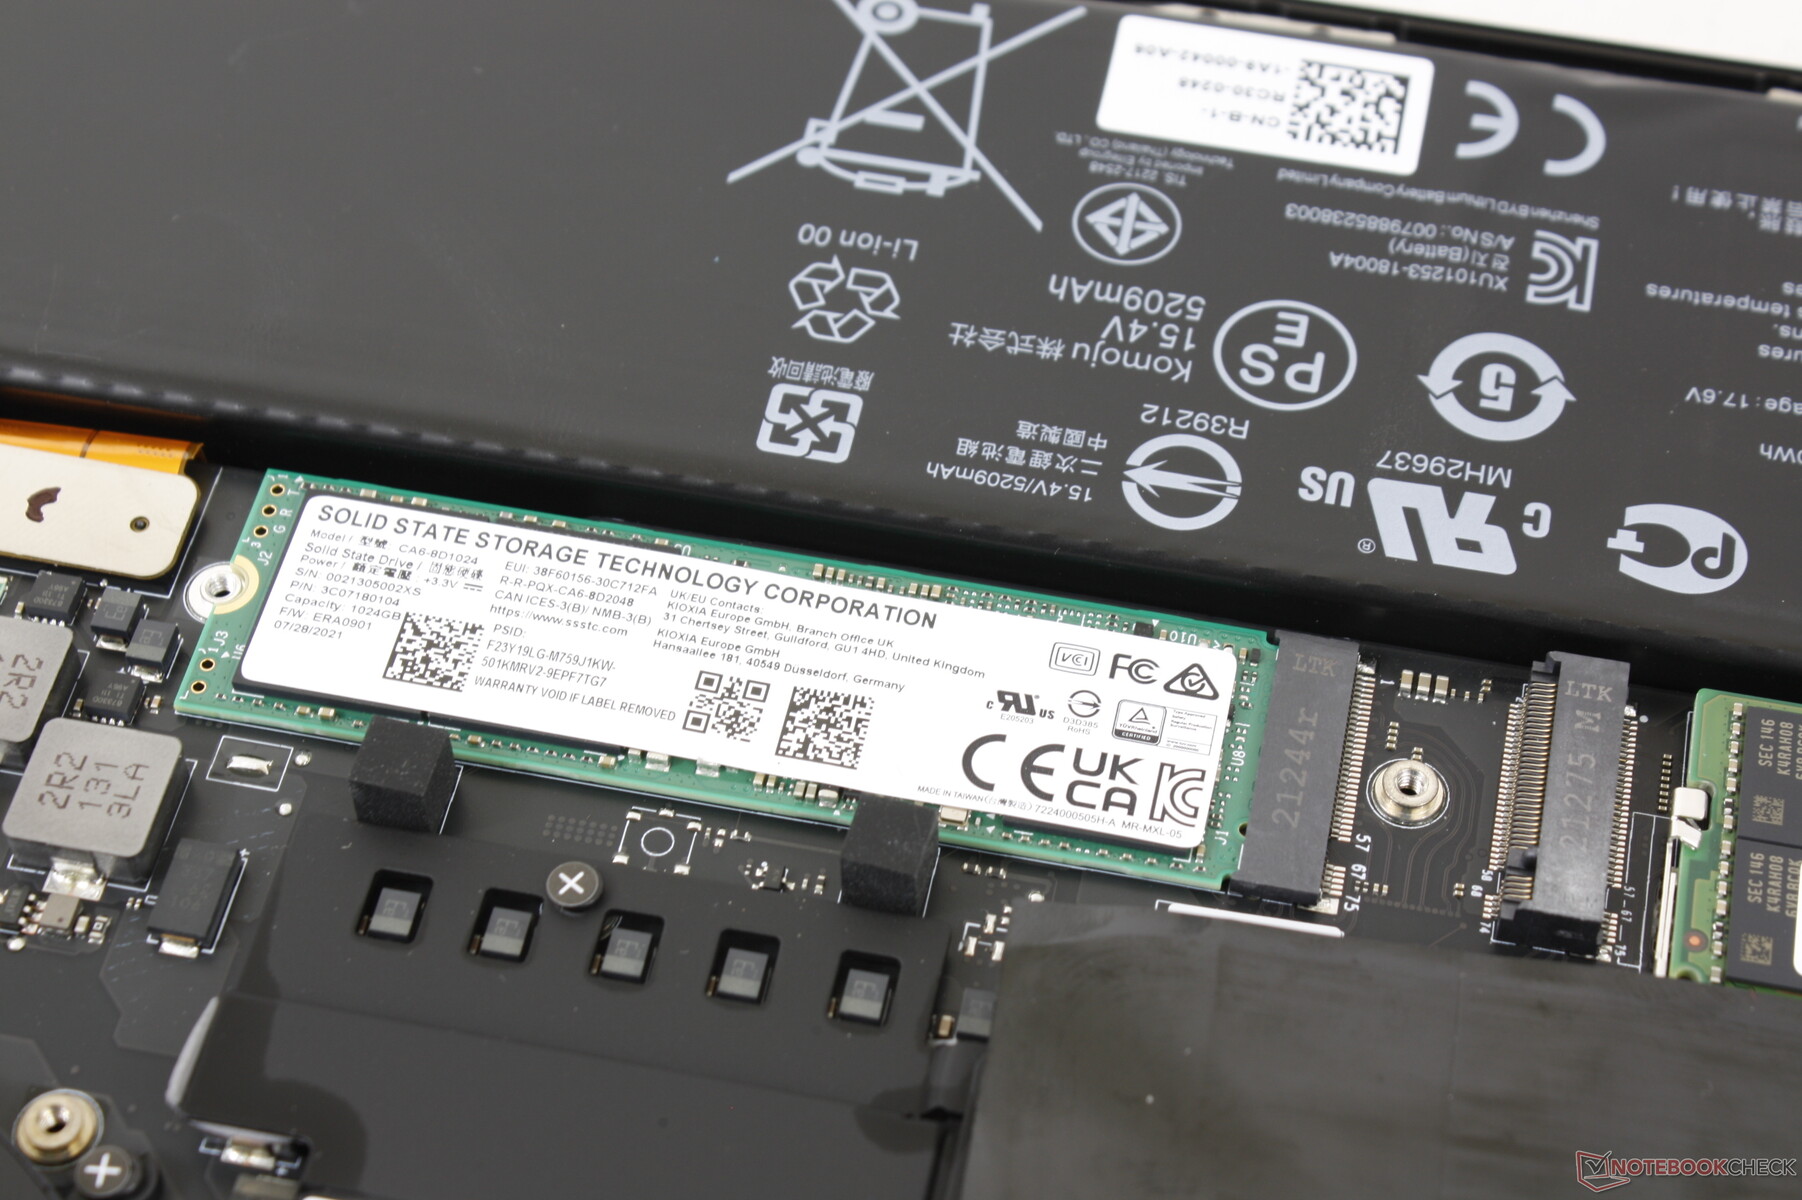
Nearly all Razer Blade laptops use either Lite-On or Samsung SSDs and the latest Blade 15 is no exception. Our test unit comes equipped with the 1 TB Lite-On CA6-8D1024 PCIe4 x4 NVMe SSD for sequential read and write rates of up to 6800 MB/s and 4800 MB/s, respectively. Our DiskSpd Read Loop test shows that the drive has no issues maintaining its maximum performance levels for extended periods.

* ... smaller is better
Disk Throttling: DiskSpd Read Loop, Queue Depth 8
GPU Performance
Graphics performance is about 15 to 25 percent higher than the Blade 15 RTX 3080 or 30 to 45 percent faster than the Blade 15 RTX 2080 Max-Q. Certain alternatives like the Schenker XMG Neo 15 E22 or Schenker Uniwill Technology GM7AG8P come with higher-power 150+ W versions of the same GeForce RTX 3080 Ti GPU for a 10 to 15 percent performance boost over our Blade 15 RTX 3080 Ti.
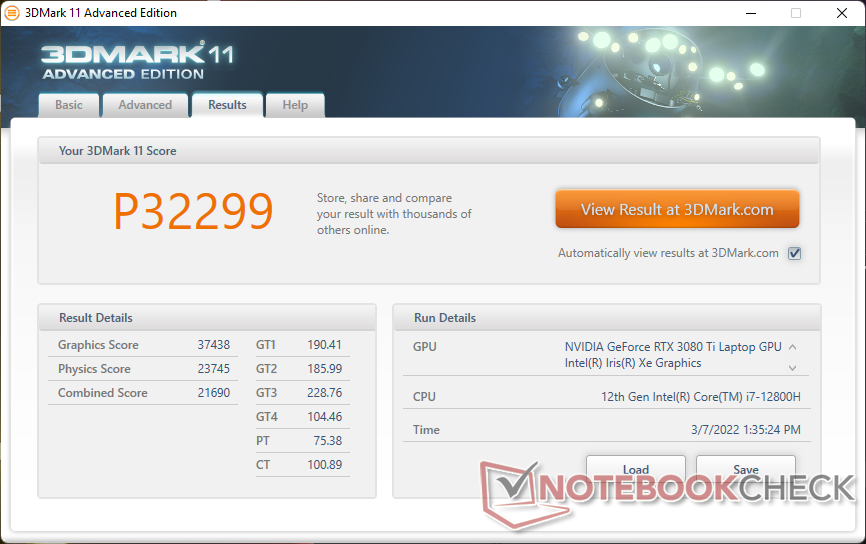
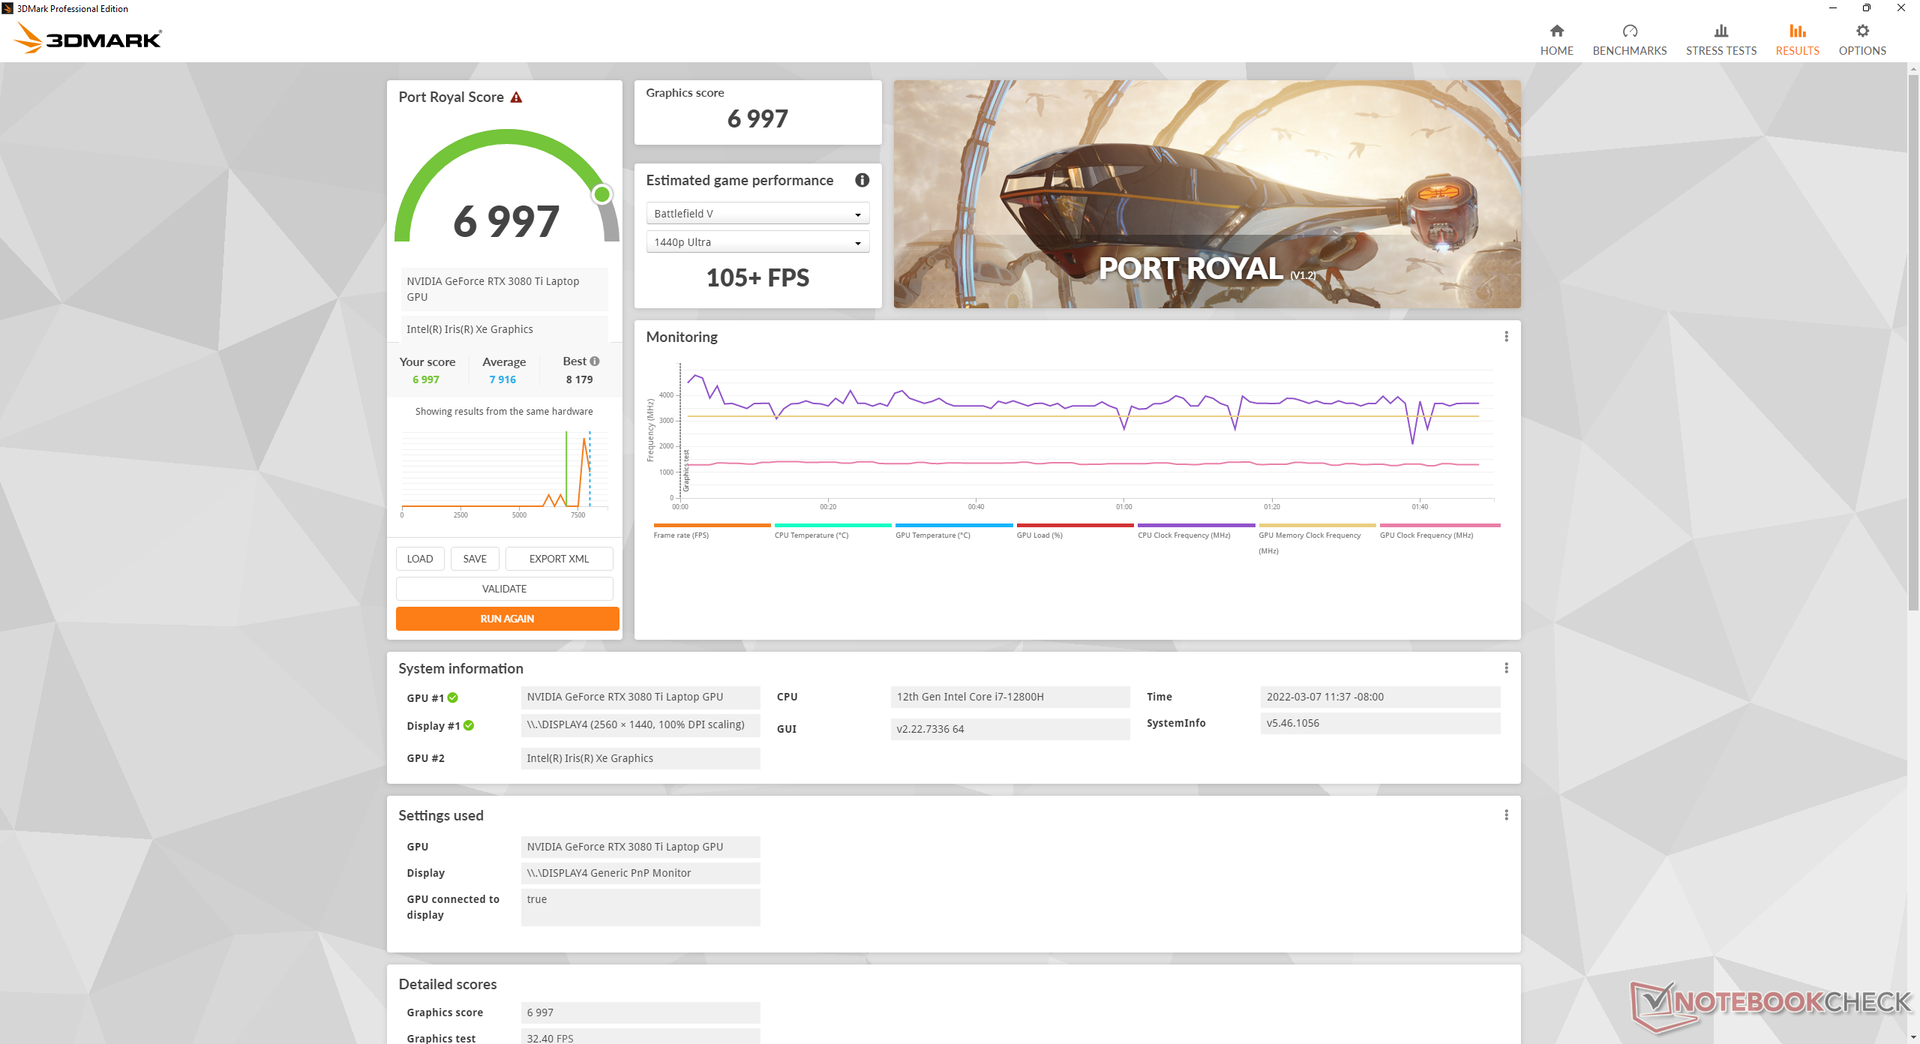
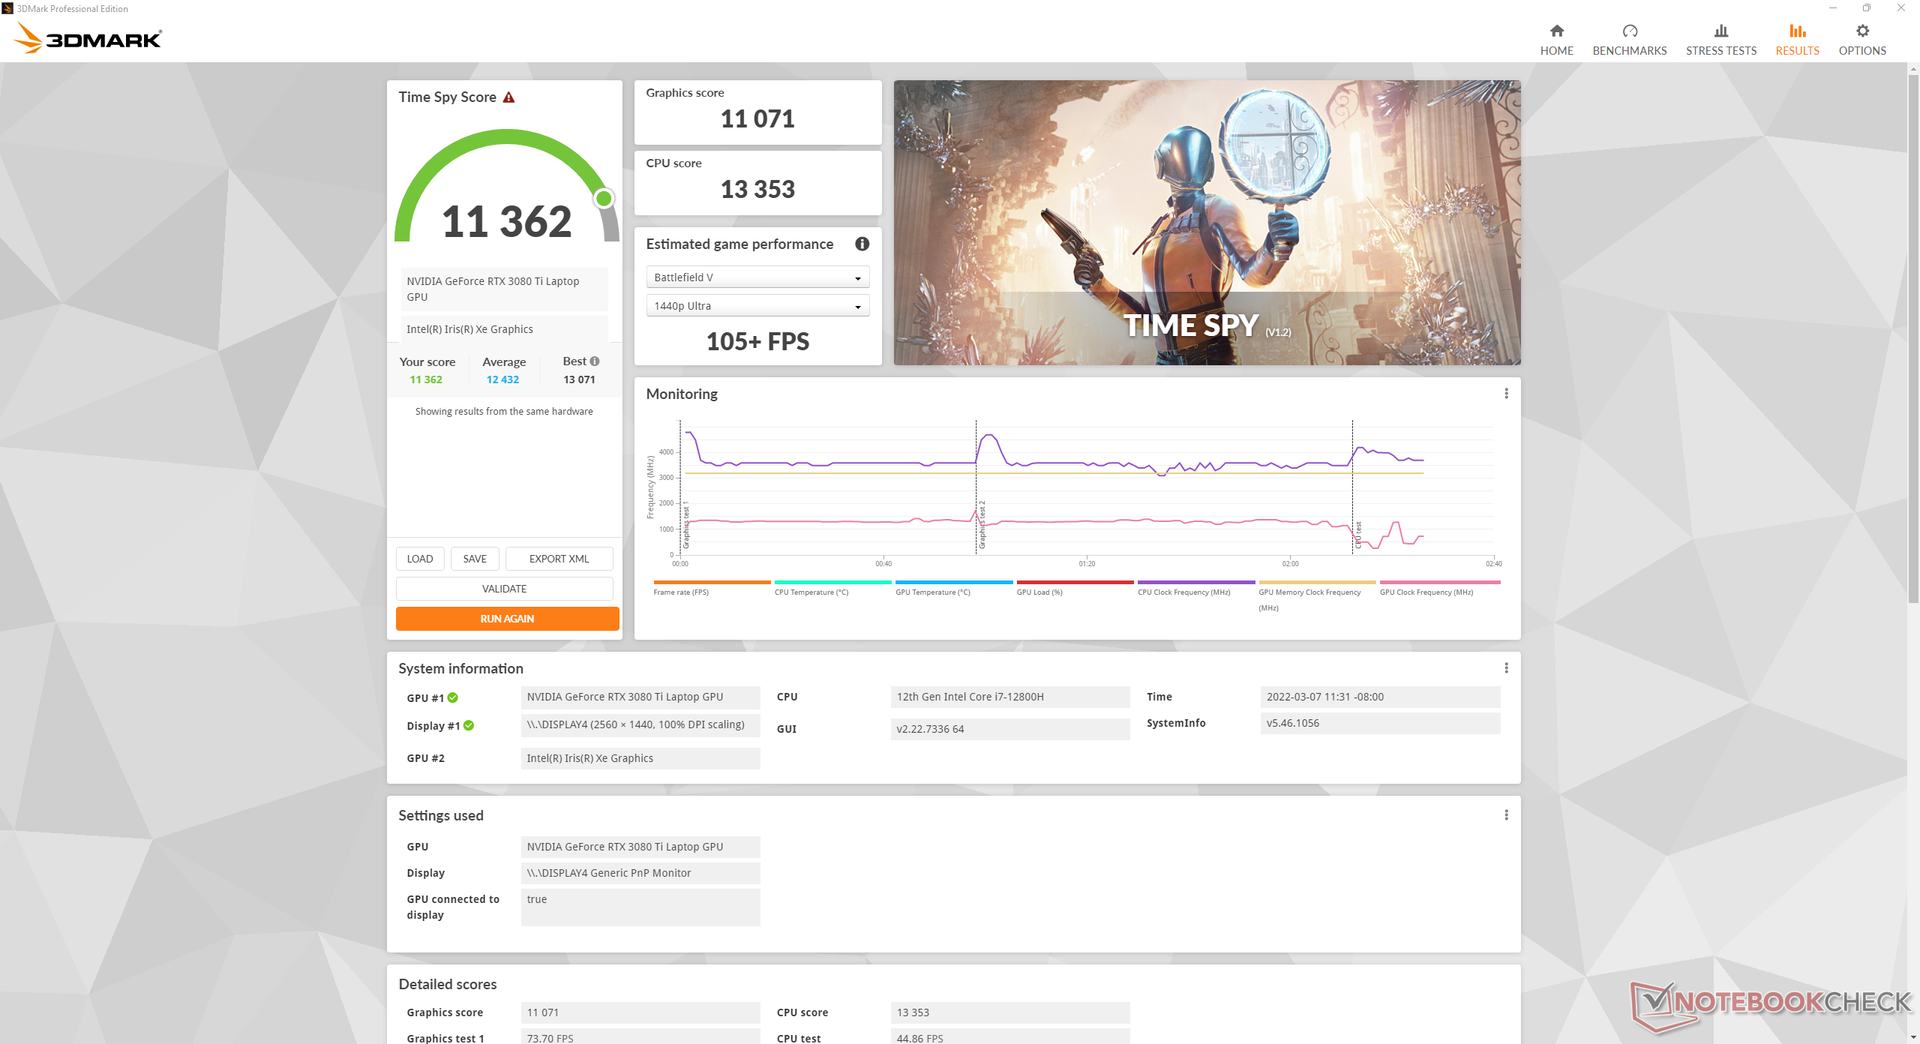

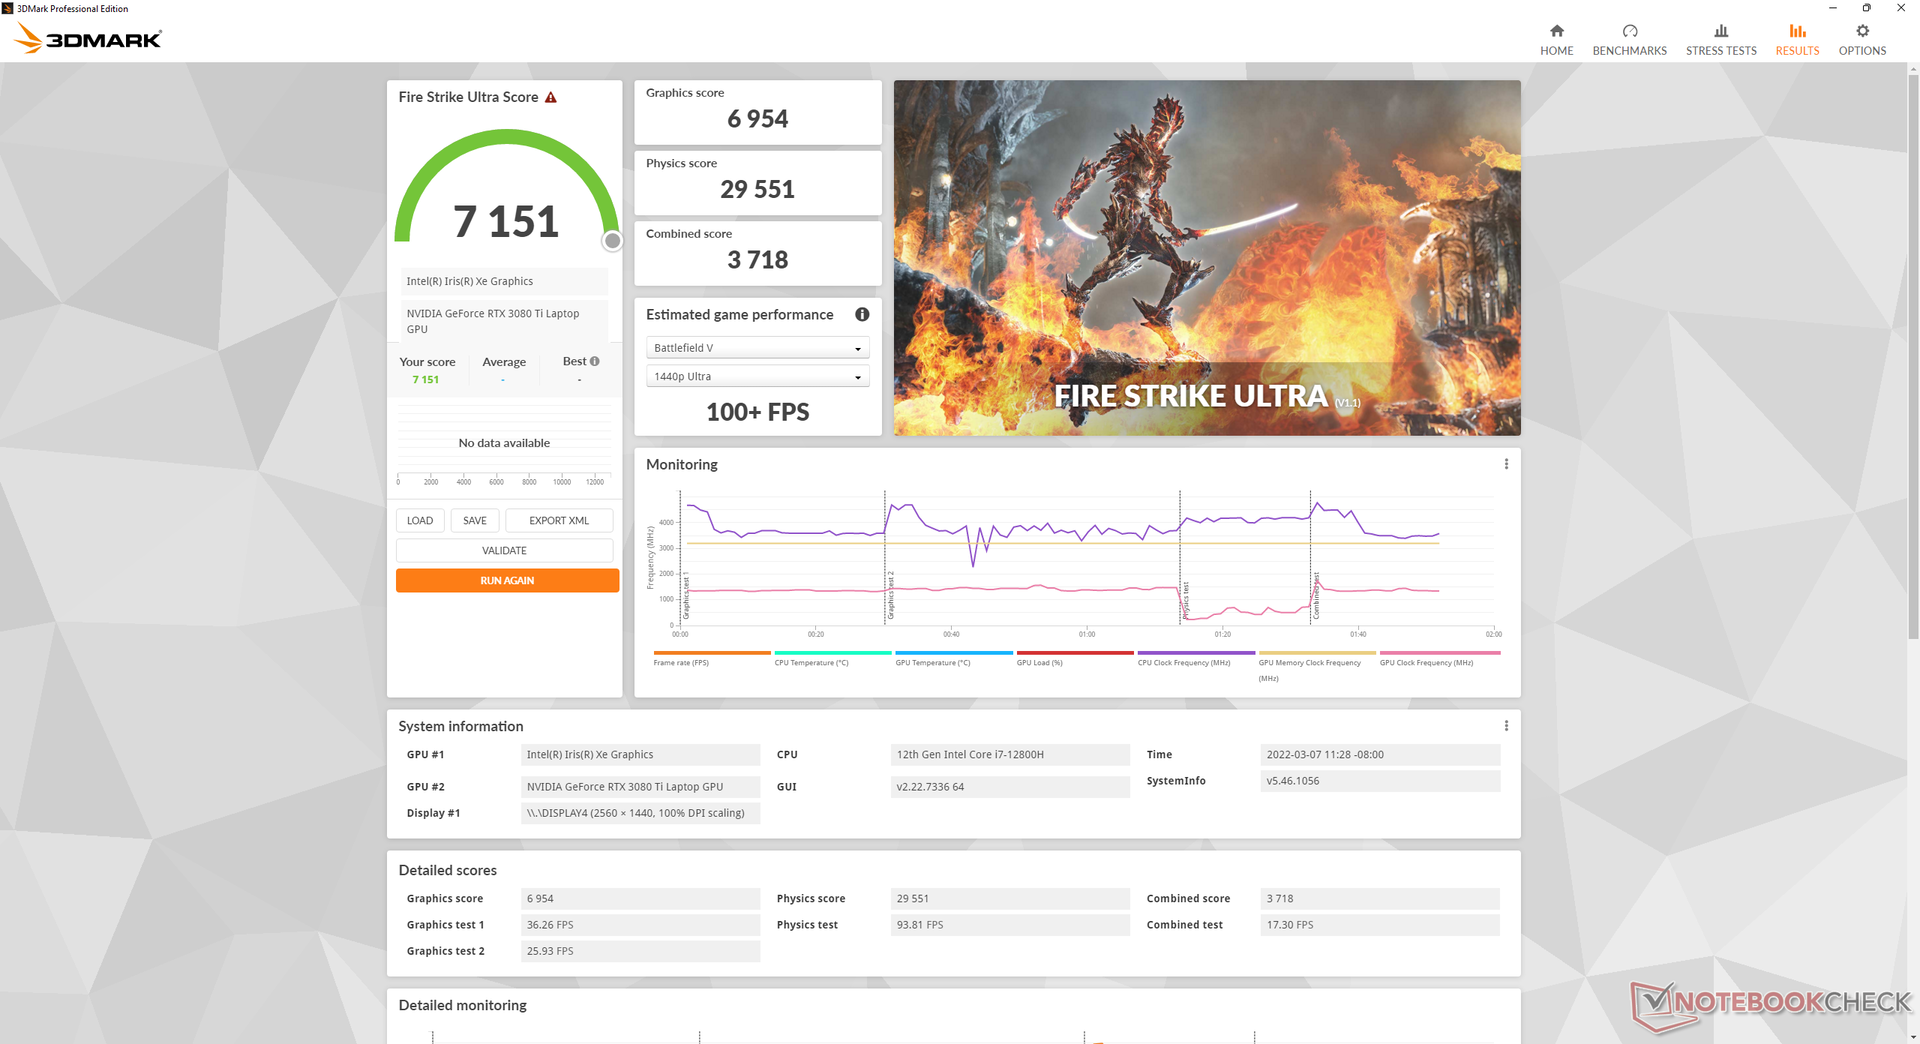
| 3DMark 11 Performance | 32299 points | |
| 3DMark Cloud Gate Standard Score | 60579 points | |
| 3DMark Fire Strike Score | 25025 points | |
| 3DMark Time Spy Score | 11362 points | |
Help | ||
Witcher 3 FPS Chart
| low | med. | high | ultra | QHD | |
|---|---|---|---|---|---|
| GTA V (2015) | 186 | 181 | 177 | 118 | 97.8 |
| The Witcher 3 (2015) | 457.4 | 320.9 | 213.7 | 107.2 | |
| Dota 2 Reborn (2015) | 181 | 169 | 164 | 156 | |
| Final Fantasy XV Benchmark (2018) | 178 | 141 | 106 | 82.9 | |
| X-Plane 11.11 (2018) | 158 | 140 | 110 | ||
| Far Cry 5 (2018) | 179 | 151 | 144 | 135 | 107 |
| Strange Brigade (2018) | 442 | 252 | 205 | 184 | 132 |
Emissions
System Noise
Fan noise is dependent on the Synapse power profile. We recommend running the system on Silent mode when web browsing or video streaming as the fans will otherwise pulse more frequently if on Balanced or High performance modes. The downside to Silent mode is that the palm rests and bottom of the laptop will be noticeably warmer since the fans are running much more slowly.
Fan noise when running Witcher 3 on High Performance mode is similar to what we recorded on older Blade 15 models at around 45 dB(A) which is still much quieter than on the competing XPG Xenia 15 or Eurocom Nightsky ARX315. However, this can increase to the 49 to 52 dB(A) range if the CPU is stressed much further.
Noise level
| Idle |
| 26.2 / 26.2 / 28.4 dB(A) |
| Load |
| 44.7 / 51.9 dB(A) |
 | ||
30 dB silent 40 dB(A) audible 50 dB(A) loud |
||
min: | ||
| Razer Blade 15 2022 GeForce RTX 3080 Ti Laptop GPU, i7-12800H, SSSTC CA6-8D1024 | Razer Blade 15 Advanced Model Early 2021 GeForce RTX 3080 Laptop GPU, i7-10875H, Samsung PM981a MZVLB1T0HBLR | Razer Blade 15 RTX 2080 Super Max-Q GeForce RTX 2080 Super Max-Q, i7-10875H, Samsung PM981a MZVLB1T0HBLR | Schenker XMG Neo 15 E22 (Early 2022, RTX 3080 Ti) GeForce RTX 3080 Ti Laptop GPU, i7-12700H, Samsung SSD 980 Pro 250GB MZ-V8P250BW | ADATA XPG Xenia 15 GeForce RTX 3070 Laptop GPU, i7-11800H, ADATA XPG Gammix S70 1TB | Eurocom Nightsky ARX315 GeForce RTX 3070 Laptop GPU, R9 5900X, Samsung SSD 980 Pro 1TB MZ-V8P1T0BW | |
|---|---|---|---|---|---|---|
| Noise | -4% | -8% | 2% | 5% | -15% | |
| off / environment * (dB) | 25.4 | 24 6% | 30.1 -19% | 24 6% | 24.8 2% | 25.3 -0% |
| Idle Minimum * (dB) | 26.2 | 26 1% | 30.1 -15% | 24 8% | 24.9 5% | 25.9 1% |
| Idle Average * (dB) | 26.2 | 28 -7% | 30.1 -15% | 24 8% | 24.9 5% | 27.9 -6% |
| Idle Maximum * (dB) | 28.4 | 40 -41% | 30.1 -6% | 27.76 2% | 24.9 12% | 40.8 -44% |
| Load Average * (dB) | 44.7 | 45 -1% | 46.8 -5% | 38.81 13% | 28.8 36% | 55.2 -23% |
| Witcher 3 ultra * (dB) | 44.7 | 43 4% | 48.4 -8% | 54.2 -21% | 52.7 -18% | 52.4 -17% |
| Load Maximum * (dB) | 51.9 | 45 13% | 46 11% | 54.18 -4% | 54.9 -6% | 60.3 -16% |
* ... smaller is better
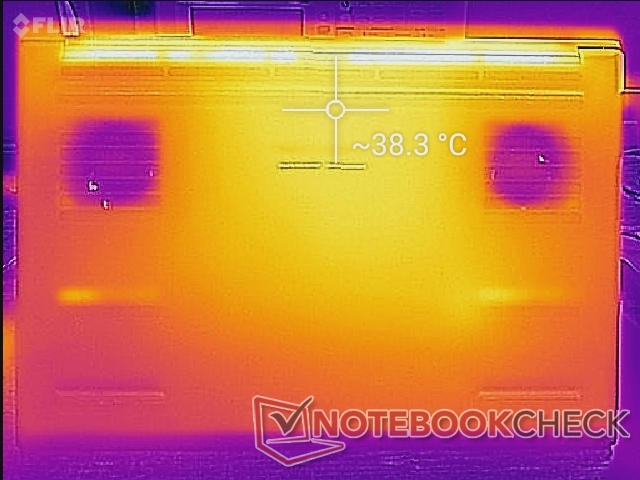
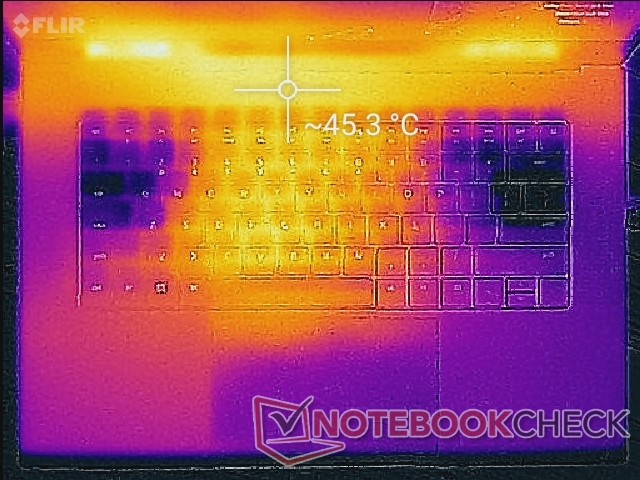
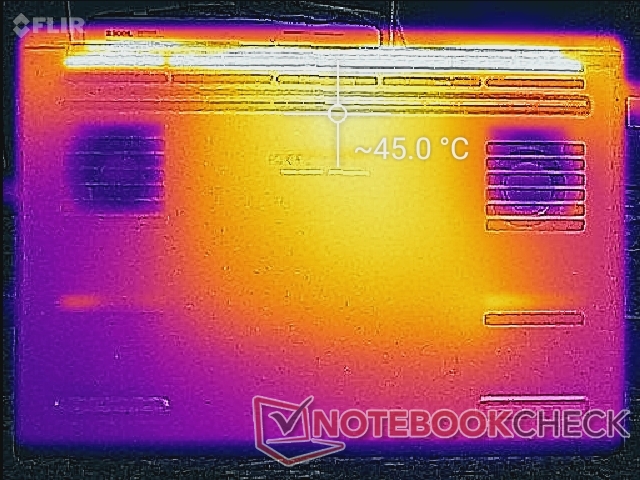
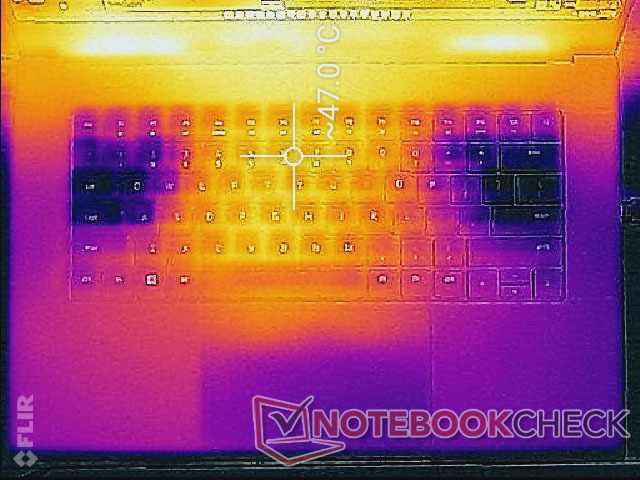
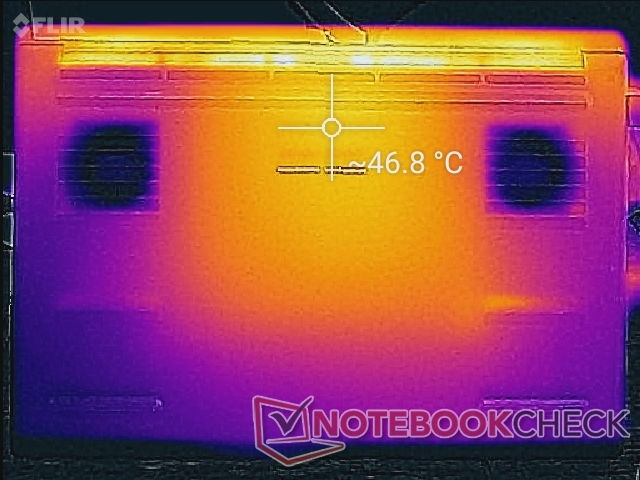
Temperature
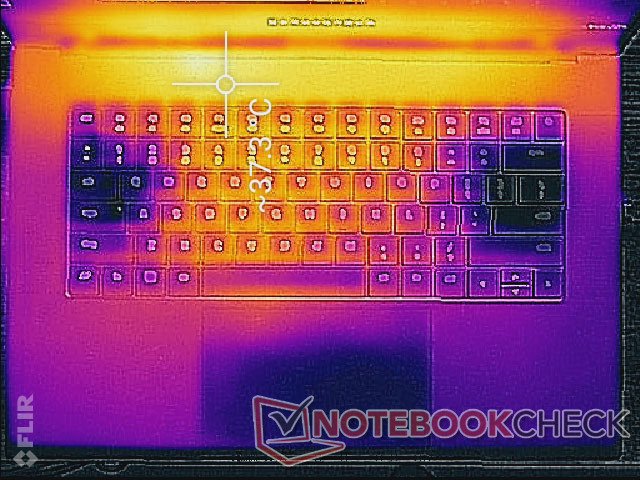
Surface temperatures are warm even when idling on desktop. Hot spots can reach over 37 C on the top and bottom which are comparable numbers to the ultrathin XPG Xenia 15 or MSI Vector GP66 under similar conditions. Expect the keyboard center to be a toasty 48 C when gaming.
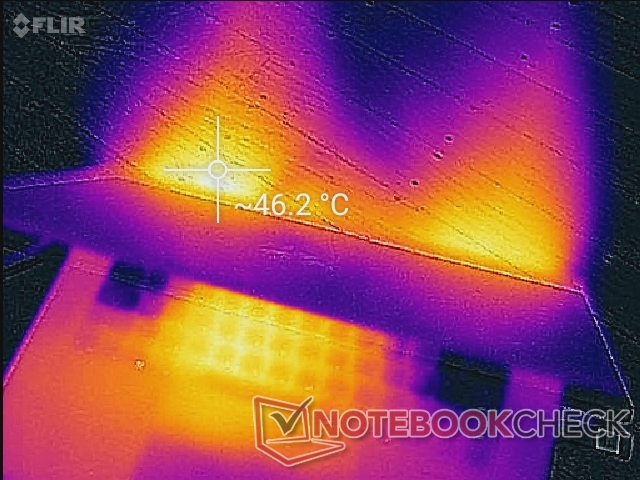
(-) The maximum temperature on the upper side is 50 °C / 122 F, compared to the average of 40.4 °C / 105 F, ranging from 21.2 to 68.8 °C for the class Gaming.
(-) The bottom heats up to a maximum of 47 °C / 117 F, compared to the average of 43.2 °C / 110 F
(±) In idle usage, the average temperature for the upper side is 32.4 °C / 90 F, compared to the device average of 33.9 °C / 93 F.
(±) Playing The Witcher 3, the average temperature for the upper side is 36 °C / 97 F, compared to the device average of 33.9 °C / 93 F.
(+) The palmrests and touchpad are reaching skin temperature as a maximum (34 °C / 93.2 F) and are therefore not hot.
(-) The average temperature of the palmrest area of similar devices was 28.8 °C / 83.8 F (-5.2 °C / -9.4 F).
| Razer Blade 15 2022 Intel Core i7-12800H, NVIDIA GeForce RTX 3080 Ti Laptop GPU | Razer Blade 15 Advanced Model Early 2021 Intel Core i7-10875H, NVIDIA GeForce RTX 3080 Laptop GPU | Razer Blade 15 RTX 2080 Super Max-Q Intel Core i7-10875H, NVIDIA GeForce RTX 2080 Super Max-Q | Schenker XMG Neo 15 E22 (Early 2022, RTX 3080 Ti) Intel Core i7-12700H, NVIDIA GeForce RTX 3080 Ti Laptop GPU | ADATA XPG Xenia 15 Intel Core i7-11800H, NVIDIA GeForce RTX 3070 Laptop GPU | Eurocom Nightsky ARX315 AMD Ryzen 9 5900X, NVIDIA GeForce RTX 3070 Laptop GPU | |
|---|---|---|---|---|---|---|
| Heat | 6% | 7% | -7% | -12% | 6% | |
| Maximum Upper Side * (°C) | 50 | 49 2% | 52 -4% | 52 -4% | 49 2% | 36.2 28% |
| Maximum Bottom * (°C) | 47 | 54 -15% | 53 -13% | 68 -45% | 64.2 -37% | 49.6 -6% |
| Idle Upper Side * (°C) | 37.4 | 30 20% | 29.3 22% | 32 14% | 37.6 -1% | 32.6 13% |
| Idle Bottom * (°C) | 38.4 | 32 17% | 30.2 21% | 36 6% | 42.2 -10% | 43.2 -13% |
* ... smaller is better
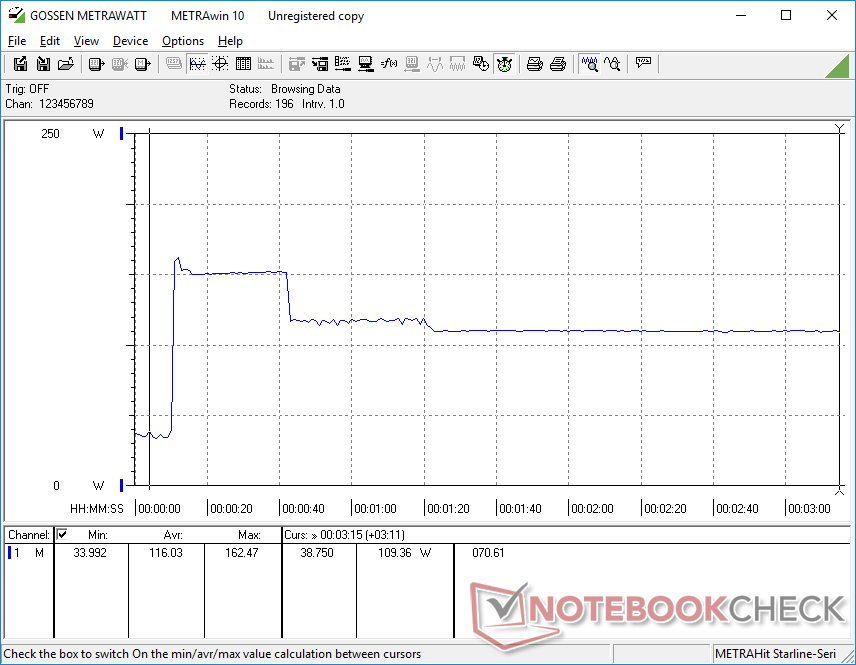
Stress Test
When stressed with Prime95, the CPU would boost to 3.1 GHz for the first few seconds until reaching a core temperature of 80 C. Thereafter, clock rates and temperature would stabilize at around 2.2 GHz and 66 C, respectively. CPU package draw would also drop from the initial spike of 90 W to a more stable 55 W.
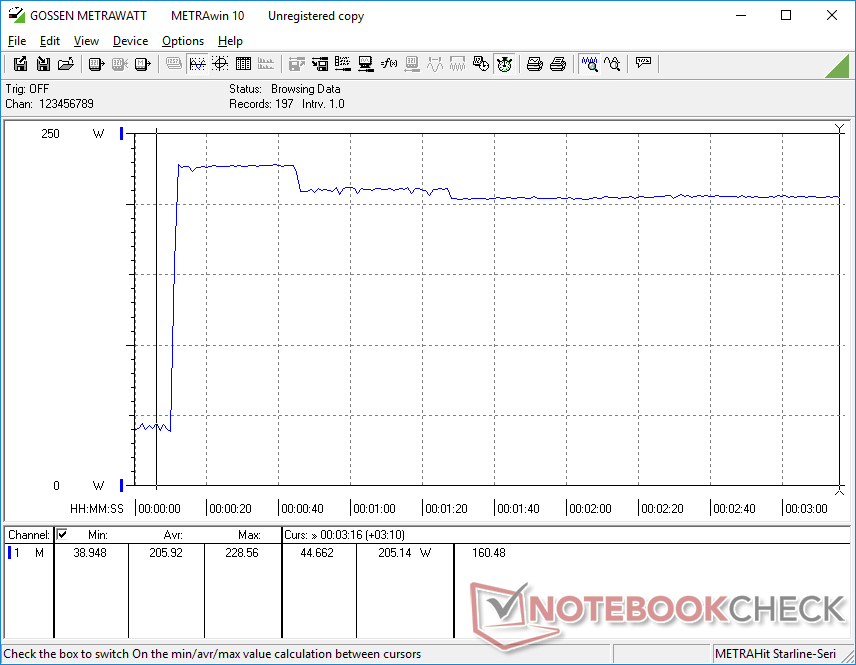
Running Witcher 3 would cause the CPU and GPU to stabilize at 74 C and 67 C, respectively, compared to 73 C and 71 C on last year's Blade 15 RTX 3080 model (or 67 C and 75 C on the Blade 15 Base Model). Core temperatures are therefore not very different year-over-year despite the increases in CPU and GPU performance.
Running on battery power will limit performance. A Fire Strike test on batteries would return Physics and Graphics scores of 10560 and 8439 points, respectively, compared to 28455 and 28601 points when on mains.
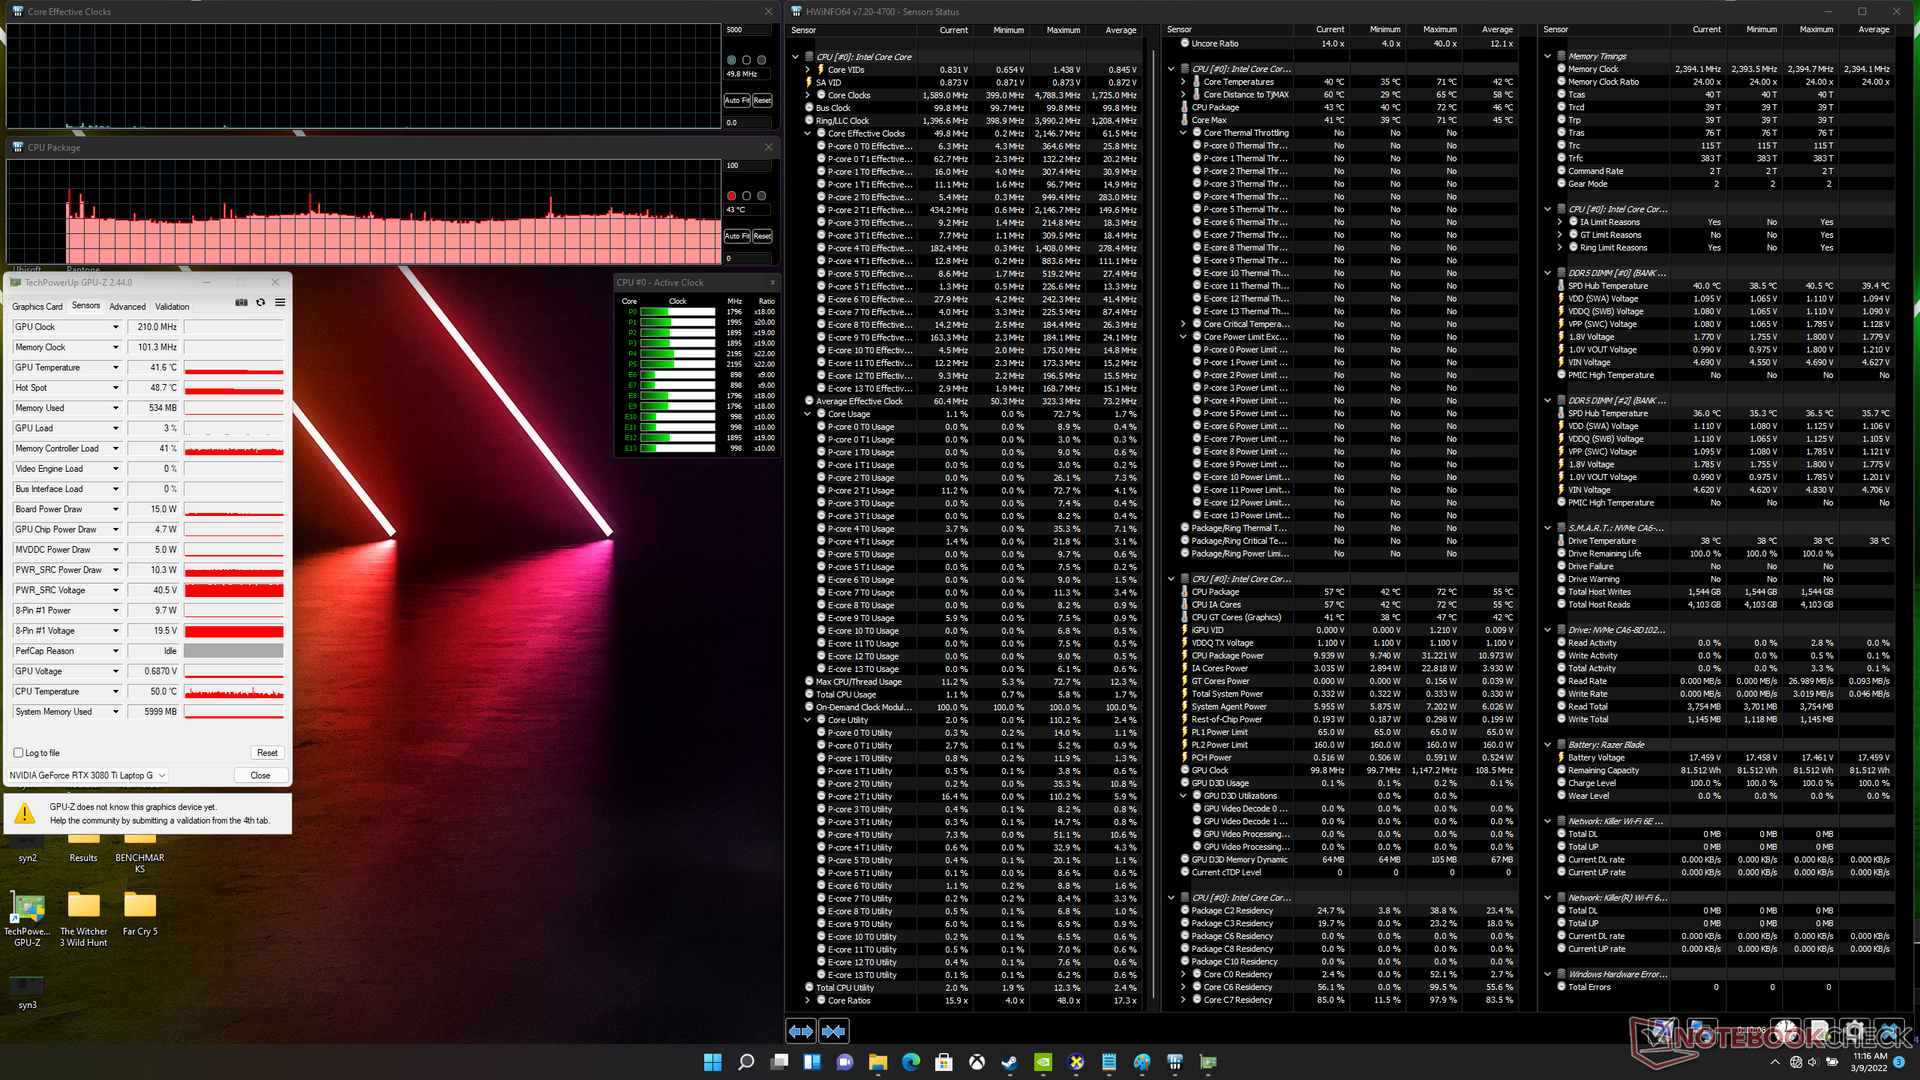
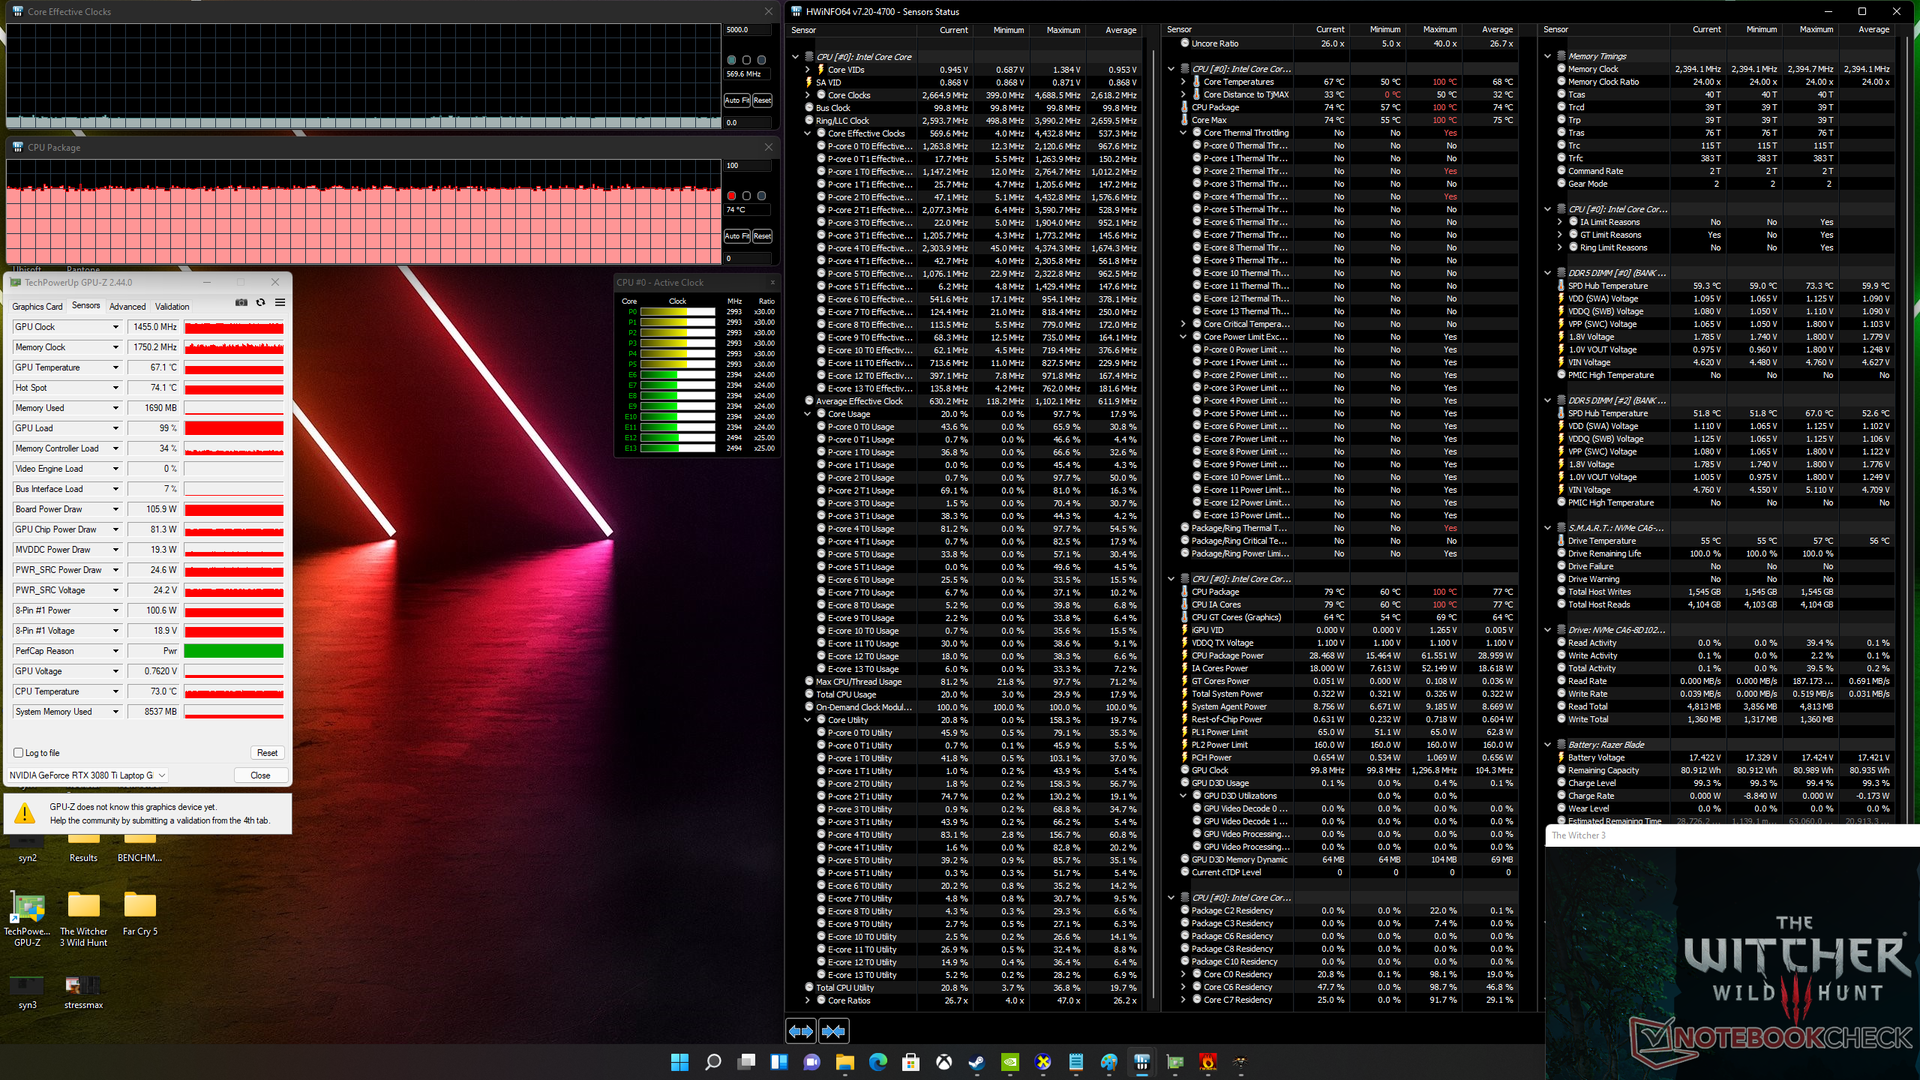
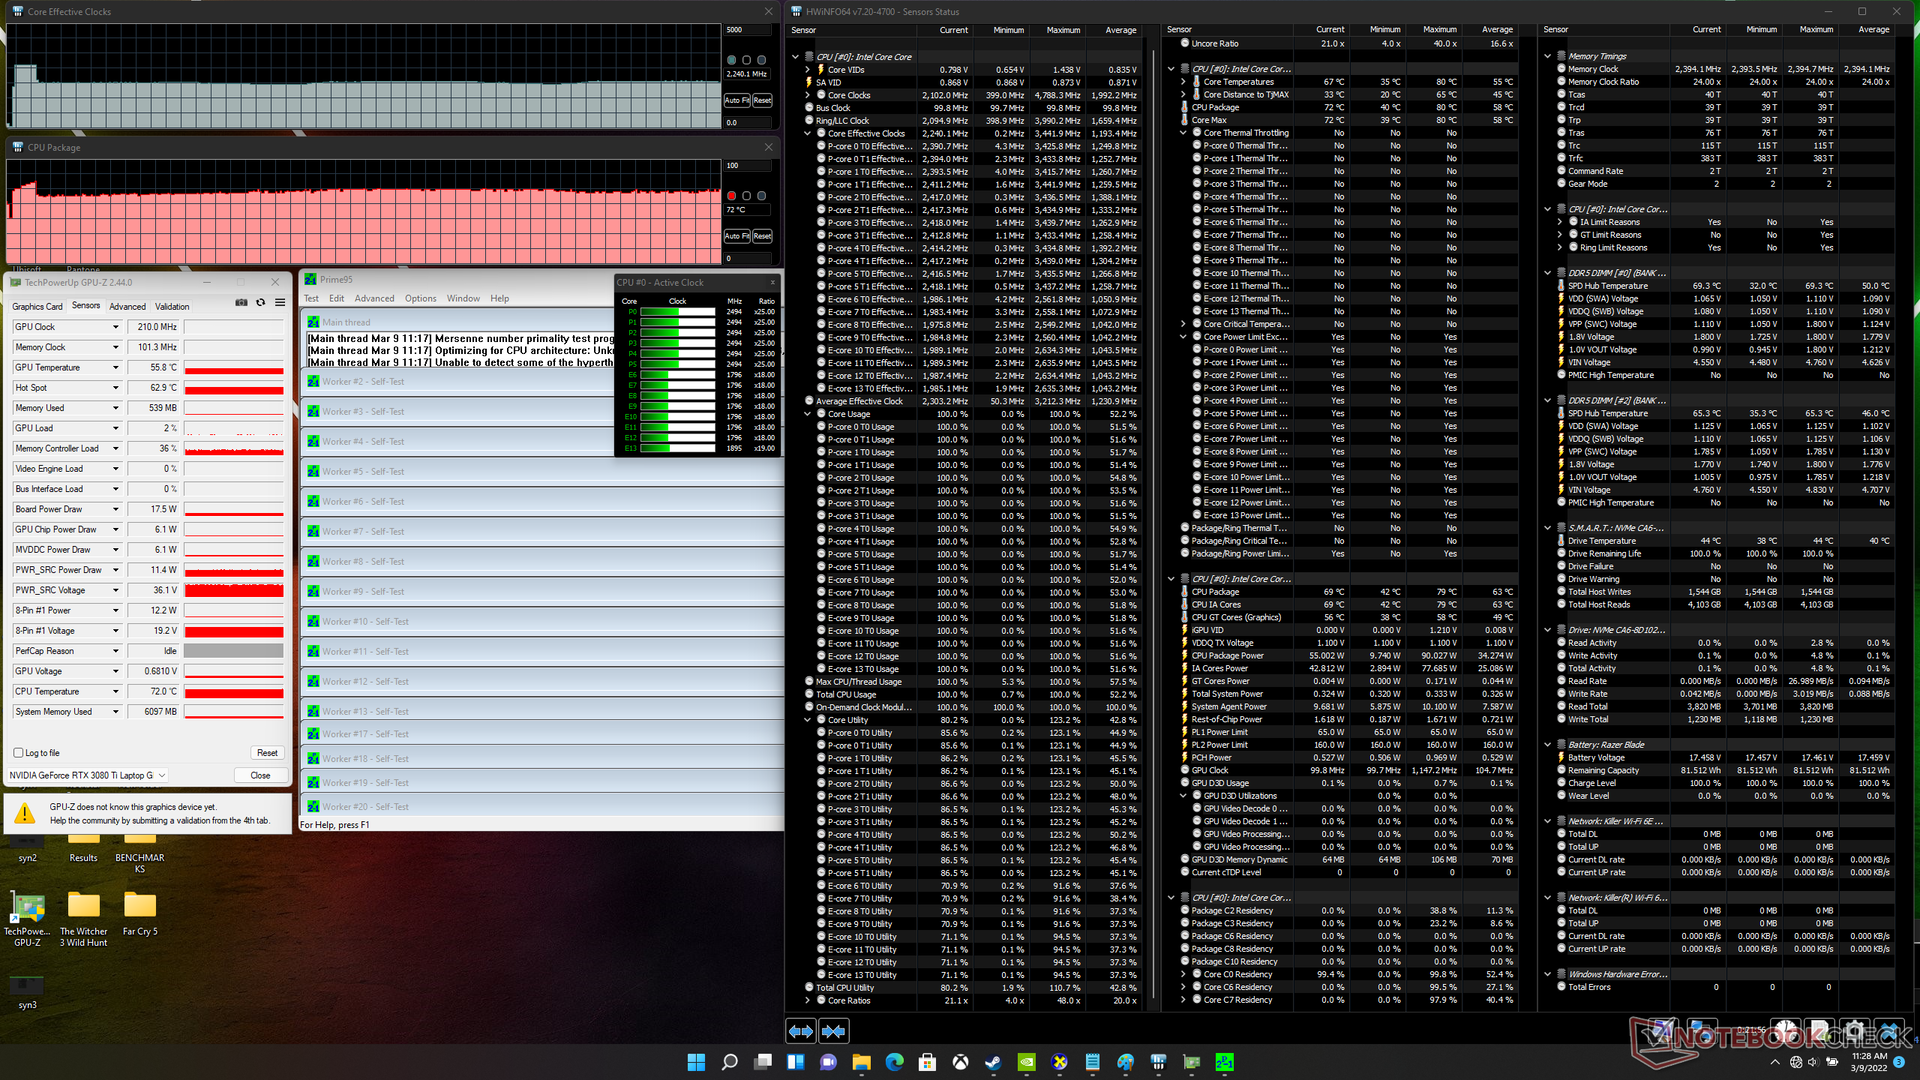
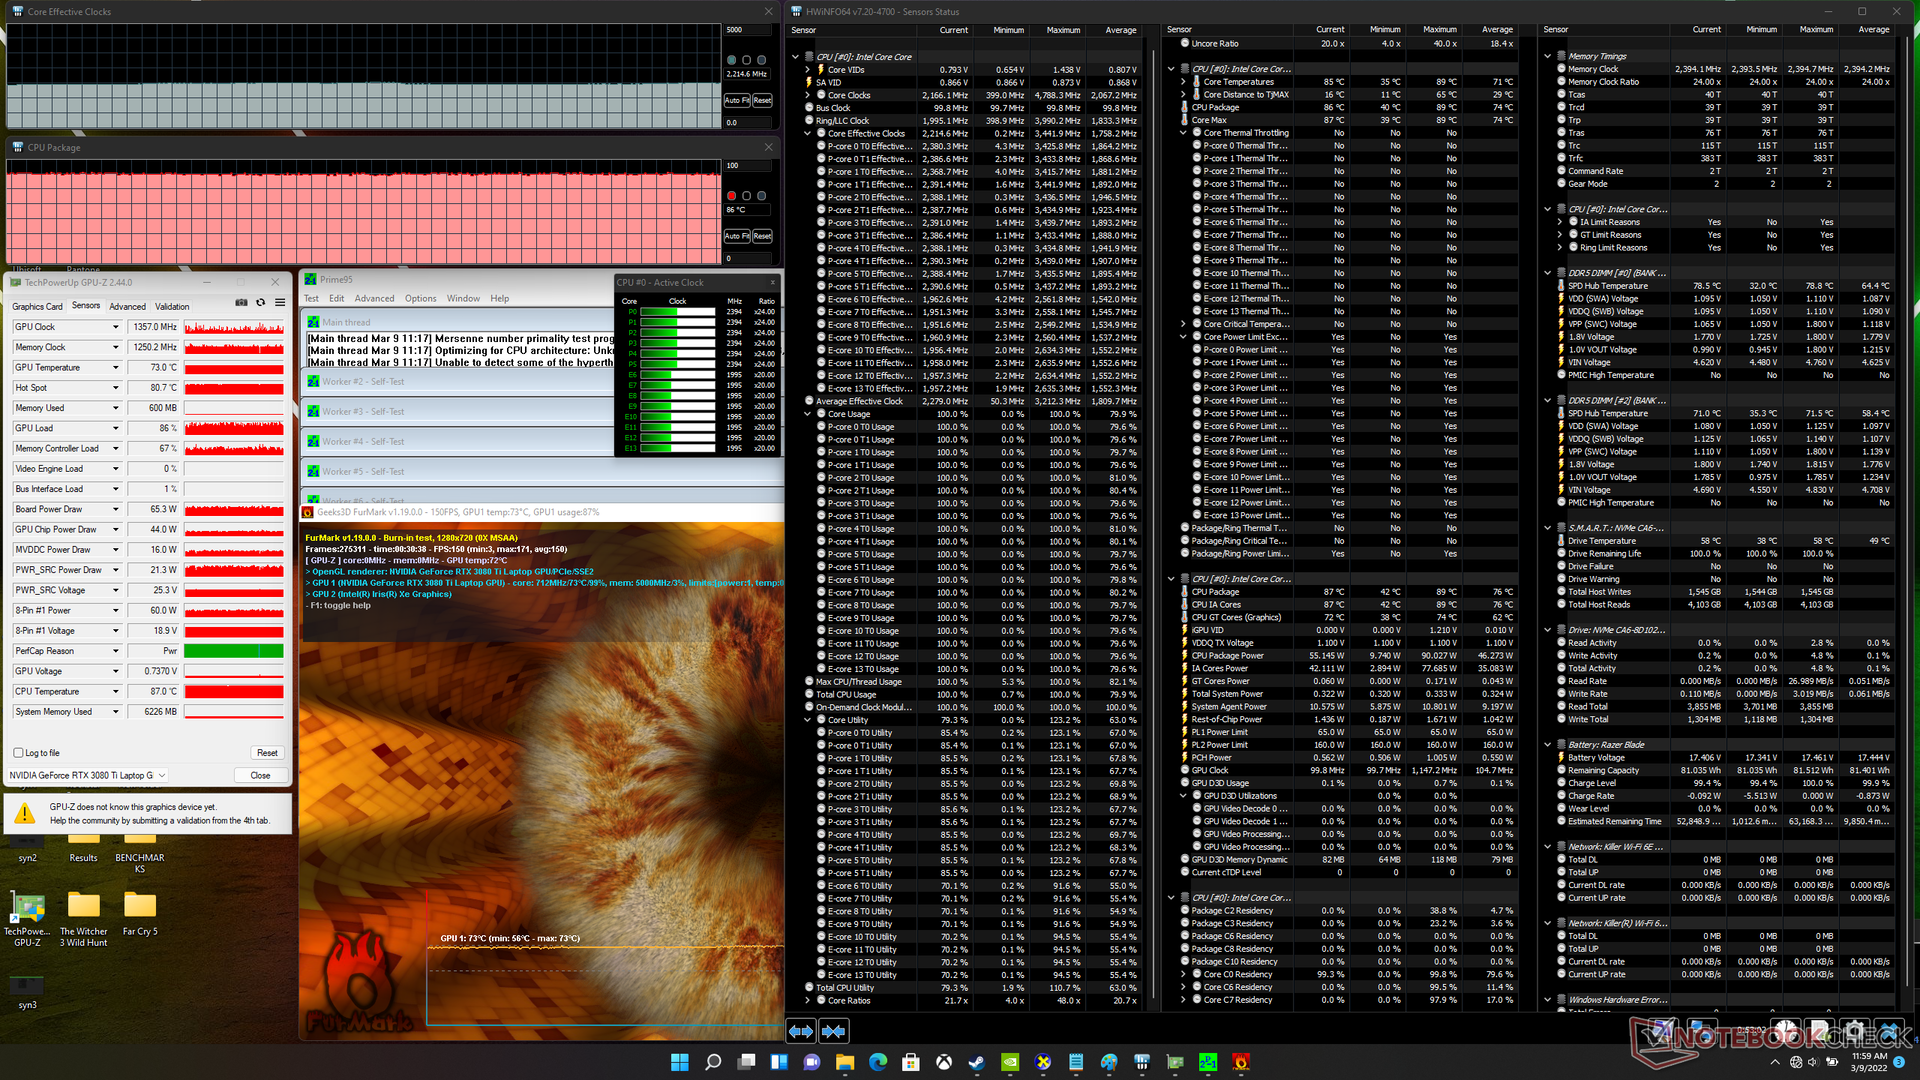
| CPU Clock (GHz) | GPU Clock (MHz) | Average CPU Temperature (°C) | Average GPU Temperature (°C) | |
| System Idle | -- | -- | 43 | 42 |
| Prime95 Stress | 2.2 | -- | 72 | 56 |
| Prime95 + FurMark Stress | 2.2 | ~1357 | 86 | 73 |
| Witcher 3 Stress | 0.6 | 1455 | 74 | 67 |
Speakers
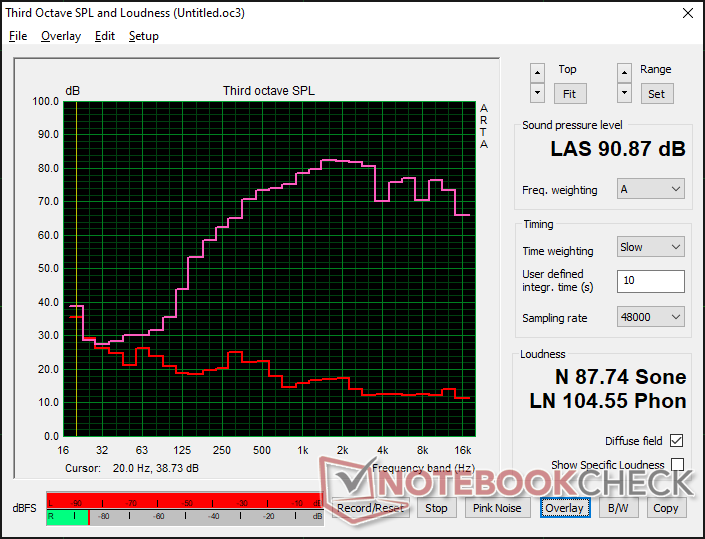
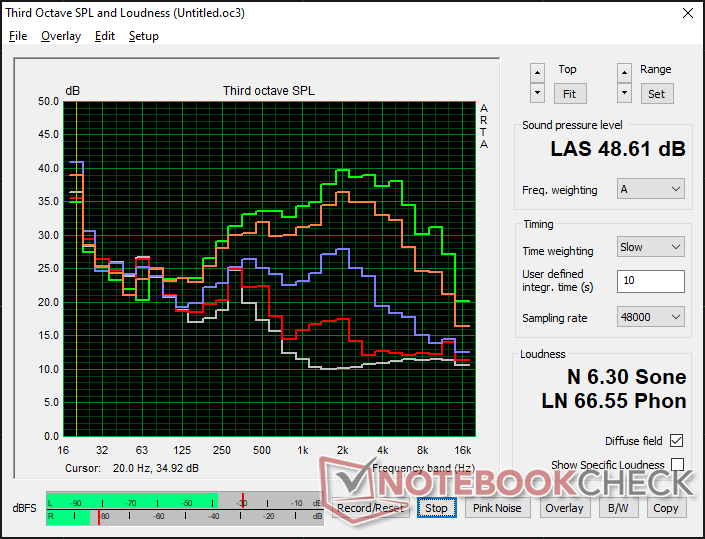
Razer Blade 15 2022 audio analysis
(+) | speakers can play relatively loud (90.9 dB)
Bass 100 - 315 Hz
(-) | nearly no bass - on average 21% lower than median
(±) | linearity of bass is average (9.7% delta to prev. frequency)
Mids 400 - 2000 Hz
(+) | balanced mids - only 3.9% away from median
(+) | mids are linear (3.9% delta to prev. frequency)
Highs 2 - 16 kHz
(+) | balanced highs - only 4.2% away from median
(±) | linearity of highs is average (7.8% delta to prev. frequency)
Overall 100 - 16.000 Hz
(±) | linearity of overall sound is average (15.7% difference to median)
Compared to same class
» 37% of all tested devices in this class were better, 7% similar, 57% worse
» The best had a delta of 6%, average was 18%, worst was 132%
Compared to all devices tested
» 24% of all tested devices were better, 5% similar, 71% worse
» The best had a delta of 4%, average was 23%, worst was 134%
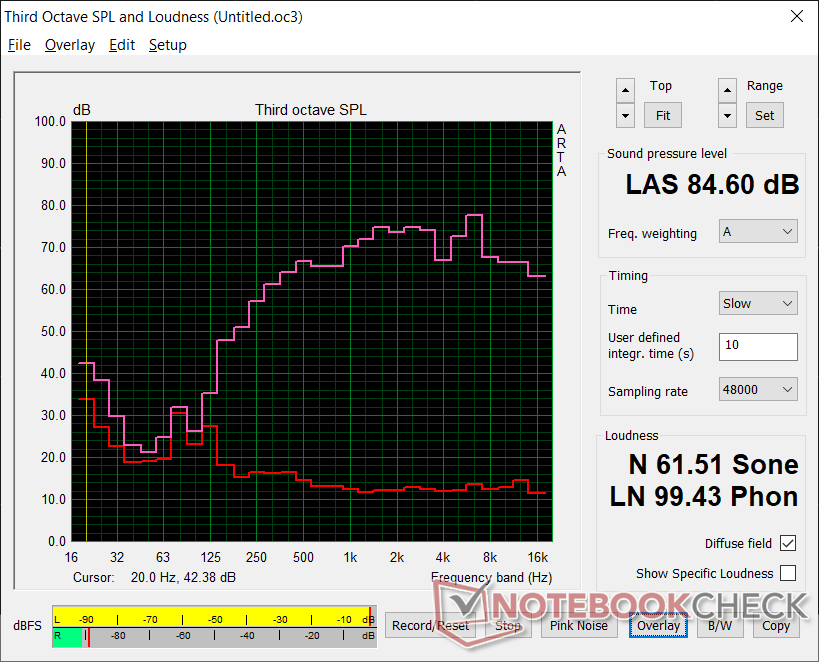
Apple MacBook Pro 16 2021 M1 Pro audio analysis
(+) | speakers can play relatively loud (84.7 dB)
Bass 100 - 315 Hz
(+) | good bass - only 3.8% away from median
(+) | bass is linear (5.2% delta to prev. frequency)
Mids 400 - 2000 Hz
(+) | balanced mids - only 1.3% away from median
(+) | mids are linear (2.1% delta to prev. frequency)
Highs 2 - 16 kHz
(+) | balanced highs - only 1.9% away from median
(+) | highs are linear (2.7% delta to prev. frequency)
Overall 100 - 16.000 Hz
(+) | overall sound is linear (4.6% difference to median)
Compared to same class
» 0% of all tested devices in this class were better, 0% similar, 100% worse
» The best had a delta of 5%, average was 17%, worst was 45%
Compared to all devices tested
» 0% of all tested devices were better, 0% similar, 100% worse
» The best had a delta of 4%, average was 23%, worst was 134%
Energy Management
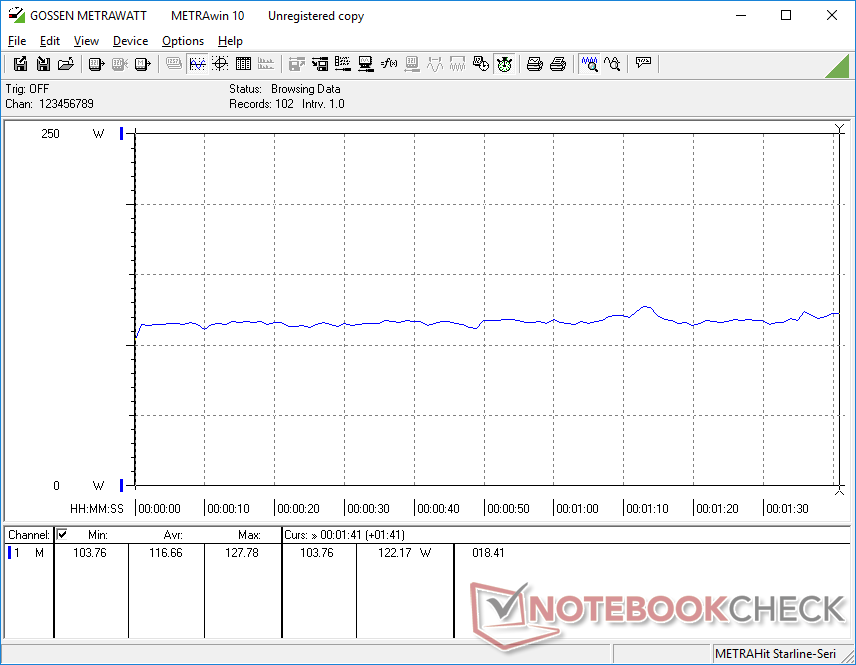
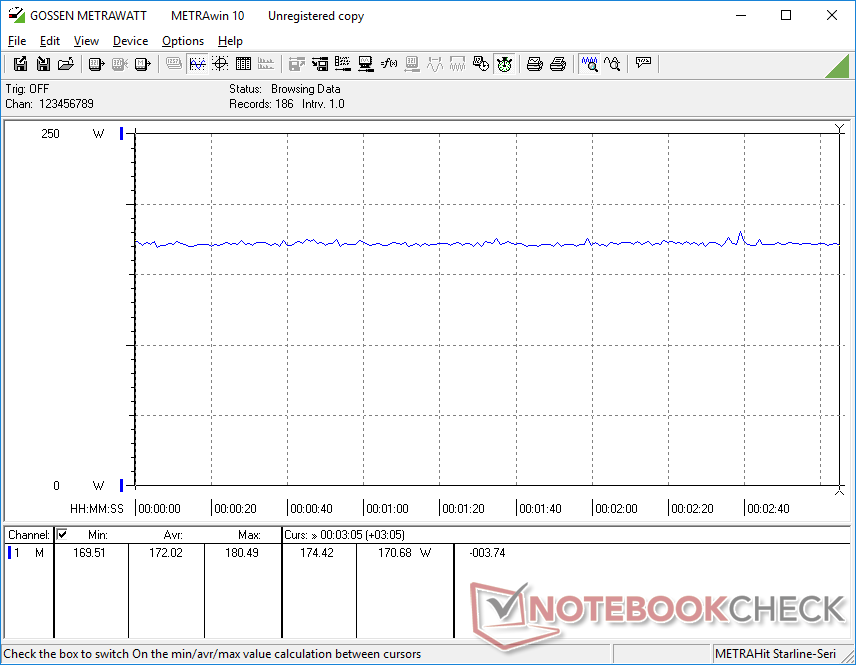
Power Consumption
Users are getting over 2x the CPU multi-thread performance and a 15 to 25 percent graphics boost when compared to the early 2021 Blade 15. Power consumption is subsequently higher on our latest Blade 15 model by up to 60 W when fully stressed or about 30 W when running games. The Schenker XMG Neo 15 E22 with its 175 W RTX 3080 Ti will consume even more power than our Blade 15 and its 110 W RTX 3080 Ti.
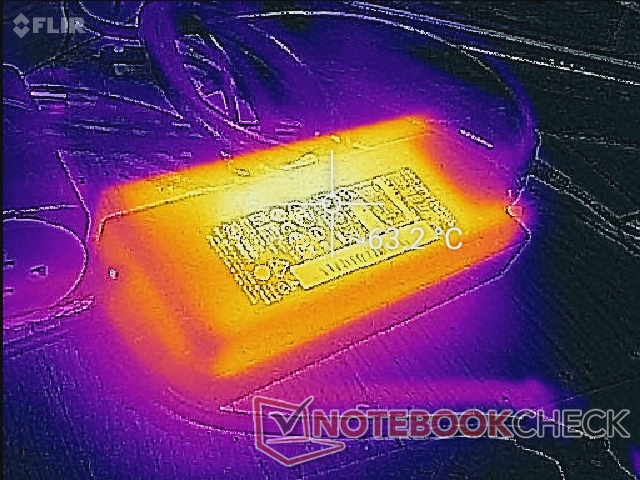
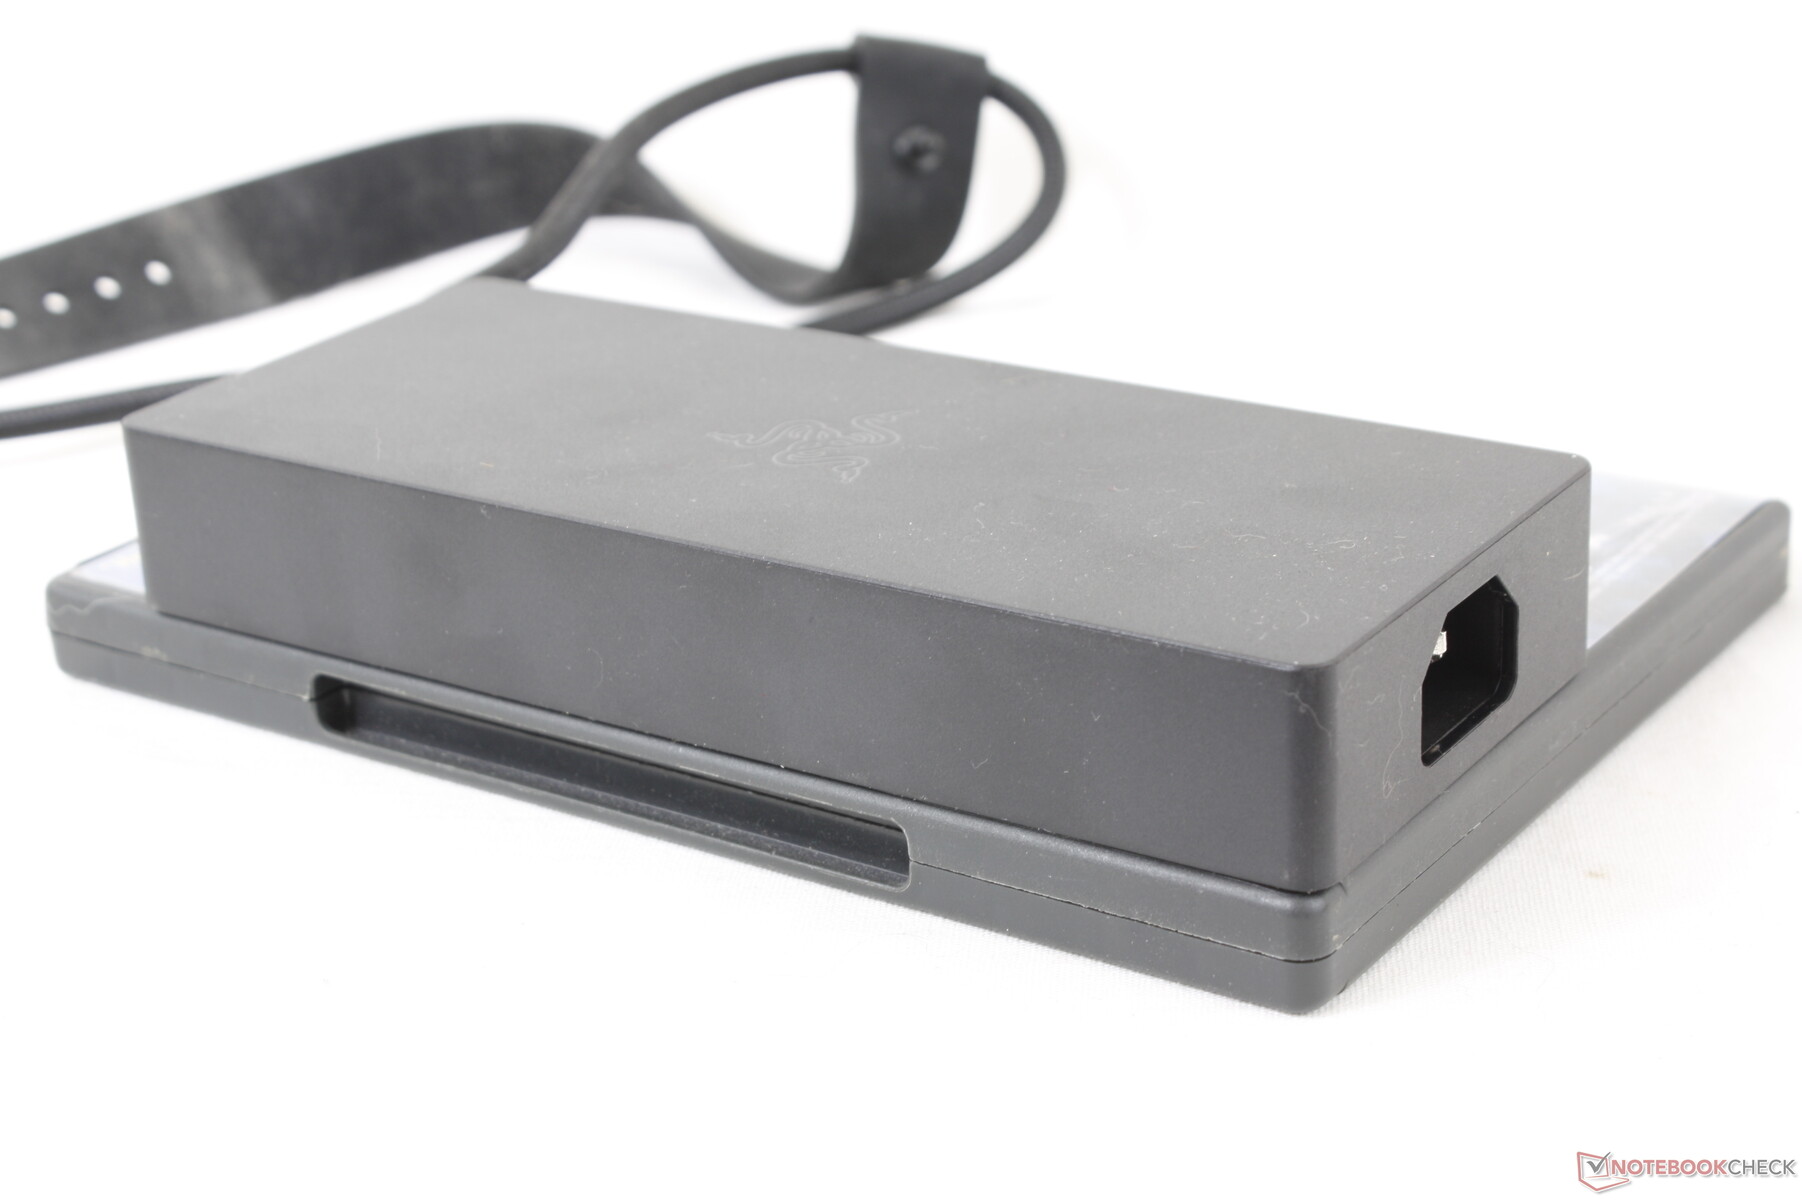
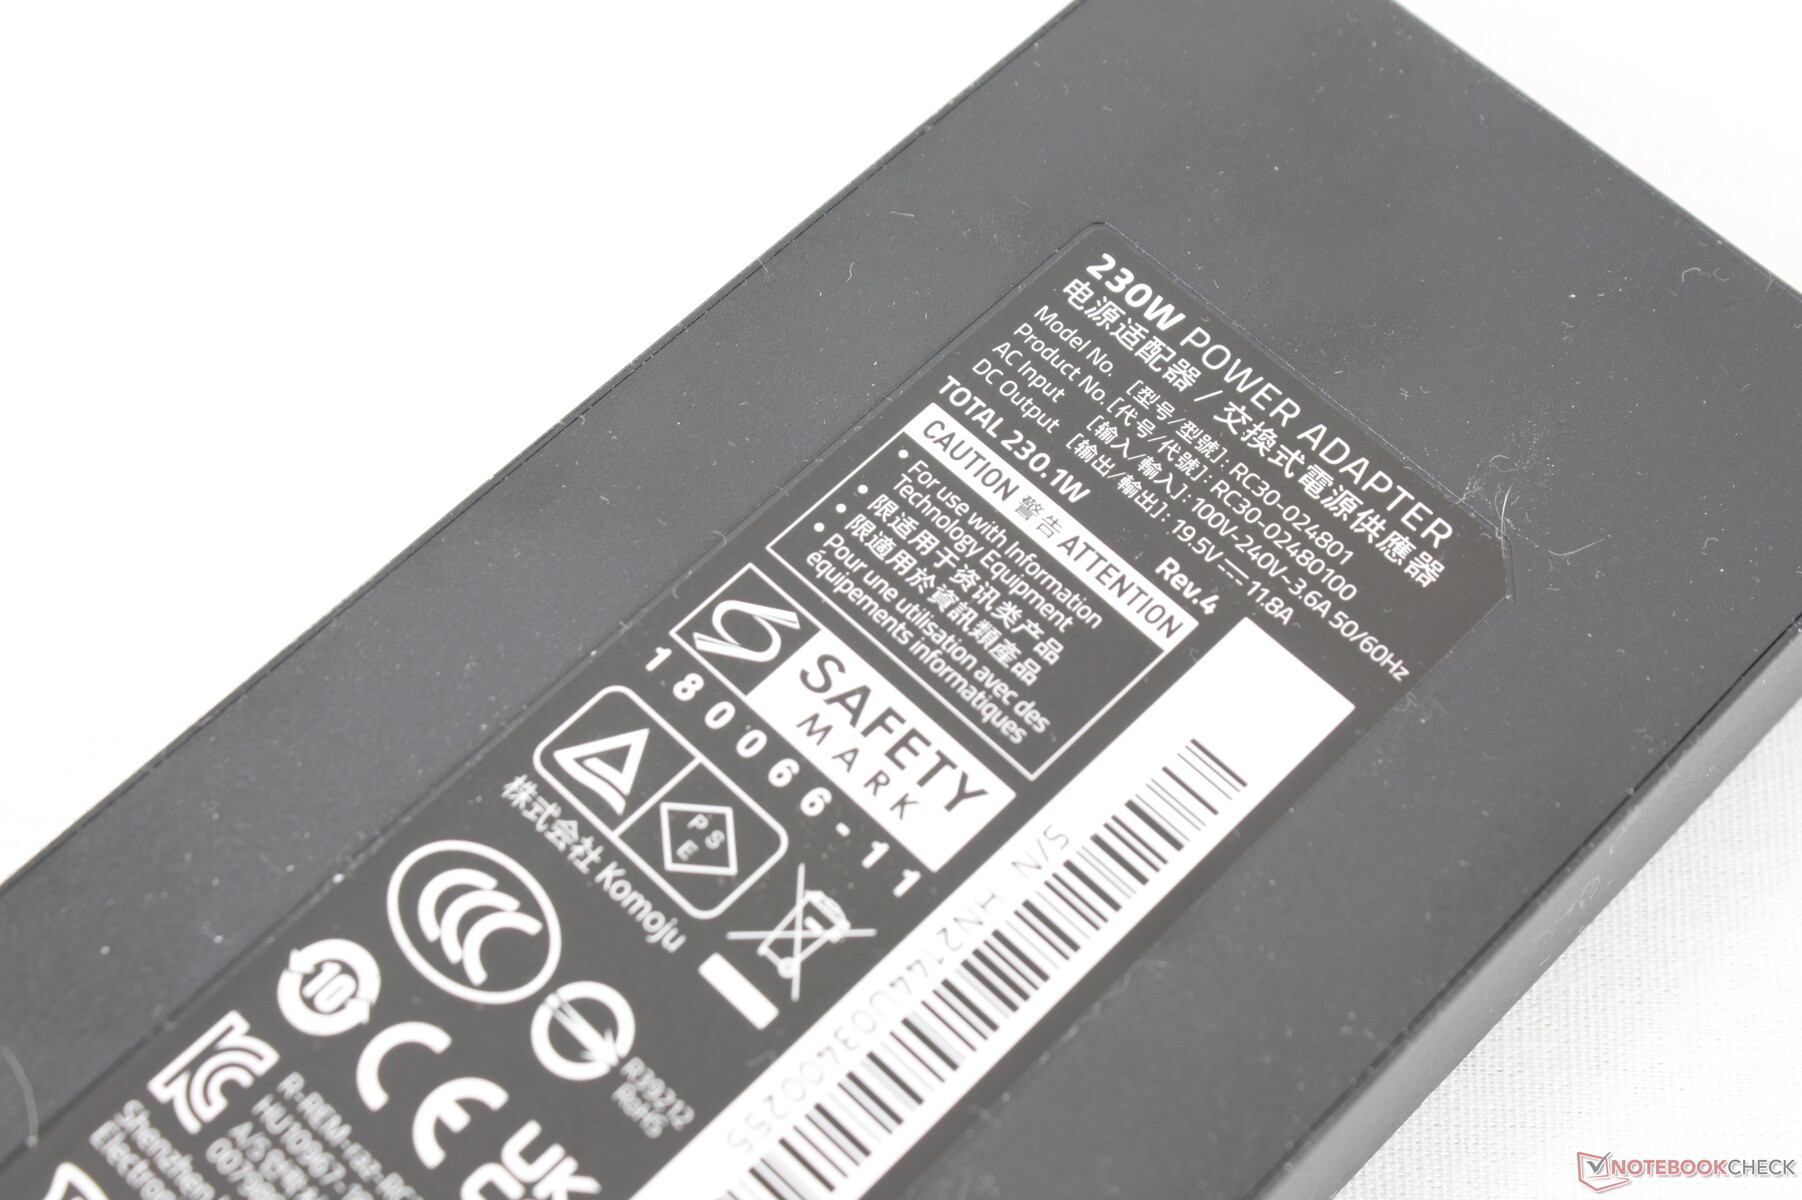
The 230 W AC adapter is relatively small (~17 x 7 x 2.5 cm) when compared to most other adapters of equivalent power for easier transporting. We're able to record a temporary maximum draw of 228 W when both the CPU and GPU are at 100 percent utilization.
| Off / Standby | |
| Idle | |
| Load |
|
Key:
min: | |
| Razer Blade 15 2022 i7-12800H, GeForce RTX 3080 Ti Laptop GPU, SSSTC CA6-8D1024, IPS, 2560x1440, 15.6" | Razer Blade 15 Advanced Model Early 2021 i7-10875H, GeForce RTX 3080 Laptop GPU, Samsung PM981a MZVLB1T0HBLR, IPS, 1920x1080, 15.6" | Razer Blade 15 RTX 2080 Super Max-Q i7-10875H, GeForce RTX 2080 Super Max-Q, Samsung PM981a MZVLB1T0HBLR, IPS, 1920x1080, 15.6" | Schenker XMG Neo 15 E22 (Early 2022, RTX 3080 Ti) i7-12700H, GeForce RTX 3080 Ti Laptop GPU, Samsung SSD 980 Pro 250GB MZ-V8P250BW, IPS, 2560x1440, 15.6" | ADATA XPG Xenia 15 i7-11800H, GeForce RTX 3070 Laptop GPU, ADATA XPG Gammix S70 1TB, IPS, 2560x1440, 15.6" | Eurocom Nightsky ARX315 R9 5900X, GeForce RTX 3070 Laptop GPU, Samsung SSD 980 Pro 1TB MZ-V8P1T0BW, IPS, 1920x1080, 15.6" | |
|---|---|---|---|---|---|---|
| Power Consumption | 39% | 37% | 15% | 27% | -54% | |
| Idle Minimum * (Watt) | 33.2 | 13 61% | 10.6 68% | 14 58% | 8.9 73% | 55 -66% |
| Idle Average * (Watt) | 36.4 | 15 59% | 13.1 64% | 18 51% | 14.4 60% | 68.2 -87% |
| Idle Maximum * (Watt) | 37.6 | 22 41% | 15.8 58% | 19 49% | 31.1 17% | 72.5 -93% |
| Load Average * (Watt) | 116.7 | 98 16% | 131 -12% | 115 1% | 97 17% | 149.2 -28% |
| Witcher 3 ultra * (Watt) | 172 | 126 27% | 146 15% | 228 -33% | 188 -9% | 233 -35% |
| Load Maximum * (Watt) | 228.6 | 165 28% | 169 26% | 307 -34% | 222.2 3% | 255.8 -12% |
* ... smaller is better
Power Consumption Witcher 3 / Stresstest
Power Consumption external Monitor
Battery Life
WLAN runtimes are shorter than on previous generation models likely due in part to the more demand 1440p 240 Hz panel. We're able to squeeze almost 5 hours of real-world WLAN use when on the Balanced power profile with Nvidia Optimus set to the iGPU and the display set to 150 nits. In comparison, we're able to squeeze 6 hours or longer on the 2021 Blade 15 when under similar testing conditions.
Charging from empty to full capacity with the included AC adapter takes under 90 minutes. The system can also be charged via third-party USB-C adapters.
| Razer Blade 15 2022 i7-12800H, GeForce RTX 3080 Ti Laptop GPU, 80 Wh | Razer Blade 15 Advanced Model Early 2021 i7-10875H, GeForce RTX 3080 Laptop GPU, 80 Wh | Razer Blade 15 RTX 2080 Super Max-Q i7-10875H, GeForce RTX 2080 Super Max-Q, 80 Wh | Schenker XMG Neo 15 E22 (Early 2022, RTX 3080 Ti) i7-12700H, GeForce RTX 3080 Ti Laptop GPU, 93 Wh | ADATA XPG Xenia 15 i7-11800H, GeForce RTX 3070 Laptop GPU, 94 Wh | Eurocom Nightsky ARX315 R9 5900X, GeForce RTX 3070 Laptop GPU, 62 Wh | |
|---|---|---|---|---|---|---|
| Battery runtime | 84% | 24% | 37% | 78% | -80% | |
| WiFi v1.3 (h) | 4.9 | 9 84% | 6.1 24% | 6.7 37% | 8.7 78% | 1 -80% |
| Reader / Idle (h) | 14.4 | 8.7 | 14 | |||
| H.264 (h) | 8.9 | 7.3 | 6.9 | |||
| Load (h) | 2 | 1.9 | 3.8 | 1.5 |
Pros
Cons
Verdict
The 2022 Blade 15 offers roughly 15 to 25 percent faster graphics performance and 20 percent faster CPU performance over last year's Core i7-11800H and RTX 3080 model. Thankfully, the system doesn't need to run noticeably louder or warmer to achieve faster results, but both power consumption and battery life take a hit. The higher consumption in particular appears to be a trend amongst many 12th gen Core laptops including the Schenker Uniwill Technology GM7AG8P or MSI Vector GP66 when compared to their previous generation counterparts. We're also glad to not see below-average CPU performance which was the case for the 10th gen Core i7-10875H model.
The Blade 15 with 12th gen Intel crams even more performance under a familiar design without needing to compromise on noise or heat. Don't expect battery life to be any longer, however.
With that in mind, the newest Blade 15 is the iterative yearly update to an already excellent chassis. The larger traditional keycaps are welcomed especially for those who weren't fans of Razer's optical keyboard "experiment" on the 2019 Blade 15 while the relatively small AC adapter deserves some recognition for being more portable than most others. Perhaps next year's model can finally add a webcam shutter that many cheaper laptops come with nowadays.
Price and Availability
Razer Blade 15 2022
- 03/12/2022 v7 (old)
Allen Ngo
Price comparison
