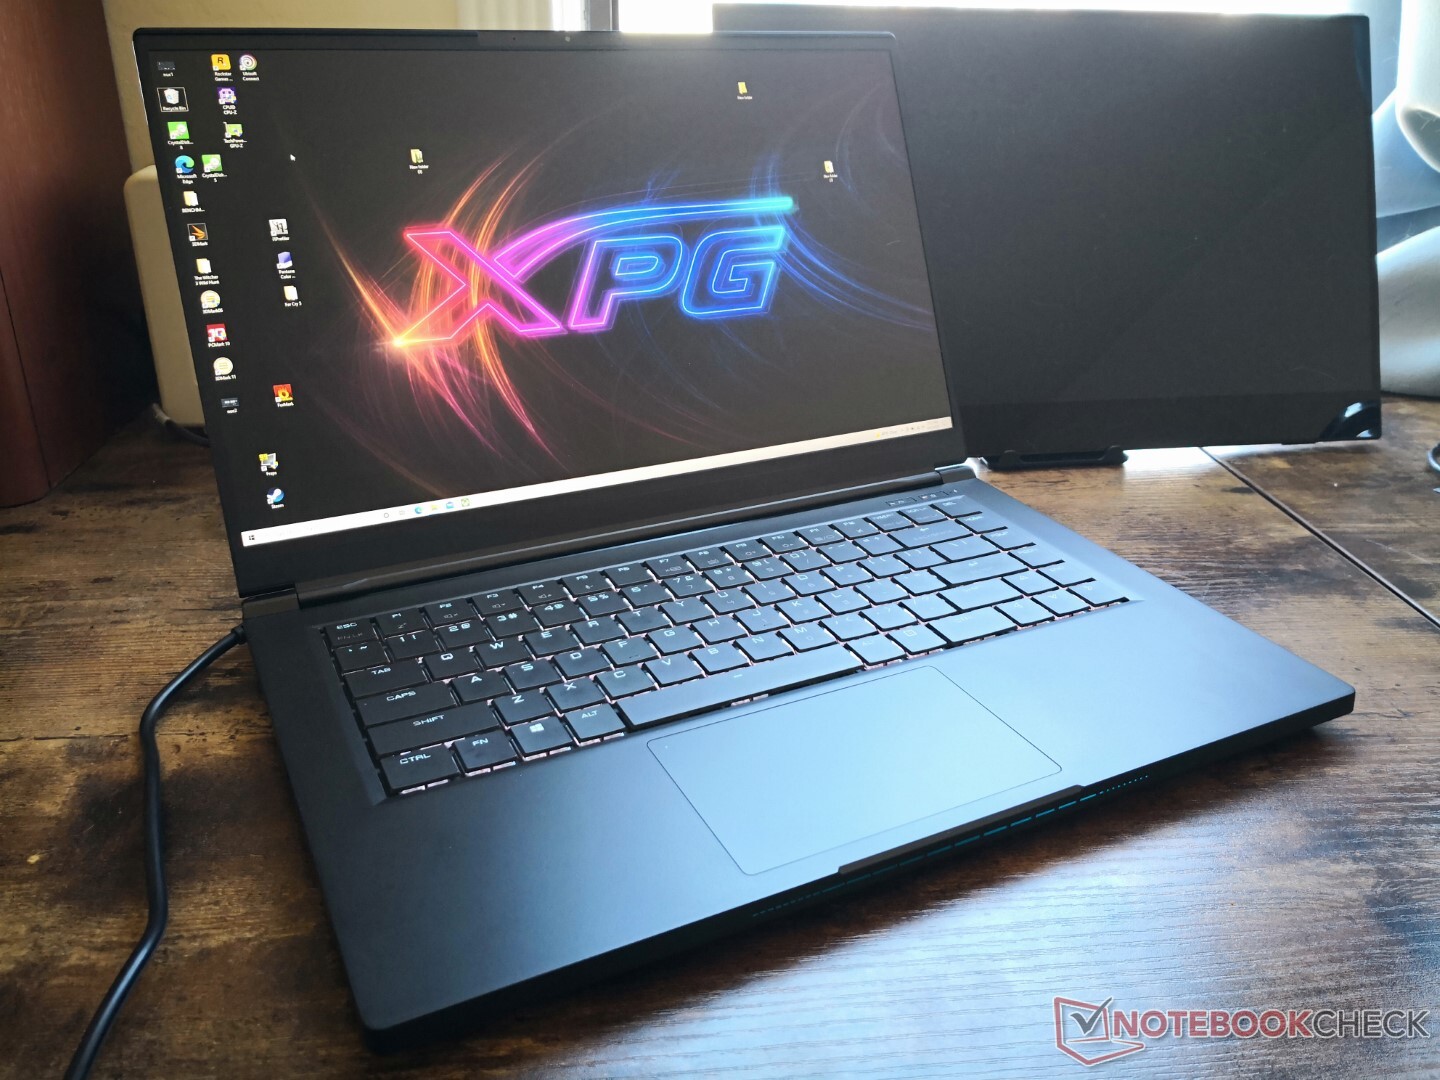
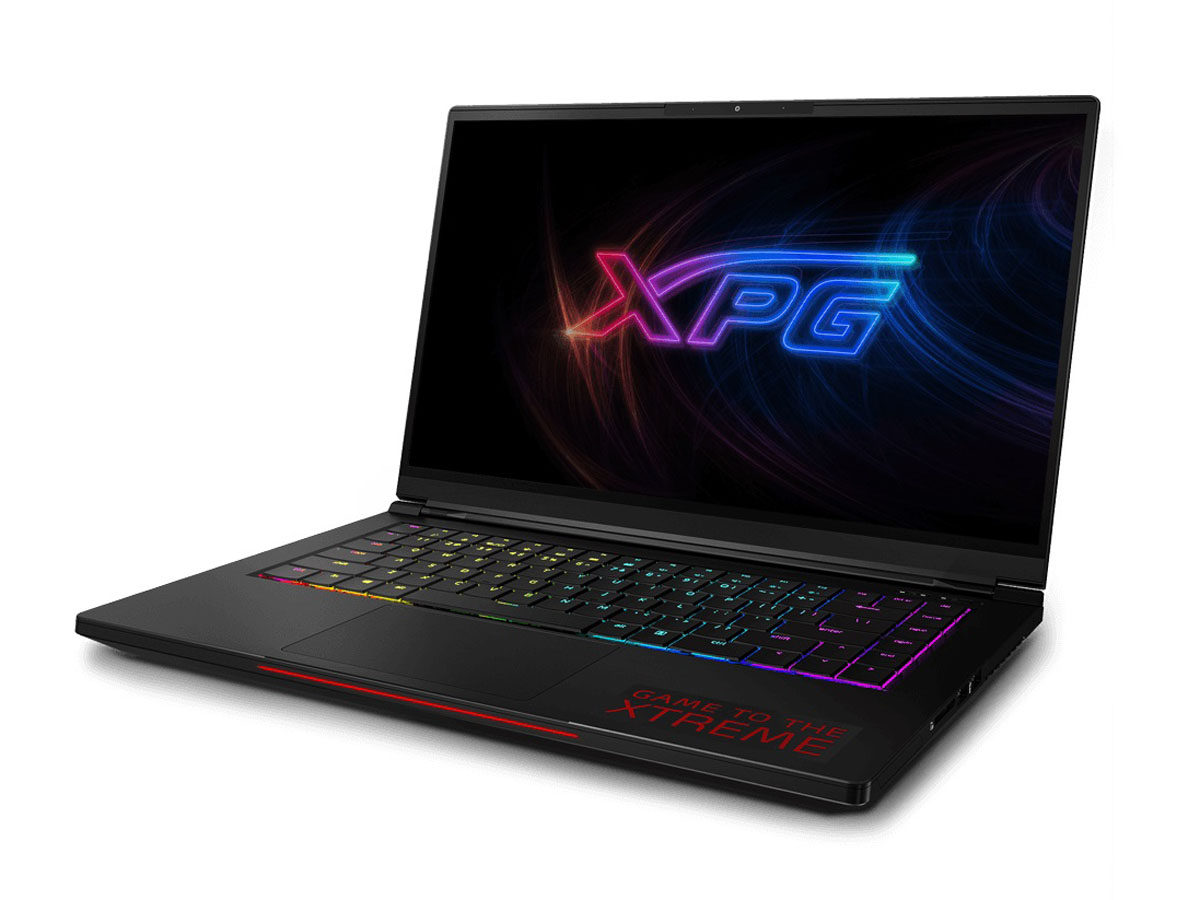
ADATA XPG Xenia 15 laptop review: Almost as sharp as a Razer Blade

After launching the XPG Xenia Xe and Xenia 14 back in May and July, respectively, ADATA is now ready to update its gaming-centric Xenia 15 with Tiger Lake-H and Nvidia Ampere GPUs to replace the Coffee Lake-H and Turing options on the older model. Other upgrades include a new 1440p 165 Hz display instead of 1080p 144 Hz and support for both PCIe4 SSDs and Thunderbolt 4 instead of only PCIe3 and Thunderbolt 3.
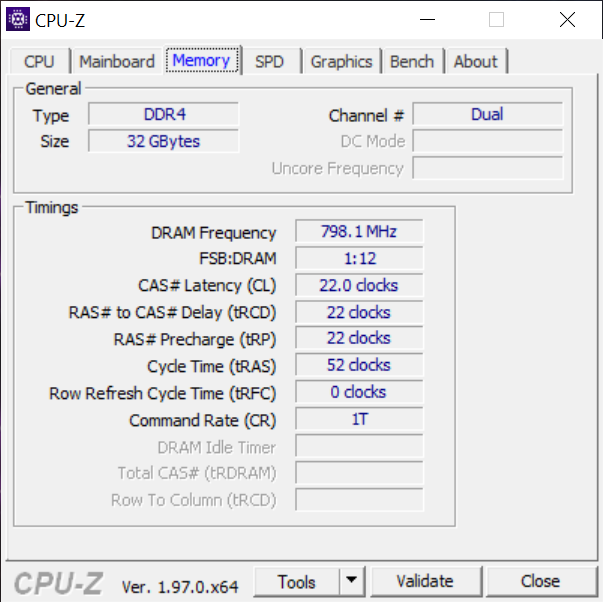
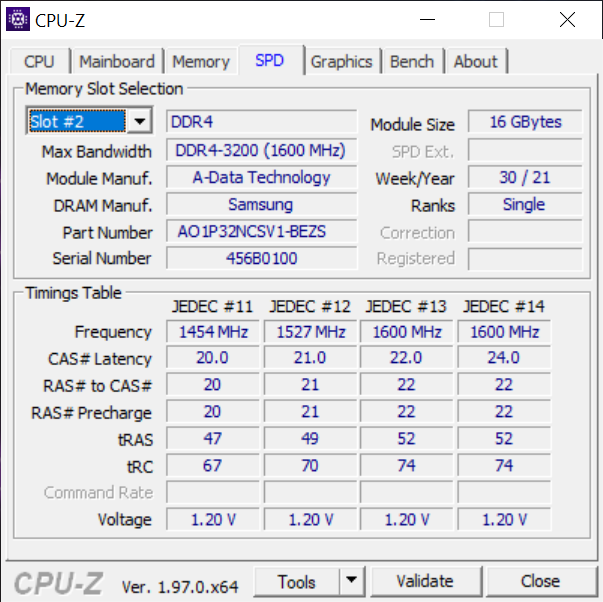
Our exact configuration with GeForce RTX 3070, 32 GB of RAM, and 1 TB of storage is now shipping for $2499 USD, but lesser SKUs may be available for less. The model competes with other ultrathin 15.6-inch gaming laptops like the Razer Blade 15, MSI GS66, Asus Zephyrus S15, Lenovo Legion 7, or Dell Alienware x15.
More ADATA reviews:
potential competitors in comparison
Rating | Date | Model | Weight | Height | Size | Resolution | Price |
|---|---|---|---|---|---|---|---|
| 87.3 % v7 (old) | 10 / 2021 | ADATA XPG Xenia 15 i7-11800H, GeForce RTX 3070 Laptop GPU | 1.9 kg | 20.5 mm | 15.60" | 2560x1440 | |
| 82.9 % v7 (old) | 10 / 2021 | MSI Delta 15 A5EFK R9 5900HX, Radeon RX 6700M | 2 kg | 19 mm | 15.60" | 1920x1080 | |
| 87.2 % v7 (old) | 09 / 2021 | Alienware x15 RTX 3070 P111F i7-11800H, GeForce RTX 3070 Laptop GPU | 2.4 kg | 15.9 mm | 15.60" | 2560x1440 | |
| 88.9 % v7 (old) | 07 / 2021 | Razer Blade 15 Advanced (Mid 2021) i7-11800H, GeForce RTX 3080 Laptop GPU | 2 kg | 16.99 mm | 15.60" | 1920x1080 | |
| 84 % v7 (old) | 02 / 2021 | MSI GS66 Stealth 10UG i7-10870H, GeForce RTX 3070 Laptop GPU | 2.1 kg | 19.8 mm | 15.60" | 1920x1080 | |
| 83.8 % v7 (old) | 02 / 2021 | Asus ROG Zephyrus G15 GA503Q R9 5900HS, GeForce RTX 3080 Laptop GPU | 2 kg | 20 mm | 15.60" | 2560x1440 |
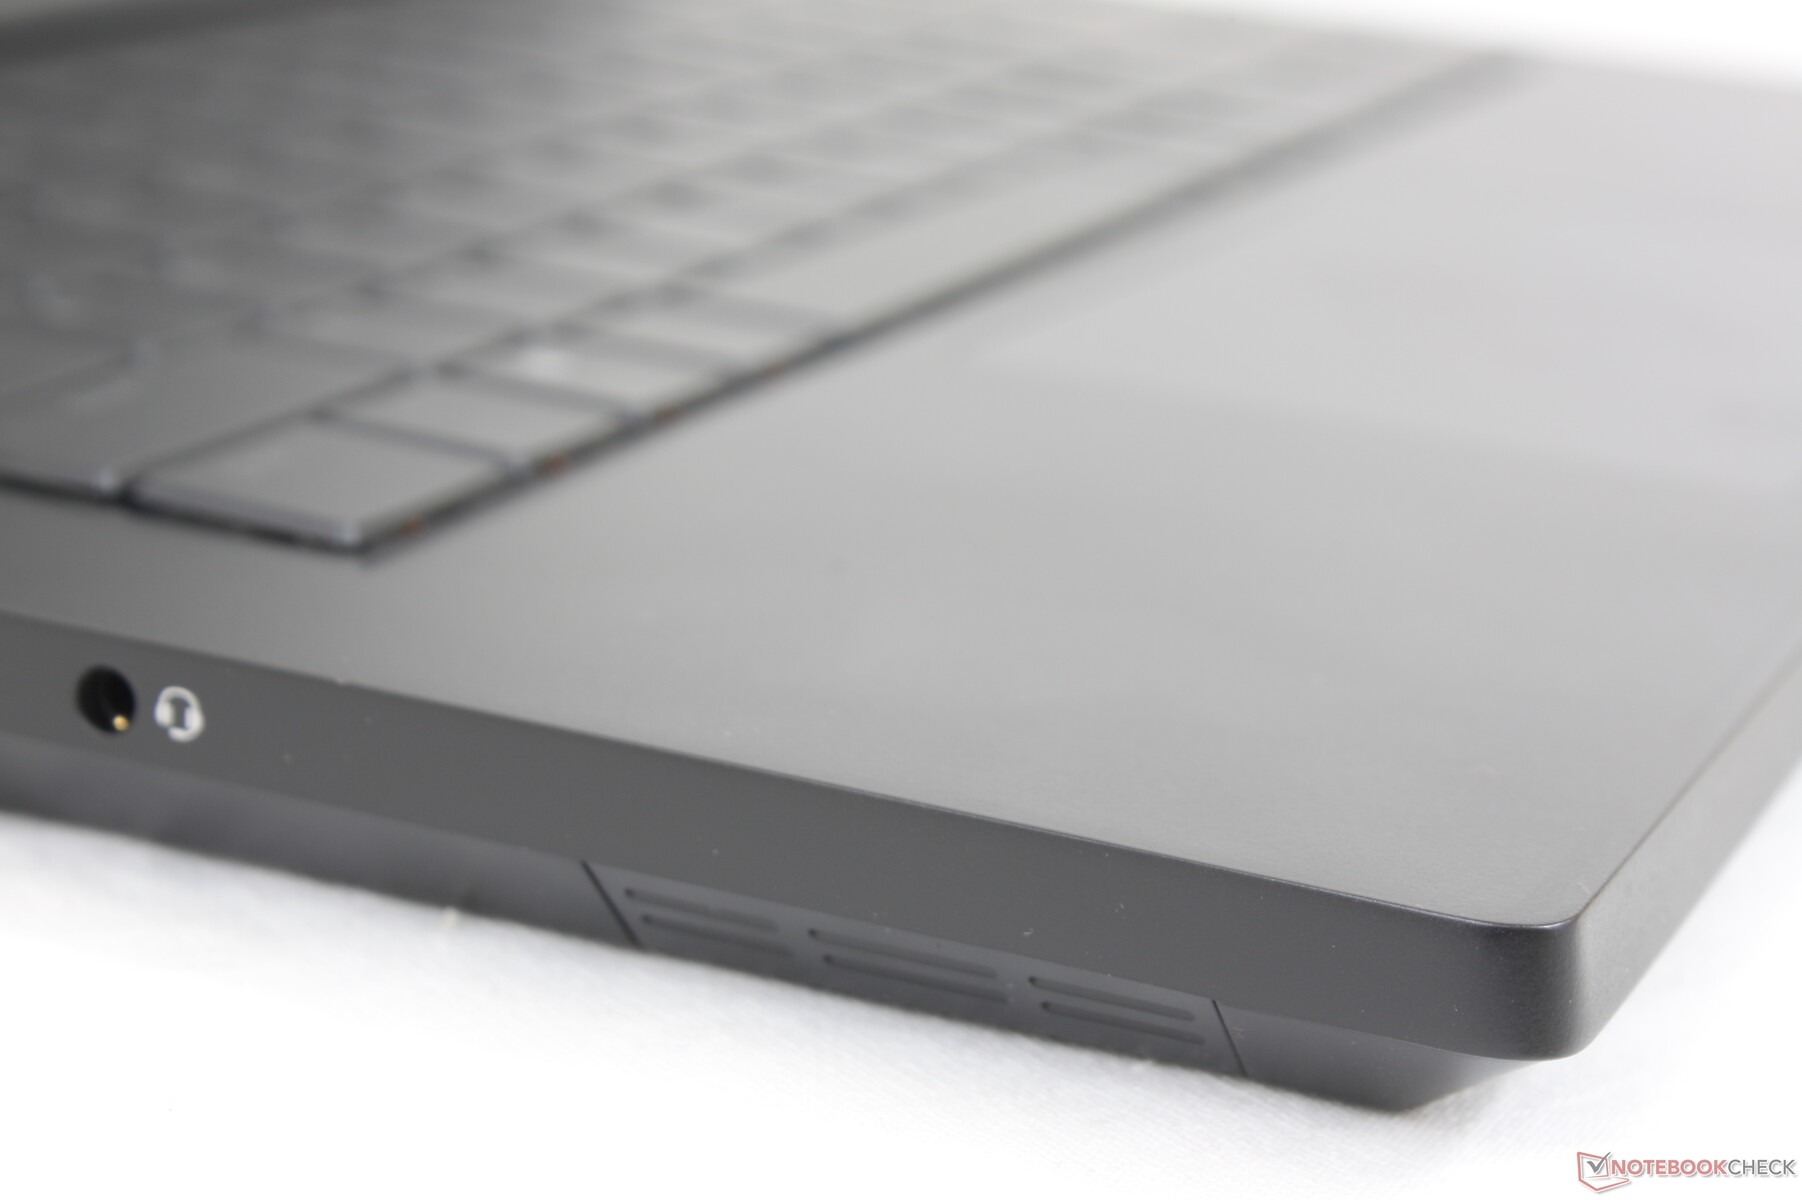
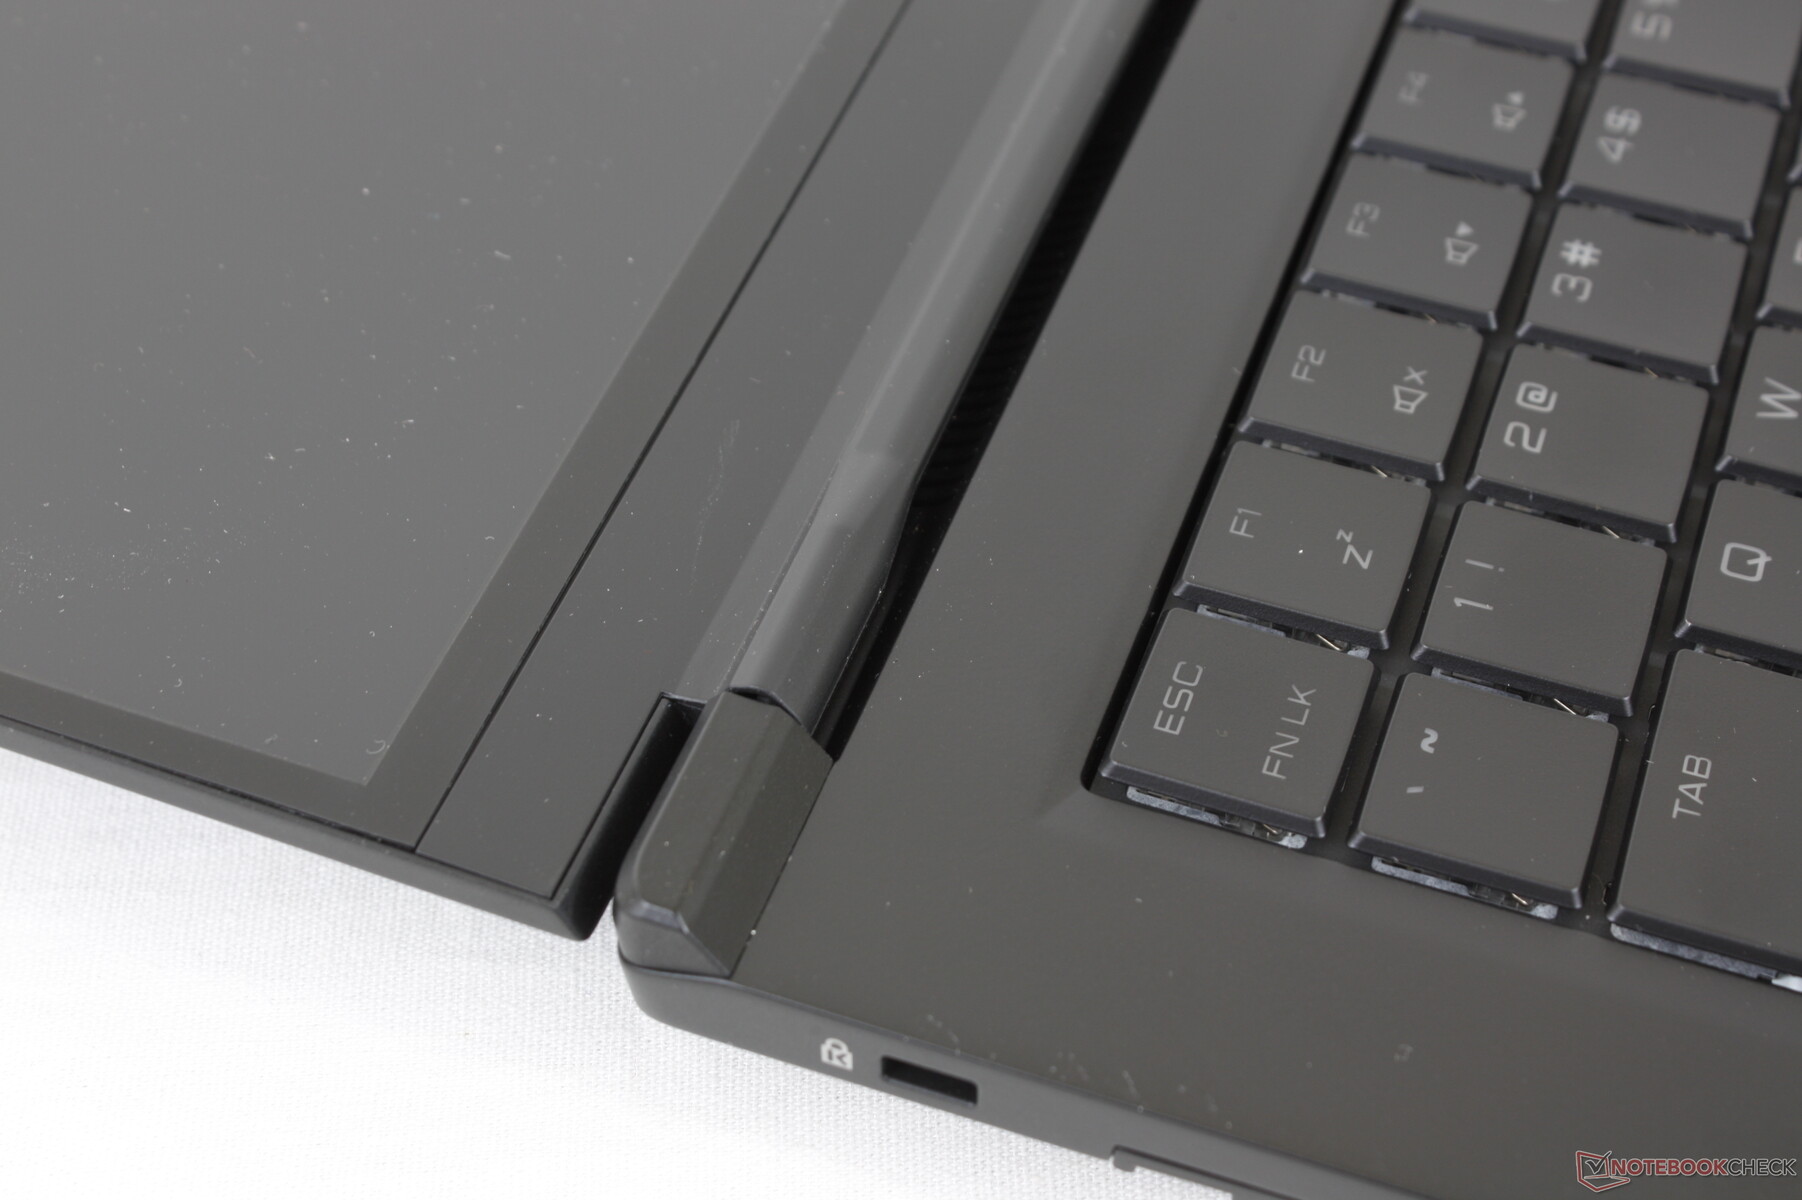
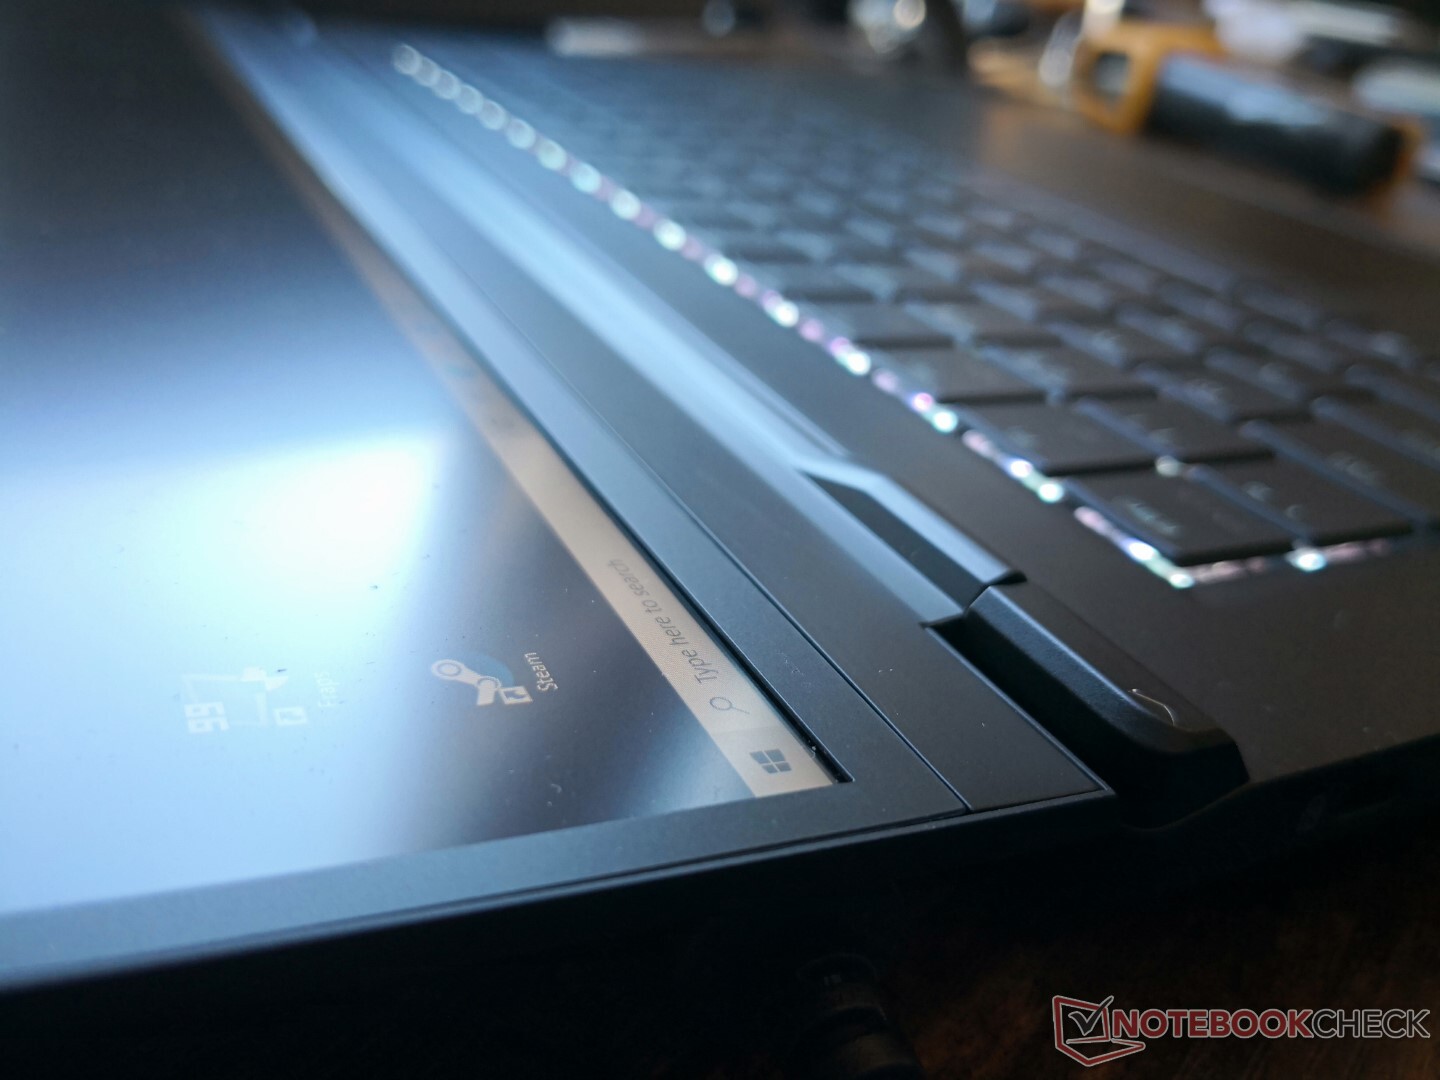
Case — Strong Base, Weak Hinges
The chassis has many similarities to the Schenker Core 15 or Neo 15 since all these models utilize Tongfang white label designs. ADATA is a reseller of the chassis meaning users can likely find the exact same model from another reseller depending on region. Unlike the two aforementioned Schenker models, however, the XPG Xenia 15 is smaller in all three dimensions and slightly lighter for an even more compact look. Its footprint is very nearly the same as the Razer Blade 15 Advanced, but it is a bit thicker nonetheless by just over 3 millimeters.
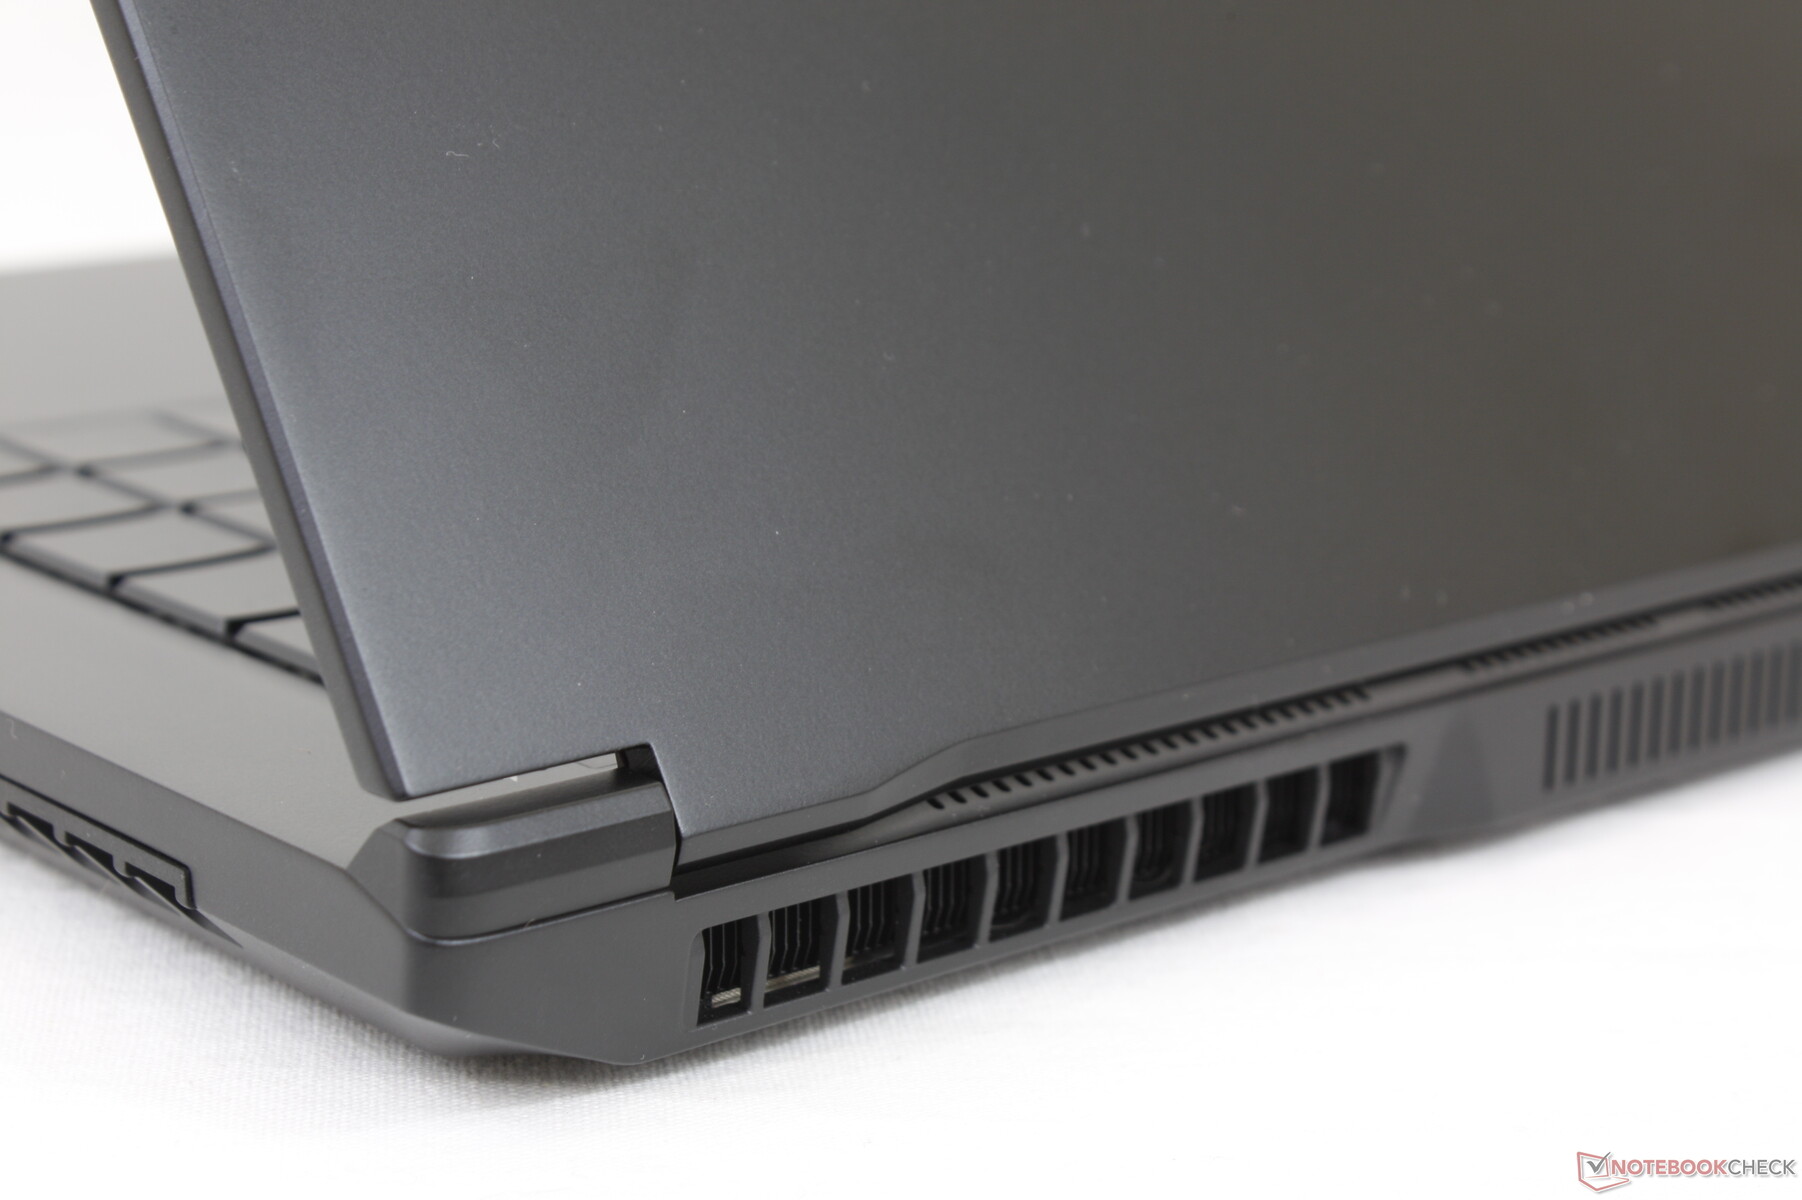
The magnesium alloy base feels as solid as on the Blade 15 and even better than on the Asus Zephyrus S15 or Lenovo Legion 5 which exhibit more flexing and creaking. The lid and hinges, however, are much weaker and feel of lower quality than the base. The hinges in particular become weaker at wider angles and they teeter quite noticeably as well. This is definitely something that could be improved upon for a potential next generation design.
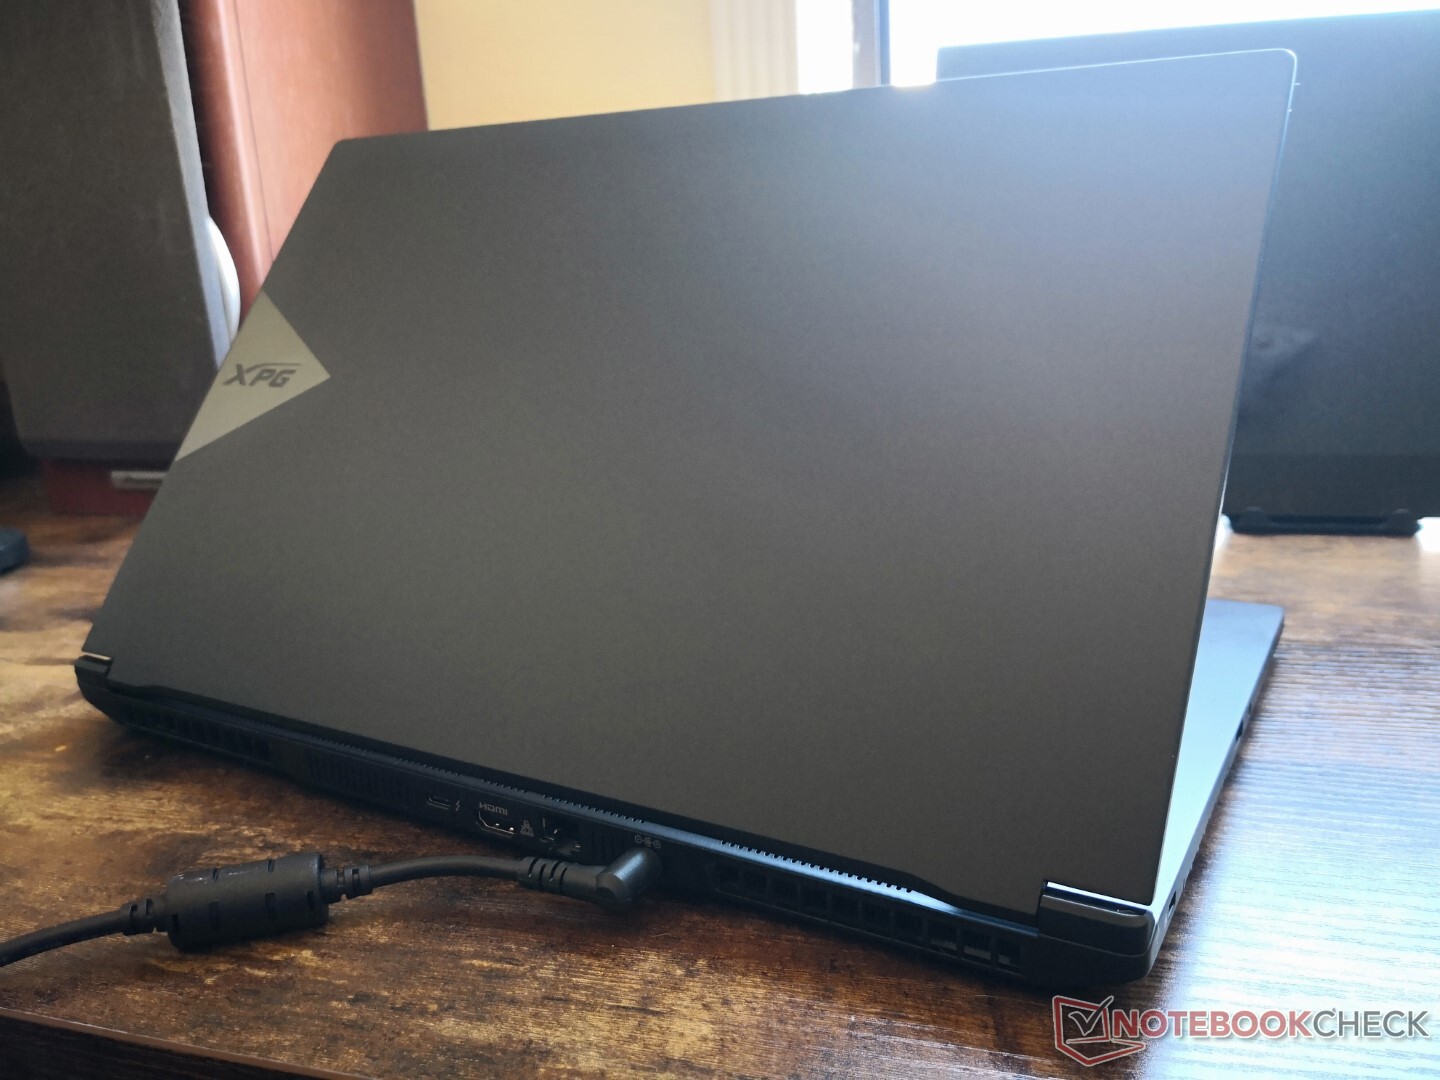
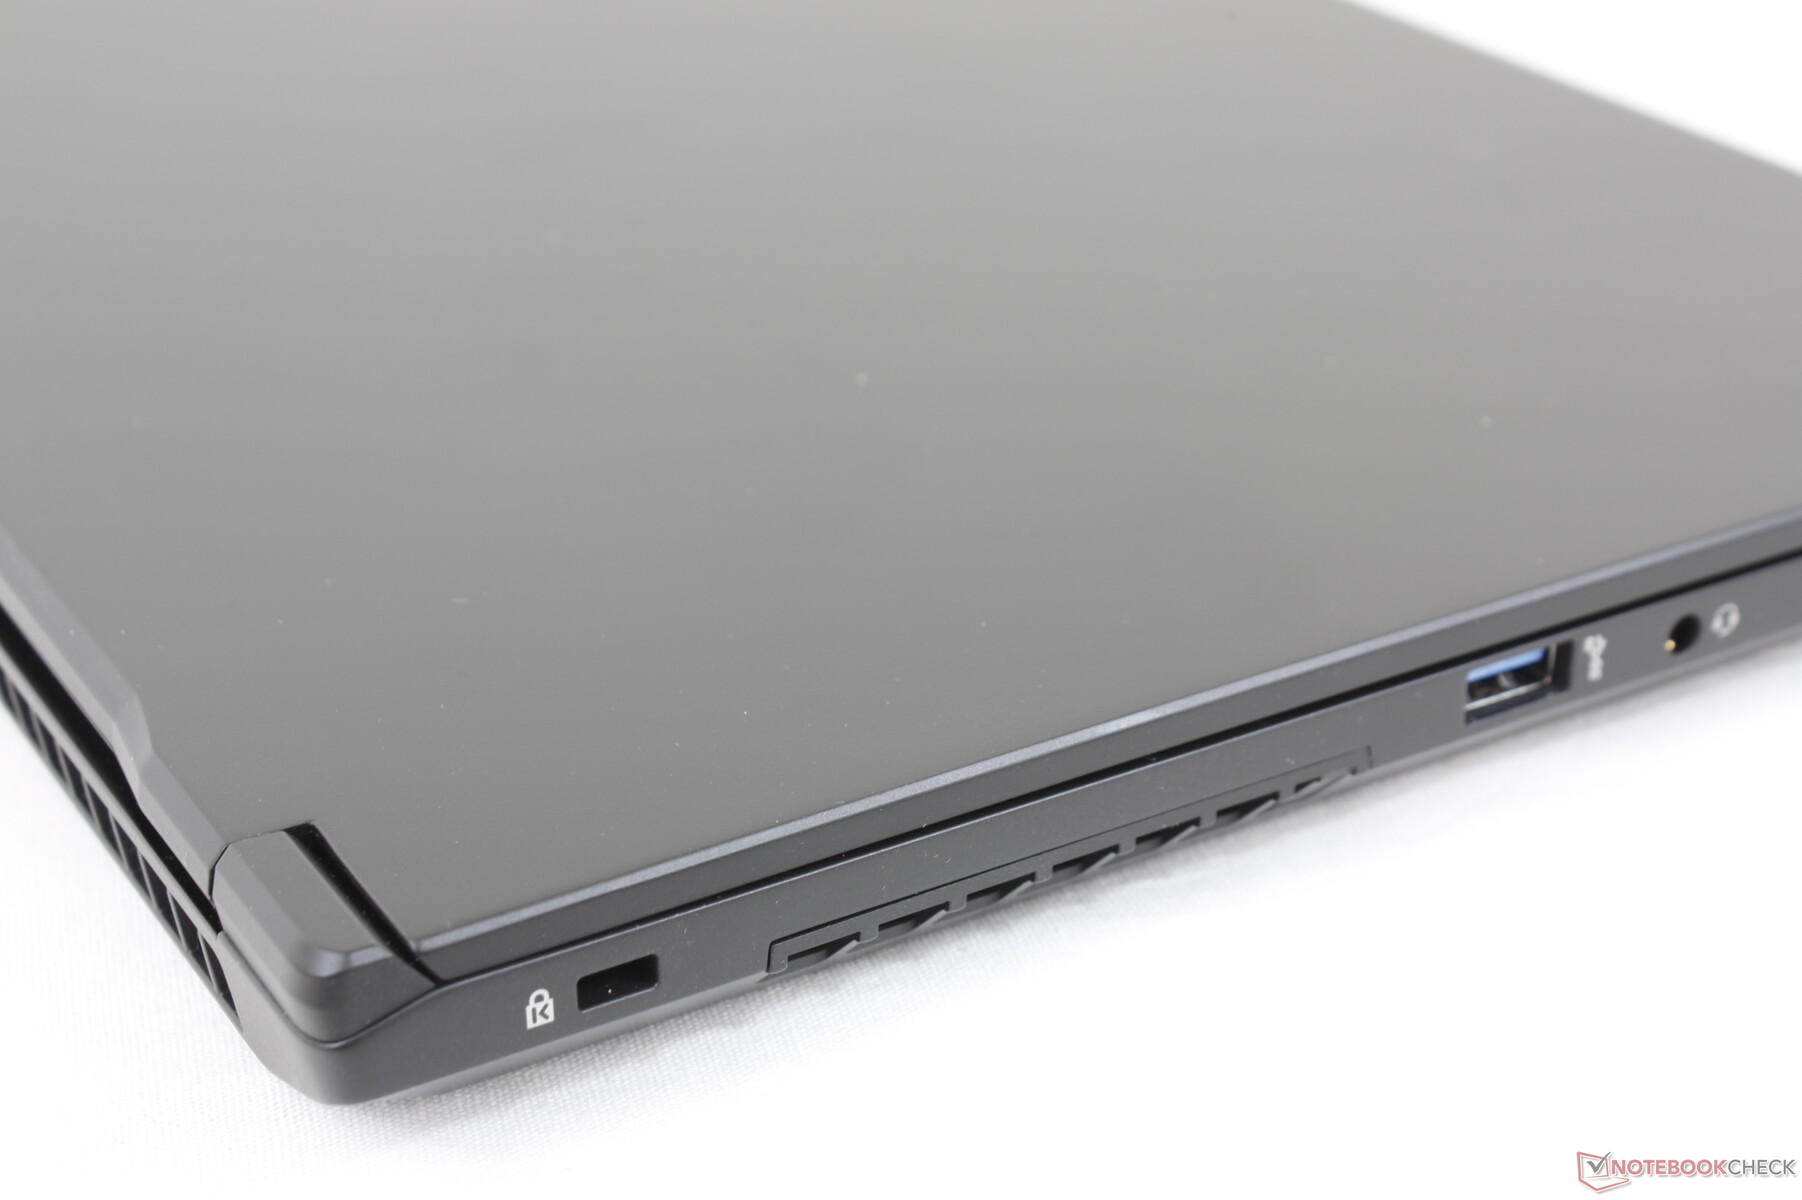
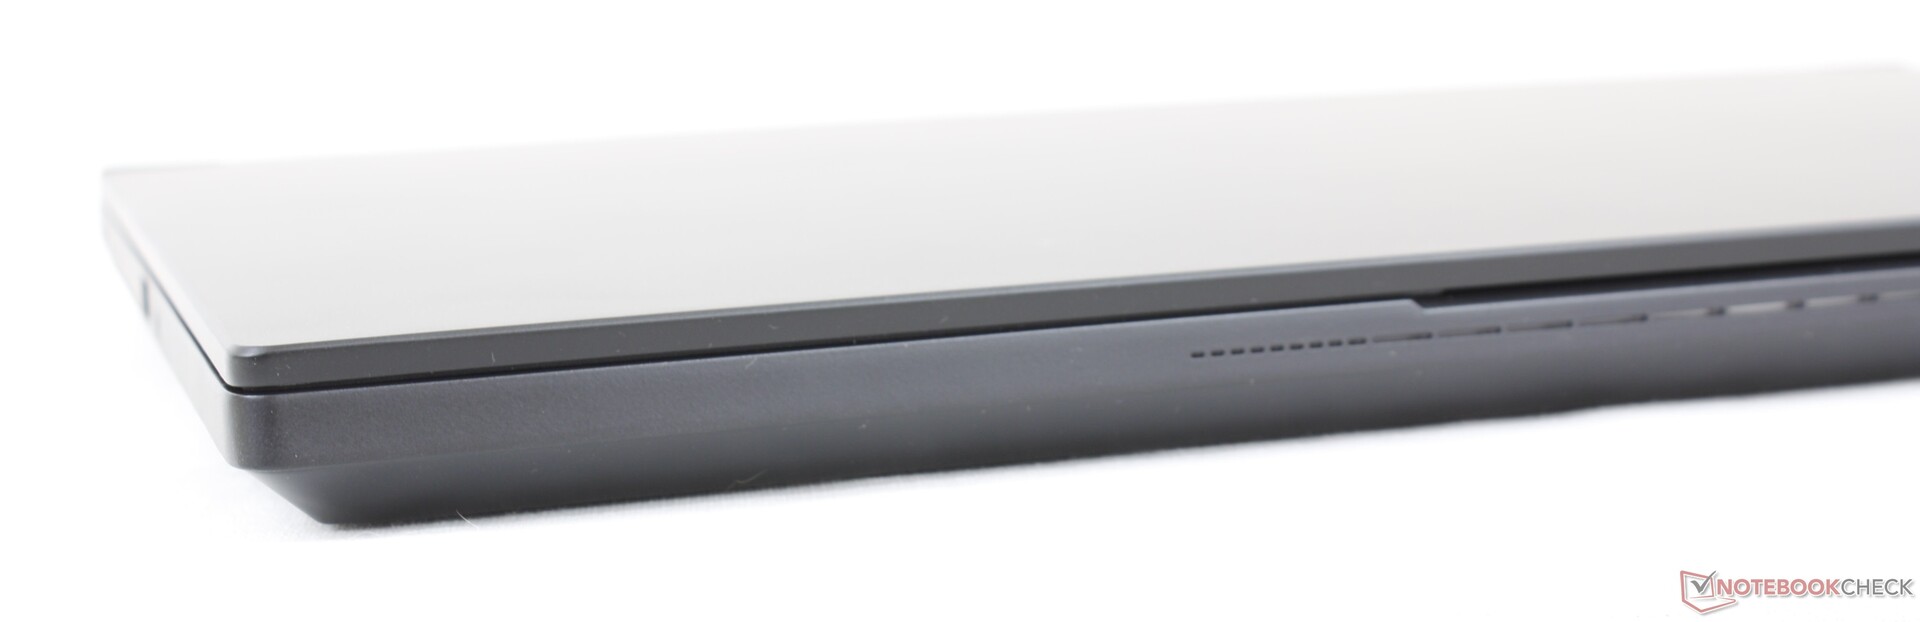
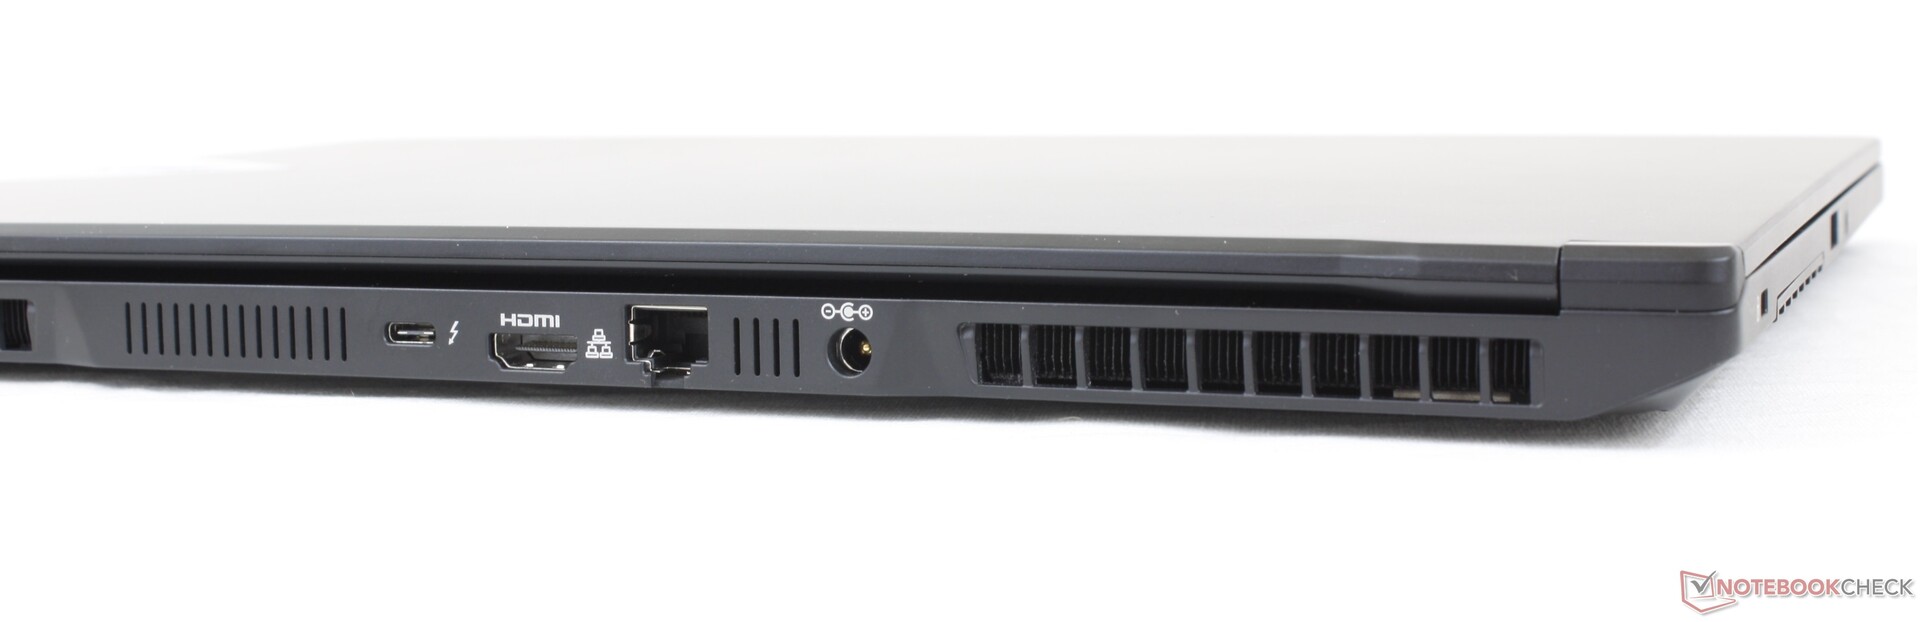
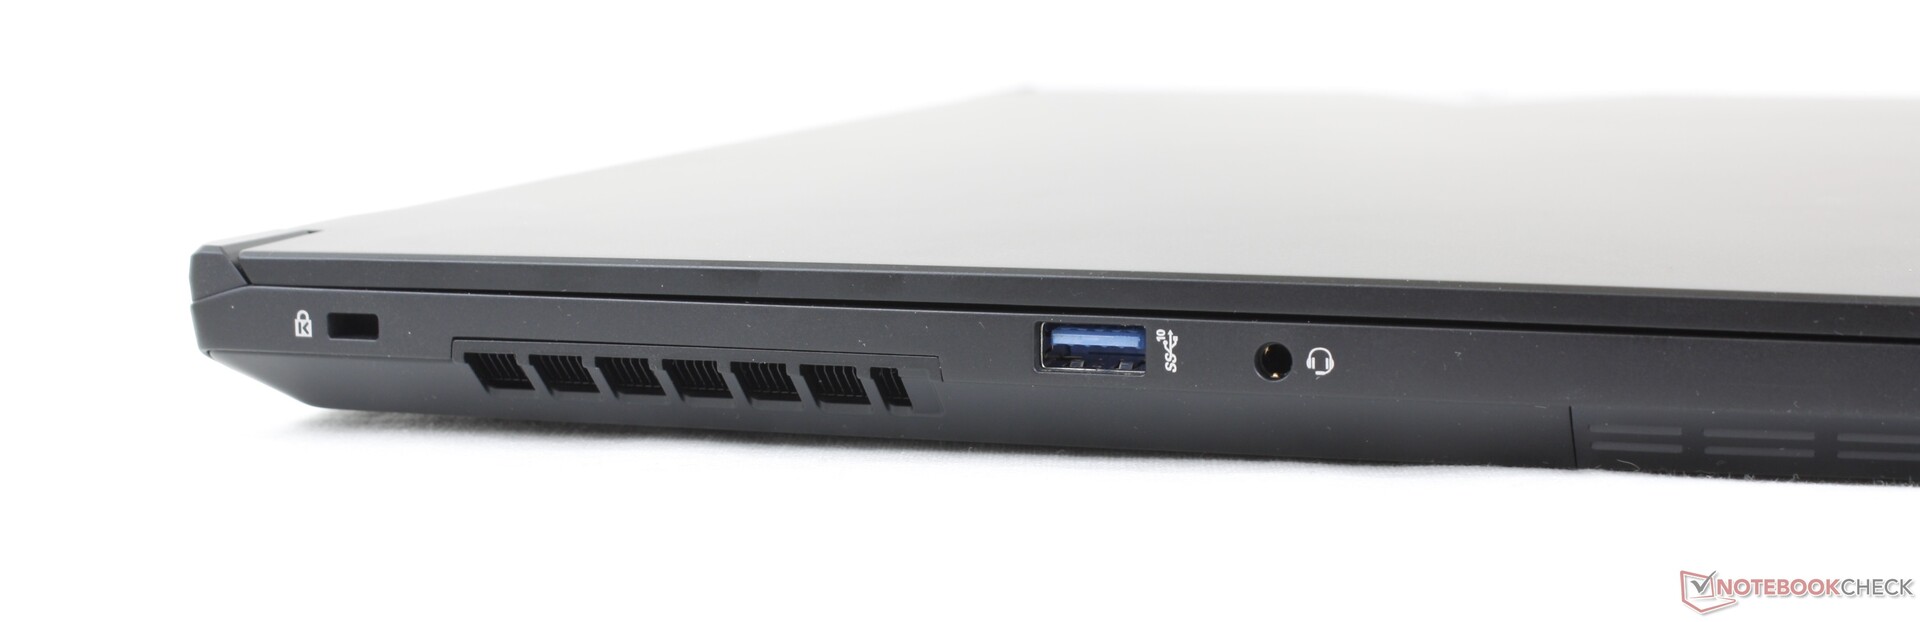
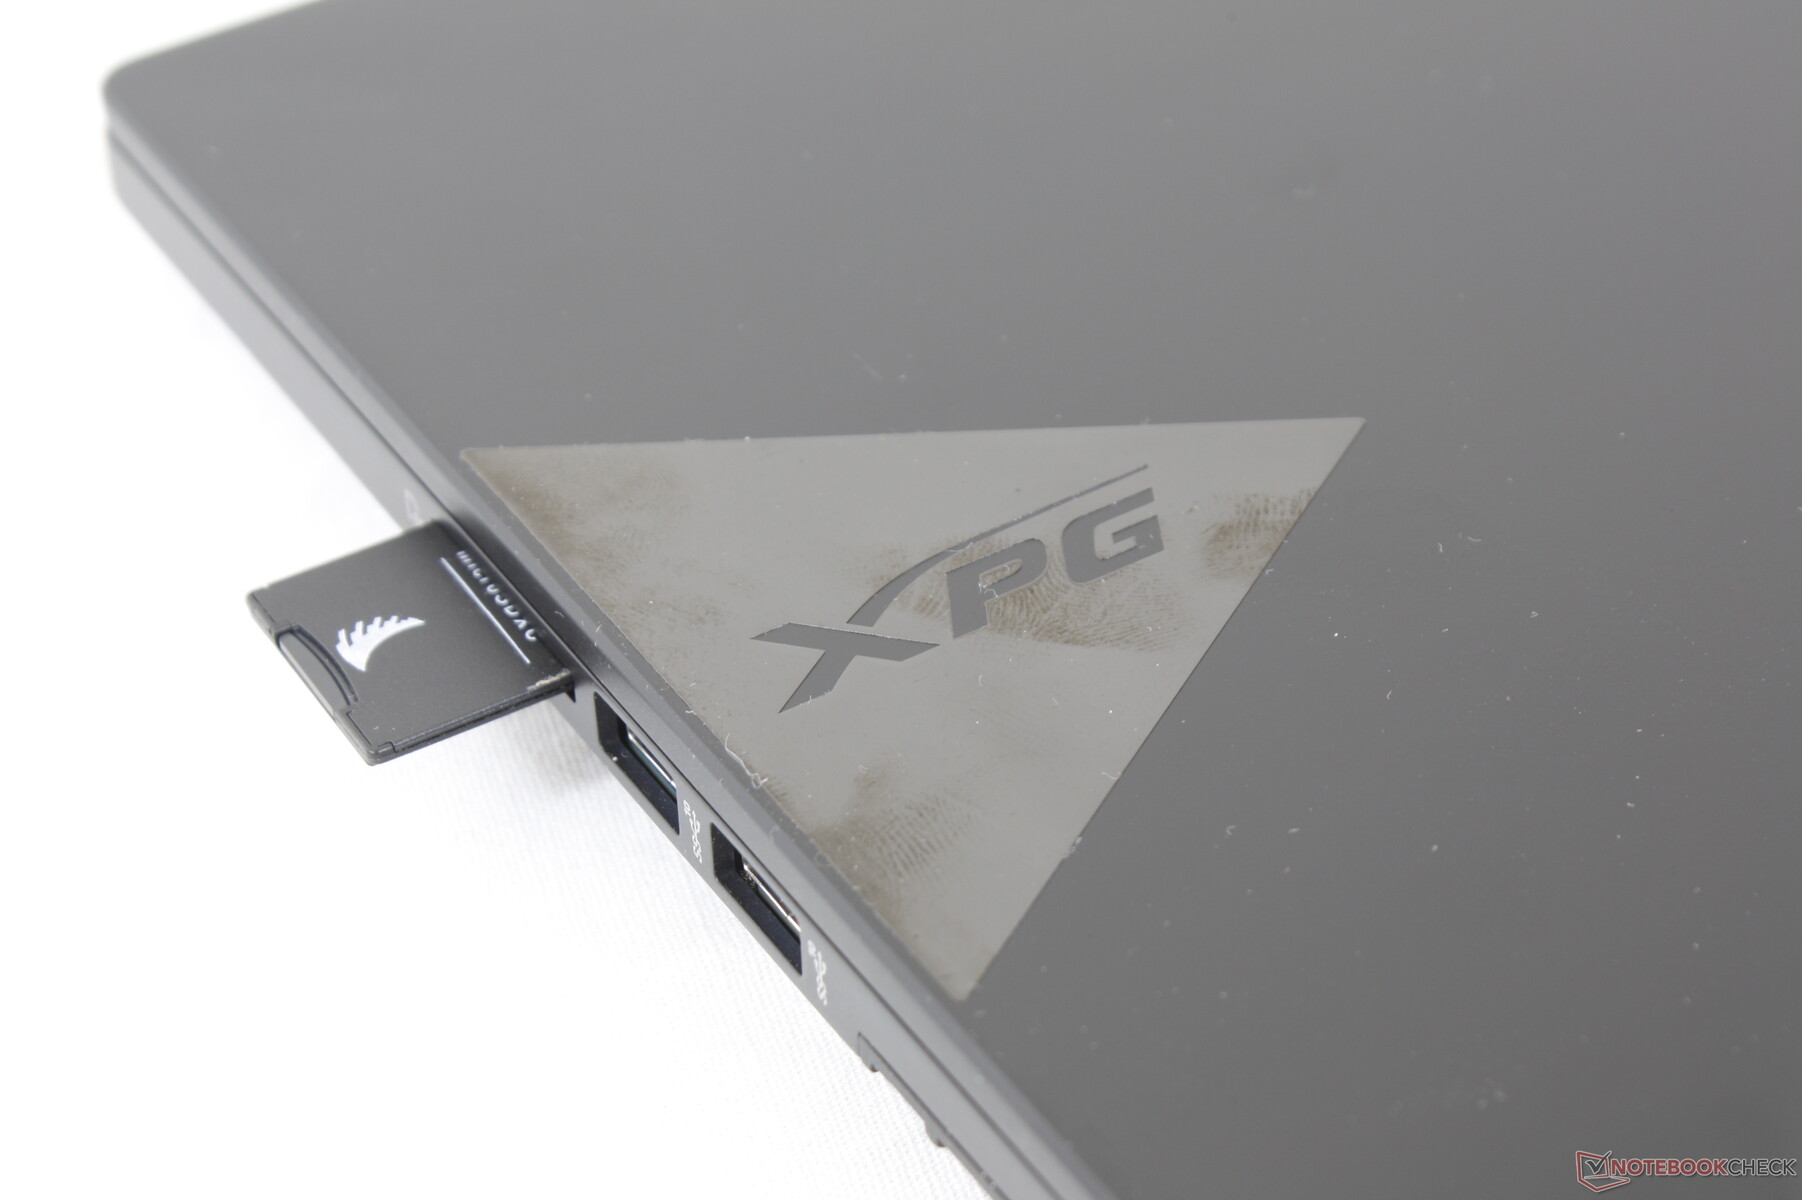
Connectivity — Thunderbolt 4 Support
Port options and positioning are similar to the Schenker XMG Neo 15 but with some minor differences. The dedicated 3.5 mm microphone jack, for example, is now gone while the rear RJ-45 port has no protective flap.
It's worth mentioning that the USB-C port on this machine cannot be used to recharge the laptop unlike on most other gaming laptops these days. We tried two different USB-C AC adapters which would work on the MSI GS66, Razer Blade 15, and Alienware x15 but they would not work on our ADATA.
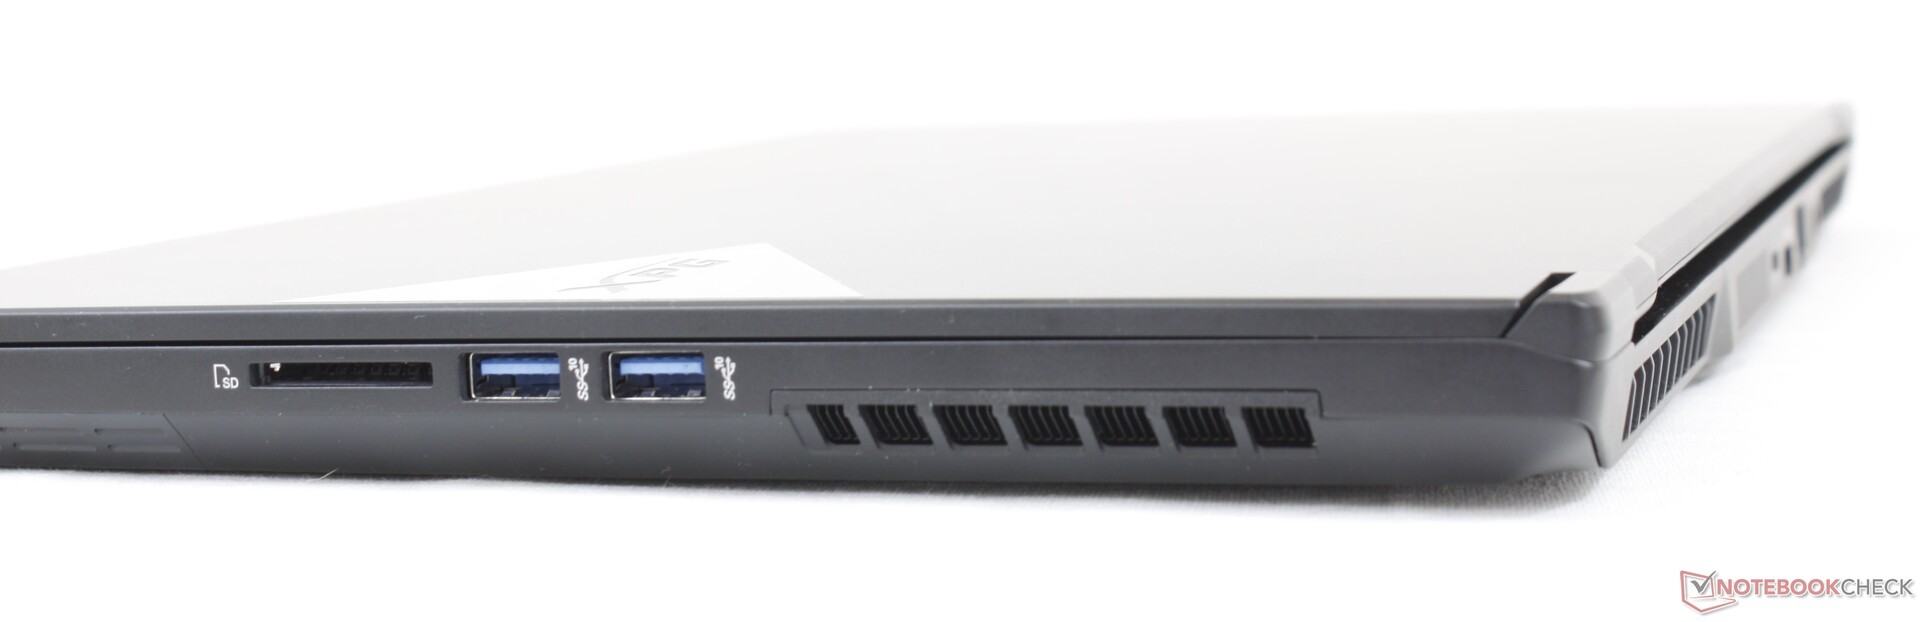
SD Card Reader
Transfer rates are average at less than half the speed of the card reader on the Alienware x15. Nonetheless, we appreciate that the system integrates a card reader in the first place which is more than what we can say for the Razer Blade 15 or MSI GS66.
| SD Card Reader | |
| average JPG Copy Test (av. of 3 runs) | |
| Alienware x15 RTX 3070 P111F (AV Pro V60) | |
| ADATA XPG Xenia 15 (AV Pro V60) | |
| maximum AS SSD Seq Read Test (1GB) | |
| Alienware x15 RTX 3070 P111F (AV Pro V60) | |
| ADATA XPG Xenia 15 (AV Pro V60) | |
Communication
Performance could have been more stable when paired to our Netgear RAX200 test router. Transfer rates would occasionally dip to the low 300 to 500 Mbps range even after multiple retests when it should be consistently over 1 Gbps.
Webcam
The 720p webcam is of poor quality which is not uncommon on most laptops. The Razer Blade 17 continues to be one of the few gaming laptops with a 1080p webcam. There isn't even a privacy shutter here, but at least an IR camera is present for Windows Hello support.


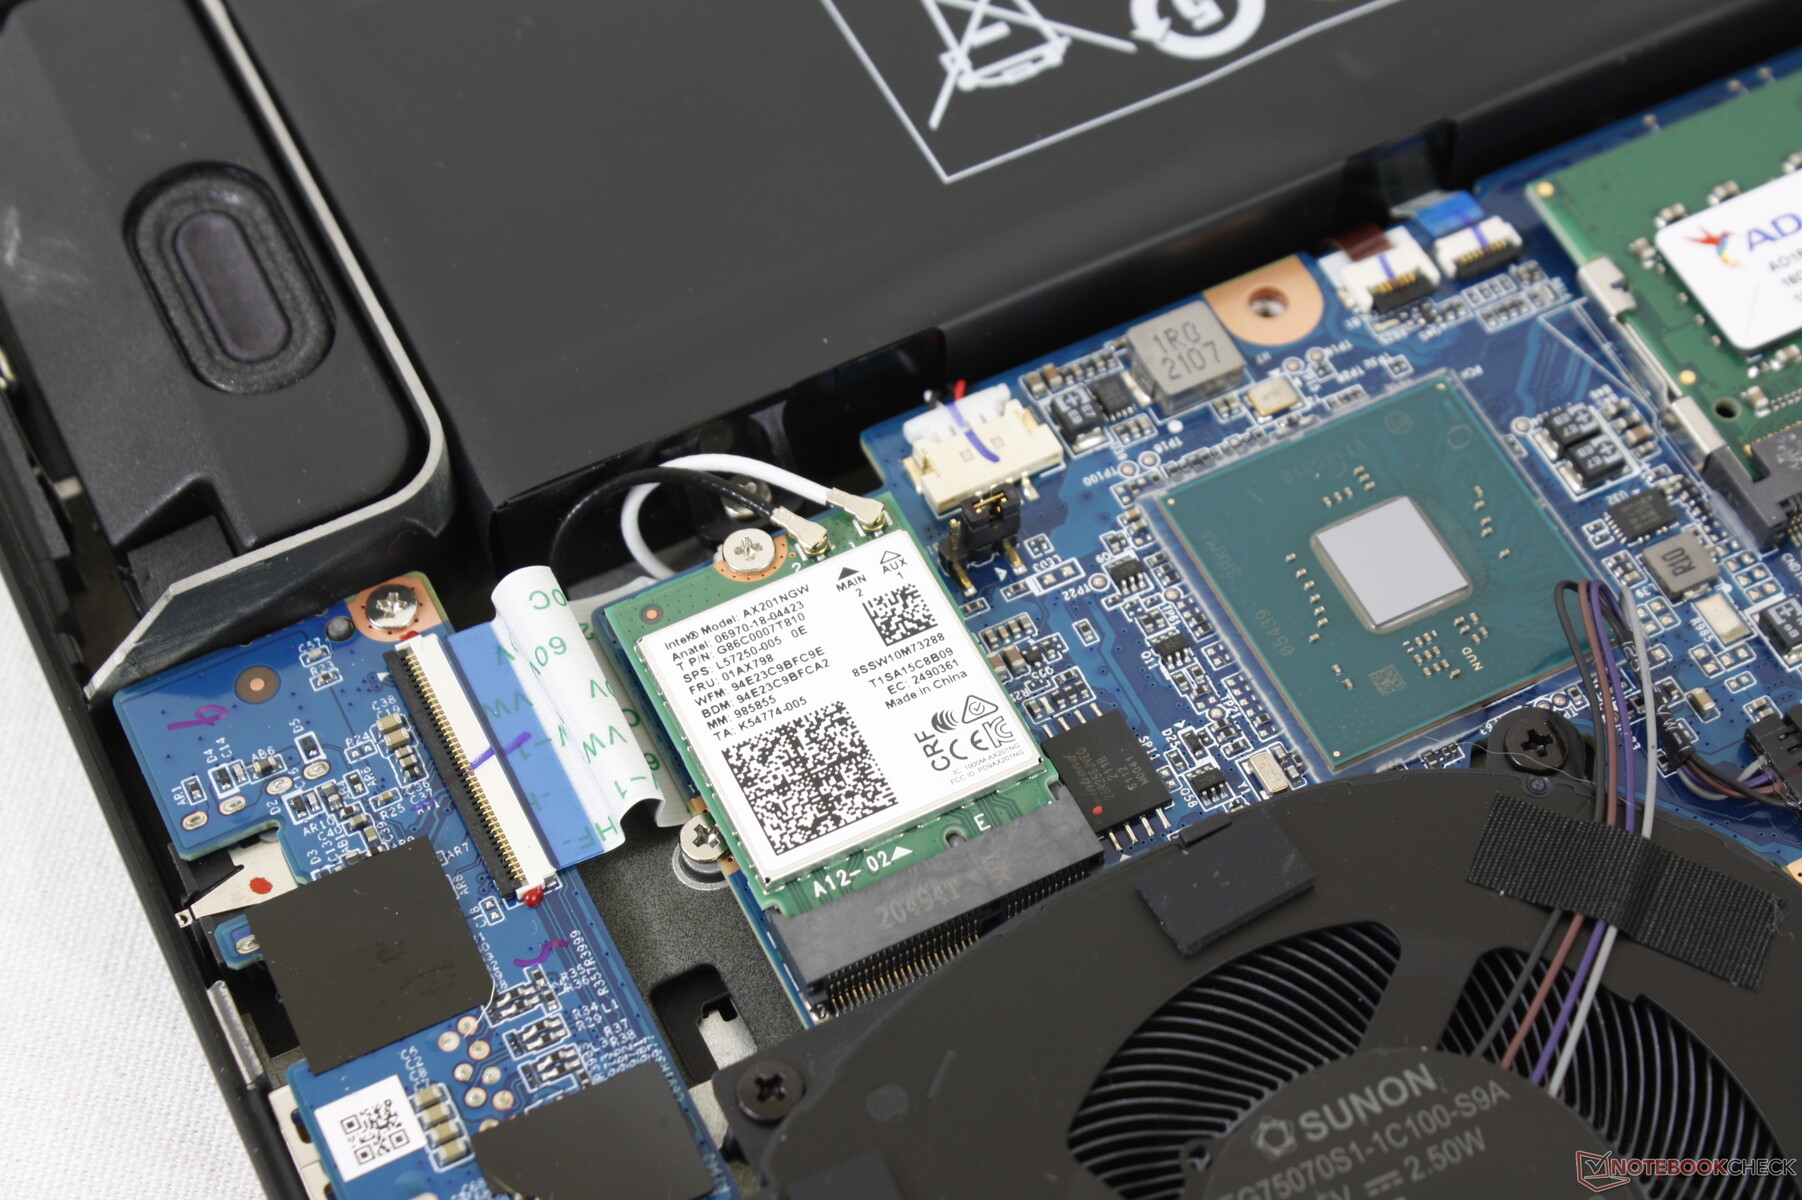
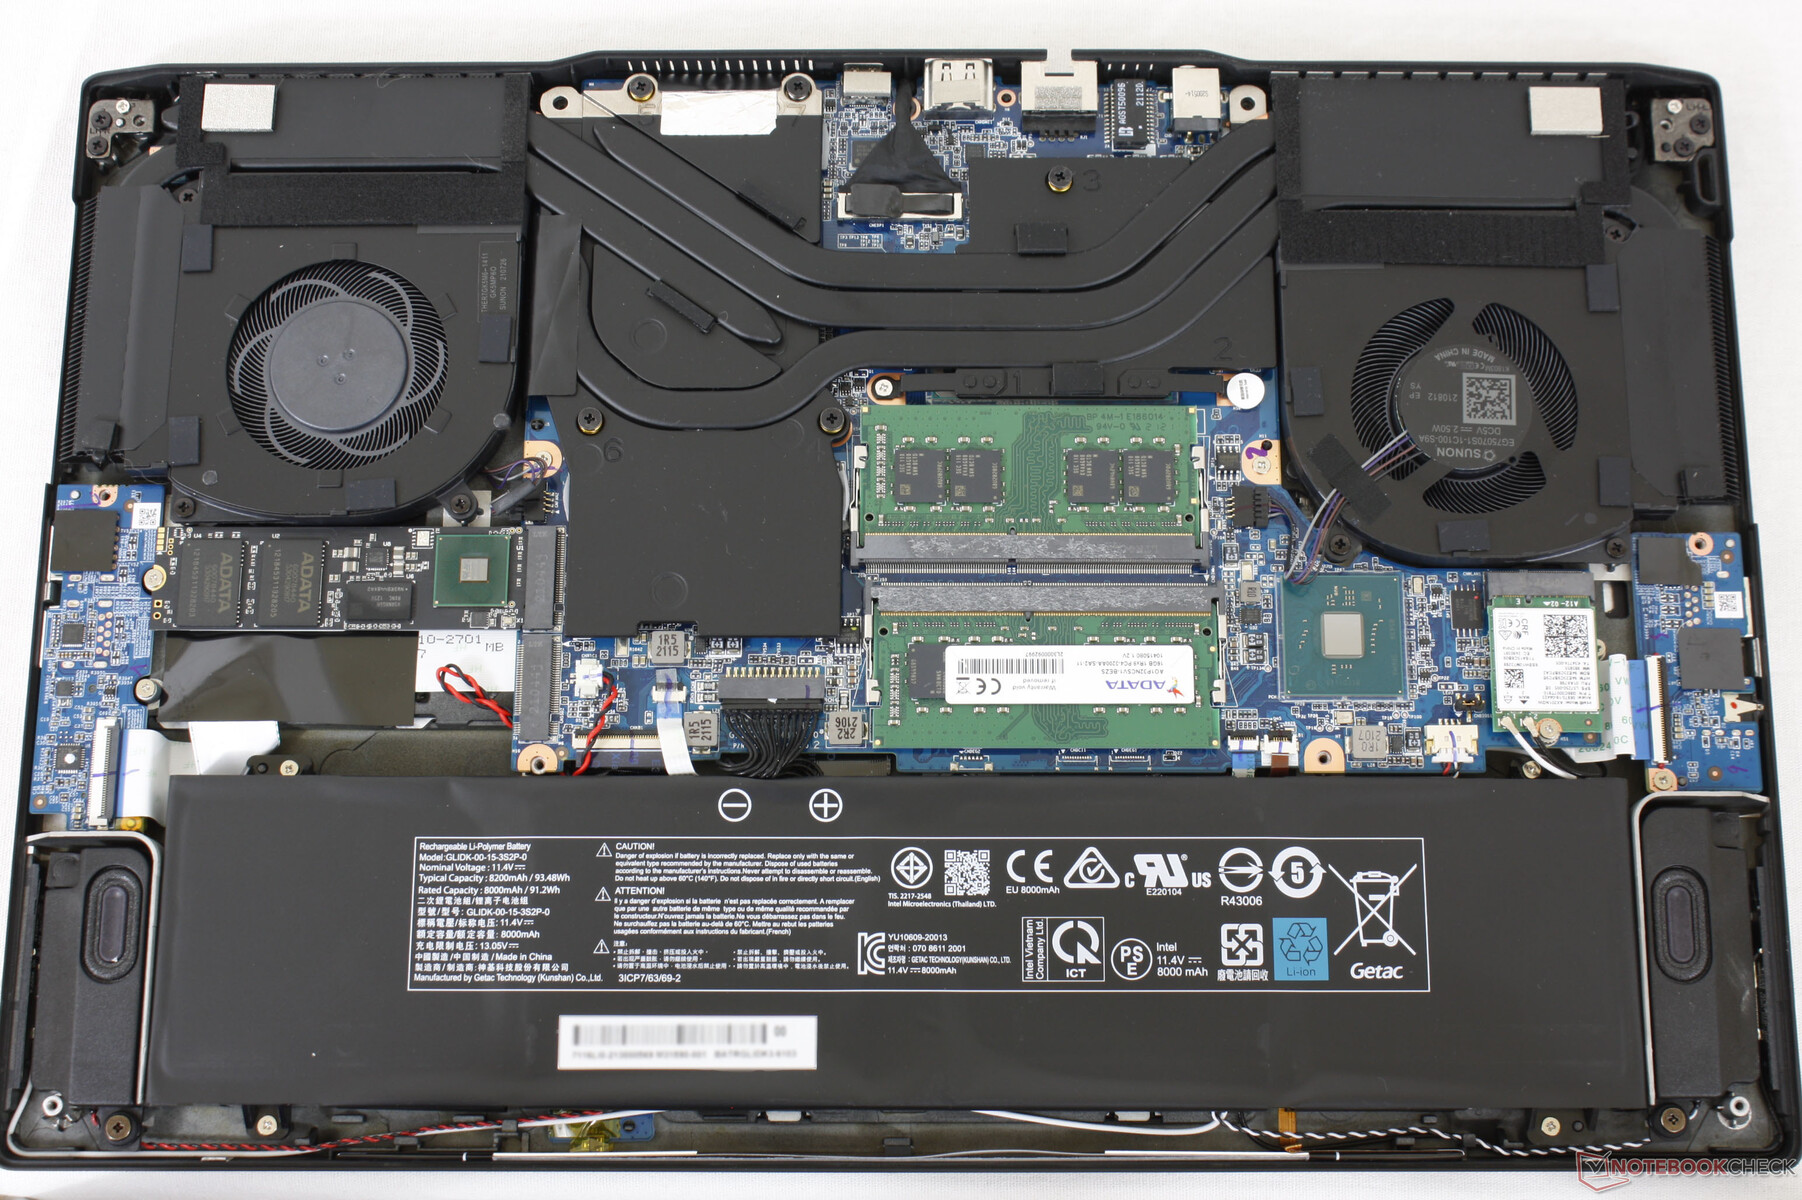
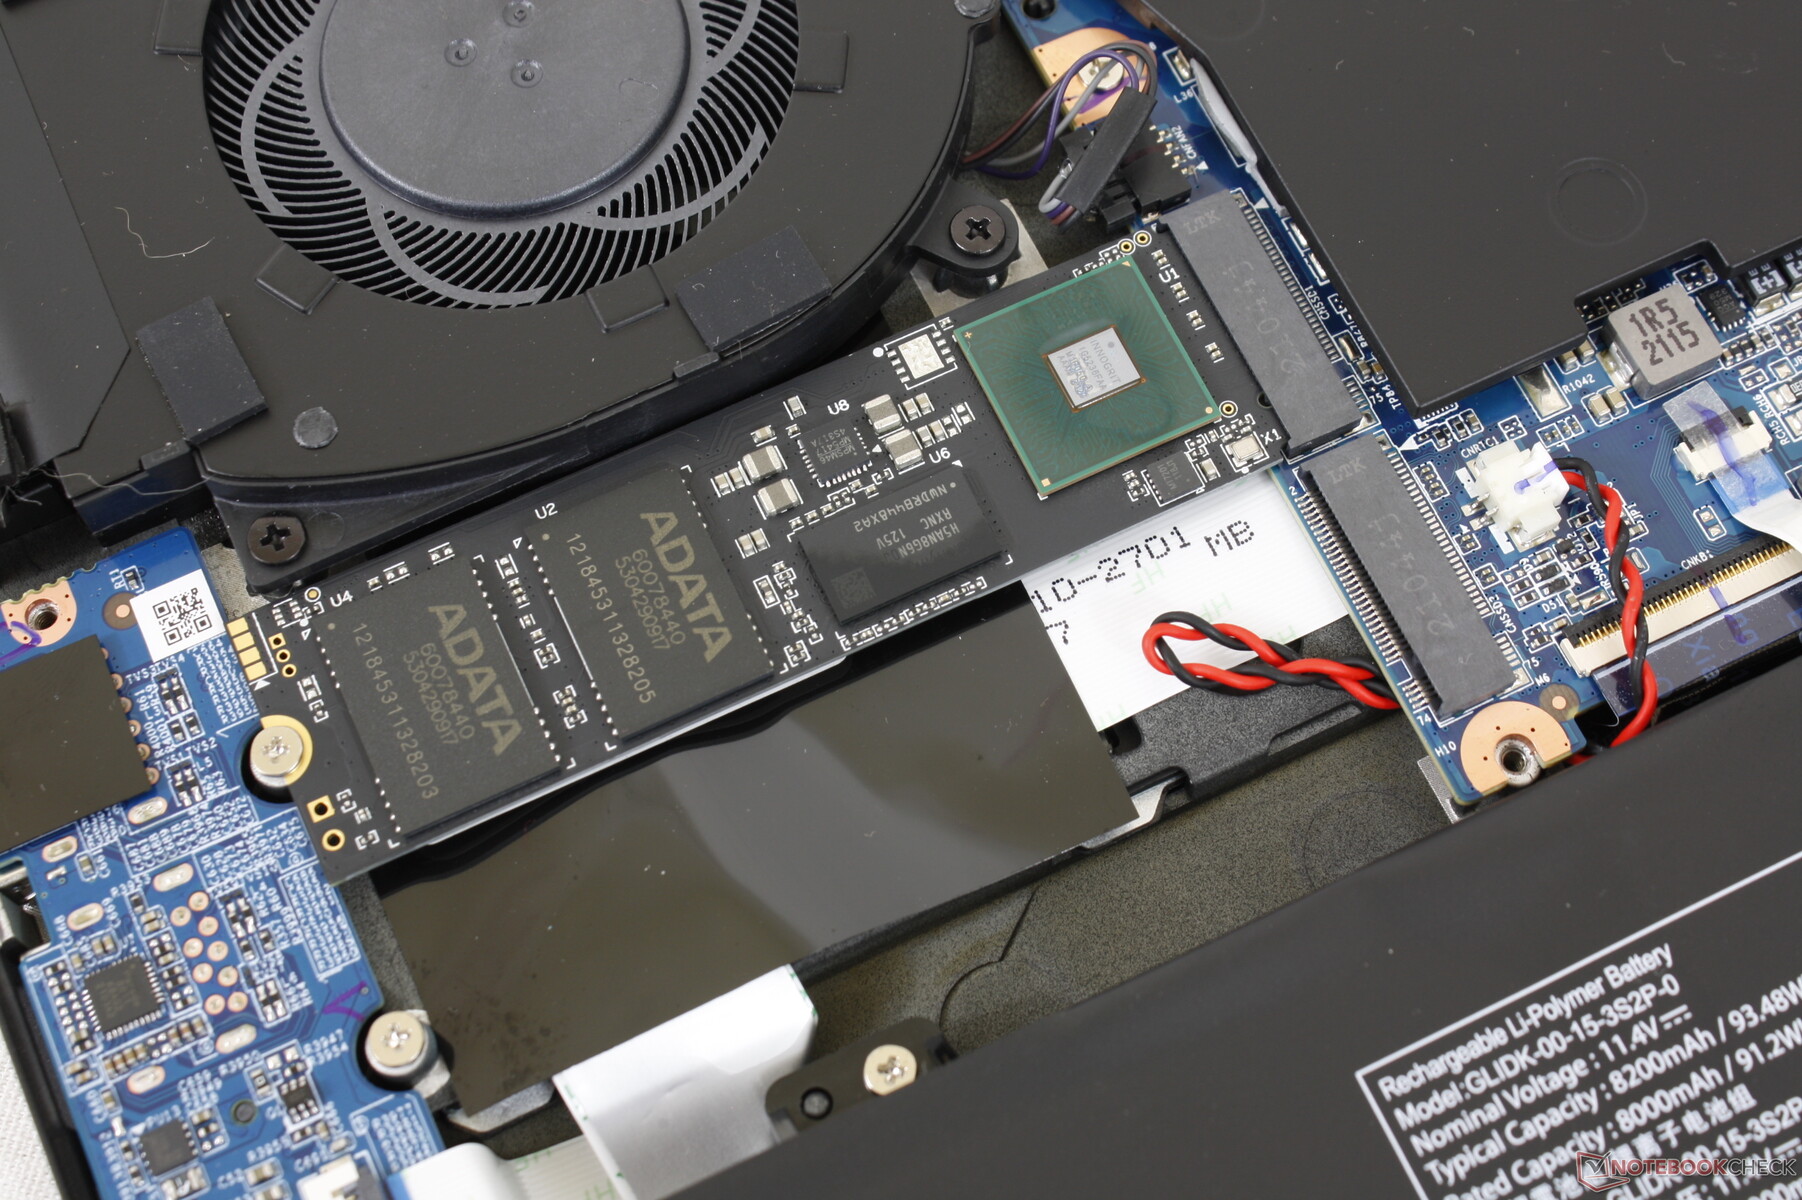
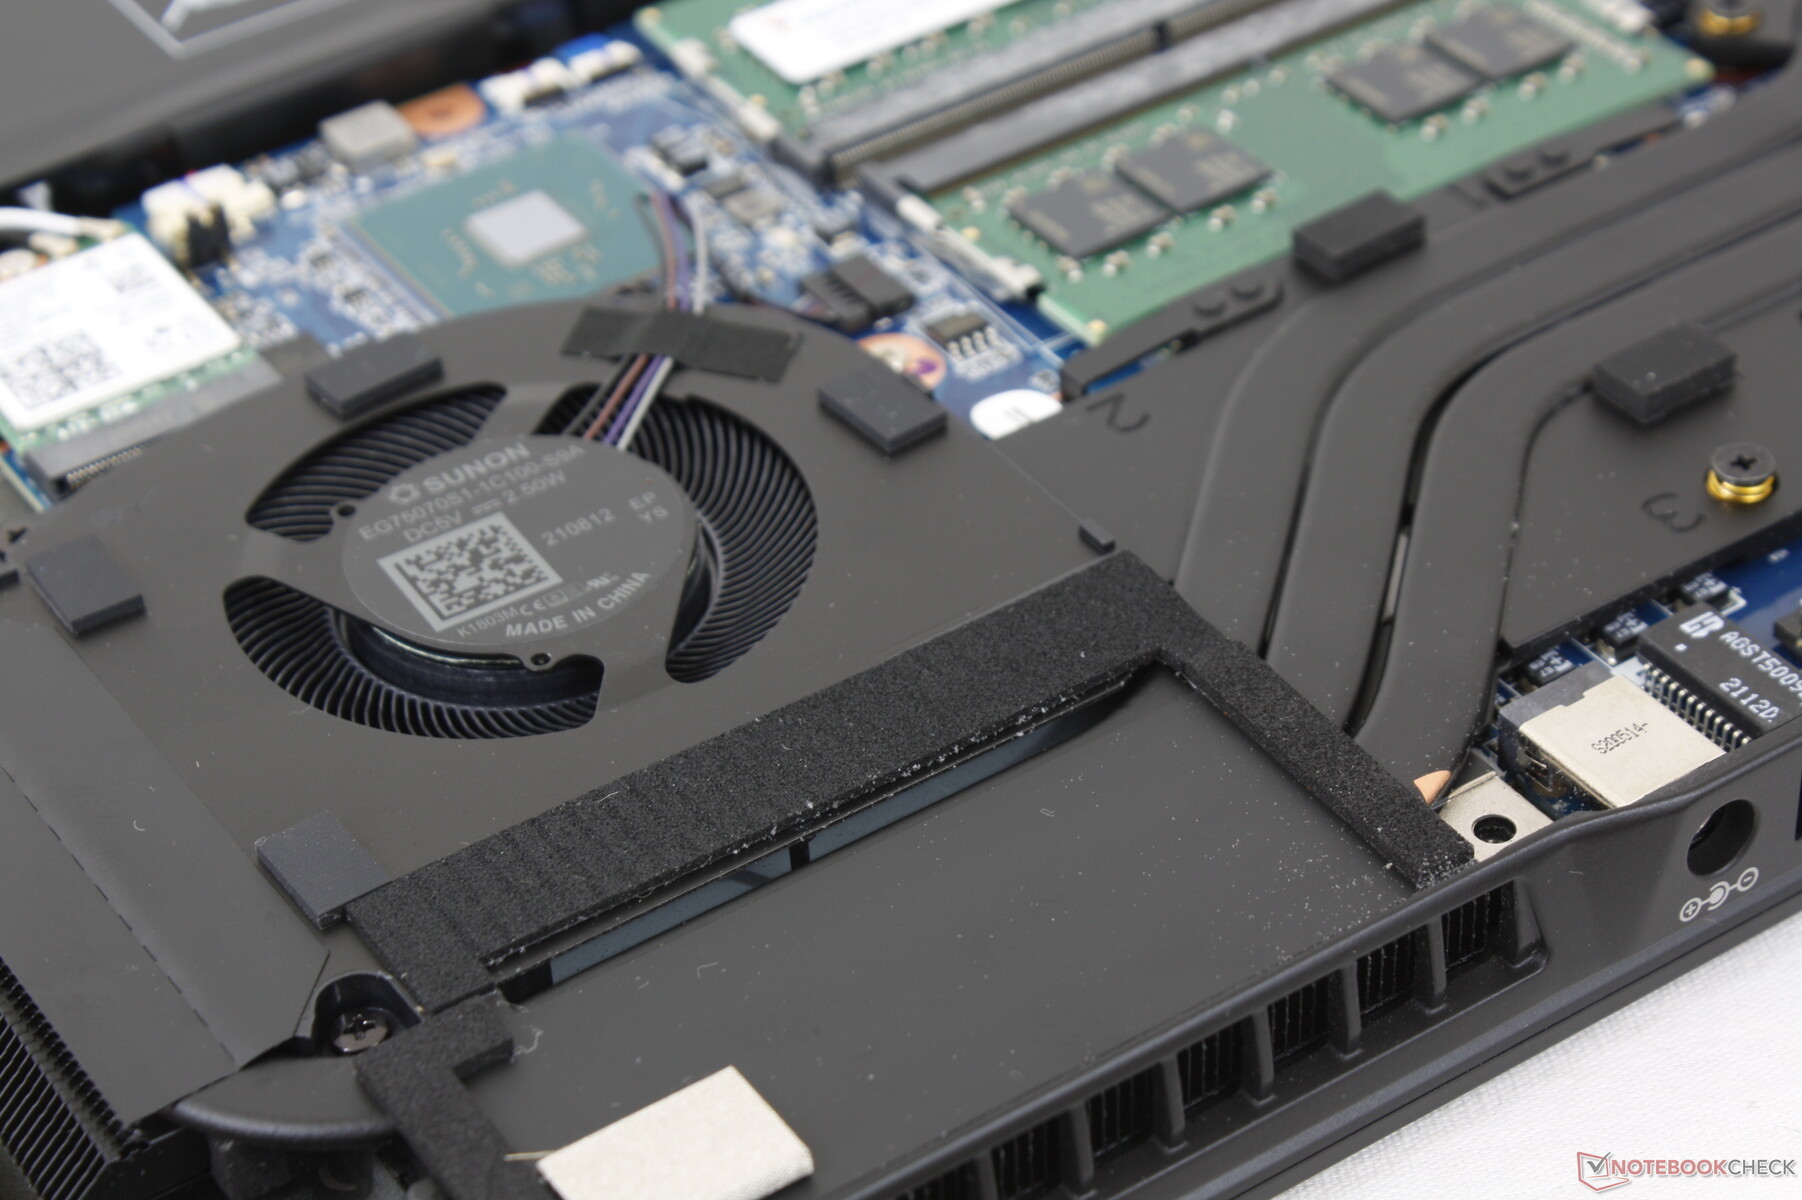
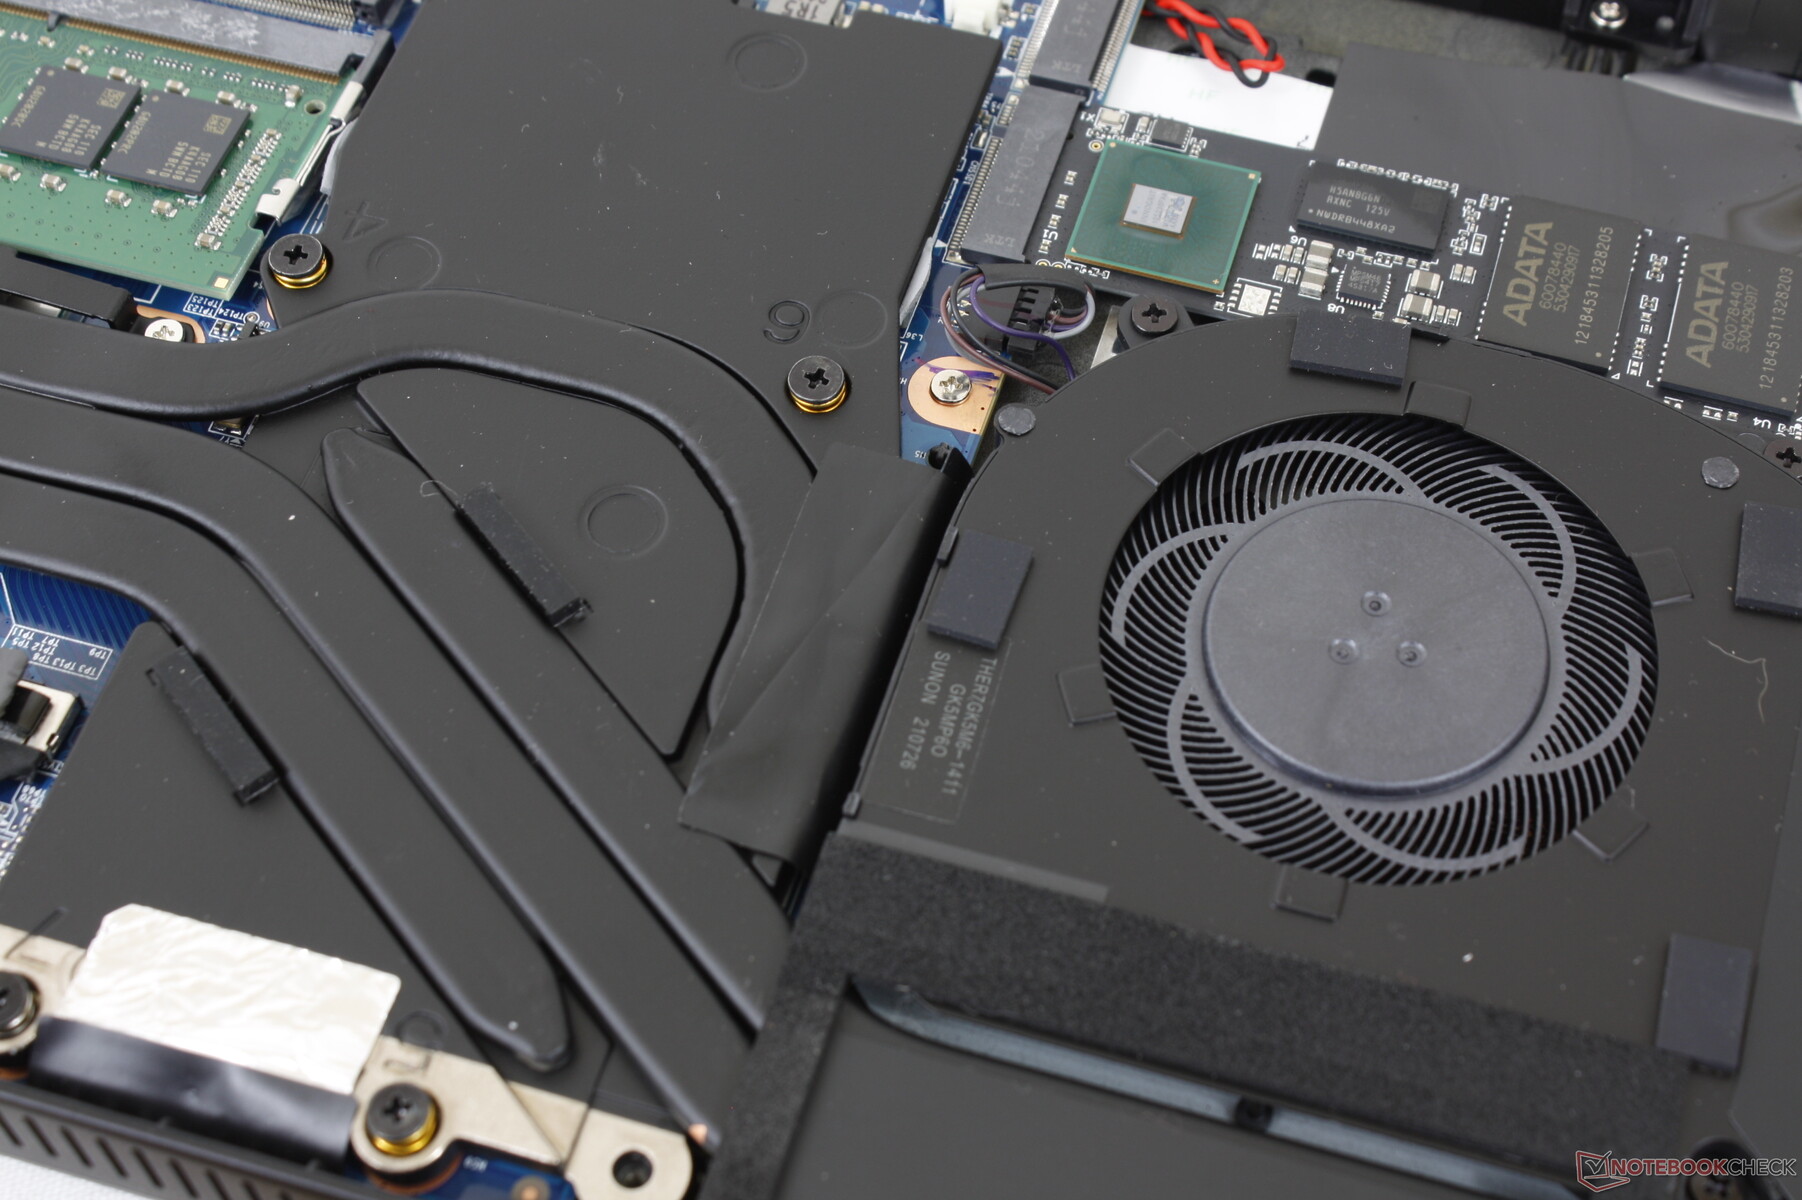
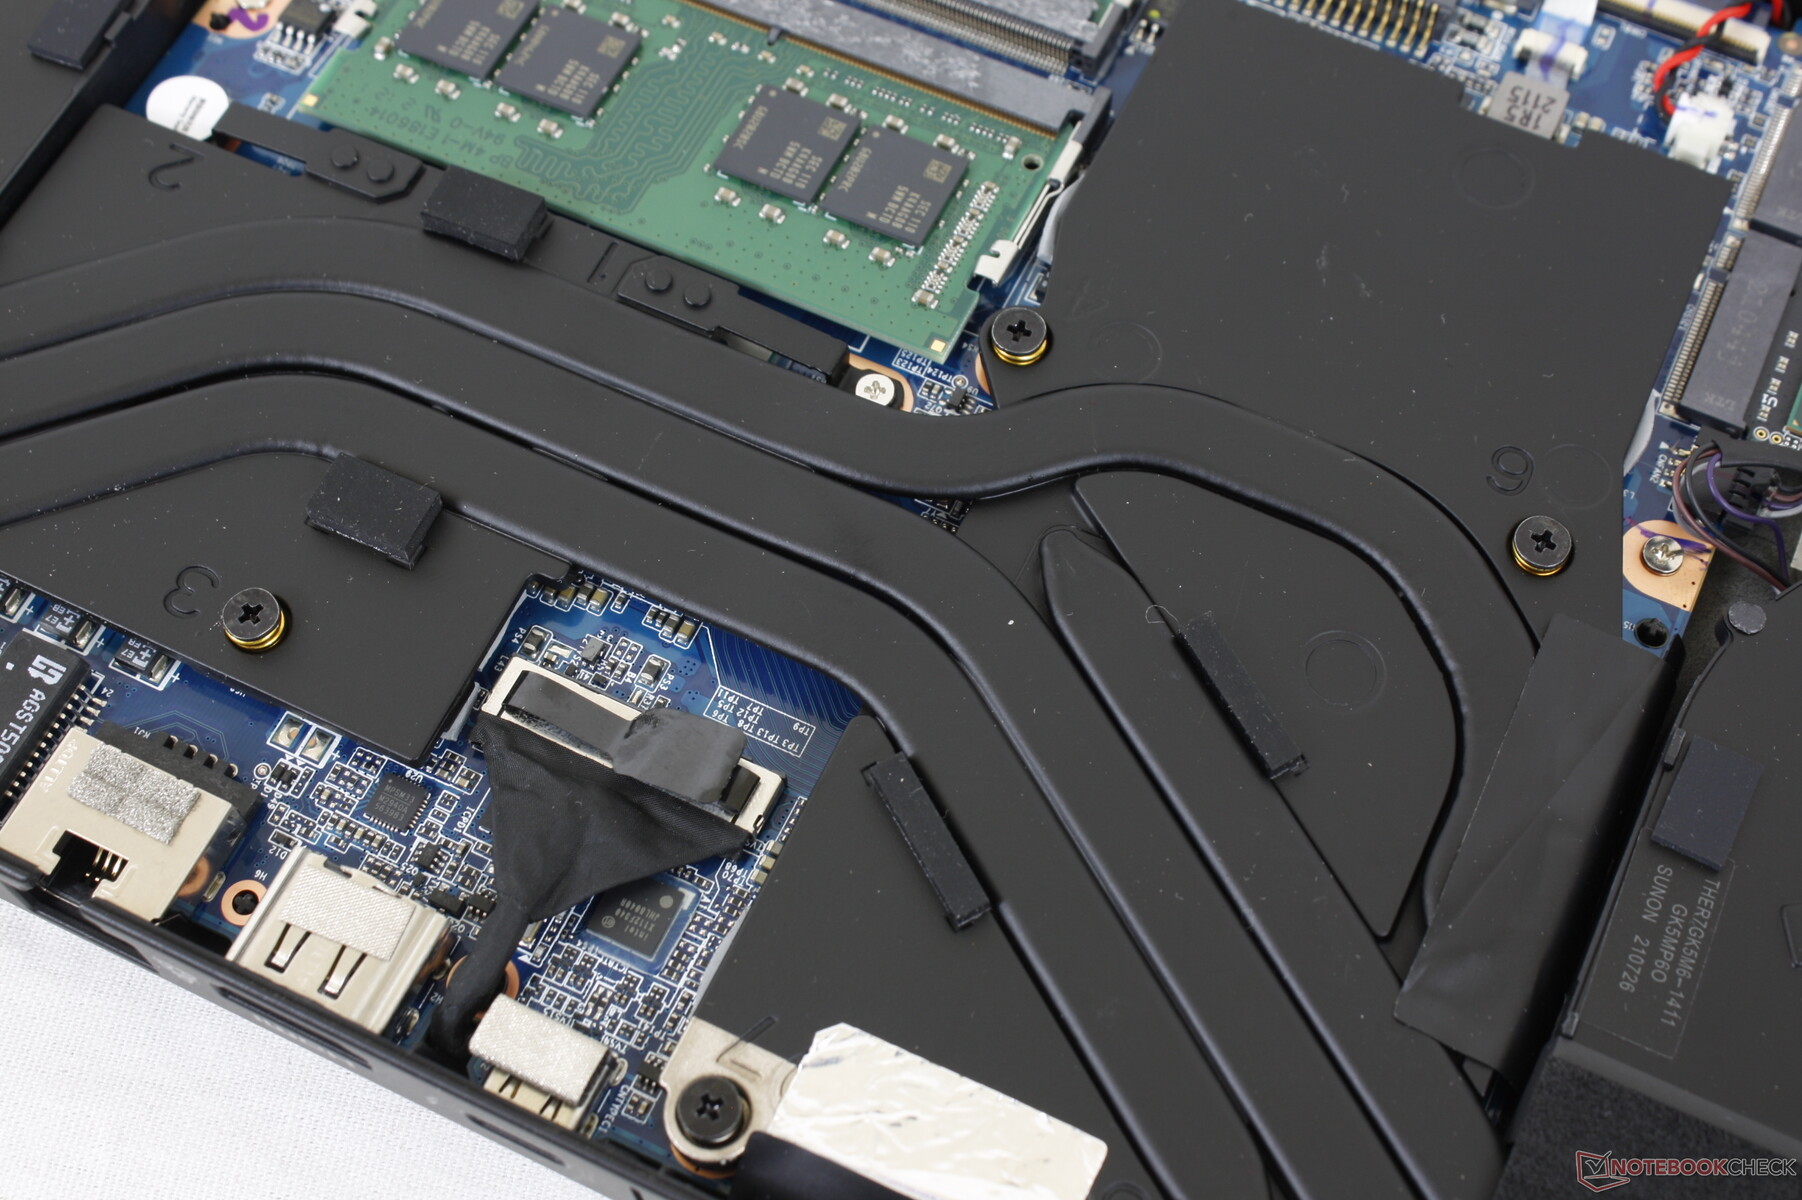
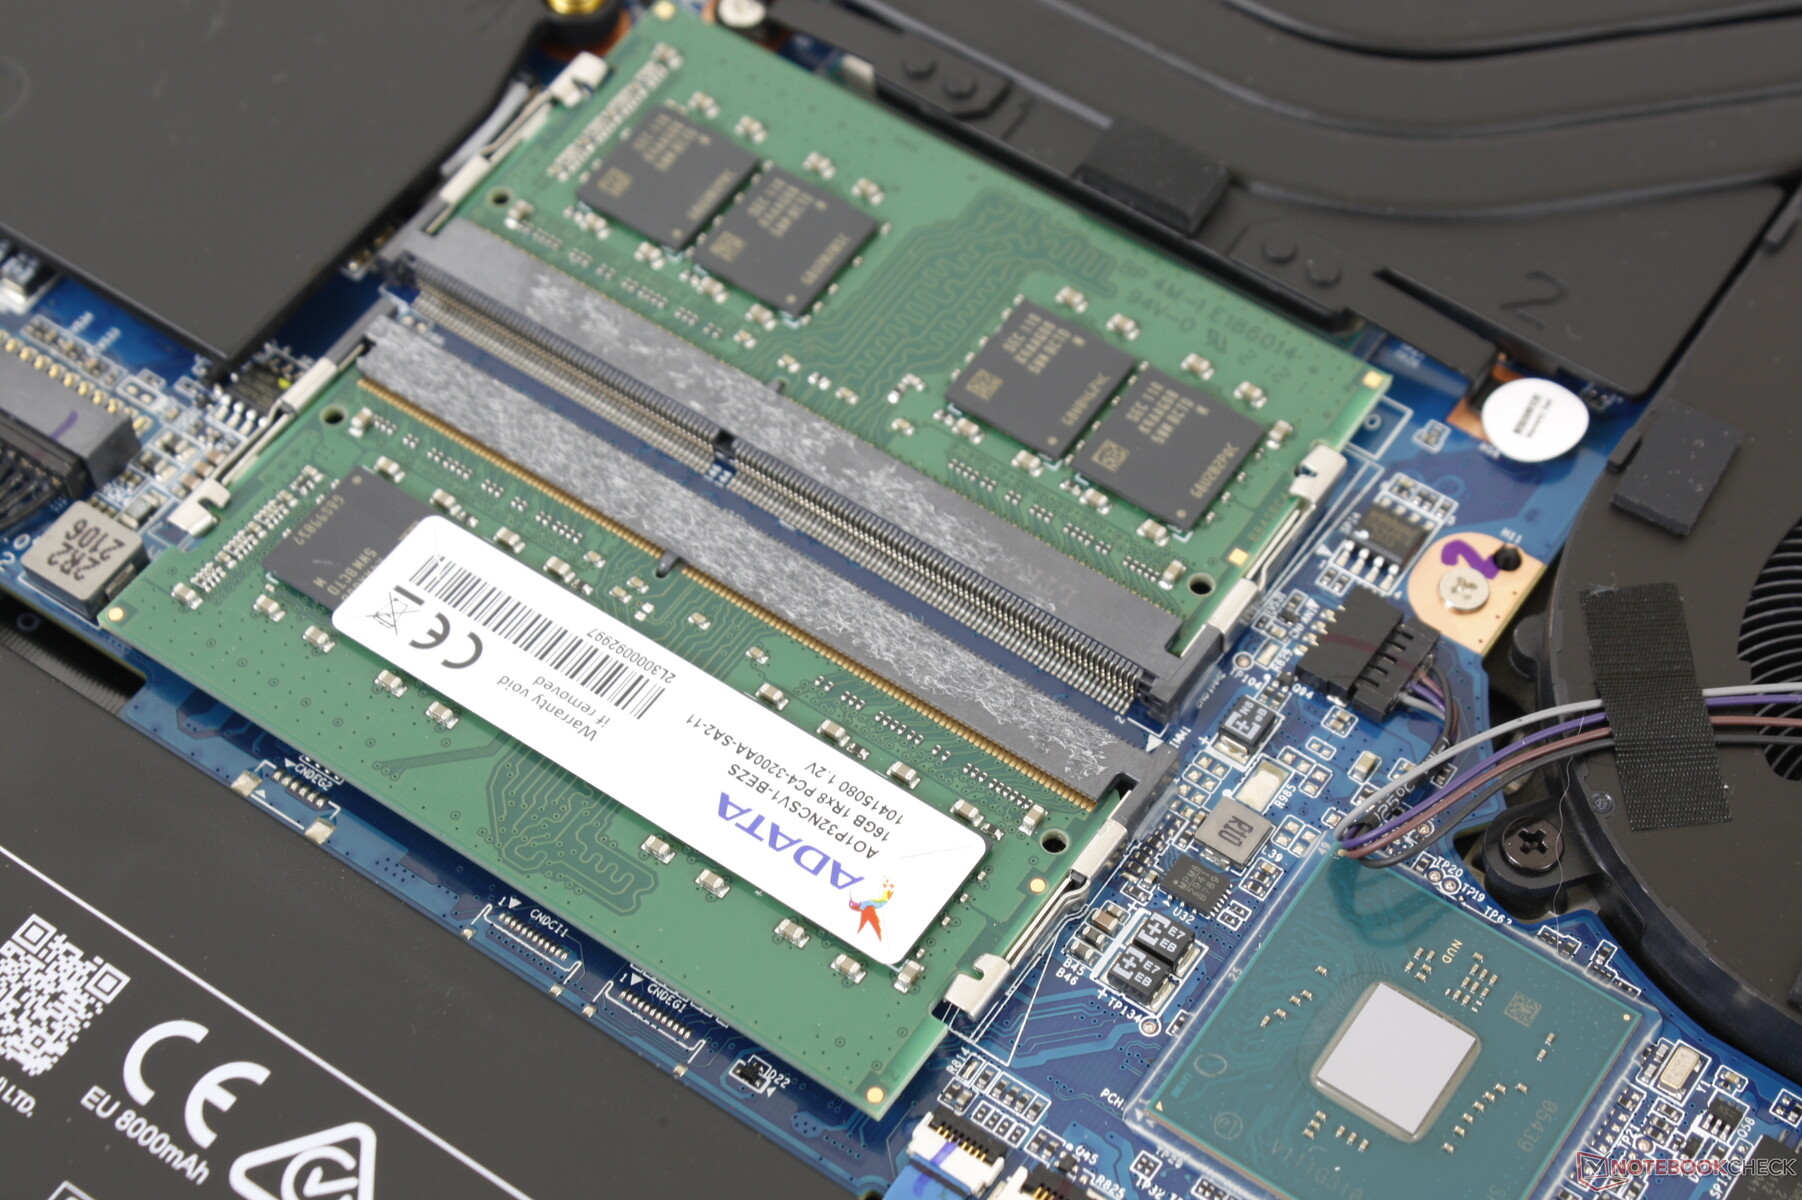
Maintenance — Easy Servicing
The bottom panel requires a standard Philips screwdriver to remove as opposed to a Torx wrench on the Razer Blade series. Owners have direct access to two M.2 storage slots, two SODIMM slots, battery, and the WLAN module.
Accessories and Warranty
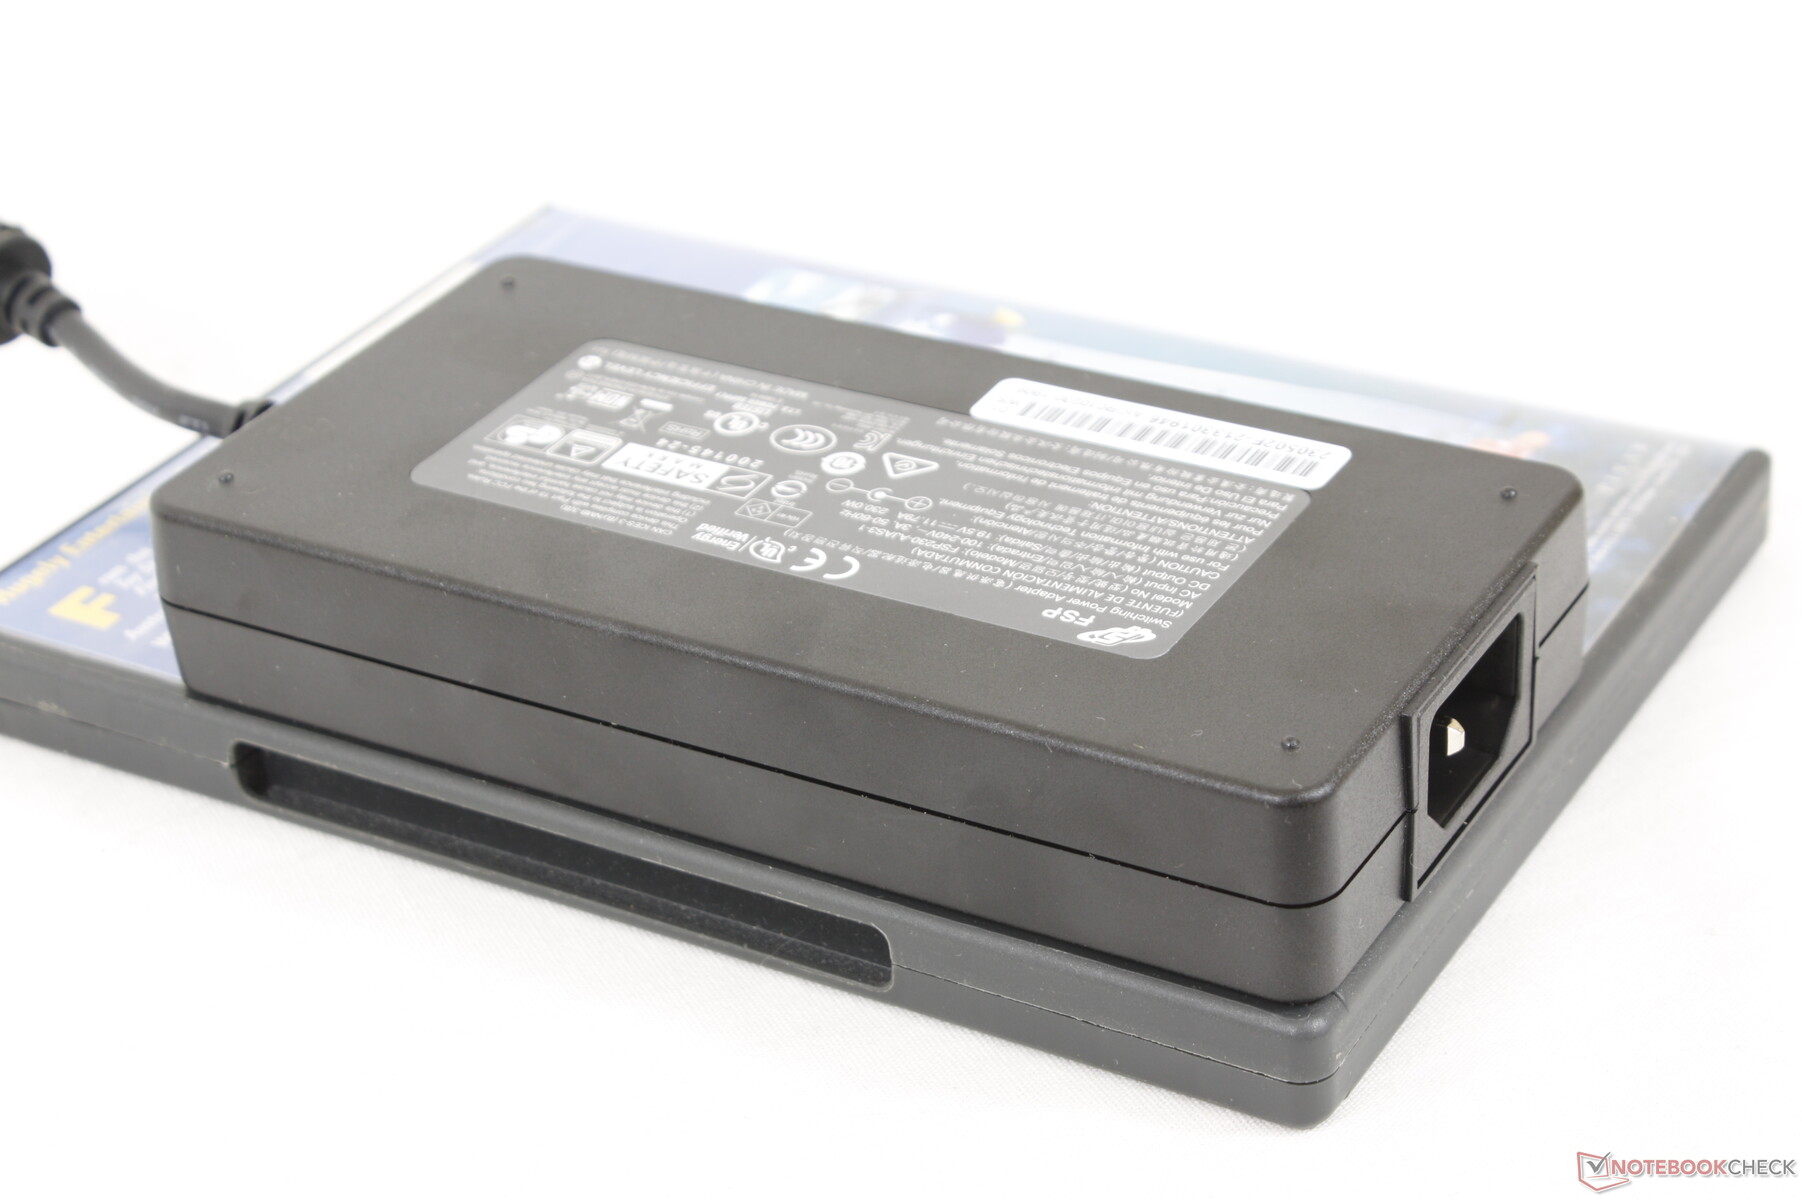
The retail box includes the usual manual and AC adapter with no extras. A standard one-year limited manufacturer warranty applies.
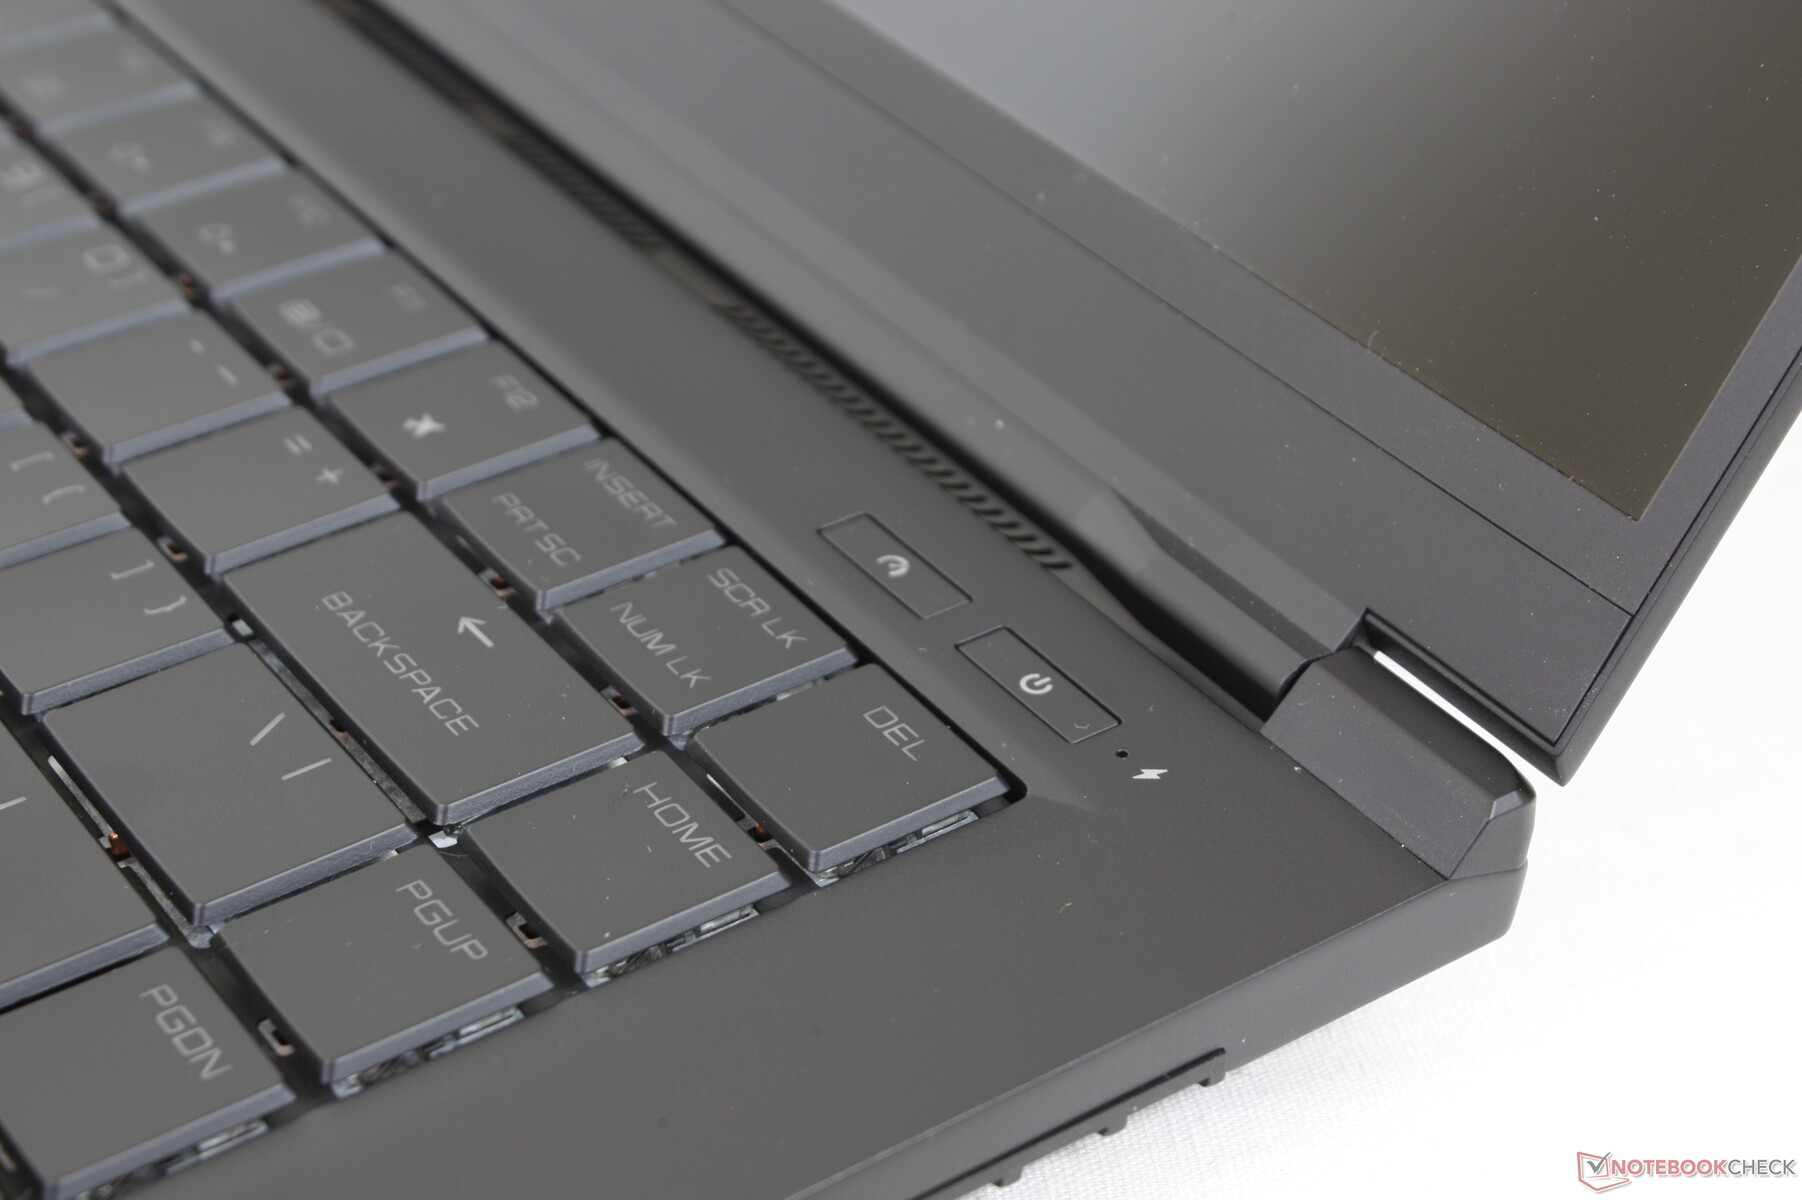
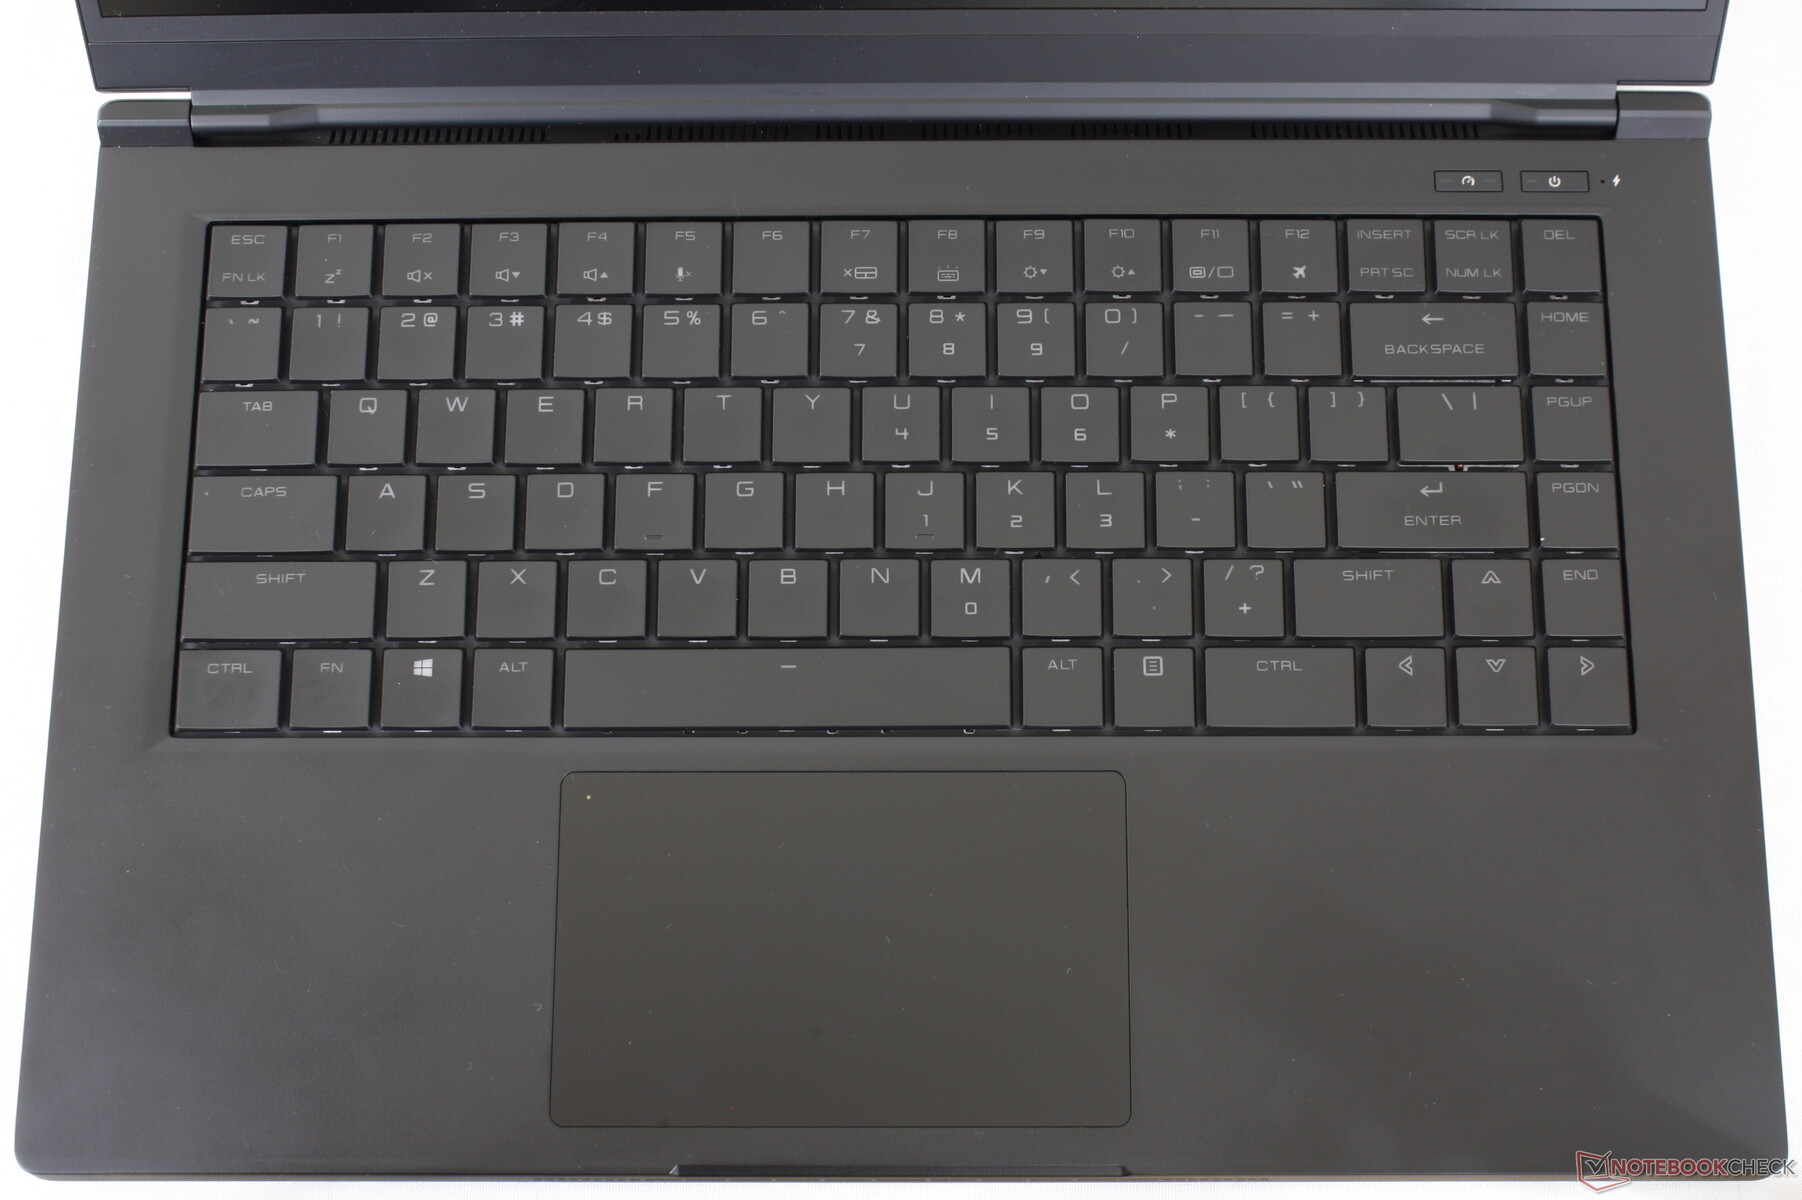
Input Devices — Optical Mechanical Keys
Keyboard
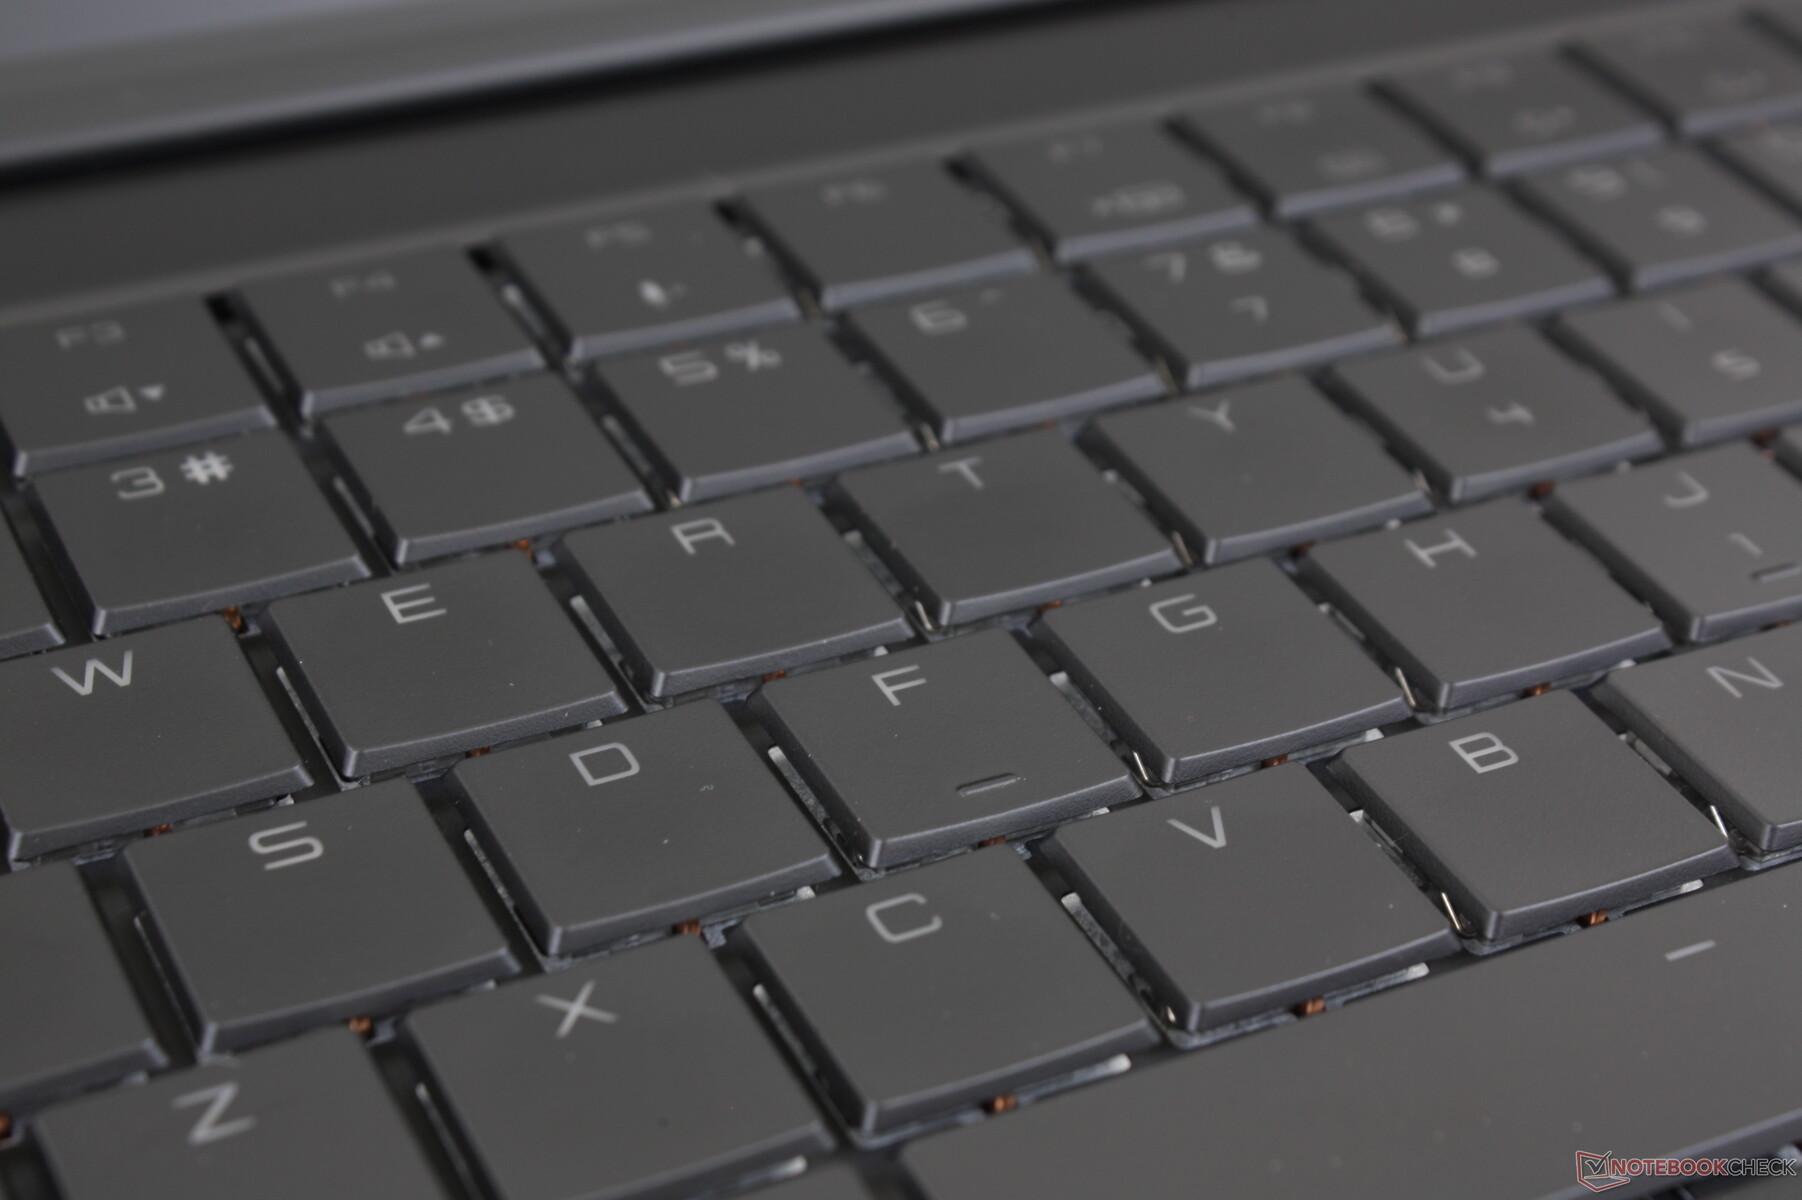
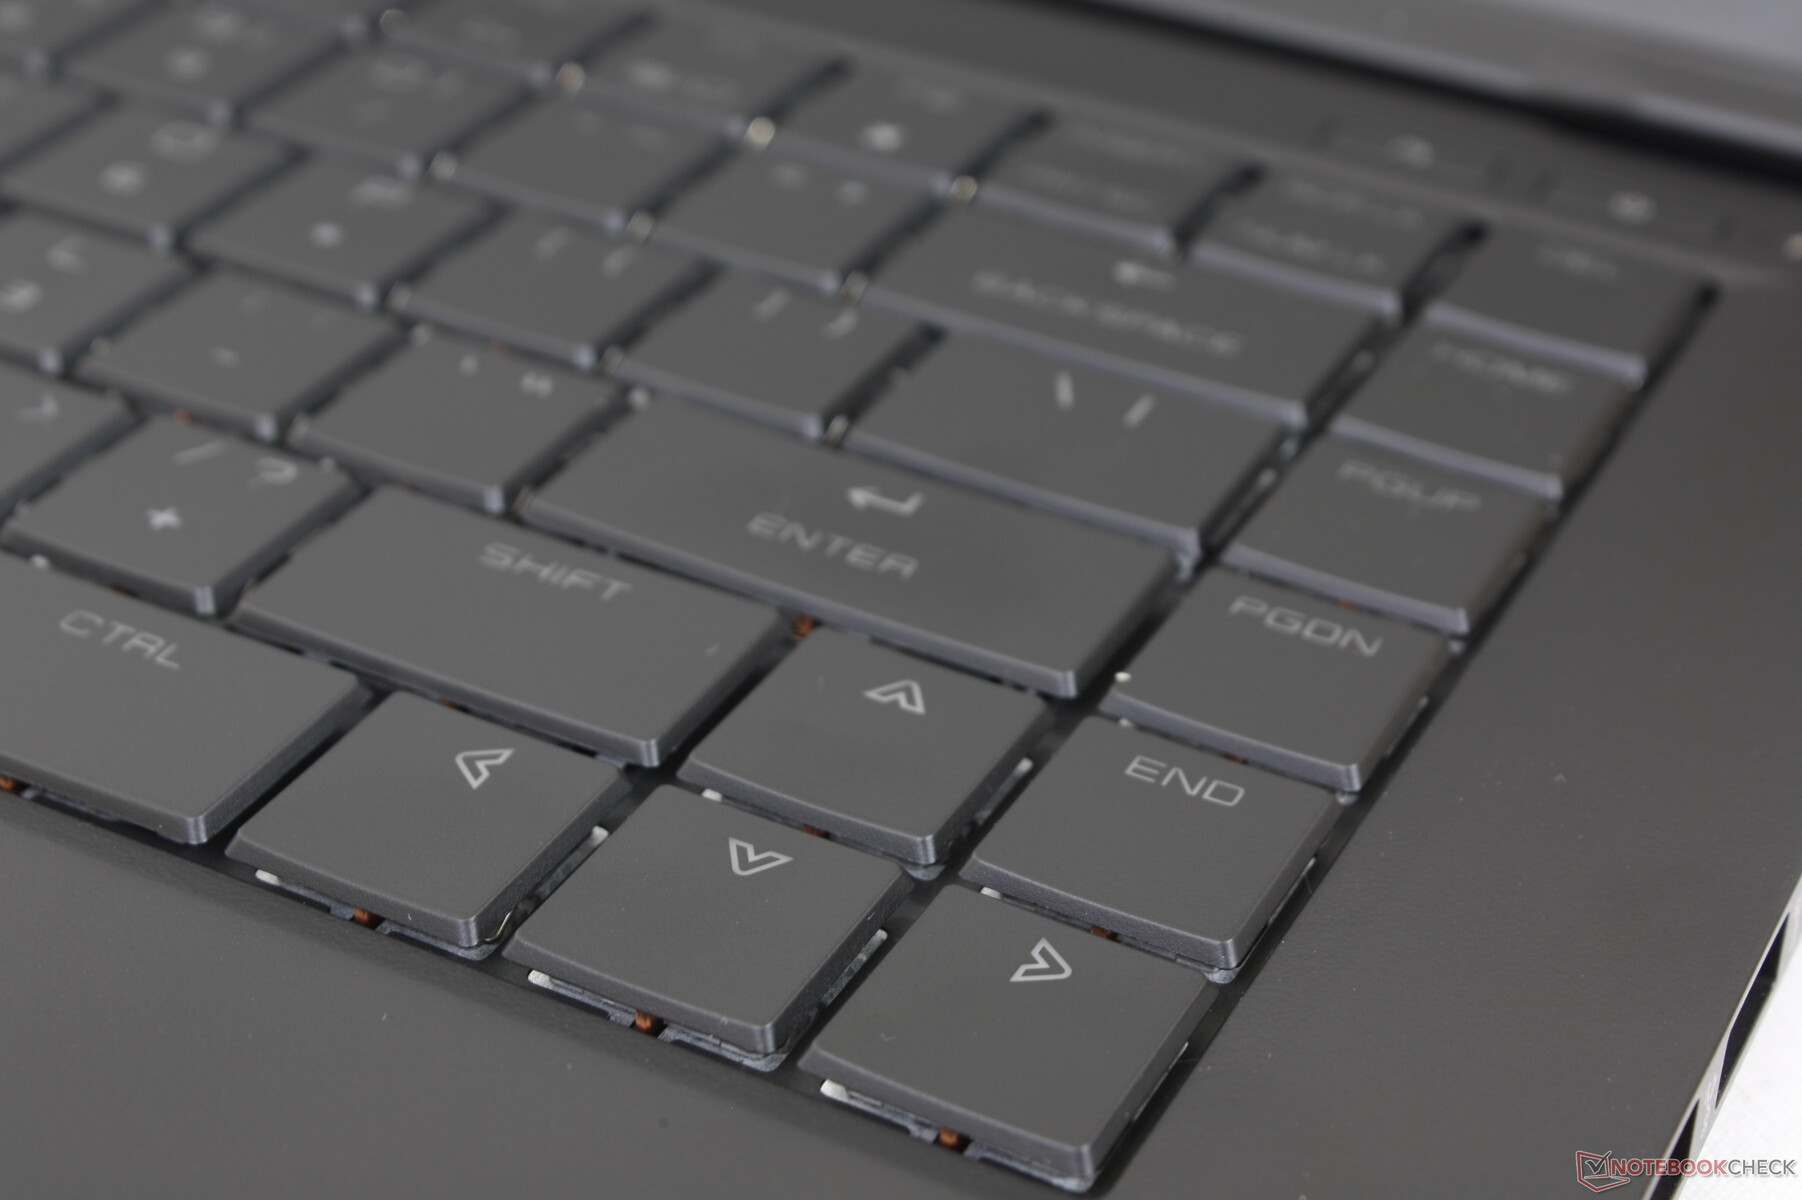
ADATA describes its optical mechanical keyboard as "silent" and with feedback most similar to Cherry Brown switches. In reality, these keys are still much louder than traditional Ultrabook keys especially when pressing Space or Enter. We find feedback to be sharper than the keys on the Razer Blade 15 or MSI GS66 but softer than the mechanical keys on the new Alienware x15.
One particular point of criticism we have about the keyboard is that the dark gray font on each key contrasts poorly with the black key caps. Thus, it is difficult to see the printing on each key even when in a brightly lit room. Enabling the backlight alleviates this issue, but users shouldn't be forced to turn on the backlight just to be able to see the keys especially if battery life is a concern.
All primary and secondary key symbols are backlit unlike on the Alienware x15.
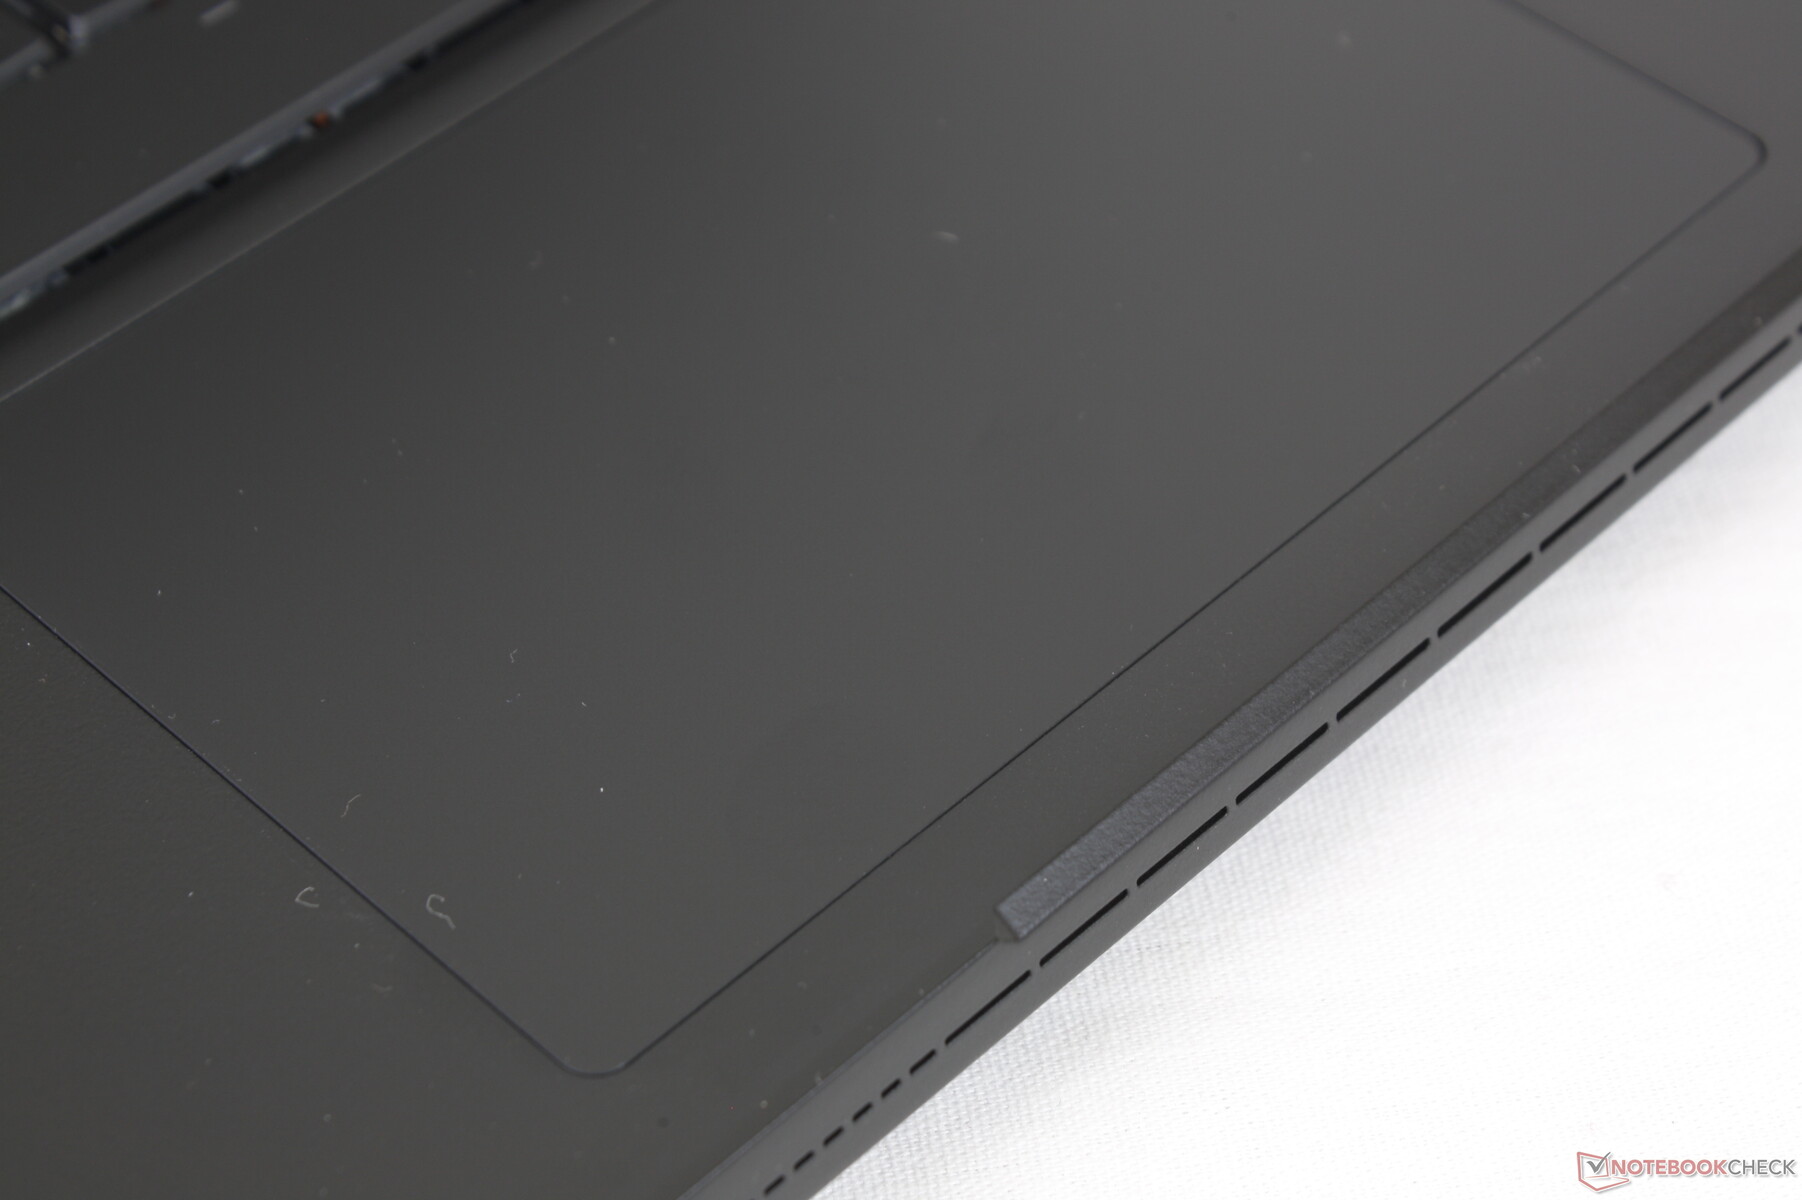
Touchpad
The clickpad is smaller than the one on the Razer Blade 15 (11.6 x 7.2 cm vs. 13 x 8 cm). However, we find the clickpad on the ADATA system to be more comfortable to use simply because its integrated mouse keys are not nearly as spongy as on the Razer. Feedback is both clickier and louder for a more satisfying experience.
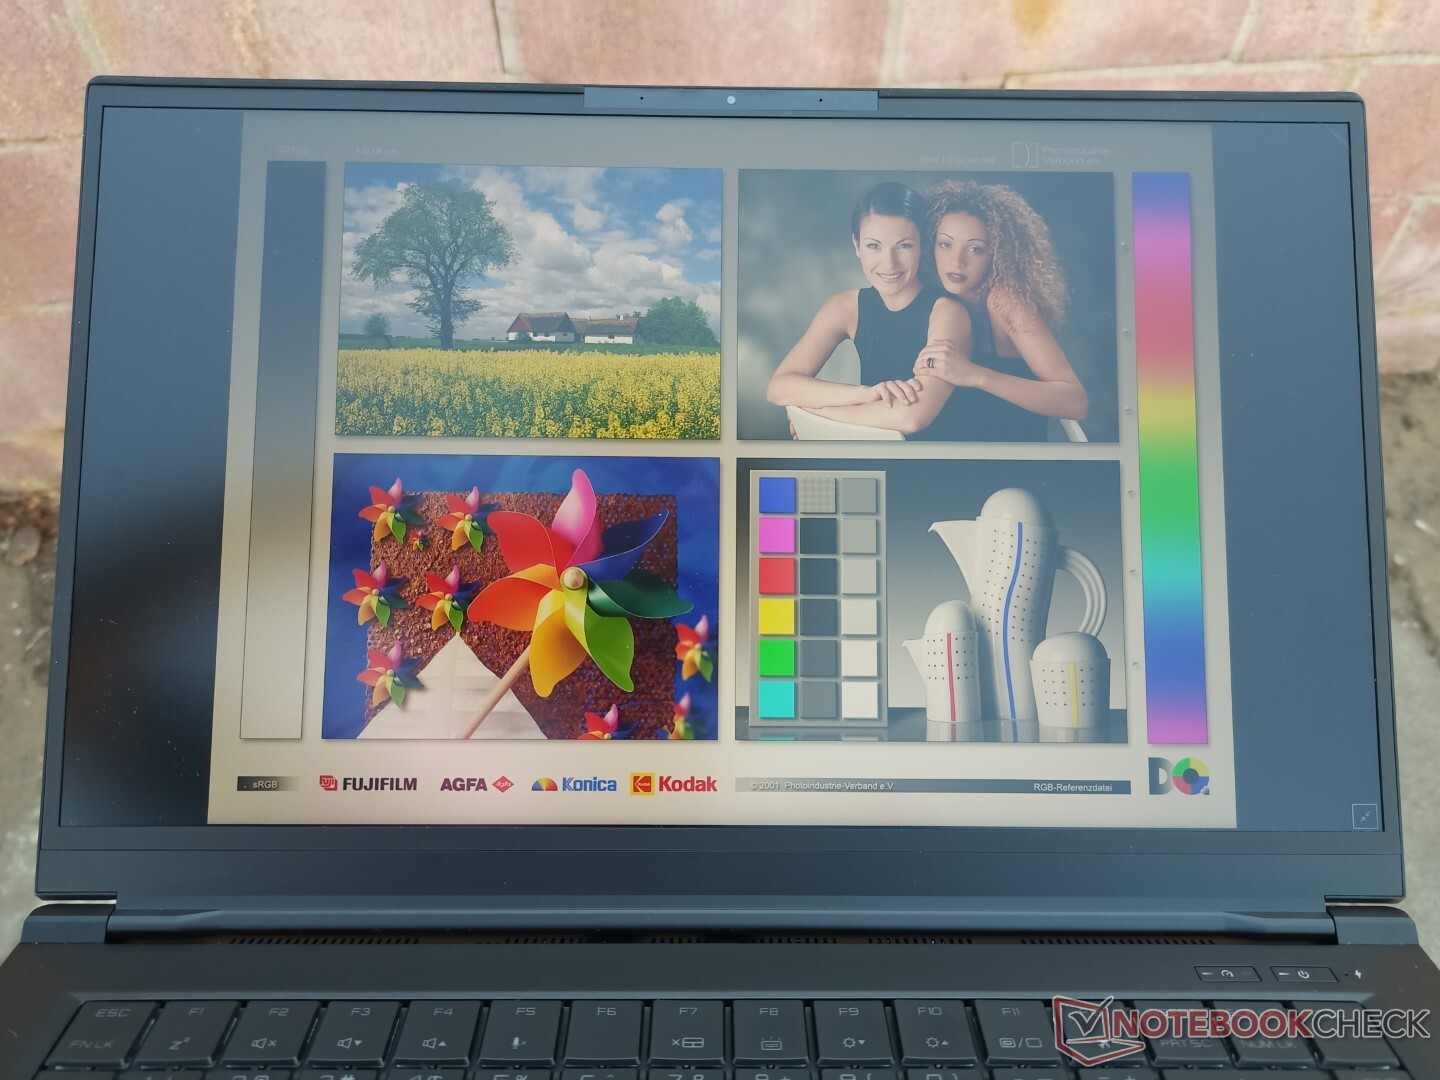
Display — Almost Perfect for Gaming
The XPG Xenia 15 uses the exact same BOE NE156QHM-NY2 1440p IPS panel as found on the Schenker XMG Core 15 or XMG Neo 15. Thus, the viewing experience here is very similar in regards to colors, resolution, refresh rates, and response times. The latter two in particular are very fast at 165 Hz and 25.6 ms combined, respectively, to make this 1440p panel an excellent fit for smooth gaming with minimal ghosting.
The main drawback to this panel is its lack of G-Sync support. Advanced Optimus is not supported here and so users will have to make do with regular Optimus. G-Sync on external monitors is supported.


| |||||||||||||||||||||||||
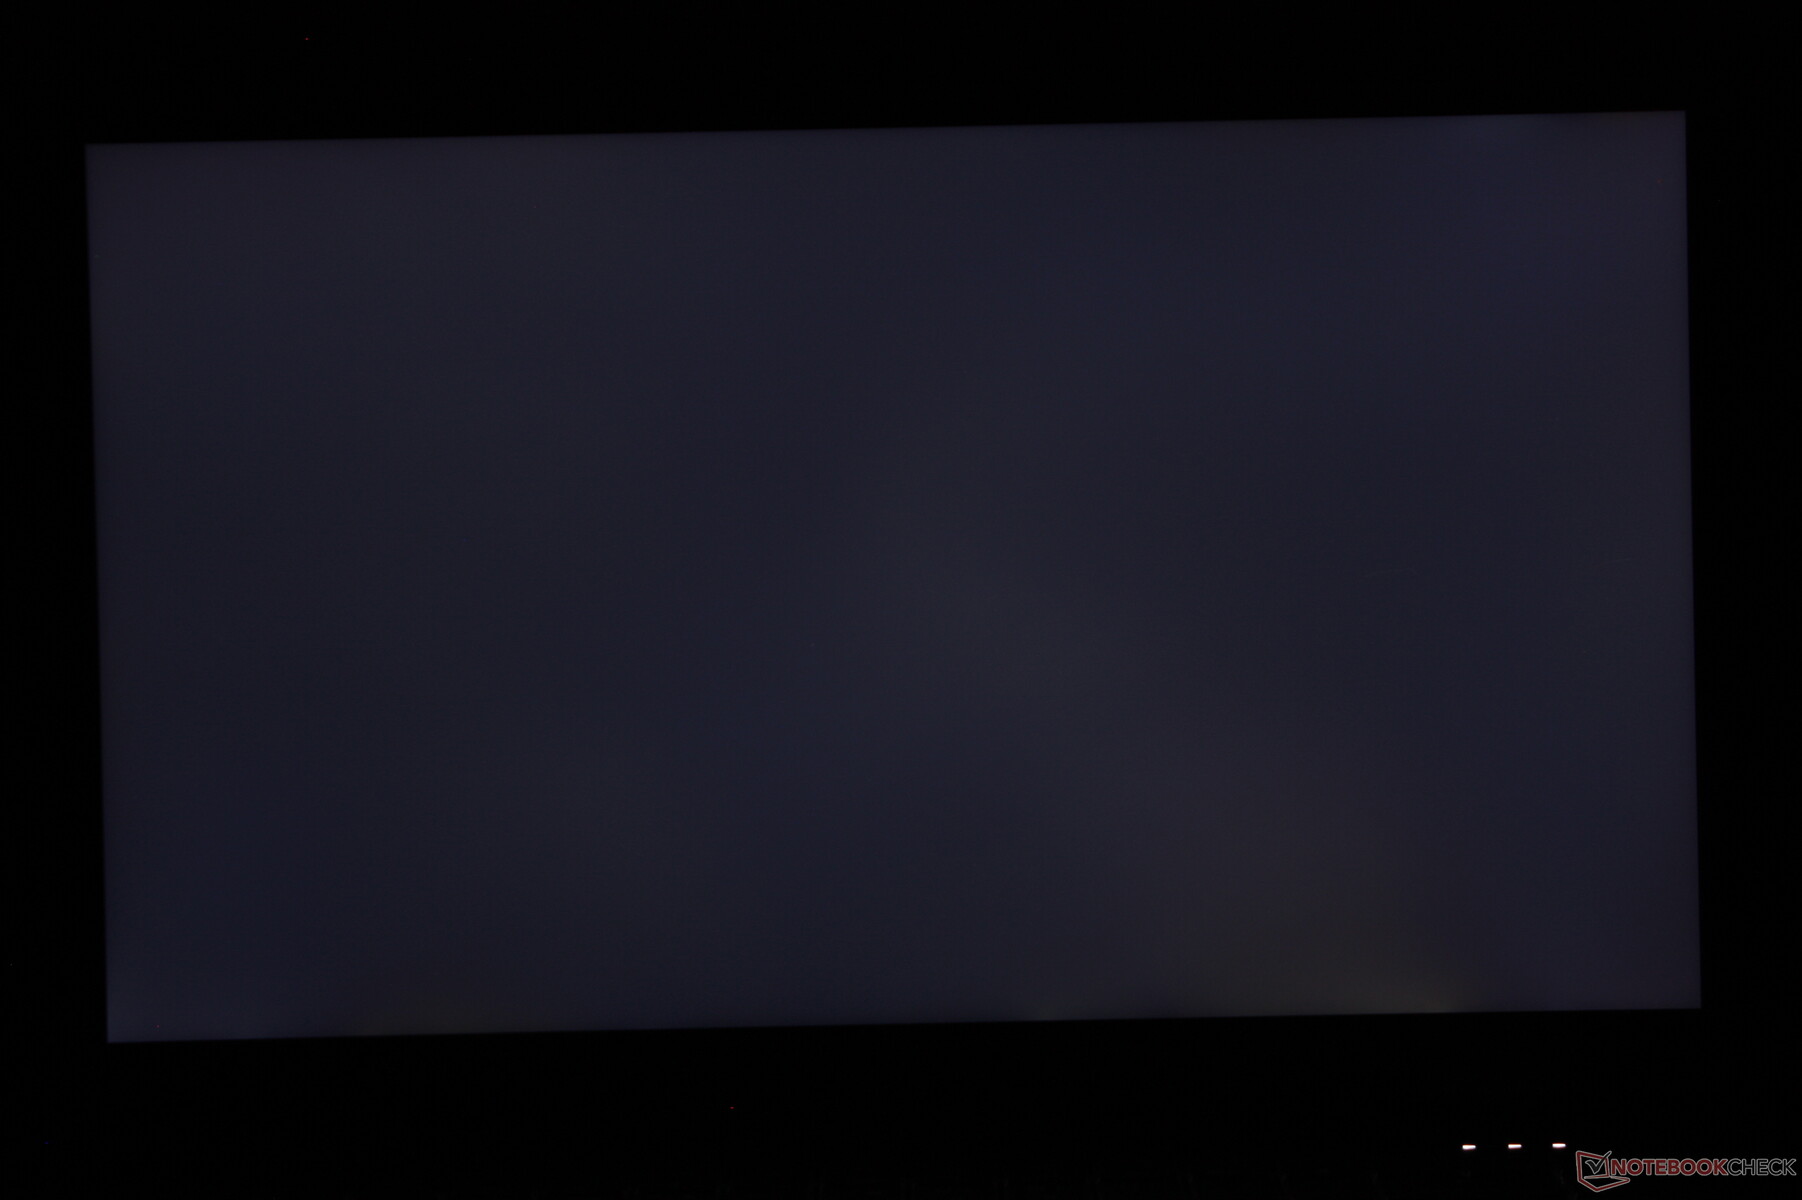
Brightness Distribution: 82 %
Center on Battery: 321.1 cd/m²
Contrast: 845:1 (Black: 0.38 cd/m²)
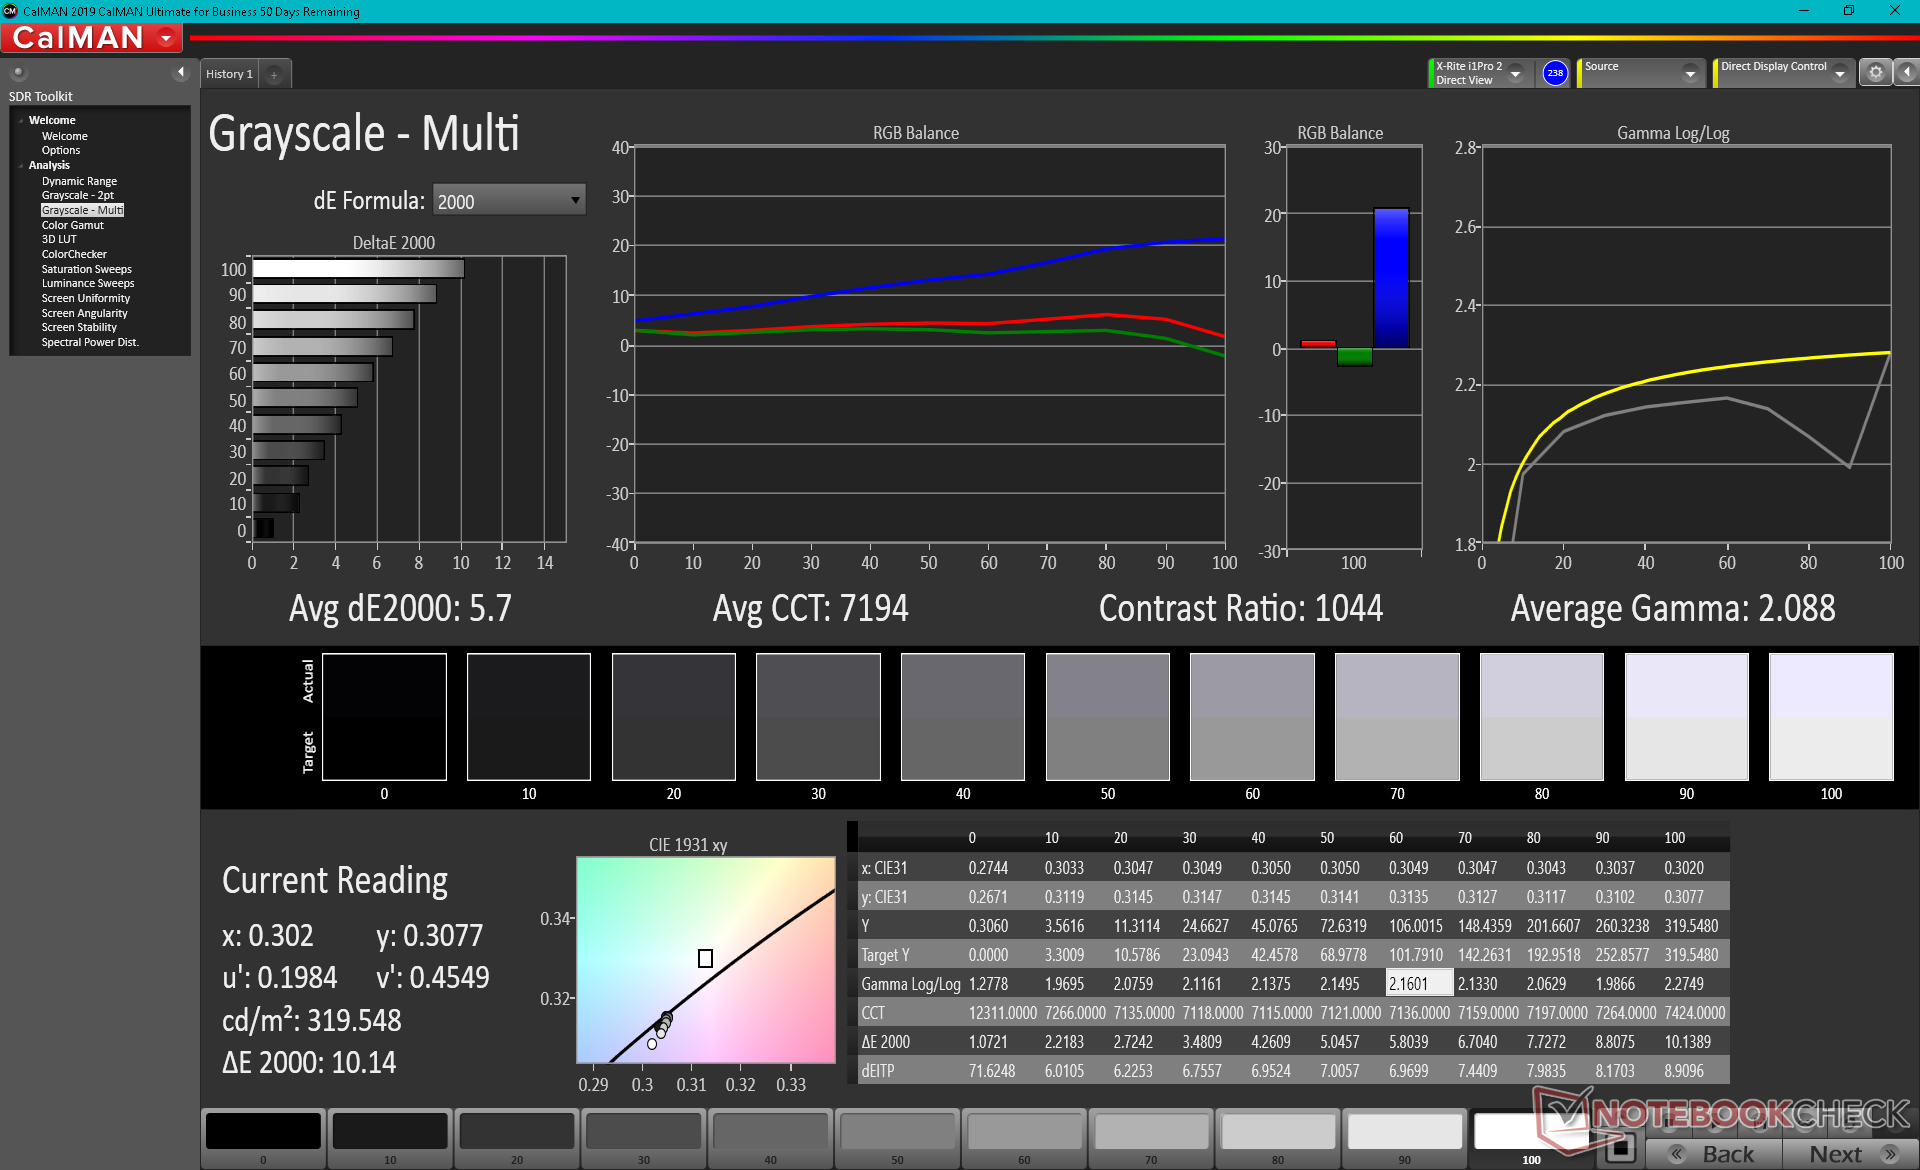
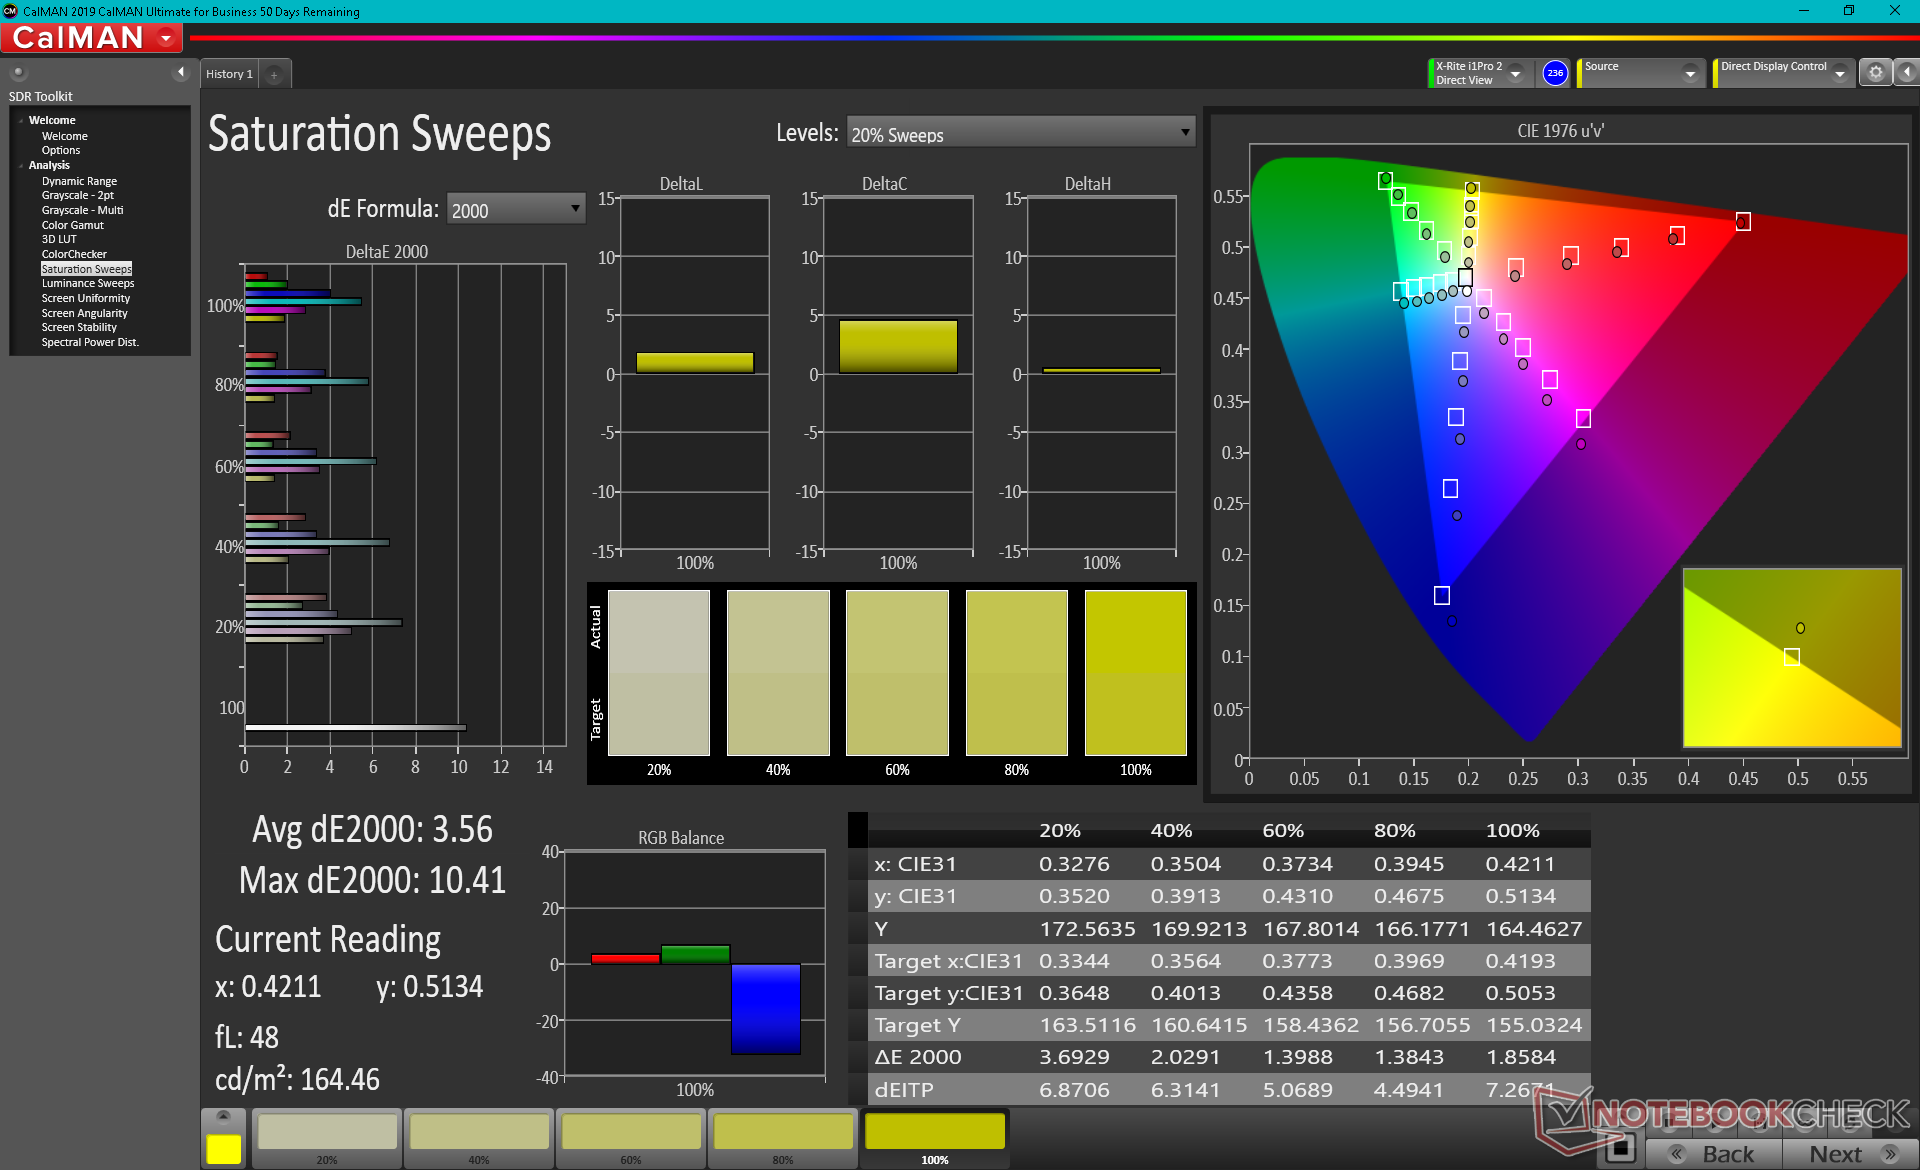
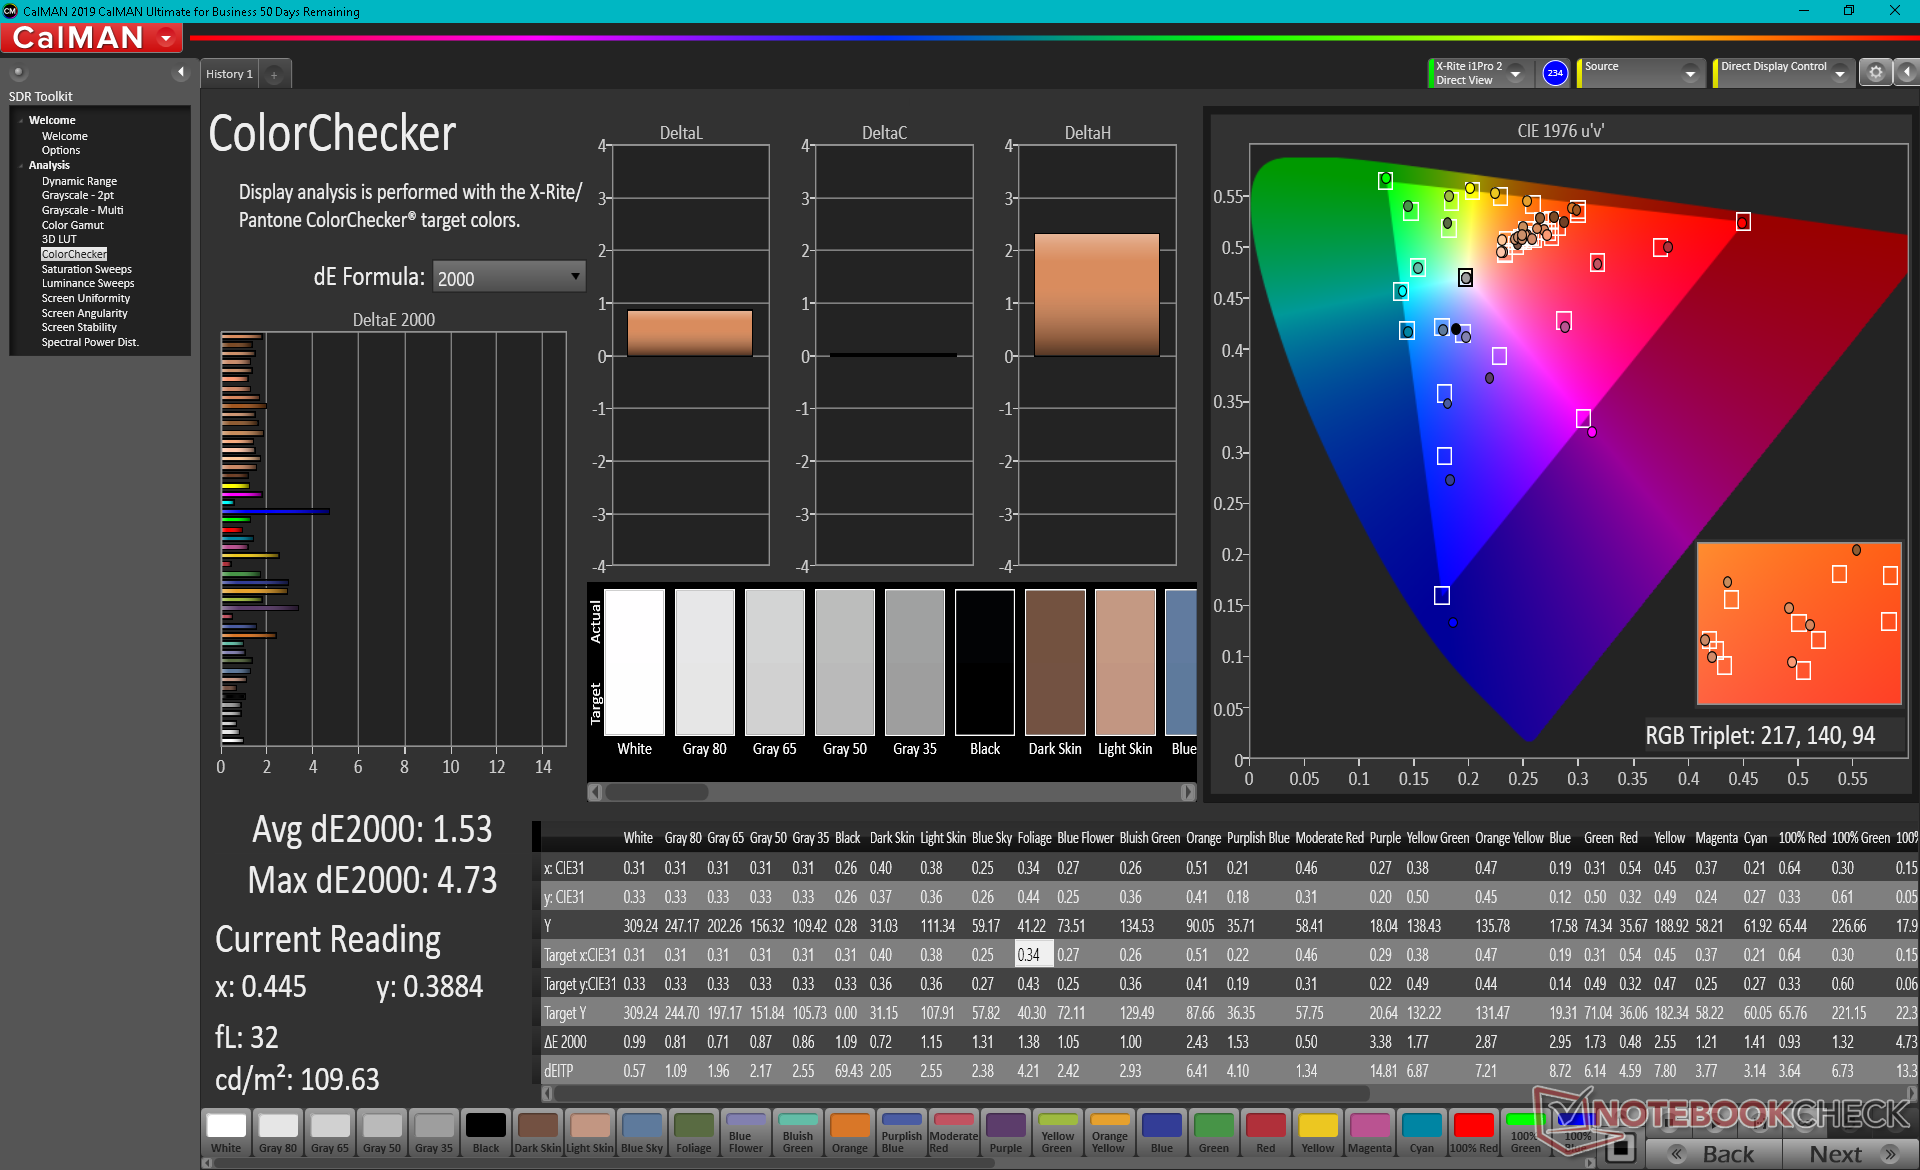
ΔE ColorChecker Calman: 3.21 | ∀{0.5-29.43 Ø4.73}
calibrated: 1.53
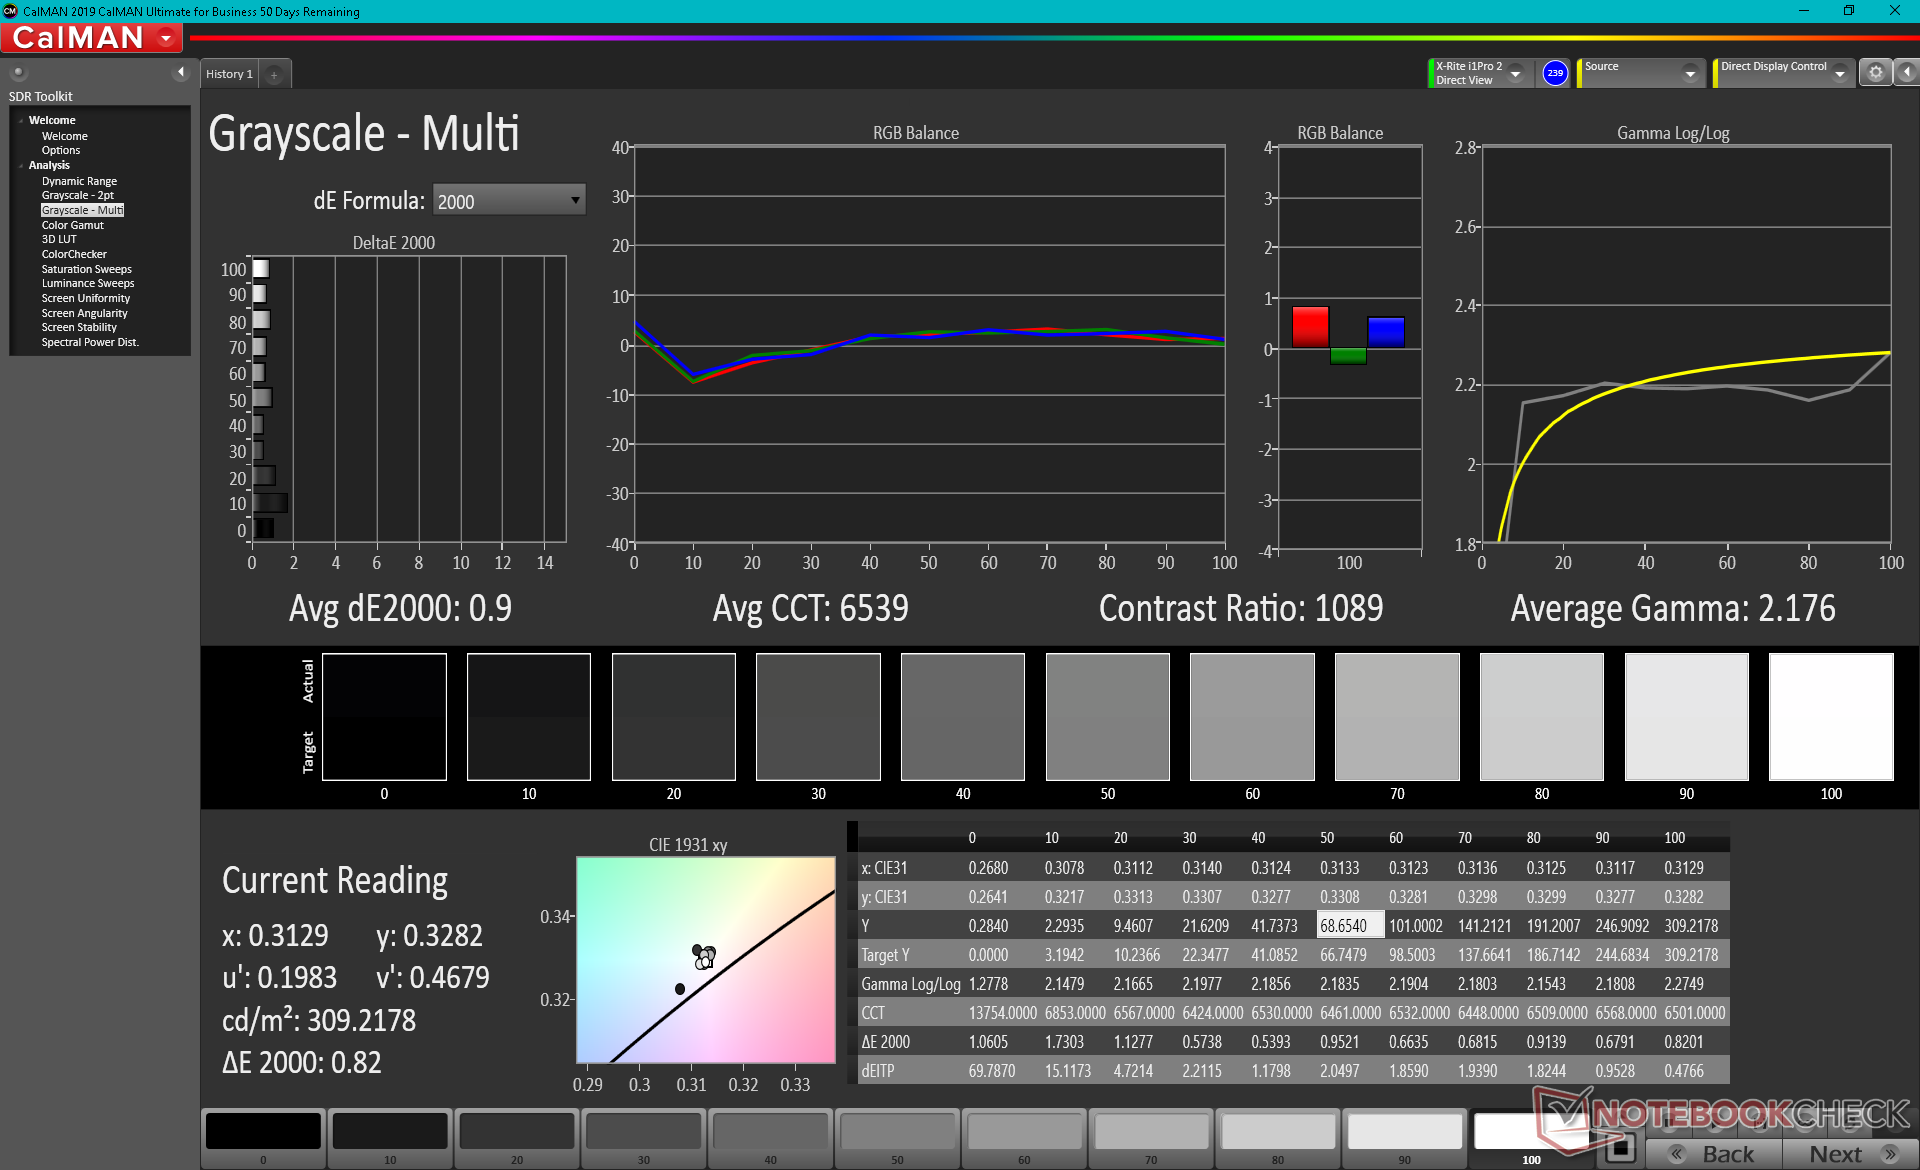
ΔE Greyscale Calman: 5.7 | ∀{0.09-98 Ø4.97}
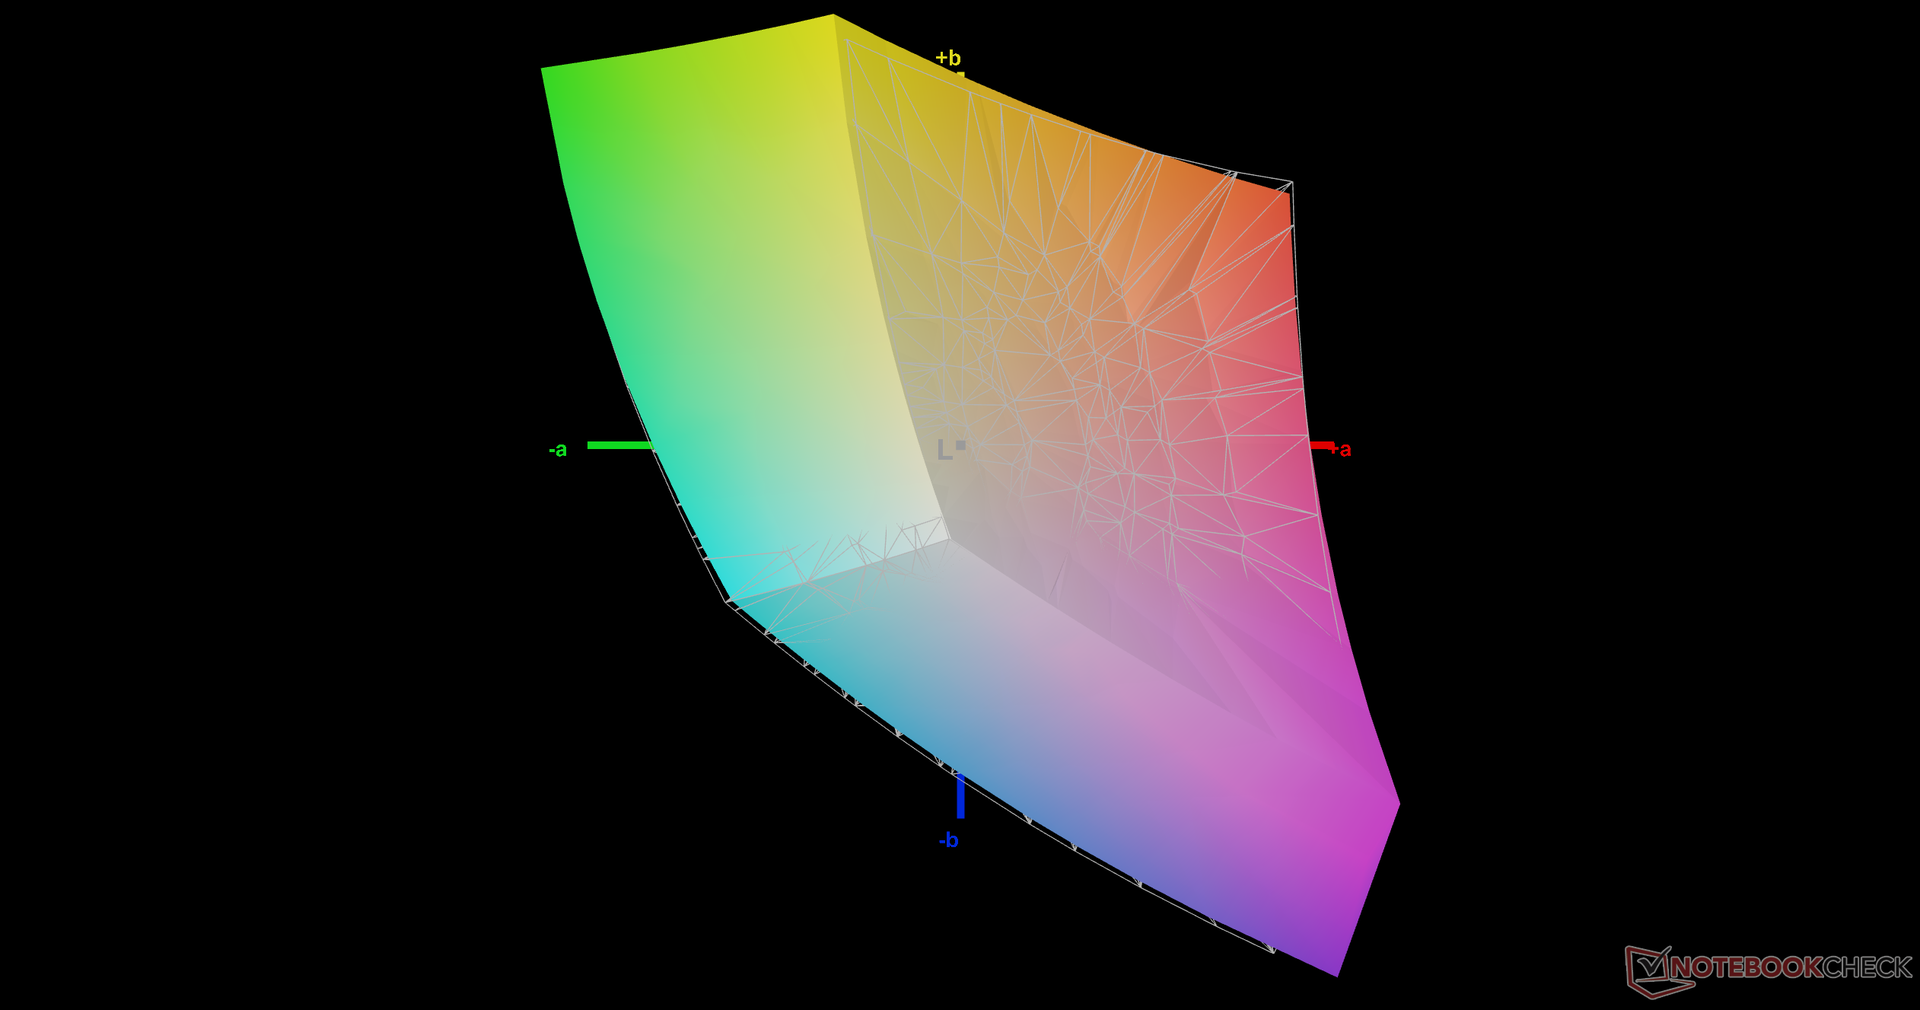
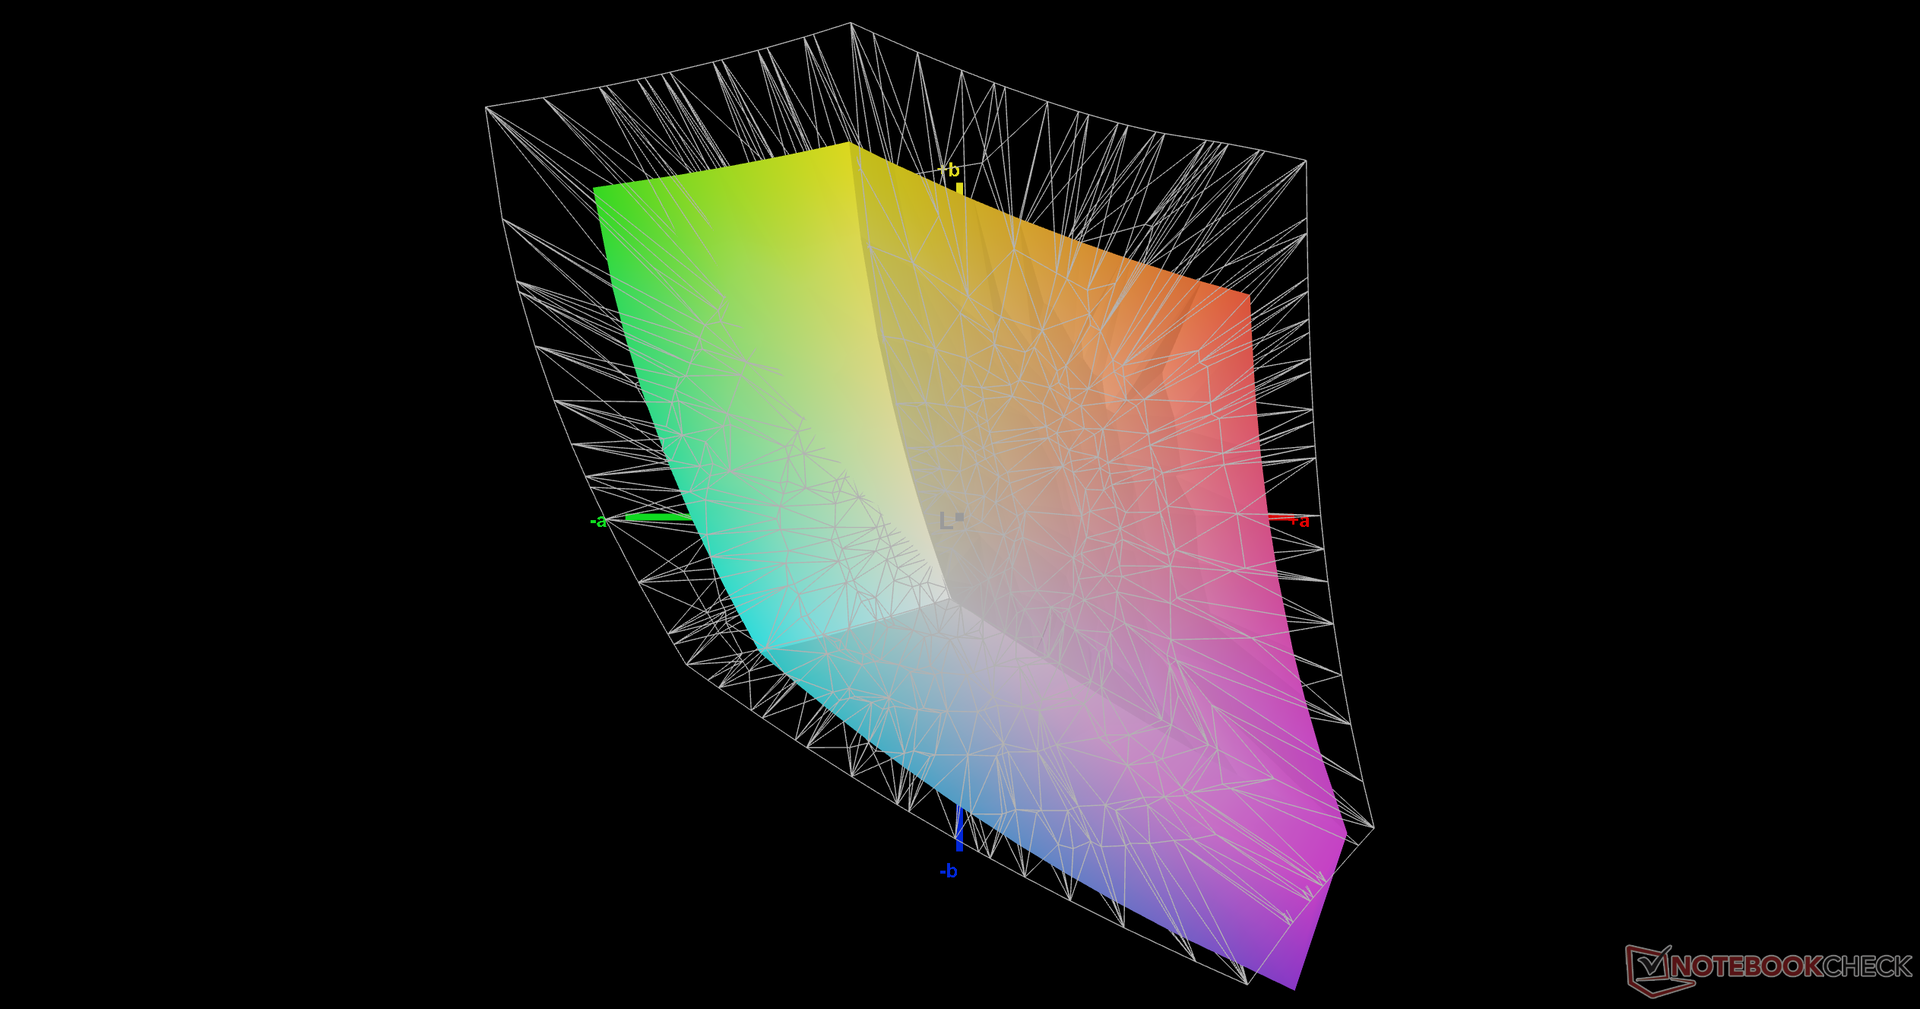
69.1% AdobeRGB 1998 (Argyll 3D)
98.1% sRGB (Argyll 3D)
68.2% Display P3 (Argyll 3D)
Gamma: 2.09
CCT: 7194 K
| ADATA XPG Xenia 15 BOE CQ NE156QHM-NY2, IPS, 15.6", 2560x1440 | MSI Delta 15 A5EFK LQ156M1JW03 (SHP155D), IPS-Level, 15.6", 1920x1080 | Alienware x15 RTX 3070 P111F LG Philips 156QHG, IPS, 15.6", 2560x1440 | Razer Blade 15 Advanced (Mid 2021) TL156VDXP02-0, IPS, 15.6", 1920x1080 | MSI GS66 Stealth 10UG AU Optronics B156HAN12.0, IPS, 15.6", 1920x1080 | Asus ROG Zephyrus G15 GA503Q CMN N156KME-GNA (CMN152A), IPS-Level, 15.6", 2560x1440 | |
|---|---|---|---|---|---|---|
| Display | -1% | 23% | -1% | -0% | 23% | |
| Display P3 Coverage (%) | 68.2 | 66.5 -2% | 97.8 43% | 66.9 -2% | 67.7 -1% | 97.3 43% |
| sRGB Coverage (%) | 98.1 | 97.8 0% | 99.9 2% | 97.1 -1% | 98.4 0% | 99.9 2% |
| AdobeRGB 1998 Coverage (%) | 69.1 | 67.6 -2% | 69 0% | 69.1 0% | 86.2 25% | |
| Response Times | 10% | 13% | 43% | -2% | 21% | |
| Response Time Grey 50% / Grey 80% * (ms) | 13.6 ? | 12.8 ? 6% | 12 ? 12% | 4.2 ? 69% | 14.4 ? -6% | 8.8 ? 35% |
| Response Time Black / White * (ms) | 12 ? | 10.4 ? 13% | 10.4 ? 13% | 10 ? 17% | 11.6 ? 3% | 11.2 ? 7% |
| PWM Frequency (Hz) | 23580 ? | |||||
| Screen | 10% | 14% | 26% | 16% | -0% | |
| Brightness middle (cd/m²) | 321.1 | 291 -9% | 409.5 28% | 353.4 10% | 259.5 -19% | 327 2% |
| Brightness (cd/m²) | 308 | 266 -14% | 390 27% | 340 10% | 264 -14% | 309 0% |
| Brightness Distribution (%) | 82 | 88 7% | 88 7% | 92 12% | 90 10% | 89 9% |
| Black Level * (cd/m²) | 0.38 | 0.36 5% | 0.47 -24% | 0.31 18% | 0.25 34% | 0.33 13% |
| Contrast (:1) | 845 | 808 -4% | 871 3% | 1140 35% | 1038 23% | 991 17% |
| Colorchecker dE 2000 * | 3.21 | 2.98 7% | 3.48 -8% | 2.17 32% | 2.52 21% | 4.49 -40% |
| Colorchecker dE 2000 max. * | 10.56 | 7.59 28% | 6.31 40% | 5.69 46% | 5.55 47% | 8.42 20% |
| Colorchecker dE 2000 calibrated * | 1.53 | 0.91 41% | 0.89 42% | 1.05 31% | 1.93 -26% | 2.27 -48% |
| Greyscale dE 2000 * | 5.7 | 4.2 26% | 5 12% | 3.4 40% | 1.7 70% | 4.2 26% |
| Gamma | 2.09 105% | 2.293 96% | 2.16 102% | 2.2 100% | 2.04 108% | 2.173 101% |
| CCT | 7194 90% | 7624 85% | 6591 99% | 6830 95% | 6414 101% | 7014 93% |
| Color Space (Percent of AdobeRGB 1998) (%) | 63.3 | 86 | ||||
| Color Space (Percent of sRGB) (%) | 98.8 | 99 | ||||
| Total Average (Program / Settings) | 6% /
7% | 17% /
15% | 23% /
23% | 5% /
10% | 15% /
8% |
* ... smaller is better
Color space encompasses 69 percent of AdobeRGB and nearly all of sRGB to be acceptable for most graphics editing tasks in addition to the aforementioned fast-paced gaming scenarios.
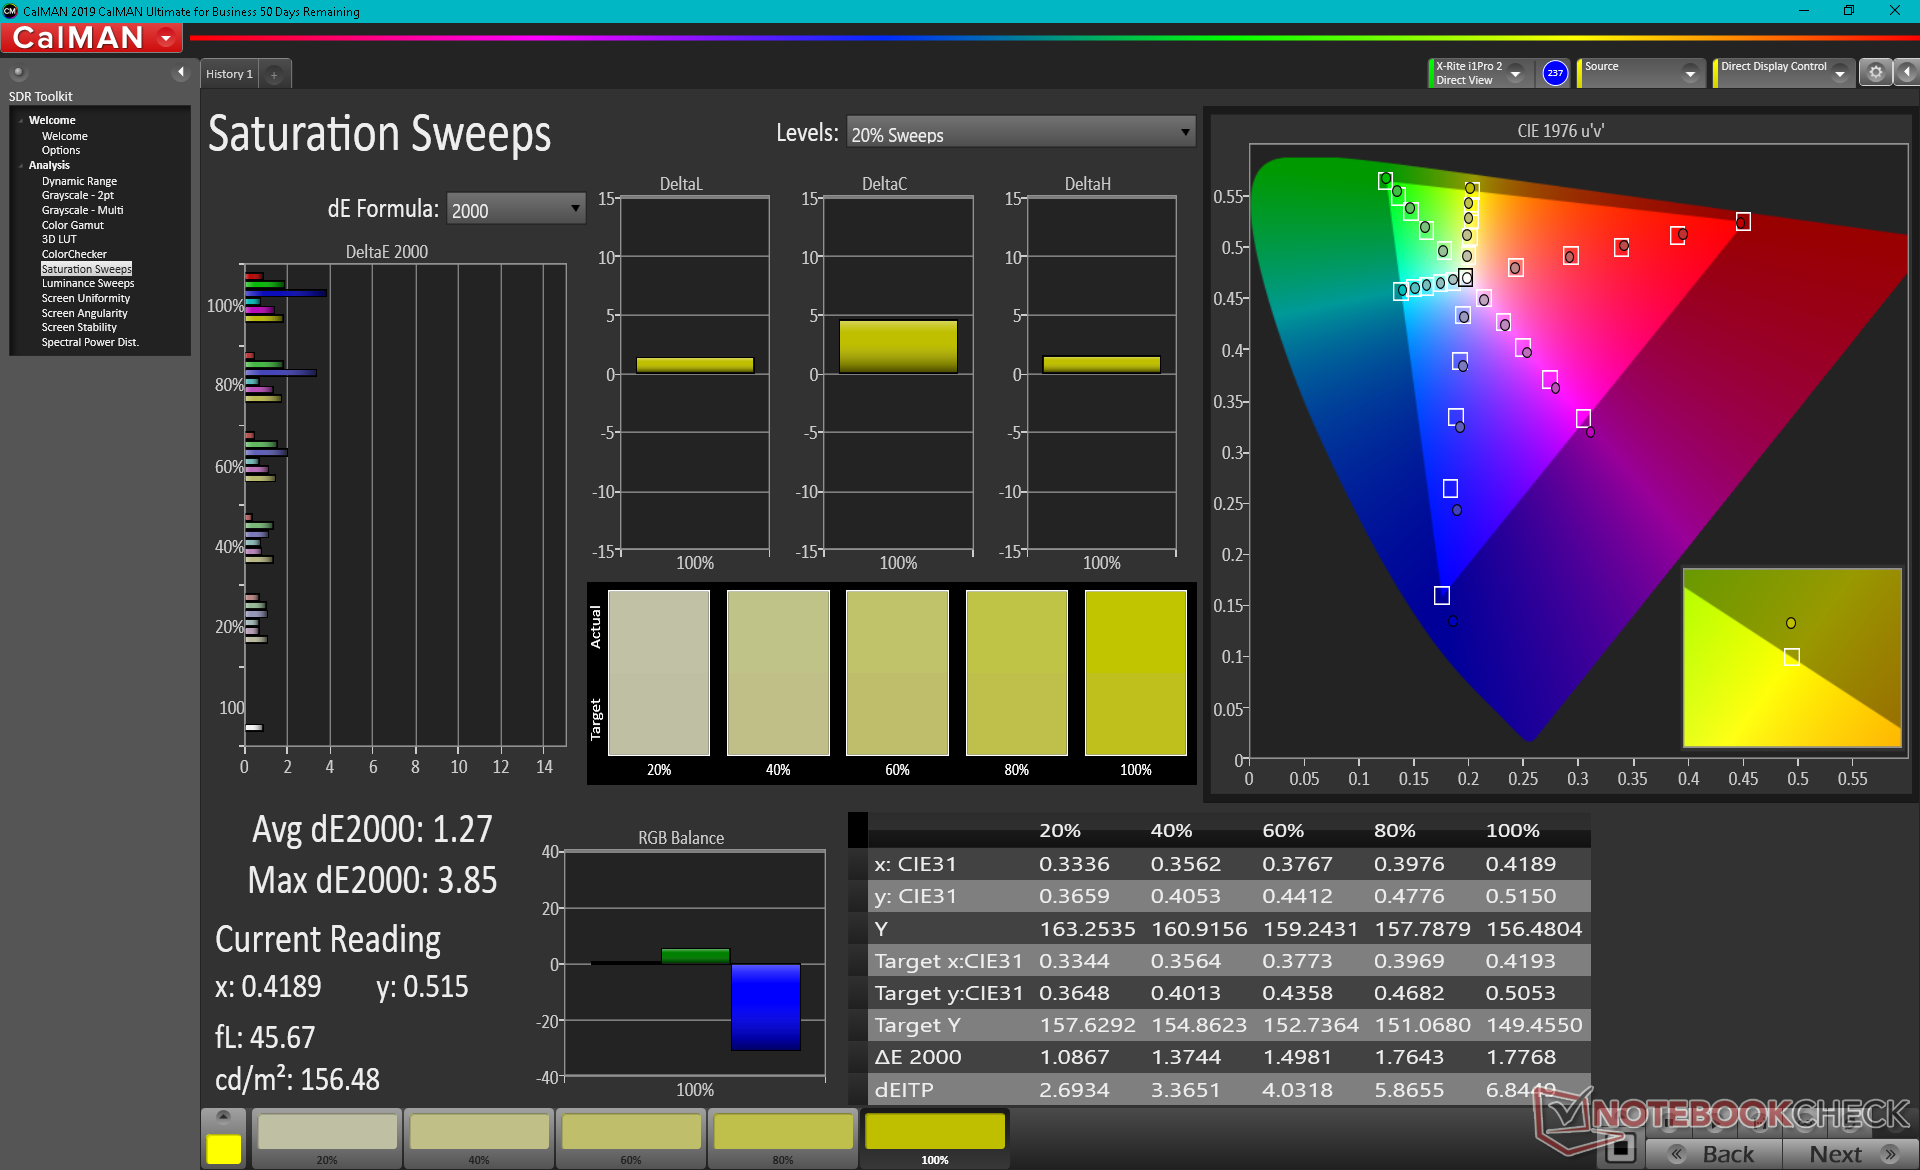
The display could have been better calibrated out of the box. Color temperature in particular is too cool for a relatively high average grayscale deltaE value of 5.7. A proper calibration with our X-Rite colorimeter addresses this to fully exploit the sRGB coverage of the panel as shown by our Calman results below.

Display Response Times
| ↔ Response Time Black to White | ||
|---|---|---|
| 12 ms ... rise ↗ and fall ↘ combined | ↗ 6.8 ms rise | 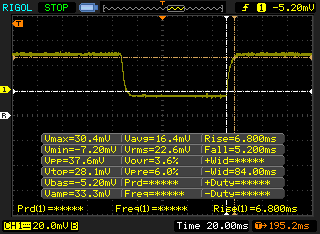 |
| ↘ 5.2 ms fall | ||
| The screen shows good response rates in our tests, but may be too slow for competitive gamers. In comparison, all tested devices range from 0.1 (minimum) to 240 (maximum) ms. » 31 % of all devices are better. This means that the measured response time is better than the average of all tested devices (19.9 ms). | ||
| ↔ Response Time 50% Grey to 80% Grey | ||
| 13.6 ms ... rise ↗ and fall ↘ combined | ↗ 7.6 ms rise | 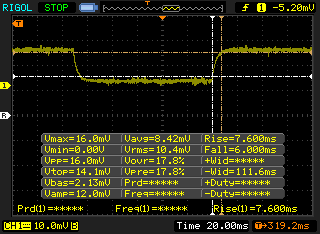 |
| ↘ 6 ms fall | ||
| The screen shows good response rates in our tests, but may be too slow for competitive gamers. In comparison, all tested devices range from 0.165 (minimum) to 636 (maximum) ms. » 27 % of all devices are better. This means that the measured response time is better than the average of all tested devices (31.1 ms). | ||
Screen Flickering / PWM (Pulse-Width Modulation)
| Screen flickering / PWM not detected | 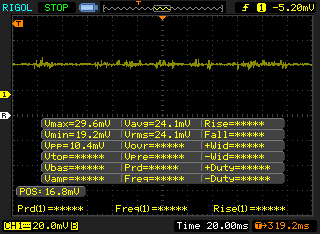 | ||
In comparison: 52 % of all tested devices do not use PWM to dim the display. If PWM was detected, an average of 7794 (minimum: 5 - maximum: 343500) Hz was measured. | |||
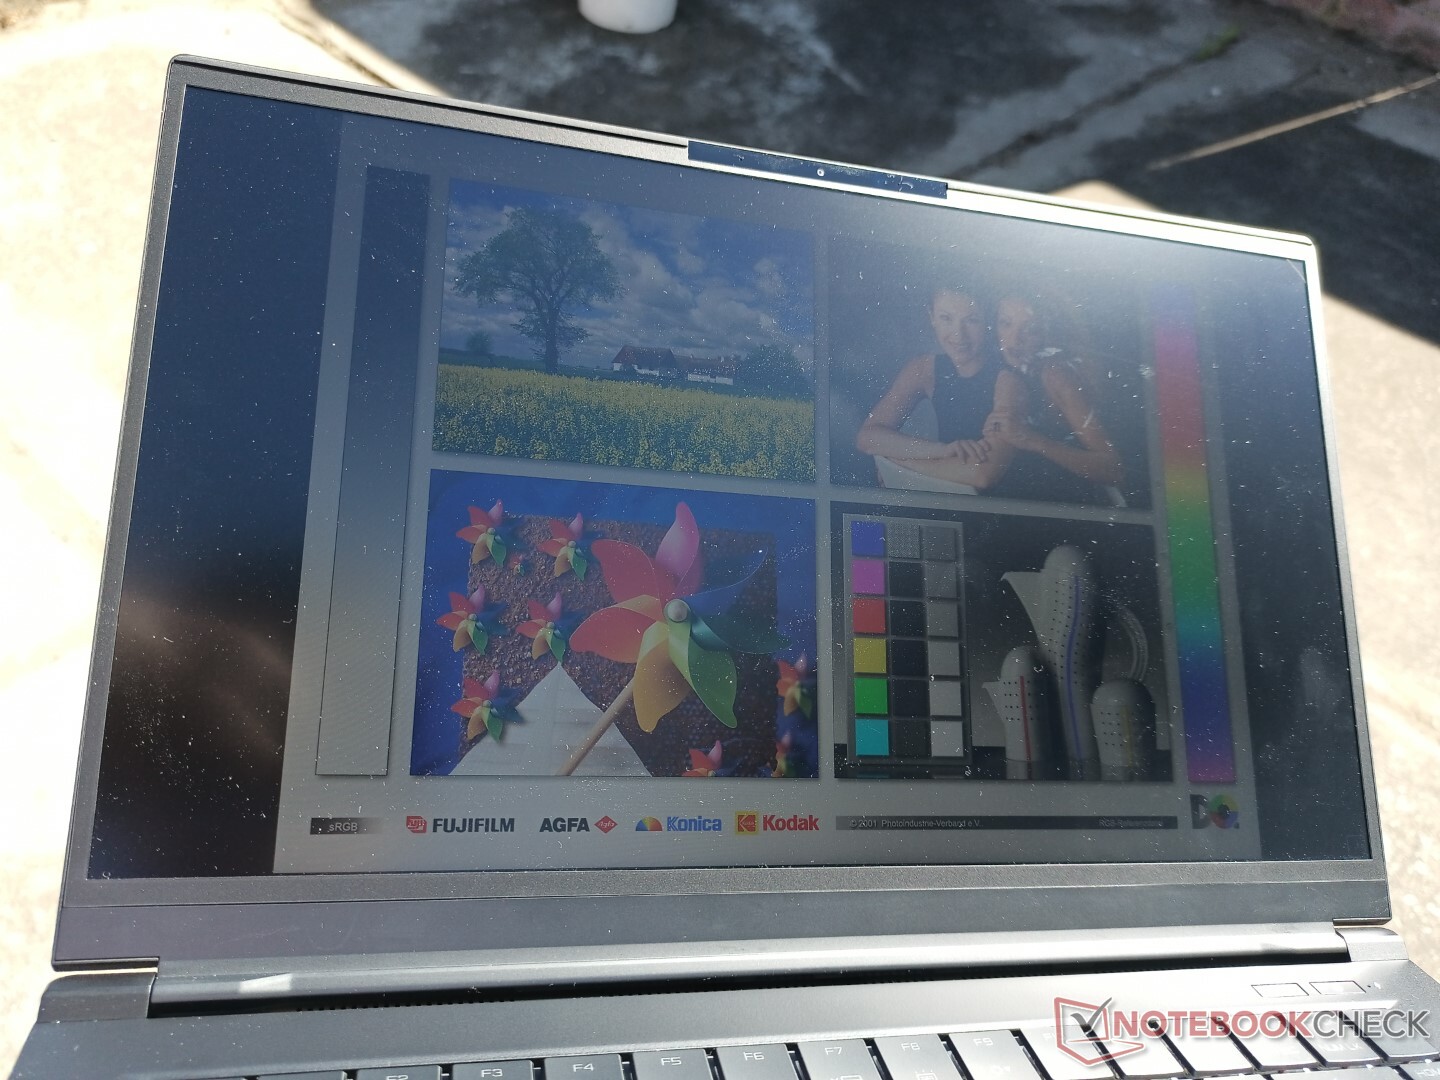
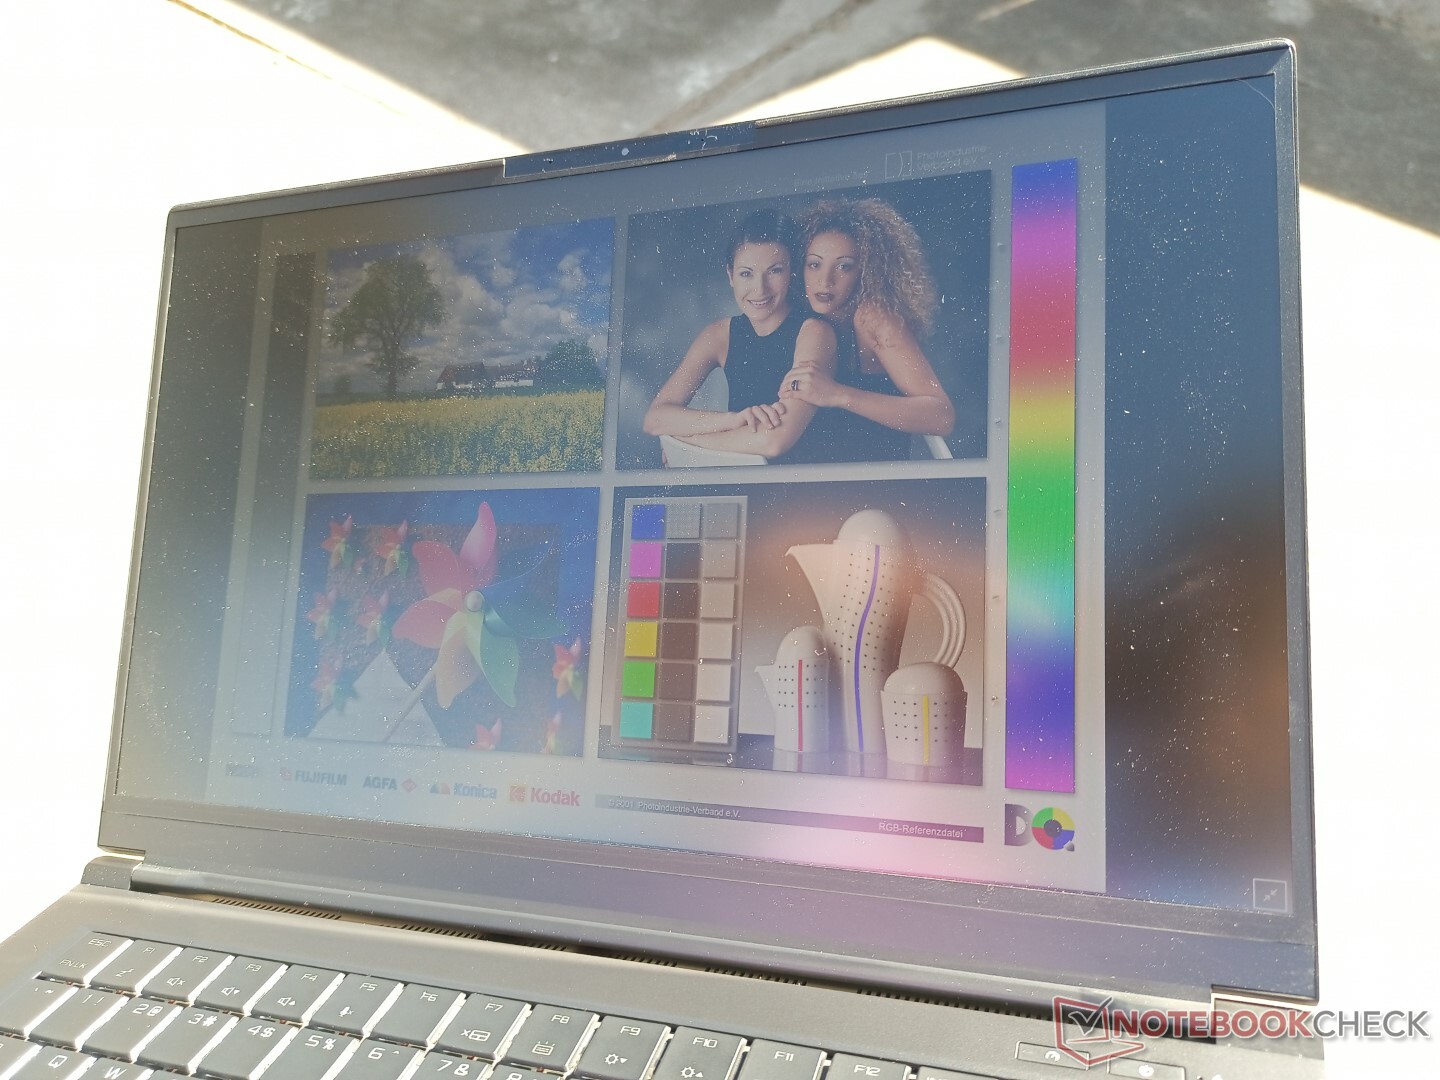
Both maximum brightness and outdoor visibility are comparable to most other gaming laptops. Nonetheless, the matte panel and wide 180-degree hinges give the Xenia 15 a slight edge when it comes to reducing glare.

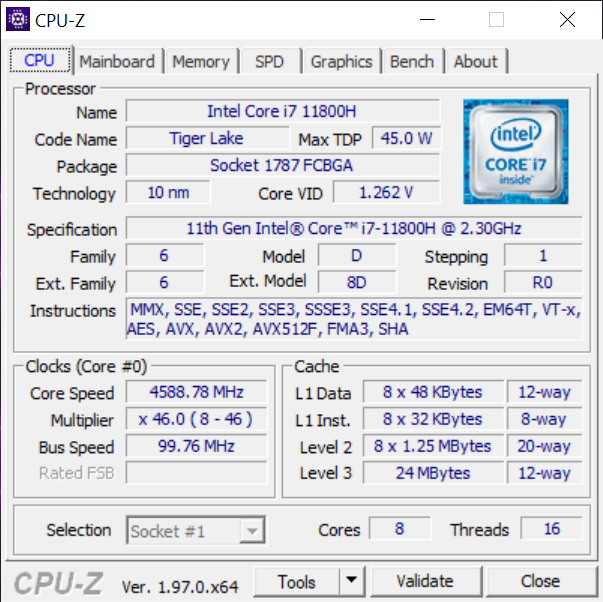
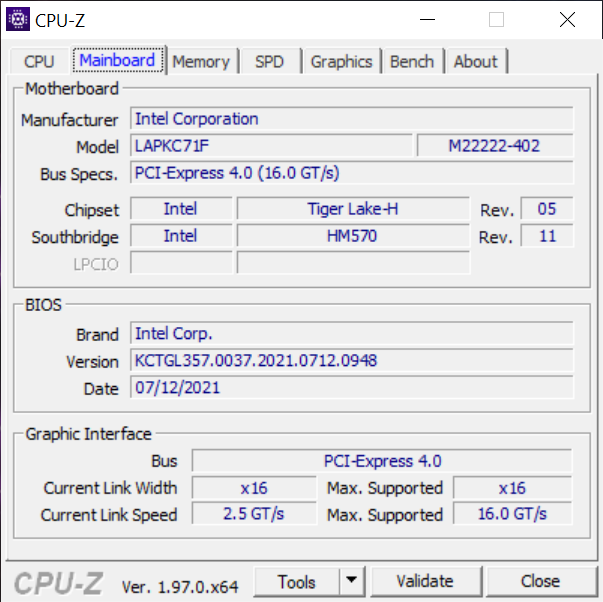
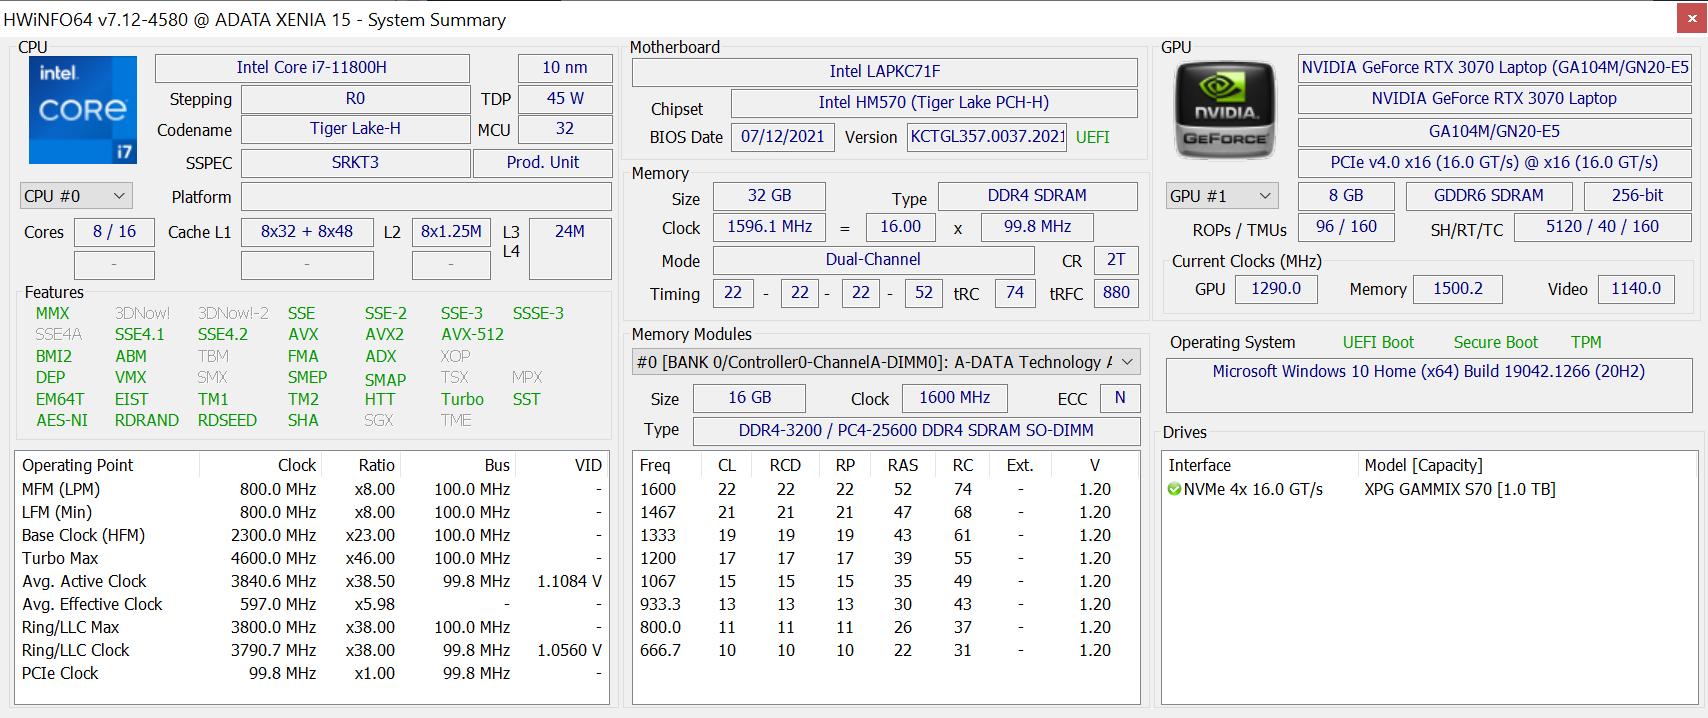
Performance — Tiger Lake-H with 125 W TGP GPU
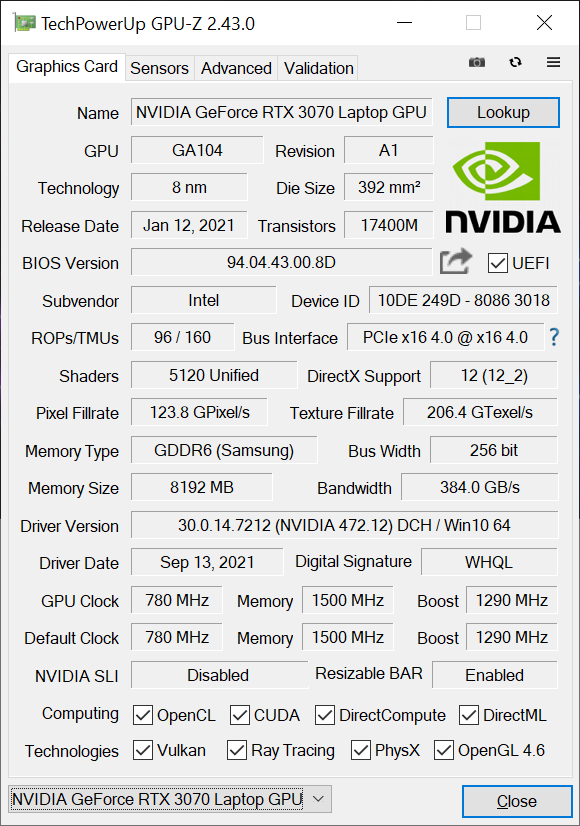
The Nvidia control panel explicitly states a 145 W TGP for the RTX 3070 in our Xenia 15, but ADATA says the laptop is only capable of reaching 125 W which we can confirm in our Stress Test section below. Even so, this is higher than what the GPUs are rated for in both the Razer Blade 15 (105 W TGP) and MSI GS66 (95 W TGP).
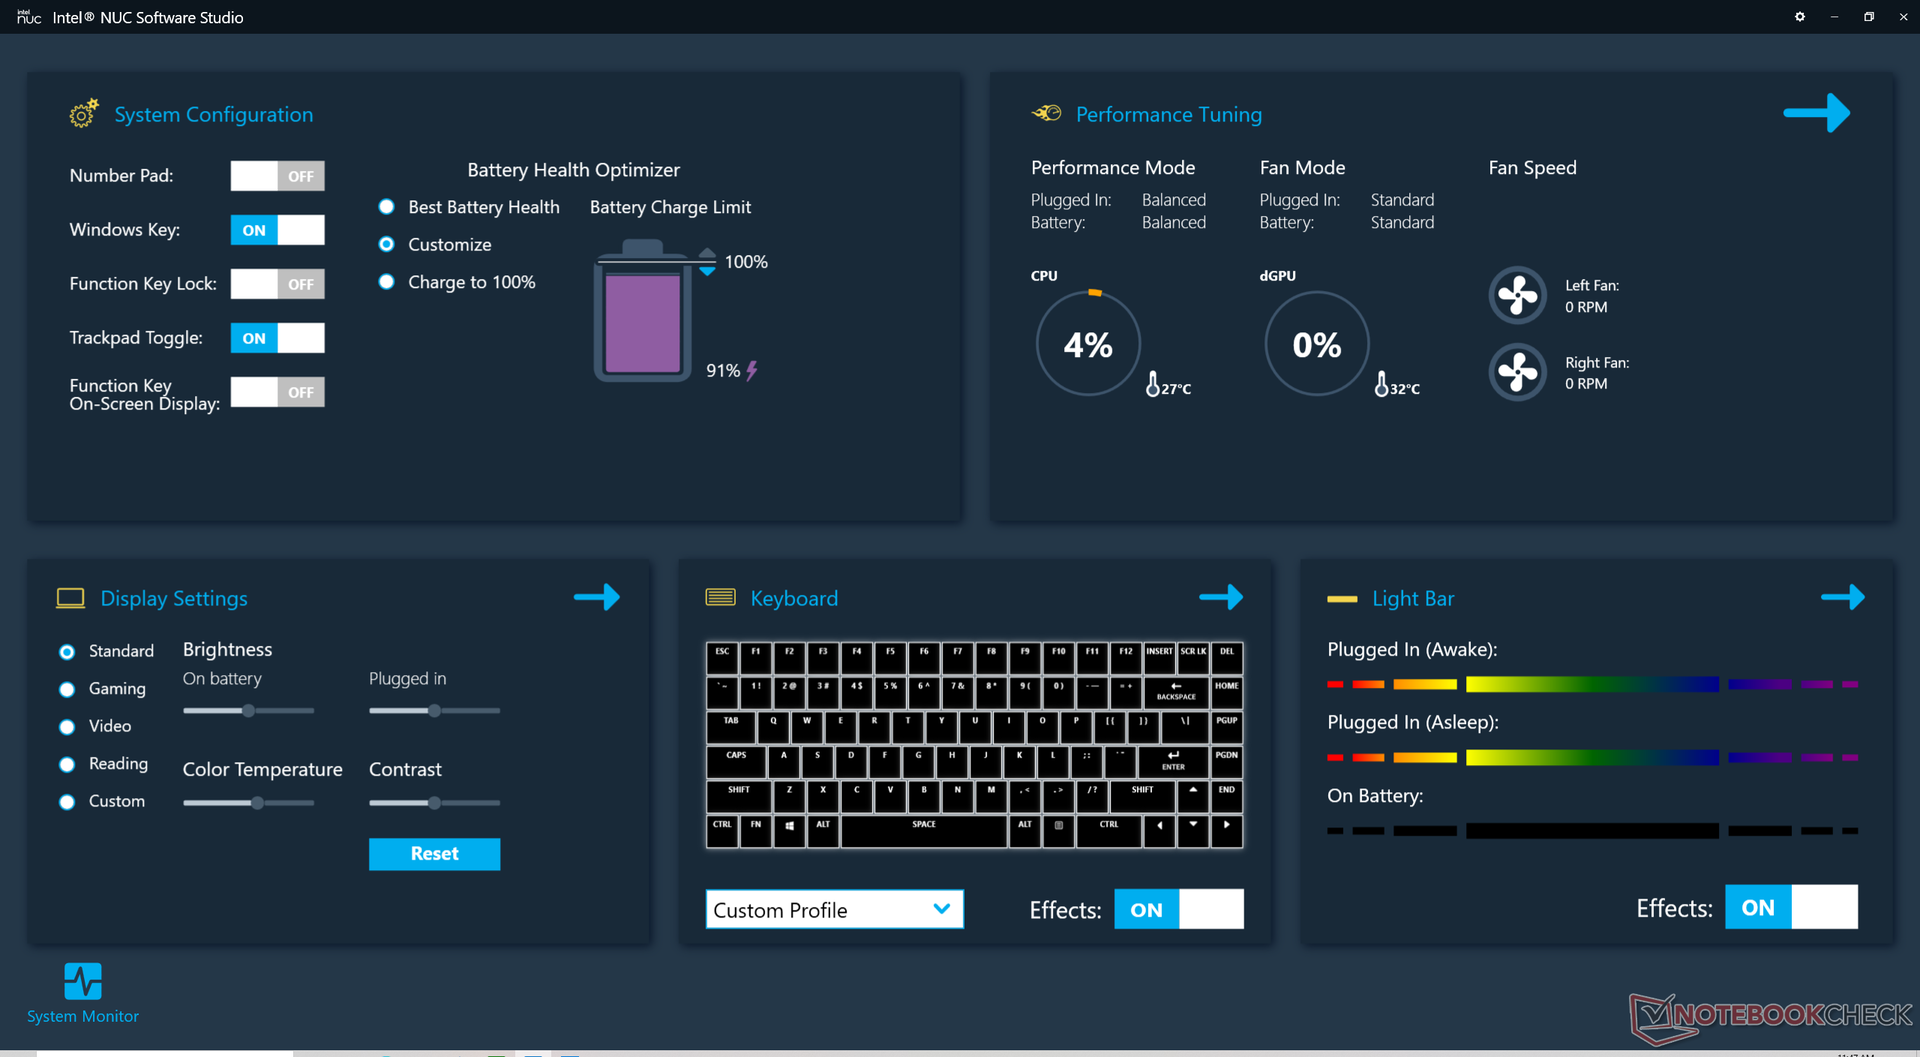
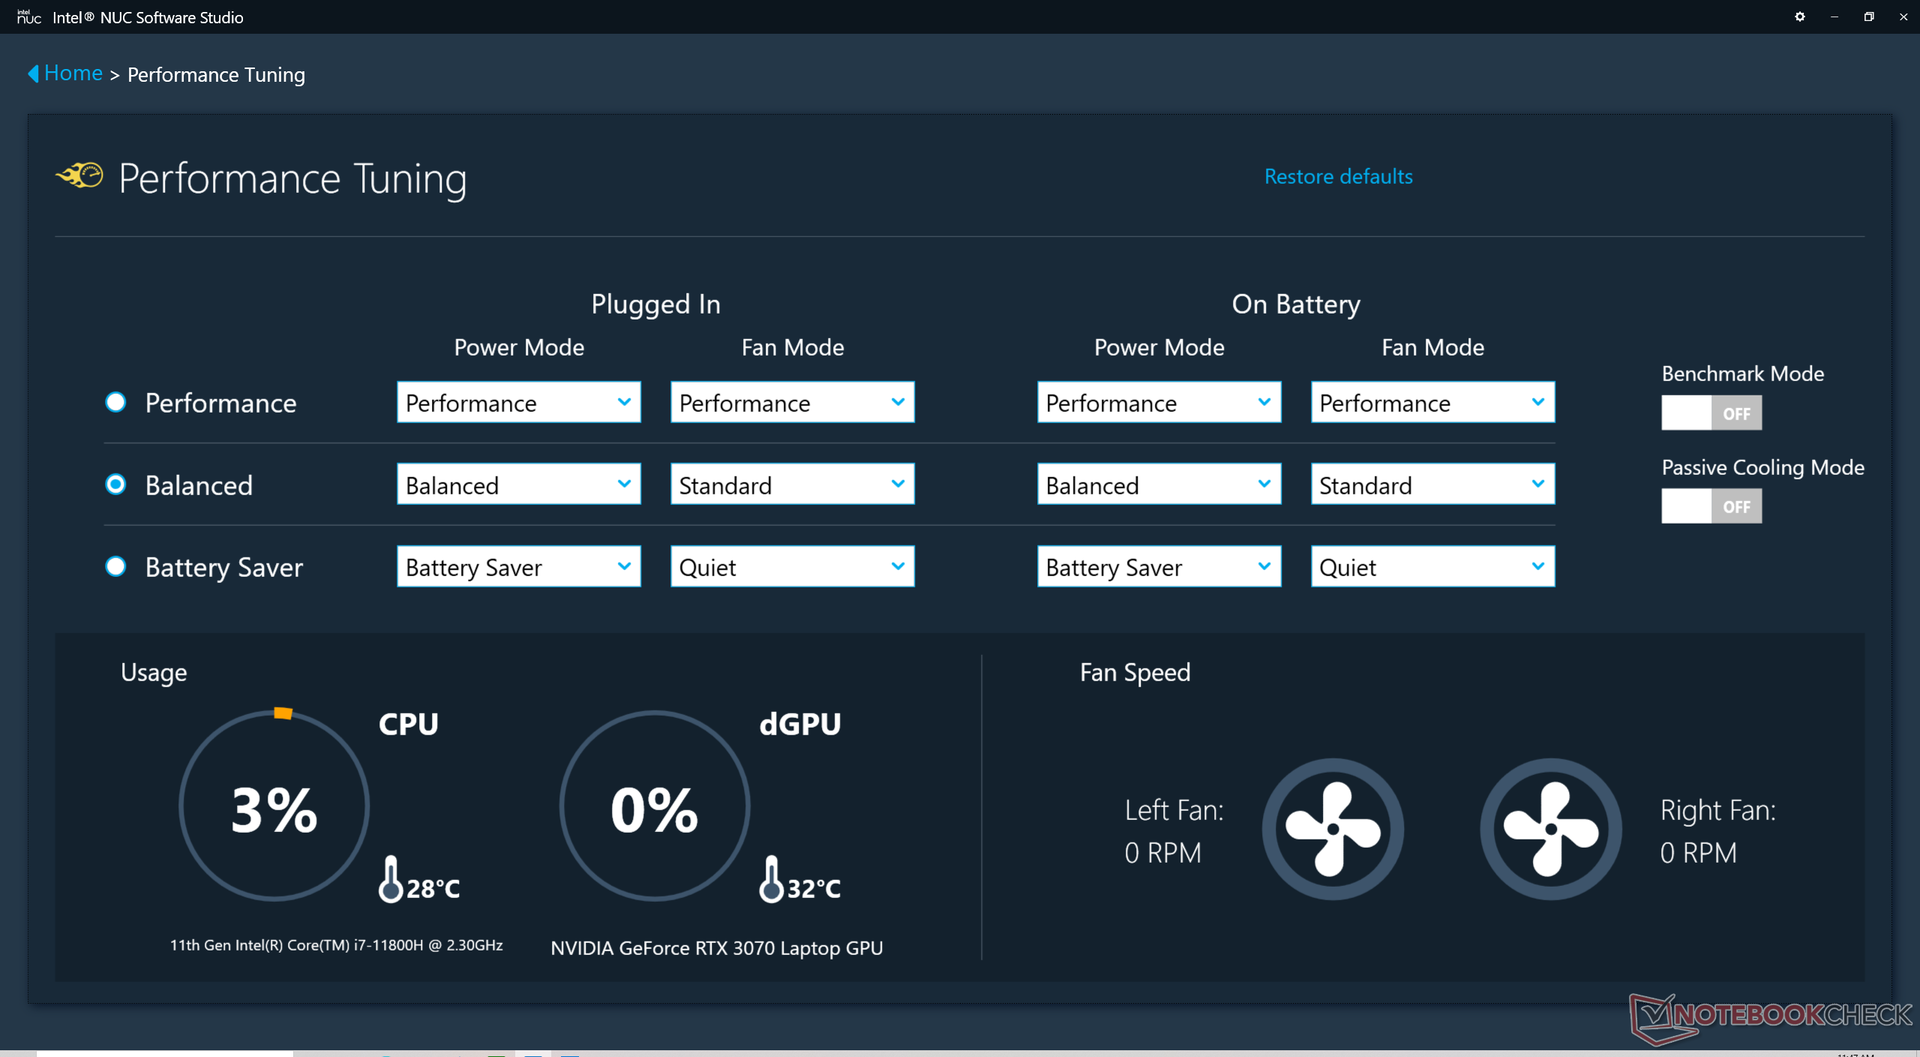
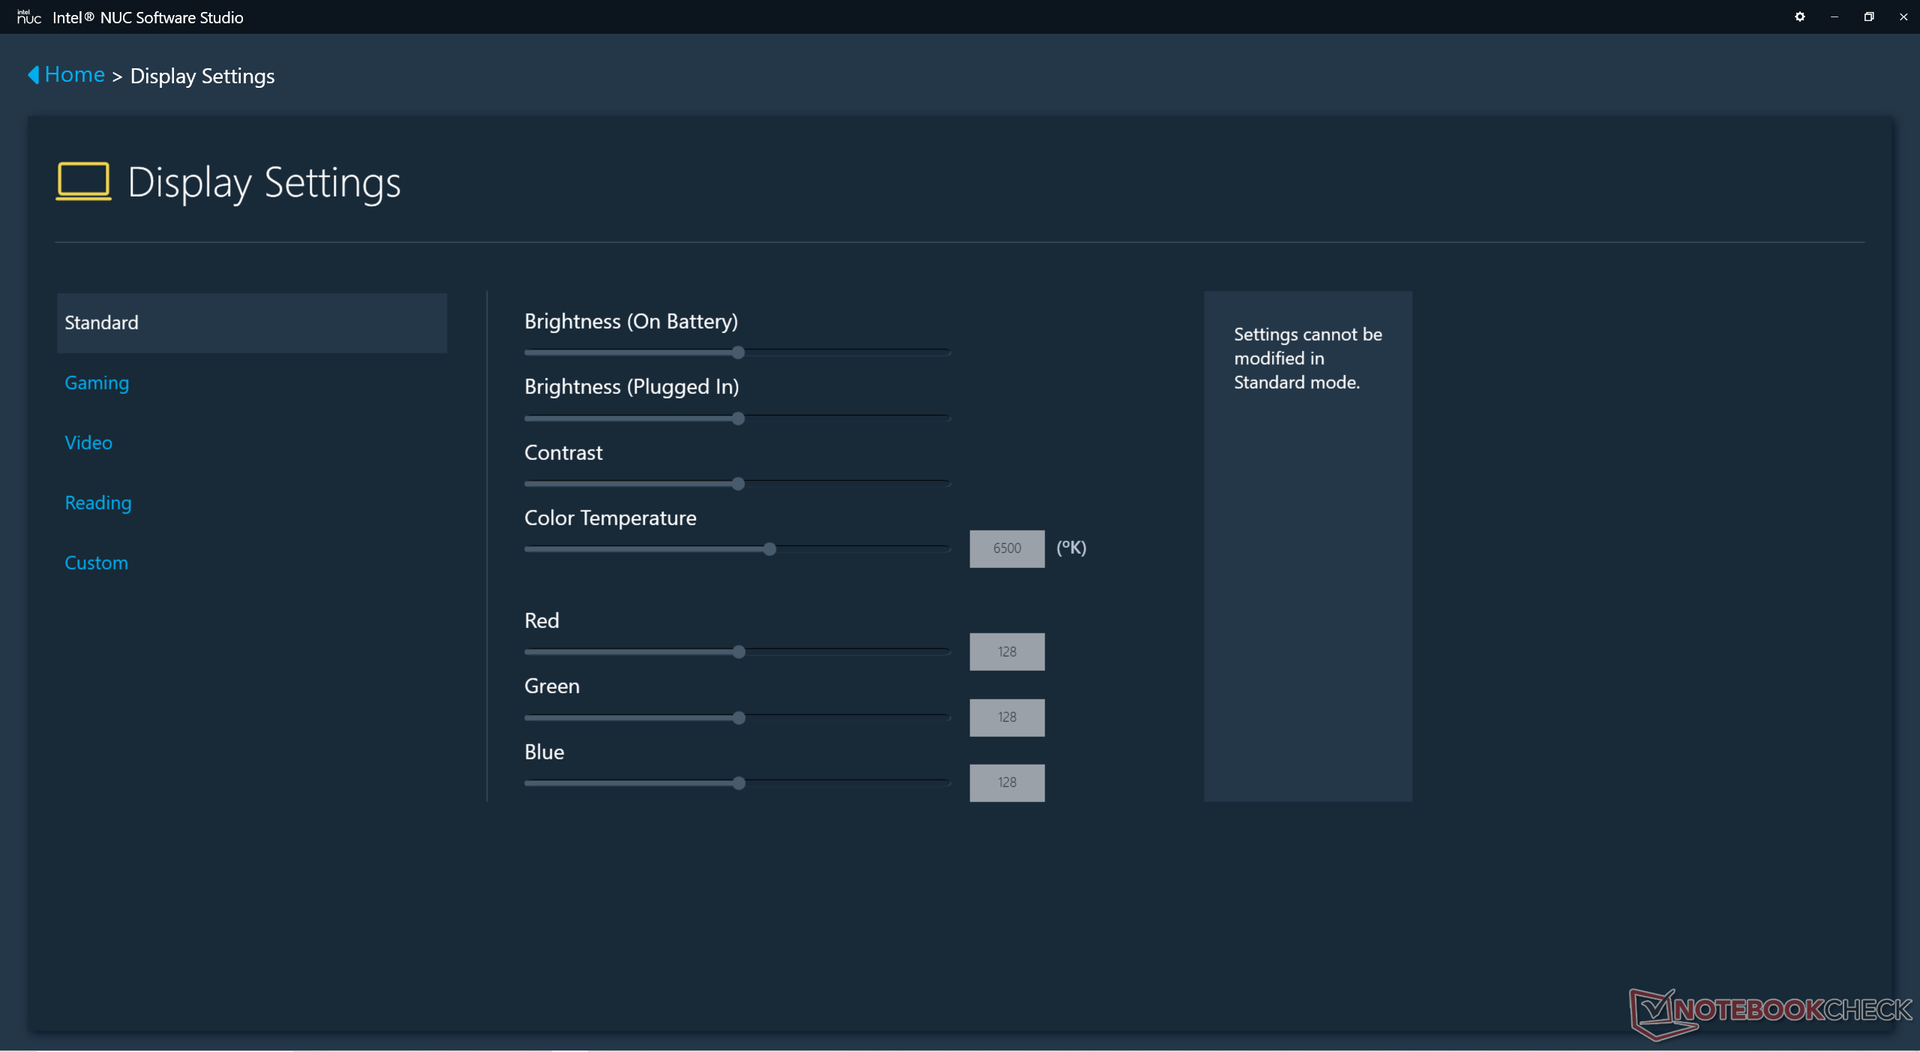
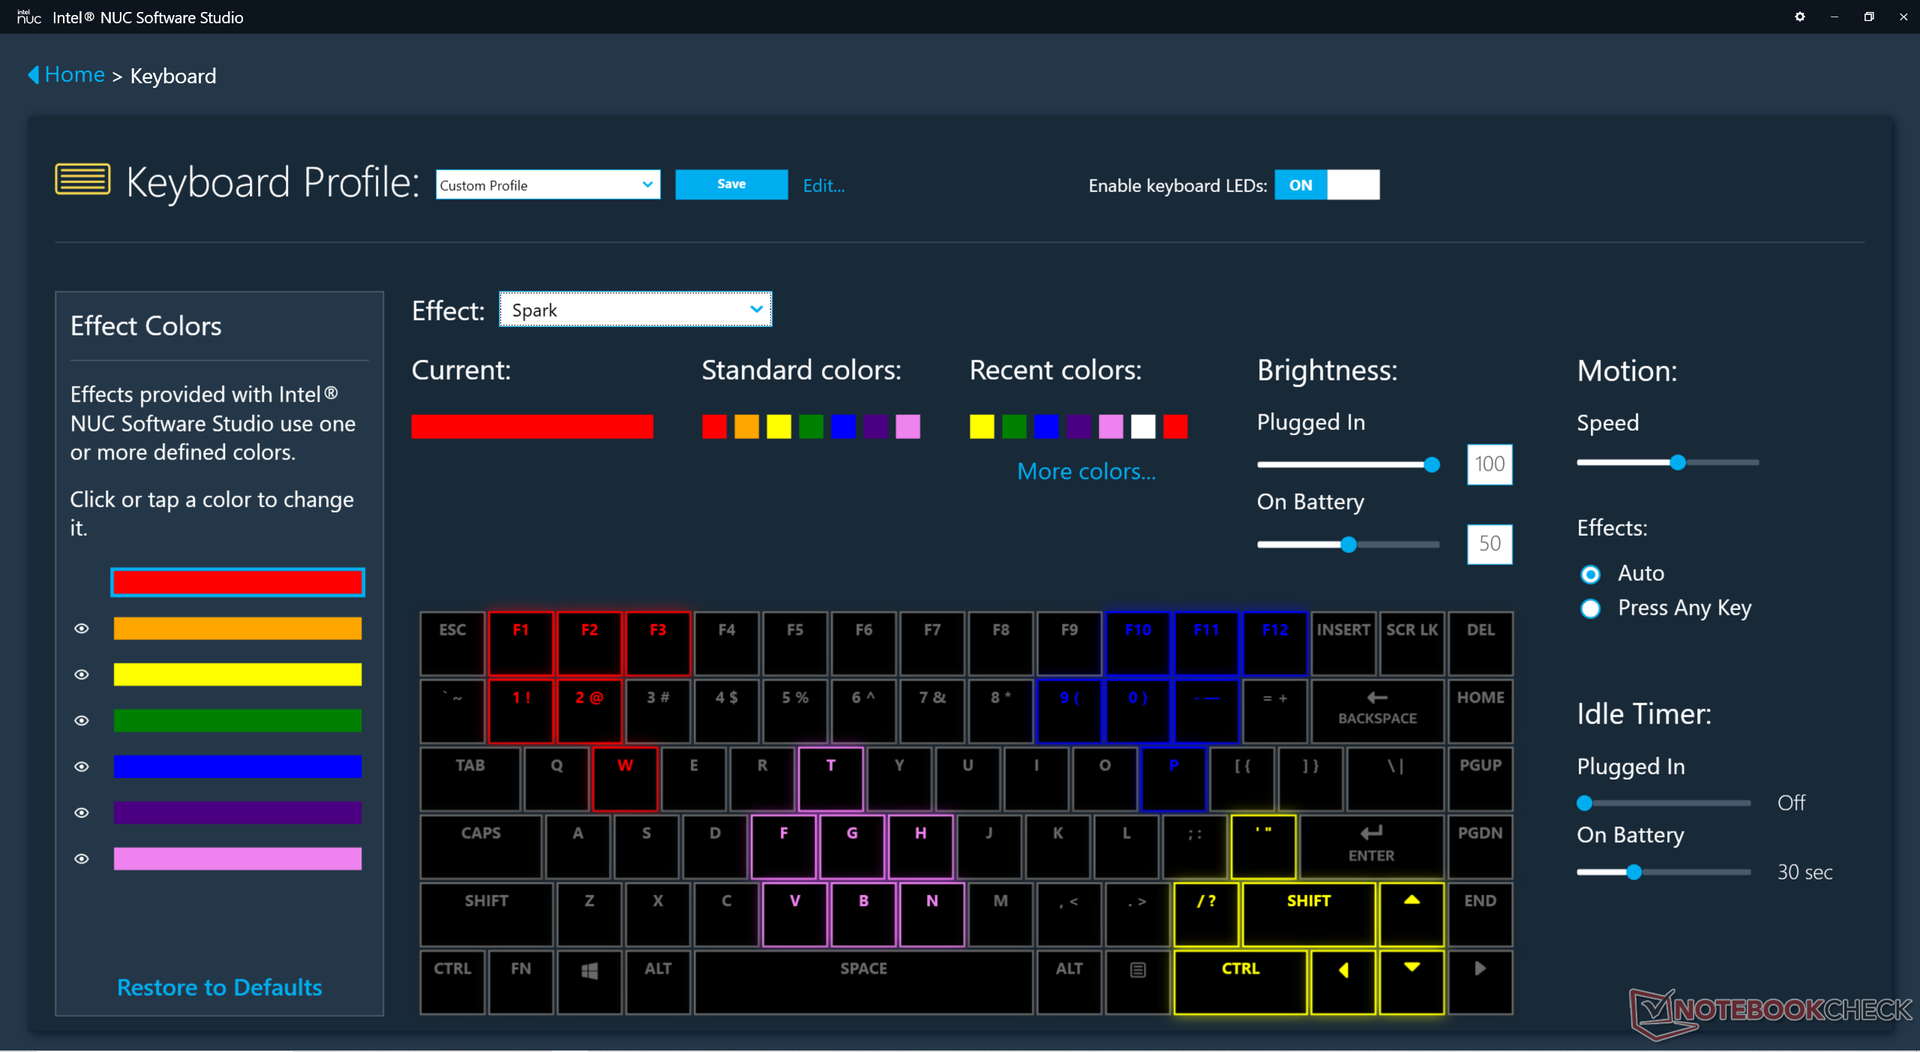
Owners should become familiar with the pre-installed NUC Software Studio application as it is the control center for the laptop. Important features such as per-key RGB lighting, color profiles, battery, and performance are all toggled here. Our unit was set to Performance mode prior to running any benchmarks below. There is a unique "Benchmark Mode" which is just another term for "maximum fan mode", but we left this feature off unless otherwise stated.
Processor
CPU performance is stable and within just a few percentage points of the average laptop in our database equipped with the same Core i7-11800H CPU. A few models can run the processor at higher Turbo Boost clock rates for longer periods such as on the Alienware x15 for almost 20 percent faster multi-thread performance as shown by our CineBench R15 loop results below.
Cinebench R15 Multi Loop
Cinebench R23: Multi Core | Single Core
Cinebench R15: CPU Multi 64Bit | CPU Single 64Bit
Blender: v2.79 BMW27 CPU
7-Zip 18.03: 7z b 4 -mmt1 | 7z b 4
Geekbench 5.5: Single-Core | Multi-Core
HWBOT x265 Benchmark v2.2: 4k Preset
LibreOffice : 20 Documents To PDF
R Benchmark 2.5: Overall mean
| Cinebench R23 / Multi Core | |
| Asus ROG Strix Scar 15 G533QS | |
| MSI GS76 Stealth 11UH | |
| ADATA XPG Xenia 15 | |
| Dell G15 5515 | |
| Average Intel Core i7-11800H (6508 - 14088, n=48) | |
| Schenker XMG Core 15 Ampere | |
| Aorus 15P XC | |
| Razer Blade 15 Base Edition 2021, i7-10750H RTX 3060 | |
| Acer Aspire Nitro 5 AN515-55-57GF | |
| Cinebench R23 / Single Core | |
| MSI GS76 Stealth 11UH | |
| ADATA XPG Xenia 15 | |
| Average Intel Core i7-11800H (1386 - 1522, n=45) | |
| Asus ROG Strix Scar 15 G533QS | |
| Dell G15 5515 | |
| Schenker XMG Core 15 Ampere | |
| Aorus 15P XC | |
| Razer Blade 15 Base Edition 2021, i7-10750H RTX 3060 | |
| Acer Aspire Nitro 5 AN515-55-57GF | |
| Geekbench 5.5 / Single-Core | |
| MSI GS76 Stealth 11UH | |
| Average Intel Core i7-11800H (1429 - 1625, n=40) | |
| Dell G15 5515 | |
| Aorus 15P XC | |
| Razer Blade 15 Base Edition 2021, i7-10750H RTX 3060 | |
| Asus Zephyrus S15 GX502L | |
| Schenker XMG Core 15 Ampere | |
| Acer Aspire Nitro 5 AN515-55-57GF | |
| Schenker XMG Pro 15 | |
| Geekbench 5.5 / Multi-Core | |
| MSI GS76 Stealth 11UH | |
| Average Intel Core i7-11800H (4655 - 9851, n=40) | |
| Schenker XMG Core 15 Ampere | |
| Aorus 15P XC | |
| Asus Zephyrus S15 GX502L | |
| Dell G15 5515 | |
| Schenker XMG Pro 15 | |
| Razer Blade 15 Base Edition 2021, i7-10750H RTX 3060 | |
| Acer Aspire Nitro 5 AN515-55-57GF | |
| HWBOT x265 Benchmark v2.2 / 4k Preset | |
| Asus ROG Strix Scar 15 G533QS | |
| ADATA XPG Xenia 15 | |
| MSI GS76 Stealth 11UH | |
| Dell G15 5515 | |
| Average Intel Core i7-11800H (7.38 - 17.4, n=46) | |
| Schenker XMG Core 15 Ampere | |
| Asus Zephyrus S15 GX502L | |
| Aorus 15P XC | |
| Schenker XMG Pro 15 | |
| Razer Blade 15 Base Edition 2021, i7-10750H RTX 3060 | |
| Acer Aspire Nitro 5 AN515-55-57GF | |
| LibreOffice / 20 Documents To PDF | |
| Dell G15 5515 | |
| Acer Aspire Nitro 5 AN515-55-57GF | |
| Schenker XMG Core 15 Ampere | |
| Aorus 15P XC | |
| Asus ROG Strix Scar 15 G533QS | |
| MSI GS76 Stealth 11UH | |
| Razer Blade 15 Base Edition 2021, i7-10750H RTX 3060 | |
| Asus Zephyrus S15 GX502L | |
| Average Intel Core i7-11800H (38.6 - 59.9, n=45) | |
| ADATA XPG Xenia 15 | |
* ... smaller is better
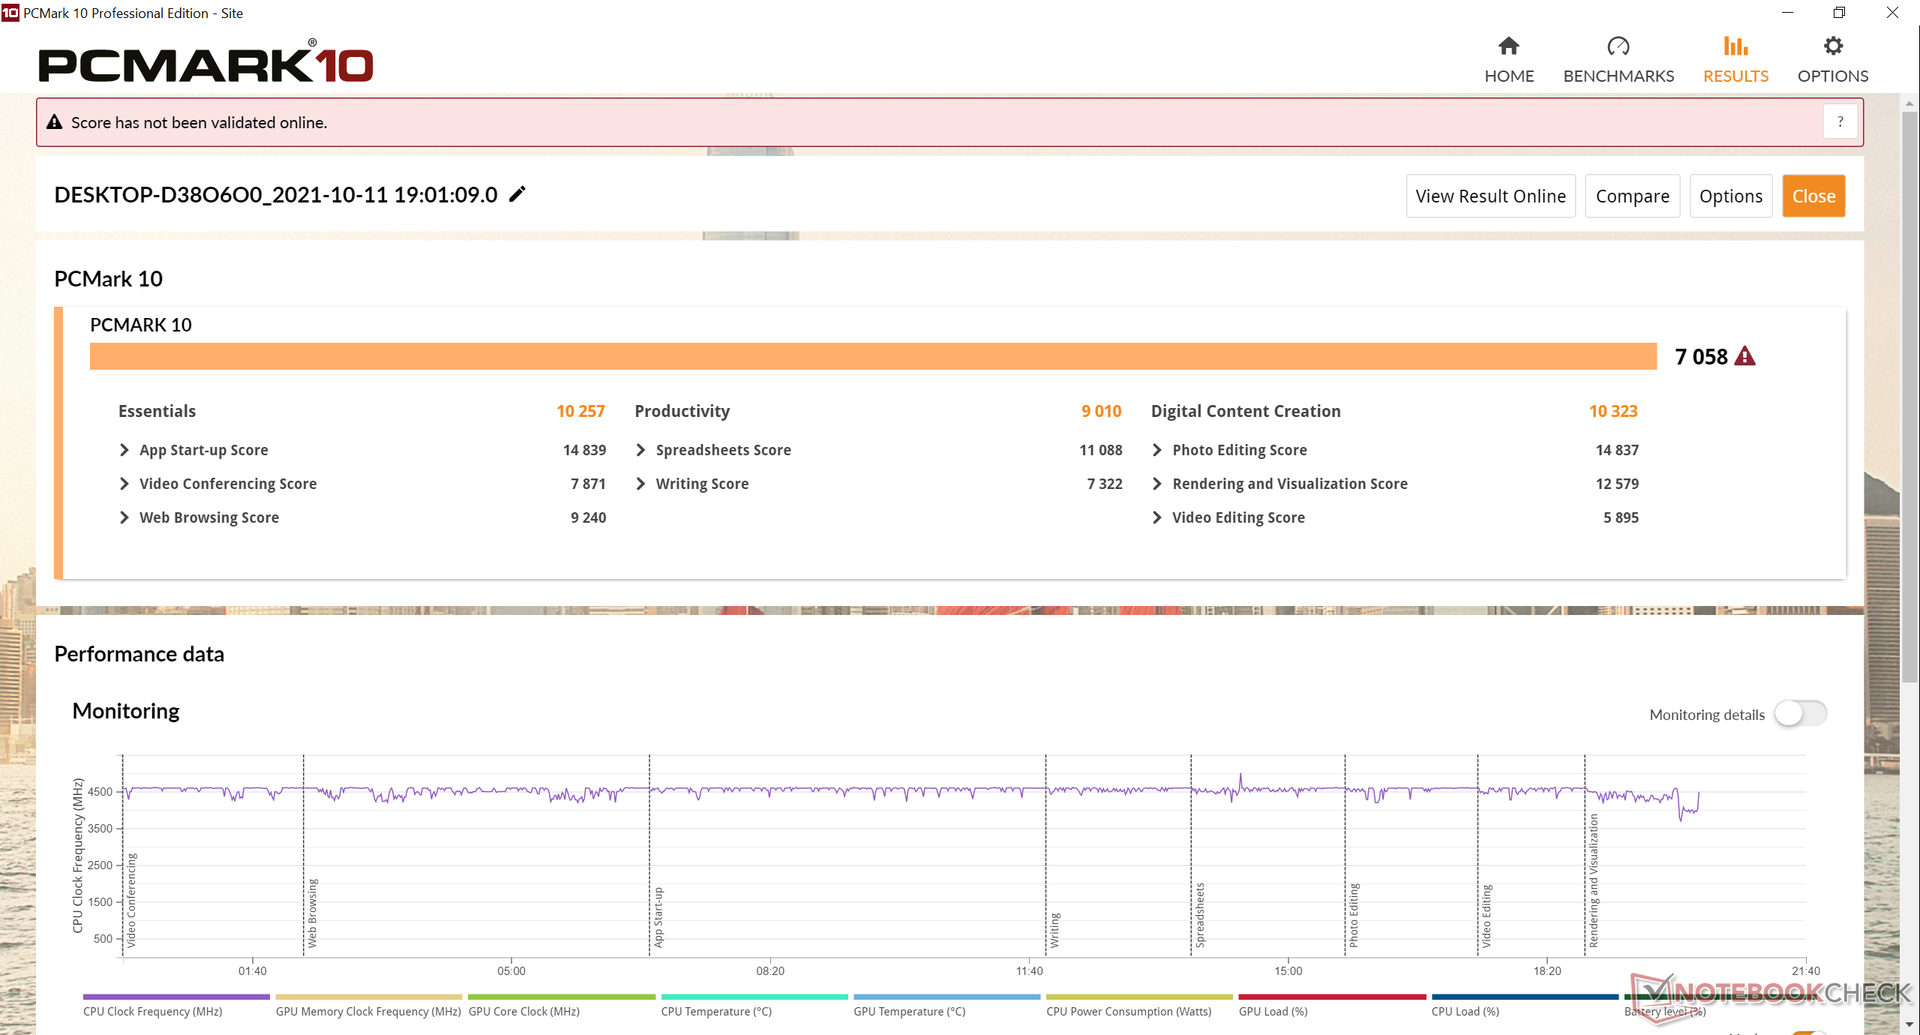
System Performance
PCMark results are excellent and comparable to other high-end gaming laptops with GeForce RTX graphics. We appreciate the lack of any pre-installed bloatware as well.
| PCMark 10 / Score | |
| Razer Blade 15 Advanced (Mid 2021) | |
| MSI Delta 15 A5EFK | |
| Alienware x15 RTX 3070 P111F | |
| ADATA XPG Xenia 15 | |
| Average Intel Core i7-11800H, NVIDIA GeForce RTX 3070 Laptop GPU (6126 - 7311, n=11) | |
| Asus ROG Zephyrus G15 GA503Q | |
| MSI GS66 Stealth 10UG | |
| PCMark 10 / Essentials | |
| Razer Blade 15 Advanced (Mid 2021) | |
| MSI Delta 15 A5EFK | |
| Alienware x15 RTX 3070 P111F | |
| ADATA XPG Xenia 15 | |
| Asus ROG Zephyrus G15 GA503Q | |
| Average Intel Core i7-11800H, NVIDIA GeForce RTX 3070 Laptop GPU (9248 - 10832, n=11) | |
| MSI GS66 Stealth 10UG | |
| PCMark 10 / Productivity | |
| MSI Delta 15 A5EFK | |
| Asus ROG Zephyrus G15 GA503Q | |
| Average Intel Core i7-11800H, NVIDIA GeForce RTX 3070 Laptop GPU (8571 - 9669, n=11) | |
| Alienware x15 RTX 3070 P111F | |
| Razer Blade 15 Advanced (Mid 2021) | |
| ADATA XPG Xenia 15 | |
| MSI GS66 Stealth 10UG | |
| PCMark 10 / Digital Content Creation | |
| Alienware x15 RTX 3070 P111F | |
| Razer Blade 15 Advanced (Mid 2021) | |
| MSI Delta 15 A5EFK | |
| ADATA XPG Xenia 15 | |
| Average Intel Core i7-11800H, NVIDIA GeForce RTX 3070 Laptop GPU (7627 - 10851, n=11) | |
| Asus ROG Zephyrus G15 GA503Q | |
| MSI GS66 Stealth 10UG | |
| PCMark 10 Score | 7058 points | |
Help | ||
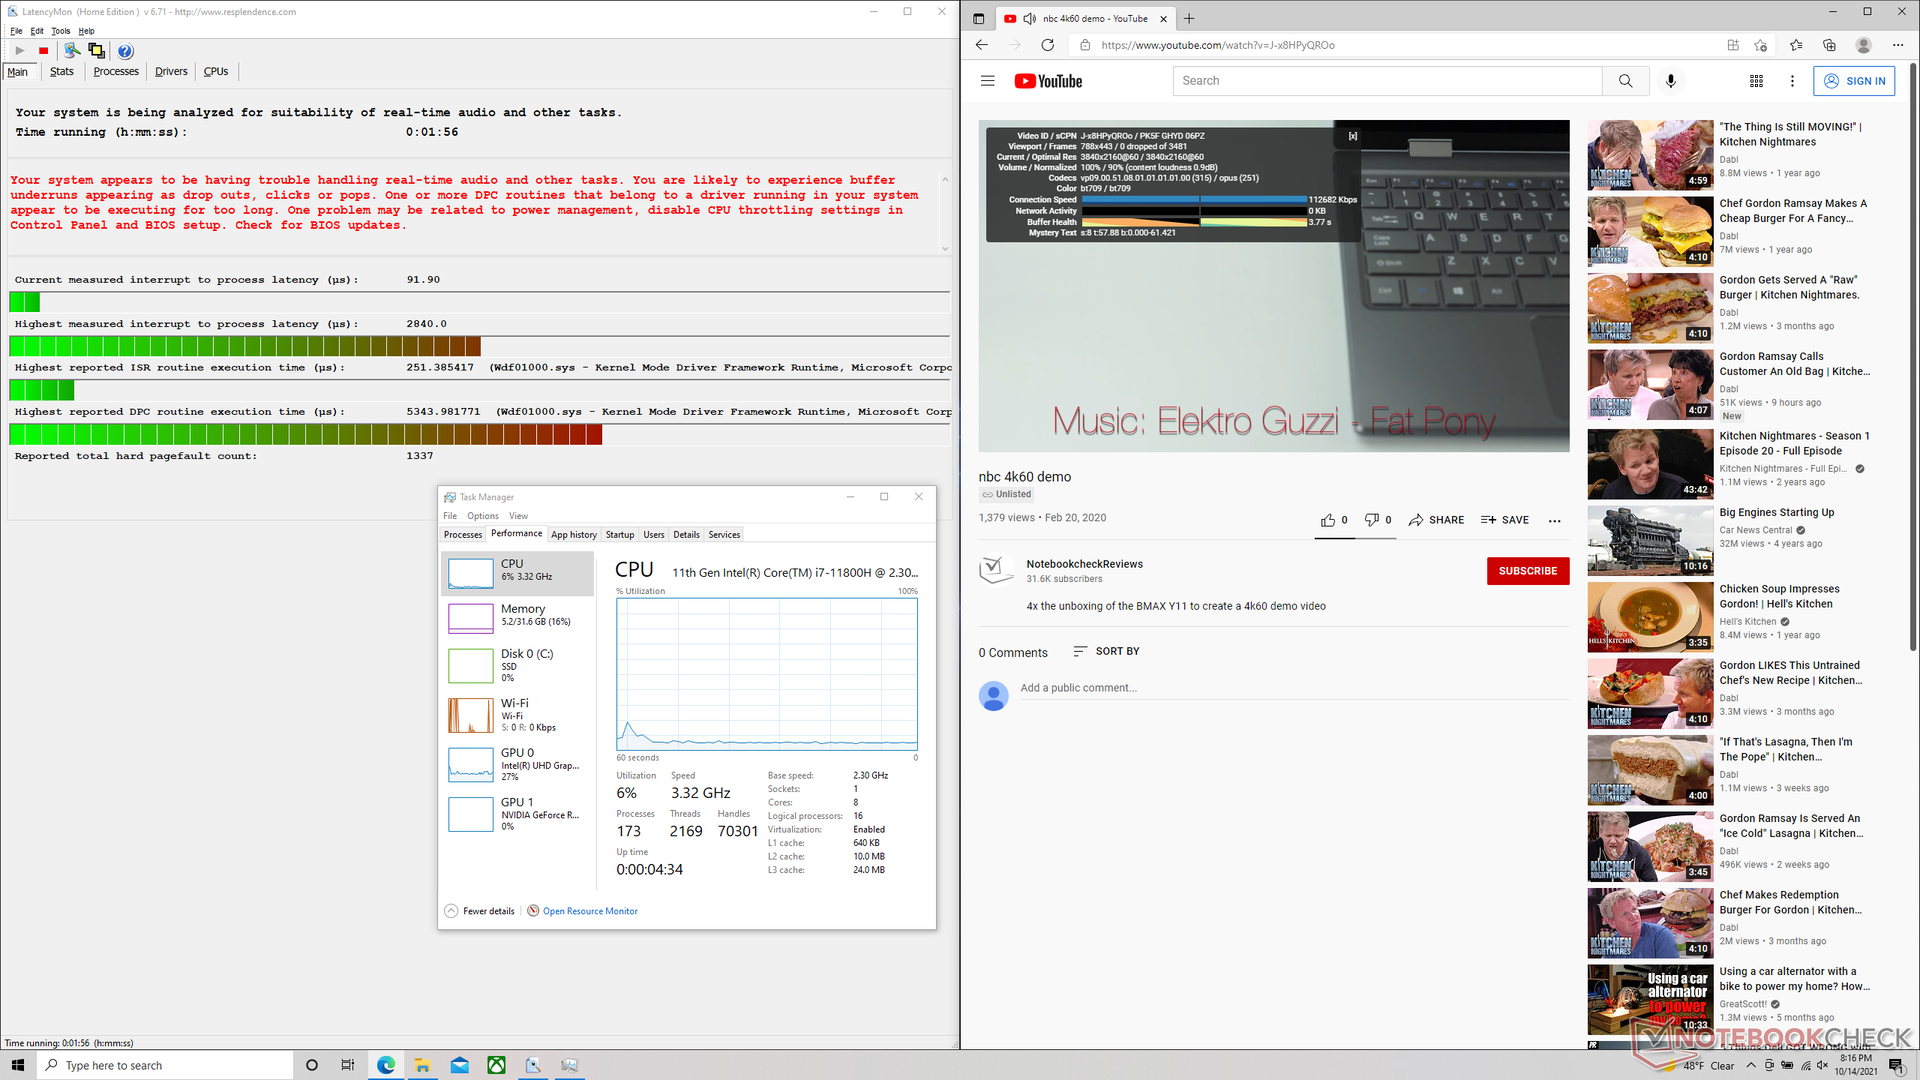
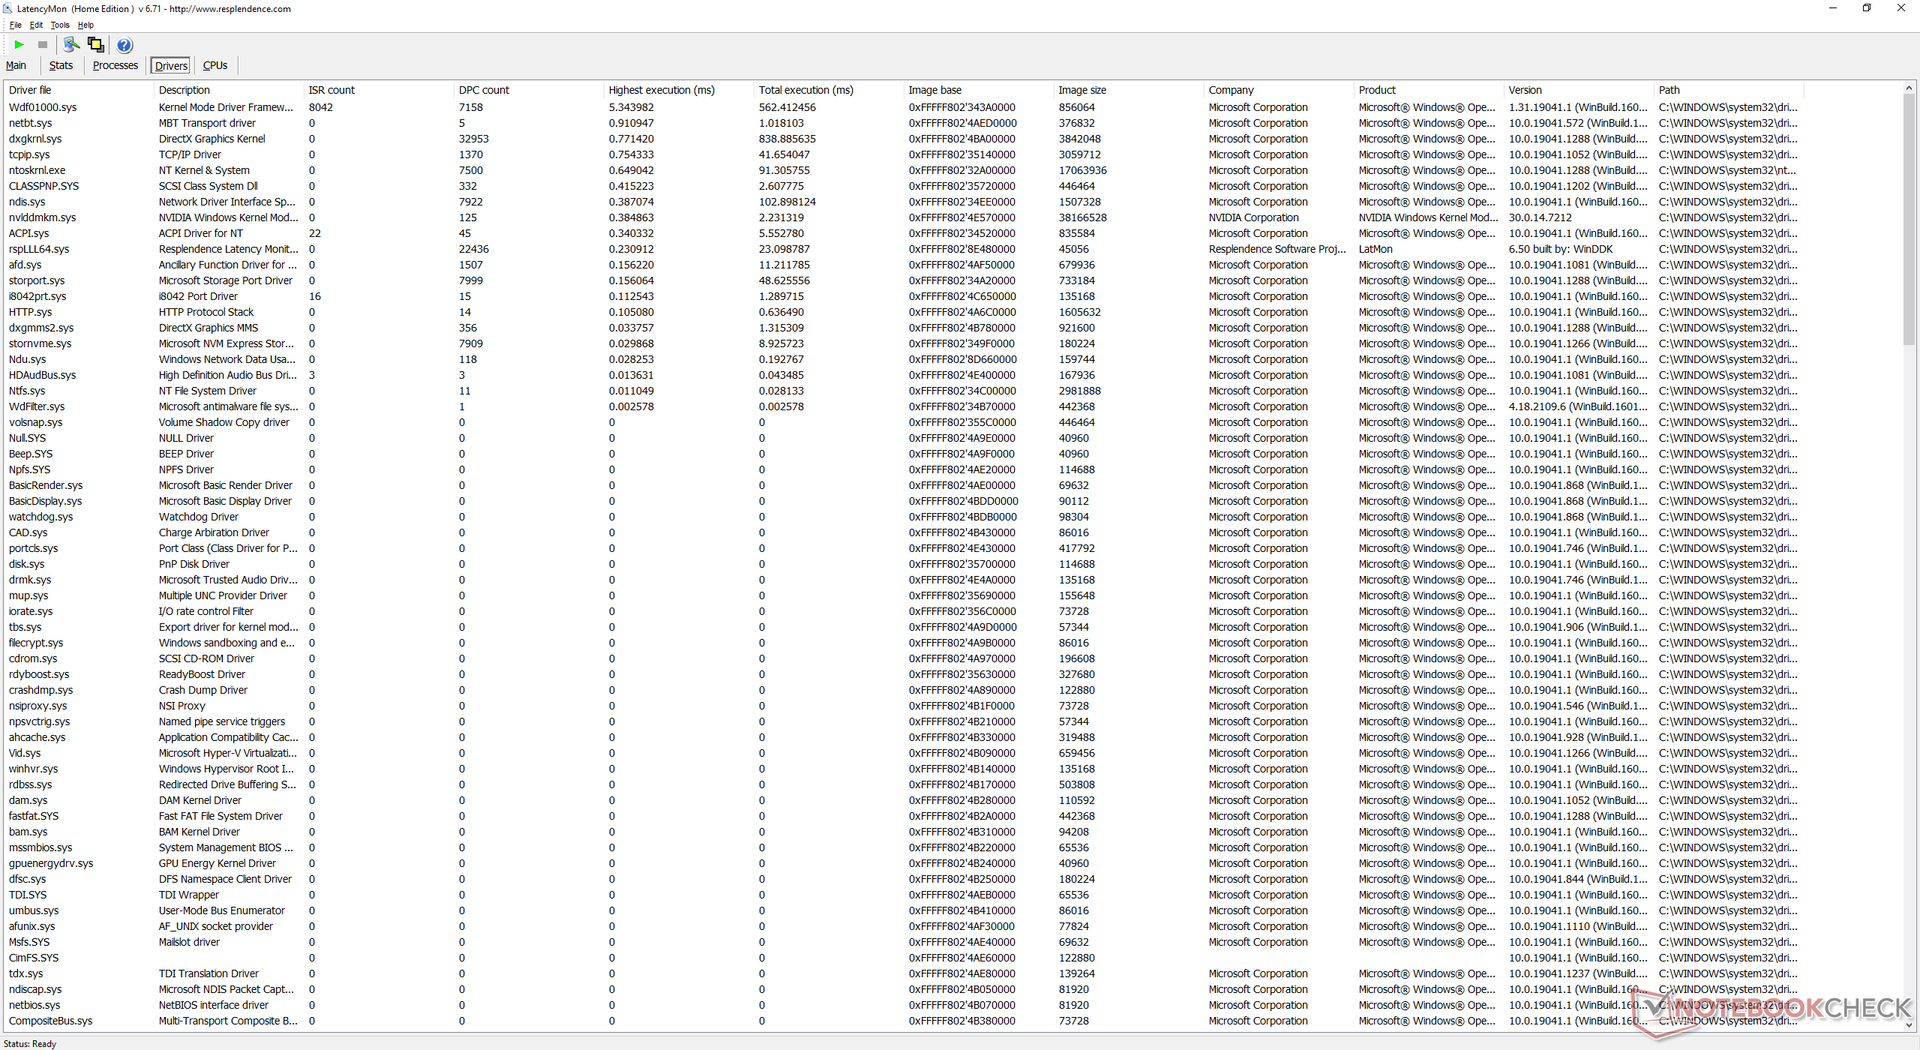
DPC Latency
LatencyMon reveals issues when opening multiple browser tabs on our homepage while 4K video playback at 60 FPS is otherwise silky smooth and with no dropped frames.
| DPC Latencies / LatencyMon - interrupt to process latency (max), Web, Youtube, Prime95 | |
| Razer Blade 15 Advanced (Mid 2021) | |
| ADATA XPG Xenia 15 | |
| MSI Delta 15 A5EFK | |
| Alienware x15 RTX 3070 P111F | |
| MSI GS66 Stealth 10UG | |
| Asus ROG Zephyrus G15 GA503Q | |
* ... smaller is better
Storage Devices — Up to Two M.2 NVMe SSDs
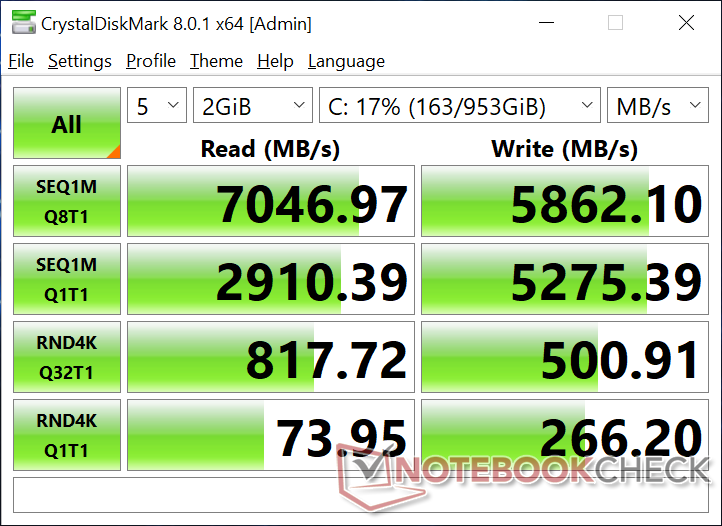
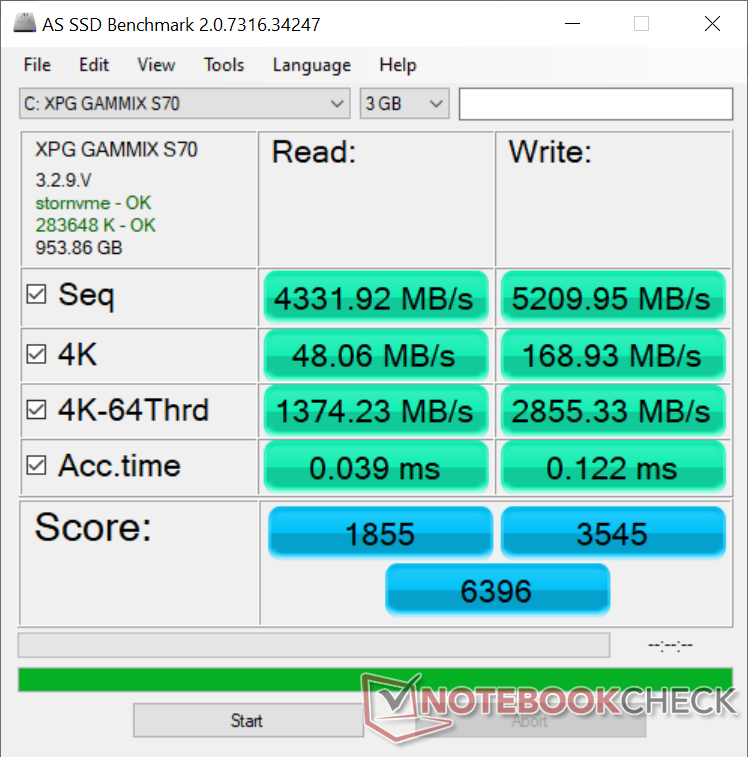
All SKUs come with a Gammix S70 PCIe4 NVMe SSD from ADATA which is an upgrade from the Gammix S50 series as found on the smaller Xenia 14. The 1 TB model on our test unit can reach read and write rates of up to 7000 MB/s and 6000 MB/s, respectively, compared to 7000 MB/s and 5200 MB/s on the competing Samsung PM9A1. This is certainly one of the fastest drives you can find on a consumer laptop at the moment. There is no heat spreader, however, unlike on larger laptops like the Alienware x15 or HP ZBook Fury 15 G8.
| ADATA XPG Xenia 15 ADATA XPG Gammix S70 1TB | MSI Delta 15 A5EFK Micron 2210 MTFDHBA1T0QFD | Razer Blade 15 Advanced (Mid 2021) SSSTC CA6-8D1024 | MSI GS66 Stealth 10UG WDC PC SN730 SDBPNTY-1T00 | Asus ROG Zephyrus G15 GA503Q SK Hynix HFM001TD3JX013N | |
|---|---|---|---|---|---|
| AS SSD | -39% | 36% | -8% | -16% | |
| Seq Read (MB/s) | 4332 | 2023 -53% | 5739 32% | 2198 -49% | 2950 -32% |
| Seq Write (MB/s) | 5210 | 1836 -65% | 4201 -19% | 2596 -50% | 1600 -69% |
| 4K Read (MB/s) | 48.06 | 56.4 17% | 53.8 12% | 43.81 -9% | 53.6 12% |
| 4K Write (MB/s) | 168.9 | 130.2 -23% | 179.2 6% | 115.5 -32% | 126.8 -25% |
| 4K-64 Read (MB/s) | 1374 | 899 -35% | 2959 115% | 1692 23% | 1429 4% |
| 4K-64 Write (MB/s) | 2855 | 1164 -59% | 1891 -34% | 2162 -24% | 2177 -24% |
| Access Time Read * (ms) | 0.039 | 0.096 -146% | 0.027 31% | 0.056 -44% | 0.064 -64% |
| Access Time Write * (ms) | 0.122 | 0.031 75% | 0.154 -26% | 0.098 20% | 0.029 76% |
| Score Read (Points) | 1855 | 1158 -38% | 3587 93% | 1956 5% | 1778 -4% |
| Score Write (Points) | 3545 | 1478 -58% | 2490 -30% | 2537 -28% | 2464 -30% |
| Score Total (Points) | 6396 | 3233 -49% | 7821 22% | 5513 -14% | 5090 -20% |
| Copy ISO MB/s (MB/s) | 2261 | 3027 34% | 2236 -1% | ||
| Copy Program MB/s (MB/s) | 408.3 | 1177 188% | 690 69% | ||
| Copy Game MB/s (MB/s) | 1241 | 2170 75% | 1546 25% | ||
| CrystalDiskMark 5.2 / 6 | -46% | 8% | -40% | -34% | |
| Write 4K (MB/s) | 264.7 | 136.2 -49% | 295.6 12% | 163.1 -38% | 156.4 -41% |
| Read 4K (MB/s) | 74 | 59.9 -19% | 85.7 16% | 48.97 -34% | 66.7 -10% |
| Write Seq (MB/s) | 5268 | 1846 -65% | 4149 -21% | 2607 -51% | 2318 -56% |
| Read Seq (MB/s) | 2878 | 1714 -40% | 4203 46% | 2316 -20% | 2151 -25% |
| Write 4K Q32T1 (MB/s) | 501 | 344.2 -31% | 715 43% | 338 -33% | 525 5% |
| Read 4K Q32T1 (MB/s) | 819 | 582 -29% | 709 -13% | 475.6 -42% | 452.1 -45% |
| Write Seq Q32T1 (MB/s) | 5862 | 1874 -68% | 4681 -20% | 3090 -47% | 3055 -48% |
| Read Seq Q32T1 (MB/s) | 7060 | 2096 -70% | 6905 -2% | 3421 -52% | 3607 -49% |
| Total Average (Program / Settings) | -43% /
-42% | 22% /
25% | -24% /
-19% | -25% /
-23% |
* ... smaller is better

Disk Throttling: DiskSpd Read Loop, Queue Depth 8
GPU Performance — Close to a GeForce RTX 3080
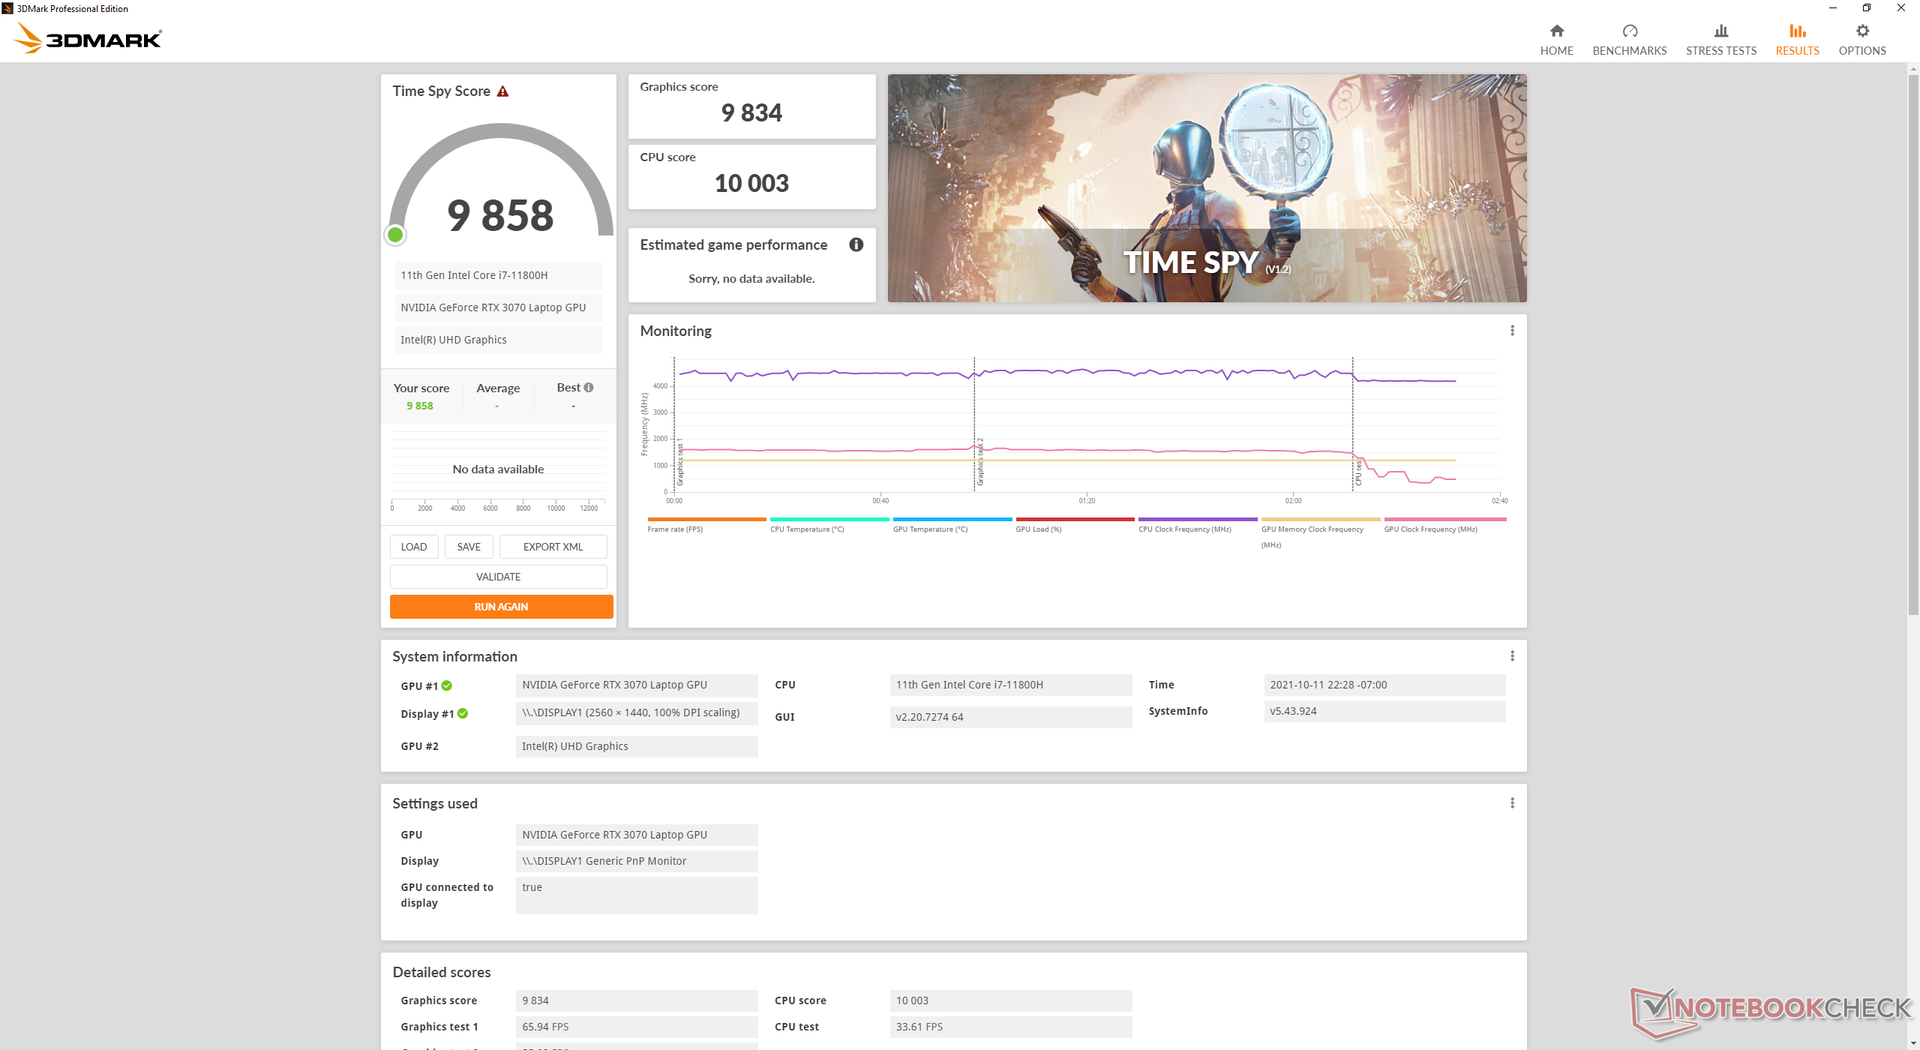
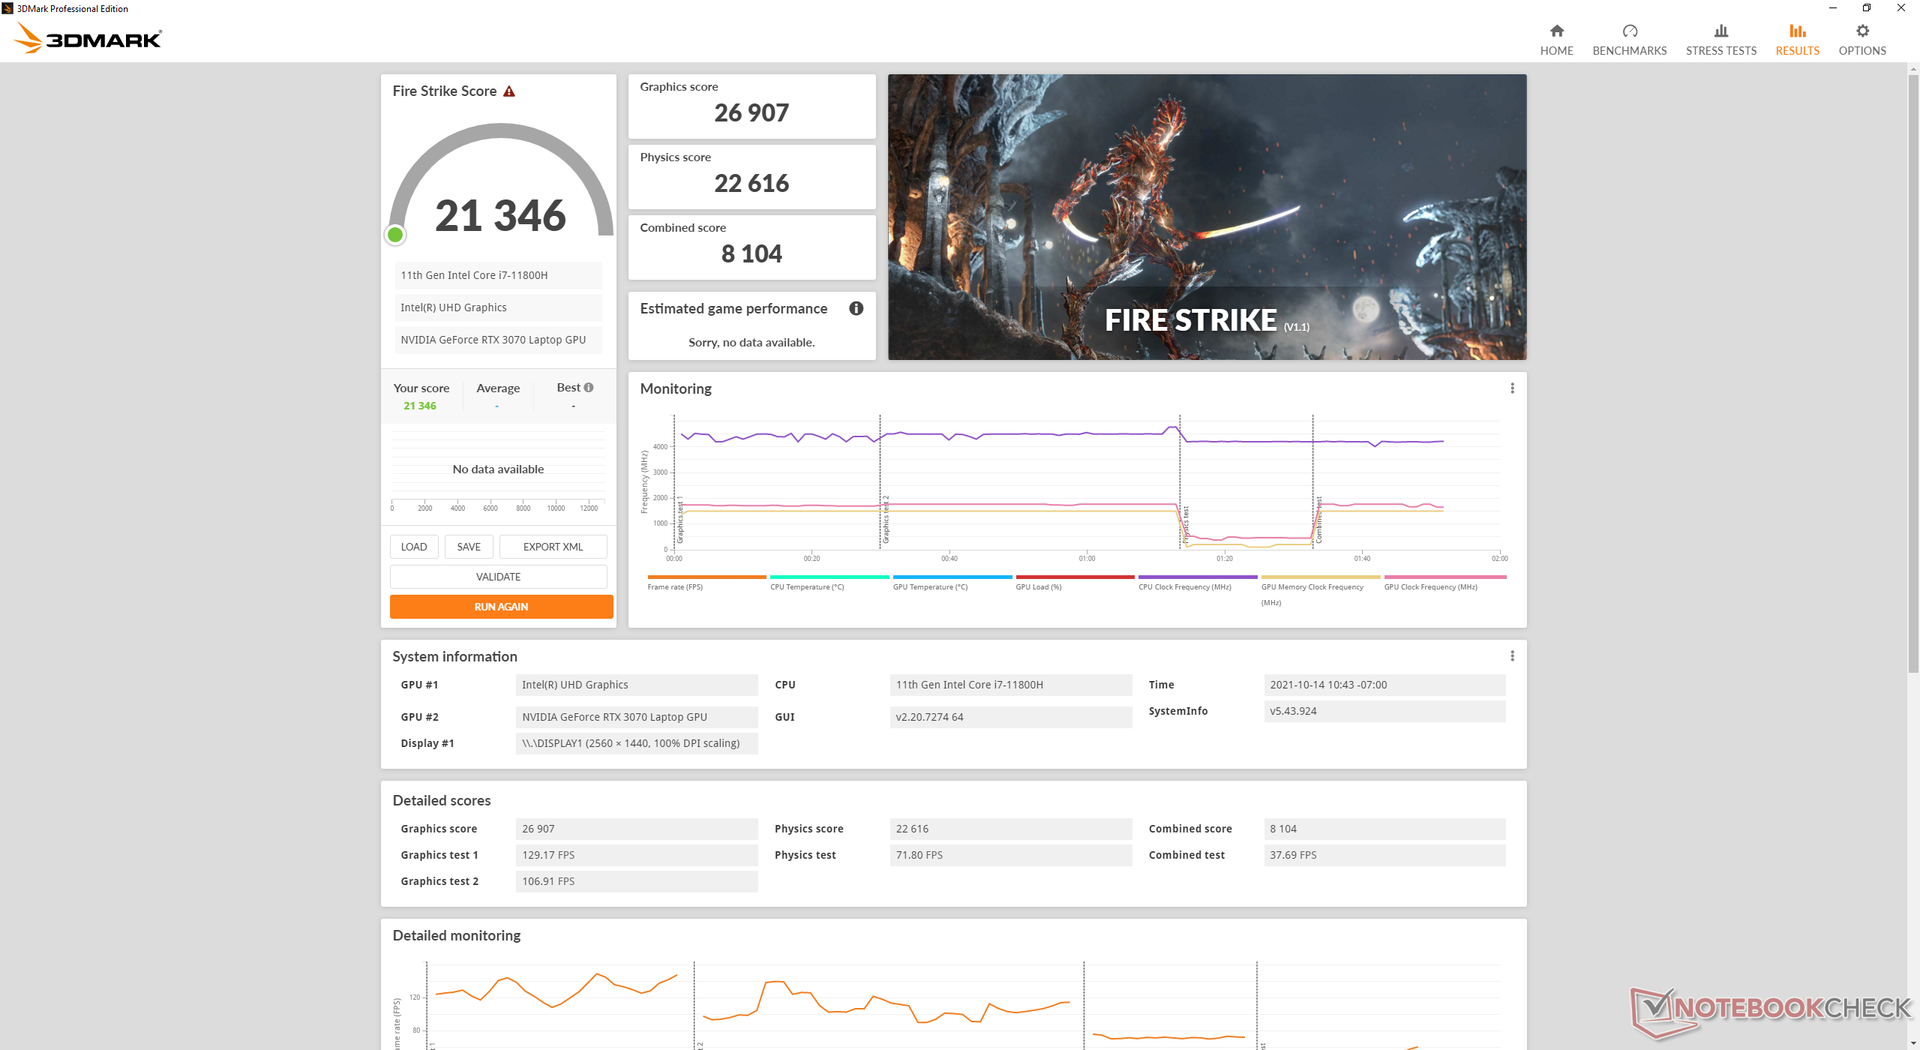
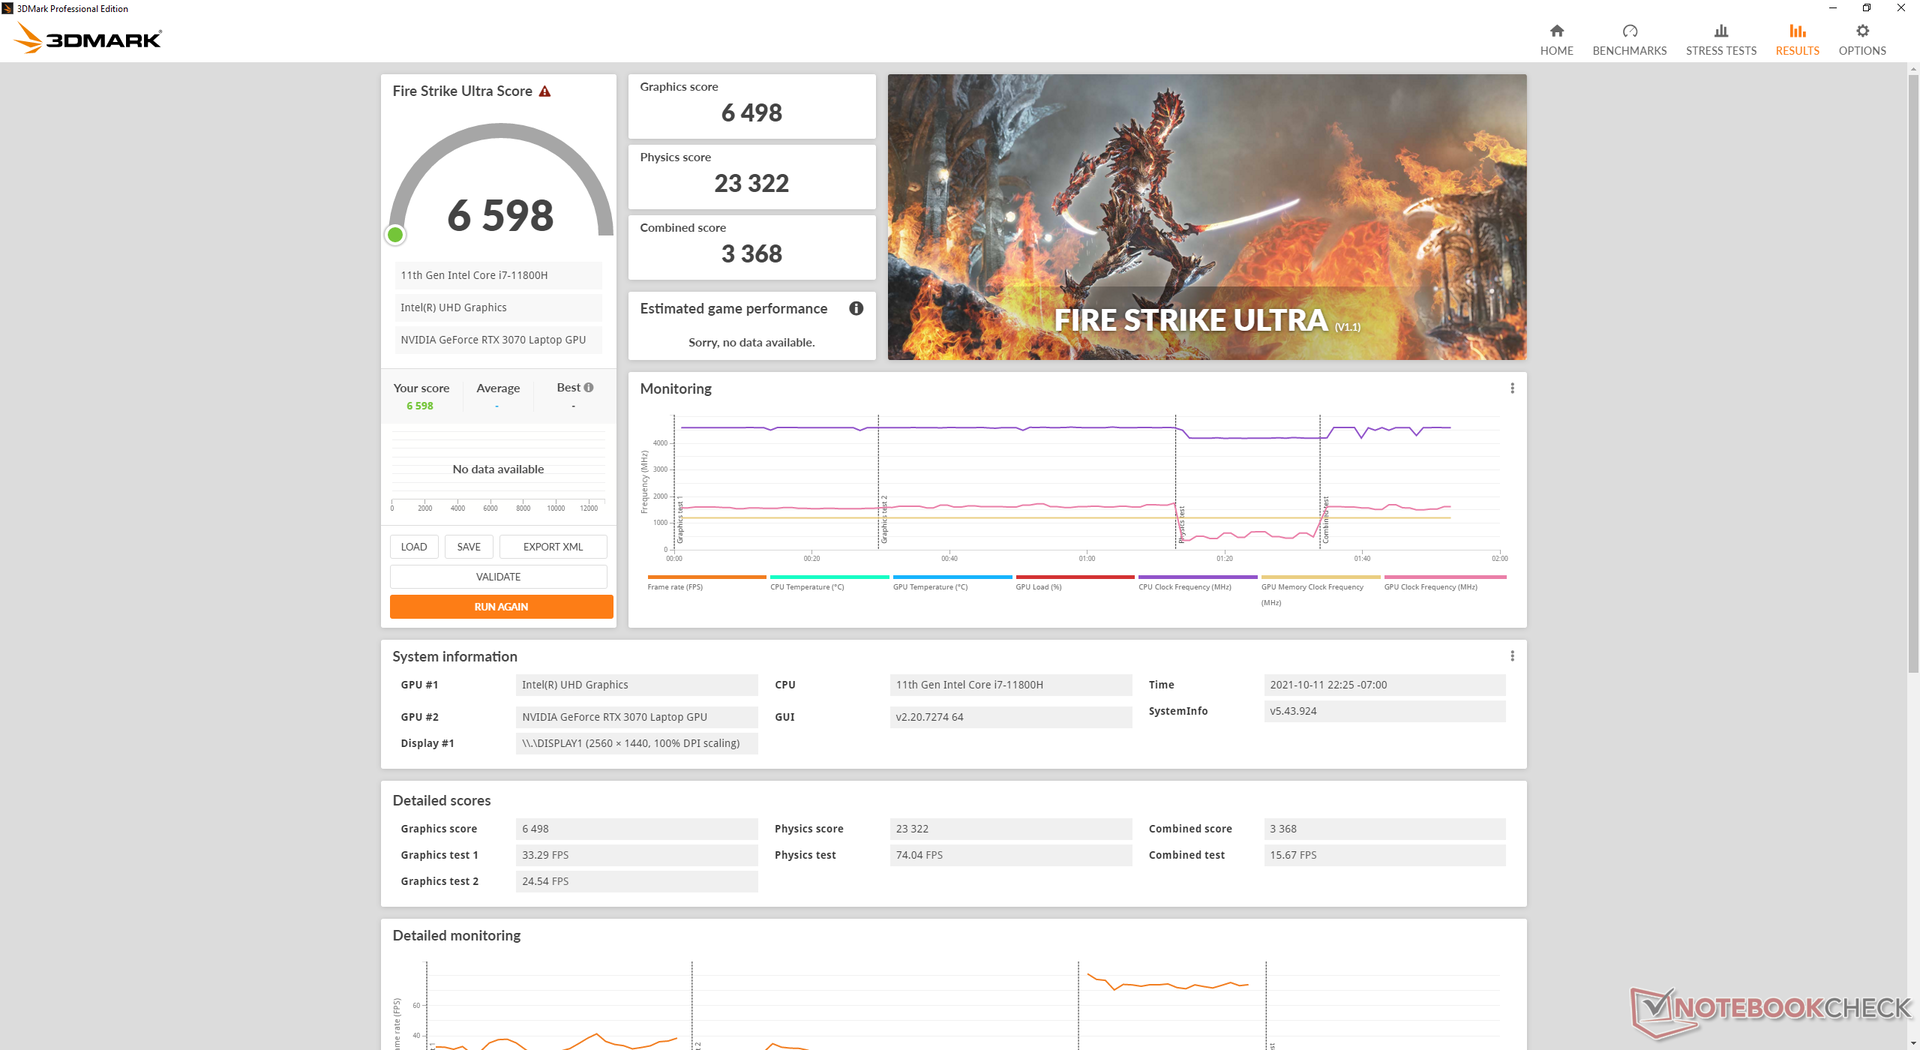
The mobile GeForce RTX 3070 is performing where we expect it to be relative to other laptops with the same GPU if not just slightly faster. Performance is even faster when "Benchmark Mode" is enabled albeit by just the smallest of margins (26126 vs. 26907 points in Fire Strike).
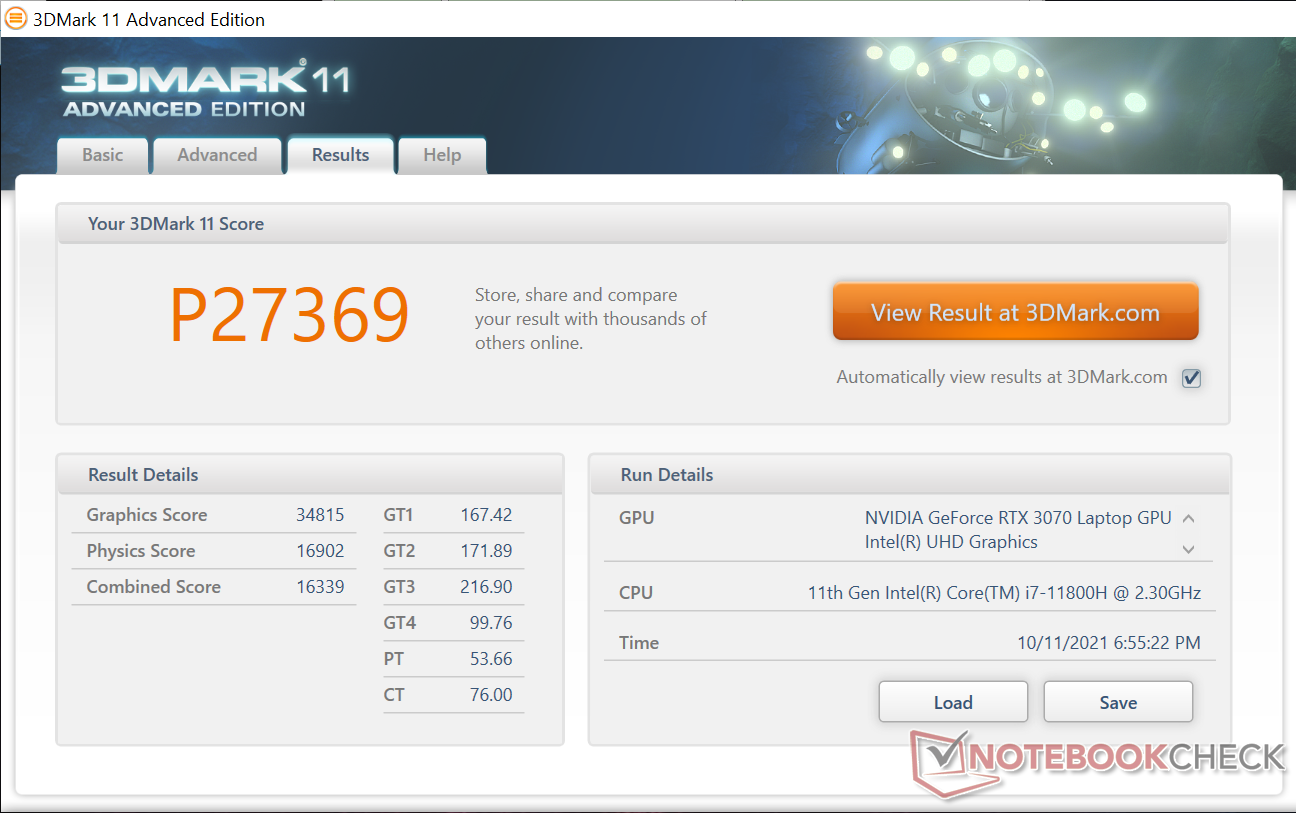
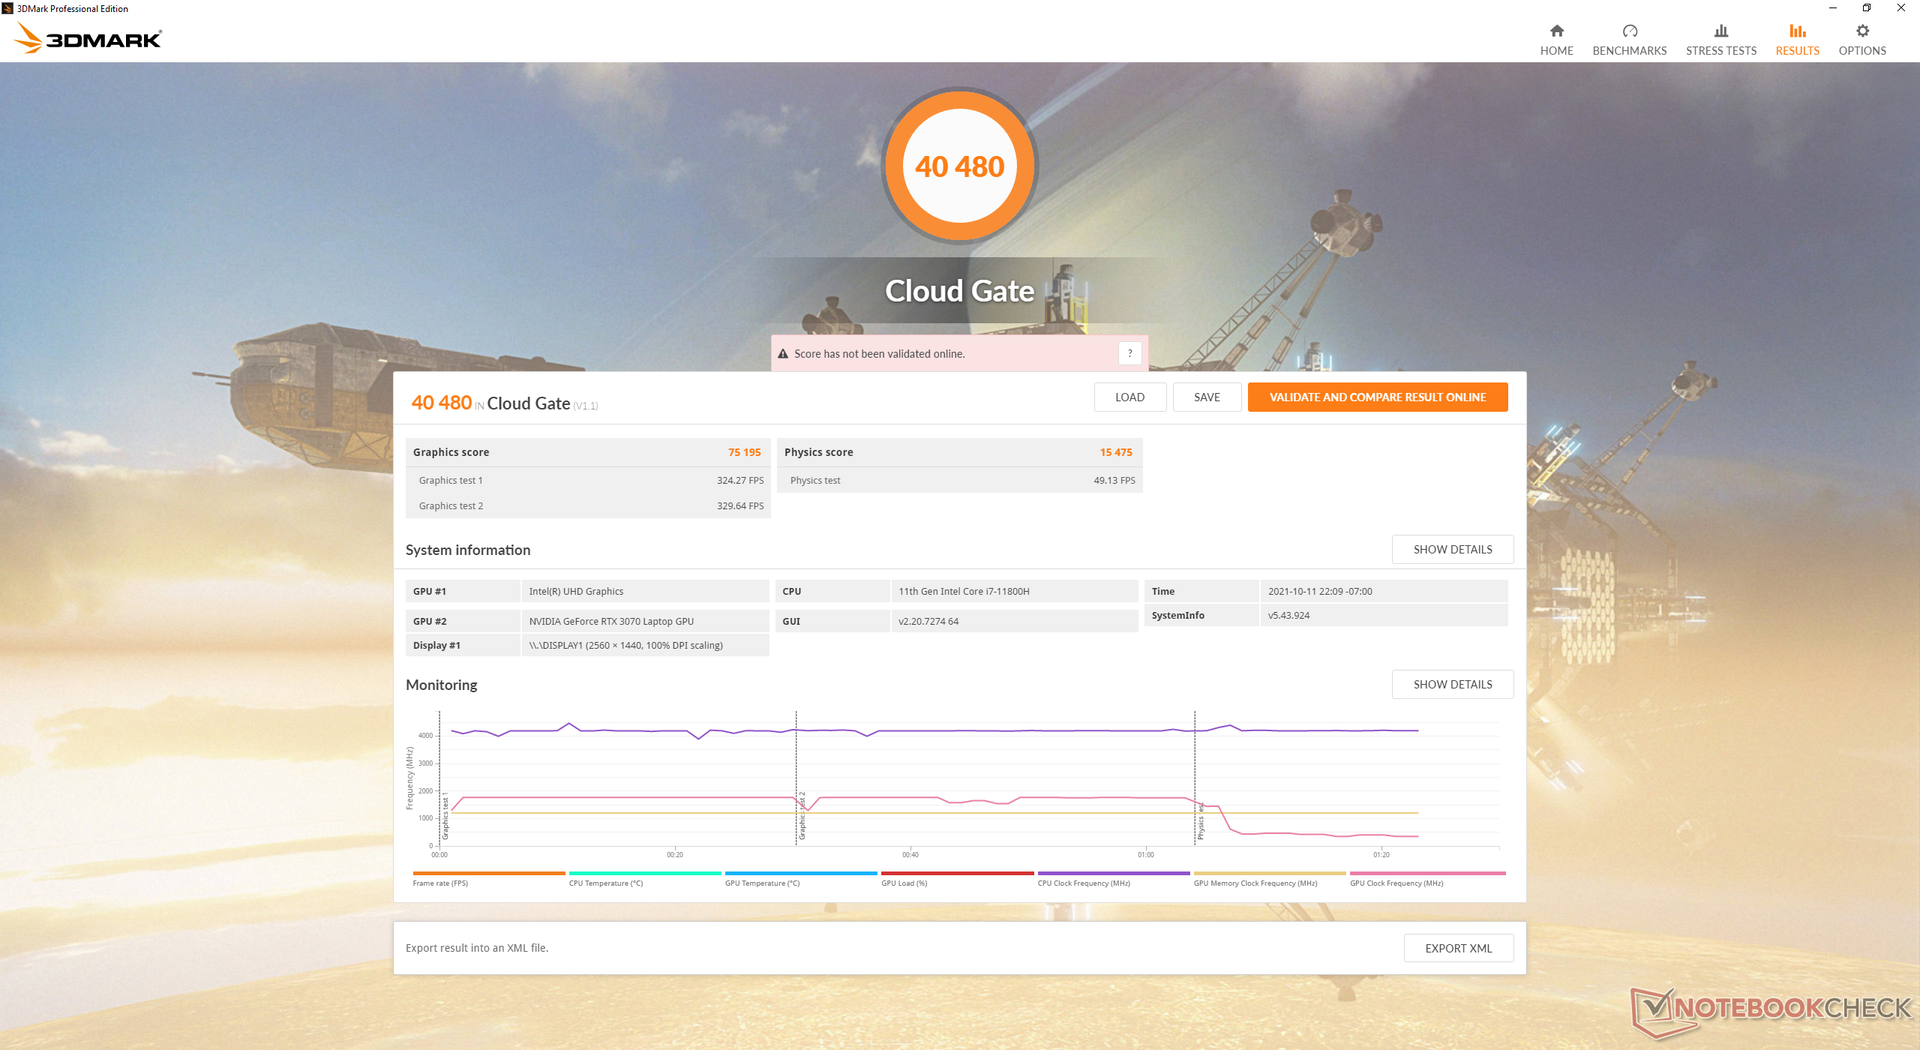

| 3DMark 11 Performance | 27369 points | |
| 3DMark Cloud Gate Standard Score | 40480 points | |
| 3DMark Fire Strike Score | 20893 points | |
| 3DMark Time Spy Score | 9858 points | |
Help | ||
Witcher 3 FPS Chart
| low | med. | high | ultra | QHD | |
|---|---|---|---|---|---|
| GTA V (2015) | 180 | 173 | 159 | 95.4 | 85.4 |
| The Witcher 3 (2015) | 376.6 | 279.6 | 181 | 94.8 | |
| Dota 2 Reborn (2015) | 160 | 141 | 134 | 127 | |
| Final Fantasy XV Benchmark (2018) | 171 | 125 | 93.5 | 71.9 | |
| X-Plane 11.11 (2018) | 103 | 94.2 | 75.2 | ||
| Far Cry 5 (2018) | 145 | 116 | 111 | 105 | 91 |
| Strange Brigade (2018) | 406 | 231 | 192 | 170 | 128 |
Emissions
System Noise — Loud Gamer
The fans do an excellent job at remaining quiet for as long as possible when under low to medium loads. When running 3DMark 06, for example, the fan noise would remain just under 29 dB(A) compared to over 40 dB(A) on the Blade 15 or Zephyrus G15. This could explain the warmer than usual surface temperatures below when idling on desktop or web browsing.
Fan noise when gaming is loud even for a gaming laptop. Running Witcher 3 results in a stable fan noise of almost 53 dB(A) compared to 46 dB(A) on the Blade 15 or GS66. Fan noise becomes even louder when Benchmark Mode is enabled at almost 55 dB(A).
| ADATA XPG Xenia 15 GeForce RTX 3070 Laptop GPU, i7-11800H, ADATA XPG Gammix S70 1TB | MSI Delta 15 A5EFK Radeon RX 6700M, R9 5900HX, Micron 2210 MTFDHBA1T0QFD | Alienware x15 RTX 3070 P111F GeForce RTX 3070 Laptop GPU, i7-11800H, WDC PC SN730 SDBPNTY-512G | Razer Blade 15 Advanced (Mid 2021) GeForce RTX 3080 Laptop GPU, i7-11800H, SSSTC CA6-8D1024 | MSI GS66 Stealth 10UG GeForce RTX 3070 Laptop GPU, i7-10870H, WDC PC SN730 SDBPNTY-1T00 | Asus ROG Zephyrus G15 GA503Q GeForce RTX 3080 Laptop GPU, R9 5900HS, SK Hynix HFM001TD3JX013N | |
|---|---|---|---|---|---|---|
| Noise | -18% | -2% | -5% | -25% | -13% | |
| off / environment * (dB) | 24.8 | 25 -1% | 24.1 3% | 25.1 -1% | 26.2 -6% | 25 -1% |
| Idle Minimum * (dB) | 24.9 | 25 -0% | 26.6 -7% | 25.3 -2% | 34 -37% | 26 -4% |
| Idle Average * (dB) | 24.9 | 30 -20% | 26.6 -7% | 25.3 -2% | 34 -37% | 27 -8% |
| Idle Maximum * (dB) | 24.9 | 40 -61% | 26.6 -7% | 25.3 -2% | 34 -37% | 31 -24% |
| Load Average * (dB) | 28.8 | 47 -63% | 30.9 -7% | 42 -46% | 47.2 -64% | 49 -70% |
| Witcher 3 ultra * (dB) | 52.7 | 48 9% | 49.9 5% | 45.6 13% | 46.3 12% | 49 7% |
| Load Maximum * (dB) | 54.9 | 51 7% | 53.5 3% | 51.6 6% | 58.2 -6% | 51 7% |
* ... smaller is better
Noise level
| Idle |
| 24.9 / 24.9 / 24.9 dB(A) |
| Load |
| 28.8 / 54.9 dB(A) |
 | ||
30 dB silent 40 dB(A) audible 50 dB(A) loud |
||
min: | ||
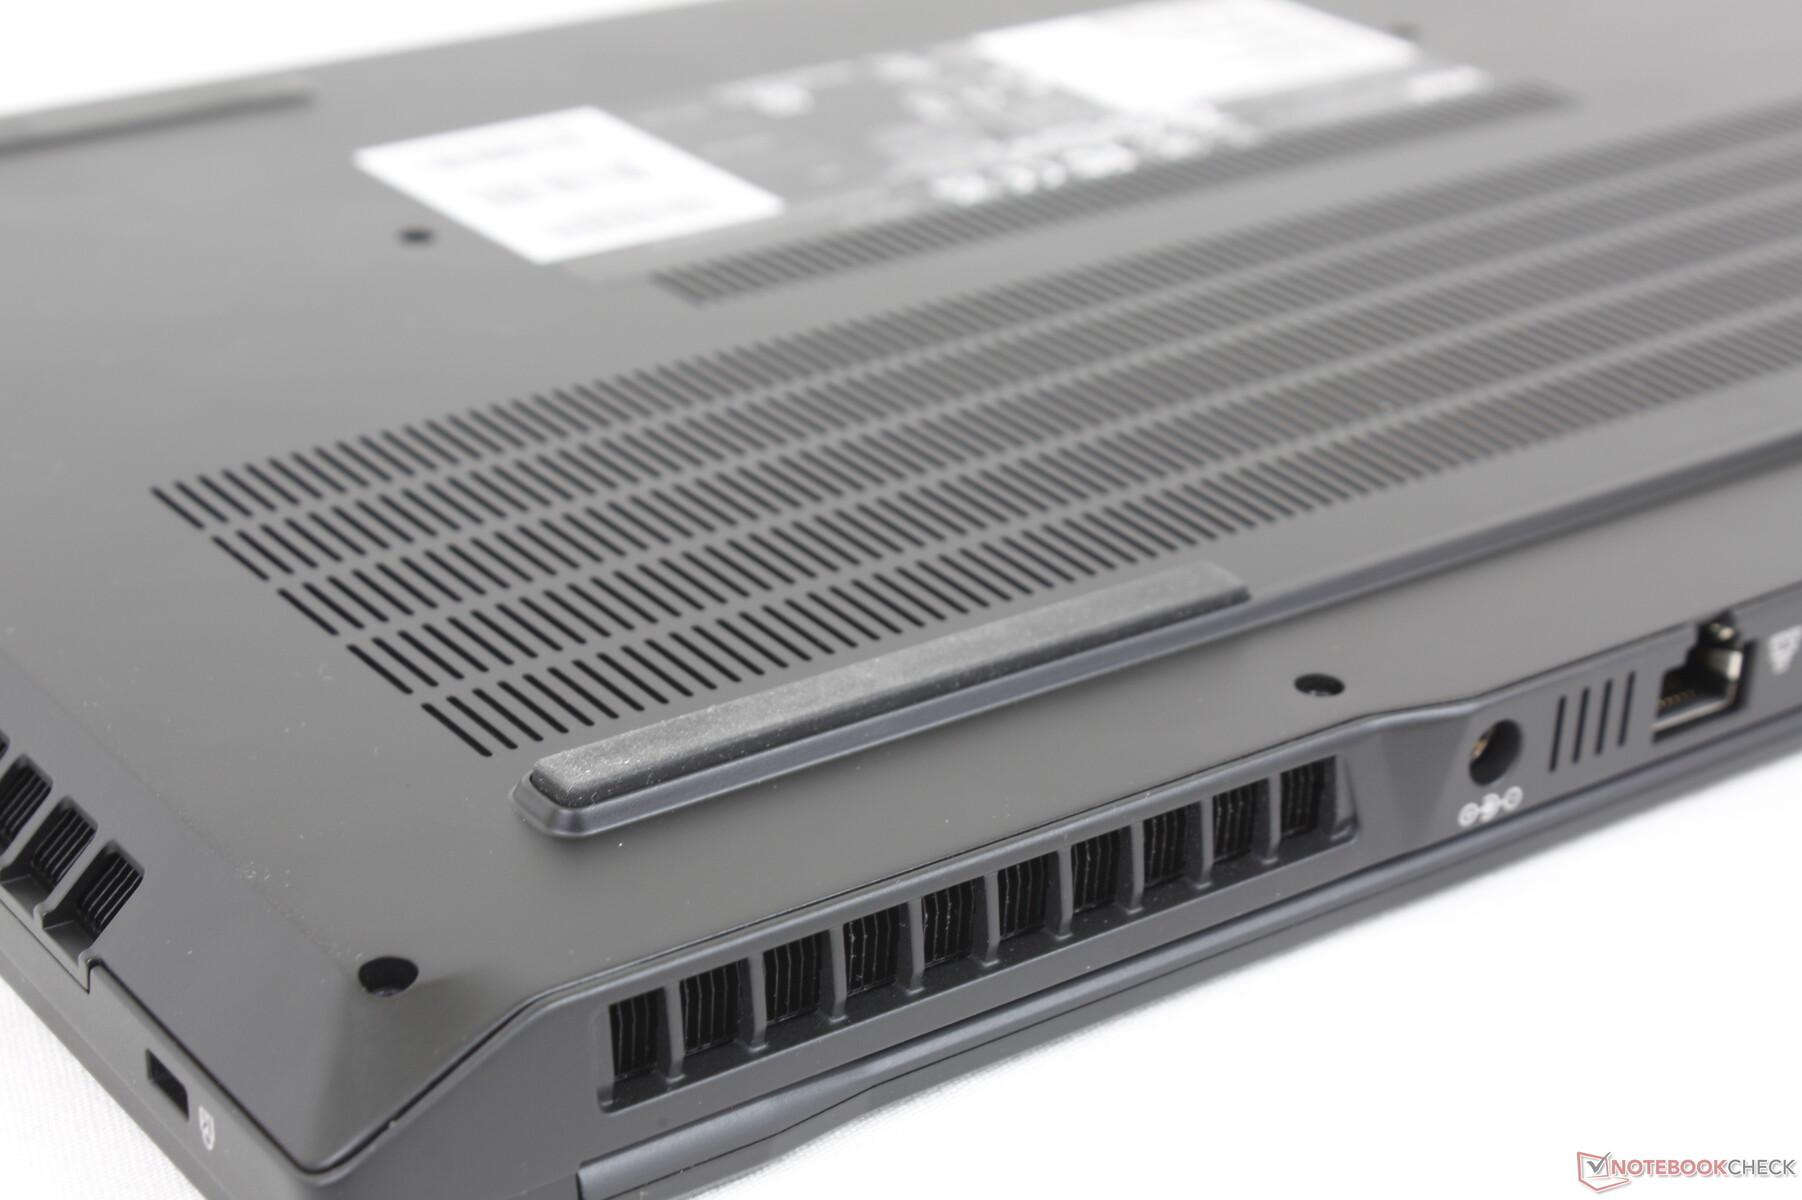
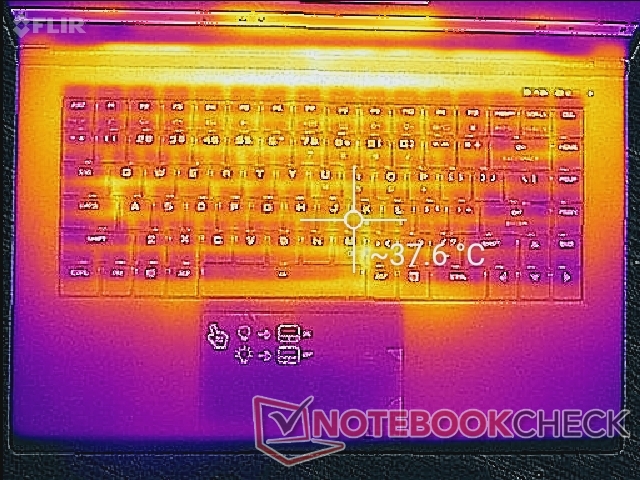
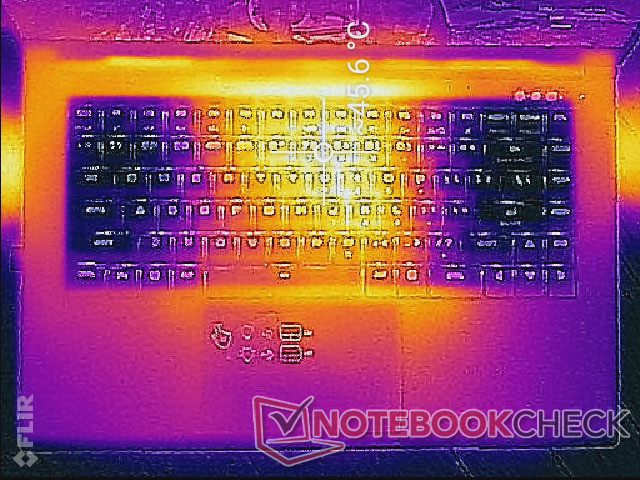
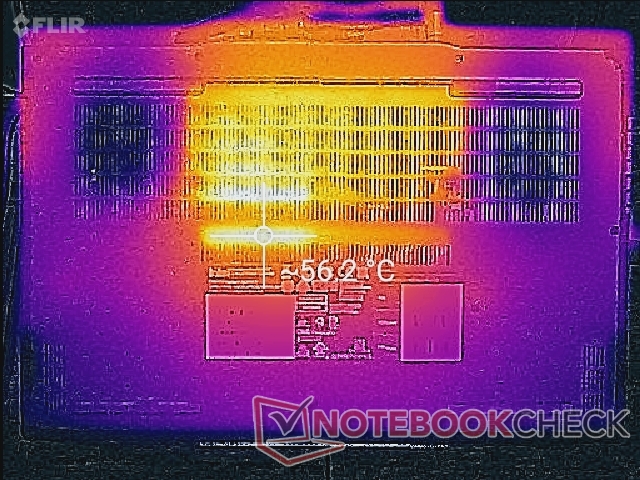
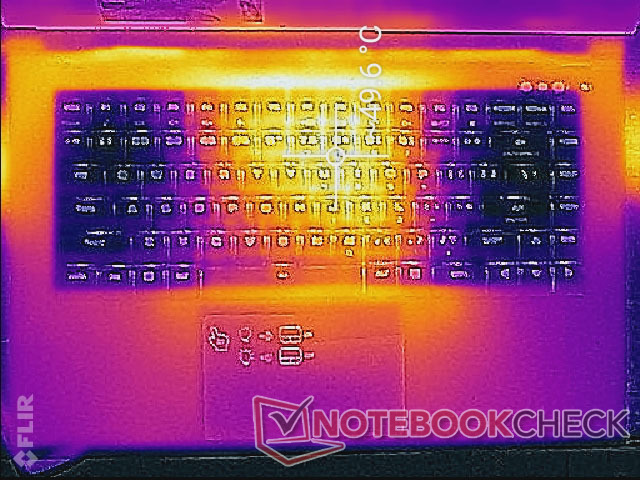
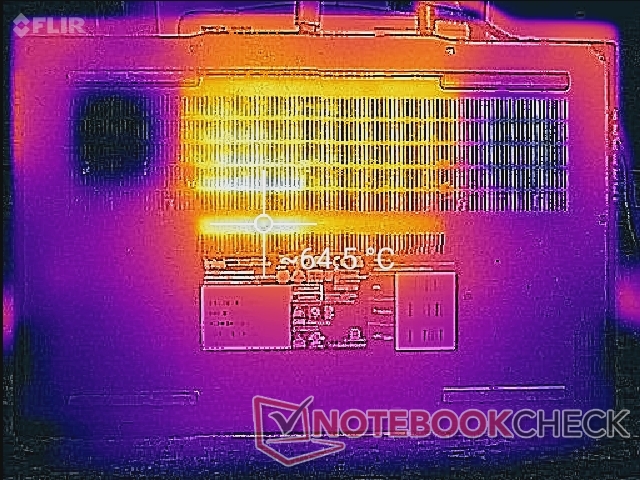
Temperature — Lots of Ventilation
Surface temperatures are generally very warm even when idling on desktop since the fans tend to idle. Hot spots under such a scneario can be as warm as 38 C or 42 C on the top and bottom sides of the laptop, respectively. The center of the keyboard can reach up to 50 C when gaming compared to 45 C on the MSI GS66 or Razer Blade 15 Advanced.
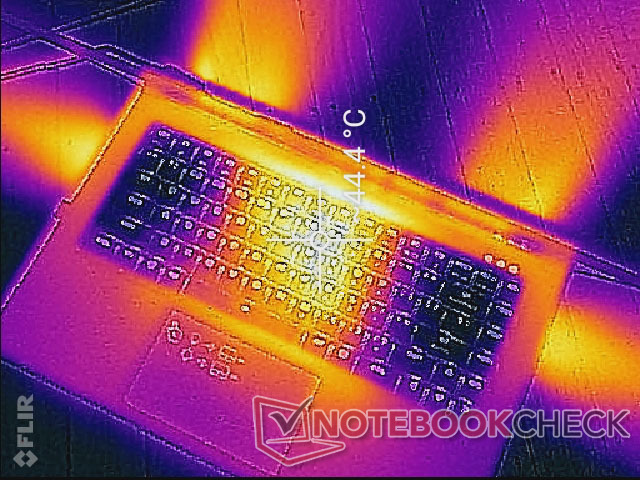
(-) The maximum temperature on the upper side is 49 °C / 120 F, compared to the average of 40.4 °C / 105 F, ranging from 21.2 to 68.8 °C for the class Gaming.
(-) The bottom heats up to a maximum of 64.2 °C / 148 F, compared to the average of 43.2 °C / 110 F
(±) In idle usage, the average temperature for the upper side is 35 °C / 95 F, compared to the device average of 33.9 °C / 93 F.
(±) Playing The Witcher 3, the average temperature for the upper side is 33.4 °C / 92 F, compared to the device average of 33.9 °C / 93 F.
(+) The palmrests and touchpad are reaching skin temperature as a maximum (34.4 °C / 93.9 F) and are therefore not hot.
(-) The average temperature of the palmrest area of similar devices was 28.8 °C / 83.8 F (-5.6 °C / -10.1 F).

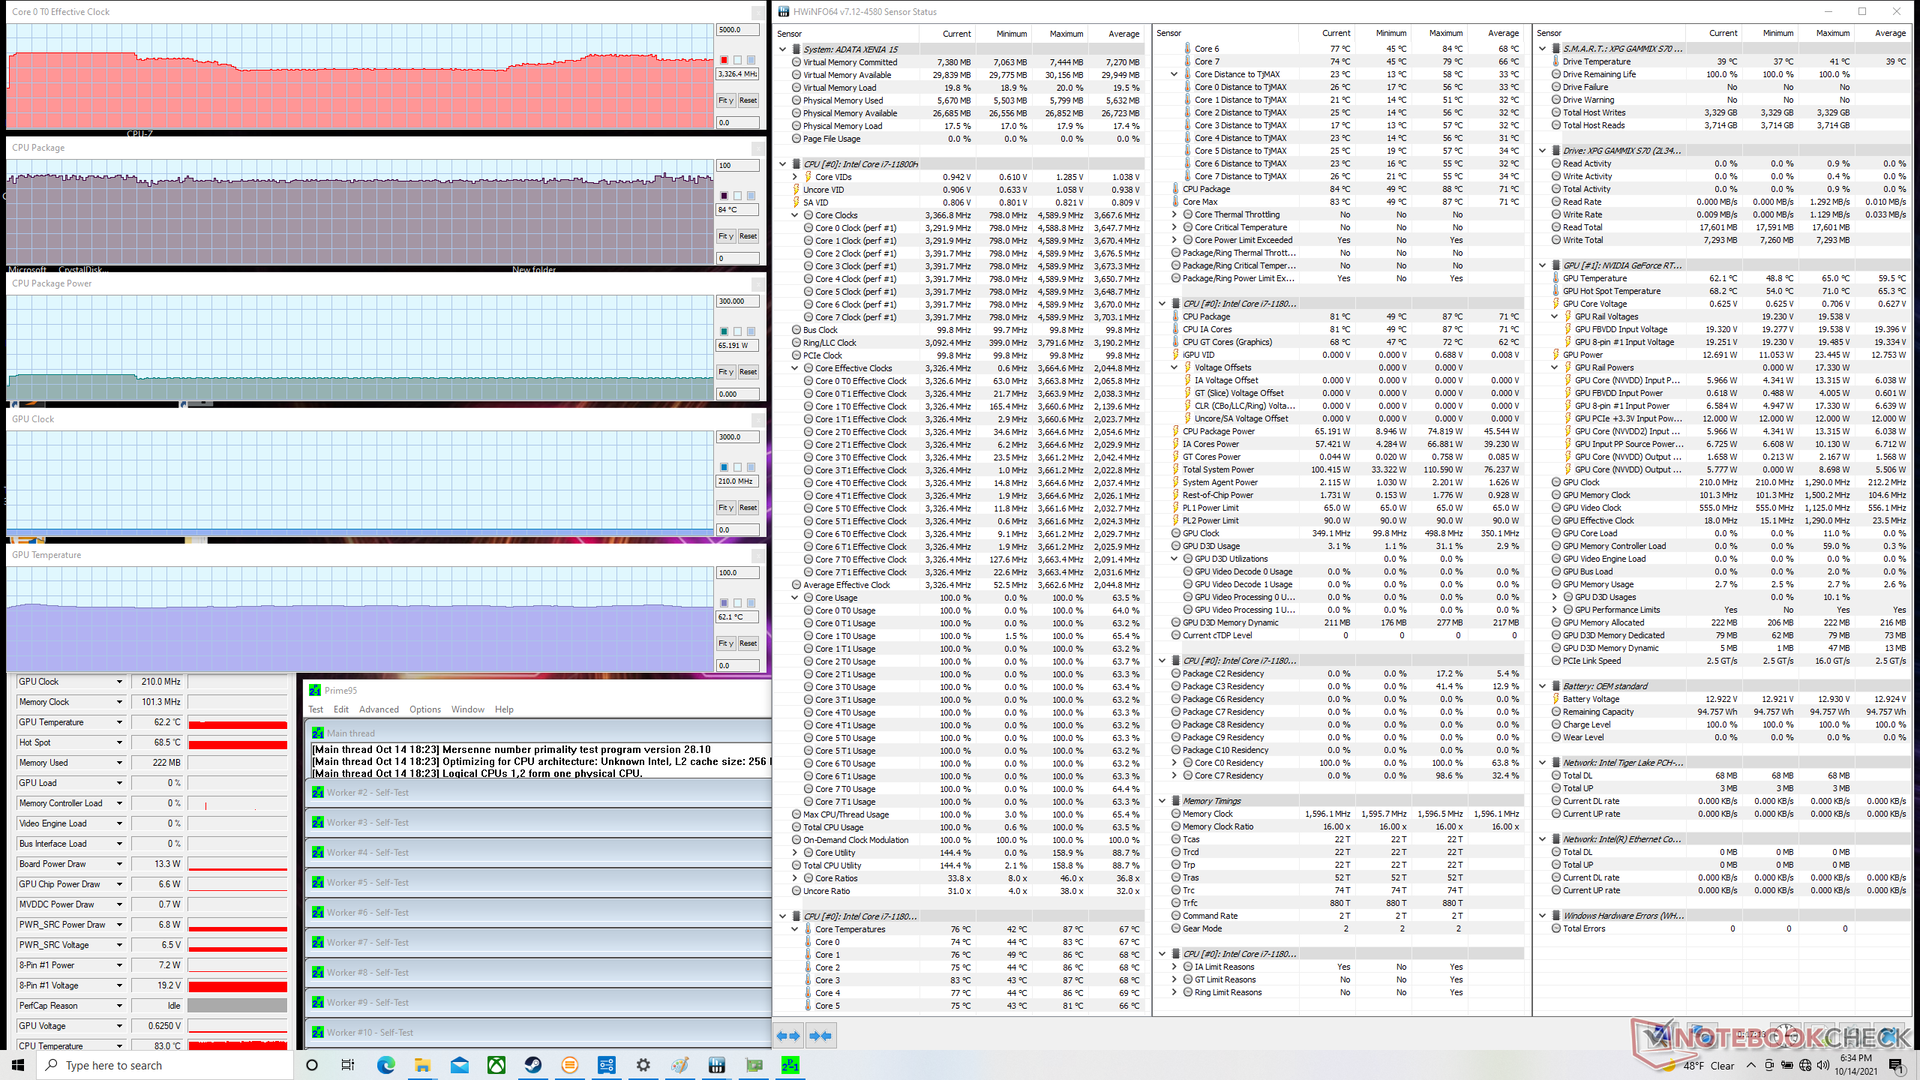
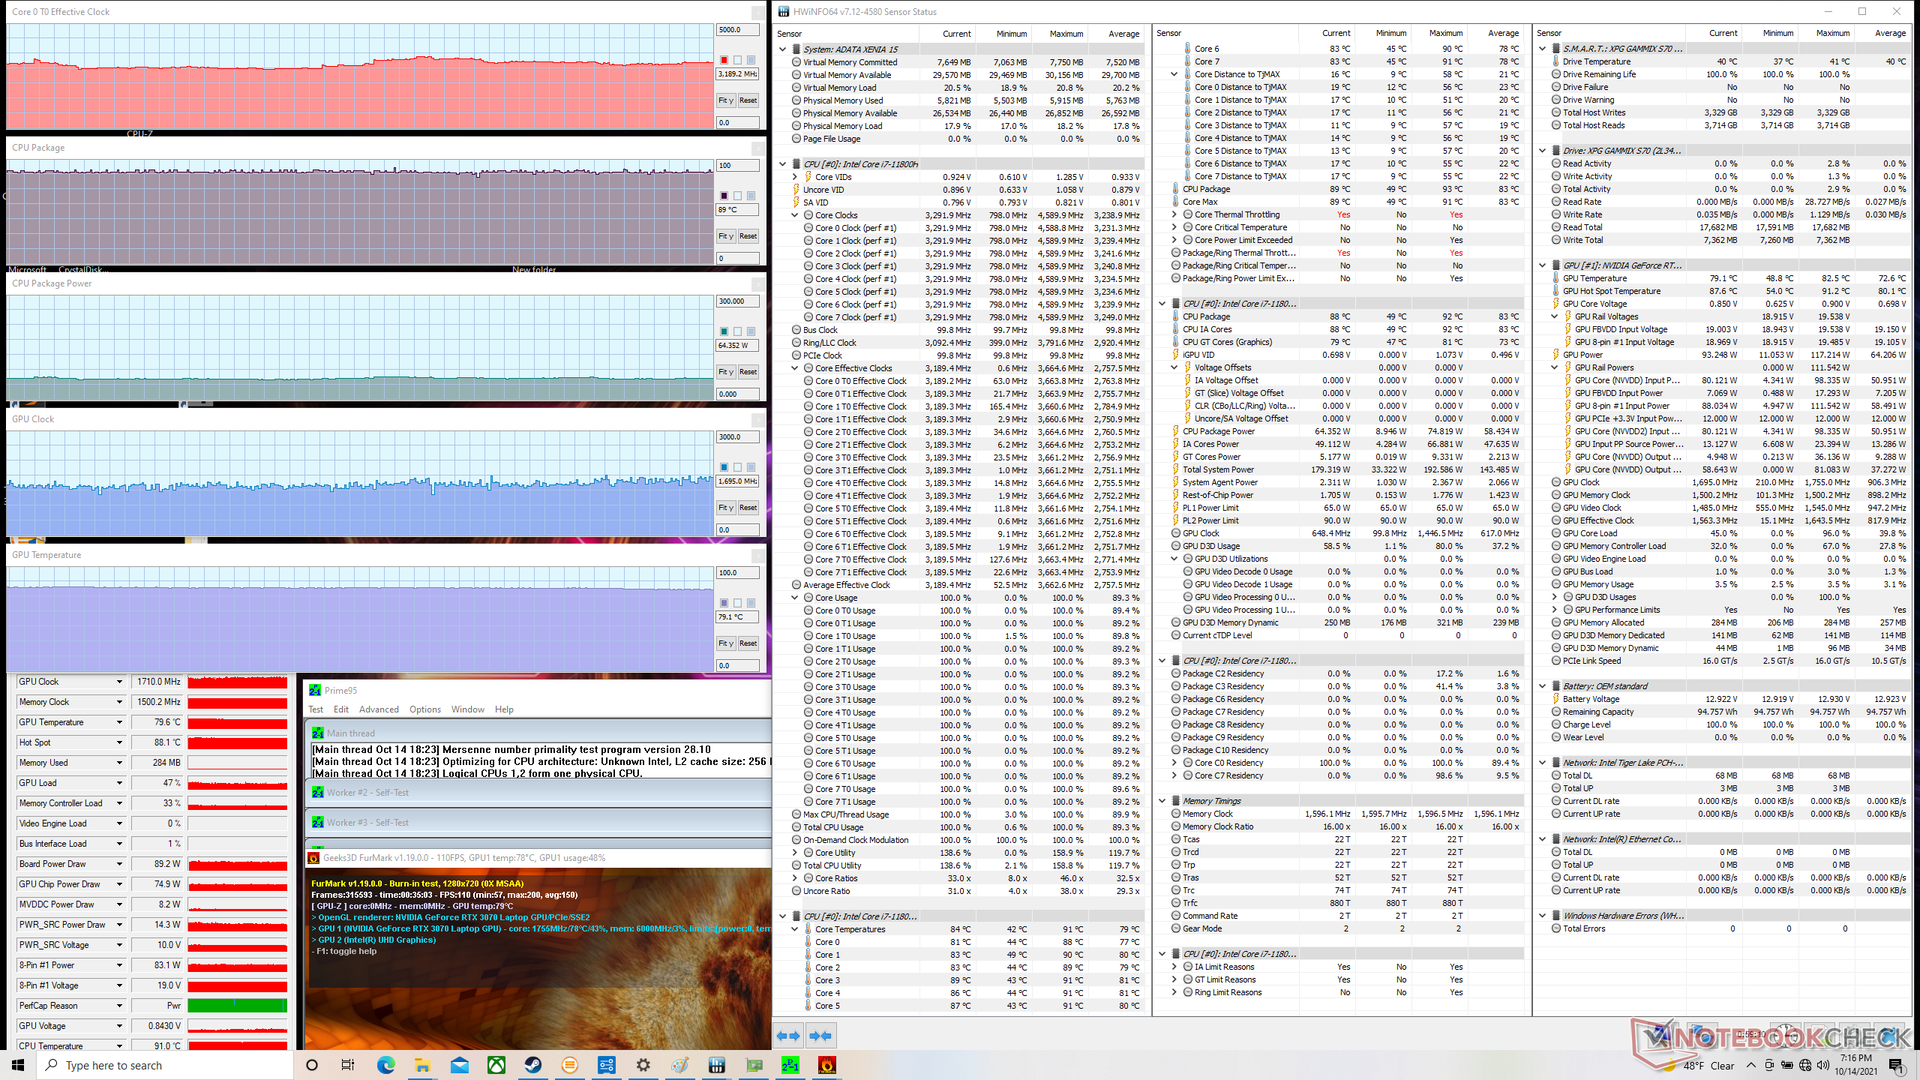
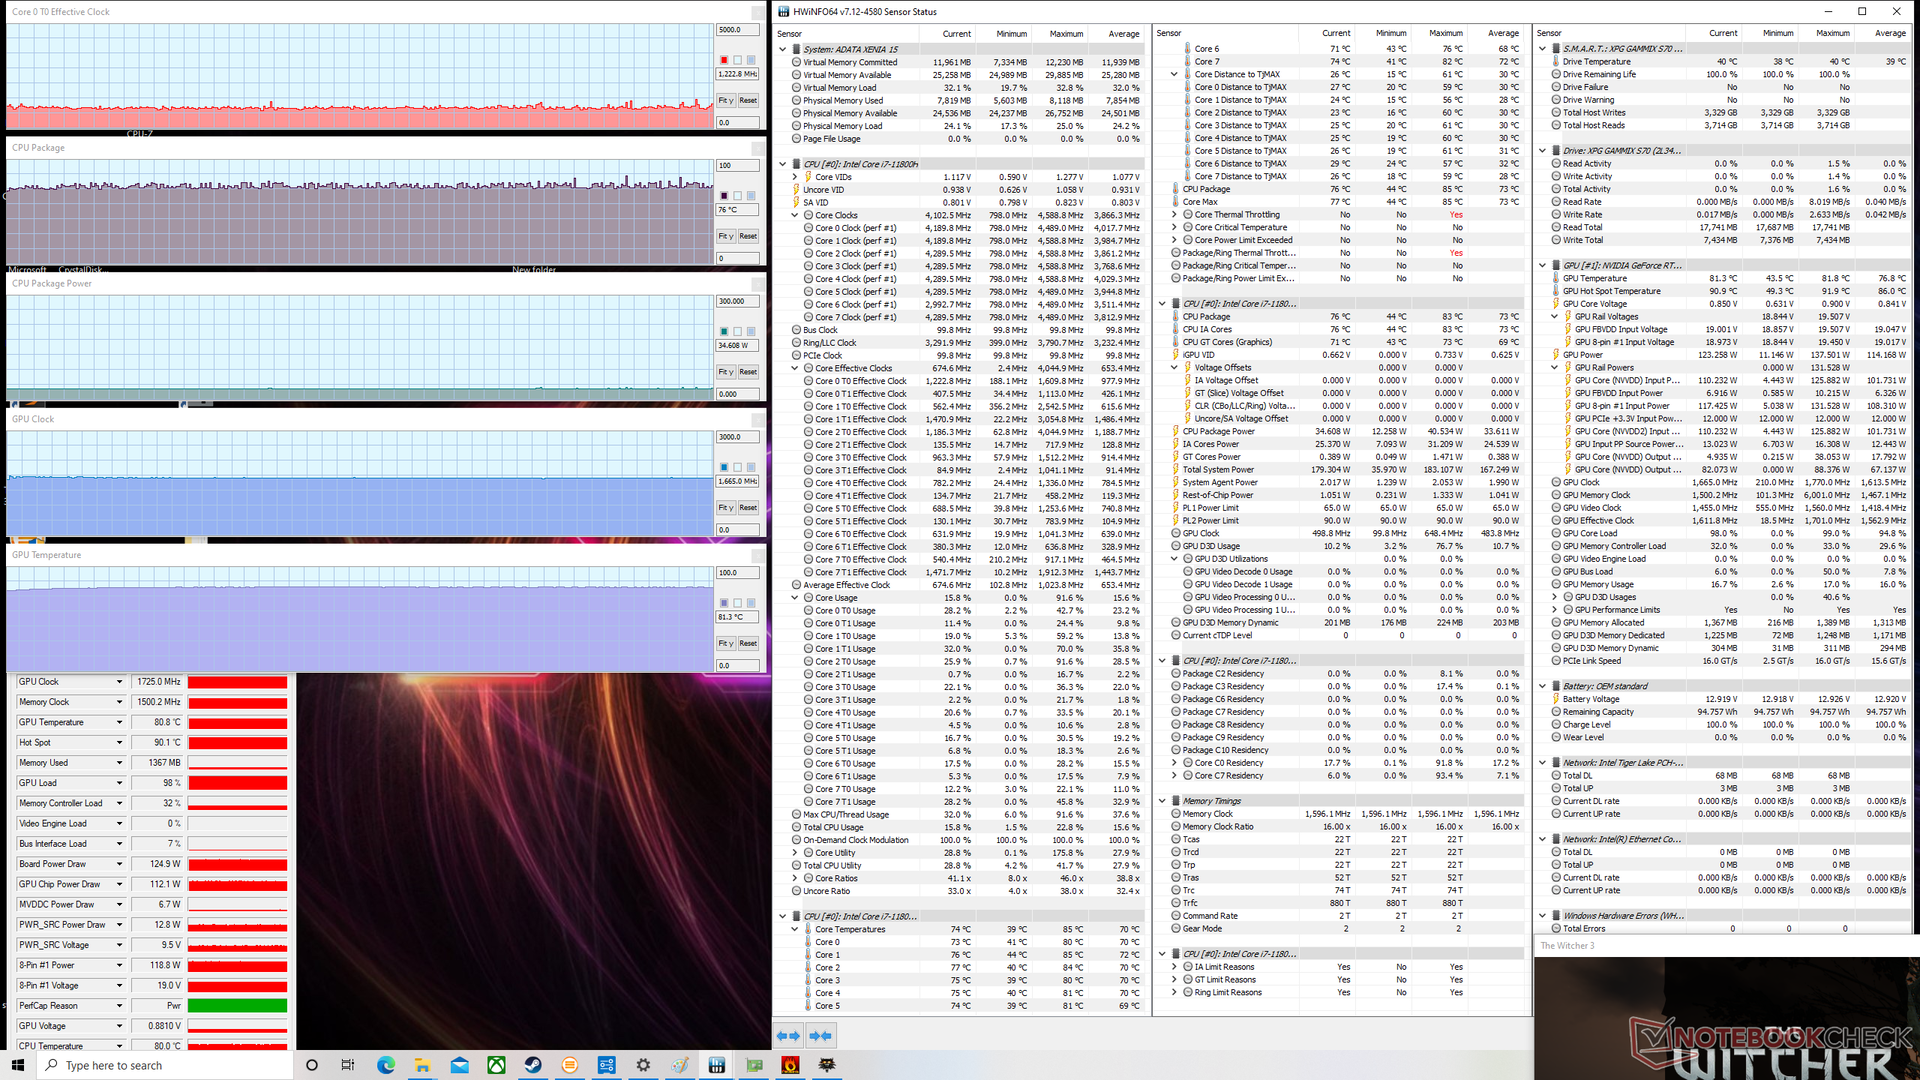
Stress Test
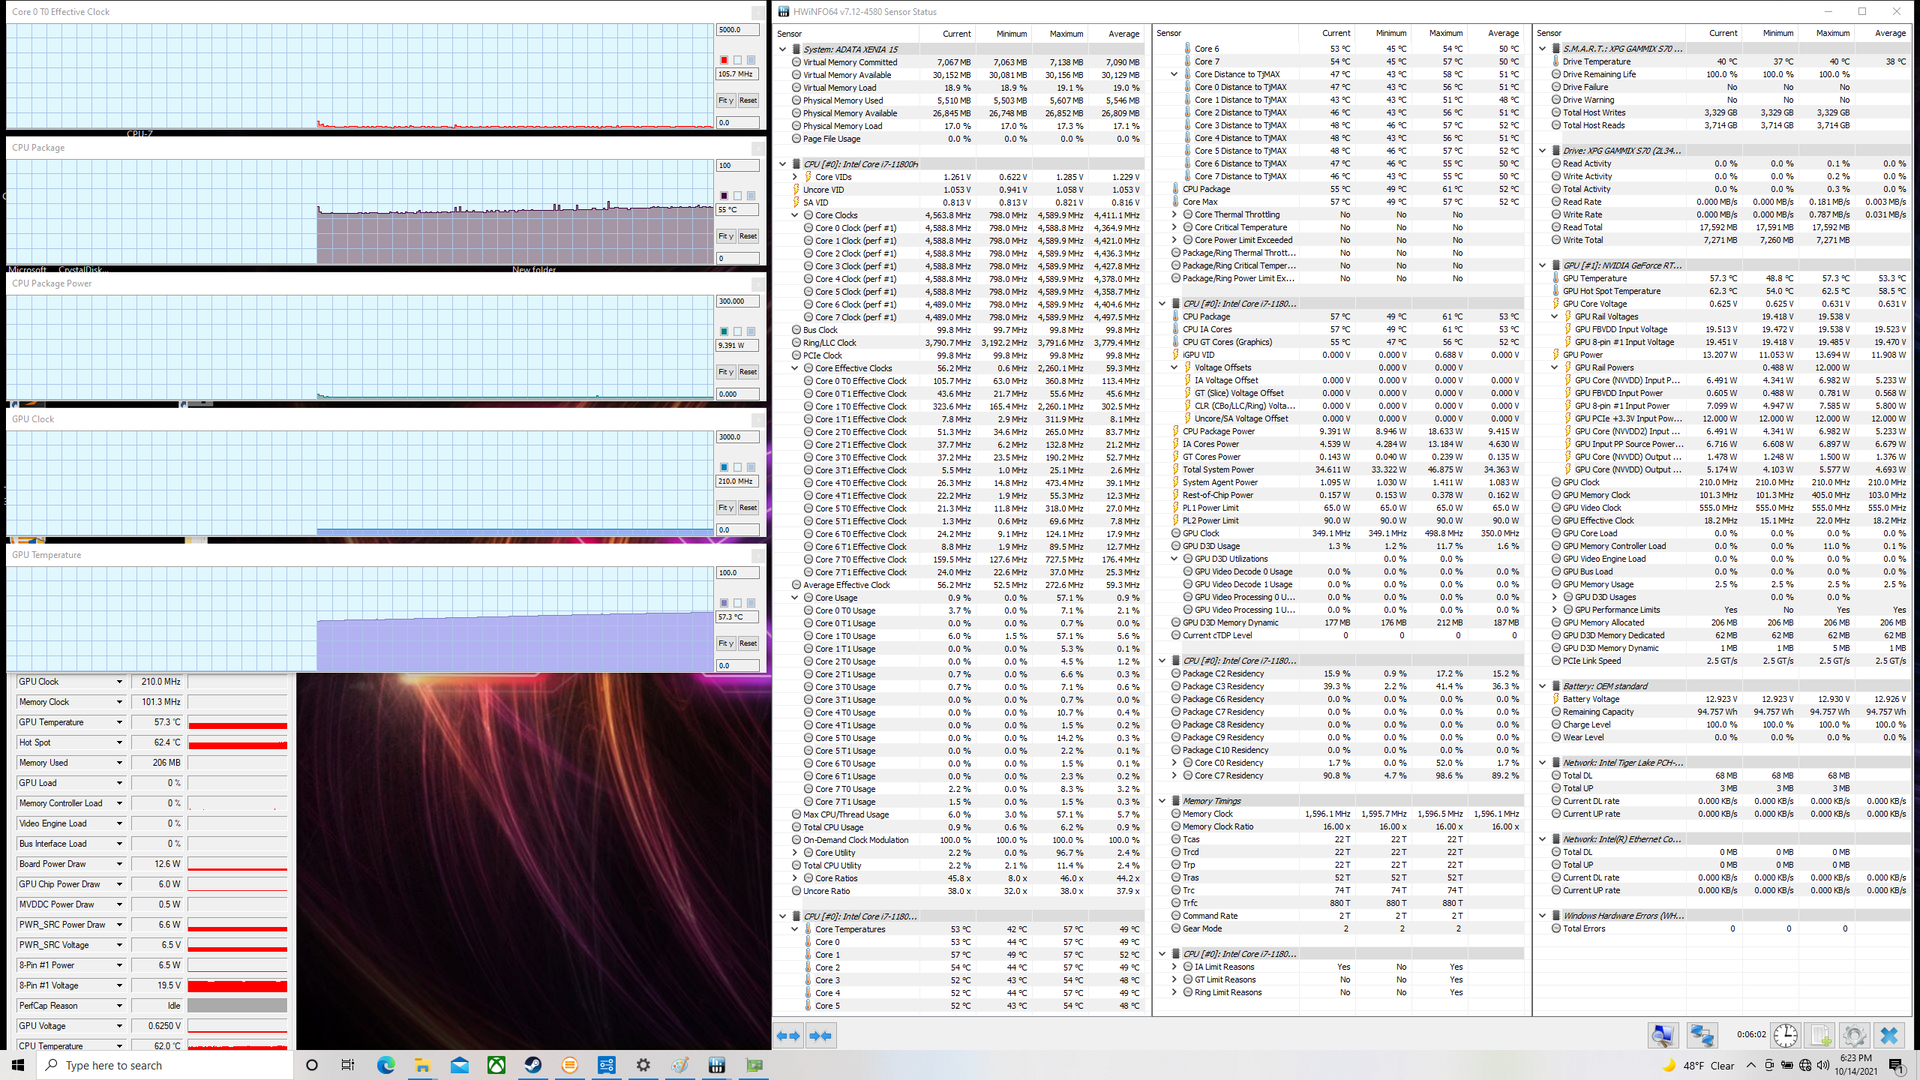
When stressed with Prime95, the CPU would boost to 3.7 GHz for the first minute or so before dropping and cycling between 2.8 GHz and 3.5 GHz every few minutes. Core temperature would stabilize at around 80 C which is slightly cooler than what we recorded on the MSI GS66 under similar loads.
Things get interesting when testing Benchmark Mode on games. Running Witcher 3 with Benchmark Mode off would result in a stable GPU clock rate and board power draw of 1620 MHz and 111 W, respectively, compared to 1725 MHz and 125 W with Benchmark Mode engaged. Thus, enabling the feature is required in order to squeeze as much performance from the GPU as possible. The CPU and GPU would stabilize at 76 C and 81 C when running Witcher 3 on Benchmark Mode, respectively, which are comparable numbers to the Razer Blade 15 Advanced.
Running on battery power will limit performance. A Fire Strike run on batteries would return Physics and Graphics scores of 19060 and 18191 points, respectively, compared to 22616 and 26907 points when on mains.

| CPU Clock (GHz) | GPU Clock (MHz) | Average CPU Temperature (°C) | Average GPU Temperature (°C) | |
| System Idle | -- | -- | 56 | 58 |
| Prime95 Stress | 2.8 - 3.5 | -- | ~80 | 63 |
| Prime95 + FurMark Stress | ~3.2 | 1710 | 89 | 79 |
| Witcher 3 Stress (Benchmark Mode off) | 3.0+ | 1620 | 74 | 76 |
| Witcher 3 Stress (Benchmark Mode on) | 4.1+ | 1725 | 76 | 81 |
Speakers — Hard to Hear when Gaming
The integrated speakers are on the weak side especially when gaming since the fans can be quite loud. Maximum volume is also softer than on the GS66. You'll definitely want a pair of headphones when gaming to better hear the in-game audio.


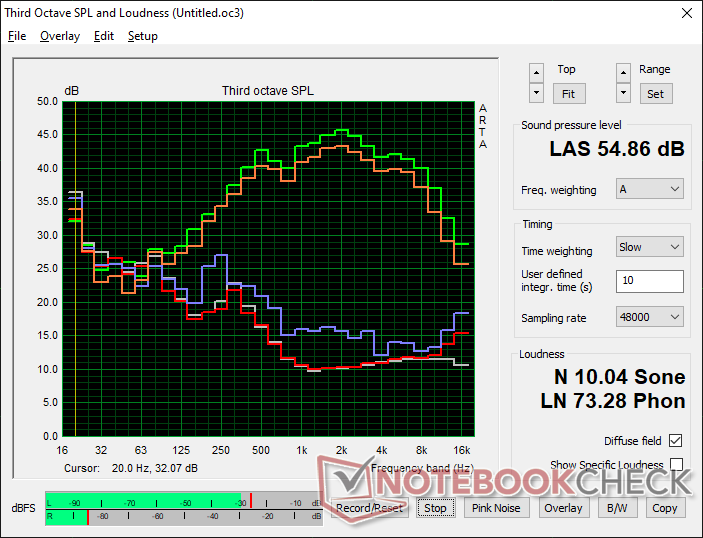
ADATA XPG Xenia 15 audio analysis
(±) | speaker loudness is average but good (77.6 dB)
Bass 100 - 315 Hz
(-) | nearly no bass - on average 20.5% lower than median
(±) | linearity of bass is average (12.7% delta to prev. frequency)
Mids 400 - 2000 Hz
(±) | higher mids - on average 5.1% higher than median
(+) | mids are linear (5.7% delta to prev. frequency)
Highs 2 - 16 kHz
(+) | balanced highs - only 1.9% away from median
(+) | highs are linear (3.7% delta to prev. frequency)
Overall 100 - 16.000 Hz
(±) | linearity of overall sound is average (17.3% difference to median)
Compared to same class
» 47% of all tested devices in this class were better, 12% similar, 41% worse
» The best had a delta of 6%, average was 18%, worst was 132%
Compared to all devices tested
» 32% of all tested devices were better, 8% similar, 59% worse
» The best had a delta of 4%, average was 24%, worst was 134%
Apple MacBook 12 (Early 2016) 1.1 GHz audio analysis
(+) | speakers can play relatively loud (83.6 dB)
Bass 100 - 315 Hz
(±) | reduced bass - on average 11.3% lower than median
(±) | linearity of bass is average (14.2% delta to prev. frequency)
Mids 400 - 2000 Hz
(+) | balanced mids - only 2.4% away from median
(+) | mids are linear (5.5% delta to prev. frequency)
Highs 2 - 16 kHz
(+) | balanced highs - only 2% away from median
(+) | highs are linear (4.5% delta to prev. frequency)
Overall 100 - 16.000 Hz
(+) | overall sound is linear (10.2% difference to median)
Compared to same class
» 7% of all tested devices in this class were better, 2% similar, 91% worse
» The best had a delta of 5%, average was 18%, worst was 53%
Compared to all devices tested
» 5% of all tested devices were better, 1% similar, 94% worse
» The best had a delta of 4%, average was 24%, worst was 134%
Energy Management
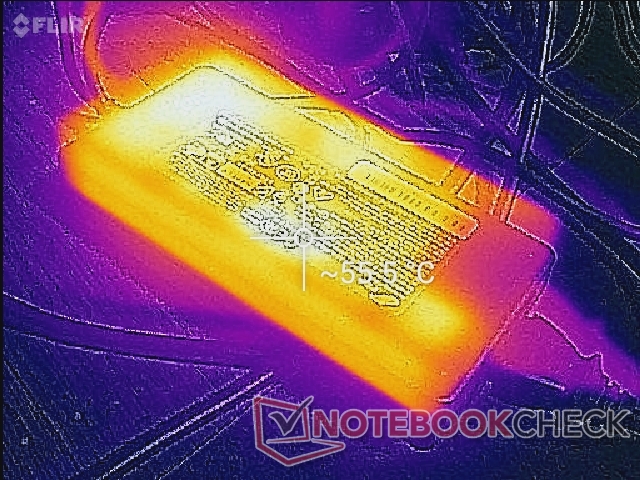
Power Consumption
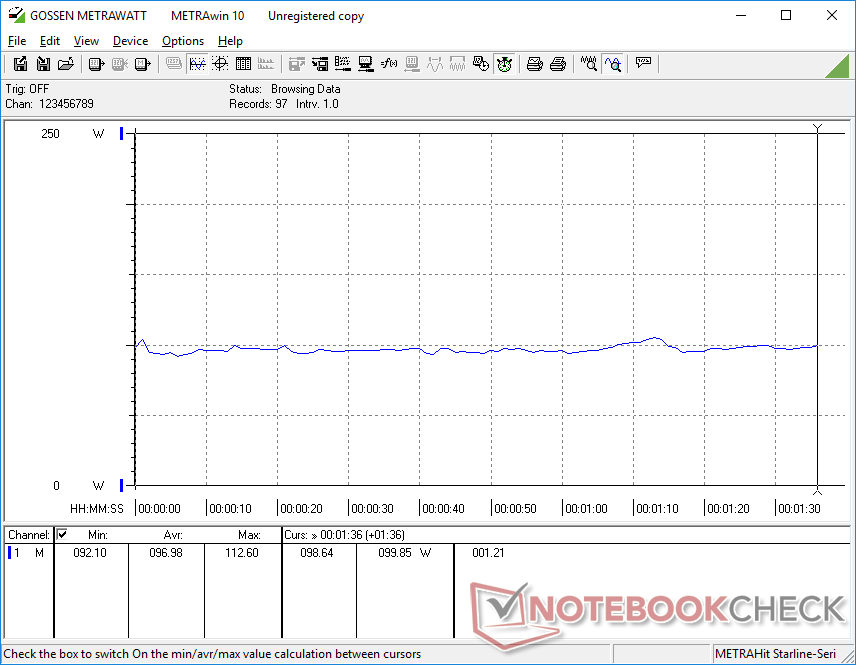
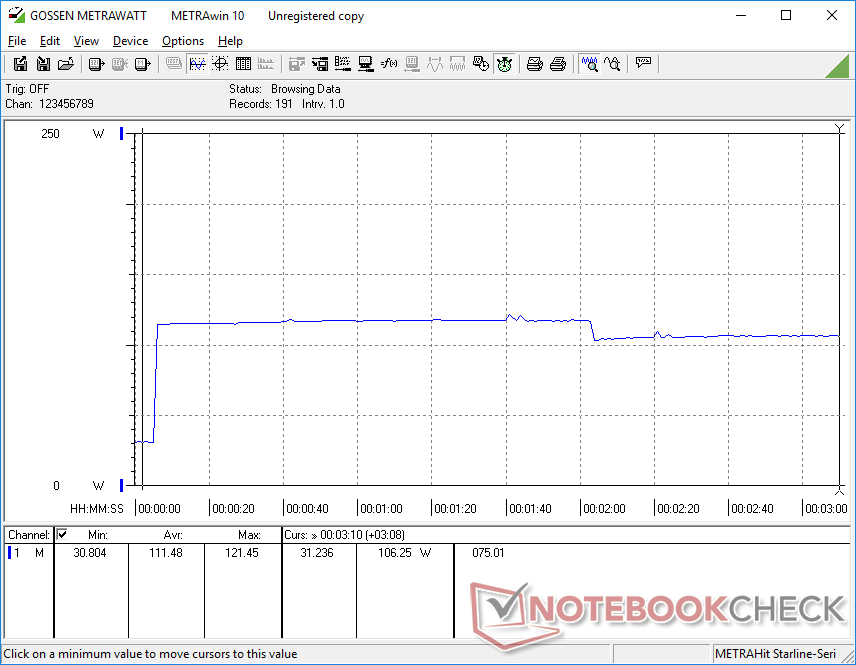
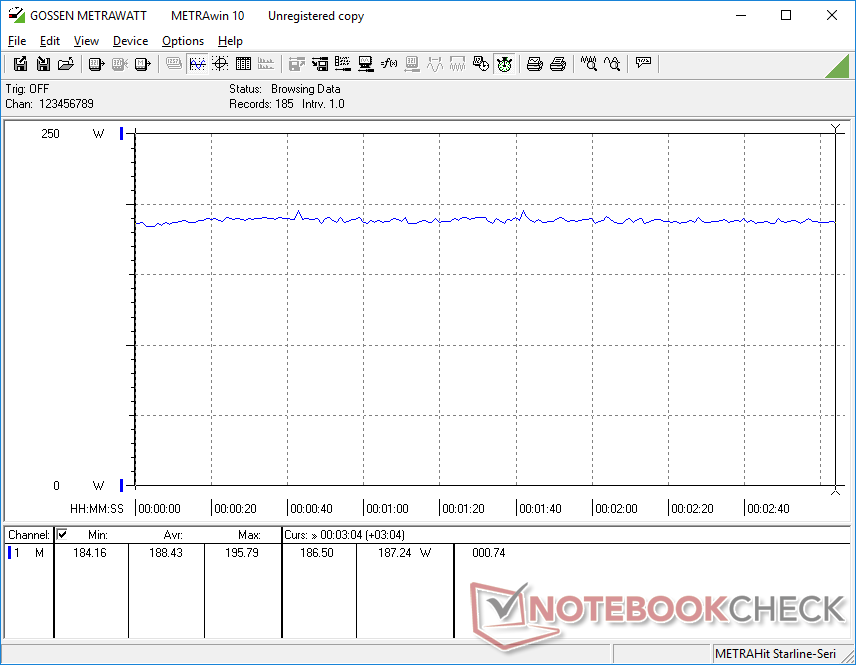
The system draws between 8 W and 32 W when under low loads depending on the brightness setting, power profile, and GPU setting. Running Witcher 3 would draw around 188 W or even almost 200 W if on Benchmark Mode to be more than what we've recorded on many other ultrathin 15.6-inch GeForce RTX laptops. The higher resolution QHD panel and 125 W target TGP are likely responsible for the higher wattages since other laptops in this size category typically come with FHD panels and ~100 W GPUs instead.
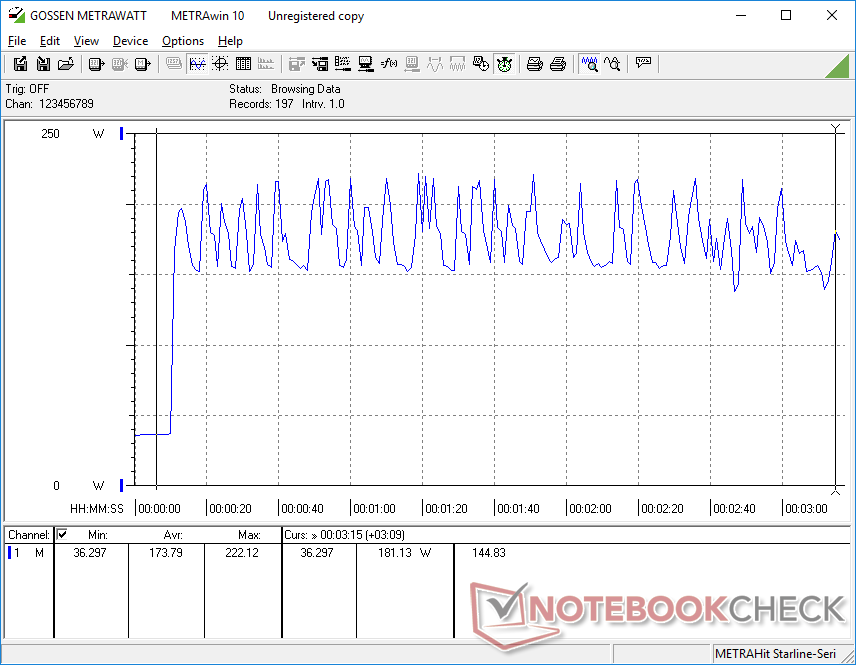
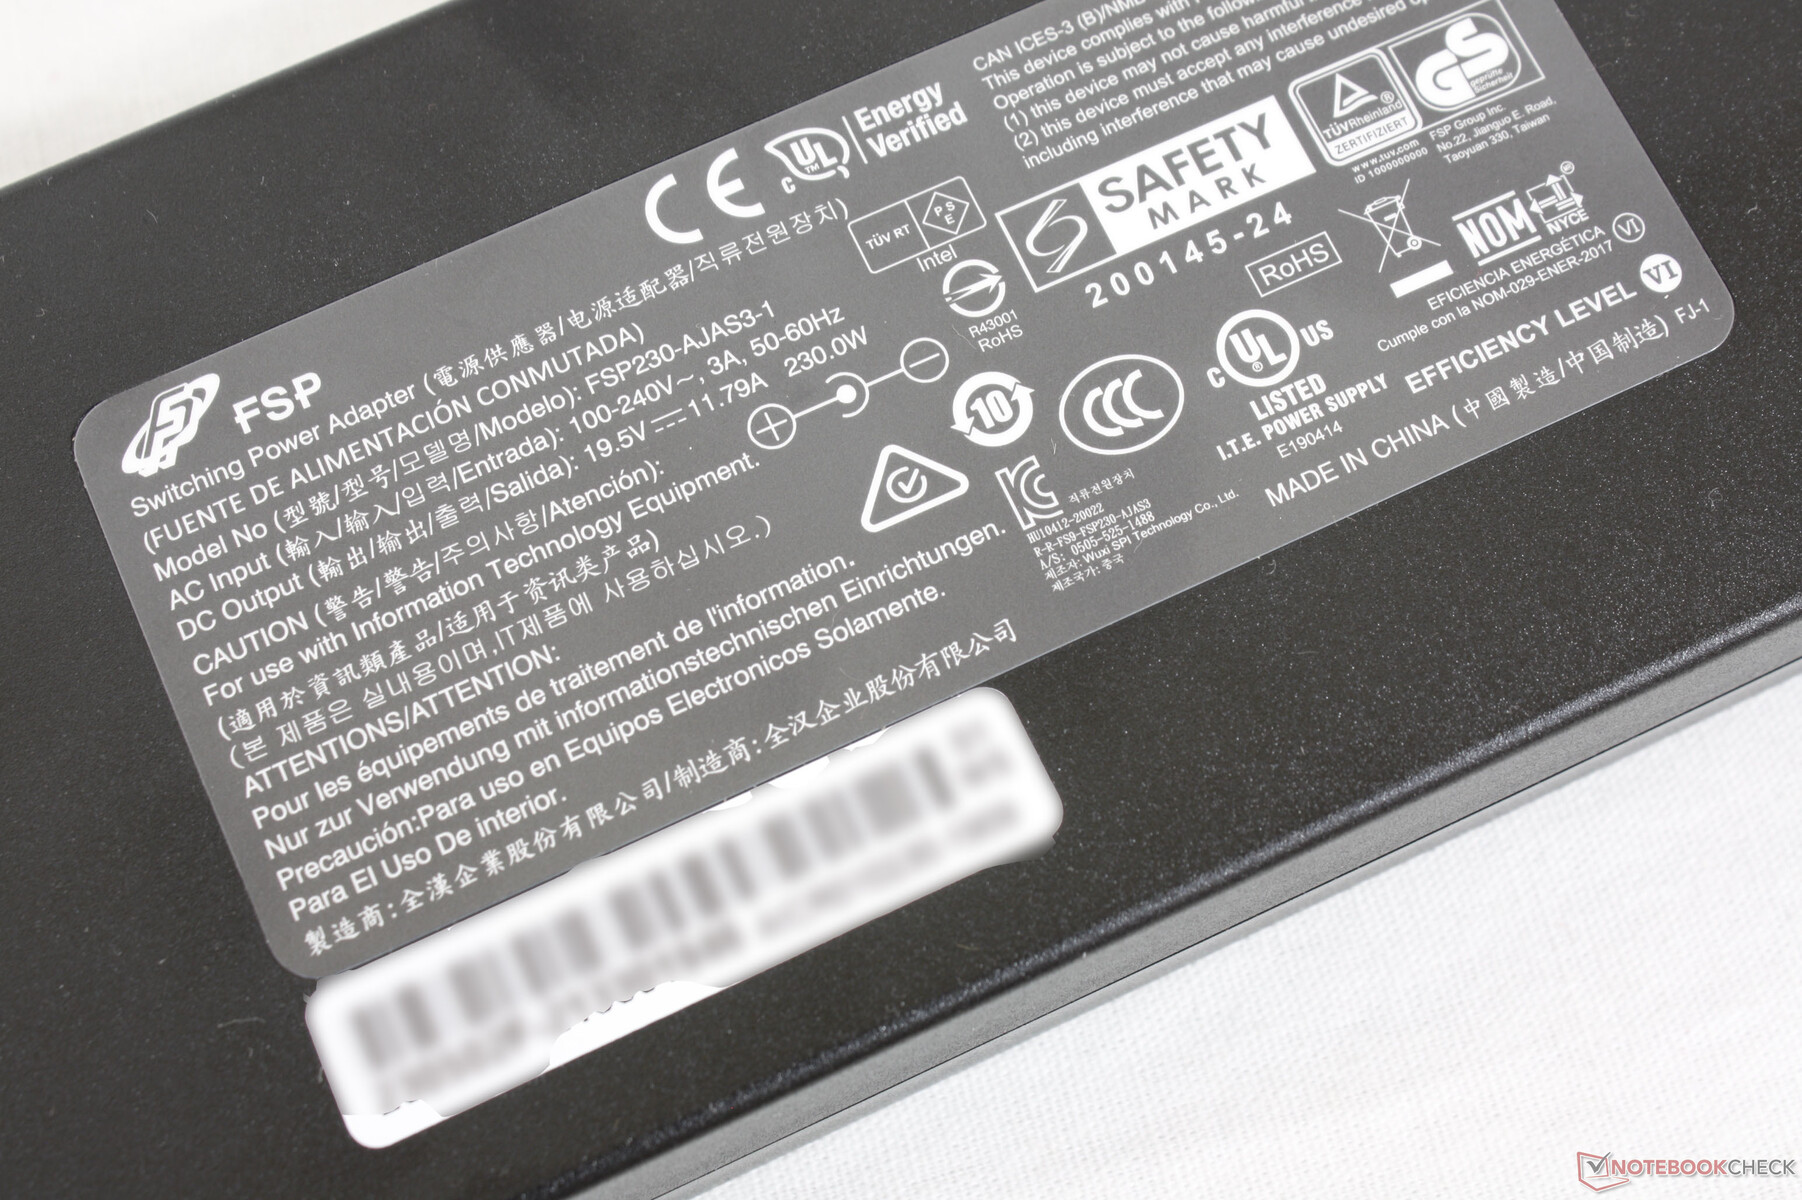
We're able to record a maximum draw of 222 W from the medium-sized (~15.1 x 7.5 x 2.6 cm) 230 W AC adapter when running Prime95 and FurMark simultaneously. Consumption would fluctuate heavily between 150 W and 222 W likely due to thermal concerns. The battery will charge more slowly when running such high loads as well but it will not slowly drain over time.
| Off / Standby | |
| Idle | |
| Load |
|
Key:
min: | |
| ADATA XPG Xenia 15 i7-11800H, GeForce RTX 3070 Laptop GPU, ADATA XPG Gammix S70 1TB, IPS, 2560x1440, 15.6" | MSI Delta 15 A5EFK R9 5900HX, Radeon RX 6700M, Micron 2210 MTFDHBA1T0QFD, IPS-Level, 1920x1080, 15.6" | Alienware x15 RTX 3070 P111F i7-11800H, GeForce RTX 3070 Laptop GPU, WDC PC SN730 SDBPNTY-512G, IPS, 2560x1440, 15.6" | Razer Blade 15 Advanced (Mid 2021) i7-11800H, GeForce RTX 3080 Laptop GPU, SSSTC CA6-8D1024, IPS, 1920x1080, 15.6" | MSI GS66 Stealth 10UG i7-10870H, GeForce RTX 3070 Laptop GPU, WDC PC SN730 SDBPNTY-1T00, IPS, 1920x1080, 15.6" | Asus ROG Zephyrus G15 GA503Q R9 5900HS, GeForce RTX 3080 Laptop GPU, SK Hynix HFM001TD3JX013N, IPS-Level, 2560x1440, 15.6" | |
|---|---|---|---|---|---|---|
| Power Consumption | -3% | -21% | -34% | -6% | 15% | |
| Idle Minimum * (Watt) | 8.9 | 10 -12% | 15.7 -76% | 19.5 -119% | 12.9 -45% | 10 -12% |
| Idle Average * (Watt) | 14.4 | 18 -25% | 20.3 -41% | 23.3 -62% | 15.4 -7% | 12 17% |
| Idle Maximum * (Watt) | 31.1 | 25 20% | 43 -38% | 40.1 -29% | 27.1 13% | 17 45% |
| Load Average * (Watt) | 97 | 101 -4% | 94.4 3% | 98.9 -2% | 98.2 -1% | 108 -11% |
| Witcher 3 ultra * (Watt) | 188 | 187 1% | 167 11% | 174 7% | 164.9 12% | 123 35% |
| Load Maximum * (Watt) | 222.2 | 217 2% | 183.4 17% | 214 4% | 232.9 -5% | 182 18% |
* ... smaller is better
Power Consumption Witcher 3 / Stresstest
Battery Life — Large 94 Wh Battery
Runtimes are longer than expected at almost 9 hours of real-world WLAN use to be longer than what we recorded on the MSI GS66 or Alienware x15 by a few hours each.
Charging from empty to full capacity takes about 100 minutes with the included AC adapter.
| ADATA XPG Xenia 15 i7-11800H, GeForce RTX 3070 Laptop GPU, 94 Wh | MSI Delta 15 A5EFK R9 5900HX, Radeon RX 6700M, 82 Wh | Alienware x15 RTX 3070 P111F i7-11800H, GeForce RTX 3070 Laptop GPU, 87 Wh | Razer Blade 15 Advanced (Mid 2021) i7-11800H, GeForce RTX 3080 Laptop GPU, 80 Wh | MSI GS66 Stealth 10UG i7-10870H, GeForce RTX 3070 Laptop GPU, 99.9 Wh | Asus ROG Zephyrus G15 GA503Q R9 5900HS, GeForce RTX 3080 Laptop GPU, 90 Wh | |
|---|---|---|---|---|---|---|
| Battery runtime | -8% | -34% | -32% | 2% | -2% | |
| Reader / Idle (h) | 14 | 11.1 -21% | 9.7 -31% | 10.8 -23% | 12.1 -14% | |
| WiFi v1.3 (h) | 8.7 | 7.9 -9% | 6.1 -30% | 5.9 -32% | 7.1 -18% | 9.4 8% |
| Load (h) | 1.5 | 1.6 7% | 0.9 -40% | 2.2 47% | 1.5 0% |
Pros
Cons
Verdict — Faster than it Looks
The XPG Xenia 15 is a surprisingly strong contender to longstanding ultrathin gaming laptops like the Razer Blade 15, MSI GS66, or Asus Zephyrus S15. The ADATA laptop is able to incorporate a better keyboard than any of those aforementioned models and even a higher TGP target to squeeze out more performance from the Nvidia GPU. End-user RAM and storage upgrades are welcomed whereas GS66 owners are forced to break an anti-tamper sticker just to remove the bottom panel. The base is also quite strong and less prone to flexing or creaking than on the Zephyrus S15 or Lenovo Legion 7.
The small footprint, high TGP target, strong base, and excellent 1440p 165 Hz display carry the XPG Xenia 15 to greater heights than other ultrathin gaming laptops. The wobbly lid, extra loud fans, and soft speakers pull it back a few notches.
Cramming a 125 W GPU inside an ultrathin chassis has its drawbacks. In particular, fan noise when gaming is noticeably louder than the competition to the point where it overwhelms the integrated speakers. Meanwhile, the hinges don't leave strong impressions especially when compared to the stiffer hinges on most Asus Zephyrus laptops. We're not as confident about how well the hinges on the Xenia 15 will hold up two to three years down the line.
As a whole, we're impressed by how much performance the Xenia 15 offers considering that it has a smaller footprint than many other ultrathin 15.6-inch gaming laptops. The 1440p165 display and clicky keyboard are some of the best in this size class for gaming and otherwise.
Price and availability
The ADATA XPG Xenia 15 with 11th gen Intel CPU is now available at Best Buy for $2499 USD. Other major retailers have yet to stock the 2021 Xenia 15 and are instead still selling the older model with 9th gen Intel CPUs instead as of this writing.
ADATA XPG Xenia 15
- 10/18/2021 v7 (old)
Allen Ngo
Price comparison
