Razer Blade 15 Base Model Laptop Review: 95 W GeForce RTX 3060 Holds Up Well
Razer has refreshed its Blade 15 lineup this year to include Nvidia Ampere GPUs across the board and an even thinner chassis design for the latest Advanced Model SKUs. Options range from the GeForce RTX 3060 to the RTX 3080 and a new 165 Hz QHD panel as an intermediate between the usual FHD and 4K options.
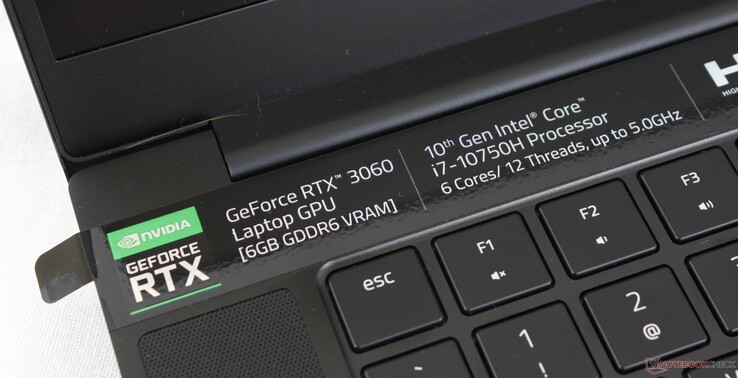
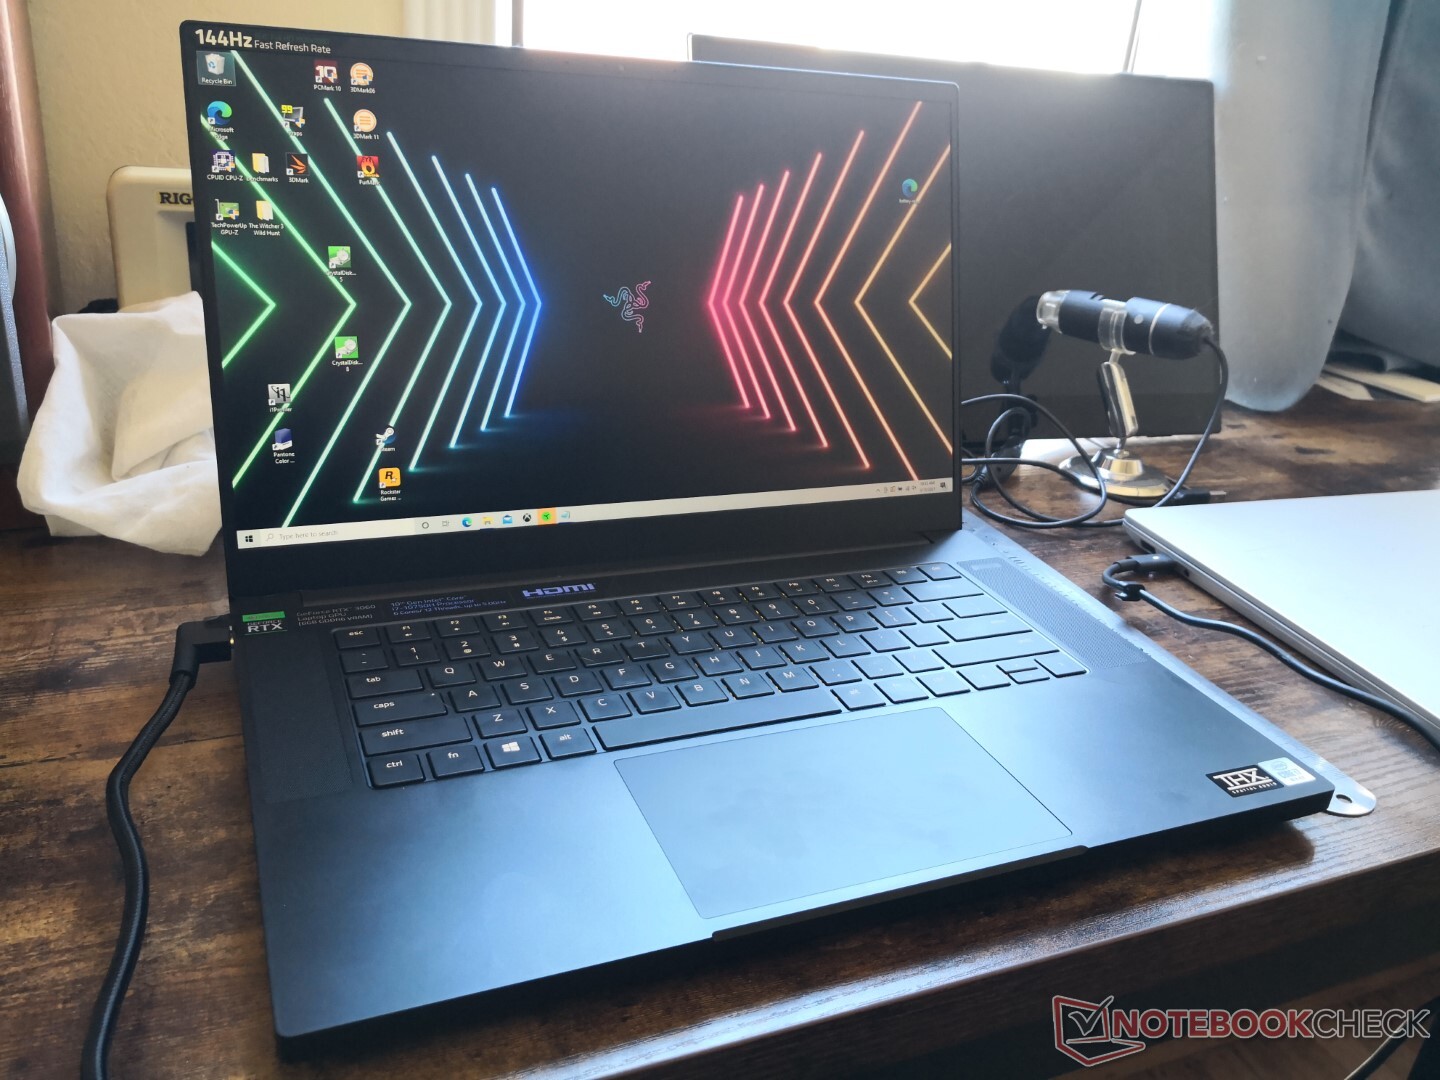
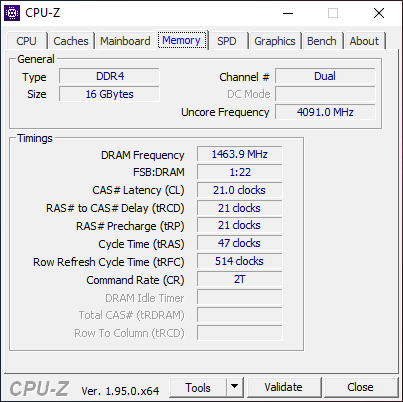
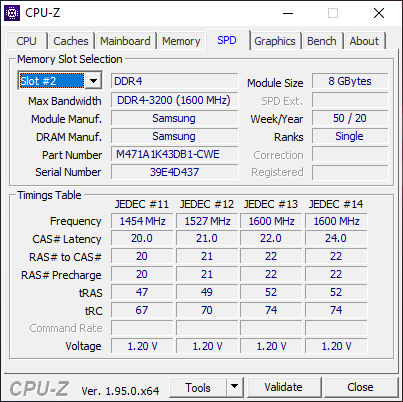
Our review unit today is the least expensive Blade 15 Base Model equipped with the GeForce RTX 3060 GPU, 144 Hz IPS display, Core i7-10750H CPU, and 16 GB of RAM for about $1699 USD (or $1499 on sale). With mobile Ampere being nowhere near their desktop counterparts in terms of performance, we're eager to see how the Blade 15 RTX 3060 can compare to last year's Blade 15 RTX 2060 and 2070 Max-Q configurations.
Competitors to the Blade 15 Base Model include other upper mid-range gaming laptops like the MSI GS66, Asus Zephyrus S, Aorus 15, or the Lenovo Legion 7i.
More Razer reviews:
potential competitors in comparison
Rating | Date | Model | Weight | Height | Size | Resolution | Price |
|---|---|---|---|---|---|---|---|
| 85.5 % v7 (old) | 03 / 2021 | Razer Blade 15 Base Edition 2021, i7-10750H RTX 3060 i7-10750H, GeForce RTX 3060 Laptop GPU | 2.1 kg | 19.9 mm | 15.60" | 1920x1080 | |
| 86.9 % v7 (old) | 08 / 2020 | Razer Blade 15 RTX 2070 Super Max-Q i7-10875H, GeForce RTX 2070 Super Max-Q | 2.1 kg | 17.8 mm | 15.60" | 1920x1080 | |
| 85 % v7 (old) | 02 / 2021 | Asus ROG Strix G15 G513QR R9 5900HX, GeForce RTX 3070 Laptop GPU | 2.3 kg | 27.2 mm | 15.60" | 1920x1080 | |
| 84 % v7 (old) | 02 / 2021 | MSI GS66 Stealth 10UG i7-10870H, GeForce RTX 3070 Laptop GPU | 2.1 kg | 19.8 mm | 15.60" | 1920x1080 | |
| 80.4 % v7 (old) | 03 / 2021 | MSI GF65 Thin 10UE i7-10750H, GeForce RTX 3060 Laptop GPU | 1.9 kg | 21.7 mm | 15.60" | 1920x1080 | |
| 82.1 % v7 (old) | 10 / 2020 | Asus ROG Zephyrus M15 GU502LU-BI7N4 i7-10750H, GeForce GTX 1660 Ti Mobile | 2 kg | 18.9 mm | 15.60" | 1920x1080 |
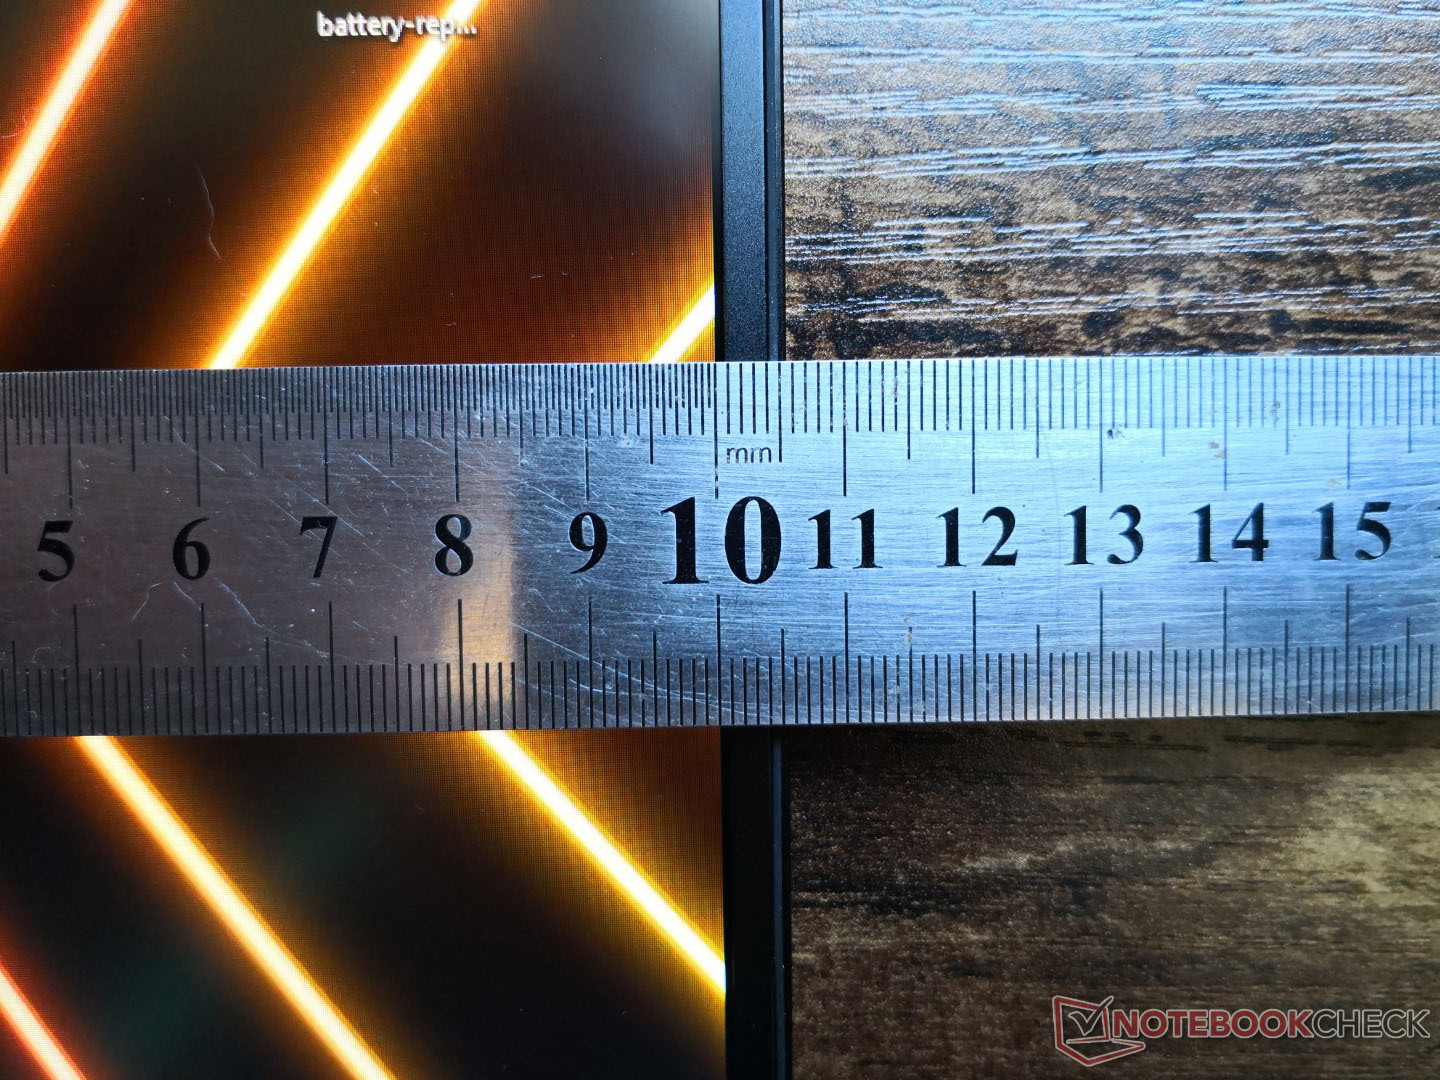
Case
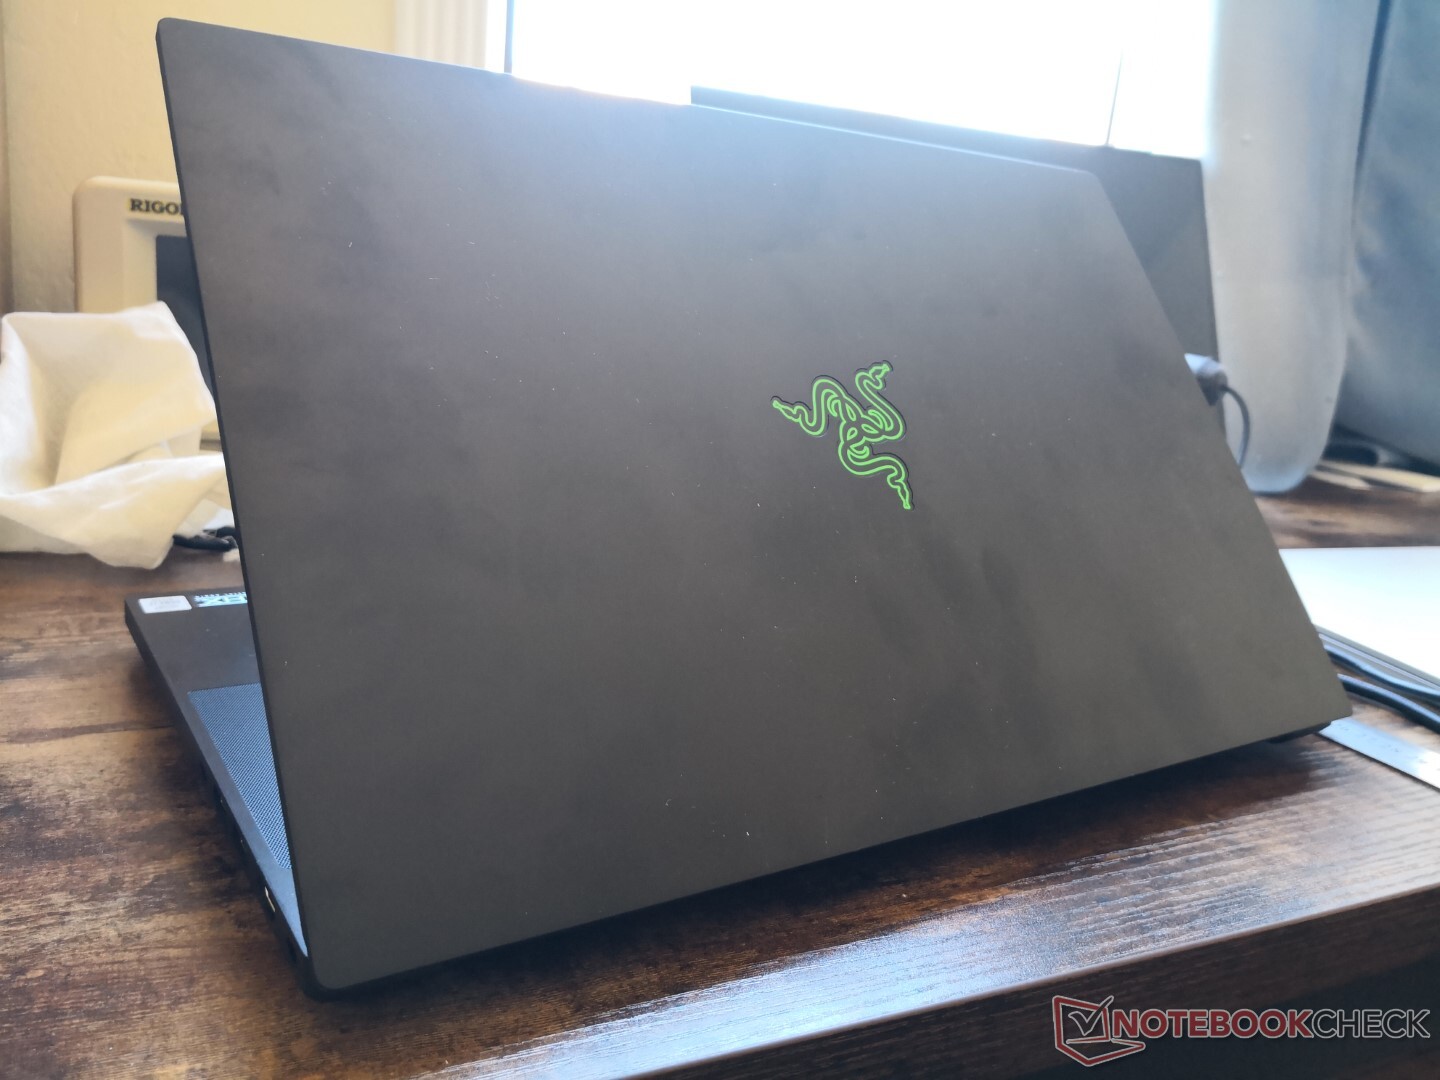
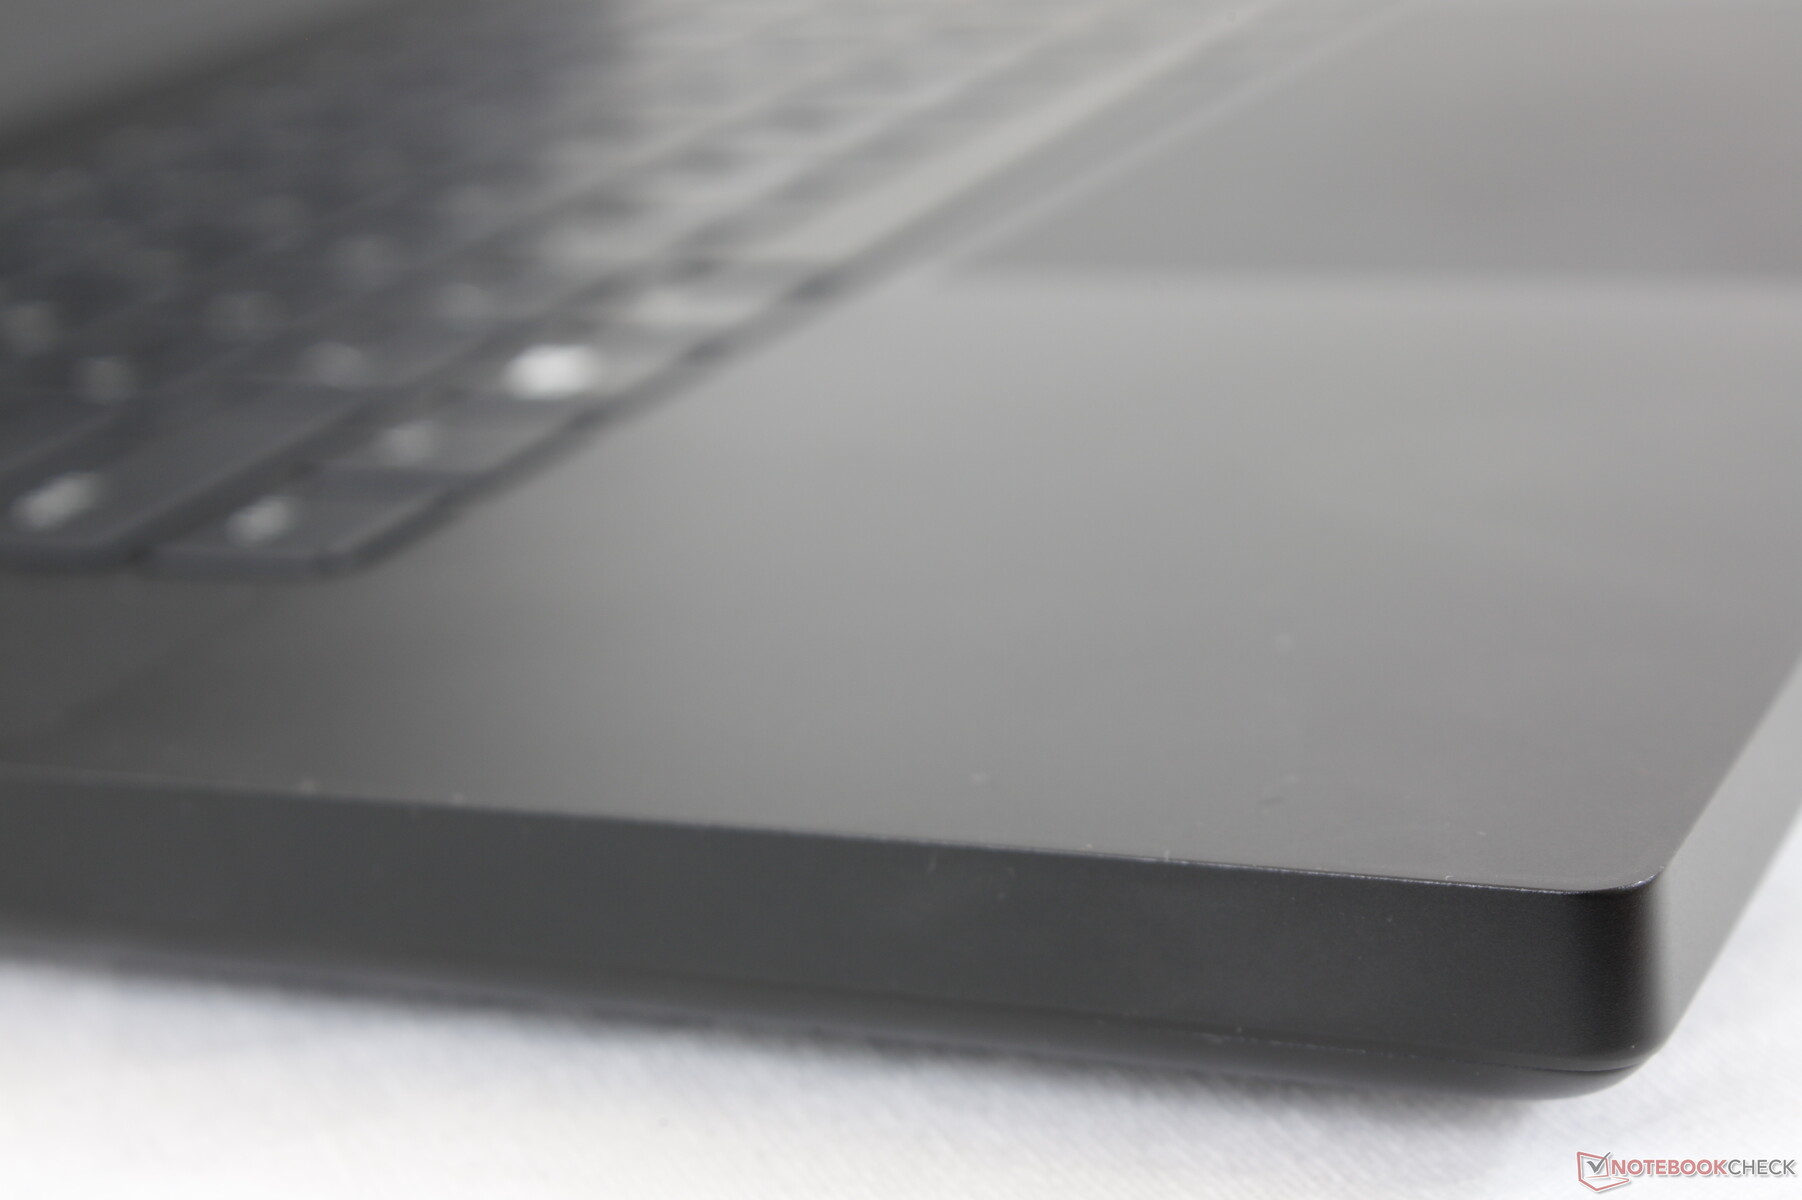
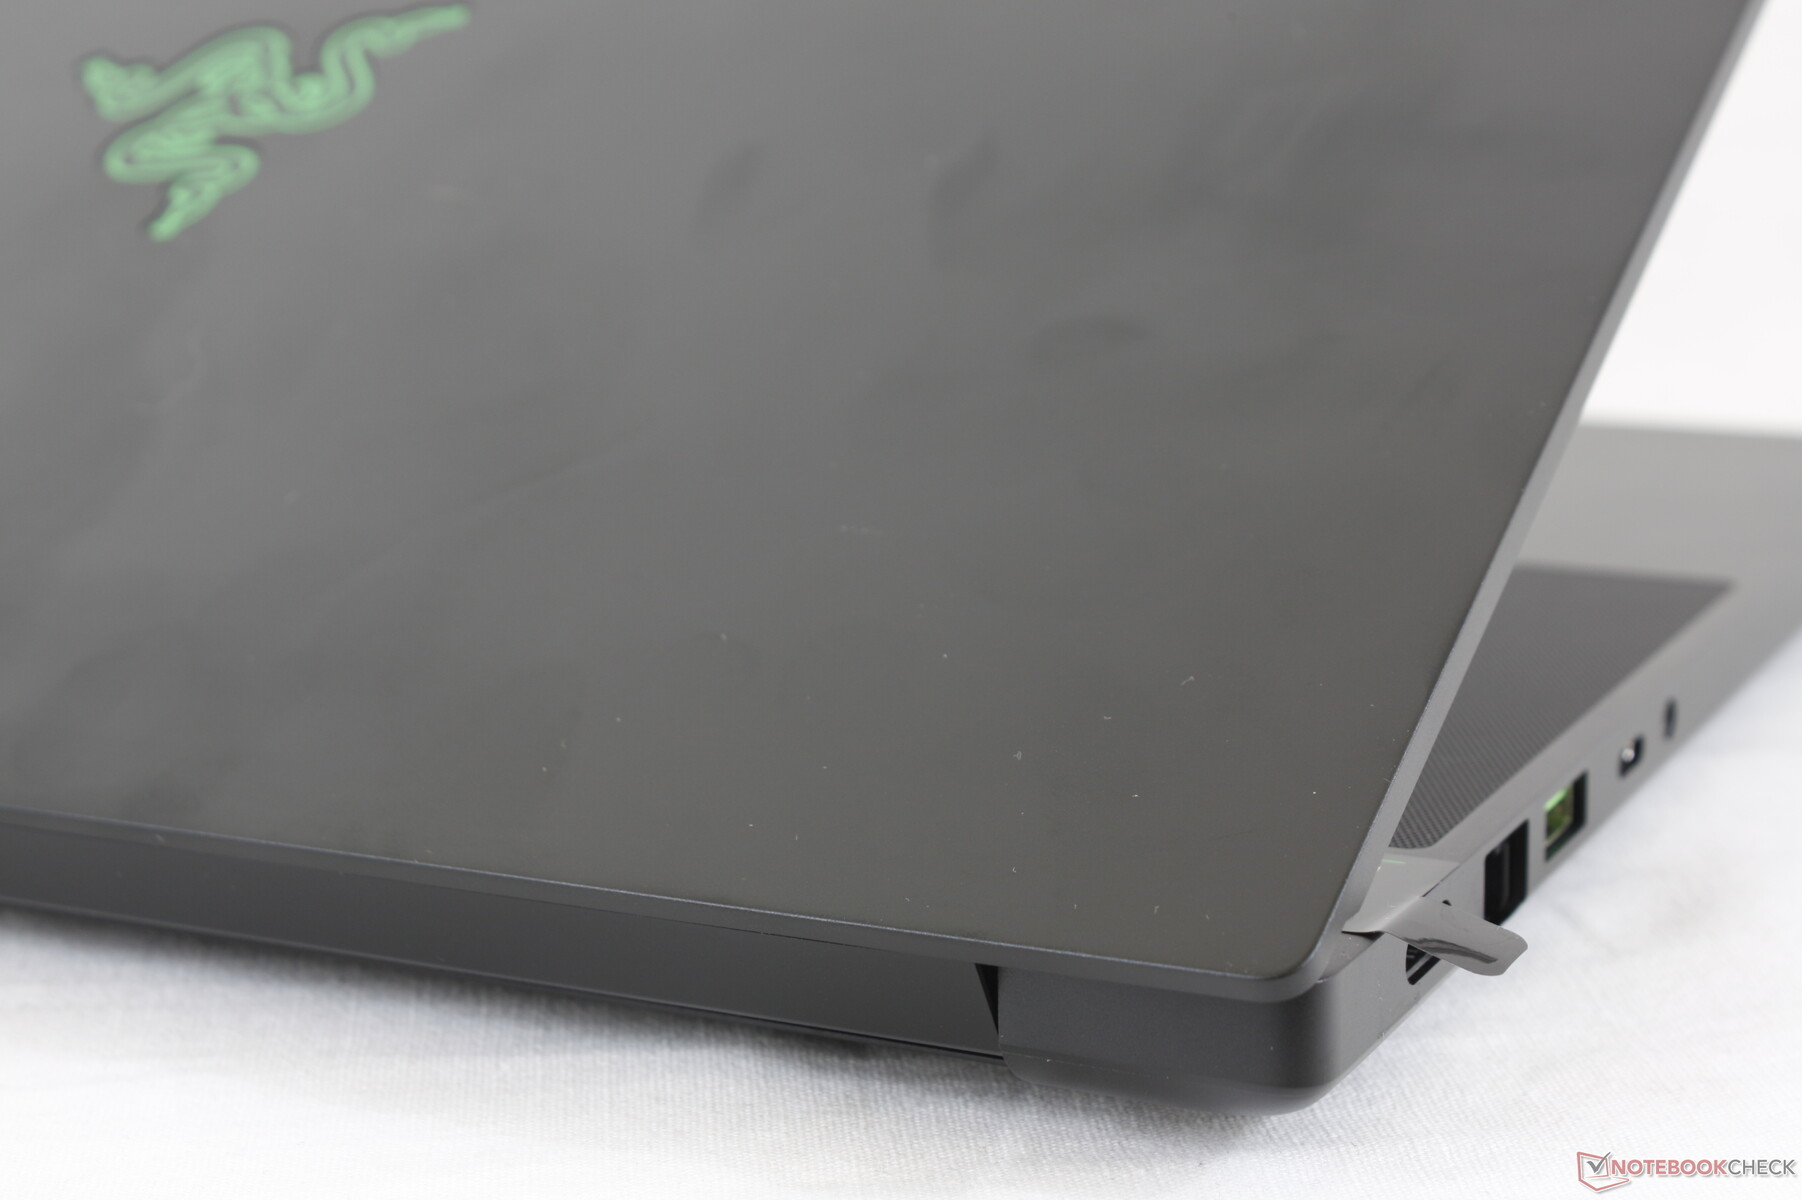
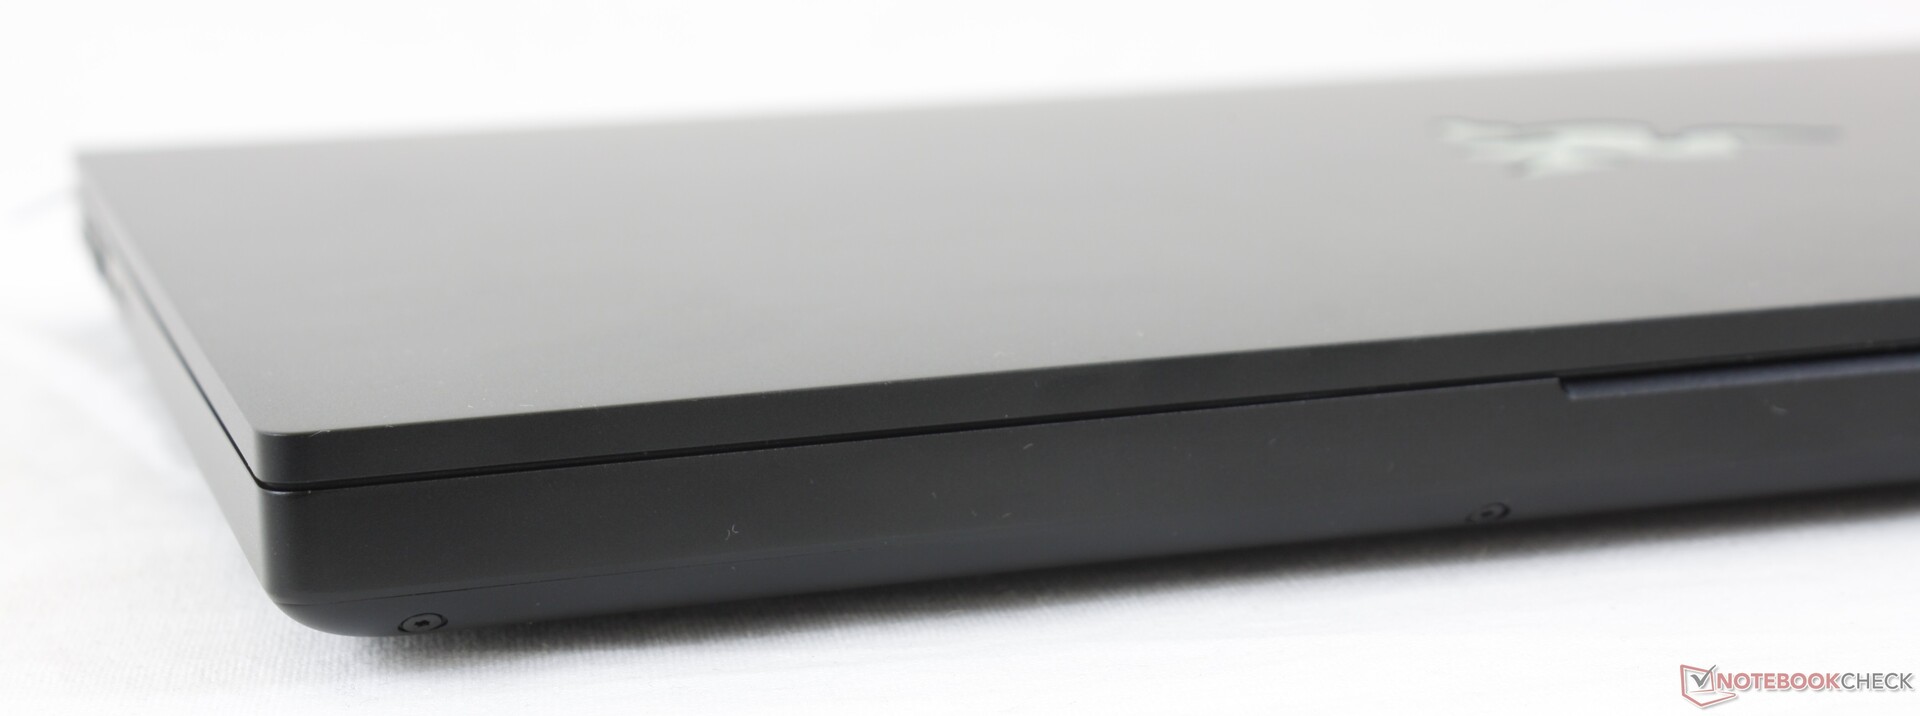
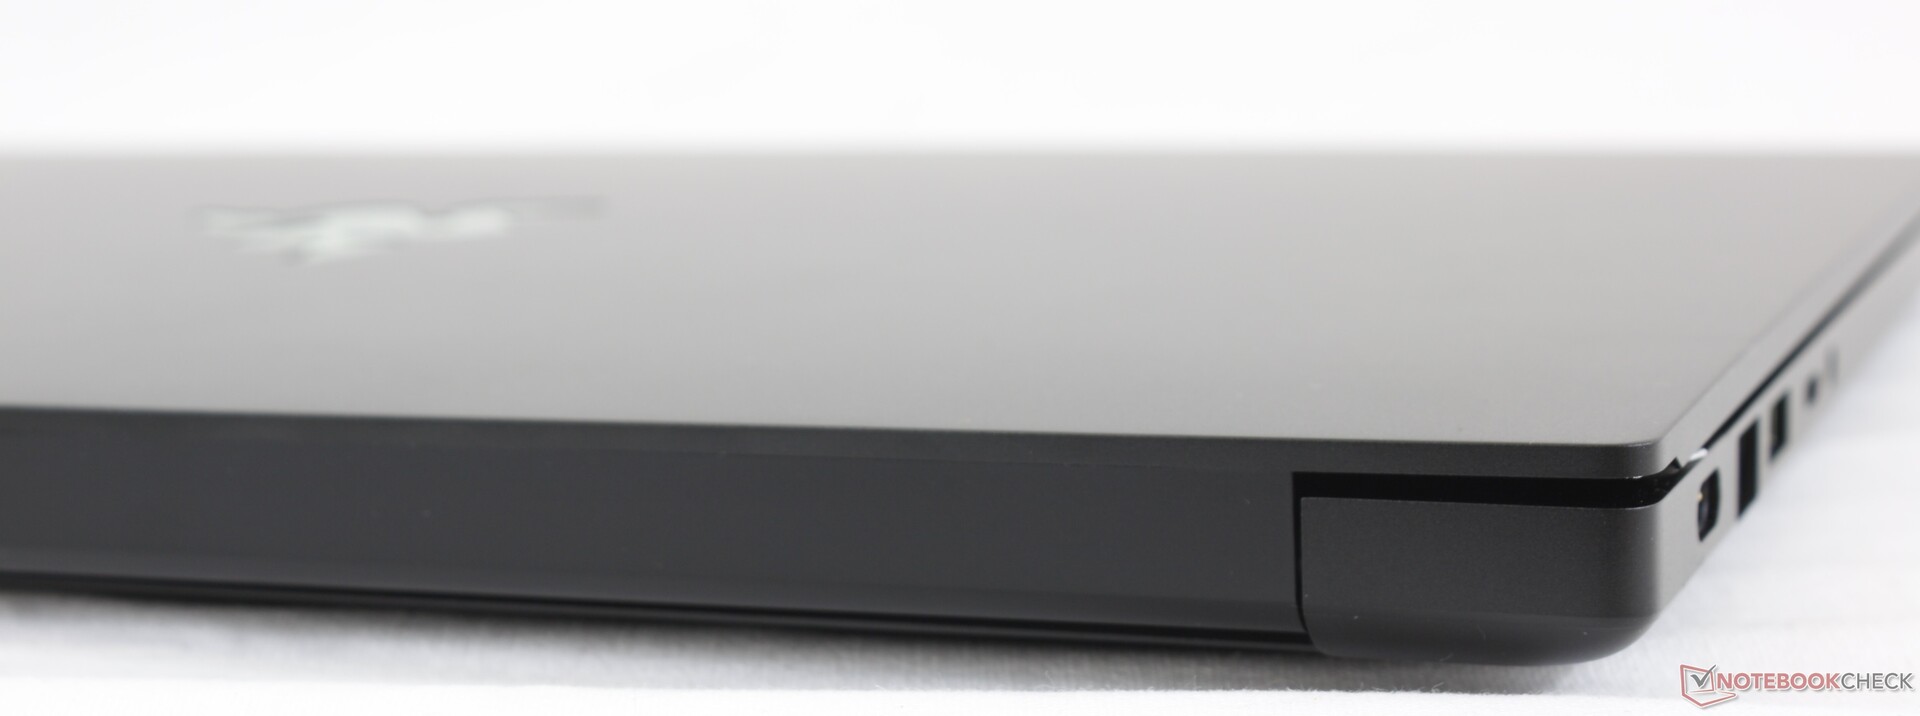
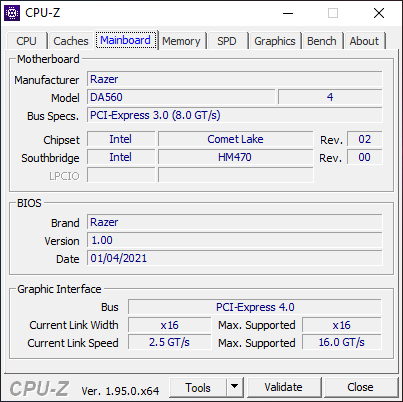
The 2021 Blade 15 Base Model uses the same chassis as the Base Model SKUs from 2019 and 2020 and so all our existing comments about the physical features of the laptop still apply. Users will have to shell out more money for the Blade 15 Advanced Model if they want the thinner chassis. It's worth noting that the 2021 Advanced Model is even thinner than the 2020 Advanced model by about 1 mm (16.99 mm vs. 17.8 mm).
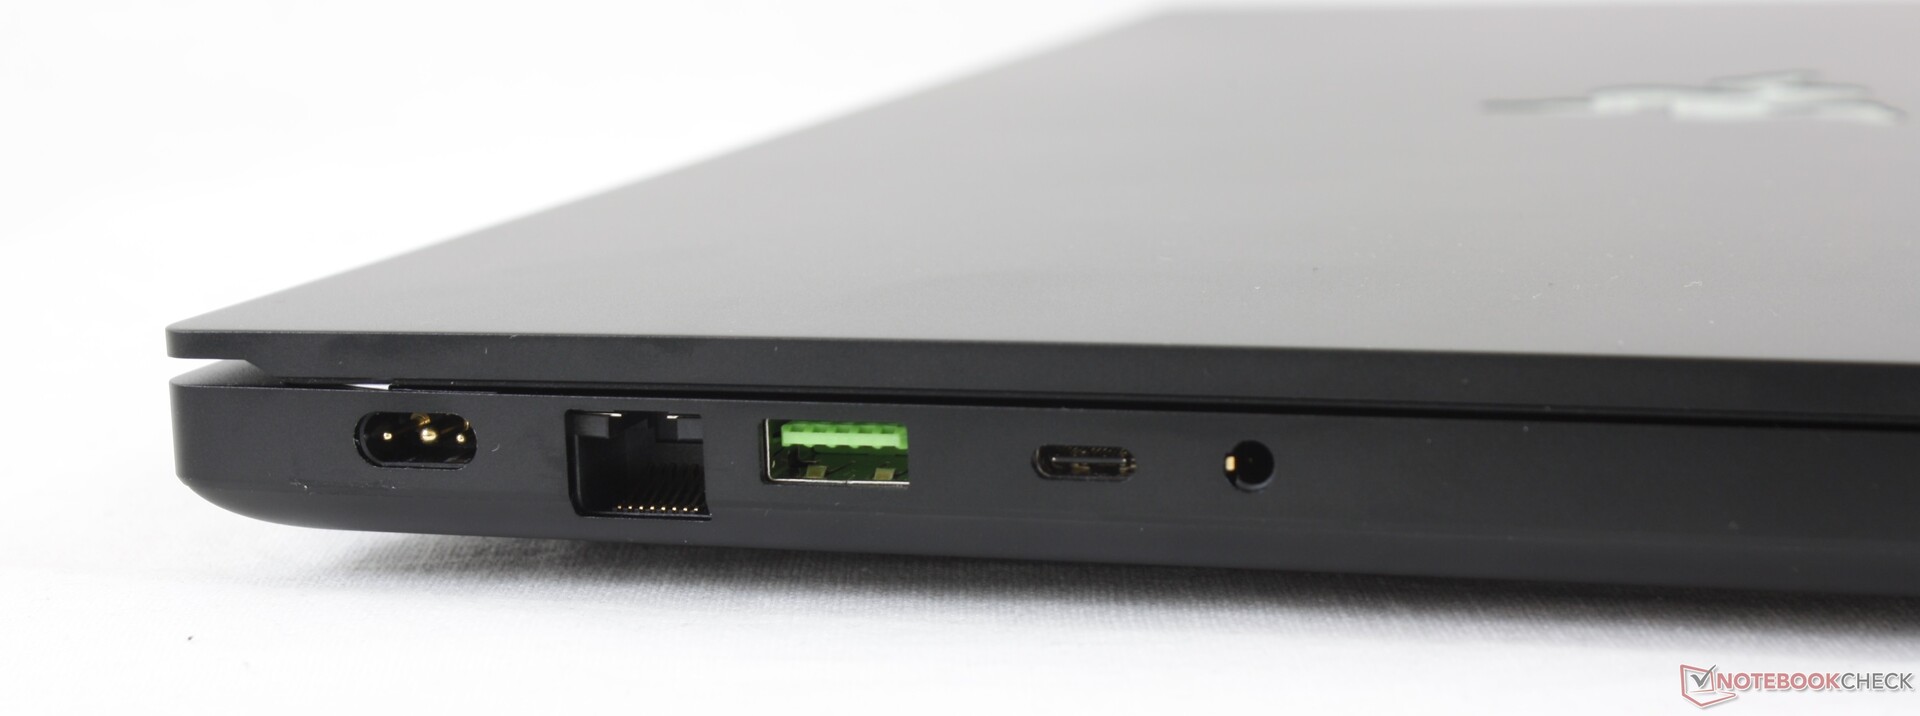
Connectivity
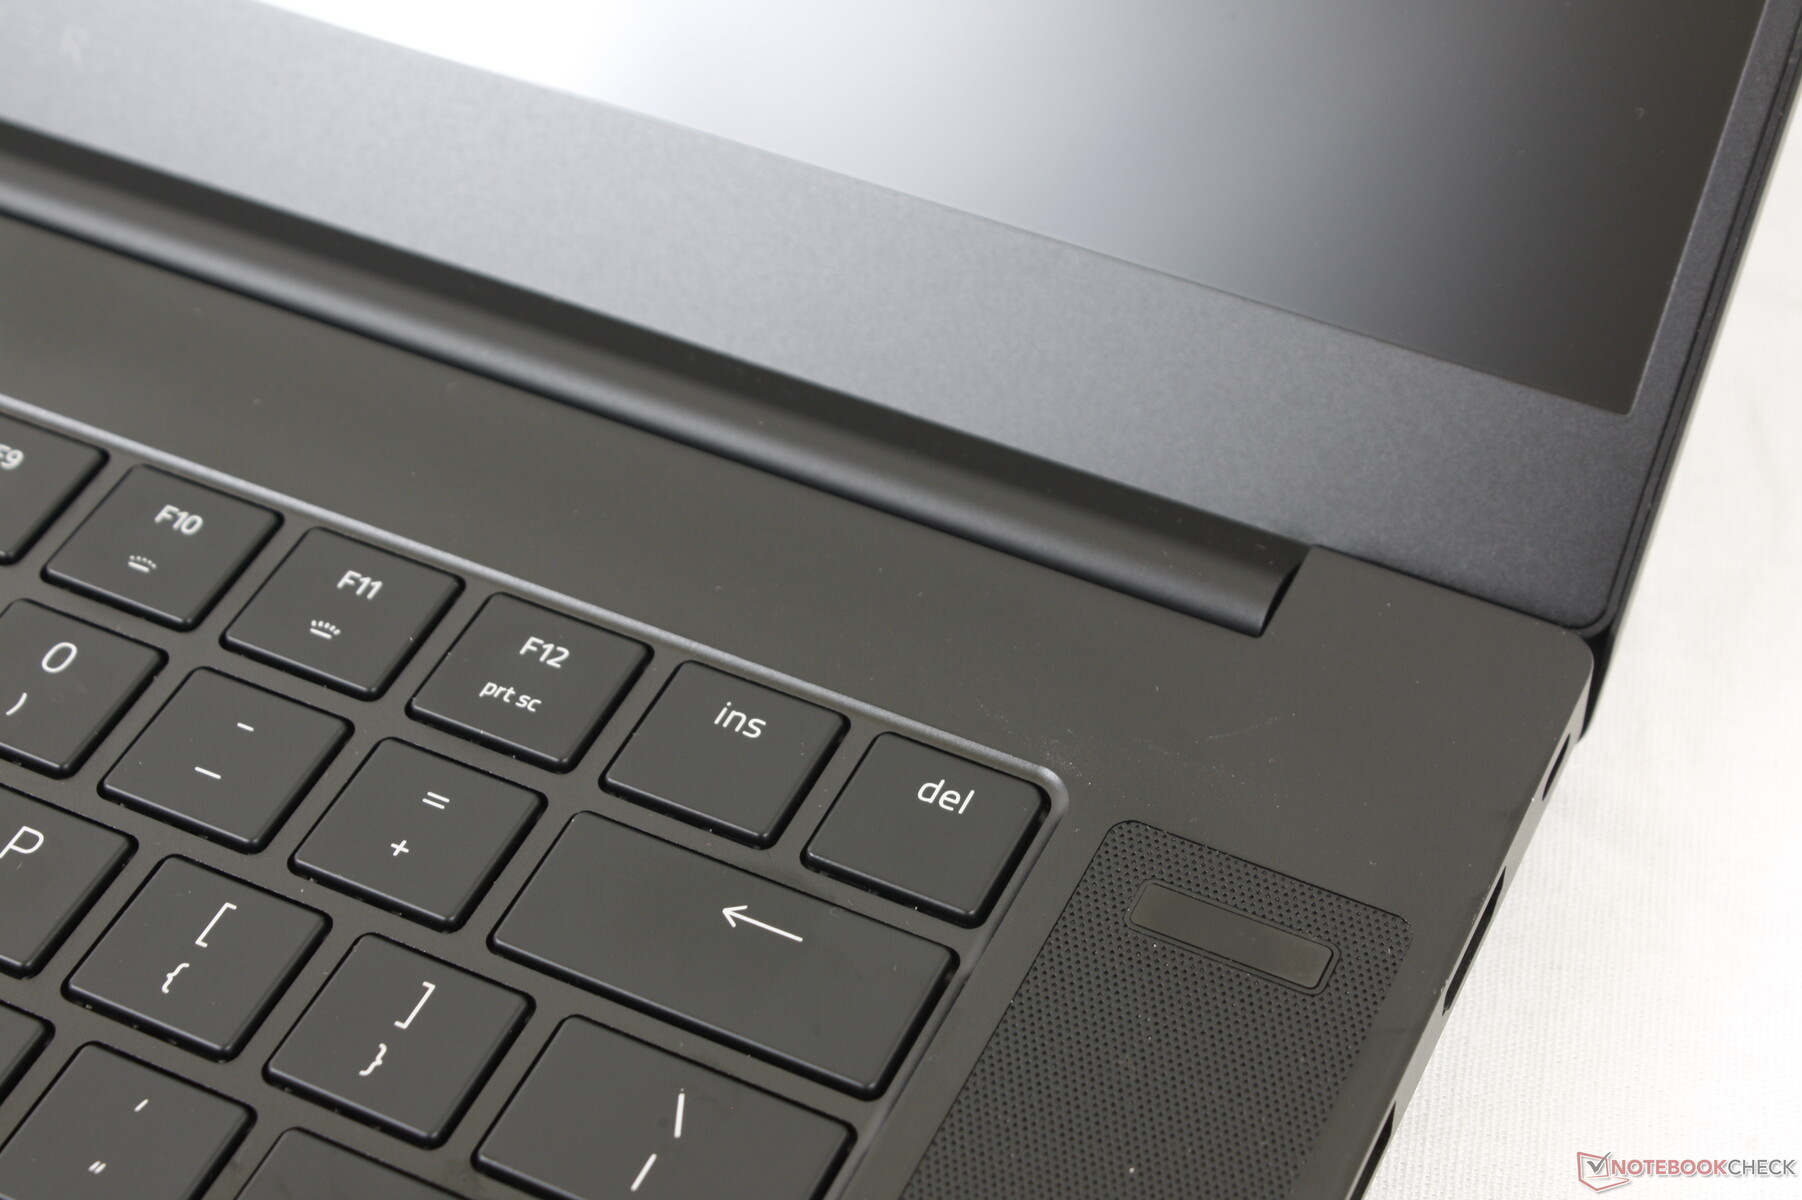
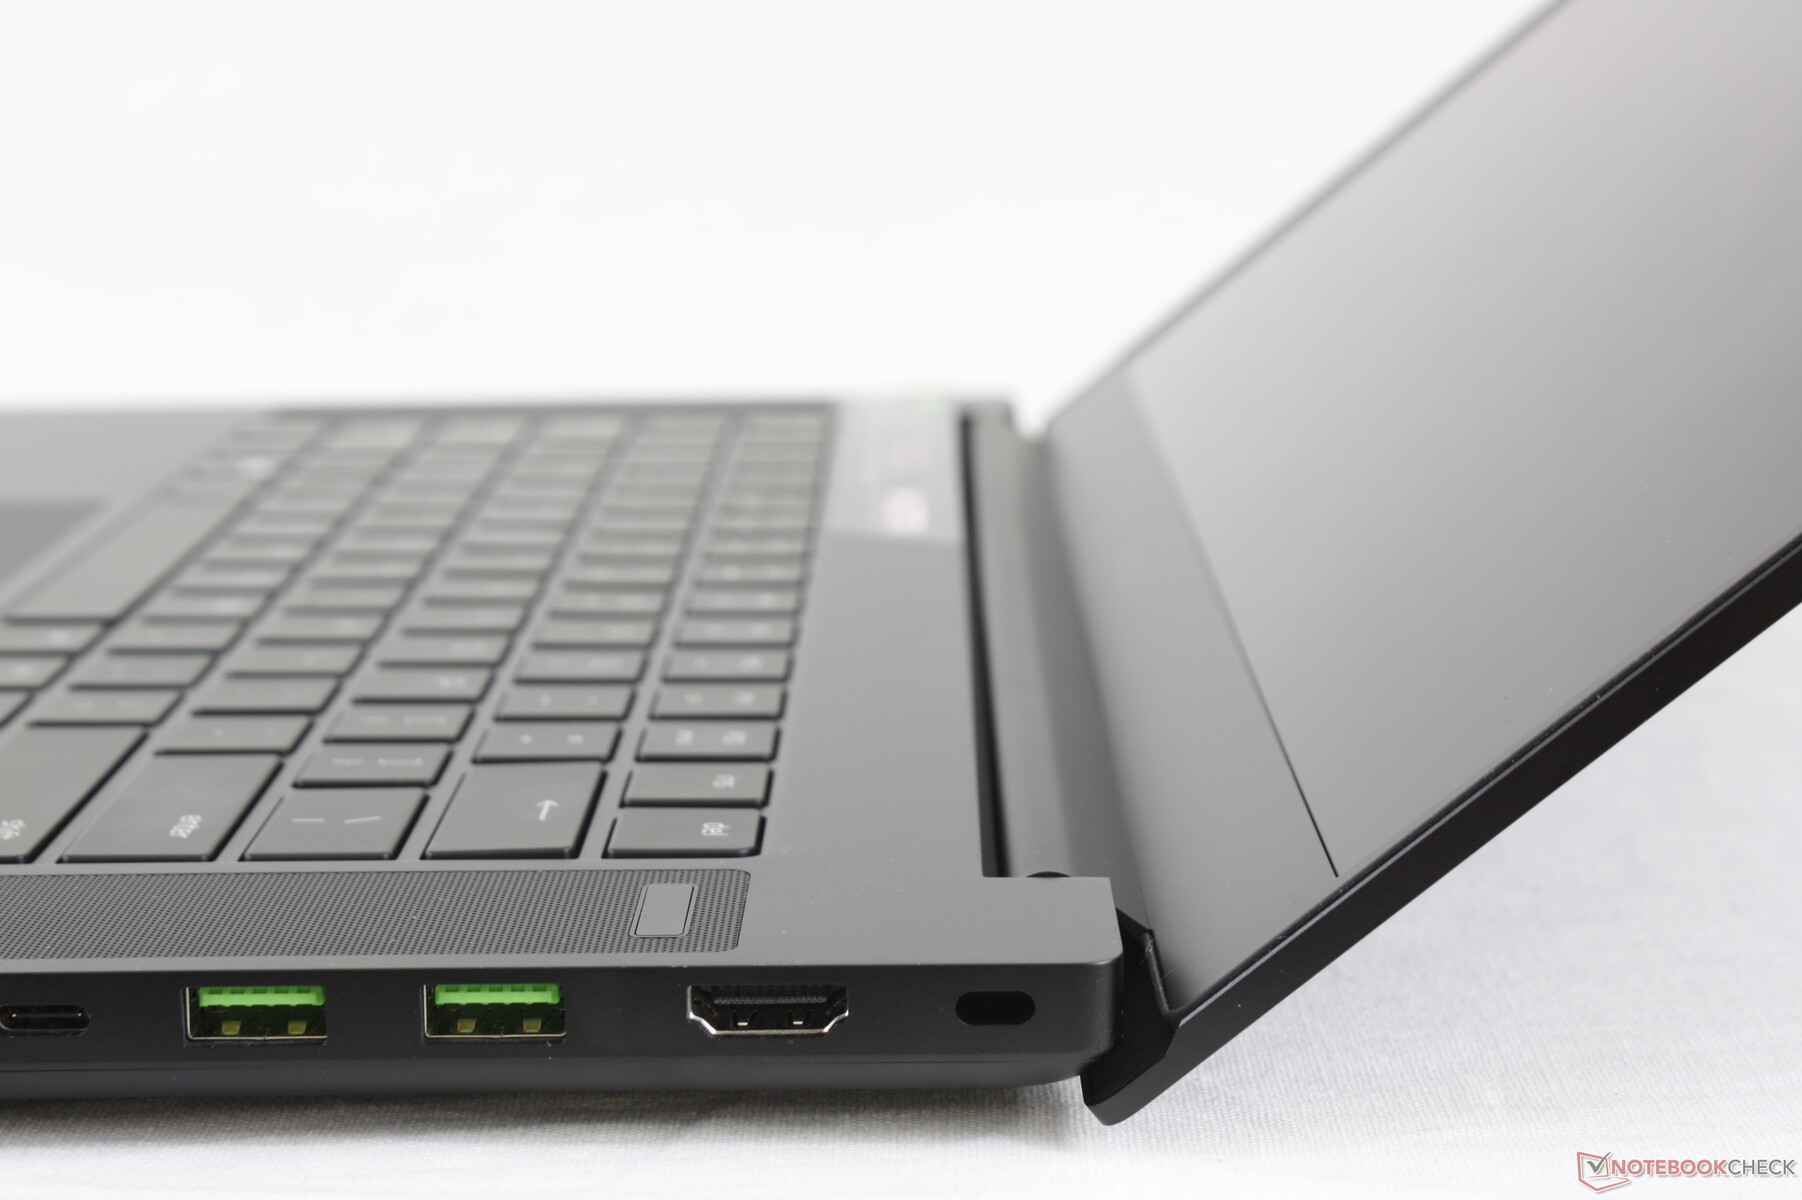
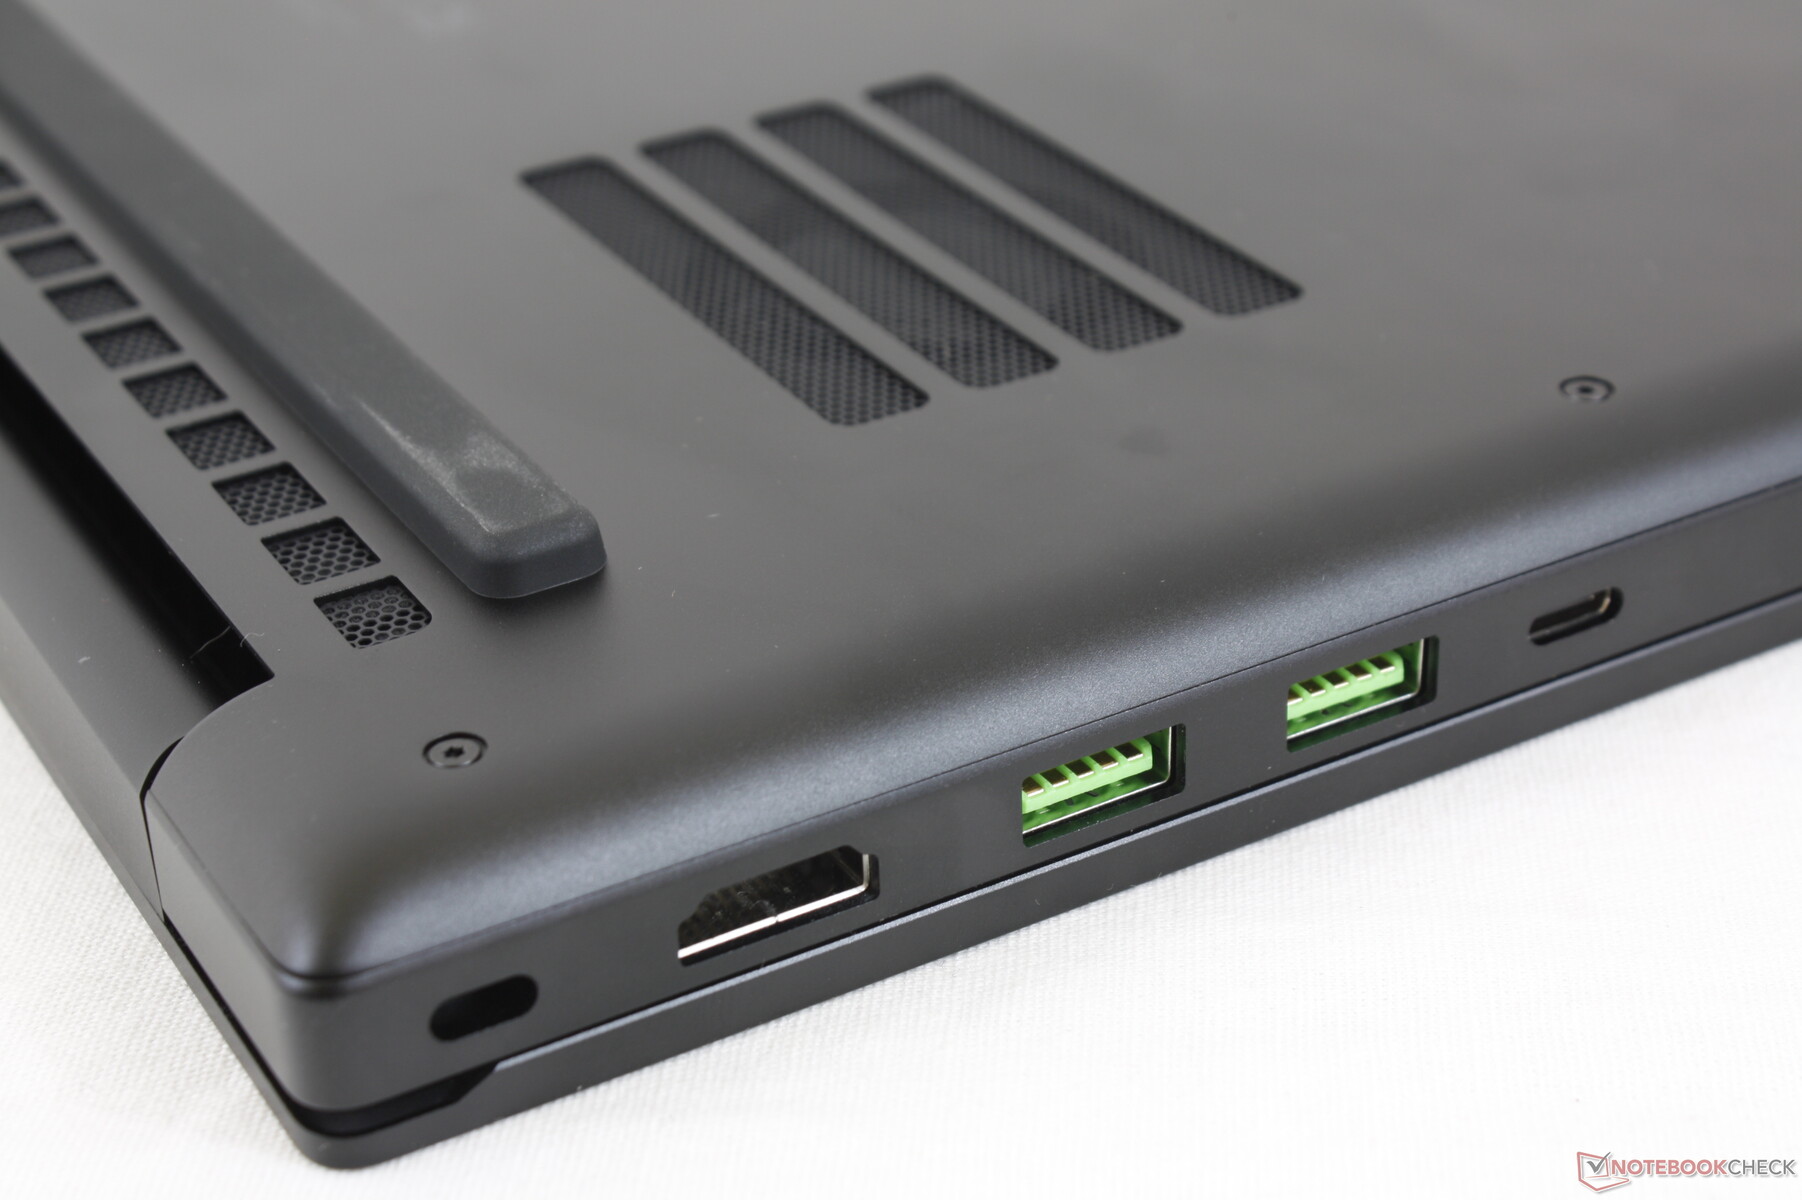
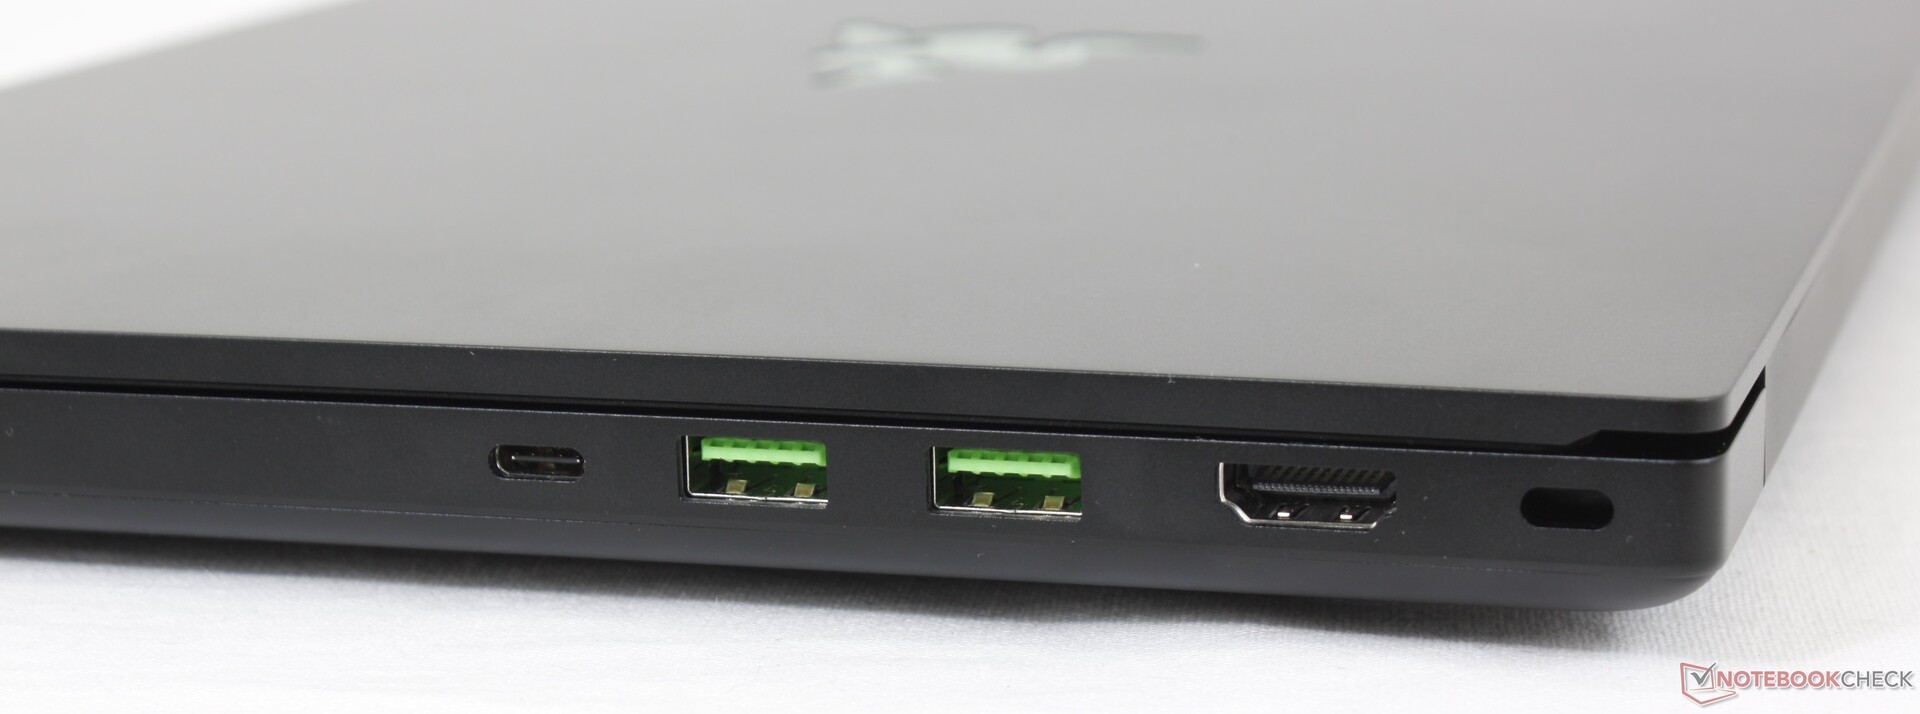
Aside from minor updates to the USB-A and HDMI ports which are now Gen. 2 and 2.1 compliant, respectively, port options haven't changed from the 2020 Blade 15 Base Model. The Gigabit Ethernet port continues to be the easiest way to distinguish between the Base Model and Advanced Model.
Port positioning is slightly different when compared to the 2019 Base Model.
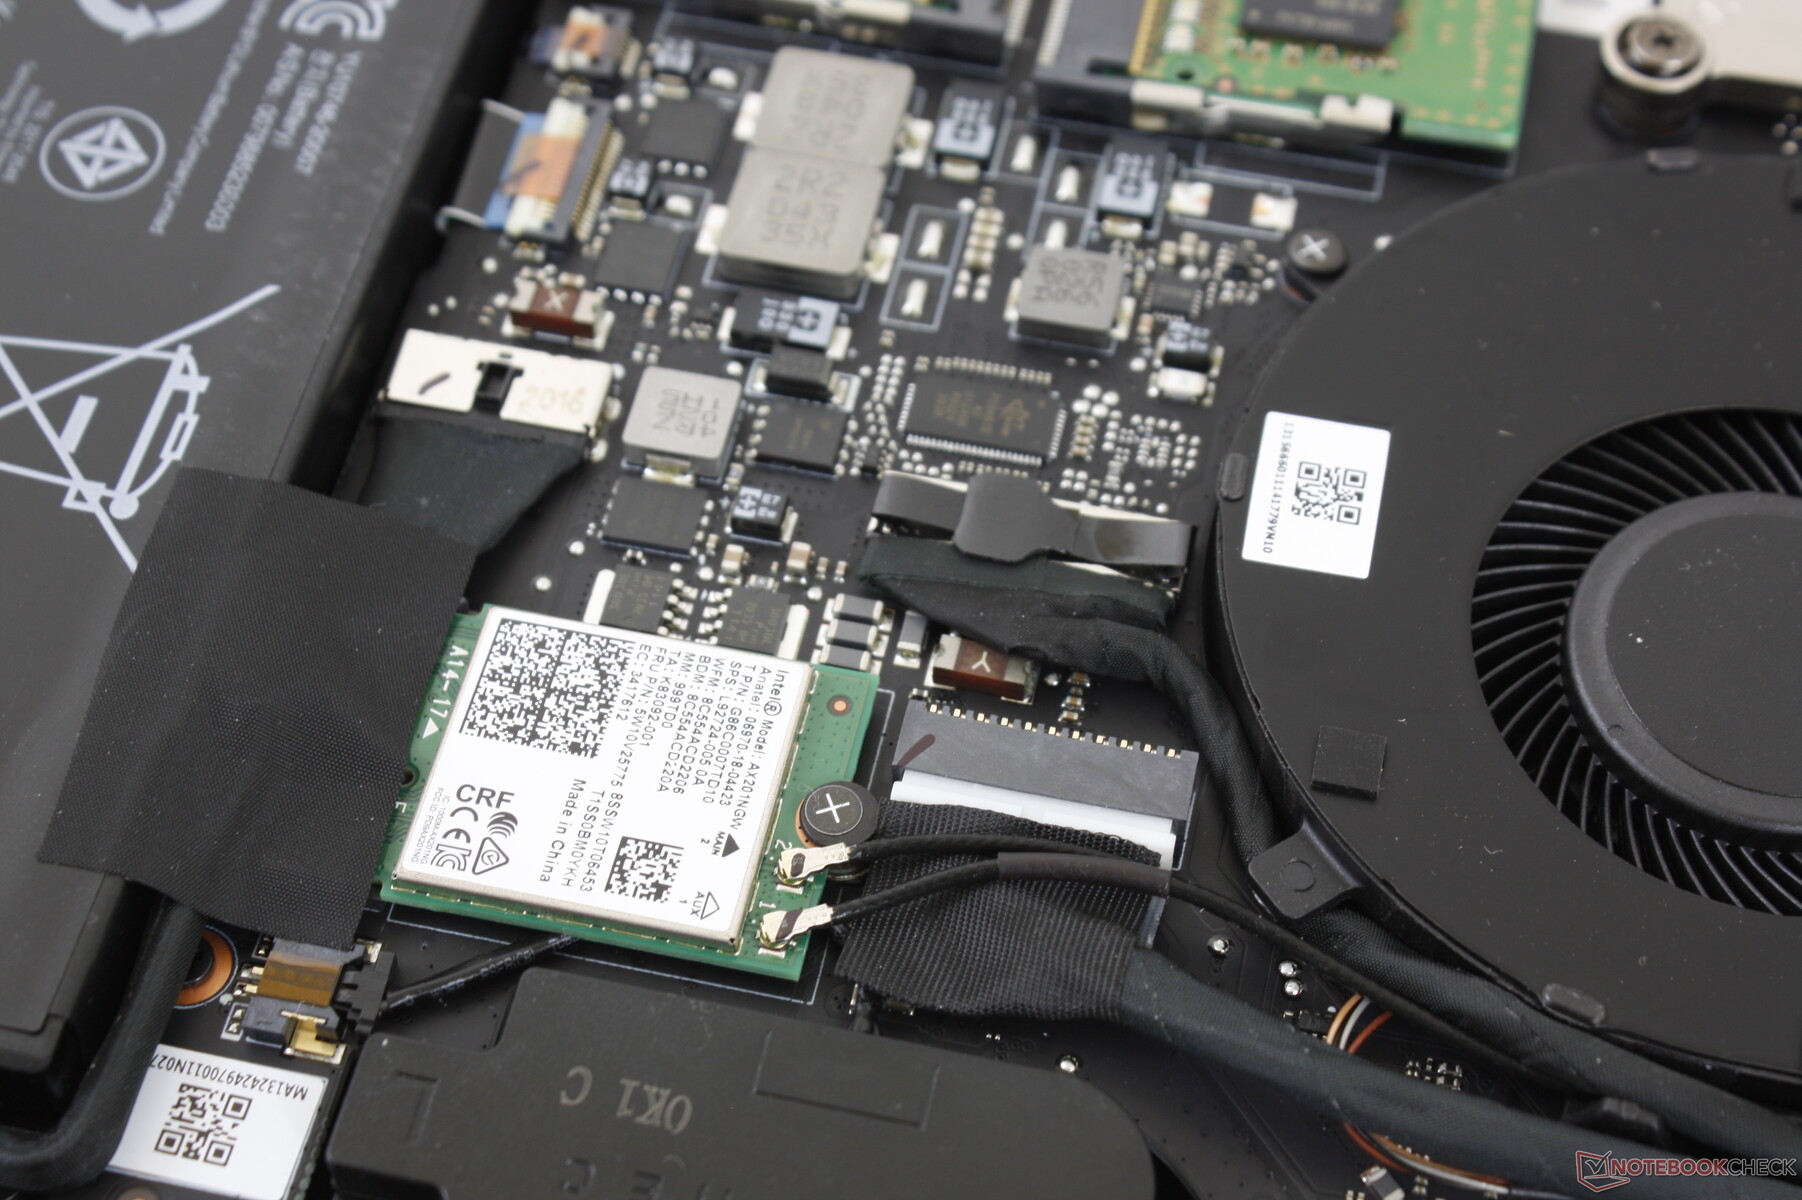
Communication
Webcam


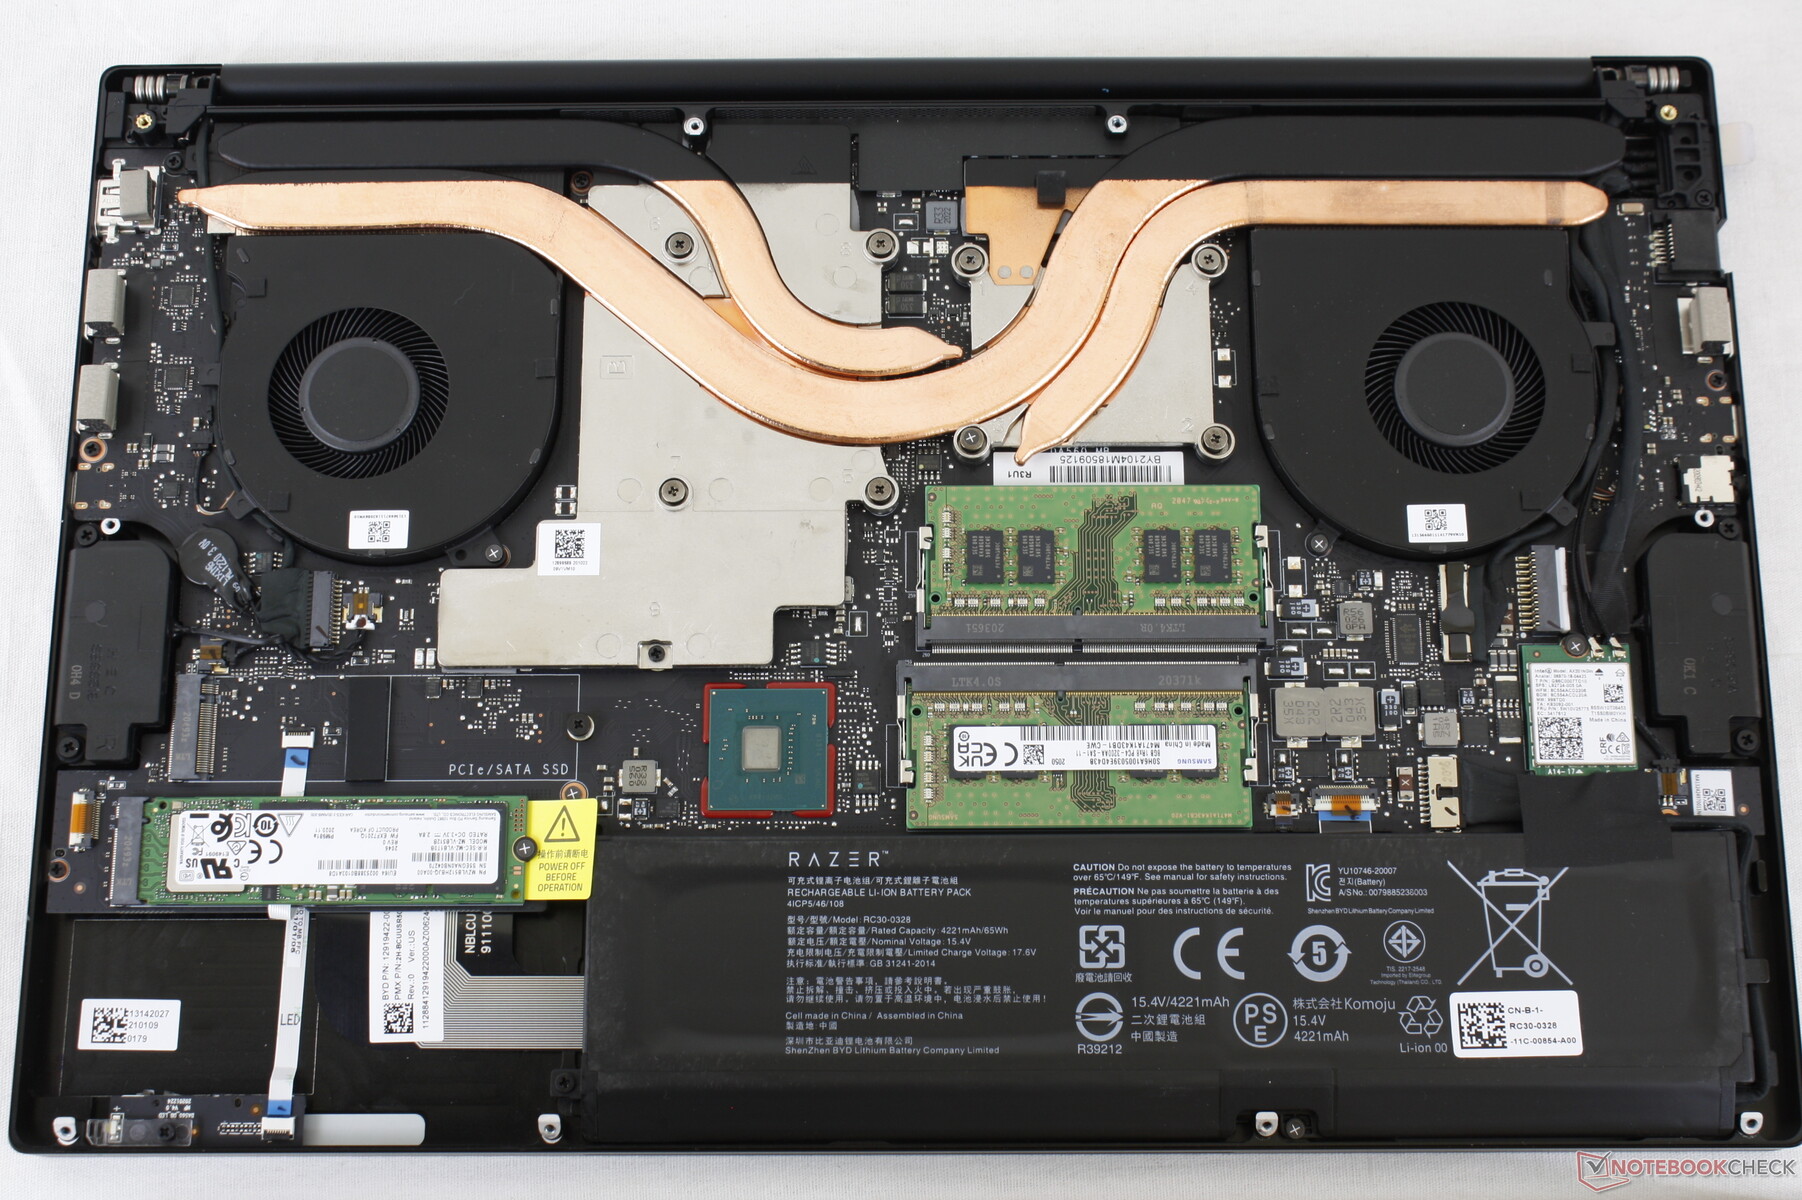
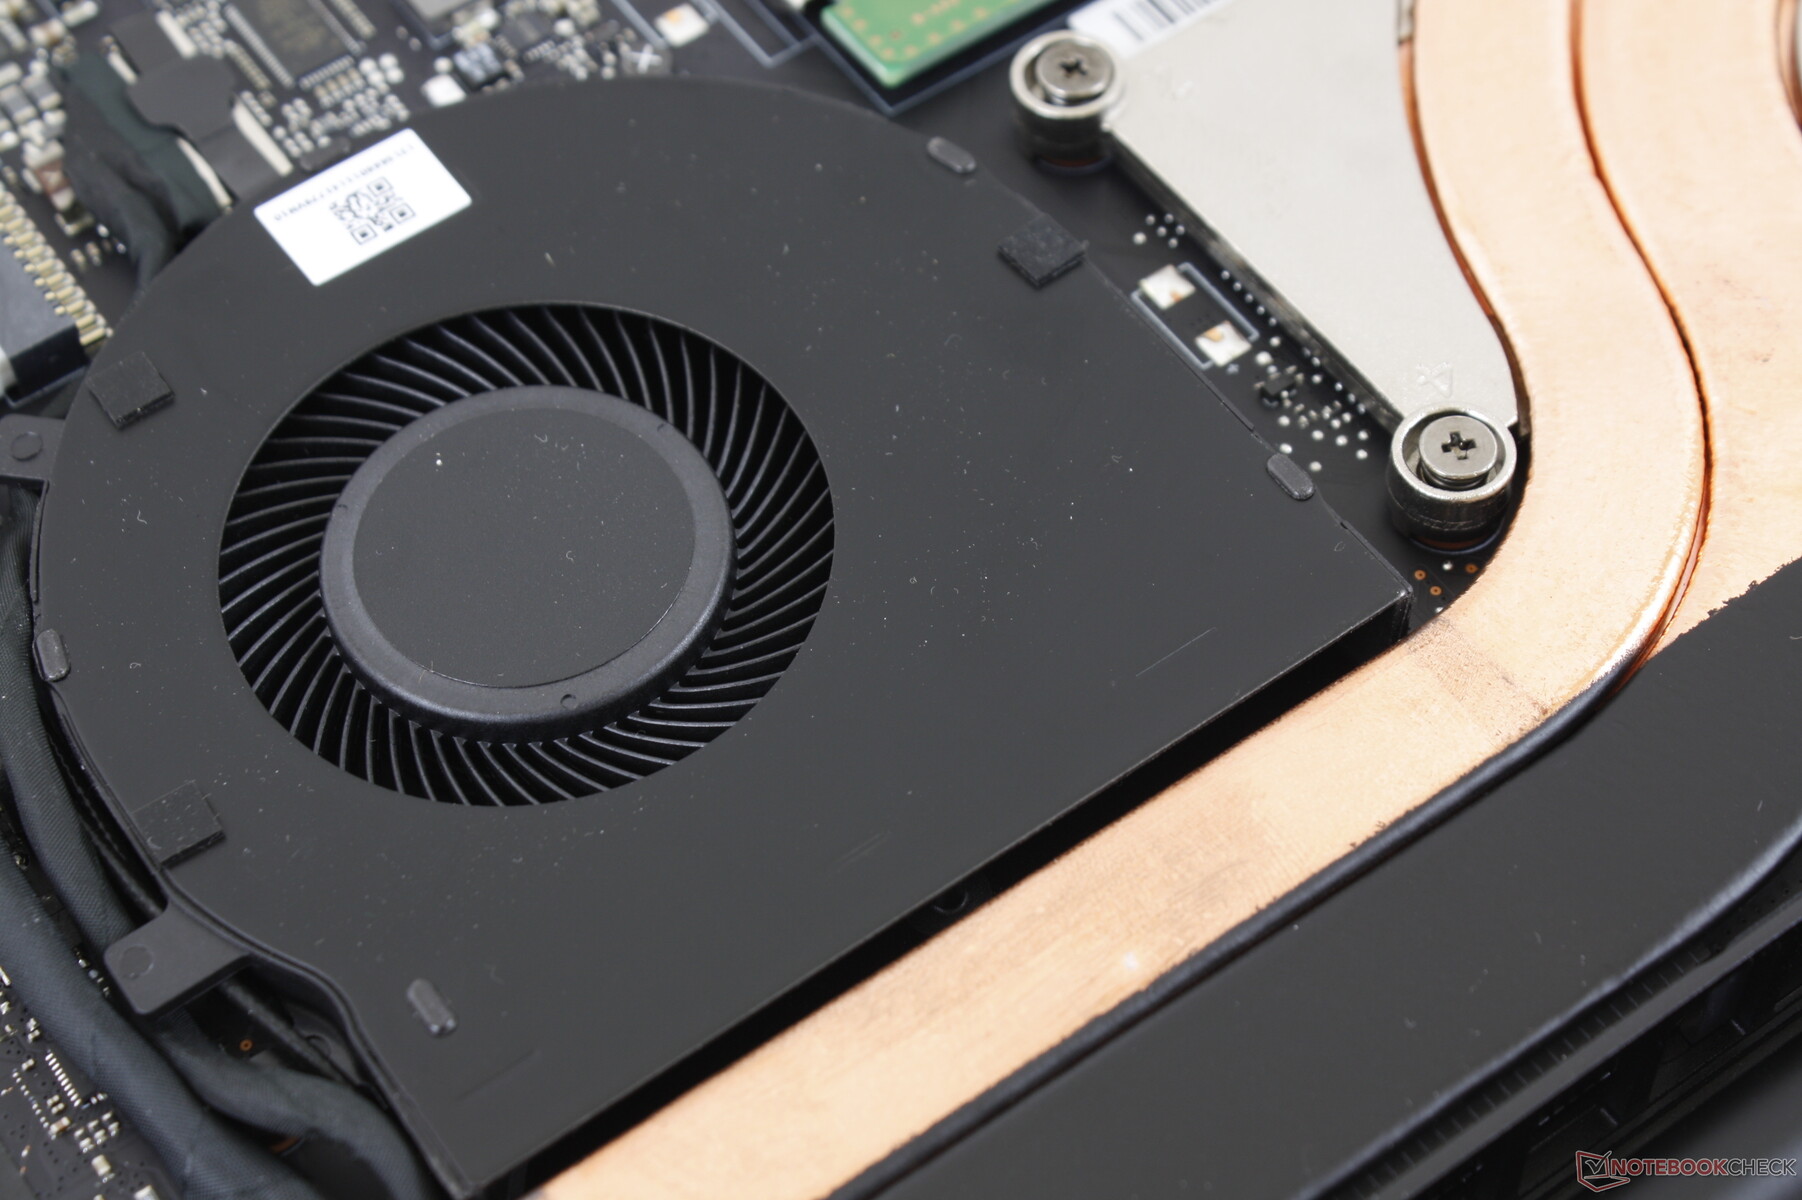
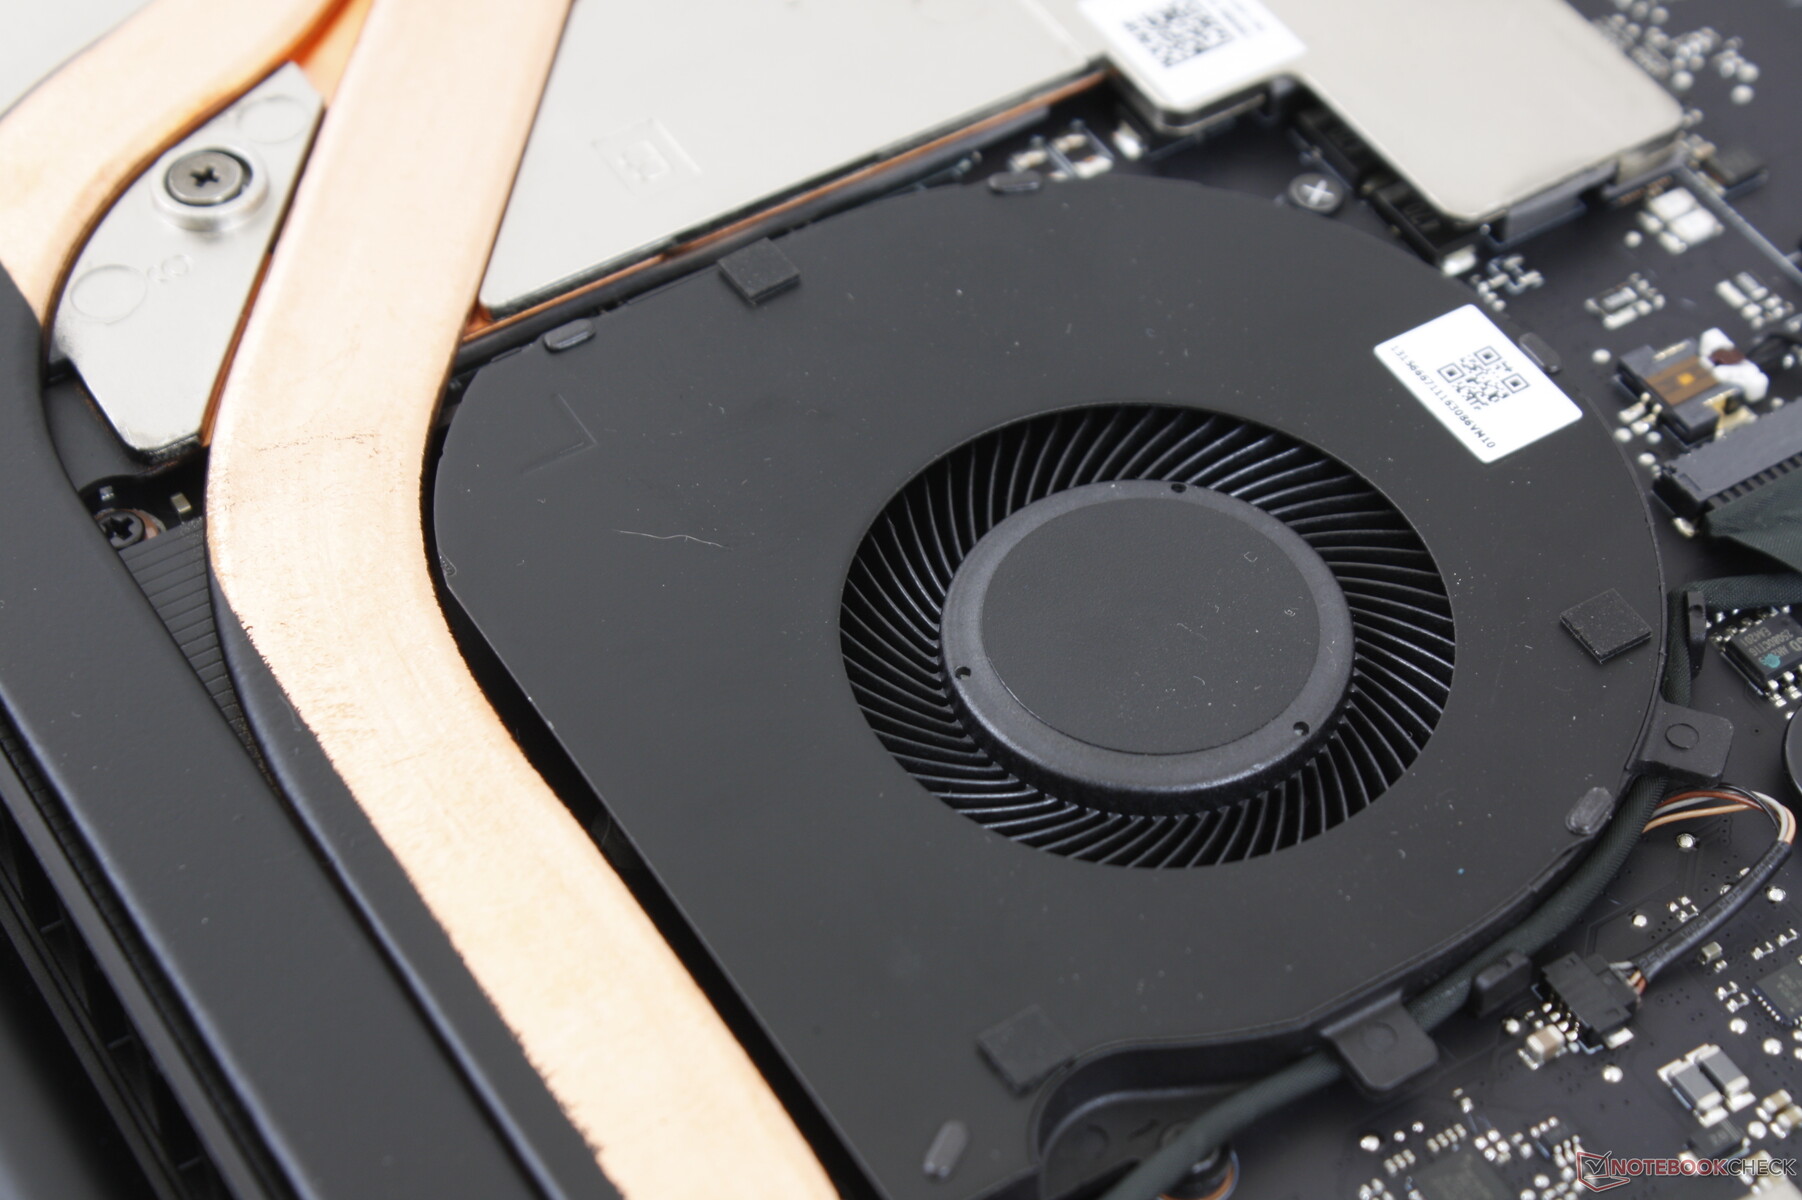
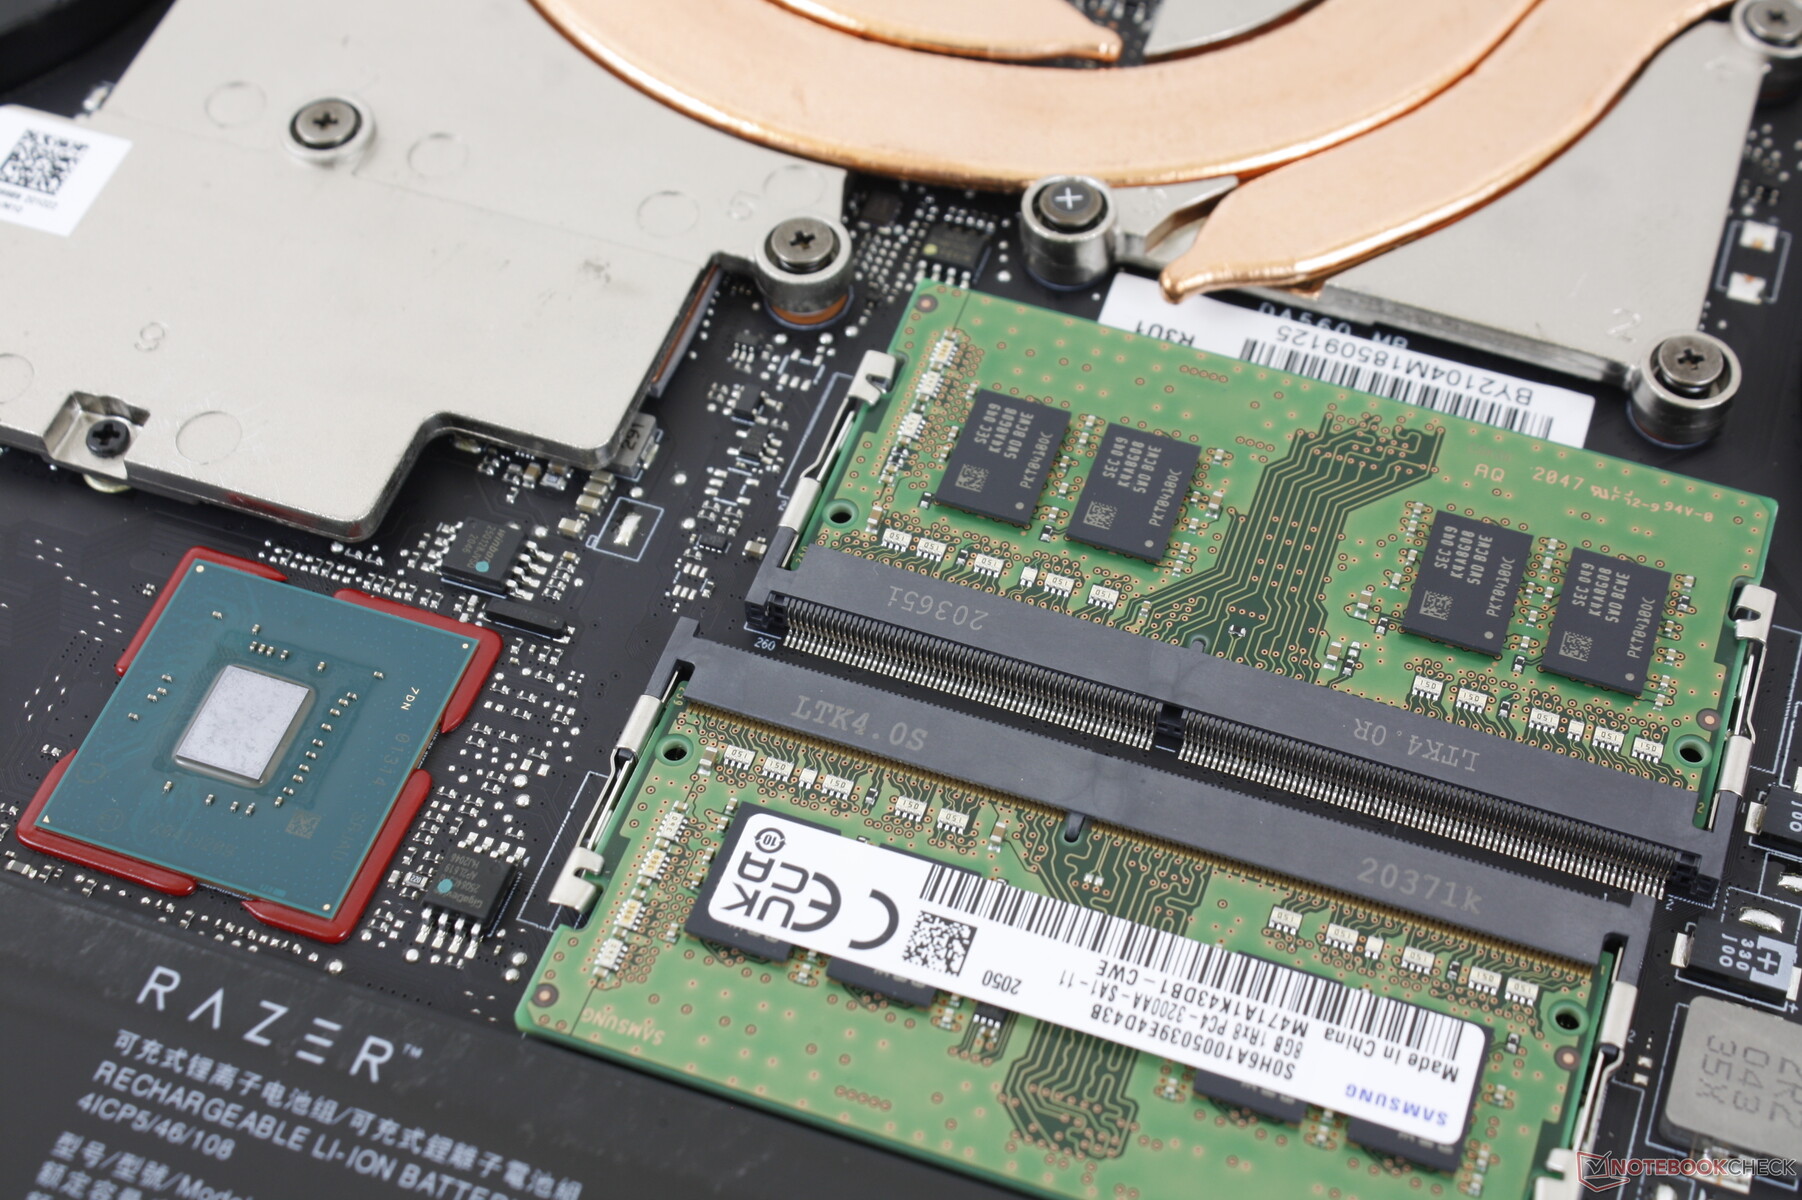
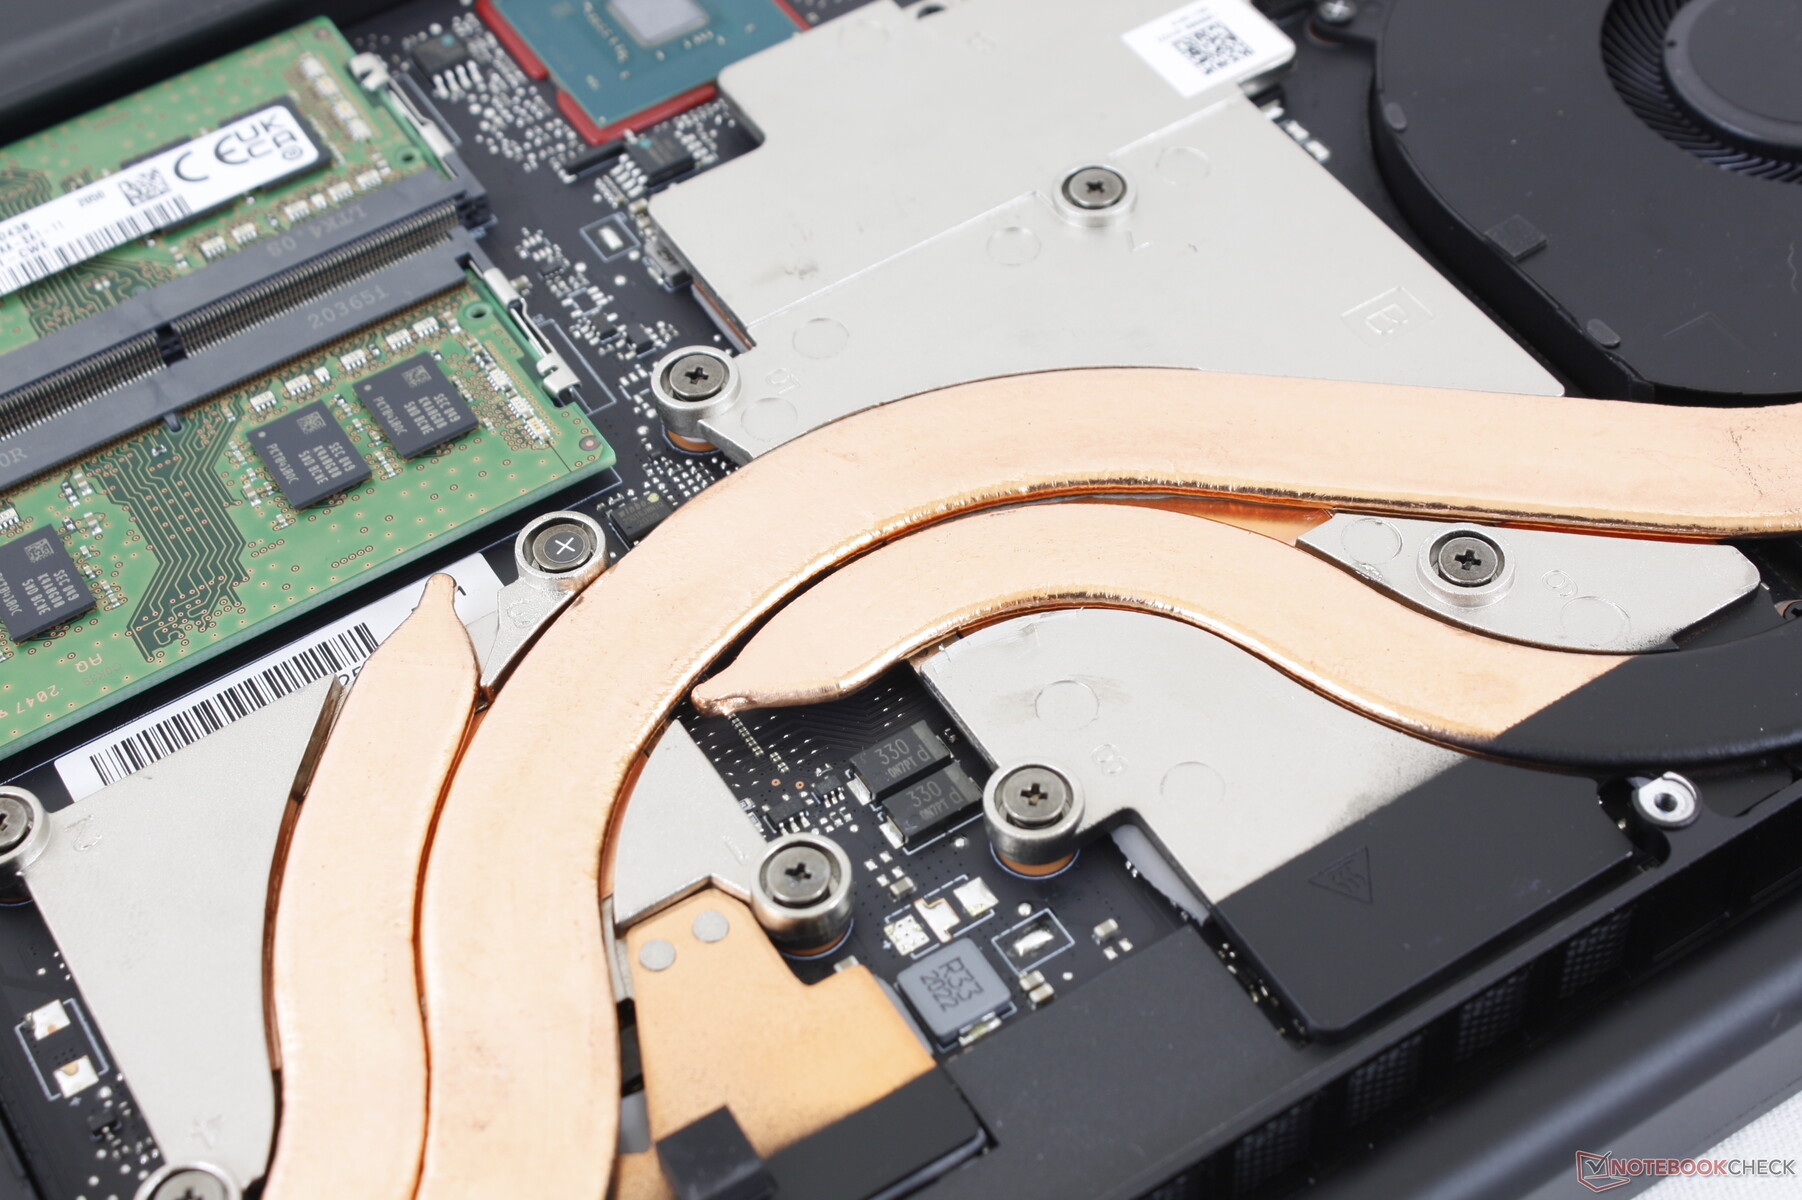
Maintenance
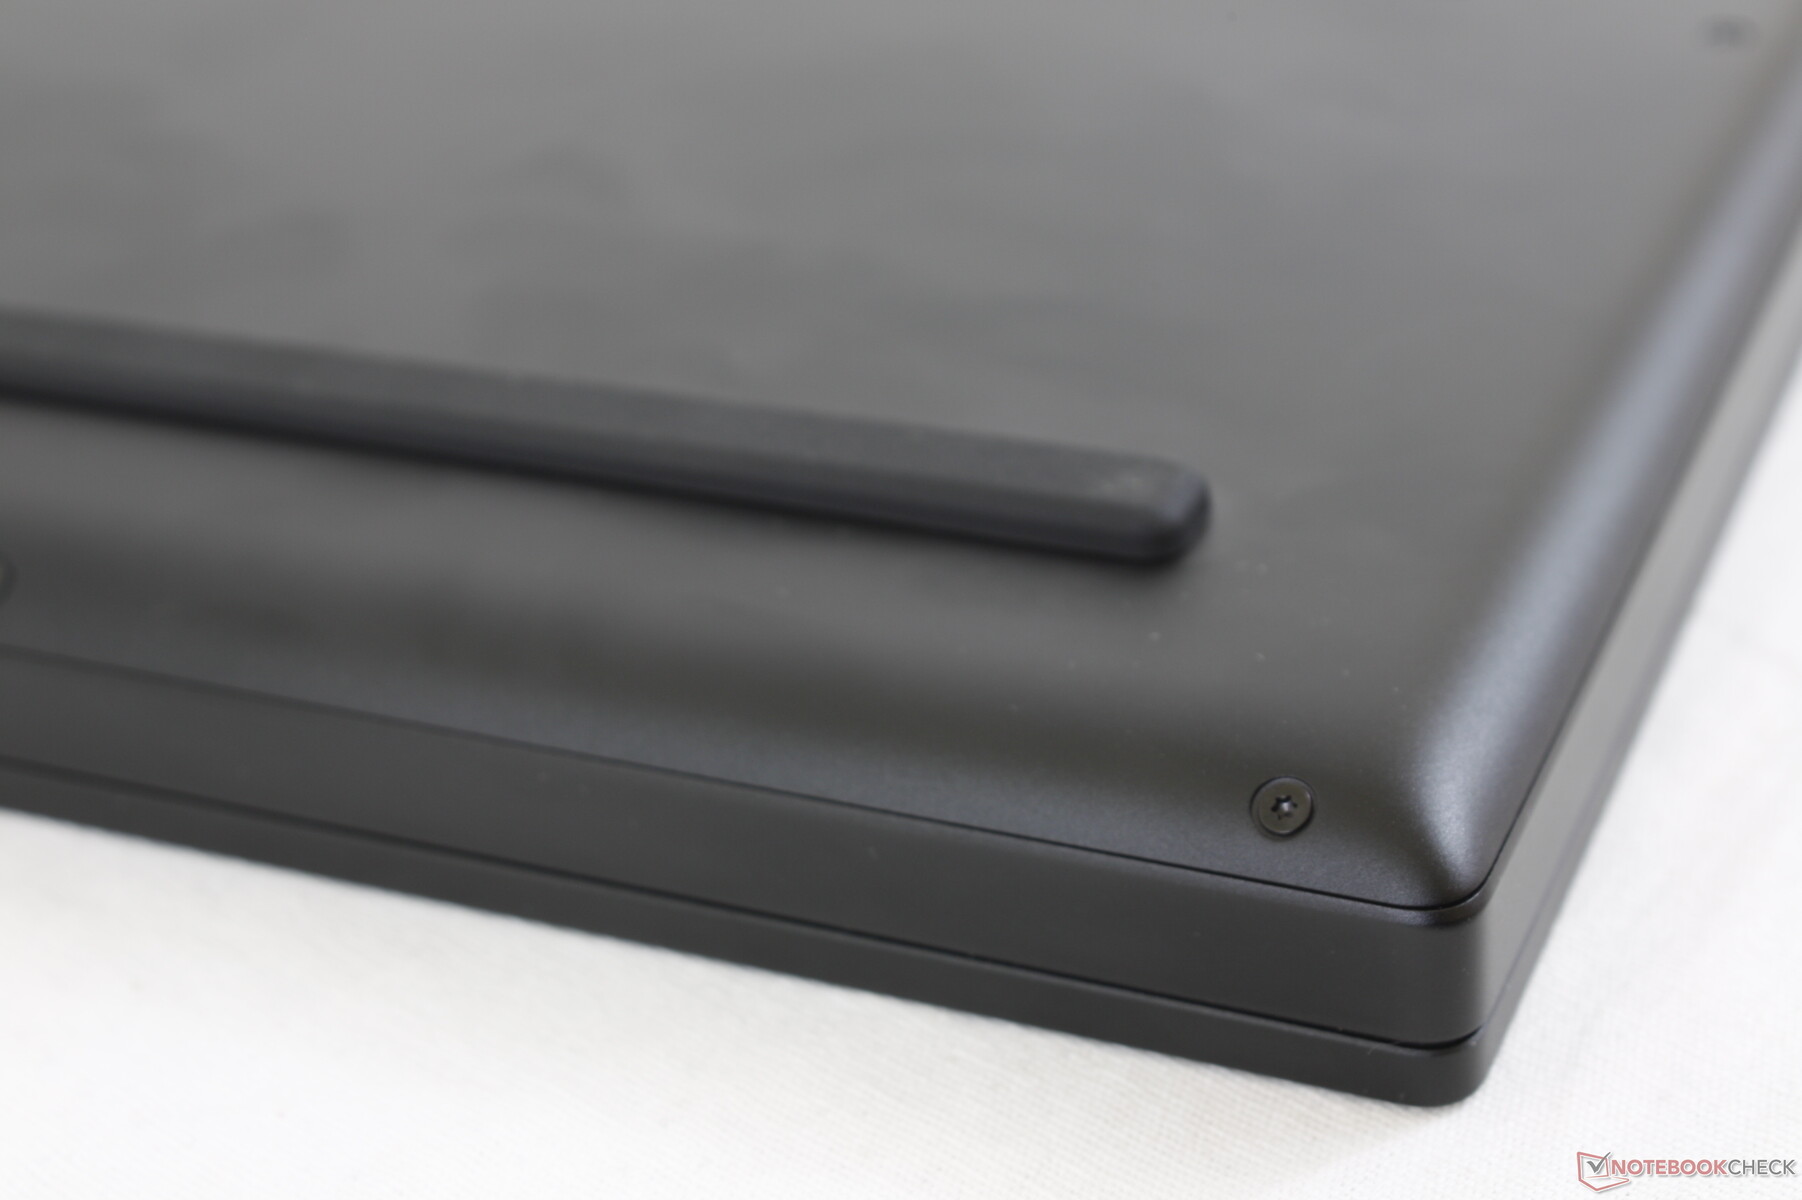
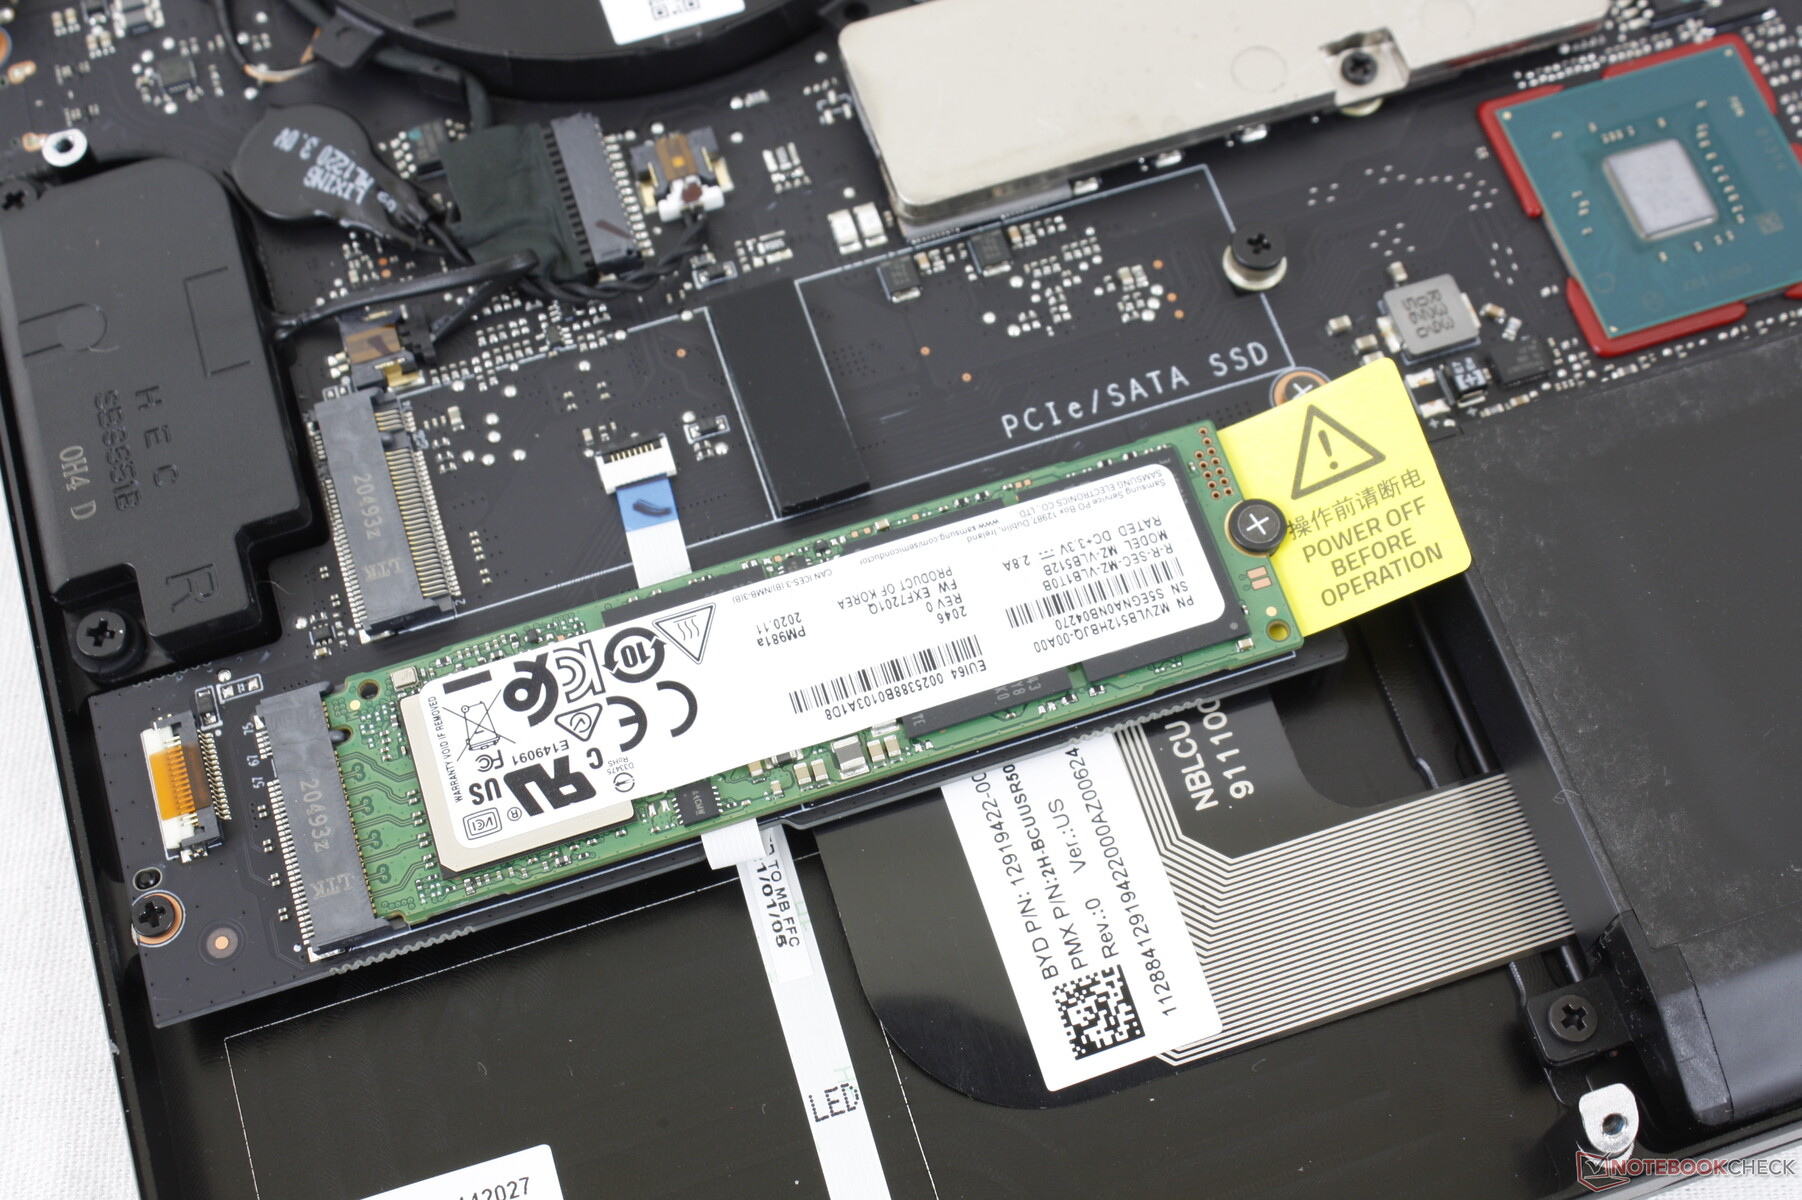
The bottom panel comes off more readily than on most other gaming laptops for easy servicing. Note that there is no longer a 2.5-inch SATA III bay unlike on the first generation Blade 15 Base Model.
Accessories and Warranty
The retail box includes a few Razer logo stickers alongside the usual paperwork and AC adapter. A one-year limited warranty applies.
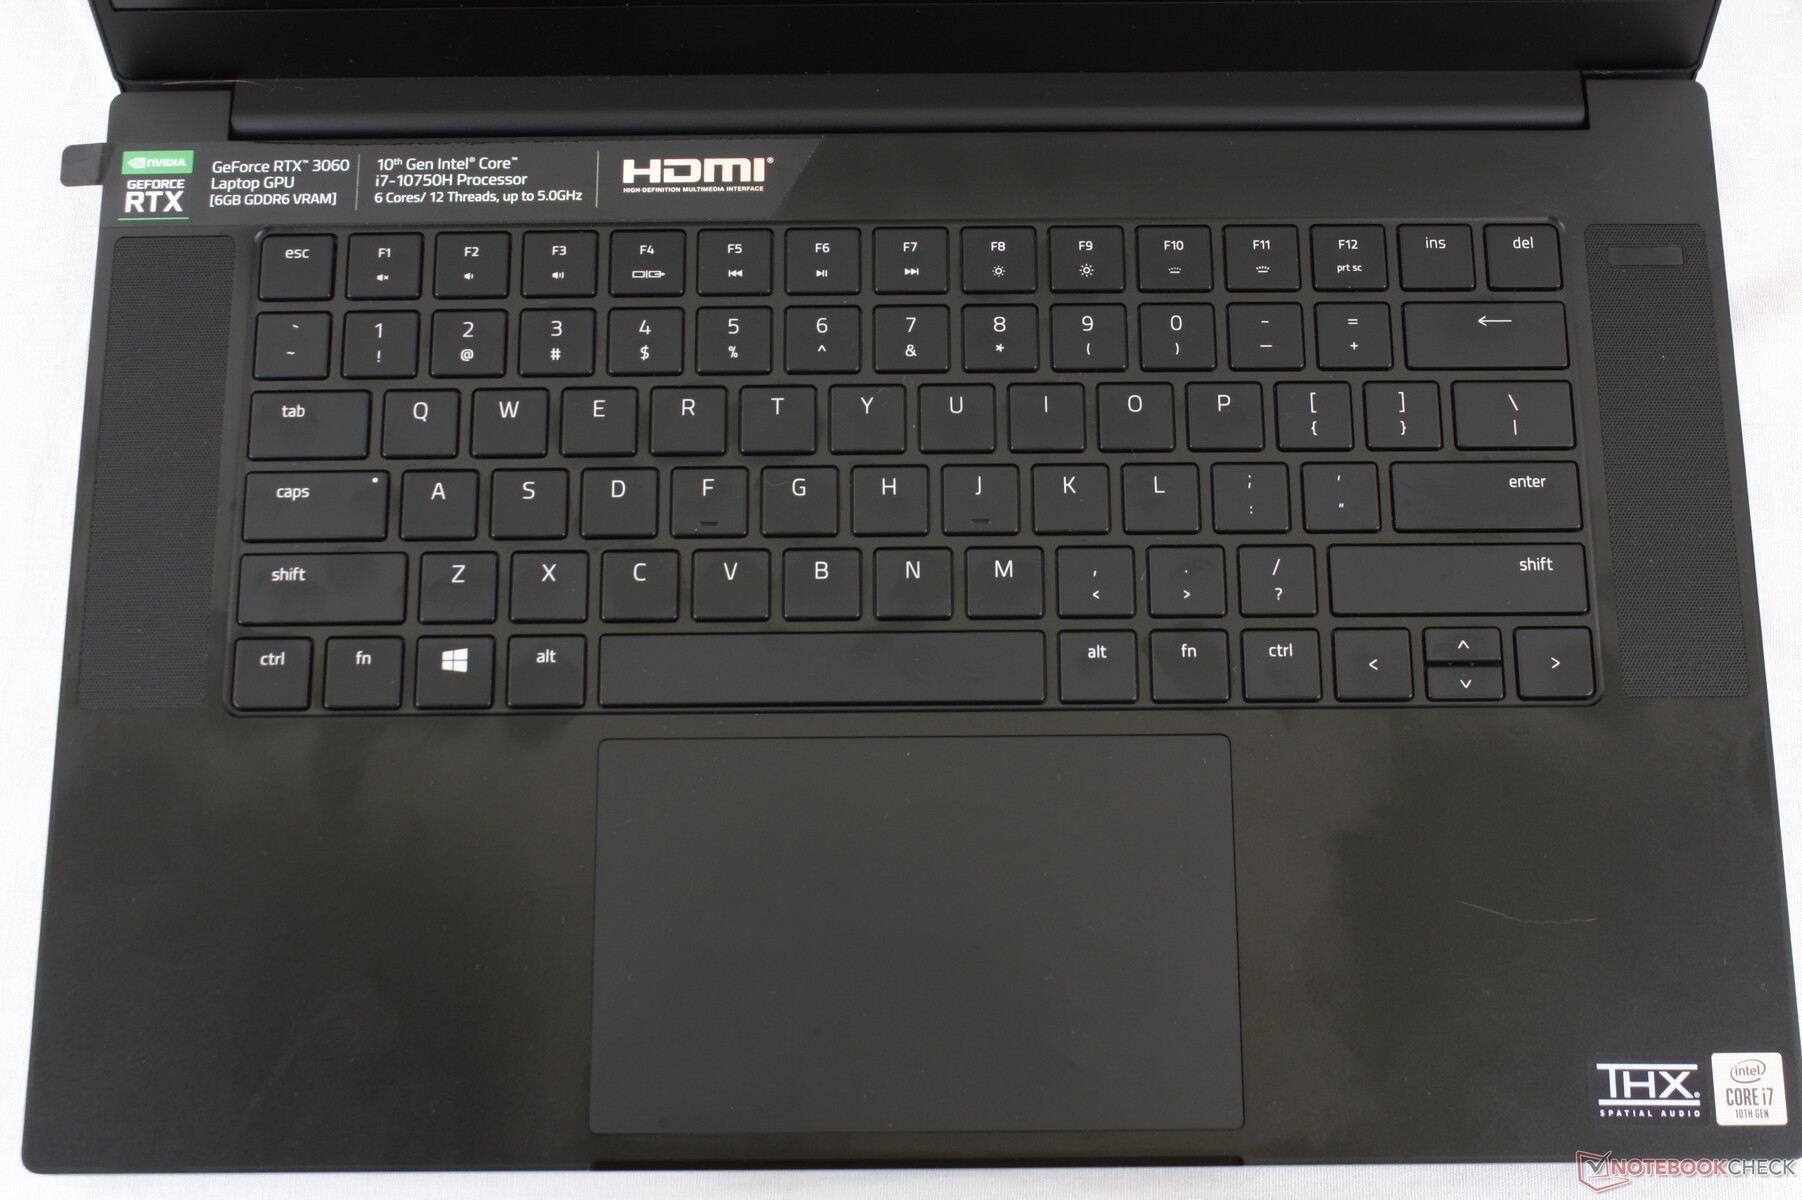
Input Devices
Keyboard
Key feedback and travel continue to be weak and shallow, respectively, similar to the keyboard on the Asus Zephyrus GX501/531 series. Most other gaming laptops have deeper key travel for a more satisfying typing experience than our Razer including on the MSI GS66, HP Omen 15, or Asus ROG Strix. We hope to see Razer improve upon the keyboard on future iterations which has remained unchanged for many years now.
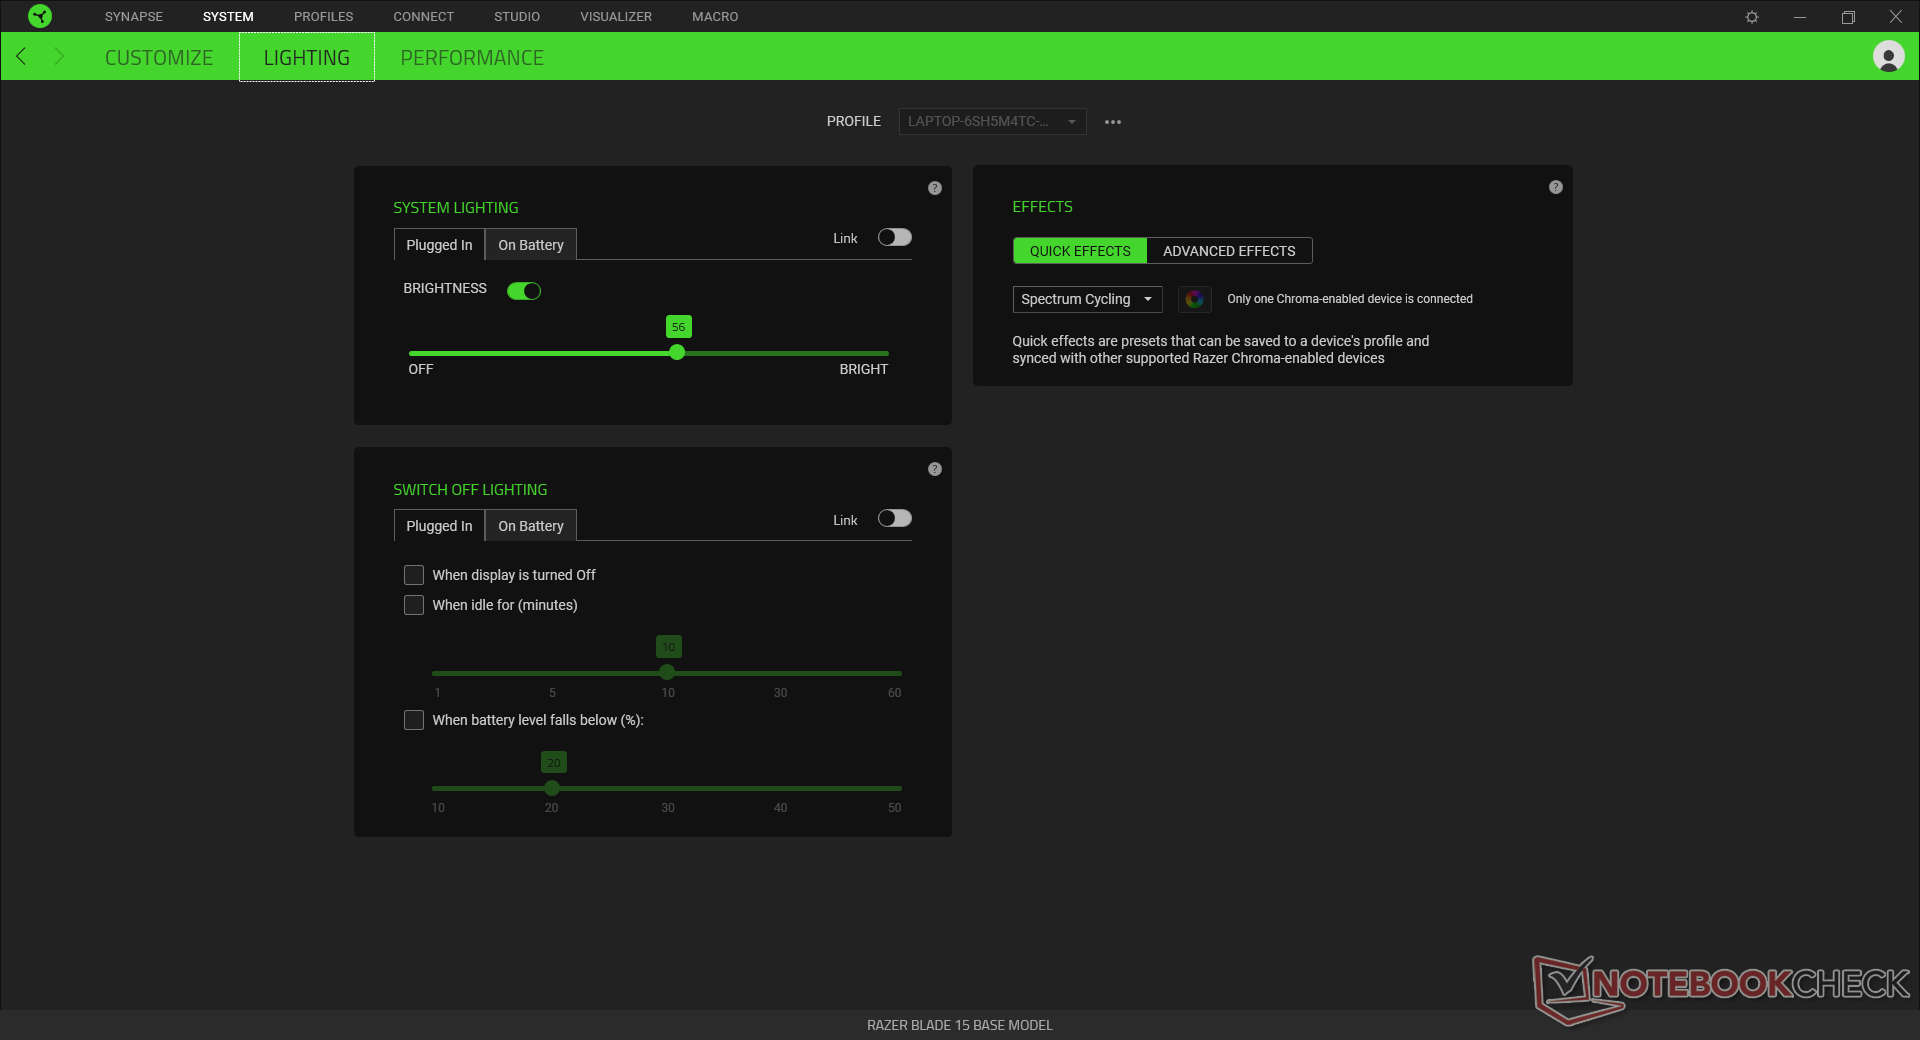
RGB keyboard lighting comes standard while per-key options are available only on the Advanced Model.
Touchpad
The clickpad hasn't changed from last year's design. It's still large at 13 x 8 cm and the integrated mouse keys are still spongy and quiet. As a result, cursor control is roomy and comfortable but mouse inputs have unsatisfying feedback.


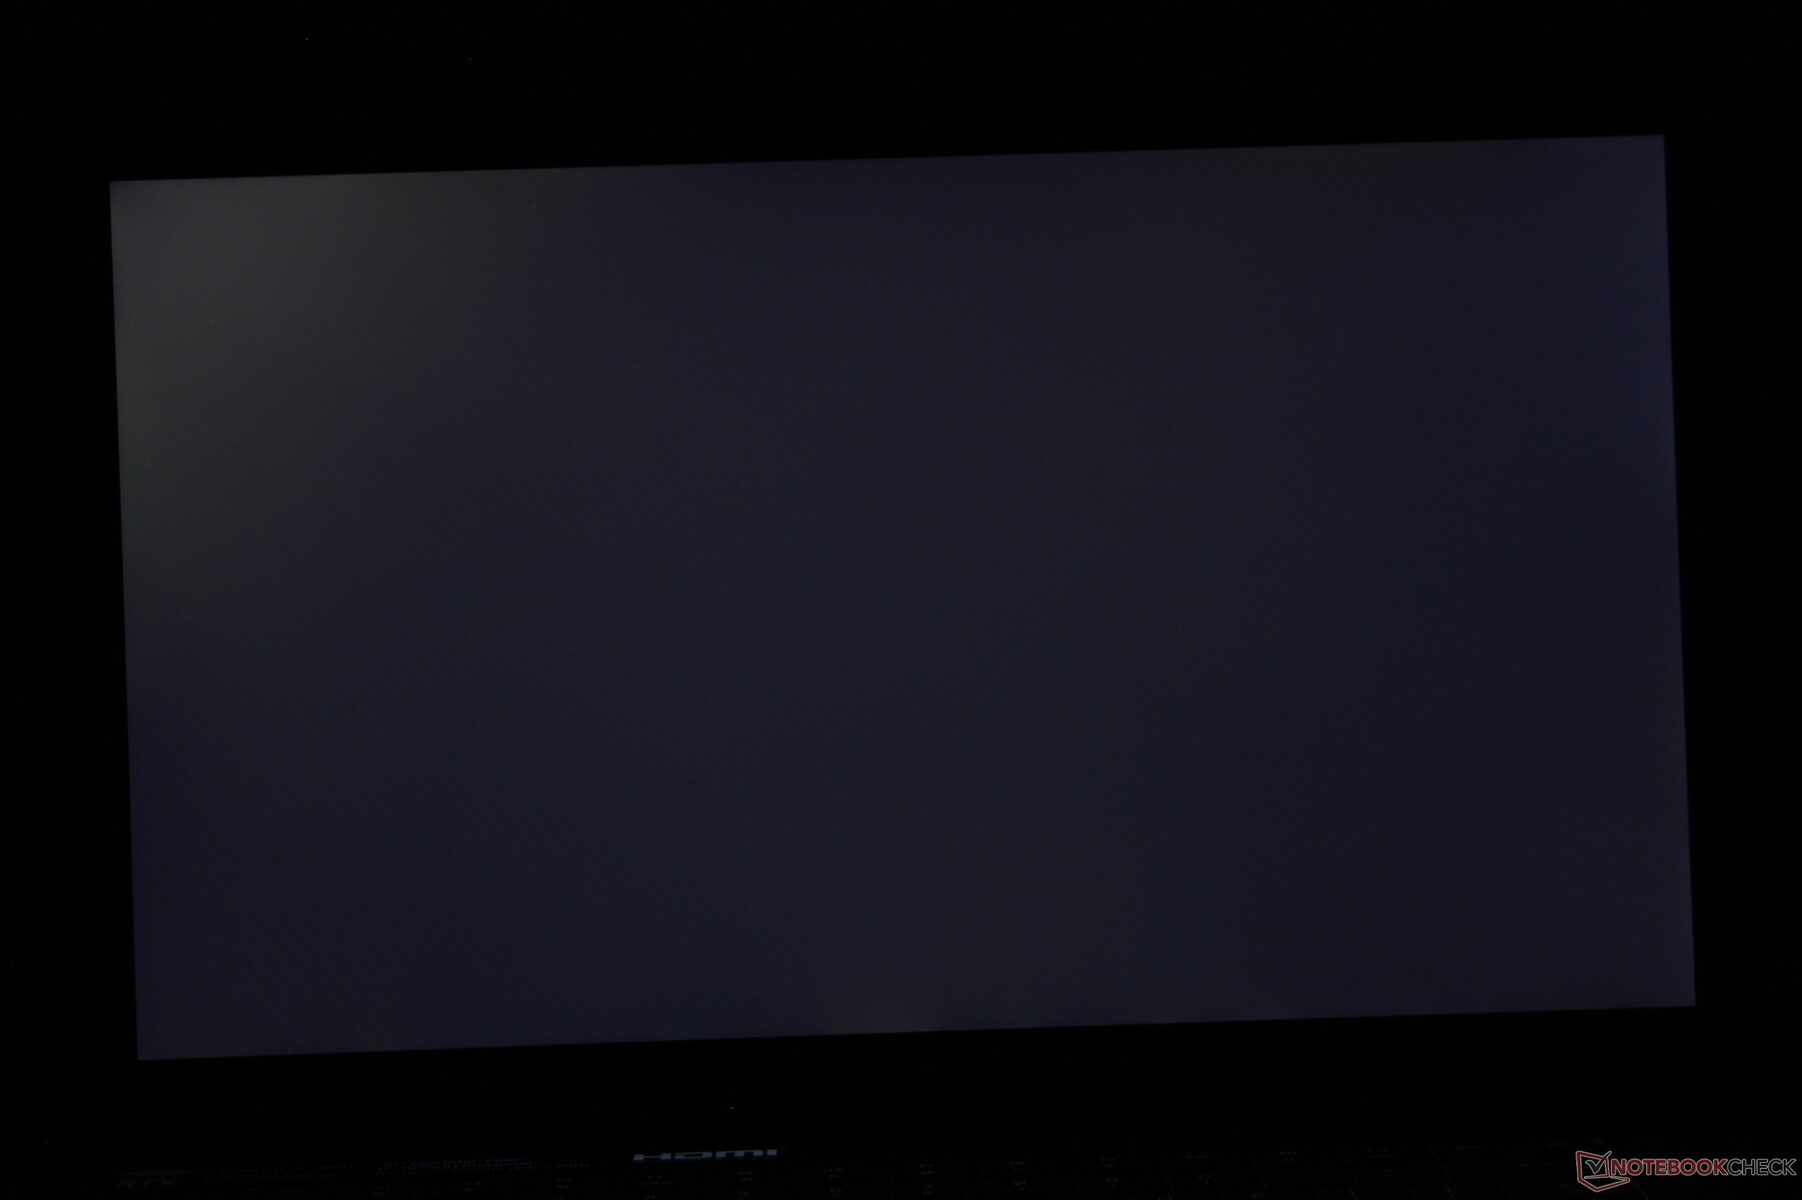
Display
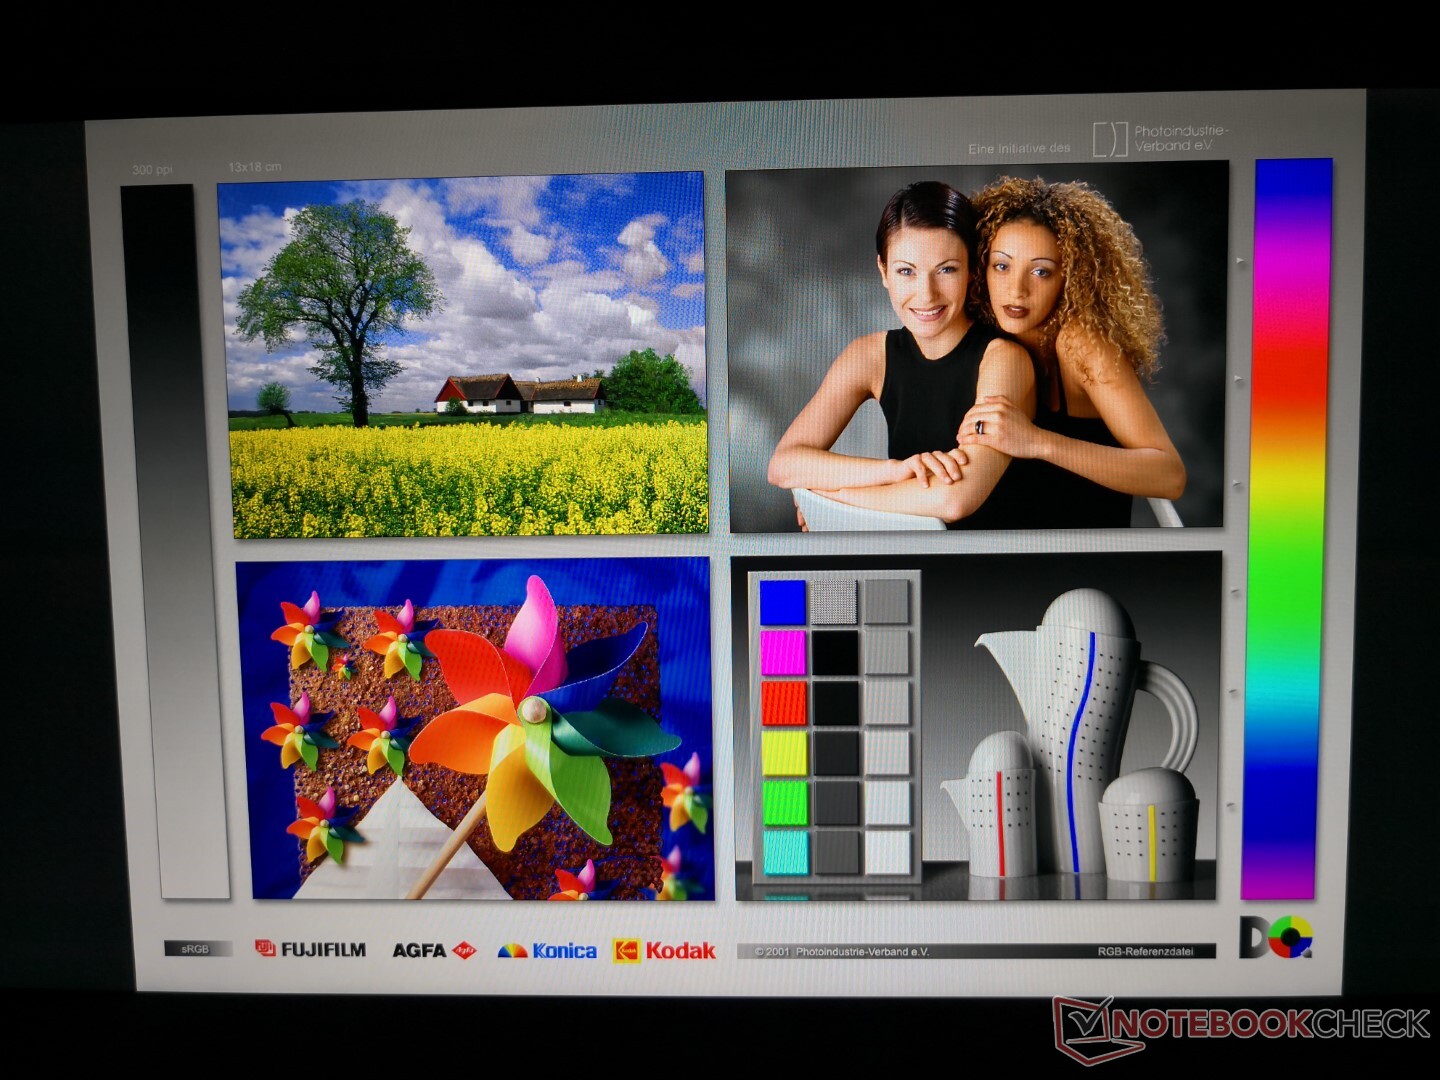
The 2021 Blade 15 Base Model uses the same 144 Hz BOE NV156FHM-N4K IPS panel as on the 2019 Blade 15 Base Model and the Acer Predator Triton 500. This is an upper mid-range panel with an excellent contrast ratio of about 1000:1, near-complete sRGB coverage, and fast response times for almost no ghosting. Pulse-width modulation is present on all brightness levels up to 99 percent, however, which is something we didn't observe on the 300 Hz panel on last year's Blade 15 Advanced Model. Users sensitive to onscreen flickering may want to avoid this panel or choose a different panel option.

| |||||||||||||||||||||||||
Brightness Distribution: 89 %
Center on Battery: 317.2 cd/m²
Contrast: 1023:1 (Black: 0.31 cd/m²)
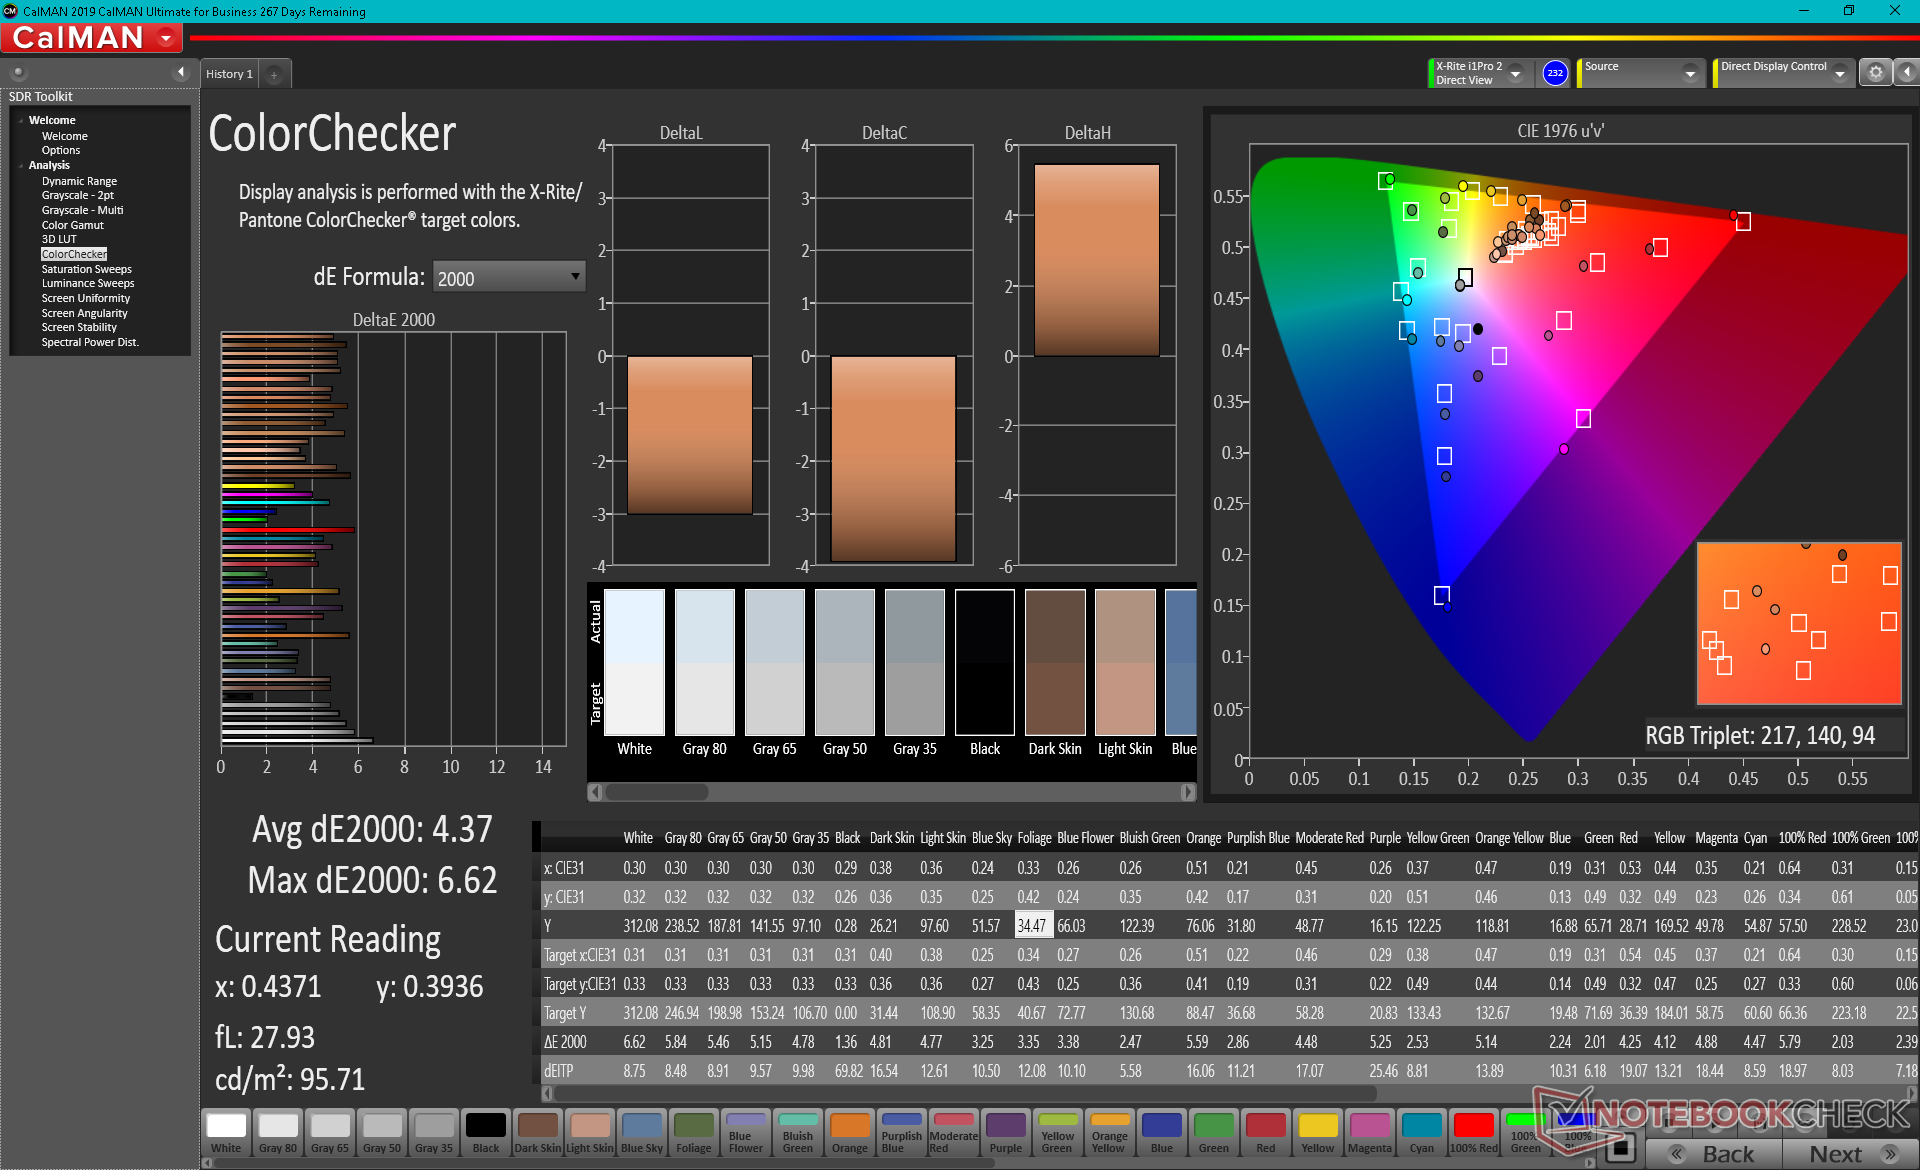
ΔE ColorChecker Calman: 4.37 | ∀{0.5-29.43 Ø4.73}
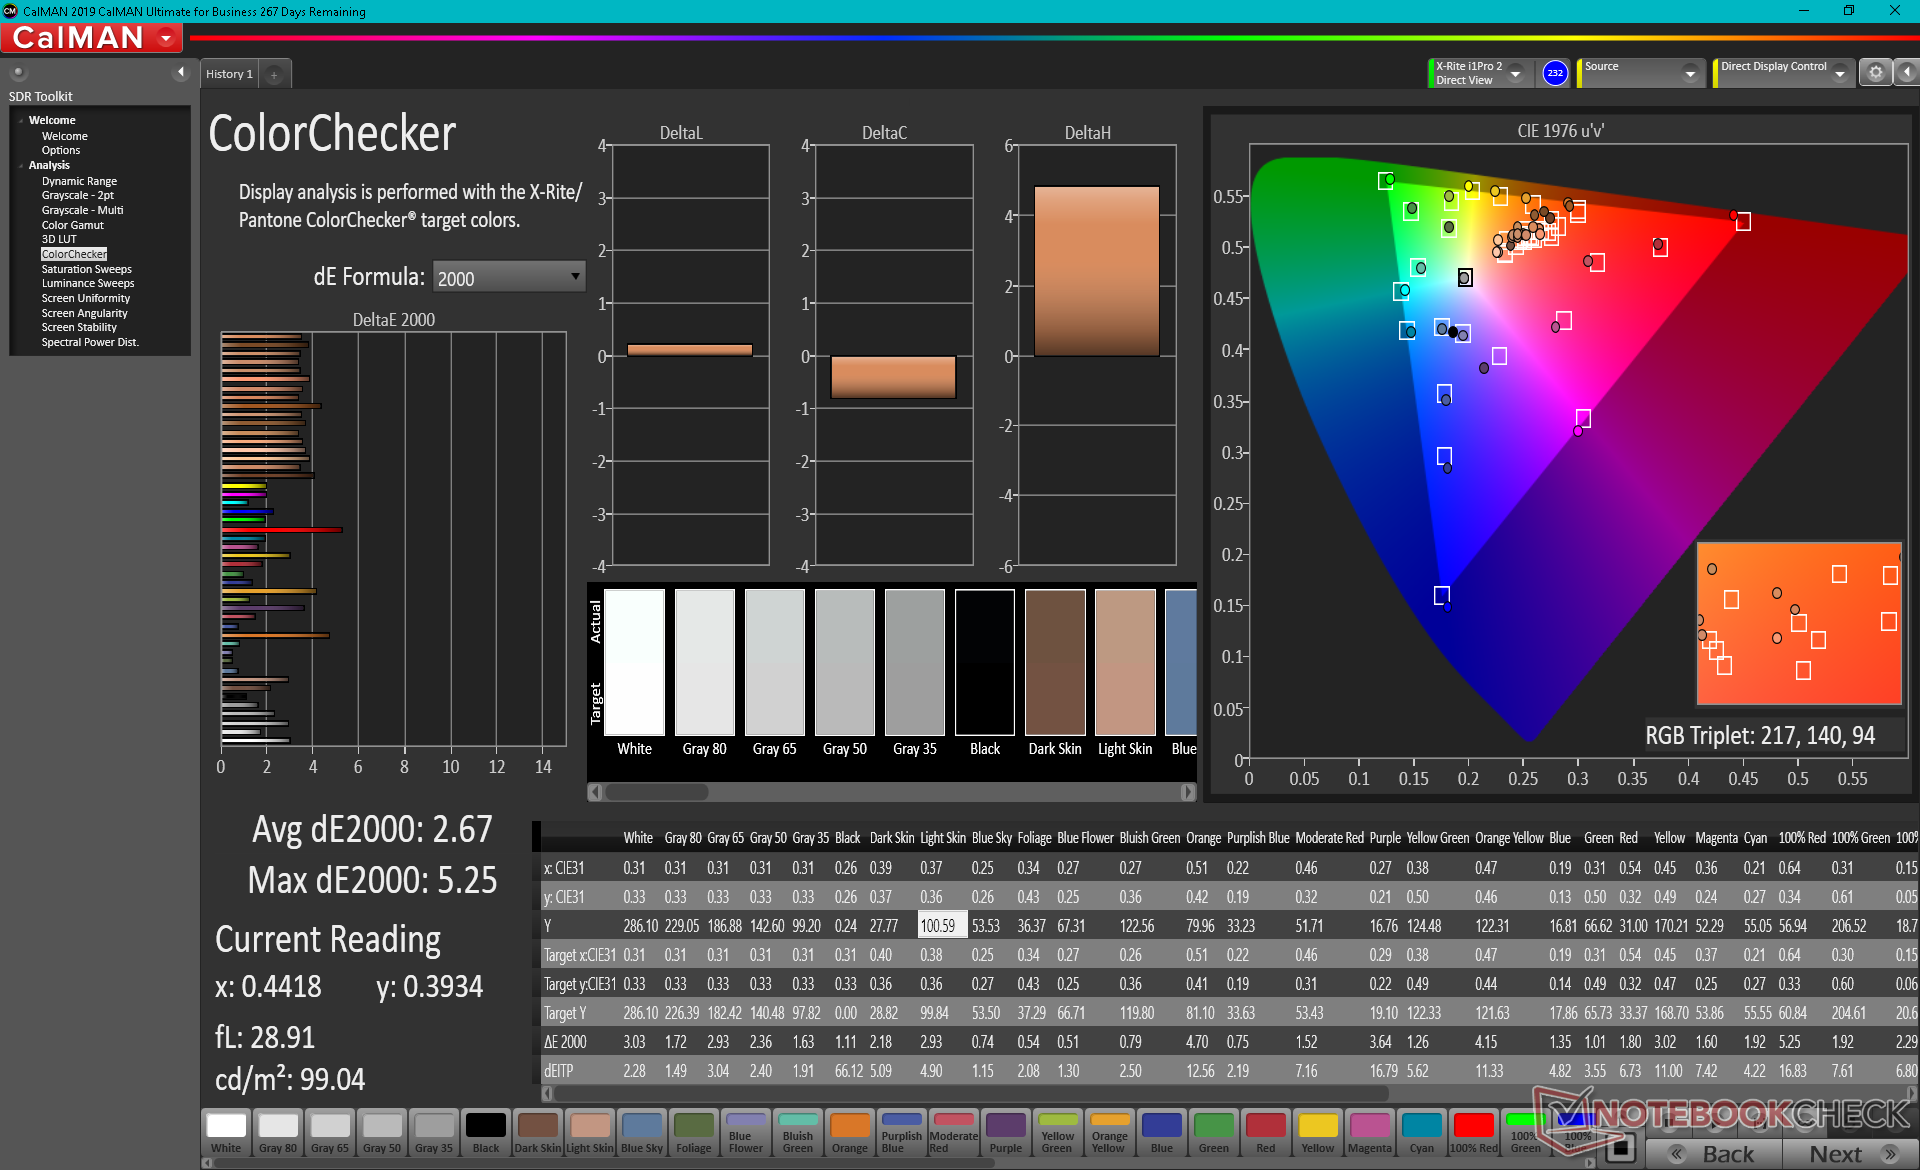
calibrated: 2.67
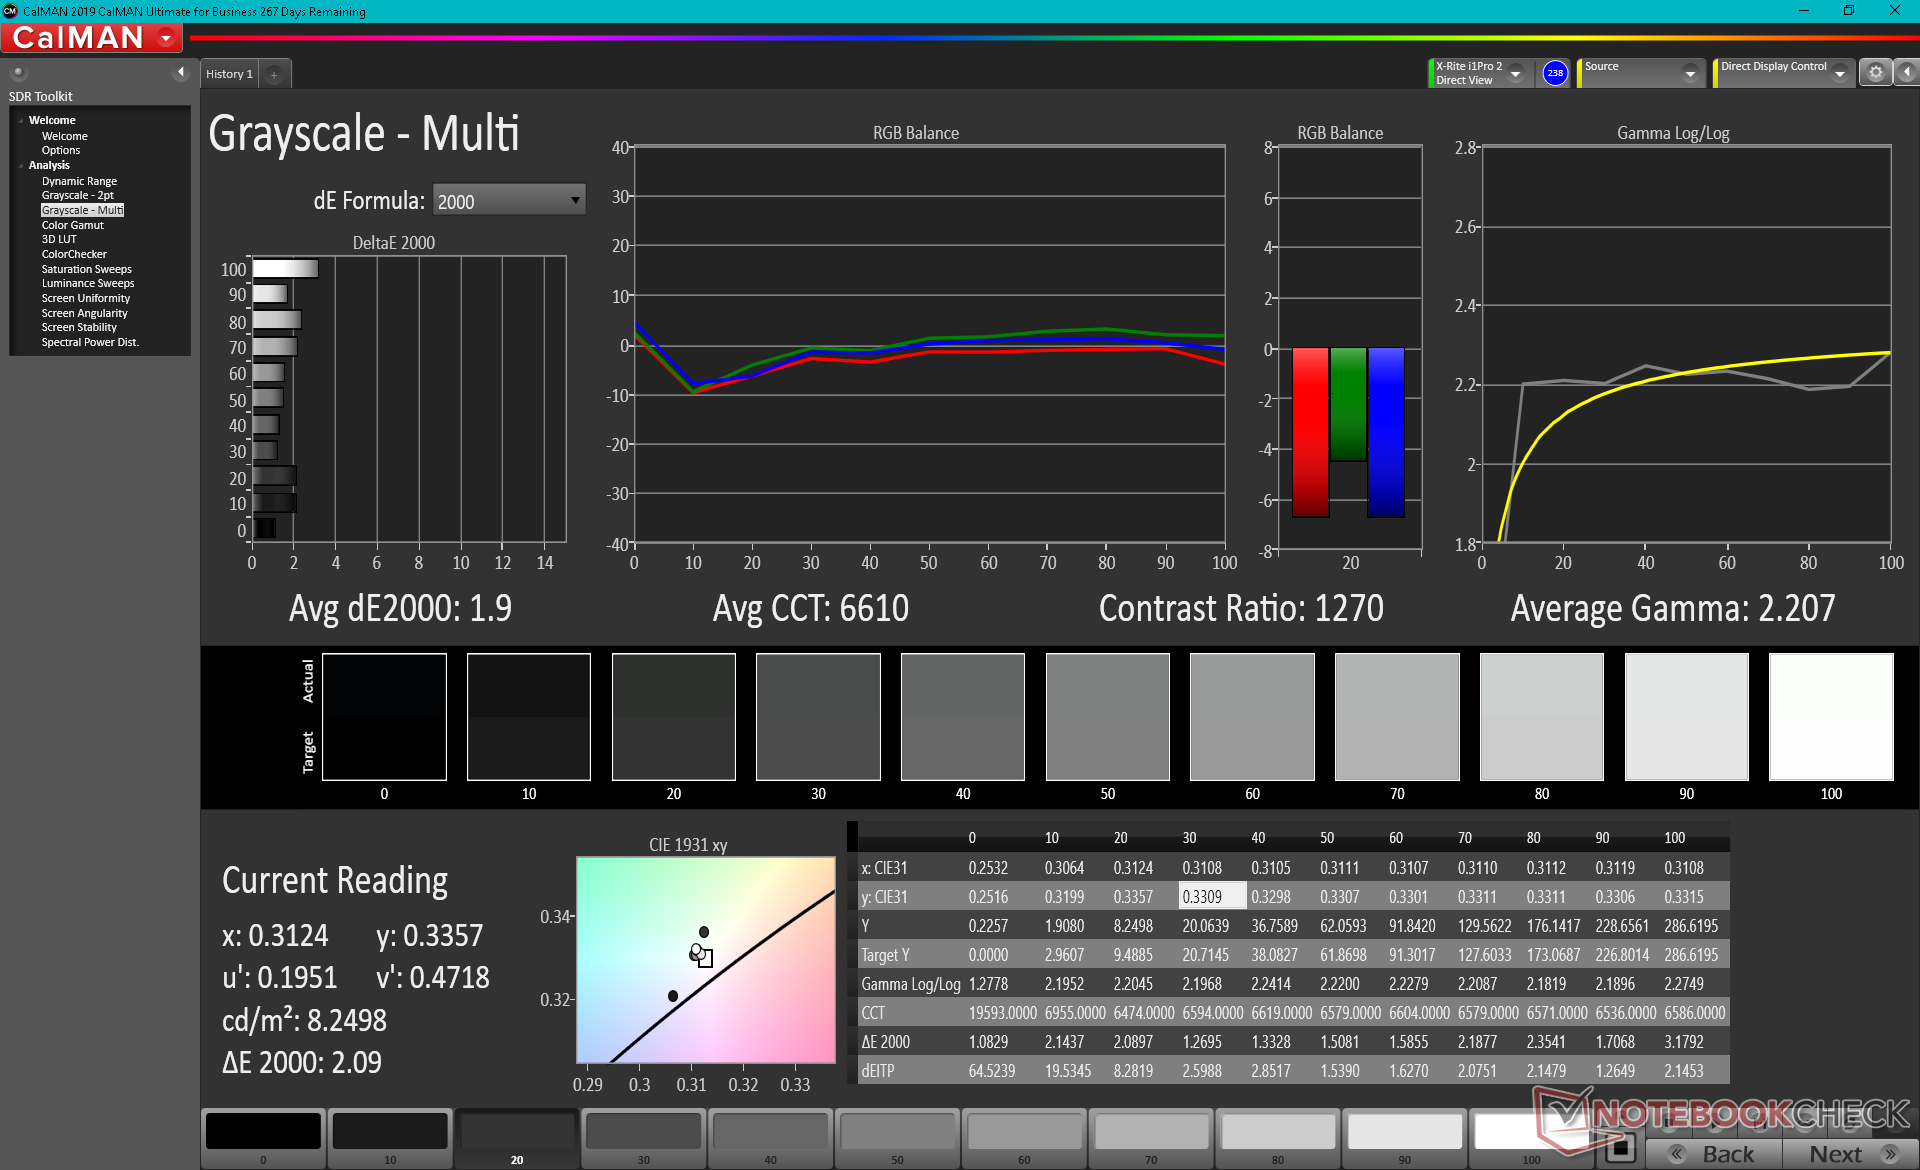
ΔE Greyscale Calman: 4.5 | ∀{0.09-98 Ø4.97}
91.4% sRGB (Argyll 1.6.3 3D)
59.2% AdobeRGB 1998 (Argyll 1.6.3 3D)
65.5% AdobeRGB 1998 (Argyll 3D)
91.8% sRGB (Argyll 3D)
64.3% Display P3 (Argyll 3D)
Gamma: 2.4
CCT: 7418 K
| Razer Blade 15 Base Edition 2021, i7-10750H RTX 3060 BOE NV156FHM-N4K, IPS, 15.6", 1920x1080 | Razer Blade 15 RTX 2070 Super Max-Q AU Optronics B156HAN12.0, IPS, 15.6", 1920x1080 | Asus ROG Strix G15 G513QR LQ156M1JW25, IPS, 15.6", 1920x1080 | MSI GS66 Stealth 10UG AU Optronics B156HAN12.0, IPS, 15.6", 1920x1080 | MSI GF65 Thin 10UE AU Optronics B156HAN08.4, IPS, 15.6", 1920x1080 | Asus ROG Zephyrus M15 GU502LU-BI7N4 Panda LM156LF-2F01, IPS, 15.6", 1920x1080 | |
|---|---|---|---|---|---|---|
| Display | 8% | 4% | 6% | -40% | -38% | |
| Display P3 Coverage (%) | 64.3 | 69.4 8% | 67.7 5% | 67.7 5% | 37.65 -41% | 39.32 -39% |
| sRGB Coverage (%) | 91.8 | 98.8 8% | 94.3 3% | 98.4 7% | 56.3 -39% | 59.1 -36% |
| AdobeRGB 1998 Coverage (%) | 65.5 | 70.5 8% | 68.2 4% | 69.1 5% | 38.9 -41% | 40.65 -38% |
| Response Times | 42% | 8% | -40% | -267% | -176% | |
| Response Time Grey 50% / Grey 80% * (ms) | 8.8 ? | 3.2 ? 64% | 8.2 ? 7% | 14.4 ? -64% | 36.8 ? -318% | 26 ? -195% |
| Response Time Black / White * (ms) | 10 ? | 8 ? 20% | 9.2 ? 8% | 11.6 ? -16% | 31.6 ? -216% | 25.6 ? -156% |
| PWM Frequency (Hz) | 1000 ? | |||||
| Screen | 10% | 10% | 14% | -26% | -30% | |
| Brightness middle (cd/m²) | 317.2 | 345.4 9% | 308 -3% | 259.5 -18% | 266.5 -16% | 282.5 -11% |
| Brightness (cd/m²) | 306 | 342 12% | 288 -6% | 264 -14% | 262 -14% | 260 -15% |
| Brightness Distribution (%) | 89 | 90 1% | 86 -3% | 90 1% | 91 2% | 86 -3% |
| Black Level * (cd/m²) | 0.31 | 0.34 -10% | 0.23 26% | 0.25 19% | 0.18 42% | 0.34 -10% |
| Contrast (:1) | 1023 | 1016 -1% | 1339 31% | 1038 1% | 1481 45% | 831 -19% |
| Colorchecker dE 2000 * | 4.37 | 3.18 27% | 3.28 25% | 2.52 42% | 5.33 -22% | 4.89 -12% |
| Colorchecker dE 2000 max. * | 6.62 | 6.57 1% | 8.51 -29% | 5.55 16% | 18.28 -176% | 17.46 -164% |
| Colorchecker dE 2000 calibrated * | 2.67 | 1.77 34% | 0.83 69% | 1.93 28% | 4.36 -63% | 4.75 -78% |
| Greyscale dE 2000 * | 4.5 | 3.8 16% | 5 -11% | 1.7 62% | 4.5 -0% | 2.2 51% |
| Gamma | 2.4 92% | 2.15 102% | 2.057 107% | 2.04 108% | 2.35 94% | 2.14 103% |
| CCT | 7418 88% | 7109 91% | 7393 88% | 6414 101% | 6289 103% | 6850 95% |
| Color Space (Percent of AdobeRGB 1998) (%) | 59.2 | 64.3 9% | 68 15% | 63.3 7% | 35.6 -40% | 37.2 -37% |
| Color Space (Percent of sRGB) (%) | 91.4 | 99 8% | 90 -2% | 98.8 8% | 55.8 -39% | 58.5 -36% |
| Total Average (Program / Settings) | 20% /
13% | 7% /
9% | -7% /
6% | -111% /
-59% | -81% /
-50% |
* ... smaller is better
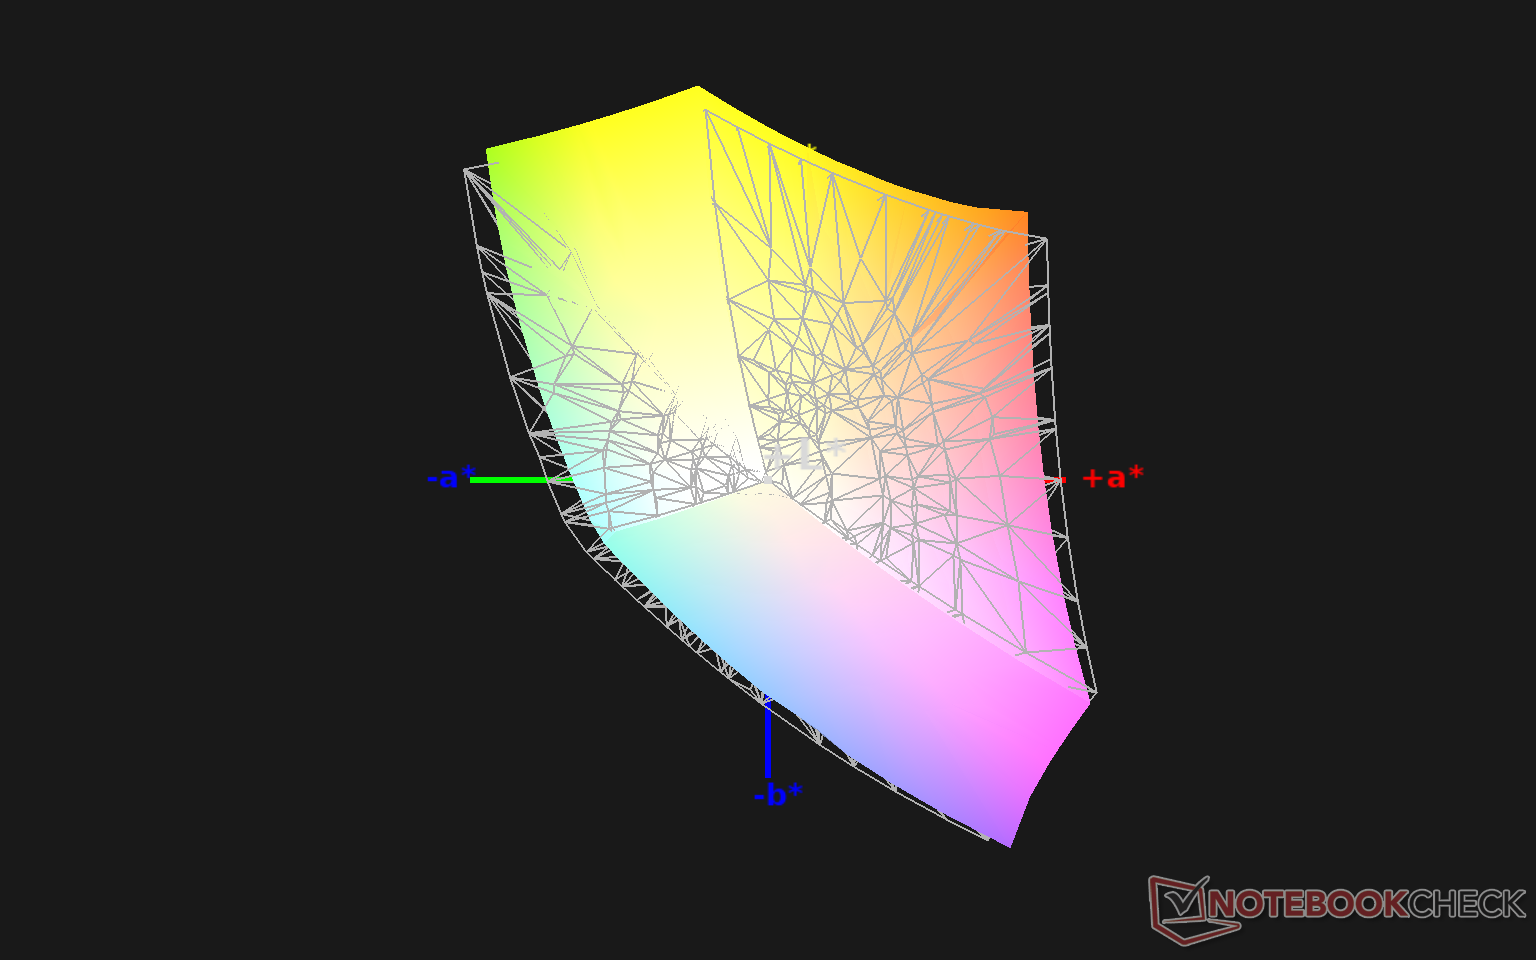
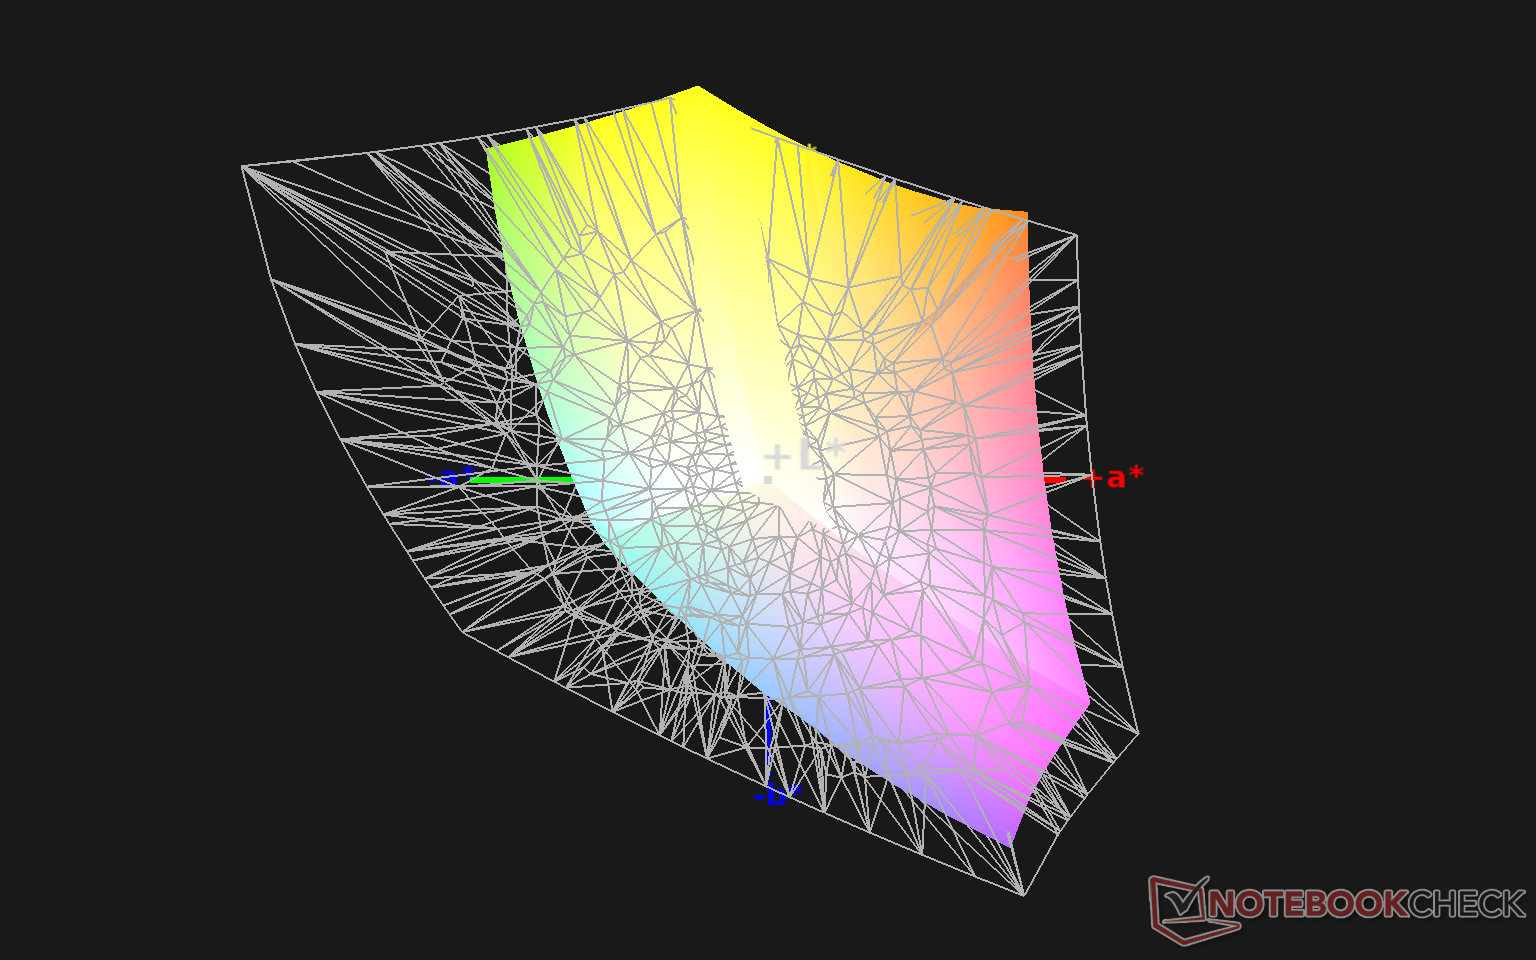
Color space covers over 90 percent of sRGB much like on most other mid-range to high-end gaming laptops. Cheaper laptops like the MSI GF65 or Asus Zephyrus M15 GU502 may cover just 60 percent of sRGB in comparison. For deeper colors, users would have to consider the pricier 4K OLED configuration instead.
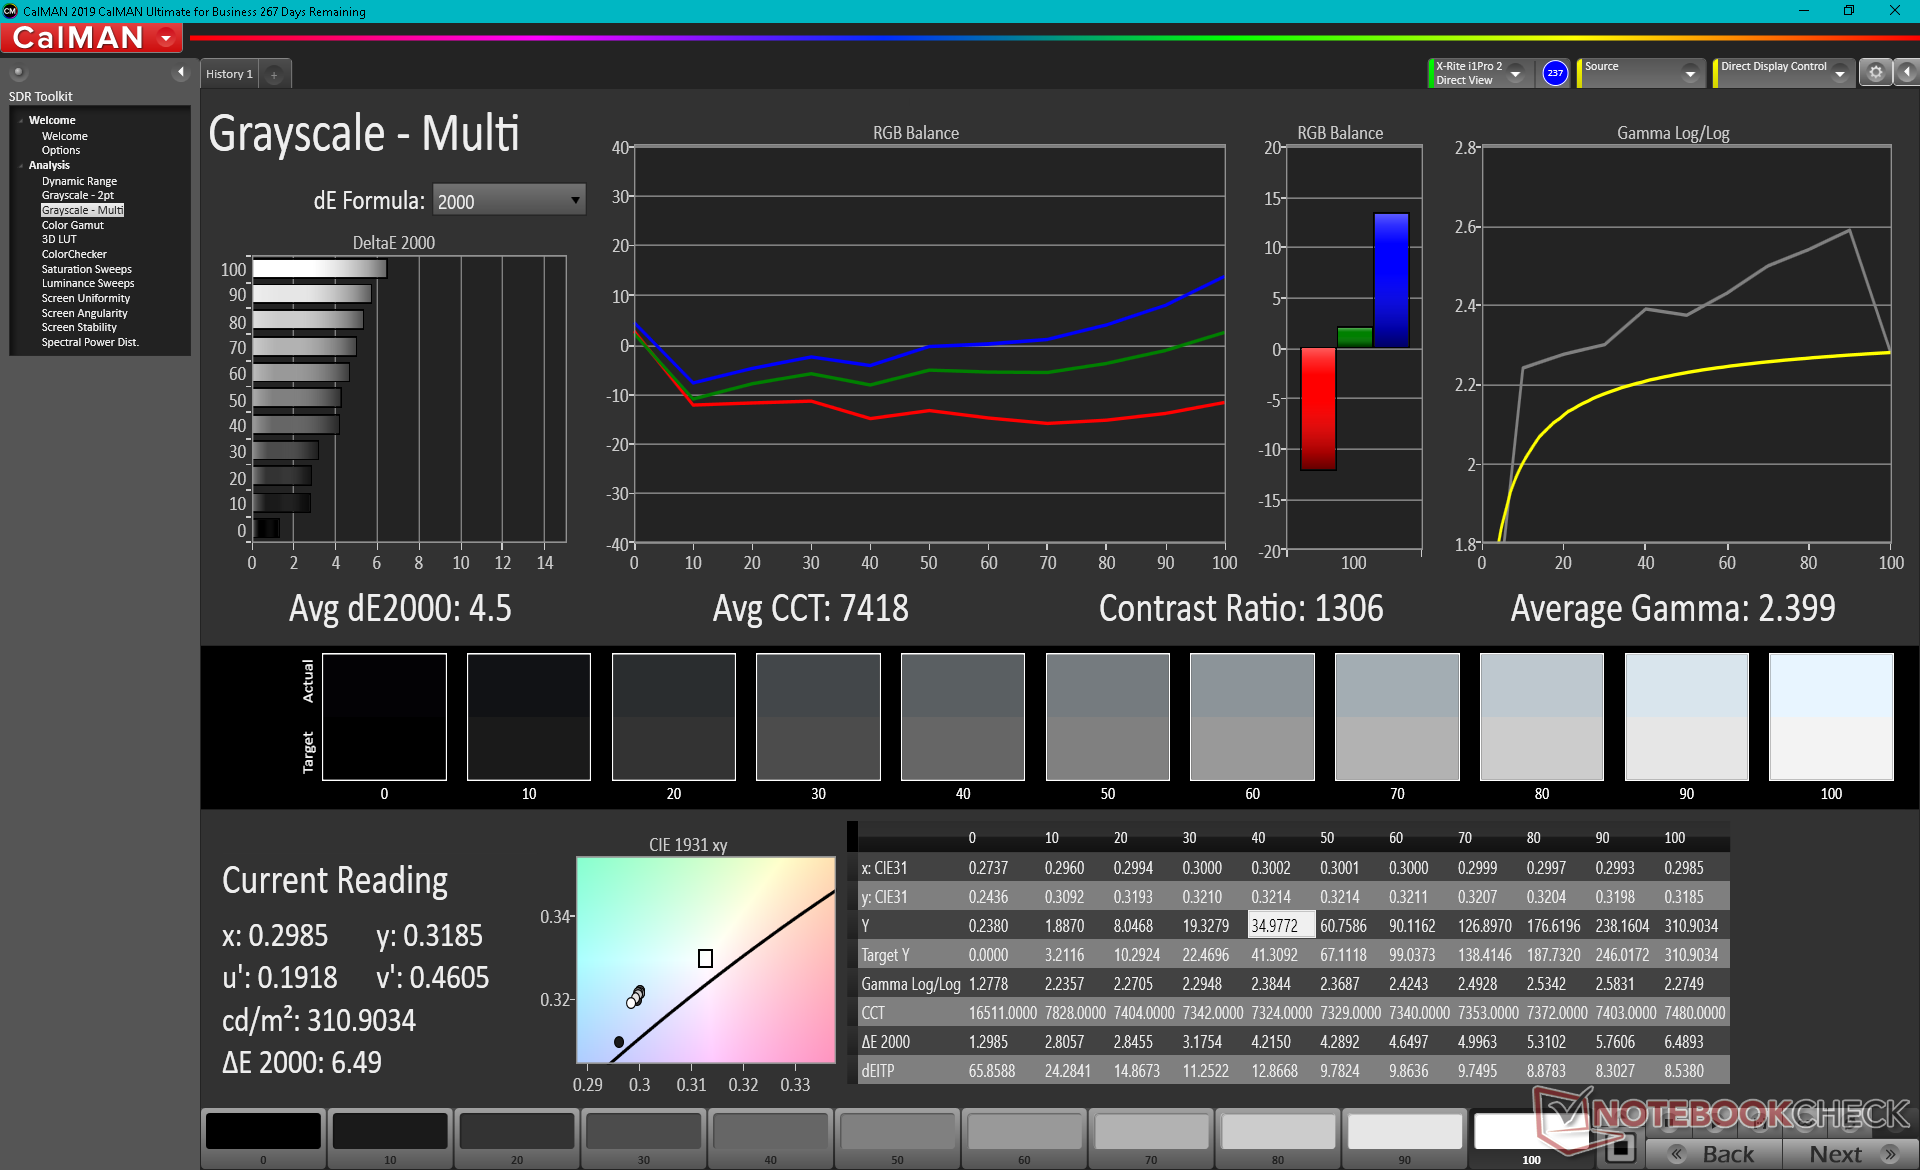
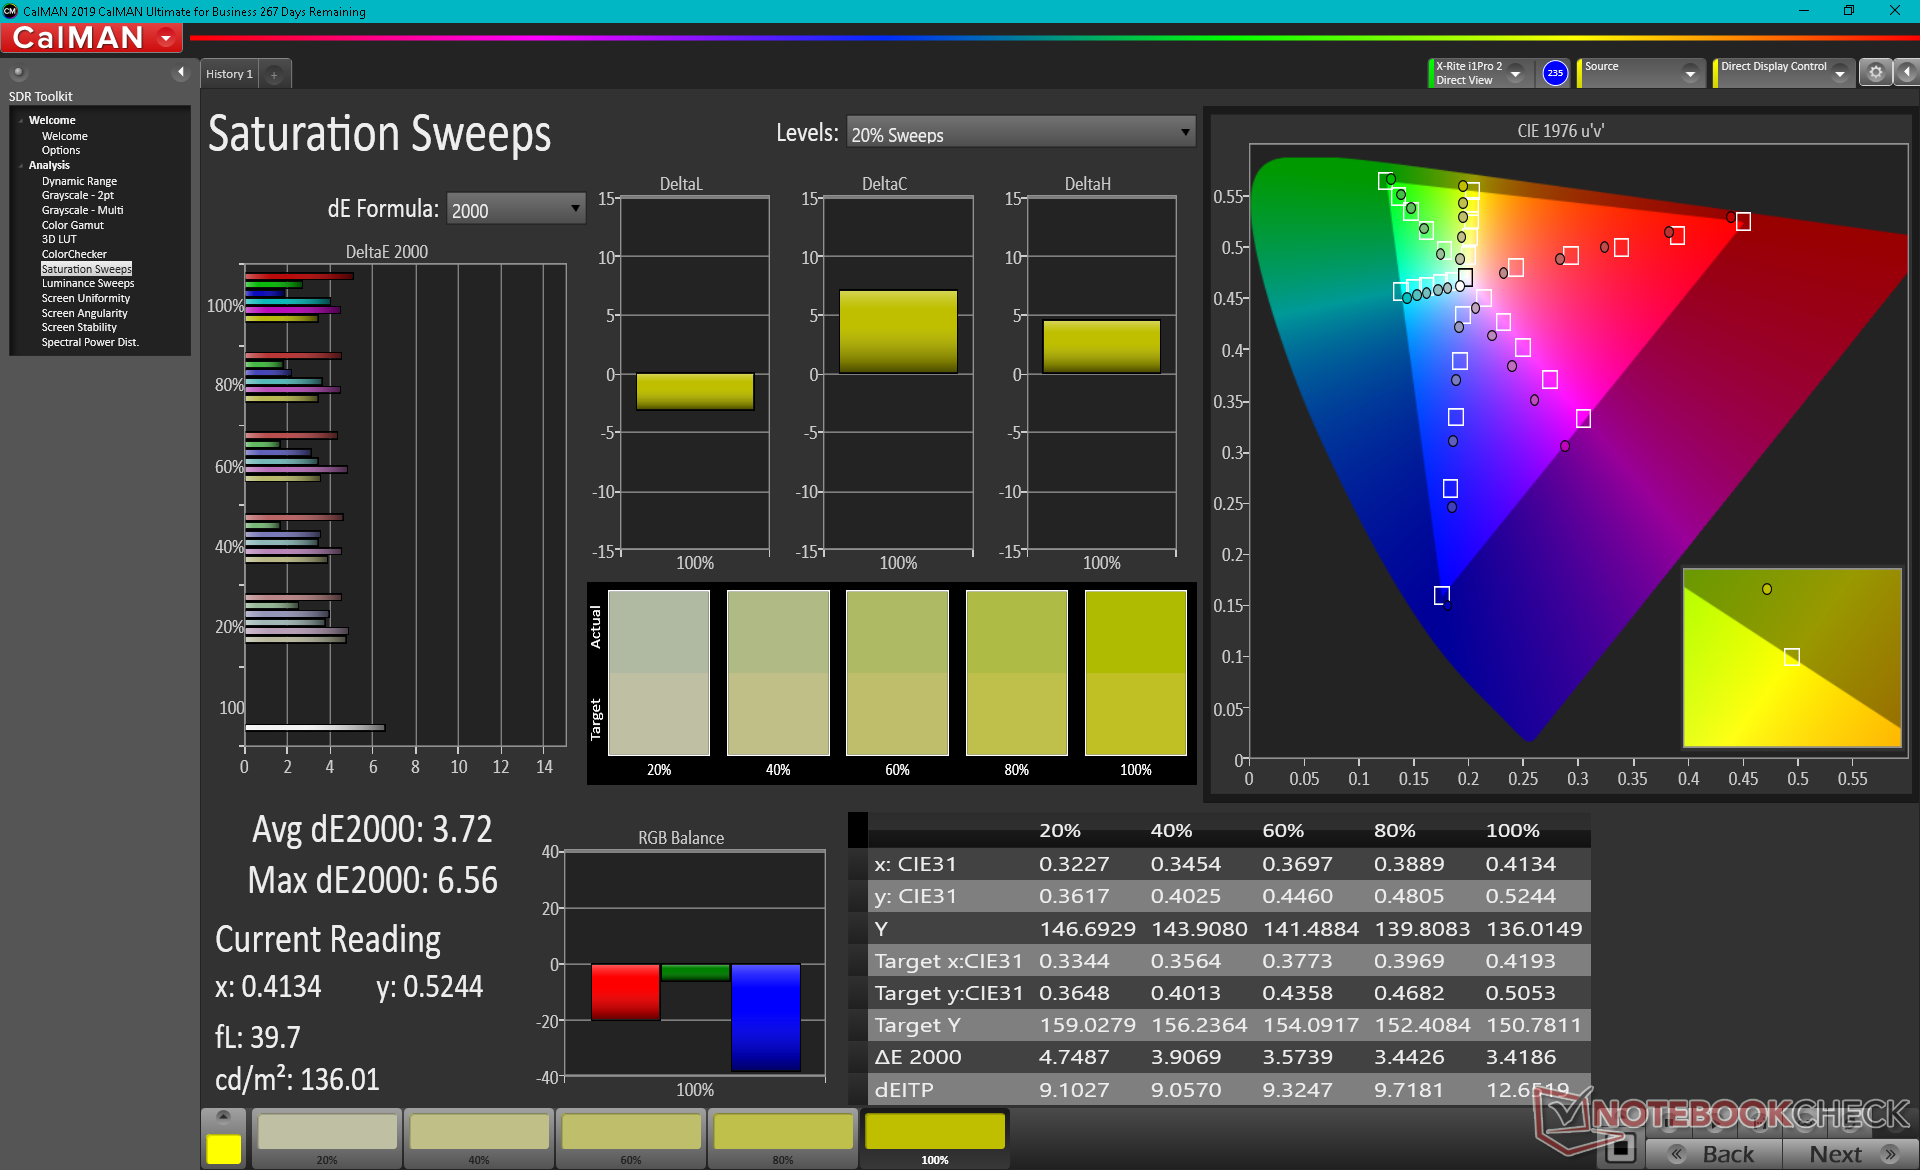
X-Rite colorimeter measurements show color temperature to be too cool out of the box. After calibrating the panel ourselves, average grayscale DeltaE would decrease from 4.5 to just 1.9 and color accuracy would subsequently improve across the board.
Display Response Times
| ↔ Response Time Black to White | ||
|---|---|---|
| 10 ms ... rise ↗ and fall ↘ combined | ↗ 5.6 ms rise | 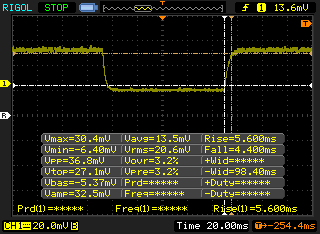 |
| ↘ 4.4 ms fall | ||
| The screen shows good response rates in our tests, but may be too slow for competitive gamers. In comparison, all tested devices range from 0.1 (minimum) to 240 (maximum) ms. » 27 % of all devices are better. This means that the measured response time is better than the average of all tested devices (19.9 ms). | ||
| ↔ Response Time 50% Grey to 80% Grey | ||
| 8.8 ms ... rise ↗ and fall ↘ combined | ↗ 4.4 ms rise | 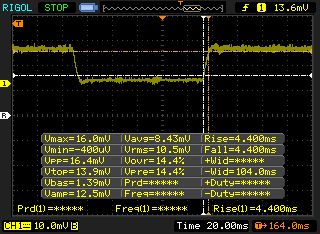 |
| ↘ 4.4 ms fall | ||
| The screen shows fast response rates in our tests and should be suited for gaming. In comparison, all tested devices range from 0.165 (minimum) to 636 (maximum) ms. » 22 % of all devices are better. This means that the measured response time is better than the average of all tested devices (31.1 ms). | ||
Screen Flickering / PWM (Pulse-Width Modulation)
| Screen flickering / PWM detected | 1000 Hz | ≤ 99 % brightness setting | 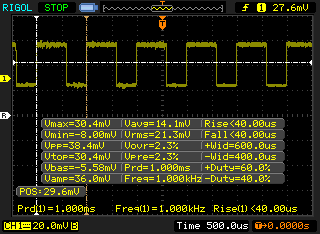 |
The display backlight flickers at 1000 Hz (worst case, e.g., utilizing PWM) Flickering detected at a brightness setting of 99 % and below. There should be no flickering or PWM above this brightness setting. The frequency of 1000 Hz is quite high, so most users sensitive to PWM should not notice any flickering. In comparison: 52 % of all tested devices do not use PWM to dim the display. If PWM was detected, an average of 7798 (minimum: 5 - maximum: 343500) Hz was measured. | |||
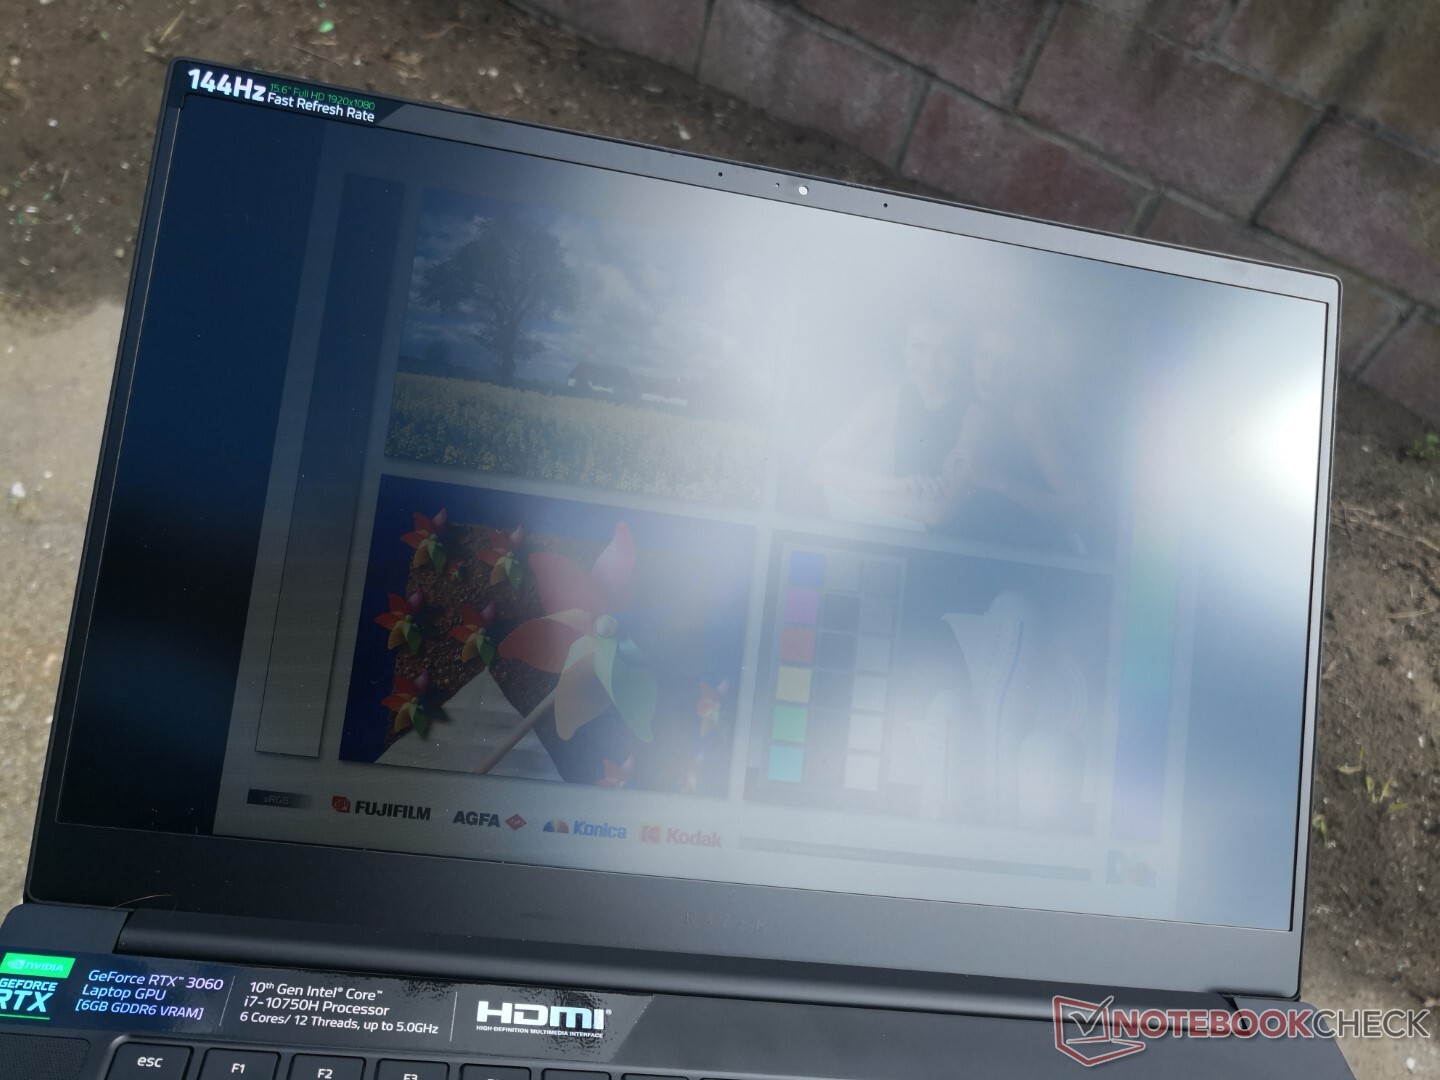
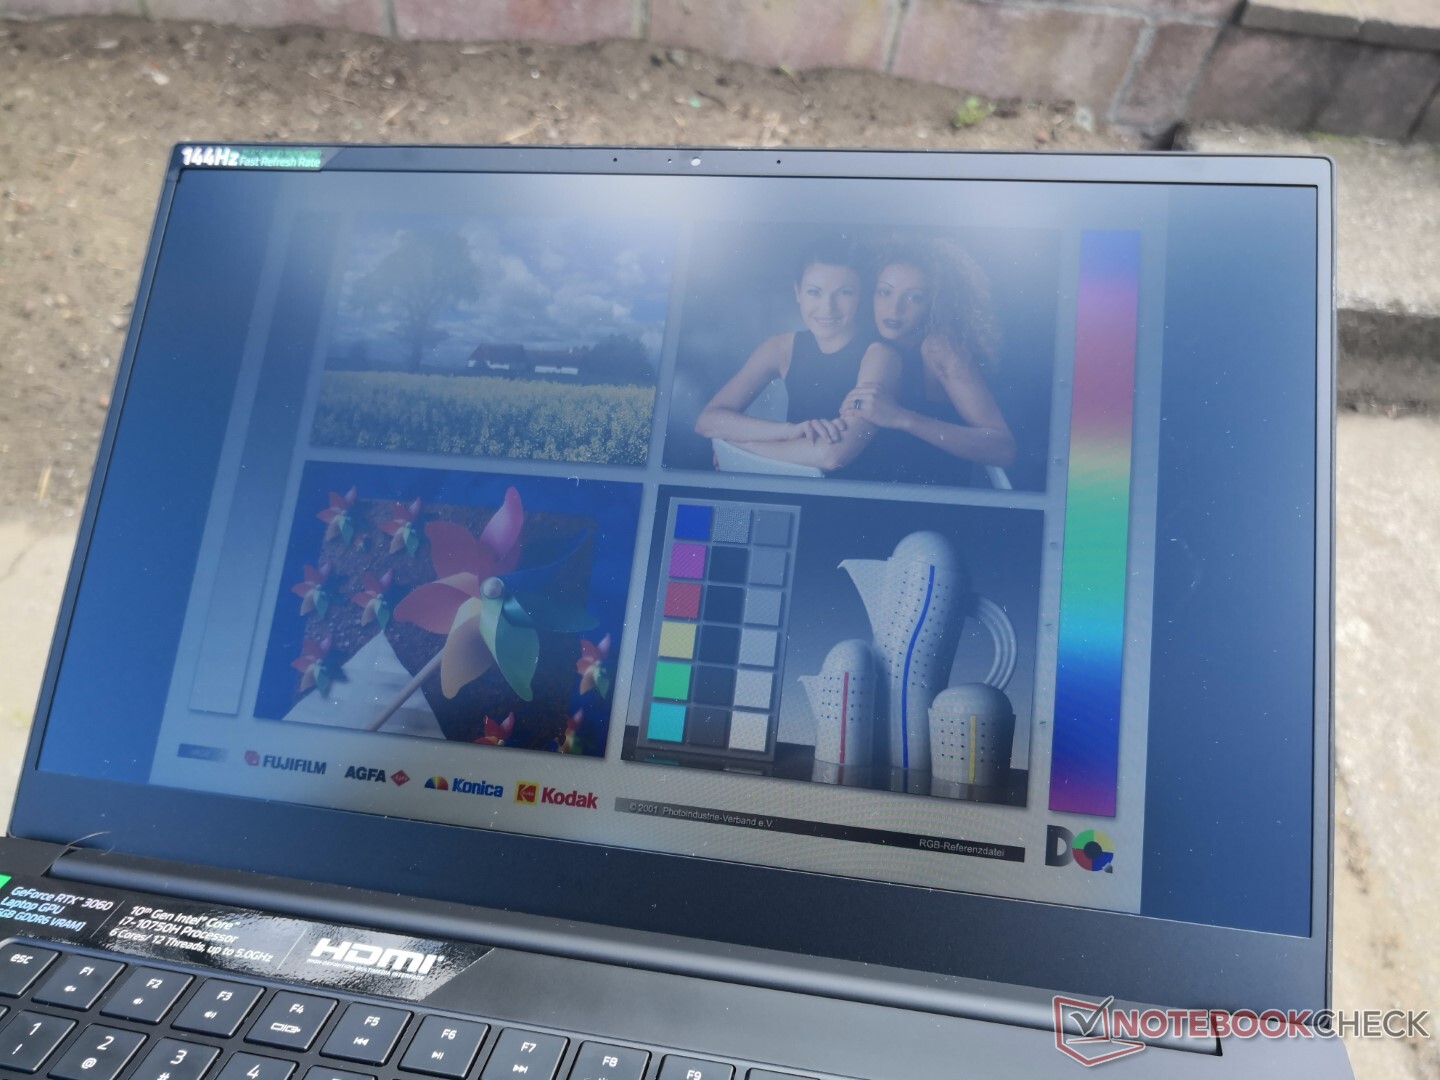
Outdoor visibility is decent only when under shade as the display isn't bright enough to overcome direct sunlight. The glossy OLED touchscreen option may be slightly brighter than our matte option, but this will likely be offset by the inevitable increase in glare.

Performance
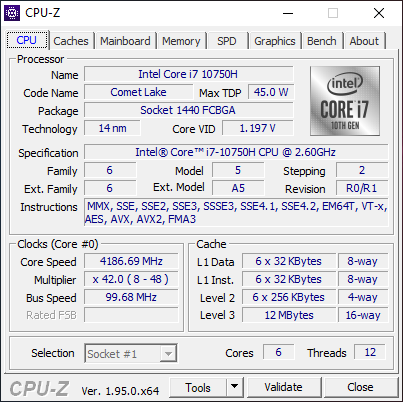
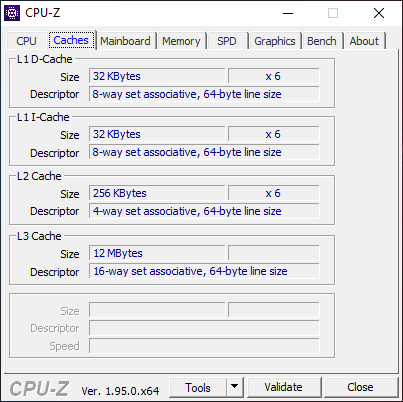
Razer offers only Core i7-10750H and Core i7-10875H CPU options with no Core i5 or Core i9 to "dilute" the series. Max-Q options are also gone as Nvidia has dropped the moniker altogether from mobile Ampere.
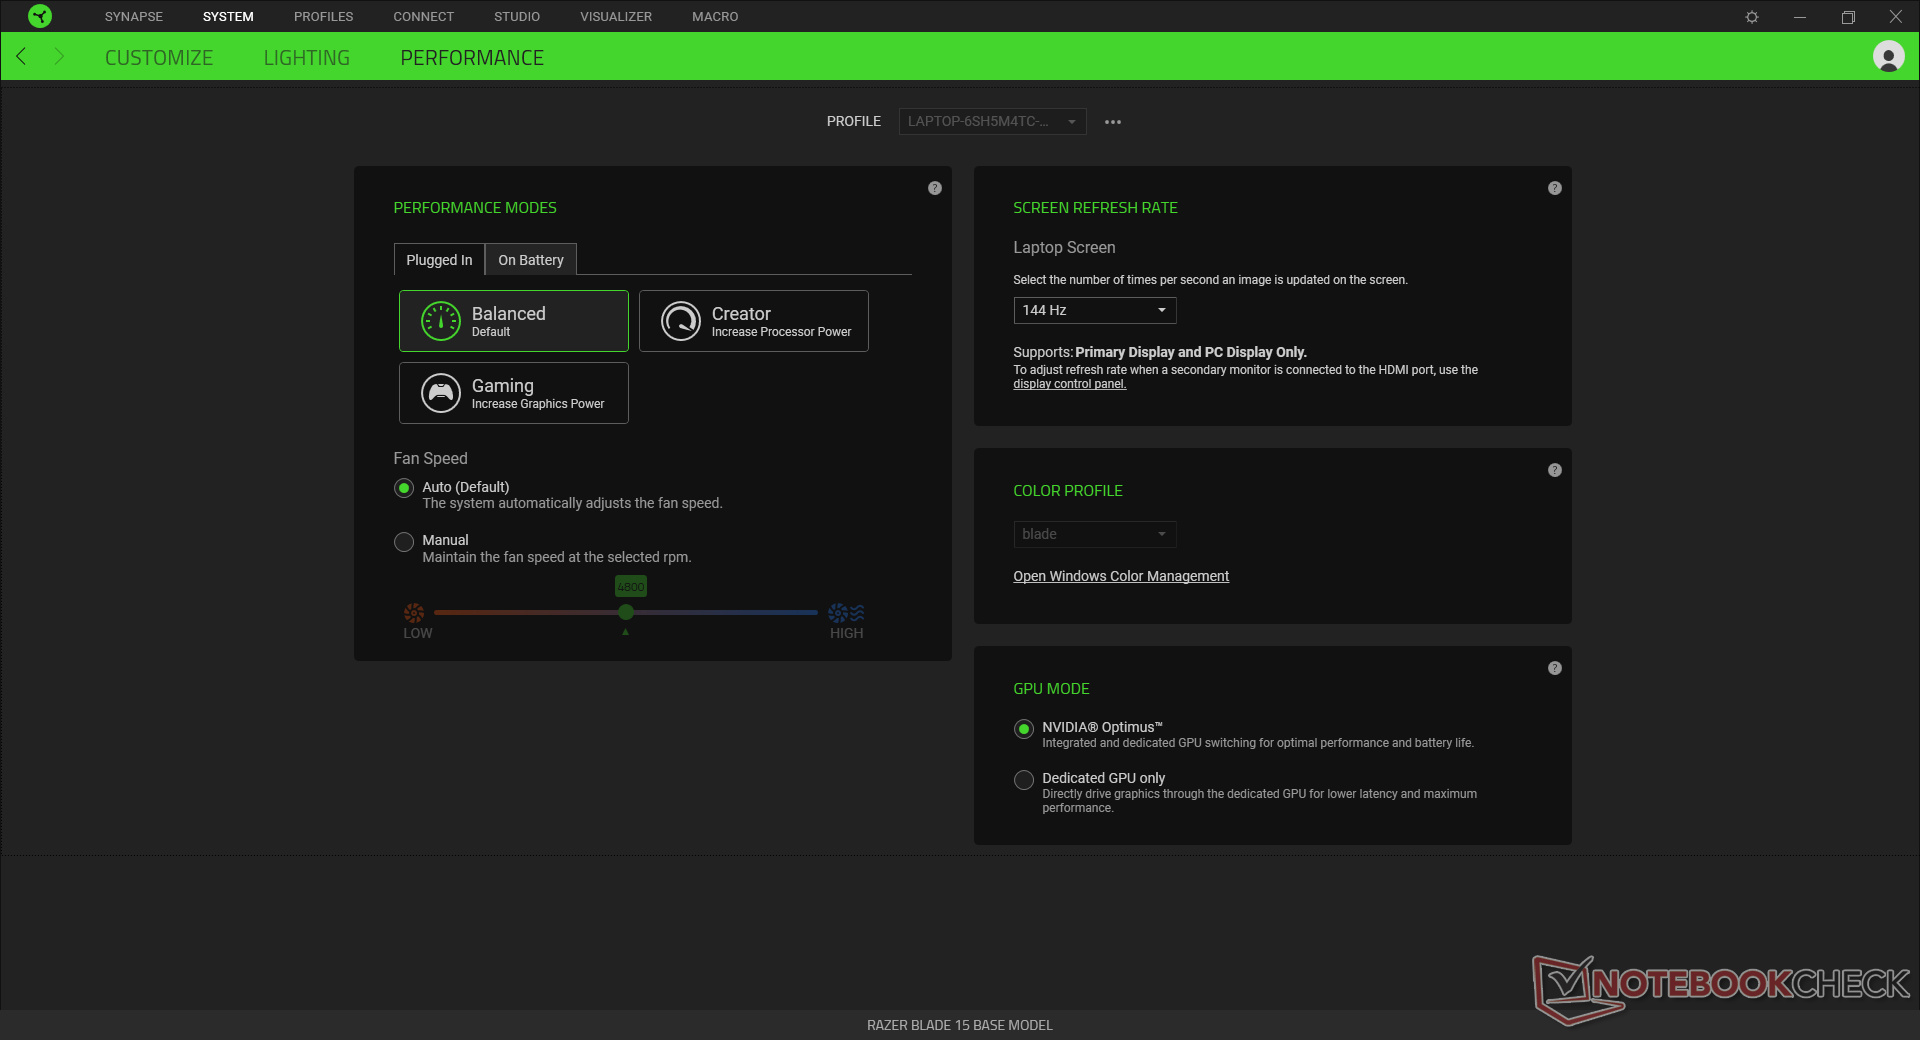
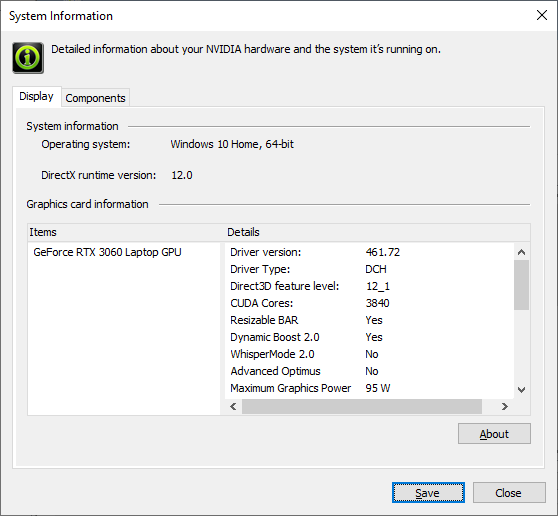
Nvidia Optimus comes standard and G-Sync is once again not available on any configuration. Resizable Bar, however, is now supported. The 144 Hz native refresh rate will work no matter which GPU is active.
We recommend users become familiar with the pre-loaded Synapse software as many Razer-specific features are located here.
Processor
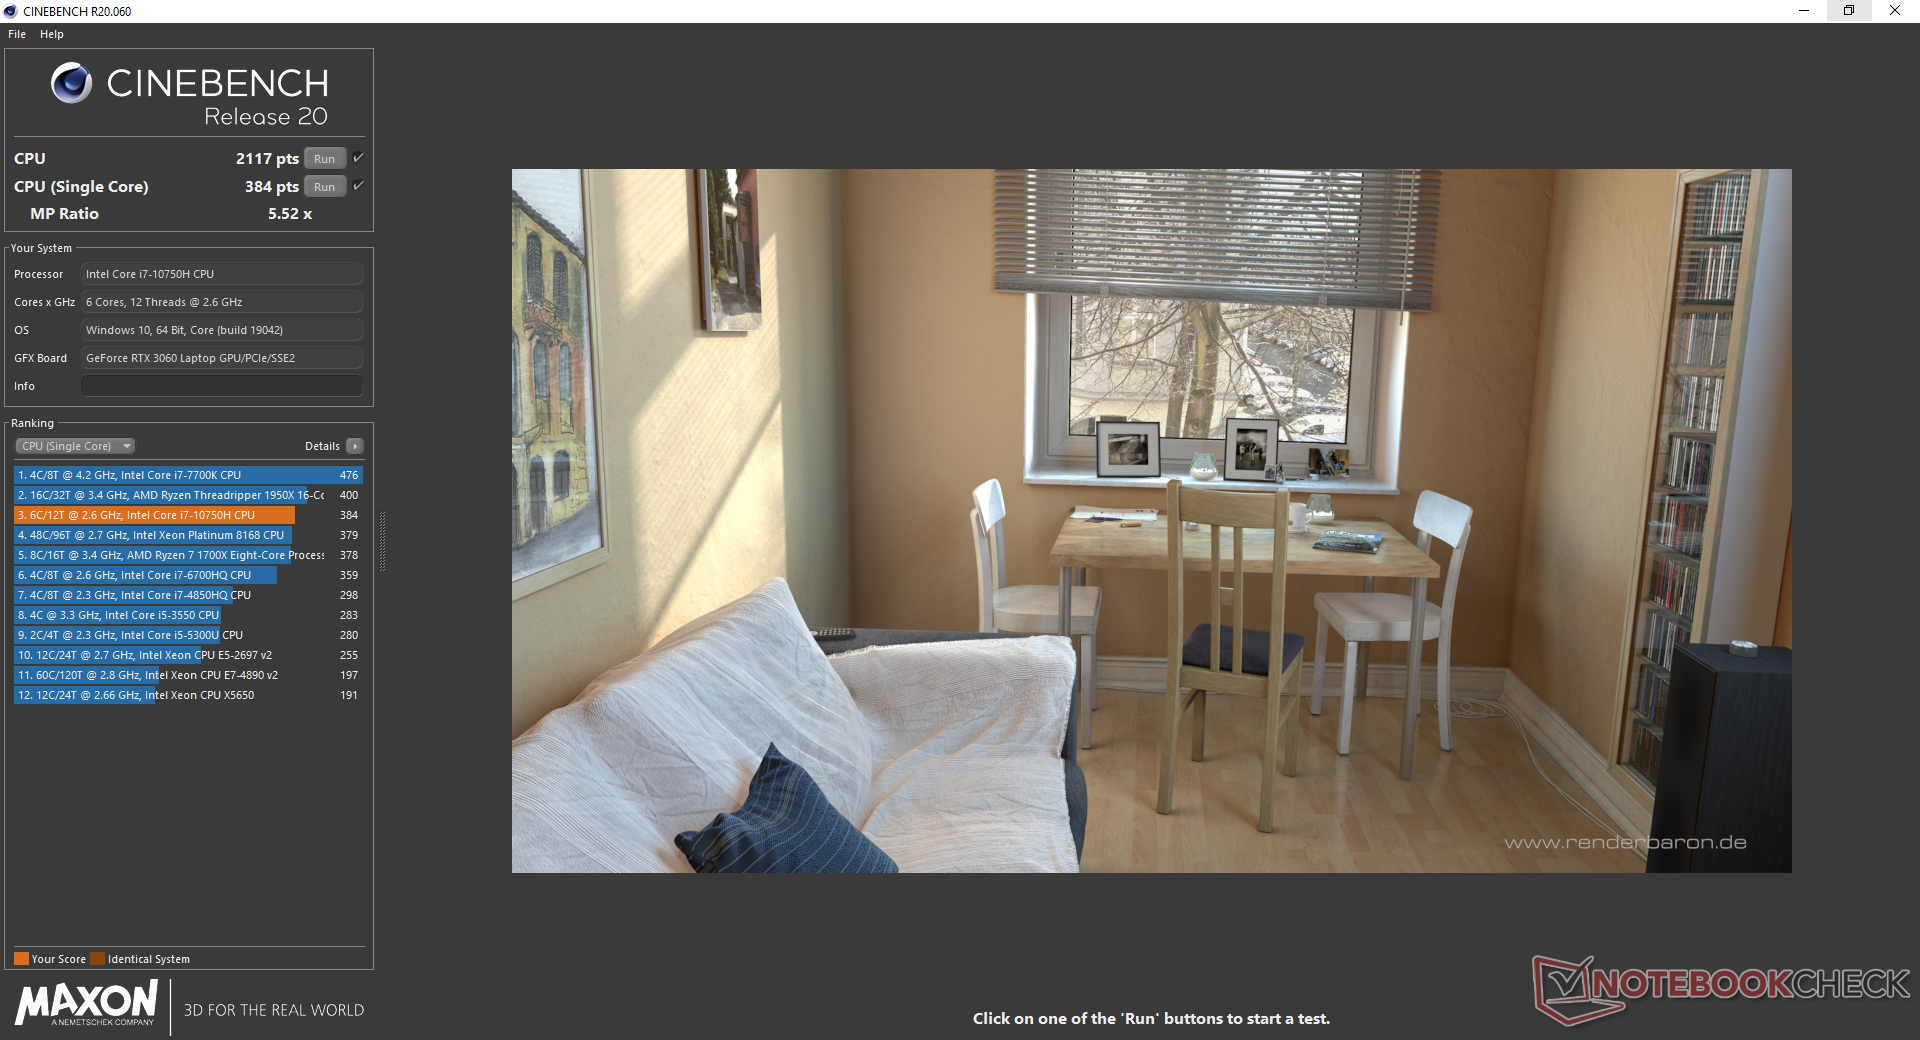
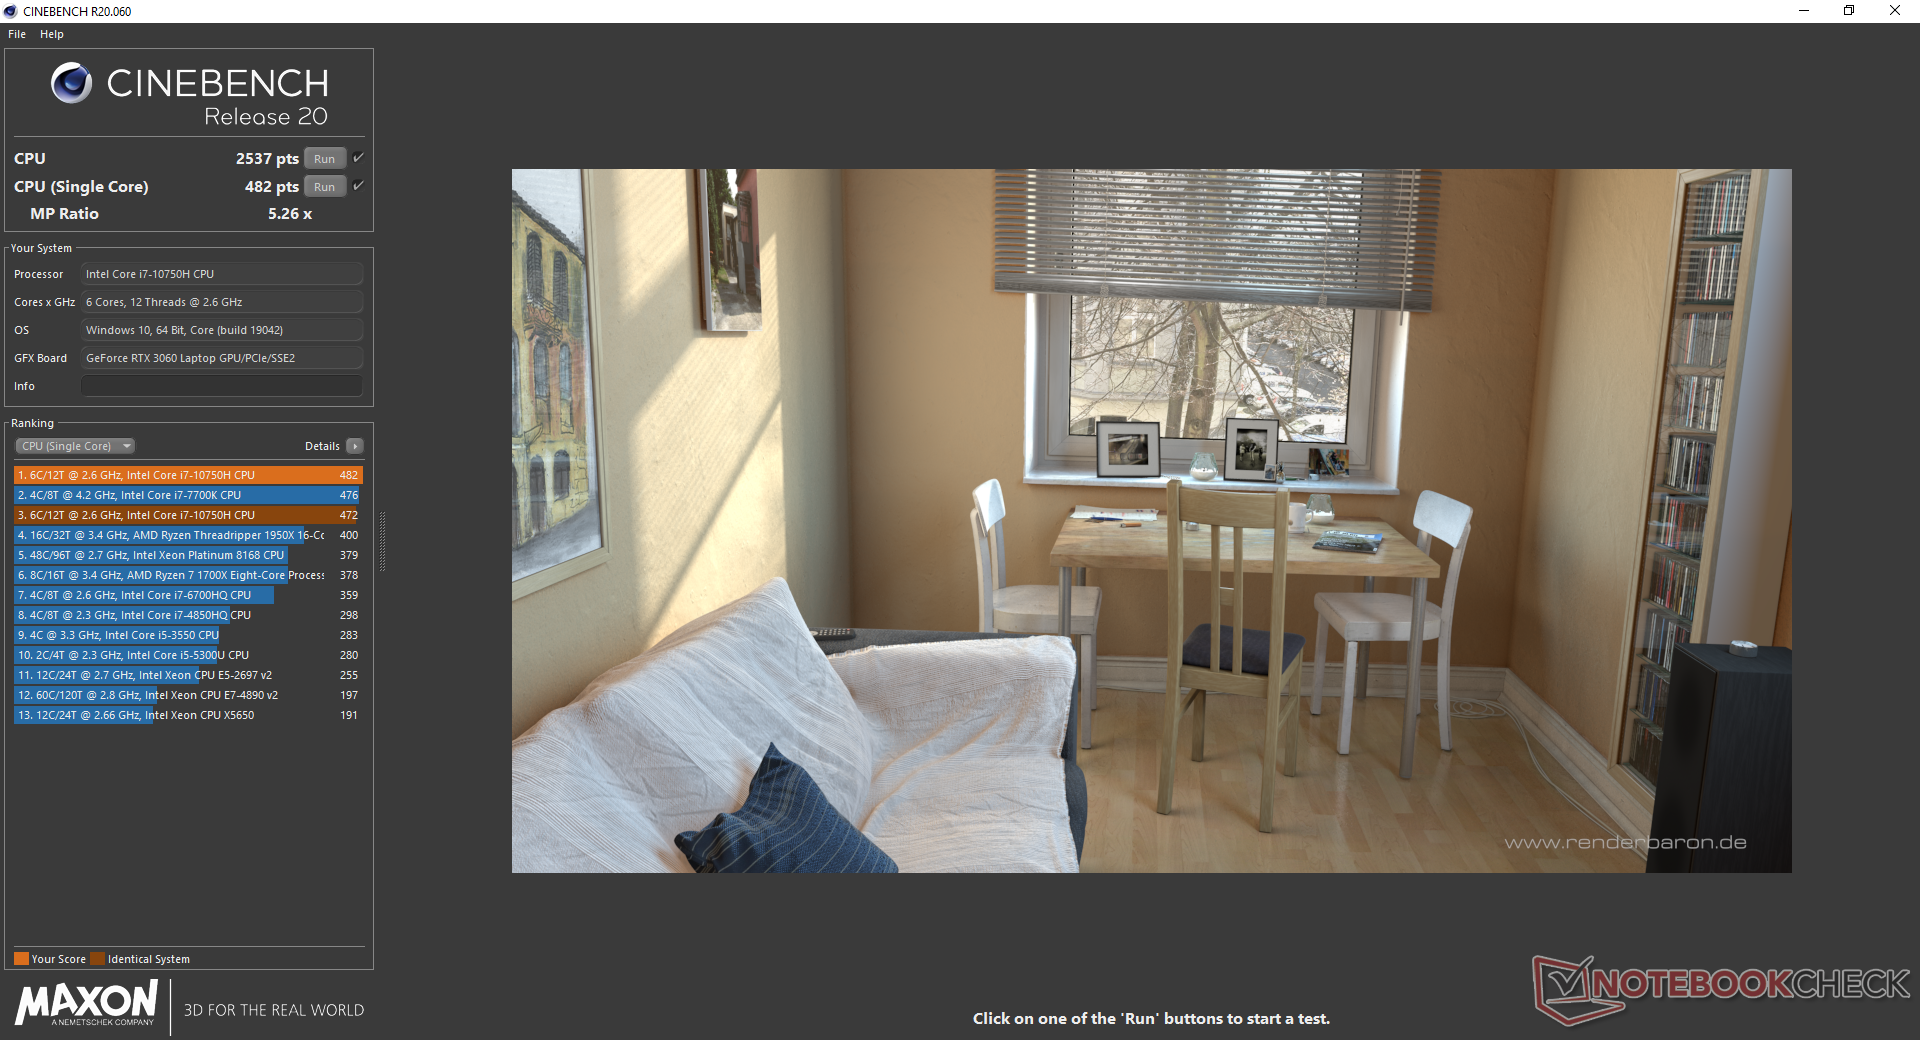
CPU performance is dependent on the chosen power profile — Balanced, Game, or Creator — each accessible via the Razer Synapse software. Multi-thread performance on Creator mode is about 10 percent slower than the average laptop with the same Core i7-10750H CPU. If on Game mode, however, multi-thread performance will drop even further by as much as 17 percent in our experience. Turbo Boost sustainability is also not as good as we had hoped as detailed in our Stress Test section below. Upgrading to the Blade 15 Advanced Model with the octa-core Core i7-10875H can increase xT performance by as much as 80 percent in this scenario.
| Power Profile | CineBench R20 Multi-Thread Score | CineBench R20 Multi-Thread Score |
|---|---|---|
| Balanced mode | 2234 | 482 |
| Game mode | 2117 | 384 |
| Creator mode | 2537 | 482 |

Cinebench R15: CPU Multi 64Bit | CPU Single 64Bit
Blender: v2.79 BMW27 CPU
7-Zip 18.03: 7z b 4 -mmt1 | 7z b 4
Geekbench 5.5: Single-Core | Multi-Core
HWBOT x265 Benchmark v2.2: 4k Preset
LibreOffice : 20 Documents To PDF
R Benchmark 2.5: Overall mean
| 7-Zip 18.03 / 7z b 4 -mmt1 | |
| Asus ROG Strix G15 G513QR | |
| MSI GS66 Stealth 10UG | |
| Acer Nitro 5 AN515-45-R05E | |
| Razer Blade 15 Base Edition 2021, i7-10750H RTX 3060 | |
| Asus Zephyrus S15 GX502L | |
| Average Intel Core i7-10750H (4504 - 5470, n=43) | |
| Dell G5 15 5500 09E2 | |
| Schenker XMG Core 15 Ampere | |
| Schenker XMG Pro 15 | |
| Geekbench 5.5 / Single-Core | |
| Asus ROG Strix G15 G513QR | |
| Acer Nitro 5 AN515-45-R05E | |
| MSI GS66 Stealth 10UG | |
| Razer Blade 15 Base Edition 2021, i7-10750H RTX 3060 | |
| Average Intel Core i7-10750H (1114 - 1333, n=43) | |
| Asus Zephyrus S15 GX502L | |
| Schenker XMG Core 15 Ampere | |
| Dell G5 15 5500 09E2 | |
| Schenker XMG Pro 15 | |
| Geekbench 5.5 / Multi-Core | |
| Schenker XMG Core 15 Ampere | |
| MSI GS66 Stealth 10UG | |
| Asus Zephyrus S15 GX502L | |
| Asus ROG Strix G15 G513QR | |
| Acer Nitro 5 AN515-45-R05E | |
| Average Intel Core i7-10750H (4443 - 6674, n=43) | |
| Schenker XMG Pro 15 | |
| Razer Blade 15 Base Edition 2021, i7-10750H RTX 3060 | |
| Dell G5 15 5500 09E2 | |
| HWBOT x265 Benchmark v2.2 / 4k Preset | |
| Asus ROG Strix G15 G513QR | |
| Schenker XMG Core 15 Ampere | |
| Asus Zephyrus S15 GX502L | |
| MSI GS66 Stealth 10UG | |
| Acer Nitro 5 AN515-45-R05E | |
| Average Intel Core i7-10750H (5.54 - 11.6, n=43) | |
| Schenker XMG Pro 15 | |
| Razer Blade 15 Base Edition 2021, i7-10750H RTX 3060 | |
| Dell G5 15 5500 09E2 | |
| LibreOffice / 20 Documents To PDF | |
| Dell G5 15 5500 09E2 | |
| Schenker XMG Core 15 Ampere | |
| Acer Nitro 5 AN515-45-R05E | |
| Average Intel Core i7-10750H (43.1 - 99.2, n=43) | |
| Asus ROG Strix G15 G513QR | |
| MSI GS66 Stealth 10UG | |
| Razer Blade 15 Base Edition 2021, i7-10750H RTX 3060 | |
| Asus Zephyrus S15 GX502L | |
| R Benchmark 2.5 / Overall mean | |
| Schenker XMG Pro 15 | |
| Dell G5 15 5500 09E2 | |
| Razer Blade 15 Base Edition 2021, i7-10750H RTX 3060 | |
| Average Intel Core i7-10750H (0.578 - 0.708, n=42) | |
| Asus Zephyrus S15 GX502L | |
| MSI GS66 Stealth 10UG | |
| Schenker XMG Core 15 Ampere | |
| Acer Nitro 5 AN515-45-R05E | |
| Asus ROG Strix G15 G513QR | |
* ... smaller is better
System Performance
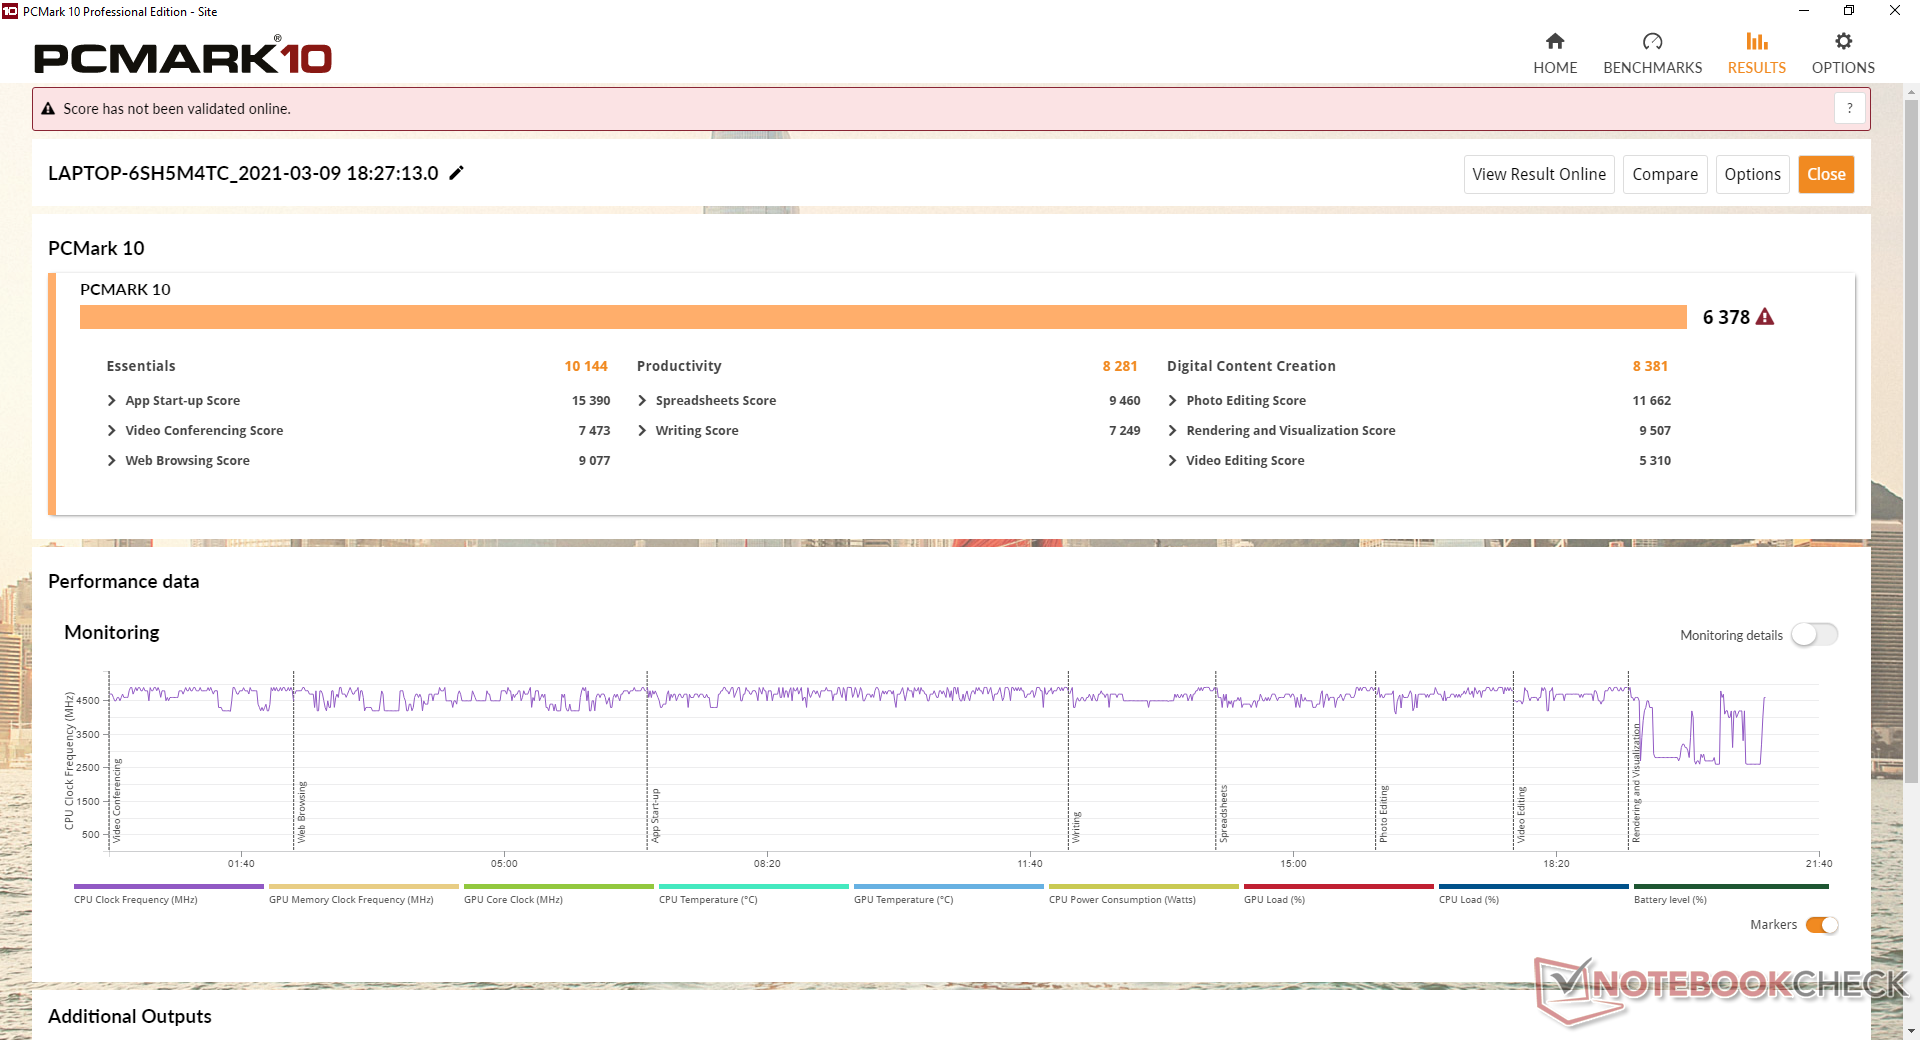
PCMark results are slightly below the Blade 15 RTX 2070 Max-Q likely due to the faster octa-core Core i7-10875H option for the Advanced model.
We experienced some issues with the Razer Synapse software where the program would often hang if disconnected from the Internet. This is something we've been seeing across the entire Blade family and not just on this particular Blade 15 model.
| PCMark 10 Score | 6378 points | |
Help | ||
DPC Latency
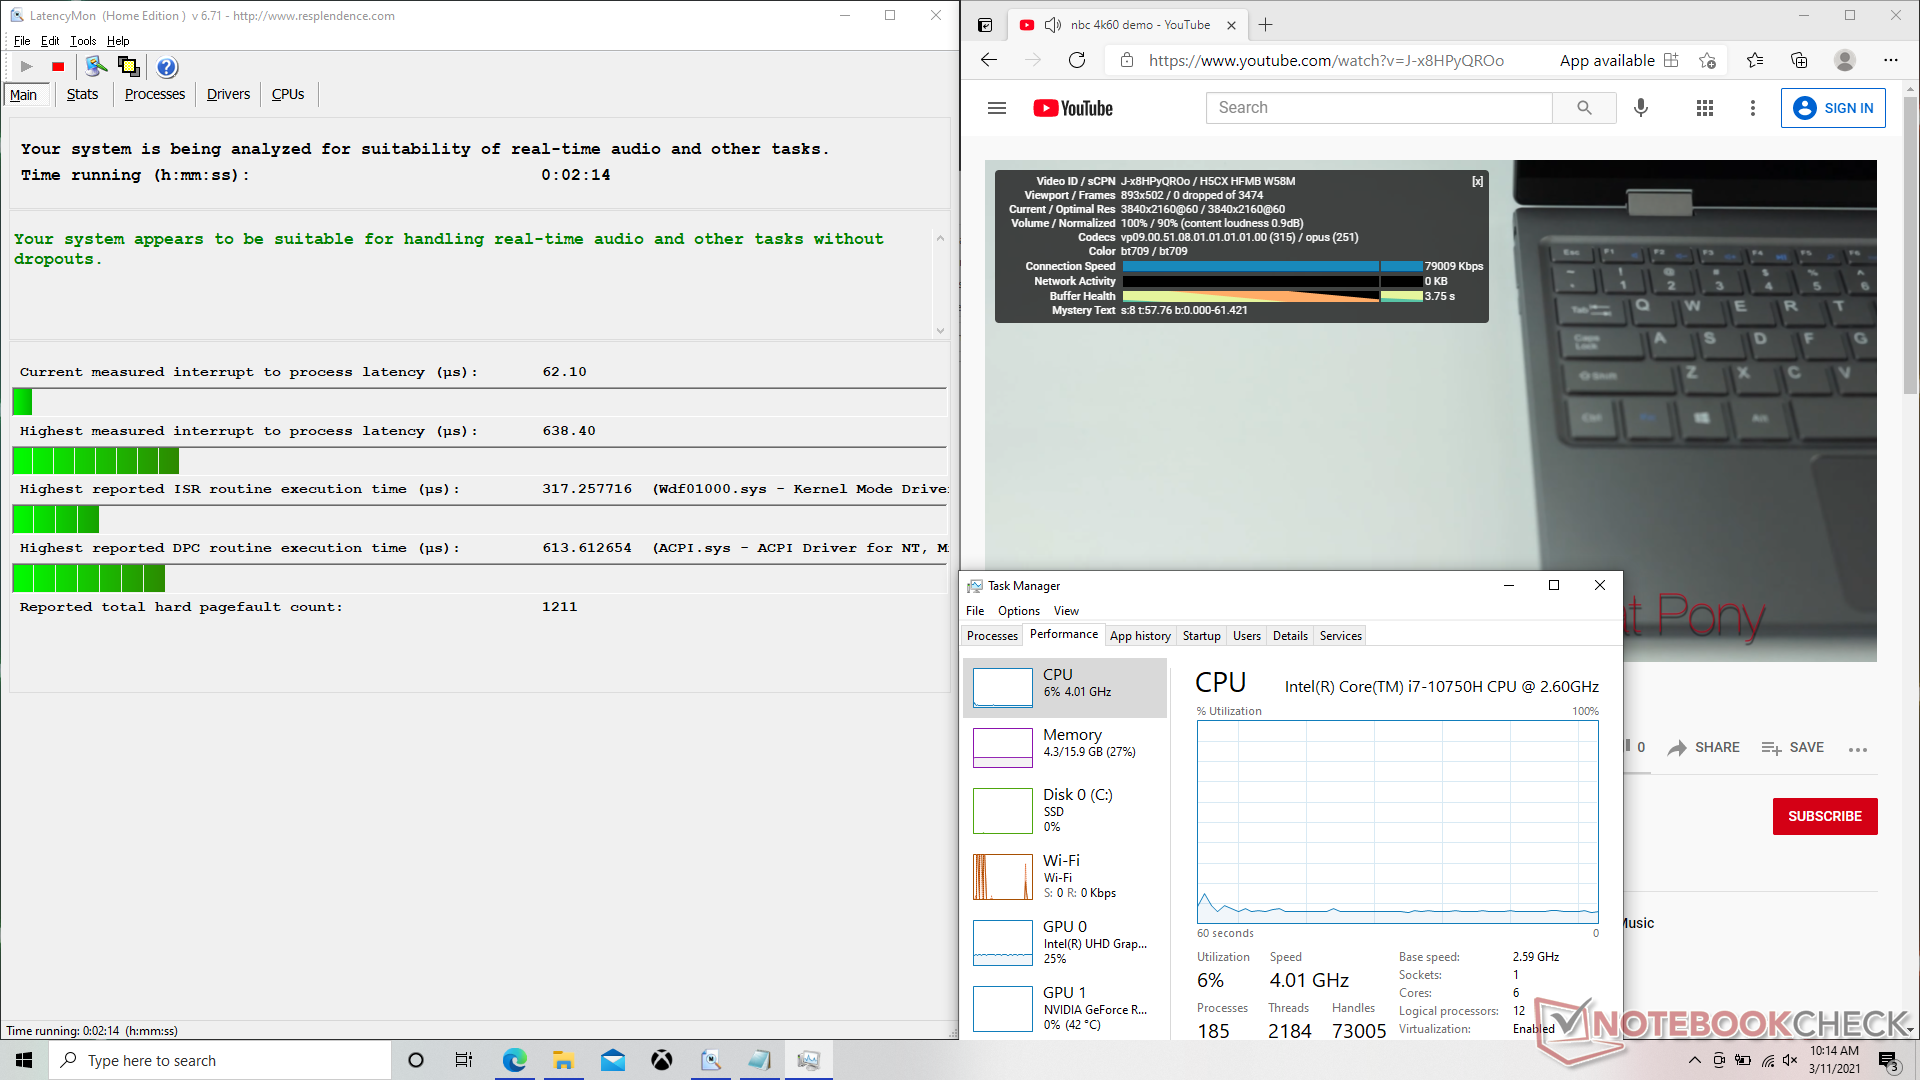
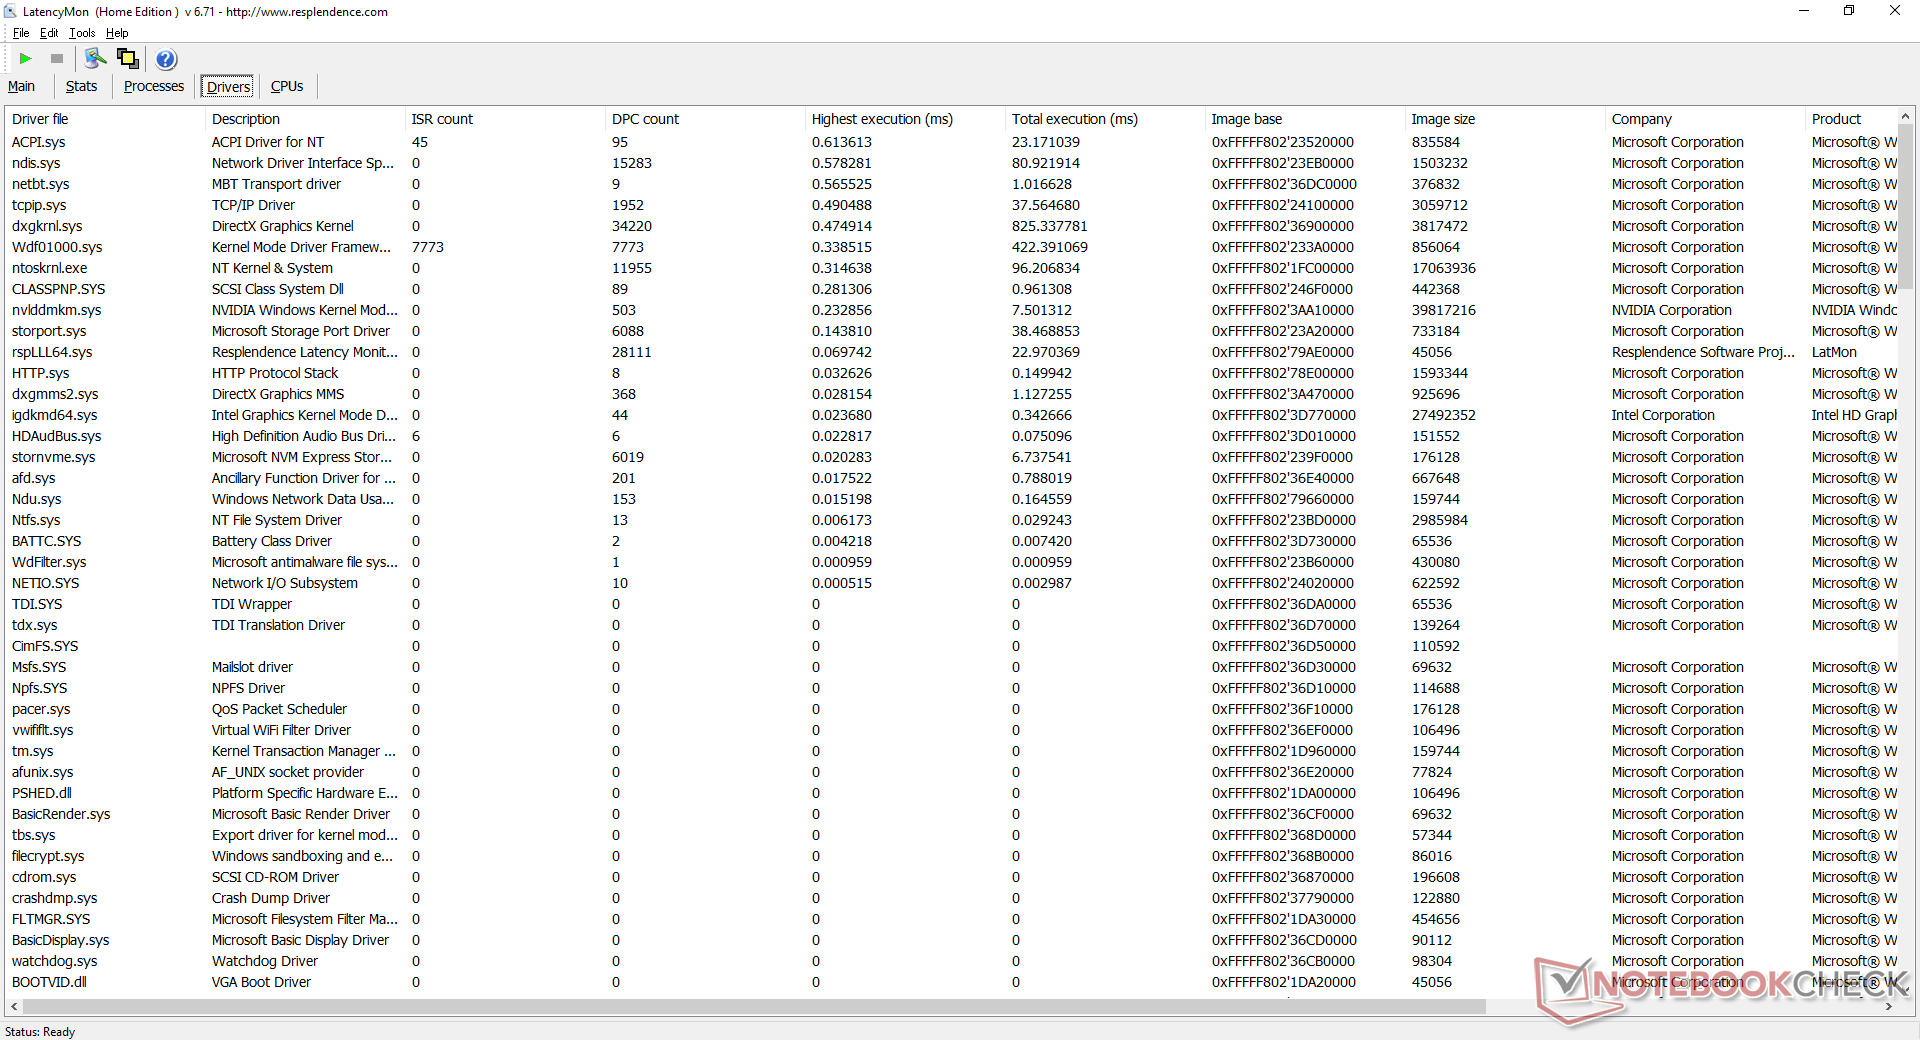
LatencyMon shows no DPC latency issues when opening multiple browser tabs on our homepage. 4K video playback at 60 FPS is also smooth and with no dropped frames.
| DPC Latencies / LatencyMon - interrupt to process latency (max), Web, Youtube, Prime95 | |
| Asus ROG Zephyrus M15 GU502LU-BI7N4 | |
| Razer Blade 15 RTX 2070 Super Max-Q | |
| MSI GF65 Thin 10UE | |
| MSI GS66 Stealth 10UG | |
| Razer Blade 15 Base Edition 2021, i7-10750H RTX 3060 | |
| Asus ROG Strix G15 G513QR | |
* ... smaller is better
Storage Devices
| Razer Blade 15 Base Edition 2021, i7-10750H RTX 3060 Samsung SSD PM981a MZVLB512HBJQ | Razer Blade 15 RTX 2070 Super Max-Q Samsung SSD PM981a MZVLB512HBJQ | MSI GS66 Stealth 10UG WDC PC SN730 SDBPNTY-1T00 | MSI GF65 Thin 10UE Samsung SSD PM981 MZVLB1T0HALR | Dell G5 15 5500 09E2 Toshiba KBG40ZNS512G NVMe | |
|---|---|---|---|---|---|
| AS SSD | -3% | 6% | 10% | -79% | |
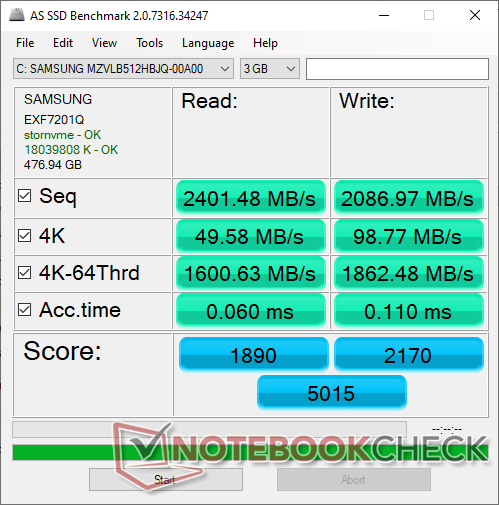
| Seq Read (MB/s) | 2401 | 1957 -18% | 2198 -8% | 3002 25% | 1776 -26% |
| Seq Write (MB/s) | 2087 | 2092 0% | 2596 24% | 2420 16% | 721 -65% |
| 4K Read (MB/s) | 49.58 | 50.2 1% | 43.81 -12% | 48.46 -2% | 38.58 -22% |
| 4K Write (MB/s) | 98.8 | 96.5 -2% | 115.5 17% | 114.3 16% | 70.9 -28% |
| 4K-64 Read (MB/s) | 1601 | 1594 0% | 1692 6% | 1873 17% | 945 -41% |
| 4K-64 Write (MB/s) | 1862 | 2005 8% | 2162 16% | 1882 1% | 191.8 -90% |
| Access Time Read * (ms) | 0.06 | 0.057 5% | 0.056 7% | 0.045 25% | 0.111 -85% |
| Access Time Write * (ms) | 0.11 | 0.112 -2% | 0.098 11% | 0.101 8% | 0.588 -435% |
| Score Read (Points) | 1890 | 1840 -3% | 1956 3% | 2221 18% | 1161 -39% |
| Score Write (Points) | 2170 | 2310 6% | 2537 17% | 2238 3% | 335 -85% |
| Score Total (Points) | 5015 | 5103 2% | 5513 10% | 5565 11% | 2043 -59% |
| Copy ISO MB/s (MB/s) | 2206 | 1793 -19% | 2236 1% | 2421 10% | 1037 -53% |
| Copy Program MB/s (MB/s) | 694 | 573 -17% | 690 -1% | 705 2% | 429.7 -38% |
| Copy Game MB/s (MB/s) | 1555 | 1418 -9% | 1546 -1% | 1490 -4% | 892 -43% |
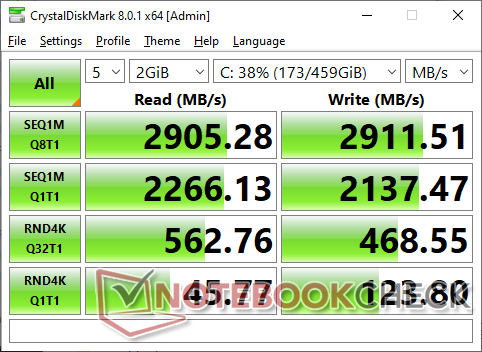
| CrystalDiskMark 5.2 / 6 | 5% | 5% | 2% | -34% | |
| Write 4K (MB/s) | 123.8 | 139.8 13% | 163.1 32% | 157.3 27% | 89.3 -28% |
| Read 4K (MB/s) | 45.53 | 48.62 7% | 48.97 8% | 46.69 3% | 41.42 -9% |
| Write Seq (MB/s) | 2132 | 2260 6% | 2607 22% | 2389 12% | 1182 -45% |
| Read Seq (MB/s) | 2067 | 2135 3% | 2316 12% | 2196 6% | 1532 -26% |
| Write 4K Q32T1 (MB/s) | 462.9 | 499.3 8% | 338 -27% | 407.6 -12% | 283.2 -39% |
| Read 4K Q32T1 (MB/s) | 553 | 552 0% | 475.6 -14% | 519 -6% | 353.2 -36% |
| Write Seq Q32T1 (MB/s) | 2955 | 2960 0% | 3090 5% | 2401 -19% | 1220 -59% |
| Read Seq Q32T1 (MB/s) | 3246 | 3269 1% | 3421 5% | 3344 3% | 2329 -28% |
| Write 4K Q8T8 (MB/s) | 288.1 | ||||
| Read 4K Q8T8 (MB/s) | 1049 | ||||
| Total Average (Program / Settings) | 1% /
-0% | 6% /
6% | 6% /
7% | -57% /
-63% |
* ... smaller is better

Disk Throttling: DiskSpd Read Loop, Queue Depth 8
GPU Performance
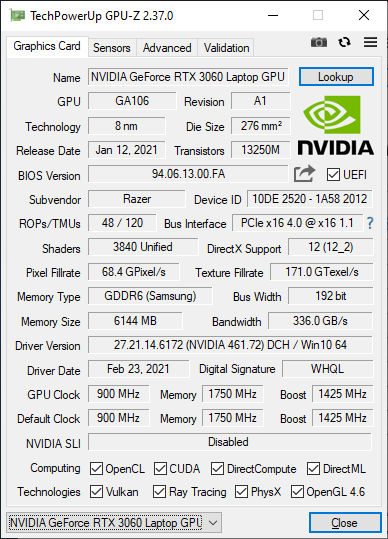
The 95 W mobile GeForce RTX 3060 is within single-digit percentage points of the GeForce RTX 2070 Max-Q according to 3DMark. Upgrading to the RTX 3070 Blade 15 option is expected to increase graphics performance by 15 to 30 percent depending on Razer's TGP target.
When running actual games, however, the RTX 3060 pulls out ahead of the RTX 2070 Max-Q especially when on higher settings where games are more GPU bound. GTA V and Final Fantasy XV, for example, are about 30 percent faster on our Blade 15 when compared to the average GeForce RTX 2070 Max-Q laptop.
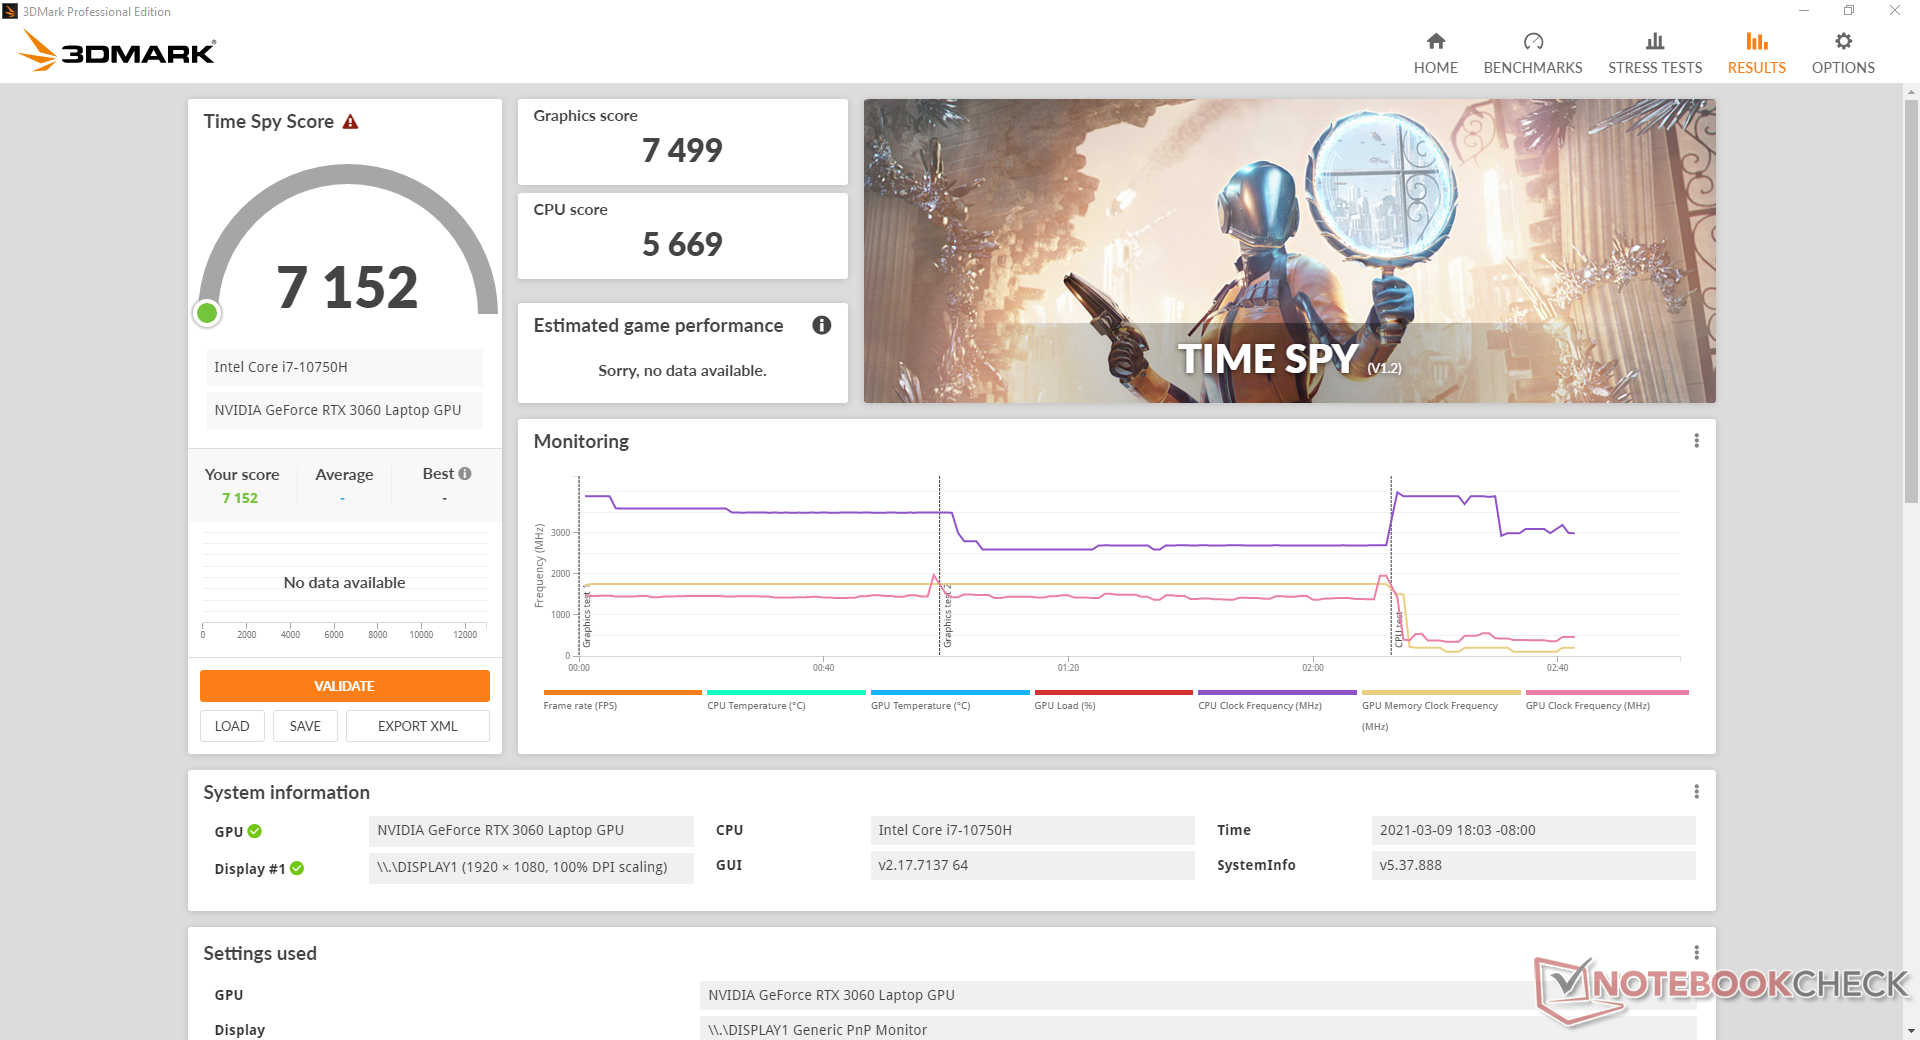
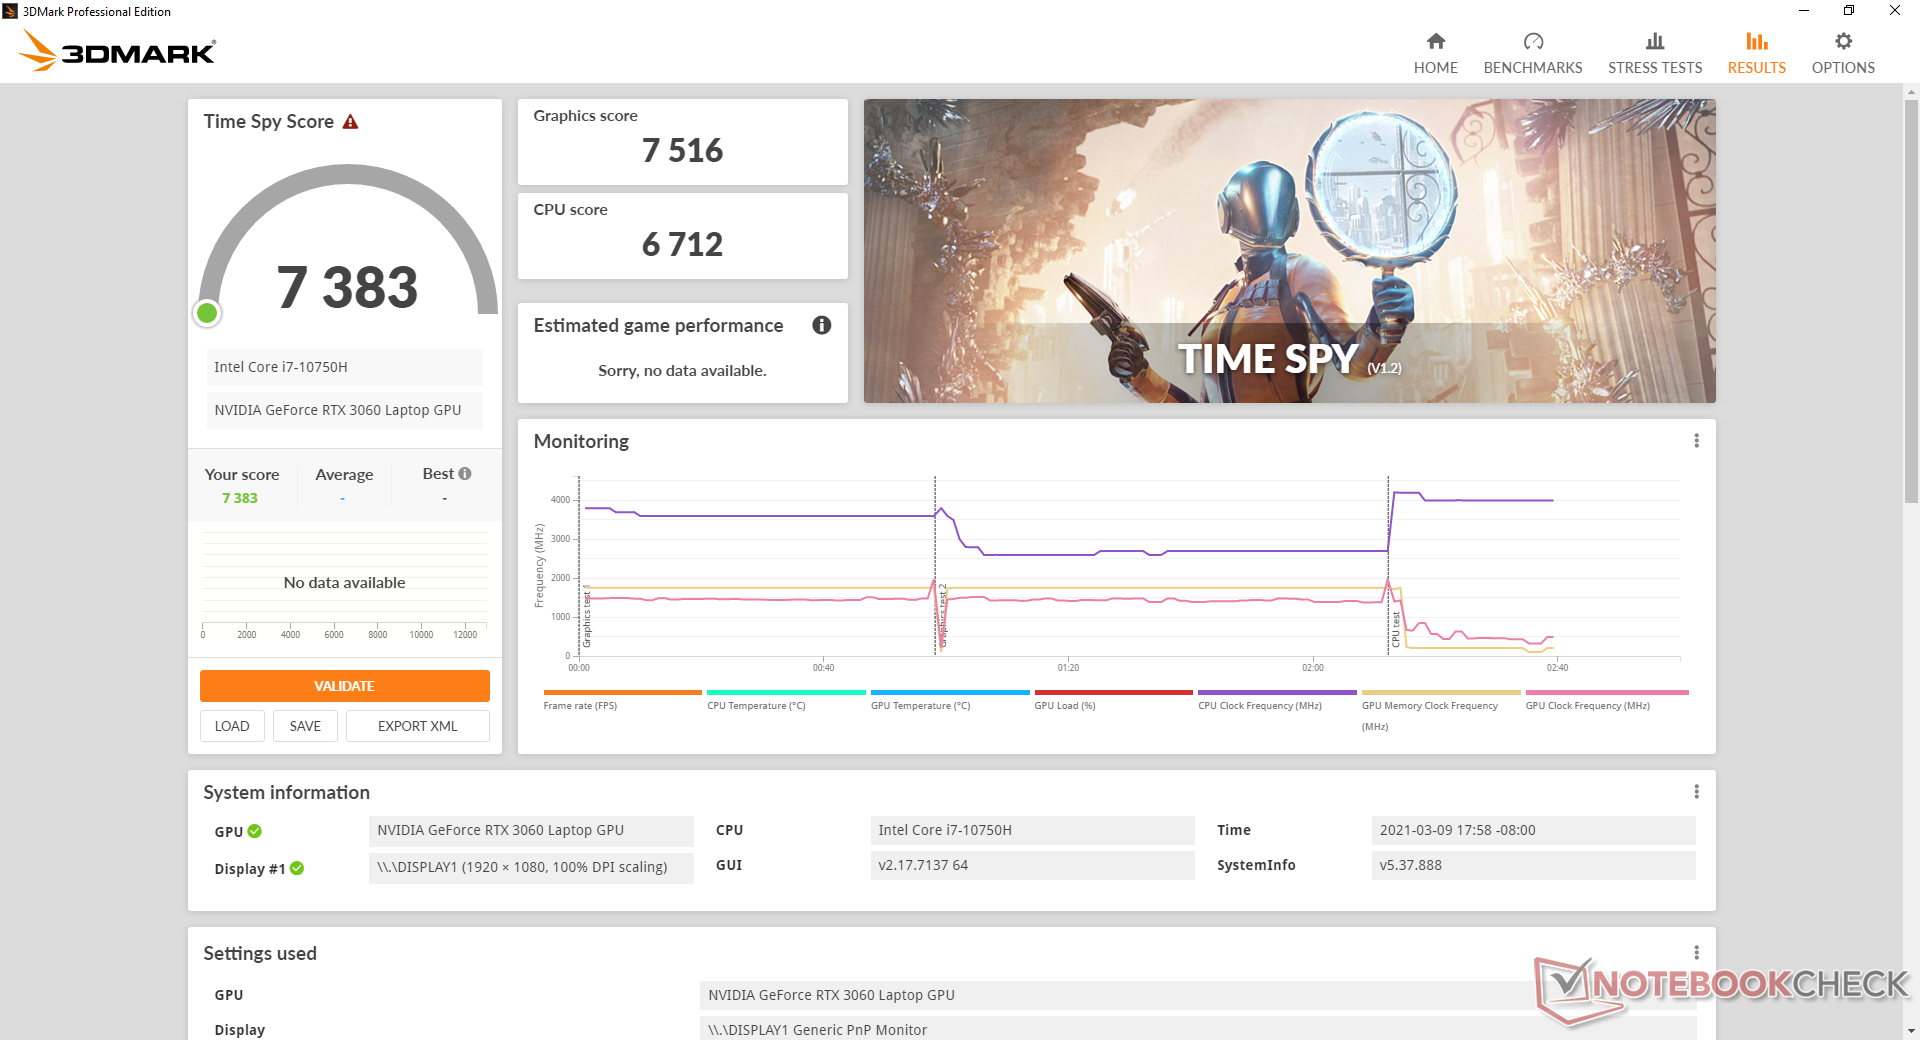
There is a small but not insignificant change in graphics performance depending on the power profile selected as shown by the table below. Most notably, jumping from Creator mode to Game mode results in a 5 percent increase in Time Spy Graphics score.
| Power Profile | Time Spy CPU Score | Time Spy GPU Score |
|---|---|---|
| Balanced mode | 5669 | 7499 |
| Game mode | 5709 | 7897 |
| Creator mode | 6712 | 7516 |
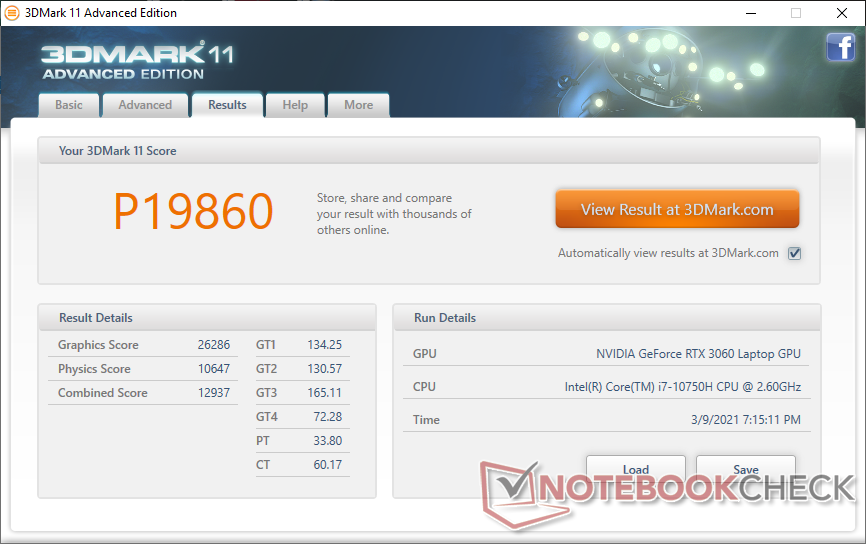

| 3DMark 11 Performance | 19860 points | |
| 3DMark Cloud Gate Standard Score | 34027 points | |
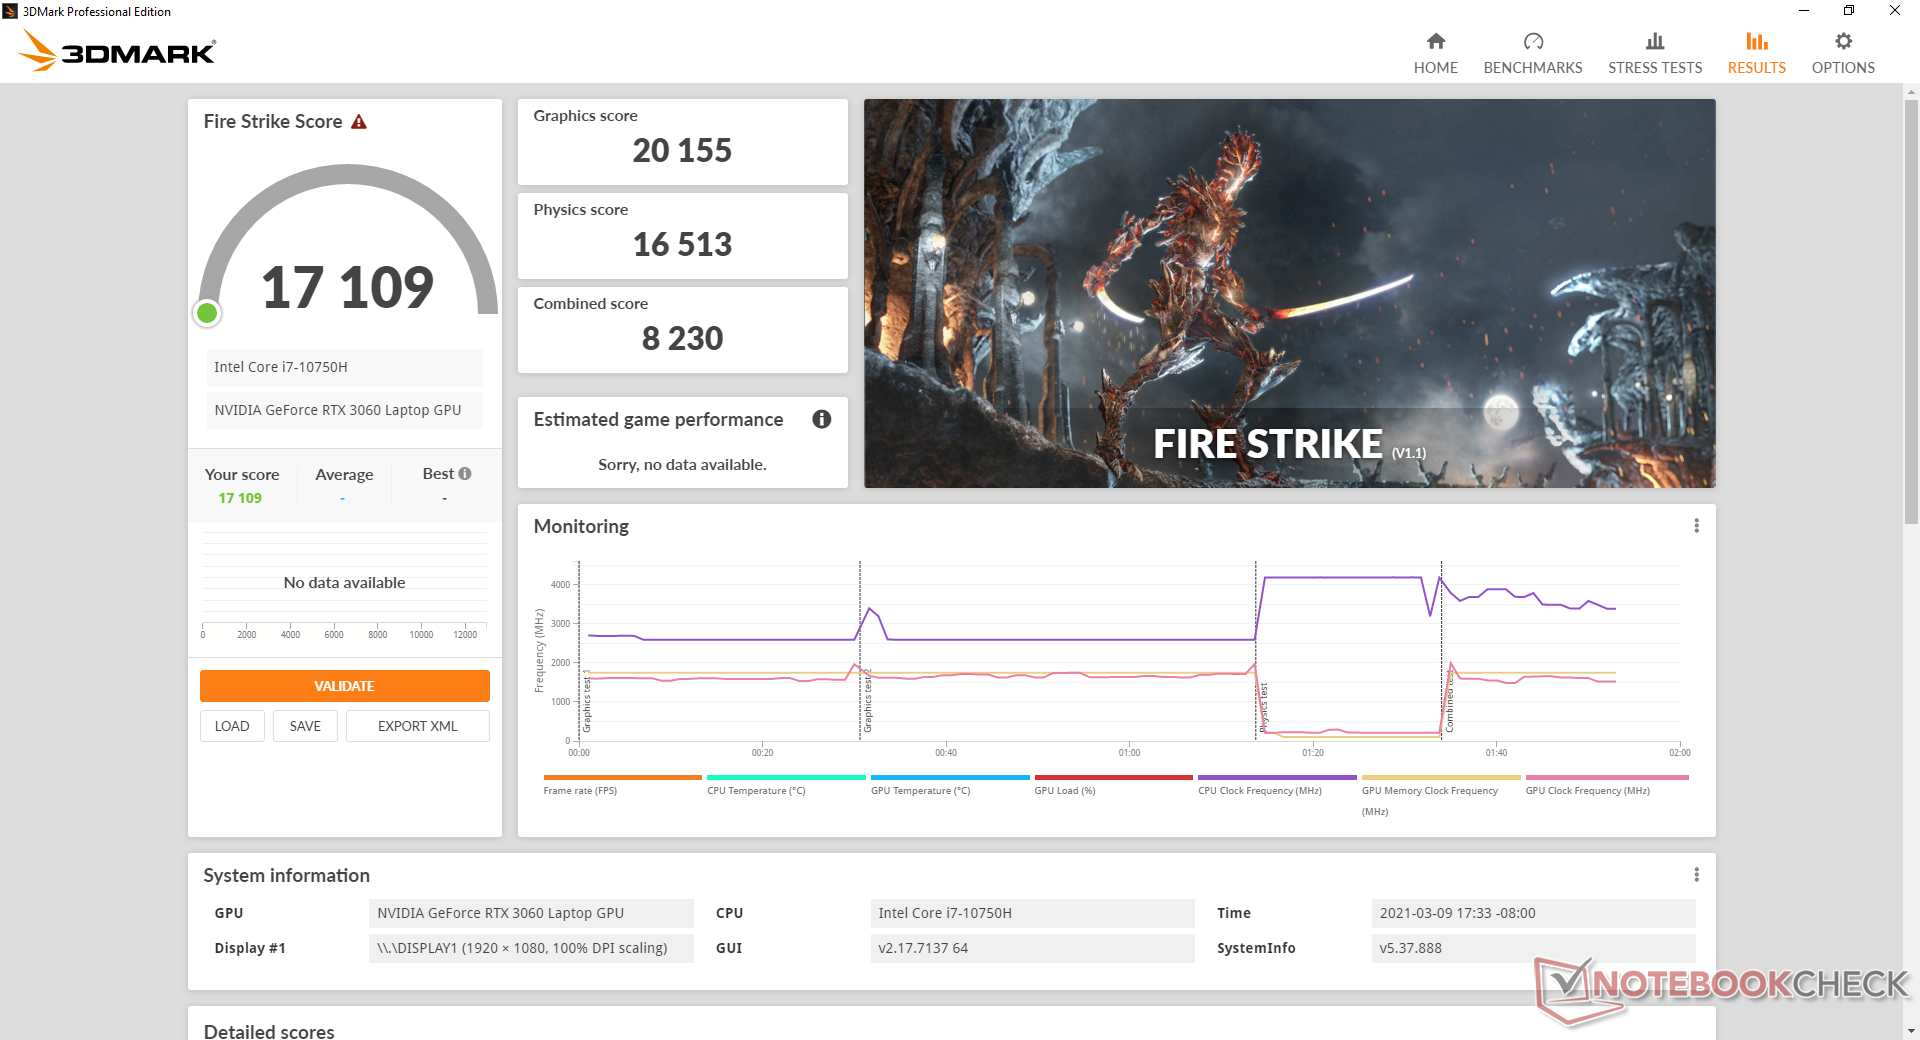
| 3DMark Fire Strike Score | 17109 points | |
| 3DMark Time Spy Score | 7467 points | |
Help | ||
| low | med. | high | ultra | |
|---|---|---|---|---|
| GTA V (2015) | 175 | 168 | 149 | 84.5 |
| The Witcher 3 (2015) | 252.6 | 210.9 | 155 | 80.3 |
| Dota 2 Reborn (2015) | 147 | 134 | 128 | 121 |
| Final Fantasy XV Benchmark (2018) | 137 | 109 | 81.2 | |
| X-Plane 11.11 (2018) | 103 | 93 | 78.9 | |
| Strange Brigade (2018) | 359 | 210 | 164 | 141 |
Emissions
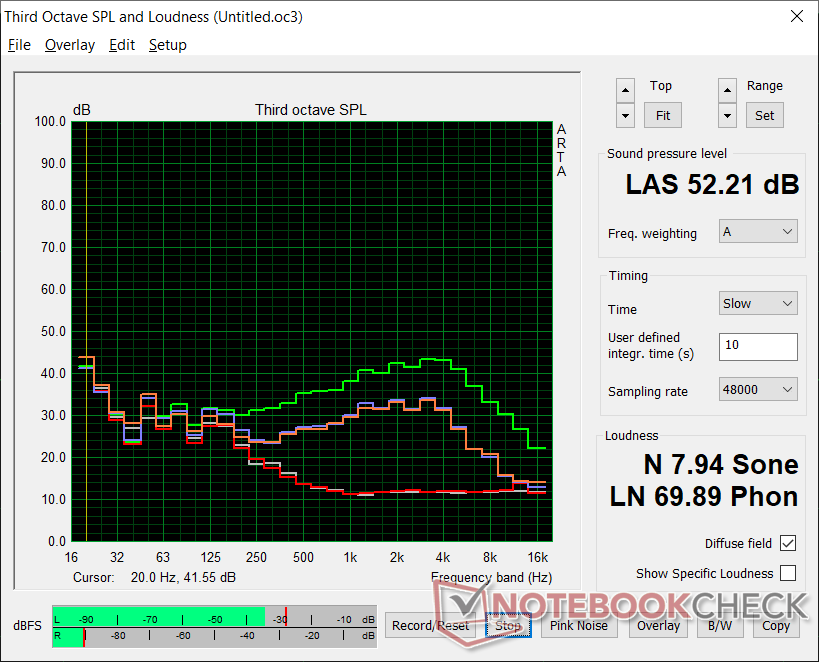
System Noise
The internal fans will idle when running very low loads for a silent experience. They tend to pulse frequently if on the High Performance profile, however, and so we recommend Balanced mode or lower to limit fan activity.
Fan noise when gaming will range between 42 dB(A) and 52 dB(A) depending on the CPU load much like on the 2020 Blade 15 Advanced Model. Results are pretty close to what we recorded on the Asus ROG Strix G15 under similar loads. Manually setting the fans to maximum via Synapse will cause the fans to run at a flat 52 dB(A) no matter the load.
| Razer Blade 15 Base Edition 2021, i7-10750H RTX 3060 GeForce RTX 3060 Laptop GPU, i7-10750H, Samsung SSD PM981a MZVLB512HBJQ | Razer Blade 15 RTX 2070 Super Max-Q GeForce RTX 2070 Super Max-Q, i7-10875H, Samsung SSD PM981a MZVLB512HBJQ | Asus ROG Strix G15 G513QR GeForce RTX 3070 Laptop GPU, R9 5900HX, SK Hynix HFM001TD3JX013N | MSI GS66 Stealth 10UG GeForce RTX 3070 Laptop GPU, i7-10870H, WDC PC SN730 SDBPNTY-1T00 | MSI GF65 Thin 10UE GeForce RTX 3060 Laptop GPU, i7-10750H, Samsung SSD PM981 MZVLB1T0HALR | Asus ROG Zephyrus M15 GU502LU-BI7N4 GeForce GTX 1660 Ti Mobile, i7-10750H, Intel SSD 660p SSDPEKNW512G8 | |
|---|---|---|---|---|---|---|
| Noise | -8% | -9% | -20% | -14% | -16% | |
| off / environment * (dB) | 25.3 | 27 -7% | 24 5% | 26.2 -4% | 24.7 2% | 25.8 -2% |
| Idle Minimum * (dB) | 25.4 | 27 -6% | 25 2% | 34 -34% | 33.1 -30% | 25.8 -2% |
| Idle Average * (dB) | 25.4 | 27 -6% | 31 -22% | 34 -34% | 33.1 -30% | 33.2 -31% |
| Idle Maximum * (dB) | 25.4 | 27 -6% | 33 -30% | 34 -34% | 33.1 -30% | 33.2 -31% |
| Load Average * (dB) | 42.5 | 44.7 -5% | 45 -6% | 47.2 -11% | 42.7 -0% | 37.3 12% |
| Witcher 3 ultra * (dB) | 42 | 51.2 -22% | 48 -14% | 46.3 -10% | 40.6 3% | 60.8 -45% |
| Load Maximum * (dB) | 52.2 | 54 -3% | 50 4% | 58.2 -11% | 59.4 -14% | 60.8 -16% |
* ... smaller is better
Noise level
| Idle |
| 25.4 / 25.4 / 25.4 dB(A) |
| Load |
| 42.5 / 52.2 dB(A) |
 | ||
30 dB silent 40 dB(A) audible 50 dB(A) loud |
||
min: | ||
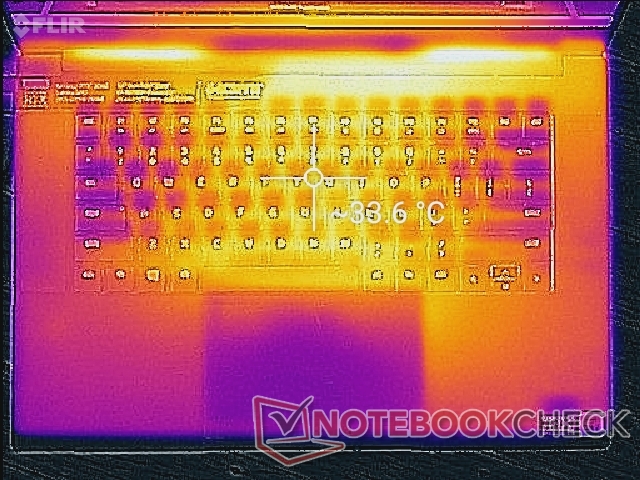
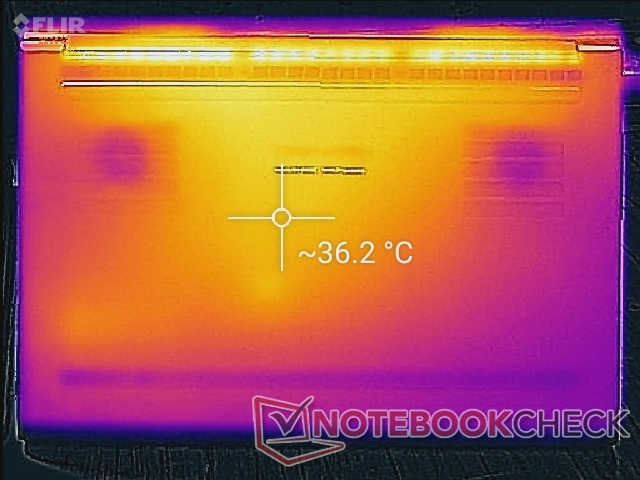
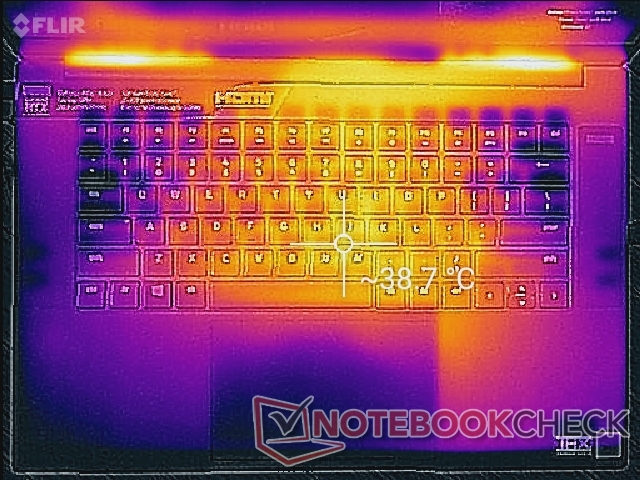
Temperature
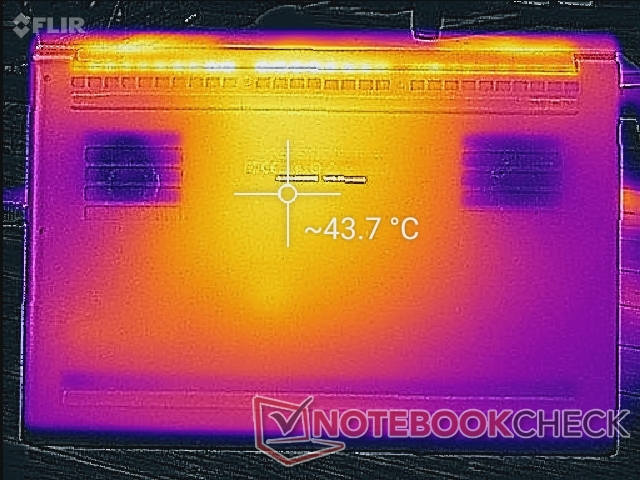
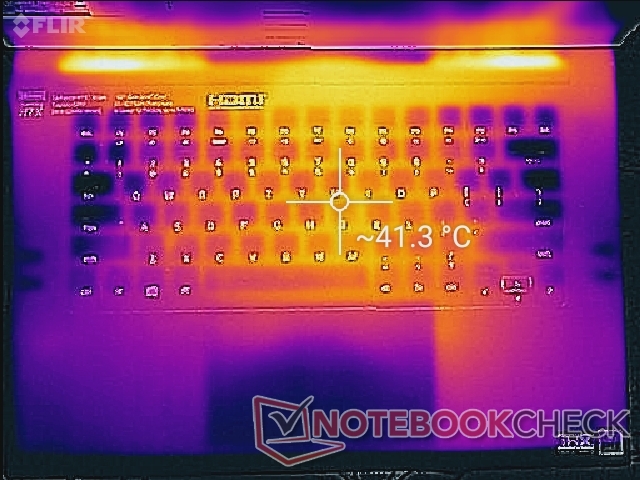
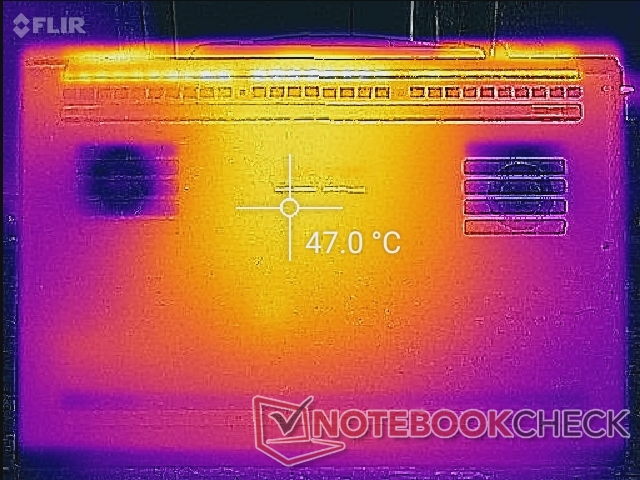
Hot spots when gaming aren't as warm as on the MSI GS66. Nonetheless, the frontal areas are warmer than on most other gaming laptops probably due to the tighter unibody chassis design of the Razer and the smaller ventilation grilles on the bottom panel. The palm rests can range from 30 C to 35 C compared to just 26 C on the GS66 when gaming.
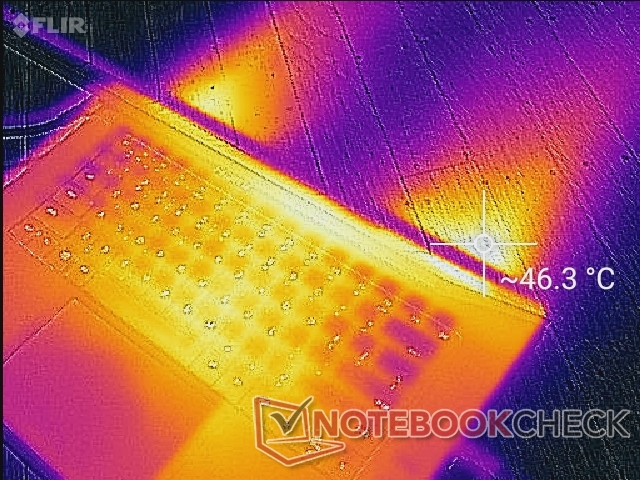

(-) The maximum temperature on the upper side is 45.2 °C / 113 F, compared to the average of 40.4 °C / 105 F, ranging from 21.2 to 68.8 °C for the class Gaming.
(-) The bottom heats up to a maximum of 48 °C / 118 F, compared to the average of 43.2 °C / 110 F
(+) In idle usage, the average temperature for the upper side is 30.3 °C / 87 F, compared to the device average of 33.9 °C / 93 F.
(+) The palmrests and touchpad are reaching skin temperature as a maximum (34.2 °C / 93.6 F) and are therefore not hot.
(-) The average temperature of the palmrest area of similar devices was 28.8 °C / 83.8 F (-5.4 °C / -9.8 F).
Stress Test
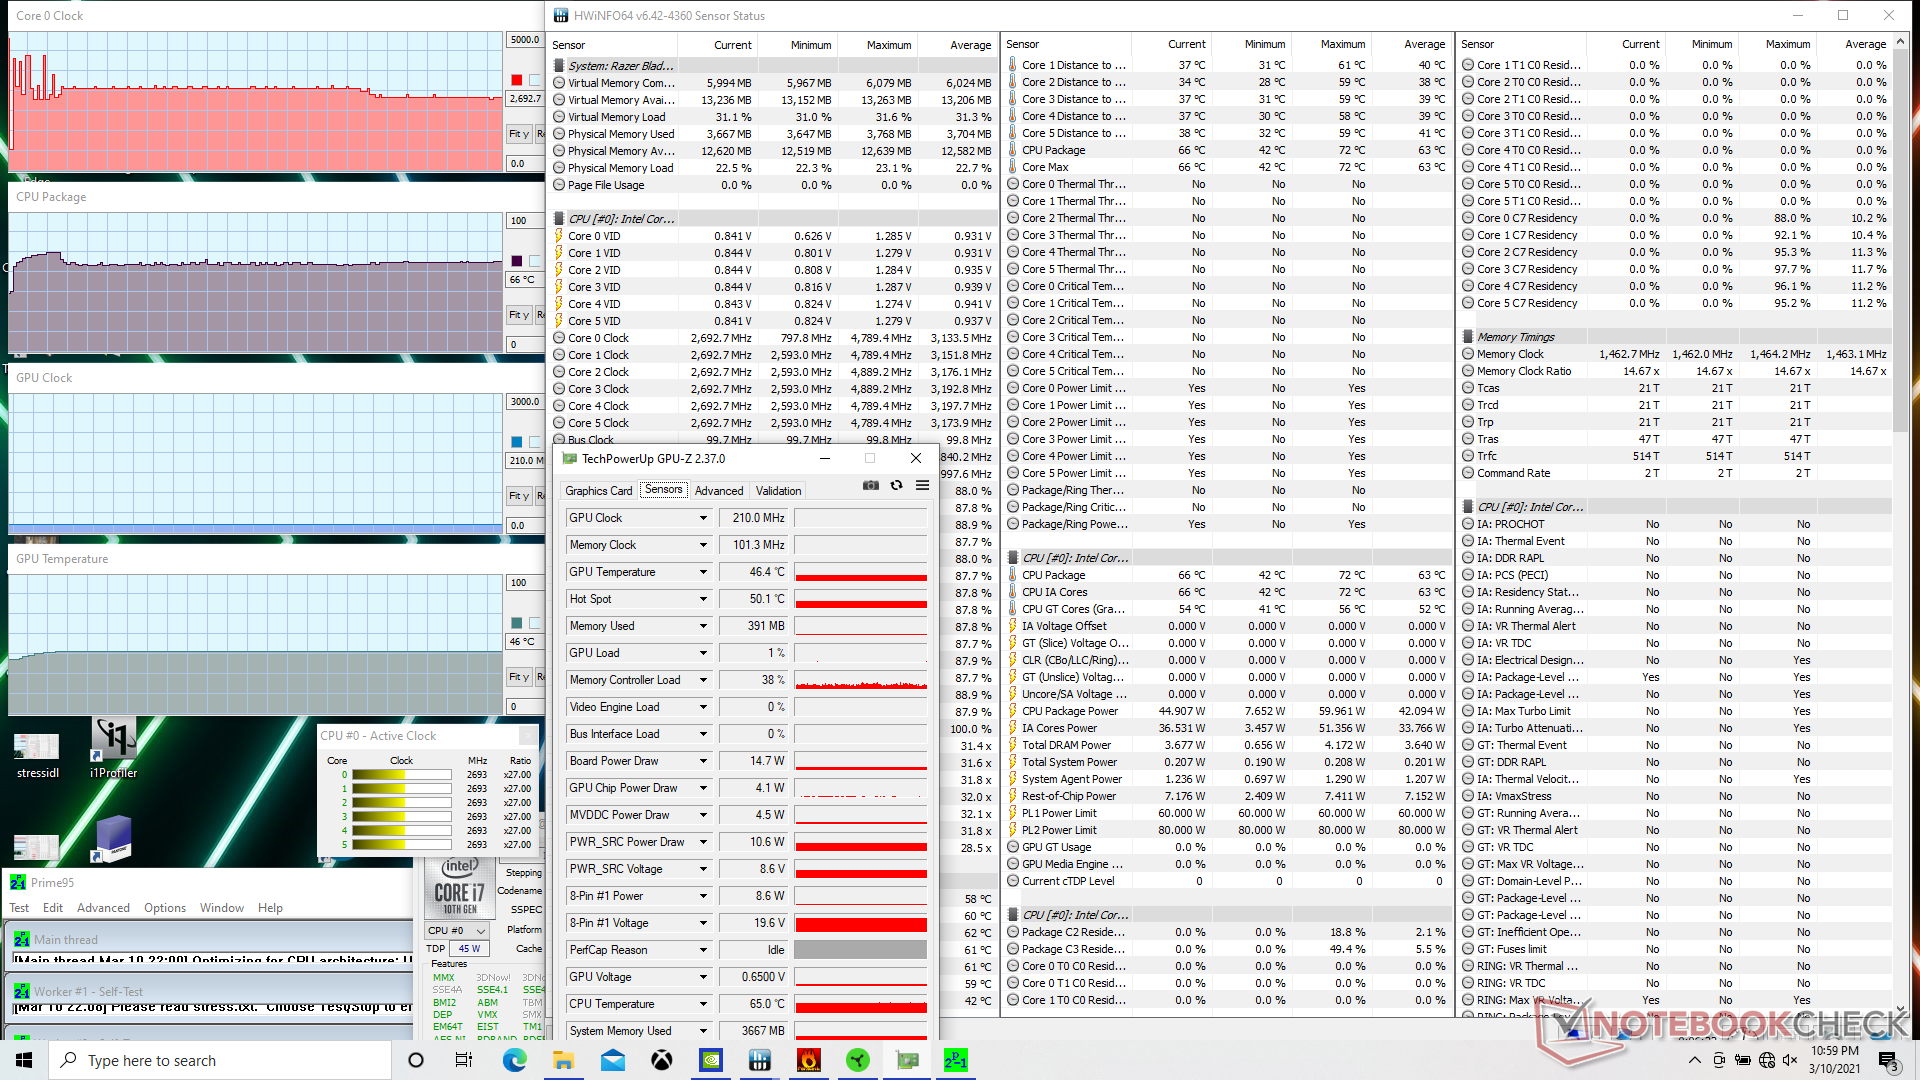
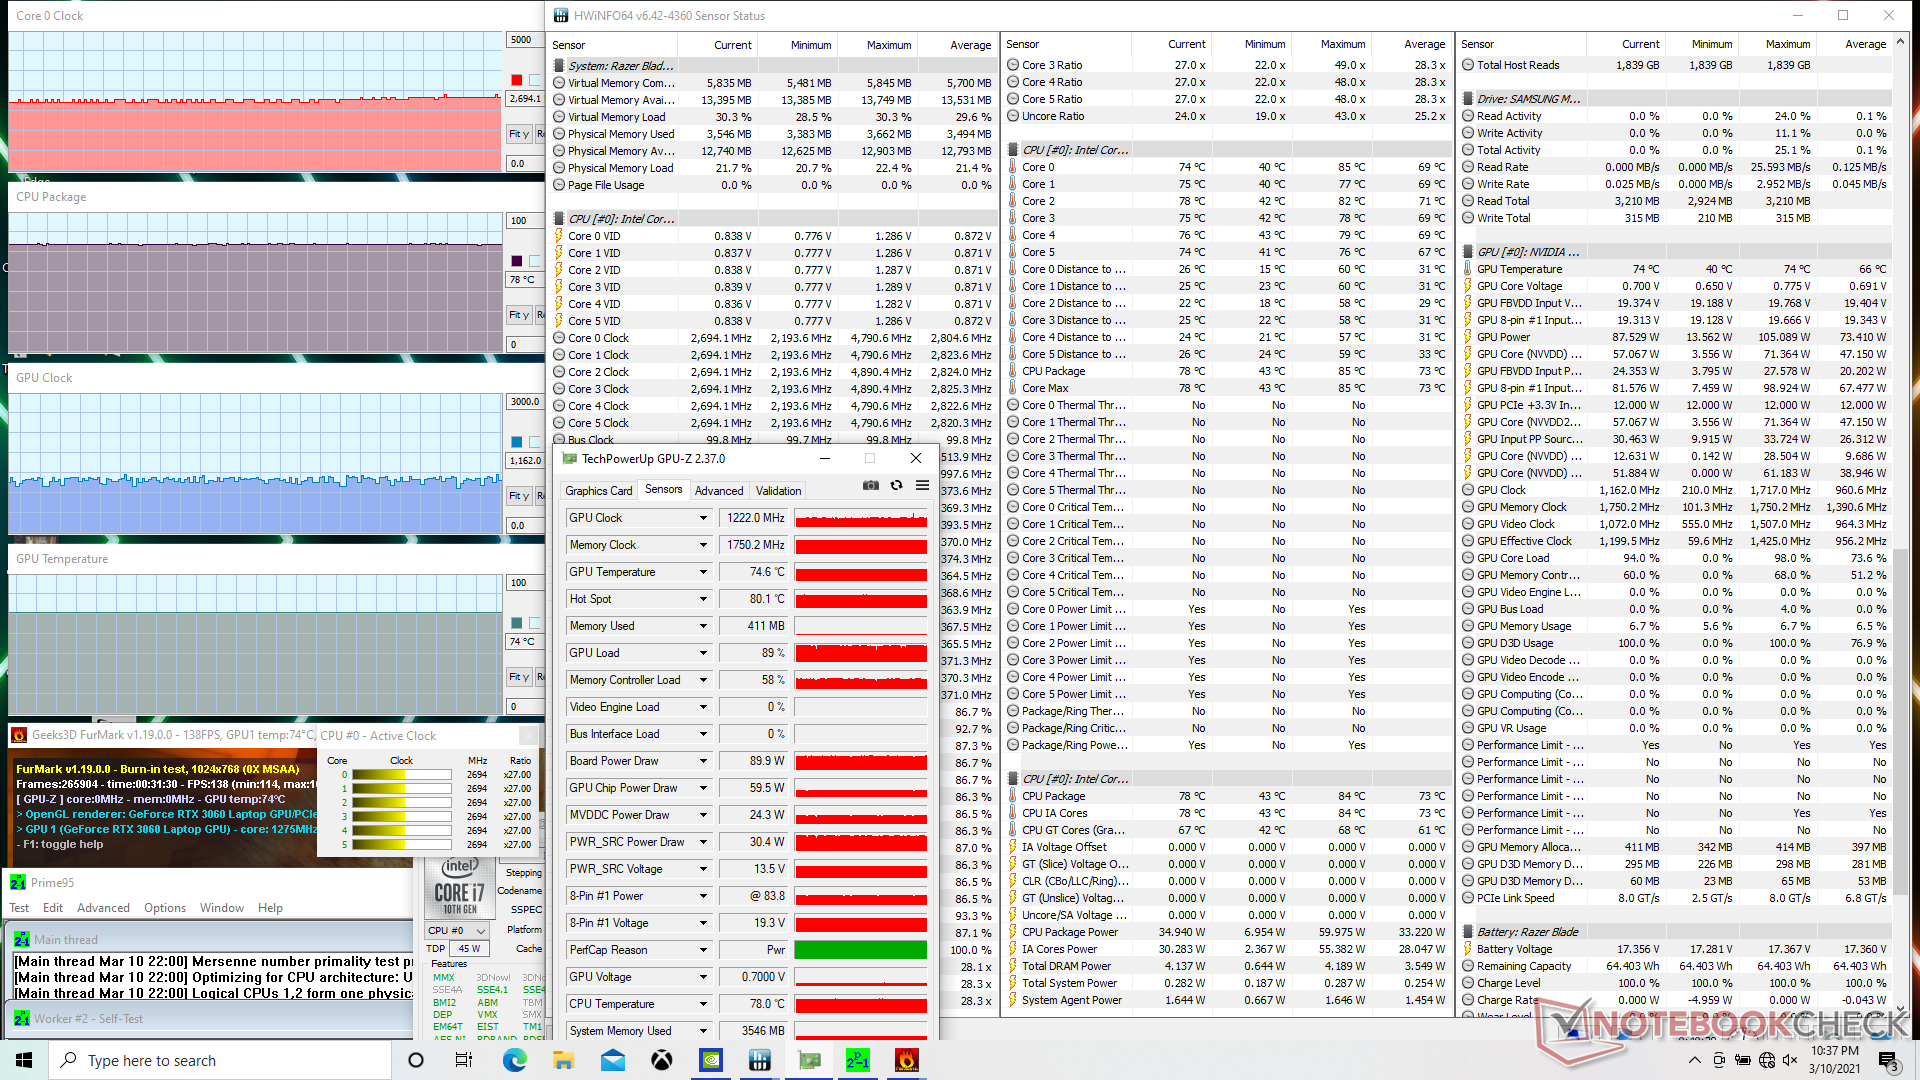
When running Prime95 on Game mode to stress the CPU, clock rates would boost to 4.2 GHz for just the first few seconds until hitting a core temperature of 73 C. Clock rates would then drop and stabilize at 2.5 GHz and 58 C, respectively. Repeating this test on Creator mode would see clock rates jump to 4.2 GHz before dropping yet again. Only this time, however, the drop is slower and more steady at 3 GHz and then finally 2.7 GHz at the cost of a higher core temperature of 63 C.
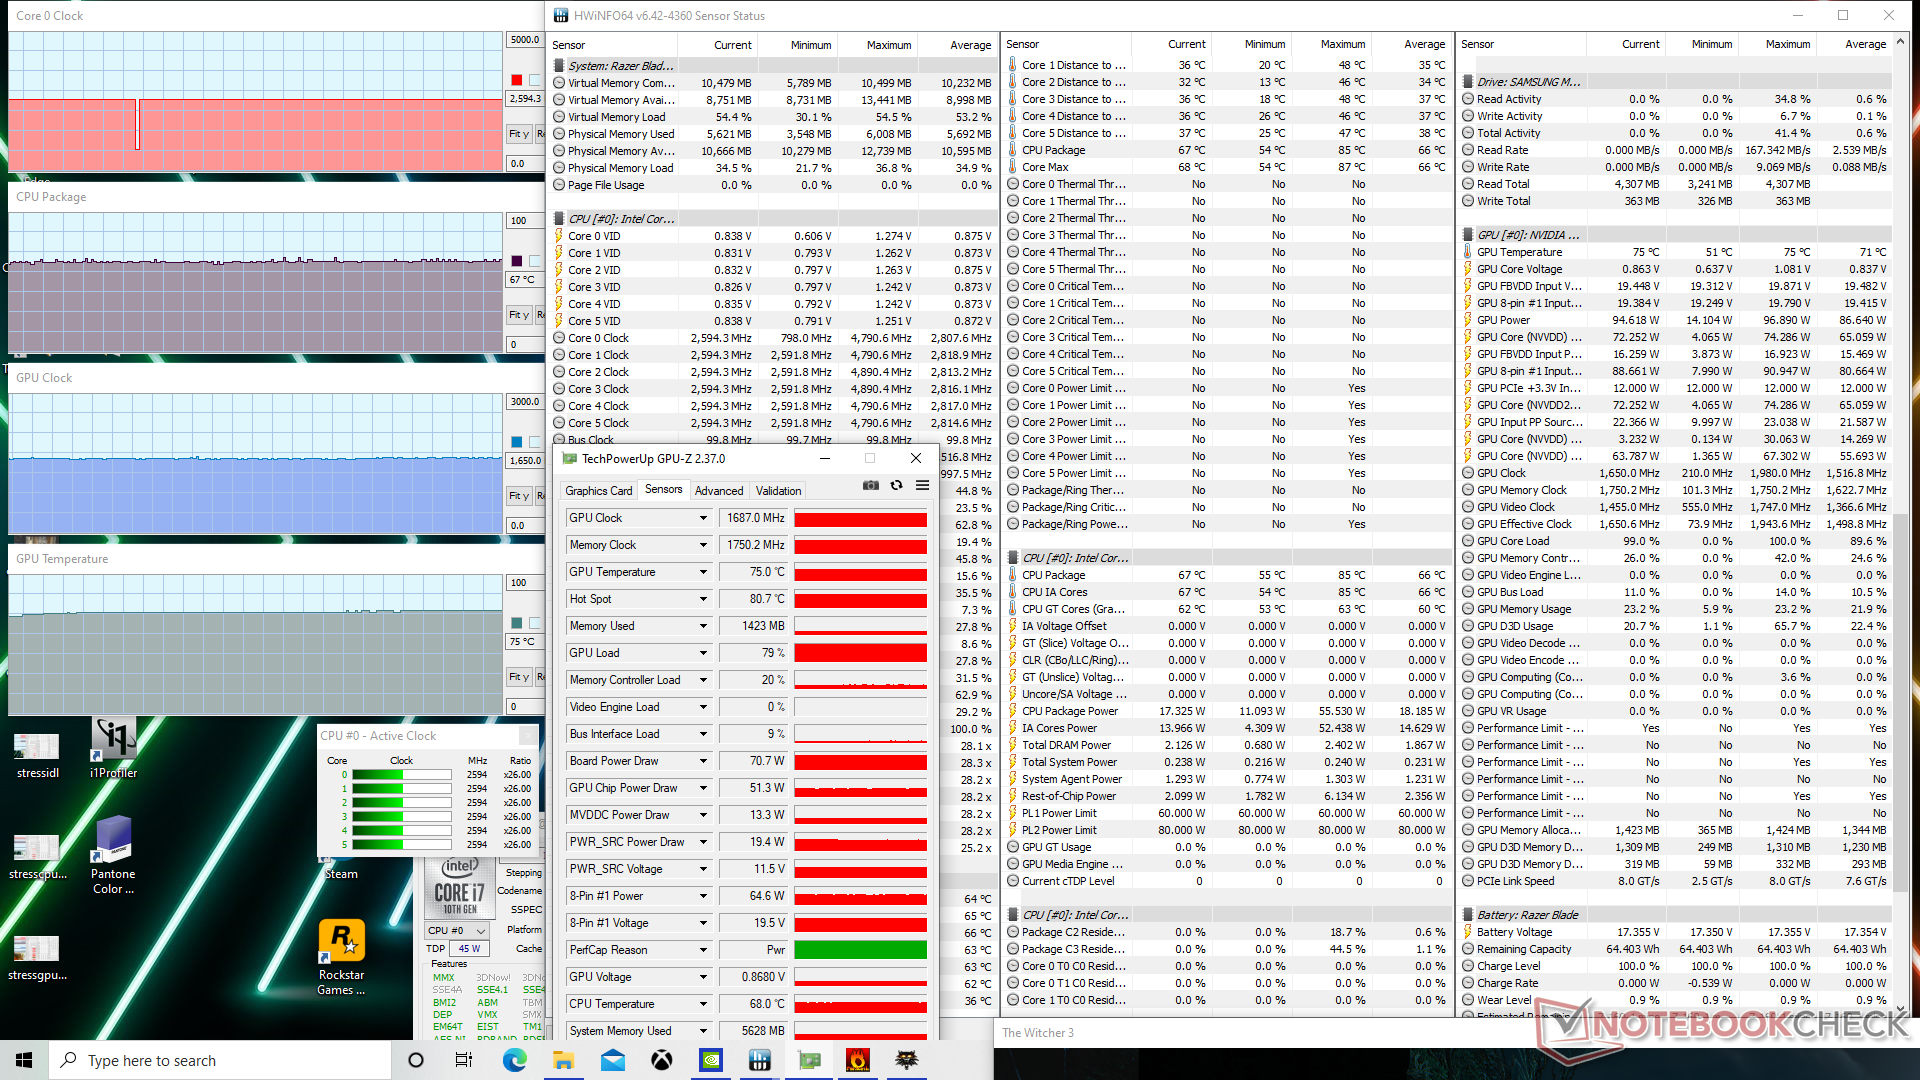
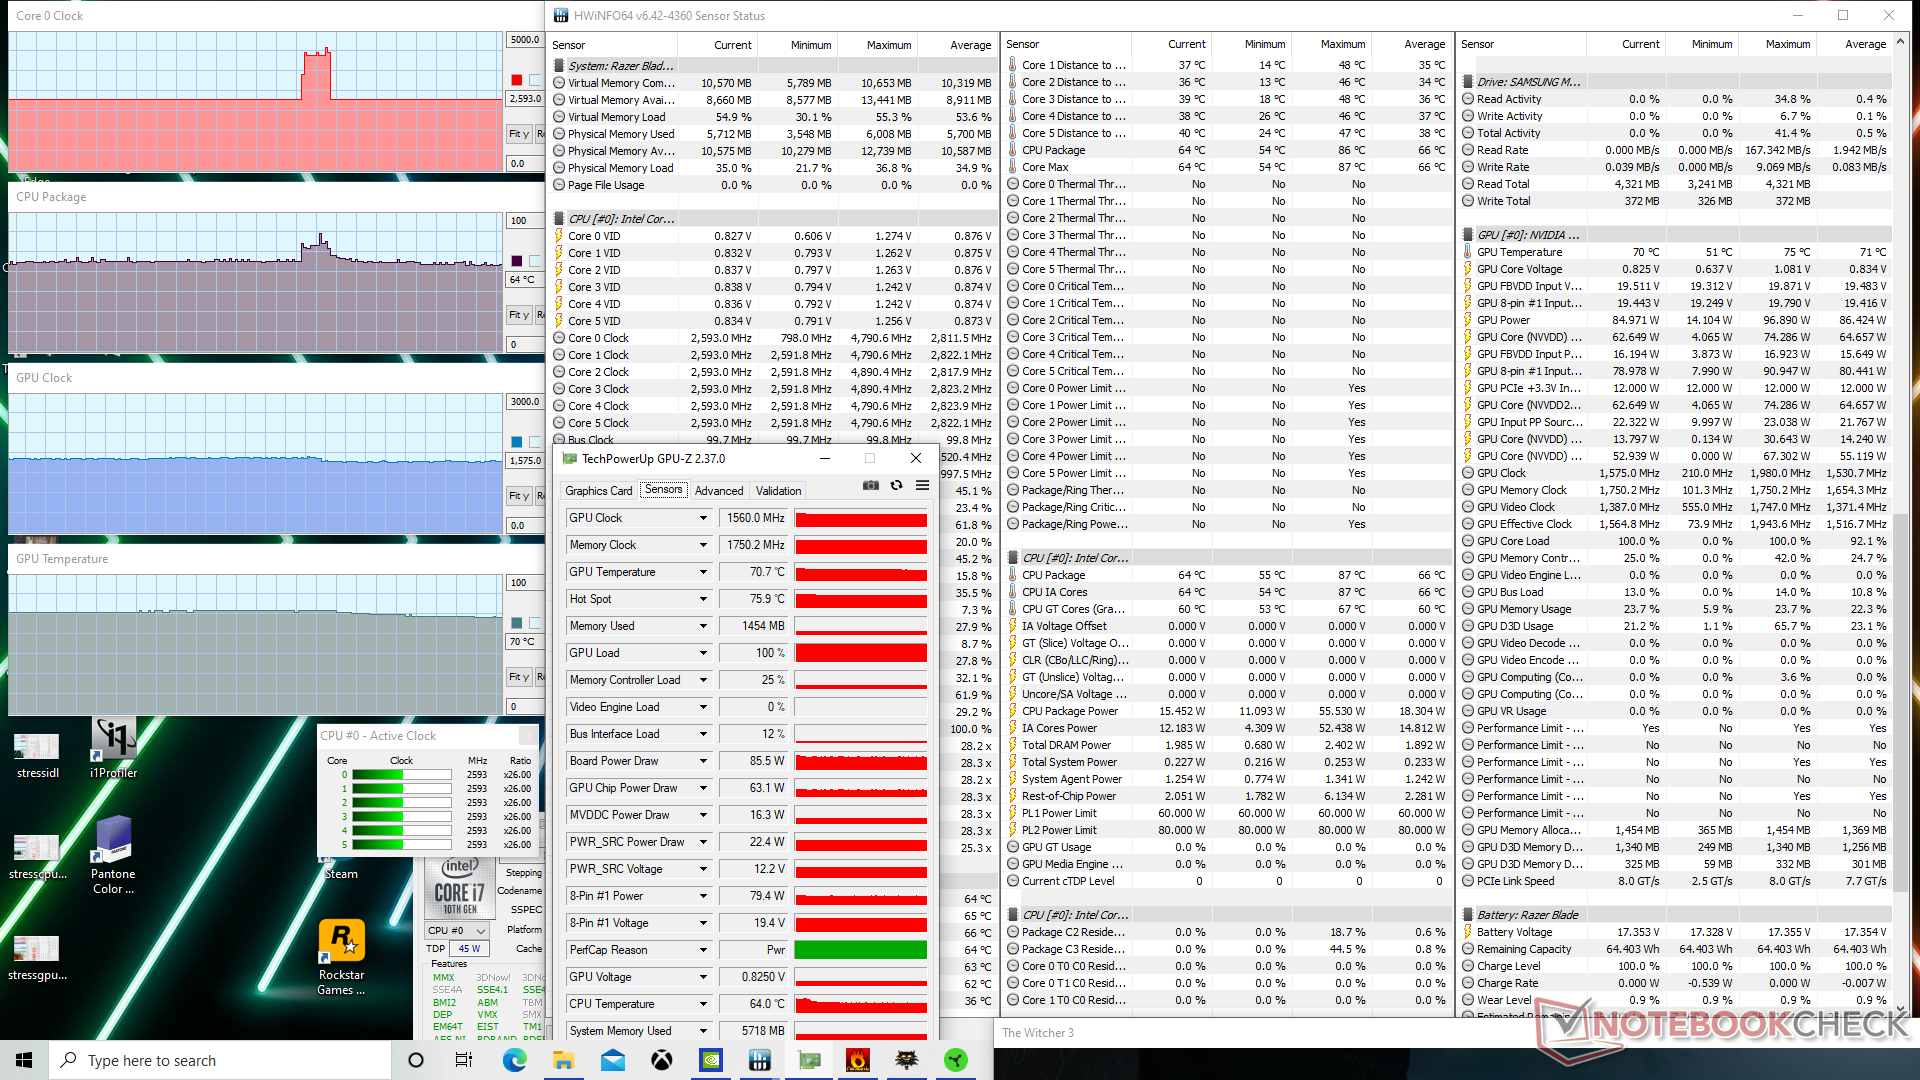
Running Witcher 3 on Game mode would result in slightly higher GPU clock rates and temperatures than on Creator mode as shown by our table and screenshots below. These small but measurable changes align with our 3DMark results from above. GPU board power draw seems to hover between 85 W and 90 W when running the game.
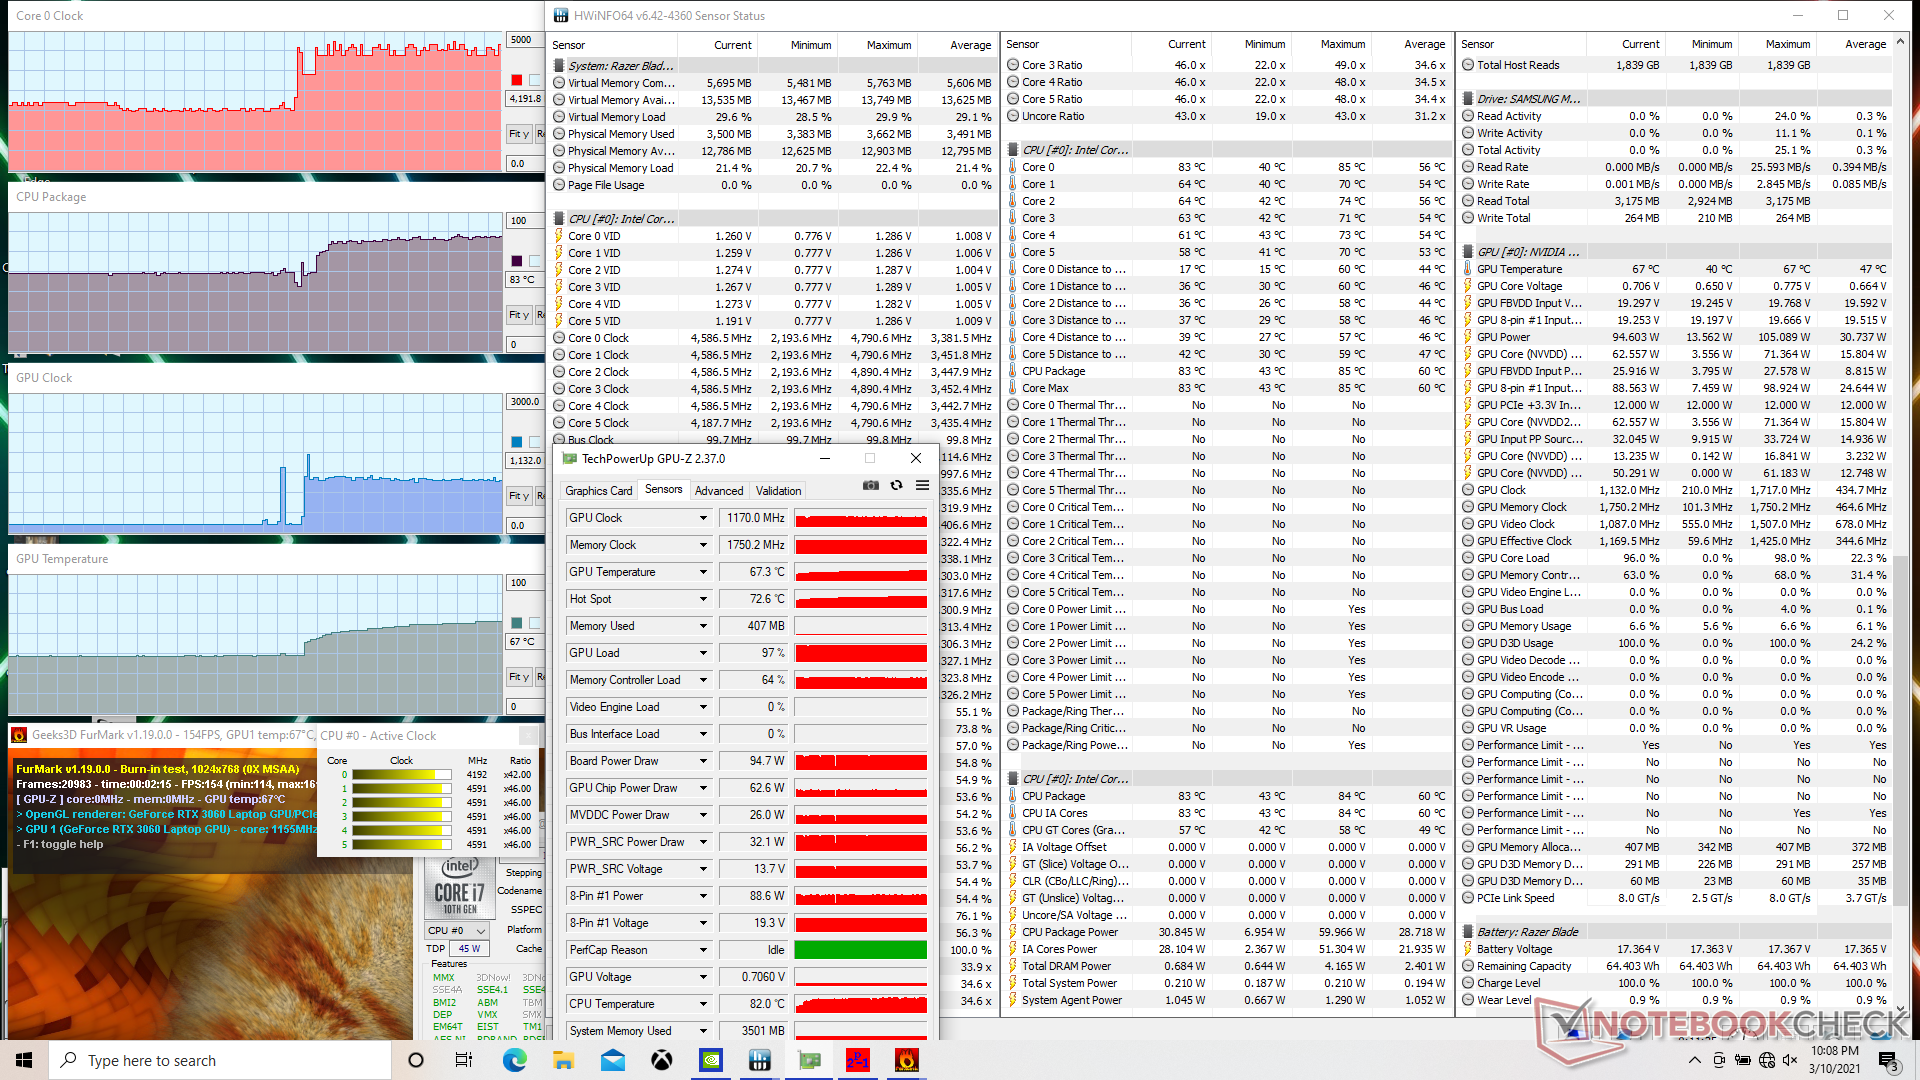
Running FurMark on Game mode to put the GPU at 100 percent utilization would result in a steady board power draw of 94.7 W which is very close to the advertised 95 W TGP. Core temperatures never appear rise above 74 C to 78 C based on our stress tests.
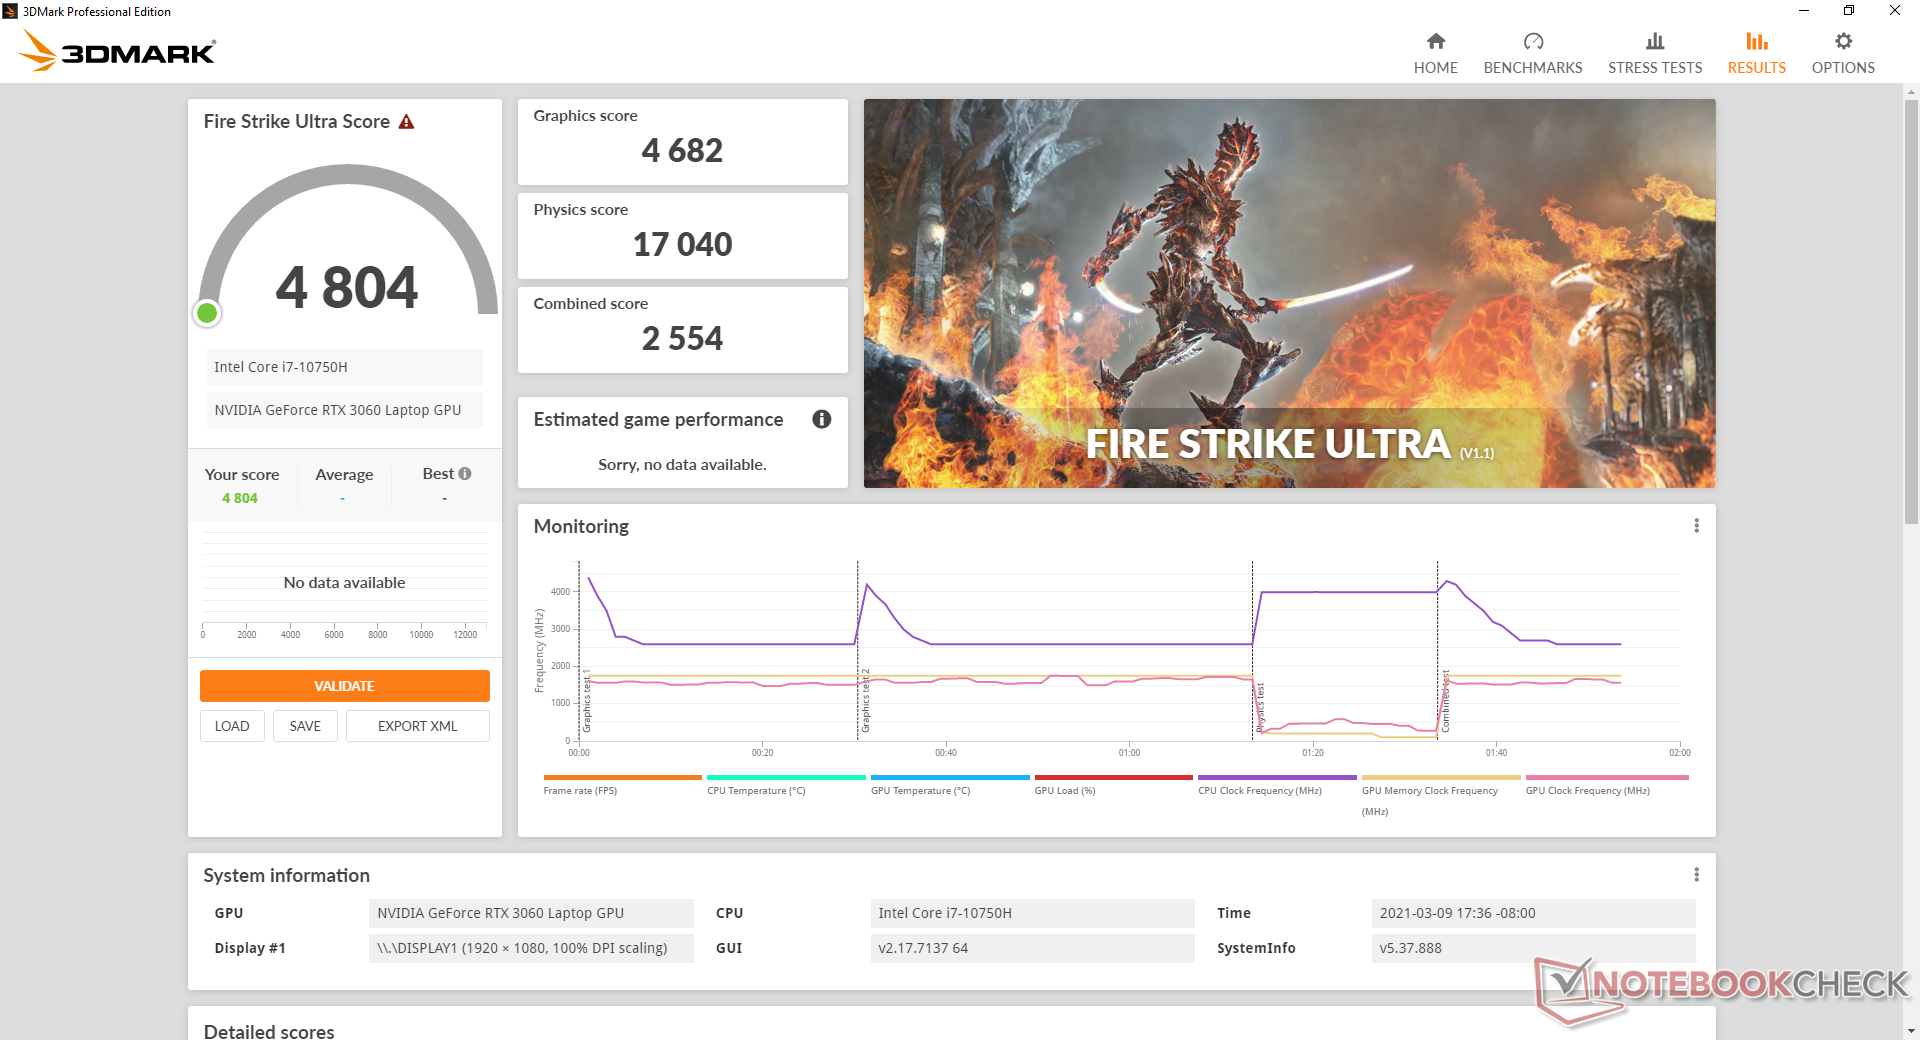
Running on batteries will reduce performance. A Fire Strike test on battery power would return Physics and Graphics scores of 8609 and 4753 points, respectively, compared to 16513 and 20155 points when on mains. Both Creator and Game modes are disabled if on battery power.
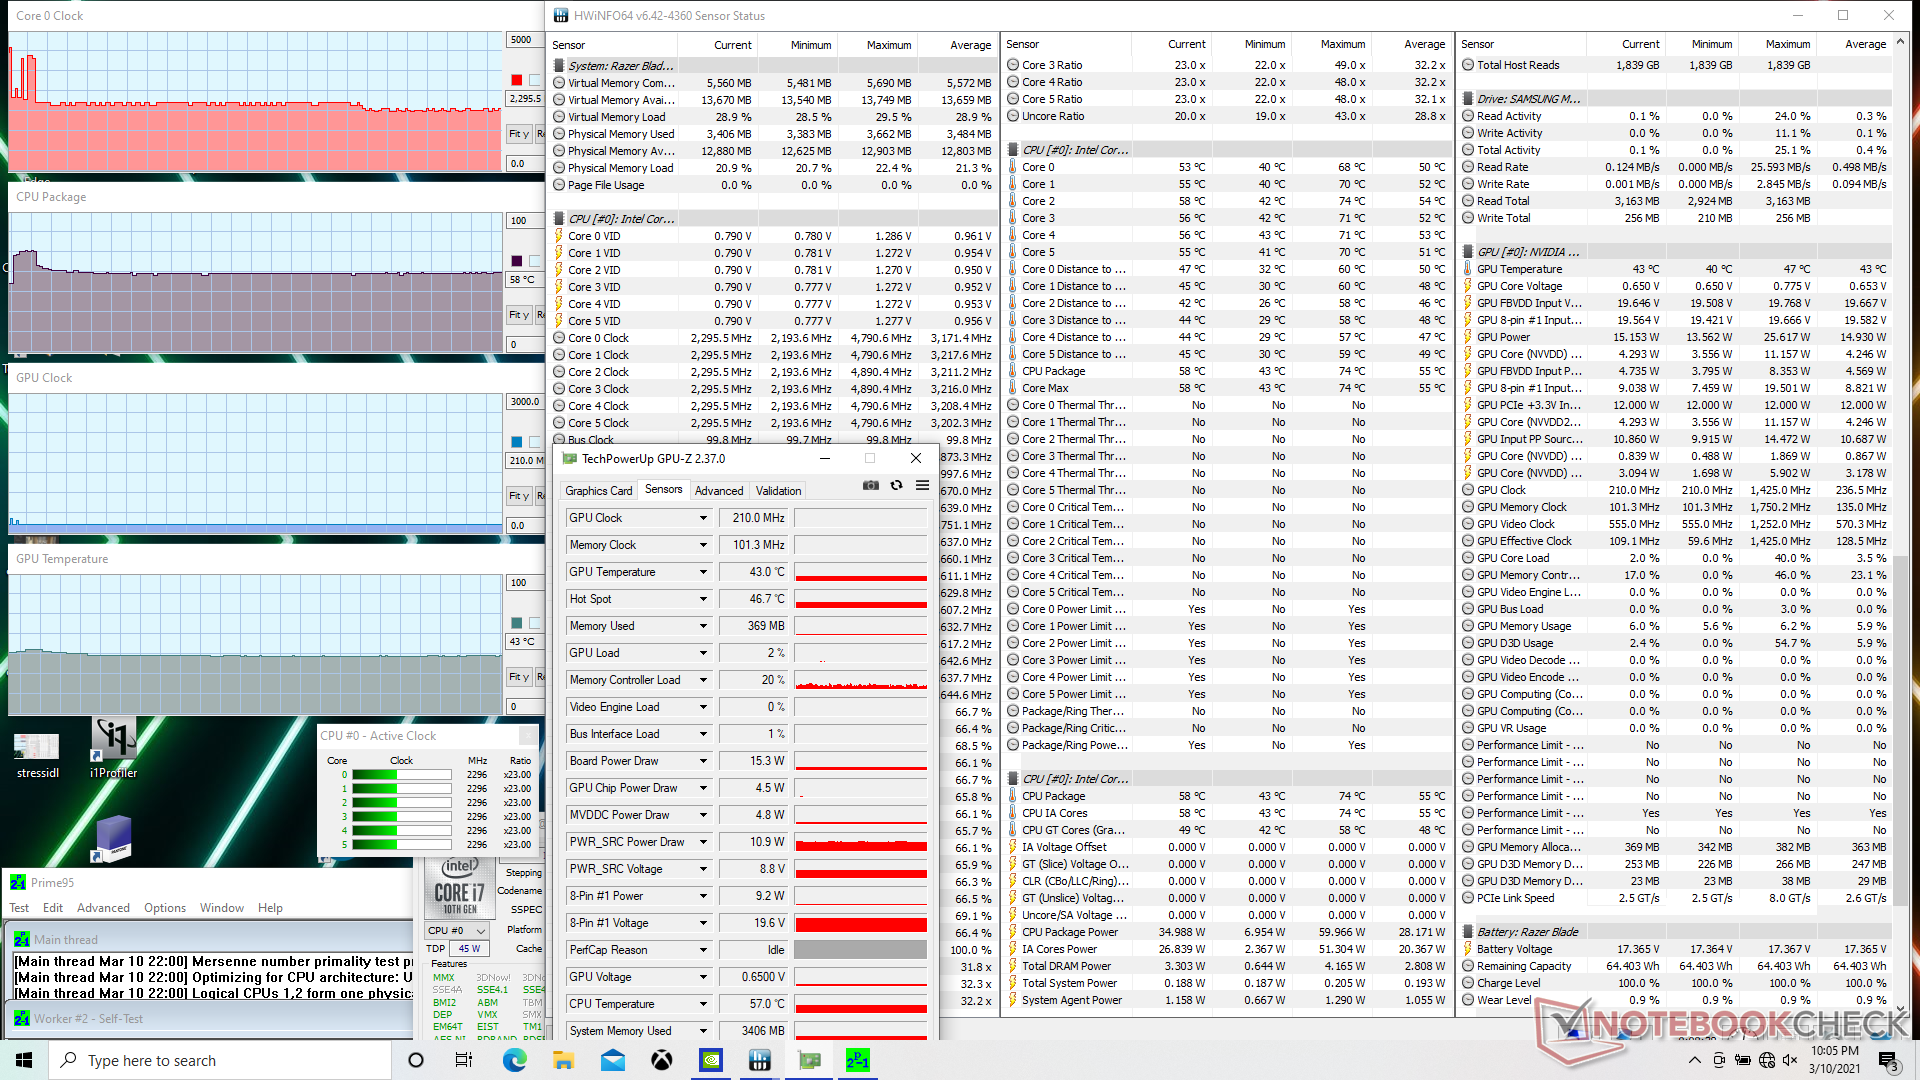
| CPU Clock (GHz) | GPU Clock (MHz) | Average CPU Temperature (°C) | Average GPU Temperature (°C) | |
| System Idle | -- | -- | 47 | 44 |
| Prime95 Stress (Game mode) | 2.2 - 2.3 | -- | 58 | 43 |
| Prime95 Stress (Creator mode) | 2.7 | -- | 66 | 46 |
| FurMark Stress (Game mode) | -- | 1170 | 83 | 67 |
| Witcher 3 Stress (Game mode) | 2.6 | 1687 | 67 | 75 |
| Witcher 3 Stress (Creator mode) | 2.6 | 1560 | 64 | 70 |
| Prime95 + FurMark Stress (Game mode) | 2.6 - 2.7 | 1222 | 78 | 74 |
Speakers


Razer Blade 15 Base Edition 2021, i7-10750H RTX 3060 audio analysis
(±) | speaker loudness is average but good (78.9 dB)
Bass 100 - 315 Hz
(-) | nearly no bass - on average 18.9% lower than median
(±) | linearity of bass is average (13% delta to prev. frequency)
Mids 400 - 2000 Hz
(±) | higher mids - on average 5.2% higher than median
(+) | mids are linear (6.2% delta to prev. frequency)
Highs 2 - 16 kHz
(+) | balanced highs - only 3.3% away from median
(±) | linearity of highs is average (7.4% delta to prev. frequency)
Overall 100 - 16.000 Hz
(±) | linearity of overall sound is average (18.1% difference to median)
Compared to same class
» 57% of all tested devices in this class were better, 8% similar, 35% worse
» The best had a delta of 6%, average was 18%, worst was 132%
Compared to all devices tested
» 38% of all tested devices were better, 8% similar, 54% worse
» The best had a delta of 4%, average was 24%, worst was 134%
Apple MacBook 12 (Early 2016) 1.1 GHz audio analysis
(+) | speakers can play relatively loud (83.6 dB)
Bass 100 - 315 Hz
(±) | reduced bass - on average 11.3% lower than median
(±) | linearity of bass is average (14.2% delta to prev. frequency)
Mids 400 - 2000 Hz
(+) | balanced mids - only 2.4% away from median
(+) | mids are linear (5.5% delta to prev. frequency)
Highs 2 - 16 kHz
(+) | balanced highs - only 2% away from median
(+) | highs are linear (4.5% delta to prev. frequency)
Overall 100 - 16.000 Hz
(+) | overall sound is linear (10.2% difference to median)
Compared to same class
» 7% of all tested devices in this class were better, 2% similar, 91% worse
» The best had a delta of 5%, average was 18%, worst was 53%
Compared to all devices tested
» 5% of all tested devices were better, 1% similar, 94% worse
» The best had a delta of 4%, average was 24%, worst was 134%
Energy Management
Power Consumption
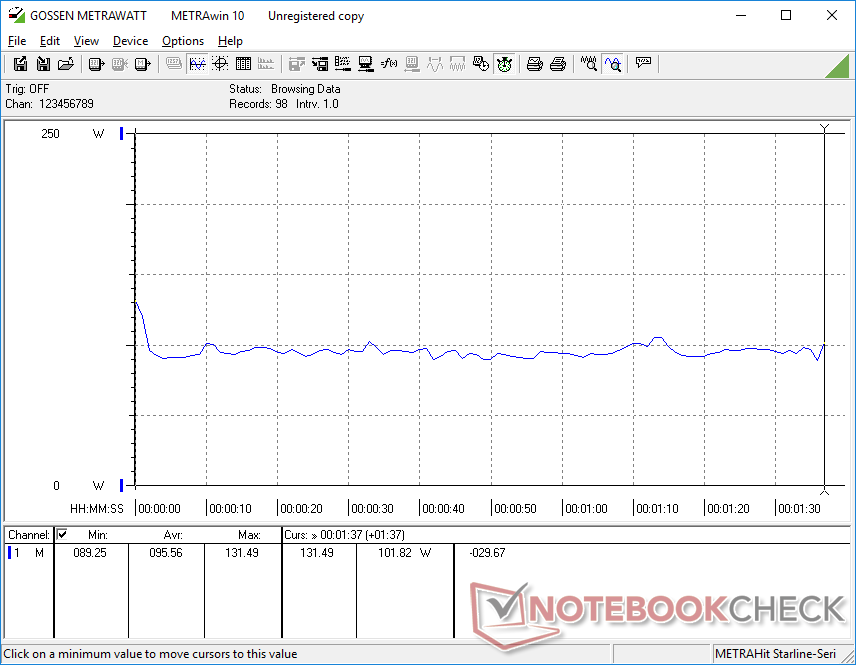
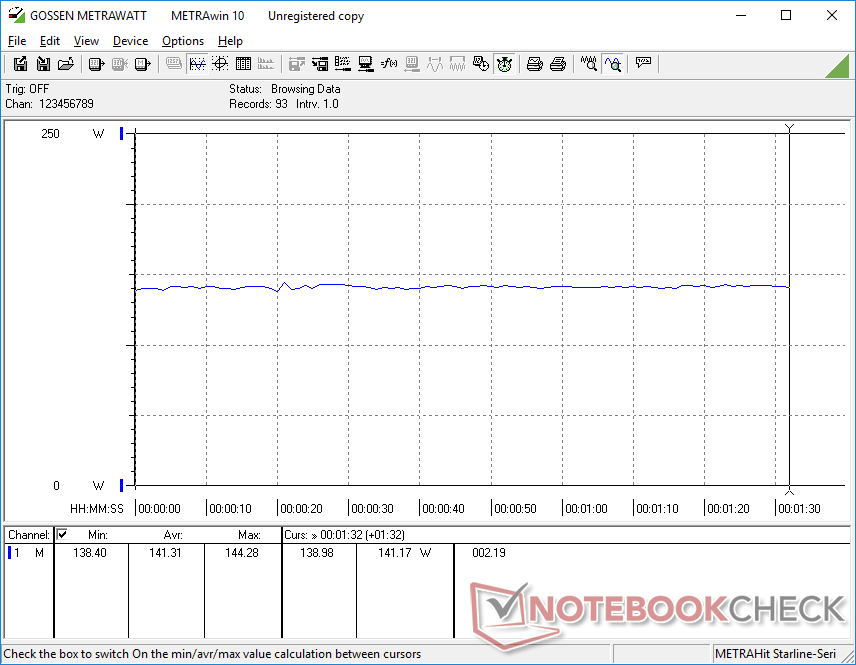
The Blade 15 RTX 3060 draws less power from the outlet overall when compared to the RTX 2070 Max-Q despite being neck-to-neck in 3DMark to indicate higher performance-per-watt. Note that the MSI GF65 with the same RTX 3060 draws even less power than our Blade 15 when gaming because it targets a lower TGP (70 W vs. 95 W). Perhaps not by coincidence, the MSI draws exactly 25.6 W less when running Witcher 3 which is very close to the difference in TGP between the two models.
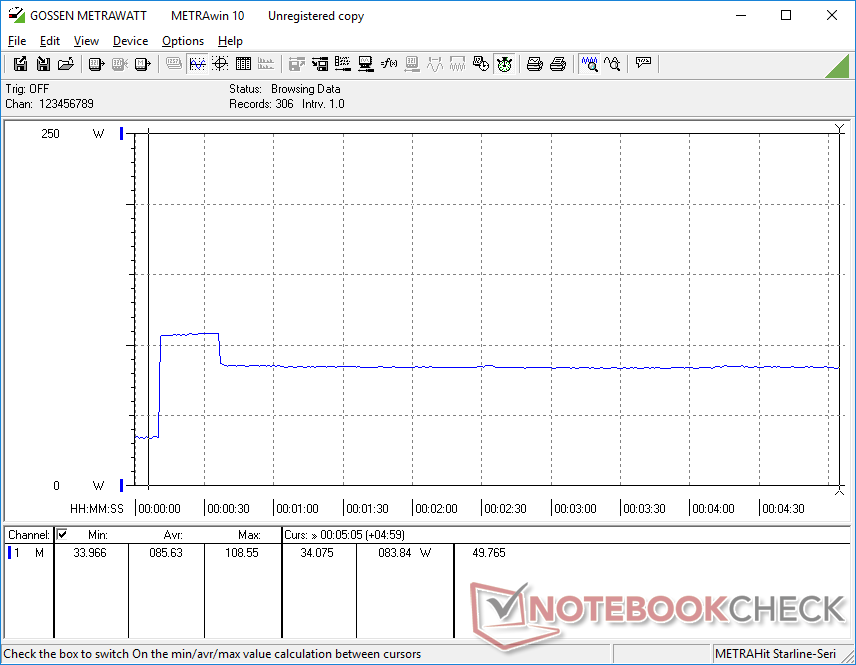
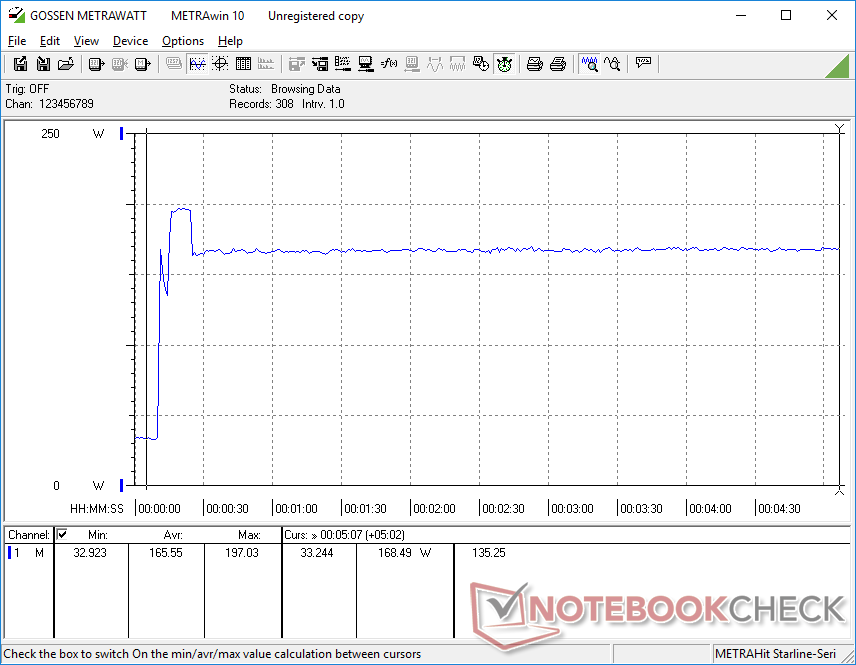
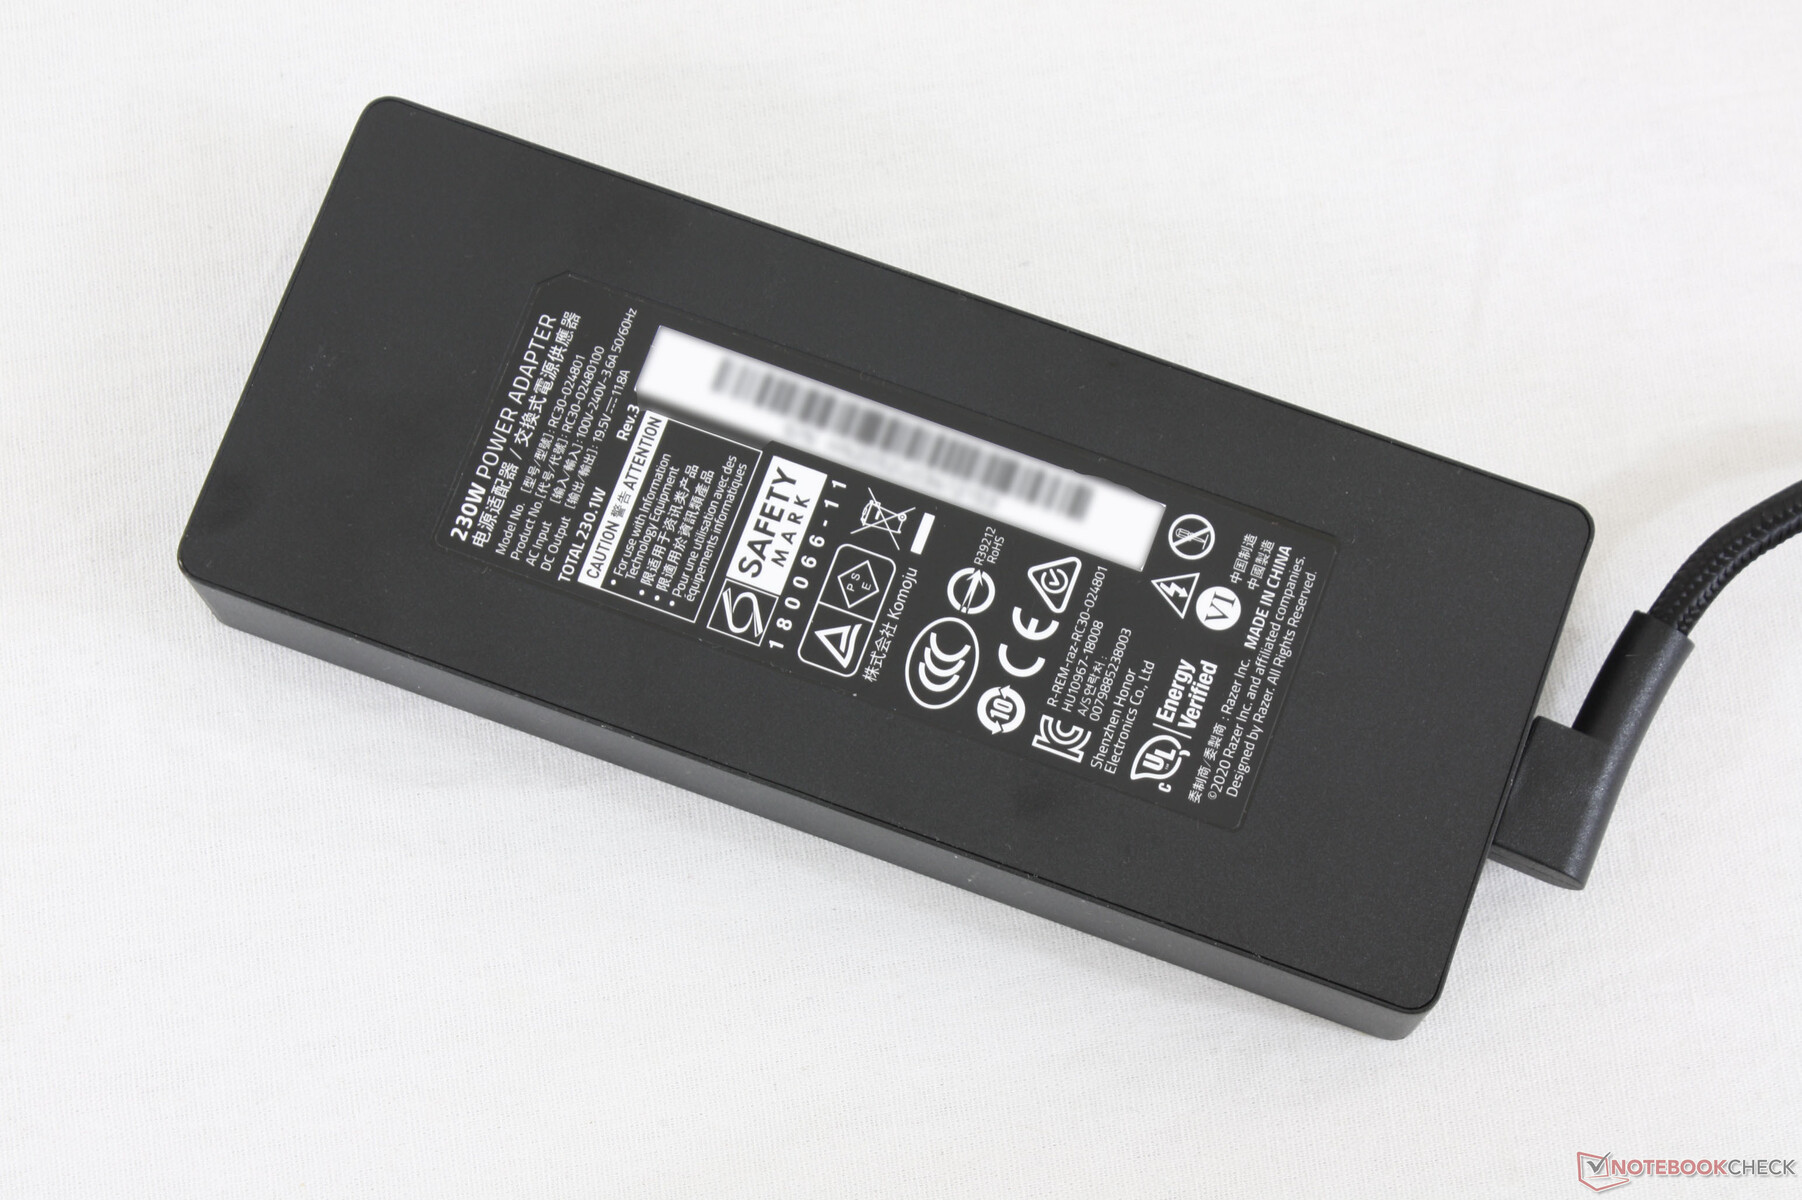
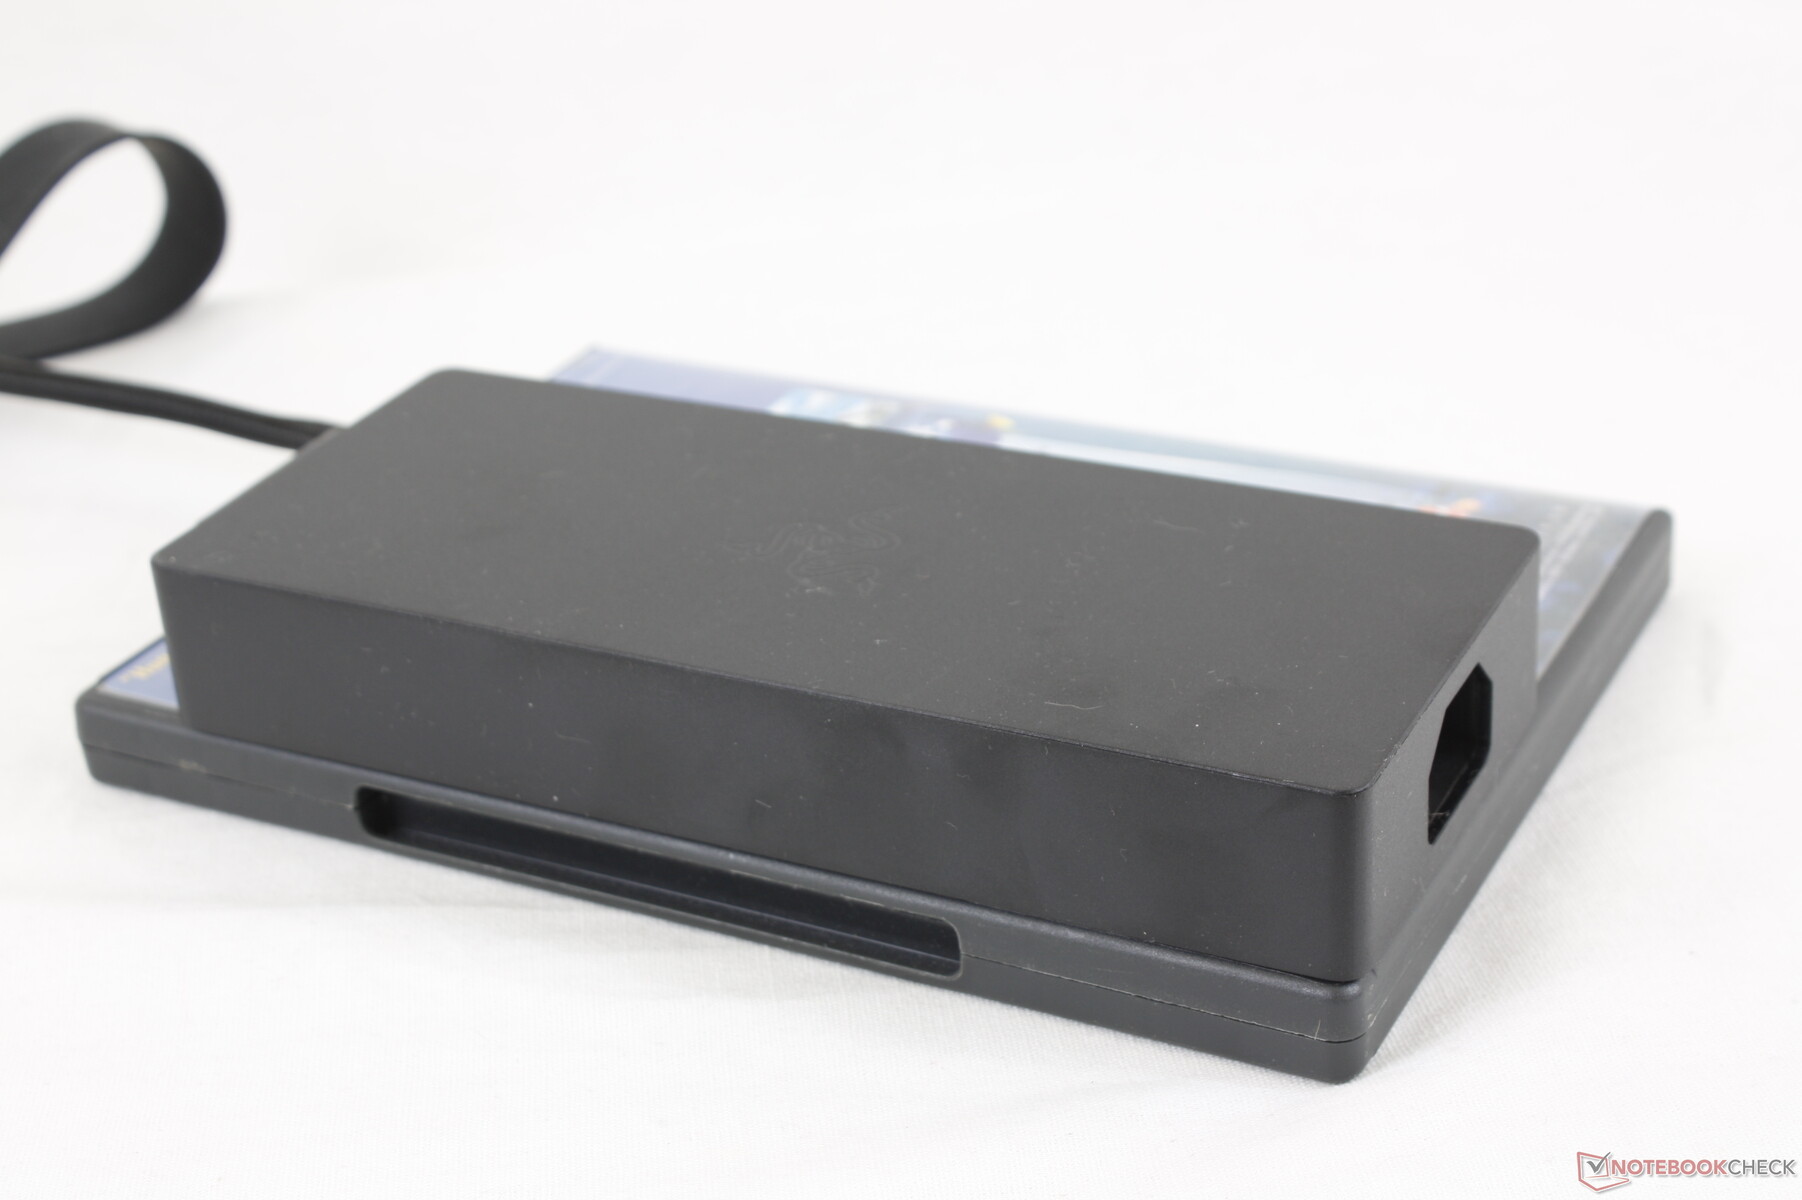
We're able to measure a maximum draw of 197 W from the small-medium (~17 x 7 x 2.5 cm) 230 W AC adapter when running Prime95 and FurMark simultaneously. The battery will continue to recharge even if subjected to such extreme processing loads.
| Off / Standby | |
| Idle | |
| Load |
|
Key:
min: | |
| Razer Blade 15 Base Edition 2021, i7-10750H RTX 3060 i7-10750H, GeForce RTX 3060 Laptop GPU, Samsung SSD PM981a MZVLB512HBJQ, IPS, 1920x1080, 15.6" | Razer Blade 15 RTX 2070 Super Max-Q i7-10875H, GeForce RTX 2070 Super Max-Q, Samsung SSD PM981a MZVLB512HBJQ, IPS, 1920x1080, 15.6" | MSI GS66 Stealth 10UG i7-10870H, GeForce RTX 3070 Laptop GPU, WDC PC SN730 SDBPNTY-1T00, IPS, 1920x1080, 15.6" | MSI GF65 Thin 10UE i7-10750H, GeForce RTX 3060 Laptop GPU, Samsung SSD PM981 MZVLB1T0HALR, IPS, 1920x1080, 15.6" | Asus ROG Zephyrus M15 GU502LU-BI7N4 i7-10750H, GeForce GTX 1660 Ti Mobile, Intel SSD 660p SSDPEKNW512G8, IPS, 1920x1080, 15.6" | |
|---|---|---|---|---|---|
| Power Consumption | -22% | -6% | 24% | -5% | |
| Idle Minimum * (Watt) | 11.7 | 14.3 -22% | 12.9 -10% | 5.4 54% | 10 15% |
| Idle Average * (Watt) | 16 | 22.3 -39% | 15.4 4% | 12.8 20% | 16.9 -6% |
| Idle Maximum * (Watt) | 29.3 | 36.9 -26% | 27.1 8% | 19.5 33% | 28.3 3% |
| Load Average * (Watt) | 95.6 | 118.4 -24% | 98.2 -3% | 86.6 9% | 122.7 -28% |
| Witcher 3 ultra * (Watt) | 141.3 | 153.7 -9% | 164.9 -17% | 115.7 18% | 143.2 -1% |
| Load Maximum * (Watt) | 197 | 220.8 -12% | 232.9 -18% | 175.2 11% | 224.1 -14% |
* ... smaller is better
Battery Life
Battery capacity is smaller than on the Blade 15 Advanced Model (65 Wh vs. 80 Wh) and runtimes are shorter as a result. We're able to record just under 5 hours of real-world WLAN use compared to almost 6.5 hours on the Blade 15 Advanced.
Charging from empty to full capacity is relatively fast at approximately 90 minutes. Users cannot recharge the Base Model via USB-C; such a feature is reserved for the Advanced Model only.
| Razer Blade 15 Base Edition 2021, i7-10750H RTX 3060 i7-10750H, GeForce RTX 3060 Laptop GPU, 65 Wh | Razer Blade 15 RTX 2070 Super Max-Q i7-10875H, GeForce RTX 2070 Super Max-Q, 80 Wh | Asus ROG Strix G15 G513QR R9 5900HX, GeForce RTX 3070 Laptop GPU, 90 Wh | MSI GS66 Stealth 10UG i7-10870H, GeForce RTX 3070 Laptop GPU, 99.9 Wh | MSI GF65 Thin 10UE i7-10750H, GeForce RTX 3060 Laptop GPU, 51 Wh | Asus ROG Zephyrus M15 GU502LU-BI7N4 i7-10750H, GeForce GTX 1660 Ti Mobile, 76 Wh | |
|---|---|---|---|---|---|---|
| Battery runtime | 31% | 34% | 44% | 4% | 23% | |
| Reader / Idle (h) | 7.8 | 10.8 38% | 11.1 42% | |||
| WiFi v1.3 (h) | 4.8 | 6.3 31% | 7.4 54% | 7.1 48% | 4.6 -4% | 5.9 23% |
| Load (h) | 1.5 | 1.7 13% | 2.2 47% | 1.1 -27% |
Pros
Cons
Verdict
As of this writing, the 2021 Blade 15 Base Edition with GeForce RTX 3060 graphics and 2020 Blade 15 Base Edition with RTX 2070 Max-Q graphics costs $1700 and $1600, respectively. Both come with the same CPU, 144 Hz display, 16 GB RAM, and 512 GB SSD. Based on our gaming tests, however, the RTX 3060 option will run games faster by slight to moderate margins especially on demanding titles with settings cranked to high. It's a bit more expensive, but users are getting slightly more power from the more efficient GPU in return and with Resizable Bar support as well.
Razer's least expensive 2021 Blade 15 RTX 3060 configuration is on par with last year's GeForce RTX 2080 Max-Q option. It's a good reason to upgrade for gamers with Pascal or older laptops, but those with Turing laptops aren't missing all that much here.
The 2021 Base Edition is still a minor year-over-year update meaning it retains almost all the advantages and disadvantages of the 2020 version. CPU performance continues to be mediocre and a lot of features are still absent including USB-C charging and per-key RGB lighting despite the relatively high starting price. It's too bad that users can't merge Creator mode and Game mode into one "Super" mode as maximum CPU performance and maximum GPU performance are mutually exclusive on this system. Reaching very high frame rates well above 100 FPS will be more challenging on some games as a result.
Price and availability
Razer Blade 15 Base Edition 2021, i7-10750H RTX 3060
- 03/14/2021 v7 (old)
Allen Ngo
Price comparison
