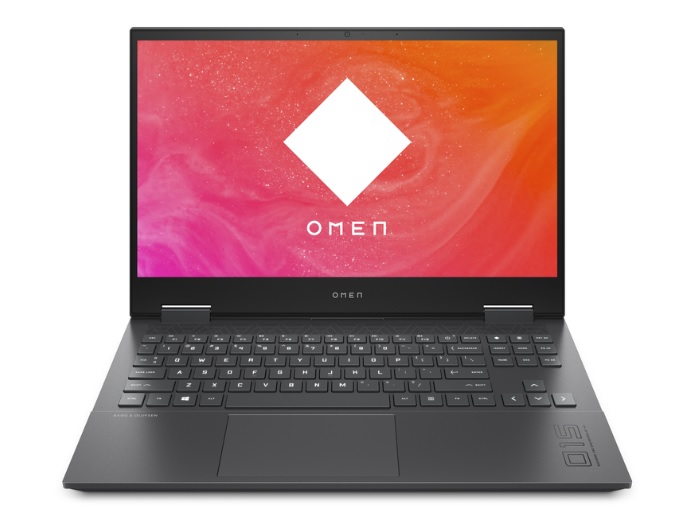
HP Omen 15 laptop Review: Strong AMD processor makes Intel tremble

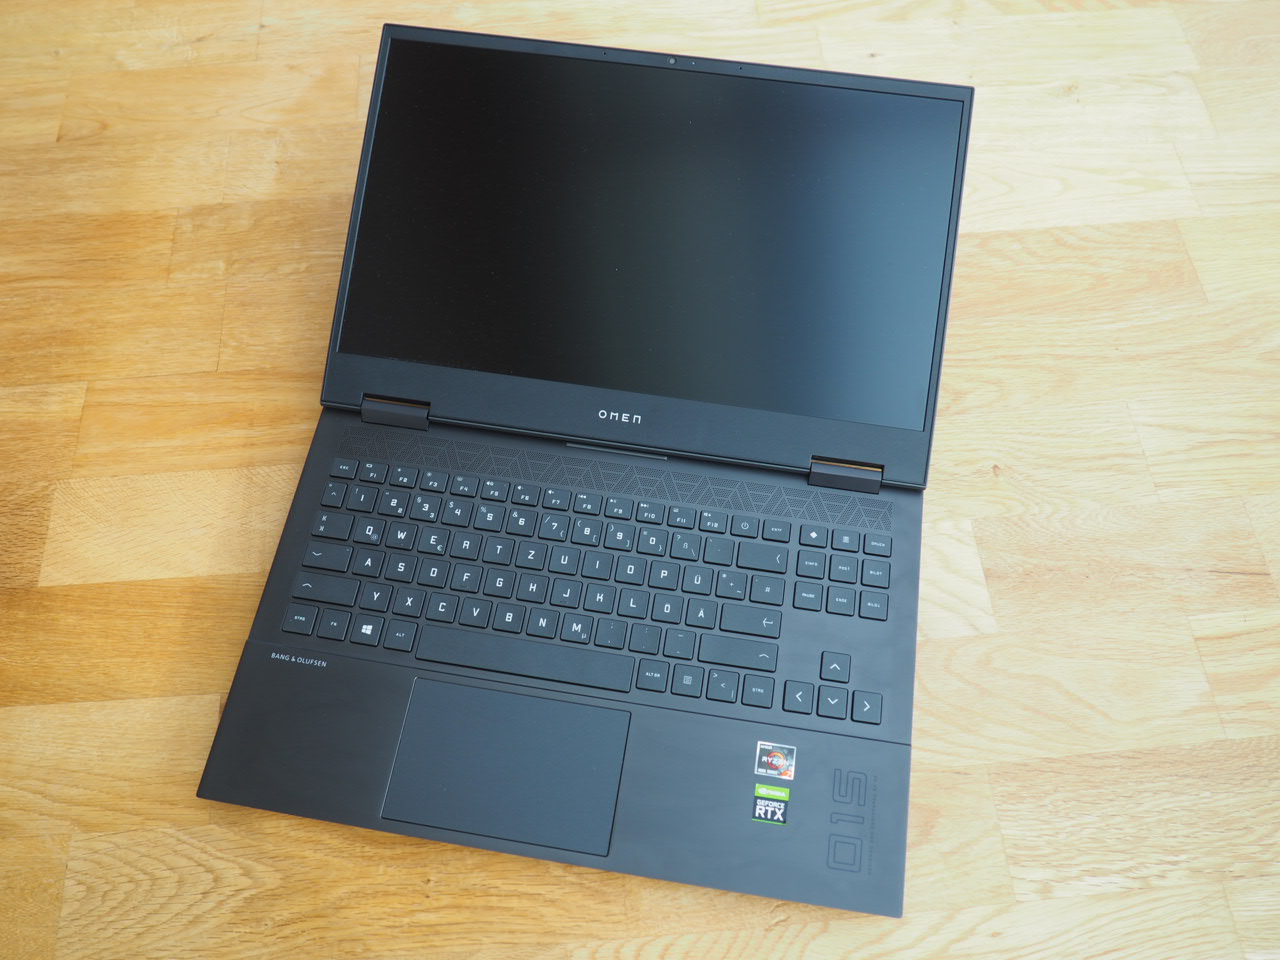
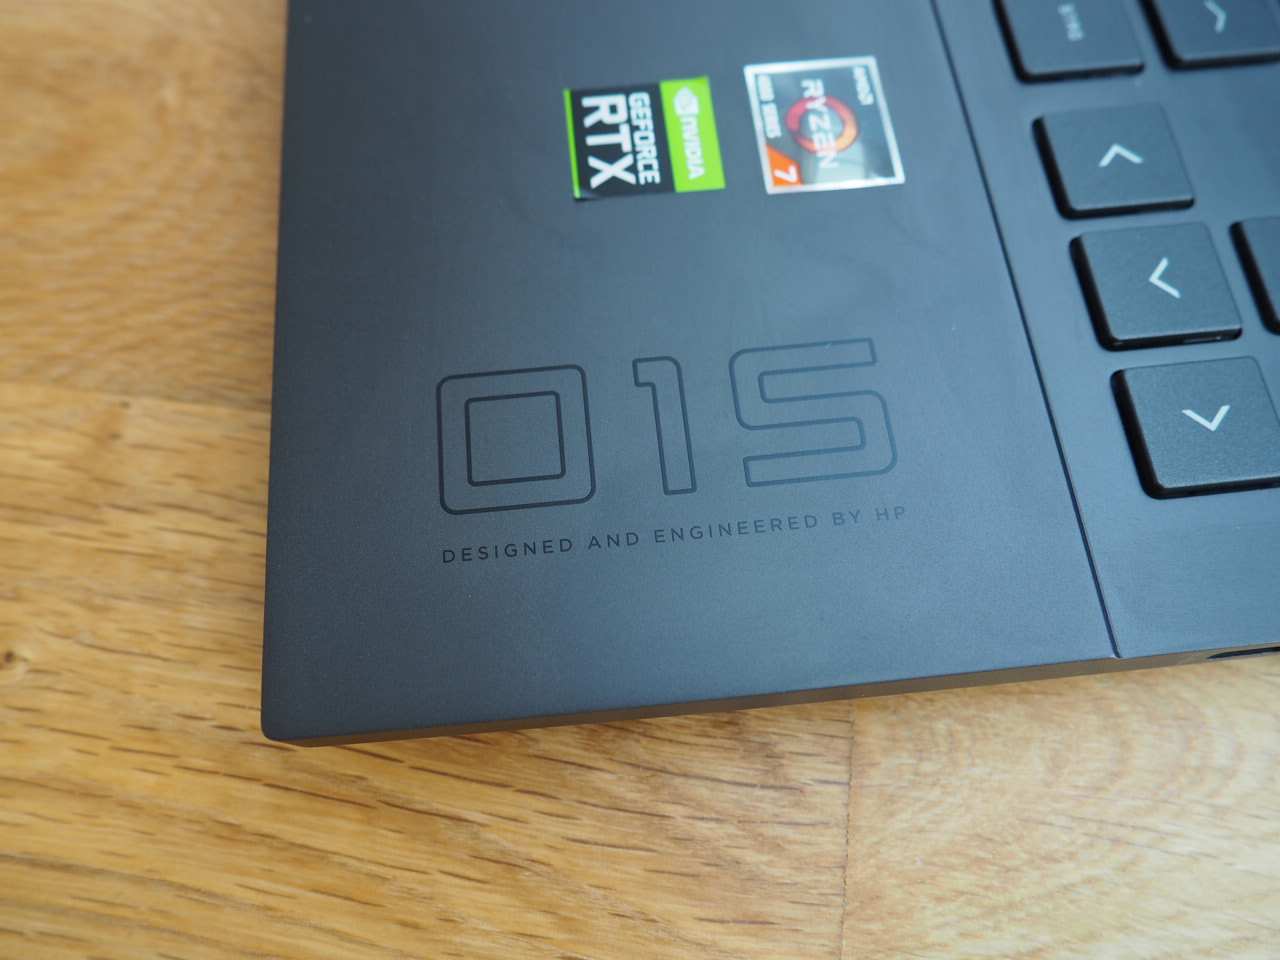
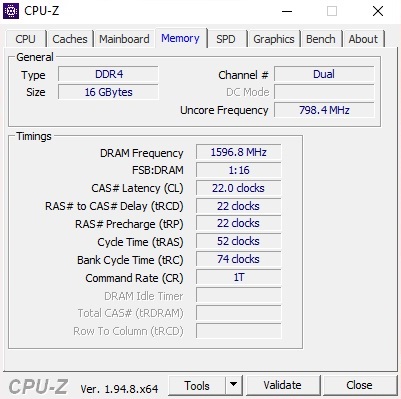
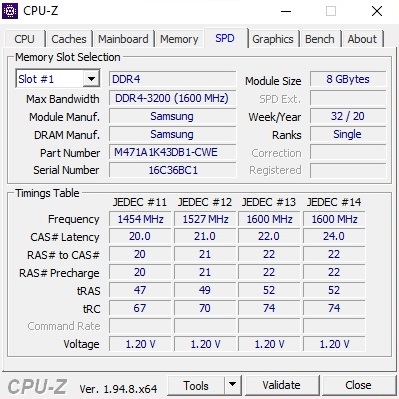
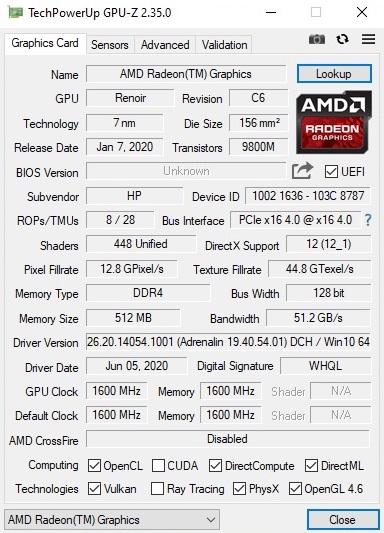
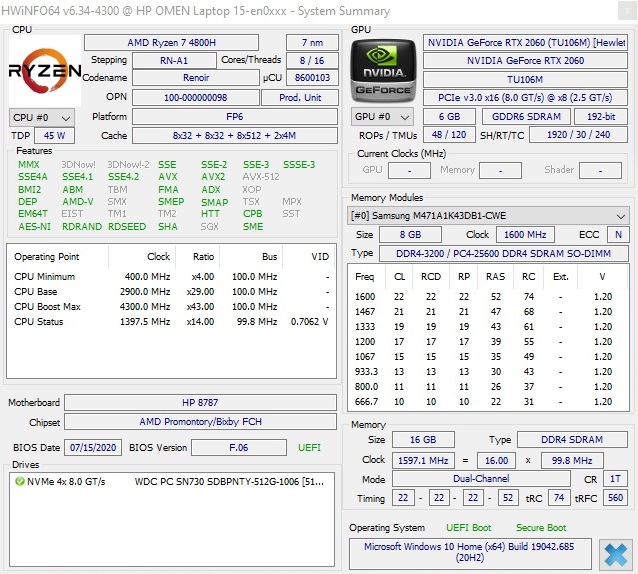
HP's Omen 15 has a very broad hardware portfolio. There are not only various Intel models, but also several AMD variants. A mid-range or high-end chip from Nvidia's Turing generation is used as the graphics card (GeForce GTX 1650 Ti to RTX 2070). One of the best price-performance ratios is currently offered by the Omen 15-en0375ng tested by us, for around 1,260 Euros (~$1530, which contains a Ryzen 7 4800H and a GeForce RTX 2060, as mentioned at the beginning). The generated pictures are displayed on a matte IPS panel with 1,920 x 1,080 pixels. In addition, there are 2x 8 GB DDR4-3,200 RAM in dual-channel mode and a 512 GB NVMe SSD in the space-saving M.2 format. The package is rounded off by Windows 10 Home 64 bit as the operating system.
The Omen 15-en0375ng's competitors include other 15-inch budget gamers with RTX 2060, such as the Schenker XMG Core 15, the Asus TUF A15, the Acer Predator Triton 300, the Aorus 5 KB, and the Lenovo Legion 5. These notebooks each appear in the table as comparison devices.
Possible competitors in comparison
Rating | Date | Model | Weight | Height | Size | Resolution | Price |
|---|---|---|---|---|---|---|---|
| 82.8 % v7 (old) | 01 / 2021 | HP Omen 15-en0375ng R7 4800H, GeForce RTX 2060 Mobile | 2.2 kg | 23 mm | 15.60" | 1920x1080 | |
| 82.1 % v7 (old) | 09 / 2020 | Schenker XMG Core 15 GK5NR0O R7 4800H, GeForce RTX 2060 Mobile | 2 kg | 19.9 mm | 15.60" | 1920x1080 | |
| 82.7 % v7 (old) | 06 / 2020 | Asus TUF Gaming A15 FA506IV-HN172 R7 4800H, GeForce RTX 2060 Mobile | 2.2 kg | 24.9 mm | 15.60" | 1920x1080 | |
| 82.1 % v7 (old) | 12 / 2020 | Acer Predator Triton 300 PT315-52-79LP i7-10750H, GeForce RTX 2060 Mobile | 2.1 kg | 19.9 mm | 15.60" | 1920x1080 | |
| 83.7 % v7 (old) | 10 / 2020 | Aorus 5 KB i7-10750H, GeForce RTX 2060 Mobile | 2.1 kg | 28 mm | 15.60" | 1920x1080 | |
| 83.3 % v7 (old) | 07 / 2020 | Lenovo Legion 5 15IMH05H i5-10300H, GeForce RTX 2060 Mobile | 2.5 kg | 26.1 mm | 15.60" | 1920x1080 |
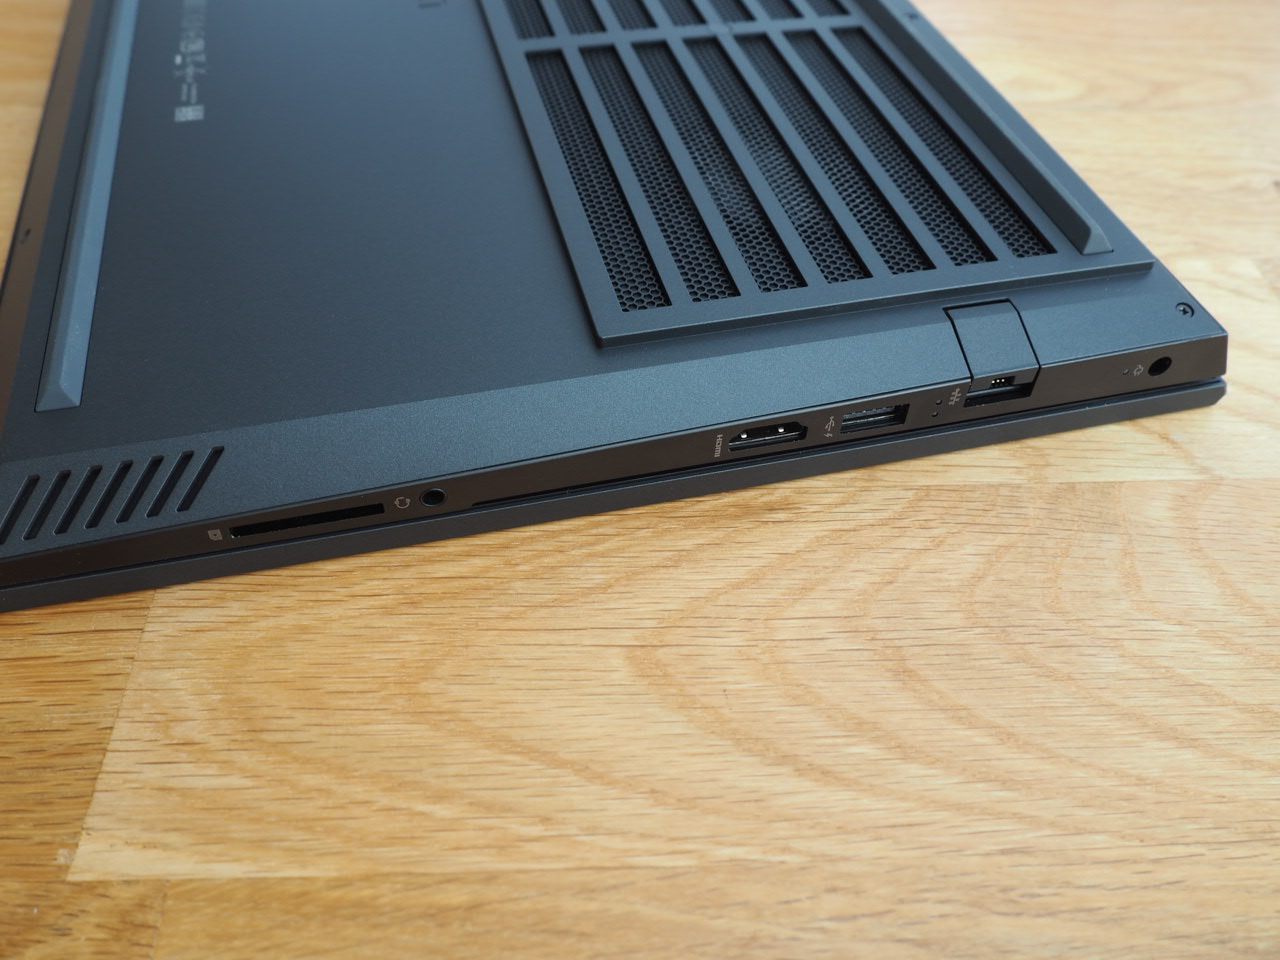
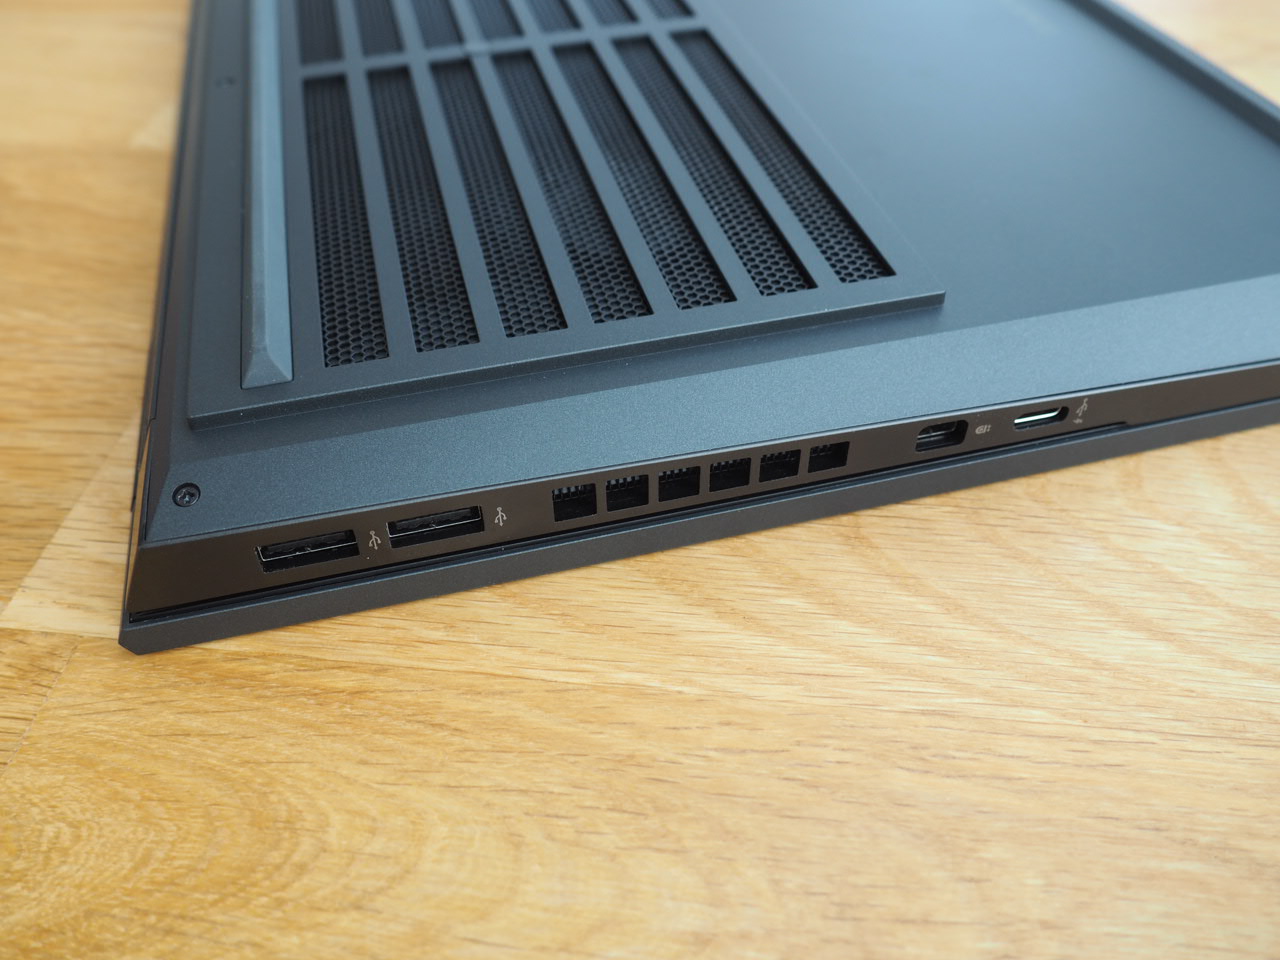
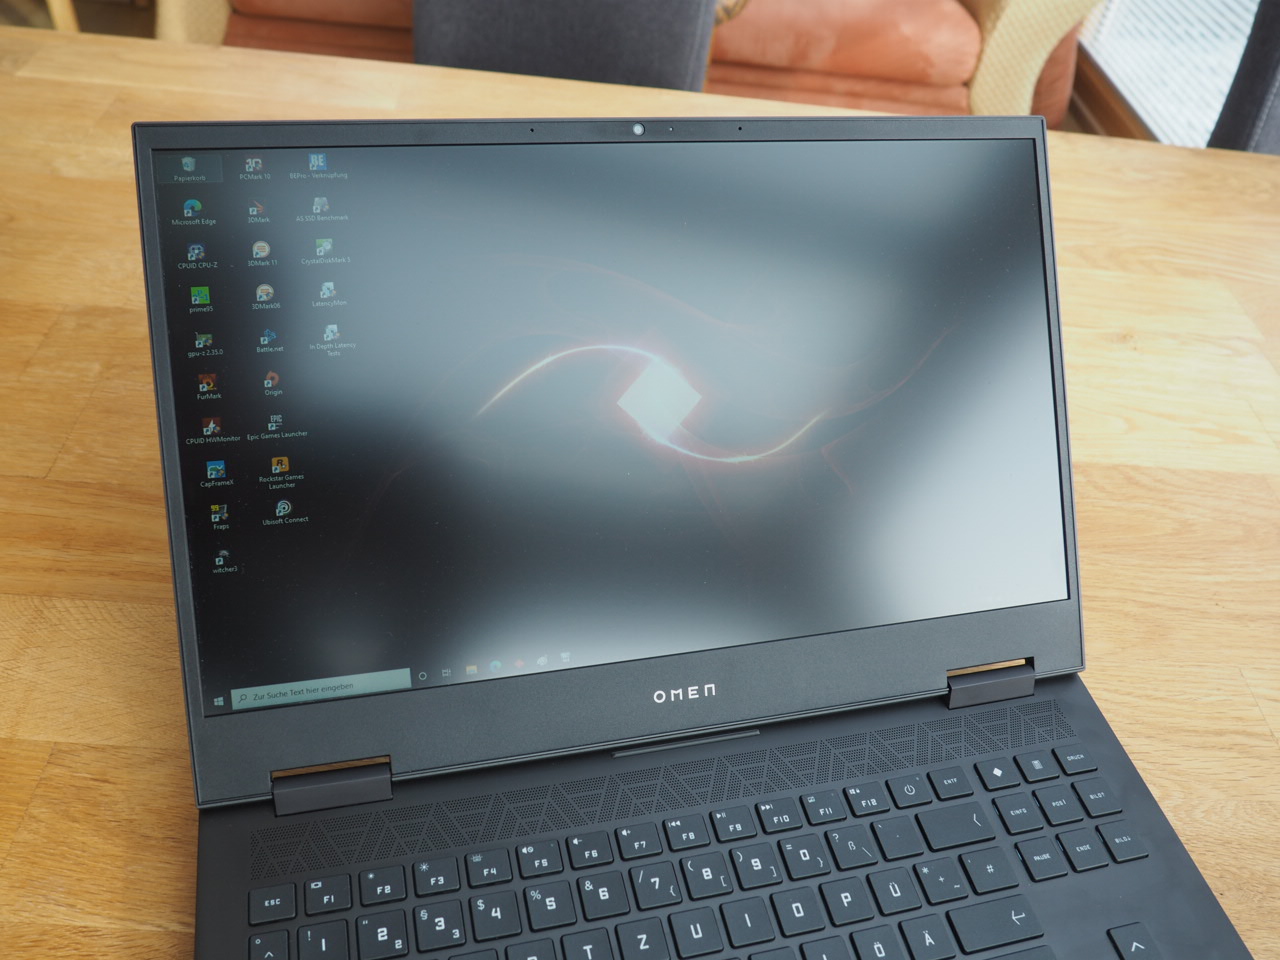
The chassis is basically the same as the Omen 15-ek0456ng we tested a few months ago, which is why we refrain from analyzing the chassis, the equipment and the input devices again. However, the models are not completely identical. For example, the AMD version has a white instead of red keyboard labeling or illumination. Buyers will also have to do without a Thunderbolt 3 port.

SDCardreader
| SD Card Reader | |
| average JPG Copy Test (av. of 3 runs) | |
| Average of class Gaming (20.9 - 210, n=54, last 2 years) | |
| Aorus 5 KB (Toshiba Exceria Pro SDXC 64 GB UHS-II) | |
| HP Omen 15-en0375ng (Toshiba Exceria Pro SDXC 64 GB UHS-II) | |
| Schenker XMG Core 15 GK5NR0O (Toshiba Exceria Pro SDXC 64 GB UHS-II) | |
| maximum AS SSD Seq Read Test (1GB) | |
| Average of class Gaming (25.5 - 261, n=51, last 2 years) | |
| HP Omen 15-en0375ng (Toshiba Exceria Pro SDXC 64 GB UHS-II) | |
| Aorus 5 KB (Toshiba Exceria Pro SDXC 64 GB UHS-II) | |
| Schenker XMG Core 15 GK5NR0O (Toshiba Exceria Pro SDXC 64 GB UHS-II) | |
Communication
Webcam


Display
Let's get straight to one of the biggest disappointments: the display. While the Intel variant could show off with a good 144 Hz panel in the test, the AMD edition only has a mediocre 60 Hz panel on board.
| |||||||||||||||||||||||||
Brightness Distribution: 88 %
Center on Battery: 297 cd/m²
Contrast: 900:1 (Black: 0.33 cd/m²)
ΔE ColorChecker Calman: 4.54 | ∀{0.5-29.43 Ø4.71}
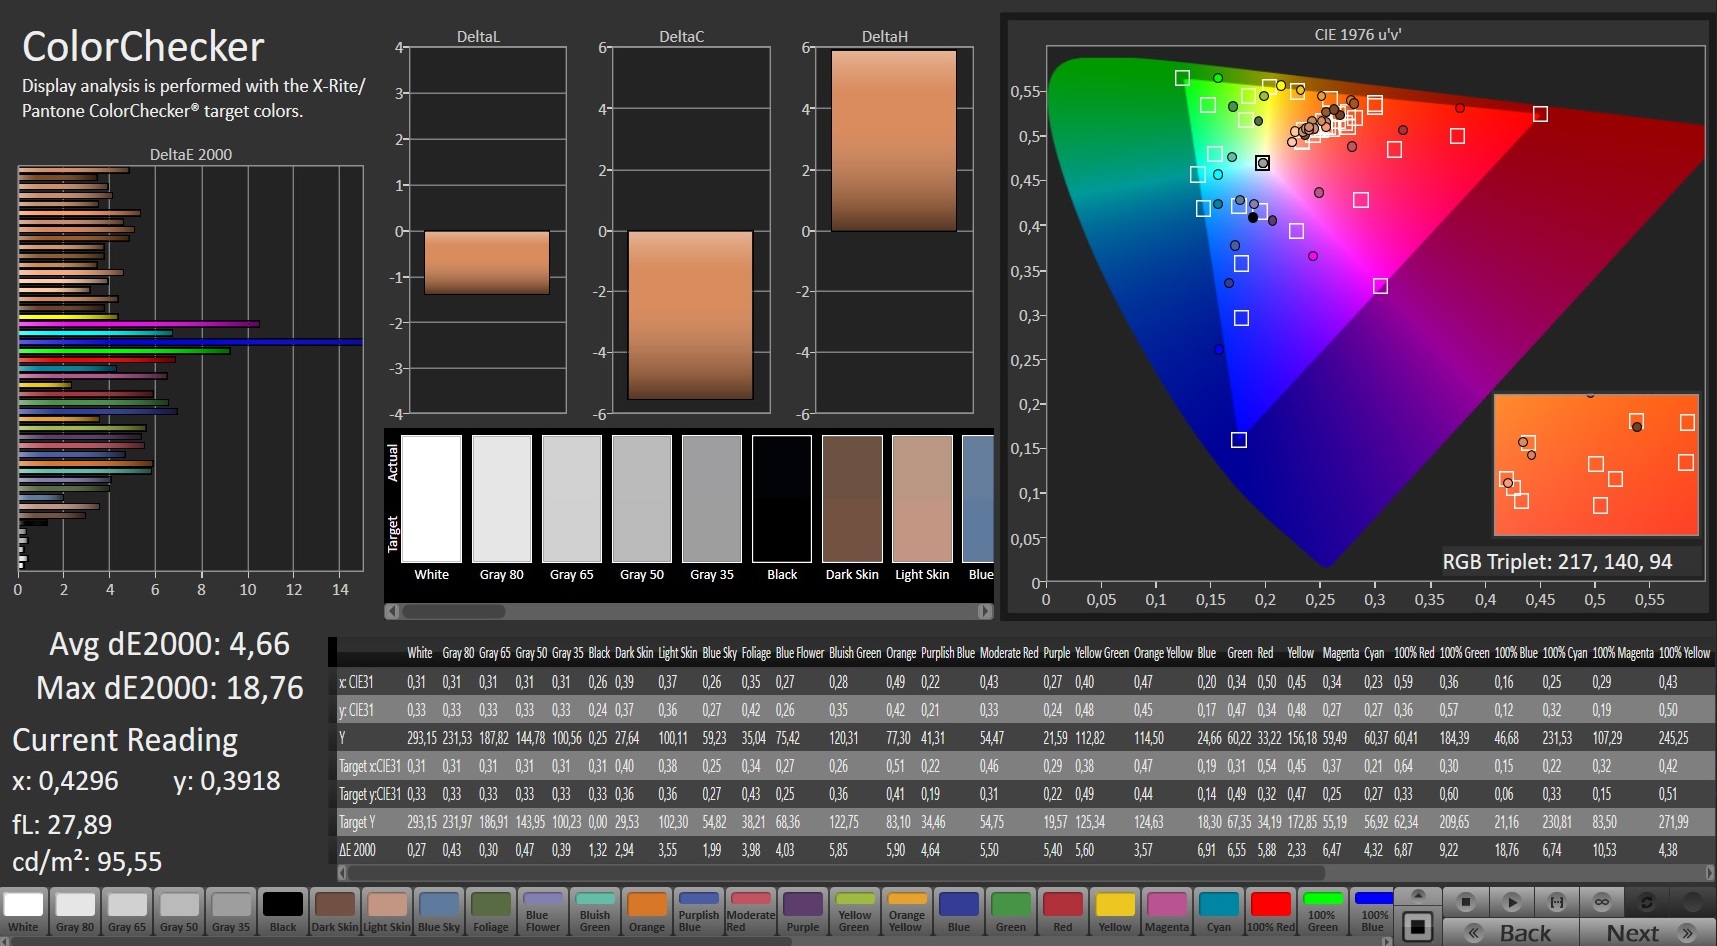
calibrated: 4.66
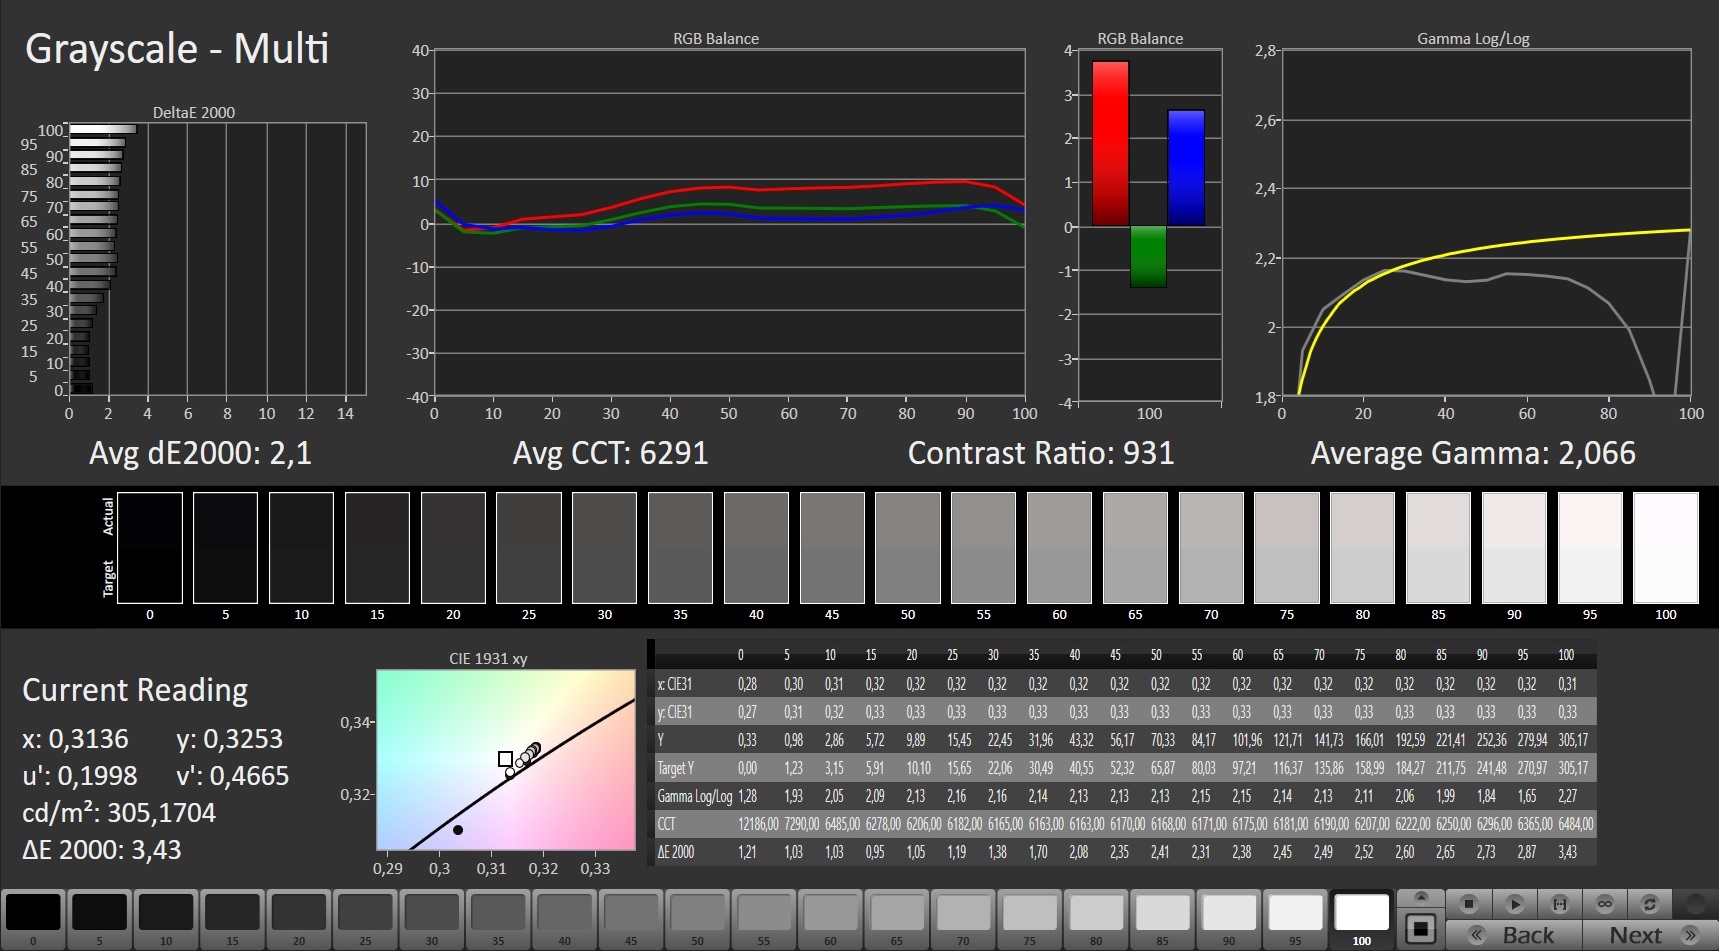
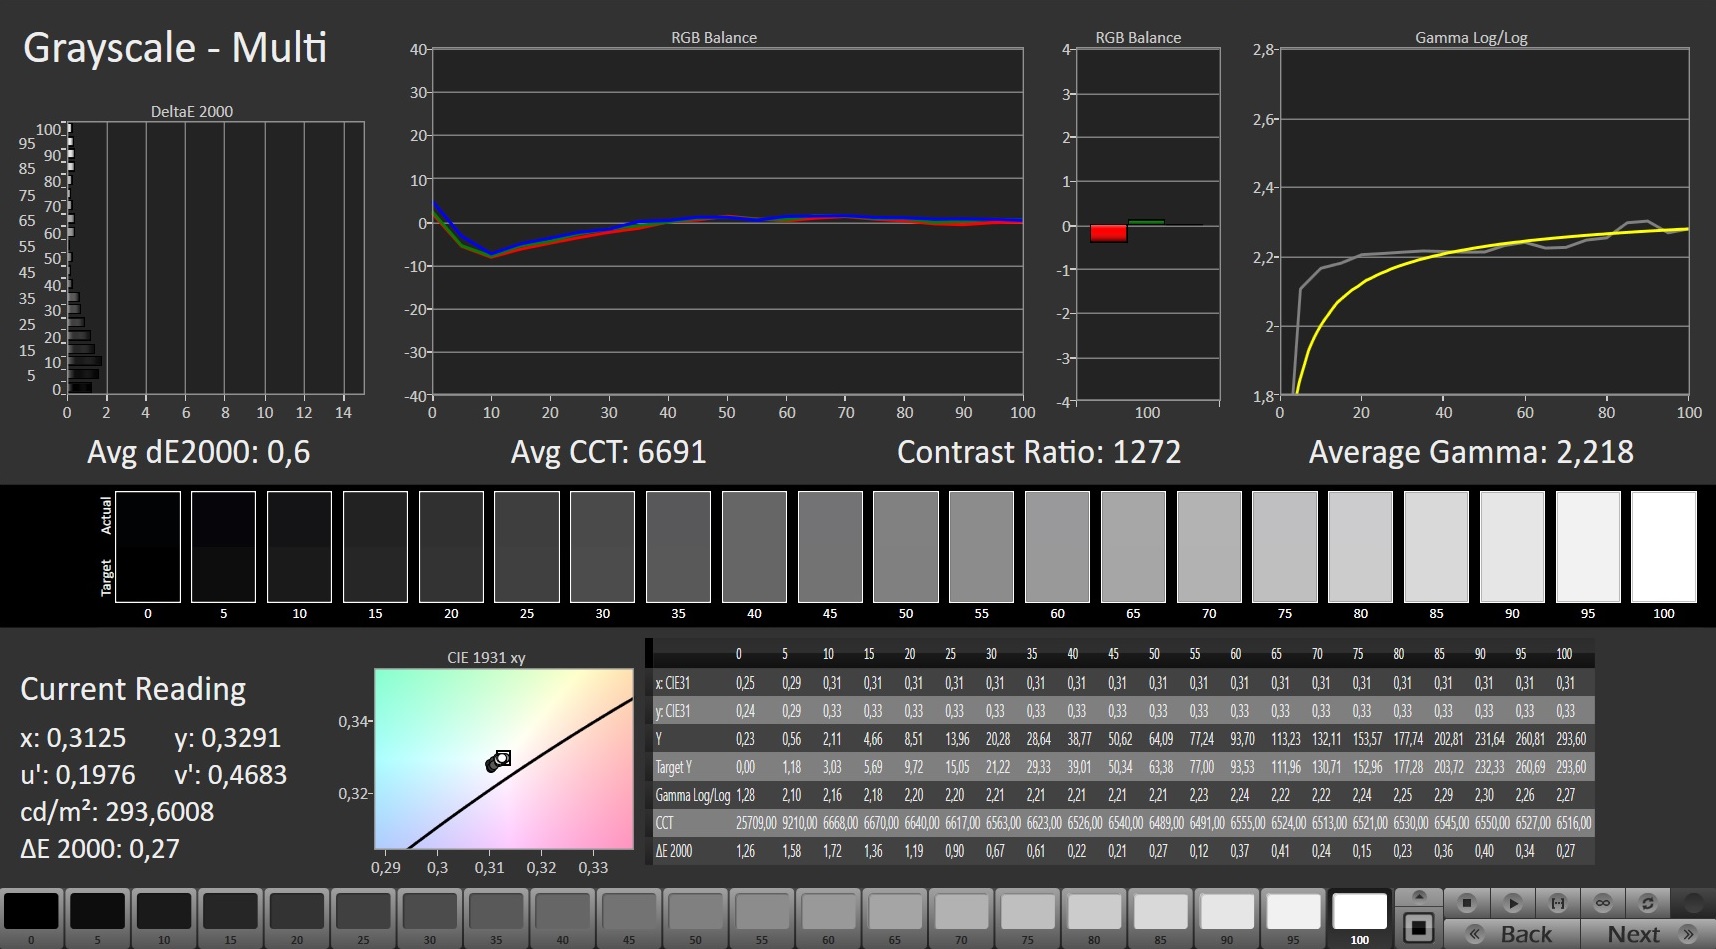
ΔE Greyscale Calman: 2.1 | ∀{0.09-98 Ø4.96}
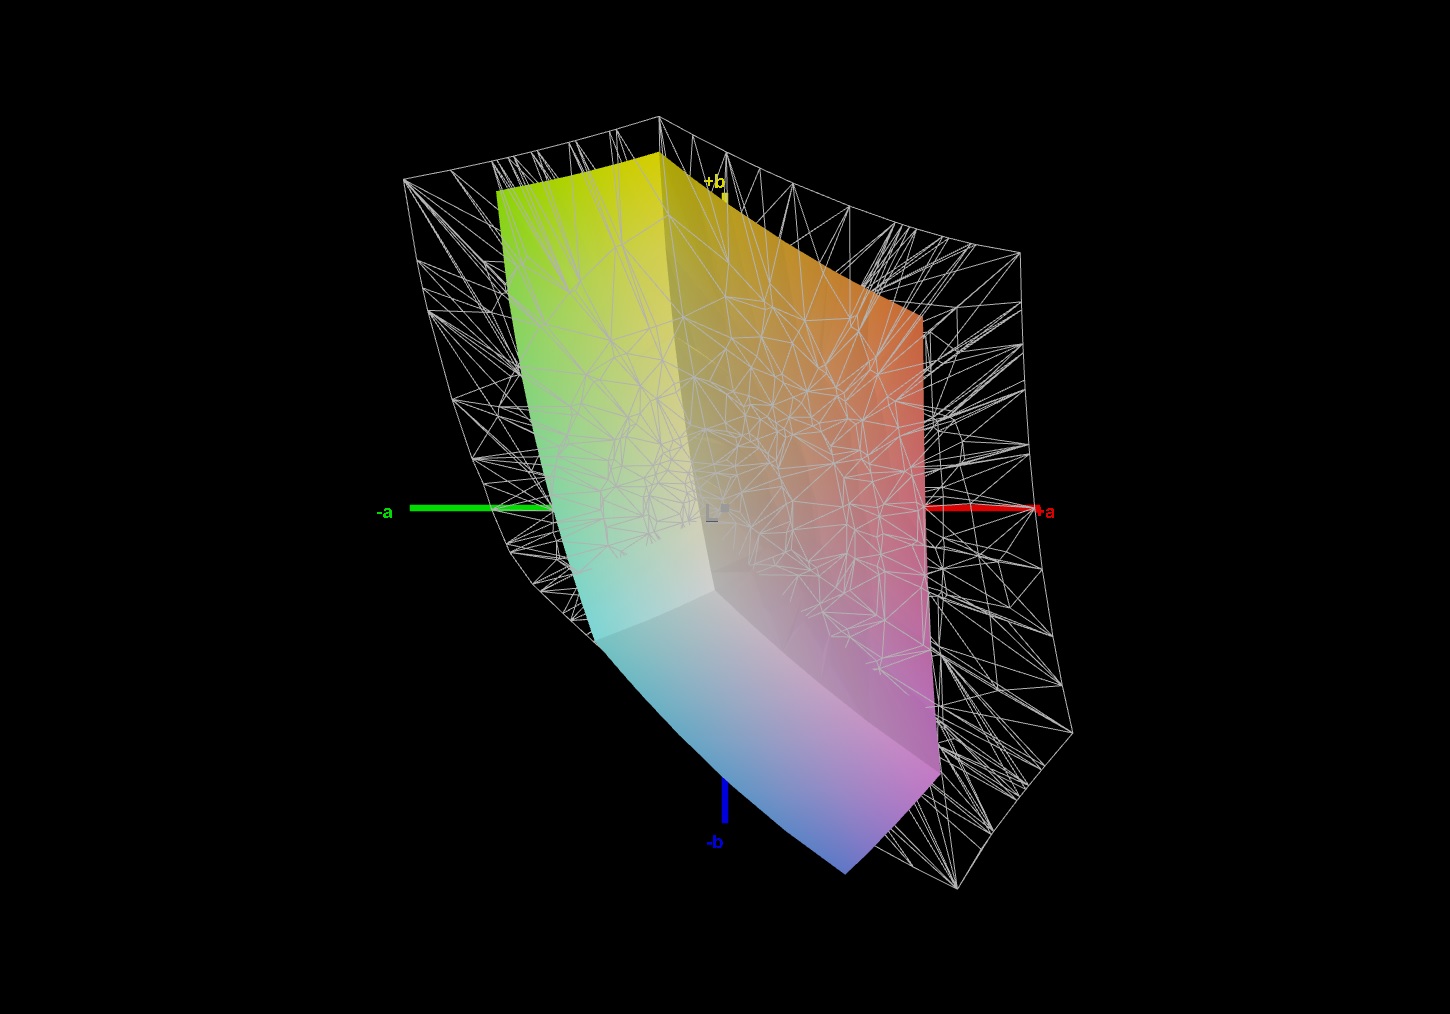
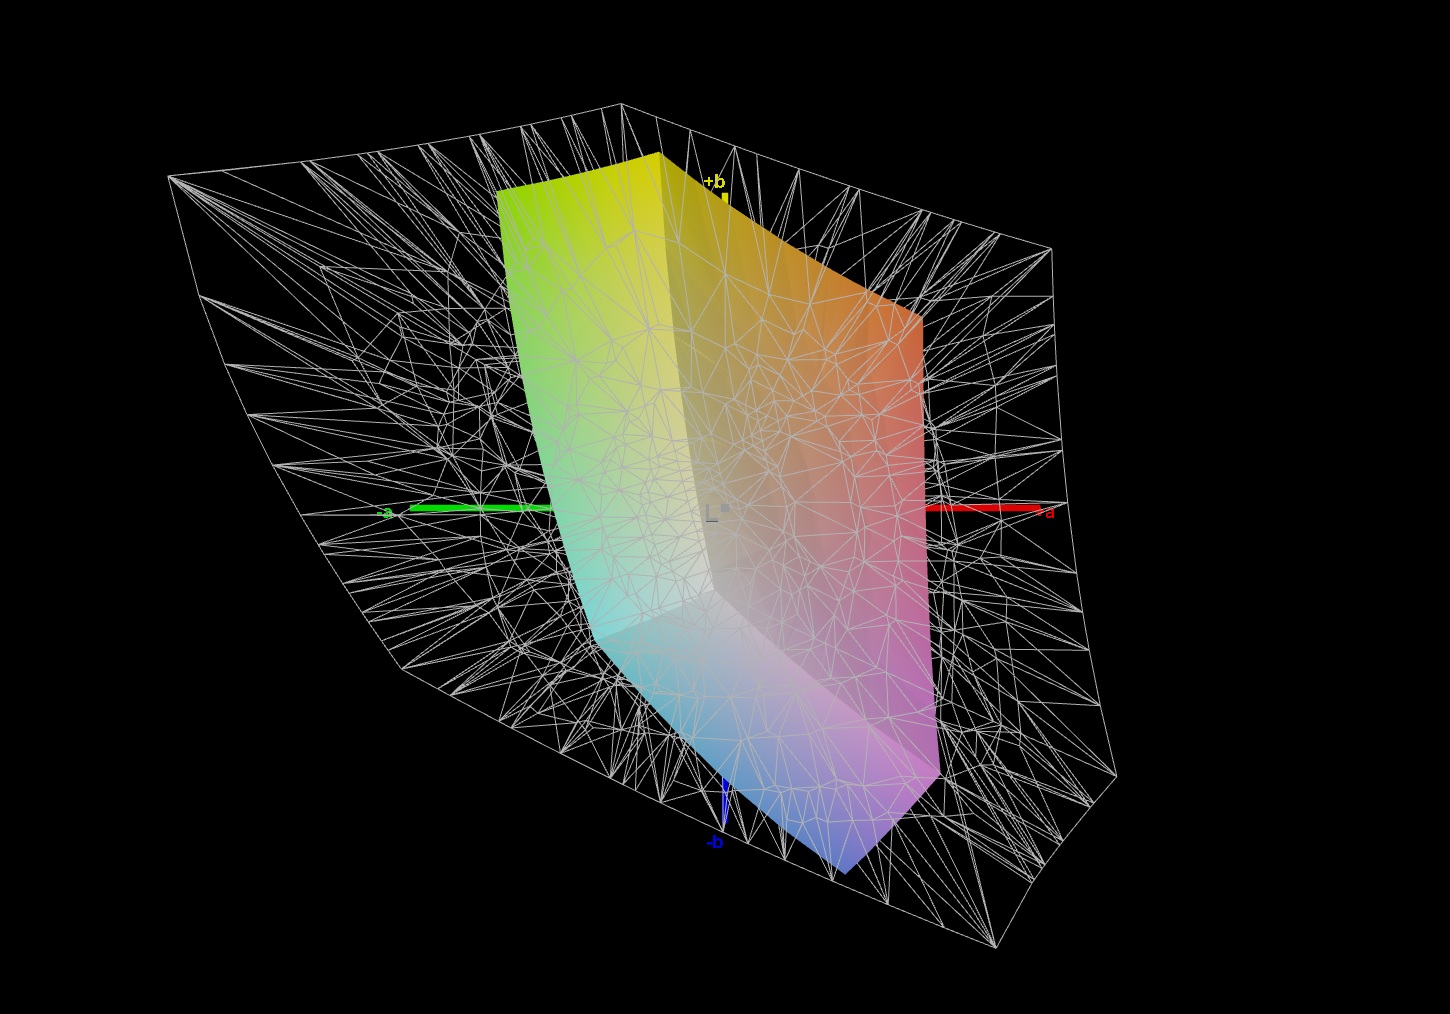
58% sRGB (Argyll 1.6.3 3D)
40% AdobeRGB 1998 (Argyll 1.6.3 3D)
40.42% AdobeRGB 1998 (Argyll 3D)
57.6% sRGB (Argyll 3D)
39.12% Display P3 (Argyll 3D)
Gamma: 2.066
CCT: 6291 K
| HP Omen 15-en0375ng BOE0852, IPS, 1920x1080, 15.6" | Schenker XMG Core 15 GK5NR0O LM156LF-1F02, IPS, 1920x1080, 15.6" | Asus TUF Gaming A15 FA506IV-HN172 LM156LF-2F01, IPS, 1920x1080, 15.6" | Acer Predator Triton 300 PT315-52-79LP BOE08FB, IPS, 1920x1080, 15.6" | Aorus 5 KB LG Philips LP156WFG-SPB2 (LGD05E8), IPS, 1920x1080, 15.6" | Lenovo Legion 5 15IMH05H BOE CQ NV156FHM-NX1, IPS, 1920x1080, 15.6" | |
|---|---|---|---|---|---|---|
| Display | 69% | 0% | 1% | 61% | -1% | |
| Display P3 Coverage (%) | 39.12 | 67.2 72% | 38.92 -1% | 39.51 1% | 63.4 62% | 38.8 -1% |
| sRGB Coverage (%) | 57.6 | 95.9 66% | 58.5 2% | 58.1 1% | 92.8 61% | 57.8 0% |
| AdobeRGB 1998 Coverage (%) | 40.42 | 68.5 69% | 40.22 0% | 40.81 1% | 64.8 60% | 40.09 -1% |
| Response Times | 61% | -14% | 4% | 50% | 16% | |
| Response Time Grey 50% / Grey 80% * (ms) | 30.4 ? | 9.6 ? 68% | 34 ? -12% | 29.2 ? 4% | 14.4 ? 53% | 26 ? 14% |
| Response Time Black / White * (ms) | 20.8 ? | 9.6 ? 54% | 24 ? -15% | 20 ? 4% | 11.2 ? 46% | 17 ? 18% |
| PWM Frequency (Hz) | 200 ? | |||||
| Screen | 0% | 1% | -8% | 33% | 0% | |
| Brightness middle (cd/m²) | 297 | 312 5% | 280 -6% | 279 -6% | 318 7% | 301 1% |
| Brightness (cd/m²) | 275 | 290 5% | 254 -8% | 257 -7% | 298 8% | 277 1% |
| Brightness Distribution (%) | 88 | 87 -1% | 88 0% | 89 1% | 87 -1% | 77 -12% |
| Black Level * (cd/m²) | 0.33 | 0.2 39% | 0.15 55% | 0.31 6% | 0.3 9% | 0.26 21% |
| Contrast (:1) | 900 | 1560 73% | 1867 107% | 900 0% | 1060 18% | 1158 29% |
| Colorchecker dE 2000 * | 4.54 | 4.84 -7% | 5.89 -30% | 5.84 -29% | 2.49 45% | 5.12 -13% |
| Colorchecker dE 2000 max. * | 18.92 | 13.85 27% | 19 -0% | 21.8 -15% | 5.06 73% | 8.86 53% |
| Colorchecker dE 2000 calibrated * | 4.66 | 1.77 62% | 4.79 -3% | 4.54 3% | 1.53 67% | 4.88 -5% |
| Greyscale dE 2000 * | 2.1 | 9 -329% | 4.08 -94% | 3.1 -48% | 1.6 24% | 3.47 -65% |
| Gamma | 2.066 106% | 2.105 105% | 2.33 94% | 2.116 104% | 2.211 100% | 2.37 93% |
| CCT | 6291 103% | 8099 80% | 7303 89% | 6577 99% | 6714 97% | 7062 92% |
| Color Space (Percent of AdobeRGB 1998) (%) | 40 | 68 70% | 37 -7% | 41 2% | 65 63% | 37 -7% |
| Color Space (Percent of sRGB) (%) | 58 | 92 59% | 58 0% | 59 2% | 89 53% | 57 -2% |
| Total Average (Program / Settings) | 43% /
21% | -4% /
-1% | -1% /
-5% | 48% /
41% | 5% /
2% |
* ... smaller is better
Besides the response time, the contrast is also much worse. Instead of more than 1400:1, the AMD model only has a ratio of 900:1. The Intel model is also usually ahead in the other disciplines - be it the color accuracy, the black value or the brightness. The Omen 15-en0375ng is hardly suitable for outdoor use due to its meager brightness (approx. 275 cd/m²).
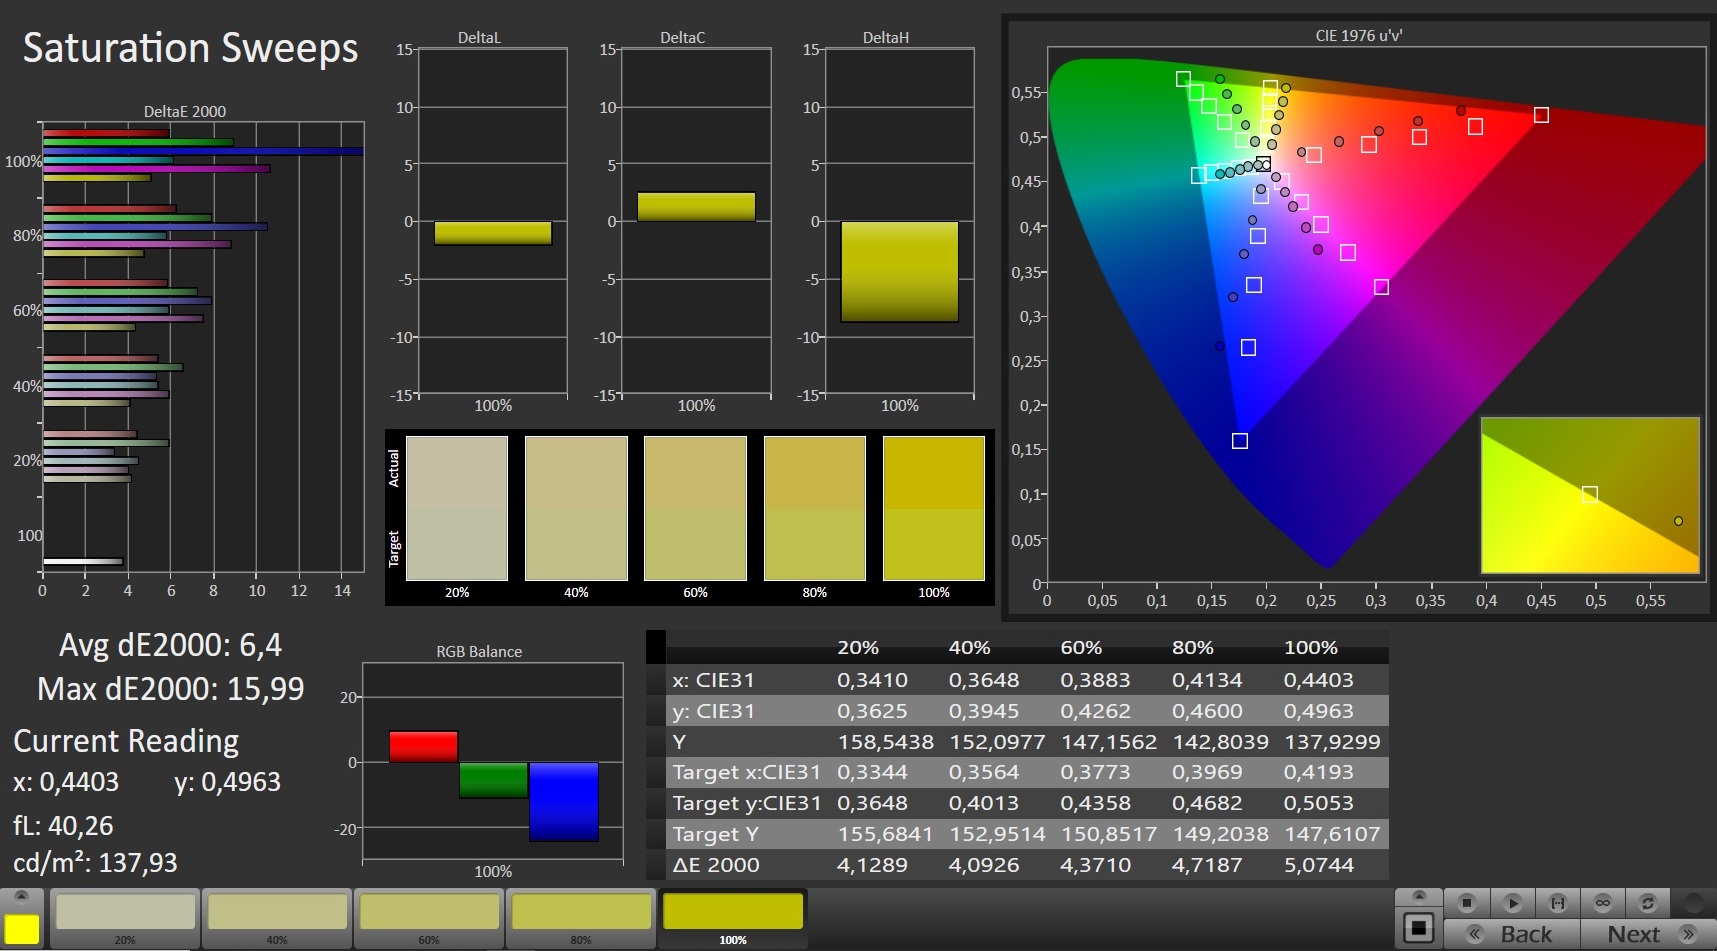
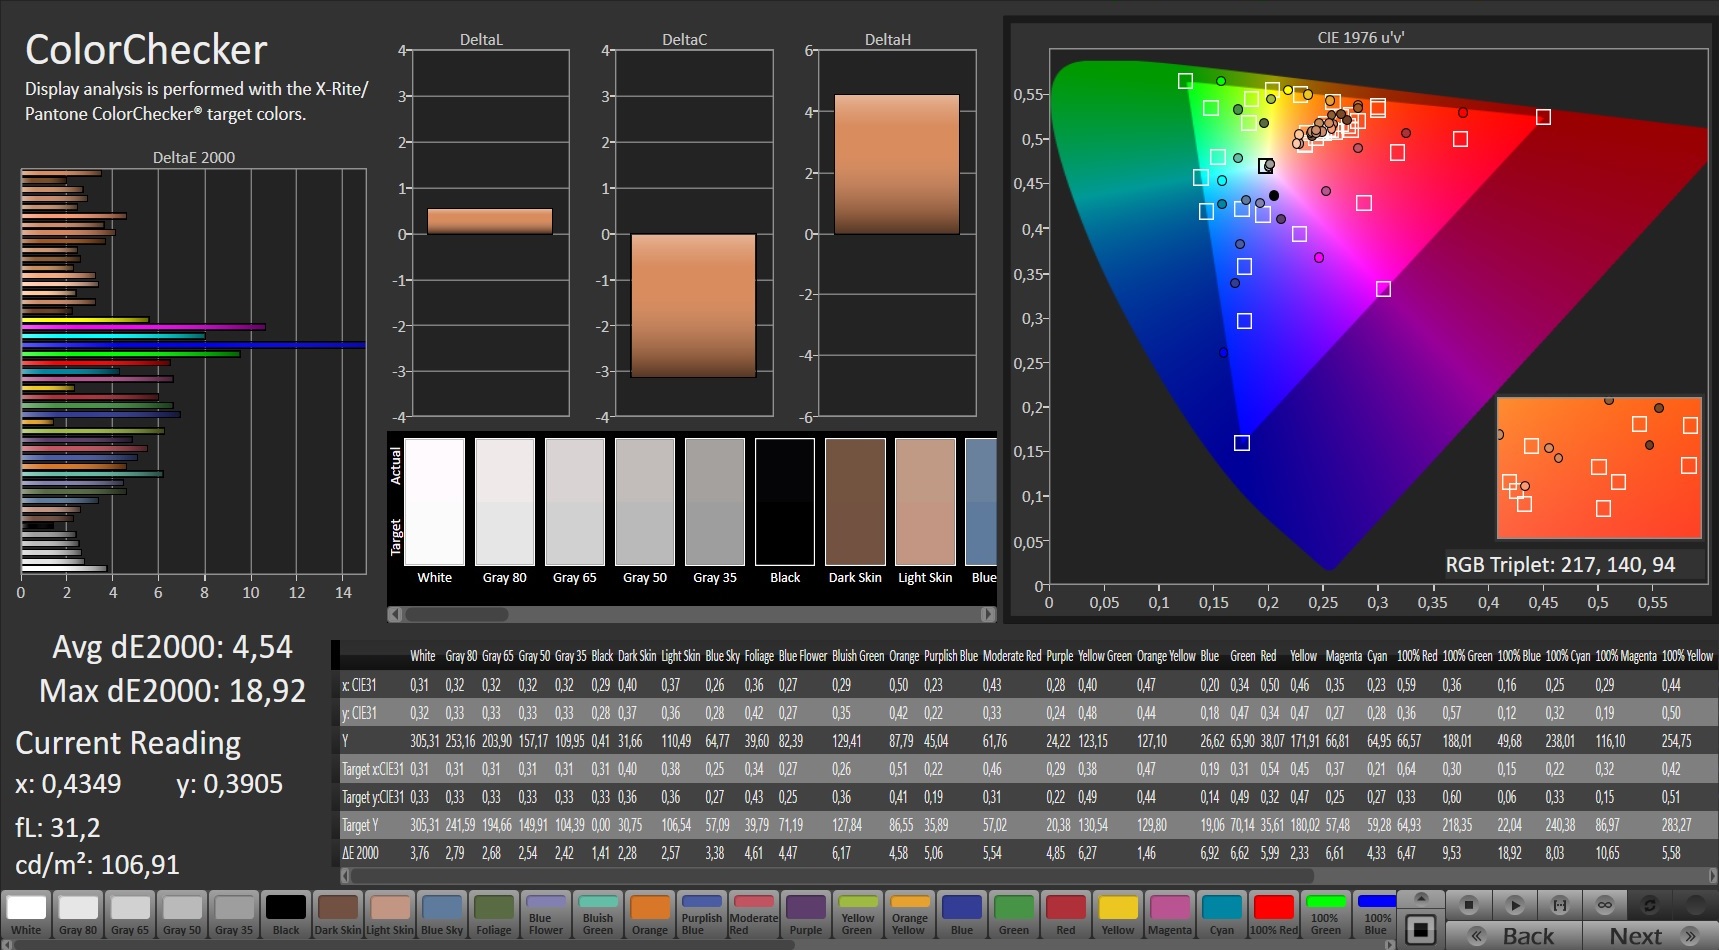
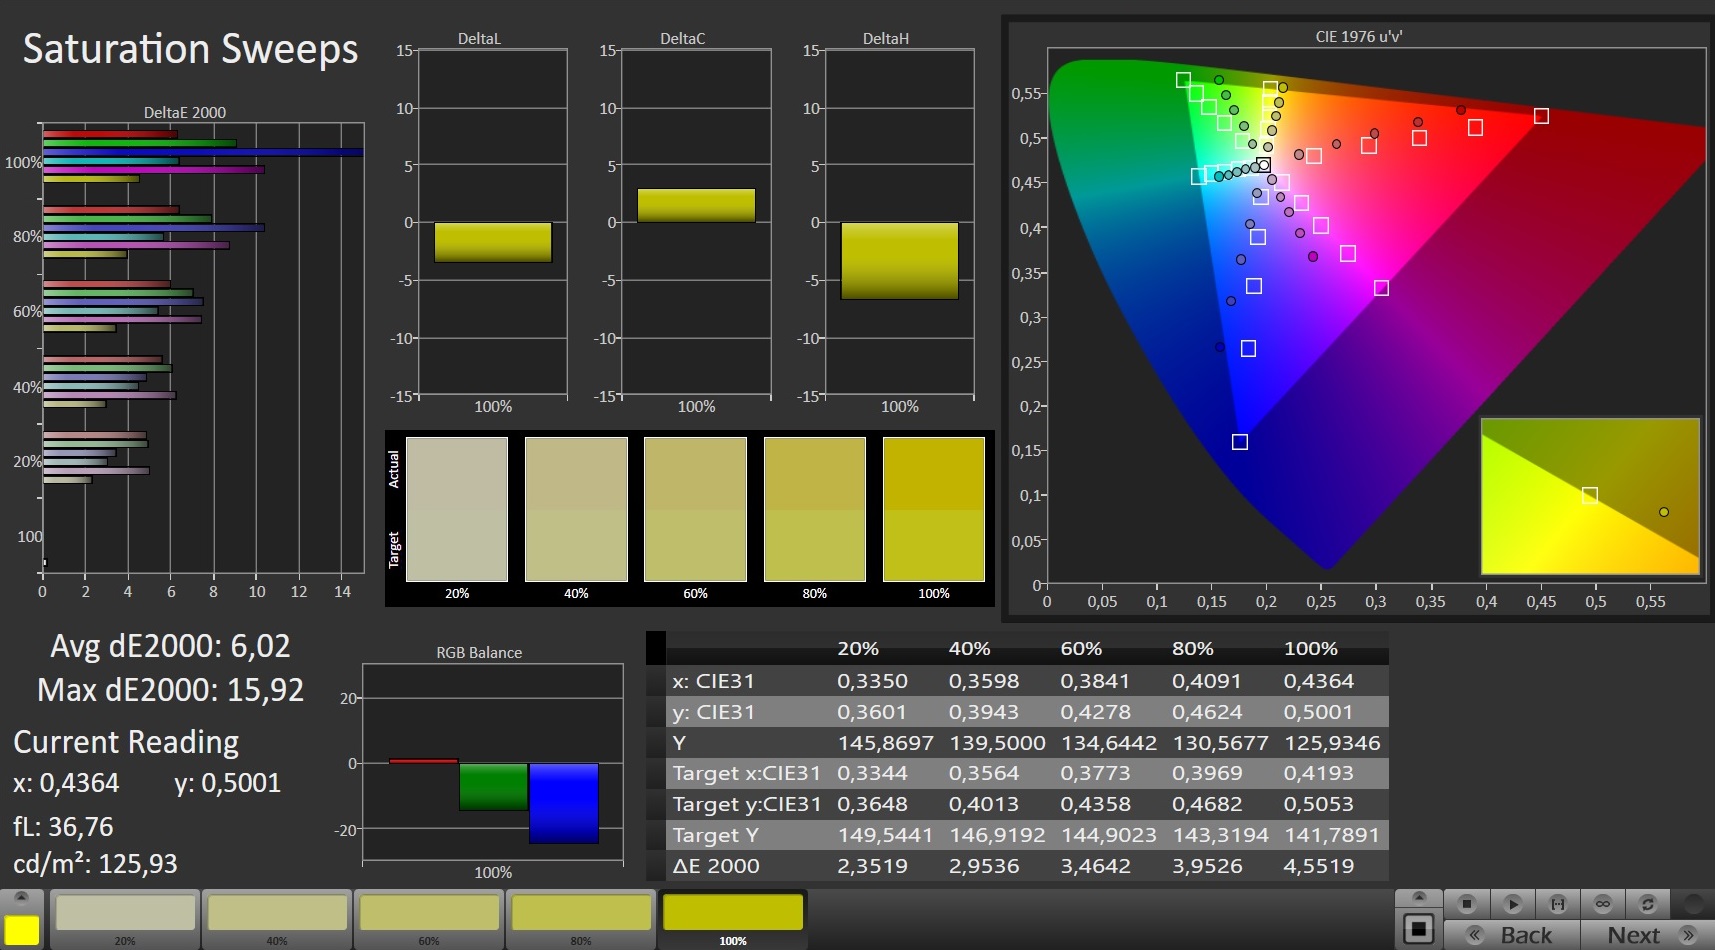
However, the small color space is the biggest drawback in our eyes: 58% sRGB and 40% AdobeRGB result in rather pale and undifferentiated pictures. The good viewing angle stability can only compensate for this shortcoming to a certain extent. All in all, the picture quality does not do justice to the notebook's price. Regardless of whether it is a budget product or a luxury machine: We expect a high-quality panel with at least 300 cd/m² brightness, at least 1000:1 contrast and at least 80% sRGB coverage for gaming laptops - and 120 Hz upwards for 1,000 Euros (~$1214).
However, HP is not alone in its poor performance. With the exception of the Schenker Core 15 and Aorus 5 KB, the displays of the competition also leave much to be desired. Attention: Below a brightness of 100%, the display flickers with 200 Hz, which can cause problems for sensitive people.

Display Response Times
| ↔ Response Time Black to White | ||
|---|---|---|
| 20.8 ms ... rise ↗ and fall ↘ combined | ↗ 11.6 ms rise | 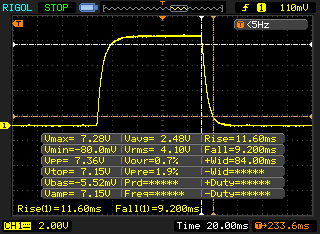 |
| ↘ 9.2 ms fall | ||
| The screen shows good response rates in our tests, but may be too slow for competitive gamers. In comparison, all tested devices range from 0.1 (minimum) to 240 (maximum) ms. » 46 % of all devices are better. This means that the measured response time is similar to the average of all tested devices (19.8 ms). | ||
| ↔ Response Time 50% Grey to 80% Grey | ||
| 30.4 ms ... rise ↗ and fall ↘ combined | ↗ 16.4 ms rise | 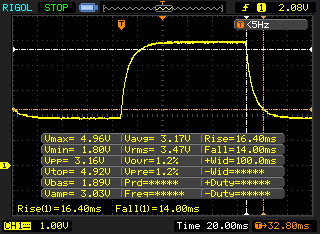 |
| ↘ 14 ms fall | ||
| The screen shows slow response rates in our tests and will be unsatisfactory for gamers. In comparison, all tested devices range from 0.165 (minimum) to 636 (maximum) ms. » 41 % of all devices are better. This means that the measured response time is similar to the average of all tested devices (31 ms). | ||
Screen Flickering / PWM (Pulse-Width Modulation)
| Screen flickering / PWM detected | 200 Hz | ≤ 99 % brightness setting | 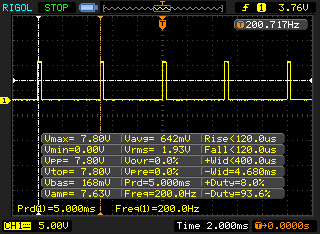 |
The display backlight flickers at 200 Hz (worst case, e.g., utilizing PWM) Flickering detected at a brightness setting of 99 % and below. There should be no flickering or PWM above this brightness setting. The frequency of 200 Hz is relatively low, so sensitive users will likely notice flickering and experience eyestrain at the stated brightness setting and below. In comparison: 52 % of all tested devices do not use PWM to dim the display. If PWM was detected, an average of 7754 (minimum: 5 - maximum: 343500) Hz was measured. | |||
Test conditions
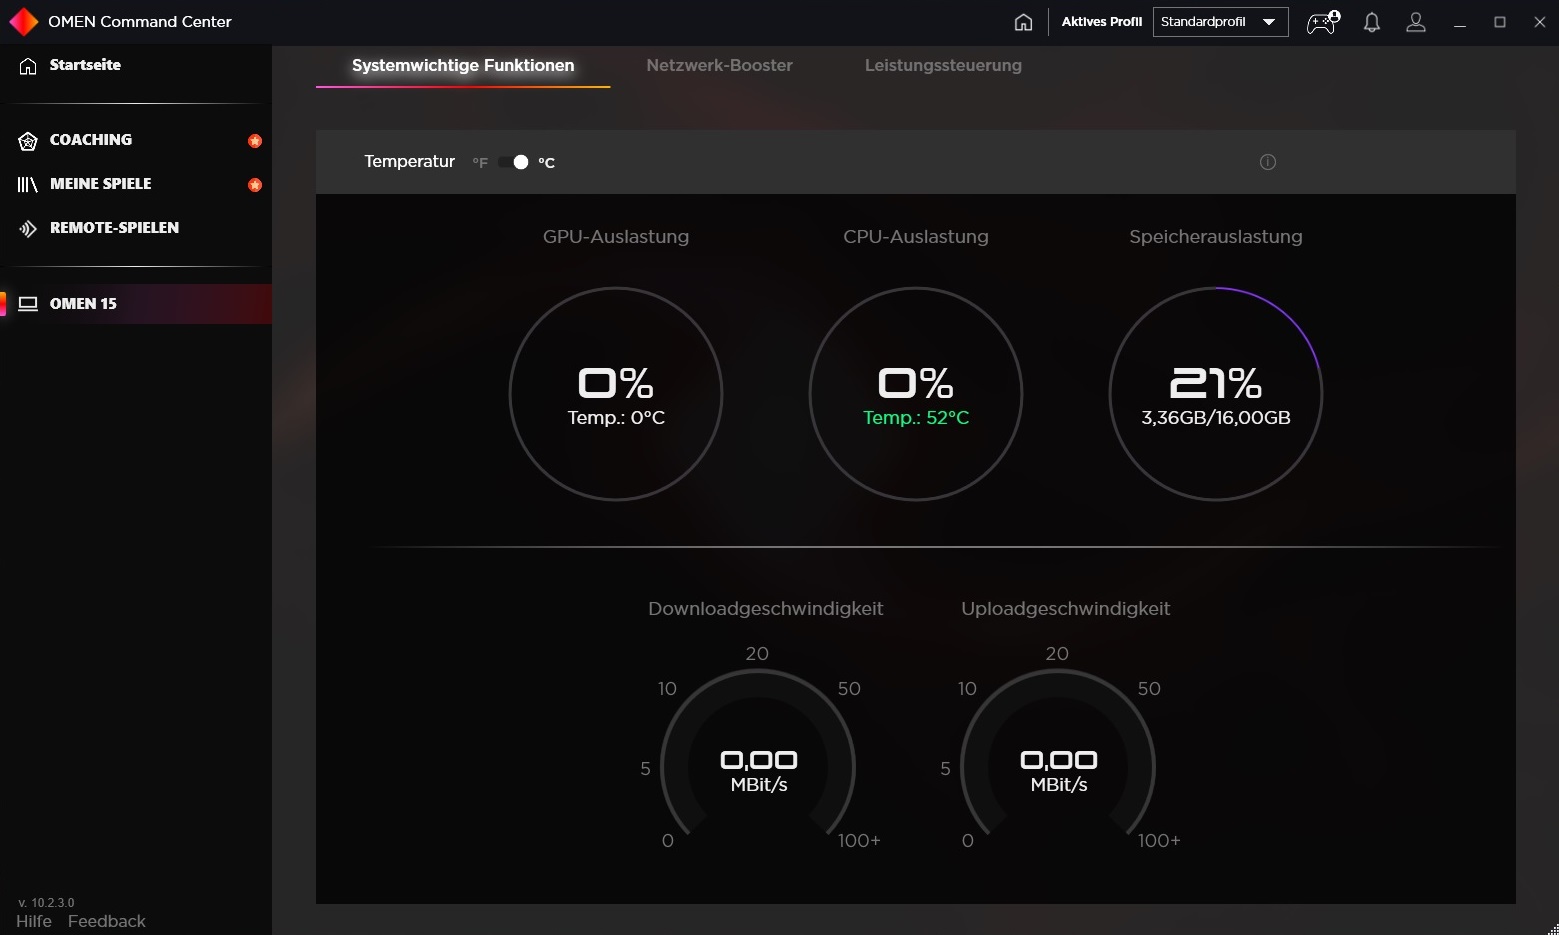
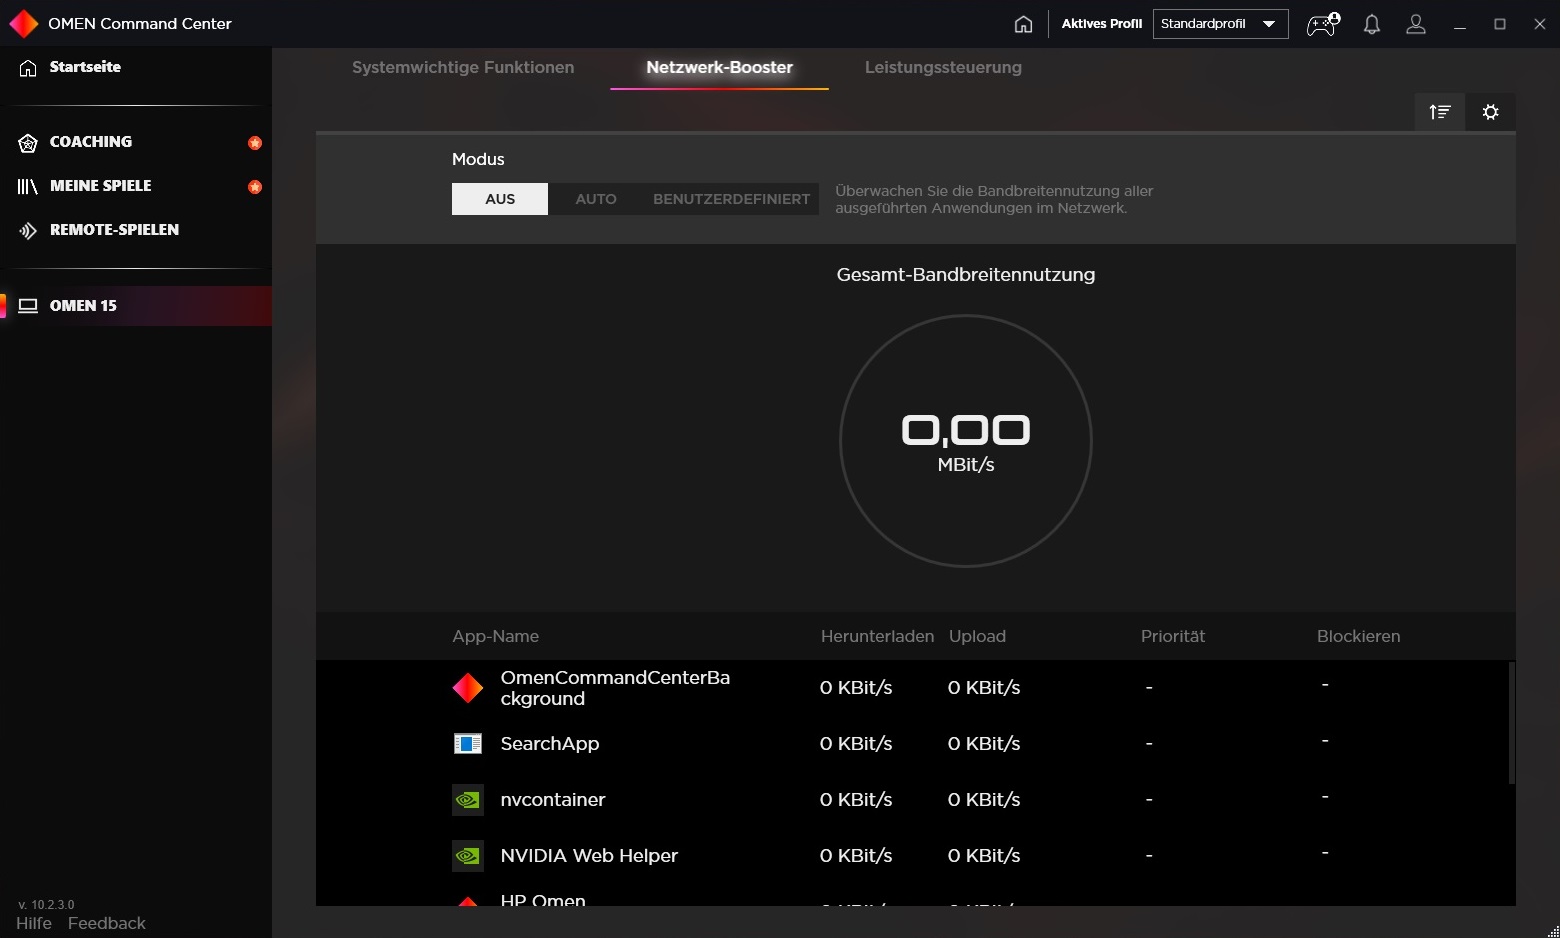
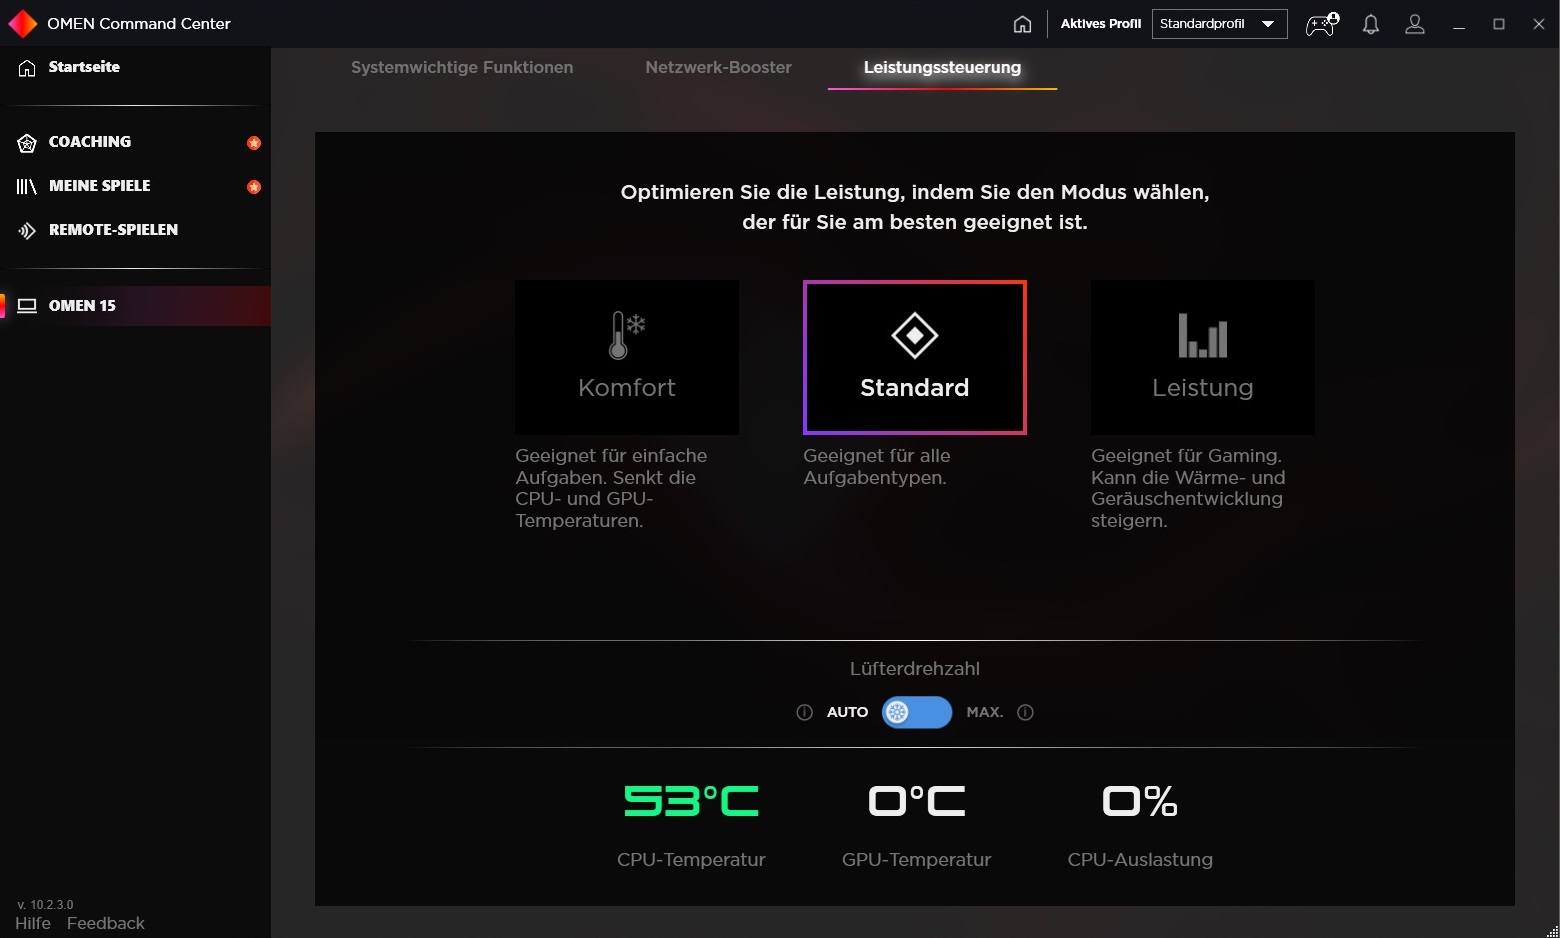
Tuning fans can let off steam in the pre-installed Command Center. Besides system monitoring, the tool also offers a network booster and performance control. The latter includes three profiles that affect the performance and the temperatures or volume. Our tests were always performed with the standard mode, which is supposed to be suitable for all task types and is active out of the box. The fans always ran in automatic mode (see screenshot #3).
Power
Although it is a budget device in terms of price, the Omen 15-en0375ng definitely belongs to the high-end segment. This is mainly due to the strong eight-core processor, which rarely has advantages over a fast four- or six-core in games so far, but shows its muscles in specialized applications and generally has more future-proofing.
Processor
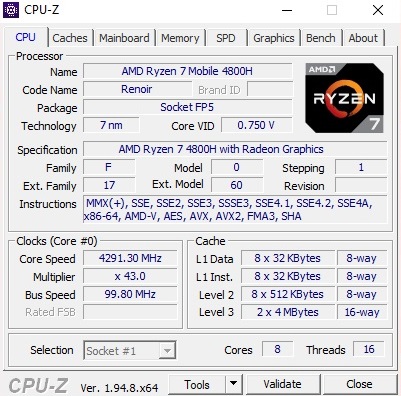
The benchmarks impressively prove that AMD is currently setting the tone in the CPU sector and has overtaken Intel. Thanks to its many cores, the Ryzen 7 4800H, which can process up to 16 threads simultaneously via SMT, sprints about 50% past the Core i7-10750H, which is very popular among gaming laptops, in multi-core applications like Cinebench R15. The lead over the Core i5-10300H, for example in the Legion 5 15IMH05H, is even around 100%.
Although the performance drops by a few percent under prolonged load, the Omen 15-en0375ng also cuts a good figure in the Cinebench loop. The clock is roughly on par with the 4800H competitor Schenker Core 15, whereas the Asus TUF A15 has to deal with a strongly fluctuating Turbo.
* ... smaller is better
System performance
The Omen 15 is also a frontrunner when it comes to system performance. 5,766 points in PCMark 10 catapult the 15-incher to the top position.
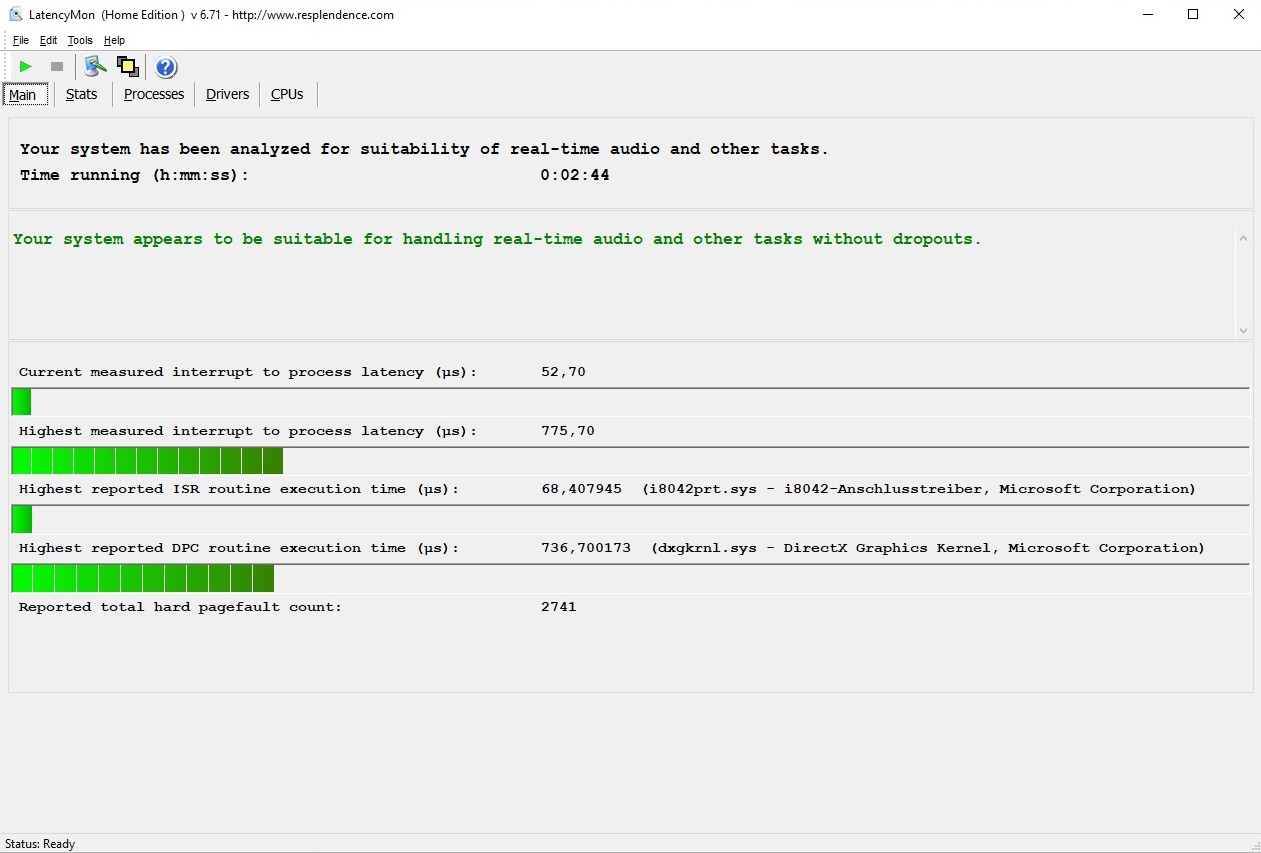
DPC latencies
In terms of latencies, the notebook also does not have to listen to any criticism. According to the LatencyMon tool, the system is well suited for real-time content and applications.
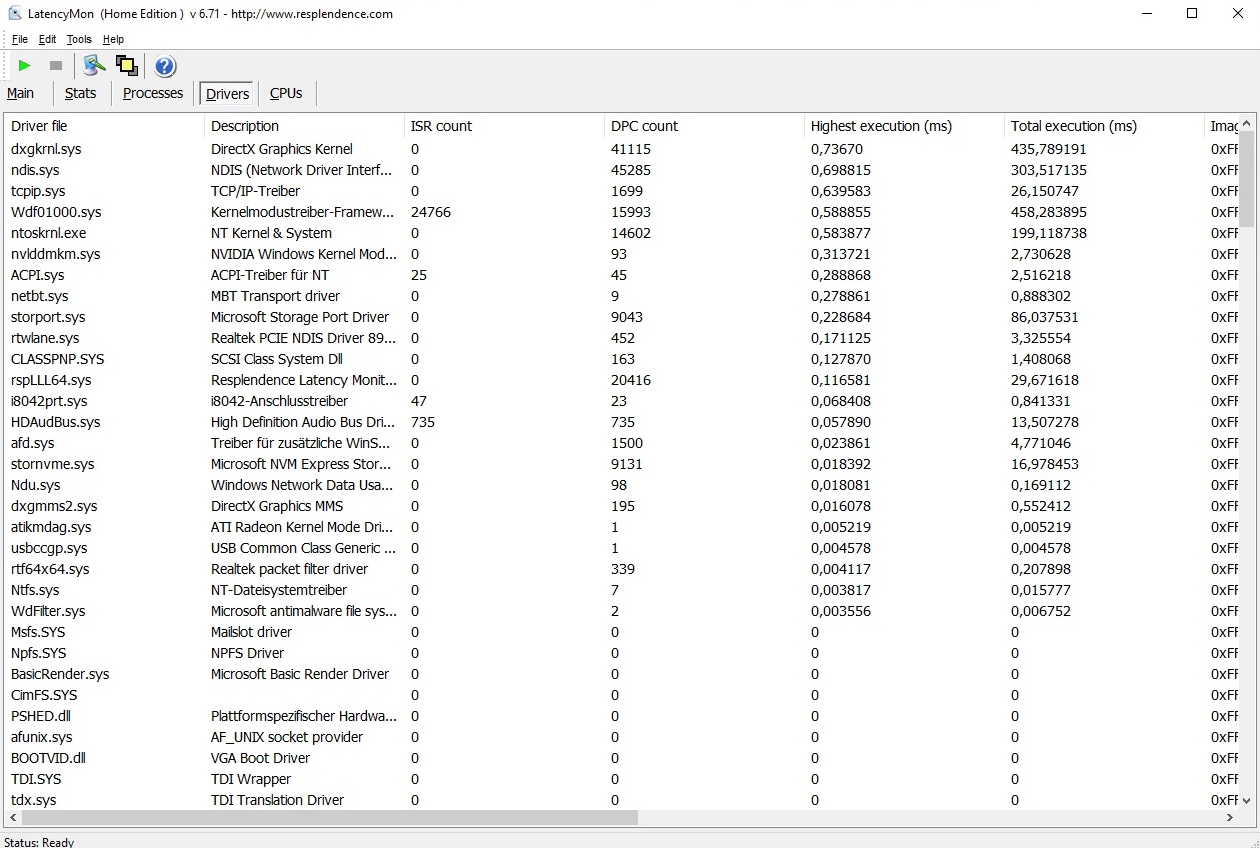
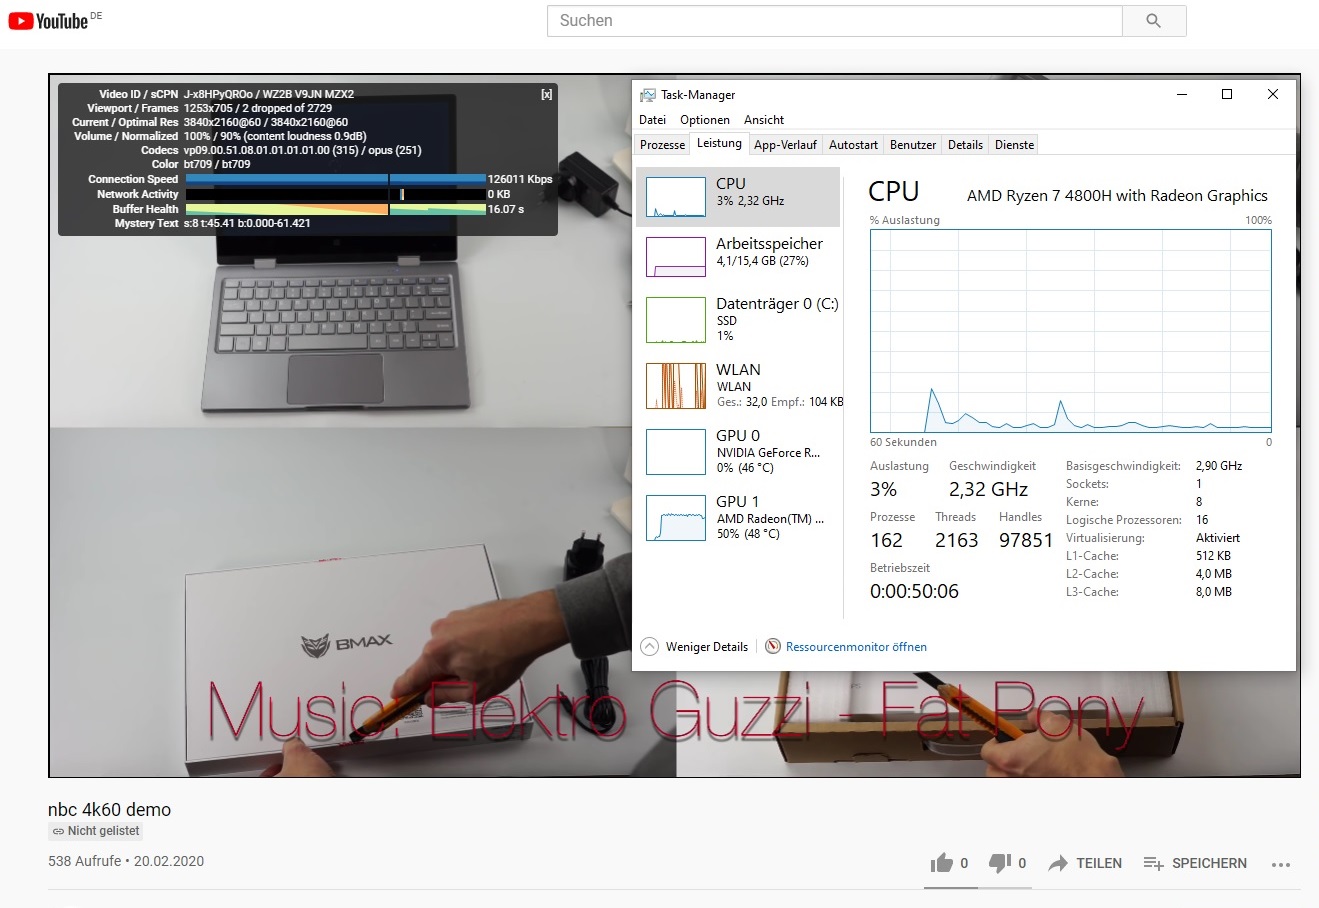
| DPC Latencies / LatencyMon - interrupt to process latency (max), Web, Youtube, Prime95 | |
| Schenker XMG Core 15 GK5NR0O | |
| Acer Predator Triton 300 PT315-52-79LP | |
| Aorus 5 KB | |
| Asus TUF Gaming A15 FA506IV-HN172 | |
| HP Omen 15-en0375ng | |
| Lenovo Legion 5 15IMH05H | |
* ... smaller is better
Mass storage
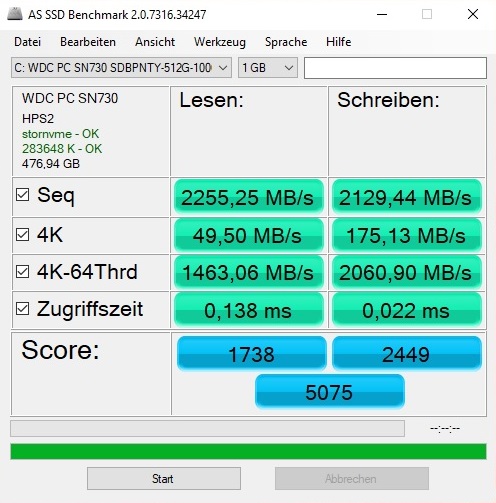
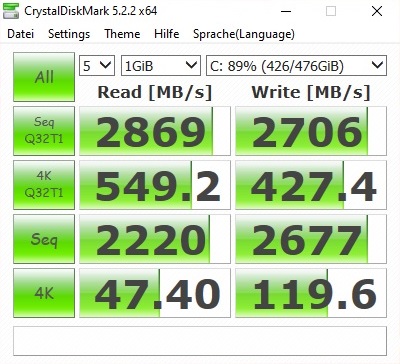
Buyers can also look forward to a fast mass storage device. The 512 GB model WDC PC SN730 installed in the review sample achieves more than 2000 MB/s in sequential read and write, which is a very good result. No wonder, since it is a modern PCIe/NVMe drive.
| HP Omen 15-en0375ng WDC PC SN730 SDBPNTY-512G | Schenker XMG Core 15 GK5NR0O Samsung SSD 970 EVO Plus 500GB | Asus TUF Gaming A15 FA506IV-HN172 Kingston OM8PCP3512F-AB | Acer Predator Triton 300 PT315-52-79LP WDC PC SN730 SDBQNTY-1T00 | Aorus 5 KB ADATA XPG SX8200 Pro (ASX8200PNP-512GT) | Lenovo Legion 5 15IMH05H Samsung PM991 MZALQ512HALU | Average WDC PC SN730 SDBPNTY-512G | |
|---|---|---|---|---|---|---|---|
| CrystalDiskMark 5.2 / 6 | 28% | -13% | -0% | 10% | -18% | 3% | |
| Write 4K (MB/s) | 119.6 | 233 95% | 219.8 84% | 117.5 -2% | 162.1 36% | 145.4 22% | 164.3 ? 37% |
| Read 4K (MB/s) | 47.4 | 54.5 15% | 50.2 6% | 47.36 0% | 60.7 28% | 51.6 9% | 48.2 ? 2% |
| Write Seq (MB/s) | 2677 | 3050 14% | 979 -63% | 2748 3% | 2366 -12% | 1007 -62% | 2096 ? -22% |
| Read Seq (MB/s) | 2220 | 3042 37% | 1990 -10% | 2084 -6% | 2633 19% | 1145 -48% | 2123 ? -4% |
| Write 4K Q32T1 (MB/s) | 427.4 | 520 22% | 516 21% | 407.3 -5% | 428.2 0% | 468.4 10% | 451 ? 6% |
| Read 4K Q32T1 (MB/s) | 549 | 546 -1% | 298.3 -46% | 474.6 -14% | 582 6% | 528 -4% | 509 ? -7% |
| Write Seq Q32T1 (MB/s) | 2706 | 3241 20% | 982 -64% | 3069 13% | 2480 -8% | 1381 -49% | 2551 ? -6% |
| Read Seq Q32T1 (MB/s) | 2869 | 3538 23% | 1907 -34% | 3154 10% | 3121 9% | 2291 -20% | 3330 ? 16% |
| AS SSD | 15% | -29% | -3% | -17% | -36% | -16% | |
| Seq Read (MB/s) | 2255 | 2836 26% | 1682 -25% | 2369 5% | 2795 24% | 2012 -11% | 2605 ? 16% |
| Seq Write (MB/s) | 2129 | 2452 15% | 904 -58% | 2446 15% | 2172 2% | 1261 -41% | 1905 ? -11% |
| 4K Read (MB/s) | 49.5 | 60.4 22% | 60.2 22% | 40.61 -18% | 53.3 8% | 43.66 -12% | 45.8 ? -7% |
| 4K Write (MB/s) | 175.1 | 190.5 9% | 164.8 -6% | 103.2 -41% | 121.3 -31% | 109.3 -38% | 155.6 ? -11% |
| 4K-64 Read (MB/s) | 1463 | 1283 -12% | 472.5 -68% | 1637 12% | 714 -51% | 851 -42% | 1181 ? -19% |
| 4K-64 Write (MB/s) | 2061 | 2298 11% | 845 -59% | 1961 -5% | 1376 -33% | 780 -62% | 1372 ? -33% |
| Access Time Read * (ms) | 0.138 | 0.034 75% | 0.087 37% | 0.06 57% | 0.049 64% | 0.117 15% | 0.0801 ? 42% |
| Access Time Write * (ms) | 0.022 | 0.02 9% | 0.02 9% | 0.036 -64% | 0.036 -64% | 0.036 -64% | 0.04195 ? -91% |
| Score Read (Points) | 1738 | 1627 -6% | 701 -60% | 1915 10% | 1046 -40% | 1096 -37% | 1488 ? -14% |
| Score Write (Points) | 2449 | 2734 12% | 1101 -55% | 2309 -6% | 1714 -30% | 1016 -59% | 1718 ? -30% |
| Score Total (Points) | 5075 | 5184 2% | 2143 -58% | 5205 3% | 3279 -35% | 2643 -48% | 3938 ? -22% |
| Total Average (Program / Settings) | 22% /
20% | -21% /
-22% | -2% /
-2% | -4% /
-6% | -27% /
-28% | -7% /
-8% |
* ... smaller is better

Continuous reading: DiskSpd Read Loop, Queue Depth 8
Graphics card
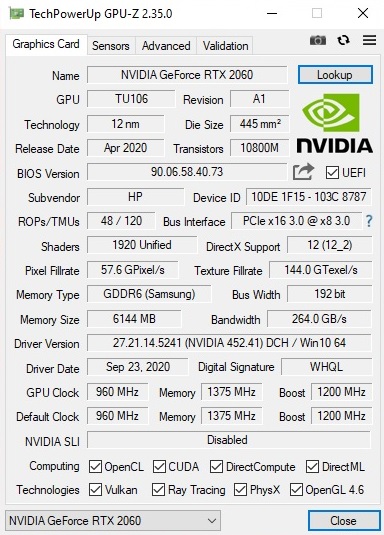
The GeForce RTX 2060 is the perfect companion for gamers who want to invest at most 1,500 Euros (~$1820) in a notebook. The DirectX 12 model is located between the mid- and upper-range in terms of performance and, in contrast to its cheaper brothers, can boast "real" ray-tracing capabilities.
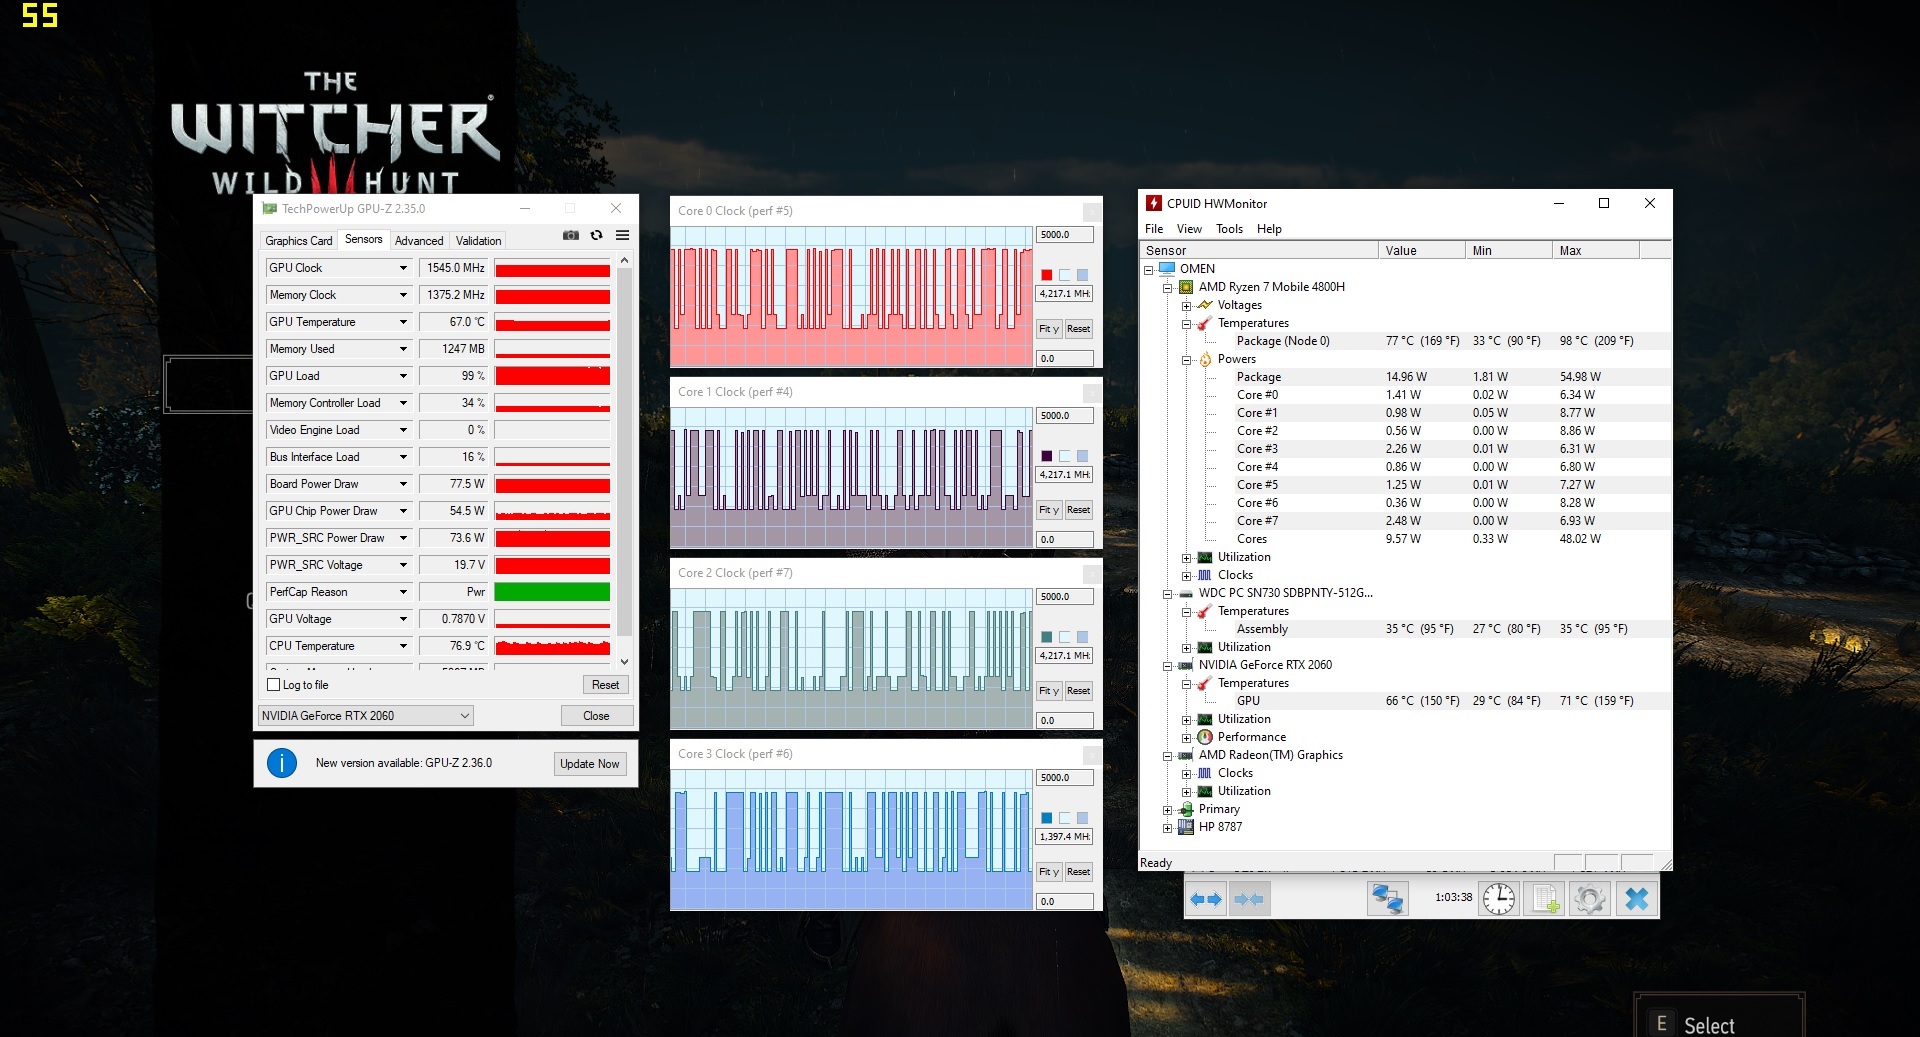
While the CPU power is - as already explained - above average, the GPU speed falls behind the competition a bit. The Omen 15-en0375ng brings up the rear in the 3DMark tests, but the difference is often marginal and subjectively hardly noticeable. The same applies to the subtle frame rate drop in the Witcher 3 test (about 1 hour @FHD/Ultra), which simulates a longer 3D load.
| 3DMark 11 Performance | 18798 points | |
| 3DMark Cloud Gate Standard Score | 38655 points | |
| 3DMark Fire Strike Score | 14526 points | |
| 3DMark Time Spy Score | 6161 points | |
Help | ||
Gaming performance
The combination of Ryzen 7 4800H and GeForce RTX 2060 is fast enough to play most current games smoothly with 1,920 x 1,080 pixels and maximum details. Only very demanding and/or poorly optimized games, such as Watch Dogs Legion, Dirt 5 and Cyberpunk 2077, drop the Avg FPS below the 40 mark.
| The Witcher 3 | |
| 1920x1080 High Graphics & Postprocessing (Nvidia HairWorks Off) | |
| Average of class Gaming (341 - 404, n=2, last 2 years) | |
| Lenovo Legion 5 15IMH05H | |
| HP Omen 15-en0375ng | |
| Asus TUF Gaming A15 FA506IV-HN172 | |
| Schenker XMG Core 15 GK5NR0O | |
| 1920x1080 Ultra Graphics & Postprocessing (HBAO+) | |
| Average of class Gaming (104.7 - 240, n=7, last 2 years) | |
| Lenovo Legion 5 15IMH05H | |
| Asus TUF Gaming A15 FA506IV-HN172 | |
| Acer Predator Triton 300 PT315-52-79LP | |
| Schenker XMG Core 15 GK5NR0O | |
| Aorus 5 KB | |
| HP Omen 15-en0375ng | |
| low | med. | high | ultra | |
|---|---|---|---|---|
| GTA V (2015) | 165 | 159 | 127 | 70.8 |
| The Witcher 3 (2015) | 107 | 56.4 | ||
| Dota 2 Reborn (2015) | 123 | 115 | 109 | 104 |
| X-Plane 11.11 (2018) | 91.5 | 81.9 | 68.8 | |
| Shadow of the Tomb Raider (2018) | 83 | 73 | ||
| Battlefield V (2018) | 102 | 93.1 | ||
| Borderlands 3 (2019) | 61.9 | 48.1 | ||
| Valorant (2020) | 177 | |||
| Crysis Remastered (2020) | 52.9 | 40 | ||
| FIFA 21 (2020) | 163 | 161 | ||
| Watch Dogs Legion (2020) | 66 | 36 | ||
| Dirt 5 (2020) | 59.2 | 38.7 | ||
| Assassin´s Creed Valhalla (2020) | 53 | 46 | ||
| Call of Duty Black Ops Cold War (2020) | 62.2 | 57.1 | ||
| Yakuza Like a Dragon (2020) | 71.8 | 64.1 | ||
| Immortals Fenyx Rising (2020) | 54 | 51 | ||
| Cyberpunk 2077 1.0 (2020) | 45.3 | 38.8 |
Emissions
Noise emissions
The fan control leaves a decent impression when idling and during simple activities (office, web, etc.). Although there can be short upsurges every now and then, the fans usually stand still, which leads to silent operation. Under load, however, the 15-incher clearly attracts attention. 48 dB(A) in the Witcher 3 test is similar to the noise level of the competition, which reaches 47 to 51 dB(A).
Noise level
| Idle |
| 24 / 25 / 37 dB(A) |
| Load |
| 45 / 51 dB(A) |
 | ||
30 dB silent 40 dB(A) audible 50 dB(A) loud |
||
min: | ||
| HP Omen 15-en0375ng R7 4800H, GeForce RTX 2060 Mobile | Schenker XMG Core 15 GK5NR0O R7 4800H, GeForce RTX 2060 Mobile | Asus TUF Gaming A15 FA506IV-HN172 R7 4800H, GeForce RTX 2060 Mobile | Acer Predator Triton 300 PT315-52-79LP i7-10750H, GeForce RTX 2060 Mobile | Aorus 5 KB i7-10750H, GeForce RTX 2060 Mobile | Lenovo Legion 5 15IMH05H i5-10300H, GeForce RTX 2060 Mobile | Average of class Gaming | |
|---|---|---|---|---|---|---|---|
| Noise | -2% | -6% | -2% | -8% | -6% | -0% | |
| off / environment * (dB) | 24 | 25 -4% | 30.2 -26% | 25 -4% | 25 -4% | 30.7 -28% | 24.1 ? -0% |
| Idle Minimum * (dB) | 24 | 26 -8% | 30.2 -26% | 25 -4% | 26 -8% | 30.7 -28% | 26 ? -8% |
| Idle Average * (dB) | 25 | 30 -20% | 30.2 -21% | 29 -16% | 30 -20% | 30.7 -23% | 27.4 ? -10% |
| Idle Maximum * (dB) | 37 | 32 14% | 30.2 18% | 34 8% | 34 8% | 30.7 17% | 30.1 ? 19% |
| Load Average * (dB) | 45 | 46 -2% | 40 11% | 44 2% | 53 -18% | 36.6 19% | 43.6 ? 3% |
| Witcher 3 ultra * (dB) | 48 | 48 -0% | 49 -2% | 49 -2% | 51 -6% | 47 2% | |
| Load Maximum * (dB) | 51 | 48 6% | 49 4% | 49 4% | 56 -10% | 50.9 -0% | 54.2 ? -6% |
* ... smaller is better
Temperature
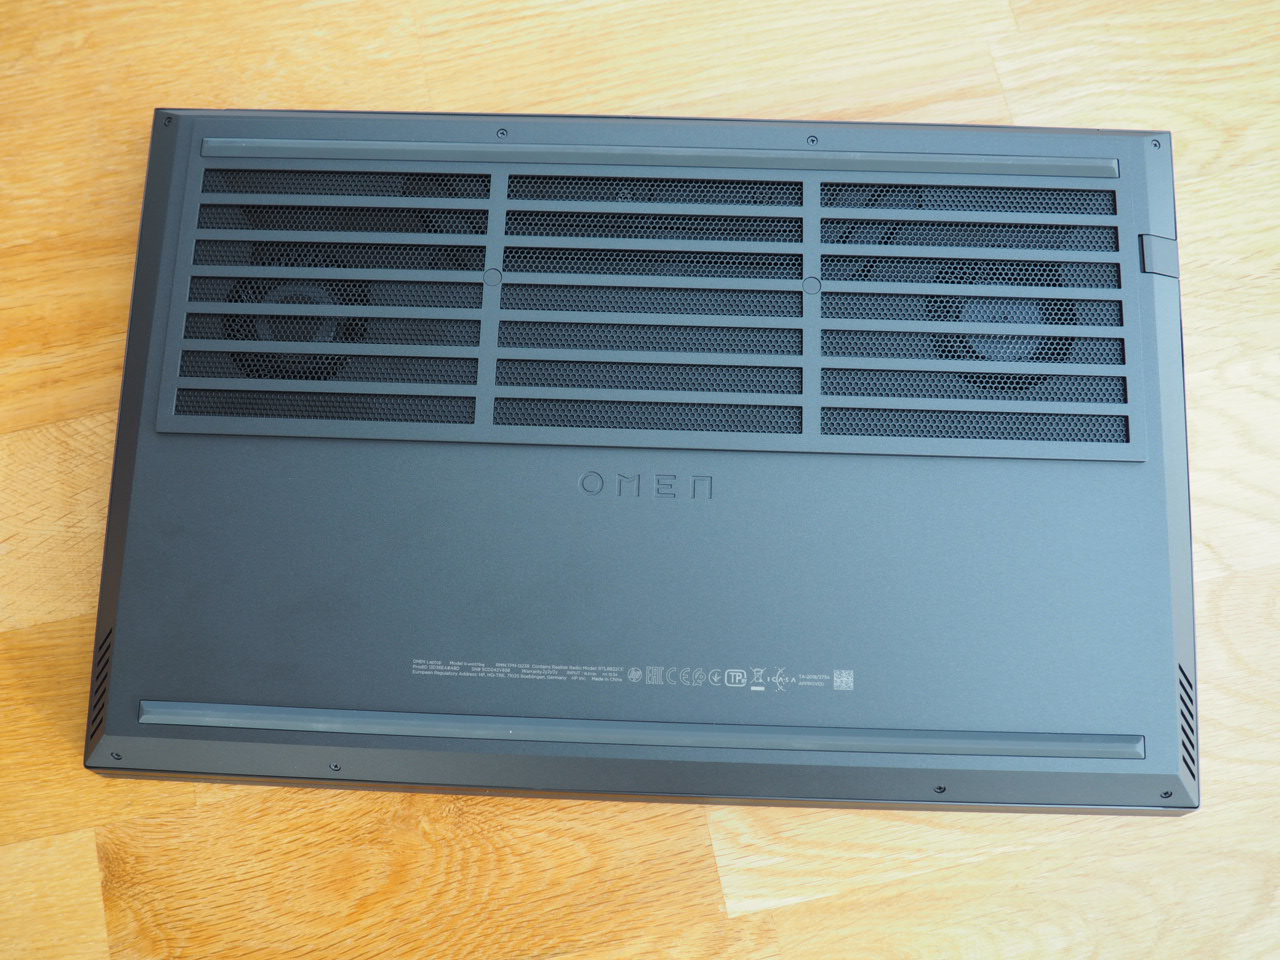
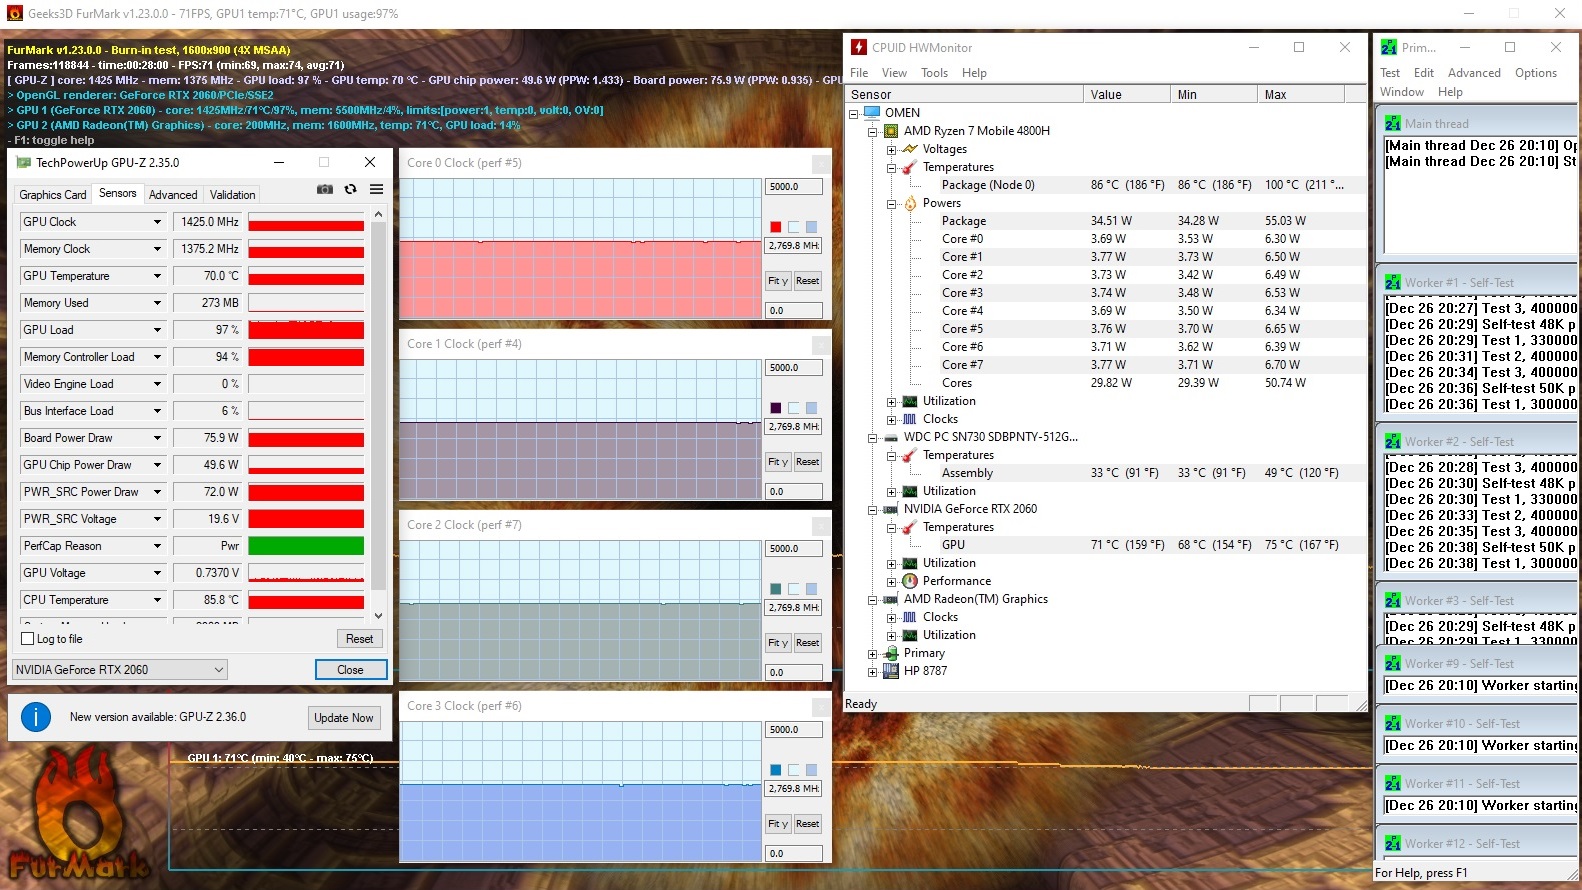
The temperature development of the chassis varies a lot. While the case's bottom heats up to over 50 °C (122 °F) in some places under full load, the top only reaches a maximum of 42 °C (107.6 °F) - a moderate rate. Under the hood, the processor in particular heats up. After 60 minutes of stress testing with the Furmark and Prime95 tools, the Ryzen 7 4800H made itself comfortable at around 86 °C (186.8 °F). The GeForce RTX 2060 stayed noticeably cooler with just under 70 °C (158 °F). The values in the Witcher 3 test can be seen in the first screenshot.
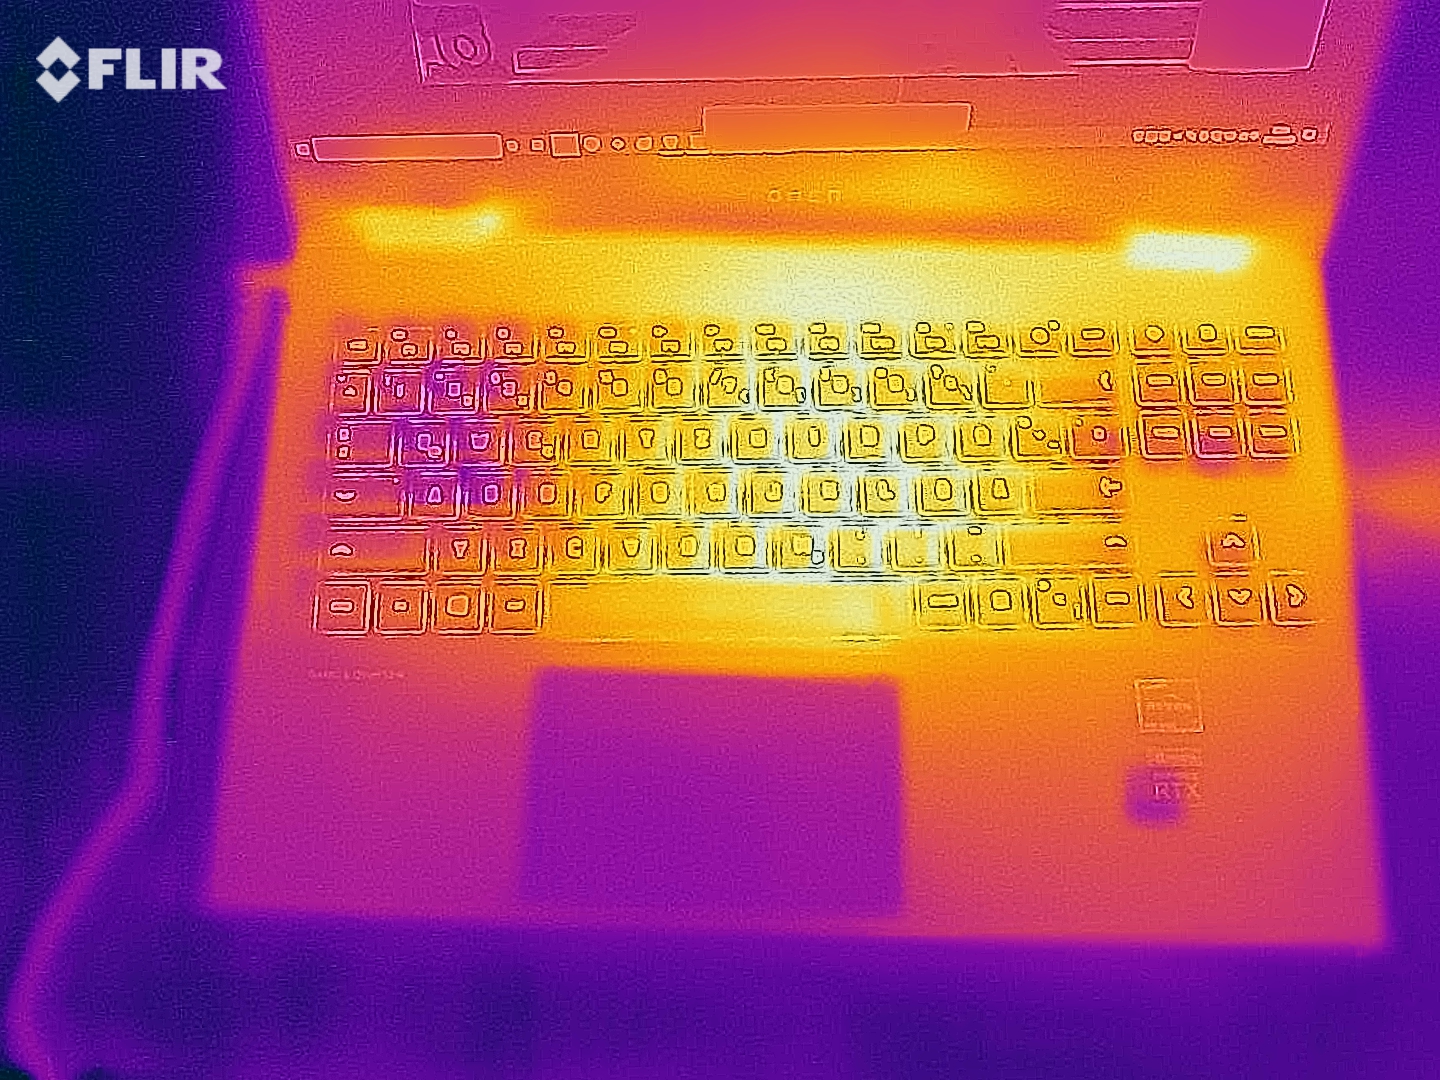
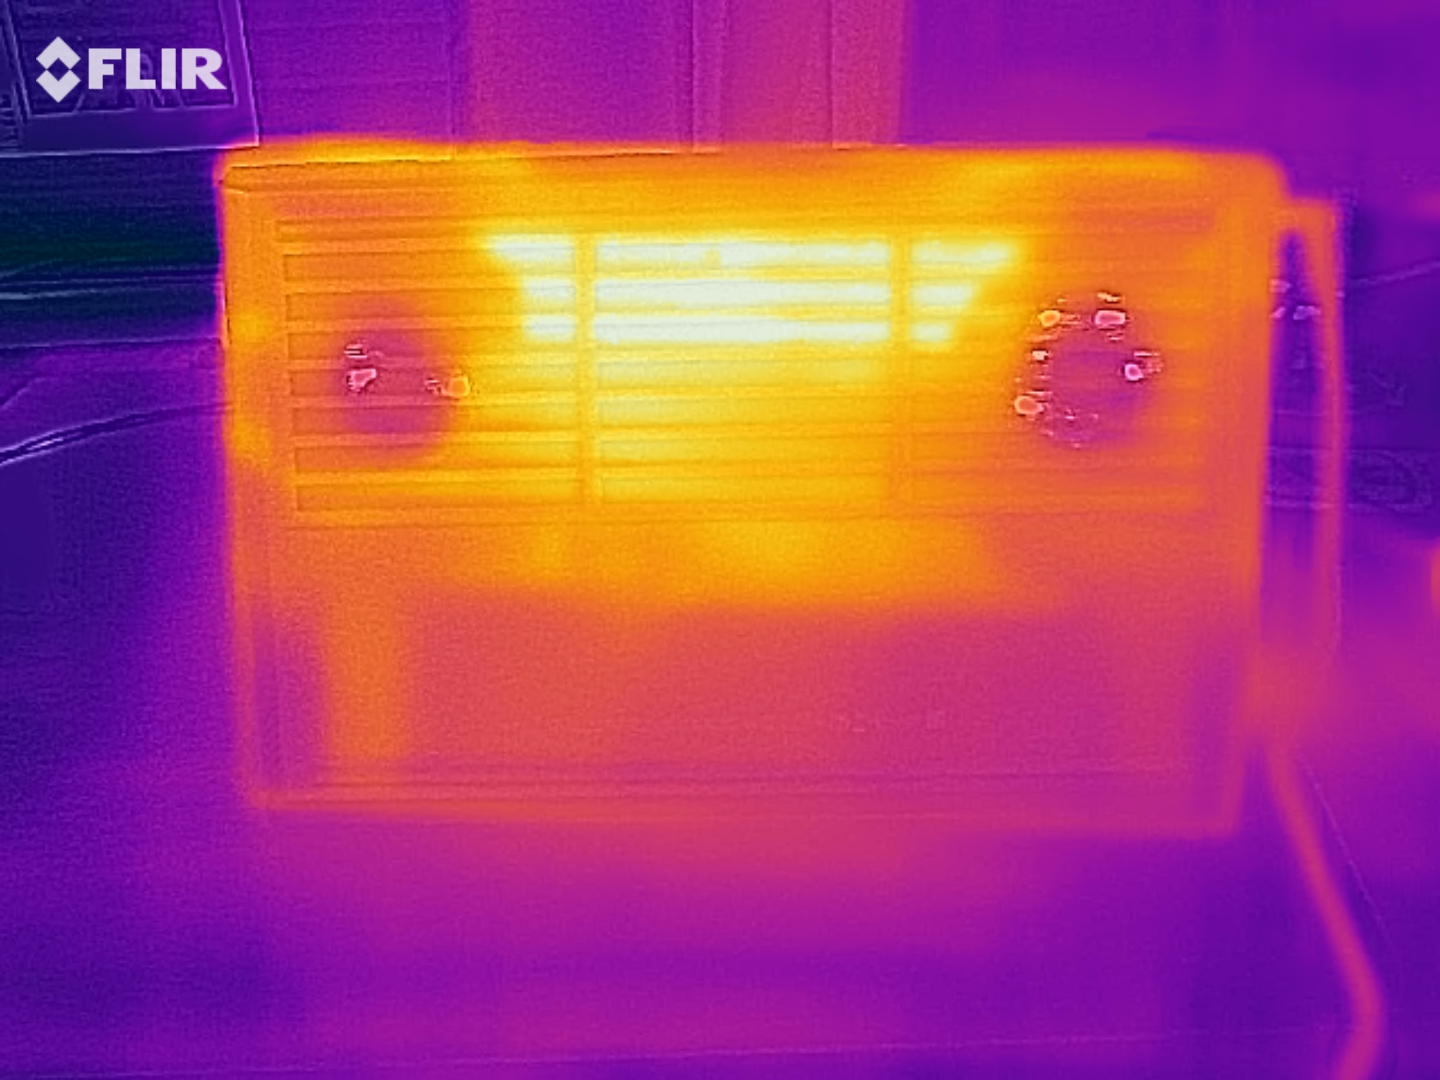
(±) The maximum temperature on the upper side is 42 °C / 108 F, compared to the average of 40.4 °C / 105 F, ranging from 21.2 to 68.8 °C for the class Gaming.
(-) The bottom heats up to a maximum of 54 °C / 129 F, compared to the average of 43.2 °C / 110 F
(+) In idle usage, the average temperature for the upper side is 27.1 °C / 81 F, compared to the device average of 33.9 °C / 93 F.
(-) Playing The Witcher 3, the average temperature for the upper side is 38.7 °C / 102 F, compared to the device average of 33.9 °C / 93 F.
(+) The palmrests and touchpad are reaching skin temperature as a maximum (35 °C / 95 F) and are therefore not hot.
(-) The average temperature of the palmrest area of similar devices was 28.8 °C / 83.8 F (-6.2 °C / -11.2 F).
| HP Omen 15-en0375ng R7 4800H, GeForce RTX 2060 Mobile | Schenker XMG Core 15 GK5NR0O R7 4800H, GeForce RTX 2060 Mobile | Asus TUF Gaming A15 FA506IV-HN172 R7 4800H, GeForce RTX 2060 Mobile | Acer Predator Triton 300 PT315-52-79LP i7-10750H, GeForce RTX 2060 Mobile | Aorus 5 KB i7-10750H, GeForce RTX 2060 Mobile | Lenovo Legion 5 15IMH05H i5-10300H, GeForce RTX 2060 Mobile | Average of class Gaming | |
|---|---|---|---|---|---|---|---|
| Heat | -14% | 4% | -21% | -11% | 2% | -7% | |
| Maximum Upper Side * (°C) | 42 | 51 -21% | 42.9 -2% | 55 -31% | 50 -19% | 46.3 -10% | 45.2 ? -8% |
| Maximum Bottom * (°C) | 54 | 64 -19% | 49.9 8% | 65 -20% | 49 9% | 44.4 18% | 48.1 ? 11% |
| Idle Upper Side * (°C) | 28 | 29 -4% | 27.8 1% | 32 -14% | 35 -25% | 28.1 -0% | 31 ? -11% |
| Idle Bottom * (°C) | 29 | 32 -10% | 27 7% | 34 -17% | 31 -7% | 29.4 -1% | 34.2 ? -18% |
* ... smaller is better
Loudspeaker
HP Omen 15-en0375ng audio analysis
(+) | speakers can play relatively loud (82 dB)
Bass 100 - 315 Hz
(-) | nearly no bass - on average 21.4% lower than median
(-) | bass is not linear (15% delta to prev. frequency)
Mids 400 - 2000 Hz
(+) | balanced mids - only 1.9% away from median
(+) | mids are linear (4.3% delta to prev. frequency)
Highs 2 - 16 kHz
(+) | balanced highs - only 3.3% away from median
(+) | highs are linear (6.6% delta to prev. frequency)
Overall 100 - 16.000 Hz
(+) | overall sound is linear (14.7% difference to median)
Compared to same class
» 29% of all tested devices in this class were better, 7% similar, 64% worse
» The best had a delta of 6%, average was 18%, worst was 132%
Compared to all devices tested
» 19% of all tested devices were better, 4% similar, 77% worse
» The best had a delta of 4%, average was 23%, worst was 134%
Schenker XMG Core 15 GK5NR0O audio analysis
(+) | speakers can play relatively loud (85 dB)
Bass 100 - 315 Hz
(-) | nearly no bass - on average 24.2% lower than median
(±) | linearity of bass is average (14.8% delta to prev. frequency)
Mids 400 - 2000 Hz
(+) | balanced mids - only 2% away from median
(+) | mids are linear (3.8% delta to prev. frequency)
Highs 2 - 16 kHz
(±) | higher highs - on average 7.1% higher than median
(±) | linearity of highs is average (9% delta to prev. frequency)
Overall 100 - 16.000 Hz
(±) | linearity of overall sound is average (18.8% difference to median)
Compared to same class
» 62% of all tested devices in this class were better, 8% similar, 30% worse
» The best had a delta of 6%, average was 18%, worst was 132%
Compared to all devices tested
» 43% of all tested devices were better, 8% similar, 49% worse
» The best had a delta of 4%, average was 23%, worst was 134%
Power management
Energy absorption
For a gaming notebook, the power consumption is within limits. The Omen 15-en0375ng is relatively frugal with 4 to 22 watts in idle mode, which promises good battery runtimes. Even under load, the consumption rates are usually better than those of the competition. There are many indications that the Ryzen 7 4800H is more energy-efficient than its Intel counterparts - thanks to the modern manufacturing process (7 vs 14 nm).
| Off / Standby | |
| Idle | |
| Load |
|
Key:
min: | |
| HP Omen 15-en0375ng R7 4800H, GeForce RTX 2060 Mobile | Schenker XMG Core 15 GK5NR0O R7 4800H, GeForce RTX 2060 Mobile | Asus TUF Gaming A15 FA506IV-HN172 R7 4800H, GeForce RTX 2060 Mobile | Acer Predator Triton 300 PT315-52-79LP i7-10750H, GeForce RTX 2060 Mobile | Aorus 5 KB i7-10750H, GeForce RTX 2060 Mobile | Lenovo Legion 5 15IMH05H i5-10300H, GeForce RTX 2060 Mobile | Average of class Gaming | |
|---|---|---|---|---|---|---|---|
| Power Consumption | -43% | -5% | -4% | -31% | 12% | -80% | |
| Idle Minimum * (Watt) | 4 | 12 -200% | 5.4 -35% | 4 -0% | 8 -100% | 3.2 20% | 13 ? -225% |
| Idle Average * (Watt) | 9 | 14 -56% | 10 -11% | 10 -11% | 12 -33% | 8.3 8% | 19 ? -111% |
| Idle Maximum * (Watt) | 22 | 20 9% | 10.5 52% | 19 14% | 21 5% | 8.7 60% | 24.6 ? -12% |
| Load Average * (Watt) | 102 | 103 -1% | 135 -32% | 96 6% | 128 -25% | 82 20% | 110.7 ? -9% |
| Witcher 3 ultra * (Watt) | 119 | 125 -5% | 144 -21% | 136 -14% | 138 -16% | 151 -27% | |
| Load Maximum * (Watt) | 182 | 193 -6% | 147 19% | 214 -18% | 217 -19% | 195 -7% | 259 ? -42% |
* ... smaller is better
Battery life
One of the biggest strengths of the Omen 15-en0375ng is its battery life. Up to 20 hours in the ideal case (minimum load & display brightness) and about 10.5 hours of Internet surfing via WLAN (brightness reduced to about 150 d/m²) are outstanding in the gaming segment. Only Lenovo's Legion 5 can come close to these rates. However, the performance also drops significantly in battery mode. The frame rate dropped by almost 90(!)% in the Witcher 3 test without a power supply. However, performance or not: 70.9 Wh battery capacity should be a model for the competition (48 to 62 Wh).
| HP Omen 15-en0375ng R7 4800H, GeForce RTX 2060 Mobile, 70.9 Wh | Schenker XMG Core 15 GK5NR0O R7 4800H, GeForce RTX 2060 Mobile, 62 Wh | Asus TUF Gaming A15 FA506IV-HN172 R7 4800H, GeForce RTX 2060 Mobile, 48 Wh | Acer Predator Triton 300 PT315-52-79LP i7-10750H, GeForce RTX 2060 Mobile, 58.7 Wh | Aorus 5 KB i7-10750H, GeForce RTX 2060 Mobile, 48.96 Wh | Lenovo Legion 5 15IMH05H i5-10300H, GeForce RTX 2060 Mobile, 60 Wh | Average of class Gaming | |
|---|---|---|---|---|---|---|---|
| Battery runtime | -41% | -29% | -39% | -51% | -27% | -36% | |
| Reader / Idle (h) | 20 | 7.8 -61% | 9.8 -51% | 9.6 -52% | 9 -55% | 14.1 -29% | 8.27 ? -59% |
| WiFi v1.3 (h) | 10.5 | 5.9 -44% | 6.2 -41% | 5.5 -48% | 4.8 -54% | 7.2 -31% | 7.11 ? -32% |
| Load (h) | 1.8 | 1.5 -17% | 1.9 6% | 1.5 -17% | 1 -44% | 1.4 -22% | 1.502 ? -17% |
| H.264 (h) | 6.2 | 5.4 | 9.2 | 8.32 ? |
Pros
Cons
Conclusion
If you can put up with a color-poor 60 Hz display and a high noise level in 3D mode, the Omen 15-en0375ng is a powerful and not too expensive gaming notebook.
We consider around 1,260 Euros (~$1530) for a Ryzen 7 4800H, a GeForce RTX 2060, a 512 GB SSD and 16 GB dual-channel RAM to be a good offer that appeals to price-conscious gamers. Very high details are rarely a problem in the native resolution of 1,920 x 1,080. Buyers will also be spoiled with a top-notch battery life that even beats most other notebook classes.
If HP now improves the speed of the WLAN module, the stability of the case and the repeatedly criticized picture quality, the competition will have to dress extra warmly.
Note: Other AMD models of the Omen 15 offer a (probably better) 144 Hz panel.
Availability
The tested model with the suffix en0375ng is only listed by very few online stores (e.g. Mediamarkt & Saturn) and is unfortunately not available there at the moment.
HP Omen 15-en0375ng
- 12/29/2020 v7 (old)
Florian Glaser
Price comparison

