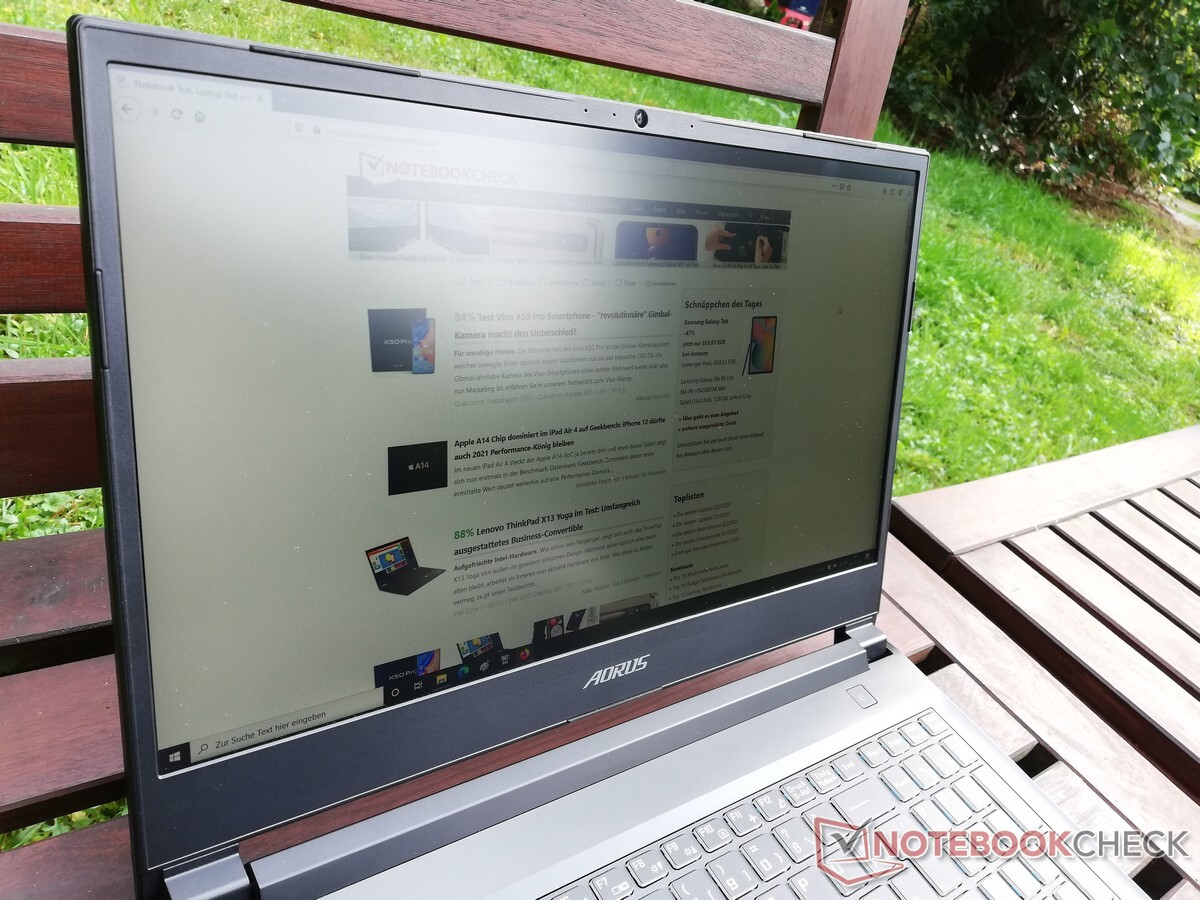
Aorus 5 KB laptop in review: Gigabyte builds upon Clevo barebone with the RTX 2060

Prospective buyers can certainly spend up to 4,000 Euros (~$4,706) on an Aorus laptop as was the case with the release of the Aorus 17 YA, for example. The Aorus 15-SA and Aorus 15G XB models were rather mid-priced at just over and just under 2,000 Euros (~$2,353), but they weren't as inexpensive as our current test device. The latter offers an Intel Core i7-10750H, 16 GB of RAM, a 512 GB SSD, and an Nvidia GeForce RTX 2060 for about 1,200 Euros (~$1,412).
With this configuration, the Aorus 5 KB has to face the competing devices listed below, to which other gaming laptops from our database can be added under each section.
Rating | Date | Model | Weight | Height | Size | Resolution | Price |
|---|---|---|---|---|---|---|---|
| 83.7 % v7 (old) | 10 / 2020 | Aorus 5 KB i7-10750H, GeForce RTX 2060 Mobile | 2.1 kg | 28 mm | 15.60" | 1920x1080 | |
| 83.3 % v7 (old) | 02 / 2020 | Schenker XMG Pro 15 i7-9750H, GeForce RTX 2070 Mobile | 2.5 kg | 30 mm | 15.60" | 1920x1080 | |
| 82.7 % v7 (old) | 06 / 2020 | Asus TUF Gaming A15 FA506IV-HN172 R7 4800H, GeForce RTX 2060 Mobile | 2.2 kg | 24.9 mm | 15.60" | 1920x1080 | |
| 83.3 % v7 (old) | 07 / 2020 | Lenovo Legion 5 15IMH05H i5-10300H, GeForce RTX 2060 Mobile | 2.5 kg | 26.1 mm | 15.60" | 1920x1080 | |
| 81.1 % v7 (old) | 10 / 2020 | HP Pavilion Gaming 15-ec1177ng R7 4800H, GeForce GTX 1660 Ti Max-Q | 2 kg | 23.5 mm | 15.60" | 1920x1080 |
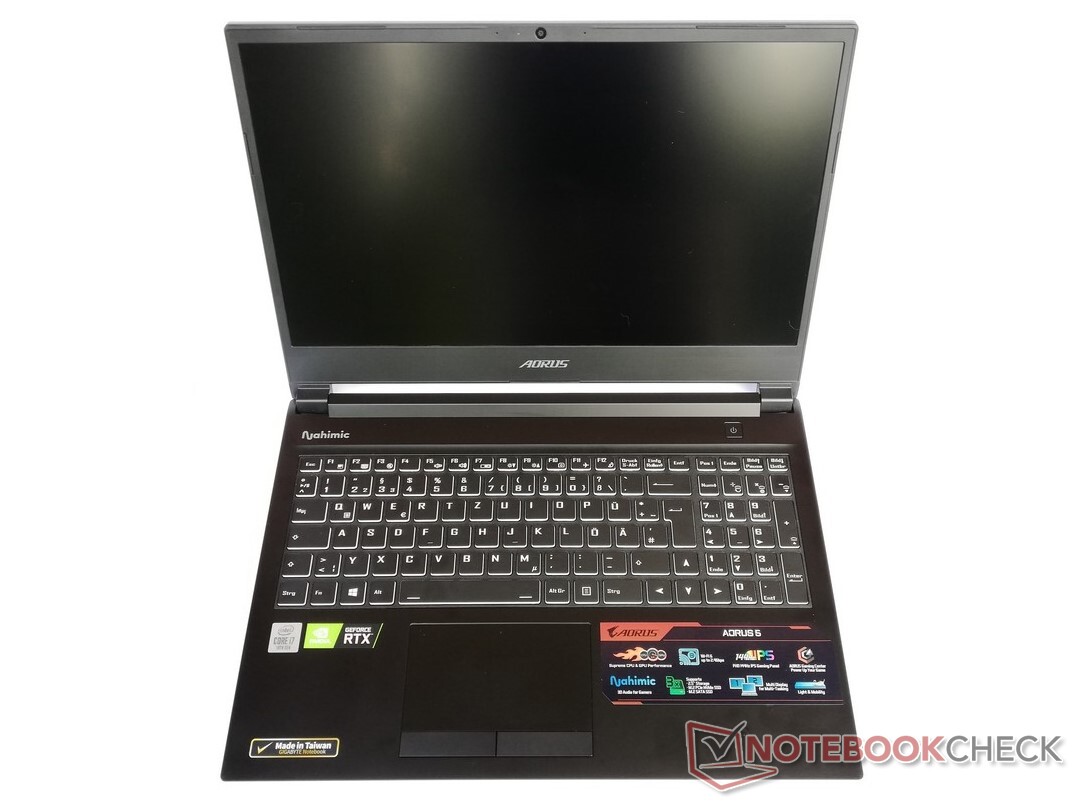
Case - Gaming laptop with replaceable battery
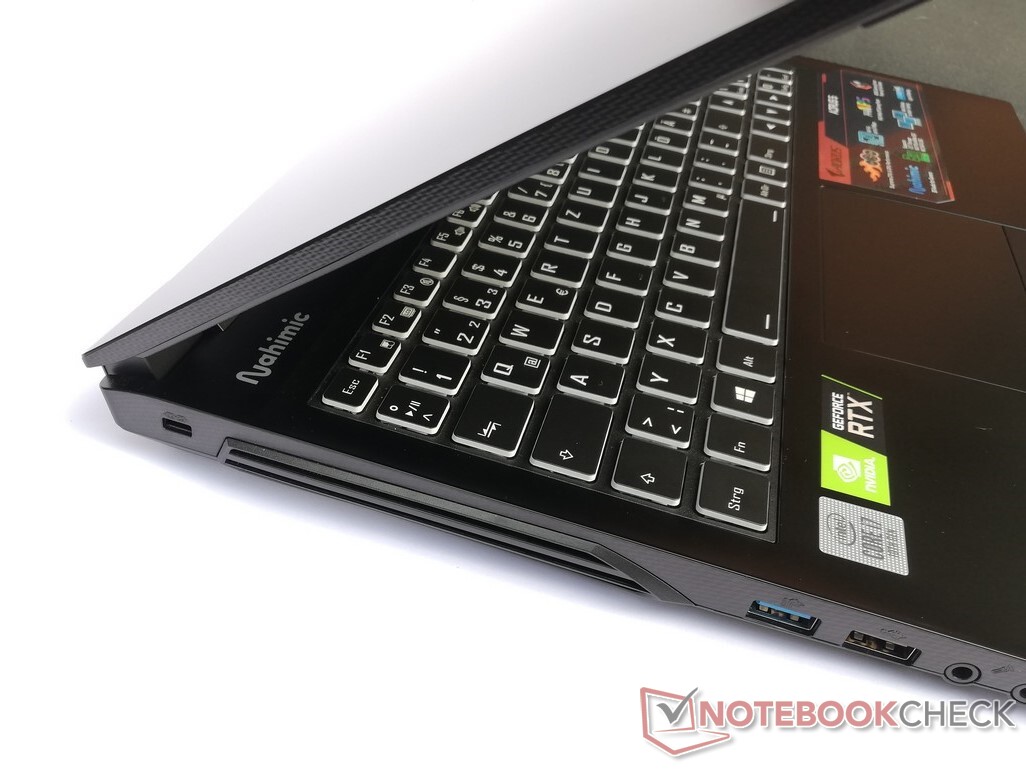
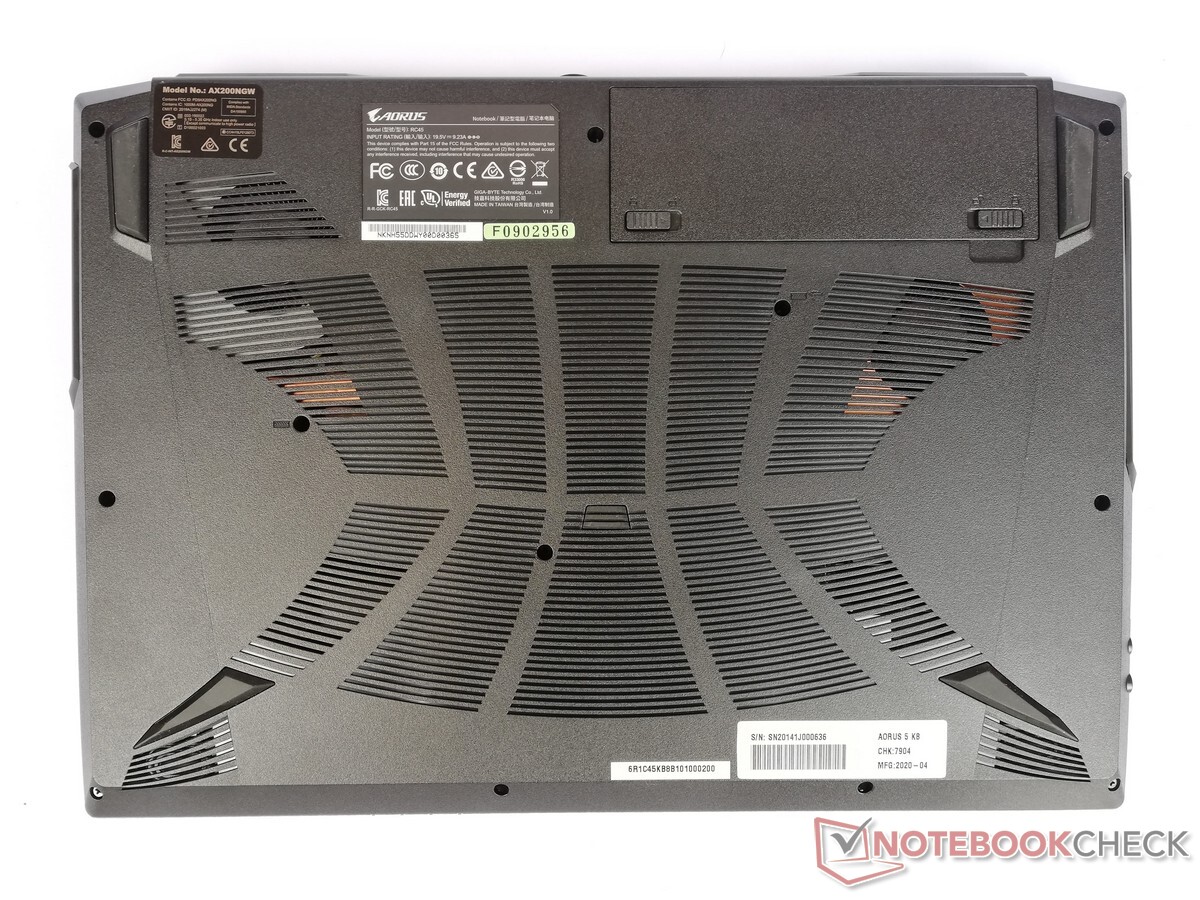
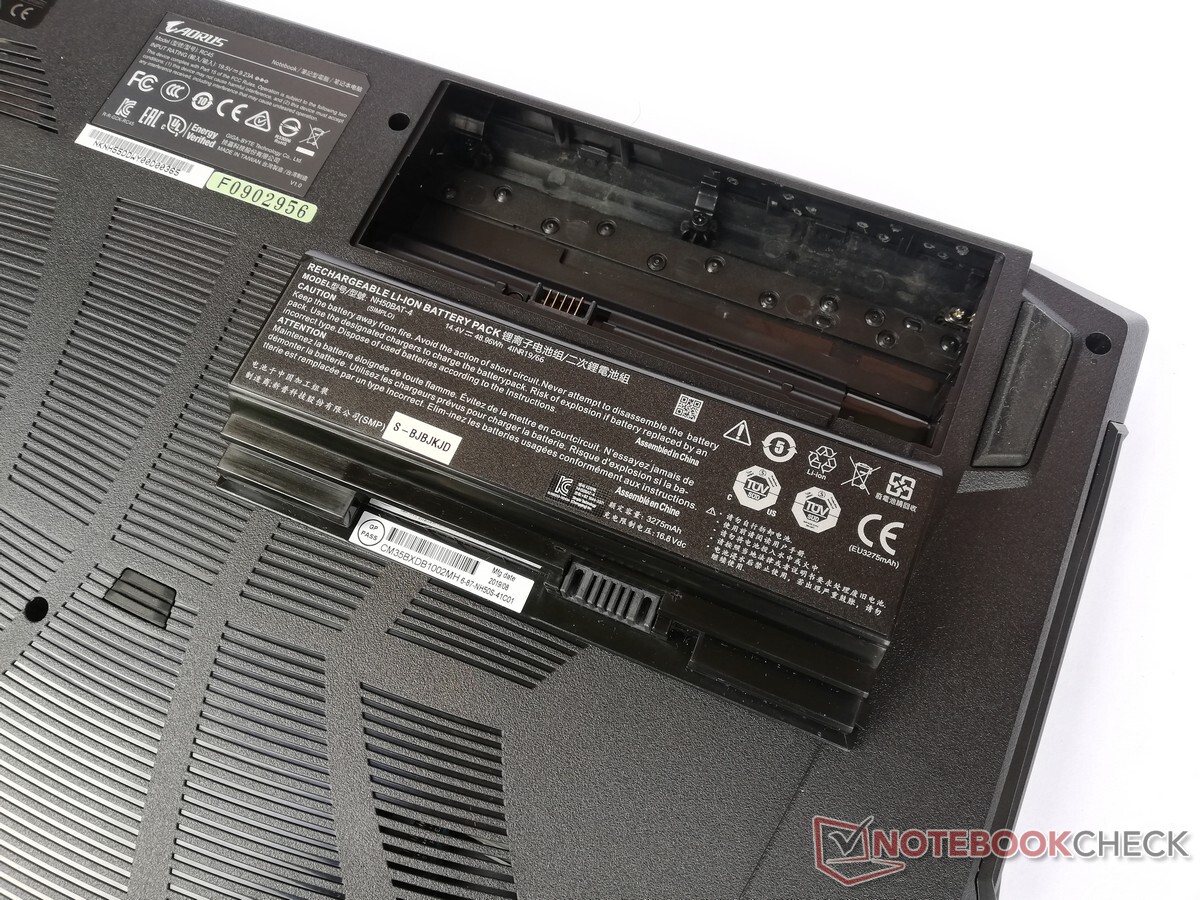
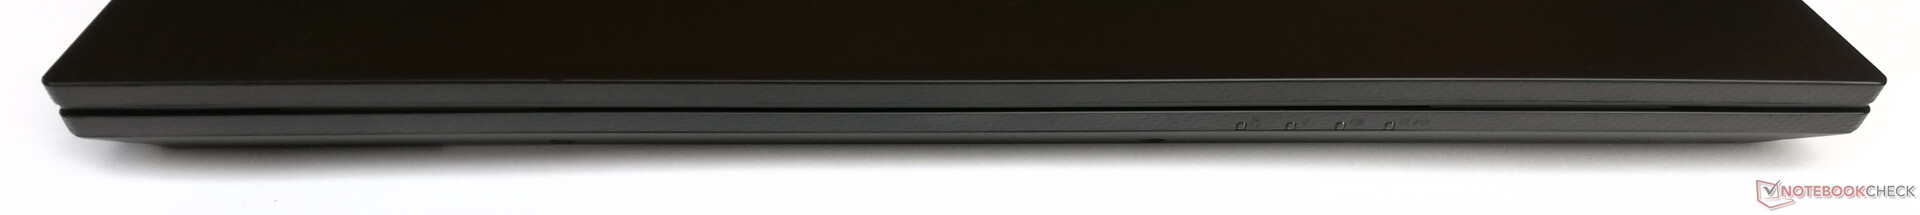
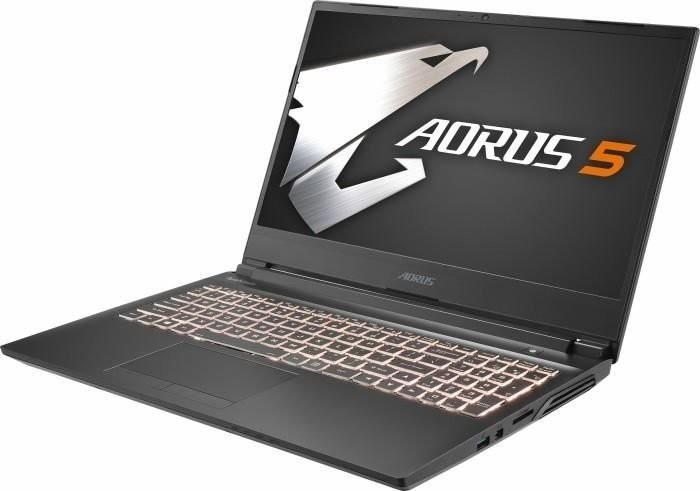
Gigabyte has chosen a barebone from Clevo for the case of the Aorus 5 KB as we've already seen, for example, in the 17-inch Nexoc GH7. A 15-inch model made of plastic is used here, and it shows no weaknesses in terms of workmanship. The gap dimensions are even all around, and the material used appears robust. The lid can be opened with one hand up to an aperture angle of about 120° and is held firmly by the hinges in each chosen position. The battery can be removed at the bottom of the gaming laptop without tools.
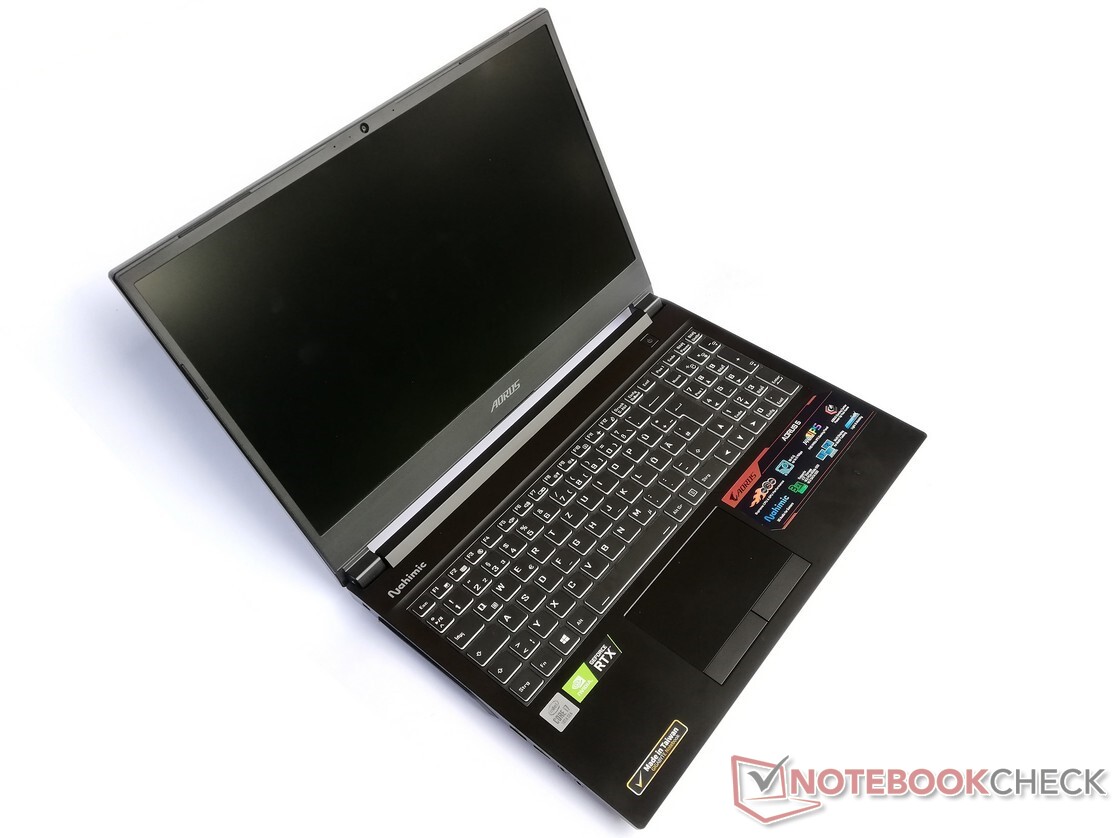
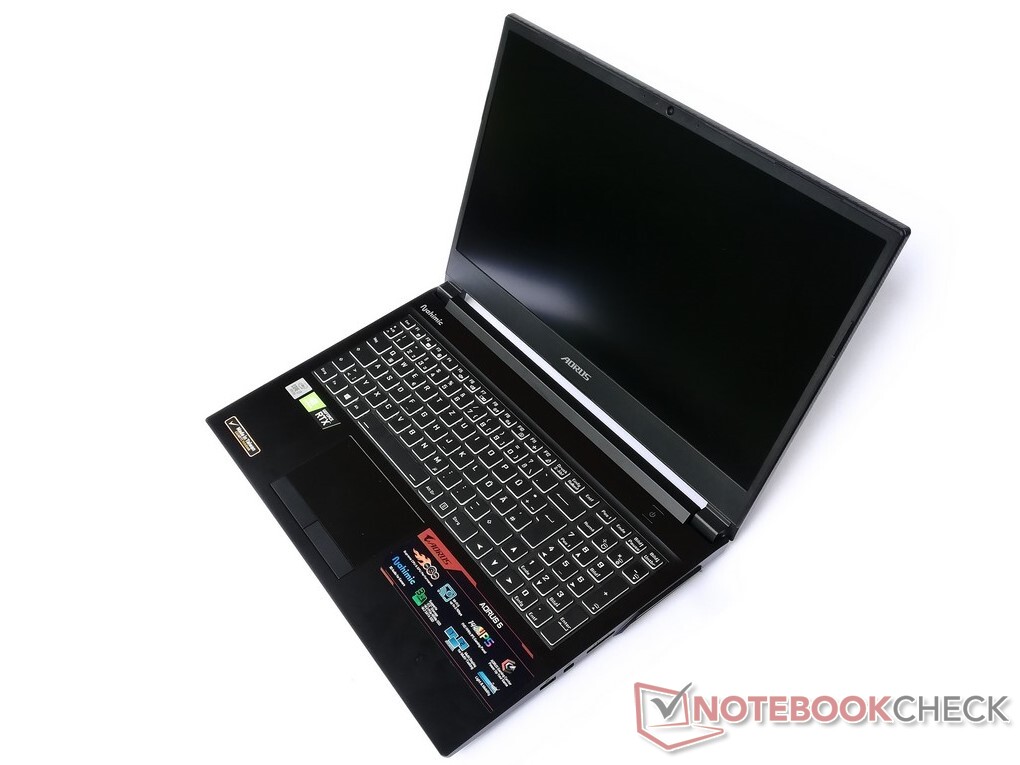
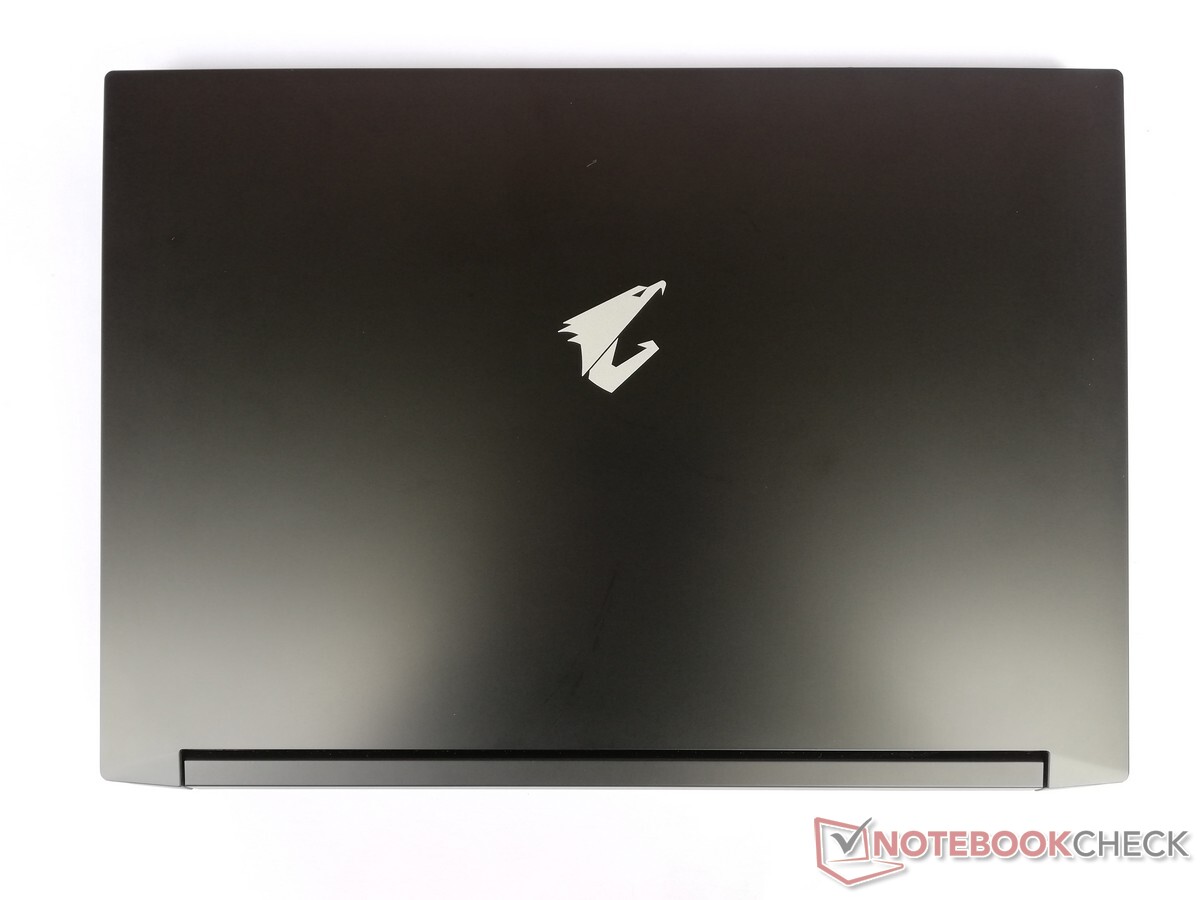
At a weight of 2.1 kg, the Aorus 5 KB belongs to the lighter gaming laptops in our test field. The dimensions and especially the thickness correspond to the level that comparable competitors have to offer.
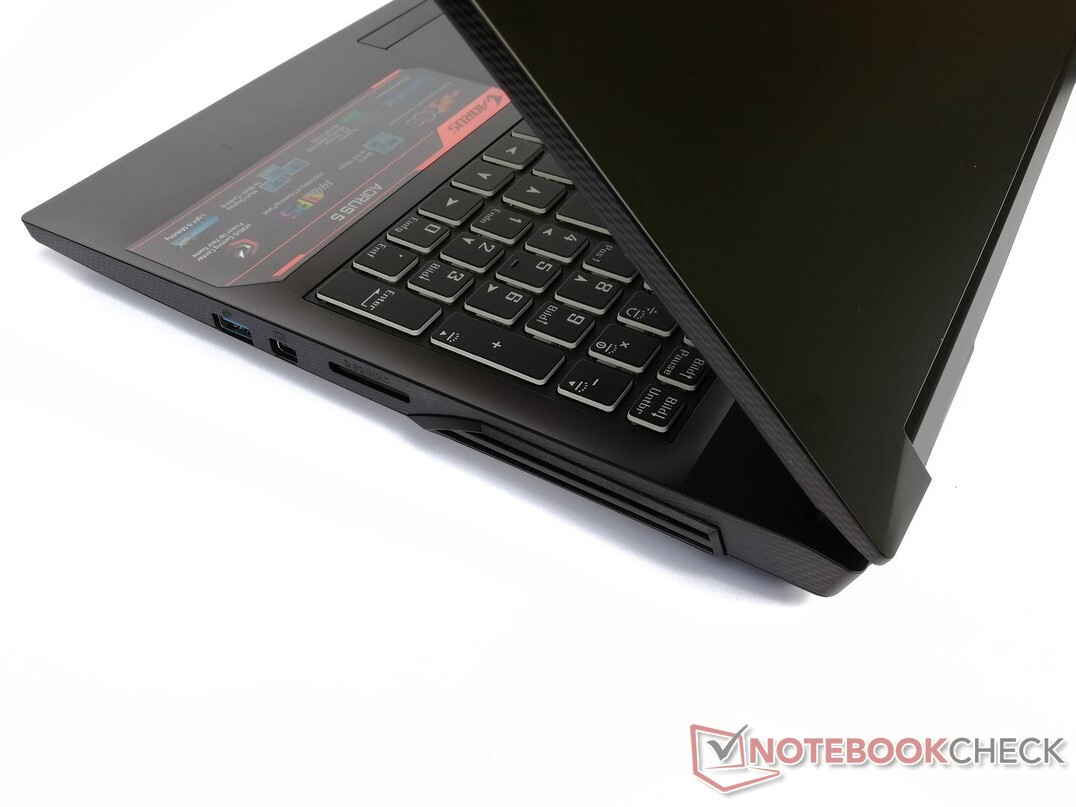
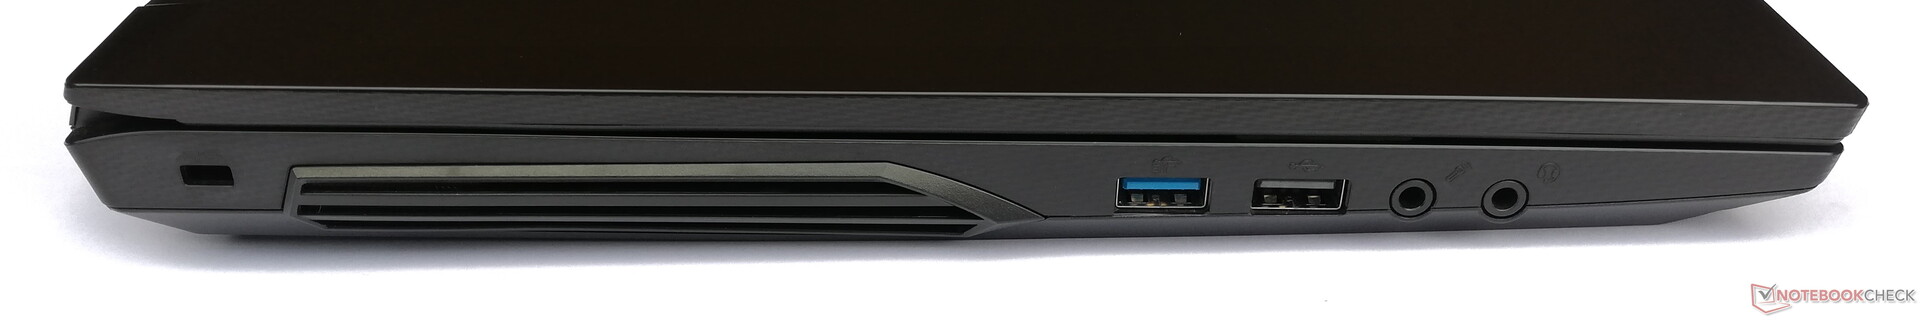
Connectivity - No Thunderbolt in the Aorus 5 KB
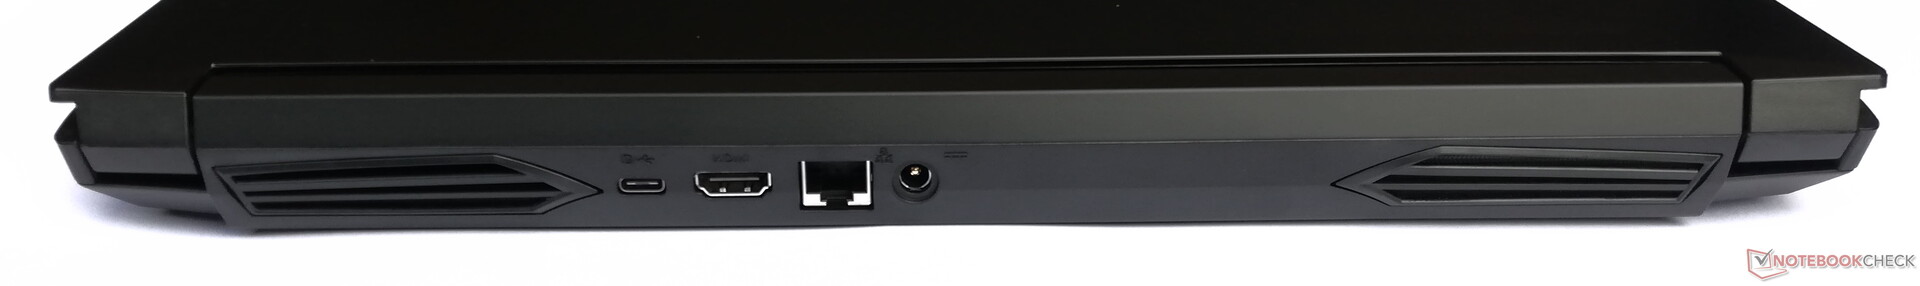
The Aorus 5 KB offers an extensive selection of connections. The manufacturer doesn't include a Thunderbolt 3 port, but in return, there are USB ports with the USB 3.2 Gen 2 standard that also support DisplayPort via USB Type-C.
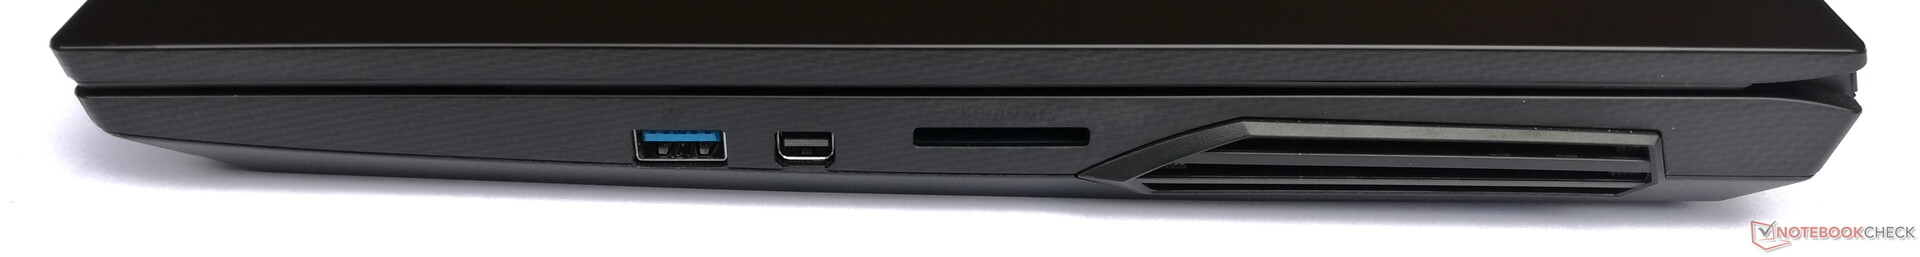
SD card reader
The Aorus 5 KB's memory card reader achieves speeds of 76 MB/s for copying and 86 MB/s for writing data with our reference memory card, the 64 GB Toshiba Exceria Pro UHS-II SDXC. This result is below the average of other gaming laptops tested by us, but it's still suitable for everyday use. Inserted memory cards almost fit into the card reader completely and only protrude about 2 mm from the edge of the case.
| SD Card Reader | |
| average JPG Copy Test (av. of 3 runs) | |
| Schenker XMG Pro 15 (Toshiba Exceria Pro SDXC 64 GB UHS-II) | |
| Average of class Gaming (20.9 - 210, n=55, last 2 years) | |
| Aorus 5 KB (Toshiba Exceria Pro SDXC 64 GB UHS-II) | |
| HP Pavilion Gaming 15-ec1177ng (Toshiba Exceria Pro SDXC 64 GB UHS-II) | |
| maximum AS SSD Seq Read Test (1GB) | |
| Schenker XMG Pro 15 (Toshiba Exceria Pro SDXC 64 GB UHS-II) | |
| Average of class Gaming (25.5 - 261, n=52, last 2 years) | |
| Aorus 5 KB (Toshiba Exceria Pro SDXC 64 GB UHS-II) | |
| HP Pavilion Gaming 15-ec1177ng (Toshiba Exceria Pro SDXC 64 GB UHS-II) | |
Communication
The Aorus 5 KB has a Gigabit LAN port and can establish wireless connections over Bluetooth 5.0 as well as Wi-Fi 6. In combination with our Netgear Nighthawk AX12 reference router, the gaming laptop reaches very high speeds of 1,380 Mb/s for receiving and sending data. In our test field, only the Schenker XMG Pro 15 is a little faster in terms of data transmission.
Webcam
Like most current laptops, the Aorus 5 KB's webcam has a low resolution of 0.9 MP. Even without zooming in, the photo of our test charts shows a clear blurriness and a rough graininess that becomes even more pronounced in poor light. In addition, colors appear pale and much brighter than on our ColorChecker Passport.

")
")
Accessories
In the box, the Aorus 5 KB comes with a 180-watt power adapter alongside the laptop.
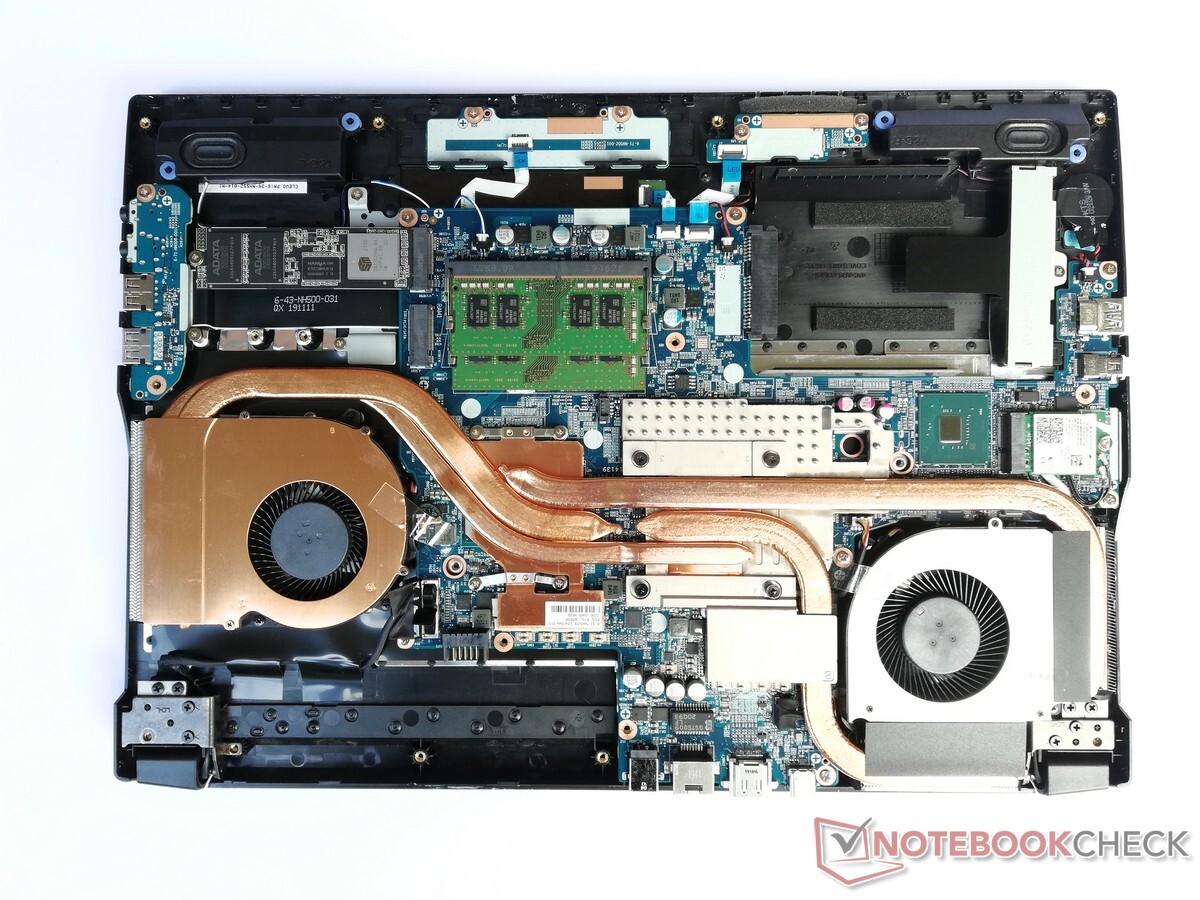
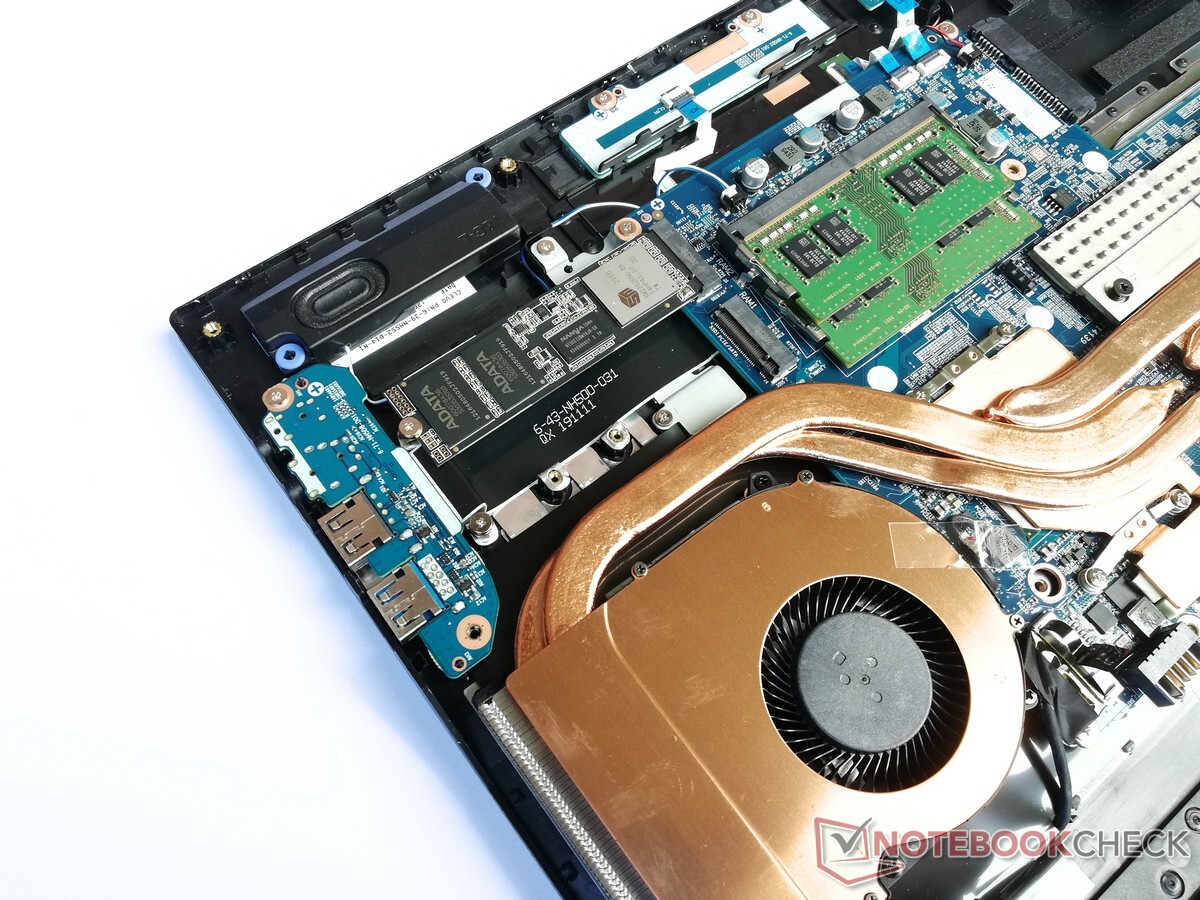
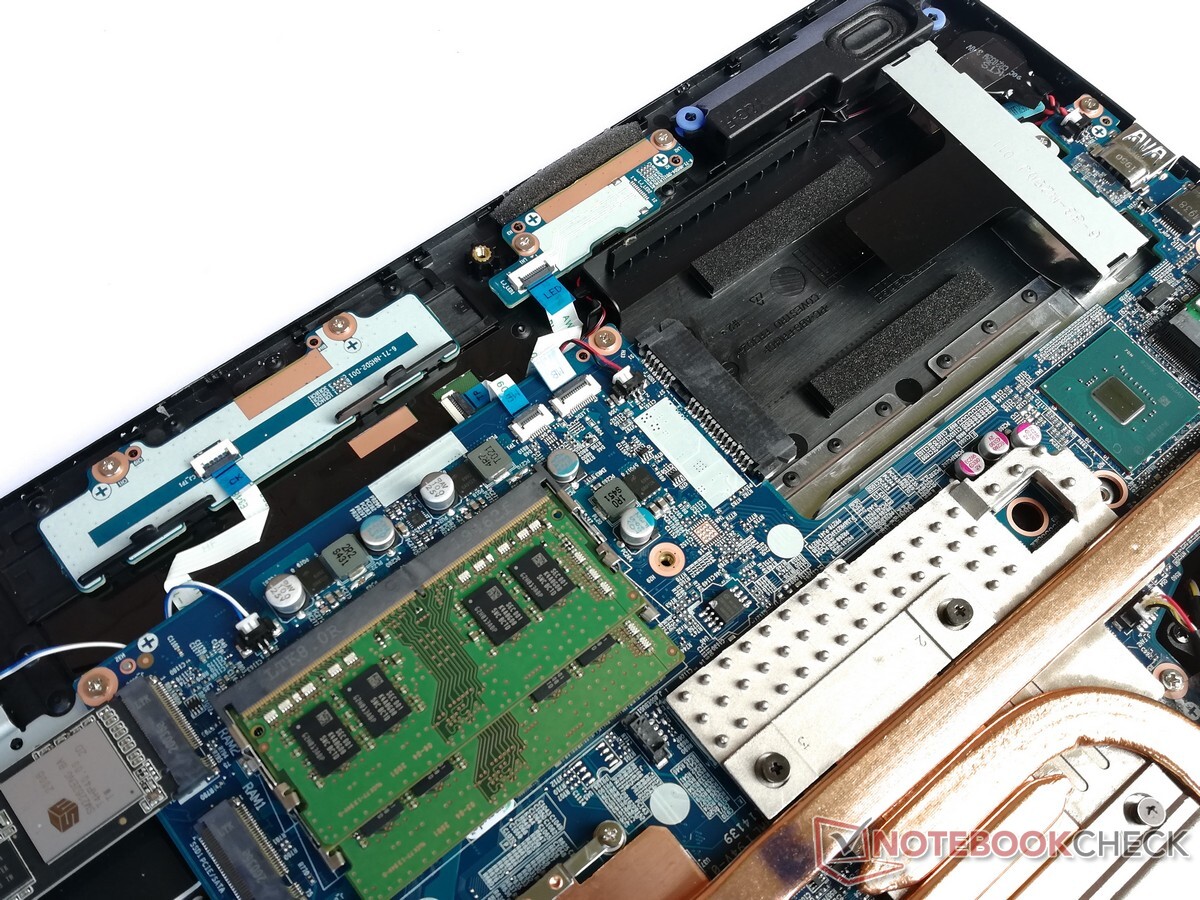
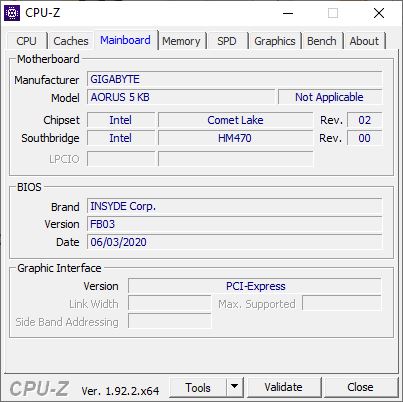
Maintenance
The bottom cover of the Aorus 5 KB can be detached after removing all screws on the bottom and in the battery compartment. Users should proceed carefully here and use a plastic spatula to gradually remove the chassis parts from the retaining brackets along the edges. Inside the case, you will have access to the SSD and RAM. The fans can also be cleaned easily. In addition, a SATA port and a second M.2 slot are available for the installation of additional mass storage devices.
Warranty
Gigabyte grants buyers of the Aorus 5 KB a warranty period of three years.
Input devices - Good keyboard with fixed colors
Keyboard
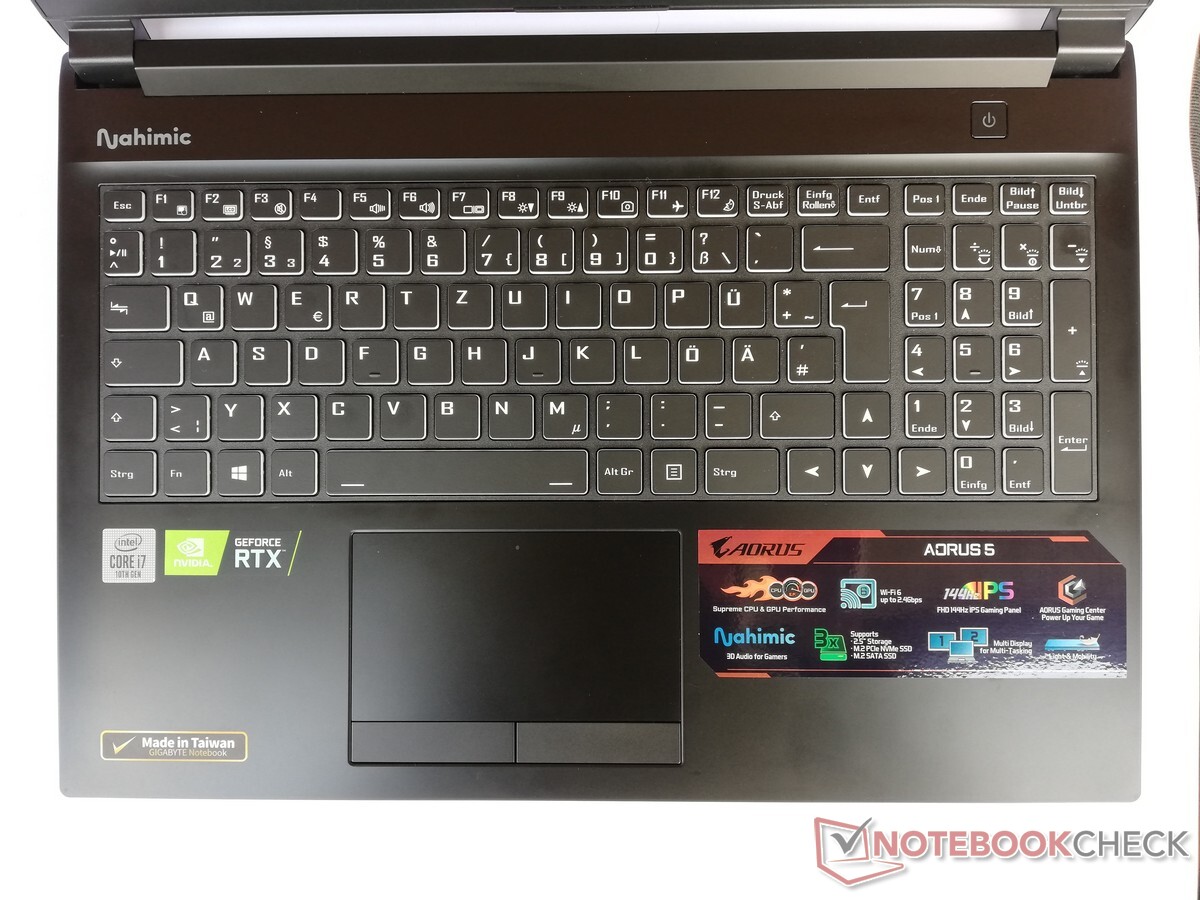
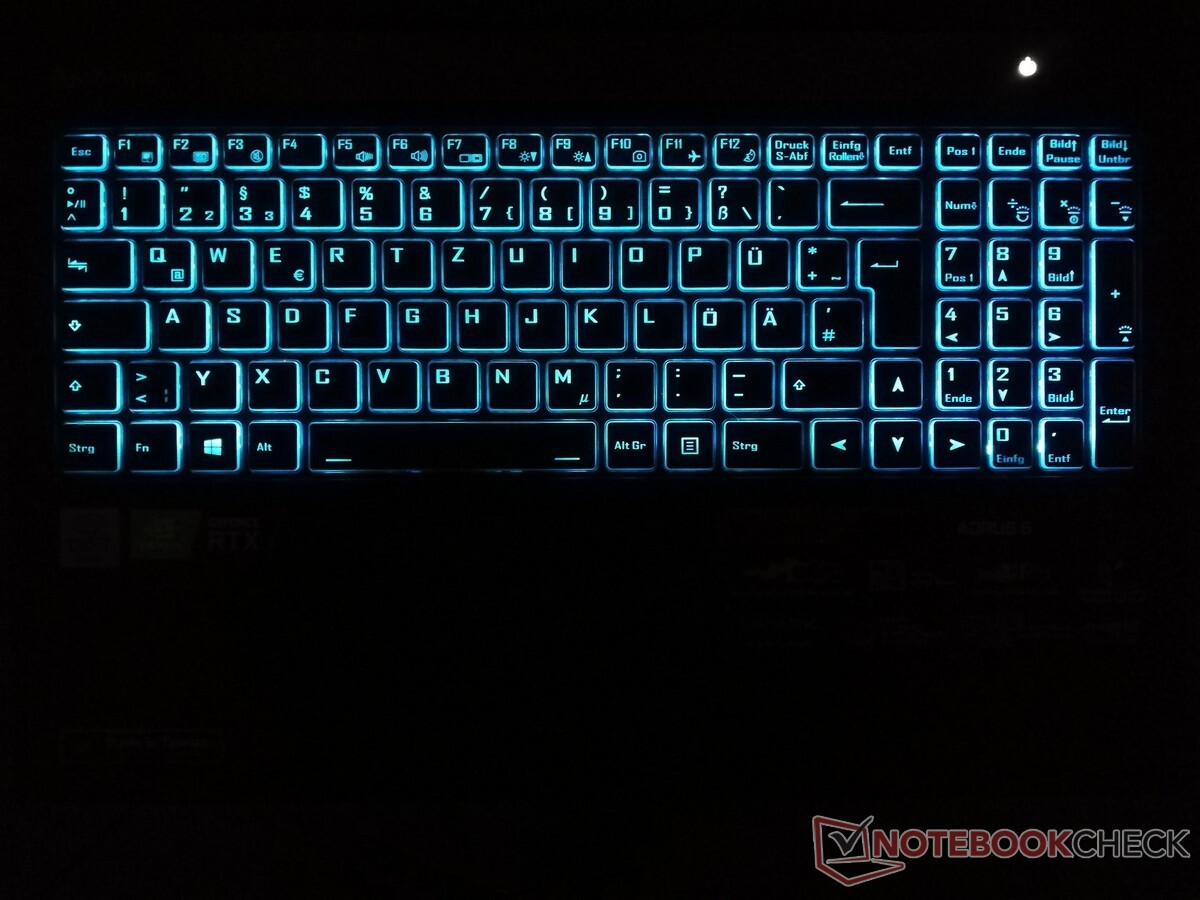
The keyboard of the Aorus 5 KB is well suited for typing longer texts. All keys offer a nonslip surface and a pleasant pressure point. On the positive side, the normal-size arrow keys stand out as well as the fact that the delete, end, home, and insert keys have not been placed as secondary assignments. The illumination of the keys is even and doesn't dazzle, but only predefined colors are available. A white backlight, for example, is not available.
Touchpad
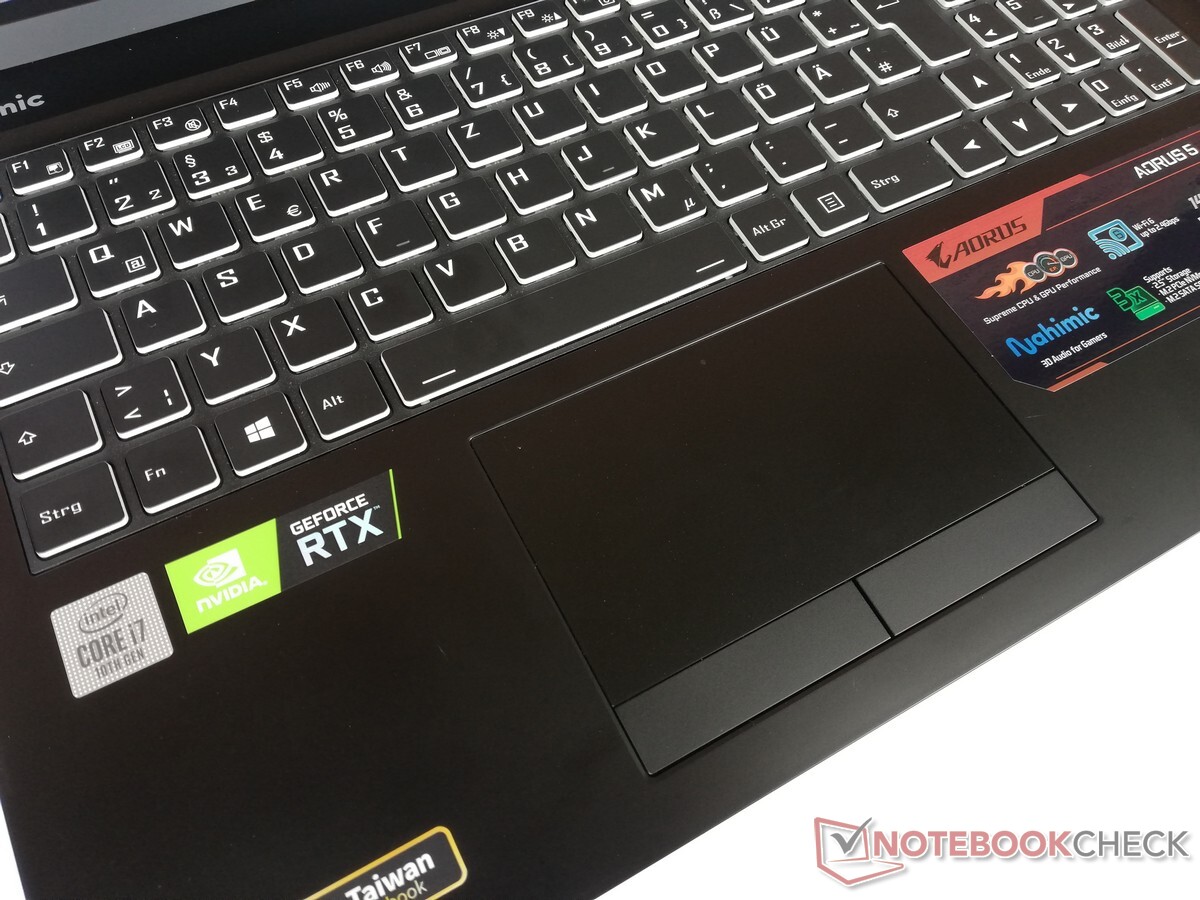
Users of the Aorus 5 have a touchpad with separate mouse buttons at their disposal as a mouse replacement. It's well suited to control the mouse pointer, and both the left and right mouse buttons are triggered with a clear pressure point.
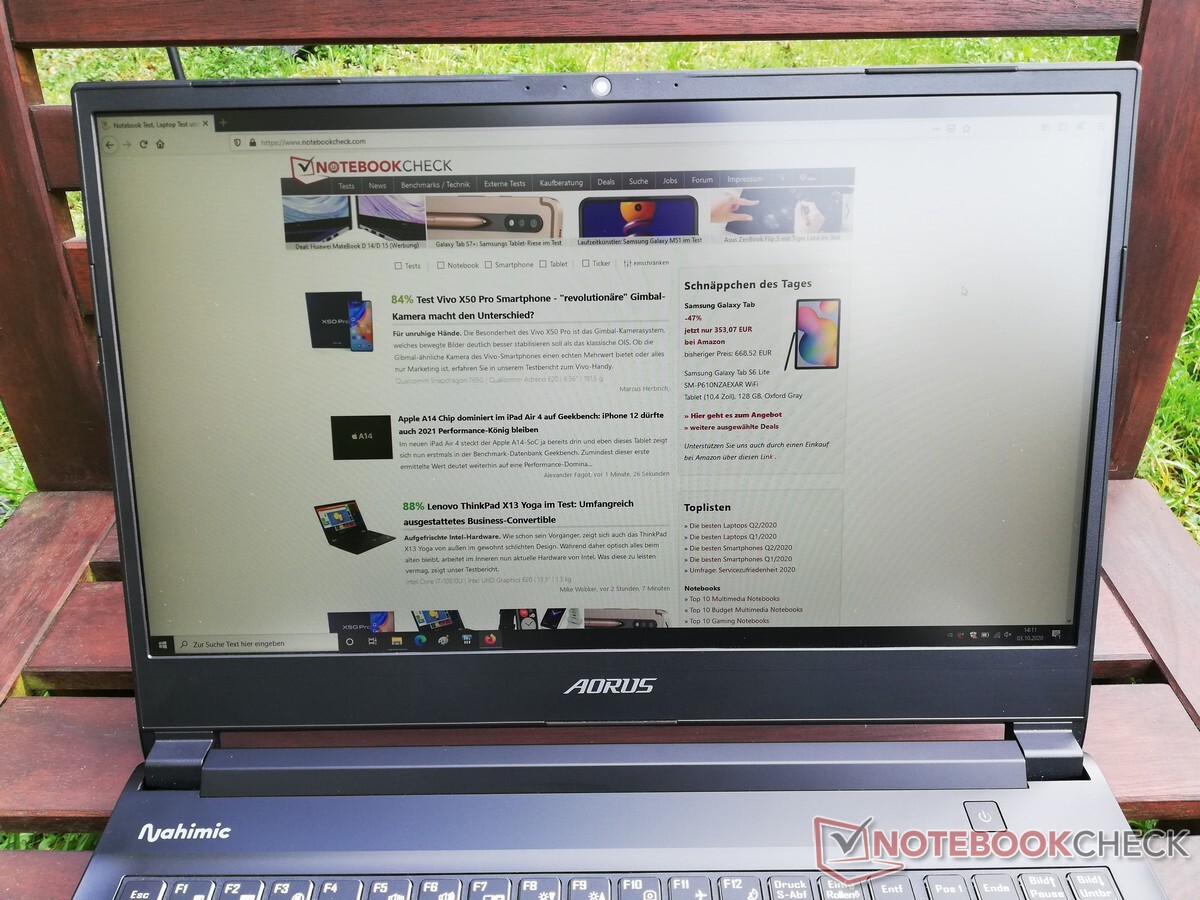
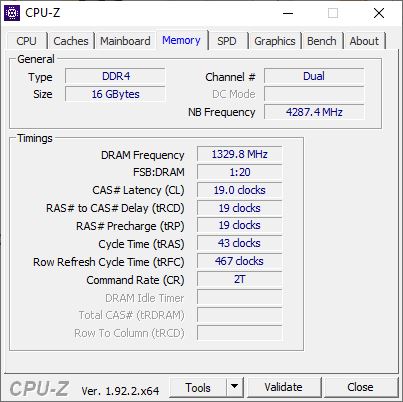
Display - 144 Hz panel in gaming laptop
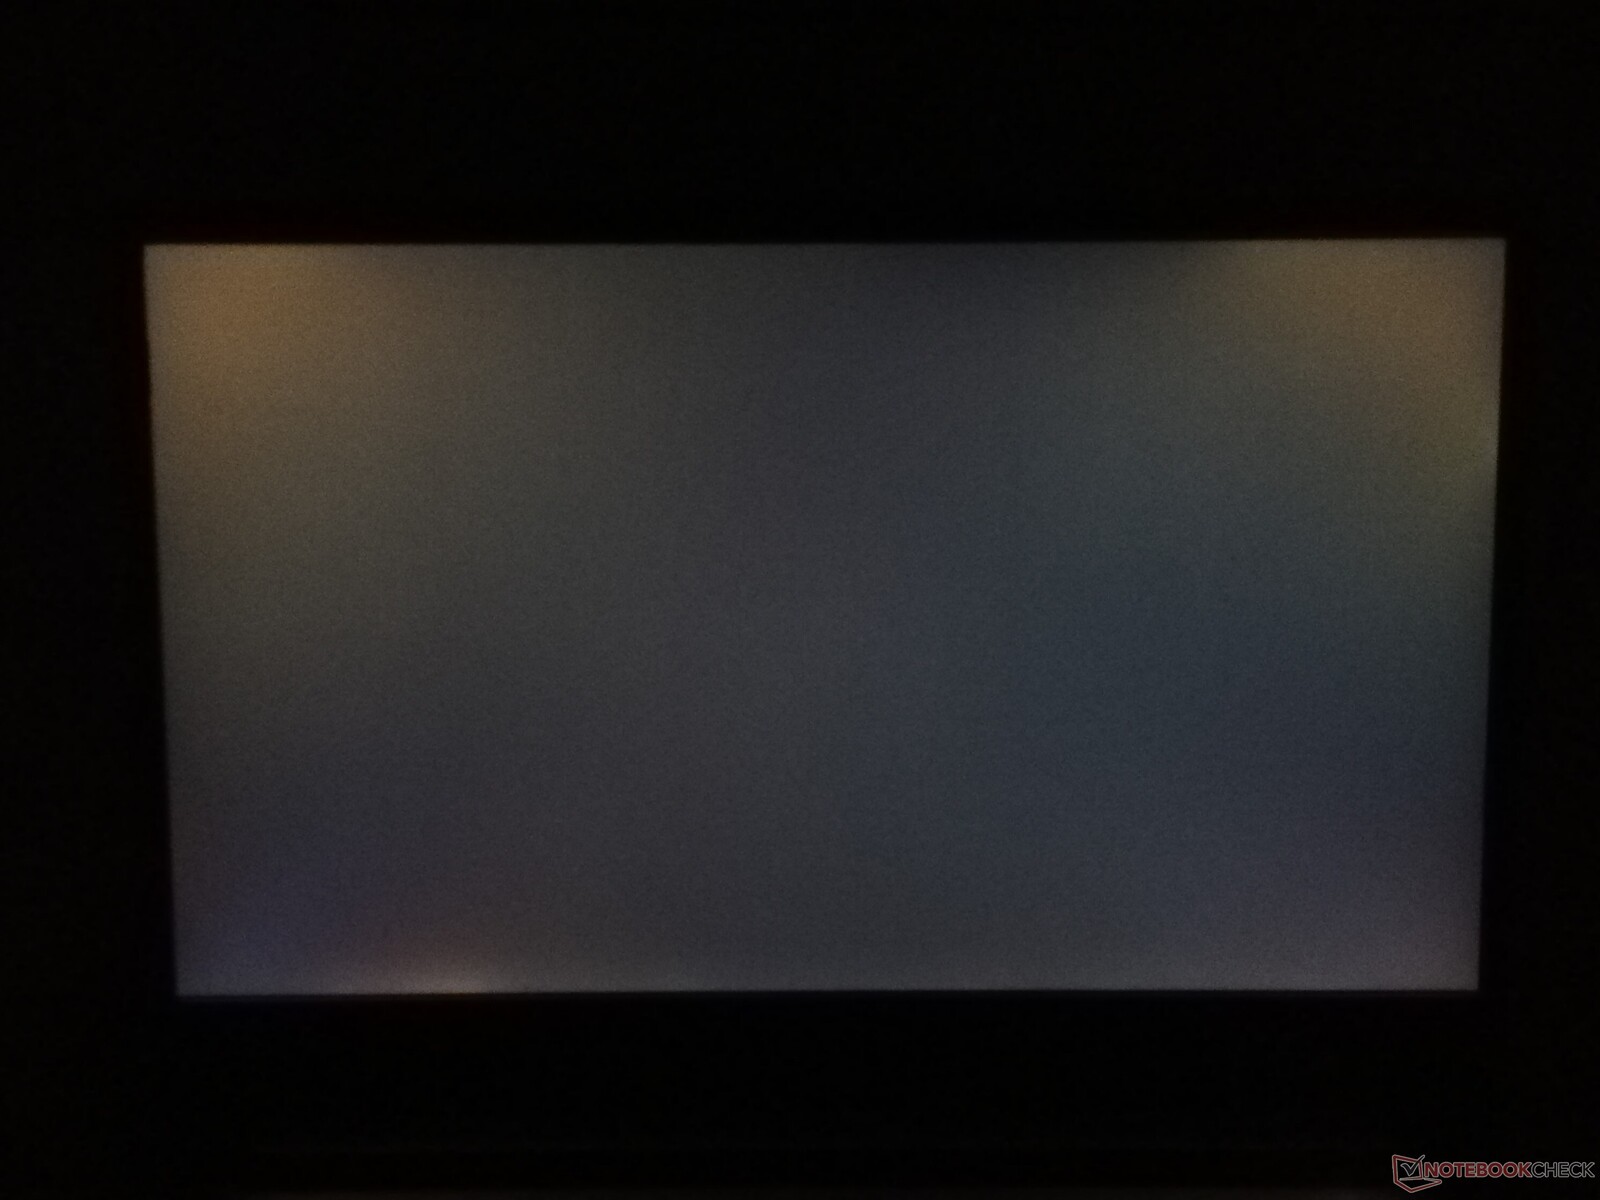
The Aorus 5 KB's screen consists of a 15.6-inch IPS panel and offers a resolution of 1920x1080 pixels with a refresh rate of 144 Hz. The maximum brightness of 298 cd/m² on average sits in the middle of our test field; the same applies to the brightness distribution of 87%. PWM isn't used for brightness control, so users with sensitive eyes don't have to fear any problems.
| |||||||||||||||||||||||||
Brightness Distribution: 87 %
Center on Battery: 318 cd/m²
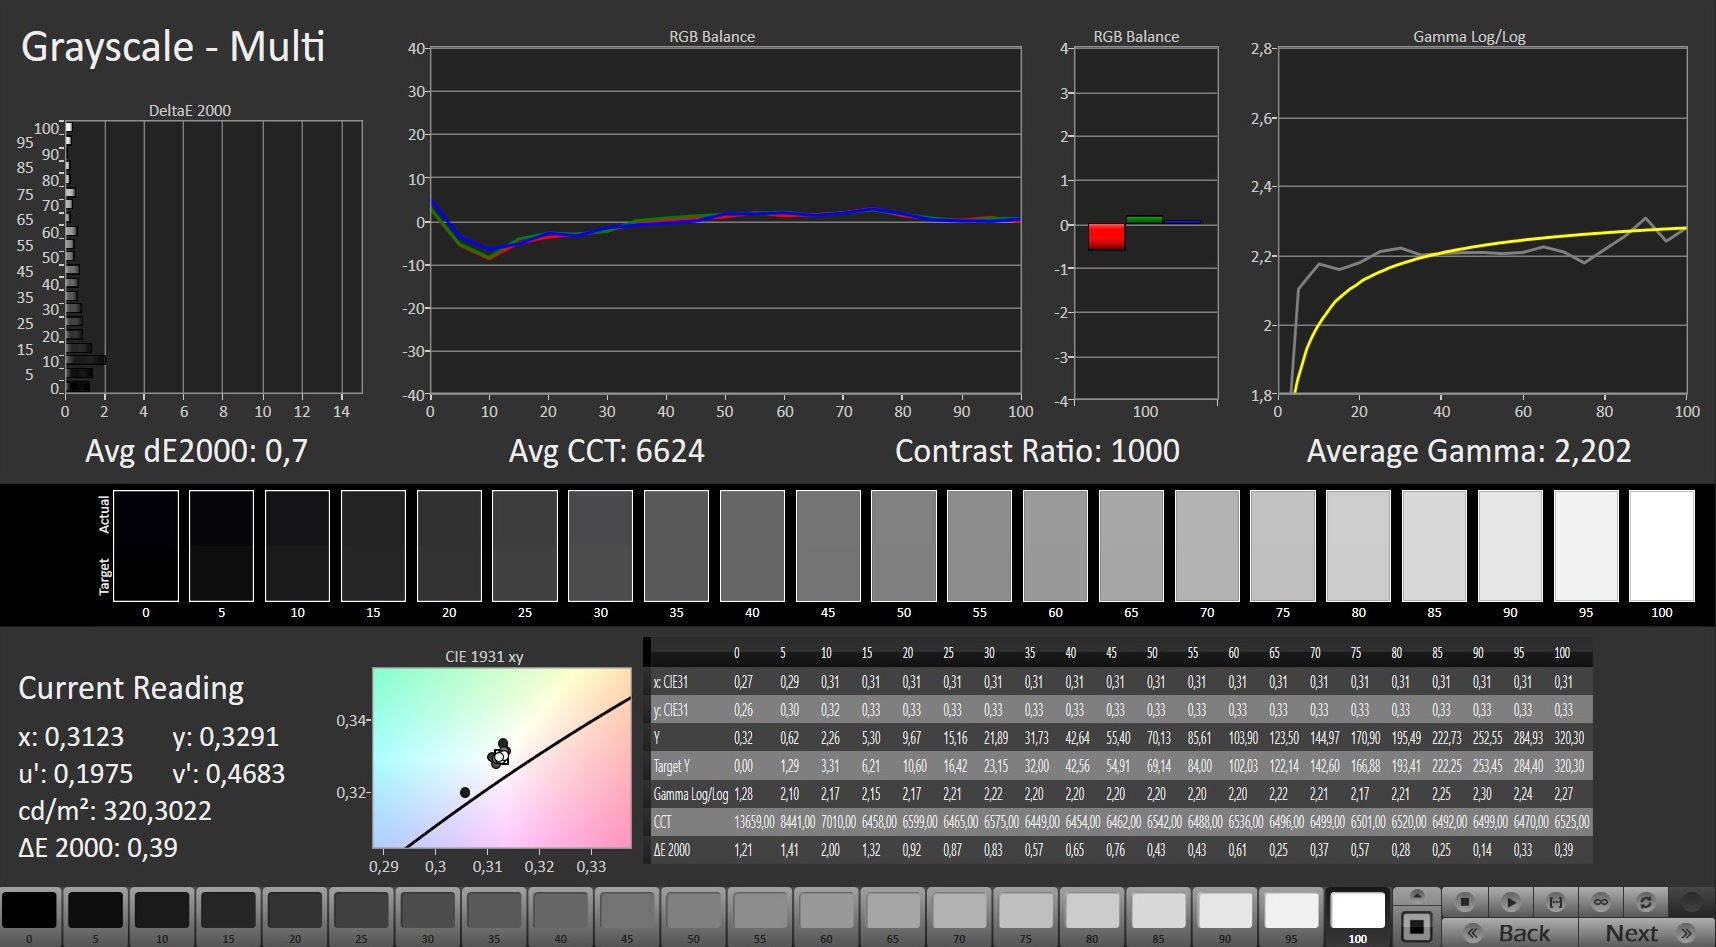
Contrast: 1060:1 (Black: 0.3 cd/m²)
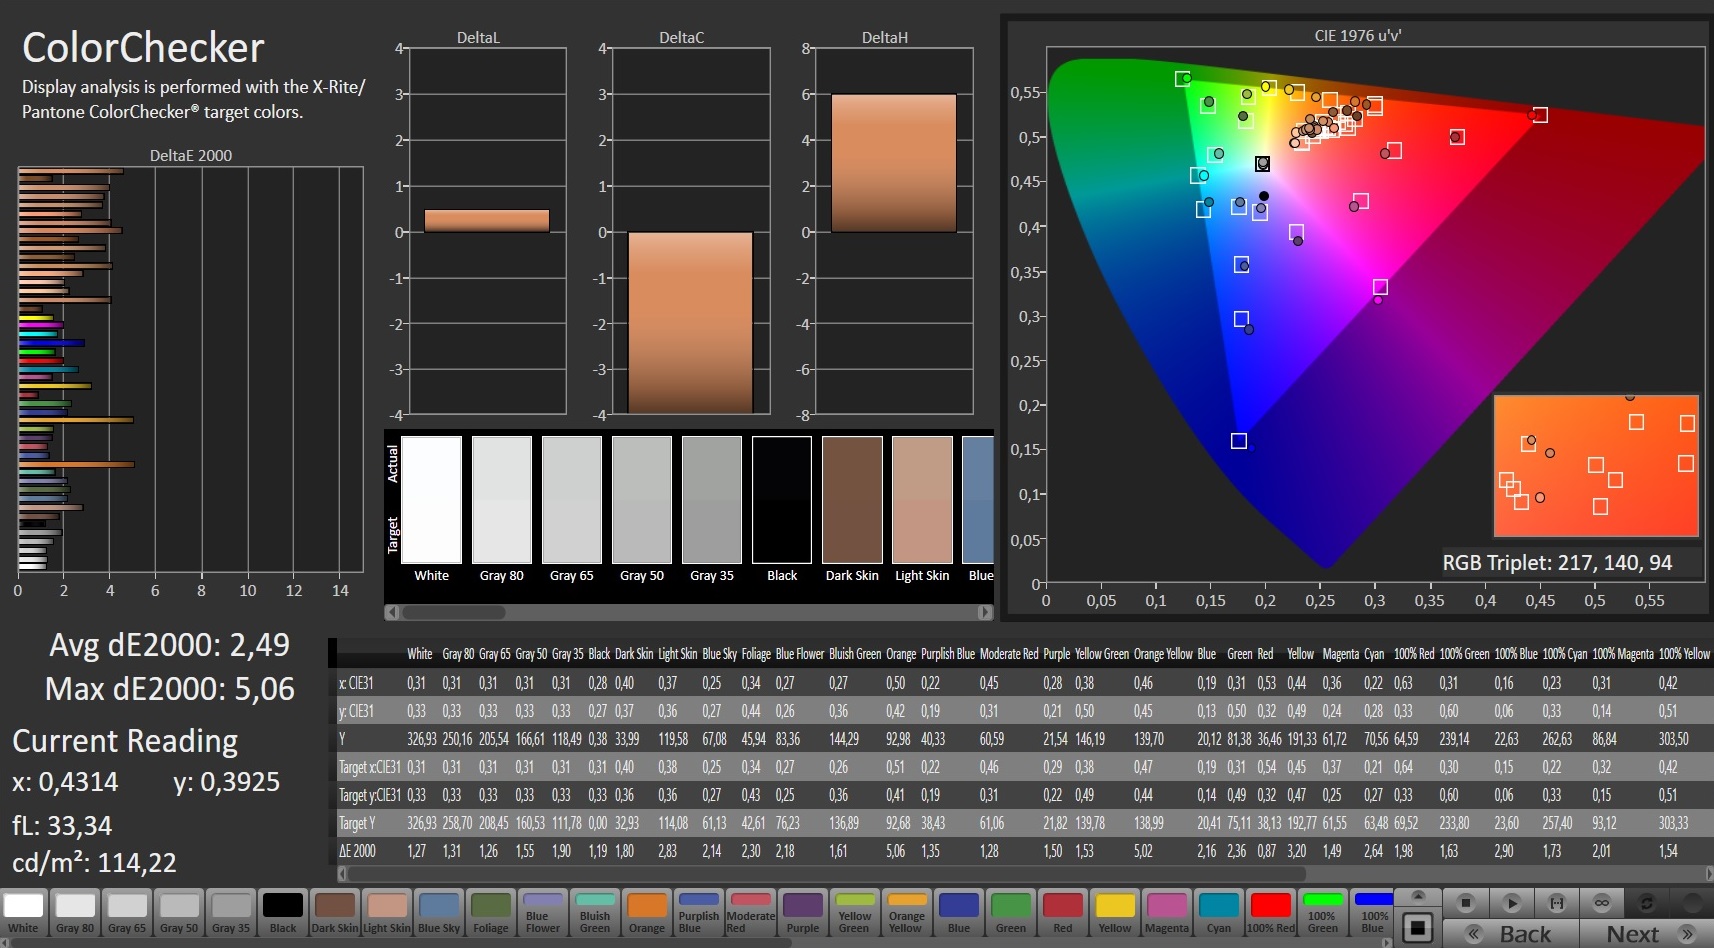
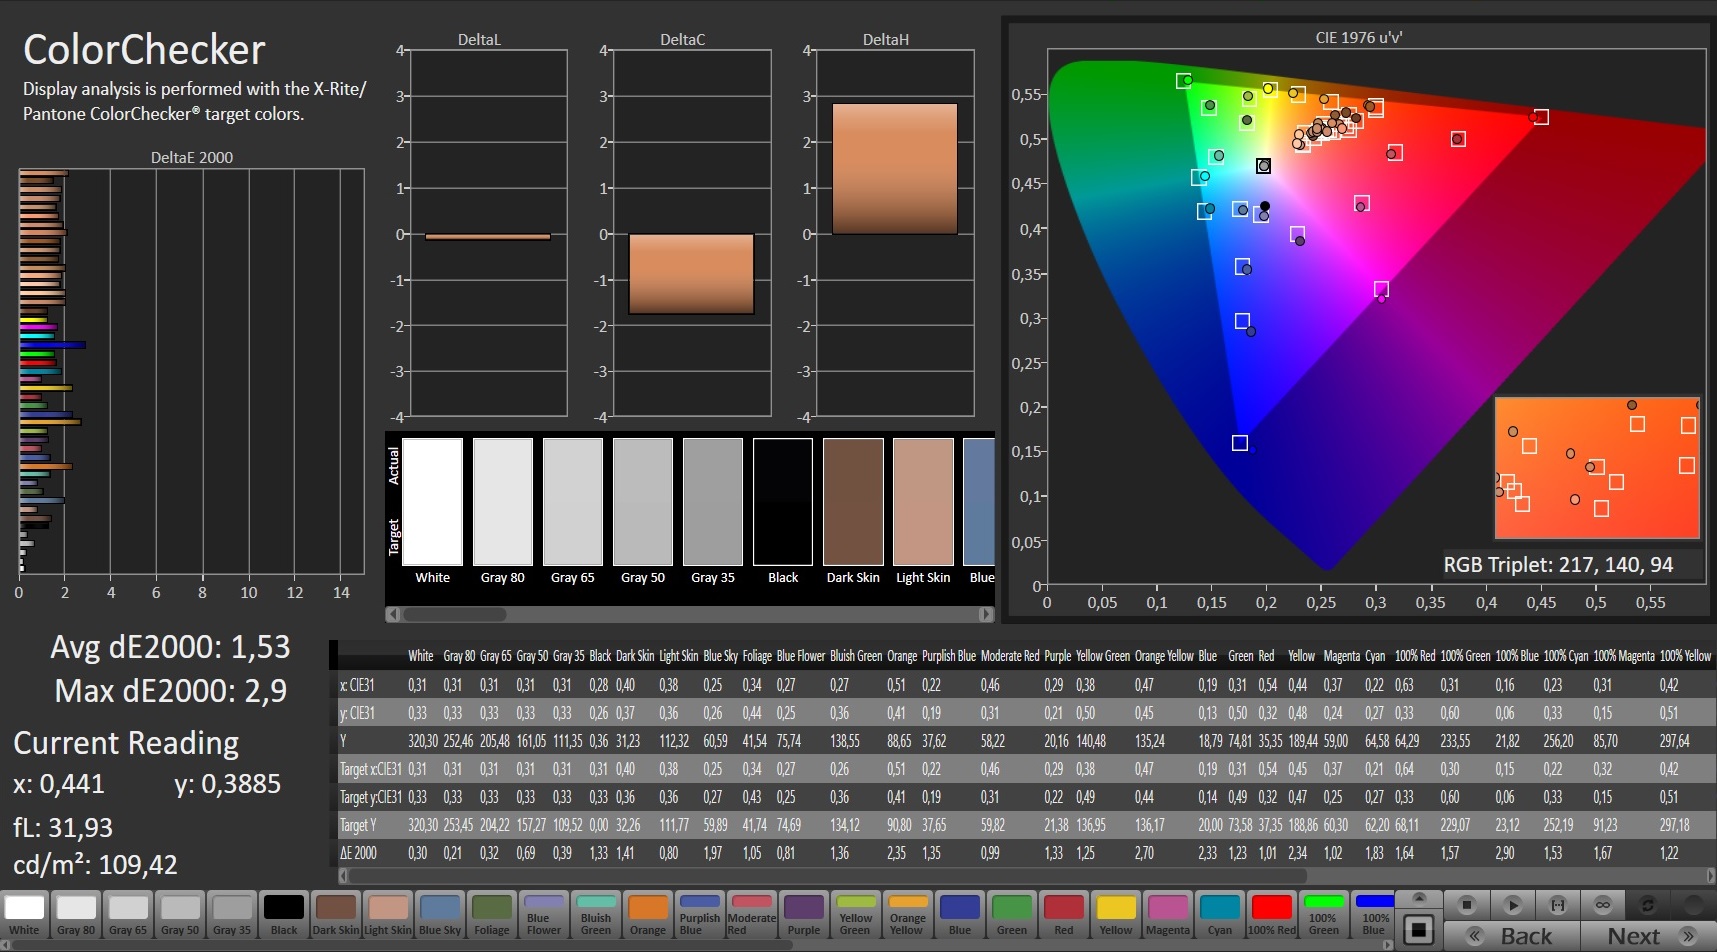
ΔE ColorChecker Calman: 2.49 | ∀{0.5-29.43 Ø4.73}
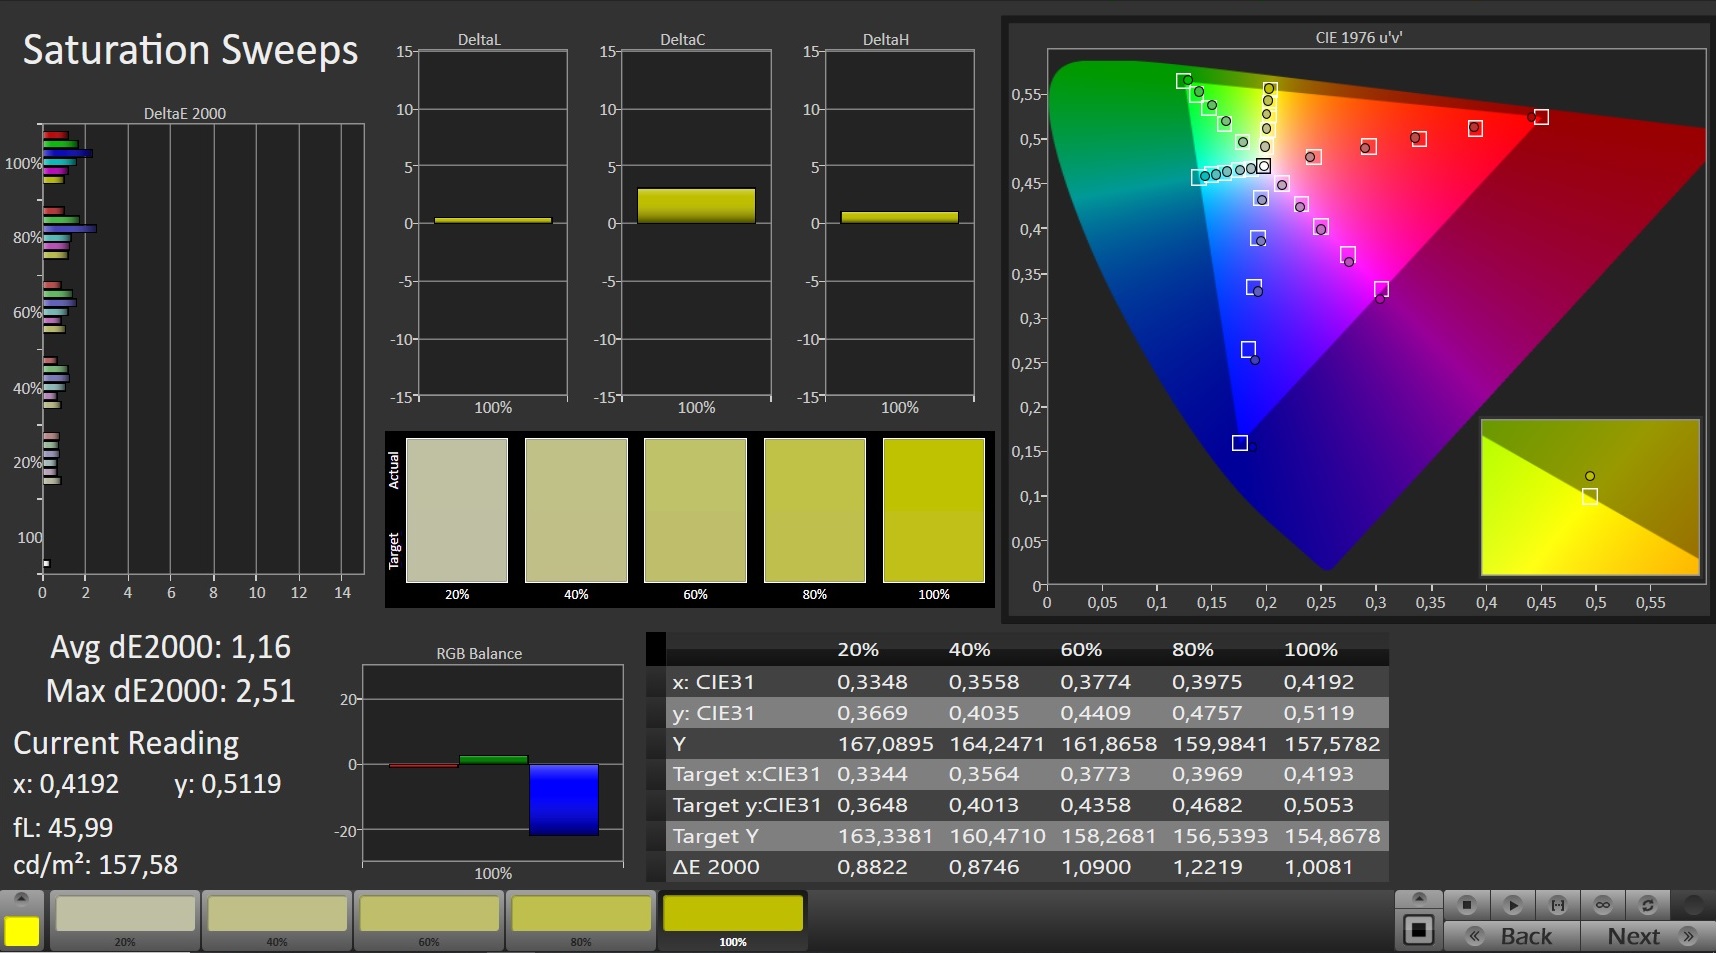
calibrated: 1.53
ΔE Greyscale Calman: 1.6 | ∀{0.09-98 Ø4.97}
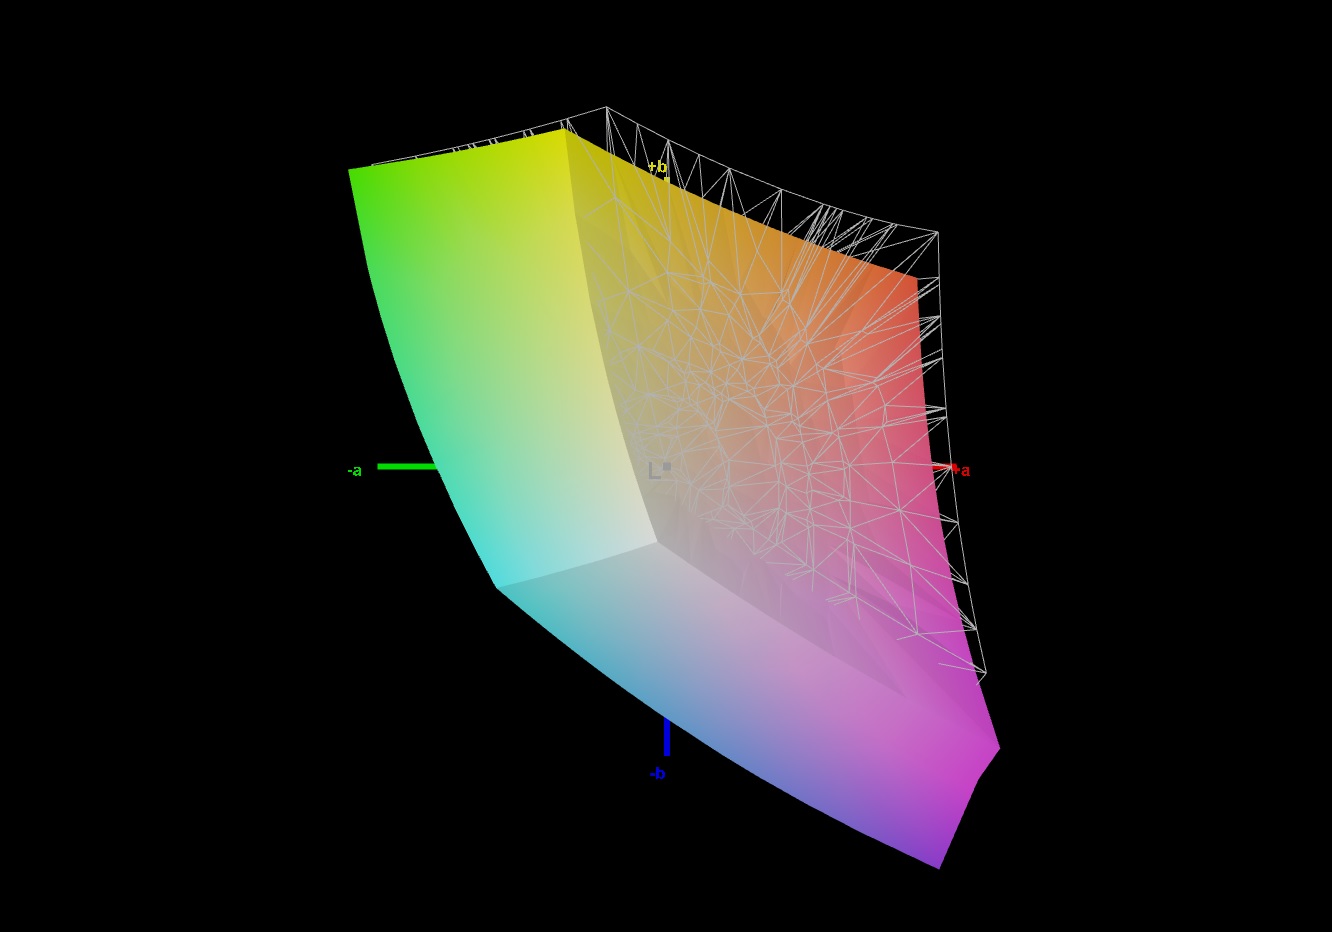
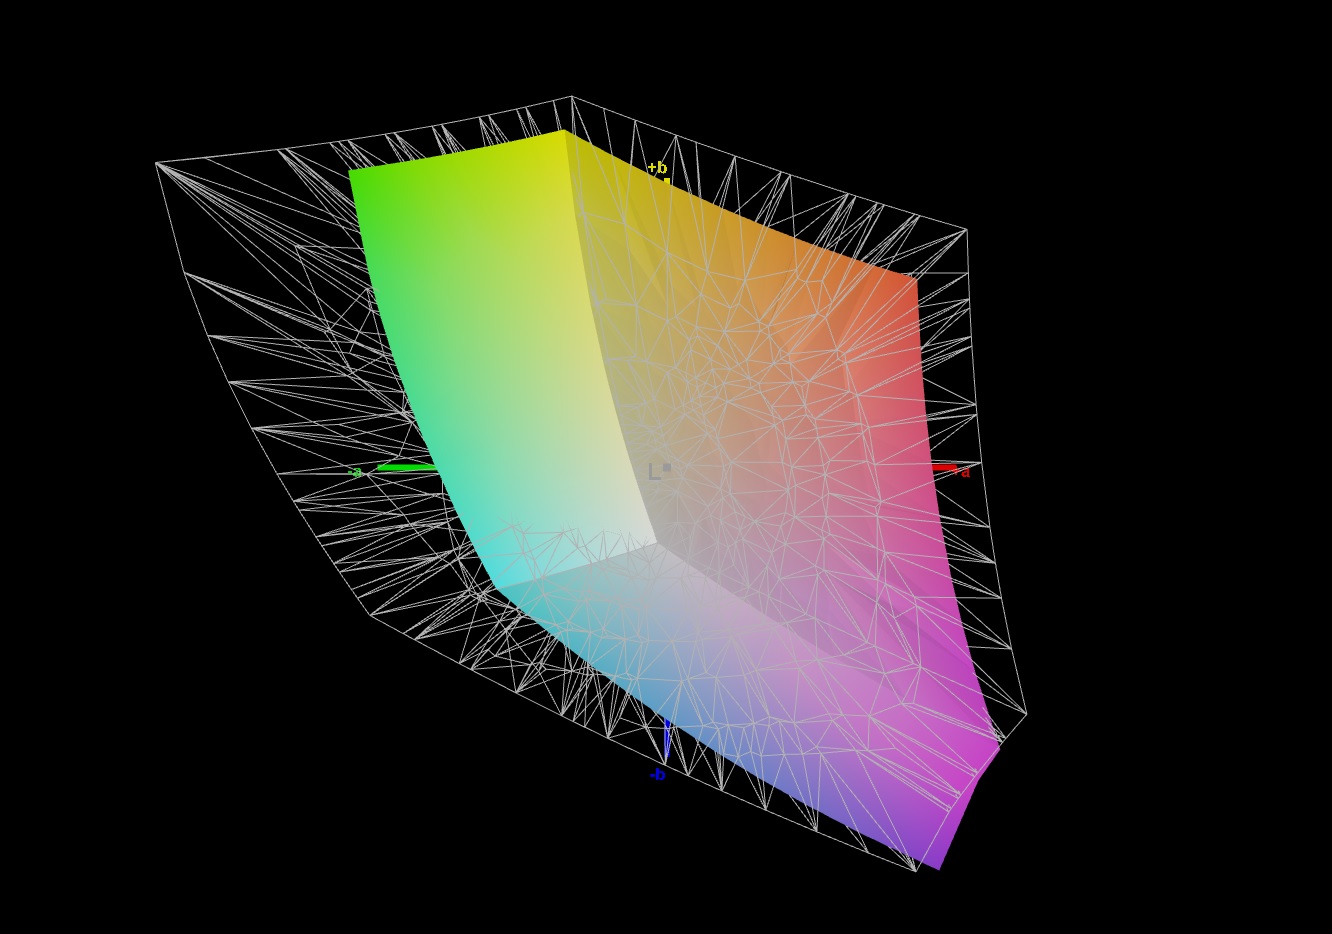
89% sRGB (Argyll 1.6.3 3D)
65% AdobeRGB 1998 (Argyll 1.6.3 3D)
64.8% AdobeRGB 1998 (Argyll 3D)
92.8% sRGB (Argyll 3D)
63.4% Display P3 (Argyll 3D)
Gamma: 2.211
CCT: 6714 K
| Aorus 5 KB LG Philips LP156WFG-SPB2 (LGD05E8), IPS, 1920x1080, 15.6" | Schenker XMG Pro 15 AU Optronics B156HAN (AUO80ED), IPS, 1920x1080, 15.6" | Asus TUF Gaming A15 FA506IV-HN172 LM156LF-2F01, IPS, 1920x1080, 15.6" | Lenovo Legion 5 15IMH05H BOE CQ NV156FHM-NX1, IPS, 1920x1080, 15.6" | HP Pavilion Gaming 15-ec1177ng LG Philips LP156WFG-SPK1, IPS, 1920x1080, 15.6" | |
|---|---|---|---|---|---|
| Display | 4% | -38% | -38% | 1% | |
| Display P3 Coverage (%) | 63.4 | 66.7 5% | 38.92 -39% | 38.8 -39% | 64.9 2% |
| sRGB Coverage (%) | 92.8 | 94.4 2% | 58.5 -37% | 57.8 -38% | 93.1 0% |
| AdobeRGB 1998 Coverage (%) | 64.8 | 68.1 5% | 40.22 -38% | 40.09 -38% | 65.9 2% |
| Response Times | -10% | -125% | -67% | -5% | |
| Response Time Grey 50% / Grey 80% * (ms) | 14.4 ? | 17.2 ? -19% | 34 ? -136% | 26 ? -81% | 16 ? -11% |
| Response Time Black / White * (ms) | 11.2 ? | 11.2 ? -0% | 24 ? -114% | 17 ? -52% | 11 ? 2% |
| PWM Frequency (Hz) | |||||
| Screen | -29% | -69% | -54% | 4% | |
| Brightness middle (cd/m²) | 318 | 346 9% | 280 -12% | 301 -5% | 363 14% |
| Brightness (cd/m²) | 298 | 346 16% | 254 -15% | 277 -7% | 327 10% |
| Brightness Distribution (%) | 87 | 89 2% | 88 1% | 77 -11% | 84 -3% |
| Black Level * (cd/m²) | 0.3 | 0.28 7% | 0.15 50% | 0.26 13% | 0.185 38% |
| Contrast (:1) | 1060 | 1236 17% | 1867 76% | 1158 9% | 1962 85% |
| Colorchecker dE 2000 * | 2.49 | 4.62 -86% | 5.89 -137% | 5.12 -106% | 2.69 -8% |
| Colorchecker dE 2000 max. * | 5.06 | 8.93 -76% | 19 -275% | 8.86 -75% | 5.06 -0% |
| Colorchecker dE 2000 calibrated * | 1.53 | 1.58 -3% | 4.79 -213% | 4.88 -219% | 1.7 -11% |
| Greyscale dE 2000 * | 1.6 | 4.95 -209% | 4.08 -155% | 3.47 -117% | 2.77 -73% |
| Gamma | 2.211 100% | 2.36 93% | 2.33 94% | 2.37 93% | 2.56 86% |
| CCT | 6714 97% | 7733 84% | 7303 89% | 7062 92% | 6385 102% |
| Color Space (Percent of AdobeRGB 1998) (%) | 65 | 61 -6% | 37 -43% | 37 -43% | 60.3 -7% |
| Color Space (Percent of sRGB) (%) | 89 | 94 6% | 58 -35% | 57 -36% | 92.8 4% |
| Total Average (Program / Settings) | -12% /
-21% | -77% /
-70% | -53% /
-53% | 0% /
3% |
* ... smaller is better
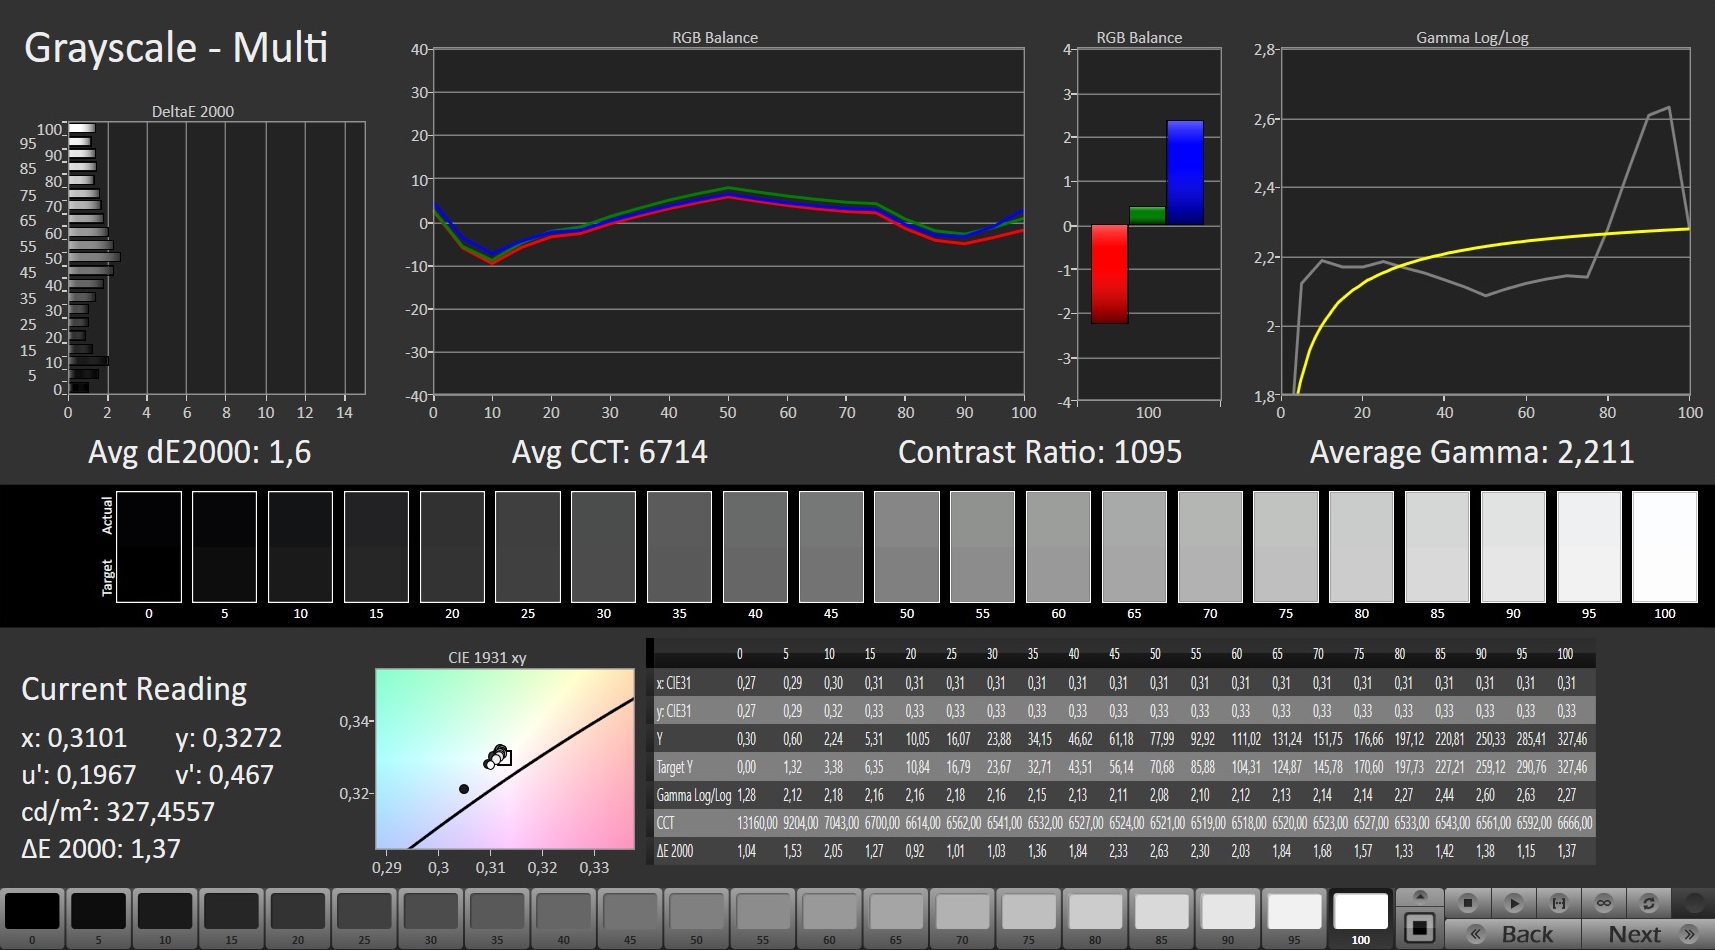
Our measurements show that the Aorus 5 KB's display has a solid black level of 0.3 cd/m² and an equally solid contrast ratio of 1,060:1. Although both values are surpassed by the other gaming laptops in our test field, they are definitely suitable for everyday use.
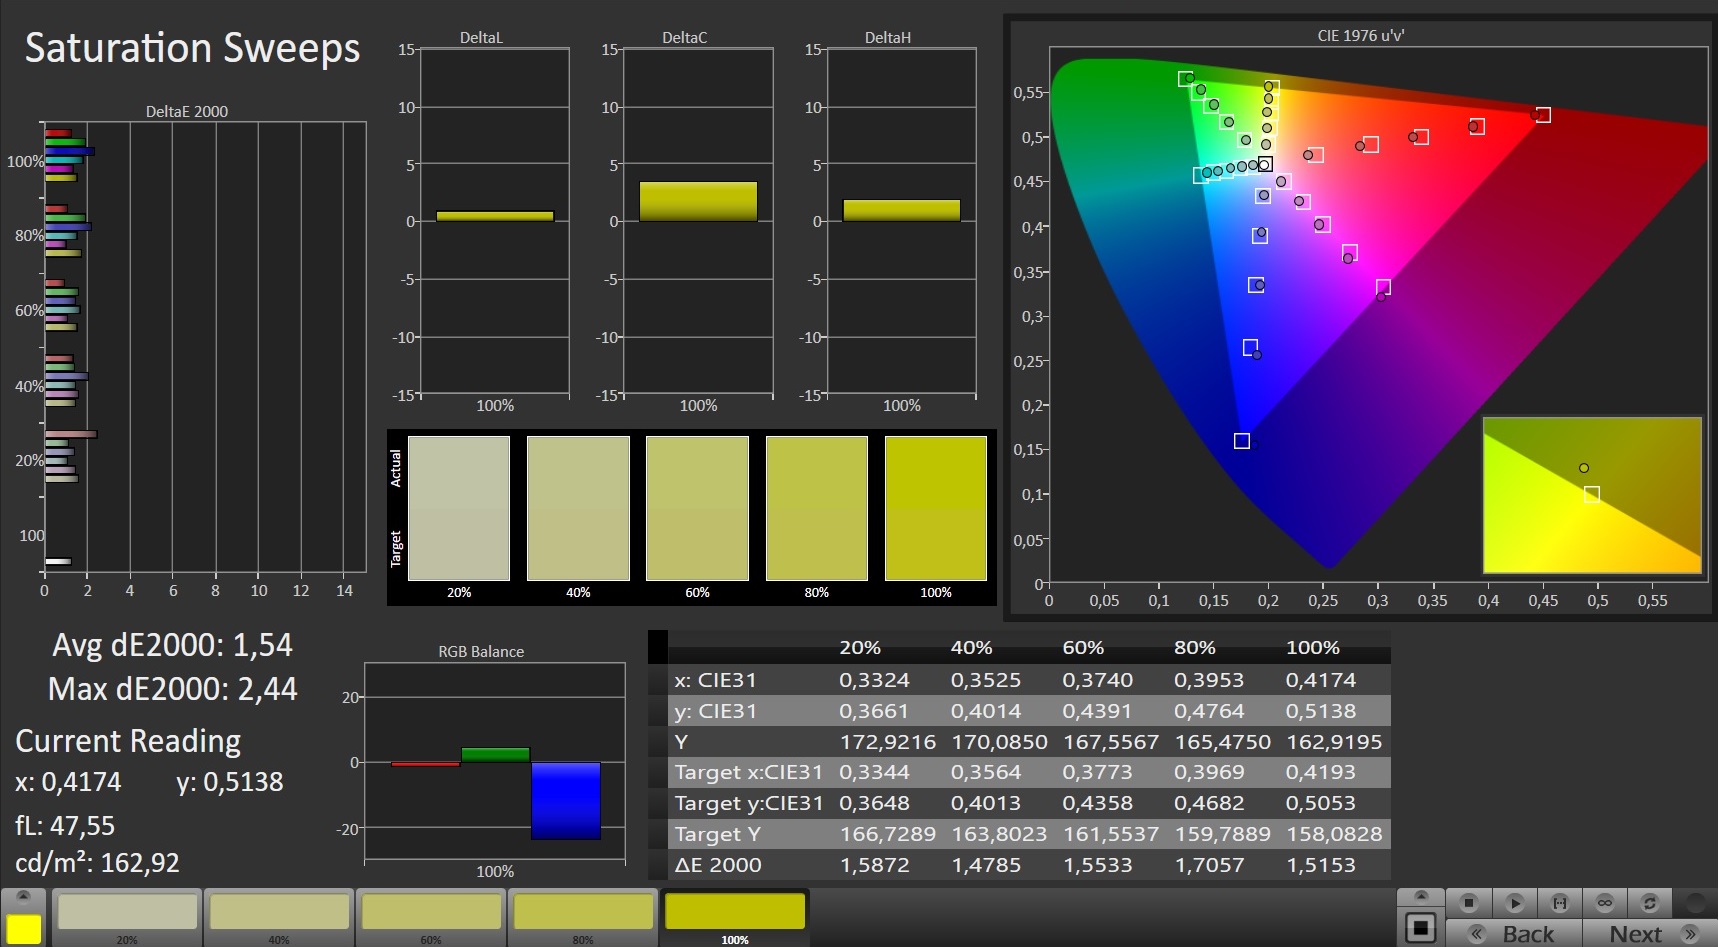
The CalMAN analysis also shows that the screen displays content with a very low Delta E 2000 deviation and balanced color components out of the box. However, calibration can still bring about a slight improvement. The corresponding ICC file can be downloaded in the window located at the top, to the right of the display's brightness distribution graph.
On cloudy days and in places in the shade, the brightness of the Aorus 5 KB is sufficient to display image content legibly.
Display Response Times
| ↔ Response Time Black to White | ||
|---|---|---|
| 11.2 ms ... rise ↗ and fall ↘ combined | ↗ 6.8 ms rise | 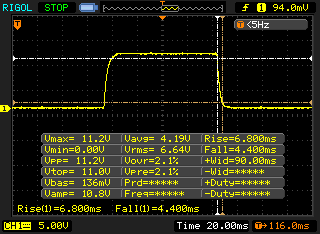 |
| ↘ 4.4 ms fall | ||
| The screen shows good response rates in our tests, but may be too slow for competitive gamers. In comparison, all tested devices range from 0.1 (minimum) to 240 (maximum) ms. » 30 % of all devices are better. This means that the measured response time is better than the average of all tested devices (19.9 ms). | ||
| ↔ Response Time 50% Grey to 80% Grey | ||
| 14.4 ms ... rise ↗ and fall ↘ combined | ↗ 7.6 ms rise | 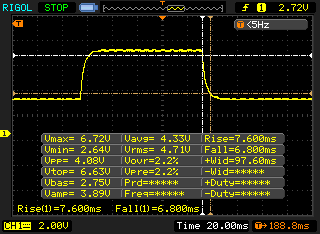 |
| ↘ 6.8 ms fall | ||
| The screen shows good response rates in our tests, but may be too slow for competitive gamers. In comparison, all tested devices range from 0.165 (minimum) to 636 (maximum) ms. » 28 % of all devices are better. This means that the measured response time is better than the average of all tested devices (31.1 ms). | ||
Screen Flickering / PWM (Pulse-Width Modulation)
| Screen flickering / PWM not detected | 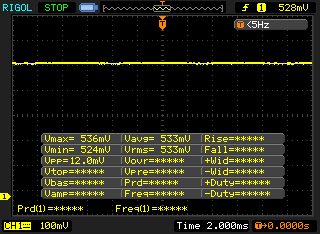 | ||
In comparison: 52 % of all tested devices do not use PWM to dim the display. If PWM was detected, an average of 7798 (minimum: 5 - maximum: 343500) Hz was measured. | |||
The IPS panel of the Aorus 5 KB is very viewing-angle stable and displays image content from almost any angle without it becoming distorted or showing wrong colors.

Performance - Good performance under continuous load
With the Aorus 5 KB, Gigabyte is targeting gamers who want to play modern and upcoming games smoothly and in Full HD resolution. Besides the configuration presented here, the gaming laptop is also available with a modified memory configuration and Nvidia's GeForce GTX 1660 Ti.
All the following benchmark tests were performed under the "Turbo" performance profile and the "Automatic" fan profile.
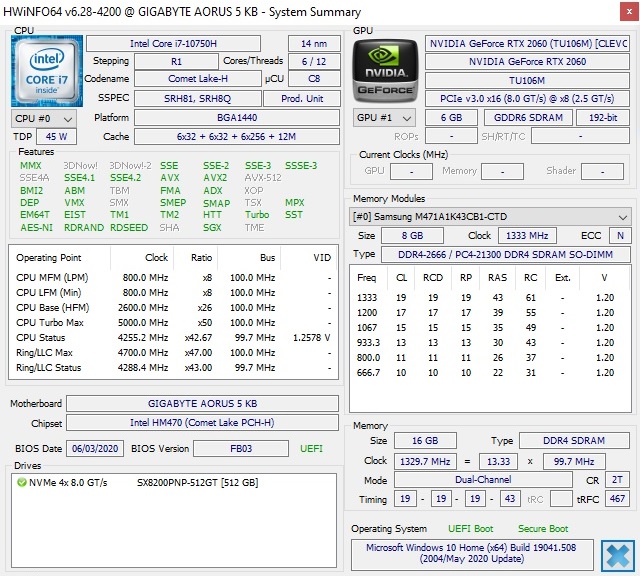
Processor
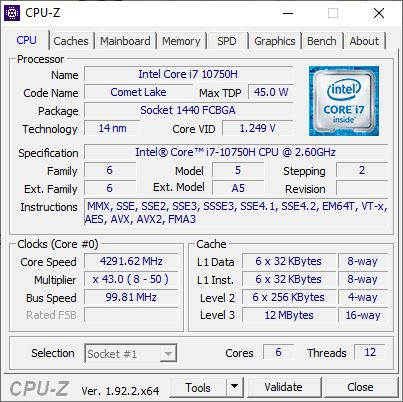
The Intel Core i7-10750H used here is a processor with six cores that can process up to twelve threads simultaneously. The clock rates are between 2.6 and 5 GHz, whereby high clock speeds can only be maintained over longer periods of time with sufficient cooling. Our Cinebench R15 endurance test shows that the fans of the Aorus 5 KB need a moment to be able to sufficiently cool the CPU. This results in a slightly larger performance drop, but it's leveled out after a short time.
Compared to other laptops that we've tested with this CPU, the Aorus 5 KB achieves slightly above-average results. Compared to our test field, it can consequently secure itself a good place in the upper middle section of the results.
* ... smaller is better
System performance
In the PCMark 10 test for system performance, the Aorus 5 achieves second place in our test field. Depending on the individual discipline, it has to admit defeat either to the HP Pavilion Gaming 15 or to the Schenker XMG Pro 15. During our daily testing, the Aorus 5 KB ran smoothly at all times and showed no micro stuttering or the like. Programs could be started without any problems, and files were accessed without delays as well.
The performance achieved by other laptops in our tests can be found in our CPU Benchmarks article.
| PCMark 10 Score | 5452 points | |
Help | ||
DPC latencies
In our test with LatencyMon, the Aorus 5 shows slightly increased delay times. Therefore, it's only partially suitable for real-time applications.
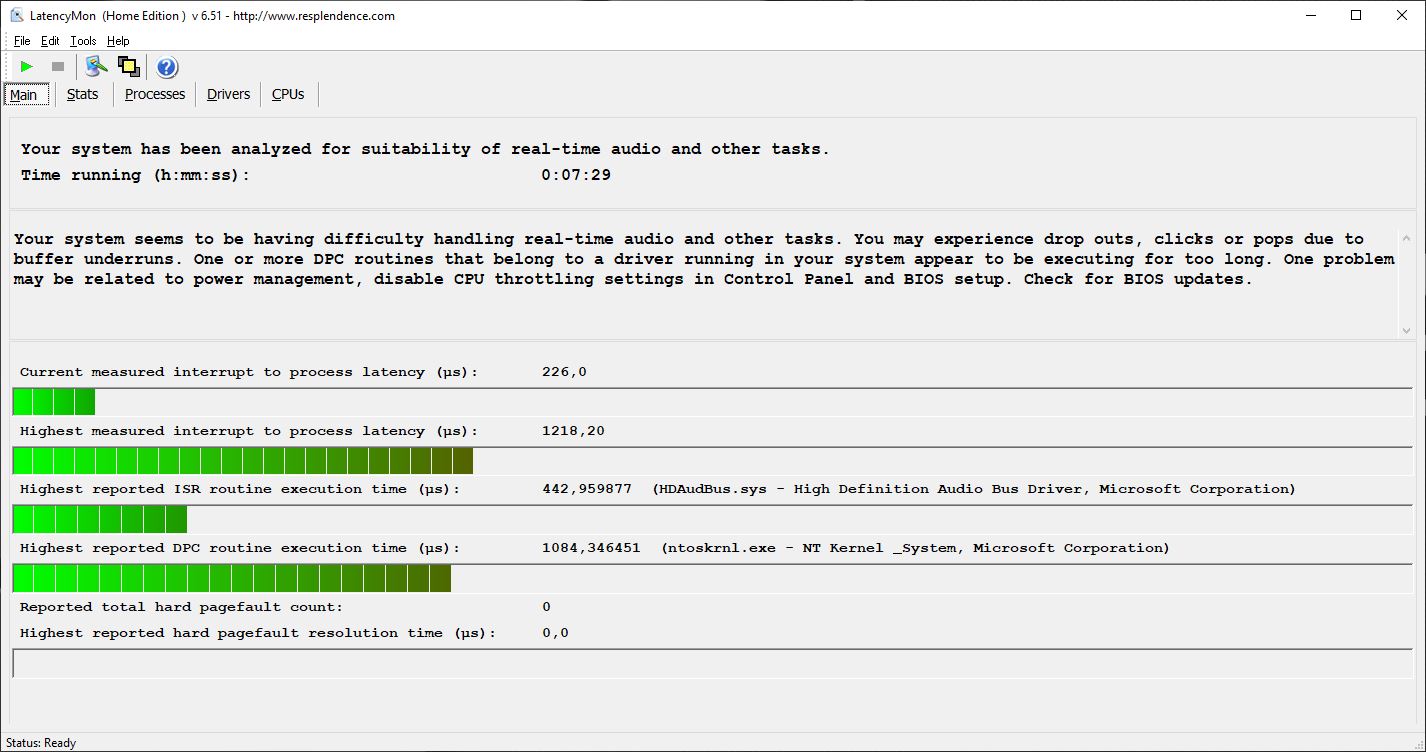

| DPC Latencies / LatencyMon - interrupt to process latency (max), Web, Youtube, Prime95 | |
| Aorus 5 KB | |
| Asus TUF Gaming A15 FA506IV-HN172 | |
| HP Pavilion Gaming 15-ec1177ng | |
| Lenovo Legion 5 15IMH05H | |
* ... smaller is better
Storage
In our test configuration of the Aorus 5, Gigabyte uses a 512 GB SSD from Adata. It achieves very good read and write speeds, whereby only the Samsung 970 EVO Plus in the Schenker XMG Pro 15 can score even better.
The performance that can be expected from other storage devices can be found in our HDD/SSD Benchmarks article.
| Aorus 5 KB ADATA XPG SX8200 Pro (ASX8200PNP-512GT) | Schenker XMG Pro 15 Samsung SSD 970 EVO Plus 500GB | Asus TUF Gaming A15 FA506IV-HN172 Kingston OM8PCP3512F-AB | Lenovo Legion 5 15IMH05H Samsung PM991 MZALQ512HALU | HP Pavilion Gaming 15-ec1177ng Intel SSD 660p SSDPEKNW512G8 | Average ADATA XPG SX8200 Pro (ASX8200PNP-512GT) | |
|---|---|---|---|---|---|---|
| CrystalDiskMark 5.2 / 6 | -1% | -24% | -26% | -35% | -6% | |
| Write 4K (MB/s) | 162.1 | 120.6 -26% | 219.8 36% | 145.4 -10% | 110 -32% | 149.5 ? -8% |
| Read 4K (MB/s) | 60.7 | 46.13 -24% | 50.2 -17% | 51.6 -15% | 52.8 -13% | 53.6 ? -12% |
| Write Seq (MB/s) | 2366 | 2900 23% | 979 -59% | 1007 -57% | 983 -58% | 2346 ? -1% |
| Read Seq (MB/s) | 2633 | 2929 11% | 1990 -24% | 1145 -57% | 1608 -39% | 2501 ? -5% |
| Write 4K Q32T1 (MB/s) | 428.2 | 372.2 -13% | 516 21% | 468.4 9% | 461.3 8% | 419 ? -2% |
| Read 4K Q32T1 (MB/s) | 582 | 422.2 -27% | 298.3 -49% | 528 -9% | 345.4 -41% | 520 ? -11% |
| Write Seq Q32T1 (MB/s) | 2480 | 3245 31% | 982 -60% | 1381 -44% | 982 -60% | 2463 ? -1% |
| Read Seq Q32T1 (MB/s) | 3121 | 3565 14% | 1907 -39% | 2291 -27% | 1820 -42% | 2997 ? -4% |
| AS SSD | 40% | -21% | -31% | -32% | -5% | |
| Seq Read (MB/s) | 2795 | 2975 6% | 1682 -40% | 2012 -28% | 1553 -44% | 2688 ? -4% |
| Seq Write (MB/s) | 2172 | 2597 20% | 904 -58% | 1261 -42% | 868 -60% | 1888 ? -13% |
| 4K Read (MB/s) | 53.3 | 62.3 17% | 60.2 13% | 43.66 -18% | 56.6 6% | 53.3 ? 0% |
| 4K Write (MB/s) | 121.3 | 150.9 24% | 164.8 36% | 109.3 -10% | 153.6 27% | 124.8 ? 3% |
| 4K-64 Read (MB/s) | 714 | 1508 111% | 472.5 -34% | 851 19% | 325.3 -54% | 714 ? 0% |
| 4K-64 Write (MB/s) | 1376 | 2239 63% | 845 -39% | 780 -43% | 762 -45% | 1114 ? -19% |
| Access Time Read * (ms) | 0.049 | 0.038 22% | 0.087 -78% | 0.117 -139% | 0.07 -43% | 0.05575 ? -14% |
| Access Time Write * (ms) | 0.036 | 0.025 31% | 0.02 44% | 0.036 -0% | 0.046 -28% | 0.03125 ? 13% |
| Score Total (Points) | 3279 | 5463 67% | 2143 -35% | 2643 -19% | 1802 -45% | 2968 ? -9% |
| Total Average (Program / Settings) | 20% /
21% | -23% /
-22% | -29% /
-29% | -34% /
-33% | -6% /
-5% |
* ... smaller is better

Continuous load read: DiskSpd Read Loop, Queue Depth 8
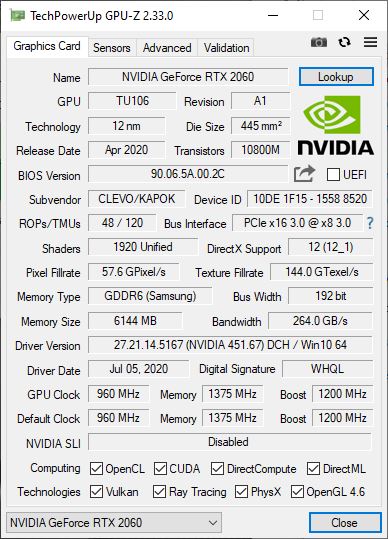
Graphics card
An Nvidia GeForce RTX 2060 is responsible for displaying image content in the Aorus 5 KB. It supports features like DLSS and Real-Time Ray Tracing and is also suitable for demanding tasks. In the 3DMark benchmarks, the GPU achieves results that meet our expectations for the hardware.
The performance achieved by other graphics cards in comparison can be found in our GPU Benchmarks article.
| 3DMark 11 Performance | 18491 points | |
| 3DMark Fire Strike Score | 15034 points | |
| 3DMark Time Spy Score | 6258 points | |
Help | ||
Gaming performance
Nvidia's GeForce RTX 2060 can run modern and upcoming games smoothly at Full HD resolution and maximum details. In the titles that we tested, high frame rates are possible without any problems. However, a stable 60 fps can't always be guaranteed in very demanding titles.
Our GPU Games article shows the performance that can be expected from the Nvidia GeForce RTX 2060 in other games.
| The Witcher 3 - 1920x1080 Ultra Graphics & Postprocessing (HBAO+) | |
| Average of class Gaming (95 - 240, n=8, last 2 years) | |
| Schenker XMG Pro 15 | |
| Lenovo Legion 5 15IMH05H | |
| Average NVIDIA GeForce RTX 2060 Mobile (50.6 - 74, n=40) | |
| Asus TUF Gaming A15 FA506IV-HN172 | |
| Aorus 5 KB | |
| HP Pavilion Gaming 15-ec1177ng | |
| Far Cry 5 - 1920x1080 Ultra Preset AA:T | |
| Average of class Gaming (70 - 151, n=10, last 2 years) | |
| Lenovo Legion 5 15IMH05H | |
| Aorus 5 KB | |
| Average NVIDIA GeForce RTX 2060 Mobile (76 - 90, n=9) | |
| Final Fantasy XV Benchmark - 1920x1080 High Quality | |
| Average of class Gaming (41 - 215, n=104, last 2 years) | |
| Aorus 5 KB | |
| Average NVIDIA GeForce RTX 2060 Mobile (52 - 67.5, n=7) | |
| Doom Eternal - 1920x1080 Ultra Preset | |
| Aorus 5 KB | |
| Lenovo Legion 5 15IMH05H | |
| Average NVIDIA GeForce RTX 2060 Mobile (98.7 - 138, n=10) | |
| HP Pavilion Gaming 15-ec1177ng | |
The continuous load test with The Witcher 3 in the "Ultra" graphics setting shows that users have to expect a slight drop in frame rates when operating times become prolonged.
| low | med. | high | ultra | |
|---|---|---|---|---|
| The Witcher 3 (2015) | 57 | |||
| Dota 2 Reborn (2015) | 140 | 128 | 121 | 115 |
| Final Fantasy XV Benchmark (2018) | 66.1 | |||
| X-Plane 11.11 (2018) | 107 | 93.1 | 79.1 | |
| Far Cry 5 (2018) | 84 | |||
| Doom Eternal (2020) | 129 |
Emissions - Easily adjustable fans
Noise emissions
Under load, the Aorus 5 KB's fans can become very loud at up to 56 dB(A). Users who don't constantly utilize the maximum possible performance, however, can achieve a significantly lower noise level thanks to an adjustable fan profile. On our test device, there was an occasional coil whine when the battery was charged.
Noise level
| Idle |
| 26 / 30 / 34 dB(A) |
| Load |
| 53 / 56 dB(A) |
 | ||
30 dB silent 40 dB(A) audible 50 dB(A) loud |
||
min: | ||
Temperature
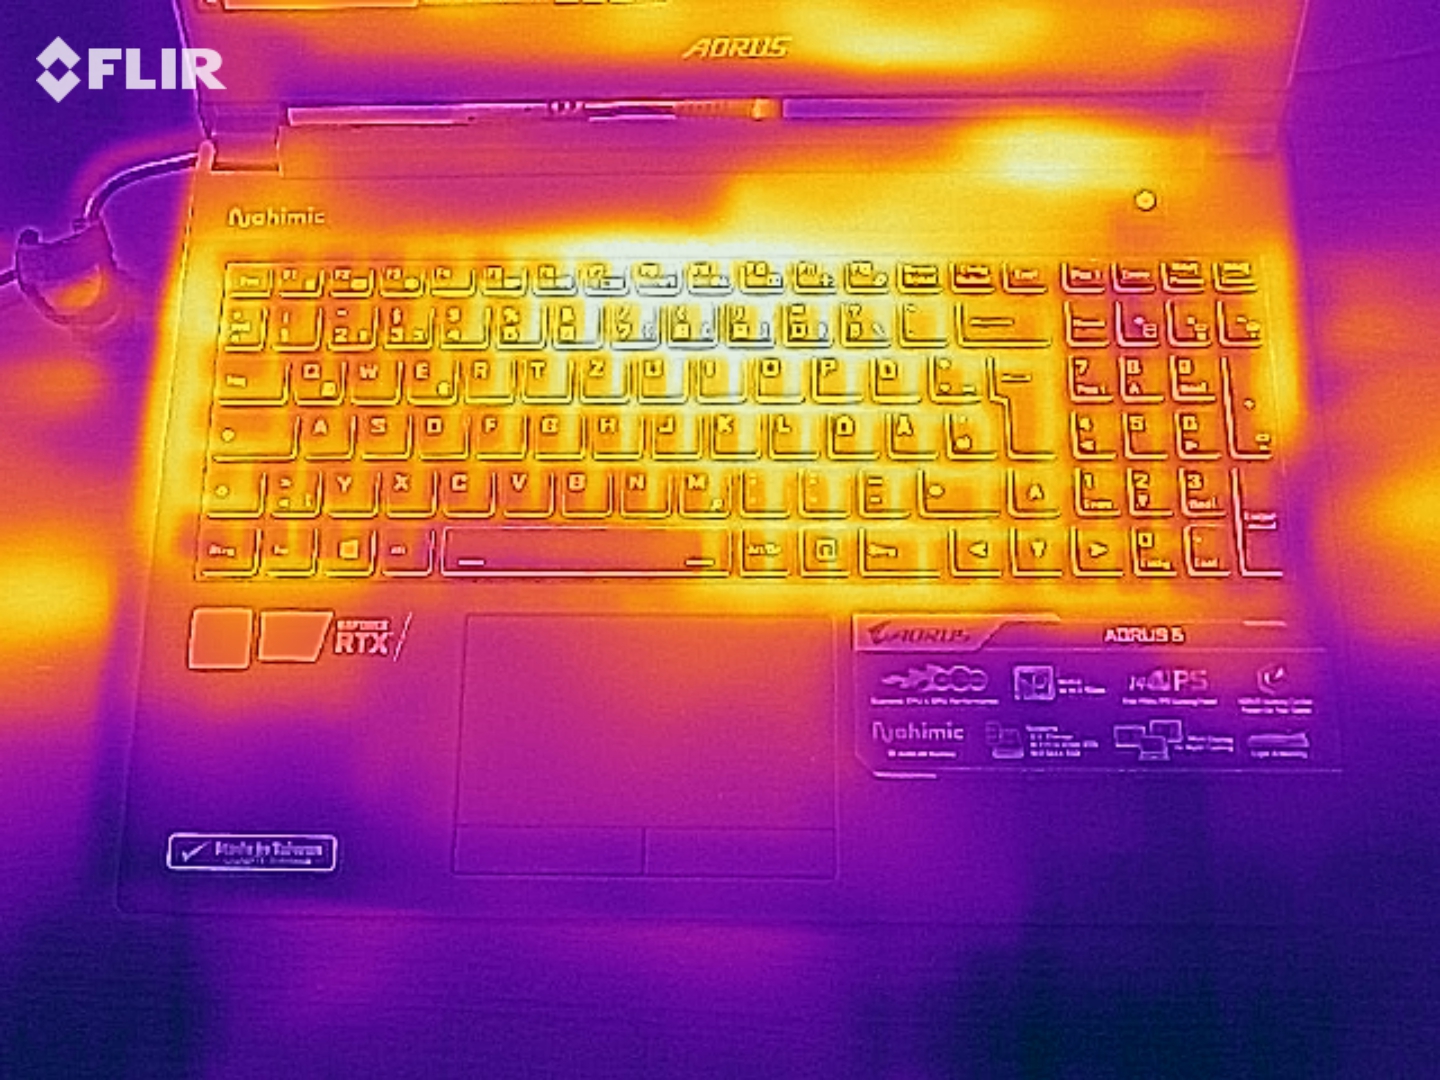
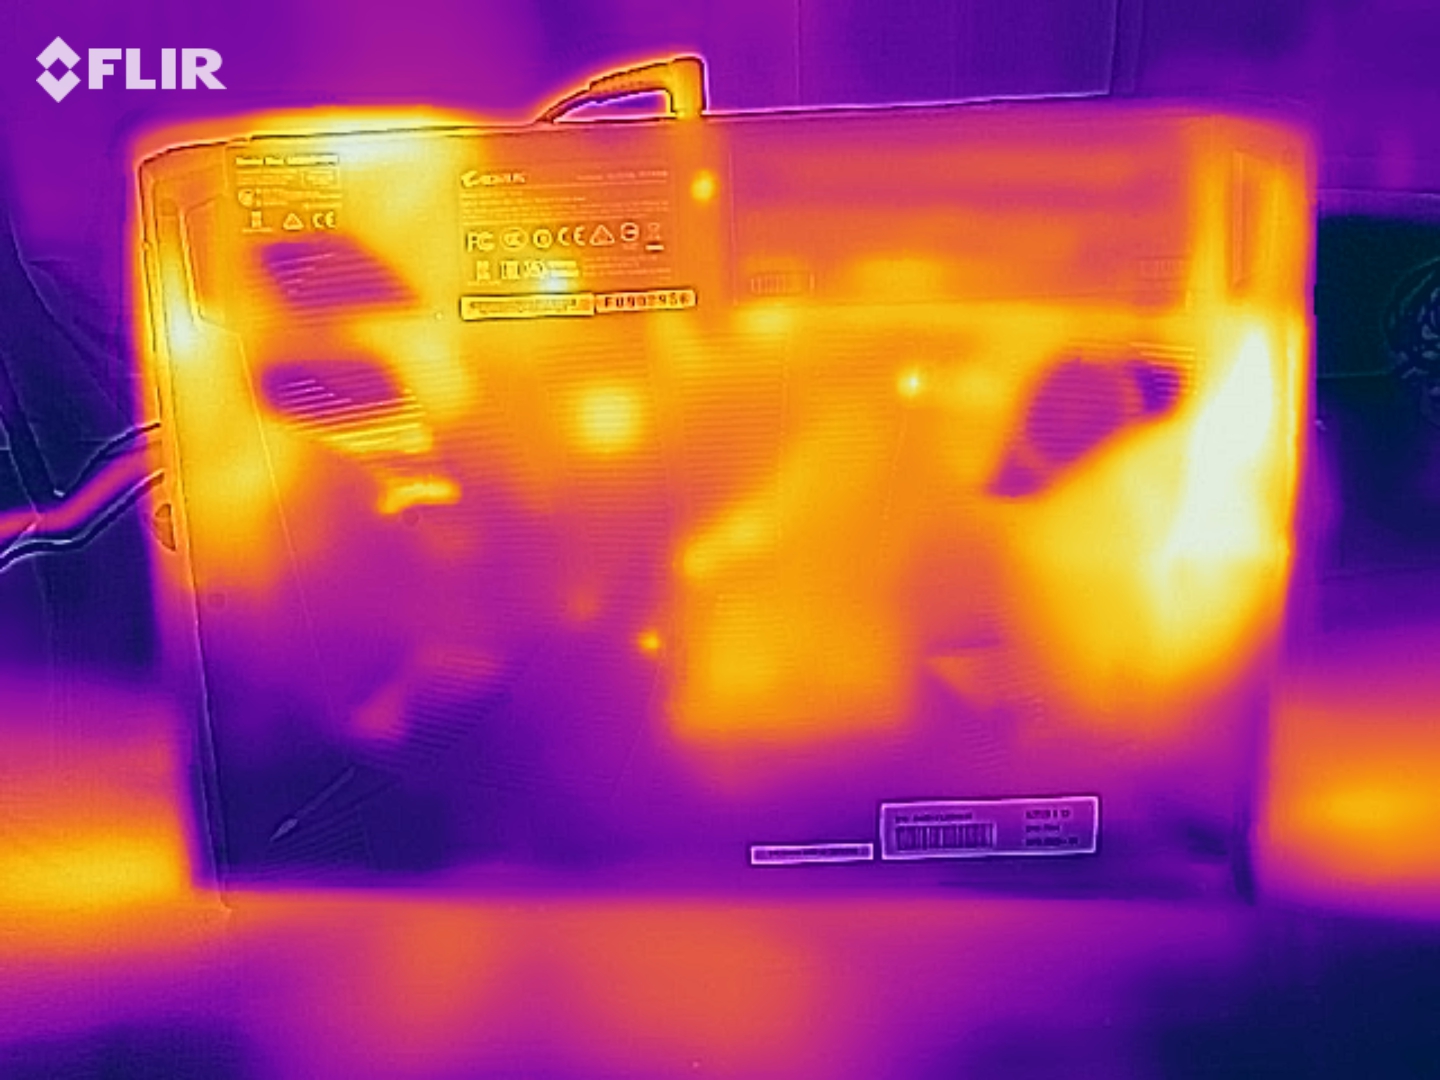
In our full load test, the surface temperatures of the Aorus 5 rose up to 50 °C (~122 °F). As a result, the laptop feels significantly warm and can no longer be placed comfortably on the lap, for example.
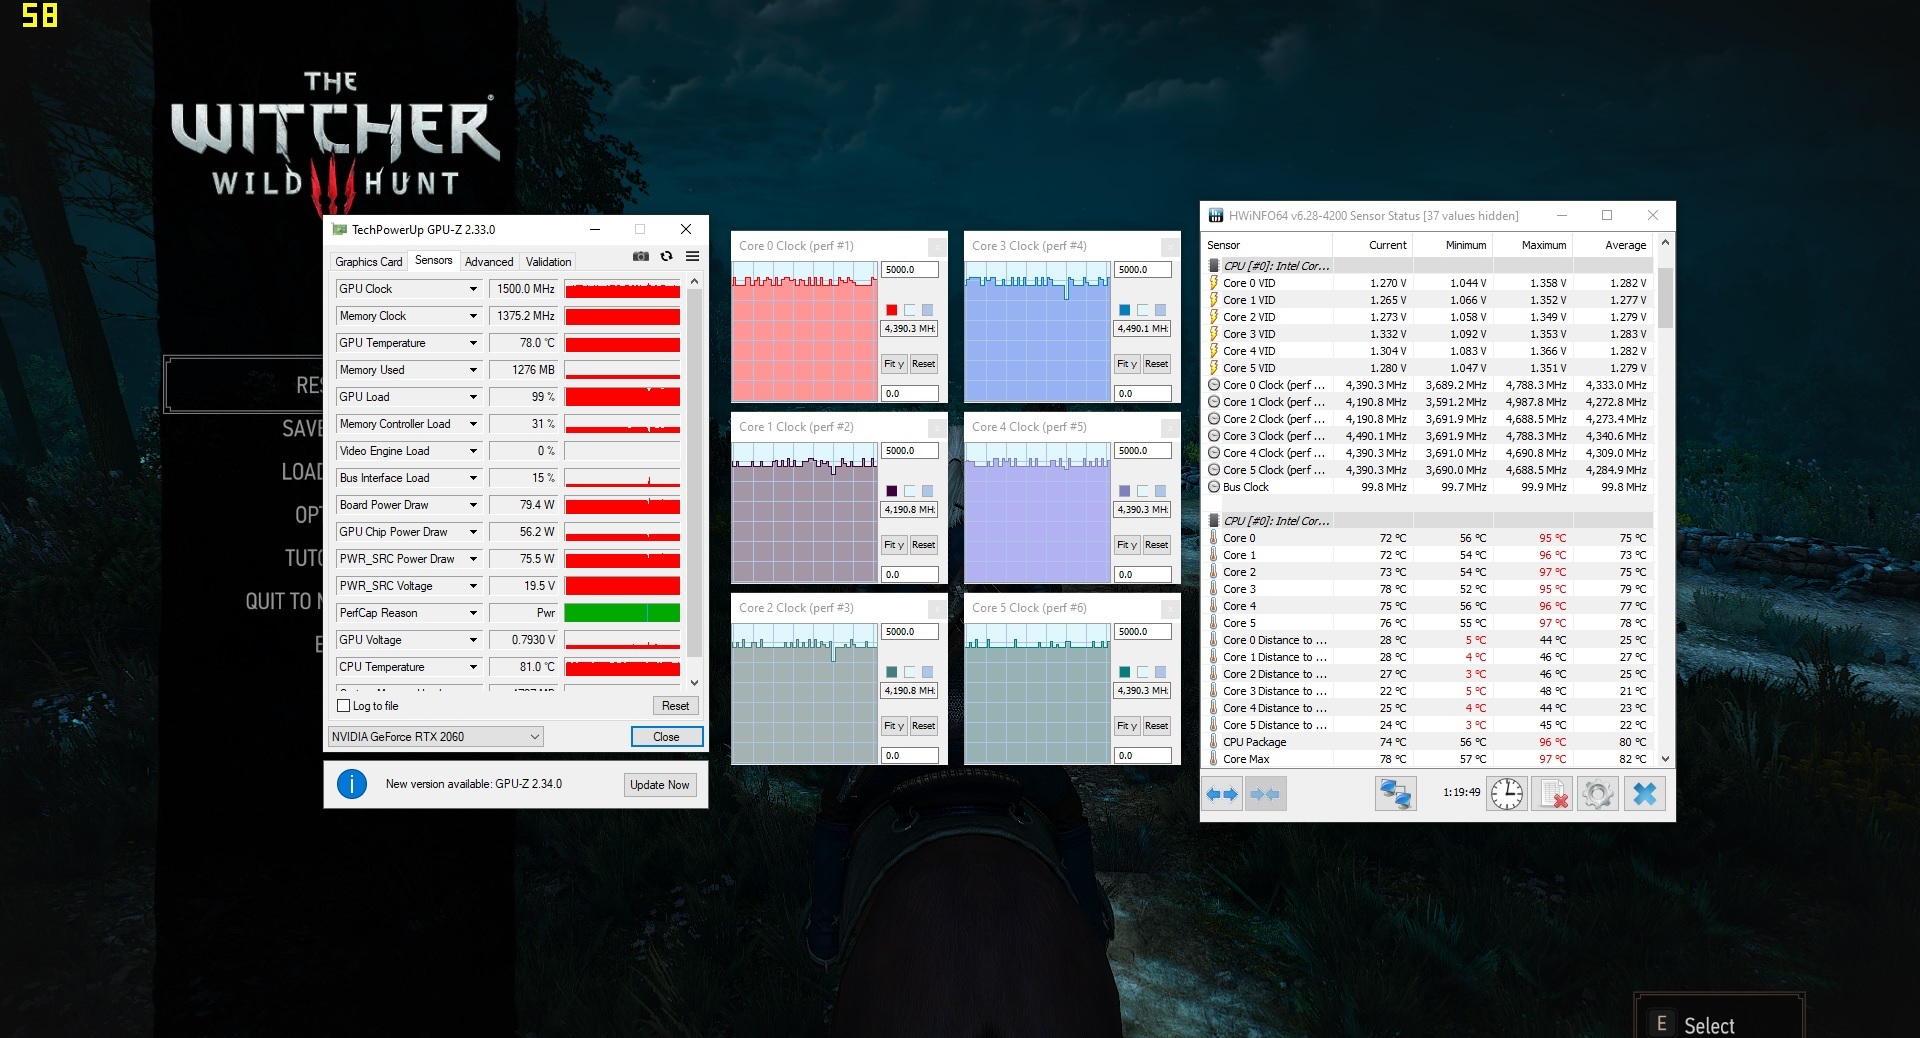
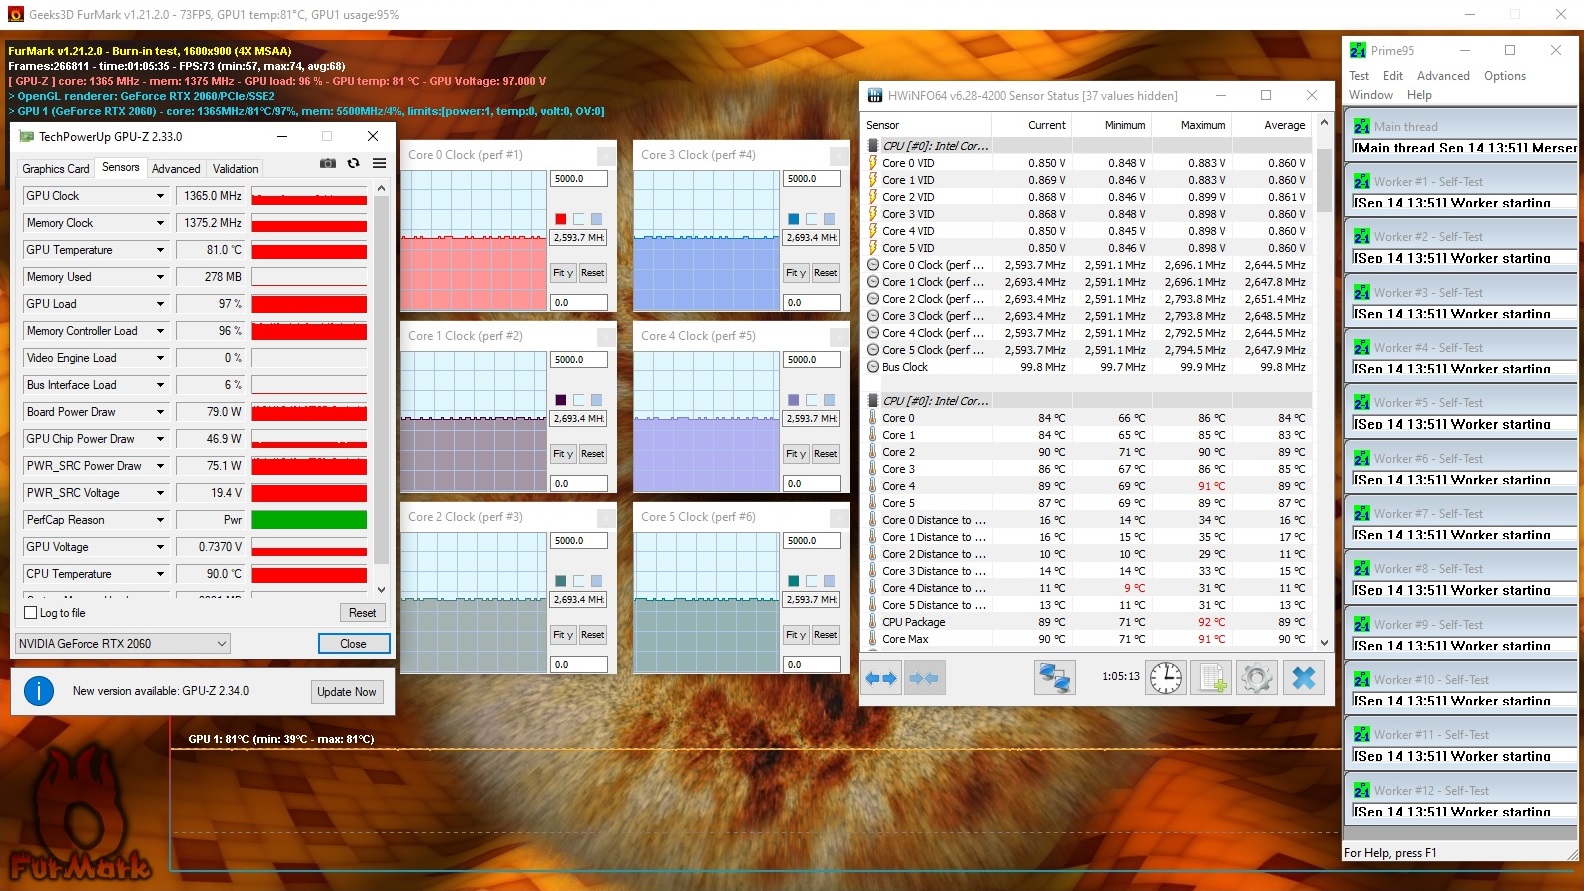
During our approximately one-hour stress test, the temperatures inside the Aorus 5 rose up to 92 °C (~198 °F). The CPU's clock rates dropped to about 2.6 GHz, which was still above the base clock speed. Therefore, users don't have to fear performance drops even under heavy load.
(-) The maximum temperature on the upper side is 50 °C / 122 F, compared to the average of 40.4 °C / 105 F, ranging from 21.2 to 68.8 °C for the class Gaming.
(-) The bottom heats up to a maximum of 49 °C / 120 F, compared to the average of 43.2 °C / 110 F
(+) In idle usage, the average temperature for the upper side is 31.8 °C / 89 F, compared to the device average of 33.9 °C / 93 F.
(-) Playing The Witcher 3, the average temperature for the upper side is 42.6 °C / 109 F, compared to the device average of 33.9 °C / 93 F.
(±) The palmrests and touchpad can get very hot to the touch with a maximum of 39 °C / 102.2 F.
(-) The average temperature of the palmrest area of similar devices was 28.8 °C / 83.8 F (-10.2 °C / -18.4 F).
Speakers
The speakers of the Aorus 5 offer relatively high volume and a wide sound spectrum, where the lower tones are somewhat underrepresented. They are certainly suitable for the occasional playback of media content, but external speakers or headphones are recommended in the long run.
Aorus 5 KB audio analysis
(+) | speakers can play relatively loud (88 dB)
Bass 100 - 315 Hz
(-) | nearly no bass - on average 33.1% lower than median
(-) | bass is not linear (16.2% delta to prev. frequency)
Mids 400 - 2000 Hz
(+) | balanced mids - only 4.3% away from median
(+) | mids are linear (4.1% delta to prev. frequency)
Highs 2 - 16 kHz
(+) | balanced highs - only 2.8% away from median
(+) | highs are linear (4% delta to prev. frequency)
Overall 100 - 16.000 Hz
(±) | linearity of overall sound is average (17.7% difference to median)
Compared to same class
» 52% of all tested devices in this class were better, 10% similar, 38% worse
» The best had a delta of 6%, average was 18%, worst was 132%
Compared to all devices tested
» 35% of all tested devices were better, 8% similar, 57% worse
» The best had a delta of 4%, average was 24%, worst was 134%
HP Pavilion Gaming 15-ec1177ng audio analysis
(-) | not very loud speakers (60.8 dB)
Bass 100 - 315 Hz
(-) | nearly no bass - on average 22% lower than median
(±) | linearity of bass is average (11.9% delta to prev. frequency)
Mids 400 - 2000 Hz
(+) | balanced mids - only 2.7% away from median
(±) | linearity of mids is average (10.9% delta to prev. frequency)
Highs 2 - 16 kHz
(+) | balanced highs - only 2.3% away from median
(±) | linearity of highs is average (7.3% delta to prev. frequency)
Overall 100 - 16.000 Hz
(±) | linearity of overall sound is average (23.2% difference to median)
Compared to same class
» 84% of all tested devices in this class were better, 4% similar, 11% worse
» The best had a delta of 6%, average was 18%, worst was 132%
Compared to all devices tested
» 69% of all tested devices were better, 5% similar, 25% worse
» The best had a delta of 4%, average was 24%, worst was 134%
Energy management - Average battery life
Energy consumption
We measure a power consumption of up to 217 watts under load. However, we can assume this to be a peak value that only occurs for a short time, since the gaming laptop manages to run our The Witcher 3 Ultra test with a power consumption of 138 watts.
The USB Type-C port can't be used to charge the laptop.
| Off / Standby | |
| Idle | |
| Load |
|
Key:
min: | |
| Aorus 5 KB i7-10750H, GeForce RTX 2060 Mobile | Schenker XMG Pro 15 i7-9750H, GeForce RTX 2070 Mobile | Asus TUF Gaming A15 FA506IV-HN172 R7 4800H, GeForce RTX 2060 Mobile | Lenovo Legion 5 15IMH05H i5-10300H, GeForce RTX 2060 Mobile | HP Pavilion Gaming 15-ec1177ng R7 4800H, GeForce GTX 1660 Ti Max-Q | Average of class Gaming | |
|---|---|---|---|---|---|---|
| Power Consumption | -32% | 20% | 31% | 38% | -28% | |
| Idle Minimum * (Watt) | 8 | 15 -88% | 5.4 32% | 3.2 60% | 3.8 52% | 13.3 ? -66% |
| Idle Average * (Watt) | 12 | 19 -58% | 10 17% | 8.3 31% | 7.7 36% | 19 ? -58% |
| Idle Maximum * (Watt) | 21 | 26 -24% | 10.5 50% | 8.7 59% | 9.5 55% | 24.5 ? -17% |
| Load Average * (Watt) | 128 | 101 21% | 135 -5% | 82 36% | 90 30% | 108.1 ? 16% |
| Witcher 3 ultra * (Watt) | 138 | 177 -28% | 144 -4% | 151 -9% | 99 28% | |
| Load Maximum * (Watt) | 217 | 245 -13% | 147 32% | 195 10% | 156 28% | 254 ? -17% |
* ... smaller is better
Battery life
In our practical WLAN test, the Aorus 5 KB achieves a runtime of 4:45 hours. This is slightly above the average value for the gaming category. A quick-charge function or the like is not available.
| Aorus 5 KB i7-10750H, GeForce RTX 2060 Mobile, 48.96 Wh | Schenker XMG Pro 15 i7-9750H, GeForce RTX 2070 Mobile, 62 Wh | Asus TUF Gaming A15 FA506IV-HN172 R7 4800H, GeForce RTX 2060 Mobile, 48 Wh | Lenovo Legion 5 15IMH05H i5-10300H, GeForce RTX 2060 Mobile, 60 Wh | HP Pavilion Gaming 15-ec1177ng R7 4800H, GeForce GTX 1660 Ti Max-Q, 52.5 Wh | Average of class Gaming | |
|---|---|---|---|---|---|---|
| Battery runtime | -16% | 43% | 49% | 27% | 30% | |
| Reader / Idle (h) | 9 | 5.2 -42% | 9.8 9% | 14.1 57% | 8.71 ? -3% | |
| WiFi v1.3 (h) | 4.8 | 3.5 -27% | 6.2 29% | 7.2 50% | 6.1 27% | 7.01 ? 46% |
| Load (h) | 1 | 1.2 20% | 1.9 90% | 1.4 40% | 1.47 ? 47% |
Pros
Cons
Verdict - Solid, well-equipped barebone
With the Aorus 5 KB, Gigabyte delivers a comparatively inexpensive gaming laptop that shines with its extensive maintenance options. Especially the expansion options for the storage devices are numerous, but access to the RAM and fans is also possible. The performance is at the expected level for the hardware and can also be maintained well under load. In addition, the possibility to influence performance and fan behavior through the software also provides users with good control mechanisms.
The Aorus 5 KB offers many maintenance options and can keep up its performance even under load.
By using a Clevo barebone, Aorus didn't set its own accents on the case. Furthermore, the keyboard's backlight control is limited to predefined colors. However, the workmanship, the 144 Hz panel, and the port selection are rock solid and should please most users.
Aorus 5 KB
- 10/06/2020 v7 (old)
Mike Wobker
Price comparison

