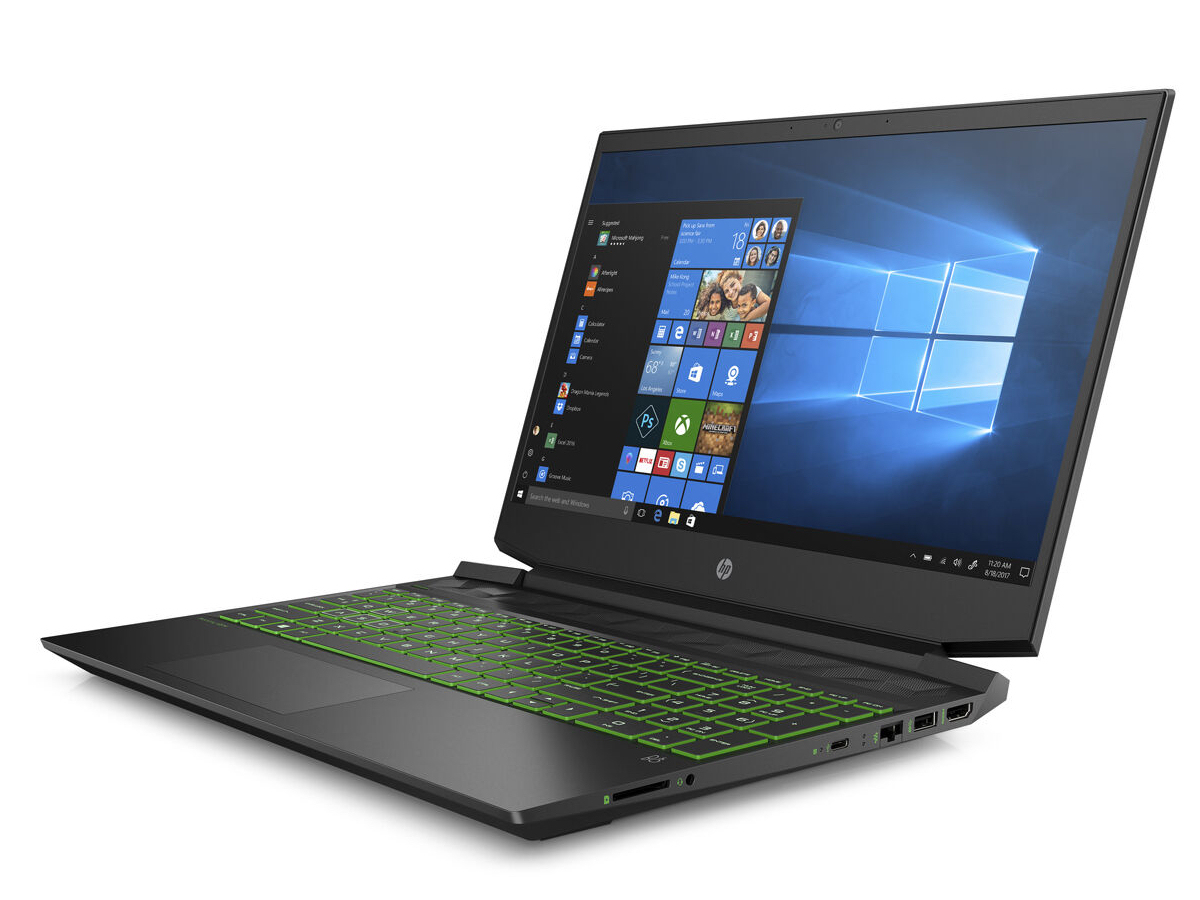
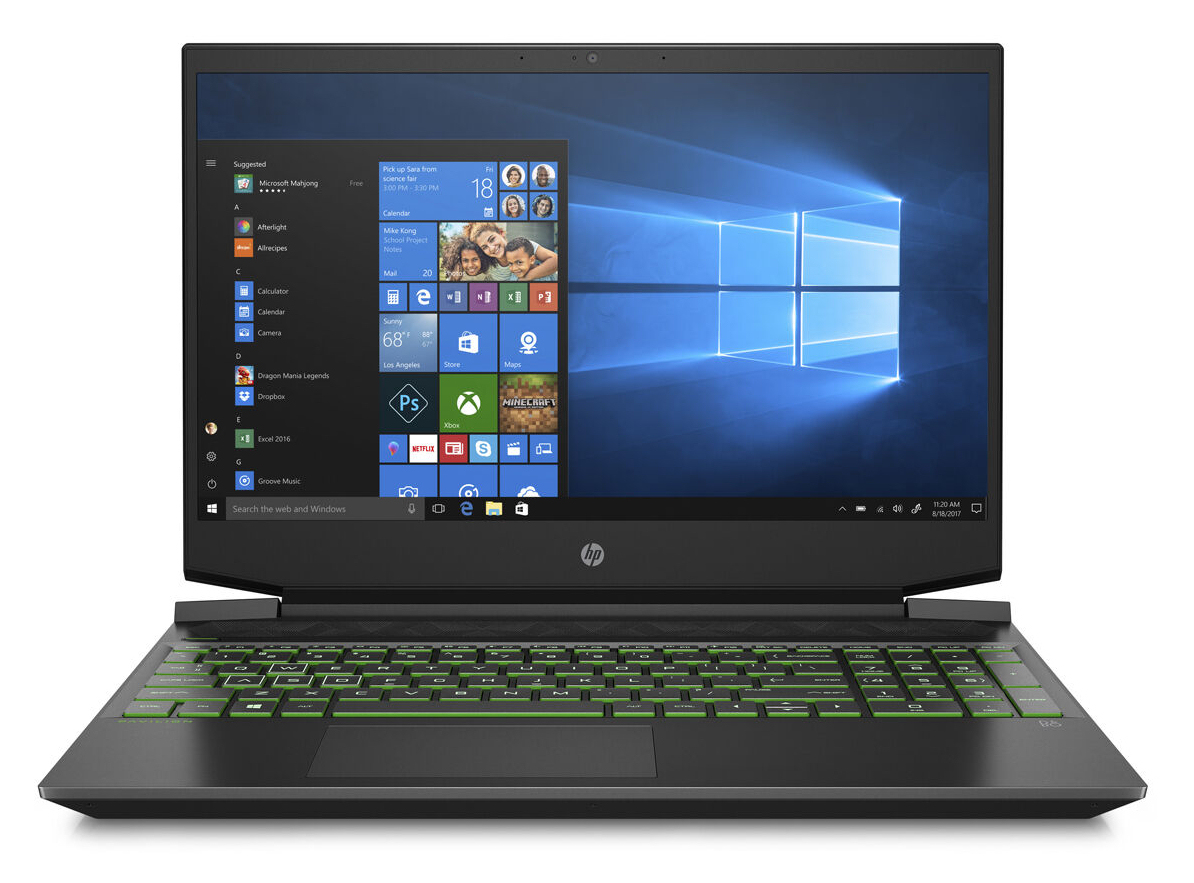
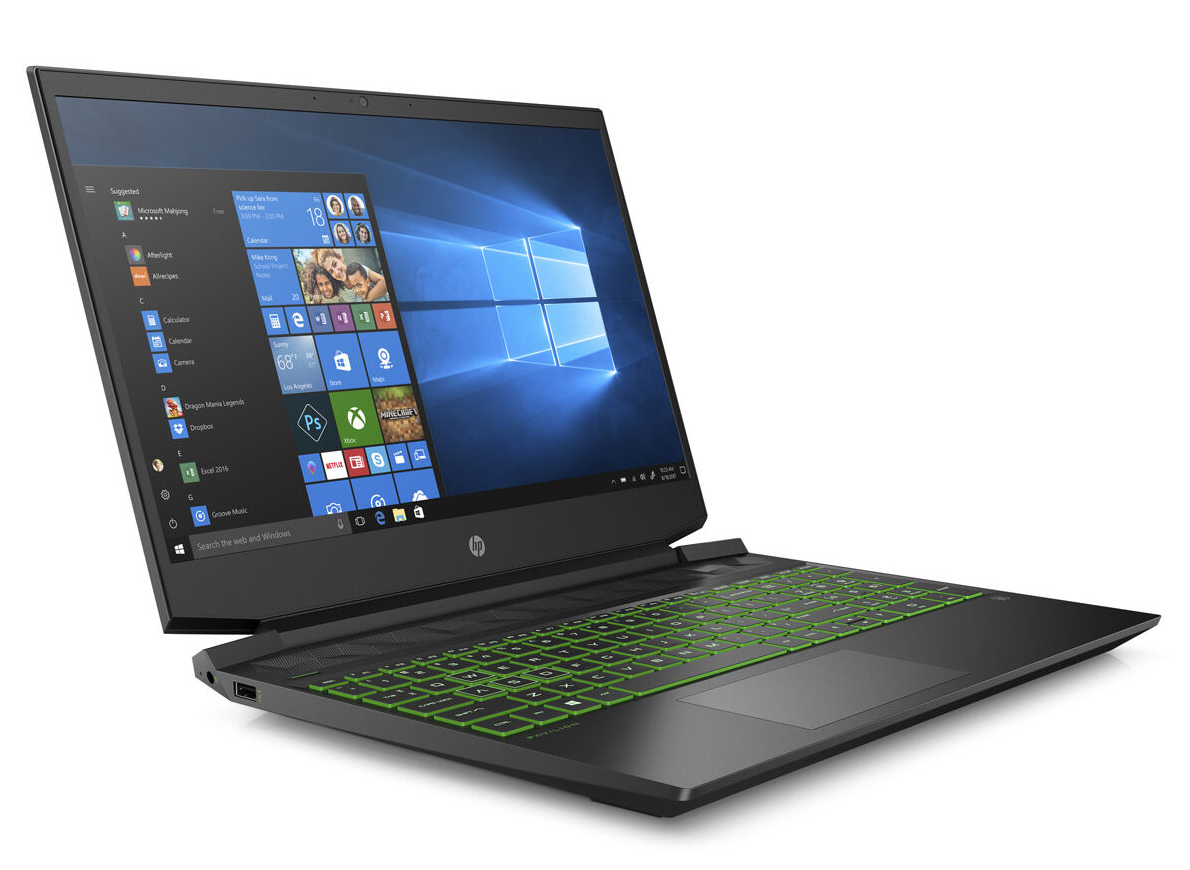
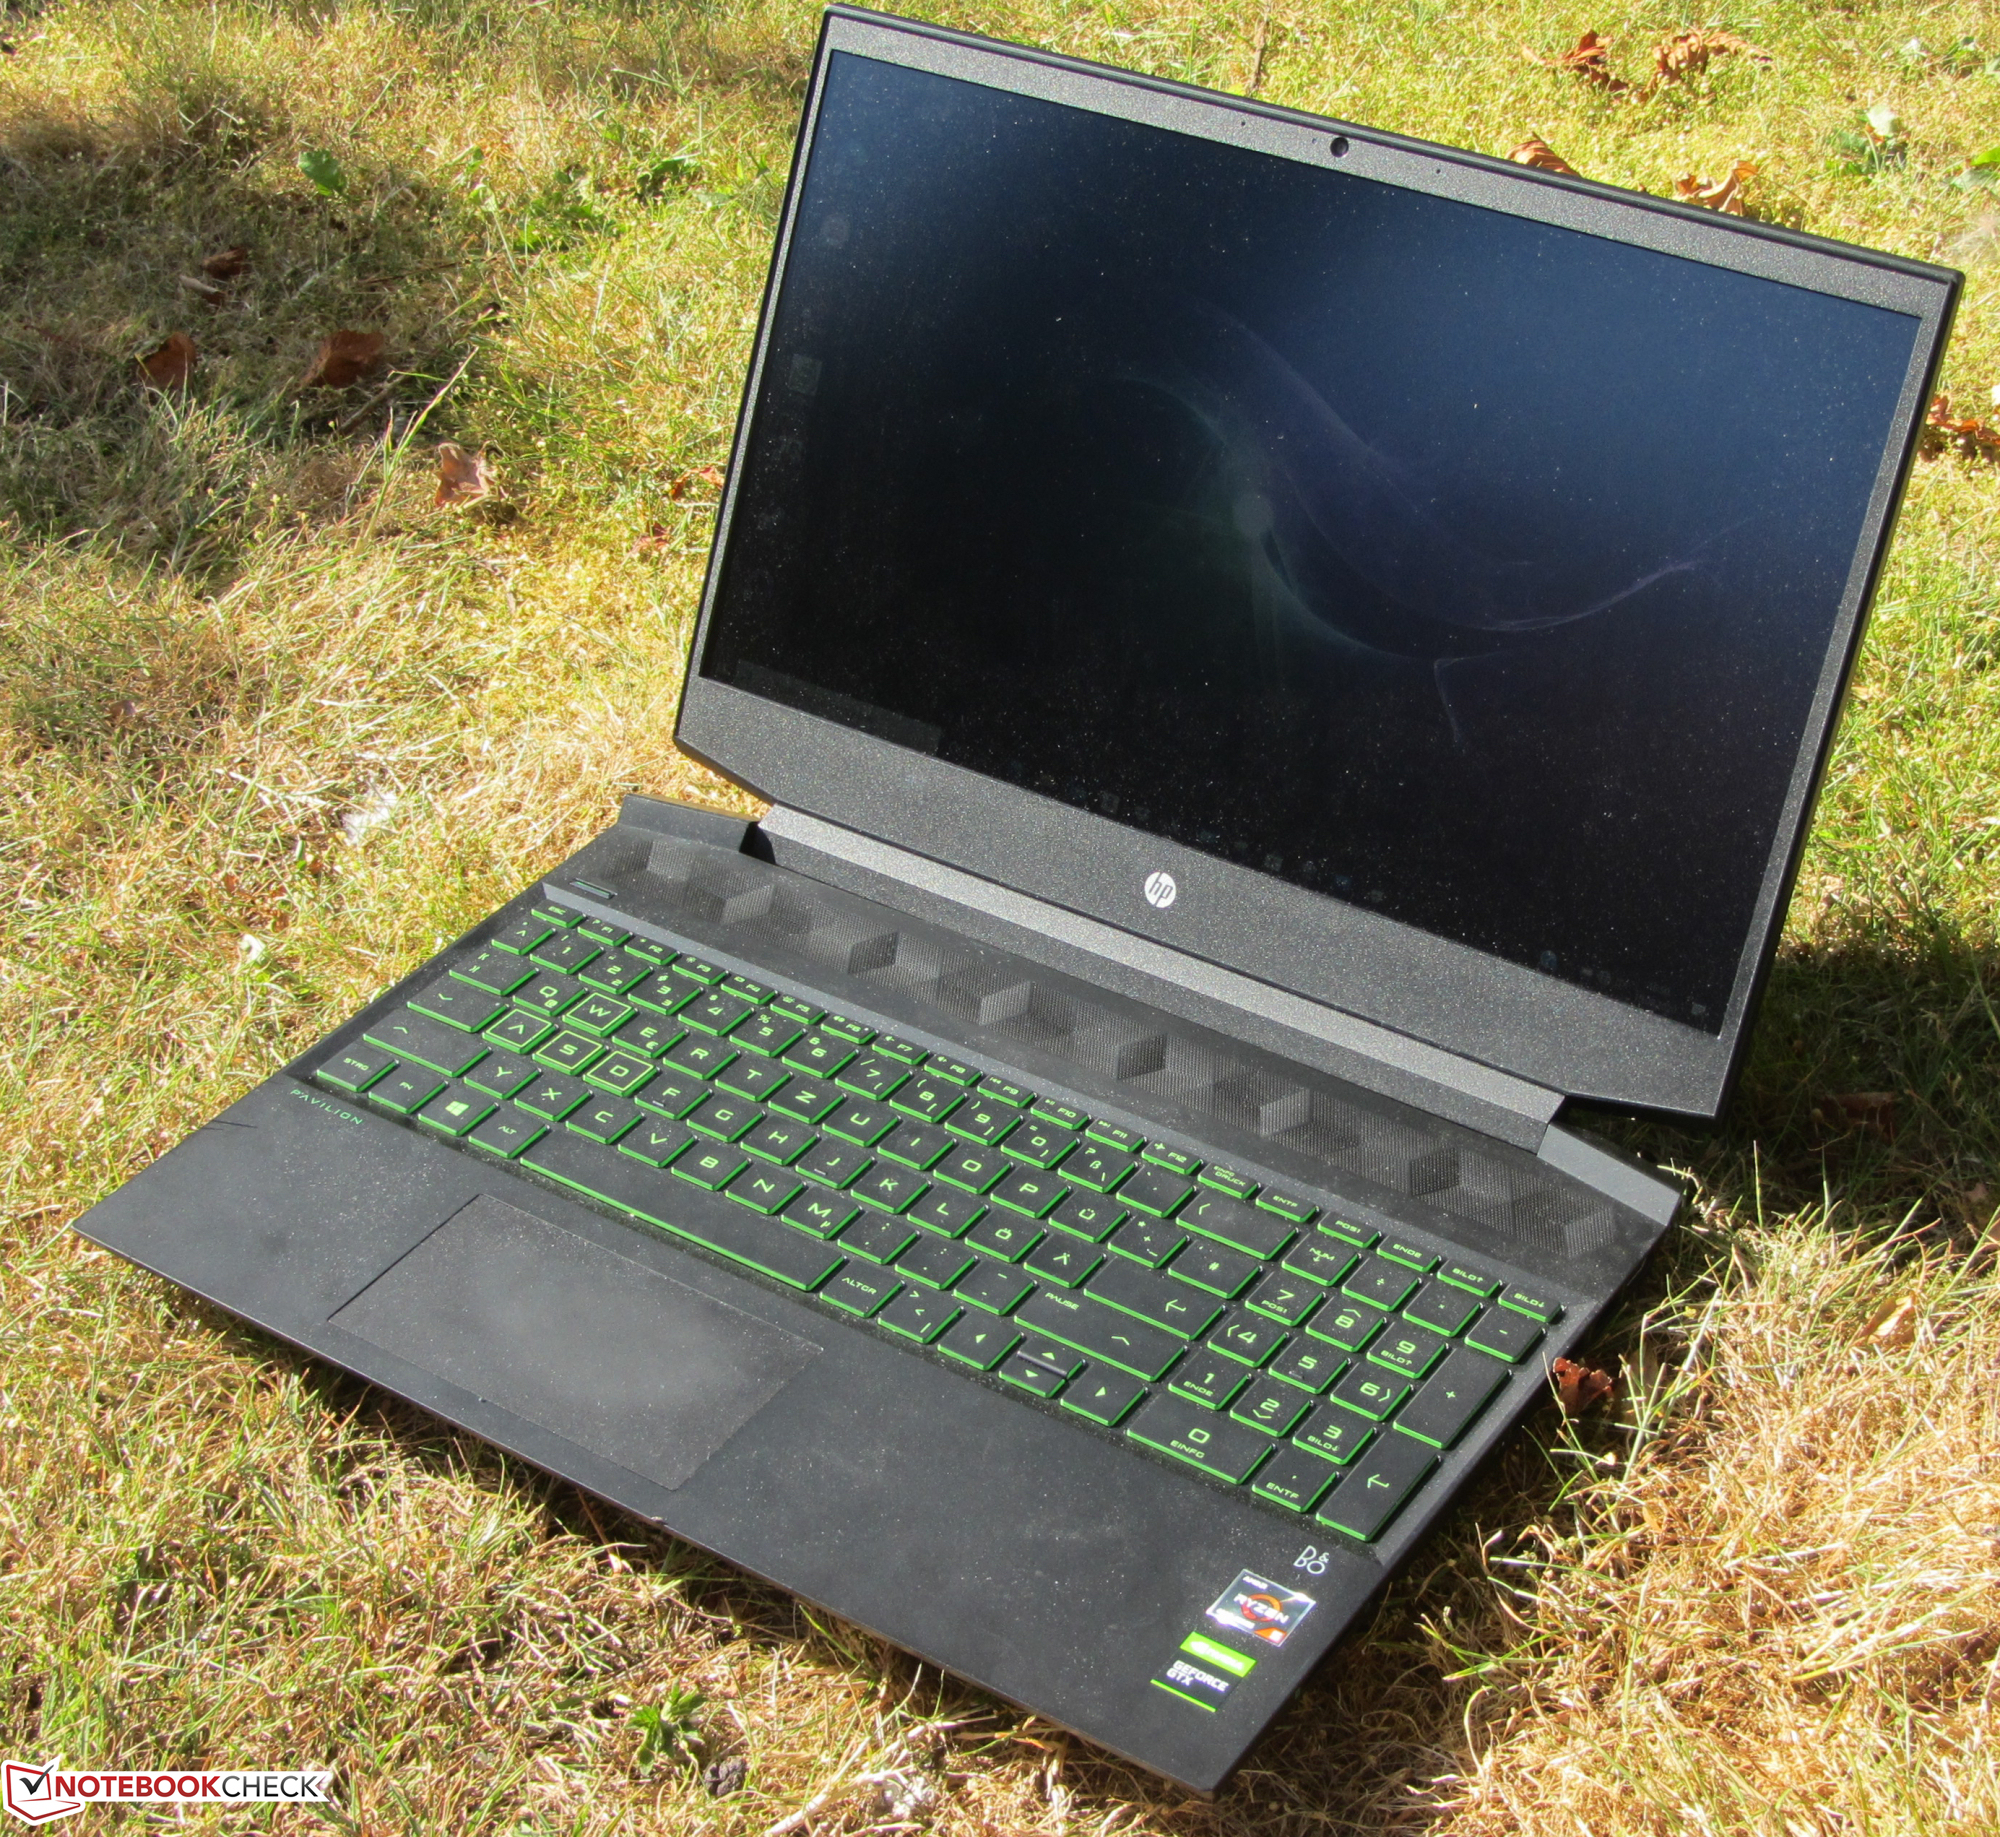
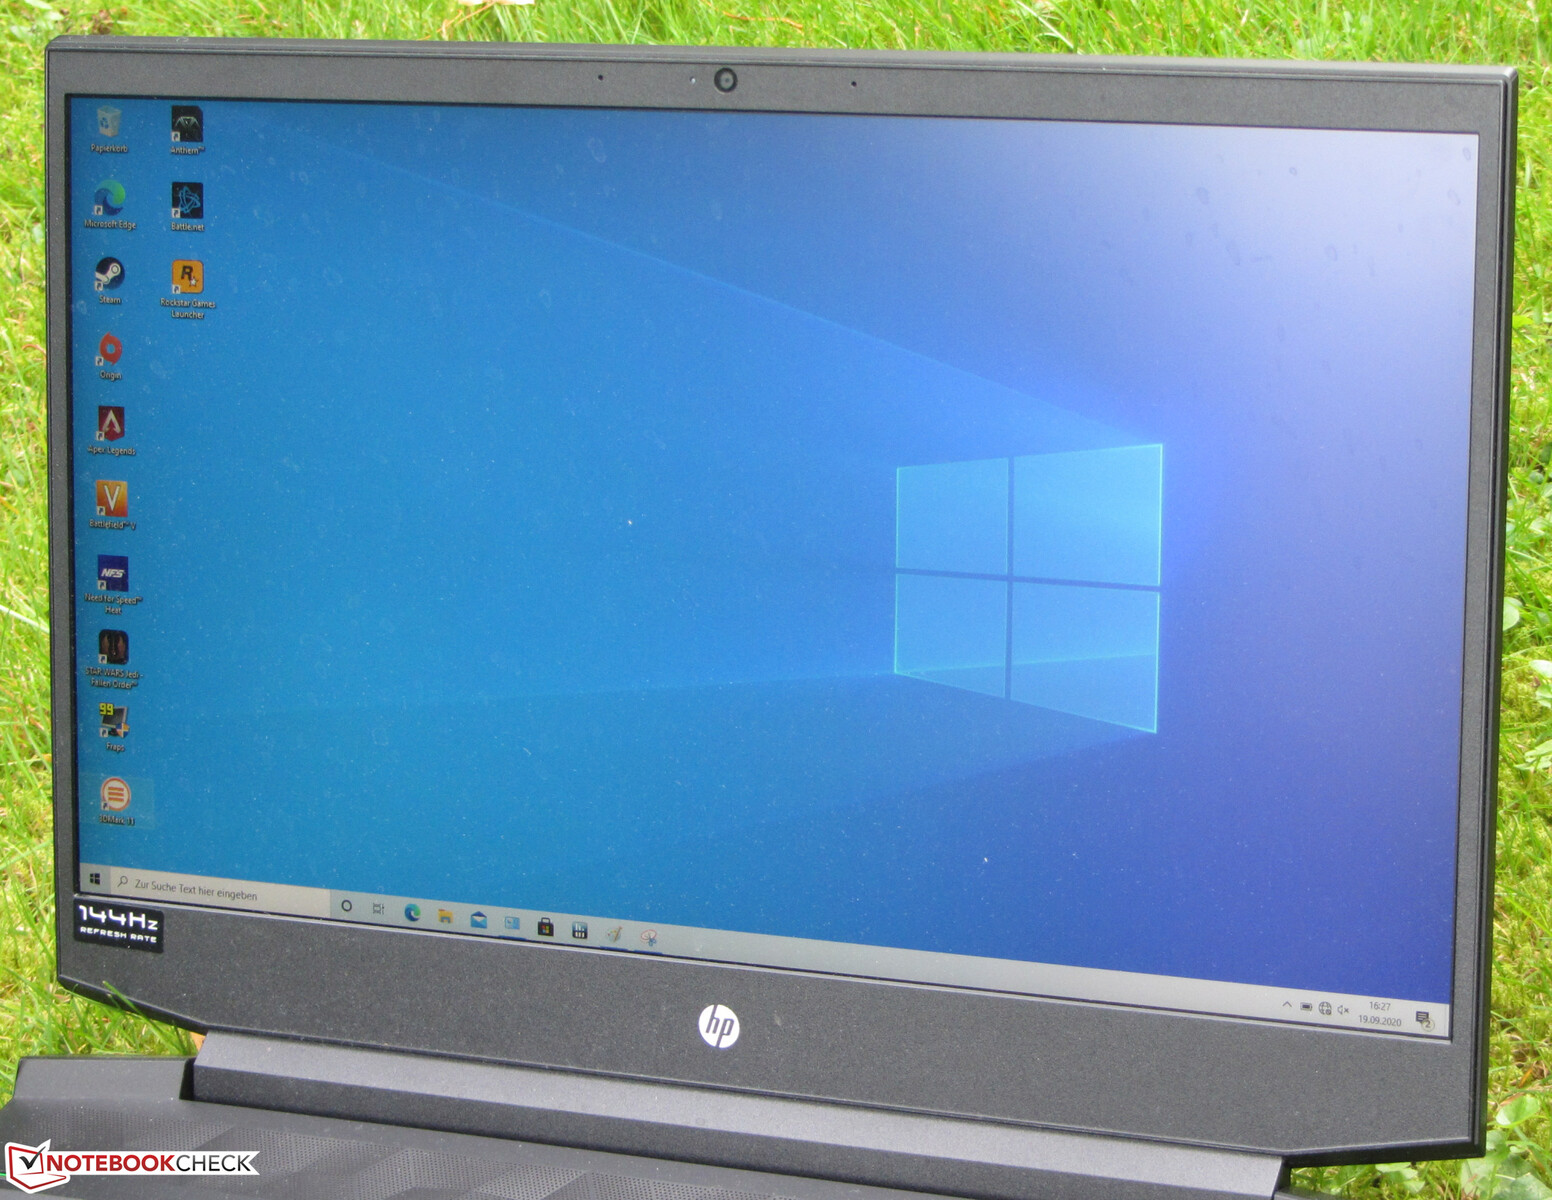
HP Pavilion Gaming 15 in review: Inexpensive gaming laptop with a lot of power under the hood

The Pavilion Gaming 15 series stands for 15.6-inch gaming laptops that offer a good price-performance ratio. We have already reviewed three current EC models in the series. We now have the Pavilion Gaming 15-ec1177ng, one of the most powerful and expensive (about 1,200 Euros (~$1,407)) representatives of the series. On board are a Ryzen 7 4800H APU and a GeForce GTX 1660 Ti Max-Q graphics core. Competitors include devices like the Dell G3 15 3500, the Acer Nitro 5 AN515-44, the Asus TUF A15 FA506I, and the Lenovo IdeaPad Gaming 3i 15IMH05.
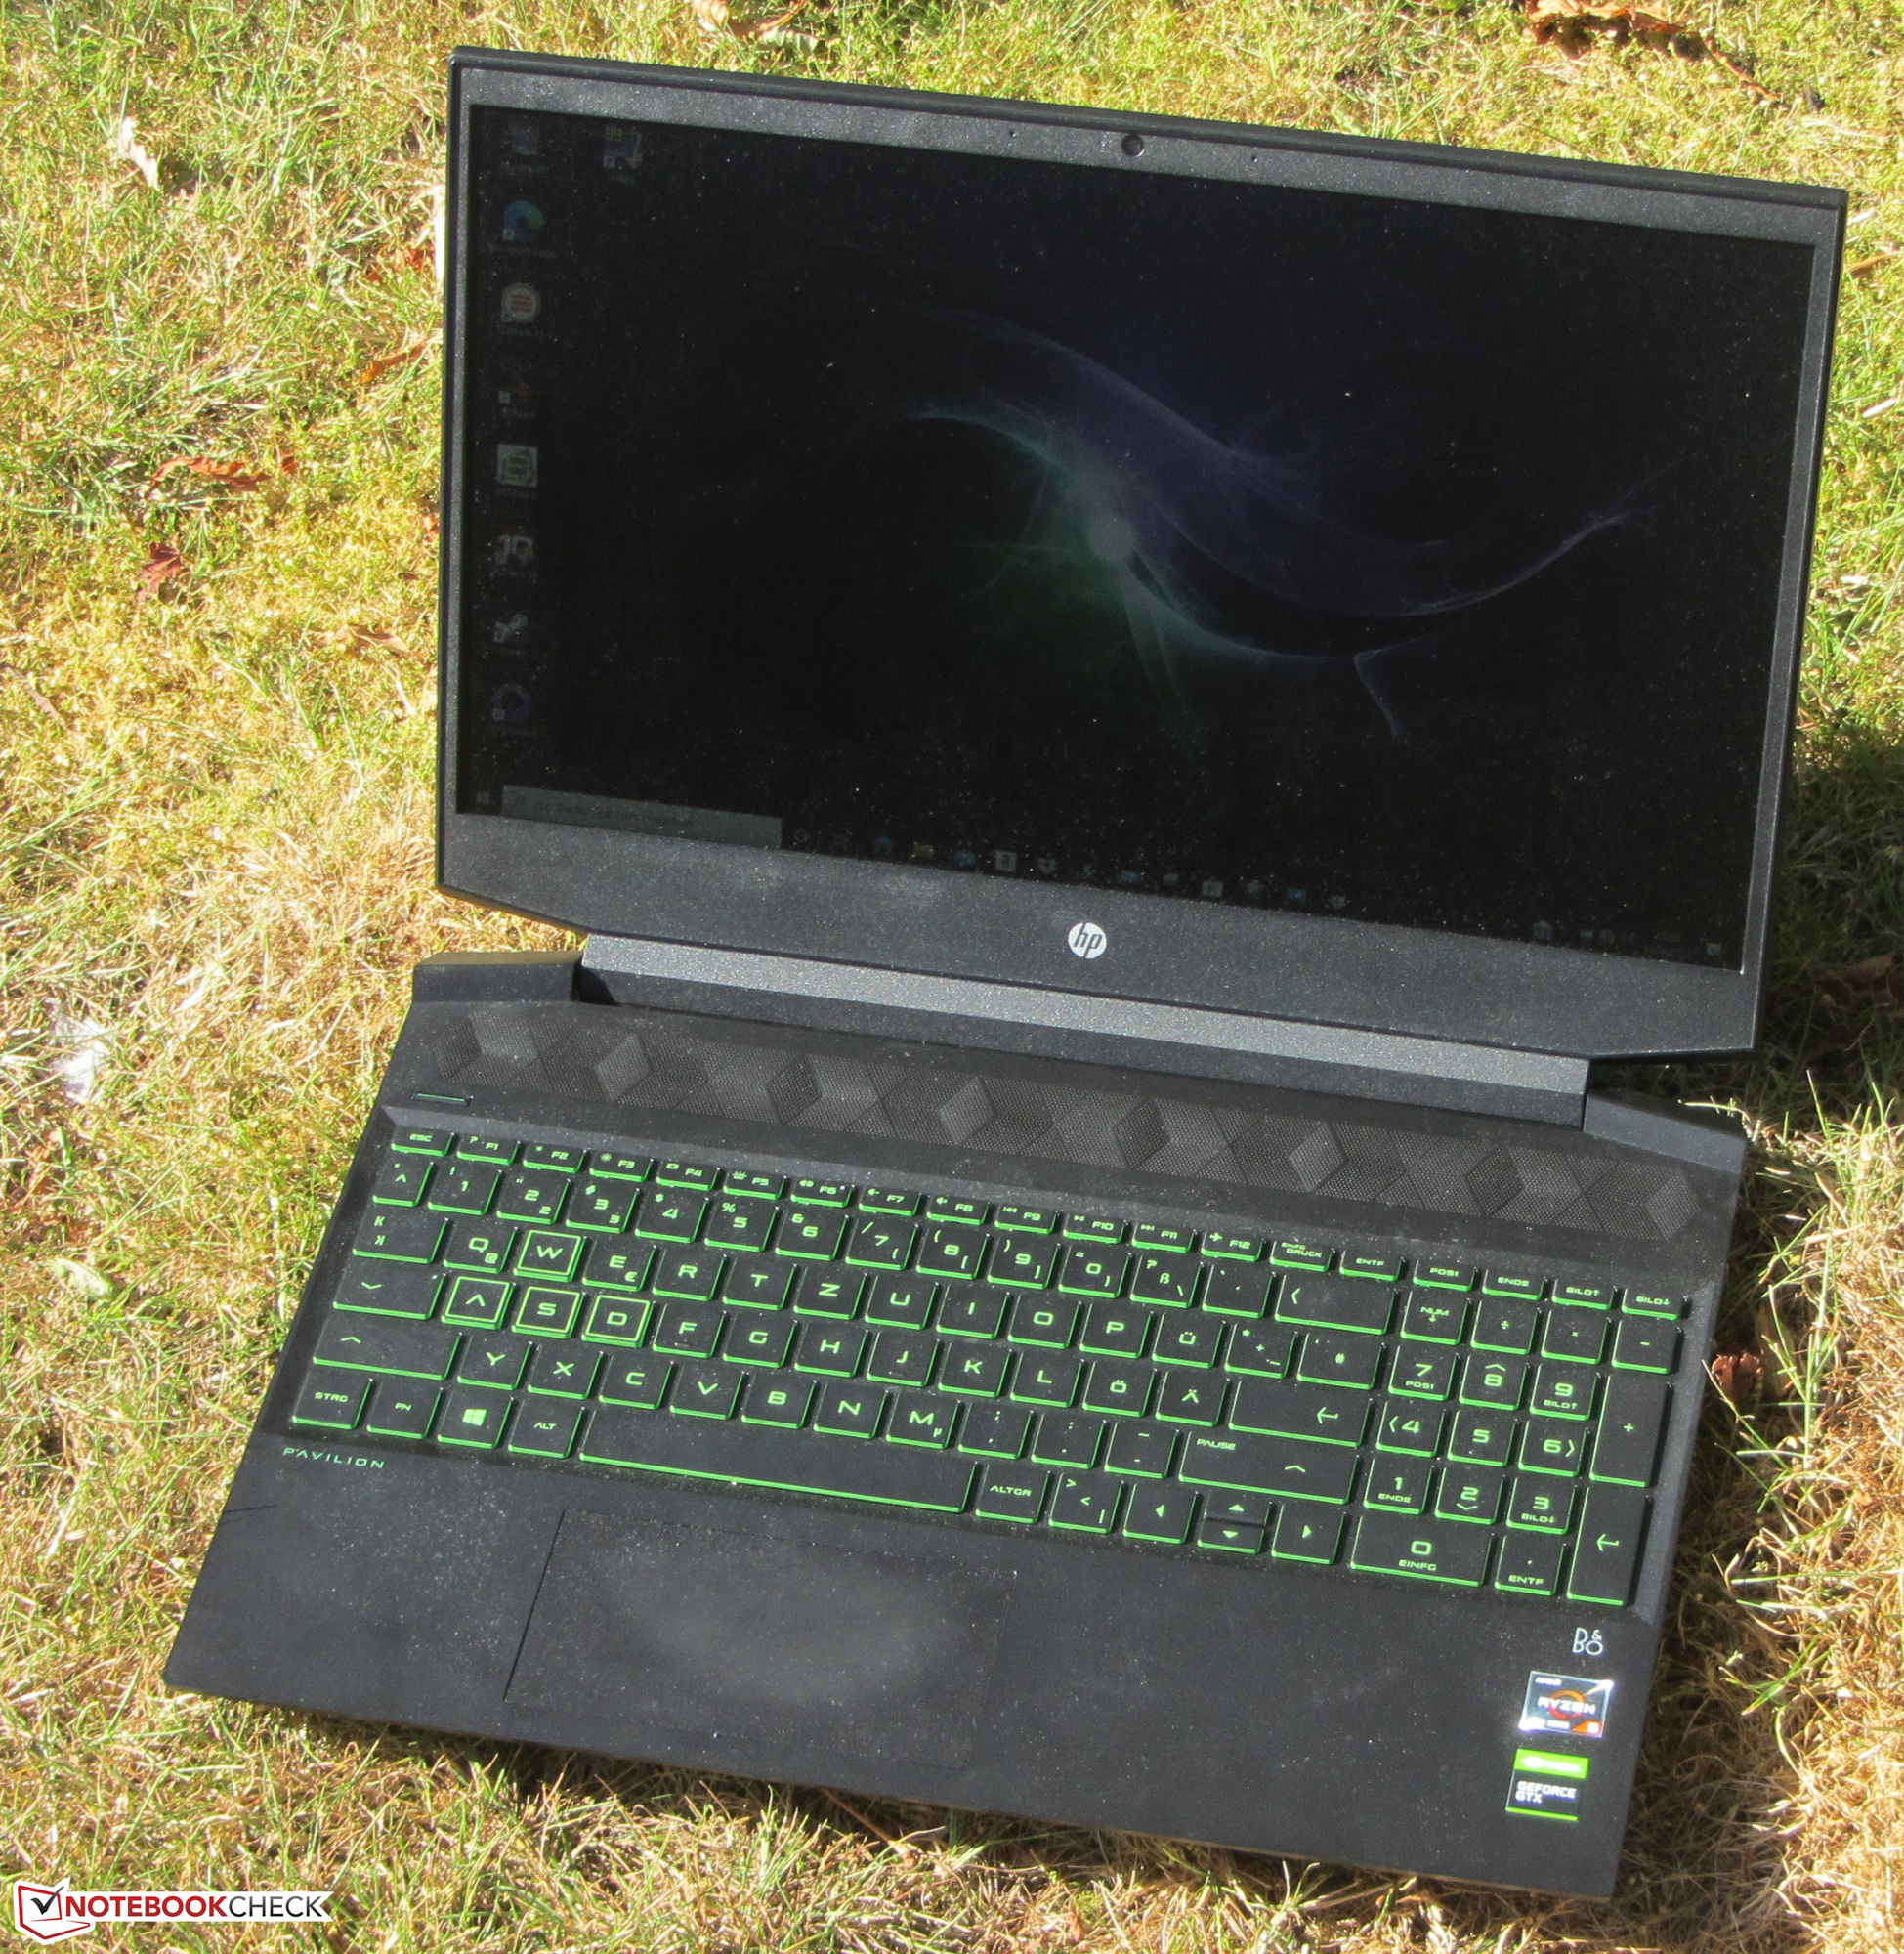
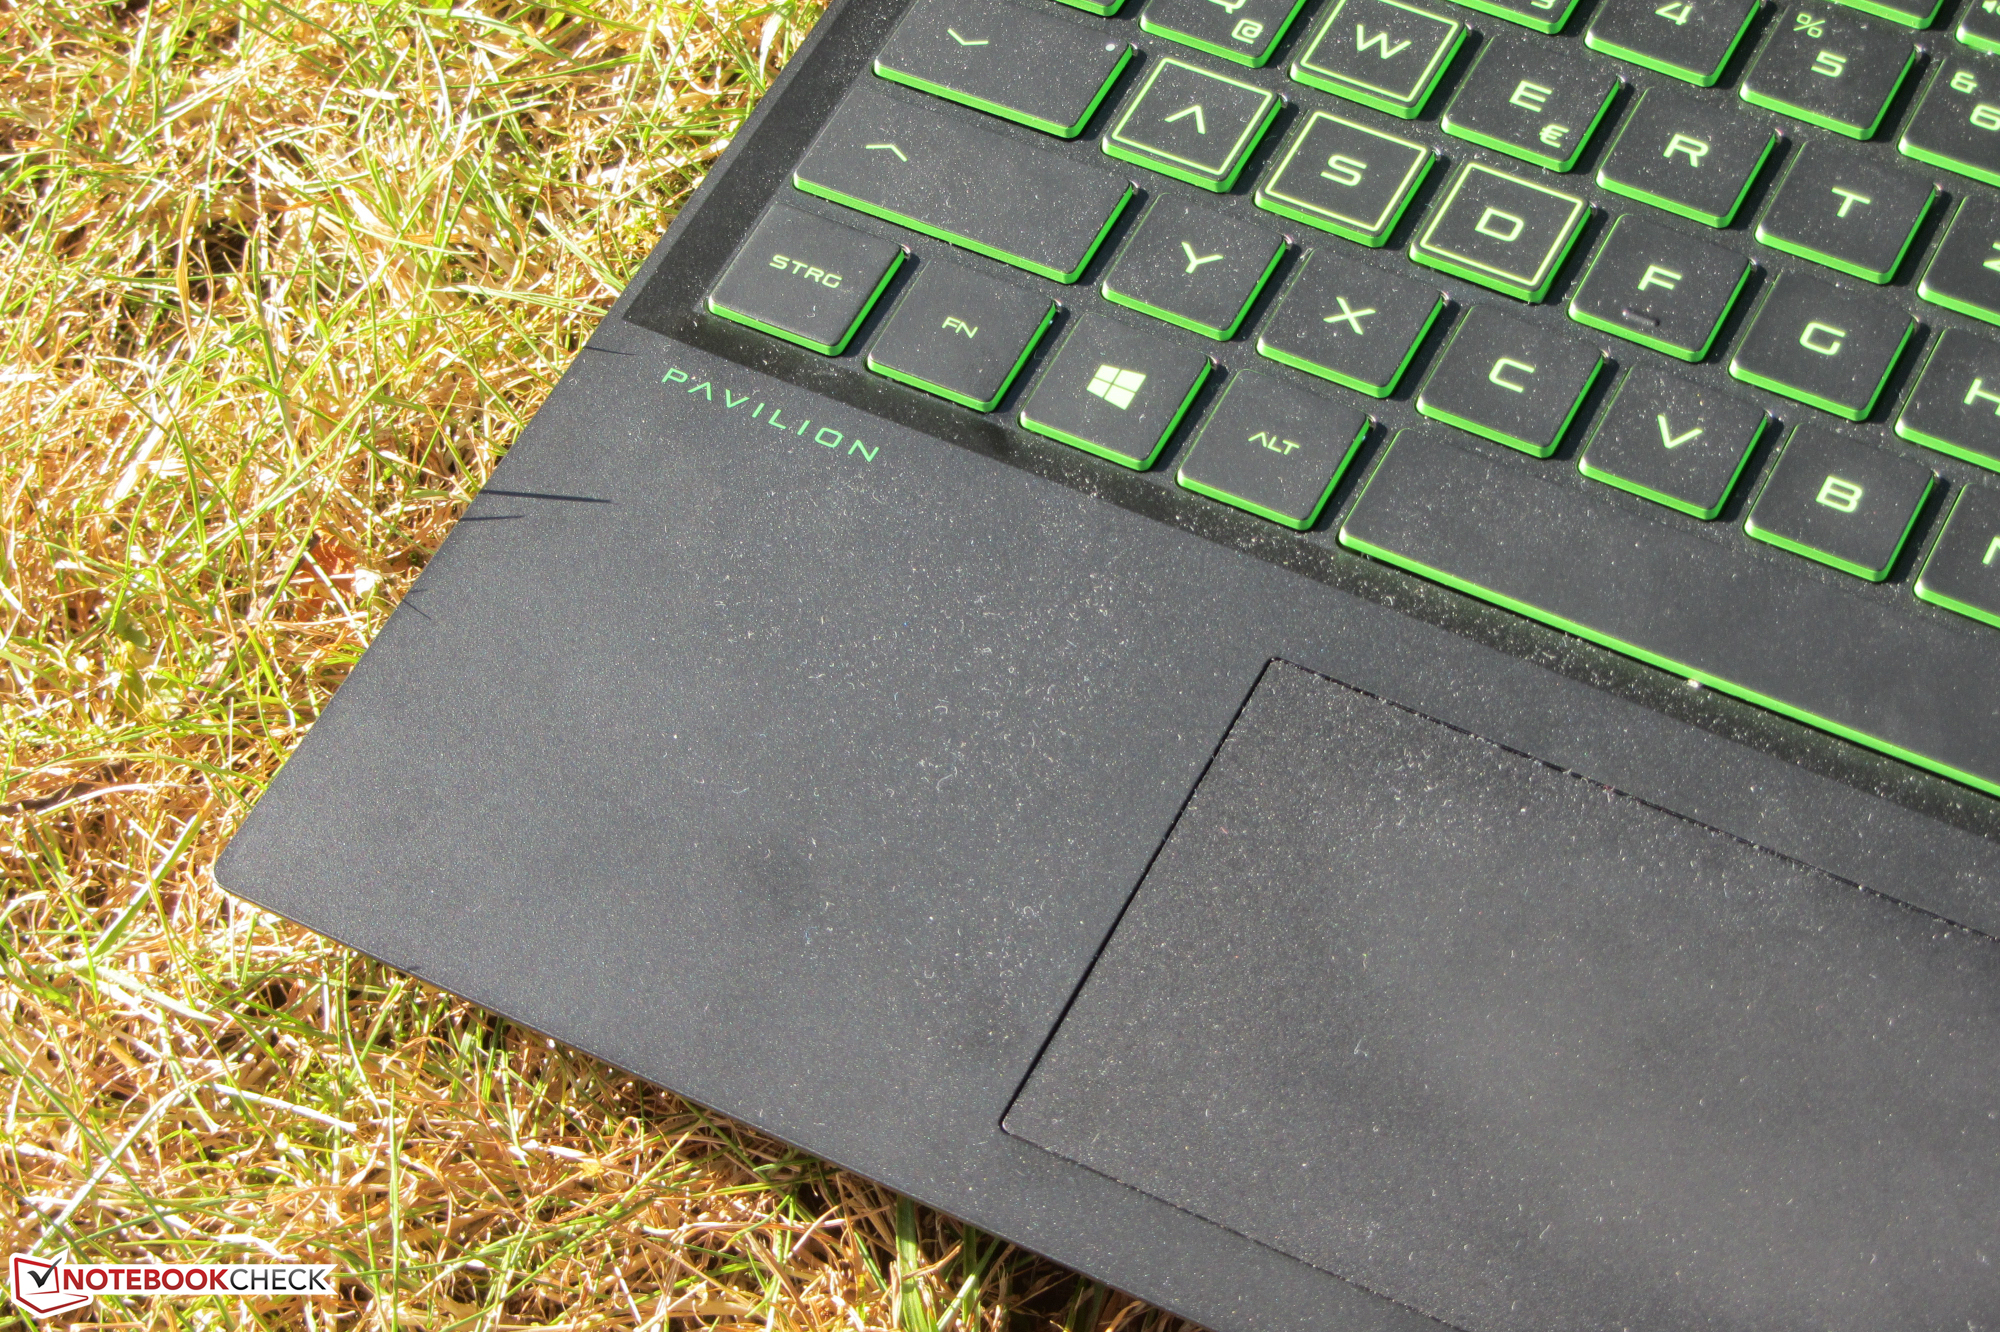
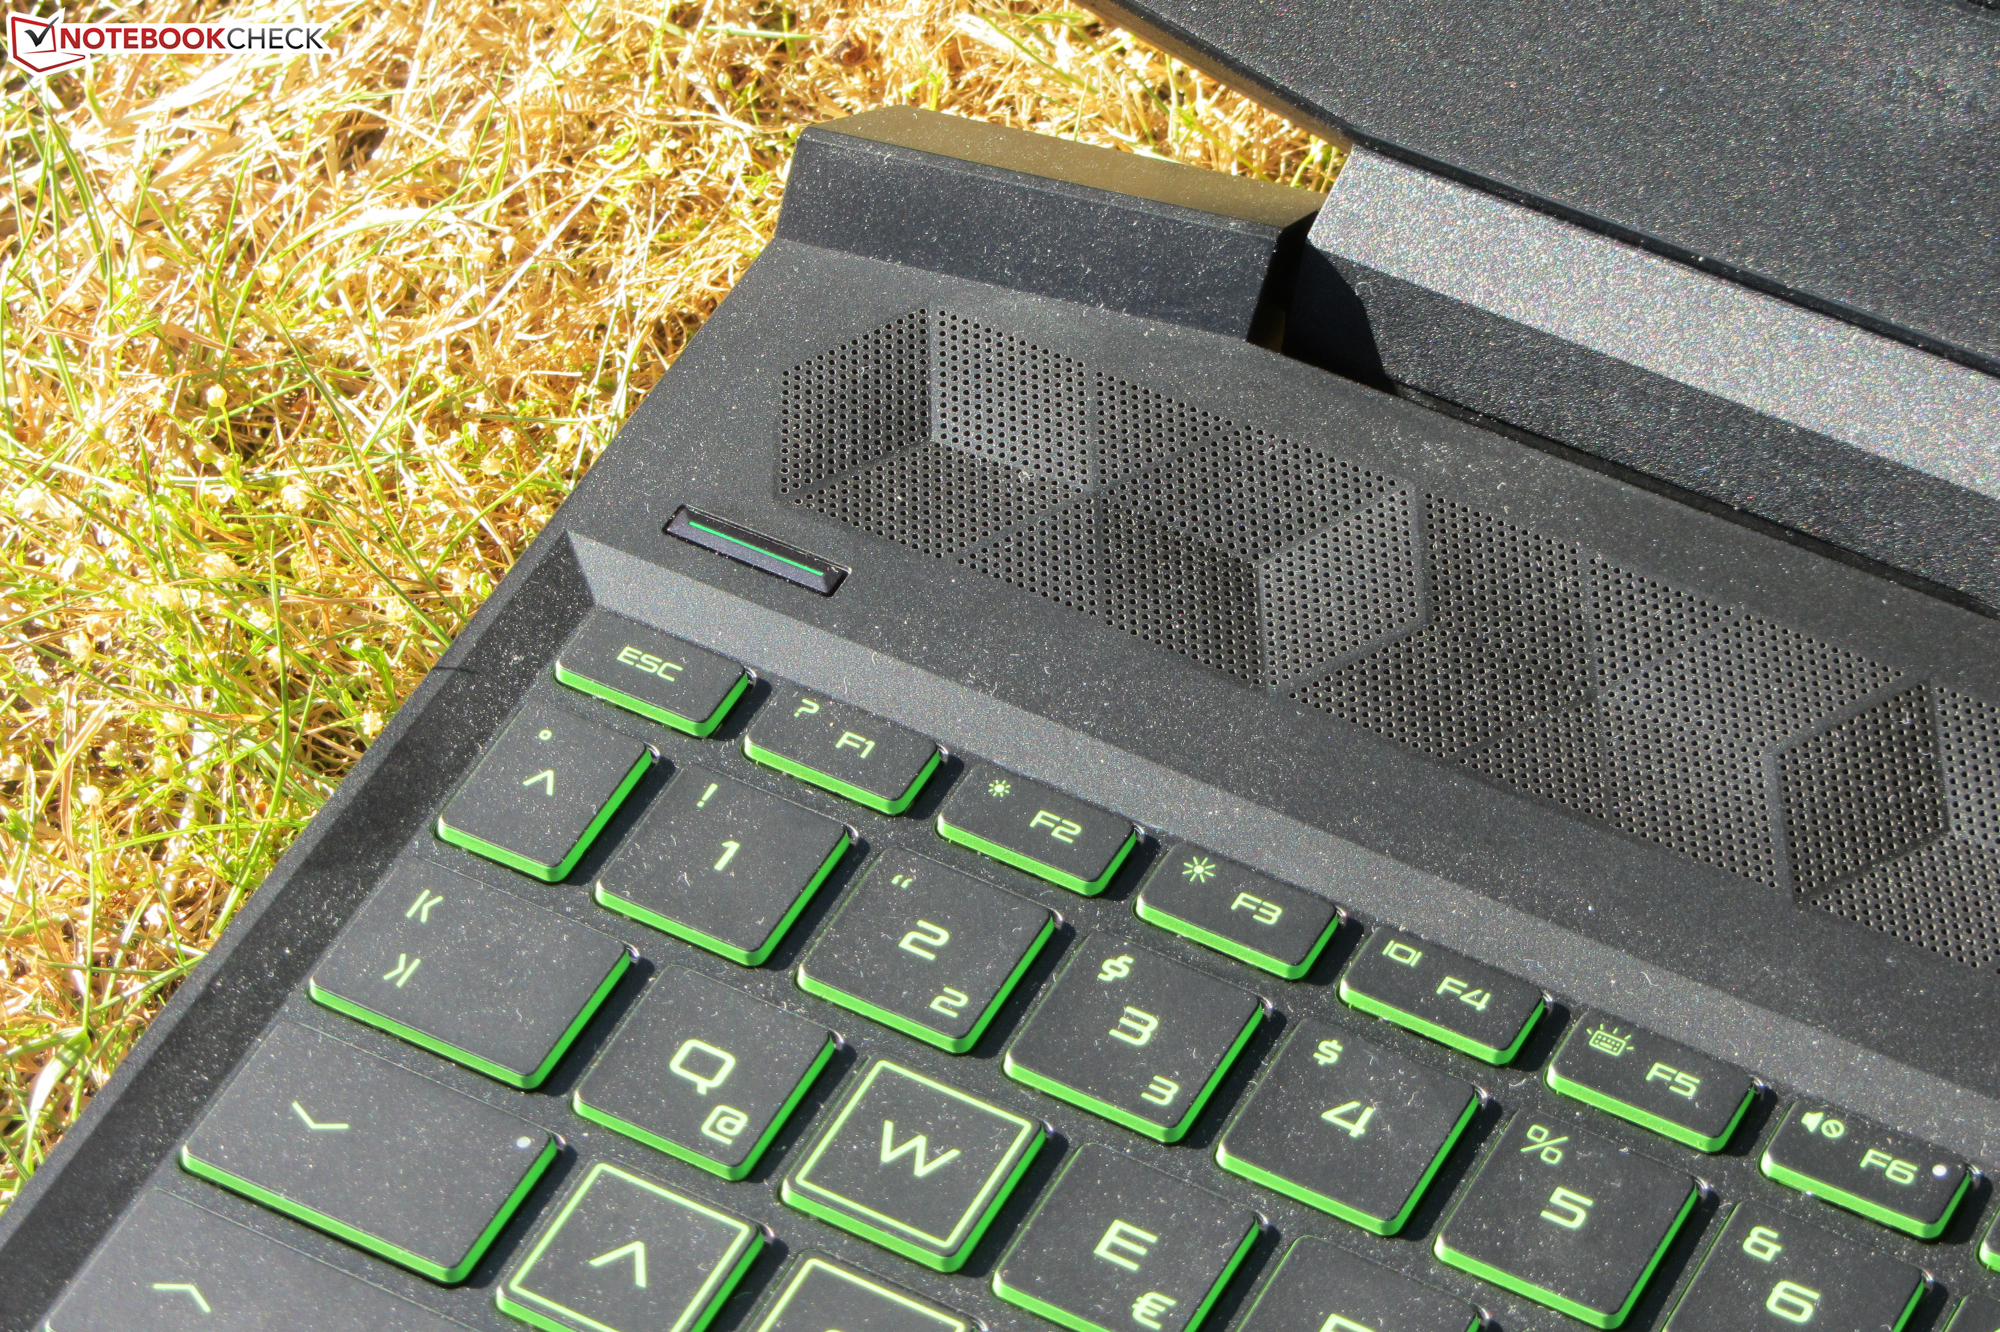
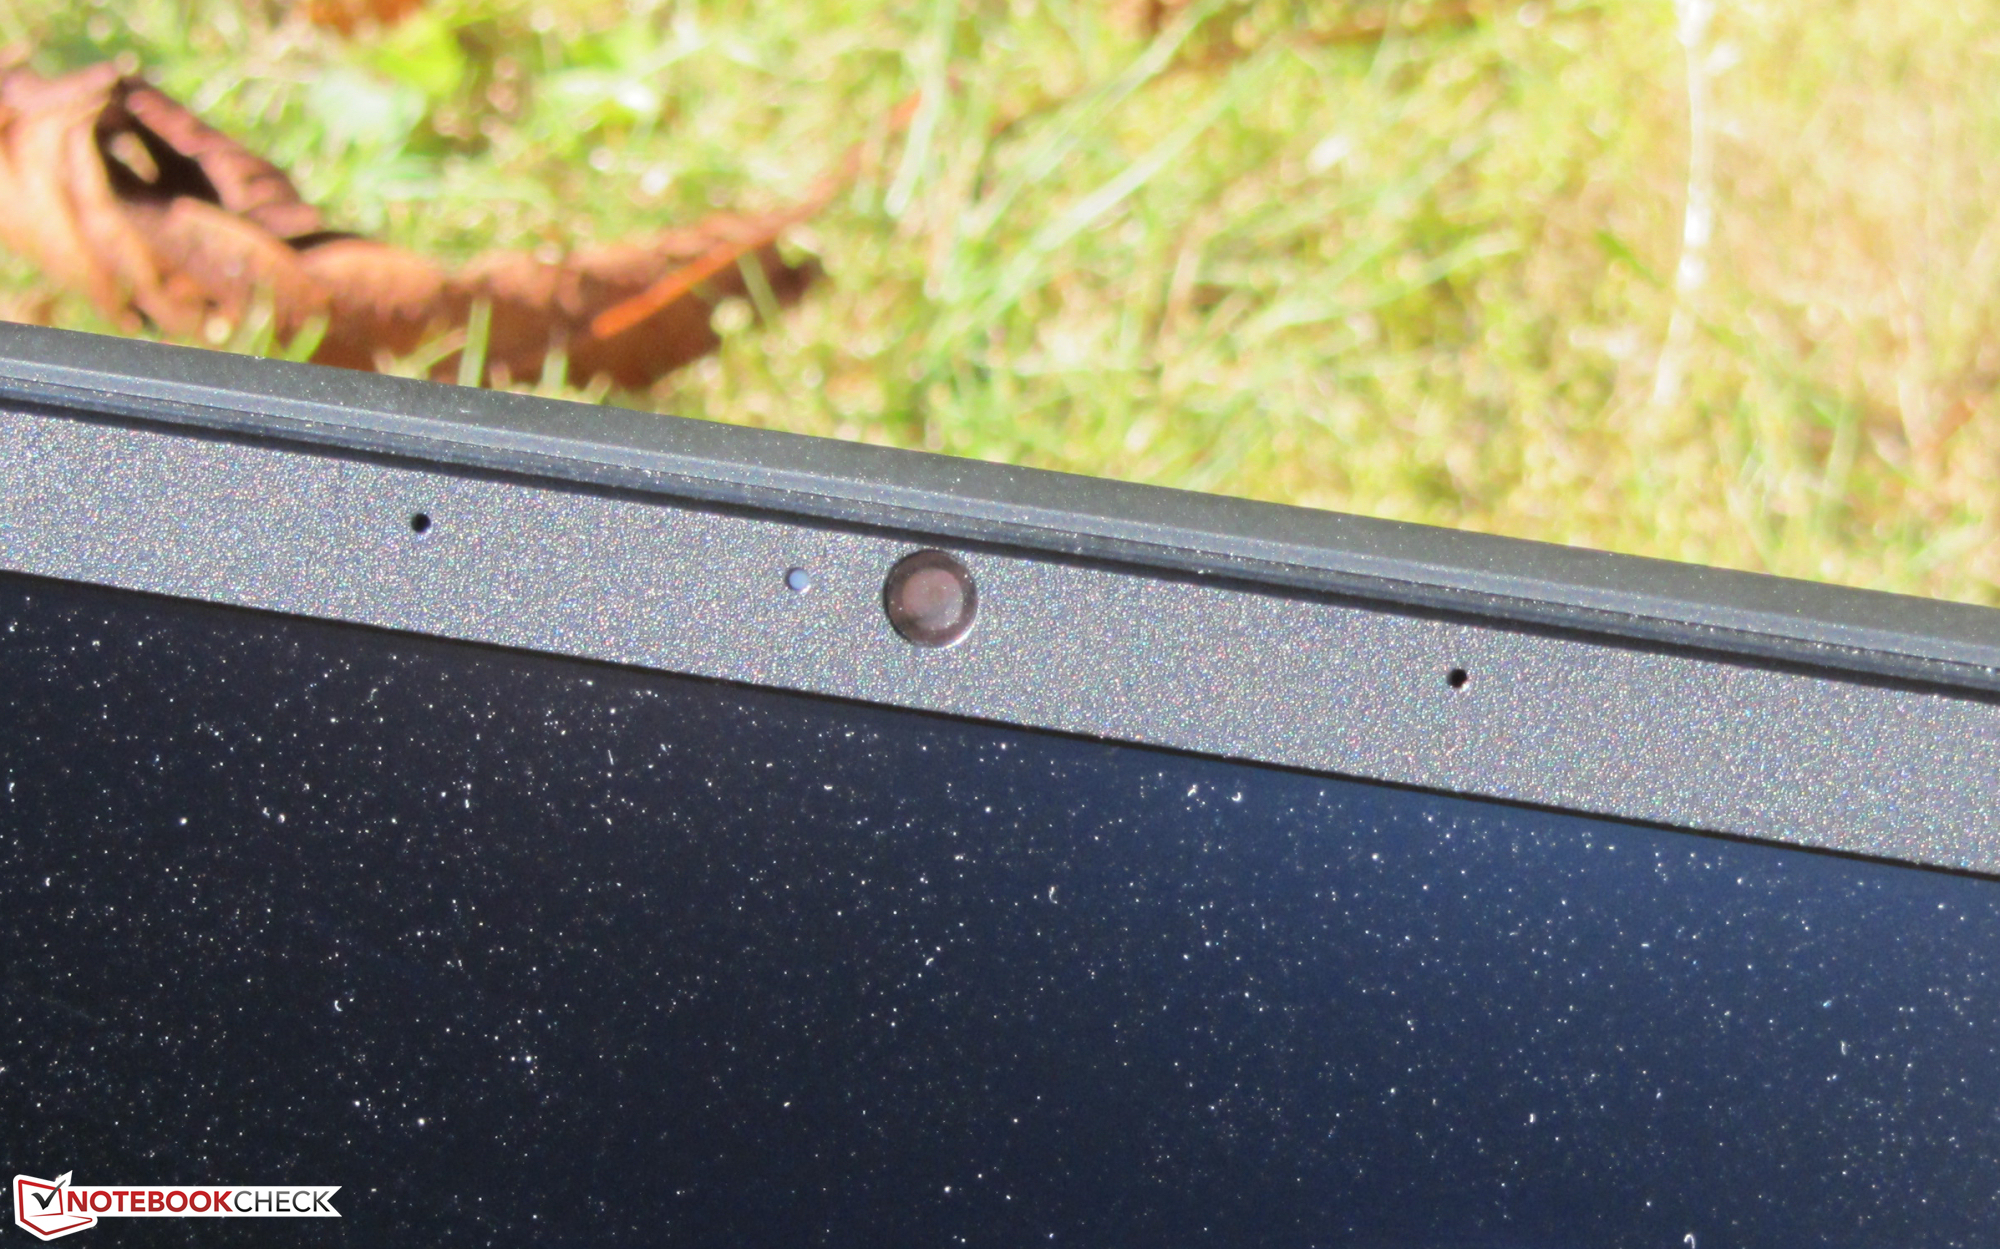
Since the Pavilion is identical in construction to its sibling models, we won't go any further into the case, connectivity, input devices, and speakers. The corresponding information can be found in the review of the HP Pavilion Gaming 15-ec0002ng.
Rating | Date | Model | Weight | Height | Size | Resolution | Price |
|---|---|---|---|---|---|---|---|
| 81.1 % v7 (old) | 10 / 2020 | HP Pavilion Gaming 15-ec1177ng R7 4800H, GeForce GTX 1660 Ti Max-Q | 2 kg | 23.5 mm | 15.60" | 1920x1080 | |
| 81.6 % v7 (old) | 09 / 2020 | Dell G3 15 3500-G4DG2 i7-10750H, GeForce RTX 2060 Mobile | 2.3 kg | 22 mm | 15.60" | 1920x1080 | |
| 79.8 % v7 (old) | 06 / 2020 | Acer Nitro 5 AN515-44-R5FT R5 4600H, GeForce GTX 1650 Ti Mobile | 2.2 kg | 24 mm | 15.60" | 1920x1080 | |
| 82.7 % v7 (old) | 06 / 2020 | Asus TUF Gaming A15 FA506IV-HN172 R7 4800H, GeForce RTX 2060 Mobile | 2.2 kg | 24.9 mm | 15.60" | 1920x1080 | |
| 78.4 % v7 (old) | 07 / 2020 | Lenovo IdeaPad Gaming 3i 15IMH05 i5-10300H, GeForce GTX 1650 Mobile | 2.2 kg | 24.9 mm | 15.60" | 1920x1080 |
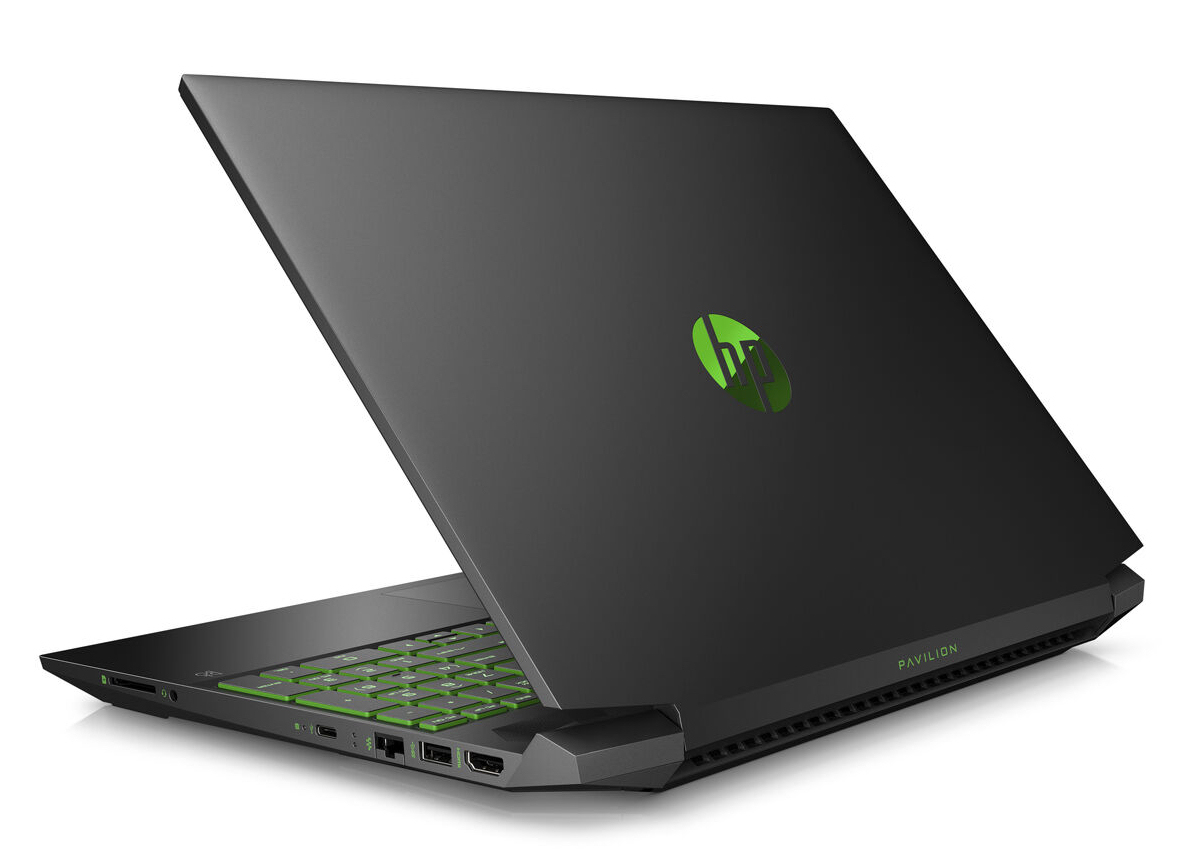
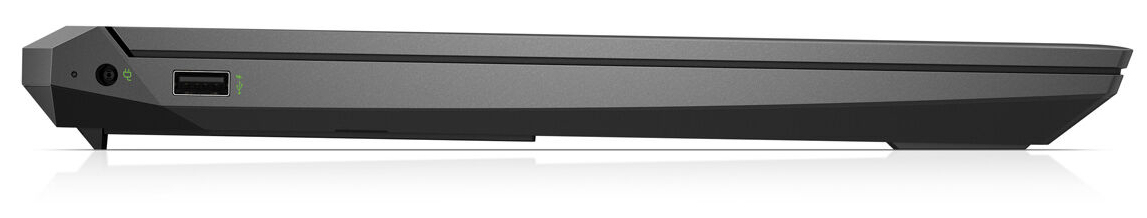
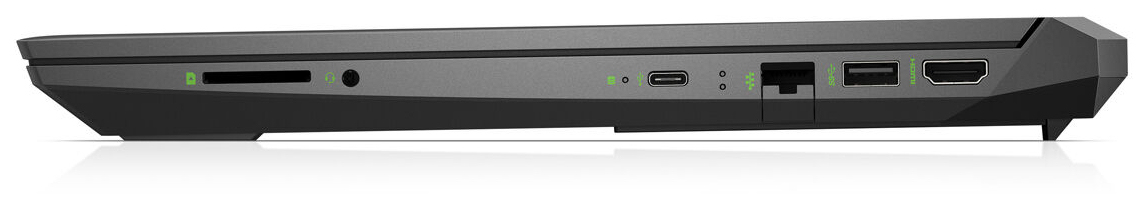
Port configuration
| SD Card Reader | |
| average JPG Copy Test (av. of 3 runs) | |
| Average of class Gaming (20.9 - 210, n=54, last 2 years) | |
| HP Pavilion Gaming 15-ec1206ng (Toshiba Exceria Pro SDXC 64 GB UHS-II) | |
| HP Pavilion Gaming 15-ec1177ng (Toshiba Exceria Pro SDXC 64 GB UHS-II) | |
| HP Pavilion Gaming 15-ec0017ng (Toshiba Exceria Pro SDXC 64 GB UHS-II) | |
| HP Pavilion Gaming 15-ec0002ng (Toshiba Exceria Pro SDXC 64 GB UHS-II) | |
| Dell G3 15 3500-G4DG2 (Toshiba Exceria Pro SDXC 64 GB UHS-II) | |
| maximum AS SSD Seq Read Test (1GB) | |
| Average of class Gaming (25.5 - 261, n=51, last 2 years) | |
| HP Pavilion Gaming 15-ec0017ng (Toshiba Exceria Pro SDXC 64 GB UHS-II) | |
| HP Pavilion Gaming 15-ec0002ng (Toshiba Exceria Pro SDXC 64 GB UHS-II) | |
| HP Pavilion Gaming 15-ec1177ng (Toshiba Exceria Pro SDXC 64 GB UHS-II) | |
| HP Pavilion Gaming 15-ec1206ng (Toshiba Exceria Pro SDXC 64 GB UHS-II) | |
| Dell G3 15 3500-G4DG2 (Toshiba Exceria Pro SDXC 64 GB UHS-II) | |


Display - Bright, high-contrast, responsive

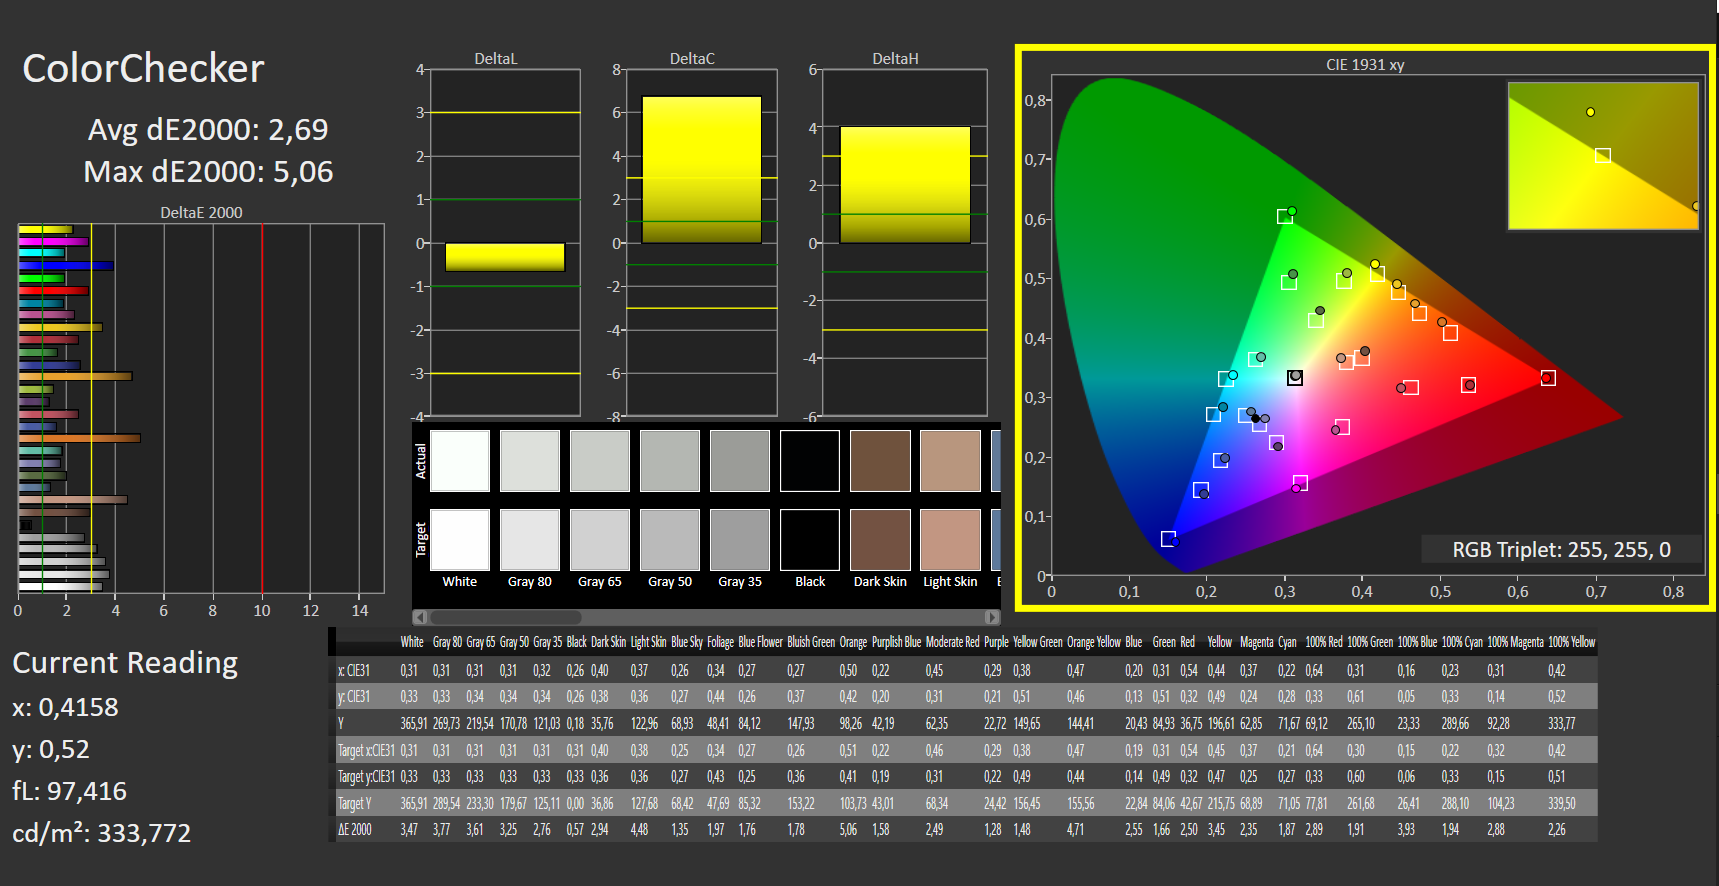
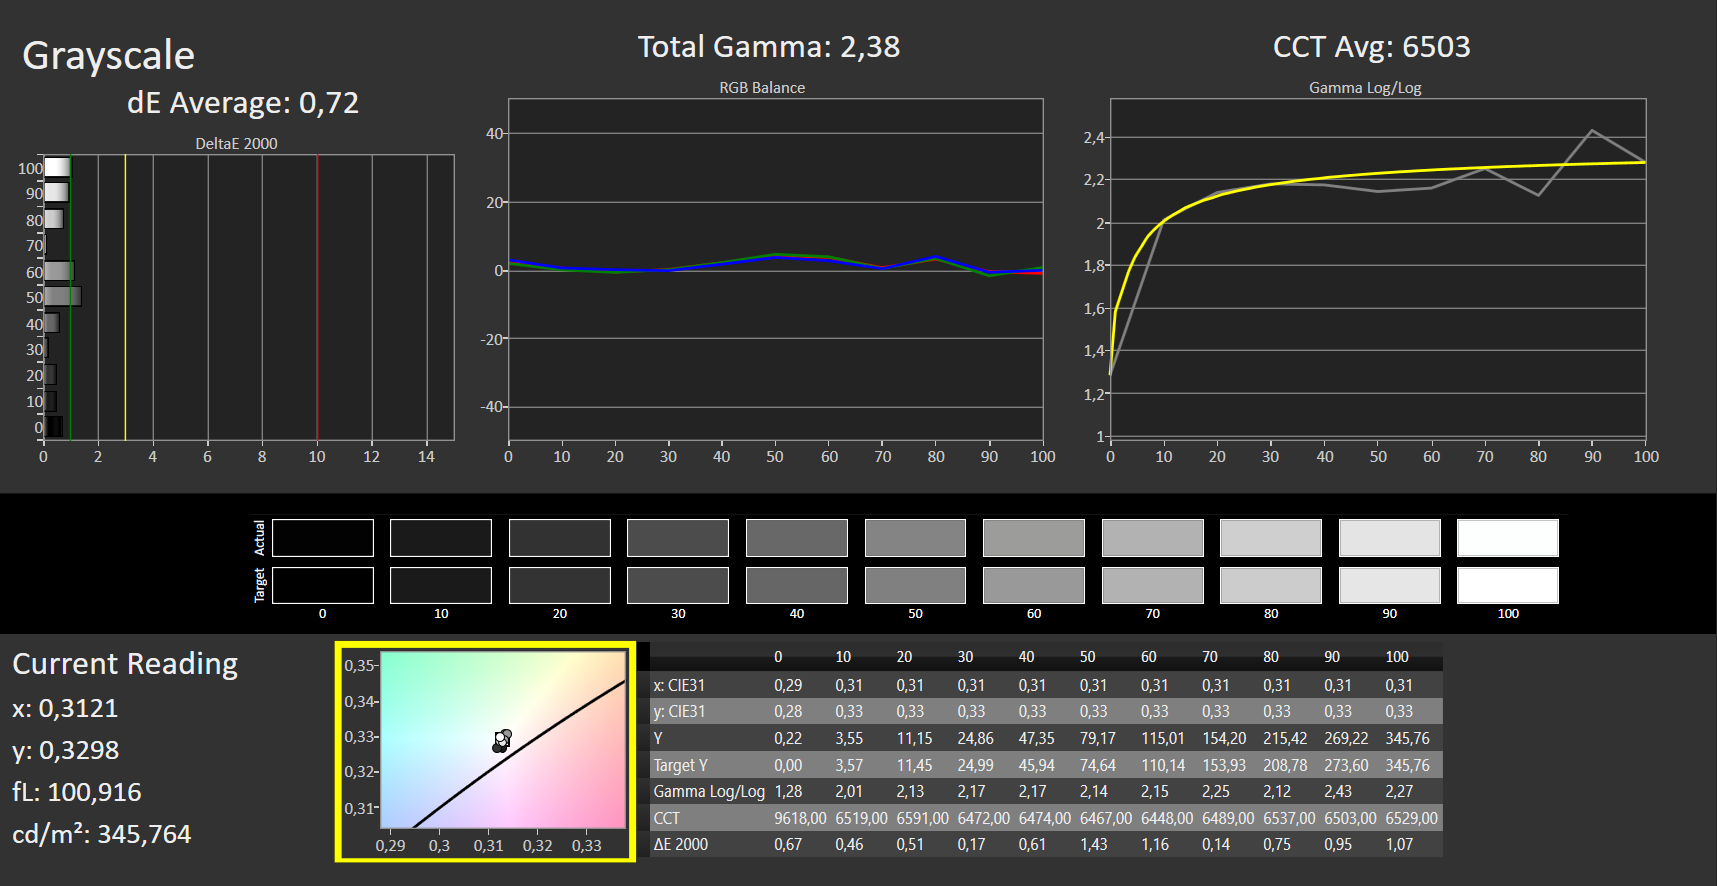
The brightness (327.1 cd/m²) and contrast (1,962:1) of the 15.6-inch matte screen (1920x1080 pixels) are pleasing. In addition, the 144 Hz panel delivers fast response times. Positive: We could not detect any PWM flickering.
| |||||||||||||||||||||||||
Brightness Distribution: 84 %
Center on Battery: 365 cd/m²
Contrast: 1962:1 (Black: 0.185 cd/m²)
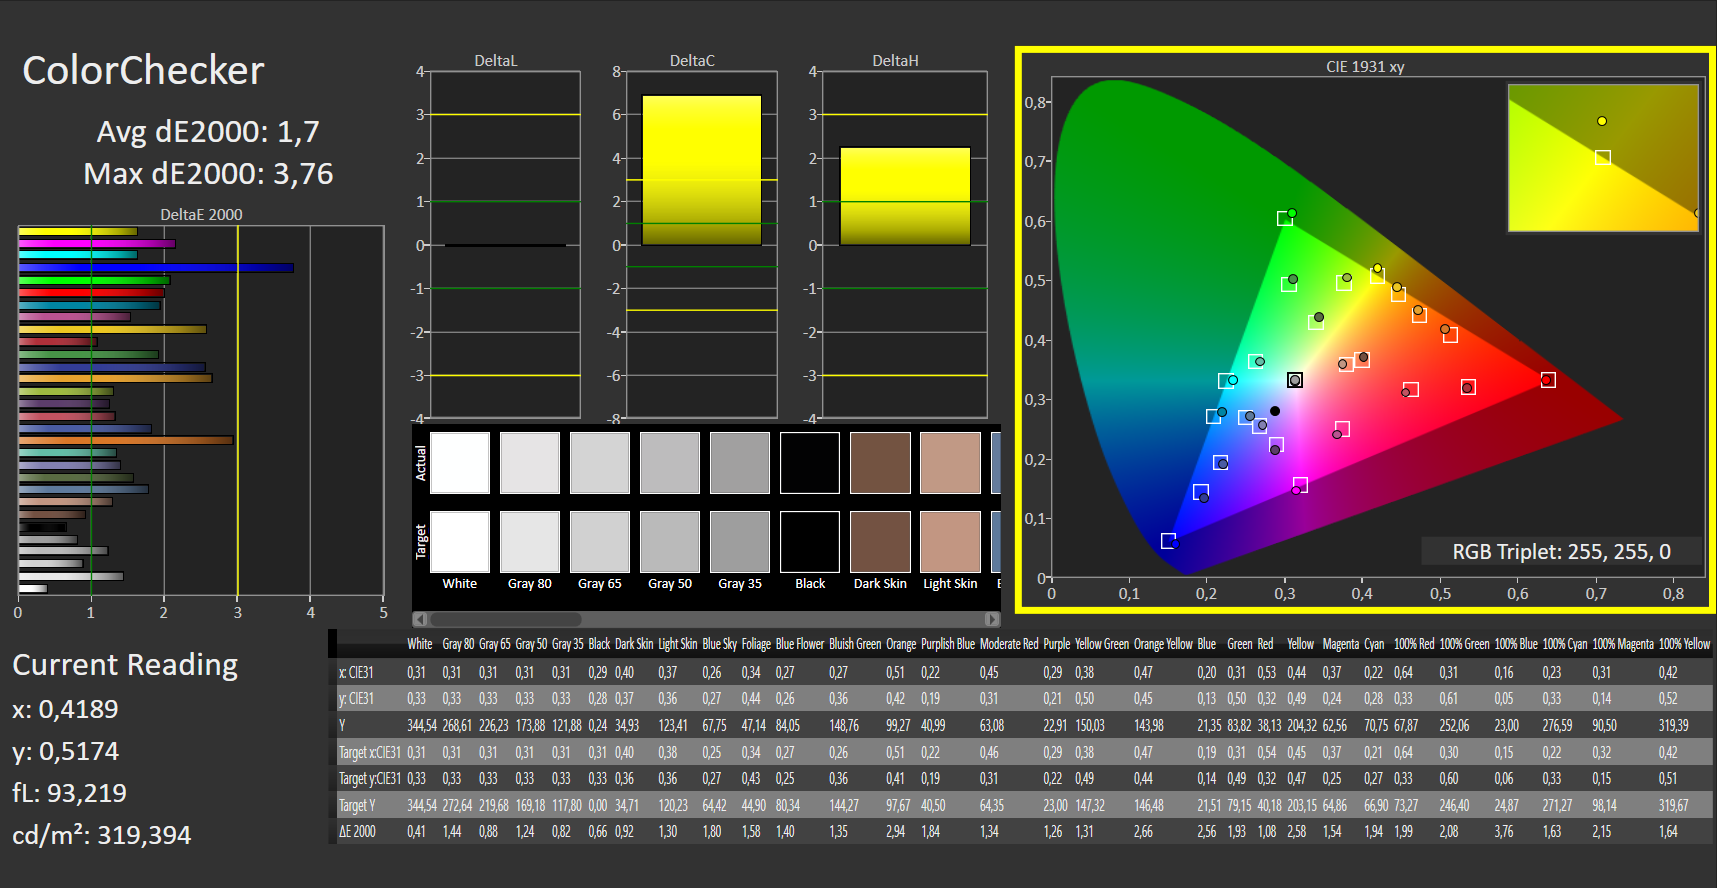
ΔE ColorChecker Calman: 2.69 | ∀{0.5-29.43 Ø4.71}
calibrated: 1.7
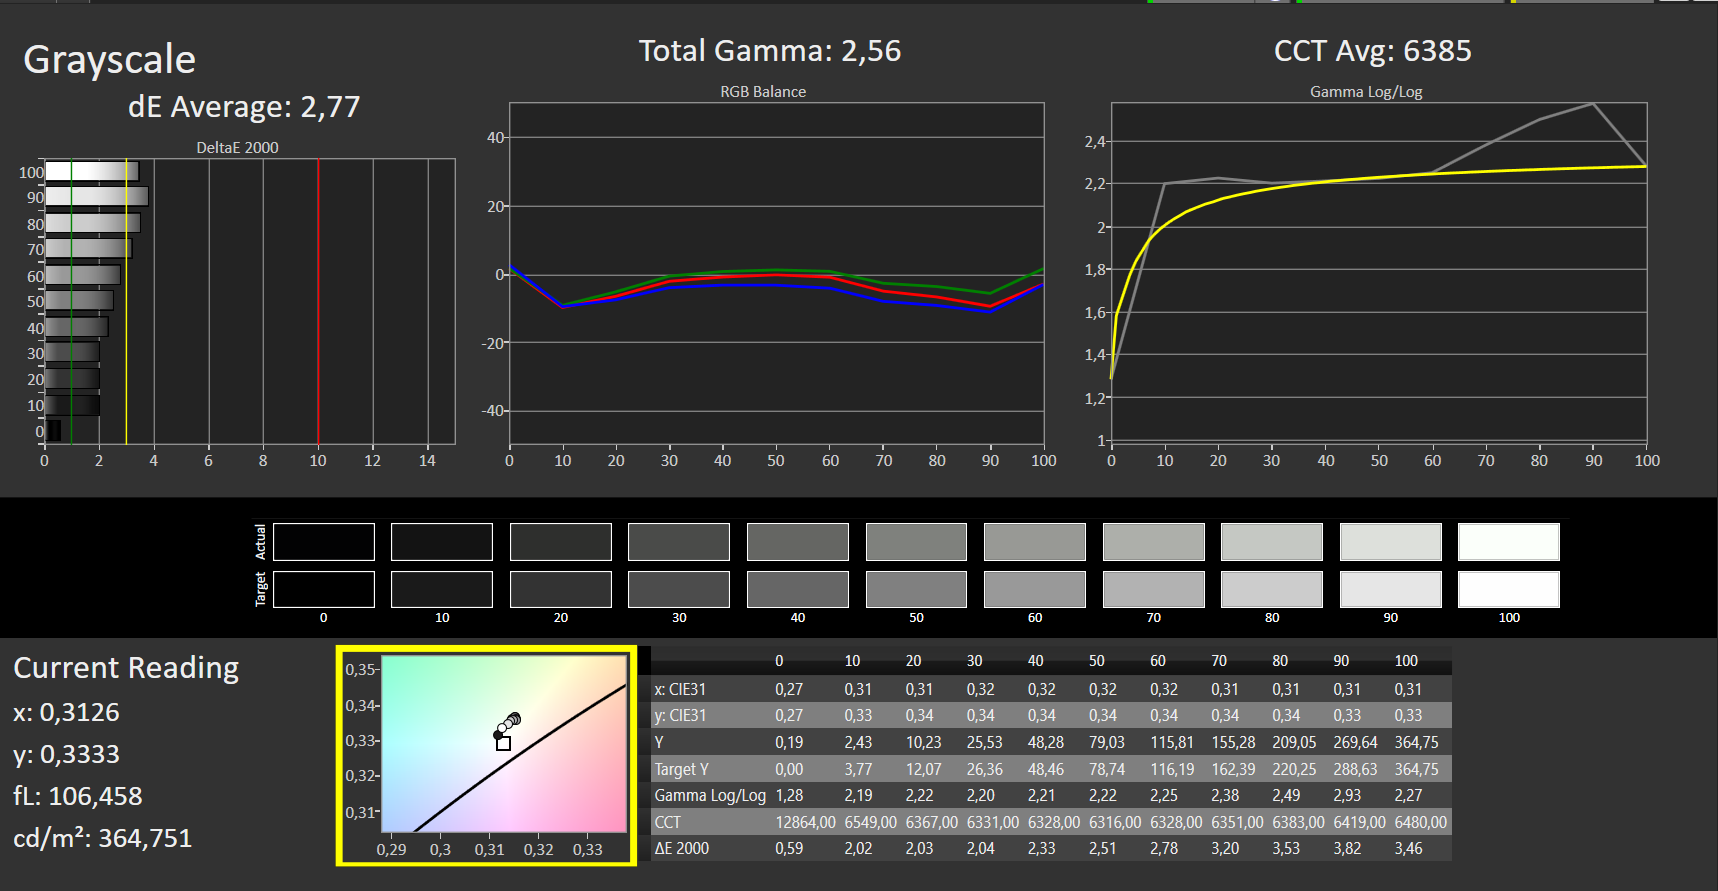
ΔE Greyscale Calman: 2.77 | ∀{0.09-98 Ø4.96}
92.8% sRGB (Argyll 1.6.3 3D)
60.3% AdobeRGB 1998 (Argyll 1.6.3 3D)
65.9% AdobeRGB 1998 (Argyll 3D)
93.1% sRGB (Argyll 3D)
64.9% Display P3 (Argyll 3D)
Gamma: 2.56
CCT: 6385 K
| HP Pavilion Gaming 15-ec1177ng LG Philips LP156WFG-SPK1, IPS, 1920x1080, 15.6" | Dell G3 15 3500-G4DG2 AU Optronics AUO80ED, IPS, 1920x1080, 15.6" | Acer Nitro 5 AN515-44-R5FT Panda LM156LF-2F01 (NCP004D), IPS, 1920x1080, 15.6" | Asus TUF Gaming A15 FA506IV-HN172 LM156LF-2F01, IPS, 1920x1080, 15.6" | Lenovo IdeaPad Gaming 3i 15IMH05 BOE CQ NV156FHM-NX1, IPS, 1920x1080, 15.6" | Asus ROG Strix G15 G512LI Panda LM156LF-2F01, IPS, 1920x1080, 15.6" | HP Pavilion Gaming 15-ec1206ng Chi Mei CMN150D, IPS, 1920x1080, 15.6" | HP Pavilion Gaming 15-ec0002ng Chi Mei N156HGA-EA3, TN LED, 1920x1080, 15.6" | HP Pavilion Gaming 15-ec0017ng AU Optronics B156HAK02.0, IPS, 1920x1080, 15.6" | |
|---|---|---|---|---|---|---|---|---|---|
| Display | 1% | -35% | -39% | -40% | -38% | -35% | -35% | -3% | |
| Display P3 Coverage (%) | 64.9 | 64.6 0% | 41.16 -37% | 38.92 -40% | 38.04 -41% | 39.73 -39% | 41.36 -36% | 41.22 -36% | 62.8 -3% |
| sRGB Coverage (%) | 93.1 | 93.9 1% | 61.8 -34% | 58.5 -37% | 56.6 -39% | 59.8 -36% | 62 -33% | 61.8 -34% | 89.2 -4% |
| AdobeRGB 1998 Coverage (%) | 65.9 | 66.4 1% | 42.56 -35% | 40.22 -39% | 39.3 -40% | 41.06 -38% | 42.76 -35% | 42.62 -35% | 63.8 -3% |
| Response Times | 20% | -164% | -116% | -56% | -131% | -107% | -106% | -157% | |
| Response Time Grey 50% / Grey 80% * (ms) | 16 ? | 14 ? 12% | 40.8 ? -155% | 34 ? -113% | 25 ? -56% | 33.6 ? -110% | 33.6 ? -110% | 44 ? -175% | 40 ? -150% |
| Response Time Black / White * (ms) | 11 ? | 8 ? 27% | 30 ? -173% | 24 ? -118% | 17 ? -55% | 27.6 ? -151% | 22.4 ? -104% | 15 ? -36% | 29 ? -164% |
| PWM Frequency (Hz) | 24750 ? | 250 ? | |||||||
| Screen | -28% | -55% | -66% | -89% | -79% | -23% | -107% | -33% | |
| Brightness middle (cd/m²) | 363 | 301 -17% | 287 -21% | 280 -23% | 305 -16% | 271.2 -25% | 277 -24% | 233 -36% | 302 -17% |
| Brightness (cd/m²) | 327 | 298 -9% | 271 -17% | 254 -22% | 294 -10% | 252 -23% | 248 -24% | 211 -35% | 291 -11% |
| Brightness Distribution (%) | 84 | 81 -4% | 88 5% | 88 5% | 70 -17% | 79 -6% | 83 -1% | 82 -2% | 84 0% |
| Black Level * (cd/m²) | 0.185 | 0.23 -24% | 0.25 -35% | 0.15 19% | 0.405 -119% | 0.53 -186% | 0.16 14% | 0.405 -119% | 0.25 -35% |
| Contrast (:1) | 1962 | 1309 -33% | 1148 -41% | 1867 -5% | 753 -62% | 512 -74% | 1731 -12% | 575 -71% | 1208 -38% |
| Colorchecker dE 2000 * | 2.69 | 4.68 -74% | 4.77 -77% | 5.89 -119% | 6.01 -123% | 5.04 -87% | 3.6 -34% | 8.22 -206% | 4.84 -80% |
| Colorchecker dE 2000 max. * | 5.06 | 17.15 -239% | 19 -275% | 21.9 -333% | 16.07 -218% | 8.53 -69% | 18.6 -268% | 8.18 -62% | |
| Colorchecker dE 2000 calibrated * | 1.7 | 1.87 -10% | 3.73 -119% | 4.79 -182% | 5.12 -201% | 4.26 -151% | 2.88 -69% | 2.63 -55% | |
| Greyscale dE 2000 * | 2.77 | 5.79 -109% | 2.7 3% | 4.08 -47% | 3.23 -17% | 3.4 -23% | 1.75 37% | 10.13 -266% | 4.31 -56% |
| Gamma | 2.56 86% | 2.46 89% | 2.115 104% | 2.33 94% | 2.43 91% | 2.09 105% | 2.23 99% | 2.27 97% | 2.56 86% |
| CCT | 6385 102% | 7706 84% | 7187 90% | 7303 89% | 6818 95% | 7079 92% | 6695 97% | 11323 57% | 7318 89% |
| Color Space (Percent of AdobeRGB 1998) (%) | 60.3 | 61 1% | 43 -29% | 37 -39% | 36 -40% | 37.8 -37% | 39 -35% | 39 -35% | 58 -4% |
| Color Space (Percent of sRGB) (%) | 92.8 | 94 1% | 61 -34% | 58 -37% | 56 -40% | 59.5 -36% | 62 -33% | 62 -33% | 89 -4% |
| Total Average (Program / Settings) | -2% /
-16% | -85% /
-65% | -74% /
-67% | -62% /
-76% | -83% /
-78% | -55% /
-36% | -83% /
-92% | -64% /
-43% |
* ... smaller is better
Display Response Times
| ↔ Response Time Black to White | ||
|---|---|---|
| 11 ms ... rise ↗ and fall ↘ combined | ↗ 7 ms rise | 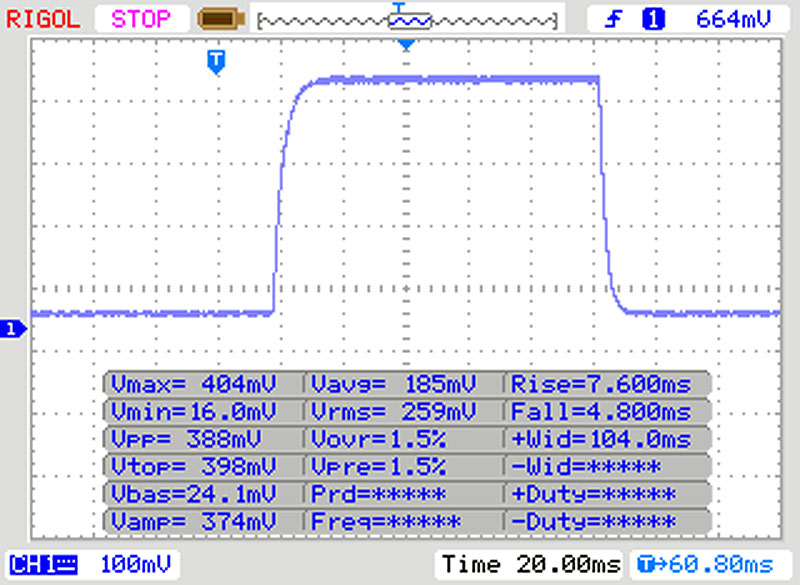 |
| ↘ 4 ms fall | ||
| The screen shows good response rates in our tests, but may be too slow for competitive gamers. In comparison, all tested devices range from 0.1 (minimum) to 240 (maximum) ms. » 30 % of all devices are better. This means that the measured response time is better than the average of all tested devices (19.8 ms). | ||
| ↔ Response Time 50% Grey to 80% Grey | ||
| 16 ms ... rise ↗ and fall ↘ combined | ↗ 9 ms rise | 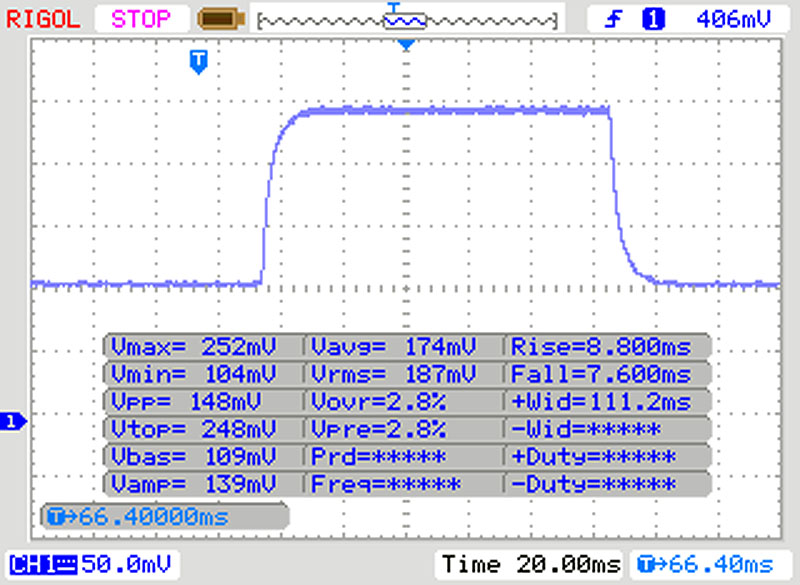 |
| ↘ 7 ms fall | ||
| The screen shows good response rates in our tests, but may be too slow for competitive gamers. In comparison, all tested devices range from 0.165 (minimum) to 636 (maximum) ms. » 30 % of all devices are better. This means that the measured response time is better than the average of all tested devices (31 ms). | ||
Screen Flickering / PWM (Pulse-Width Modulation)
| Screen flickering / PWM not detected | 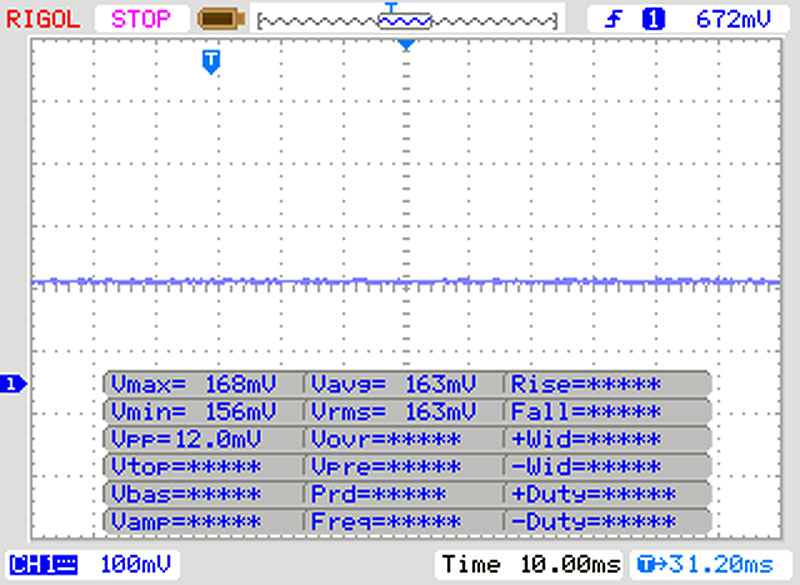 | ||
In comparison: 52 % of all tested devices do not use PWM to dim the display. If PWM was detected, an average of 7757 (minimum: 5 - maximum: 343500) Hz was measured. | |||
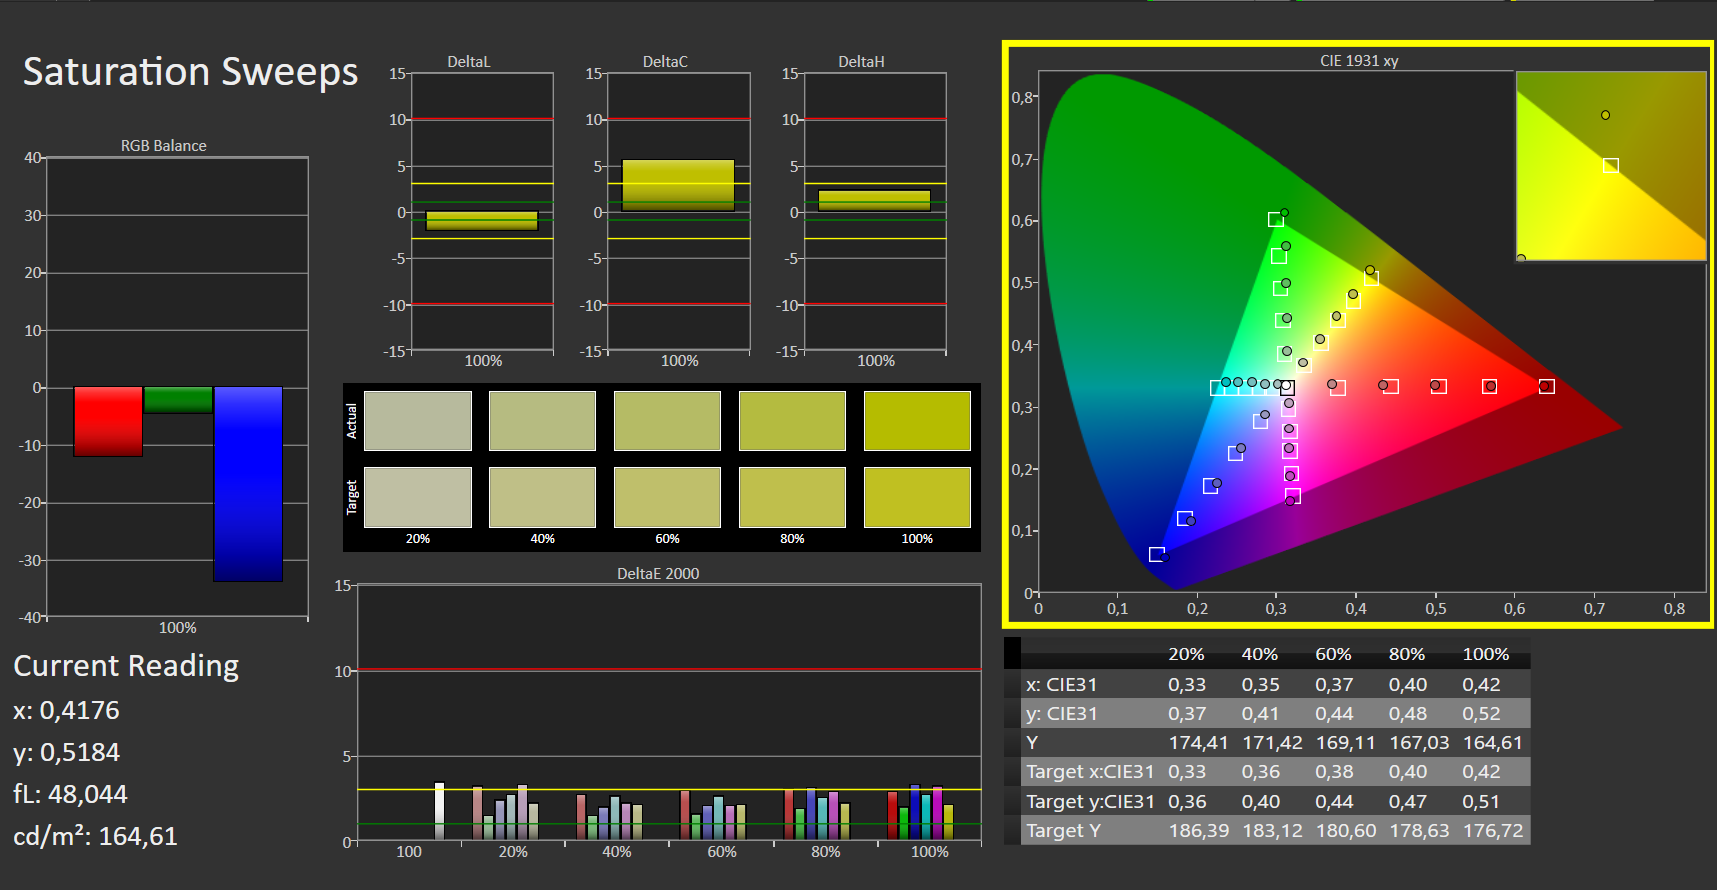
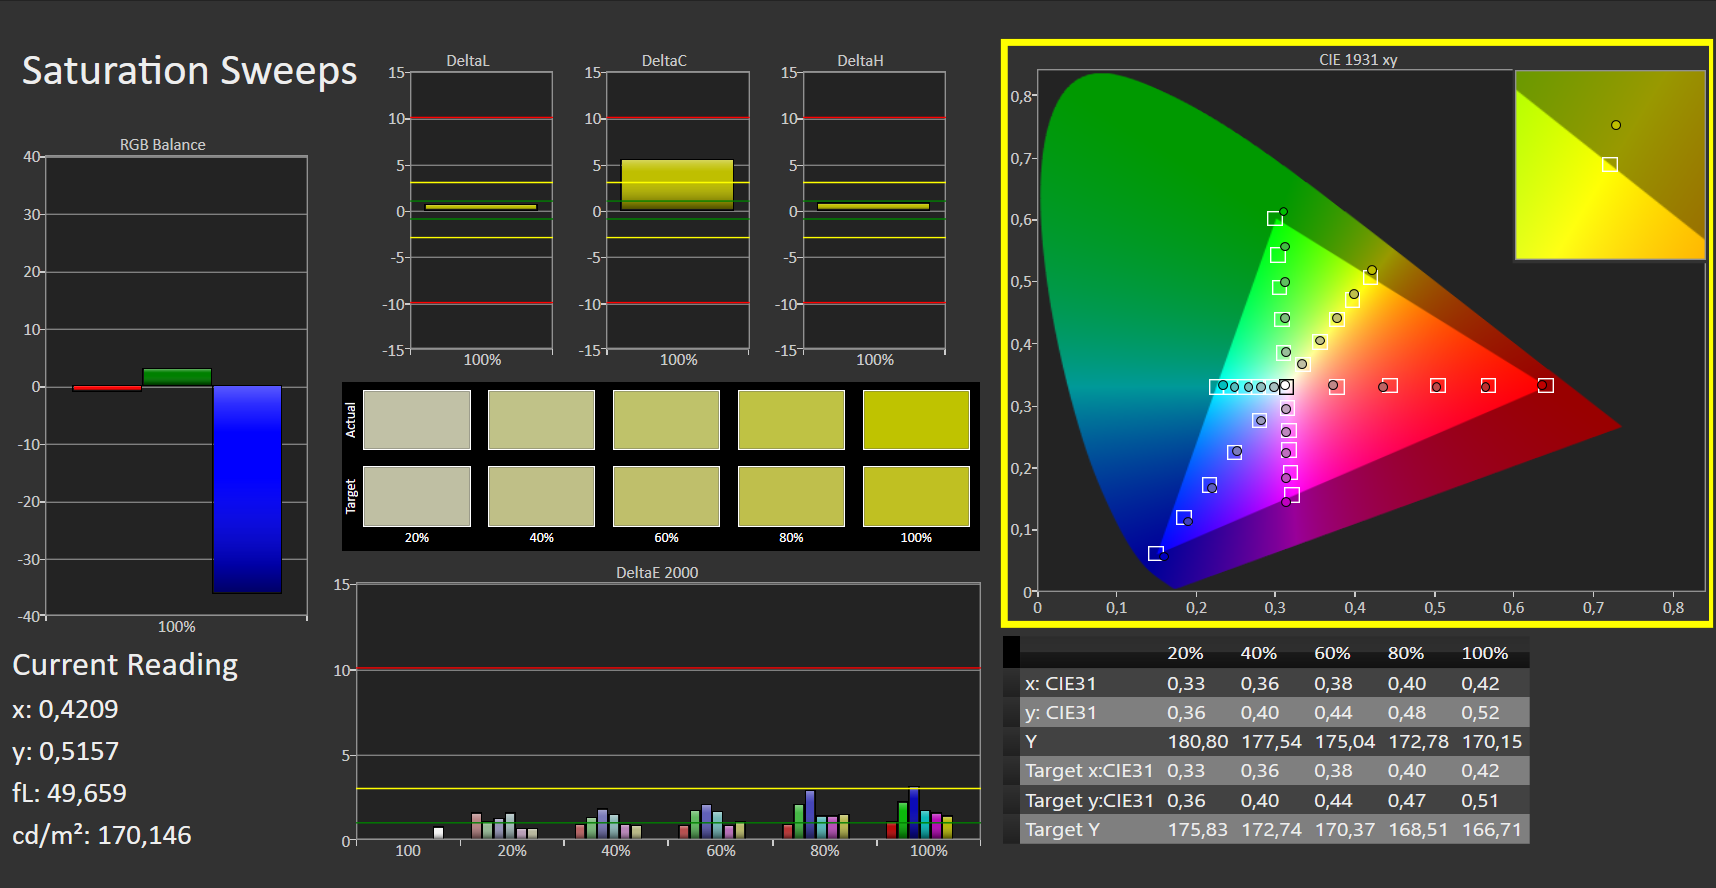
The display already shows a good color reproduction out of the box. With a Delta E 2000 color deviation of just under 2.7, the target (Delta E less than 3) is met. The display does not suffer from a blue tint. Moreover, calibration provides for improvements. In this way, the color deviation is reduced to 1.7, and the grayscales are displayed in a more balanced way. The AdobeRGB (60.3%) and sRGB (92.8%) color spaces are not fully reproduced.
HP equips the gaming laptop with a viewing-angle stable IPS panel. Thus the screen can be read from any position. Outdoors, the display can be read when the sun is not too bright.
Performance - Pavilion with ultra-powerful APU
With the Pavilion Gaming 15, HP delivers a gaming laptop in the 15.6-inch format. It brings all modern computer games smoothly onto the screen and, thanks to a very strong CPU, cuts a fine figure beyond gaming too. Our test device costs just under 1,200 Euros (~$1,407). In addition, other configuration variants are available. The prices start at just under 700 Euros (~$821).
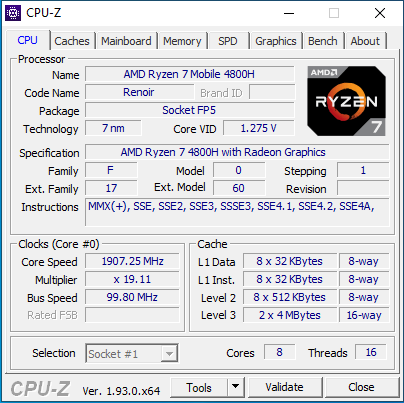
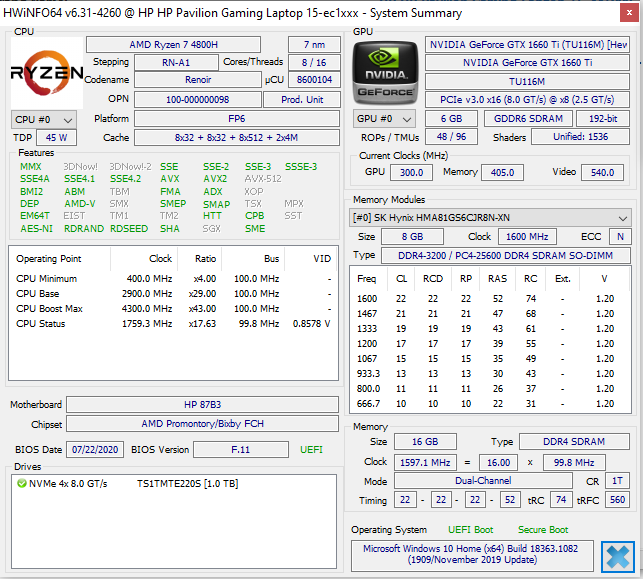
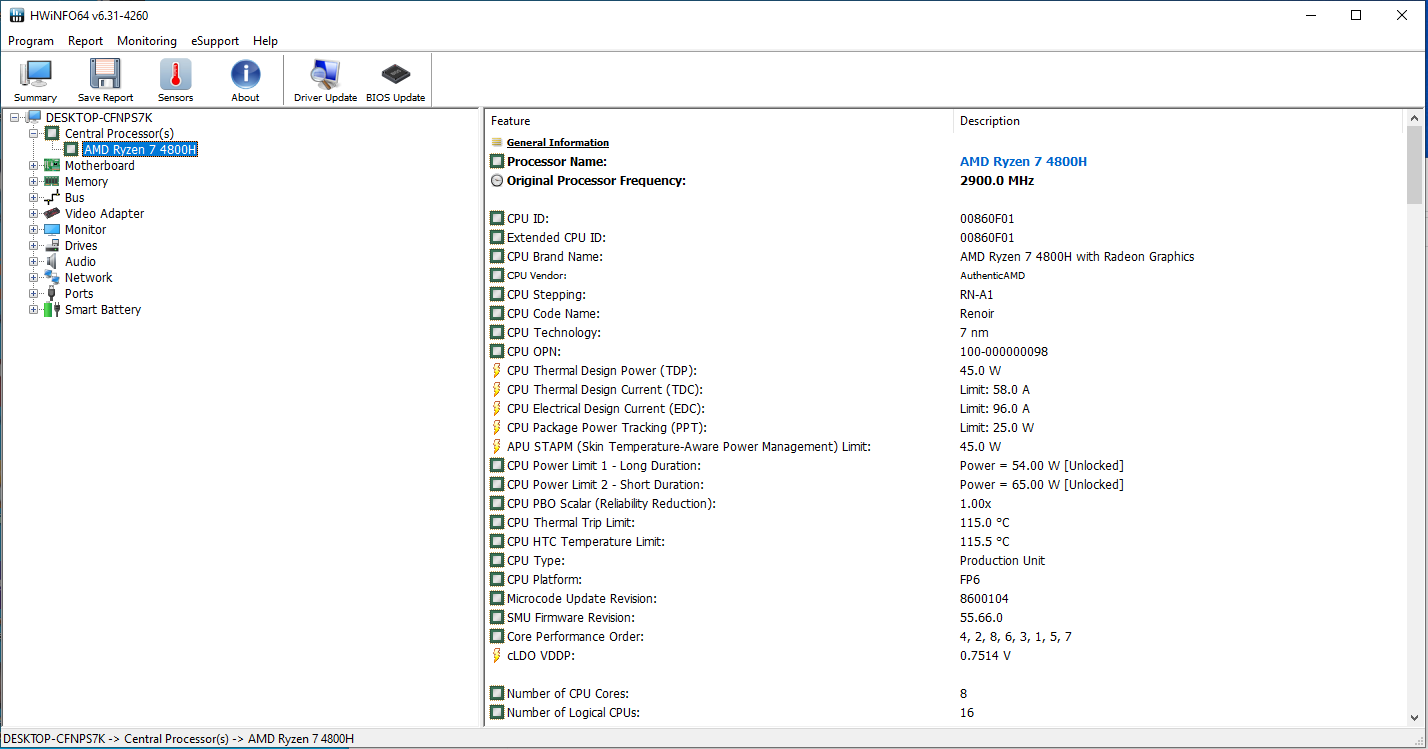
Processor
The HP laptop has a Ryzen 7 4800H (Renoir) APU on board. The CPU part of the APU consists of an octa-core processor that operates at a base speed of 2.9 GHz. An increase up to 4.2 GHz is possible via Turbo. Simultaneous multithreading (two threads can be processed per core) is supported.
The multithread tests of the Cinebench benchmarks are run at 3.7 to 4.1 GHz (plugged in) and 3 to 3.1 GHz (battery power). The single-thread tests are processed at 1.4 to 4.2 GHz (plugged in and on battery power).
We verify if the CPU Turbo is also consistently used when plugged in by running the Cinebench R15 benchmark's multithread test in a continuous loop for at least 30 minutes. Turbo is used to a large extent.
* ... smaller is better
System performance
The system is fast and smooth. The built-in hardware provides more than enough computing power for all common application areas - gaming, video-editing, image-processing, office applications, and Internet use. This is accompanied by very good PCMark results.
| PCMark 8 Home Score Accelerated v2 | 4805 points | |
| PCMark 8 Creative Score Accelerated v2 | 5920 points | |
| PCMark 8 Work Score Accelerated v2 | 5580 points | |
| PCMark 10 Score | 5602 points | |
Help | ||
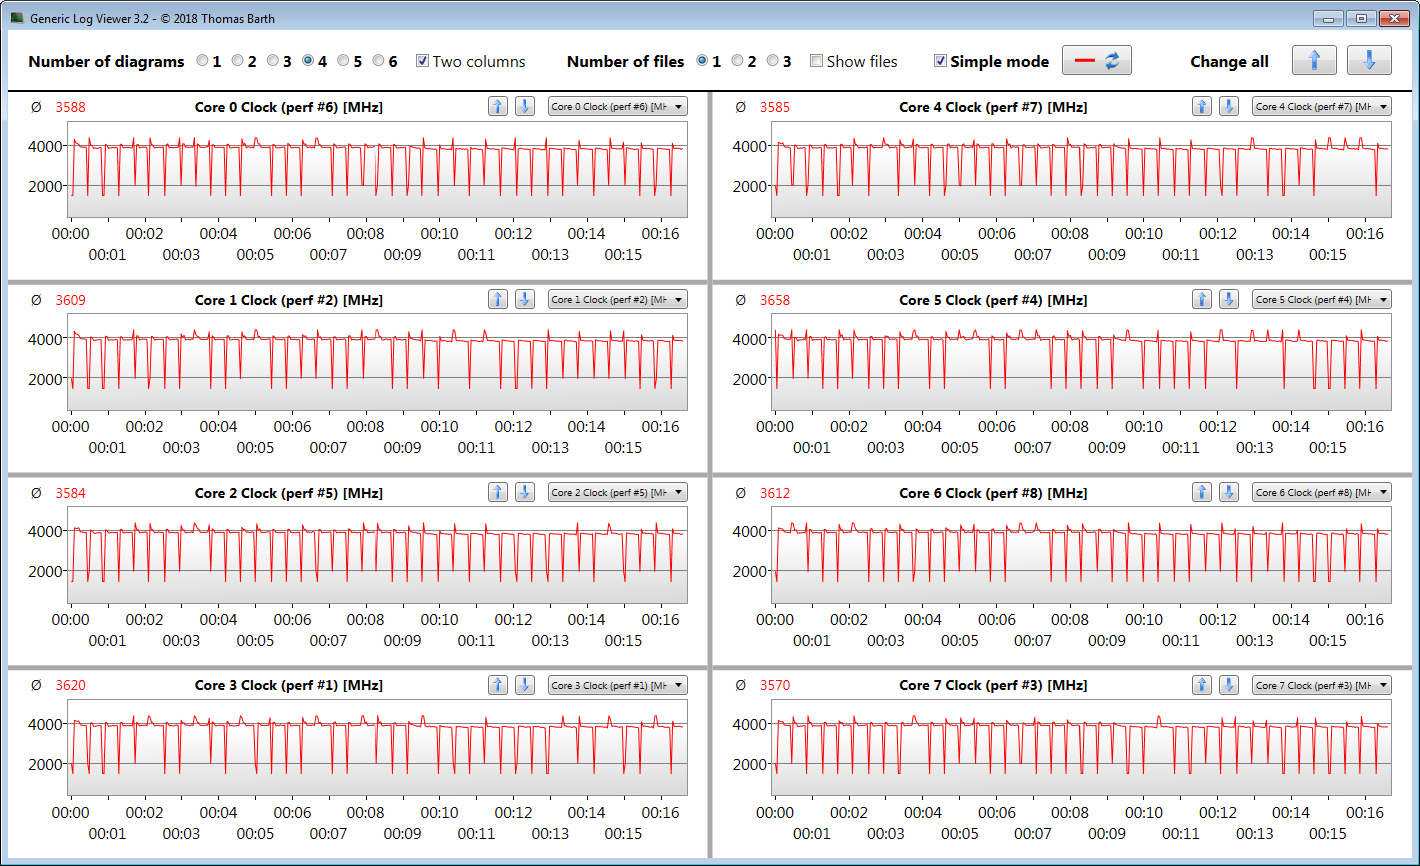
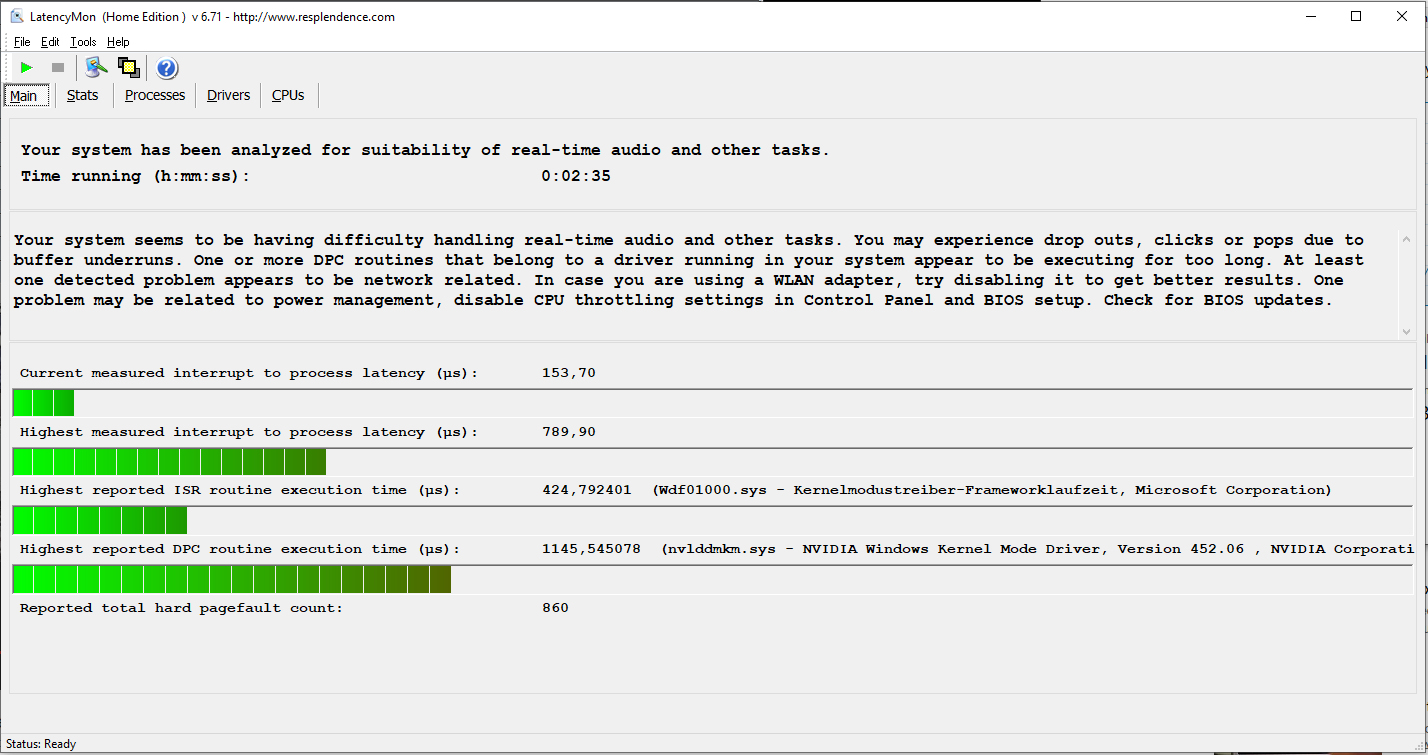
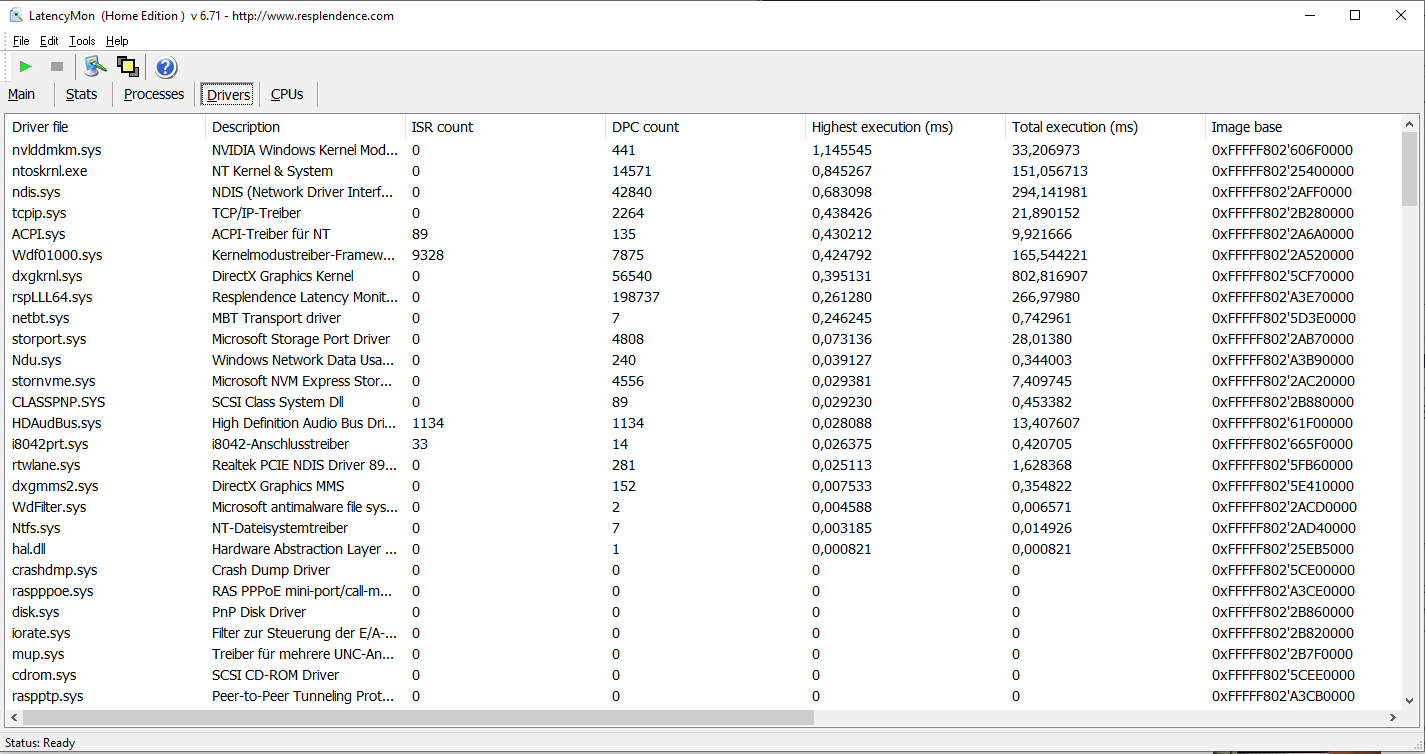
DPC latencies
In our standardized latency monitor test (web surfing, 4K video playback, high-load Prime95), we could observe issues with the DPC latencies. The system doesn't seem to be suitable for real-time video and audio-editing.
| DPC Latencies / LatencyMon - interrupt to process latency (max), Web, Youtube, Prime95 | |
| Dell G3 15 3500-G4DG2 | |
| Asus ROG Strix G15 G512LI | |
| Acer Nitro 5 AN515-44-R5FT | |
| Asus TUF Gaming A15 FA506IV-HN172 | |
| HP Pavilion Gaming 15-ec1177ng | |
| Lenovo IdeaPad Gaming 3i 15IMH05 | |
| HP Pavilion Gaming 15-ec1206ng | |
* ... smaller is better
Storage
The system drive is a 512 GB NVMe SSD (M.2 2280) from Intel that provides good transfer speeds. It's not one of the fastest SSDs, though. The laptop also has room for a 2.5-inch storage device. The SATA slot and mounting frame are available.

| HP Pavilion Gaming 15-ec1177ng Intel SSD 660p SSDPEKNW512G8 | Dell G3 15 3500-G4DG2 SK Hynix BC511 HFM512GDJTNI | Acer Nitro 5 AN515-44-R5FT SK Hynix BC511 HFM512GDJTNI | Asus TUF Gaming A15 FA506IV-HN172 Kingston OM8PCP3512F-AB | Lenovo IdeaPad Gaming 3i 15IMH05 SK hynix BC511 HFM512GDHTNI-87A0B | Asus ROG Strix G15 G512LI Intel SSD 660p SSDPEKNW512G8 | HP Pavilion Gaming 15-ec1206ng Toshiba KBG40ZNV512G | HP Pavilion Gaming 15-ec0002ng Intel SSD 660p SSDPEKNW512G8 | HP Pavilion Gaming 15-ec0017ng WDC PC SN720 SDAPNTW-256G | Average Intel SSD 660p SSDPEKNW512G8 | Average of class Gaming | |
|---|---|---|---|---|---|---|---|---|---|---|---|
| CrystalDiskMark 5.2 / 6 | -4% | 0% | 15% | 1% | -4% | 16% | -3% | 23% | -1% | 176% | |
| Write 4K (MB/s) | 110 | 99.6 -9% | 94.7 -14% | 219.8 100% | 130 18% | 125.4 14% | 111.5 1% | 136.9 24% | 148 35% | 136 ? 24% | 199.6 ? 81% |
| Read 4K (MB/s) | 52.8 | 38.8 -27% | 38.91 -26% | 50.2 -5% | 44.44 -16% | 52.7 0% | 38.17 -28% | 57 8% | 43.73 -17% | 55.2 ? 5% | 78.6 ? 49% |
| Write Seq (MB/s) | 983 | 1117 14% | 1056 7% | 979 0% | 1059 8% | 943 -4% | 1515 54% | 968 -2% | 1617 64% | 926 ? -6% | 3758 ? 282% |
| Read Seq (MB/s) | 1608 | 1030 -36% | 1183 -26% | 1990 24% | 1105 -31% | 1383 -14% | 1576 -2% | 1631 1% | 1753 9% | 1523 ? -5% | 3633 ? 126% |
| Write 4K Q32T1 (MB/s) | 461.3 | 445.2 -3% | 445.3 -3% | 516 12% | 490.3 6% | 437.9 -5% | 365.4 -21% | 237 -49% | 246.3 -47% | 380 ? -18% | 614 ? 33% |
| Read 4K Q32T1 (MB/s) | 345.4 | 331.8 -4% | 477.7 38% | 298.3 -14% | 309.2 -10% | 334.9 -3% | 504 46% | 337.1 -2% | 368 7% | 334 ? -3% | 710 ? 106% |
| Write Seq Q32T1 (MB/s) | 982 | 1102 12% | 1063 8% | 982 0% | 1053 7% | 960 -2% | 1493 52% | 963 -2% | 1618 65% | 987 ? 1% | 5333 ? 443% |
| Read Seq Q32T1 (MB/s) | 1820 | 2227 22% | 2154 18% | 1907 5% | 2261 24% | 1530 -16% | 2340 29% | 1863 2% | 3027 66% | 1744 ? -4% | 7102 ? 290% |
| Write 4K Q8T8 (MB/s) | 981 | 810 ? | 1308 ? | ||||||||
| Read 4K Q8T8 (MB/s) | 300.9 | 344 ? | 1647 ? | ||||||||
| AS SSD | 10% | 22% | 7% | 13% | -17% | 7% | -40% | 12% | -7% | 203% | |
| Seq Read (MB/s) | 1553 | 1305 -16% | 1504 -3% | 1682 8% | 1348 -13% | 1157 -25% | 2048 32% | 1623 5% | 2607 68% | 1423 ? -8% | 5591 ? 260% |
| Seq Write (MB/s) | 868 | 767 -12% | 1064 23% | 904 4% | 1000 15% | 675 -22% | 1039 20% | 891 3% | 1518 75% | 828 ? -5% | 3972 ? 358% |
| 4K Read (MB/s) | 56.6 | 41.84 -26% | 51.5 -9% | 60.2 6% | 48.04 -15% | 49.99 -12% | 52.8 -7% | 48.06 -15% | 39.16 -31% | 51.3 ? -9% | 71.1 ? 26% |
| 4K Write (MB/s) | 153.6 | 90.1 -41% | 123.2 -20% | 164.8 7% | 103.3 -33% | 114 -26% | 146 -5% | 102.1 -34% | 104.9 -32% | 128.9 ? -16% | 215 ? 40% |
| 4K-64 Read (MB/s) | 325.3 | 773 138% | 703 116% | 472.5 45% | 755 132% | 322.2 -1% | 1285 295% | 325.6 0% | 513 58% | 326 ? 0% | 1618 ? 397% |
| 4K-64 Write (MB/s) | 762 | 711 -7% | 730 -4% | 845 11% | 749 -2% | 759 0% | 758 -1% | 94.1 -88% | 416.7 -45% | 721 ? -5% | 2935 ? 285% |
| Access Time Read * (ms) | 0.07 | 0.09 -29% | 0.064 9% | 0.087 -24% | 0.061 13% | 0.07 -0% | 0.155 -121% | 0.171 -144% | 0.076 -9% | 0.09003 ? -29% | 0.06364 ? 9% |
| Access Time Write * (ms) | 0.046 | 0.04 13% | 0.031 33% | 0.02 57% | 0.036 22% | 0.137 -198% | 0.202 -339% | 0.048 -4% | 0.037 20% | 0.07378 ? -60% | 0.03794 ? 18% |
| Score Read (Points) | 537 | 945 76% | 905 69% | 701 31% | 938 75% | 488 -9% | 1543 187% | 536 0% | 813 51% | 519 ? -3% | 2248 ? 319% |
| Score Write (Points) | 1002 | 878 -12% | 960 -4% | 1101 10% | 952 -5% | 940 -6% | 1008 1% | 285 -72% | 673 -33% | 932 ? -7% | 3547 ? 254% |
| Score Total (Points) | 1802 | 2290 27% | 2321 29% | 2143 19% | 2365 31% | 1673 -7% | 3298 83% | 1077 -40% | 1858 3% | 1708 ? -5% | 6872 ? 281% |
| Copy ISO MB/s (MB/s) | 1301 | 675 -48% | 749 -42% | 939 -28% | 691 -47% | 566 -56% | 1639 26% | 1109 ? -15% | 3168 ? 144% | ||
| Copy Program MB/s (MB/s) | 313.7 | 248.4 -21% | 342.5 9% | 489.9 56% | 345.8 10% | 223.8 -29% | 284.2 -9% | 468 ? 49% | 981 ? 213% | ||
| Copy Game MB/s (MB/s) | 621 | 535 -14% | 571 -8% | 895 44% | 517 -17% | 104.3 -83% | 767 24% | 760 ? 22% | 2112 ? 240% | ||
| Total Average (Program / Settings) | 3% /
4% | 11% /
13% | 11% /
10% | 7% /
8% | -11% /
-12% | 12% /
10% | -22% /
-26% | 18% /
16% | -4% /
-4% | 190% /
193% |
* ... smaller is better
Continuous load read: DiskSpd Read Loop, Queue Depth 8
Graphics card
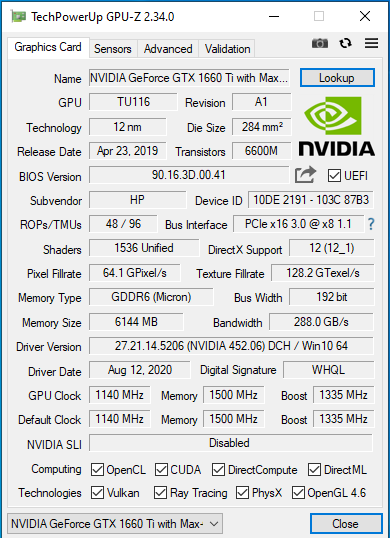
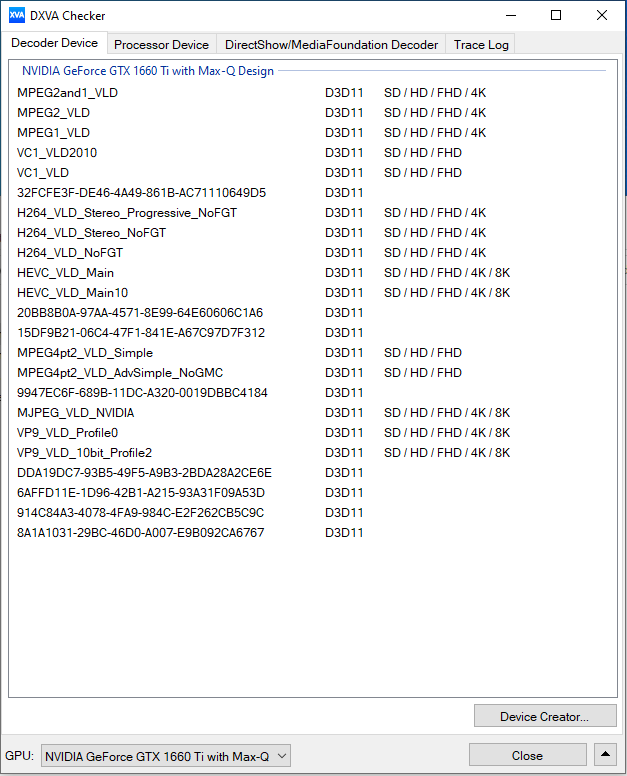
The GeForce GTX 1660 Ti Max-Q graphics core (Turing) belongs to the upper mid-range. Nvidia specifies a speed level between 1,140 MHz (base) and 1,335 MHz (boost) for this DirectX 12 GPU.
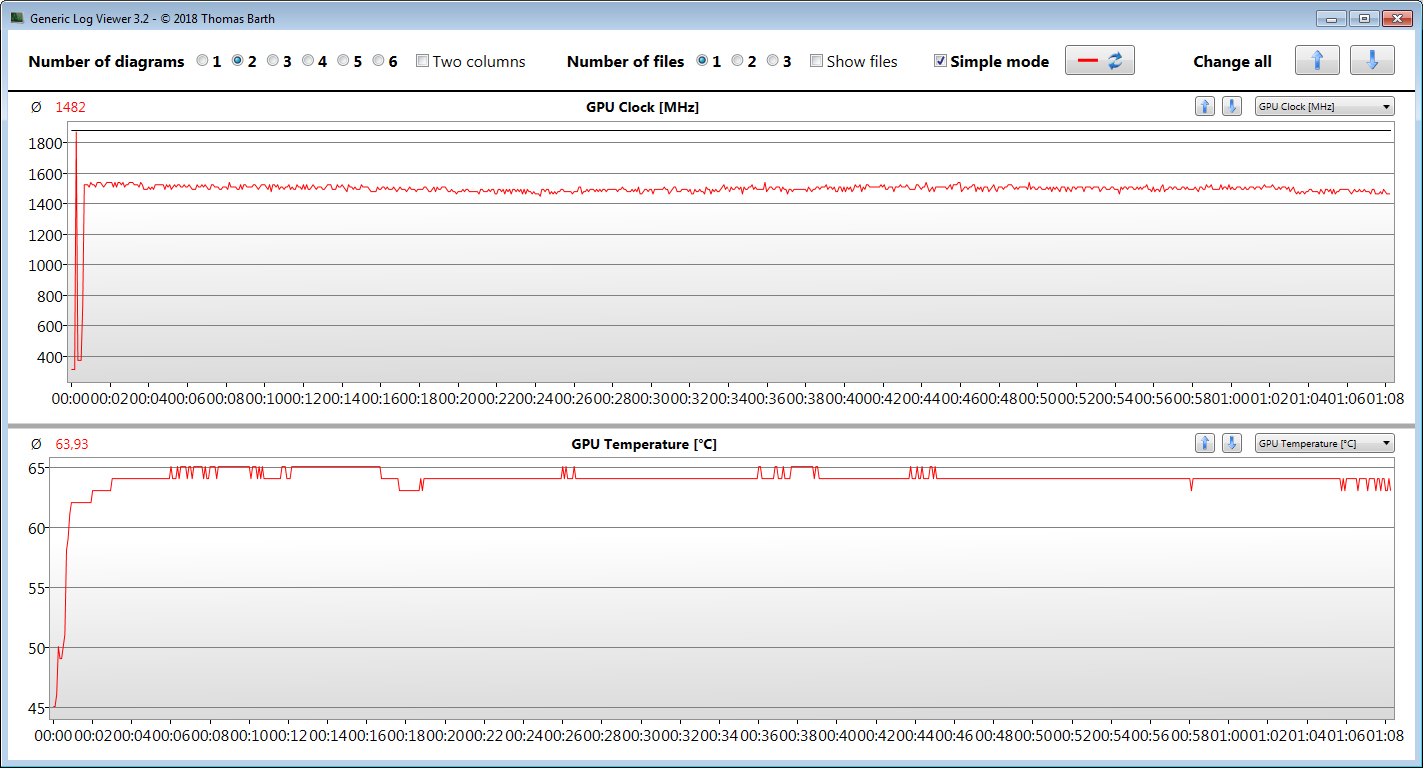
Higher clock rates are feasible if the GPU doesn't reach a specified temperature and/or energy threshold. In this way, we register a maximum of 1,869 MHz. Moreover, our The Witcher 3 test is run at an average speed of 1,482 MHz. The GPU can make use of fast GDDR6 graphics memory (6,144 MB).
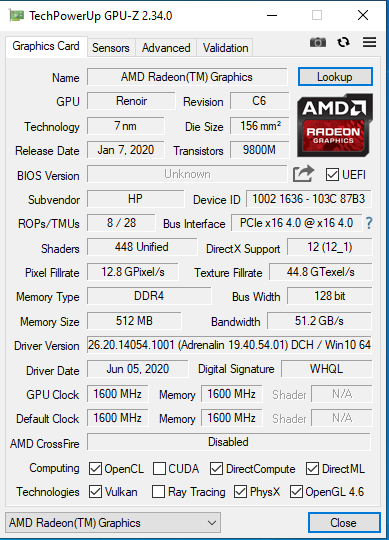
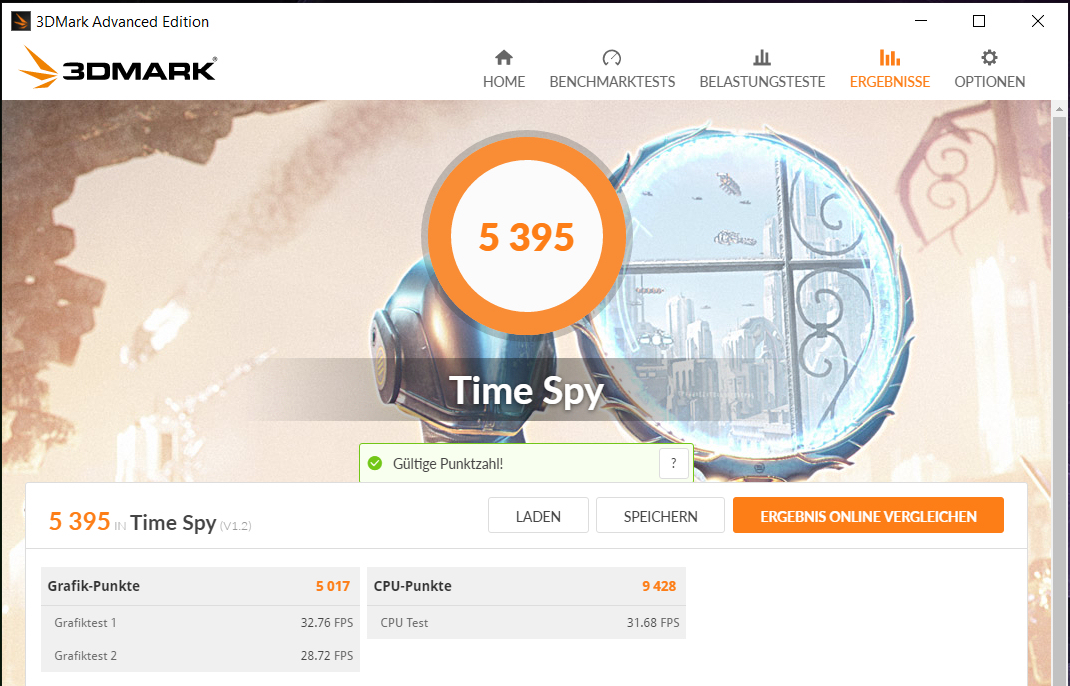
The results in the 3DMark benchmarks are at a normal level for this GPU. The Vega 7 GPU that's integrated into the processor is active, and the laptop works with Nvidia's Optimus graphics-switching solution.
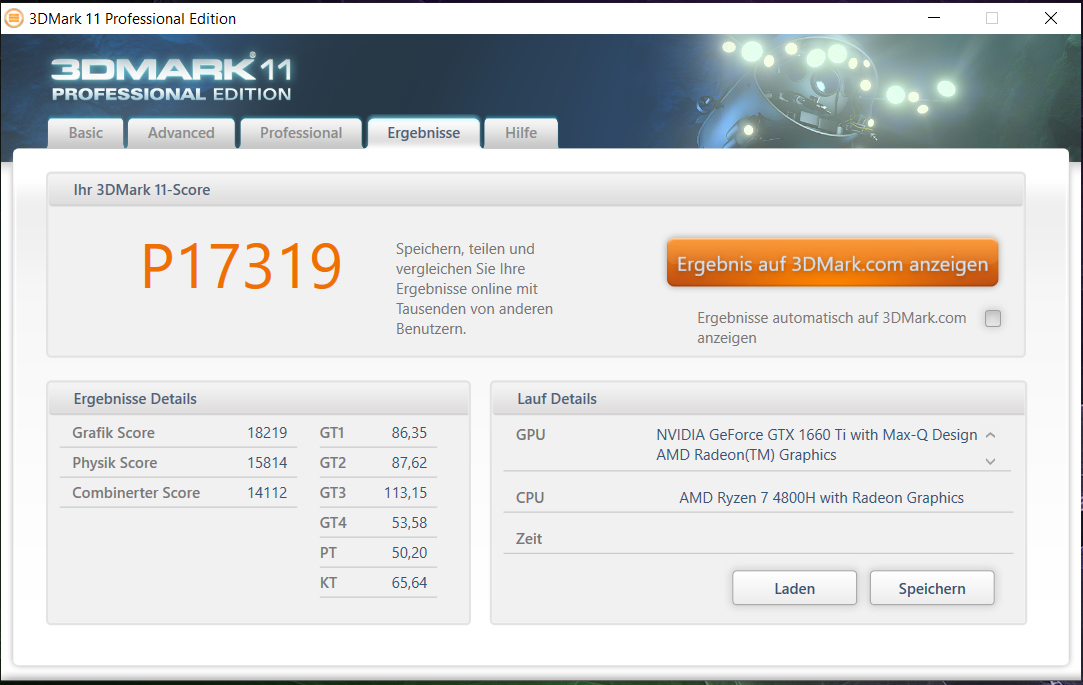
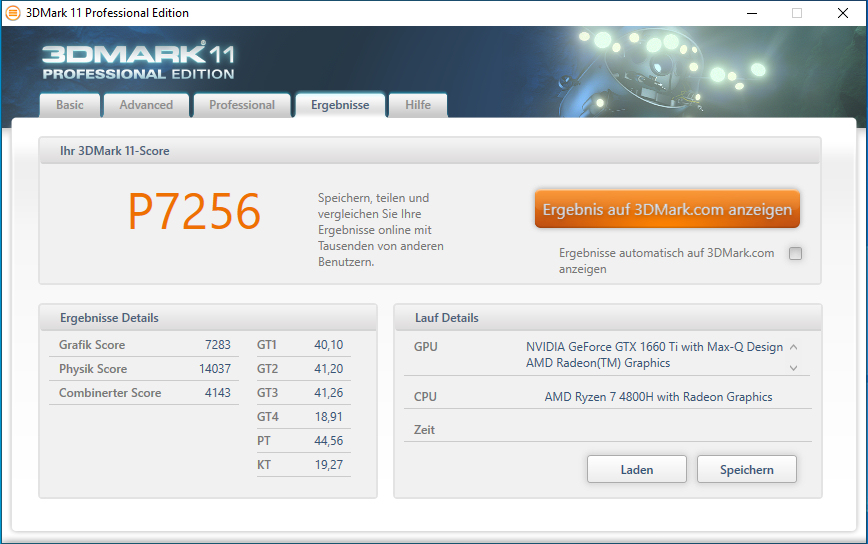
| 3DMark 11 Performance | 17319 points | |
| 3DMark Cloud Gate Standard Score | 39942 points | |
| 3DMark Fire Strike Score | 12487 points | |
| 3DMark Time Spy Score | 6395 points | |
Help | ||
Gaming performance
The built-in hardware brings all the games in our database smoothly onto the screen. Full HD resolution and high to sometimes maximum quality settings can be selected. Resolutions beyond Full HD (an appropriate monitor would have to be plugged in for this) are possible at a reduced quality level in some cases.
| Red Dead Redemption 2 - 1920x1080 High Settings | |
| HP Pavilion Gaming 15-ec1177ng | |
| Average NVIDIA GeForce GTX 1660 Ti Max-Q (n=1) | |
| Acer Nitro 5 AN515-44-R5FT | |
| Lenovo IdeaPad Gaming 3i 15IMH05 | |
| HP Pavilion Gaming 15-ec0002ng | |
| Escape from Tarkov - 1920x1080 Ultra Preset | |
| HP Pavilion Gaming 15-ec1177ng | |
| Average NVIDIA GeForce GTX 1660 Ti Max-Q (n=1) | |
| Lenovo IdeaPad Gaming 3i 15IMH05 | |
| Star Wars Jedi Fallen Order - 1920x1080 Epic Preset | |
| HP Pavilion Gaming 15-ec1177ng | |
| Average NVIDIA GeForce GTX 1660 Ti Max-Q (n=1) | |
| Lenovo IdeaPad Gaming 3i 15IMH05 | |
| HP Pavilion Gaming 15-ec0002ng | |
| Call of Duty Modern Warfare 2019 - 1920x1080 Maximum Settings AA:T2X Filmic SM | |
| HP Pavilion Gaming 15-ec1177ng | |
| Average NVIDIA GeForce GTX 1660 Ti Max-Q (n=1) | |
| Acer Nitro 5 AN515-44-R5FT | |
| Lenovo IdeaPad Gaming 3i 15IMH05 | |
| HP Pavilion Gaming 15-ec1206ng | |
| HP Pavilion Gaming 15-ec0002ng | |
| Doom Eternal - 1920x1080 Ultra Preset | |
| Dell G3 15 3500-G4DG2 | |
| HP Pavilion Gaming 15-ec1177ng | |
| Average NVIDIA GeForce GTX 1660 Ti Max-Q (n=1) | |
| F1 2020 - 1920x1080 Ultra High Preset AA:T AF:16x | |
| HP Pavilion Gaming 15-ec1177ng | |
| Average NVIDIA GeForce GTX 1660 Ti Max-Q (n=1) | |
| HP Pavilion Gaming 15-ec1206ng | |
| Death Stranding - 1920x1080 Very High Preset | |
| HP Pavilion Gaming 15-ec1177ng | |
| Average NVIDIA GeForce GTX 1660 Ti Max-Q (n=1) | |
| HP Pavilion Gaming 15-ec1206ng | |
In order to verify whether the frame rates remain largely constant even over a prolonged period of time, we let the game The Witcher 3 run for about 60 minutes at Full HD resolution and maximum quality settings. The character is not moved. A drop in frame rates wasn't found.
| low | med. | high | ultra | |
|---|---|---|---|---|
| BioShock Infinite (2013) | 263.2 | 249.5 | 226.9 | 119.2 |
| The Witcher 3 (2015) | 258.3 | 166.4 | 95.3 | 53.2 |
| Battlefield V (2018) | 152 | 102.6 | 92.2 | 85 |
| Apex Legends (2019) | 144 | 133.9 | 99.6 | 99.6 |
| Ghost Recon Breakpoint (2019) | 114 | 72 | 66 | 51 |
| Call of Duty Modern Warfare 2019 (2019) | 135.2 | 88 | 72.6 | 62.6 |
| Need for Speed Heat (2019) | 95.8 | 83 | 73.9 | 66.9 |
| Star Wars Jedi Fallen Order (2019) | 91.5 | 78.1 | 72.4 | |
| Red Dead Redemption 2 (2019) | 115.1 | 71.7 | 47.2 | 29.4 |
| Escape from Tarkov (2020) | 121.2 | 98.3 | 90.5 | 87.7 |
| Hunt Showdown (2020) | 176.8 | 81.2 | 63.3 | |
| Doom Eternal (2020) | 168.9 | 101.7 | 95.4 | 93.4 |
| Gears Tactics (2020) | 214.7 | 130.2 | 79.9 | 56.1 |
| F1 2020 (2020) | 219 | 130 | 112 | 79 |
| Death Stranding (2020) | 136.1 | 87.7 | 81.3 | 78.4 |
| Horizon Zero Dawn (2020) | 119 | 78 | 65 | 51 |
| Flight Simulator 2020 (2020) | 55.1 | 49.4 | 37.1 | 25.3 |
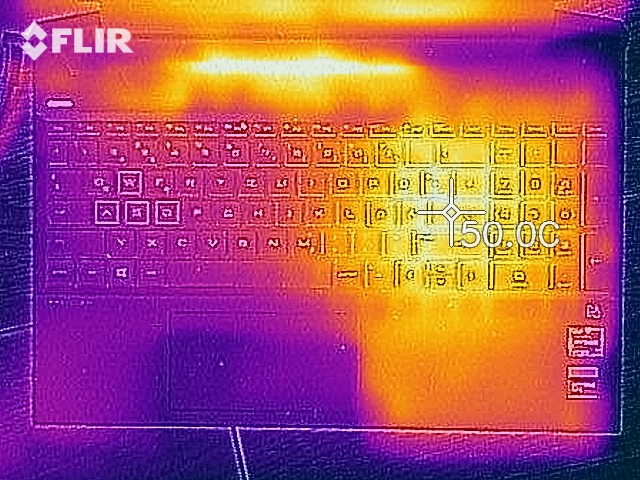
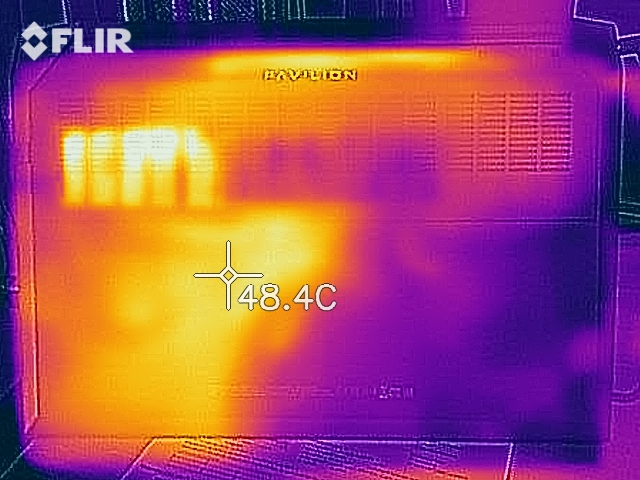
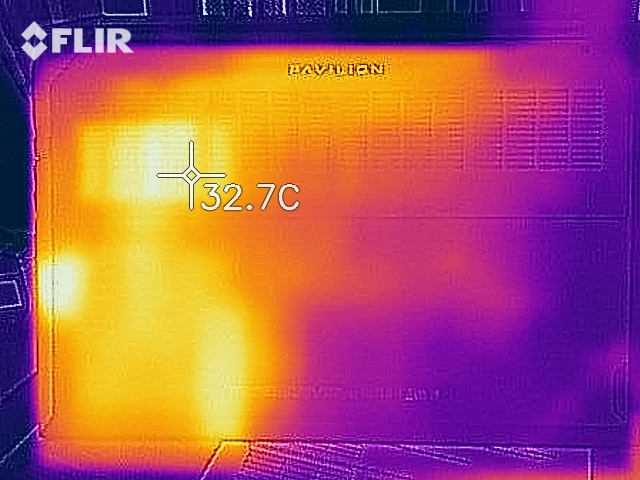
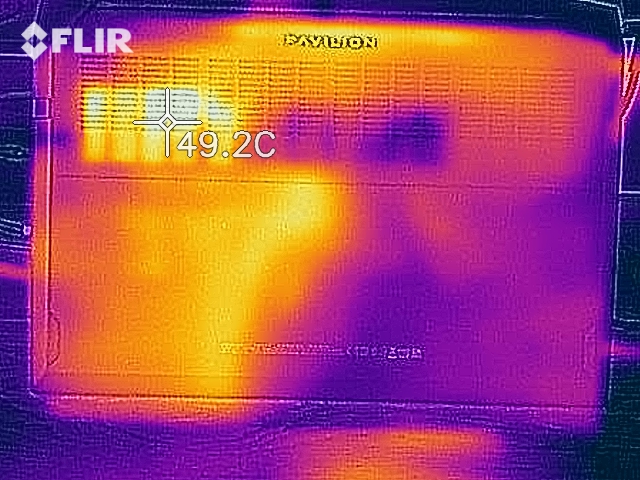
Emissions and energy - The HP laptop doesn't get particularly hot
Noise emissions
The two fans are often quiet in idle usage and there is silence. But they turn up under load. In this way, we register a maximum sound pressure level of 47 dB(A) during the stress test. At a level of 42.2 dB(A), there is less noise during our The Witcher 3 test.
Noise level
| Idle |
| 27 / 27 / 27 dB(A) |
| Load |
| 42.4 / 47 dB(A) |
 | ||
30 dB silent 40 dB(A) audible 50 dB(A) loud |
||
min: | ||
Temperature
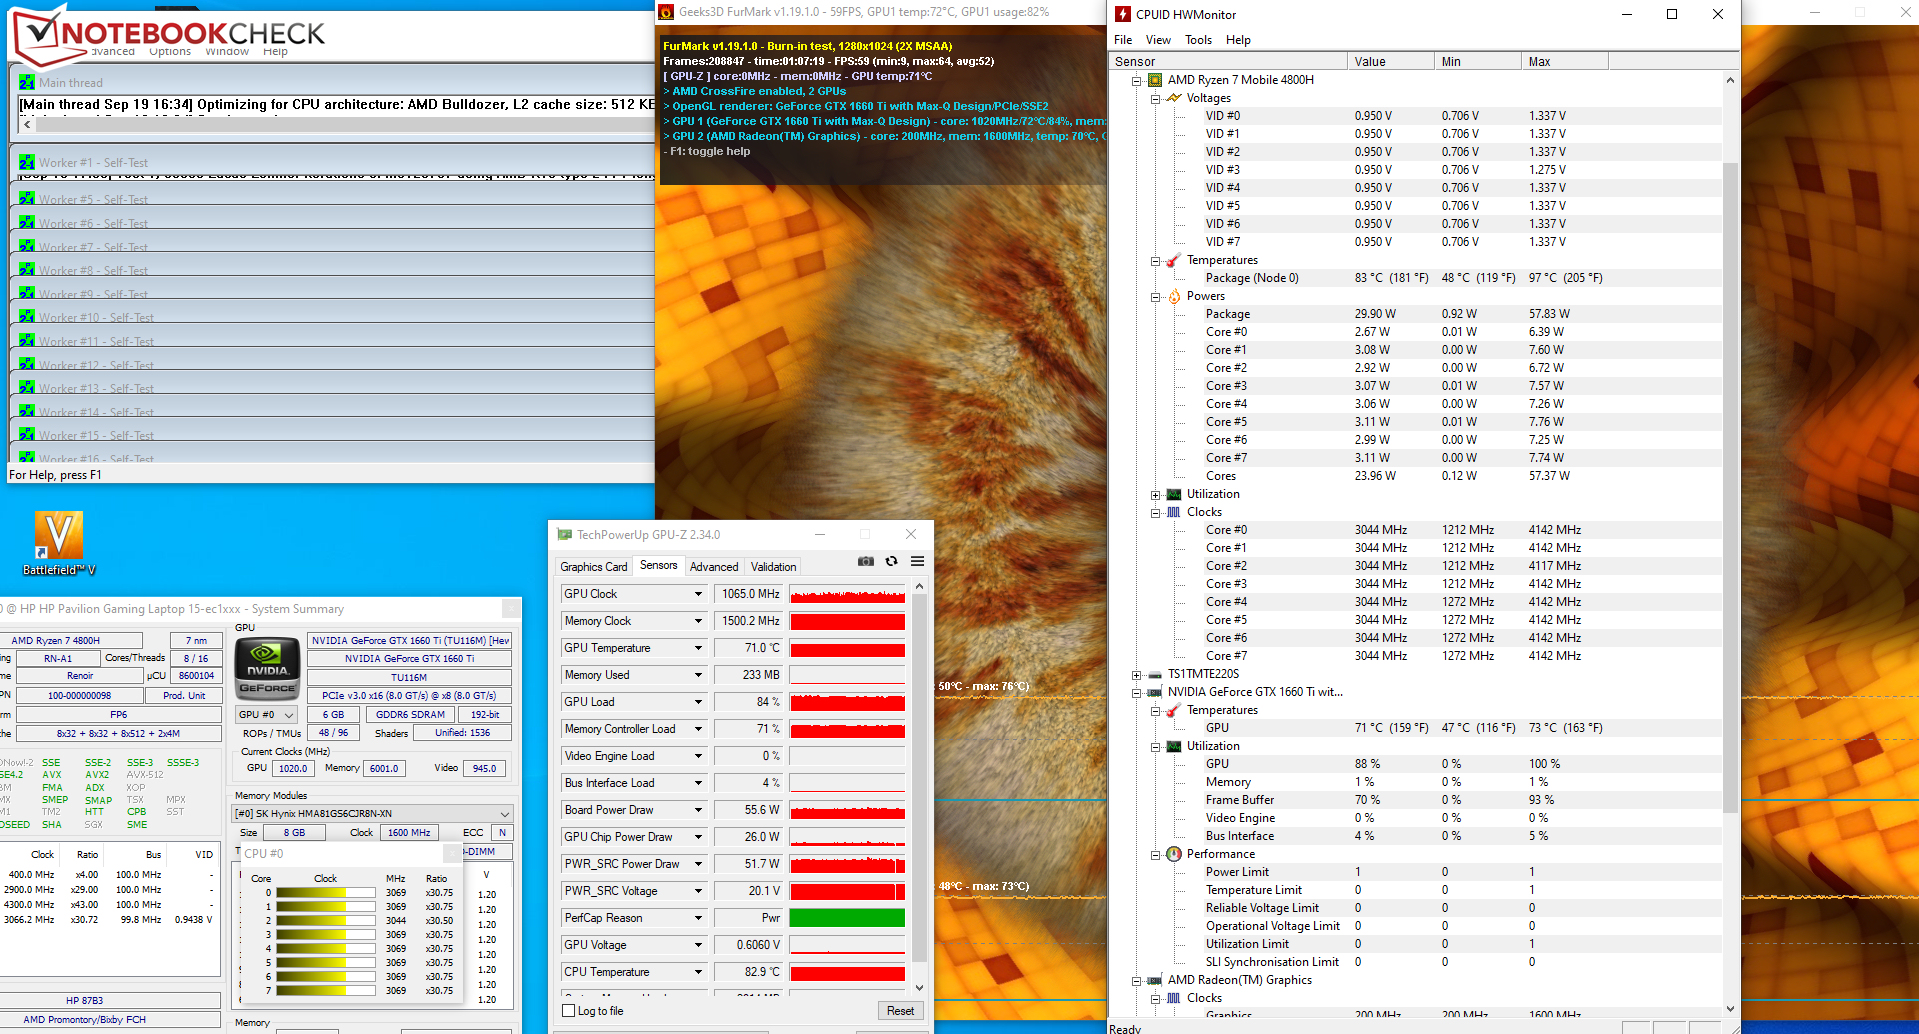
Our stress test (Prime95 and FurMark run for at least an hour) is ran by the processor at 4 GHz for a short time. The clock rate then drops to between 3 and 3.1 GHz and remains at this level. The graphics core operates at 900 to 1,200 MHz. On battery power, the clock rates are 1.7 to 1.9 GHz (CPU) and 1,000 to 1,700 MHz (GPU), respectively. The stress test represents an extreme scenario that doesn't occur in everyday life. With this test, we check whether the system remains stable even under full load.
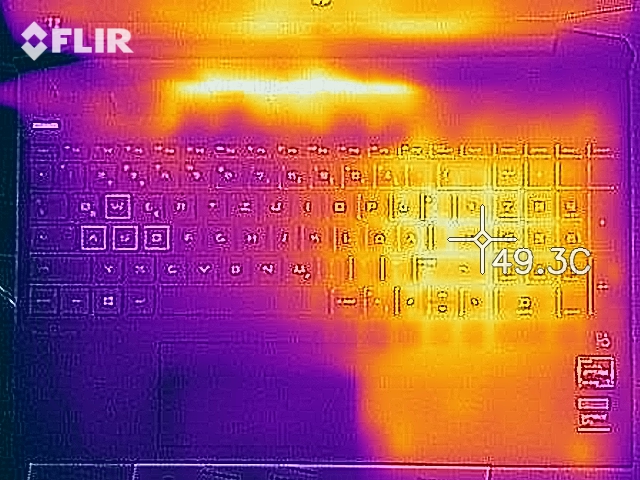
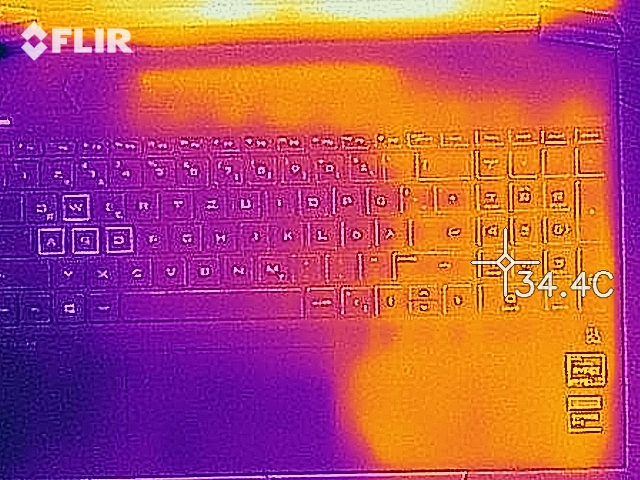
The laptop doesn't heat up particularly strongly. During the stress test, we register temperatures in the lower 40-°C range (~104 °F) at three measuring points. Furthermore, heat development is significantly lower when performing our The Witcher 3 test. In everyday use, the temperatures are in the green range.
(±) The maximum temperature on the upper side is 42.9 °C / 109 F, compared to the average of 40.4 °C / 105 F, ranging from 21.2 to 68.8 °C for the class Gaming.
(+) The bottom heats up to a maximum of 39.5 °C / 103 F, compared to the average of 43.2 °C / 110 F
(+) In idle usage, the average temperature for the upper side is 25.6 °C / 78 F, compared to the device average of 33.9 °C / 93 F.
(±) Playing The Witcher 3, the average temperature for the upper side is 32.5 °C / 91 F, compared to the device average of 33.9 °C / 93 F.
(±) The palmrests and touchpad can get very hot to the touch with a maximum of 36.5 °C / 97.7 F.
(-) The average temperature of the palmrest area of similar devices was 28.8 °C / 83.8 F (-7.7 °C / -13.9 F).
Speakers
HP Pavilion Gaming 15-ec1177ng audio analysis
(-) | not very loud speakers (60.8 dB)
Bass 100 - 315 Hz
(-) | nearly no bass - on average 22% lower than median
(±) | linearity of bass is average (11.9% delta to prev. frequency)
Mids 400 - 2000 Hz
(+) | balanced mids - only 2.7% away from median
(±) | linearity of mids is average (10.9% delta to prev. frequency)
Highs 2 - 16 kHz
(+) | balanced highs - only 2.3% away from median
(±) | linearity of highs is average (7.3% delta to prev. frequency)
Overall 100 - 16.000 Hz
(±) | linearity of overall sound is average (23.2% difference to median)
Compared to same class
» 84% of all tested devices in this class were better, 4% similar, 11% worse
» The best had a delta of 6%, average was 18%, worst was 132%
Compared to all devices tested
» 70% of all tested devices were better, 5% similar, 25% worse
» The best had a delta of 4%, average was 23%, worst was 134%
Energy consumption
There are no abnormalities in terms of energy consumption. We register a maximum power consumption of 9.5 watts in idle usage. During our stress test, the value rises up to 156 watts. In gaming mode (The Witcher 3 test), the demand is lower at an average of 99 watts (96 to 106 watts). The 200-watt power adapter still offers a lot of leeway.
| Off / Standby | |
| Idle | |
| Load |
|
Key:
min: | |
Battery life
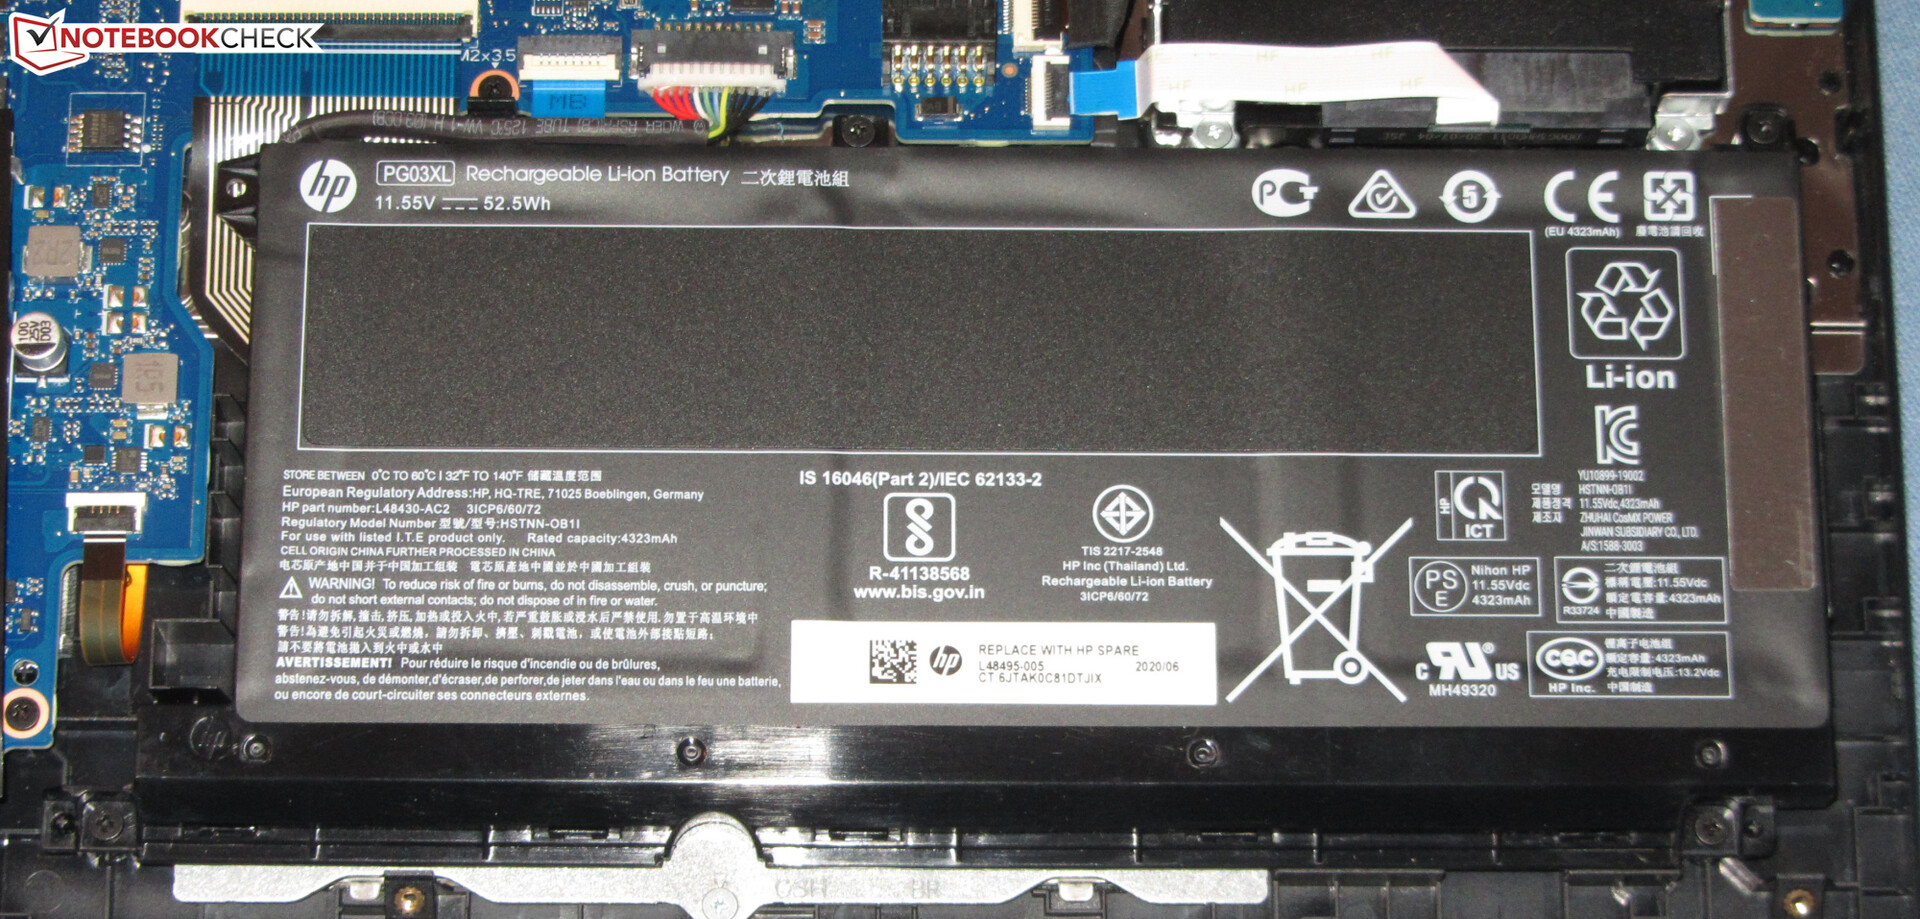
In our practical WLAN test (a script is used to reproduce the load caused by accessing websites), the HP laptop reaches a runtime of 6:07 hours. This value is perfectly fine for a gaming laptop, but it's significantly lower than the values of its sibling models.
We dedicated a lot of time to investigating the battery life. We tried to find out whether the installed hardware generally requires more energy than the hardware of the sibling models in WLAN operation, or whether a problem or a misconfiguration in our the test device was leading to the increased demand.
We can't give a clear answer here, but we can exclude some explanations at least: Neither a fresh installation of Windows 10 on one of our SSDs nor the use of the previous BIOS version has led to improvements.
Pros
Cons
Verdict

Thanks to the Ryzen 7 4800H APU and the GeForce GTX 1660 Ti Max-Q graphics core, the Pavilion Gaming can bring all the latest computer games smoothly onto the screen. Full HD resolution and high to maximum quality settings can normally be used.
The top model of the Pavilion Gaming 15 series offers a lot of performance at an attractive price.
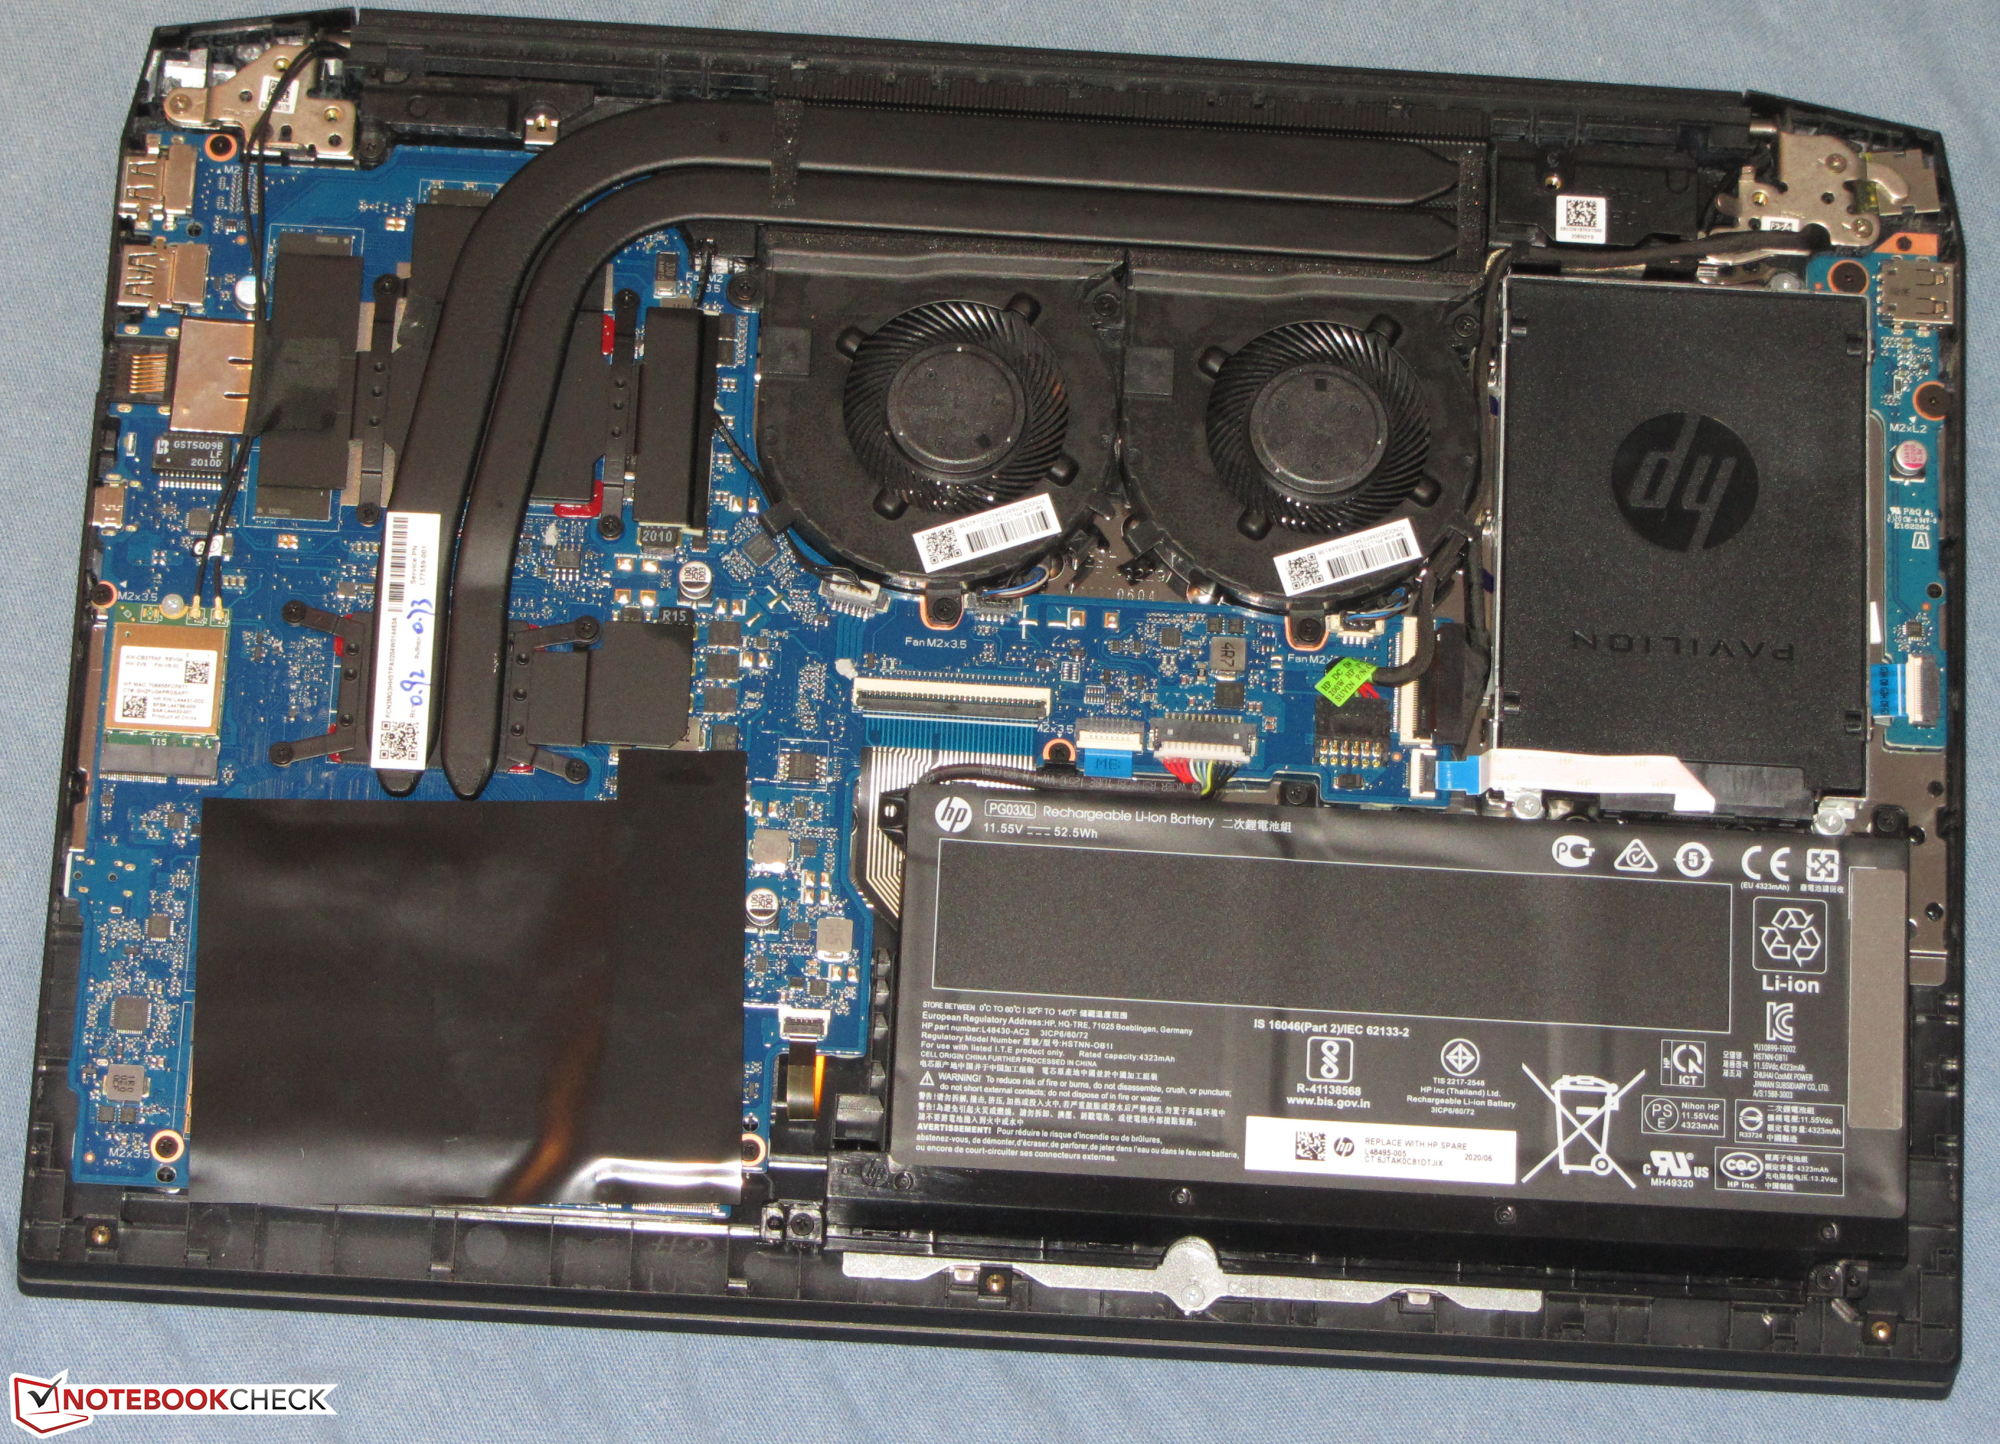
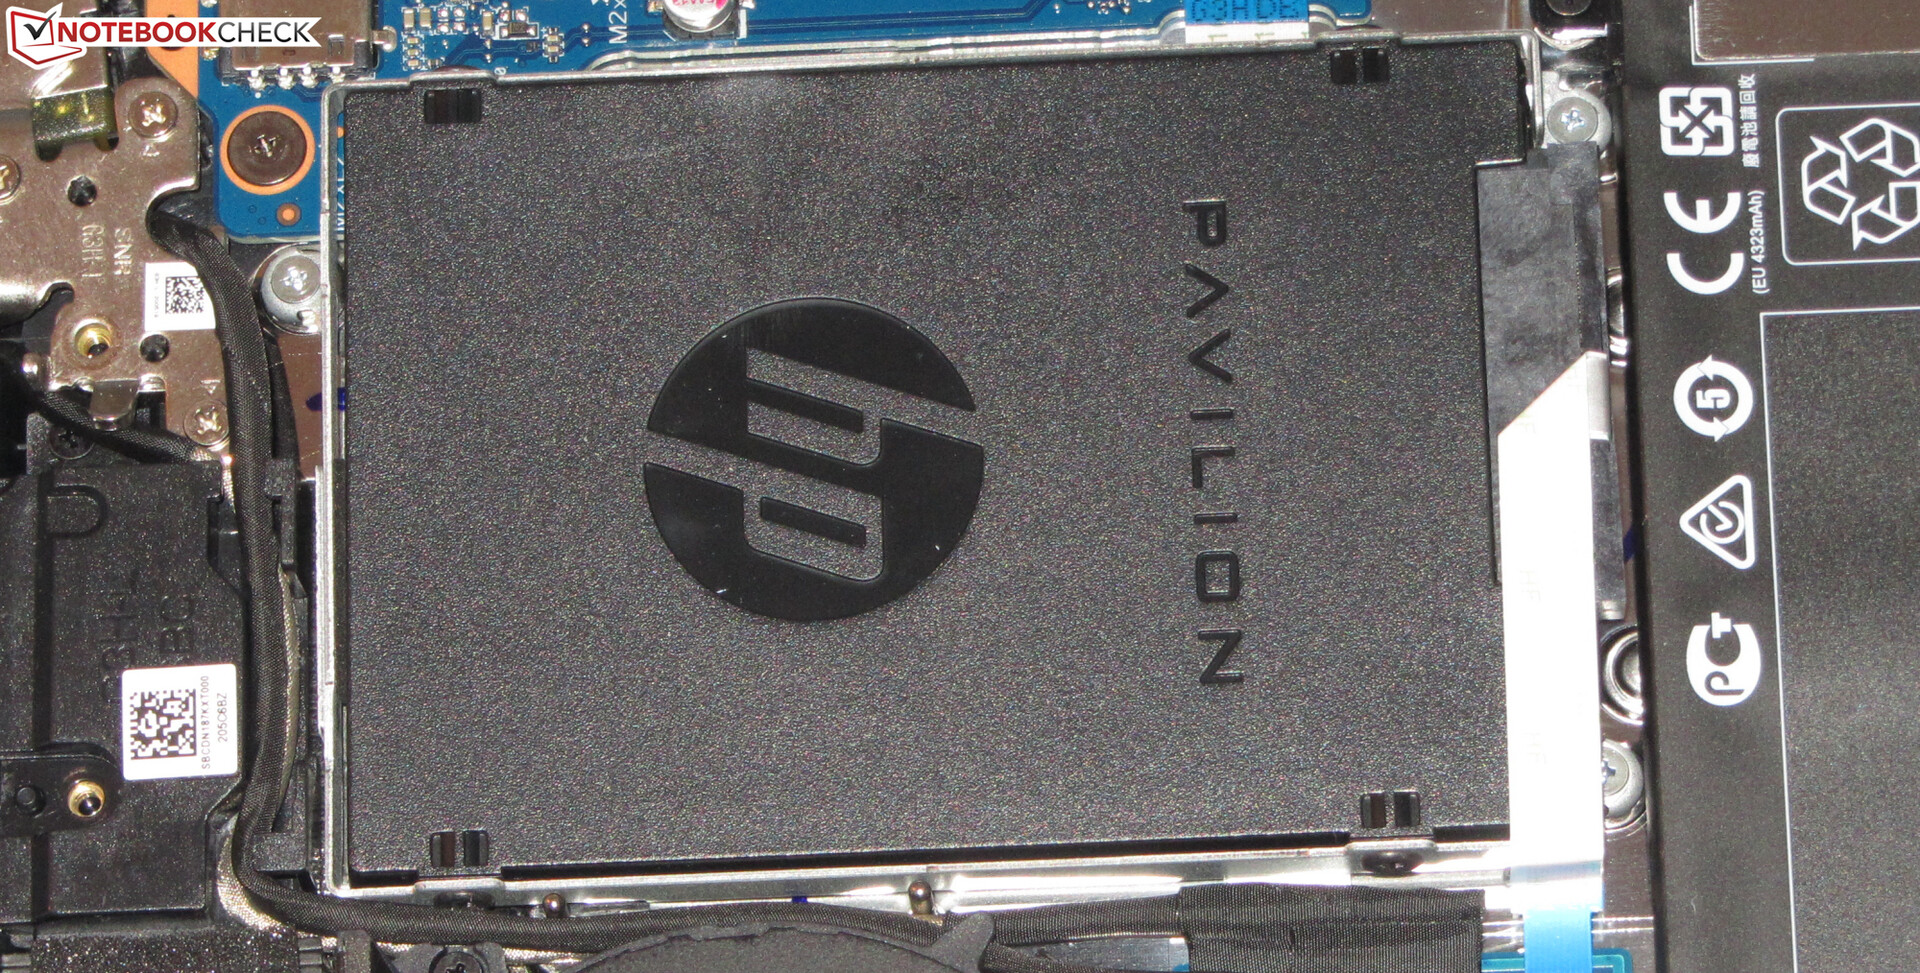
The hardware is equipped with 16 GB of RAM (2x 8 GB, dual-channel mode; 32 GB max.). At 512 GB, the storage space is a bit tight for a gaming laptop. Replacing the fast NVMe SSD would be possible. Alternatively, a 2.5-inch storage drive can be additionally installed. All maintenance and upgrade procedures require removing the bottom cover.
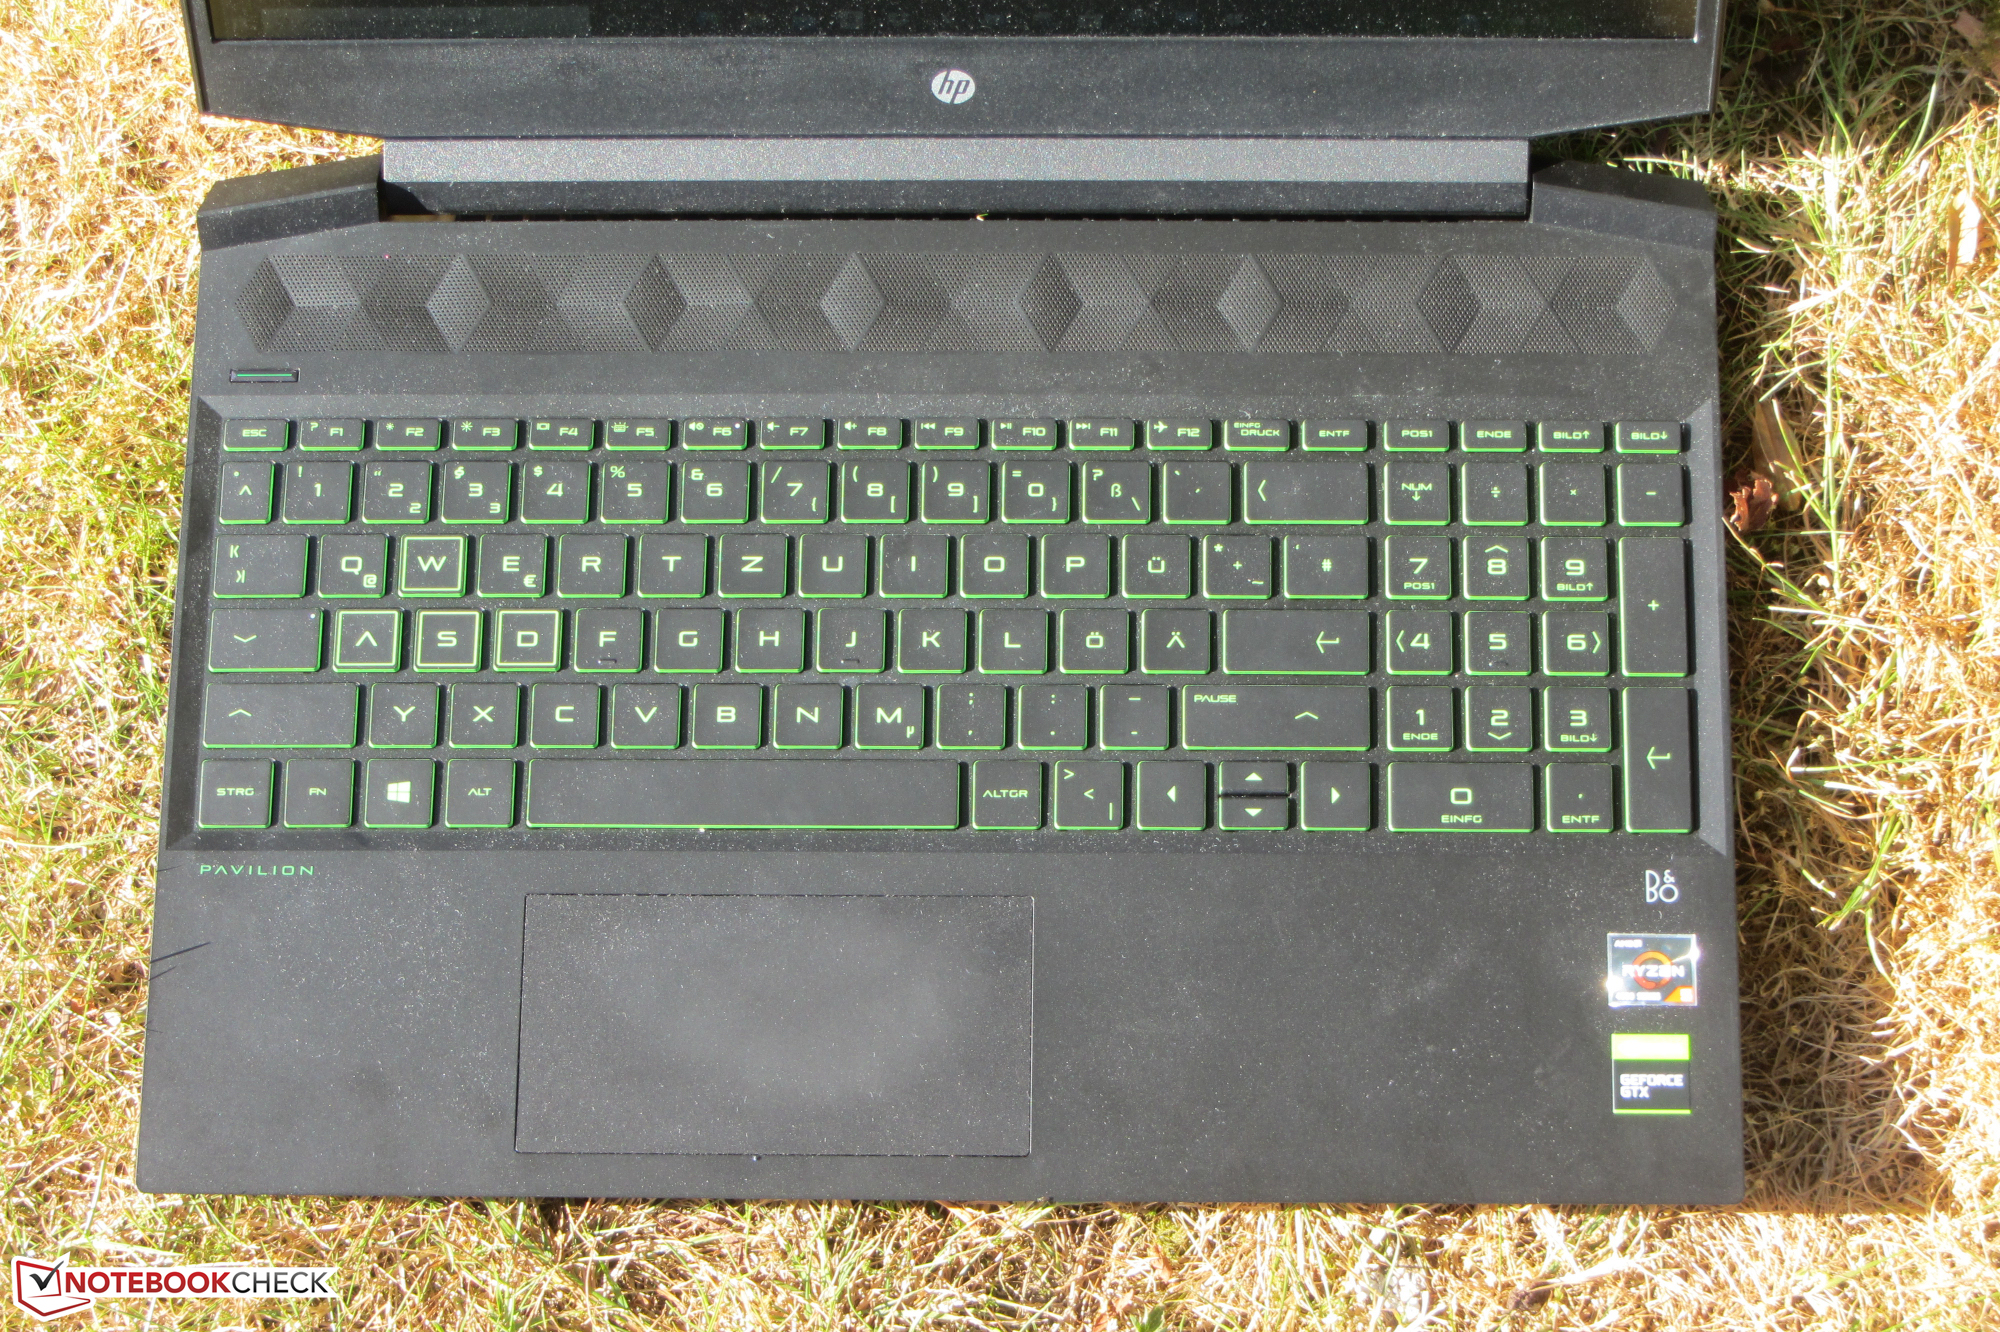
The battery life is perfectly acceptable, but it doesn't reach the very good values of the identically built sibling models. The chiclet keyboard (green backlight, two brightness levels) has proven to be suitable for everyday use. On the other hand, the laptop doesn't have a generous port configuration, but the most necessary connections are available.
The IPS display (Full HD, 144 Hz) scores points with a matte surface, stable viewing angles, high contrast, good brightness, fast response times, and great color reproduction. The color-space coverage is also pleasing.
HP Pavilion Gaming 15-ec1177ng
- 09/29/2020 v7 (old)
Sascha Mölck
Price comparison

