Dell G3 15 3500 laptop in review: Robust gaming notebook with 144 Hz screen

In addition to Alienware notebooks, Dell also sells gaming laptops under its own brand name. This includes, among others, the Dell G5 15, which we were recently able to view in a pure AMD version. Now we'll take a look at the somewhat cheaper G3 series, of which we could already get an impression with the Dell G3 15 3590, for example. This series also includes our current test device, the Dell G3 15 3500, which offers an Intel Core i7-10750H, an Nvidia GeForce RTX 2060, 16 GB RAM and a 512 GB SSD in the configuration tested in this review.
With this equipment, it must be able to compete with the similarly priced competitors, which we have listed in the table below. Under each section you can also add other notebooks from our database for comparison.
Rating | Date | Model | Weight | Height | Size | Resolution | Price |
|---|---|---|---|---|---|---|---|
| 81.6 % v7 (old) | 09 / 2020 | Dell G3 15 3500-G4DG2 i7-10750H, GeForce RTX 2060 Mobile | 2.3 kg | 22 mm | 15.60" | 1920x1080 | |
| 81.2 % v7 (old) | 08 / 2020 | Nexoc GH5 515IG i5-10300H, GeForce GTX 1650 Mobile | 2.1 kg | 24.9 mm | 15.60" | 1920x1080 | |
| 79.5 % v7 (old) | 07 / 2020 | MSI Bravo 15 A4DCR R7 4800H, Radeon RX 5300M | 2 kg | 22 mm | 15.60" | 1920x1080 | |
| 80.6 % v7 (old) | 06 / 2020 | Acer Nitro 5 AN517-52-77DS i7-10750H, GeForce RTX 2060 Mobile | 2.2 kg | 24.9 mm | 17.30" | 1920x1080 |
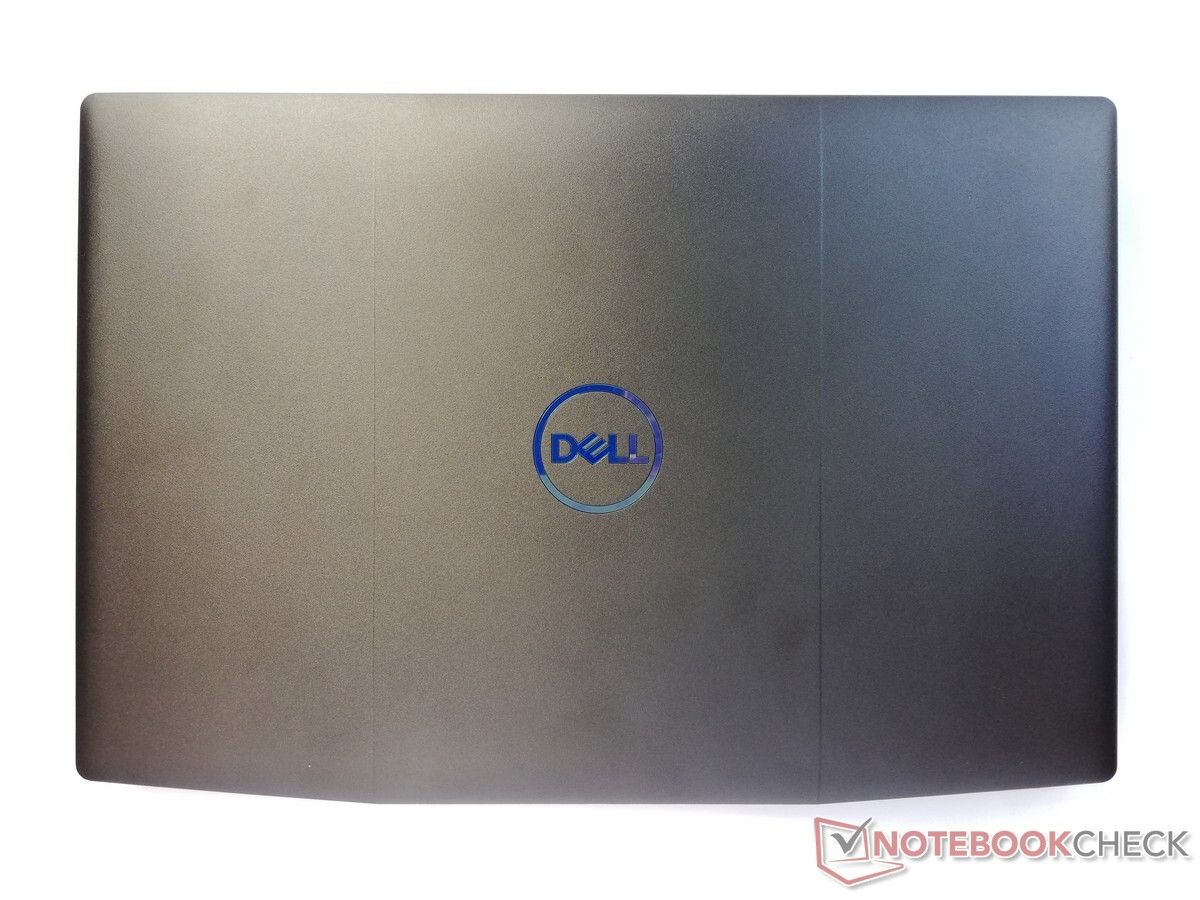
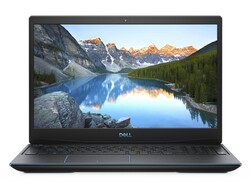
Case - Solid gaming laptop
Dell manufactures the G3 15 from a very robust plastic. This does not give way even under strong pressure and gives the gaming notebook an extremely robust impression. Although small decorative stripes here and there provide an eye-catcher, the G3 15 looks rather classic overall. The screen is also very torsion-resistant and can be opened with one hand without distorting it. The maximum opening angle is around 140°.
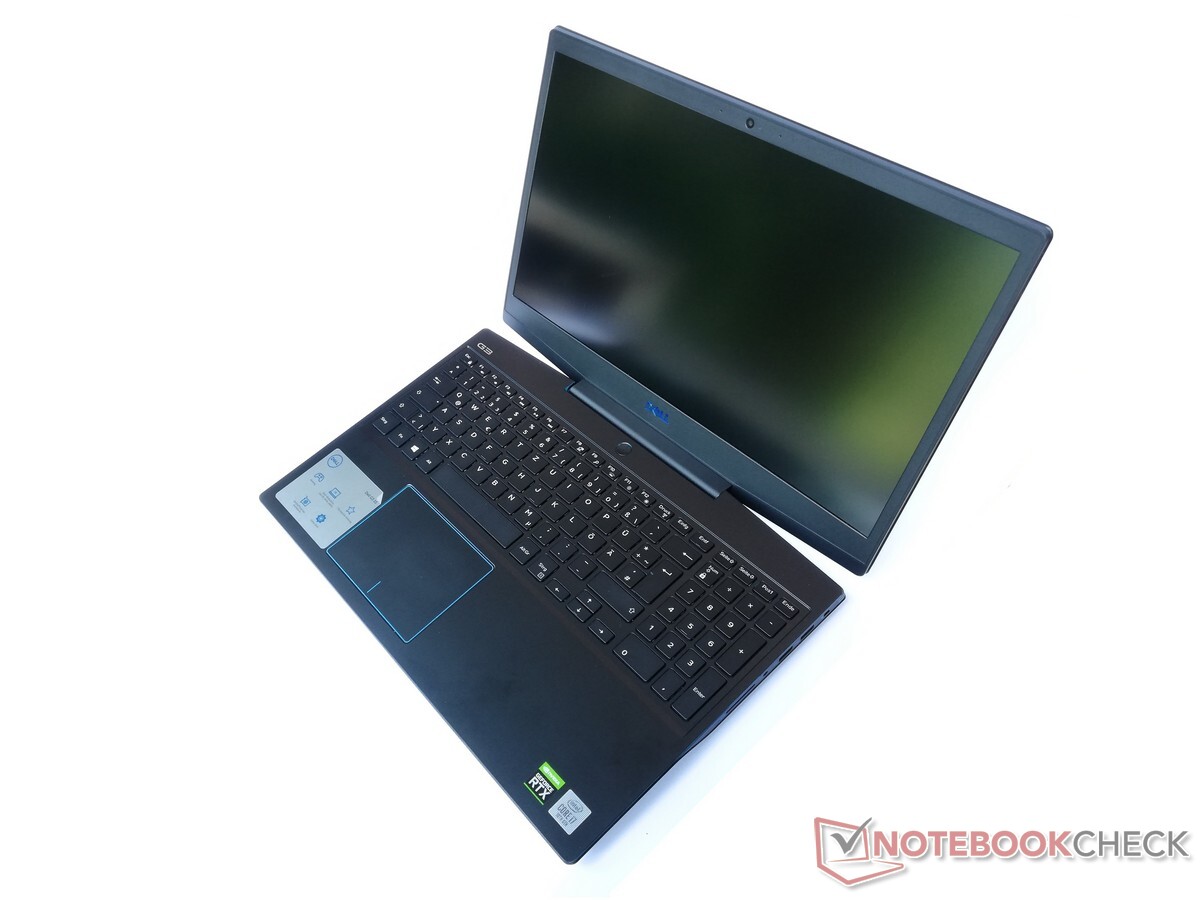
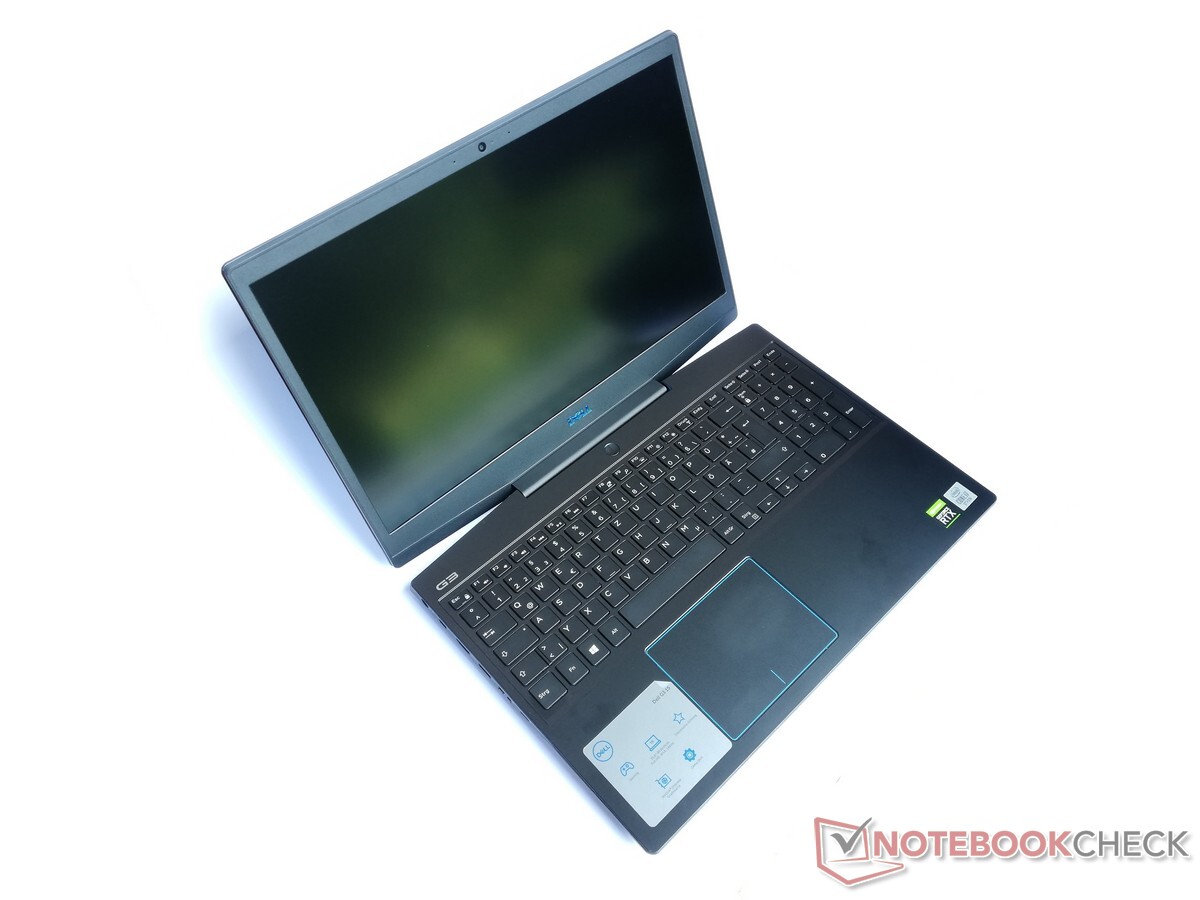
With a weight of approximately 2.3 kilograms, the G3 15 is not a light notebook and is also the heaviest from the range of similar tested devices. The same applies to the dimensions, with Dell's laptop surpassing its 15-inch competitors, especially in terms of thickness and width.
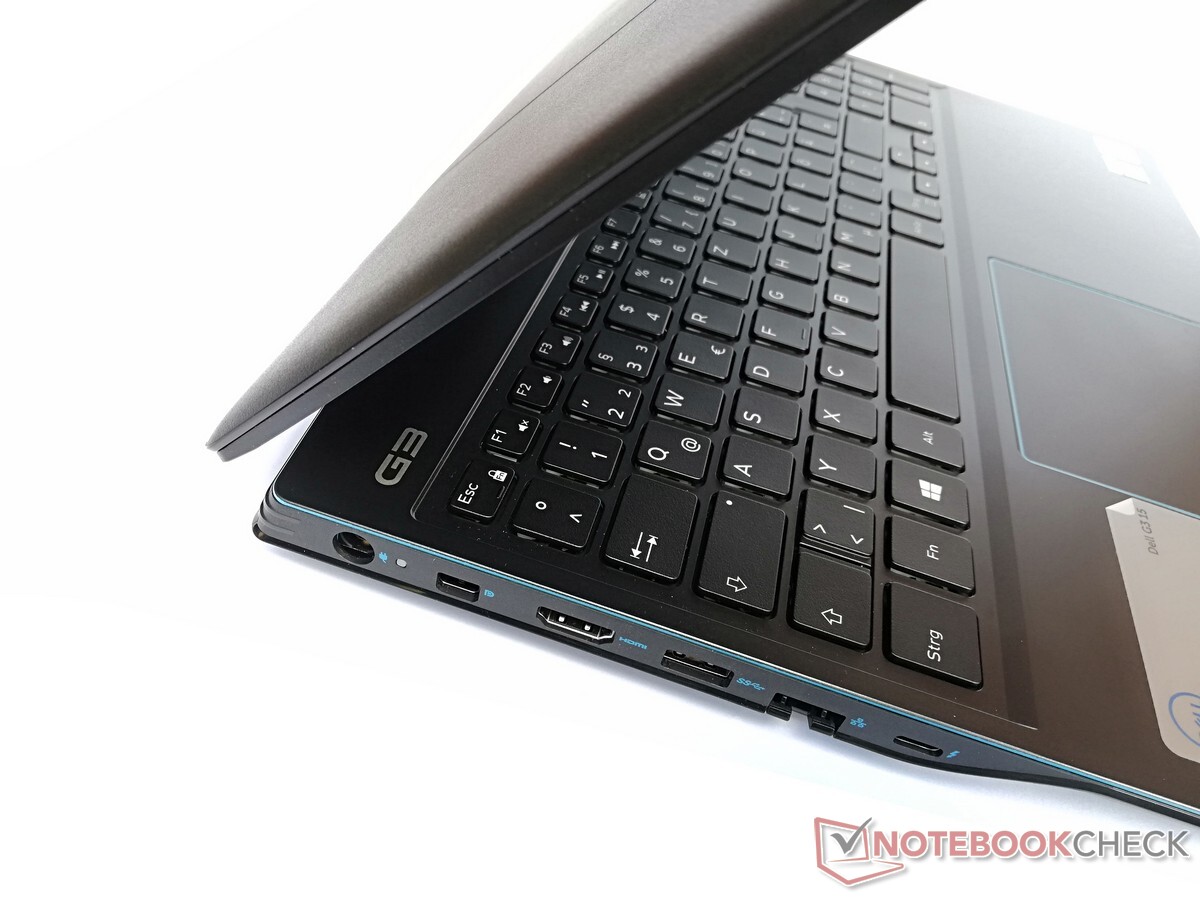
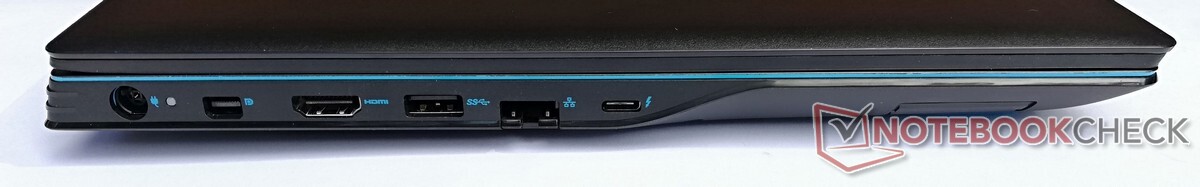
Ports - Dell G3 15 with Thunderbolt 3
The Dell G3 15 offers a good choice of ports. It is especially noticeable that numerous monitors can be connected to the gaming notebook. Not only is there an HDMI and a mini-display port available for this purpose but display devices can also be connected via the Thunderbolt 3 connector.
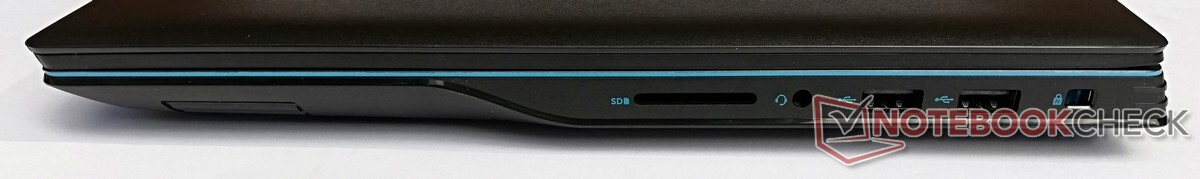
Memory card reader
The Dell G3 15's memory card reader does not fully accept SD cards, causing them to protrude approximately 1.5 cm beyond the edge. In addition, our reference memory card Toshiba Exceria Pro SDXC 64GB UHS-II achieves slow speeds of 23.8 MB/s when copying and 27.1 MB/s when reading data.
| SD Card Reader | |
| average JPG Copy Test (av. of 3 runs) | |
| Average of class Gaming (20.9 - 210, n=55, last 2 years) | |
| Nexoc GH5 515IG (Toshiba Exceria Pro SDXC 64 GB UHS-II) | |
| Dell G3 15 3500-G4DG2 (Toshiba Exceria Pro SDXC 64 GB UHS-II) | |
| maximum AS SSD Seq Read Test (1GB) | |
| Average of class Gaming (25.5 - 261, n=52, last 2 years) | |
| Nexoc GH5 515IG (Toshiba Exceria Pro SDXC 64 GB UHS-II) | |
| Dell G3 15 3500-G4DG2 (Toshiba Exceria Pro SDXC 64 GB UHS-II) | |
Communication
Dell G3 15 users can connect via a LAN port, Bluetooth 5.0 and Wi-Fi 6. In combination with our reference router Netgear Nighthawk AX12, the gaming laptop achieves very good values of an average of 1,417 Mb/s for receiving and 1,337 Mb/s for transmitting data.
Webcam
The Dell G3 15's webcam records images at a low 0.9 MP. Our test shots therefore show noticeable blurring and pale colours even under very good lighting conditions. Nowadays, this is the case with most current laptops.


Accessories
The Dell G3 15 only comes with the notebook itself and a suitable power supply unit. However, Dell offers numerous general and gaming-related accessories, which range from external input devices to carrying cases and monitors.
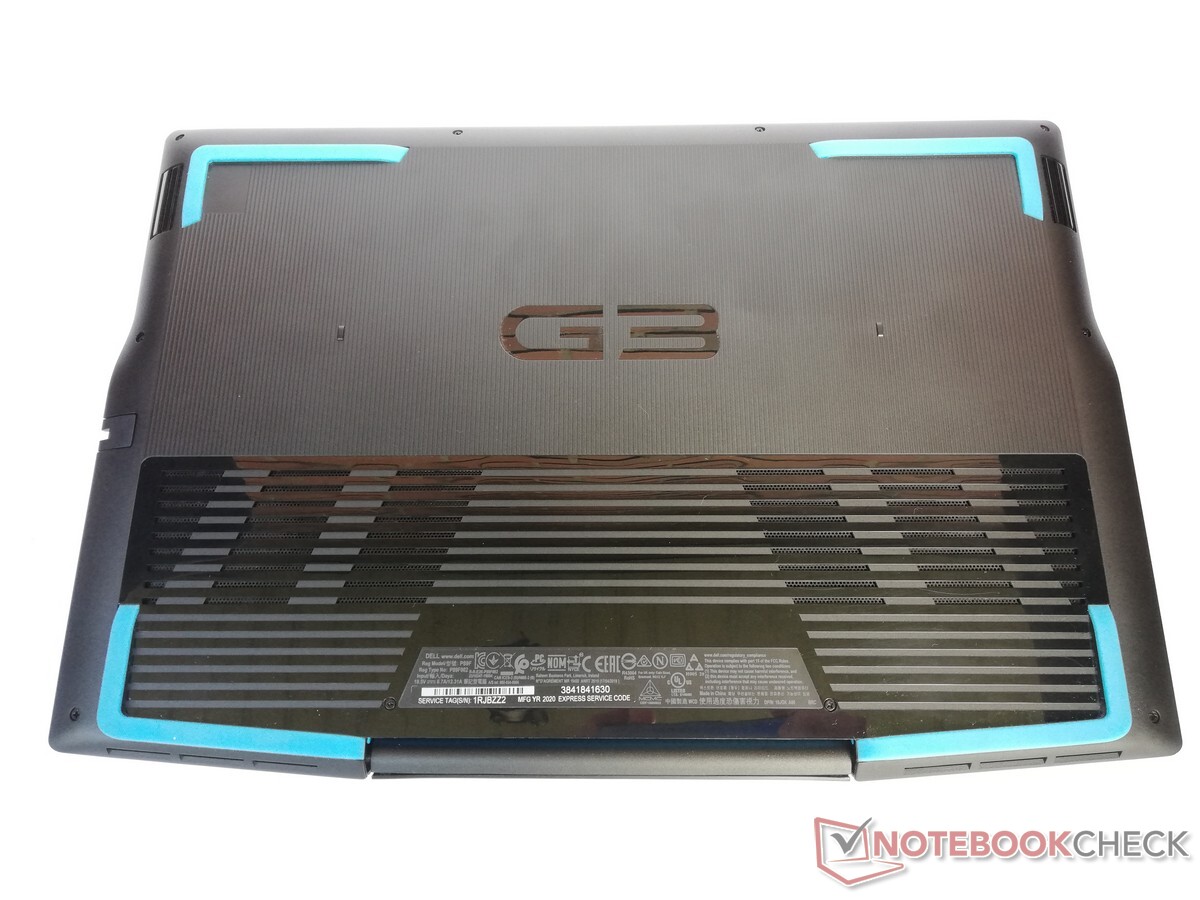
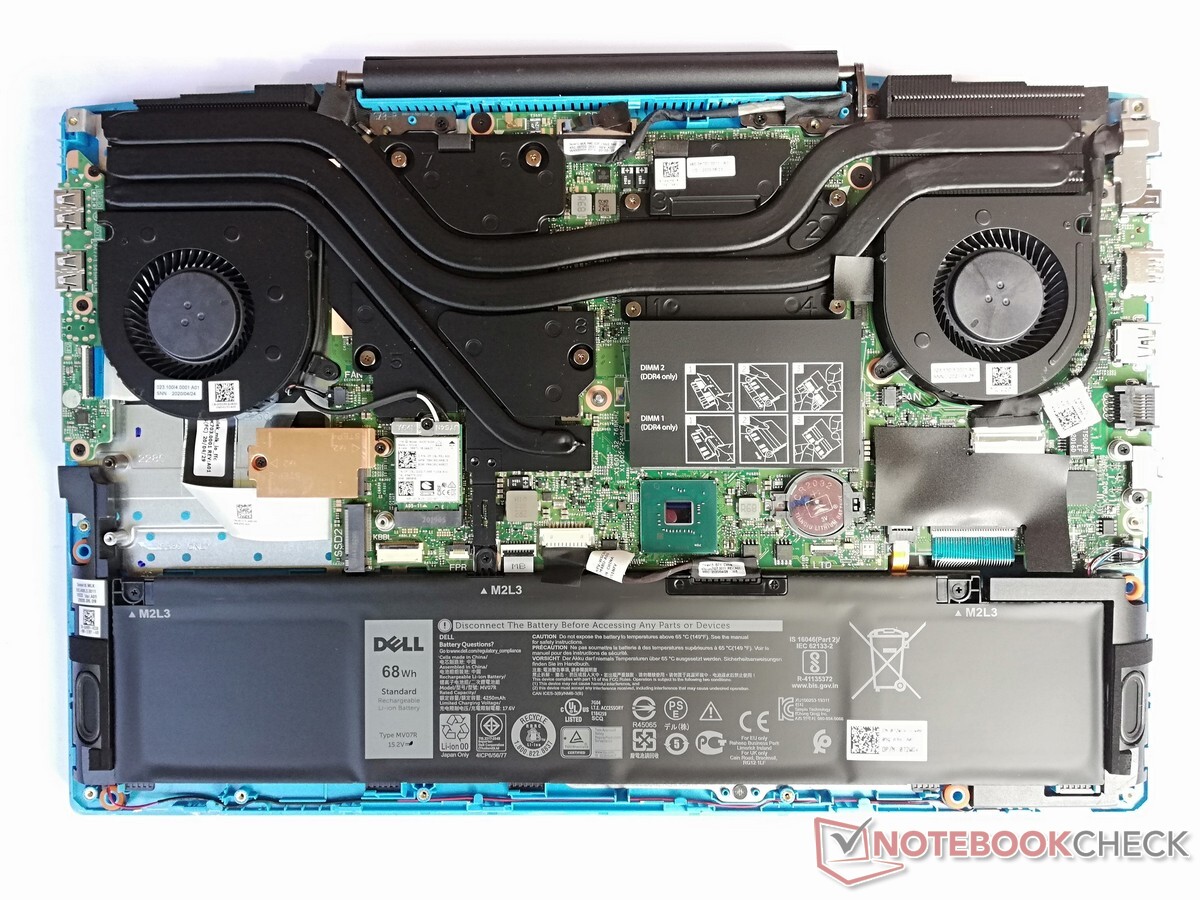
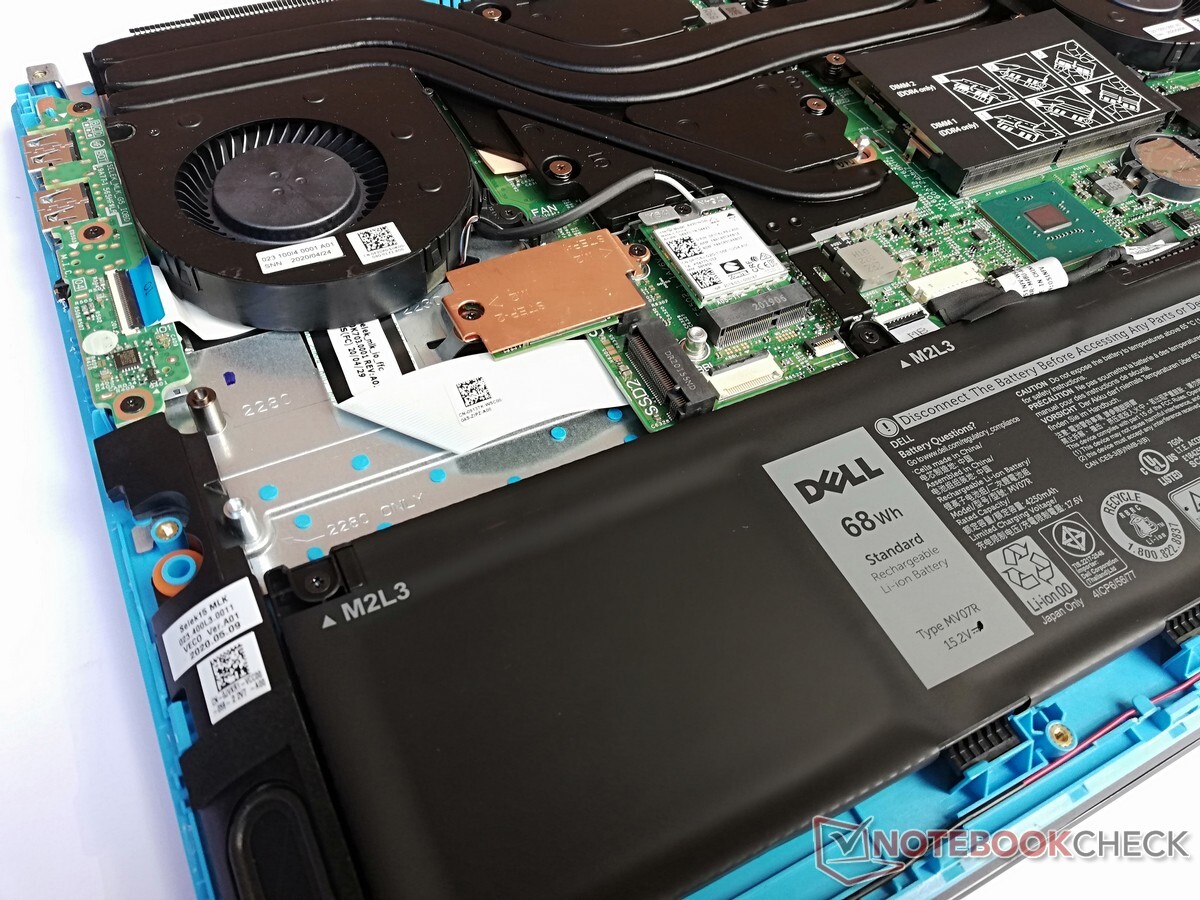
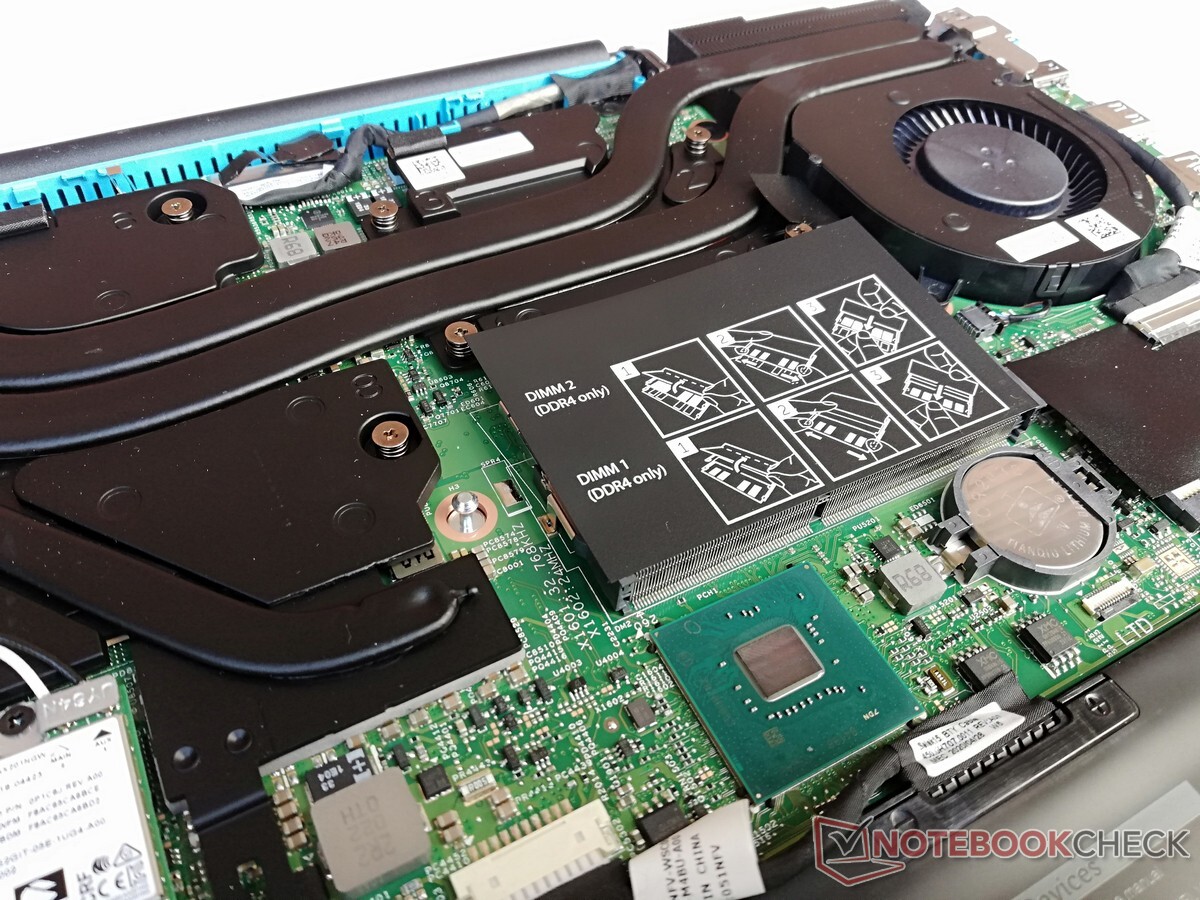
Maintenance
Users can open the bottom of the Dell G3 15 after removing all visible screws. The case is a bit obstructive, especially in the hinge areas, but it can be removed with a little patience. Afterwards, access to all internal components is possible, allowing the fans to be cleaned and the hard drive and RAM to be replaced or upgraded.
Warranty
Dell offers a 12-month warranty to buyers of the G3 15, which can be extended for an additional charge.
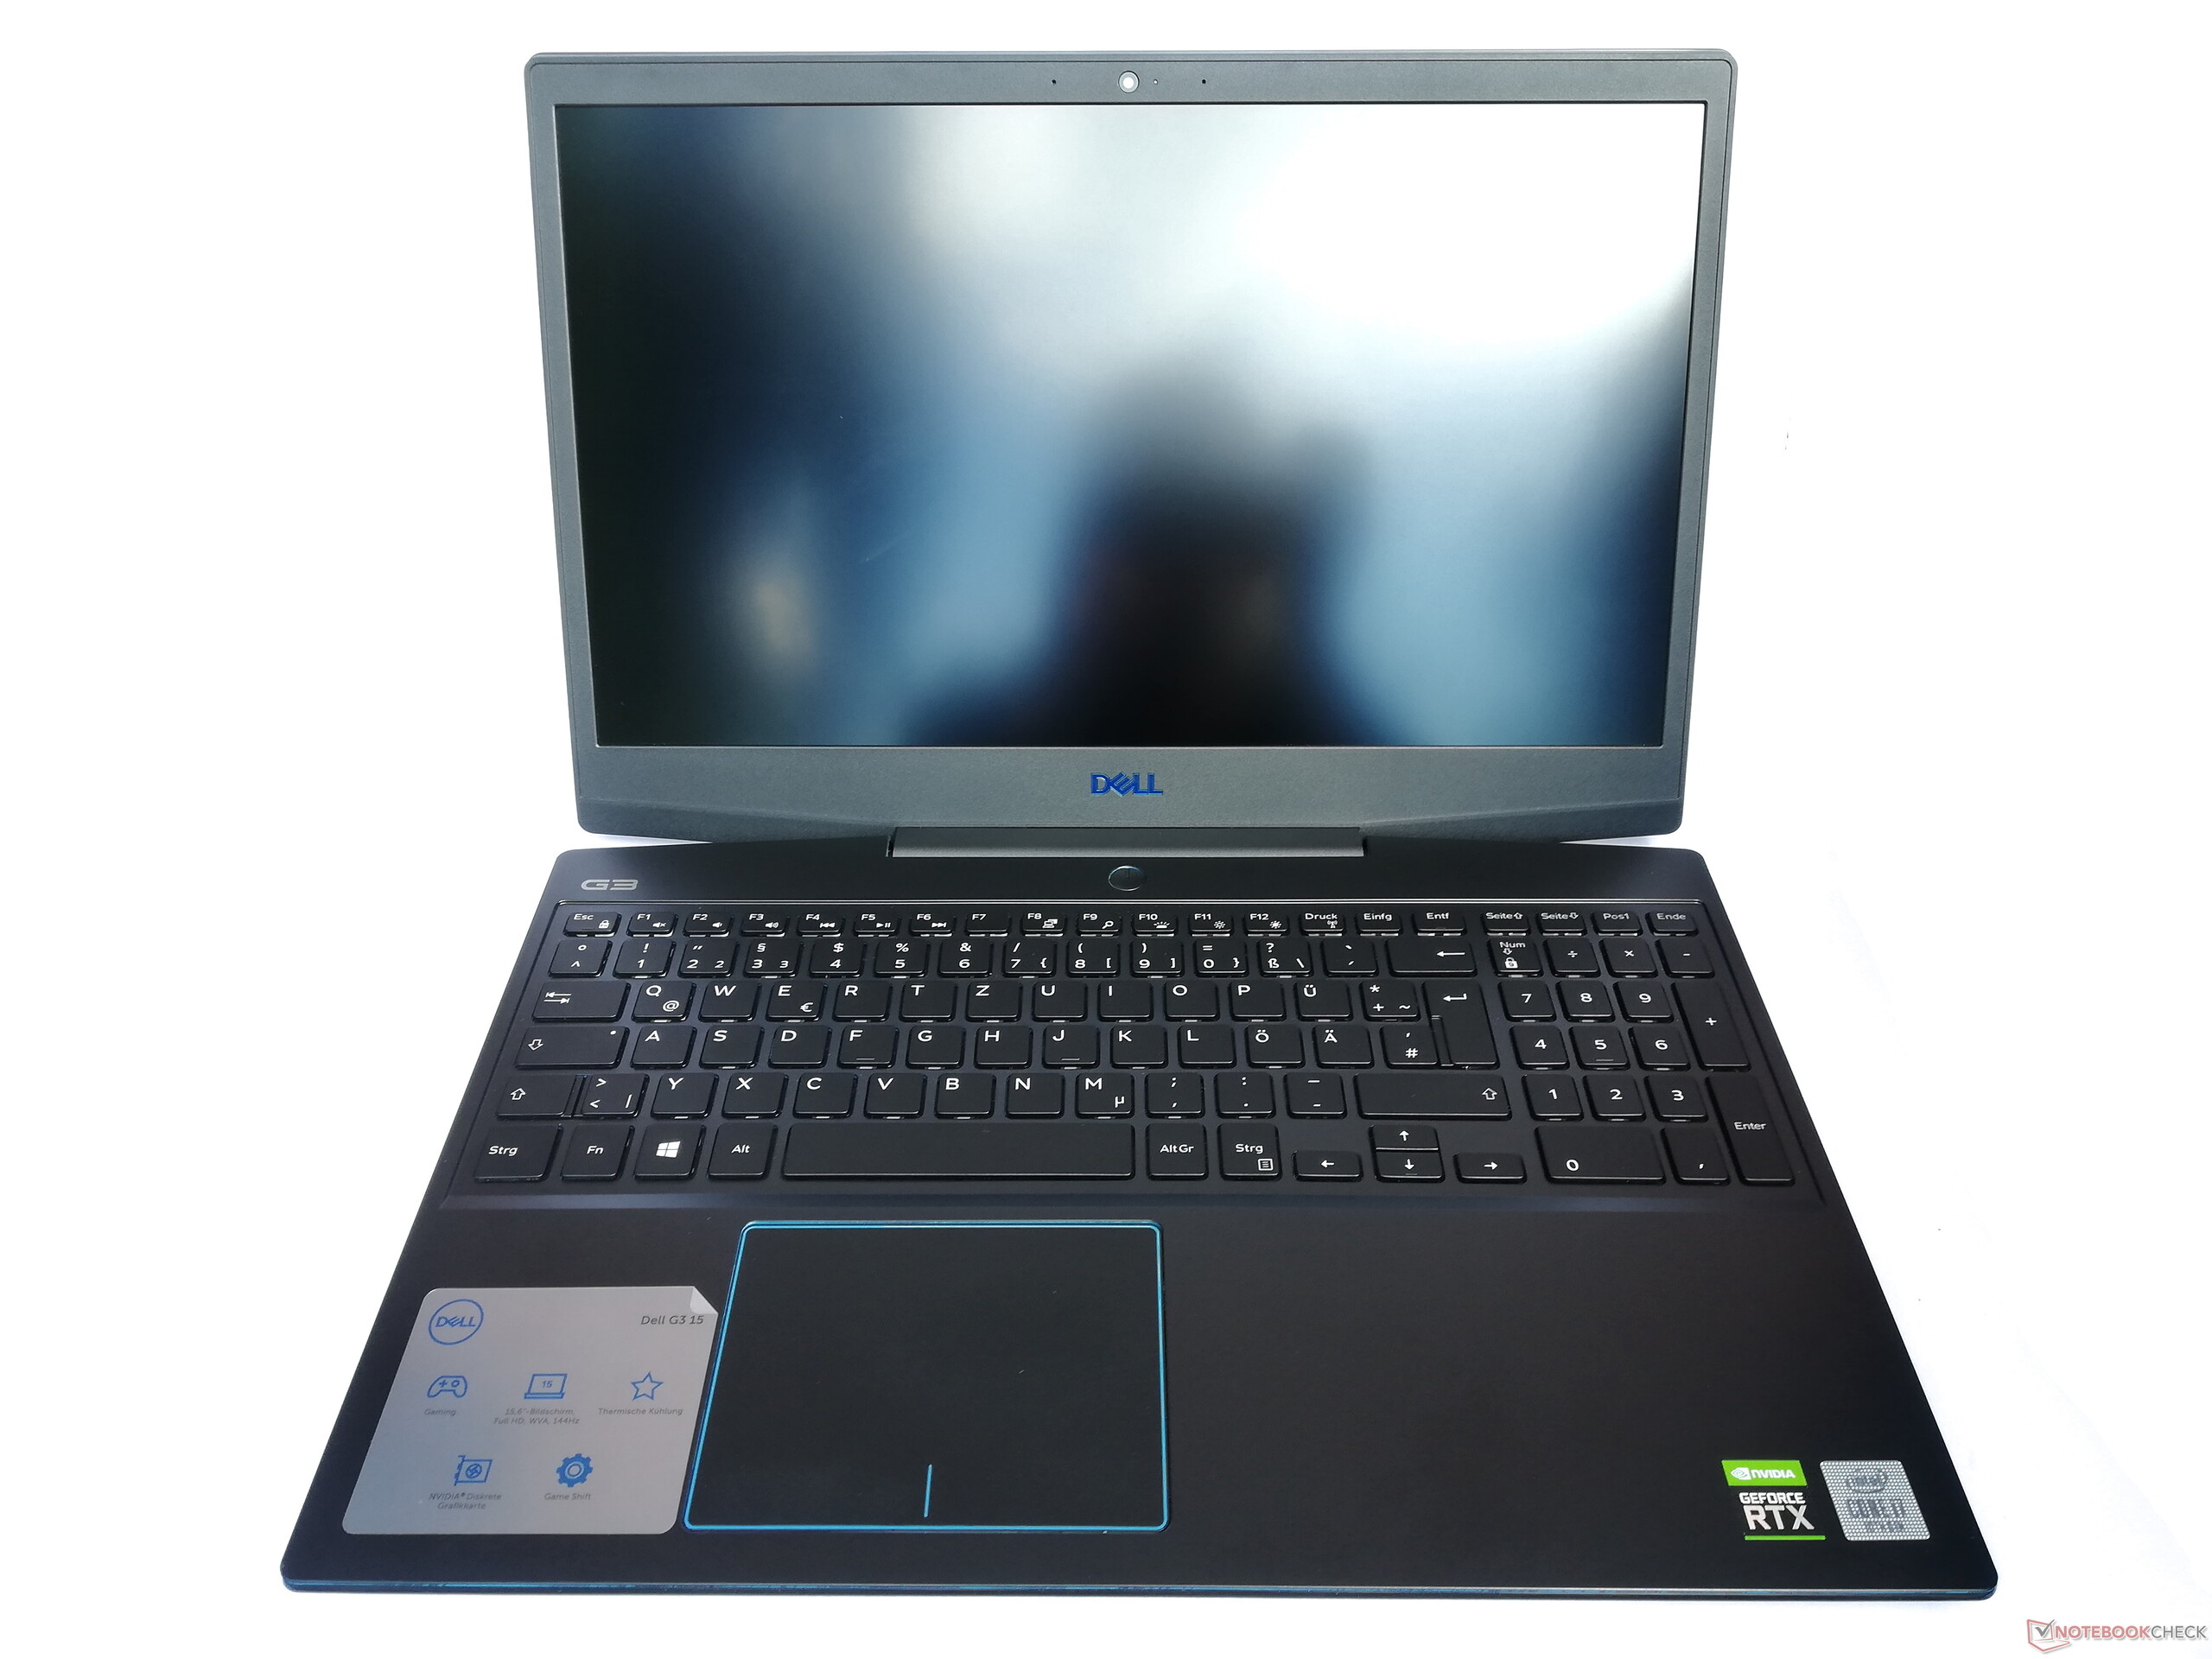
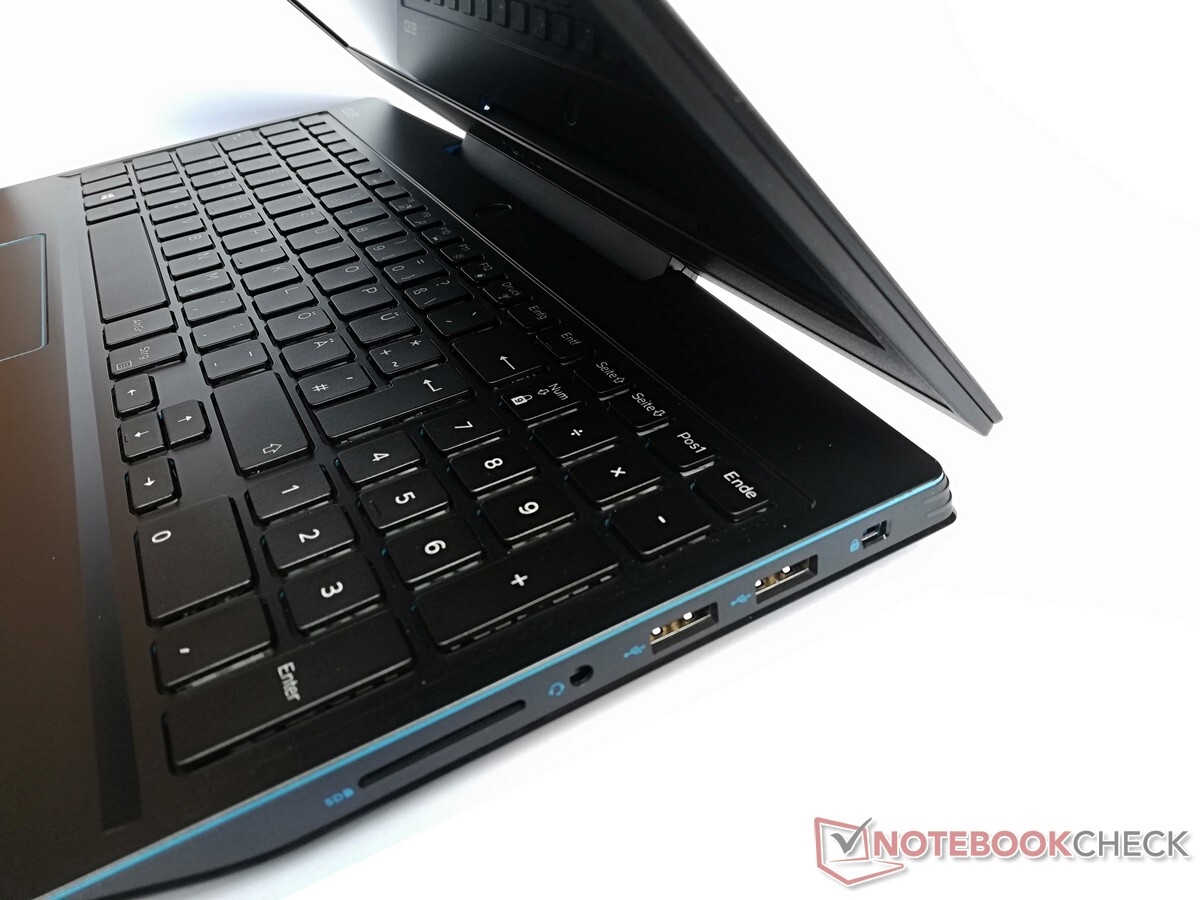
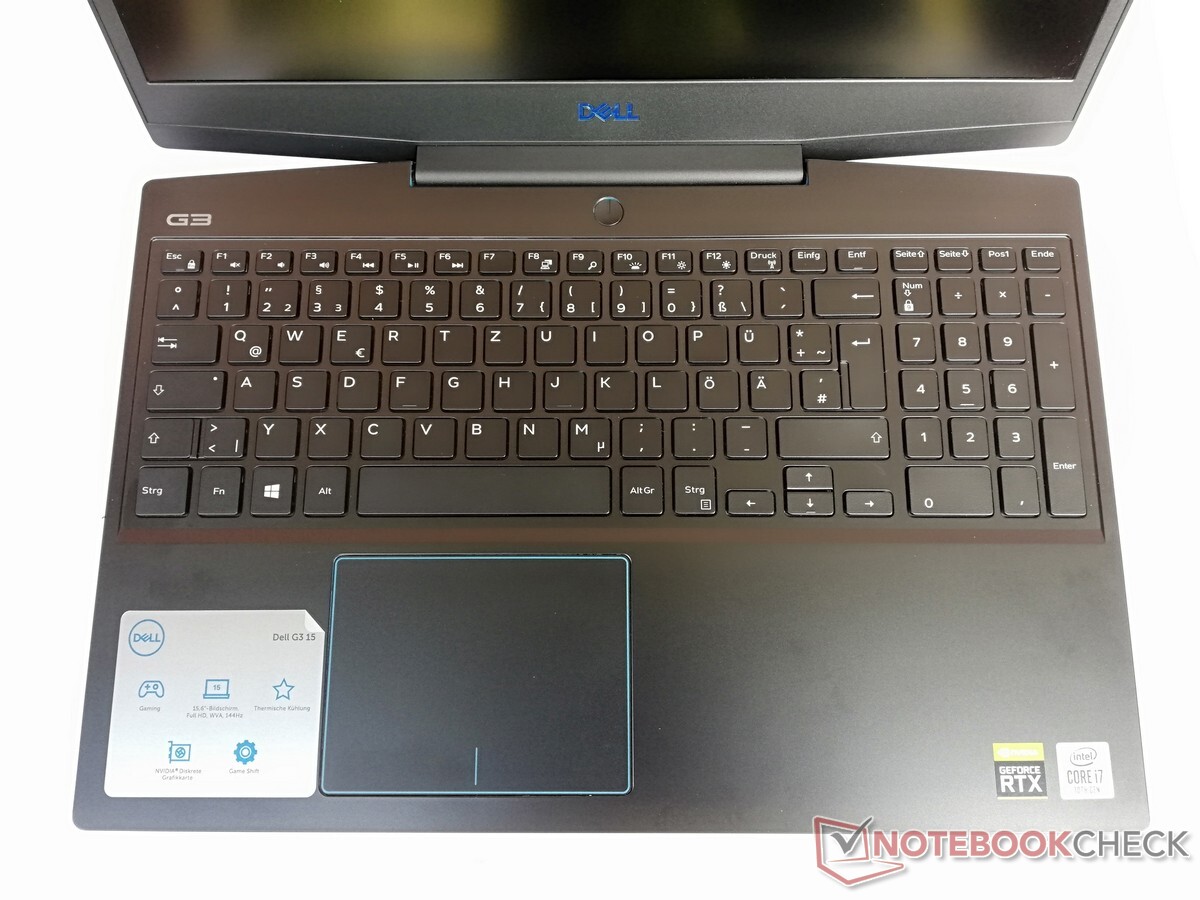
Input devices - gaming laptop with backlight
Keyboard
The keys on Dell's gaming laptop allow your fingertips to stay firmly in place and respond to input with a distinct pressure point. Frequent writers will also get along well with the keyboard, whereby the somewhat small Enter key takes some getting used to. The arrow keys are also narrower, but the free space around them prevents any mistakes.
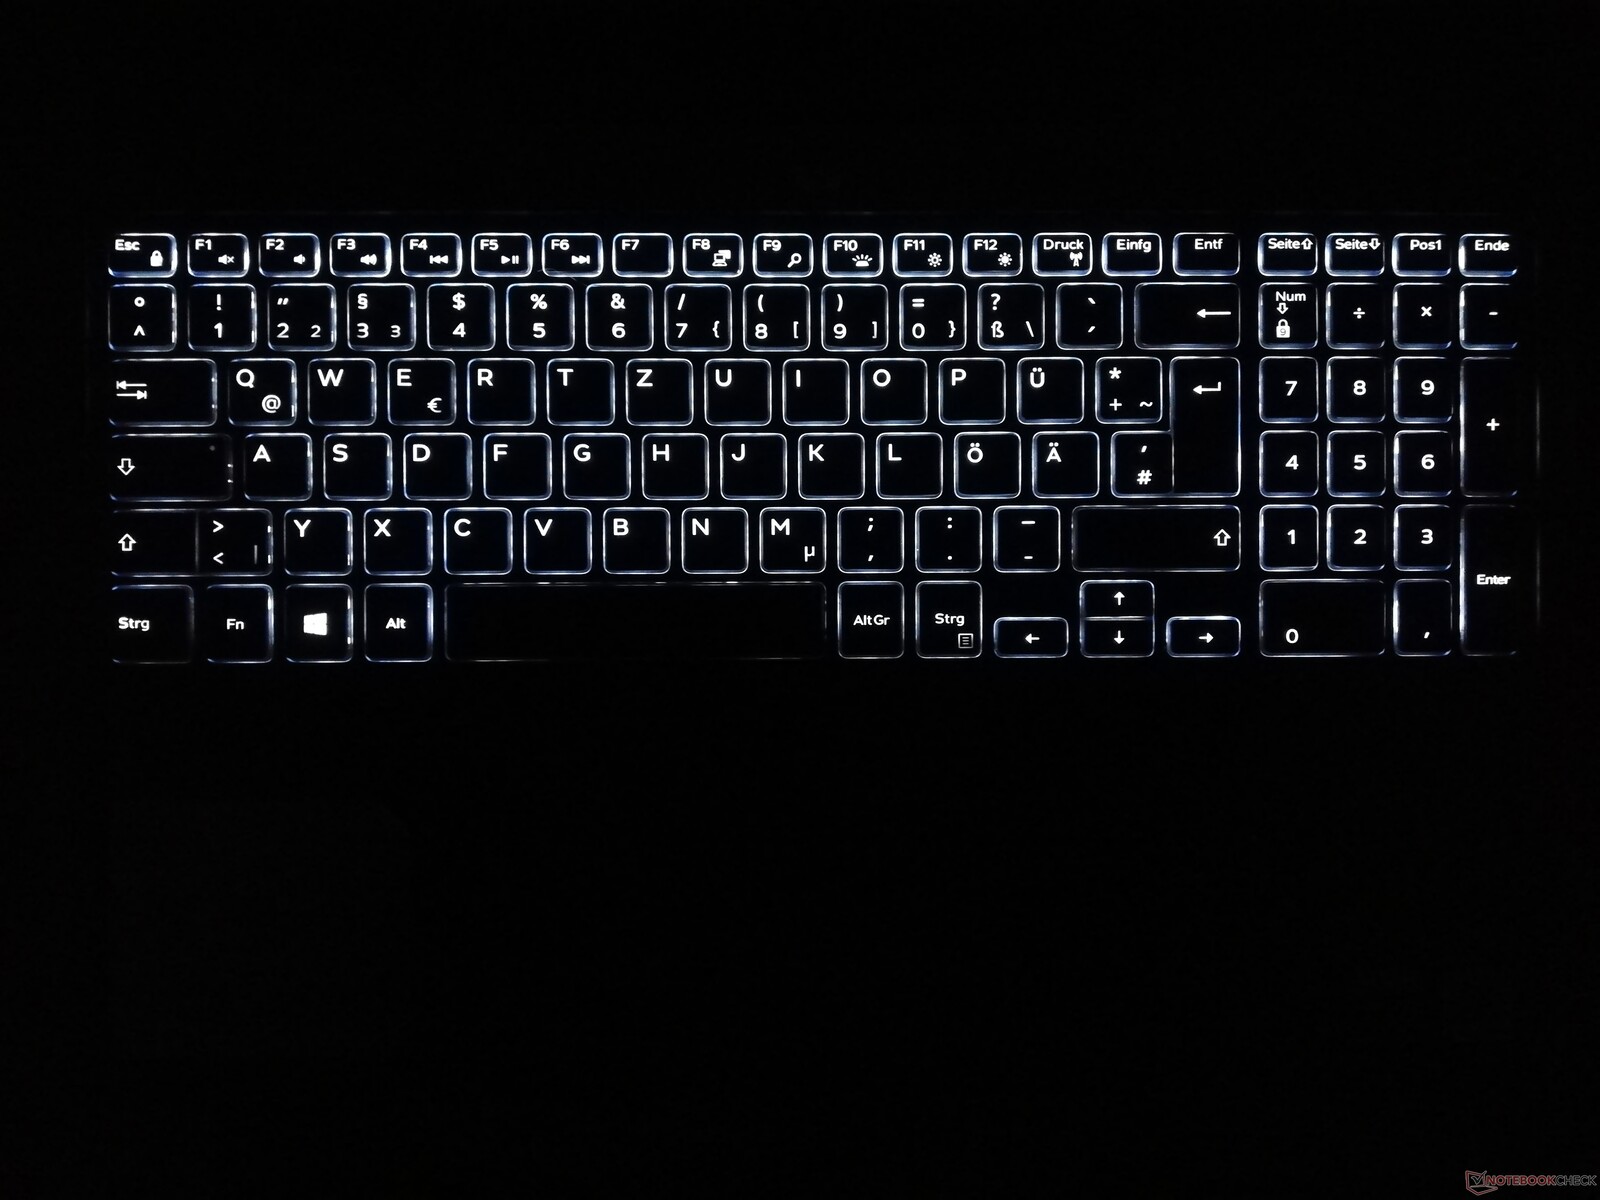
Under poor lighting conditions, the two-stage white backlighting makes it easier to read the key labelling.
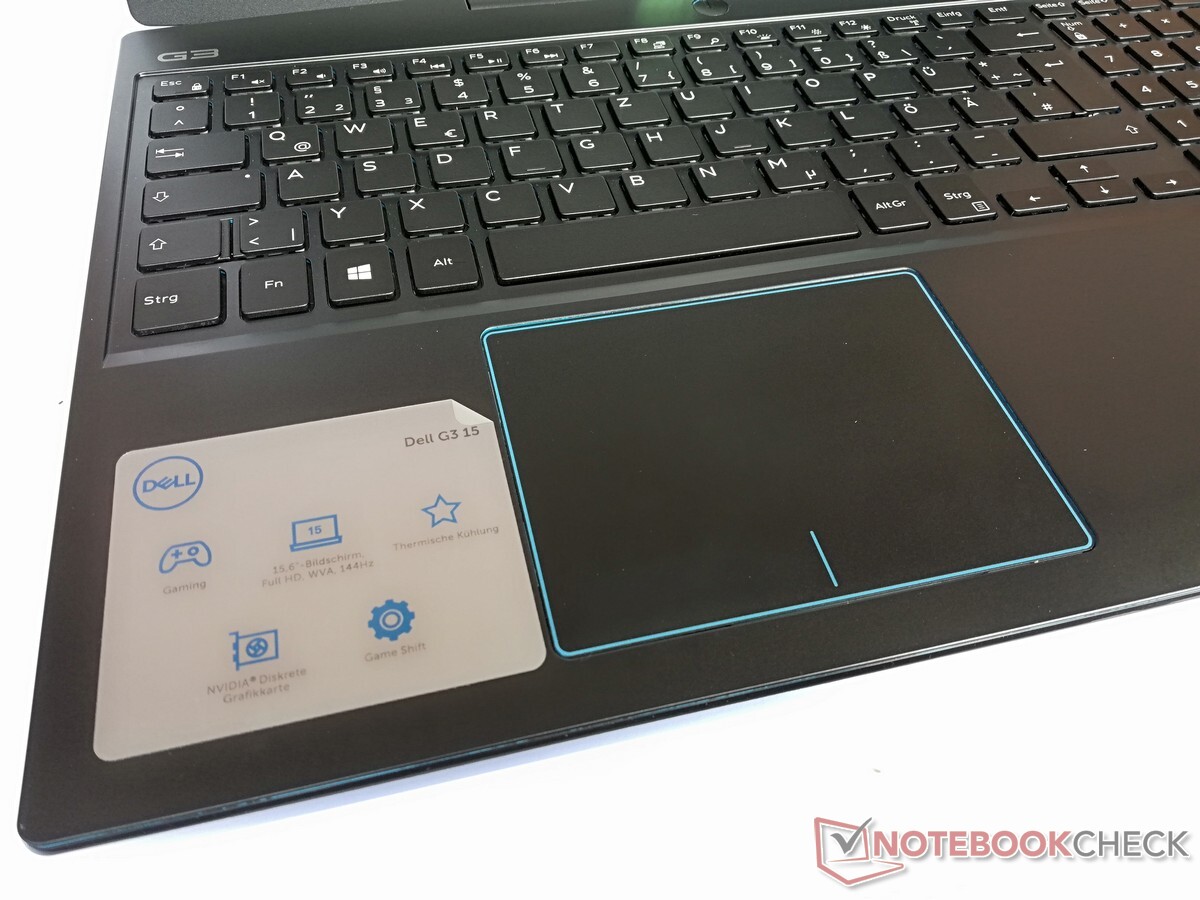
Touchpad
A ClickPad is available as a mouse replacement for users in the Dell G3 15. It is large enough and its smooth surface allows for easy navigation of the mouse pointer. The mouse buttons, which are positioned in the lower area, trigger with a quiet clicking sound and they offer an even pressure point on both sides.
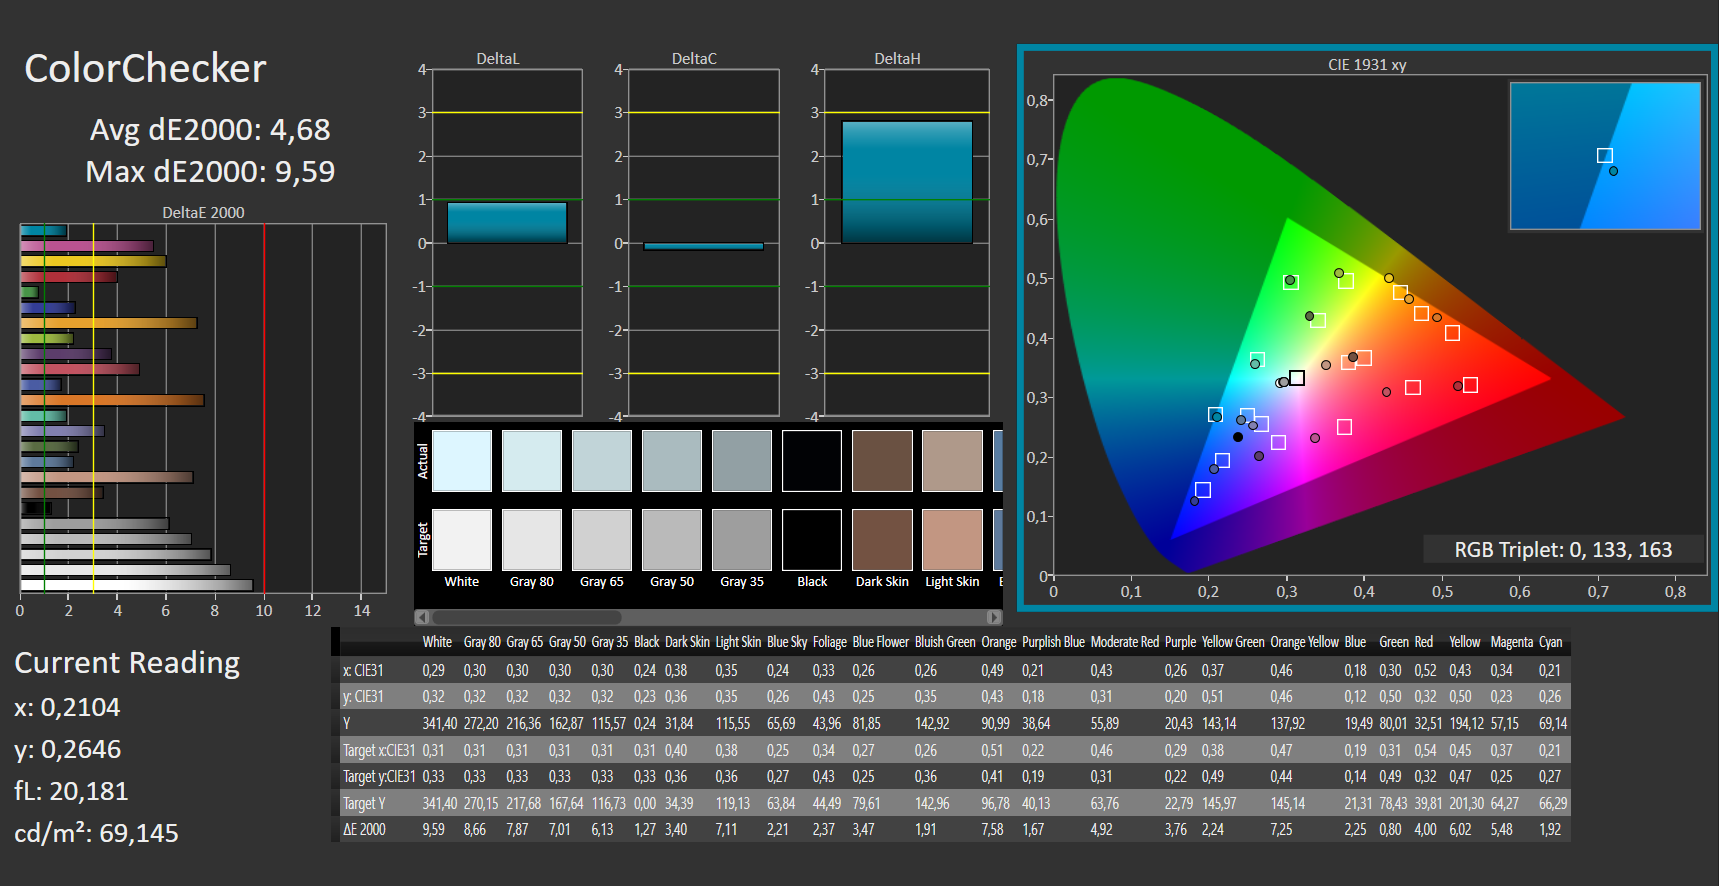
Display - 144 Hz screen with good colours


The Dell G3 15's screen is made up of a 15.6-inch IPS panel and offers a resolution of 1920x1080 pixels and a refresh rate of 144 Hz. The brightness is at a good level with an average of 298 nits and is therefore high enough for second place in our range of tested devices. However, this does not apply to the illumination of the panel, which is very low at 81%. With dark picture contents, light screen bleeding is also noticeable.
According to our measurements, Dell refrains from using PWM, which means that even users with sensitive eyes don't have to worry about problems when using this gaming laptop.
| |||||||||||||||||||||||||
Brightness Distribution: 81 %
Center on Battery: 305 cd/m²
Contrast: 1309:1 (Black: 0.23 cd/m²)
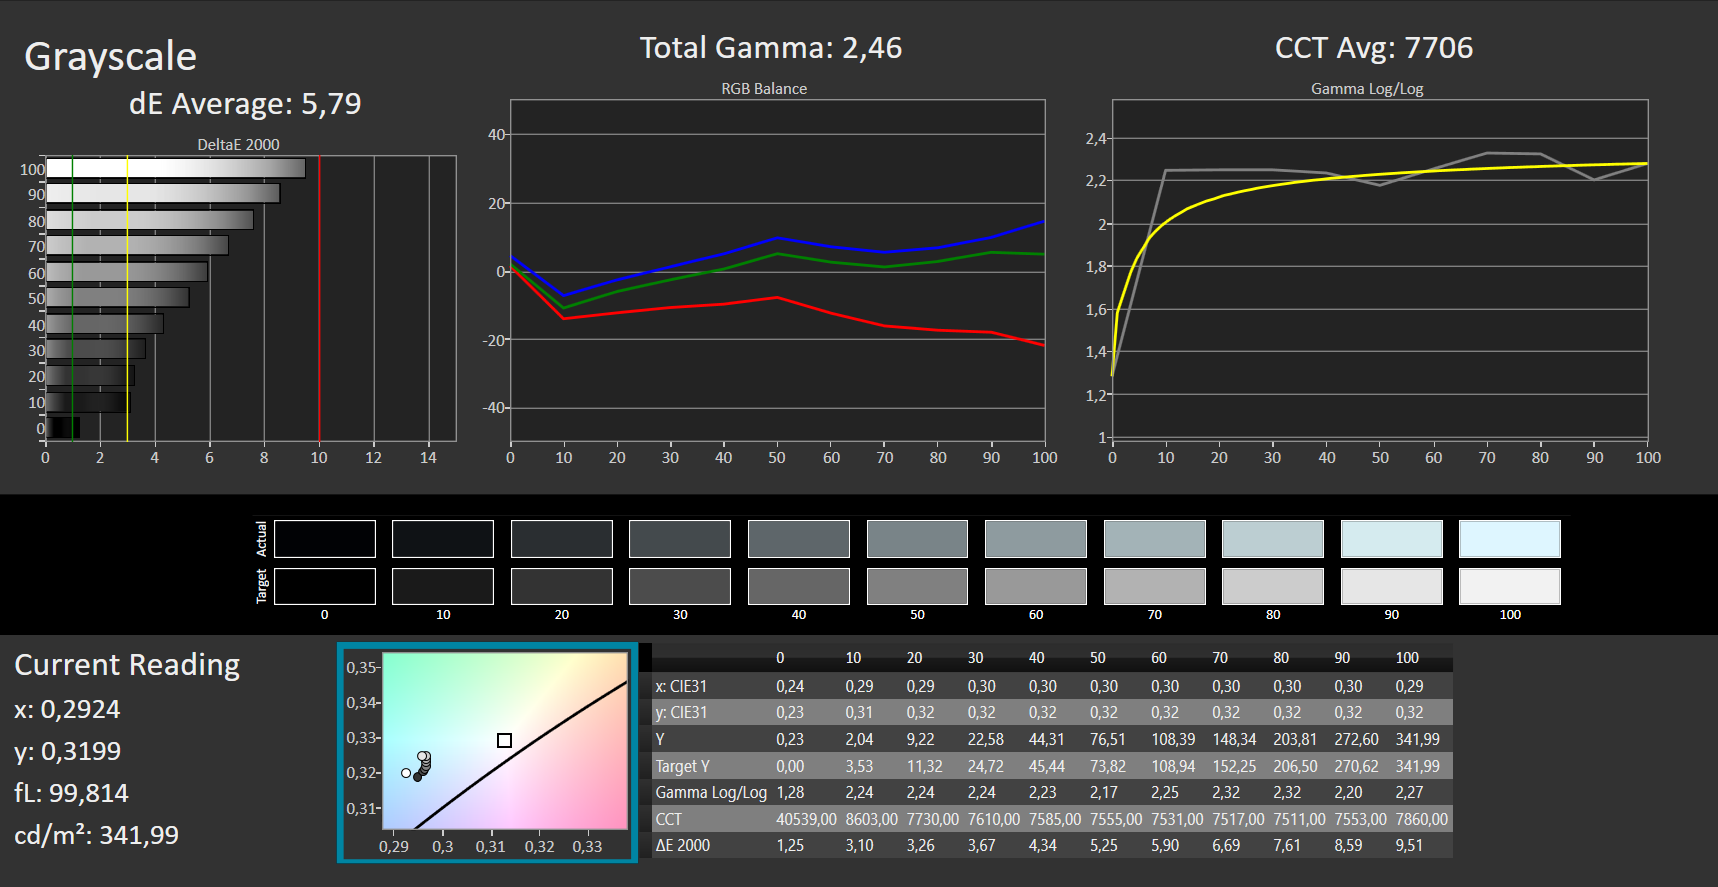
ΔE ColorChecker Calman: 4.68 | ∀{0.5-29.43 Ø4.73}
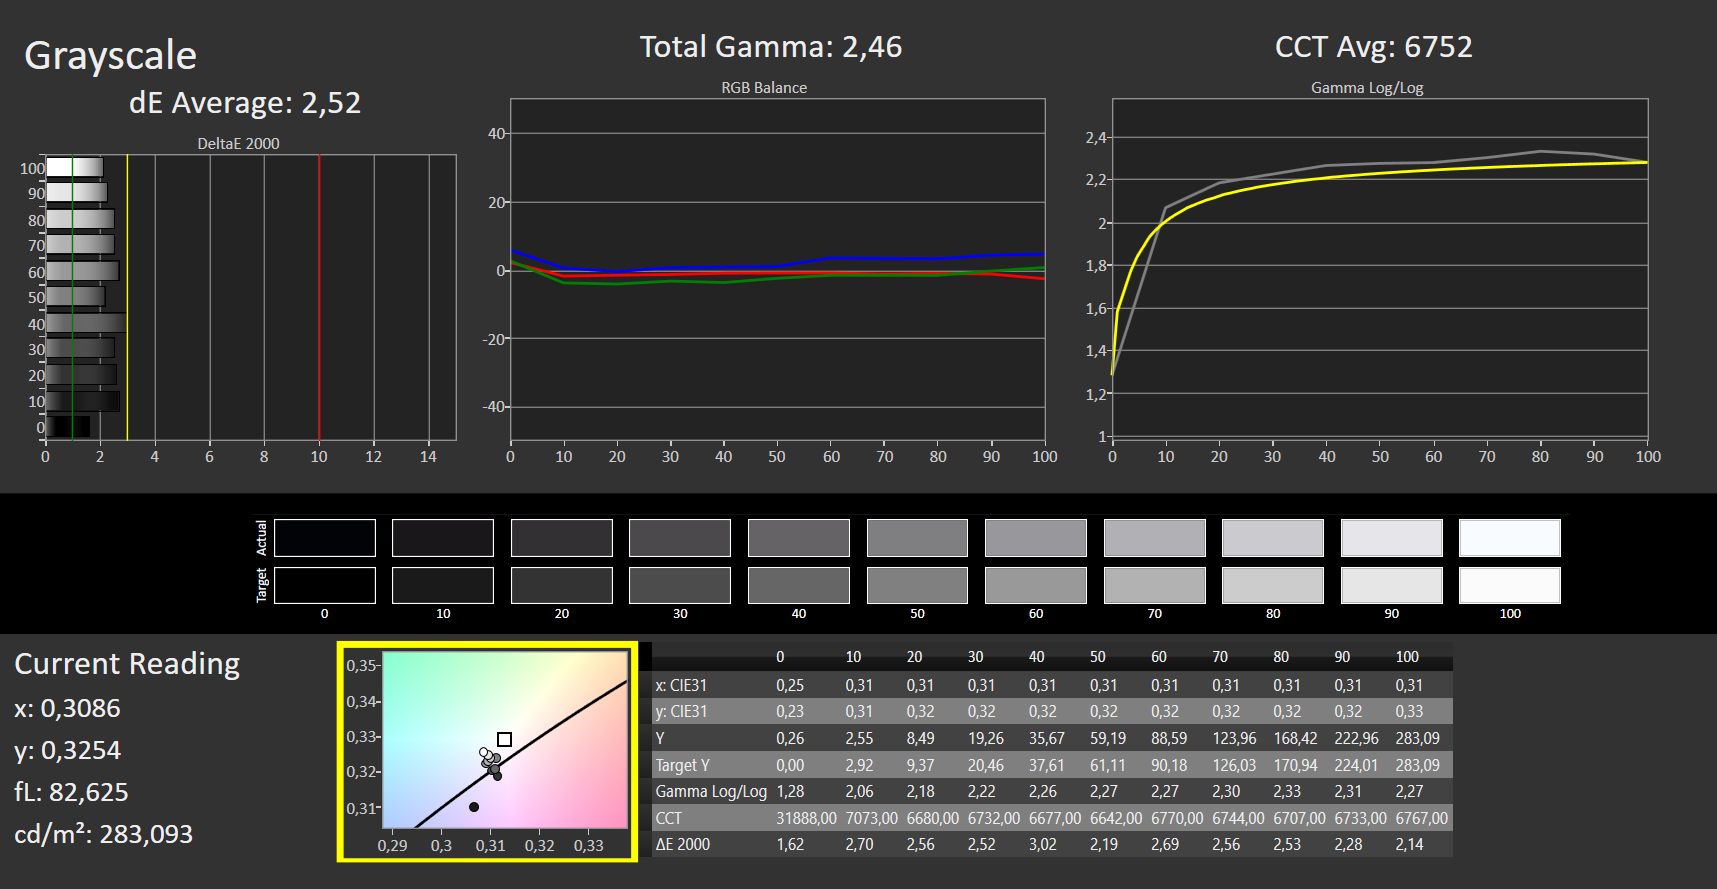
calibrated: 1.87
ΔE Greyscale Calman: 5.79 | ∀{0.09-98 Ø4.97}
94% sRGB (Argyll 1.6.3 3D)
61% AdobeRGB 1998 (Argyll 1.6.3 3D)
66.4% AdobeRGB 1998 (Argyll 3D)
93.9% sRGB (Argyll 3D)
64.6% Display P3 (Argyll 3D)
Gamma: 2.46
CCT: 7706 K
| Dell G3 15 3500-G4DG2 AU Optronics AUO80ED, IPS, 1920x1080, 15.6" | Nexoc GH5 515IG LG Philips LP156WFC-SPD1, IPS, 1920x1080, 15.6" | MSI Bravo 15 A4DCR AU Optronics B156HAN08.0 (AUO80ED), IPS-Level, 1920x1080, 15.6" | Acer Nitro 5 AN517-52-77DS AU Optronics B173HAN04.7, IPS, 1920x1080, 17.3" | |
|---|---|---|---|---|
| Display | -40% | -6% | -38% | |
| Display P3 Coverage (%) | 64.6 | 37.91 -41% | 62 -4% | 39.47 -39% |
| sRGB Coverage (%) | 93.9 | 57 -39% | 86.8 -8% | 58.9 -37% |
| AdobeRGB 1998 Coverage (%) | 66.4 | 39.19 -41% | 62.7 -6% | 40.77 -39% |
| Response Times | -182% | -22% | -188% | |
| Response Time Grey 50% / Grey 80% * (ms) | 14 ? | 34.8 ? -149% | 16 ? -14% | 35 ? -150% |
| Response Time Black / White * (ms) | 8 ? | 25.2 ? -215% | 10.4 ? -30% | 26 ? -225% |
| PWM Frequency (Hz) | ||||
| Screen | -15% | -12% | -38% | |
| Brightness middle (cd/m²) | 301 | 261 -13% | 311 3% | 263 -13% |
| Brightness (cd/m²) | 298 | 254 -15% | 313 5% | 246 -17% |
| Brightness Distribution (%) | 81 | 93 15% | 88 9% | 85 5% |
| Black Level * (cd/m²) | 0.23 | 0.23 -0% | 0.43 -87% | 0.47 -104% |
| Contrast (:1) | 1309 | 1135 -13% | 723 -45% | 560 -57% |
| Colorchecker dE 2000 * | 4.68 | 4.71 -1% | 4.5 4% | 5.07 -8% |
| Colorchecker dE 2000 calibrated * | 1.87 | 3.67 -96% | 2.65 -42% | 4.9 -162% |
| Greyscale dE 2000 * | 5.79 | 2.76 52% | 3.3 43% | 2.55 56% |
| Gamma | 2.46 89% | 2.42 91% | 2.129 103% | 2.37 93% |
| CCT | 7706 84% | 7090 92% | 7227 90% | 6446 101% |
| Color Space (Percent of AdobeRGB 1998) (%) | 61 | 36 -41% | 63 3% | 37 -39% |
| Color Space (Percent of sRGB) (%) | 94 | 56 -40% | 86 -9% | 59 -37% |
| Colorchecker dE 2000 max. * | 7.6 | 7.97 | 20.5 | |
| Total Average (Program / Settings) | -79% /
-42% | -13% /
-12% | -88% /
-58% |
* ... smaller is better


Thanks to a good contrast ratio of 1,309:1, a comparatively low black level of 0.23 cd/m² and good colour-space coverage of 94% (sRGB), colours on the Dell G3 15 are well distinguished from one another and black image content appears deep and rich.
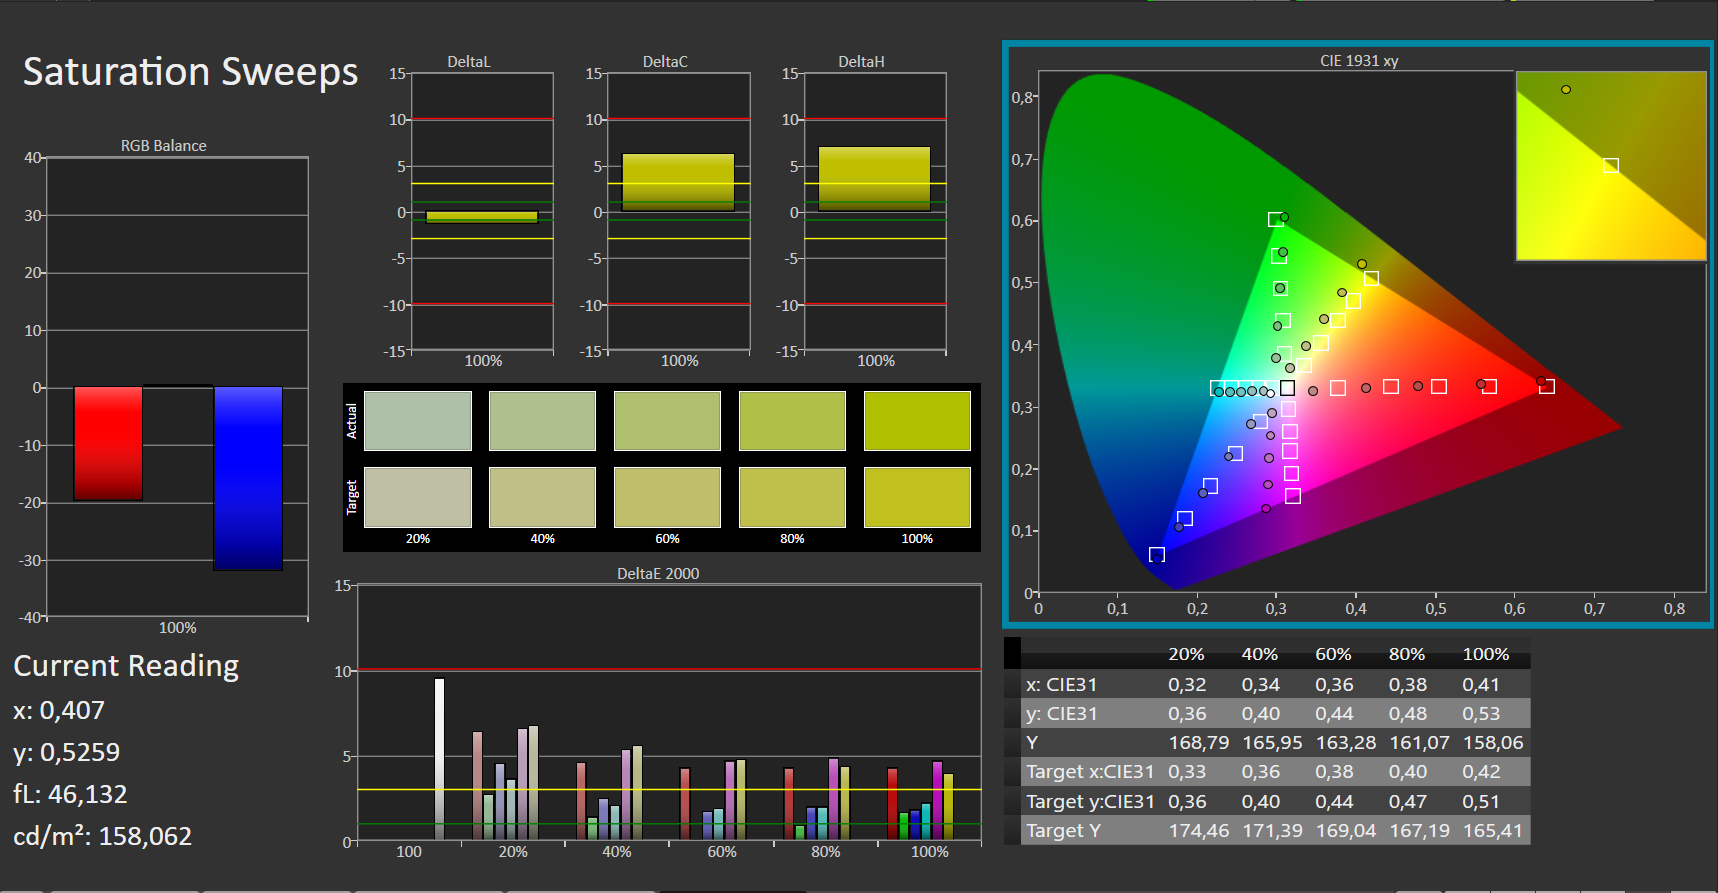
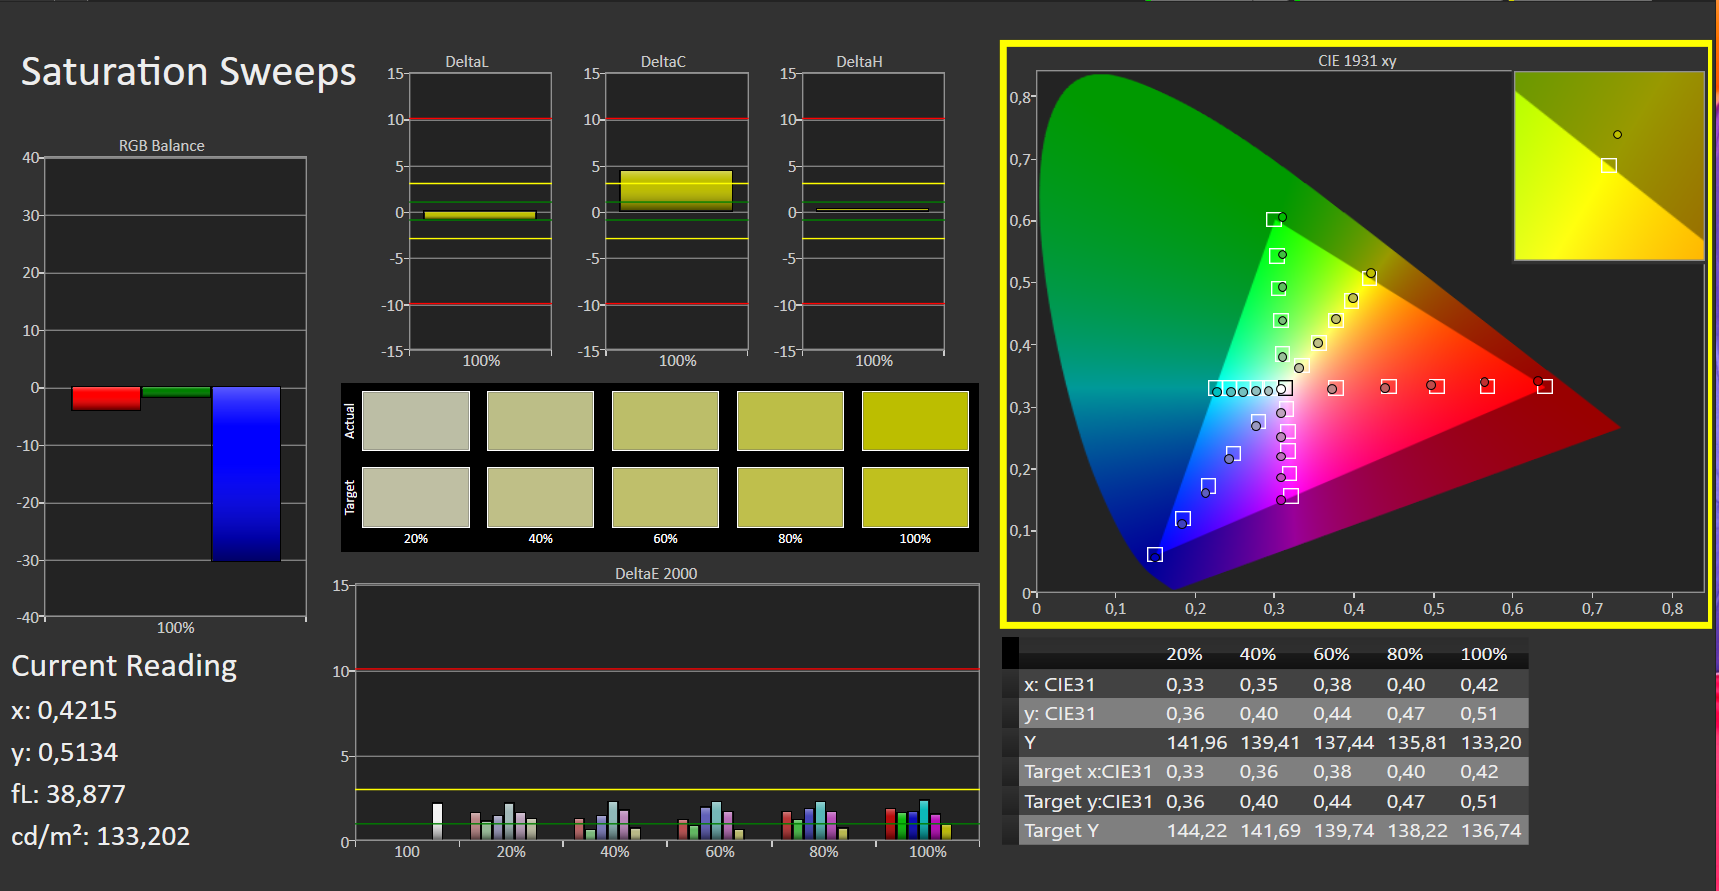
CalMAN analysis also shows that colours are displayed with a reduced red component. However, this can be compensated for by calibration. The corresponding ICC file can be downloaded in the window at the top right of the graphic about the screen's distribution of brightness.

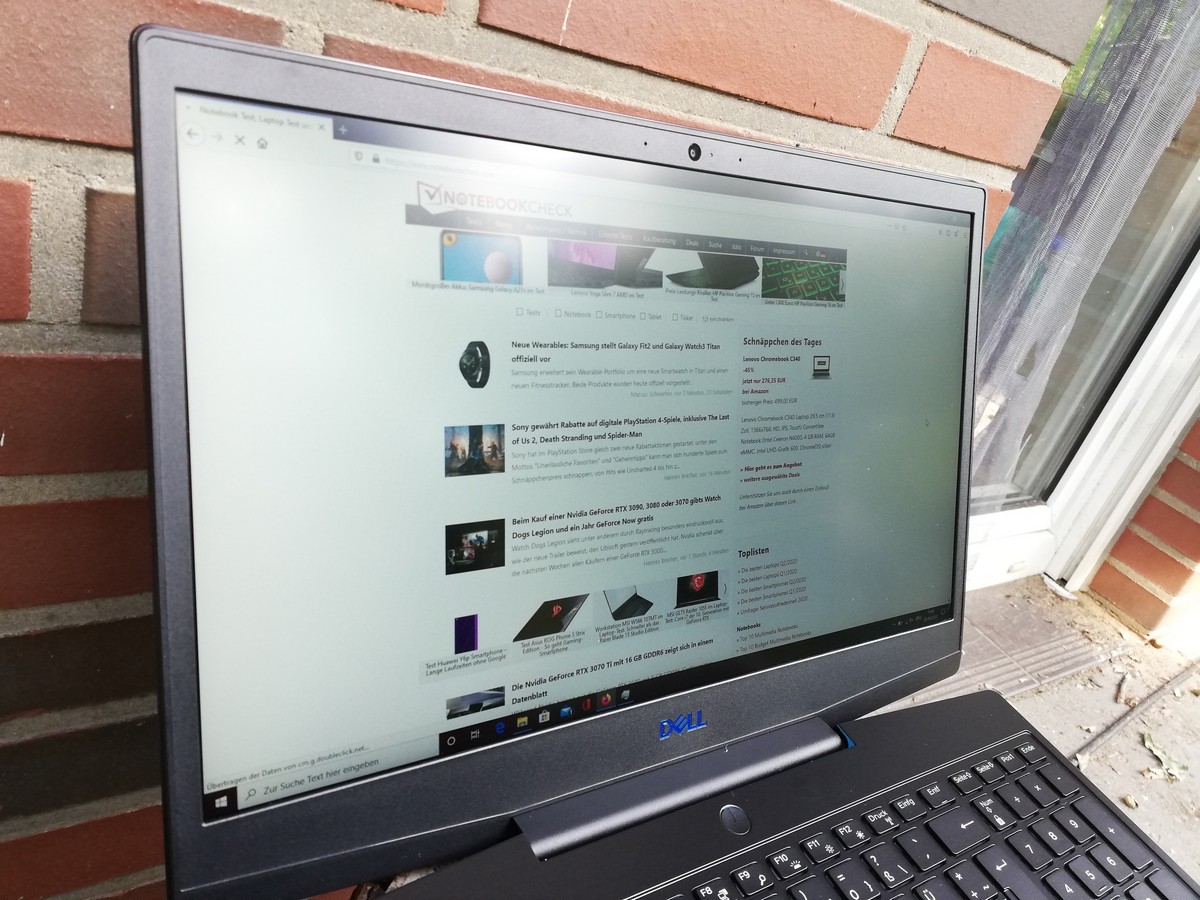
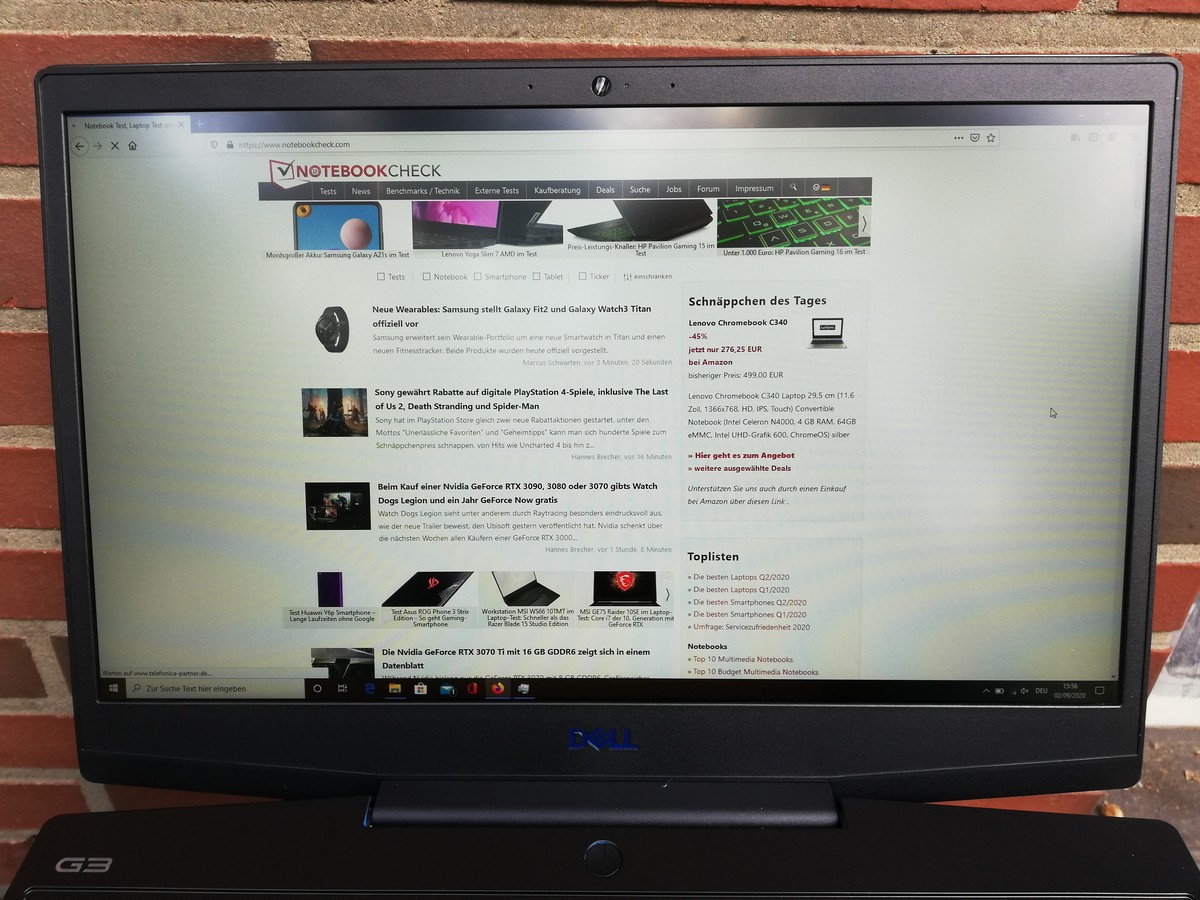
The Dell G3 15 is good for outdoor use due to its relatively high brightness value. However, users should still prefer shaded places, as screen contents are much harder to read in direct sunlight.
Display Response Times
| ↔ Response Time Black to White | ||
|---|---|---|
| 8 ms ... rise ↗ and fall ↘ combined | ↗ 4 ms rise | 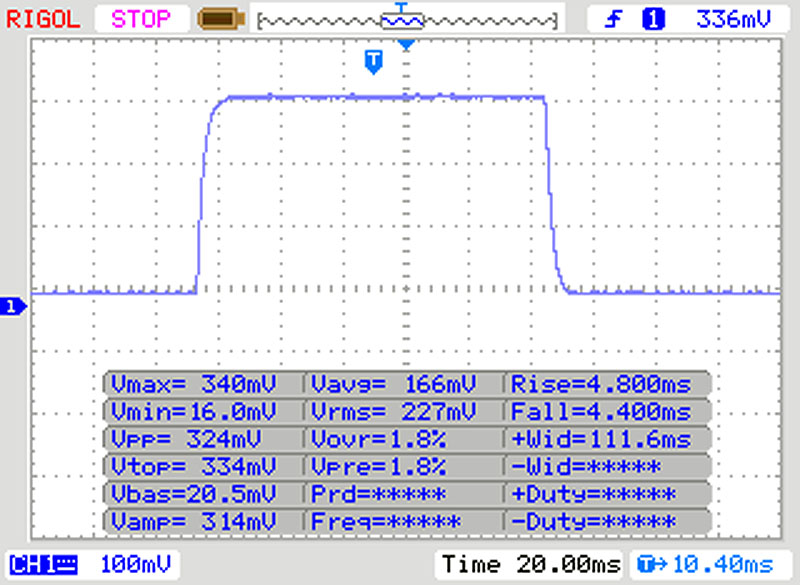 |
| ↘ 4 ms fall | ||
| The screen shows fast response rates in our tests and should be suited for gaming. In comparison, all tested devices range from 0.1 (minimum) to 240 (maximum) ms. » 22 % of all devices are better. This means that the measured response time is better than the average of all tested devices (19.9 ms). | ||
| ↔ Response Time 50% Grey to 80% Grey | ||
| 14 ms ... rise ↗ and fall ↘ combined | ↗ 7 ms rise | 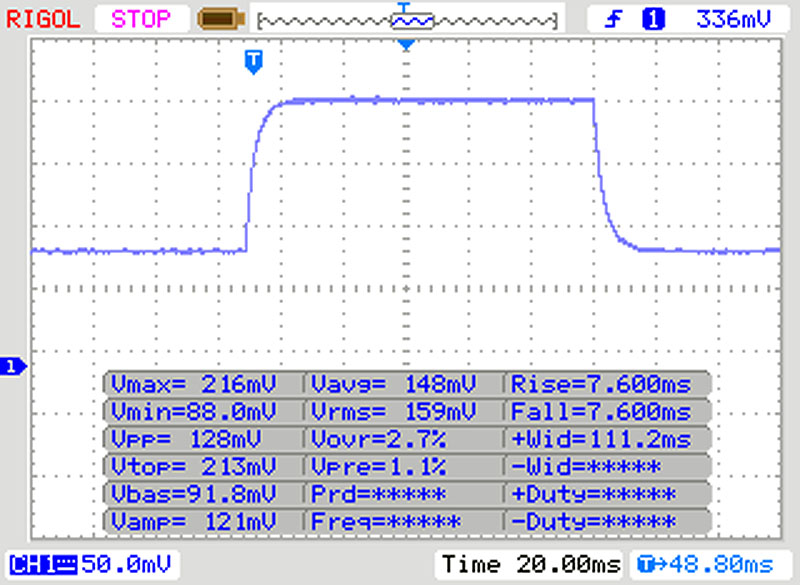 |
| ↘ 7 ms fall | ||
| The screen shows good response rates in our tests, but may be too slow for competitive gamers. In comparison, all tested devices range from 0.165 (minimum) to 636 (maximum) ms. » 28 % of all devices are better. This means that the measured response time is better than the average of all tested devices (31.1 ms). | ||
Screen Flickering / PWM (Pulse-Width Modulation)
| Screen flickering / PWM not detected |  | ||
In comparison: 52 % of all tested devices do not use PWM to dim the display. If PWM was detected, an average of 7801 (minimum: 5 - maximum: 343500) Hz was measured. | |||
The IPS panel of the Dell G3 15 has a very stable viewing angle. Screen content can be viewed from almost any angle without being distorted or displayed with distorted colours.

Performance - Suitable for Full HD gaming
The Dell G3 15 is aimed at gamers and offers the corresponding hardware equipment. Besides the configuration tested here, models with Nvidia's GeForce GTX 1650 Ti and GeForce GTX 1660 Ti are also available. Additionally, an Intel Core i5-10300H is available as an alternative processor. In each variant Full HD gaming should be possible even with slightly higher graphics settings.

Processor
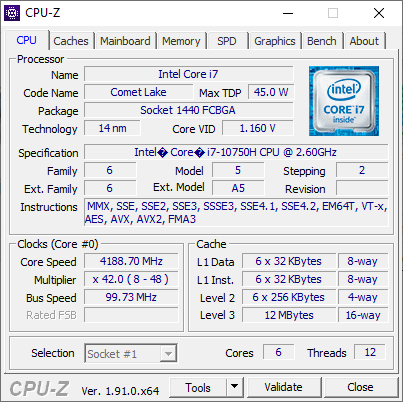
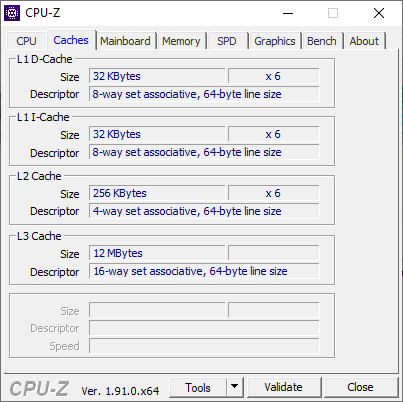
The Intel Core i7-10750H used here is a processor with six cores that can process up to 12 threads simultaneously. The clock rates lie between 2.6 and 5 GHz, whereby the cooling system is largely responsible for how long high clock rates can be maintained. In our Cinebench R15 continuous load test, performance remains at a constant level at the beginning and drops by about 8% after a few runs.
In the individual CPU performance tests, the Dell G3 15 achieved average results. In comparison to comparable competition, it shows that other laptops with Intel Core i7-10750H tested by us are able to make better use of their processor.
Cinebench R15: CPU Single 64Bit | CPU Multi 64Bit
Blender: v2.79 BMW27 CPU
7-Zip 18.03: 7z b 4 -mmt1 | 7z b 4
Geekbench 5.5: Single-Core | Multi-Core
HWBOT x265 Benchmark v2.2: 4k Preset
LibreOffice : 20 Documents To PDF
R Benchmark 2.5: Overall mean
| Cinebench R20 / CPU (Single Core) | |
| Average of class Gaming (442 - 895, n=112, last 2 years) | |
| Acer Nitro 5 AN517-52-77DS | |
| MSI Bravo 15 A4DCR | |
| Average Intel Core i7-10750H (431 - 504, n=43) | |
| Dell G3 15 3500-G4DG2 | |
| Nexoc GH5 515IG | |
| Cinebench R20 / CPU (Multi Core) | |
| Average of class Gaming (4029 - 16108, n=112, last 2 years) | |
| MSI Bravo 15 A4DCR | |
| Acer Nitro 5 AN517-52-77DS | |
| Average Intel Core i7-10750H (1749 - 3325, n=43) | |
| Dell G3 15 3500-G4DG2 | |
| Nexoc GH5 515IG | |
| Cinebench R15 / CPU Single 64Bit | |
| Average of class Gaming (188.8 - 343, n=112, last 2 years) | |
| Average Intel Core i7-10750H (184 - 213, n=45) | |
| Acer Nitro 5 AN517-52-77DS | |
| Dell G3 15 3500-G4DG2 | |
| MSI Bravo 15 A4DCR | |
| Nexoc GH5 515IG | |
| Cinebench R15 / CPU Multi 64Bit | |
| Average of class Gaming (1578 - 6271, n=113, last 2 years) | |
| MSI Bravo 15 A4DCR | |
| Acer Nitro 5 AN517-52-77DS | |
| Average Intel Core i7-10750H (804 - 1418, n=50) | |
| Dell G3 15 3500-G4DG2 | |
| Nexoc GH5 515IG | |
| Blender / v2.79 BMW27 CPU | |
| Nexoc GH5 515IG | |
| Dell G3 15 3500-G4DG2 | |
| Average Intel Core i7-10750H (322 - 587, n=43) | |
| Acer Nitro 5 AN517-52-77DS | |
| MSI Bravo 15 A4DCR | |
| Average of class Gaming (80 - 330, n=110, last 2 years) | |
| 7-Zip 18.03 / 7z b 4 -mmt1 | |
| Average of class Gaming (4199 - 7436, n=111, last 2 years) | |
| Average Intel Core i7-10750H (4504 - 5470, n=43) | |
| Acer Nitro 5 AN517-52-77DS | |
| Nexoc GH5 515IG | |
| Dell G3 15 3500-G4DG2 | |
| MSI Bravo 15 A4DCR | |
| 7-Zip 18.03 / 7z b 4 | |
| Average of class Gaming (33491 - 148086, n=111, last 2 years) | |
| MSI Bravo 15 A4DCR | |
| Average Intel Core i7-10750H (26040 - 37345, n=43) | |
| Acer Nitro 5 AN517-52-77DS | |
| Dell G3 15 3500-G4DG2 | |
| Nexoc GH5 515IG | |
| Geekbench 5.5 / Single-Core | |
| Average of class Gaming (986 - 2474, n=111, last 2 years) | |
| Average Intel Core i7-10750H (1114 - 1333, n=43) | |
| Acer Nitro 5 AN517-52-77DS | |
| Dell G3 15 3500-G4DG2 | |
| Nexoc GH5 515IG | |
| MSI Bravo 15 A4DCR | |
| Geekbench 5.5 / Multi-Core | |
| Average of class Gaming (6460 - 27010, n=111, last 2 years) | |
| MSI Bravo 15 A4DCR | |
| Acer Nitro 5 AN517-52-77DS | |
| Dell G3 15 3500-G4DG2 | |
| Average Intel Core i7-10750H (4443 - 6674, n=43) | |
| Nexoc GH5 515IG | |
| HWBOT x265 Benchmark v2.2 / 4k Preset | |
| Average of class Gaming (11.5 - 44.3, n=111, last 2 years) | |
| MSI Bravo 15 A4DCR | |
| Average Intel Core i7-10750H (5.54 - 11.6, n=43) | |
| Acer Nitro 5 AN517-52-77DS | |
| Dell G3 15 3500-G4DG2 | |
| Nexoc GH5 515IG | |
| LibreOffice / 20 Documents To PDF | |
| MSI Bravo 15 A4DCR | |
| Nexoc GH5 515IG | |
| Dell G3 15 3500-G4DG2 | |
| Average Intel Core i7-10750H (43.1 - 99.2, n=43) | |
| Acer Nitro 5 AN517-52-77DS | |
| Average of class Gaming (19 - 88.8, n=111, last 2 years) | |
| R Benchmark 2.5 / Overall mean | |
| Dell G3 15 3500-G4DG2 | |
| Acer Nitro 5 AN517-52-77DS | |
| Nexoc GH5 515IG | |
| Average Intel Core i7-10750H (0.578 - 0.708, n=42) | |
| MSI Bravo 15 A4DCR | |
| Average of class Gaming (0.3439 - 0.759, n=112, last 2 years) | |
* ... smaller is better
System performance
The Dell G3 15 achieved a good overall result in the PCMark 10 system performance test. It was able to assert itself against our range of tested devices, especially in the discipline "Digital Content Creation", and it also achieved a good "Productivity" value. The gaming laptop ran smoothly at all times in everyday testing and showed neither micro stutters nor unnecessary loading times.
In our CPU benchmark list you can see the results other notebooks achieved in our tests.
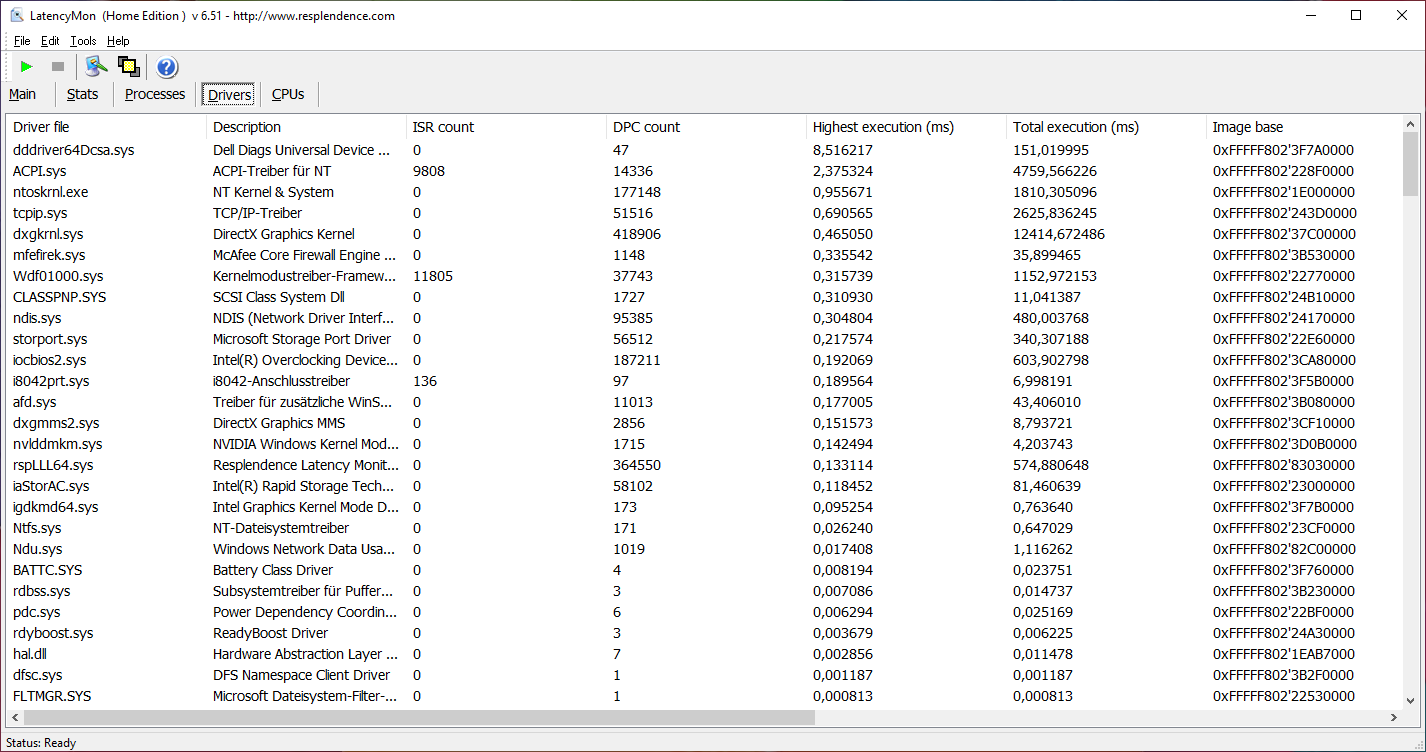
DPC latency
In our test, the Dell G3 15 shows very high interruption times and should therefore not be used for real-time processing.

| DPC Latencies / LatencyMon - interrupt to process latency (max), Web, Youtube, Prime95 | |
| Dell G3 15 3500-G4DG2 | |
| MSI Bravo 15 A4DCR | |
| Acer Nitro 5 AN517-52-77DS | |
| Nexoc GH5 515IG | |
* ... smaller is better
Storage solution
Dell installs a 512 GB SSD from SK Hynix in the G3 15. This is not one of the fastest models on the market but still achieves solid read and write rates in our benchmark tests.
Our HDD/SSD benchmark list shows what performance can be expected from comparable mass storage devices.
| Dell G3 15 3500-G4DG2 SK Hynix BC511 HFM512GDJTNI | Nexoc GH5 515IG Samsung SSD 860 Evo 512GB | MSI Bravo 15 A4DCR Samsung PM981a MZVLB1T0HBLR | Acer Nitro 5 AN517-52-77DS WDC PC SN530 SDBPNPZ-1T00 | Average SK Hynix BC511 HFM512GDJTNI | |
|---|---|---|---|---|---|
| CrystalDiskMark 5.2 / 6 | -33% | 74% | 35% | 6% | |
| Write 4K (MB/s) | 99.6 | 89.6 -10% | 118.3 19% | 140 41% | 111 ? 11% |
| Read 4K (MB/s) | 38.8 | 40.88 5% | 43.73 13% | 49.04 26% | 42.6 ? 10% |
| Write Seq (MB/s) | 1117 | 518 -54% | 2854 156% | 1963 76% | 1037 ? -7% |
| Read Seq (MB/s) | 1030 | 539 -48% | 2302 123% | 1455 41% | 1100 ? 7% |
| Write 4K Q32T1 (MB/s) | 445.2 | 304 -32% | 418.5 -6% | 398.2 -11% | 410 ? -8% |
| Read 4K Q32T1 (MB/s) | 331.8 | 329 -1% | 517 56% | 461.9 39% | 444 ? 34% |
| Write Seq Q32T1 (MB/s) | 1102 | 529 -52% | 3008 173% | 1969 79% | 1072 ? -3% |
| Read Seq Q32T1 (MB/s) | 2227 | 561 -75% | 3568 60% | 1927 -13% | 2269 ? 2% |
| AS SSD | -30% | 114% | 45% | 13% | |
| Seq Read (MB/s) | 1305 | 524 -60% | 2730 109% | 1804 38% | 1458 ? 12% |
| Seq Write (MB/s) | 767 | 495 -35% | 2513 228% | 1922 151% | 900 ? 17% |
| 4K Read (MB/s) | 41.84 | 38.93 -7% | 61.4 47% | 38.21 -9% | 49 ? 17% |
| 4K Write (MB/s) | 90.1 | 87.3 -3% | 156.1 73% | 105 17% | 114.9 ? 28% |
| 4K-64 Read (MB/s) | 773 | 380 -51% | 1780 130% | 976 26% | 776 ? 0% |
| 4K-64 Write (MB/s) | 711 | 335.7 -53% | 1920 170% | 1150 62% | 744 ? 5% |
| Access Time Read * (ms) | 0.09 | 0.073 19% | 0.063 30% | 0.061 ? 32% | |
| Access Time Write * (ms) | 0.04 | 0.039 2% | 0.025 37% | 0.045 -13% | 0.03329 ? 17% |
| Score Read (Points) | 945 | 471 -50% | 2114 124% | 1194 26% | 970 ? 3% |
| Score Write (Points) | 878 | 472 -46% | 2327 165% | 1747 99% | 949 ? 8% |
| Score Total (Points) | 2290 | 1198 -48% | 5518 141% | 3563 56% | 2401 ? 5% |
| Total Average (Program / Settings) | -32% /
-32% | 94% /
97% | 40% /
41% | 10% /
10% |
* ... smaller is better

Continuous read: DiskSpd Read Loop, Queue Depth 8
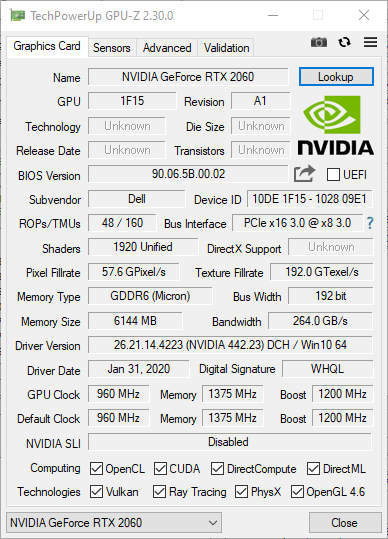
Graphics card
Dell uses an Nvidia GeForce RTX 2060 in our test model of the G3 15. This graphics card is also suitable for more complex 3D applications but doesn't achieve quite as good benchmark results as other notebooks with this graphics unit. In the 3DMark tests the values are up to 10% below the average of other laptops with this GPU that we tested.
Our GPU benchmark list shows how the installed Nvidia GeForce RTX 2060 compares with other graphics cards.
| 3DMark 11 Performance | 16634 points | |
| 3DMark Cloud Gate Standard Score | 31580 points | |
| 3DMark Fire Strike Score | 13566 points | |
Help | ||
Gaming performance
With the Nvidia GeForce RTX 2060, most current games can be played smoothly with high graphics settings and in Full HD resolution. Accordingly, the titles we tested ran smoothly with high frame rates and did not show any frame drops or similar.
The performance that can be expected in other titles from Nvidia's GeForce RTX 2060 can be seen in our GPU games list.
| The Witcher 3 - 1920x1080 Ultra Graphics & Postprocessing (HBAO+) | |
| Average of class Gaming (95 - 240, n=8, last 2 years) | |
| Acer Nitro 5 AN517-52-77DS | |
| Average NVIDIA GeForce RTX 2060 Mobile (50.6 - 74, n=40) | |
| Dell G3 15 3500-G4DG2 | |
| Nexoc GH5 515IG | |
| MSI Bravo 15 A4DCR | |
| Far Cry 5 - 1920x1080 Ultra Preset AA:T | |
| Average of class Gaming (70 - 151, n=10, last 2 years) | |
| Average NVIDIA GeForce RTX 2060 Mobile (76 - 90, n=9) | |
| Dell G3 15 3500-G4DG2 | |
| Doom Eternal - 1920x1080 Ultra Preset | |
| Average NVIDIA GeForce RTX 2060 Mobile (98.7 - 138, n=10) | |
| Acer Nitro 5 AN517-52-77DS | |
| Dell G3 15 3500-G4DG2 | |
| MSI Bravo 15 A4DCR | |
In the extended test with The Witcher 3 on the graphics setting "Ultra", the Dell G3 15 shows only slight variations in graphics performance over a long period. At the end of the approximately one-hour test, however, a clear drop can be noticed, which then stabilises between 30 and 40 fps. This means that fluid gaming is still possible, but users must expect performance drops after long playing times for very demanding titles.
| low | med. | high | ultra | |
|---|---|---|---|---|
| The Witcher 3 (2015) | 50.6 | |||
| Dota 2 Reborn (2015) | 139 | 125 | 117 | 111 |
| X-Plane 11.11 (2018) | 104 | 85.2 | 72.4 | |
| Far Cry 5 (2018) | 80 | |||
| Doom Eternal (2020) | 98.7 |
Emissions - The Dell G3 15 runs hot
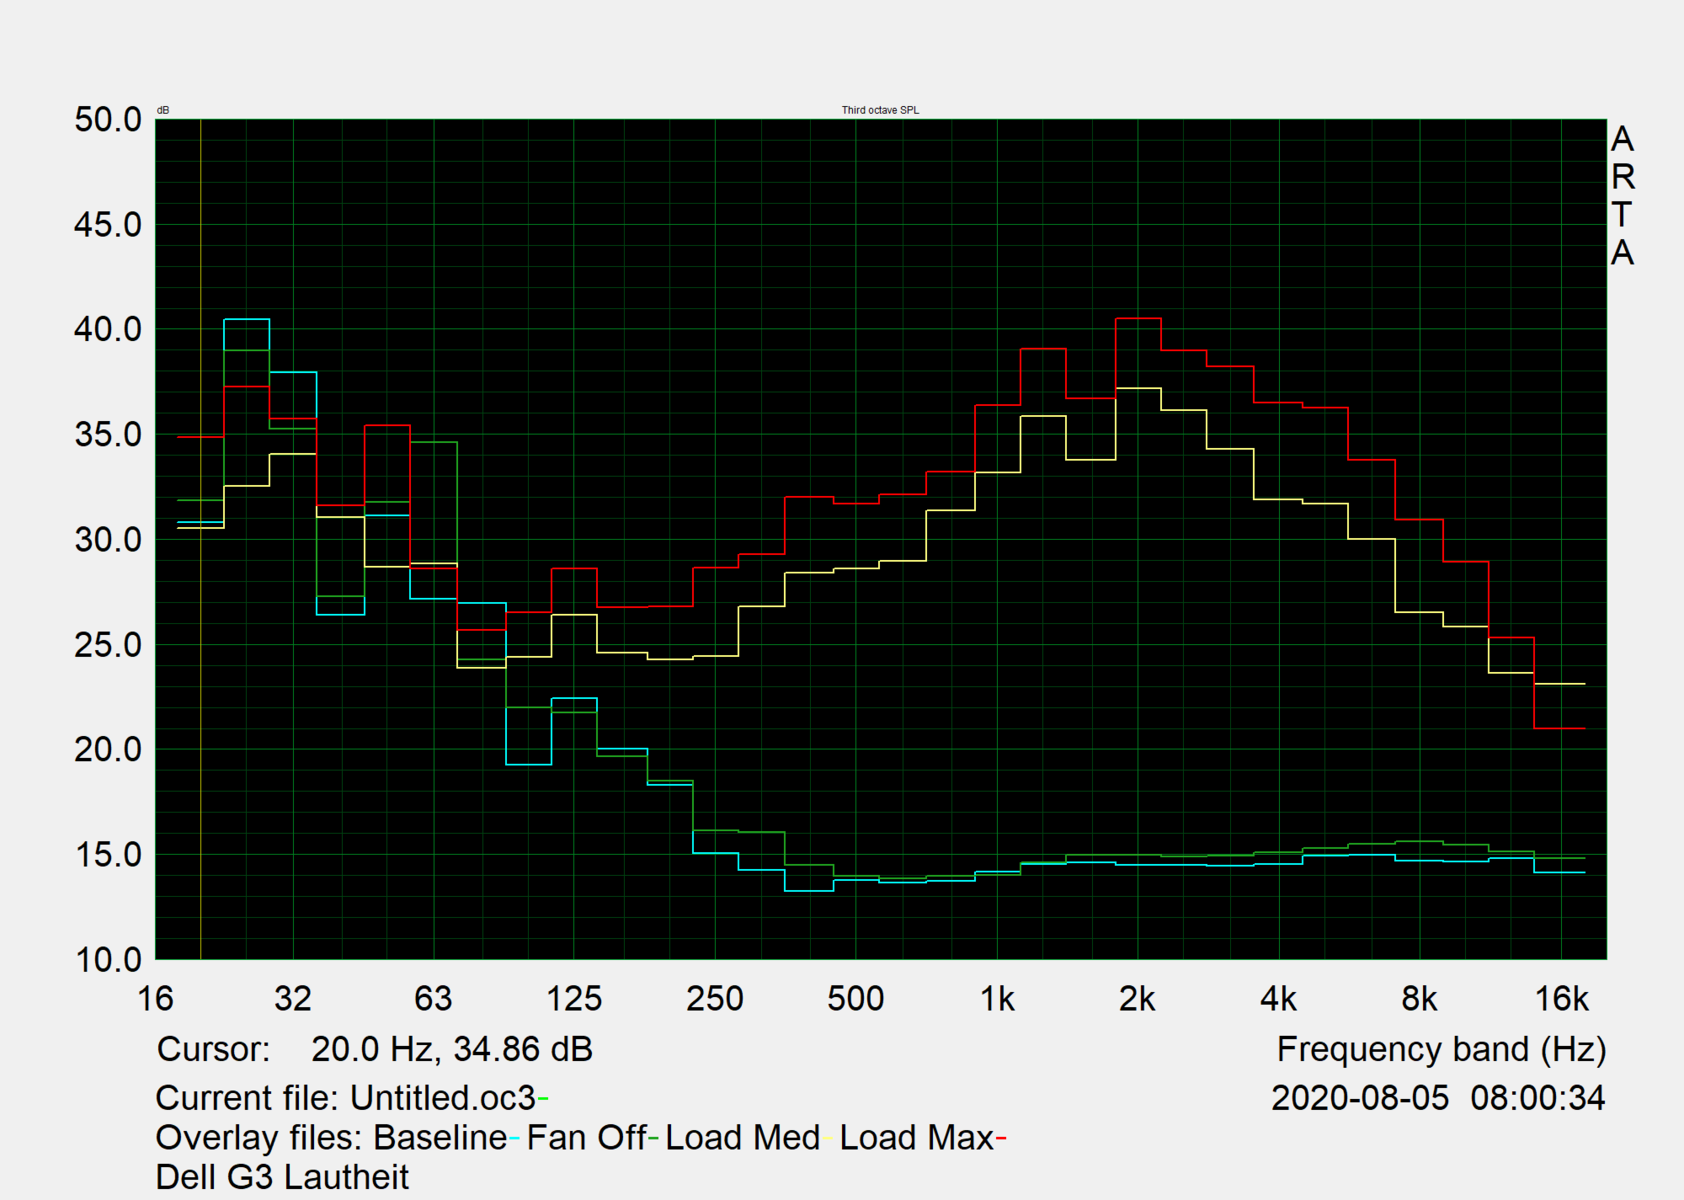
Noise emissions
The Dell G3 15's fans can become very loud with up to 48.7 dB(A) under load. The resulting noise is even but can't be easily faded out in the ambient noise. Users should therefore consider external headphones to counteract the noise level.
Noise level
| Idle |
| 27.1 / 27.1 / 30.8 dB(A) |
| Load |
| 45.3 / 48.7 dB(A) |
 | ||
30 dB silent 40 dB(A) audible 50 dB(A) loud |
||
min: | ||
Temperatures
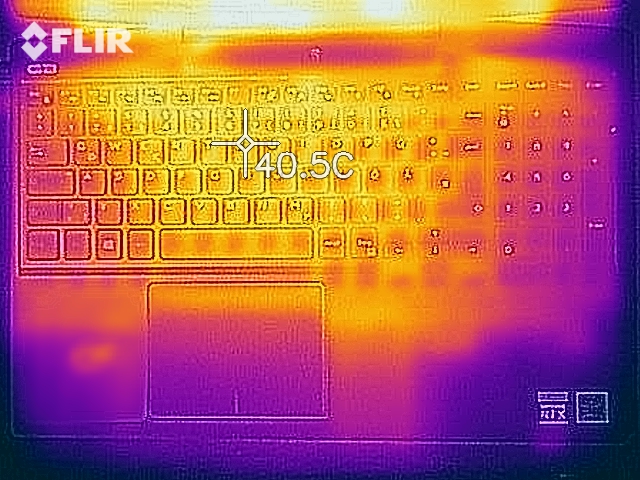
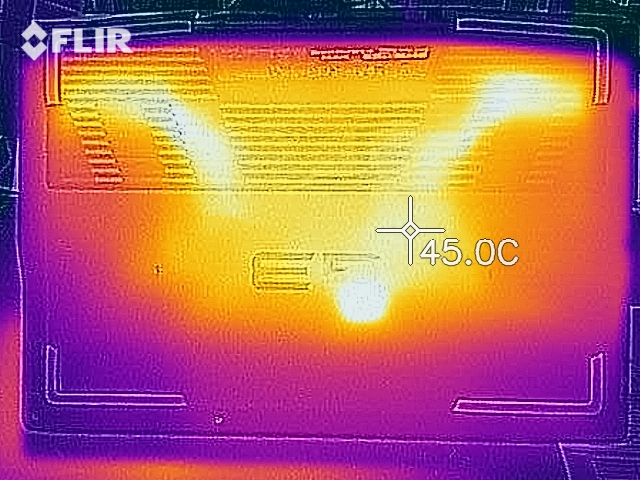
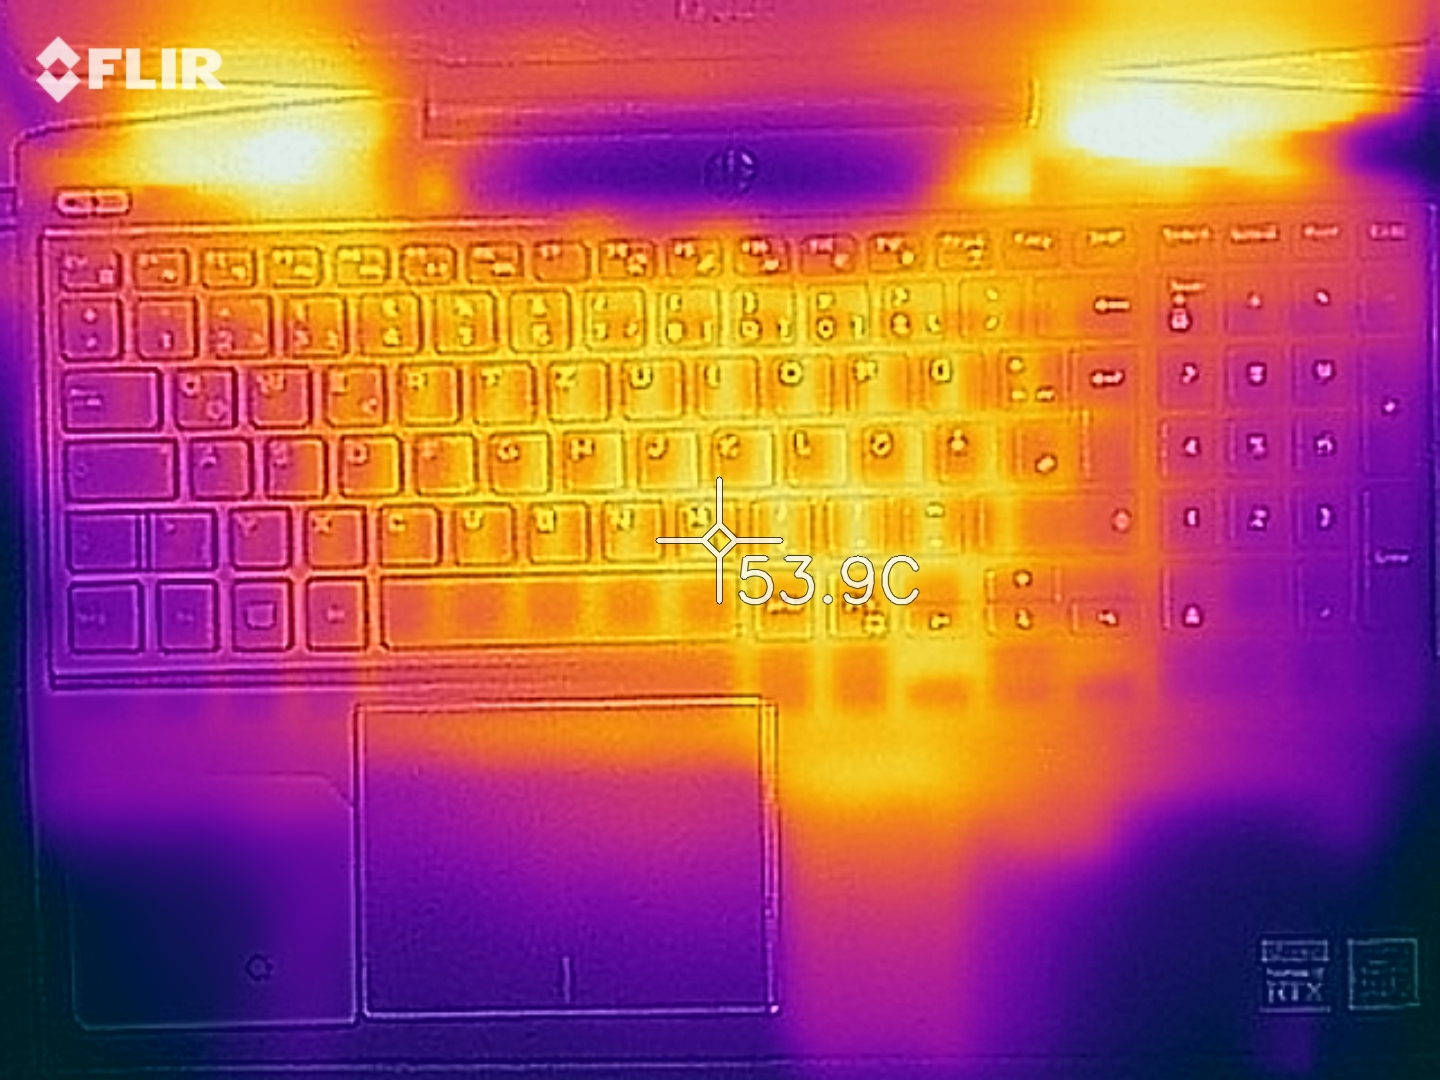
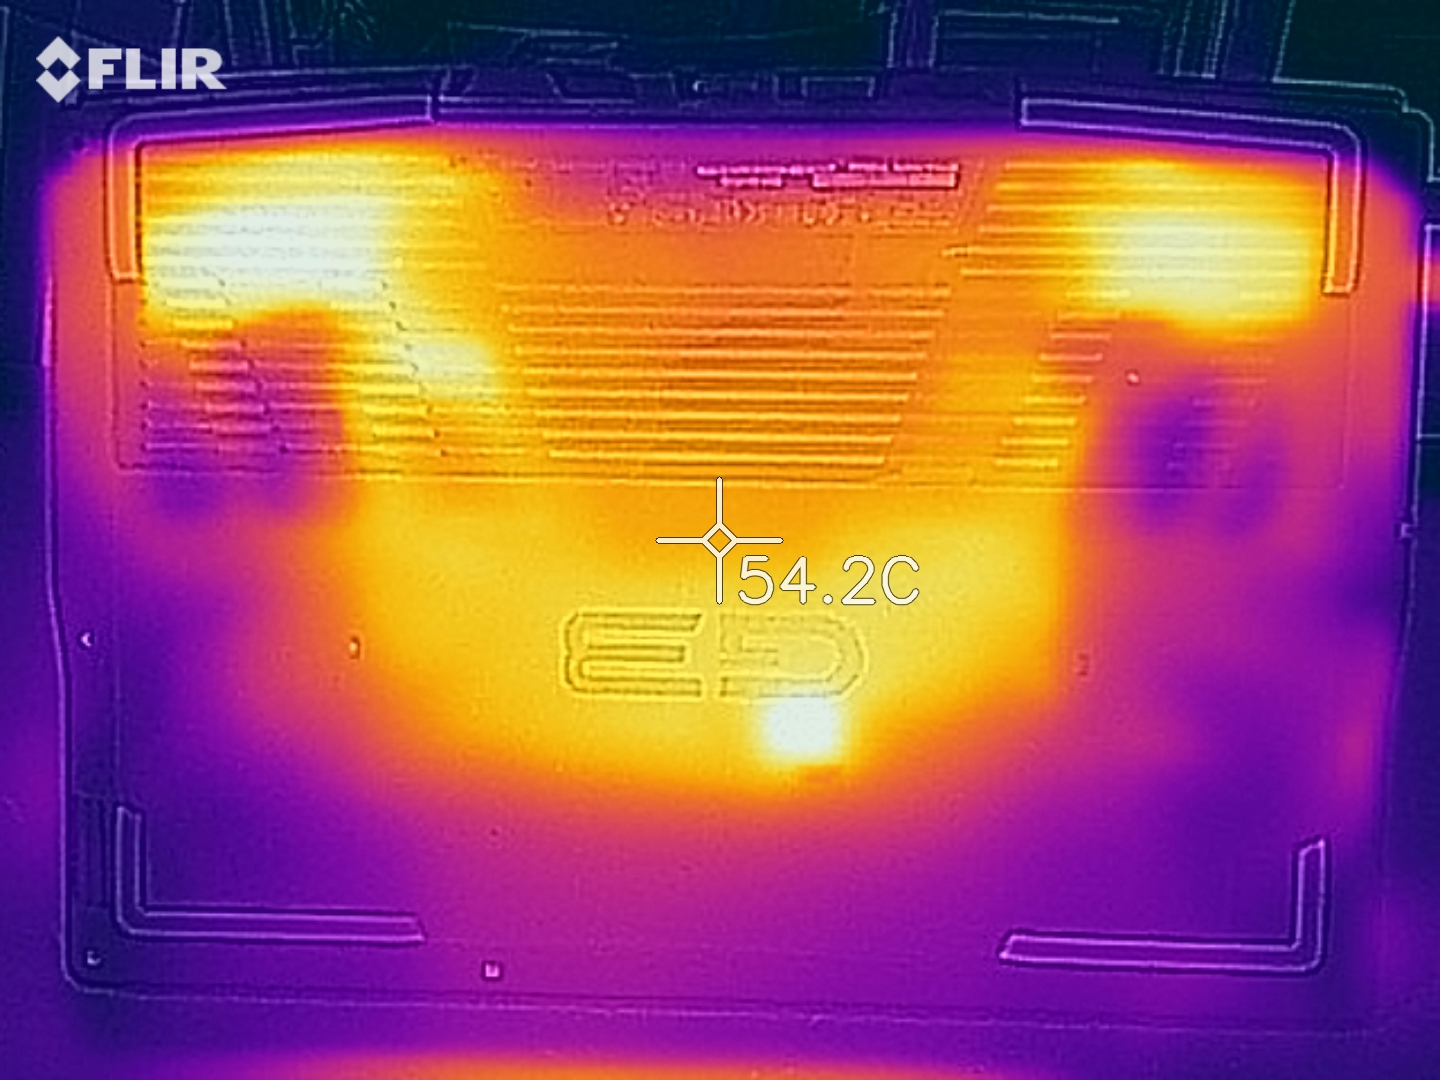
Our measurements show that the Dell G3 15 has surface temperatures of up to 58.6 °C (137.48 °F) under load. Thus, the gaming notebook warms up quite strongly, with the warmest points being on the underside of the base unit. However, the wrist-rests always remain moderately warm, which doesn't limit the use of the laptop. However, a placement on the thighs is not recommended for prolonged gaming.
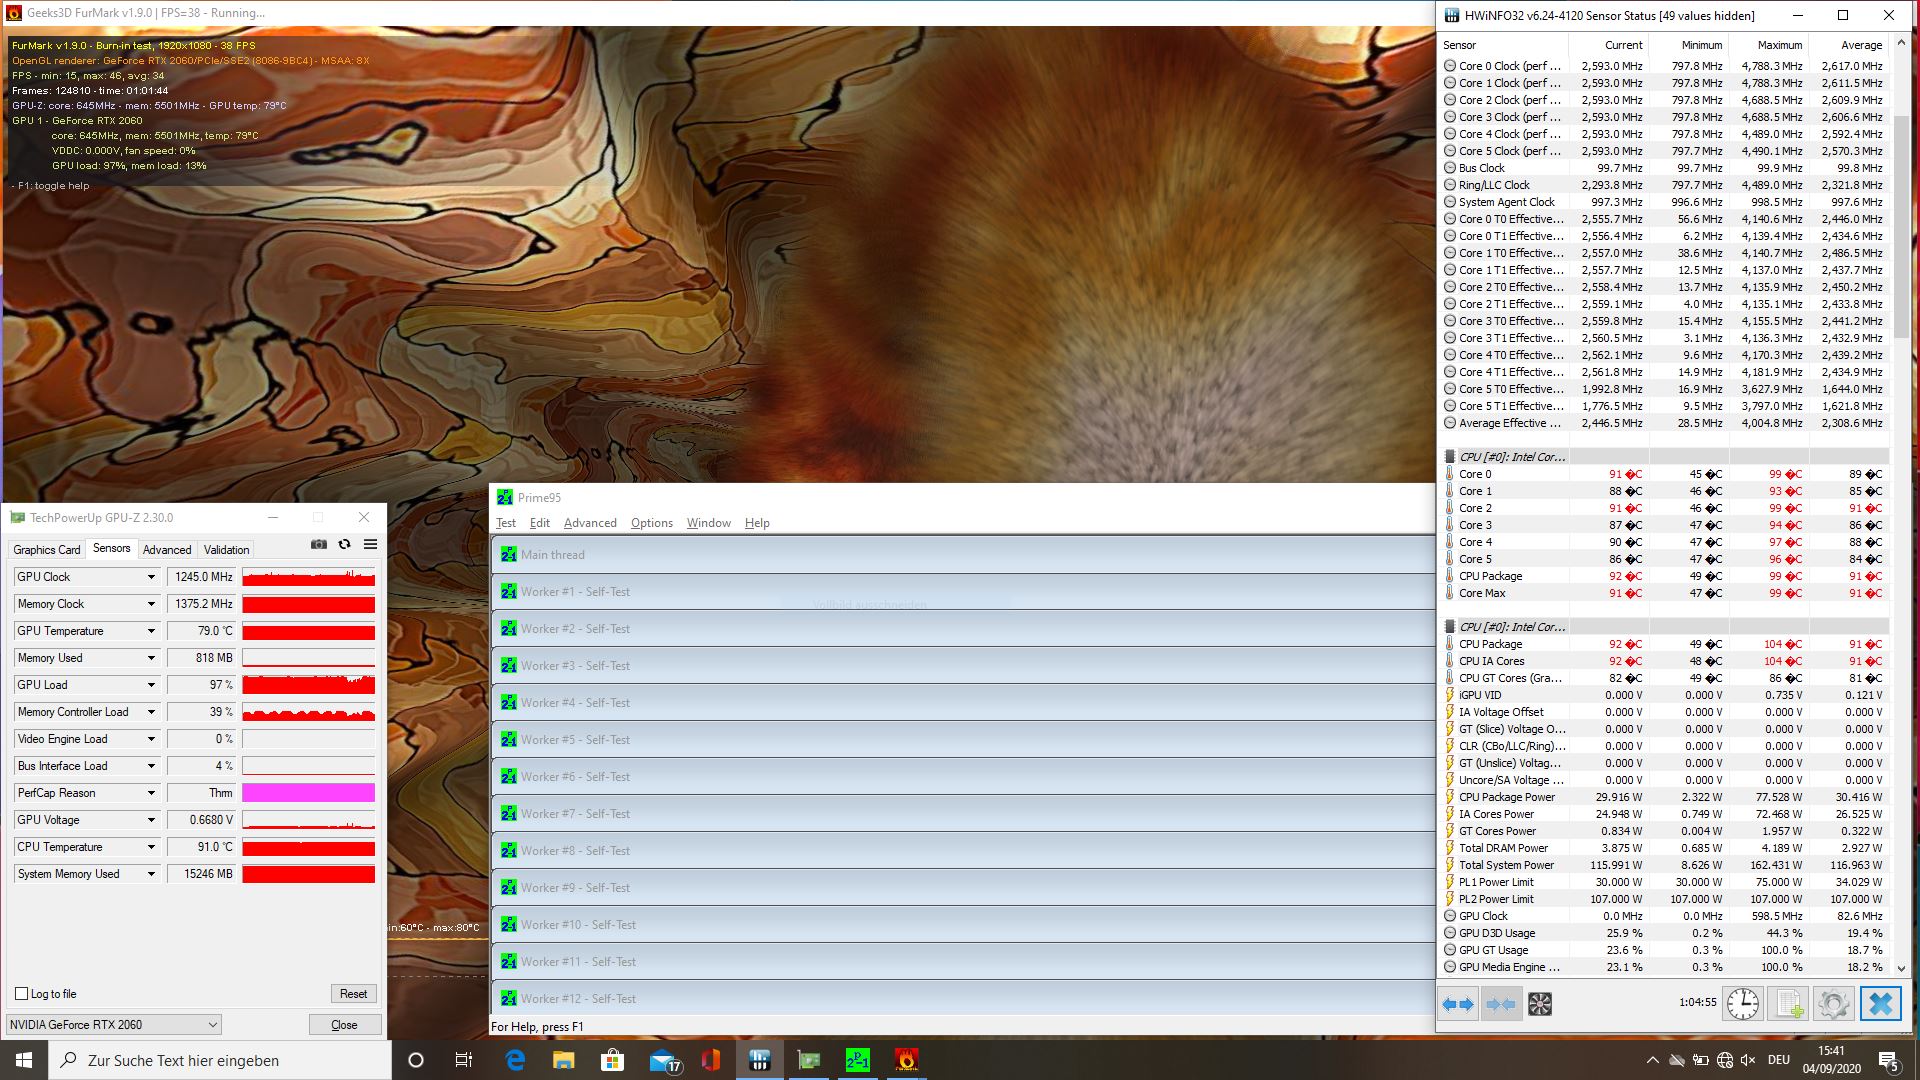
At the beginning of our approximately one-hour stress test, the temperatures inside the gaming laptop temporarily rise up to 100 °C (212 °F). However, the fans quickly push this value back down to below 80 °C (176 °F) and an average of 90 °C (194 °F) is maintained until the end of the approximately one-hour test. The clock rates drop to around 2.5 GHz, which is only slightly below the base rate. As the notebook could still be operated smoothly during the test, users do not have to expect restrictions due to too high temperatures.
(-) The maximum temperature on the upper side is 50.3 °C / 123 F, compared to the average of 40.4 °C / 105 F, ranging from 21.2 to 68.8 °C for the class Gaming.
(-) The bottom heats up to a maximum of 58.6 °C / 137 F, compared to the average of 43.2 °C / 110 F
(+) In idle usage, the average temperature for the upper side is 31 °C / 88 F, compared to the device average of 33.9 °C / 93 F.
(-) Playing The Witcher 3, the average temperature for the upper side is 44.1 °C / 111 F, compared to the device average of 33.9 °C / 93 F.
(+) The palmrests and touchpad are reaching skin temperature as a maximum (35.8 °C / 96.4 F) and are therefore not hot.
(-) The average temperature of the palmrest area of similar devices was 28.8 °C / 83.8 F (-7 °C / -12.6 F).
Speakers
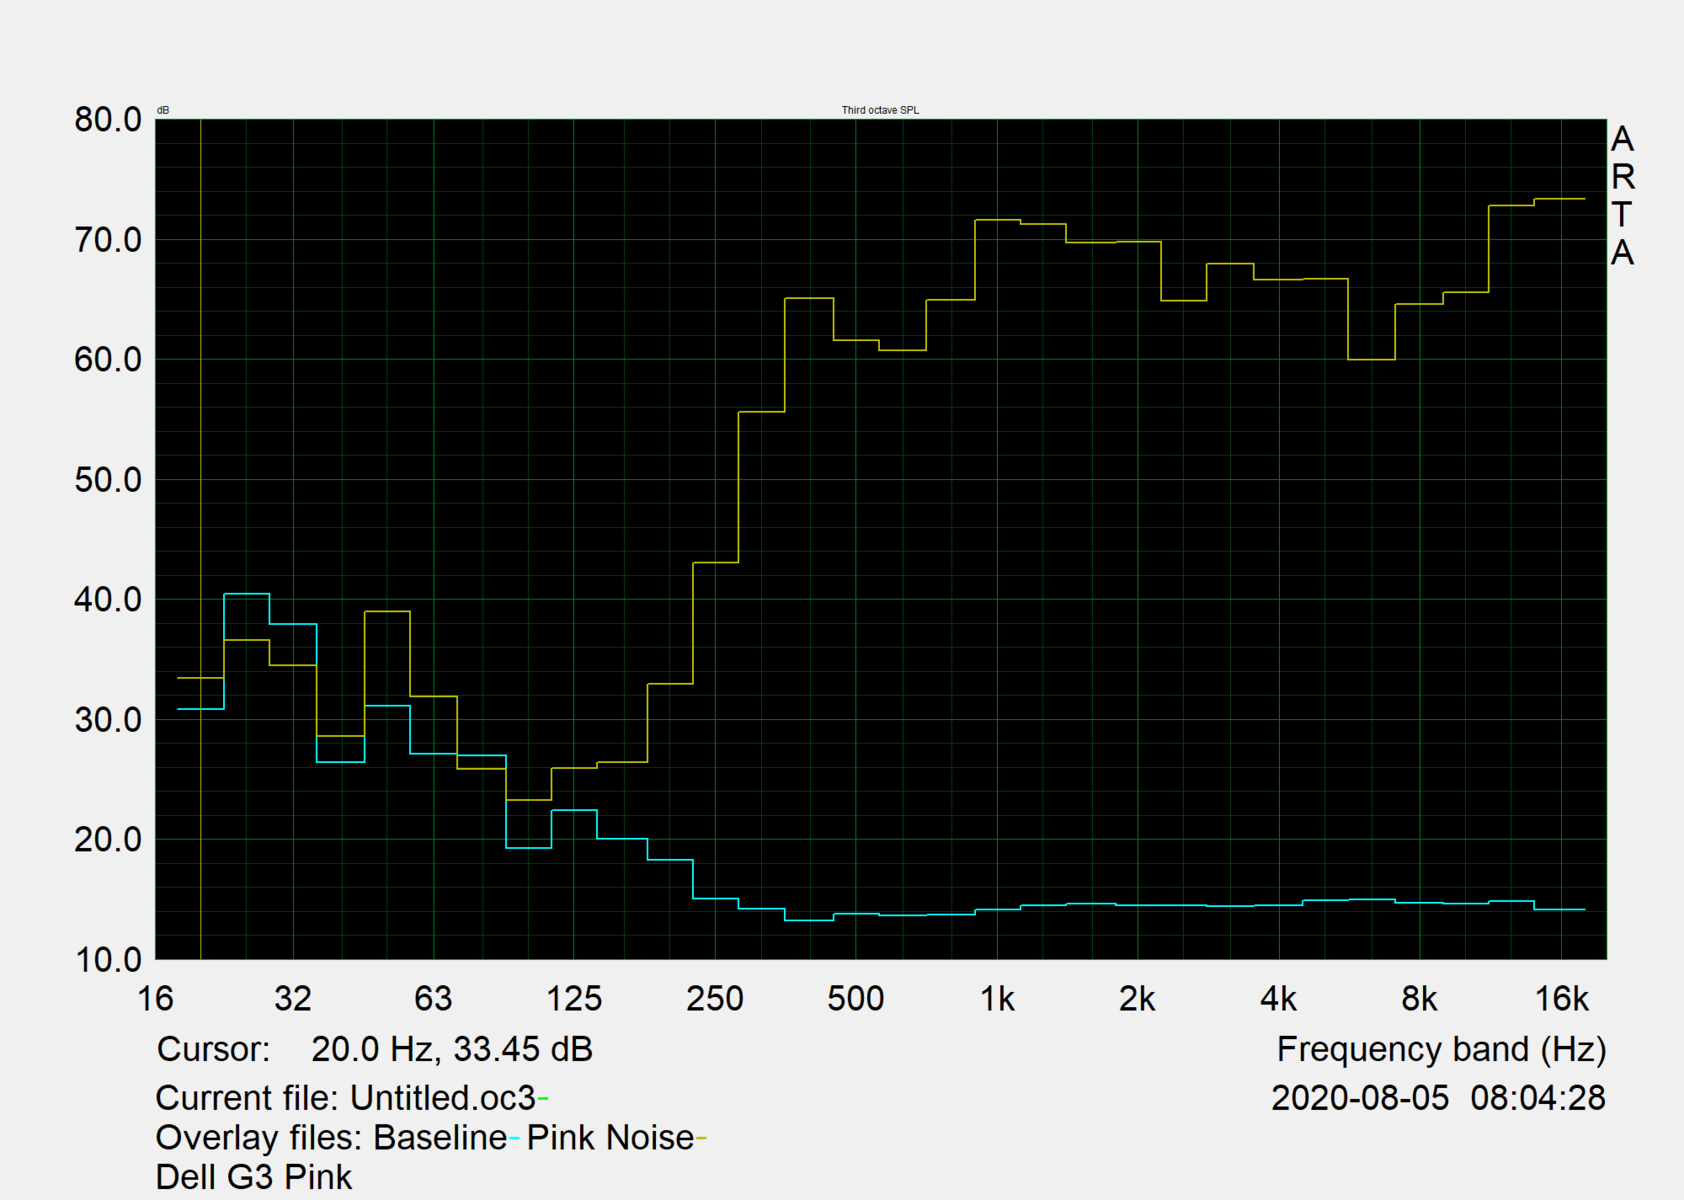
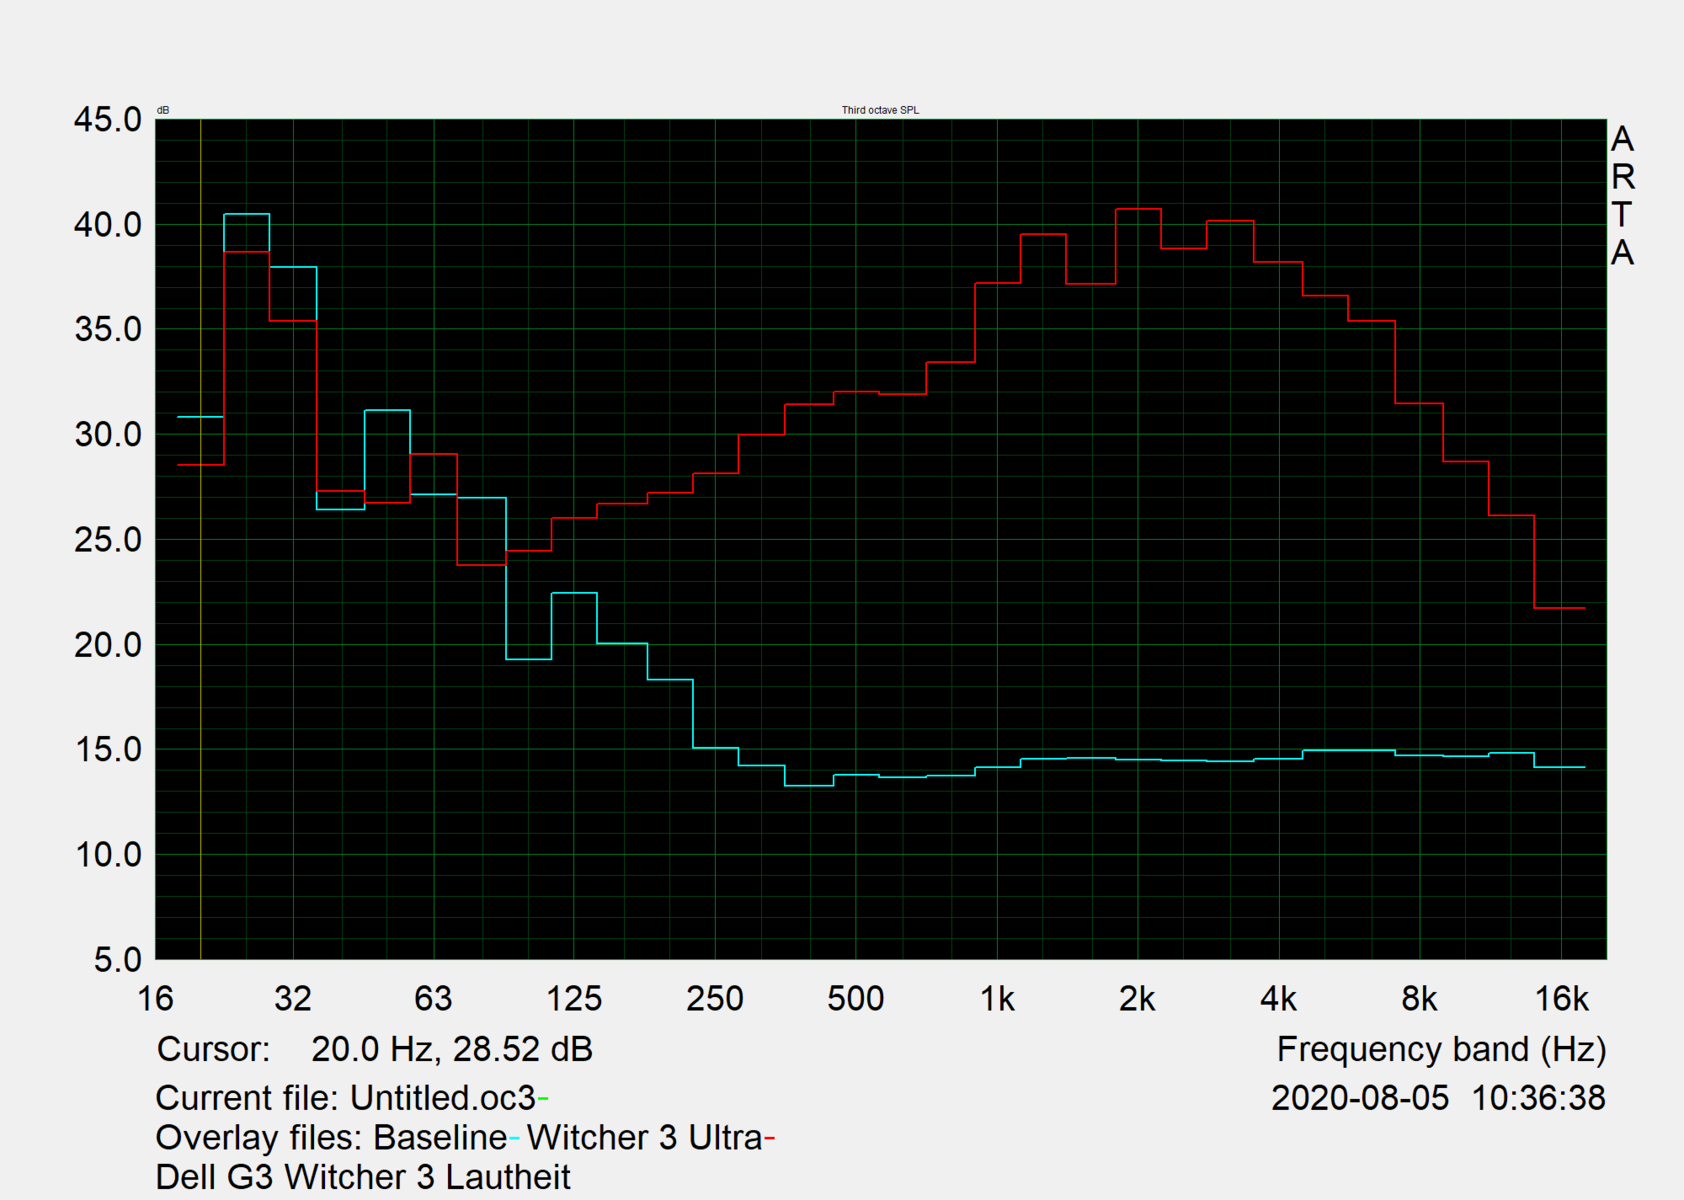
The Dell G3 15's speakers offer a medium volume and a wide sound spectrum but lack deep frequencies. This makes the gaming laptop suitable for occasional playback of media content, but users should use external speakers or headphones in the long run.
Dell G3 15 3500-G4DG2 audio analysis
(±) | speaker loudness is average but good (73.3 dB)
Bass 100 - 315 Hz
(-) | nearly no bass - on average 30.4% lower than median
(±) | linearity of bass is average (11.6% delta to prev. frequency)
Mids 400 - 2000 Hz
(+) | balanced mids - only 3.8% away from median
(+) | mids are linear (6.6% delta to prev. frequency)
Highs 2 - 16 kHz
(+) | balanced highs - only 1.8% away from median
(+) | highs are linear (6.2% delta to prev. frequency)
Overall 100 - 16.000 Hz
(±) | linearity of overall sound is average (21.9% difference to median)
Compared to same class
» 79% of all tested devices in this class were better, 6% similar, 16% worse
» The best had a delta of 6%, average was 18%, worst was 132%
Compared to all devices tested
» 63% of all tested devices were better, 7% similar, 31% worse
» The best had a delta of 4%, average was 24%, worst was 134%
MSI Bravo 15 A4DCR audio analysis
(+) | speakers can play relatively loud (83 dB)
Bass 100 - 315 Hz
(-) | nearly no bass - on average 19.8% lower than median
(±) | linearity of bass is average (12.7% delta to prev. frequency)
Mids 400 - 2000 Hz
(+) | balanced mids - only 2.7% away from median
(+) | mids are linear (4.7% delta to prev. frequency)
Highs 2 - 16 kHz
(+) | balanced highs - only 2.6% away from median
(+) | highs are linear (5.9% delta to prev. frequency)
Overall 100 - 16.000 Hz
(+) | overall sound is linear (14.6% difference to median)
Compared to same class
» 28% of all tested devices in this class were better, 7% similar, 65% worse
» The best had a delta of 6%, average was 18%, worst was 132%
Compared to all devices tested
» 19% of all tested devices were better, 4% similar, 77% worse
» The best had a delta of 4%, average was 24%, worst was 134%
Power management - Five hours battery operation in Wi-Fi
Energy consumption
Our measurements certify that the Dell laptop has an average power consumption both in idle and under load. In comparison to the range of similar tested devices, the G3 15 3500 is somewhat more economical, especially in idle, and it only has to admit defeat to the Acer Nitro 5 AN517.
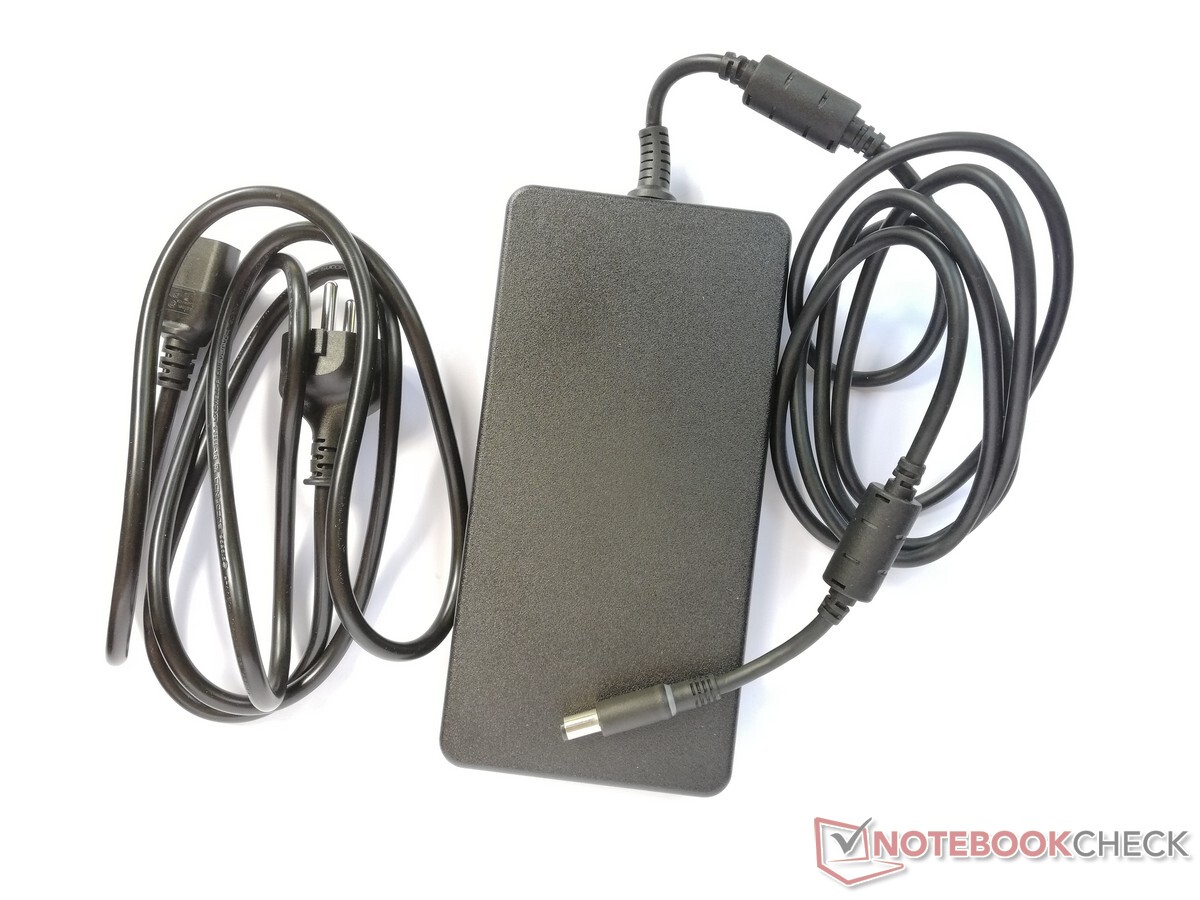
The included power supply turns out to be very large, and with an output power of 240 watts it is large enough to guarantee a safe power supply.
| Off / Standby | |
| Idle | |
| Load |
|
Key:
min: | |
| Dell G3 15 3500-G4DG2 i7-10750H, GeForce RTX 2060 Mobile, SK Hynix BC511 HFM512GDJTNI, IPS, 1920x1080, 15.6" | Nexoc GH5 515IG i5-10300H, GeForce GTX 1650 Mobile, Samsung SSD 860 Evo 512GB, IPS, 1920x1080, 15.6" | MSI Bravo 15 A4DCR R7 4800H, Radeon RX 5300M, Samsung PM981a MZVLB1T0HBLR, IPS-Level, 1920x1080, 15.6" | Acer Nitro 5 AN517-52-77DS i7-10750H, GeForce RTX 2060 Mobile, WDC PC SN530 SDBPNPZ-1T00, IPS, 1920x1080, 17.3" | Average NVIDIA GeForce RTX 2060 Mobile | Average of class Gaming | |
|---|---|---|---|---|---|---|
| Power Consumption | 32% | -12% | 14% | -32% | -48% | |
| Idle Minimum * (Watt) | 7 | 3 57% | 11 -57% | 5.4 23% | 11.5 ? -64% | 13.3 ? -90% |
| Idle Average * (Watt) | 10.2 | 7 31% | 14 -37% | 9.8 4% | 16.5 ? -62% | 19 ? -86% |
| Idle Maximum * (Watt) | 15 | 16 -7% | 25 -67% | 10.9 27% | 23.7 ? -58% | 24.5 ? -63% |
| Load Average * (Watt) | 147 | 85 42% | 72 51% | 104 29% | 107.5 ? 27% | 108.1 ? 26% |
| Witcher 3 ultra * (Watt) | 131 | 86 34% | 100 24% | 134.3 -3% | ||
| Load Maximum * (Watt) | 197 | 134 32% | 163 17% | 193 2% | 199.7 ? -1% | 254 ? -29% |
* ... smaller is better
Battery life
In our hands-on Wi-Fi test, the Dell G3 15 achieves a runtime of a little more than five hours. Thus, it can't use its 68 Wh strong battery as well as similarly equipped competing devices, but it scores better than the average of all gaming laptops we tested.
| Dell G3 15 3500-G4DG2 i7-10750H, GeForce RTX 2060 Mobile, 68 Wh | Nexoc GH5 515IG i5-10300H, GeForce GTX 1650 Mobile, 48.96 Wh | MSI Bravo 15 A4DCR R7 4800H, Radeon RX 5300M, 51 Wh | Acer Nitro 5 AN517-52-77DS i7-10750H, GeForce RTX 2060 Mobile, 57.48 Wh | Average of class Gaming | |
|---|---|---|---|---|---|
| Battery runtime | 32% | -21% | 33% | 14% | |
| Reader / Idle (h) | 7.5 | 14.9 99% | 7 -7% | 11 47% | 8.71 ? 16% |
| WiFi v1.3 (h) | 5.2 | 6.4 23% | 4.5 -13% | 6.6 27% | 7.01 ? 35% |
| Load (h) | 1.6 | 1.2 -25% | 0.9 -44% | 2 25% | 1.47 ? -8% |
Pros
Cons
Verdict - Dell's gaming laptop is suitable for everyday use

In our test, the Dell G3 15 3500 proves to be a very solid gaming notebook. This not only applies to the performance but also to the casing. The robust plastic provides a lot of stability, so we would certainly transport the G3 15 without hesitation. When compared to the competition, the design does not set new standards, but it doesn't have to. With its good maintenance options and a Thunderbolt 3 connector, there is also potential for future upgrades.
The Dell G3 15 is a robust gaming laptop with enough power for high graphics levels in Full HD resolution.
However, there are also minor weaknesses to be found with the Dell G3 15 3500. These include, for example, the slow memory card reader, which allows SD cards to protrude well beyond the edge of the case. The battery life should also be a bit better in view of the available 68 Wh, and the screen is also not first class with its tendency towards screen bleeding. But for the reasonable price tag, all this is quite bearable.
Dell G3 15 3500-G4DG2
- 09/07/2020 v7 (old)
Mike Wobker
Price comparison
