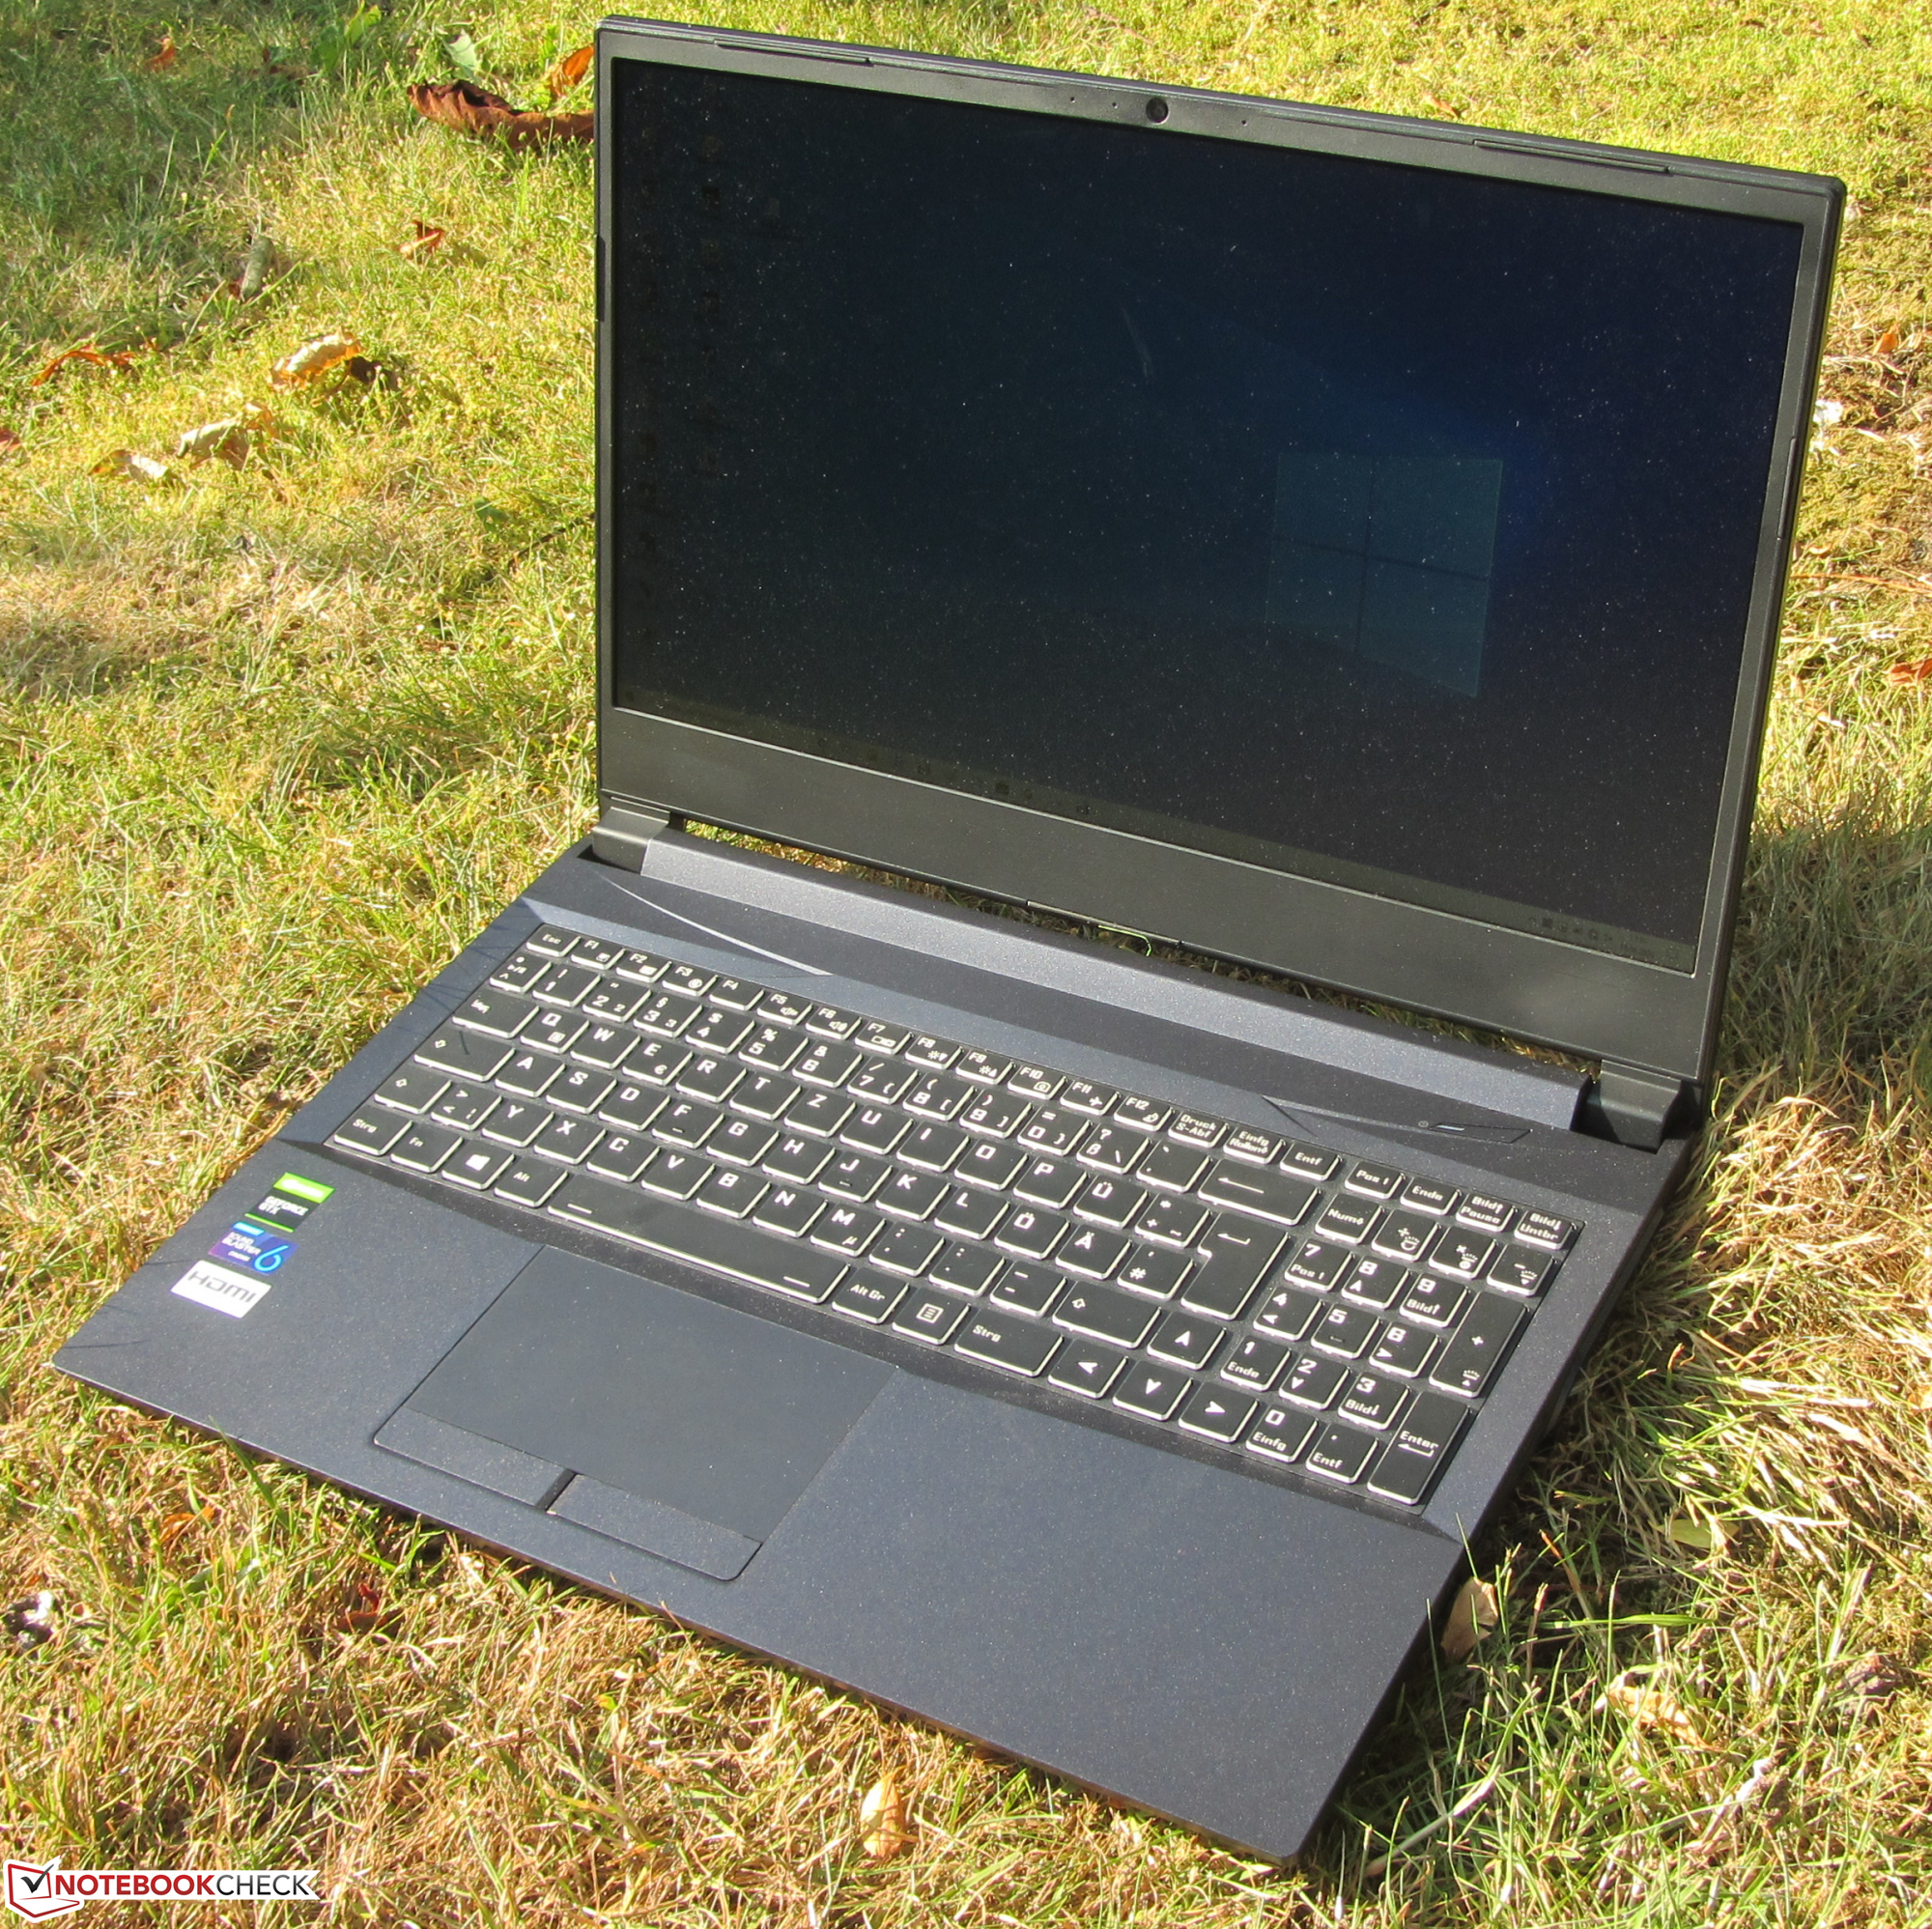
Nexoc GH5 515IG (Clevo NH50DB): Entry-level gaming laptop offers room for three storage drives

With prices starting at 850 Euros (~$1,009), the Nexoc GH5 515IG is a low-priced gaming laptop. The built-in hardware combination of a Core i5-10300H quad-core processor and GeForce GTX 1650 graphics core provides for decent computing power on the gaming front. This isn't an in-house development made by Nexoc since the device is based on the NH50DB barebone from Clevo. Competitors include devices like the Asus TUF FX505DT, the Lenovo IdeaPad Gaming 3i 15IMH05, the Dell G3 3590, the HP Pavilion Gaming 15, the Acer Nitro 5 AN515-44, and the MSI Bravo 15 A4DCR.
Rating | Date | Model | Weight | Height | Size | Resolution | Price |
|---|---|---|---|---|---|---|---|
| 81.2 % v7 (old) | 08 / 2020 | Nexoc GH5 515IG i5-10300H, GeForce GTX 1650 Mobile | 2.1 kg | 24.9 mm | 15.60" | 1920x1080 | |
| 78.4 % v7 (old) | 07 / 2020 | Lenovo IdeaPad Gaming 3i 15IMH05 i5-10300H, GeForce GTX 1650 Mobile | 2.2 kg | 24.9 mm | 15.60" | 1920x1080 | |
| 80.4 % v6 (old) | 07 / 2019 | Asus TUF FX505DT-EB73 R7 3750H, GeForce GTX 1650 Mobile | 2.2 kg | 26.8 mm | 15.60" | 1920x1080 | |
| 79.3 % v7 (old) | 10 / 2019 | Dell G3 3590 i5-9300H, GeForce GTX 1650 Mobile | 2.5 kg | 21.6 mm | 15.60" | 1920x1080 | |
| 75.4 % v7 (old) | 03 / 2020 | HP Pavilion Gaming 15-ec0002ng R5 3550H, GeForce GTX 1050 Mobile | 2.3 kg | 23.5 mm | 15.60" | 1920x1080 | |
| 79.8 % v7 (old) | 06 / 2020 | Acer Nitro 5 AN515-44-R5FT R5 4600H, GeForce GTX 1650 Ti Mobile | 2.2 kg | 24 mm | 15.60" | 1920x1080 | |
| 79.5 % v7 (old) | 07 / 2020 | MSI Bravo 15 A4DCR R7 4800H, Radeon RX 5300M | 2 kg | 22 mm | 15.60" | 1920x1080 |
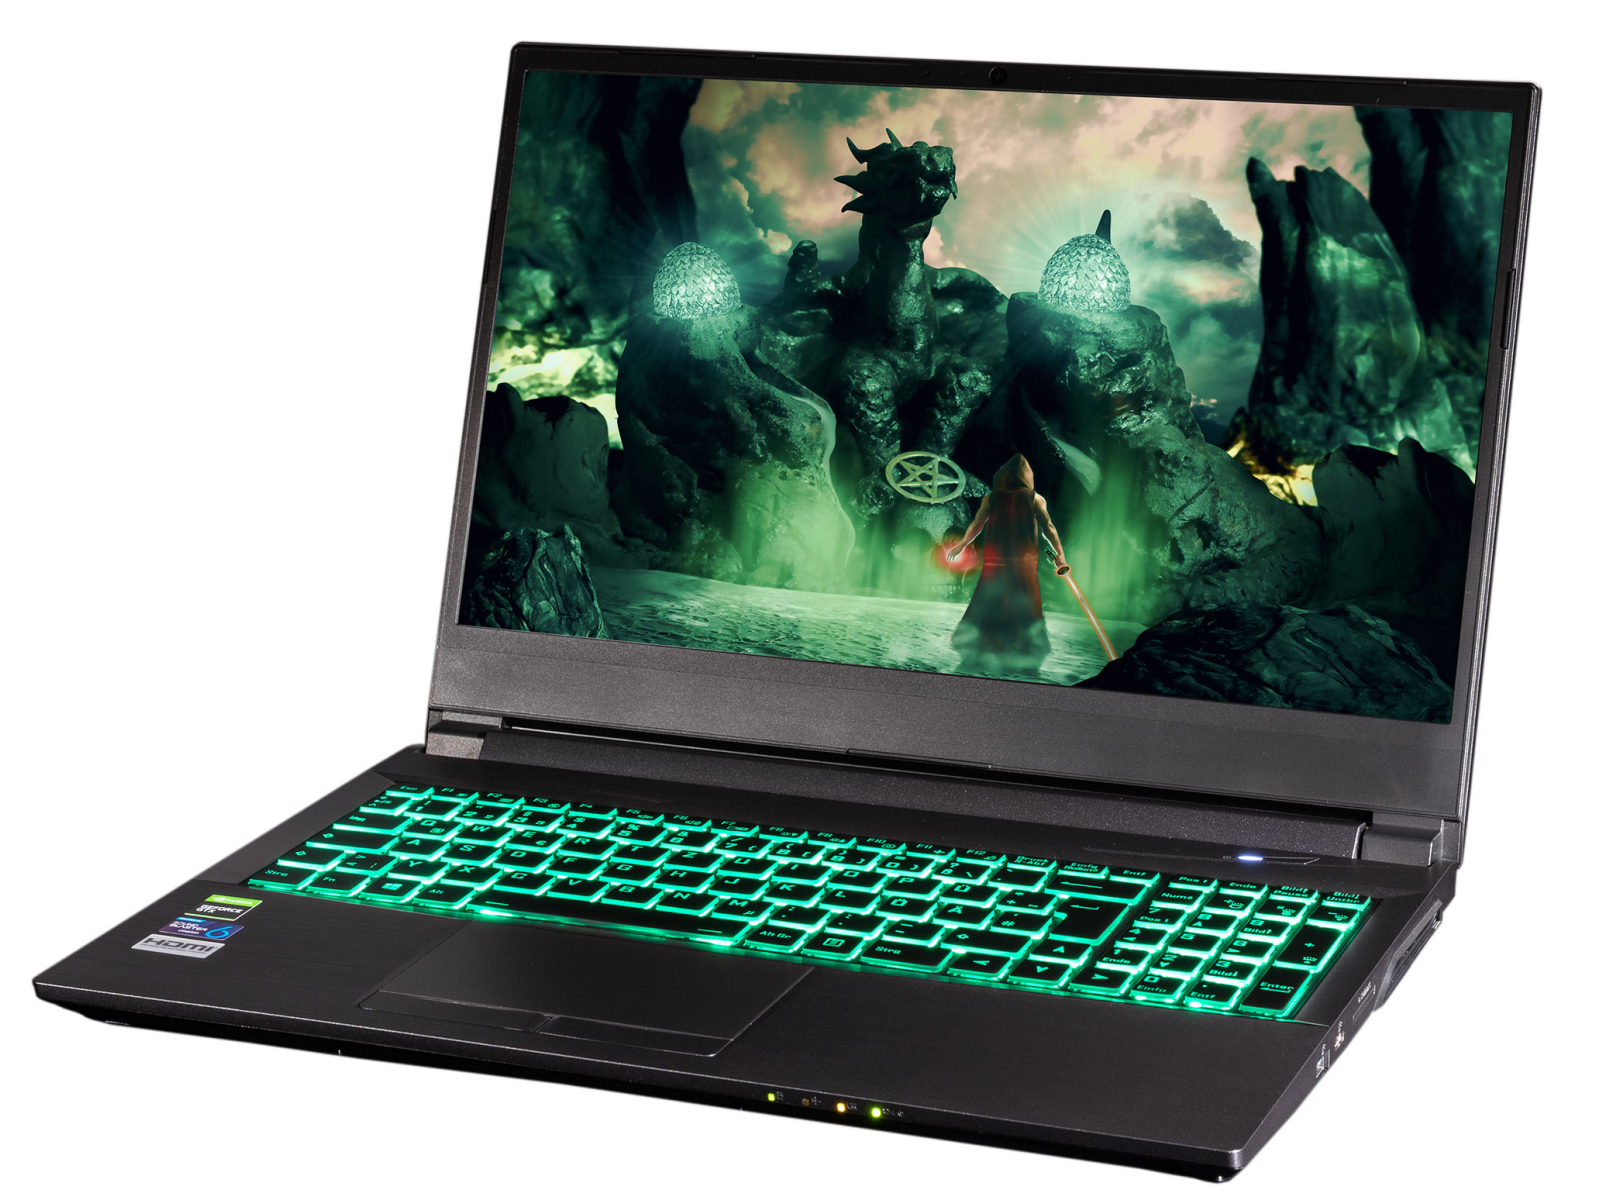
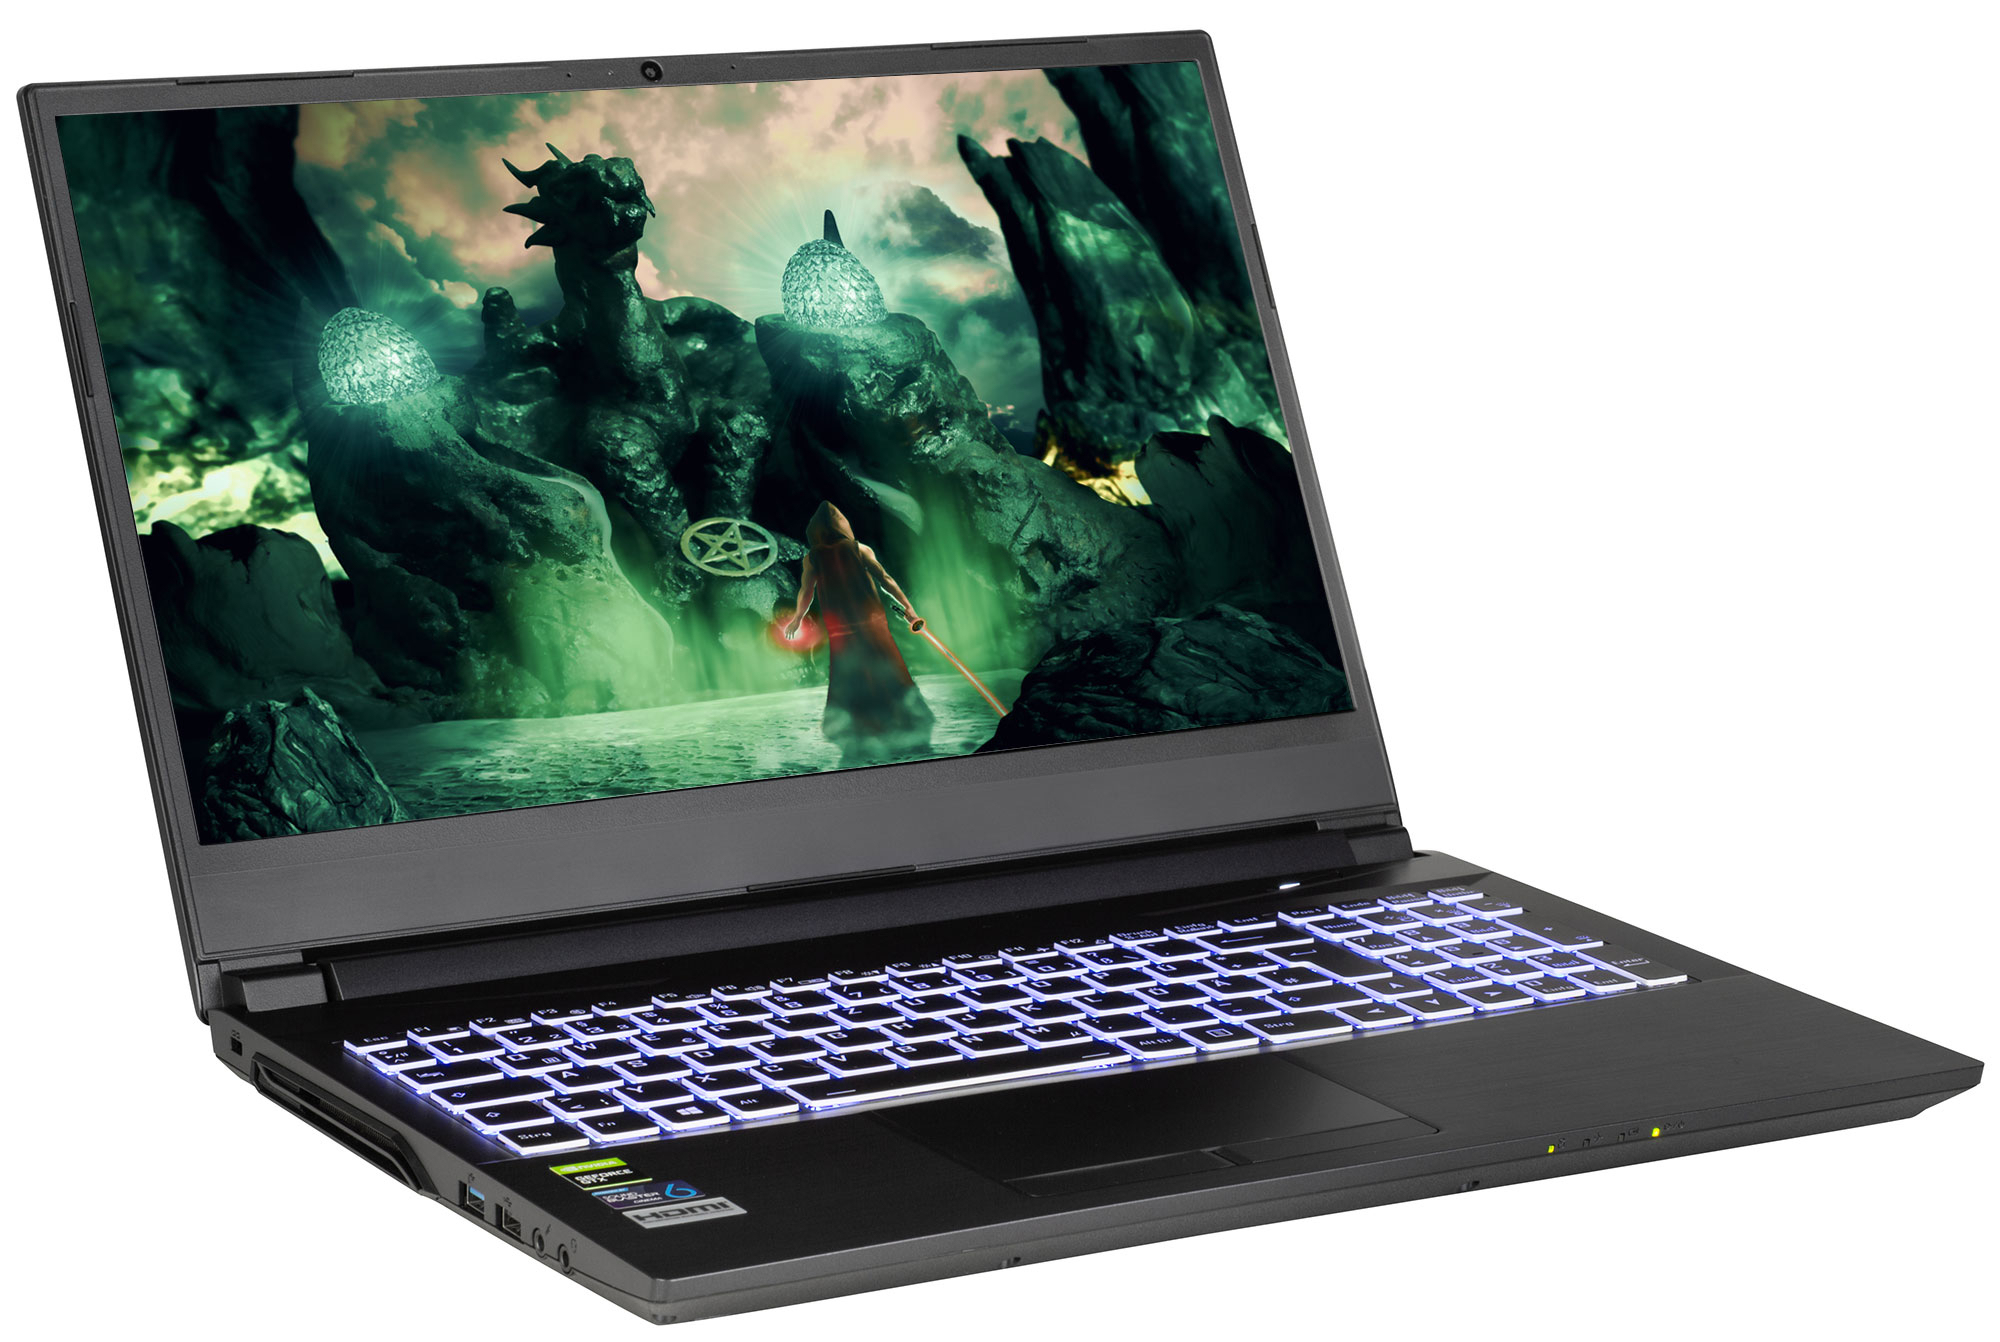
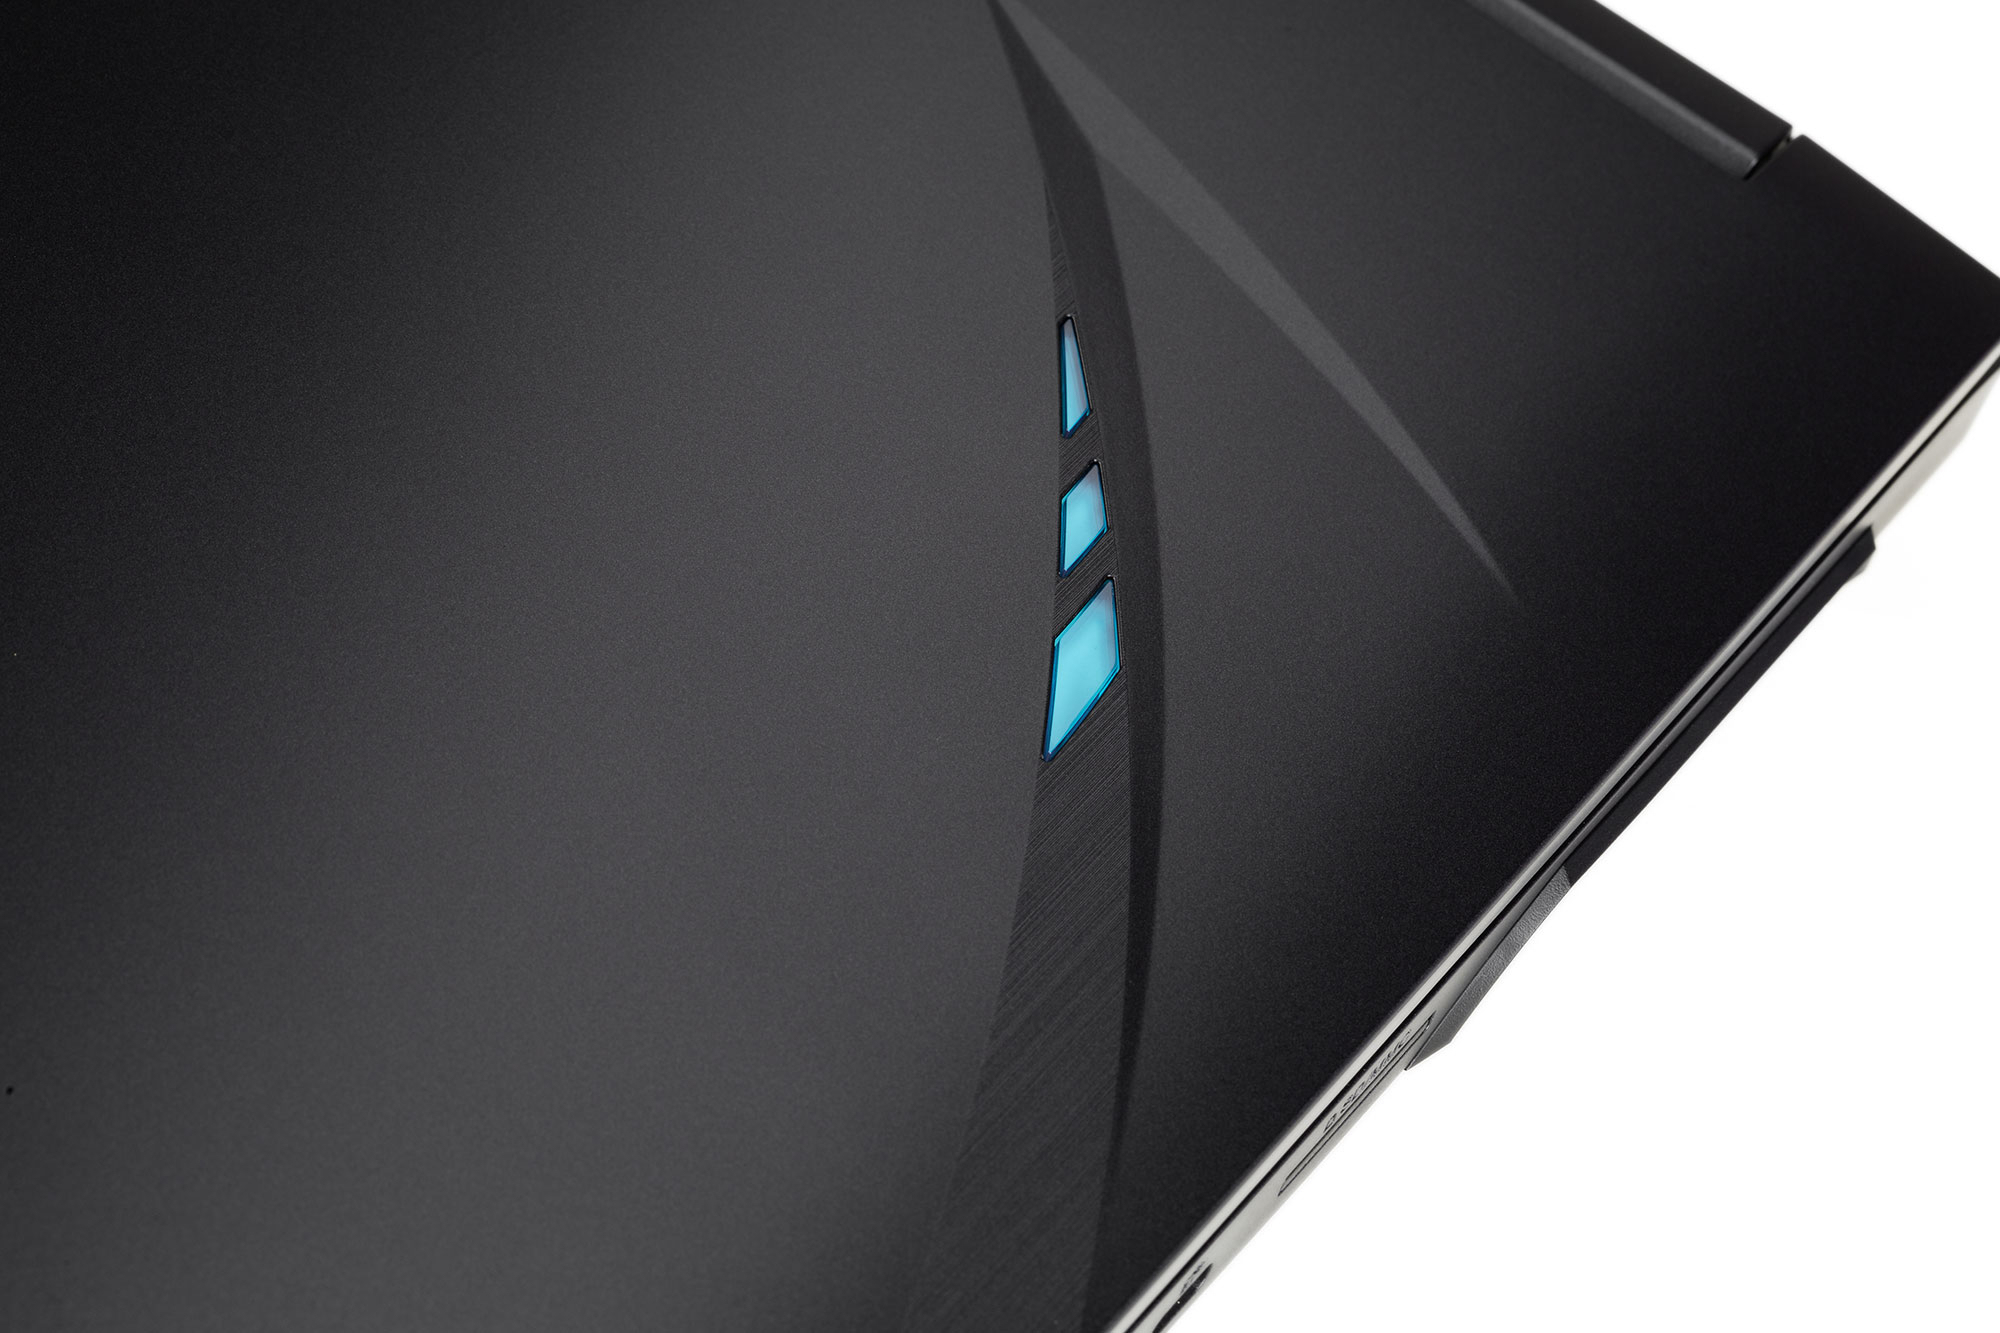
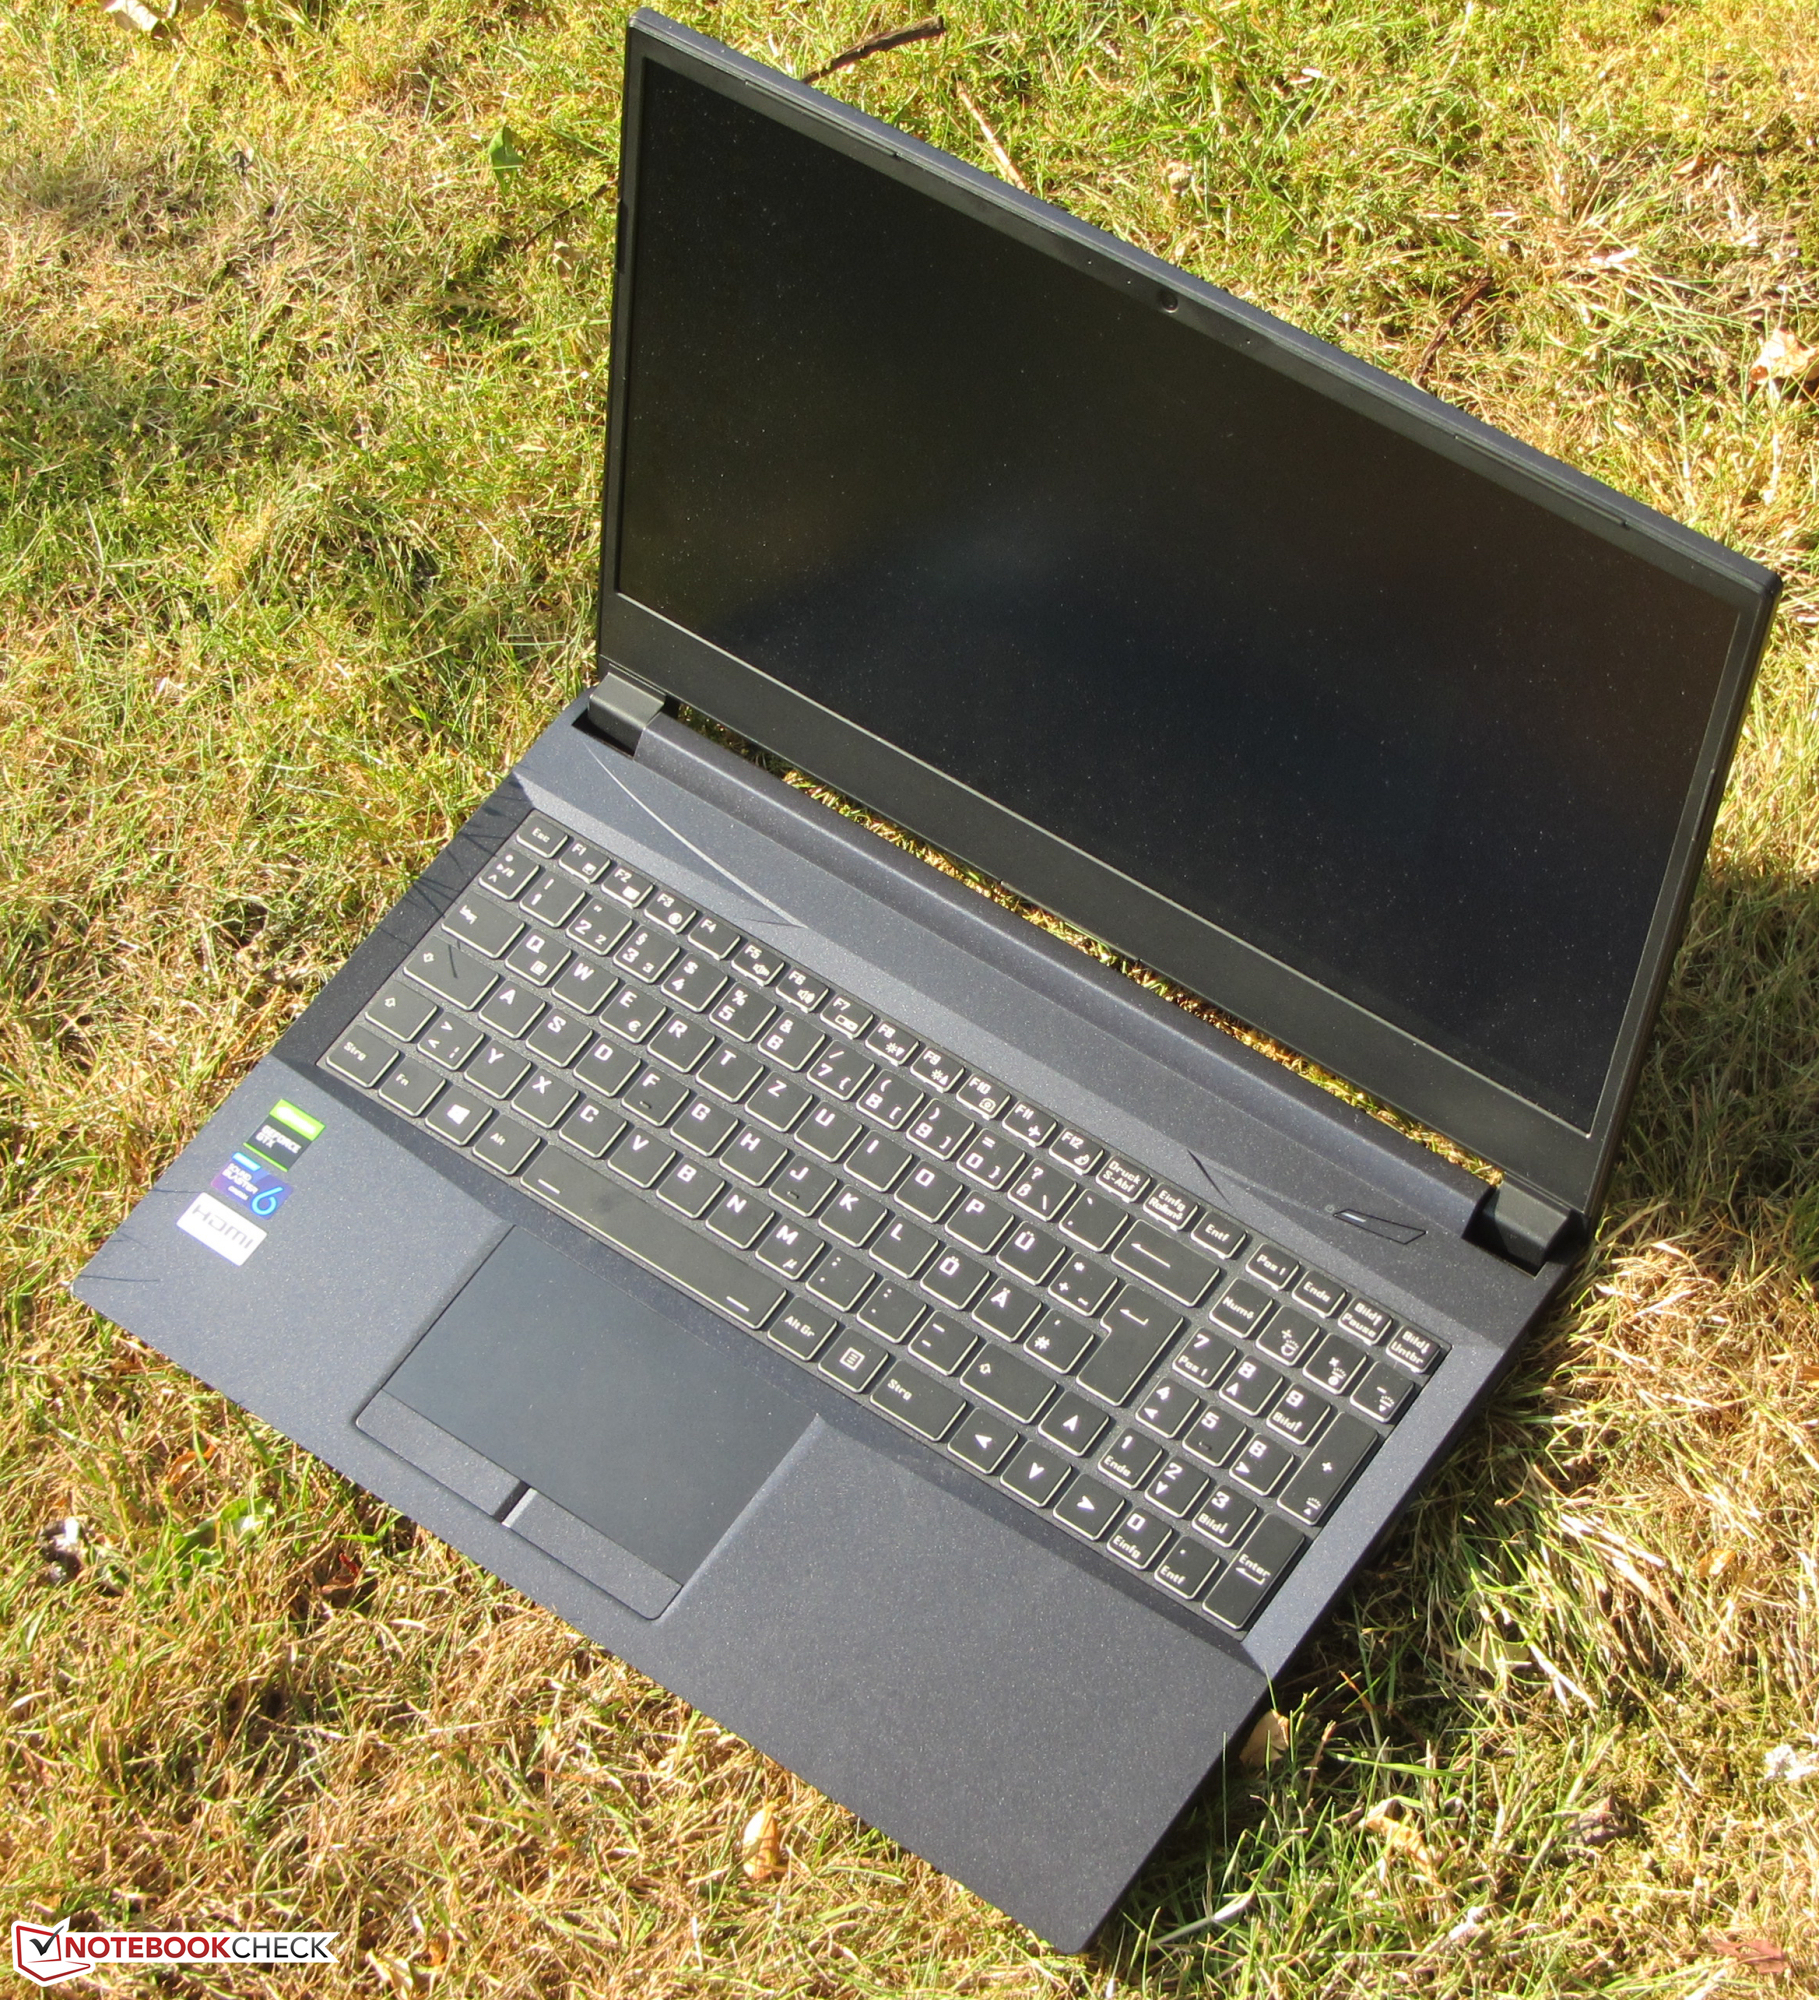
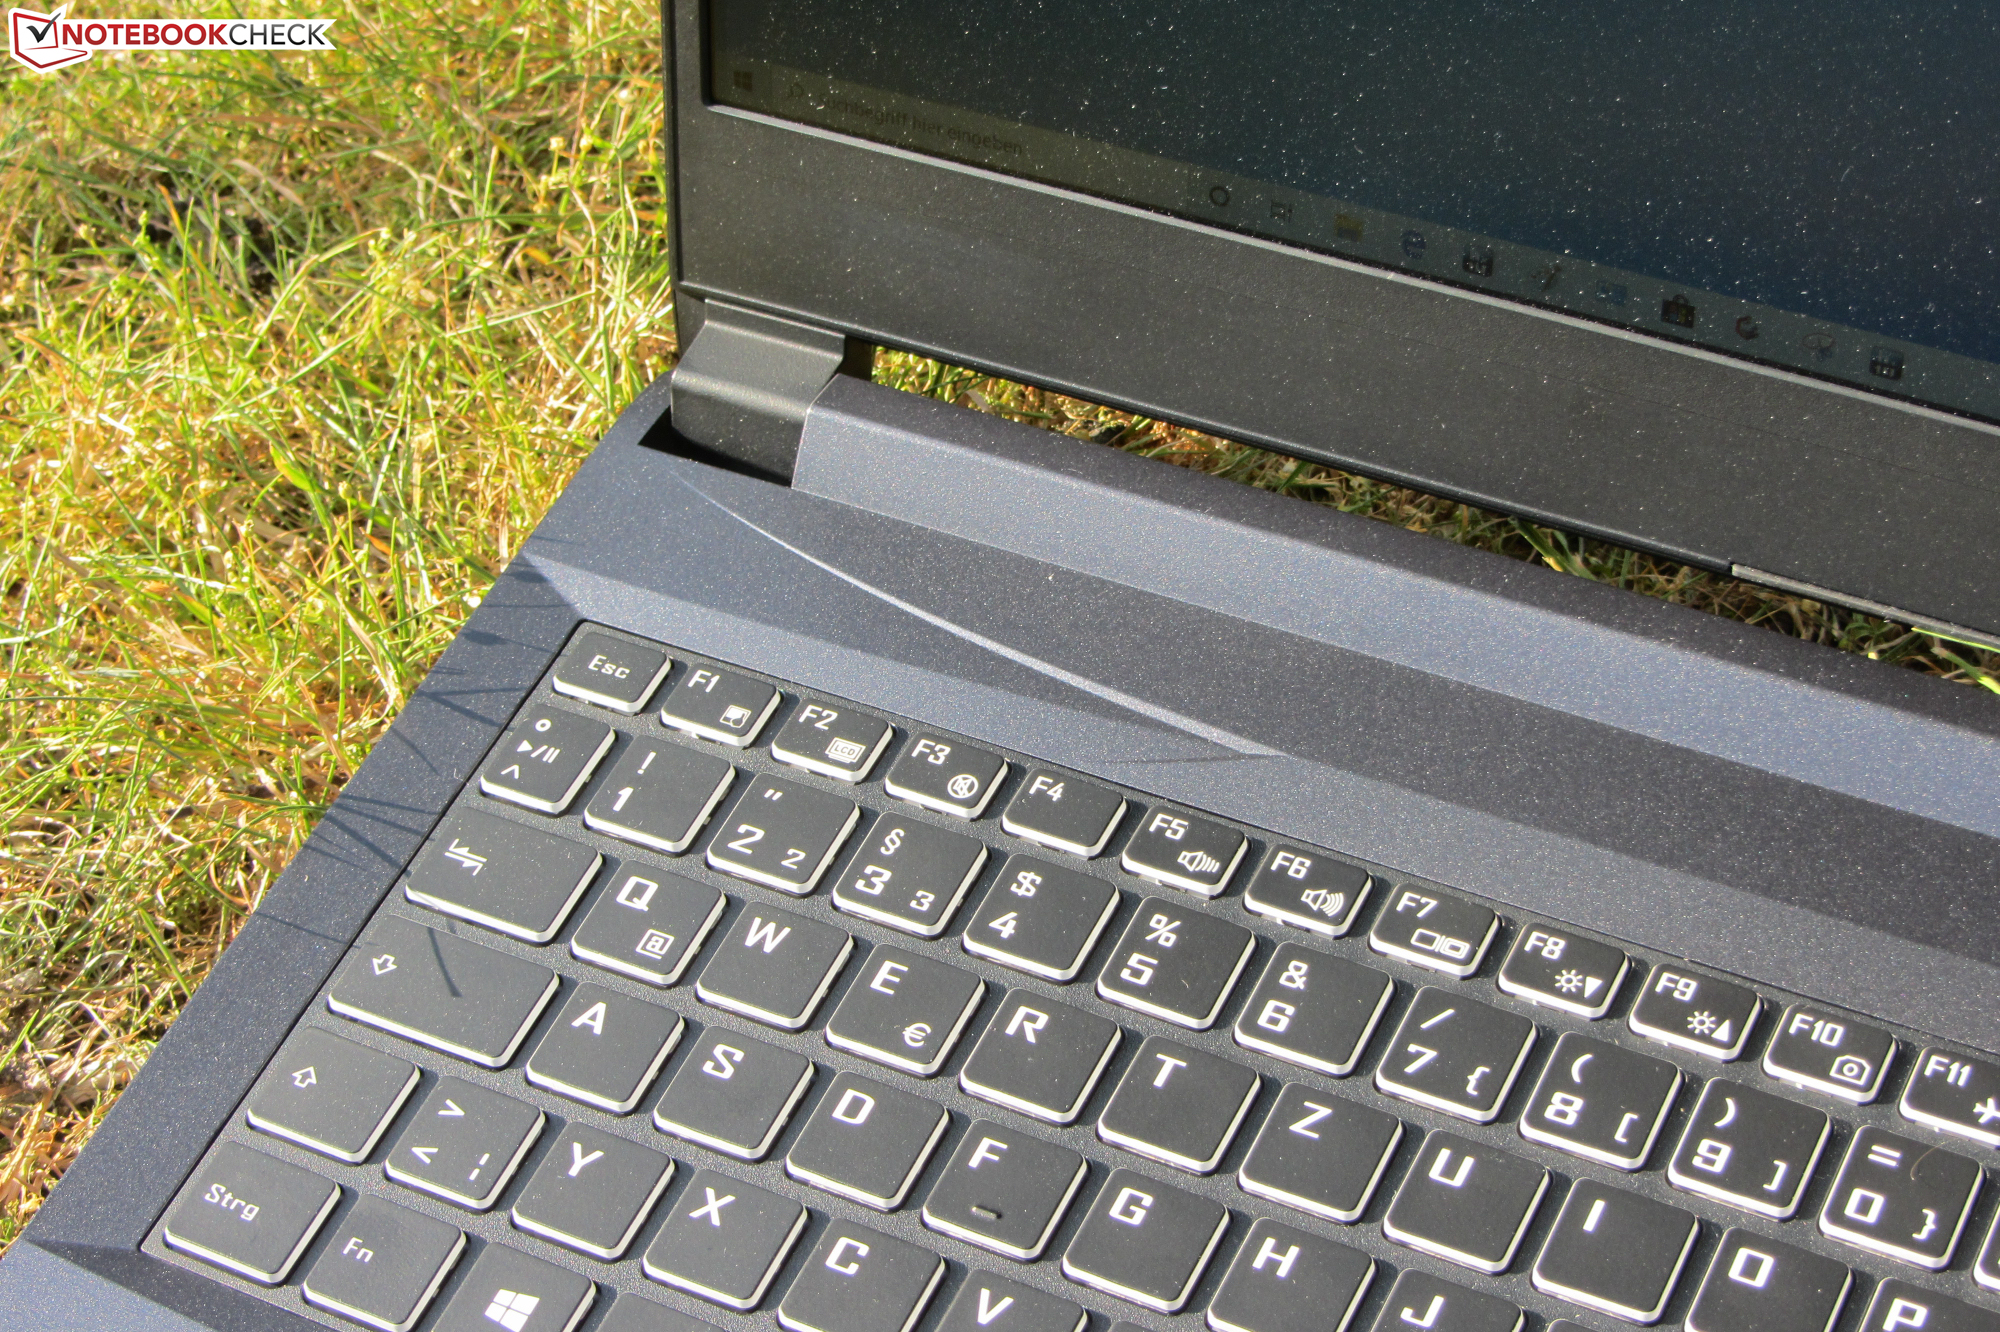
Case - Nexoc has chosen a sober look
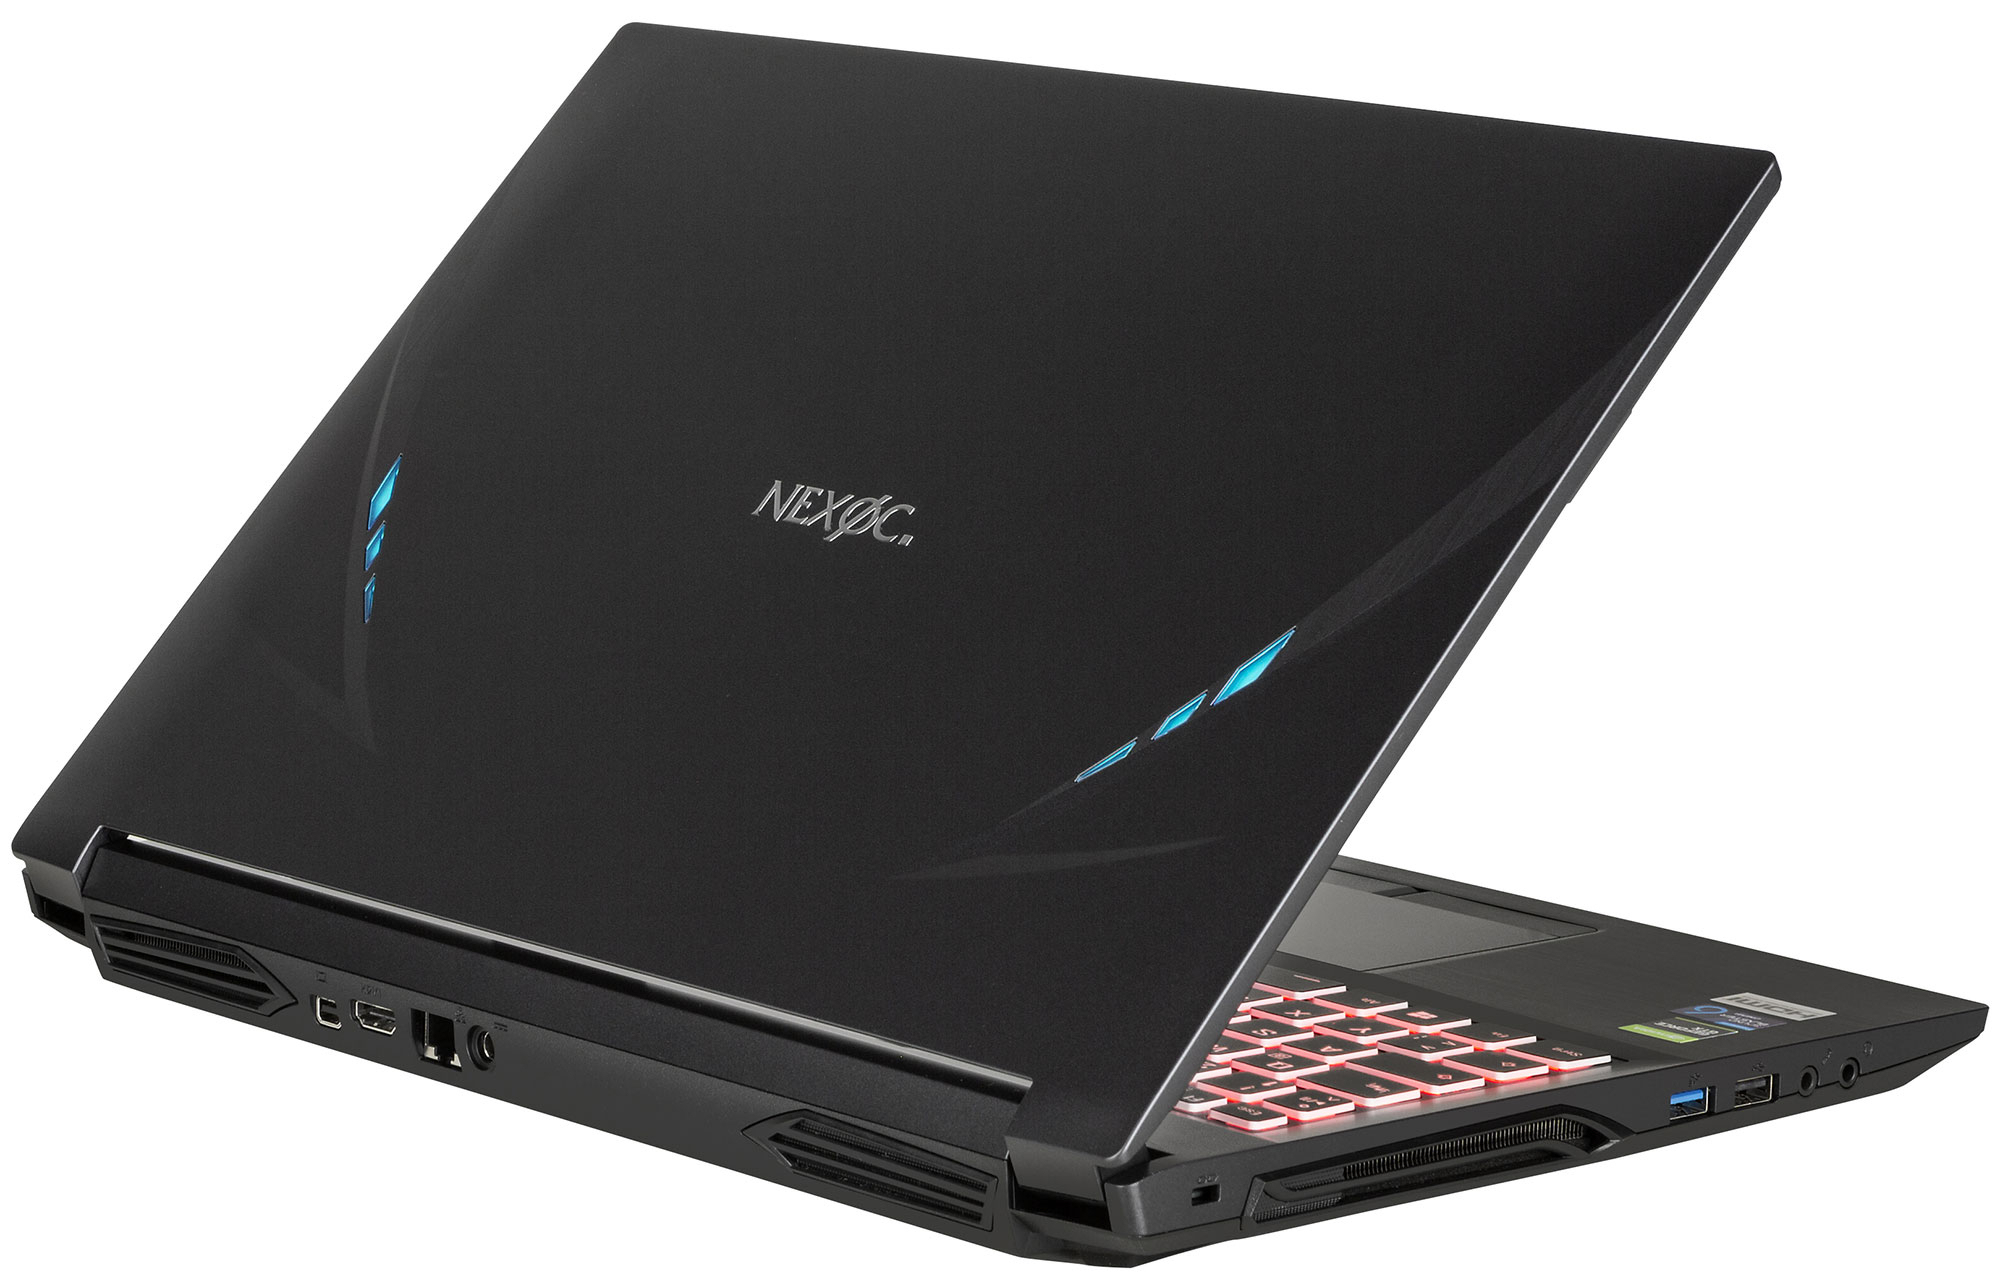
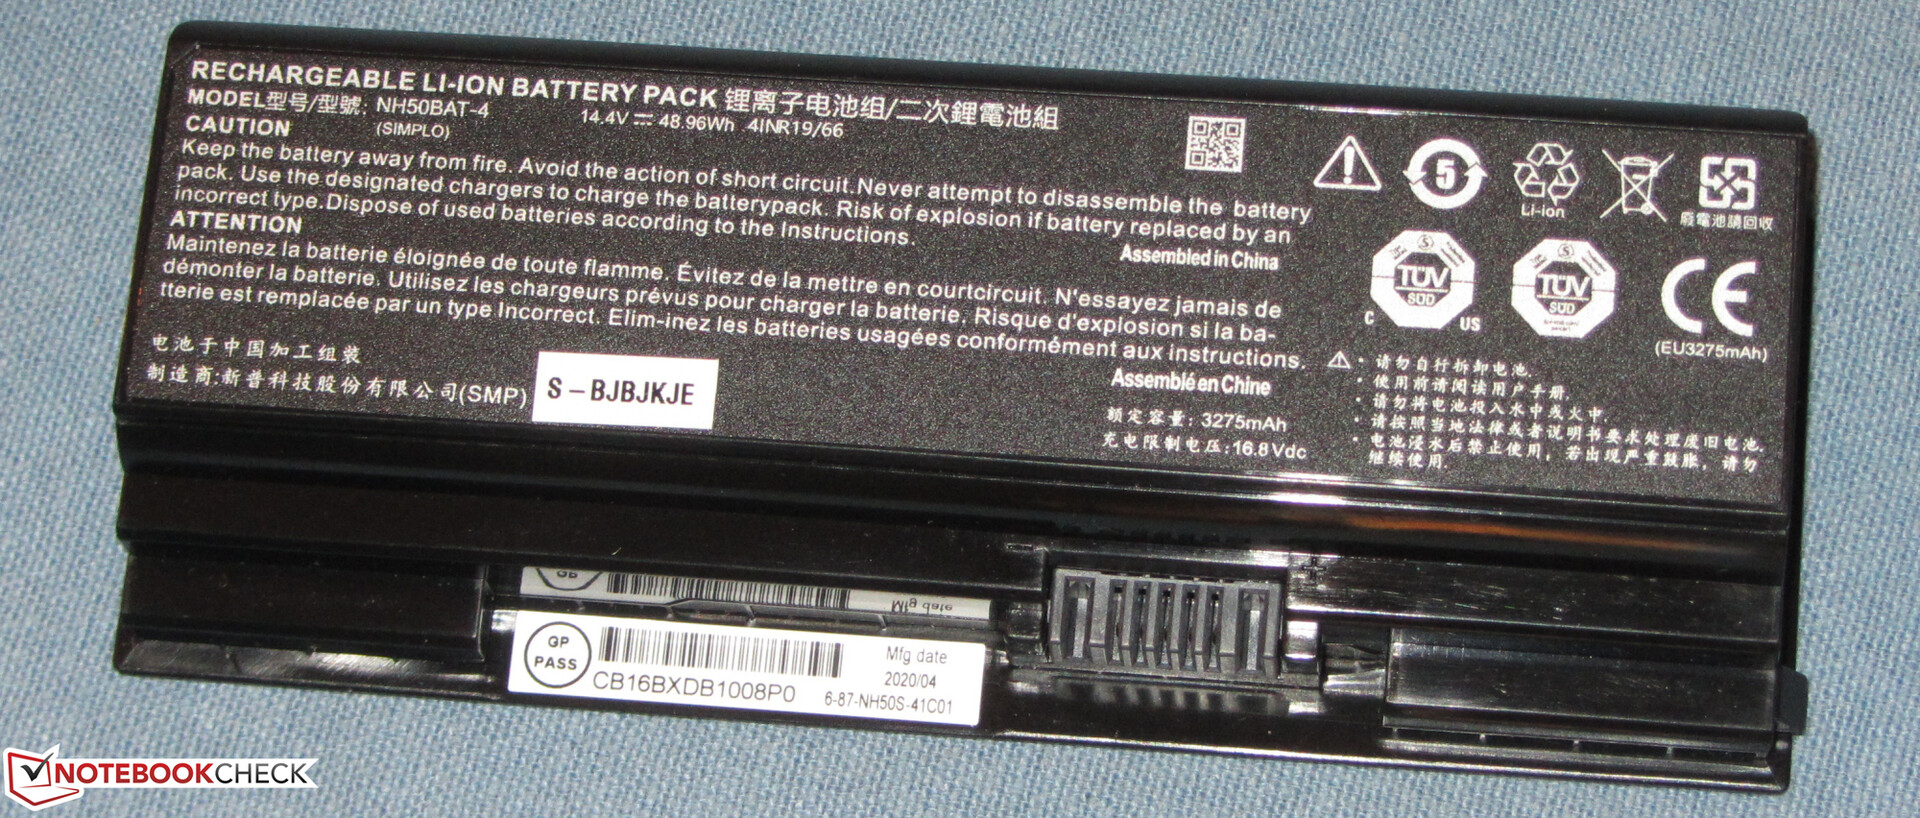
The black plastic case has a largely sober design and you'll look in vain for striking design features. Color accents are set by illuminated elements on the back of the lid. Nexoc has mainly relied on smooth surfaces. Only the palm rest has a texture that is supposed to imitate brushed metal. Furthermore, the battery isn't firmly installed and can be removed at any time without issues. On the other hand, the gaming laptop doesn't have a maintenance hatch. In order to get to the inside, the bottom cover has to be removed. More about this later.
The chassis is well manufactured. The gap dimensions are in order, and sharp edges aren't noticeable. The base unit can be twisted a bit, but the whole situation is kept within the limits. Moreover, the lid can be twisted to a larger extent. However, exerting pressure on the back of the lid doesn't lead to image distortions. The hinges hold the lid firmly in position and barely allow it to wobble. Opening the lid with one hand is possible.
In terms of size and weight, the GH5 is largely on a par with its competitors.
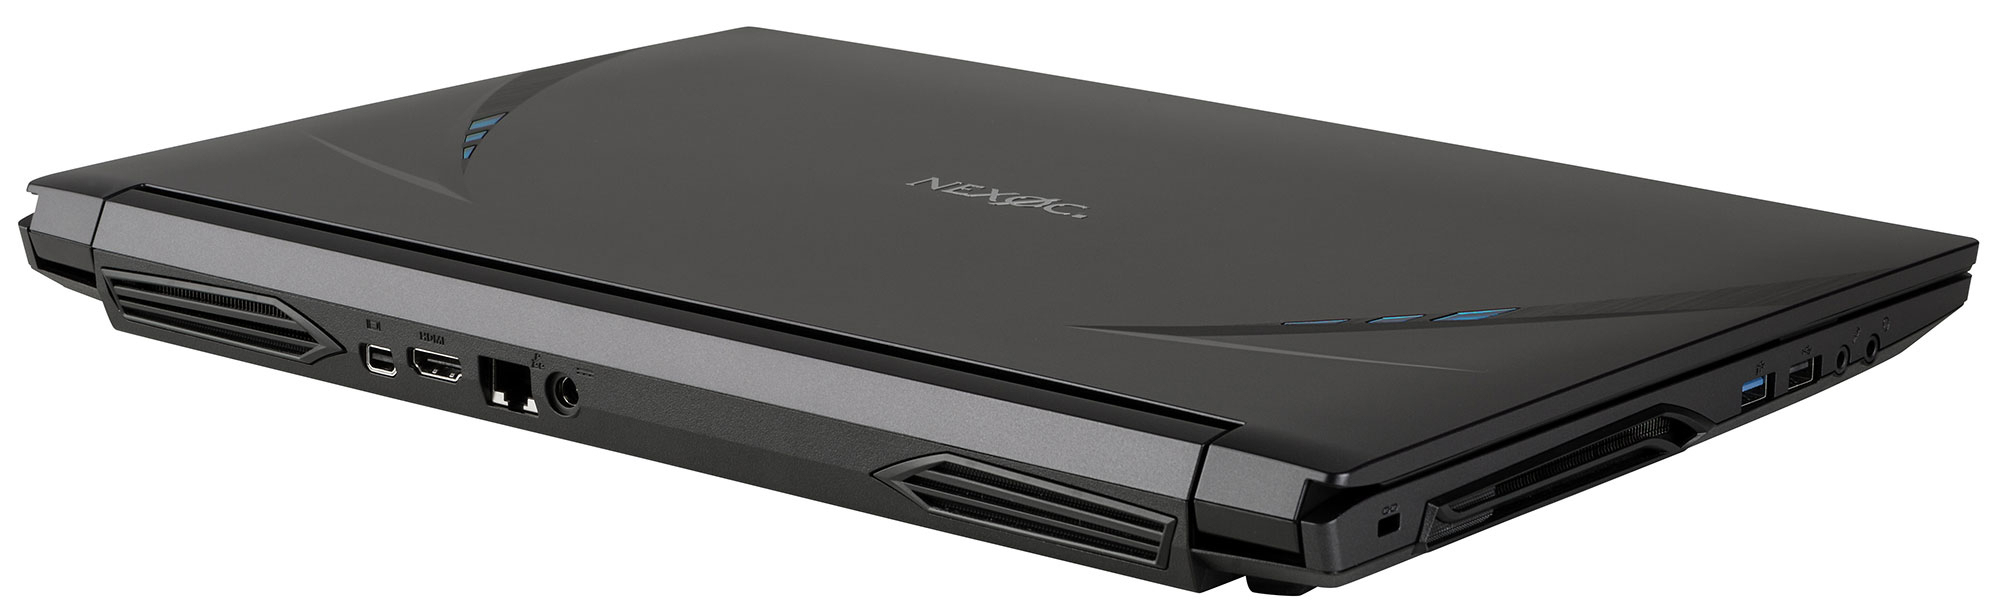
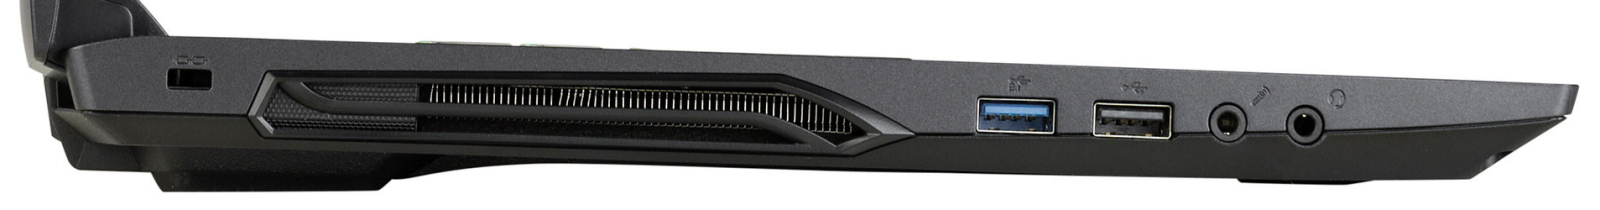
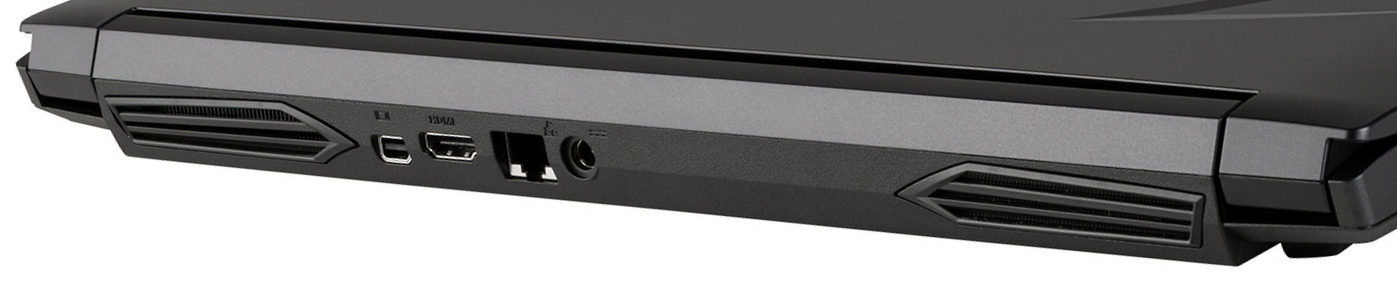
Connectivity - The GH5 doesn't offer Thunderbolt 3
The laptop offers a well-rounded port configuration. Each of the three USB Type-A ports supports a different standard - 1x USB 2.0, 1x USB 3.2 Gen 1, and 1x USB 3.2 Gen 2. The USB Type-C port (USB 3.2 Gen 2) is only used for data transfer or for connecting peripherals. It doesn't support DisplayPort via USB-C or Power Delivery. Furthermore, the GH5 provides two video outputs with its HDMI and Mini DisplayPort connections. This is accompanied by a Gigabit Ethernet port and two audio connections (combo audio, microphone input).
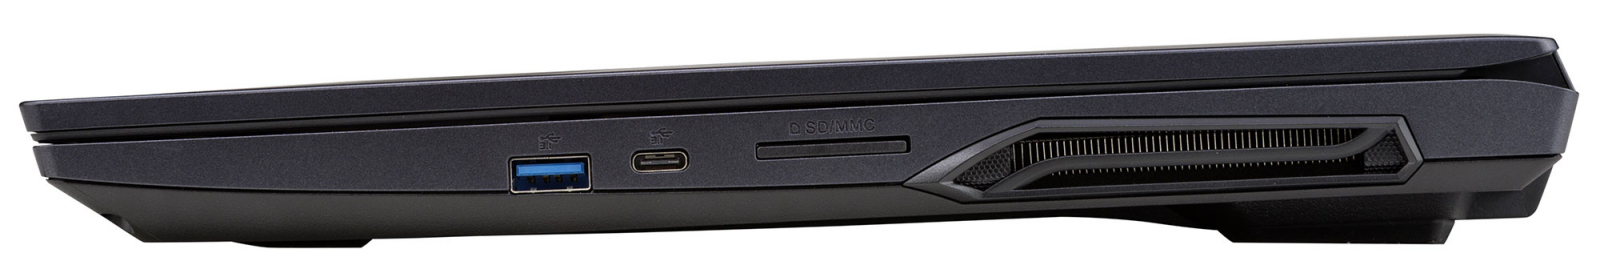
SD card reader
SD cards fit almost completely into the memory card reader and are locked in place. With respective transfer speeds of 86 MB/s (copying large data blocks) and 81 MB/s (transferring 250 jpg image files of about 5 MB each), the model installed here is one of the faster representatives of its kind. We test memory card readers using a reference card (the 64 GB Toshiba Exceria Pro SDXC UHS-II).
| SD Card Reader | |
| average JPG Copy Test (av. of 3 runs) | |
| Average of class Gaming (20.9 - 210, n=54, last 2 years) | |
| Nexoc GH5 515IG (Toshiba Exceria Pro SDXC 64 GB UHS-II) | |
| HP Pavilion Gaming 15-ec0002ng (Toshiba Exceria Pro SDXC 64 GB UHS-II) | |
| Dell G3 3590 (Toshiba Exceria Pro SDXC 64 GB UHS-II) | |
| maximum AS SSD Seq Read Test (1GB) | |
| Average of class Gaming (25.5 - 261, n=51, last 2 years) | |
| Nexoc GH5 515IG (Toshiba Exceria Pro SDXC 64 GB UHS-II) | |
| HP Pavilion Gaming 15-ec0002ng (Toshiba Exceria Pro SDXC 64 GB UHS-II) | |
| Dell G3 3590 (Toshiba Exceria Pro SDXC 64 GB UHS-II) | |
Communication
Nexoc uses a WLAN chip (AX201) from Intel that supports the 802.11a/b/g/n/ac/ax WLAN standards. The transmission speeds determined under optimal conditions (no other WLAN devices nearby, short distance between laptop and server PC) are excellent. In addition, wired network connections are handled by a representative of Realtek's well-known RTL8168/8111 family, and it performs its tasks smoothly.
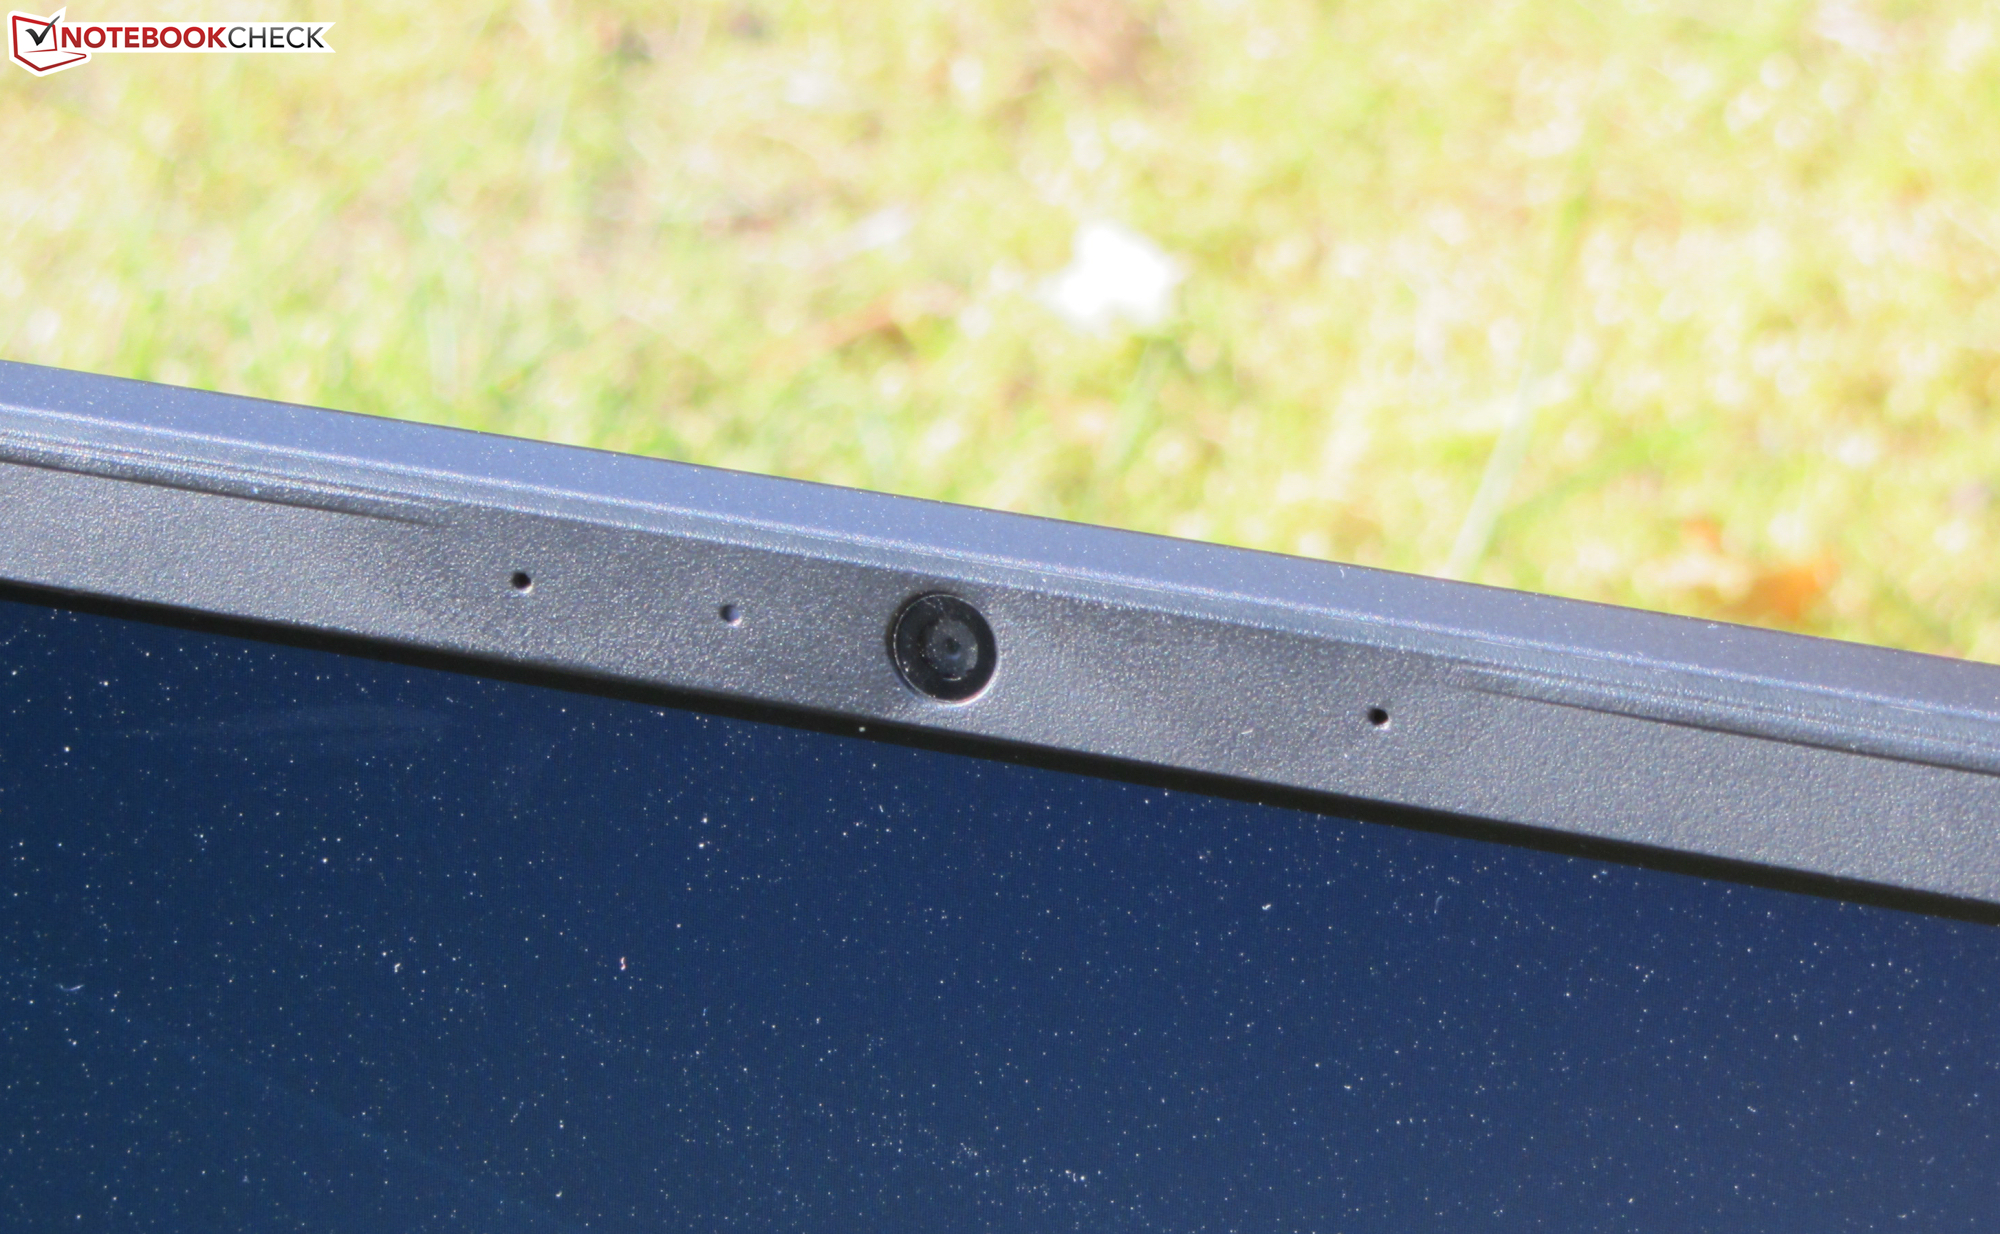
Webcam
The webcam (0.9 MP; max. 1280x720 pixels) can't stand out from other models in terms of image quality. The color accuracy is not convincing. With a color deviation of almost 12, the target (Delta E less than 3) is clearly missed.


Accessories
Besides the usual documents (quick-start guide, warranty information), the laptop comes with a driver DVD.
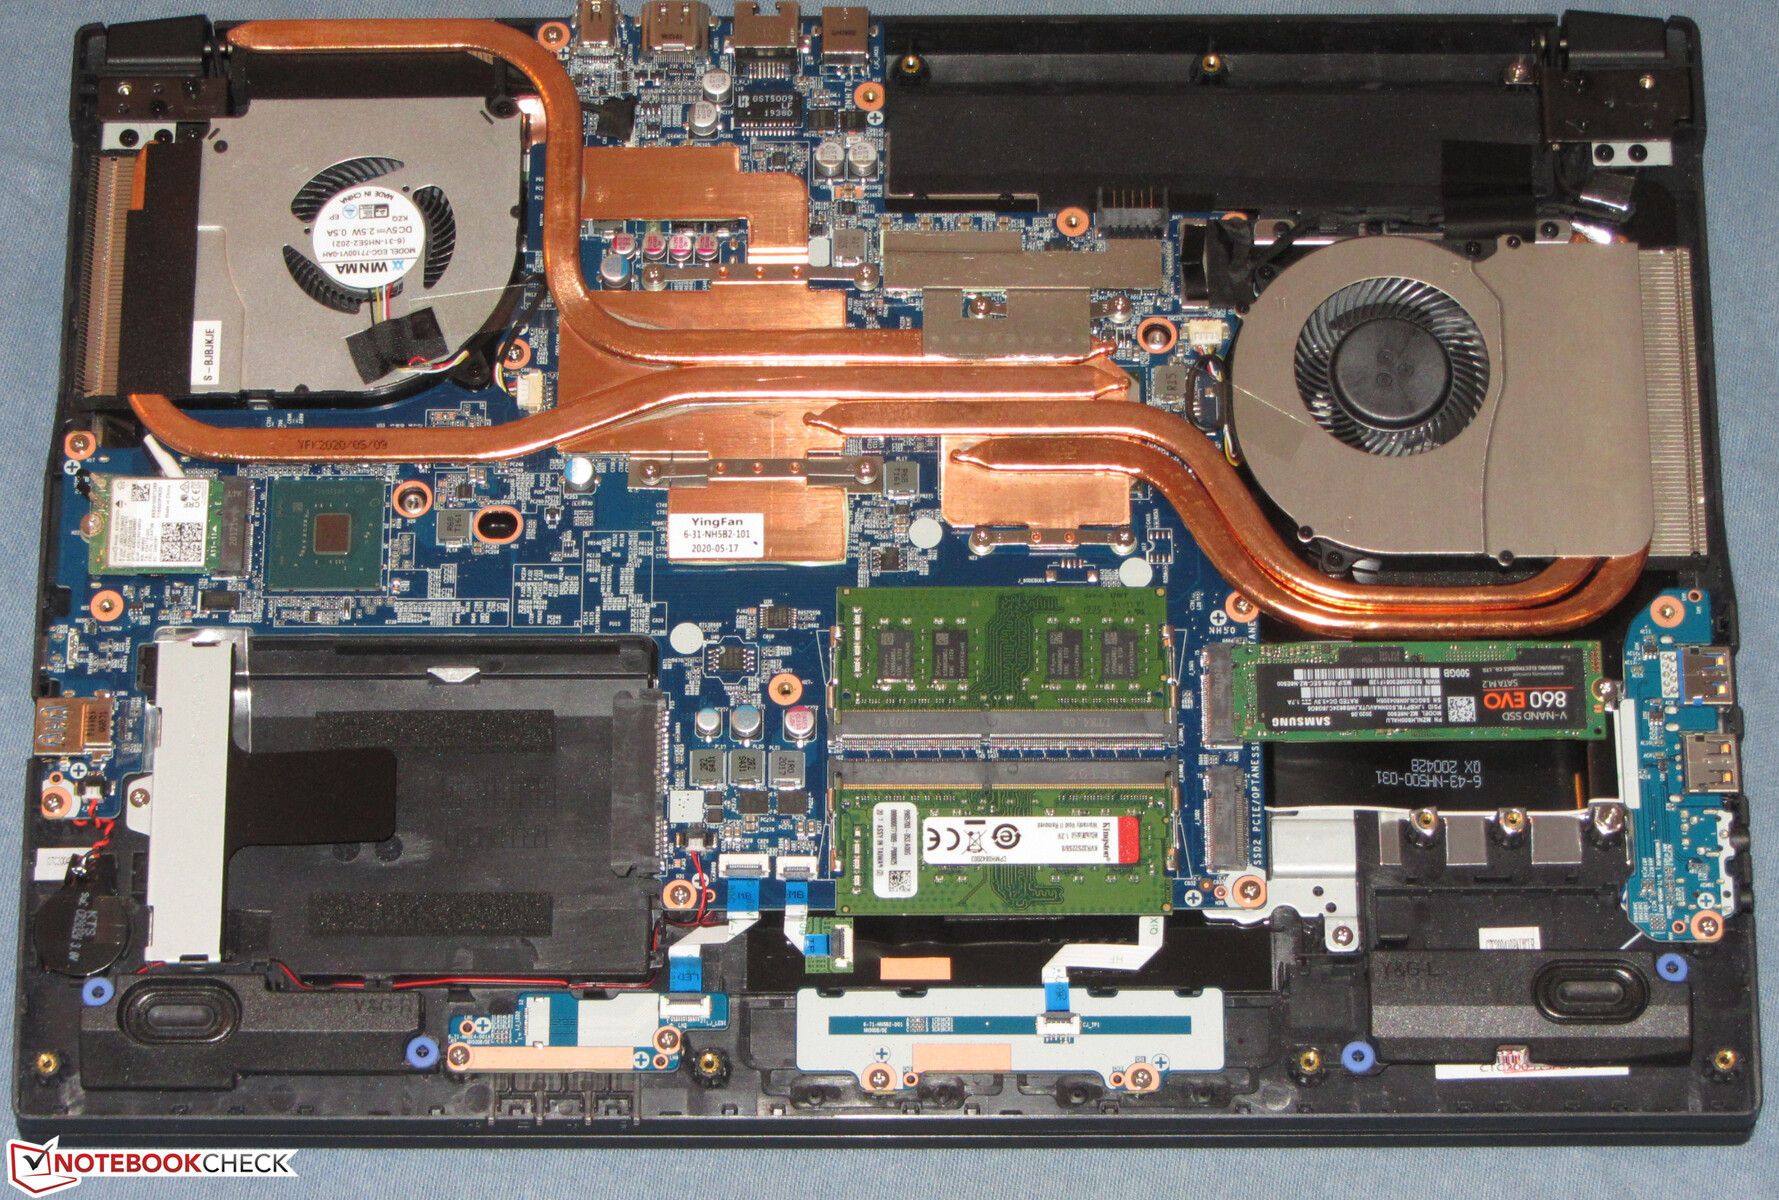
Maintenance
The Nexoc laptop doesn't have a maintenance hatch. To get to the inside, the bottom cover needs to be detached. In order to do this, all screws on the underside of the device have to be removed. Attention: The battery compartment also contains screws that need to be loosened! The bottom cover can then be lifted with the aid of a flat spatula. It sits quite tightly in its place.
Warranty
Nexoc grants the GH5 a two-year warranty. Moreover, we couldn't find any warranty extensions.
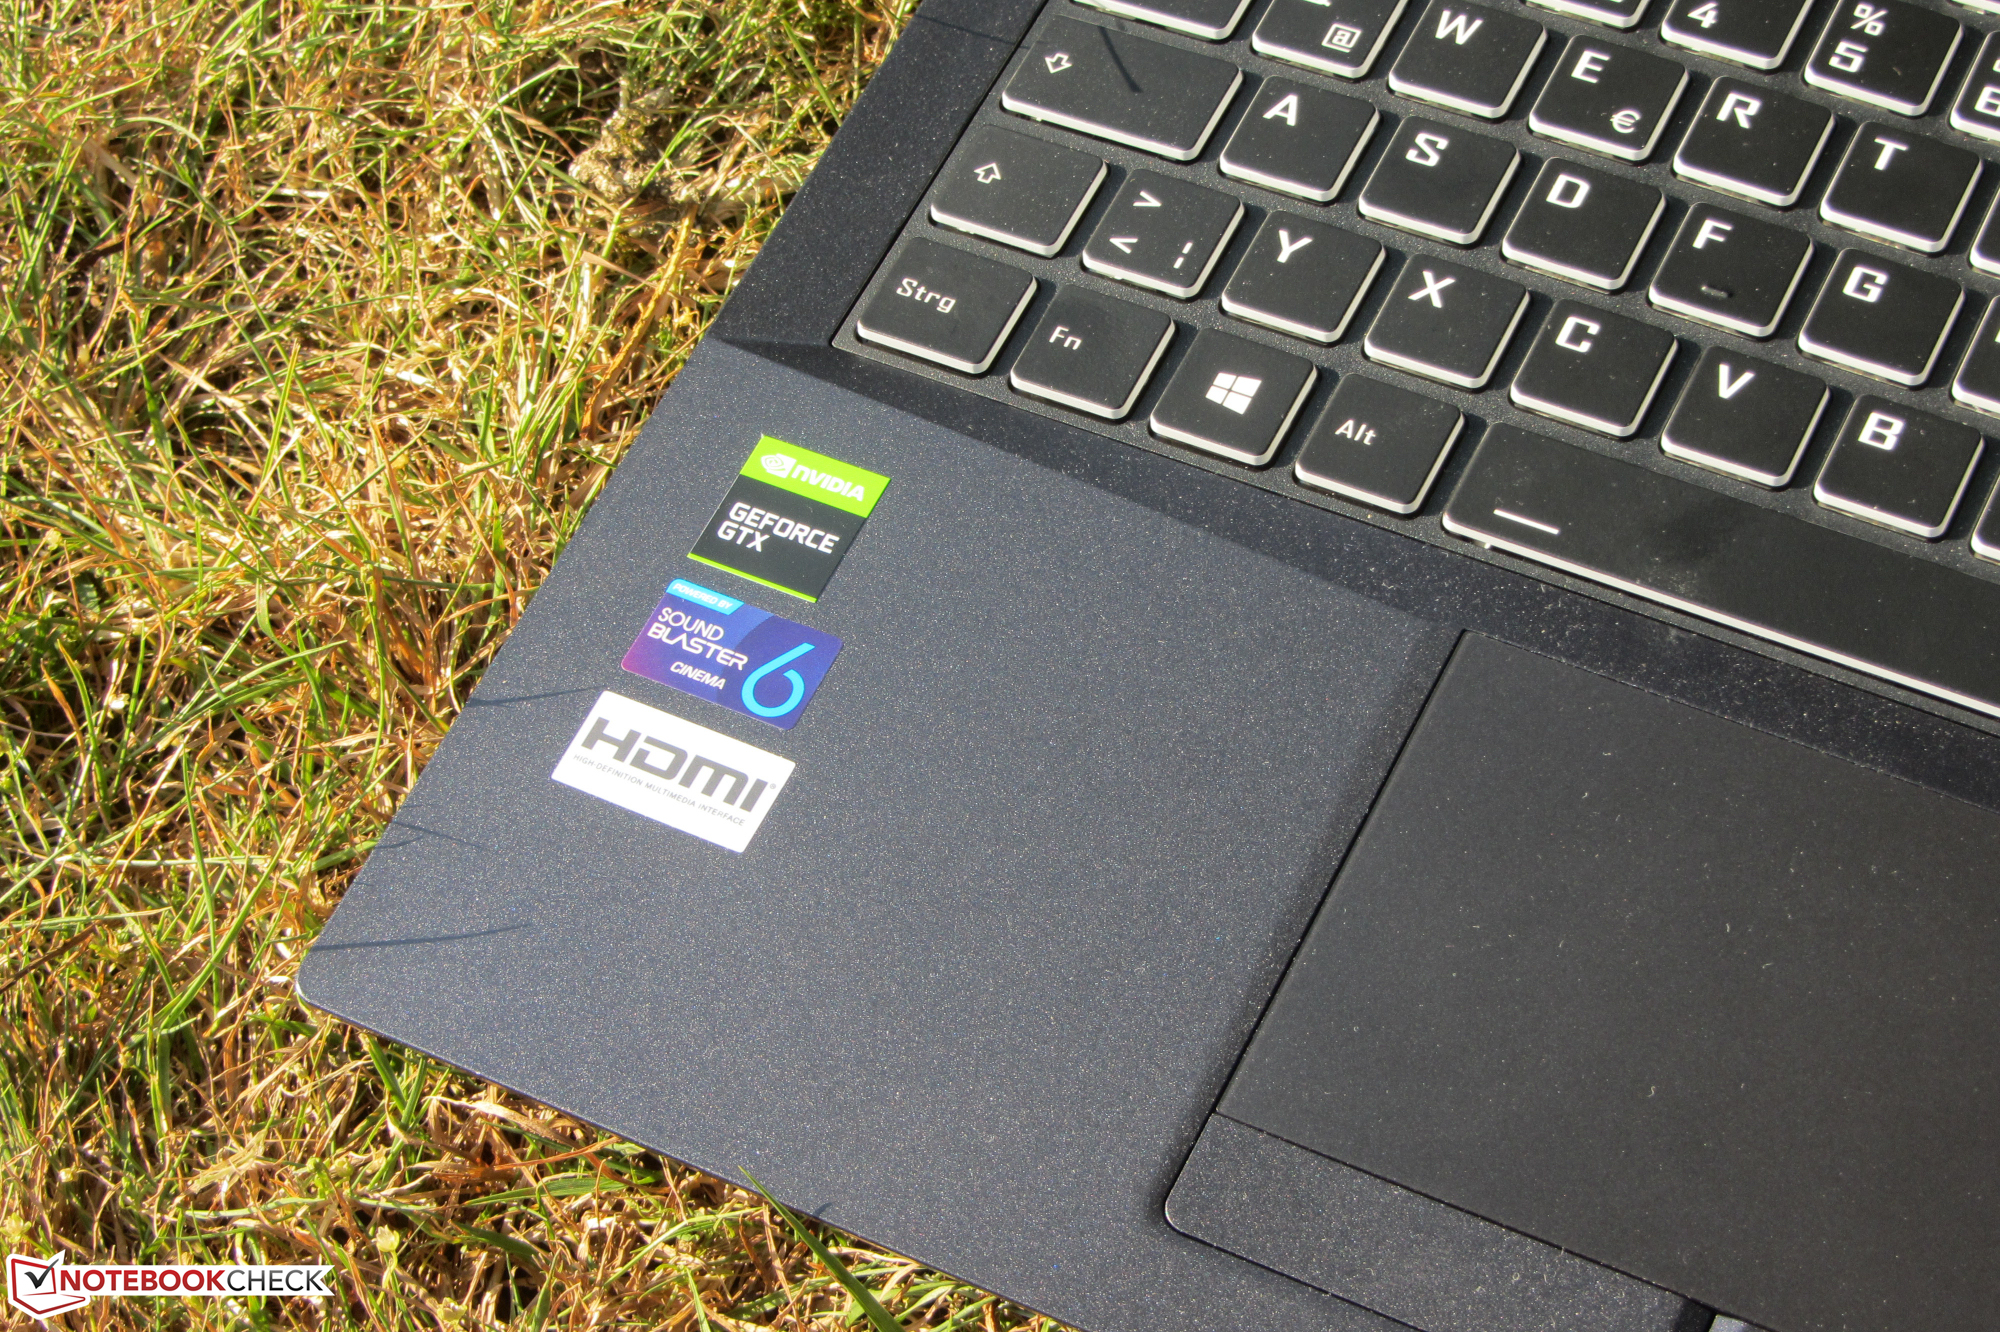
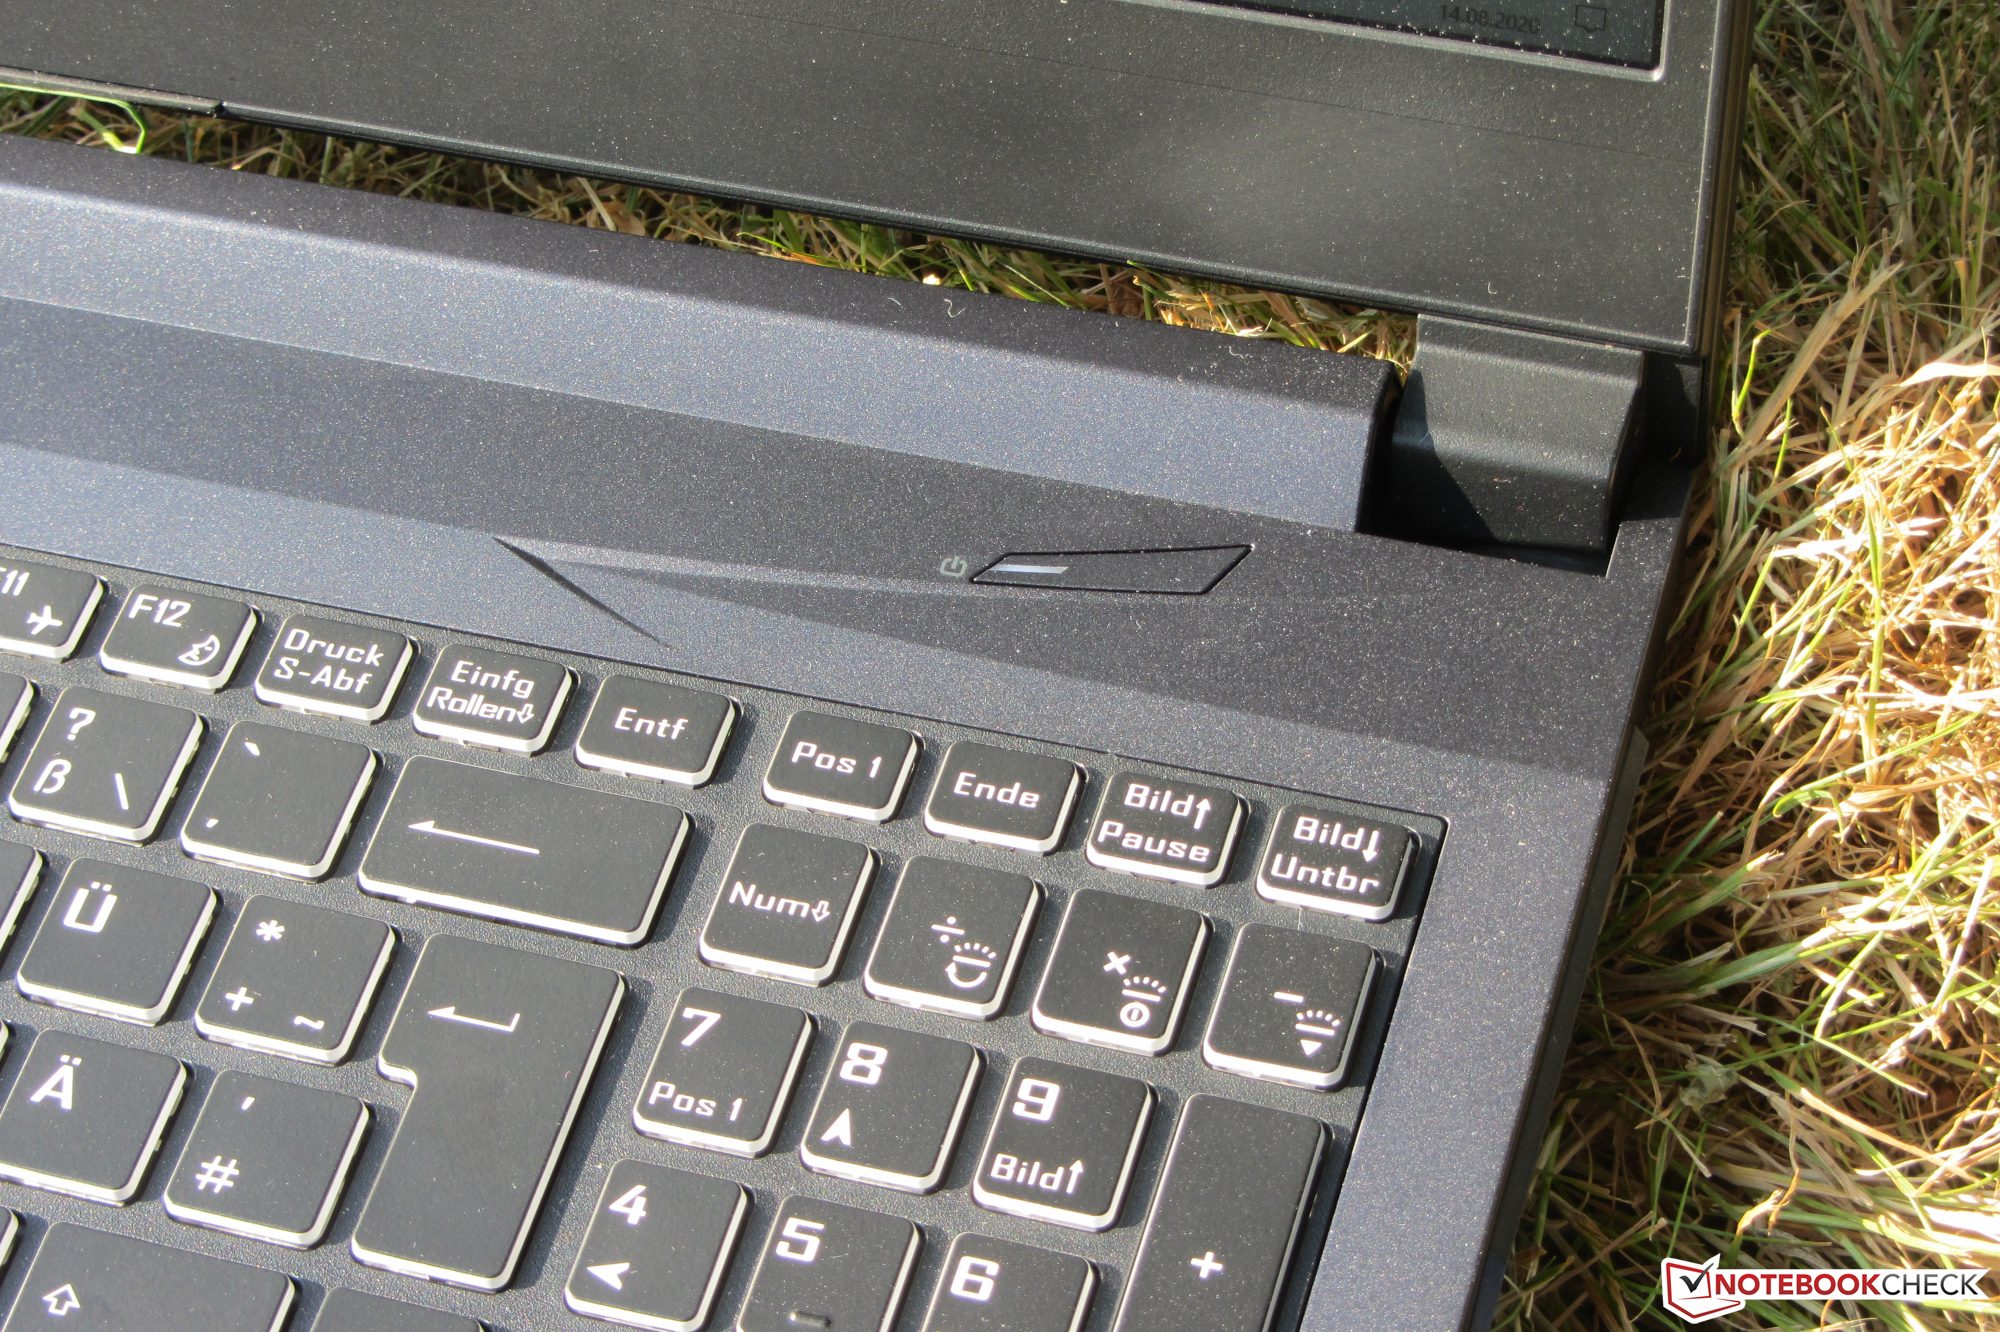
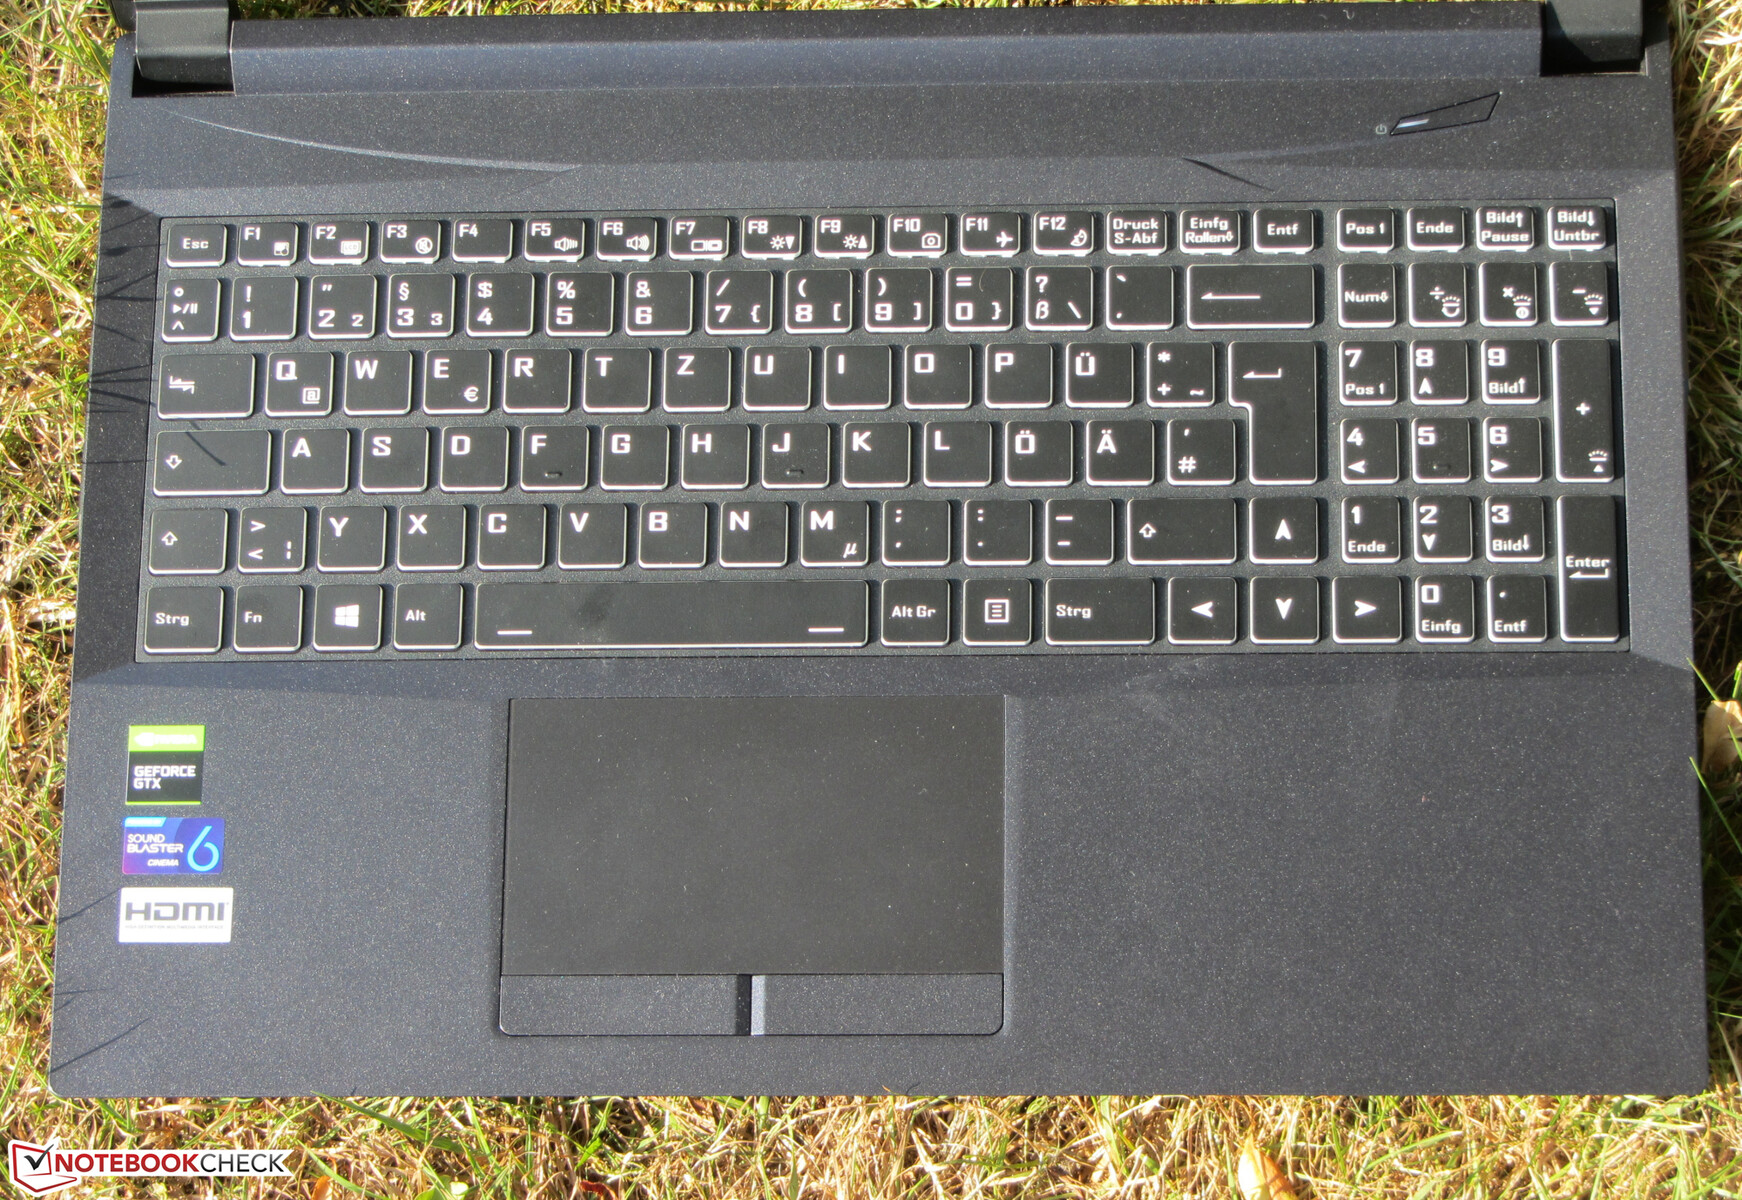
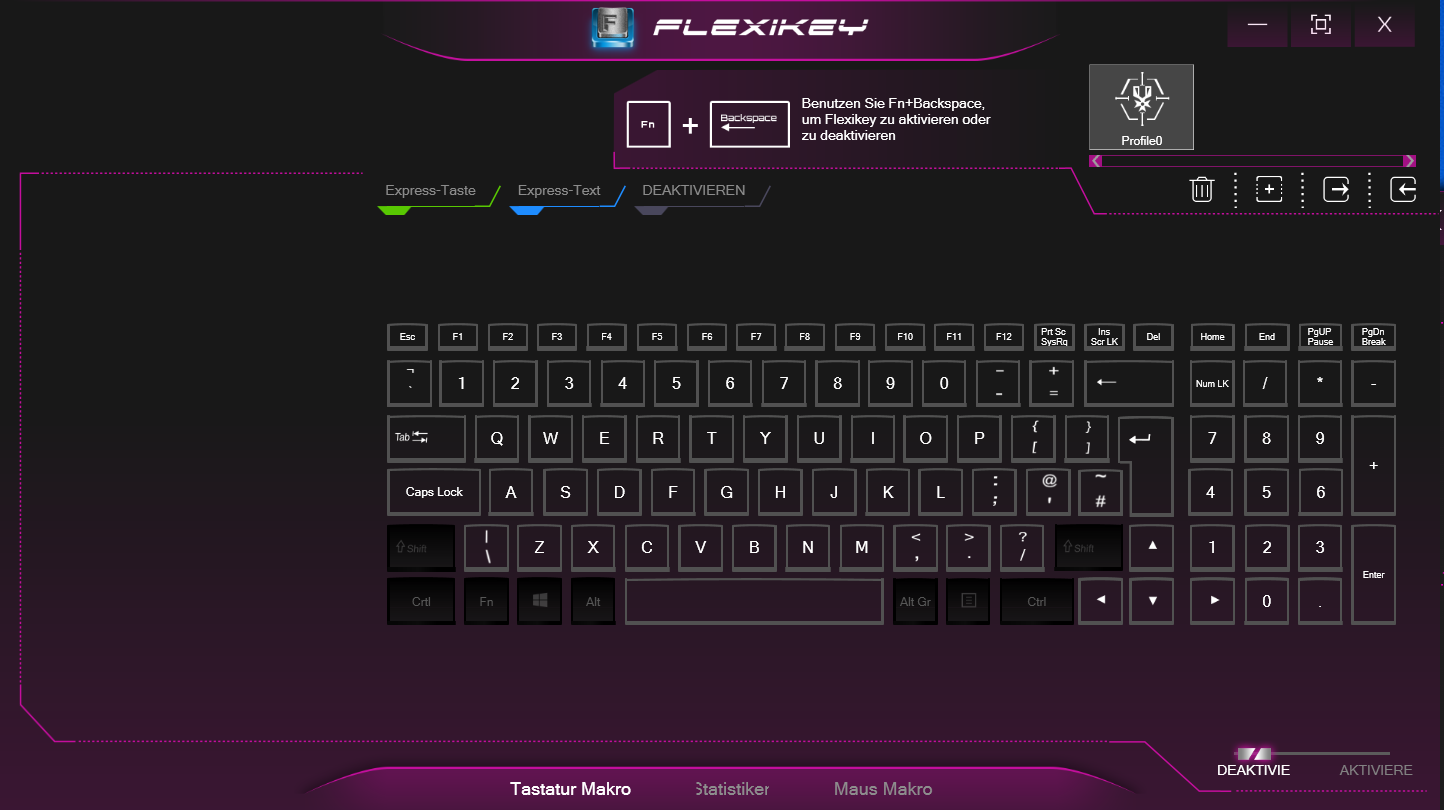
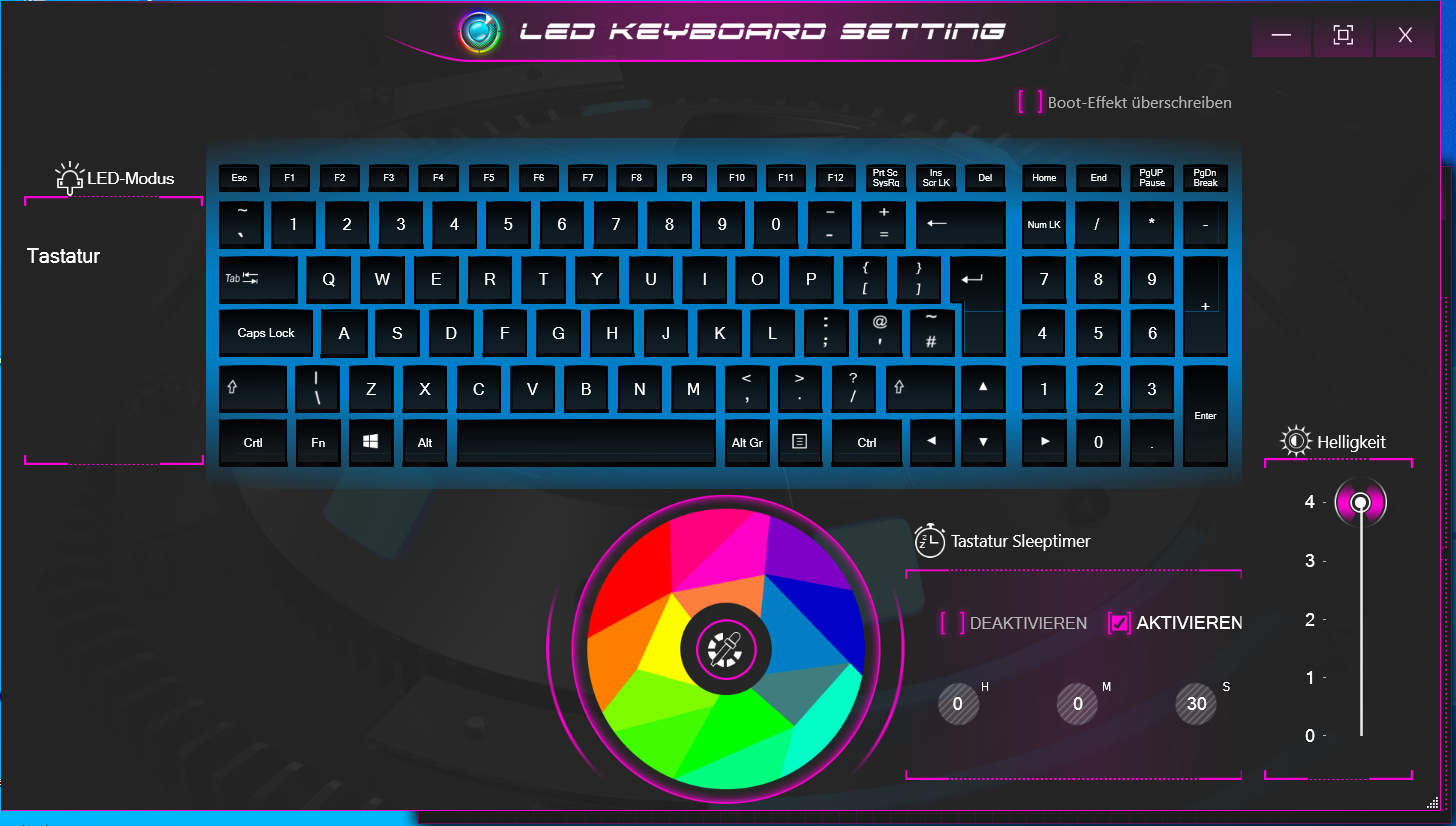
Input devices - RGB lighting on board
Keyboard
The flat, smooth keys of the backlit chiclet keyboard have a medium travel and a clear pressure point. However, the resistance offered by the keys could be firmer for our taste. At best, the keyboard yields slightly during typing. This didn't prove to be annoying, though. Overall, Nexoc delivers a keyboard suitable for everyday use here.
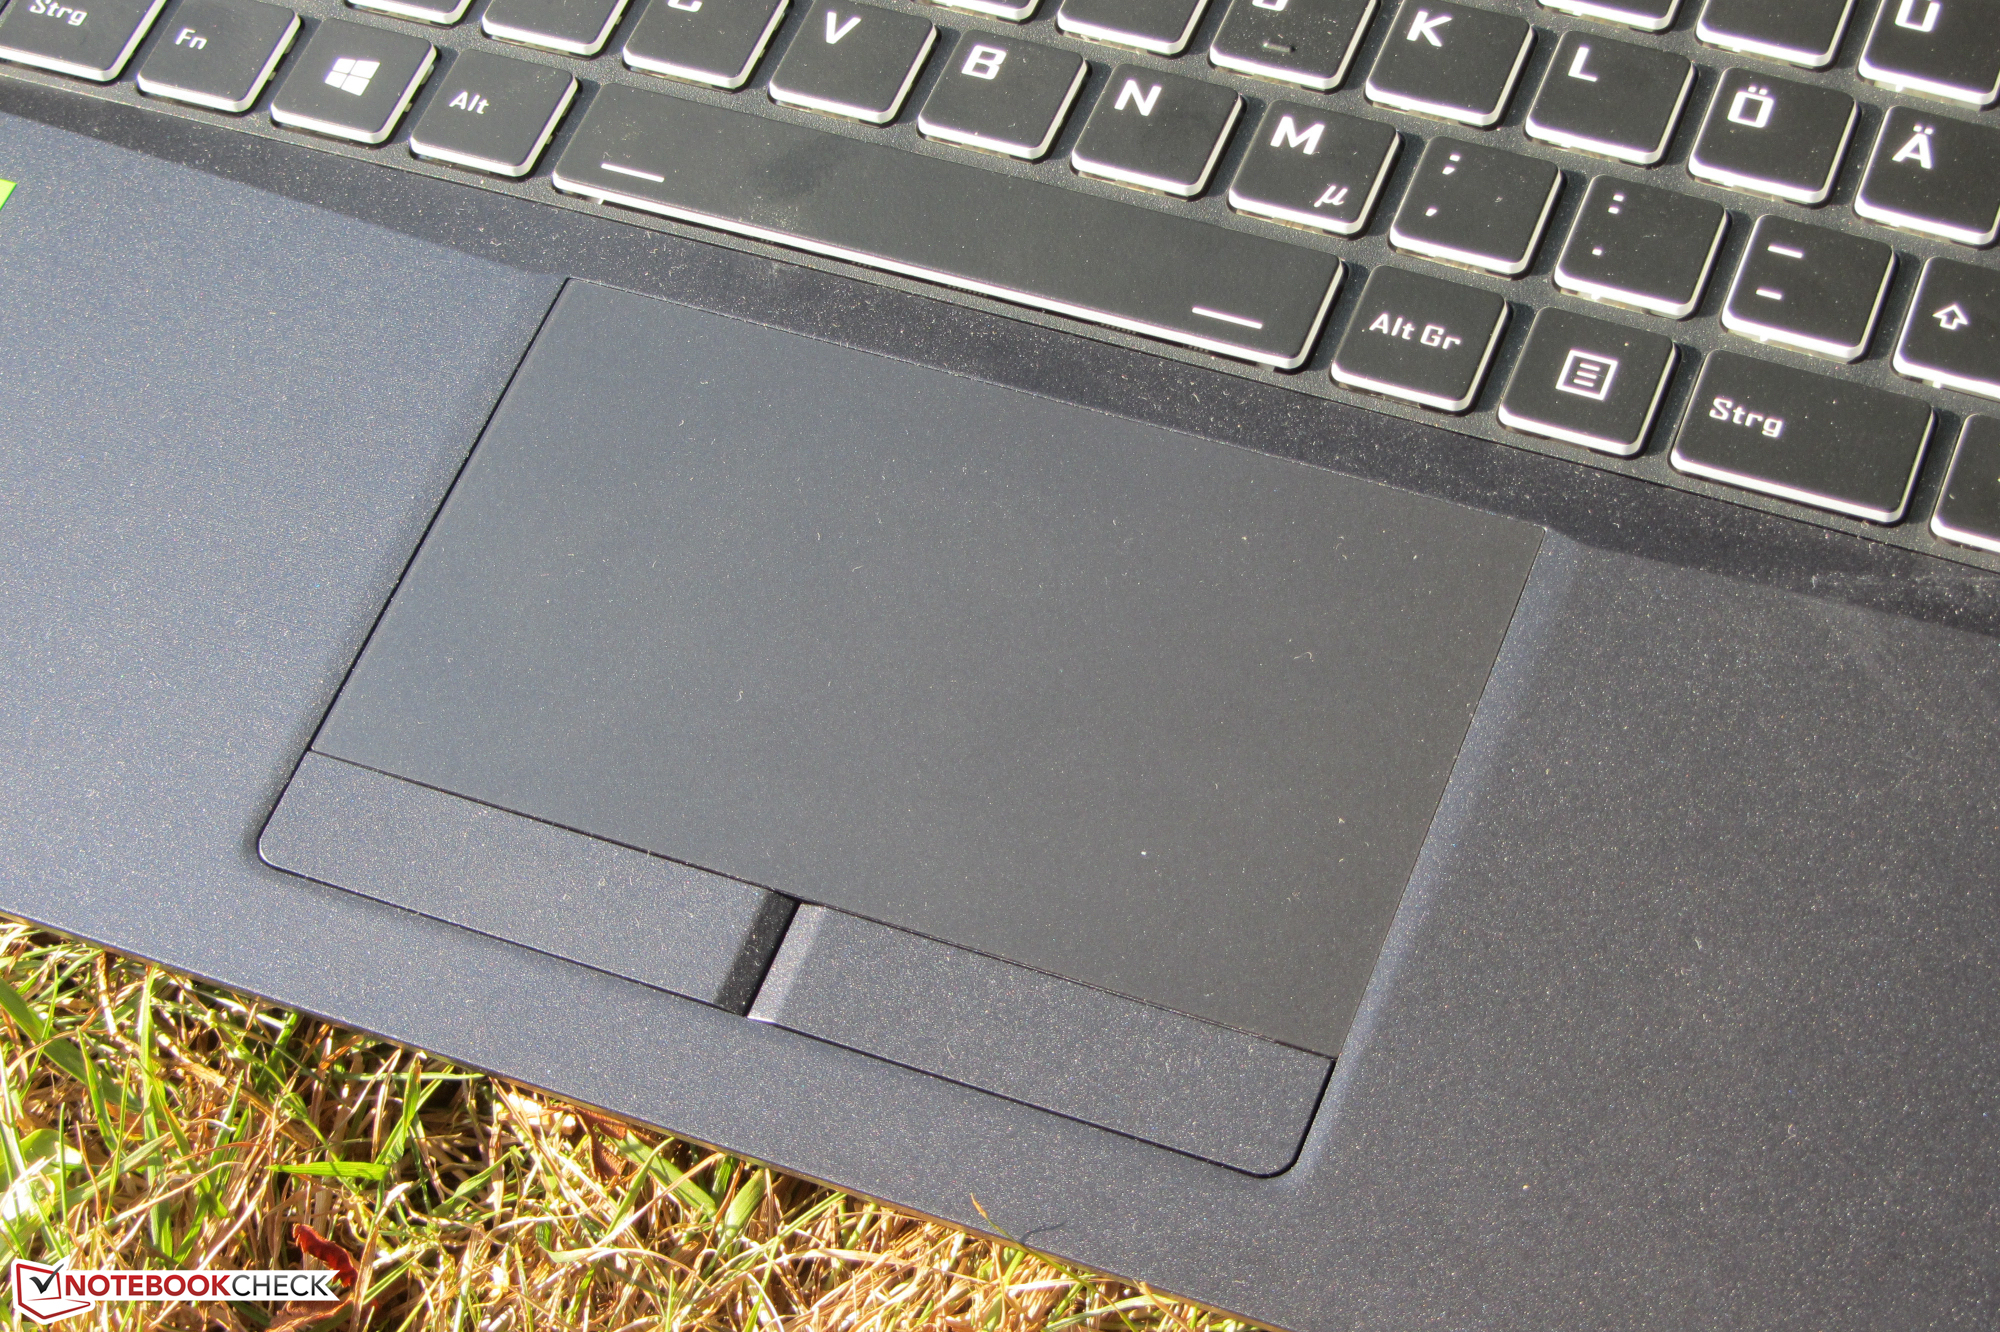
Touchpad
The multi-touch capable touchpad takes up an area of about 11 x 6.3 cm. As a result, a lot of space is available for using gesture controls. The smooth pad surface makes it easy for the fingers to glide on it. In addition, the pad also reacts to input in the corners. The two separate mouse buttons below the pad provide a short travel and a clear pressure point.
Display - Dim IPS panel
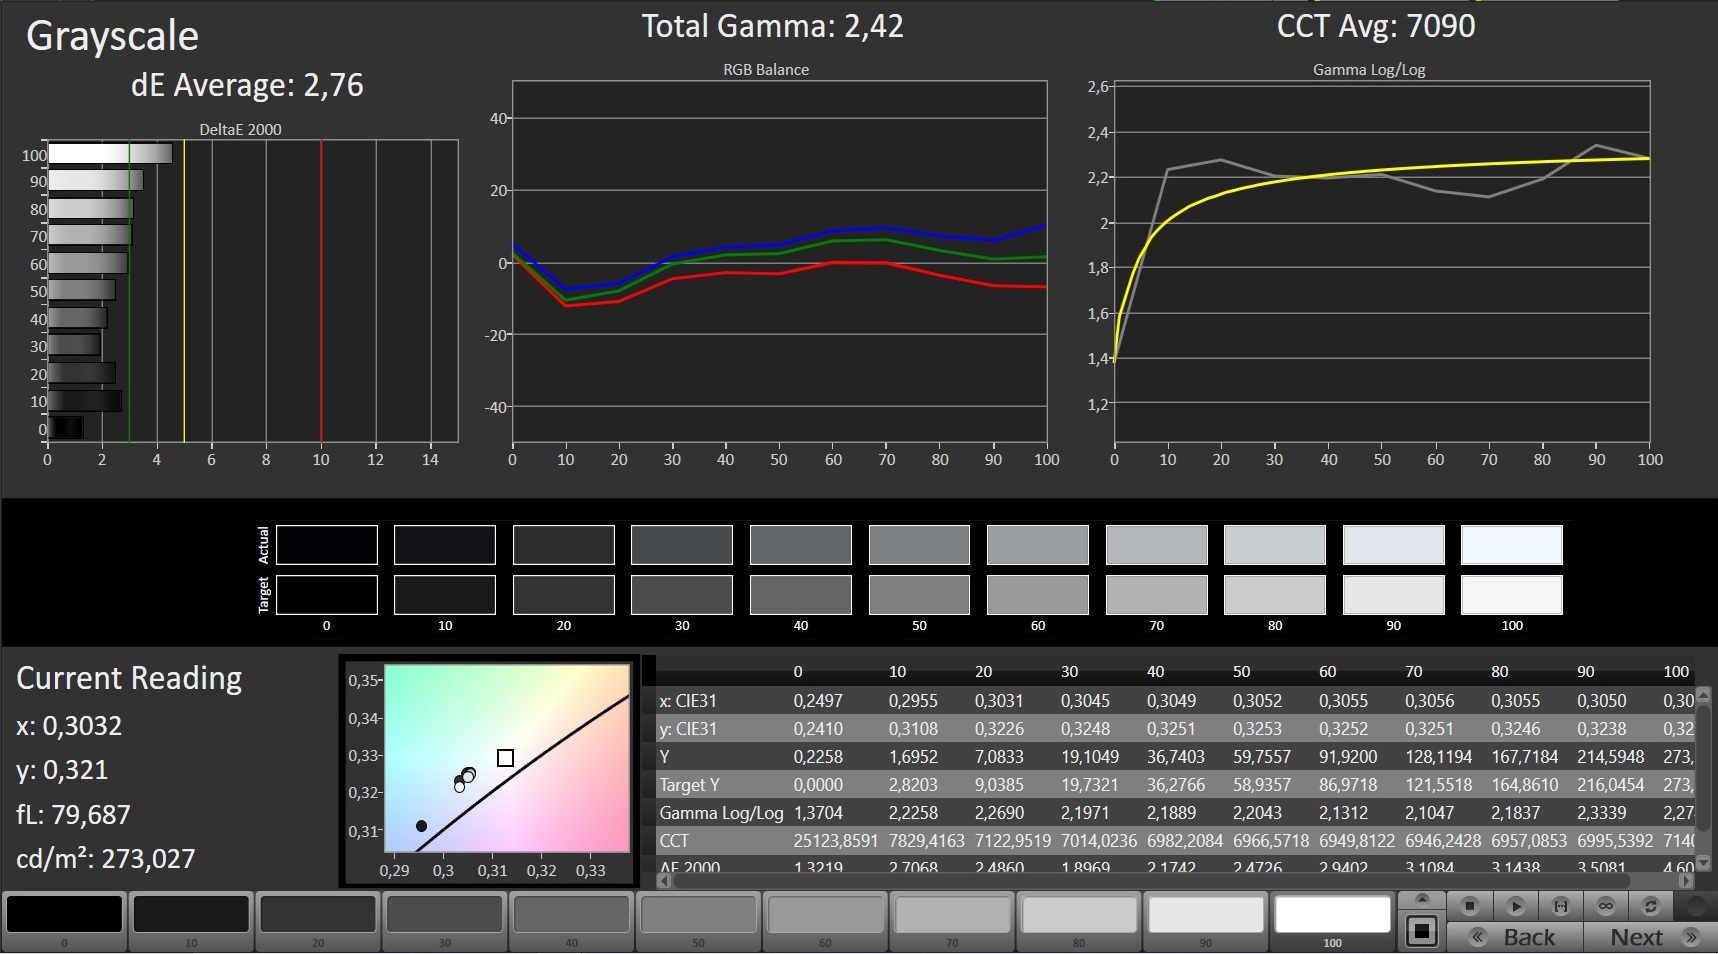
The 15.6-inch display has a native resolution of 1920x1080 pixels. While the contrast (1,135:1) is within the target (> 1,000:1), the maximum brightness (253.6 cd/m²) is too low. We consider values beyond 300 cd/m² to be good. In addition, the 60 Hz panel's response times won't knock anyone's socks off. Positive: The screen doesn't show any PWM flickering.
| |||||||||||||||||||||||||
Brightness Distribution: 93 %
Center on Battery: 261 cd/m²
Contrast: 1135:1 (Black: 0.23 cd/m²)
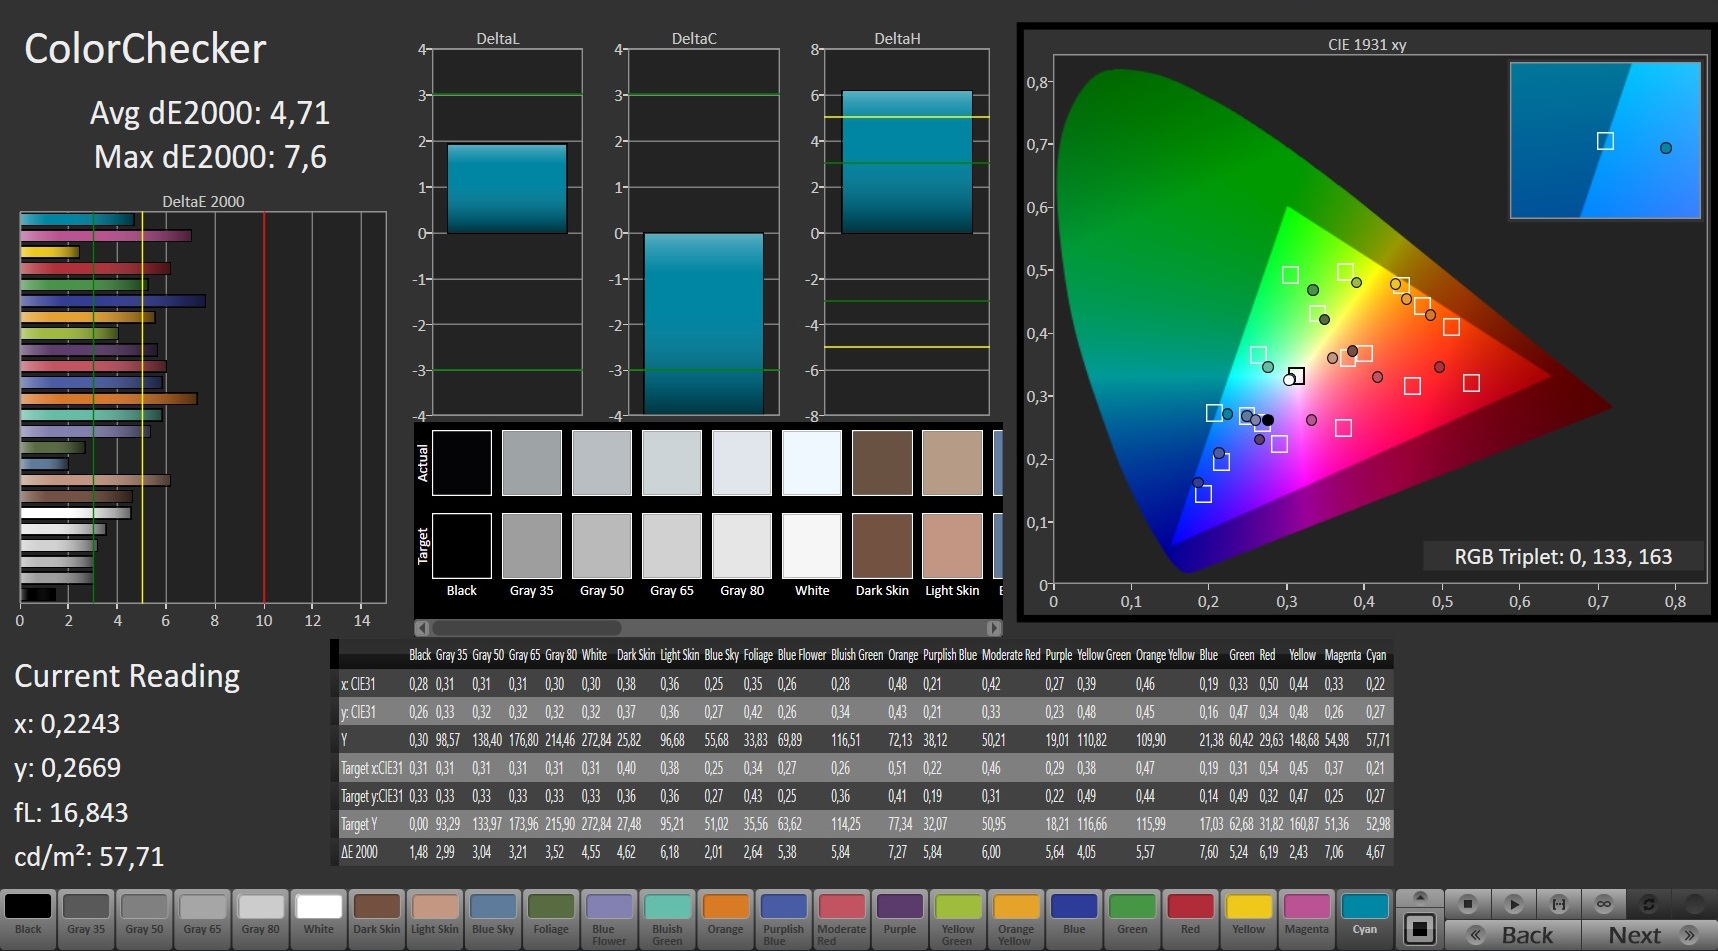
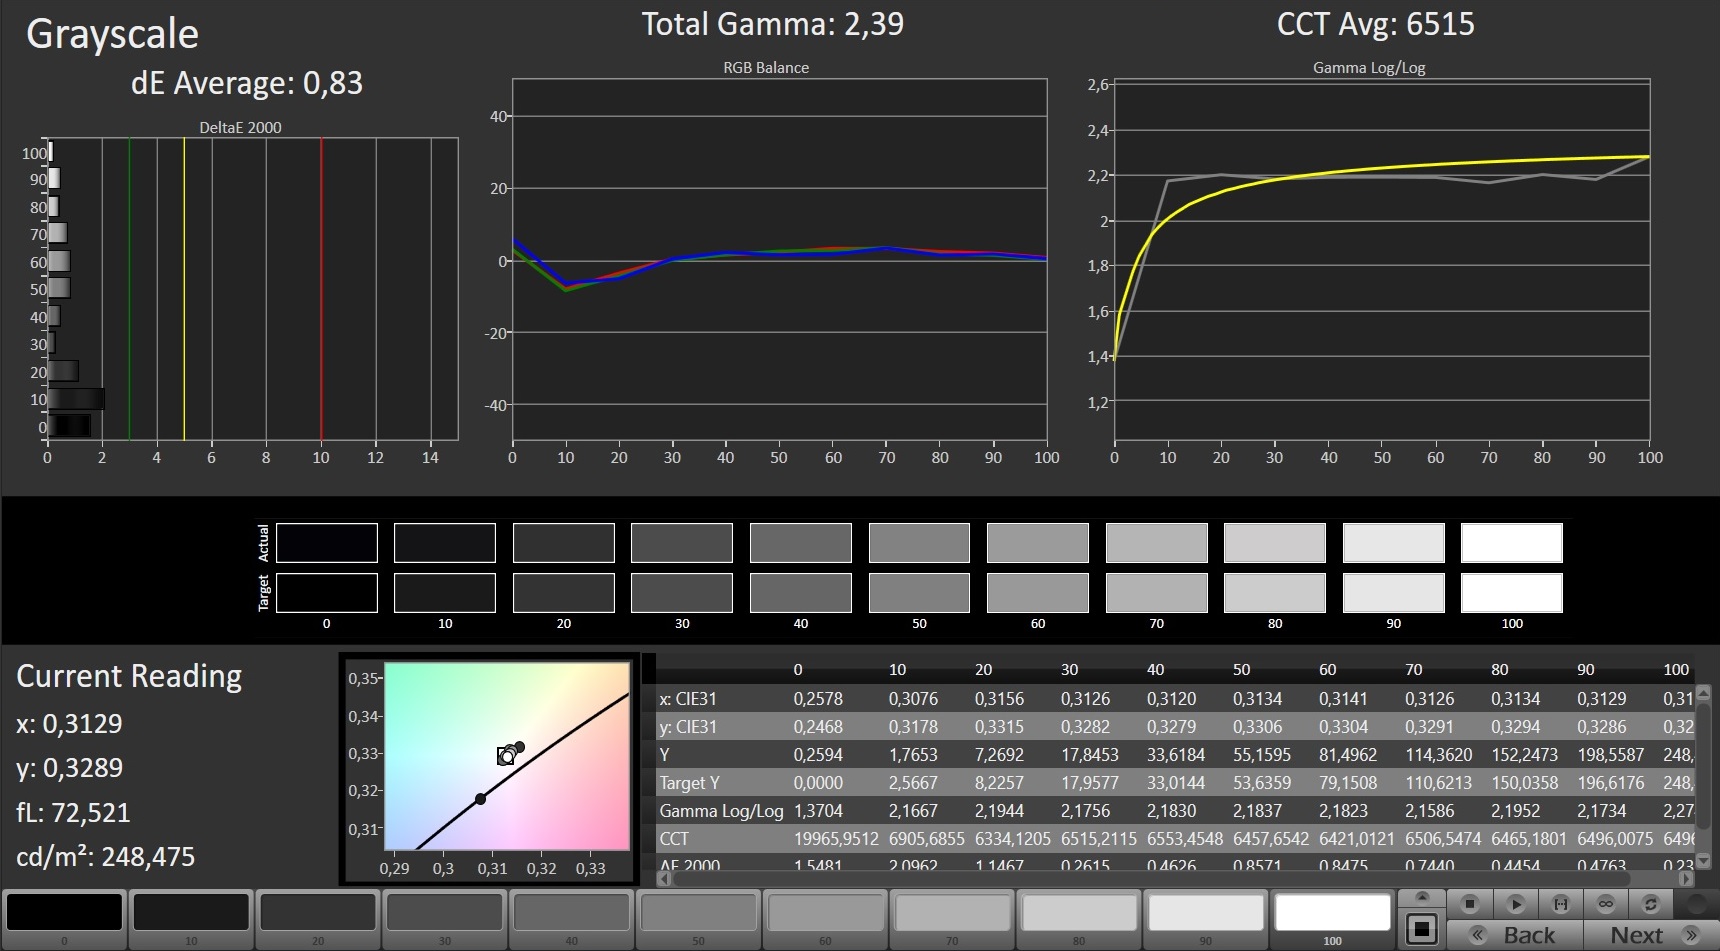
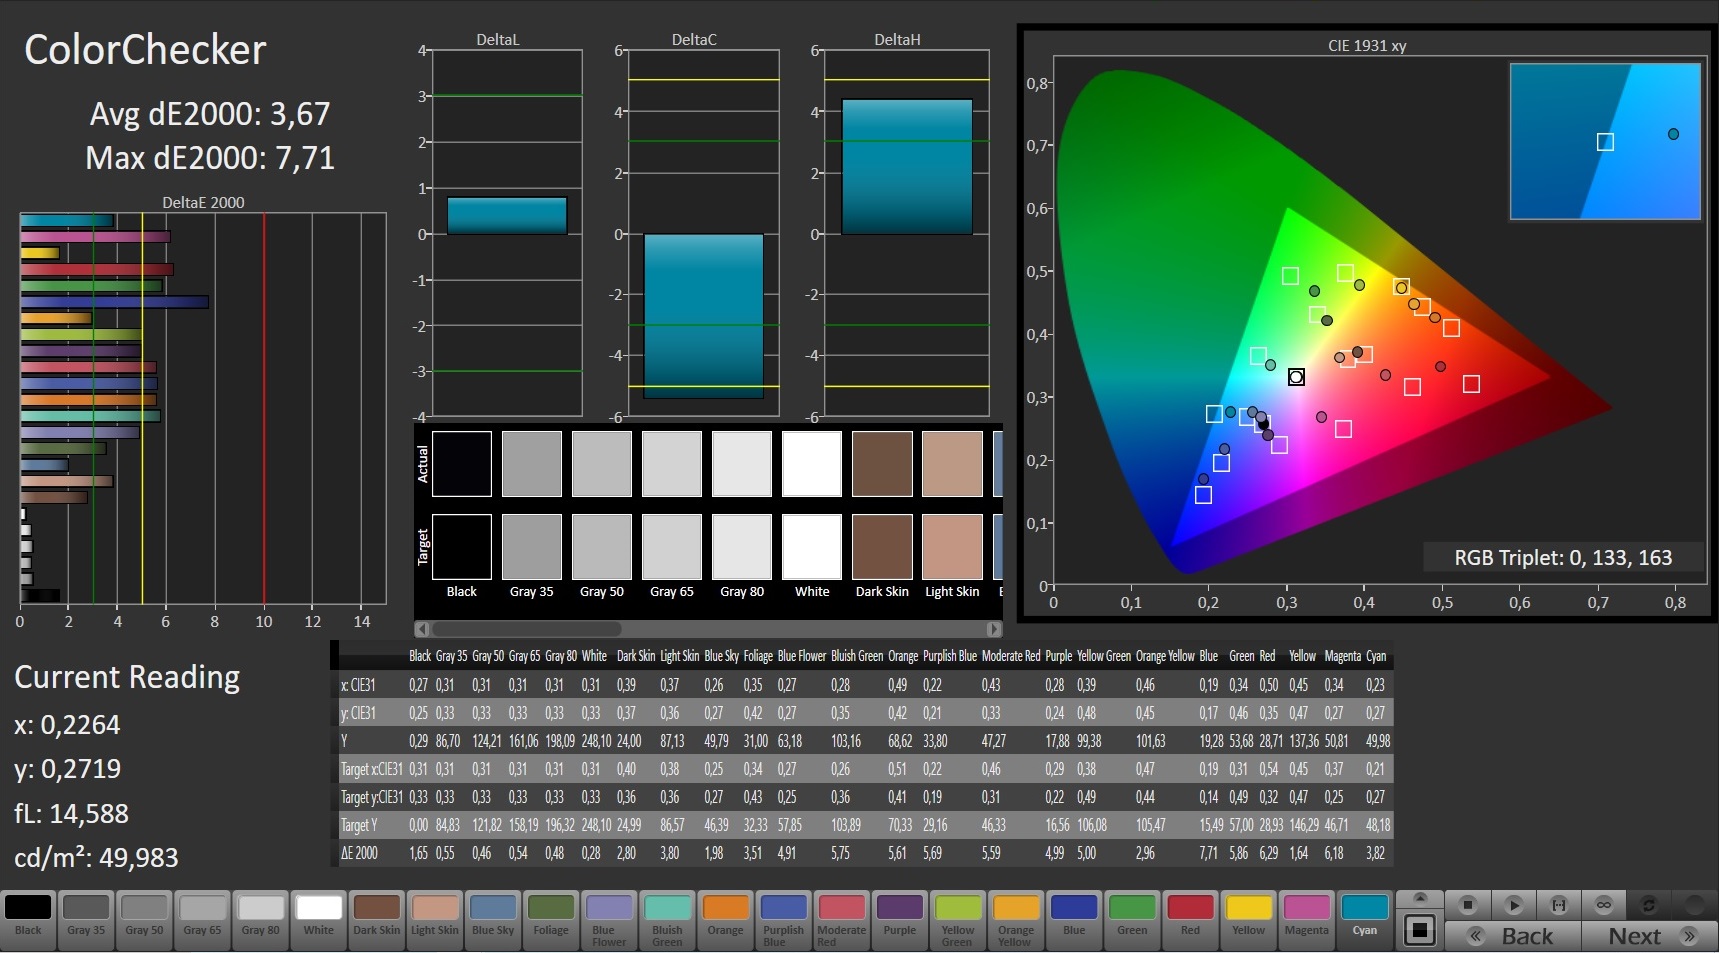
ΔE ColorChecker Calman: 4.71 | ∀{0.5-29.43 Ø4.71}
calibrated: 3.67
ΔE Greyscale Calman: 2.76 | ∀{0.09-98 Ø4.96}
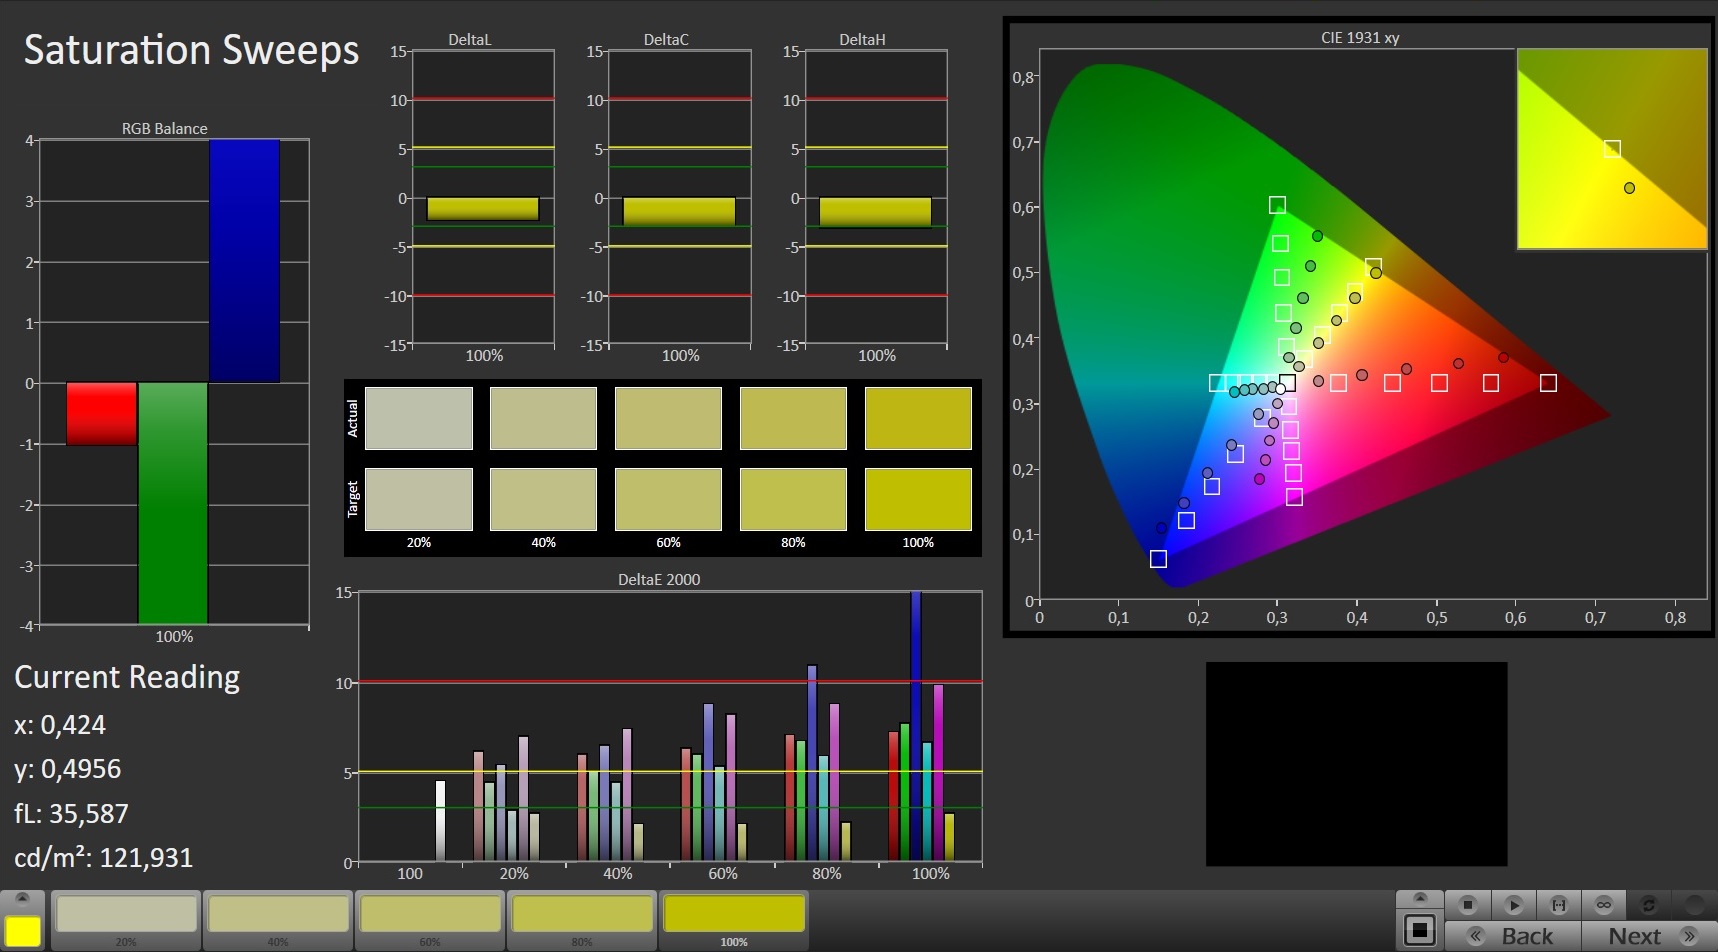
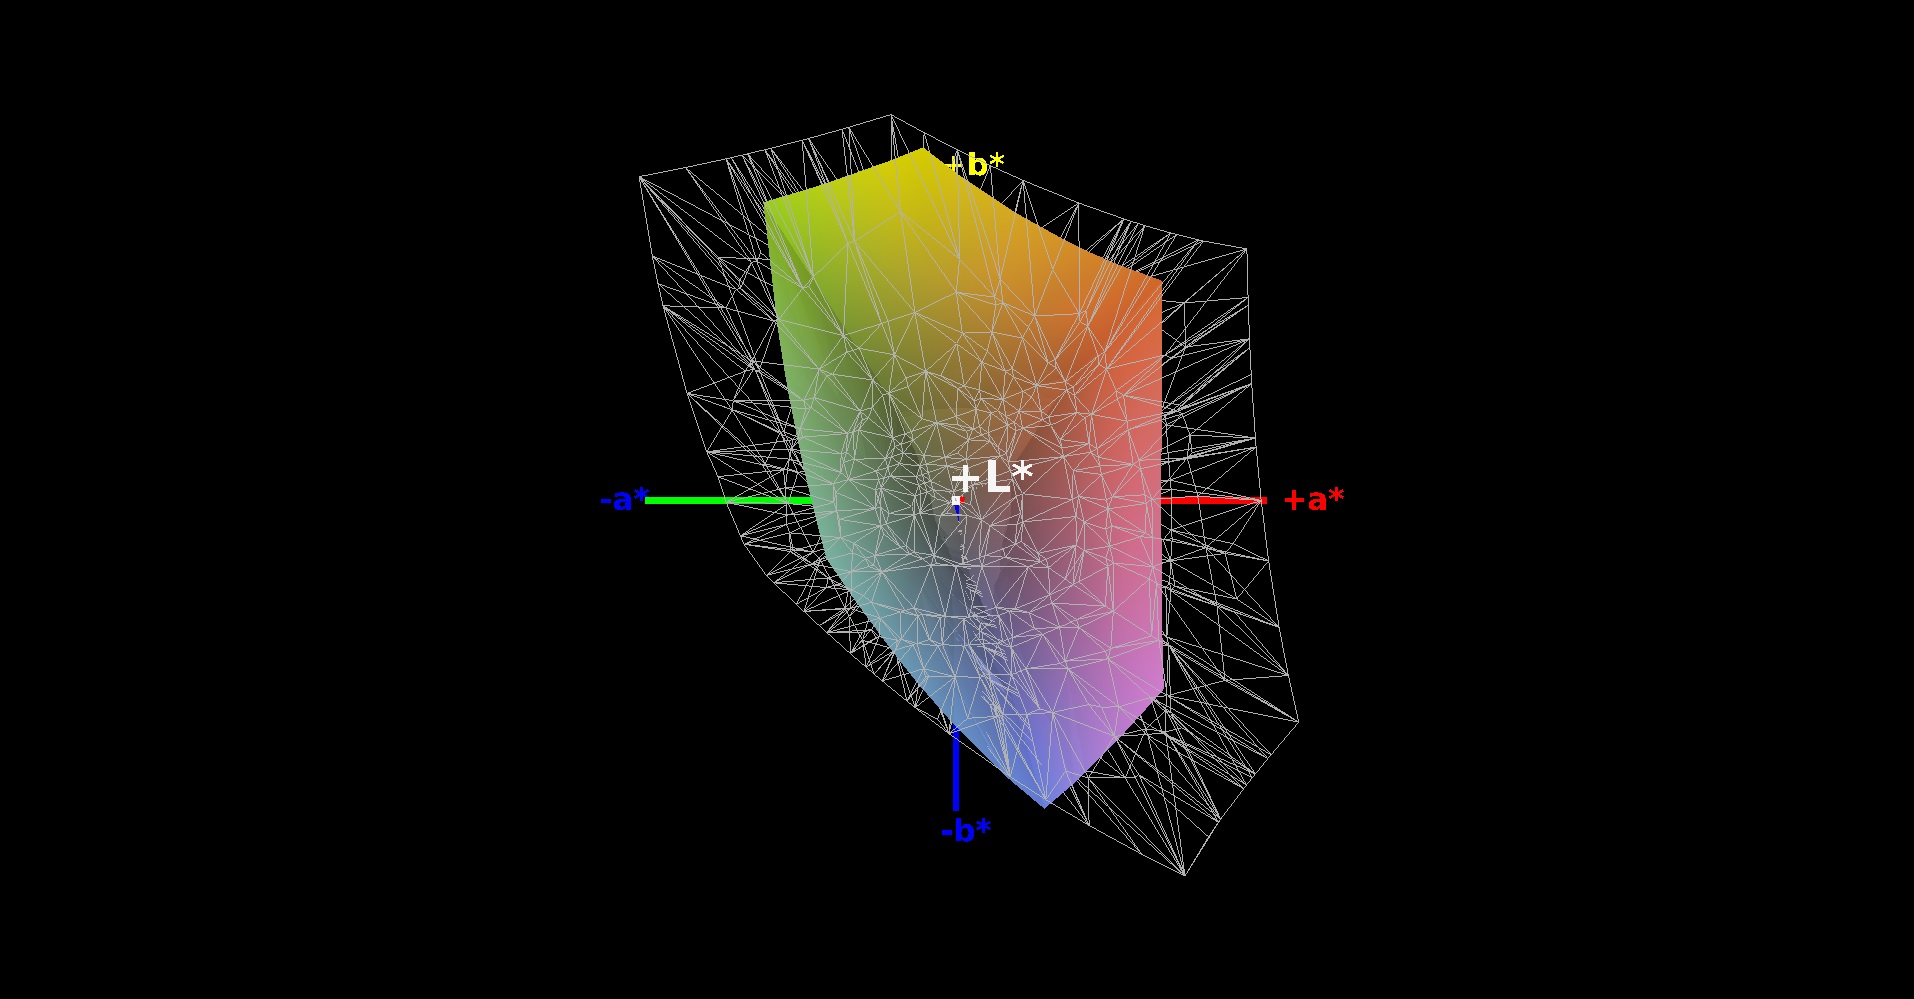
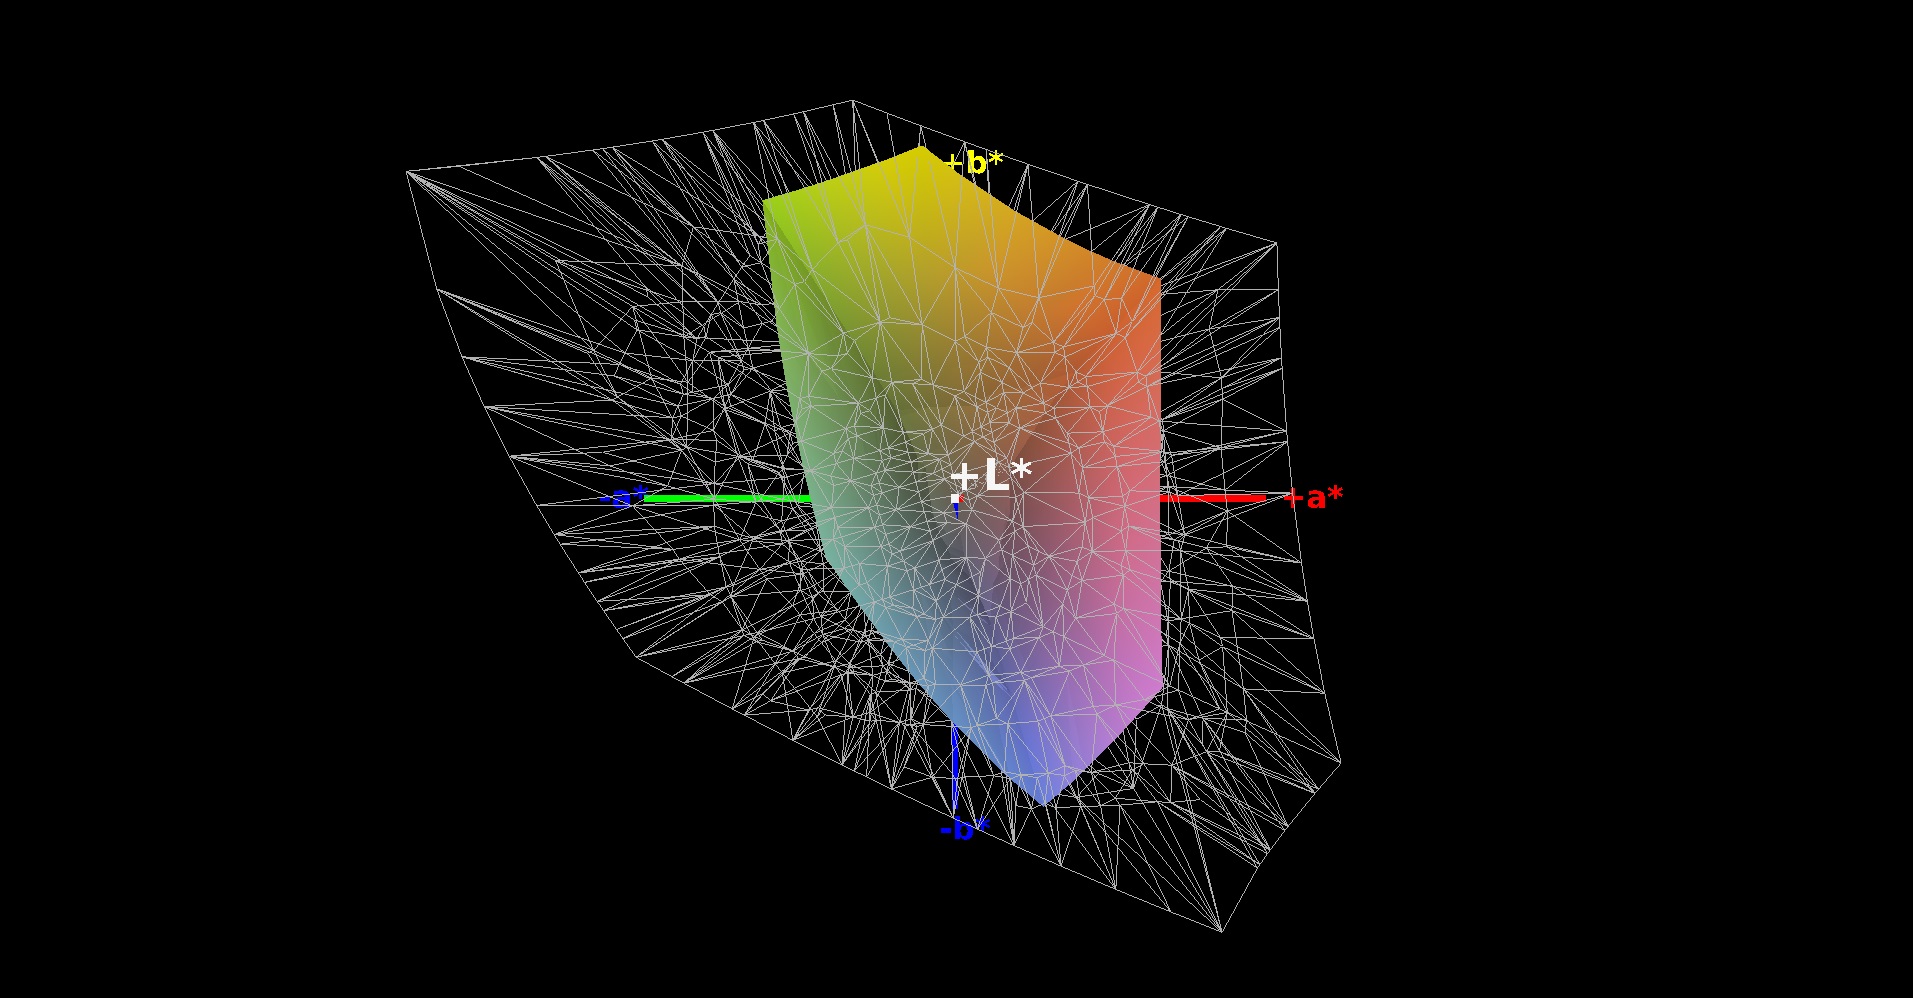
56% sRGB (Argyll 1.6.3 3D)
36% AdobeRGB 1998 (Argyll 1.6.3 3D)
39.19% AdobeRGB 1998 (Argyll 3D)
57% sRGB (Argyll 3D)
37.91% Display P3 (Argyll 3D)
Gamma: 2.42
CCT: 7090 K
| Nexoc GH5 515IG LG Philips LP156WFC-SPD1, IPS, 1920x1080, 15.6" | Lenovo IdeaPad Gaming 3i 15IMH05 BOE CQ NV156FHM-NX1, IPS, 1920x1080, 15.6" | Asus TUF FX505DT-EB73 Panda LM156LF-GL, IPS, 1920x1080, 15.6" | Dell G3 3590 BOE NV15N3D, IPS, 1920x1080, 15.6" | HP Pavilion Gaming 15-ec0002ng Chi Mei N156HGA-EA3, TN LED, 1920x1080, 15.6" | Acer Nitro 5 AN515-44-R5FT Panda LM156LF-2F01 (NCP004D), IPS, 1920x1080, 15.6" | MSI Bravo 15 A4DCR AU Optronics B156HAN08.0 (AUO80ED), IPS-Level, 1920x1080, 15.6" | |
|---|---|---|---|---|---|---|---|
| Display | -0% | 4% | 6% | 9% | 9% | 59% | |
| Display P3 Coverage (%) | 37.91 | 38.04 0% | 39.56 4% | 40.13 6% | 41.22 9% | 41.16 9% | 62 64% |
| sRGB Coverage (%) | 57 | 56.6 -1% | 59.5 4% | 59.8 5% | 61.8 8% | 61.8 8% | 86.8 52% |
| AdobeRGB 1998 Coverage (%) | 39.19 | 39.3 0% | 40.91 4% | 41.47 6% | 42.62 9% | 42.56 9% | 62.7 60% |
| Response Times | 31% | 2% | -31% | 7% | -18% | 57% | |
| Response Time Grey 50% / Grey 80% * (ms) | 34.8 ? | 25 ? 28% | 30.4 ? 13% | 46 ? -32% | 44 ? -26% | 40.8 ? -17% | 16 ? 54% |
| Response Time Black / White * (ms) | 25.2 ? | 17 ? 33% | 27.6 ? -10% | 32.4 ? -29% | 15 ? 40% | 30 ? -19% | 10.4 ? 59% |
| PWM Frequency (Hz) | 200 ? | 250 ? | |||||
| Screen | -34% | -29% | -24% | -63% | -9% | 5% | |
| Brightness middle (cd/m²) | 261 | 305 17% | 286.2 10% | 276.2 6% | 233 -11% | 287 10% | 311 19% |
| Brightness (cd/m²) | 254 | 294 16% | 267 5% | 261 3% | 211 -17% | 271 7% | 313 23% |
| Brightness Distribution (%) | 93 | 70 -25% | 84 -10% | 86 -8% | 82 -12% | 88 -5% | 88 -5% |
| Black Level * (cd/m²) | 0.23 | 0.405 -76% | 0.33 -43% | 0.24 -4% | 0.405 -76% | 0.25 -9% | 0.43 -87% |
| Contrast (:1) | 1135 | 753 -34% | 867 -24% | 1151 1% | 575 -49% | 1148 1% | 723 -36% |
| Colorchecker dE 2000 * | 4.71 | 6.01 -28% | 5.45 -16% | 5.56 -18% | 8.22 -75% | 4.77 -1% | 4.5 4% |
| Colorchecker dE 2000 max. * | 7.6 | 21.9 -188% | 18.08 -138% | 23.45 -209% | 18.6 -145% | 17.15 -126% | 7.97 -5% |
| Colorchecker dE 2000 calibrated * | 3.67 | 5.12 -40% | 4.47 -22% | 5.23 -43% | 3.73 -2% | 2.65 28% | |
| Greyscale dE 2000 * | 2.76 | 3.23 -17% | 5.3 -92% | 2.8 -1% | 10.13 -267% | 2.7 2% | 3.3 -20% |
| Gamma | 2.42 91% | 2.43 91% | 2.1 105% | 2.37 93% | 2.27 97% | 2.115 104% | 2.129 103% |
| CCT | 7090 92% | 6818 95% | 7679 85% | 6710 97% | 11323 57% | 7187 90% | 7227 90% |
| Color Space (Percent of AdobeRGB 1998) (%) | 36 | 36 0% | 37.6 4% | 37.8 5% | 39 8% | 43 19% | 63 75% |
| Color Space (Percent of sRGB) (%) | 56 | 56 0% | 59.1 6% | 59 5% | 62 11% | 61 9% | 86 54% |
| Total Average (Program / Settings) | -1% /
-20% | -8% /
-19% | -16% /
-19% | -16% /
-40% | -6% /
-7% | 40% /
21% |
* ... smaller is better
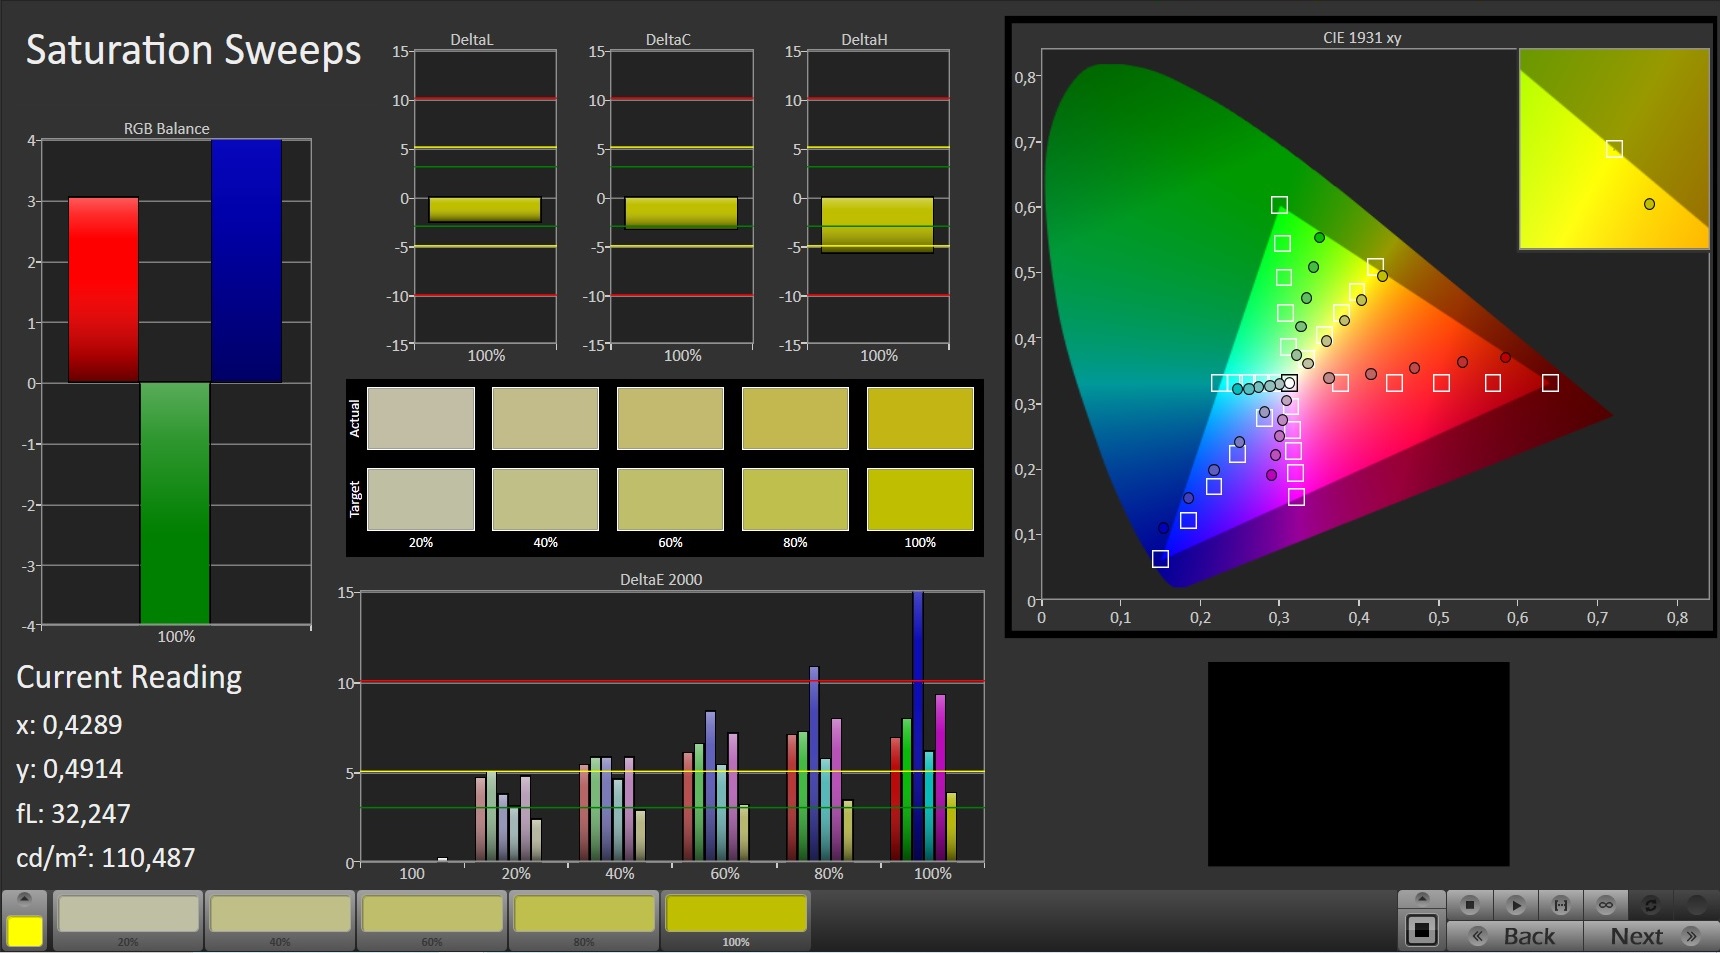
Out of the box, the display shows a decent color reproduction. With a Delta E 2000 color deviation of just under 4.7, however, the target (Delta E less than 3) is missed. The display doesn't suffer from a blue tint. Moreover, calibration provides only slight improvements. In this way, the color deviation drops to 3.67, and the grayscales are displayed in a more balanced way. The AdobeRGB (36%) and sRGB (56%) color spaces aren't fully mapped.
Display Response Times
| ↔ Response Time Black to White | ||
|---|---|---|
| 25.2 ms ... rise ↗ and fall ↘ combined | ↗ 15.2 ms rise | 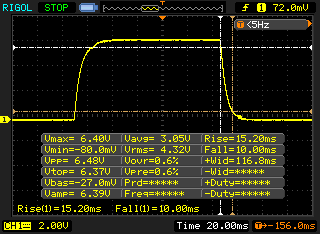 |
| ↘ 10 ms fall | ||
| The screen shows relatively slow response rates in our tests and may be too slow for gamers. In comparison, all tested devices range from 0.1 (minimum) to 240 (maximum) ms. » 61 % of all devices are better. This means that the measured response time is worse than the average of all tested devices (19.8 ms). | ||
| ↔ Response Time 50% Grey to 80% Grey | ||
| 34.8 ms ... rise ↗ and fall ↘ combined | ↗ 17.6 ms rise | 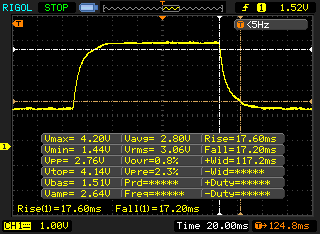 |
| ↘ 17.2 ms fall | ||
| The screen shows slow response rates in our tests and will be unsatisfactory for gamers. In comparison, all tested devices range from 0.165 (minimum) to 636 (maximum) ms. » 49 % of all devices are better. This means that the measured response time is worse than the average of all tested devices (30.9 ms). | ||
Screen Flickering / PWM (Pulse-Width Modulation)
| Screen flickering / PWM not detected | 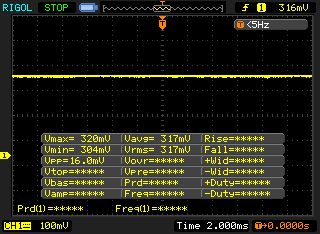 | ||
In comparison: 52 % of all tested devices do not use PWM to dim the display. If PWM was detected, an average of 7744 (minimum: 5 - maximum: 343500) Hz was measured. | |||
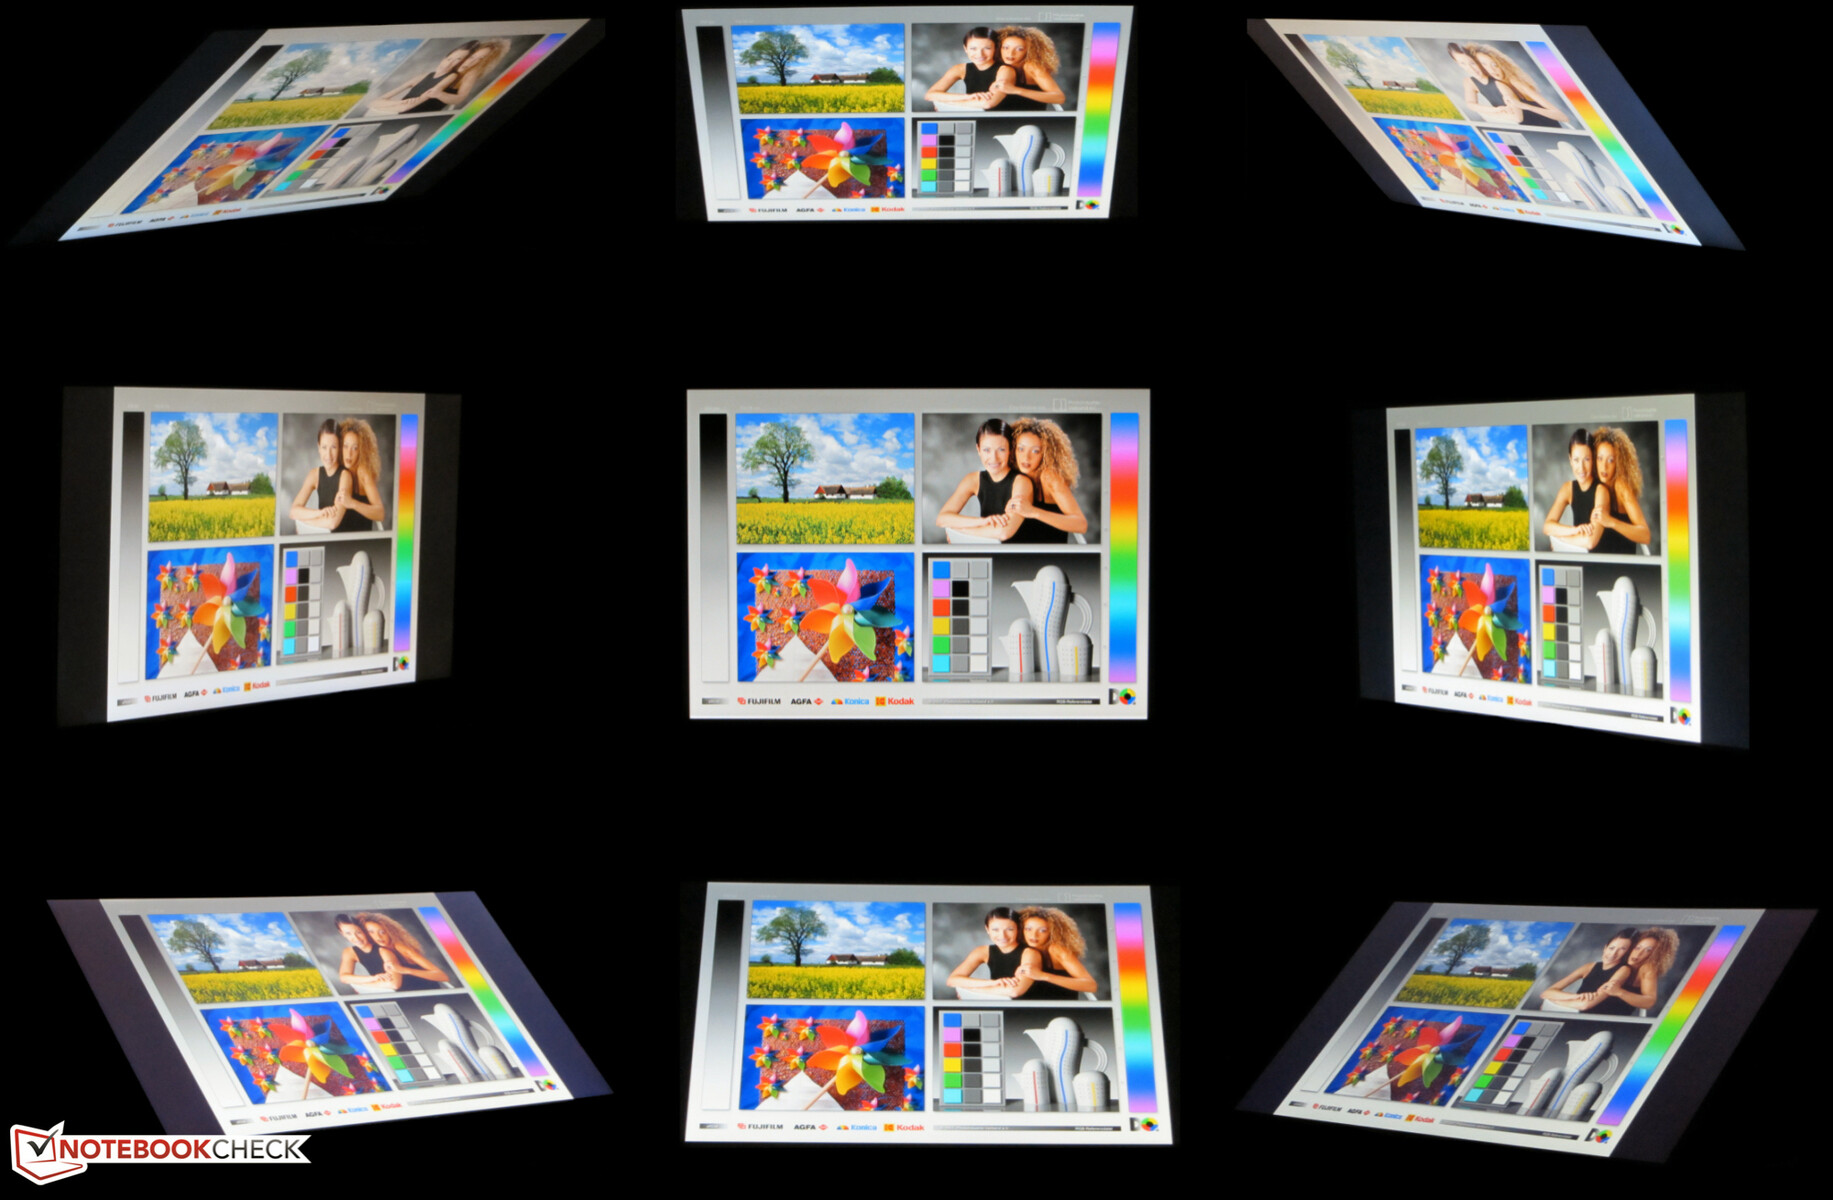
The Nexoc laptop is equipped with a viewing-angle-stable IPS panel. Consequently, the screen can be read from any position. Reading the display outdoors is only possible when the sun is not too bright.

Performance - The Core i5 runs at full speed
Nexoc has a 15.6-inch gaming laptop in its range with the GH5 515IG. It brings every modern game smoothly onto the screen and also cuts a fine figure in all other application areas. Furthermore, our test device will set you back about 1,040 Euros (~$1,225). The device can be individually configured in the Nexoc online shop.

Test conditions
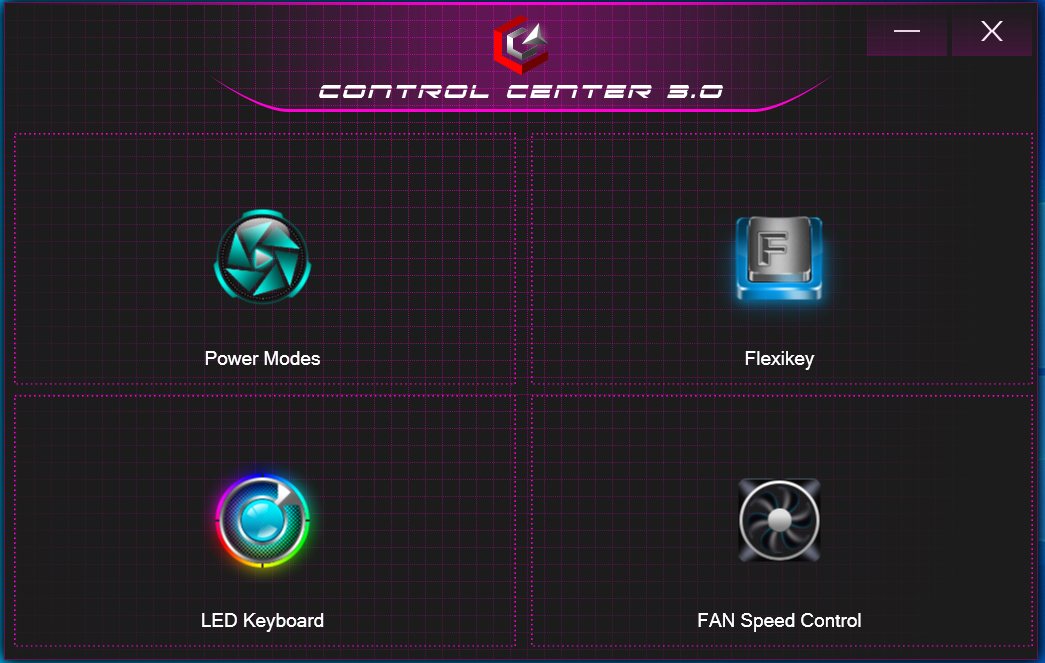
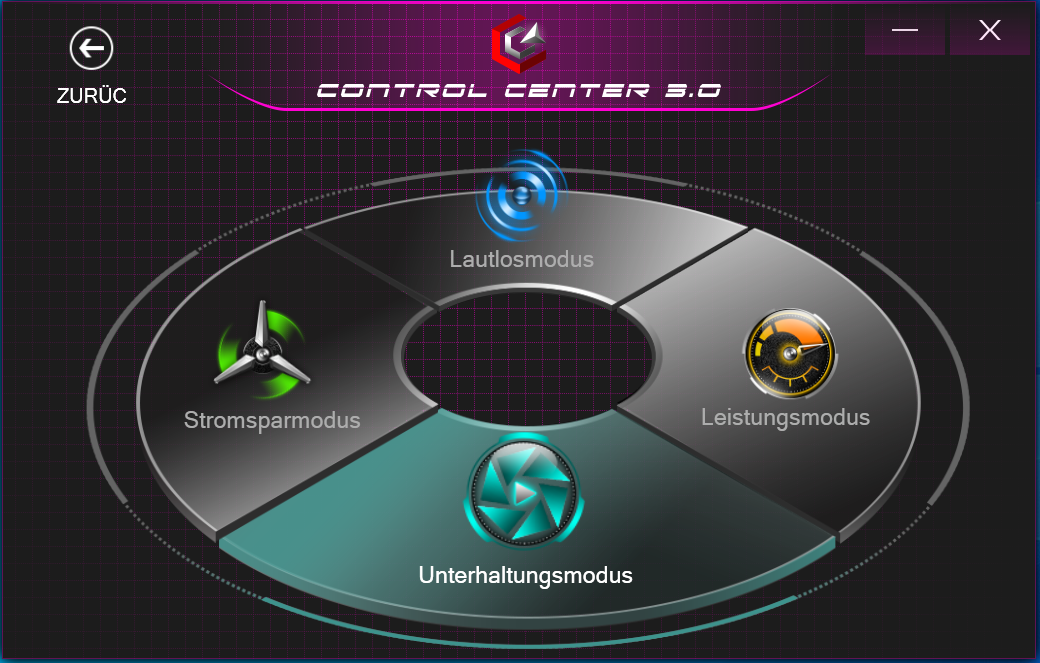
The preinstalled Control Center software allows, among other things, the fan control to be adjusted and an energy profile to be selected. We carried out all tests with automatic fan control and the "Entertainment Mode" energy profile.

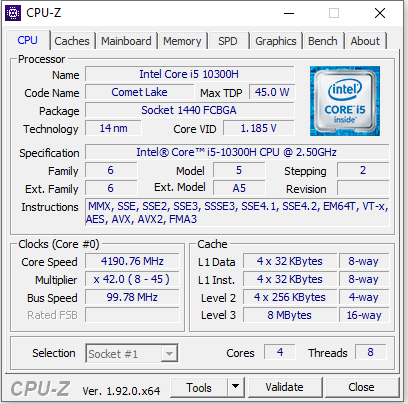
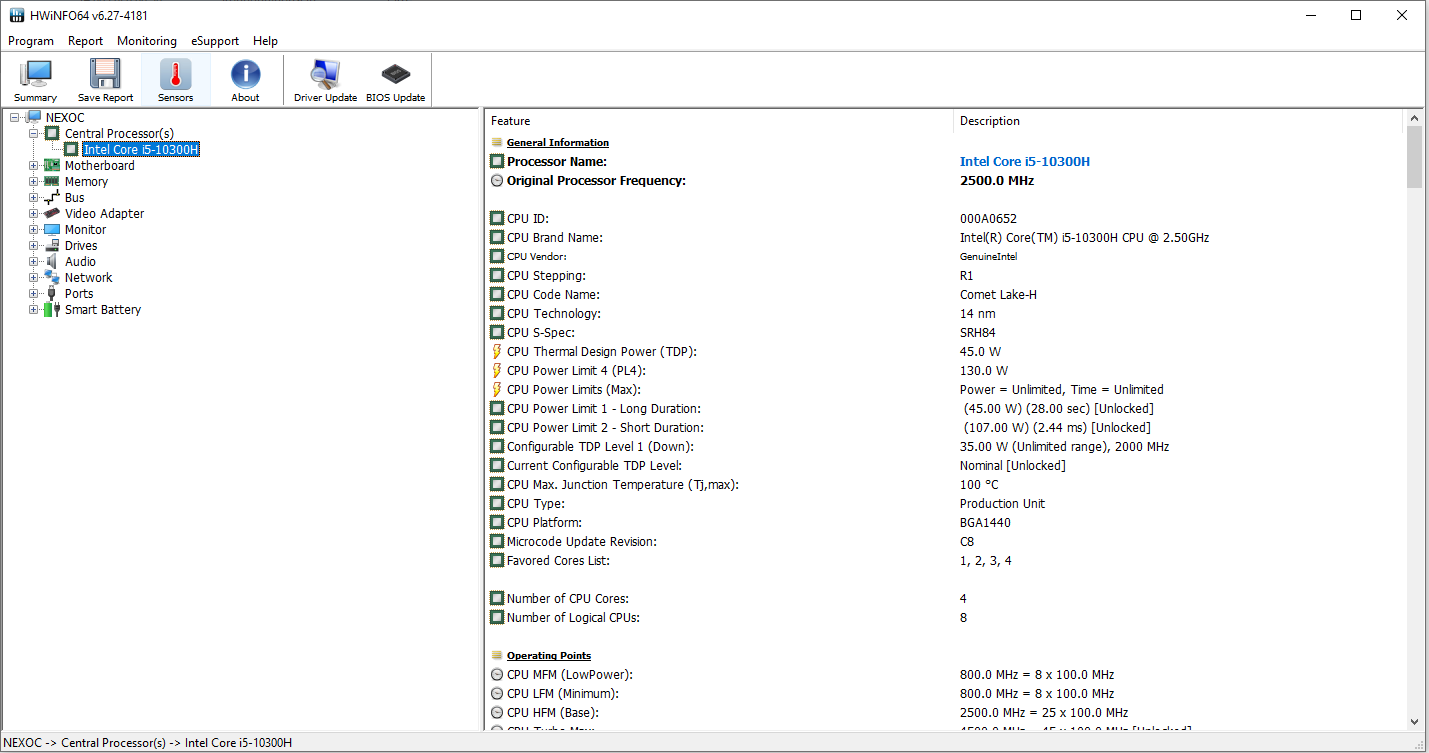
Processor
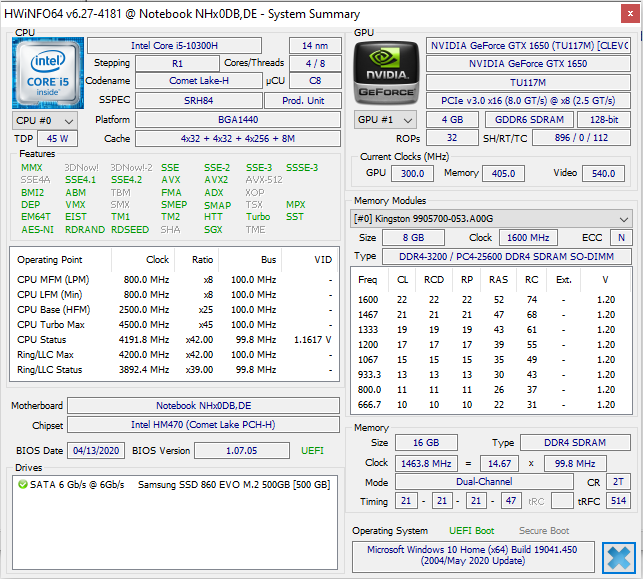
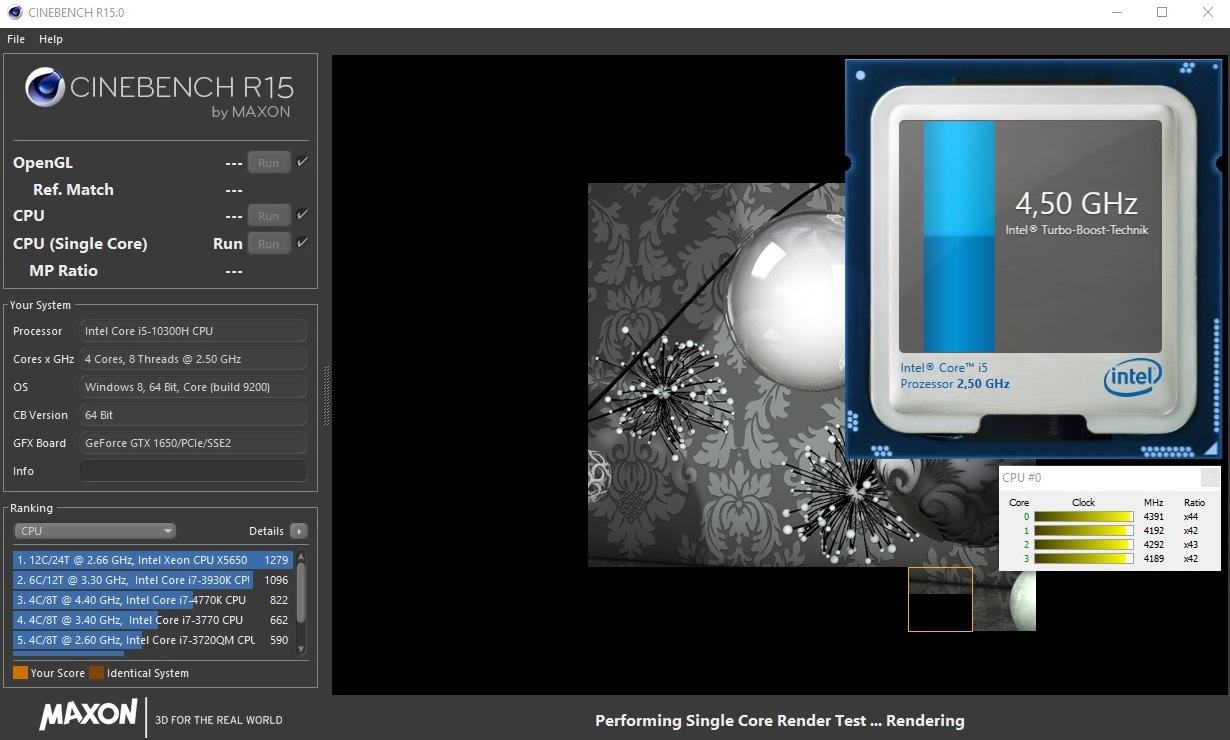
The Nexoc laptop has a Core i5-10300H quad-core processor (Comet Lake) on board that has a TDP of 45 watts. The CPU operates at a base speed of 2.5 GHz. Via Turbo, the clock speed can be increased to 4.2 GHz (four cores) or 4.5 GHz (one core). Hyper-Threading (two threads can be processed per core) is supported.
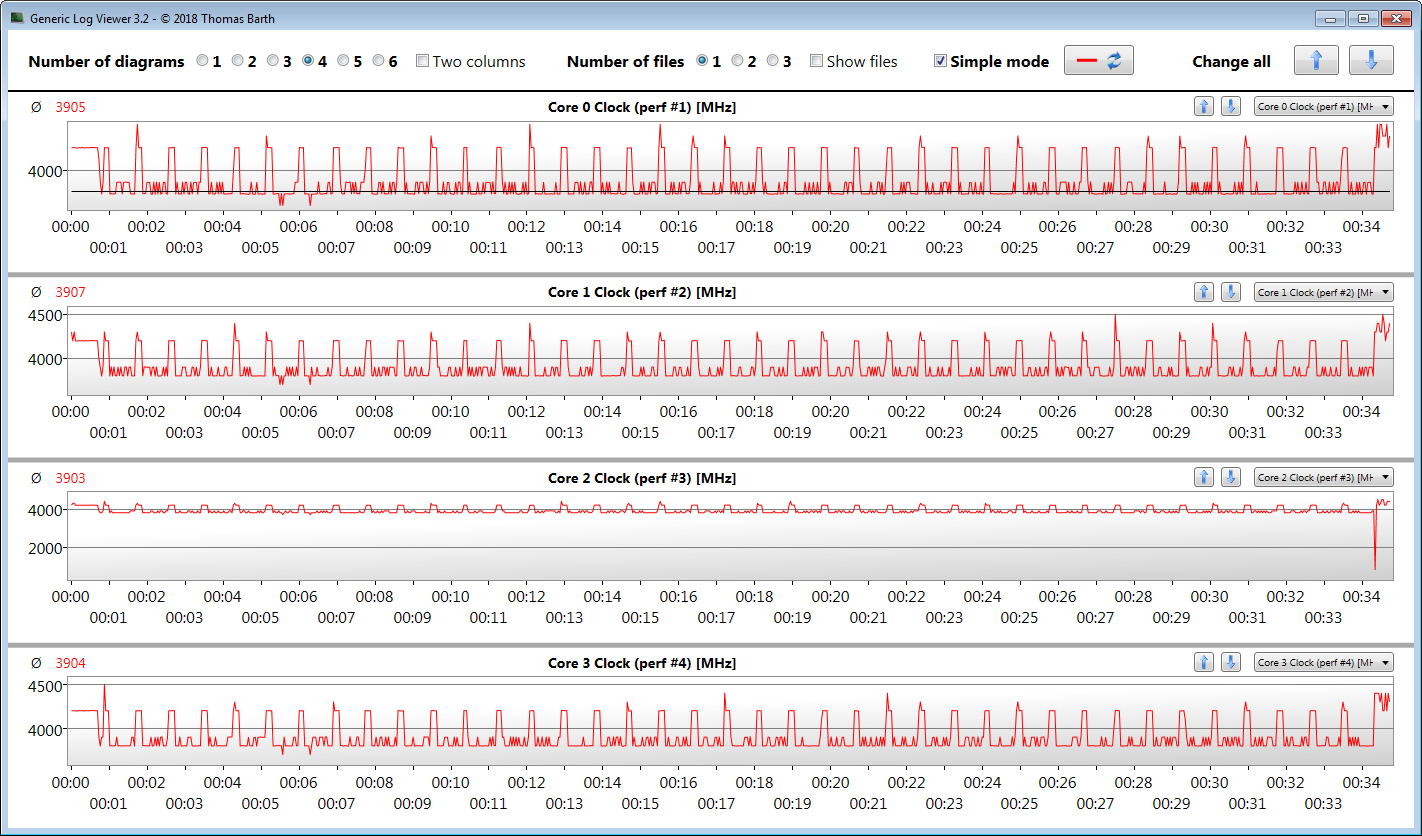
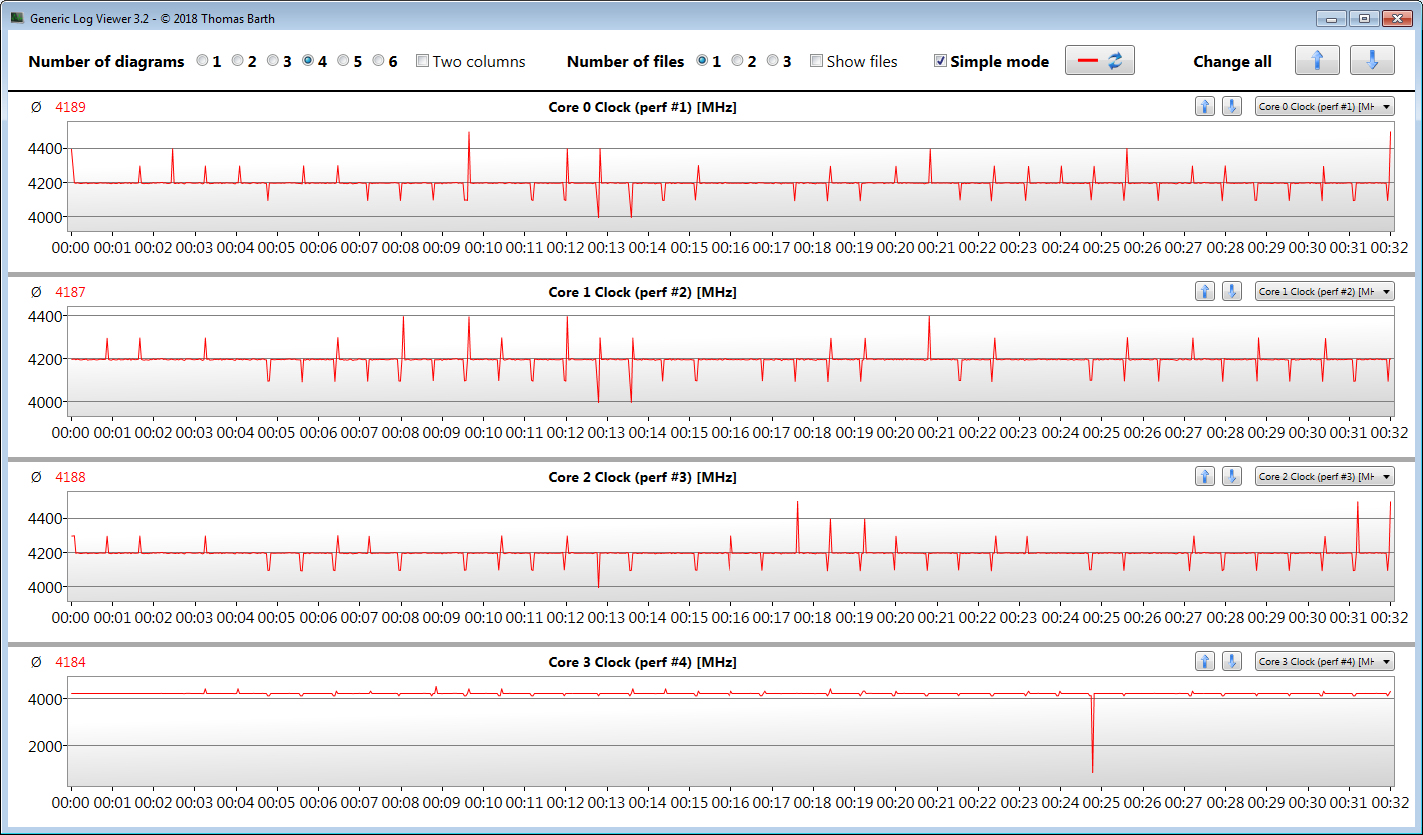
The processor briefly runs the multithread tests of the Cinebench benchmarks at 4.2 GHz. The clock rate then drops to 3.8 to 3.9 GHz. The single-thread tests are run at 4.2 to 4.5 GHz. Moreover, on battery power, the clock speeds are 2.8 to 3.5 GHz (multithread) and 3.2 to 4.5 GHz (single-thread), respectively.
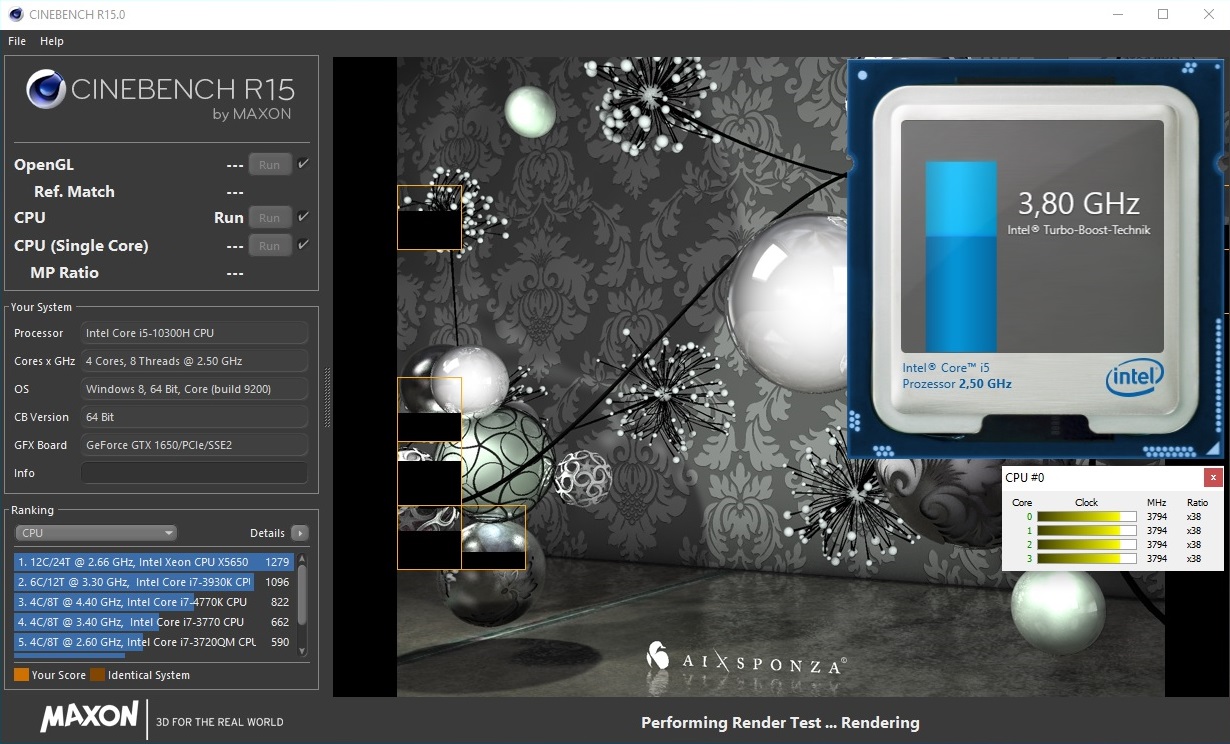
We verify if the CPU Turbo is also consistently used when plugged in by running the Cinebench R15 benchmark's multithread test in a continuous loop for at least 30 minutes. The results drop from the first to the second run and then remain at a quite constant level. Turbo constantly works at a high speed level.
A glance at the diagram reveals that the GH5 lags a bit behind the Lenovo Ideapad Gaming 3i, which is equipped with the same CPU. A tie can be reached by activating the performance mode within the Nexoc Control Center. The Core i5 then works at maximum quad-core Turbo speeds.
| Cinebench R15 | |
| CPU Single 64Bit | |
| Lenovo IdeaPad Gaming 3i 15IMH05 | |
| MSI Bravo 15 A4DCR | |
| Nexoc GH5 515IG | |
| Nexoc GH5 515IG (Leistungsmodus) | |
| Acer Nitro 5 AN515-44-R5FT | |
| Dell G3 3590 | |
| Asus TUF FX505DT-EB73 | |
| HP Pavilion Gaming 15-ec0002ng | |
| CPU Multi 64Bit | |
| MSI Bravo 15 A4DCR | |
| Acer Nitro 5 AN515-44-R5FT | |
| Nexoc GH5 515IG (Leistungsmodus) | |
| Lenovo IdeaPad Gaming 3i 15IMH05 | |
| Nexoc GH5 515IG | |
| Asus TUF FX505DT-EB73 | |
| Dell G3 3590 | |
| HP Pavilion Gaming 15-ec0002ng | |
| Blender - v2.79 BMW27 CPU | |
| Nexoc GH5 515IG | |
| Lenovo IdeaPad Gaming 3i 15IMH05 | |
| Acer Nitro 5 AN515-44-R5FT | |
| MSI Bravo 15 A4DCR | |
| HWBOT x265 Benchmark v2.2 - 4k Preset | |
| MSI Bravo 15 A4DCR | |
| Acer Nitro 5 AN515-44-R5FT | |
| Lenovo IdeaPad Gaming 3i 15IMH05 | |
| Nexoc GH5 515IG | |
| LibreOffice - 20 Documents To PDF | |
| MSI Bravo 15 A4DCR | |
| Acer Nitro 5 AN515-44-R5FT | |
| Nexoc GH5 515IG | |
| Lenovo IdeaPad Gaming 3i 15IMH05 | |
| R Benchmark 2.5 - Overall mean | |
| Lenovo IdeaPad Gaming 3i 15IMH05 | |
| Acer Nitro 5 AN515-44-R5FT | |
| Nexoc GH5 515IG | |
| MSI Bravo 15 A4DCR | |
* ... smaller is better
System performance
The system works well and smoothly, and the built-in processor offers enough computing power for all common application areas. In addition, the dedicated graphics core makes it possible to play computer games. Good PCMark results are added to this.
| PCMark 8 Home Score Accelerated v2 | 3971 points | |
| PCMark 8 Creative Score Accelerated v2 | 4576 points | |
| PCMark 8 Work Score Accelerated v2 | 5179 points | |
| PCMark 10 Score | 4936 points | |
Help | ||
| PCMark 10 - Score | |
| MSI Bravo 15 A4DCR | |
| Nexoc GH5 515IG | |
| Acer Nitro 5 AN515-44-R5FT | |
| Dell G3 3590 | |
| Asus TUF FX505DT-EB73 | |
| Lenovo IdeaPad Gaming 3i 15IMH05 | |
| HP Pavilion Gaming 15-ec0002ng | |
| PCMark 8 | |
| Home Score Accelerated v2 | |
| Nexoc GH5 515IG | |
| Asus TUF FX505DT-EB73 | |
| Lenovo IdeaPad Gaming 3i 15IMH05 | |
| Dell G3 3590 | |
| HP Pavilion Gaming 15-ec0002ng | |
| Work Score Accelerated v2 | |
| Lenovo IdeaPad Gaming 3i 15IMH05 | |
| Nexoc GH5 515IG | |
| Dell G3 3590 | |
| HP Pavilion Gaming 15-ec0002ng | |
| Asus TUF FX505DT-EB73 | |
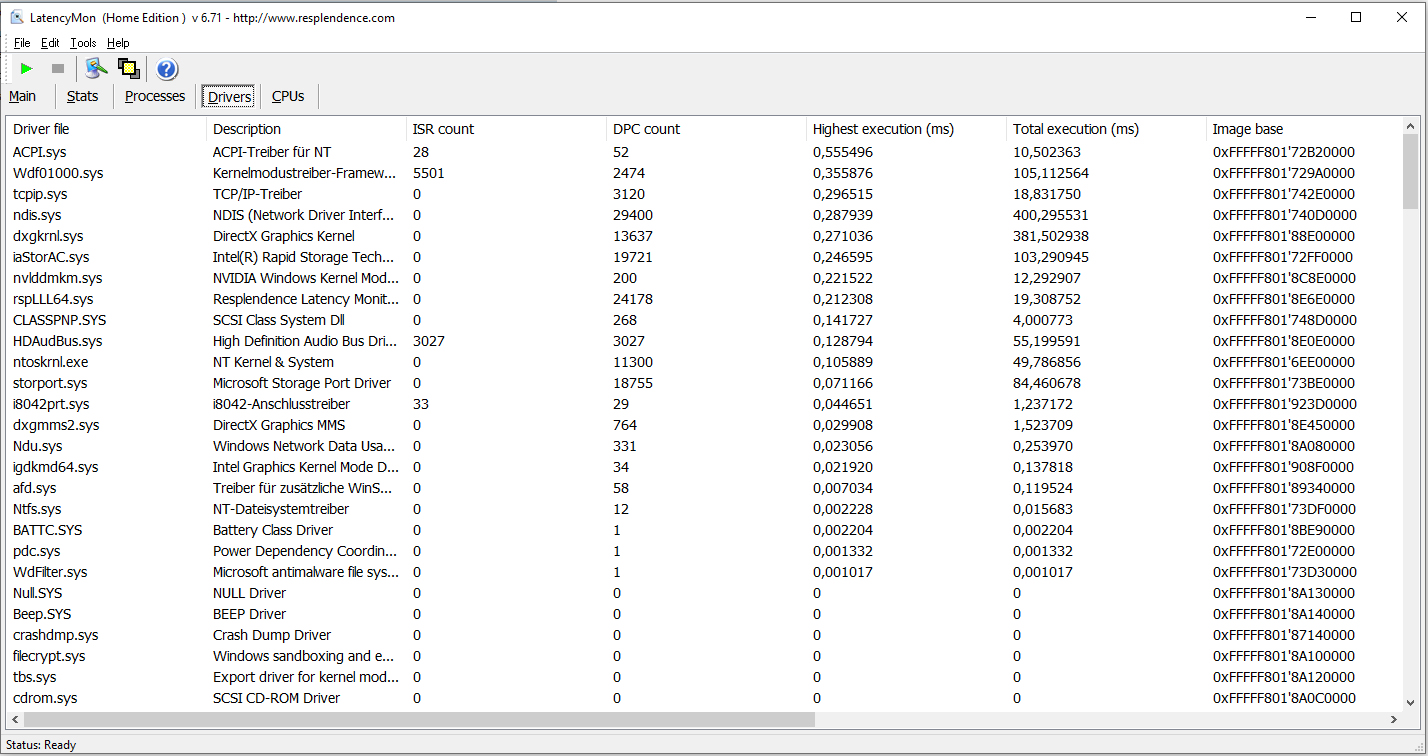
DPC latencies
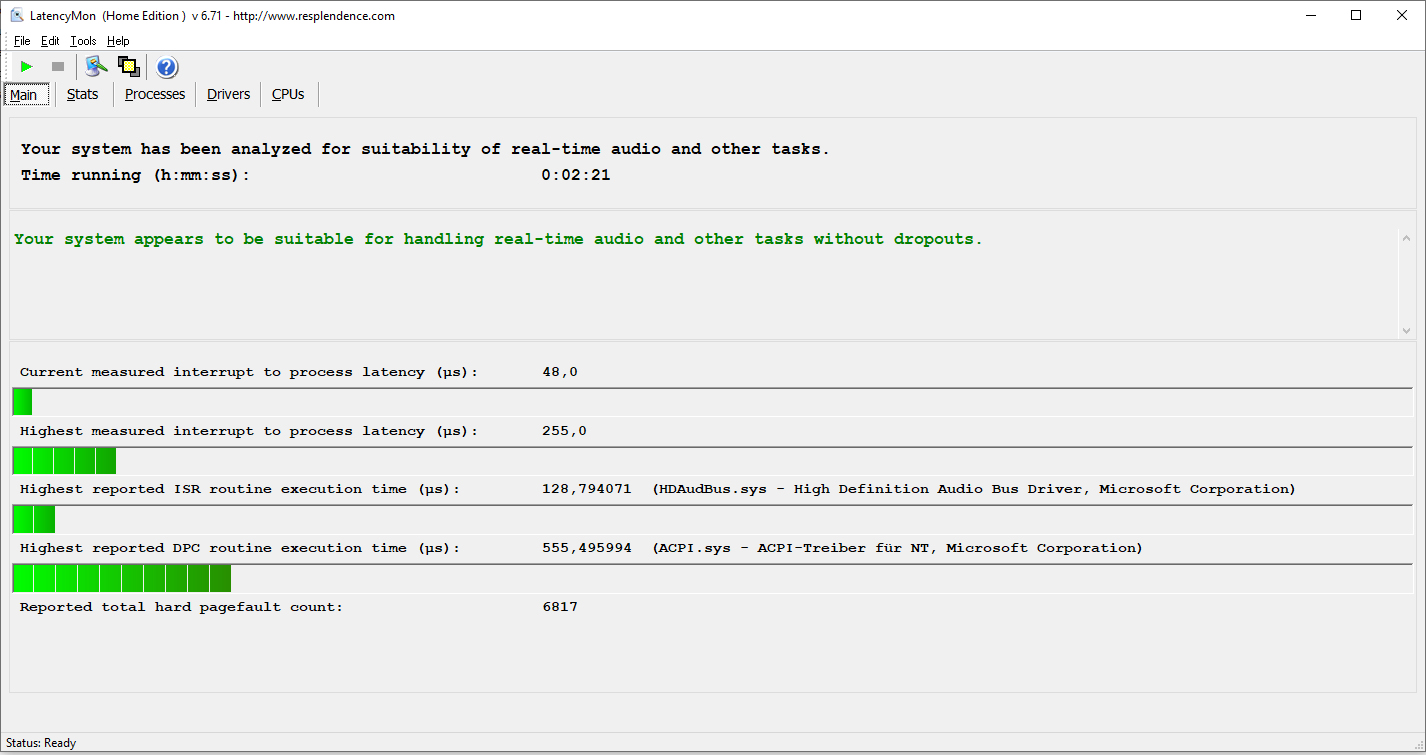
In our standardized latency monitor test (web surfing, 4K video rendering, high-load Prime95) we couldn't observe any issues with the DPC latencies. The system seems to be suitable for real-time video and audio-editing.
| DPC Latencies / LatencyMon - interrupt to process latency (max), Web, Youtube, Prime95 | |
| MSI Bravo 15 A4DCR | |
| Acer Nitro 5 AN515-44-R5FT | |
| Lenovo IdeaPad Gaming 3i 15IMH05 | |
| Nexoc GH5 515IG | |
* ... smaller is better
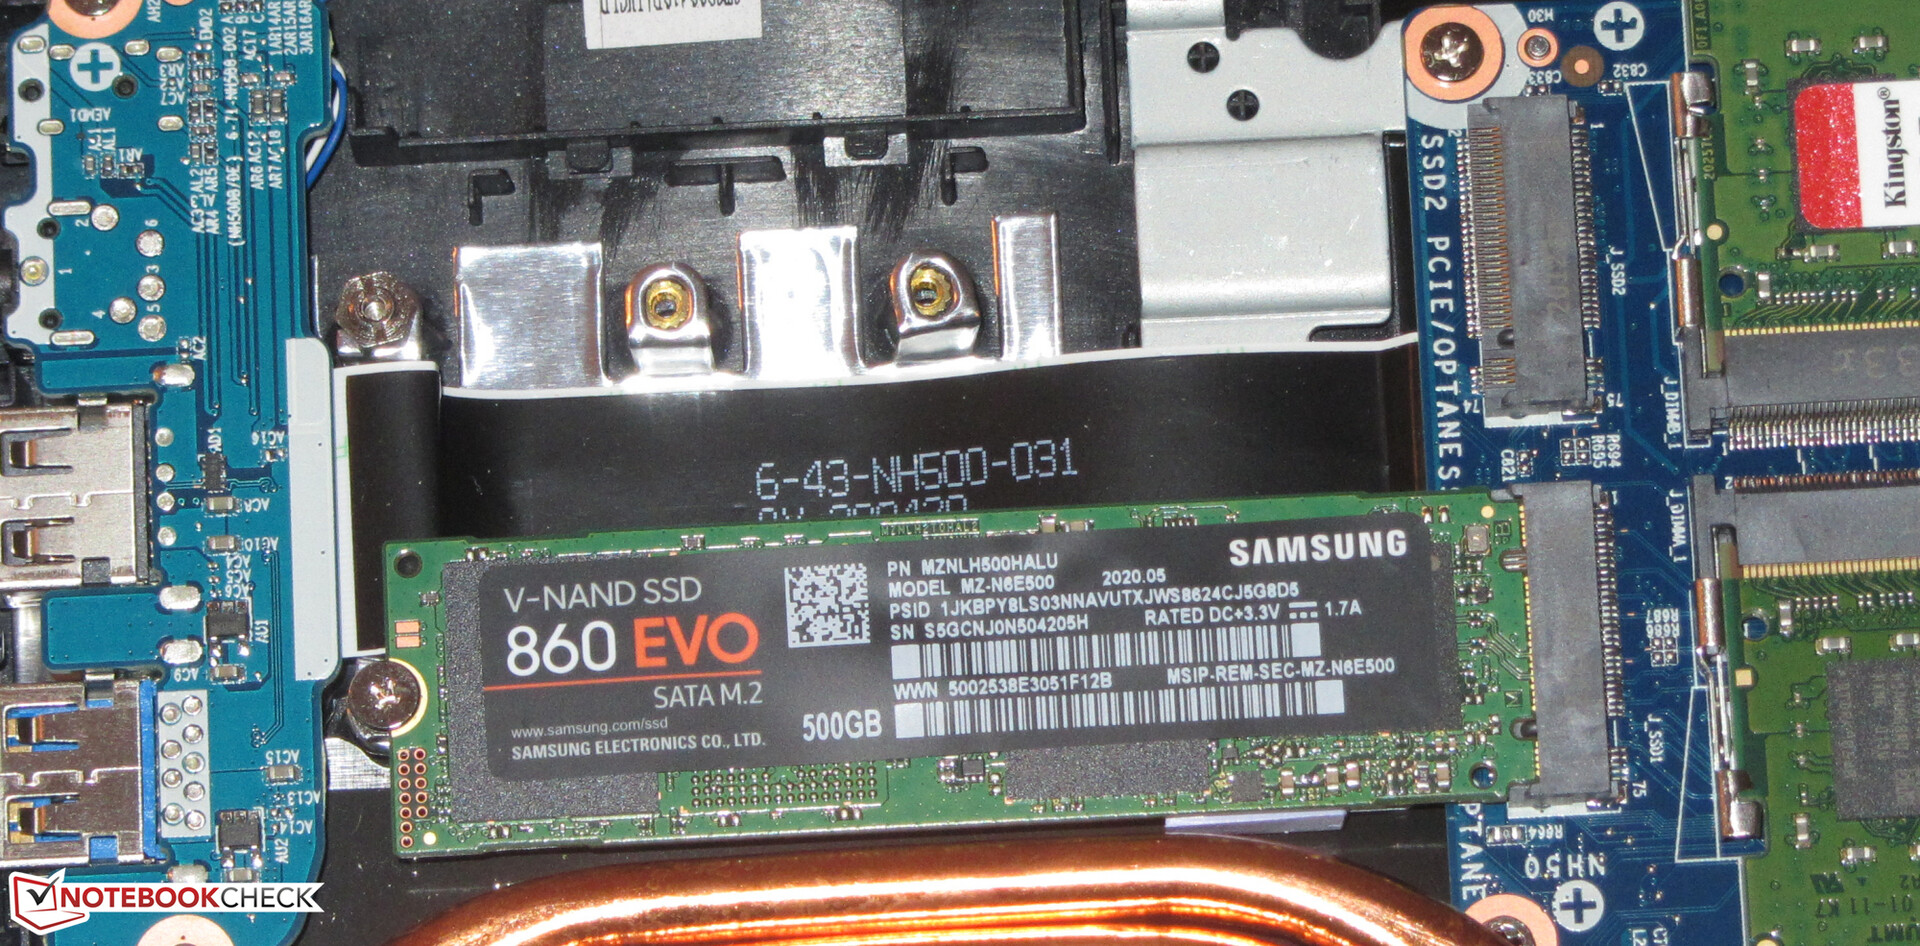
Storage
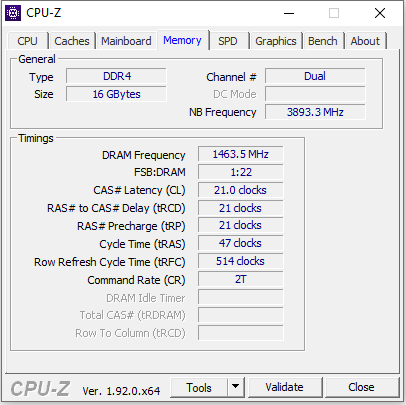
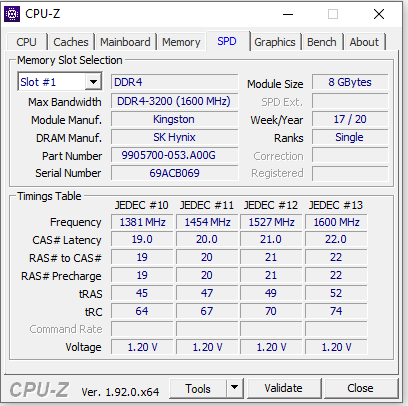
The system drive is a SATA SSD (M.2 2280) from Samsung that provides 500 GB of storage space. Moreover, the transfer rates of the SSD are alright. The SATA standard allows maximum transfer speeds of 600 MB/s. This means that the SSD installed here lags far behind NVMe models.
The choice of a SATA system drive is surprising, but it's not a problem here. The GH5 can be configured very individually within the Nexoc online shop. Various NVMe models are available too.
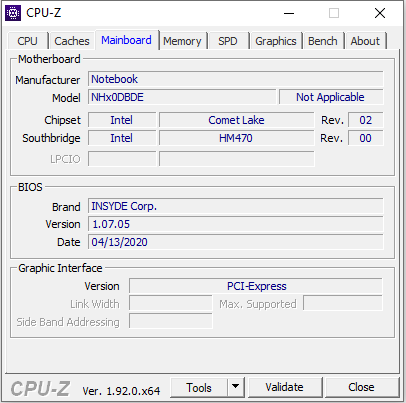
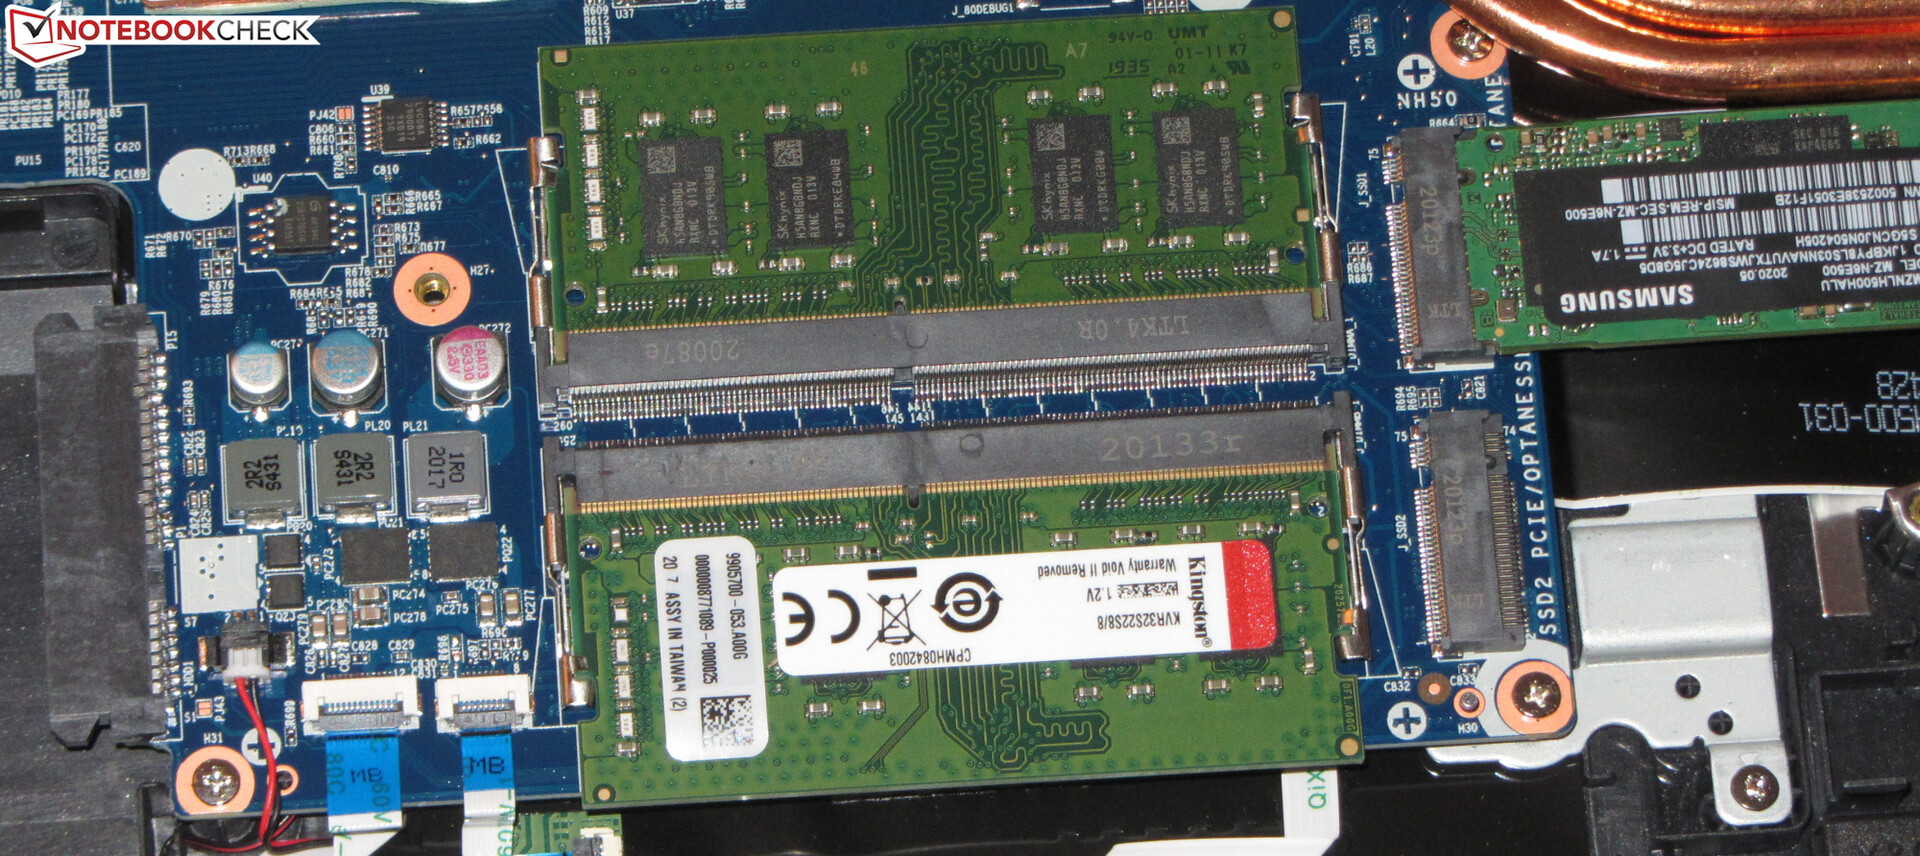
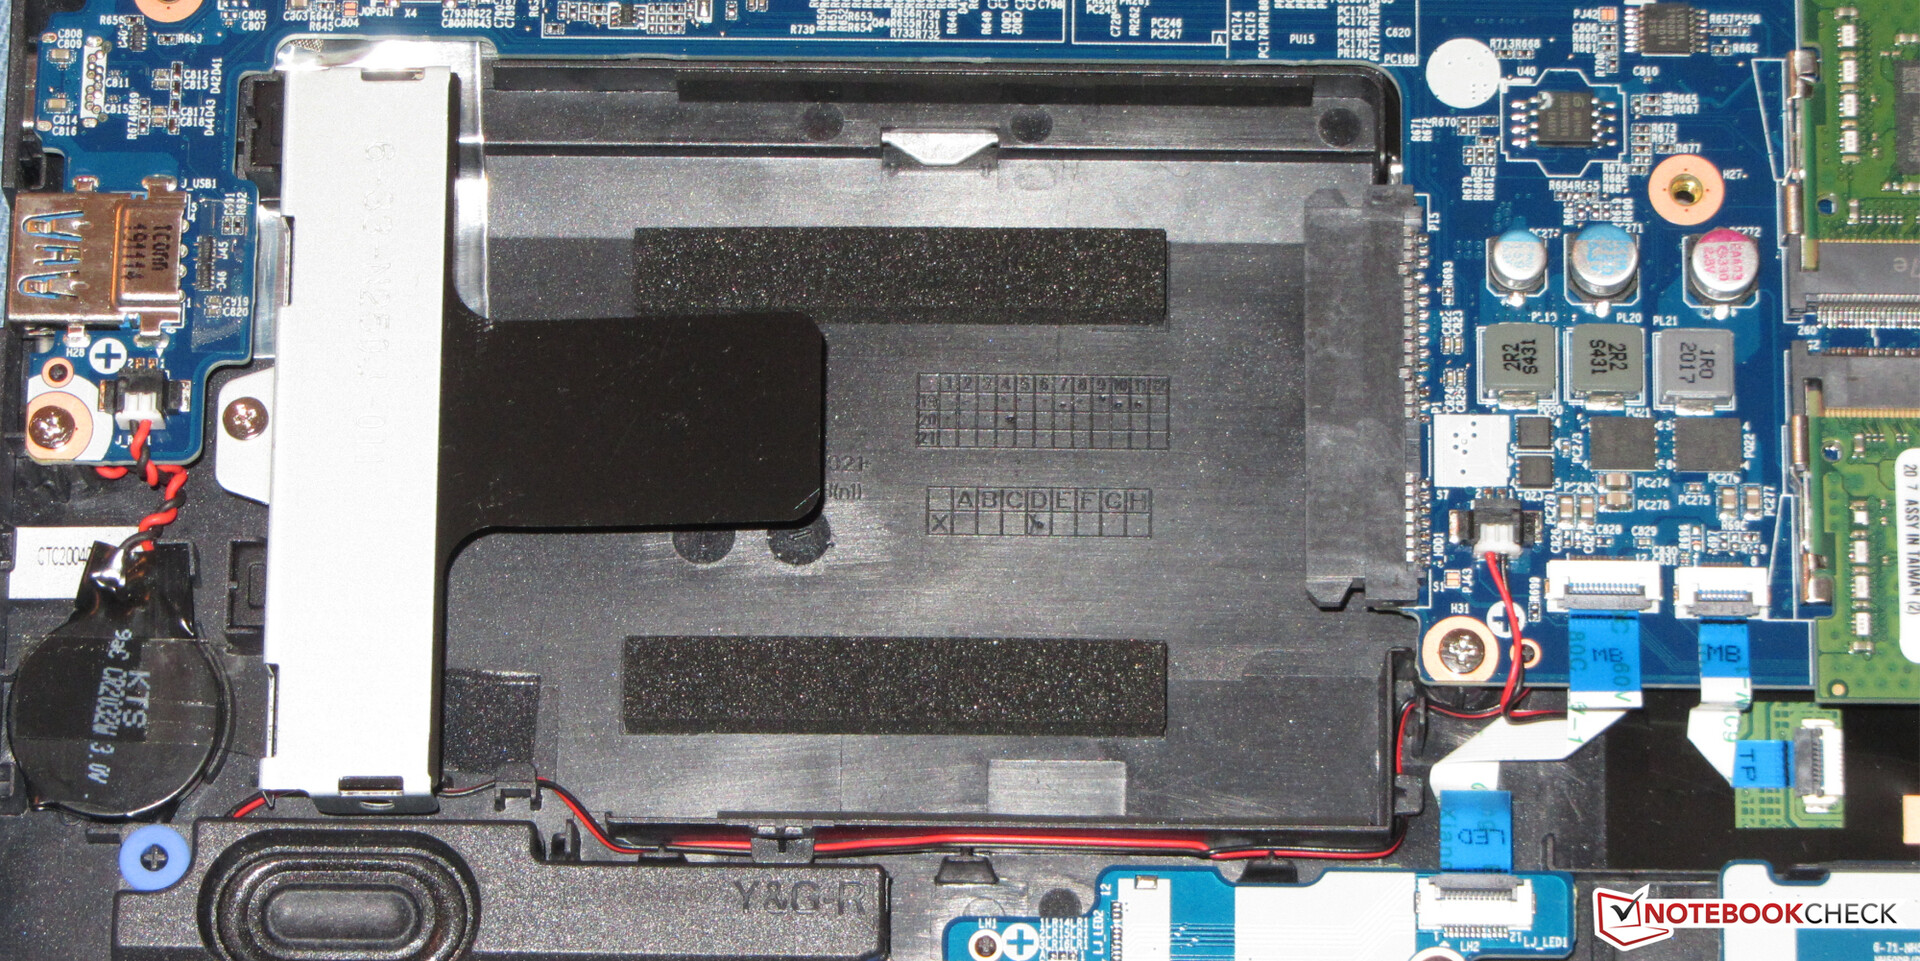
The laptop comes with two M.2 slots (1x NVMe/SATA, 1x NVMe) that accept SSDs in the 2230, 2242, and 2280 formats. If both slots are equipped with NVMe SSDs, these could form a RAID 0 or RAID 1 array if required. In addition, there's still room for a 2.5-inch storage drive inside the laptop. The mounting frame and SATA slot are available.

| Nexoc GH5 515IG Samsung SSD 860 Evo 512GB | Lenovo IdeaPad Gaming 3i 15IMH05 SK hynix BC511 HFM512GDHTNI-87A0B | Asus TUF FX505DT-EB73 Intel SSD 660p SSDPEKNW512G8 | Dell G3 3590 Toshiba BG4 KBG40ZNS128G | HP Pavilion Gaming 15-ec0002ng Intel SSD 660p SSDPEKNW512G8 | Acer Nitro 5 AN515-44-R5FT SK Hynix BC511 HFM512GDJTNI | MSI Bravo 15 A4DCR Samsung PM981a MZVLB1T0HBLR | |
|---|---|---|---|---|---|---|---|
| CrystalDiskMark 5.2 / 6 | 90% | 81% | 85% | 88% | 240% | ||
| Write 4K (MB/s) | 89.6 | 130 45% | 137.5 53% | 136.9 53% | 94.7 6% | 118.3 32% | |
| Read 4K (MB/s) | 40.88 | 44.44 9% | 57 39% | 57 39% | 38.91 -5% | 43.73 7% | |
| Write Seq (MB/s) | 518 | 1059 104% | 984 90% | 968 87% | 1056 104% | 2854 451% | |
| Read Seq (MB/s) | 539 | 1105 105% | 1564 190% | 1631 203% | 1183 119% | 2302 327% | |
| Write 4K Q32T1 (MB/s) | 304 | 490.3 61% | 237.4 -22% | 237 -22% | 445.3 46% | 418.5 38% | |
| Read 4K Q32T1 (MB/s) | 329 | 309.2 -6% | 340.7 4% | 337.1 2% | 477.7 45% | 517 57% | |
| Write Seq Q32T1 (MB/s) | 529 | 1053 99% | 959 81% | 963 82% | 1063 101% | 3008 469% | |
| Read Seq Q32T1 (MB/s) | 561 | 2261 303% | 1732 209% | 1863 232% | 2154 284% | 3568 536% | |
| AS SSD | 71% | 58% | -194% | -2% | 82% | 269% | |
| Seq Read (MB/s) | 524 | 1348 157% | 1019 94% | 1174 124% | 1623 210% | 1504 187% | 2730 421% |
| Seq Write (MB/s) | 495 | 1000 102% | 889 80% | 186 -62% | 891 80% | 1064 115% | 2513 408% |
| 4K Read (MB/s) | 38.93 | 48.04 23% | 48.22 24% | 34.01 -13% | 48.06 23% | 51.5 32% | 61.4 58% |
| 4K Write (MB/s) | 87.3 | 103.3 18% | 115.5 32% | 69.4 -21% | 102.1 17% | 123.2 41% | 156.1 79% |
| 4K-64 Read (MB/s) | 380 | 755 99% | 321.5 -15% | 424 12% | 325.6 -14% | 703 85% | 1780 368% |
| 4K-64 Write (MB/s) | 335.7 | 749 123% | 787 134% | 68.8 -80% | 94.1 -72% | 730 117% | 1920 472% |
| Access Time Read * (ms) | 0.073 | 0.061 16% | 0.065 11% | 0.168 -130% | 0.171 -134% | 0.064 12% | 0.063 14% |
| Access Time Write * (ms) | 0.039 | 0.036 8% | 0.047 -21% | 0.94 -2310% | 0.048 -23% | 0.031 21% | 0.025 36% |
| Score Read (Points) | 471 | 938 99% | 472 0% | 575 22% | 536 14% | 905 92% | 2114 349% |
| Score Write (Points) | 472 | 952 102% | 992 110% | 157 -67% | 285 -40% | 960 103% | 2327 393% |
| Score Total (Points) | 1198 | 2365 97% | 1717 43% | 987 -18% | 1077 -10% | 2321 94% | 5518 361% |
| Copy ISO MB/s (MB/s) | 500 | 749 50% | 942 88% | 215.7 -57% | 566 13% | ||
| Copy Program MB/s (MB/s) | 283.8 | 342.5 21% | 444.5 57% | 108.2 -62% | 223.8 -21% | ||
| Copy Game MB/s (MB/s) | 319.6 | 571 79% | 867 171% | 165.9 -48% | 104.3 -67% | ||
| Total Average (Program / Settings) | 81% /
78% | 70% /
66% | -194% /
-194% | 42% /
30% | 85% /
84% | 255% /
257% |
* ... smaller is better
Continuous load read: DiskSpd Read Loop, Queue Depth 8
Graphics card
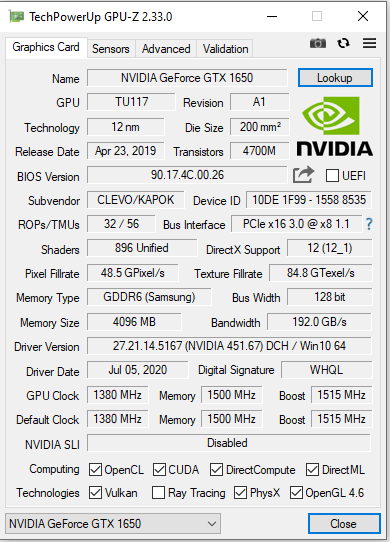
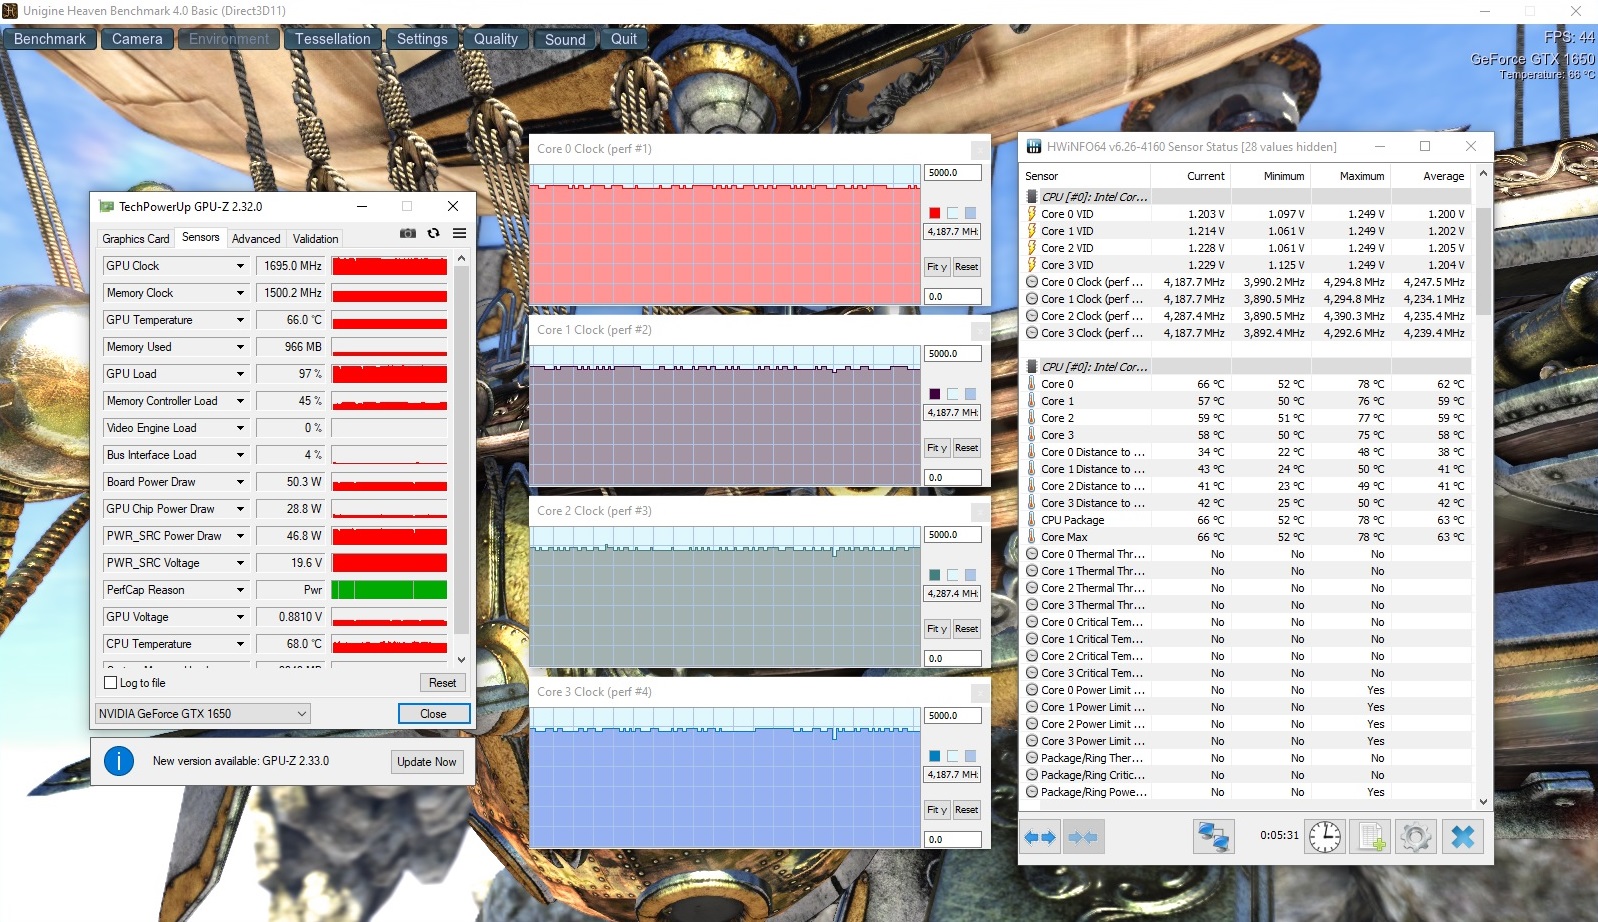
The GeForce GTX 1650 graphics core (Turing) is a mid-range GPU. Nvidia specifies a speed level between 1,380 MHz (base) and 1,515 MHz (boost) for this DirectX 12 GPU.
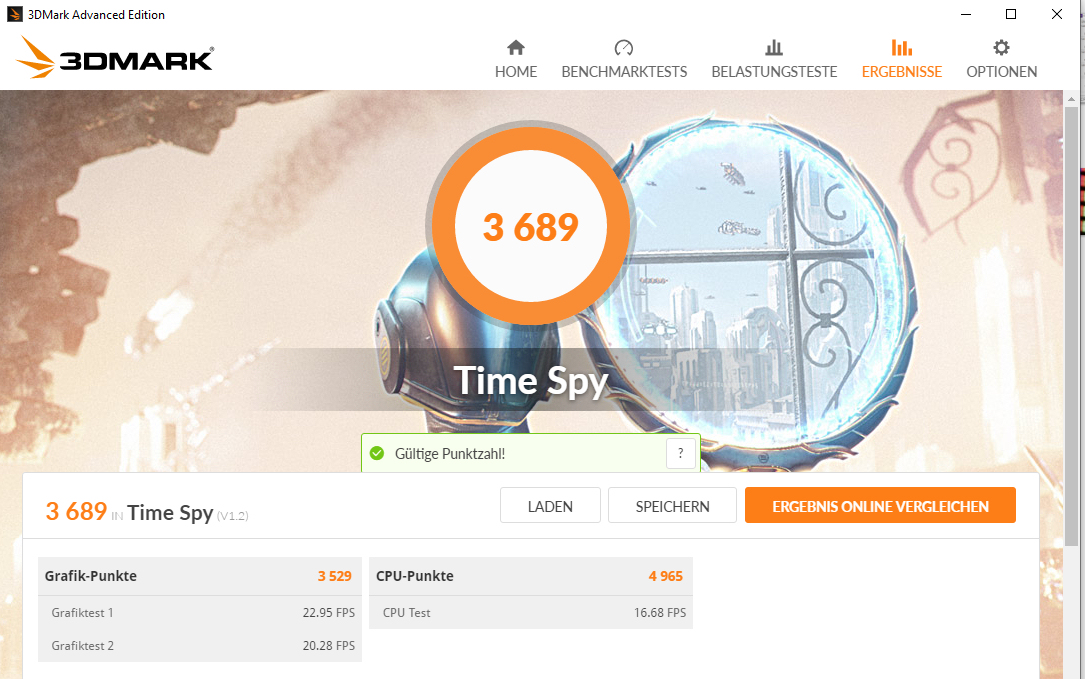
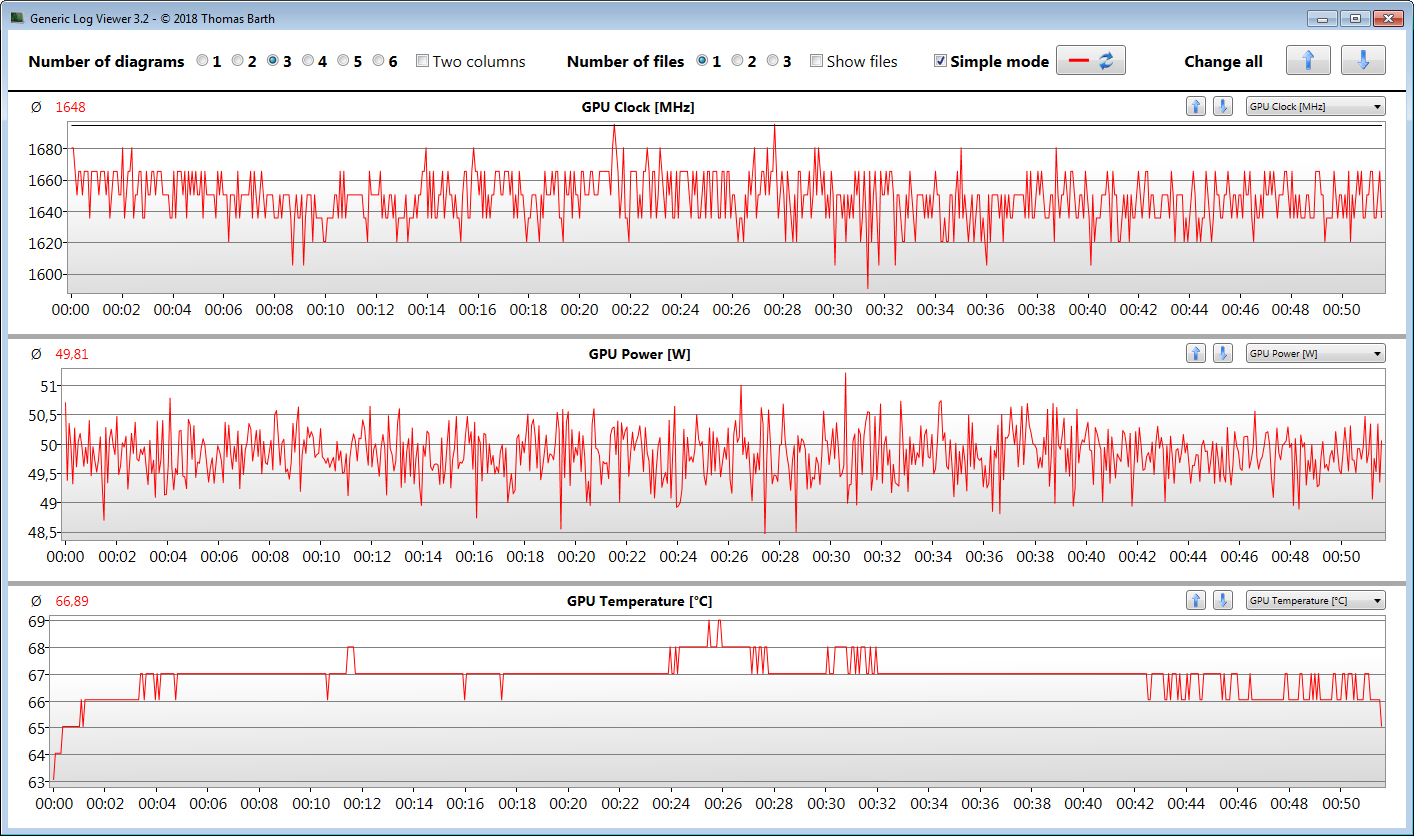
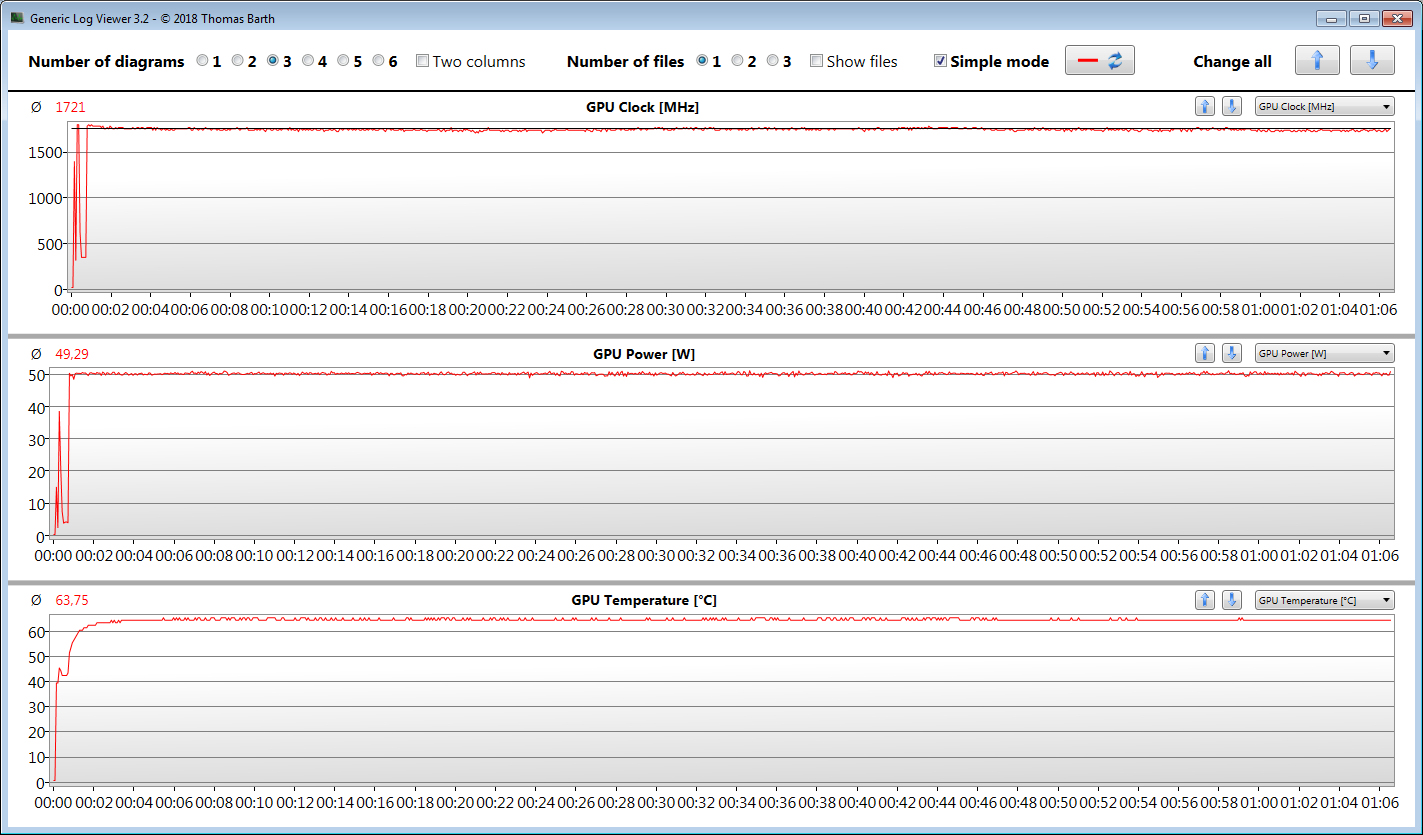
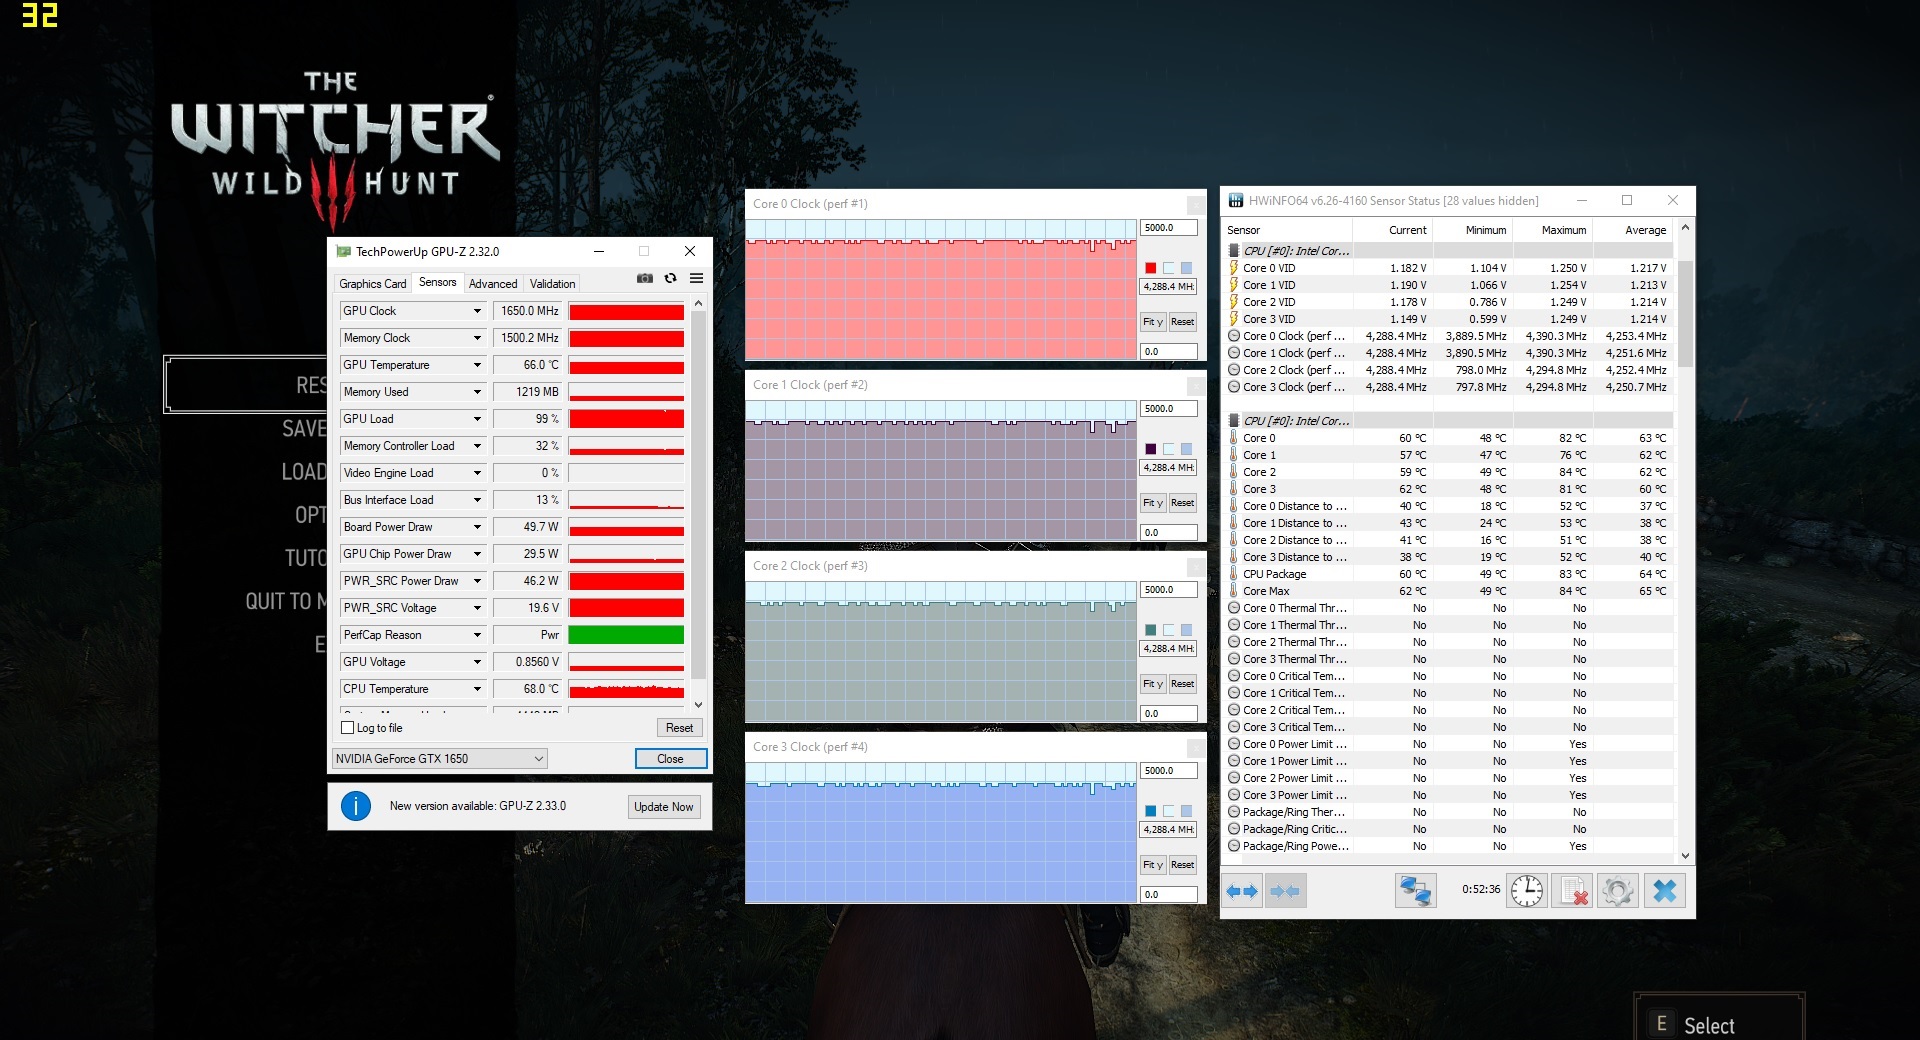
Higher clock rates are feasible if the GPU doesn't reach a defined temperature and/or energy threshold. In this way, we register a maximum of 1,785 MHz, which, however, can only be maintained for a short time. Our The Witcher 3 test is run at an average speed of 1,648 MHz and 1,721 MHz (performance mode), respectively. The GPU is able to access fast GDDR6 graphics memory (4,096 MB).
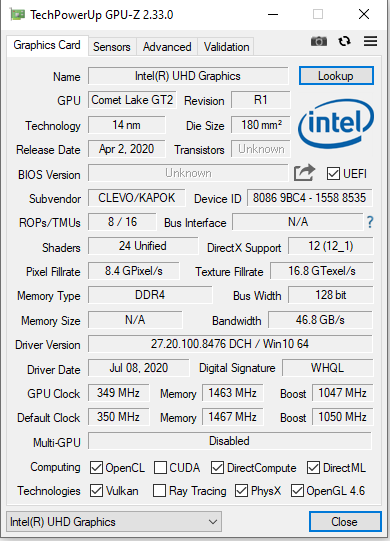
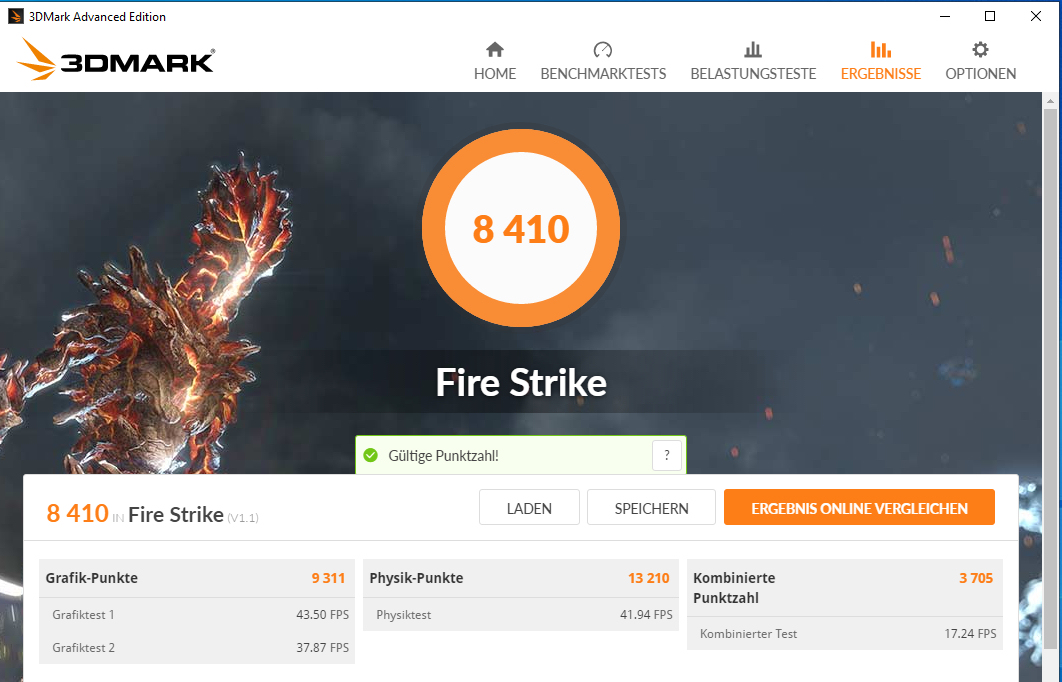
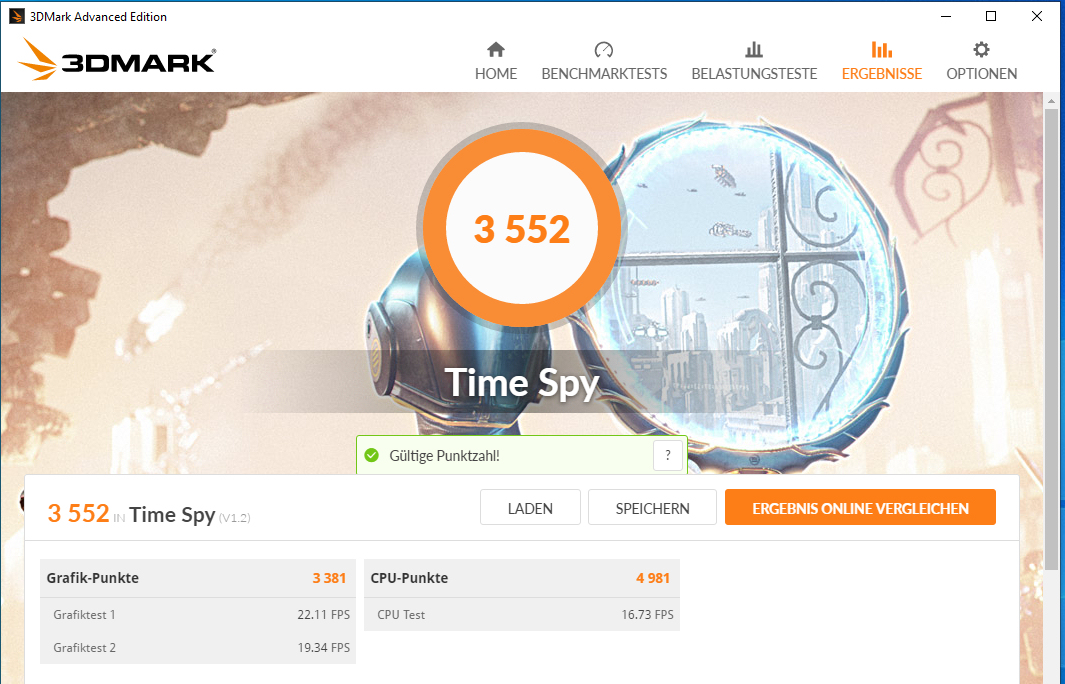
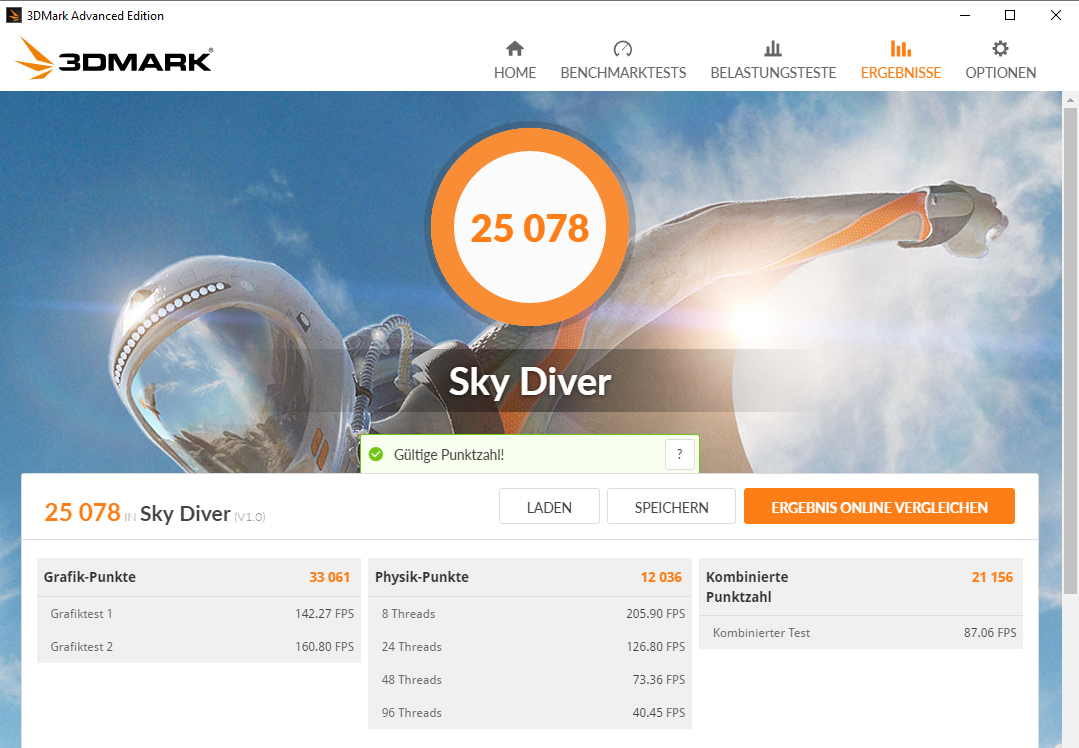
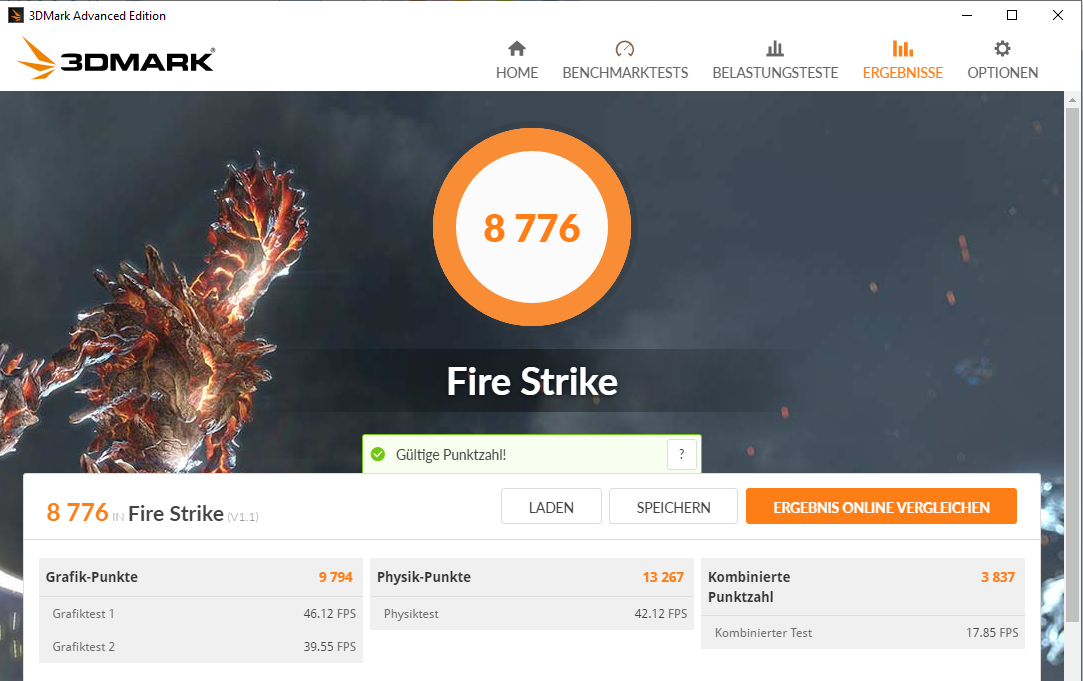
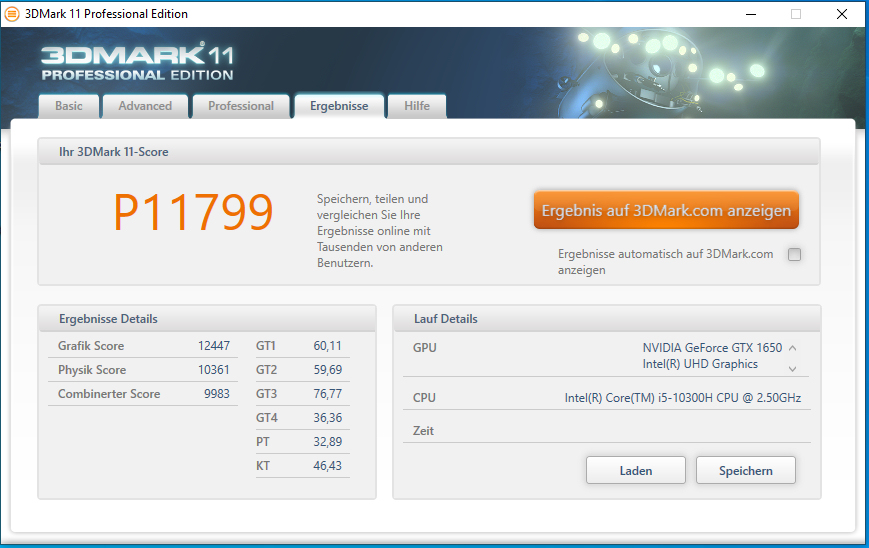
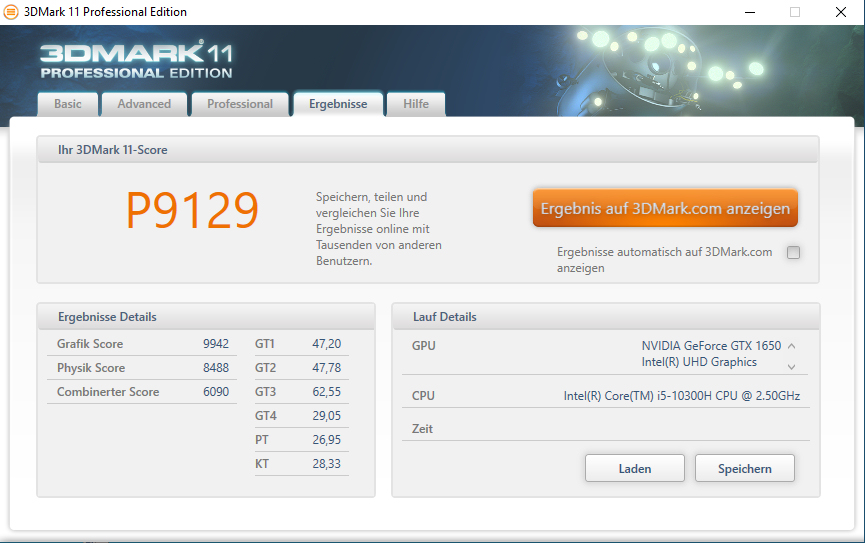
The results in the 3DMark benchmarks are at a normal level for this GPU. The UHD Graphics 630 GPU that's integrated into the processor is active, and the laptop works with Nvidia's Optimus graphics-switching solution. Furthermore, activating the performance mode within the Control Center generates a slight increase in graphics performance.
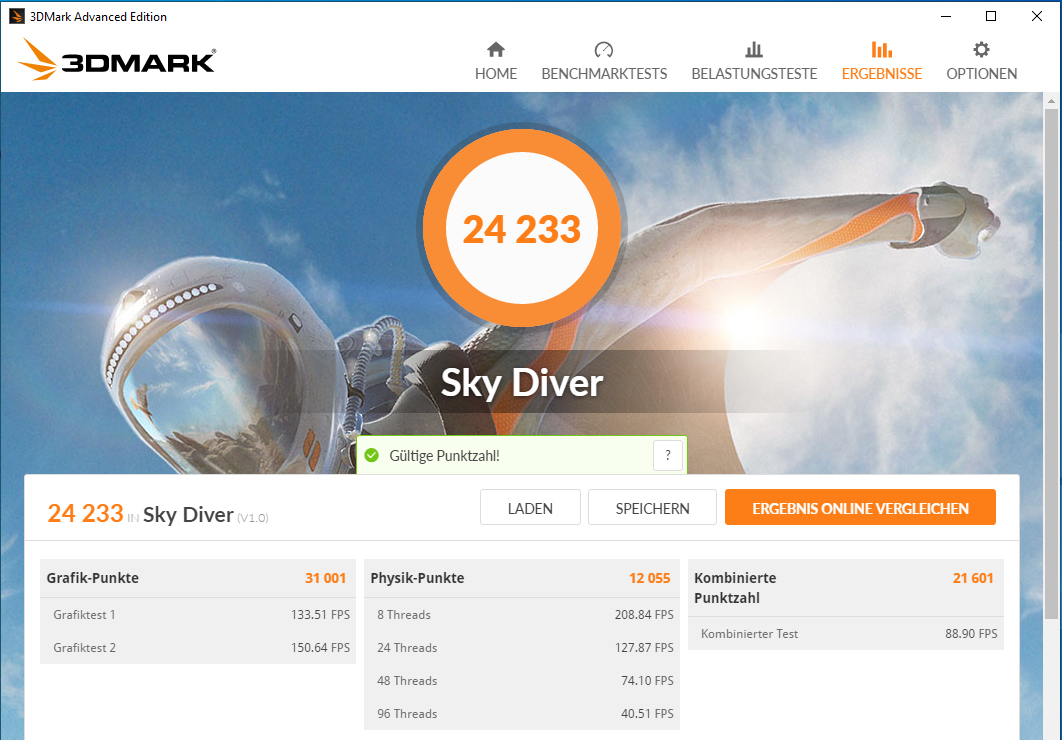
| 3DMark 06 Standard Score | 36299 points | |
| 3DMark 11 Performance | 11799 points | |
| 3DMark Cloud Gate Standard Score | 27676 points | |
| 3DMark Fire Strike Score | 8410 points | |
| 3DMark Time Spy Score | 3552 points | |
Help | ||
| 3DMark 11 - 1280x720 Performance GPU | |
| MSI Bravo 15 A4DCR | |
| Acer Nitro 5 AN515-44-R5FT | |
| Asus TUF FX505DT-EB73 | |
| Dell G3 3590 | |
| Lenovo IdeaPad Gaming 3i 15IMH05 | |
| Nexoc GH5 515IG | |
| HP Pavilion Gaming 15-ec0002ng | |
| 3DMark | |
| 1280x720 Cloud Gate Standard Graphics | |
| Lenovo IdeaPad Gaming 3i 15IMH05 | |
| Nexoc GH5 515IG | |
| Dell G3 3590 | |
| MSI Bravo 15 A4DCR | |
| Acer Nitro 5 AN515-44-R5FT | |
| Asus TUF FX505DT-EB73 | |
| HP Pavilion Gaming 15-ec0002ng | |
| 1920x1080 Fire Strike Graphics | |
| MSI Bravo 15 A4DCR | |
| Acer Nitro 5 AN515-44-R5FT | |
| Nexoc GH5 515IG (Leistungsmodus) | |
| Lenovo IdeaPad Gaming 3i 15IMH05 | |
| Asus TUF FX505DT-EB73 | |
| Dell G3 3590 | |
| Nexoc GH5 515IG | |
| HP Pavilion Gaming 15-ec0002ng | |
| 2560x1440 Time Spy Graphics | |
| Acer Nitro 5 AN515-44-R5FT | |
| Asus TUF FX505DT-EB73 | |
| MSI Bravo 15 A4DCR | |
| Nexoc GH5 515IG (Leistungsmodus) | |
| Dell G3 3590 | |
| Lenovo IdeaPad Gaming 3i 15IMH05 | |
| Nexoc GH5 515IG | |
| HP Pavilion Gaming 15-ec0002ng | |
Gaming performance
The Nexoc GH5's CPU-GPU combination brings all the games in our database smoothly onto the screen. Full HD resolution and medium to high quality settings can usually be used, and more is possible in some cases.
| Shadow of the Tomb Raider - 1920x1080 Highest Preset AA:T | |
| Acer Nitro 5 AN515-44-R5FT | |
| Lenovo IdeaPad Gaming 3i 15IMH05 | |
| Nexoc GH5 515IG (Leistungsmodus) | |
| Nexoc GH5 515IG | |
| Asus TUF FX505DT-EB73 | |
| MSI Bravo 15 A4DCR | |
| HP Pavilion Gaming 15-ec0002ng | |
| The Witcher 3 - 1920x1080 Ultra Graphics & Postprocessing (HBAO+) | |
| Nexoc GH5 515IG | |
| Acer Nitro 5 AN515-44-R5FT | |
| MSI Bravo 15 A4DCR | |
| Lenovo IdeaPad Gaming 3i 15IMH05 | |
| Nexoc GH5 515IG (Leistungsmodus) | |
| Asus TUF FX505DT-EB73 | |
| Dell G3 3590 | |
| HP Pavilion Gaming 15-ec0002ng | |
| BioShock Infinite - 1920x1080 Ultra Preset, DX11 (DDOF) | |
| Nexoc GH5 515IG (Leistungsmodus) | |
| Lenovo IdeaPad Gaming 3i 15IMH05 | |
| Nexoc GH5 515IG | |
| Dell G3 3590 | |
| Asus TUF FX505DT-EB73 | |
| HP Pavilion Gaming 15-ec0002ng | |
| Star Wars Jedi Fallen Order - 1920x1080 Epic Preset | |
| MSI Bravo 15 A4DCR | |
| Lenovo IdeaPad Gaming 3i 15IMH05 | |
| Nexoc GH5 515IG | |
| HP Pavilion Gaming 15-ec0002ng | |
| Gears Tactics - 1920x1080 Ultra Preset | |
| Acer Nitro 5 AN515-44-R5FT | |
| Lenovo IdeaPad Gaming 3i 15IMH05 | |
| MSI Bravo 15 A4DCR | |
| Nexoc GH5 515IG (Leistungsmodus) | |
| Nexoc GH5 515IG | |
| Doom Eternal - 1920x1080 High Preset | |
| Lenovo IdeaPad Gaming 3i 15IMH05 | |
| Nexoc GH5 515IG | |
| MSI Bravo 15 A4DCR | |
| F1 2020 - 1920x1080 Ultra High Preset AA:T AF:16x | |
| Nexoc GH5 515IG | |
In order to verify whether the frame rates remain largely constant even over a prolonged period of time, we let the game The Witcher 3 run for about 60 minutes at Full HD resolution and maximum quality settings. The character embodied by the player is not moved during this whole period. A drop in frame rates wasn't found.
| low | med. | high | ultra | |
|---|---|---|---|---|
| BioShock Infinite (2013) | 332.4 | 250.2 | 226.1 | 95.2 |
| The Witcher 3 (2015) | 187.9 | 118.4 | 67.2 | 38.5 |
| Shadow of the Tomb Raider (2018) | 115 | 61 | 51 | 44 |
| Call of Duty Modern Warfare 2019 (2019) | 97.5 | 61.5 | 51.1 | 43.3 |
| Star Wars Jedi Fallen Order (2019) | 78.3 | 61.1 | 51.8 | |
| Doom Eternal (2020) | 148.6 | 81.4 | 62.6 | |
| Gears Tactics (2020) | 230.8 | 89.7 | 61 | 41.9 |
| F1 2020 (2020) | 182 | 104 | 81 | 57 |
| Death Stranding (2020) | 104.9 | 62.8 | 57.3 | 56.5 |
| Horizon Zero Dawn (2020) | 95 | 54 | 45 | 34 |
Emissions - The Nexoc laptop produces a lot of noise under load
Noise emissions
In idle usage, the two fans hold back to a large extent and produce a quiet noise. Occasionally, they're even completely quiet, and silence prevails. The fans really turn up under load, though. As a result, we register a sound pressure level of 52 dB(A) even in the medium load range. During the stress test and our The Witcher 3 test, the values are 53 dB(A) and 48 dB(A), respectively. Without a headset, gaming is no fun here.
For an overall lower noise level, it's necessary to switch to silent mode within the Control Center. However, this is at the expense of performance.
Noise level
| Idle |
| 25 / 31 / 33 dB(A) |
| Load |
| 53 / 53 dB(A) |
 | ||
30 dB silent 40 dB(A) audible 50 dB(A) loud |
||
min: | ||
| Nexoc GH5 515IG i5-10300H, GeForce GTX 1650 Mobile | Lenovo IdeaPad Gaming 3i 15IMH05 i5-10300H, GeForce GTX 1650 Mobile | Asus TUF FX505DT-EB73 R7 3750H, GeForce GTX 1650 Mobile | Dell G3 3590 i5-9300H, GeForce GTX 1650 Mobile | HP Pavilion Gaming 15-ec0002ng R5 3550H, GeForce GTX 1050 Mobile | Acer Nitro 5 AN515-44-R5FT R5 4600H, GeForce GTX 1650 Ti Mobile | MSI Bravo 15 A4DCR R7 4800H, Radeon RX 5300M | |
|---|---|---|---|---|---|---|---|
| Noise | -4% | 3% | 2% | 3% | -3% | -9% | |
| off / environment * (dB) | 25 | 30.7 -23% | 28.2 -13% | 28.4 -14% | 30.3 -21% | 30 -20% | 30 -20% |
| Idle Minimum * (dB) | 25 | 30.7 -23% | 28.2 -13% | 29.2 -17% | 30.3 -21% | 30 -20% | 31 -24% |
| Idle Average * (dB) | 31 | 30.7 1% | 28.2 9% | 29.4 5% | 30.3 2% | 32 -3% | 32 -3% |
| Idle Maximum * (dB) | 33 | 30.7 7% | 31.4 5% | 29.4 11% | 31 6% | 34 -3% | 40 -21% |
| Load Average * (dB) | 53 | 49.7 6% | 39.8 25% | 39 26% | 39.3 26% | 46 13% | 48 9% |
| Witcher 3 ultra * (dB) | 48 | 47 2% | 47 2% | 49.5 -3% | 42.9 11% | 47 2% | 48 -0% |
| Load Maximum * (dB) | 53 | 50.3 5% | 50.2 5% | 49.7 6% | 43.3 18% | 49 8% | 54 -2% |
* ... smaller is better
Temperature
Our stress test (Prime95 and FurMark run for at least an hour) is run by the processor and graphic core at 3.2 GHz and 1,230 MHz, respectively. The clock rates are 1.3 to 1.4 GHz (CPU) and 500 to 800 MHz (GPU), respectively, on battery power. The stress test represents an extreme scenario that doesn't occur in everyday life. We use this test to check if the system remains stable even under full load.
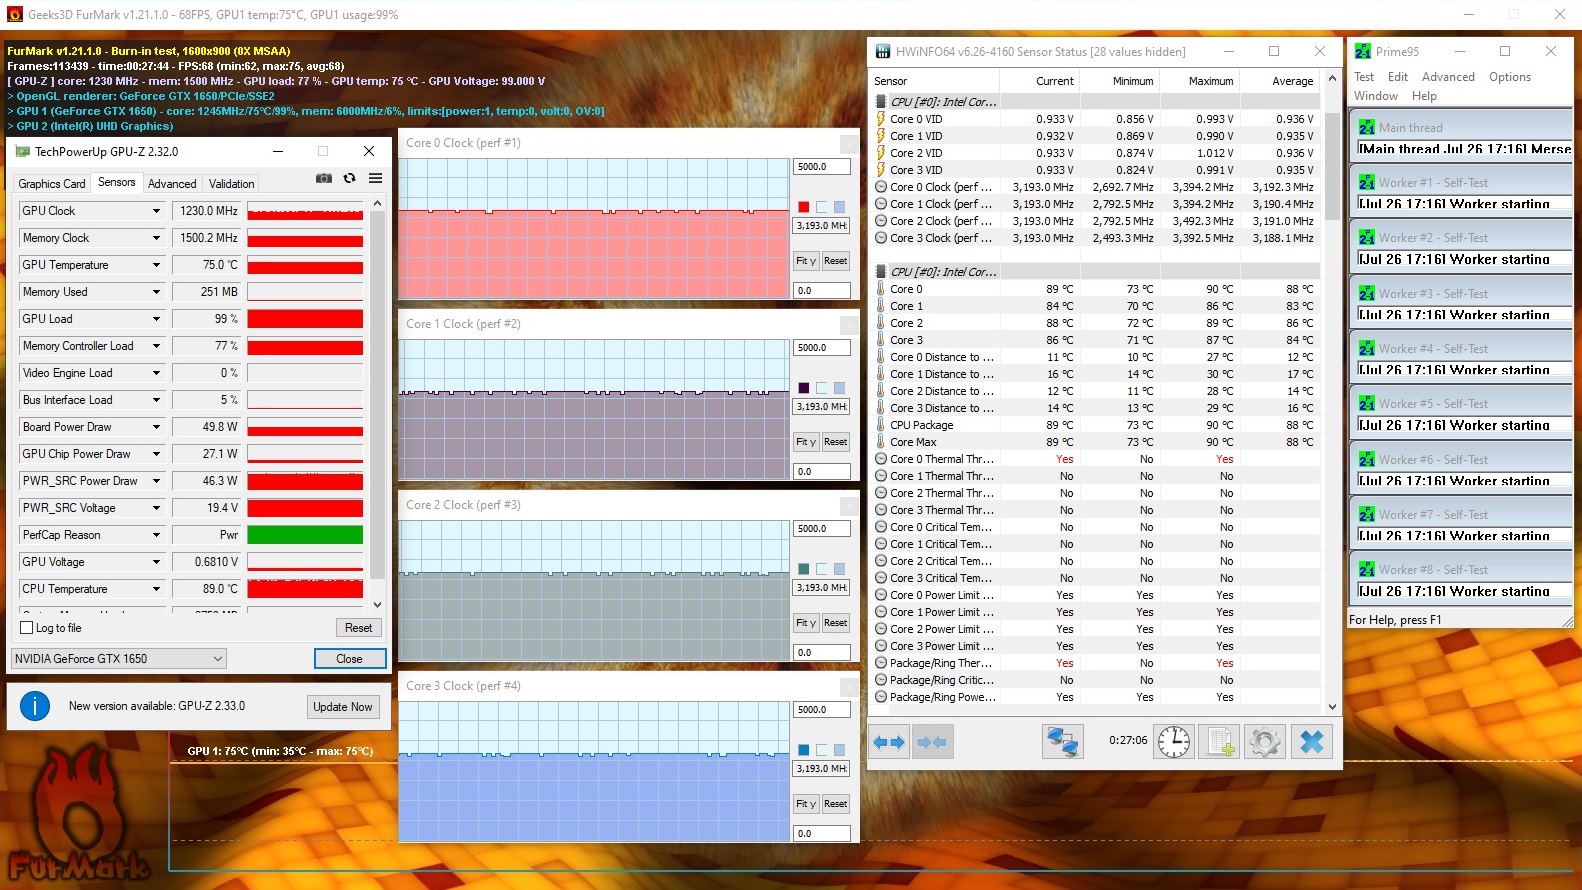
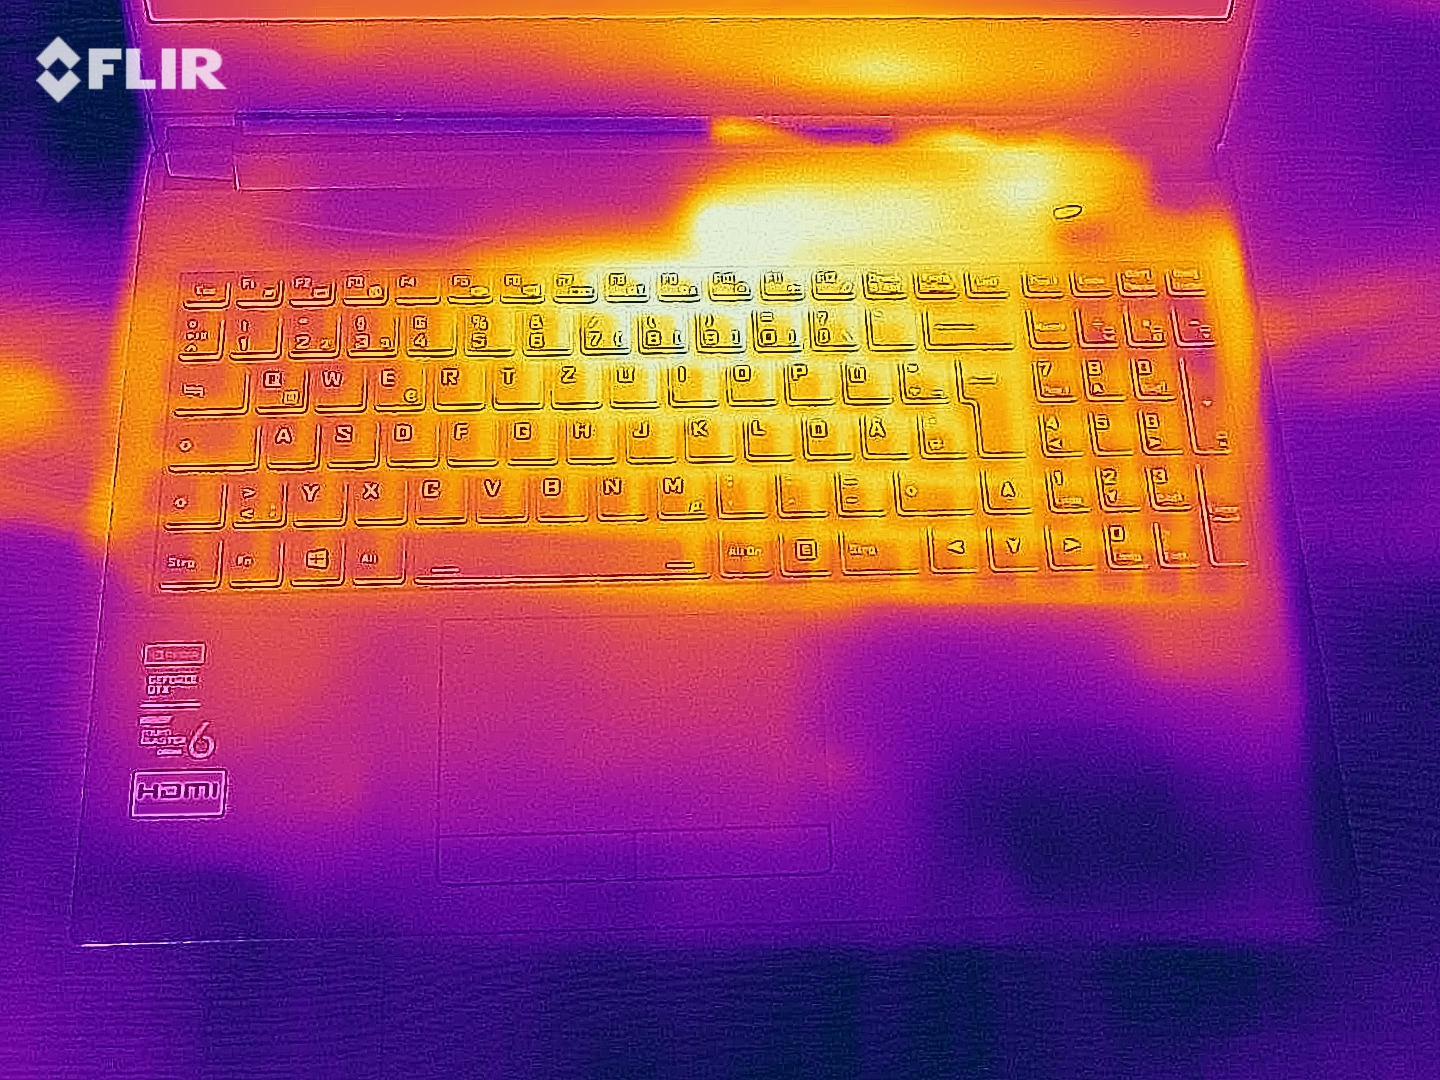
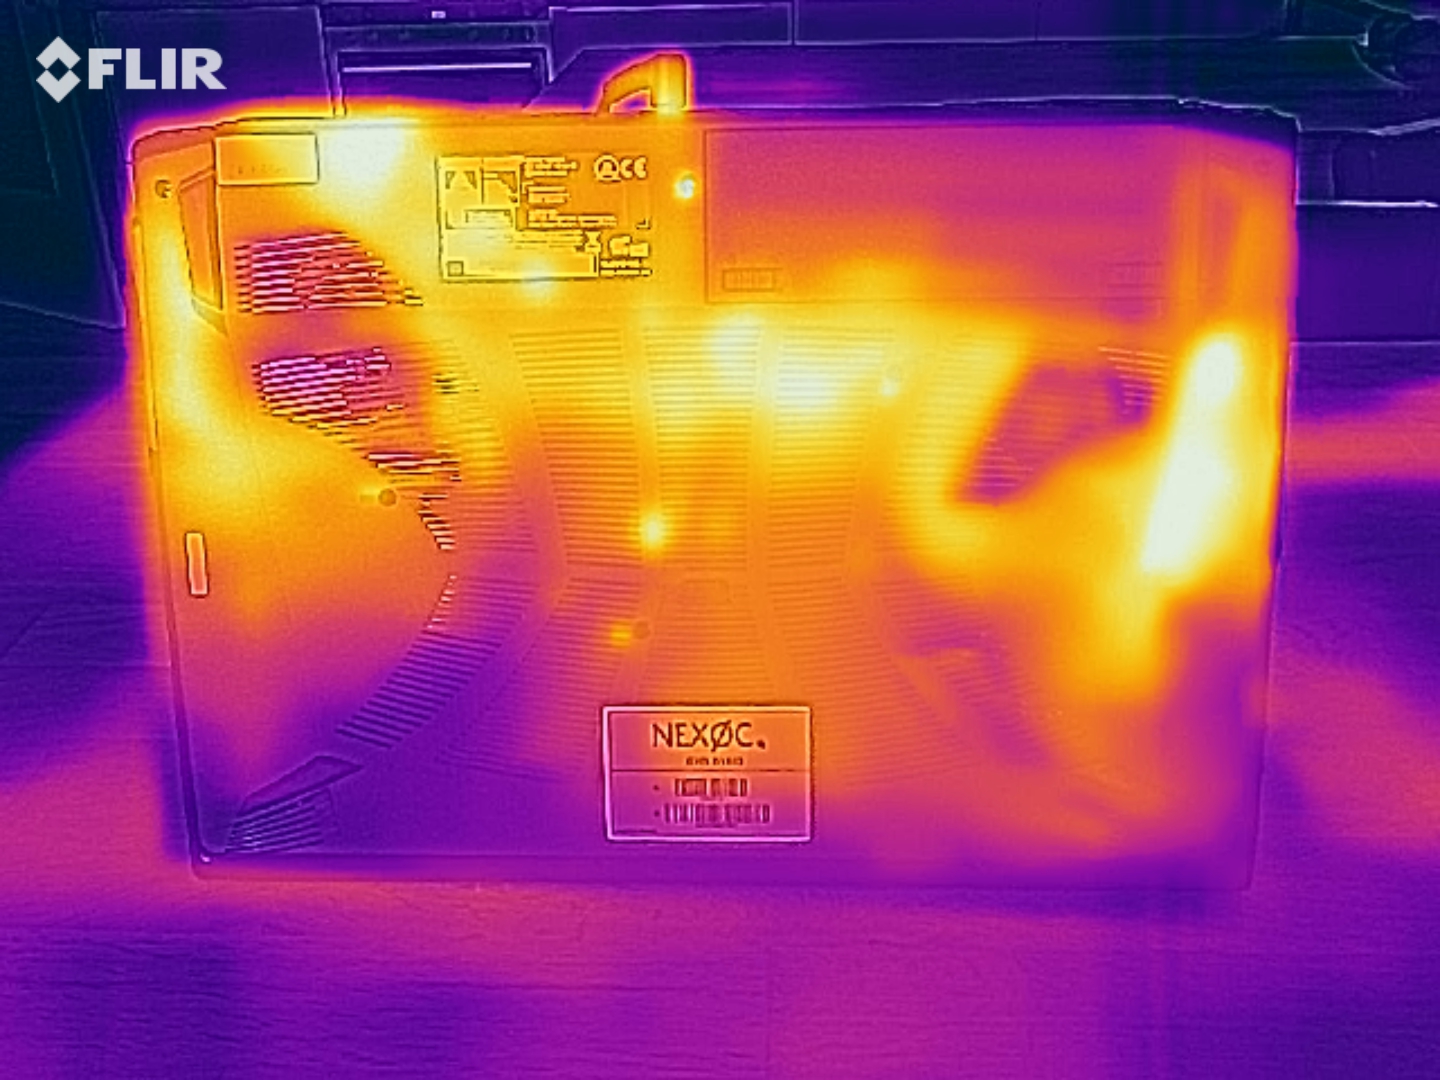
The laptop doesn't heat up excessively. During the stress test, we register temperatures in the upper 40-°C range (~104 °F) at several measuring points. Moreover, heat development is lower when performing our The Witcher 3 test. The temperatures are in the green range in everyday use.
(-) The maximum temperature on the upper side is 48 °C / 118 F, compared to the average of 40.4 °C / 105 F, ranging from 21.2 to 68.8 °C for the class Gaming.
(-) The bottom heats up to a maximum of 47 °C / 117 F, compared to the average of 43.2 °C / 110 F
(+) In idle usage, the average temperature for the upper side is 27.6 °C / 82 F, compared to the device average of 33.9 °C / 93 F.
(-) Playing The Witcher 3, the average temperature for the upper side is 38.1 °C / 101 F, compared to the device average of 33.9 °C / 93 F.
(+) The palmrests and touchpad are reaching skin temperature as a maximum (34 °C / 93.2 F) and are therefore not hot.
(-) The average temperature of the palmrest area of similar devices was 28.8 °C / 83.8 F (-5.2 °C / -9.4 F).
| Nexoc GH5 515IG i5-10300H, GeForce GTX 1650 Mobile | Lenovo IdeaPad Gaming 3i 15IMH05 i5-10300H, GeForce GTX 1650 Mobile | Asus TUF FX505DT-EB73 R7 3750H, GeForce GTX 1650 Mobile | Dell G3 3590 i5-9300H, GeForce GTX 1650 Mobile | HP Pavilion Gaming 15-ec0002ng R5 3550H, GeForce GTX 1050 Mobile | Acer Nitro 5 AN515-44-R5FT R5 4600H, GeForce GTX 1650 Ti Mobile | MSI Bravo 15 A4DCR R7 4800H, Radeon RX 5300M | |
|---|---|---|---|---|---|---|---|
| Heat | 2% | -5% | -13% | 11% | -2% | -8% | |
| Maximum Upper Side * (°C) | 48 | 43 10% | 41.2 14% | 49 -2% | 41 15% | 49 -2% | 51 -6% |
| Maximum Bottom * (°C) | 47 | 50.6 -8% | 40 15% | 49.8 -6% | 39.1 17% | 50 -6% | 50 -6% |
| Idle Upper Side * (°C) | 28 | 27.2 3% | 34.6 -24% | 32.4 -16% | 26 7% | 28 -0% | 30 -7% |
| Idle Bottom * (°C) | 28 | 27.5 2% | 34.4 -23% | 35.6 -27% | 26.5 5% | 28 -0% | 31 -11% |
* ... smaller is better
Speakers
The stereo speakers are placed in the front area of the bottom of the device. They produce a decent sound but with hardly any bass. For a better sound experience, headphones or external speakers should be used.
Nexoc GH5 515IG audio analysis
(±) | speaker loudness is average but good (81 dB)
Bass 100 - 315 Hz
(-) | nearly no bass - on average 24.4% lower than median
(±) | linearity of bass is average (13% delta to prev. frequency)
Mids 400 - 2000 Hz
(+) | balanced mids - only 4.3% away from median
(±) | linearity of mids is average (7.5% delta to prev. frequency)
Highs 2 - 16 kHz
(±) | higher highs - on average 5% higher than median
(±) | linearity of highs is average (8.3% delta to prev. frequency)
Overall 100 - 16.000 Hz
(±) | linearity of overall sound is average (20.2% difference to median)
Compared to same class
» 72% of all tested devices in this class were better, 6% similar, 23% worse
» The best had a delta of 6%, average was 18%, worst was 132%
Compared to all devices tested
» 53% of all tested devices were better, 8% similar, 39% worse
» The best had a delta of 4%, average was 23%, worst was 134%
Energy management - Battery life is very decent
Energy consumption
We register a maximum power consumption of 16 watts in idle usage. During our stress test, the value increases up to 134 watts. Furthermore, with an average of 86 watts, the demand is lower in gaming mode (The Witcher 3 test). The power adapter's rated output is 120 watts.
| Off / Standby | |
| Idle | |
| Load |
|
Key:
min: | |
| Nexoc GH5 515IG i5-10300H, GeForce GTX 1650 Mobile | Lenovo IdeaPad Gaming 3i 15IMH05 i5-10300H, GeForce GTX 1650 Mobile | Asus TUF FX505DT-EB73 R7 3750H, GeForce GTX 1650 Mobile | Dell G3 3590 i5-9300H, GeForce GTX 1650 Mobile | HP Pavilion Gaming 15-ec0002ng R5 3550H, GeForce GTX 1050 Mobile | Acer Nitro 5 AN515-44-R5FT R5 4600H, GeForce GTX 1650 Ti Mobile | MSI Bravo 15 A4DCR R7 4800H, Radeon RX 5300M | |
|---|---|---|---|---|---|---|---|
| Power Consumption | -24% | -23% | -36% | 18% | -5% | -74% | |
| Idle Minimum * (Watt) | 3 | 5.1 -70% | 7 -133% | 6.2 -107% | 1.9 37% | 5 -67% | 11 -267% |
| Idle Average * (Watt) | 7 | 8.2 -17% | 9.9 -41% | 8.4 -20% | 7.2 -3% | 8 -14% | 14 -100% |
| Idle Maximum * (Watt) | 16 | 10.6 34% | 12 25% | 27.7 -73% | 9.6 40% | 13 19% | 25 -56% |
| Load Average * (Watt) | 85 | 128 -51% | 68.4 20% | 91 -7% | 74 13% | 69 19% | 72 15% |
| Witcher 3 ultra * (Watt) | 86 | 109 -27% | 94.9 -10% | 94.4 -10% | 75 13% | 78 9% | 100 -16% |
| Load Maximum * (Watt) | 134 | 150 -12% | 130.9 2% | 131.5 2% | 124 7% | 124 7% | 163 -22% |
* ... smaller is better
Battery life
The battery life is absolutely in order for a gaming laptop. Our WLAN test (accessing websites using a script) and video test (the short film Big Buck Bunny (H.264 encoding, Full HD) running in a loop) are completed by the 15.6-incher after 6:24 h and 6:28 h, respectively.
| Nexoc GH5 515IG i5-10300H, GeForce GTX 1650 Mobile, 48.96 Wh | Lenovo IdeaPad Gaming 3i 15IMH05 i5-10300H, GeForce GTX 1650 Mobile, 45 Wh | Asus TUF FX505DT-EB73 R7 3750H, GeForce GTX 1650 Mobile, 48 Wh | Dell G3 3590 i5-9300H, GeForce GTX 1650 Mobile, 51 Wh | HP Pavilion Gaming 15-ec0002ng R5 3550H, GeForce GTX 1050 Mobile, 52.5 Wh | Acer Nitro 5 AN515-44-R5FT R5 4600H, GeForce GTX 1650 Ti Mobile, 57.48 Wh | MSI Bravo 15 A4DCR R7 4800H, Radeon RX 5300M, 51 Wh | |
|---|---|---|---|---|---|---|---|
| Battery runtime | 11% | -16% | 4% | 31% | 15% | -36% | |
| Reader / Idle (h) | 14.9 | 12.4 -17% | 7.8 -48% | 13.5 -9% | 13.8 -7% | 7 -53% | |
| H.264 (h) | 6.5 | 7.3 12% | |||||
| WiFi v1.3 (h) | 6.4 | 6.3 -2% | 4.8 -25% | 6.7 5% | 8.4 31% | 8.7 36% | 4.5 -30% |
| Load (h) | 1.2 | 1.8 50% | 1.5 25% | 1.4 17% | 1.4 17% | 0.9 -25% |
Pros
Cons
Verdict
Nexoc's gaming laptop brings all the latest computer games smoothly onto the screen thanks to its Core i5-10300H processor and GeForce GTX 1650 graphics core. However, maximum quality settings are mostly beyond the reach of the device's owners. Positive: The CPU and GPU can run at high speeds for prolonged periods of time.
With the GH5 515IG, Nexoc delivers a well-rounded gaming laptop from the entry-level segment that can be customized to users' own needs.
The laptop can be individually configured in the Nexoc online shop. While the base version is available for around 850 Euros (~$1,001), about 1,040 Euros (~$1,225) has to be paid for the configuration variant provided to us. We can live with the built-in SATA SSD (500 GB, M.2 2280) since it is possible to choose a configuration with an additional drive. An NVMe SSD is recommended as a system drive for all potential buyers.
The laptop has room for two M.2 SSDs (1x NVMe/SATA, 1x NVMe; RAID 0/1) and a 2.5-inch storage drive. If the storage space of the built-in 500 GB SSD runs out, it can be easily expanded. To do so, the laptop's bottom cover would have to be removed since there's no maintenance hatch.
The Full HD IPS display offers stable viewing angles, a matte surface, good contrast, and a decent color reproduction. But the maximum brightness is too low. The color-space coverage is no cause for enthusiasm either. Furthermore, the built-in keyboard (RGB lighting) has proven to be suitable for everyday use, while the battery life turned out to be very decent.
Nexoc GH5 515IG
- 08/19/2020 v7 (old)
Sascha Mölck
Price comparison

