MSI Bravo 15 A4DCR Laptop Review: For bargain hunters

If you are looking for a gaming notebook for around $1000 and would prefer an AMD chip, you will want to take a closer look at the MSI Bravo 15. The 15-inch device offers a good price-to-performance ratio and is clearly aiming for our Budget-Top-10 list. The processor is a Ryzen chip from AMD's 4000 series and the graphics chip is either a Radeon RX 5300M with 3 GB of VRAM (A4DCR) or a Radeon RX 5500M with 4 GB of VRAM (A4DDR). Images are displayed on the Full-HD display, which also supports FreeSync, with 120 or 144 Hz.
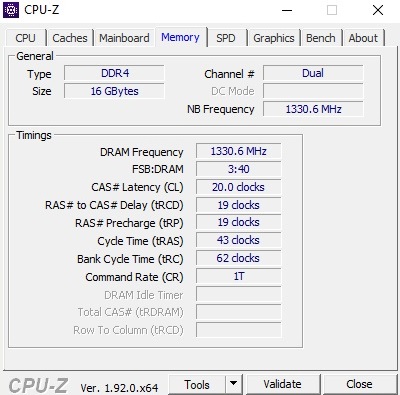
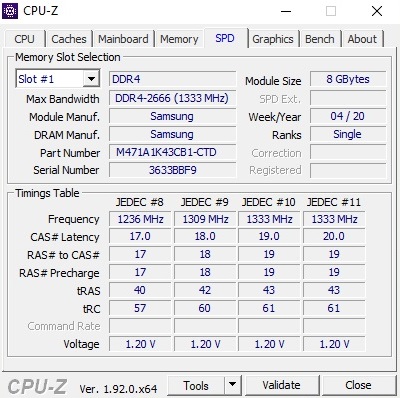
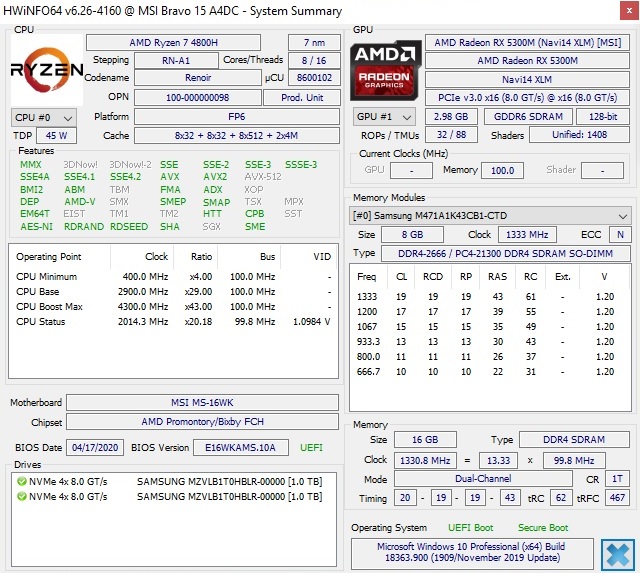
Our test unit, which is equipped with a Ryzen 7 4800H, a Radeon RX 5300M, a 144-Hz panel, 16 GB of DDR4 RAM (2x 8 GB of dual channel mode) and two 1-TB SSDs, is a presample. This means that there might still be some changes to the inside or outside of the final product. For example, the keyboard backlight didn't work on our test unit, which we didn't include in our overall rating.
The Bravo 15's competition includes other 15-inch budget gamers such as the Asus TUF FX505DT, the Dell G5 15 5590, the HP Omen 15 and the recently tested Acer Nitro 5 AN515-44. All these notebooks are included in our comparison tables.
Rating | Date | Model | Weight | Height | Size | Resolution | Price |
|---|---|---|---|---|---|---|---|
| 79.5 % v7 (old) | 07 / 2020 | MSI Bravo 15 A4DCR R7 4800H, Radeon RX 5300M | 2 kg | 22 mm | 15.60" | 1920x1080 | |
| 79.8 % v7 (old) | 06 / 2020 | Acer Nitro 5 AN515-44-R5FT R5 4600H, GeForce GTX 1650 Ti Mobile | 2.2 kg | 24 mm | 15.60" | 1920x1080 | |
| 80.4 % v6 (old) | 07 / 2019 | Asus TUF FX505DT-EB73 R7 3750H, GeForce GTX 1650 Mobile | 2.2 kg | 26.8 mm | 15.60" | 1920x1080 | |
| 79.6 % v7 (old) | 10 / 2019 | Dell G5 15 5590-PCNJJ i5-9300H, GeForce GTX 1650 Mobile | 2.7 kg | 23.7 mm | 15.60" | 1920x1080 | |
| 81.5 % v7 (old) | 07 / 2019 | HP Omen 15-dc1020ng i5-9300H, GeForce GTX 1650 Mobile | 2.3 kg | 25 mm | 15.60" | 1920x1080 |
Case
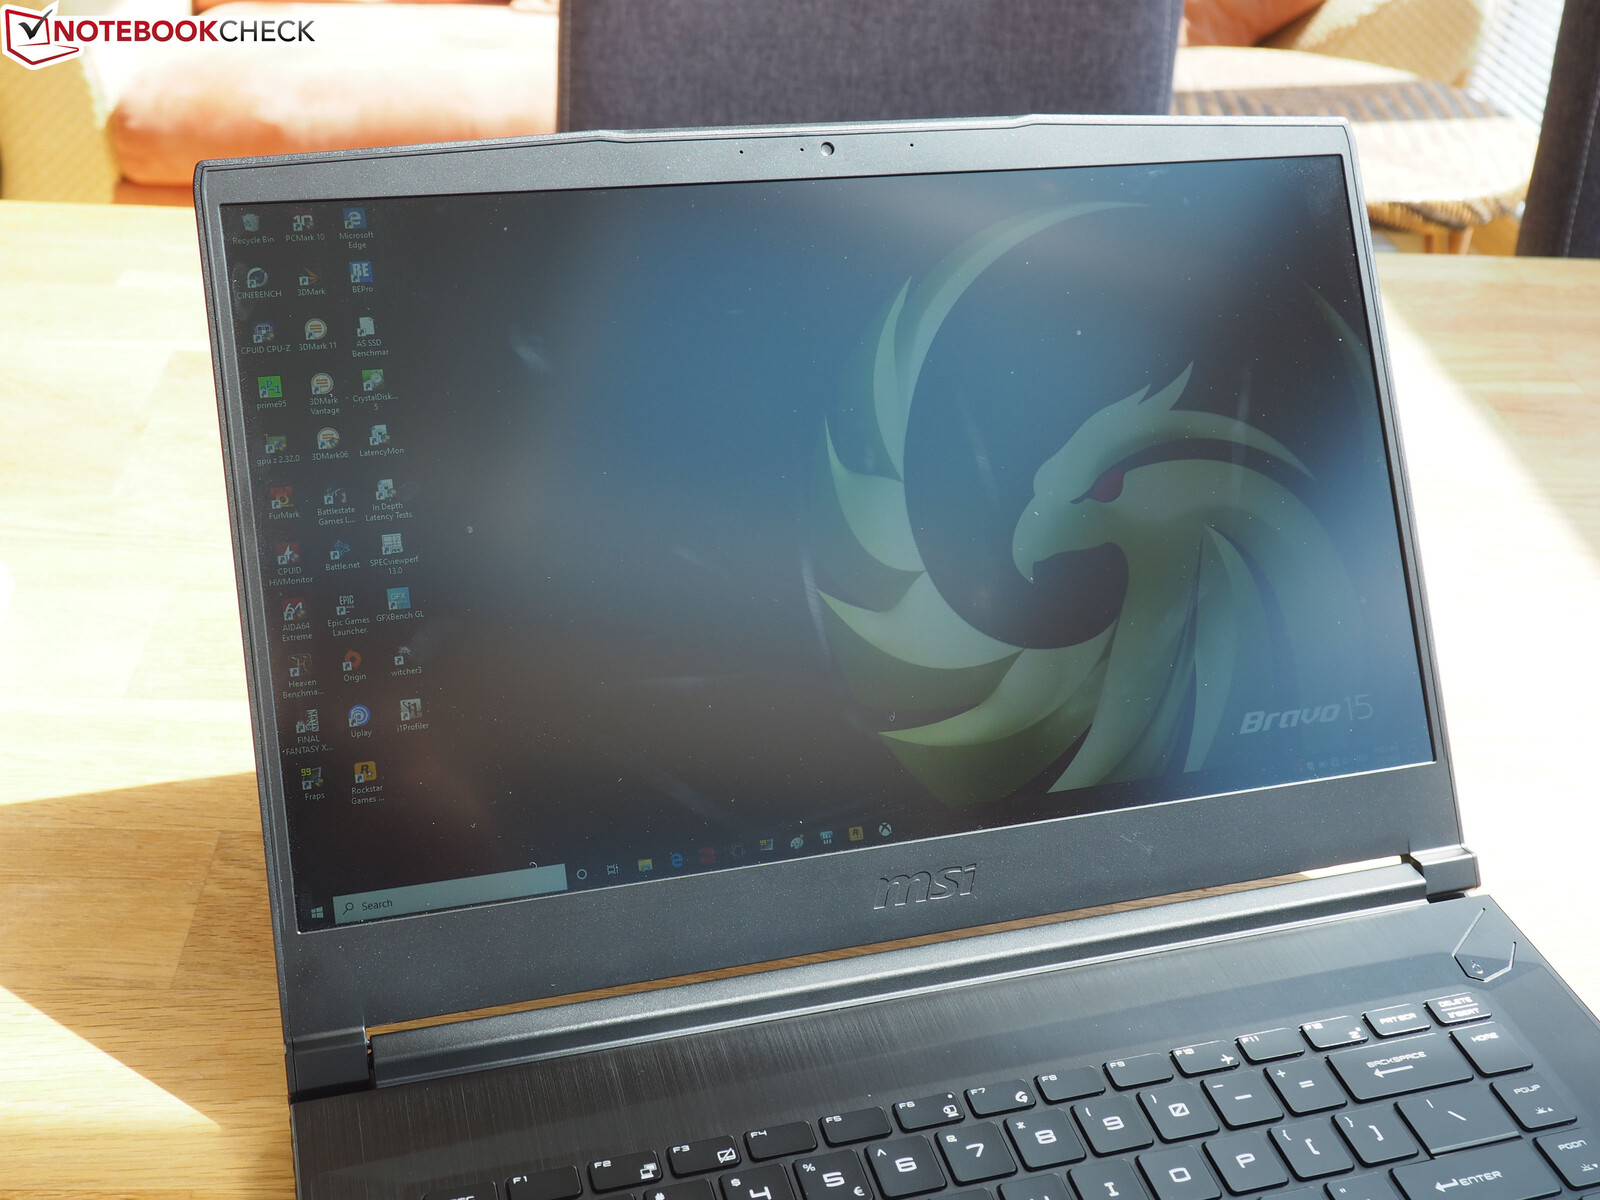
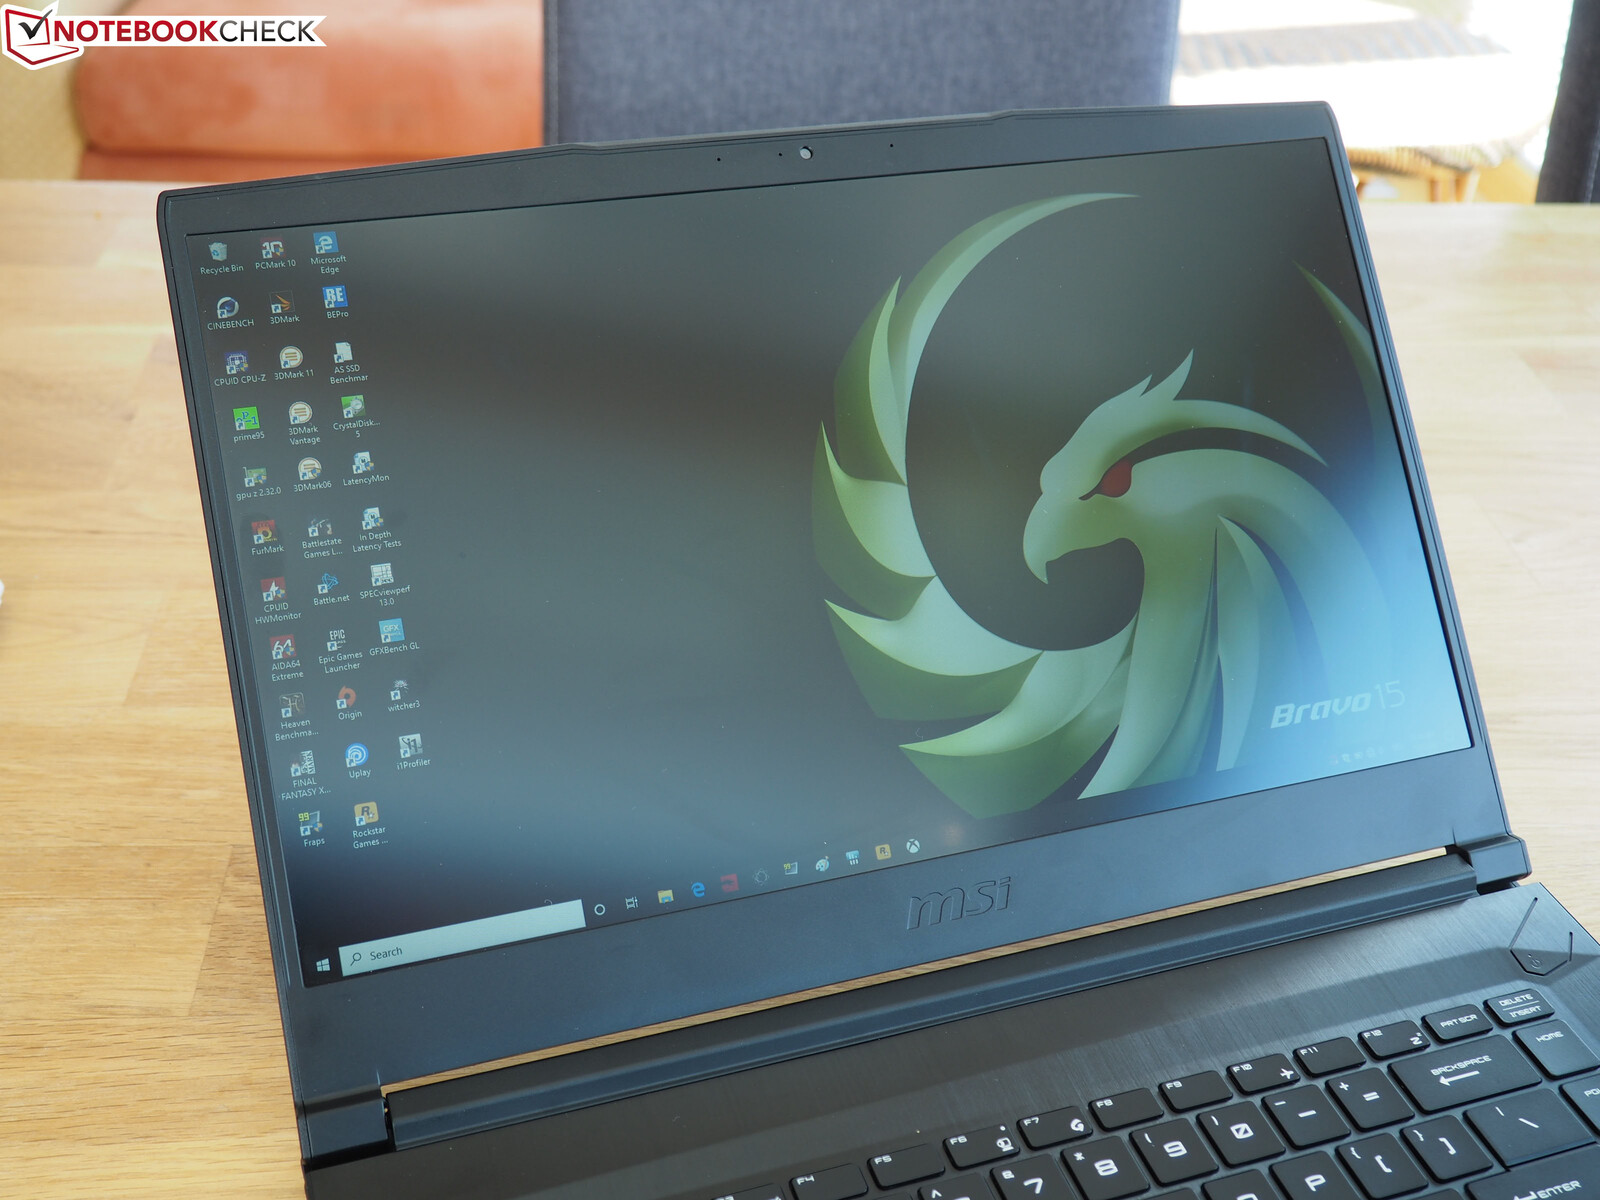
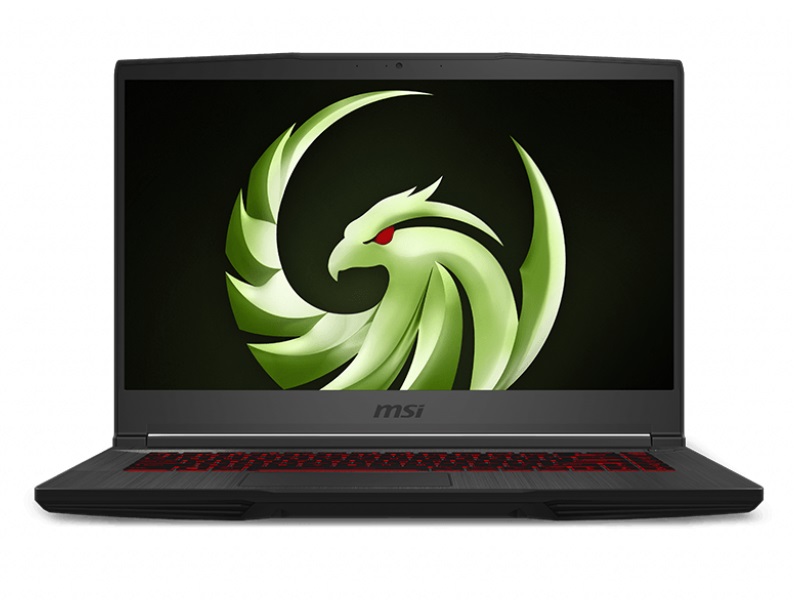
Unlike some competitors, MSI has not just settled for a load of plastic but offers a certain level of quality even in this $1000 range. The lid and top of the base unit are made of brushed aluminum. Stability isn't perfect despite the use of metal, however, with both the cover and the base unit susceptible to being warped and bent in several areas. This can lead to creaking and cracking. The workmanship is good and all edges had a nice finish on our test sample.
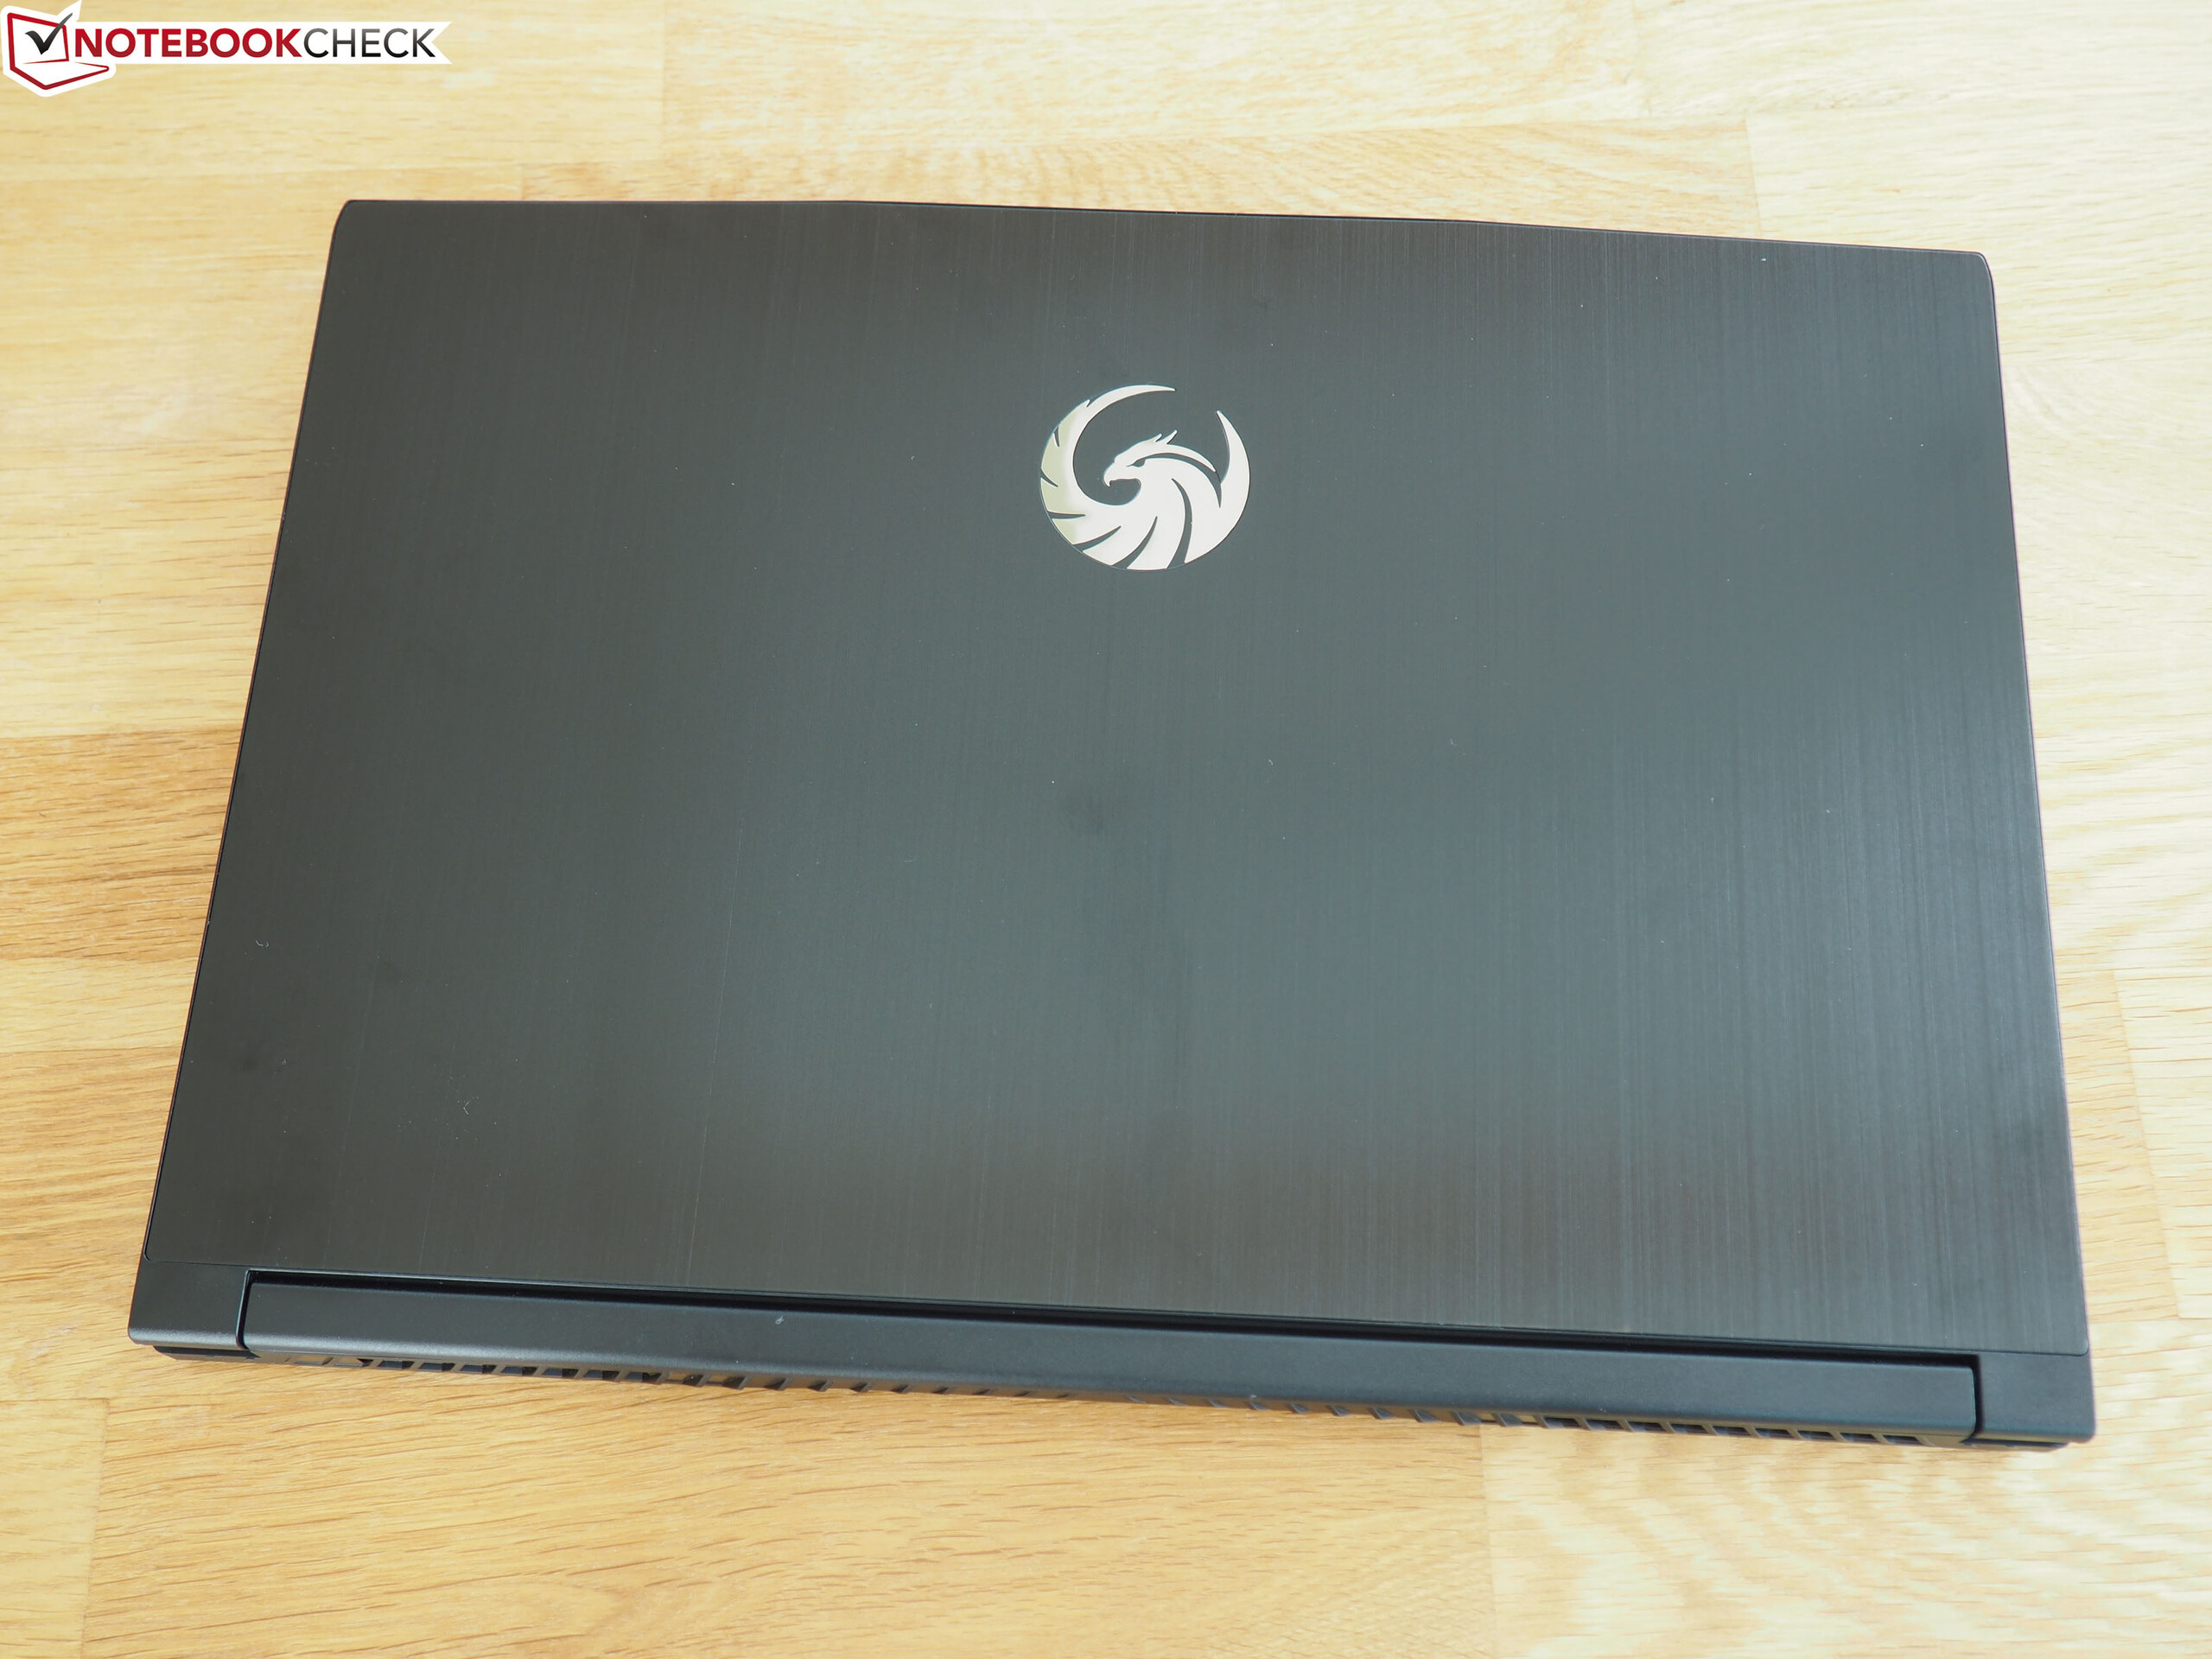
MSI has chosen a rather discreet look for its Bravo 15. Only the red keyboard backlighting and the winged creature on the lid point to the device's gaming origins. Otherwise the case is very simple and has a subtle dark surface.
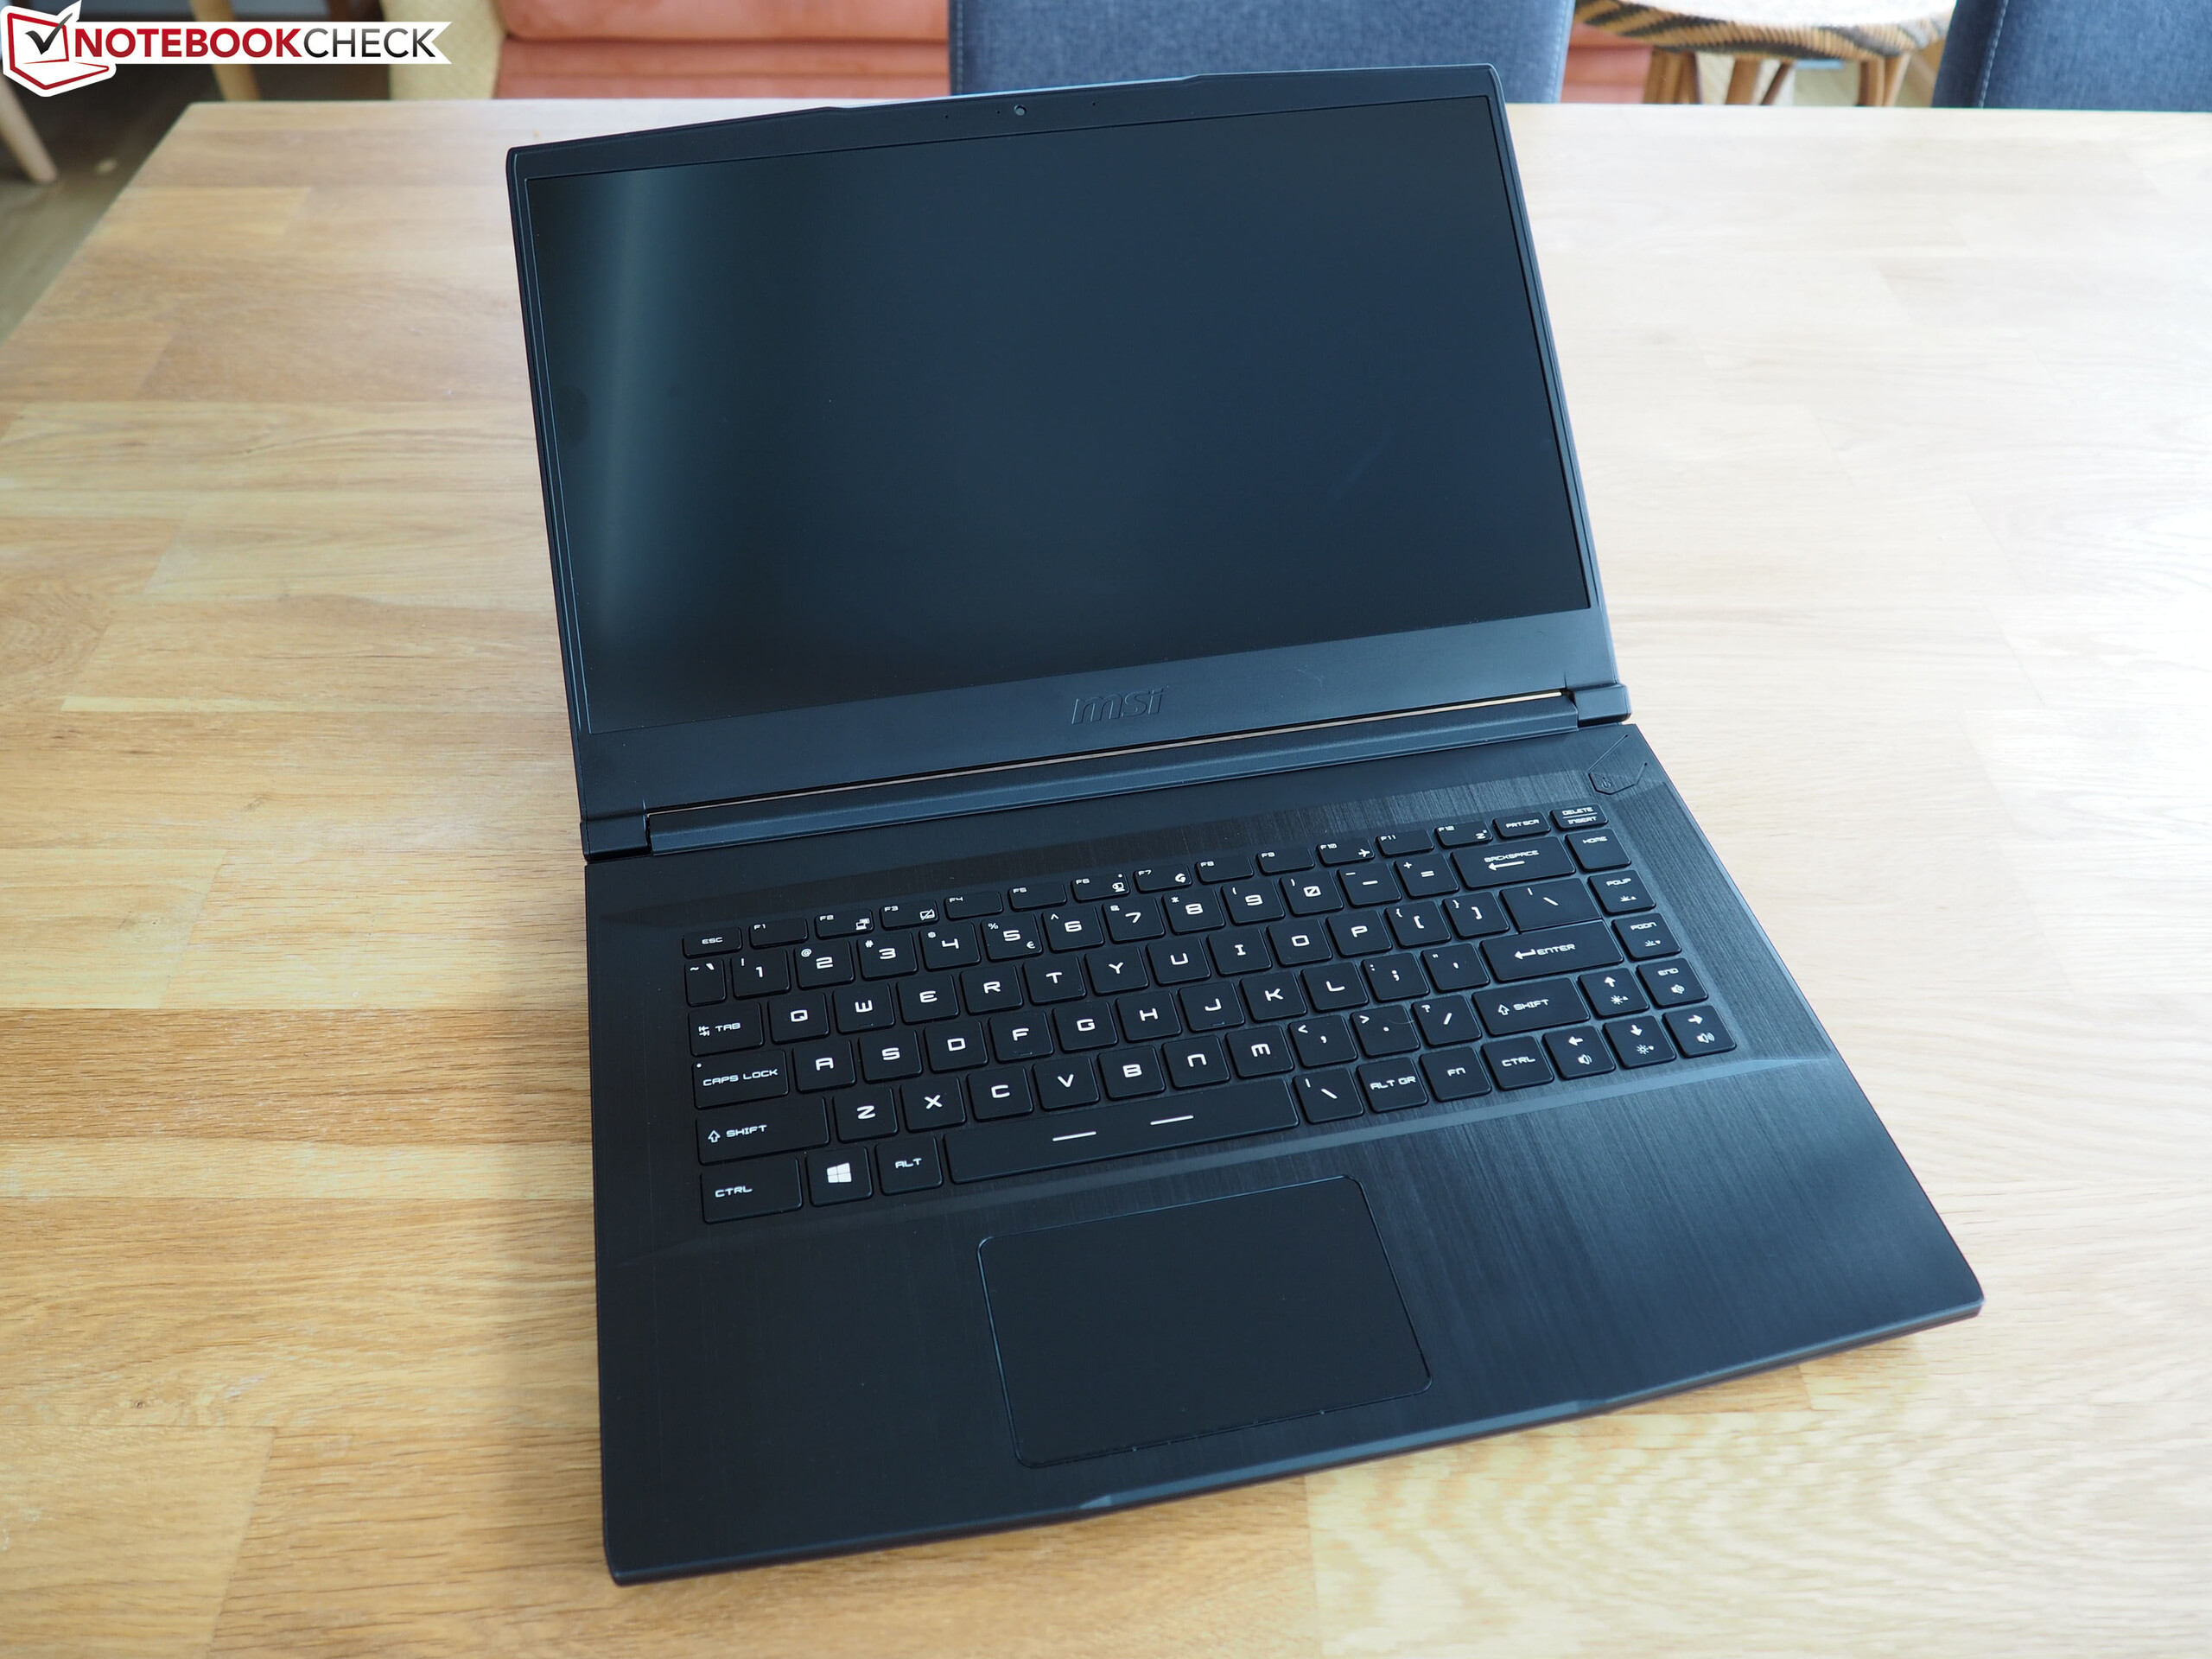

The Bravo 15 is surprisingly light. It is the lightest device of our comparison field at 2 kg (~4.9 lb). The competition weighs at least 200 g (~7 oz) more. These devices are all thicker than our test unit (2.2 cm/~0.87 in) as well. These moderate dimensions (slim bezel design) make the Bravo 15 a nice travel companion.
Connectivity
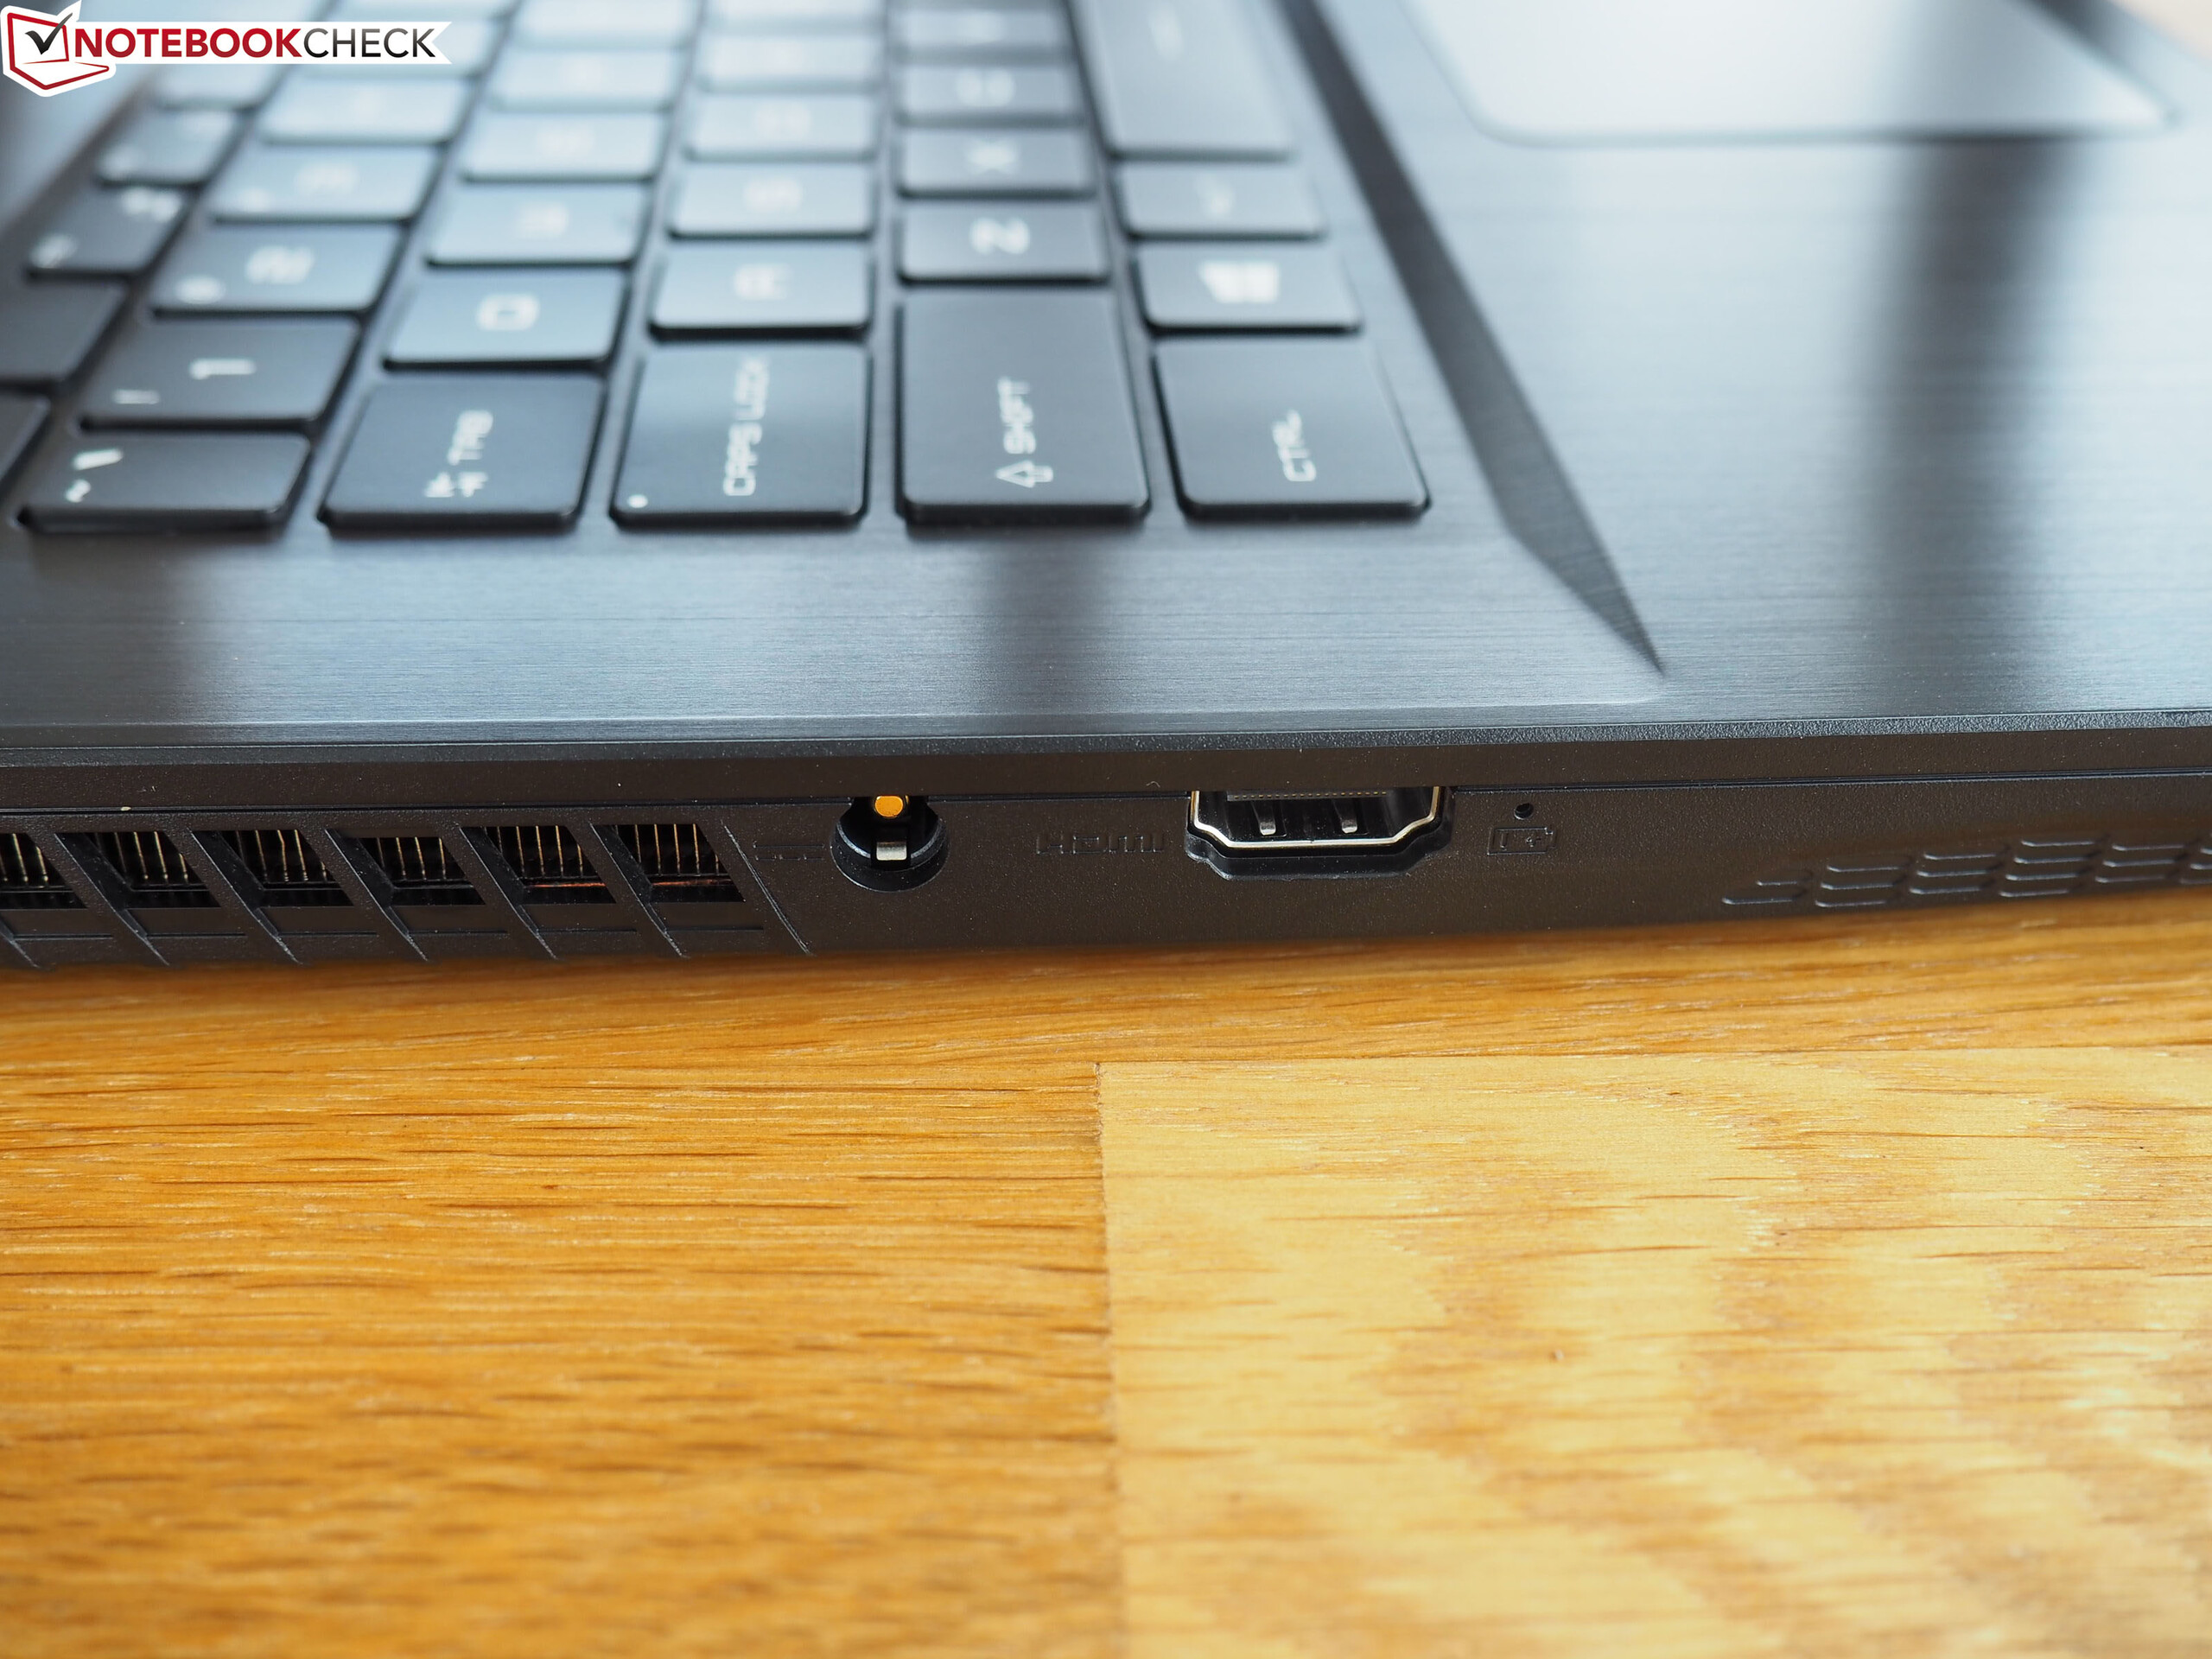
Ports
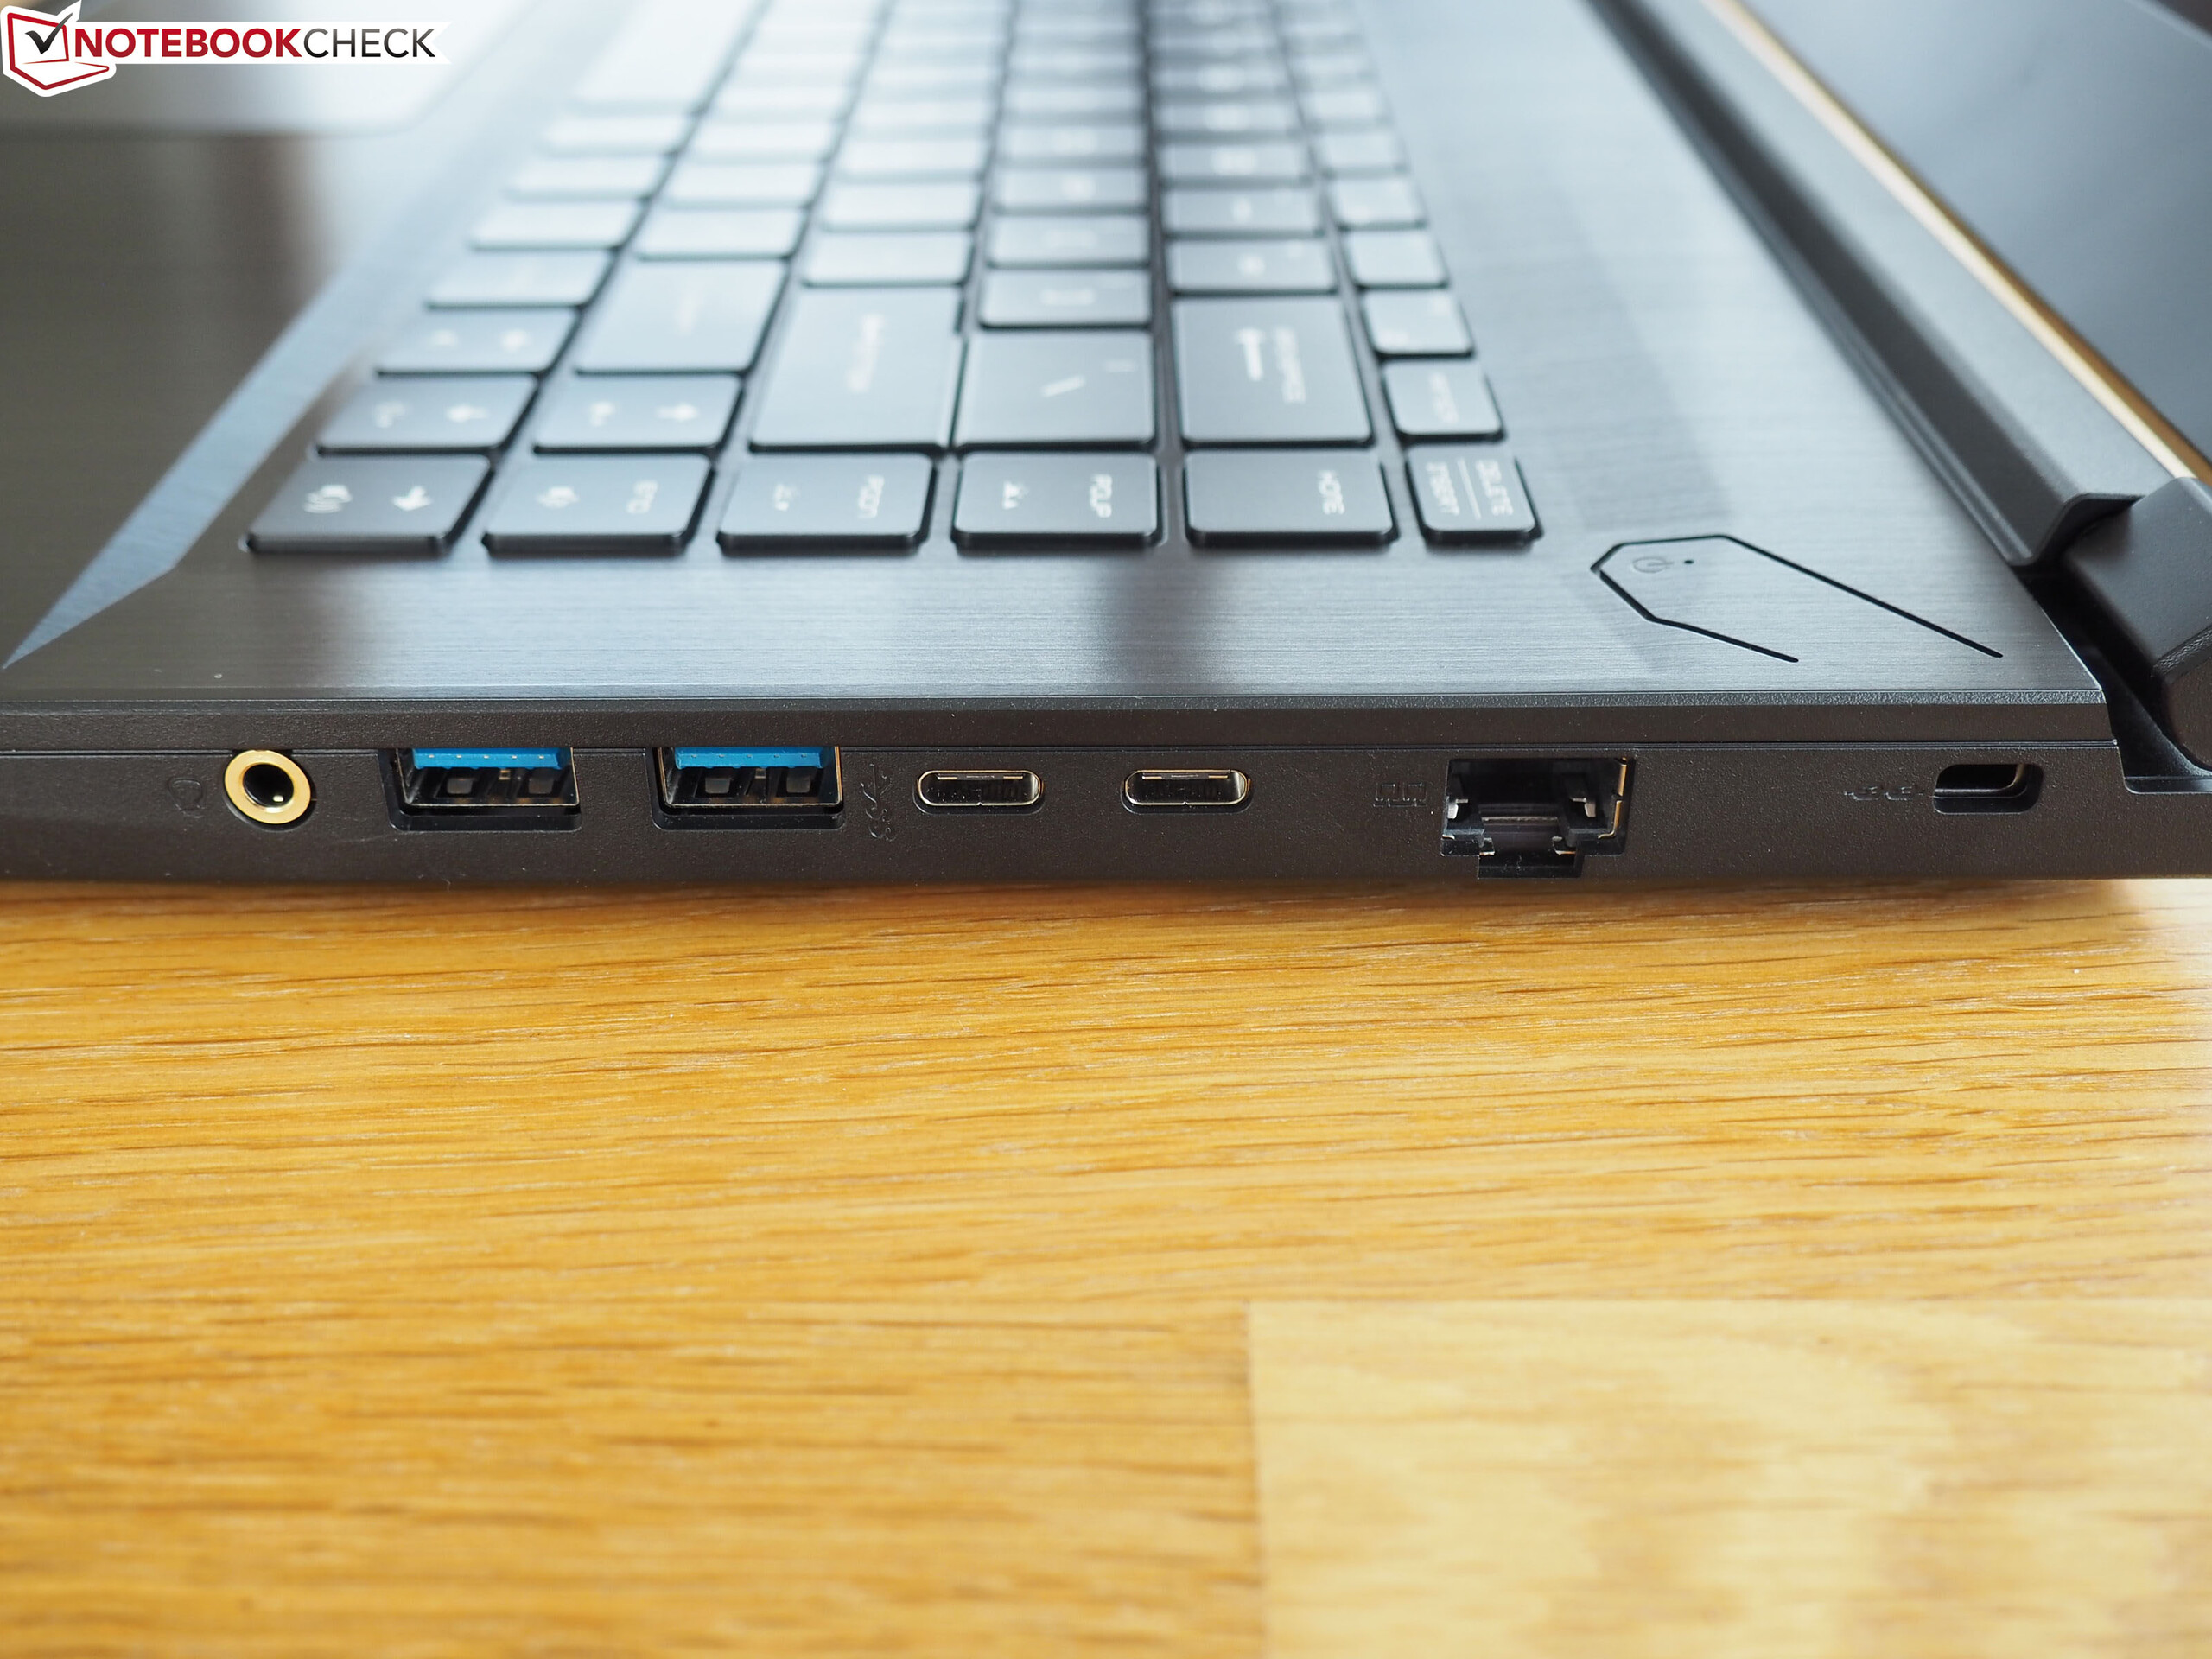
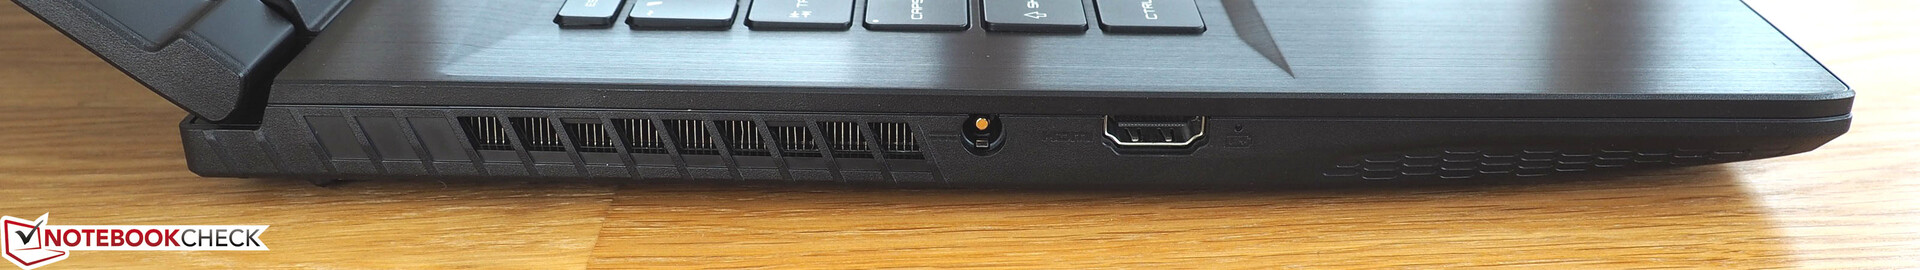
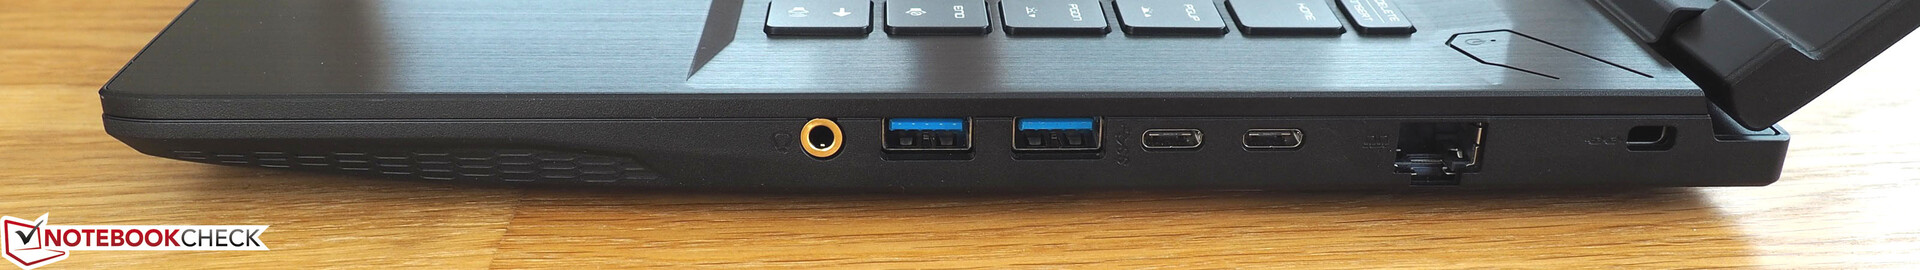
MSI was rather strict when it came to port selection. The device lacks a DisplayPort, a card reader and a Thunderbolt 3 port. The available USB ports (2x Type A + 2x Type C) don't even support the 3.1 Gen 2 standard and instead are based on USB 3.0. The HDMI port isn't really up to date either (only 30 Hz @ 4K). The RJ45 port, the gold audio jack and the Kensington Lock only partly make up for these deletions.
We weren't particularly impressed by port distribution either. The fact that all USB ports are positioned on the right side with the power supply placed in the middle is rather awkward.
Communication
There is nothing to complain about in terms of Wi-Fi performance. MSI has equipped its Bravo 15 with the speedy Intel Wi-Fi 6 AX200 module, which easily passed the 1000 MBit/s mark in our sending and receiving test (1 m/~3.3 ft distance to the router). The results are only comparable to the Acer Nitro 5 due to our recently updated test setup.
Webcam
Don't expect a good webcam from the Bravo 15. The image quality is very modest - as with most laptops.


Accessories
The test configuration comes with a rather flat 180W AC adapter that is fairly light at 630 g (~1.4 lb).
Maintenance
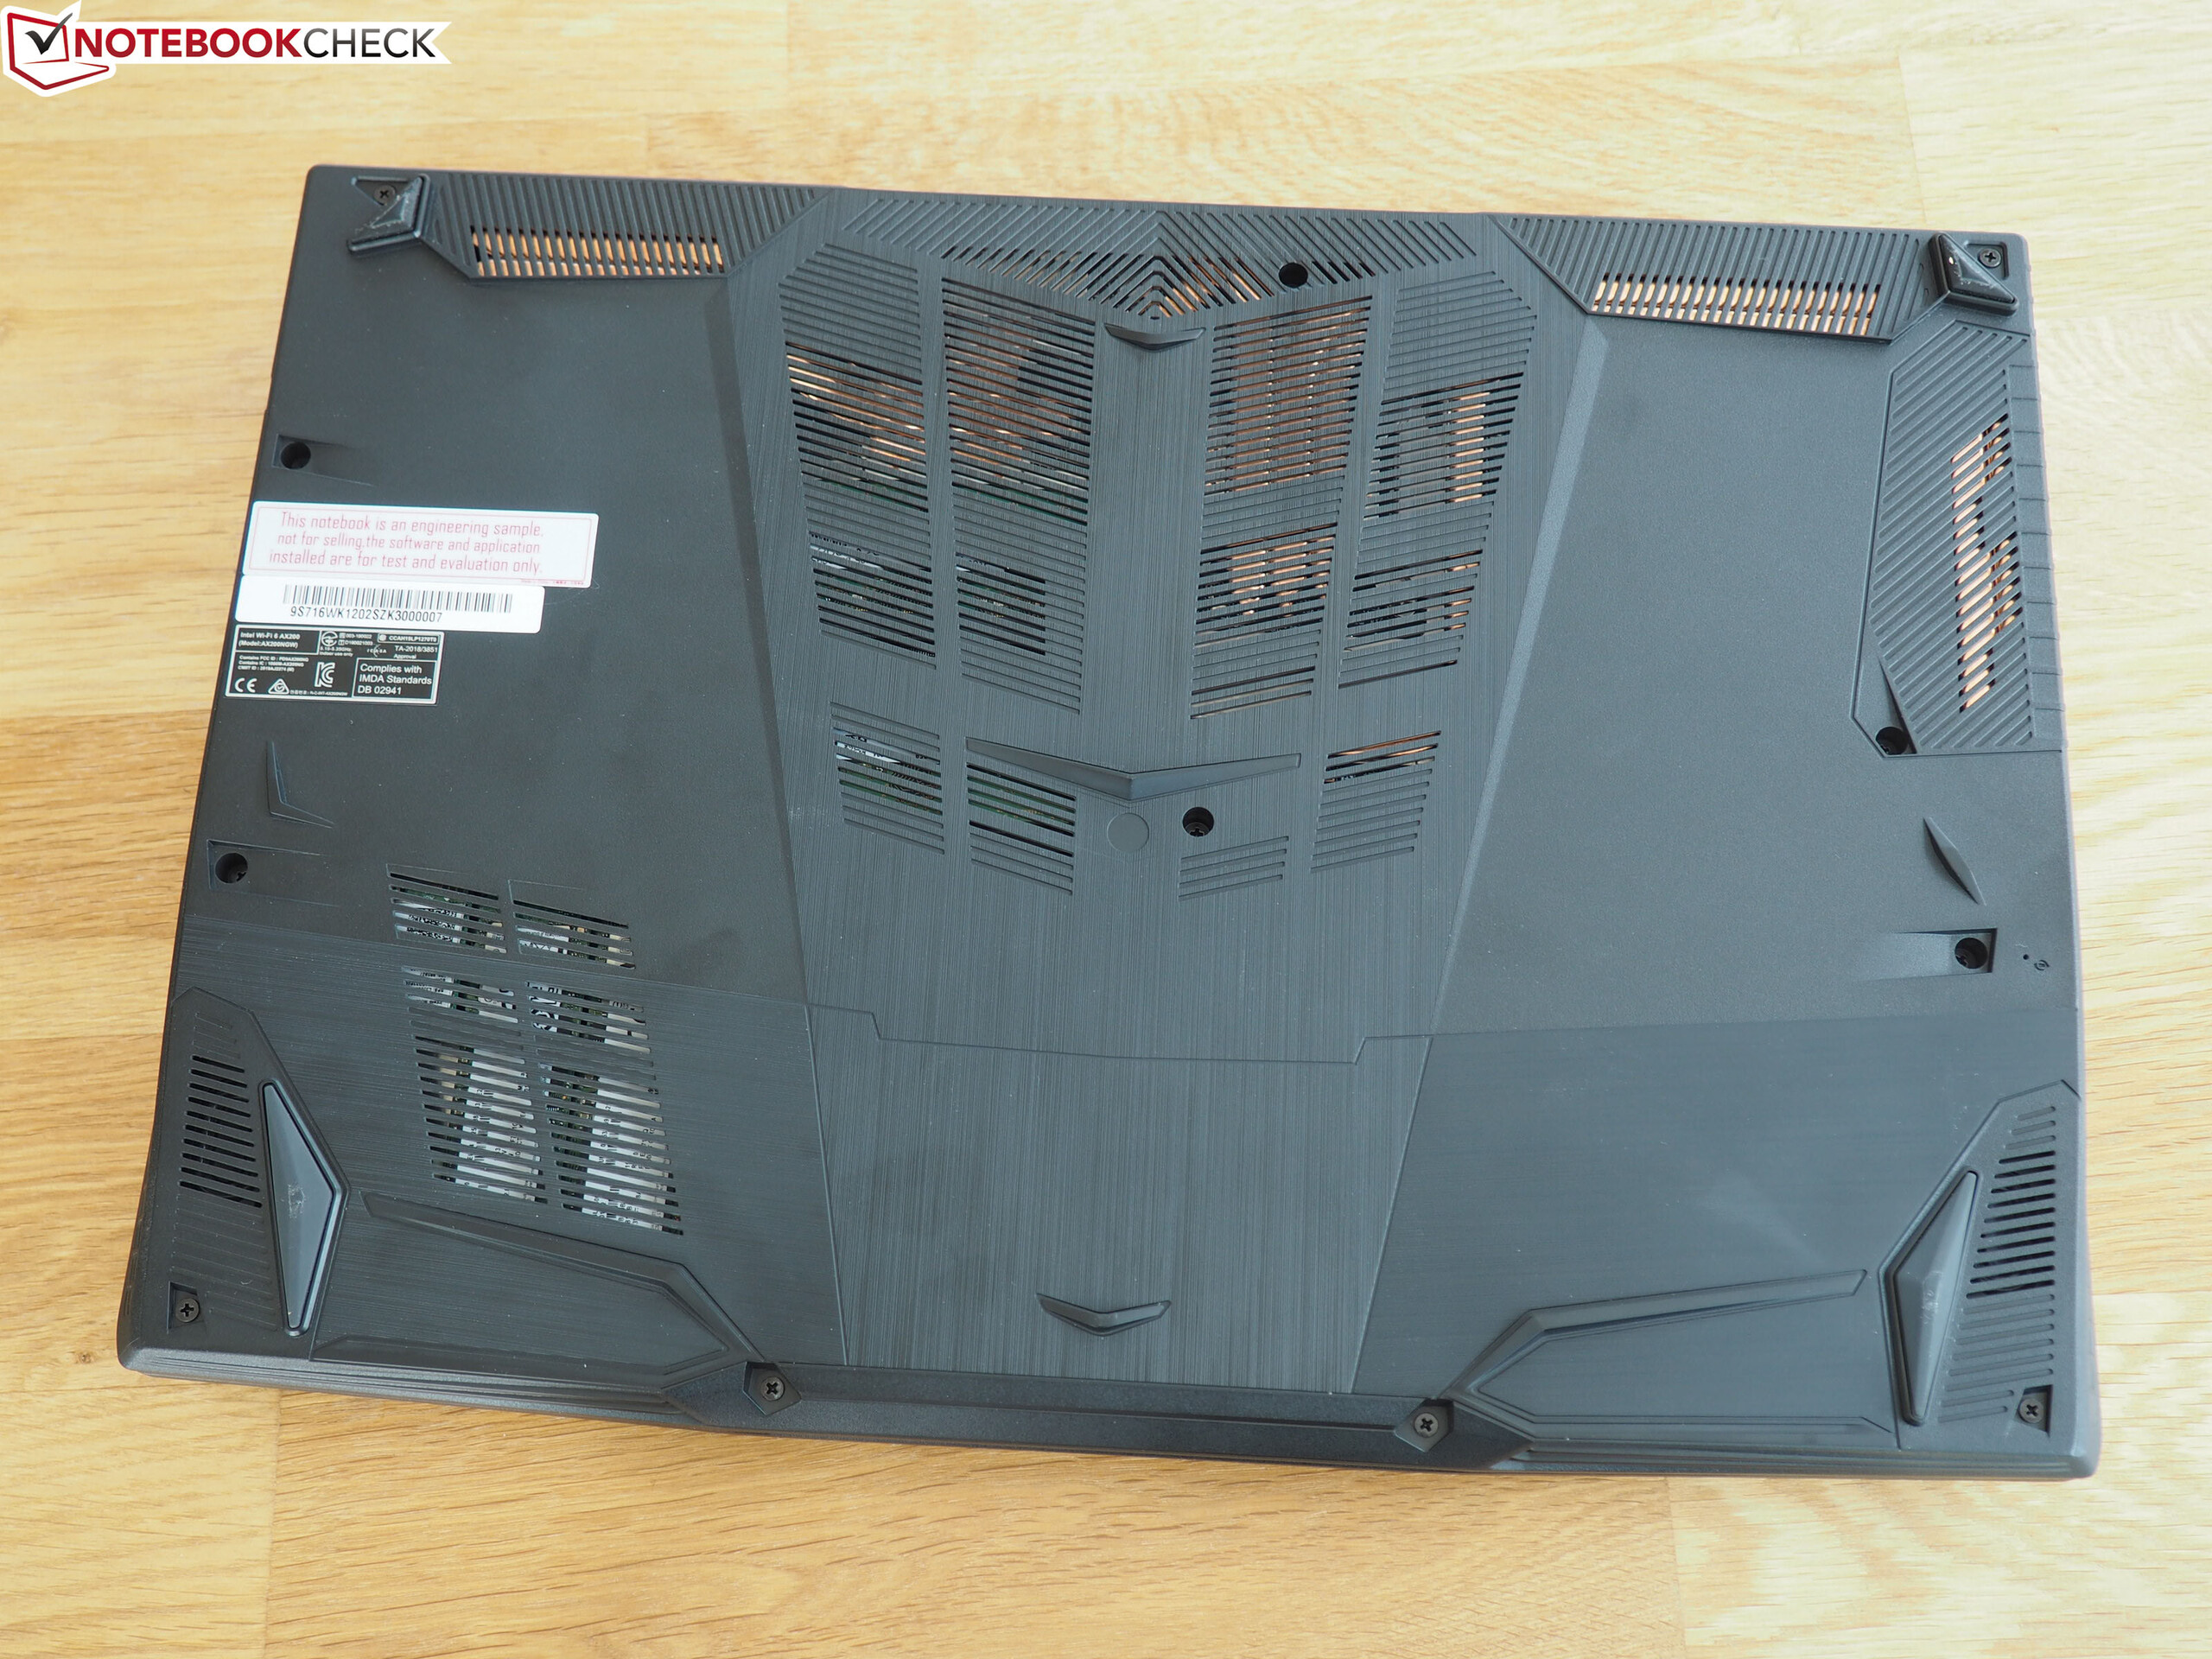
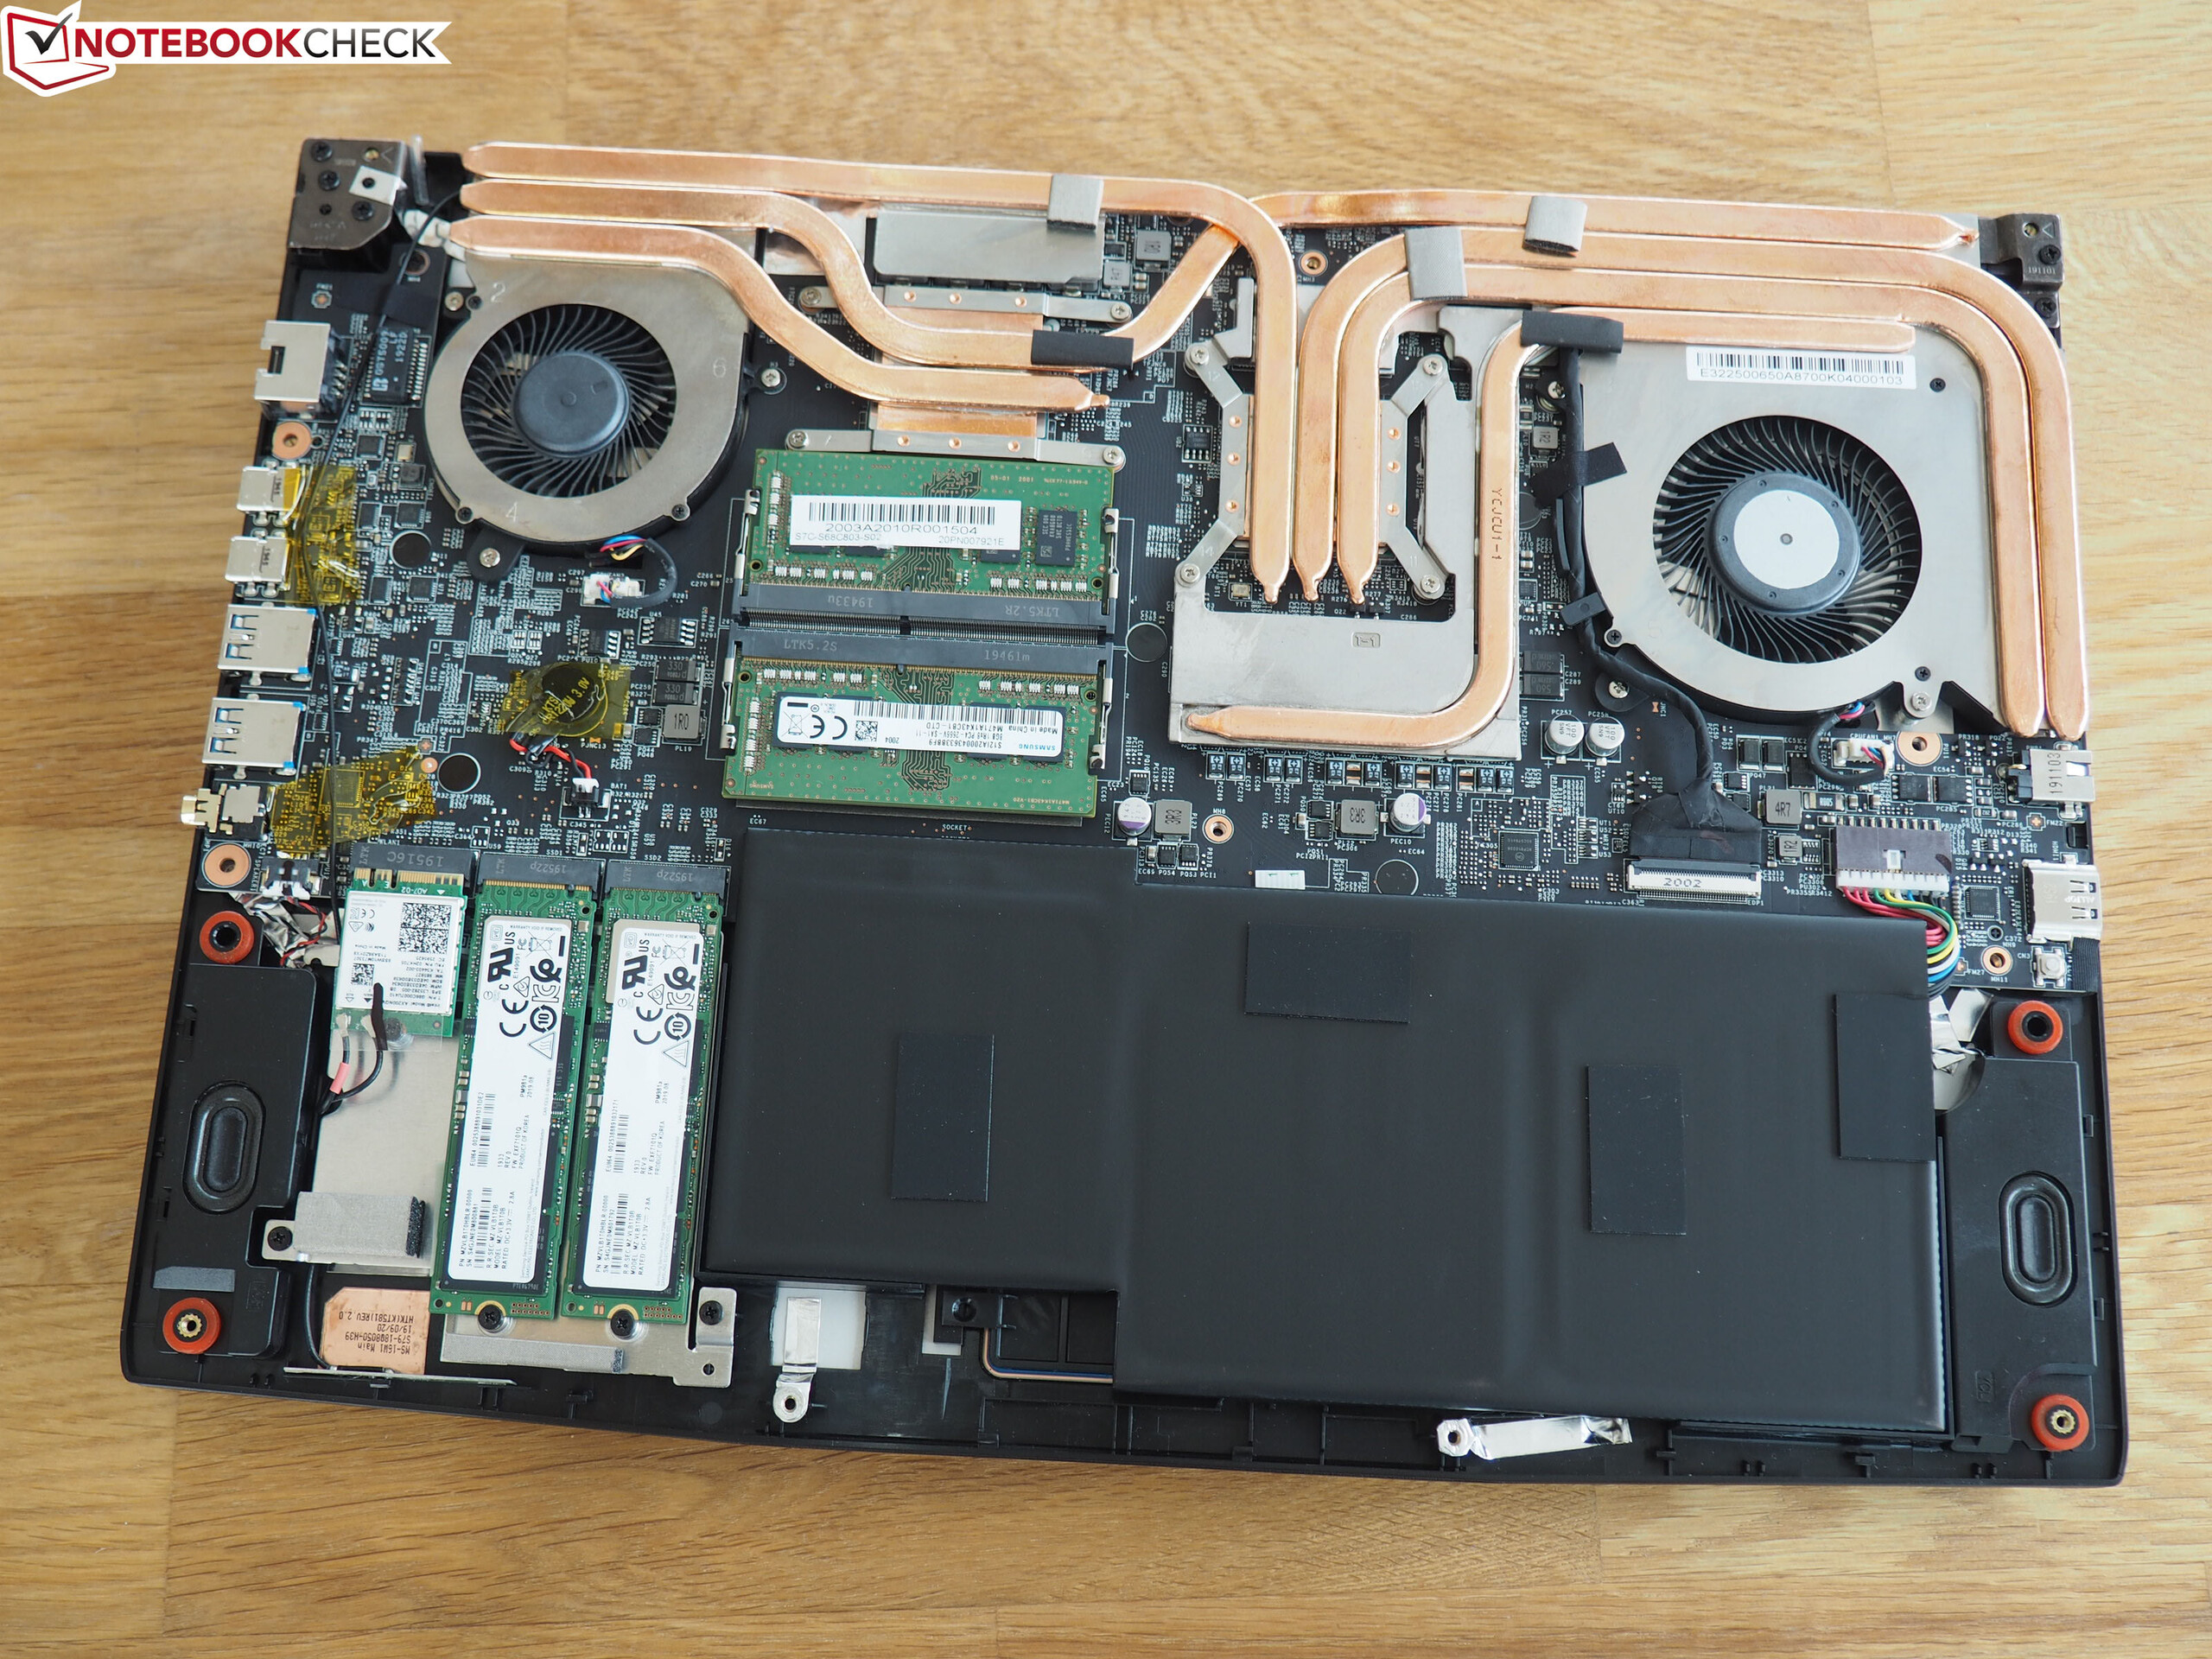
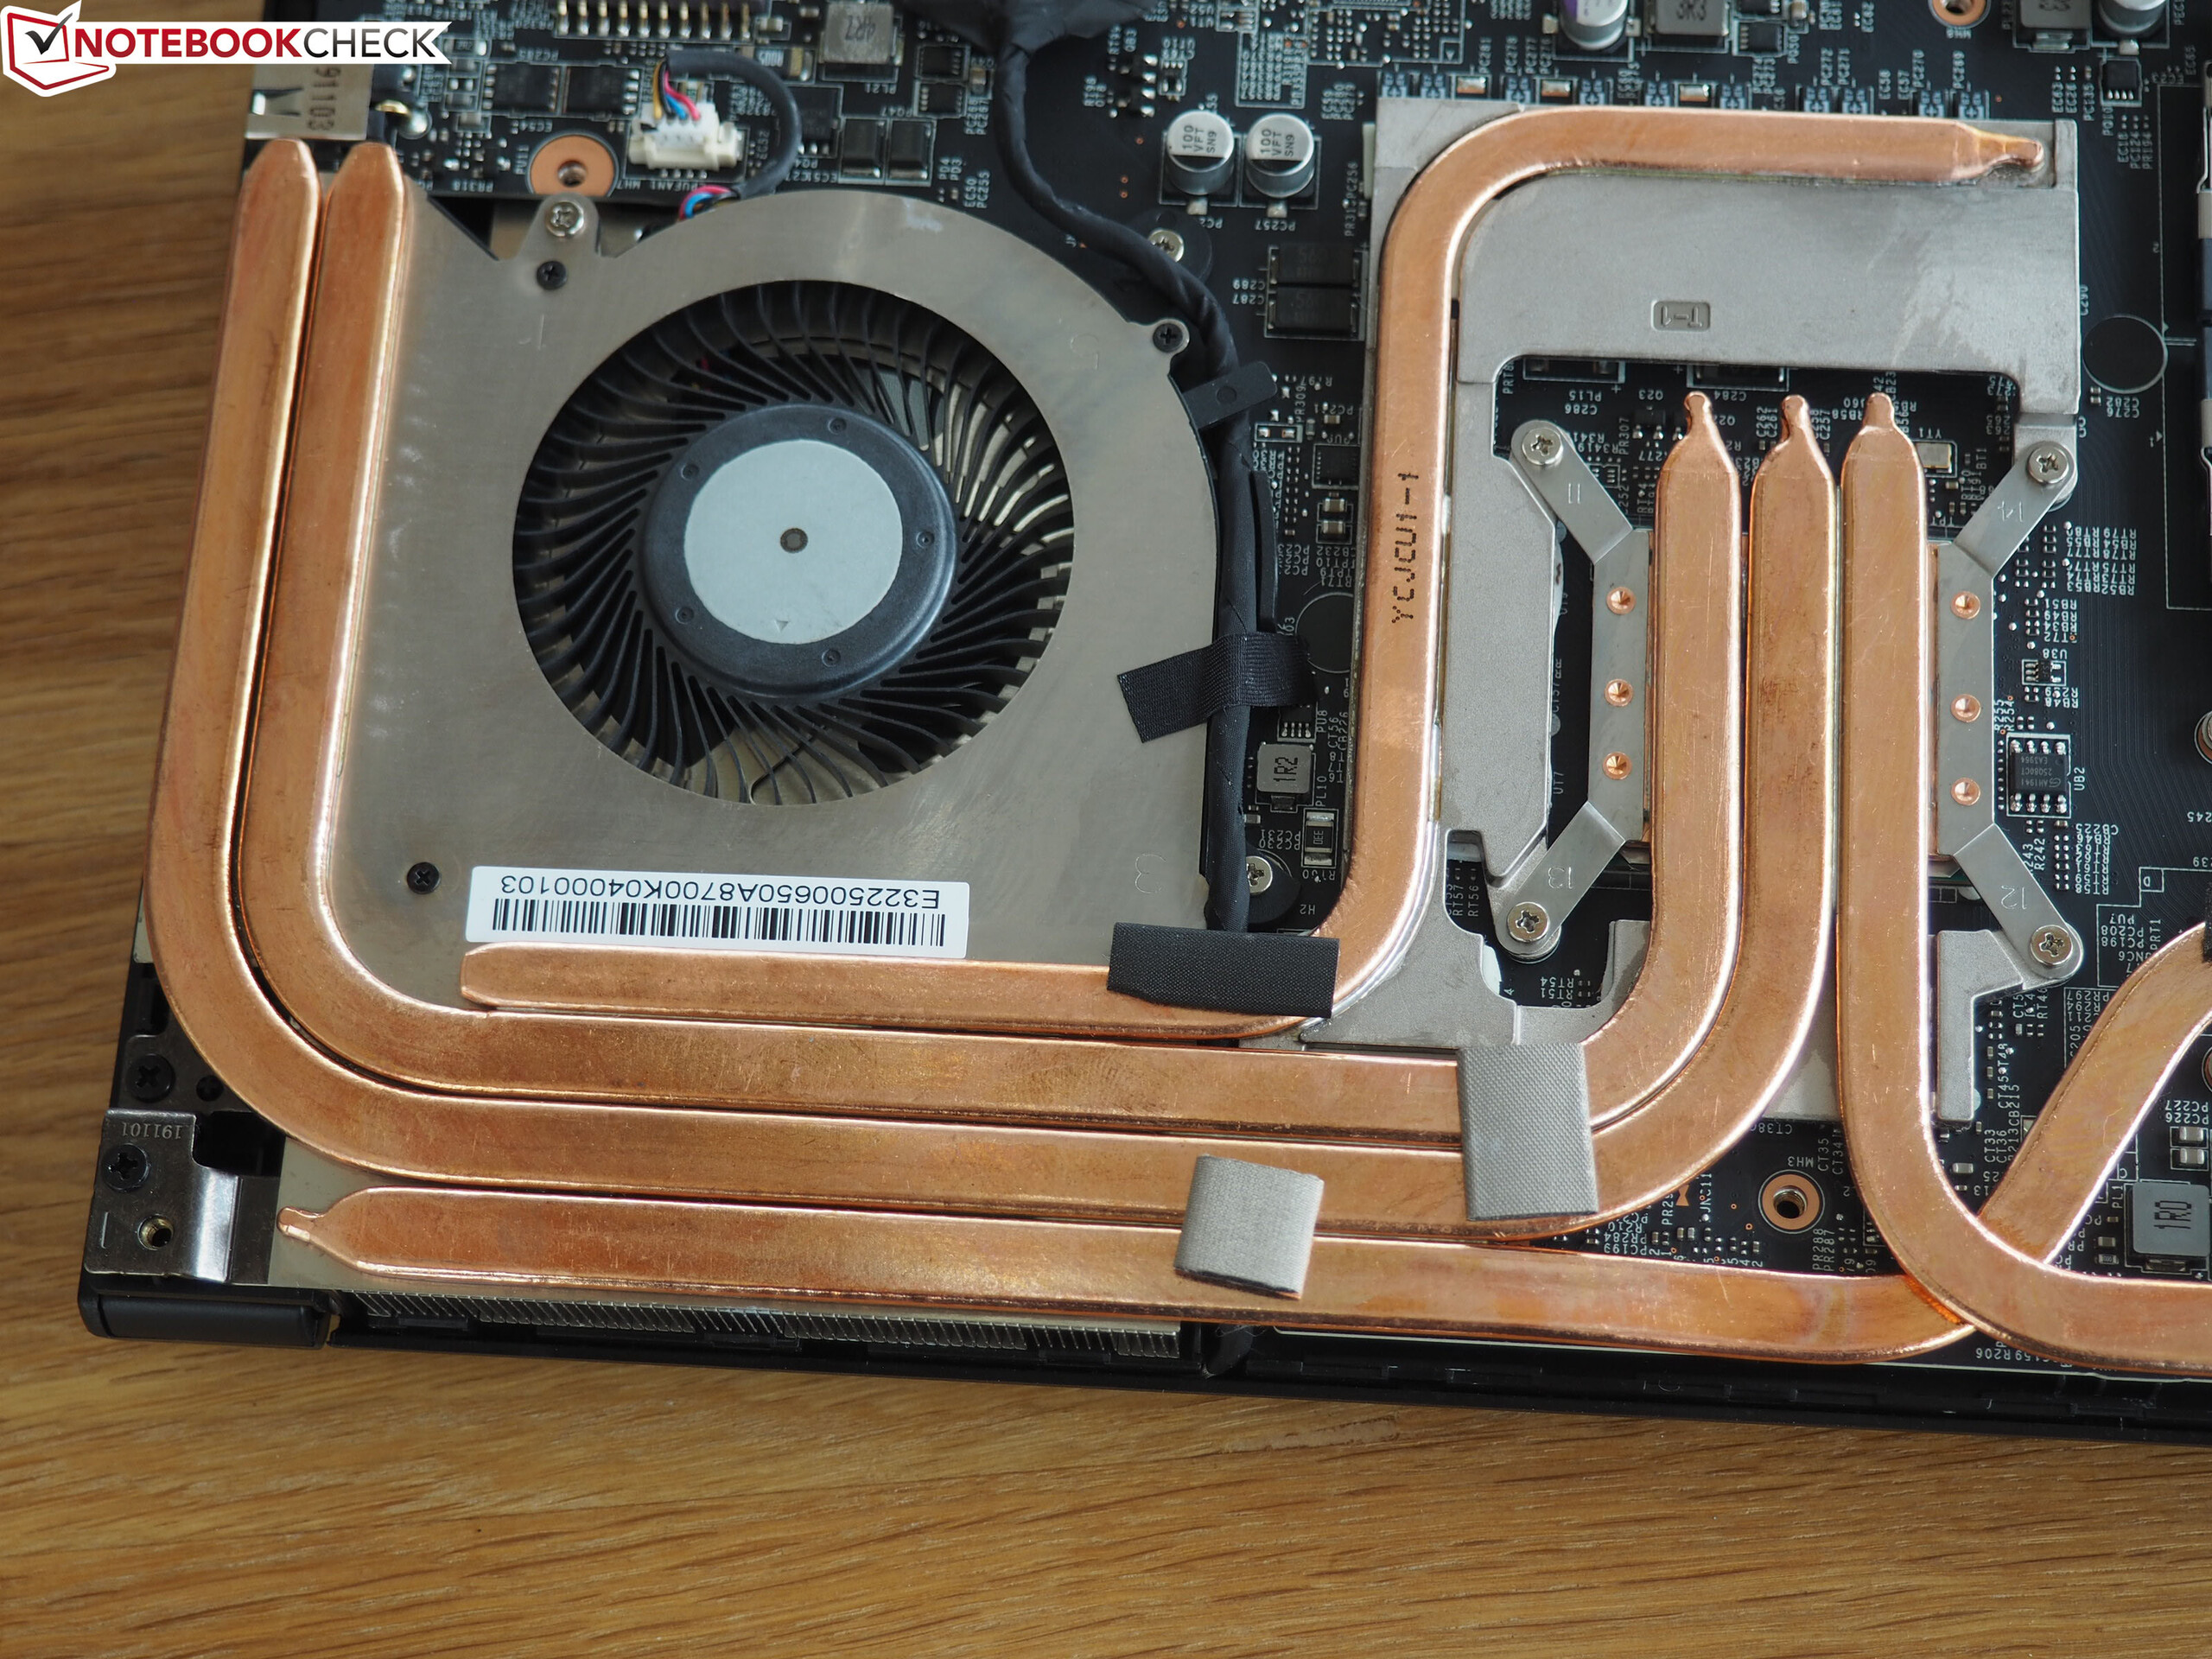
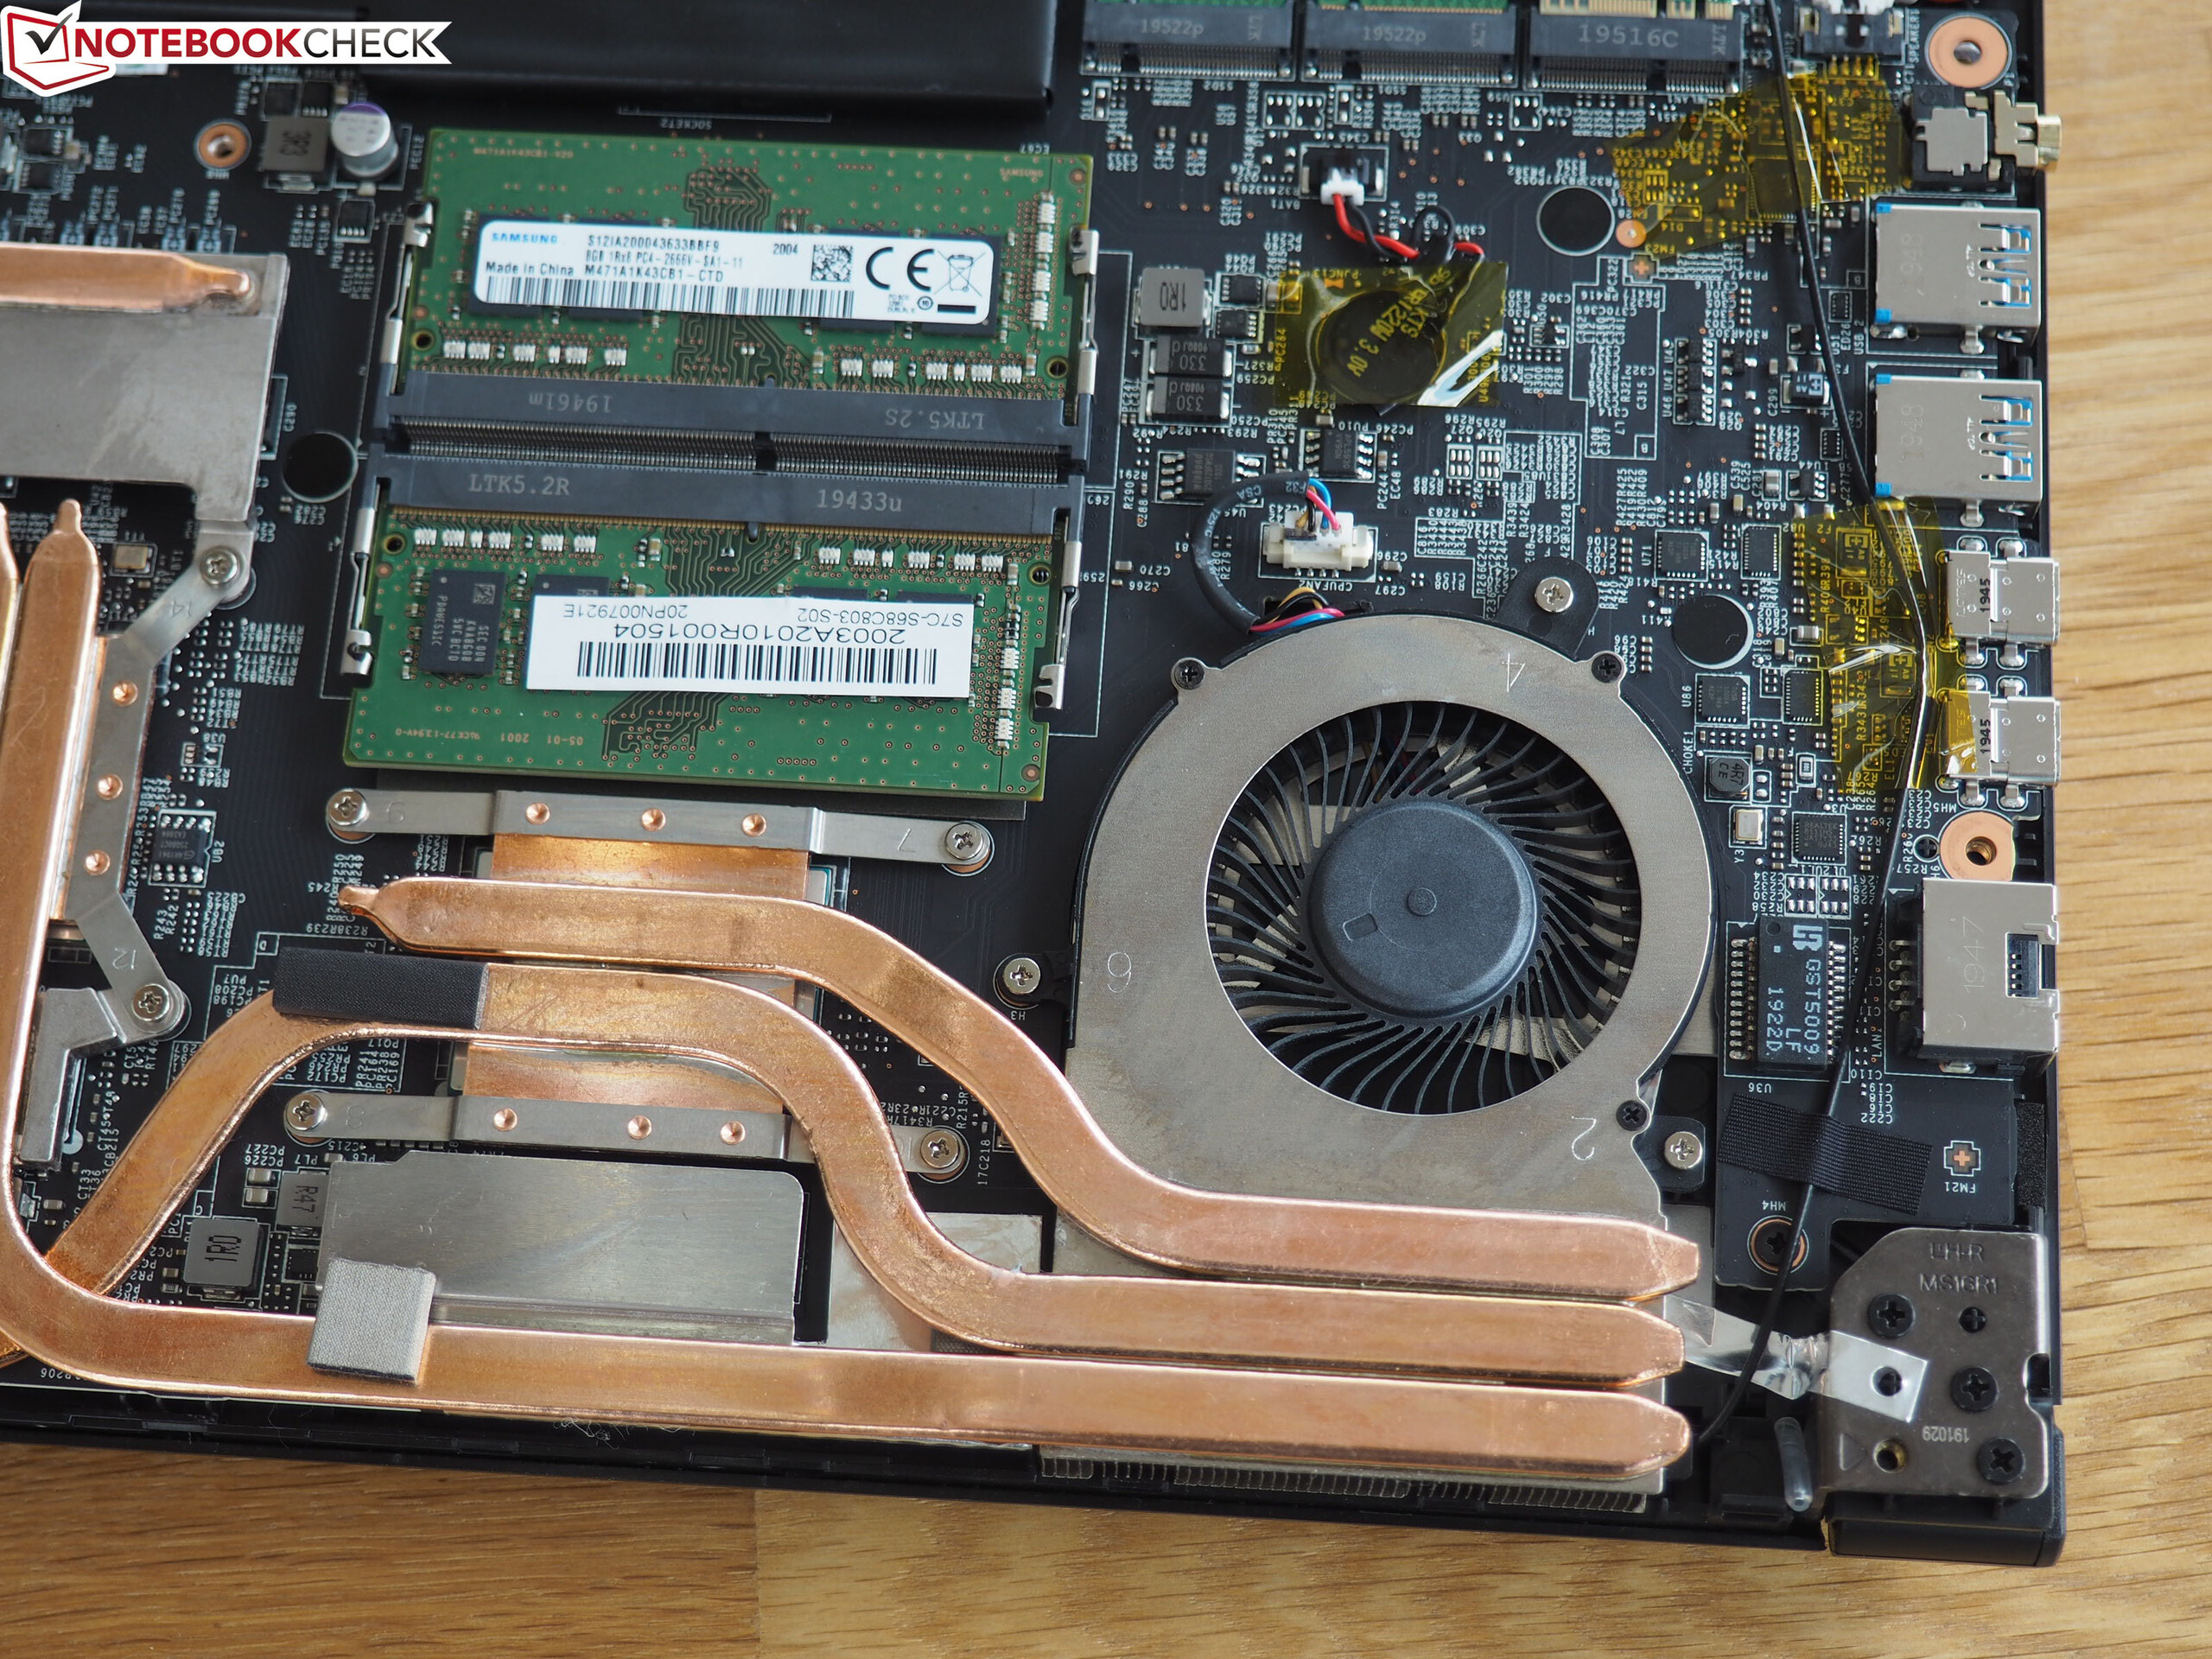
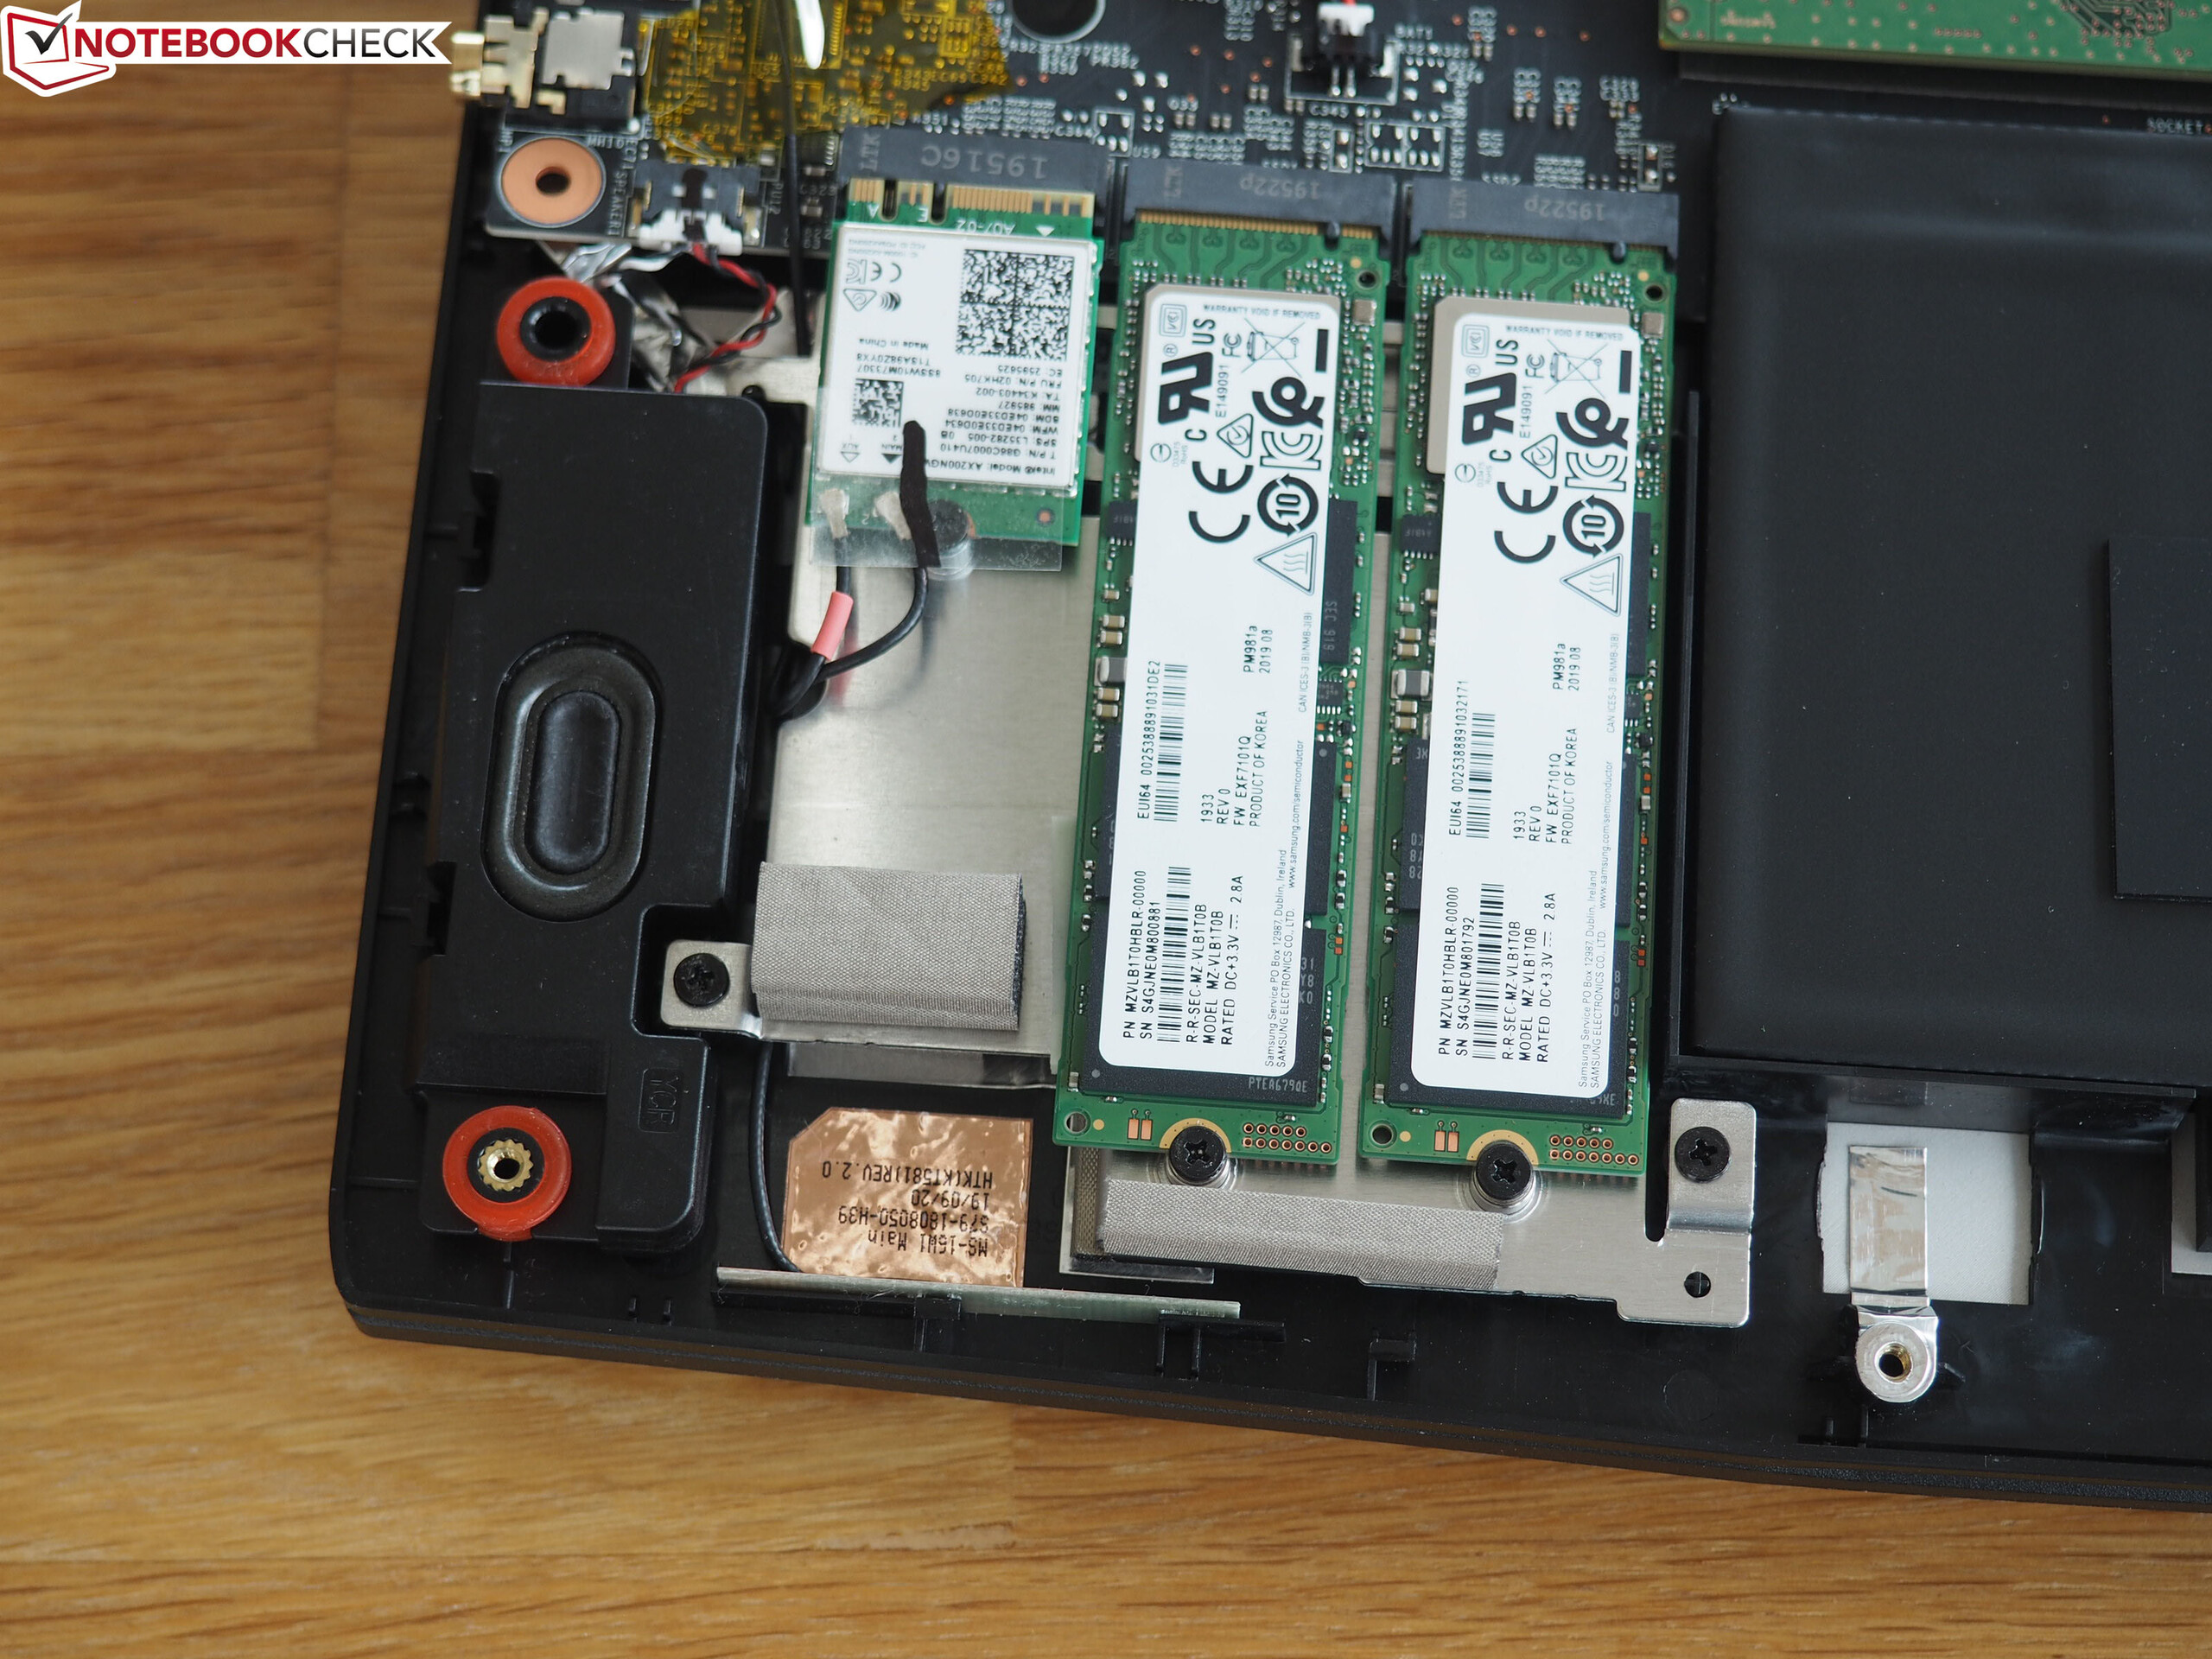
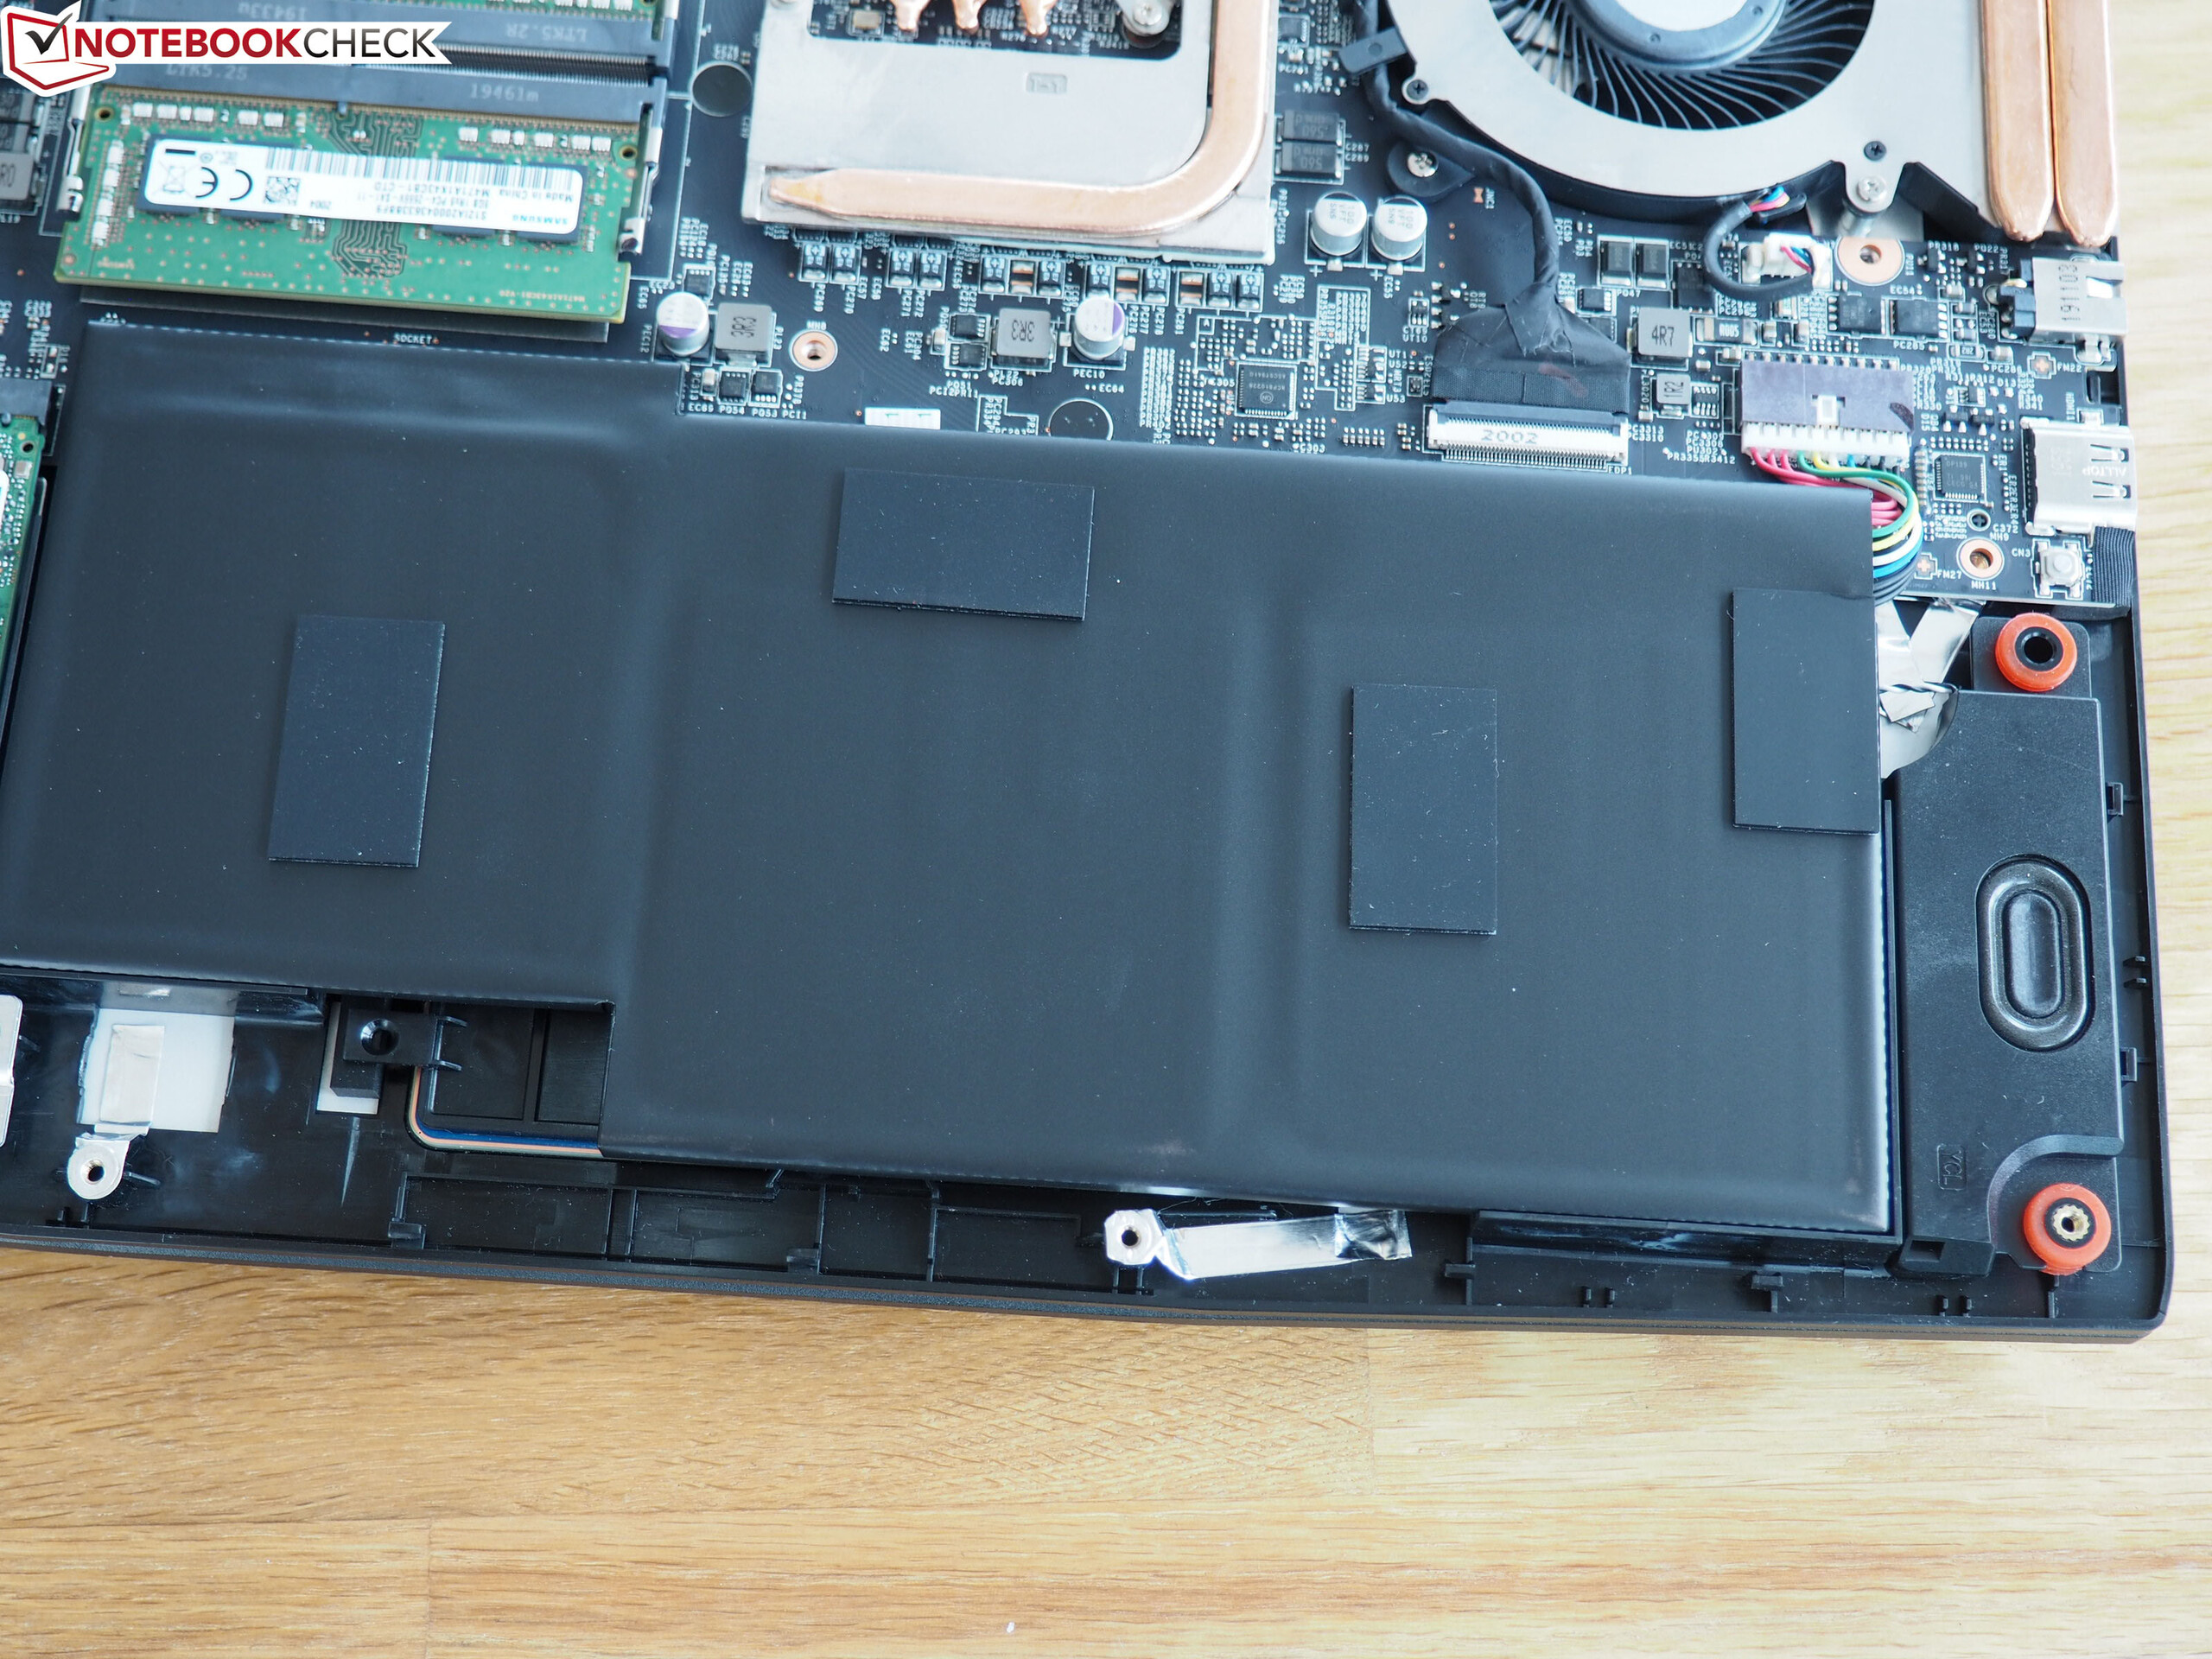
In order to reach the inside of this device users will have to remove 12 Phillips screws and lift off the bottom cover with a flat tool (e.g. a spatula). Users then have access to two SO-DIMM banks, two M.2 slots (all occupied), the network module, the battery and the cooling system. The latter consists of two fans and several heat pipes (see photo).
Warranty
The warranty covers 24 months (pick-up and return service).
Input Devices
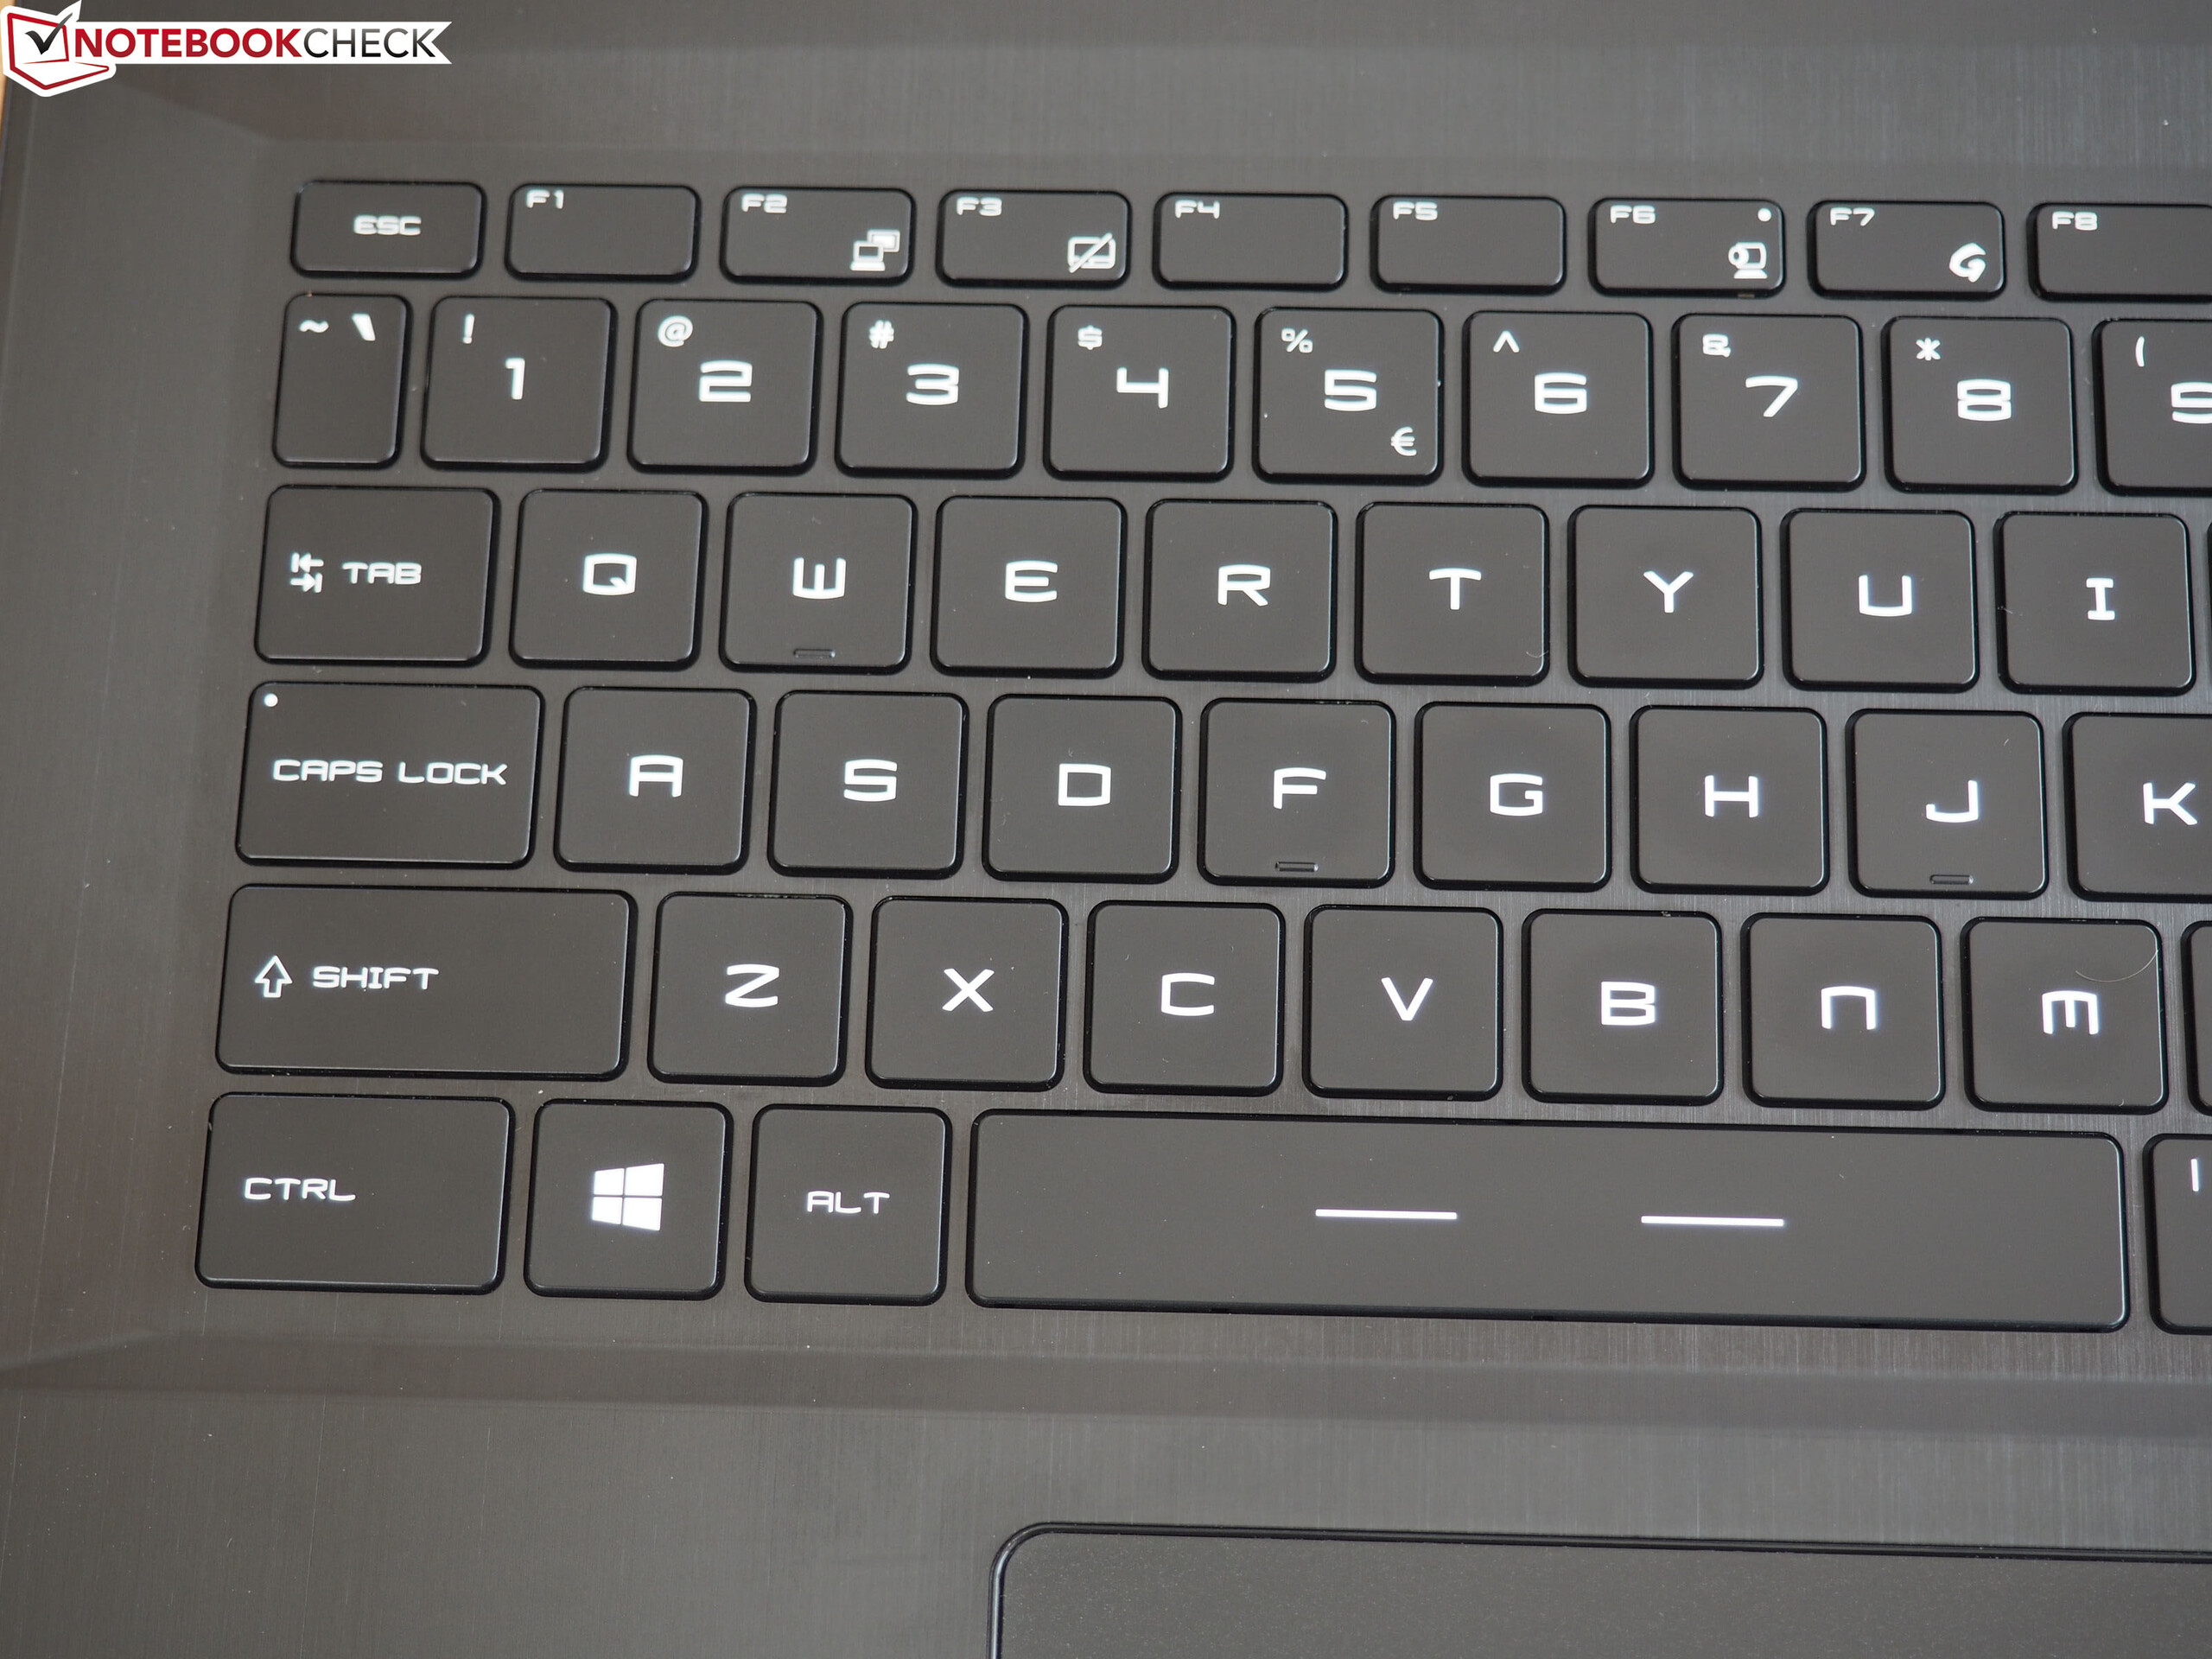
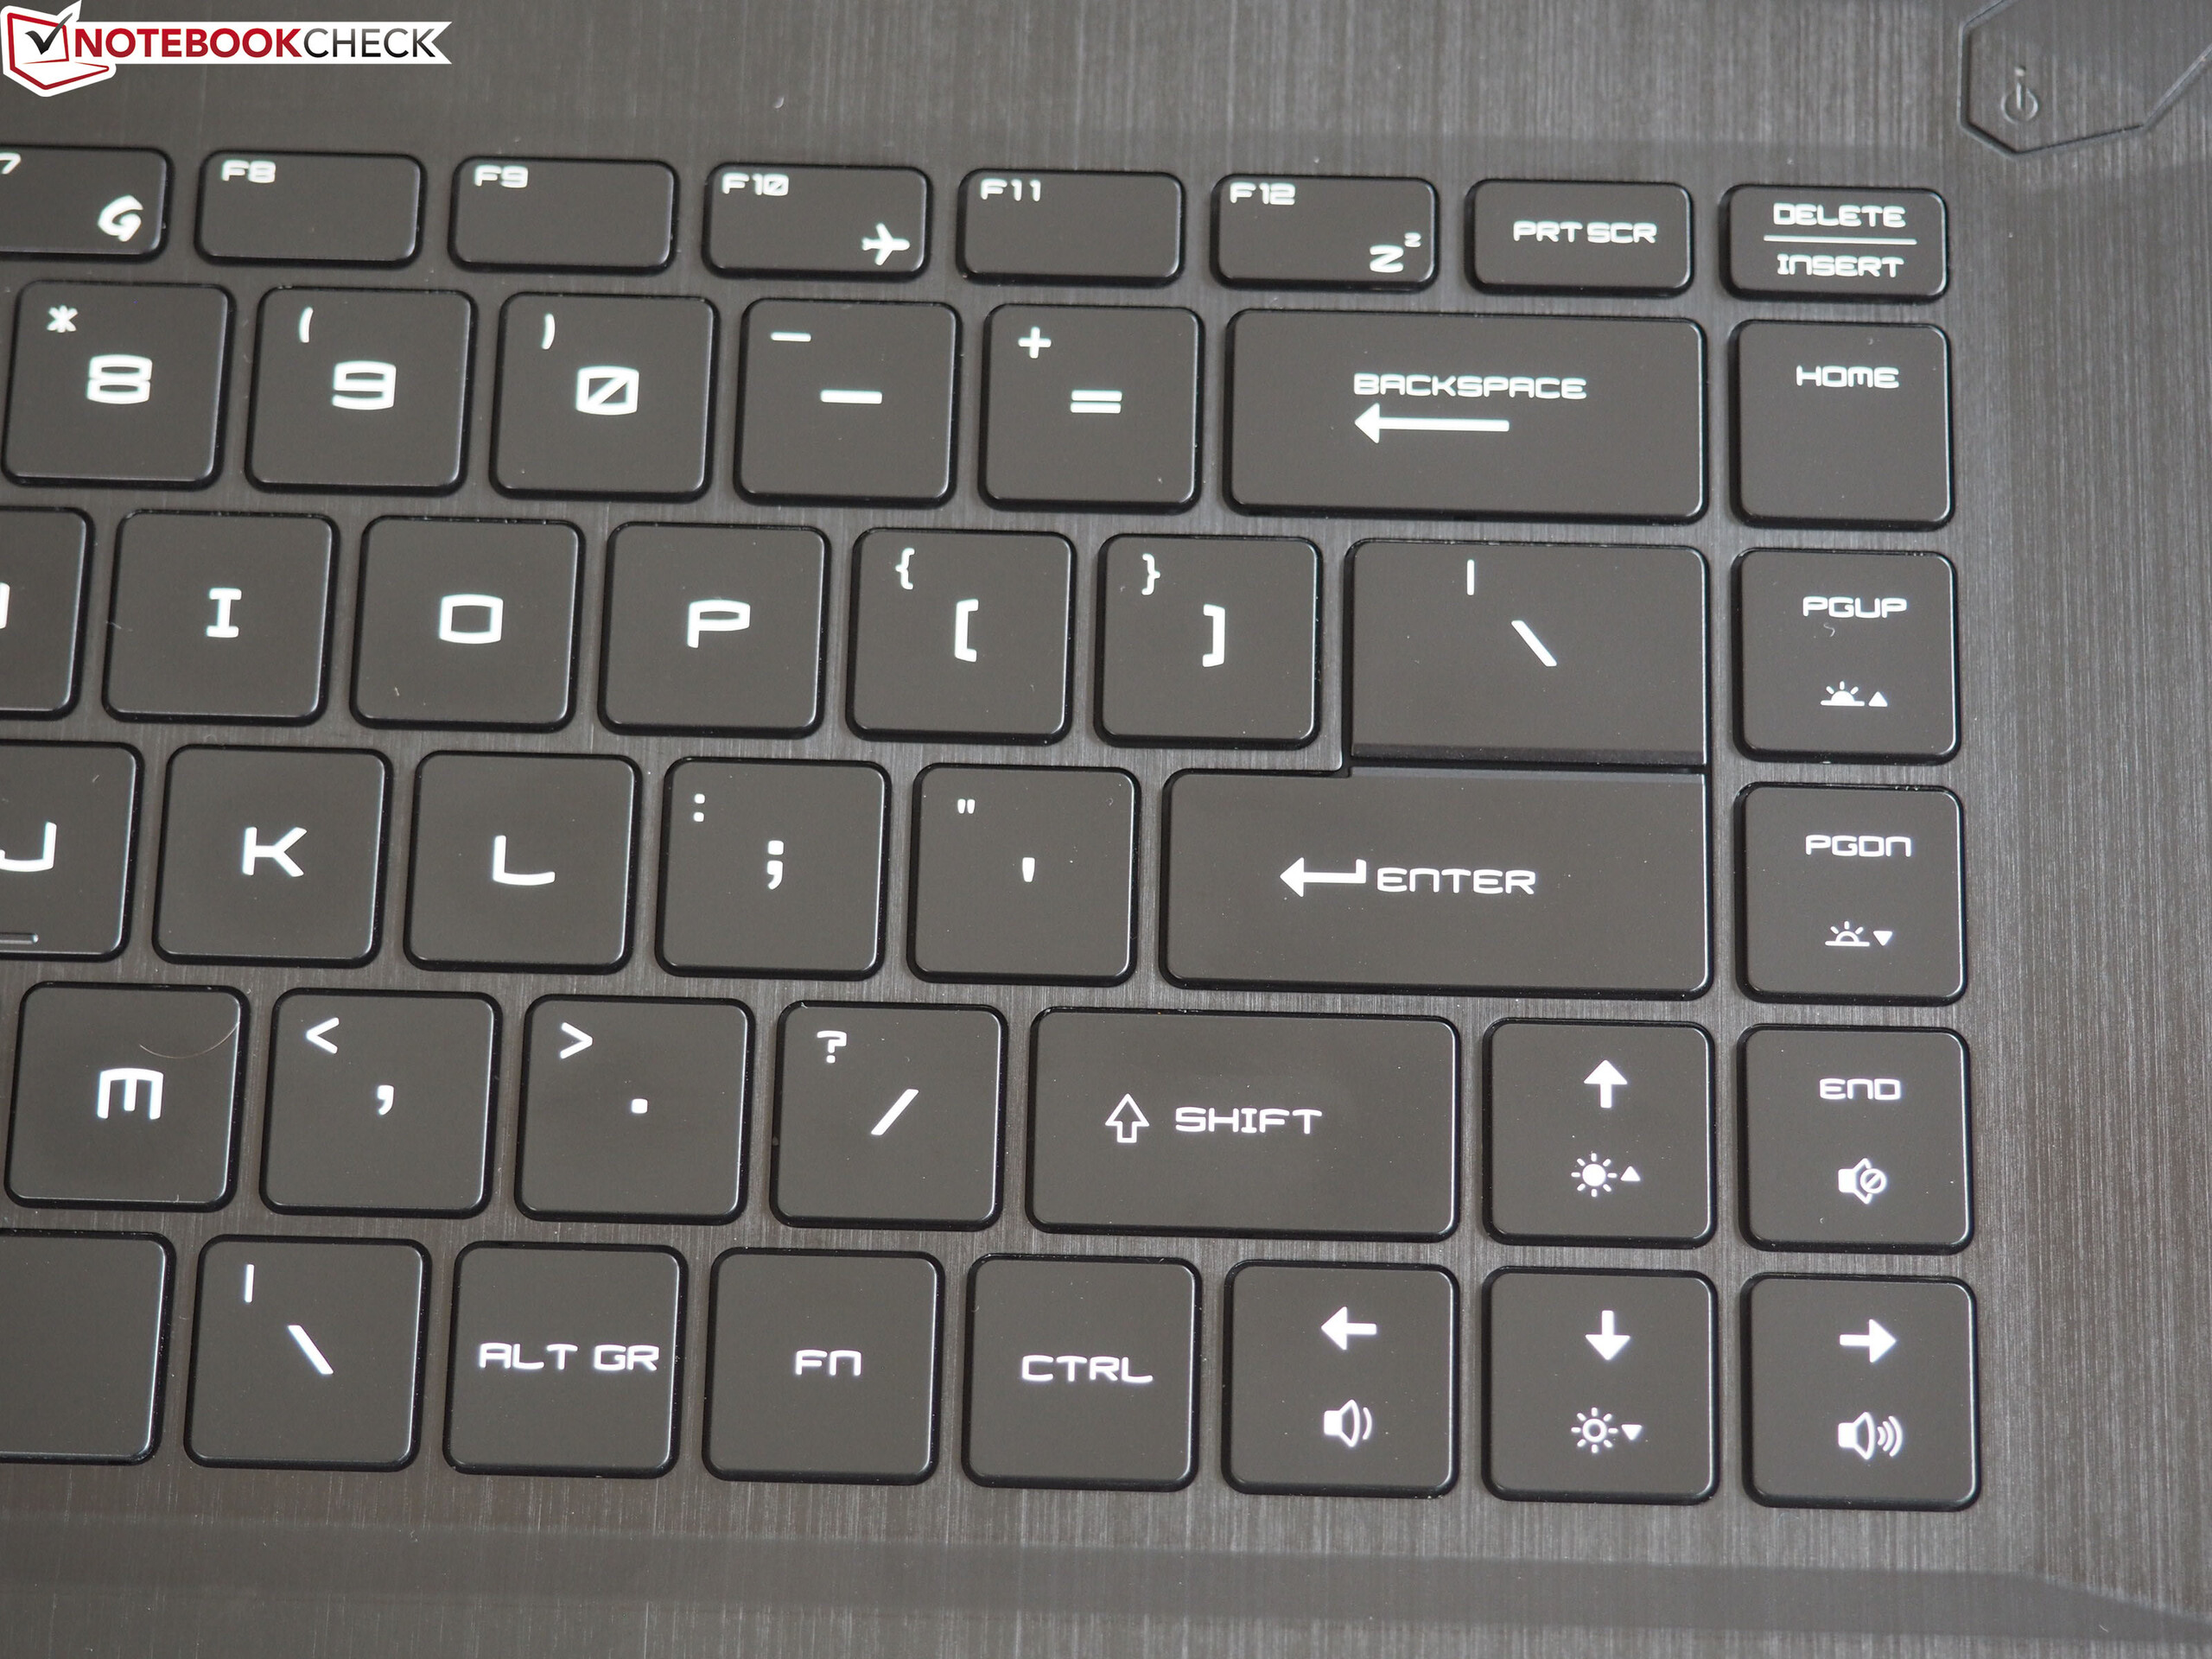
Keyboard
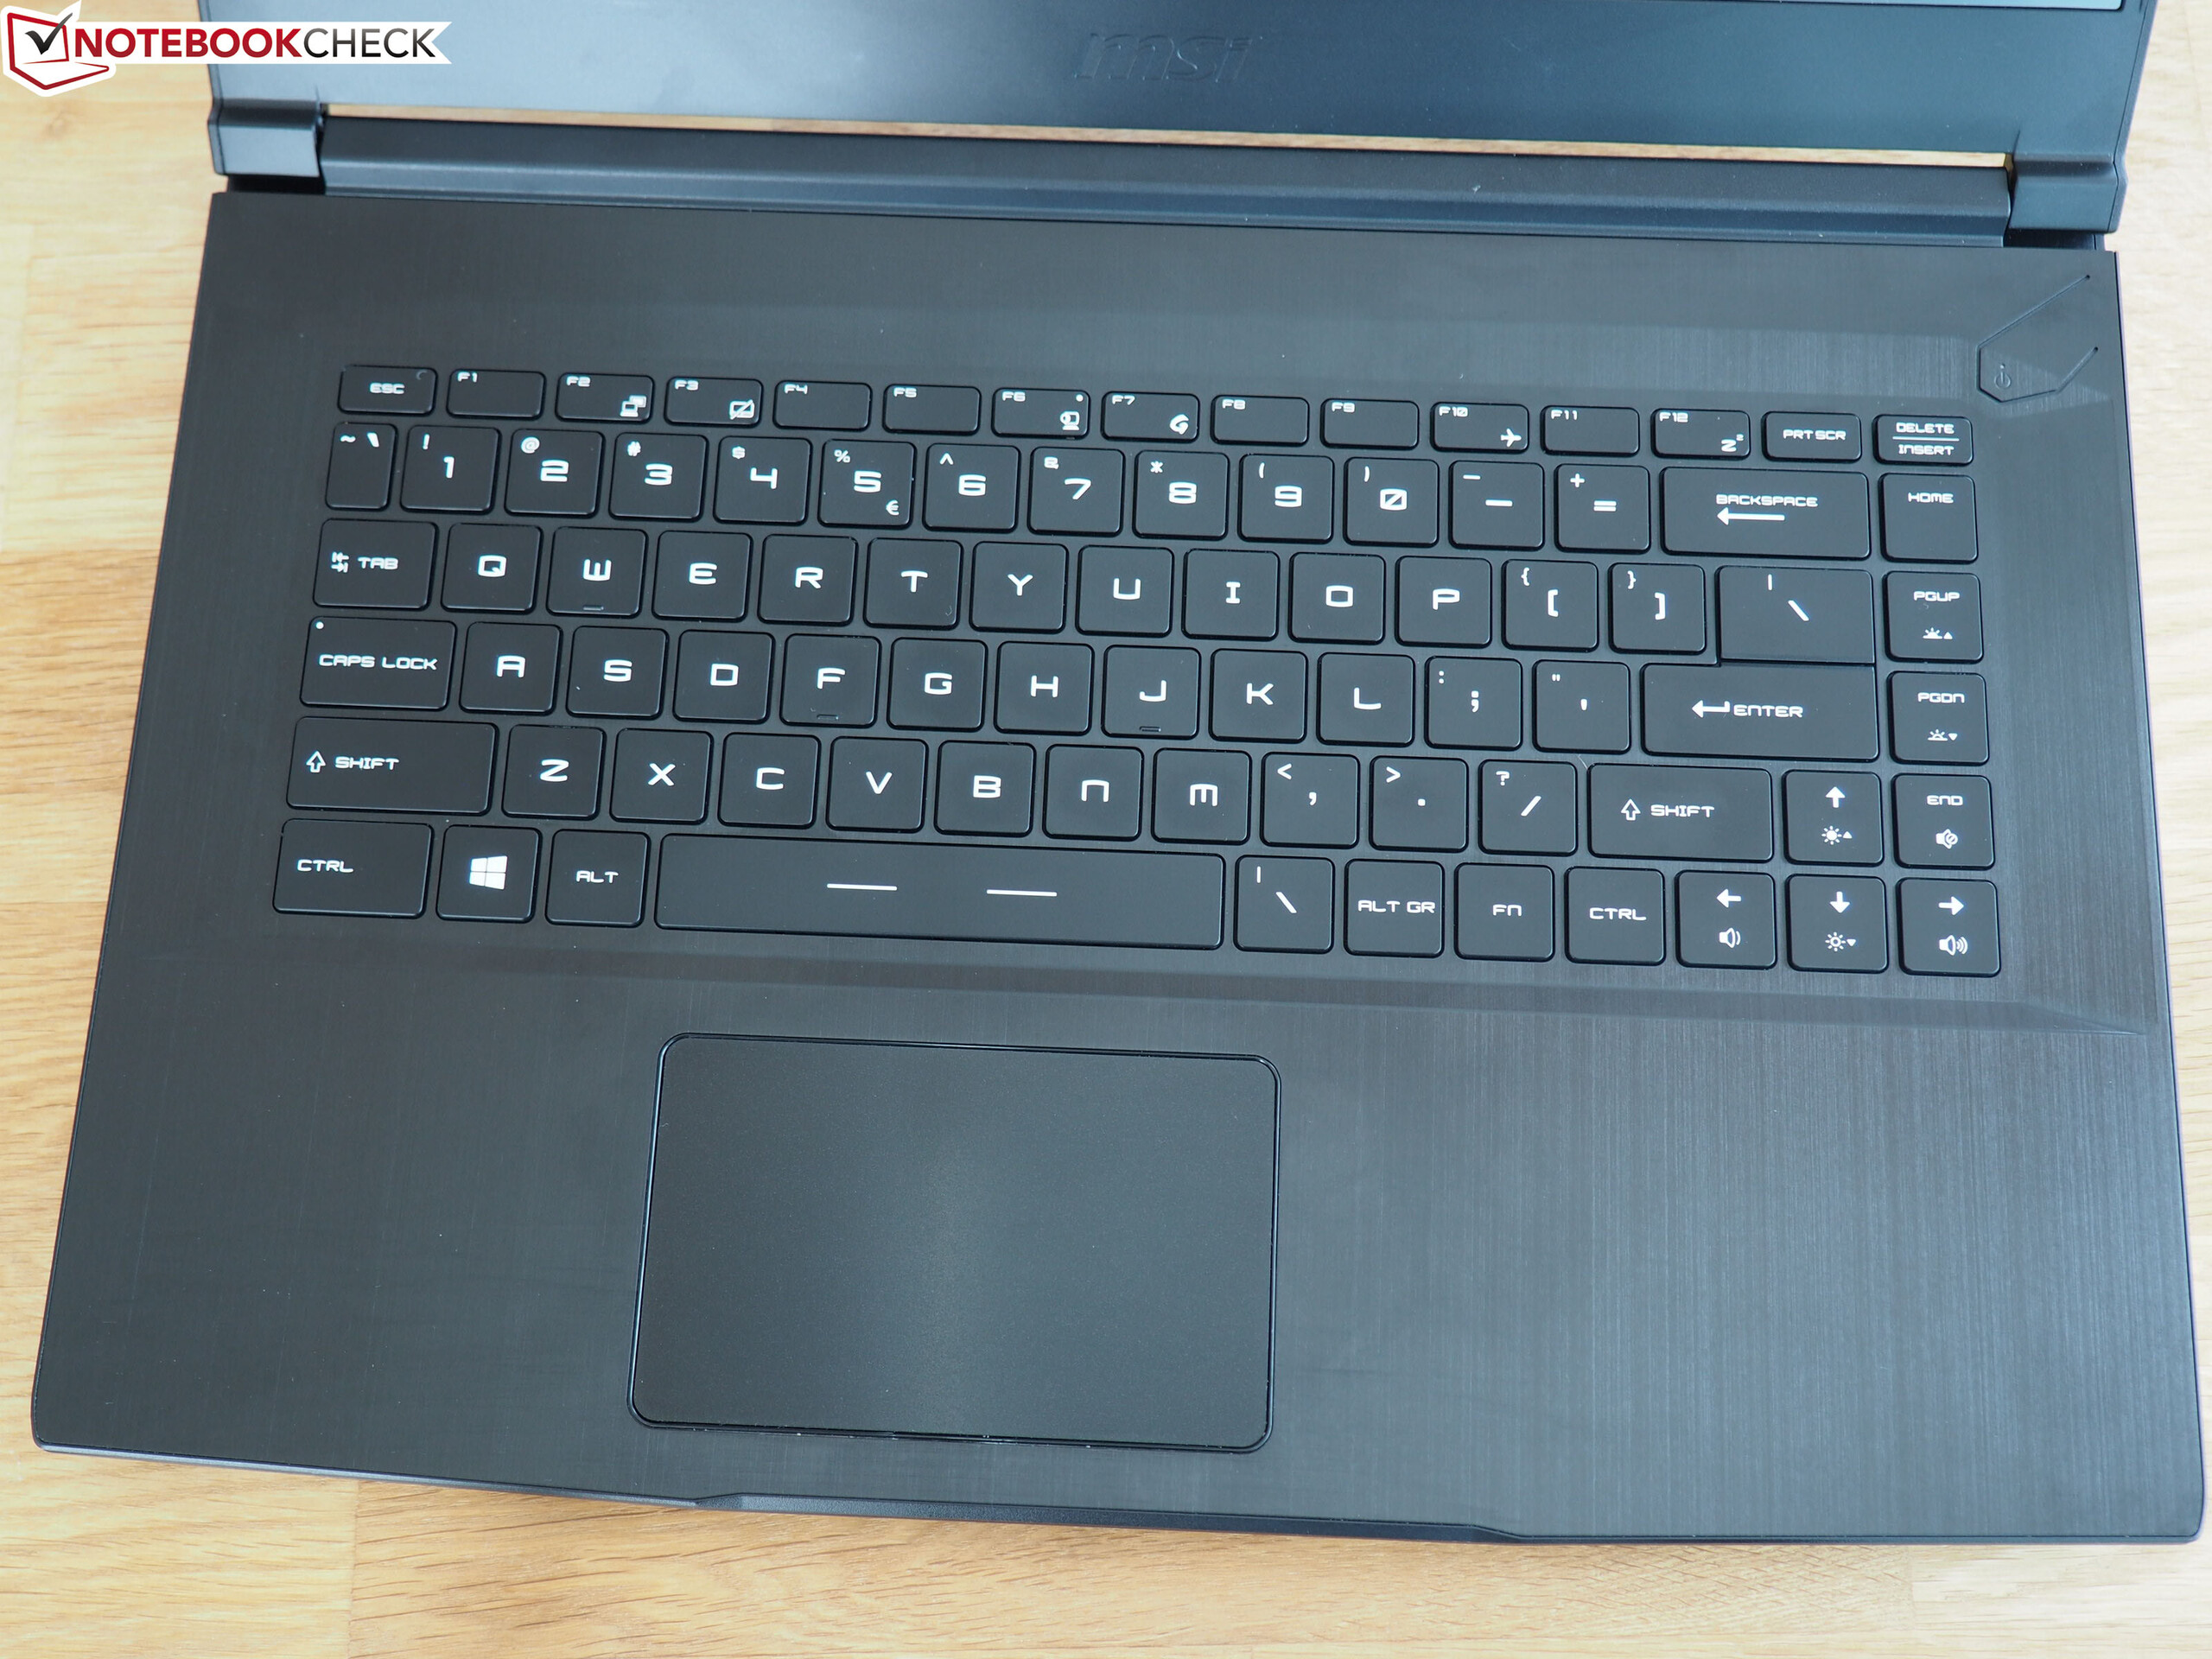
If you are used to typing on standard keyboards, you might need some time to get used to the MSI laptop's layout. The enter key is reduced to one line and several keys have been moved around - this makes it difficult to get going at first. The fairly loud typing noise and fact that MSI has foregone a number pad might be an issue for some users. The device nevertheless receives a rating of "good" due to its decent dimensions (including arrow keys). Unlike on the Bravo 17, the wrist rest is adequately large.
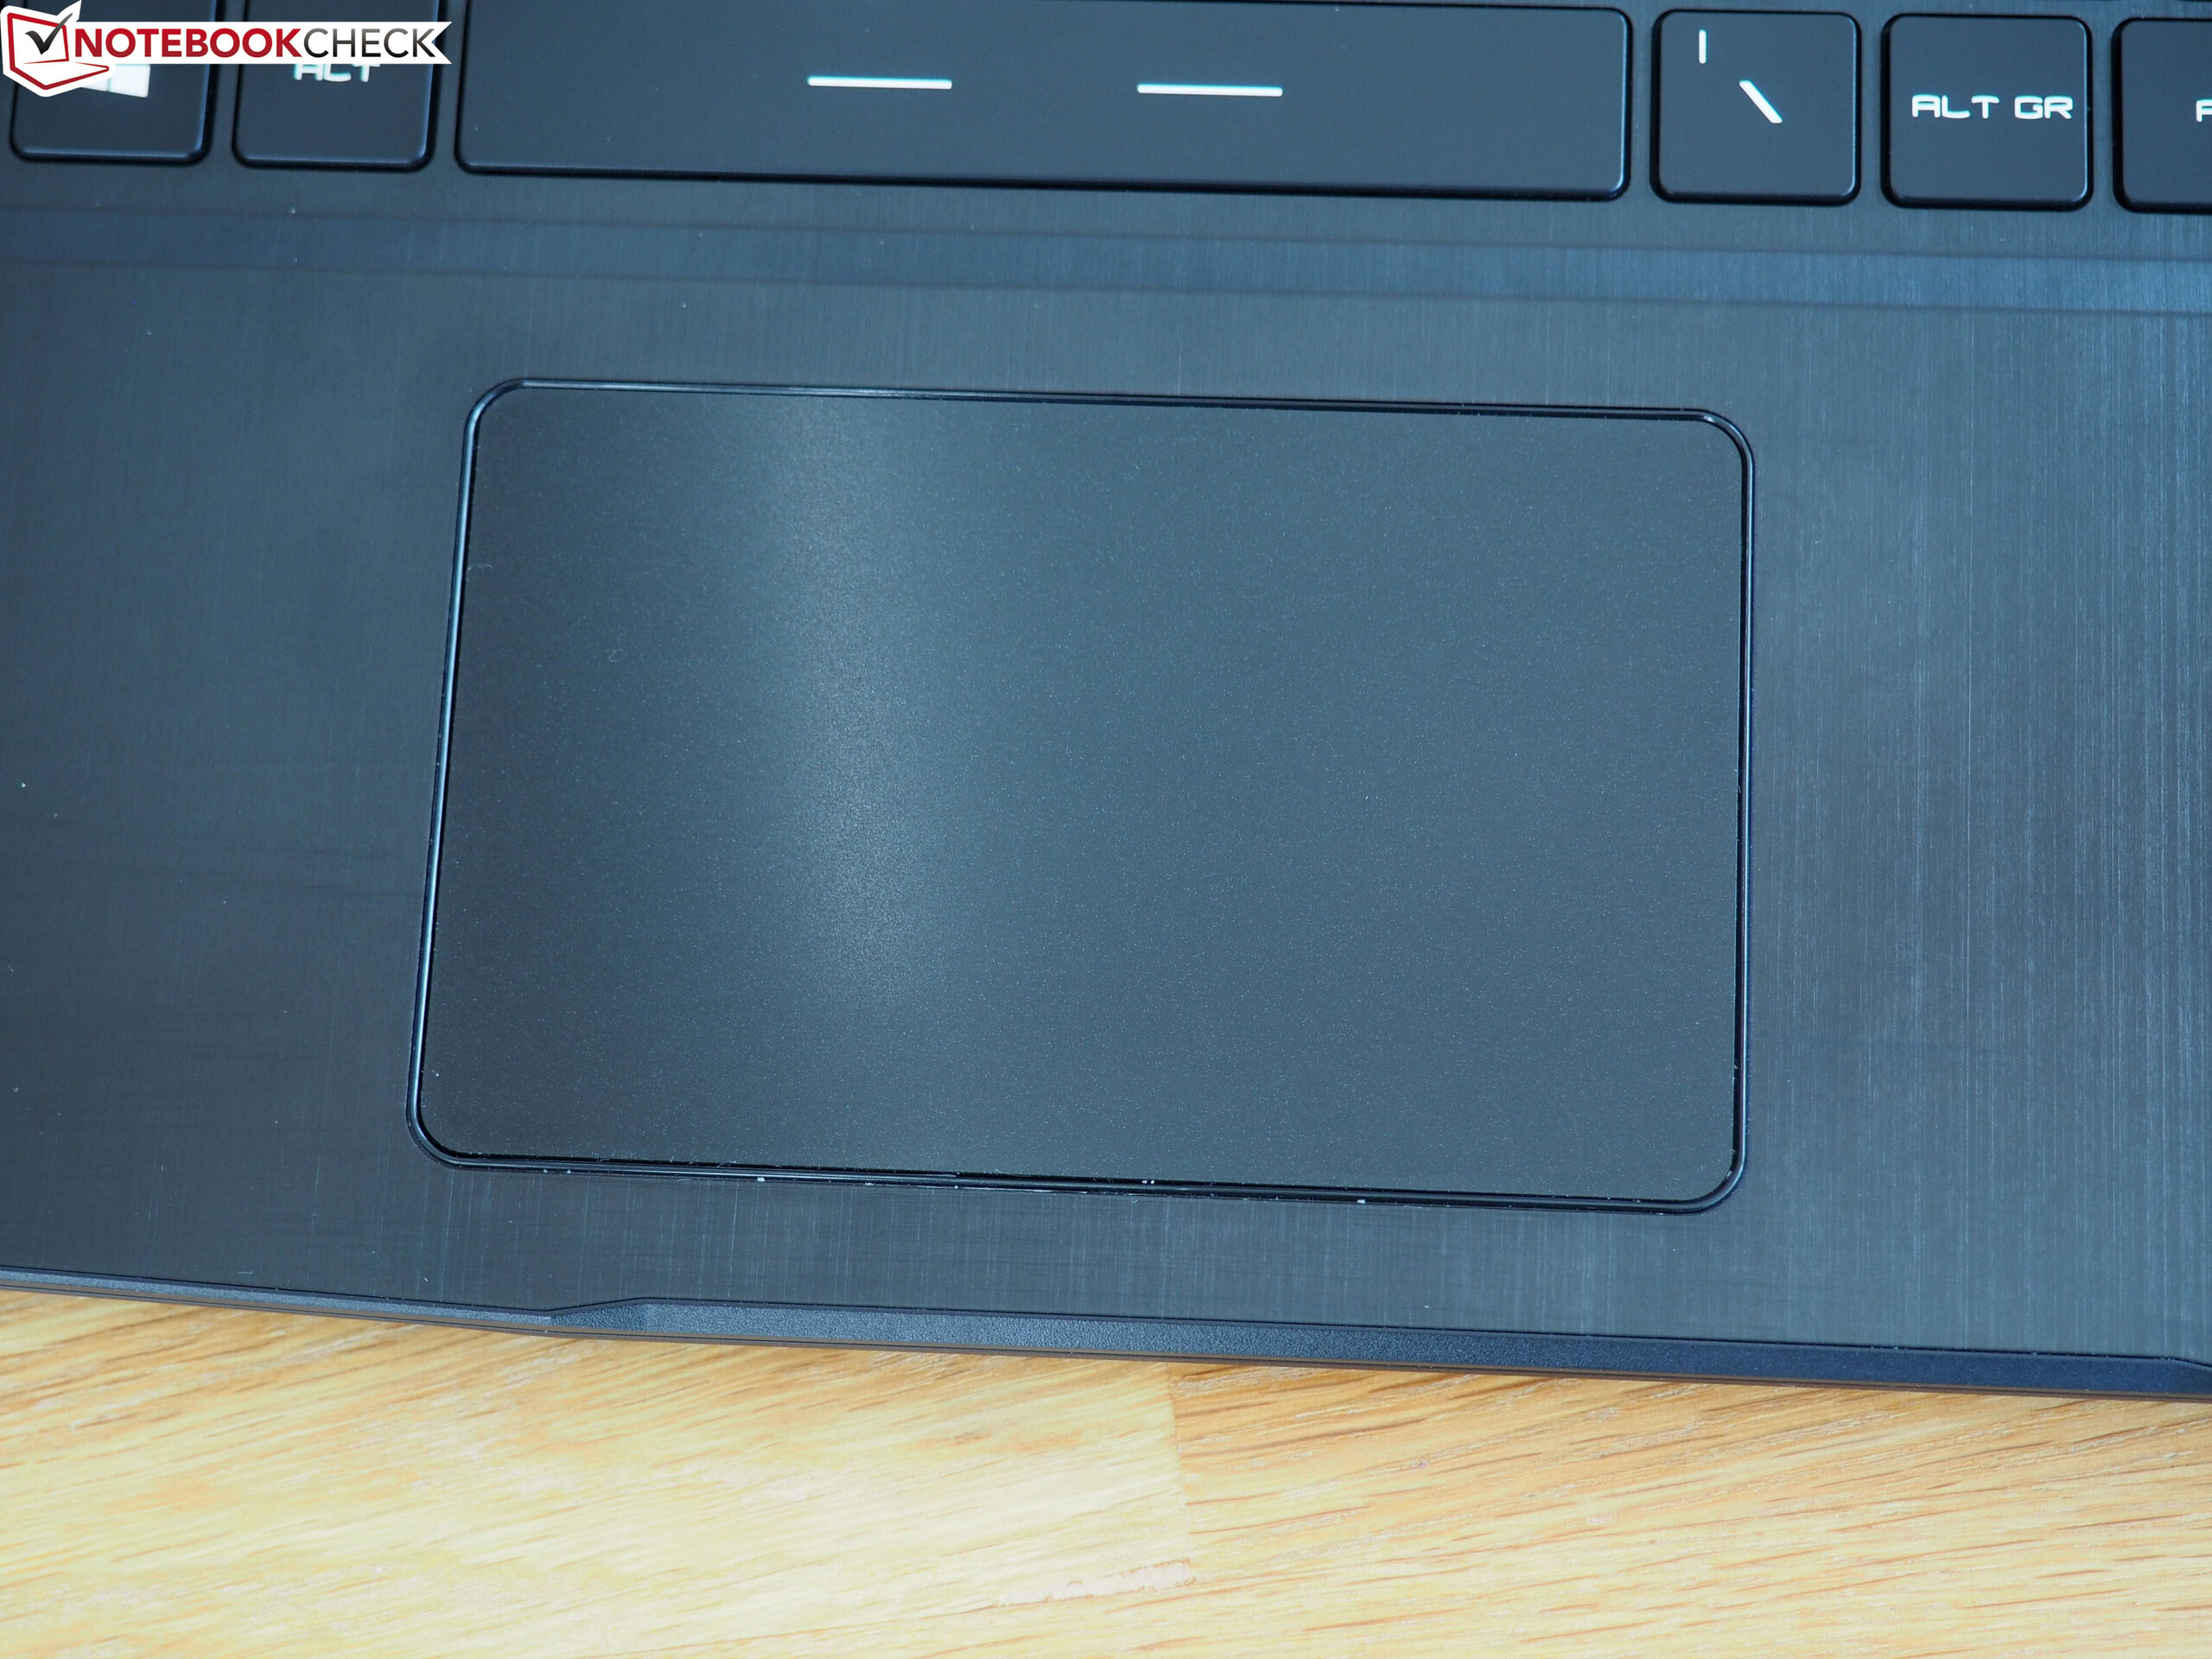
Touchpad
The 10.5x6.5 cm (~4.1 x 2.6 in) large touchpad is a mixed bag. While it offers a smooth surface and guarantees fast, precise cursor control, its integrated mouse buttons appear cheap with their rather loud clatter. The touchpad overall is not very sturdy (particularly in the right lower corner). In short: MSI could still improve its input devices.
Display
Some aspects of the Bravo 15's 144-Hz panel are a lot more appealing than the 120-Hz screen on the Bravo 17.
| |||||||||||||||||||||||||
Brightness Distribution: 88 %
Center on Battery: 311 cd/m²
Contrast: 723:1 (Black: 0.43 cd/m²)
ΔE ColorChecker Calman: 4.5 | ∀{0.5-29.43 Ø4.72}
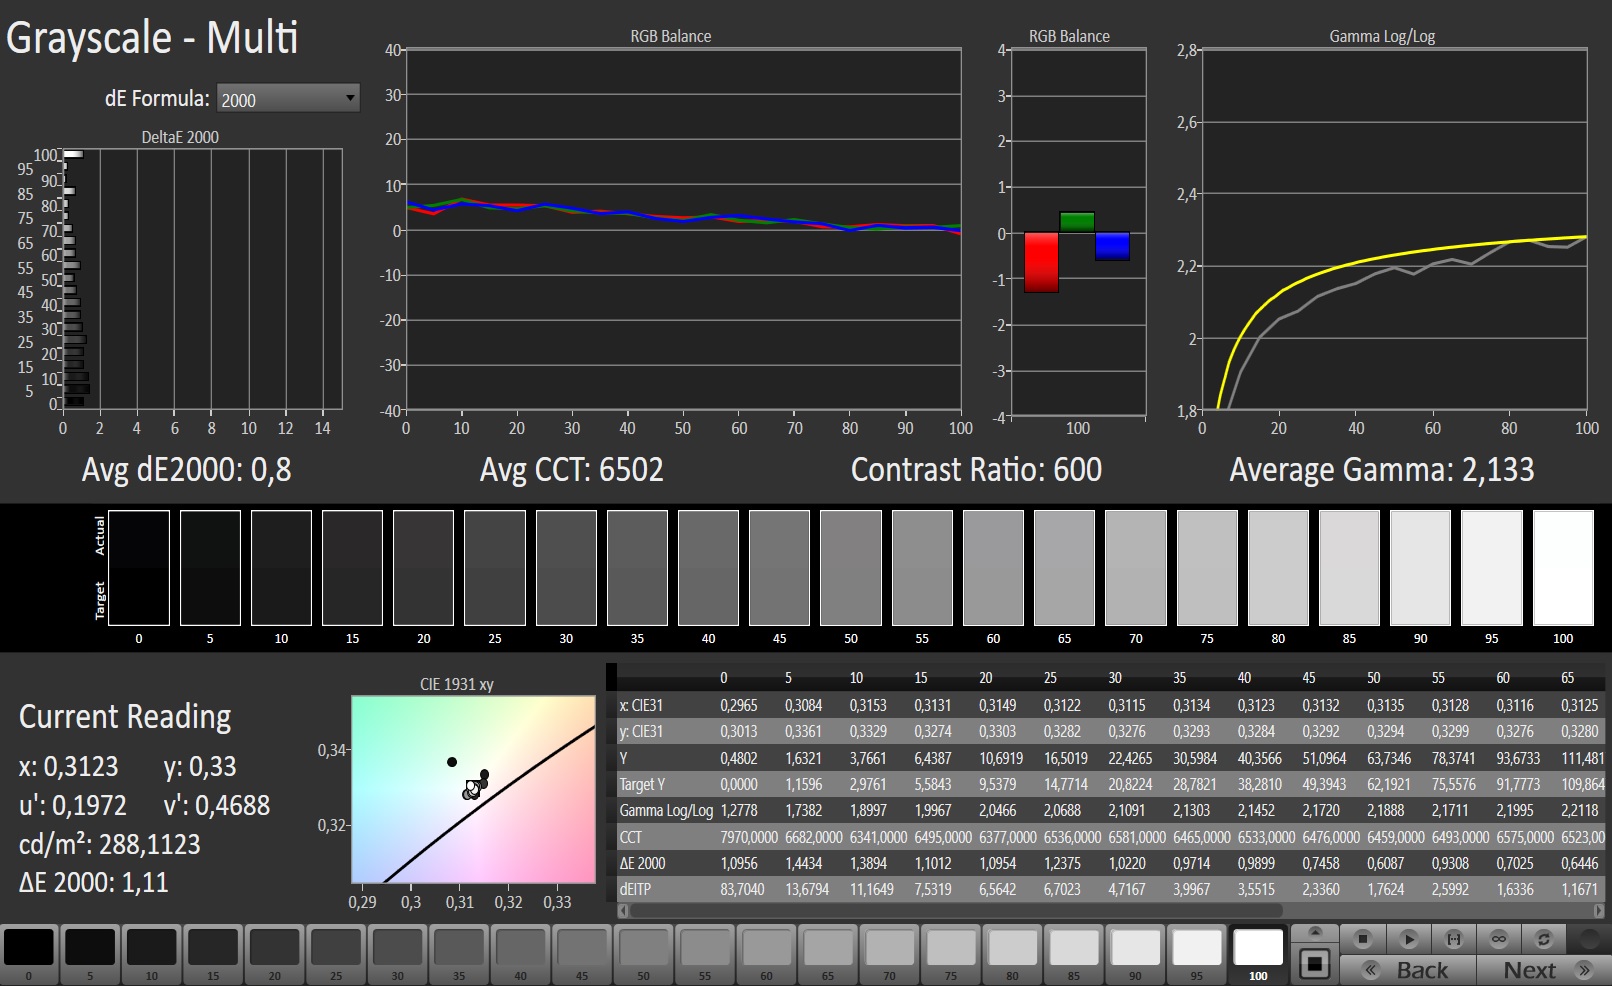
calibrated: 2.65
ΔE Greyscale Calman: 3.3 | ∀{0.09-98 Ø4.97}
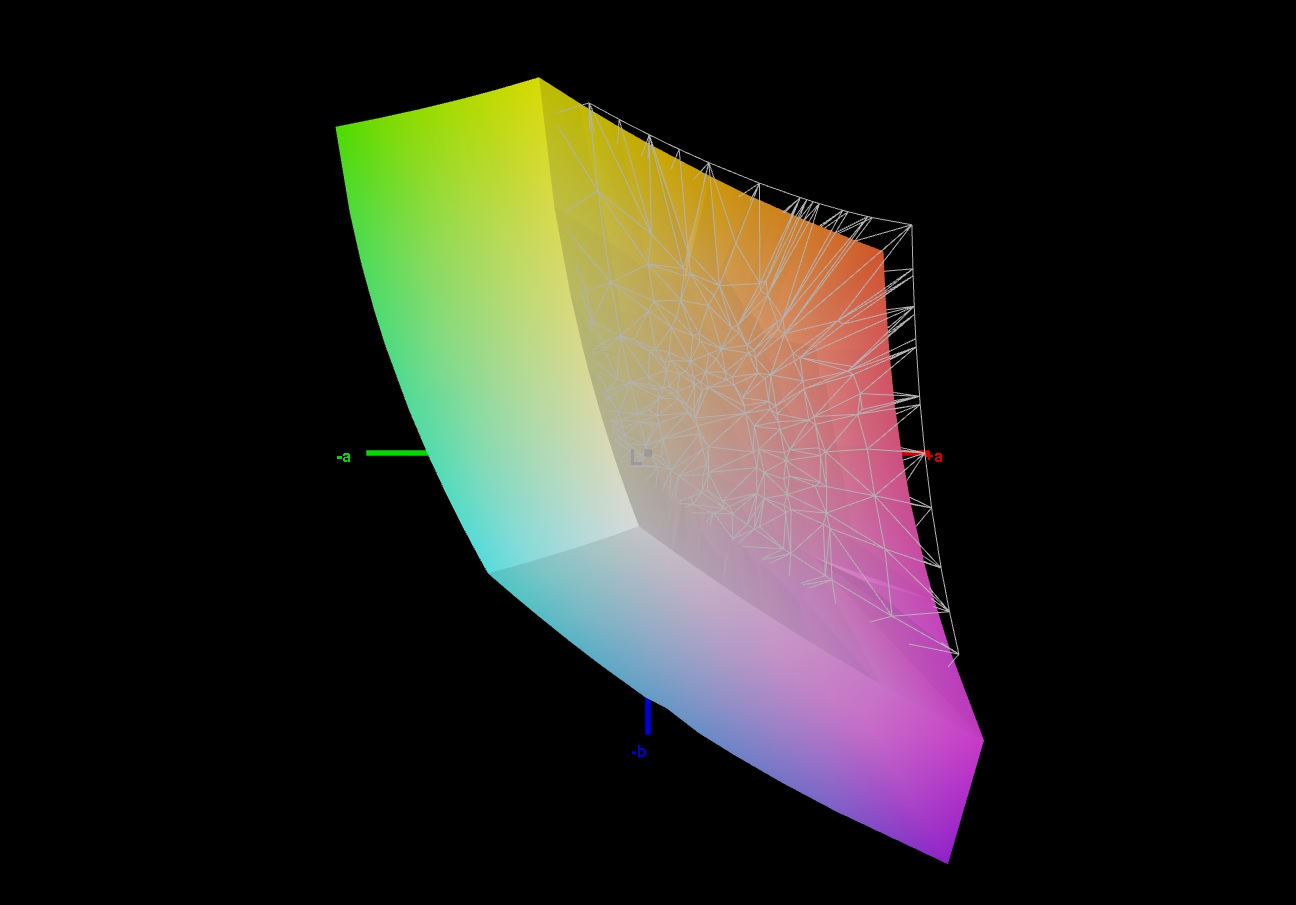
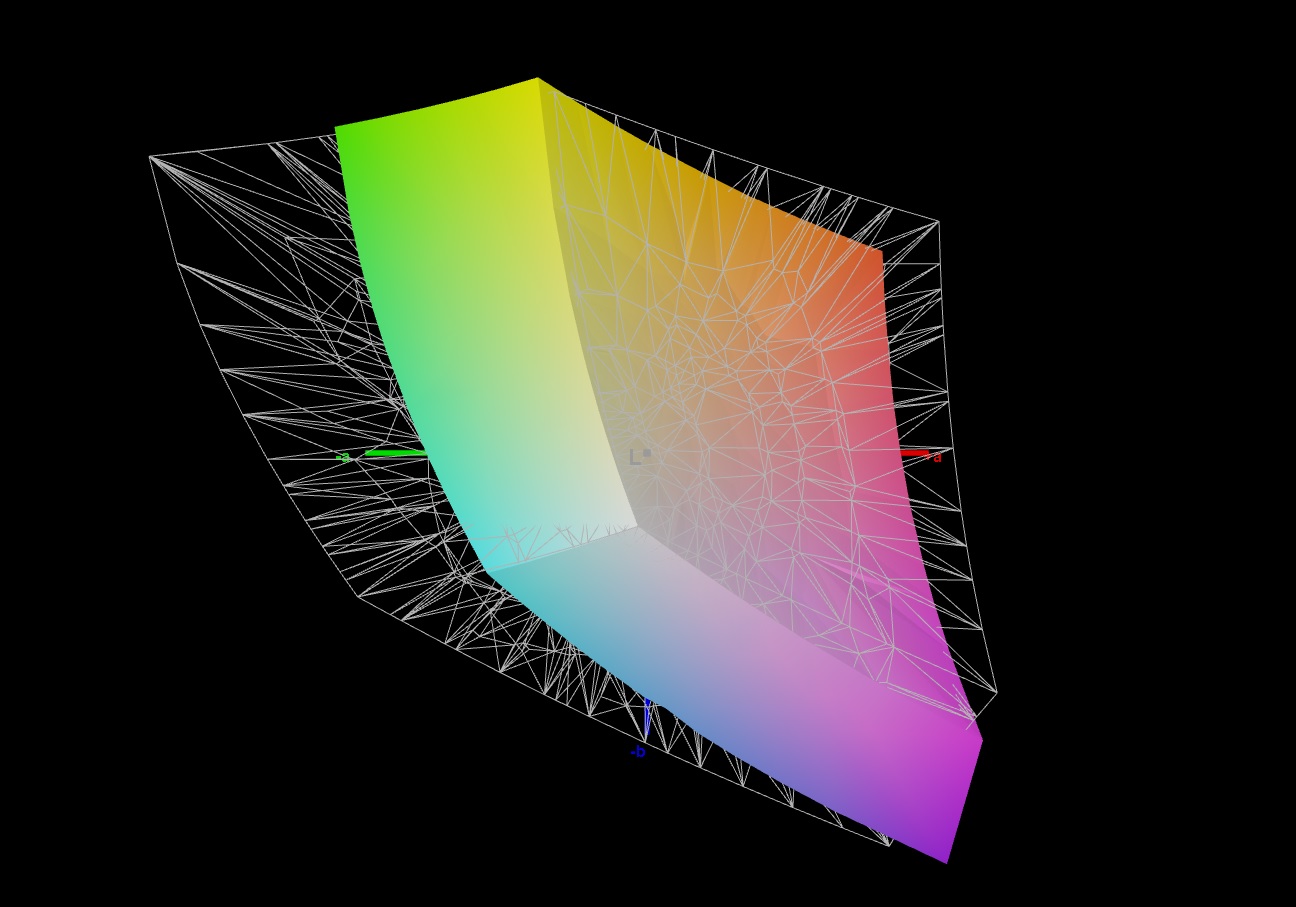
86% sRGB (Argyll 1.6.3 3D)
63% AdobeRGB 1998 (Argyll 1.6.3 3D)
62.7% AdobeRGB 1998 (Argyll 3D)
86.8% sRGB (Argyll 3D)
62% Display P3 (Argyll 3D)
Gamma: 2.129
CCT: 7227 K
| MSI Bravo 15 A4DCR AU Optronics B156HAN08.0 (AUO80ED), IPS-Level, 1920x1080 | Acer Nitro 5 AN515-44-R5FT Panda LM156LF-2F01 (NCP004D), IPS, 1920x1080 | Asus TUF FX505DT-EB73 Panda LM156LF-GL, IPS, 1920x1080 | Dell G5 15 5590-PCNJJ AU Optronics B156HAN (AUO23ED), IPS, 1920x1080 | HP Omen 15-dc1020ng LGD05CE, IPS, 1920x1080 | |
|---|---|---|---|---|---|
| Display | -32% | -34% | 34% | -36% | |
| Display P3 Coverage (%) | 62 | 41.16 -34% | 39.56 -36% | 83.1 34% | 38.37 -38% |
| sRGB Coverage (%) | 86.8 | 61.8 -29% | 59.5 -31% | 99.9 15% | 57.6 -34% |
| AdobeRGB 1998 Coverage (%) | 62.7 | 42.56 -32% | 40.91 -35% | 96.8 54% | 39.69 -37% |
| Response Times | -172% | -128% | -194% | -168% | |
| Response Time Grey 50% / Grey 80% * (ms) | 16 ? | 40.8 ? -155% | 30.4 ? -90% | 48 ? -200% | 40 ? -150% |
| Response Time Black / White * (ms) | 10.4 ? | 30 ? -188% | 27.6 ? -165% | 30 ? -188% | 29.6 ? -185% |
| PWM Frequency (Hz) | |||||
| Screen | -11% | -30% | -19% | -23% | |
| Brightness middle (cd/m²) | 311 | 287 -8% | 286.2 -8% | 234 -25% | 251 -19% |
| Brightness (cd/m²) | 313 | 271 -13% | 267 -15% | 216 -31% | 232 -26% |
| Brightness Distribution (%) | 88 | 88 0% | 84 -5% | 87 -1% | 76 -14% |
| Black Level * (cd/m²) | 0.43 | 0.25 42% | 0.33 23% | 0.22 49% | 0.17 60% |
| Contrast (:1) | 723 | 1148 59% | 867 20% | 1064 47% | 1476 104% |
| Colorchecker dE 2000 * | 4.5 | 4.77 -6% | 5.45 -21% | 6.52 -45% | 6.2 -38% |
| Colorchecker dE 2000 max. * | 7.97 | 17.15 -115% | 18.08 -127% | 10.58 -33% | 18.6 -133% |
| Colorchecker dE 2000 calibrated * | 2.65 | 3.73 -41% | 4.47 -69% | 3.56 -34% | 4.8 -81% |
| Greyscale dE 2000 * | 3.3 | 2.7 18% | 5.3 -61% | 5.33 -62% | 4.2 -27% |
| Gamma | 2.129 103% | 2.115 104% | 2.1 105% | 2.86 77% | 2.32 95% |
| CCT | 7227 90% | 7187 90% | 7679 85% | 5983 109% | 7454 87% |
| Color Space (Percent of AdobeRGB 1998) (%) | 63 | 43 -32% | 37.6 -40% | 36 -43% | 36.5 -42% |
| Color Space (Percent of sRGB) (%) | 86 | 61 -29% | 59.1 -31% | 57 -34% | 57.4 -33% |
| Total Average (Program / Settings) | -72% /
-35% | -64% /
-43% | -60% /
-31% | -76% /
-43% |
* ... smaller is better
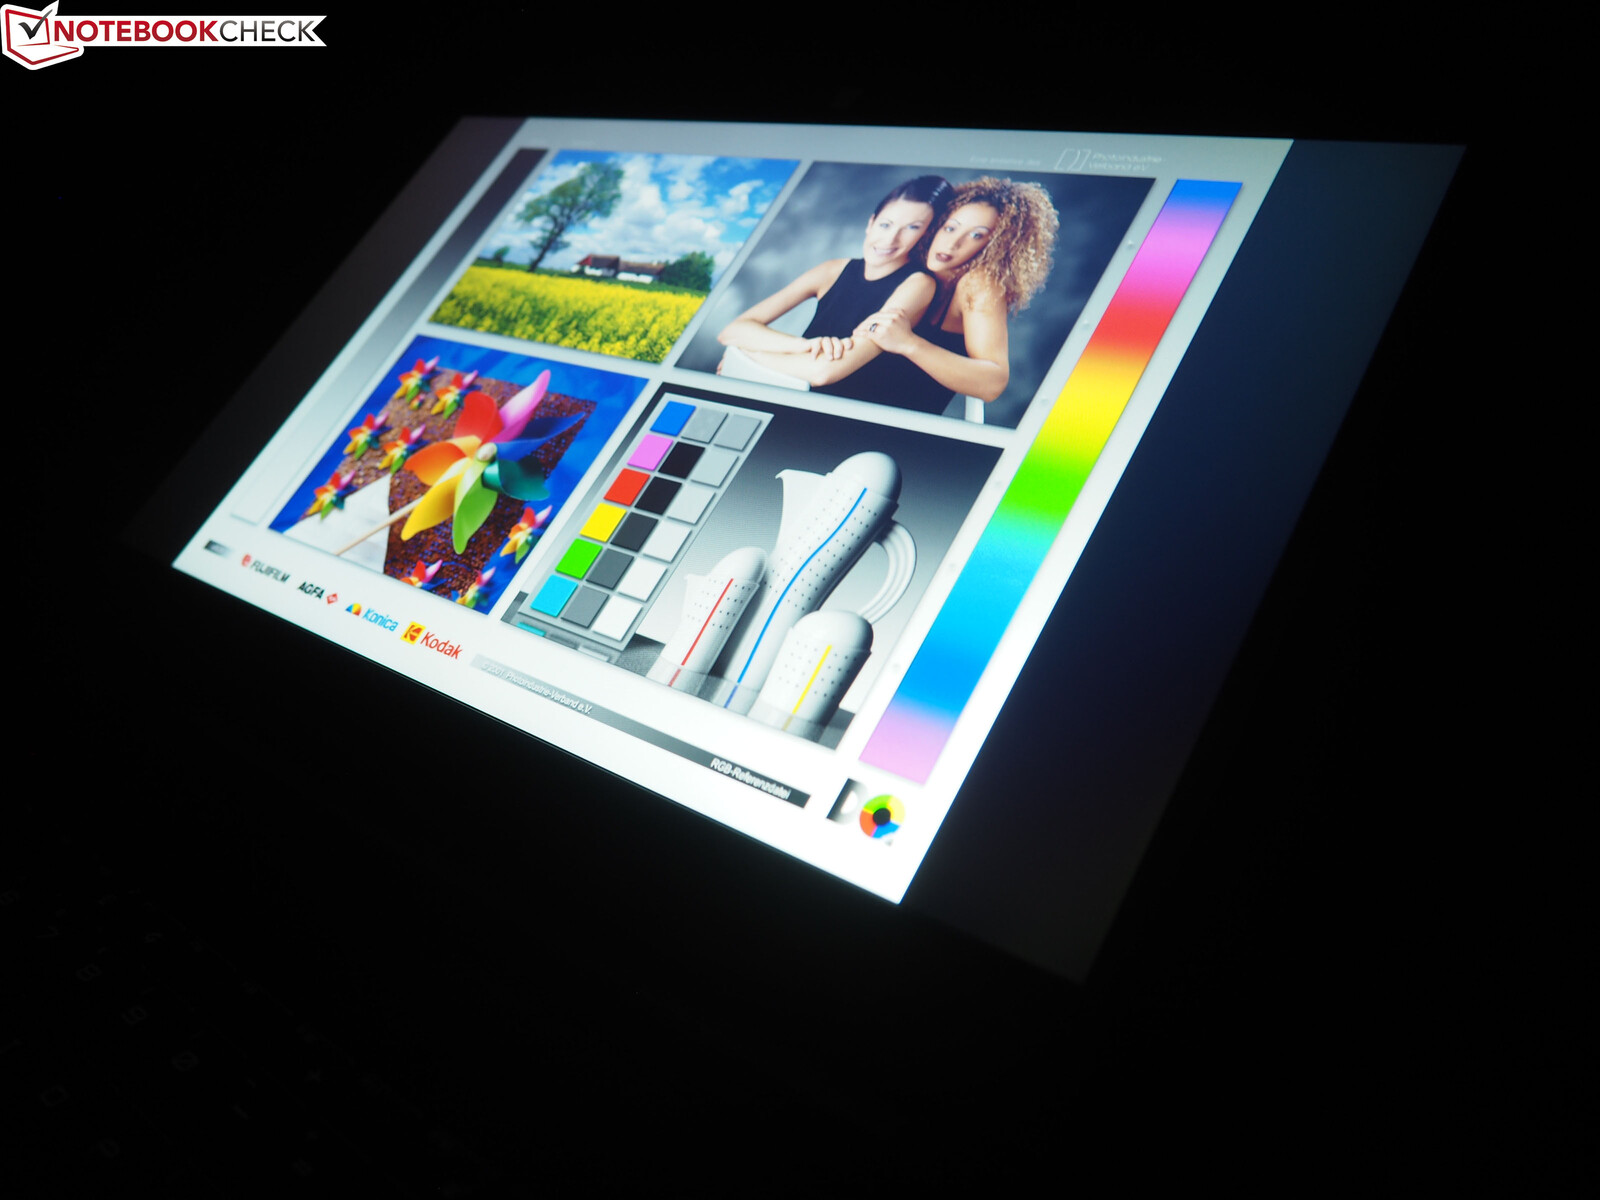
For one, both brightness and color space coverage are higher. While 313 cd/m² isn't the best result, it is sufficient for most situations (although things might get a little more difficult outdoors and/or in direct (sun)light). 86 percent sRGB coverage and 63 percent AdobeRGB coverage is reasonable for this price range.
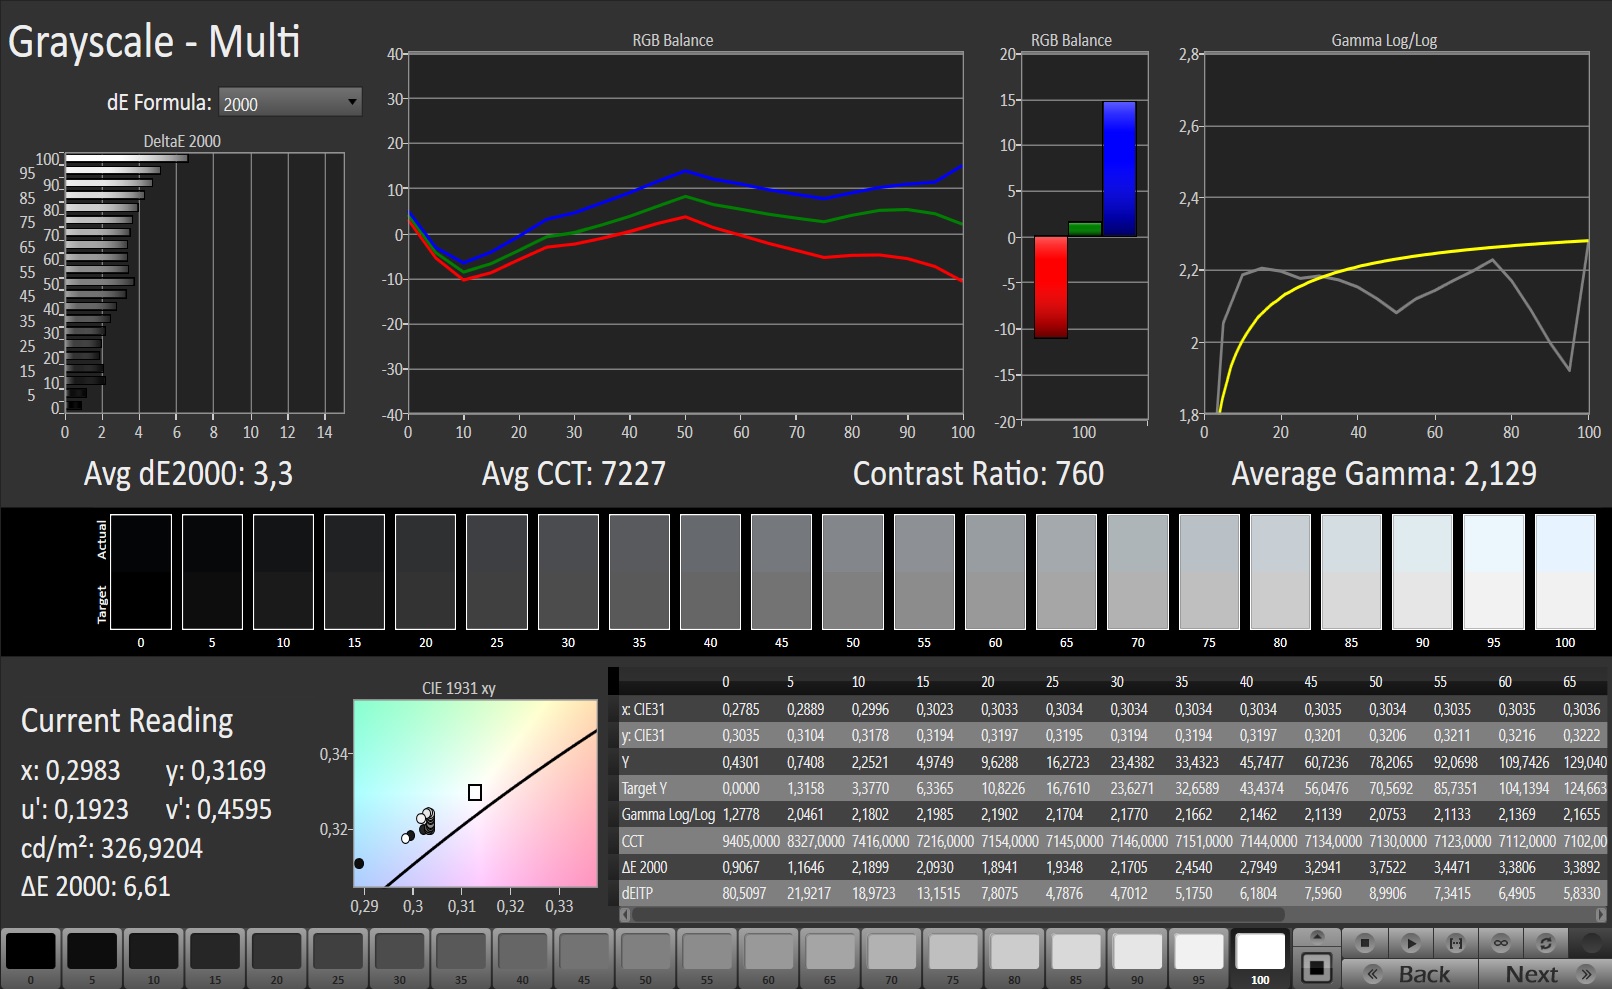
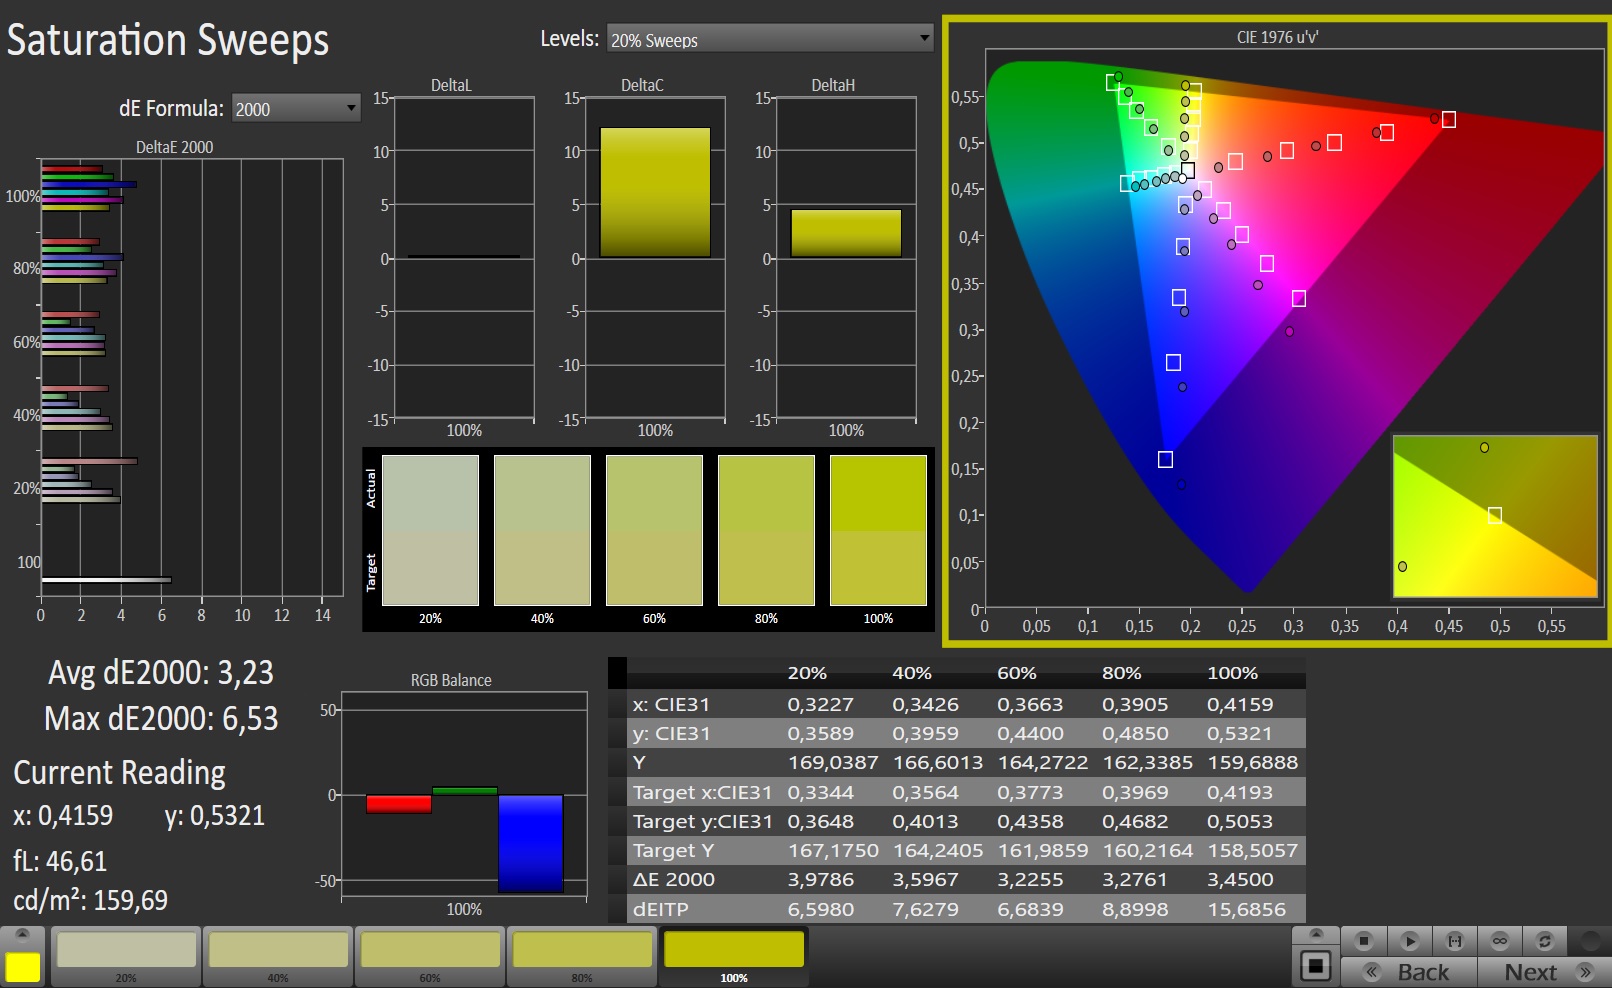
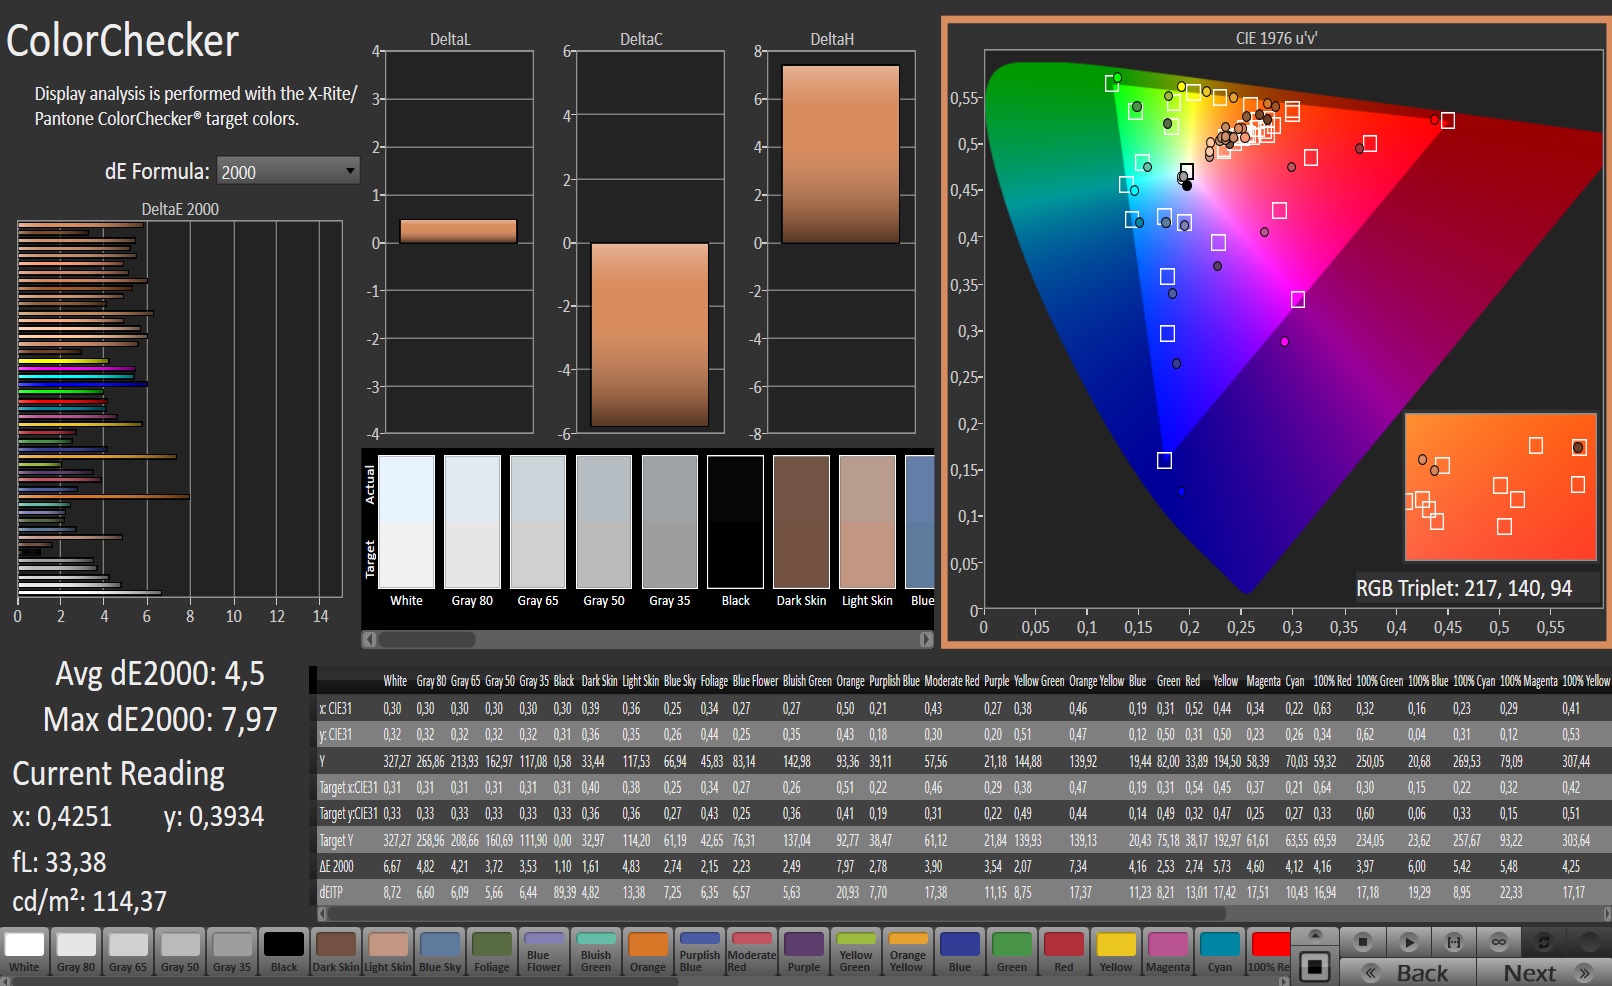
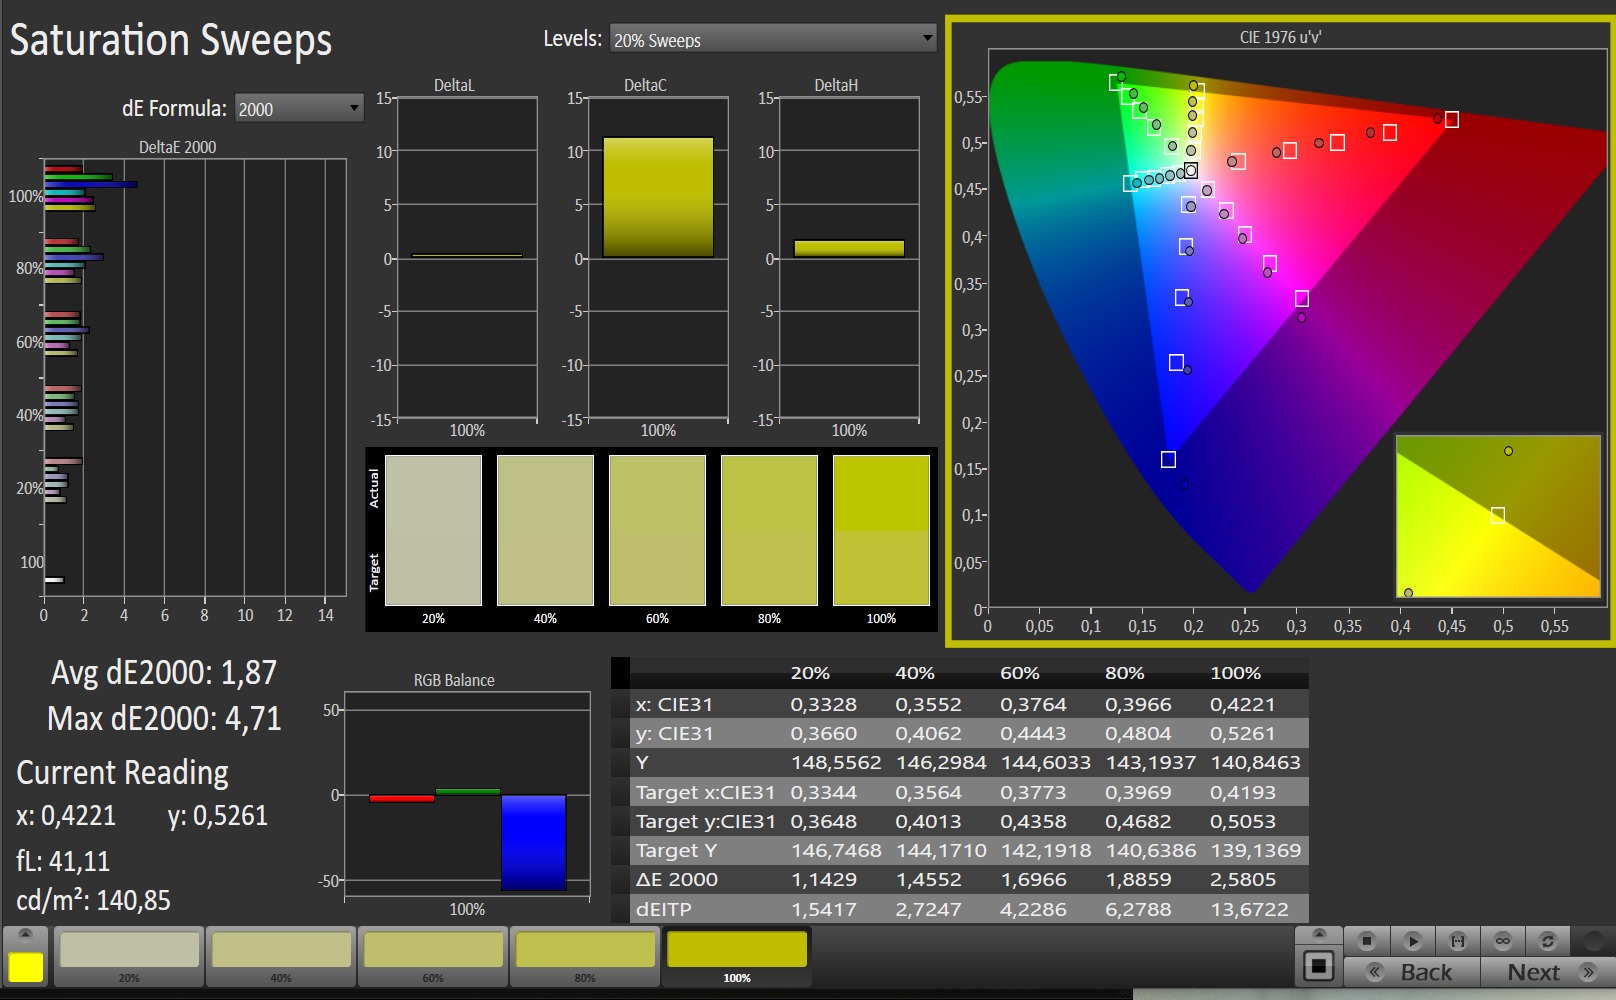
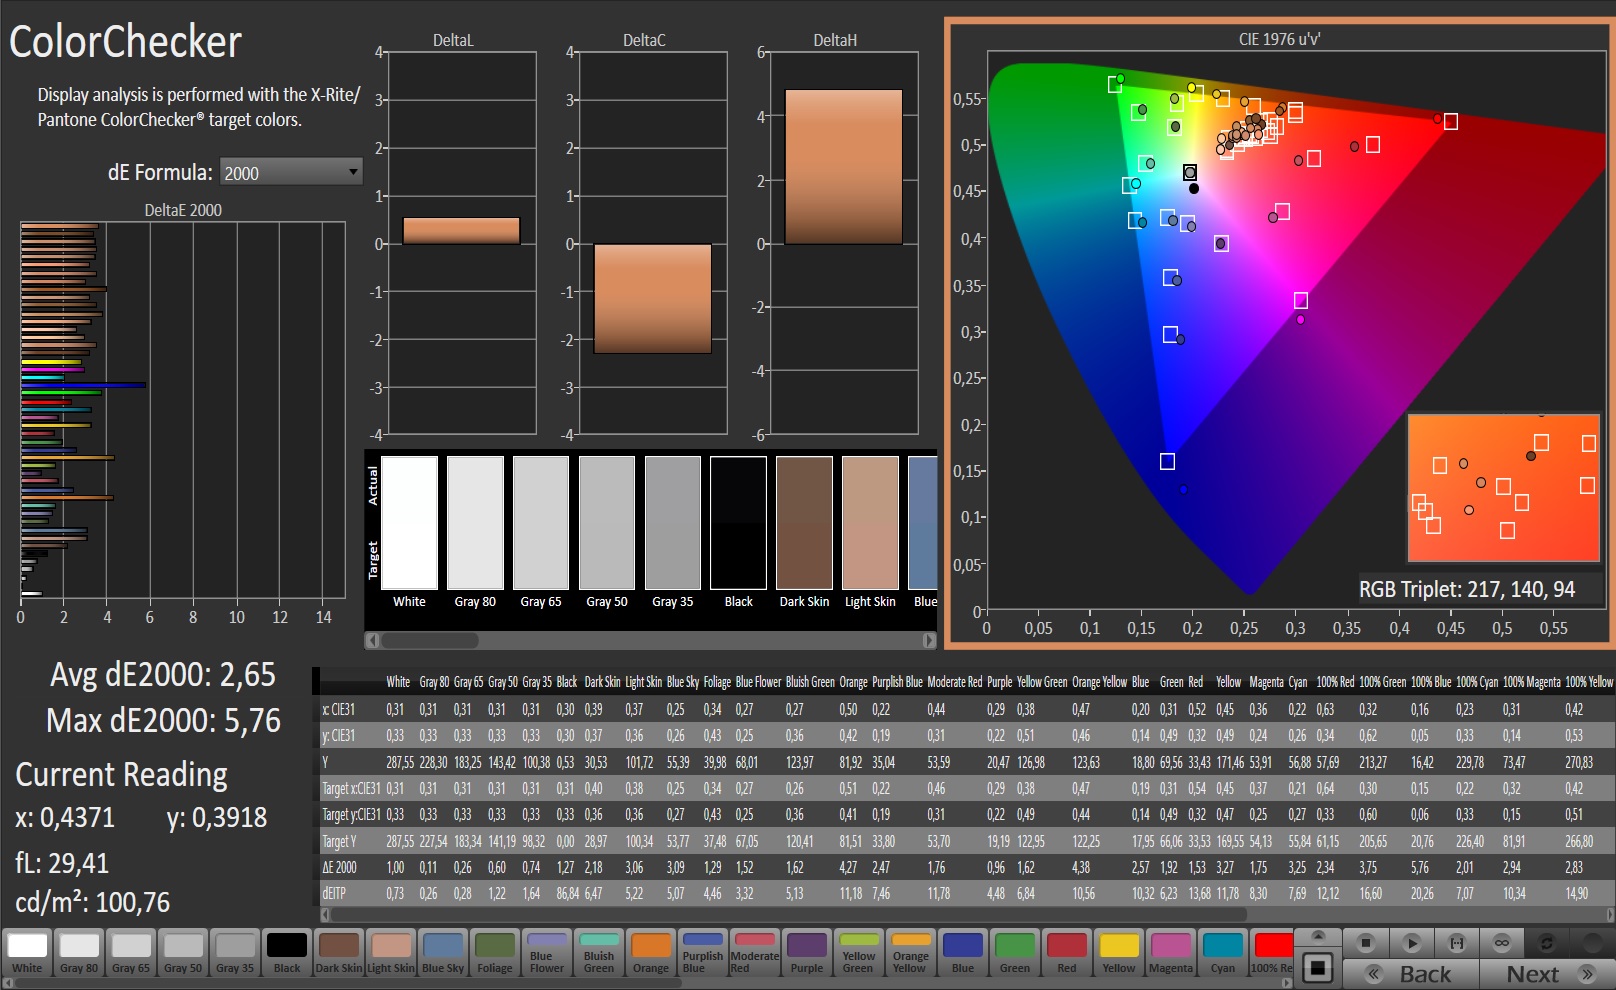
The color accuracy is average, as is the contrast ratio: The Bravo only reaches 720:1 due to its mediocre black value of 0.43 cd/m².
Instead, the 144-Hz panel offers good viewing angles, FreeSync support and a short response time of 10 ms black to white and 16 ms gray to gray. We did not notice any PWM flickering on the panel.
Display Response Times
| ↔ Response Time Black to White | ||
|---|---|---|
| 10.4 ms ... rise ↗ and fall ↘ combined | ↗ 6 ms rise | 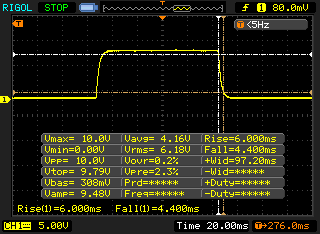 |
| ↘ 4.4 ms fall | ||
| The screen shows good response rates in our tests, but may be too slow for competitive gamers. In comparison, all tested devices range from 0.1 (minimum) to 240 (maximum) ms. » 28 % of all devices are better. This means that the measured response time is better than the average of all tested devices (19.8 ms). | ||
| ↔ Response Time 50% Grey to 80% Grey | ||
| 16 ms ... rise ↗ and fall ↘ combined | ↗ 7.6 ms rise | 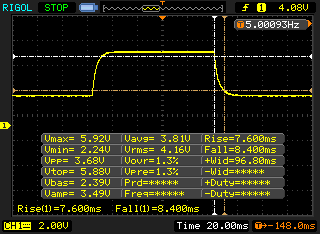 |
| ↘ 8.4 ms fall | ||
| The screen shows good response rates in our tests, but may be too slow for competitive gamers. In comparison, all tested devices range from 0.165 (minimum) to 636 (maximum) ms. » 30 % of all devices are better. This means that the measured response time is better than the average of all tested devices (31 ms). | ||
Screen Flickering / PWM (Pulse-Width Modulation)
| Screen flickering / PWM not detected | 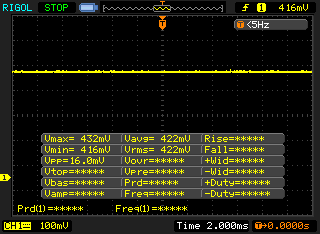 | ||
In comparison: 52 % of all tested devices do not use PWM to dim the display. If PWM was detected, an average of 7753 (minimum: 5 - maximum: 343500) Hz was measured. | |||
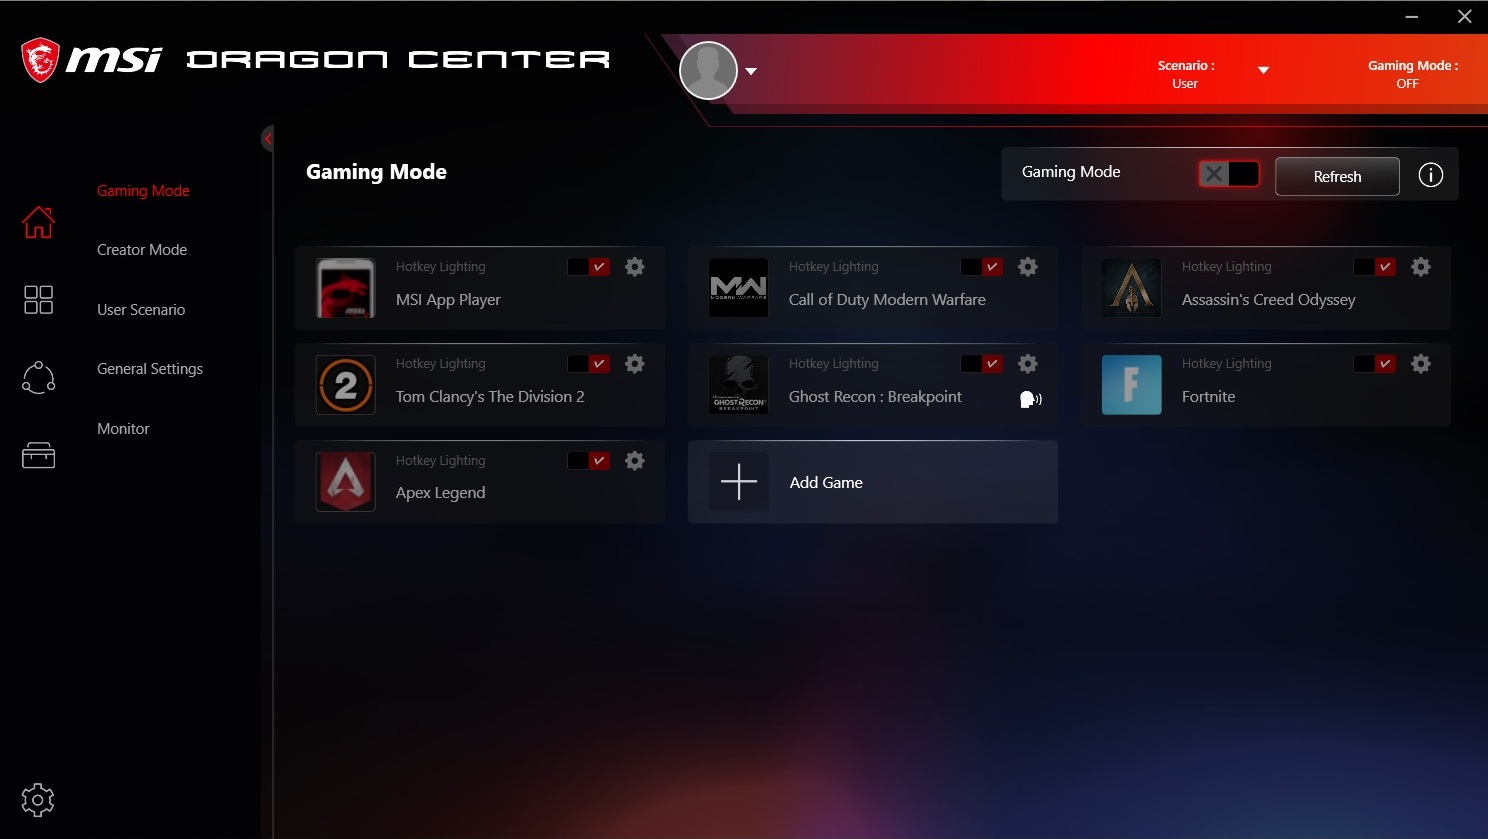
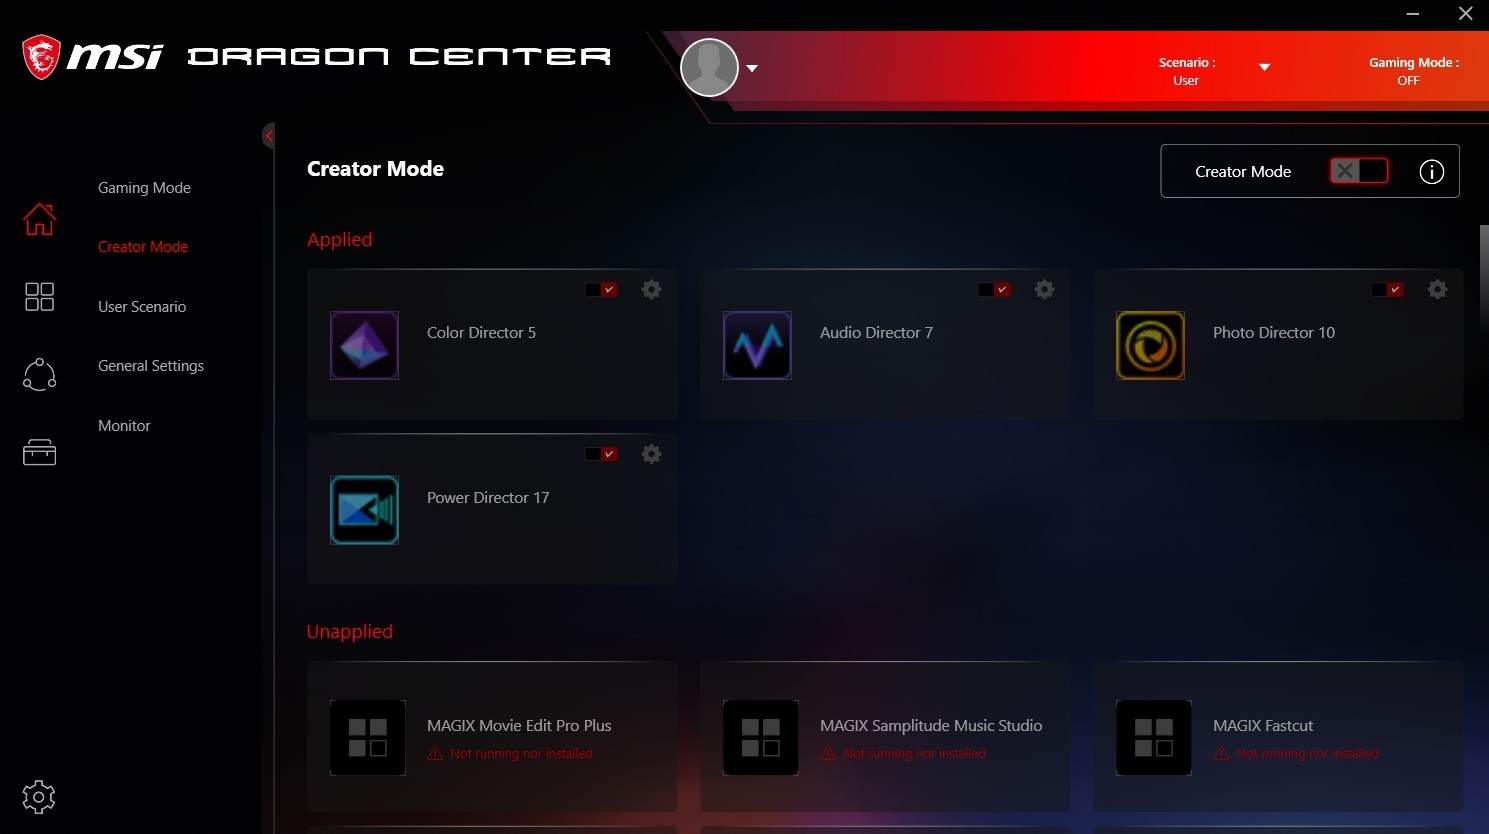
Testing conditions
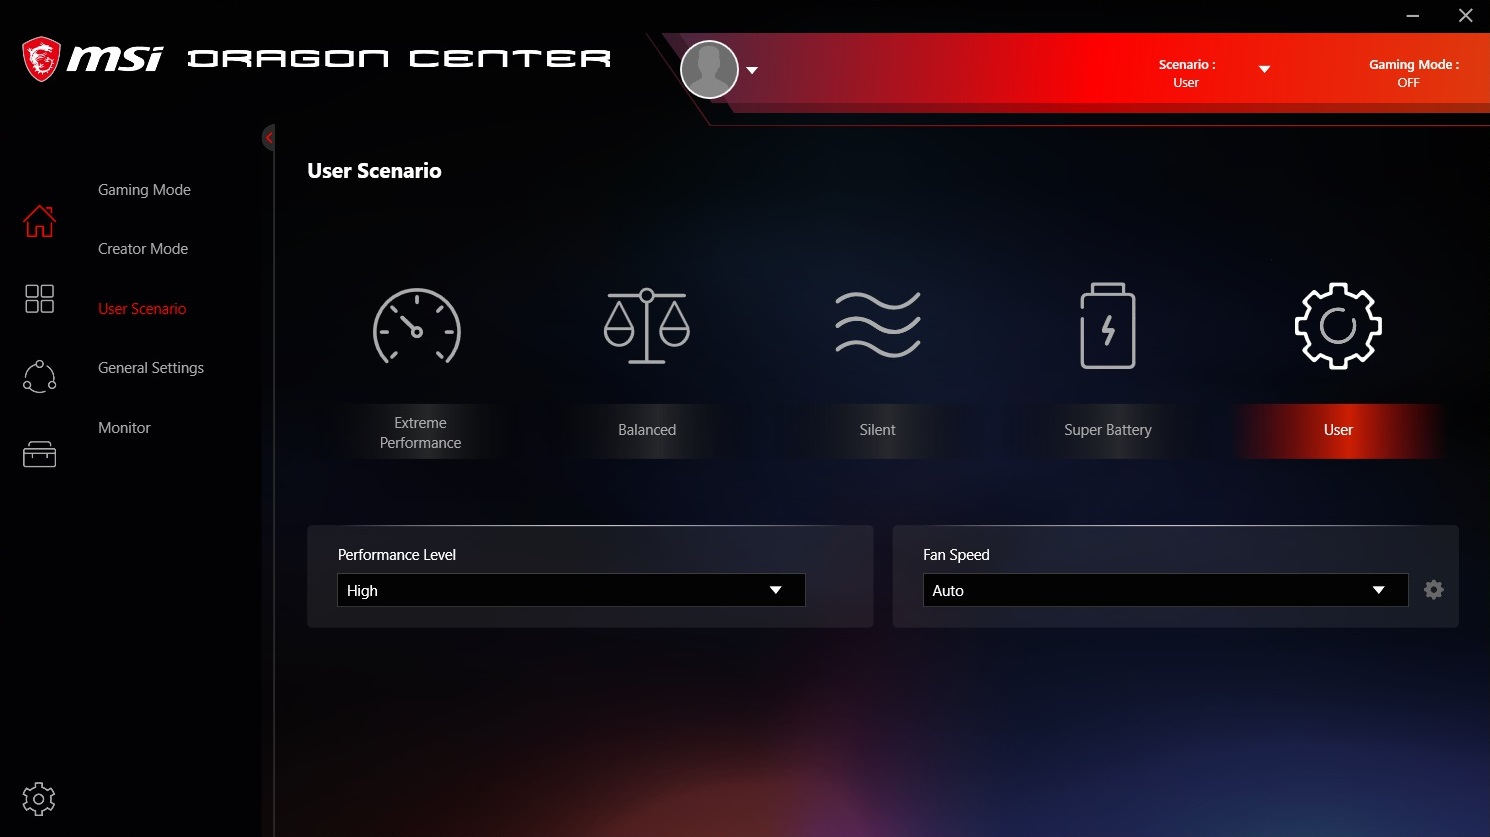
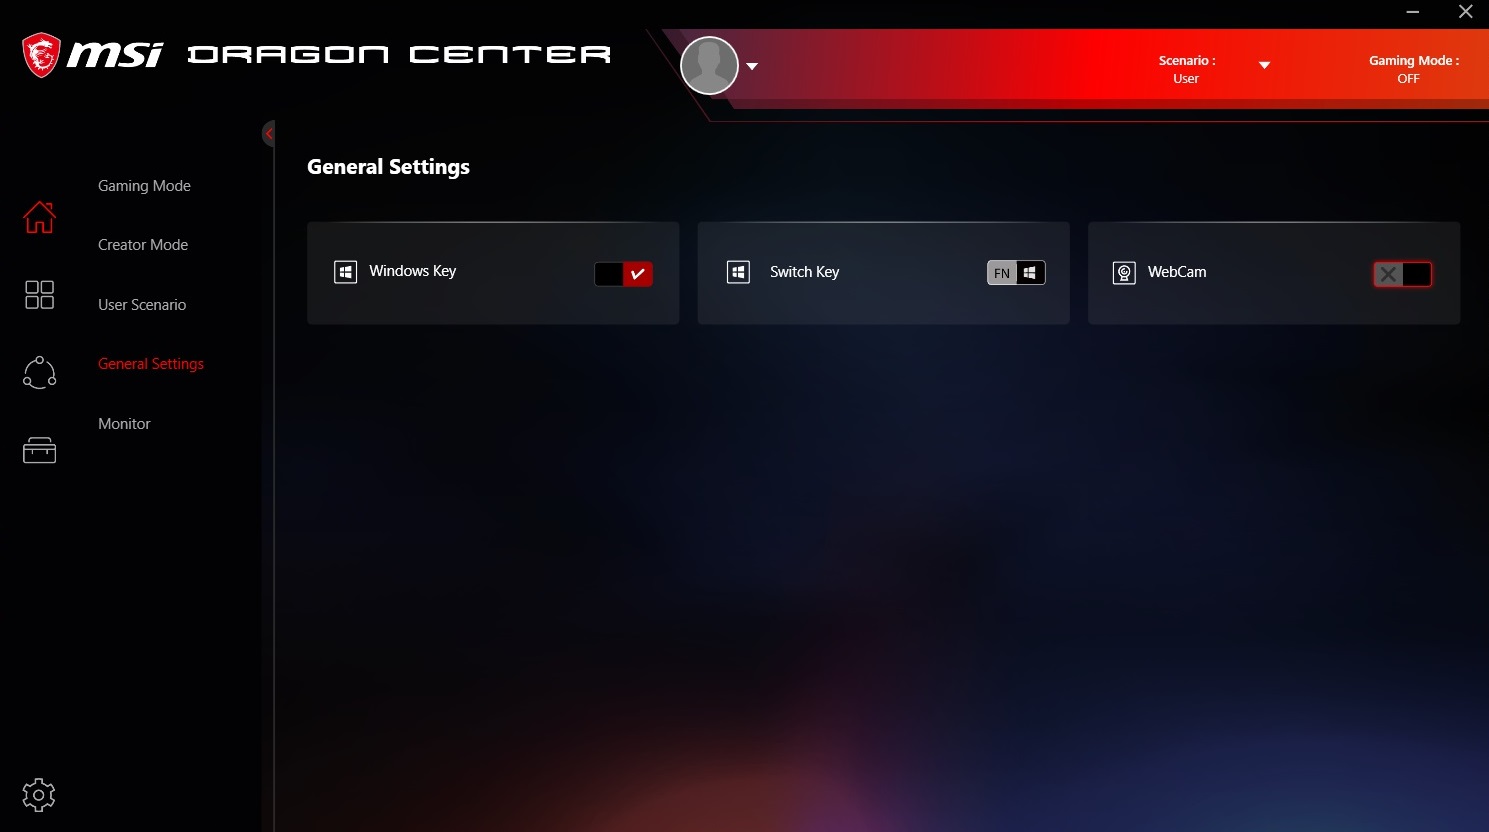
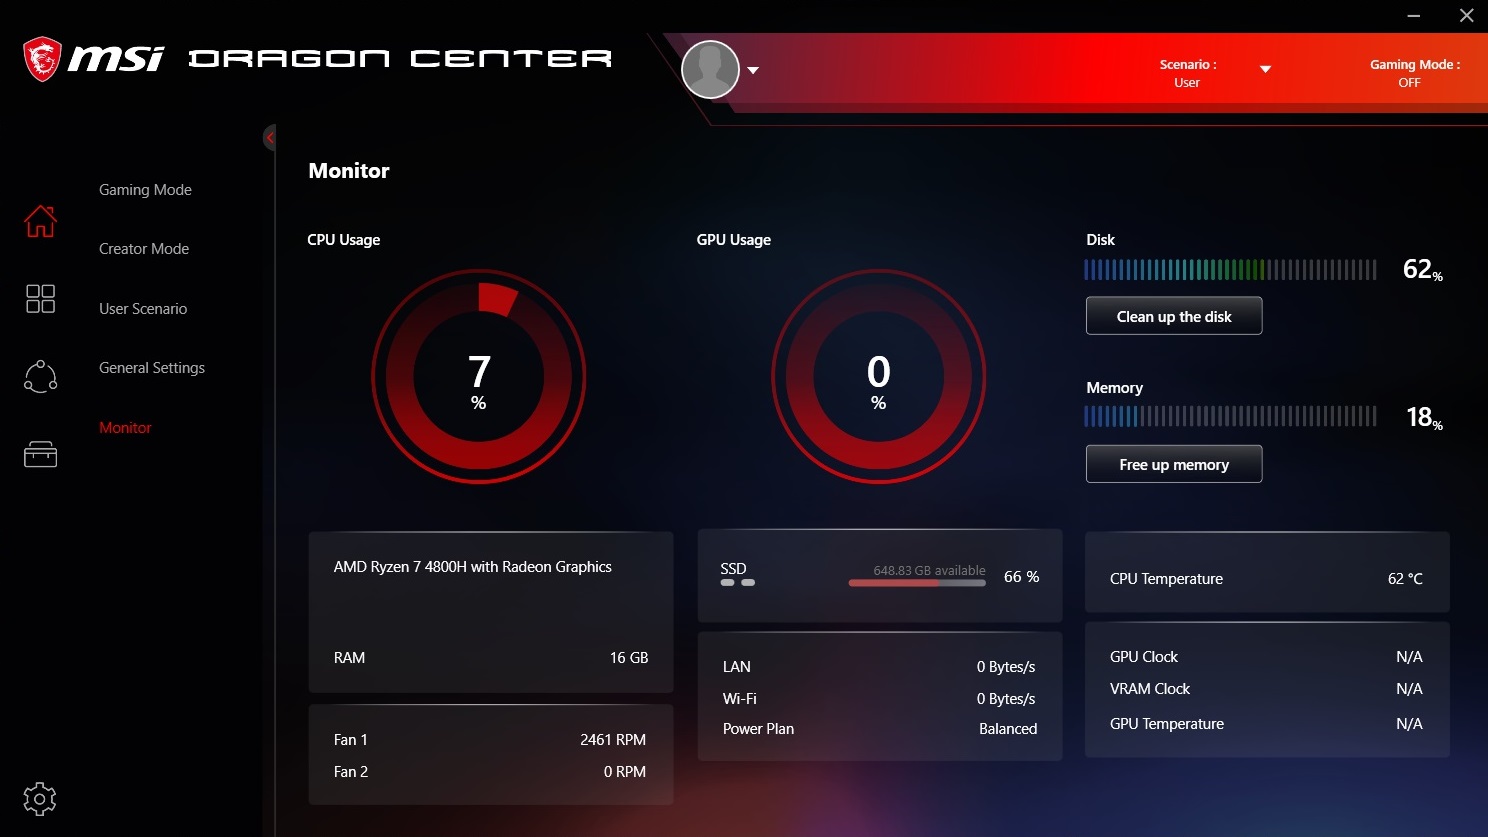
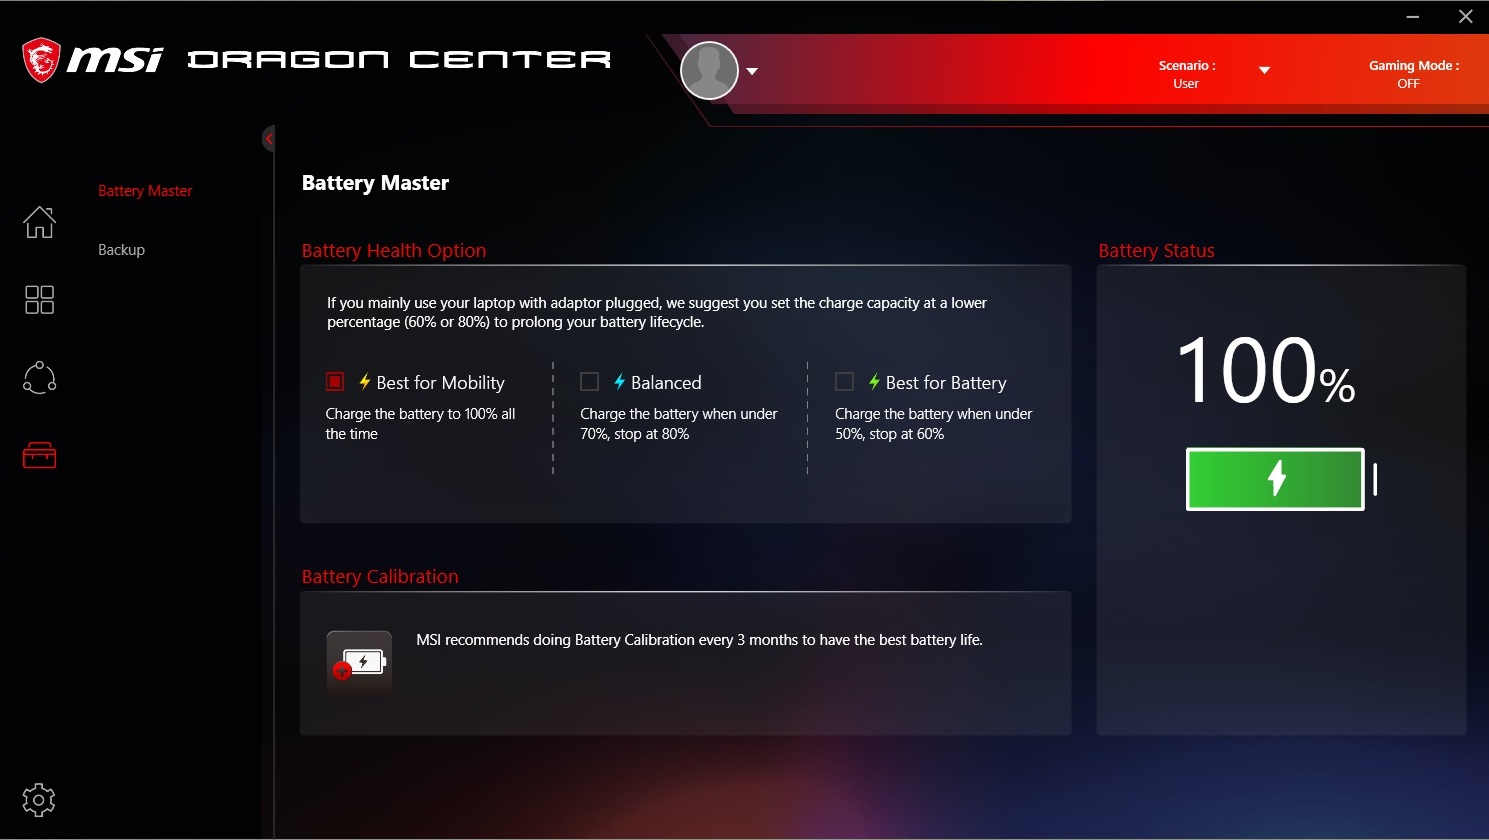
The preinstalled Dragon Center enables users to make numerous changes to the system. Our measurements were conducted in the "user" scenario (performance level "high" + fan speed "auto").
Performance
Although the CPU offers high-end speeds, the Bravo 15 really belongs into the mid-range segment. Even now, the Radeon RX 5300M often reaches its limits during 3D applications.
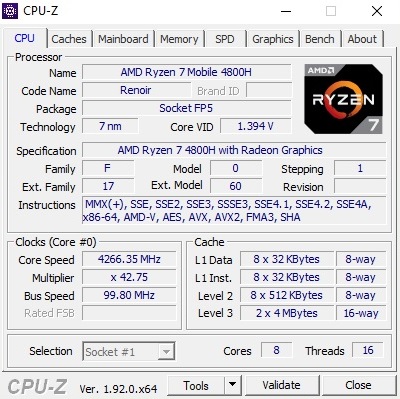

Processor
The AMD Ryzen 7 4800H is a real firecracker that not only challenges Intel's hexa-core processors but also their octa-core modules.
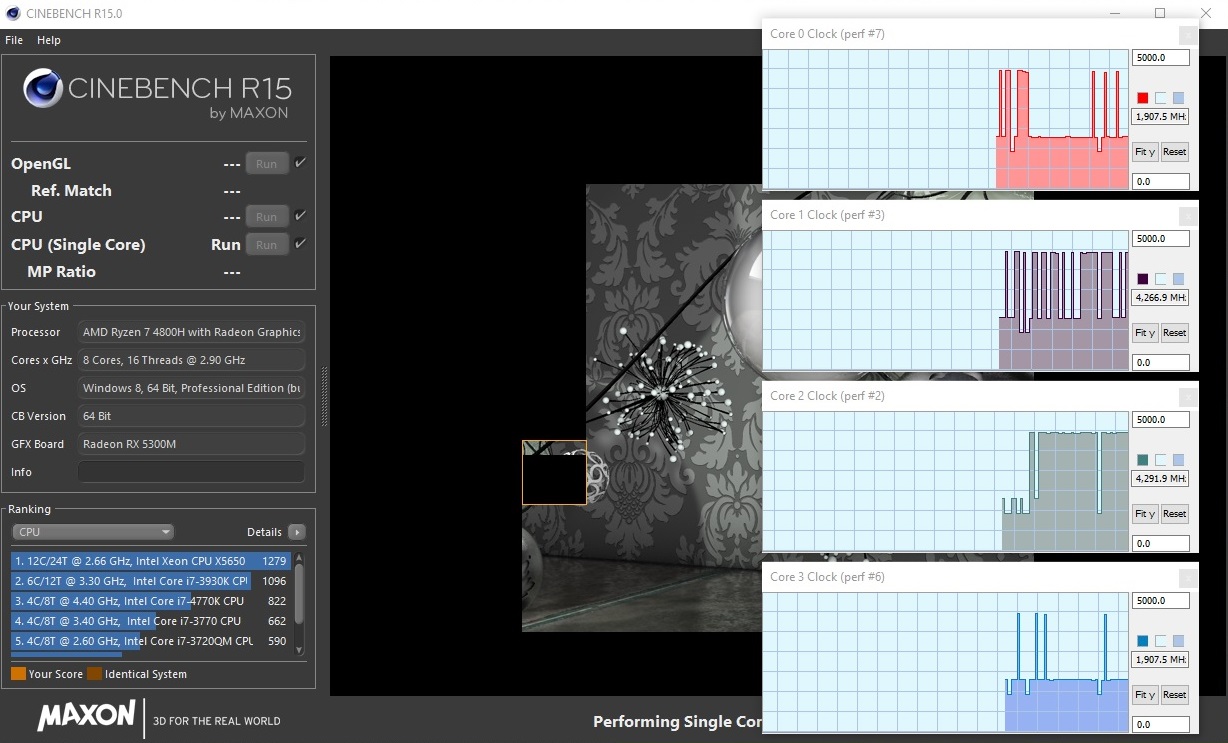
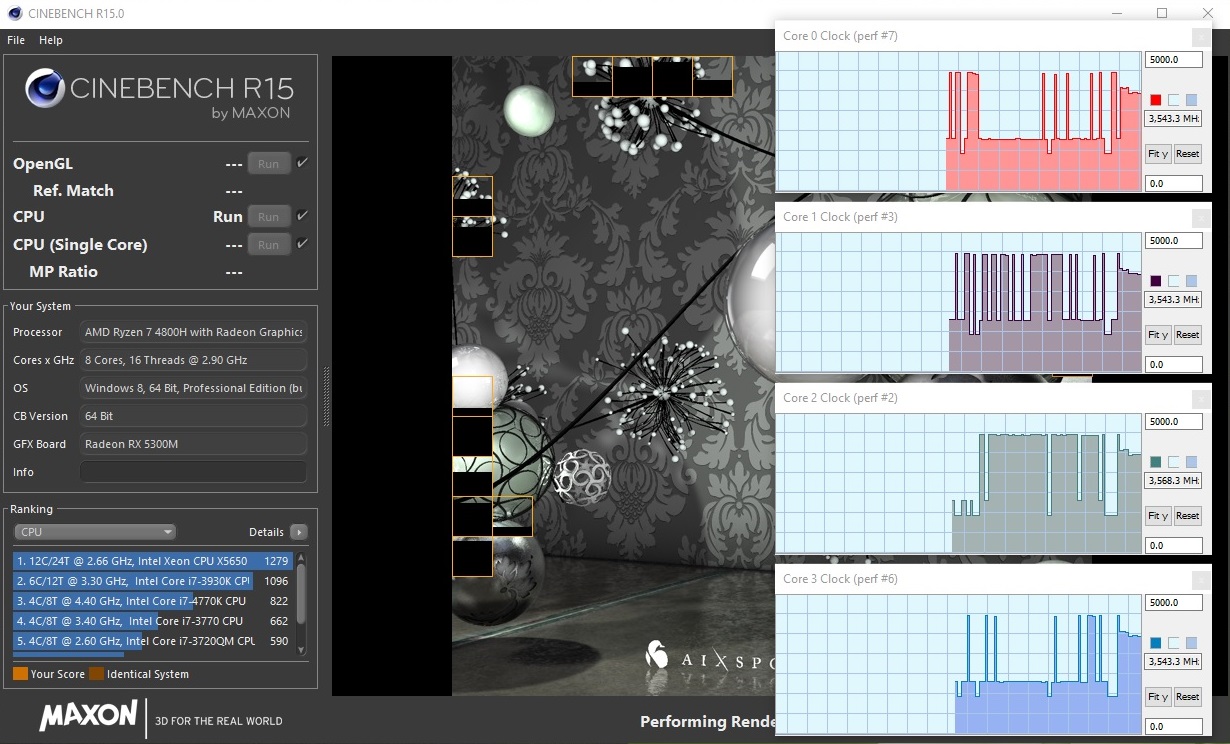
The 7-nm Renoir model has eight cores and supports SMT to work up to 16 threads simultaneously. The Ryzen 7 4800H's turbo boost is put to good use in our Bravo 15. The CineBench R15 multi-core test, which maxes out all cores, resulted in an average 3.6 GHz. The base clock rate of this chip is 2.9 GHz. In ideal conditions, this CPU even reaches 4.2 GHz.
The competition's processors can't keep up with the 4800H - whether it's the Core i5-9300H or the Ryzen 7 3750H. Both CPUs fall behind by more than 50 percent during our multi-core test. Only the Ryzen 5 4600H in the Nitro 4 can almost keep up (-20 percent).
| Blender - v2.79 BMW27 CPU | |
| HP Omen 15-dc1020ng | |
| Acer Nitro 5 AN515-44-R5FT | |
| MSI Bravo 15 A4DCR | |
| Average of class Gaming (80 - 330, n=104, last 2 years) | |
| HWBOT x265 Benchmark v2.2 - 4k Preset | |
| Average of class Gaming (11.5 - 44.3, n=105, last 2 years) | |
| MSI Bravo 15 A4DCR | |
| Acer Nitro 5 AN515-44-R5FT | |
| HP Omen 15-dc1020ng | |
| LibreOffice - 20 Documents To PDF | |
| MSI Bravo 15 A4DCR | |
| Acer Nitro 5 AN515-44-R5FT | |
| Average of class Gaming (33.2 - 88.8, n=105, last 2 years) | |
| R Benchmark 2.5 - Overall mean | |
| Acer Nitro 5 AN515-44-R5FT | |
| MSI Bravo 15 A4DCR | |
| Average of class Gaming (0.3439 - 0.759, n=106, last 2 years) | |
* ... smaller is better
System Performance
The Bravo 15's excellent system performance, which is due in large part to the speedy processor, lands it first place in our comparison table. The 5639 points in PCMark 10 could also be coming from a notebook that costs two or three times as much.
However, similar to the Bravo 17, the 15-inch version does have to deal with occasional short freezes in some situations (e.g. when opening programs). These might be connected to the graphics switching technology. We also noticed several blue and black screens, which is not uncommon in AMD laptops (drivers!).
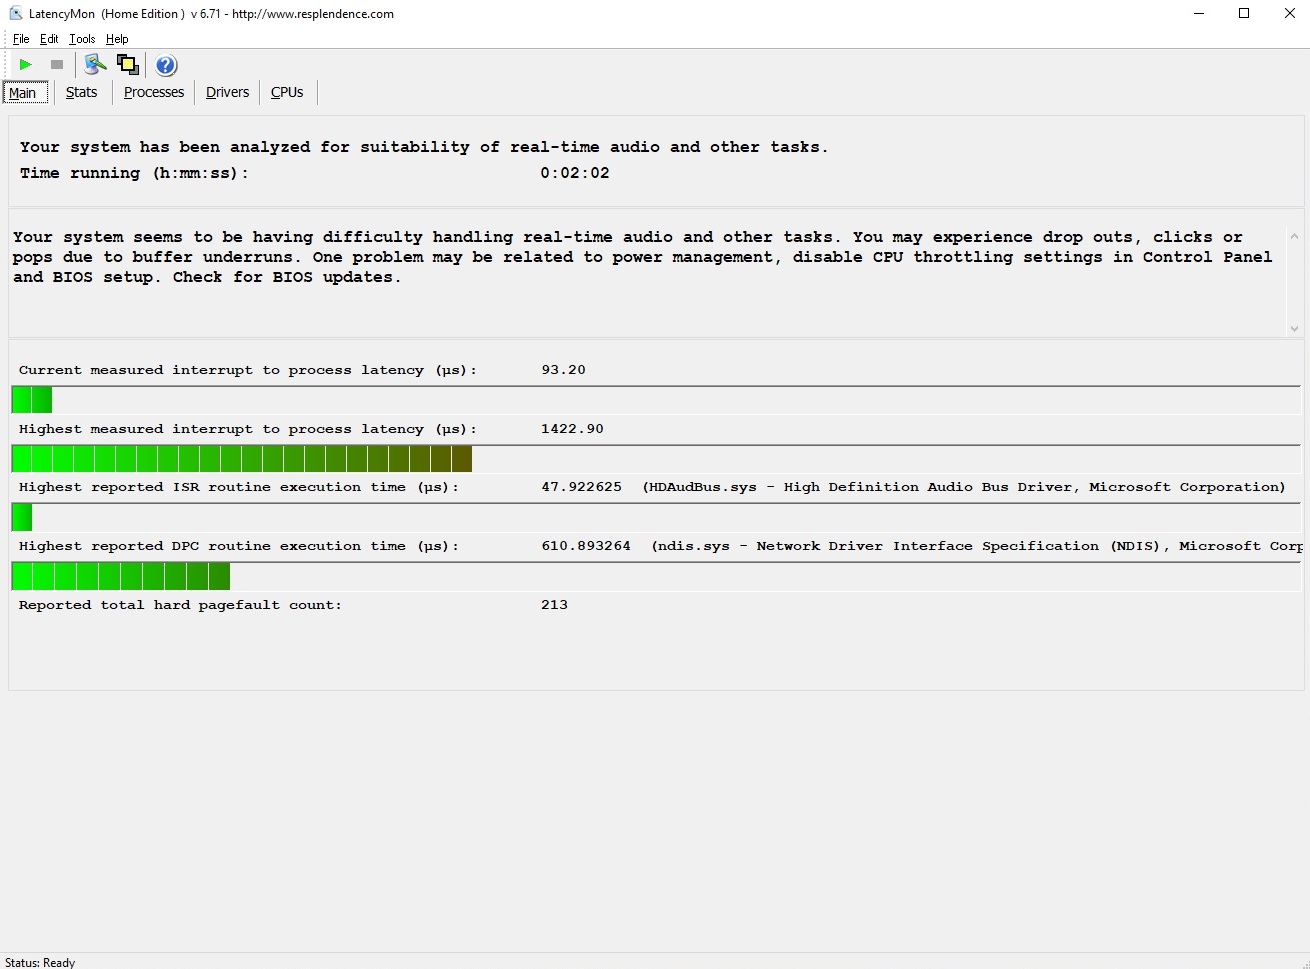
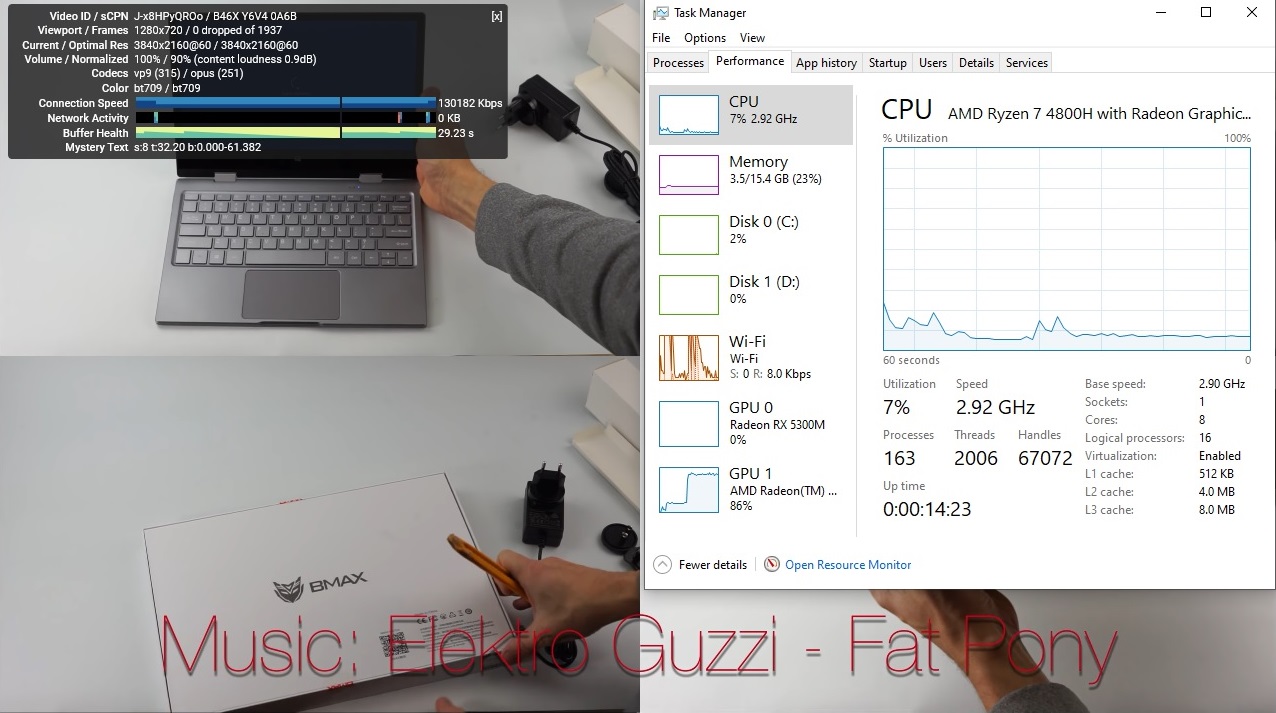
DPC Latencies
MSI could also improve on their latencies. Although our 4K YouTube video was displayed smoothly, the LatencyMon tool didn't give the Bravo 15 particularly good marks.

| DPC Latencies / LatencyMon - interrupt to process latency (max), Web, Youtube, Prime95 | |
| MSI Bravo 15 A4DCR | |
| Acer Nitro 5 AN515-44-R5FT | |
* ... smaller is better
Storage Devices
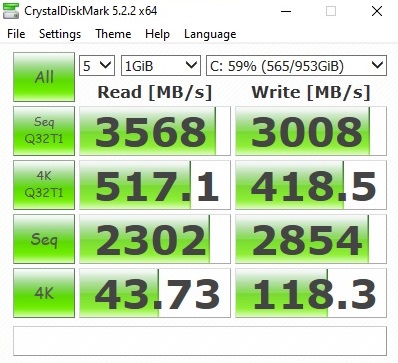
The storage configuration in our test unit will probably not be available for purchase. Our presample was equipped with two SSDs with a capacity of 1000 GB each. The model, however, might be used in serial production. The PM981a is a fast NVMe drive from Samsung that should easily manage to keep up with its competition from SK Hynix (Acer Nitro 5), Intel (Asus TUF FX505), Kingston (Dell G5 15) and WDC (HP Omen 15). The M.2 SSD reaches a sequential rate of over 2000 MB/s.
| MSI Bravo 15 A4DCR Samsung PM981a MZVLB1T0HBLR | Acer Nitro 5 AN515-44-R5FT SK Hynix BC511 HFM512GDJTNI | Asus TUF FX505DT-EB73 Intel SSD 660p SSDPEKNW512G8 | Dell G5 15 5590-PCNJJ KBG30ZMS128G | HP Omen 15-dc1020ng WDC PC SN720 SDAQNTW-512G | |
|---|---|---|---|---|---|
| CrystalDiskMark 5.2 / 6 | -31% | -31% | -67% | -14% | |
| Write 4K (MB/s) | 118.3 | 94.7 -20% | 137.5 16% | 65.3 -45% | 112.1 -5% |
| Read 4K (MB/s) | 43.73 | 38.91 -11% | 57 30% | 29.71 -32% | 42.01 -4% |
| Write Seq (MB/s) | 2854 | 1056 -63% | 984 -66% | 128.8 -95% | 1964 -31% |
| Read Seq (MB/s) | 2302 | 1183 -49% | 1564 -32% | 859 -63% | 2065 -10% |
| Write 4K Q32T1 (MB/s) | 418.5 | 445.3 6% | 237.4 -43% | 95.8 -77% | 318.2 -24% |
| Read 4K Q32T1 (MB/s) | 517 | 477.7 -8% | 340.7 -34% | 197.6 -62% | 406.7 -21% |
| Write Seq Q32T1 (MB/s) | 3008 | 1063 -65% | 959 -68% | 132.5 -96% | 2534 -16% |
| Read Seq Q32T1 (MB/s) | 3568 | 2154 -40% | 1732 -51% | 1208 -66% | 3438 -4% |

GPU Performance
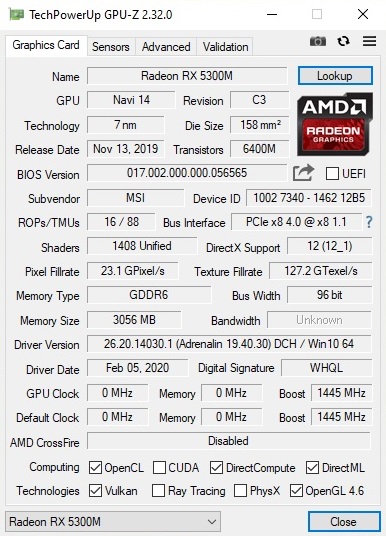
In line with the 7-nm CPU, the GPU is also a 7-nm chip of the Navi generation. The Radeon RX 5300M is a trimmed-down version of the RX 5500M.
| 3DMark 06 Standard Score | 36032 points | |
| 3DMark Vantage P Result | 39264 points | |
| 3DMark 11 Performance | 14048 points | |
| 3DMark Cloud Gate Standard Score | 32417 points | |
| 3DMark Fire Strike Score | 9404 points | |
| 3DMark Time Spy Score | 3872 points | |
Help | ||
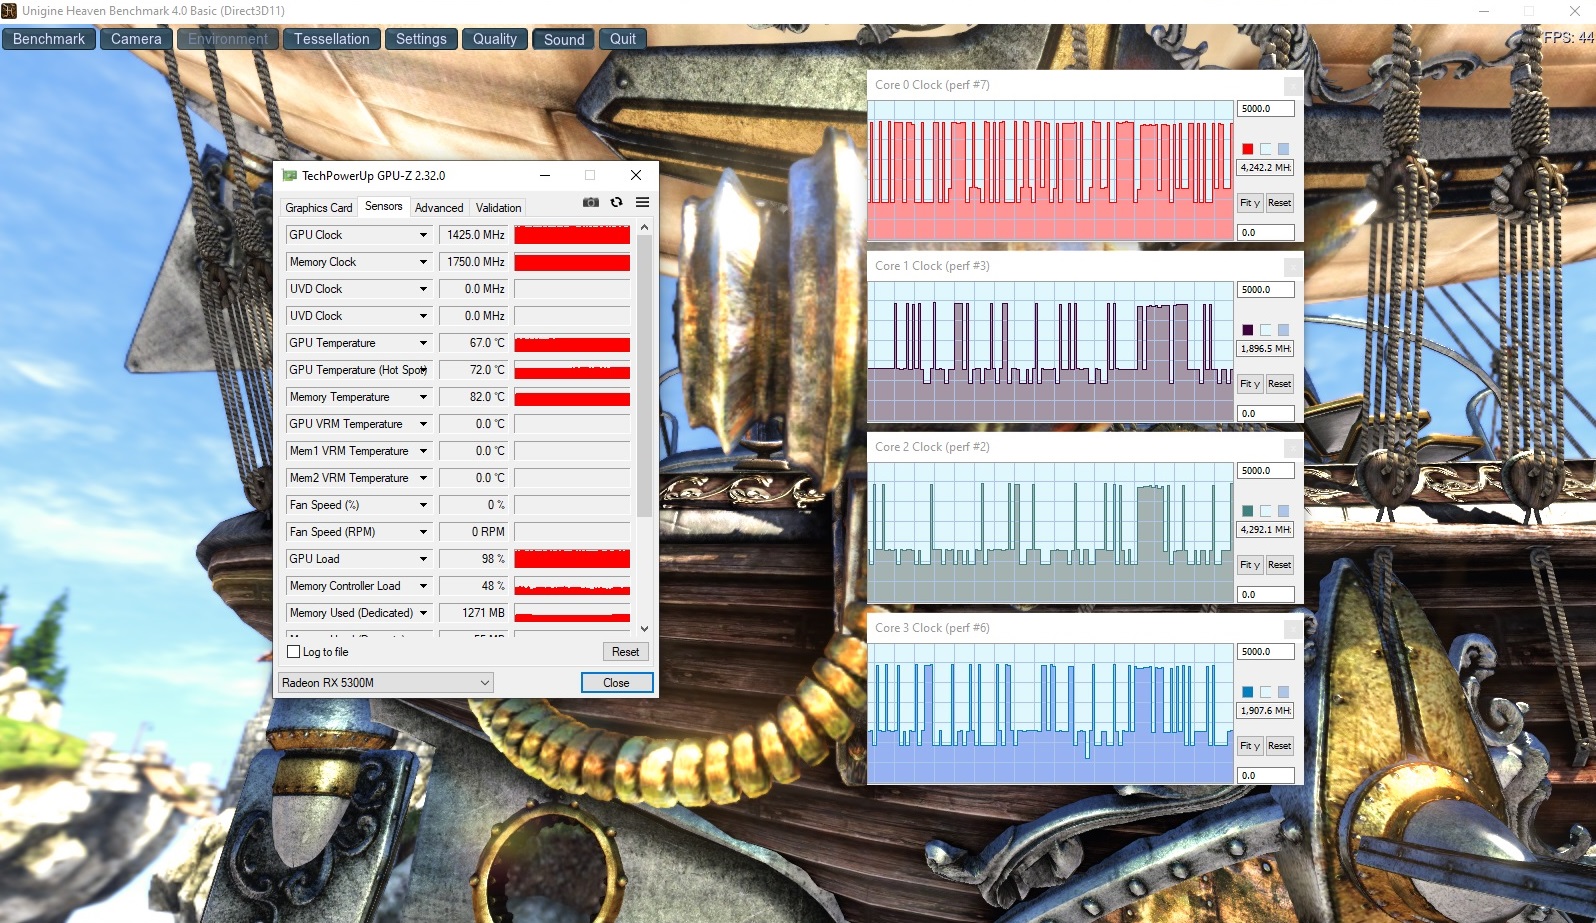
While the amount of Shader units is identical (1408), the video memory only offers 3 rather than 4 GB (interface: 96 vs. 128 bit), which can become an issue particularly when playing modern games (freezes increased both in duration and severity). The RX 5300M also has significantly lower clock rates, which means that the maximum turbo reaches 1445 rather than 1645 MHz.
At least the Bravo 15 maxes out the GPU boost under load. There were no noticeable issues during our 60 minute Witcher 3 test and the Radeon RX 5300M completed our set of benchmarks with similar results to the GeForce GTX 1650 (Ti), which is what we expected.
Gaming Performance
Provided you are happy with high rather than maximum details, the Radeon RX 5300M should be a good companion for the Full-HD panel. The GPU usually reaches over 40 FPS in this scenario. Only very demanding or badly programmed/optimized games such as Red Dead Redemption 2 might still be difficult to play smoothly.
| The Witcher 3 | |
| 1920x1080 High Graphics & Postprocessing (Nvidia HairWorks Off) | |
| Average of class Gaming (n=1last 2 years) | |
| Acer Nitro 5 AN515-44-R5FT | |
| Asus TUF FX505DT-EB73 | |
| HP Omen 15-dc1020ng | |
| MSI Bravo 15 A4DCR | |
| Dell G5 15 5590-PCNJJ | |
| 1920x1080 Ultra Graphics & Postprocessing (HBAO+) | |
| Average of class Gaming (104.7 - 240, n=6, last 2 years) | |
| Acer Nitro 5 AN515-44-R5FT | |
| MSI Bravo 15 A4DCR | |
| HP Omen 15-dc1020ng | |
| Asus TUF FX505DT-EB73 | |
| Dell G5 15 5590-PCNJJ | |
If possible, users should update the GPU driver. The fact that the version installed was too old came up with several titles during testing (Doom Eternal wouldn't even start).
| low | med. | high | ultra | |
|---|---|---|---|---|
| GTA V (2015) | 163 | 86.1 | 42.6 | |
| The Witcher 3 (2015) | 178 | 122 | 60 | 38.3 |
| Dota 2 Reborn (2015) | 113 | 108 | 97.9 | 94.7 |
| Fortnite (2018) | 131 | 114 | 81.8 | 58.2 |
| Final Fantasy XV Benchmark (2018) | 98.4 | 51.6 | 29.3 | |
| Kingdom Come: Deliverance (2018) | 118 | 70.4 | 60.8 | 38.3 |
| X-Plane 11.11 (2018) | 51.5 | 39.5 | 34.9 | |
| Monster Hunter World (2018) | 80.6 | 60.1 | 52.2 | 42.6 |
| Shadow of the Tomb Raider (2018) | 114 | 60 | 48 | 36 |
| Assassin´s Creed Odyssey (2018) | 72 | 59 | 42 | 25 |
| Hitman 2 (2018) | 74.5 | 65.7 | 55.8 | 48.8 |
| Battlefield V (2018) | 140 | 91.8 | 79.4 | 70.8 |
| Darksiders III (2018) | 155 | 76.8 | 62.2 | 54.9 |
| Just Cause 4 (2018) | 108 | 79.1 | 56 | 52.5 |
| Apex Legends (2019) | 143 | 87.2 | 68.6 | 67.6 |
| Far Cry New Dawn (2019) | 88 | 69 | 64 | 58 |
| Metro Exodus (2019) | 105 | 51.2 | 36.1 | 28.6 |
| Dirt Rally 2.0 (2019) | 190 | 110 | 89.9 | 49.5 |
| The Division 2 (2019) | 120 | 75 | 63 | 42 |
| Anno 1800 (2019) | 83.4 | 60.3 | 39.7 | 20.6 |
| Rage 2 (2019) | 121 | 54.8 | 30.4 | 29.8 |
| F1 2019 (2019) | 176 | 106 | 94 | 81 |
| Control (2019) | 132 | 41.8 | 29.4 | |
| Borderlands 3 (2019) | 97.3 | 63.6 | 40.9 | 36 |
| FIFA 20 (2019) | 190 | 172 | 160 | 153 |
| Ghost Recon Breakpoint (2019) | 82 | 51 | 41 | 22 |
| GRID 2019 (2019) | 164 | 76.8 | 54.8 | 25.5 |
| Call of Duty Modern Warfare 2019 (2019) | 127 | 72.2 | 57.9 | 47 |
| Need for Speed Heat (2019) | 78.6 | 67.9 | 58.6 | 52.9 |
| Star Wars Jedi Fallen Order (2019) | 71.2 | 61.1 | 53.1 | |
| Red Dead Redemption 2 (2019) | 95.4 | 41.2 | 32.1 | |
| Escape from Tarkov (2020) | 121 | 80.5 | 70.1 | 56.7 |
| Hunt Showdown (2020) | 137 | 53 | 43.2 | |
| Doom Eternal (2020) | 0 game wont start | 0 game wont start | 0 game wont start | 0 game wont start |
| Gears Tactics (2020) | 231 | 100 | 66.4 | 47.5 |
Emissions
System Noise
Fan control didn't turn out particularly well judging by our presample. On the one hand you have the fans that sometimes turn up while idling, seemingly for no reason, reaching around 40 dB(A), on the other the Bravo 15 becomes rather loud under load. 48 to 54 dB(A) are not for the fainthearted, which is why we would recommend users to connect headphones during 3D applications.
Noise level
| Idle |
| 31 / 32 / 40 dB(A) |
| Load |
| 48 / 54 dB(A) |
 | ||
30 dB silent 40 dB(A) audible 50 dB(A) loud |
||
min: | ||
| MSI Bravo 15 A4DCR R7 4800H, Radeon RX 5300M | Acer Nitro 5 AN515-44-R5FT R5 4600H, GeForce GTX 1650 Ti Mobile | Asus TUF FX505DT-EB73 R7 3750H, GeForce GTX 1650 Mobile | Dell G5 15 5590-PCNJJ i5-9300H, GeForce GTX 1650 Mobile | HP Omen 15-dc1020ng i5-9300H, GeForce GTX 1650 Mobile | Average of class Gaming | |
|---|---|---|---|---|---|---|
| Noise | 5% | 11% | 2% | 17% | 14% | |
| off / environment * (dB) | 30 | 30 -0% | 28.2 6% | 30 -0% | 28.8 4% | 24.1 ? 20% |
| Idle Minimum * (dB) | 31 | 30 3% | 28.2 9% | 31 -0% | 28.8 7% | 25.9 ? 16% |
| Idle Average * (dB) | 32 | 32 -0% | 28.2 12% | 32 -0% | 29.5 8% | 27.4 ? 14% |
| Idle Maximum * (dB) | 40 | 34 15% | 31.4 22% | 35 12% | 31.1 22% | 30 ? 25% |
| Load Average * (dB) | 48 | 46 4% | 39.8 17% | 49 -2% | 35.2 27% | 43.3 ? 10% |
| Witcher 3 ultra * (dB) | 48 | 47 2% | 47 2% | 47 2% | 35.2 27% | |
| Load Maximum * (dB) | 54 | 49 9% | 50.2 7% | 53 2% | 41 24% | 54.2 ? -0% |
* ... smaller is better
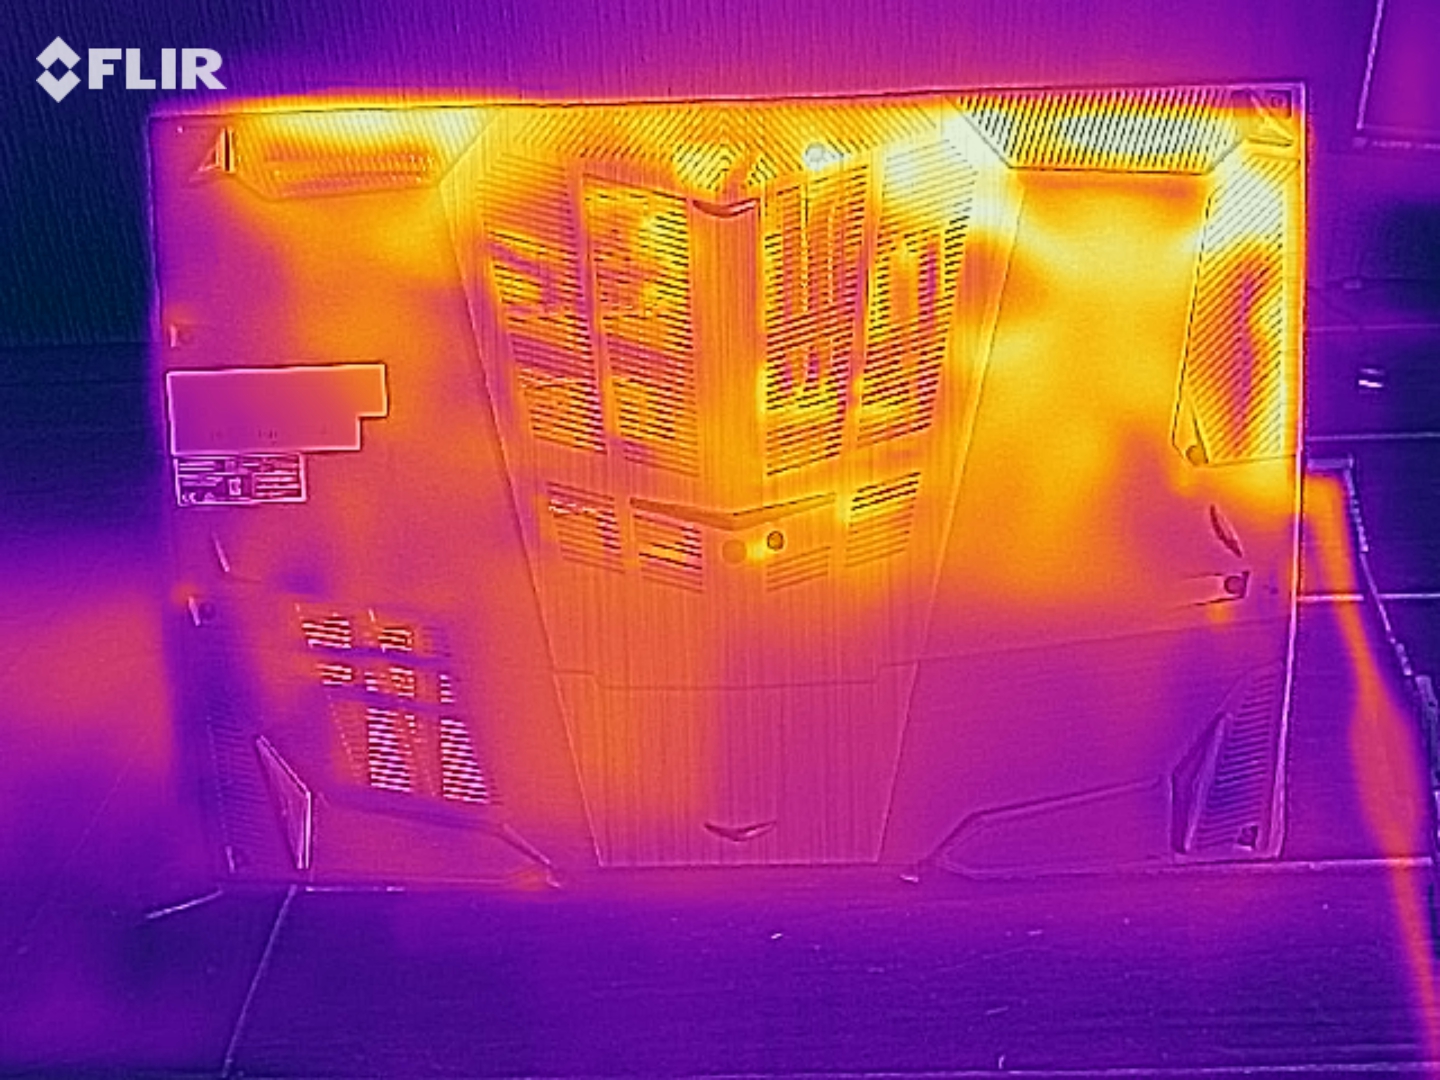
Temperature
The temperature development of the Bravo 15 is neither particularly low nor particularly high. We measured a maximum surface temperature of 51 °C (123.8 °F/top) and 50 °C (122 °F/bottom) after 60 minutes under full load (FurMark & Prime95) - that's very typical for a gaming notebook and reminds us of the temperature we measured on the Acer Nitro 5, equipped with a Ryzen 5 4600H and a GeForce GT 1650 Ti. The surface temperature remains fairly comfortable at around 30 °C (86 °F) while idling.
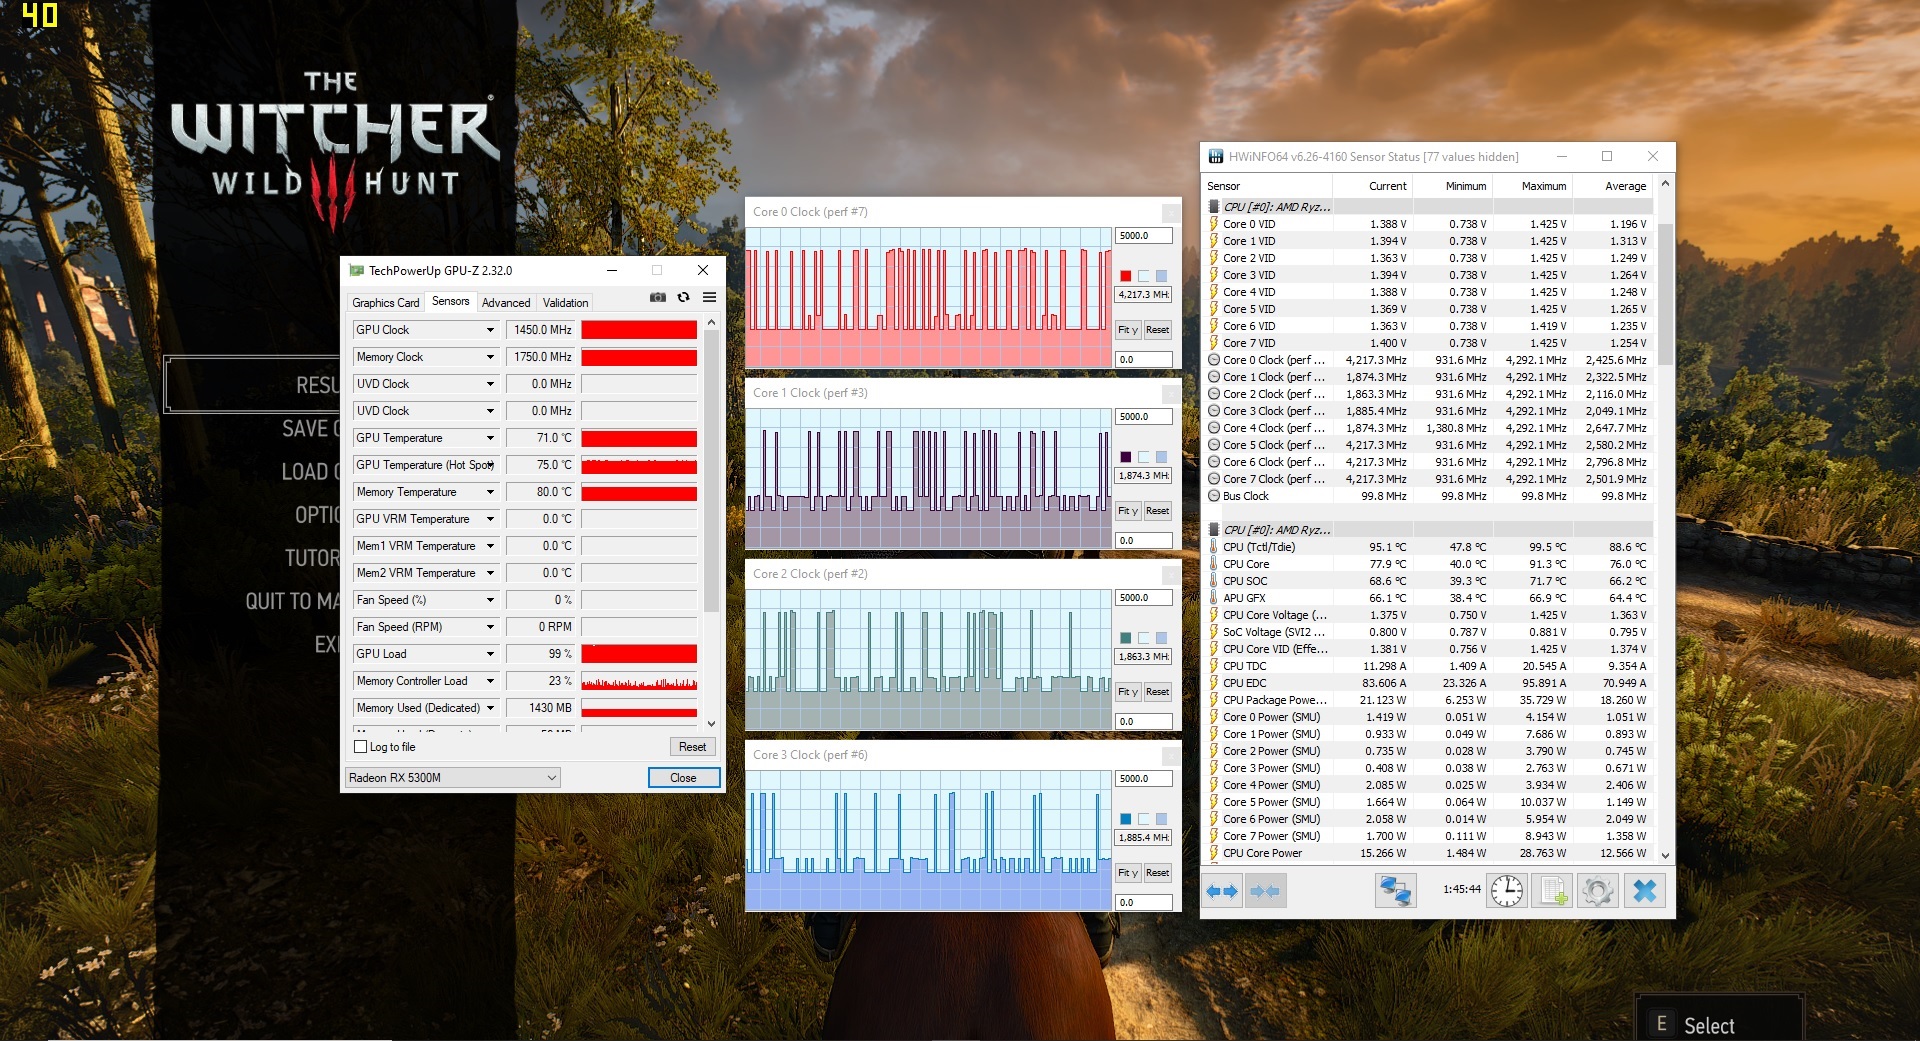
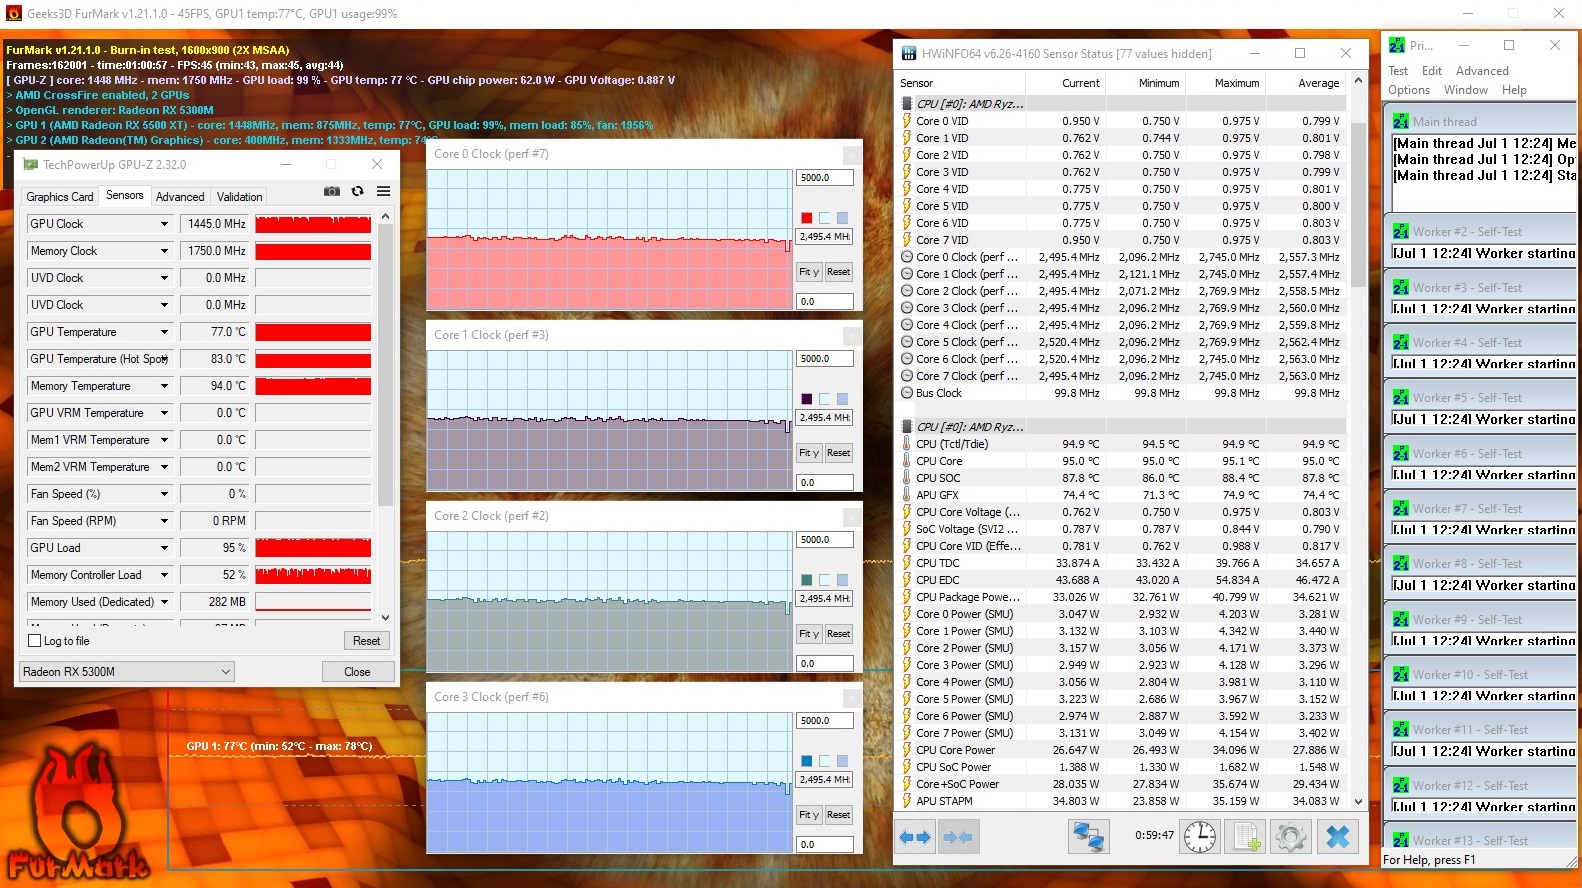
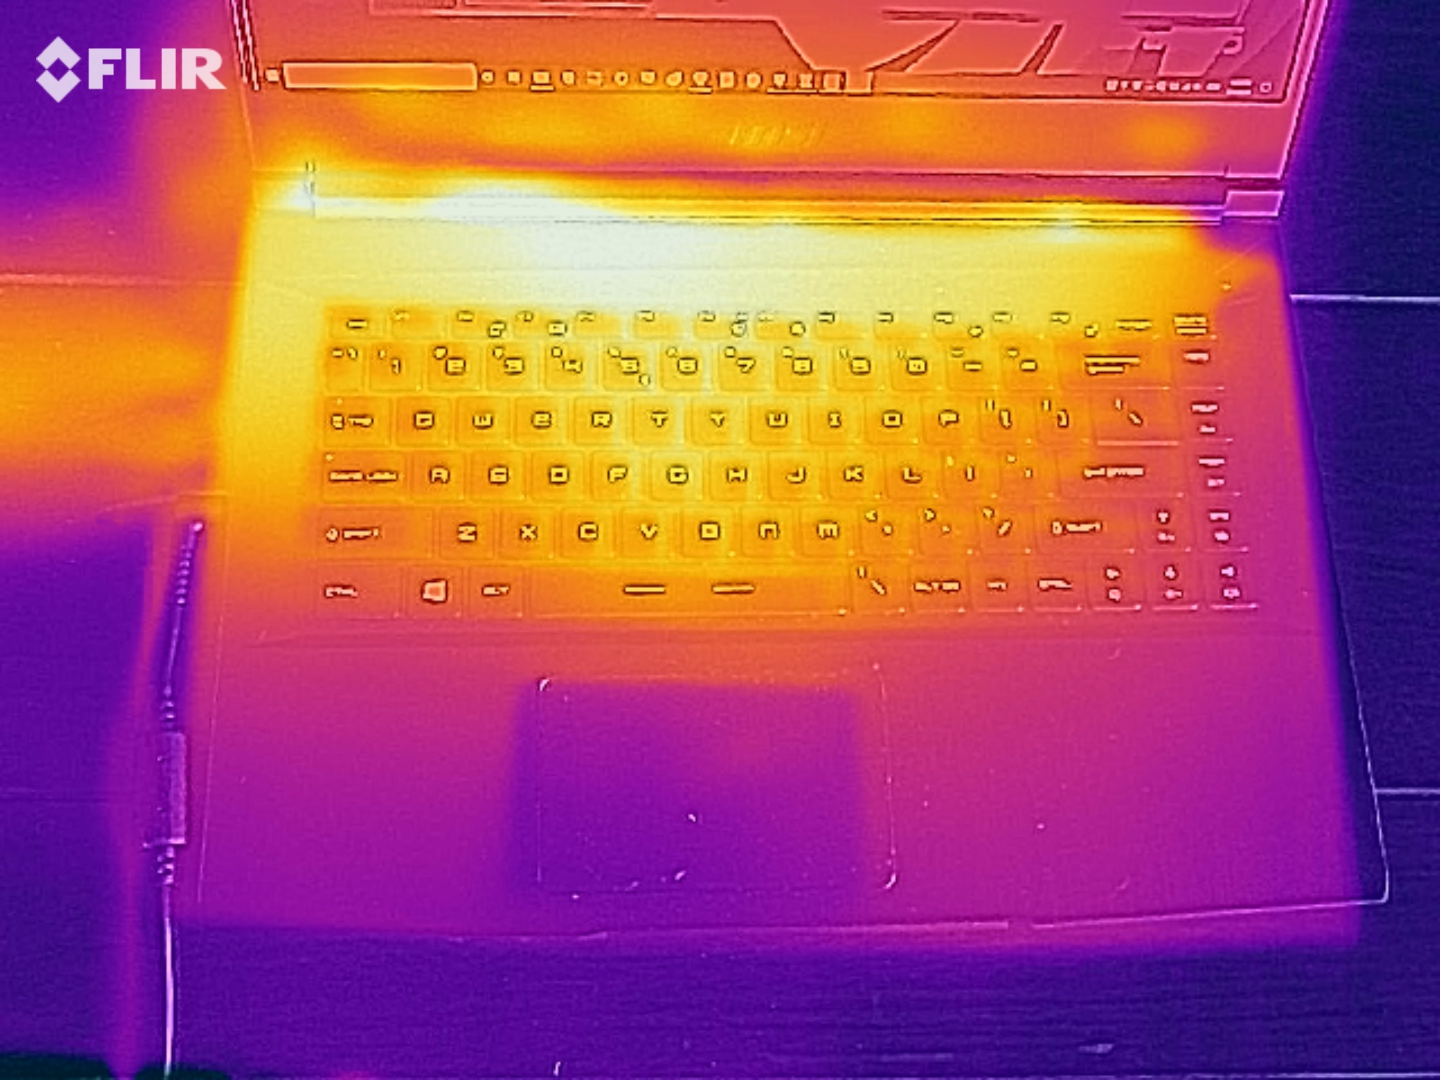
The CPU and GPU heat up differently during our stress test. While the Radeon RX 5300M remains below 80 °C (176 °F), the Ryzen 6 4800H reaches over 90 °C (194 °F) at a certain point.
(-) The maximum temperature on the upper side is 51 °C / 124 F, compared to the average of 40.4 °C / 105 F, ranging from 21.2 to 68.8 °C for the class Gaming.
(-) The bottom heats up to a maximum of 50 °C / 122 F, compared to the average of 43.2 °C / 110 F
(+) In idle usage, the average temperature for the upper side is 29.3 °C / 85 F, compared to the device average of 33.9 °C / 93 F.
(-) Playing The Witcher 3, the average temperature for the upper side is 41.9 °C / 107 F, compared to the device average of 33.9 °C / 93 F.
(±) The palmrests and touchpad can get very hot to the touch with a maximum of 36 °C / 96.8 F.
(-) The average temperature of the palmrest area of similar devices was 28.8 °C / 83.8 F (-7.2 °C / -13 F).
| MSI Bravo 15 A4DCR R7 4800H, Radeon RX 5300M | Acer Nitro 5 AN515-44-R5FT R5 4600H, GeForce GTX 1650 Ti Mobile | Asus TUF FX505DT-EB73 R7 3750H, GeForce GTX 1650 Mobile | Dell G5 15 5590-PCNJJ i5-9300H, GeForce GTX 1650 Mobile | HP Omen 15-dc1020ng i5-9300H, GeForce GTX 1650 Mobile | Average of class Gaming | |
|---|---|---|---|---|---|---|
| Heat | 5% | 3% | 7% | 16% | 0% | |
| Maximum Upper Side * (°C) | 51 | 49 4% | 41.2 19% | 49 4% | 40.3 21% | 45.2 ? 11% |
| Maximum Bottom * (°C) | 50 | 50 -0% | 40 20% | 55 -10% | 48.5 3% | 48.2 ? 4% |
| Idle Upper Side * (°C) | 30 | 28 7% | 34.6 -15% | 25 17% | 23.9 20% | 31.1 ? -4% |
| Idle Bottom * (°C) | 31 | 28 10% | 34.4 -11% | 26 16% | 24.6 21% | 34.3 ? -11% |
* ... smaller is better
Speaker
The sound is better than that of the main competitor, Acer Nitro 5, although even the Bravo 15 cannot produce a full bass. The sound system, which is positioned in the front corners of the notebook, reaches a maximum volume of 83 dB(A) which should fill more than a small room.
MSI Bravo 15 A4DCR audio analysis
(+) | speakers can play relatively loud (83 dB)
Bass 100 - 315 Hz
(-) | nearly no bass - on average 19.8% lower than median
(±) | linearity of bass is average (12.7% delta to prev. frequency)
Mids 400 - 2000 Hz
(+) | balanced mids - only 2.7% away from median
(+) | mids are linear (4.7% delta to prev. frequency)
Highs 2 - 16 kHz
(+) | balanced highs - only 2.6% away from median
(+) | highs are linear (5.9% delta to prev. frequency)
Overall 100 - 16.000 Hz
(+) | overall sound is linear (14.6% difference to median)
Compared to same class
» 28% of all tested devices in this class were better, 7% similar, 65% worse
» The best had a delta of 6%, average was 18%, worst was 132%
Compared to all devices tested
» 19% of all tested devices were better, 4% similar, 77% worse
» The best had a delta of 4%, average was 23%, worst was 134%
Acer Nitro 5 AN515-44-R5FT audio analysis
(±) | speaker loudness is average but good (79 dB)
Bass 100 - 315 Hz
(-) | nearly no bass - on average 24% lower than median
(±) | linearity of bass is average (11% delta to prev. frequency)
Mids 400 - 2000 Hz
(±) | higher mids - on average 5% higher than median
(+) | mids are linear (6.9% delta to prev. frequency)
Highs 2 - 16 kHz
(+) | balanced highs - only 2.3% away from median
(+) | highs are linear (3.7% delta to prev. frequency)
Overall 100 - 16.000 Hz
(±) | linearity of overall sound is average (21.5% difference to median)
Compared to same class
» 77% of all tested devices in this class were better, 5% similar, 18% worse
» The best had a delta of 6%, average was 18%, worst was 132%
Compared to all devices tested
» 61% of all tested devices were better, 7% similar, 32% worse
» The best had a delta of 4%, average was 23%, worst was 134%
Energy Management
Power Consumption
The Bravo 15 requires over 10W while idling despite having access to graphics switching technology. This is mainly due to the strong octa-core processor. The competition is powered by energy-efficient quad-core or hexa-core processors. The 15-inch laptop also consumes more power than its competitors under load (a maximum of 163W).
| Off / Standby | |
| Idle | |
| Load |
|
Key:
min: | |
| MSI Bravo 15 A4DCR R7 4800H, Radeon RX 5300M | Acer Nitro 5 AN515-44-R5FT R5 4600H, GeForce GTX 1650 Ti Mobile | Asus TUF FX505DT-EB73 R7 3750H, GeForce GTX 1650 Mobile | Dell G5 15 5590-PCNJJ i5-9300H, GeForce GTX 1650 Mobile | HP Omen 15-dc1020ng i5-9300H, GeForce GTX 1650 Mobile | Average of class Gaming | |
|---|---|---|---|---|---|---|
| Power Consumption | 33% | 25% | 28% | 29% | -31% | |
| Idle Minimum * (Watt) | 11 | 5 55% | 7 36% | 4 64% | 4.04 63% | 13 ? -18% |
| Idle Average * (Watt) | 14 | 8 43% | 9.9 29% | 7 50% | 7.2 49% | 18.6 ? -33% |
| Idle Maximum * (Watt) | 25 | 13 48% | 12 52% | 12 52% | 11.4 54% | 24.2 ? 3% |
| Load Average * (Watt) | 72 | 69 4% | 68.4 5% | 95 -32% | 80.8 -12% | 108.7 ? -51% |
| Witcher 3 ultra * (Watt) | 100 | 78 22% | 94.9 5% | 86 14% | 93.6 6% | |
| Load Maximum * (Watt) | 163 | 124 24% | 130.9 20% | 135 17% | 144.5 11% | 255 ? -56% |
* ... smaller is better
Battery Life
Due to the increased power consumption of the Bravo 15, it doesn't do quite as well in our battery test as some of its competition. Even under ideal conditions the device turns off after 7 hours. The 15-inch gamer only lasted around 4.5 hours in our Wi-Fi test (browsing the web according to a script with medium brightness). The competition does better: HP Omen 15 (~6.5 hours), Dell G5 15 (~8 hours), Acer Nitro 5 (~8.5 hours).
| MSI Bravo 15 A4DCR R7 4800H, Radeon RX 5300M, 51 Wh | Acer Nitro 5 AN515-44-R5FT R5 4600H, GeForce GTX 1650 Ti Mobile, 57.48 Wh | Asus TUF FX505DT-EB73 R7 3750H, GeForce GTX 1650 Mobile, 48 Wh | Dell G5 15 5590-PCNJJ i5-9300H, GeForce GTX 1650 Mobile, 60 Wh | HP Omen 15-dc1020ng i5-9300H, GeForce GTX 1650 Mobile, 52.5 Wh | Average of class Gaming | |
|---|---|---|---|---|---|---|
| Battery runtime | 82% | 28% | 110% | 67% | 49% | |
| Reader / Idle (h) | 7 | 13.8 97% | 7.8 11% | 14.5 107% | 15.9 127% | 8.71 ? 24% |
| WiFi v1.3 (h) | 4.5 | 8.7 93% | 4.8 7% | 8 78% | 6.4 42% | 7.07 ? 57% |
| Load (h) | 0.9 | 1.4 56% | 1.5 67% | 2.2 144% | 1.2 33% | 1.502 ? 67% |
| H.264 (h) | 8 | 8.64 ? | ||||
| Witcher 3 ultra (h) | 1 |
Pros
Cons
Verdict
Fans of AMD chips will be (very) pleased with the Bravo 15.
If you leave aside the meager port selection, the fairly short battery life and the high noise level during 3D applications, the Bravo 15 is an attractive package for price-sensitive gamers that sets new standards for CPU performance in the $1000 range. The Ryzen 7 4800H offers a lot of power and is future proof. The 144-Hz display is satisfactory to a large degree.
However, we would recommend potential buyers to choose the configuration with the Radeon RX 5500M due to the borderline video memory of the Radeon RX 5300M (4 GB rather than 3 GB GDDR6). The advantage that brings users is definitely worth the surcharge.
MSI Bravo 15 A4DCR
- 07/07/2020 v7 (old)
Florian Glaser
Price comparison

