MSI Bravo 17 laptop review: All-AMD gaming machine

Price-conscious gamers will be confronted with a wide range of exciting laptops in 2020. After a long dry spell, AMD fans are now also getting their money's worth. A good example is the brand-new MSI Bravo 17, which will be sold in stores for just under 1,250 Euros (~$1,414).
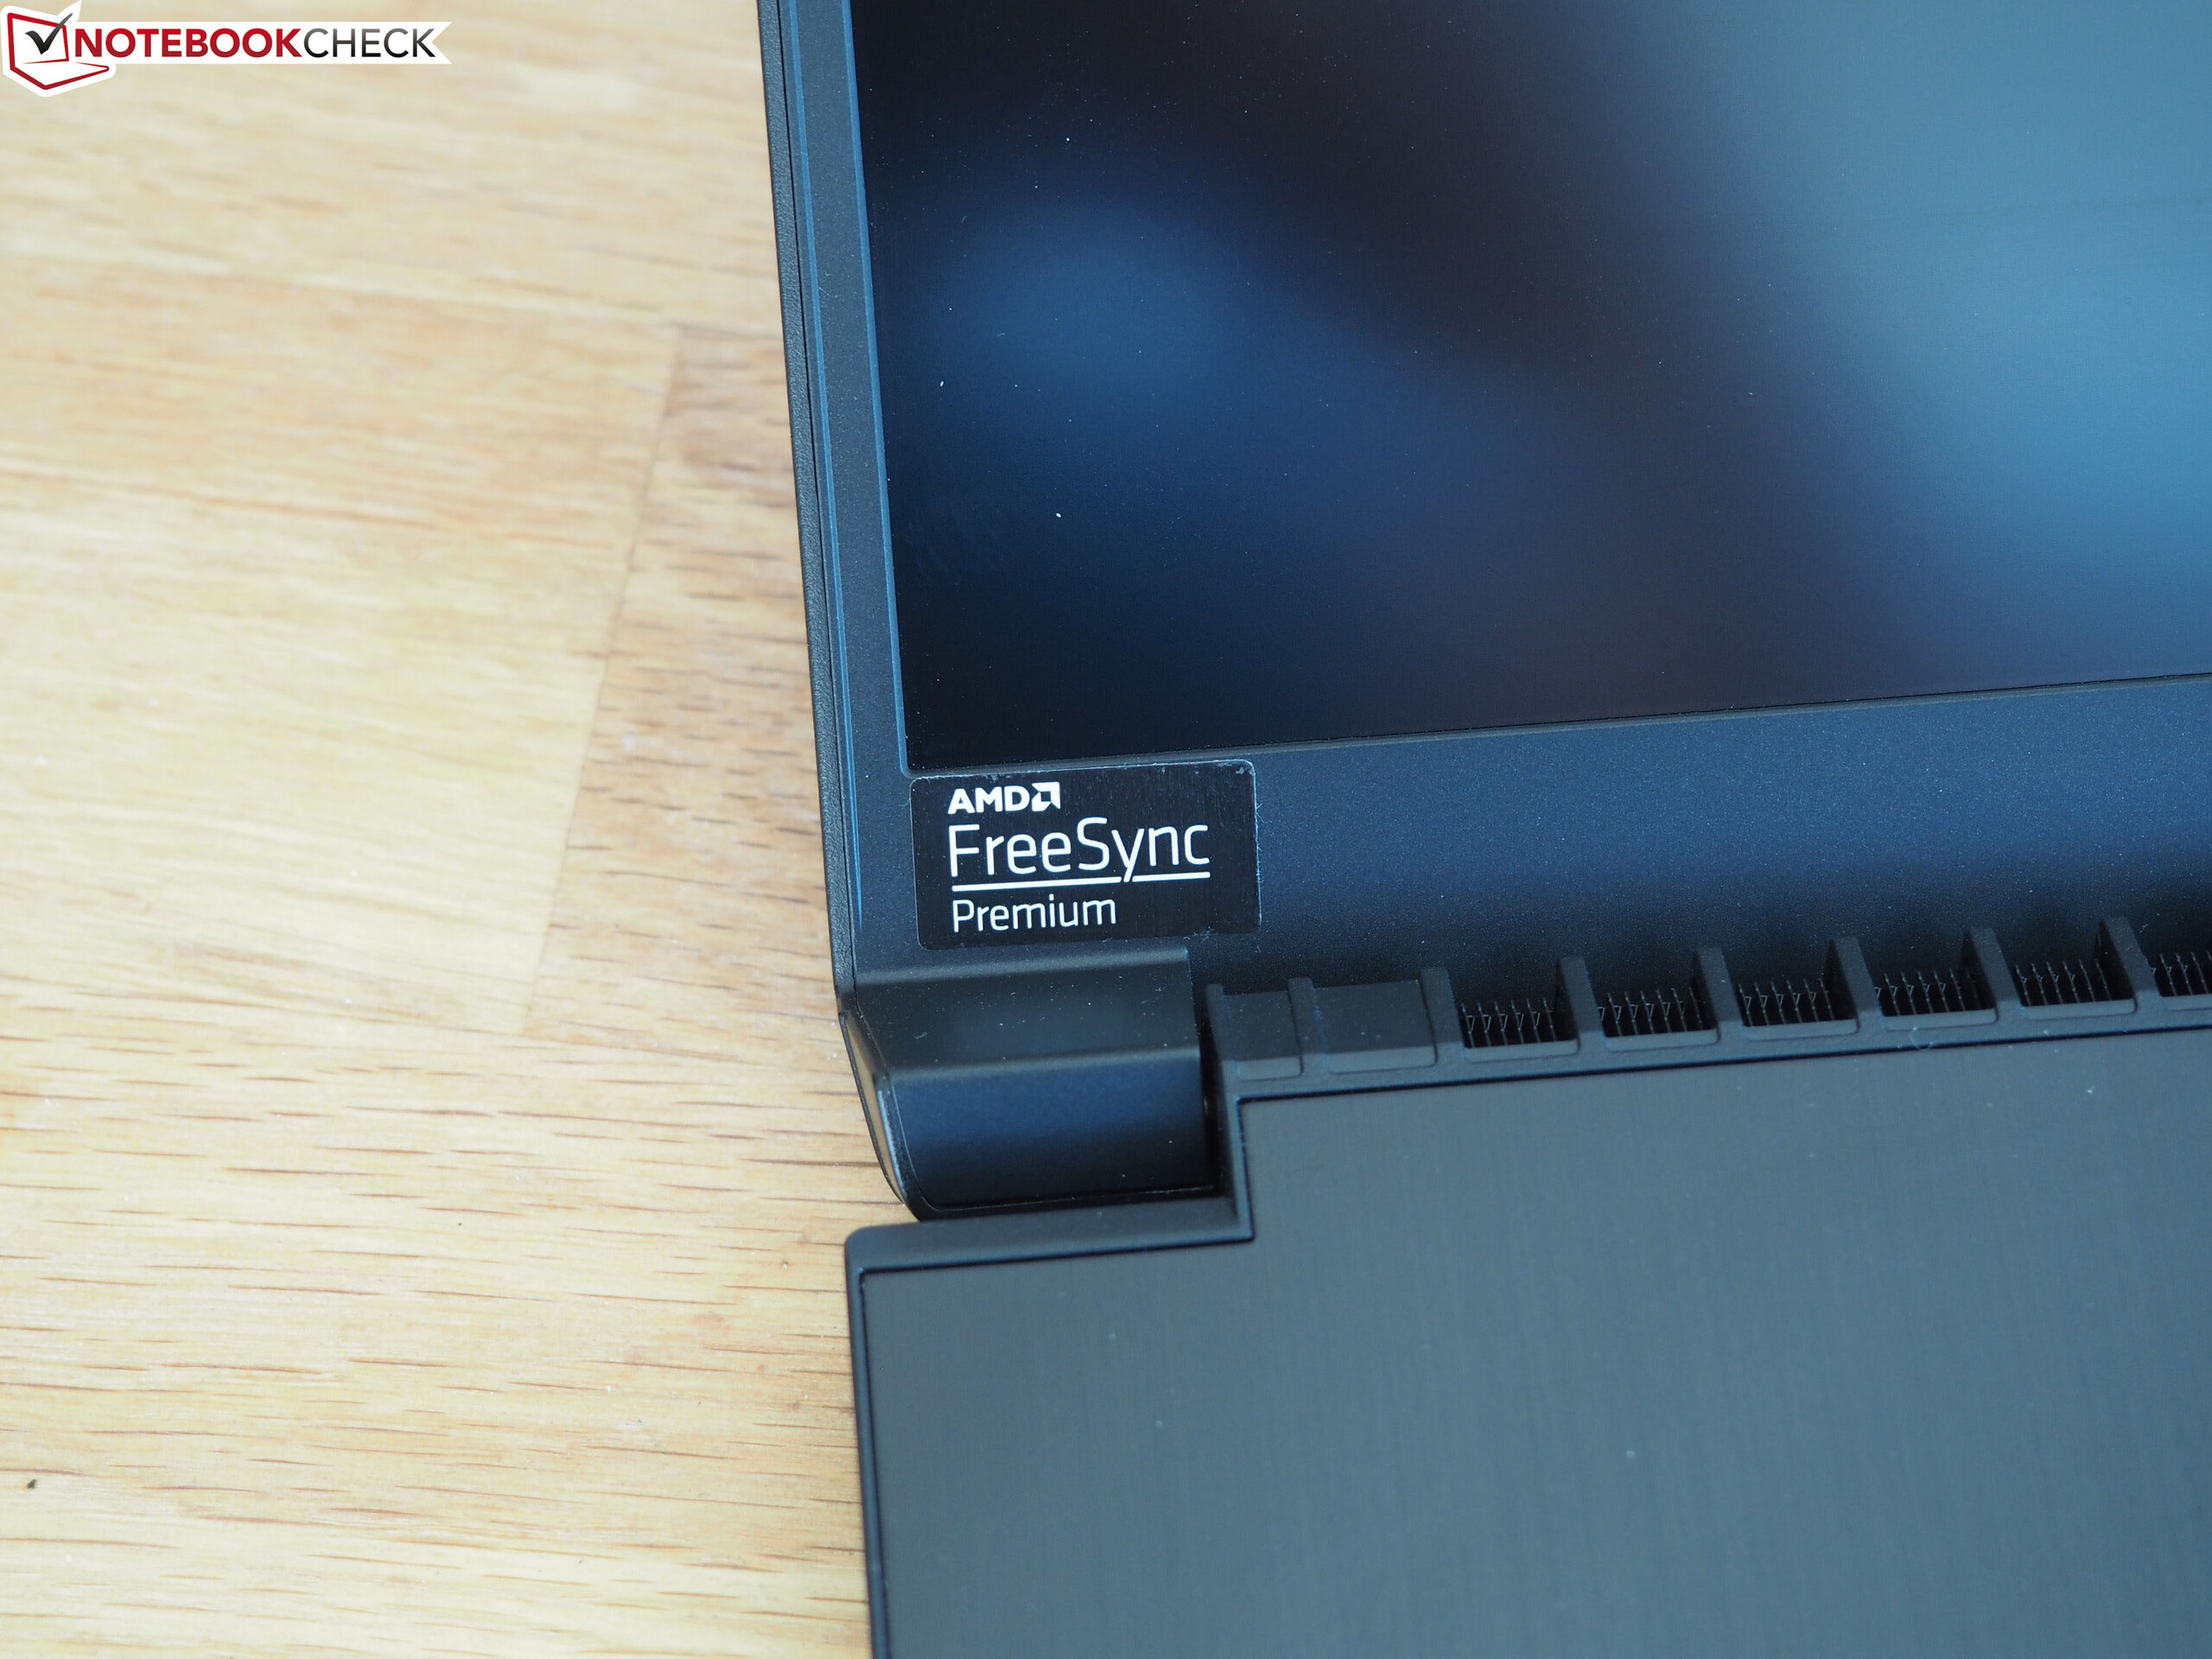
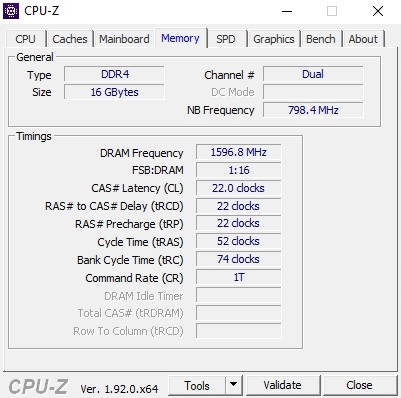
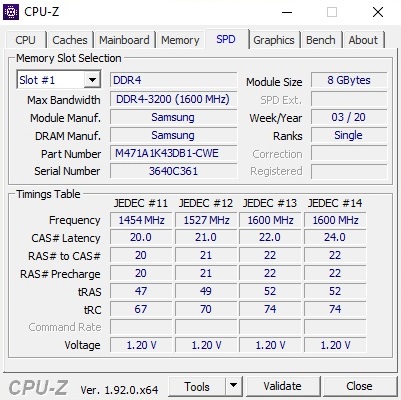
At this price, buyers receive an upper mid-range system suitable for gaming. While the Radeon RX 5500M positions itself between the GeForce GTX 1650 and the GeForce GTX 1660 Ti in terms of performance, the Ryzen 7 4800H is making even the strongest Intel CPUs tremble - not only in terms of performance but also in terms of energy efficiency. Otherwise, our test configuration also houses a 512 GB SSD and 2x 8 GB DDR4 3200 RAM sticks in dual-channel mode. Moreover, the laptop features a matte 120 Hz display with FreeSync support.
Among the Bravo 17's competitors are other budget gaming laptops in the price range of less than 1,500 Euros (~$1,696) such as the Asus TUF FX705DT, the Asus TUF A17 FA706IU, and the Lenovo Legion Y540-17IRH. The MSI Alpha 15 and MSI GF75 Thin 9SC in-house contenders also appear in the tables as comparison devices.
Rating | Date | Model | Weight | Height | Size | Resolution | Price |
|---|---|---|---|---|---|---|---|
| 80.9 % v7 (old) | 07 / 2020 | MSI Bravo 17 A4DDR R7 4800H, Radeon RX 5500M | 2.2 kg | 23 mm | 17.30" | 1920x1080 | |
| 78.8 % v7 (old) | 02 / 2020 | MSI Alpha 15 A3DDK-034 R7 3750H, Radeon RX 5500M | 2.3 kg | 27.5 mm | 15.60" | 1920x1080 | |
| 78 % v7 (old) | 07 / 2019 | MSI GF75 Thin 9SC i7-9750H, GeForce GTX 1650 Mobile | 2.3 kg | 23.1 mm | 17.30" | 1920x1080 | |
| 77.8 % v7 (old) | 06 / 2019 | Asus TUF FX705DT-AU068T R5 3550H, GeForce GTX 1650 Mobile | 2.7 kg | 26.6 mm | 17.30" | 1920x1080 | |
| 82.9 % v7 (old) | 05 / 2020 | Asus TUF A17 FA706IU-AS76 R7 4800H, GeForce GTX 1660 Ti Mobile | 2.6 kg | 26 mm | 17.30" | 1920x1080 | |
| 82.3 % v7 (old) | 07 / 2019 | Lenovo Legion Y540-17IRH i5-9300H, GeForce GTX 1660 Ti Mobile | 2.8 kg | 26.3 mm | 17.30" | 1920x1080 |
Case
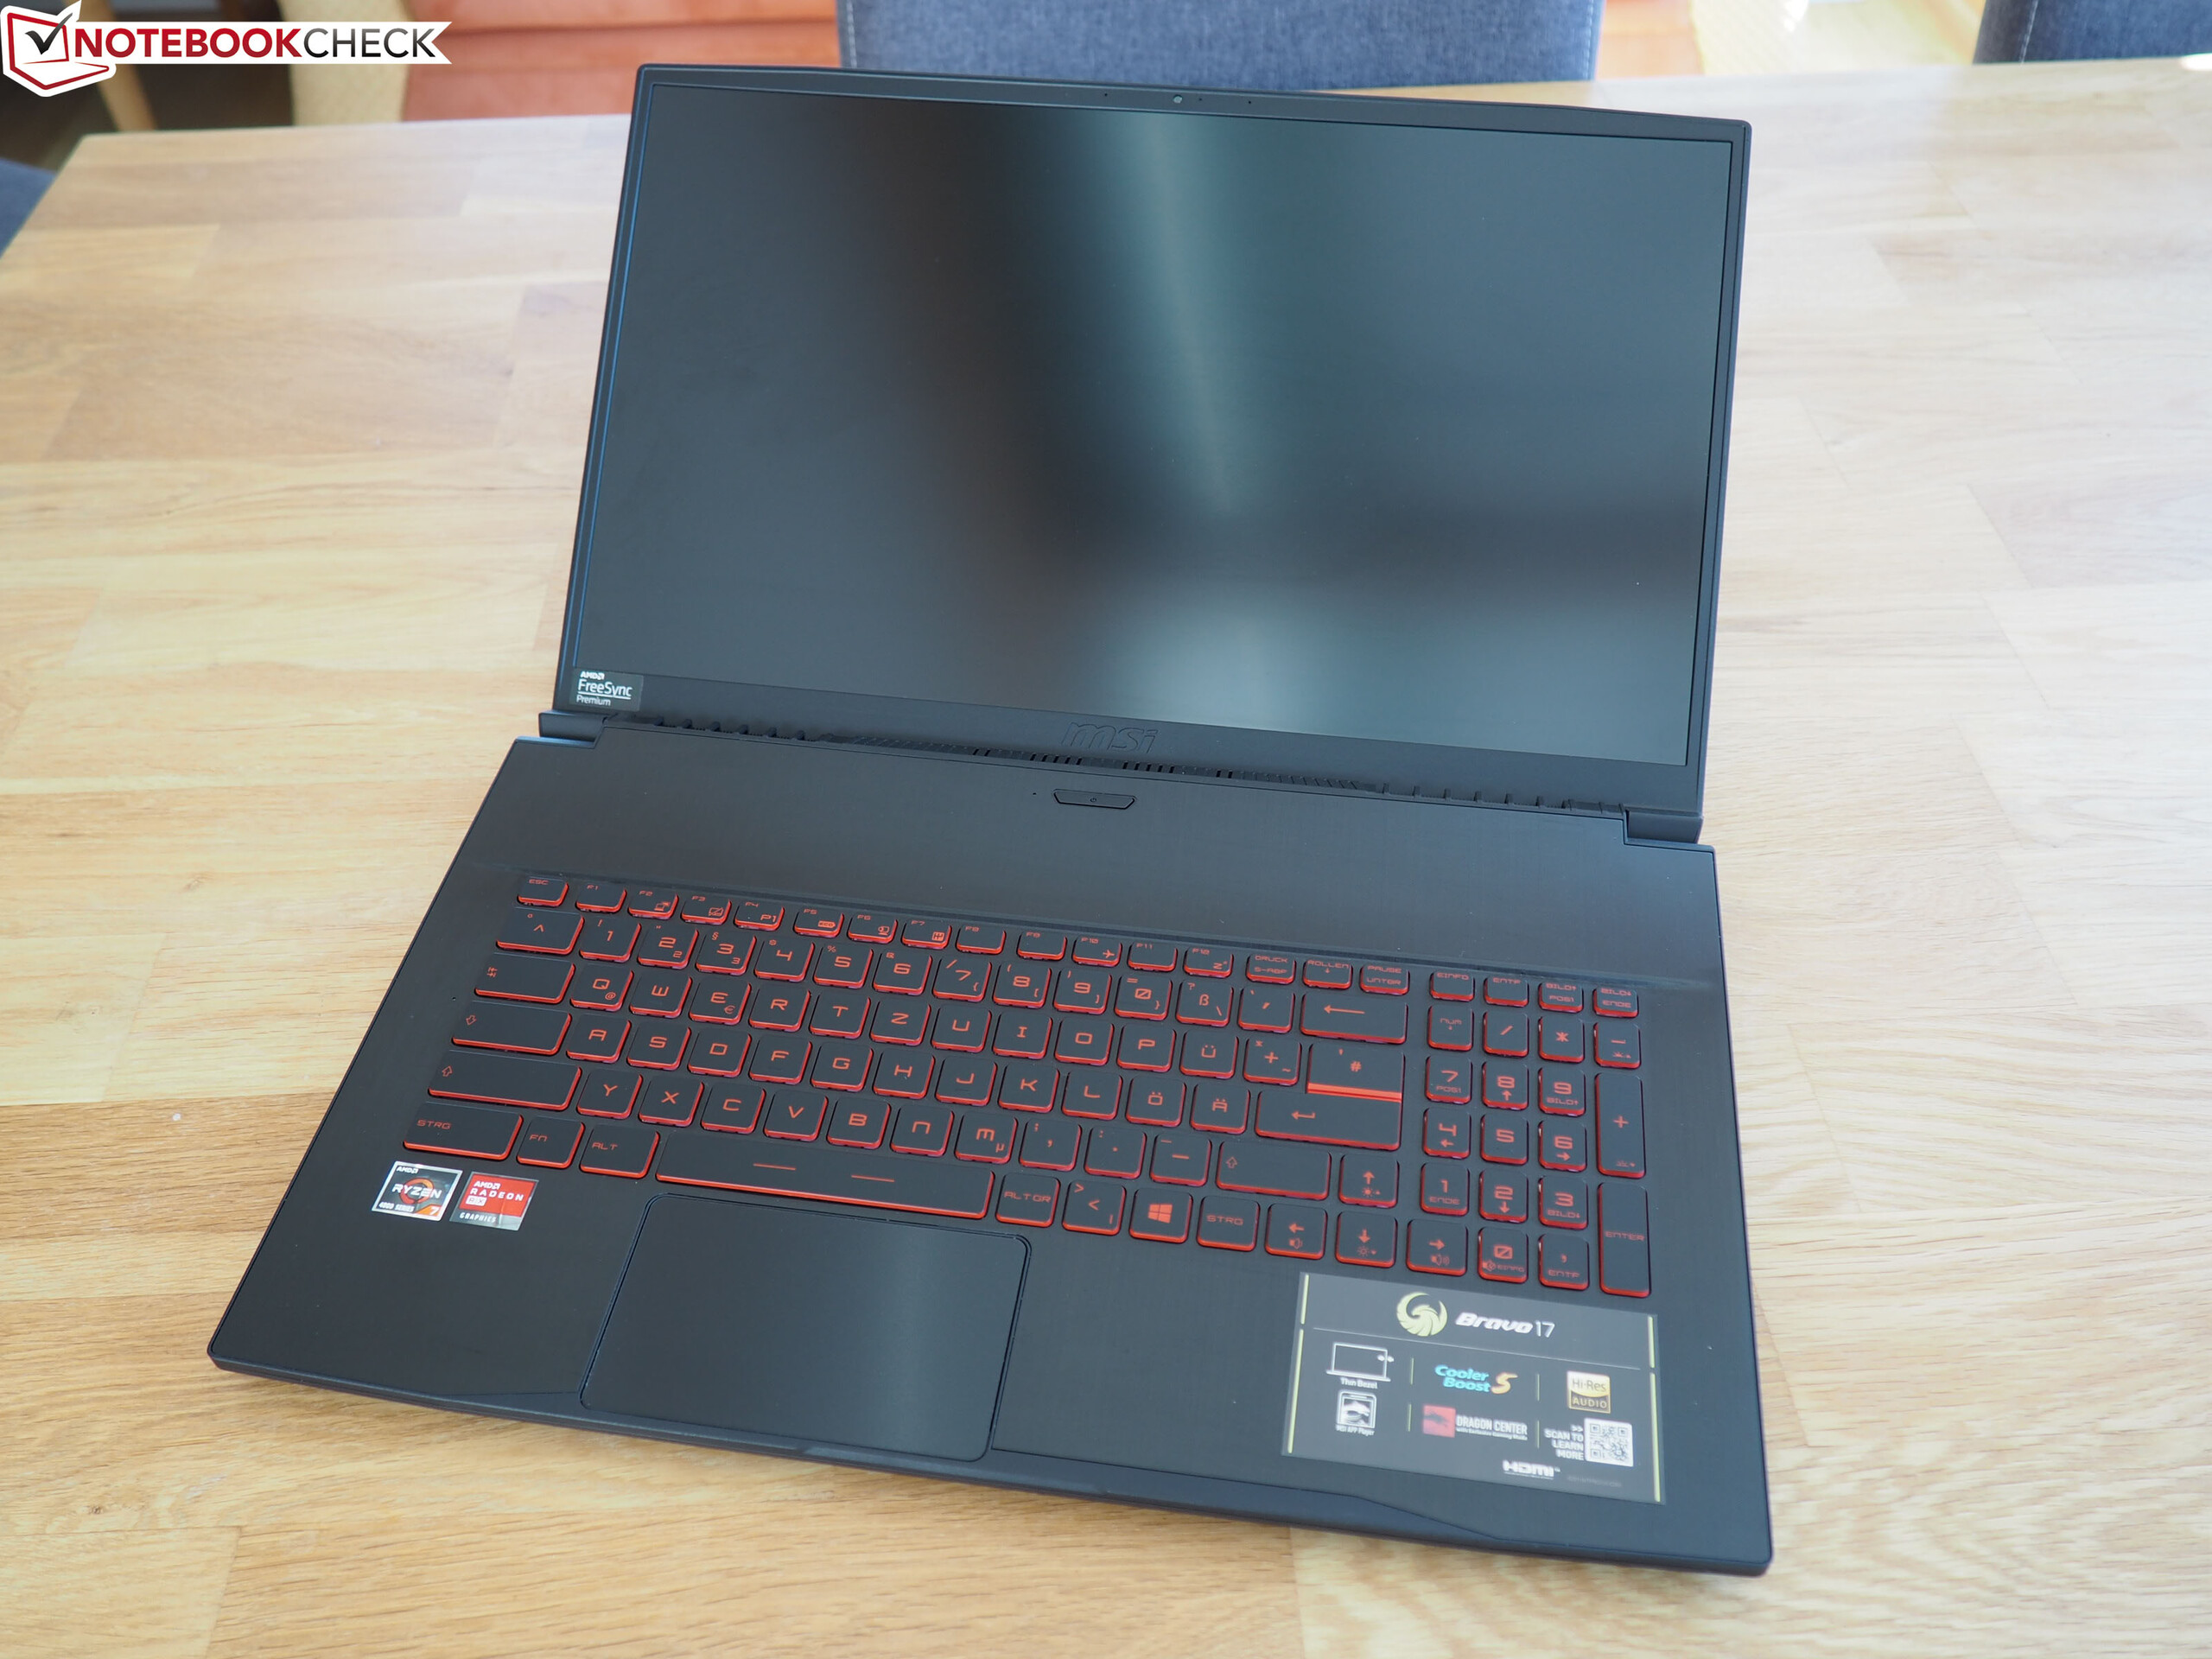
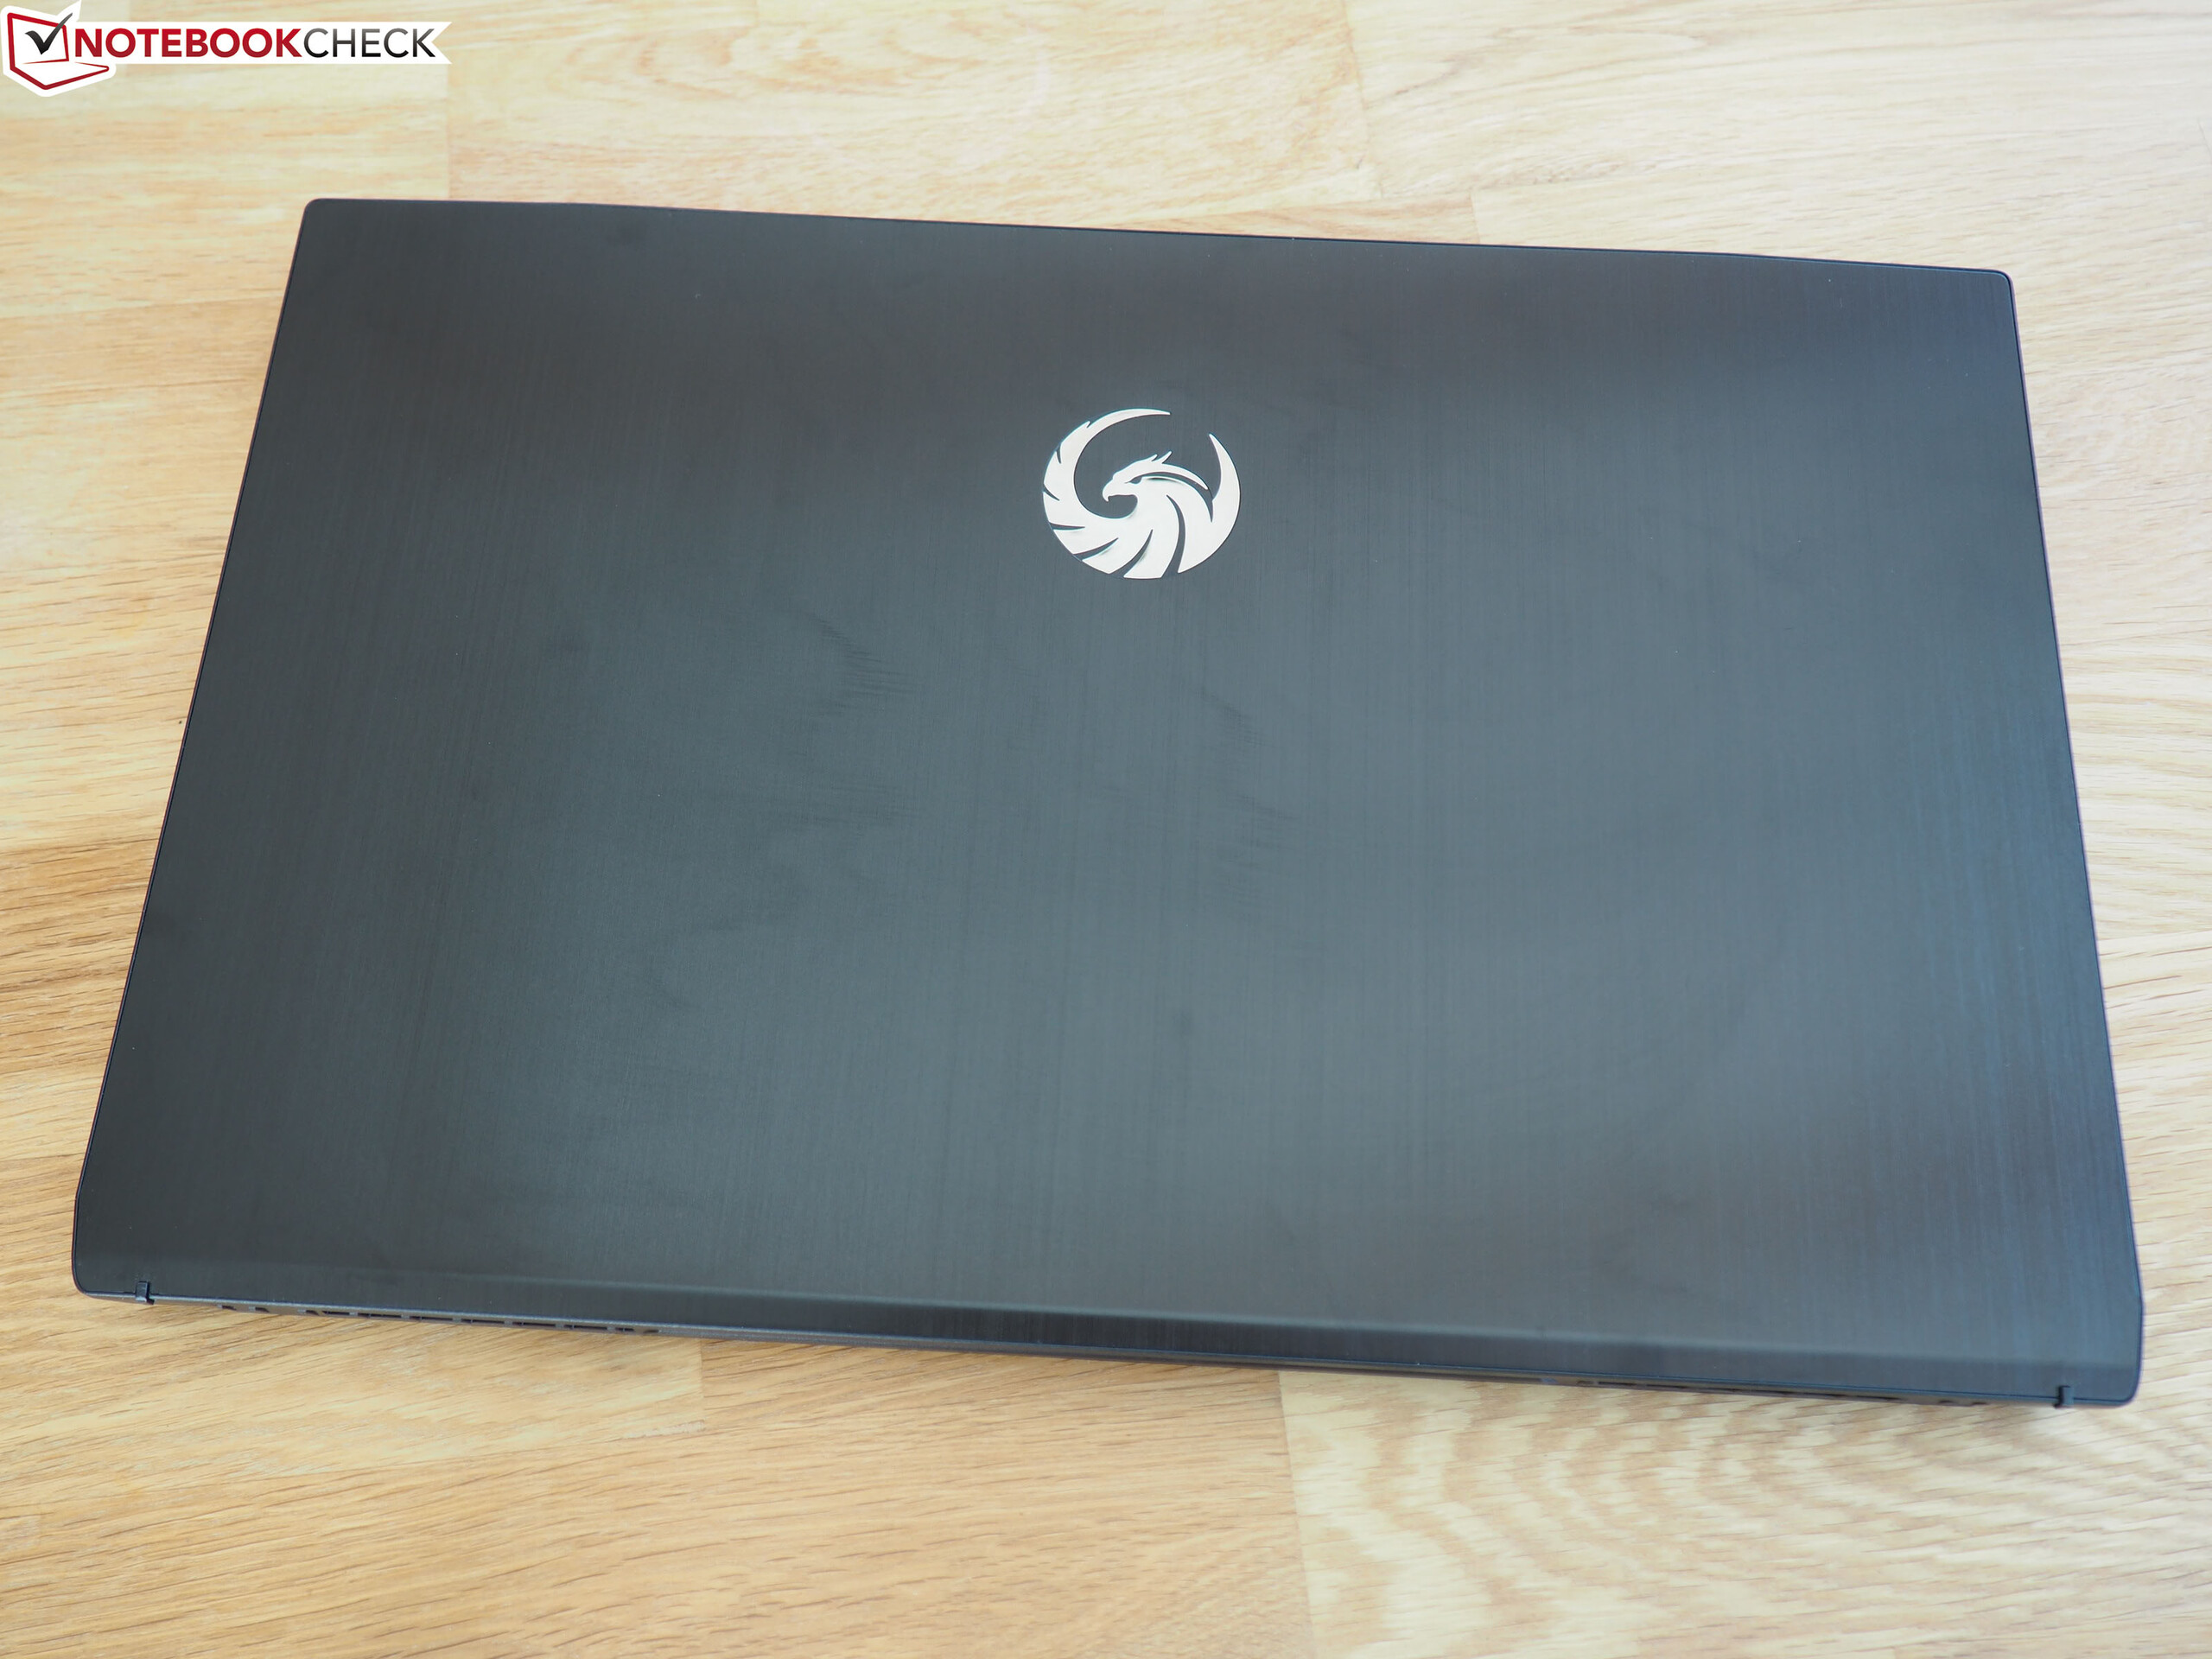
The case of the Bravo 17 looks surprisingly high quality for the estimated price. In this way, not only the lid is made of brushed aluminum but also the keyboard surroundings. You often had to live with a rattly plastic chassis in the past here. When you open the somewhat wobbly screen, the stability also cuts quite a fine figure. In most areas, the base unit can only be bent a bit under strong pressure. The design is - apart from the keyboard with red labeling - rather plain, which makes the device not look too flashy.
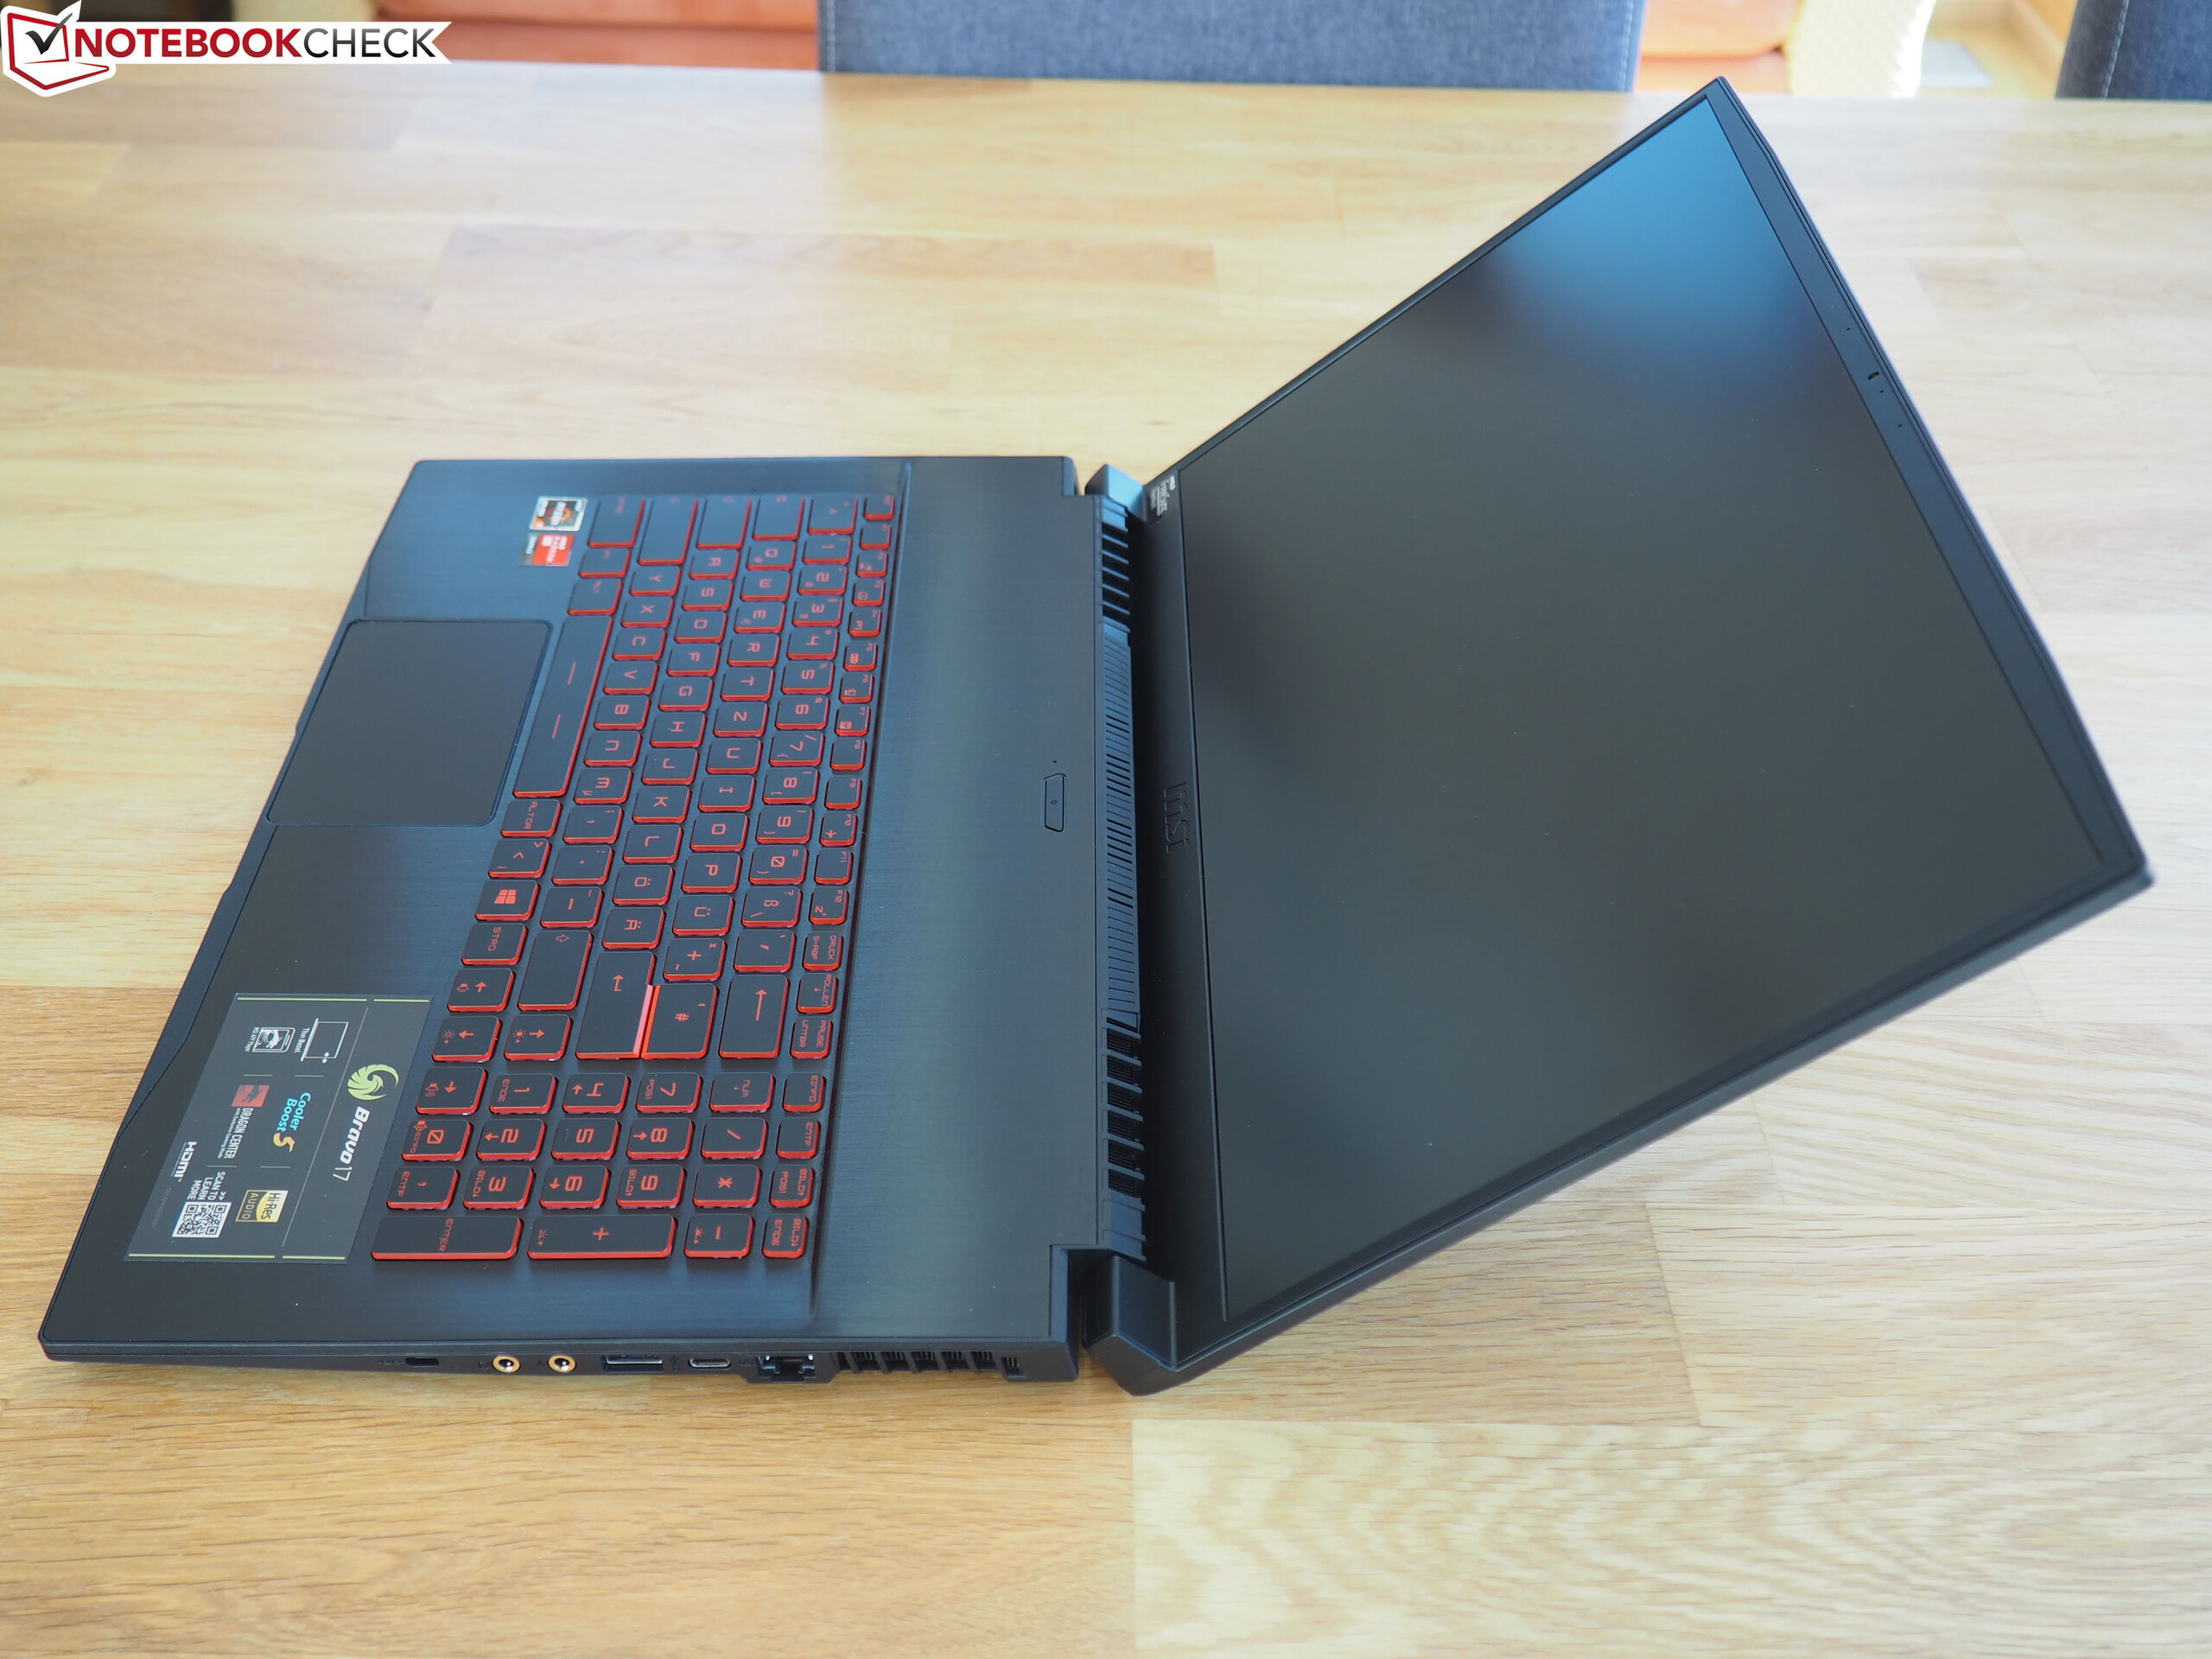
There are also plus points for the moderate weight: At 2.2 kg, the Bravo 17 is the lightest 17-incher in the test. The competition ranges between 2.3 and 2.8 kg. Some buyers will also be pleased with the low overall height: 2.3 cm guarantees a slender look. Thanks to the slim bezel design, the main dimensions are also kept within limits (39.7 x 26.0 cm). The workmanship doesn't leave anything to be desired either. In our test device, all elements merged neatly into one another. MSI could improve the rubber feet and the hinge construction, respectively. The laptop slips away very easily/quickly when it's opened.
Connectivity
Ports
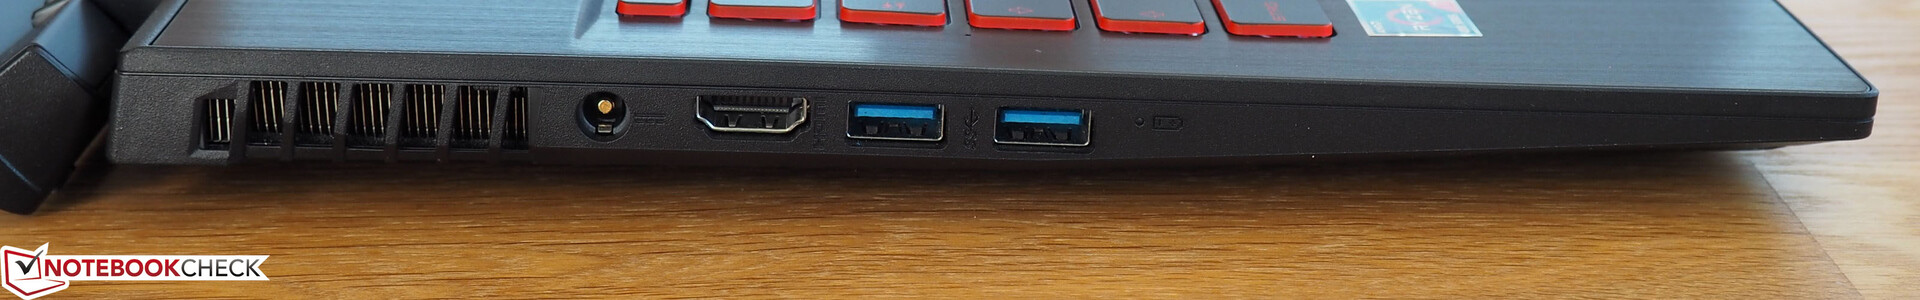
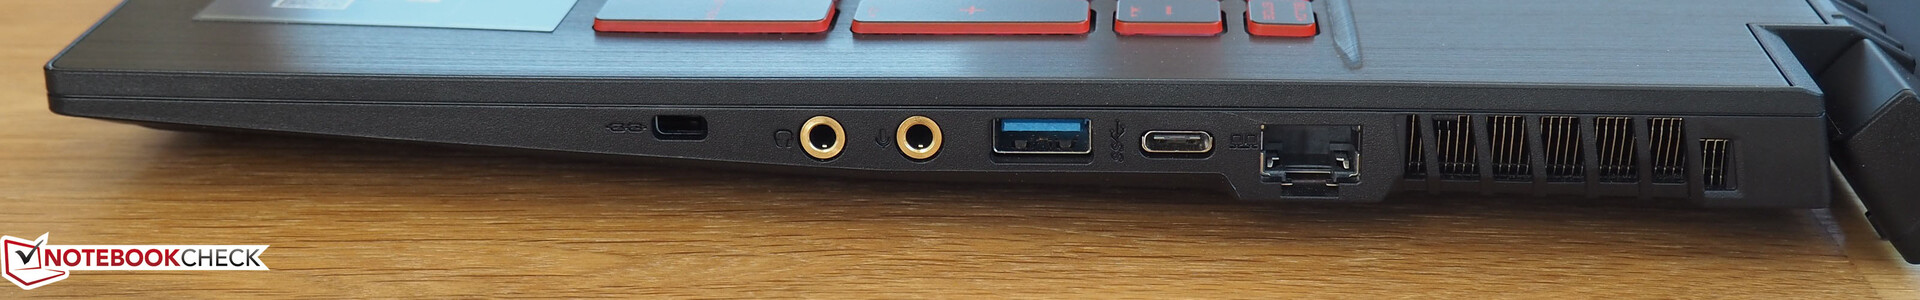
You shouldn't expect the Bravo 17 to have a generous port configuration. MSI forgoes both a DisplayPort connection as well as a card reader. USB 3.2 Gen 2 (x2), not to mention Thunderbolt 3, is also a no-show. As a result, the existing USB ports (3x Type-A, 1x Type-C) only support USB 3.2 Gen 1, which corresponds to the old 3.0 standard. In addition, there's an HDMI port (note: Only 30 Hz at 4K), an RJ45 port and two gold-plated audio jacks. Even if the arrangement of the connections isn't quite ideal due to the ventilation grills on the sides, you don't lose that much room for movement when using an external mouse.
Communication
Although the Wi-Fi results are not comparable with the competition due to the recently changed test setup (ax router instead of ac router), the Bravo 17 is right at the top of the list when it comes to WLAN performance. 880 Mb/s for sending and 1,520 Mb/s for receiving data represent good to very good values. With the Intel Wi-Fi 6 AX200, MSI has installed a cutting-edge wireless module.
Webcam
Like most laptops, the Bravo 17 also lacks a decent webcam. Neither the image sharpness nor the color accuracy are convincing (see photos).


Accessories
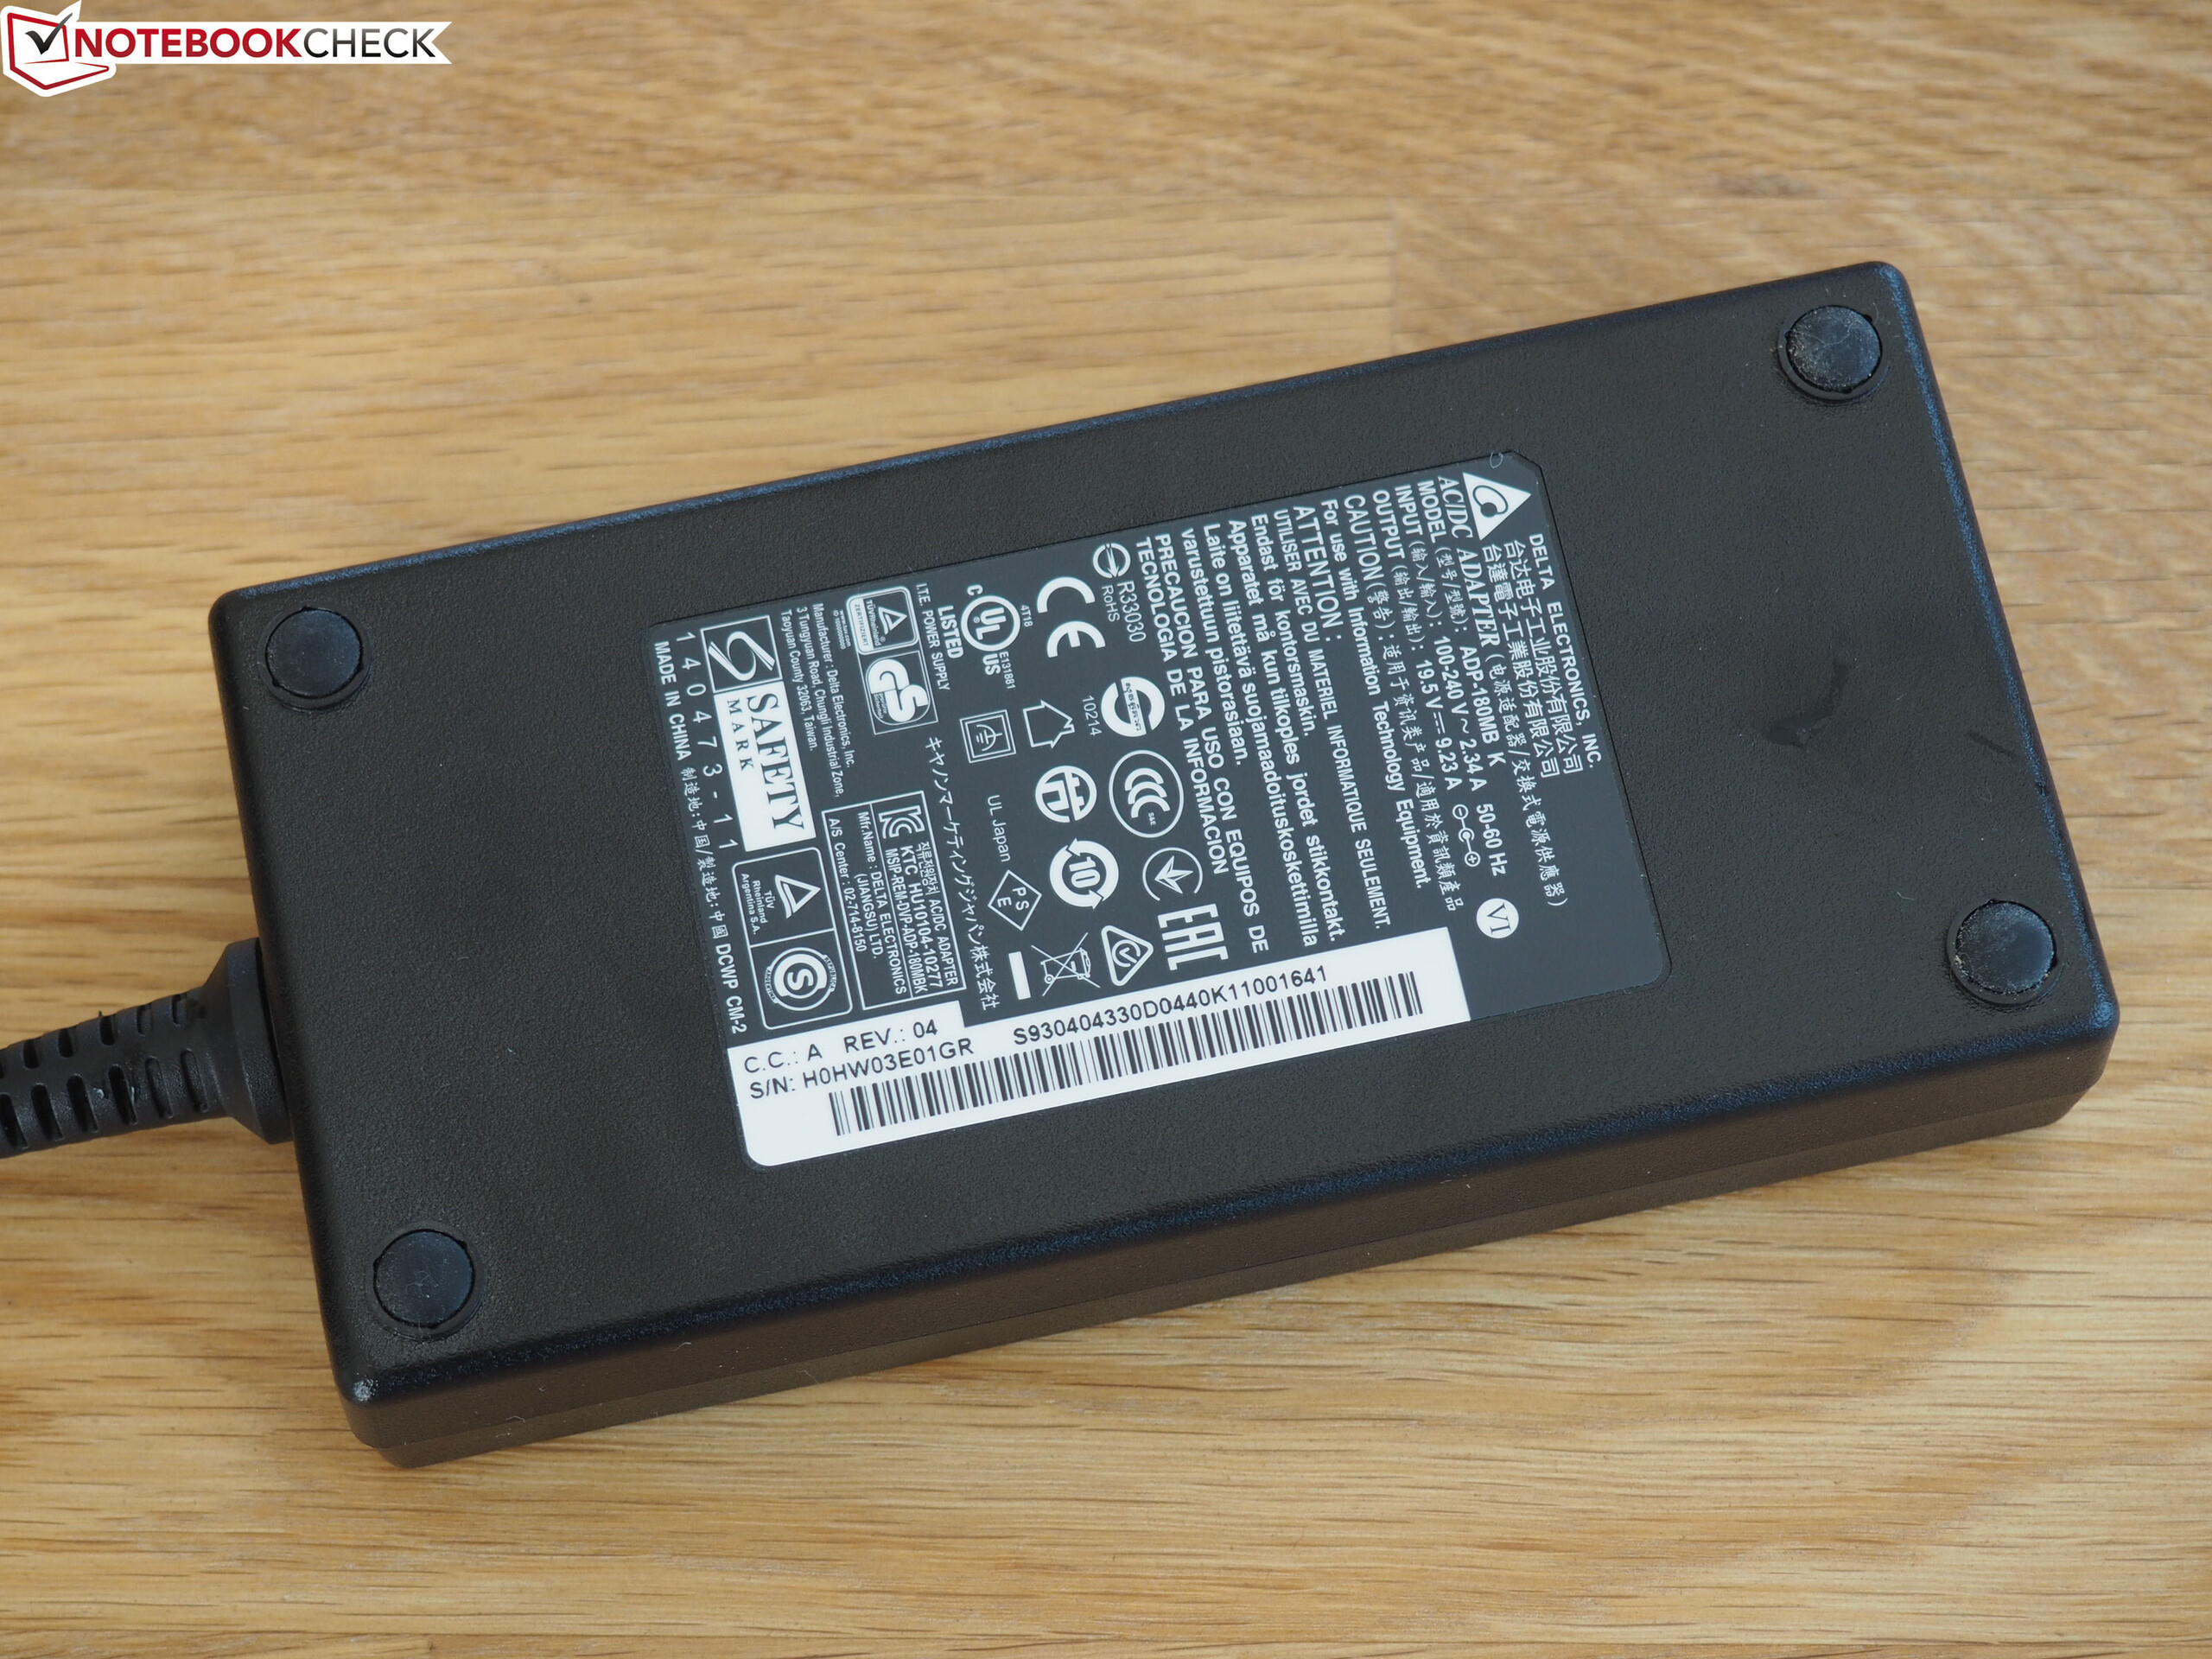
In terms of accessories, MSI has only included a quick-start guide and a recovery guide in the box. The 180-watt power adapter, which weighs approximately 600 grams, turned out to be relatively compact with a size of 15 x 7.5 x 3 cm.
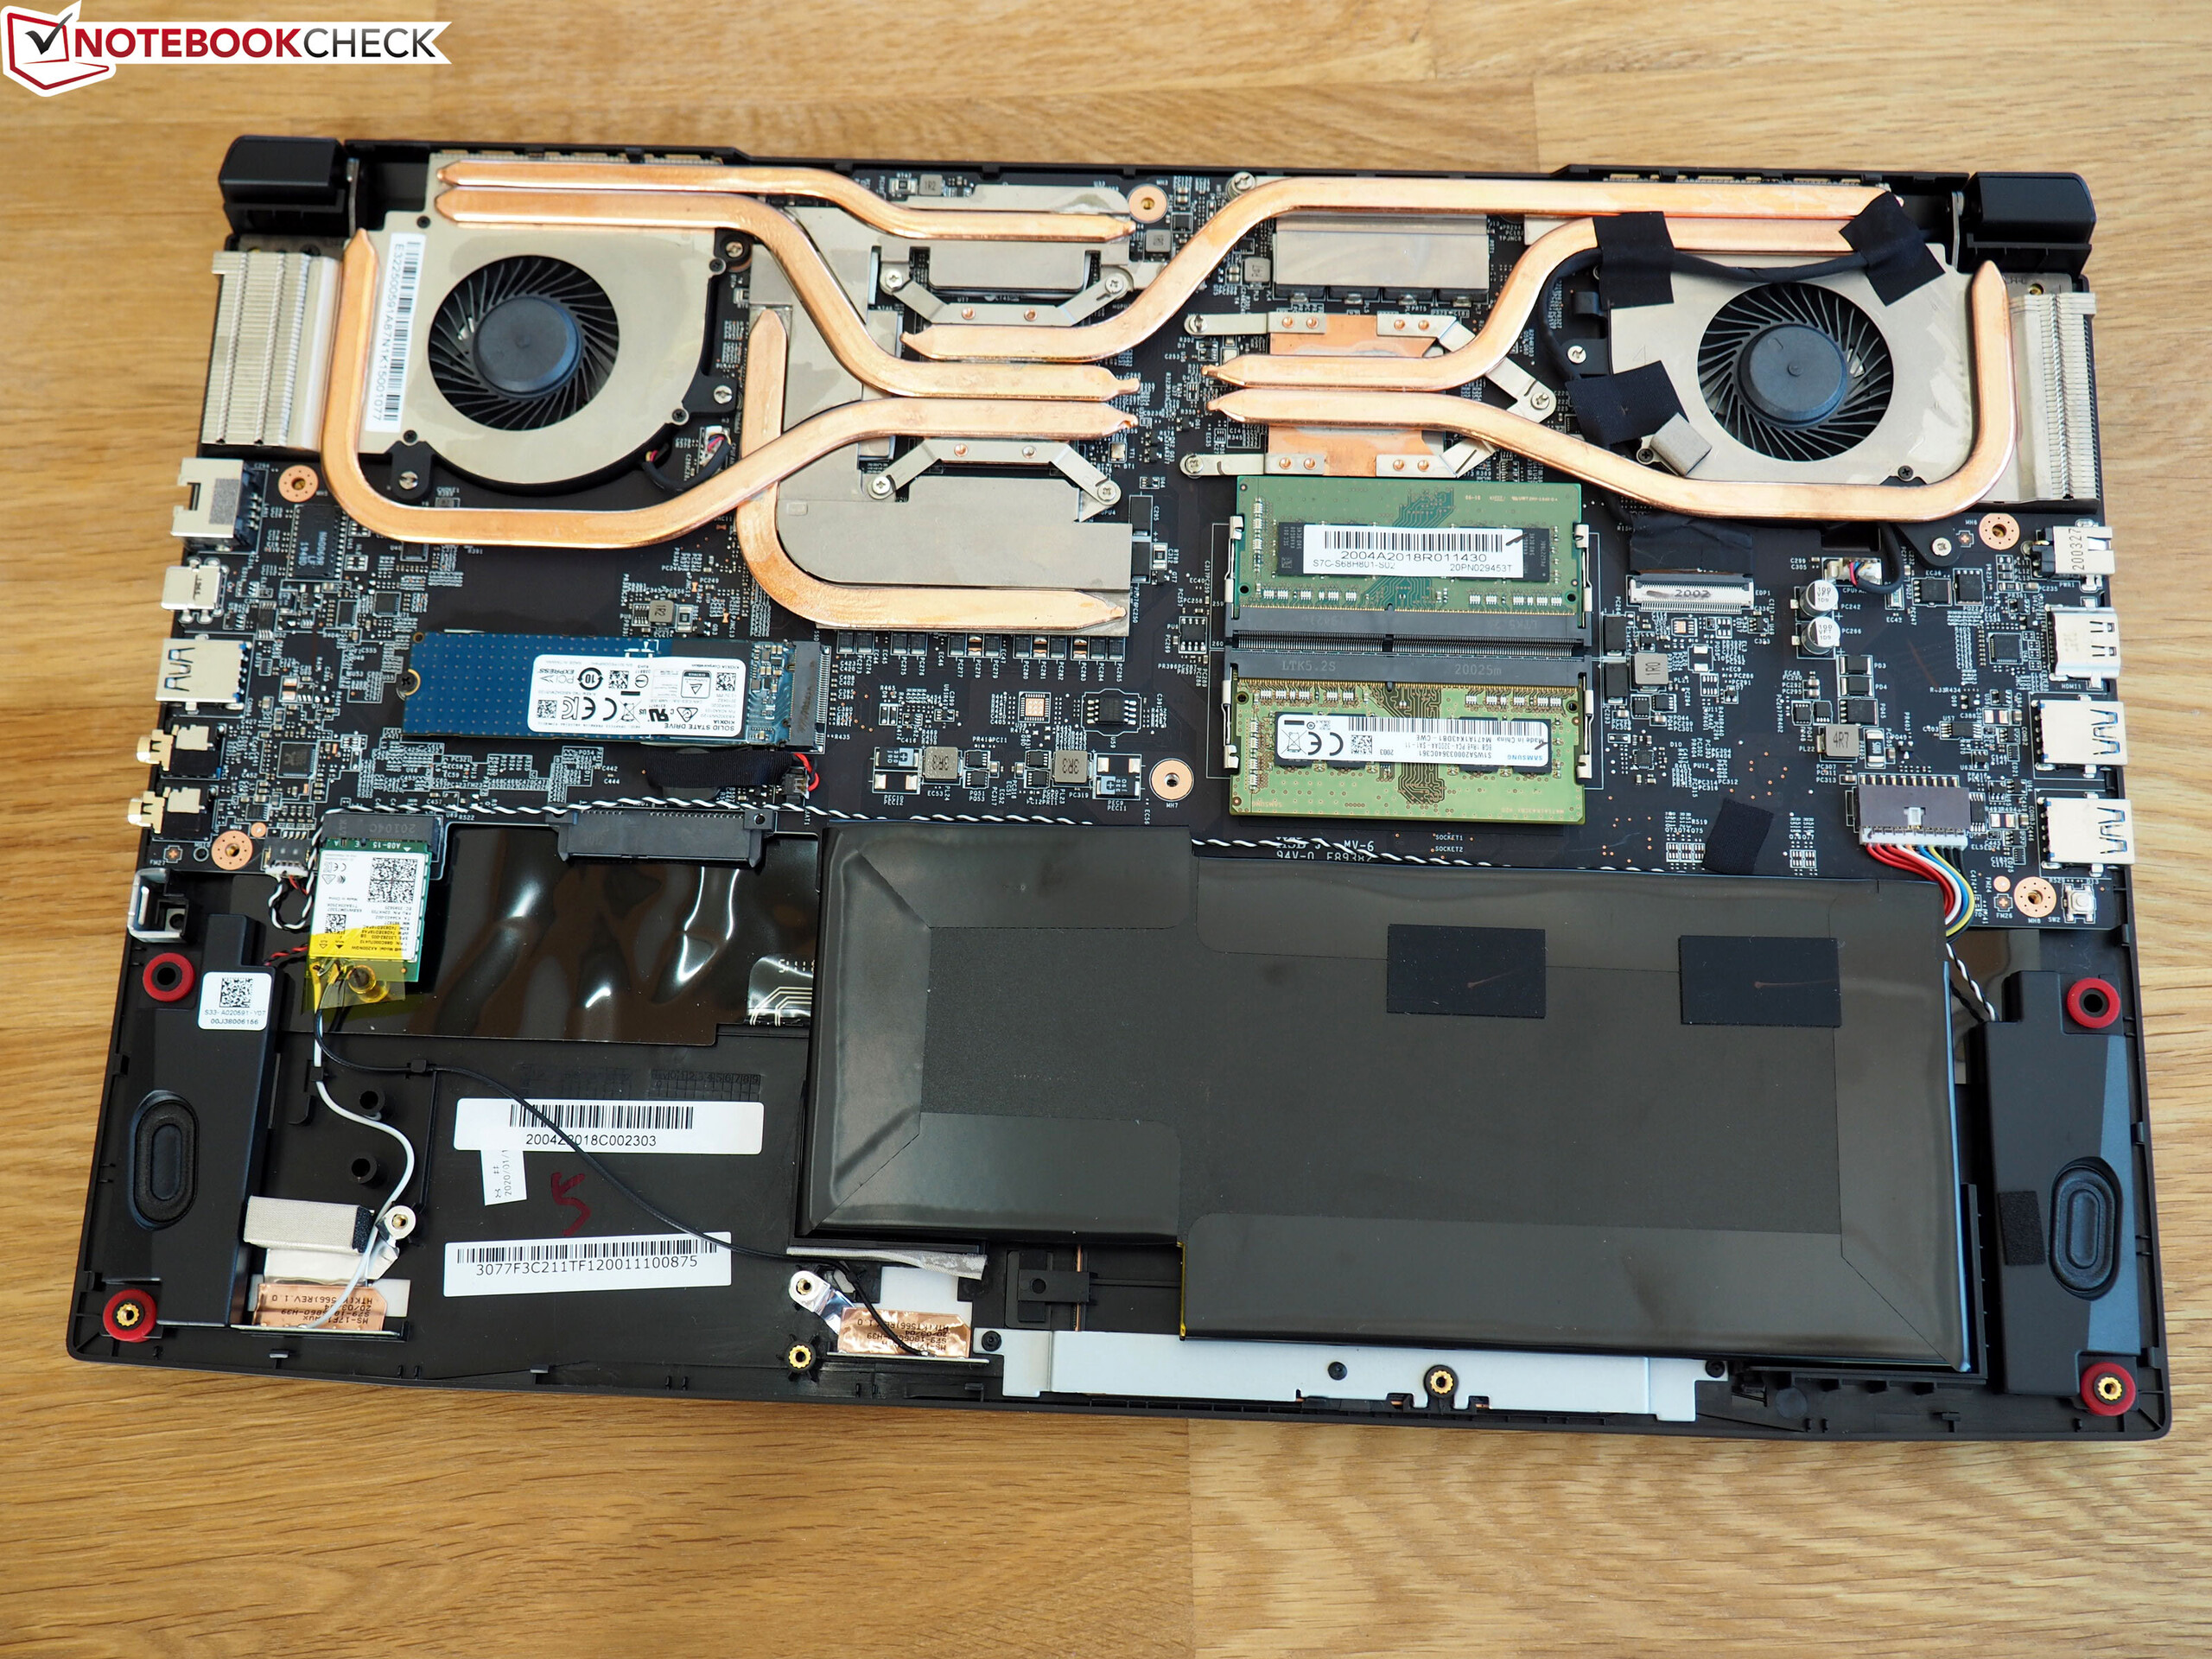
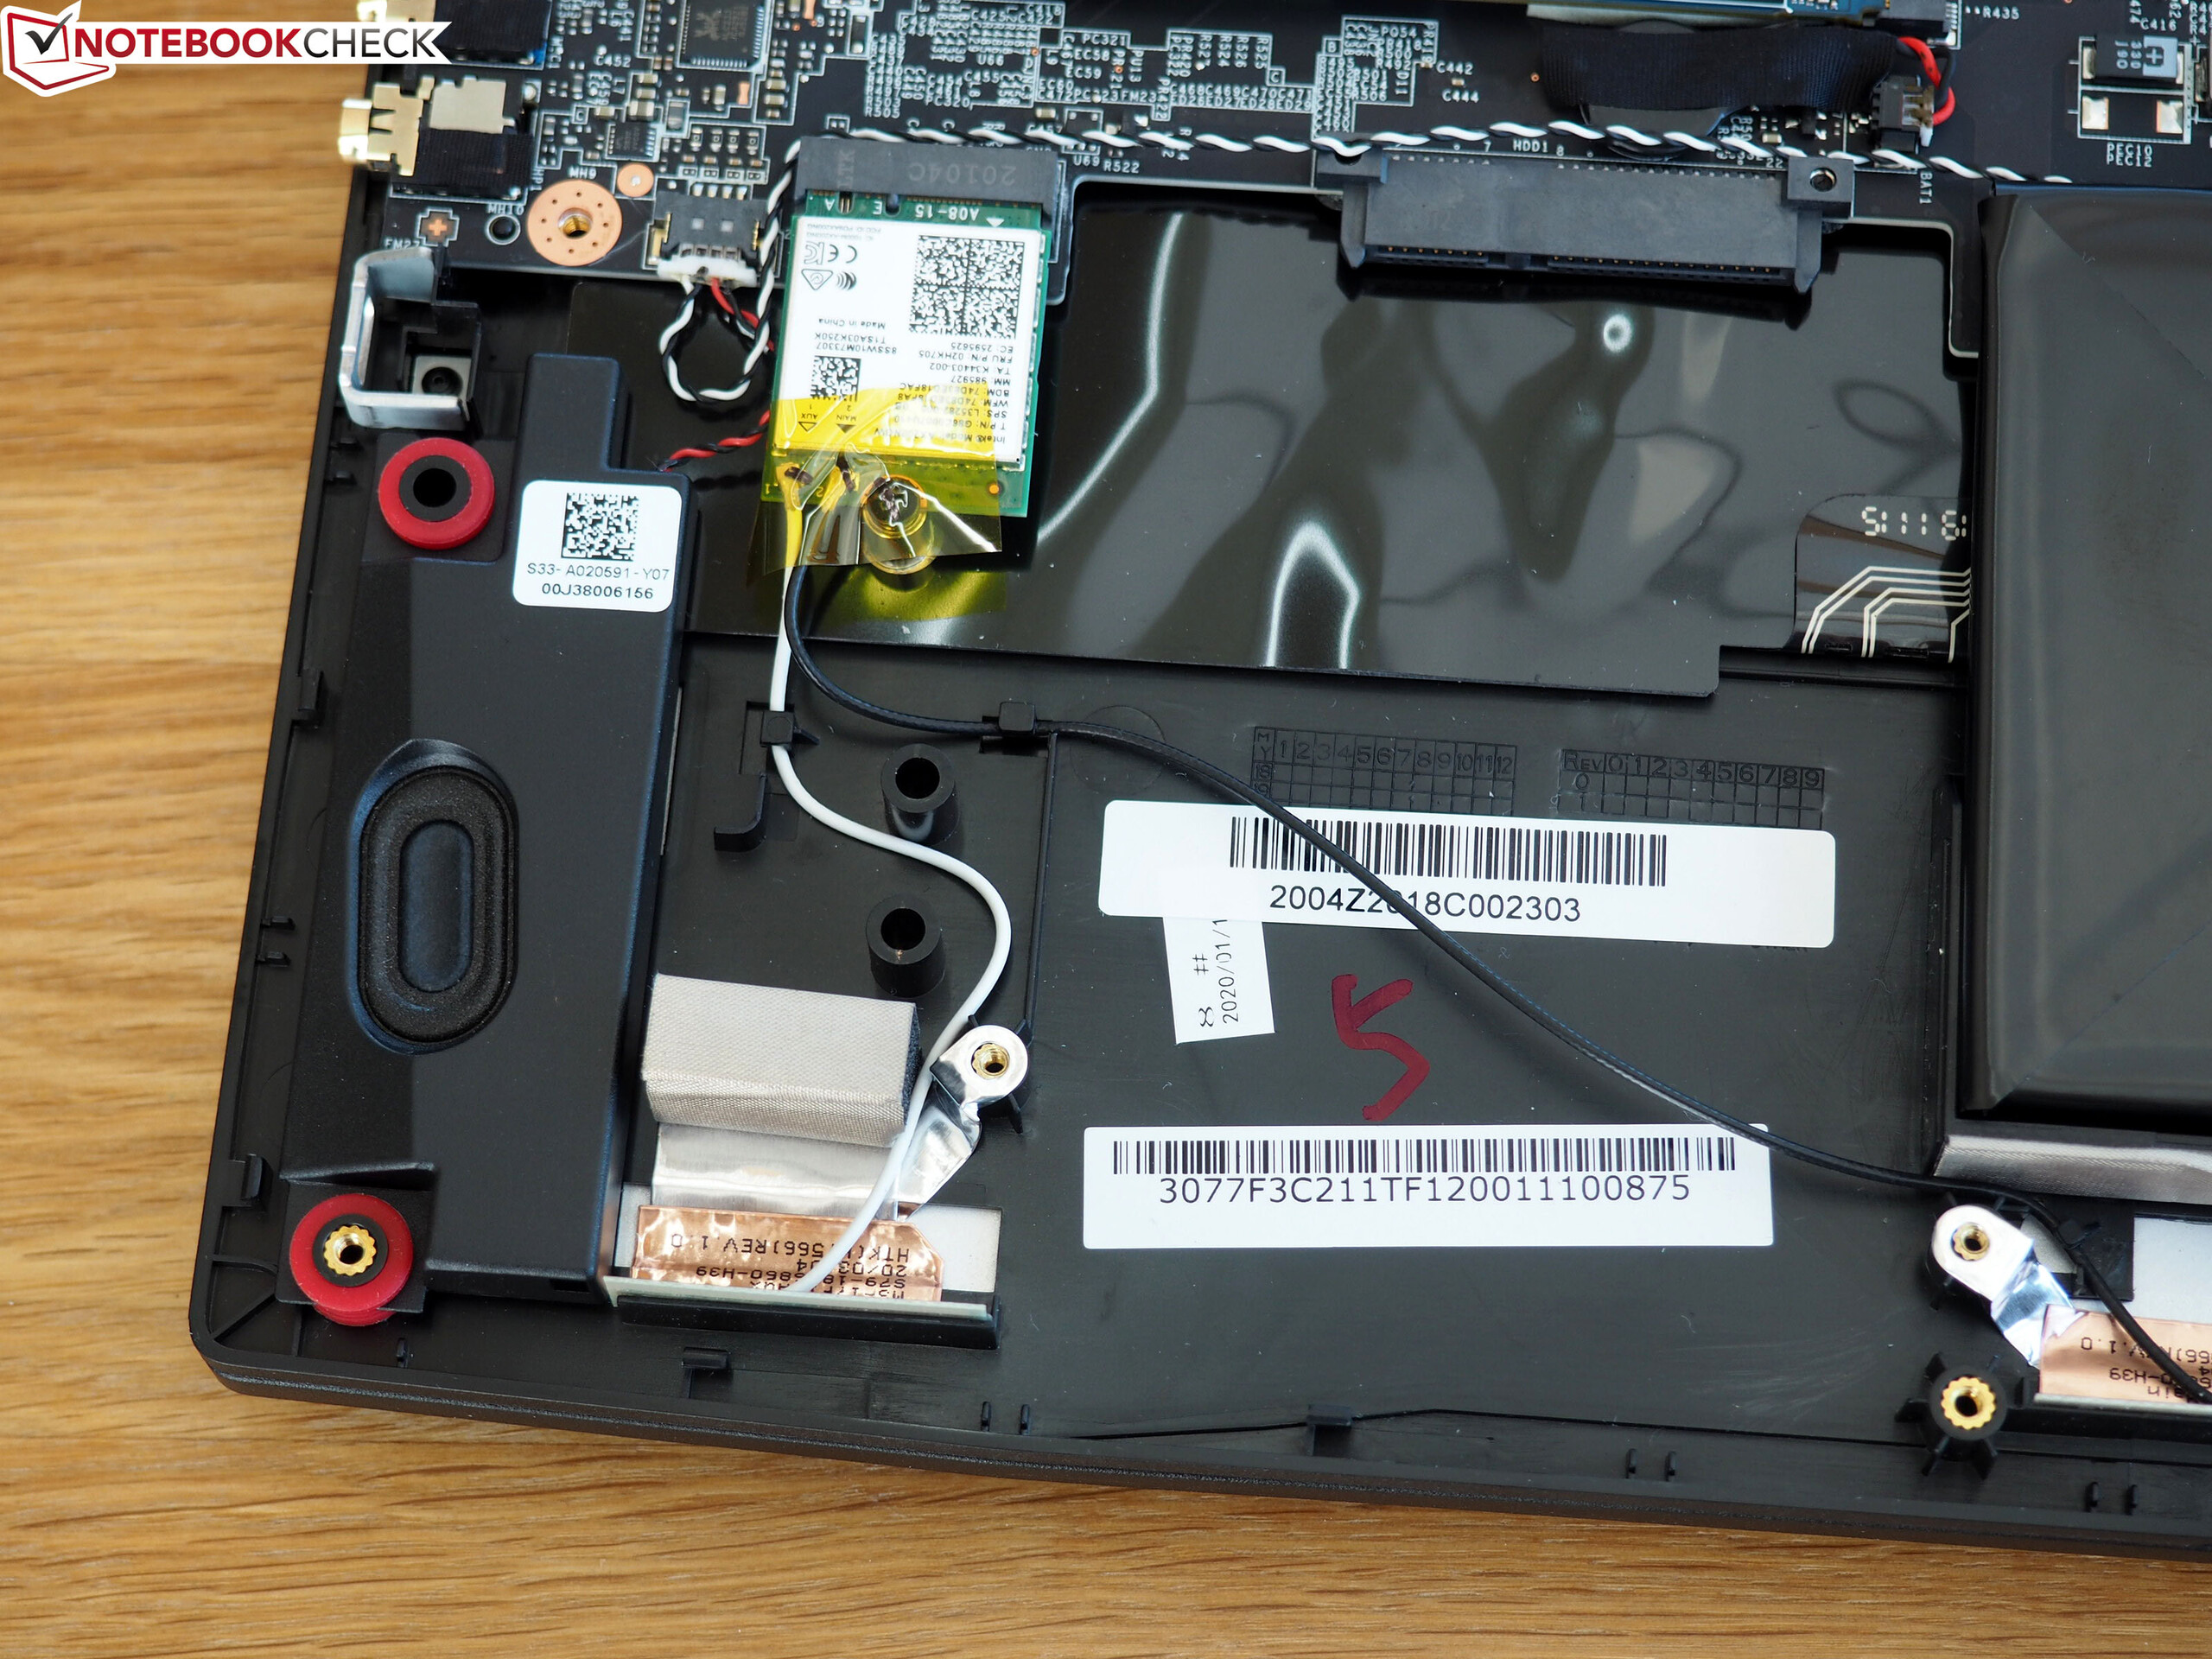
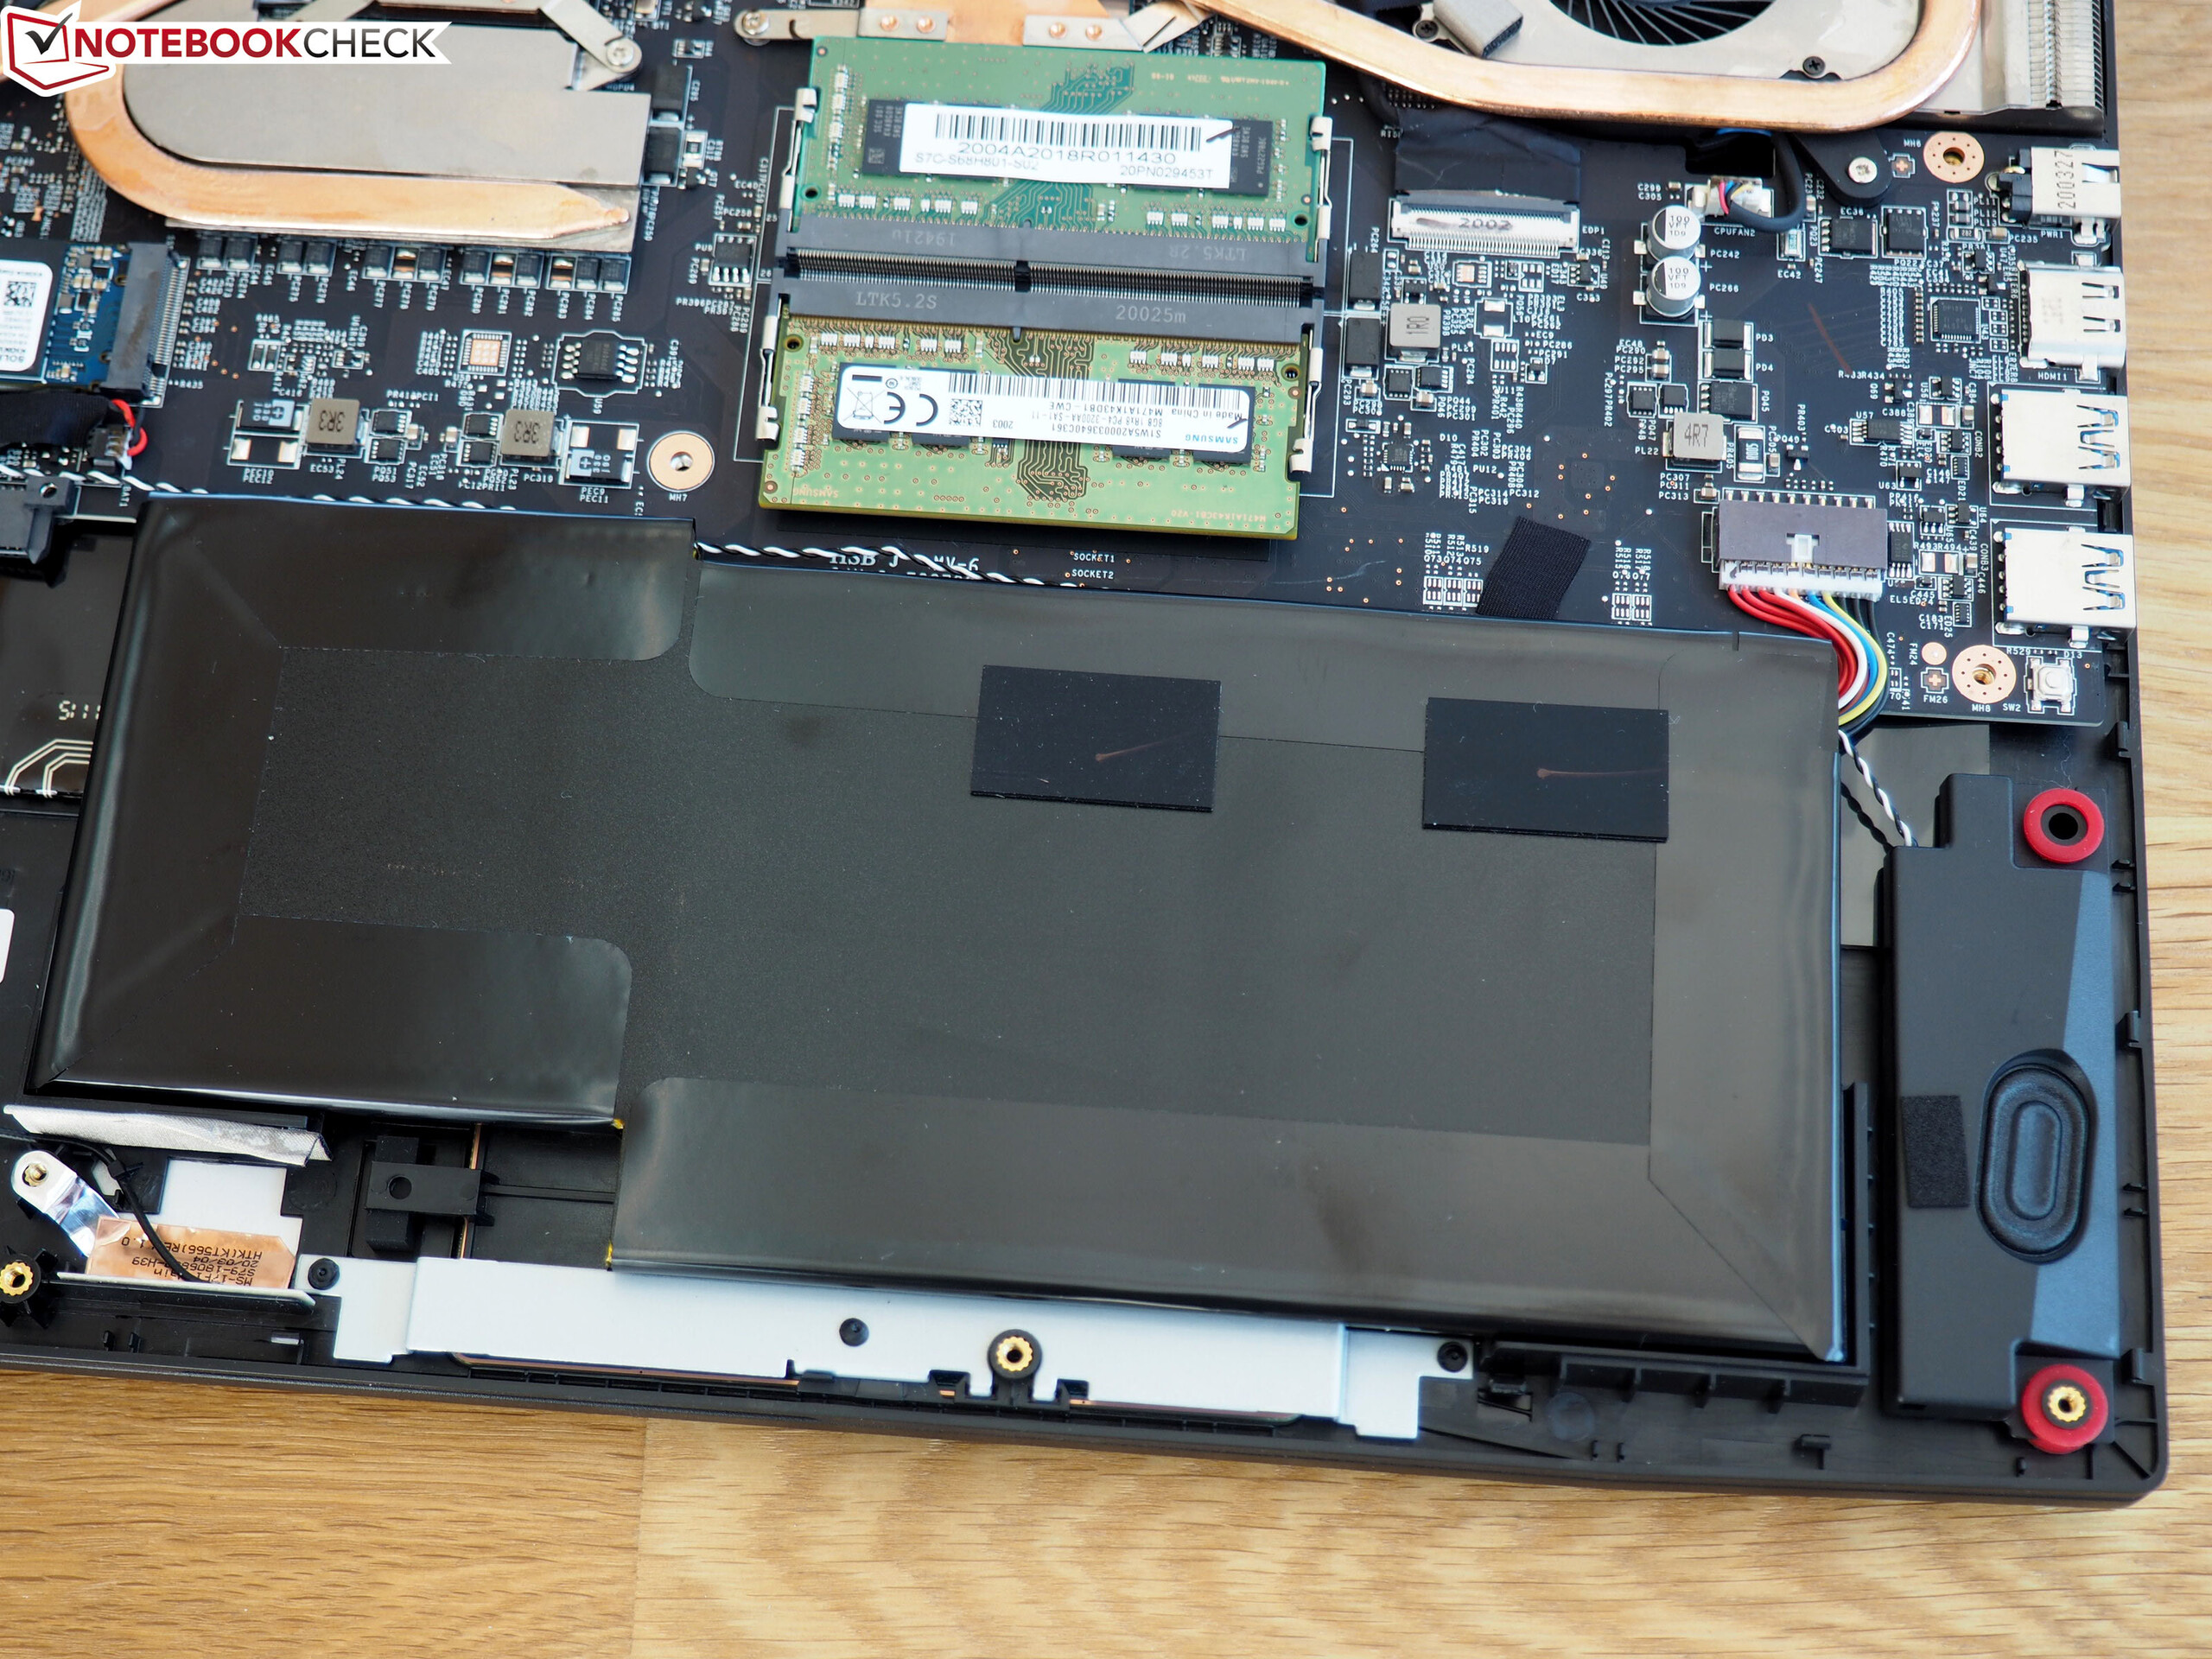
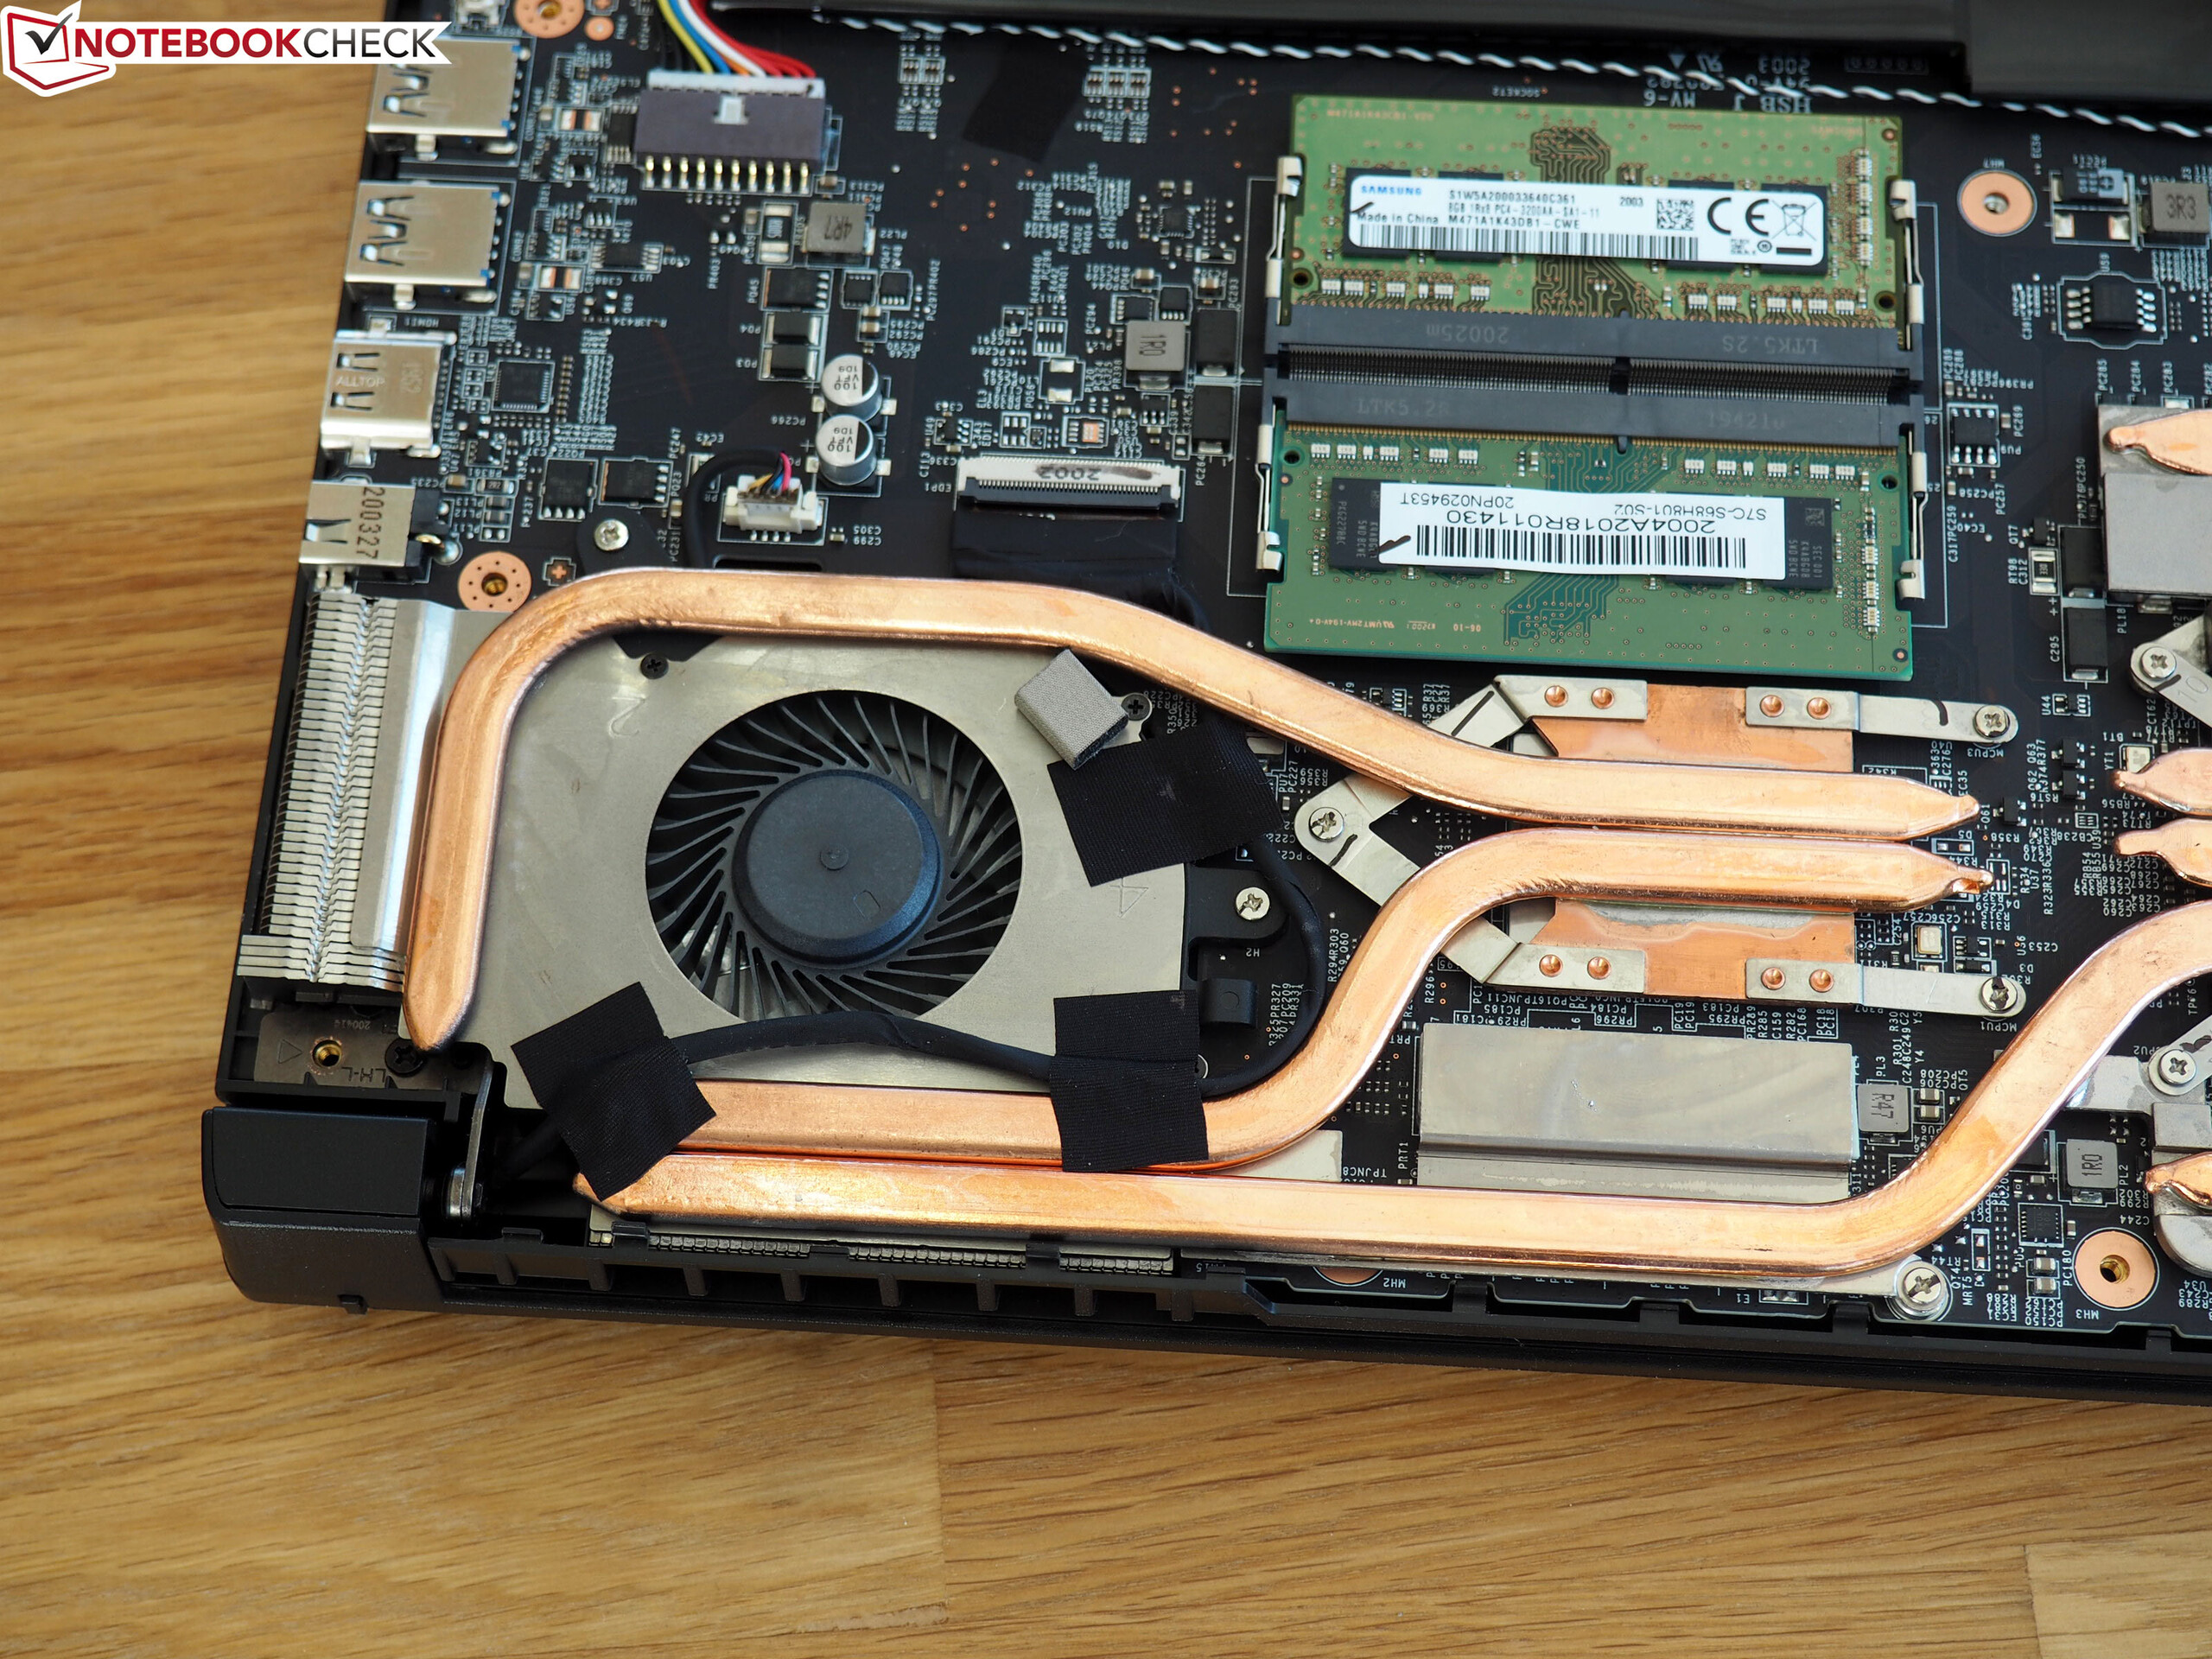
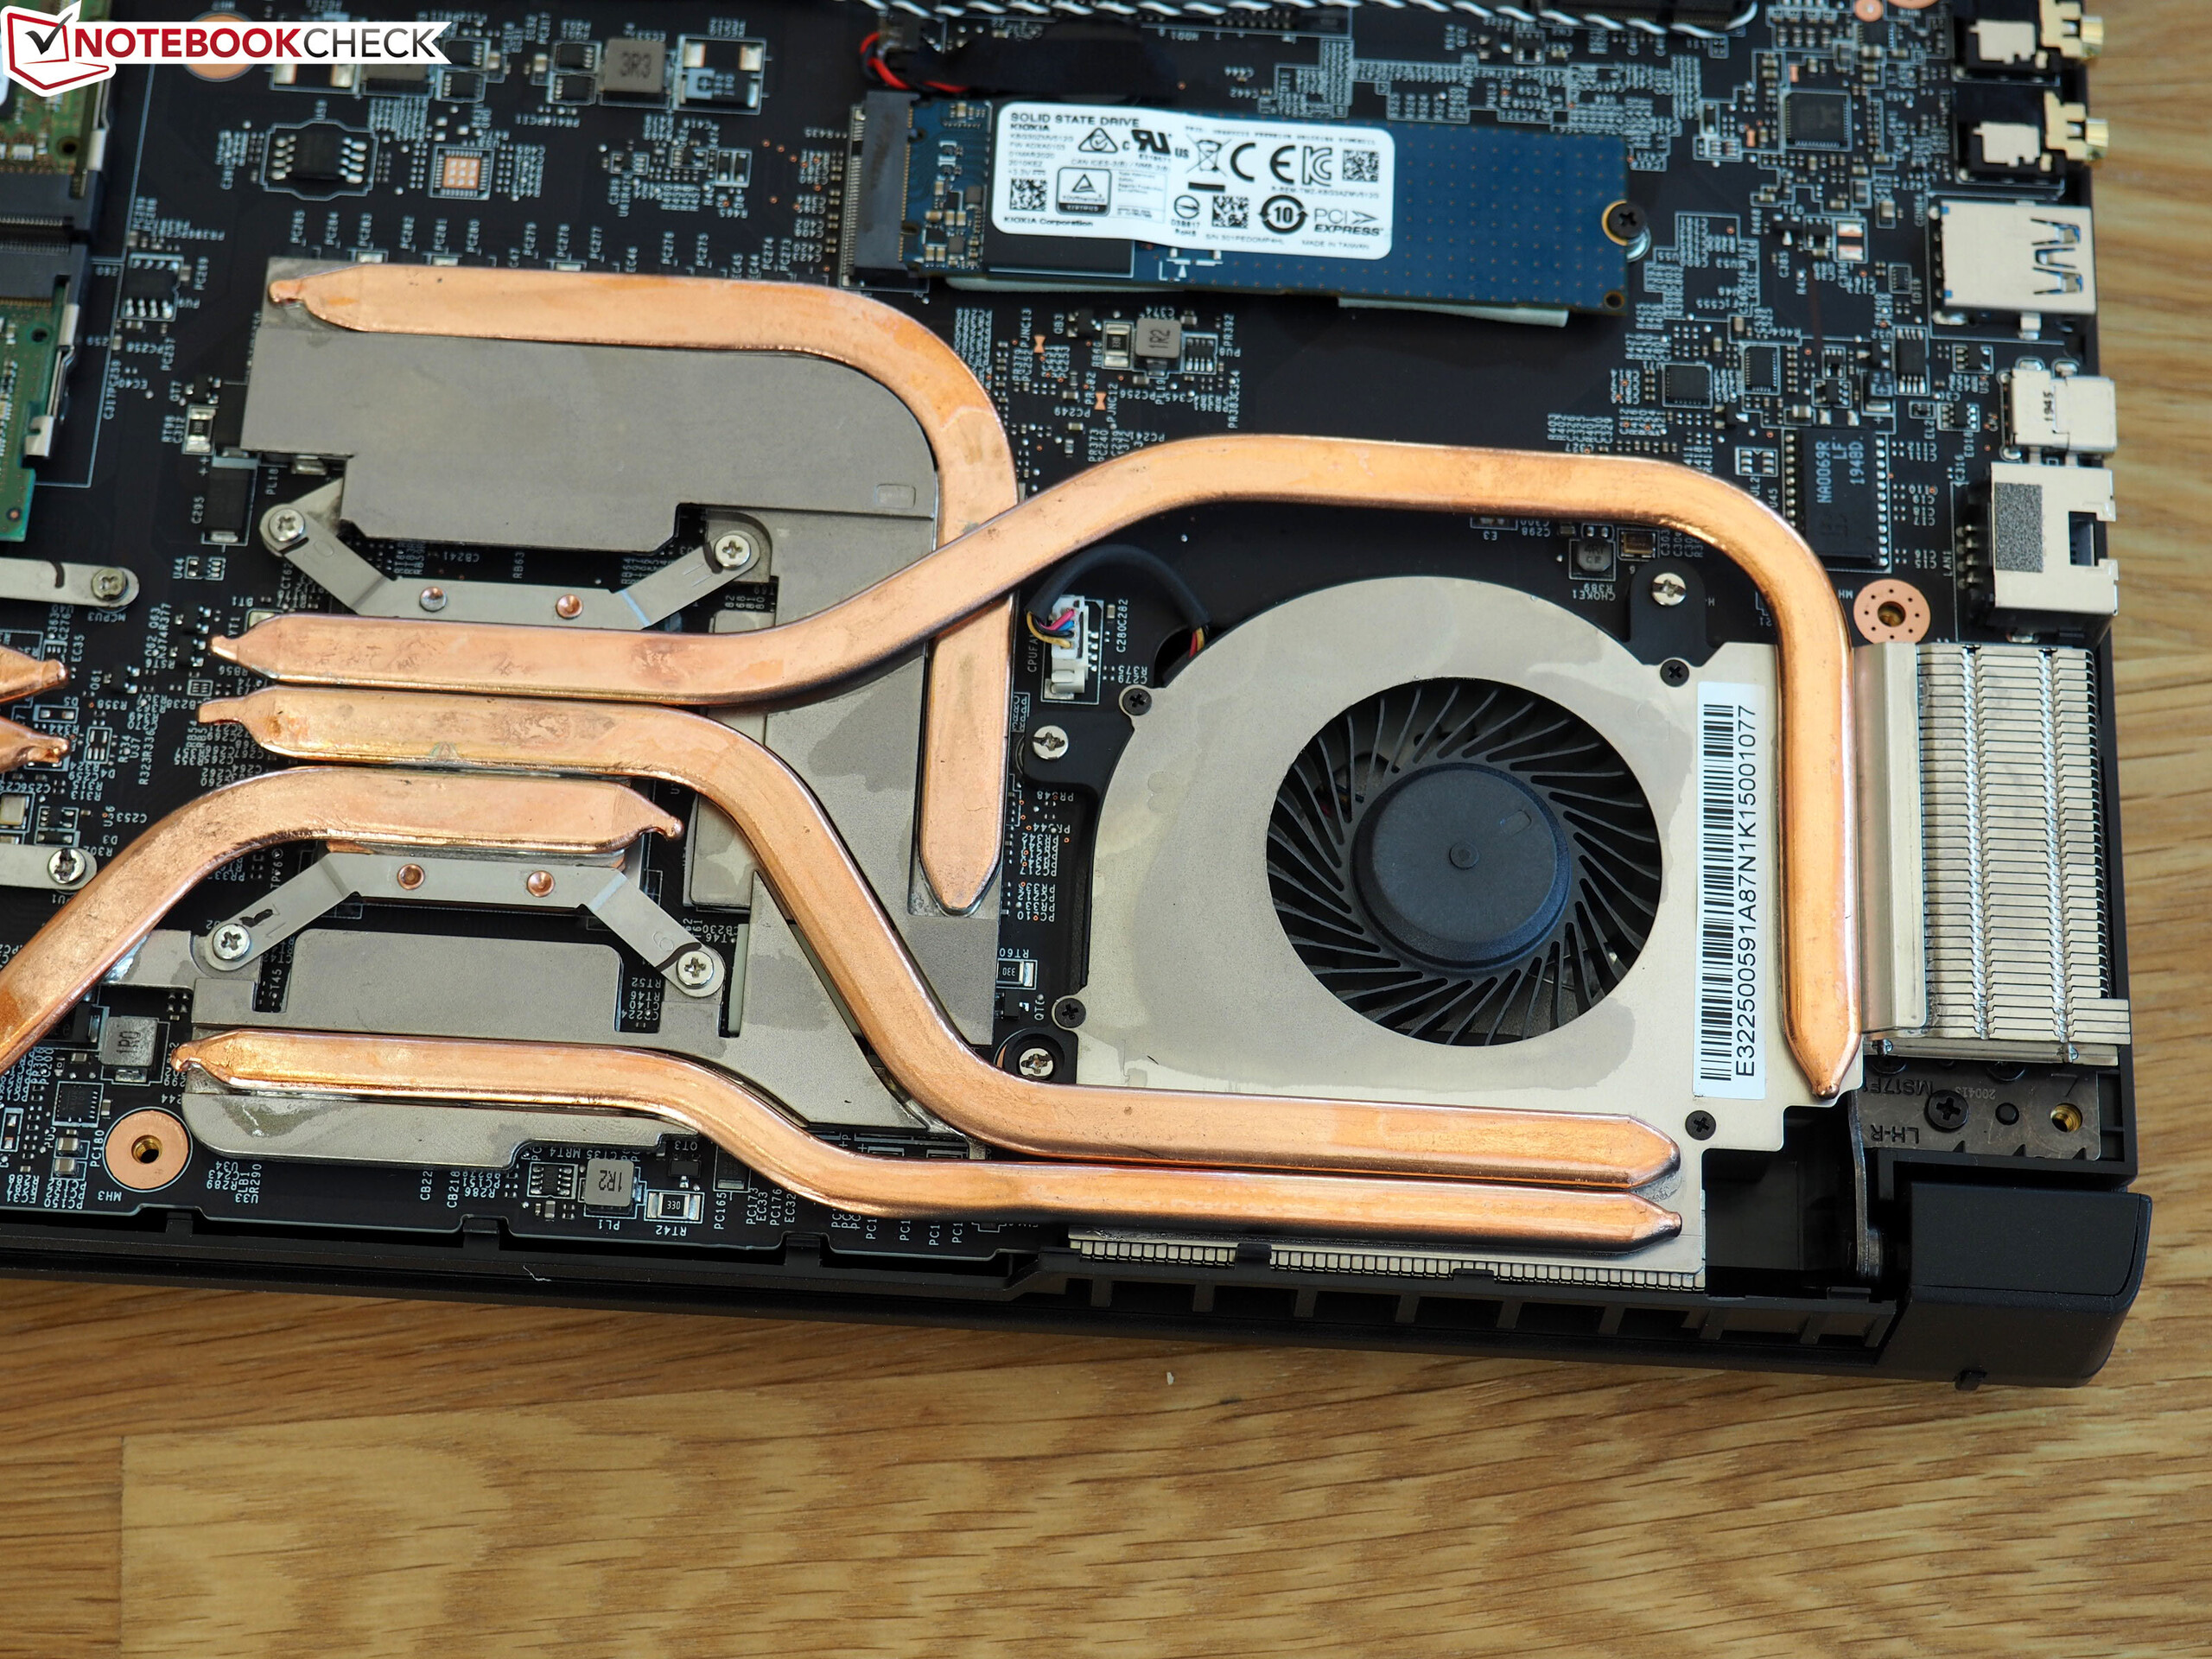
Maintenance
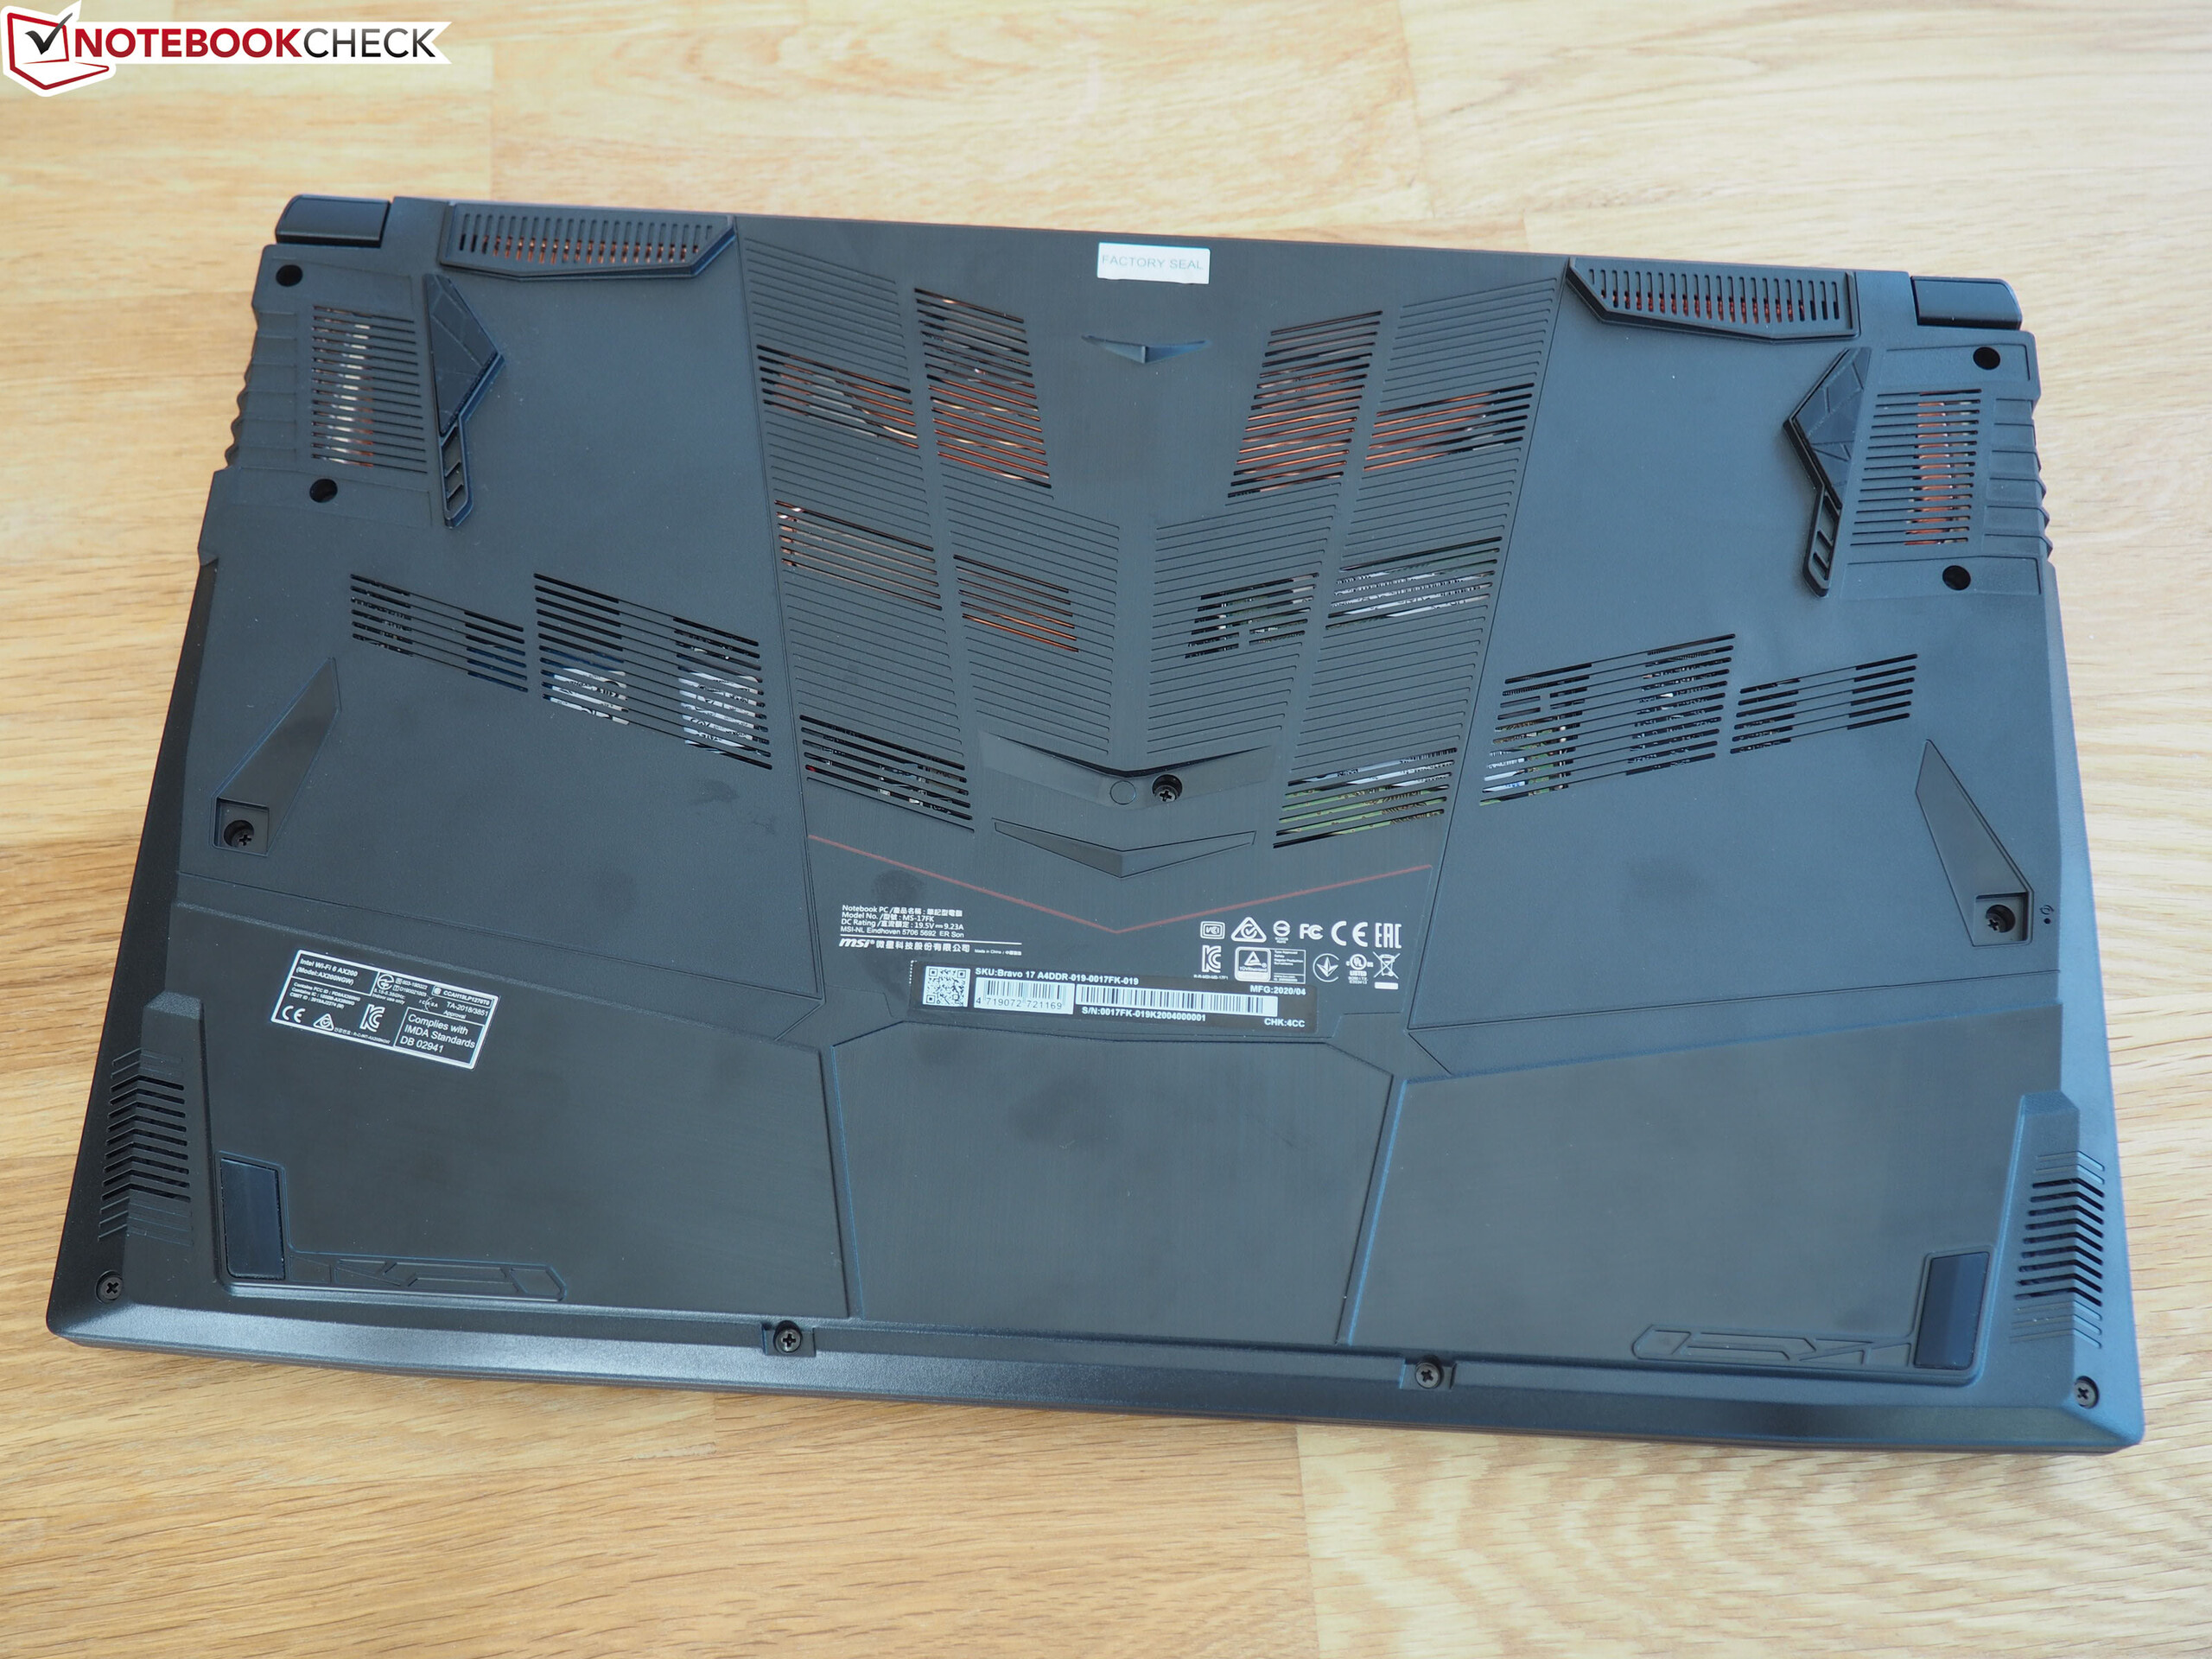
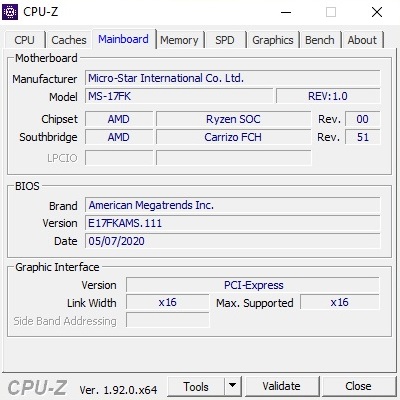
The maintenance options are typical for a gaming laptop. After you have removed the 12 Philips screws from the case bottom, the complete bottom side can be lifted out of the anchoring - provided you have some skill. Inside the chassis, you will find the battery and the Wi-Fi chip and also two RAM slots, an M.2 slot, and a (free) 2.5-inch slot. The cooling system consists of two fans with several heatpipes running from them towards the CPU and GPU (each soldered).
Warranty
The warranty is valid for 24 months. MSI mentions a pick-up-and-return service.
Input devices
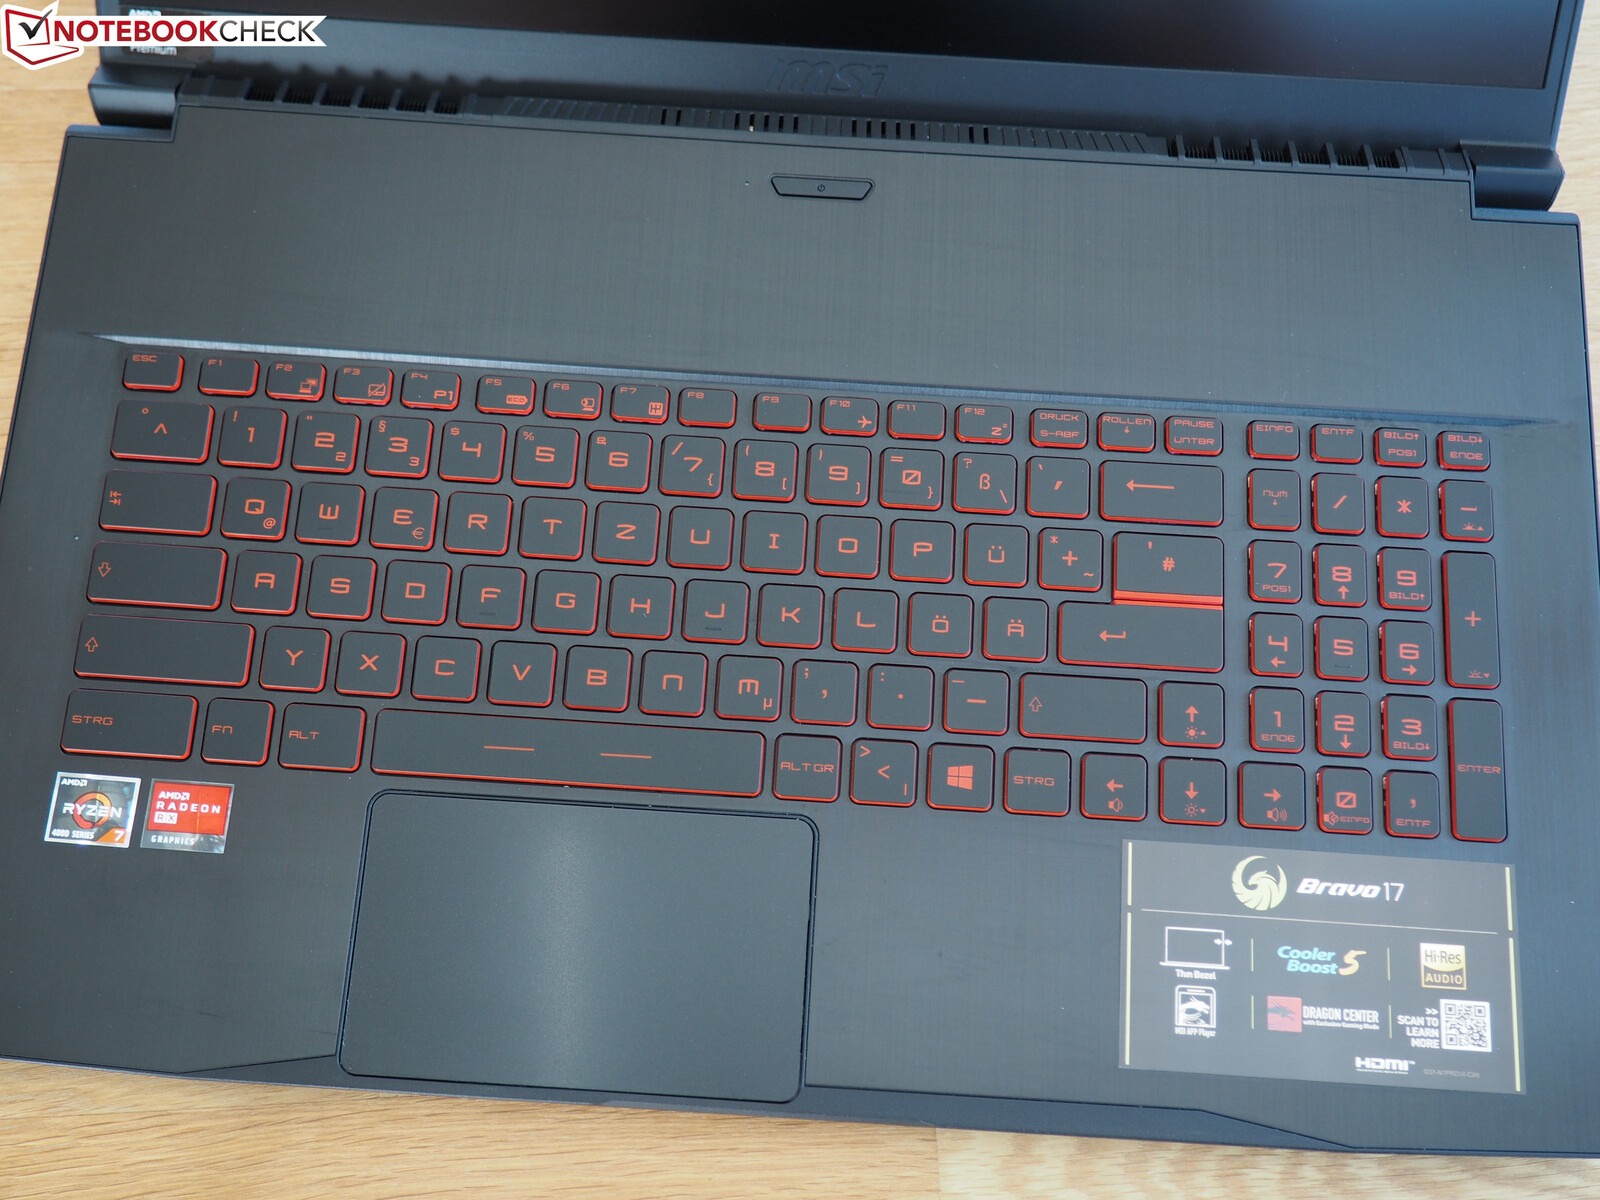
Keyboard
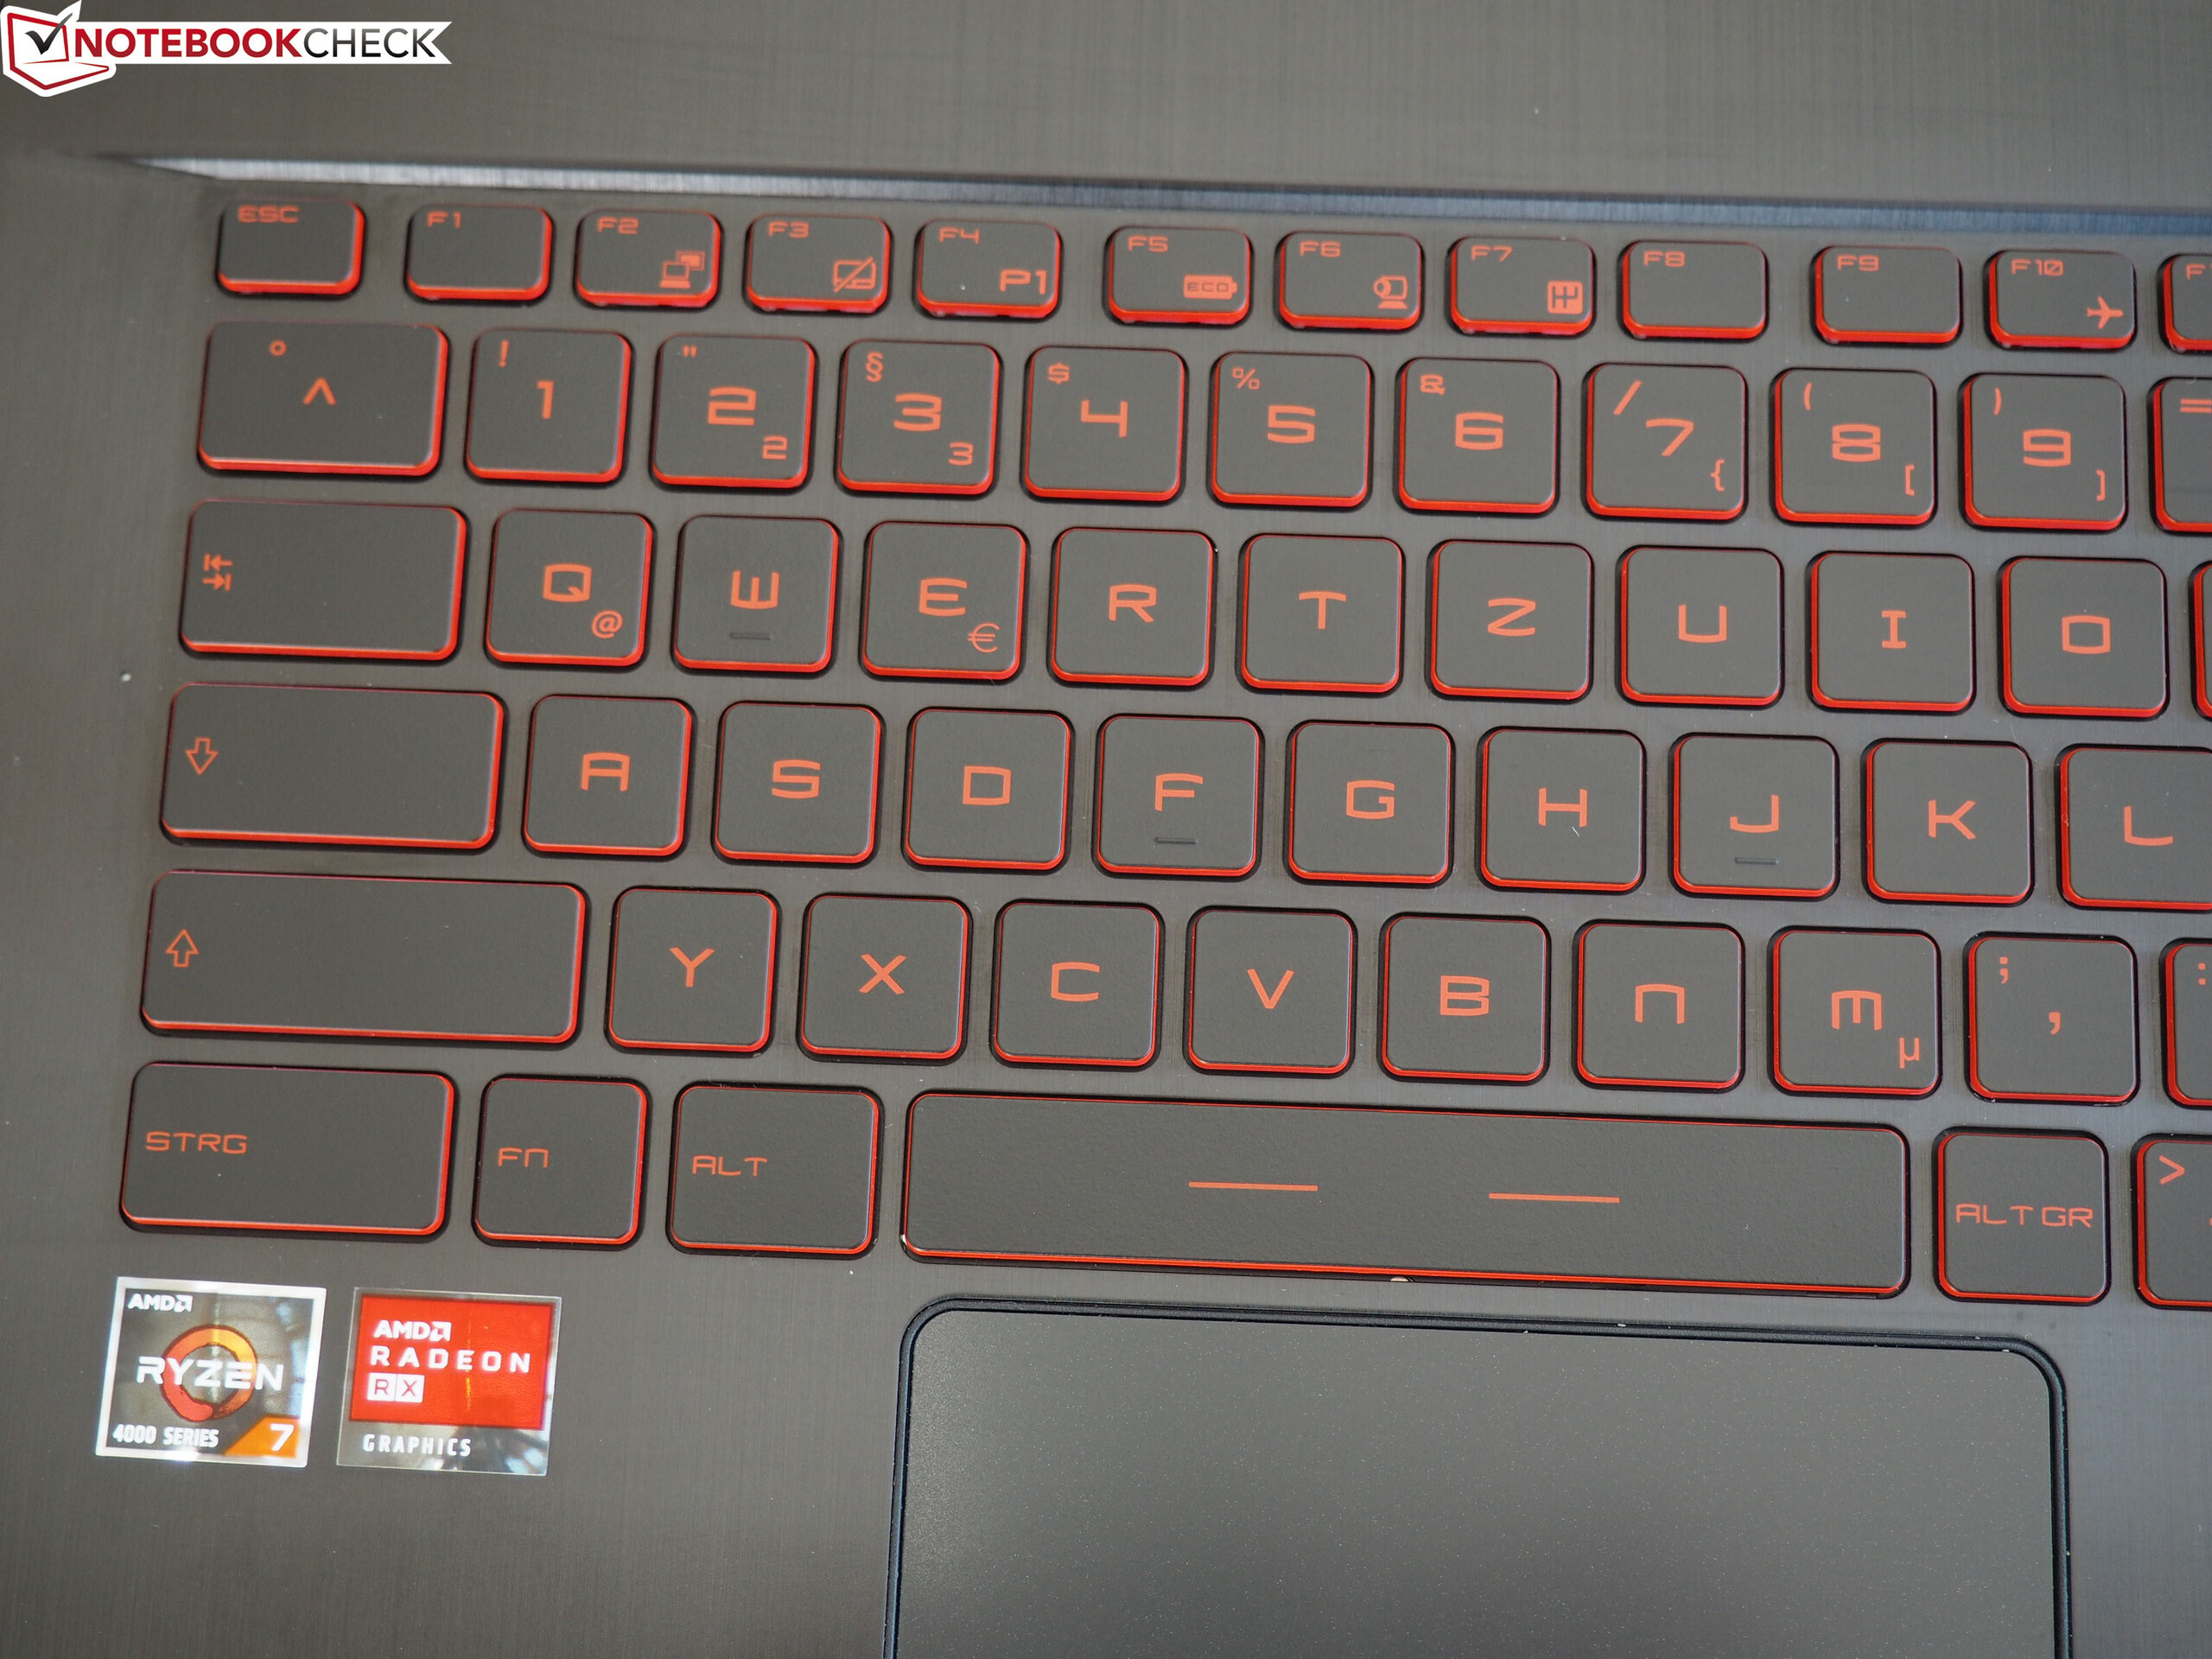
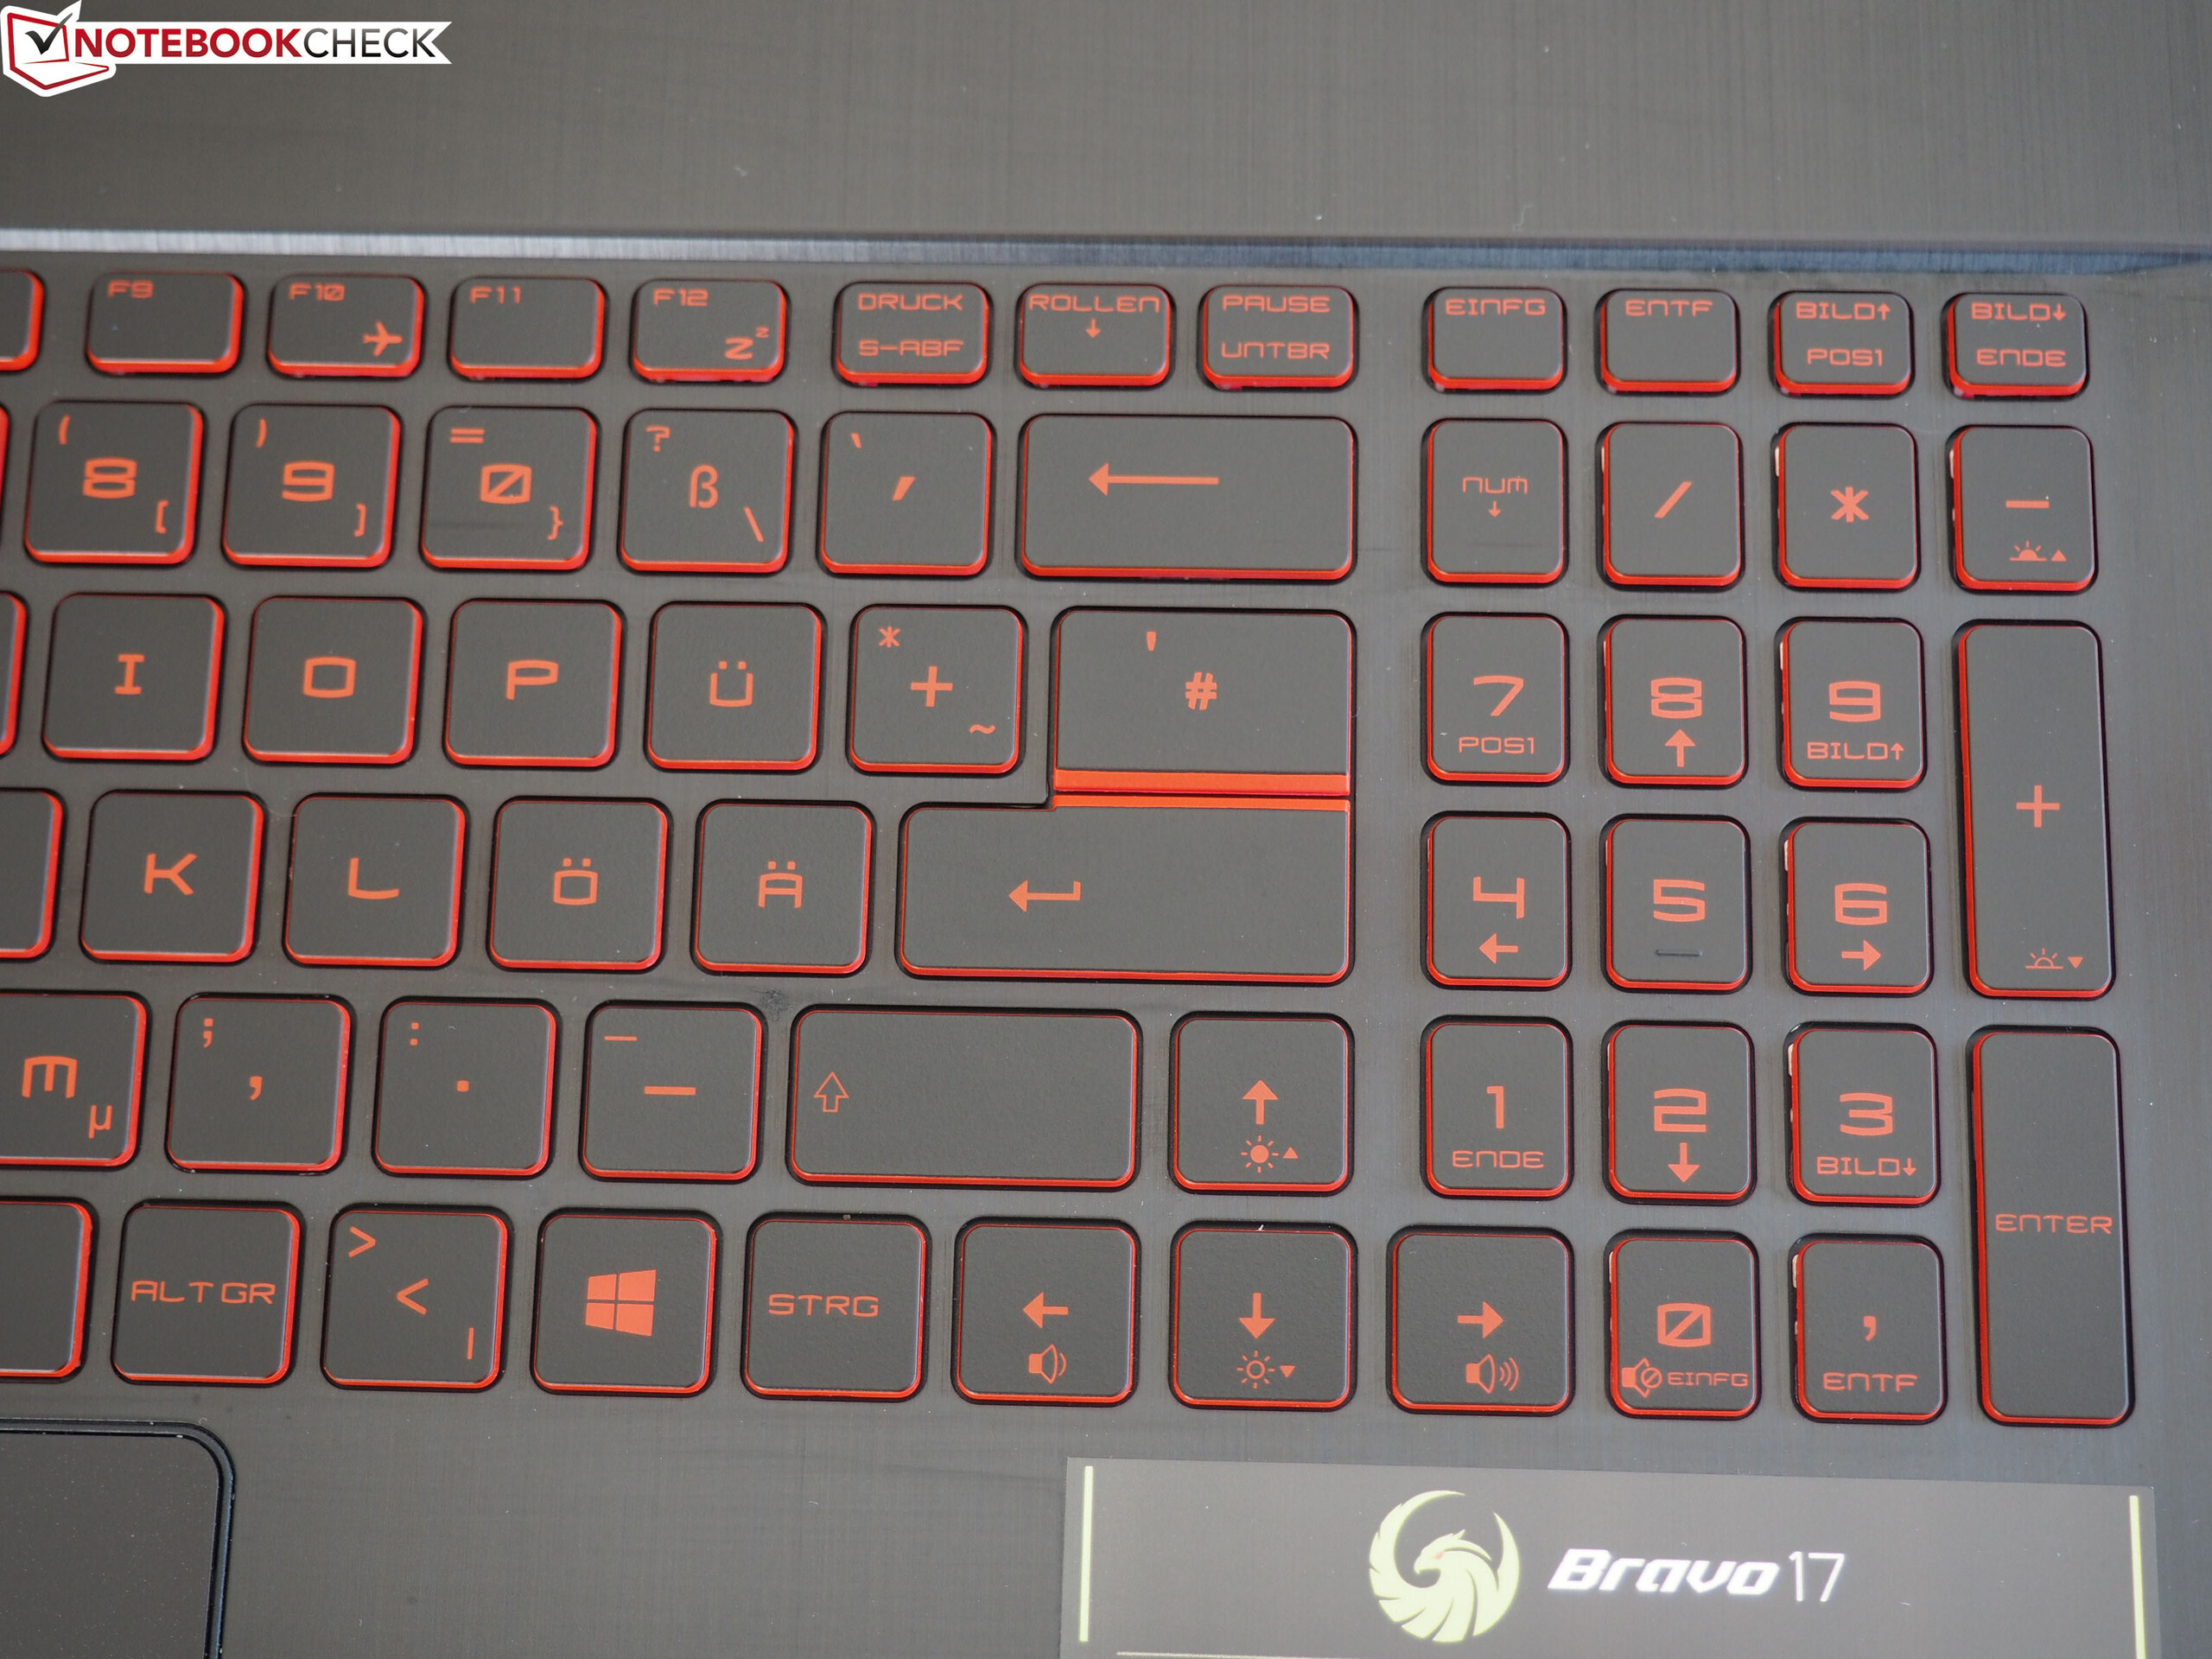
Although the keyboard model is already known from other MSI laptops, the layout requires a certain amount of getting used to. In addition to the <>| key, the # key is also in an unusual position on the German version, which can lead to incorrect entries at the beginning. Additionally, there is a single-line Enter key, which is also suboptimal. The fact that the arrow keys extend into the (rather narrow) number pad and the main field, on the other hand, is seen often.
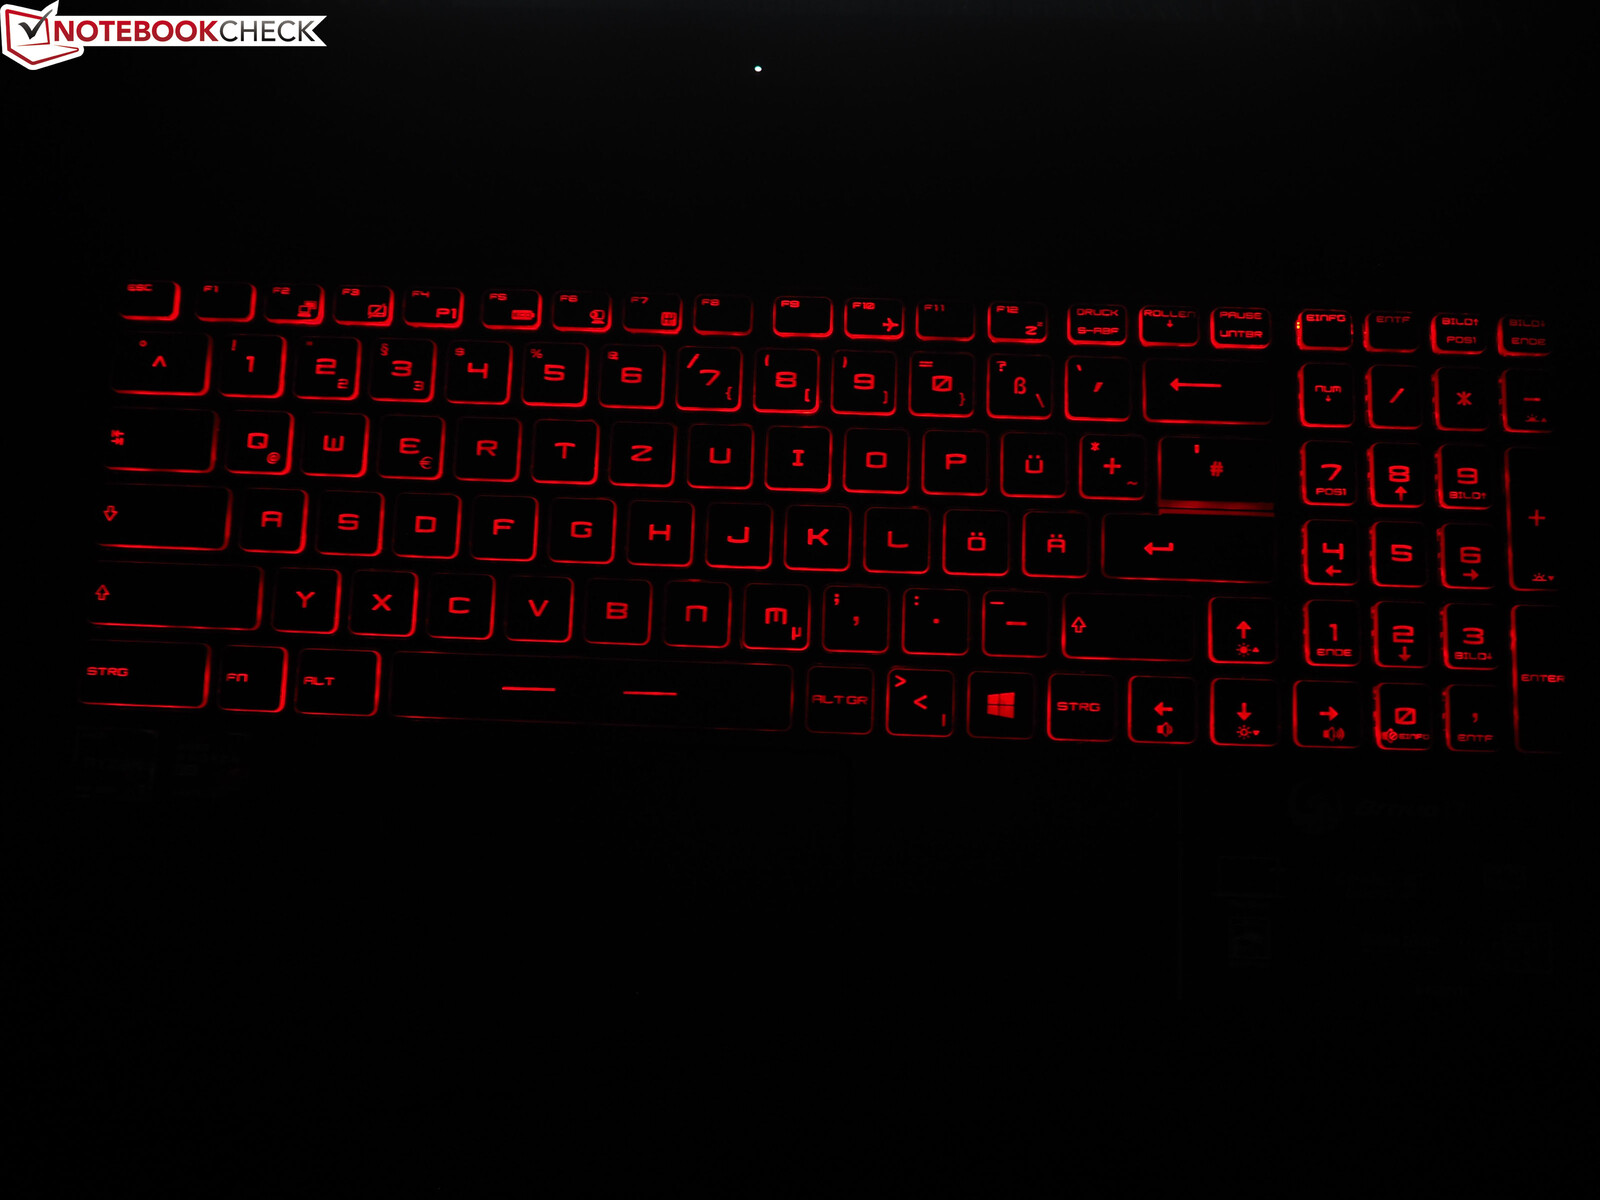
By the way, MSI forgoes RGB lighting to reduce costs a bit. The keyboard is illuminated in red to match the red labeling. We would describe the typing experience as ranging from decent to good. It feels neither particularly mushy nor particularly hard. The keyboard's positioning, in particular, is a point of criticism for MSI. Because it's placed very low, the palm rest only reaches a height of 7.5 cm. Unless you have tiny hands, your palms always lie unpleasantly on the edge or slide downwards off the case completely - an unnecessary design flaw.
Touchpad
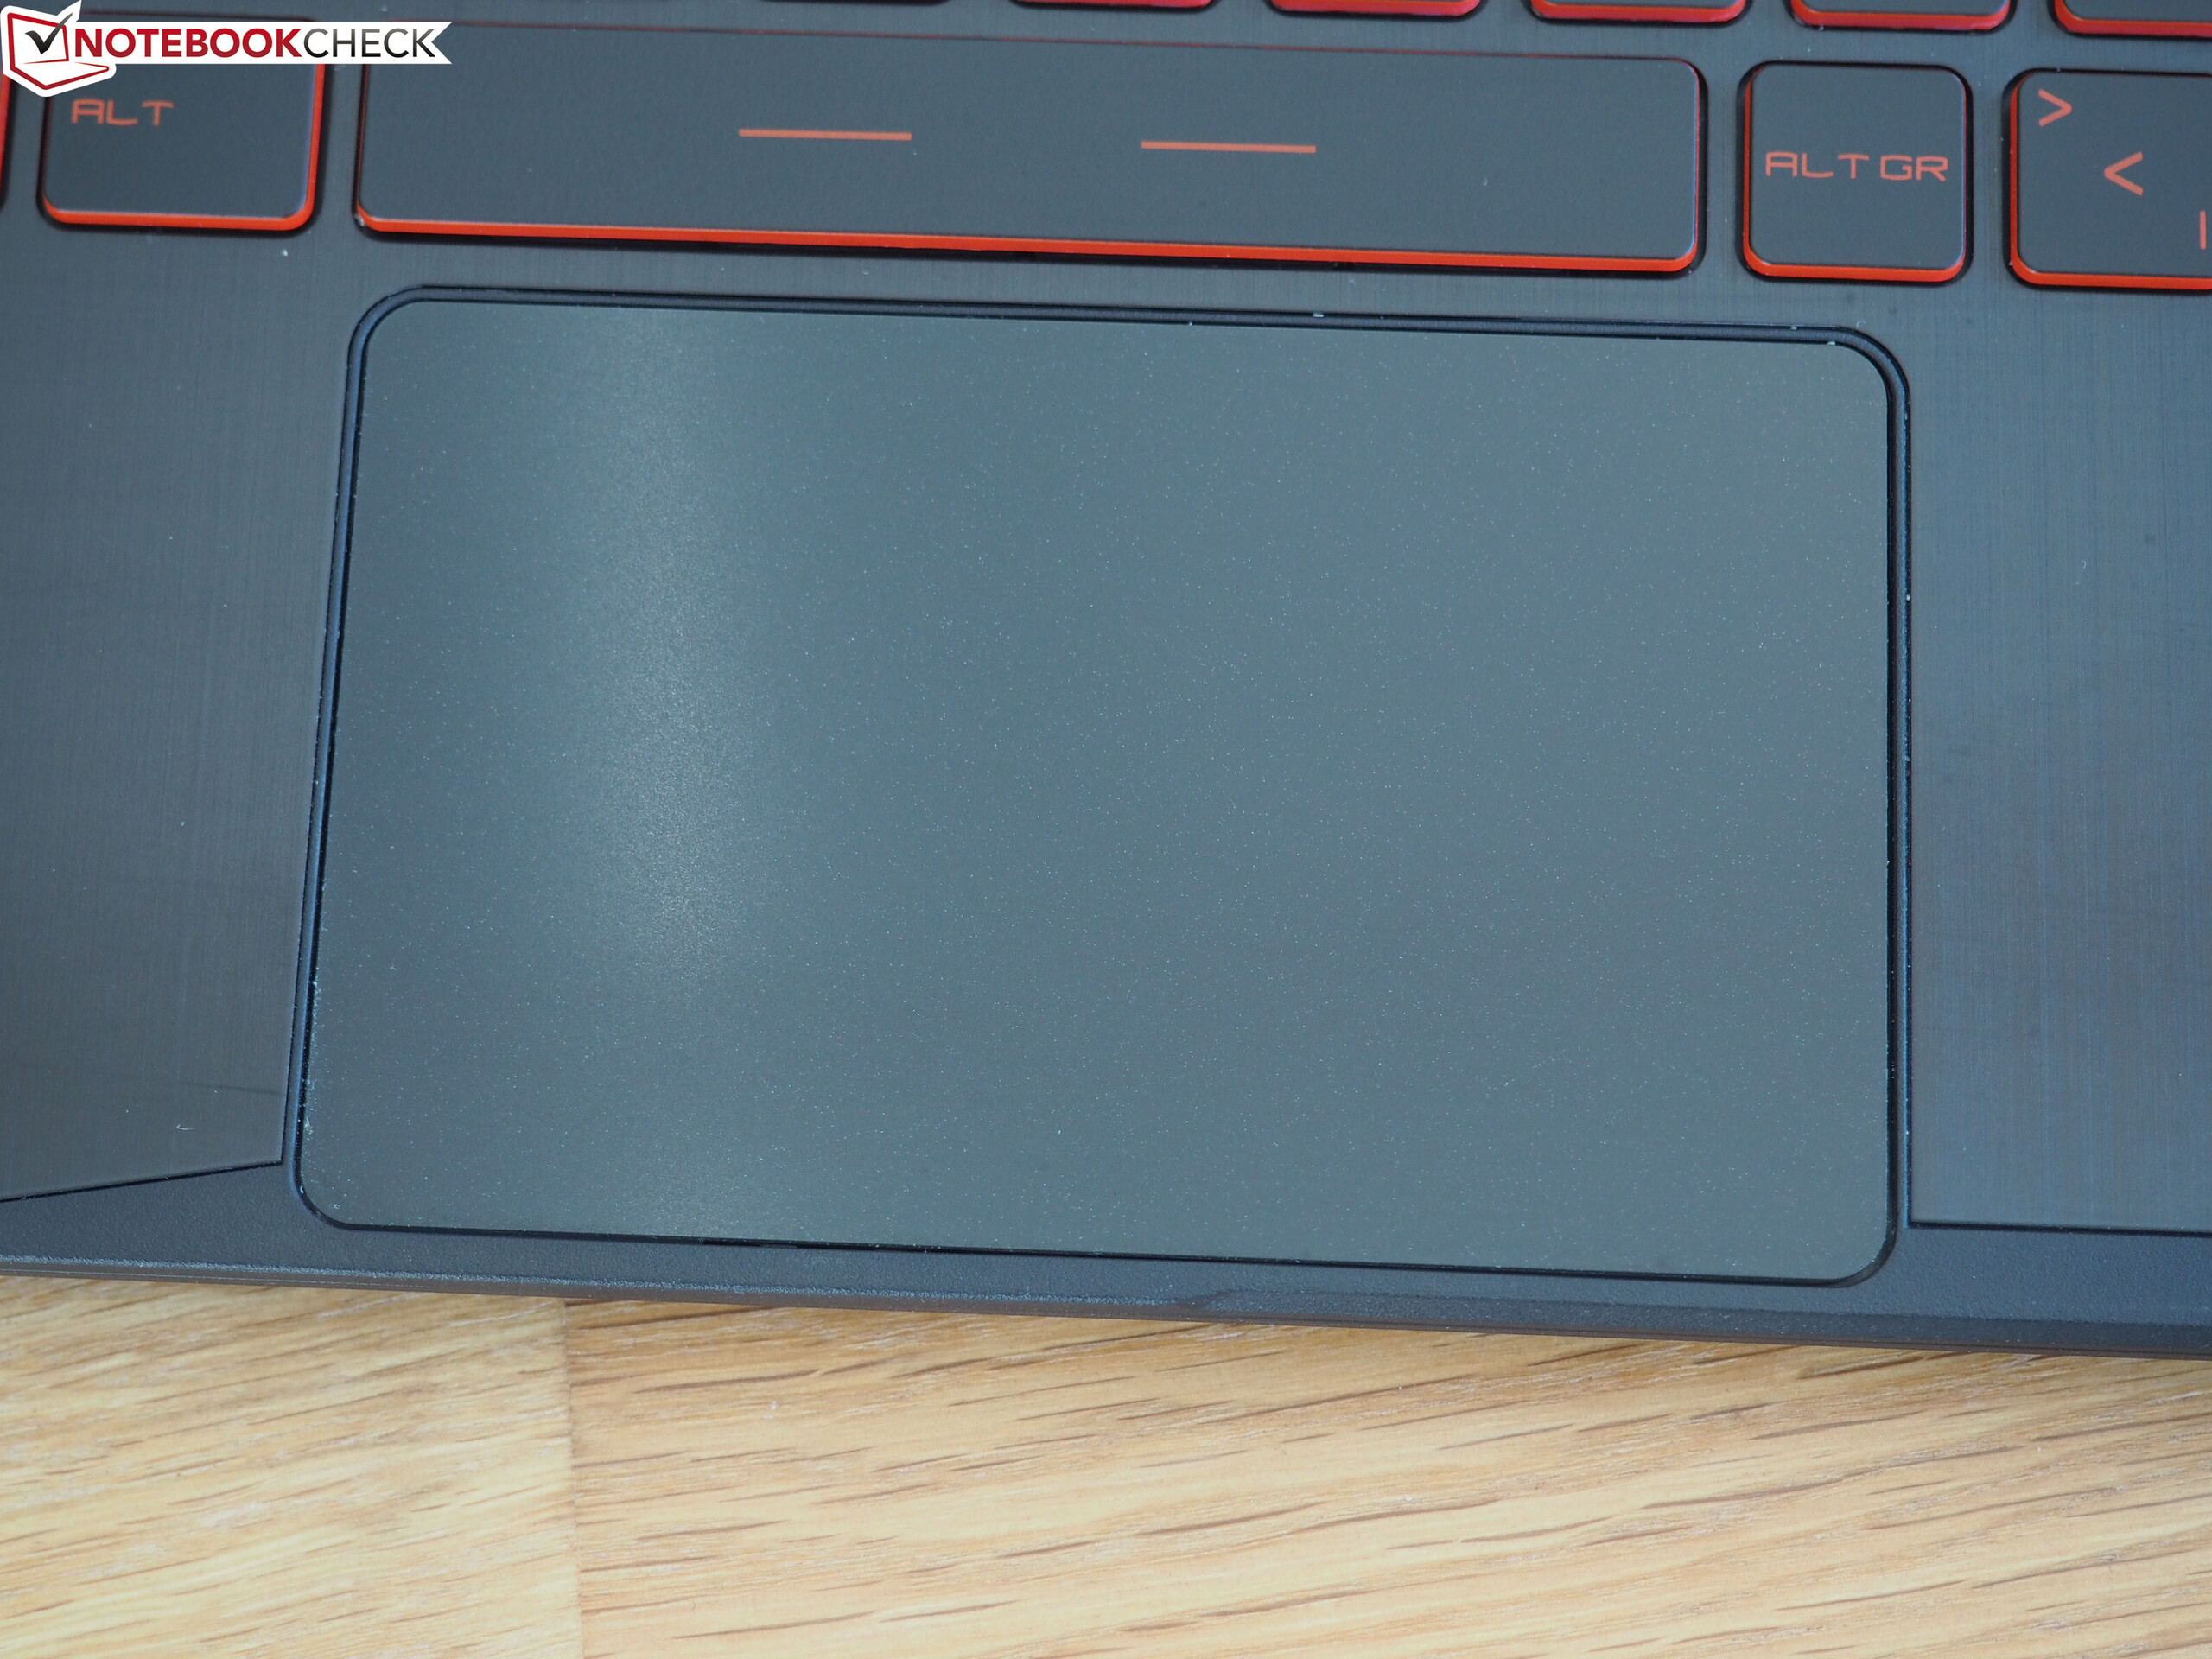
The touchpad proves to be unspectacular. Thanks to the smooth finish, fingers glide quite well over the surface. The precision isn't bad either. The same goes for the multi-touch support. Documents, websites, etc., can be zoomed and scrolled stress-free with two fingers. Gesture recognition works reliably for the most part. Since the touchpad doesn't have any dedicated keys, left and right clicks are triggered by pressing the main area. The triggering noise is - in contrast to the keyboard - relatively loud and sounds rattly. However, there's nothing to complain about with the basic stability of the mouse replacement.
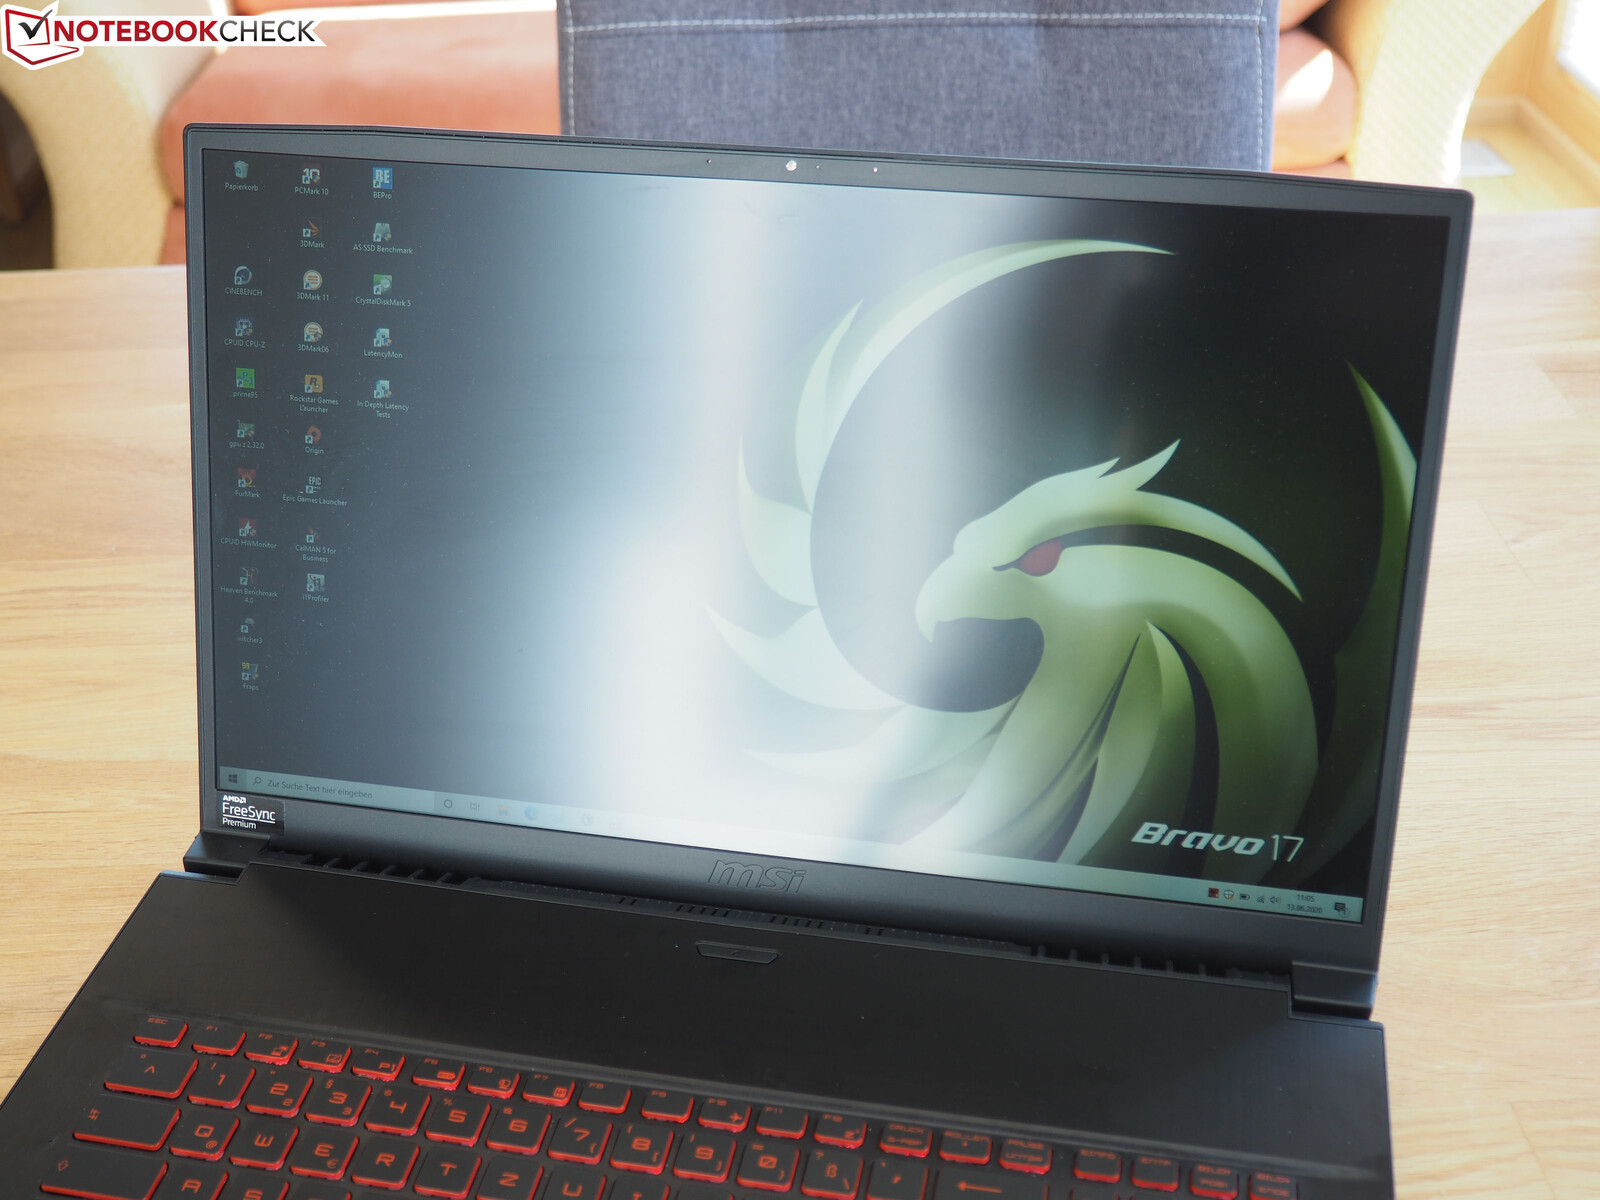
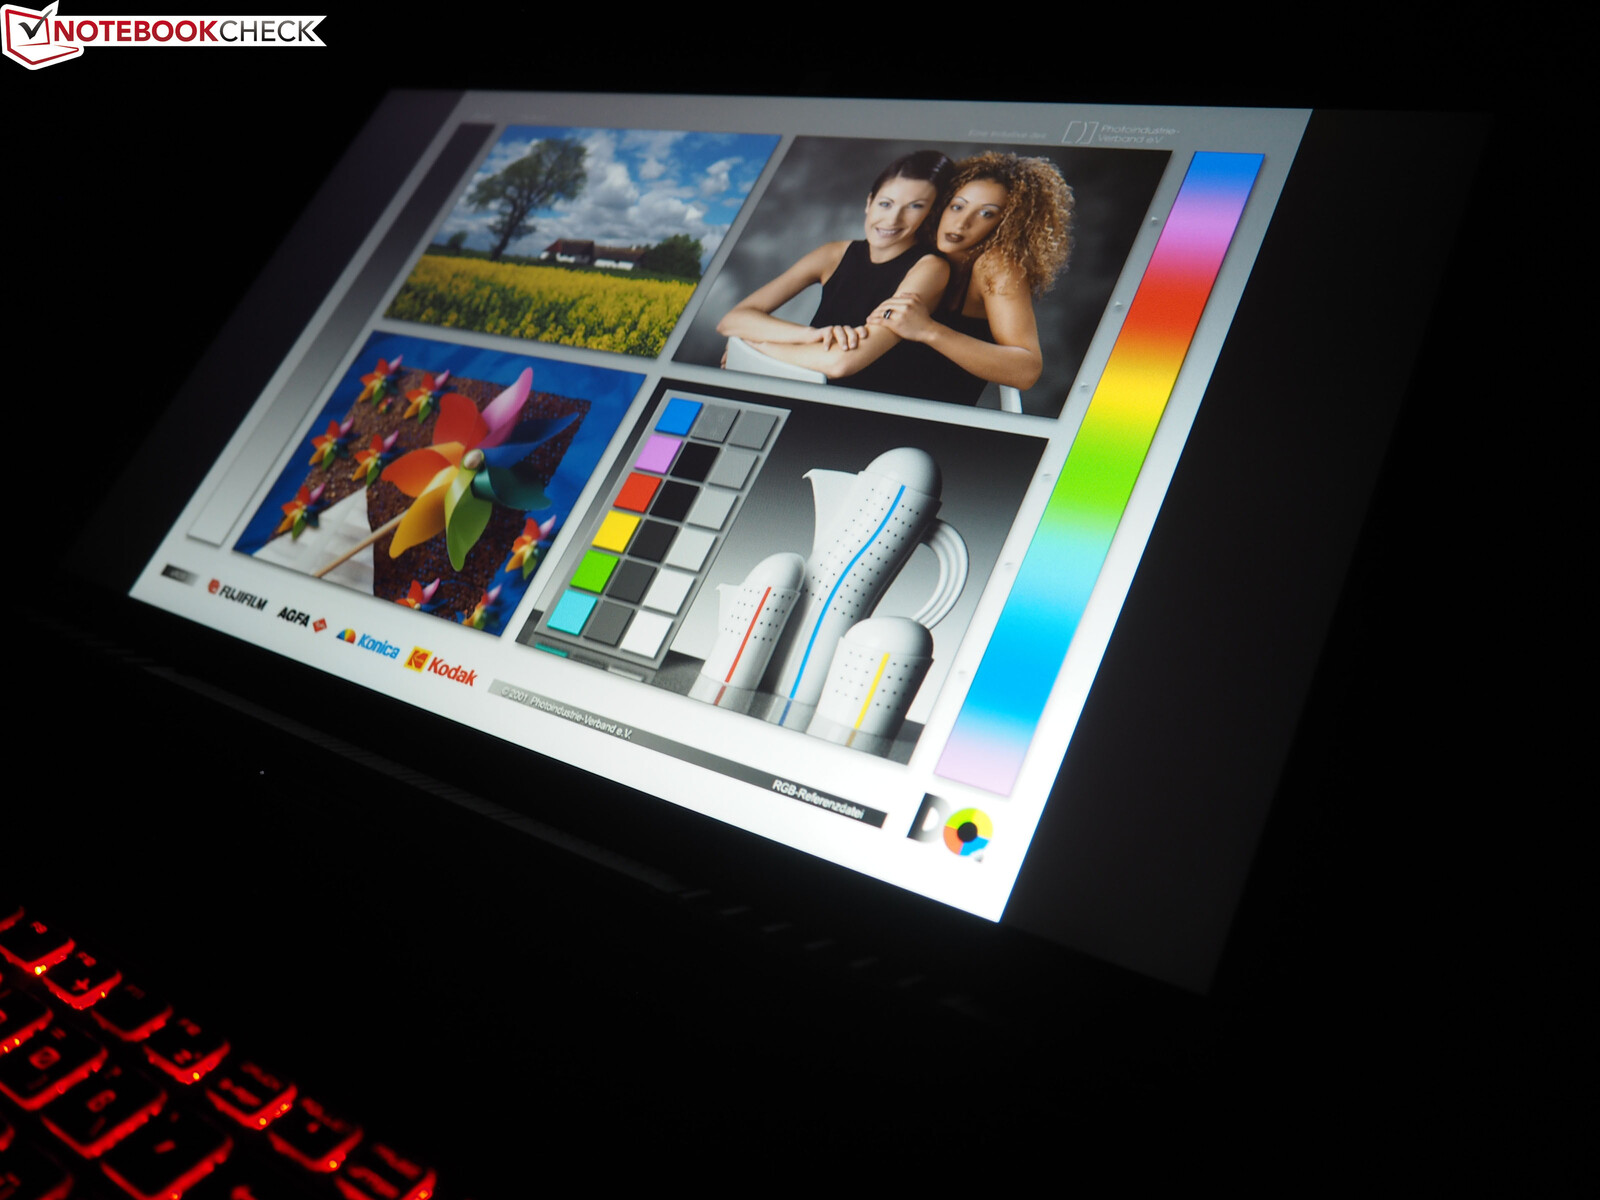
Display
The 17-inch display delivers mixed results. Let's start with the positive aspects. Due to the low black value of 0.23 cd/m², the Bravo 17 is able to offer a convincing contrast. Just under 1,150:1 should satisfy most buyers.
| |||||||||||||||||||||||||
Brightness Distribution: 88 %
Center on Battery: 264 cd/m²
Contrast: 1148:1 (Black: 0.23 cd/m²)
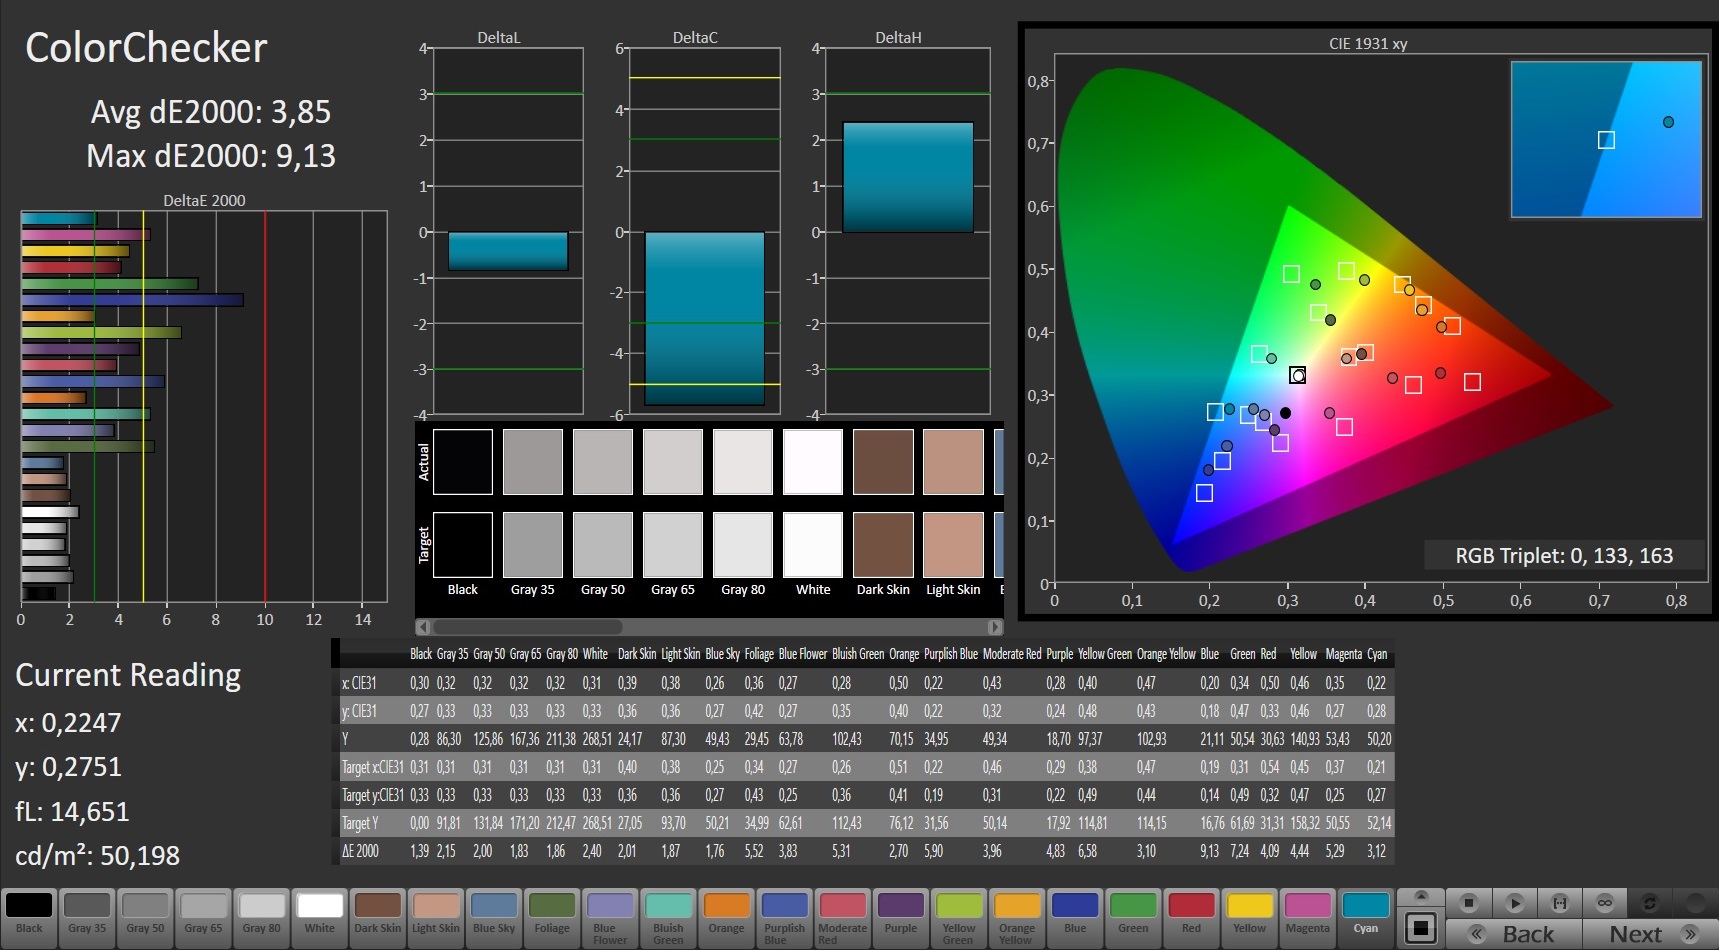
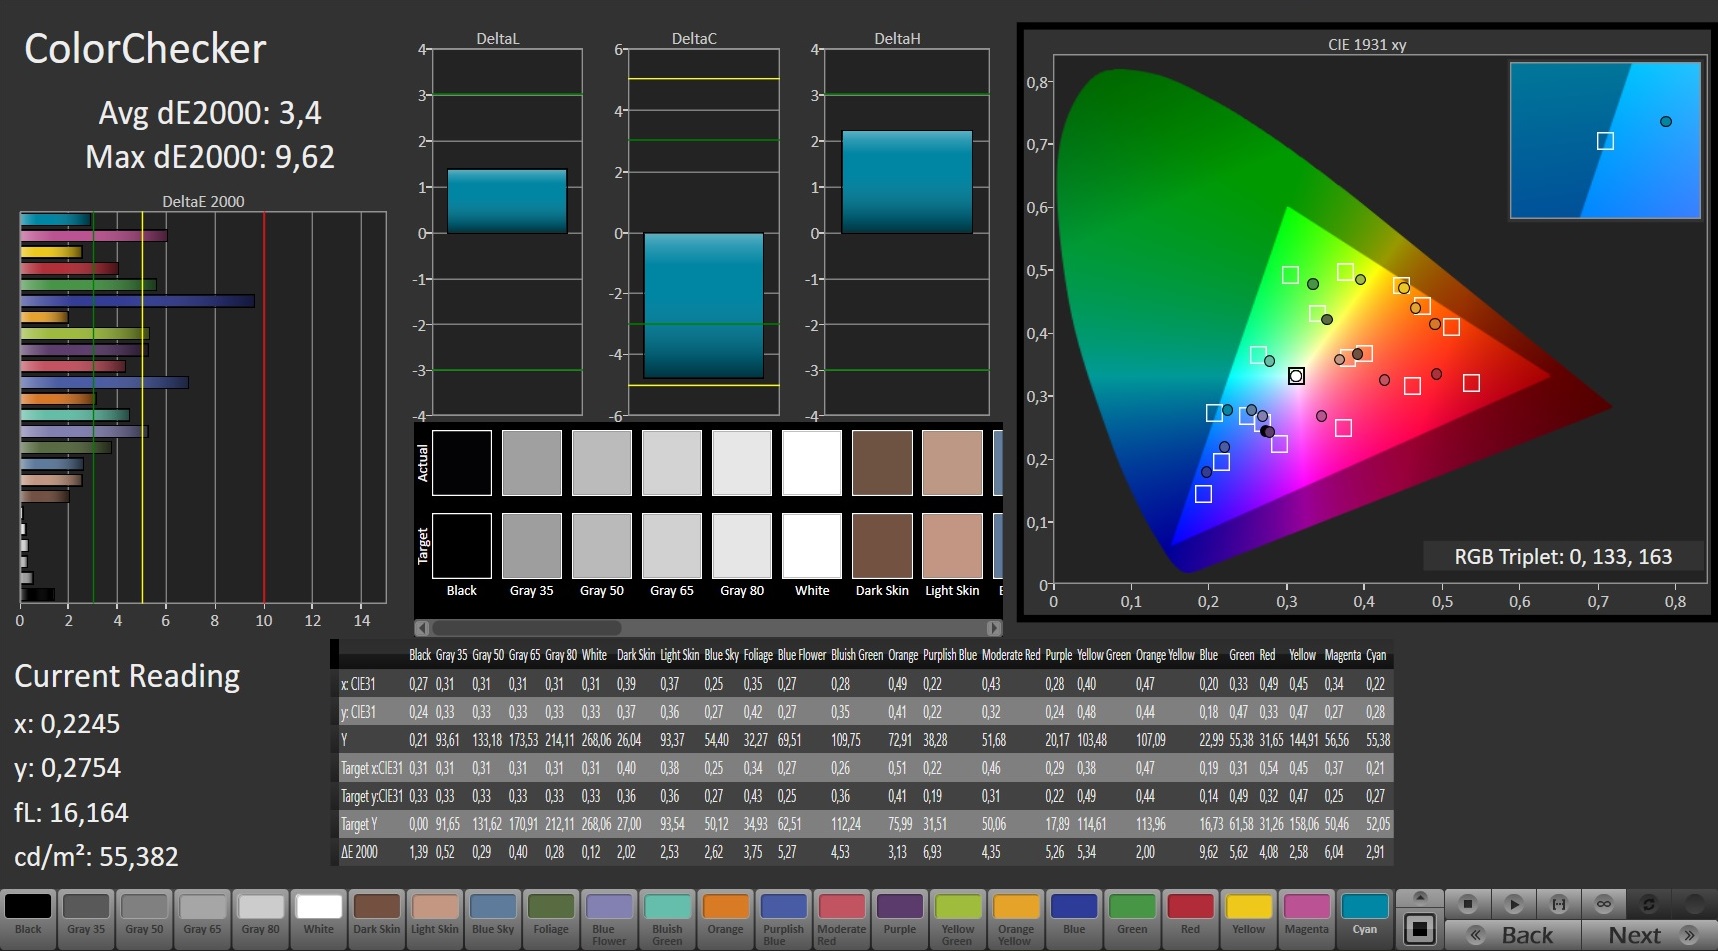
ΔE ColorChecker Calman: 3.85 | ∀{0.5-29.43 Ø4.73}
calibrated: 3.4
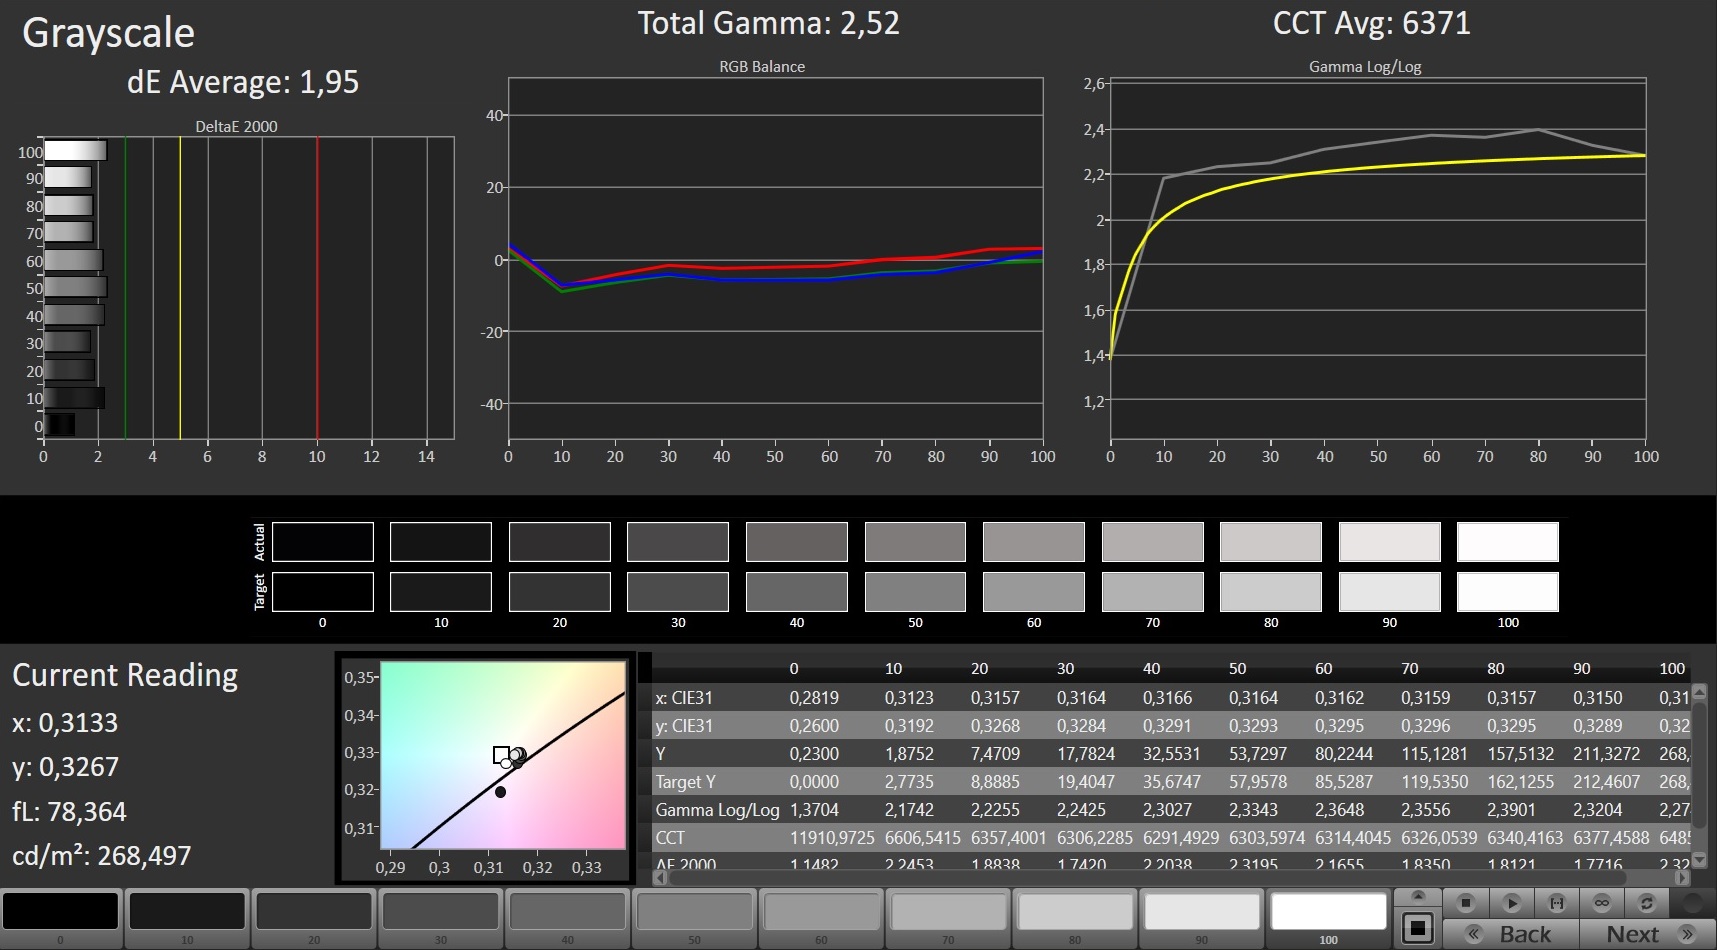
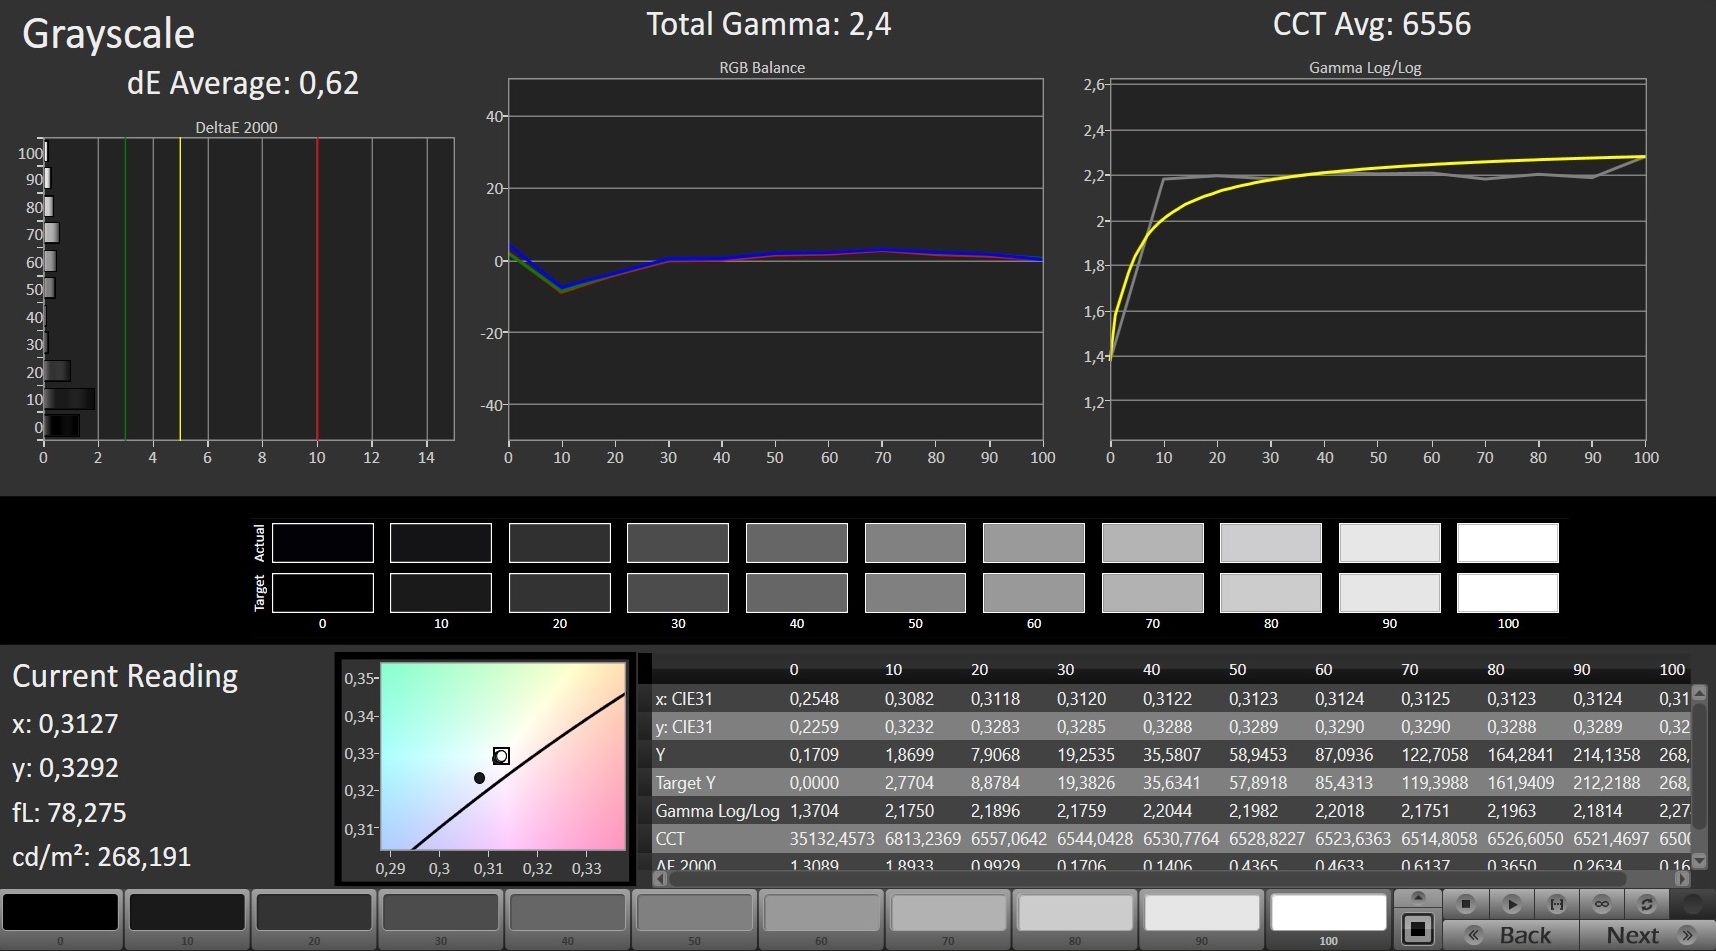
ΔE Greyscale Calman: 1.95 | ∀{0.09-98 Ø4.97}
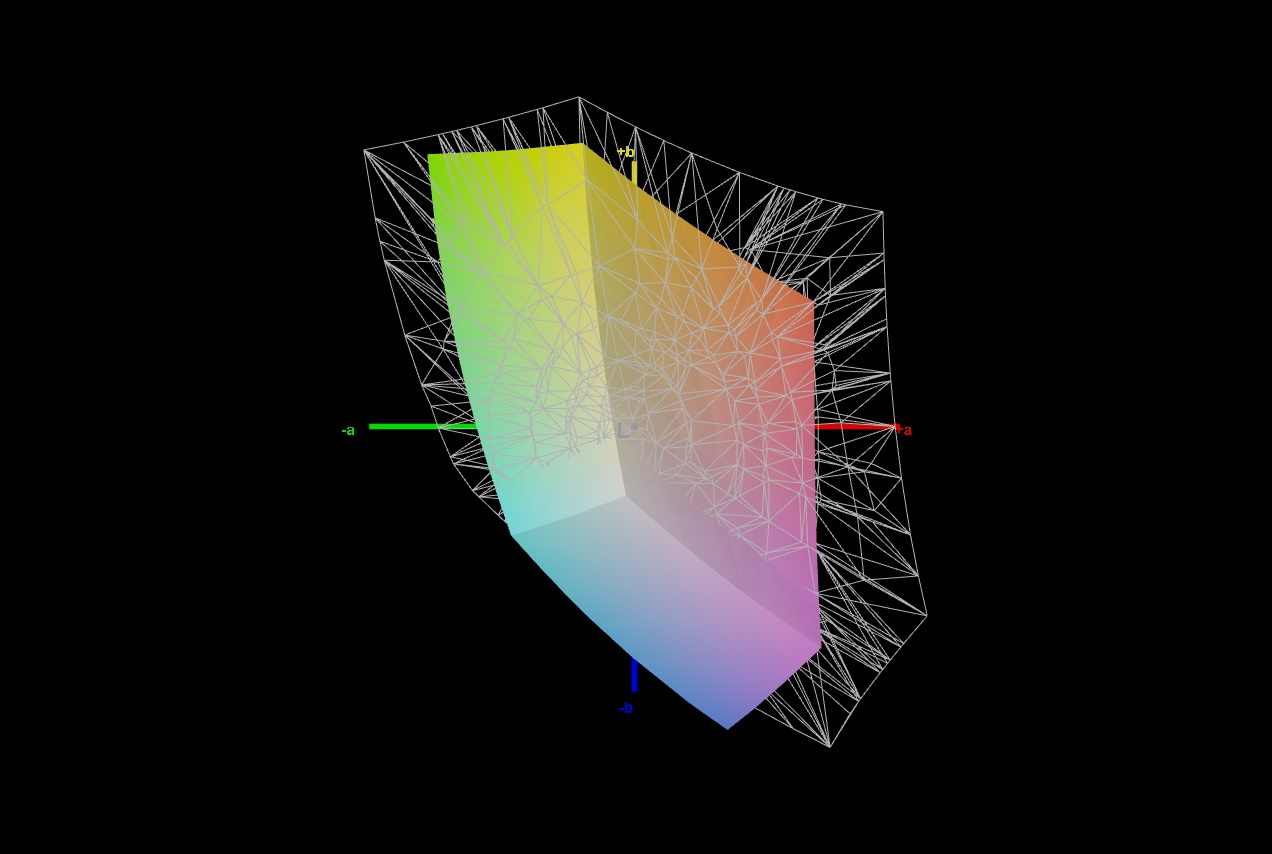
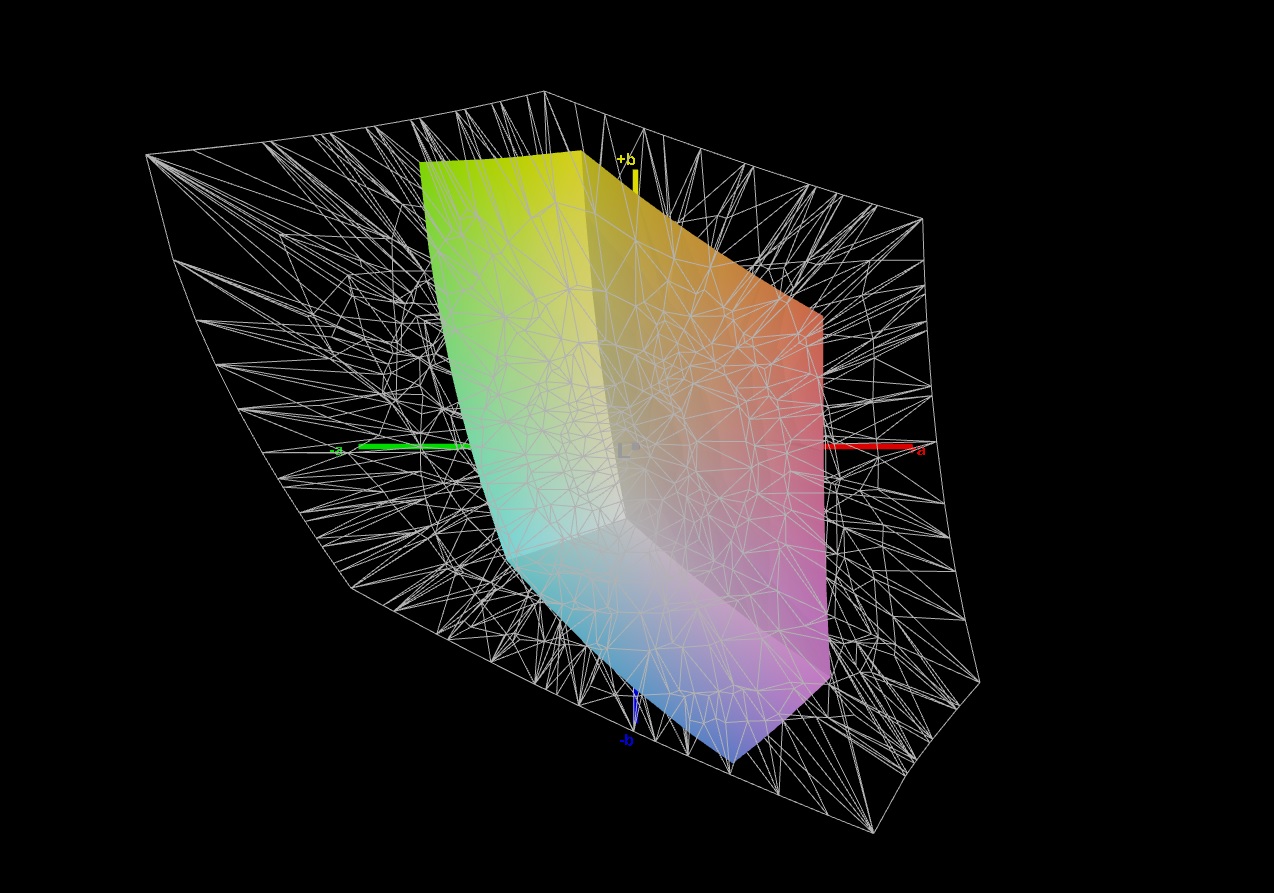
60% sRGB (Argyll 1.6.3 3D)
42% AdobeRGB 1998 (Argyll 1.6.3 3D)
41.88% AdobeRGB 1998 (Argyll 3D)
60.1% sRGB (Argyll 3D)
40.54% Display P3 (Argyll 3D)
Gamma: 2.52
CCT: 6371 K
| MSI Bravo 17 A4DDR AU Optronics B173HAN04.7 (AUO479D), IPS, 1920x1080 | MSI Alpha 15 A3DDK-034 AU Optronics B156HAN08.0 (AUO80ED), IPS, 1920x1080 | MSI GF75 Thin 9SC AU Optronics B173HAN04.2, IPS, 1920x1080 | Asus TUF FX705DT-AU068T AU Optronics B173HAN04.2, IPS, 1920x1080 | Asus TUF A17 FA706IU-AS76 BOE NV173FHM-NX1, IPS, 1920x1080 | Lenovo Legion Y540-17IRH AU Optronics B173HAN04.4 (AUO449D), IPS, 1920x1080 | |
|---|---|---|---|---|---|---|
| Display | 58% | 52% | 51% | -0% | 68% | |
| Display P3 Coverage (%) | 40.54 | 66.4 64% | 62.5 54% | 62.3 54% | 40.55 0% | 69 70% |
| sRGB Coverage (%) | 60.1 | 91 51% | 90 50% | 89.1 48% | 59.7 -1% | 98.3 64% |
| AdobeRGB 1998 Coverage (%) | 41.88 | 66.6 59% | 64 53% | 63.7 52% | 41.89 0% | 70.7 69% |
| Response Times | 74% | 6% | -2% | 40% | 56% | |
| Response Time Grey 50% / Grey 80% * (ms) | 40 ? | 7 ? 82% | 34 ? 15% | 41 ? -2% | 22.4 ? 44% | 18 ? 55% |
| Response Time Black / White * (ms) | 29.6 ? | 10.4 ? 65% | 30.4 ? -3% | 30 ? -1% | 19.2 ? 35% | 12.8 ? 57% |
| PWM Frequency (Hz) | ||||||
| Screen | -2% | 9% | 7% | -18% | 13% | |
| Brightness middle (cd/m²) | 264 | 310 17% | 344.7 31% | 316 20% | 264.8 0% | 286 8% |
| Brightness (cd/m²) | 244 | 310 27% | 332 36% | 294 20% | 253 4% | 282 16% |
| Brightness Distribution (%) | 88 | 86 -2% | 91 3% | 84 -5% | 90 2% | 87 -1% |
| Black Level * (cd/m²) | 0.23 | 0.29 -26% | 0.3 -30% | 0.32 -39% | 0.31 -35% | 0.19 17% |
| Contrast (:1) | 1148 | 1069 -7% | 1149 0% | 988 -14% | 854 -26% | 1505 31% |
| Colorchecker dE 2000 * | 3.85 | 4.78 -24% | 3.08 20% | 3.39 12% | 4.73 -23% | 3.57 7% |
| Colorchecker dE 2000 max. * | 9.13 | 8.1 11% | 6.32 31% | 5.56 39% | 18.89 -107% | 7.5 18% |
| Colorchecker dE 2000 calibrated * | 3.4 | 2.36 31% | 2.94 14% | 2.14 37% | 4.64 -36% | 1.31 61% |
| Greyscale dE 2000 * | 1.95 | 4.78 -145% | 3.8 -95% | 3.17 -63% | 1.4 28% | 4.51 -131% |
| Gamma | 2.52 87% | 2.43 91% | 2.17 101% | 2.39 92% | 2.16 102% | 2.36 93% |
| CCT | 6371 102% | 7739 84% | 7284 89% | 7098 92% | 6641 98% | 7411 88% |
| Color Space (Percent of AdobeRGB 1998) (%) | 42 | 59 40% | 58 38% | 51 21% | 38.4 -9% | 64 52% |
| Color Space (Percent of sRGB) (%) | 60 | 91 52% | 89.6 49% | 89 48% | 59.3 -1% | 98 63% |
| Total Average (Program / Settings) | 43% /
18% | 22% /
17% | 19% /
14% | 7% /
-8% | 46% /
29% |
* ... smaller is better
The situation is similar when it comes to color accuracy. The True Color MSI tool (the sRGB standard mode was tested) provides pretty good Delta E values, as our CalMAN screenshots prove. The IPS technology also guarantees pleasingly high viewing angles. Gamers will be especially pleased with the combination of FreeSync and 120 Hz, which produces a very smooth image.
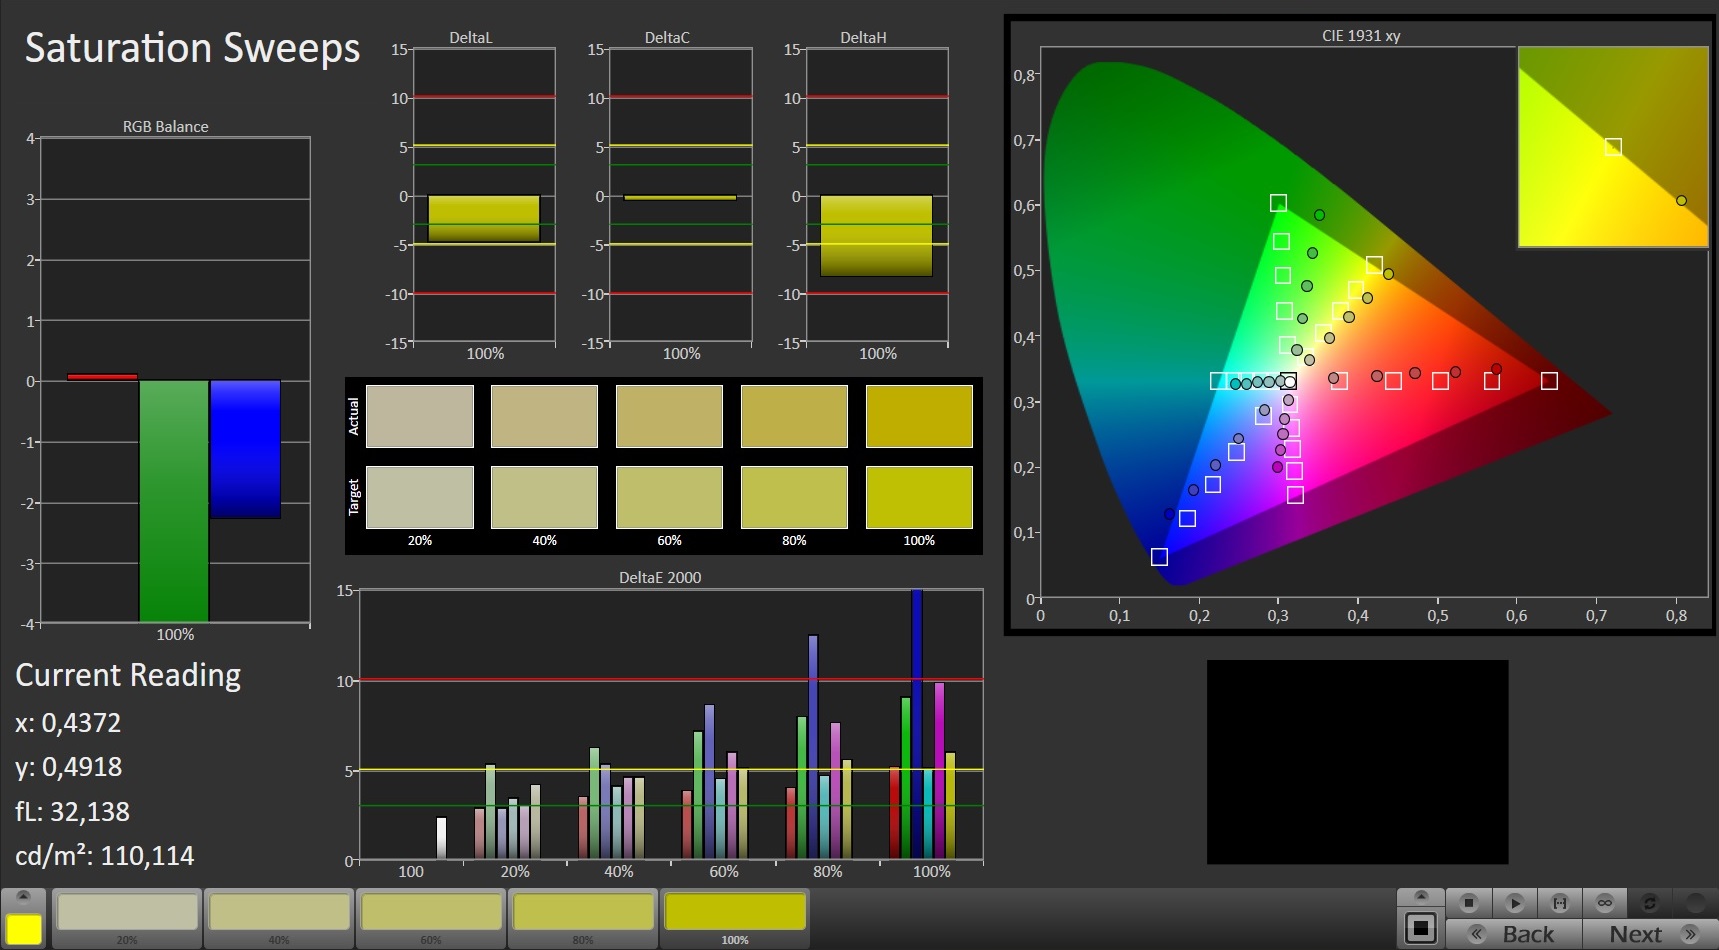
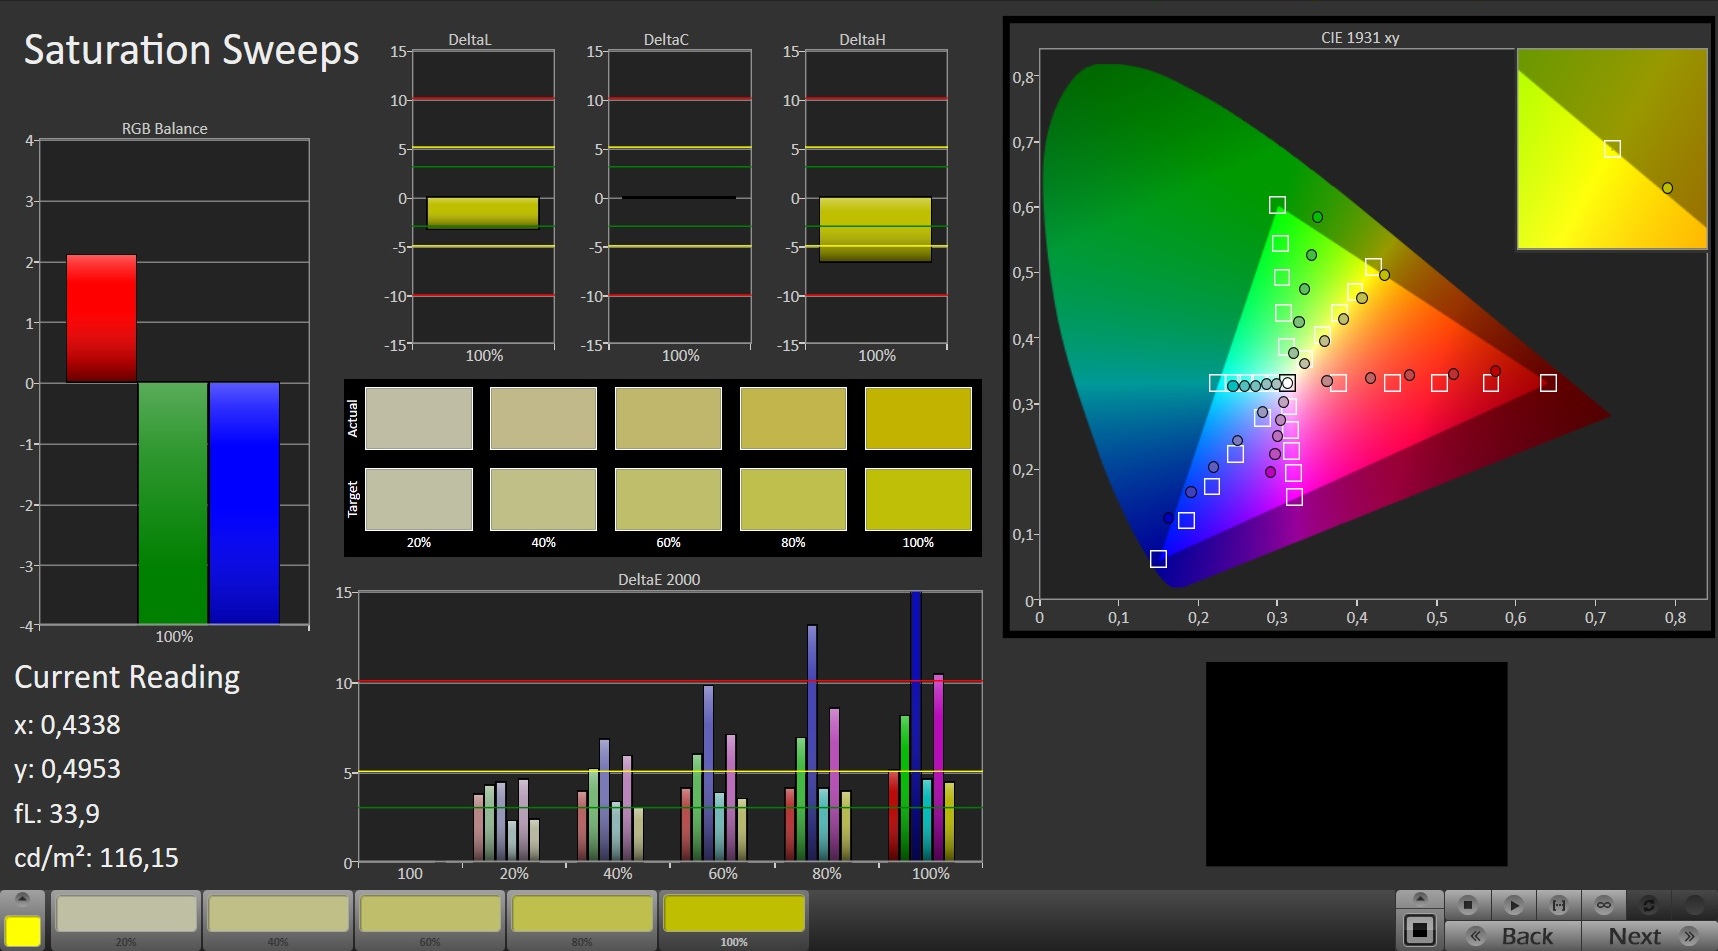
However, the 17-inch panel from AU Optronics (B173HAN04.7) has some weaknesses too. Around 243 cd/m² of luminosity is as modest as 60% of coverage for the sRGB color space. As a result, the image lacks a bit of intensity, which can be especially bothersome when it comes to photo and video segments. The Bravo 17 is also hardly suitable for outdoor use due to its poor brightness.
Despite the 120 Hz technology, the response times aren't exactly dazzling either. The mentioned shortcomings also affect other budget gaming laptops, but in our opinion, a higher-quality panel should be installed in devices costing from 1,000 Euros (~$1,131) on, at most.
Display Response Times
| ↔ Response Time Black to White | ||
|---|---|---|
| 29.6 ms ... rise ↗ and fall ↘ combined | ↗ 16.4 ms rise | 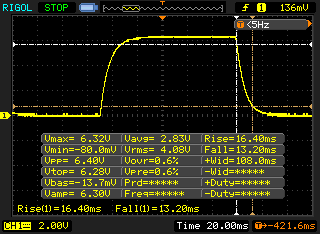 |
| ↘ 13.2 ms fall | ||
| The screen shows relatively slow response rates in our tests and may be too slow for gamers. In comparison, all tested devices range from 0.1 (minimum) to 240 (maximum) ms. » 79 % of all devices are better. This means that the measured response time is worse than the average of all tested devices (19.9 ms). | ||
| ↔ Response Time 50% Grey to 80% Grey | ||
| 40 ms ... rise ↗ and fall ↘ combined | ↗ 19.2 ms rise | 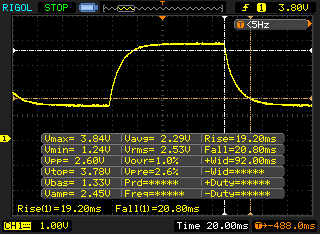 |
| ↘ 20.8 ms fall | ||
| The screen shows slow response rates in our tests and will be unsatisfactory for gamers. In comparison, all tested devices range from 0.165 (minimum) to 636 (maximum) ms. » 61 % of all devices are better. This means that the measured response time is worse than the average of all tested devices (31.1 ms). | ||
Screen Flickering / PWM (Pulse-Width Modulation)
| Screen flickering / PWM not detected | 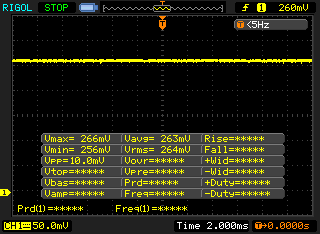 | ||
In comparison: 52 % of all tested devices do not use PWM to dim the display. If PWM was detected, an average of 7798 (minimum: 5 - maximum: 343500) Hz was measured. | |||
Test conditions
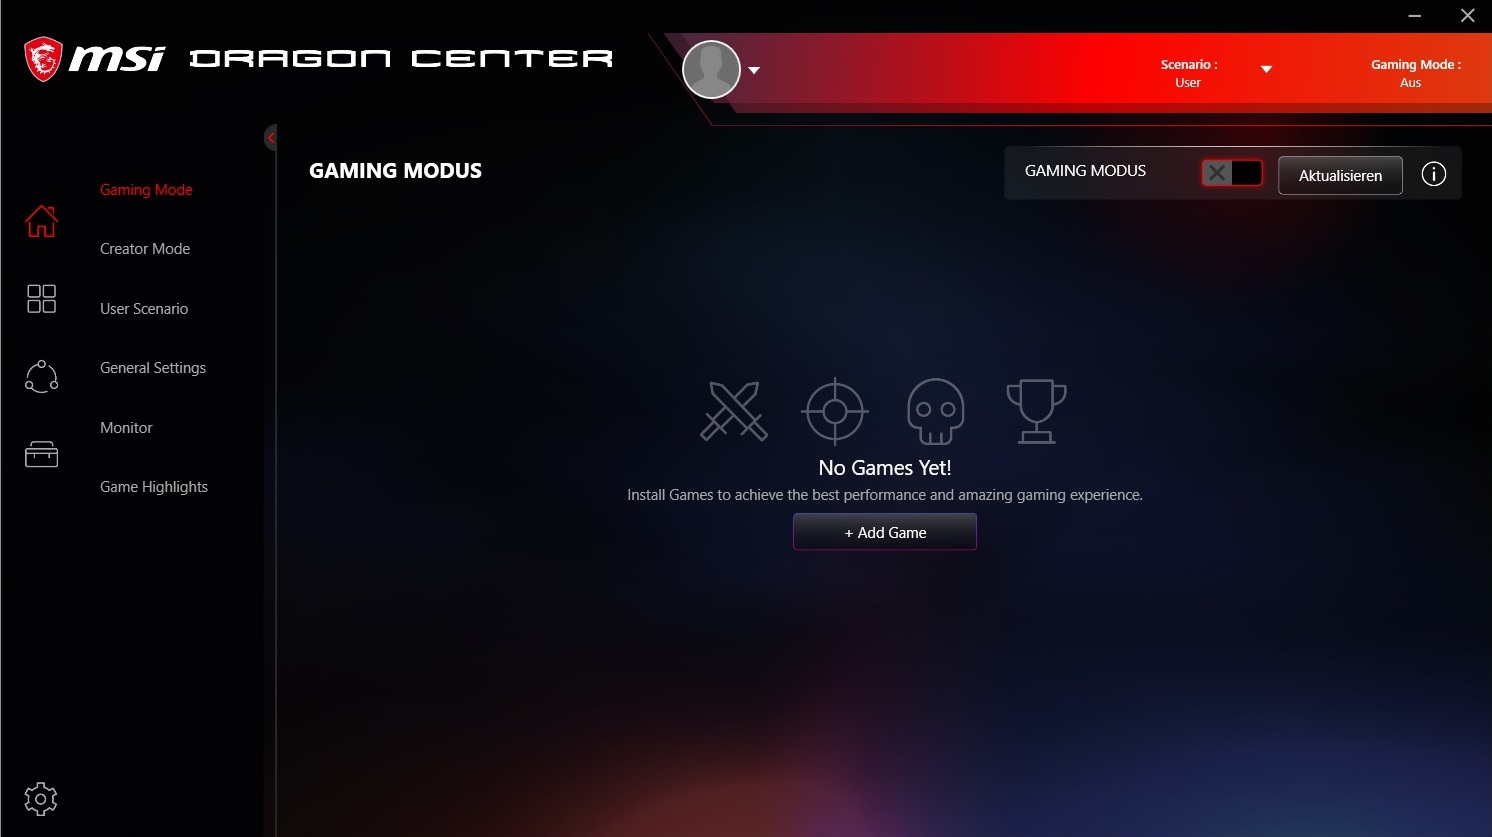
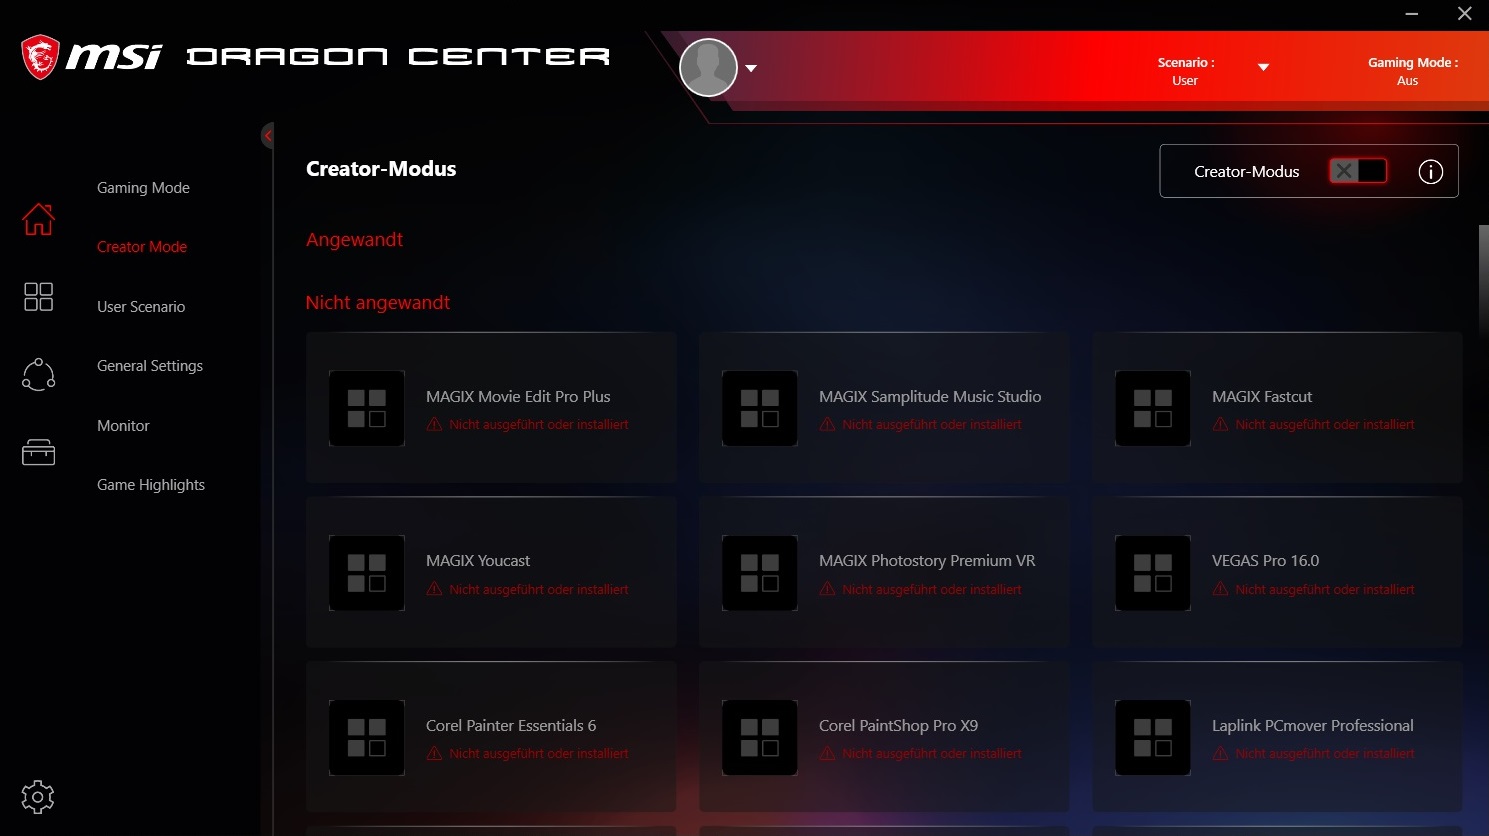
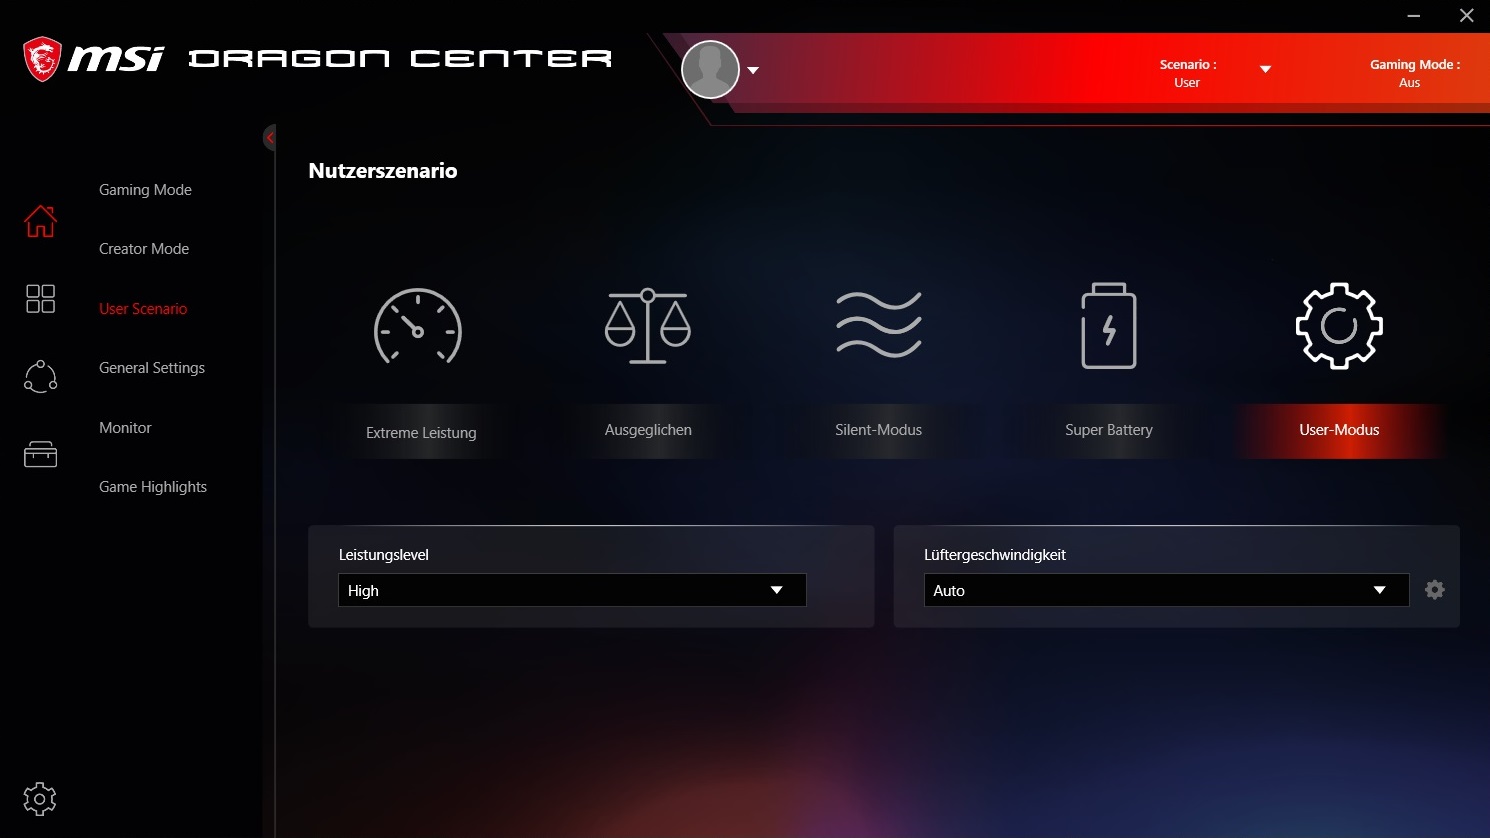
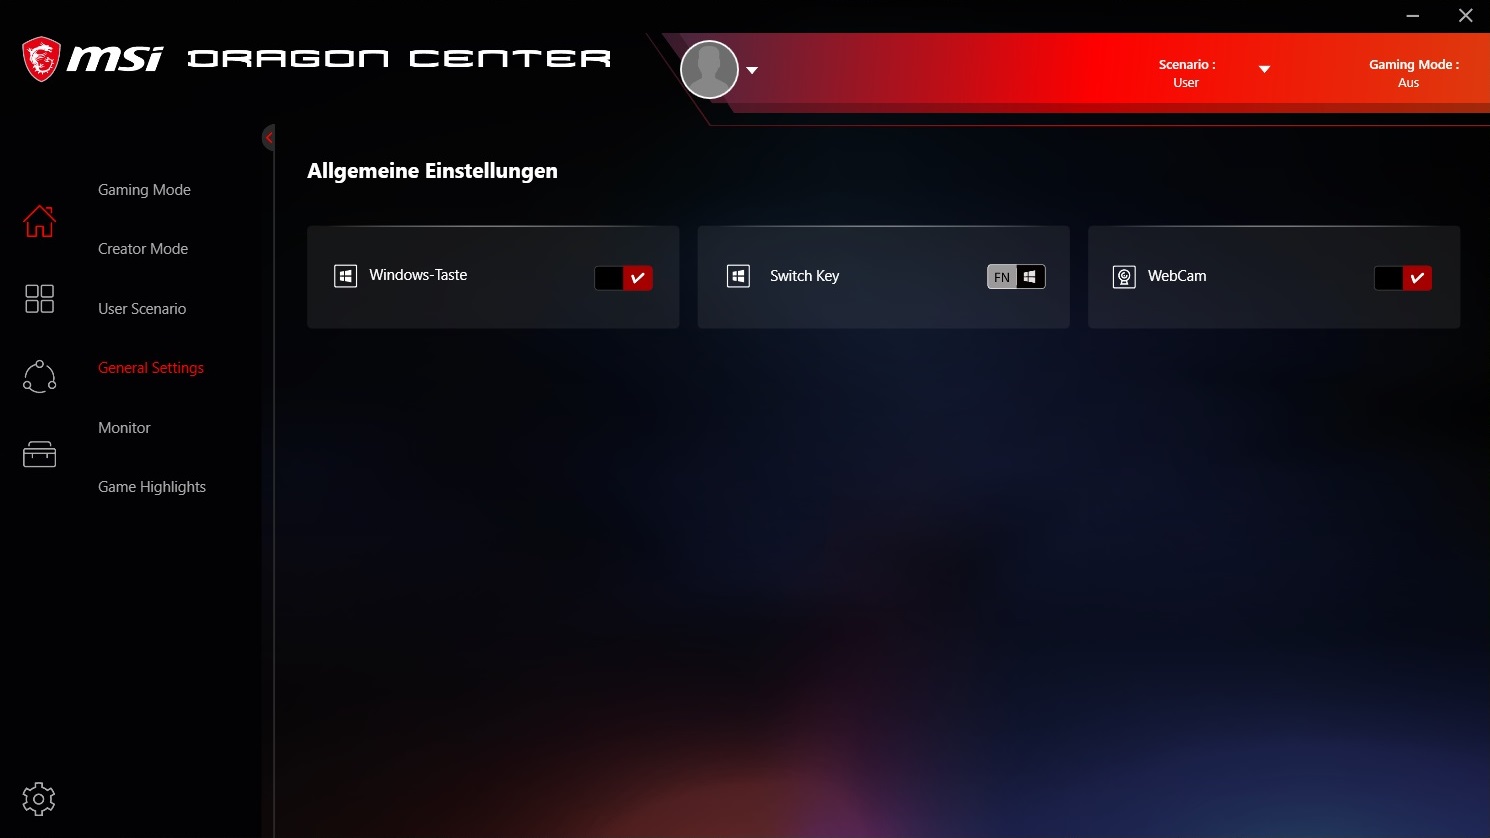
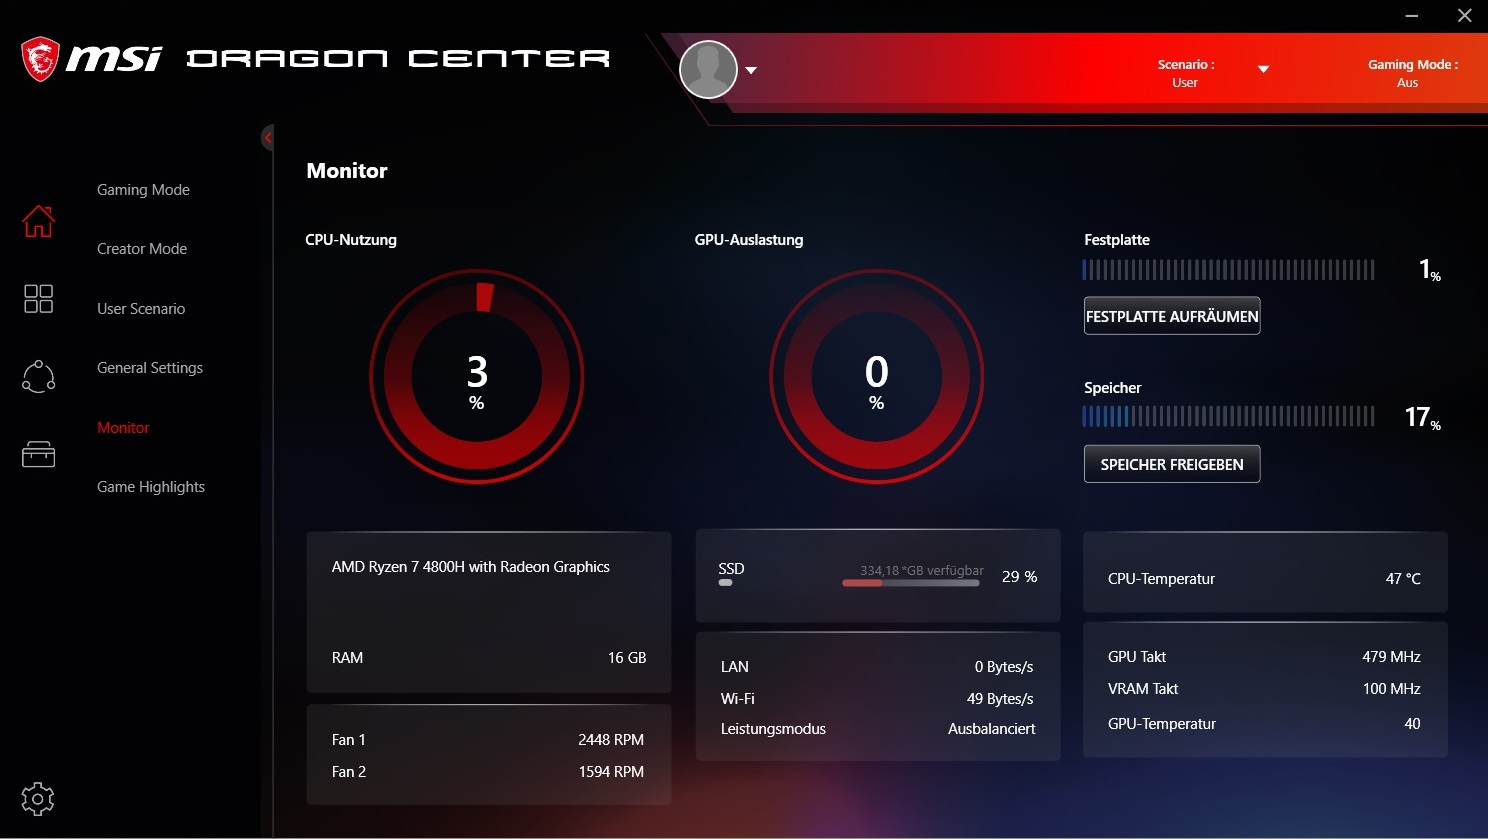
Buyers have the opportunity to adjust many system settings in the preinstalled Dragon Center. For our measurements, we used the "User" user scenario with the "High" performance level and the "Auto" fan speed.
Performance
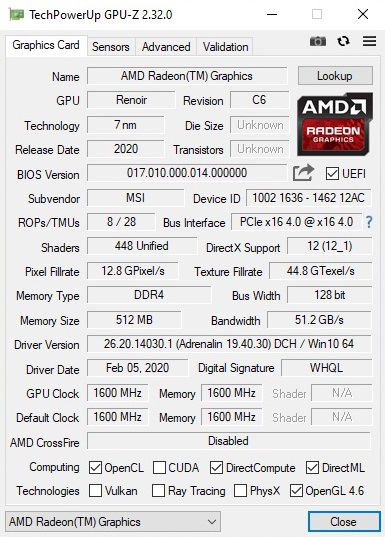
While the CPU belongs to the high-end segment, the GPU is "only" positioned in the mid-range. Since most games are graphically limited, we would, therefore, speak of an upper mid-range laptop, as mentioned at the beginning.
Processor
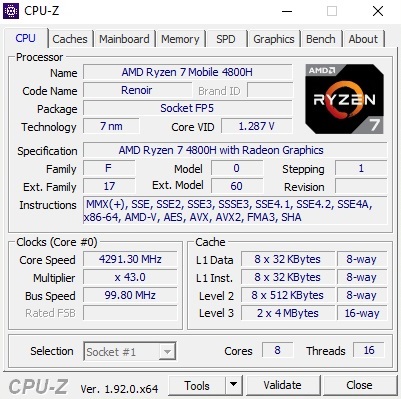
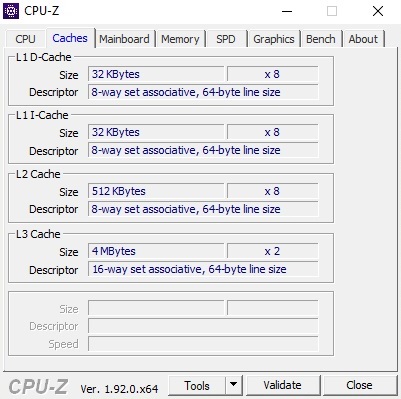
The fact that Intel has rested on its laurels for years is now becoming the doom of the former "processor king". Slowly but surely AMD is taking over the helm or rather the dominance in the CPU segment again, which seemed unthinkable a few years ago, especially for laptops. The best example of the race to catch up is the lightning-fast octa-core Ryzen 7 4800H, which is created with a 7 nm process (Intel is still stuck at 14 nm) and can process up to 16 threads in parallel via SMT. The base clock speed is 2.9 GHz, and the maximum boost speed is 4.2 GHz.
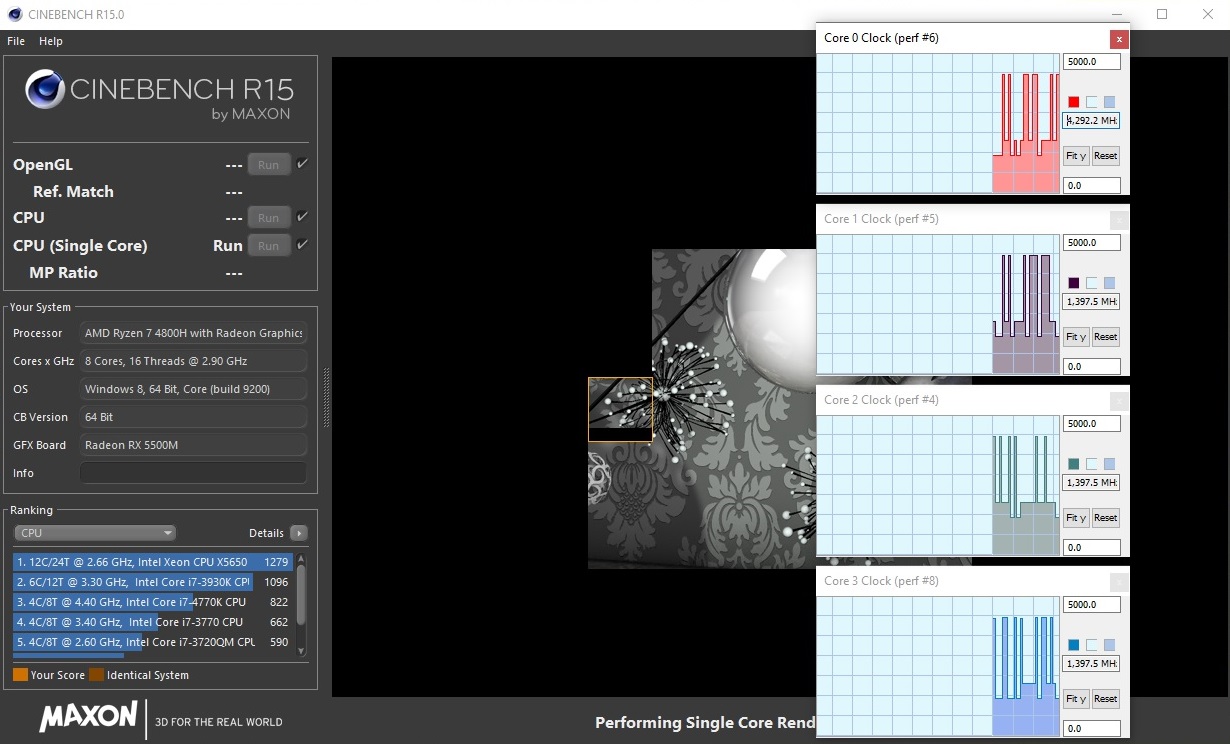
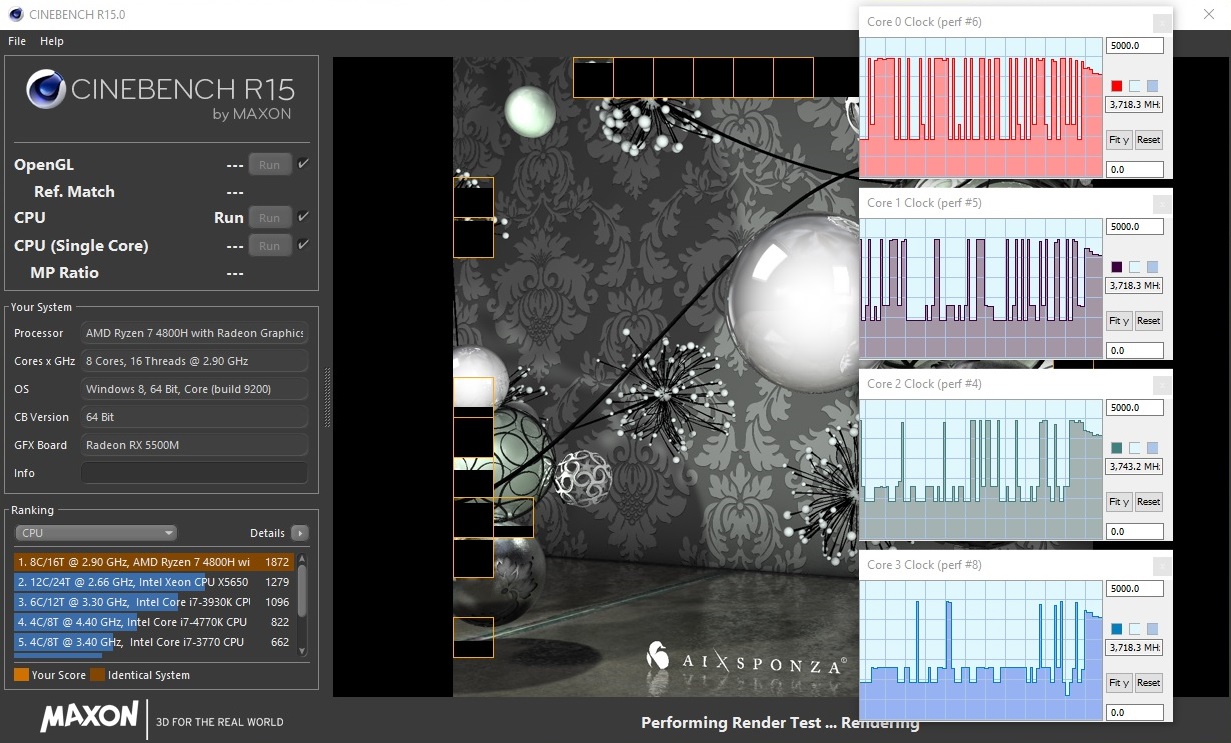
We checked how the Ryzen 7 4800H behaves in practice with the help of the Cinebench R15 benchmark. Around 3.7 GHz in the multi-core test is a good result. In contrast to other laptops, the CPU performance only drops slightly over a longer period of time (less than 5% in the Cinebench loop).
The benchmark results are particularly impressive. With a multi-score of 1,892 points, the Ryzen 7 4800H sprints almost 80% past the hexa-core Core i7-9750H processor in Cinebench R15. The gap to the popular quad-core CPU, the Core i5-9300H, is even over 120%. Ergo: Intel is currently hardly competitive when it comes to budget products and has to prepare itself for the worst in 2020.
| Blender - v2.79 BMW27 CPU | |
| Asus TUF A17 FA706IU-AS76 | |
| MSI Bravo 17 A4DDR | |
| 7-Zip 18.03 | |
| 7z b 4 -mmt1 | |
| Asus TUF A17 FA706IU-AS76 | |
| MSI Bravo 17 A4DDR | |
| 7z b 4 | |
| MSI Bravo 17 A4DDR | |
| Asus TUF A17 FA706IU-AS76 | |
| Geekbench 5.5 | |
| Single-Core | |
| MSI Bravo 17 A4DDR | |
| Asus TUF A17 FA706IU-AS76 | |
| MSI Alpha 15 A3DDK-034 | |
| Multi-Core | |
| MSI Bravo 17 A4DDR | |
| Asus TUF A17 FA706IU-AS76 | |
| MSI Alpha 15 A3DDK-034 | |
| HWBOT x265 Benchmark v2.2 - 4k Preset | |
| MSI Bravo 17 A4DDR | |
| Asus TUF A17 FA706IU-AS76 | |
| LibreOffice - 20 Documents To PDF | |
| MSI Bravo 17 A4DDR | |
| Asus TUF A17 FA706IU-AS76 | |
| R Benchmark 2.5 - Overall mean | |
| Asus TUF A17 FA706IU-AS76 | |
| MSI Bravo 17 A4DDR | |
* ... smaller is better
System performance
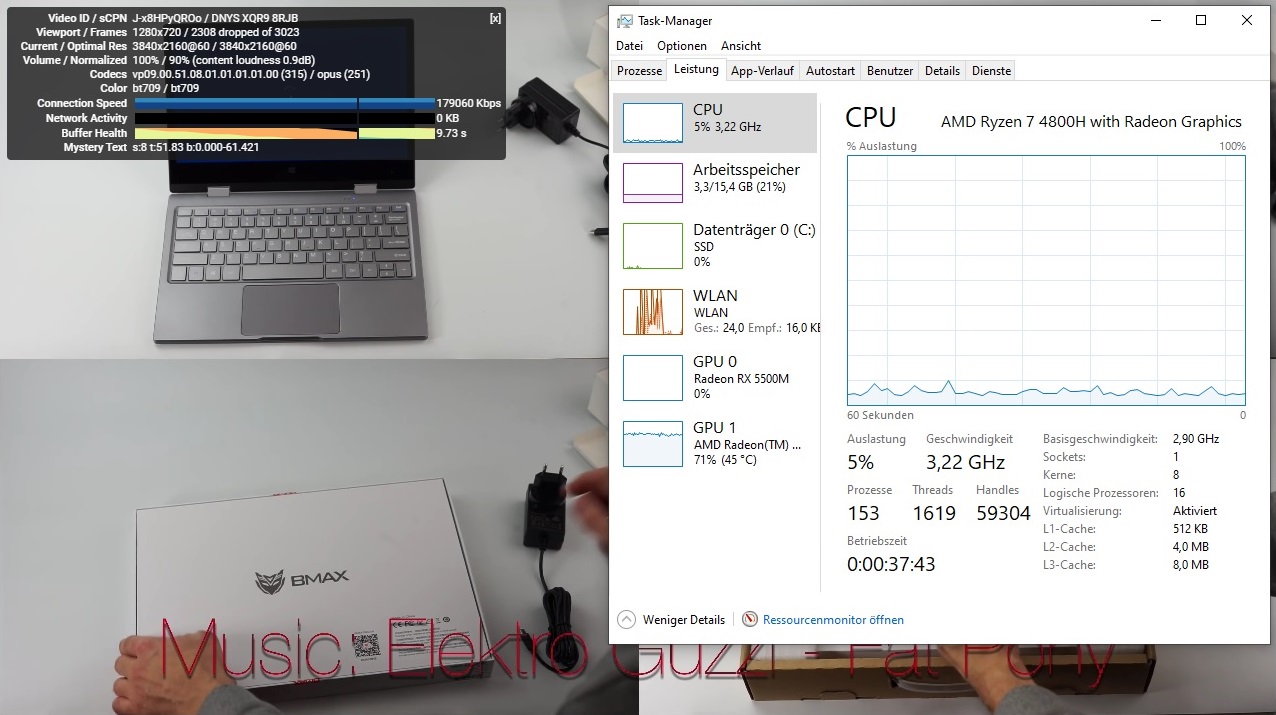
The fast processor also helps put the Bravo 17 in the top position in the system performance category. 5,970 points in PCMark 10 could also come from a genuine and considerably more expensive high-end system. However, the 17-incher has to struggle with short delays in everyday use, which mainly occur when launching a program. The graphics-switching solution, which dynamically switches between the CPU's graphics chip and the dedicated GPU depending on the application, could be to blame.
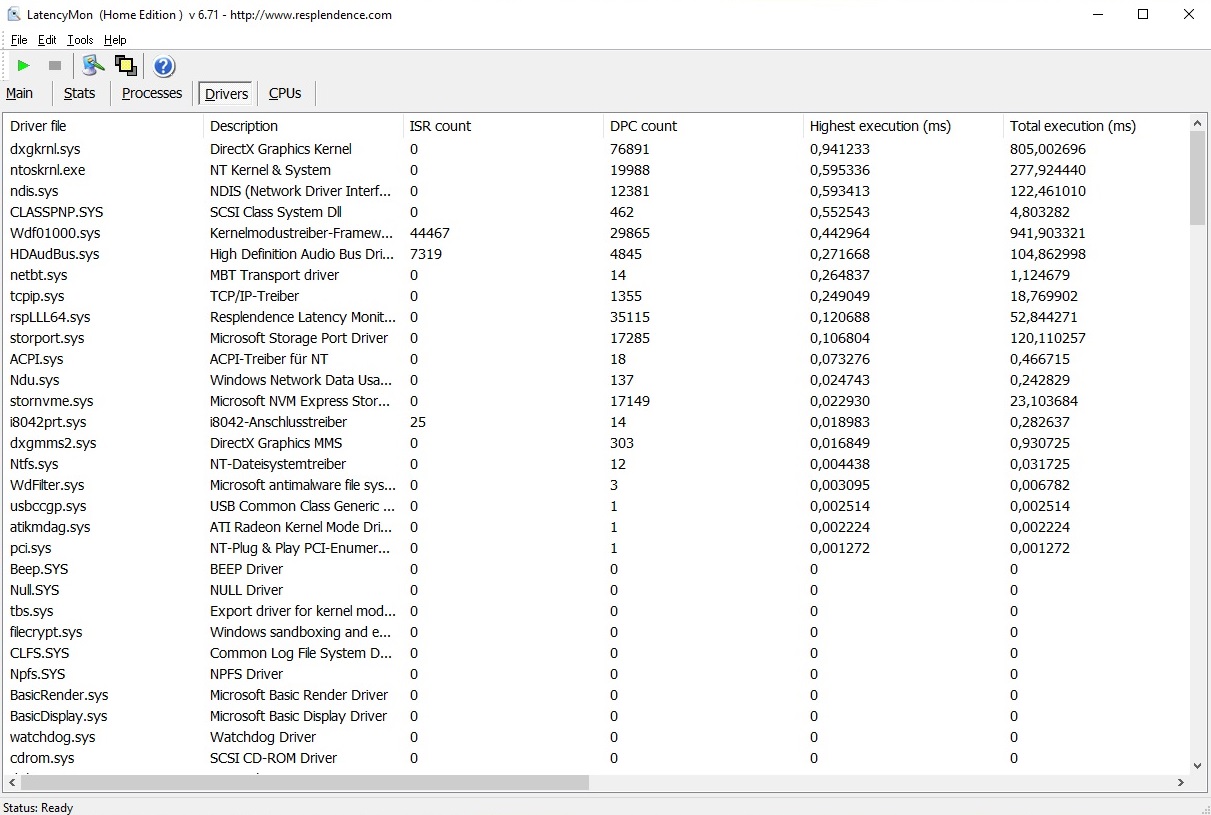
DPC latency
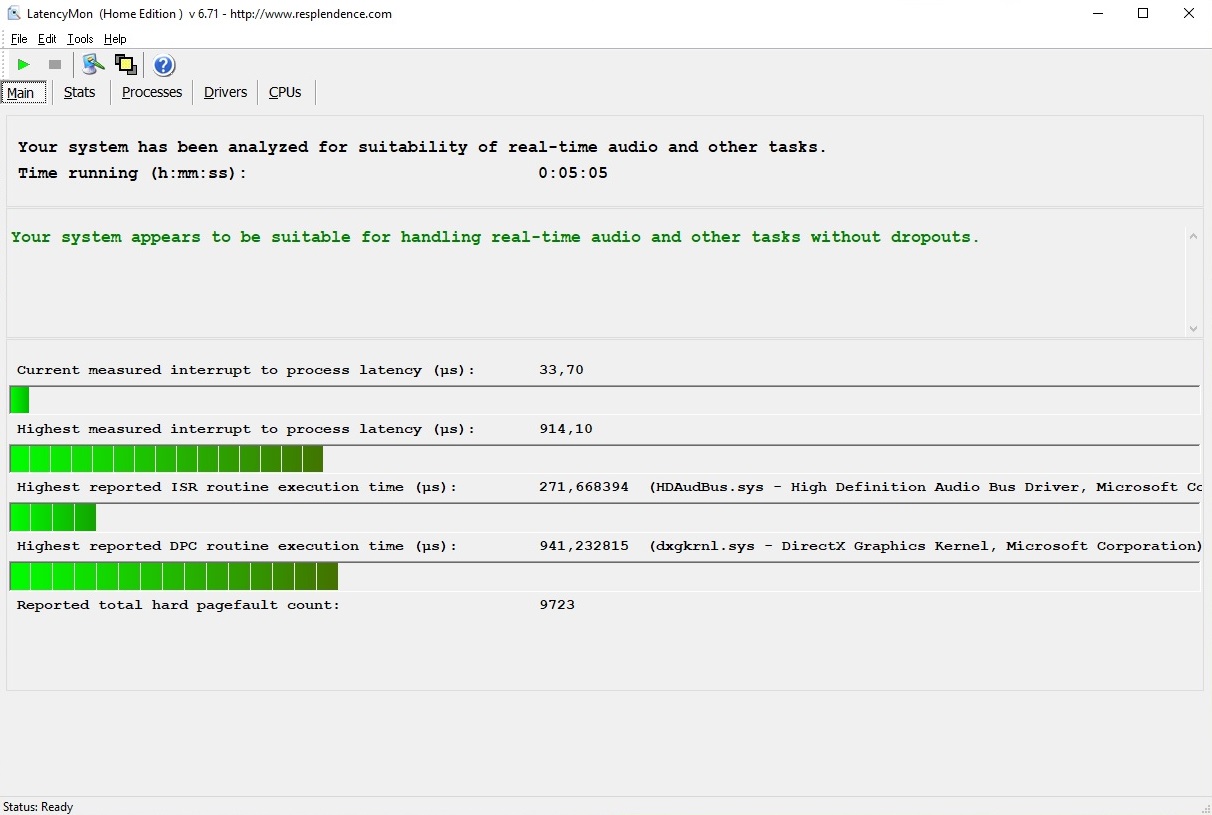
Despite the subjective delays, the Bravo 17 does quite well in the latency test (apart from the stuttery 4K YouTube video). The LatencyMon tool doesn't detect any particularly high values that would indicate a bad driver.
| DPC Latencies / LatencyMon - interrupt to process latency (max), Web, Youtube, Prime95 | |
| Asus TUF A17 FA706IU-AS76 | |
| MSI Bravo 17 A4DDR | |
* ... smaller is better
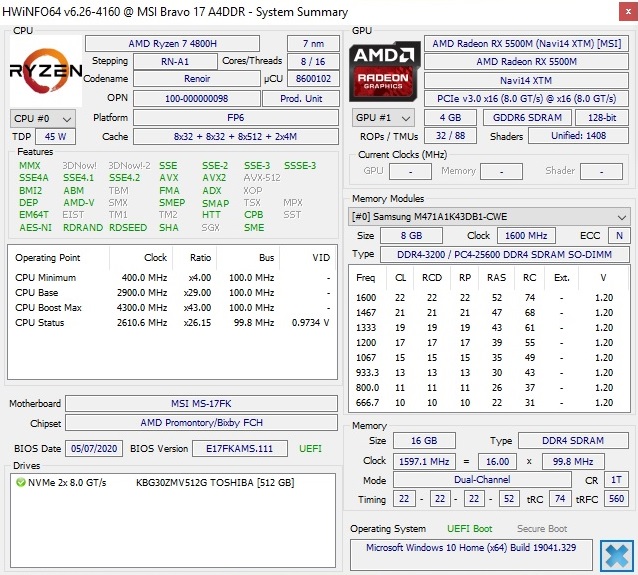
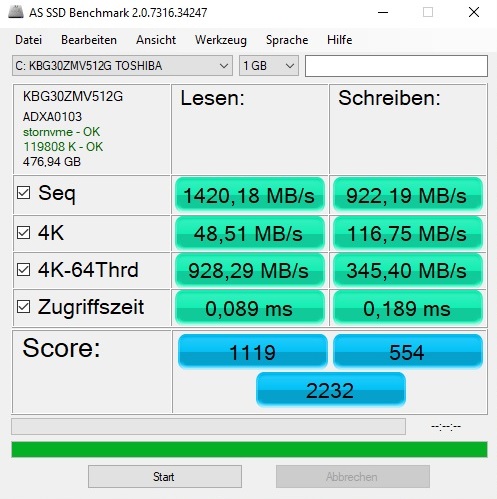
Storage
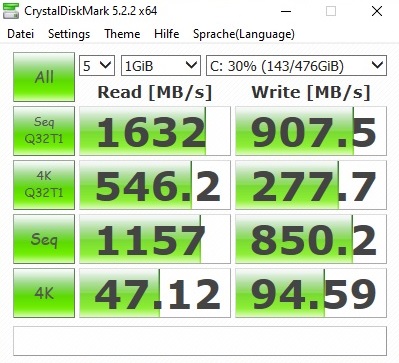
As is appropriate for a modern laptop, the operating system (Windows 10 Home 64-bit) runs on a PCIe SSD. The 512 GB Toshiba KBG30ZMV512G model built into the test device is oriented towards the Kingston SSD of the MSI Alpha 15 and the WDC drive of the Asus TUF FX705 or the Lenovo Legion Y540 in the CrystalDiskMark. On the other hand, the 1 TB models of the MSI GF75 (Crucial) and the Asus TUF A17 (Intel) are able to gain a certain lead - at least on paper.
| MSI Bravo 17 A4DDR Toshiba KBG30ZMV512G | MSI Alpha 15 A3DDK-034 Kingston RBUSNS8154P3512GJ | MSI GF75 Thin 9SC Crucial P1 SSD CT1000P1SSD8 | Asus TUF FX705DT-AU068T WDC PC SN520 SDAPNUW-256G | Asus TUF A17 FA706IU-AS76 Intel SSD 660p 1TB SSDPEKNW010T8 | Lenovo Legion Y540-17IRH WDC PC SN520 SDAPNUW-512G | |
|---|---|---|---|---|---|---|
| CrystalDiskMark 5.2 / 6 | -1% | 43% | 15% | 56% | 8% | |
| Write 4K (MB/s) | 94.6 | 105.4 11% | 133 41% | 145 53% | 189.7 101% | 105.1 11% |
| Read 4K (MB/s) | 47.12 | 33.24 -29% | 55.6 18% | 45.28 -4% | 62.3 32% | 34.41 -27% |
| Write Seq (MB/s) | 850 | 1029 21% | 1623 91% | 1301 53% | 1681 98% | 1298 53% |
| Read Seq (MB/s) | 1157 | 1098 -5% | 1386 20% | 1362 18% | 1608 39% | 1099 -5% |
| Write 4K Q32T1 (MB/s) | 277.7 | 322.1 16% | 501 80% | 249.1 -10% | 468.6 69% | 335.7 21% |
| Read 4K Q32T1 (MB/s) | 546 | 352 -36% | 584 7% | 342.1 -37% | 541 -1% | 231.4 -58% |
| Write Seq Q32T1 (MB/s) | 908 | 1036 14% | 1696 87% | 1301 43% | 1770 95% | 1454 60% |
| Read Seq Q32T1 (MB/s) | 1632 | 1606 -2% | 1572 -4% | 1732 6% | 1898 16% | 1740 7% |

Continuous load read: DiskSpd Read Loop, Queue Depth 8
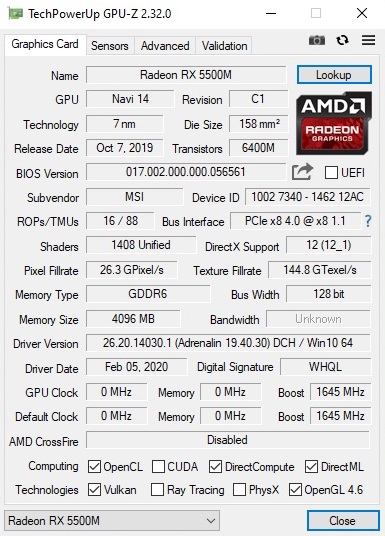
Graphics card
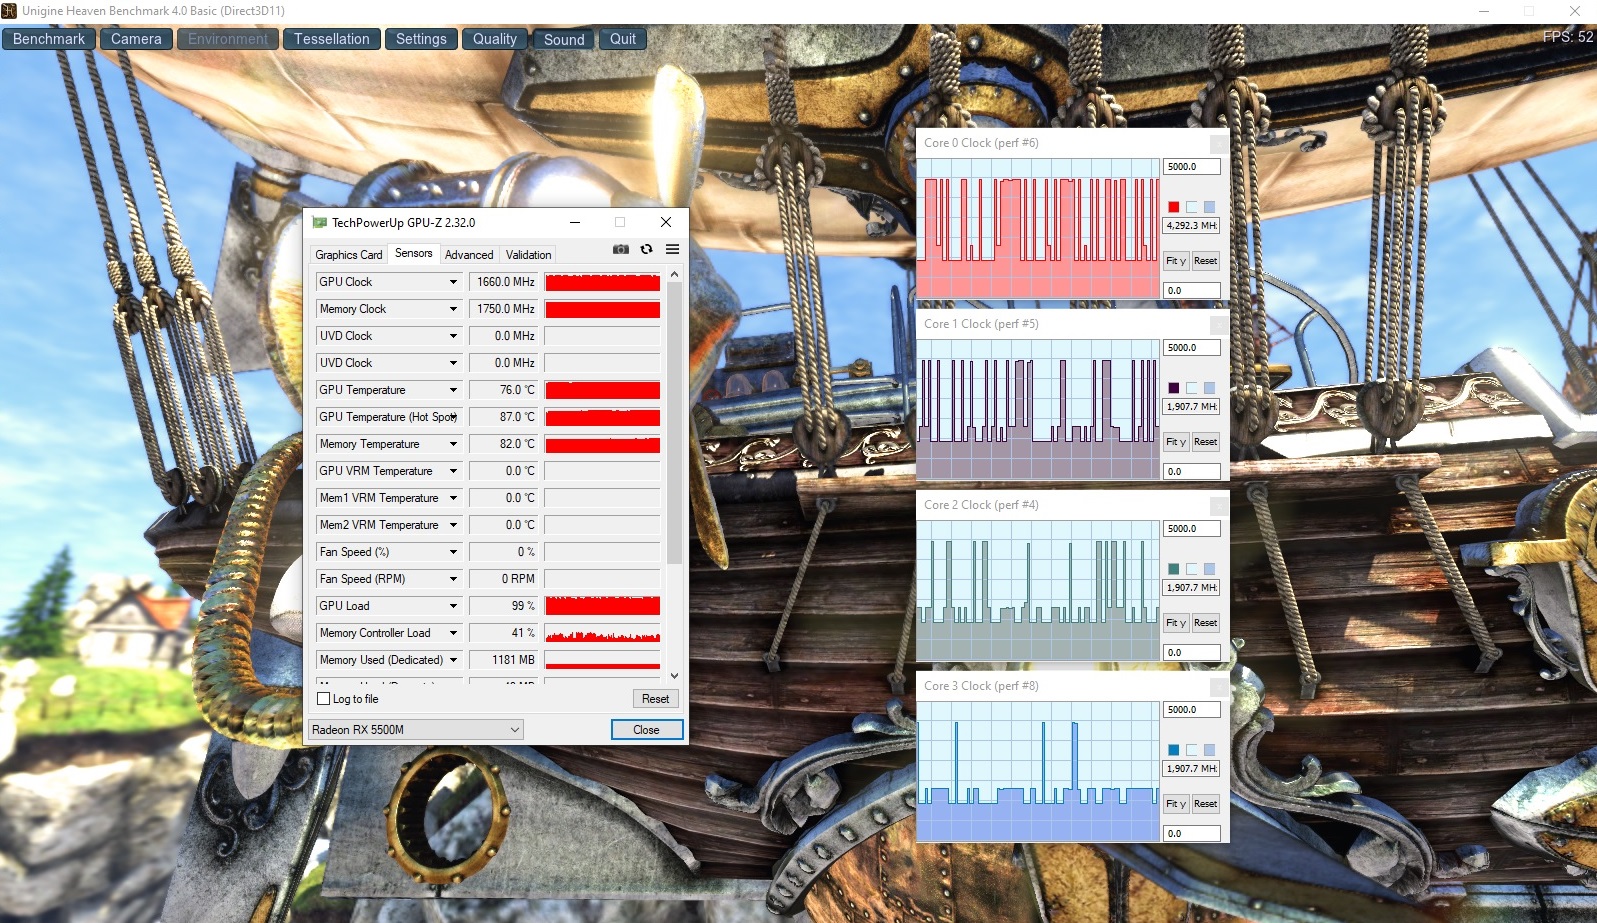
The graphics card is only partially on par with the level of the Ryzen 7 4800H. With the Radeon RX 5500M, AMD has a DirectX 12 accelerator in its portfolio that offers a performance ranging between the GTX 1650 and the GTX 1660 Ti. Depending on the benchmark, the results sometimes tend more towards one direction and sometimes rather towards the other.
| 3DMark 11 - 1280x720 Performance GPU | |
| Asus TUF A17 FA706IU-AS76 | |
| Lenovo Legion Y540-17IRH | |
| MSI Bravo 17 A4DDR | |
| MSI Alpha 15 A3DDK-034 | |
| Asus TUF FX705DT-AU068T | |
| MSI GF75 Thin 9SC | |
Technically, the RX 5500M has access to 1,408 shaders and 4 GB of GDDR6 video memory (128-bit interface). 4 GB is a borderline amount nowadays, since some games crave for at least 6 GB at higher settings.
| 3DMark 11 Performance | 16271 points | |
| 3DMark Cloud Gate Standard Score | 39492 points | |
| 3DMark Fire Strike Score | 11461 points | |
| 3DMark Time Spy Score | 4712 points | |
Help | ||
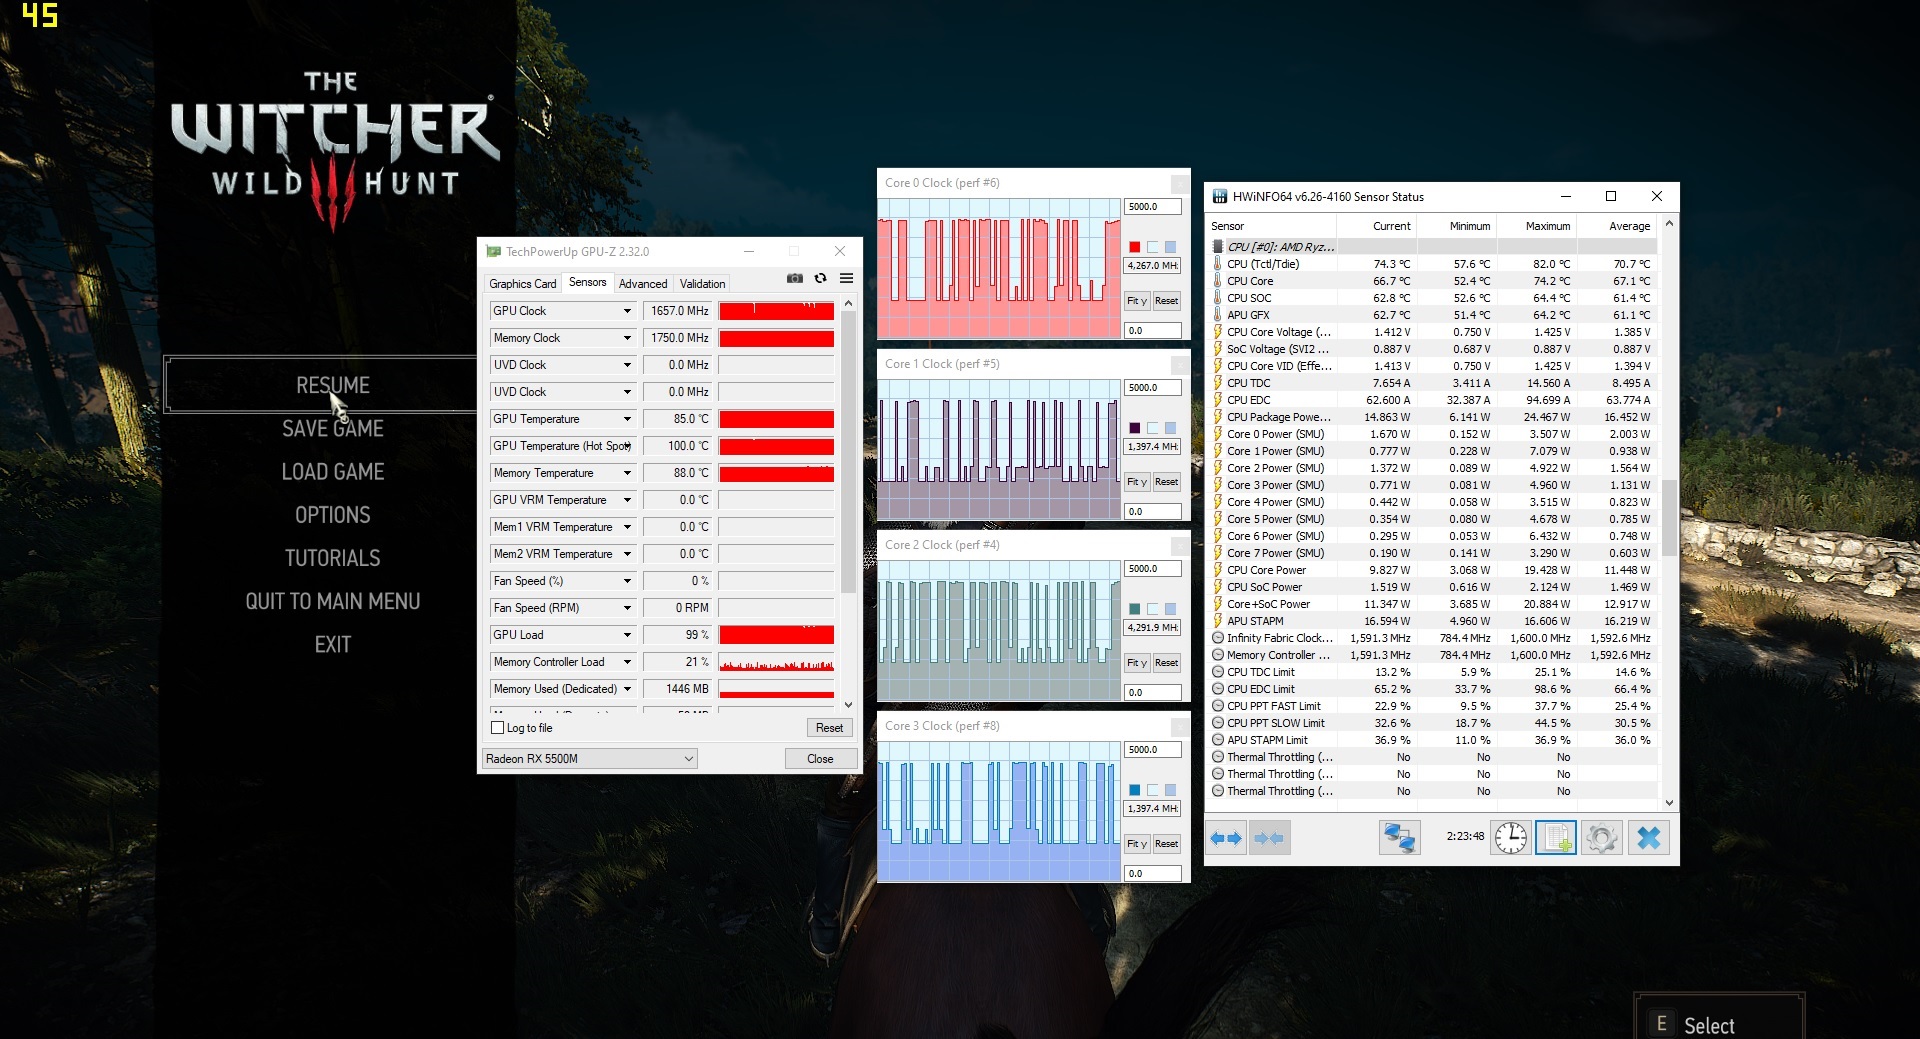
Speaking of games: We tested the clock speeds of the Navi chip for about 60 minutes with the RPG The Witcher 3. Result: The RX 5500M settles at around 1,650 MHz. That is clearly more than the base clock speed of 1,448 MHz. As you can see from the graph below, the frame rate remained very constant over the entire period of time.
Gaming performance
In general, the Radeon RX 5500M runs almost all titles at the native Full HD resolution (1920x1080) at high to maximum details, whereby the display frequency is rather rarely exploited. Stuttering only occurs in very demanding and/or moderately optimized games like Borderlands 3. Small tip: You should absolutely update the graphics driver after purchase. Some titles complained about the version with our test device. Doom Eternal didn't even want to run at all with the preinstalled driver (at least on the dedicated graphics card).
| The Witcher 3 | |
| 1920x1080 High Graphics & Postprocessing (Nvidia HairWorks Off) | |
| Lenovo Legion Y540-17IRH | |
| Asus TUF A17 FA706IU-AS76 | |
| MSI Alpha 15 A3DDK-034 | |
| MSI Bravo 17 A4DDR | |
| MSI GF75 Thin 9SC | |
| Asus TUF FX705DT-AU068T | |
| 1920x1080 Ultra Graphics & Postprocessing (HBAO+) | |
| Asus TUF A17 FA706IU-AS76 | |
| Lenovo Legion Y540-17IRH | |
| MSI Bravo 17 A4DDR | |
| MSI Alpha 15 A3DDK-034 | |
| MSI GF75 Thin 9SC | |
| Asus TUF FX705DT-AU068T | |
| low | med. | high | ultra | |
|---|---|---|---|---|
| GTA V (2015) | 168 | 104 | 53.1 | |
| The Witcher 3 (2015) | 72 | 45.4 | ||
| Dota 2 Reborn (2015) | 120 | 113 | 106 | 103 |
| X-Plane 11.11 (2018) | 49.4 | 37.9 | 34.1 | |
| Shadow of the Tomb Raider (2018) | 65 | 54 | ||
| Battlefield V (2018) | 93 | 88.2 | ||
| Borderlands 3 (2019) | 47.9 | 35.9 | ||
| Escape from Tarkov (2020) | 81.5 | 64.5 | ||
| Hunt Showdown (2020) | 56.5 | |||
| Doom Eternal (2020) | 0 | 0 | ||
| Gears Tactics (2020) | 78.5 | 55.1 |
Emissions
Noise emissions
The noise level generated in idle usage is reminiscent of the MSI GF75 with the Core i7-9750H and the GeForce GTX 1650. The two fans aren't extremely quiet, but 33 to 35 dB is still in order.
The noise level increases significantly under load. About 48 dB in The Witcher 3 and 52 dB in the stress test with the FurMark and Prime95 tools tend towards the Asus TUF A17 and the Lenovo Legion Y540, respectively, and they represent a value that ranges from clearly audible to annoyingly loud (without headphones). At least the Bravo 17 runs noticeably quieter than its MSI counterpart, the Alpha 15.
Noise level
| Idle |
| 33 / 34 / 35 dB(A) |
| Load |
| 39 / 52 dB(A) |
 | ||
30 dB silent 40 dB(A) audible 50 dB(A) loud |
||
min: | ||
| MSI Bravo 17 A4DDR R7 4800H, Radeon RX 5500M | MSI Alpha 15 A3DDK-034 R7 3750H, Radeon RX 5500M | MSI GF75 Thin 9SC i7-9750H, GeForce GTX 1650 Mobile | Asus TUF FX705DT-AU068T R5 3550H, GeForce GTX 1650 Mobile | Asus TUF A17 FA706IU-AS76 R7 4800H, GeForce GTX 1660 Ti Mobile | Lenovo Legion Y540-17IRH i5-9300H, GeForce GTX 1660 Ti Mobile | |
|---|---|---|---|---|---|---|
| Noise | -13% | 6% | 6% | 3% | 0% | |
| off / environment * (dB) | 30 | 29 3% | 28.2 6% | 30.8 -3% | 28.7 4% | 30 -0% |
| Idle Minimum * (dB) | 33 | 36 -9% | 33.6 -2% | 30.8 7% | 28.7 13% | 30 9% |
| Idle Average * (dB) | 34 | 37 -9% | 33.6 1% | 30.8 9% | 30.5 10% | 32 6% |
| Idle Maximum * (dB) | 35 | 46 -31% | 33.8 3% | 32.2 8% | 32.5 7% | 34 3% |
| Load Average * (dB) | 39 | 50 -28% | 37.2 5% | 38.6 1% | 42.5 -9% | 44 -13% |
| Witcher 3 ultra * (dB) | 48 | 51 -6% | 40.6 15% | 50.1 -4% | 50 -4% | |
| Load Maximum * (dB) | 52 | 57 -10% | 44.4 15% | 44.8 14% | 53.4 -3% | 52 -0% |
* ... smaller is better
Temperature
Despite the high volume, the Radeon RX 5500M gets pretty hot with 3D applications. Just under 85 °C (~185 °F) in our The Witcher 3 test and 88 °C (~190 °F) under full load are relatively high for a GPU. The Ryzen 7 4800H also reaches around 90 °C (~194 °F) under extreme conditions (about 70 °C (~158 °F) for The Witcher 3).
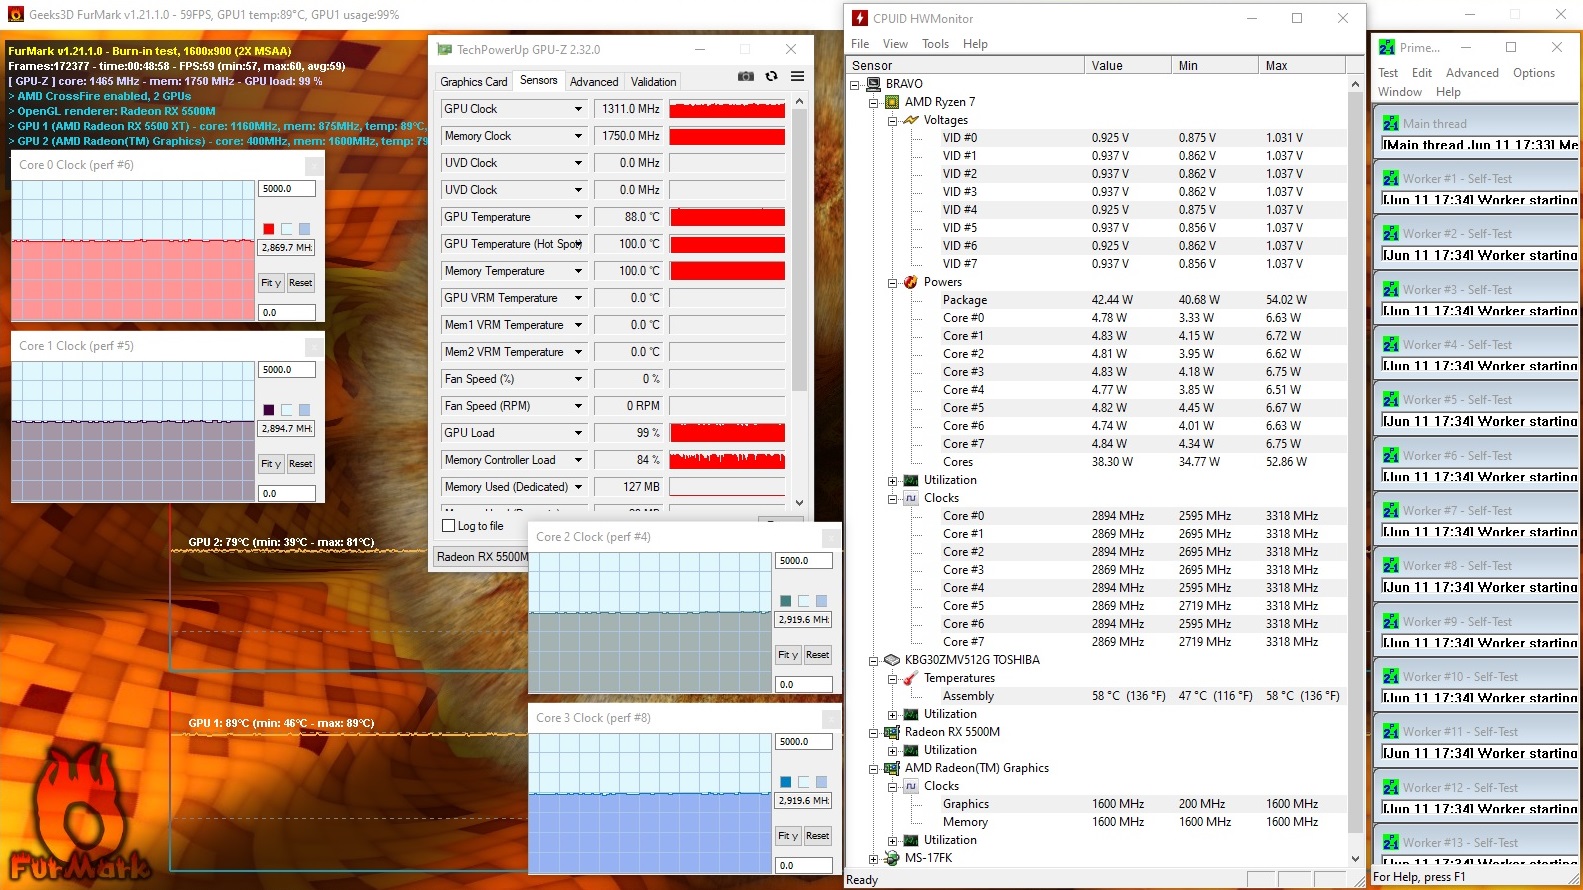
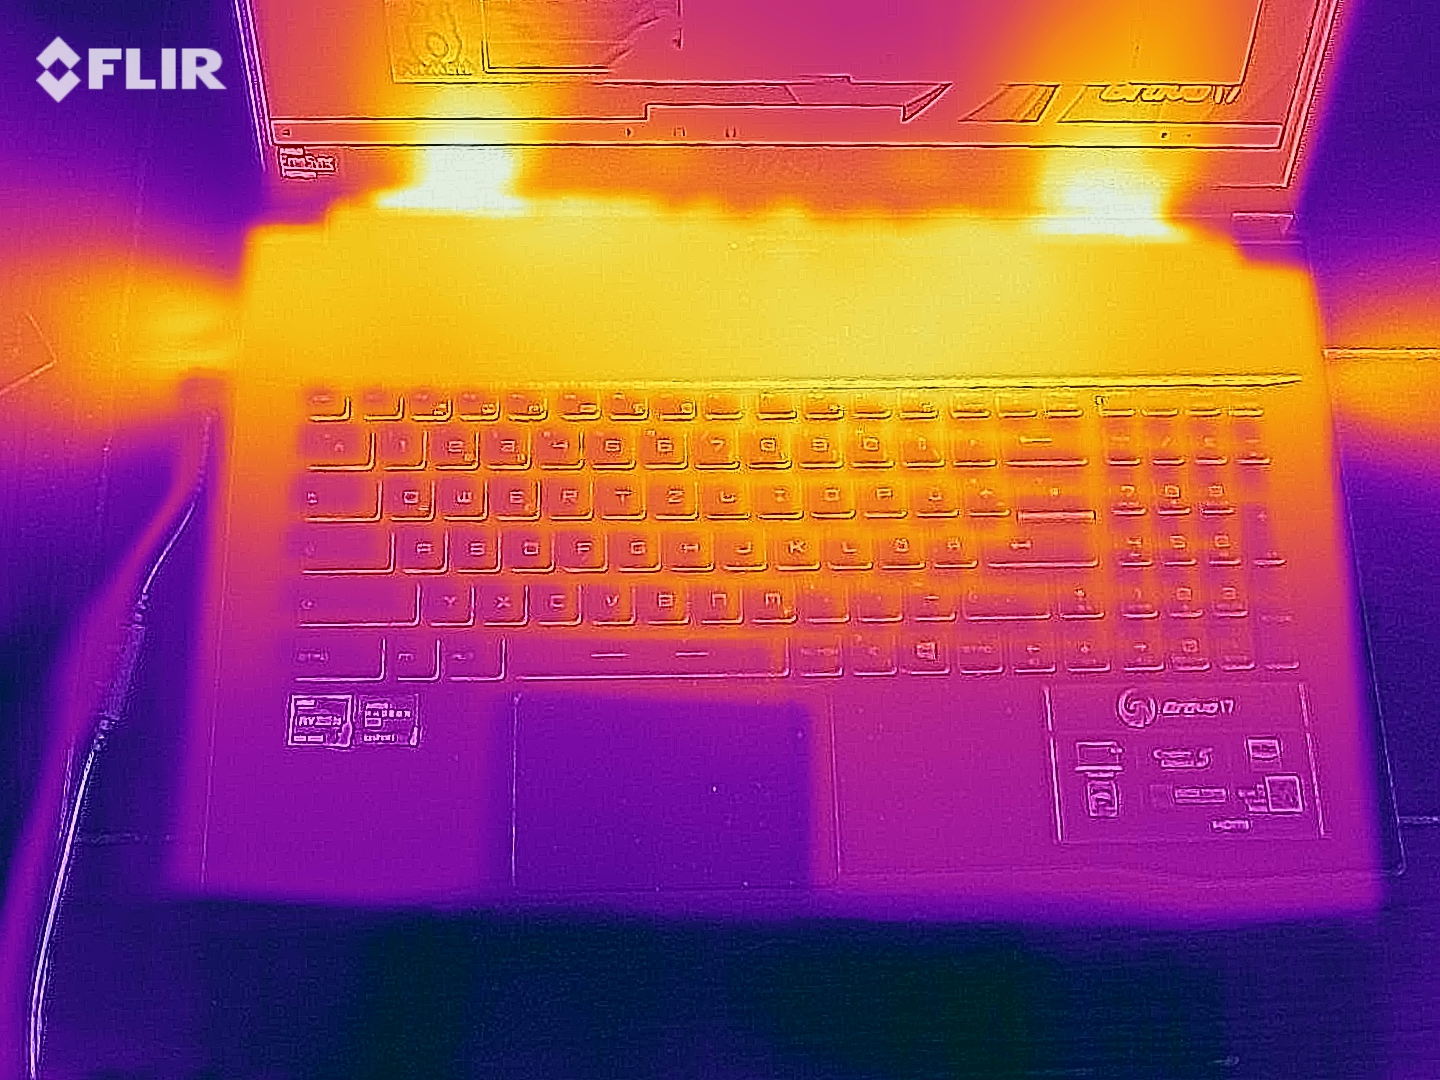
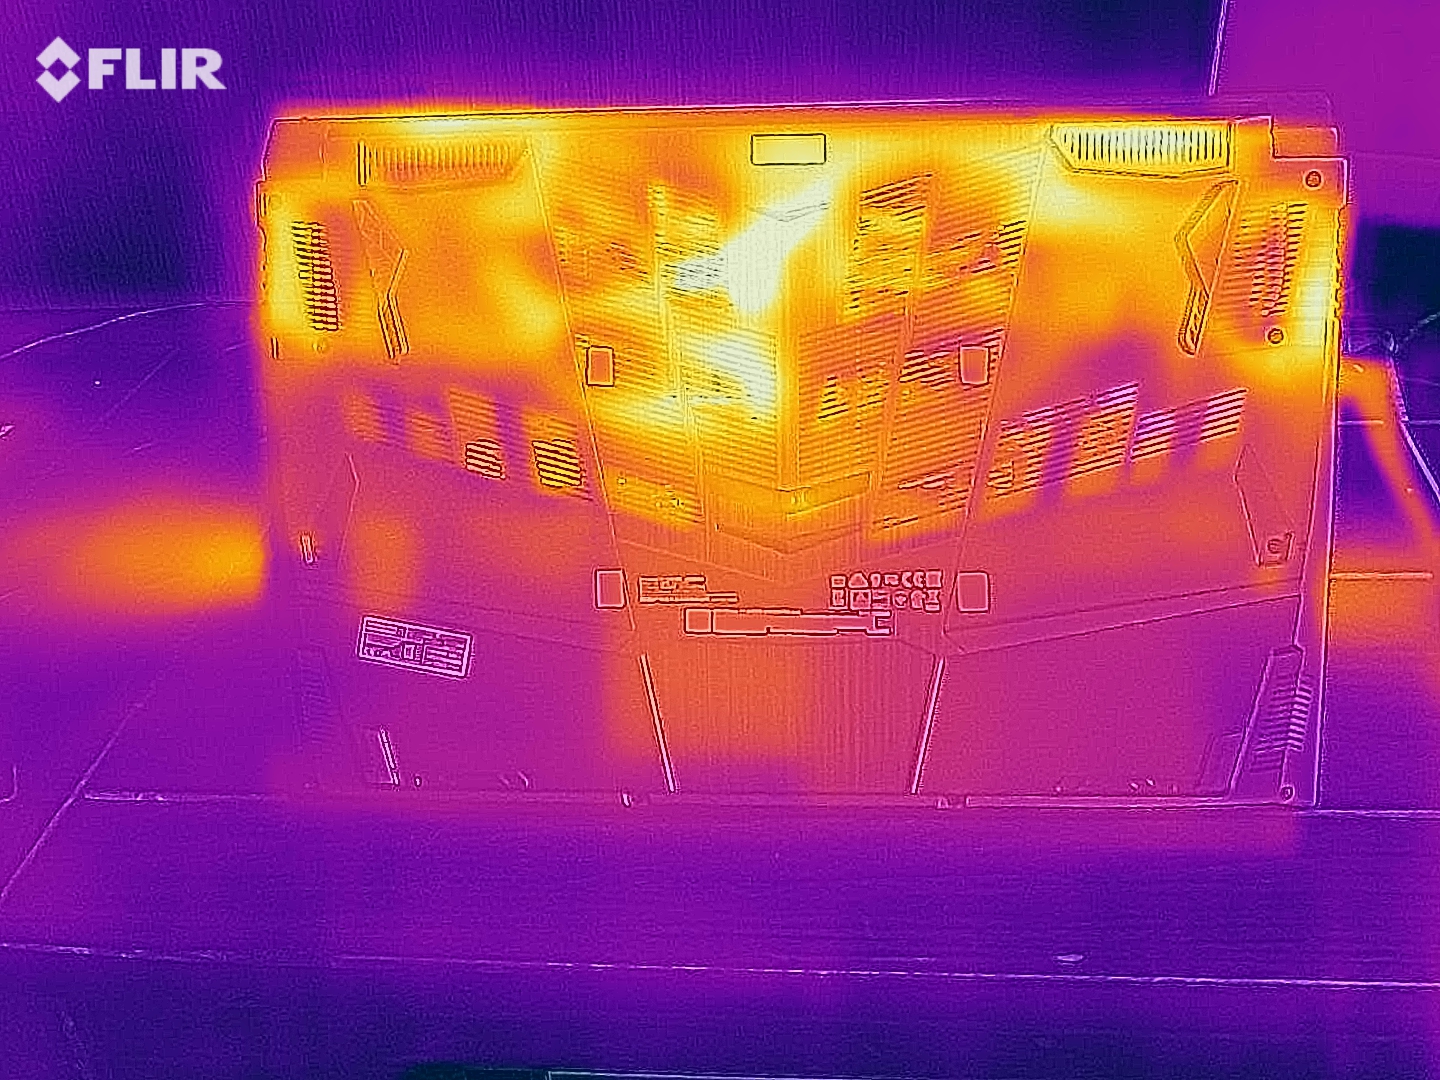
We were able to draw up to 48 °C (~118 °F) from the case's top side and up to 50 °C (~122 °F) from the bottom in the stress test. However, these temperatures primarily apply to the rear third of the laptop. In idle usage, the entire chassis stays pleasantly cool at around 24 °C (75 °F).
(-) The maximum temperature on the upper side is 48 °C / 118 F, compared to the average of 40.4 °C / 105 F, ranging from 21.2 to 68.8 °C for the class Gaming.
(-) The bottom heats up to a maximum of 50 °C / 122 F, compared to the average of 43.2 °C / 110 F
(+) In idle usage, the average temperature for the upper side is 24 °C / 75 F, compared to the device average of 33.9 °C / 93 F.
(-) Playing The Witcher 3, the average temperature for the upper side is 40.3 °C / 105 F, compared to the device average of 33.9 °C / 93 F.
(+) The palmrests and touchpad are reaching skin temperature as a maximum (33 °C / 91.4 F) and are therefore not hot.
(-) The average temperature of the palmrest area of similar devices was 28.8 °C / 83.8 F (-4.2 °C / -7.6 F).
| MSI Bravo 17 A4DDR R7 4800H, Radeon RX 5500M | MSI Alpha 15 A3DDK-034 R7 3750H, Radeon RX 5500M | MSI GF75 Thin 9SC i7-9750H, GeForce GTX 1650 Mobile | Asus TUF FX705DT-AU068T R5 3550H, GeForce GTX 1650 Mobile | Asus TUF A17 FA706IU-AS76 R7 4800H, GeForce GTX 1660 Ti Mobile | Lenovo Legion Y540-17IRH i5-9300H, GeForce GTX 1660 Ti Mobile | |
|---|---|---|---|---|---|---|
| Heat | -1% | -15% | -1% | -11% | -26% | |
| Maximum Upper Side * (°C) | 48 | 44 8% | 47.8 -0% | 41.6 13% | 47.6 1% | 48 -0% |
| Maximum Bottom * (°C) | 50 | 49 2% | 57 -14% | 38 24% | 50.8 -2% | 56 -12% |
| Idle Upper Side * (°C) | 25 | 26 -4% | 30.2 -21% | 31.7 -27% | 33 -32% | 36 -44% |
| Idle Bottom * (°C) | 26 | 28 -8% | 32 -23% | 29.5 -13% | 29 -12% | 38 -46% |
* ... smaller is better
Speakers
The 2.0 system integrated into the front area offers a good volume of maximum 84 dB and a decent sound pattern with the - other laptops send their regards - usual weaknesses in terms of bass. According to our audio analysis, the sound is better than with the thicker Alpha 15.
MSI Bravo 17 A4DDR audio analysis
(+) | speakers can play relatively loud (84 dB)
Bass 100 - 315 Hz
(-) | nearly no bass - on average 18.2% lower than median
(±) | linearity of bass is average (11.7% delta to prev. frequency)
Mids 400 - 2000 Hz
(+) | balanced mids - only 3.3% away from median
(+) | mids are linear (3.7% delta to prev. frequency)
Highs 2 - 16 kHz
(+) | balanced highs - only 2.7% away from median
(+) | highs are linear (4.7% delta to prev. frequency)
Overall 100 - 16.000 Hz
(+) | overall sound is linear (14.8% difference to median)
Compared to same class
» 29% of all tested devices in this class were better, 7% similar, 64% worse
» The best had a delta of 6%, average was 18%, worst was 132%
Compared to all devices tested
» 20% of all tested devices were better, 4% similar, 76% worse
» The best had a delta of 4%, average was 24%, worst was 134%
MSI Alpha 15 A3DDK-034 audio analysis
(+) | speakers can play relatively loud (91 dB)
Bass 100 - 315 Hz
(-) | nearly no bass - on average 31.4% lower than median
(+) | bass is linear (5.8% delta to prev. frequency)
Mids 400 - 2000 Hz
(±) | reduced mids - on average 7.4% lower than median
(±) | linearity of mids is average (9.9% delta to prev. frequency)
Highs 2 - 16 kHz
(+) | balanced highs - only 2.1% away from median
(+) | highs are linear (3.7% delta to prev. frequency)
Overall 100 - 16.000 Hz
(±) | linearity of overall sound is average (19.5% difference to median)
Compared to same class
» 67% of all tested devices in this class were better, 7% similar, 26% worse
» The best had a delta of 6%, average was 18%, worst was 132%
Compared to all devices tested
» 48% of all tested devices were better, 7% similar, 44% worse
» The best had a delta of 4%, average was 24%, worst was 134%
Energy management
Energy consumption
In comparison to the last CPU generation, AMD seems to have noticeably optimized the energy management. Instead of the 14 to 32 watts that the Alpha 15 required in idle usage (Ryzen 7 3750H), the Bravo 17 only needs 9 to 13 watts. On the other hand, the consumption under load is similar at 69 to 214 watts - but the Ryzen 7 4800H also offers twice as many cores.
| Off / Standby | |
| Idle | |
| Load |
|
Key:
min: | |
| MSI Bravo 17 A4DDR R7 4800H, Radeon RX 5500M | MSI Alpha 15 A3DDK-034 R7 3750H, Radeon RX 5500M | MSI GF75 Thin 9SC i7-9750H, GeForce GTX 1650 Mobile | Asus TUF FX705DT-AU068T R5 3550H, GeForce GTX 1650 Mobile | Asus TUF A17 FA706IU-AS76 R7 4800H, GeForce GTX 1660 Ti Mobile | Lenovo Legion Y540-17IRH i5-9300H, GeForce GTX 1660 Ti Mobile | |
|---|---|---|---|---|---|---|
| Power Consumption | -44% | -13% | 29% | -9% | -63% | |
| Idle Minimum * (Watt) | 9 | 14 -56% | 6.1 32% | 3.9 57% | 7.4 18% | 19 -111% |
| Idle Average * (Watt) | 10 | 18 -80% | 11.2 -12% | 9.6 4% | 10.5 -5% | 22 -120% |
| Idle Maximum * (Watt) | 13 | 32 -146% | 24.5 -88% | 12.2 6% | 17 -31% | 30 -131% |
| Load Average * (Watt) | 69 | 64 7% | 94.7 -37% | 59 14% | 103.7 -50% | 79 -14% |
| Witcher 3 ultra * (Watt) | 128 | 123 4% | 105.8 17% | 128.1 -0% | 134 -5% | |
| Load Maximum * (Watt) | 214 | 193 10% | 192.2 10% | 80 63% | 183.2 14% | 201 6% |
* ... smaller is better
Battery life
With a capacity of 51 Wh, the battery is not designed for particularly long runtimes. Thanks to the graphics-switching solution and the 7 nm components, the Bravo 17 lasts at least 5 hours when surfing the Internet on WLAN (medium brightness). However, even under ideal conditions, it's almost impossible to squeeze more than 7 hours out from the battery.
| MSI Bravo 17 A4DDR R7 4800H, Radeon RX 5500M, 51 Wh | MSI Alpha 15 A3DDK-034 R7 3750H, Radeon RX 5500M, 51 Wh | MSI GF75 Thin 9SC i7-9750H, GeForce GTX 1650 Mobile, 51 Wh | Asus TUF FX705DT-AU068T R5 3550H, GeForce GTX 1650 Mobile, 64 Wh | Asus TUF A17 FA706IU-AS76 R7 4800H, GeForce GTX 1660 Ti Mobile, 90 Wh | Lenovo Legion Y540-17IRH i5-9300H, GeForce GTX 1660 Ti Mobile, 57 Wh | |
|---|---|---|---|---|---|---|
| Battery runtime | -28% | -10% | 63% | 78% | -25% | |
| Reader / Idle (h) | 7.7 | 5.8 -25% | 13.6 77% | 9.1 18% | 5.2 -32% | |
| WiFi v1.3 (h) | 5.2 | 4.1 -21% | 4.7 -10% | 7.8 50% | 8.5 63% | 3.7 -29% |
| Load (h) | 1.3 | 0.8 -38% | 2.1 62% | 3.3 154% | 1.1 -15% | |
| H.264 (h) | 3.9 | 8.1 | 3.4 |
Pros
Cons
Verdict
AMD is back – and with a bang: Not necessarily on the GPU side but definitely on the CPU side.
The Ryzen 7 4800H impresses with a very high performance that puts the price-comparable Intel competition (e.g. the Core i7-9750H) in its place. Such an amount of CPU power was previously reserved for gaming laptops over 1,500 Euros (~$1,696).
With exception of the poor connectivity, the low-brightness display, and the high noise development under load, the rest of the Bravo 17 also makes a good impression. AMD fans, who have to/want to watch out for their budget, can pull the purchase trigger with confidence.
MSI Bravo 17 A4DDR
- 07/02/2020 v7 (old)
Florian Glaser
Price comparison

