MSI Alpha 15 A3DDK Laptop Review: A mid-range and power-hungry gaming laptop

The Alpha 15 A3DDK is MSI's latest 15.6-inch mid-range gaming laptop, which it equips with an AMD Ryzen 7 3750H APU and a Radeon RX 5500M GPU. Our test device, the A3DDK-034, currently retails for just under €1,300 (~$1423). However, the entry-level starts at around €1,000 (~$1095). There are already plenty of gaming laptops at this price, with the Alpha 15 having plenty of competitors to overcome. Our comparison devices will include the Acer Predator Helios 300, Dell G5 5590, HP Pavilion Gaming 15, and Lenovo Legion Y540-15IRH.
Rating | Date | Model | Weight | Height | Size | Resolution | Price |
|---|---|---|---|---|---|---|---|
| 78.8 % v7 (old) | 02 / 2020 | MSI Alpha 15 A3DDK-034 R7 3750H, Radeon RX 5500M | 2.3 kg | 27.5 mm | 15.60" | 1920x1080 | |
| 82.1 % v7 (old) | 11 / 2019 | Acer Predator Helios 300 PH315-52-79TY i7-9750H, GeForce GTX 1660 Ti Mobile | 2.3 kg | 23.2 mm | 15.60" | 1920x1080 | |
| 79.7 % v7 (old) | 10 / 2019 | HP Pavilion Gaming 15-ec0017ng R7 3750H, GeForce GTX 1660 Ti Max-Q | 2.3 kg | 23.5 mm | 15.60" | 1920x1080 | |
| 79.6 % v7 (old) | 10 / 2019 | Dell G5 15 5590-PCNJJ i5-9300H, GeForce GTX 1650 Mobile | 2.7 kg | 23.7 mm | 15.60" | 1920x1080 | |
| 82.3 % v7 (old) | 08 / 2019 | Lenovo Legion Y540-15IRH-81SX00B2GE i7-9750H, GeForce GTX 1660 Ti Mobile | 2.2 kg | 26 mm | 15.60" | 1920x1080 |
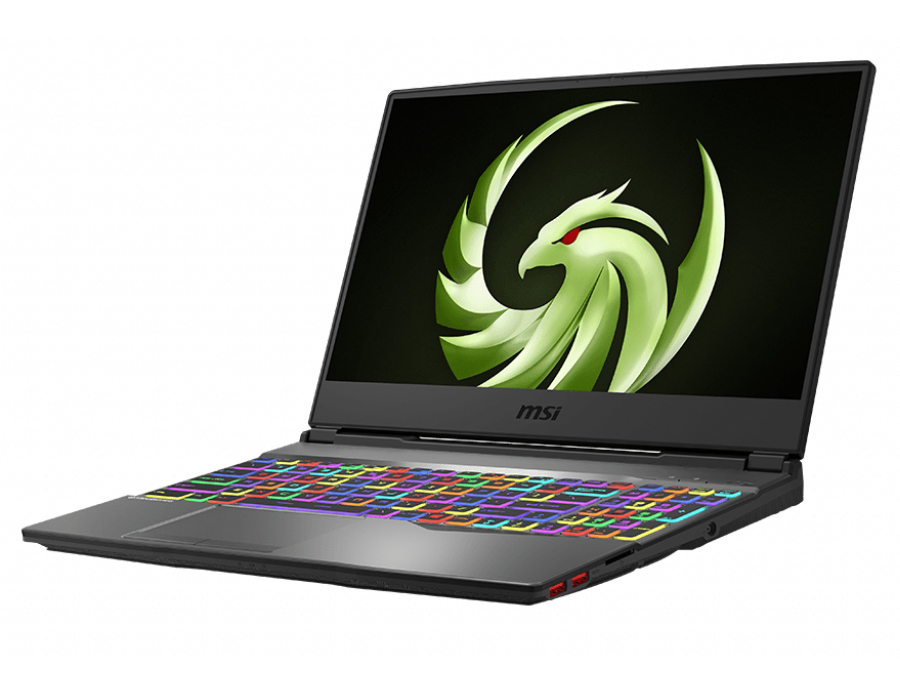
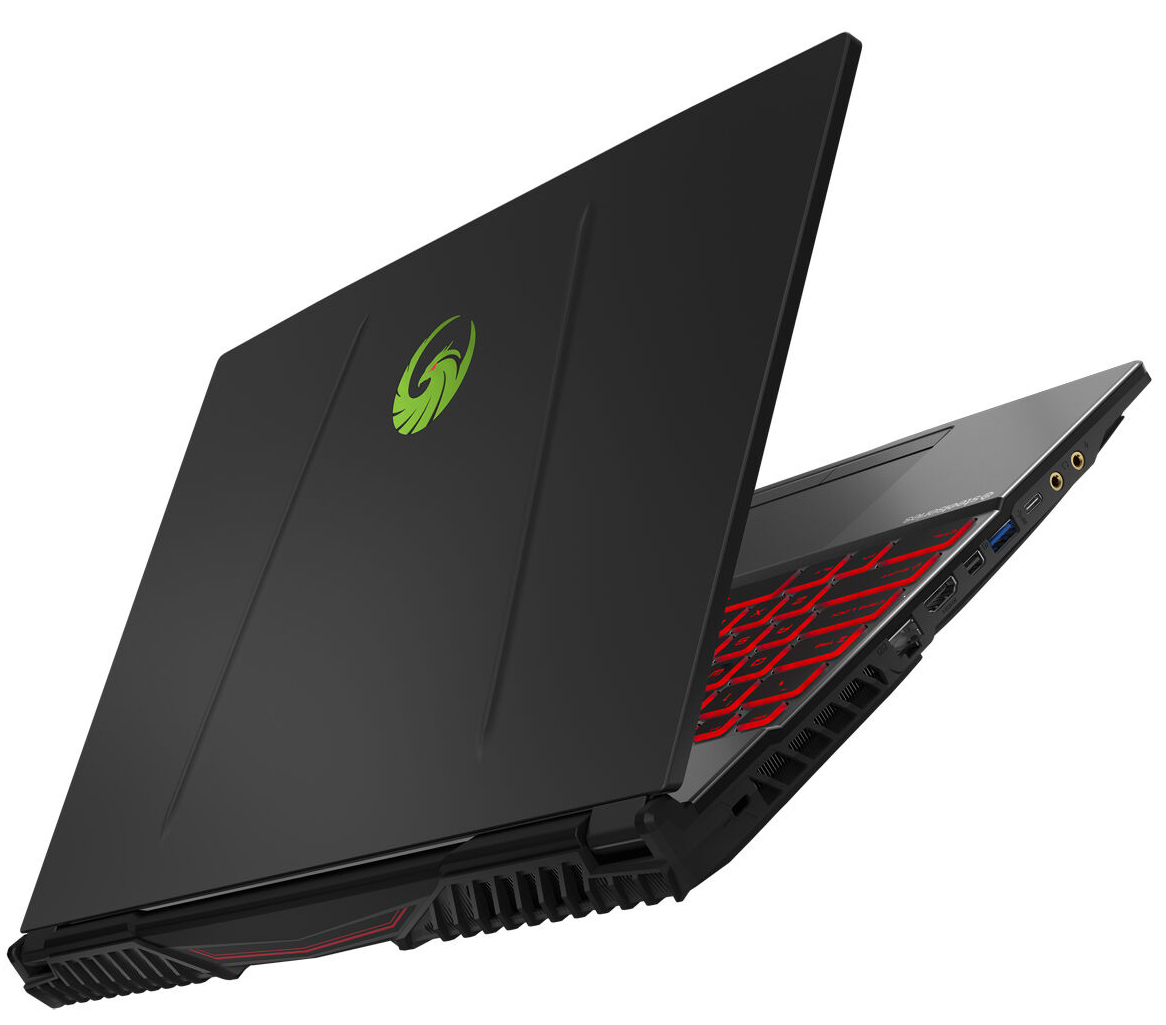
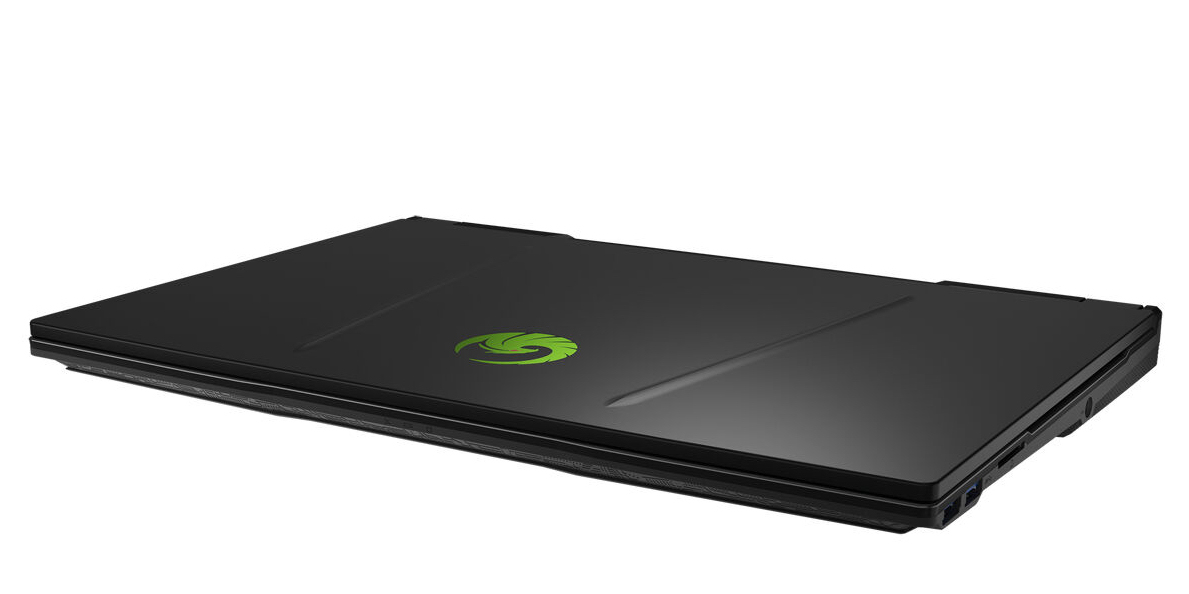
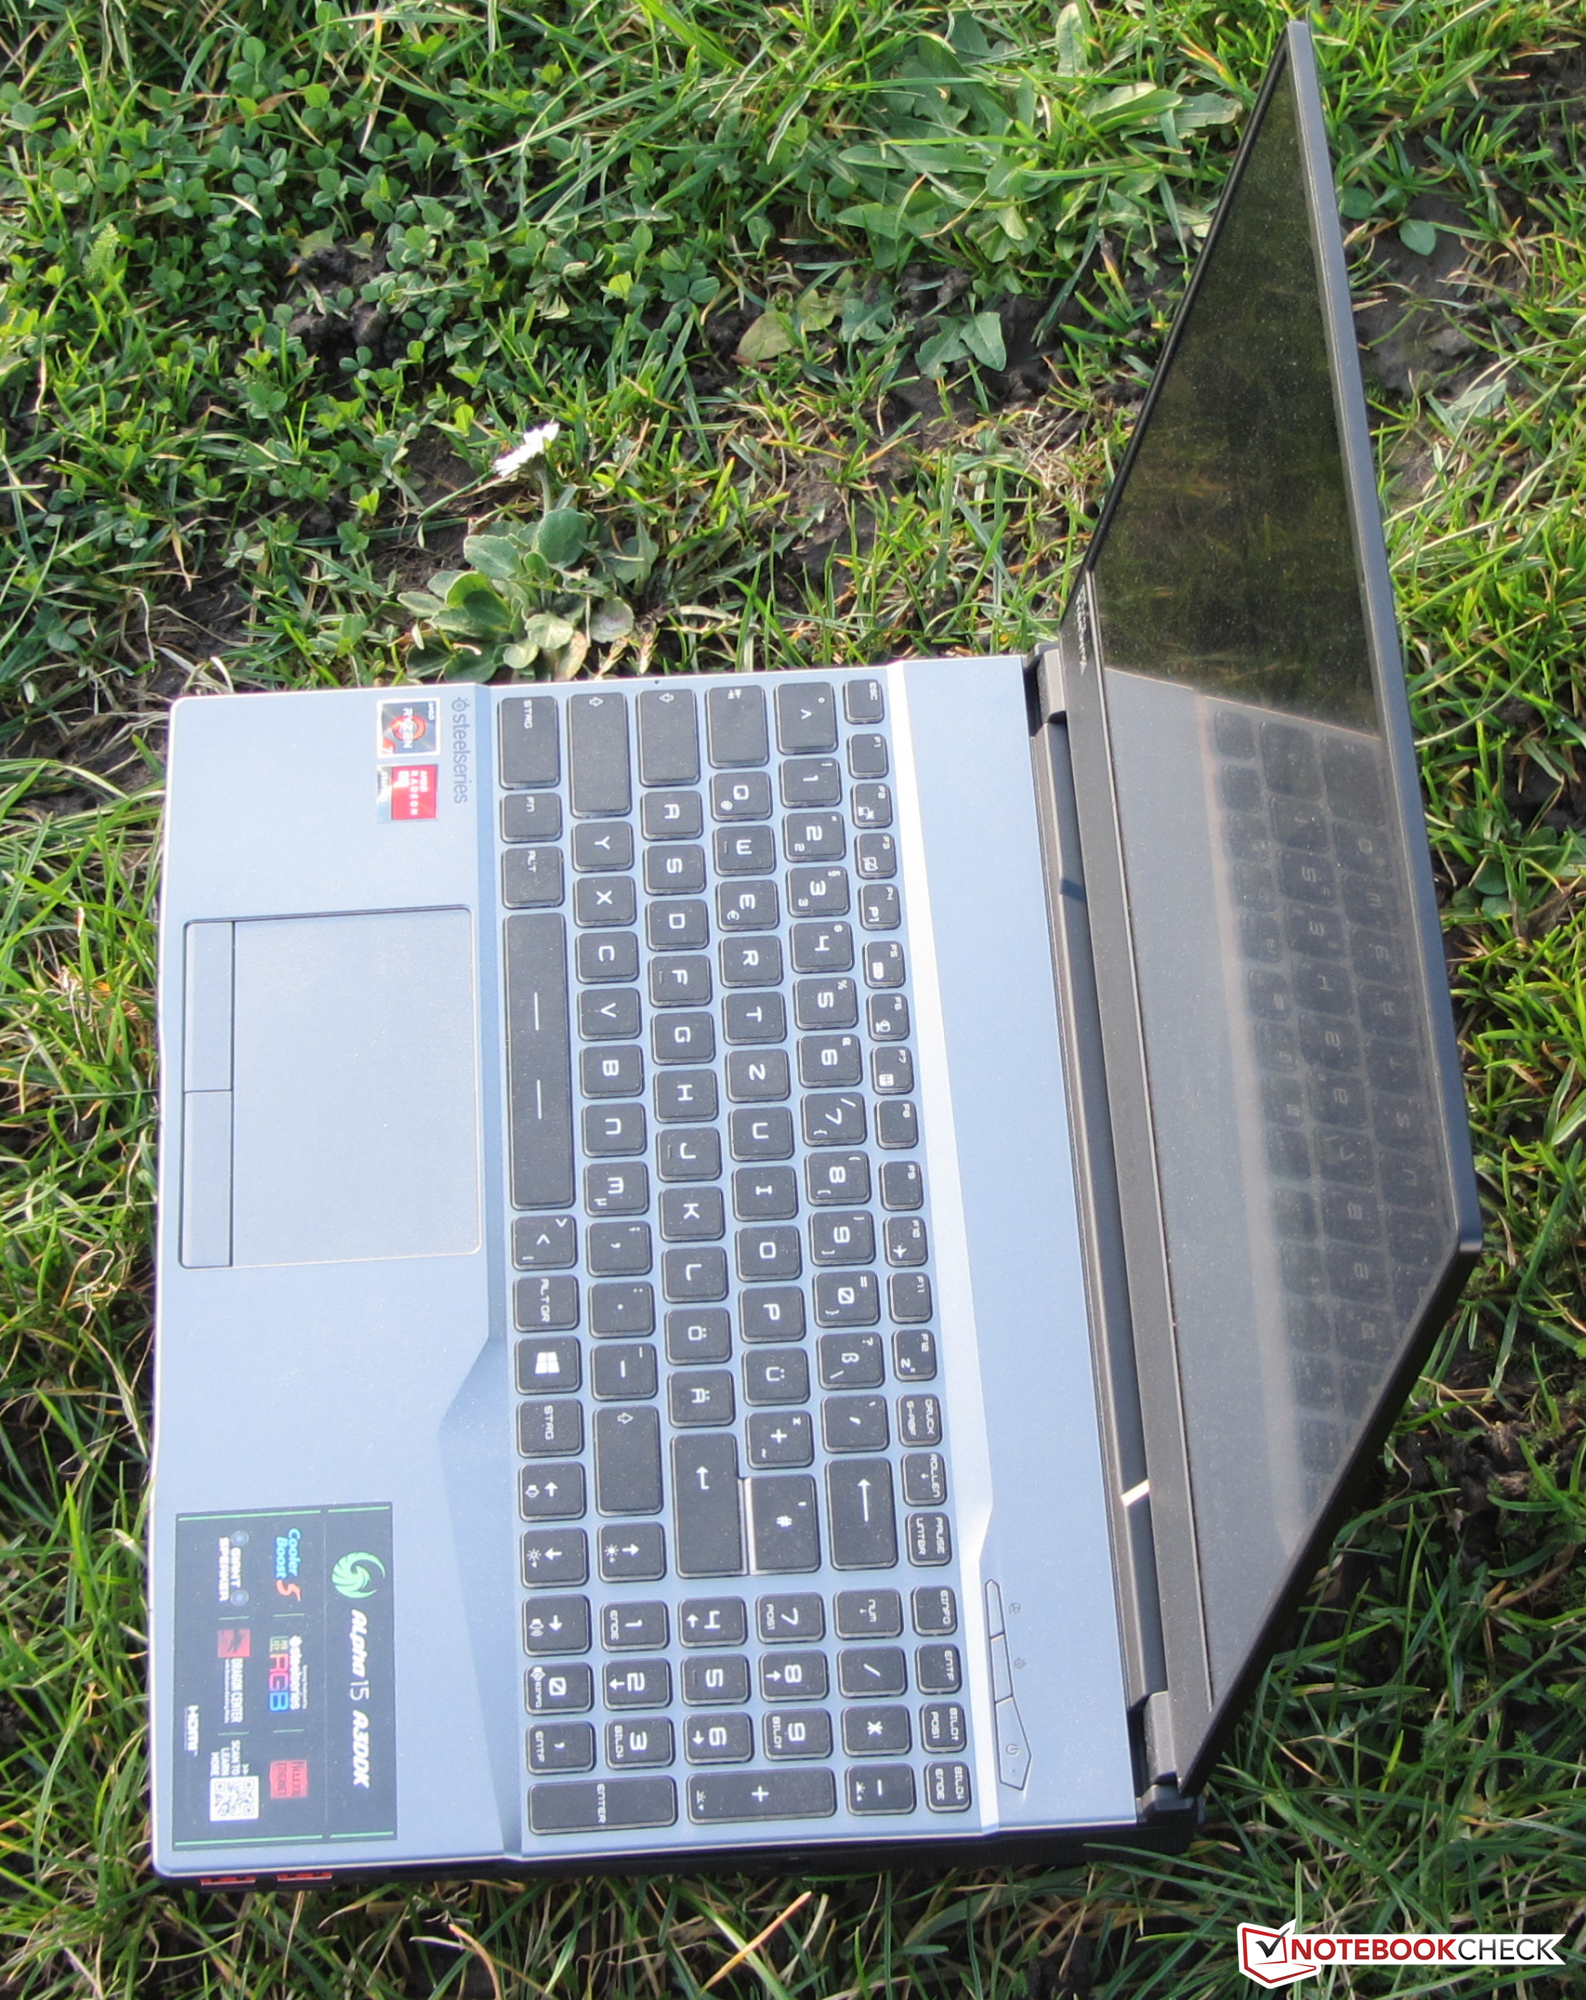
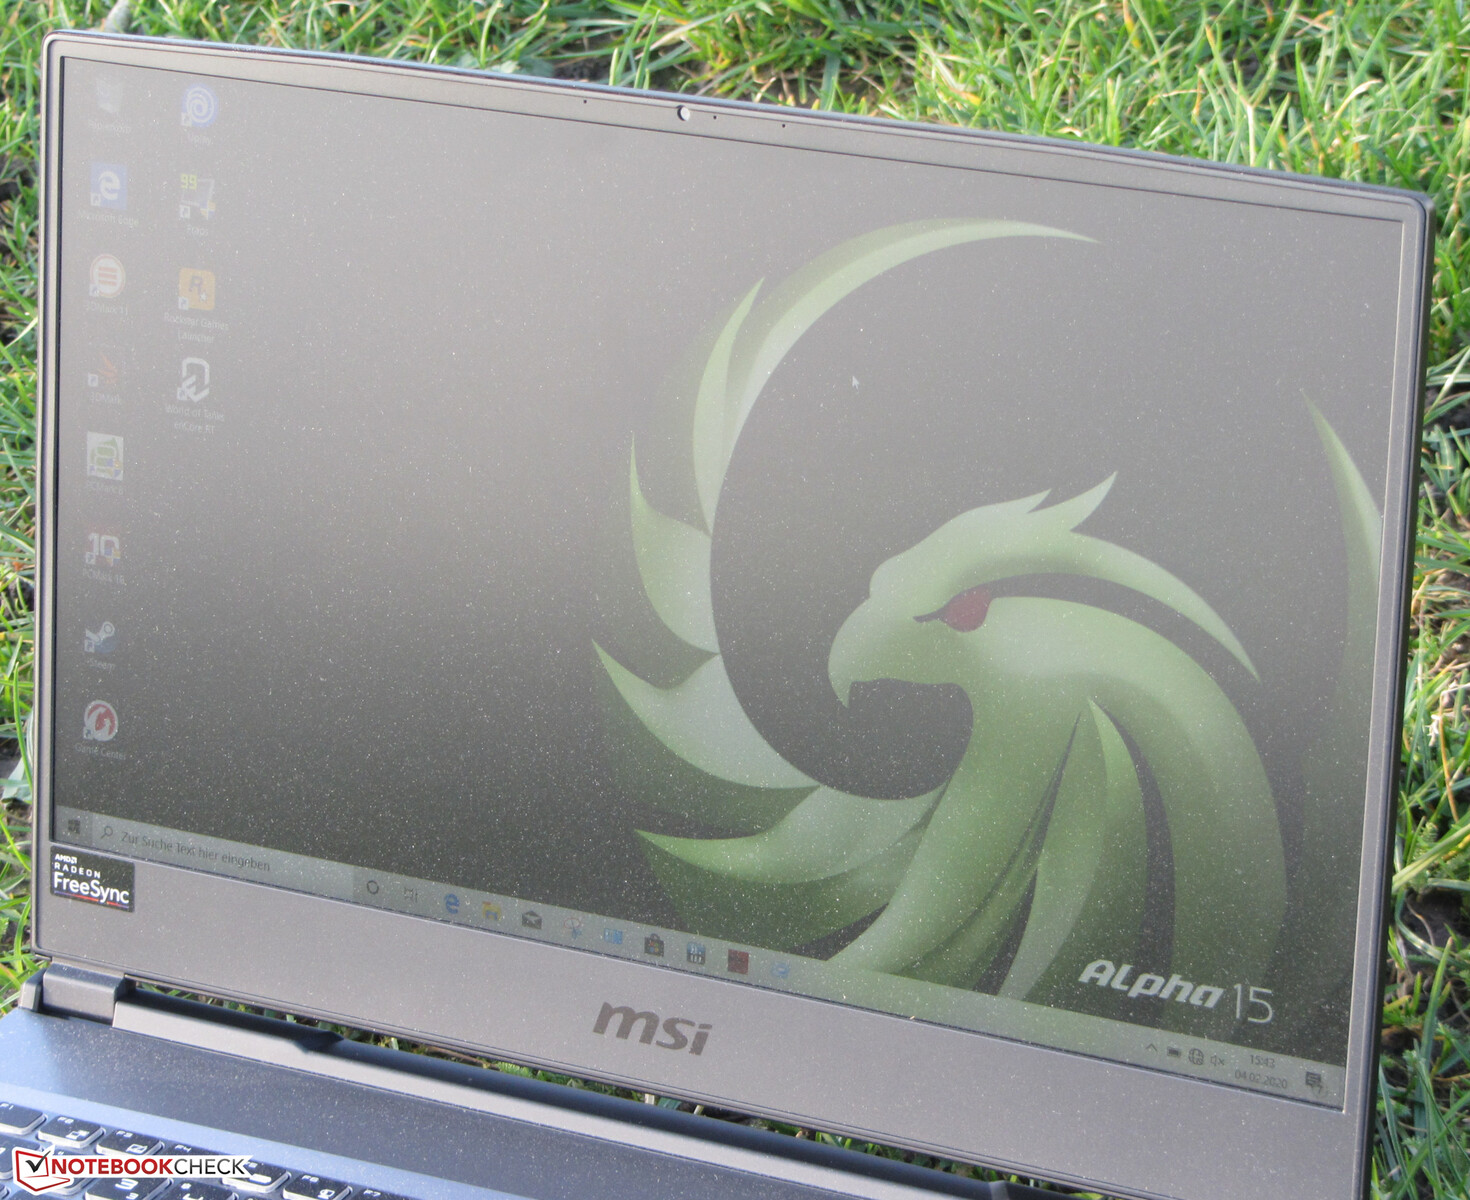
Case - MSI settles on a metal and plastic mix for the Alpha 15
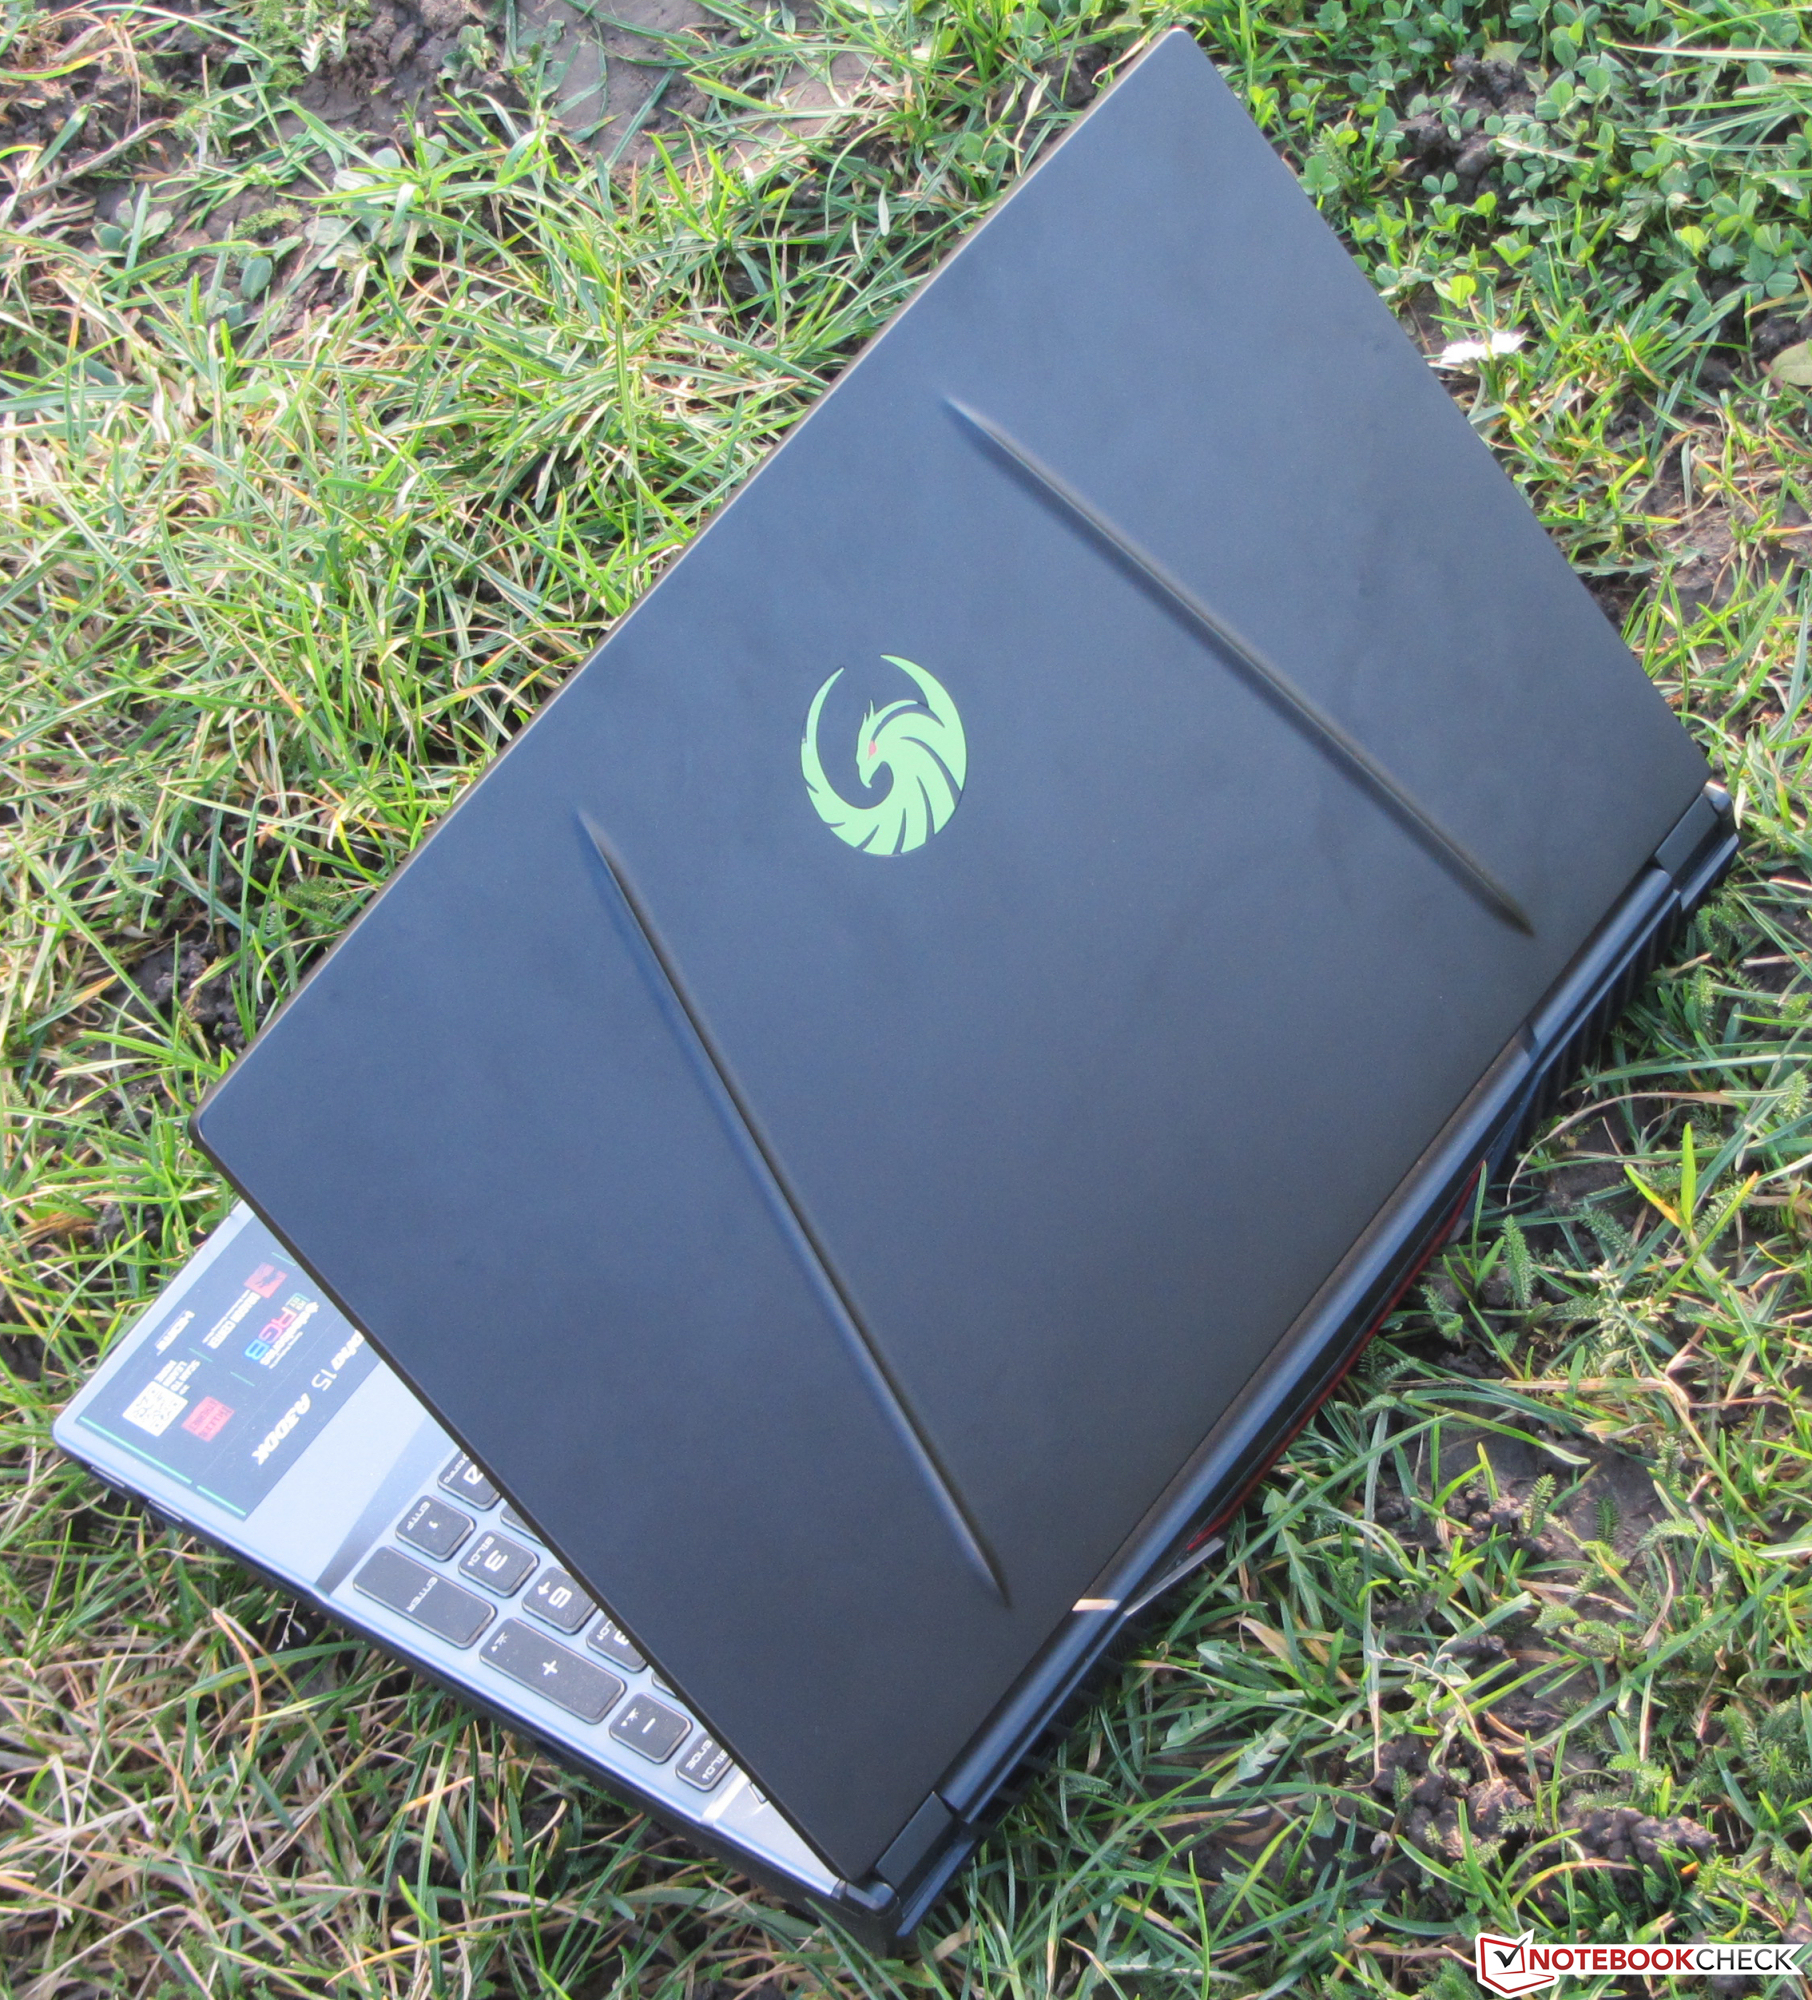
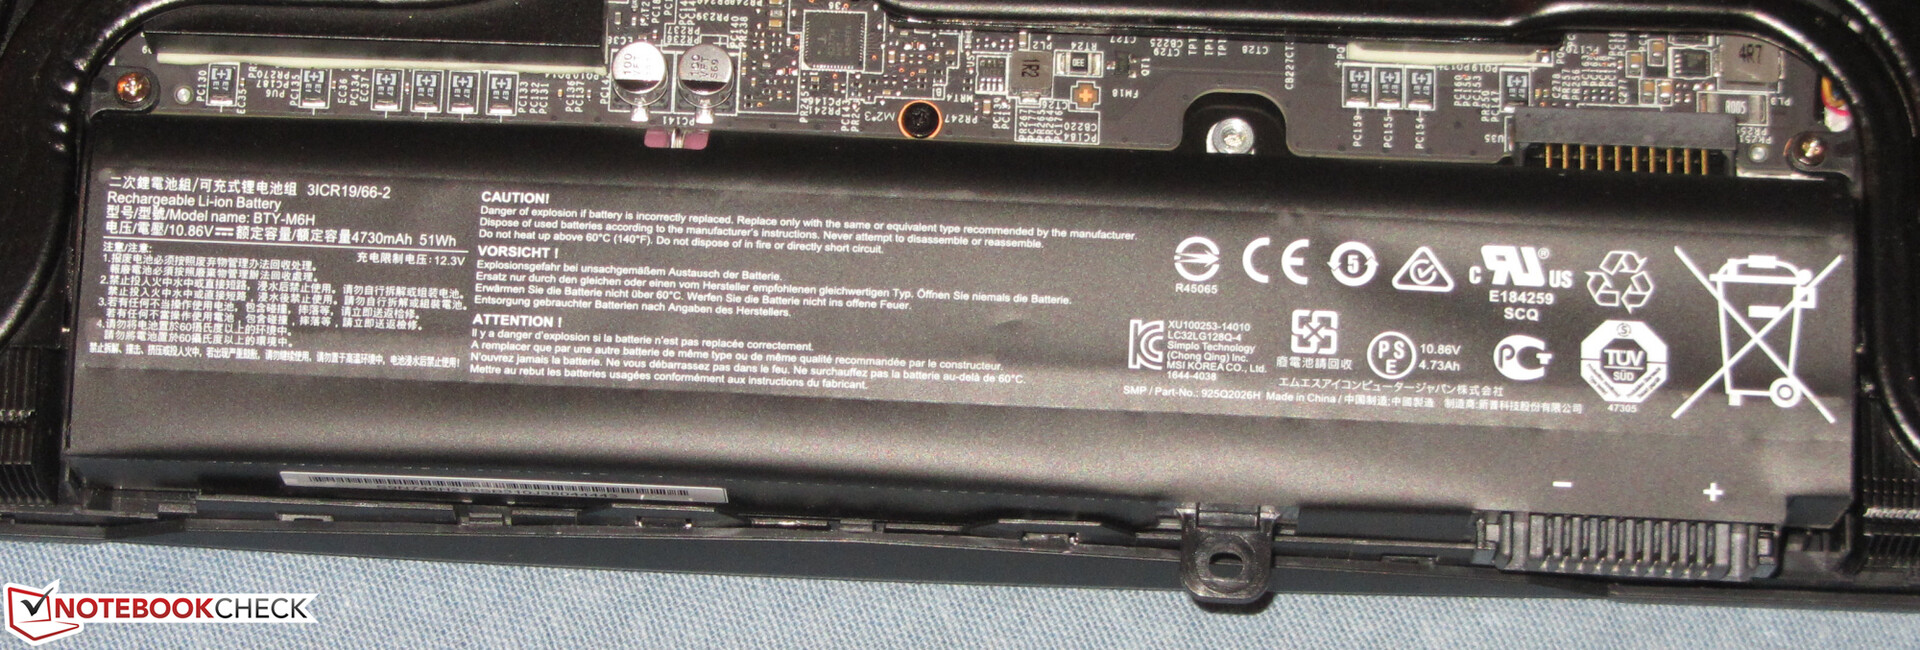
The Alpha 15 has a mostly plastic housing, with the display lid being the only thing made of metal. With exception to the keyboard deck, which is dark silver and grey, the device has a black finish. Overall, the Alpha 15 looks functional, with its most striking features being the green Alpha logo on its display lid and its illuminated USB ports. The device has slim bezels thanks to its rather compact dimensions, which helps make it look modern. MSI permanently installs the battery, though. There is no maintenance flap.
In short, the Alpha 15 is a well-made device. Our review unit suffers from no manufacturing defects, and the gaps between materials are uniformly even. There is room for improvement with the chassis' stability, though. The base unit should be stiffer, in our opinion. We found no such problems with the hinges, which hold the display firmly in place. They allow the display to be opened to about 160° and with one hand. The lid is sturdy too, with it resisting our attempts to temporarily deform the display.


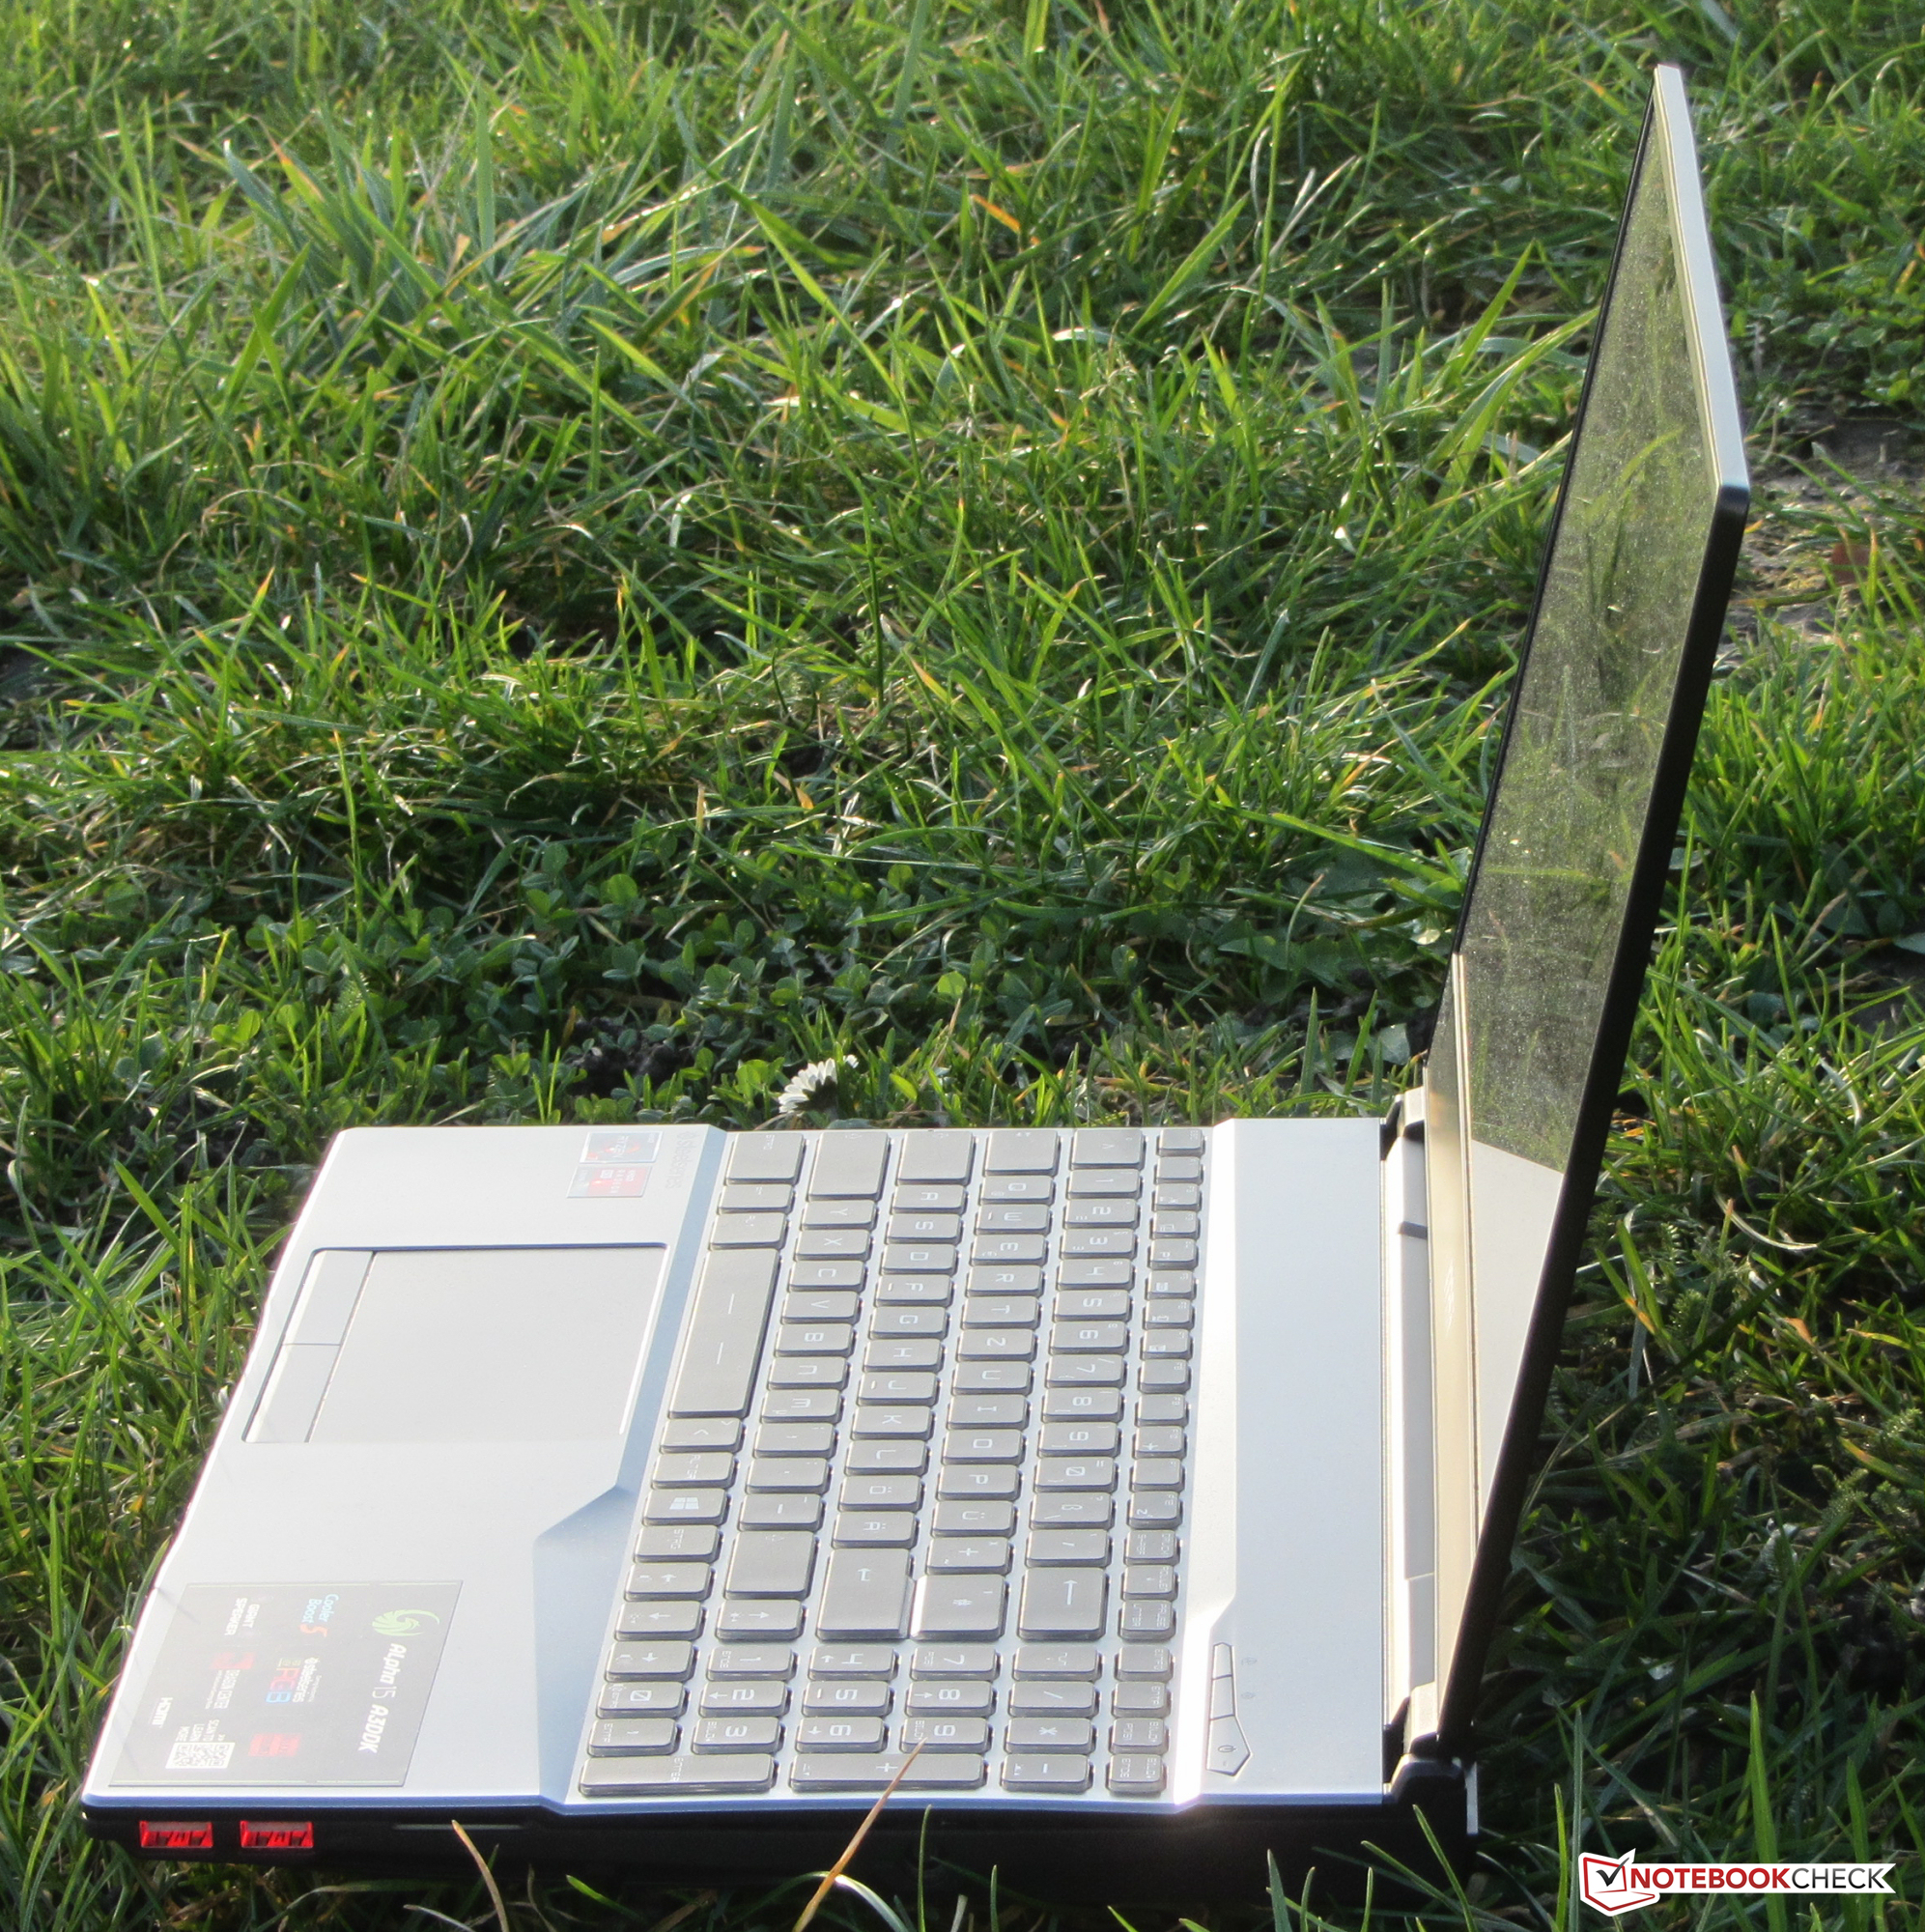
The Alpha 15 is the most compact laptop within our comparison field. It is on par with the weight of most of its competitors, too.
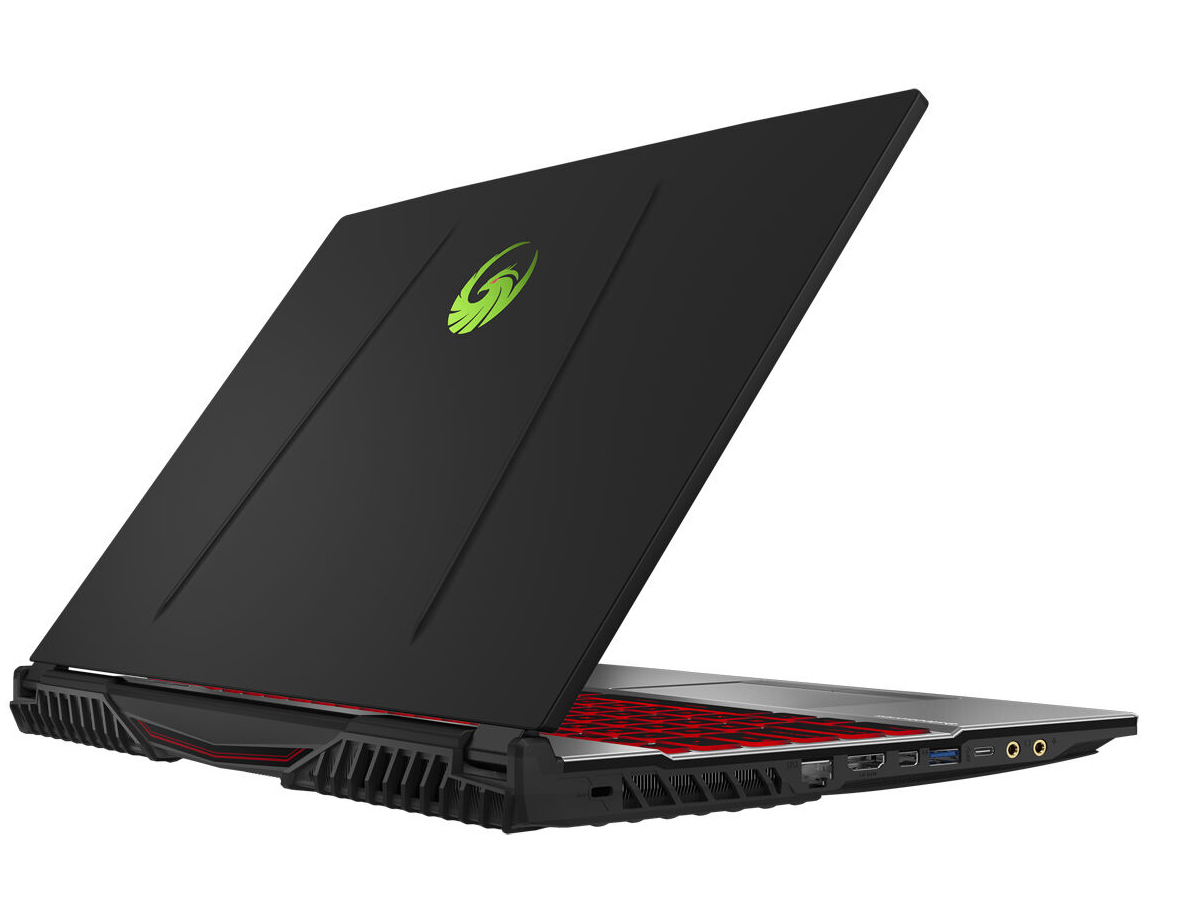
Connectivity - No Thunderbolt 3 here
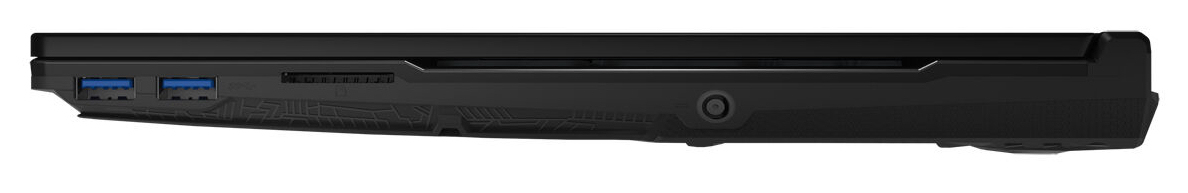
The MSI gaming laptop also comes with a comprehensive range of ports. All USB slots, three Type-A and one Type-C, operate on the latest USB 3.2 Gen1 standard, for example. Additionally, there are two video outputs, HDMI and mini DisplayPort, dedicated headphone and microphone jacks, along with a Gigabit Ethernet port. MSI has not included a Thunderbolt 3 port though, which would have permitted the option of connecting a more powerful external GPU. MSI also distributes the ports towards the front edges of the chassis, which could cause issues if you use an external mouse, for example.

SD Card Reader
The memory card reader takes it slow. When copying large data blocks, we observed our review unit peaking at 37 MB/s, which dropped to 35 MB/s when copying 250 5 MB jpg files. We test memory card readers with a Toshiba Exceria Pro SDXC 64 GB UHS-II where possible, for reference.
| SD Card Reader | |
| average JPG Copy Test (av. of 3 runs) | |
| Average of class Gaming (20.9 - 210, n=54, last 2 years) | |
| HP Pavilion Gaming 15-ec0017ng (Toshiba Exceria Pro SDXC 64 GB UHS-II) | |
| MSI Alpha 15 A3DDK-034 (Toshiba Exceria Pro SDXC 64 GB UHS-II) | |
| Dell G5 15 5590-PCNJJ (Toshiba Exceria Pro SDXC 64 GB UHS-II) | |
| maximum AS SSD Seq Read Test (1GB) | |
| Average of class Gaming (25.5 - 261, n=51, last 2 years) | |
| HP Pavilion Gaming 15-ec0017ng (Toshiba Exceria Pro SDXC 64 GB UHS-II) | |
| MSI Alpha 15 A3DDK-034 (Toshiba Exceria Pro SDXC 64 GB UHS-II) | |
| Dell G5 15 5590-PCNJJ (Toshiba Exceria Pro SDXC 64 GB UHS-II) | |
Communication
The Wi-Fi chip, a Realtek 8822CE, supports IEEE 802.11 a/b/g/n/ac. Our review unit achieved good transfer speeds during our tests, although please keep in mind that we conducted these under optimal conditions with no other Wi-Fi devices nearby and the Alpha 15 only a short distance from the router. The Killer E2600 Gigabit Ethernet controller handles wired network connections; it did its job smoothly too.
Accessories
MSI includes the usual set of accessories with the Alpha 15. Namely, warranty information a quick start guide and a power supply.
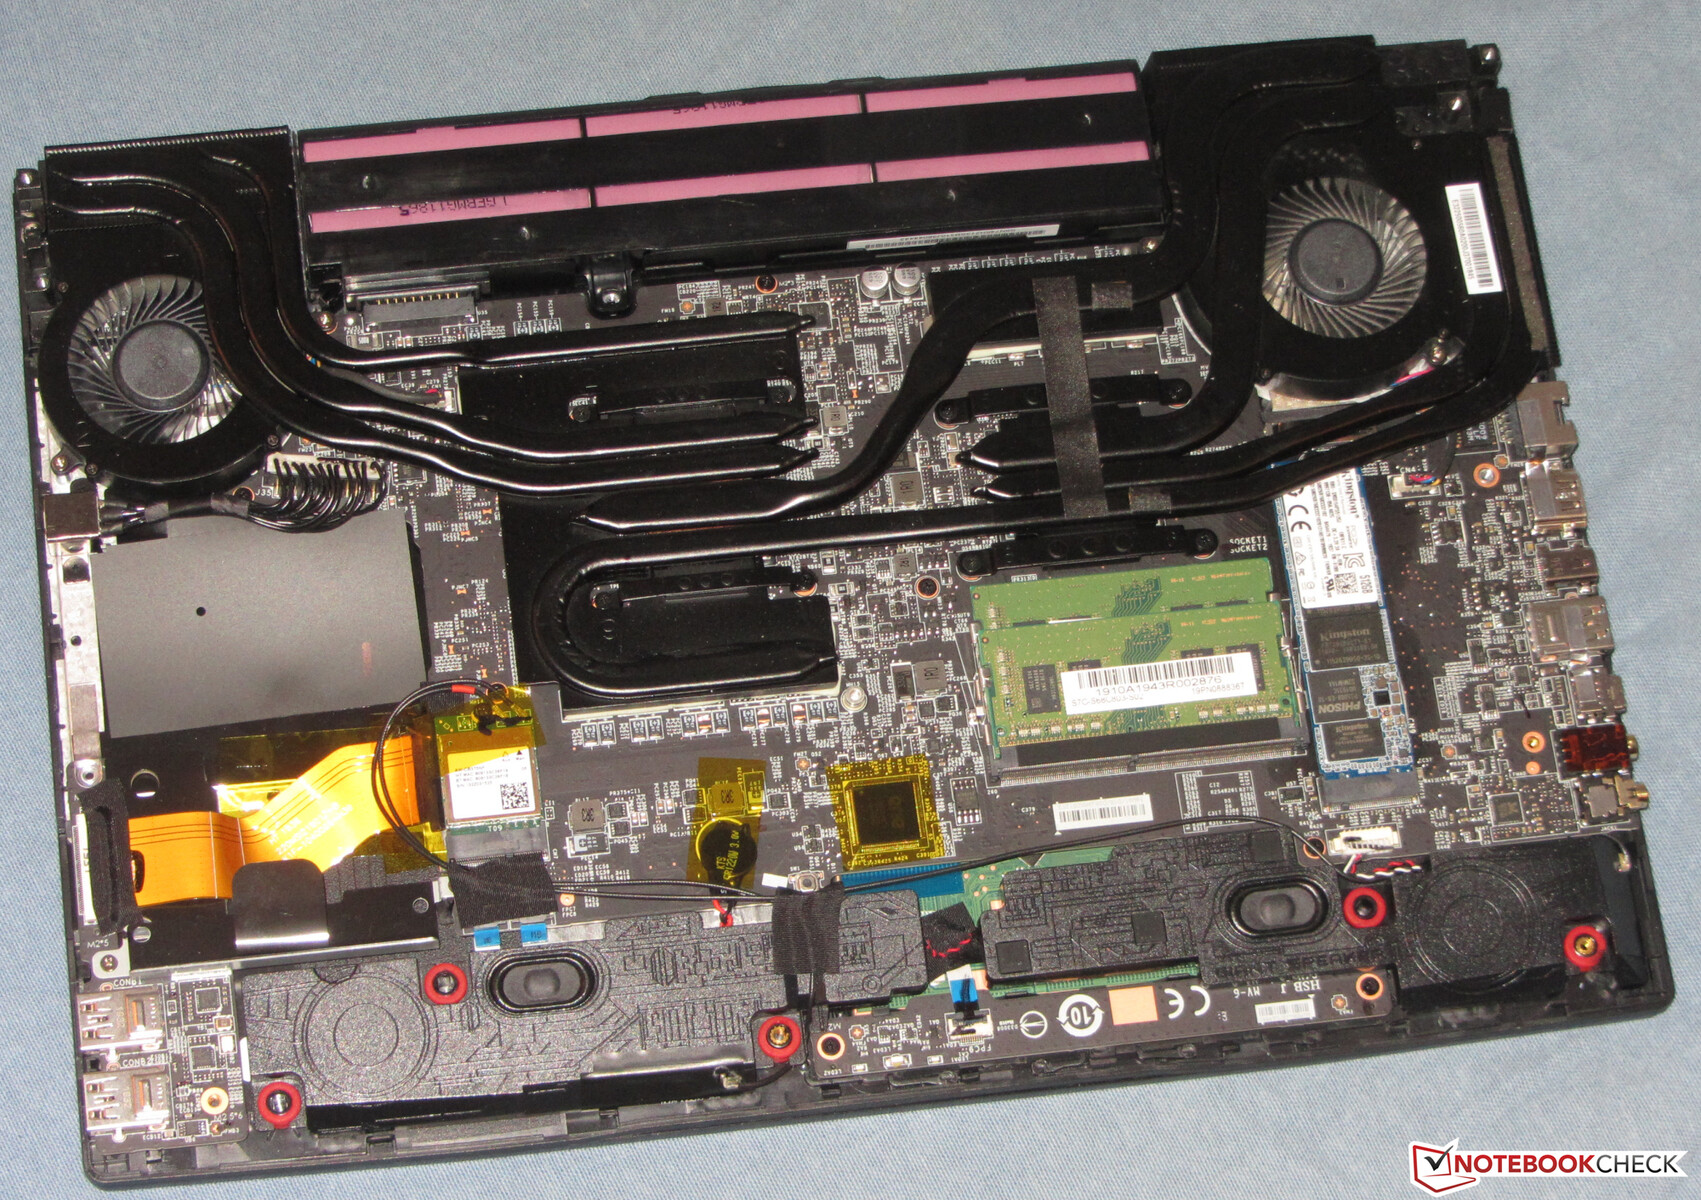
Maintenance
The Alpha 15 does not have a maintenance cover, as we mentioned earlier. To get to its innards, you must remove the lower shell, which requires removing all the screws securing it to the rest of the chassis. The base unit can then be removed with a flat tool, like a plastic spudger.
Warranty
MSI afford the Alpha 15 a two-year manufacturer's warranty by default. The company also sells an additional year's coverage for €119 (~$130), or a two-year extension for €249 (~$273).
Please see our Guarantees, Return Policies and Warranties FAQ for country-specific information.
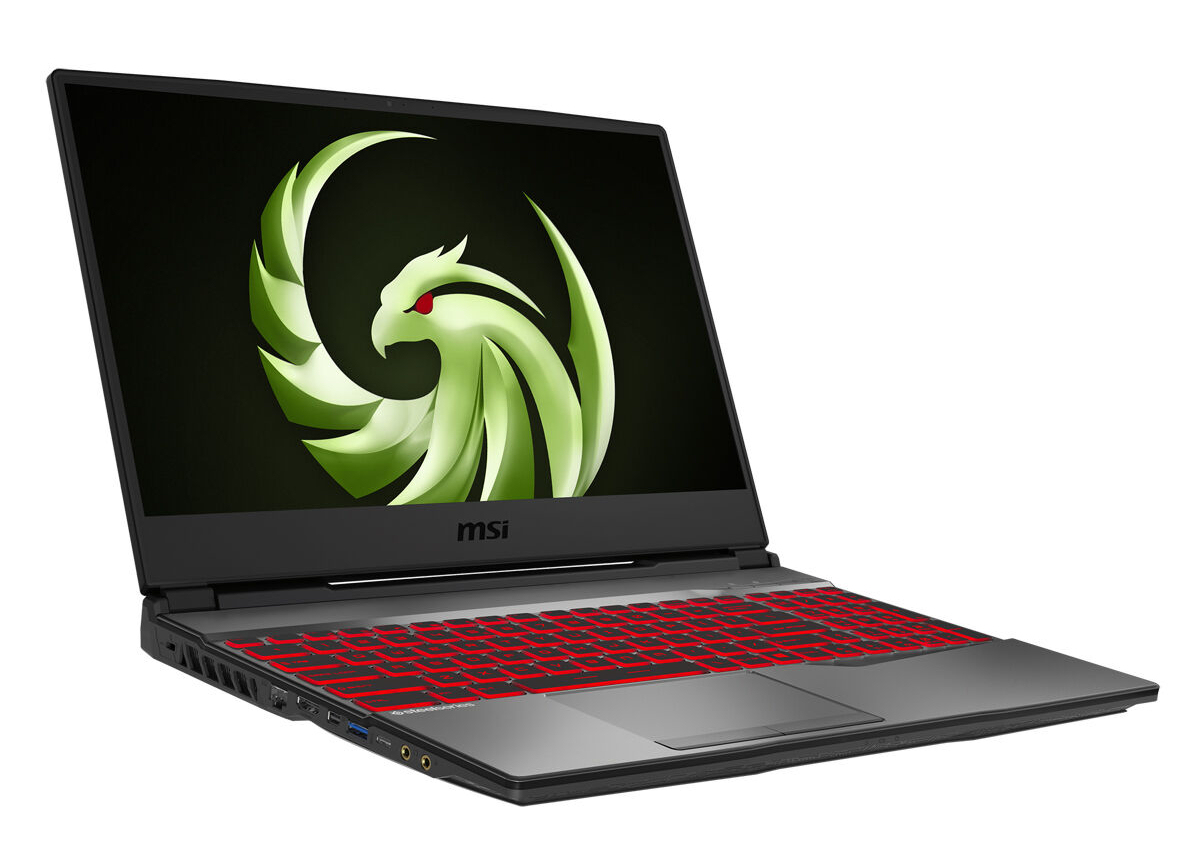
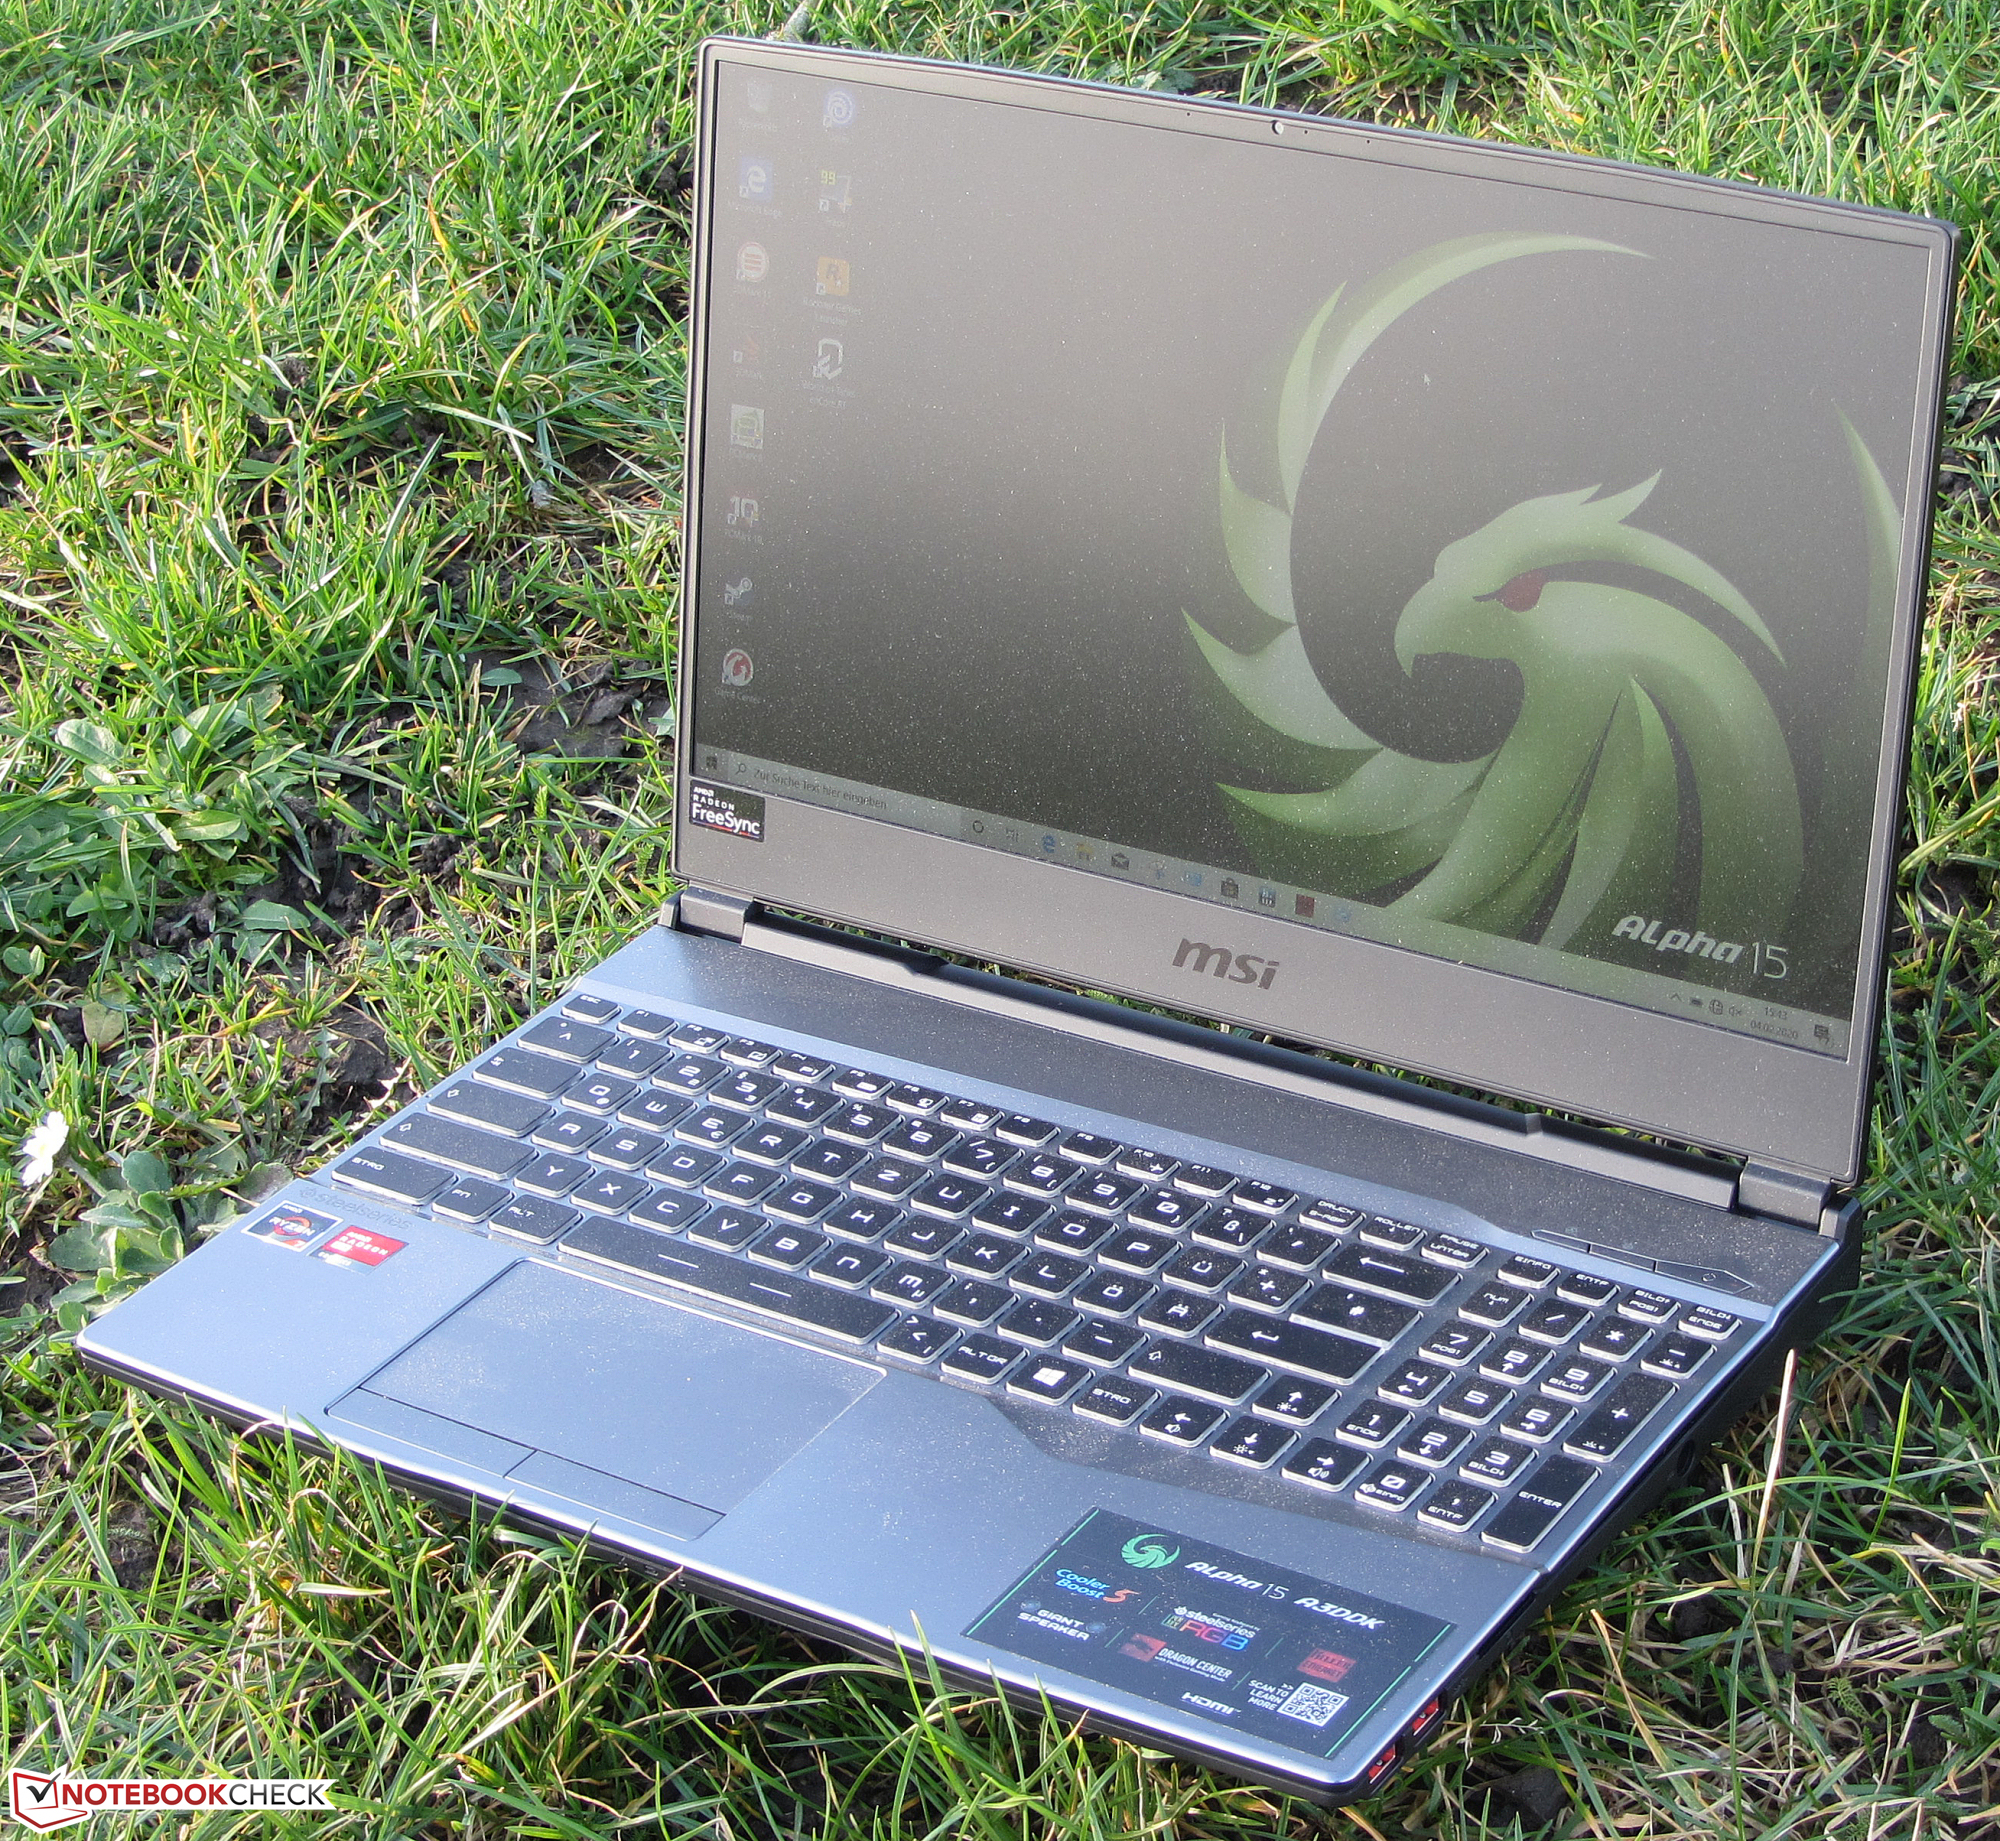
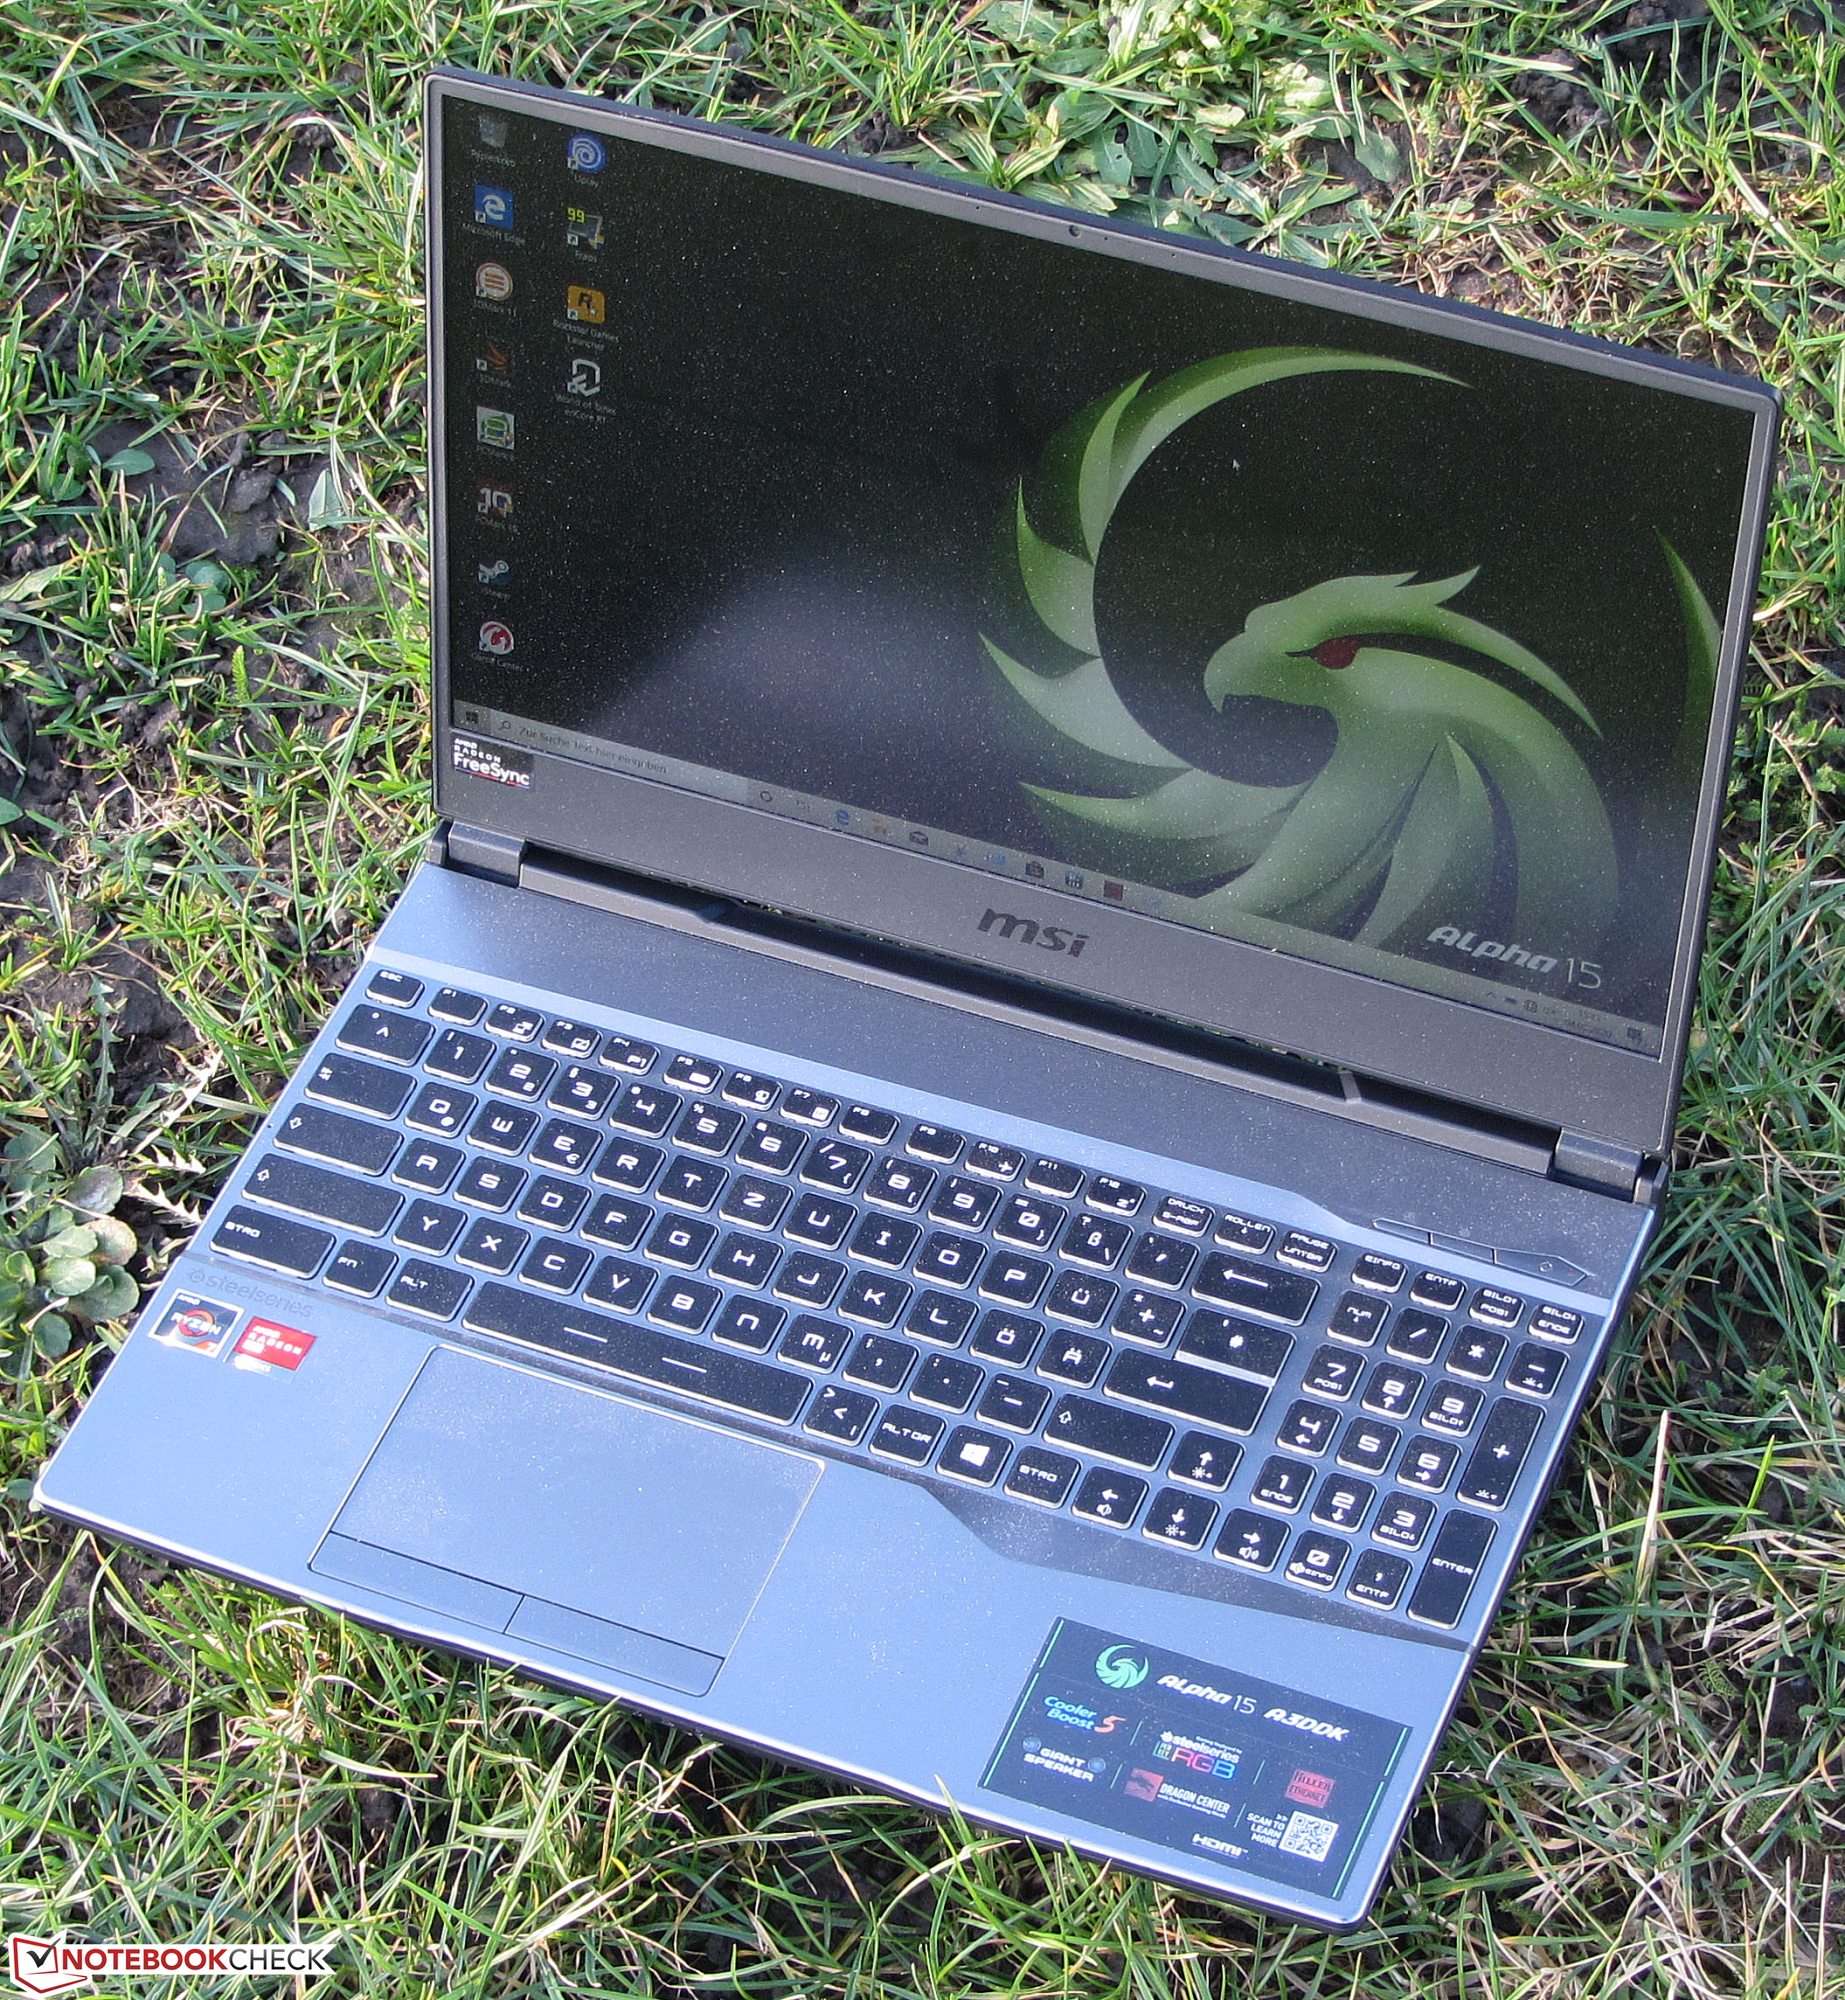
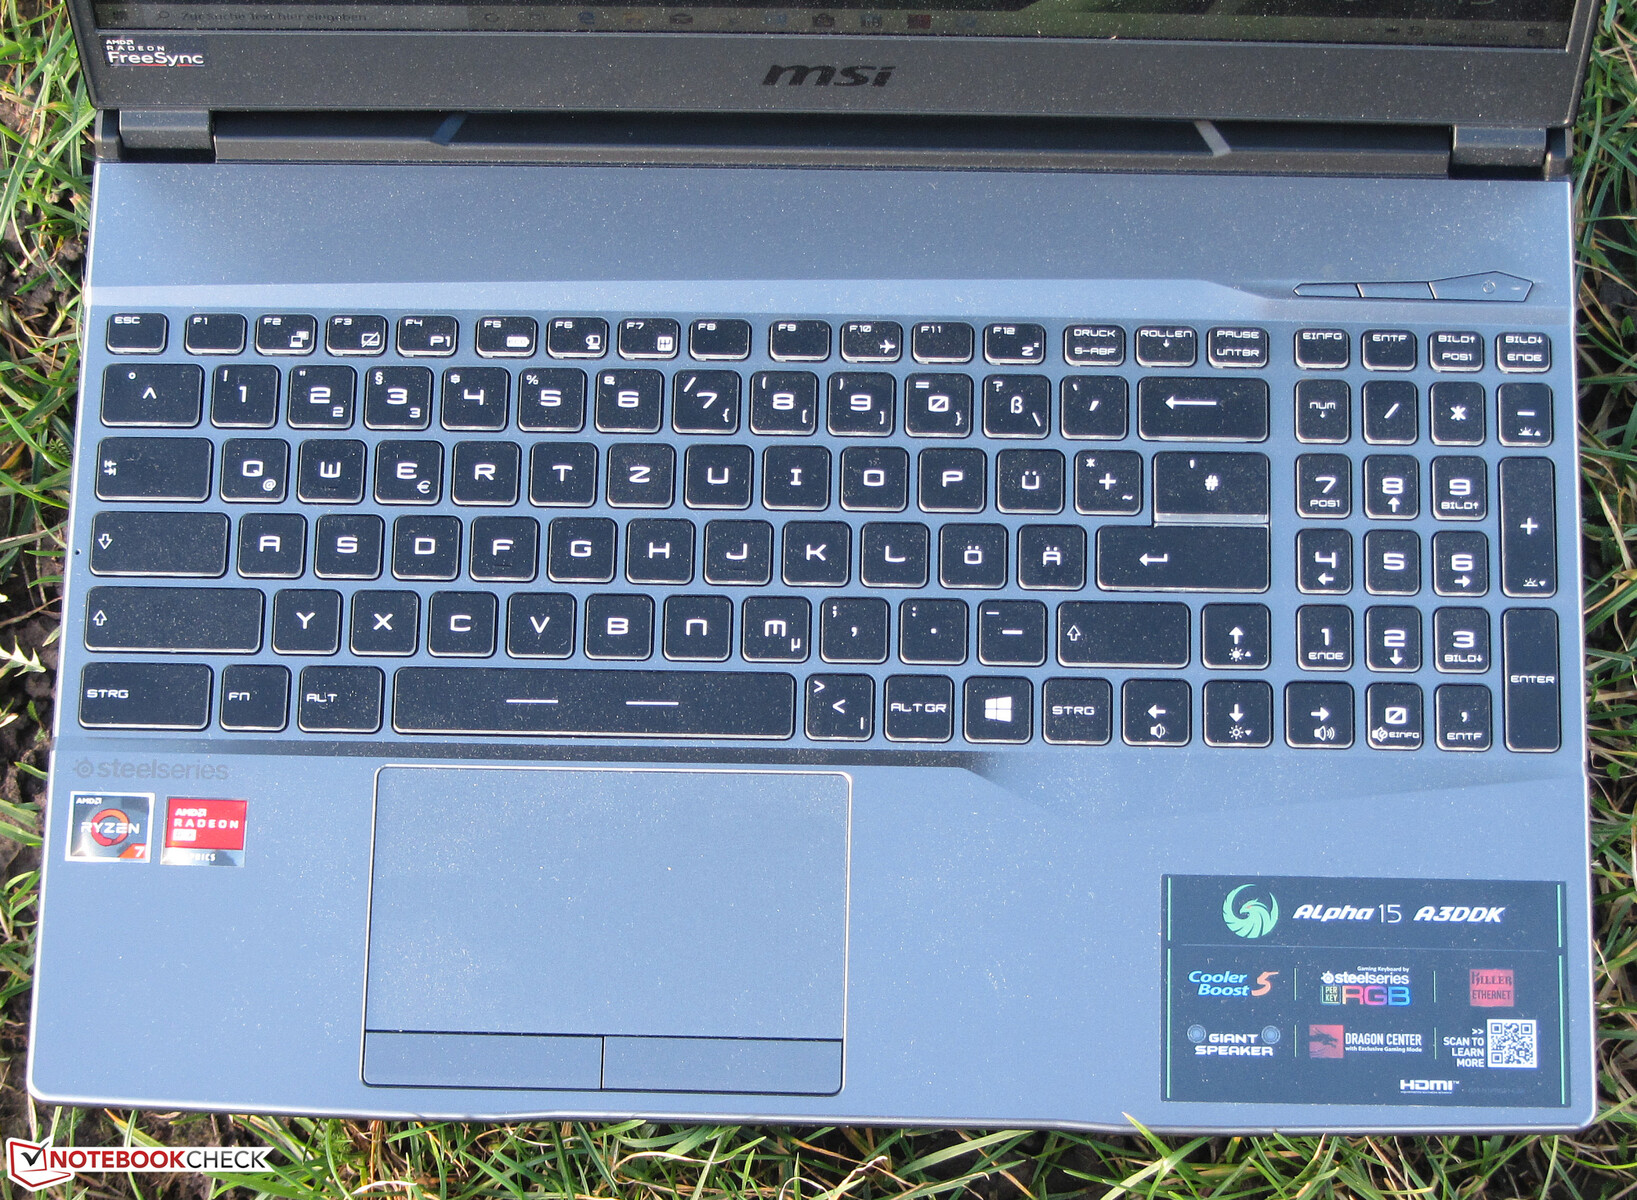
Input Devices - The Alpha's keyboard has RGB lighting
Keyboard
MSI equips the Alpha 15 with a backlit chiclet keyboard. Its flat, slightly roughened keys have a medium stroke and clear pressure points. The key resistance is adequate in our opinion, but the keyboard deck gives way slightly while typing. This did not prove overly disruptive during our tests, though. All in all, MSI has provided the Alpha 15 with a decent everyday keyboard..
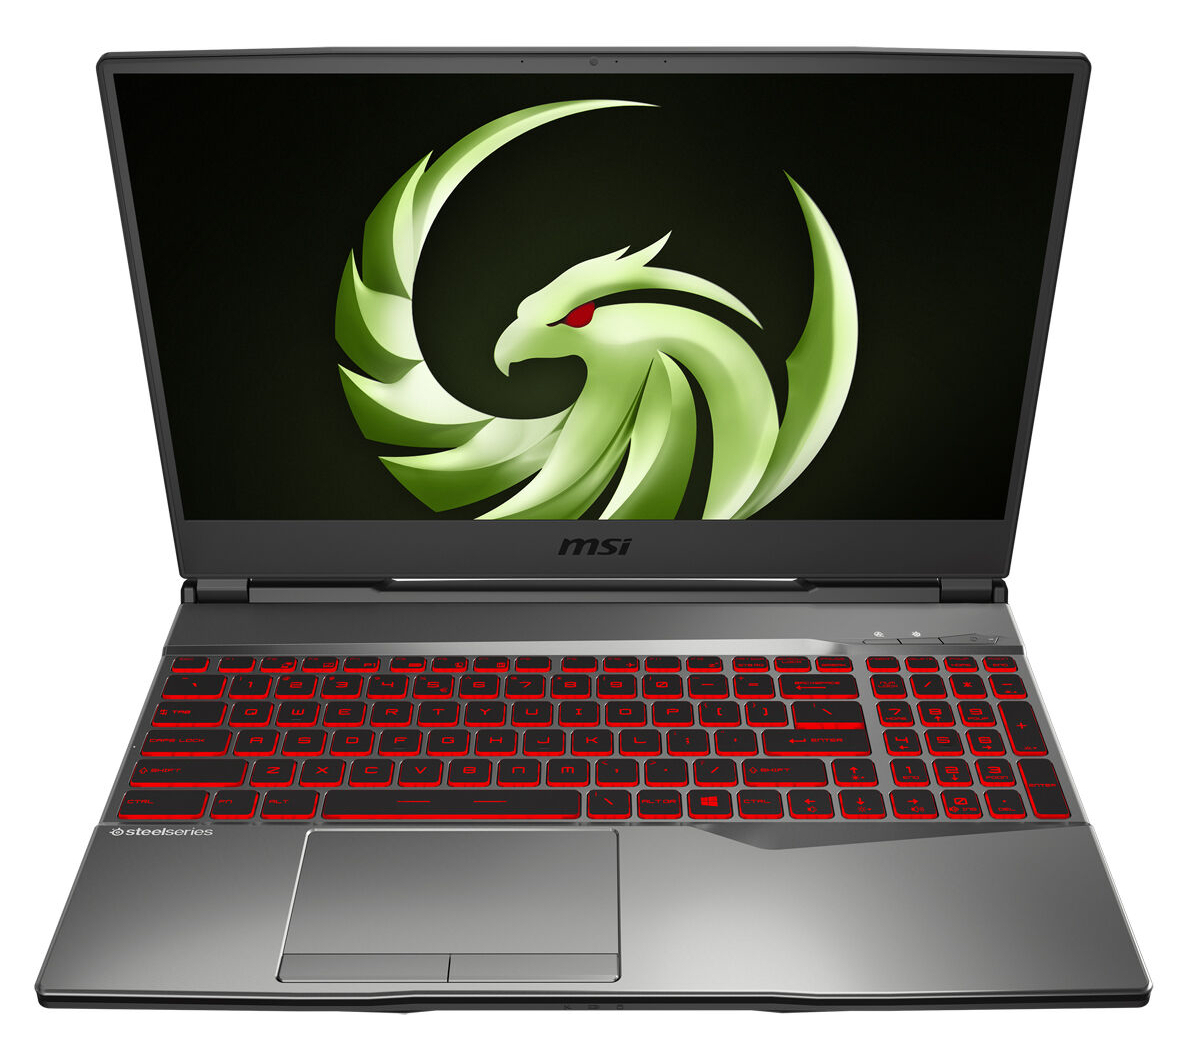
Trackpad
There is also a multi-touch trackpad that measures approximately 11 x 6.2 cm (~4.3 x 2.4 in), making it large enough on which to perform multi-finger gestures. Its smooth surface does not inhibit scrolling or swiping movements, either. The trackpad reacts precisely to inputs even into its corners, too. Additionally, two mouse buttons sit below it. Both have short strokes and clear pressure points.
Display - IPS, 144 Hz and Freesync compatible
The matte 15.6-inch display in the Alpha 15 operates natively at 1,920 x 1,080 pixels. Average maximum brightness, which we measured at 310 cd/m², and a 1,069:1 contrast ratio meet our expectations. Positively, the display does not show any PWM flickering.
The 144 Hz panel delivers fast response times too and supports AMD FreeSync. The technology dynamically adjusts refresh rates of the display and GPU to maximise image smoothness. This is most useful when gaming.
| |||||||||||||||||||||||||
Brightness Distribution: 86 %
Center on Battery: 310 cd/m²
Contrast: 1069:1 (Black: 0.29 cd/m²)
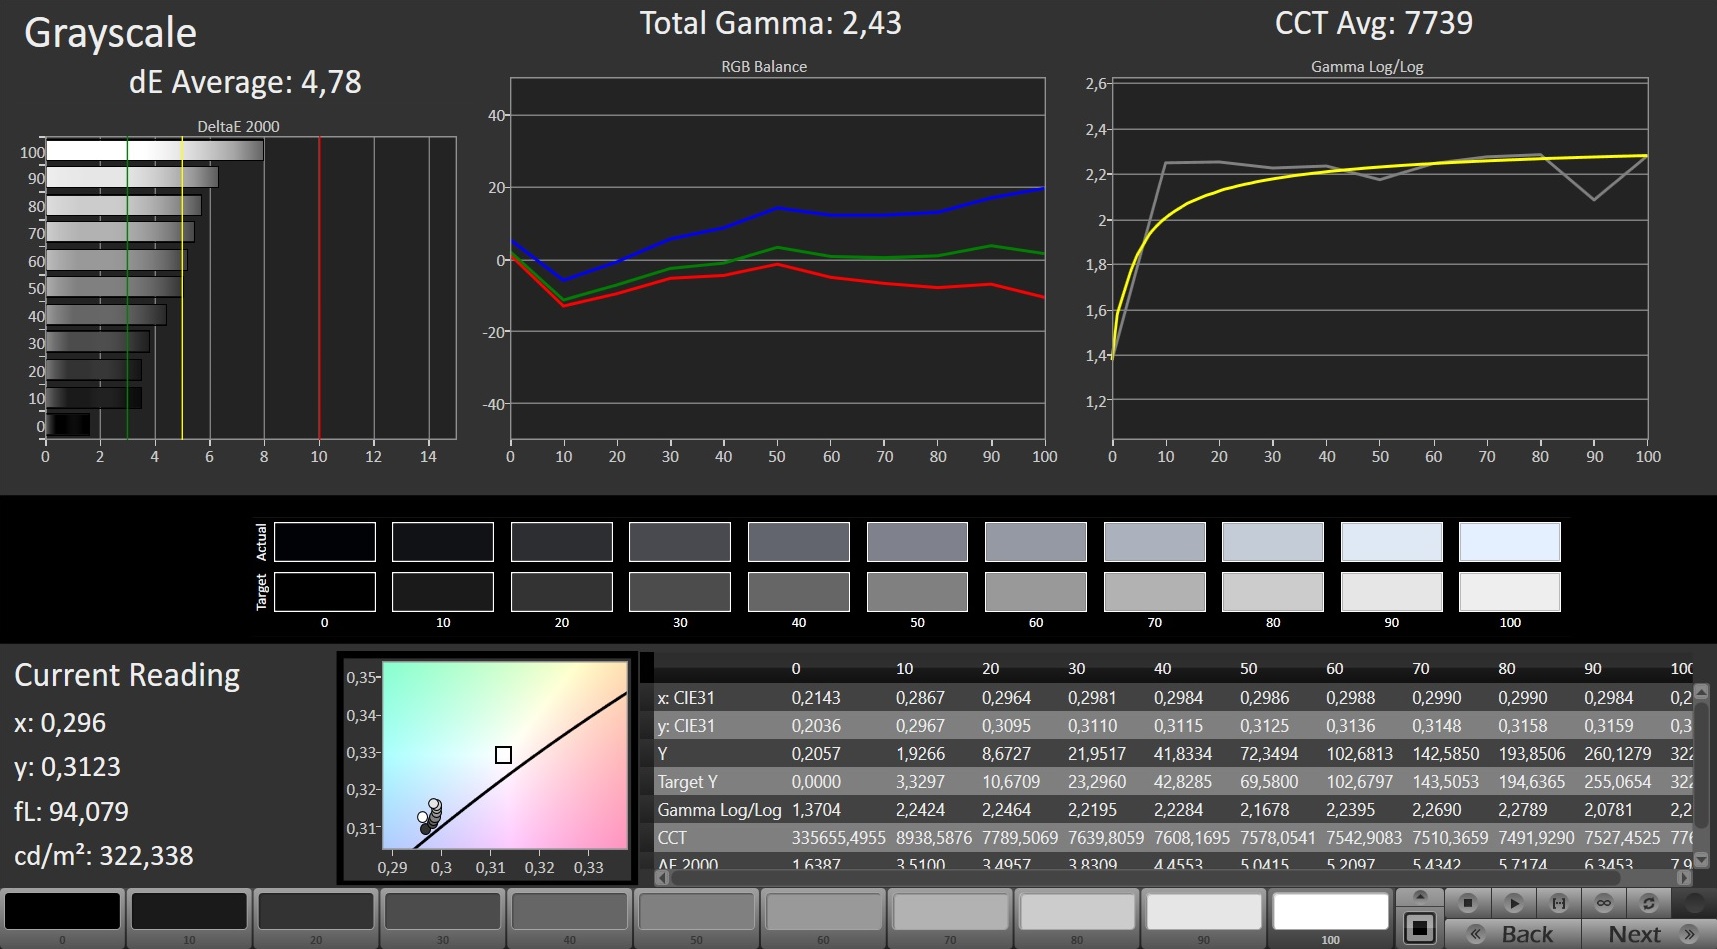
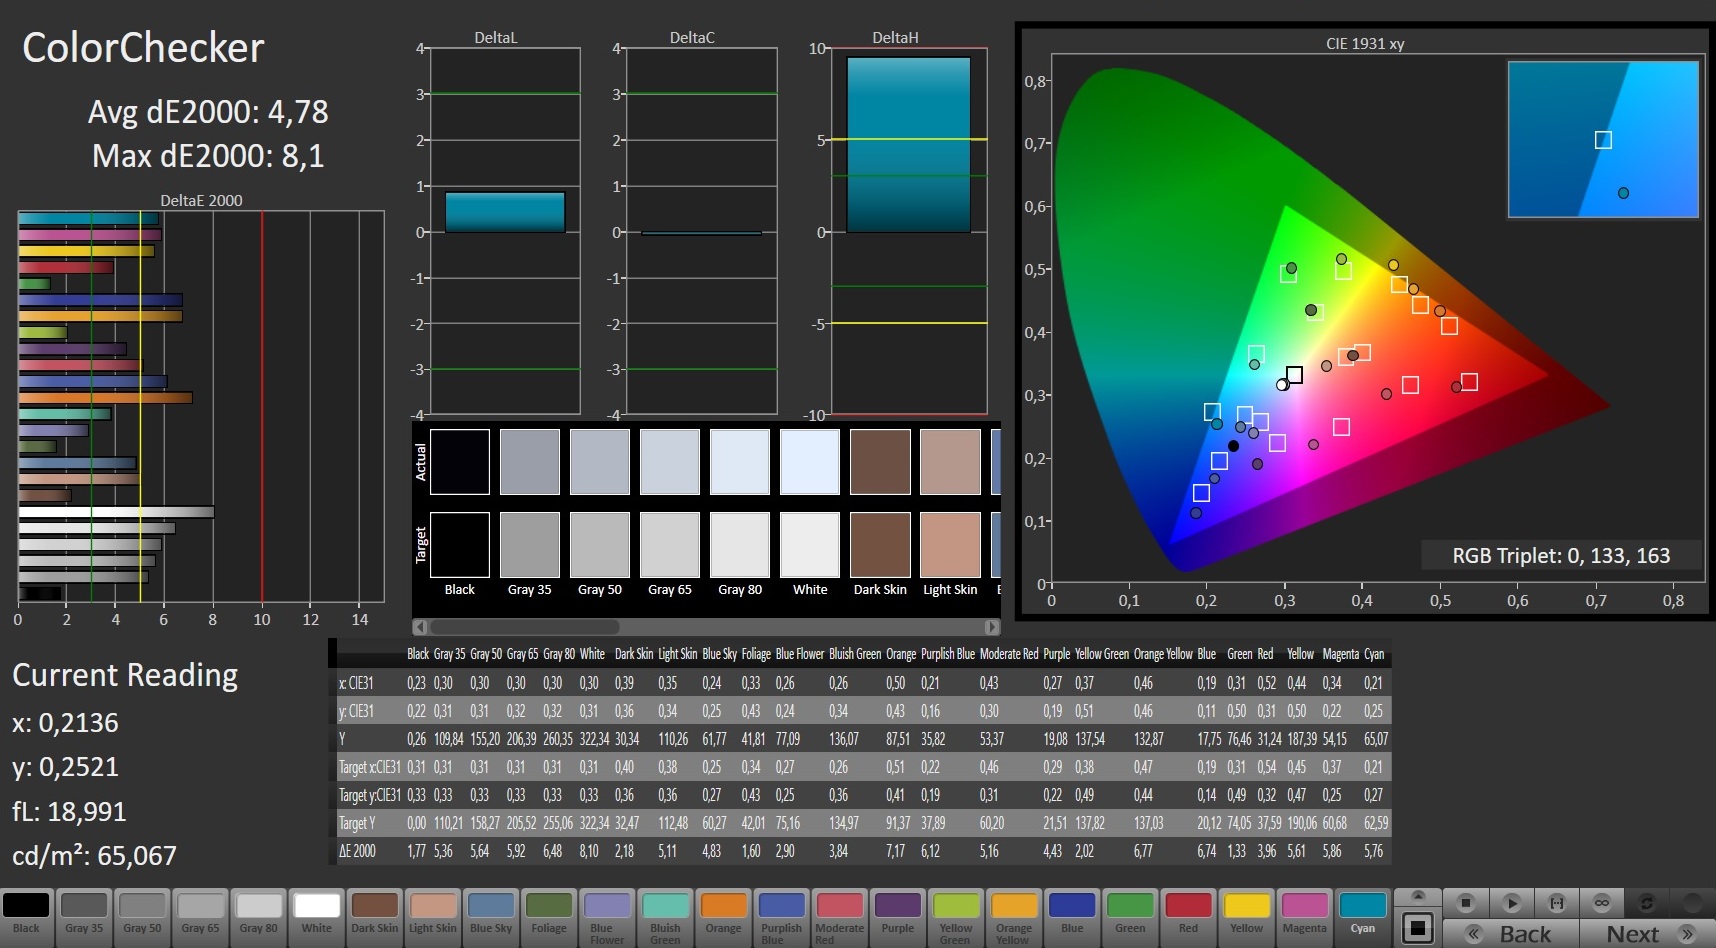
ΔE ColorChecker Calman: 4.78 | ∀{0.5-29.43 Ø4.71}
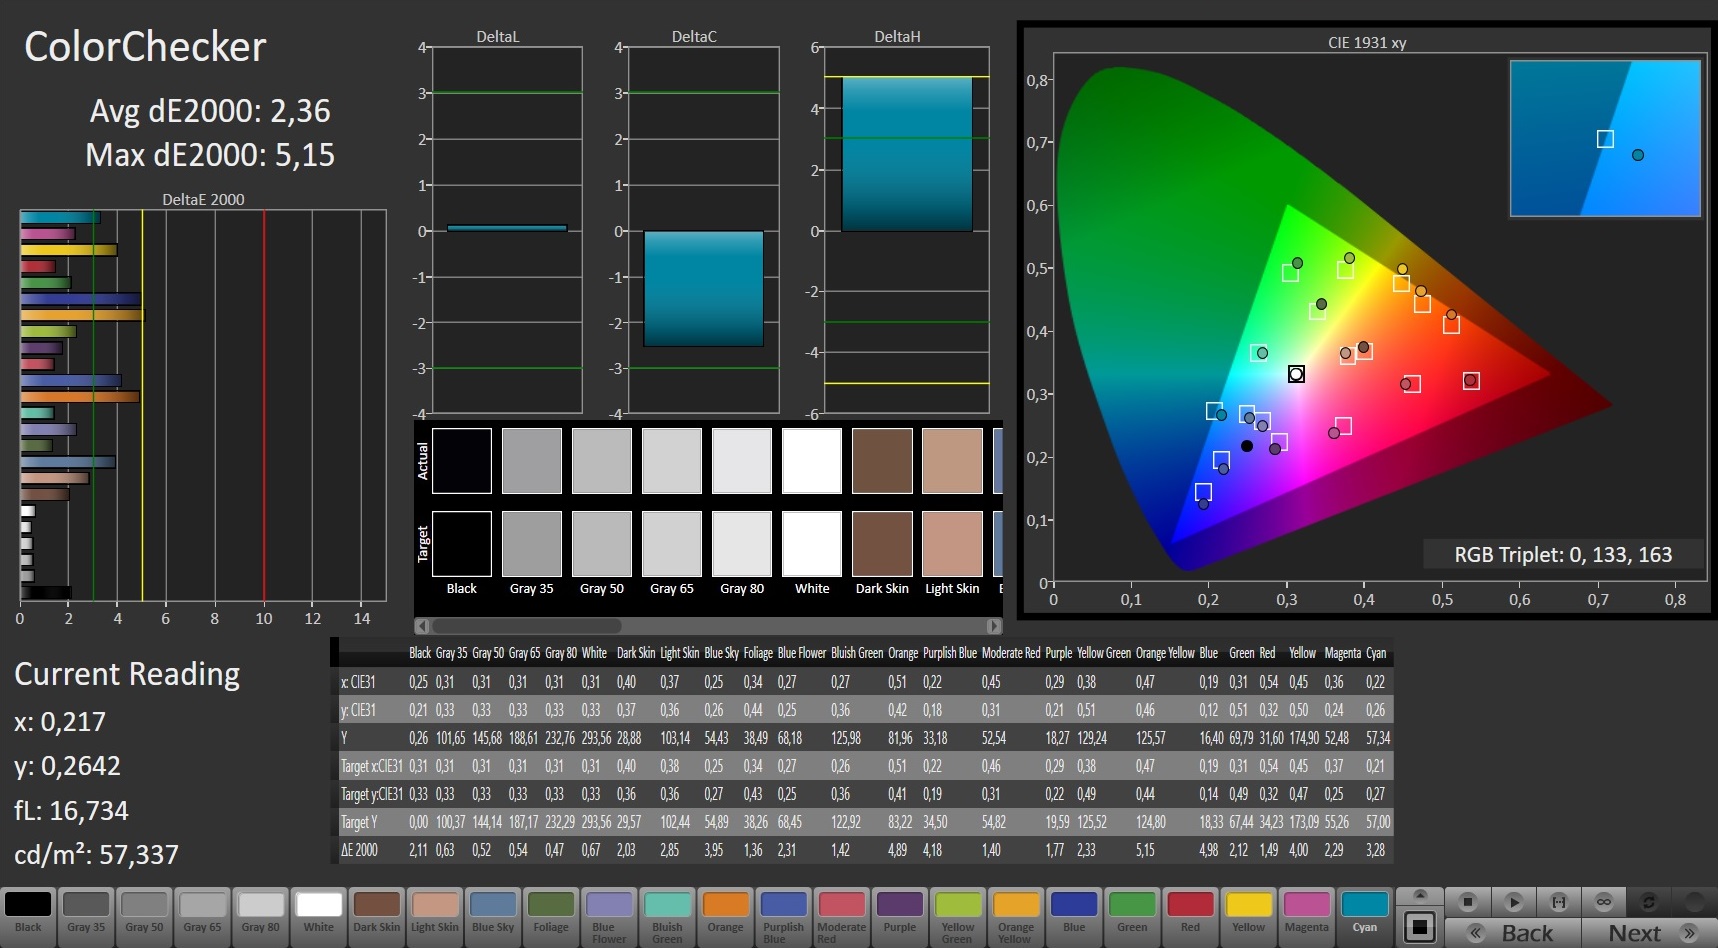
calibrated: 2.36
ΔE Greyscale Calman: 4.78 | ∀{0.09-98 Ø4.96}
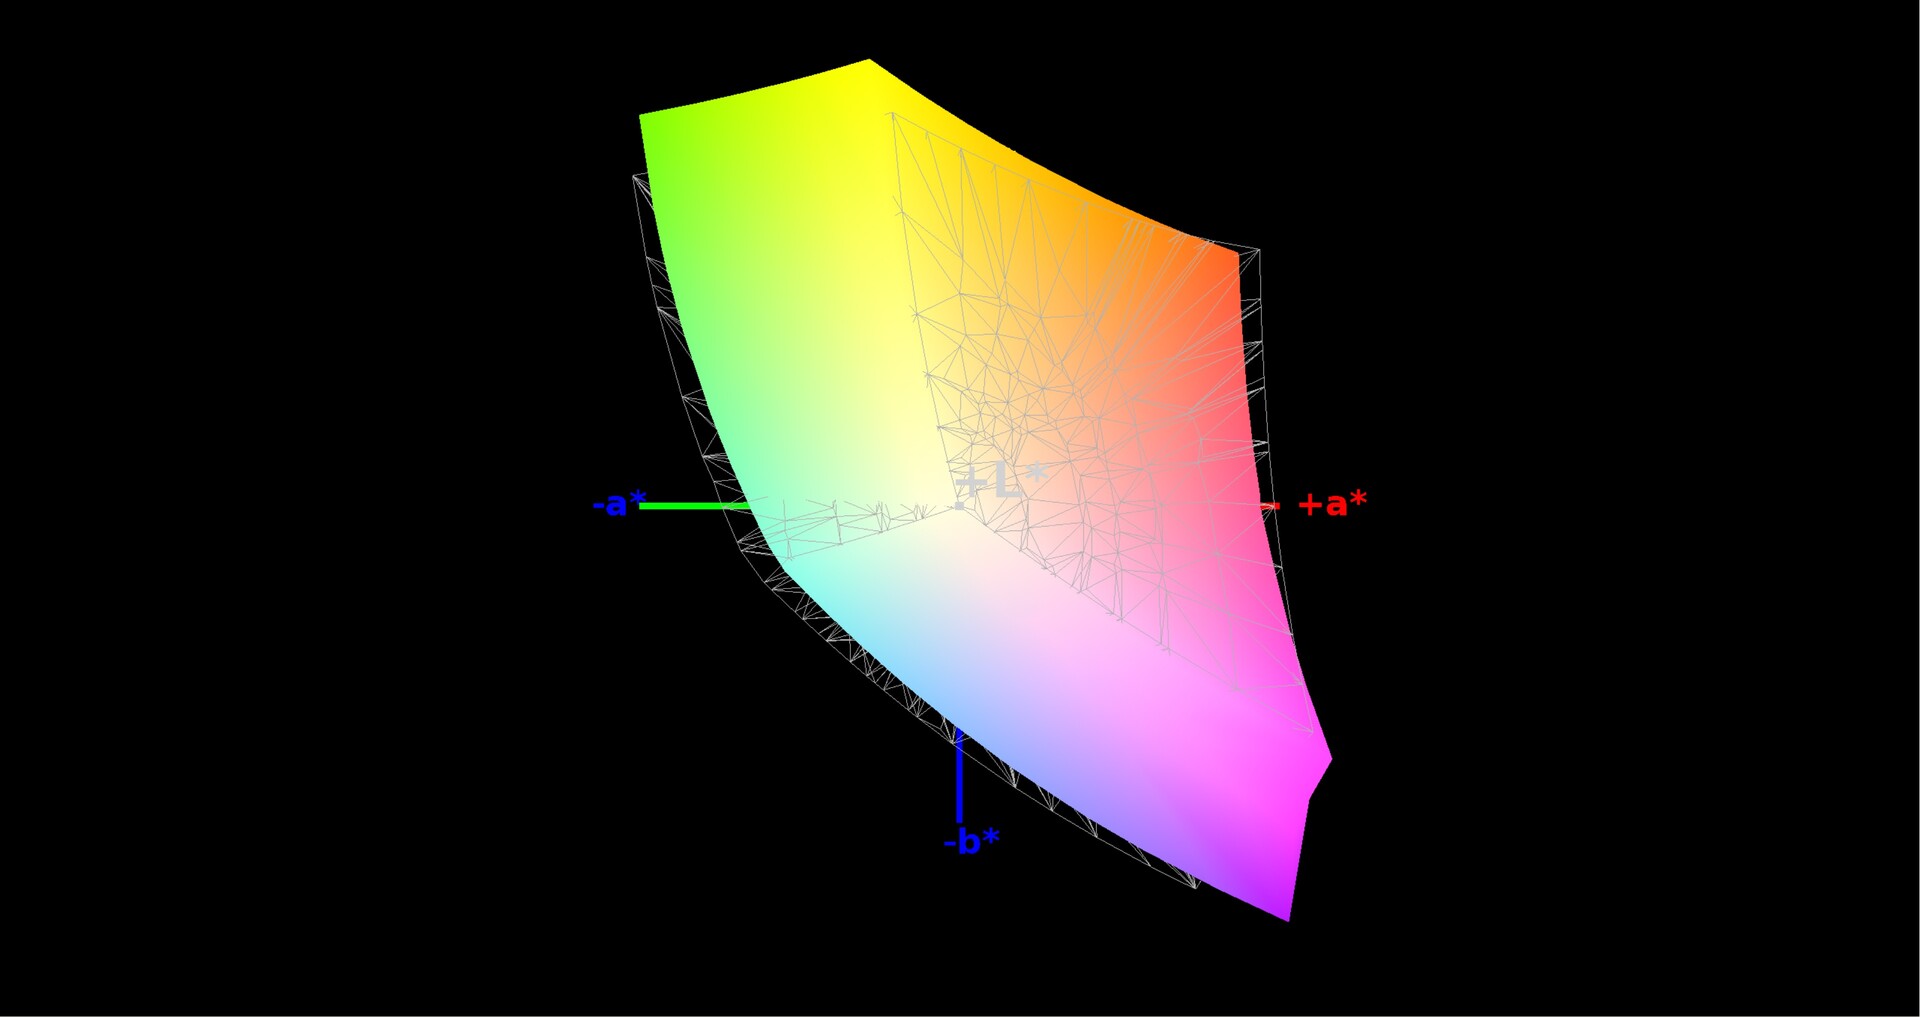
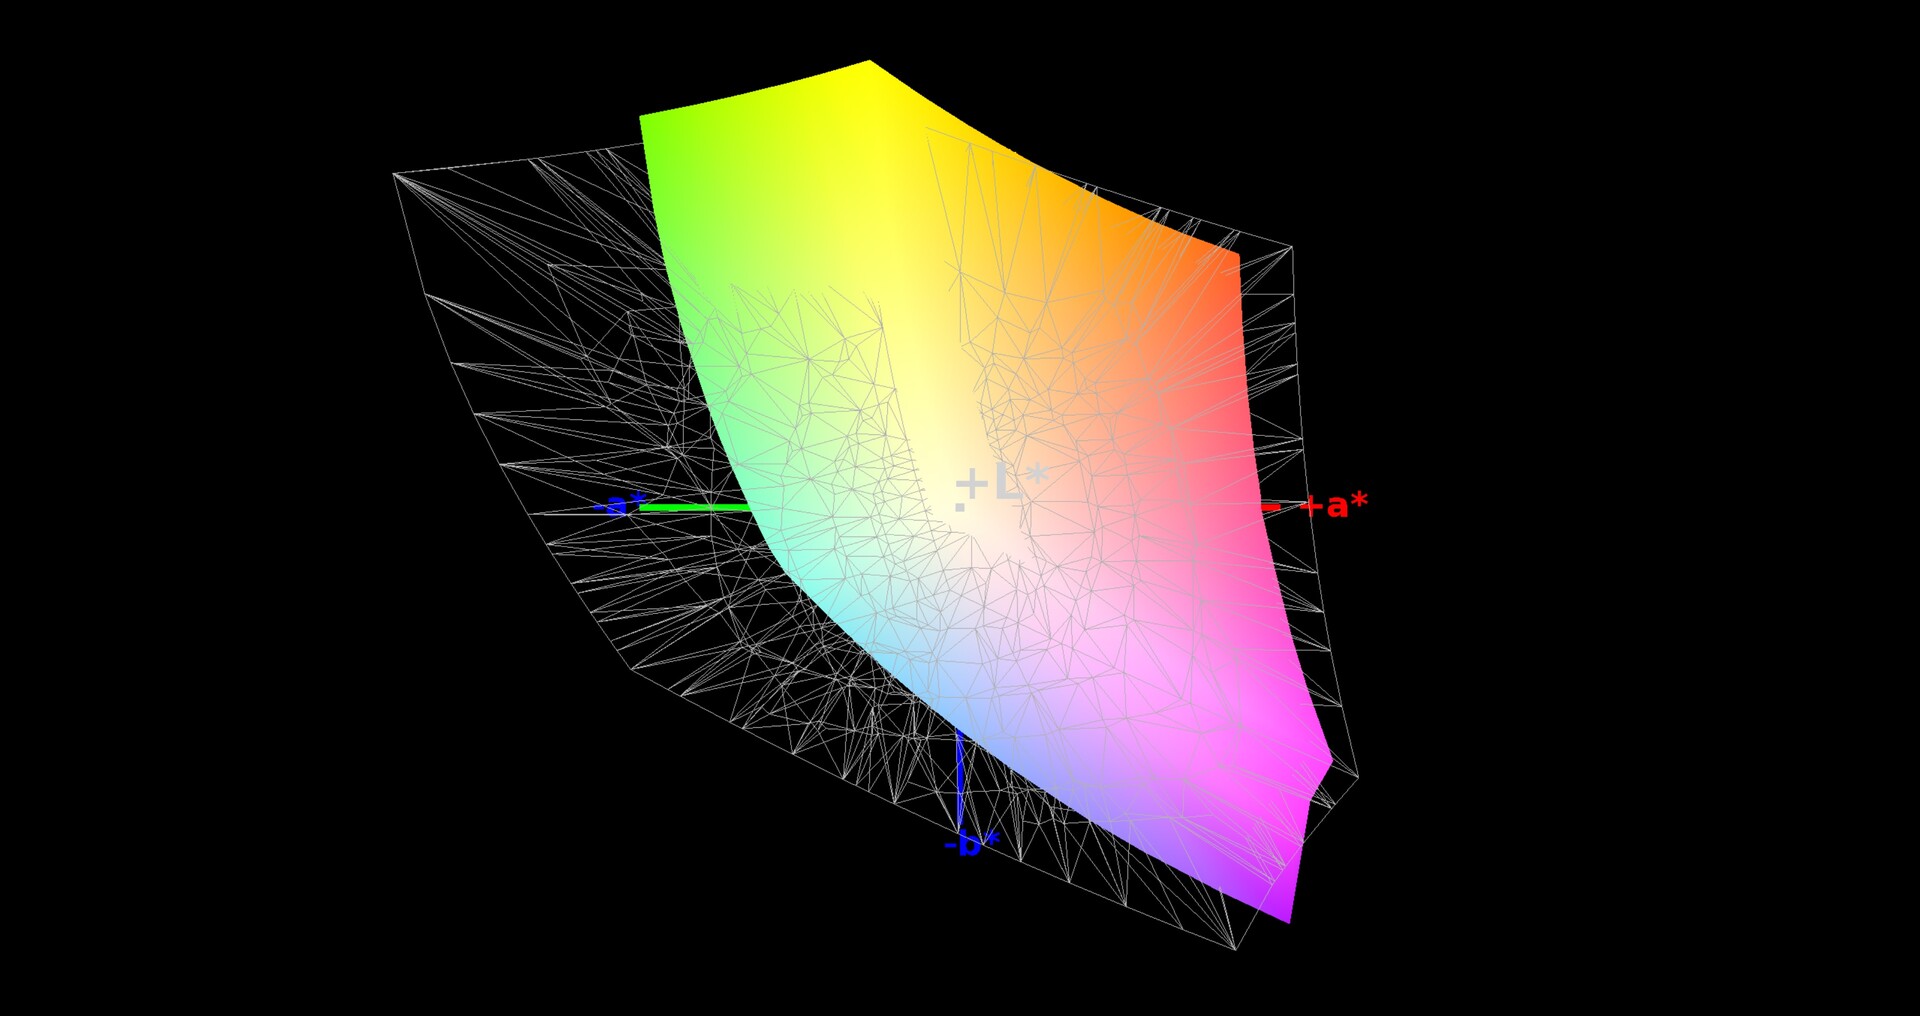
91% sRGB (Argyll 1.6.3 3D)
59% AdobeRGB 1998 (Argyll 1.6.3 3D)
66.6% AdobeRGB 1998 (Argyll 3D)
91% sRGB (Argyll 3D)
66.4% Display P3 (Argyll 3D)
Gamma: 2.43
CCT: 7739 K
| MSI Alpha 15 A3DDK-034 AU Optronics B156HAN08.0 (AUO80ED), IPS, 1920x1080 | Acer Predator Helios 300 PH315-52-79TY AUO, B156HAN08.2, IPS, 1920x1080 | HP Pavilion Gaming 15-ec0017ng AU Optronics B156HAK02.0, IPS, 1920x1080 | Dell G5 15 5590-PCNJJ AU Optronics B156HAN (AUO23ED), IPS, 1920x1080 | Lenovo Legion Y540-15IRH-81SX00B2GE BOE 084D, IPS, 1920x1080 | |
|---|---|---|---|---|---|
| Display | -1% | -4% | 27% | -2% | |
| Display P3 Coverage (%) | 66.4 | 64.1 -3% | 62.8 -5% | 83.1 25% | 63.6 -4% |
| sRGB Coverage (%) | 91 | 93 2% | 89.2 -2% | 99.9 10% | 91.7 1% |
| AdobeRGB 1998 Coverage (%) | 66.6 | 65.7 -1% | 63.8 -4% | 96.8 45% | 65.2 -2% |
| Response Times | -51% | -325% | -387% | -21% | |
| Response Time Grey 50% / Grey 80% * (ms) | 7 ? | 15 ? -114% | 40 ? -471% | 48 ? -586% | 8.8 ? -26% |
| Response Time Black / White * (ms) | 10.4 ? | 9 ? 13% | 29 ? -179% | 30 ? -188% | 12 ? -15% |
| PWM Frequency (Hz) | |||||
| Screen | 7% | 1% | -21% | 5% | |
| Brightness middle (cd/m²) | 310 | 325 5% | 302 -3% | 234 -25% | 299 -4% |
| Brightness (cd/m²) | 310 | 310 0% | 291 -6% | 216 -30% | 290 -6% |
| Brightness Distribution (%) | 86 | 82 -5% | 84 -2% | 87 1% | 89 3% |
| Black Level * (cd/m²) | 0.29 | 0.255 12% | 0.25 14% | 0.22 24% | 0.29 -0% |
| Contrast (:1) | 1069 | 1275 19% | 1208 13% | 1064 0% | 1031 -4% |
| Colorchecker dE 2000 * | 4.78 | 4.28 10% | 4.84 -1% | 6.52 -36% | 3.7 23% |
| Colorchecker dE 2000 max. * | 8.1 | 8.42 -4% | 8.18 -1% | 10.58 -31% | 7 14% |
| Colorchecker dE 2000 calibrated * | 2.36 | 1.45 39% | 2.63 -11% | 3.56 -51% | 2 15% |
| Greyscale dE 2000 * | 4.78 | 5.01 -5% | 4.31 10% | 5.33 -12% | 4.1 14% |
| Gamma | 2.43 91% | 2.6 85% | 2.56 86% | 2.86 77% | 2.19 100% |
| CCT | 7739 84% | 7678 85% | 7318 89% | 5983 109% | 7166 91% |
| Color Space (Percent of AdobeRGB 1998) (%) | 59 | 60 2% | 58 -2% | 36 -39% | 59.3 1% |
| Color Space (Percent of sRGB) (%) | 91 | 93 2% | 89 -2% | 57 -37% | 91.5 1% |
| Total Average (Program / Settings) | -15% /
-2% | -109% /
-41% | -127% /
-58% | -6% /
1% |
* ... smaller is better
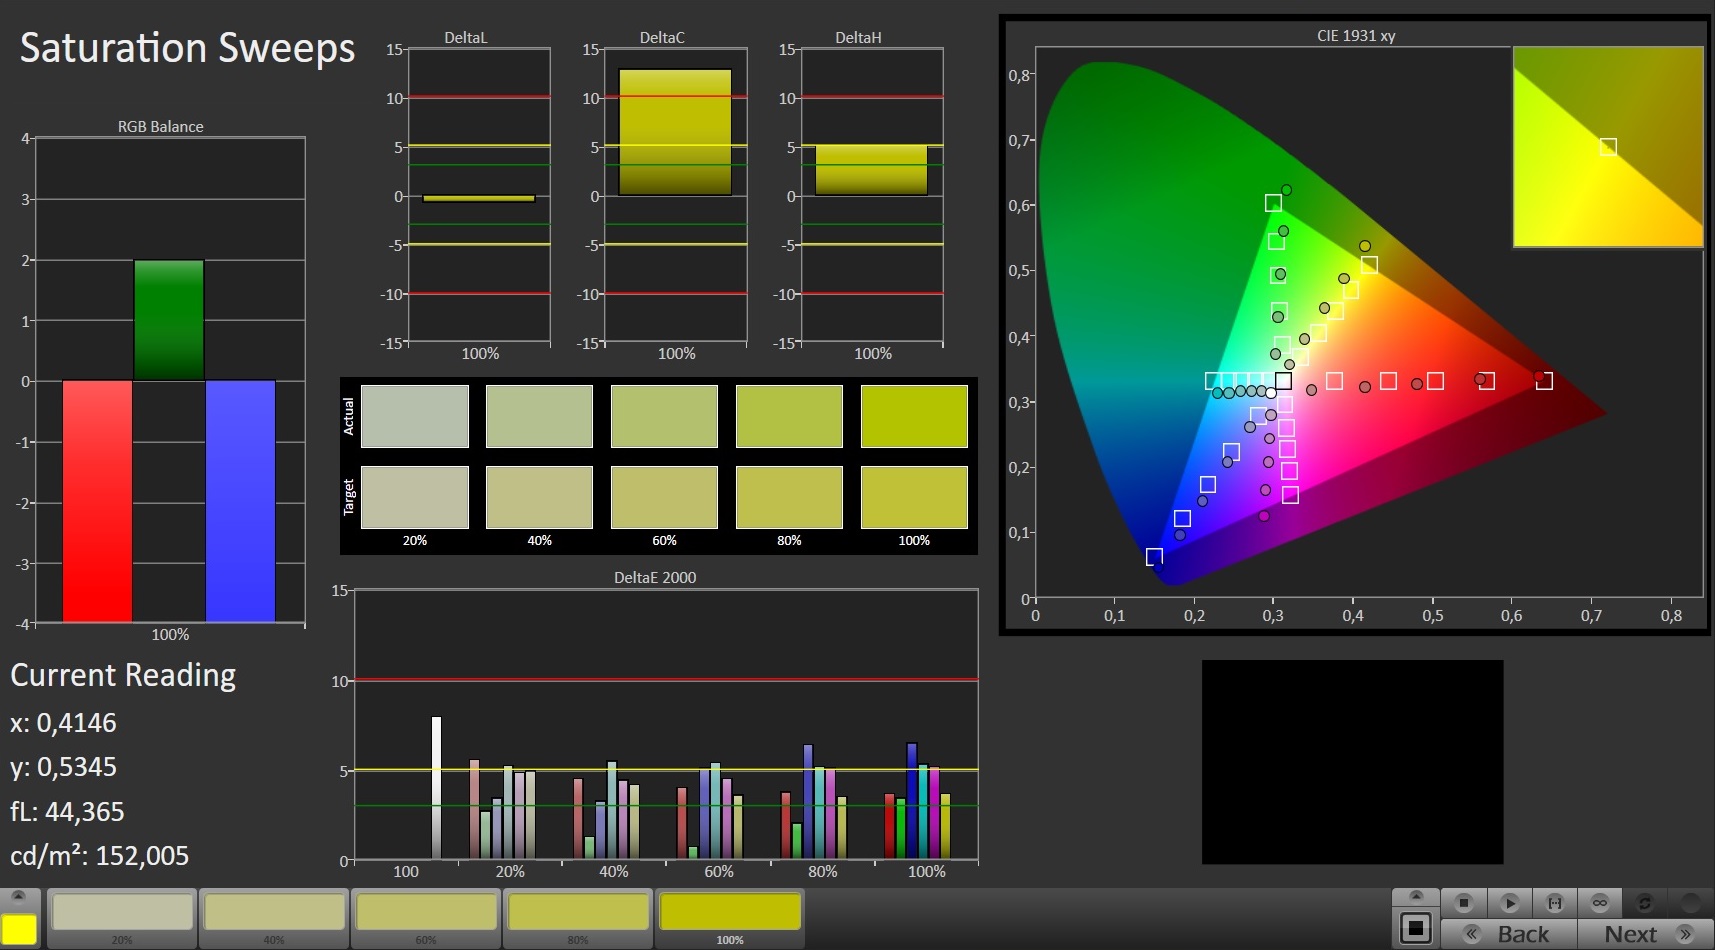
Out of the box, our review unit is impressively colour accurate. However, its Delta E 2000 colour deviation of 4.78 misses our target of less than 3. Calibrating the screen leads to improvements though, resulting in a colour deviation of 2.36. The additional calibration helps make greyscale look more balanced, too. The display cannot fully cover AdobeRGB or sRGB, though. We measured 59% AdobeRGB coverage and 91% sRGB coverage, for reference.

Display Response Times
| ↔ Response Time Black to White | ||
|---|---|---|
| 10.4 ms ... rise ↗ and fall ↘ combined | ↗ 5.2 ms rise | 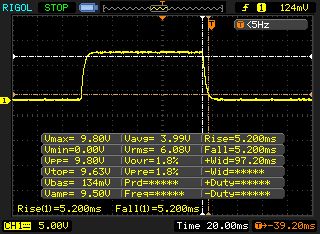 |
| ↘ 5.2 ms fall | ||
| The screen shows good response rates in our tests, but may be too slow for competitive gamers. In comparison, all tested devices range from 0.1 (minimum) to 240 (maximum) ms. » 28 % of all devices are better. This means that the measured response time is better than the average of all tested devices (19.8 ms). | ||
| ↔ Response Time 50% Grey to 80% Grey | ||
| 7 ms ... rise ↗ and fall ↘ combined | ↗ 3.4 ms rise | 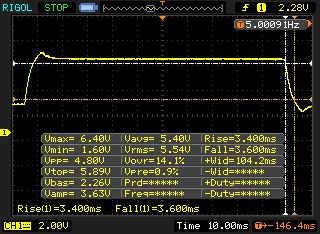 |
| ↘ 3.6 ms fall | ||
| The screen shows very fast response rates in our tests and should be very well suited for fast-paced gaming. In comparison, all tested devices range from 0.165 (minimum) to 636 (maximum) ms. » 20 % of all devices are better. This means that the measured response time is better than the average of all tested devices (30.9 ms). | ||
Screen Flickering / PWM (Pulse-Width Modulation)
| Screen flickering / PWM not detected | 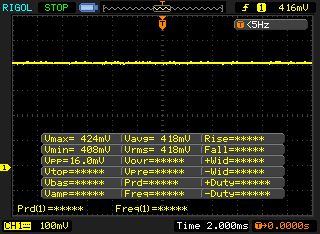 | ||
In comparison: 52 % of all tested devices do not use PWM to dim the display. If PWM was detected, an average of 7744 (minimum: 5 - maximum: 343500) Hz was measured. | |||
MSI has equipped the 15.6-incher with an IPS panel that has stable viewing angles, too. Hence, the display is readable from practically any position. The display is also readable outdoors, but only when the sun is not shining too brightly.

Performance - Mid-range AMD gaming power
The Alpha 15 A3DDK is MSI's latest 15.6-inch mid-range gaming laptop, and is one that plays all triple-A titles smoothly. The device cuts a good figure in all other areas too. Our review unit currently retails for around €1,300 (~$1423), but other variants are available starting at €1,000 (~$1095).
Test Conditions
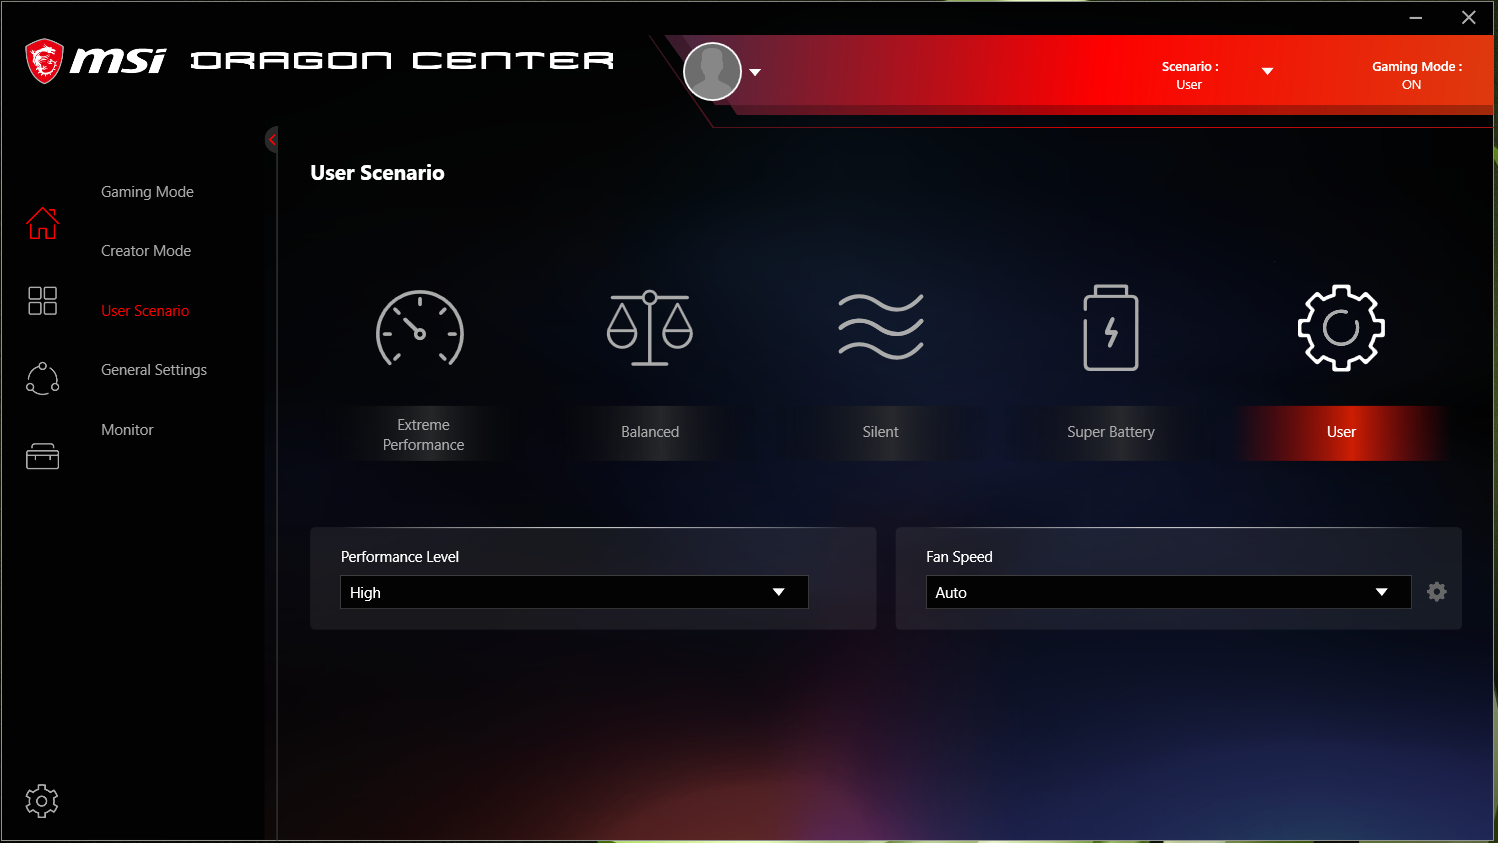
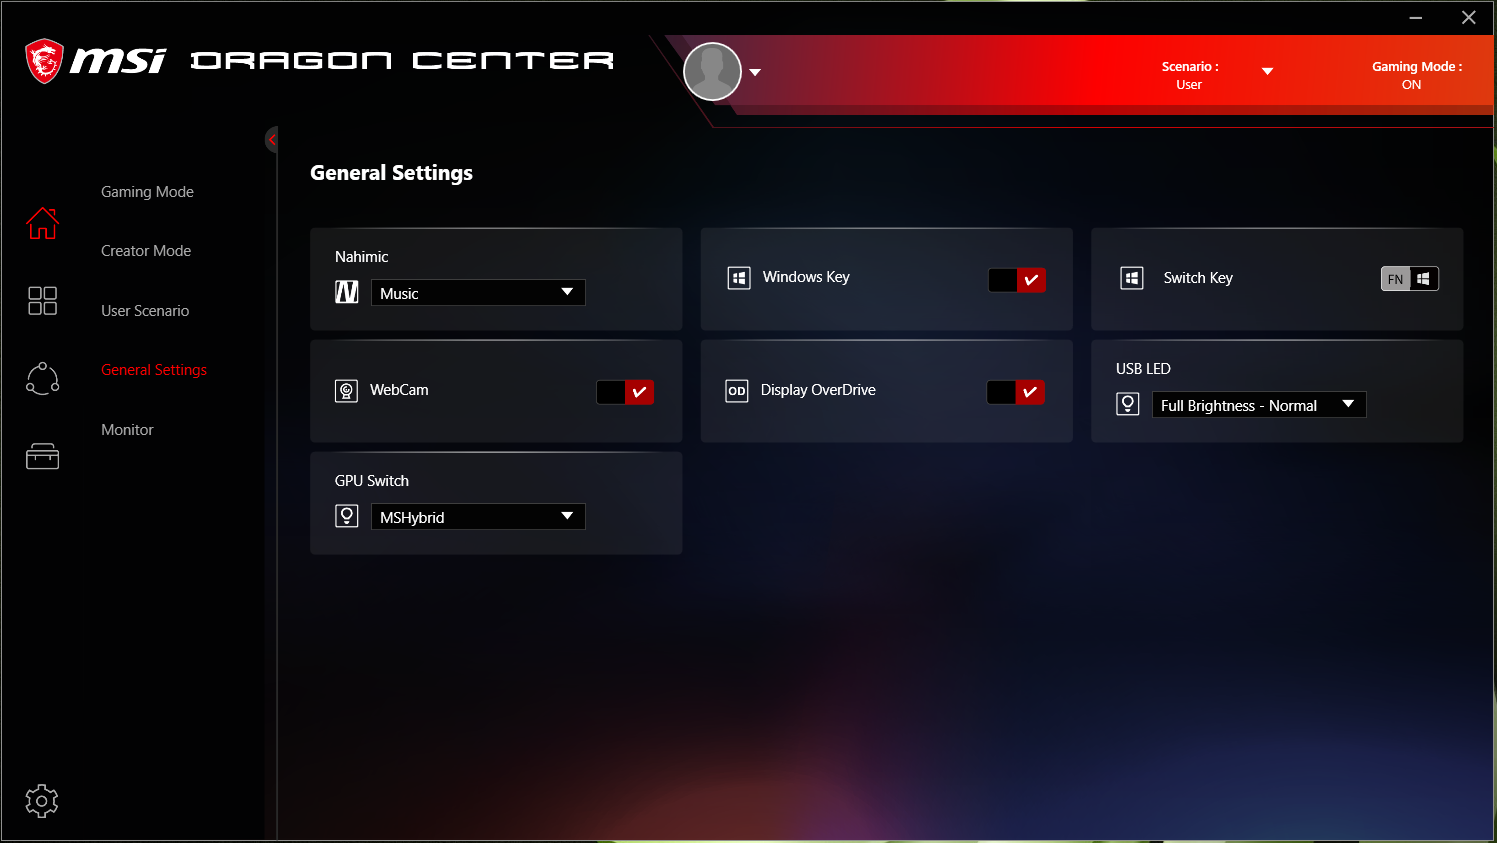
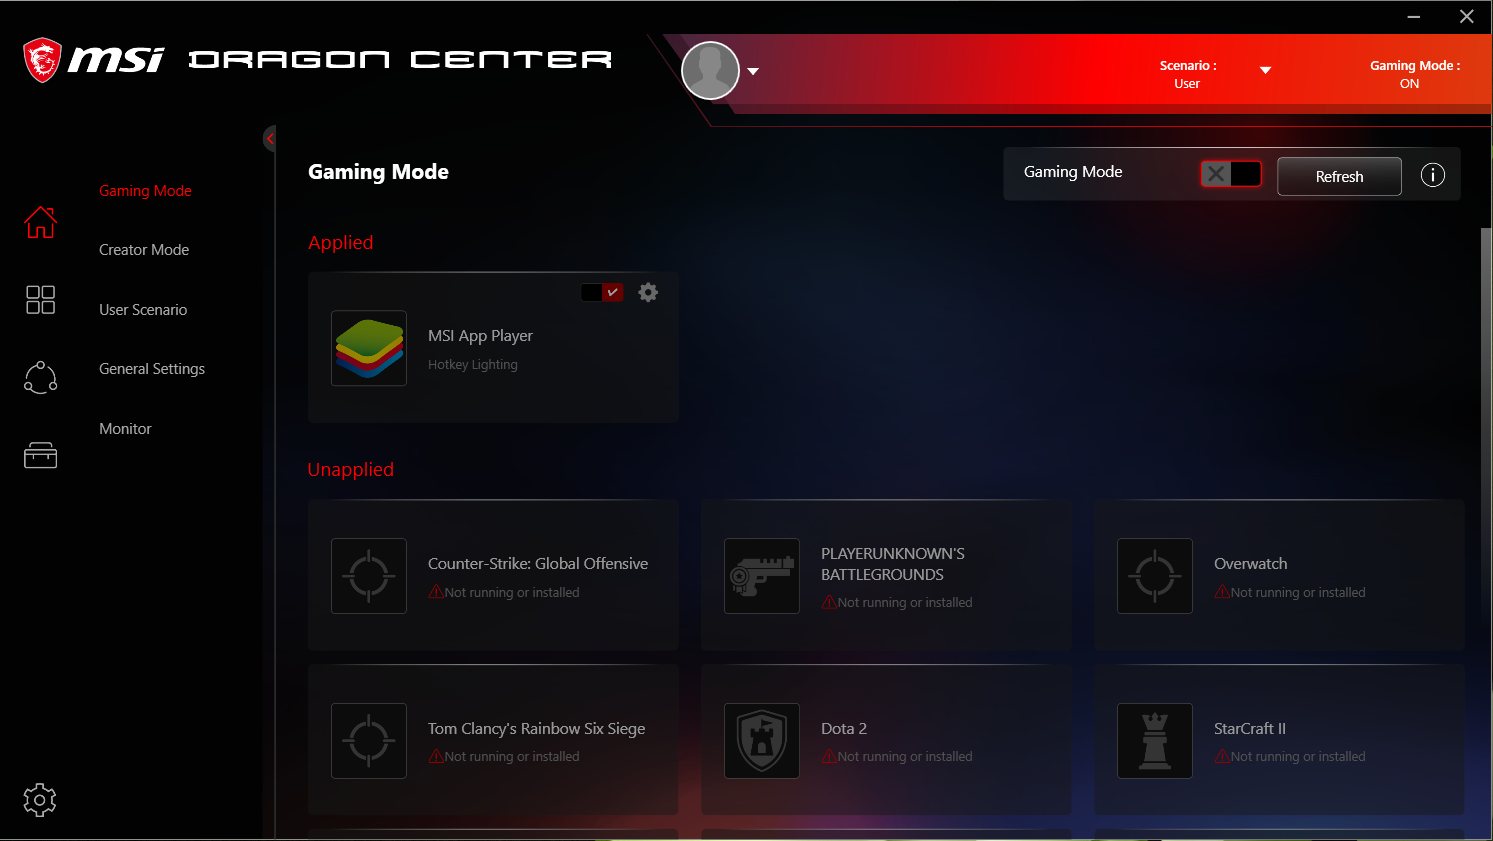
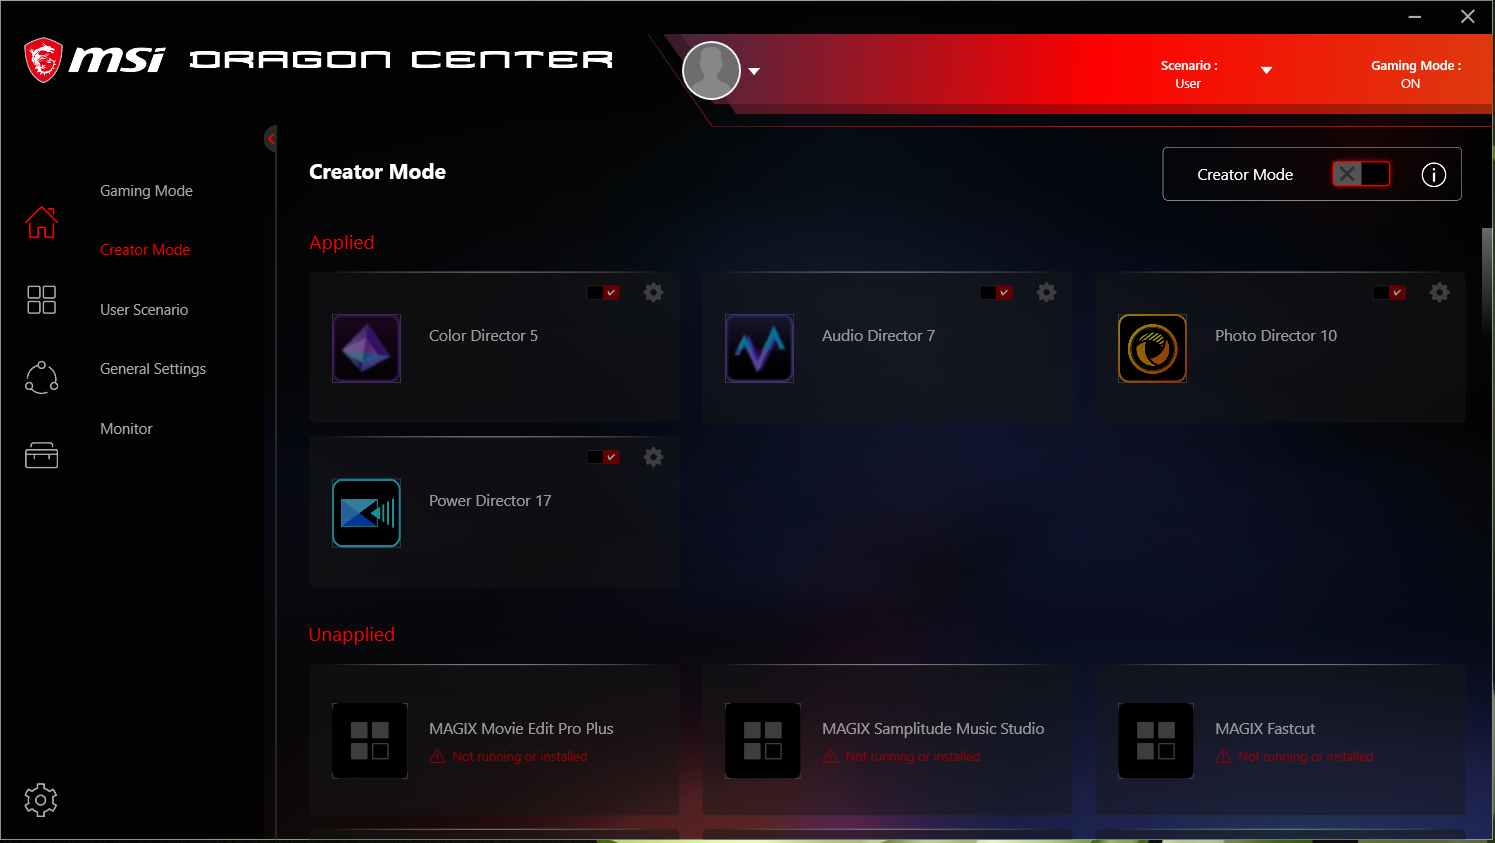
The pre-installed Dragon Center offers various performance profiles to choose from, which affect fan noise and performance. We conducted all our tests with the performance profile set to "User". We set the performance level to "High" and left the fan control on automatic mode. We left the integrated GPU on, too.
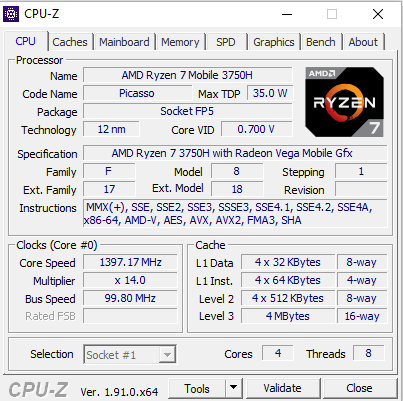
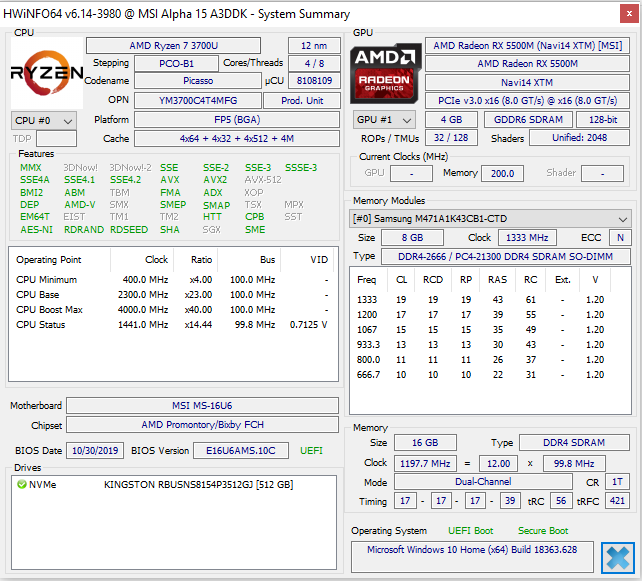
Processor
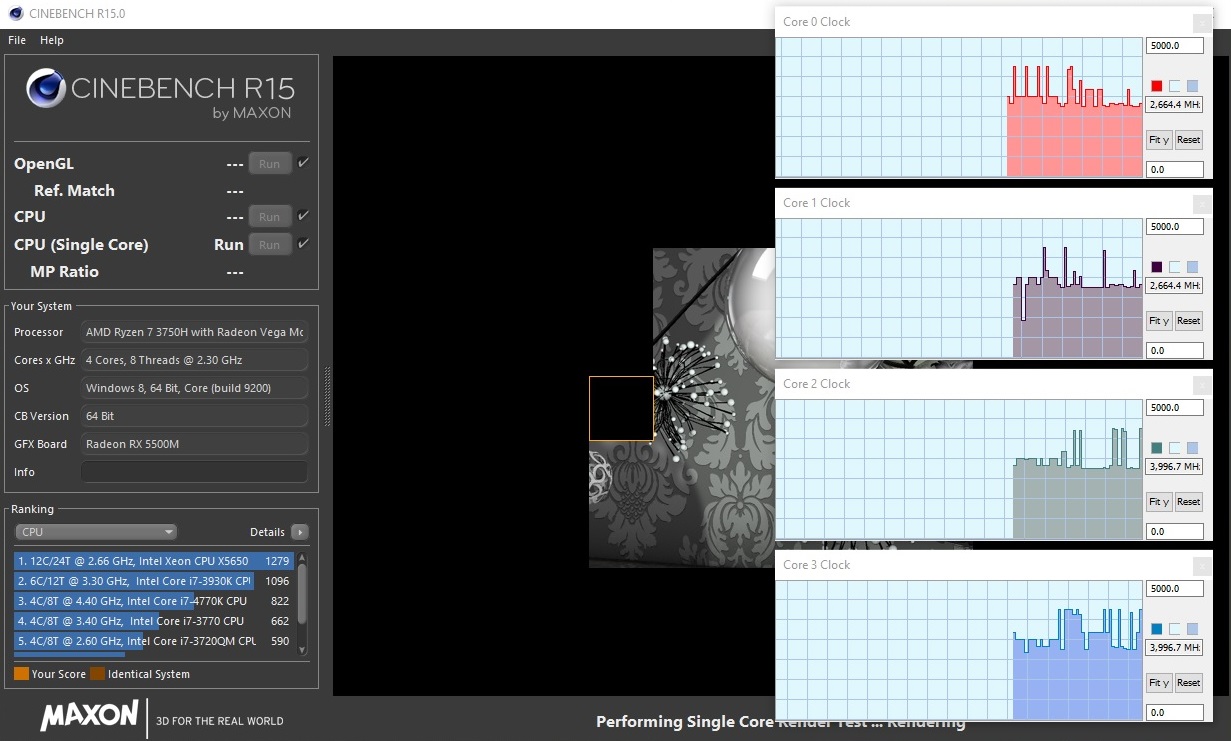
MSI has equipped our review unit with a Ryzen 7 3750H, a Picasso architecture APU. The quad-core processor has a 2.3 GHz base clock, which it can boost up to 4 GHz. It also supports Simultaneous Multithreading (SMT), a feature that allows the Ryzen 7 3750H to execute up to two threads per core simultaneously.
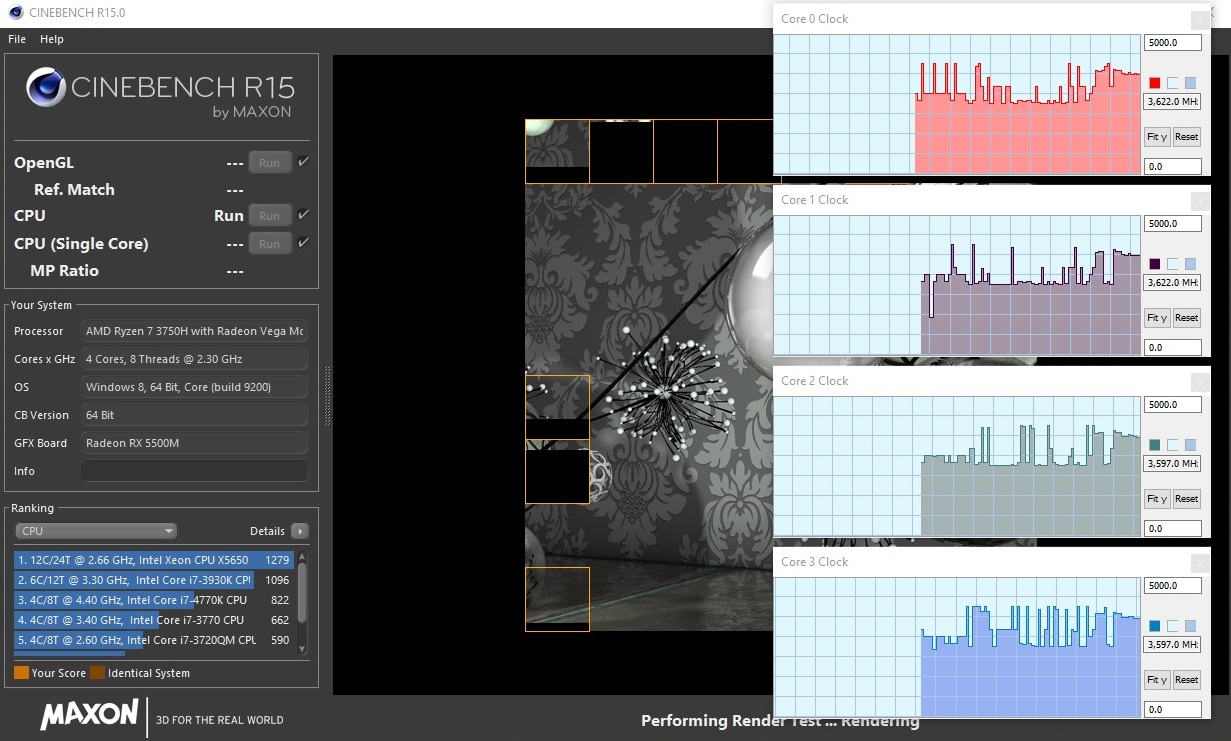
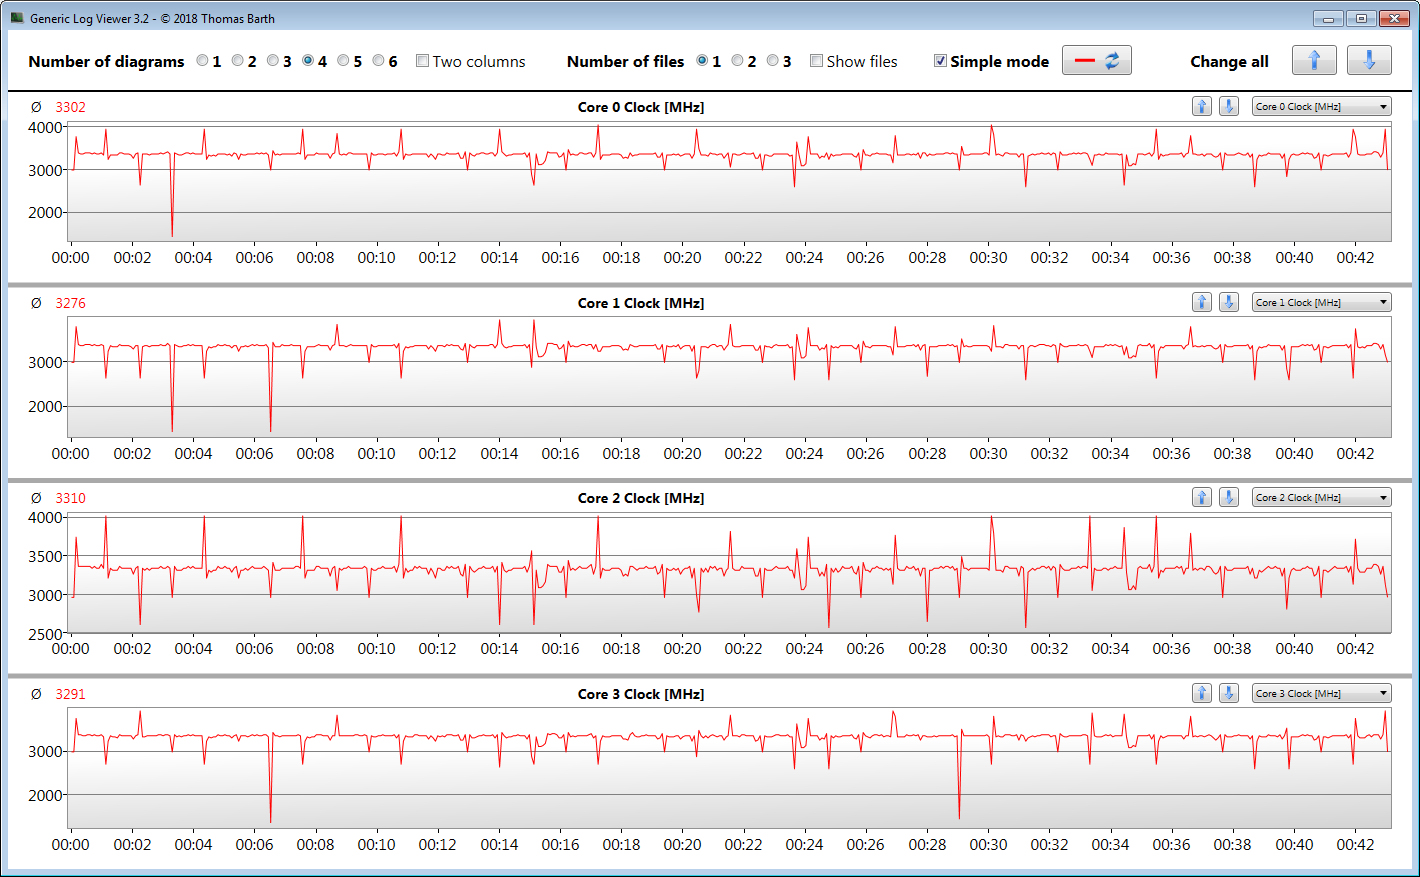
Cinebench R15 Multi 64Bit demonstrates that the CPU can operate between 3.6 and 3.8 GHz in multi-threaded tasks on mains power and 2.4 GHz on battery power. By contrast, the CPU fluctuates between 2.6 GHz to 4 GHz in single-thread tests on mains power and sustains 2.4 GHz on battery power.
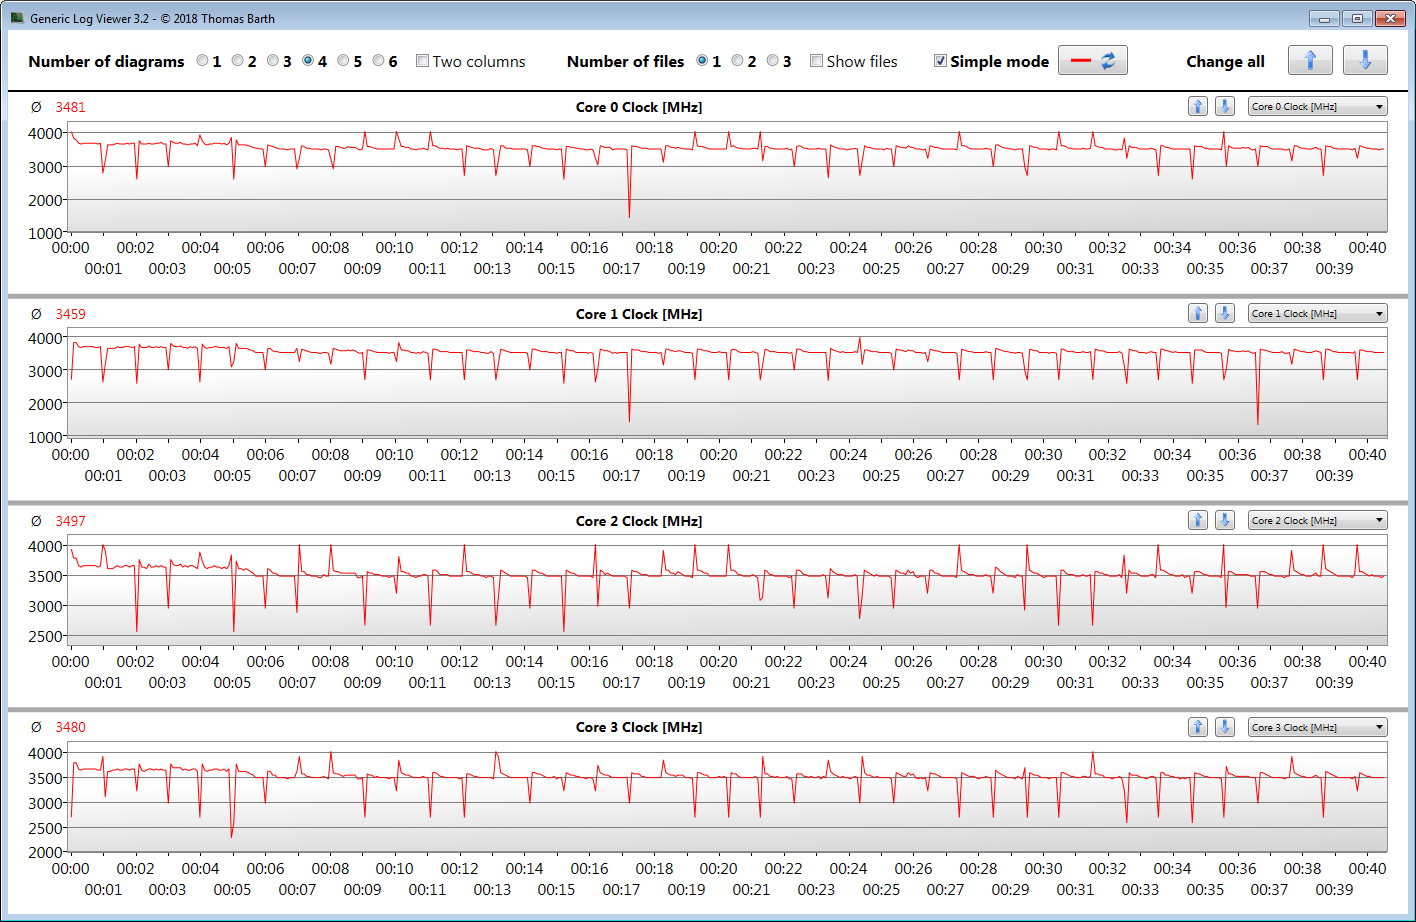
We also checked whether the CPU can maintain its turbo clock speeds permanently on mains power by running CB R15 Multi 64Bit on a loop for at least 30 minutes. Scores drop somewhat from the first to the seventh run through before stabilising at a constant level. In short, the CPU can utilise its turbo clock speeds. However, the results are somewhat disappointing as they lag behind other Ryzen 7 3750H-powered devices like the HP Pavilion Gaming 15.
MSI Dragon Center has various performance profiles, as we mentioned earlier. We also checked the effects that these profiles had. On the one hand, the "Extreme Performance" profile delivered the same results as our custom one. On the other hand, activating the "Silent" profile causes the CPU to operate at lower clock speeds, which results in lower CB R15 Multi 64Bit scores.
| Cinebench R15 | |
| CPU Single 64Bit | |
| Average of class Gaming (188.8 - 350, n=103, last 2 years) | |
| Acer Predator Helios 300 PH315-52-79TY | |
| Lenovo Legion Y540-15IRH-81SX00B2GE | |
| Dell G5 15 5590-PCNJJ | |
| MSI Alpha 15 A3DDK-034 | |
| HP Pavilion Gaming 15-ec0017ng | |
| MSI Alpha 15 A3DDK-034 (Silent) | |
| CPU Multi 64Bit | |
| Average of class Gaming (1578 - 6330, n=102, last 2 years) | |
| Acer Predator Helios 300 PH315-52-79TY | |
| Lenovo Legion Y540-15IRH-81SX00B2GE | |
| Dell G5 15 5590-PCNJJ | |
| HP Pavilion Gaming 15-ec0017ng | |
| MSI Alpha 15 A3DDK-034 | |
| MSI Alpha 15 A3DDK-034 (Silent) | |
| Cinebench R10 | |
| Rendering Single 32Bit | |
| Average of class Gaming (7457 - 12575, n=9, last 2 years) | |
| HP Pavilion Gaming 15-ec0017ng | |
| MSI Alpha 15 A3DDK-034 | |
| Rendering Multiple CPUs 32Bit | |
| Average of class Gaming (42932 - 102066, n=9, last 2 years) | |
| HP Pavilion Gaming 15-ec0017ng | |
| MSI Alpha 15 A3DDK-034 | |
| Geekbench 3 | |
| 32 Bit Multi-Core Score | |
| HP Pavilion Gaming 15-ec0017ng | |
| MSI Alpha 15 A3DDK-034 | |
| 32 Bit Single-Core Score | |
| HP Pavilion Gaming 15-ec0017ng | |
| MSI Alpha 15 A3DDK-034 | |
| Geekbench 5.0 | |
| 5.0 Multi-Core | |
| Average of class Gaming (21768 - 28184, n=3, last 2 years) | |
| HP Pavilion Gaming 15-ec0017ng | |
| MSI Alpha 15 A3DDK-034 | |
| MSI Alpha 15 A3DDK-034 (Silent) | |
| 5.0 Single-Core | |
| Average of class Gaming (2237 - 2318, n=3, last 2 years) | |
| HP Pavilion Gaming 15-ec0017ng | |
| MSI Alpha 15 A3DDK-034 | |
| MSI Alpha 15 A3DDK-034 (Silent) | |
| Geekbench 5.5 | |
| Multi-Core | |
| Average of class Gaming (6460 - 28263, n=102, last 2 years) | |
| MSI Alpha 15 A3DDK-034 | |
| Single-Core | |
| Average of class Gaming (1403 - 2474, n=102, last 2 years) | |
| MSI Alpha 15 A3DDK-034 | |
| Mozilla Kraken 1.1 - Total | |
| Lenovo Legion Y540-15IRH-81SX00B2GE | |
| MSI Alpha 15 A3DDK-034 (Edge 44) | |
| HP Pavilion Gaming 15-ec0017ng (Edge 44) | |
| Acer Predator Helios 300 PH315-52-79TY (Edge: 44.18362.387.0) | |
| Average of class Gaming (391 - 590, n=100, last 2 years) | |
| Octane V2 - Total Score | |
| Average of class Gaming (93292 - 139447, n=26, last 2 years) | |
| Lenovo Legion Y540-15IRH-81SX00B2GE | |
| Acer Predator Helios 300 PH315-52-79TY (Edge: 44.18362.387.0) | |
| HP Pavilion Gaming 15-ec0017ng (Edge 44) | |
| MSI Alpha 15 A3DDK-034 (Edge 44) | |
| JetStream 1.1 - 1.1 Total | |
| Average of class Gaming (549 - 647, n=2, last 2 years) | |
| Acer Predator Helios 300 PH315-52-79TY (Edge: 44.18362.387.0) | |
| HP Pavilion Gaming 15-ec0017ng (Edge 44) | |
| Lenovo Legion Y540-15IRH-81SX00B2GE | |
| MSI Alpha 15 A3DDK-034 (Edge 44) | |
| MSI Alpha 15 A3DDK-034 (Edge 44; Silent) | |
* ... smaller is better
System Performance
Our review unit worked smoothly and fluidly during our tests. We encountered no problems. Overall, the Alpha 15 offers enough computing power even for applications beyond gaming. This is confirmed not least by our review unit's good PCMark benchmark results.
| PCMark 8 Home Score Accelerated v2 | 4121 points | |
| PCMark 8 Creative Score Accelerated v2 | 4614 points | |
| PCMark 8 Work Score Accelerated v2 | 5045 points | |
| PCMark 10 Score | 4605 points | |
Help | ||
Storage Devices
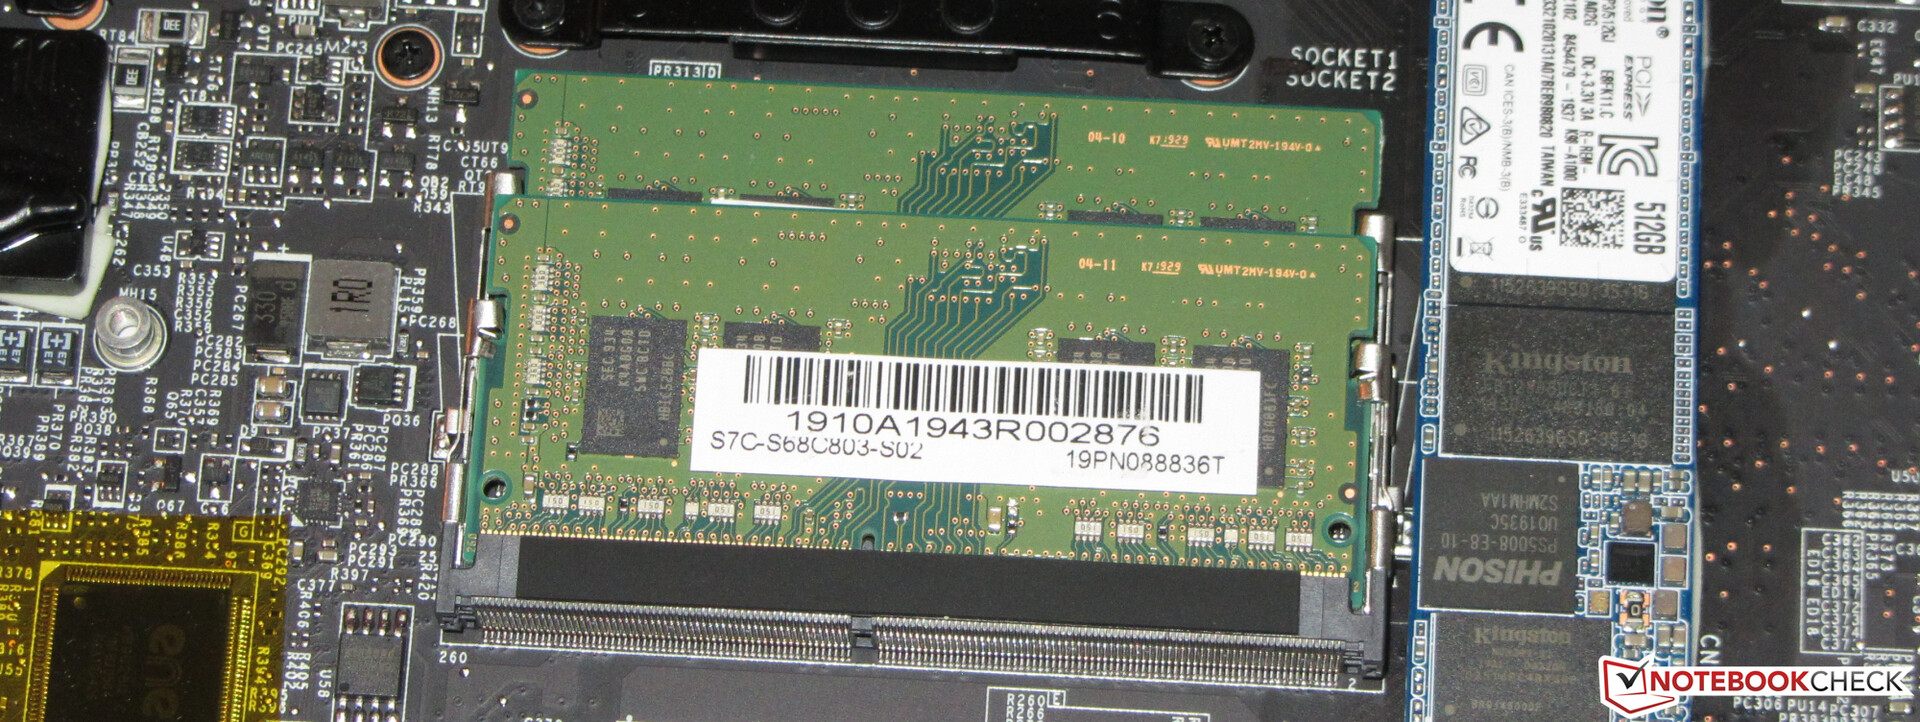
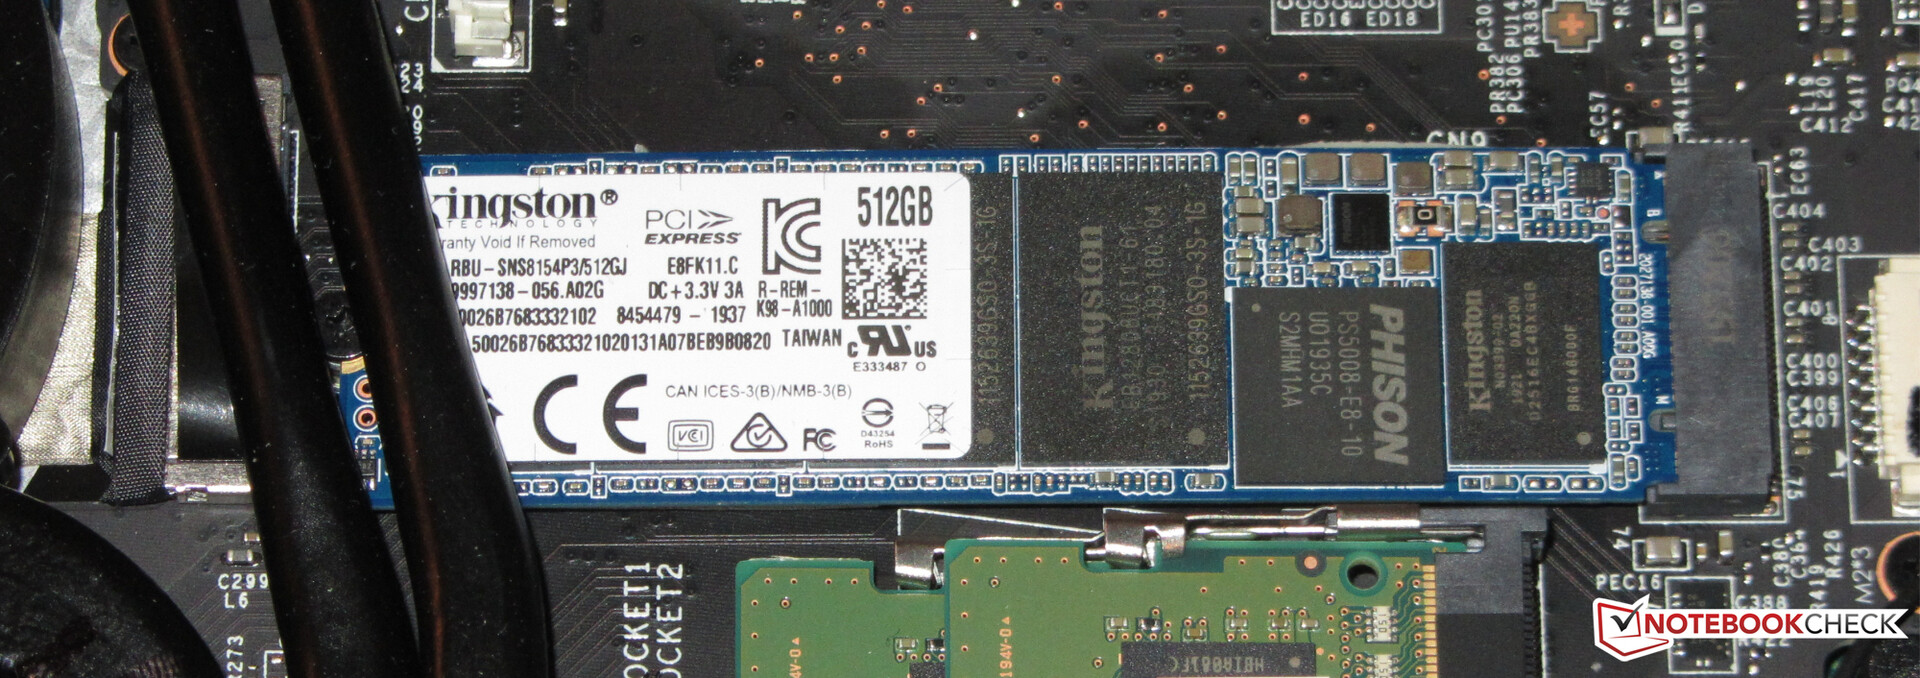
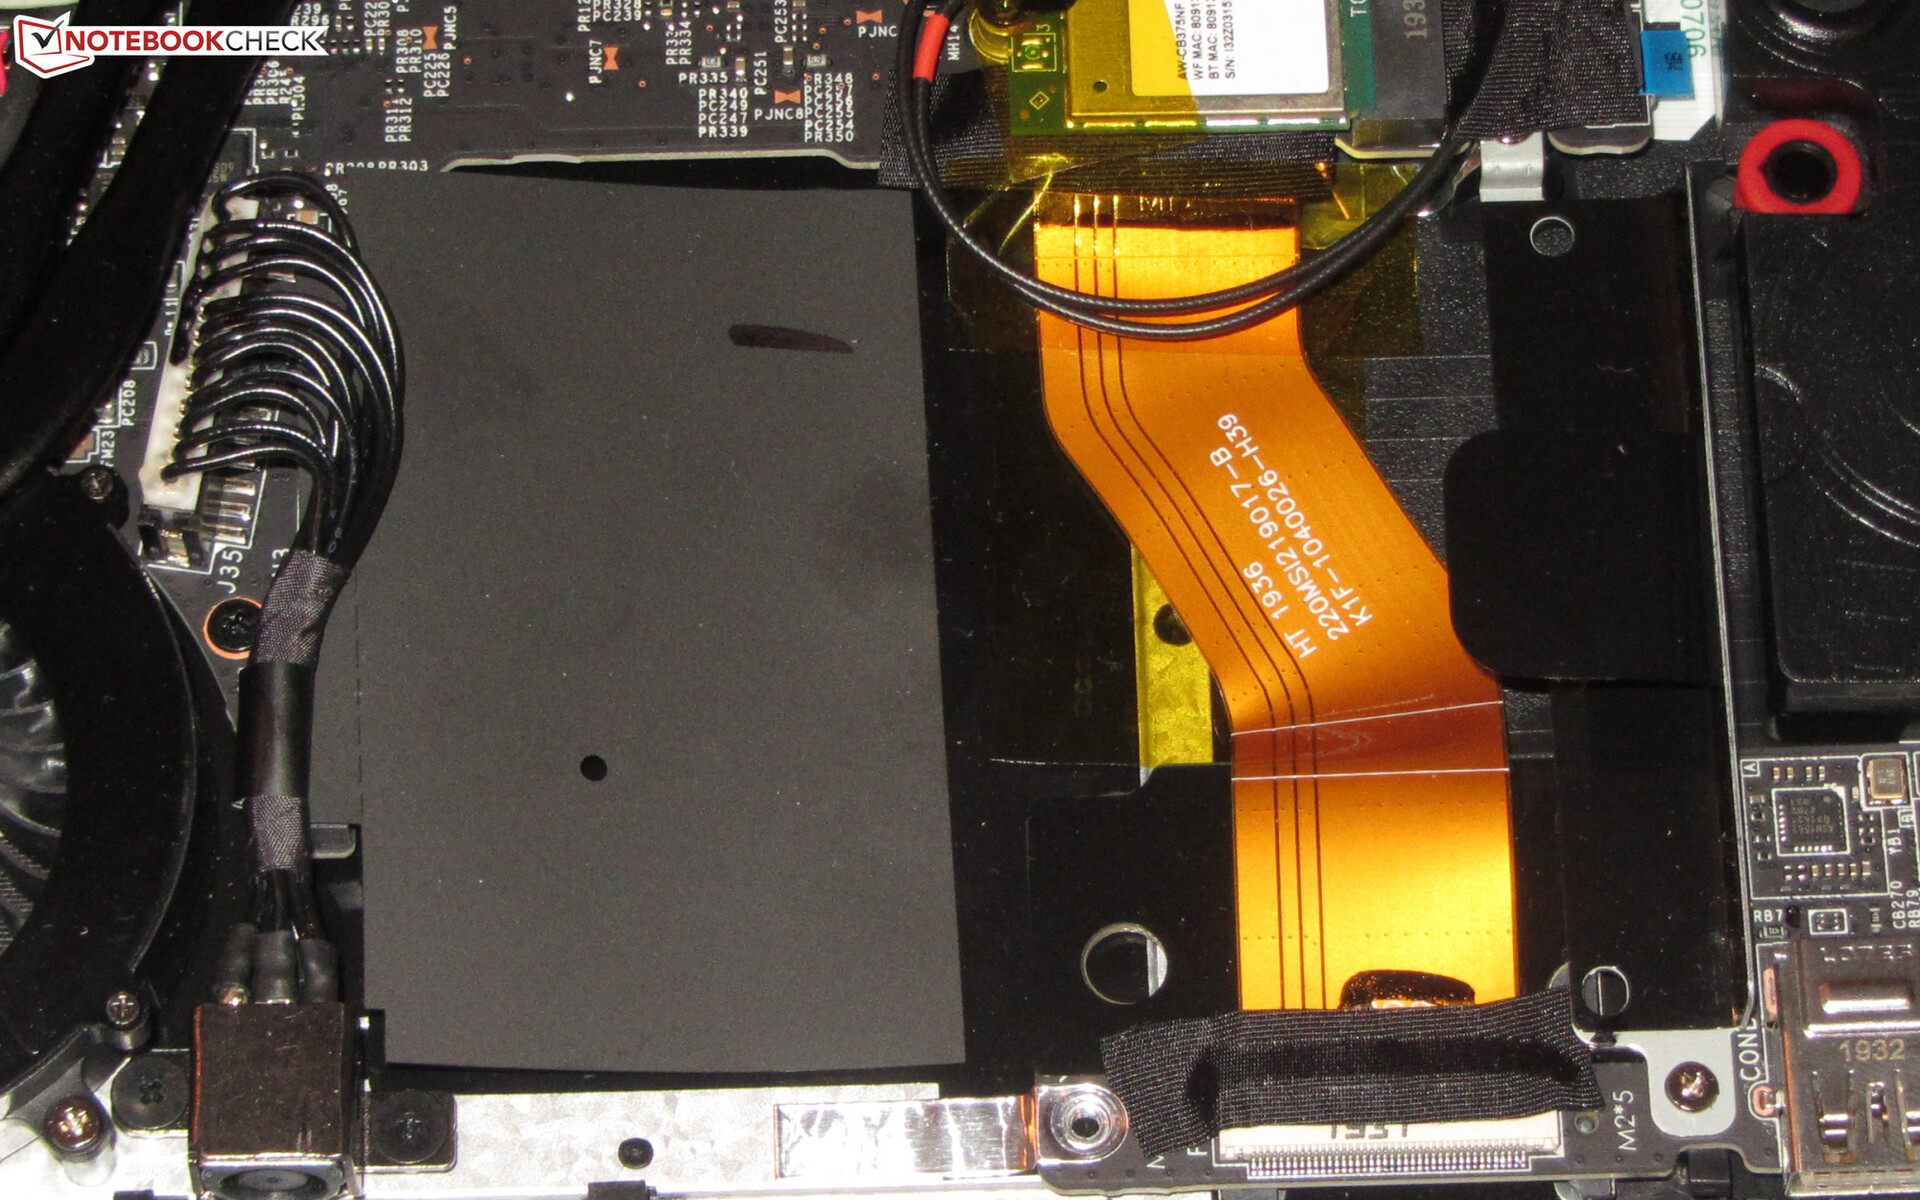
MSI includes a Kingston NVMe M.2-2280 SSD, specifically the RBUSNS8154P3512GJ, 512 GB drive. The SSD delivers good transfer rates, but it is not one of the top models among modern SSDs. The laptop also contains a 2.5-inch drive bay should you wish to add a second drive. MSI pre-installs the frame for adding a 2.5-inch drive, along with a SATA cable.

| MSI Alpha 15 A3DDK-034 Kingston RBUSNS8154P3512GJ | Acer Predator Helios 300 PH315-52-79TY WDC PC SN720 SDAPNTW-512G | HP Pavilion Gaming 15-ec0017ng WDC PC SN720 SDAPNTW-256G | Dell G5 15 5590-PCNJJ KBG30ZMS128G | Lenovo Legion Y540-15IRH-81SX00B2GE WDC PC SN720 SDAPNTW-512G | |
|---|---|---|---|---|---|
| CrystalDiskMark 5.2 / 6 | 67% | 39% | -48% | 60% | |
| Write 4K (MB/s) | 105.4 | 108.7 3% | 148 40% | 65.3 -38% | 158.8 51% |
| Read 4K (MB/s) | 33.24 | 44.91 35% | 43.73 32% | 29.71 -11% | 29.11 -12% |
| Write Seq (MB/s) | 1029 | 2424 136% | 1617 57% | 128.8 -87% | 1584 54% |
| Read Seq (MB/s) | 1098 | 1617 47% | 1753 60% | 859 -22% | 1694 54% |
| Write 4K Q32T1 (MB/s) | 322.1 | 356.9 11% | 246.3 -24% | 95.8 -70% | 536 66% |
| Read 4K Q32T1 (MB/s) | 352 | 557 58% | 368 5% | 197.6 -44% | 363.9 3% |
| Write Seq Q32T1 (MB/s) | 1036 | 2542 145% | 1618 56% | 132.5 -87% | 2536 145% |
| Read Seq Q32T1 (MB/s) | 1606 | 3218 100% | 3027 88% | 1208 -25% | 3458 115% |
Graphics Card
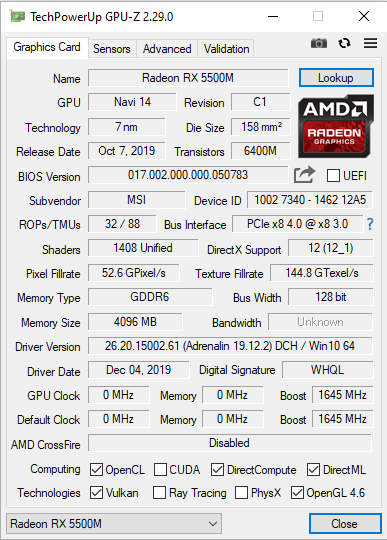
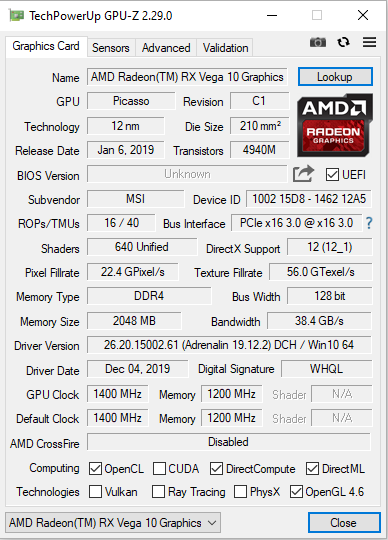
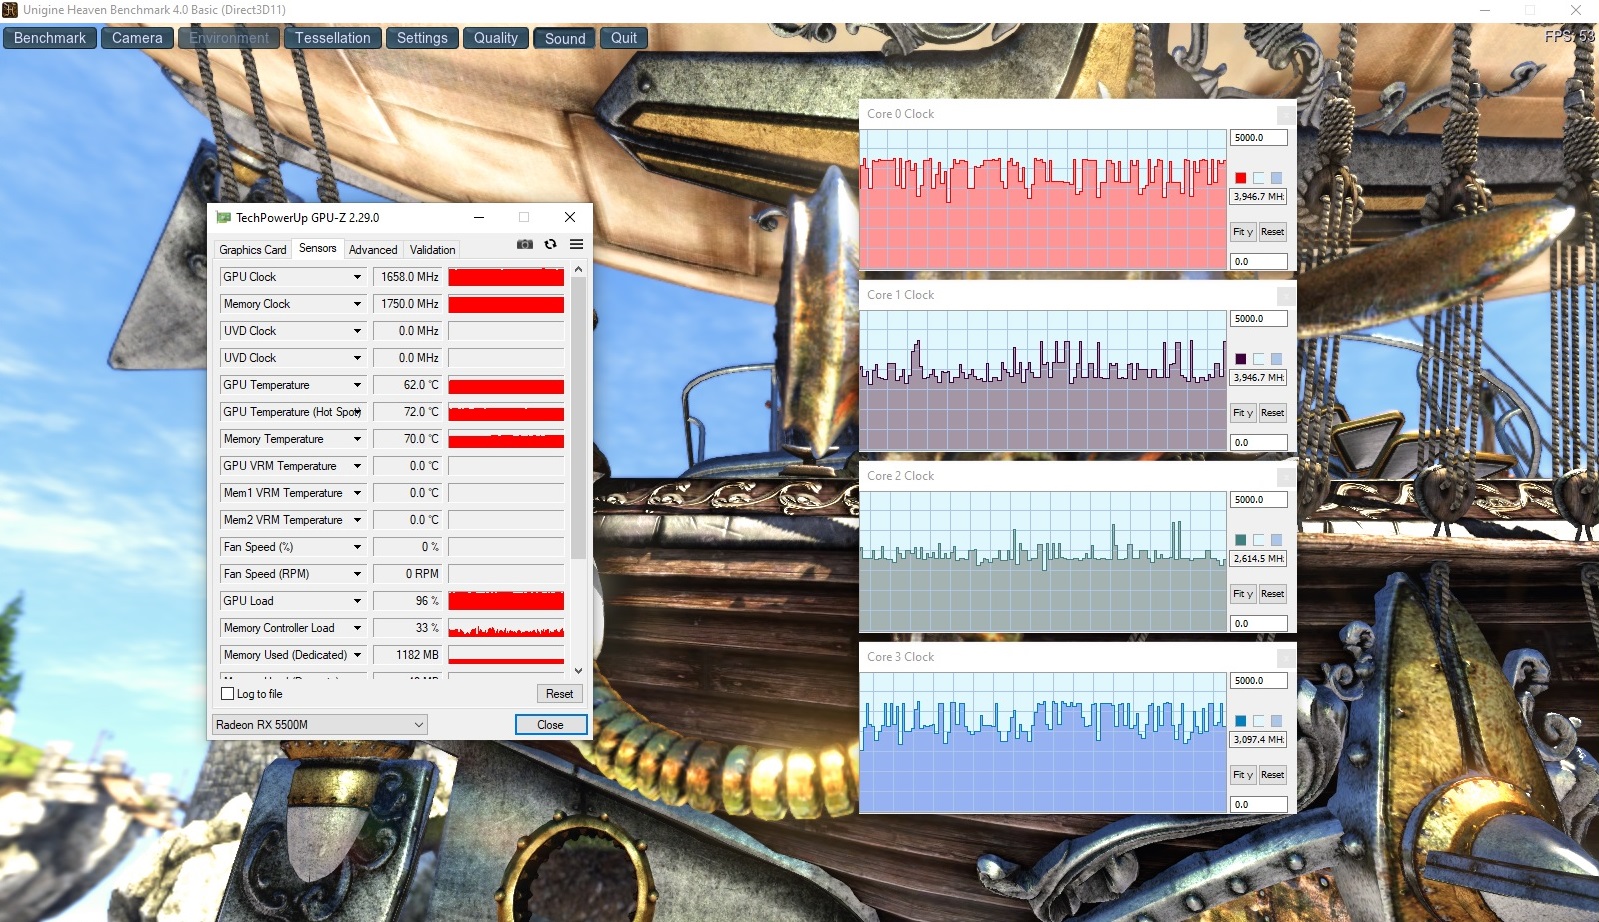
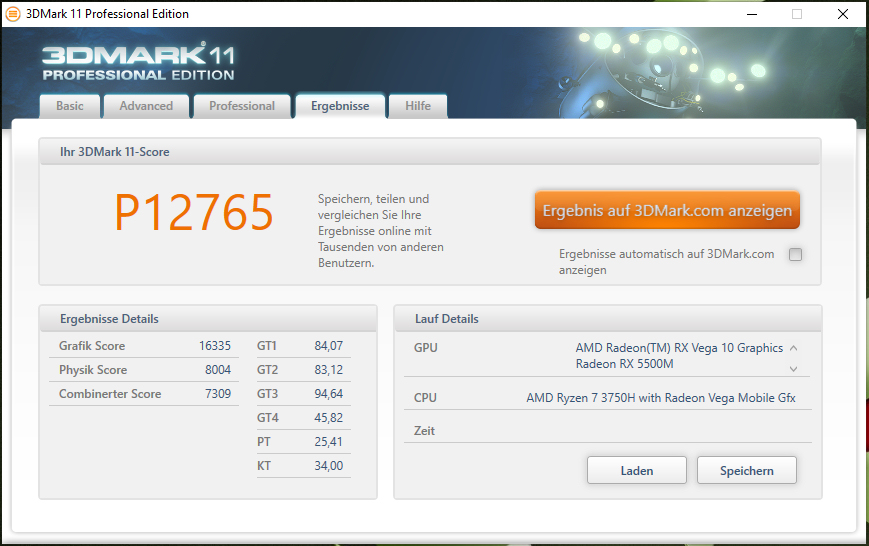
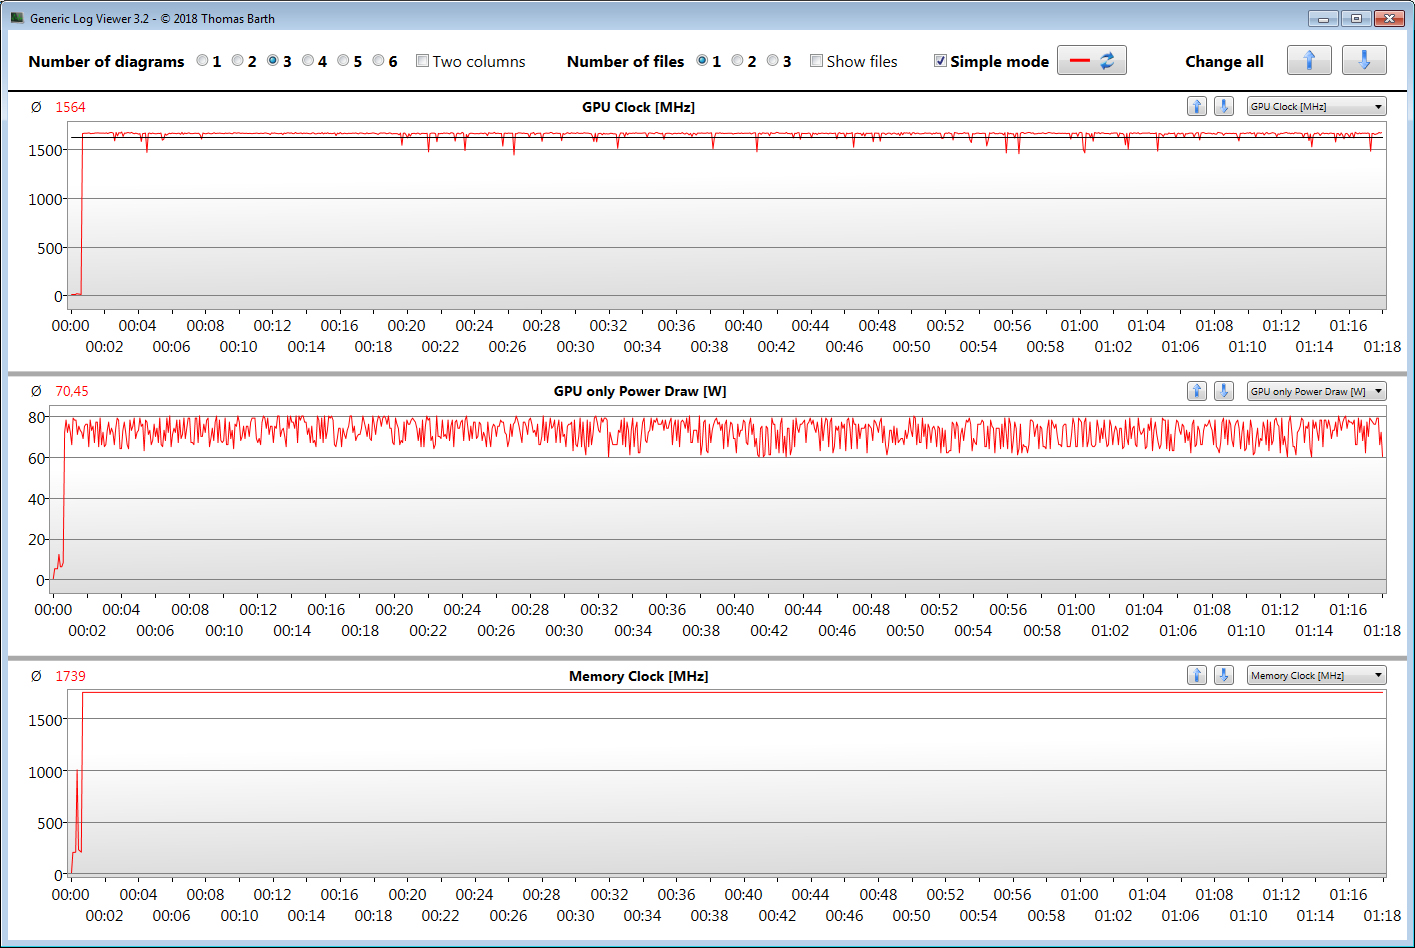
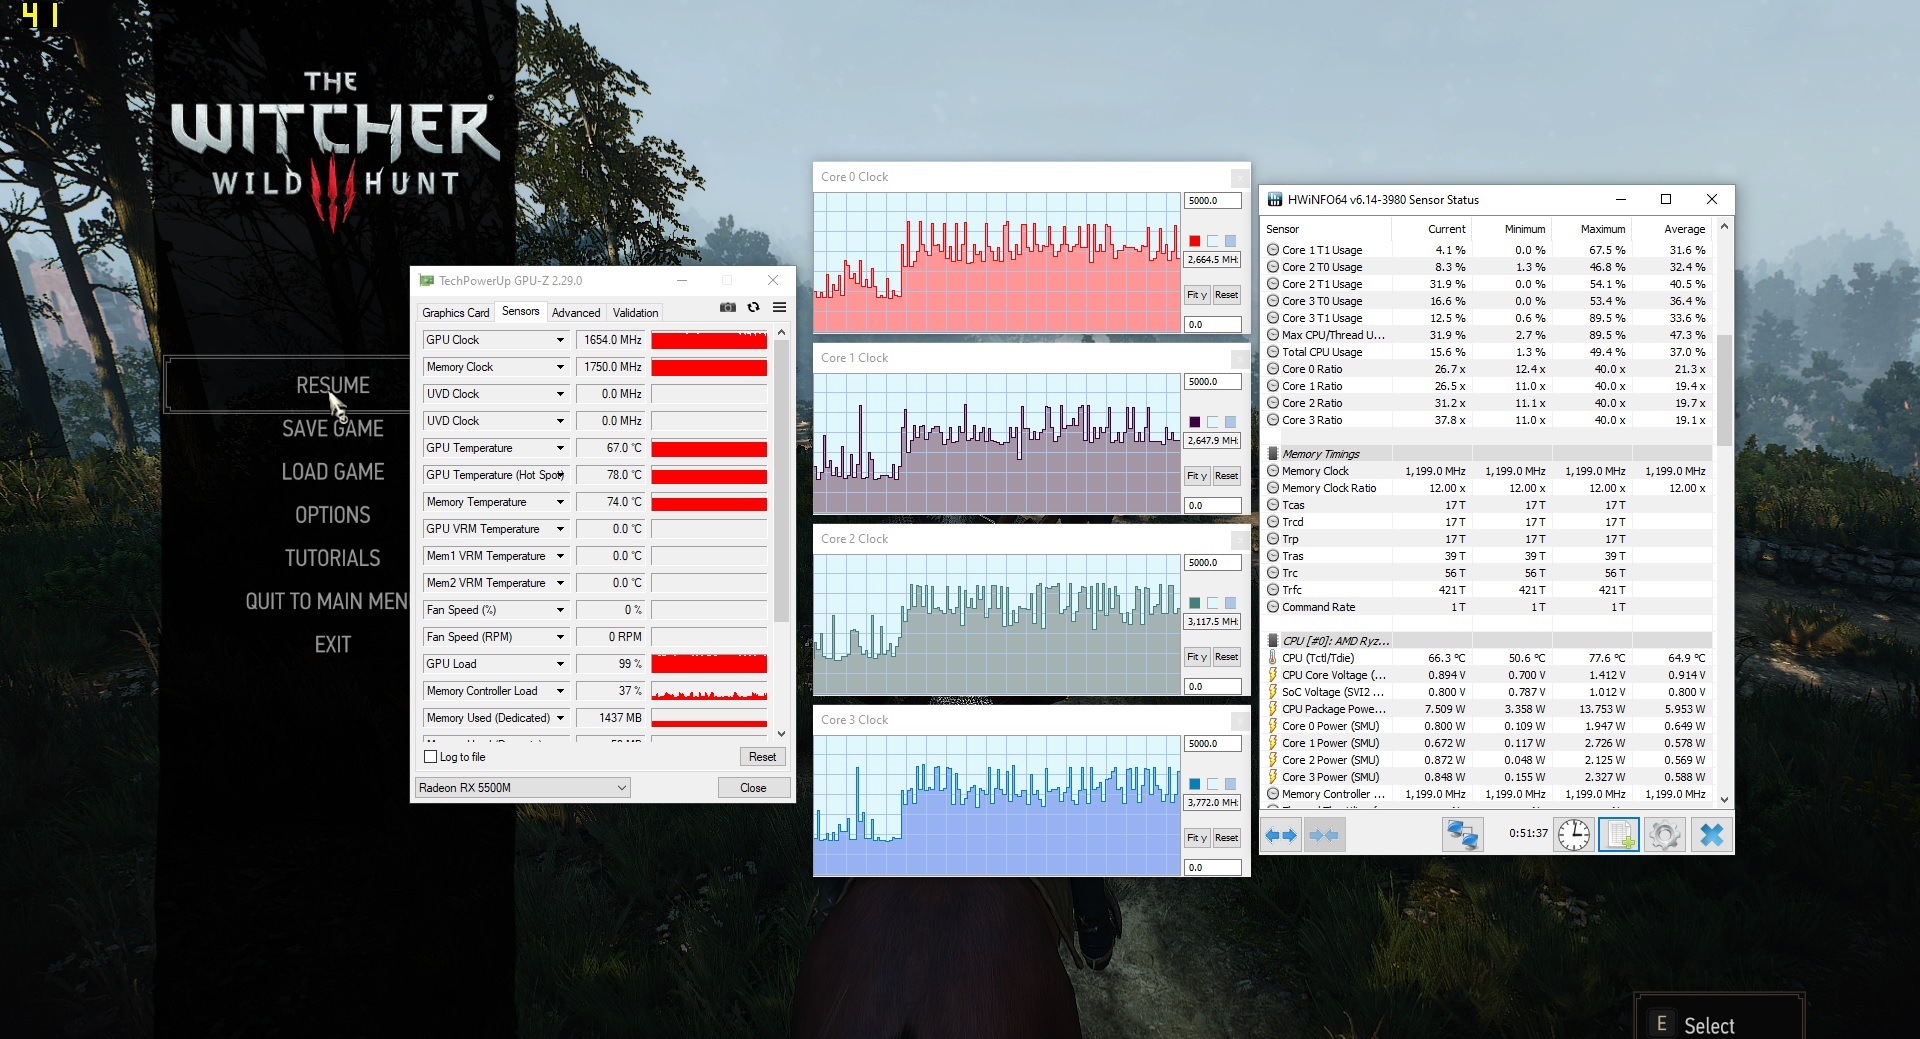
The Alpha 15 also features a Radeon RX 5500M, a Navi GPU that belongs in the upper midrange of laptop cards. The graphics core supports DirectX 12 and works at a base clock of 1,448 MHz. The card can turbo up to 1,645 MHz, although higher speeds are feasible if the GPU does not reach its temperature or power limits. Our tests revealed that the GPU can hit 1,658 MHz, for example. Meanwhile, the Radeon RX 5500M averaged 1,564 MHz when playing The Witcher 3. The GPU utilises 4 GB of fast GDDR6 VRAM, too.
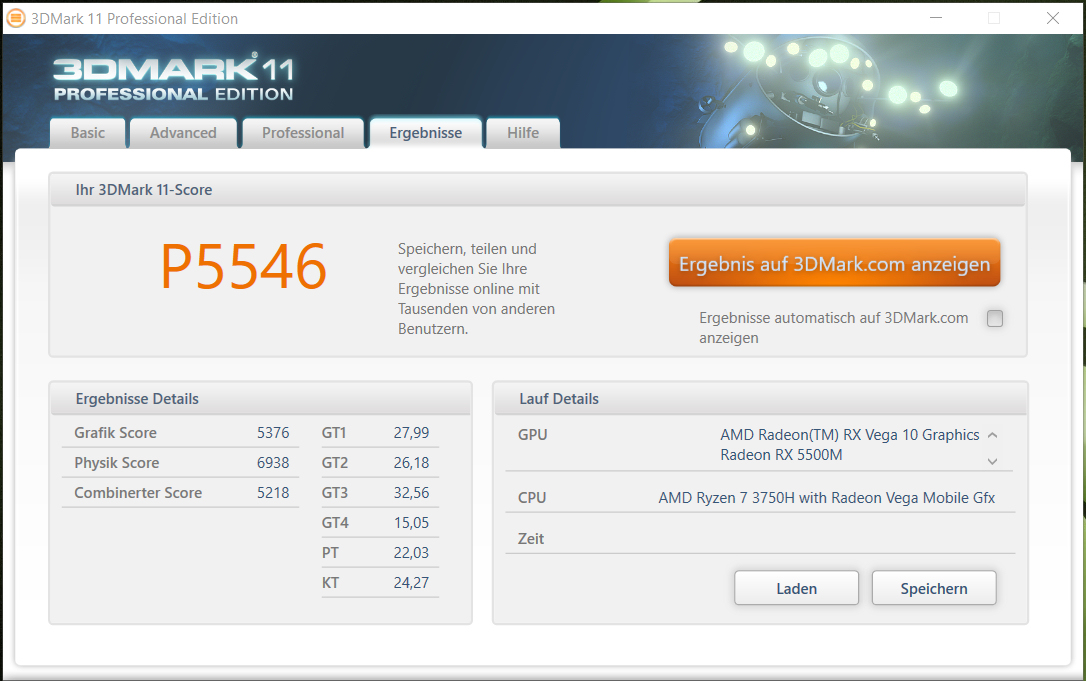
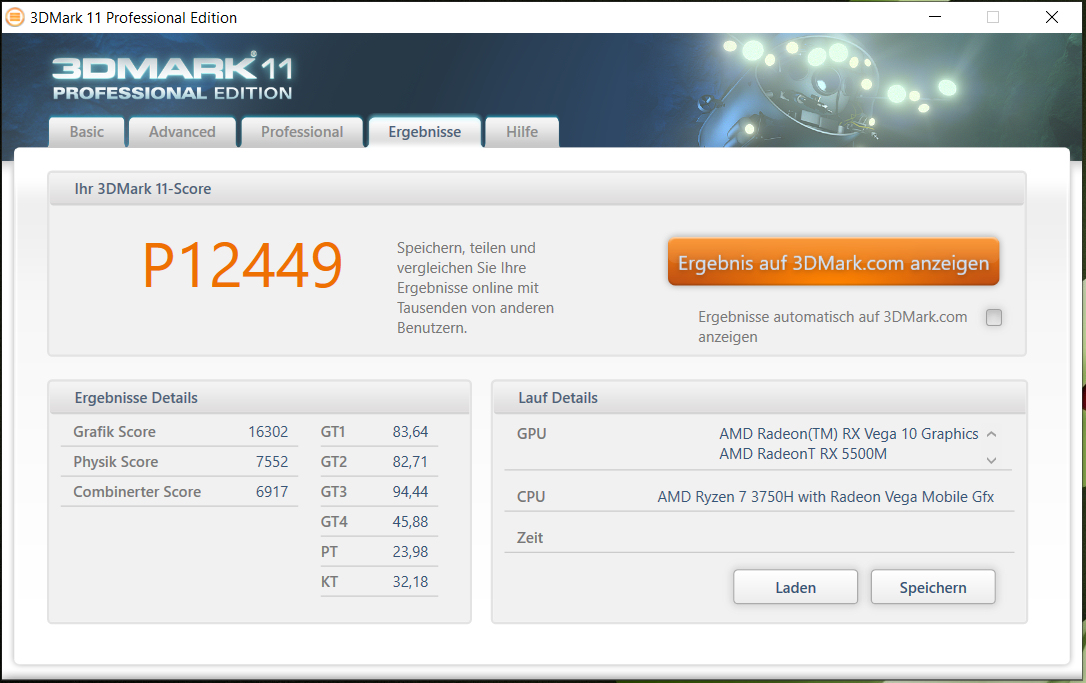
3DMark benchmark results rank the GPU between the performance of the NVIDIA GeForce GTX 1650 and the GeForce GTX 1660 Ti Max-Q. While the performance profiles of MSI Dragon Center do not affect graphics performance, they do impact physics performance. Additionally, the Alpha 15 can only deliver a third of its peak graphics performance when running on battery power. Correspondingly, the GPU can only reach 500 MHz.
The Alpha 15 also has an integrated GPU. Its RX Vega 10 GPU can be manually deactivated within Dragon Center, but AMD Enduro can switch the system between the integrated and dedicated GPUs when needed.
| 3DMark 06 Standard Score | 24966 points | |
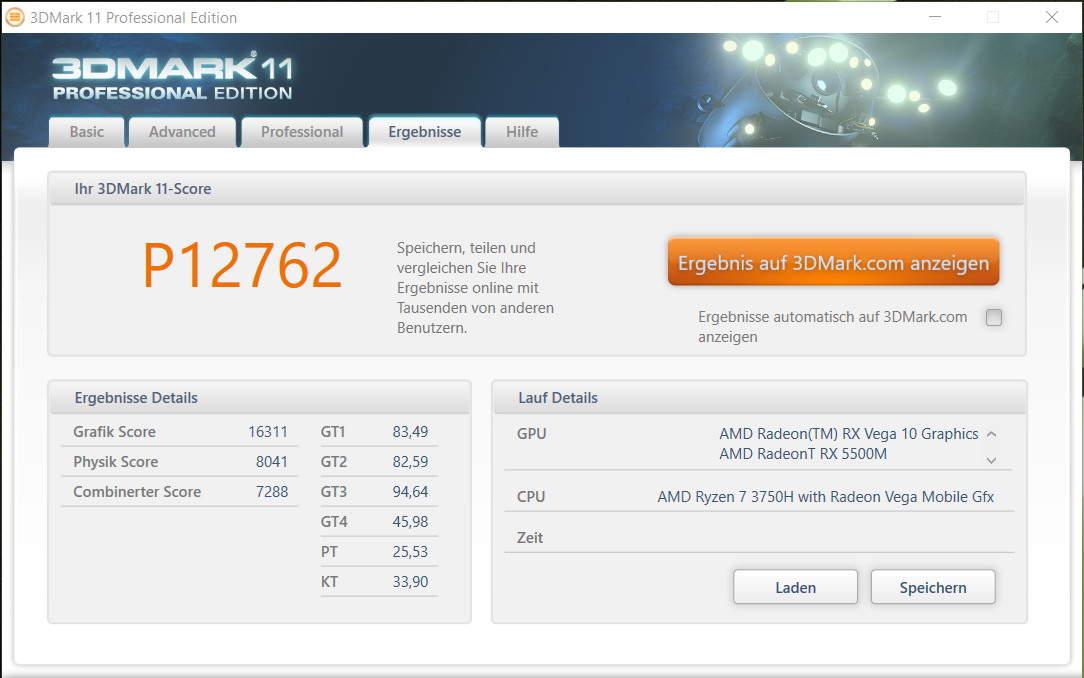
| 3DMark 11 Performance | 12765 points | |
| 3DMark Ice Storm Standard Score | 55844 points | |
| 3DMark Cloud Gate Standard Score | 21898 points | |
| 3DMark Fire Strike Score | 10319 points | |
| 3DMark Time Spy Score | 4105 points | |
Help | ||
| 3DMark 11 - 1280x720 Performance GPU | |
| Average of class Gaming (21841 - 80022, n=103, last 2 years) | |
| Lenovo Legion Y540-15IRH-81SX00B2GE | |
| Acer Predator Helios 300 PH315-52-79TY | |
| HP Pavilion Gaming 15-ec0017ng | |
| MSI Alpha 15 A3DDK-034 | |
| MSI Alpha 15 A3DDK-034 (Silent) | |
| Dell G5 15 5590-PCNJJ | |
Gaming Performance
The hardware in the Alpha 15 is capable of playing all games in our database smoothly. As a rule, the device can handle triple-A titles at 1080p and medium to high graphics settings. Our review unit can play some games at higher resolutions and graphics in some cases, though. In short, the graphics core is not made for beyond 1080p gaming. Only a few games can be played at beyond that, typically more undemanding ones.
| The Witcher 3 - 1920x1080 Ultra Graphics & Postprocessing (HBAO+) | |
| Average of class Gaming (104.7 - 240, n=7, last 2 years) | |
| Acer Predator Helios 300 PH315-52-79TY | |
| Lenovo Legion Y540-15IRH-81SX00B2GE | |
| HP Pavilion Gaming 15-ec0017ng | |
| MSI Alpha 15 A3DDK-034 | |
| MSI Alpha 15 A3DDK-034 (Silent) | |
| Dell G5 15 5590-PCNJJ | |
| BioShock Infinite - 1920x1080 Ultra Preset, DX11 (DDOF) | |
| Lenovo Legion Y540-15IRH-81SX00B2GE | |
| Acer Predator Helios 300 PH315-52-79TY | |
| HP Pavilion Gaming 15-ec0017ng | |
| MSI Alpha 15 A3DDK-034 | |
| MSI Alpha 15 A3DDK-034 (Silent) | |
| Dell G5 15 5590-PCNJJ | |
| For Honor - 1920x1080 Extreme Preset AA:T AF:16x | |
| MSI Alpha 15 A3DDK-034 | |
| F1 2019 - 1920x1080 Ultra High Preset AA:T AF:16x | |
| HP Pavilion Gaming 15-ec0017ng | |
| MSI Alpha 15 A3DDK-034 | |
| Dell G5 15 5590-PCNJJ | |
We also checked GPU performance under sustained load by running The Witcher 3 for about 60 minutes at 1080p and maximum graphics settings. We do not move the in-game character during this period, for reference. We observed no drop in framerates during this test.
| low | med. | high | ultra | |
|---|---|---|---|---|
| BioShock Infinite (2013) | 197.3 | 173.5 | 155 | 94.2 |
| The Witcher 3 (2015) | 173.6 | 129 | 73.3 | 44.7 |
| For Honor (2017) | 184.3 | 102 | 97 | 78.5 |
| Ghost Recon Wildlands (2017) | 73.1 | 52.9 | 50.3 | 27.1 |
| Final Fantasy XV Benchmark (2018) | 90.9 | 57.7 | 30.8 | |
| World of Tanks enCore (2018) | 241.9 | 176.3 | 89.7 | |
| F1 2019 (2019) | 114 | 97 | 82 | 68 |
| Control (2019) | 128.9 | 50.1 | 36.9 | |
| Borderlands 3 (2019) | 75.2 | 62.3 | 45 | 34.2 |
| Star Wars Jedi Fallen Order (2019) | 57.3 | 52.8 | 50.1 |
Emissions - The fans in the Alpha 15 do not hold back
Our custom Dragon Center profile results in the fans running permanently. They are audible even when the system is idling, and at low loads too. While they generally operate at around 36 dB(A), we observed them reaching 46 dB(A) in both scenarios. Unsurprisingly, the fans get even louder under load. They reached 57 dB(A) during our stress test, for example, although they do not get quite as loud when gaming. During our The Witcher 3 test, the fans peaked at 51 dB(A), but that is still loud enough to need to have a headset to hand.
If you like things quiet to silent, then you must set the Alpha 15 to "Silent" within Dragon Center. This comes at the expense of performance, though. Additionally, it does not prevent the fans from occasionally switching on.
Noise level
| Idle |
| 36 / 37 / 46 dB(A) |
| Load |
| 50 / 57 dB(A) |
 | ||
30 dB silent 40 dB(A) audible 50 dB(A) loud |
||
min: | ||
| MSI Alpha 15 A3DDK-034 R7 3750H, Radeon RX 5500M | Acer Predator Helios 300 PH315-52-79TY i7-9750H, GeForce GTX 1660 Ti Mobile | HP Pavilion Gaming 15-ec0017ng R7 3750H, GeForce GTX 1660 Ti Max-Q | Dell G5 15 5590-PCNJJ i5-9300H, GeForce GTX 1650 Mobile | Lenovo Legion Y540-15IRH-81SX00B2GE i7-9750H, GeForce GTX 1660 Ti Mobile | |
|---|---|---|---|---|---|
| Noise | 15% | 15% | 9% | 20% | |
| off / environment * (dB) | 29 | 30.2 -4% | 30.2 -4% | 30 -3% | 29.3 -1% |
| Idle Minimum * (dB) | 36 | 31 14% | 31.5 12% | 31 14% | 29.3 19% |
| Idle Average * (dB) | 37 | 31 16% | 31.5 15% | 32 14% | 29.3 21% |
| Idle Maximum * (dB) | 46 | 31 33% | 31.5 32% | 35 24% | 29.3 36% |
| Load Average * (dB) | 50 | 41.5 17% | 41.4 17% | 49 2% | 35.7 29% |
| Witcher 3 ultra * (dB) | 51 | 46.7 8% | 43.7 14% | 47 8% | 44.2 13% |
| Load Maximum * (dB) | 57 | 46.9 18% | 45.5 20% | 53 7% | 45.6 20% |
* ... smaller is better
Temperature
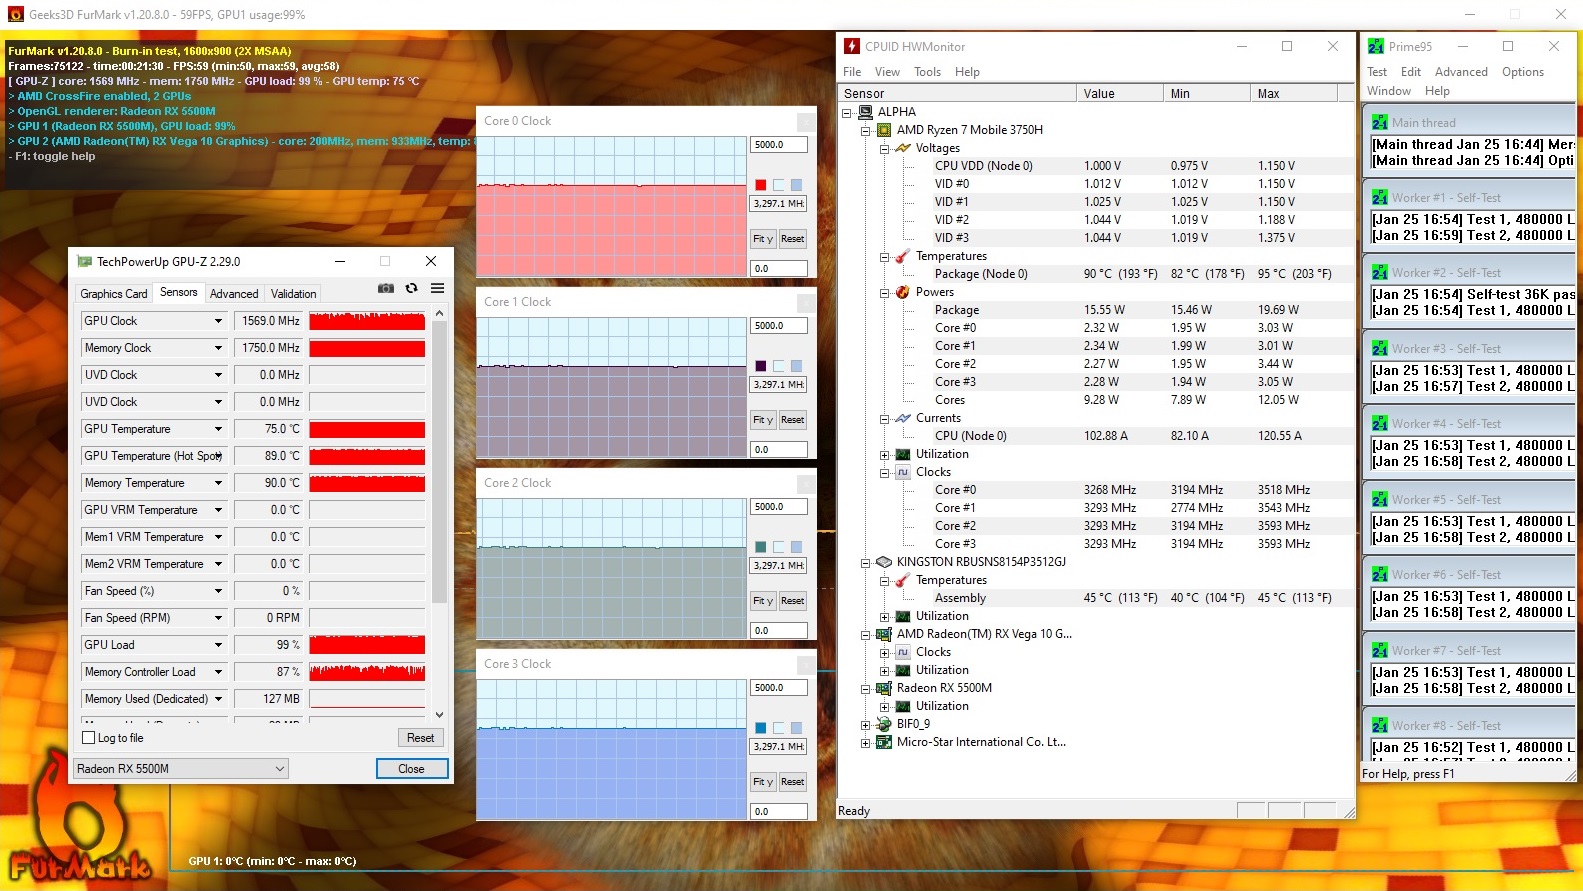
Our stress test, which we conducted by running FurMark and Prime95 for at least an hour, produced different results depending on whether the Alpha 15 was charging or not. When running from mains power, for example, the CPU managed about 3.3 GHz, with the GPU hovering at between 1,500 and 1,600 MHz. However, switching to battery power resulted in clock speeds dropping to between 2.6 and 2.8 GHz for the CPU and 200 to 400 MHz for the GPU. You should not encounter such heavy throttling in everyday life though, as we have designed our stress test to check whether machines remain stable under sustained load.
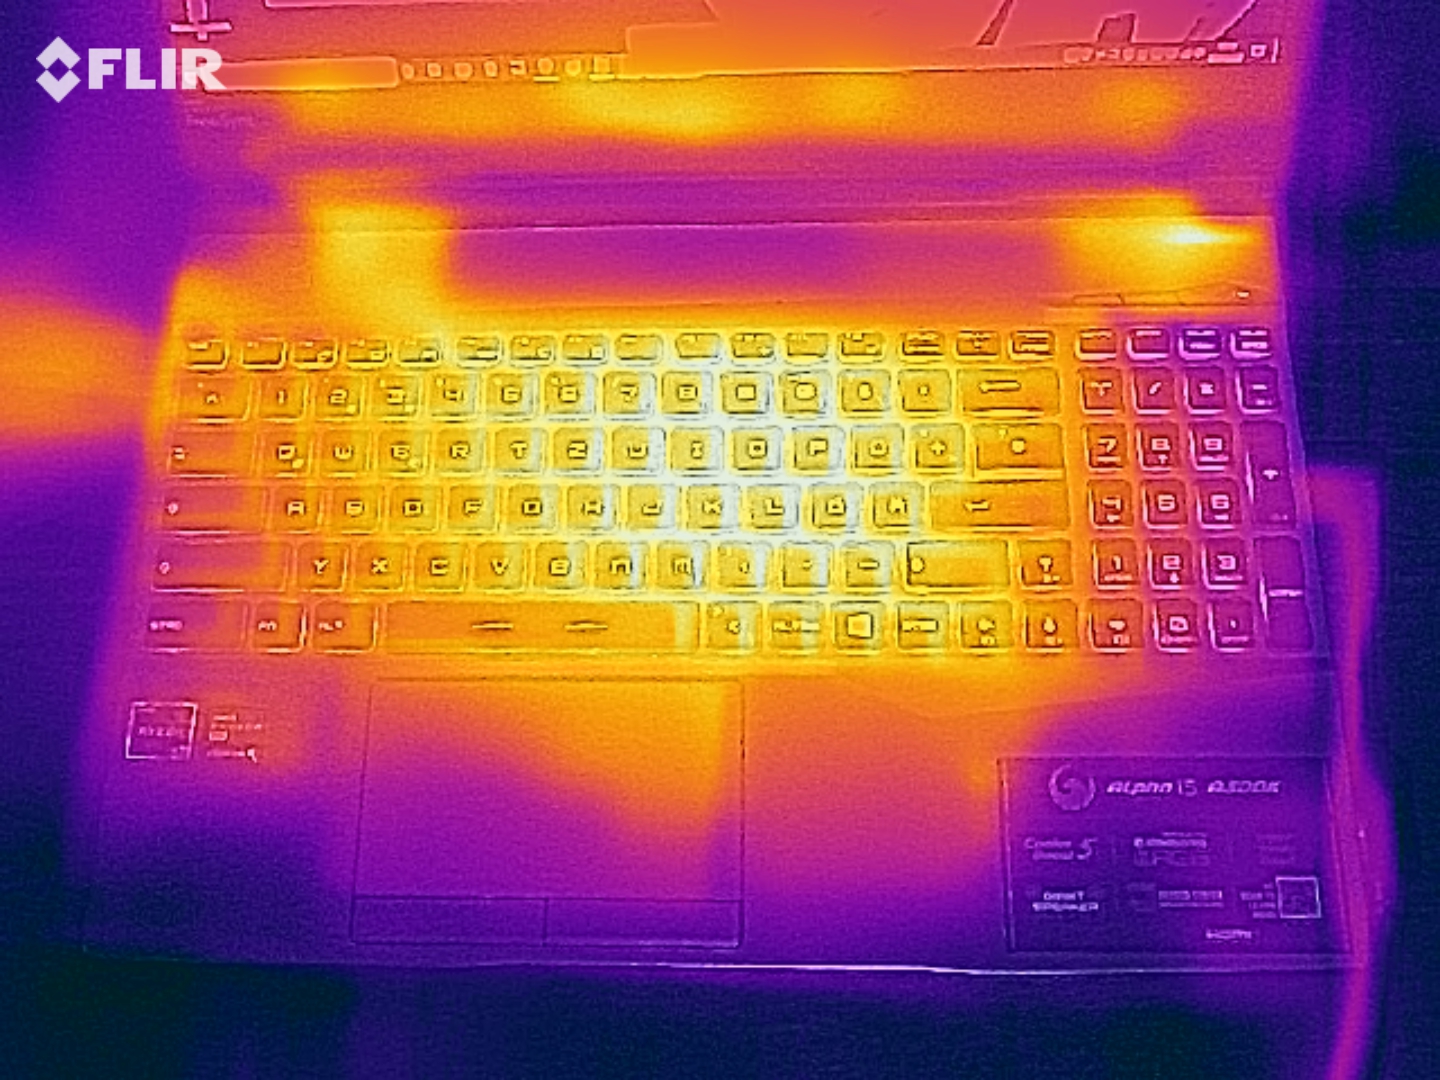
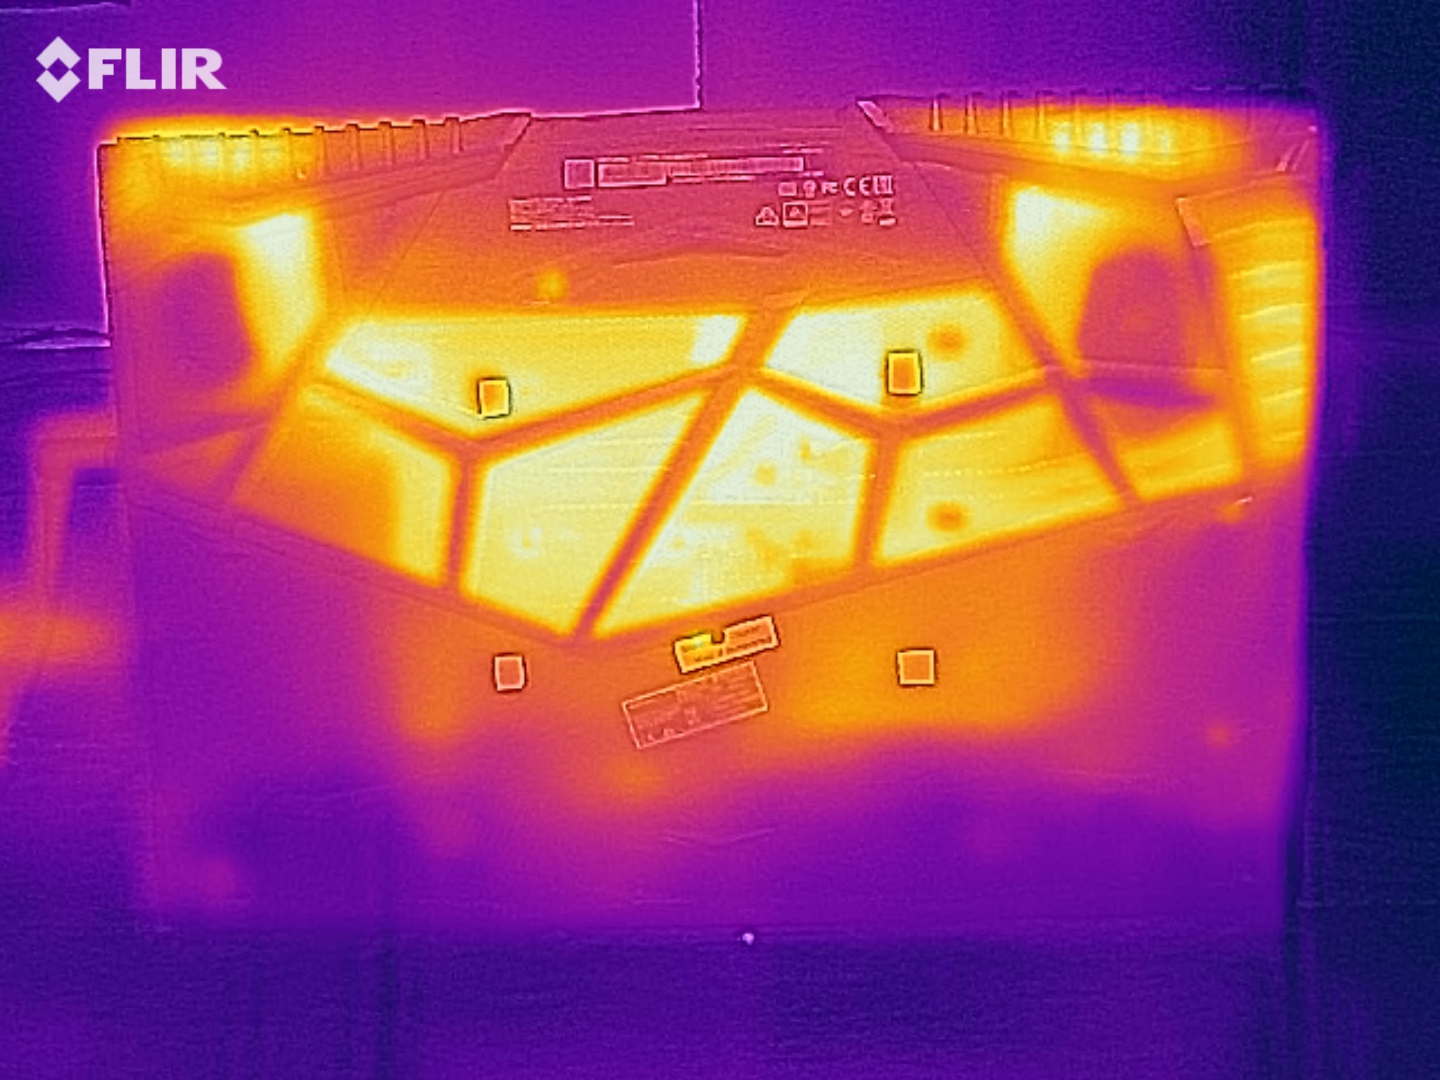
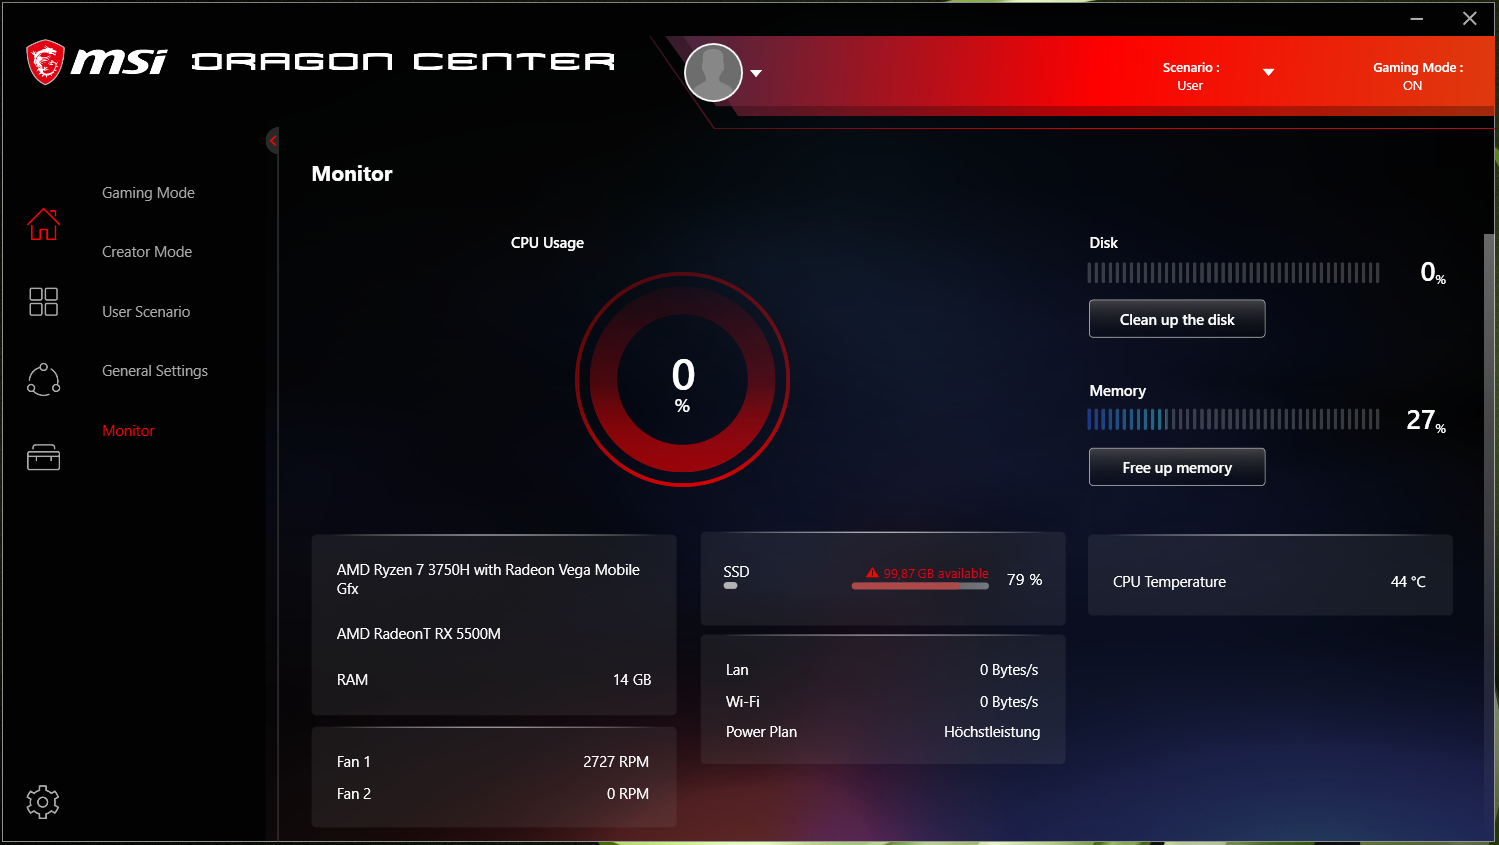
The Alpha 15 does not get excessively hot, either. During our stress test, for example, surface temperatures exceed 40 °C at most measuring points. However, they were a few degrees lower when playing The Witcher 3. In either case, the device is too hot to leave resting on your thighs or lap. You should have no such problems in everyday tasks, though.
(±) The maximum temperature on the upper side is 44 °C / 111 F, compared to the average of 40.4 °C / 105 F, ranging from 21.2 to 68.8 °C for the class Gaming.
(-) The bottom heats up to a maximum of 49 °C / 120 F, compared to the average of 43.2 °C / 110 F
(+) In idle usage, the average temperature for the upper side is 25.6 °C / 78 F, compared to the device average of 33.9 °C / 93 F.
(±) Playing The Witcher 3, the average temperature for the upper side is 37.3 °C / 99 F, compared to the device average of 33.9 °C / 93 F.
(±) The palmrests and touchpad can get very hot to the touch with a maximum of 37 °C / 98.6 F.
(-) The average temperature of the palmrest area of similar devices was 28.8 °C / 83.8 F (-8.2 °C / -14.8 F).
| MSI Alpha 15 A3DDK-034 R7 3750H, Radeon RX 5500M | Acer Predator Helios 300 PH315-52-79TY i7-9750H, GeForce GTX 1660 Ti Mobile | HP Pavilion Gaming 15-ec0017ng R7 3750H, GeForce GTX 1660 Ti Max-Q | Dell G5 15 5590-PCNJJ i5-9300H, GeForce GTX 1650 Mobile | Lenovo Legion Y540-15IRH-81SX00B2GE i7-9750H, GeForce GTX 1660 Ti Mobile | |
|---|---|---|---|---|---|
| Heat | 1% | 6% | -3% | -20% | |
| Maximum Upper Side * (°C) | 44 | 52 -18% | 44.8 -2% | 49 -11% | 42.7 3% |
| Maximum Bottom * (°C) | 49 | 46.3 6% | 40.8 17% | 55 -12% | 52.7 -8% |
| Idle Upper Side * (°C) | 26 | 24.8 5% | 25.4 2% | 25 4% | 33.1 -27% |
| Idle Bottom * (°C) | 28 | 25.4 9% | 26.6 5% | 26 7% | 41 -46% |
* ... smaller is better
Speakers
MSI has equipped the Alpha 15 with stereo speakers, which sit on the underside of the device. They sound decent to our ears, but while reproducing hardly any bass. Headphones or external speakers would offer a better listening experience than the stereo speakers here.
MSI Alpha 15 A3DDK-034 audio analysis
(+) | speakers can play relatively loud (91 dB)
Bass 100 - 315 Hz
(-) | nearly no bass - on average 31.4% lower than median
(+) | bass is linear (5.8% delta to prev. frequency)
Mids 400 - 2000 Hz
(±) | reduced mids - on average 7.4% lower than median
(±) | linearity of mids is average (9.9% delta to prev. frequency)
Highs 2 - 16 kHz
(+) | balanced highs - only 2.1% away from median
(+) | highs are linear (3.7% delta to prev. frequency)
Overall 100 - 16.000 Hz
(±) | linearity of overall sound is average (19.5% difference to median)
Compared to same class
» 68% of all tested devices in this class were better, 7% similar, 26% worse
» The best had a delta of 6%, average was 18%, worst was 132%
Compared to all devices tested
» 49% of all tested devices were better, 7% similar, 44% worse
» The best had a delta of 4%, average was 23%, worst was 134%
HP Pavilion Gaming 15-ec0017ng audio analysis
(-) | not very loud speakers (68 dB)
Bass 100 - 315 Hz
(-) | nearly no bass - on average 22.5% lower than median
(±) | linearity of bass is average (10.5% delta to prev. frequency)
Mids 400 - 2000 Hz
(+) | balanced mids - only 1.7% away from median
(±) | linearity of mids is average (8.4% delta to prev. frequency)
Highs 2 - 16 kHz
(+) | balanced highs - only 4.4% away from median
(±) | linearity of highs is average (8.1% delta to prev. frequency)
Overall 100 - 16.000 Hz
(±) | linearity of overall sound is average (23.8% difference to median)
Compared to same class
» 86% of all tested devices in this class were better, 5% similar, 10% worse
» The best had a delta of 6%, average was 18%, worst was 132%
Compared to all devices tested
» 71% of all tested devices were better, 6% similar, 22% worse
» The best had a delta of 4%, average was 23%, worst was 134%
Power Management - High power consumption and a small battery
Power Consumption
The Alpha 15 has above-average power consumption. When idling, for example, our review unit consumes up to 32 W, a value that we would only have expected if we had deactivated the integrated GPU. Moreover, we measured the device reaching 193 W during our stress test, a value that outstrips all but the Lenovo Legion Y540 of our comparison devices. Likewise, the Alpha 15 averaged around 123 W during our The Witcher 3 endurance test.
MSI includes a 180 W power supply in the box.
| Off / Standby | |
| Idle | |
| Load |
|
Key:
min: | |
| MSI Alpha 15 A3DDK-034 R7 3750H, Radeon RX 5500M | Acer Predator Helios 300 PH315-52-79TY i7-9750H, GeForce GTX 1660 Ti Mobile | HP Pavilion Gaming 15-ec0017ng R7 3750H, GeForce GTX 1660 Ti Max-Q | Dell G5 15 5590-PCNJJ i5-9300H, GeForce GTX 1650 Mobile | Lenovo Legion Y540-15IRH-81SX00B2GE i7-9750H, GeForce GTX 1660 Ti Mobile | |
|---|---|---|---|---|---|
| Power Consumption | -12% | 38% | 34% | -2% | |
| Idle Minimum * (Watt) | 14 | 17.2 -23% | 3.4 76% | 4 71% | 14.5 -4% |
| Idle Average * (Watt) | 18 | 22.6 -26% | 7.6 58% | 7 61% | 18.5 -3% |
| Idle Maximum * (Watt) | 32 | 25.5 20% | 10.2 68% | 12 62% | 20 37% |
| Load Average * (Watt) | 64 | 88 -38% | 73 -14% | 95 -48% | 81.6 -27% |
| Witcher 3 ultra * (Watt) | 123 | 107 13% | 86 30% | 132 -7% | |
| Load Maximum * (Watt) | 193 | 177 8% | 140.5 27% | 135 30% | 208.1 -8% |
* ... smaller is better
Battery Life
MSI equips the Alpha 15 with a 51 Wh battery, which achieved a runtime of 4:05 hours in our practical Wi-Fi battery life test. We conduct this test by running a script that simulates the load required to open websites. We also deactivate any power-saving features and set the display brightness to about 150 cd/m².
Moreover, the 15.6-incher needed recharging after 3:54 hours of playing a looped H.264 video. Specifically, we run Big Buck Bunny in 1080p on a loop, during which all radio modules and power-saving features are disabled. We set the display to 150 cd/m² again, too.
Overall, the Alpha 15 has underwhelming battery life. We were unable to achieve any major improvements by switching profiles in Dragon Center, either. Even using the "Super Battery" profile only netted an additional 20 minutes in our Wi-Fi test.
We also re-ran these tests with our review unit equipped with one of our SSDs, on which we installed a fresh copy of Windows 10. We did not install any MSI software either to rule out any software abnormalities. Doing so resulted in a runtime of 4:45 hours with Windows 10 set to "Balanced" mode.
| MSI Alpha 15 A3DDK-034 R7 3750H, Radeon RX 5500M, 51 Wh | Acer Predator Helios 300 PH315-52-79TY i7-9750H, GeForce GTX 1660 Ti Mobile, 58.75 Wh | HP Pavilion Gaming 15-ec0017ng R7 3750H, GeForce GTX 1660 Ti Max-Q, 52.5 Wh | Dell G5 15 5590-PCNJJ i5-9300H, GeForce GTX 1650 Mobile, 60 Wh | Lenovo Legion Y540-15IRH-81SX00B2GE i7-9750H, GeForce GTX 1660 Ti Mobile, 57 Wh | |
|---|---|---|---|---|---|
| Battery runtime | 2% | 103% | 140% | -3% | |
| Reader / Idle (h) | 5.8 | 5 -14% | 13.7 136% | 14.5 150% | 4 -31% |
| H.264 (h) | 3.9 | 3.4 -13% | 8.5 118% | ||
| WiFi v1.3 (h) | 4.1 | 3.5 -15% | 8 95% | 8 95% | 2.4 -41% |
| Load (h) | 0.8 | 1.2 50% | 1.3 63% | 2.2 175% | 1.3 63% |
Pros
Cons
Verdict - A competent and compact midrange gaming laptop let down by loud fans and short battery life
MSI has, with the Alpha 15, created a decent midrange 15.6-inch gaming laptop. Its Ryzen 7 3750H APU and Radeon RX 5500M GPU allow the Alpha 15 to play all current games smoothly. As a rule, the Alpha 15 is a 1080p gaming laptop that can play titles at medium to high graphics. In some cases, the Alpha 15 can game at beyond these levels, but only in undemanding titles. Overall, the RX 5500M sits between the GeForce GTX 1650 and GeForce GTX 1660 Ti Max-Q.
The Alpha 15 has comparatively high power consumption too, both under load and at idle. As a result, the runtimes from its 51 Wh battery are not particularly good. MSI should take another look at power management, in our opinion. The laptop also runs loudly, especially with the performance profile we used during our tests. If you do not necessarily need maximum performance, then you could use the Silent mode within MSI Dragon Center. This would at least be preferable for everyday use, anyway.
Essentially, the MSI Alpha 15 A3DDK is a successful mid-range gaming laptop. However, it suffers from weaknesses that MSI is yet to eradicate, if that is even possible.
MSI has equipped the device with a fast NVMe SSD, which offers 512 GB of storage. If that is not enough, then you could add a 2.5-inch SATA drive. MSI pre-installs the Alpha 15 with a SATA slot and mounting frame, too.
The device also has an adequately bright IPS panel, which has a matte finish and a native 1080p resolution. The panel has a good contrast ratio too, along with stable viewing angles, decent colour accuracy and short response times. It also supports AMD FreeSync technology. Additionally, the Alpha 15 has an adequate number of ports, but there is no Thunderbolt 3. The backlit keyboard is good enough for everyday use, too.
The Alpha 15 will not have an easy time asserting itself, though. Some competitors are significantly better value for money, for instance. The HP Pavilion Gaming 15-ec0017ng costs €1,150 (~$1259), a good €150 euros (~$164) less than our review unit. The Pavilion Gaming 15 offers a stronger GPU than the Alpha 15 too, along with quieter fans, lower surface temperatures, reduced power consumption and significantly better battery life.
MSI Alpha 15 A3DDK-034
- 02/07/2020 v7 (old)
Sascha Mölck
Price comparison

