MSI GP65 10SFK Laptop Review: 10th Gen Intel Core i7 Leaves its Mark
MSI announced their first batch of gaming laptops earlier this month shipping with Intel 10th gen Comet Lake-H processors. We've already tested the refreshed MSI GF75 10SCXR and brand new MSI GS66 10SFS since then with more to come in the near future.
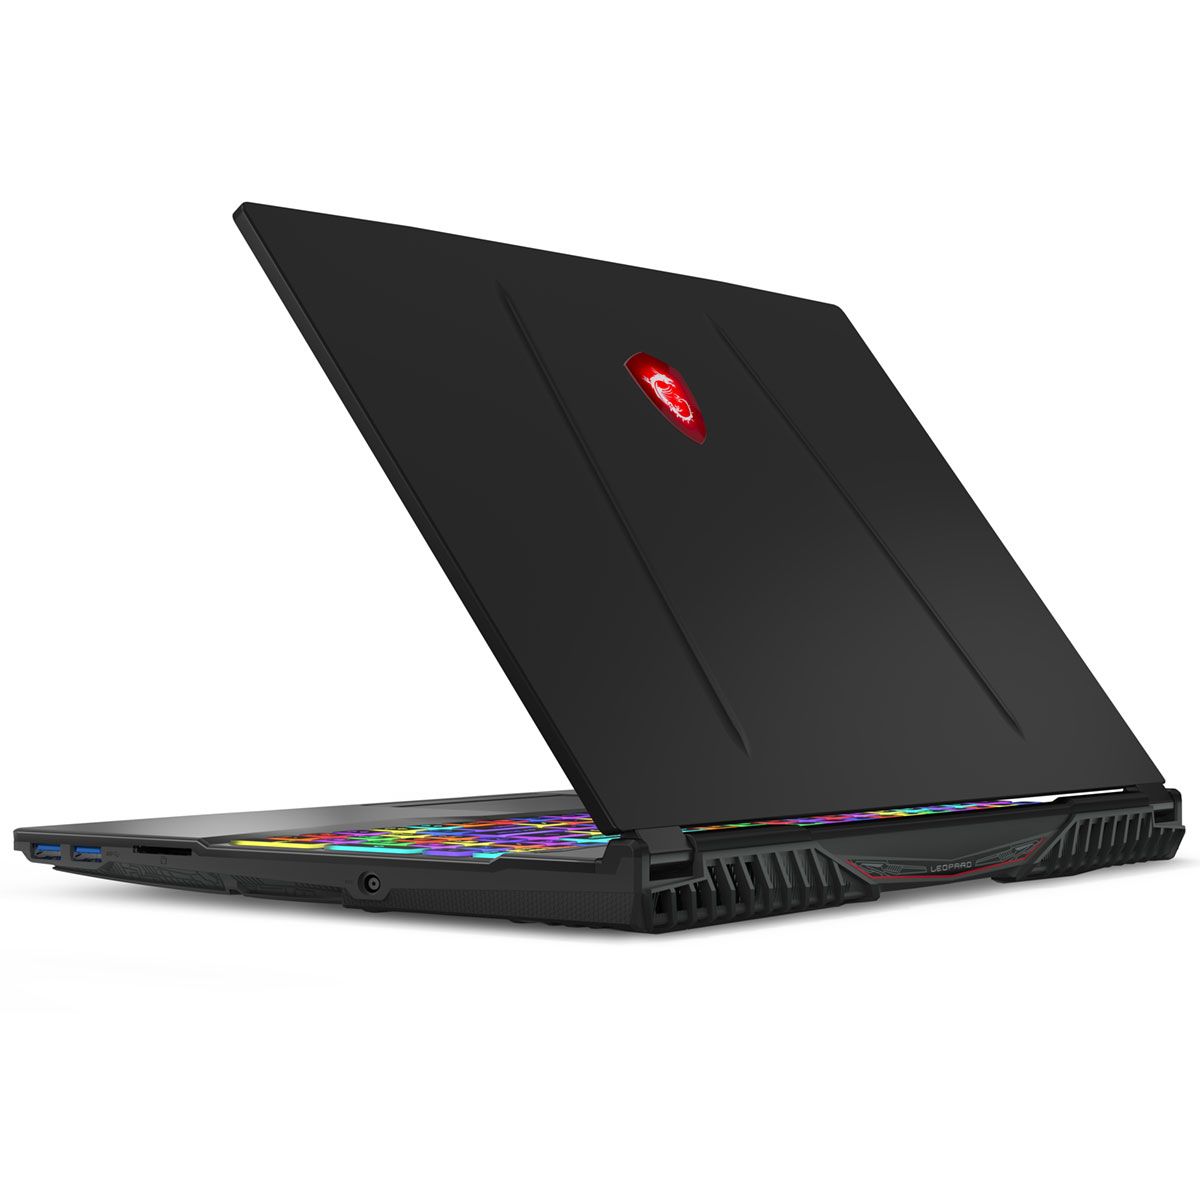
The latest model we have today is the GP65 10SFK to replace last year's GP65 9SE. Aside from the differences in CPU, GPU, and display panel, however, the chassis remains identical year-over-year. We recommend checking out our existing review on the GP65 9SE as many of our comments apply here as well.
The GP65 competes directly with other mid-range 15.6-inch gaming laptops like the Asus TUF FX505, HP Omen 15, Aorus 15, and the Lenovo Legion Y540. Our specific configuration with the Core i7-10750H CPU, GeForce RTX 2070 GPU, and 144 Hz FHD display can be found online for about $1500 USD.
More MSI reviews:
Rating | Date | Model | Weight | Height | Size | Resolution | Price |
|---|---|---|---|---|---|---|---|
| 83.2 % v7 (old) | 05 / 2020 | MSI GP65 10SFK-047US i7-10750H, GeForce RTX 2070 Mobile | 2.3 kg | 27.5 mm | 15.60" | 1920x1080 | |
| 82.1 % v7 (old) | 10 / 2019 | Asus Strix Scar III G531GW-AZ062T i7-9750H, GeForce RTX 2070 Mobile | 2.4 kg | 25 mm | 15.60" | 1920x1080 | |
| 80.4 % v6 (old) | 07 / 2019 | Asus TUF FX505DT-EB73 R7 3750H, GeForce GTX 1650 Mobile | 2.2 kg | 26.8 mm | 15.60" | 1920x1080 | |
| 86.2 % v6 (old) | 06 / 2019 | HP Omen 15-dc1303ng i7-8750H, GeForce RTX 2070 Max-Q | 2.4 kg | 25 mm | 15.60" | 1920x1080 | |
| 85.5 % v6 (old) | 06 / 2019 | Aorus 15-SA i7-9750H, GeForce GTX 1660 Ti Mobile | 2.1 kg | 24.4 mm | 15.60" | 1920x1080 |
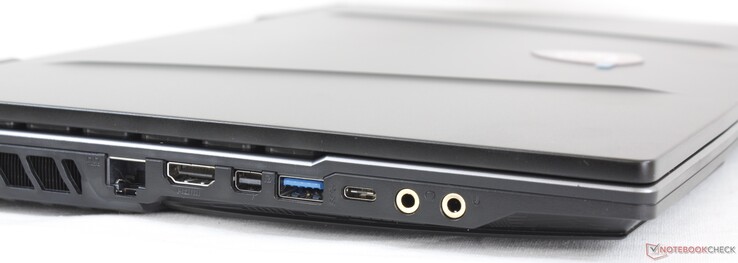
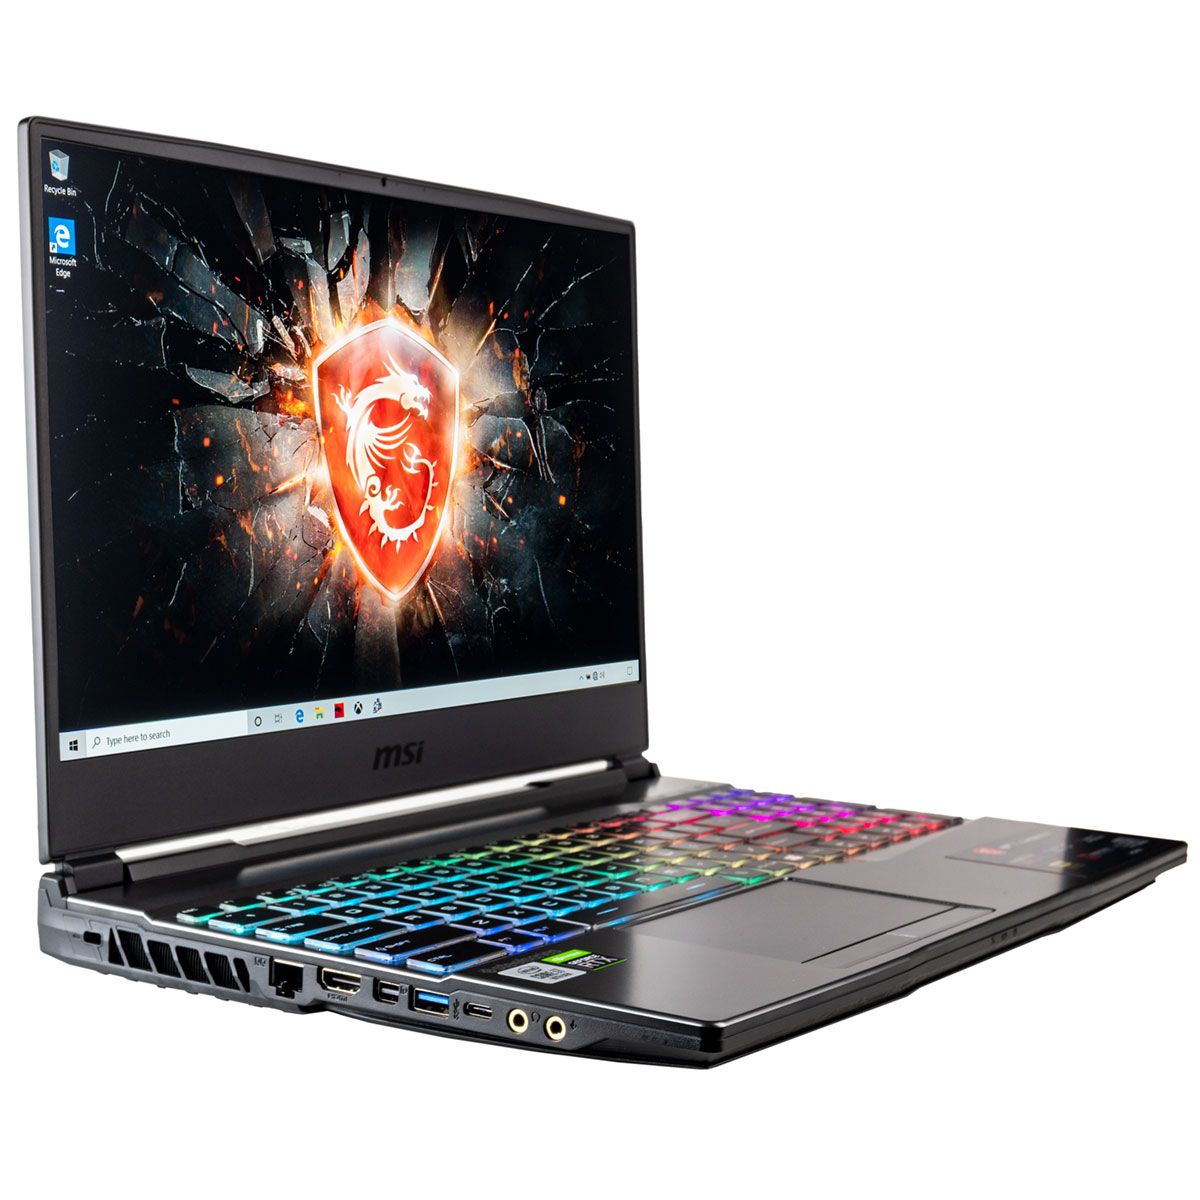
Case
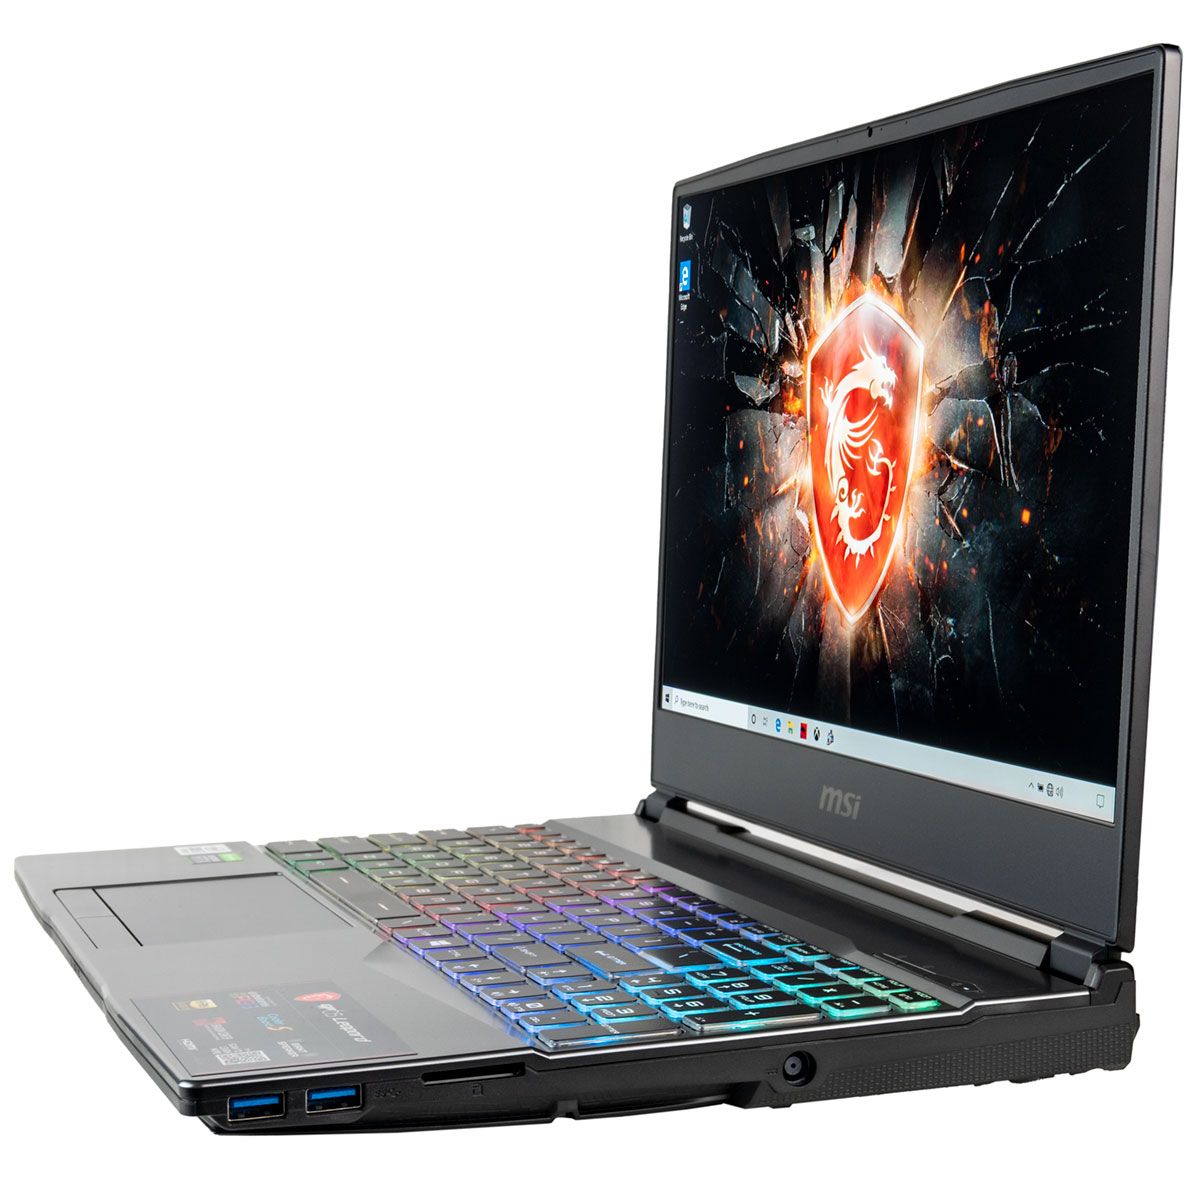
SD Card Reader
| SD Card Reader | |
| average JPG Copy Test (av. of 3 runs) | |
| HP Omen 15-dc1303ng (Toshiba Exceria Pro SDXC 64 GB UHS-II) | |
| MSI GP65 10SFK-047US (Toshiba Exceria Pro SDXC 64 GB UHS-II) | |
| MSI GP65 Leopard 9SE-225US | |
| MSI GP62 7REX-1045US (Toshiba Exceria Pro SDXC 64 GB UHS-II) | |
| maximum AS SSD Seq Read Test (1GB) | |
| HP Omen 15-dc1303ng (Toshiba Exceria Pro SDXC 64 GB UHS-II) | |
| MSI GP65 10SFK-047US (Toshiba Exceria Pro SDXC 64 GB UHS-II) | |
| MSI GP65 Leopard 9SE-225US | |
| MSI GP62 7REX-1045US (Toshiba Exceria Pro SDXC 64 GB UHS-II) | |
Communication
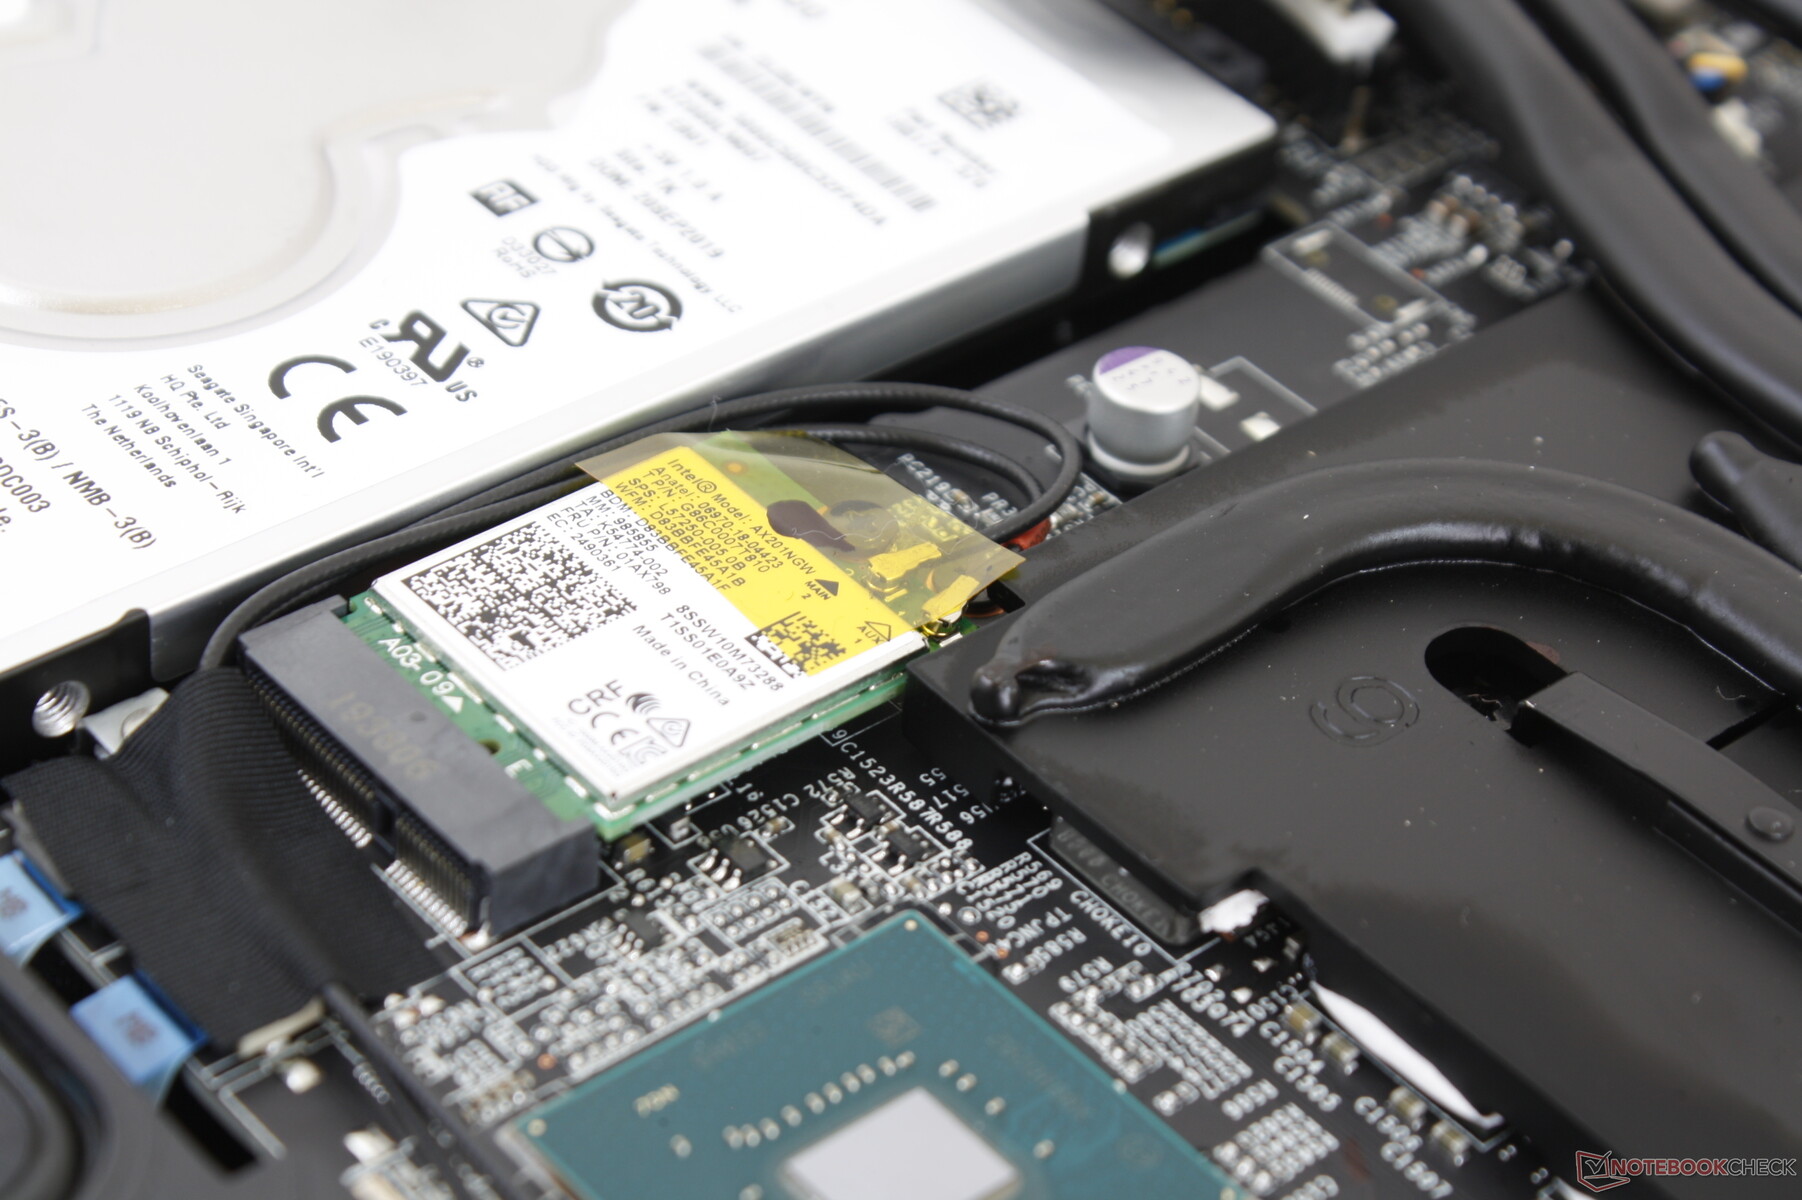
The Intel AX201 now comes standard for 802.11ax or Wi-Fi 6 connectivity whereas last year's model came with Wi-Fi 5. We experienced no issues when connected to our Netgear RAX200 test router.
Webcam


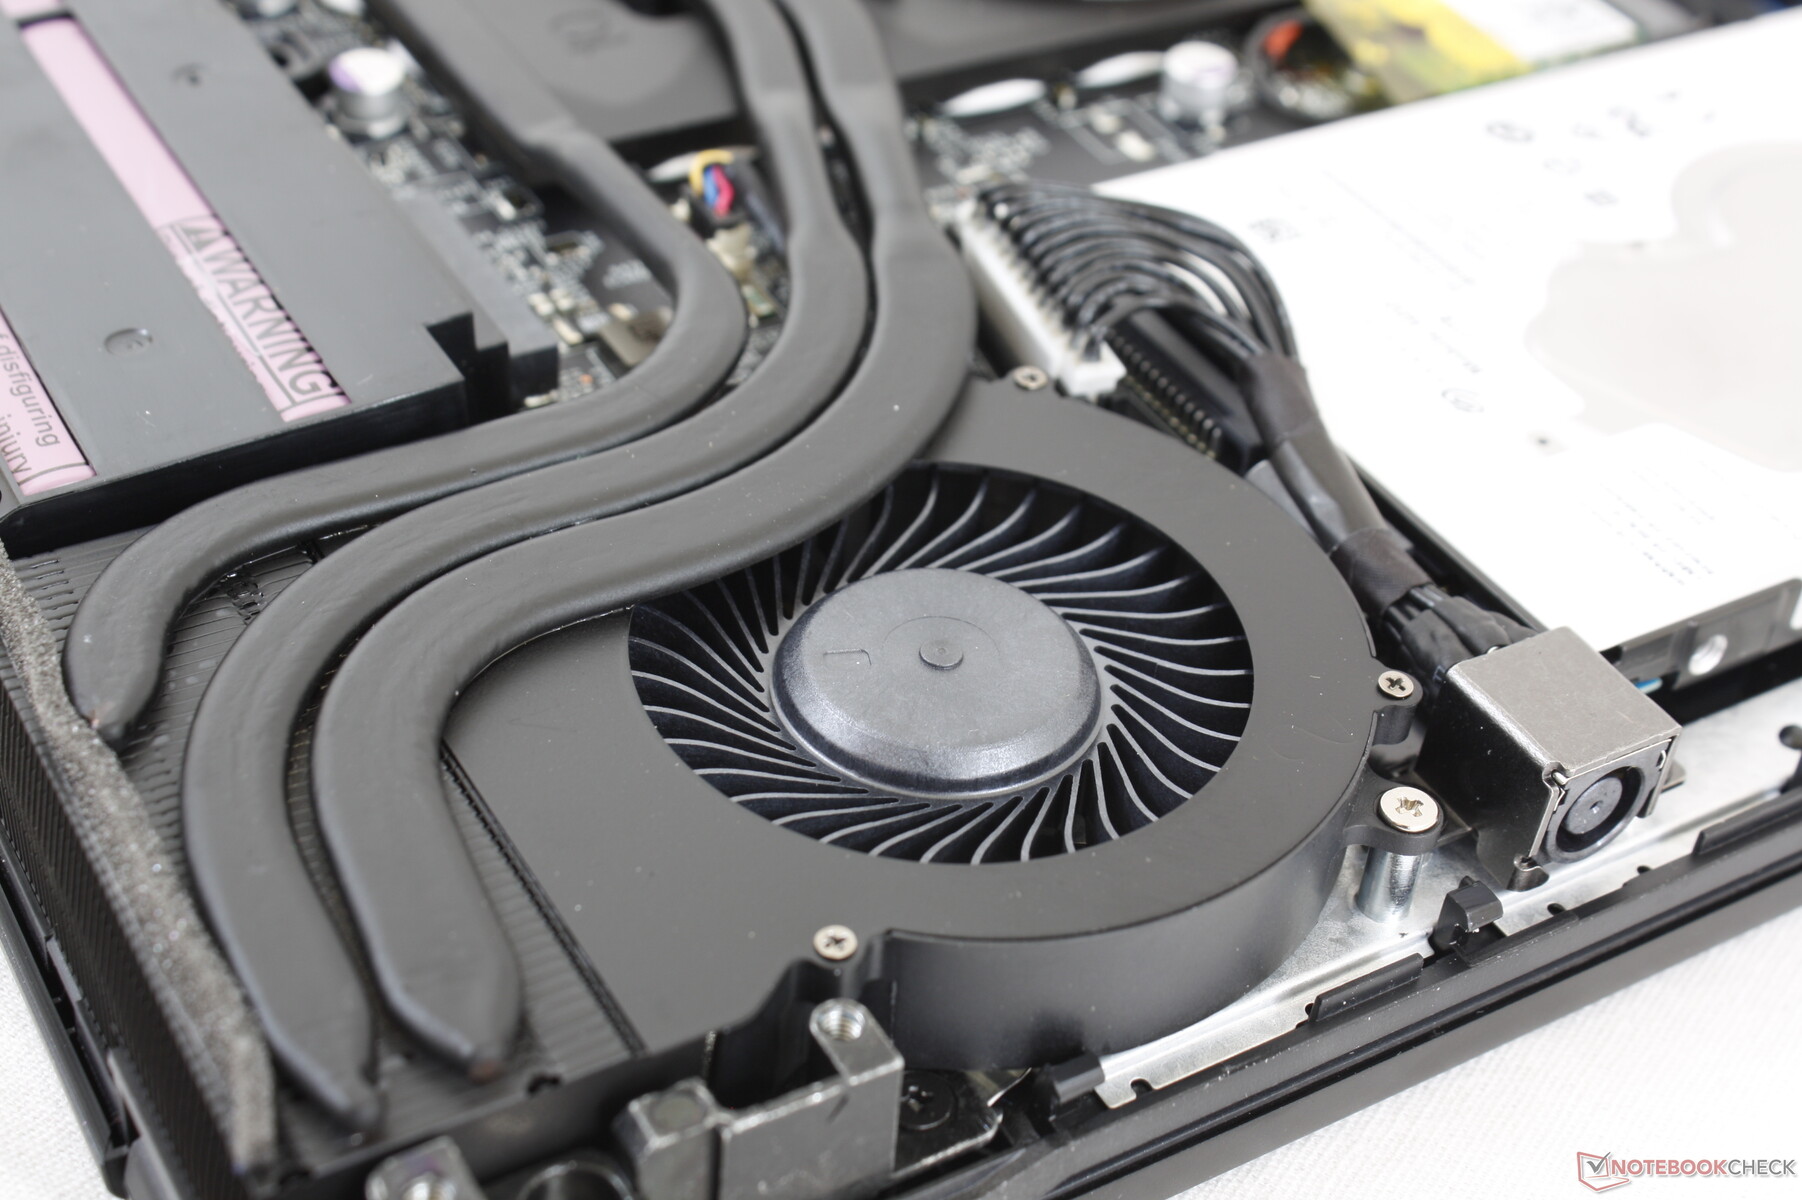
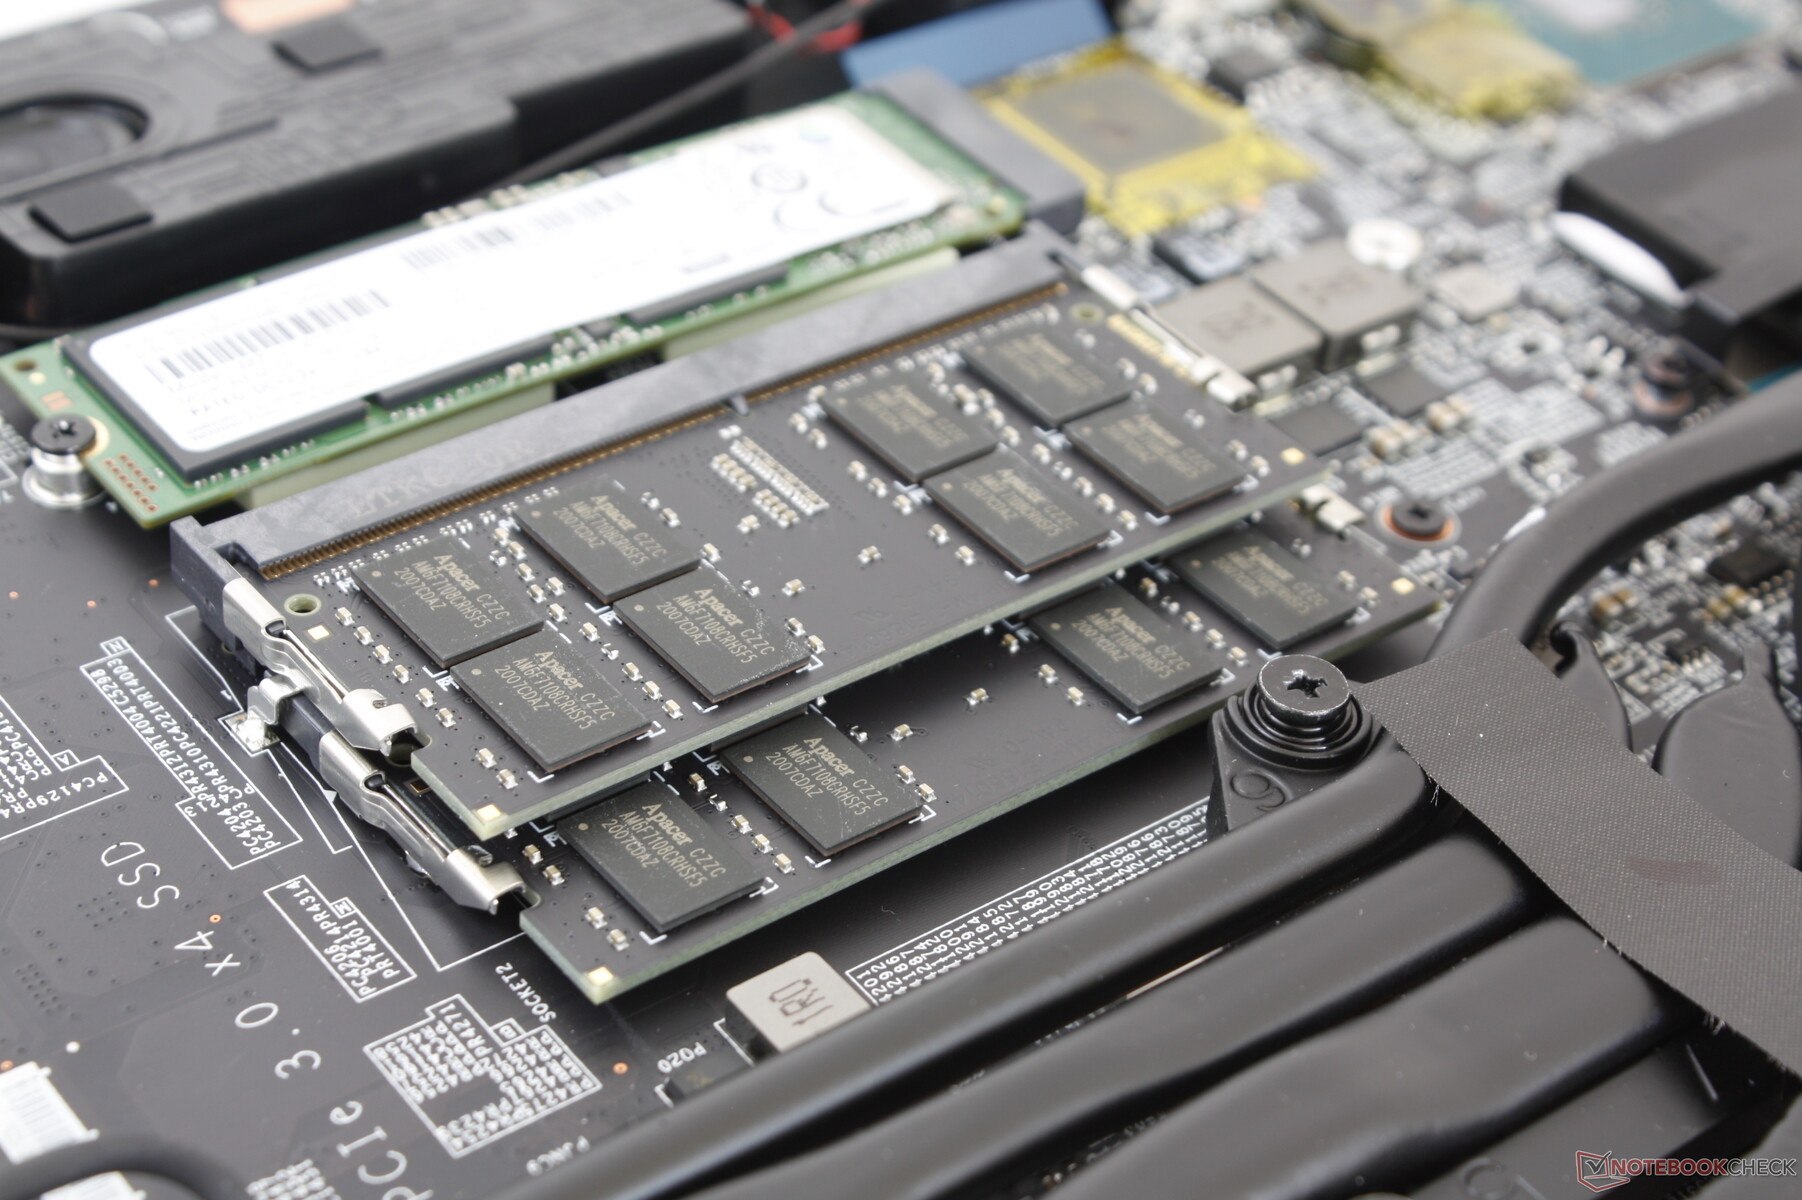
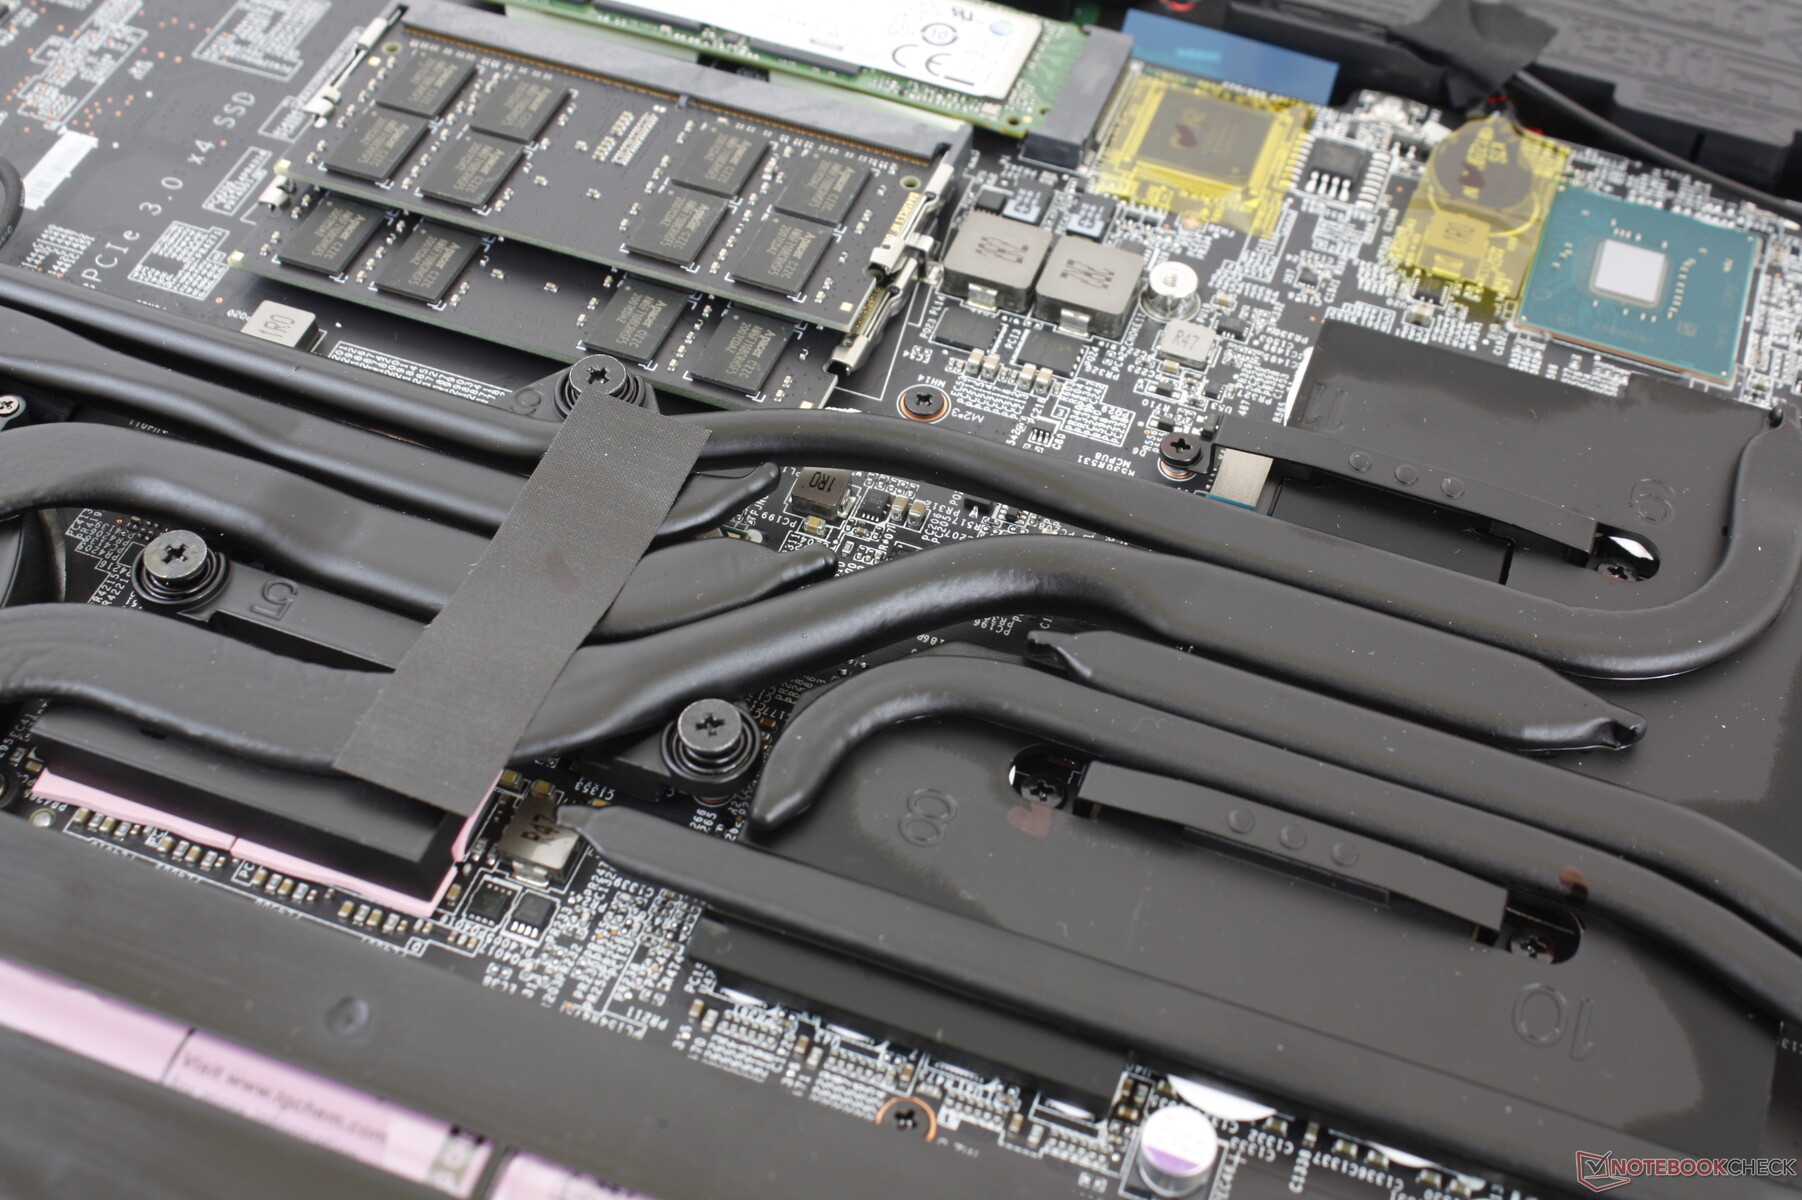
Maintenance
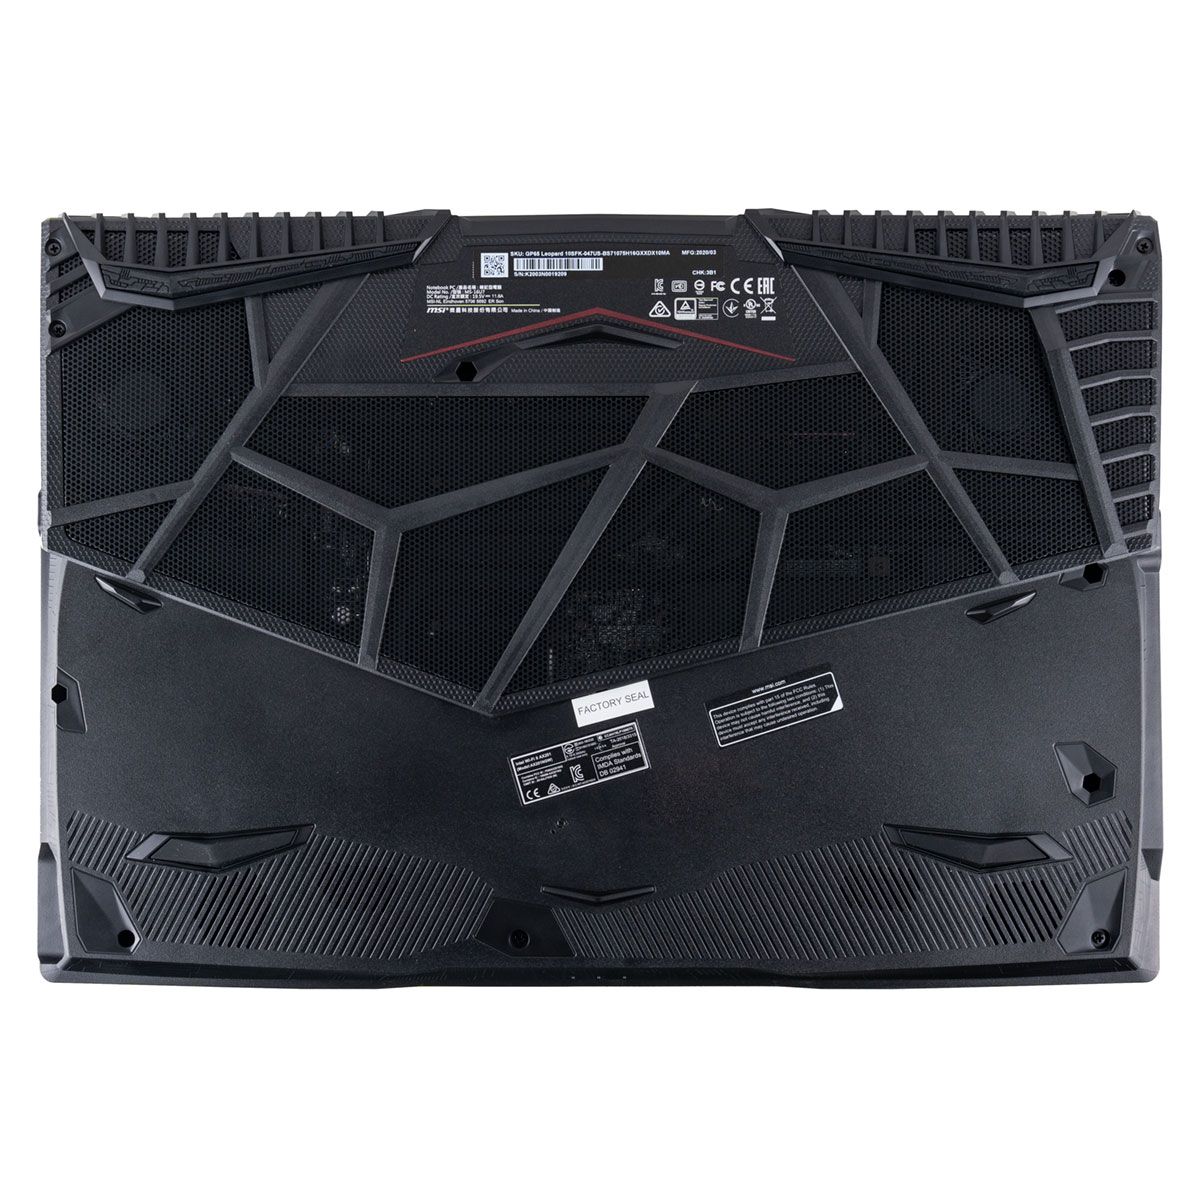
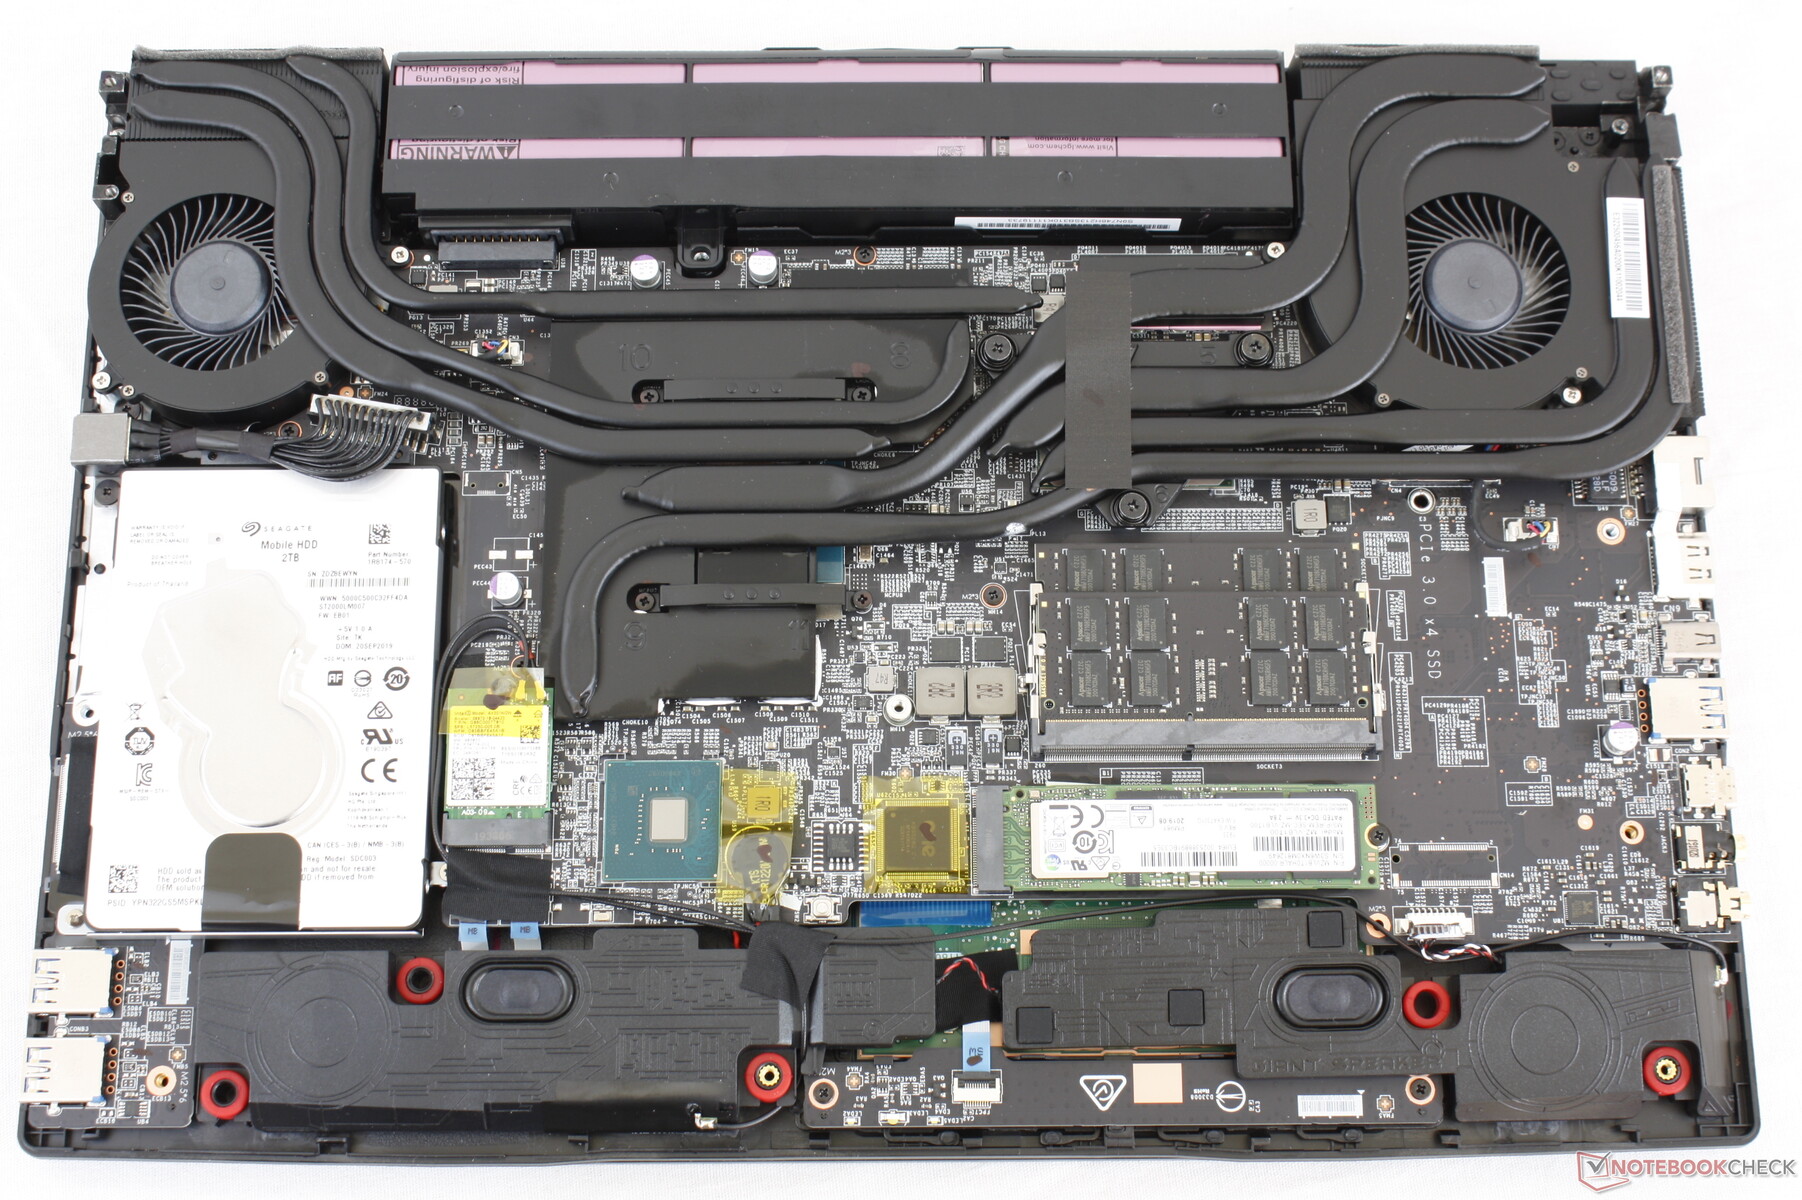
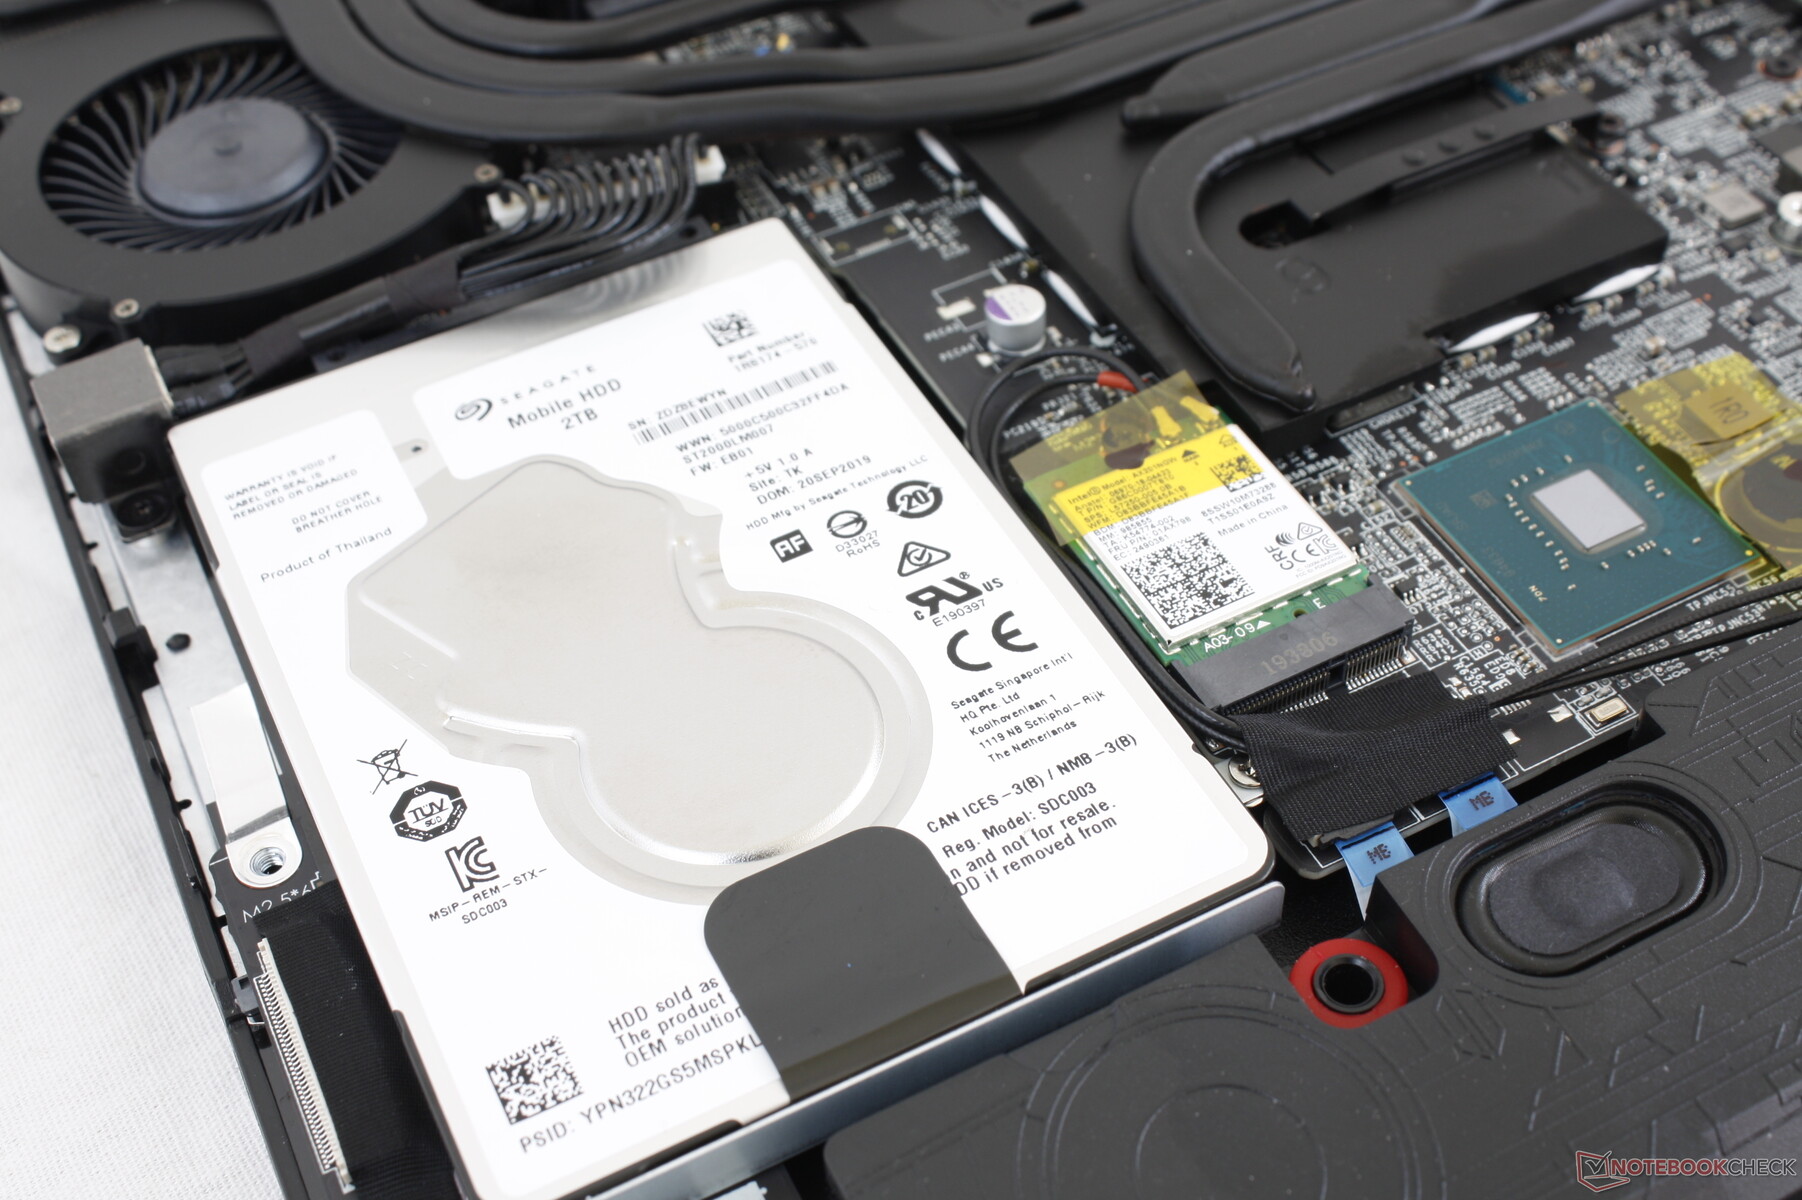
The bottom panel is secured by several Philips screws including one that is under a warranty seal sticker. Removing the panel can be tricky since the latches around the edges and corners are finicky and difficult to detach. Once inside, users will have access to two storage bays and two SODIMM slots. Note that the second M.2 2280 slot adjacent to the SODIMM slots is removed on the GP65 series.
Accessories and Warranty
There are no extras in the box other than the usual paperwork and AC adapter. The standard one-year limited warranty applies with additional protection available if purchased from CUKUSA.
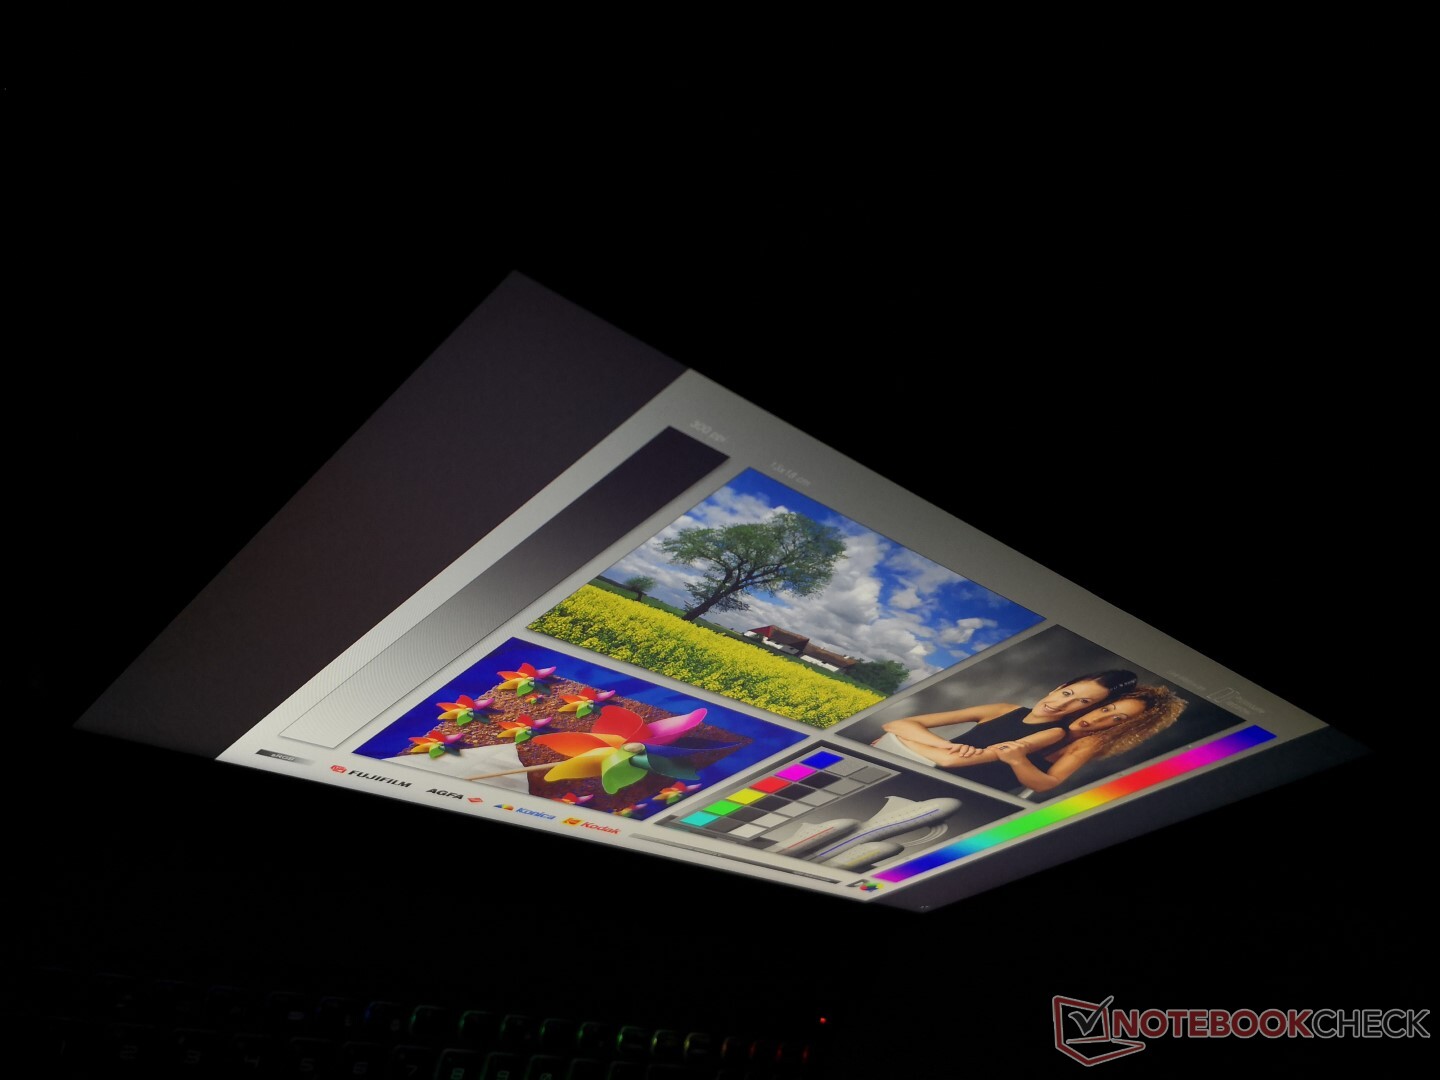
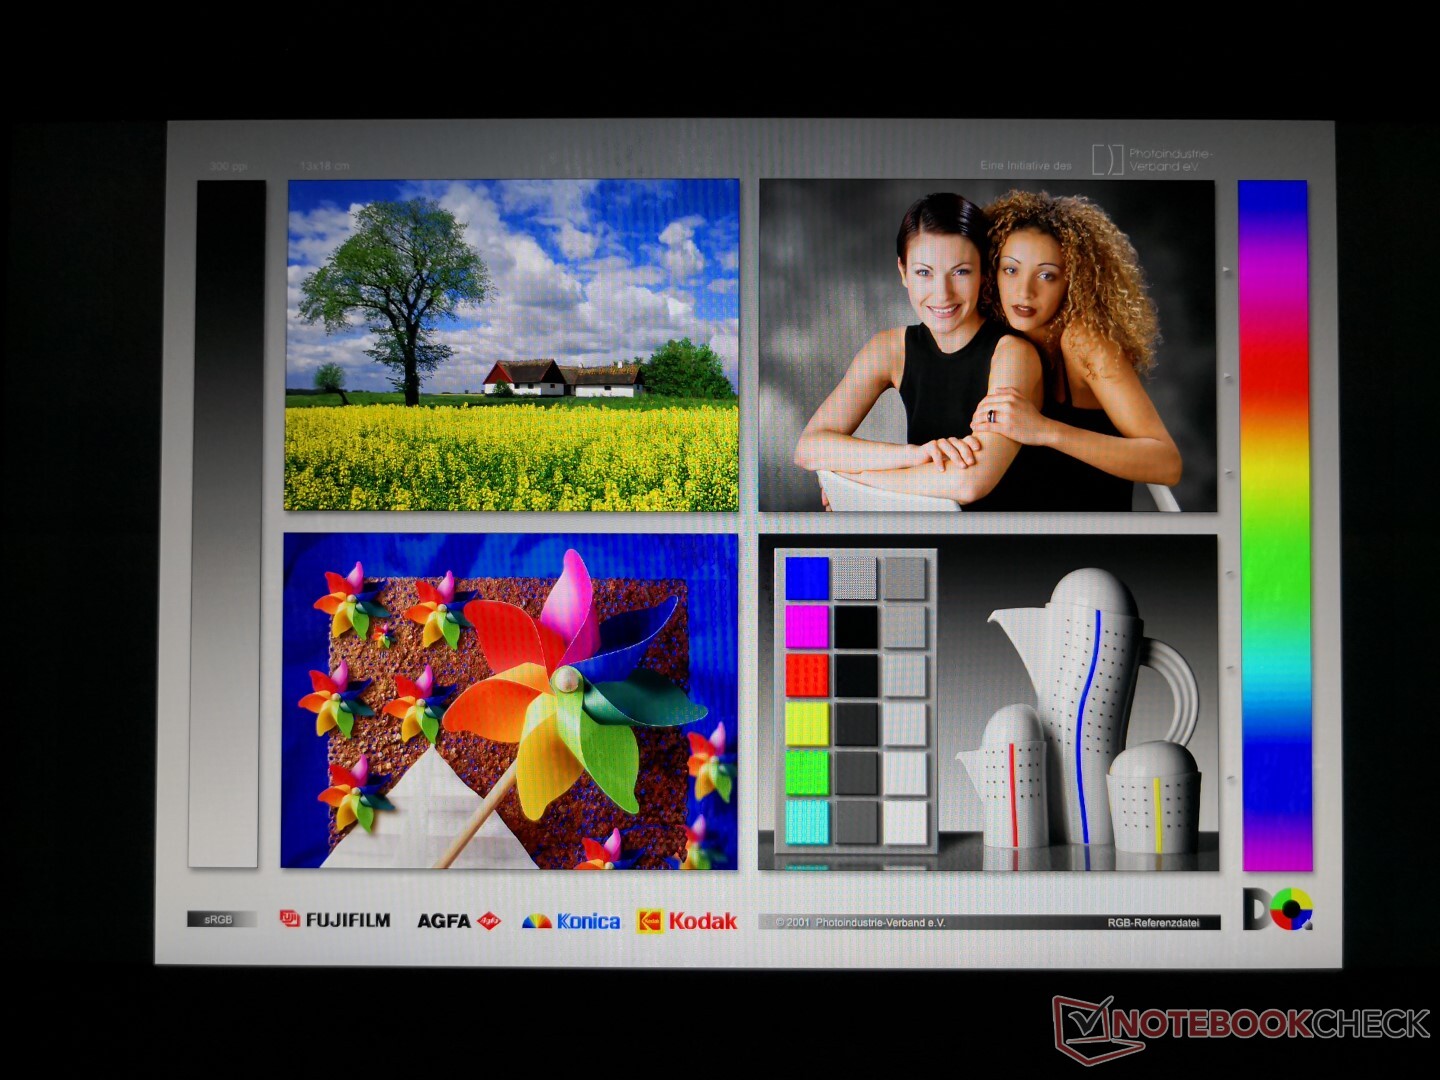
Display
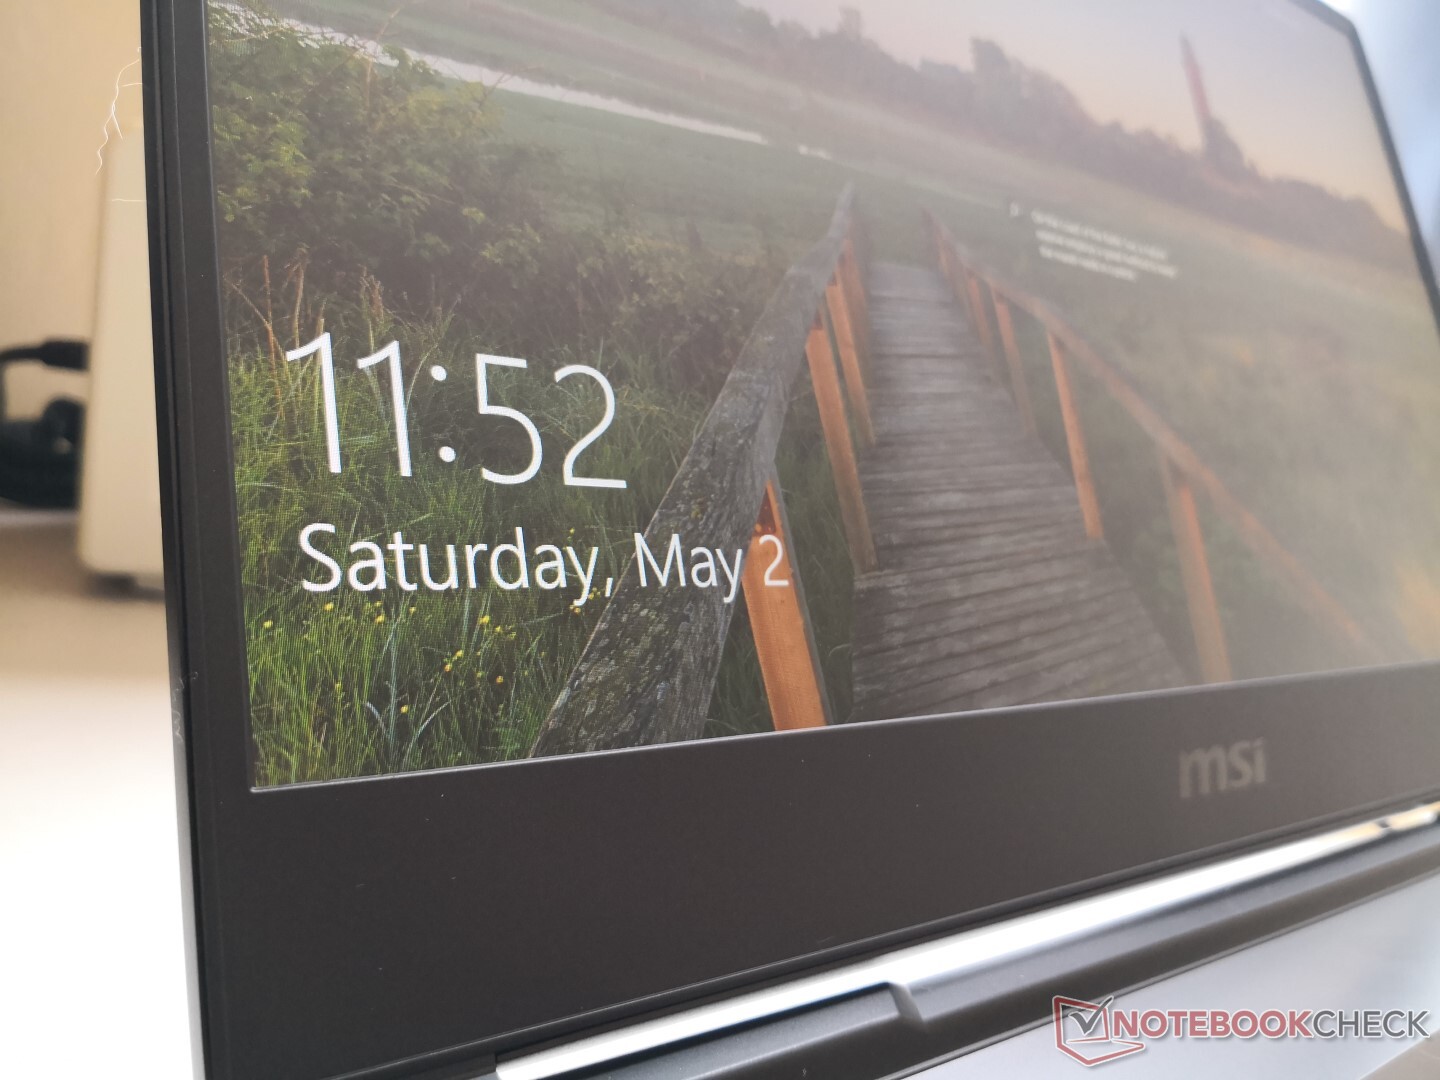
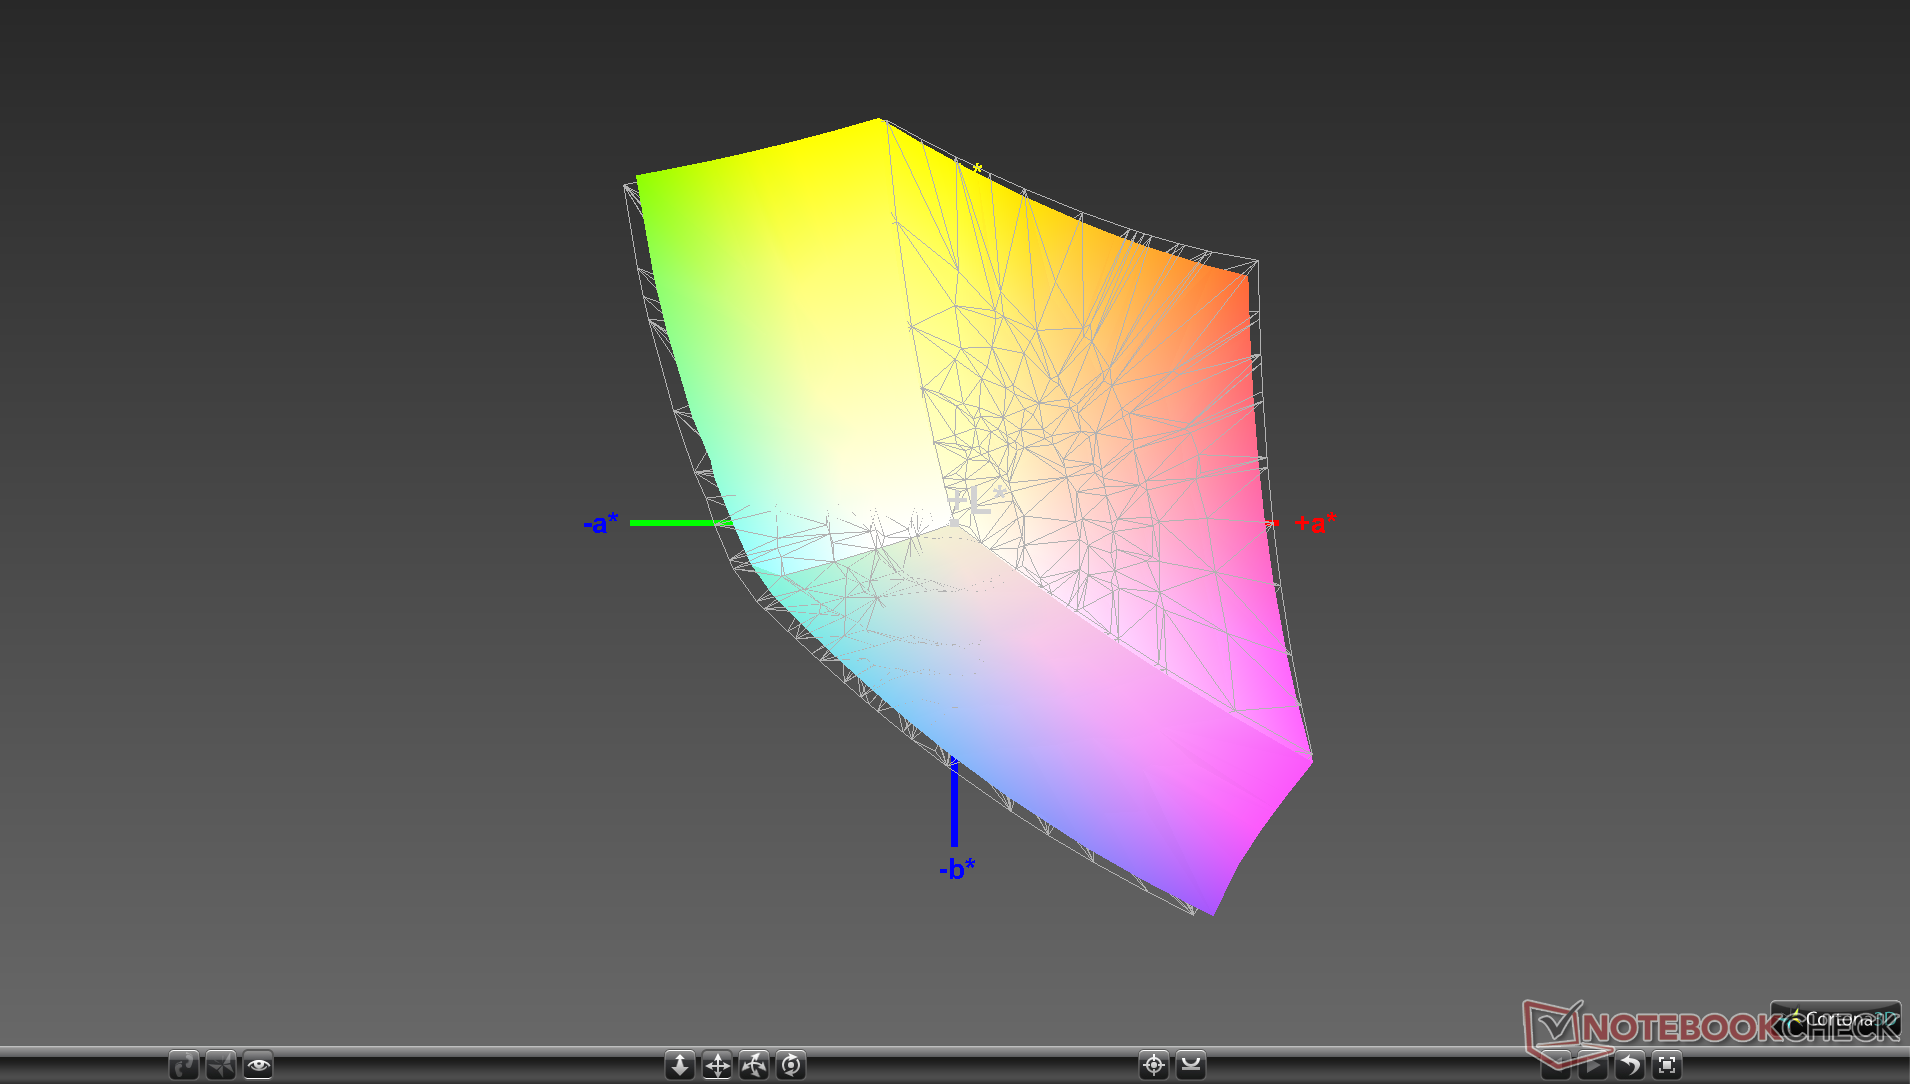
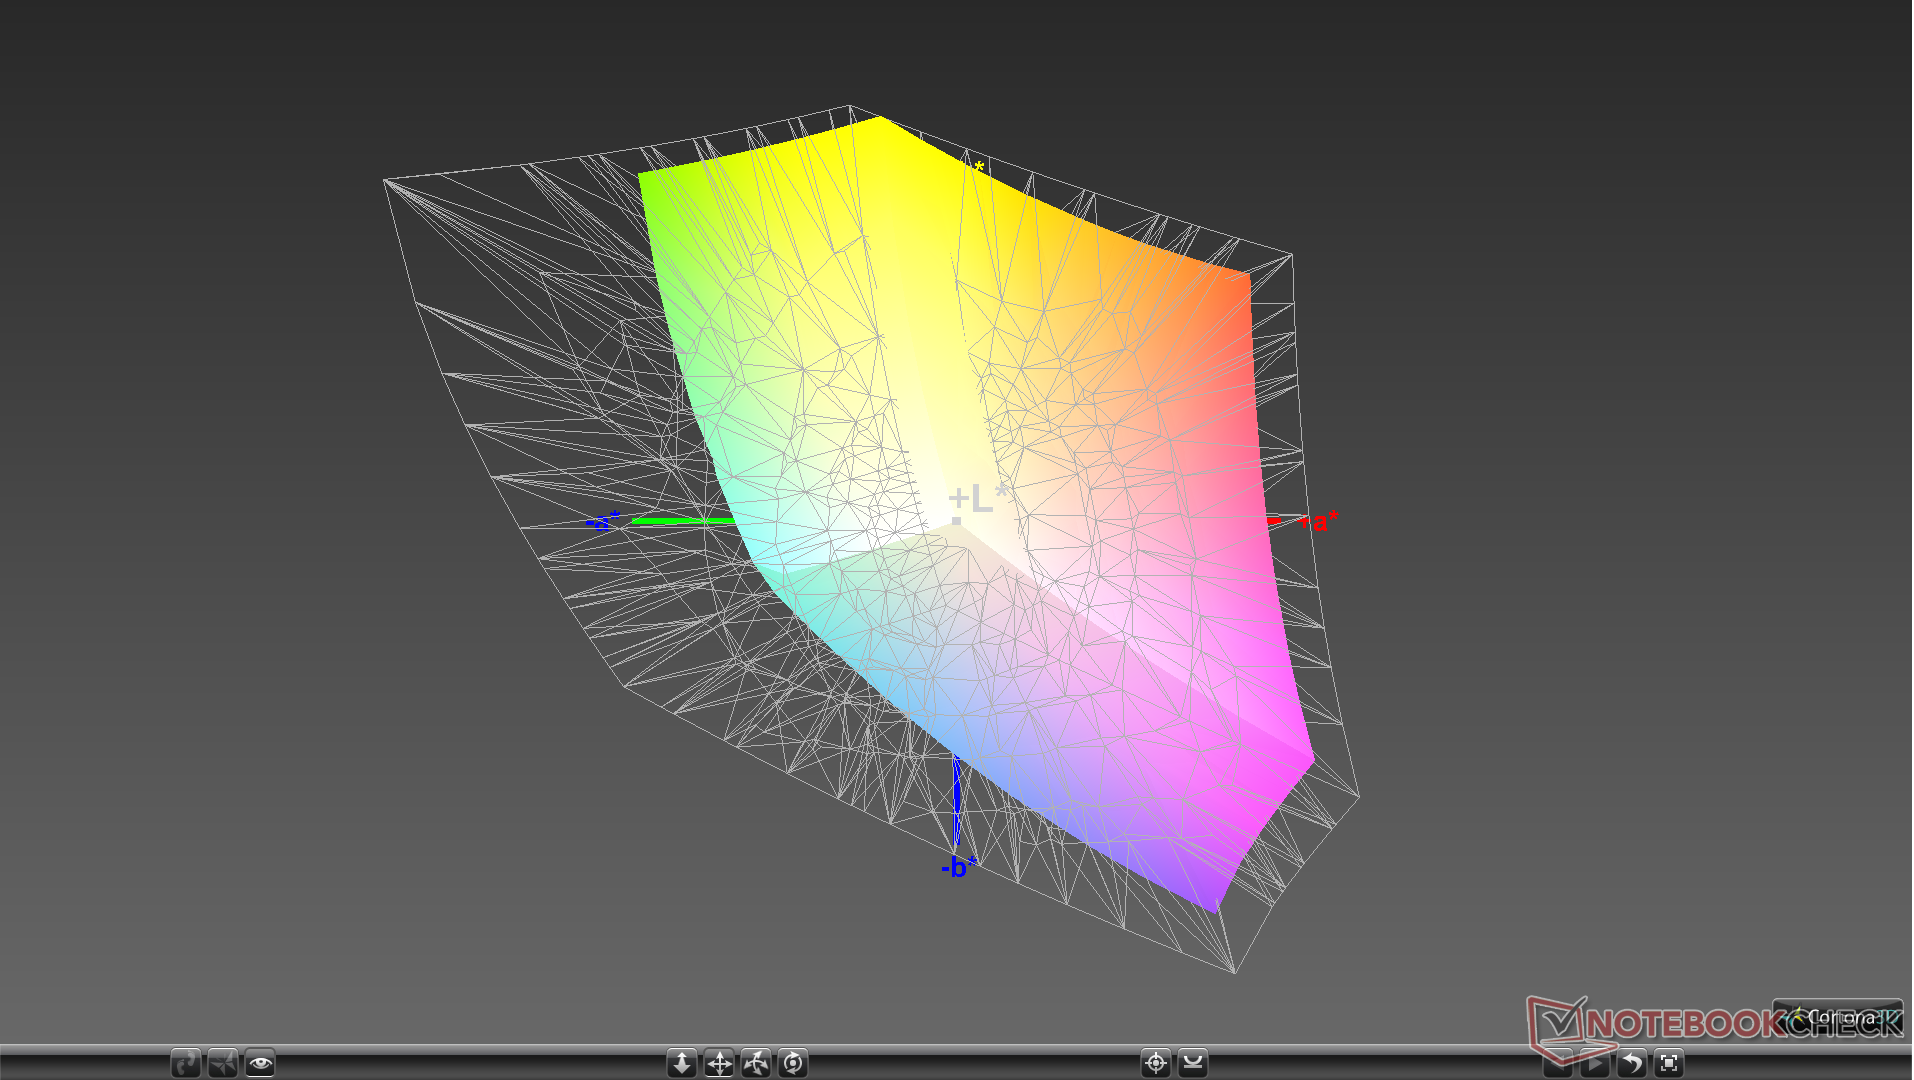
The LG Philips LP156WFG-SPB3 IPS panel on our MSI is the first to appear in our database. A similar LP156WFG-SPB2 panel can be found on the Aorus 15 with nearly the same characteristics including the native 144 Hz refresh rate, fast black-white and gray-gray response times, and relatively wide color space.
The panel on our MSI is notably brighter than average for its category at 390 nits. In comparison, other gaming laptops like the Asus Strix Scar III or Dell Alienware m15 tend to top out at 300 nits. The main drawback to the panel is its average contrast ratio of about 600:1 whereas the panels on pricier gaming laptops like on the GS65 are closer to 1000:1.

| |||||||||||||||||||||||||
Brightness Distribution: 87 %
Center on Battery: 384.9 cd/m²
Contrast: 574:1 (Black: 0.67 cd/m²)
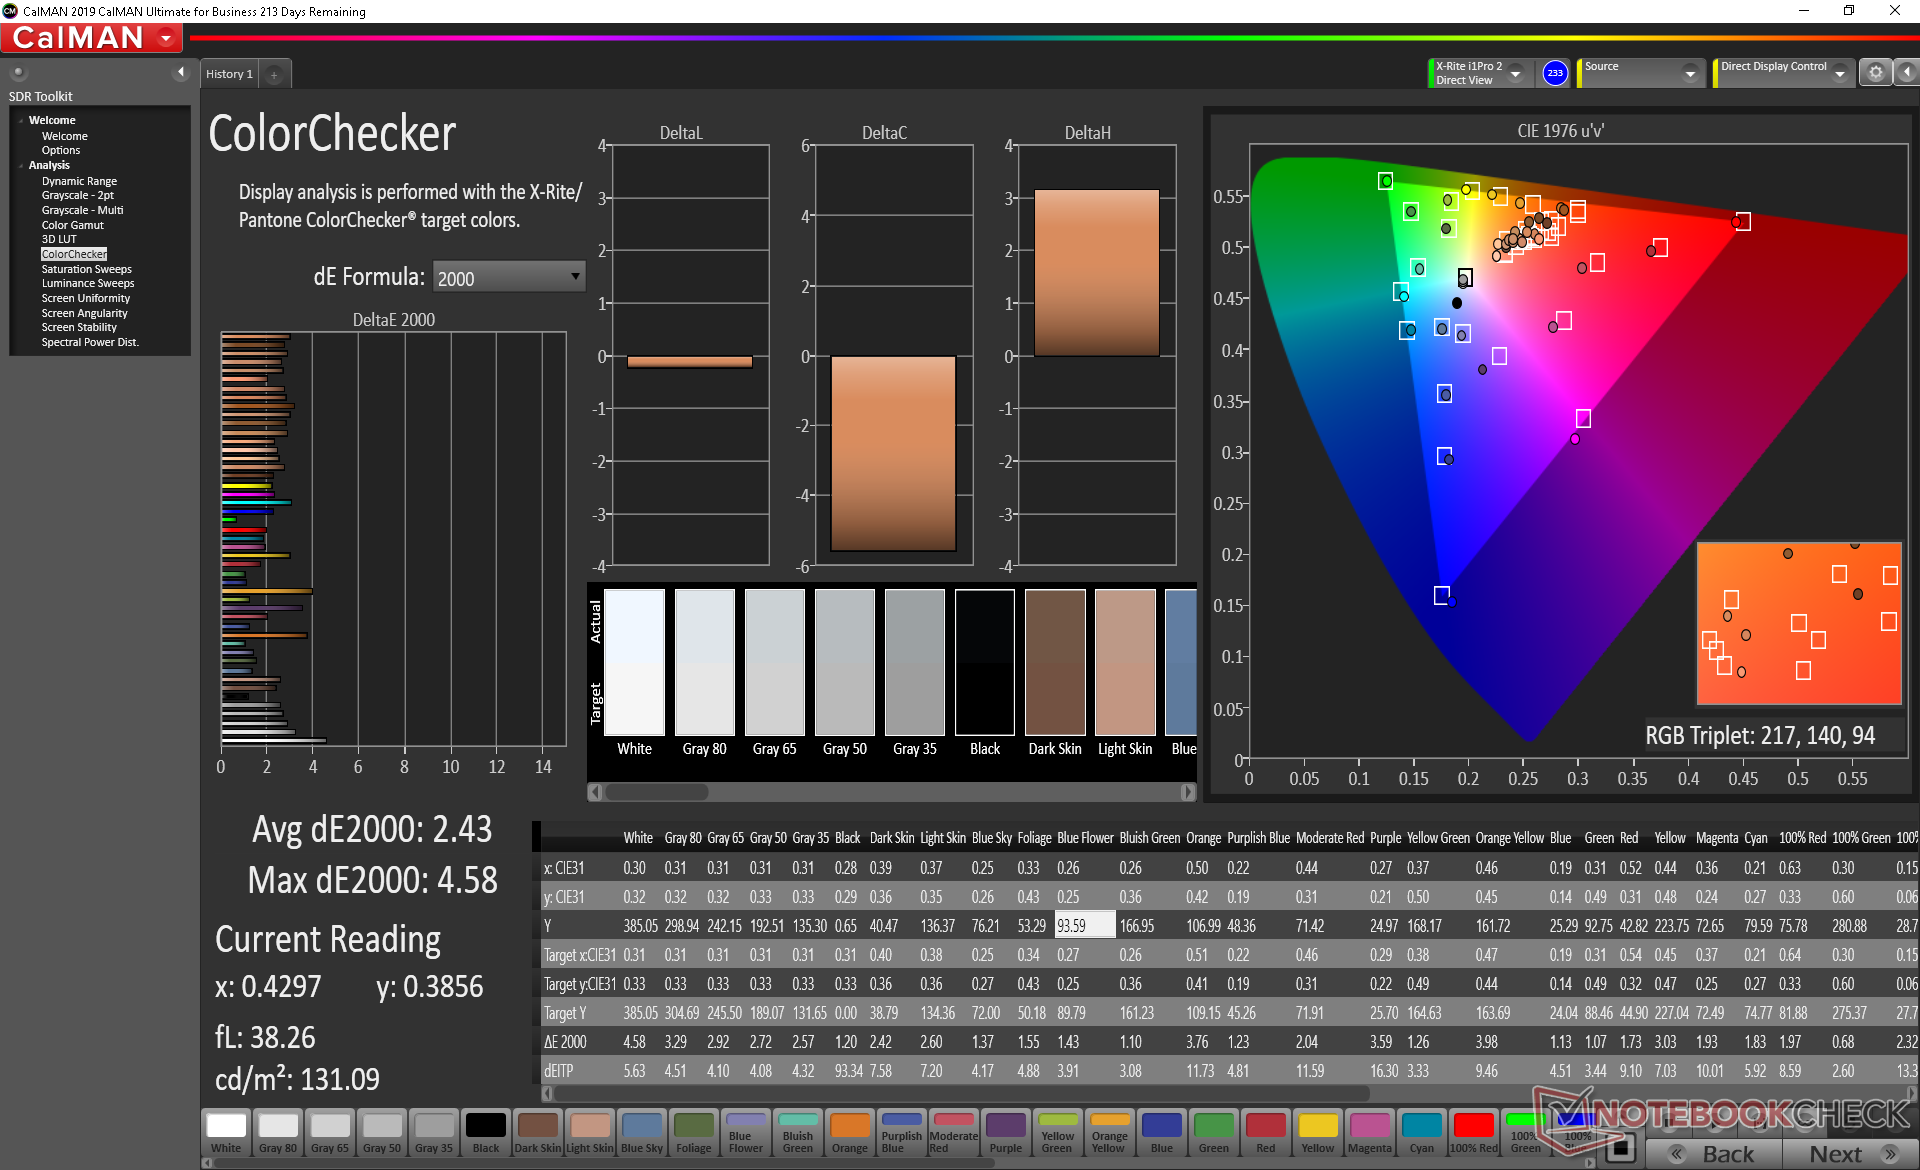
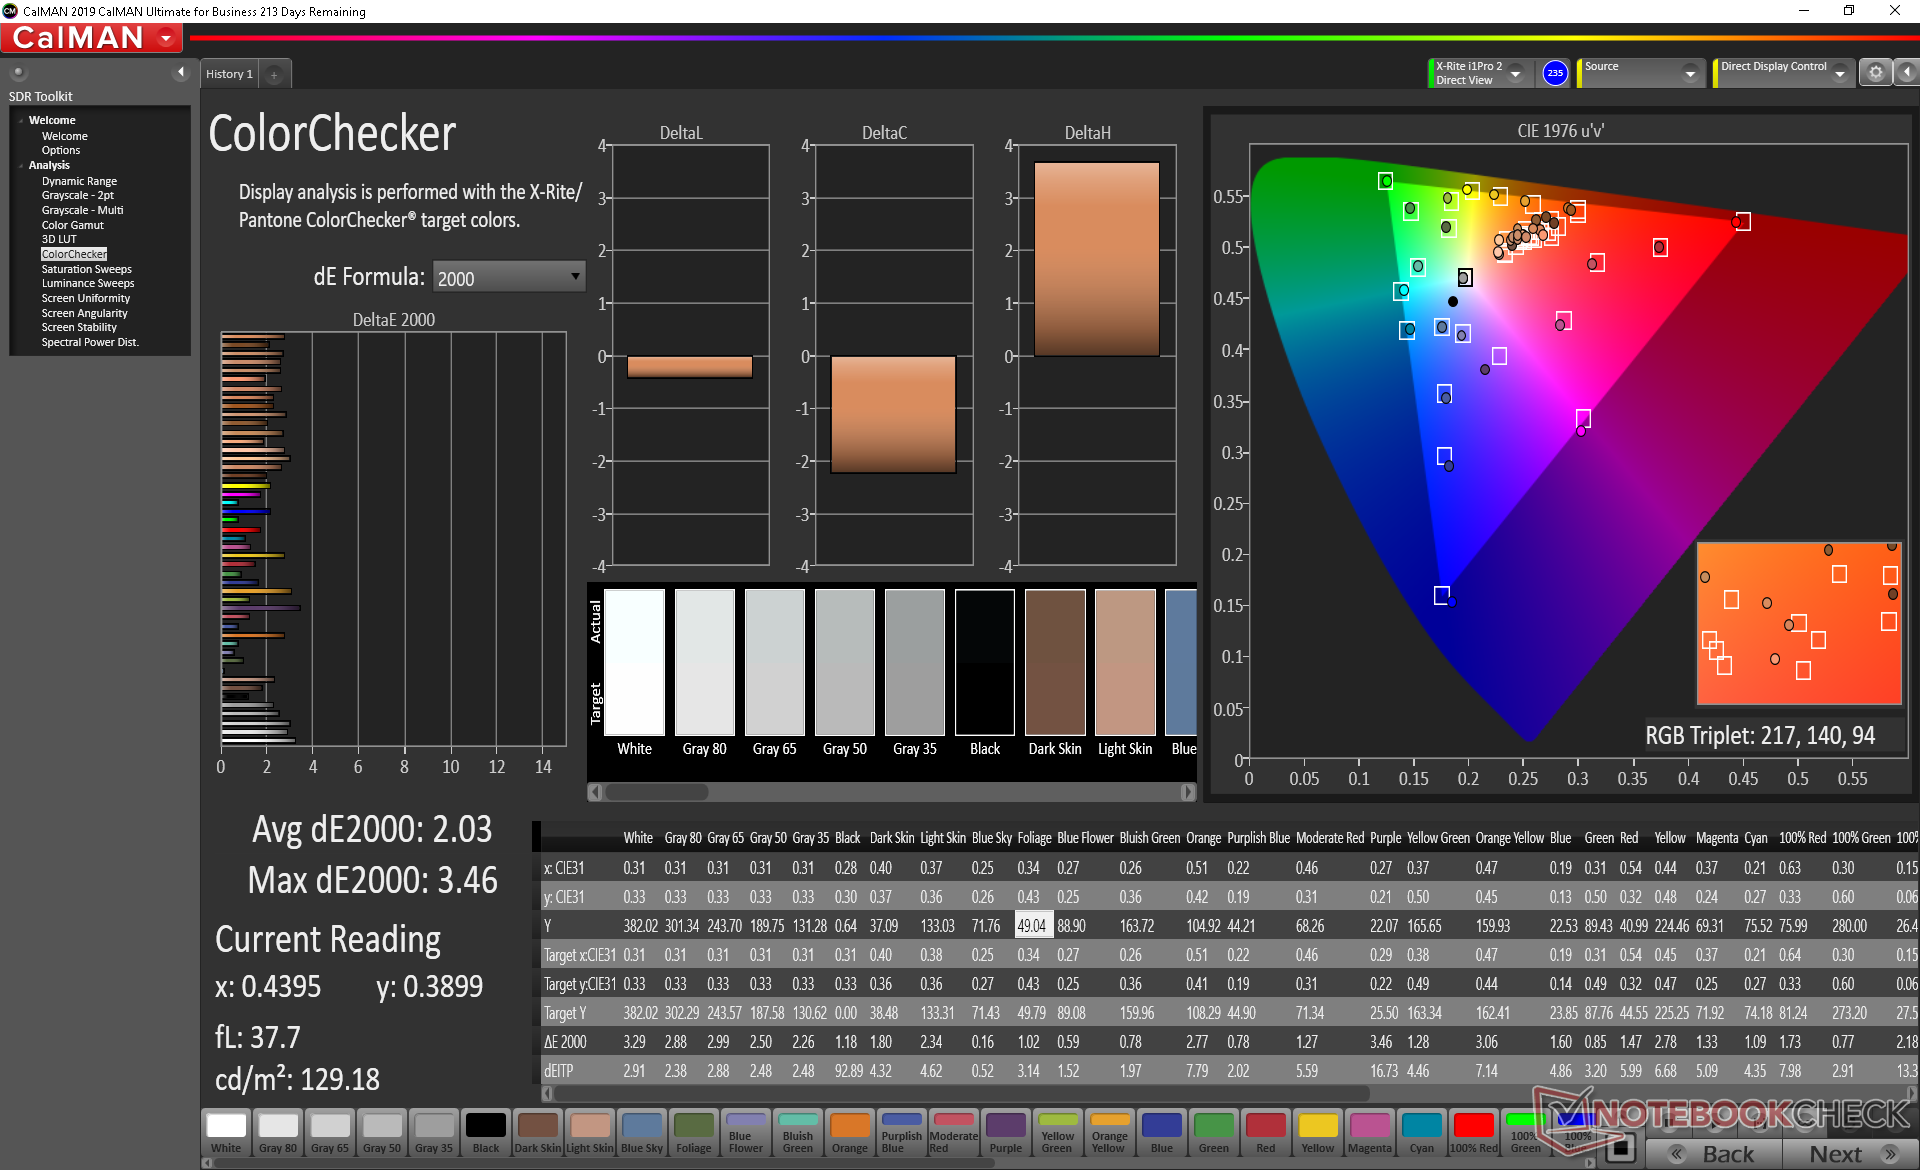
ΔE ColorChecker Calman: 2.43 | ∀{0.5-29.43 Ø4.71}
calibrated: 2.03
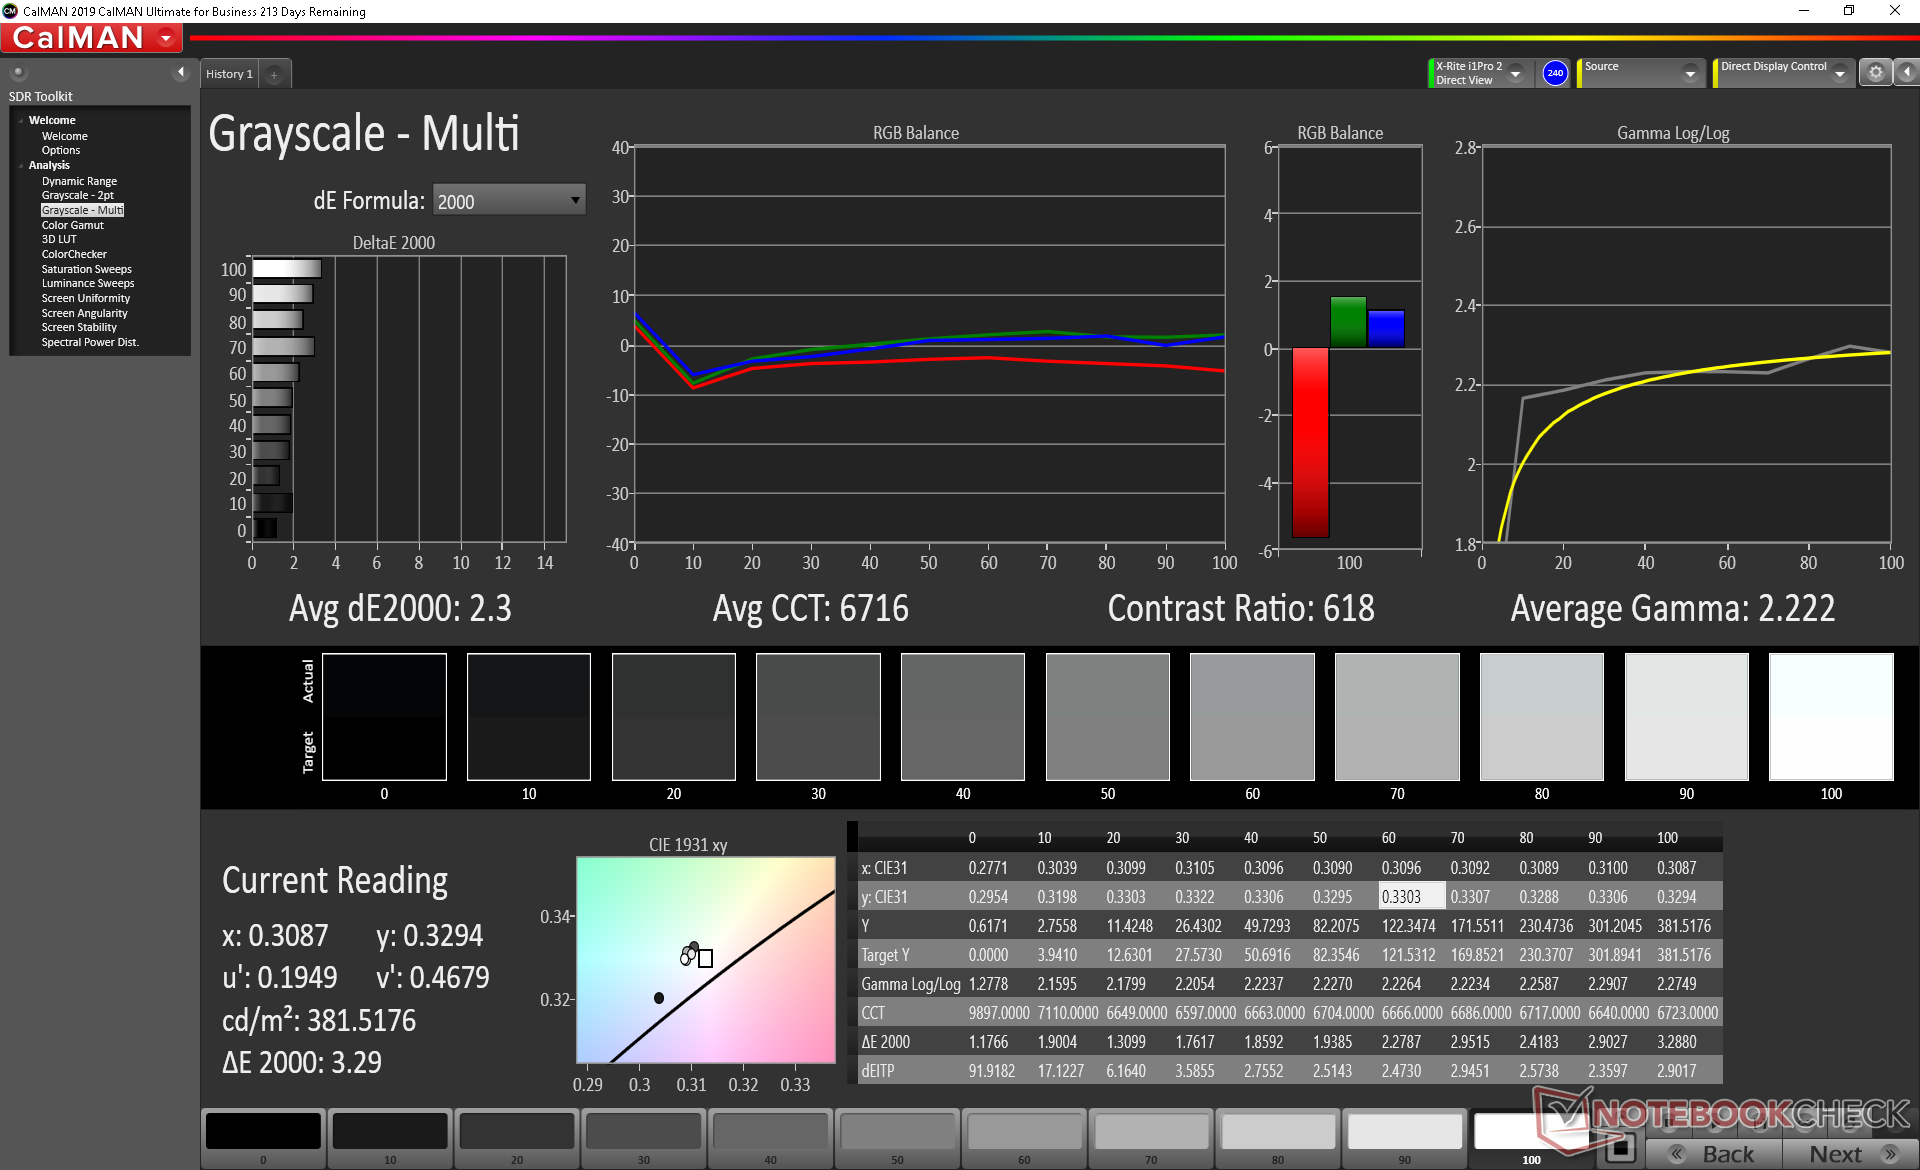
ΔE Greyscale Calman: 2.6 | ∀{0.09-98 Ø4.96}
93.9% sRGB (Argyll 1.6.3 3D)
59.7% AdobeRGB 1998 (Argyll 1.6.3 3D)
65.1% AdobeRGB 1998 (Argyll 3D)
94.4% sRGB (Argyll 3D)
63.5% Display P3 (Argyll 3D)
Gamma: 2.2
CCT: 6981 K
| MSI GP65 10SFK-047US LG Philips LP156WFG-SPB3, IPS, 15.6", 1920x1080 | MSI GP65 Leopard 9SE-225US LG Philips LGD0625, IPS, 15.6", 1920x1080 | Asus Strix Scar III G531GW-AZ062T Sharp LQ156M1JW09 (SHP14D3), IPS, 15.6", 1920x1080 | Asus TUF FX505DT-EB73 Panda LM156LF-GL, IPS, 15.6", 1920x1080 | HP Omen 15-dc1303ng LG Philips LGD05C0, IPS, 15.6", 1920x1080 | MSI GP62 7REX-1045US CMN N156HGE-EAL, TN LED, 15.6", 1920x1080 | |
|---|---|---|---|---|---|---|
| Display | 2% | 4% | -37% | -0% | 23% | |
| Display P3 Coverage (%) | 63.5 | 64.8 2% | 66.2 4% | 39.56 -38% | 63.8 0% | 85.8 35% |
| sRGB Coverage (%) | 94.4 | 96.2 2% | 97.1 3% | 59.5 -37% | 93.4 -1% | 100 6% |
| AdobeRGB 1998 Coverage (%) | 65.1 | 66.3 2% | 67.6 4% | 40.91 -37% | 65 0% | 84.2 29% |
| Response Times | 11% | -10% | -161% | -14% | -174% | |
| Response Time Grey 50% / Grey 80% * (ms) | 10.4 ? | 9.6 ? 8% | 15 ? -44% | 30.4 ? -192% | 14 ? -35% | 34.4 ? -231% |
| Response Time Black / White * (ms) | 12 ? | 10.4 ? 13% | 9 ? 25% | 27.6 ? -130% | 11 ? 8% | 26 ? -117% |
| PWM Frequency (Hz) | 250 ? | 200 ? | ||||
| Screen | 15% | -16% | -61% | 2% | -104% | |
| Brightness middle (cd/m²) | 384.9 | 348.3 -10% | 309 -20% | 286.2 -26% | 316 -18% | 265.7 -31% |
| Brightness (cd/m²) | 358 | 327 -9% | 284 -21% | 267 -25% | 295 -18% | 243 -32% |
| Brightness Distribution (%) | 87 | 85 -2% | 88 1% | 84 -3% | 84 -3% | 87 0% |
| Black Level * (cd/m²) | 0.67 | 0.4 40% | 0.42 37% | 0.33 51% | 0.42 37% | 0.63 6% |
| Contrast (:1) | 574 | 871 52% | 736 28% | 867 51% | 752 31% | 422 -26% |
| Colorchecker dE 2000 * | 2.43 | 1.6 34% | 3.99 -64% | 5.45 -124% | 2.7 -11% | 9.6 -295% |
| Colorchecker dE 2000 max. * | 4.58 | 5.07 -11% | 8.3 -81% | 18.08 -295% | 5.65 -23% | 18.5 -304% |
| Colorchecker dE 2000 calibrated * | 2.03 | 1 51% | 1.12 45% | 4.47 -120% | 1.58 22% | |
| Greyscale dE 2000 * | 2.6 | 2.3 12% | 5.43 -109% | 5.3 -104% | 2.35 10% | 12.7 -388% |
| Gamma | 2.2 100% | 2.203 100% | 2.57 86% | 2.1 105% | 2.41 91% | 2.01 109% |
| CCT | 6981 93% | 6707 97% | 7767 84% | 7679 85% | 6904 94% | 13654 48% |
| Color Space (Percent of AdobeRGB 1998) (%) | 59.7 | 61 2% | 63 6% | 37.6 -37% | 60 1% | 76 27% |
| Color Space (Percent of sRGB) (%) | 93.9 | 96 2% | 97 3% | 59.1 -37% | 93 -1% | 100 6% |
| Total Average (Program / Settings) | 9% /
12% | -7% /
-11% | -86% /
-69% | -4% /
-0% | -85% /
-88% |
* ... smaller is better
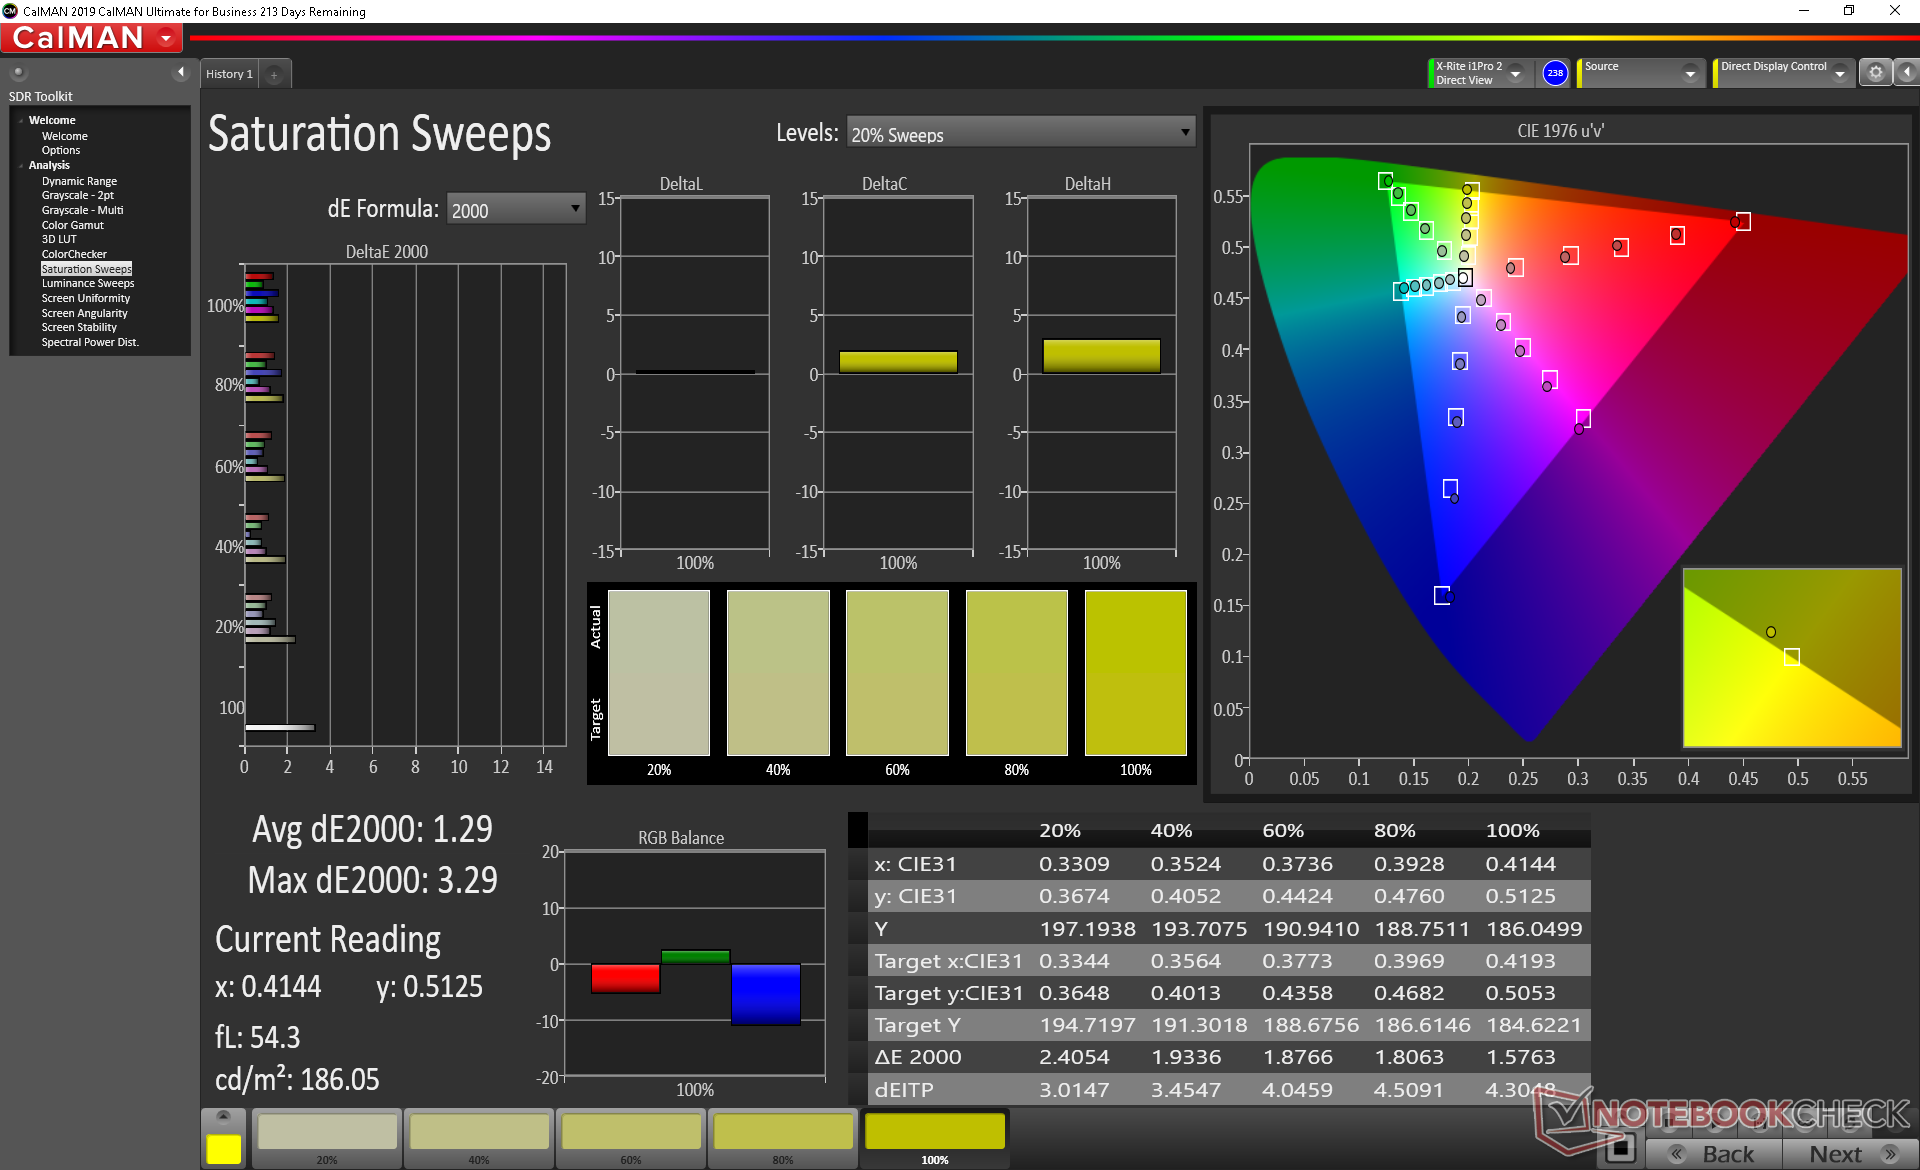
Color space covers approximately 94 percent of sRGB and 60 percent of AdobeRGB to be smaller than the color space available on the older GP62 TN panel. However, the superior response times, refresh rate, viewing angles, and overall quality of the newer panel more than make up for the color deficit.
Measurements with an X-Rite colorimeter reveal a well-calibrated display out of the box. Calibrating the display even further ourselves would result in only marginal improvements across the board meaning end-users won't need to do anything else to get the most out of the display.


Display Response Times
| ↔ Response Time Black to White | ||
|---|---|---|
| 12 ms ... rise ↗ and fall ↘ combined | ↗ 6.8 ms rise | 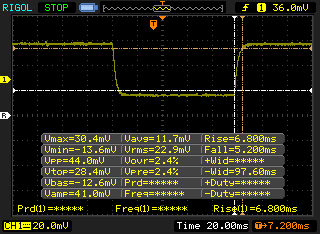 |
| ↘ 5.2 ms fall | ||
| The screen shows good response rates in our tests, but may be too slow for competitive gamers. In comparison, all tested devices range from 0.1 (minimum) to 240 (maximum) ms. » 32 % of all devices are better. This means that the measured response time is better than the average of all tested devices (19.8 ms). | ||
| ↔ Response Time 50% Grey to 80% Grey | ||
| 10.4 ms ... rise ↗ and fall ↘ combined | ↗ 6.4 ms rise | 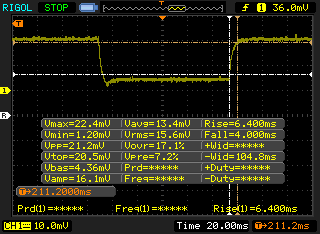 |
| ↘ 4 ms fall | ||
| The screen shows good response rates in our tests, but may be too slow for competitive gamers. In comparison, all tested devices range from 0.165 (minimum) to 636 (maximum) ms. » 24 % of all devices are better. This means that the measured response time is better than the average of all tested devices (30.9 ms). | ||
Screen Flickering / PWM (Pulse-Width Modulation)
| Screen flickering / PWM not detected | 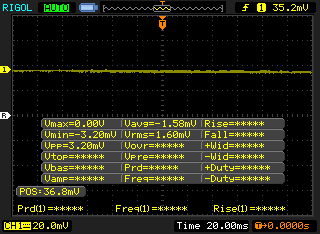 | ||
In comparison: 52 % of all tested devices do not use PWM to dim the display. If PWM was detected, an average of 7748 (minimum: 5 - maximum: 343500) Hz was measured. | |||
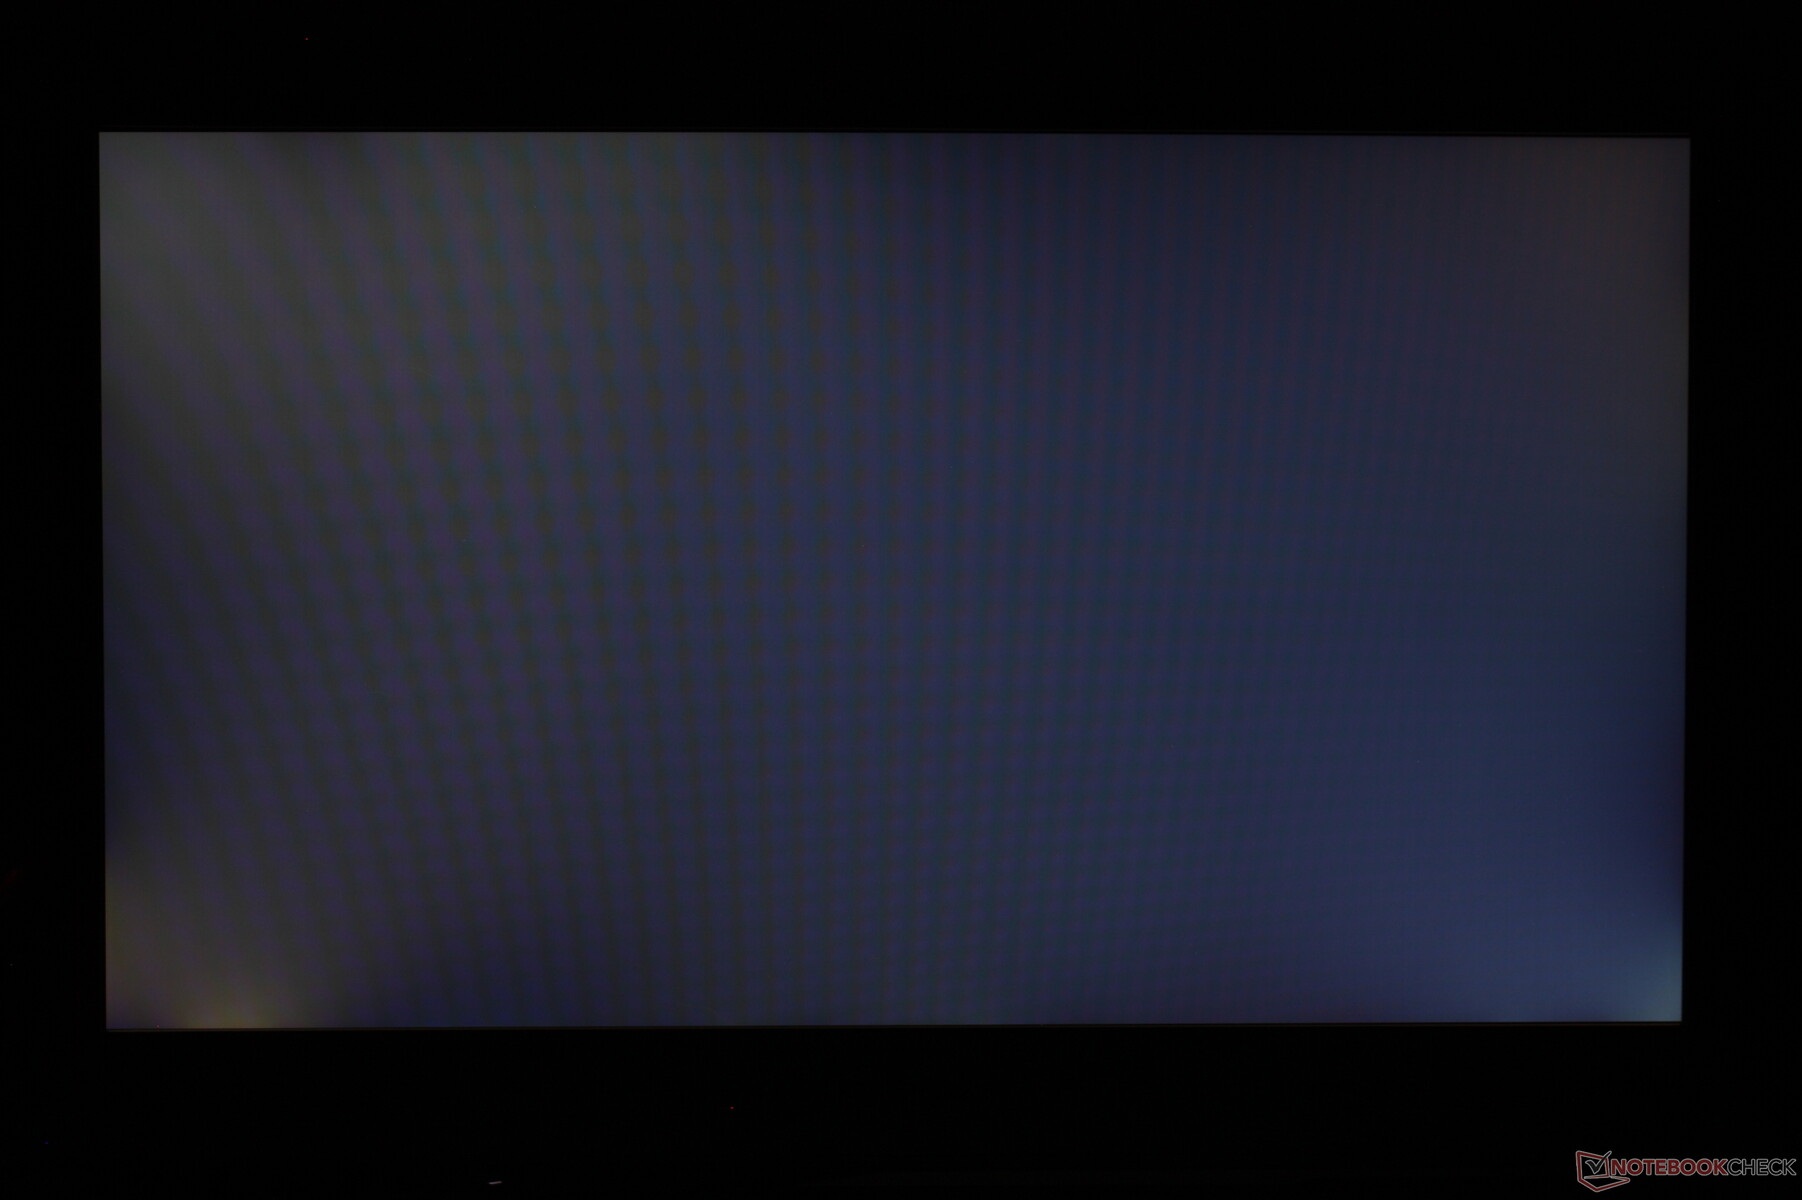
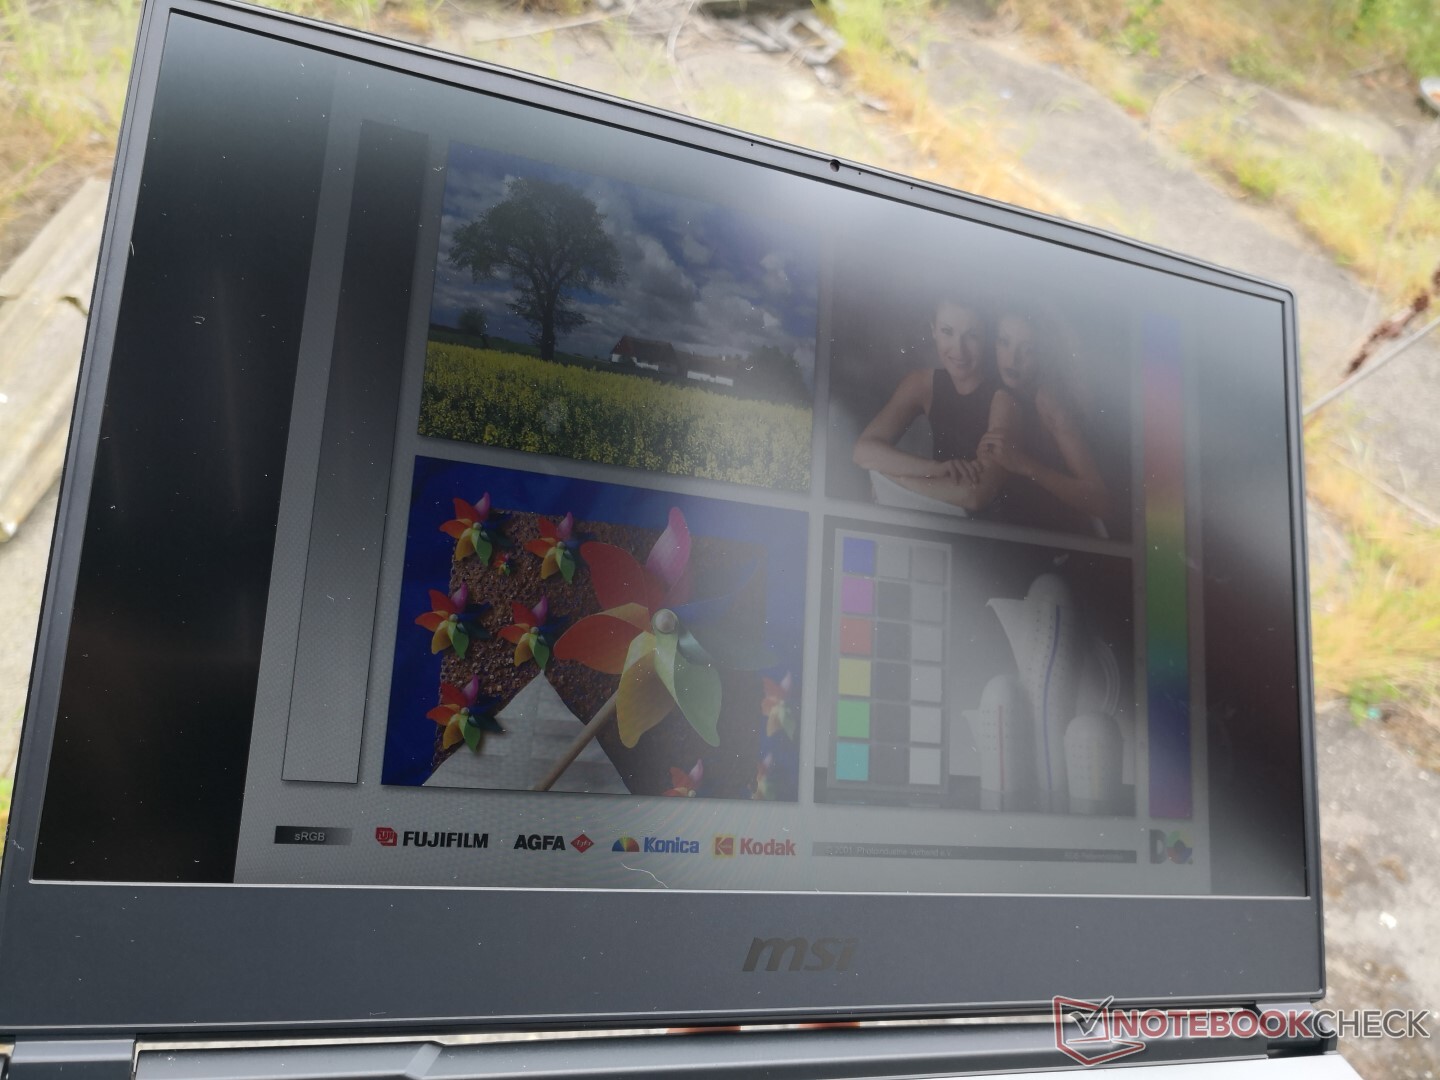
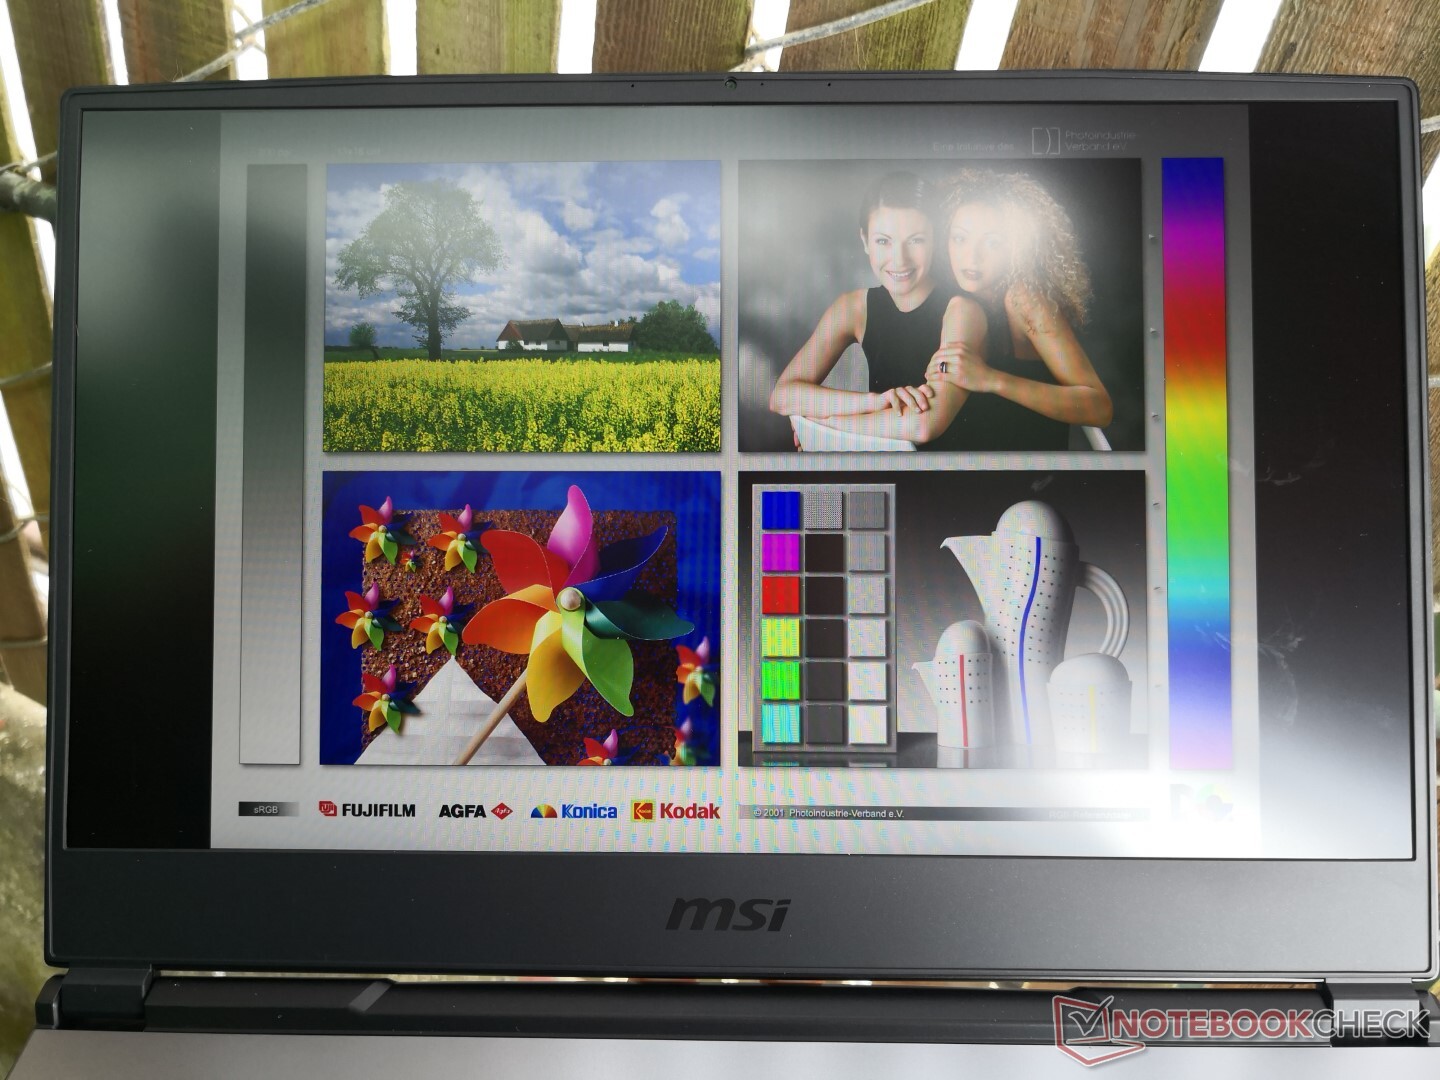
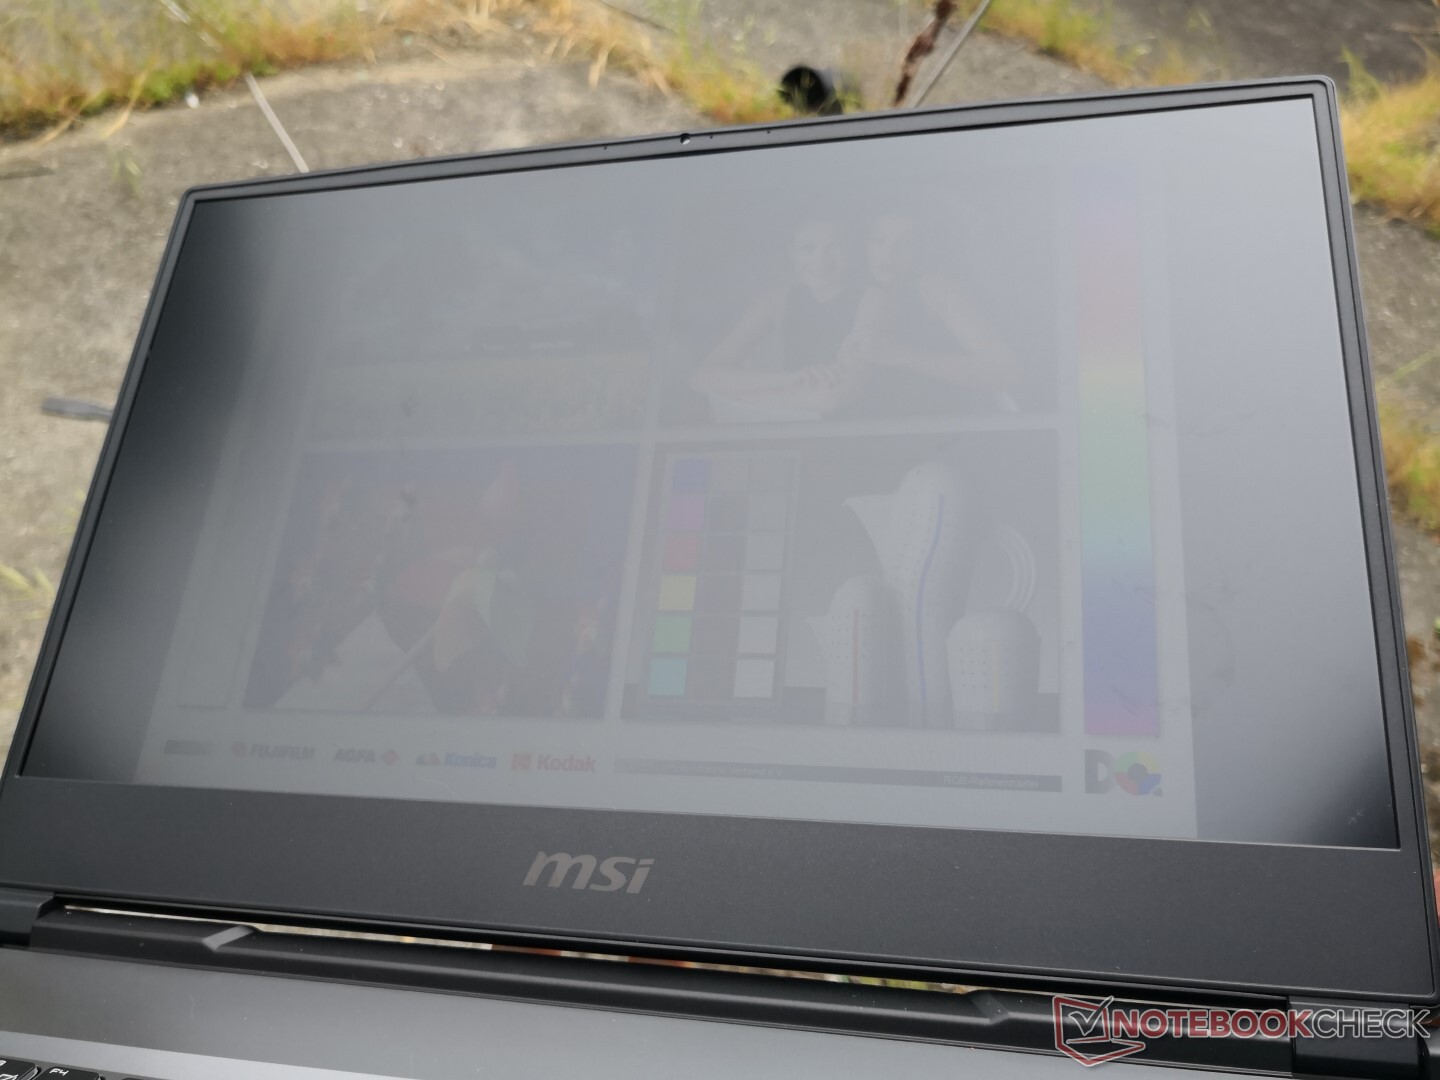
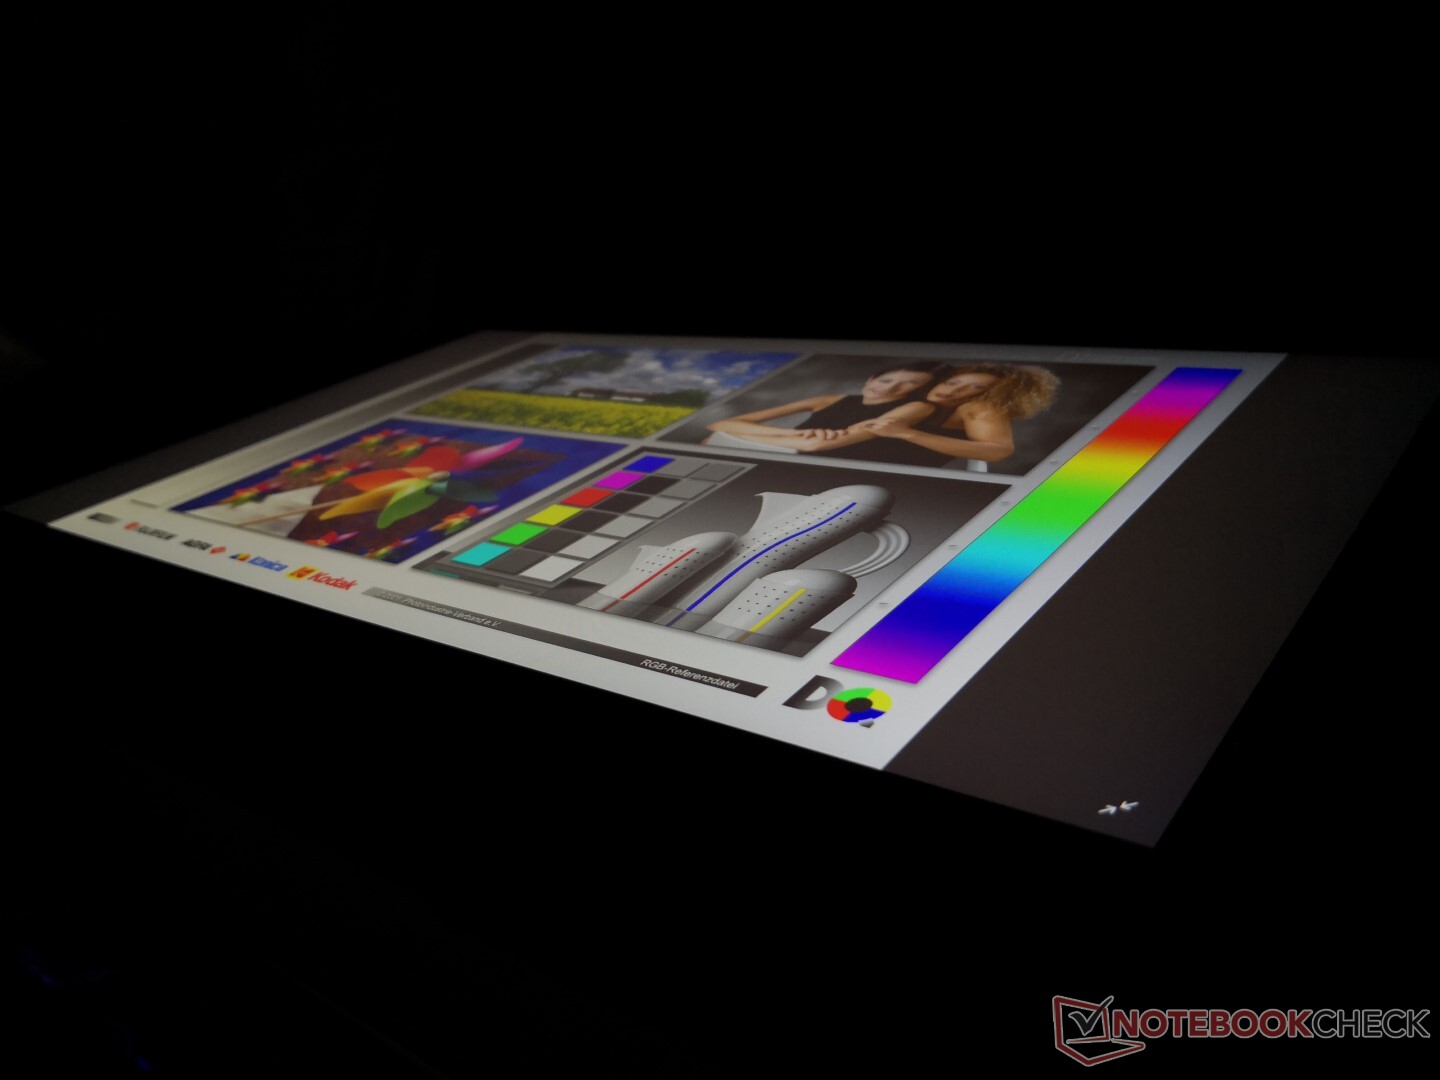
Outdoor visibility is still average for the category since gaming laptops are not designed to be used outside frequently. Most Ultrabooks have brighter displays to better mitigate glare and washed out colors.
Performance
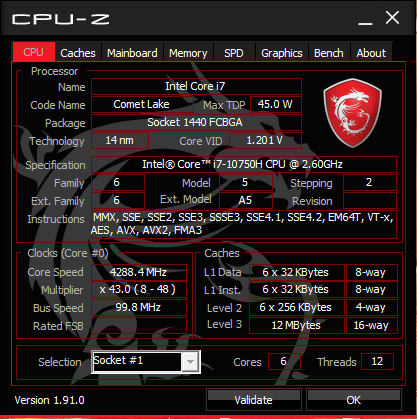
Processor
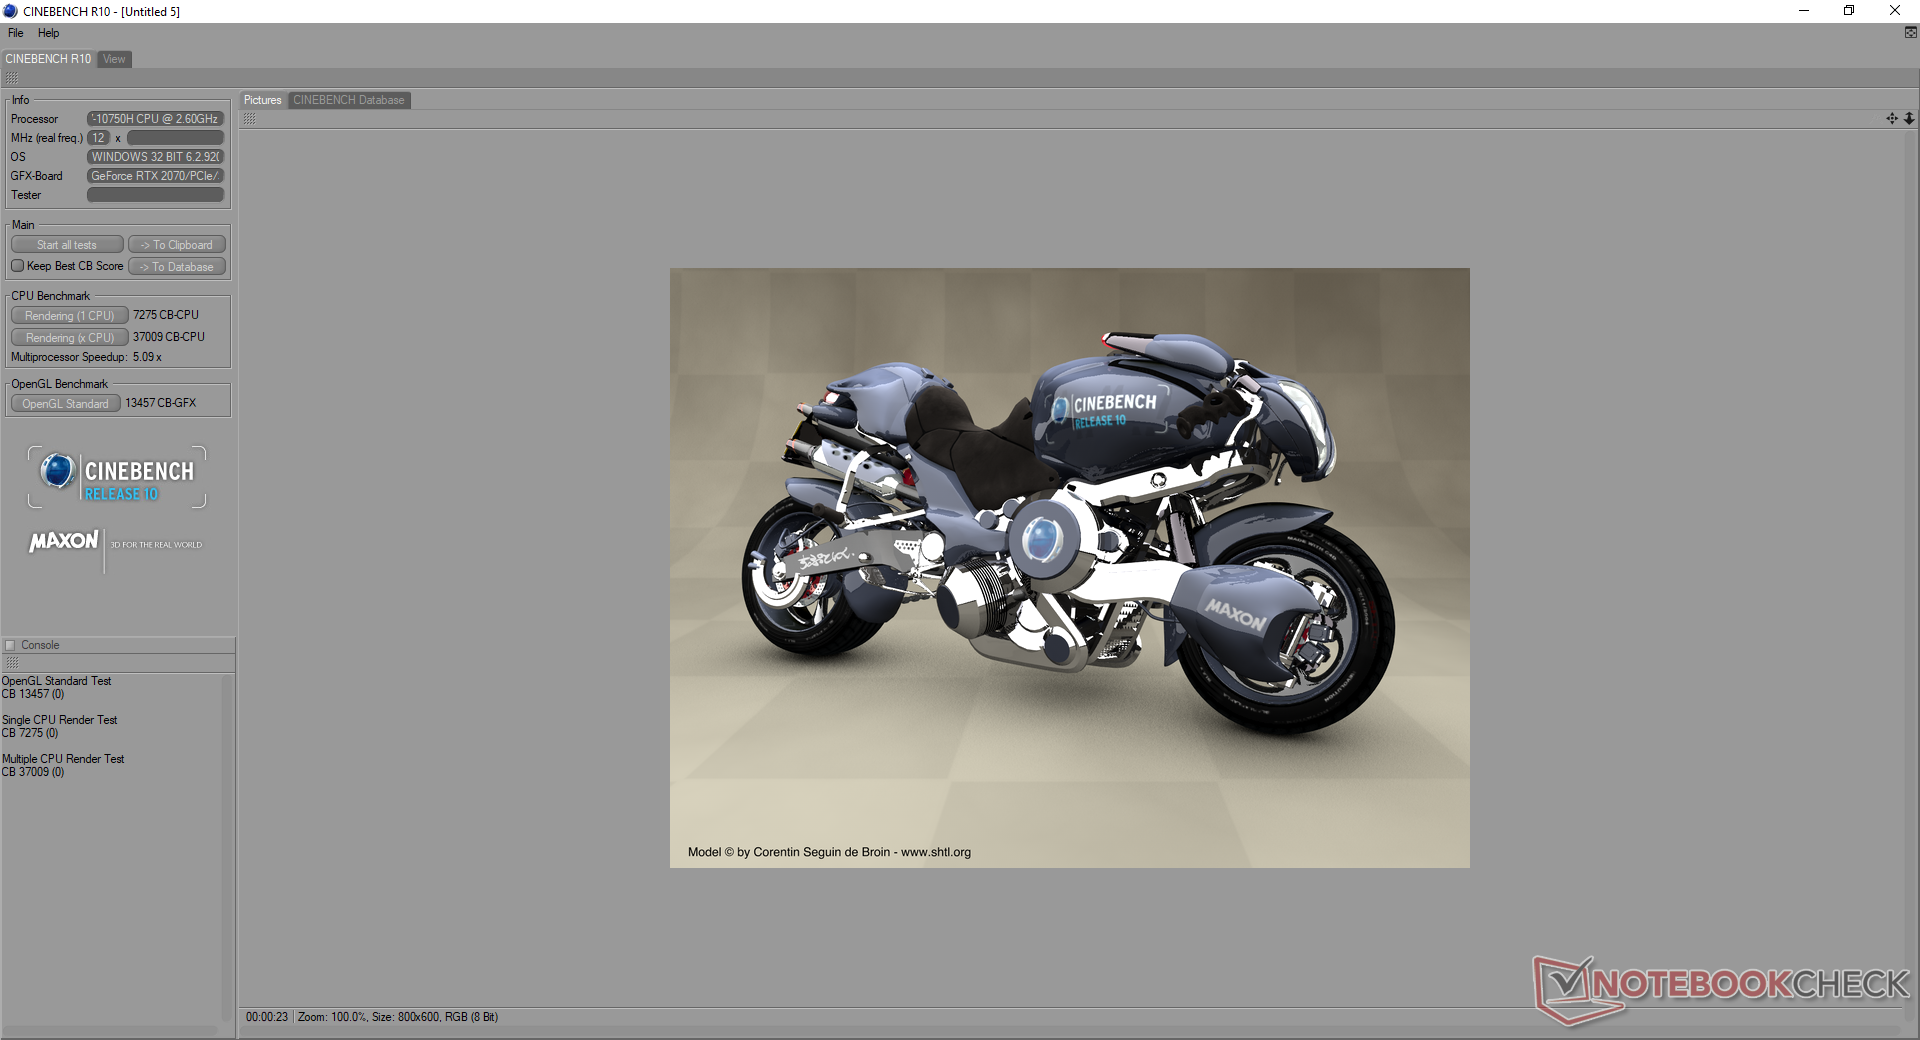
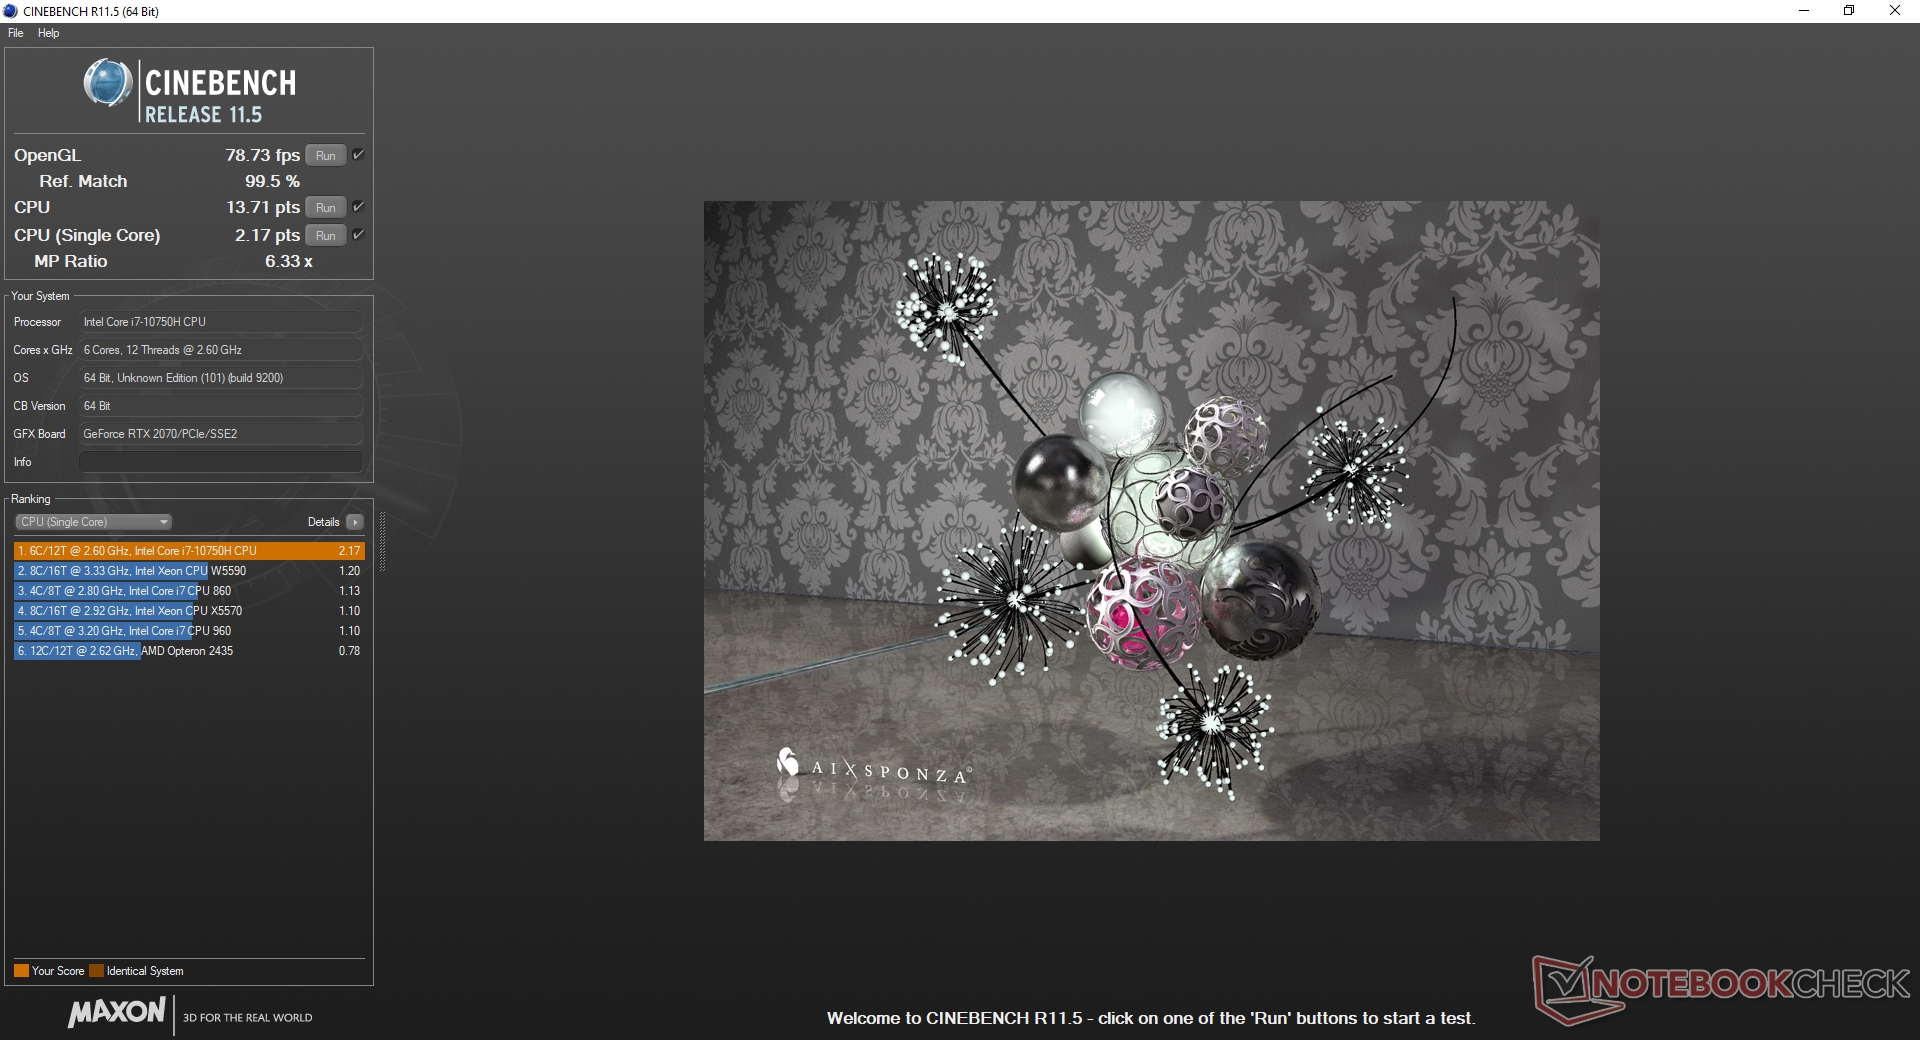
Raw CPU performance is roughly 5 to 15 percent faster than the average Core i7-9750H laptop. Users upgrading from an older Core i7-8750H laptop will see more significant gains of about 11 to 27 percent. The relatively minor gen-to-gen gains are not unexpected since Comet Lake-H shares the same 14 nm silicon as Coffee Lake-H.
Performance sustainability is excellent nonetheless. Running CineBench R15 Multi-Thread in a loop results in a performance dip of only 4 percent over time.
See our dedicated page on the Core i7-10750H for more technical details and benchmark comparisons. The hexa-core Core i7-10750H is just one step down from the octa-core Core i7-10875H that's available on the Gigabyte Aero 15.
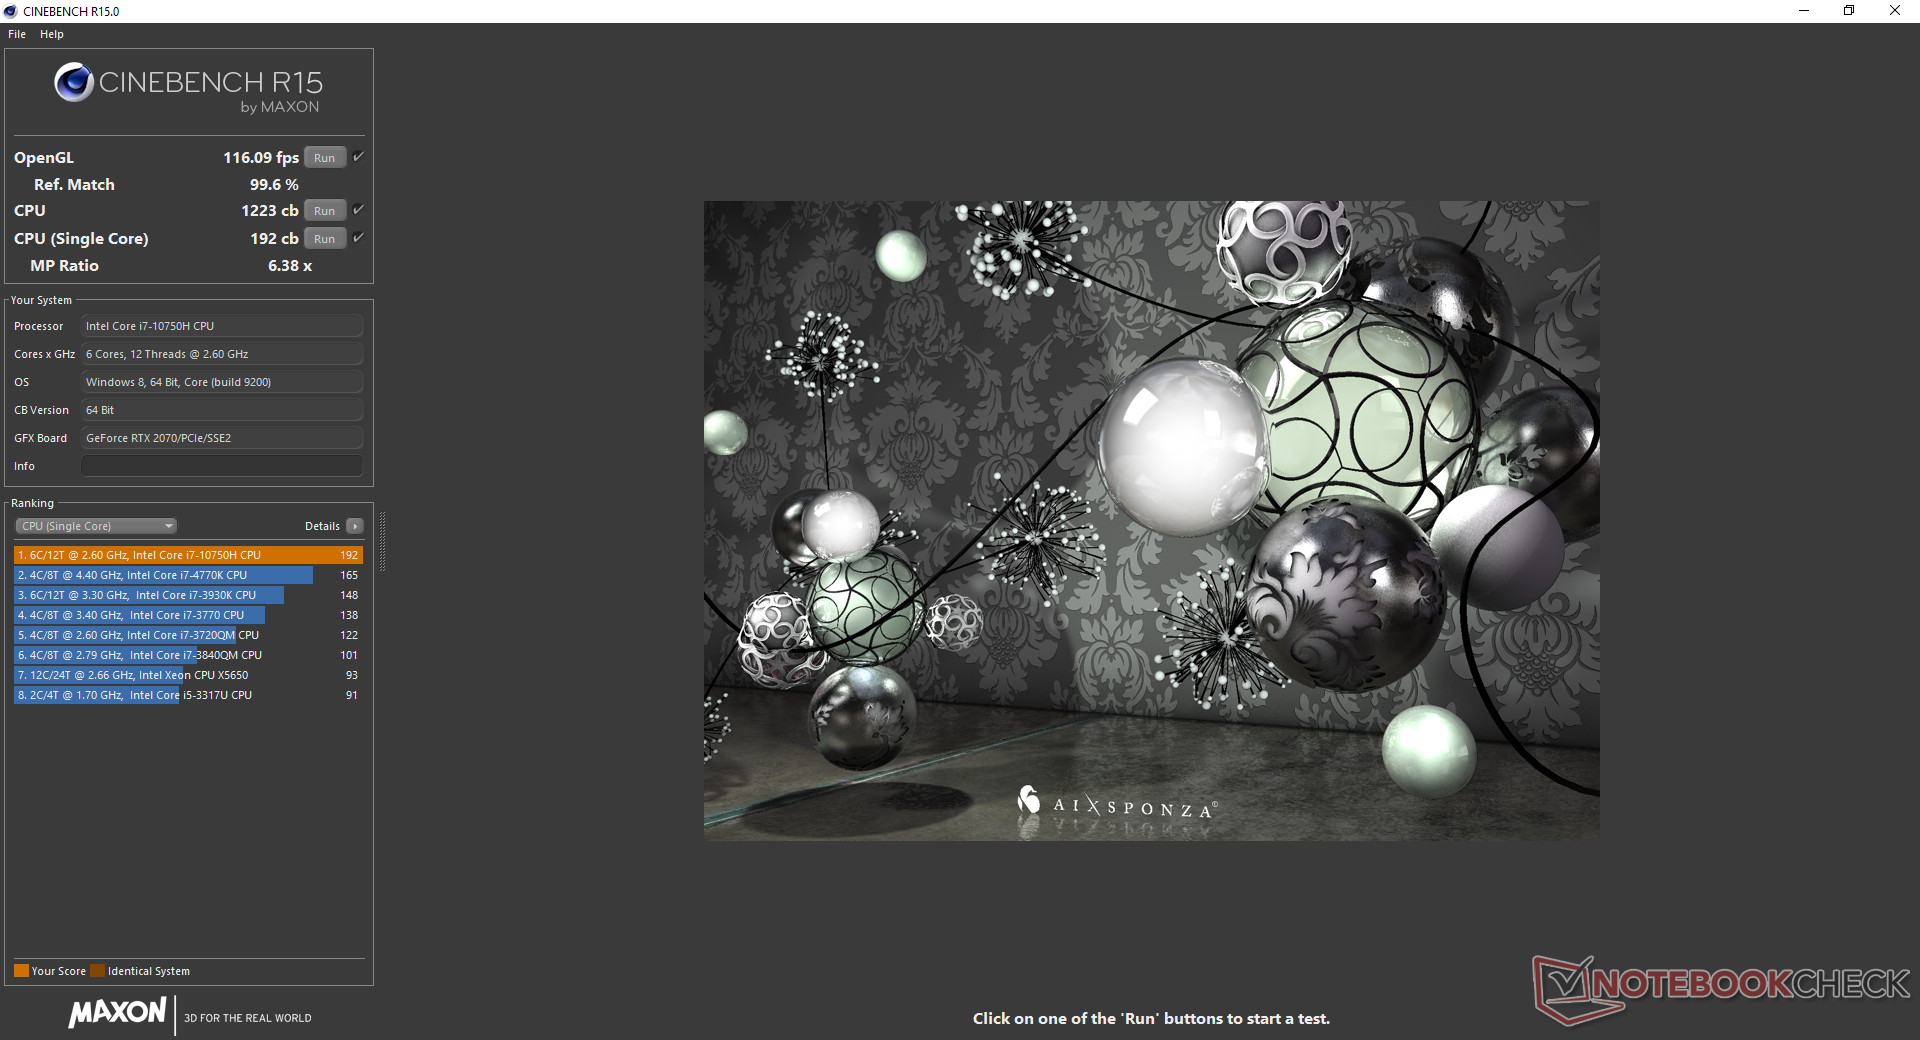
Cinebench R15: CPU Single 64Bit | CPU Multi 64Bit
Blender: v2.79 BMW27 CPU
7-Zip 18.03: 7z b 4 -mmt1 | 7z b 4
Geekbench 5.5: Single-Core | Multi-Core
HWBOT x265 Benchmark v2.2: 4k Preset
LibreOffice : 20 Documents To PDF
R Benchmark 2.5: Overall mean
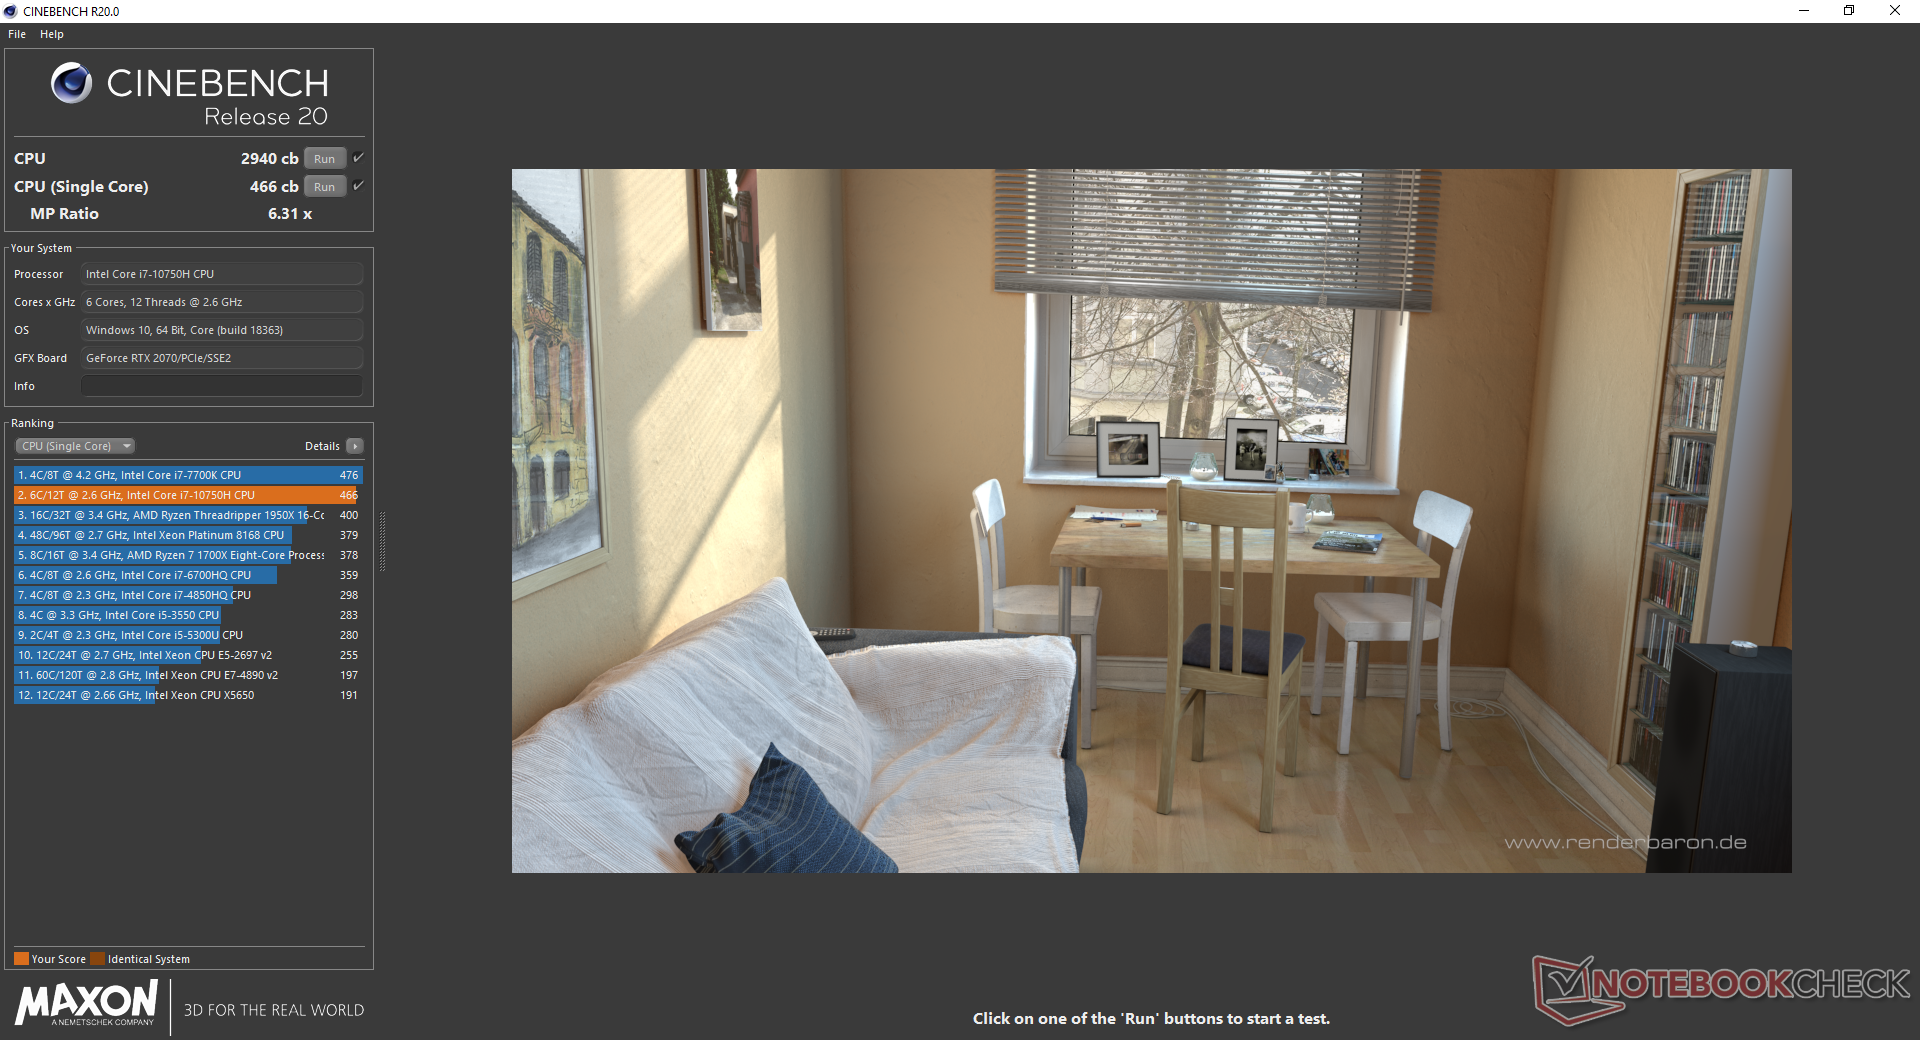
| Cinebench R20 / CPU (Multi Core) | |
| Asus Zephyrus G14 GA401IV | |
| Eurocom Nightsky RX15 | |
| AMD Ryzen 1800X - Asus Crosshair VI Hero | |
| MSI GE65 Raider 9SF-049US | |
| Gigabyte Aero 17 HDR XB | |
| MSI GP65 10SFK-047US | |
| Average Intel Core i7-9750H (2017 - 3133, n=55) | |
| Schenker Key 16 | |
| MSI GF75 Thin 10SCXR | |
| MSI GF63 Thin 9SC | |
| MSI Alpha 15 A3DDK-034 | |
| Cinebench R20 / CPU (Single Core) | |
| Gigabyte Aero 17 HDR XB | |
| Asus Zephyrus G14 GA401IV | |
| Eurocom Nightsky RX15 | |
| MSI GE65 Raider 9SF-049US | |
| MSI GP65 10SFK-047US | |
| Average Intel Core i7-9750H (416 - 486, n=55) | |
| MSI GF75 Thin 10SCXR | |
| MSI GF63 Thin 9SC | |
| Schenker Key 16 | |
| AMD Ryzen 1800X - Asus Crosshair VI Hero | |
| MSI Alpha 15 A3DDK-034 | |
| Cinebench R15 / CPU Single 64Bit | |
| Gigabyte Aero 17 HDR XB | |
| Eurocom Nightsky RX15 | |
| MSI GE65 Raider 9SF-049US | |
| MSI GP65 Leopard 9SE-225US | |
| Asus Zephyrus G14 GA401IV | |
| MSI GP65 10SFK-047US | |
| Average Intel Core i7-9750H (170 - 194, n=82) | |
| MSI GF75 Thin 10SCXR | |
| MSI GF63 Thin 9SC | |
| Schenker Key 16 | |
| AMD Ryzen 1800X - Asus Crosshair VI Hero | |
| MSI Alpha 15 A3DDK-034 | |
| Cinebench R15 / CPU Multi 64Bit | |
| Asus Zephyrus G14 GA401IV | |
| Eurocom Nightsky RX15 | |
| Gigabyte Aero 17 HDR XB | |
| MSI GE65 Raider 9SF-049US | |
| AMD Ryzen 1800X - Asus Crosshair VI Hero | |
| MSI GP65 10SFK-047US | |
| MSI GP65 Leopard 9SE-225US | |
| Average Intel Core i7-9750H (952 - 1306, n=85) | |
| Schenker Key 16 | |
| MSI GF75 Thin 10SCXR | |
| MSI GF63 Thin 9SC | |
| MSI Alpha 15 A3DDK-034 | |
| Blender / v2.79 BMW27 CPU | |
| MSI GF75 Thin 10SCXR | |
| Eurocom Nightsky RX15 | |
| Average Intel Core i7-9750H (342 - 495, n=21) | |
| MSI GP65 10SFK-047US | |
| Gigabyte Aero 17 HDR XB | |
| Asus Zephyrus G14 GA401IV | |
| AMD Ryzen 1800X - Asus Crosshair VI Hero | |
| 7-Zip 18.03 / 7z b 4 -mmt1 | |
| Gigabyte Aero 17 HDR XB | |
| Eurocom Nightsky RX15 | |
| MSI GP65 10SFK-047US | |
| Average Intel Core i7-9750H (4580 - 5090, n=21) | |
| MSI GF75 Thin 10SCXR | |
| Asus Zephyrus G14 GA401IV | |
| 7-Zip 18.03 / 7z b 4 | |
| Asus Zephyrus G14 GA401IV | |
| Gigabyte Aero 17 HDR XB | |
| Eurocom Nightsky RX15 | |
| MSI GP65 10SFK-047US | |
| Average Intel Core i7-9750H (28512 - 35174, n=21) | |
| MSI GF75 Thin 10SCXR | |
| Geekbench 5.5 / Single-Core | |
| Gigabyte Aero 17 HDR XB | |
| Asus Zephyrus G14 GA401IV | |
| MSI GP65 10SFK-047US | |
| Average Intel Core i7-9750H (1117 - 1251, n=13) | |
| MSI GF75 Thin 10SCXR | |
| MSI Alpha 15 A3DDK-034 | |
| Geekbench 5.5 / Multi-Core | |
| Asus Zephyrus G14 GA401IV | |
| Gigabyte Aero 17 HDR XB | |
| MSI GP65 10SFK-047US | |
| Average Intel Core i7-9750H (4859 - 6262, n=13) | |
| MSI GF75 Thin 10SCXR | |
| MSI Alpha 15 A3DDK-034 | |
| HWBOT x265 Benchmark v2.2 / 4k Preset | |
| Eurocom Nightsky RX15 | |
| Asus Zephyrus G14 GA401IV | |
| Gigabyte Aero 17 HDR XB | |
| MSI GP65 10SFK-047US | |
| Average Intel Core i7-9750H (7.1 - 10.7, n=21) | |
| MSI GF75 Thin 10SCXR | |
| LibreOffice / 20 Documents To PDF | |
| MSI GP65 10SFK-047US | |
| Gigabyte Aero 17 HDR XB | |
| Average Intel Core i7-9750H (54.5 - 64.7, n=9) | |
| MSI GF75 Thin 10SCXR | |
| R Benchmark 2.5 / Overall mean | |
| MSI GF75 Thin 10SCXR | |
| Average Intel Core i7-9750H (0.608 - 0.695, n=14) | |
| MSI GP65 10SFK-047US | |
| Gigabyte Aero 17 HDR XB | |
* ... smaller is better
System Performance
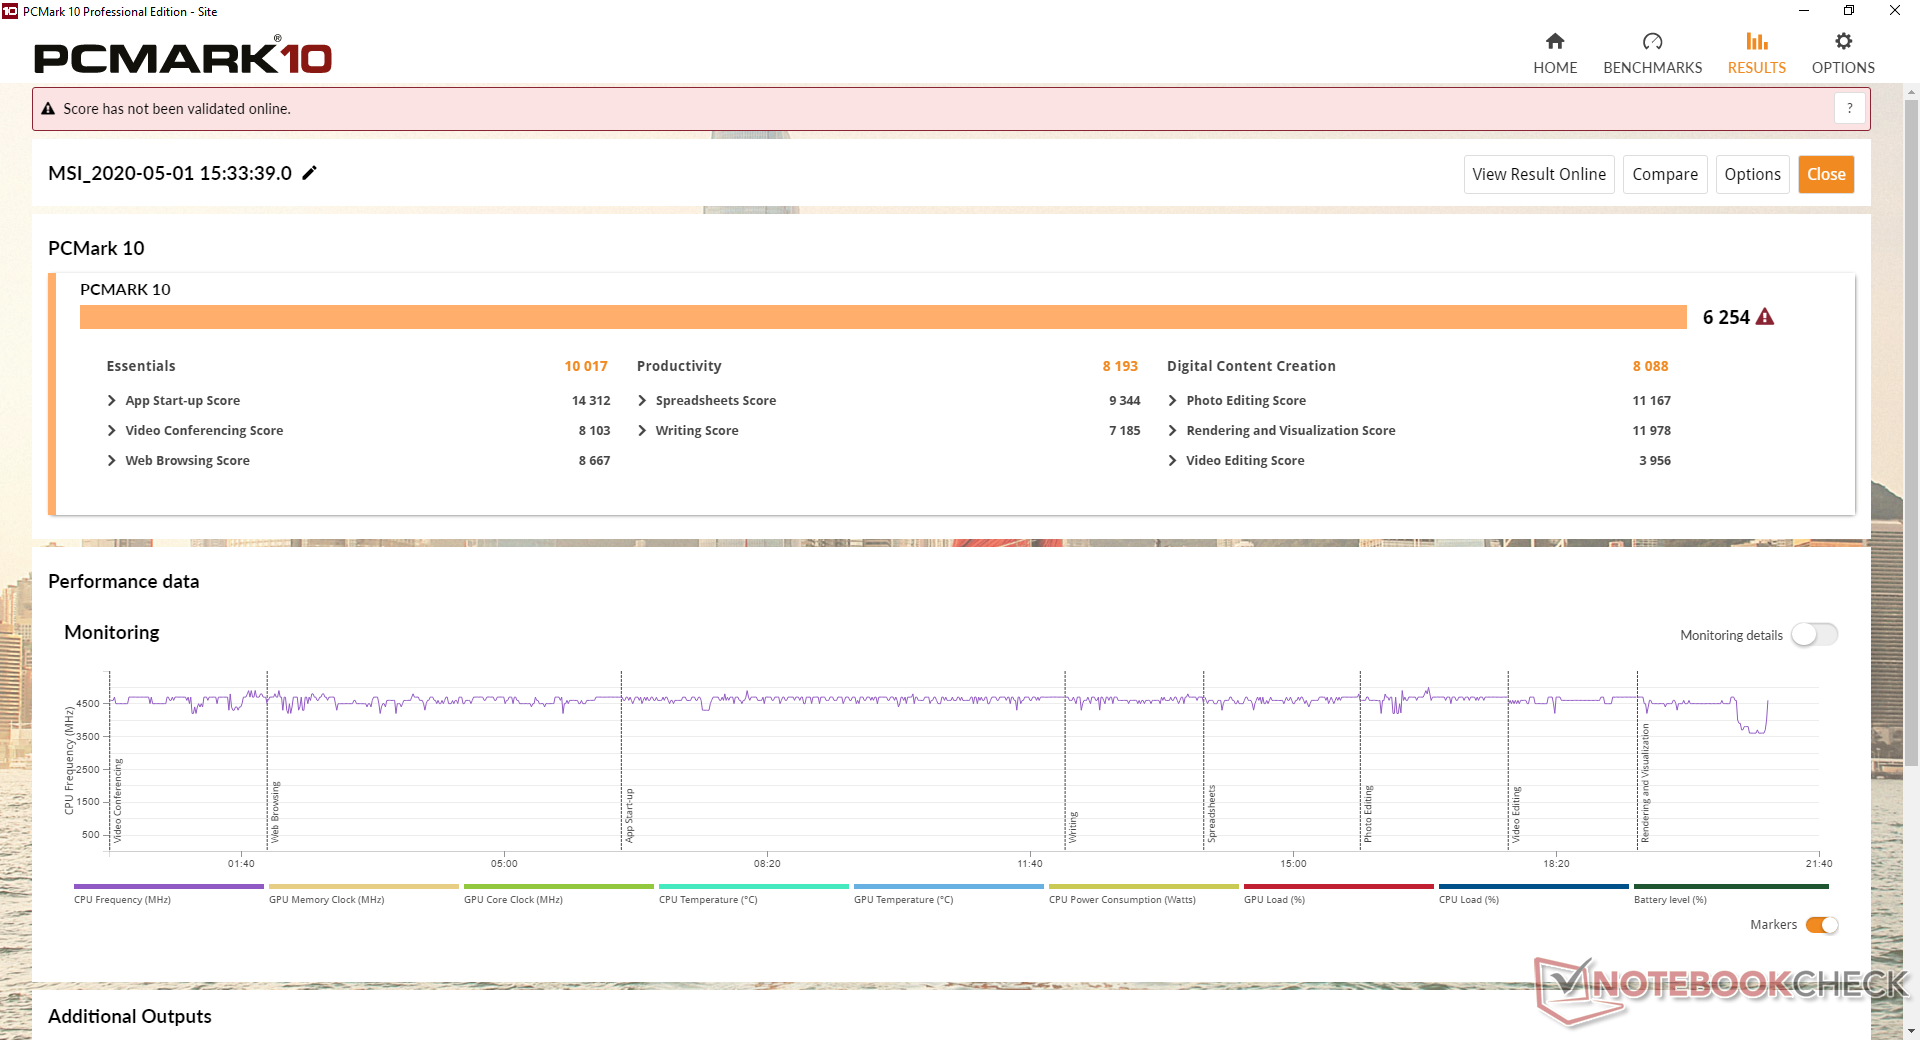
Though the differences are minor, PCMark benchmarks are consistently higher than the 2019 GP65. Users upgrading from much older Core i5-7300HQ or i7-7700HQ gaming laptops like the GP62 will see more significant gains.
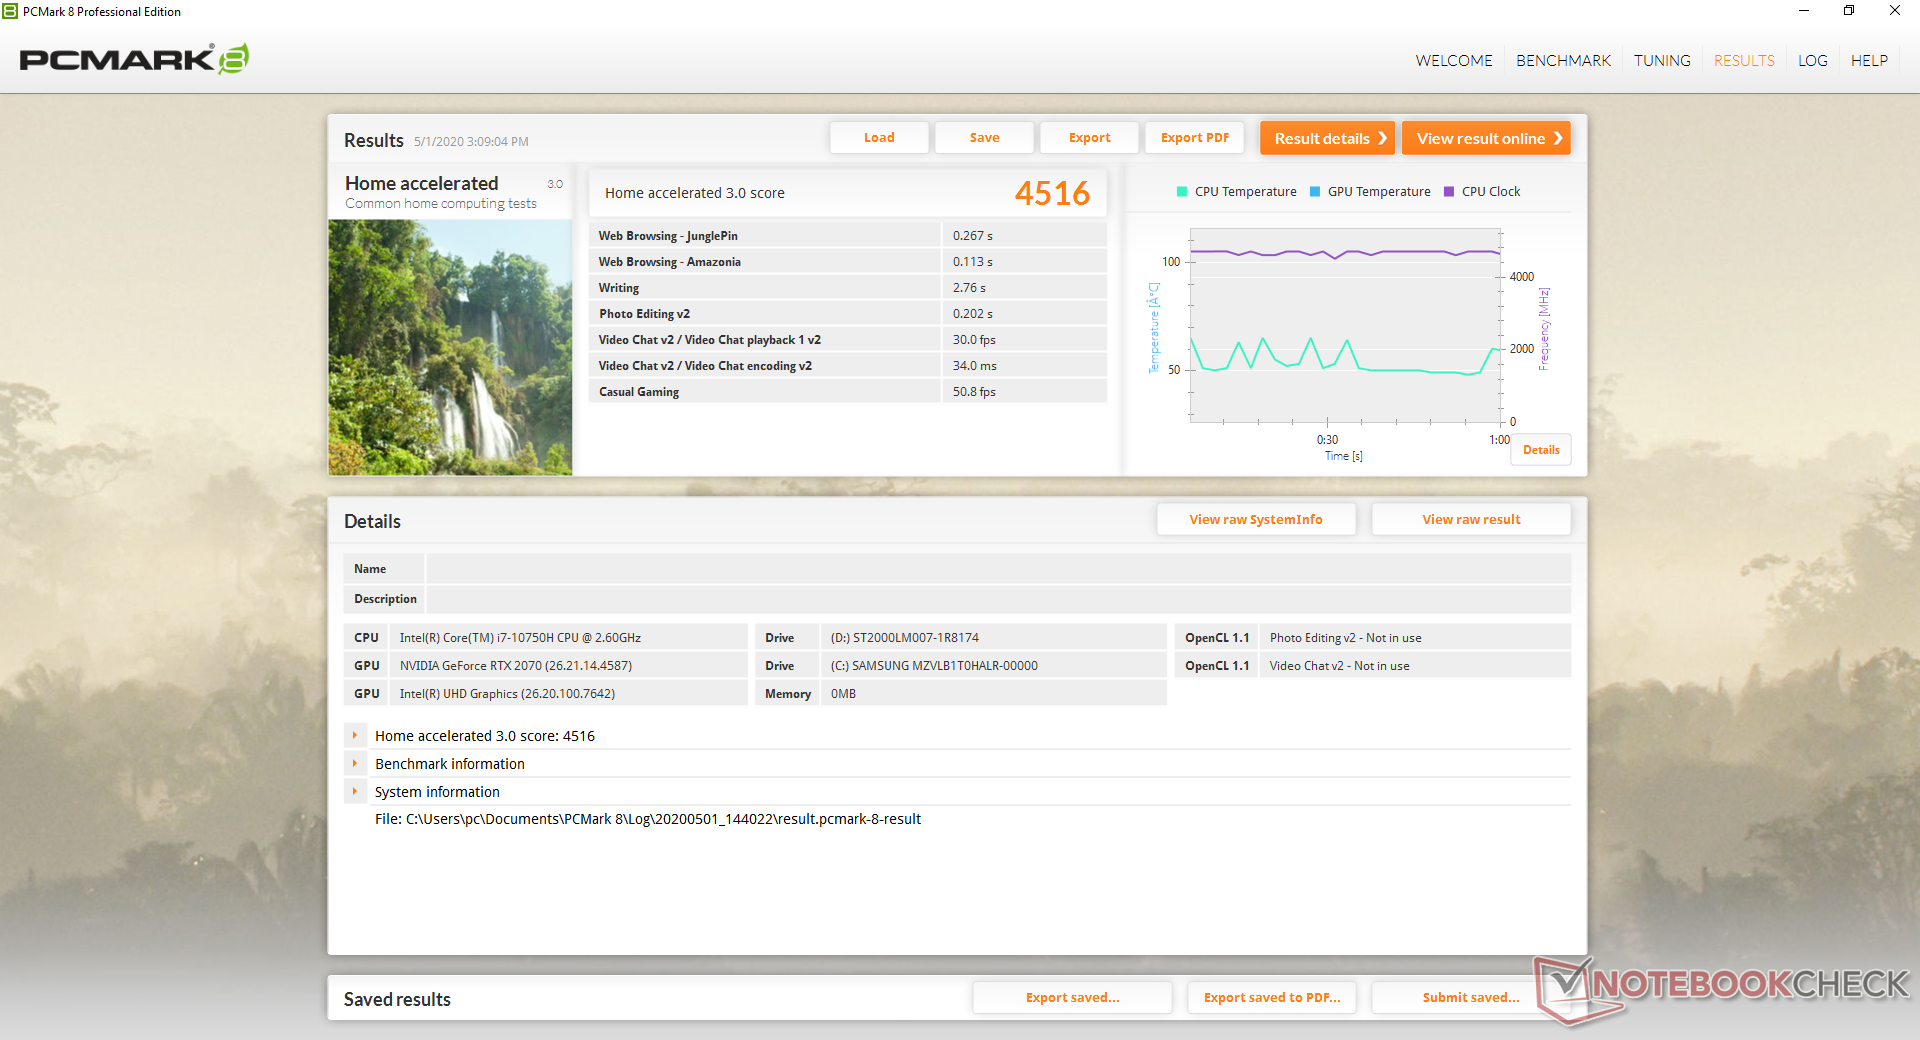

| PCMark 8 Home Score Accelerated v2 | 4516 points | |
| PCMark 8 Work Score Accelerated v2 | 5894 points | |
| PCMark 10 Score | 6254 points | |
Help | ||
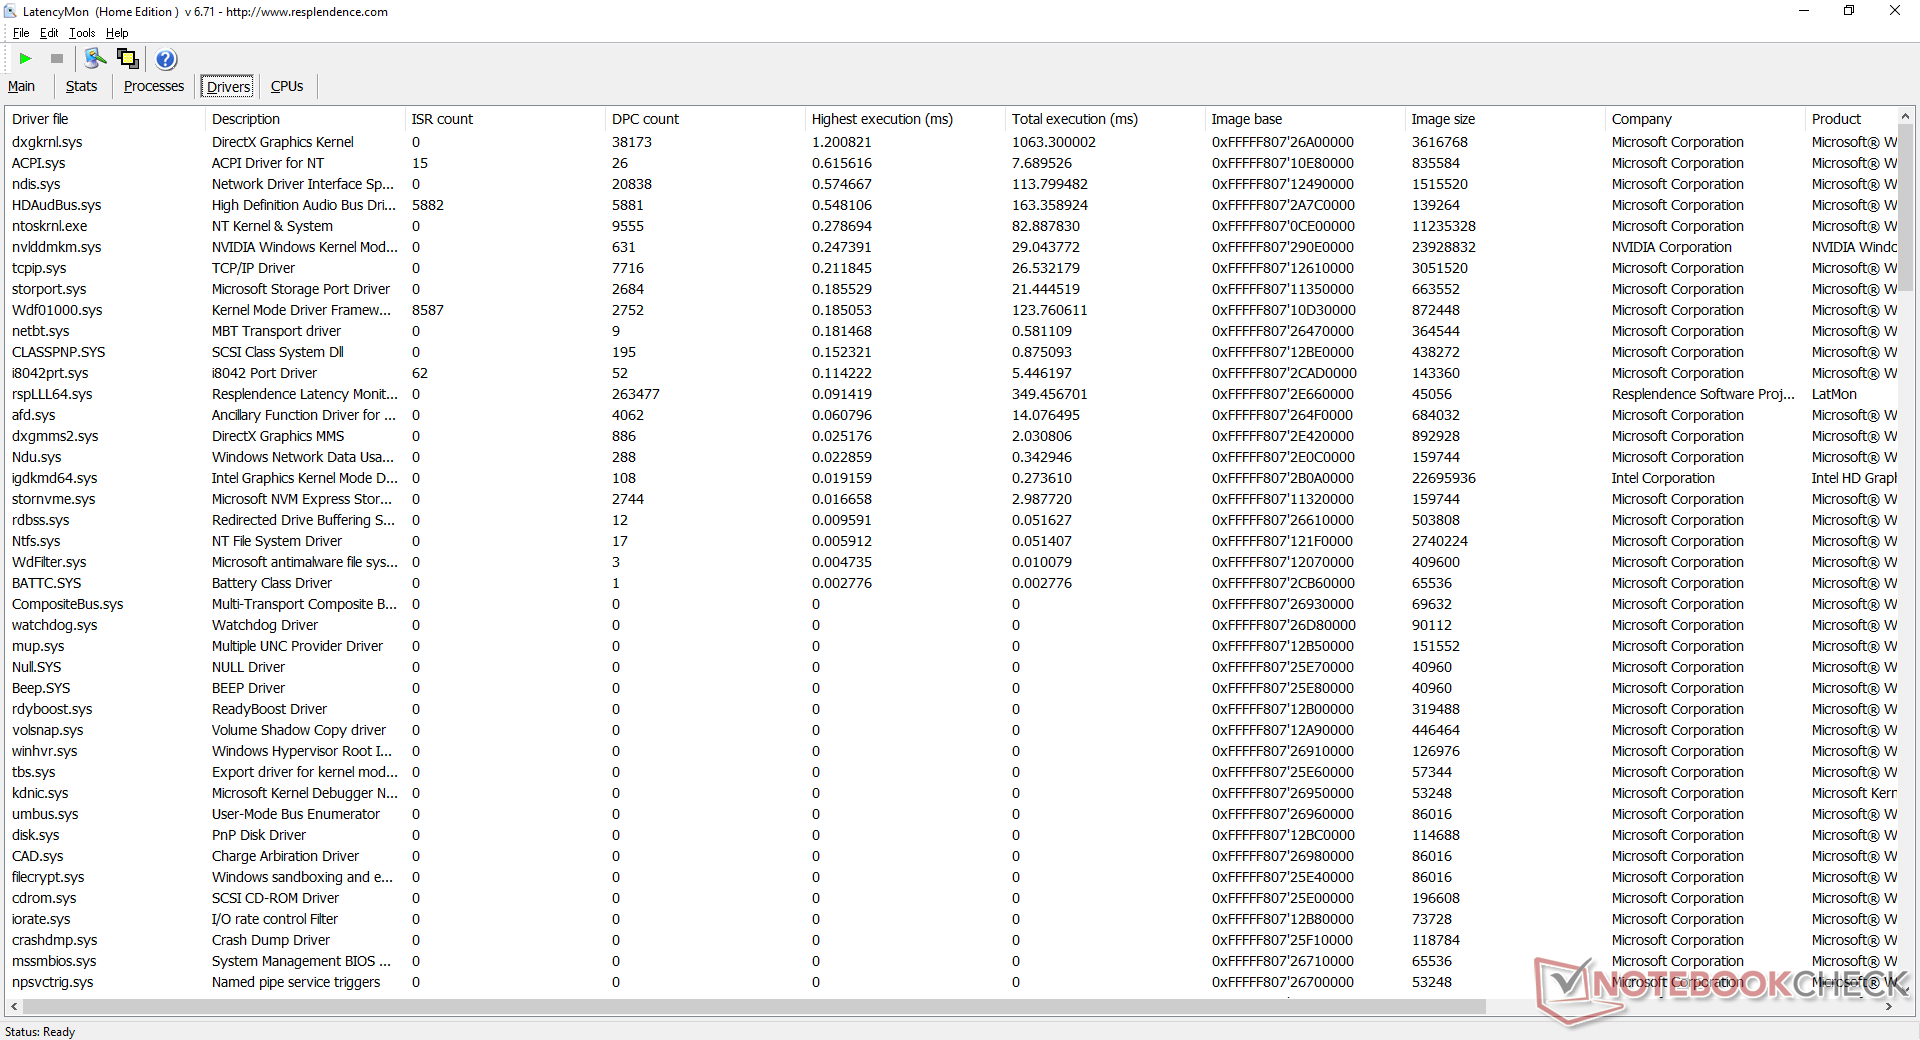
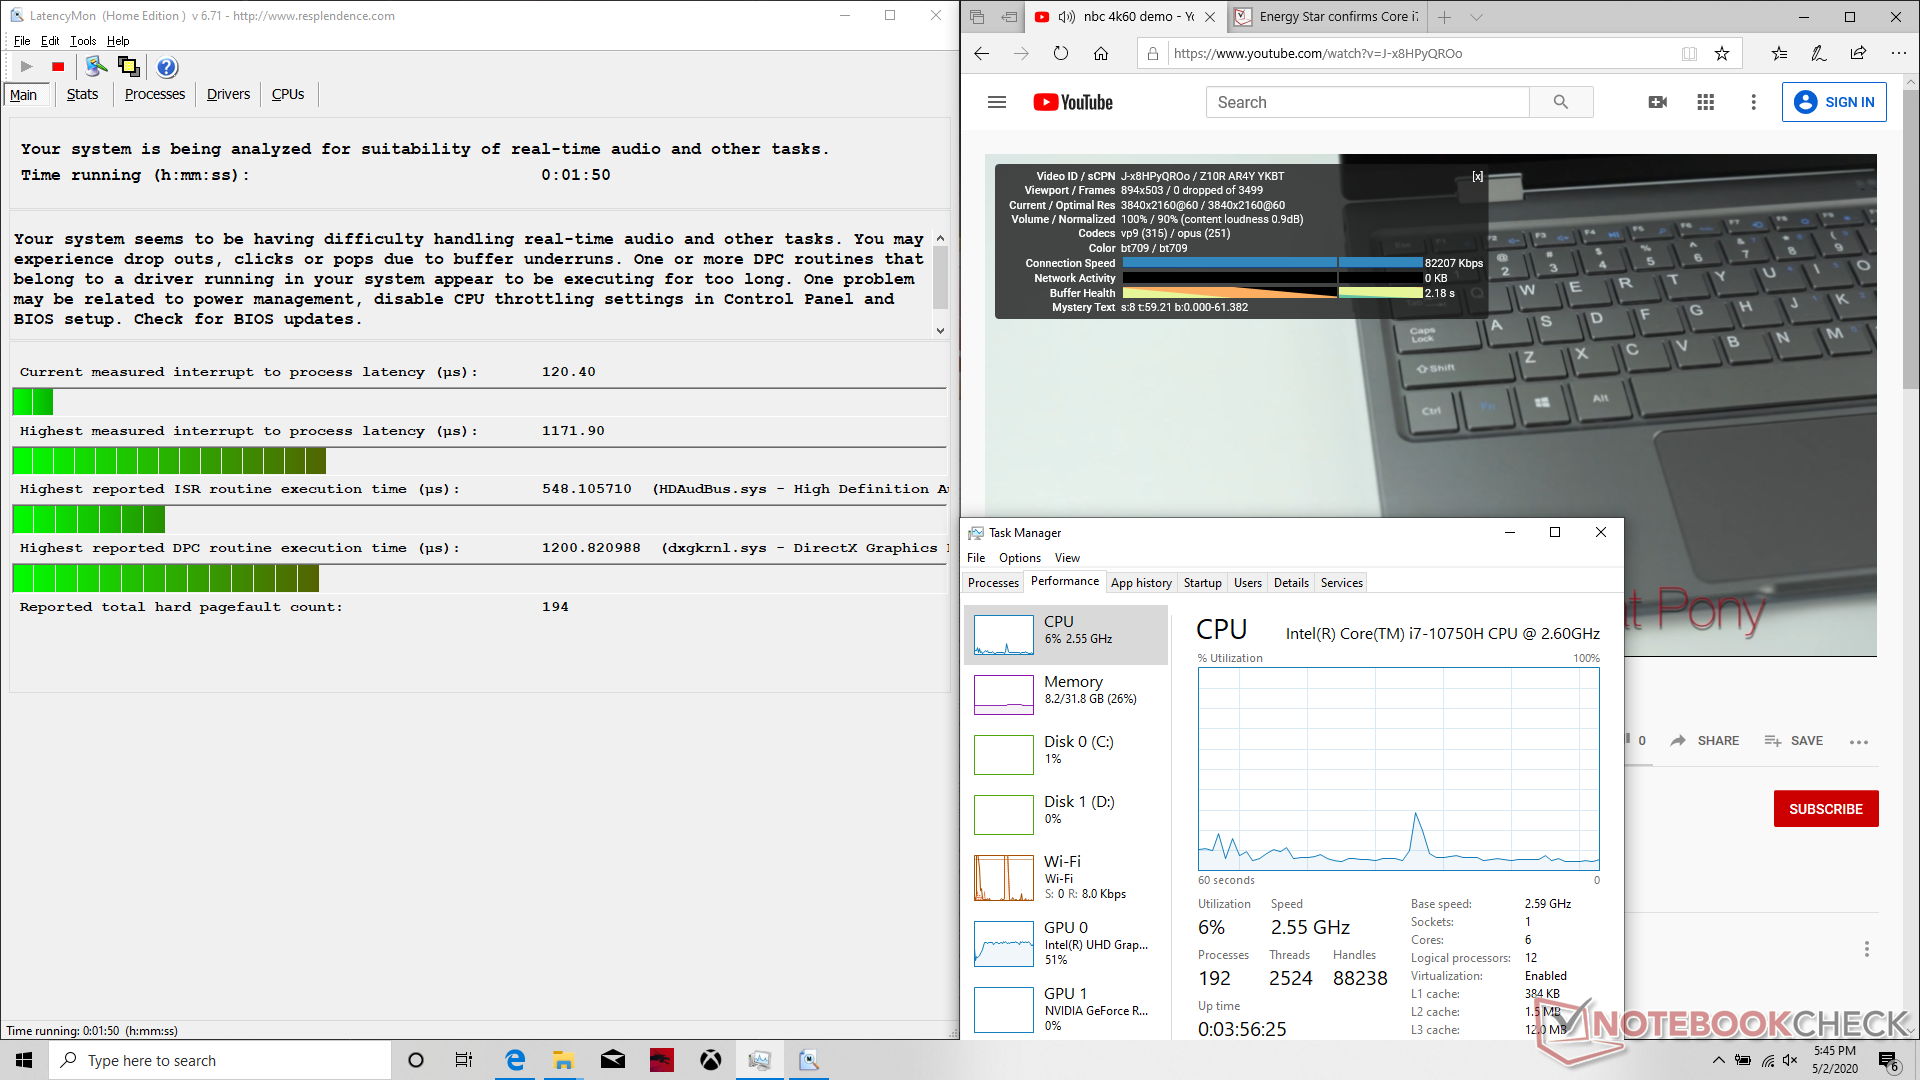
DPC Latency
LatencyMon shows DPC latency issues when opening multiple browser tabs. Thankfully, 4k video playback is smooth with no dropped frames.
| DPC Latencies / LatencyMon - interrupt to process latency (max), Web, Youtube, Prime95 | |
| MSI GP65 10SFK-047US | |
* ... smaller is better
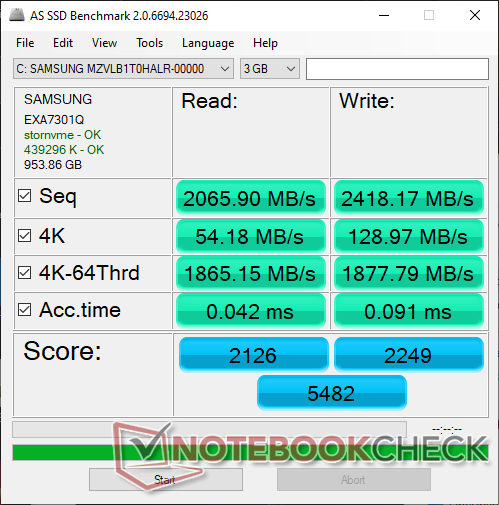
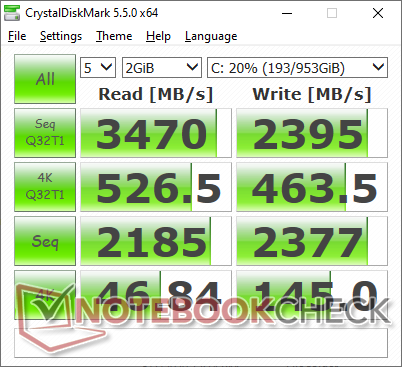
Storage Devices
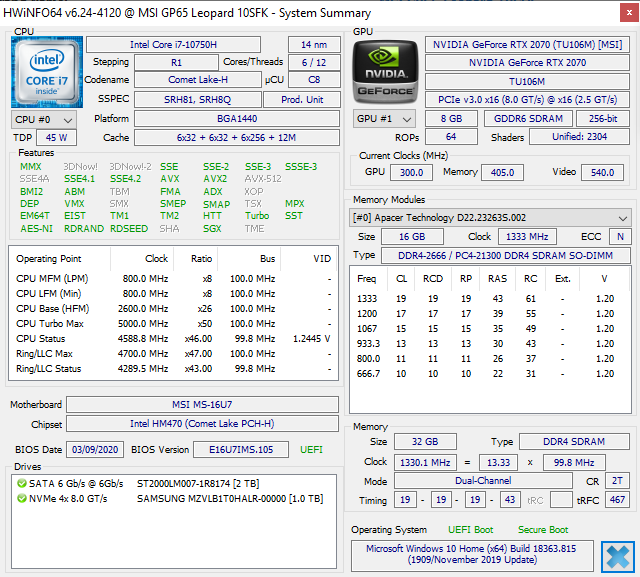
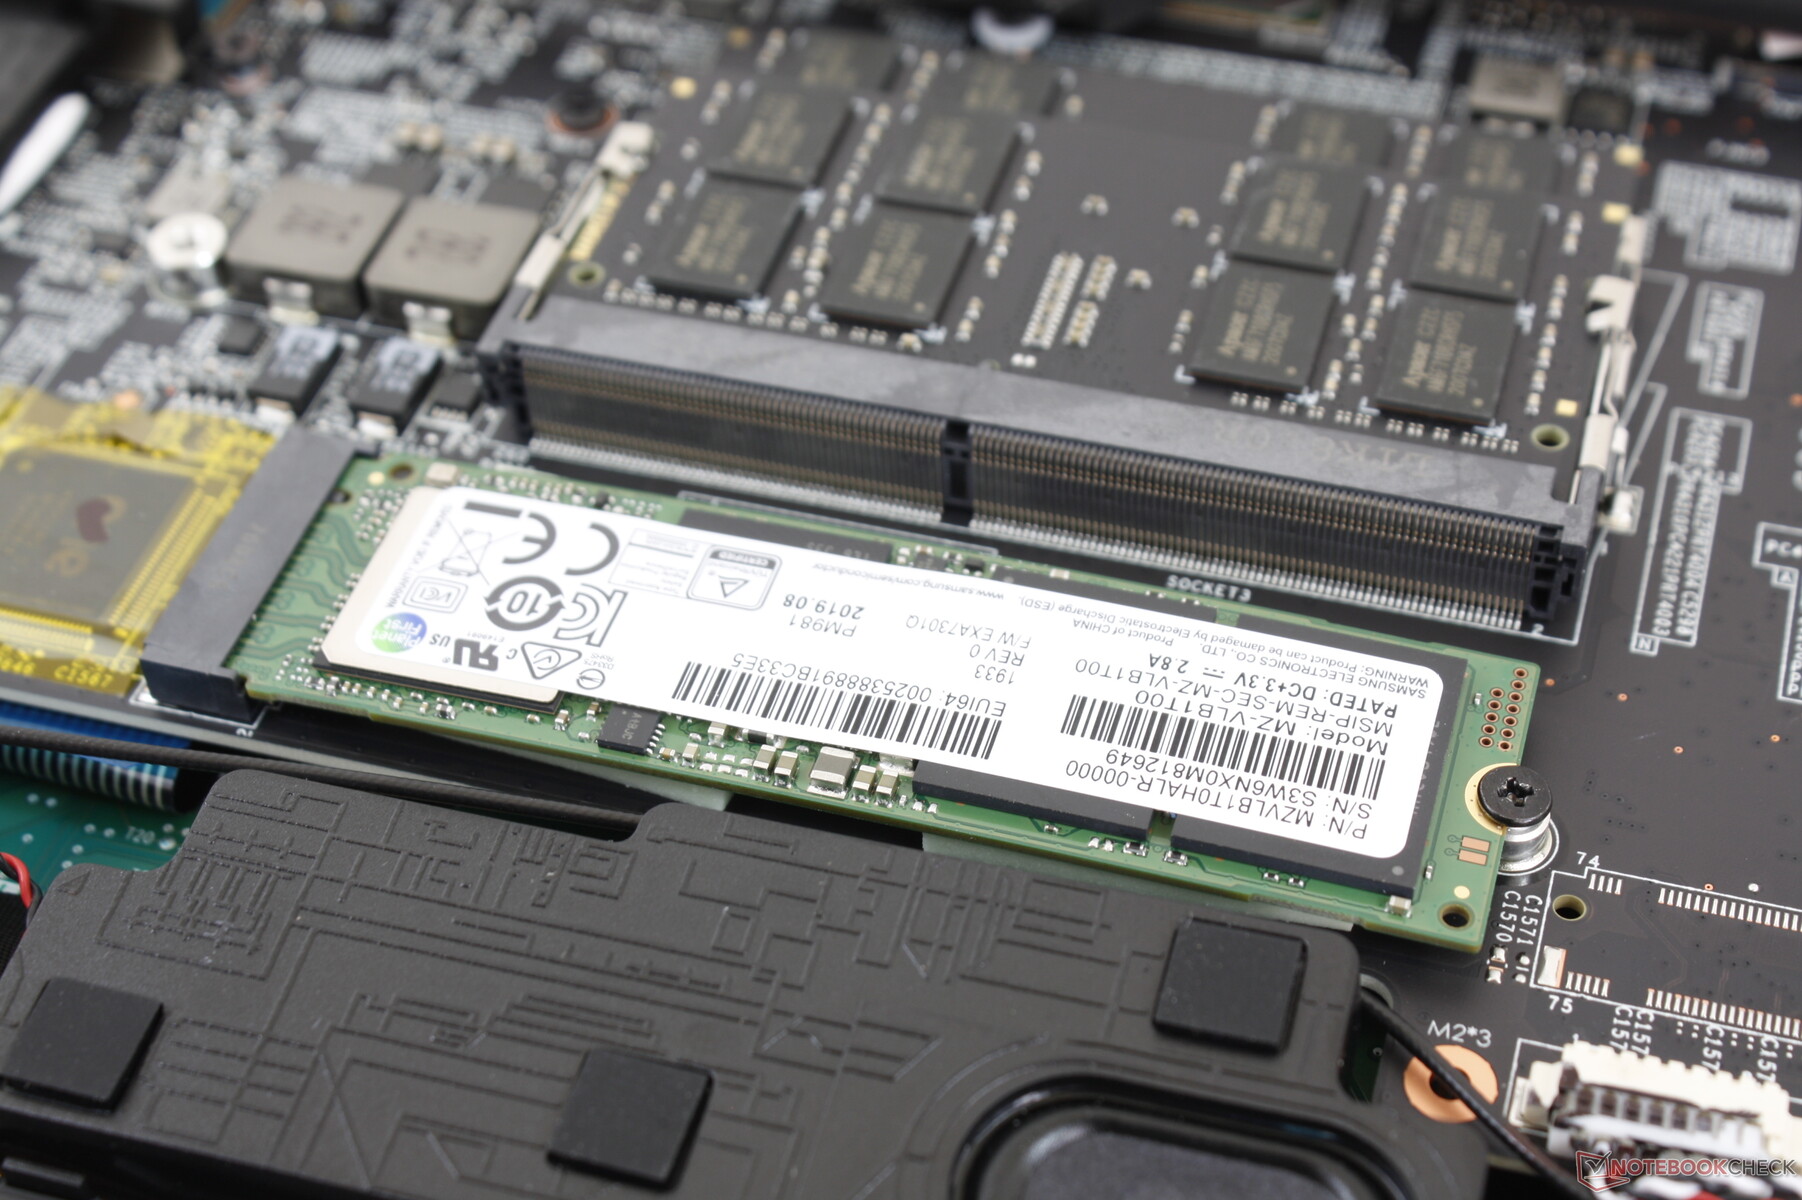
Our test unit comes with a 1 TB Samsung SSD PM981 and a secondary 2 TB Seagate ST2000LM007 HDD. The drive is only 5400 RPM, but the fast NVMe SSD more than makes up for it. The Samsung PM981 is faster than the Intel 660p series or the Toshiba XG3 series commonly found on Ultrabooks and other gaming laptops.
See our table of SSDs and HDDs for more benchmark comparisons.
| MSI GP65 10SFK-047US Samsung SSD PM981 MZVLB1T0HALR | Asus Strix Scar III G531GW-AZ062T Intel SSD 660p SSDPEKNW512G8 | Asus TUF FX505DT-EB73 Intel SSD 660p SSDPEKNW512G8 | HP Omen 15-dc1303ng Samsung SSD PM981 MZVLB256HAHQ | MSI GP62 7REX-1045US Toshiba NVMe THNSN5128GP | MSI GP65 Leopard 9SE-225US Toshiba KBG30ZMT512G | |
|---|---|---|---|---|---|---|
| AS SSD | -79% | -46% | -19% | -49% | -94% | |
| Seq Read (MB/s) | 2066 | 1163 -44% | 1019 -51% | 2485 20% | 1848 -11% | 1307 -37% |
| Seq Write (MB/s) | 2418 | 919 -62% | 889 -63% | 1575 -35% | 601 -75% | 730 -70% |
| 4K Read (MB/s) | 54.2 | 48.88 -10% | 48.22 -11% | 53.4 -1% | 35.84 -34% | 27.58 -49% |
| 4K Write (MB/s) | 129 | 90.1 -30% | 115.5 -10% | 113.5 -12% | 112 -13% | 80.3 -38% |
| 4K-64 Read (MB/s) | 1865 | 323.8 -83% | 321.5 -83% | 725 -61% | 628 -66% | 878 -53% |
| 4K-64 Write (MB/s) | 1878 | 403.8 -78% | 787 -58% | 1371 -27% | 428.2 -77% | 246.8 -87% |
| Access Time Read * (ms) | 0.042 | 0.24 -471% | 0.065 -55% | 0.059 -40% | 0.079 -88% | 0.231 -450% |
| Access Time Write * (ms) | 0.091 | 0.046 49% | 0.047 48% | 0.032 65% | 0.034 63% | 0.223 -145% |
| Score Read (Points) | 2126 | 489 -77% | 472 -78% | 1027 -52% | 849 -60% | 1036 -51% |
| Score Write (Points) | 2249 | 586 -74% | 992 -56% | 1642 -27% | 600 -73% | 400 -82% |
| Score Total (Points) | 5482 | 1332 -76% | 1717 -69% | 3163 -42% | 1829 -67% | 1940 -65% |
| Copy ISO MB/s (MB/s) | 2927 | 1269 -57% | 942 -68% | 1128 -61% | 993 -66% | |
| Copy Program MB/s (MB/s) | 728 | 452.8 -38% | 444.5 -39% | 326.3 -55% | 309.5 -57% | |
| Copy Game MB/s (MB/s) | 1614 | 755 -53% | 867 -46% | 442.8 -73% | 582 -64% | |
| CrystalDiskMark 5.2 / 6 | -34% | -33% | -27% | -25% | -33% | |
| Write 4K (MB/s) | 145 | 133.3 -8% | 137.5 -5% | 50.2 -65% | 158.4 9% | 99.3 -32% |
| Read 4K (MB/s) | 46.84 | 55.3 18% | 57 22% | 35.32 -25% | 45.04 -4% | 46.96 0% |
| Write Seq (MB/s) | 2377 | 980 -59% | 984 -59% | 991 -58% | 622 -74% | |
| Read Seq (MB/s) | 2185 | 1406 -36% | 1564 -28% | 1526 -30% | 1592 -27% | |
| Write 4K Q32T1 (MB/s) | 463.5 | 286.3 -38% | 237.4 -49% | 445.1 -4% | 434.2 -6% | 240.1 -48% |
| Read 4K Q32T1 (MB/s) | 527 | 331.5 -37% | 340.7 -35% | 526 0% | 590 12% | 581 10% |
| Write Seq Q32T1 (MB/s) | 2395 | 976 -59% | 959 -60% | 1647 -31% | 630 -74% | 686 -71% |
| Read Seq Q32T1 (MB/s) | 3470 | 1520 -56% | 1732 -50% | 3427 -1% | 2108 -39% | 1581 -54% |
| Write 4K Q8T8 (MB/s) | 748 | 268.1 | ||||
| Read 4K Q8T8 (MB/s) | 344.6 | 977 | ||||
| Total Average (Program / Settings) | -57% /
-63% | -40% /
-41% | -23% /
-22% | -37% /
-41% | -64% /
-75% |
* ... smaller is better

GPU Performance
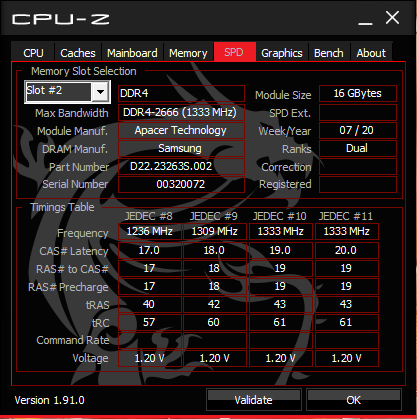
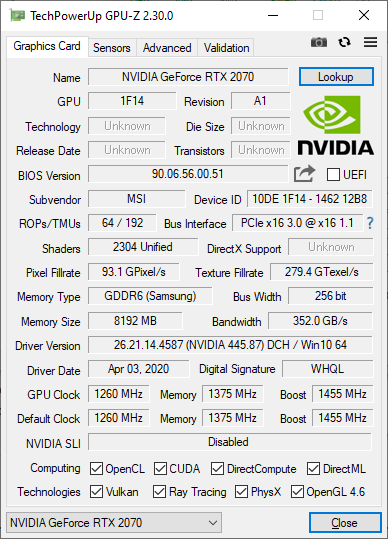
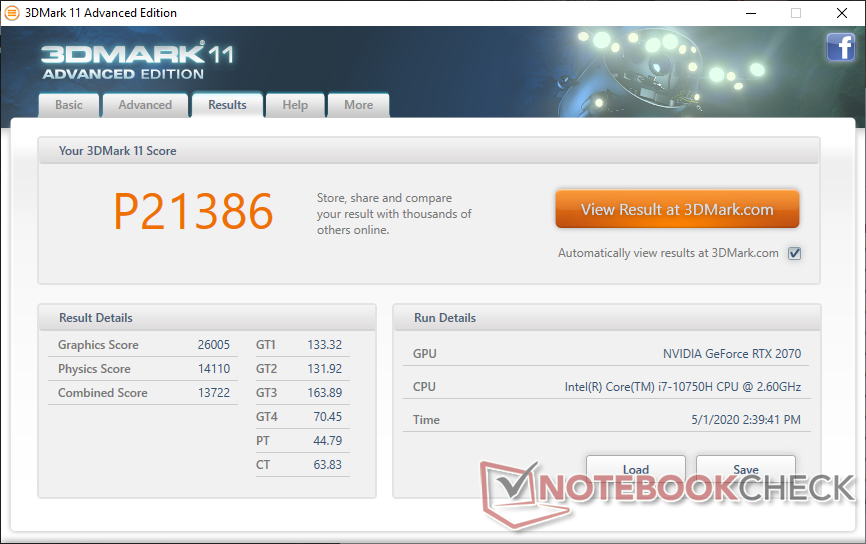
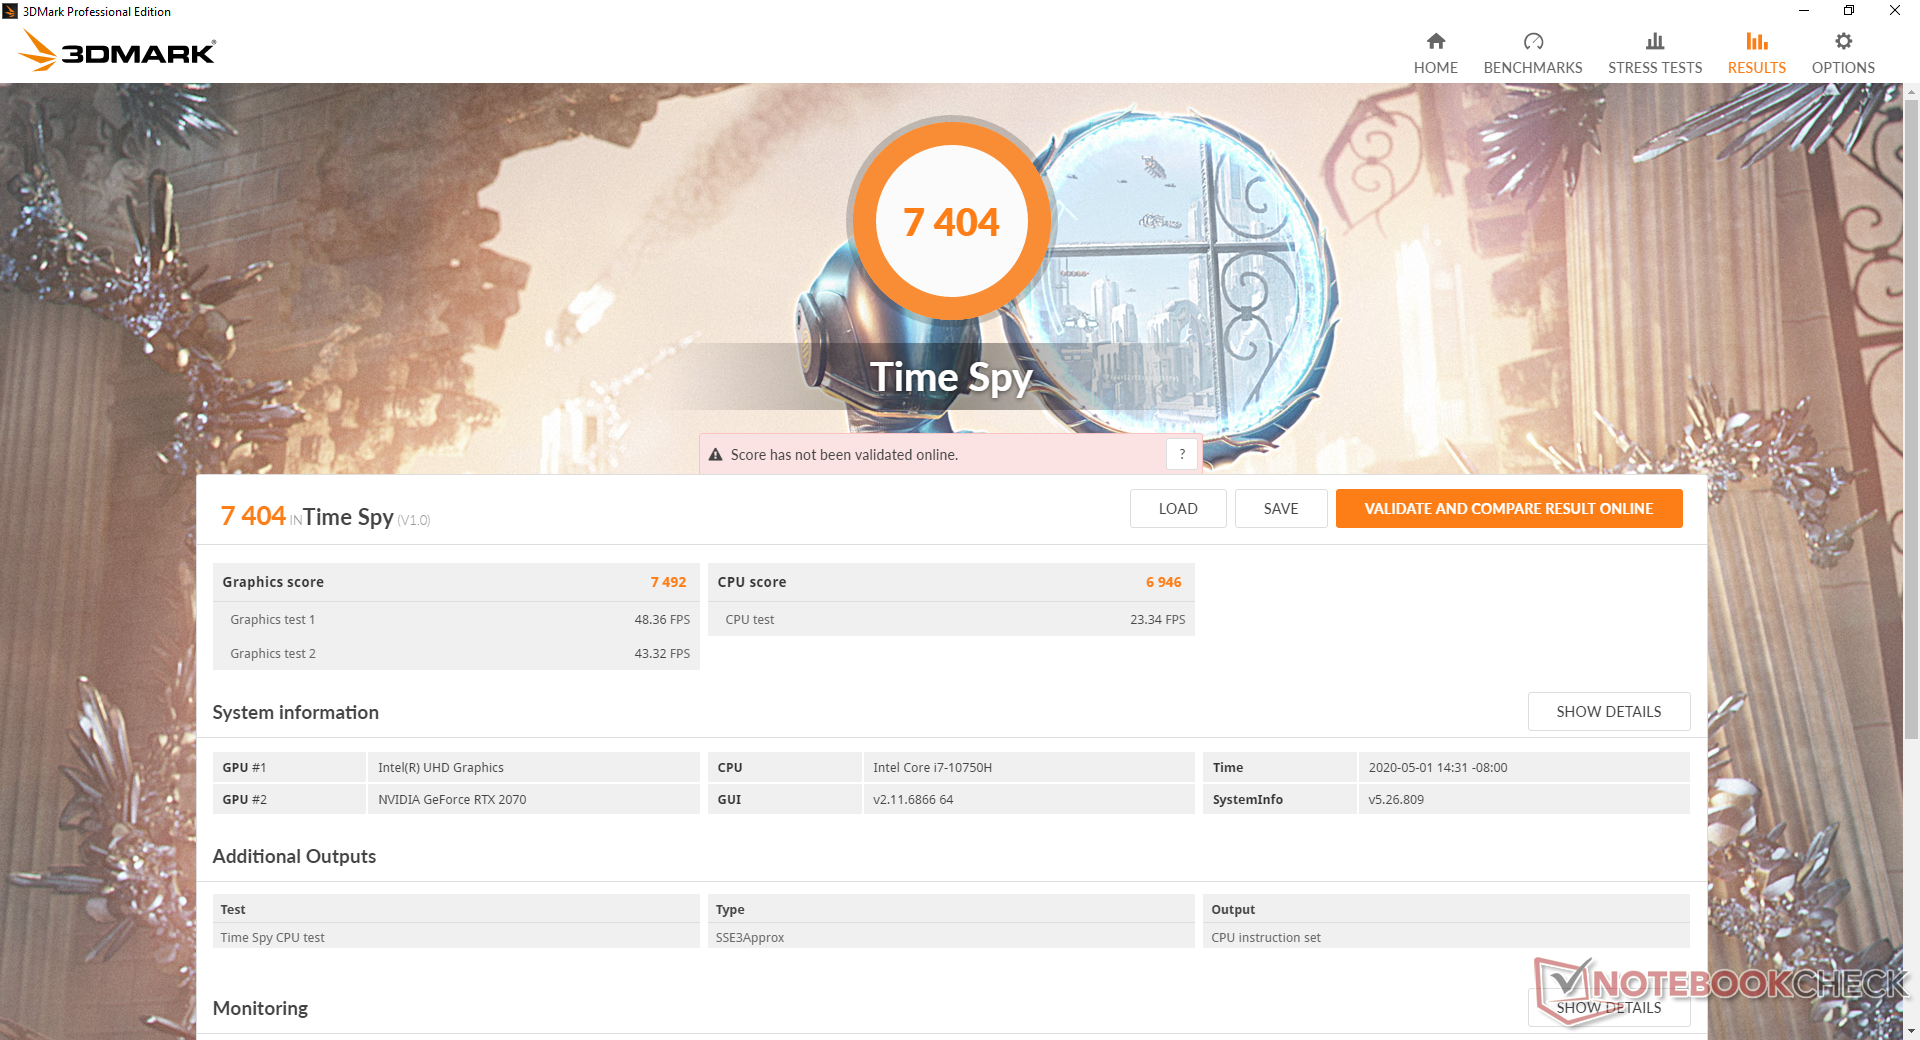
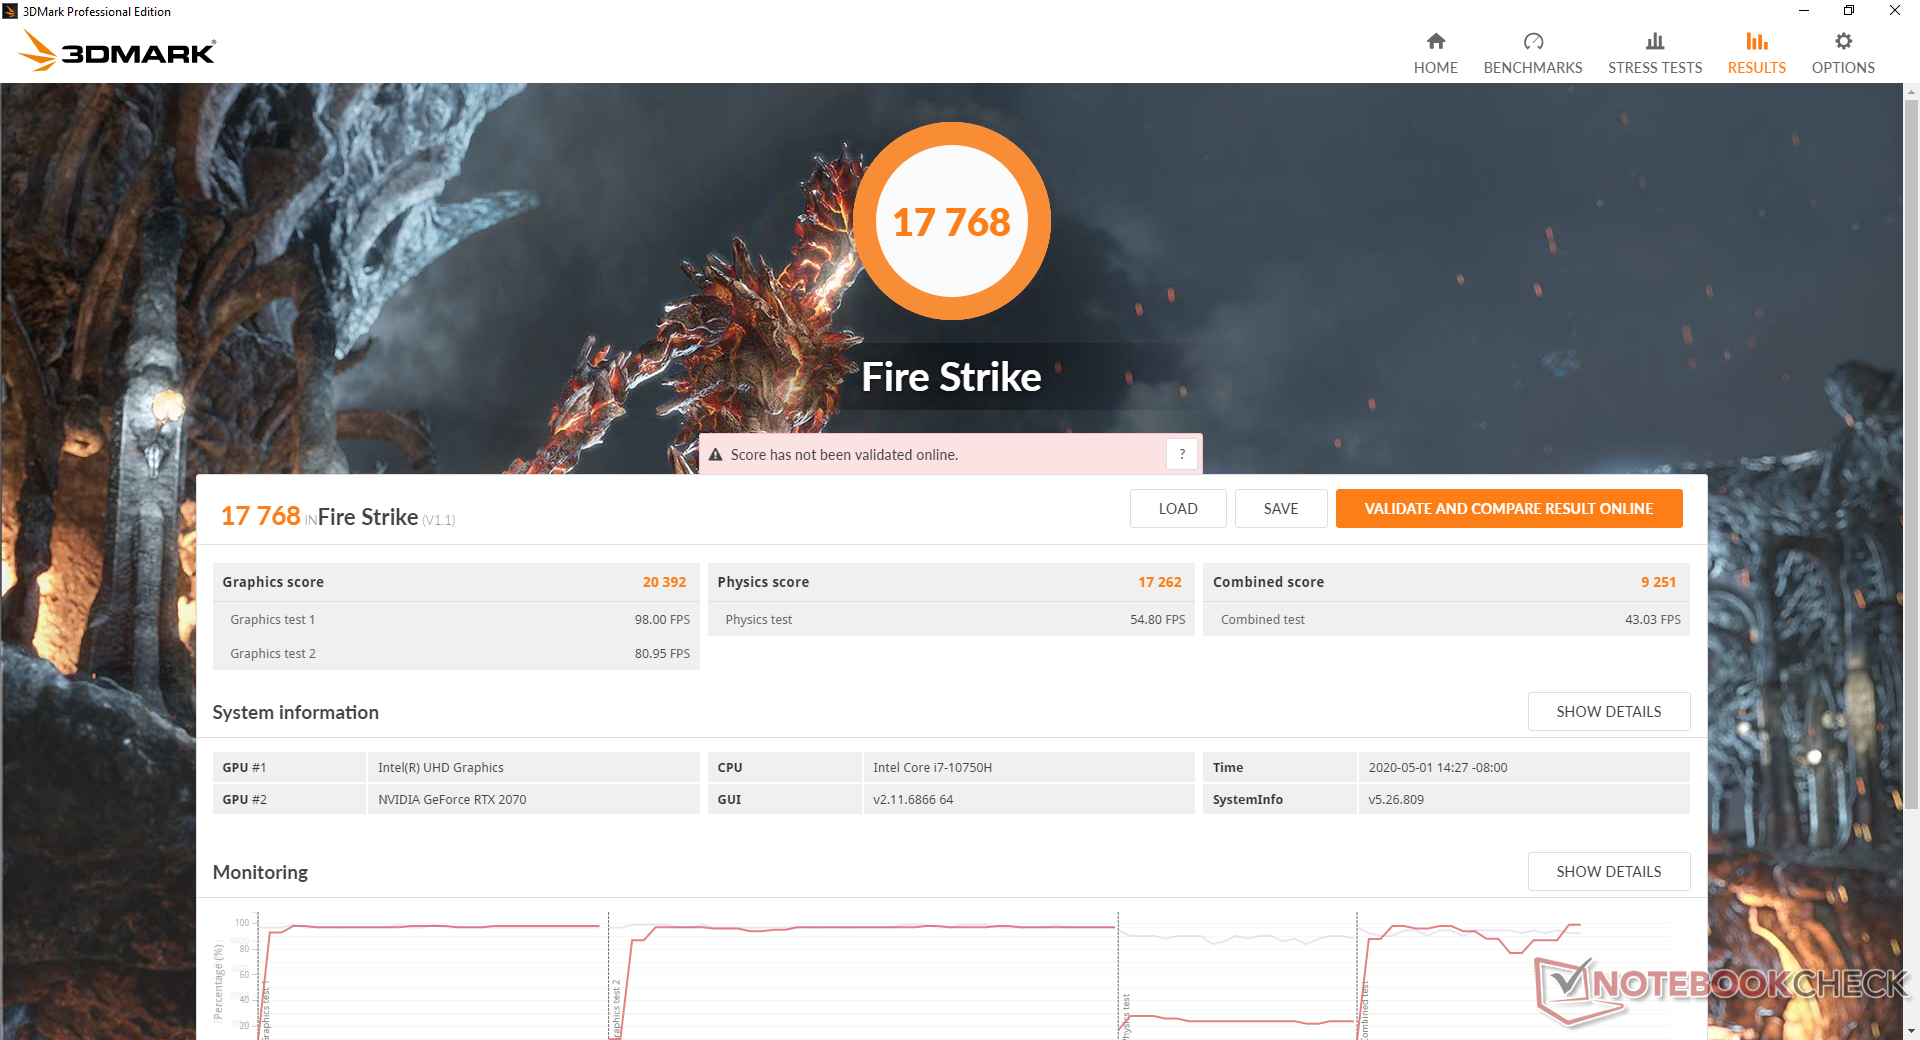
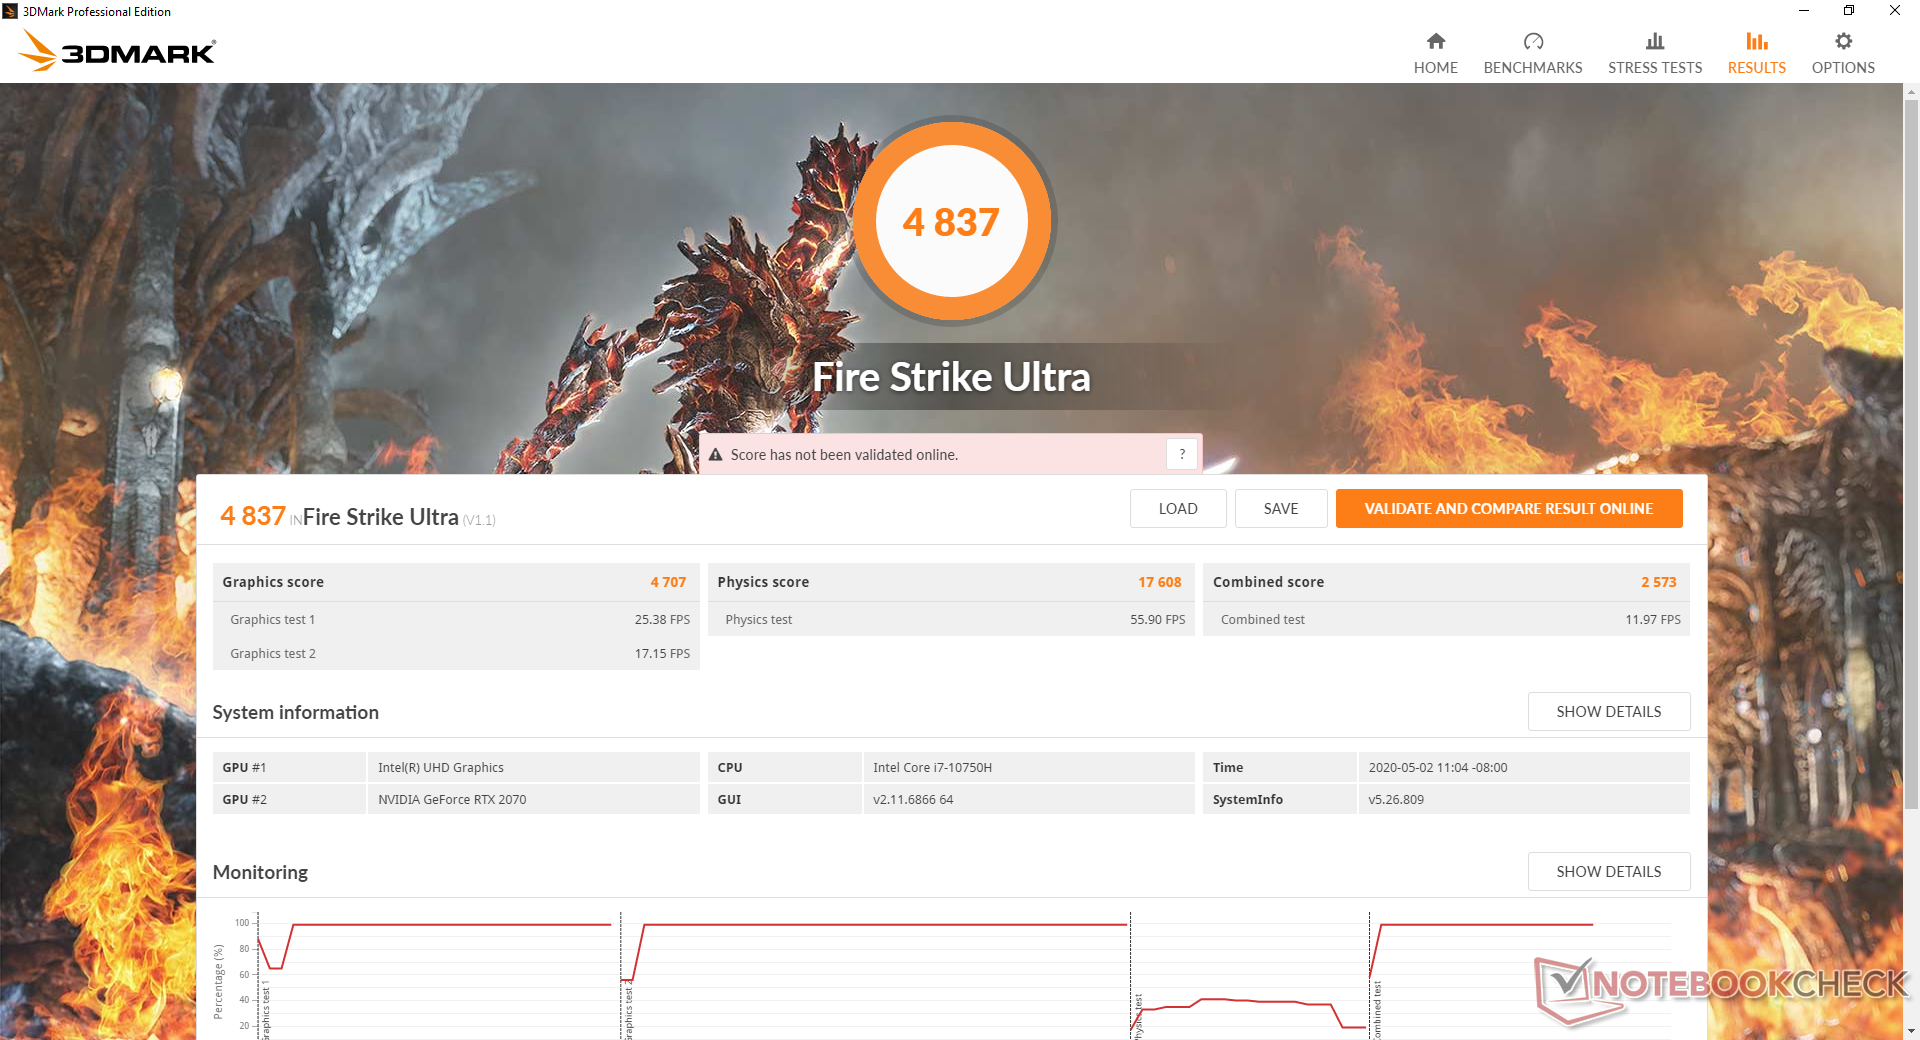
The GeForce RTX 2070 mobile in our MSI performs where we expect it to be at about 10 to 14 percent faster than the GeForce RTX 2070 Max-Q or 22 percent slower than the desktop GeForce RTX 2070. Performance when gaming is slightly higher than average by just a few percentage points likely due to both the new processor and the roomy 32 GB of DDR4-2666 RAM.
Idling on Witcher 3 for an hour shows steady frame rates with no unexpected dips for a smooth gaming performance.
See our dedicated page on the GeForce RTX 2070 mobile for more technical information and benchmark comparisons.
| 3DMark 06 Standard Score | 39513 points | |
| 3DMark 11 Performance | 21386 points | |
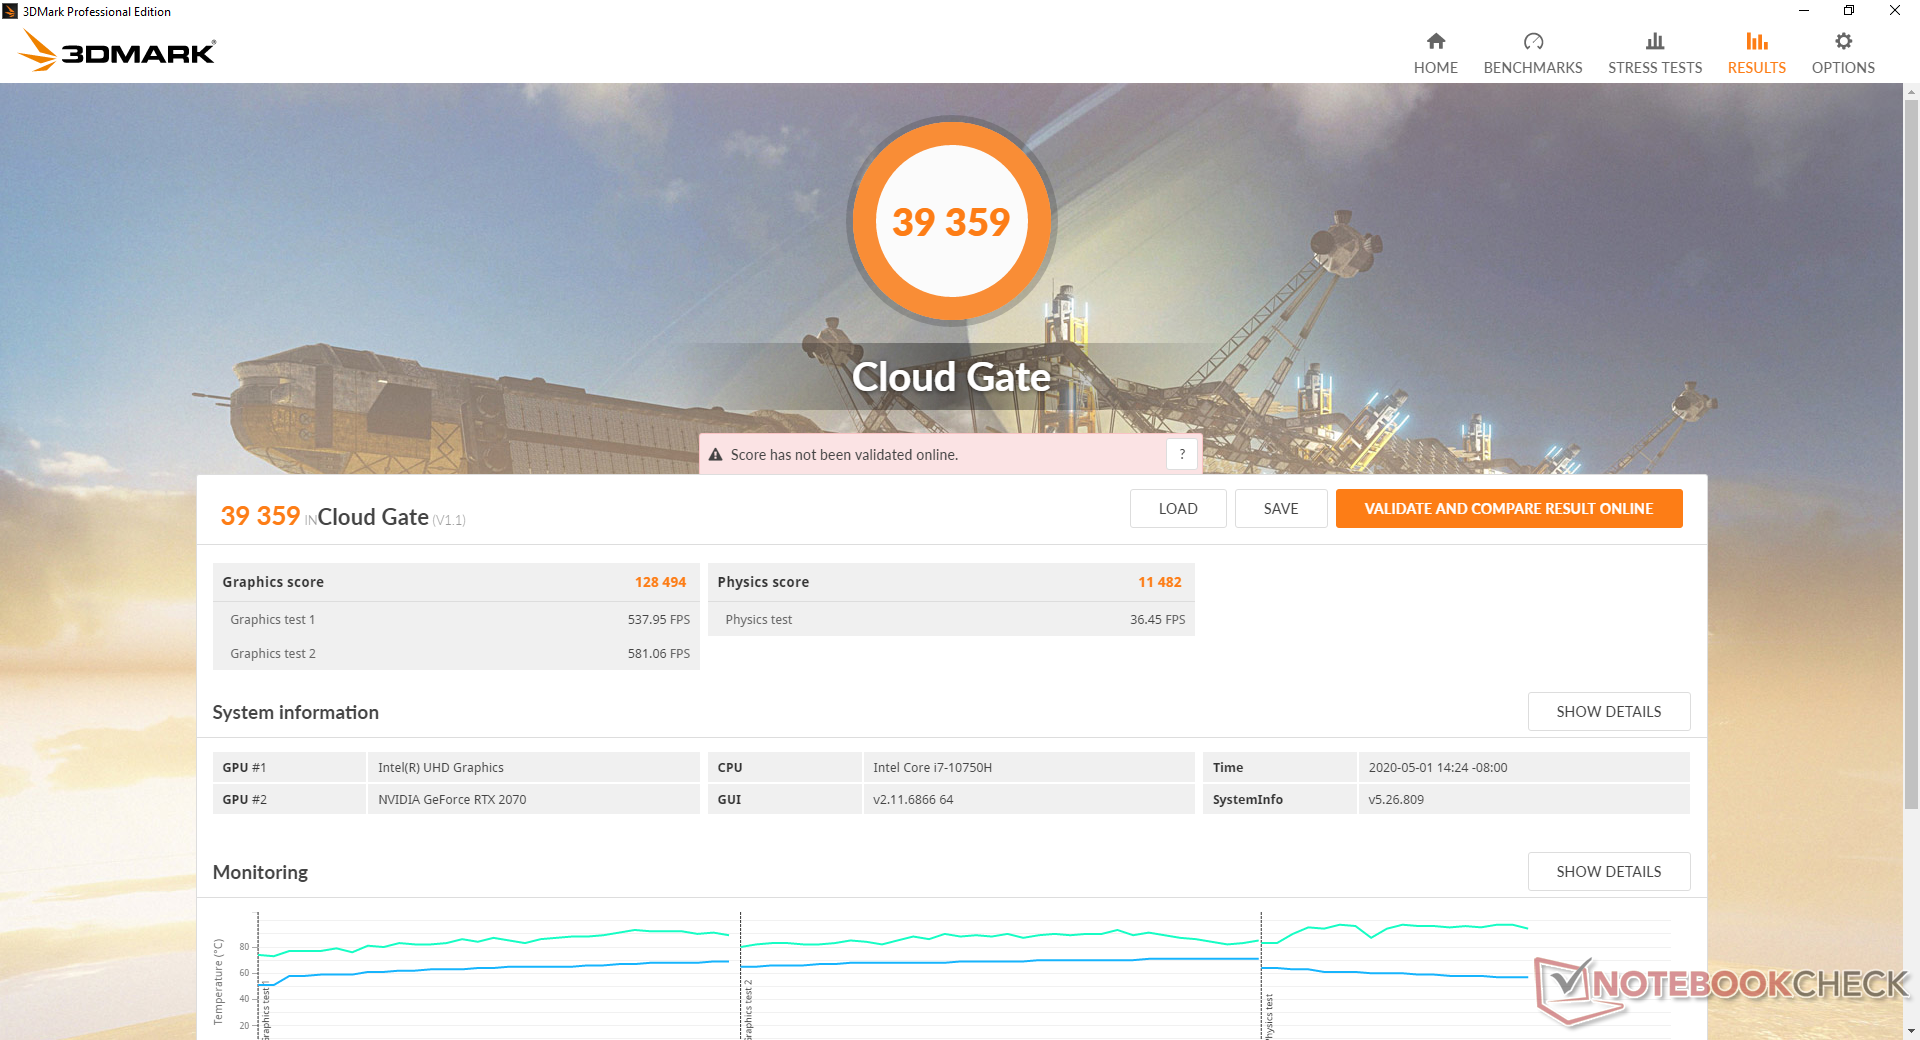
| 3DMark Cloud Gate Standard Score | 39359 points | |
| 3DMark Fire Strike Score | 17768 points | |
| 3DMark Time Spy Score | 7404 points | |
Help | ||
| Shadow of the Tomb Raider | |
| 1280x720 Lowest Preset | |
| Eurocom Sky X4C i9-9900KS | |
| MSI GF65 9SD | |
| MSI GP65 10SFK-047US | |
| Walmart EVOO Gaming 17 | |
| MSI RTX 2080 Gaming X Trio | |
| Average NVIDIA GeForce RTX 2070 Mobile (91.3 - 160, n=9) | |
| Asus G752VS | |
| Alienware 17 R4 | |
| 1920x1080 Medium Preset | |
| Eurocom Sky X4C i9-9900KS | |
| MSI RTX 2080 Gaming X Trio | |
| MSI GP65 10SFK-047US | |
| Average NVIDIA GeForce RTX 2070 Mobile (86 - 114, n=10) | |
| Walmart EVOO Gaming 17 | |
| Asus G752VS | |
| Alienware 17 R4 | |
| MSI GF65 9SD | |
| 1920x1080 Highest Preset AA:T | |
| Eurocom Sky X4C i9-9900KS | |
| MSI RTX 2080 Gaming X Trio | |
| MSI GP65 10SFK-047US | |
| Average NVIDIA GeForce RTX 2070 Mobile (74.2 - 97, n=11) | |
| Walmart EVOO Gaming 17 | |
| Alienware 17 R4 | |
| Asus G752VS | |
| MSI GF65 9SD | |
| The Witcher 3 | |
| 1024x768 Low Graphics & Postprocessing | |
| Eurocom Sky X4C i9-9900KS | |
| MSI GP65 10SFK-047US | |
| MSI RTX 2080 Gaming X Trio | |
| Walmart EVOO Gaming 17 | |
| Average NVIDIA GeForce RTX 2070 Mobile (193.9 - 357, n=12) | |
| MSI GF65 9SD | |
| 1366x768 Medium Graphics & Postprocessing | |
| Eurocom Sky X4C i9-9900KS | |
| MSI RTX 2080 Gaming X Trio | |
| MSI GP65 10SFK-047US | |
| Average NVIDIA GeForce RTX 2070 Mobile (154 - 250, n=12) | |
| Walmart EVOO Gaming 17 | |
| MSI GF65 9SD | |
| 1920x1080 High Graphics & Postprocessing (Nvidia HairWorks Off) | |
| MSI RTX 2080 Gaming X Trio | |
| Eurocom Sky X4C i9-9900KS | |
| MSI GP65 10SFK-047US | |
| Average NVIDIA GeForce RTX 2070 Mobile (115.7 - 160.8, n=17) | |
| Walmart EVOO Gaming 17 | |
| MSI GF65 9SD | |
| 1920x1080 Ultra Graphics & Postprocessing (HBAO+) | |
| MSI RTX 2080 Gaming X Trio | |
| Eurocom Sky X4C i9-9900KS | |
| MSI GP65 10SFK-047US | |
| Average NVIDIA GeForce RTX 2070 Mobile (64 - 82.1, n=21) | |
| Walmart EVOO Gaming 17 | |
| MSI GF65 9SD | |
| low | med. | high | ultra | |
|---|---|---|---|---|
| BioShock Infinite (2013) | 352 | 316 | 288.9 | 164.6 |
| The Witcher 3 (2015) | 326.4 | 244.5 | 160.8 | 82.1 |
| Dota 2 Reborn (2015) | 152 | 139 | 128 | 120 |
| X-Plane 11.11 (2018) | 102 | 91.7 | 77.5 | |
| Shadow of the Tomb Raider (2018) | 135 | 107 | 102 | 93 |
Emissions
System Noise
The fans are always active no matter the setting for a minimum fan noise of 31.9 dB(A) against a background of 29.3 dB(A). It'll be audible in a silent room, but essentially unnoticeable in offices spaces.
When running the first benchmark scene of 3DMark 06, fan noise would steadily increase until reaching 47 dB(A) towards the end of the 90-second benchmark. Results are much louder than what we recorded on last year's GP65 with the slower RTX 2060 GPU. Thankfully, fan noise remains steady at only 33.5 dB(A) if simply web browsing or video streaming.
When running Witcher 3, fan noise would stabilize at almost 54 dB(A) to be louder than most gaming laptops under similar conditions. If Cooler Boost is enabled, fan noise will jump to almost 57 dB(A) no matter the onscreen load.
We can notice no electronic noise from our test unit, but the constant fan noise would have drowned it anyway.
| MSI GP65 10SFK-047US GeForce RTX 2070 Mobile, i7-10750H, Samsung SSD PM981 MZVLB1T0HALR | Asus Strix Scar III G531GW-AZ062T GeForce RTX 2070 Mobile, i7-9750H, Intel SSD 660p SSDPEKNW512G8 | Asus TUF FX505DT-EB73 GeForce GTX 1650 Mobile, R7 3750H, Intel SSD 660p SSDPEKNW512G8 | HP Omen 15-dc1303ng GeForce RTX 2070 Max-Q, i7-8750H, Samsung SSD PM981 MZVLB256HAHQ | MSI GP62 7REX-1045US GeForce GTX 1050 Ti Mobile, i7-7700HQ, Toshiba NVMe THNSN5128GP | MSI GP65 Leopard 9SE-225US GeForce RTX 2060 Mobile, i7-9750H, Toshiba KBG30ZMT512G | |
|---|---|---|---|---|---|---|
| Noise | 5% | 10% | 3% | 7% | 12% | |
| off / environment * (dB) | 29.3 | 30 -2% | 28.2 4% | 30.5 -4% | 28 4% | 28.2 4% |
| Idle Minimum * (dB) | 31.9 | 30.6 4% | 28.2 12% | 32.8 -3% | 32.2 -1% | 29.5 8% |
| Idle Average * (dB) | 31.9 | 30.6 4% | 28.2 12% | 32.8 -3% | 32.2 -1% | 29.6 7% |
| Idle Maximum * (dB) | 33.5 | 37.7 -13% | 31.4 6% | 32.8 2% | 32.2 4% | 29.6 12% |
| Load Average * (dB) | 47 | 36.5 22% | 39.8 15% | 42.5 10% | 40.9 13% | 33 30% |
| Witcher 3 ultra * (dB) | 53.8 | 52.1 3% | 47 13% | 45.4 16% | 47.2 12% | |
| Load Maximum * (dB) | 56.7 | 48.1 15% | 50.2 11% | 47.5 16% | 48.6 14% | 52 8% |
* ... smaller is better
Noise level
| Idle |
| 31.9 / 31.9 / 33.5 dB(A) |
| Load |
| 47 / 56.7 dB(A) |
 | ||
30 dB silent 40 dB(A) audible 50 dB(A) loud |
||
min: | ||
Temperature
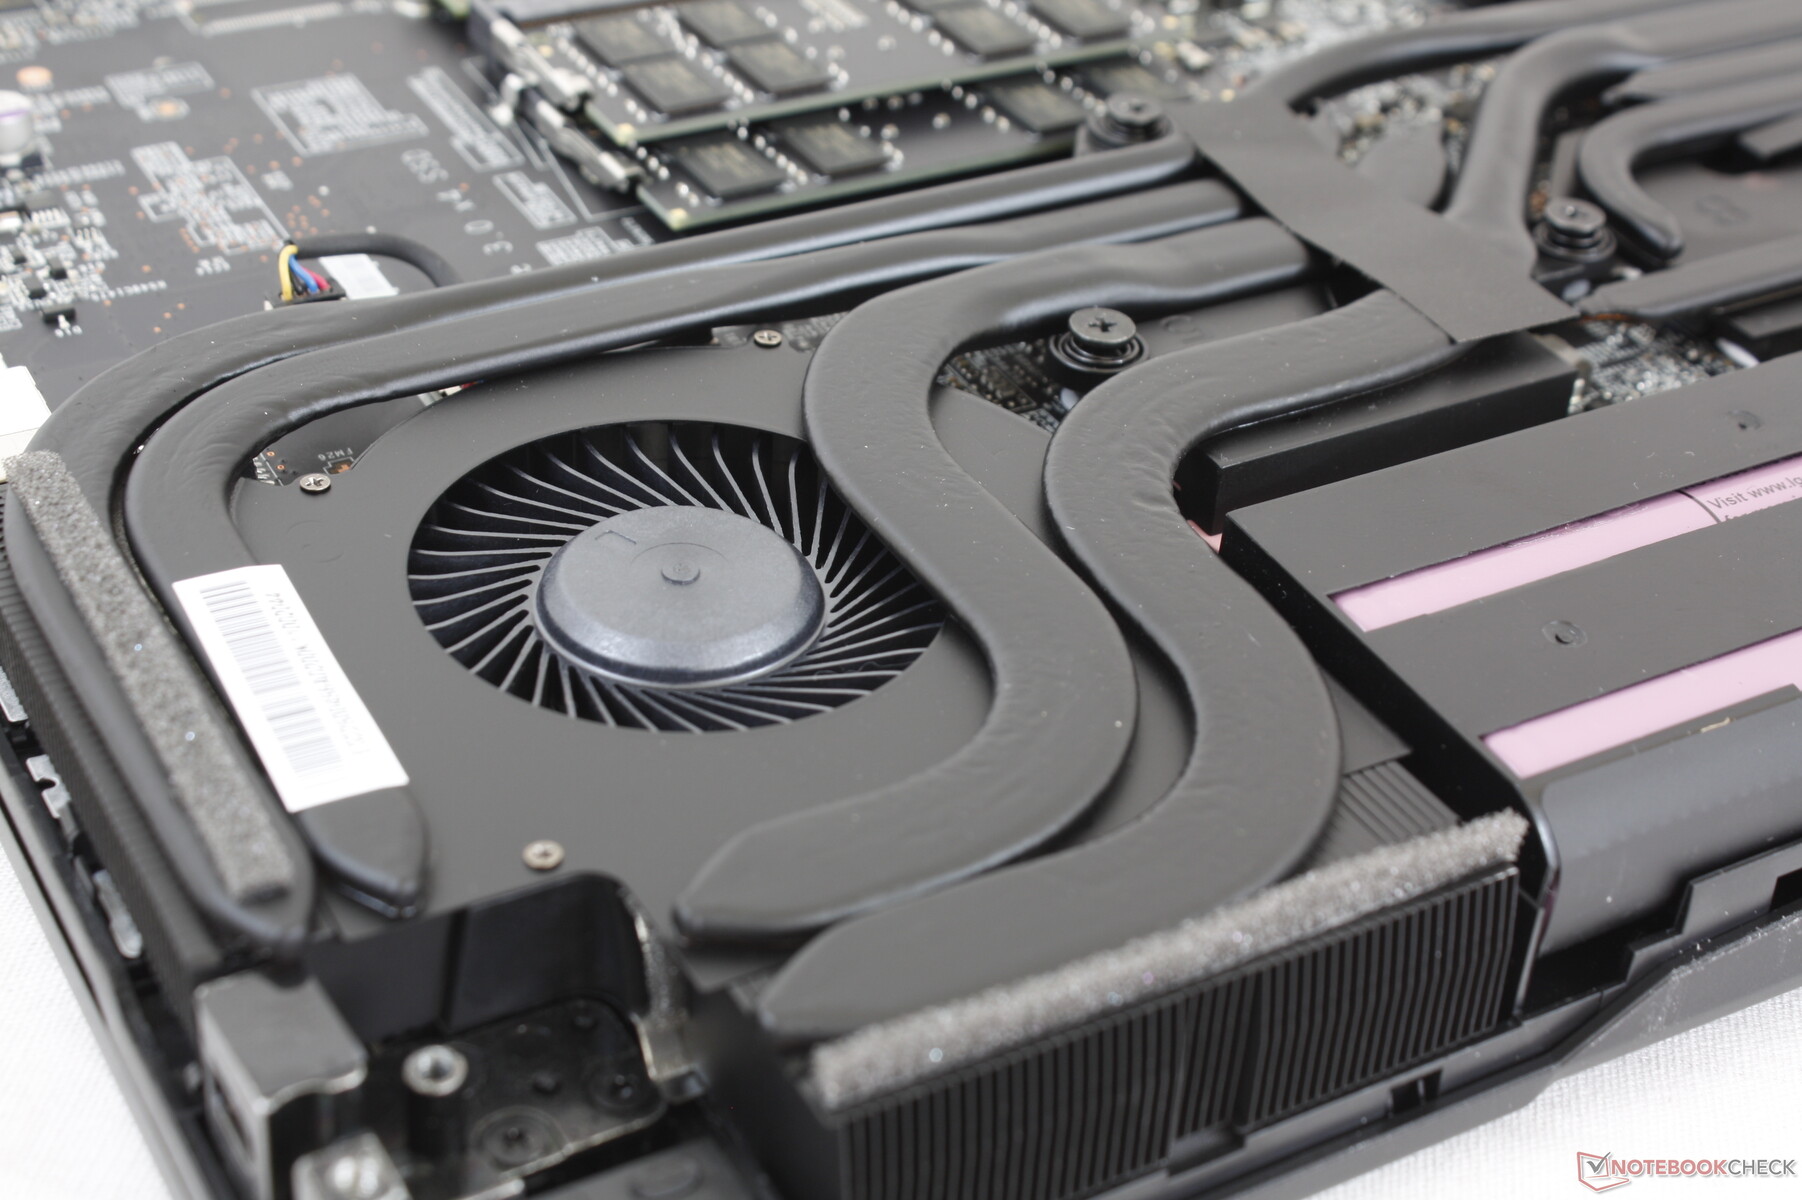
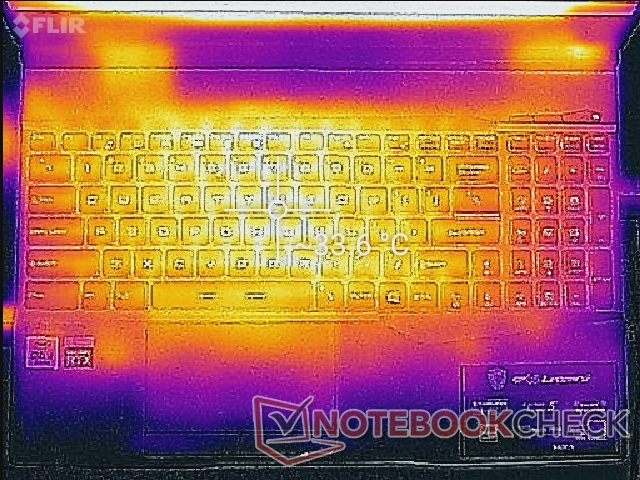
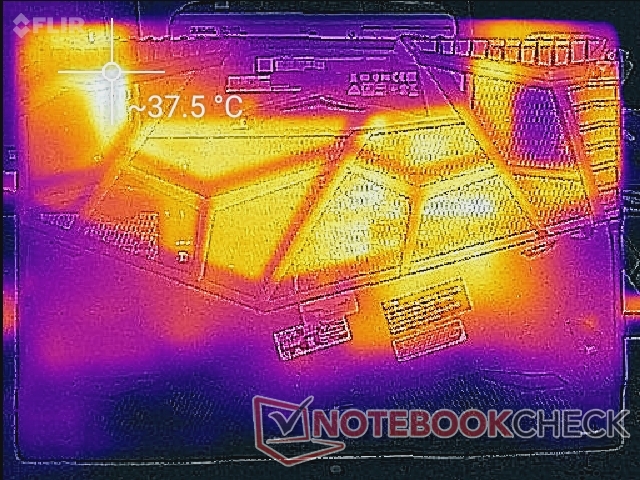
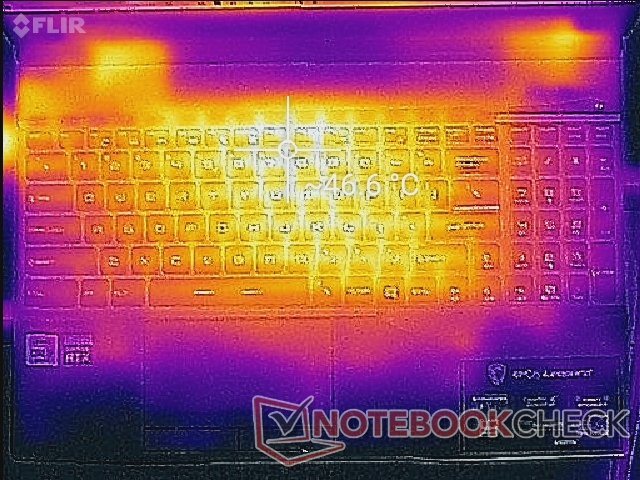
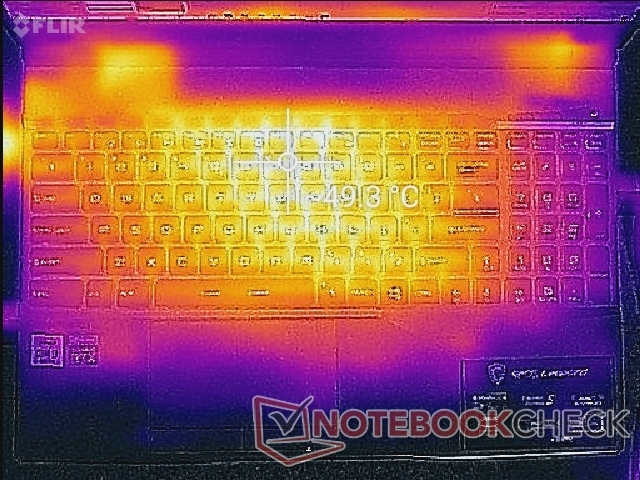
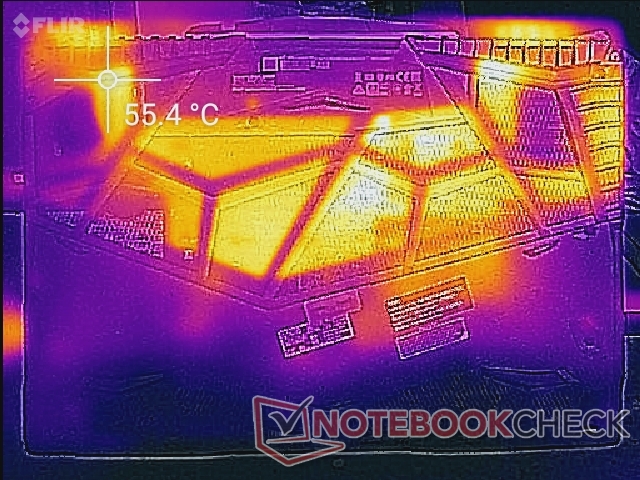
Surface temperatures are about the same as what we measured on last year's GP65 even though this newer SKU comes with the more powerful GeForce RTX 2070 GPU. Gaming, for example, causes the keyboard center to stabilize at around 46 C to 49 C. We applaud MSI for including very large ventilation grilles on the bottom panel unlike on some other gaming laptops like the Zephyrus G14 or G15.
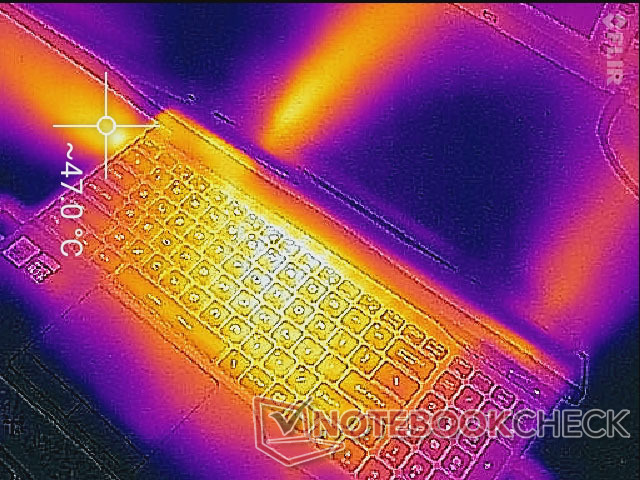
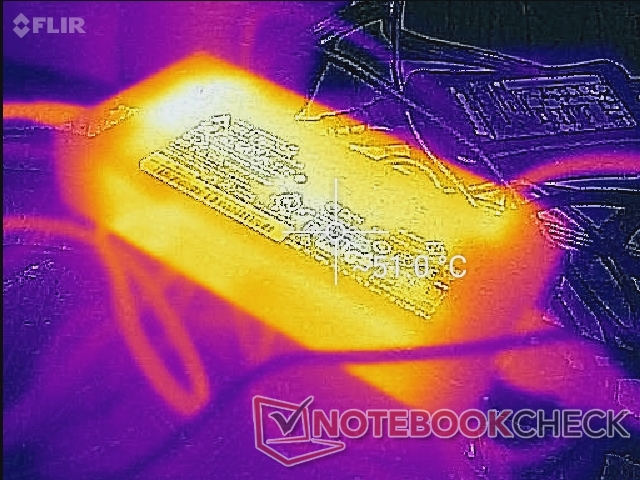
(-) The maximum temperature on the upper side is 49.4 °C / 121 F, compared to the average of 40.4 °C / 105 F, ranging from 21.2 to 68.8 °C for the class Gaming.
(-) The bottom heats up to a maximum of 57.2 °C / 135 F, compared to the average of 43.2 °C / 110 F
(+) In idle usage, the average temperature for the upper side is 30.6 °C / 87 F, compared to the device average of 33.9 °C / 93 F.
(±) Playing The Witcher 3, the average temperature for the upper side is 34.3 °C / 94 F, compared to the device average of 33.9 °C / 93 F.
(+) The palmrests and touchpad are cooler than skin temperature with a maximum of 30.8 °C / 87.4 F and are therefore cool to the touch.
(±) The average temperature of the palmrest area of similar devices was 28.8 °C / 83.8 F (-2 °C / -3.6 F).

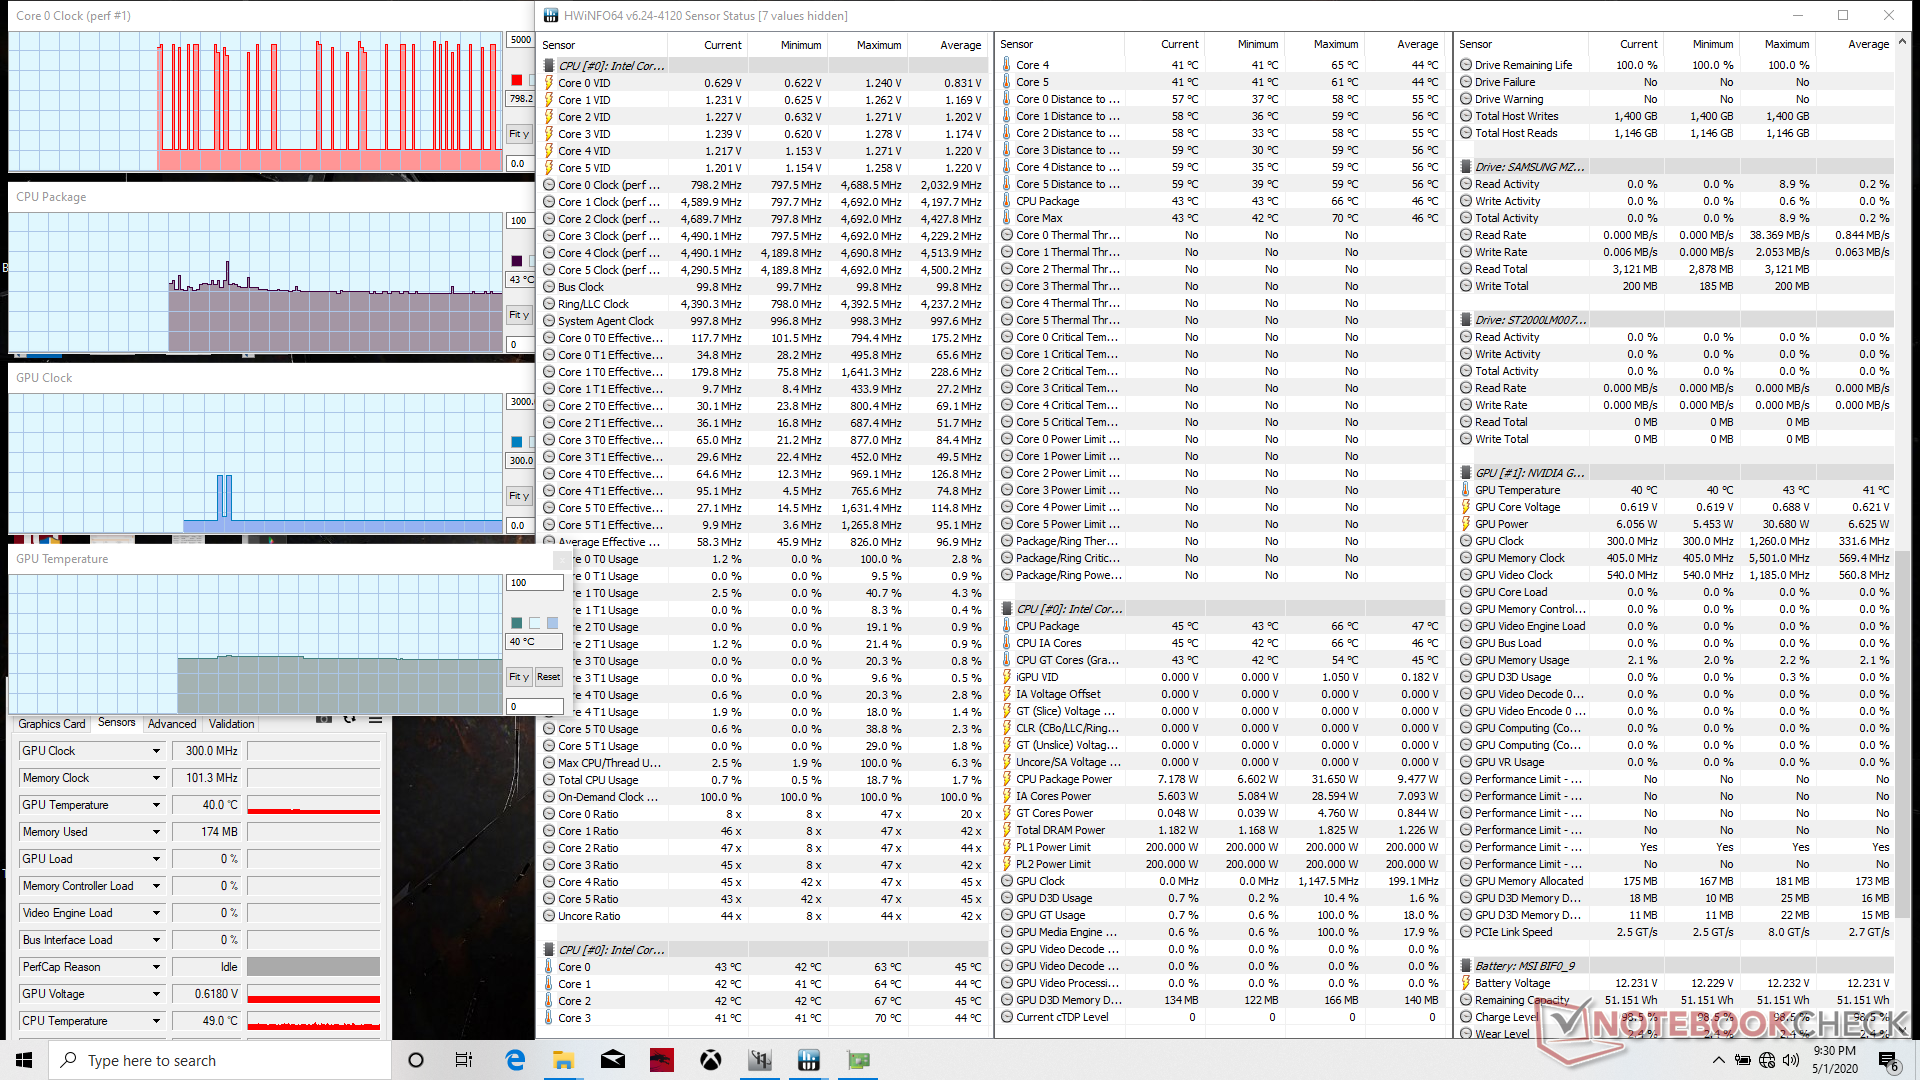
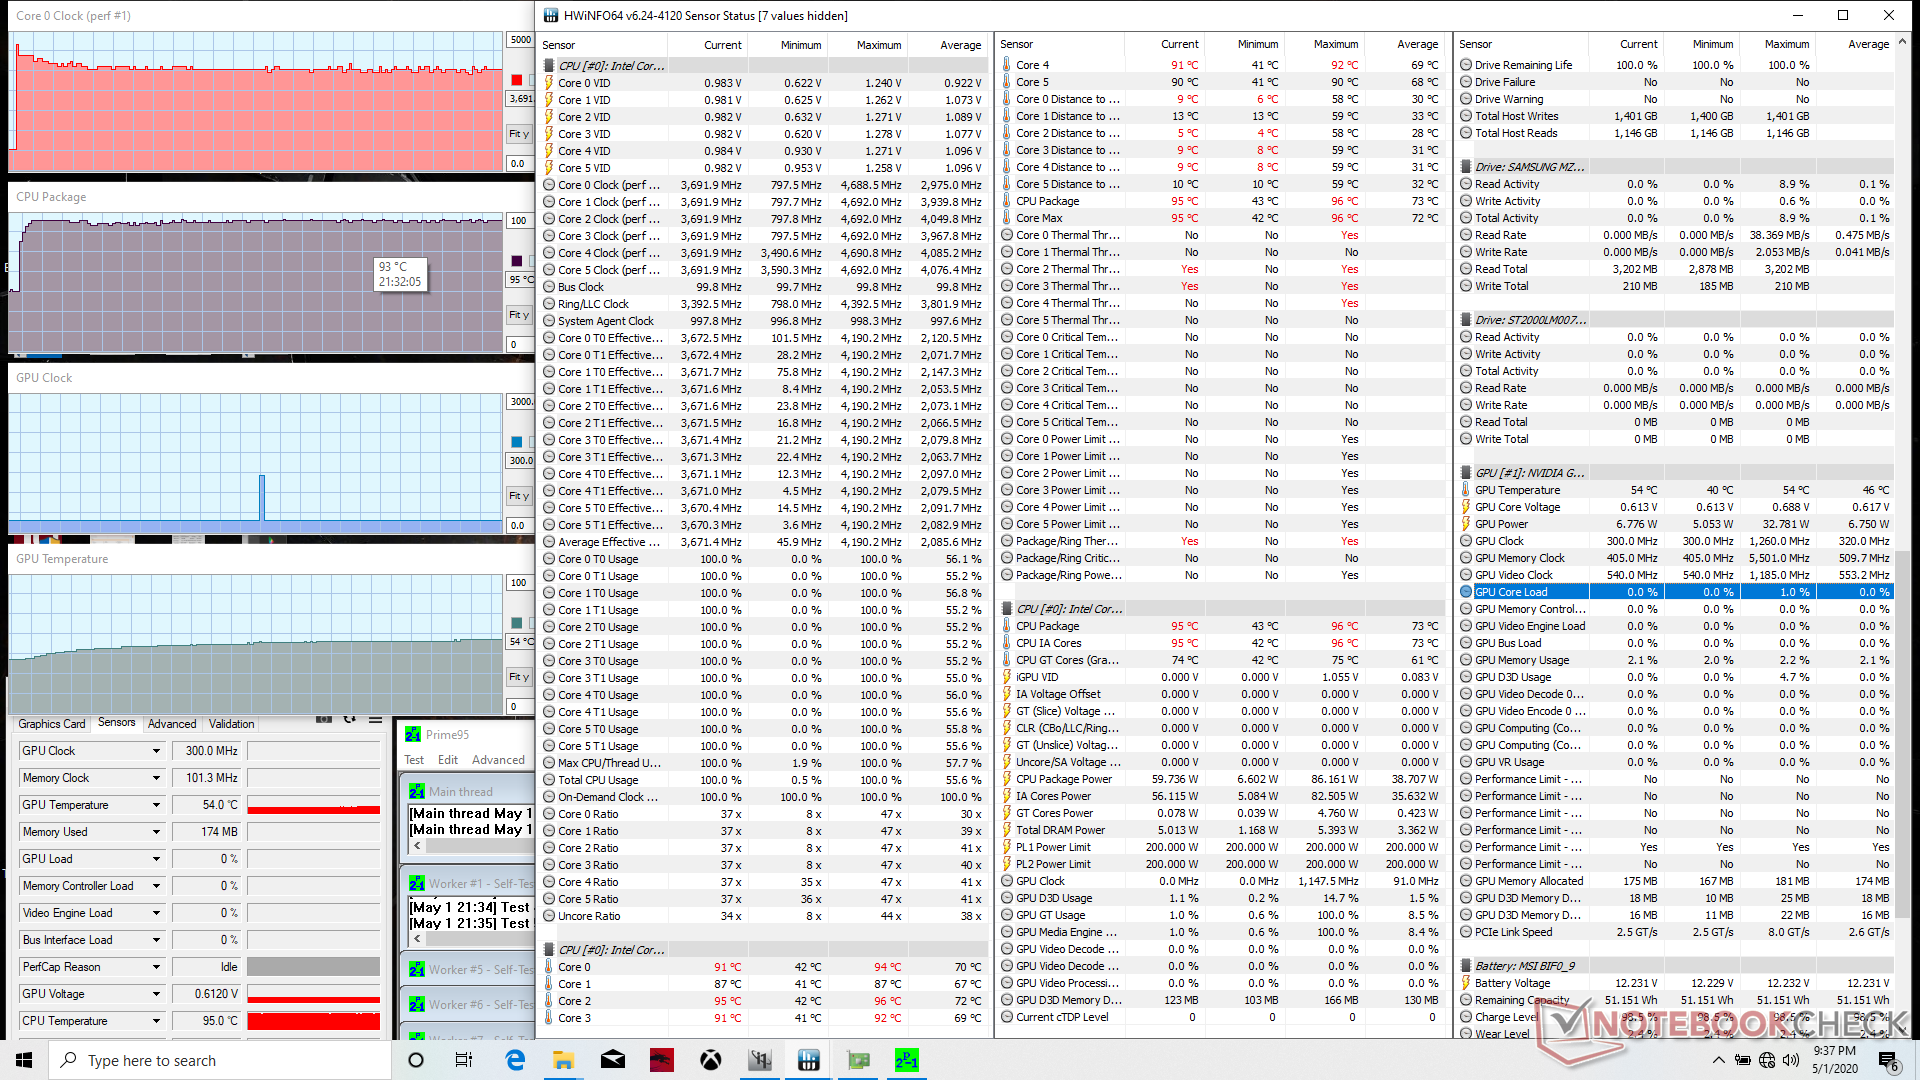
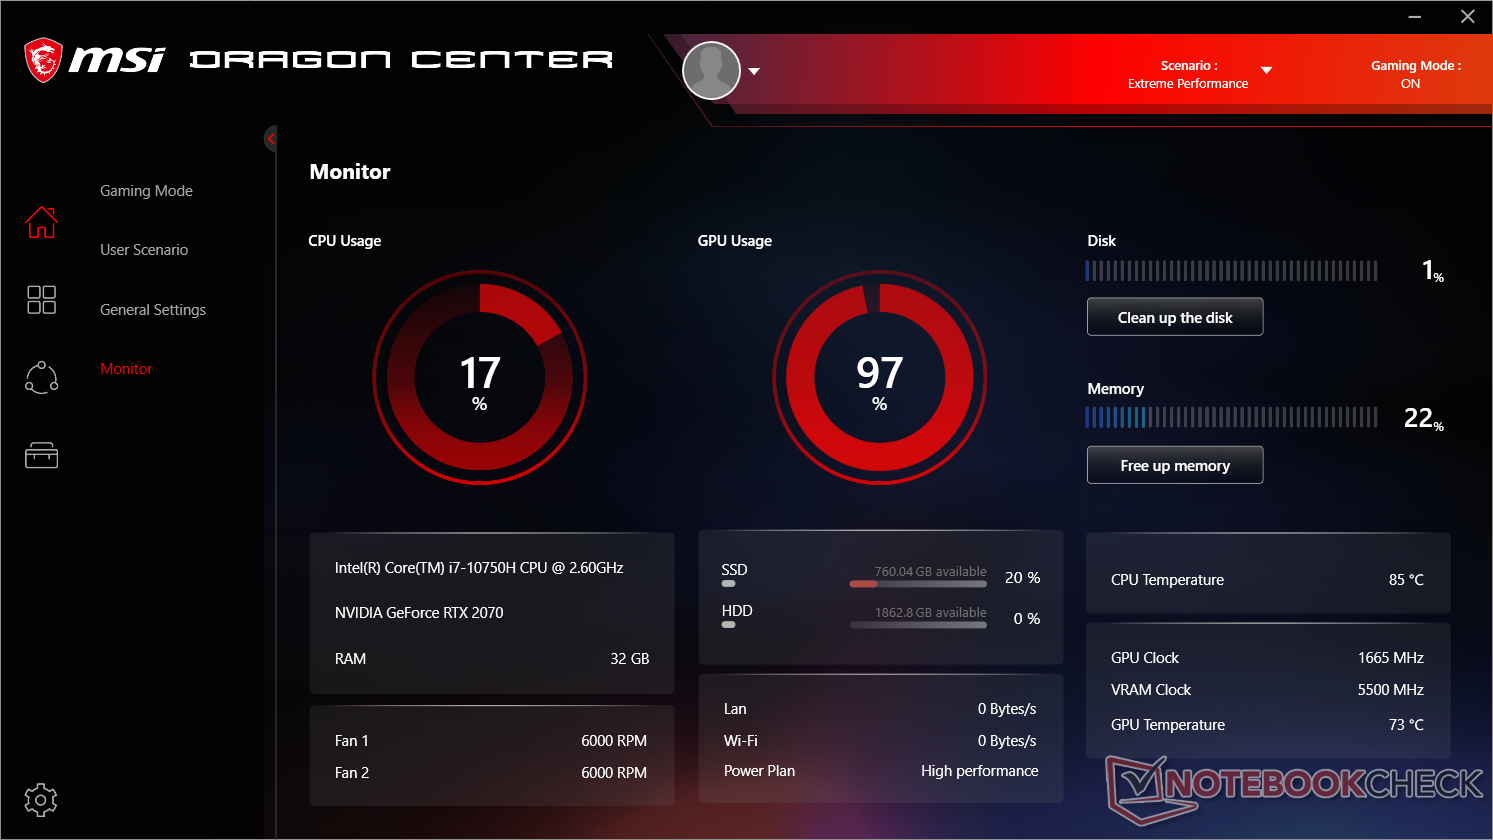
Stress Test
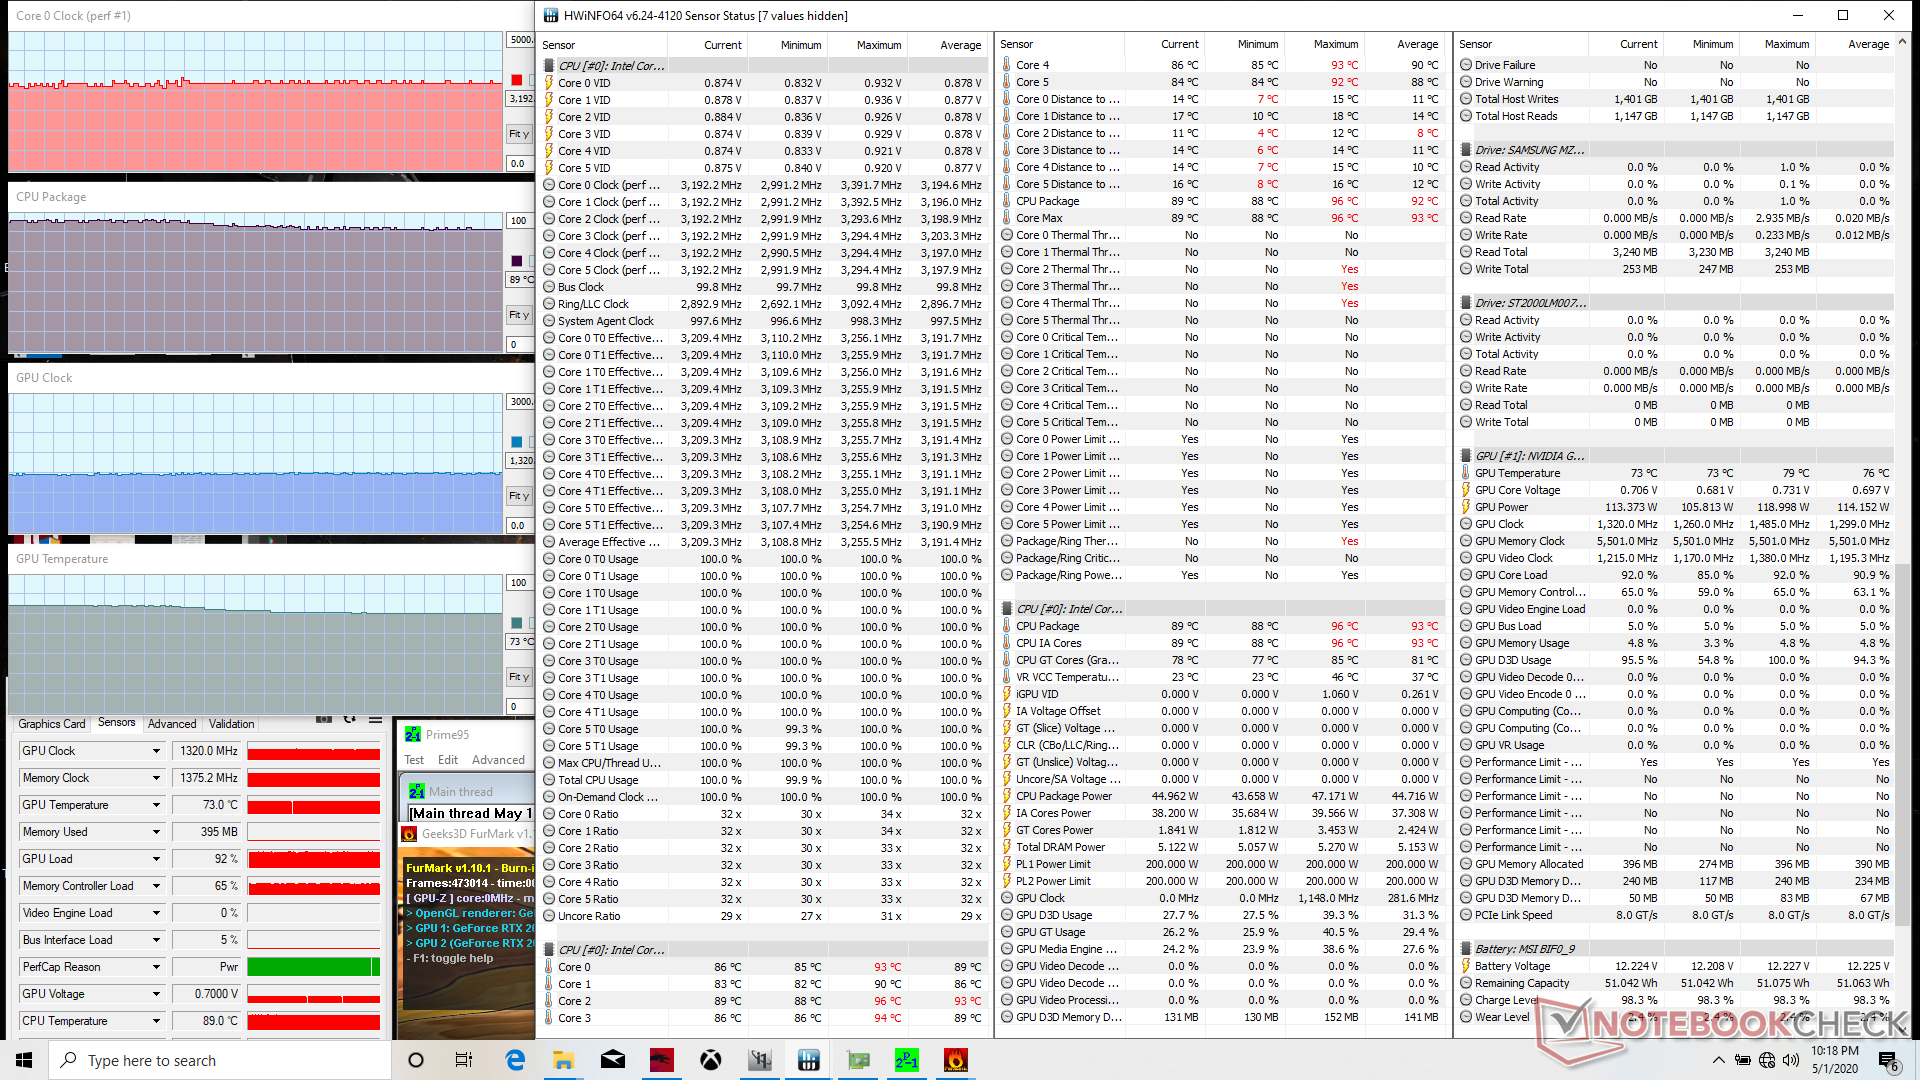
We stress the system with synthetic loads to identify for any potential throttling or stability issues. When running Prime95, the CPU would boost to 4.2 GHz for the first few seconds before steadily declining to a stable 3.7 GHz. Core temperature would also stabilize at a very warm 95 C. If running both Prime95 and FurMark simultaneously, the CPU would drop even further to 3.1 GHz while maintaining the same core temperature of 95 C. Enabling Cooler Boost mode (i.e., Maximum Fan mode) will cause core temperatures to drop by only a few degrees while keeping clock rates relatively the same as shown by the screenshots below.
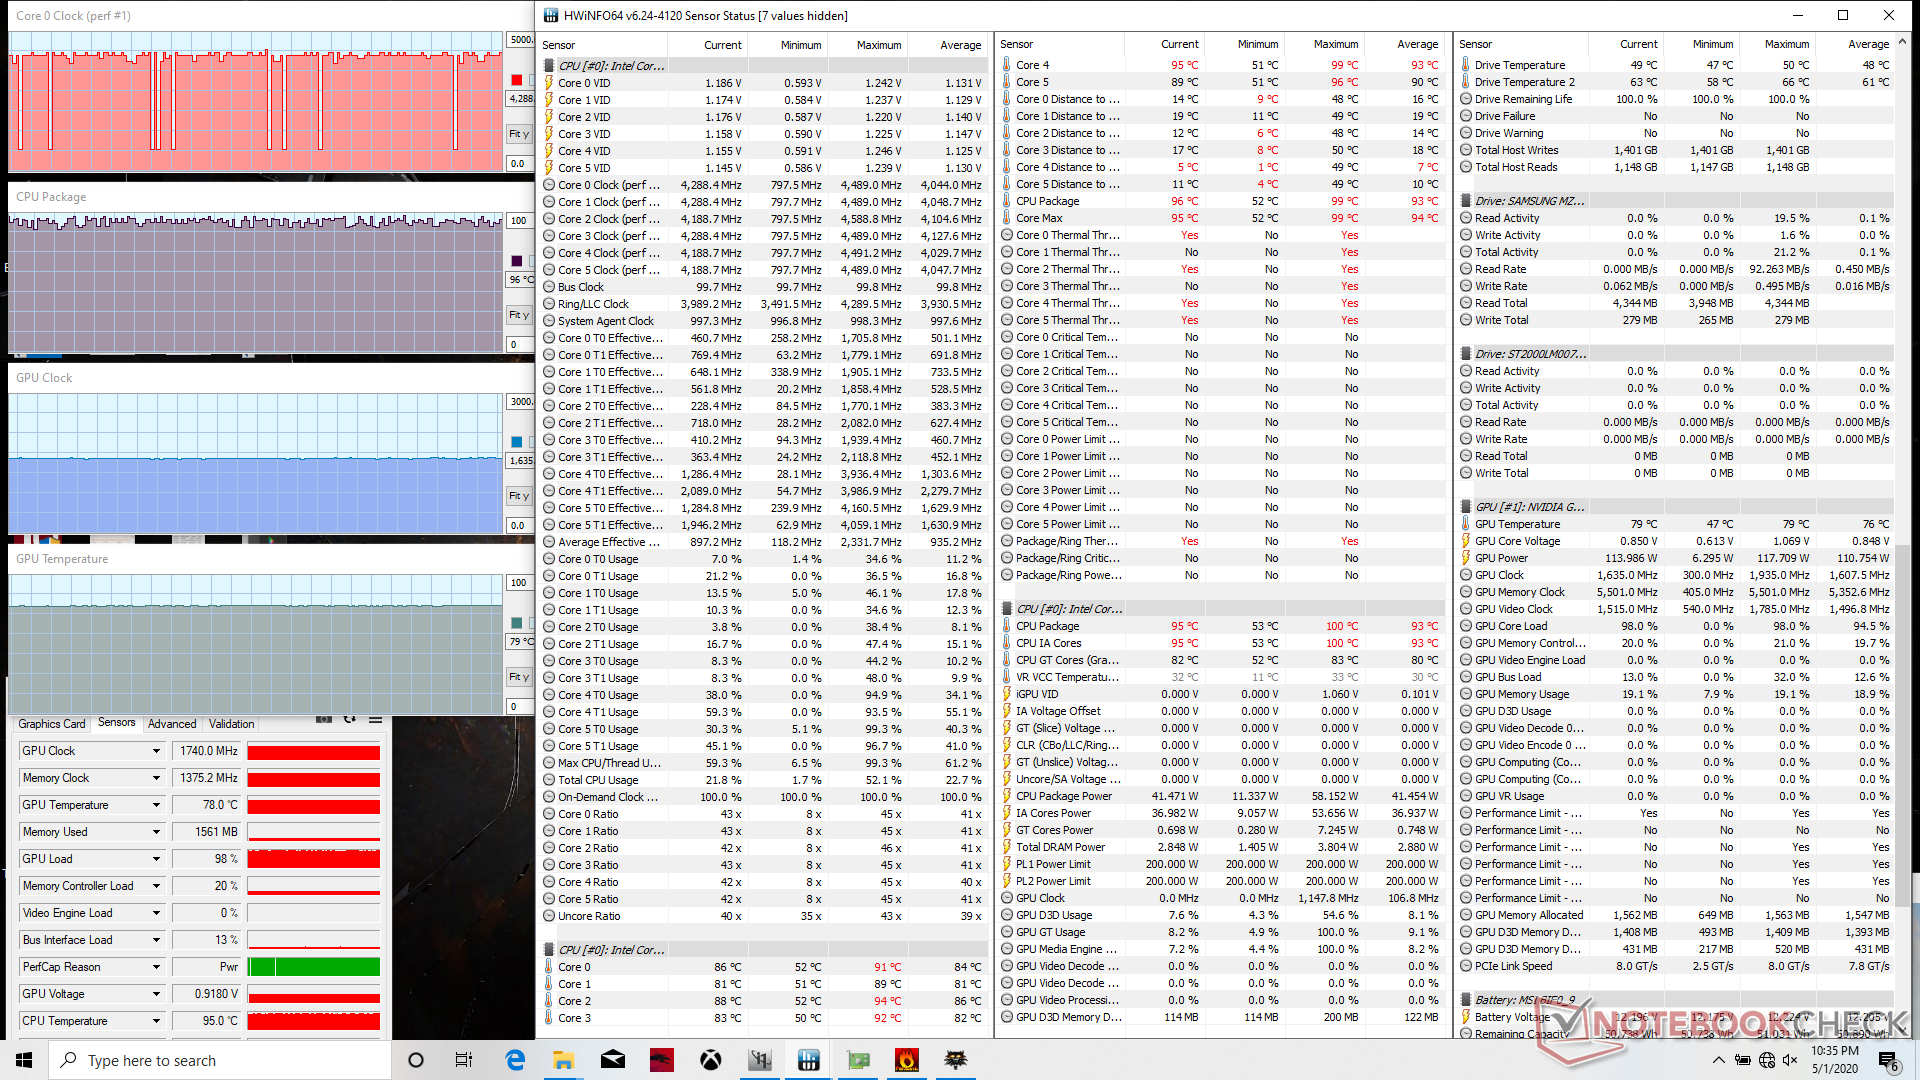
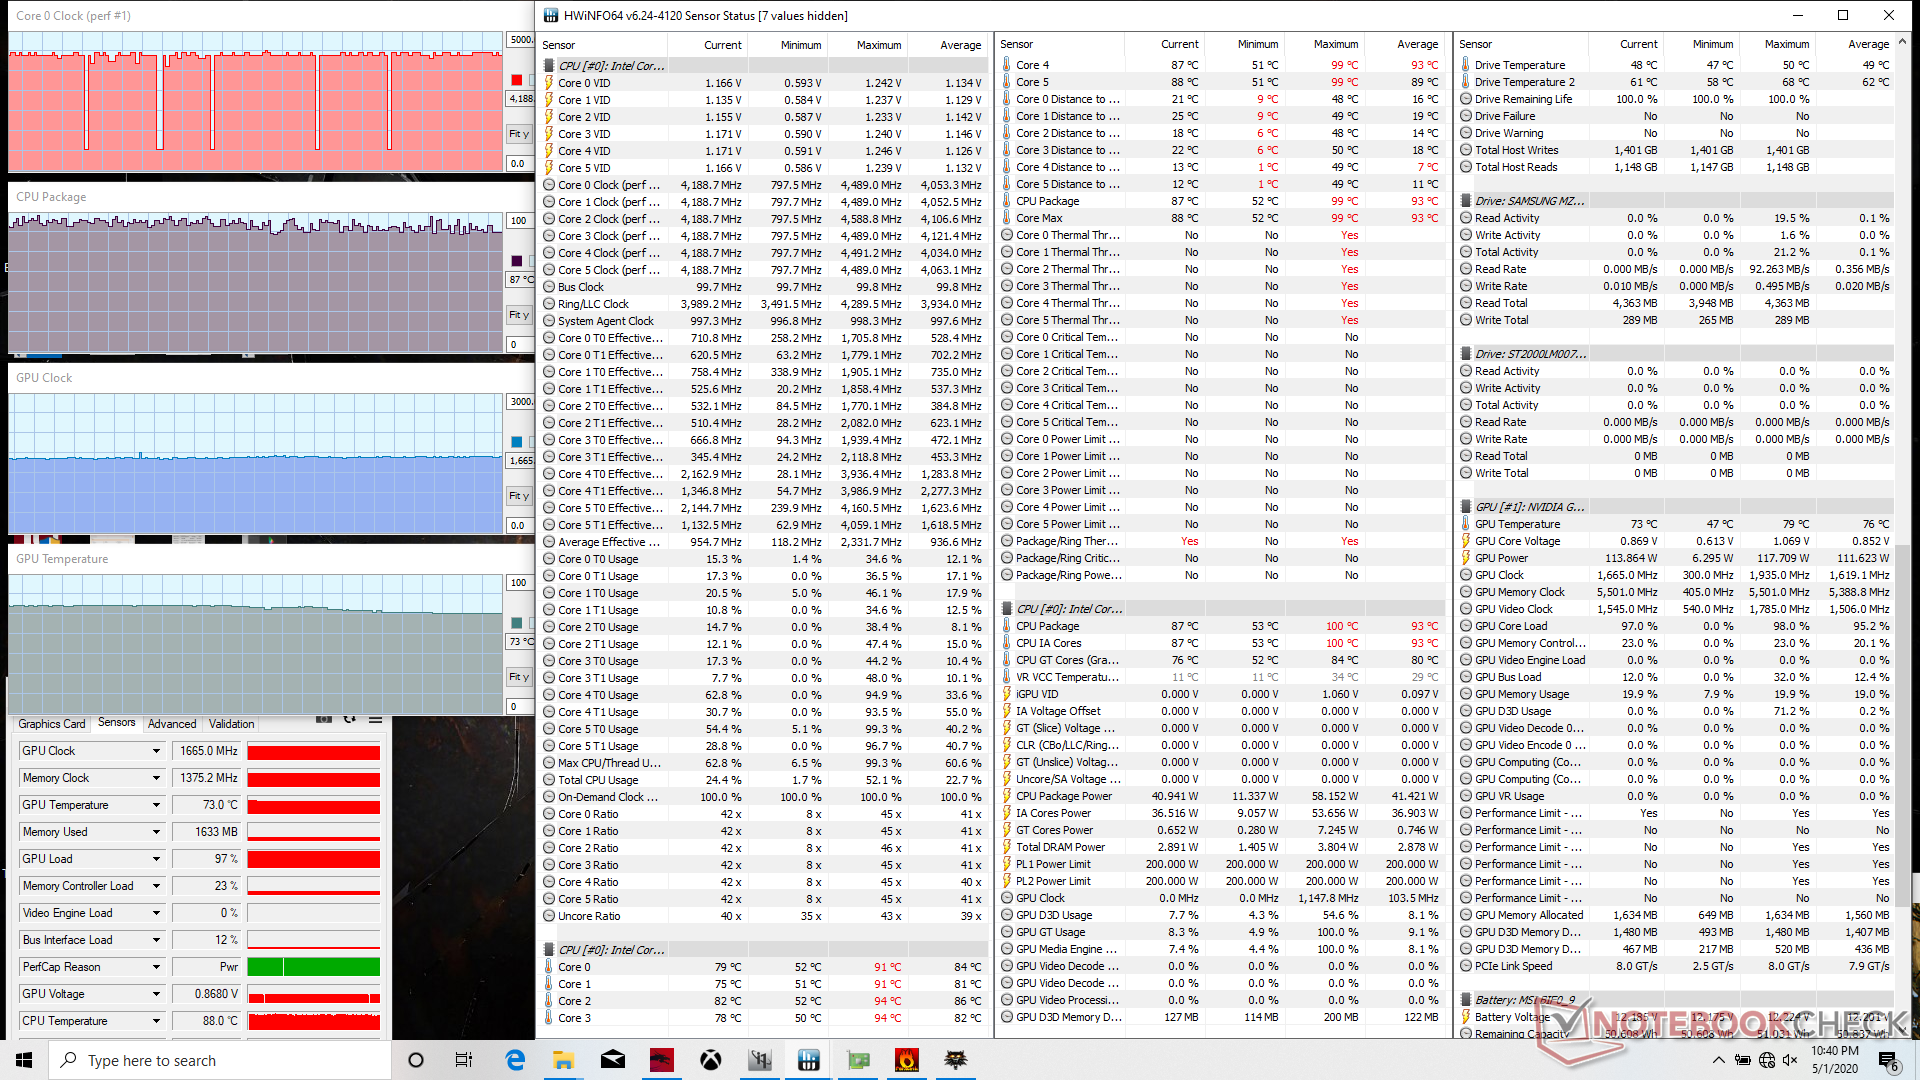
Running Witcher 3 is more representative of real-world gaming loads. Even so, the CPU would still stabilize at a high 96 C while the GPU is only a bit cooler at 79 C. In comparison, the older Core i7-9750H in the MSI GS65 would stabilize at a more reasonable 81 C when under similar conditions.
Running on batteries will impact performance. A 3DMark Fire Strike on battery power returns Physics and Graphics scores of 11586 and 5328 points, respectively. compared to 15923 and 18962 points when on mains.
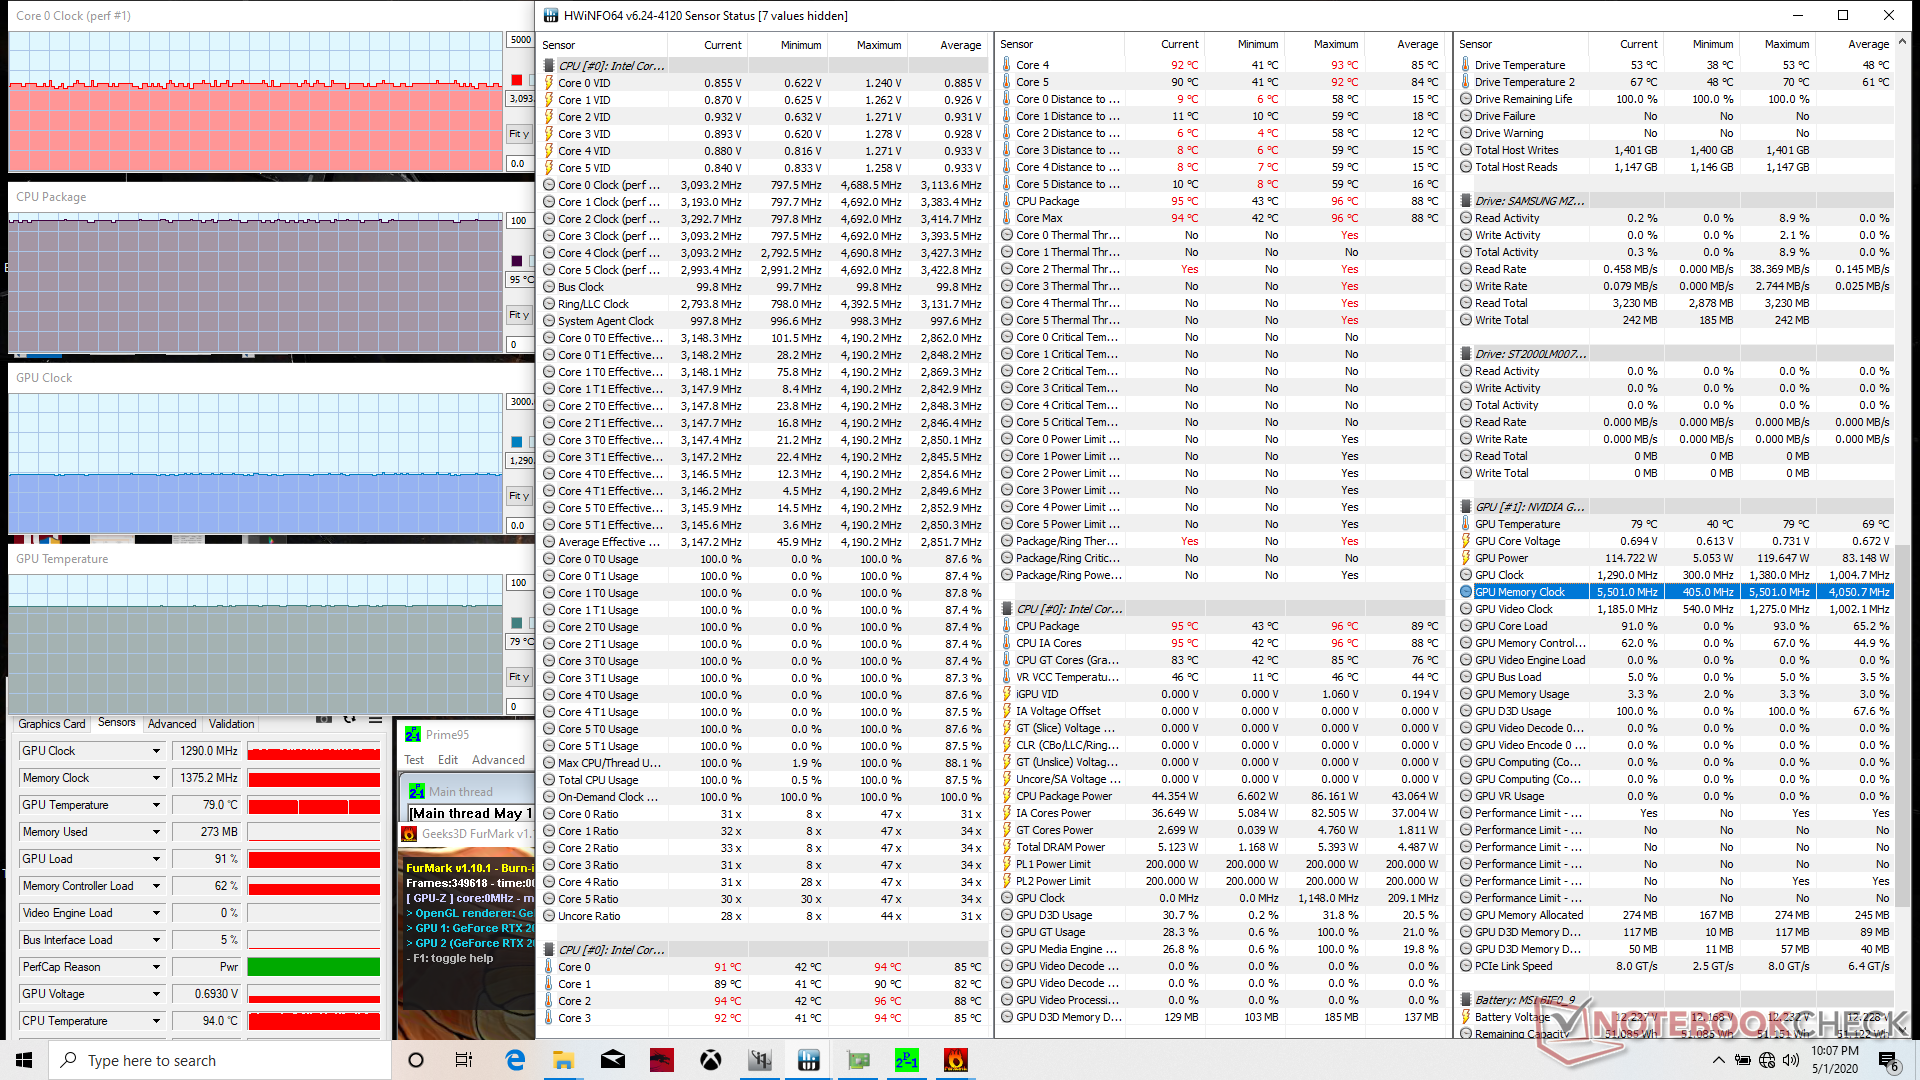

| CPU Clock (GHz) | GPU Clock (MHz) | Average CPU Temperature (°C) | Average GPU Temperature (°C) | |
| System Idle | -- | -- | 43 | 40 |
| Prime95 Stress | 3.7 | -- | 95 | 54 |
| Prime95 + FurMark Stress | 3.1 - 3.2 | 1290 | 95 | 79 |
| Prime95 + FurMark Stress (Cooler Boost on) | 3.1 - 3.2 | 1320 | 89 | 73 |
| Witcher 3 Stress | ~4.2 | 1740 | 96 | 79 |
Speakers


MSI GP65 10SFK-047US audio analysis
(+) | speakers can play relatively loud (90.3 dB)
Bass 100 - 315 Hz
(-) | nearly no bass - on average 28.5% lower than median
(+) | bass is linear (6.2% delta to prev. frequency)
Mids 400 - 2000 Hz
(±) | reduced mids - on average 8.2% lower than median
(±) | linearity of mids is average (9.1% delta to prev. frequency)
Highs 2 - 16 kHz
(+) | balanced highs - only 1.8% away from median
(+) | highs are linear (4% delta to prev. frequency)
Overall 100 - 16.000 Hz
(±) | linearity of overall sound is average (23.5% difference to median)
Compared to same class
» 85% of all tested devices in this class were better, 5% similar, 10% worse
» The best had a delta of 6%, average was 18%, worst was 132%
Compared to all devices tested
» 70% of all tested devices were better, 6% similar, 24% worse
» The best had a delta of 4%, average was 23%, worst was 134%
Apple MacBook 12 (Early 2016) 1.1 GHz audio analysis
(+) | speakers can play relatively loud (83.6 dB)
Bass 100 - 315 Hz
(±) | reduced bass - on average 11.3% lower than median
(±) | linearity of bass is average (14.2% delta to prev. frequency)
Mids 400 - 2000 Hz
(+) | balanced mids - only 2.4% away from median
(+) | mids are linear (5.5% delta to prev. frequency)
Highs 2 - 16 kHz
(+) | balanced highs - only 2% away from median
(+) | highs are linear (4.5% delta to prev. frequency)
Overall 100 - 16.000 Hz
(+) | overall sound is linear (10.2% difference to median)
Compared to same class
» 7% of all tested devices in this class were better, 2% similar, 90% worse
» The best had a delta of 5%, average was 18%, worst was 53%
Compared to all devices tested
» 5% of all tested devices were better, 1% similar, 94% worse
» The best had a delta of 4%, average was 23%, worst was 134%
Energy Management
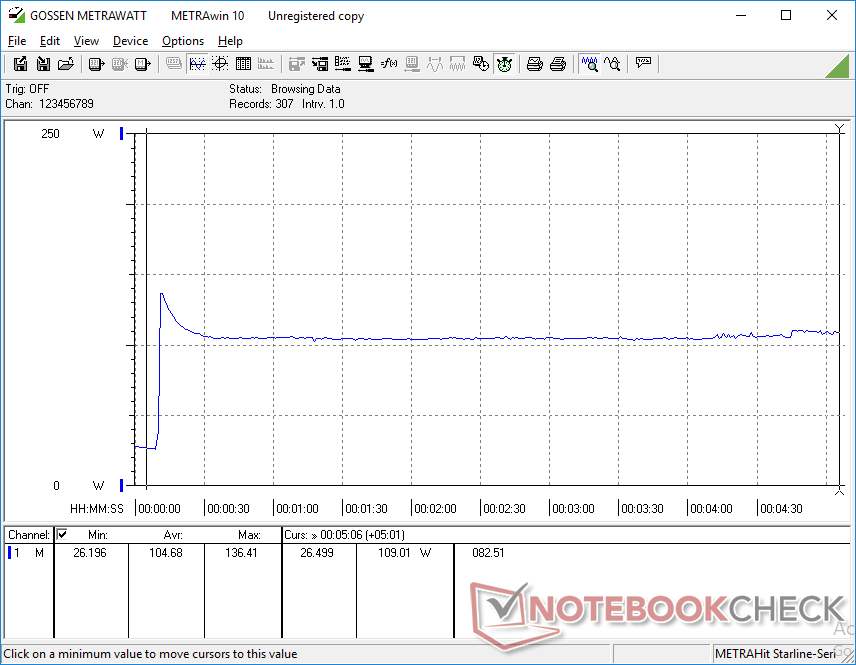
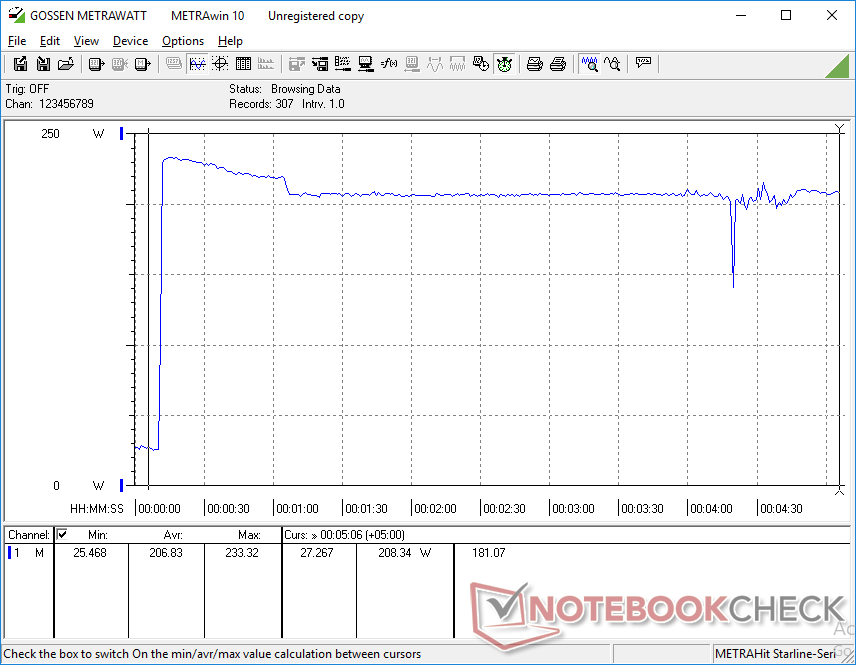
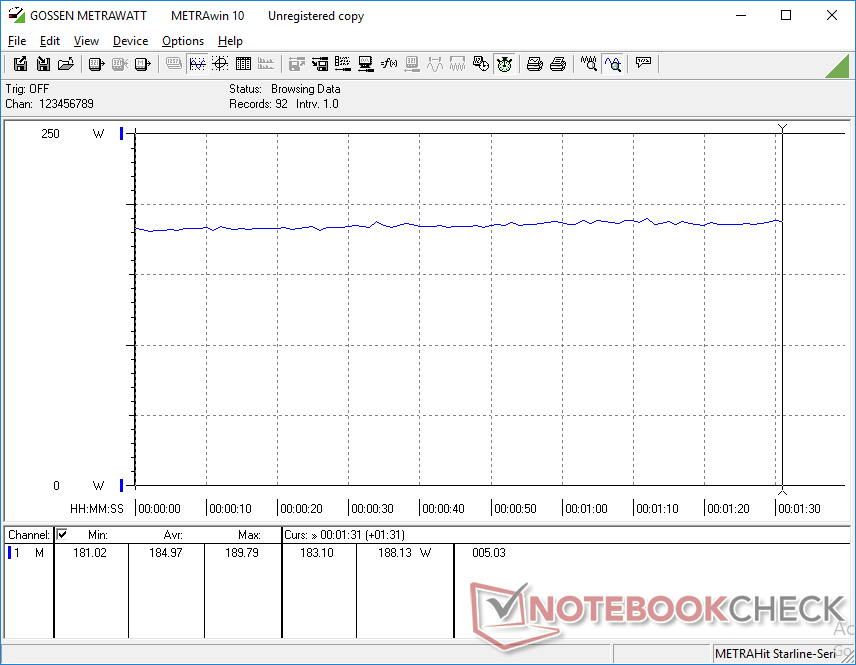
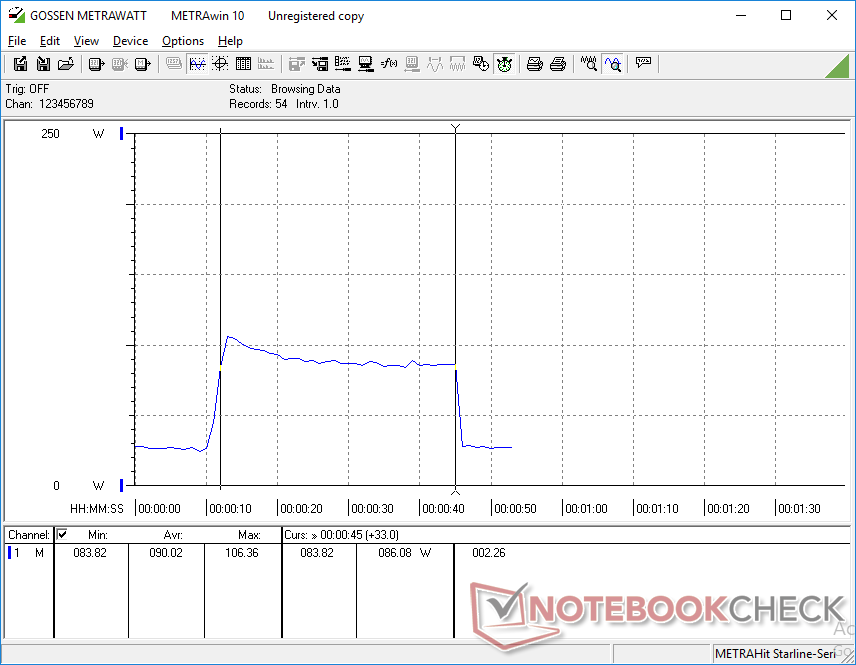
Power Consumption
Idling on desktop demands between 14 W and 24 W compared to 13 W and 21 W on the GP65. Meanwhile, running Witcher 3 consumes an average of 185 W to be 20 percent more than on the 2019 GP65 with the GeForce RTX 2060. Not coincidentally, our RTX 2070 also outperforms the RTX 2060 by about 20 percent in 3DMark benchmarks to represent a linear performance-per-watt between the RTX 2060 and RTX 2070.
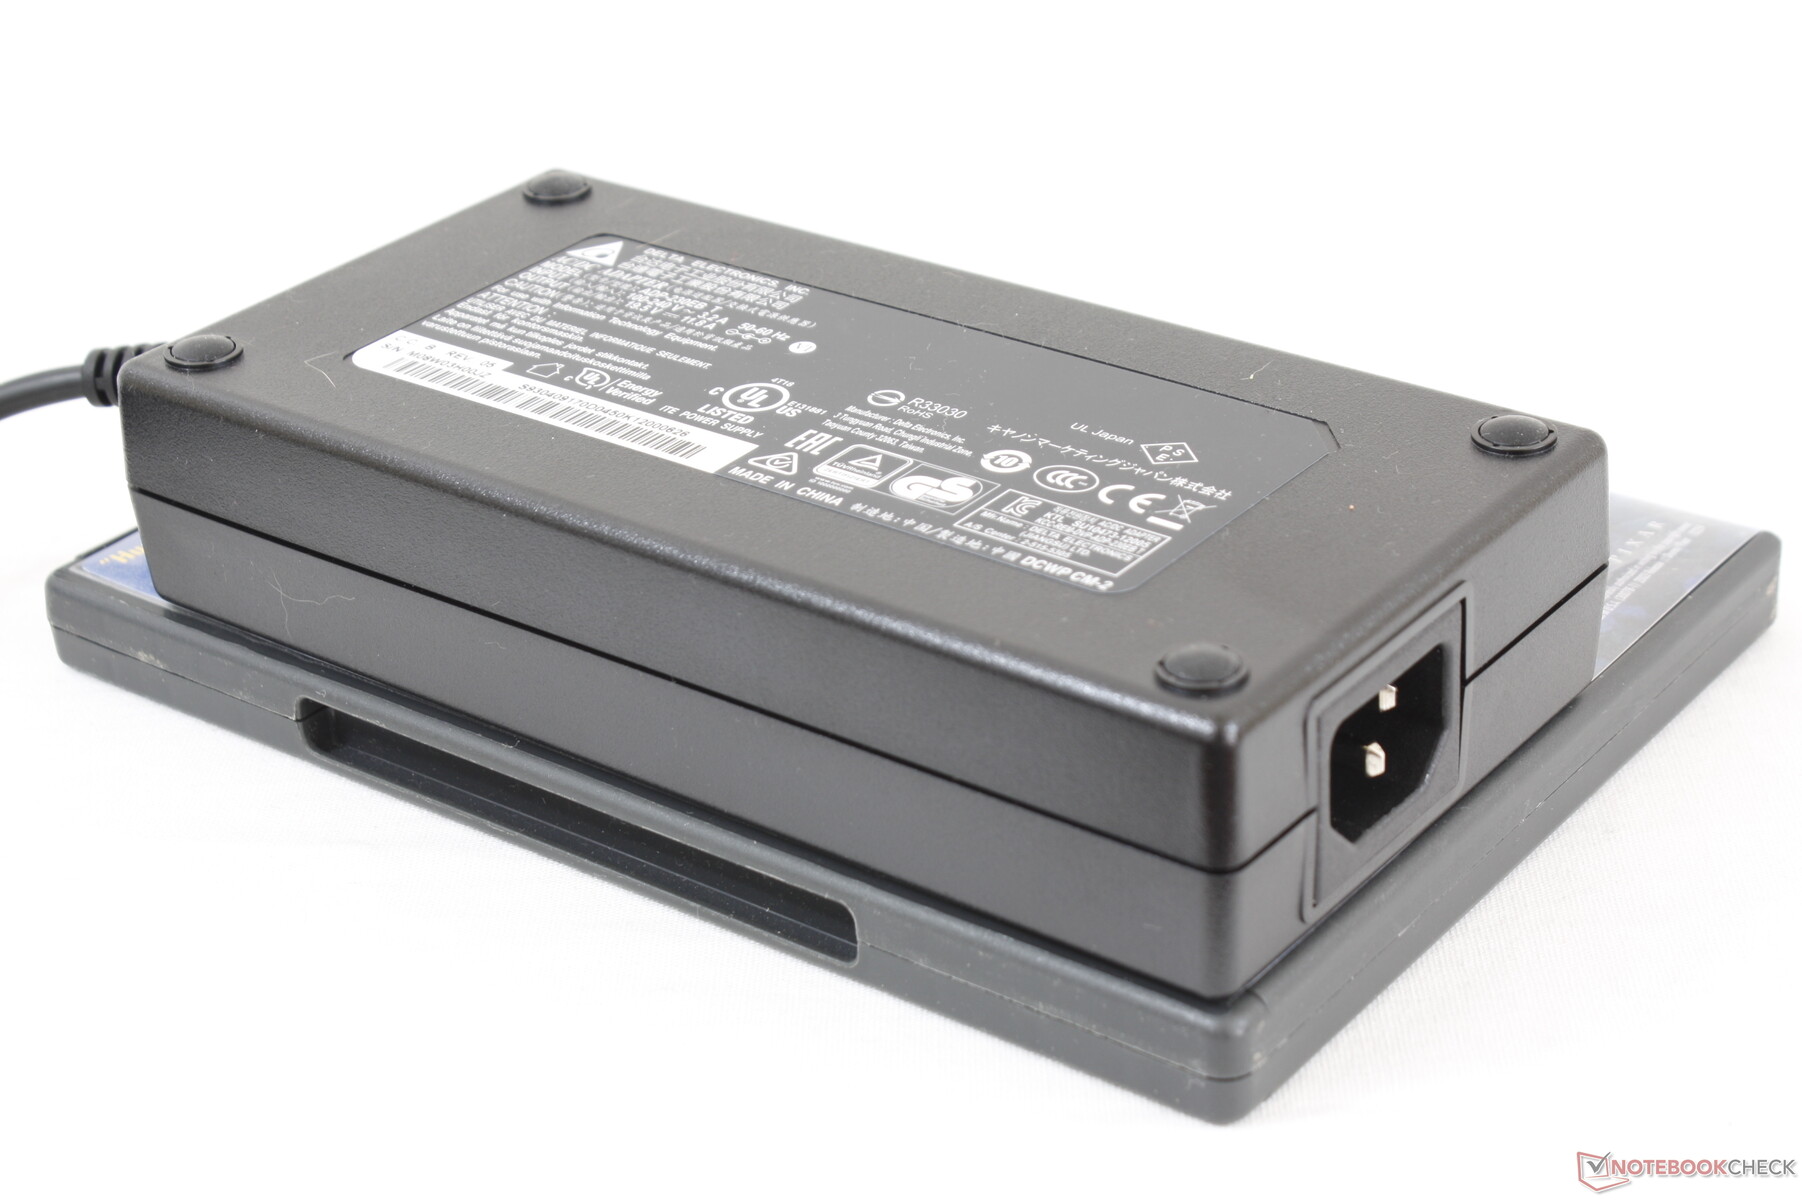
The maximum we're able to record is 233.4 W from the large (~16.8 x 8.3 x 3.5 cm) 230 W AC adapter when running both Prime95 and FurMark simultaneously. This peak consumption rate is only temporary as shown by our graphs below. When compared to the Asus Strix Scar III G531GW and Schenker XMG Pro 15 each with the same RTX 2070 GPU but older Core i7-9750H CPU, the peak consumption rate of our MSI is still well above the Asus (196 W) while being less than the Schenker (245 W). Any gen-to-gen power consumption advantages between the two CPUs would be very minor.
| Off / Standby | |
| Idle | |
| Load |
|
Key:
min: | |
| MSI GP65 10SFK-047US i7-10750H, GeForce RTX 2070 Mobile, Samsung SSD PM981 MZVLB1T0HALR, IPS, 1920x1080, 15.6" | Asus Strix Scar III G531GW-AZ062T i7-9750H, GeForce RTX 2070 Mobile, Intel SSD 660p SSDPEKNW512G8, IPS, 1920x1080, 15.6" | HP Omen 15-dc1303ng i7-8750H, GeForce RTX 2070 Max-Q, Samsung SSD PM981 MZVLB256HAHQ, IPS, 1920x1080, 15.6" | MSI GP62 7REX-1045US i7-7700HQ, GeForce GTX 1050 Ti Mobile, Toshiba NVMe THNSN5128GP, TN LED, 1920x1080, 15.6" | Aorus 15-SA i7-9750H, GeForce GTX 1660 Ti Mobile, Intel SSD 760p SSDPEKKW512G8, IPS, 1920x1080, 15.6" | MSI GP65 Leopard 9SE-225US i7-9750H, GeForce RTX 2060 Mobile, Toshiba KBG30ZMT512G, IPS, 1920x1080, 15.6" | Schenker XMG Pro 15 i7-9750H, GeForce RTX 2070 Mobile, Samsung SSD 970 EVO Plus 500GB, IPS, 1920x1080, 15.6" | |
|---|---|---|---|---|---|---|---|
| Power Consumption | 11% | 12% | 22% | -4% | 8% | -4% | |
| Idle Minimum * (Watt) | 14.2 | 11.4 20% | 14.7 -4% | 14.6 -3% | 20 -41% | 13.6 4% | 15 -6% |
| Idle Average * (Watt) | 18.8 | 13.5 28% | 18.6 1% | 17.2 9% | 23 -22% | 17.9 5% | 19 -1% |
| Idle Maximum * (Watt) | 23.9 | 21.6 10% | 22.6 5% | 17.3 28% | 29 -21% | 20.6 14% | 26 -9% |
| Load Average * (Watt) | 96.9 | 106 -9% | 90 7% | 82.7 15% | 87 10% | 96 1% | 101 -4% |
| Witcher 3 ultra * (Watt) | 185 | 186 -1% | 107 42% | 136 26% | 154.6 16% | 177 4% | |
| Load Maximum * (Watt) | 233.4 | 196 16% | 120 49% | 136.7 41% | 173 26% | 218.6 6% | 245 -5% |
* ... smaller is better
Battery Life
Runtimes are nearly identical to what we observed on last year's GP65 meaning users can expect less than 4 hours of real-world WLAN use. Charging from empty to full capacity takes just under 2 hours.
The system cannot be recharged via USB Type-C unlike on the Asus Zephyrus M.
| MSI GP65 10SFK-047US i7-10750H, GeForce RTX 2070 Mobile, 51 Wh | Asus Strix Scar III G531GW-AZ062T i7-9750H, GeForce RTX 2070 Mobile, 66 Wh | Asus TUF FX505DT-EB73 R7 3750H, GeForce GTX 1650 Mobile, 48 Wh | HP Omen 15-dc1303ng i7-8750H, GeForce RTX 2070 Max-Q, 70 Wh | MSI GP62 7REX-1045US i7-7700HQ, GeForce GTX 1050 Ti Mobile, 41 Wh | Aorus 15-SA i7-9750H, GeForce GTX 1660 Ti Mobile, 62 Wh | MSI GP65 Leopard 9SE-225US i7-9750H, GeForce RTX 2060 Mobile, 51 Wh | |
|---|---|---|---|---|---|---|---|
| Battery runtime | 51% | 30% | -11% | -22% | -24% | 5% | |
| WiFi v1.3 (h) | 3.7 | 5.6 51% | 4.8 30% | 3.3 -11% | 2.9 -22% | 2.8 -24% | 3.9 5% |
| Reader / Idle (h) | 7.8 | 5 | 4.3 | 3.5 | 6 | ||
| Load (h) | 1.5 | 1.2 | 0.7 | 2 | 1.1 |
Pros
Cons
Verdict

On the Comet Lake-U series, the gen-to-gen performance differences between it and the outgoing Whiskey Lake-U series is minimal unless if you opt for the high-end Comet Lake-U Core i7-10710U. Otherwise, lesser options like the Core i7-10510U will perform nearly the same as the older Core i7-8565U.
The same can be said for the Comet Lake-H series. The Core i7-10750H performs very closely to the Core i7-9750H to the point where any differences would be unnoticeable especially if gaming where games are more likely to be GPU bound than CPU bound. Instead, users will have to consider the higher-end Core i7-10875H option for any significant raw performance gains over the Core i7-9750H.
While not the news most enthusiasts like to hear, it's nonetheless good news for gamers looking to upgrade their old laptops. The fact that 10th gen Comet Lake-H is only marginally faster than 9th gen Coffee Lake-H at the mid-range SKU level means you can upgrade to a 9th gen Intel gaming laptop and still get essentially the same gaming experience as a more expensive 10th gen Intel model. The money saved could be used to upgrade other more tangible aspects of the laptop like display or RAM or even a better model altogether like the MSI GS65, GE65, or GS65.
The MSI GP65 10SFK is the same laptop as last year's GP65 9SE but with a slightly faster and newer processor. Users won't be missing any exciting features or enormous performance advantages by sticking with a Coffee Lake-H CPU.
MSI GP65 10SFK-047US
- 05/06/2020 v7 (old)
Allen Ngo
