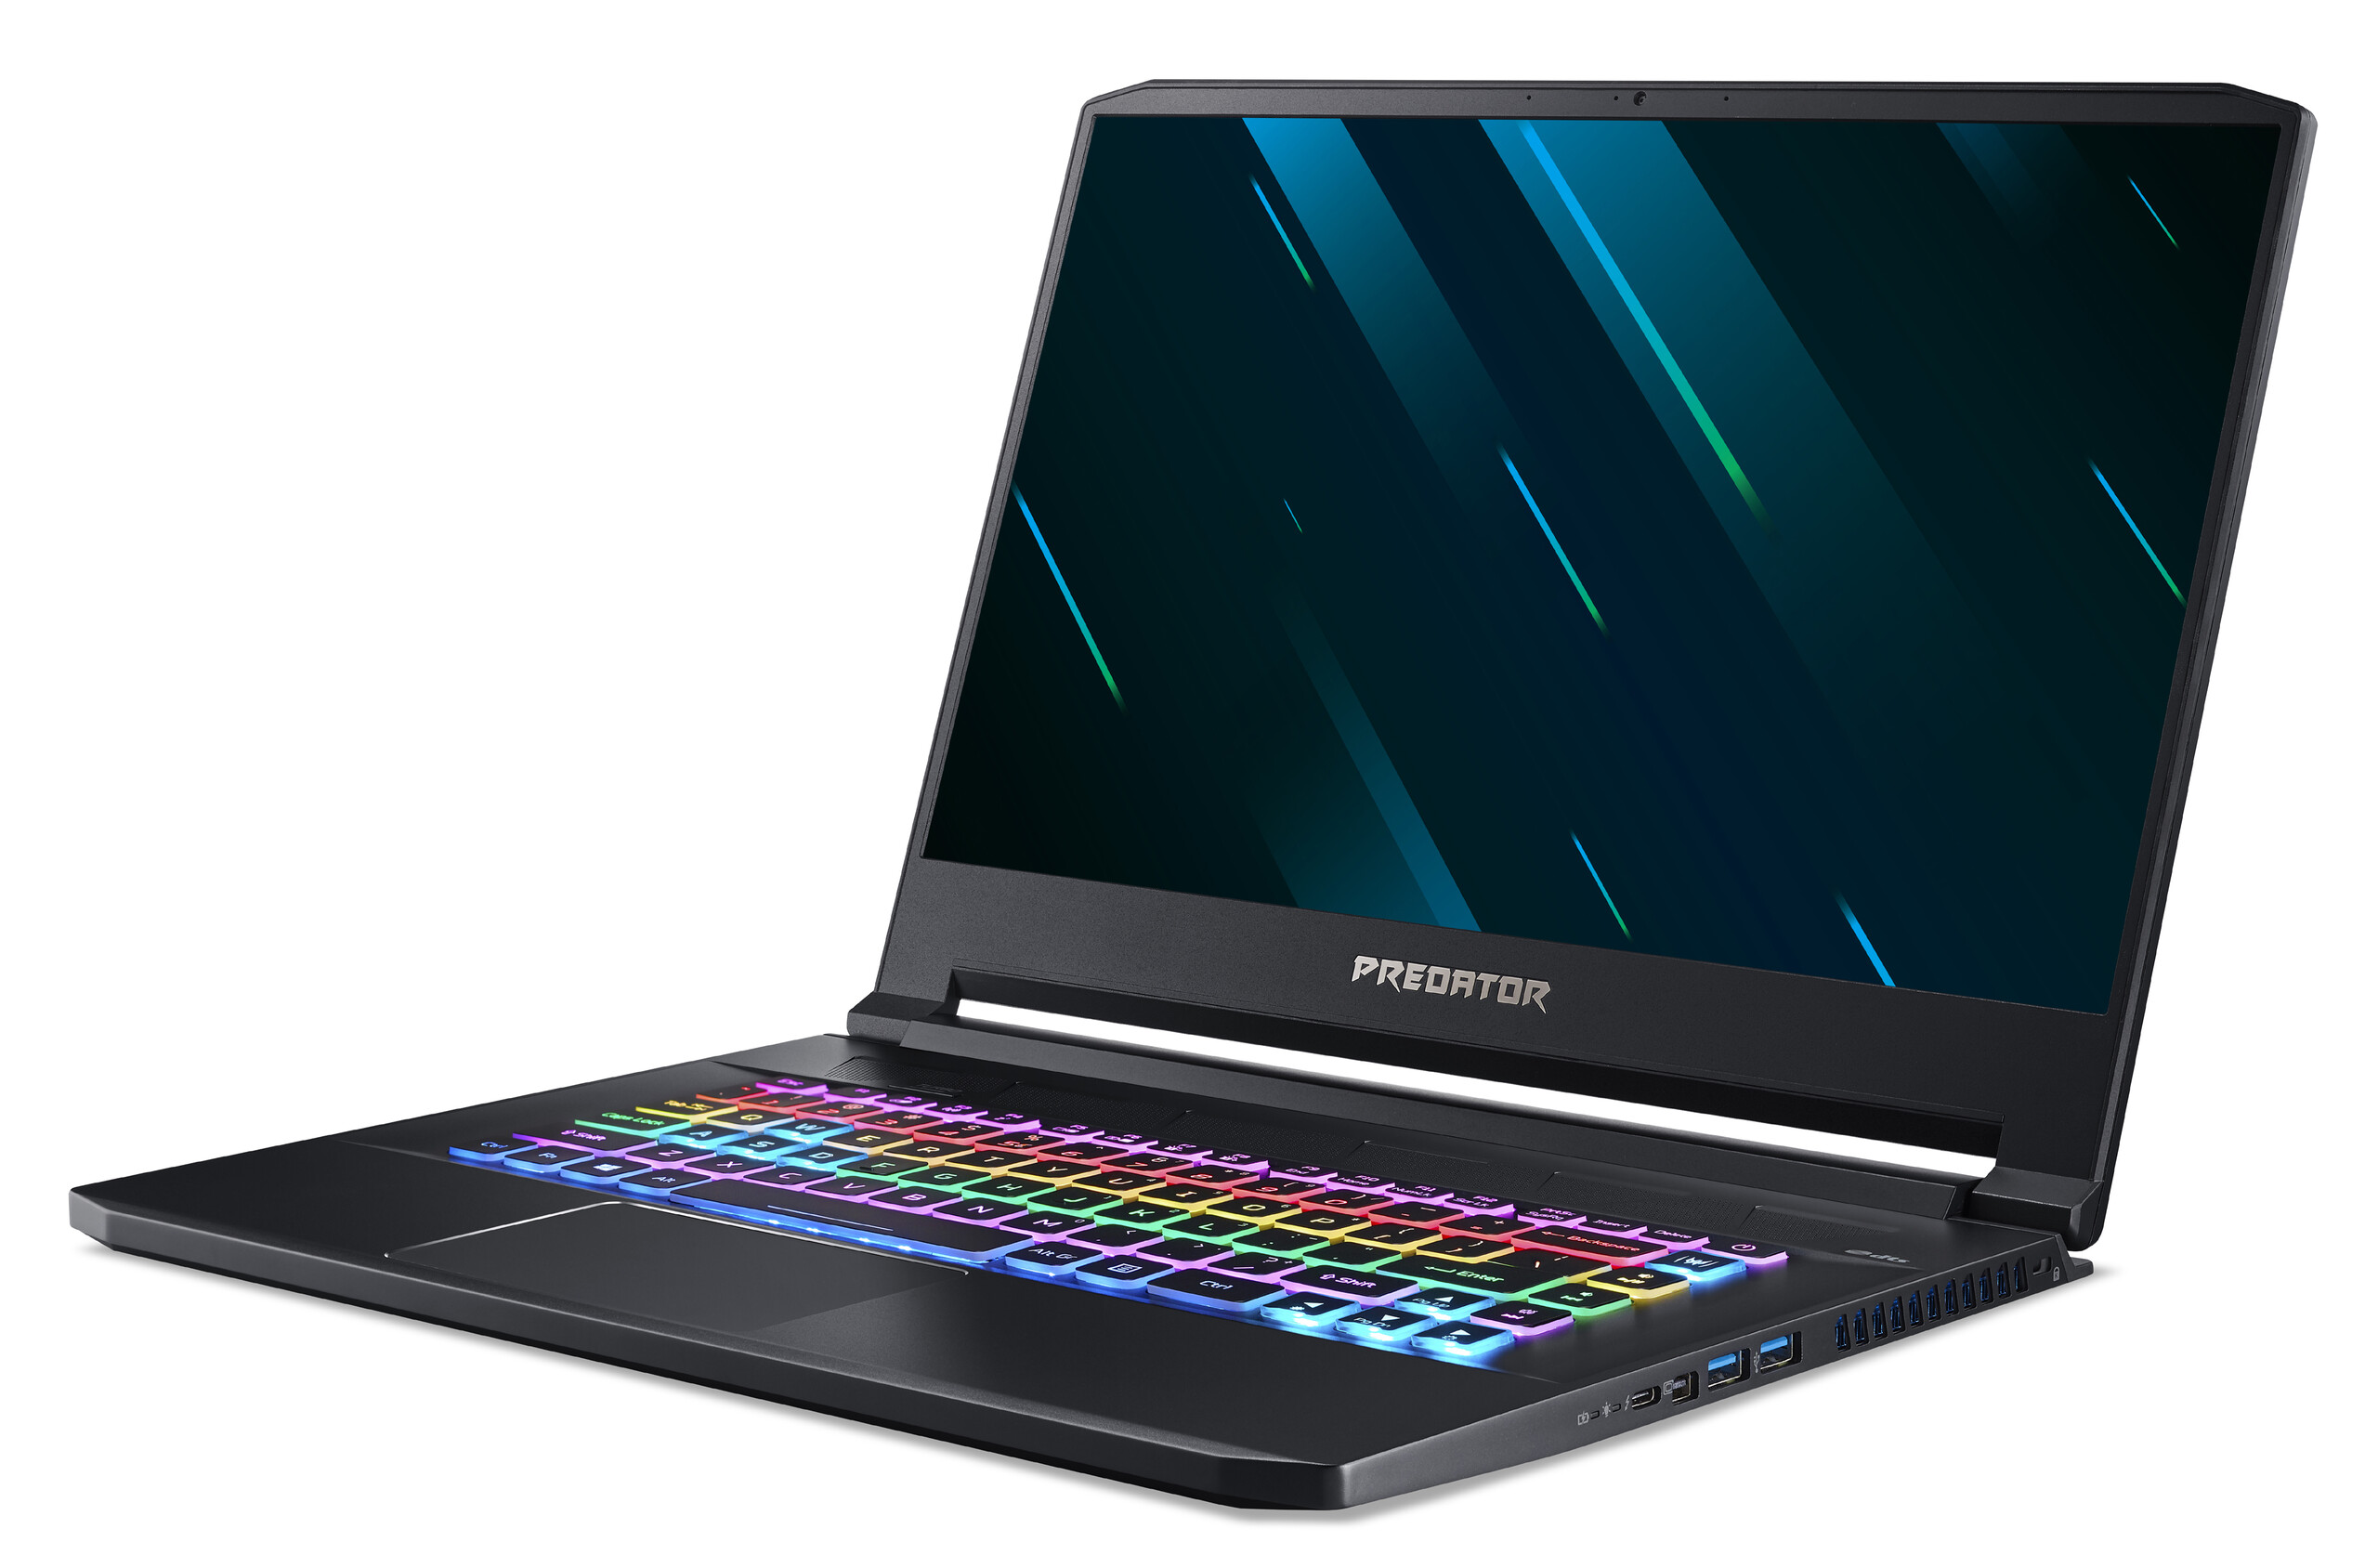
Acer Predator Triton 500 laptop review: Superstar

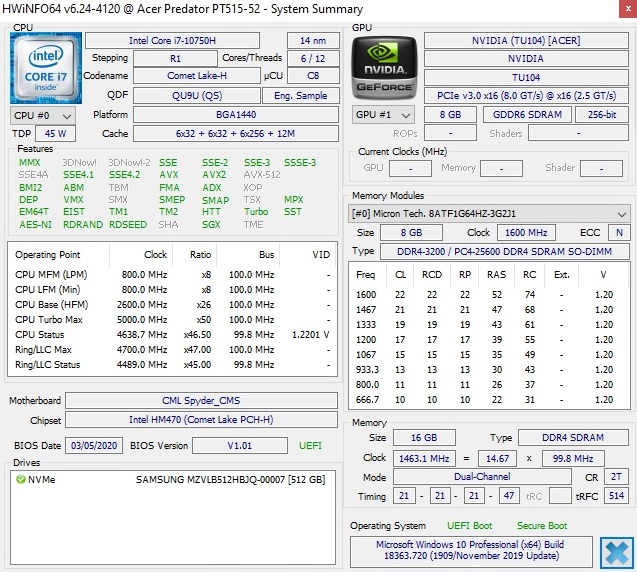
Apart from the updated graphics card, the 2020 edition of the Predator Triton 500 also offers a fresh CPU. In this way, the PT515-52-70N3 model tested by us features a hexa-core processor from Intel's 10th Core-i generation. The Core i7-10750H replaces the very successful hexa-core model from 2019, the Core i7-9750H.
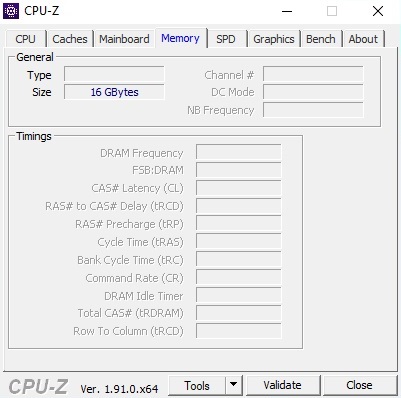
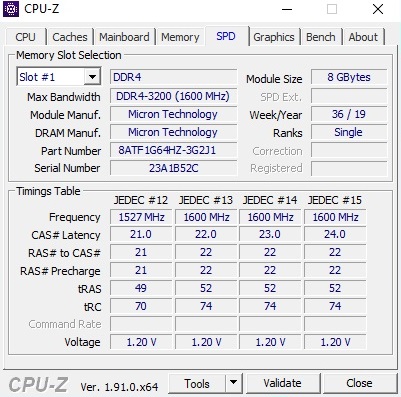
The remaining components are also pretty good. 16 GB of DDR4 RAM (2x 8 GB in dual-channel mode) and a 512 GB NVMe SSD are now part of the standard repertoire in gaming laptops. Meanwhile, a Full HD screen with lightning-fast 300 Hz takes care of the image reproduction. The package is rounded off by Windows 10 64-bit in the Pro Edition. Cost of the test device (we couldn't find a completely identical configuration in German online shops so far): About 2,500 Euros (~$2,702).
Note: Since this was a presample, the measurement and benchmark results of the final product may differ slightly.
Rating | Date | Model | Weight | Height | Size | Resolution | Price |
|---|---|---|---|---|---|---|---|
v (old) | 04 / 2020 | Acer Predator Triton 500 PT515-52-70N3 i7-10750H, GeForce RTX 2080 Super Max-Q | 2.1 kg | 18 mm | 15.60" | 1920x1080 | |
| 83.8 % v7 (old) | 06 / 2019 | MSI GS65 Stealth 9SG i7-9750H, GeForce RTX 2080 Max-Q | 2 kg | 18 mm | 15.60" | 1920x1080 | |
| 88.8 % v6 (old) | 05 / 2019 | Razer Blade 15 RTX 2080 Max-Q i7-9750H, GeForce RTX 2080 Max-Q | 2.2 kg | 17.8 mm | 15.60" | 1920x1080 | |
| 83 % v7 (old) | 09 / 2019 | Alienware m15 R2 P87F i7-9750H, GeForce RTX 2080 Max-Q | 2.2 kg | 18.3 mm | 15.60" | 1920x1080 |
Among the competitors of the Predator Triton 500 are other 15-inch laptops with a hexa-core CPU and the (old) GeForce RTX 2080 Max-Q GPU like the MSI GS65 Stealth 9SG, the Razer Blade 15 and the Alienware m15 R2. These laptops appear in the tables as comparison devices.
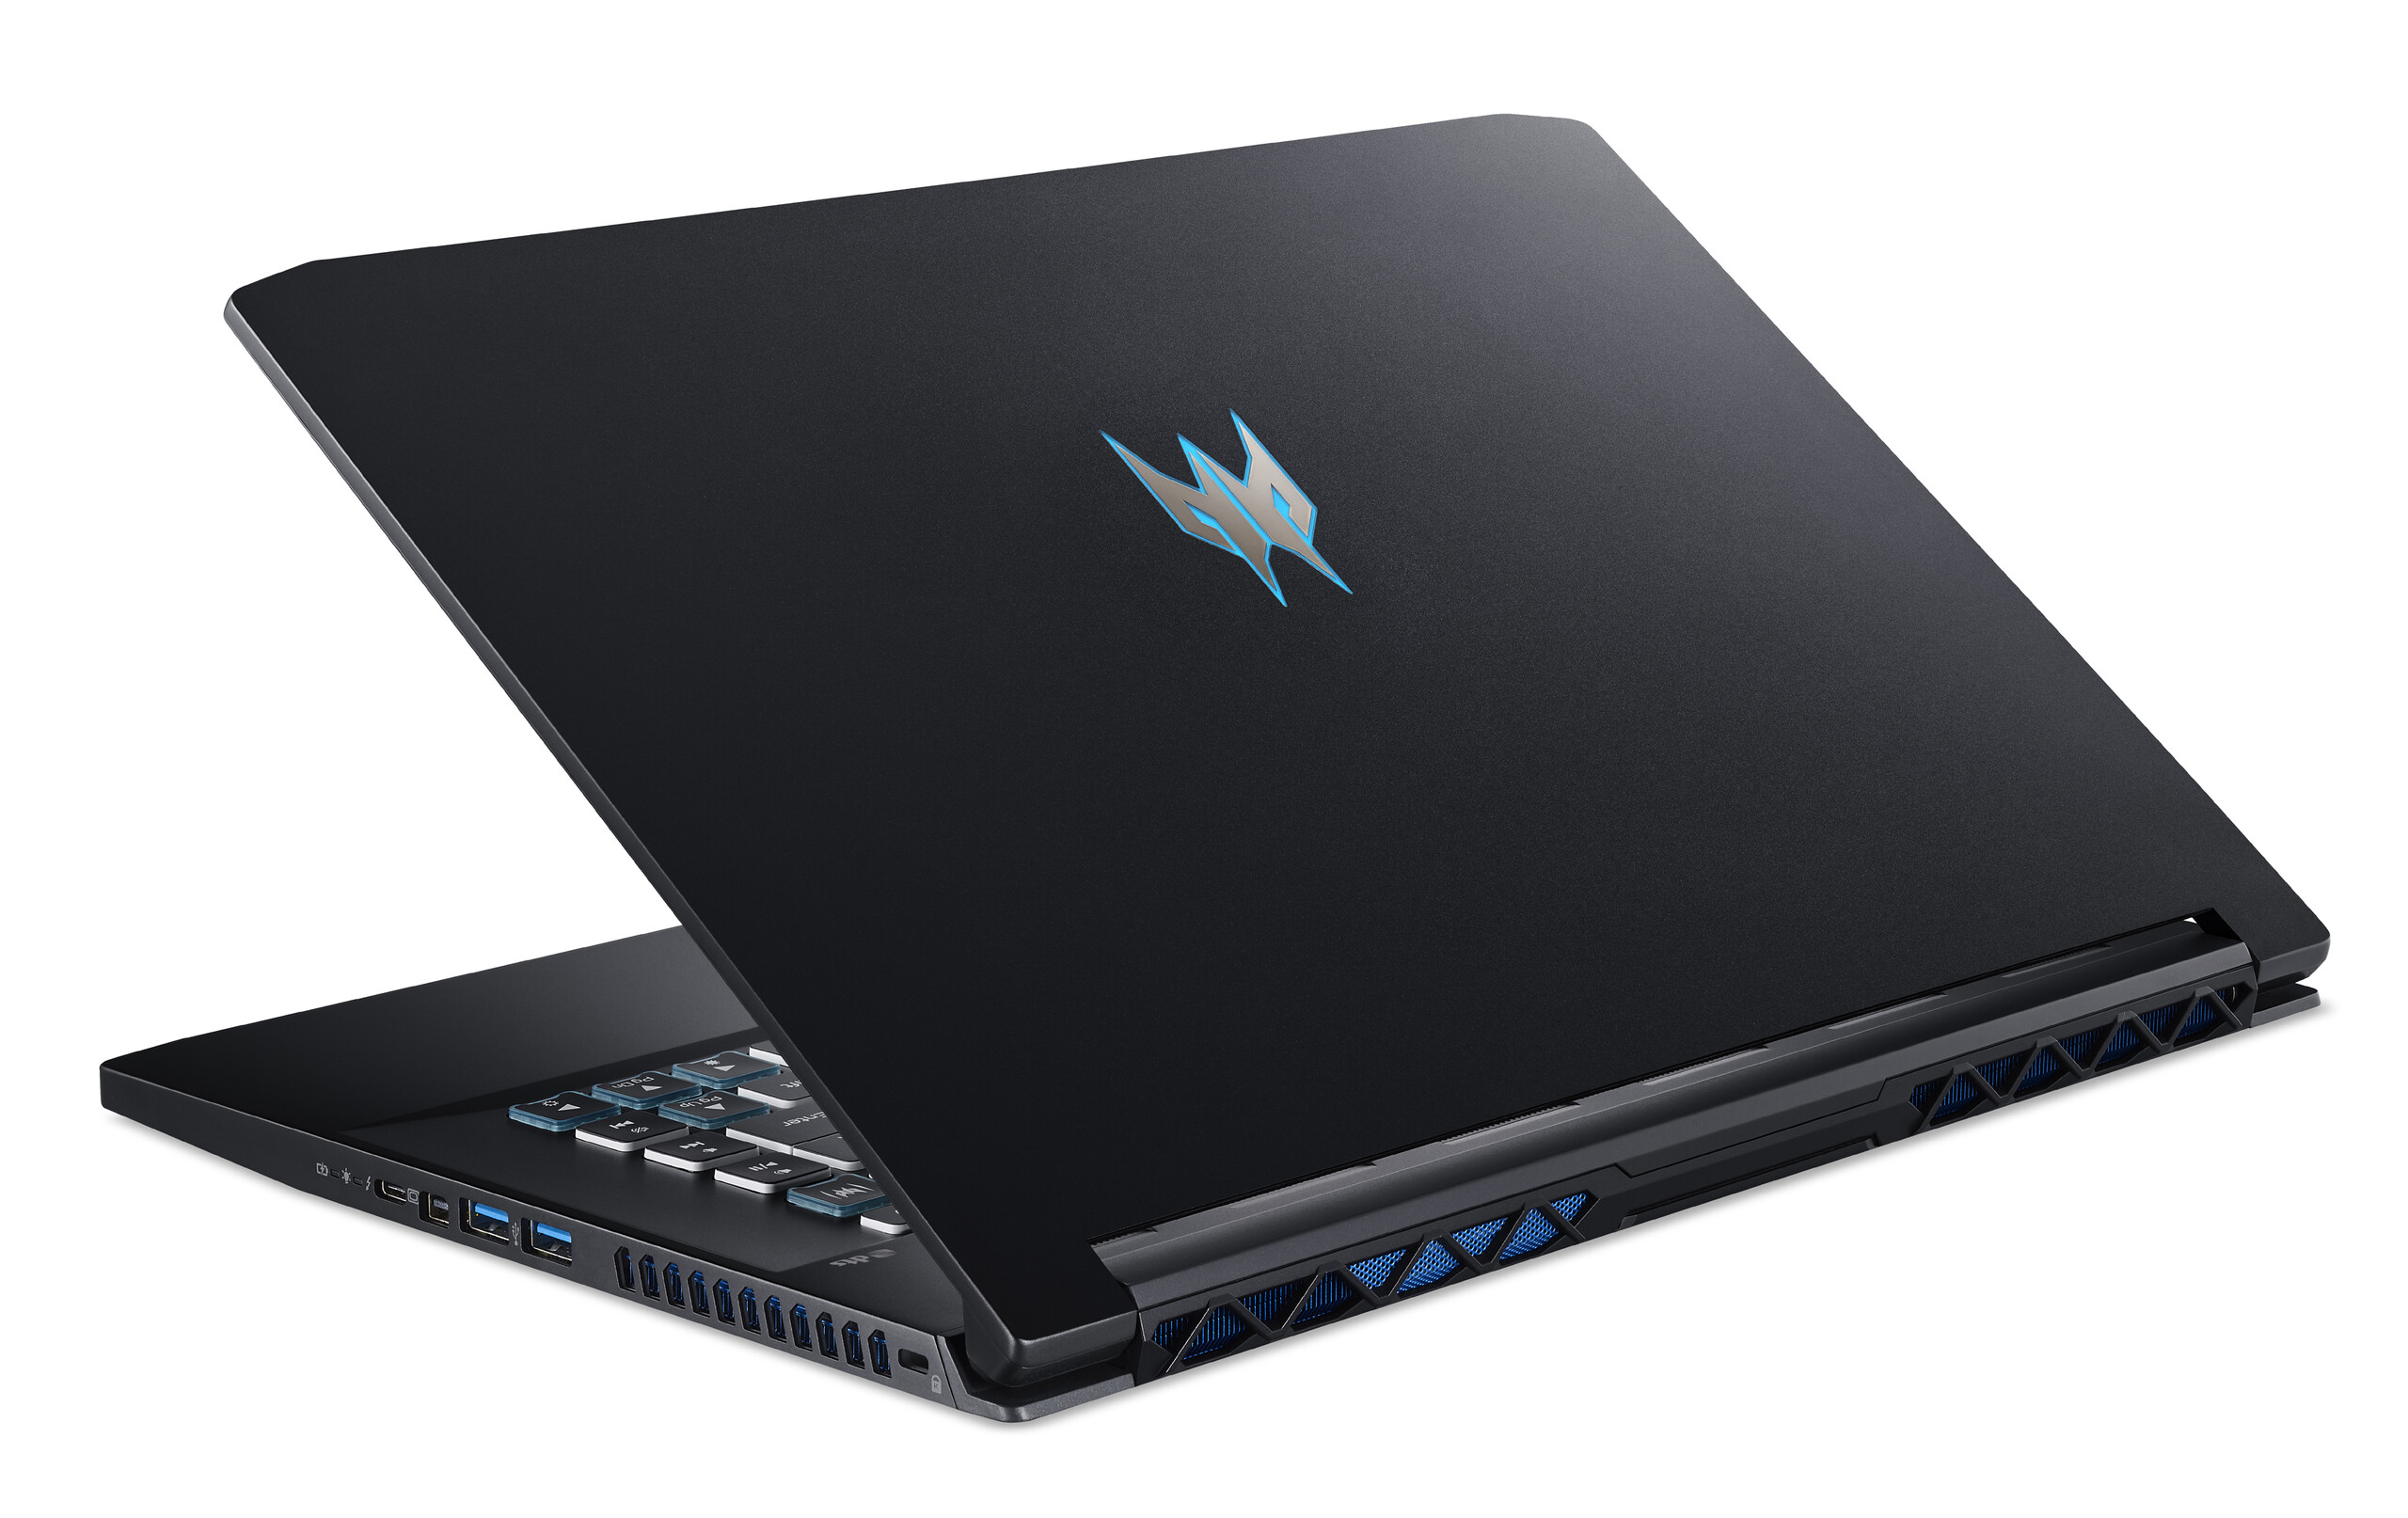
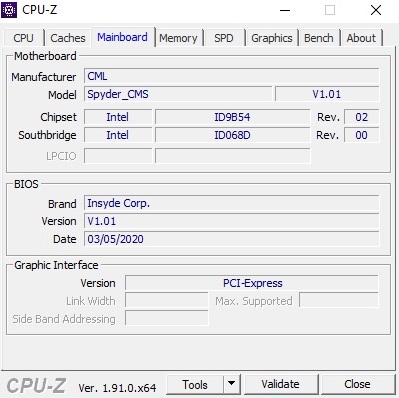
Since the chassis has remained the same except for minor details (missing lettering on the lid, a bit less ventilation slots on the bottom), we won't go again into the case, the ports and the input devices in this article. You'll find the respective information in the review of the (previous) predecessor.
Communication
| Networking | |
| iperf3 transmit AX12 | |
| Acer Predator Triton 500 PT515-52-70N3 | |
| iperf3 receive AX12 | |
| Acer Predator Triton 500 PT515-52-70N3 | |
Webcam


Display
While the 2019 models had to make do with a 144 Hz display (also very fast), the new Triton 500 - as mentioned at the beginning - trumps with a 300 Hz display. However, the change from 144 Hz to 300 Hz is subjectively much less noticeable than the change from a 60 Hz to a 144 Hz monitor, which is why buyers of last year's version shouldn't be too sad, especially as there are no advantages in terms of the measured response times.
| |||||||||||||||||||||||||
Brightness Distribution: 88 %
Center on Battery: 320 cd/m²
Contrast: 1333:1 (Black: 0.24 cd/m²)
ΔE ColorChecker Calman: 4.03 | ∀{0.5-29.43 Ø4.71}
calibrated: 0.98
ΔE Greyscale Calman: 5.94 | ∀{0.09-98 Ø4.96}
99% sRGB (Argyll 1.6.3 3D)
66% AdobeRGB 1998 (Argyll 1.6.3 3D)
72.2% AdobeRGB 1998 (Argyll 3D)
99.5% sRGB (Argyll 3D)
70.3% Display P3 (Argyll 3D)
Gamma: 2.42
CCT: 6751 K
| Acer Predator Triton 500 PT515-52-70N3 AUO B156HAN12.0 (AUO7A8C), IPS, 1920x1080, 15.6" | MSI GS65 Stealth 9SG Sharp LQ156M1JW03 (SHP14C5), IPS, 1920x1080, 15.6" | Razer Blade 15 RTX 2080 Max-Q Sharp LQ156M1JW03 (SHP14C5), IPS, 1920x1080, 15.6" | Alienware m15 R2 P87F Sharp LQ156M1, IPS, 1920x1080, 15.6" | |
|---|---|---|---|---|
| Display | -4% | -4% | -7% | |
| Display P3 Coverage (%) | 70.3 | 67.6 -4% | 66.9 -5% | 65.3 -7% |
| sRGB Coverage (%) | 99.5 | 97.5 -2% | 98.1 -1% | 95.1 -4% |
| AdobeRGB 1998 Coverage (%) | 72.2 | 68.9 -5% | 68.5 -5% | 65.9 -9% |
| Response Times | -5% | 6% | 1% | |
| Response Time Grey 50% / Grey 80% * (ms) | 14.4 ? | 13.6 ? 6% | 12.8 ? 11% | 16.4 ? -14% |
| Response Time Black / White * (ms) | 10.4 ? | 12 ? -15% | 10.4 ? -0% | 8.8 ? 15% |
| PWM Frequency (Hz) | 23260 ? | 23810 ? | 23810 ? | |
| Screen | 10% | 7% | -26% | |
| Brightness middle (cd/m²) | 320 | 282.3 -12% | 293 -8% | 324.2 1% |
| Brightness (cd/m²) | 318 | 269 -15% | 270 -15% | 304 -4% |
| Brightness Distribution (%) | 88 | 90 2% | 87 -1% | 90 2% |
| Black Level * (cd/m²) | 0.24 | 0.32 -33% | 0.29 -21% | 0.38 -58% |
| Contrast (:1) | 1333 | 882 -34% | 1010 -24% | 853 -36% |
| Colorchecker dE 2000 * | 4.03 | 1.17 71% | 1.69 58% | 5.01 -24% |
| Colorchecker dE 2000 max. * | 8.43 | 3.29 61% | 3.37 60% | 12.7 -51% |
| Colorchecker dE 2000 calibrated * | 0.98 | 1.06 -8% | 1.24 -27% | 1.64 -67% |
| Greyscale dE 2000 * | 5.94 | 1.3 78% | 2.3 61% | 7.9 -33% |
| Gamma | 2.42 91% | 2.2 100% | 2.3 96% | 2.35 94% |
| CCT | 6751 96% | 6643 98% | 6758 96% | 8455 77% |
| Color Space (Percent of AdobeRGB 1998) (%) | 66 | 63.8 -3% | 63 -5% | 60.8 -8% |
| Color Space (Percent of sRGB) (%) | 99 | 97.5 -2% | 98.5 -1% | 95.5 -4% |
| Total Average (Program / Settings) | 0% /
5% | 3% /
5% | -11% /
-19% |
* ... smaller is better
Speaking of measured values: With an average brightness of just under 320 cd/m², the Full HD panel from AUO (B156HAN12.0) isn't extremely bright but can be used for the occasional outdoor application as long as the sun doesn't shine excessively. In combination with the relatively low black value (0.24 cd/m²), a contrast of over 1,300:1 is achieved - a good result that is above the level of competing devices. The viewing angles are also convincing, as is typical with IPS.
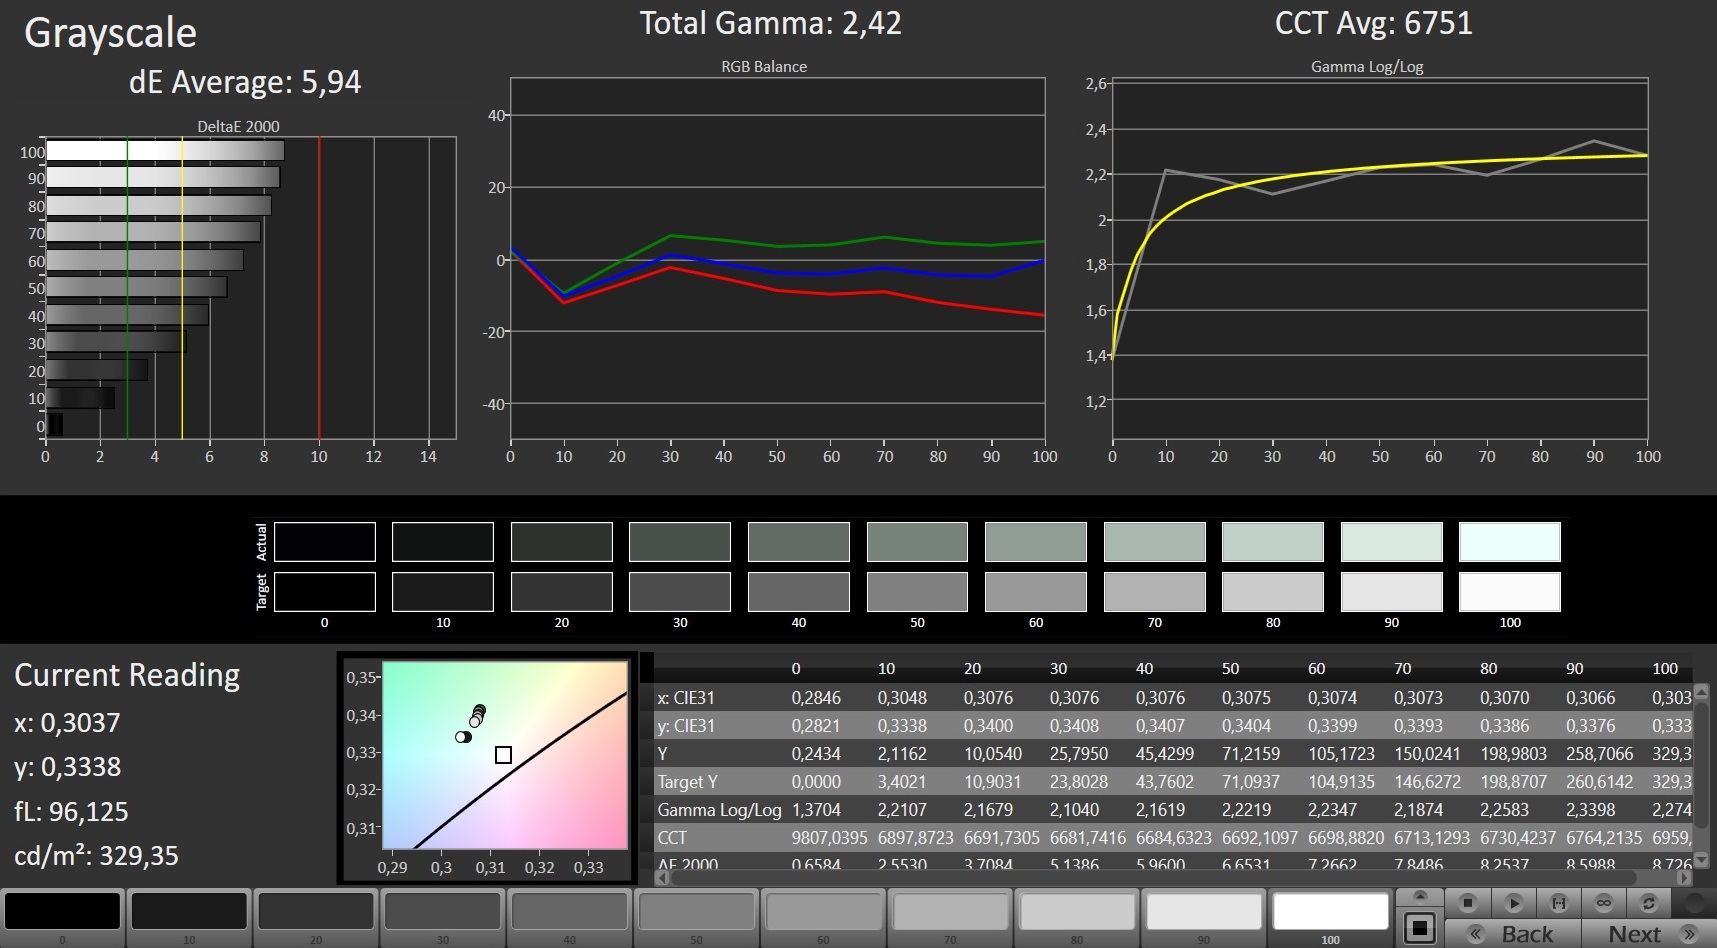
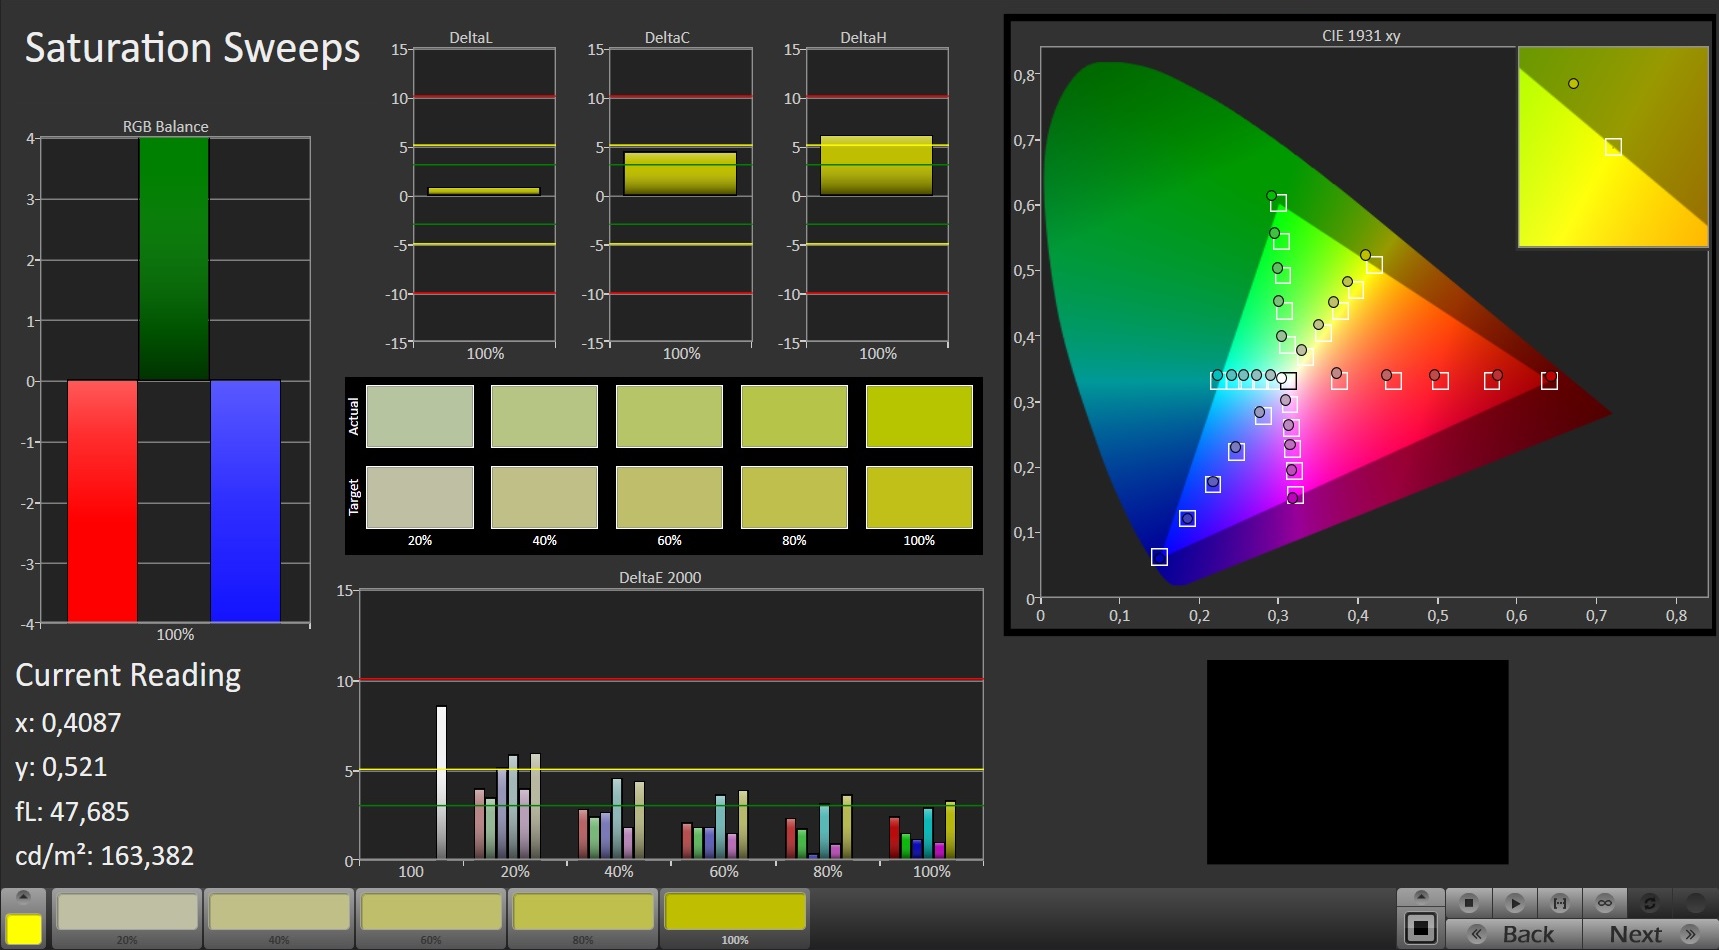
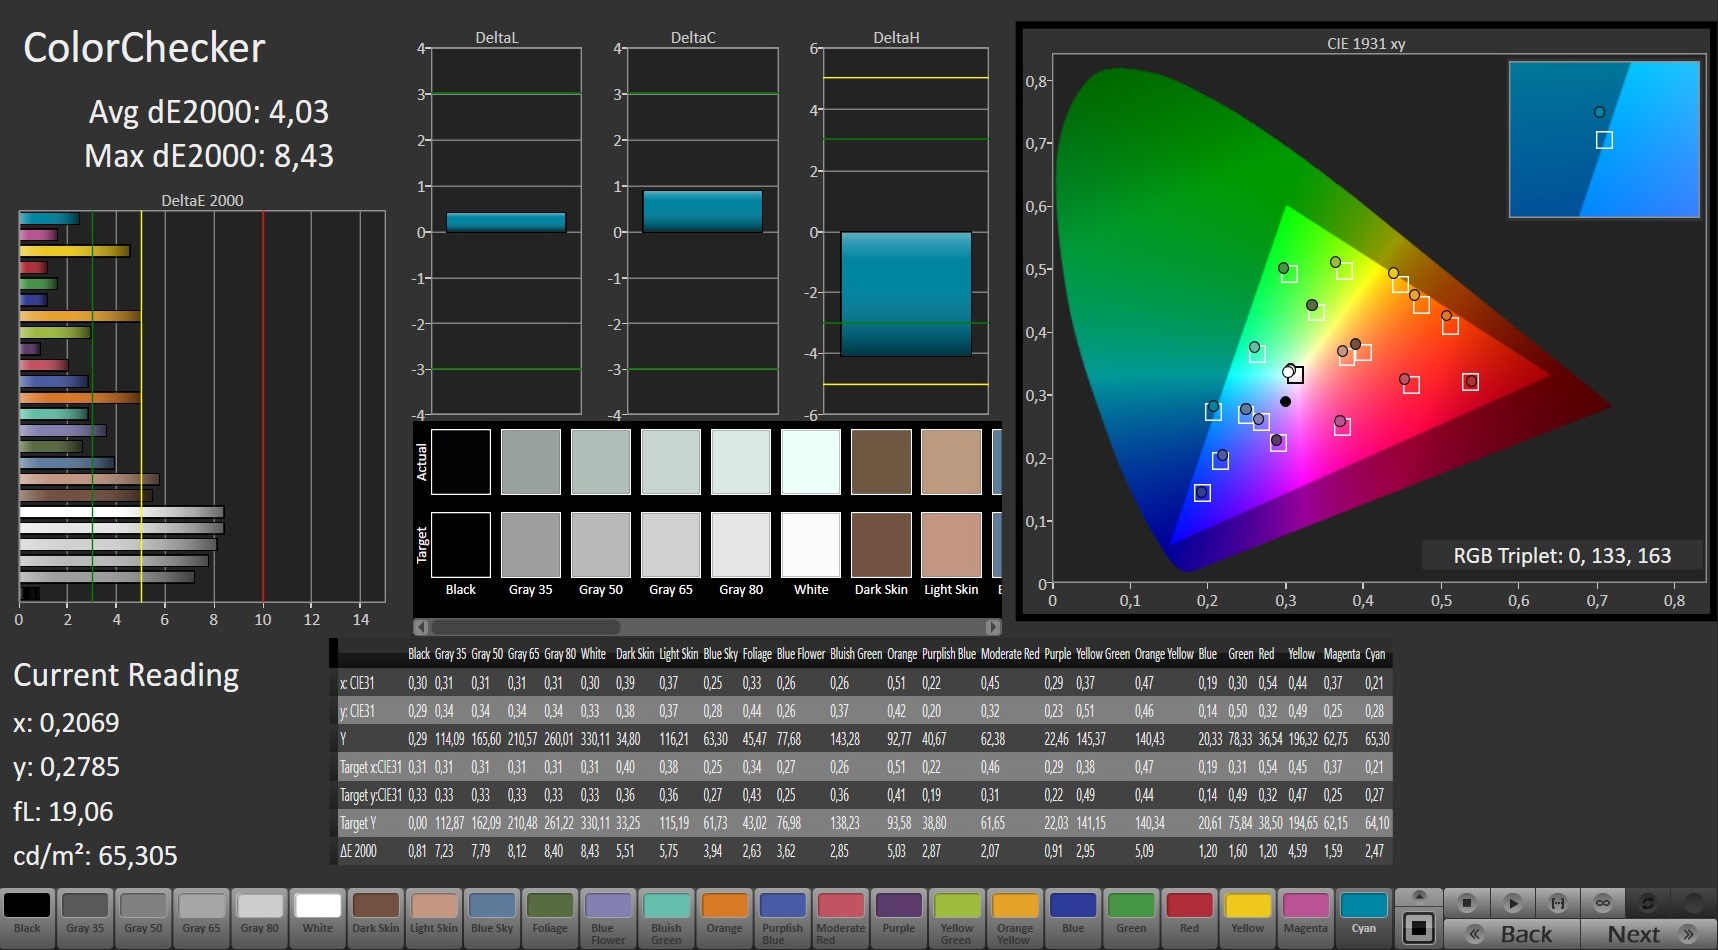
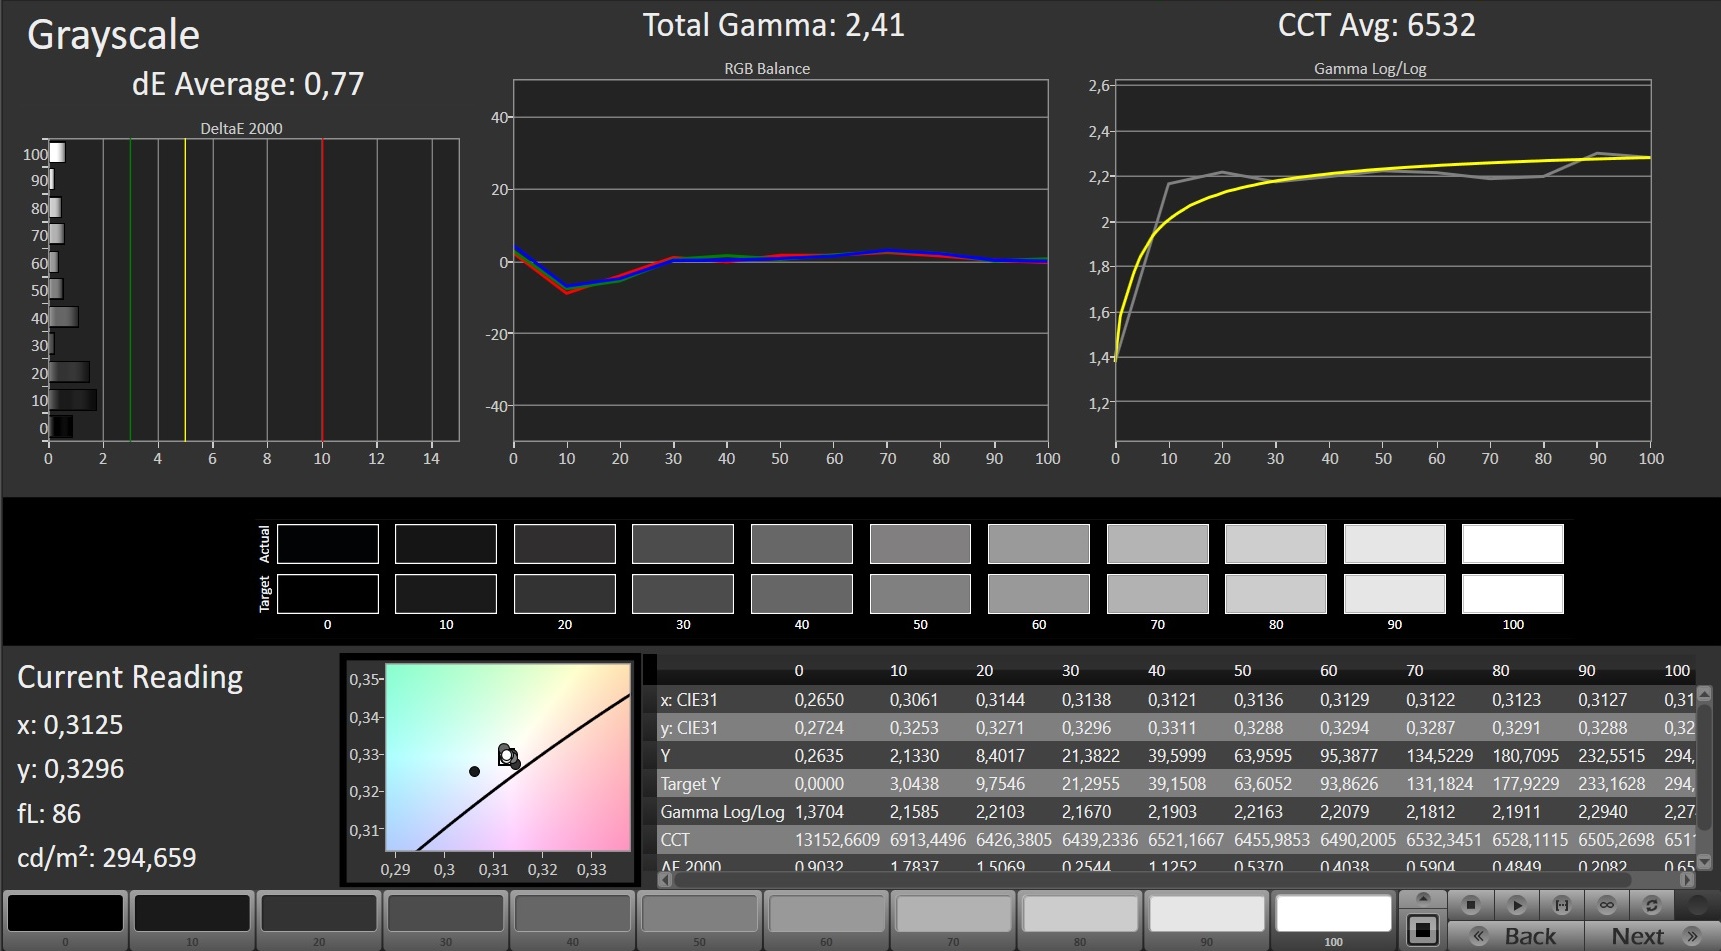
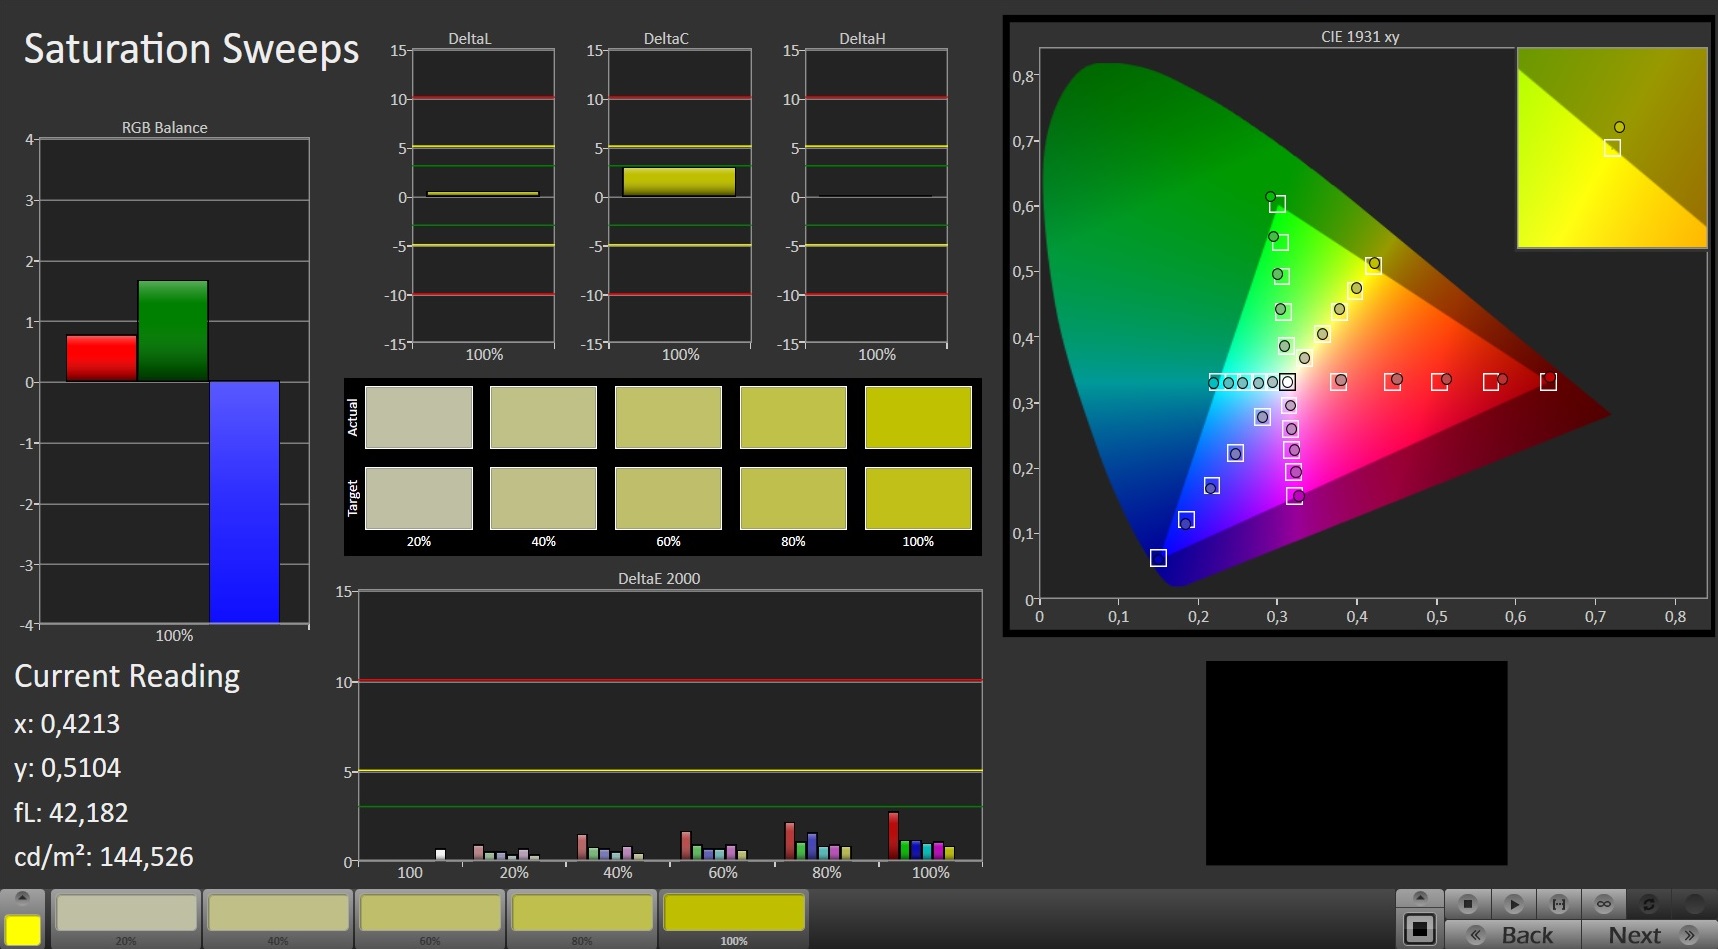
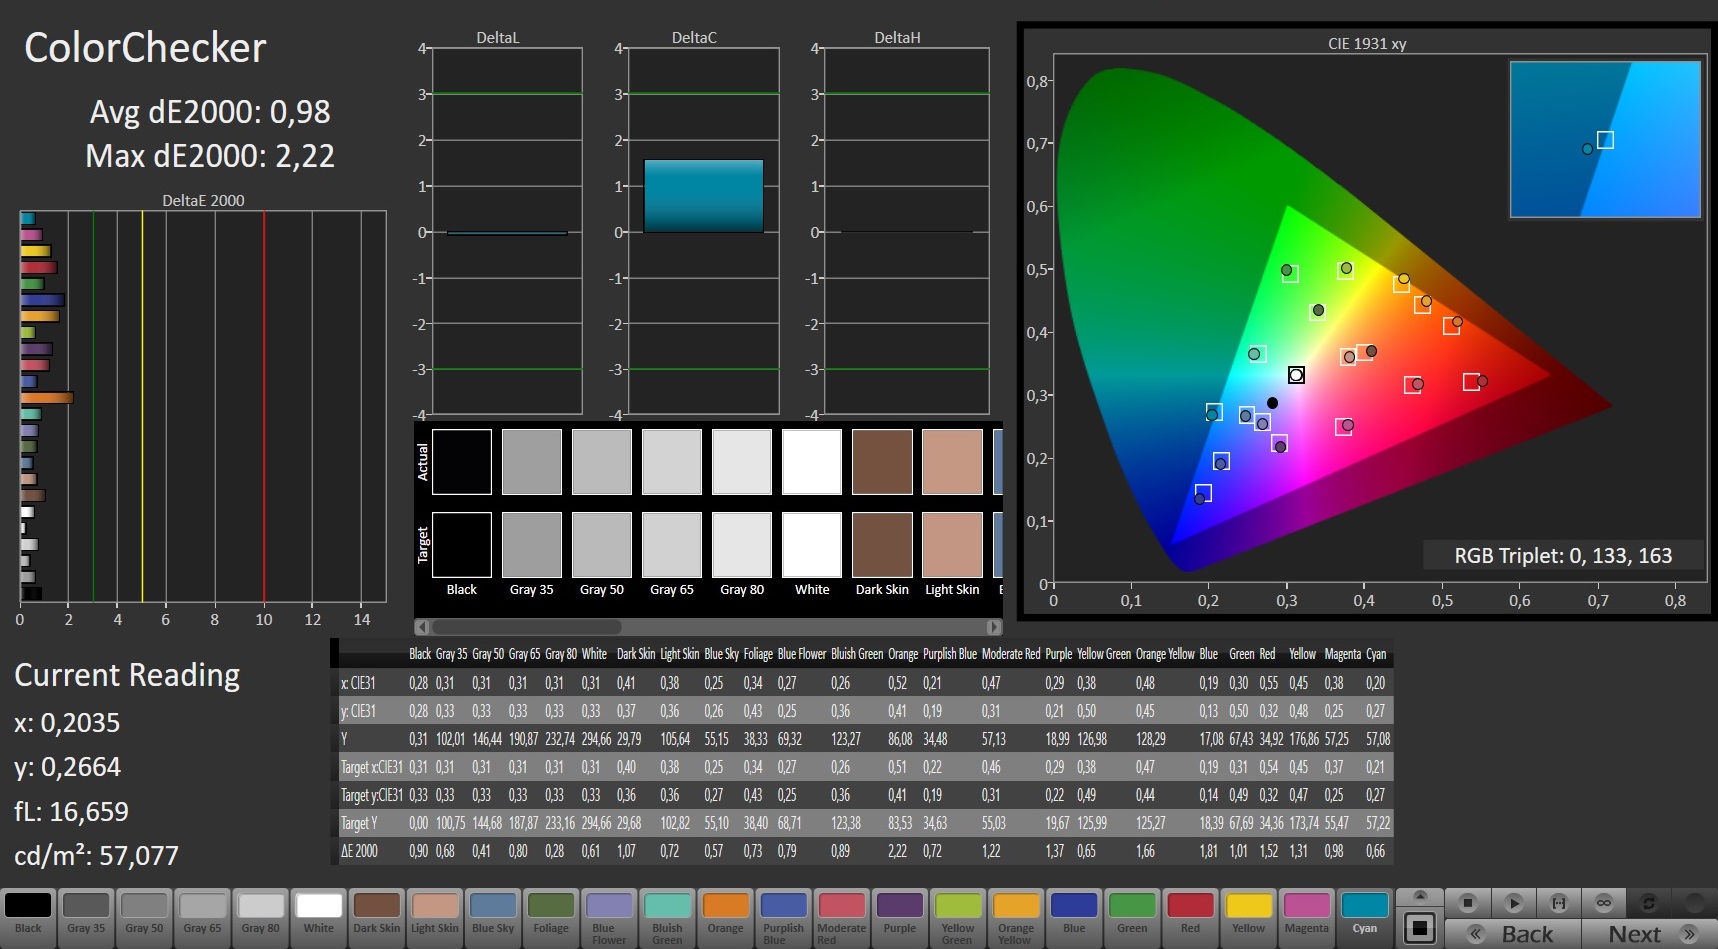
Acer could or should improve a bit in terms of color accuracy. If you look at our measurements with the CalMAN tool (see screenshots), the display only makes a mediocre impression out of the box. In order to get the grayscales and colors into the ideal range, calibration is necessary. Users who don't have any hardware for this can resort to our ICC file that is linked above.
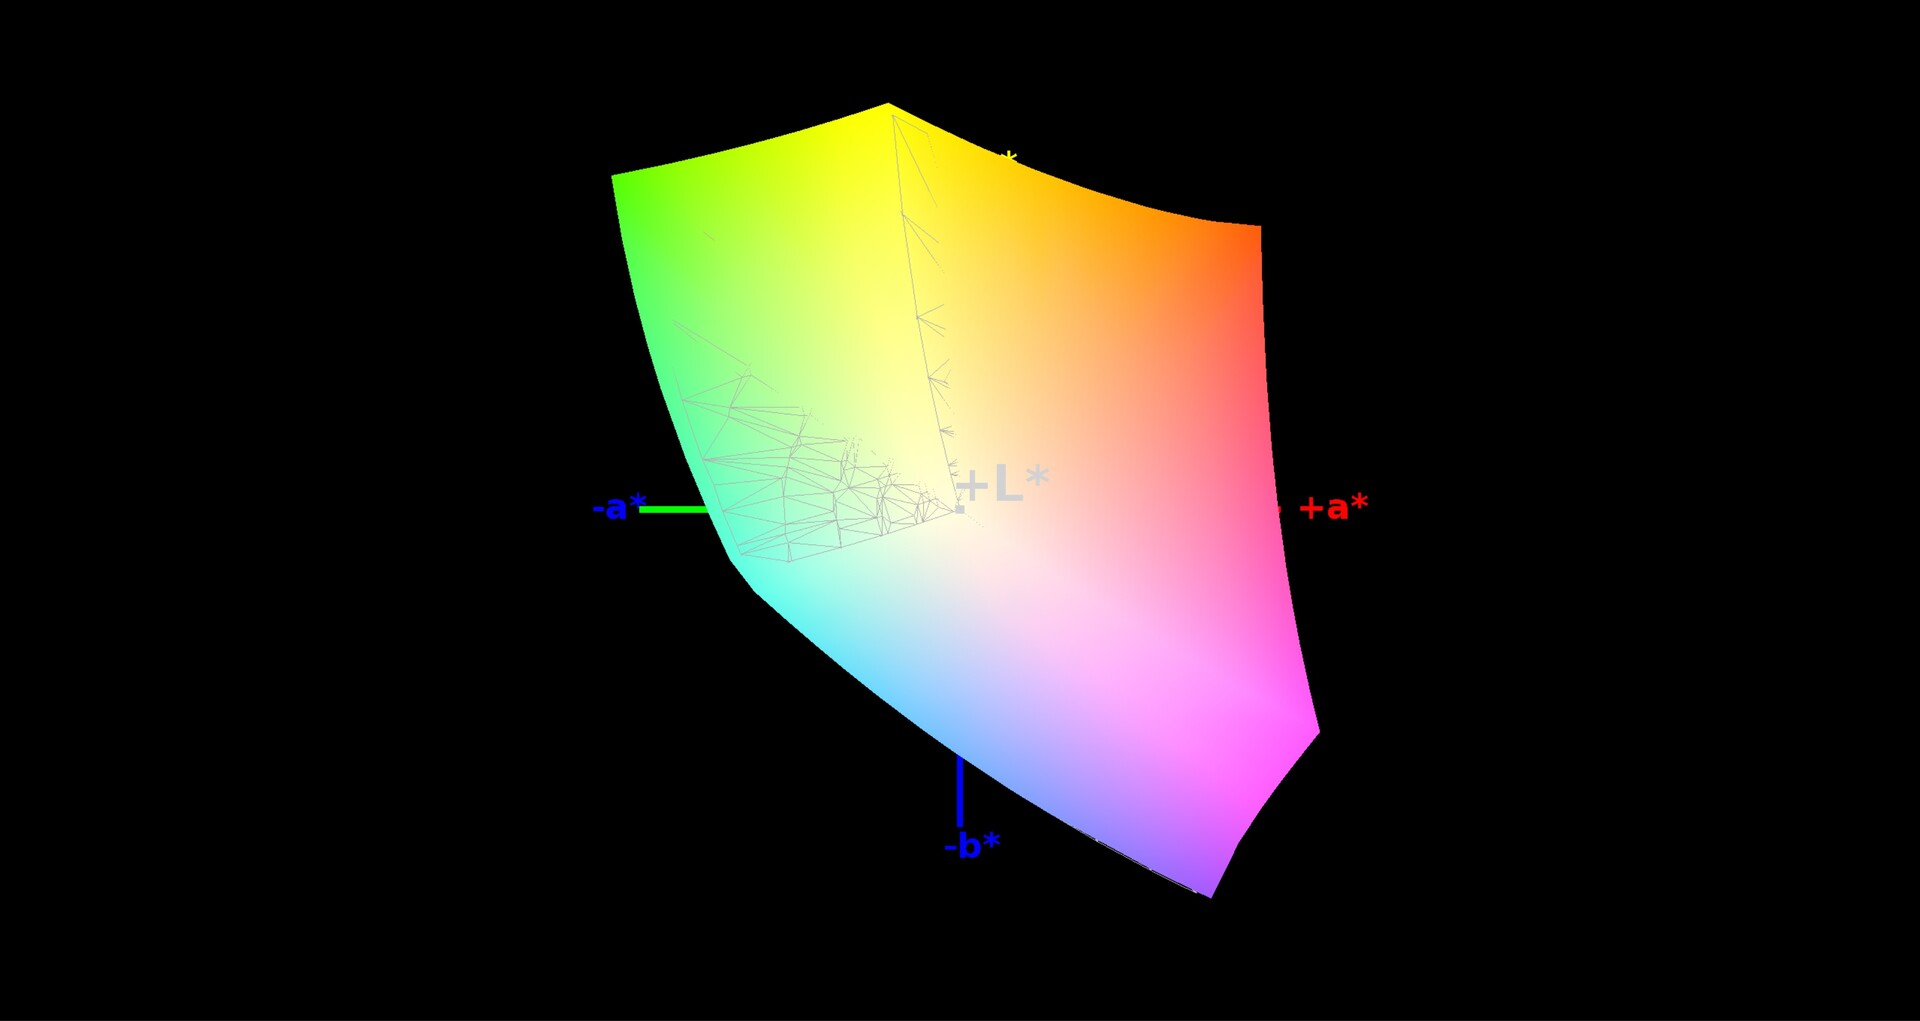
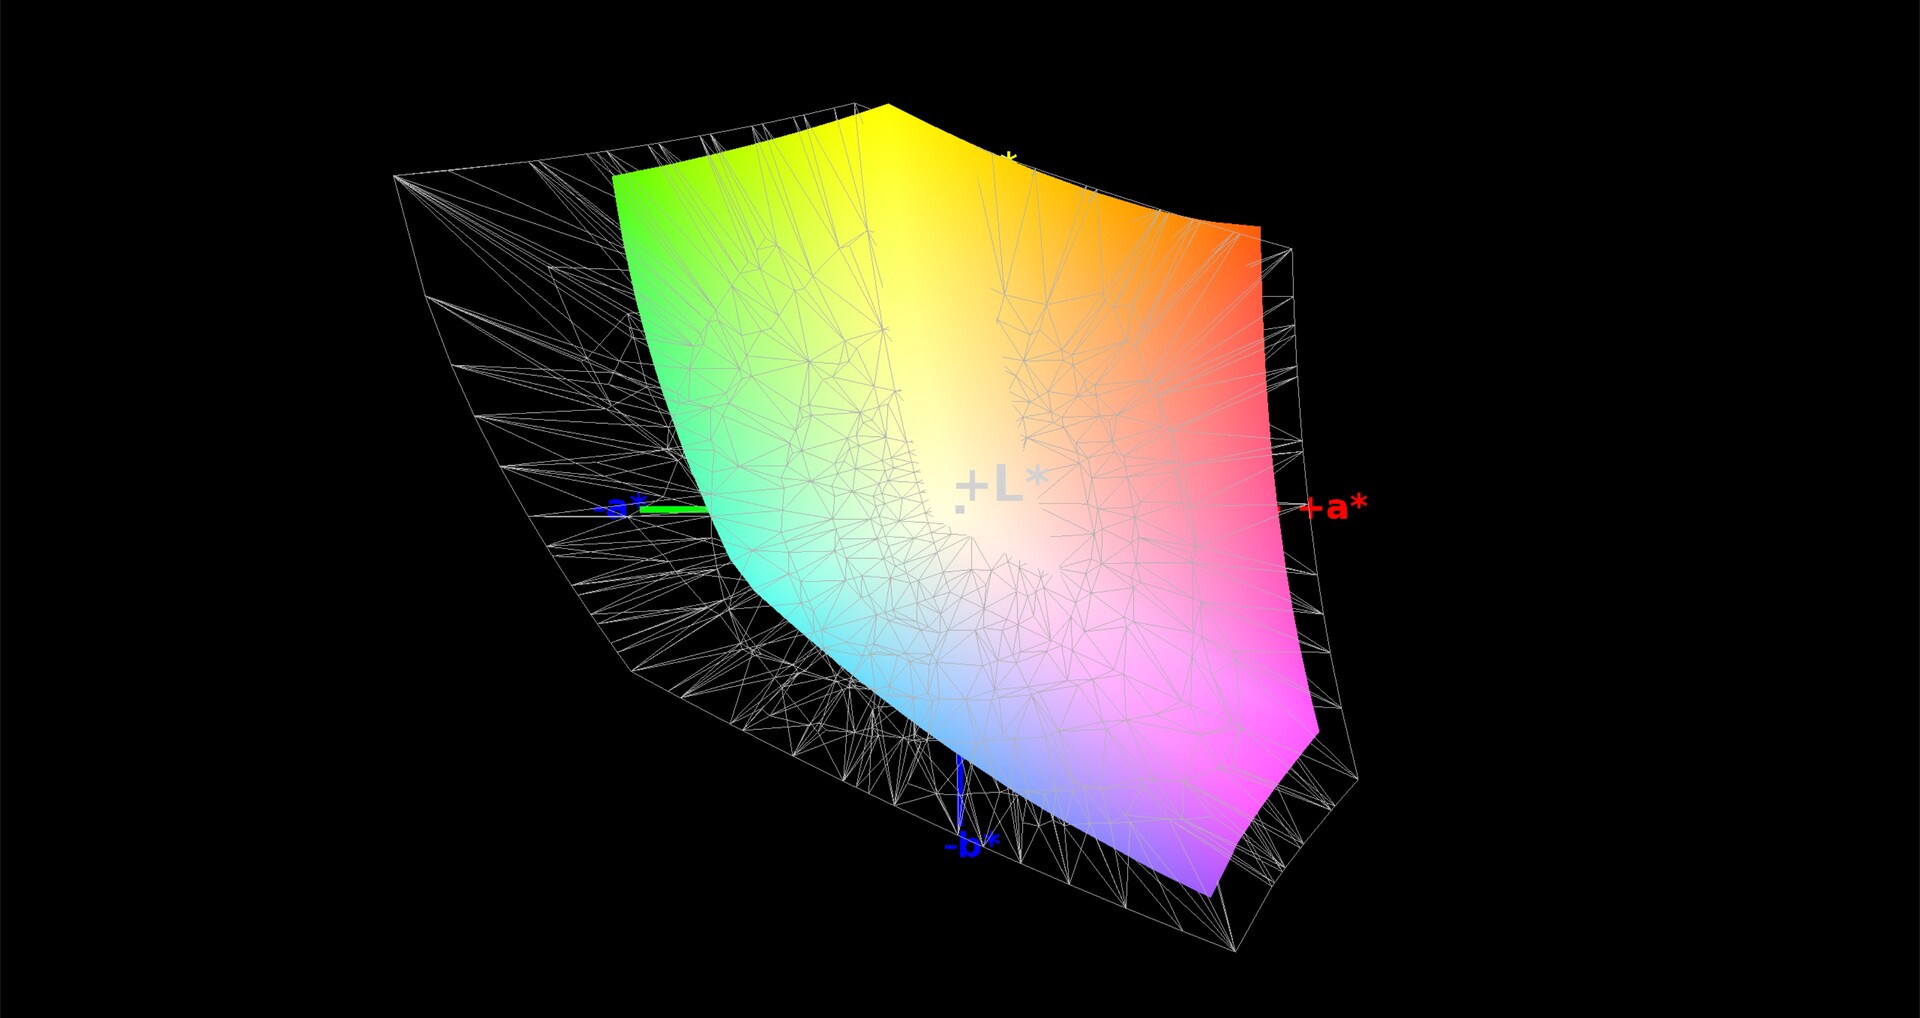
The color space, on the other hand, doesn't deserve any criticism. 99% of sRGB and 66% of AdobeRGB are more than enough for a gaming laptop.
Display Response Times
| ↔ Response Time Black to White | ||
|---|---|---|
| 10.4 ms ... rise ↗ and fall ↘ combined | ↗ 5.2 ms rise | 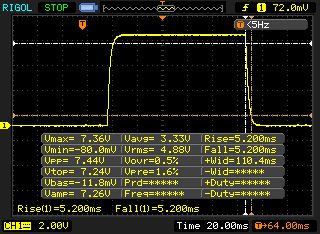 |
| ↘ 5.2 ms fall | ||
| The screen shows good response rates in our tests, but may be too slow for competitive gamers. In comparison, all tested devices range from 0.1 (minimum) to 240 (maximum) ms. » 28 % of all devices are better. This means that the measured response time is better than the average of all tested devices (19.8 ms). | ||
| ↔ Response Time 50% Grey to 80% Grey | ||
| 14.4 ms ... rise ↗ and fall ↘ combined | ↗ 7.2 ms rise | 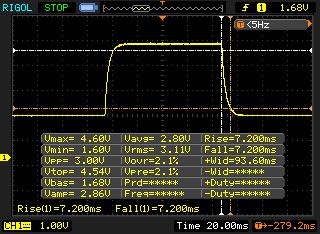 |
| ↘ 7.2 ms fall | ||
| The screen shows good response rates in our tests, but may be too slow for competitive gamers. In comparison, all tested devices range from 0.165 (minimum) to 636 (maximum) ms. » 29 % of all devices are better. This means that the measured response time is better than the average of all tested devices (30.9 ms). | ||
Screen Flickering / PWM (Pulse-Width Modulation)
| Screen flickering / PWM not detected | 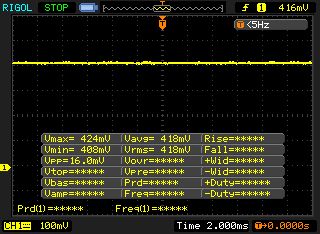 | ||
In comparison: 52 % of all tested devices do not use PWM to dim the display. If PWM was detected, an average of 7748 (minimum: 5 - maximum: 343500) Hz was measured. | |||
Test conditions
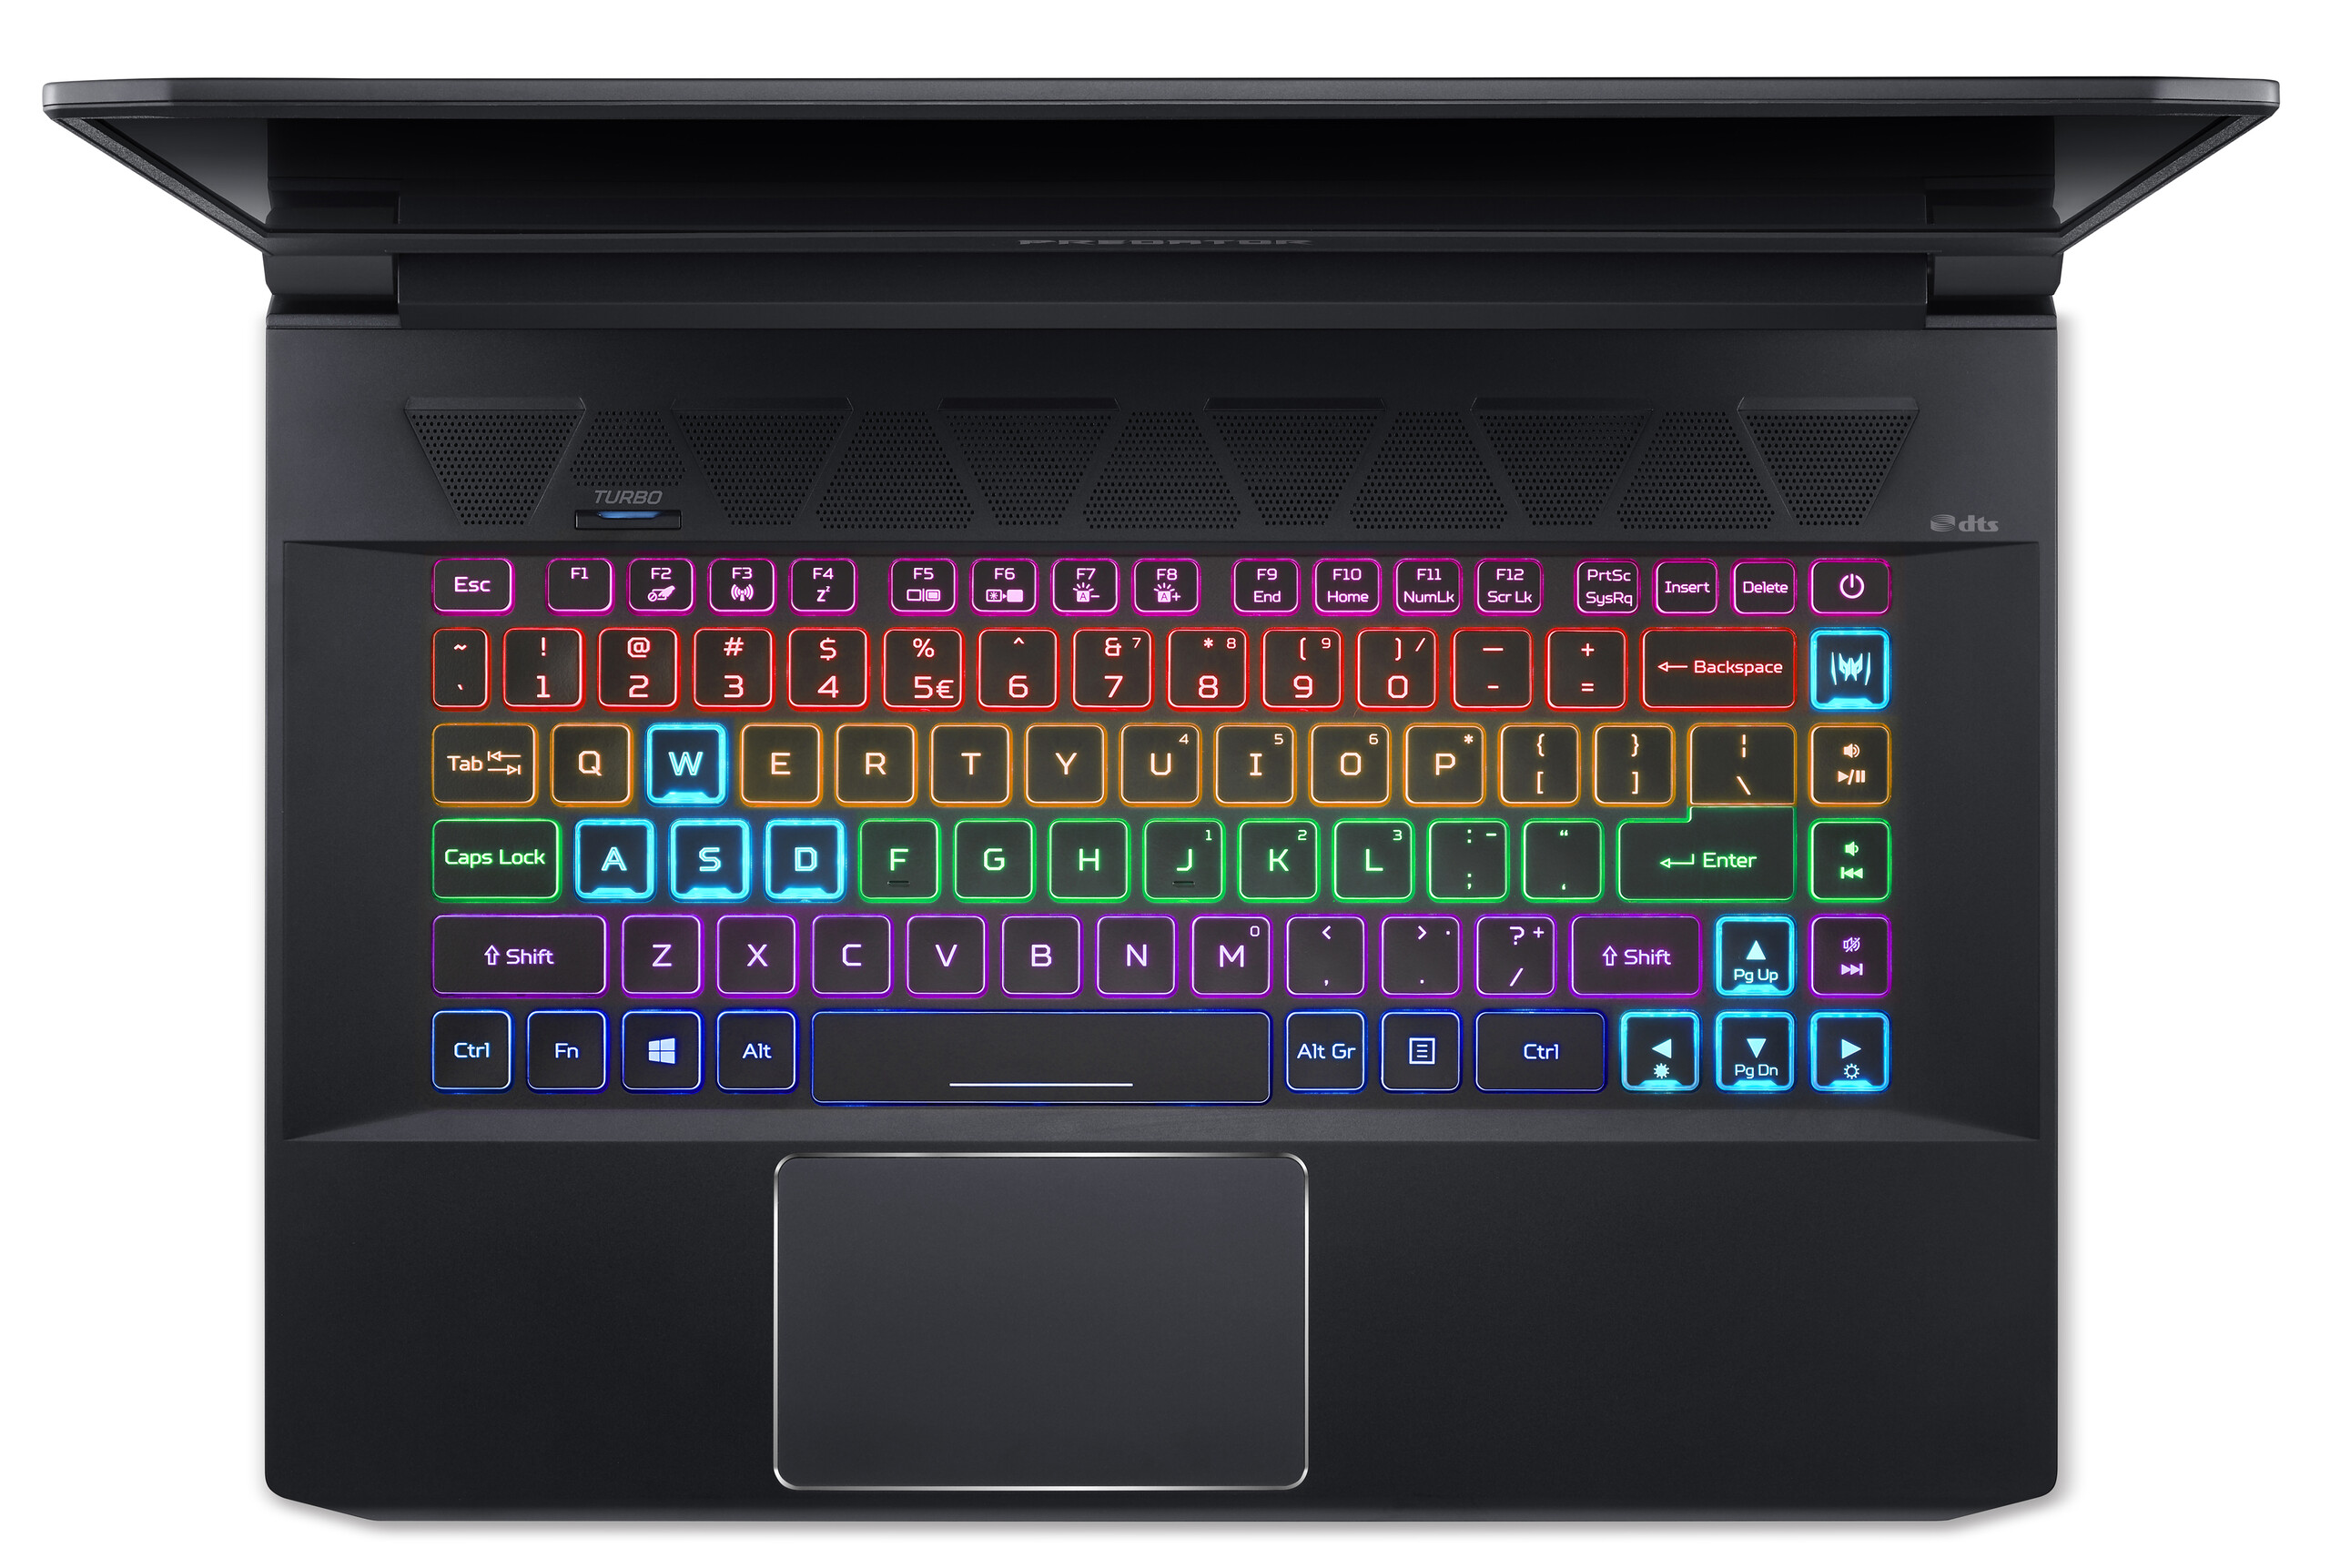
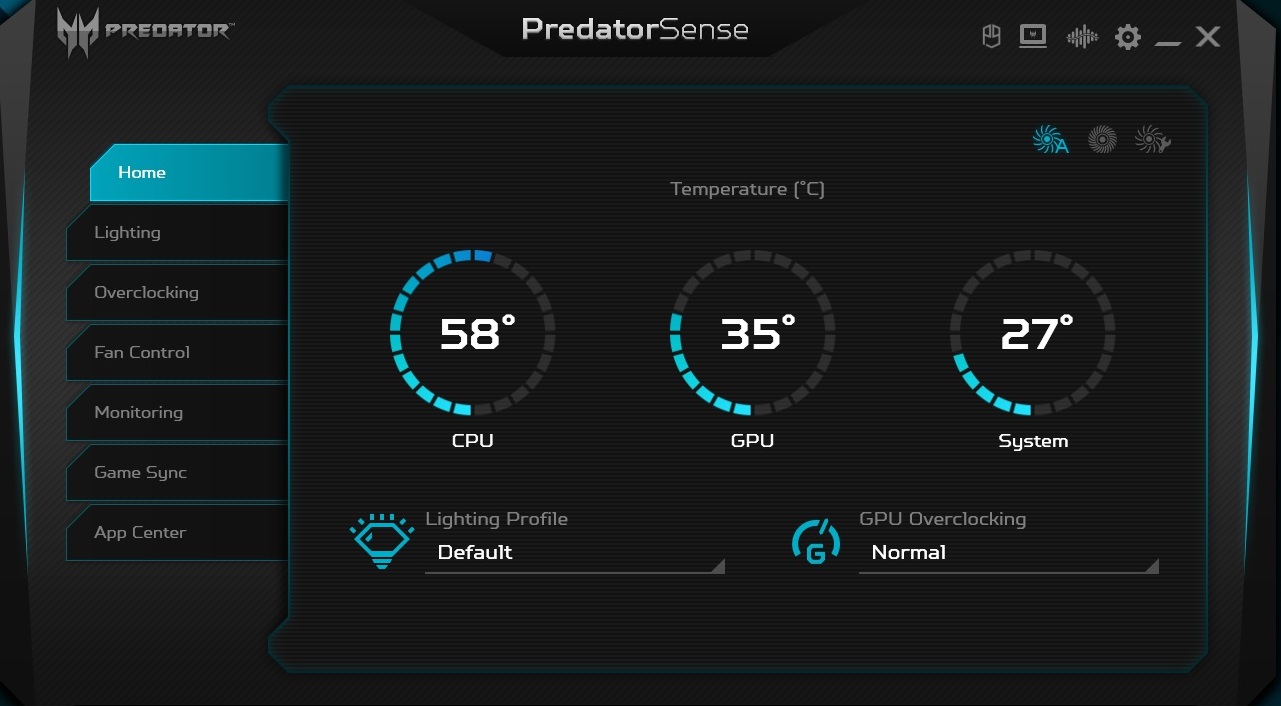
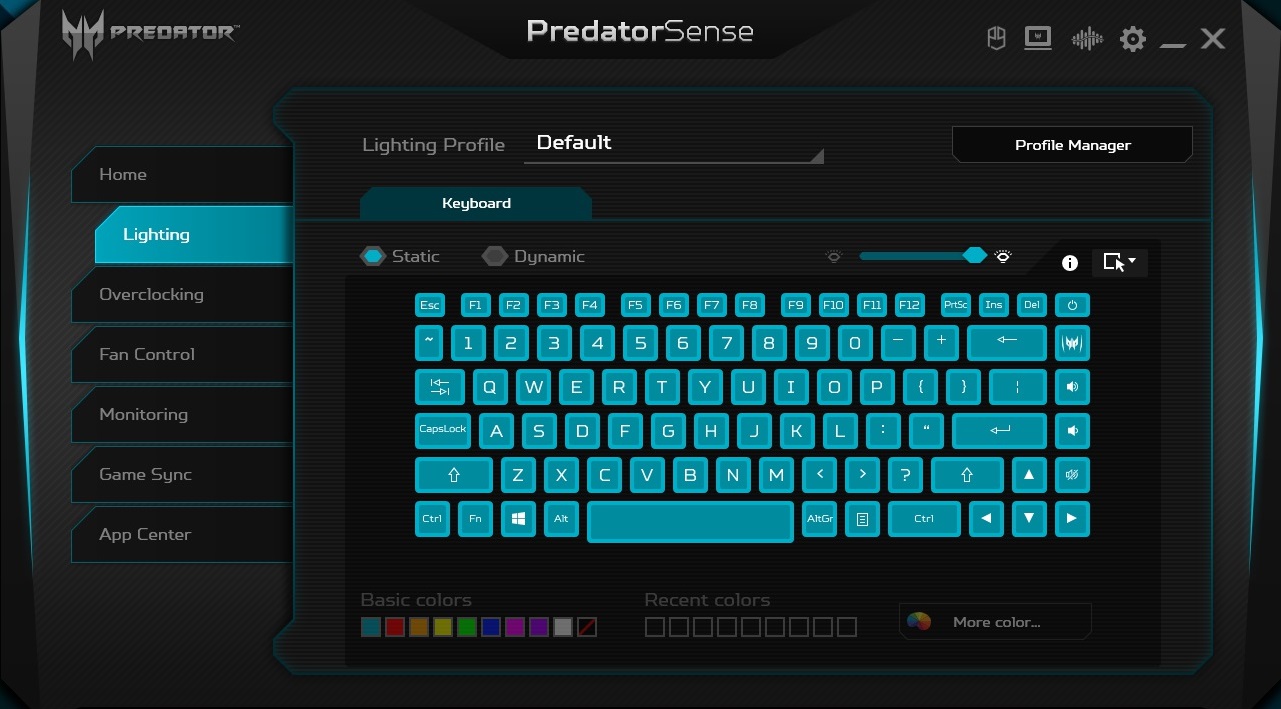
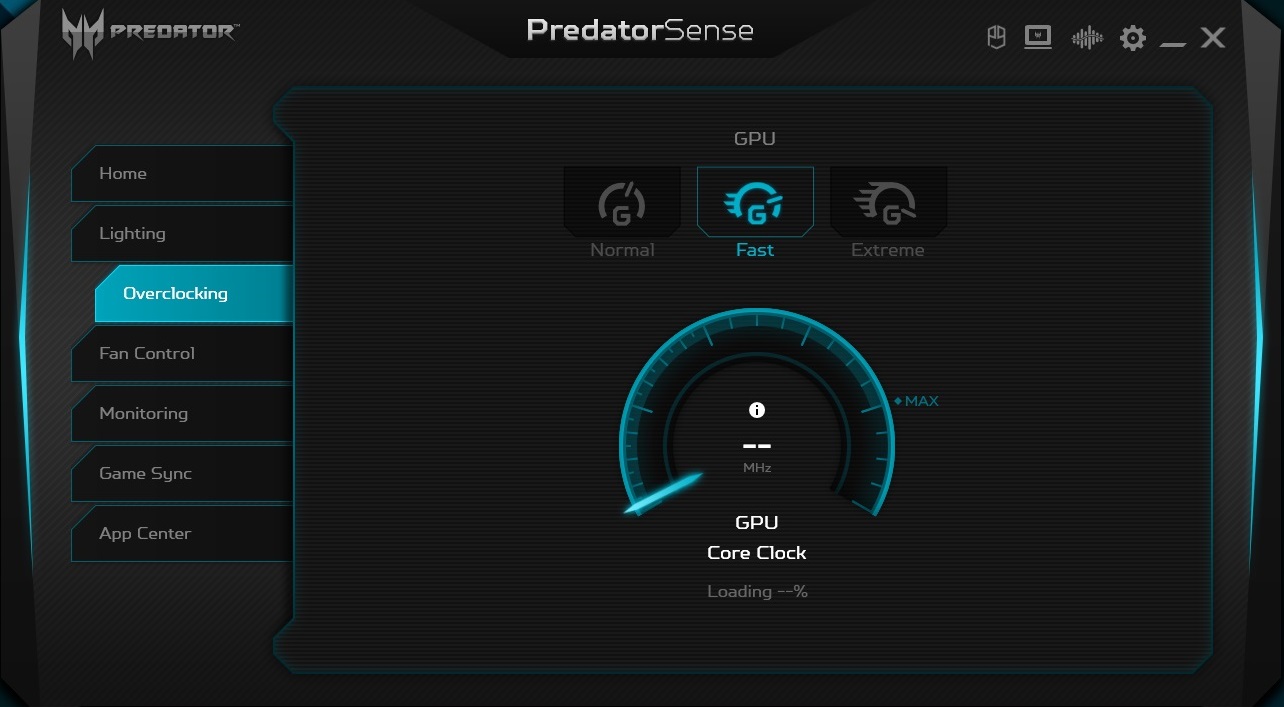
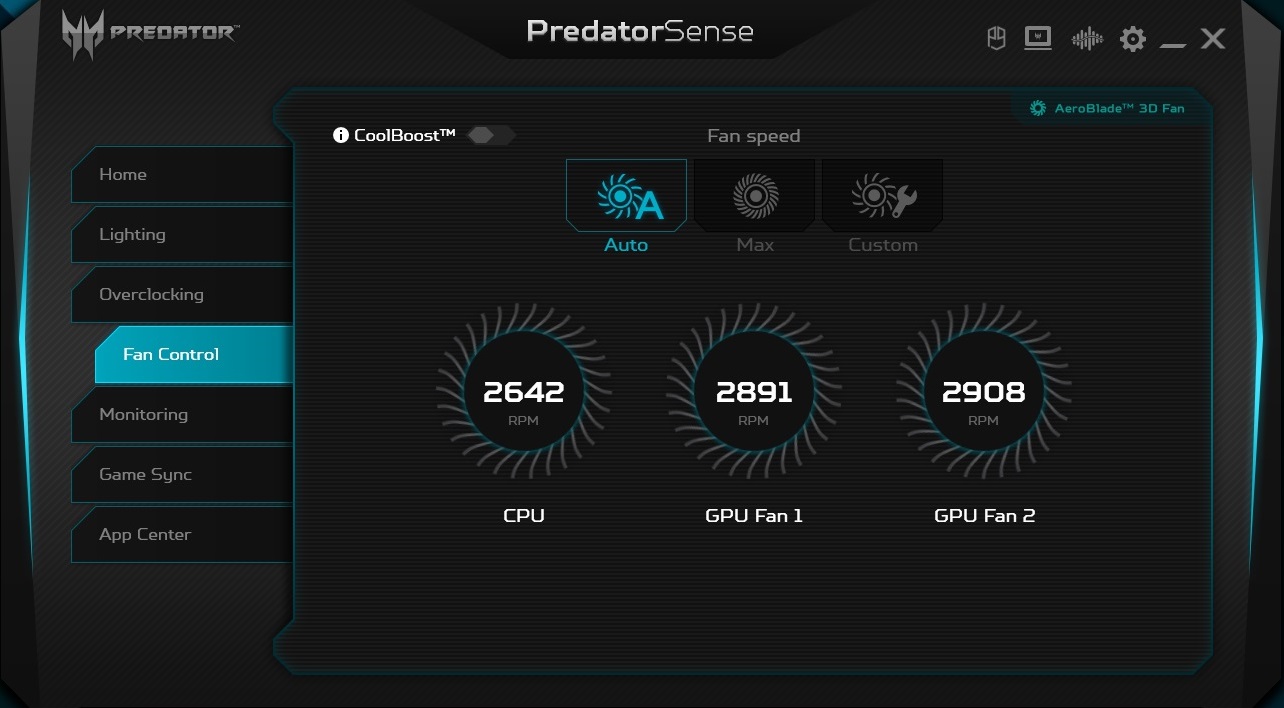
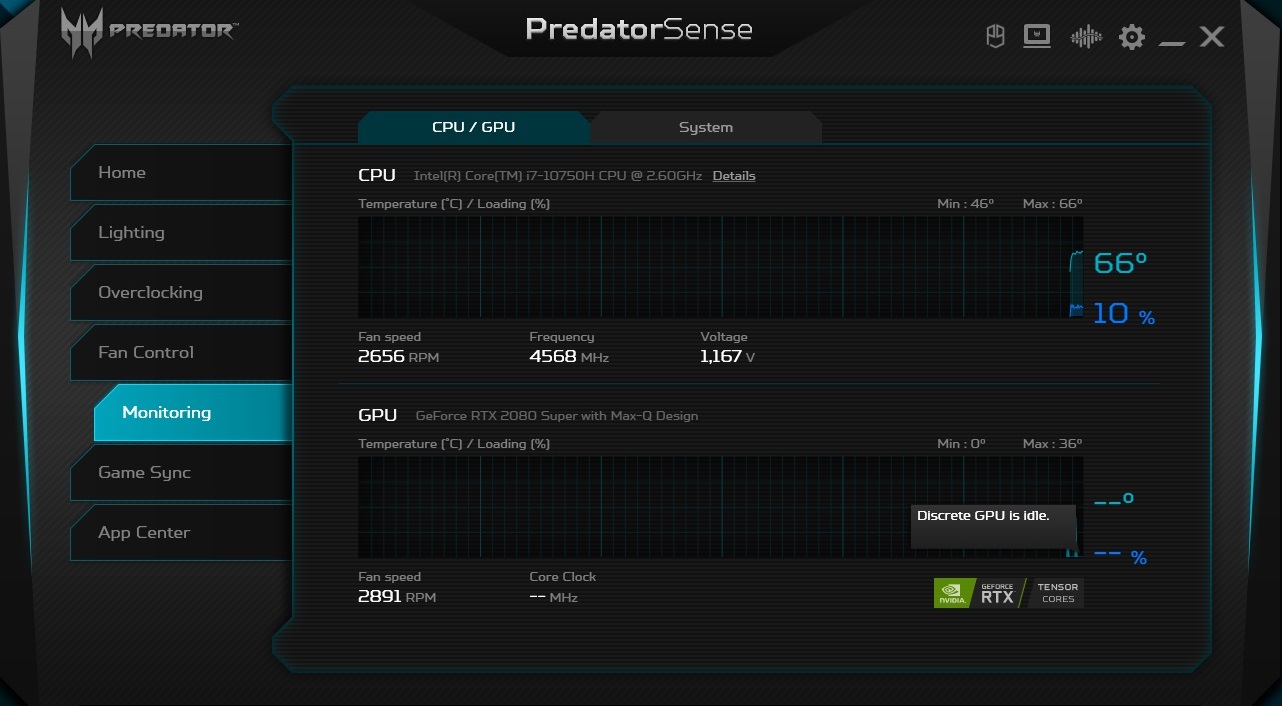
The preinstalled Predator Sense program not only lets you monitor the CPU and GPU but also allows you to adjust various system settings (including the color and mode of the keyboard lighting). Of particular interest is the Overclocking menu, which contains three performance profiles. Our measurements (with the exception of the battery tests) were conducted in Fast mode, which raises the RTX 2080 Super Max-Q's base clock speed from the standard 735 to 815 MHz (855 MHz @Extreme). The fans ran in automatic mode.
Performance
The Predator Triton 500 clearly belongs to the high-end segment. As long as you don't connect a QHD or 4K display, the 15-incher should have enough (gaming) power for the next few years.
Processor
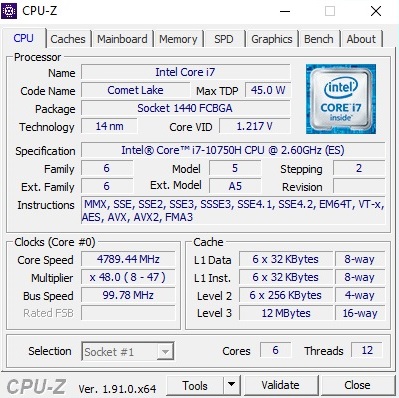
Despite the flat design, Acer packs a hexa-core CPU under the hood. Compared to the old Core i7-9750H, the Core i7-10750H reaches a maximum clock rate of 5.0 instead of 4.5 GHz, which promises a certain performance plus. Nonetheless, the processor doesn't quite reach its turbo limit in practice. According to the Cinebench R15 test, the speed is between 4.2 and 4.7 GHz under single-core load, whereas the load of all cores leads to 4.0 to 4.2 GHz.
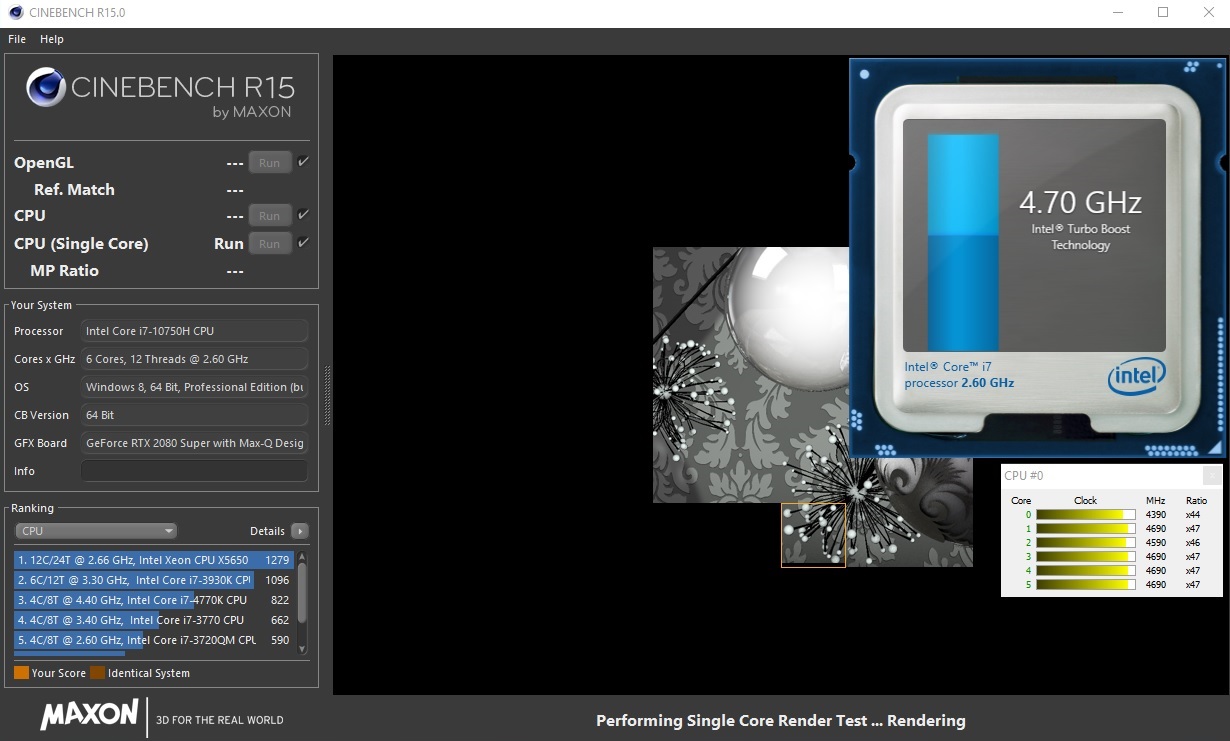
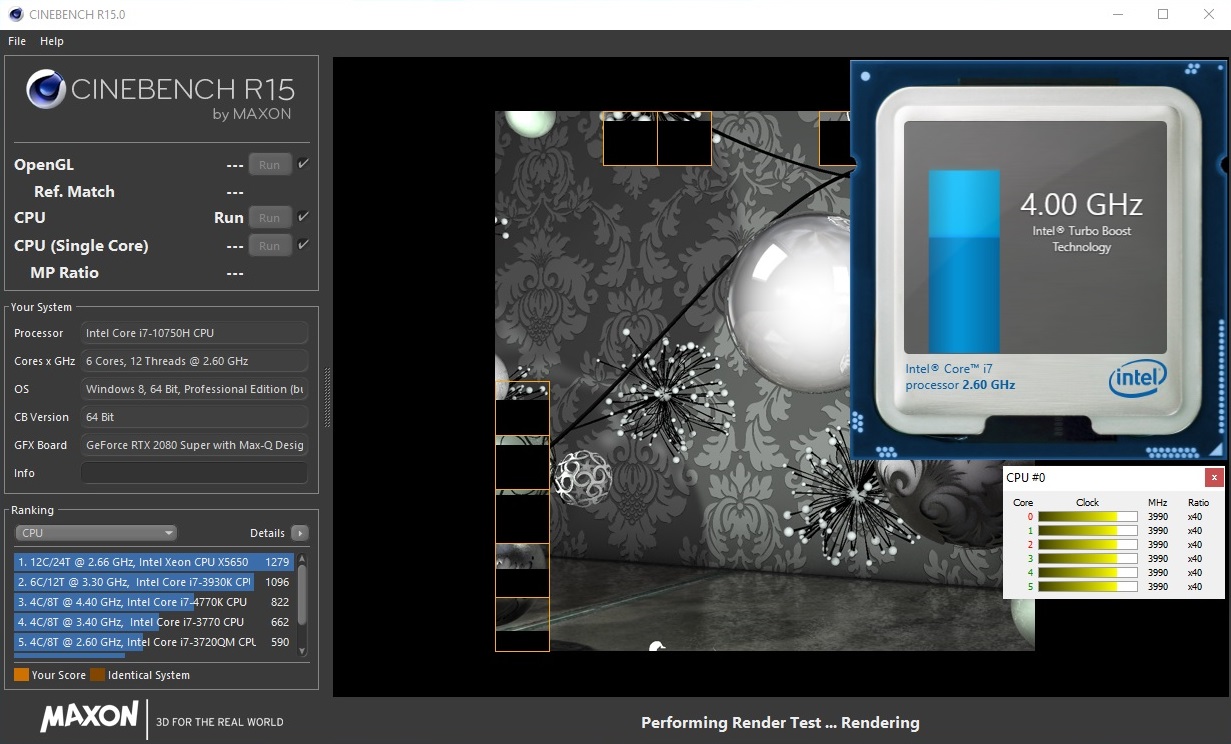
As is known from most laptops, the CPU speed drops a bit with longer use. However, the almost 6% performance loss that the Triton 500 showed in our Cinebench loop is bearable with such a compact and slim device. Other gaming laptops have a much stronger drop in performance here (e.g. the Razer Blade 15).
Depending on the comparison device, the Core i7-10750H sprints a good 10 to 20% past the Core i7-9750H in multi-core benchmarks, which corresponds to the usual performance gains in a new Intel generation.
System performance
The Triton 500 showed no abnormalities in system performance. With a total score of 5,484 points, the 15-incher makes itself comfortable between the Alienware m15 R2 (5,374 points) and the MSI GS65 Stealth 9SG (5,725 points) in the PCMark 10 test. The operating system reacts very quickly thanks to the PCIe SSD and keeps loading times and program launches pleasantly short.
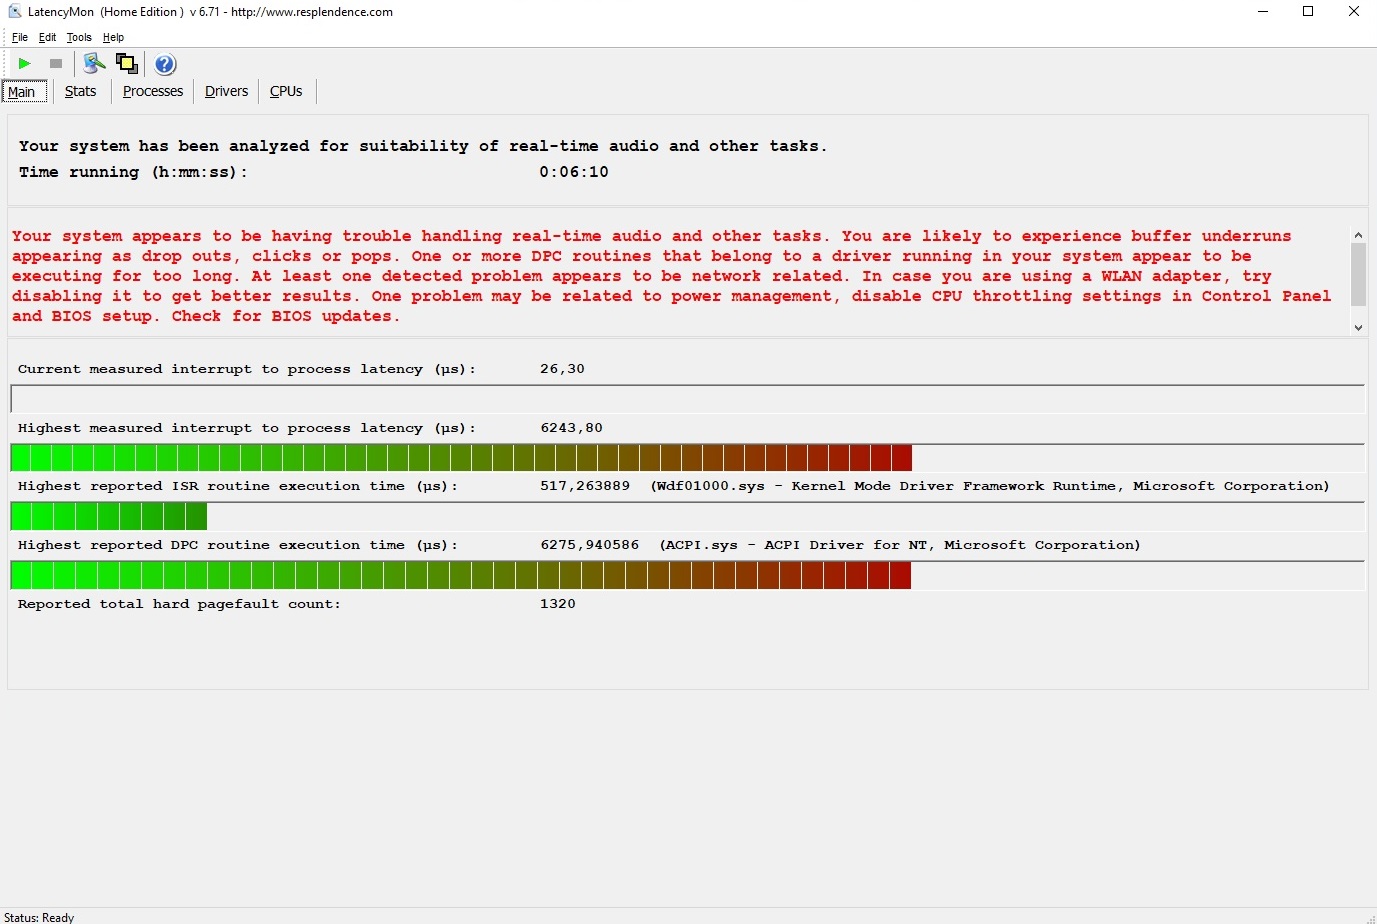
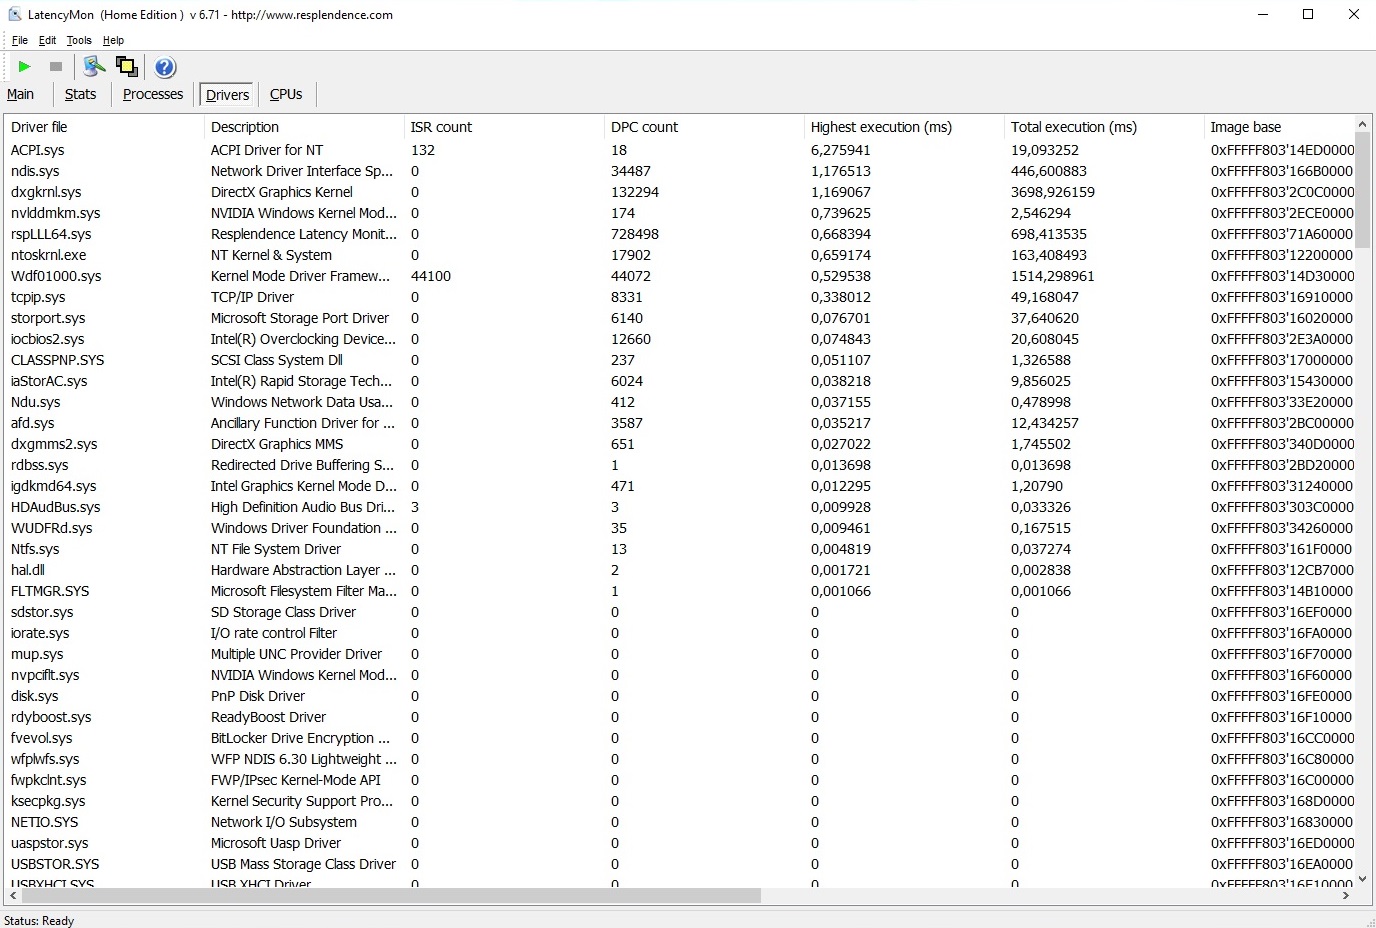
DPC latency times
The gaming machine doesn't score quite as well in the latency test. The LatencyMon tool measures relatively high values here, which can lead to short interruptions with real-time audio, for example.
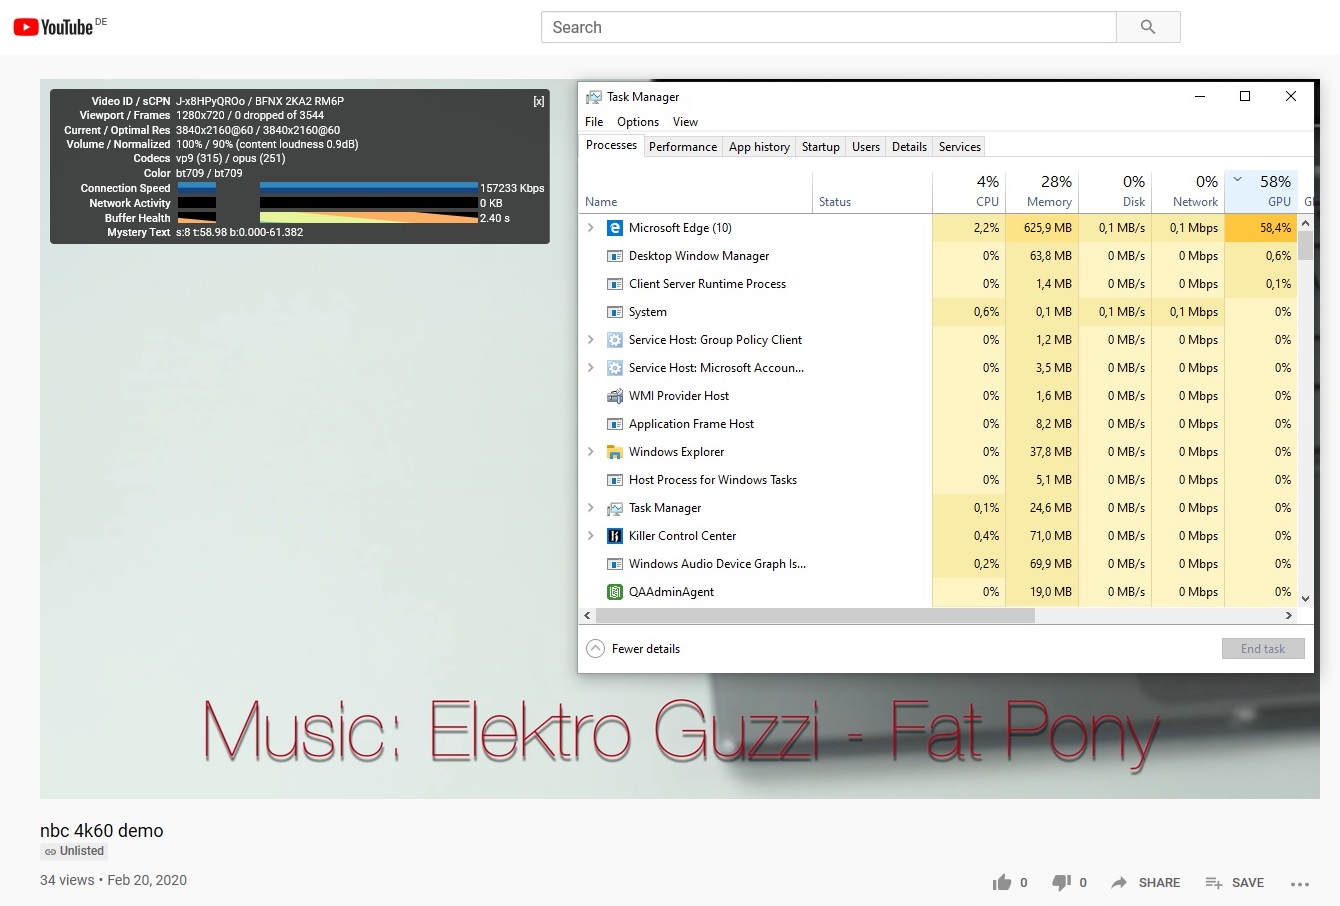
| DPC Latencies / LatencyMon - interrupt to process latency (max), Web, Youtube, Prime95 | |
| Acer Predator Triton 500 PT515-52-70N3 | |
* ... smaller is better
Storage
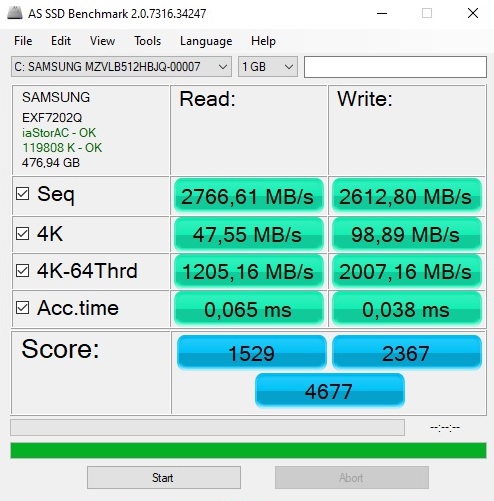
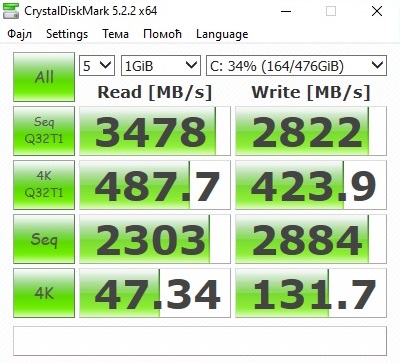
An M.2 SSD from Samsung is built into the test device as a mass storage device. The extremely popular PM981a MZVLB512HBJQ 512 GB model cuts a very good figure in both writing and reading. The SSD RAID of the Alienware m15 R2 can only stand out to a limited extent.
| Acer Predator Triton 500 PT515-52-70N3 Samsung SSD PM981a MZVLB512HBJQ | MSI GS65 Stealth 9SG Samsung SSD PM981 MZVLB512HAJQ | Razer Blade 15 RTX 2080 Max-Q Samsung SSD PM981 MZVLB512HAJQ | Alienware m15 R2 P87F 2x Toshiba XG6 KXG60ZNV512G (RAID 0) | |
|---|---|---|---|---|
| CrystalDiskMark 5.2 / 6 | -21% | -11% | 1% | |
| Write 4K (MB/s) | 131.7 | 91.3 -31% | 137.2 4% | 108.8 -17% |
| Read 4K (MB/s) | 47.34 | 40.73 -14% | 46.82 -1% | 45.41 -4% |
| Write Seq (MB/s) | 2884 | 1915 -34% | 1221 -58% | 2467 -14% |
| Read Seq (MB/s) | 2303 | 2051 -11% | 1217 -47% | 2456 7% |
| Write 4K Q32T1 (MB/s) | 423.9 | 308.3 -27% | 527 24% | 532 26% |
| Read 4K Q32T1 (MB/s) | 487.7 | 417.4 -14% | 614 26% | 590 21% |
| Write Seq Q32T1 (MB/s) | 2822 | 1922 -32% | 1986 -30% | 2801 -1% |
| Read Seq Q32T1 (MB/s) | 3478 | 3395 -2% | 3234 -7% | 3172 -9% |

Graphics card
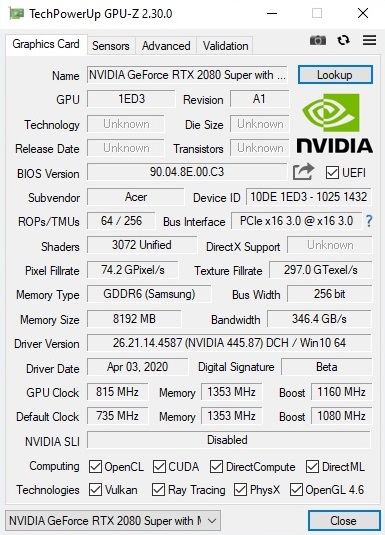
The GeForce RTX 2080 Super Max-Q differs from the old Max-Q version primarily in terms of the number of shaders. Instead of 2,944 CUDA processing units, the successor has 3,072 CUDA cores, which slightly increases performance. There are hardly any changes in the clock speeds. The GDDR6 video memory is once again 8 GB in size and uses a 256-bit interface. More details about the graphics accelerator can be found in our performance article and our GPU article.
| 3DMark 06 Standard Score | 38265 points | |
| 3DMark Vantage P Result | 60306 points | |
| 3DMark 11 Performance | 22730 points | |
| 3DMark Cloud Gate Standard Score | 38107 points | |
| 3DMark Fire Strike Score | 18678 points | |
| 3DMark Time Spy Score | 8043 points | |
Help | ||
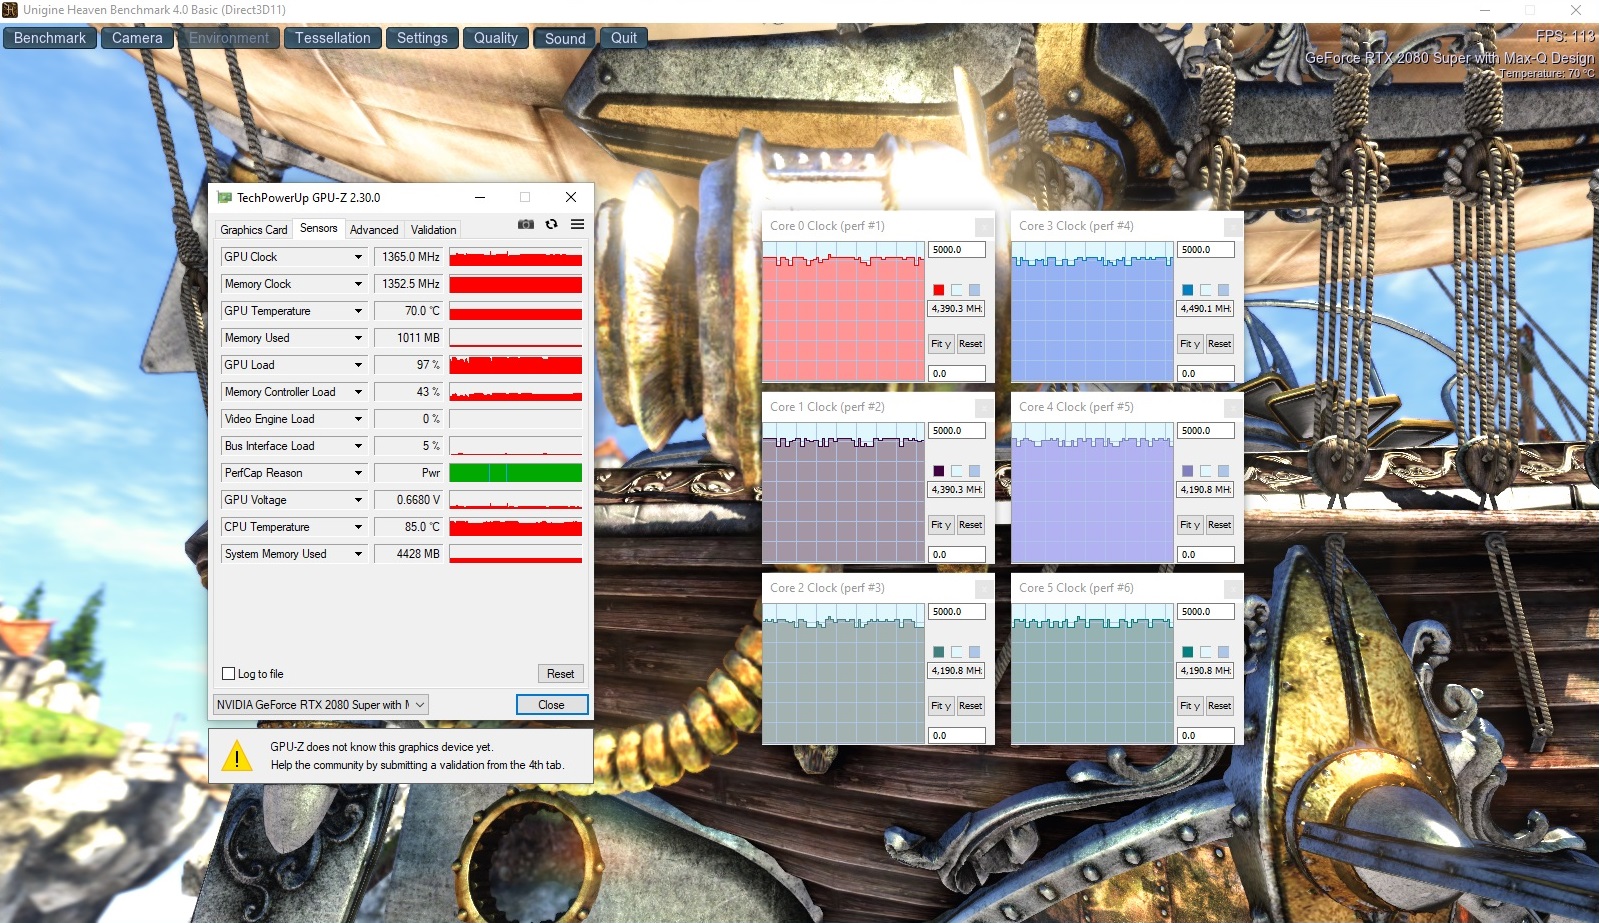
As expected, the Triton 500 pulls a little ahead of the comparison devices in the graphics benchmarks. While the Alienware m15 R2 can still keep up quite well, the Razer Blade 15 and the MSI GS65 9SG fall behind by more than 10% at times in the 3DMark tests. This is probably mainly related to the Turbo utilization, which varies greatly depending on the cooling system. In the case of the Triton 500, we were able to draw about 1,400 MHz from the RTX 2080 Super Max-Q in 3D applications.
In the sixty-minute test with the role-playing game The Witcher 3 (1920x1080, Ultra settings), there were no nasty surprises. The frame rate remained quite constant the whole time. No performance drops or other problems could be found.
Gaming performance
When using the native resolution of 1920x1080, the RTX 2080 Super Max-Q is fast enough to fire up all modern games smoothly with maximum details. Only extremely demanding titles like Anno 1800 and Red Dead Redemption 2 push the frame rate below the 60 FPS mark. Otherwise, the 300 Hz screen usually comes into its own.
| The Witcher 3 - 1920x1080 Ultra Graphics & Postprocessing (HBAO+) | |
| Average of class Gaming (104.7 - 240, n=7, last 2 years) | |
| Acer Predator Triton 500 PT515-52-70N3 | |
| Alienware m15 R2 P87F | |
| Razer Blade 15 RTX 2080 Max-Q | |
| MSI GS65 Stealth 9SG | |
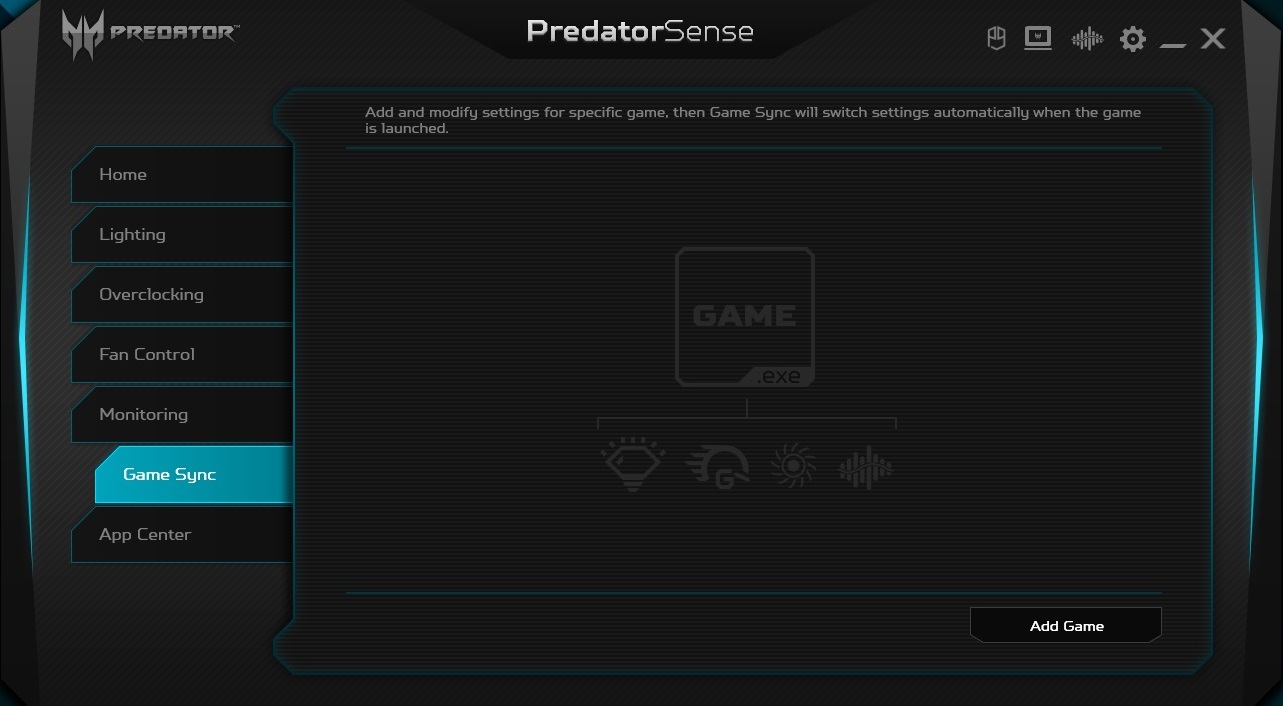
By the way, if you want a particularly smooth/clean image, you can go from the Optimus graphics-switching solution to the G-Sync image-enhancing technology within the BIOS or in the Predator Sense tool.
| low | med. | high | ultra | QHD | 4K | |
|---|---|---|---|---|---|---|
| GTA V (2015) | 179 | 172 | 153 | 85.8 | ||
| The Witcher 3 (2015) | 236 | 143 | 83.4 | 58.2 | ||
| Dota 2 Reborn (2015) | 146 | 134 | 123 | 118 | ||
| Fortnite (2018) | 121 | 114 | 99.5 | 80.3 | 44.5 | |
| Final Fantasy XV Benchmark (2018) | 103 | 80.8 | 37.6 | |||
| Kingdom Come: Deliverance (2018) | 119 | 100 | 72 | 56.1 | 31.9 | |
| X-Plane 11.11 (2018) | 107 | 93.4 | 79.5 | |||
| Monster Hunter World (2018) | 105 | 97.7 | 90 | 63.3 | 31.9 | |
| Shadow of the Tomb Raider (2018) | 111 | 105 | 97 | 72 | 39 | |
| Assassin´s Creed Odyssey (2018) | 92 | 78 | 58 | 53 | 32 | |
| Hitman 2 (2018) | 86.7 | 78.6 | 77 | 76 | 46.1 | |
| Battlefield V (2018) | 139 | 127 | 119 | 96.1 | 58.7 | |
| Darksiders III (2018) | 112 | 109 | 103 | 82.1 | 43.2 | |
| Just Cause 4 (2018) | 152 | 113 | 105 | 73.9 | 41.3 | |
| Apex Legends (2019) | 194 | 165 | 163 | 118 | 65 | |
| Far Cry New Dawn (2019) | 103 | 97 | 87 | 71 | 48 | |
| Metro Exodus (2019) | 101 | 77.8 | 63.4 | 51.2 | 31.6 | |
| Dirt Rally 2.0 (2019) | 166 | 162 | 98.8 | 76.4 | ||
| The Division 2 (2019) | 129 | 112 | 80 | 59 | 31 | |
| Anno 1800 (2019) | 94 | 74.4 | 44.9 | 38.8 | 23.2 | |
| Rage 2 (2019) | 126 | 106 | 103 | 68.4 | 34.1 | |
| F1 2019 (2019) | 174 | 141 | 138 | 122 | 74 | |
| Control (2019) | 107 | 79.8 | 48.4 | 24.9 | ||
| Borderlands 3 (2019) | 107 | 84.3 | 68.1 | 49.1 | 26.6 | |
| FIFA 20 (2019) | 251 | 241 | 240 | 239 | 190 | |
| Ghost Recon Breakpoint (2019) | 102 | 92 | 70 | 53 | 31 | |
| GRID 2019 (2019) | 85.9 | 77.7 | 72 | 66.4 | 46.9 | |
| Call of Duty Modern Warfare 2019 (2019) | 134 | 129 | 107 | 78.9 | 44.5 | |
| Need for Speed Heat (2019) | 93 | 86.6 | 83.3 | 66.9 | 40.9 | |
| Star Wars Jedi Fallen Order (2019) | 95.7 | 93.1 | 89.9 | 76.2 | 42.7 | |
| Red Dead Redemption 2 (2019) | 98 | 67.4 | 43.7 | 37 | 23.8 | |
| Escape from Tarkov (2020) | 121 | 121 | 119 | 83.1 | 39.7 | |
| Hunt Showdown (2020) | 119 | 101 | 68.8 | 32.4 | ||
| Doom Eternal (2020) | 164 | 150 | 147 | 108 | 58 |
Emissions
Noise emissions
The Triton 500 reveals weaknesses especially in terms of noise development. Analogous to many other gaming laptops, the 15-incher gets very loud under load. An average of 48 dB(A) in games almost forces you to use a headset. For comparison: The competition ranges between 45 and 49 dB(A) here.
In idle mode, the background noise draws little criticism. Although the fans aren't always off, a base sound level of around 33 dB(A) shouldn't disturb most buyers. It's rather rare for the fans to turn up unnecessarily or in an annoying way.
Noise level
| Idle |
| 30 / 33 / 36 dB(A) |
| Load |
| 50 / 50 dB(A) |
 | ||
30 dB silent 40 dB(A) audible 50 dB(A) loud |
||
min: | ||
| Acer Predator Triton 500 PT515-52-70N3 i7-10750H, GeForce RTX 2080 Super Max-Q | MSI GS65 Stealth 9SG i7-9750H, GeForce RTX 2080 Max-Q | Razer Blade 15 RTX 2080 Max-Q i7-9750H, GeForce RTX 2080 Max-Q | Alienware m15 R2 P87F i7-9750H, GeForce RTX 2080 Max-Q | Average of class Gaming | |
|---|---|---|---|---|---|
| Noise | 7% | 13% | -3% | 12% | |
| off / environment * (dB) | 30 | 28.3 6% | 28.3 6% | 28.3 6% | 24.1 ? 20% |
| Idle Minimum * (dB) | 30 | 30.4 -1% | 28.8 4% | 28.5 5% | 26 ? 13% |
| Idle Average * (dB) | 33 | 30.5 8% | 28.8 13% | 28.5 14% | 27.5 ? 17% |
| Idle Maximum * (dB) | 36 | 30.6 15% | 29 19% | 49 -36% | 30.1 ? 16% |
| Load Average * (dB) | 50 | 37.6 25% | 33.5 33% | 49 2% | 43.8 ? 12% |
| Witcher 3 ultra * (dB) | 48 | 46 4% | 45 6% | 49 -2% | |
| Load Maximum * (dB) | 50 | 55.1 -10% | 45.2 10% | 55 -10% | 54.3 ? -9% |
* ... smaller is better
Temperature
If you exclude the rather hot Alienware m15 R2, the heat development roughly follows the competition. While the chassis reaches a bit less than 30 °C (~86 °F) in idle mode, our measuring device showed up to 44 °C (~111 °F) (top) and 50 °C (~122 °F) (bottom), respectively, under full load.
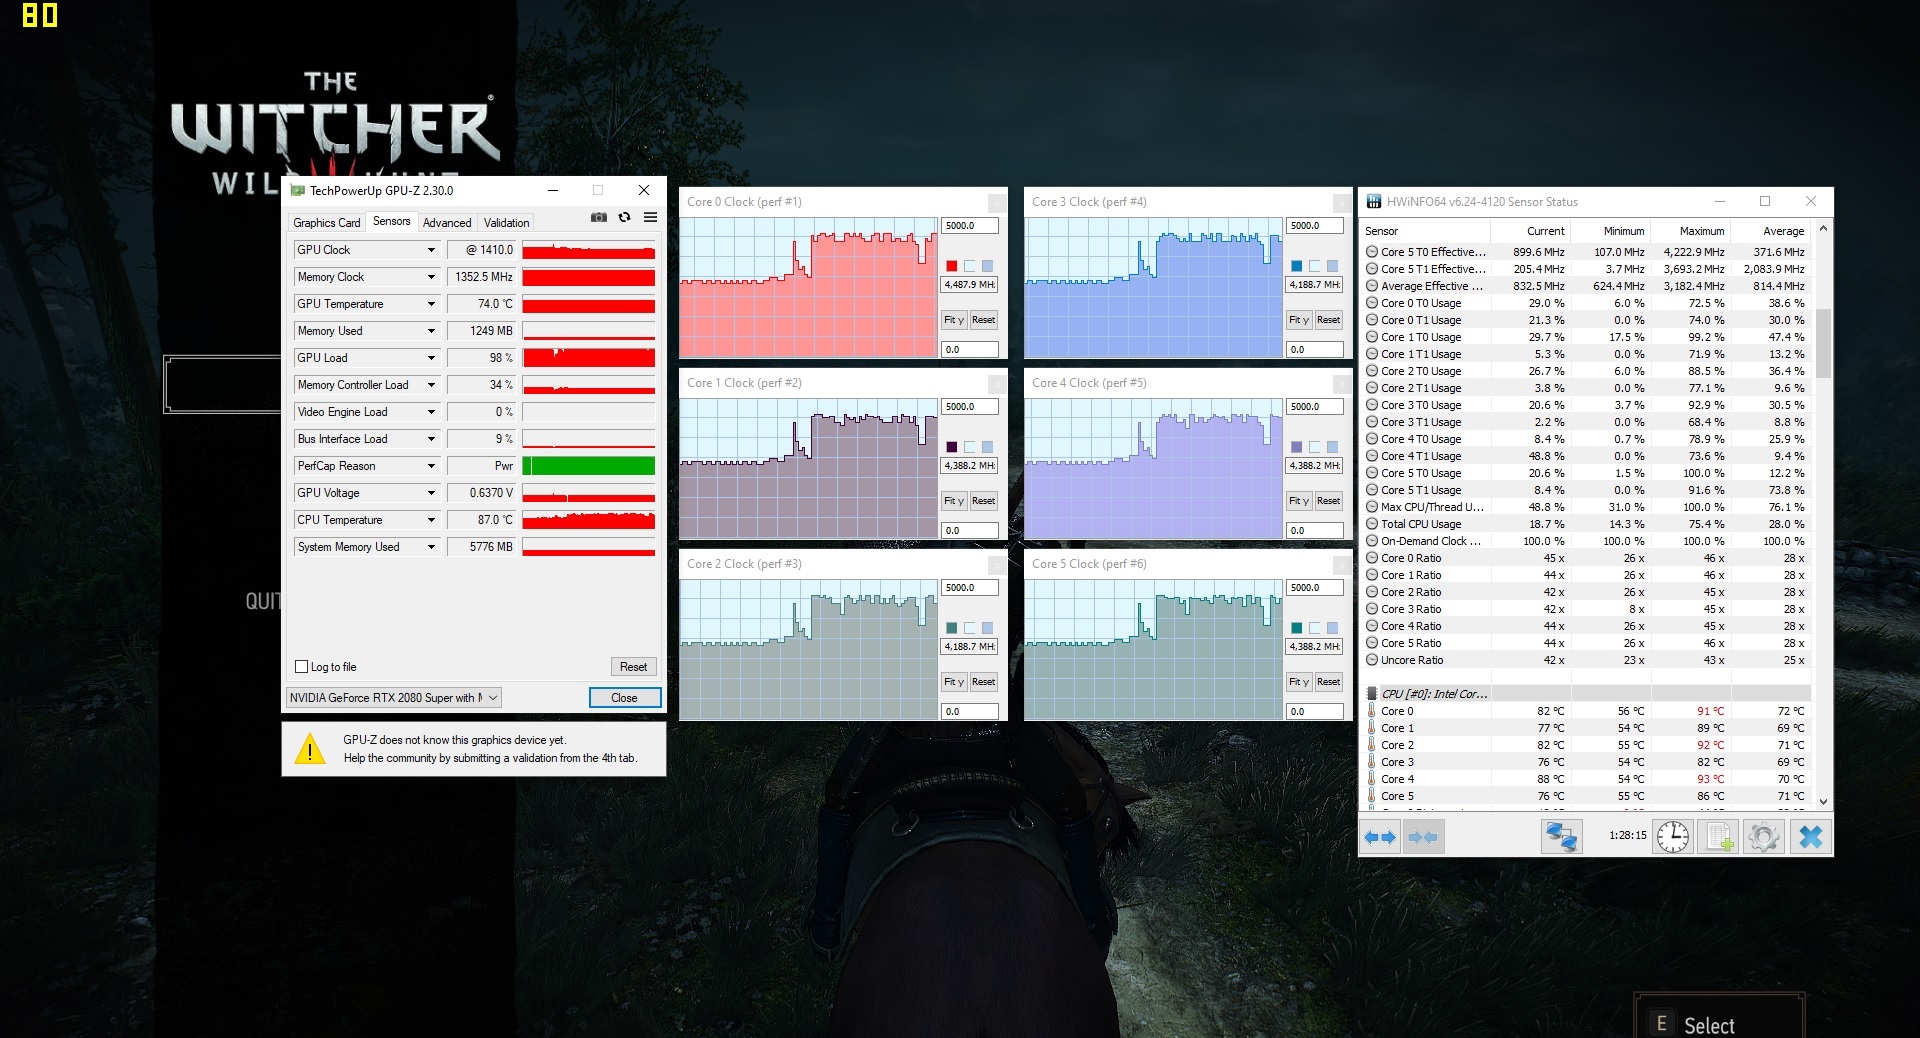
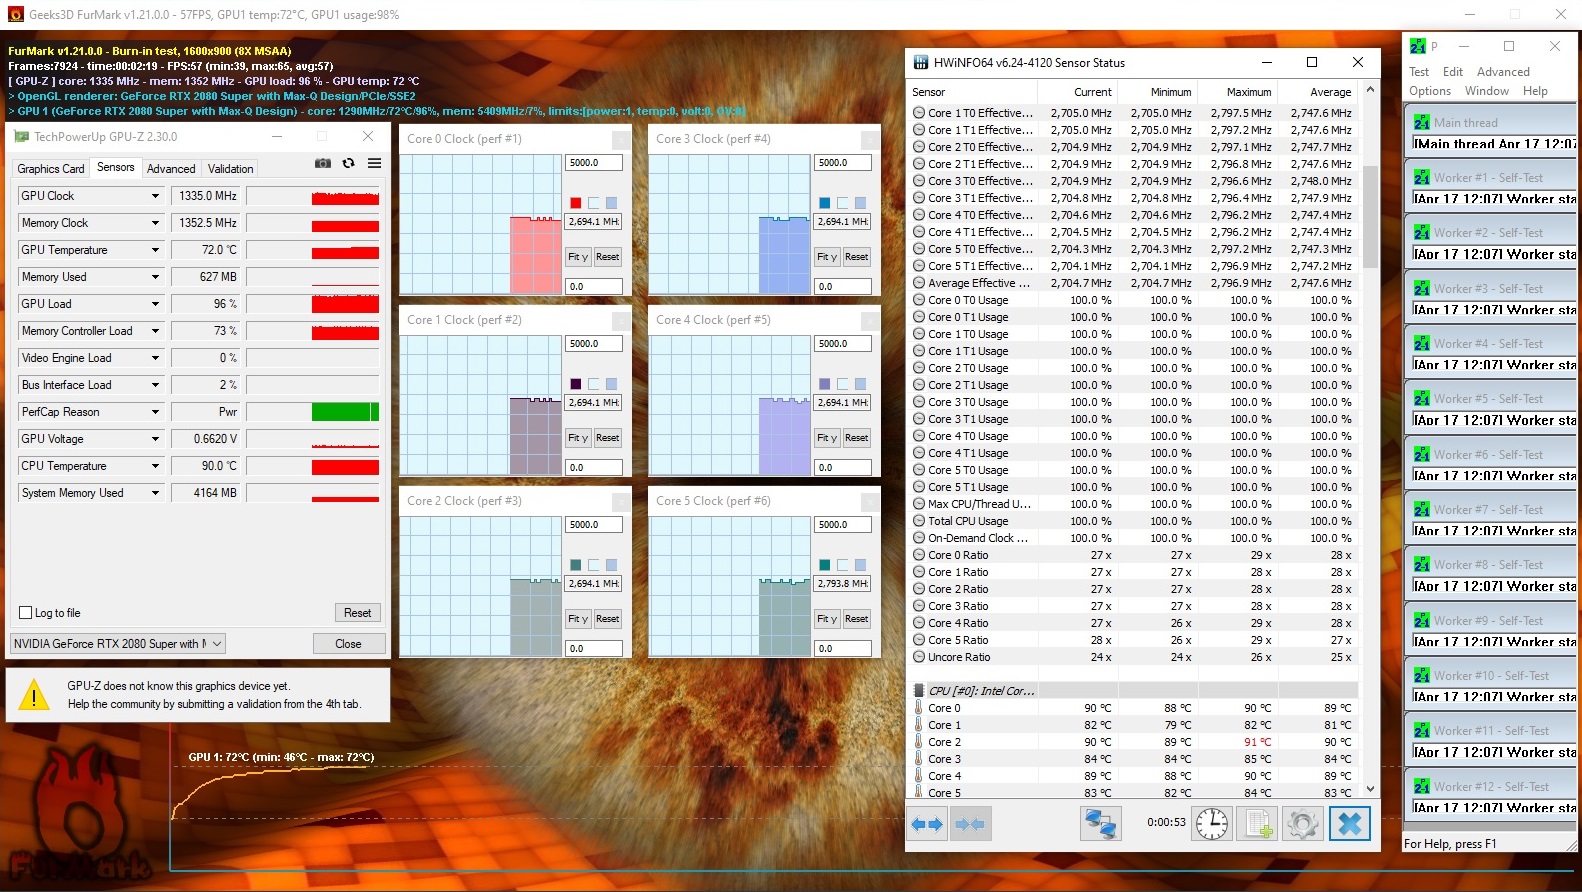
As usual, it gets considerably warmer inside the case. The sixty-minute stress test with the FurMark and Prime95 tools brought the GeForce RTX 2080 Super Max-Q to just over 70 °C (~158 °F), whereas the Core i7-10750H settled between 80 °C (~176 °F) and 90 °C (~194 °F). As you can see on the first screenshot, the values in The Witcher 3 were similar. Throttling, i.e. a reduction of speeds to below the base clock speed, didn't occur with the CPU or the GPU under load.
(±) The maximum temperature on the upper side is 44 °C / 111 F, compared to the average of 40.4 °C / 105 F, ranging from 21.2 to 68.8 °C for the class Gaming.
(-) The bottom heats up to a maximum of 50 °C / 122 F, compared to the average of 43.2 °C / 110 F
(+) In idle usage, the average temperature for the upper side is 27.9 °C / 82 F, compared to the device average of 33.9 °C / 93 F.
(-) Playing The Witcher 3, the average temperature for the upper side is 40.7 °C / 105 F, compared to the device average of 33.9 °C / 93 F.
(-) The palmrests and touchpad can get very hot to the touch with a maximum of 40 °C / 104 F.
(-) The average temperature of the palmrest area of similar devices was 28.8 °C / 83.8 F (-11.2 °C / -20.2 F).
| Acer Predator Triton 500 PT515-52-70N3 i7-10750H, GeForce RTX 2080 Super Max-Q | MSI GS65 Stealth 9SG i7-9750H, GeForce RTX 2080 Max-Q | Razer Blade 15 RTX 2080 Max-Q i7-9750H, GeForce RTX 2080 Max-Q | Alienware m15 R2 P87F i7-9750H, GeForce RTX 2080 Max-Q | Average of class Gaming | |
|---|---|---|---|---|---|
| Heat | -5% | -1% | -11% | -4% | |
| Maximum Upper Side * (°C) | 44 | 45.6 -4% | 47 -7% | 53.8 -22% | 45.2 ? -3% |
| Maximum Bottom * (°C) | 50 | 53.8 -8% | 49.2 2% | 58 -16% | 48.2 ? 4% |
| Idle Upper Side * (°C) | 29 | 28.6 1% | 28.6 1% | 29.8 -3% | 31 ? -7% |
| Idle Bottom * (°C) | 31 | 33.2 -7% | 31.4 -1% | 32.2 -4% | 34.2 ? -10% |
* ... smaller is better
Speakers
Acer Predator Triton 500 PT515-52-70N3 audio analysis
(+) | speakers can play relatively loud (83 dB)
Bass 100 - 315 Hz
(-) | nearly no bass - on average 20.2% lower than median
(±) | linearity of bass is average (11.3% delta to prev. frequency)
Mids 400 - 2000 Hz
(+) | balanced mids - only 3.7% away from median
(+) | mids are linear (3.2% delta to prev. frequency)
Highs 2 - 16 kHz
(+) | balanced highs - only 3.2% away from median
(+) | highs are linear (6.1% delta to prev. frequency)
Overall 100 - 16.000 Hz
(±) | linearity of overall sound is average (17% difference to median)
Compared to same class
» 45% of all tested devices in this class were better, 12% similar, 43% worse
» The best had a delta of 6%, average was 18%, worst was 132%
Compared to all devices tested
» 31% of all tested devices were better, 8% similar, 61% worse
» The best had a delta of 4%, average was 23%, worst was 134%
MSI GS65 Stealth 9SG audio analysis
(+) | speakers can play relatively loud (89.4 dB)
Bass 100 - 315 Hz
(-) | nearly no bass - on average 22.7% lower than median
(±) | linearity of bass is average (9% delta to prev. frequency)
Mids 400 - 2000 Hz
(±) | higher mids - on average 7% higher than median
(+) | mids are linear (6.4% delta to prev. frequency)
Highs 2 - 16 kHz
(+) | balanced highs - only 2.7% away from median
(±) | linearity of highs is average (10.6% delta to prev. frequency)
Overall 100 - 16.000 Hz
(±) | linearity of overall sound is average (23.1% difference to median)
Compared to same class
» 84% of all tested devices in this class were better, 4% similar, 12% worse
» The best had a delta of 6%, average was 18%, worst was 132%
Compared to all devices tested
» 69% of all tested devices were better, 5% similar, 26% worse
» The best had a delta of 4%, average was 23%, worst was 134%
Energy management
Energy consumption
In view of the performance offered, the energy requirement is kept within limits. Thanks to graphics switching, the Triton 500 only consumes 11 to 25 watts in idle mode. When the Nvidia GPU turns on under load, the consumption increases to 95 to 211 watts. The power adapter is of sufficient capacity with 230 watts. Typical RTX 2080 laptops (without Max-Q) usually require a 330-watt power supply.
| Off / Standby | |
| Idle | |
| Load |
|
Key:
min: | |
| Acer Predator Triton 500 PT515-52-70N3 i7-10750H, GeForce RTX 2080 Super Max-Q | MSI GS65 Stealth 9SG i7-9750H, GeForce RTX 2080 Max-Q | Razer Blade 15 RTX 2080 Max-Q i7-9750H, GeForce RTX 2080 Max-Q | Alienware m15 R2 P87F i7-9750H, GeForce RTX 2080 Max-Q | Average of class Gaming | |
|---|---|---|---|---|---|
| Power Consumption | -22% | -2% | -71% | -17% | |
| Idle Minimum * (Watt) | 11 | 18.3 -66% | 12.5 -14% | 19 -73% | 13 ? -18% |
| Idle Average * (Watt) | 15 | 22 -47% | 15.3 -2% | 40.5 -170% | 19 ? -27% |
| Idle Maximum * (Watt) | 25 | 28.8 -15% | 20.7 17% | 52 -108% | 24.5 ? 2% |
| Load Average * (Watt) | 95 | 93 2% | 90.2 5% | 132.3 -39% | 111.1 ? -17% |
| Witcher 3 ultra * (Watt) | 140 | 142.6 -2% | 162 -16% | 183.3 -31% | |
| Load Maximum * (Watt) | 211 | 215.9 -2% | 209.3 1% | 217.2 -3% | 260 ? -23% |
* ... smaller is better
Battery life
The runtimes are definitely respectable for a high-end laptop. Slightly more than 6 hours of internet surfing via WLAN with medium display brightness don't need to hide behind the competition. The 84 Wh battery manages over 8 hours under ideal conditions (no load, low display brightness). Meanwhile, you can only expect a runtime of about 1 hour at maximum brightness in everyday gaming use.
| Acer Predator Triton 500 PT515-52-70N3 i7-10750H, GeForce RTX 2080 Super Max-Q, 84 Wh | MSI GS65 Stealth 9SG i7-9750H, GeForce RTX 2080 Max-Q, 82 Wh | Razer Blade 15 RTX 2080 Max-Q i7-9750H, GeForce RTX 2080 Max-Q, 80 Wh | Alienware m15 R2 P87F i7-9750H, GeForce RTX 2080 Max-Q, 76 Wh | Average of class Gaming | |
|---|---|---|---|---|---|
| Battery runtime | -5% | 43% | -16% | 10% | |
| Reader / Idle (h) | 8.3 | 15.9 92% | 9.2 11% | 8.27 ? 0% | |
| WiFi v1.3 (h) | 6.3 | 6 -5% | 6.6 5% | 5.5 -13% | 7.11 ? 13% |
| Load (h) | 1.3 | 1.7 31% | 0.7 -46% | 1.502 ? 16% |
Pros
Cons
Verdict

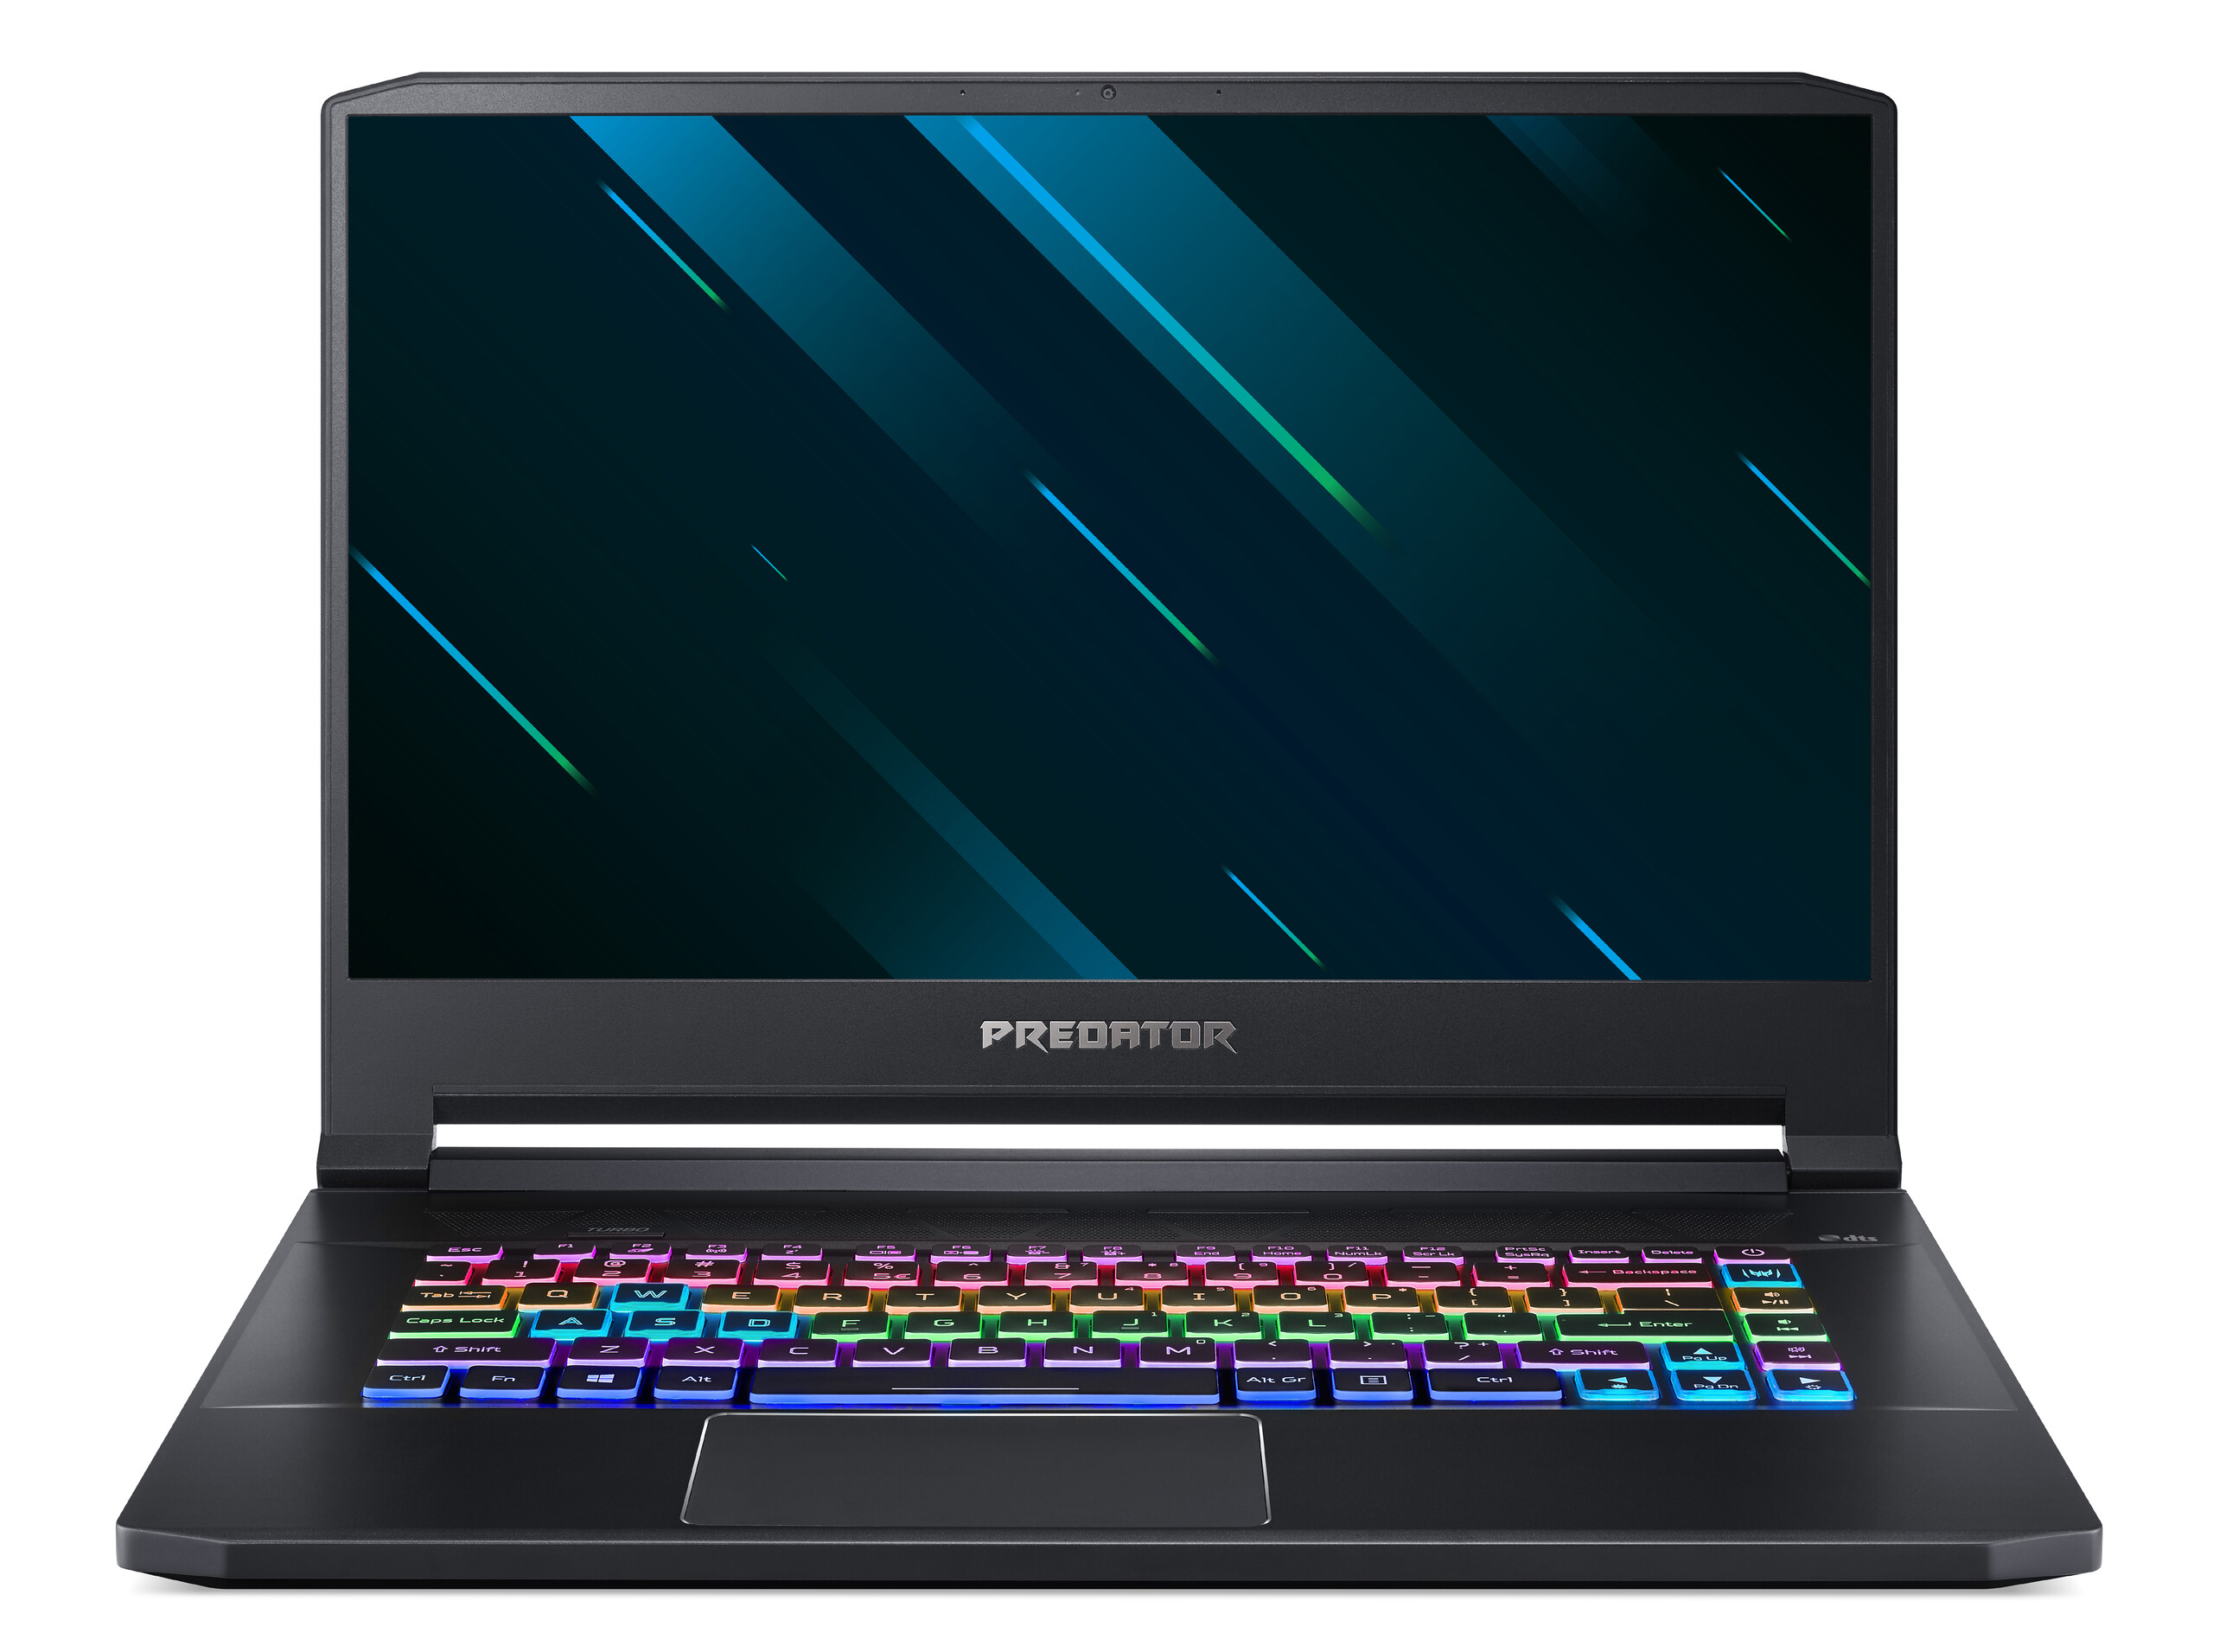
In 2020, the Predator Triton 500 continues to impress with its combination of low weight, compact dimensions and generous power.
The relatively light and flat 15-inch chassis can take on significantly thicker colleagues in many benchmarks, but the Max-Q version of the RTX 2080 Super is not exactly the best choice from a price-performance perspective. In any case, the fast GPU ensures smooth Full HD frame rates even with modern titles (at maximum settings, of course). A further highlight would be the 300 Hz screen, which isn't only responsive but rich in contrast too.
All in all, there's hardly anything to criticize about the new version of the Triton 500. The biggest point of criticism is, as so often, the background noise under load.
Price comparison

