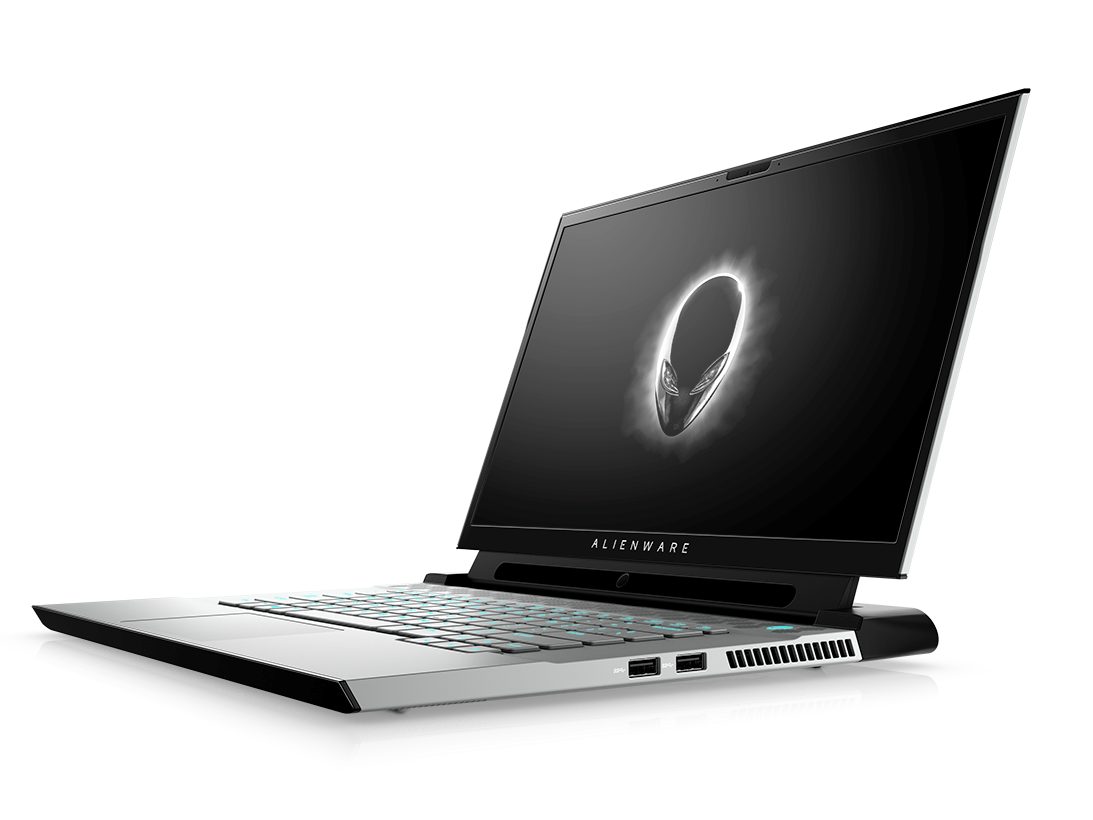
The Area-51m mini-me: Dell Alienware m15 R2 Laptop Review
Unveiled at Computex 2019 alongside the Alienware m17 R2, the Dell Alienware m15 R2 directly succeeds the barely one-year old Alienware m15 R1 with a complete chassis redesign derived from the Alienware Area-51m. The m15 series supplants the older Alienware 15 series by introducing narrow bezels, a thinner design, and optional OLED panels that have become all the rage on newer gaming laptops.
Aside from the full-on face lift, the Alienware m15 R2 carries nearly all the same core configuration options as last year's m15 R1 including the Intel 9th gen CPUs (i9-9300H, i7-9750H, i9-9980HK) and Nvidia Turing GPUs (GTX 1660 Ti, RTX 2060, RTX 2070 Max-Q, RTX 2080 Max-Q) for a wide price range of $1500 to $3000+ USD. Nonetheless, there are several important hardware differences between them that we will detail in this review of an upper mid-range Core i7/RTX 2080 Max-Q SKU.
The Alienware system competes directly with other ultra-thin 15.6-inch gaming laptops including the MSI GS65, Razer Blade 15, Asus Zephyrus S GX531, Lenovo Legion Y740-15ICH, Aorus 15, and the HP Omen X 15.
More Dell reviews:
Case
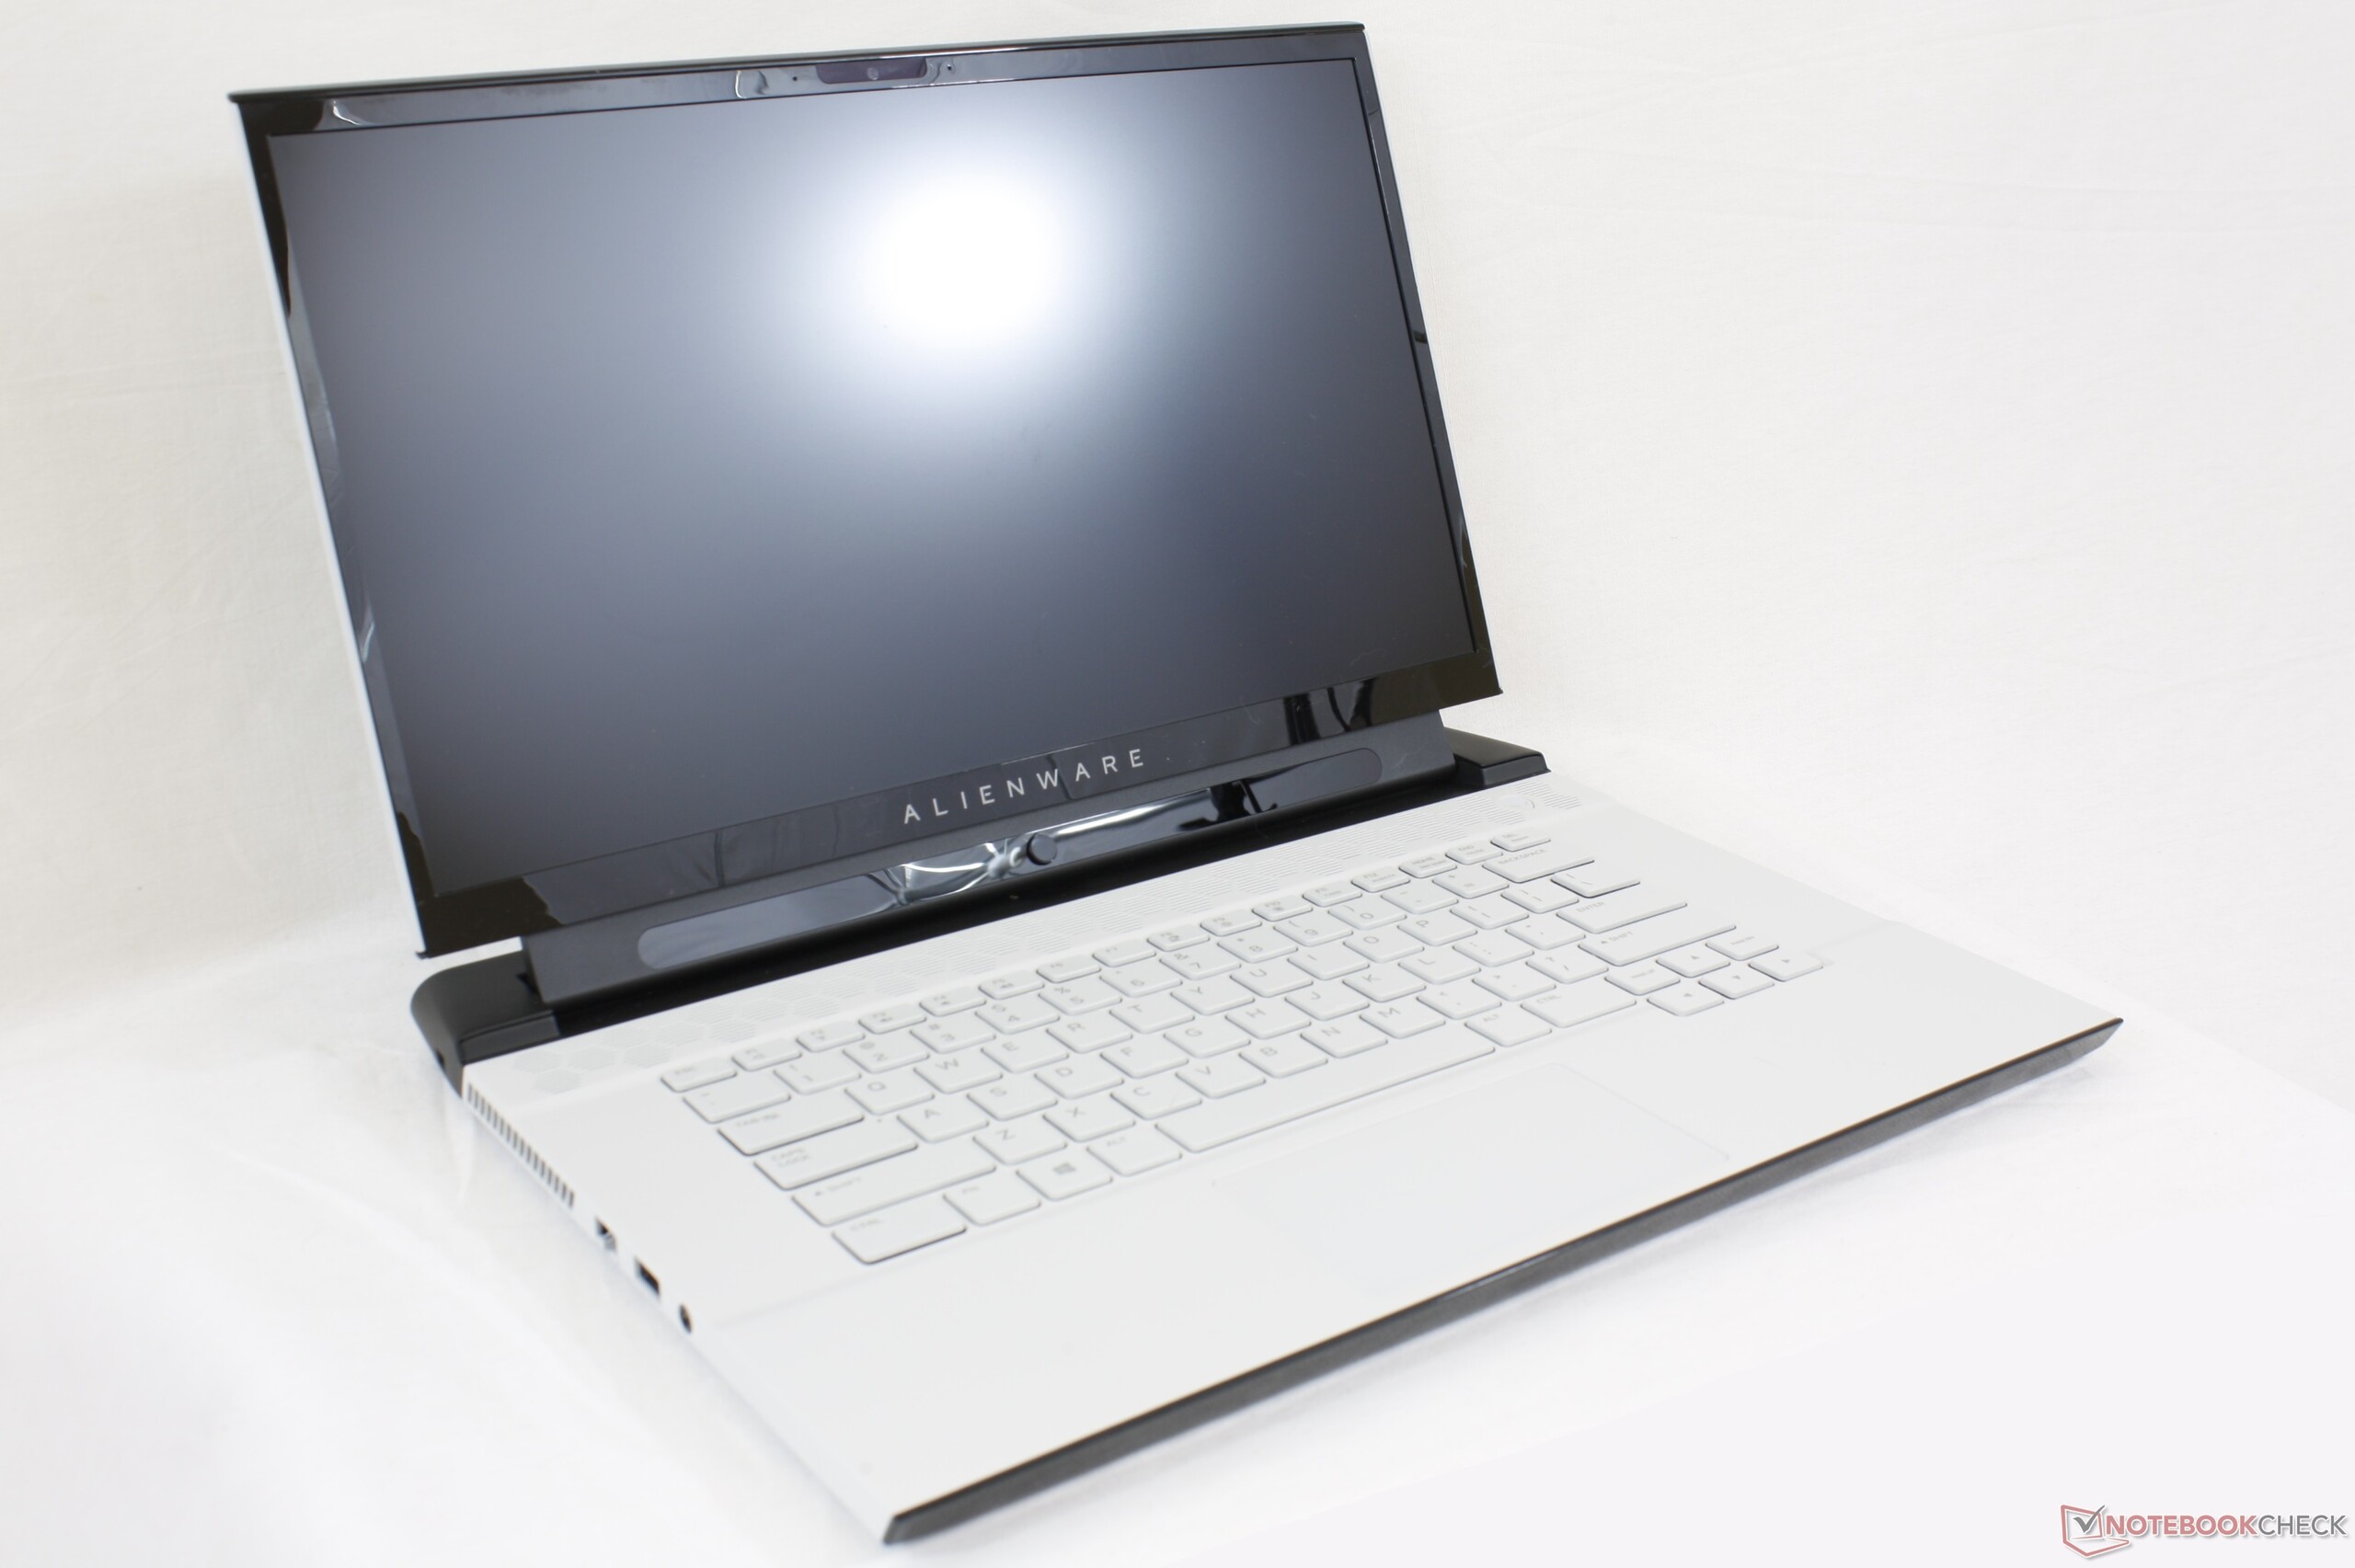
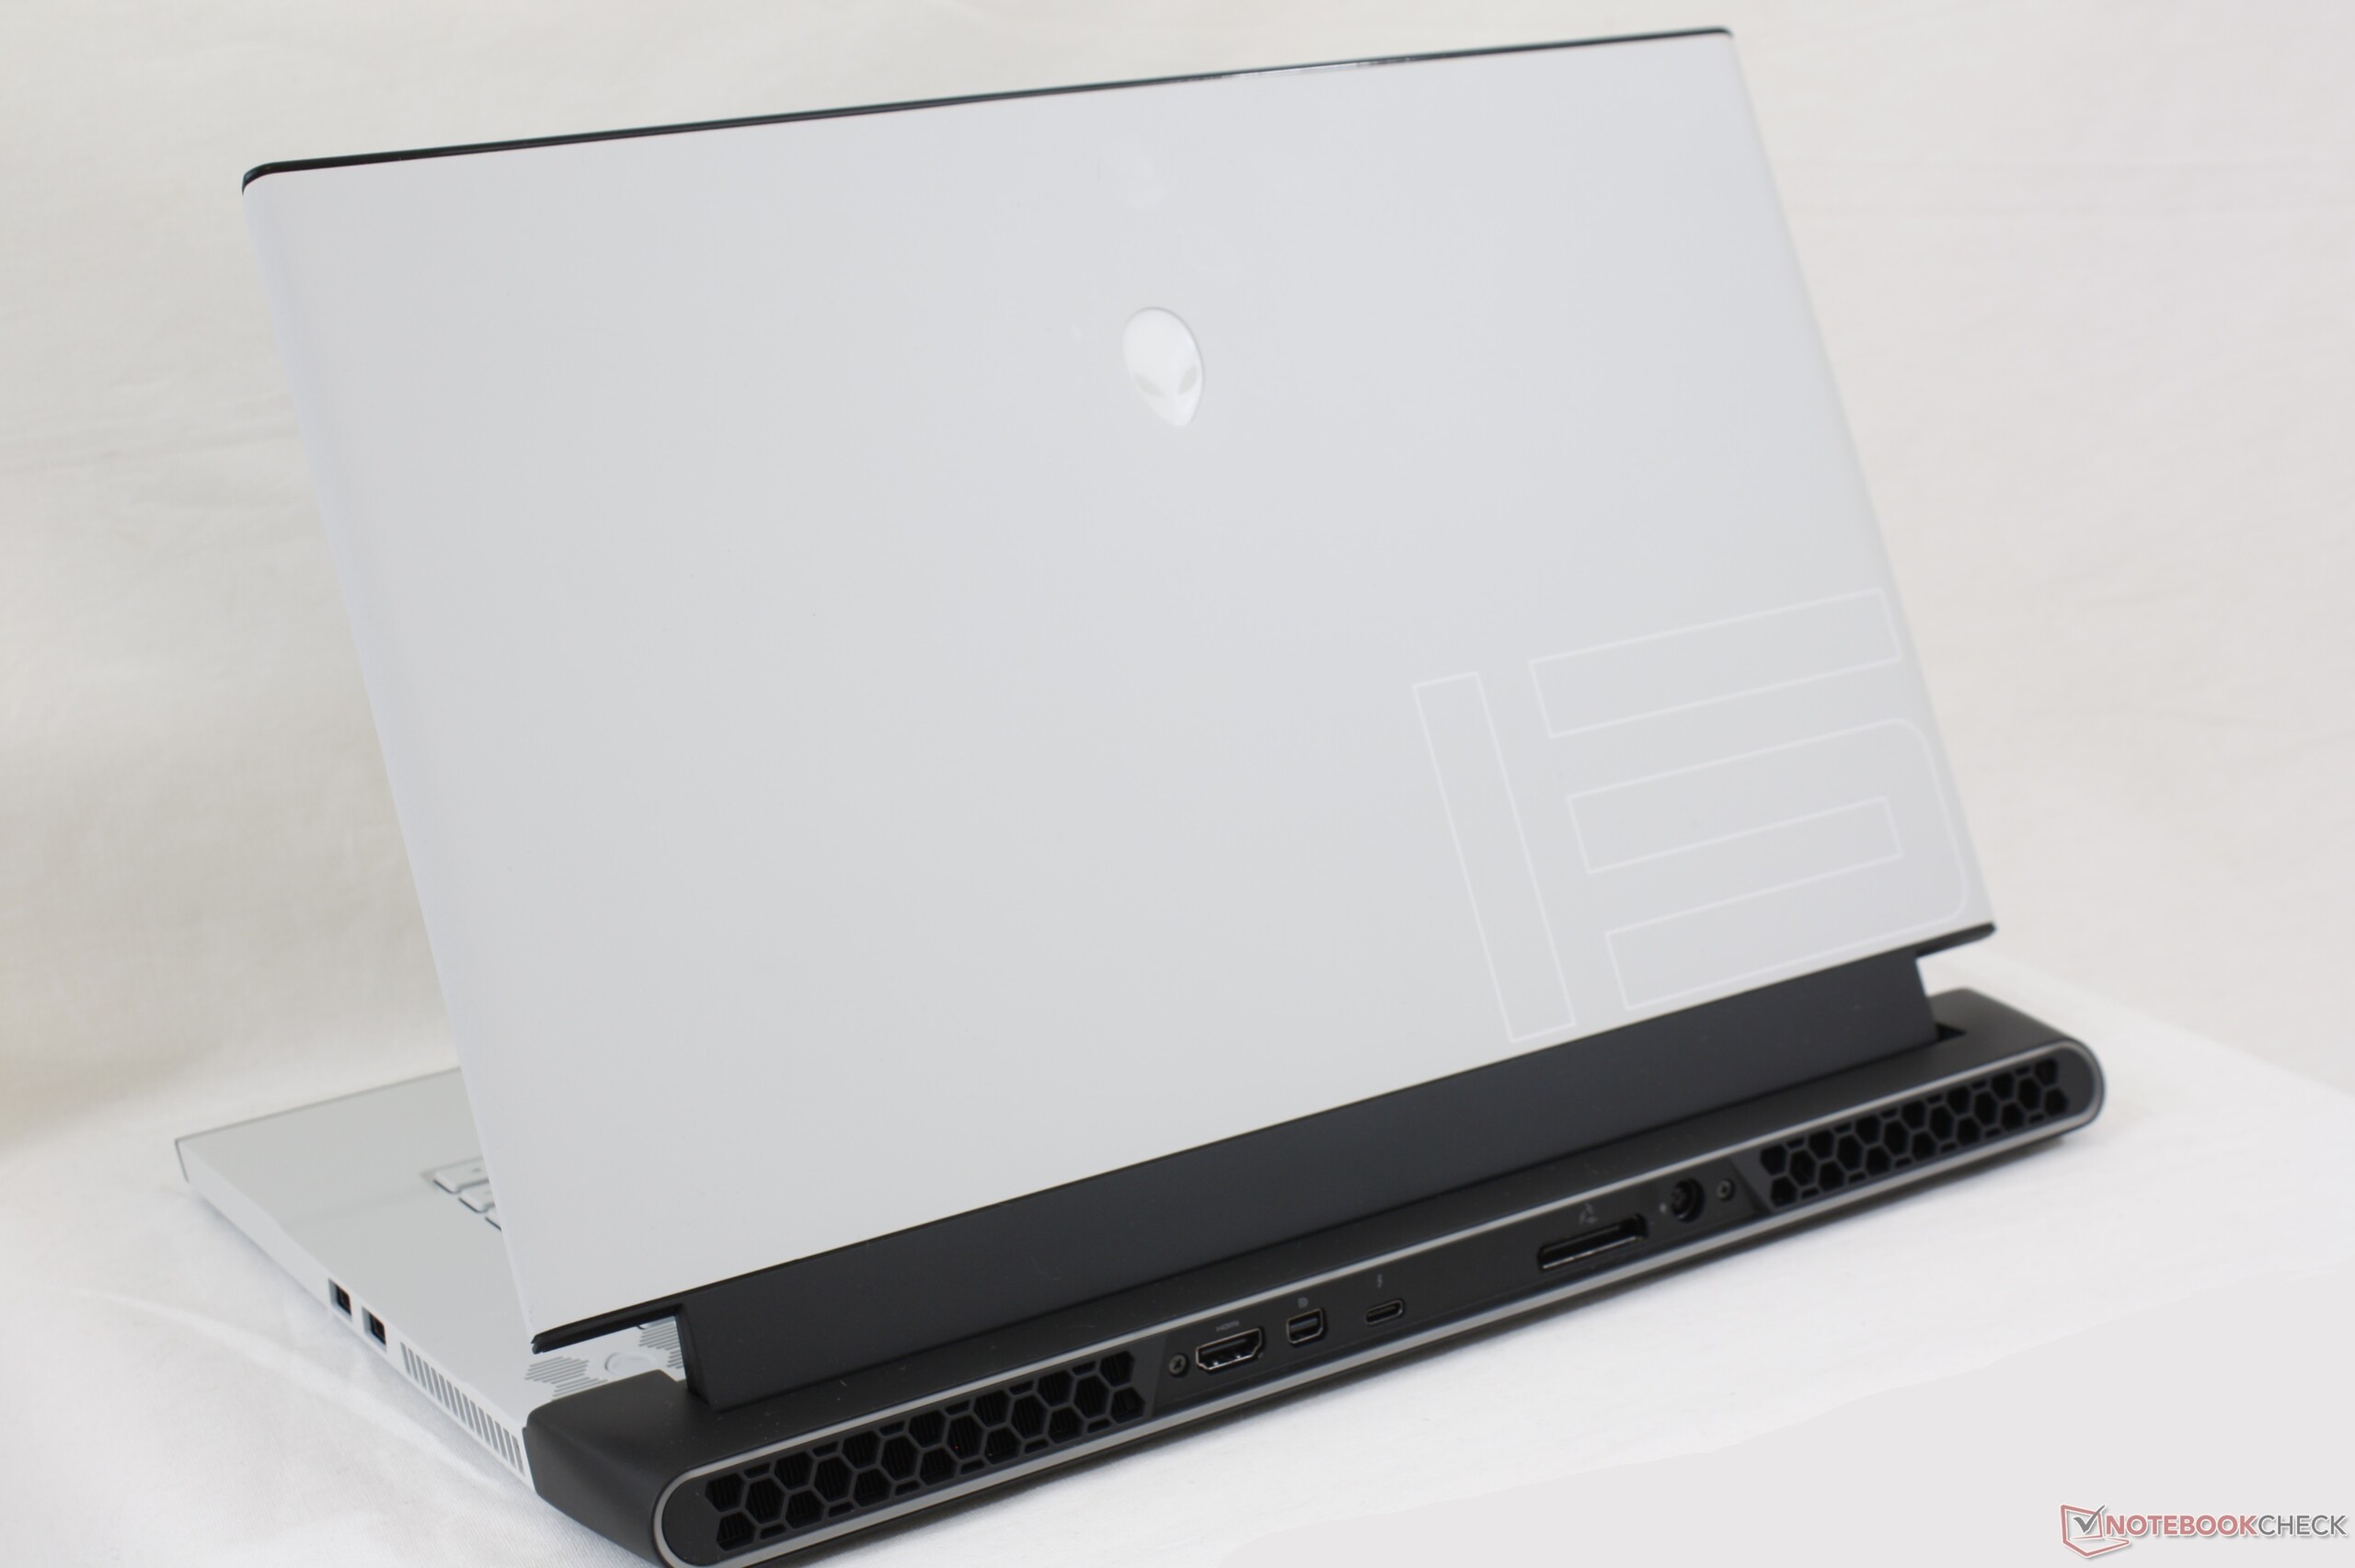
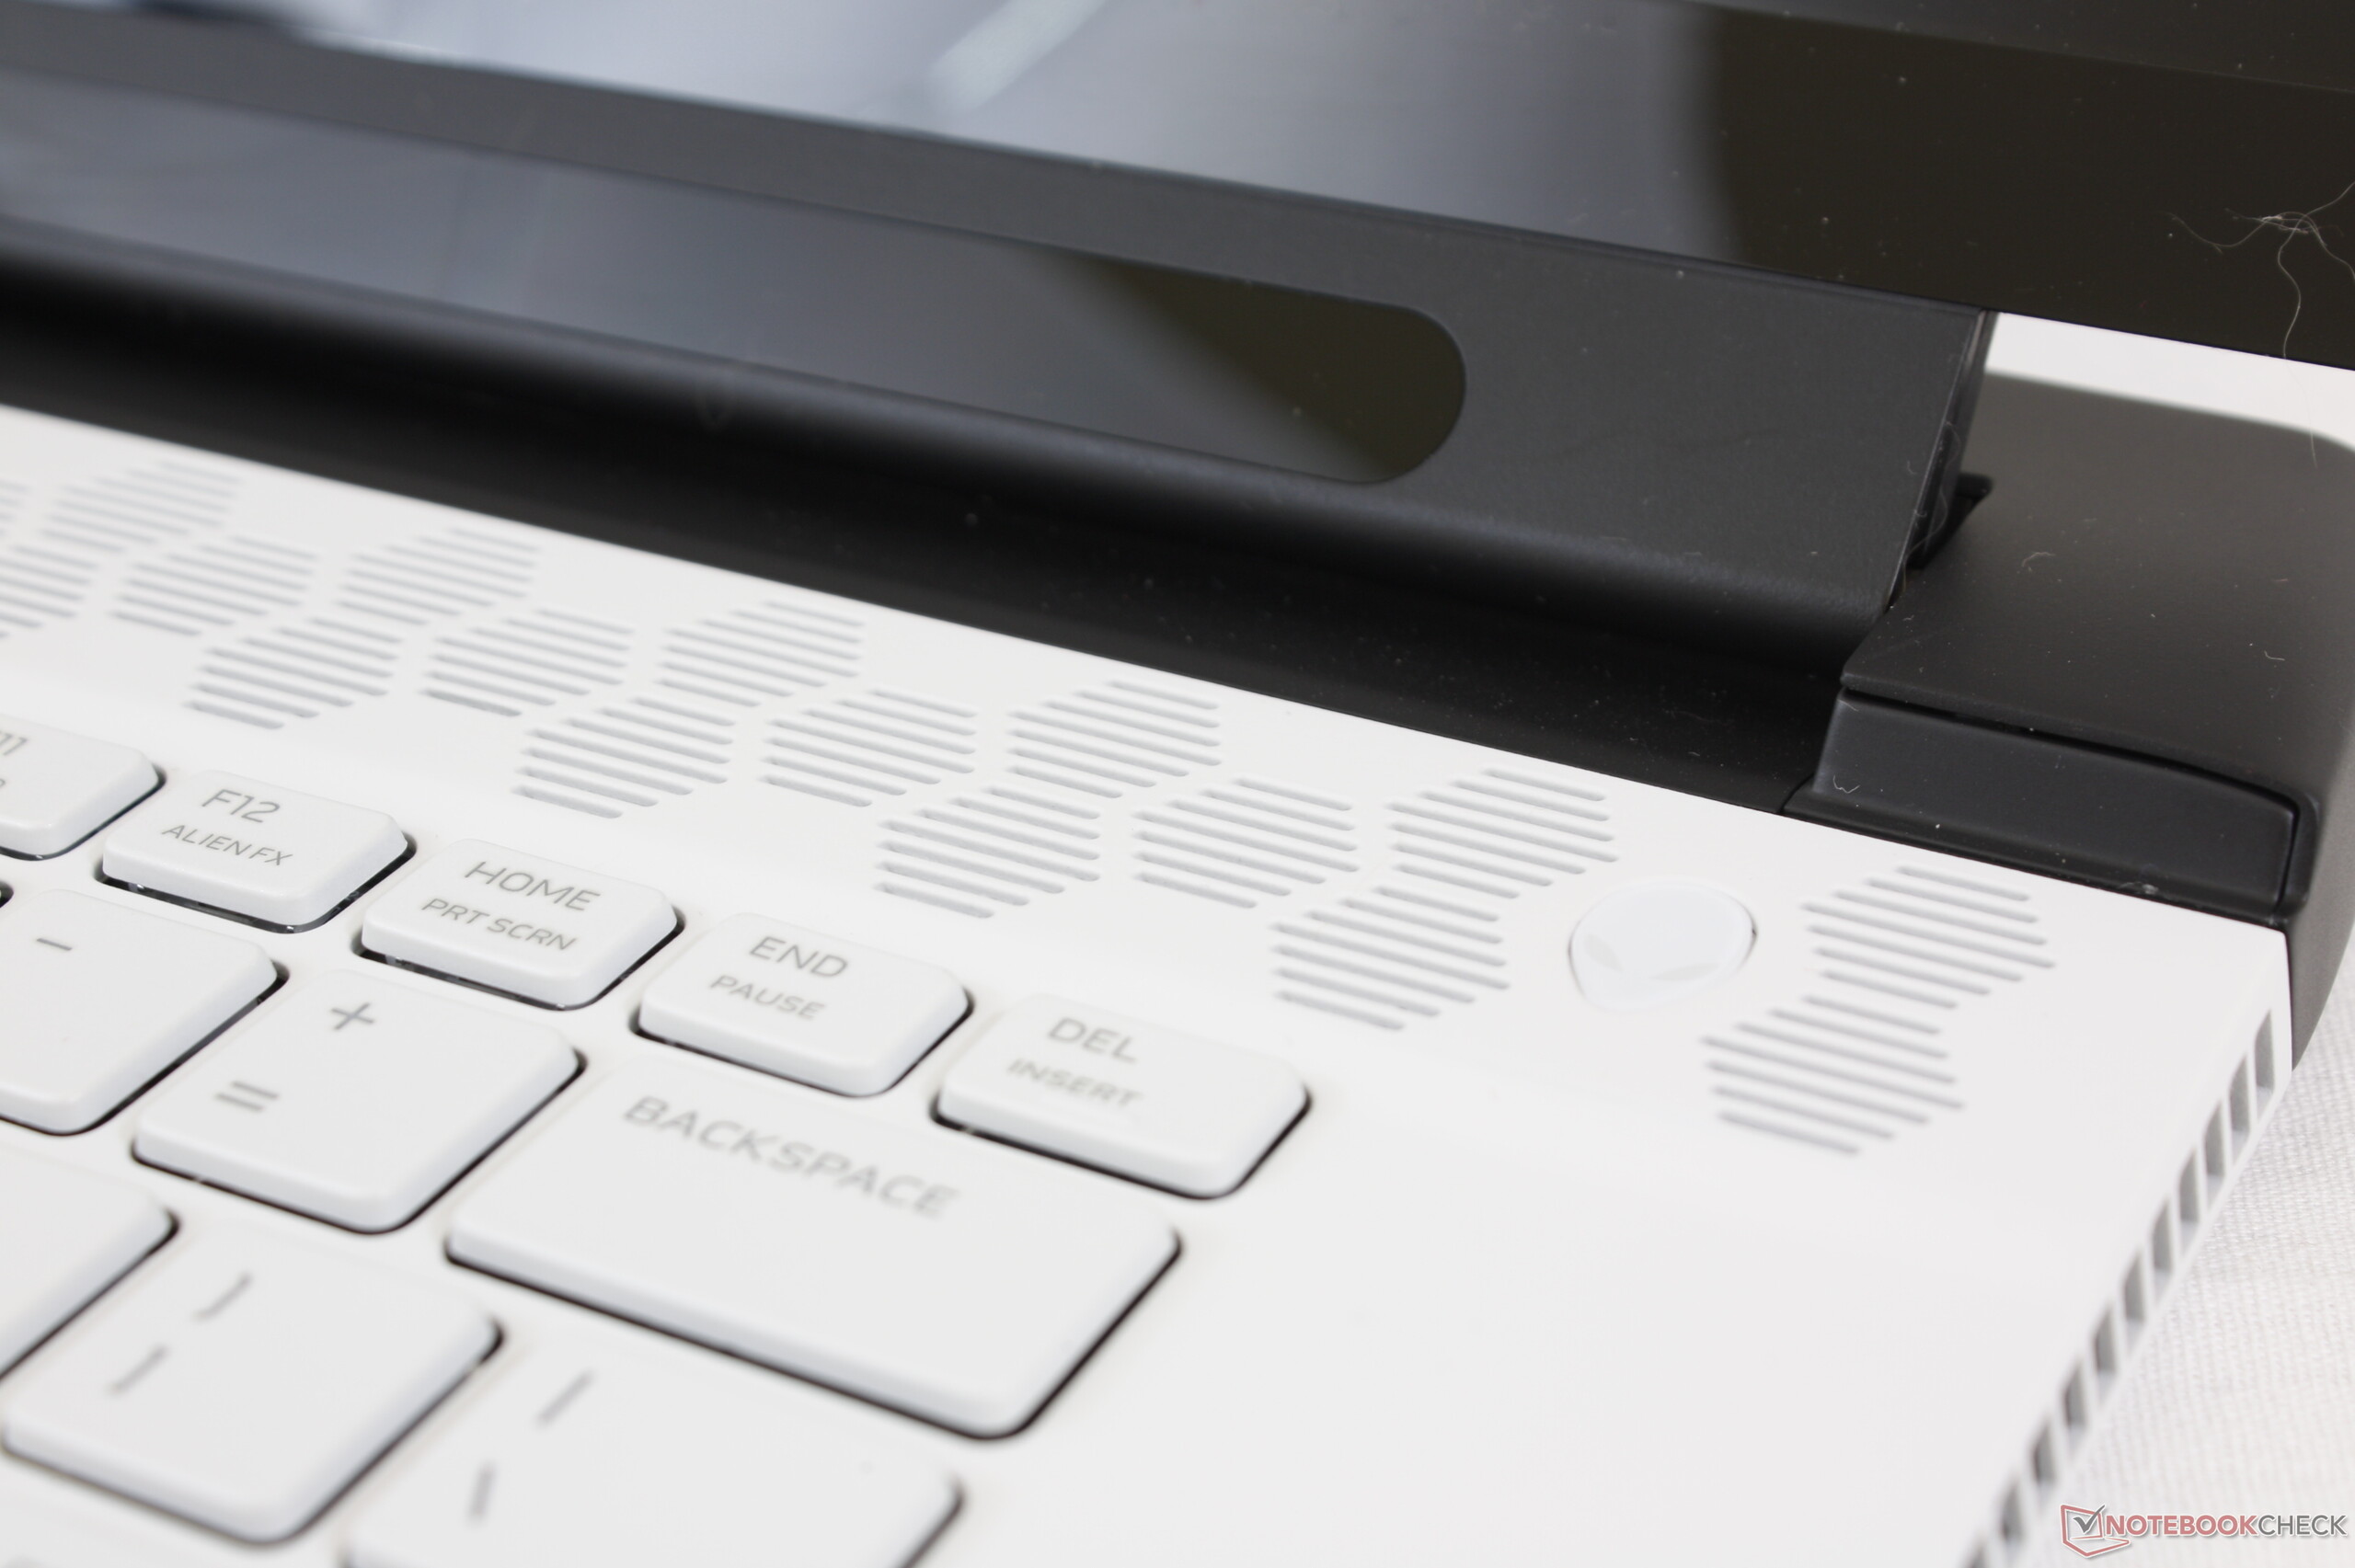
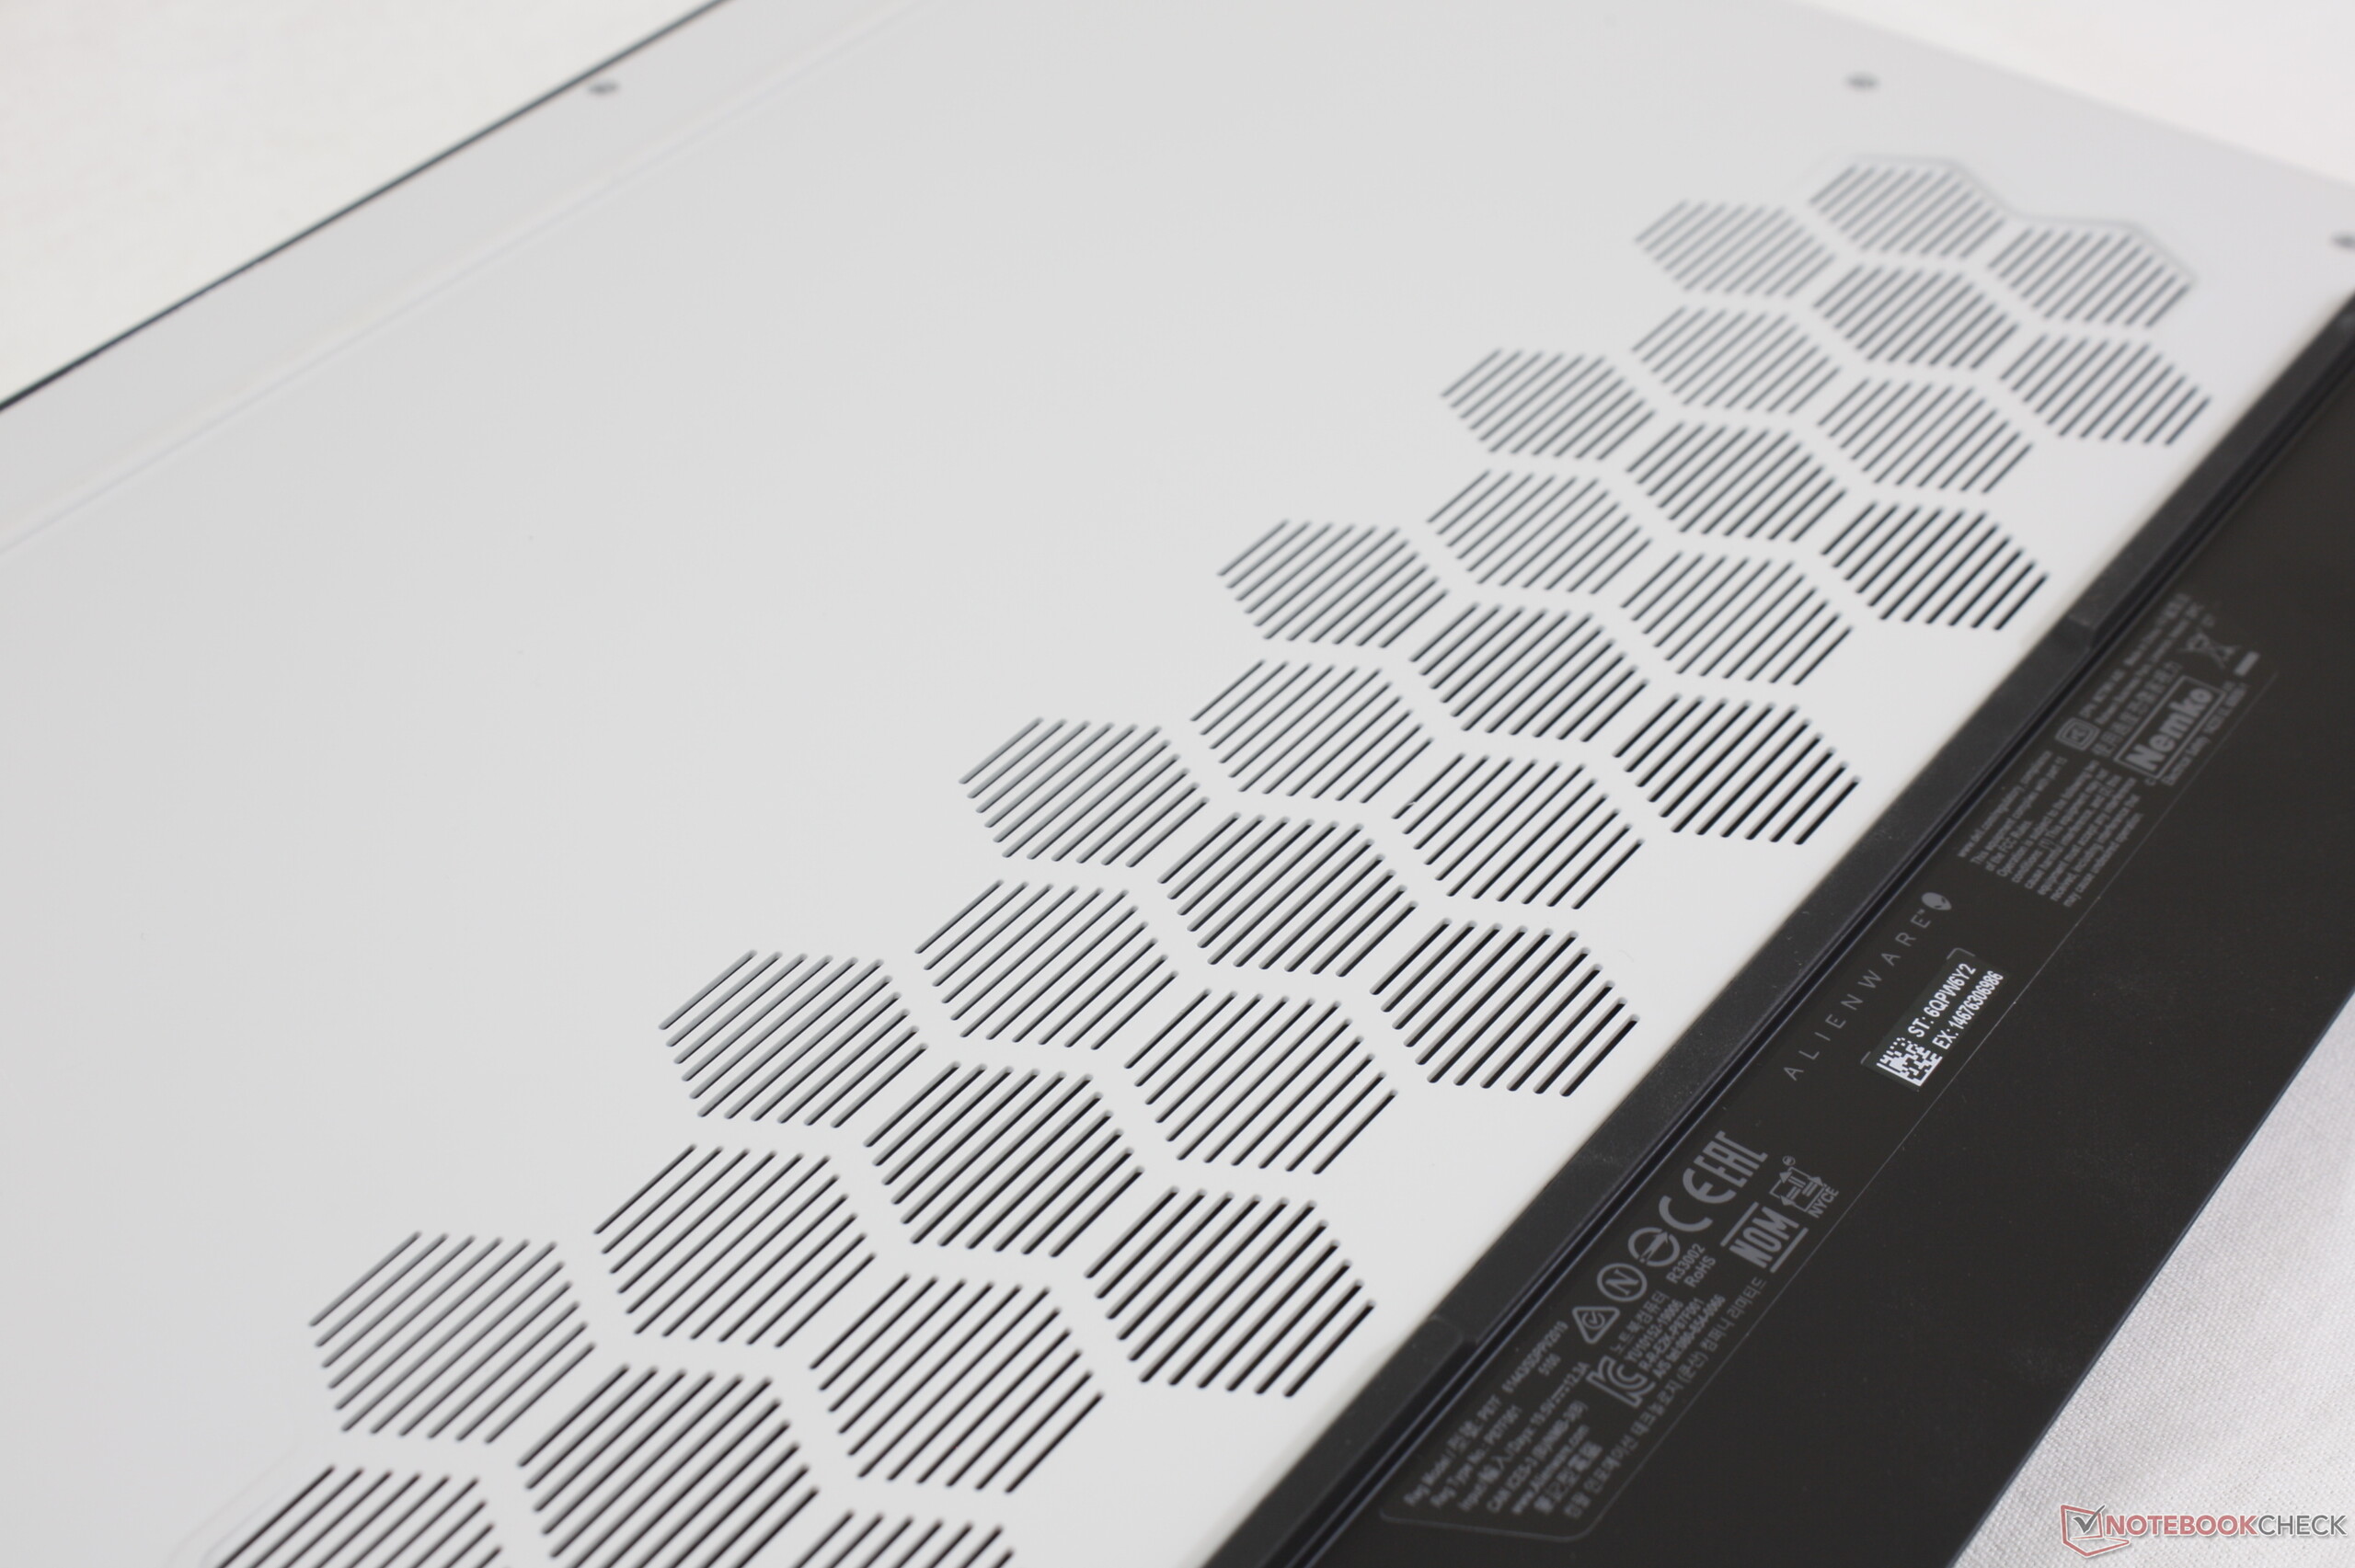
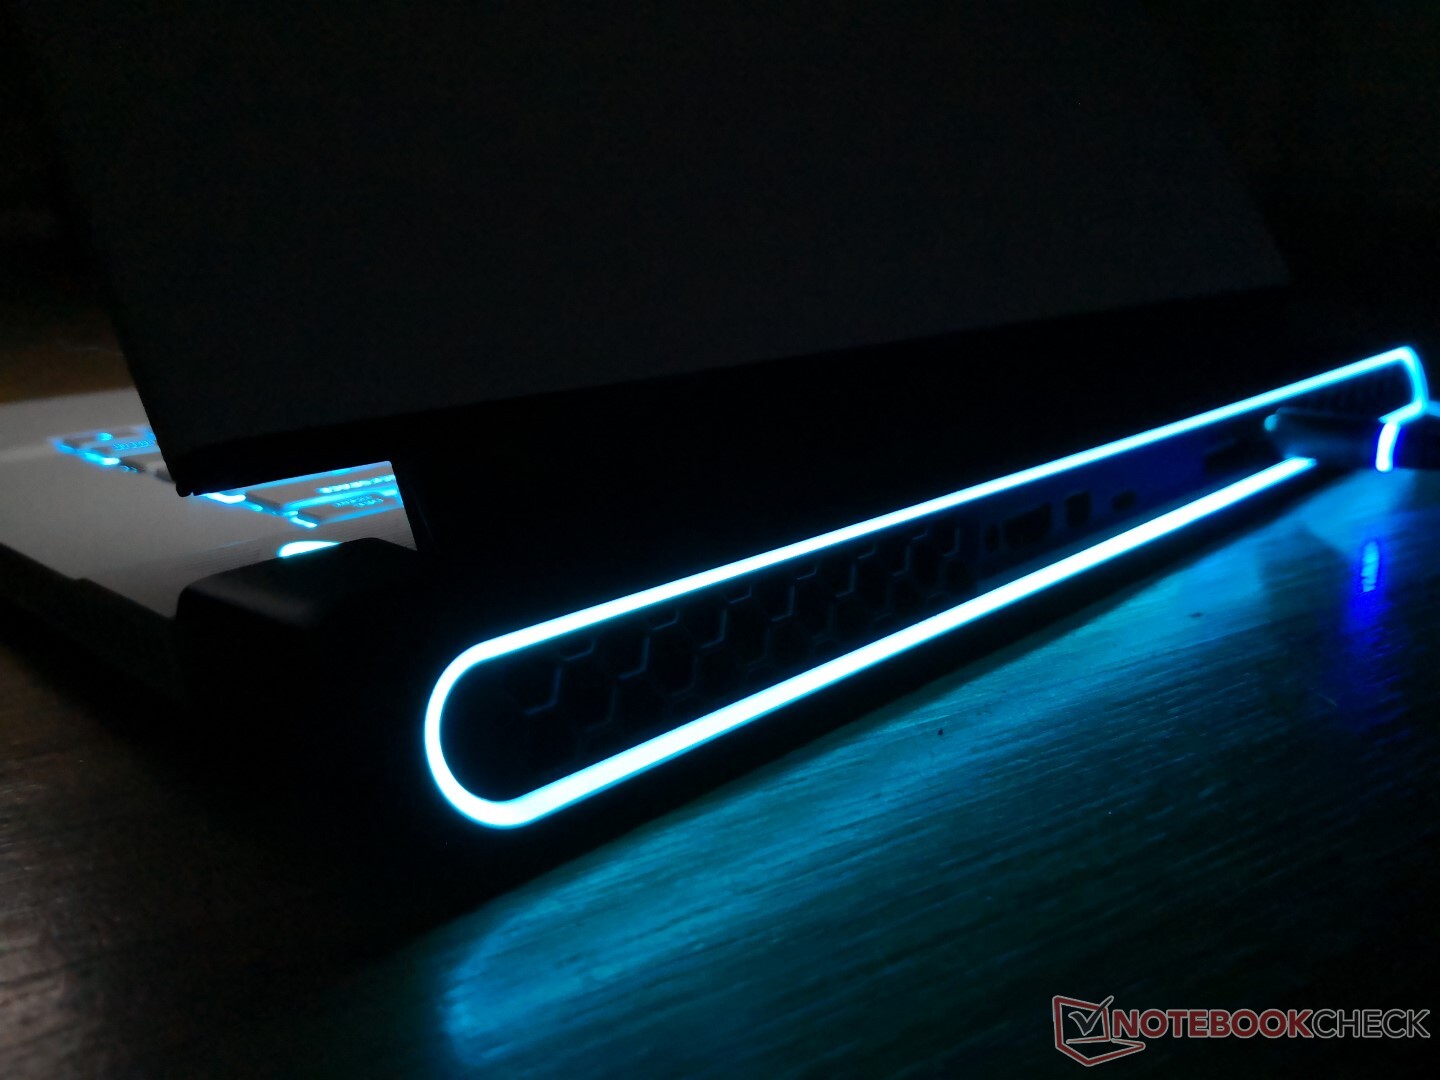
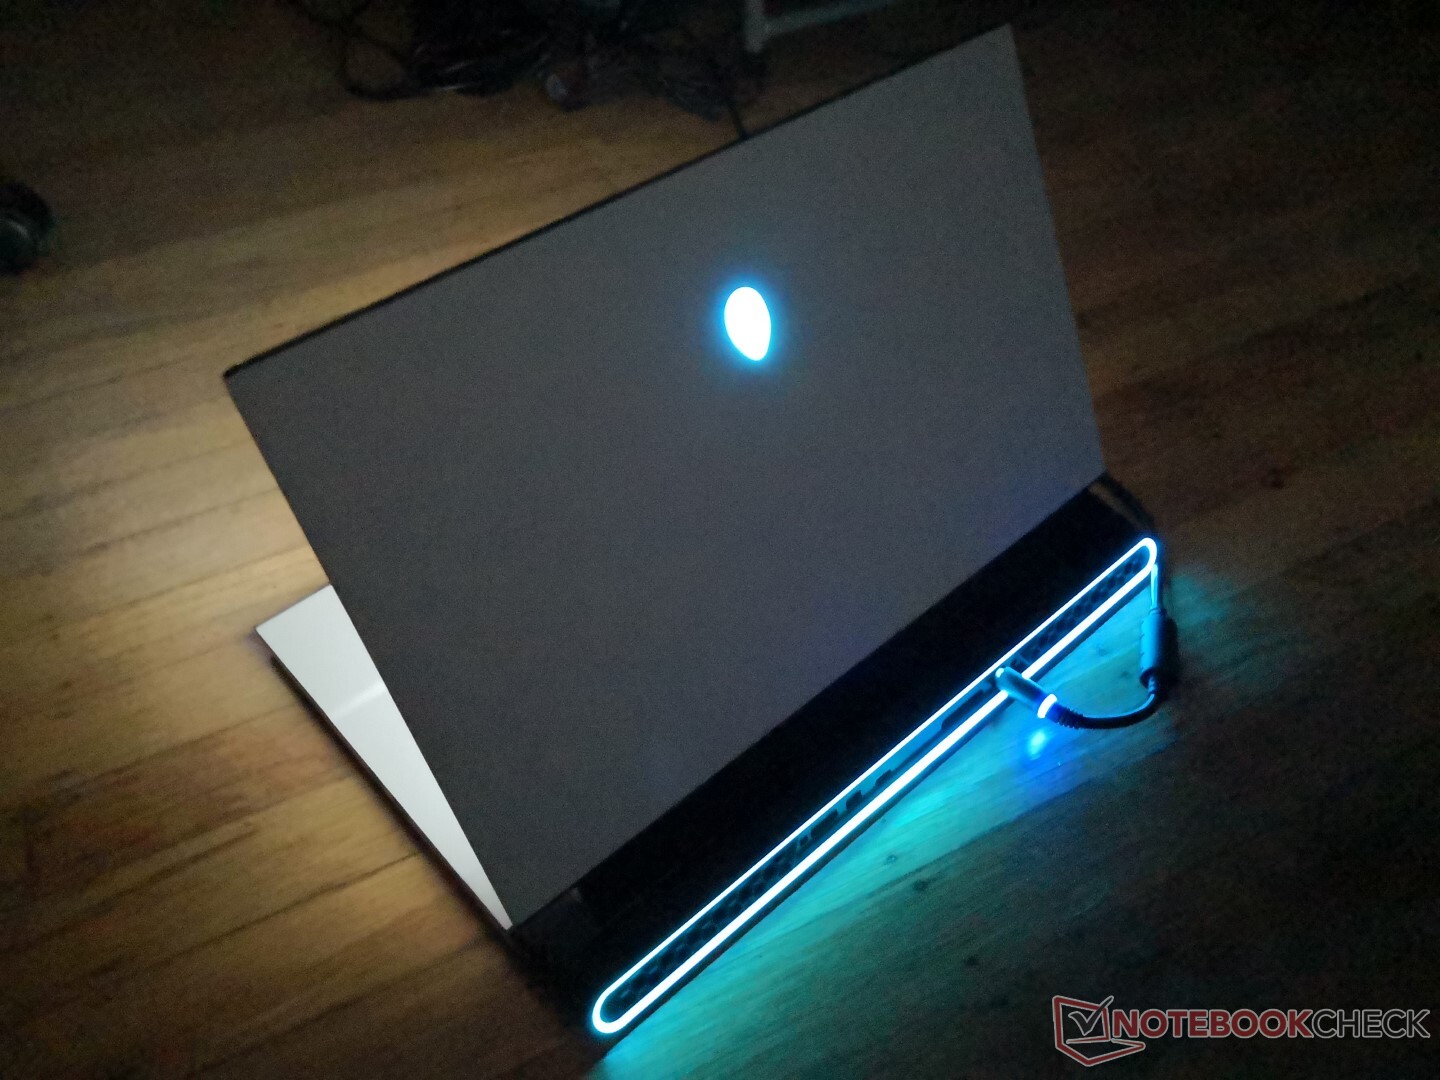
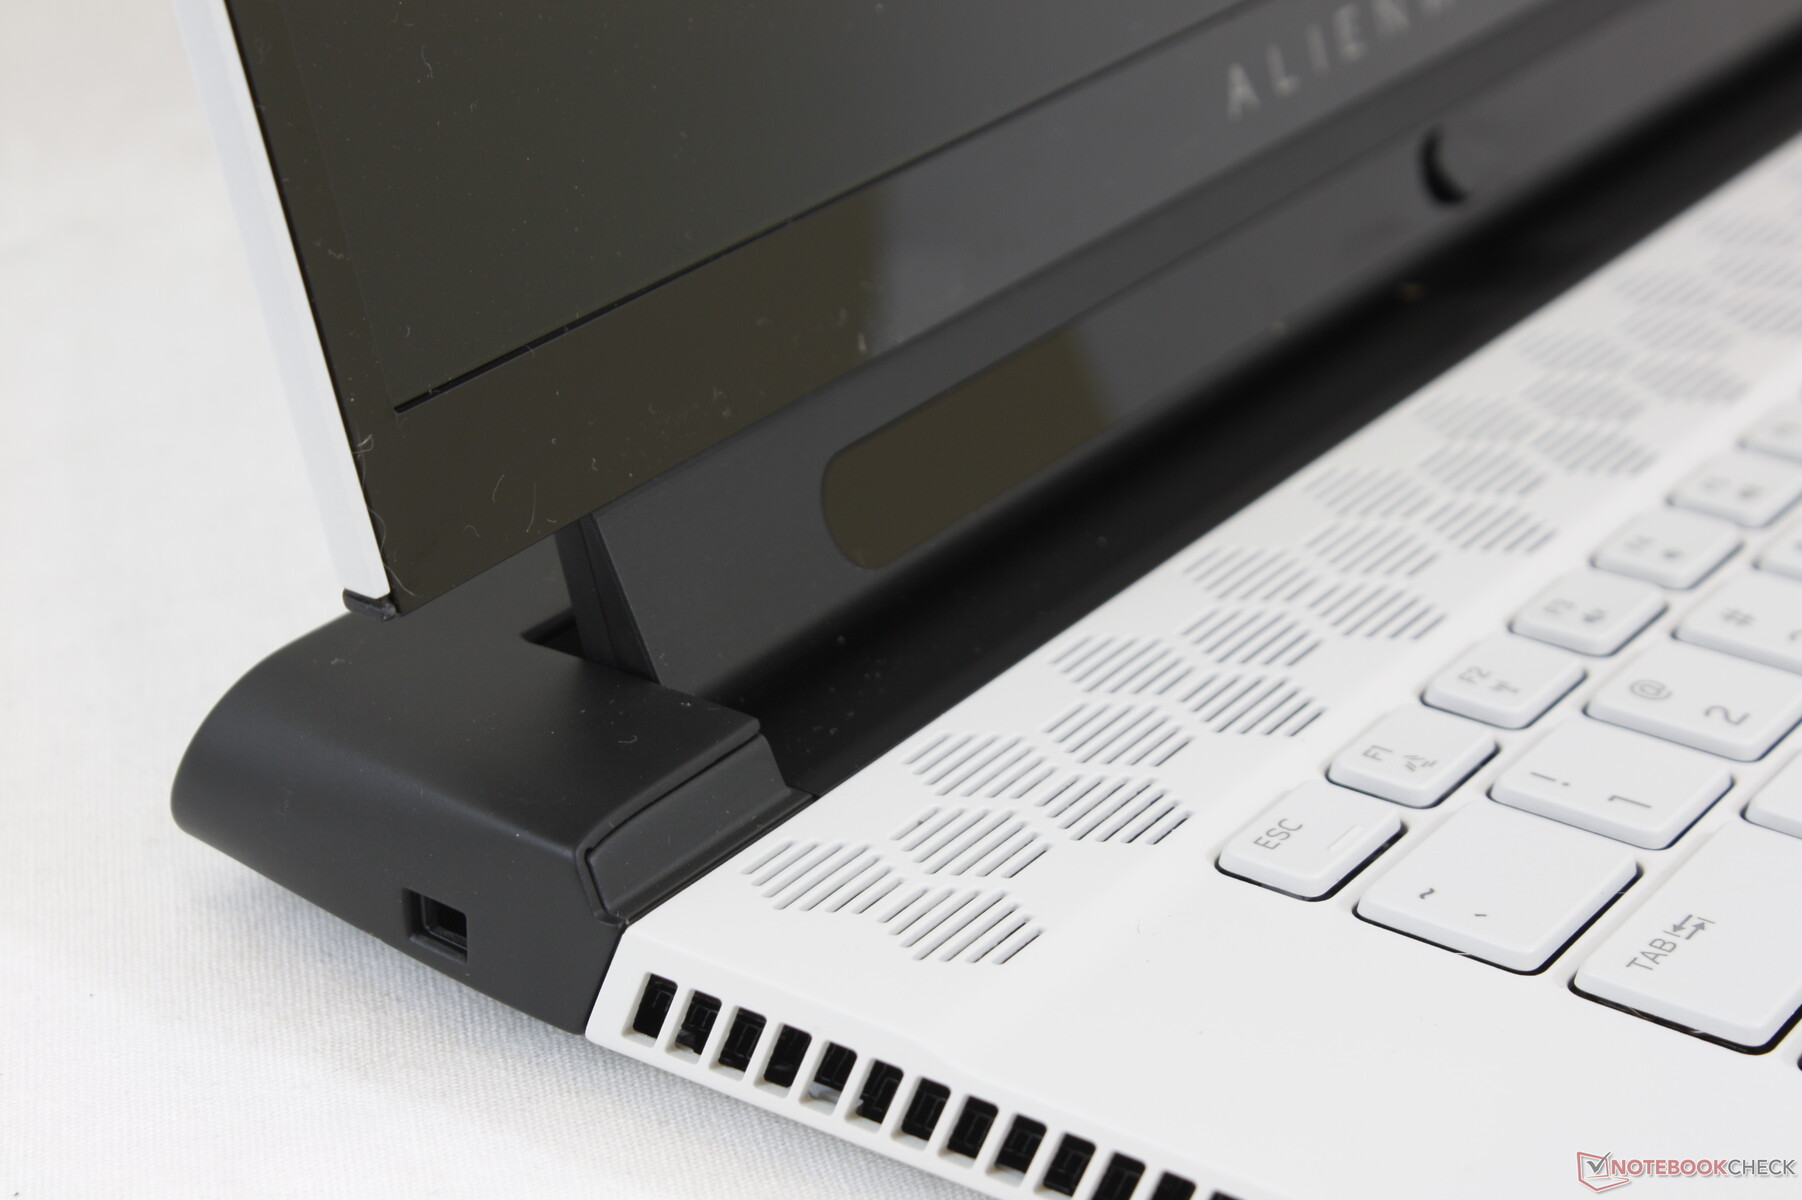
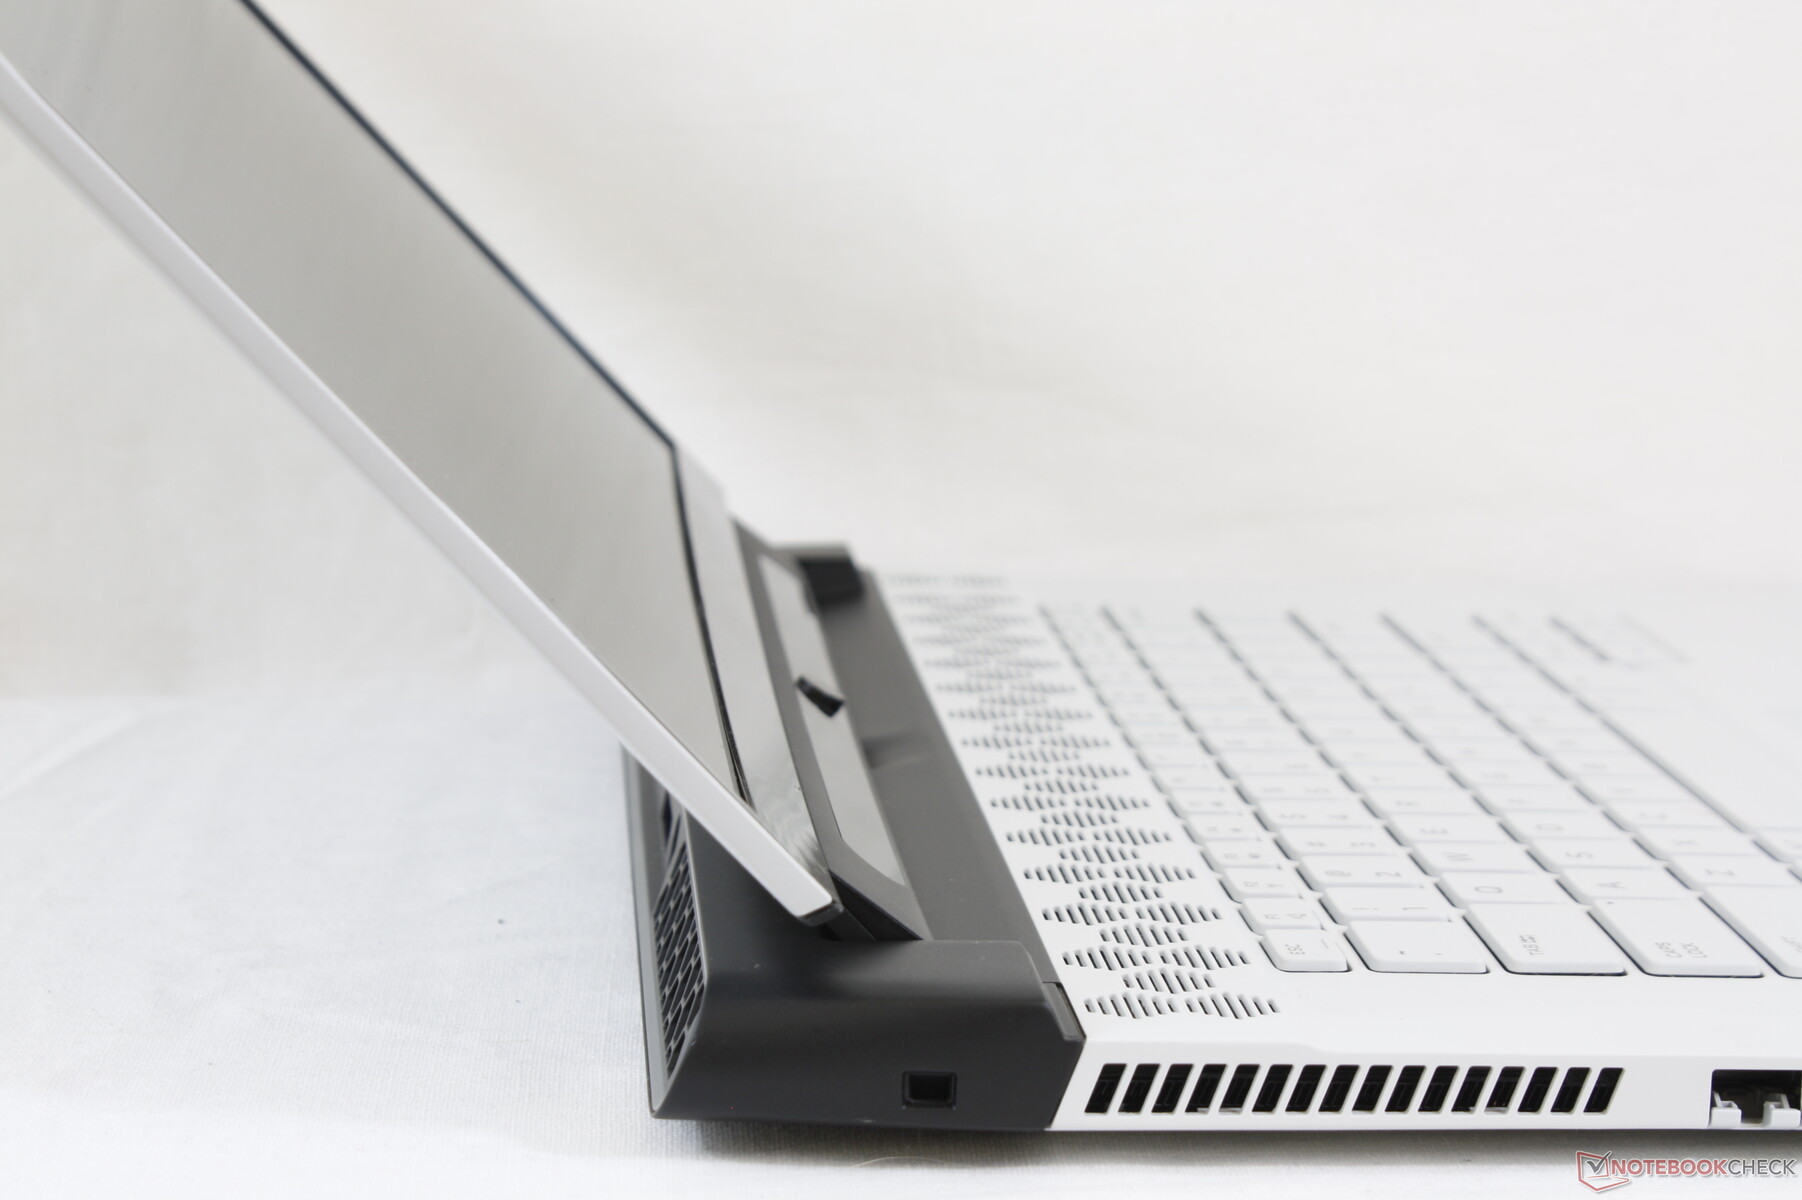
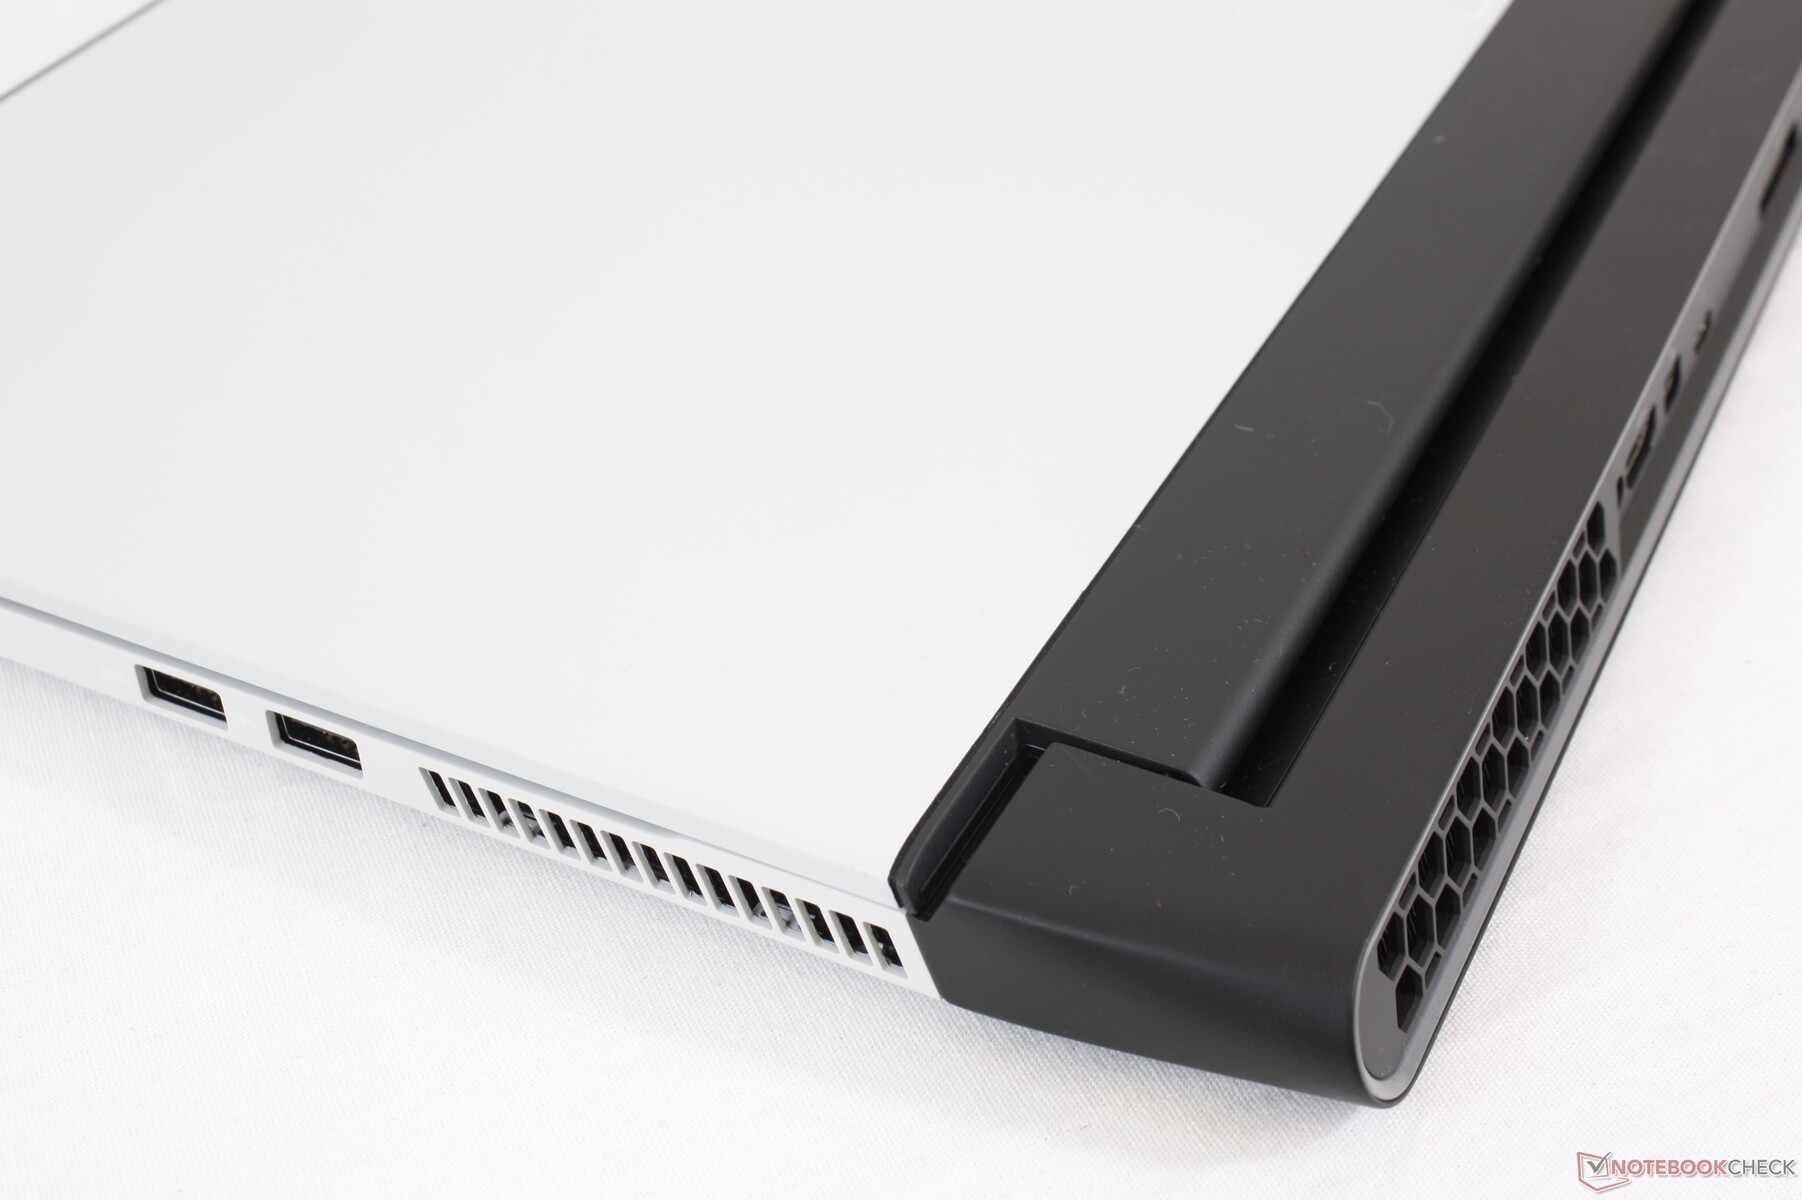
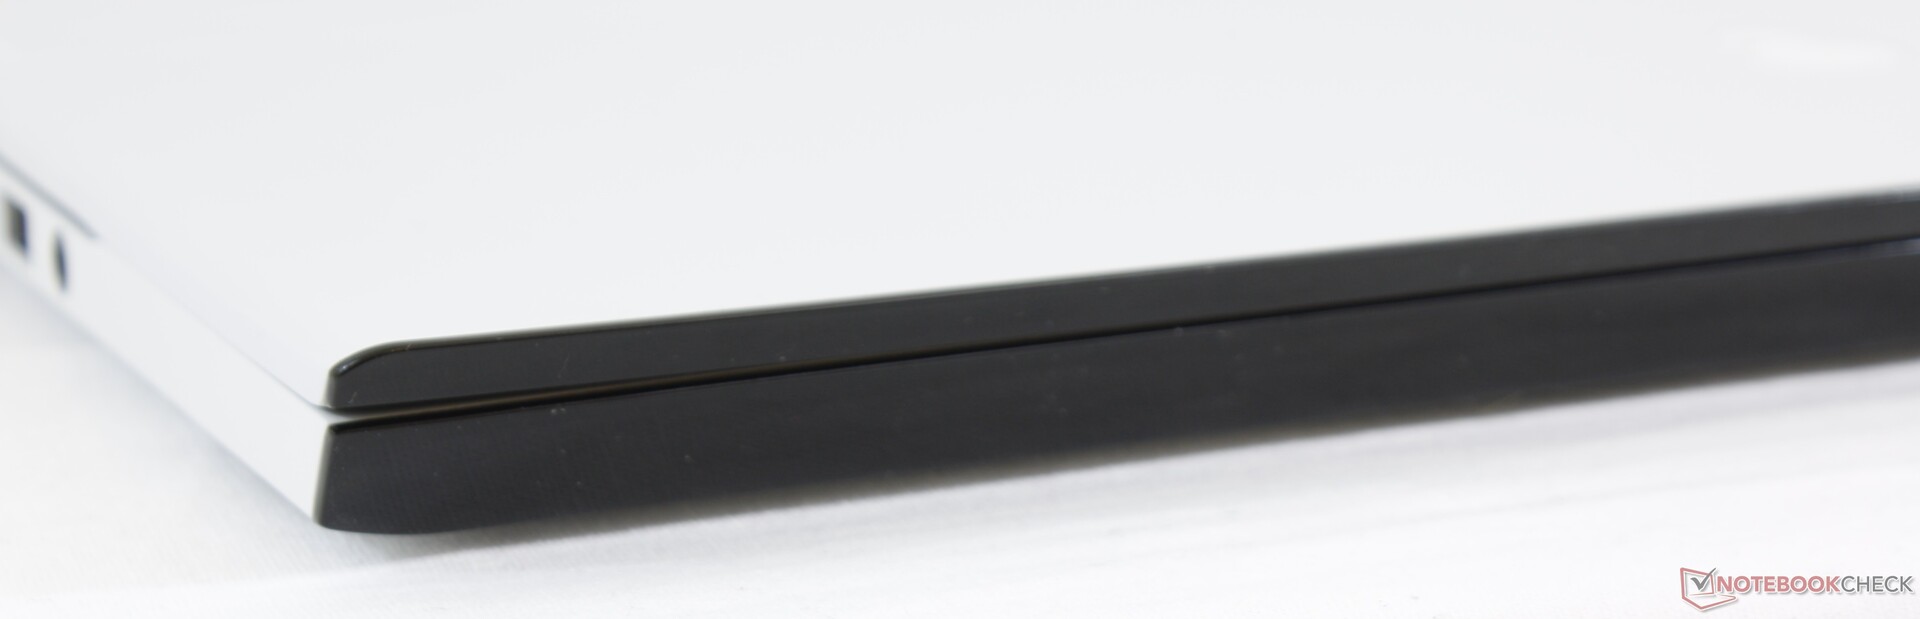
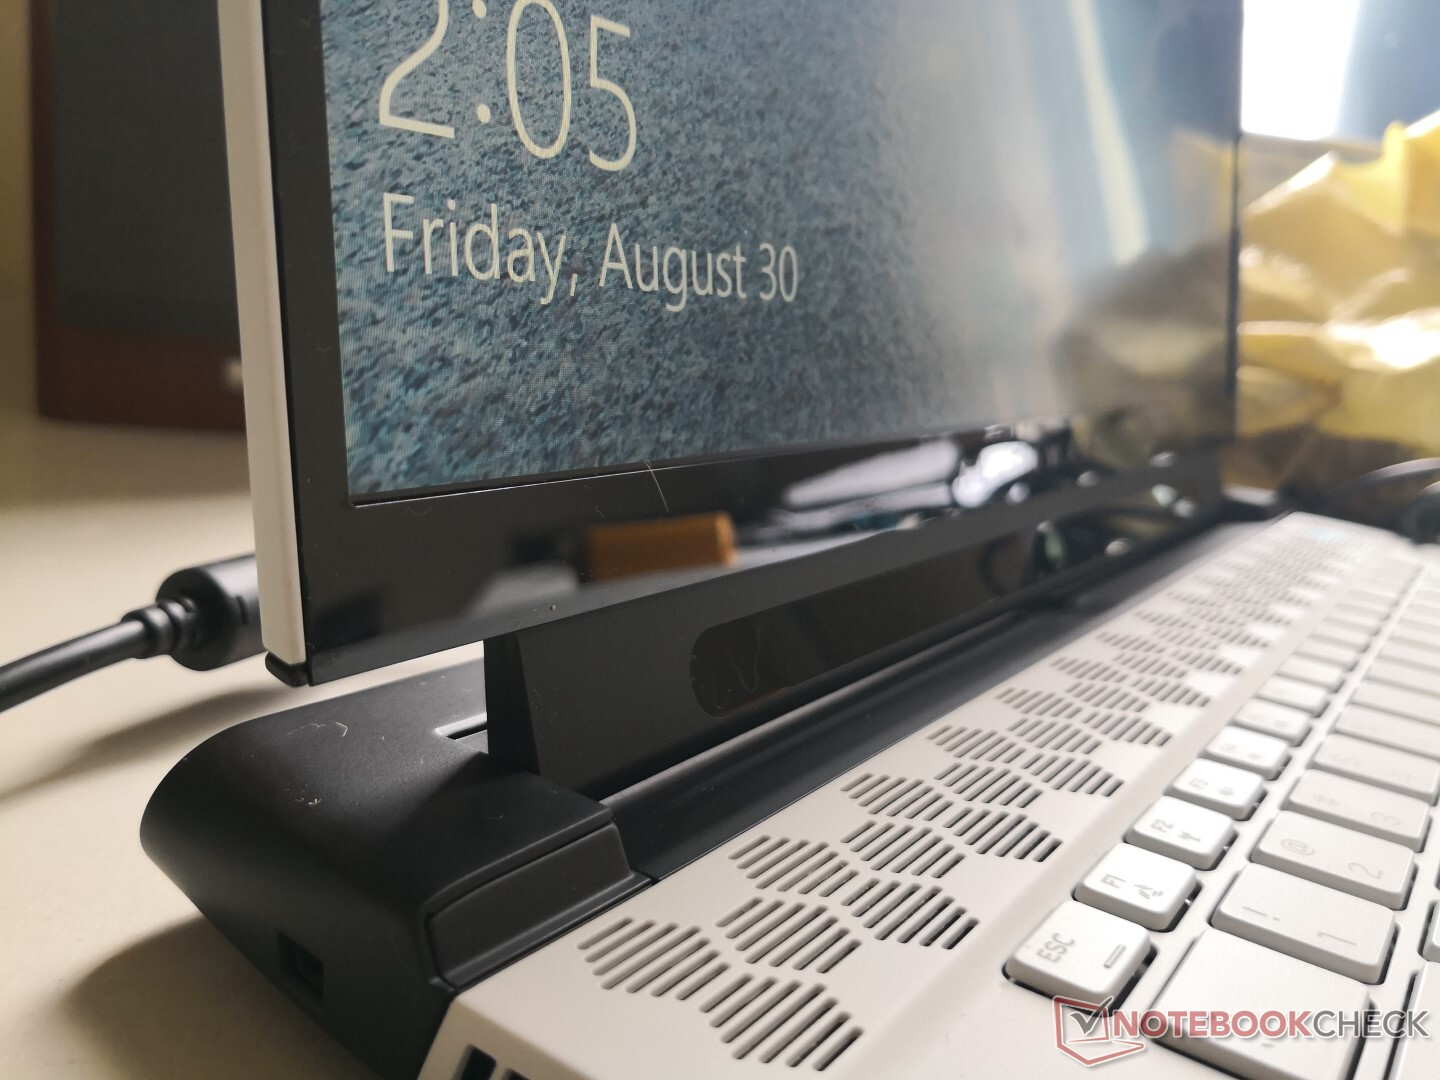
Whereas last year's Alienware m15 R1 is a miniaturized version of the original Alienware 15 R4, the new Alienware m15 R2 is a miniaturized version of the Alienware Area-51m. Dubbed "Legend", the visual design drops the sharp corners and straight edges of the Alienware 15/17 series for a rounder and smoother look. The large honeycomb grilles along the rear, bottom, and keyboard deck are perhaps the most noticeable characteristic of the new design as Dell claims this particular pattern optimizes airflow and rigidity better than the usual parallel grille design of most other laptops.
As far as durability goes, don't expect the new Alienware m15 R2 to be as sound as the hefty last generation Alienware 15 R4. The m15 R2 exhibits more twisting and creaking than its older sibling which is the price to pay for being significantly thinner and lighter. The chassis feels stronger than the MSI GS65, comparable to both the Asus Zephyrus S GX531 and Alienware m15 R1, and weaker than both the Razer Blade 15 and Gigabyte Aero 15.
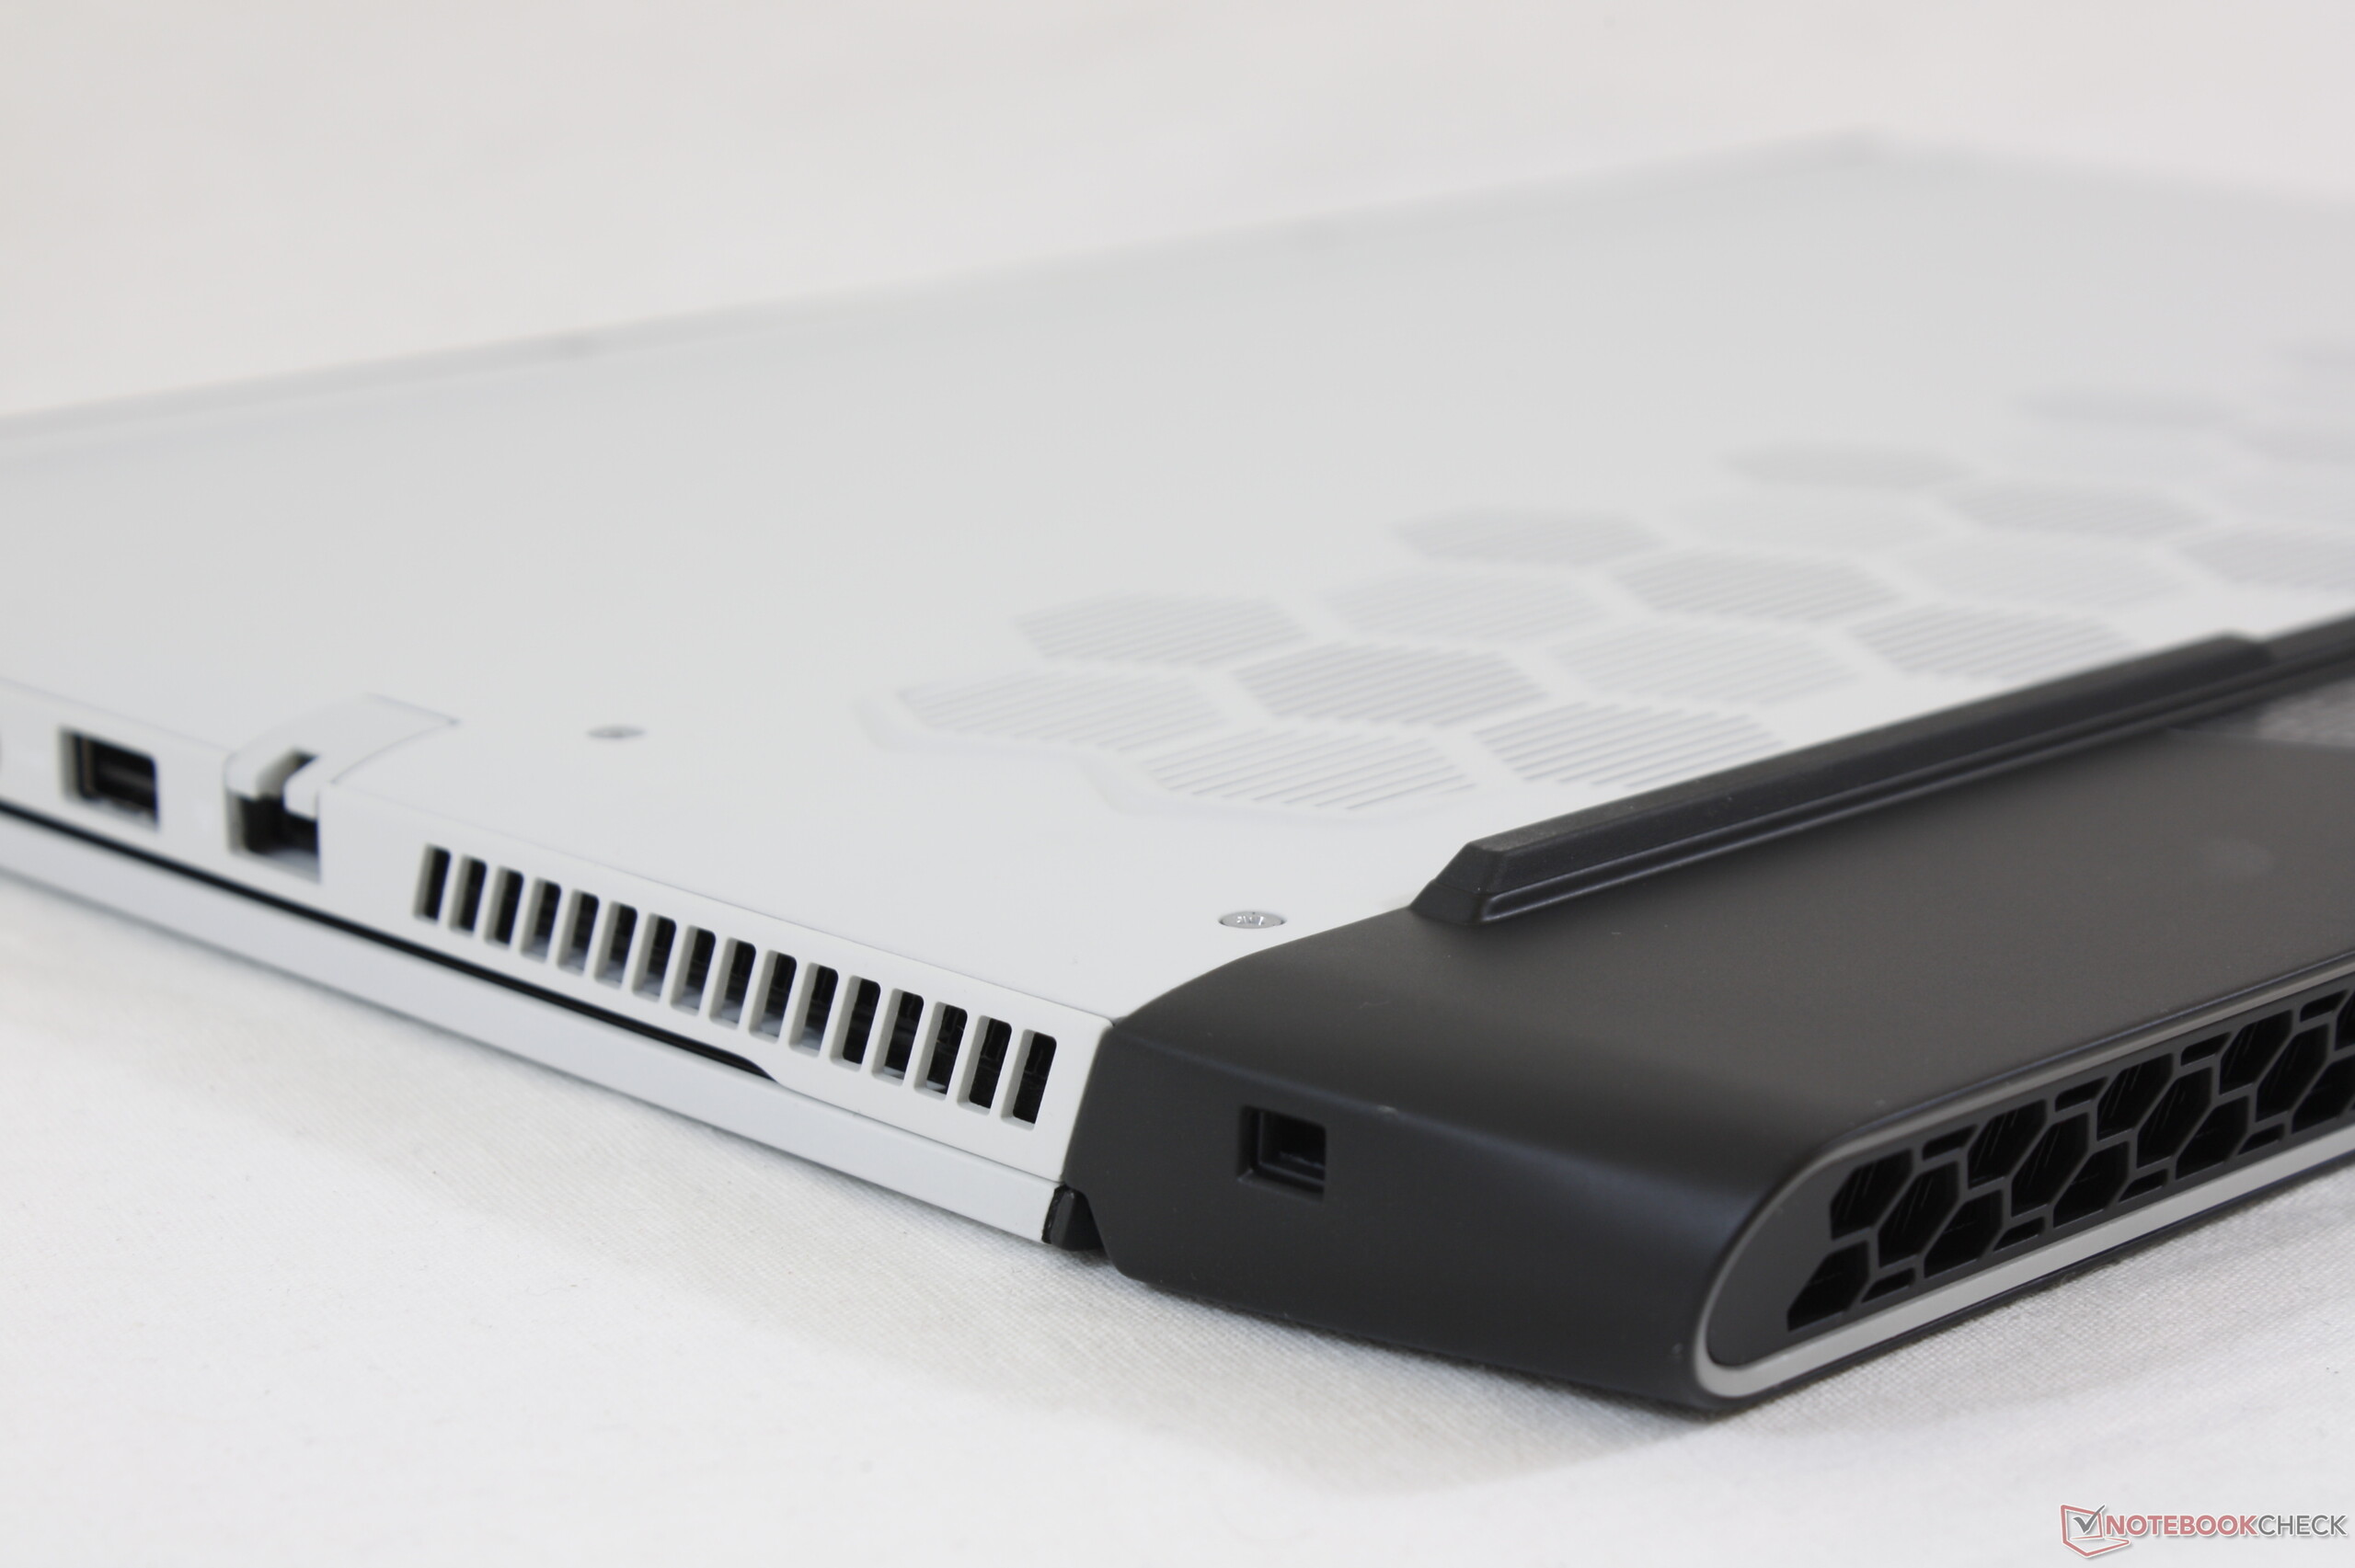
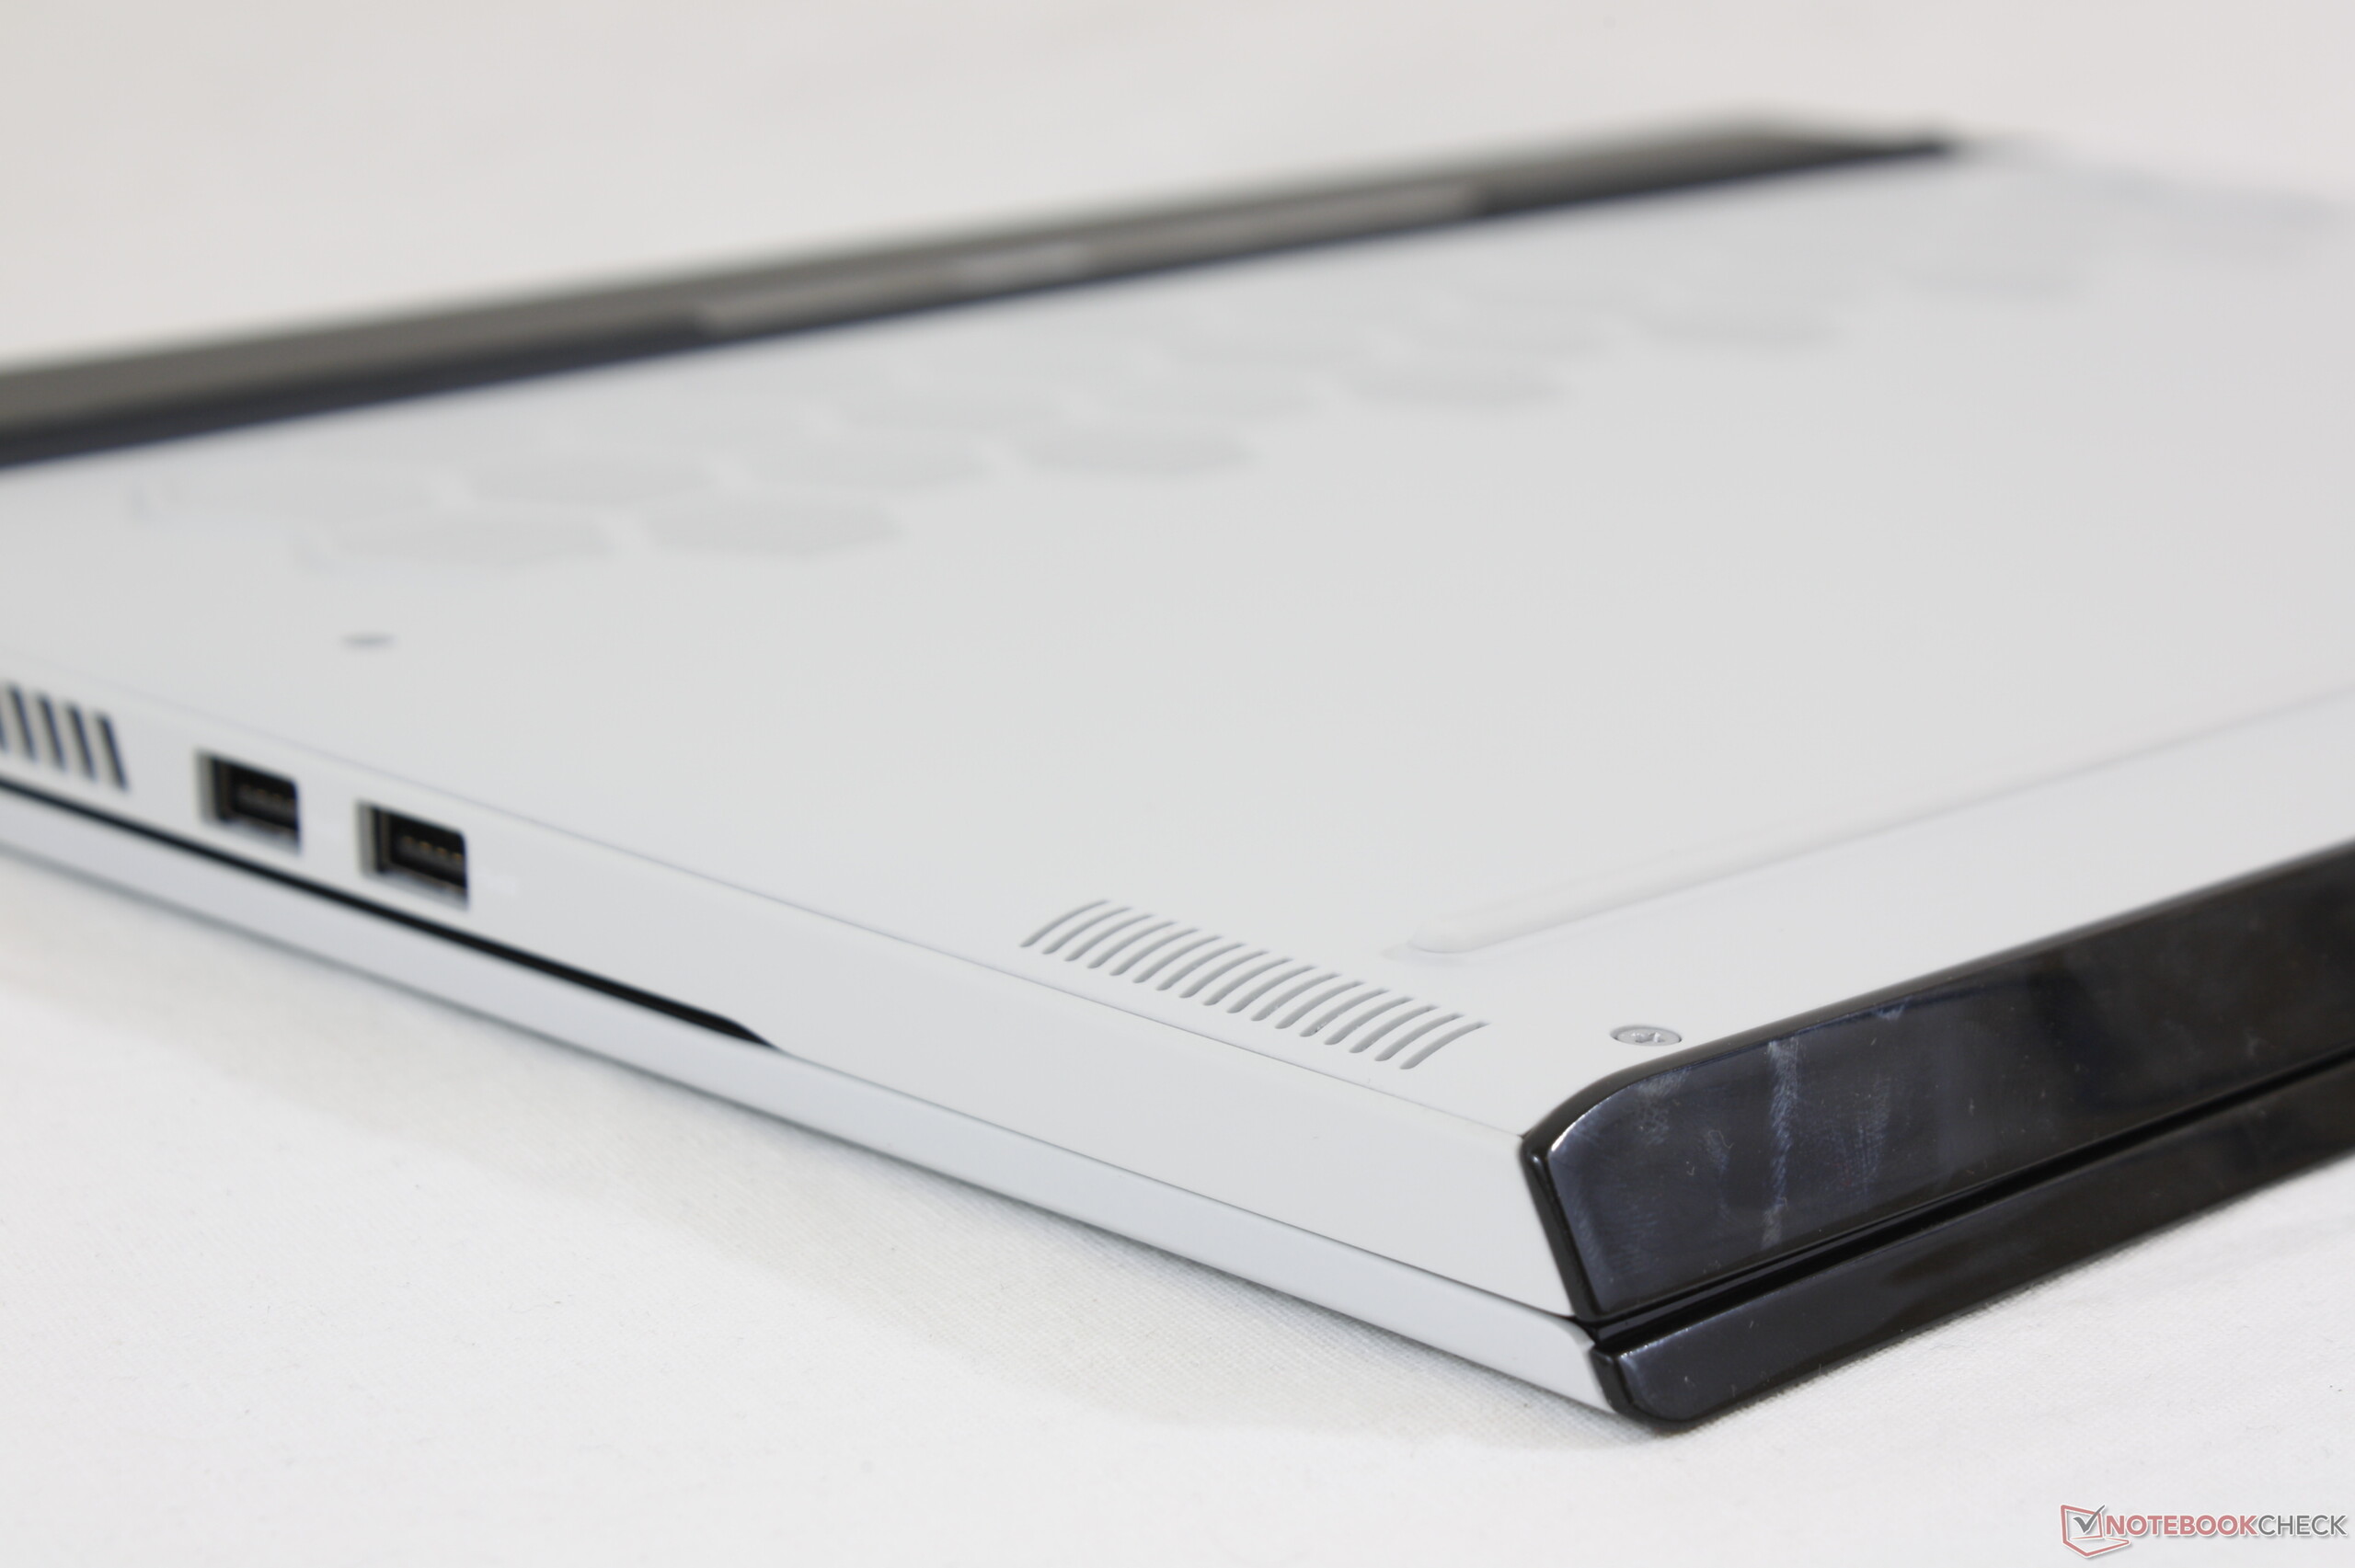
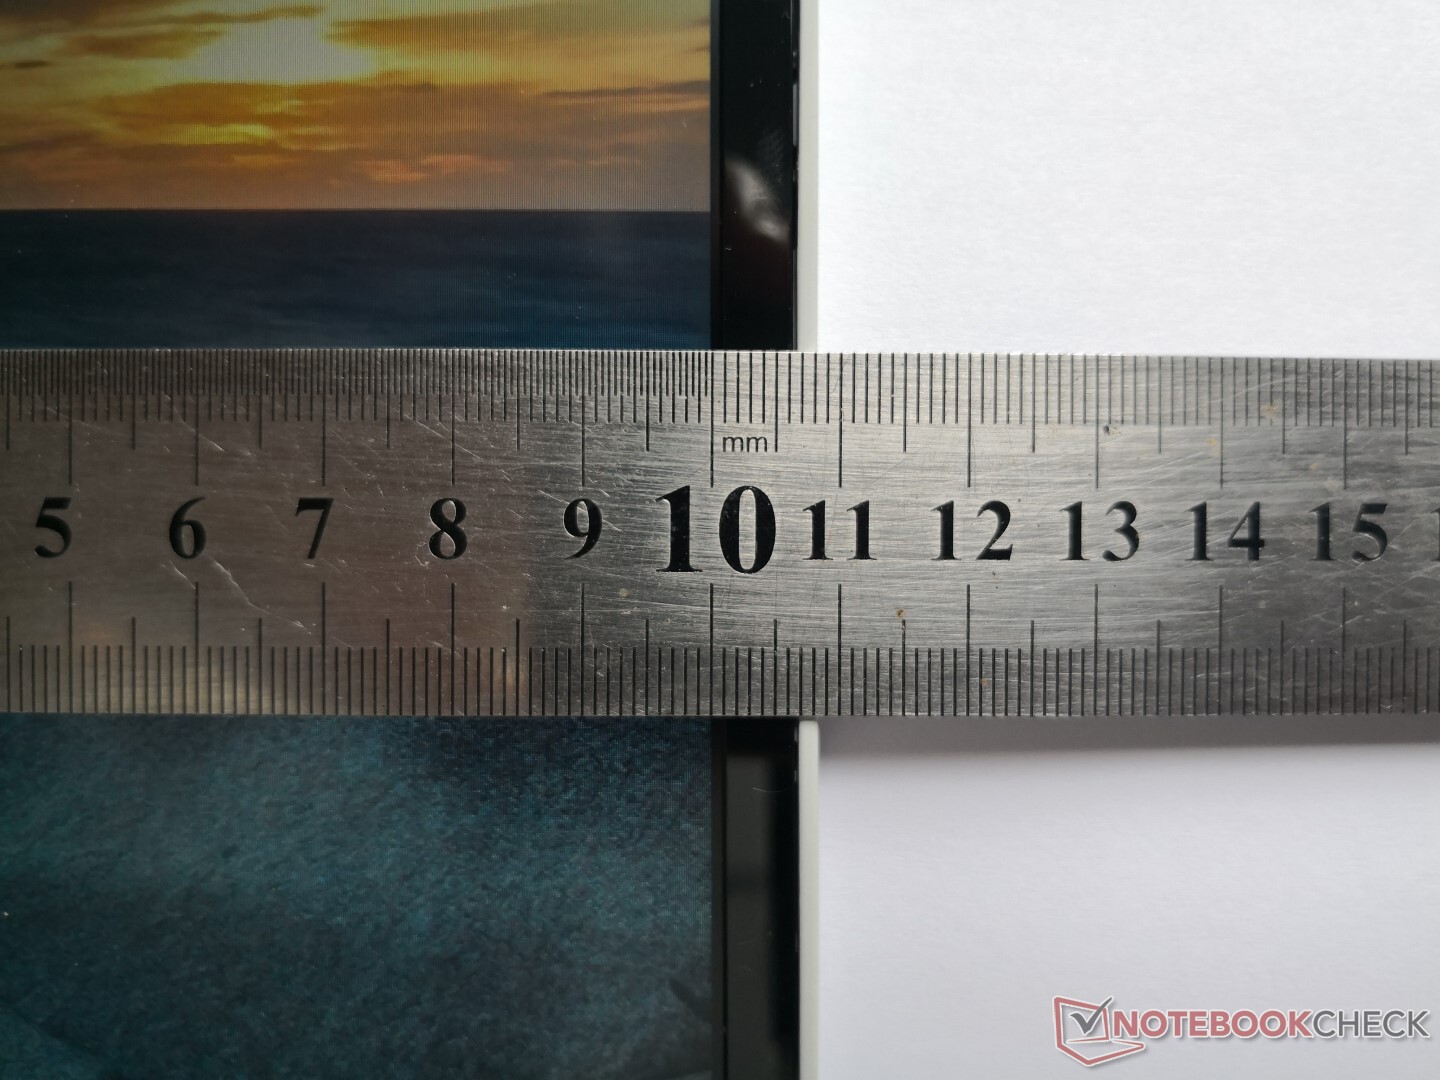
Although the Alienware 15 R2 looks completely different from the 15 R1, they are nearly identical when it comes to dimensions and weight. The 15 R2 is ever-so-slightly thinner at 19.5 mm or 20.5 mm if configured with Tobii eye-tracking. Because of its extended rear, however, the m15 series continues to be noticeably longer in length and with a larger footprint than most other competing 15.6-inch gaming laptops.
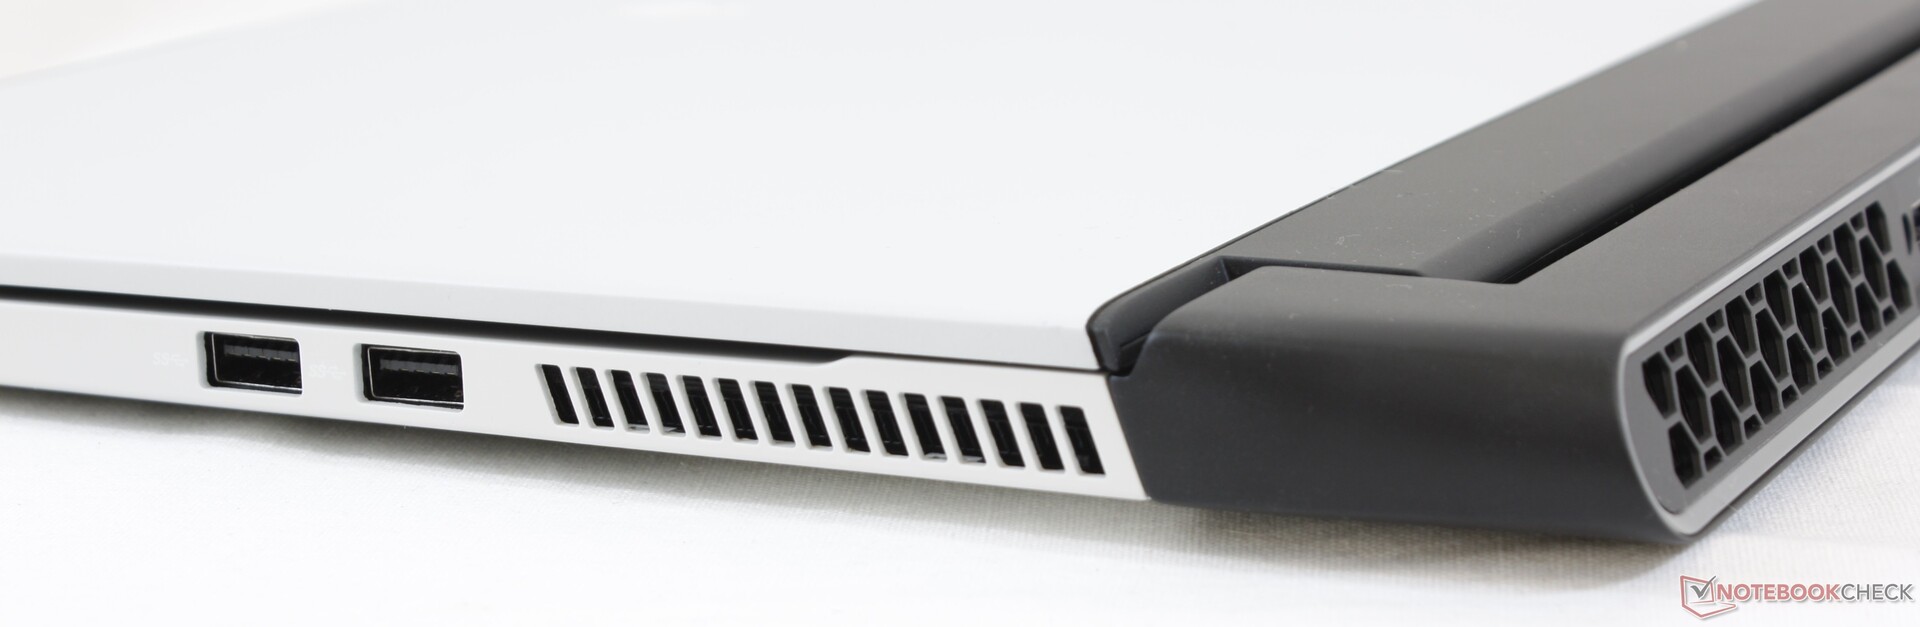
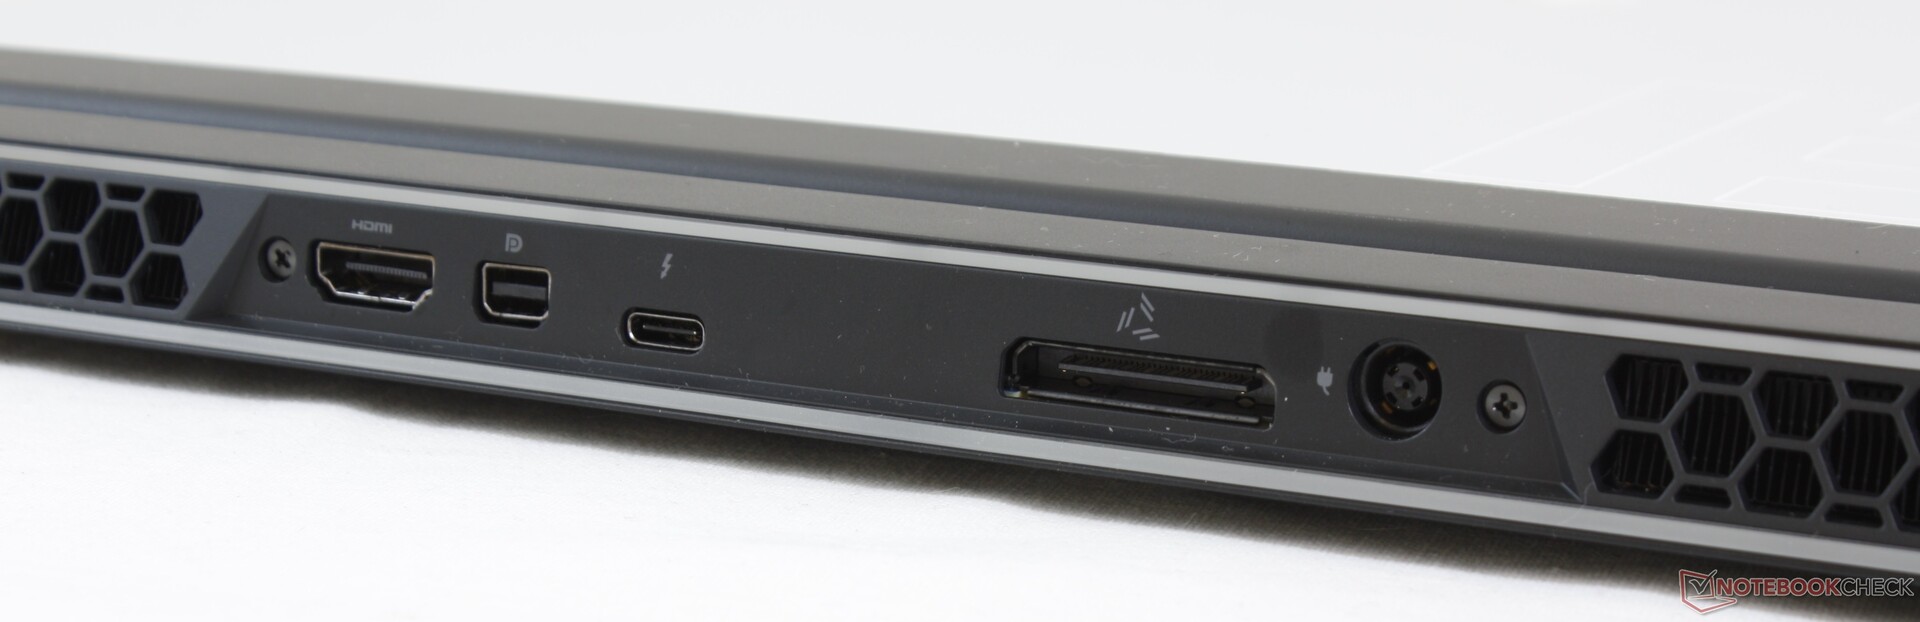
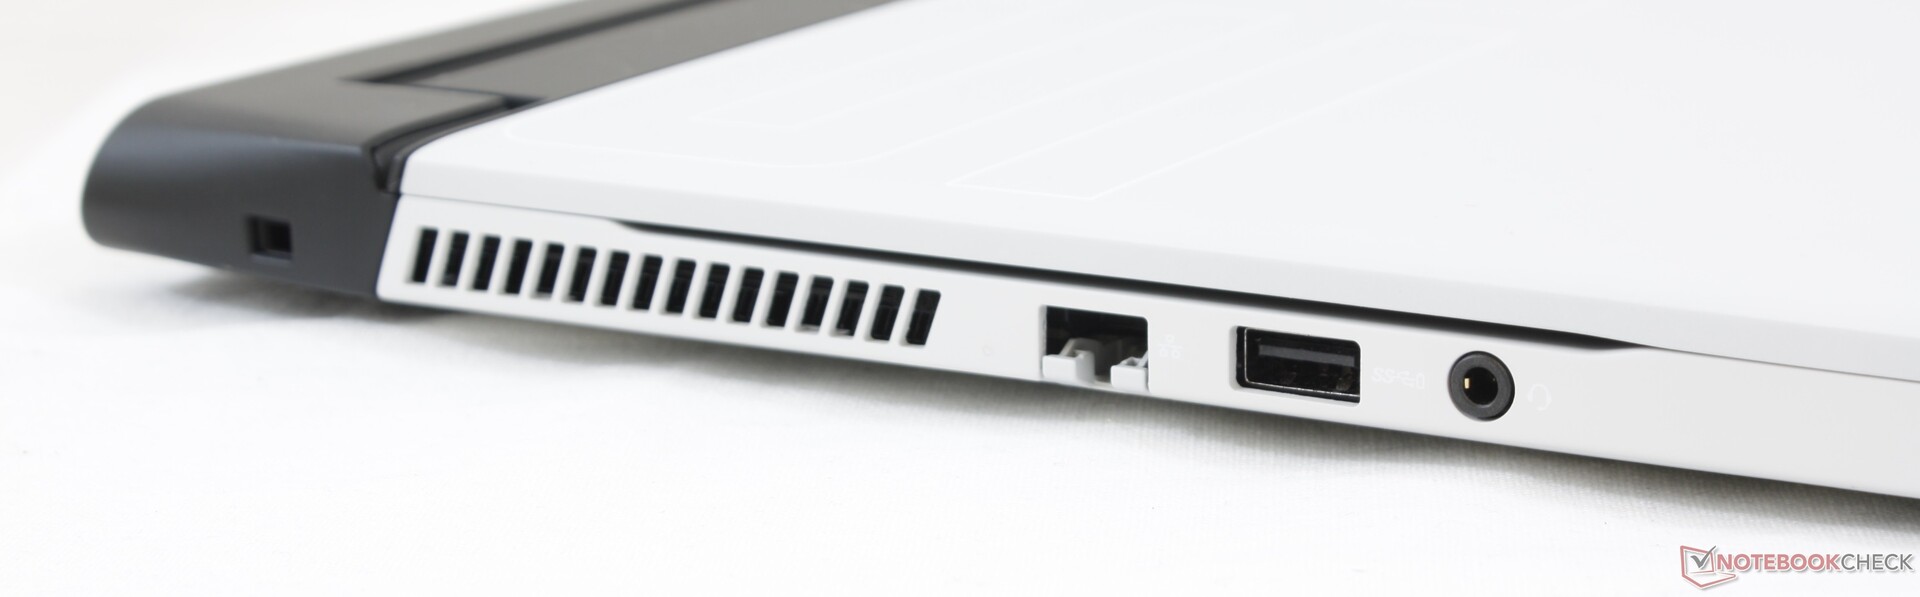
Connectivity
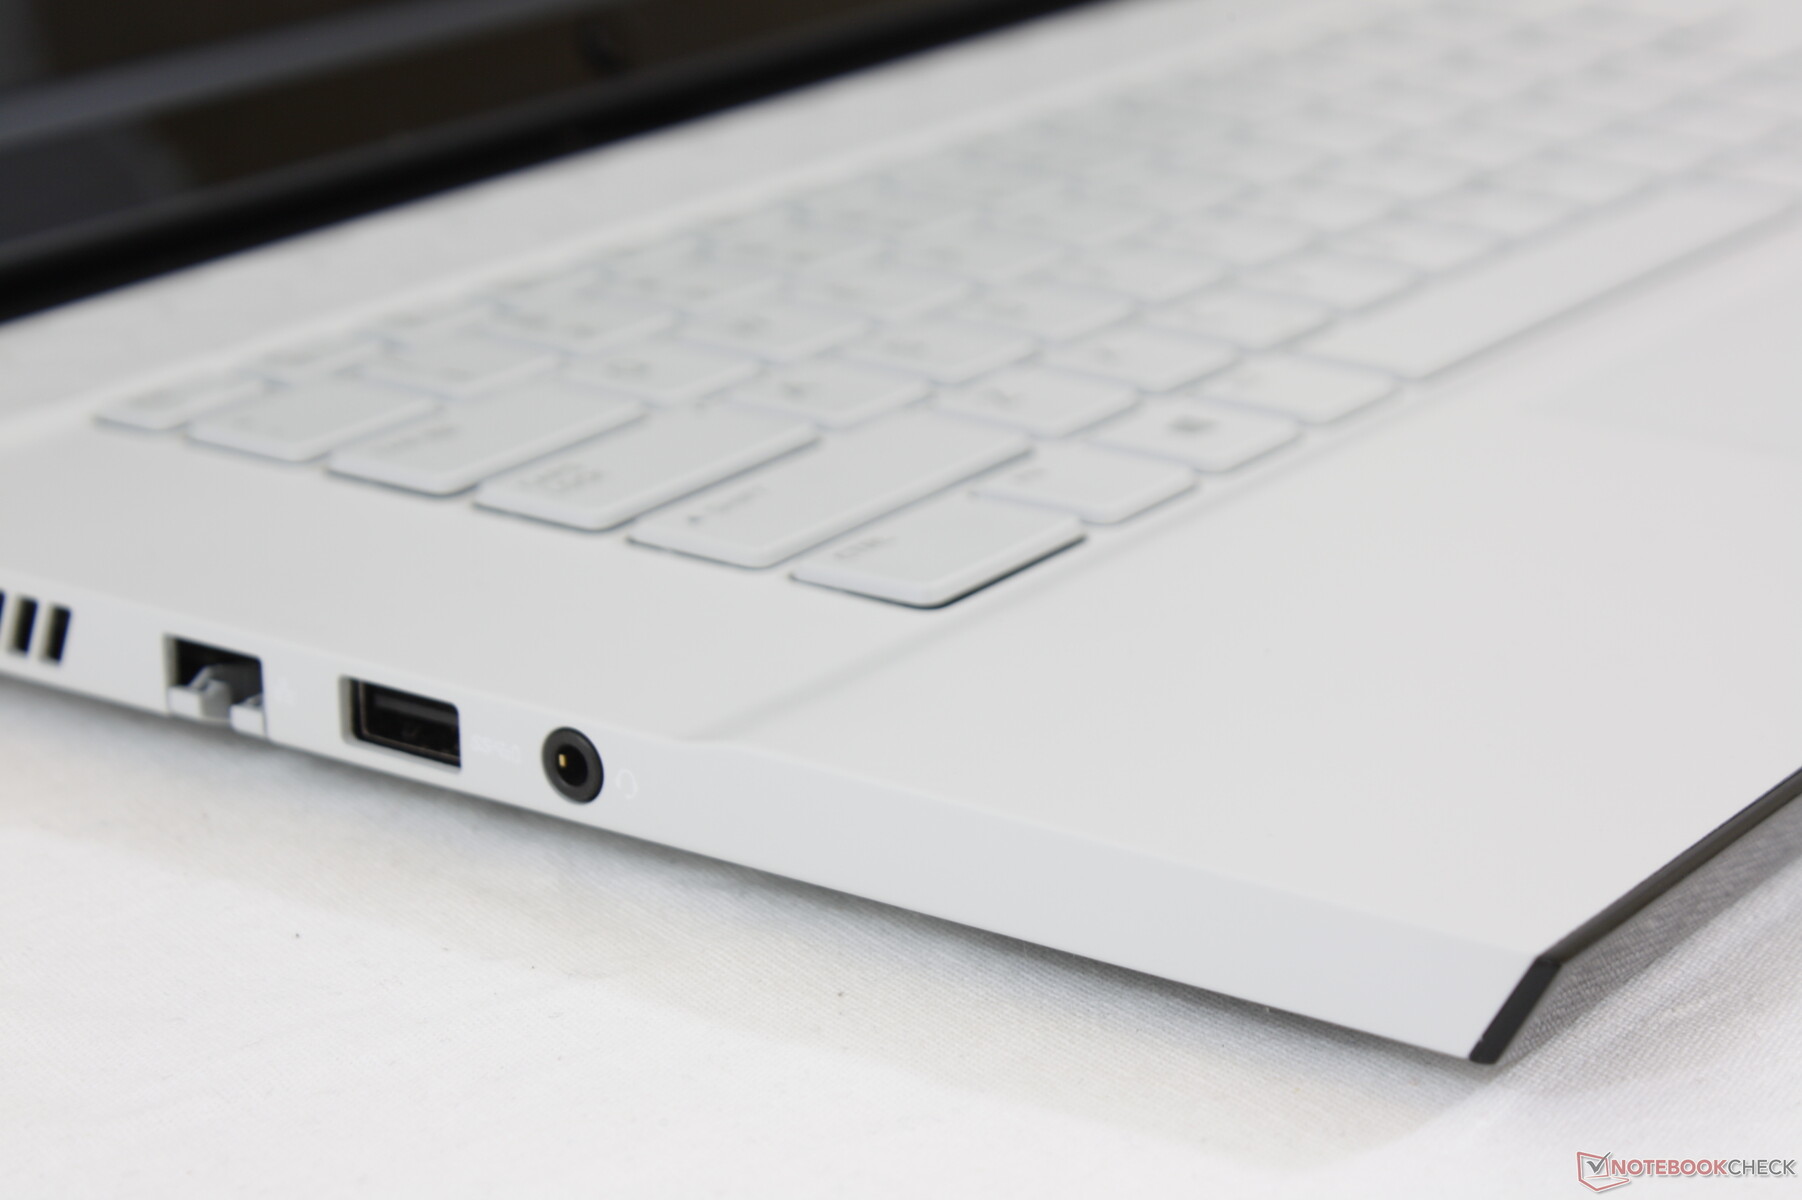
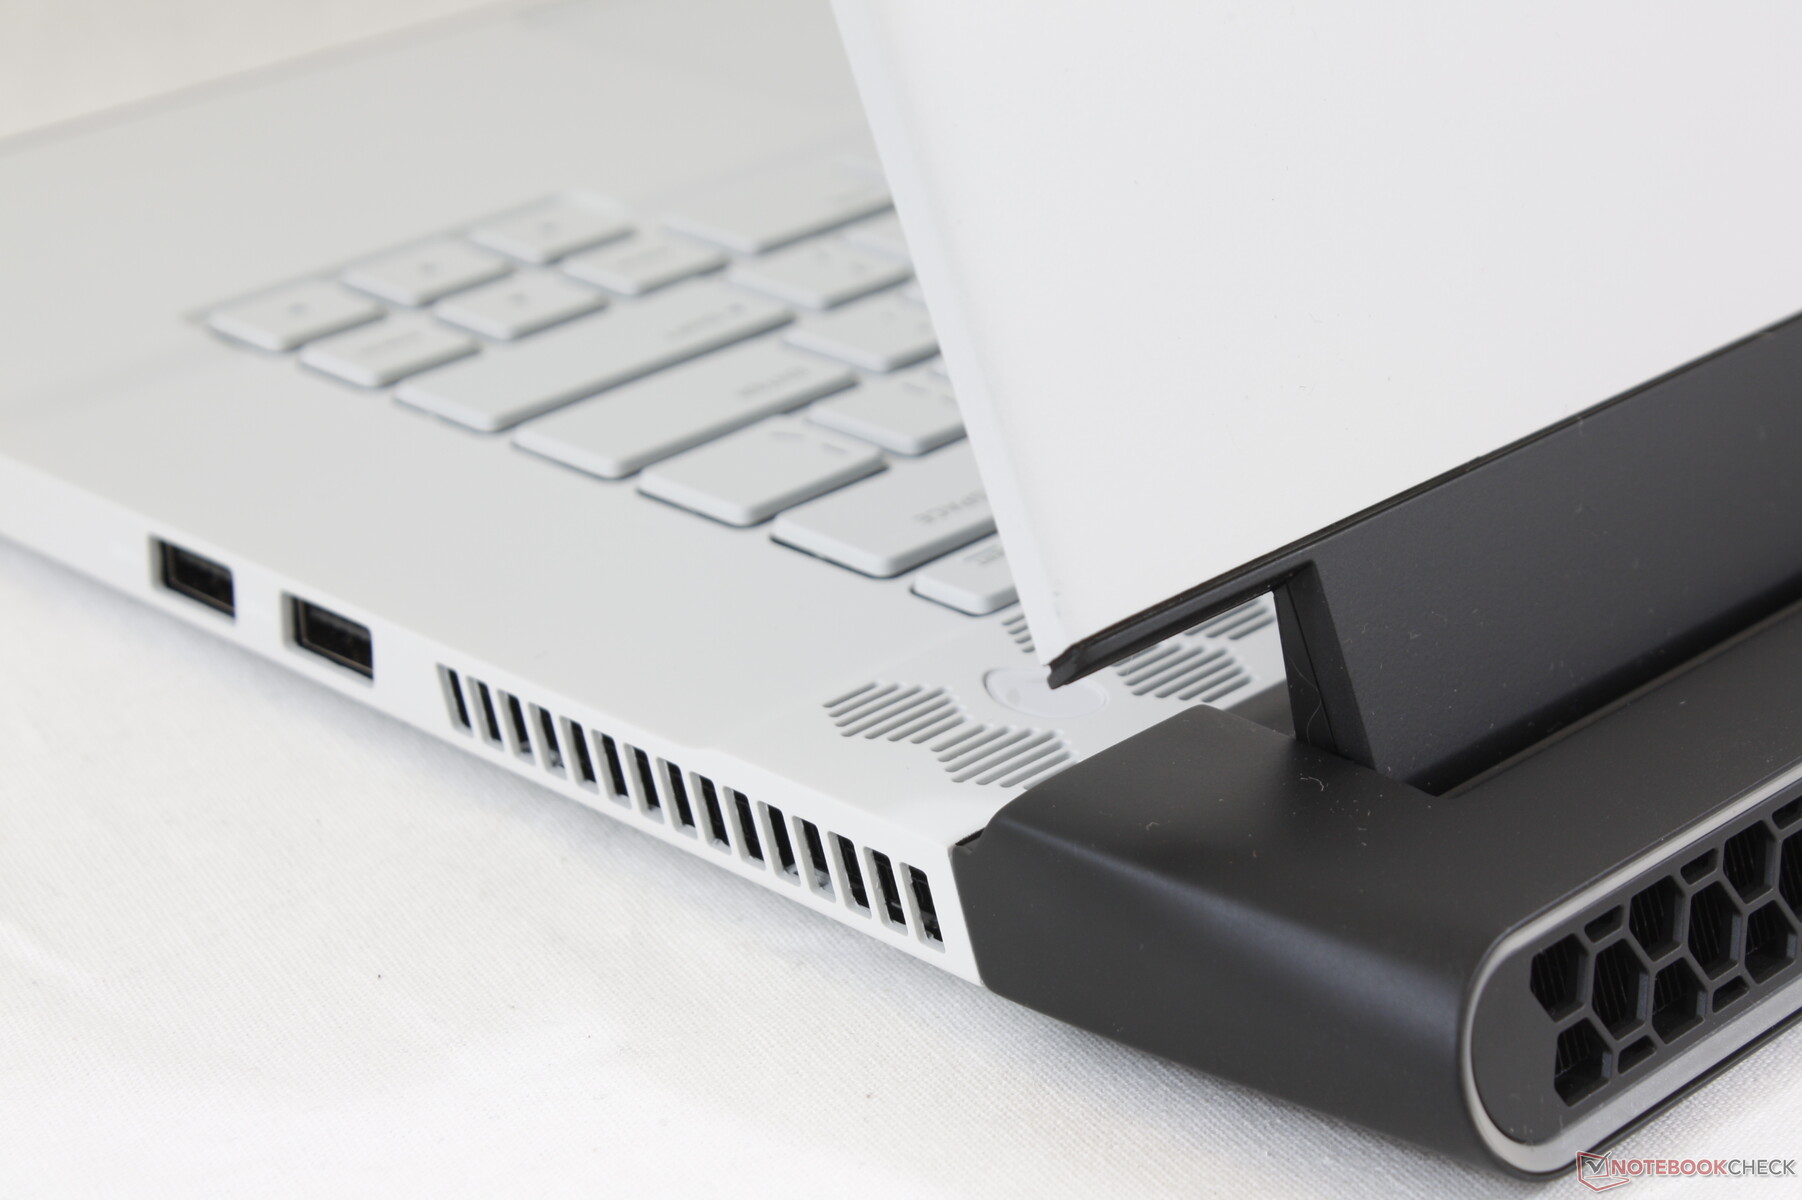
Both port options and positioning are identical to last year's Alienware m15 R1. One small upgrade is that the RJ-45 port can now support 2.5 Gbps speeds instead of "only" 1 Gbps, but everything else remains the same including the lack of an SD card reader.
Communication
Initial SKUs like our test unit have Intel 8265 and Killer AX1650 options to be Wi-Fi 6 ready. Dell says all SKUs in the near future will be upgraded to Killer AX1650 with Killer-specific features as standard. Though the Intel 8265 is nowhere near as fast as what the Killer module is capable of (867 Mbps vs. 2.4 Gbps), we didn't experience any notable connectivity issues with our unit. You'll still need a brand new router if you wish to fully exploit the benefits of Wi-Fi 6.
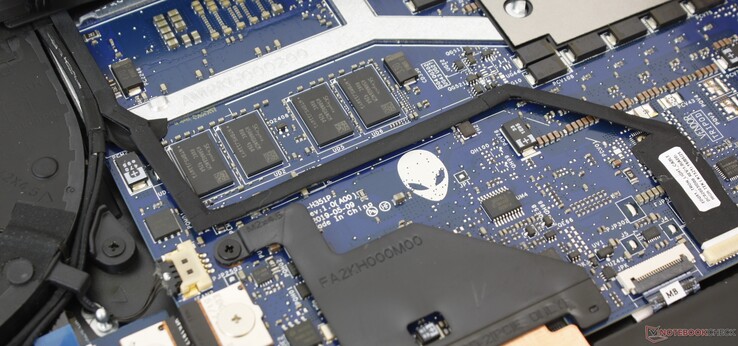
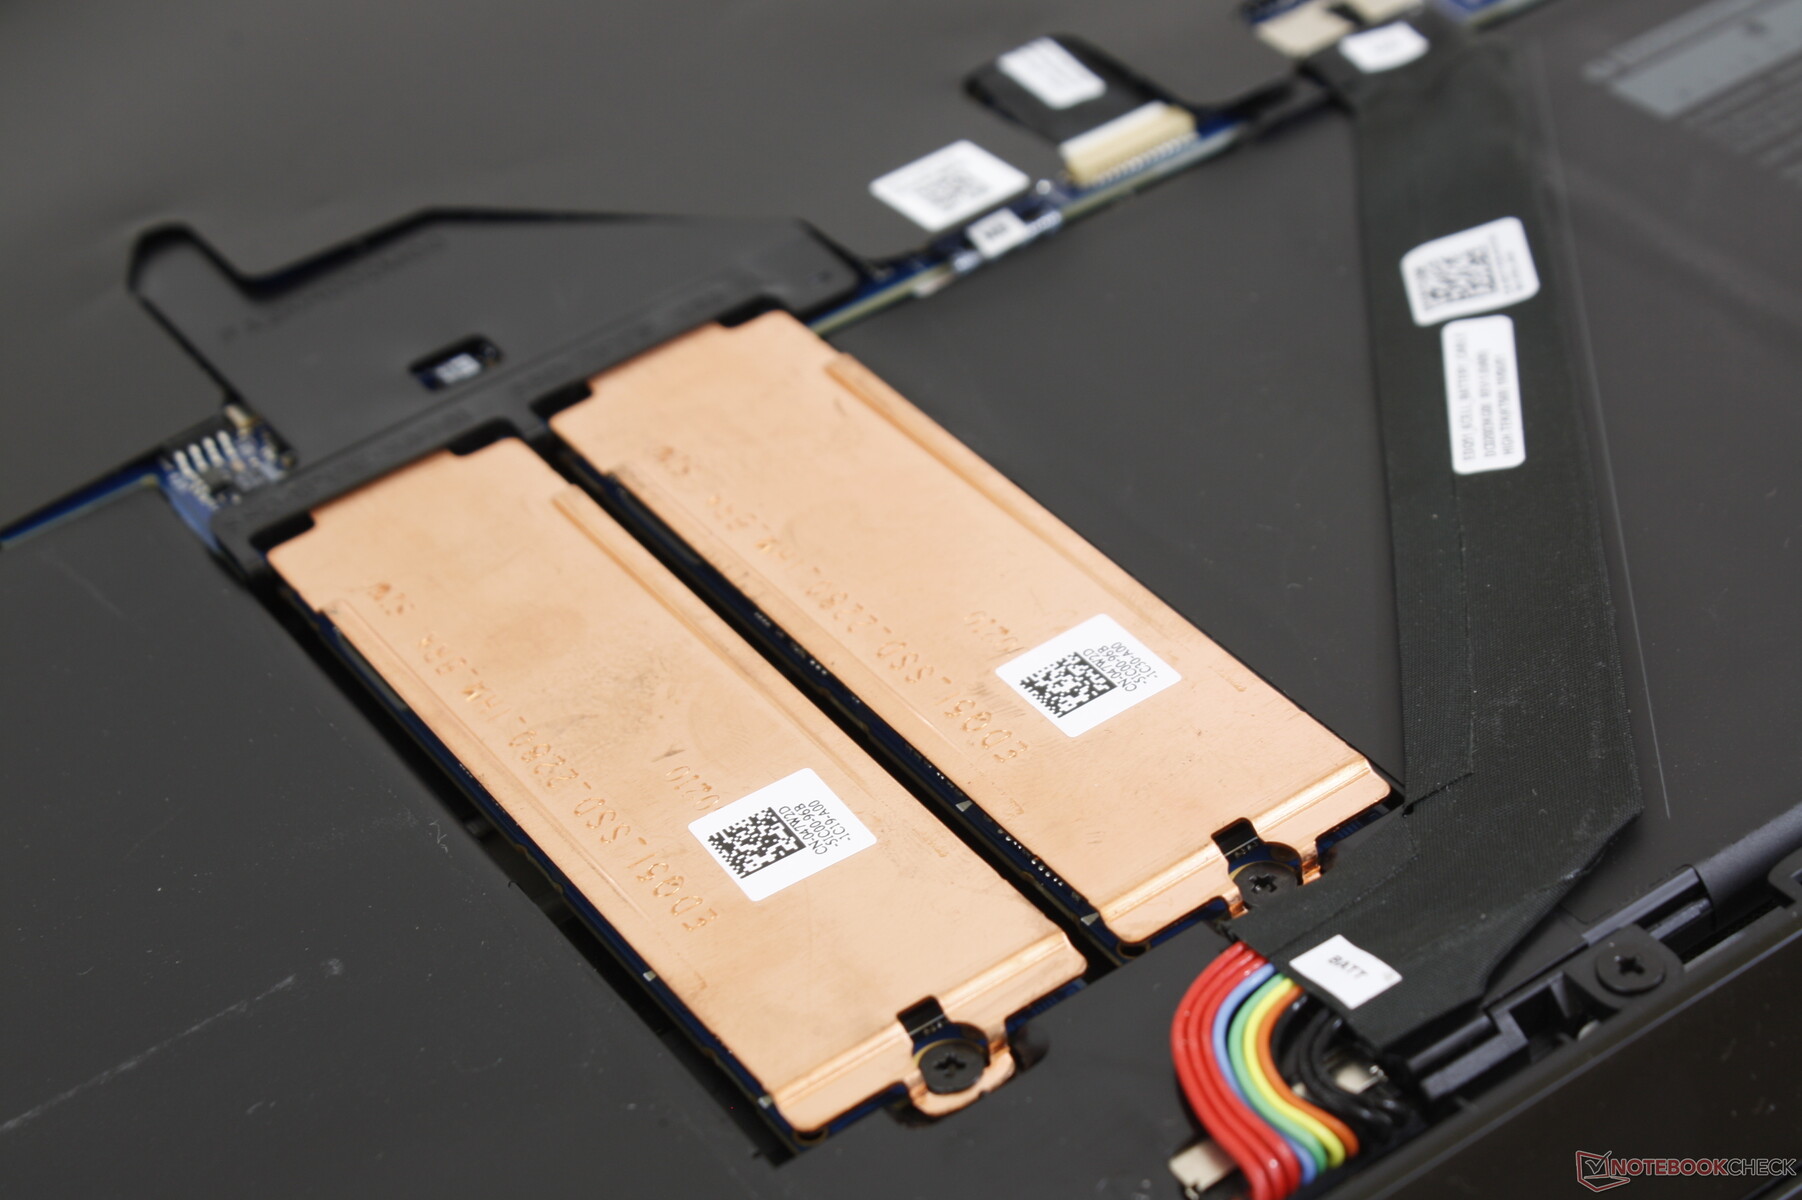
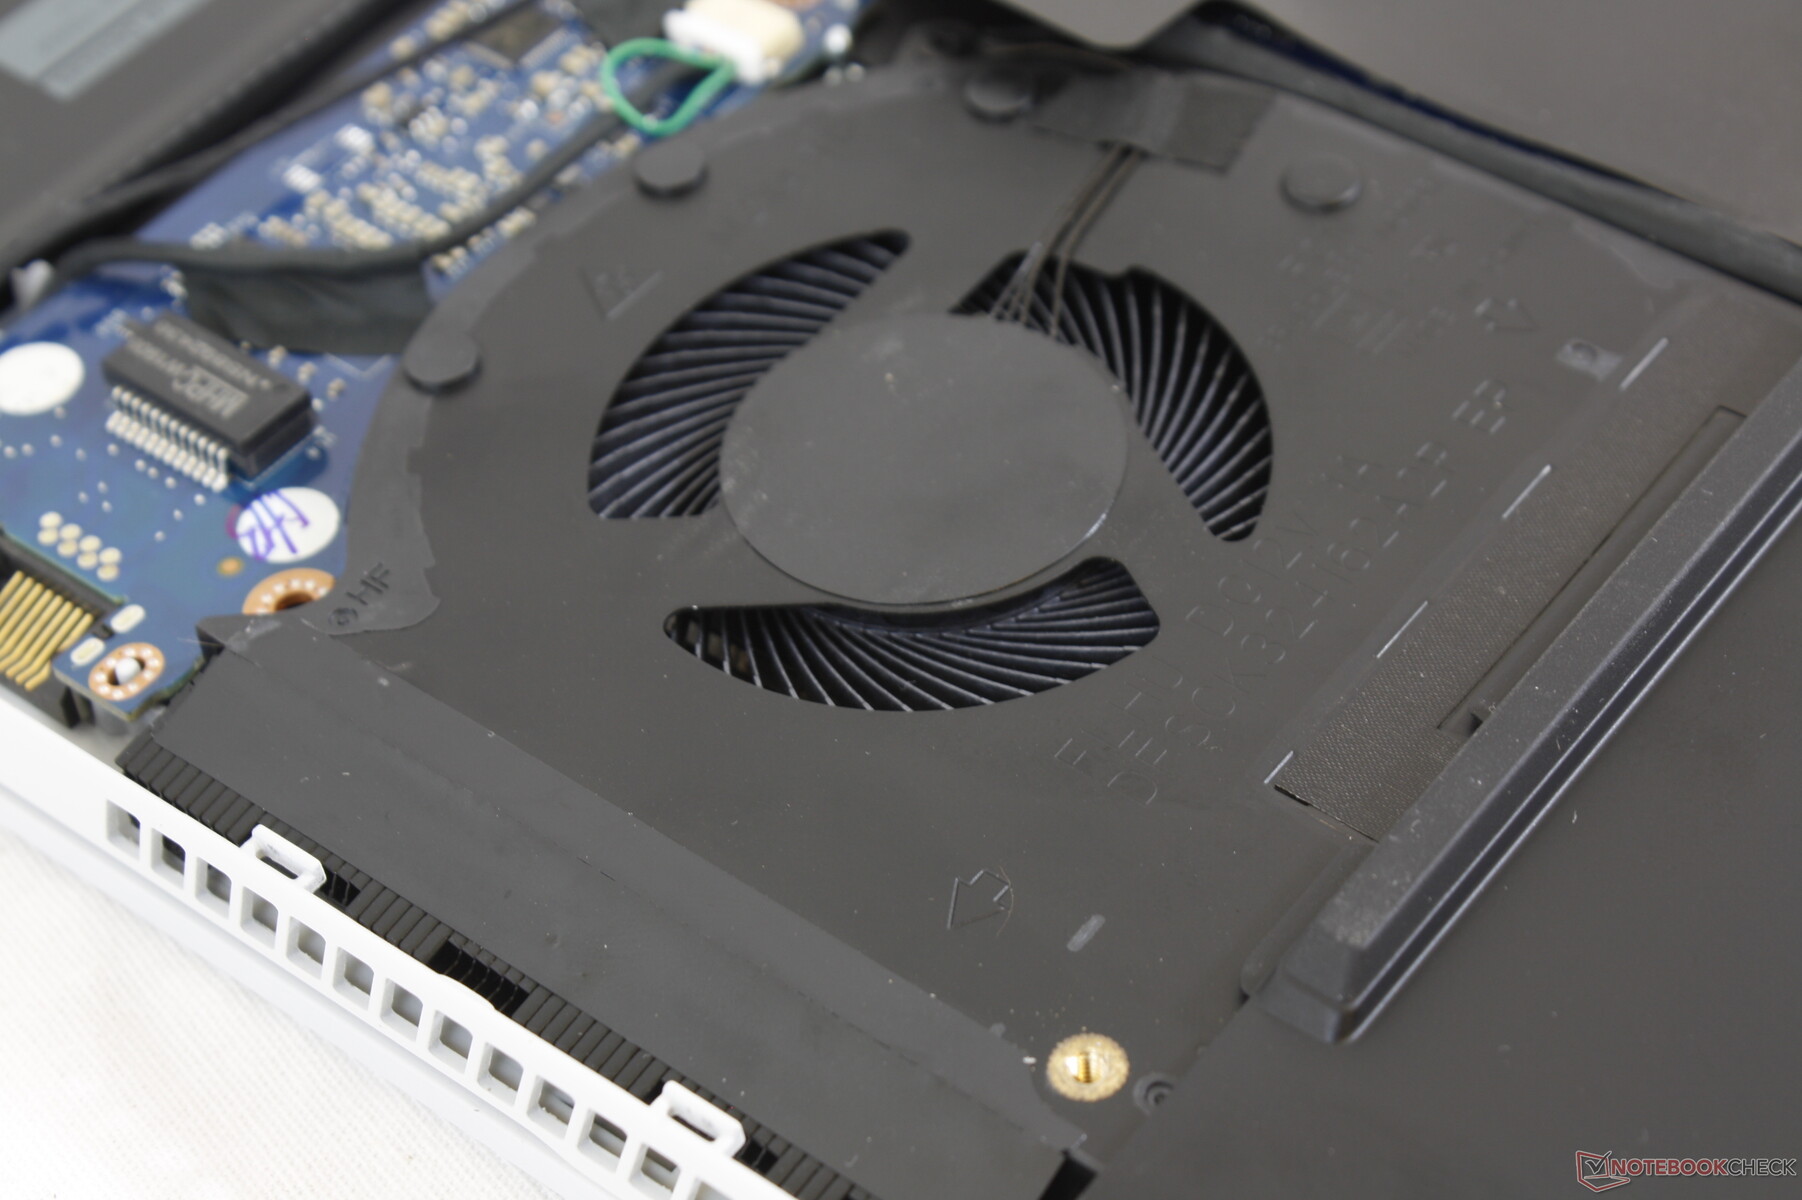
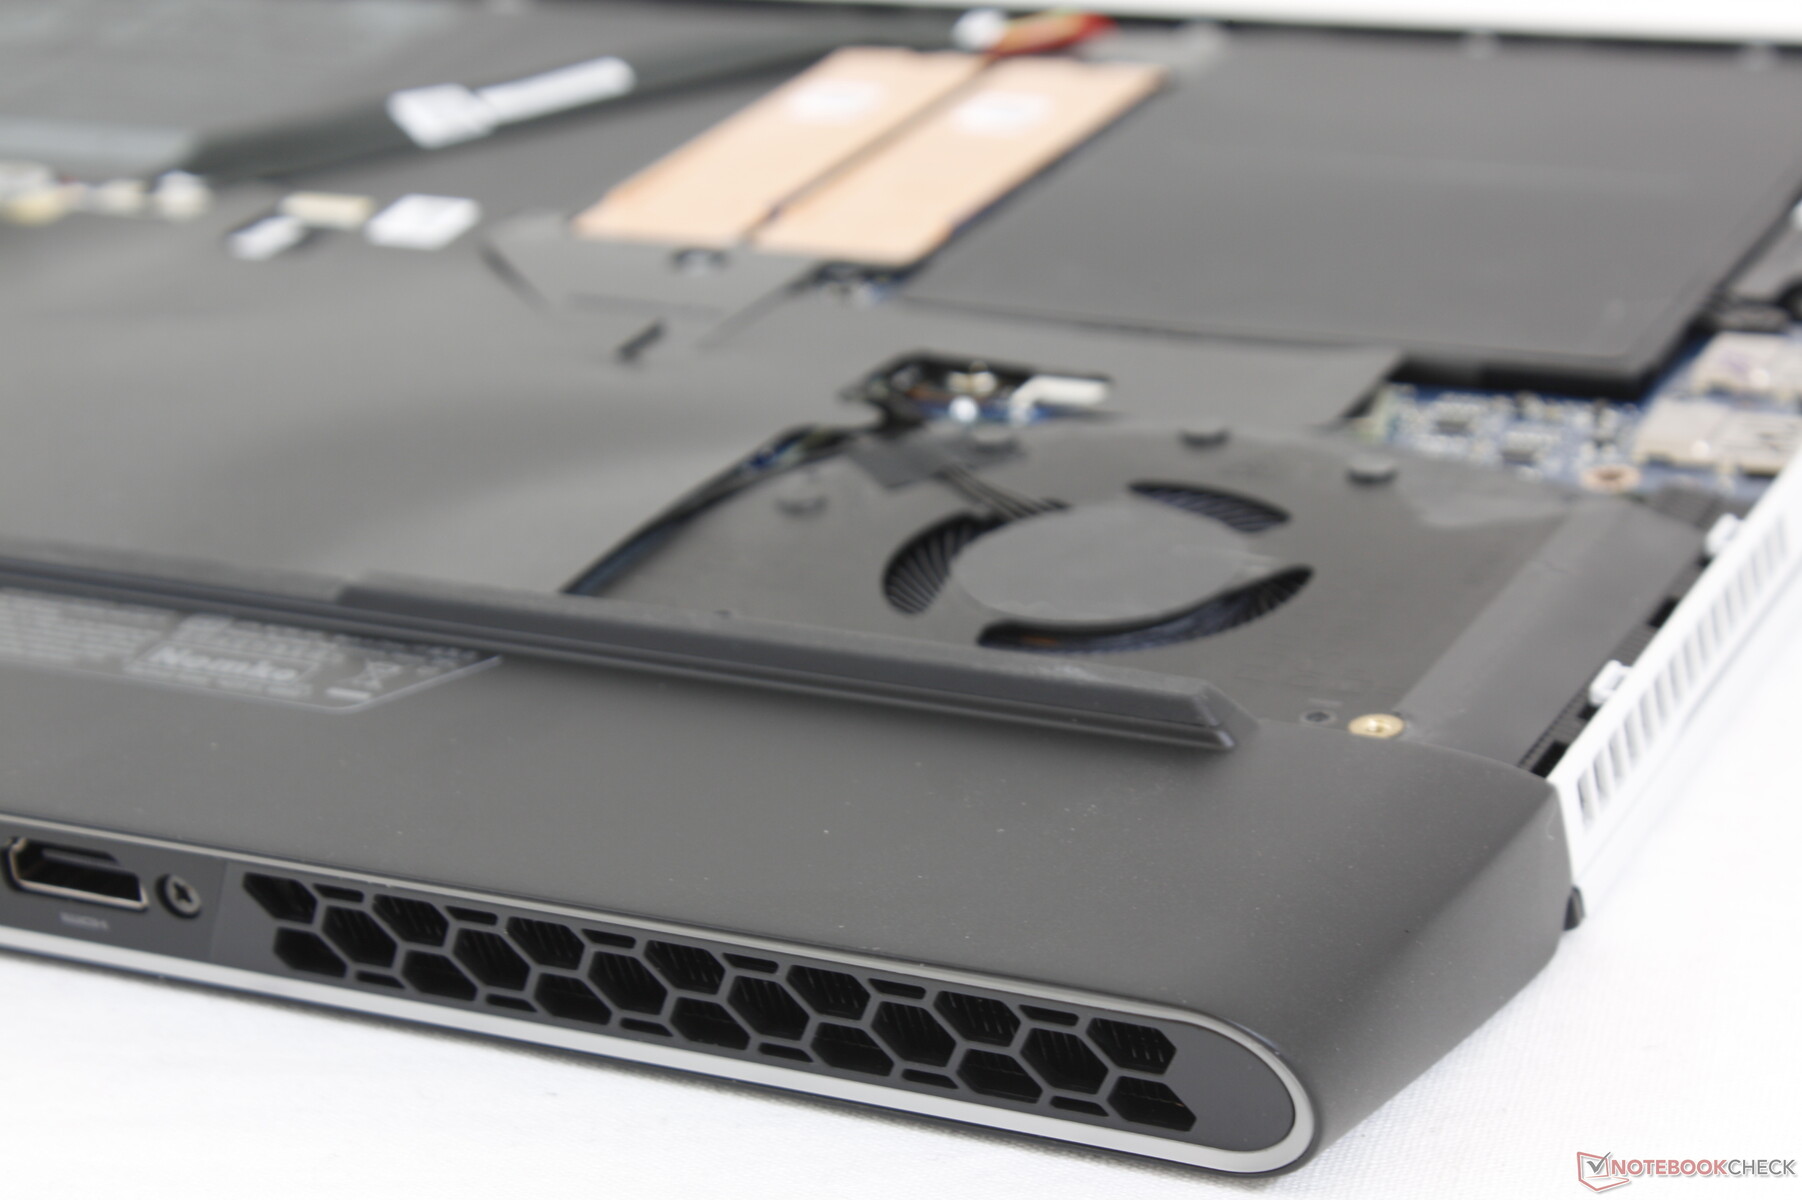
Maintenance
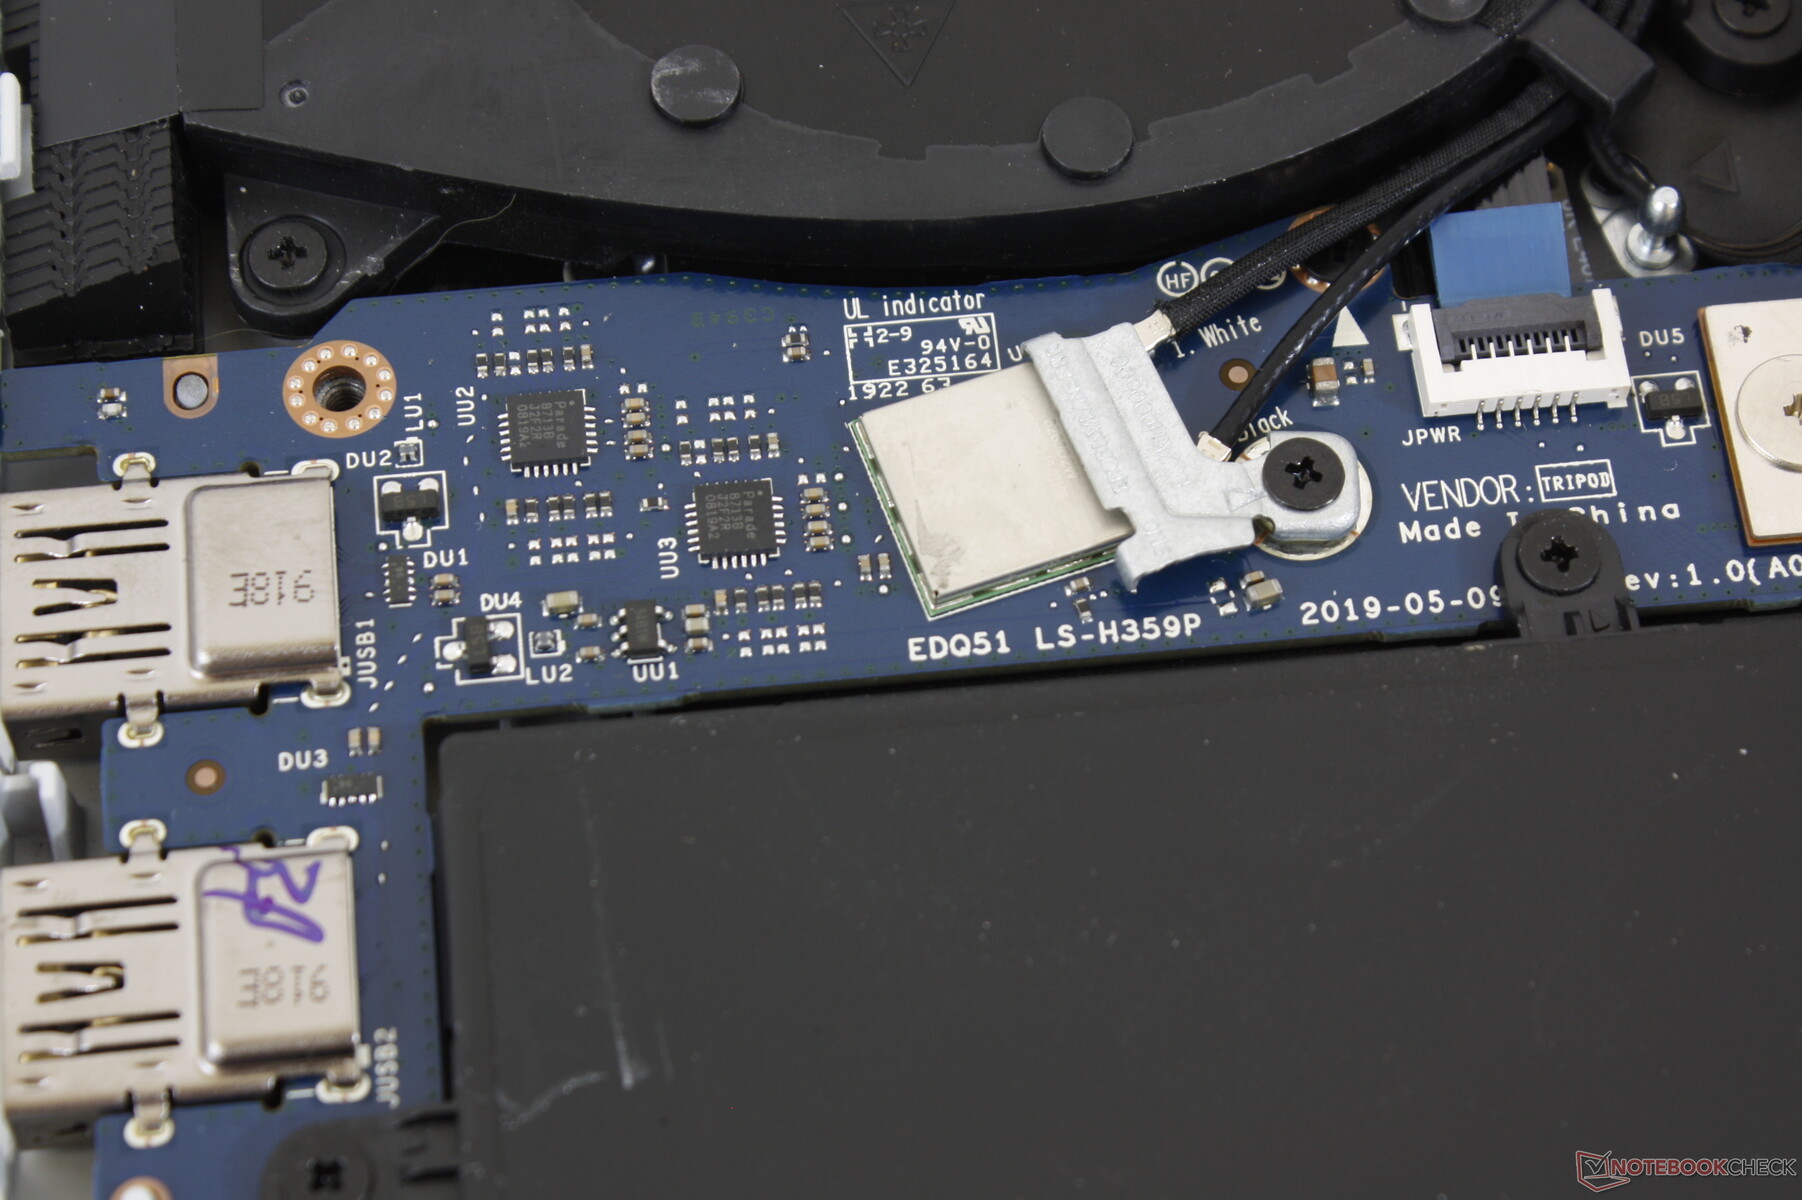
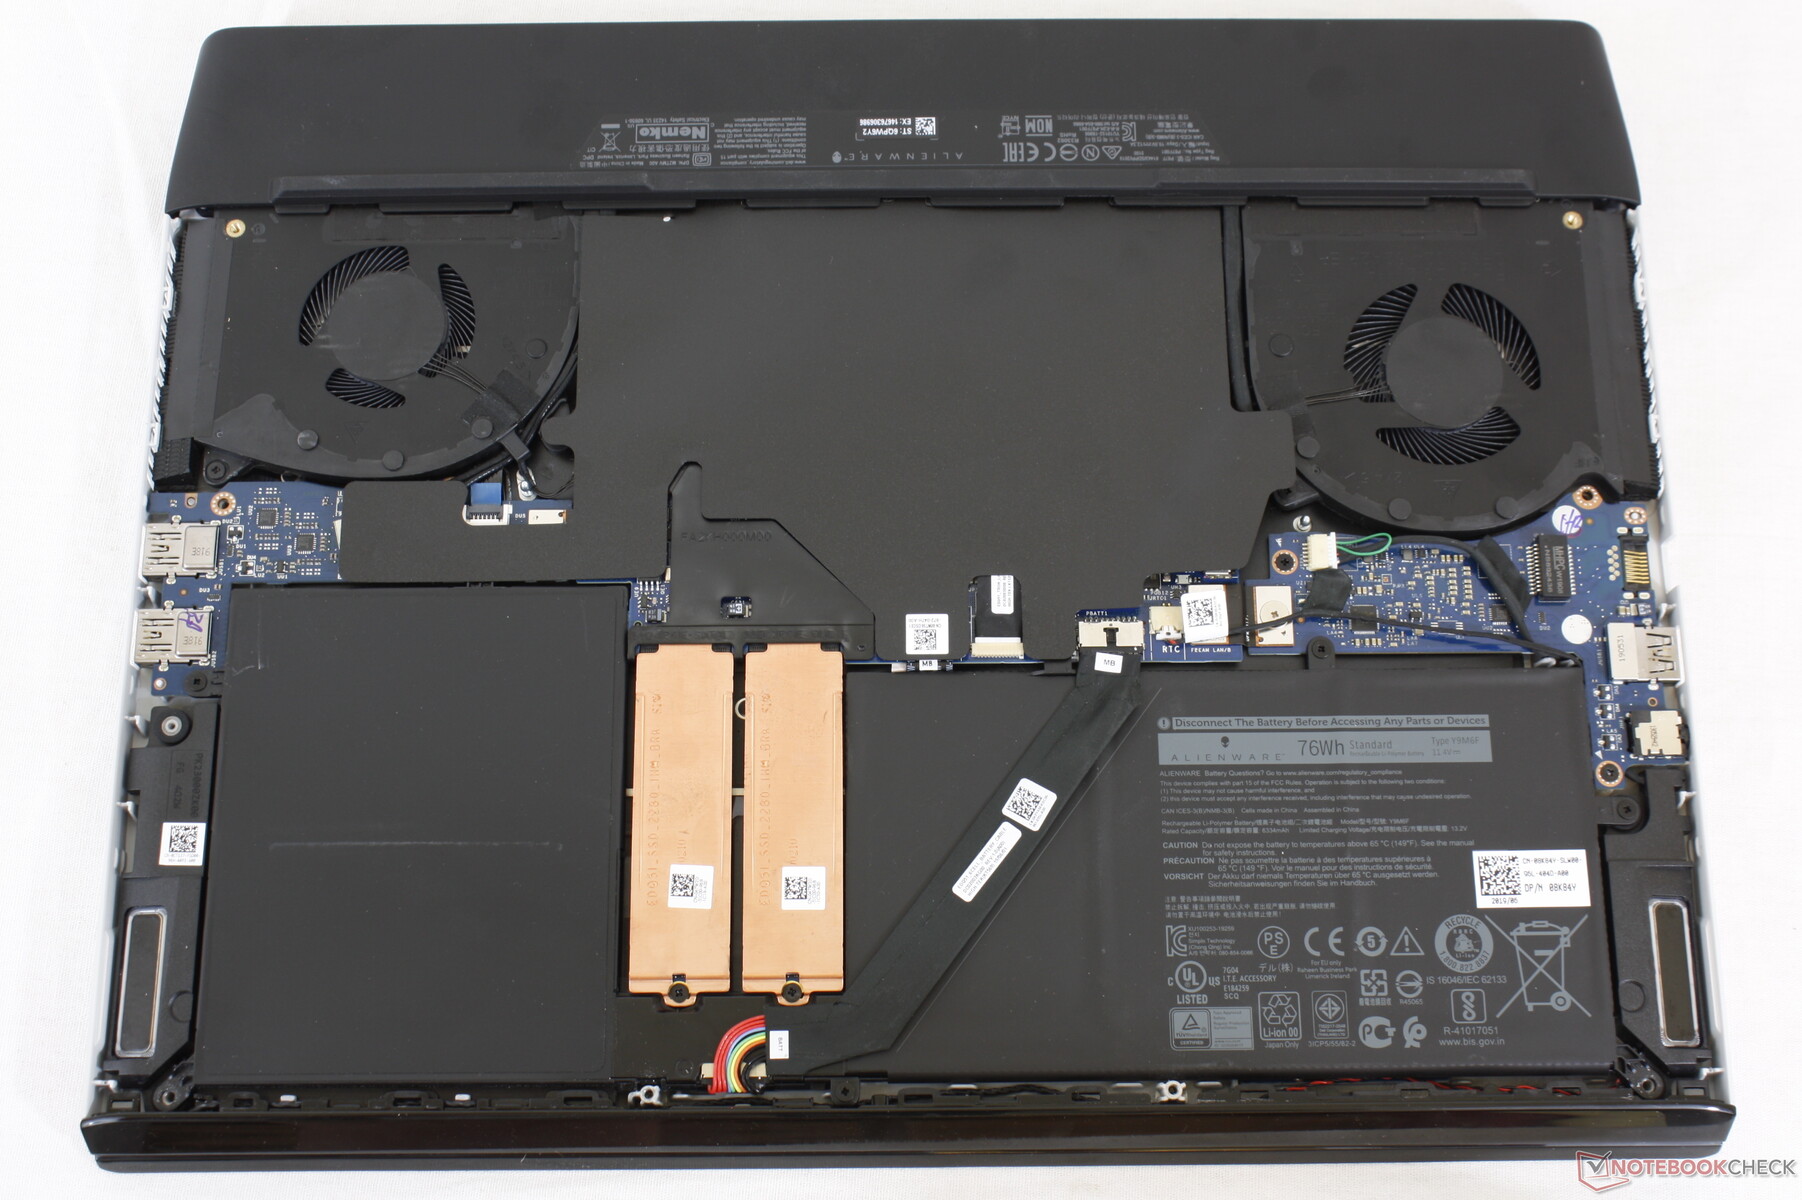
Servicing is easy and it requires only a Philips screwdriver. Unfortunately, you won't have much to actually service once inside. Core components like RAM and WLAN are soldered and there is no 2.5-inch SATA III bay to be found.
Software
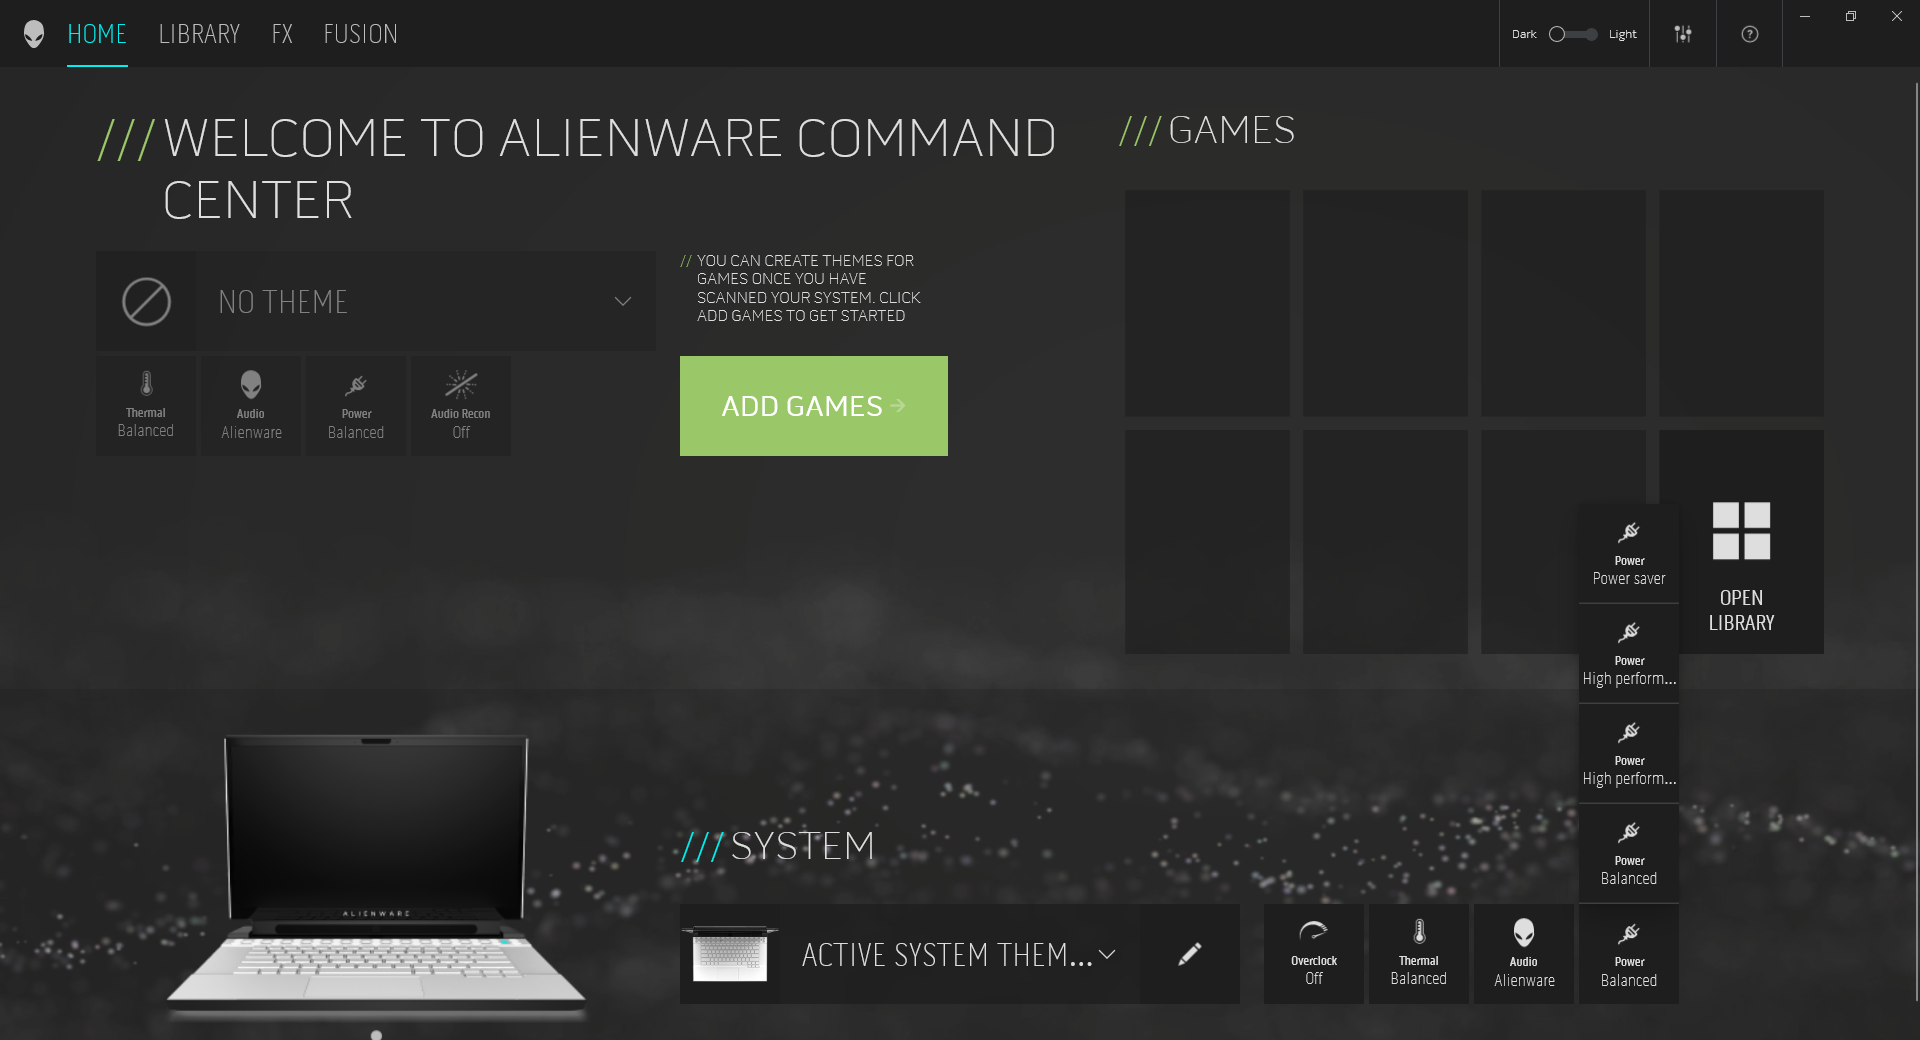
Expect the same Alienware Command Center software and features as found on the Area-51m including GPU overclocking, Alien FX, and Fusion system monitor. The problem here is that the m15 R2 chassis was not designed with the same overclocking potential as its larger Area-51m sibling and so this particular feature is not as useful here.
We recommend becoming familiar with Command Center because the performance, RGB lighting, and fan noise of the laptop are intimately tied to Dell's software instead of the default Windows power settings menu. While there's a slight learning curve, we appreciate that its system monitor feature provides real-time data like voltage, DRAM timings, temperature graphs, and fan RPMs.
Accessories and Warranty
There are no included extras in the box other than the usual Quick Start guide and warranty card. The proprietary Alienware External Graphics Amplifier remains compatible.
Along with HP and Lenovo, Dell offers a wider range of warranty options than other OEMs. The standard one-year limited protection applies with extensions of up to 5 years total.
Input Devices
Keyboard
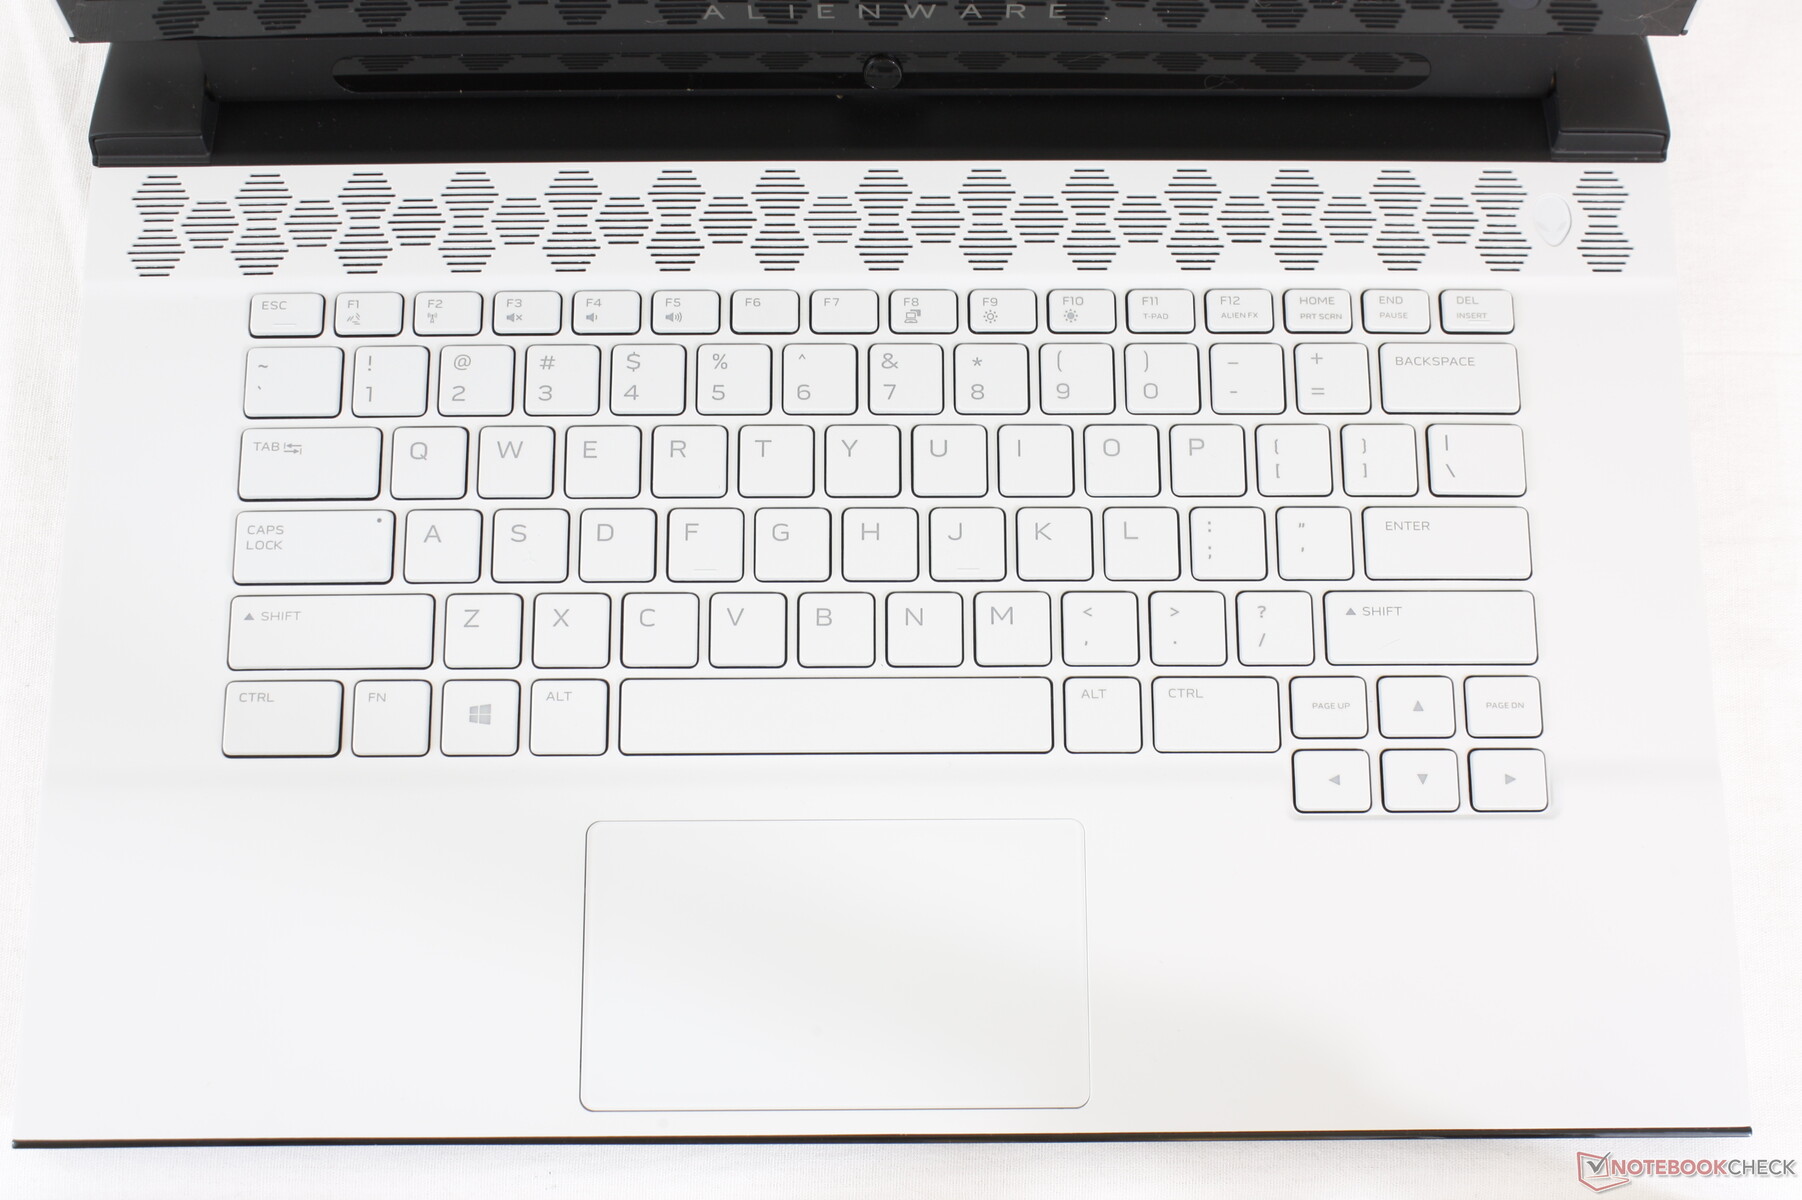
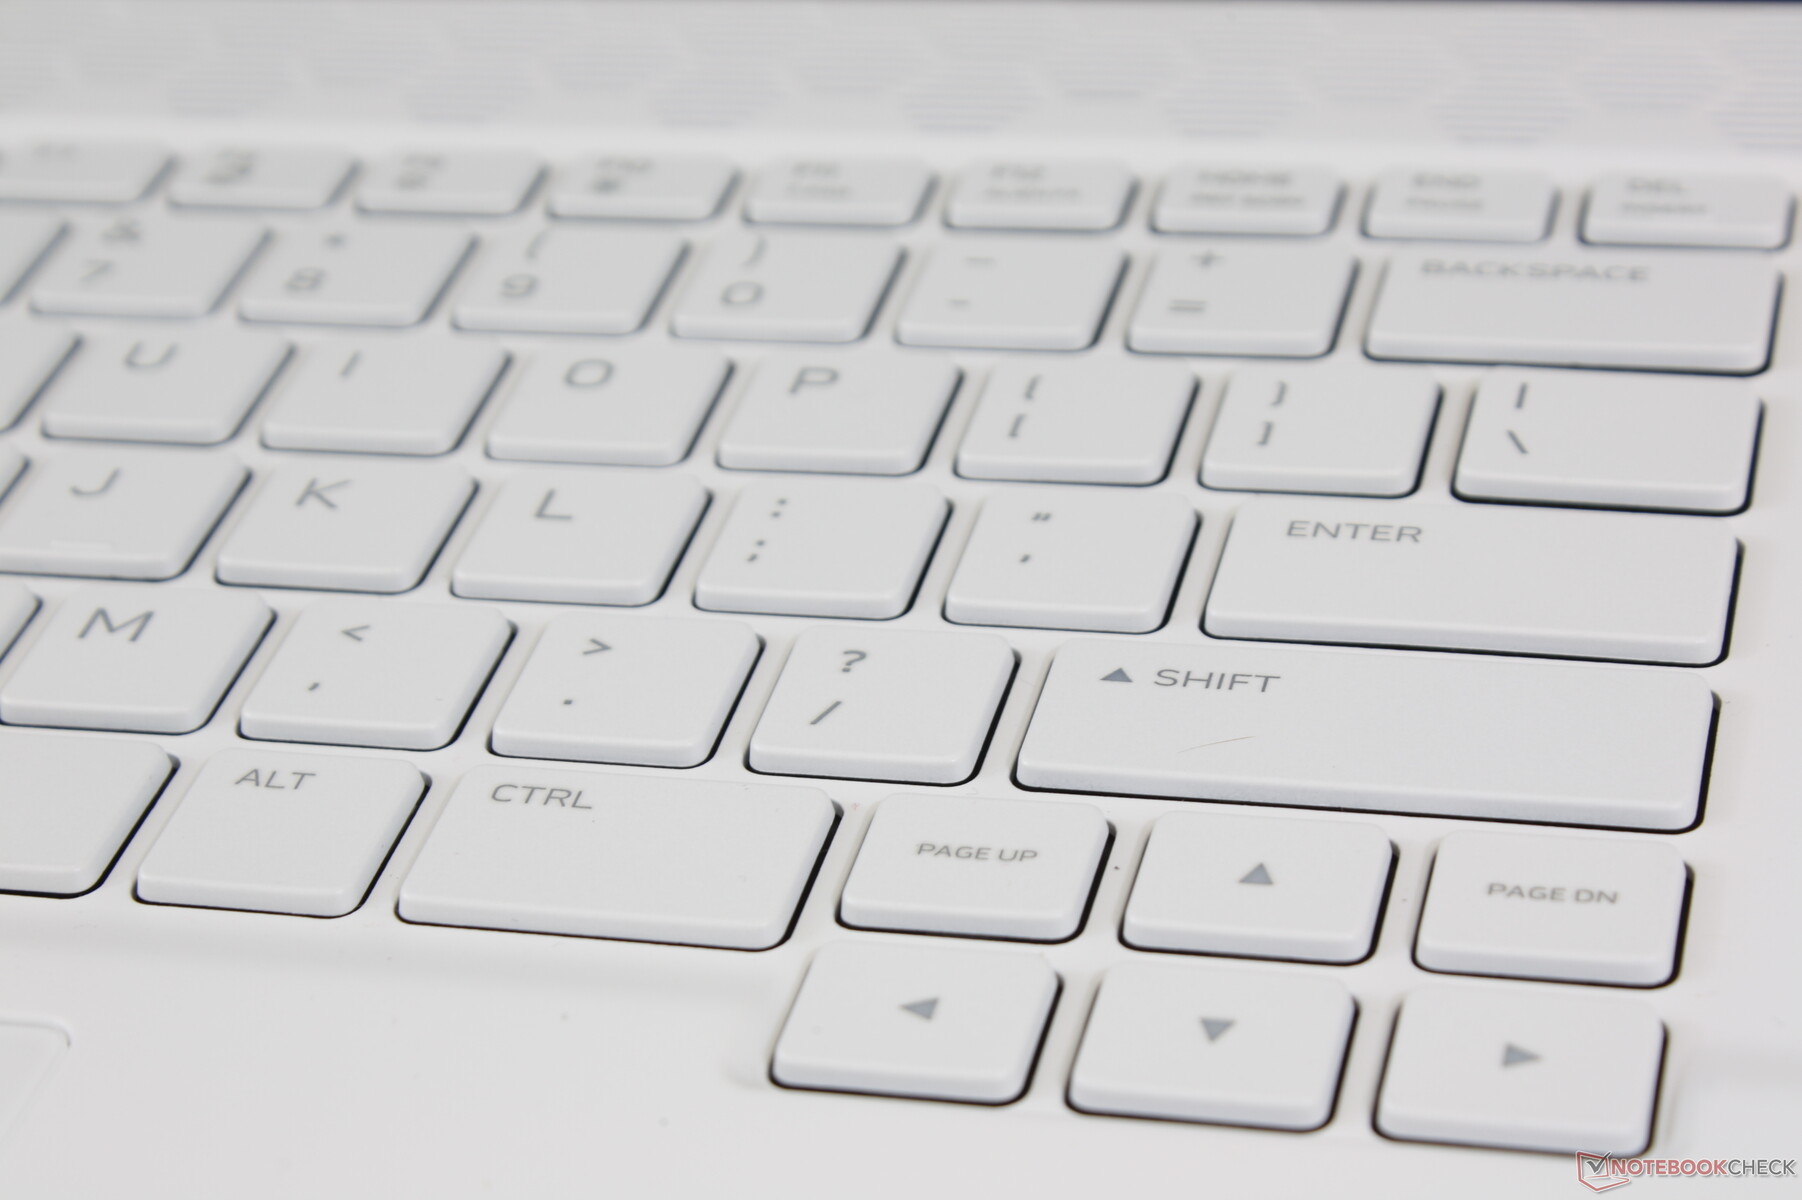
We complained about the shallow 1.4 mm key travel on last year's m15 R1 and so it's great to see that the m15 R2 keyboard has deepened its keys to 1.7 mm. Feedback feels crisper and more tactile to be closer to a gaming laptop instead of a super-thin Ultrabook.
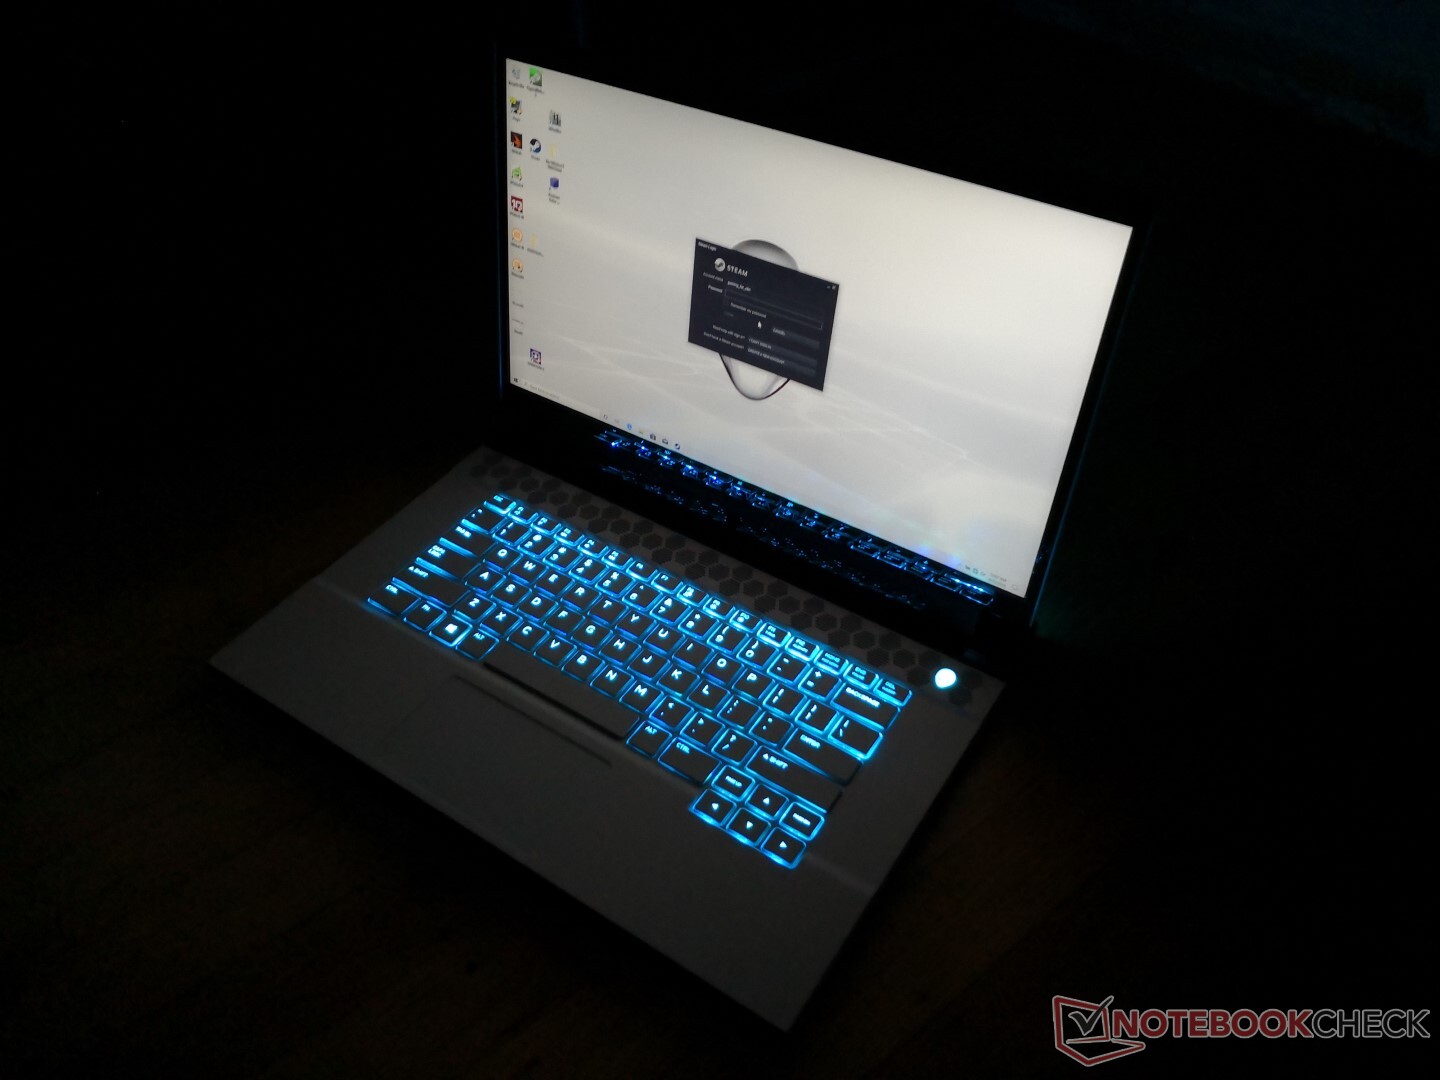
As for the layout, Dell has completely removed the integrated NumPad from the m15 R1 meaning that you'll have to get the larger 17.3-inch m17 R2 if you still want this specific feature. The m15 R2 gains per-key RGB lighting that was missing on last year's model in return. Annoyingly, there are still no preset hotkeys for adjusting the brightness of the keyboard backlight; any adjustments must be done via the Command Center window for a more cumbersome experience.
Touchpad
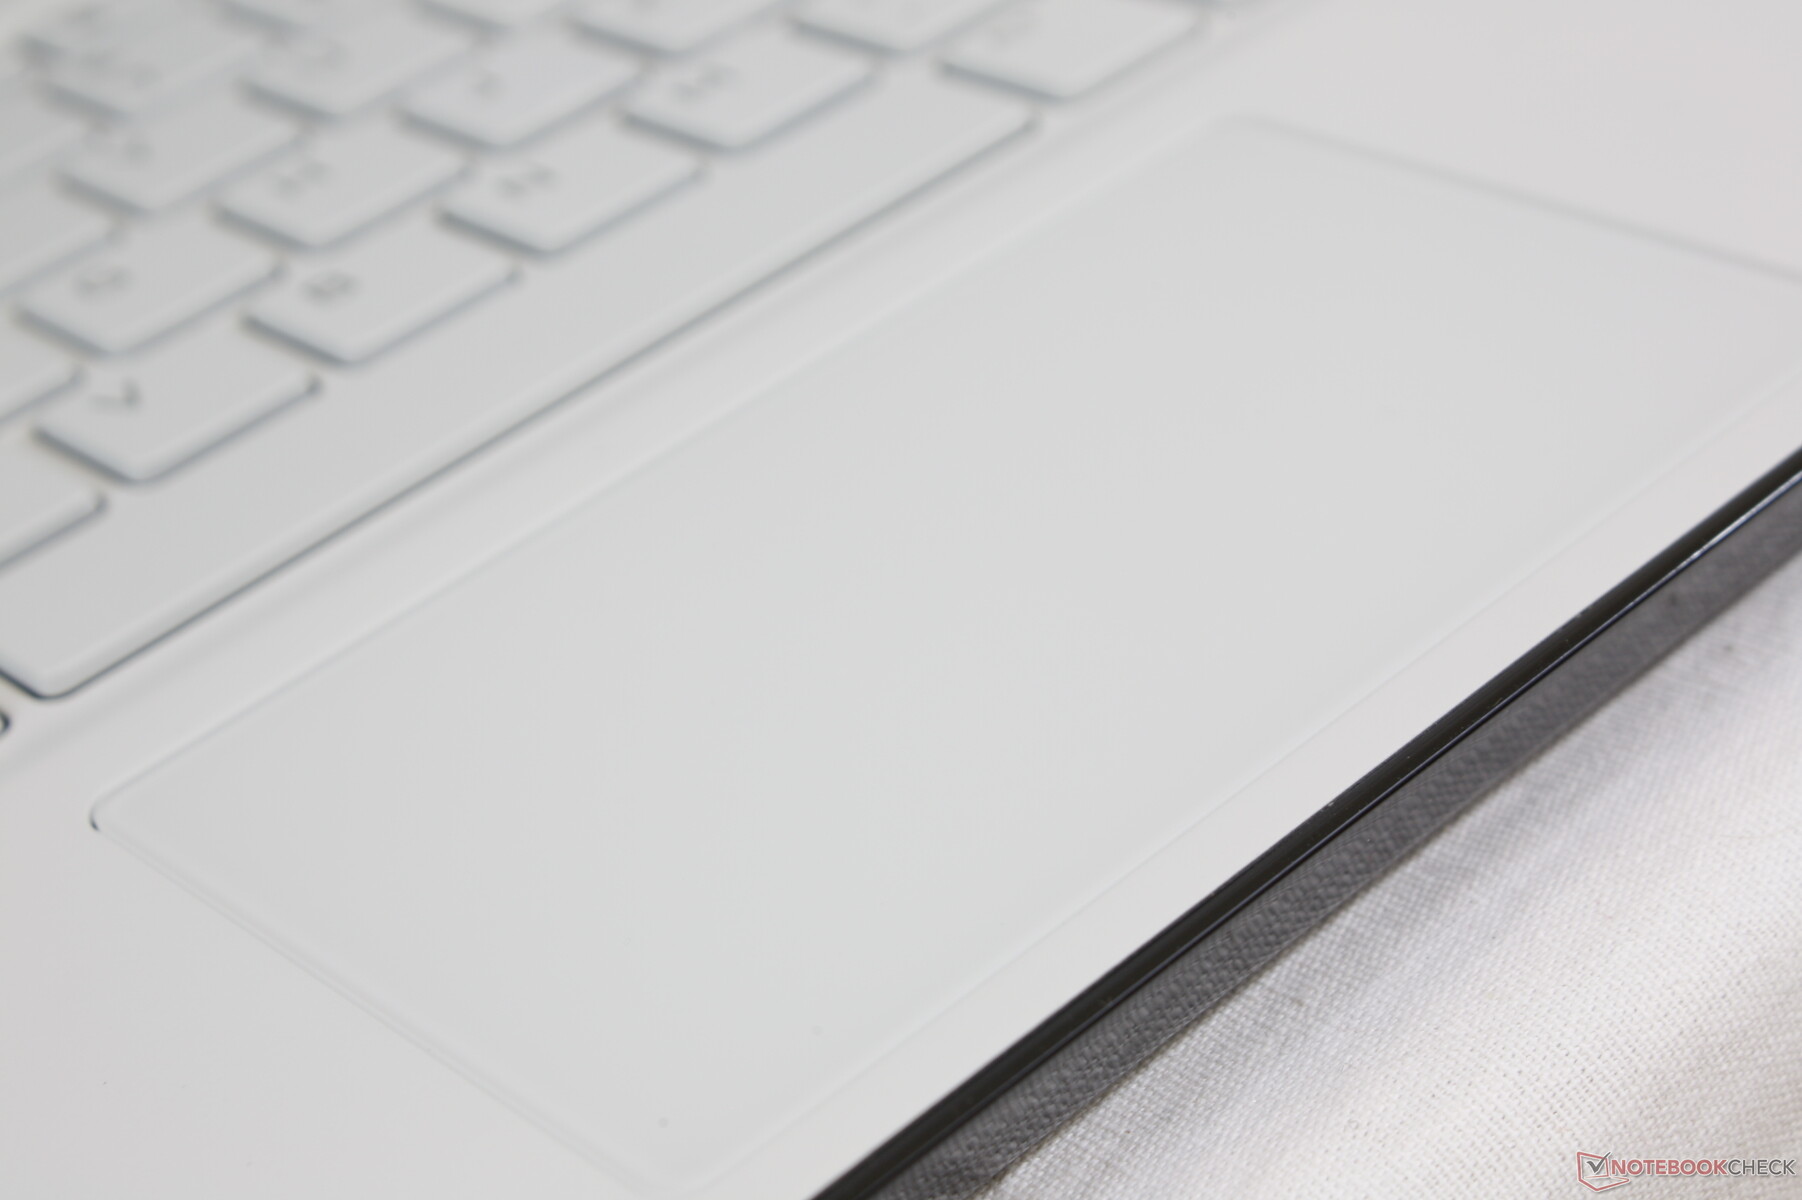
The clickpad is smaller (~10.5 x 6 cm) than on both the XPS 15 (10.5 x 8.5 cm) and original Alienware m15 R1 (10.5 x 6.5 cm). Cursor control is otherwise reliable with no jitter. There is slight sticking when moving at slow speeds, but it's not enough to impact usability. The very high refresh rate of the display gives a sense of faster responsiveness than usual.
Meanwhile, the integrated clickpad keys feel firmer than the last generation model with a louder click when pressed. We find it to be better than the integrated keys of the XPS 15 even though we still prefer dedicated mouse buttons like on the Dell Latitude 7390 for better accuracy.

Display
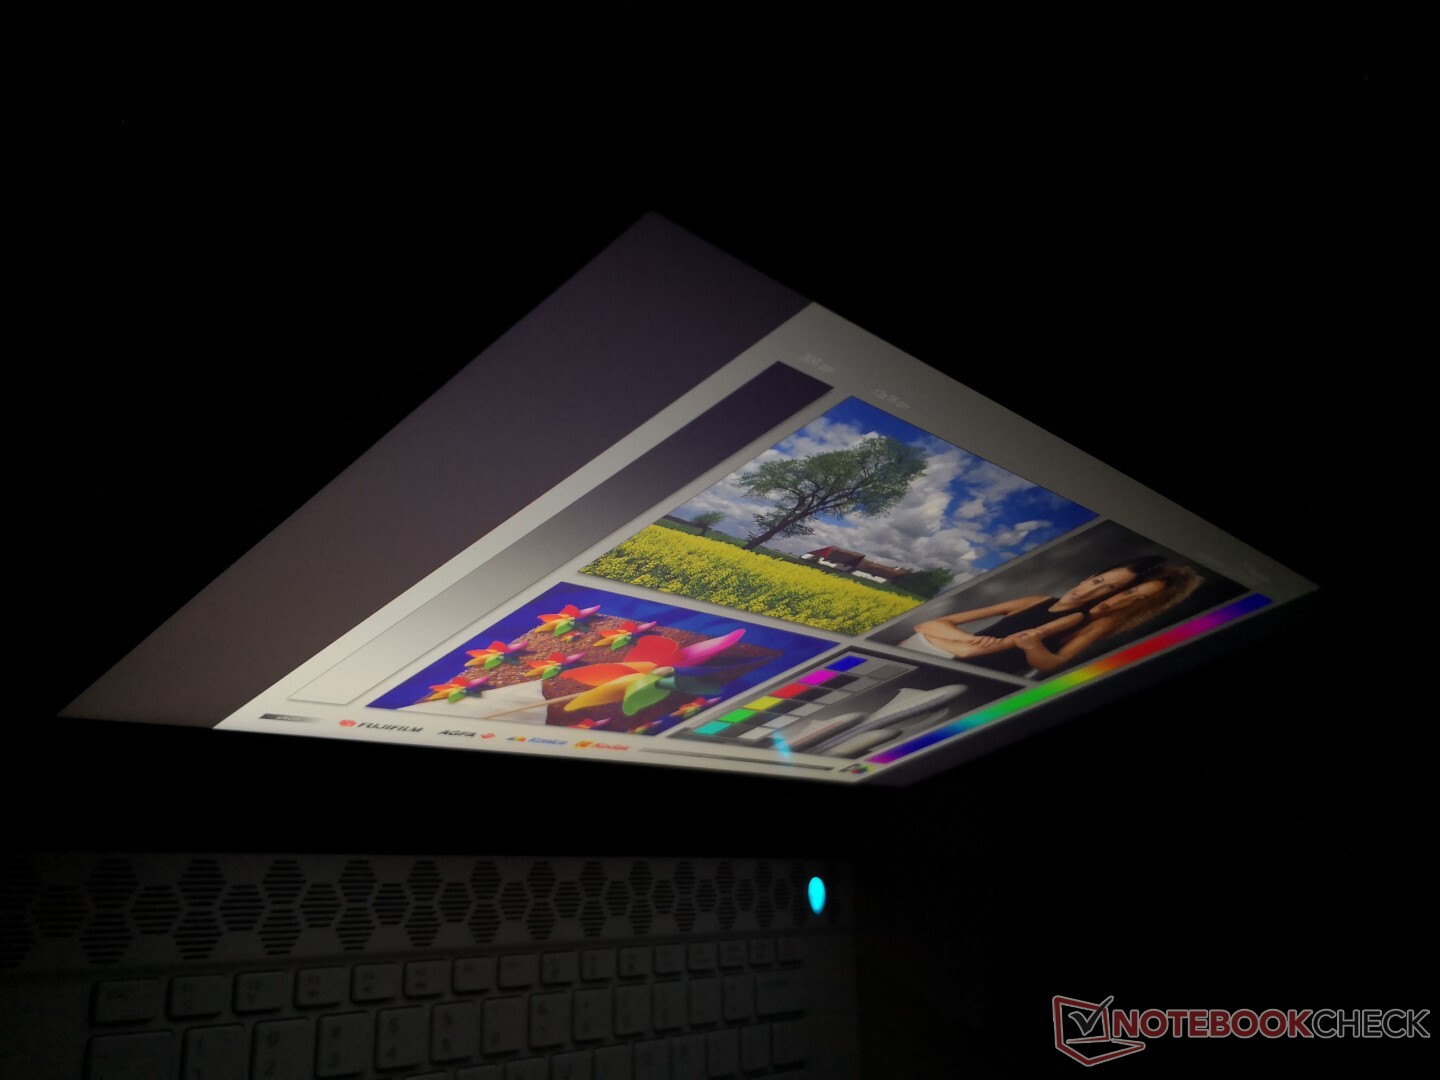
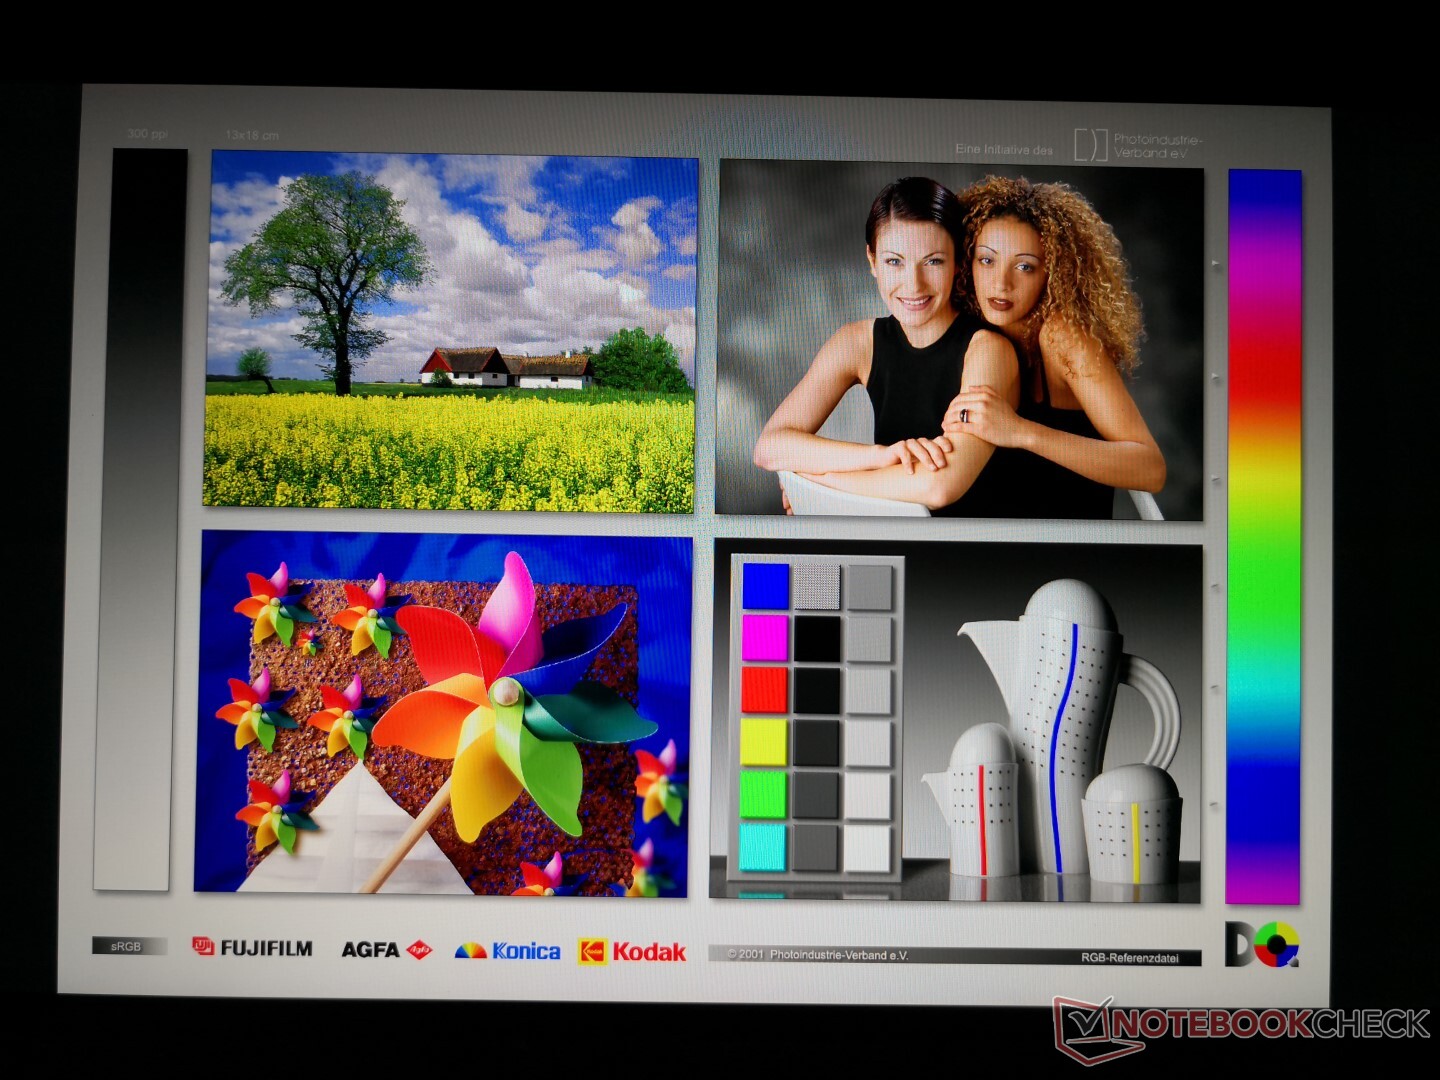
Both the Alienware m15 R2 and Razer Blade 15 share similar high quality 240 Hz Sharp LQ156M1 IPS panels. Therefore, characteristics like the respectable contrast ratio, fast response times, and wide color gamut are similar between them. It's tough to go back to 60 Hz displays once you get used to 144/240 Hz panels because of the ultra-smooth responsiveness that 60 Hz panels could never offer. Users who want 4K UHD OLED instead will find the exact same Samsung 156WR04 panel and visual experience as on the Alienware m15 R1.
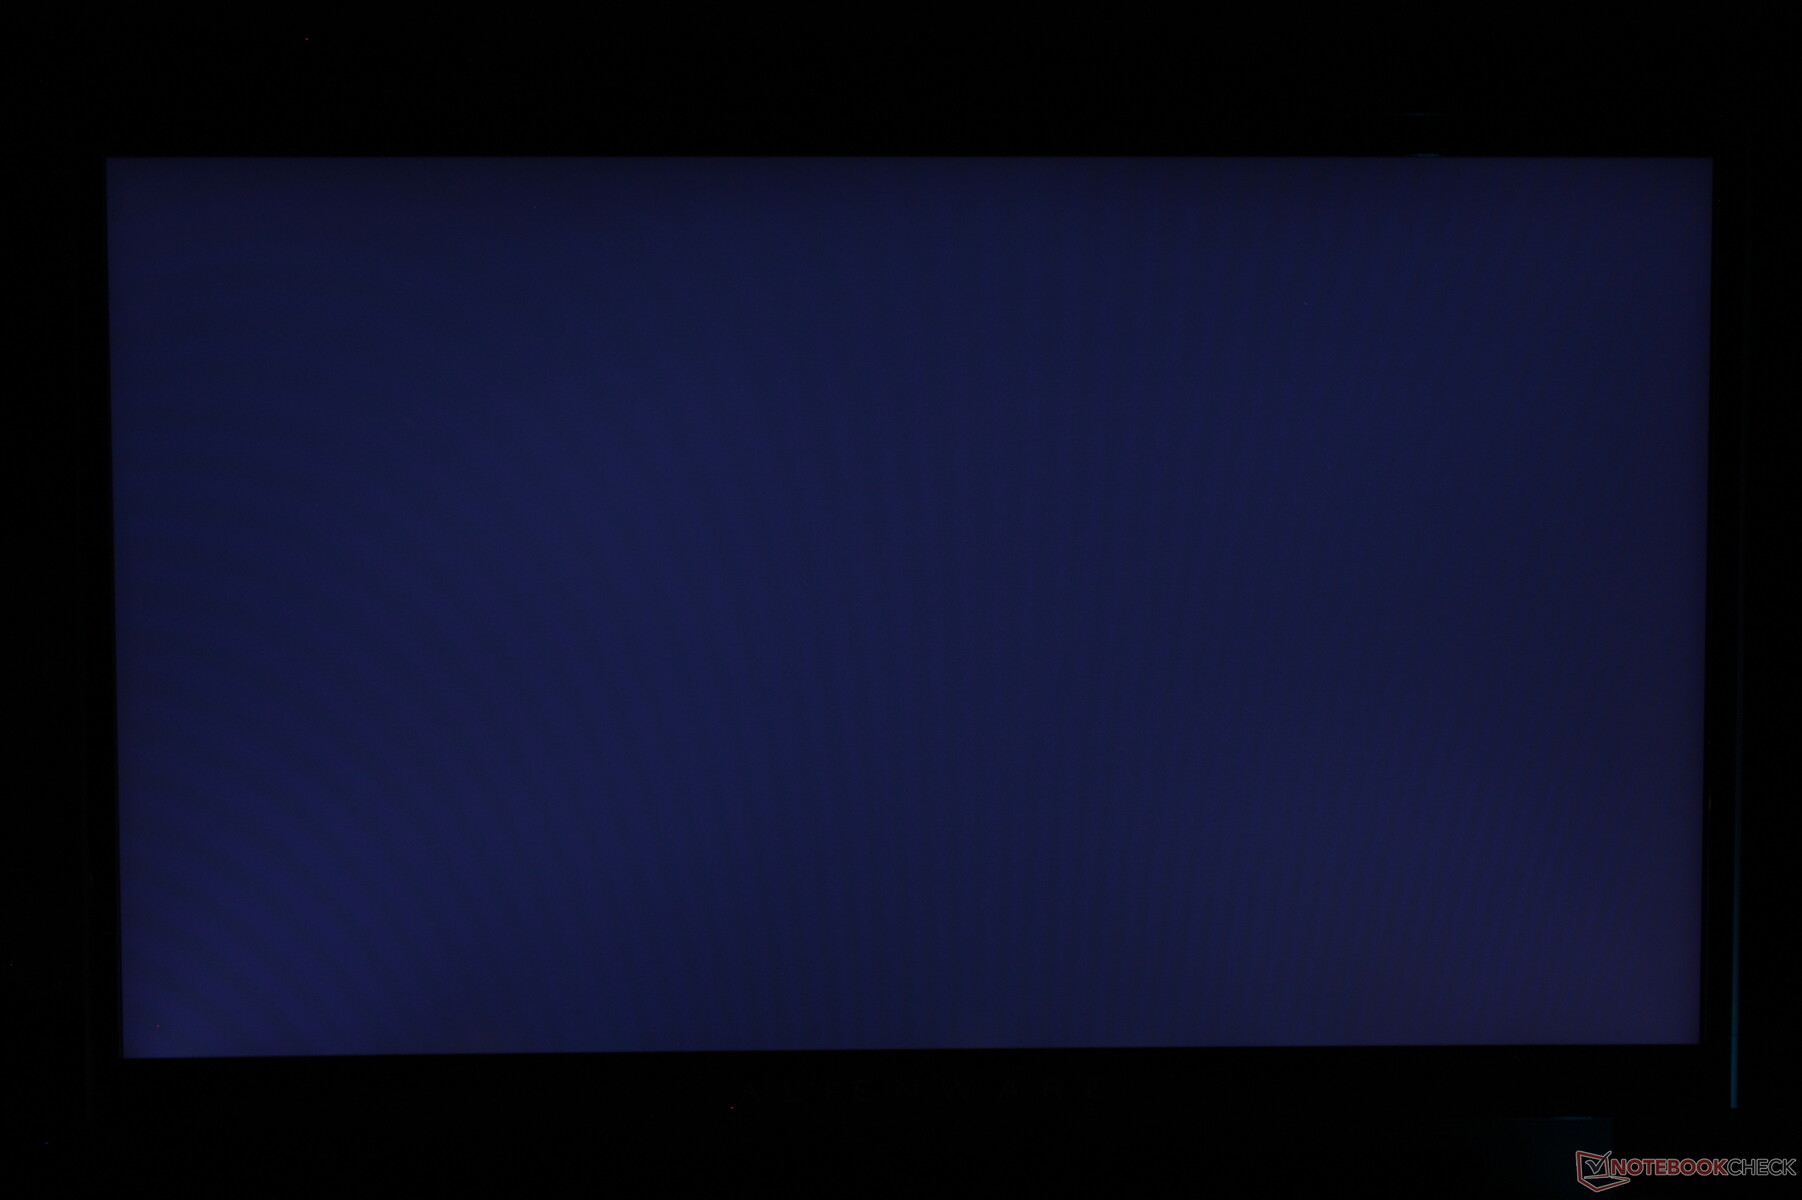
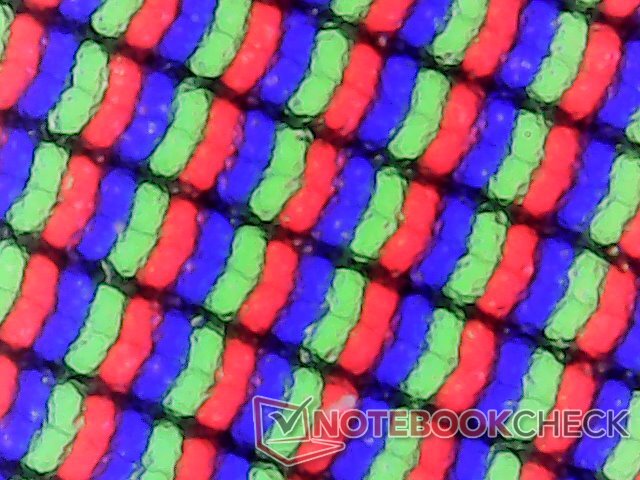
The matte panel exhibits only minimal graininess to be nearly as crisp as a glossy panel. Uneven backlight bleeding is also minimal on our particular unit. Users with the base 60 Hz display SKU of the Alienware will likely have different results than we've recorded on our 240 Hz SKU.
| |||||||||||||||||||||||||
Brightness Distribution: 90 %
Center on Battery: 324.2 cd/m²
Contrast: 853:1 (Black: 0.38 cd/m²)
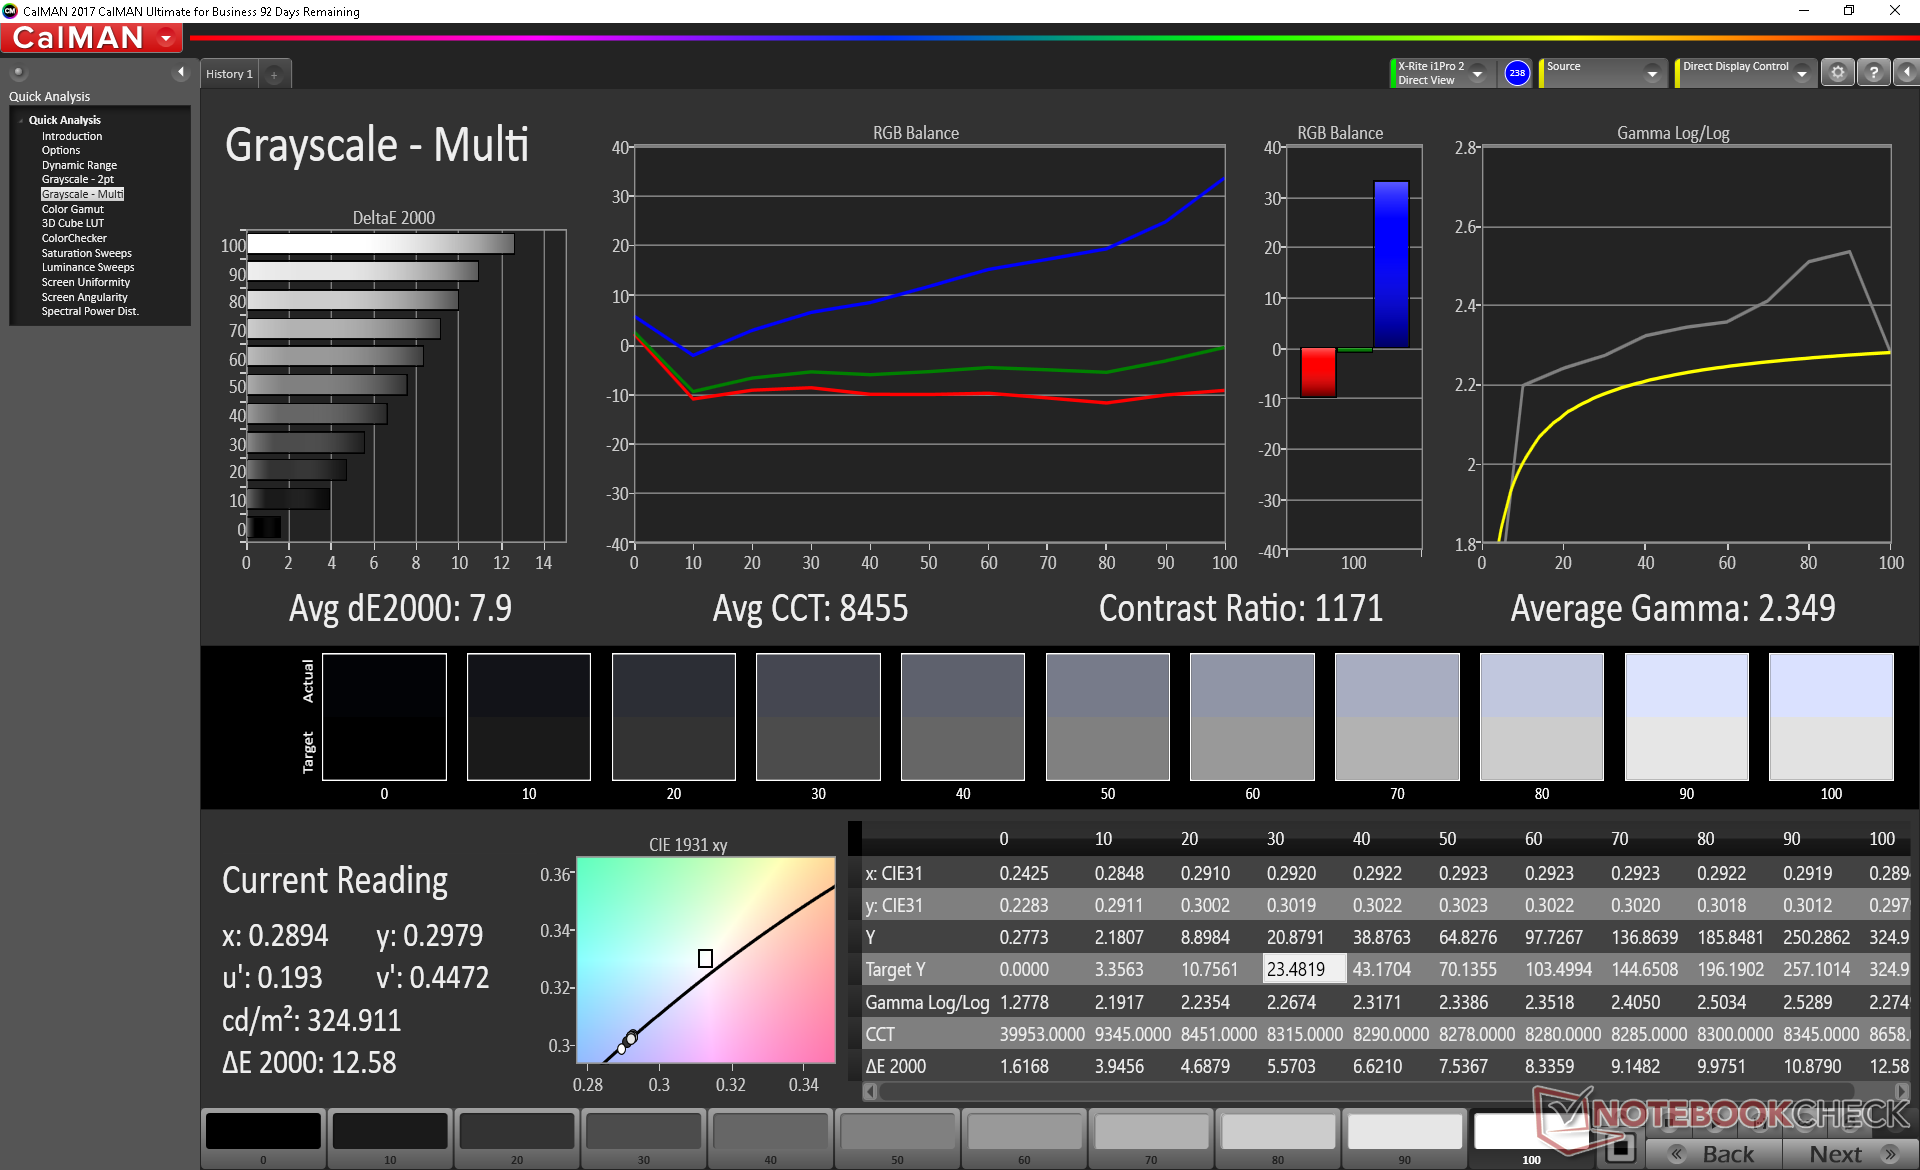
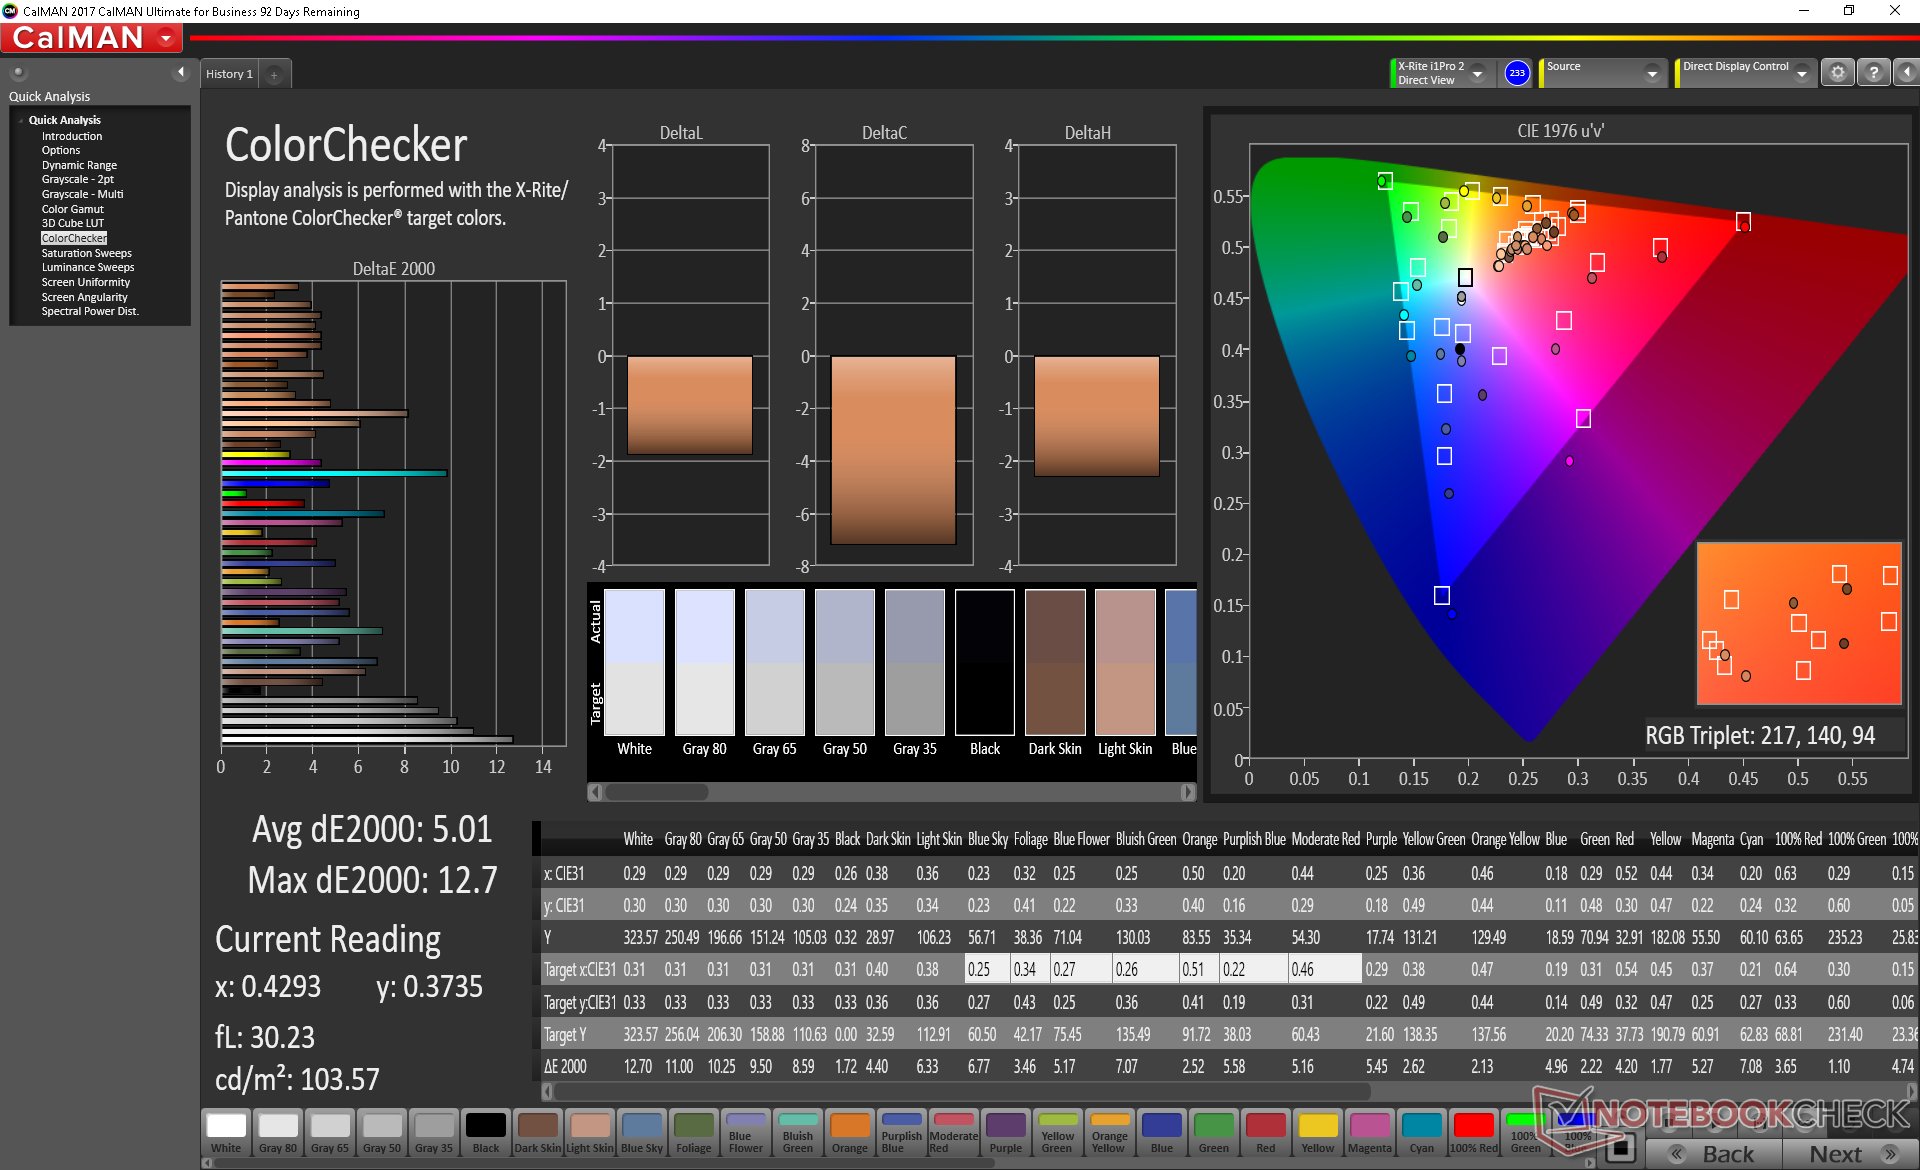
ΔE ColorChecker Calman: 5.01 | ∀{0.5-29.43 Ø4.73}
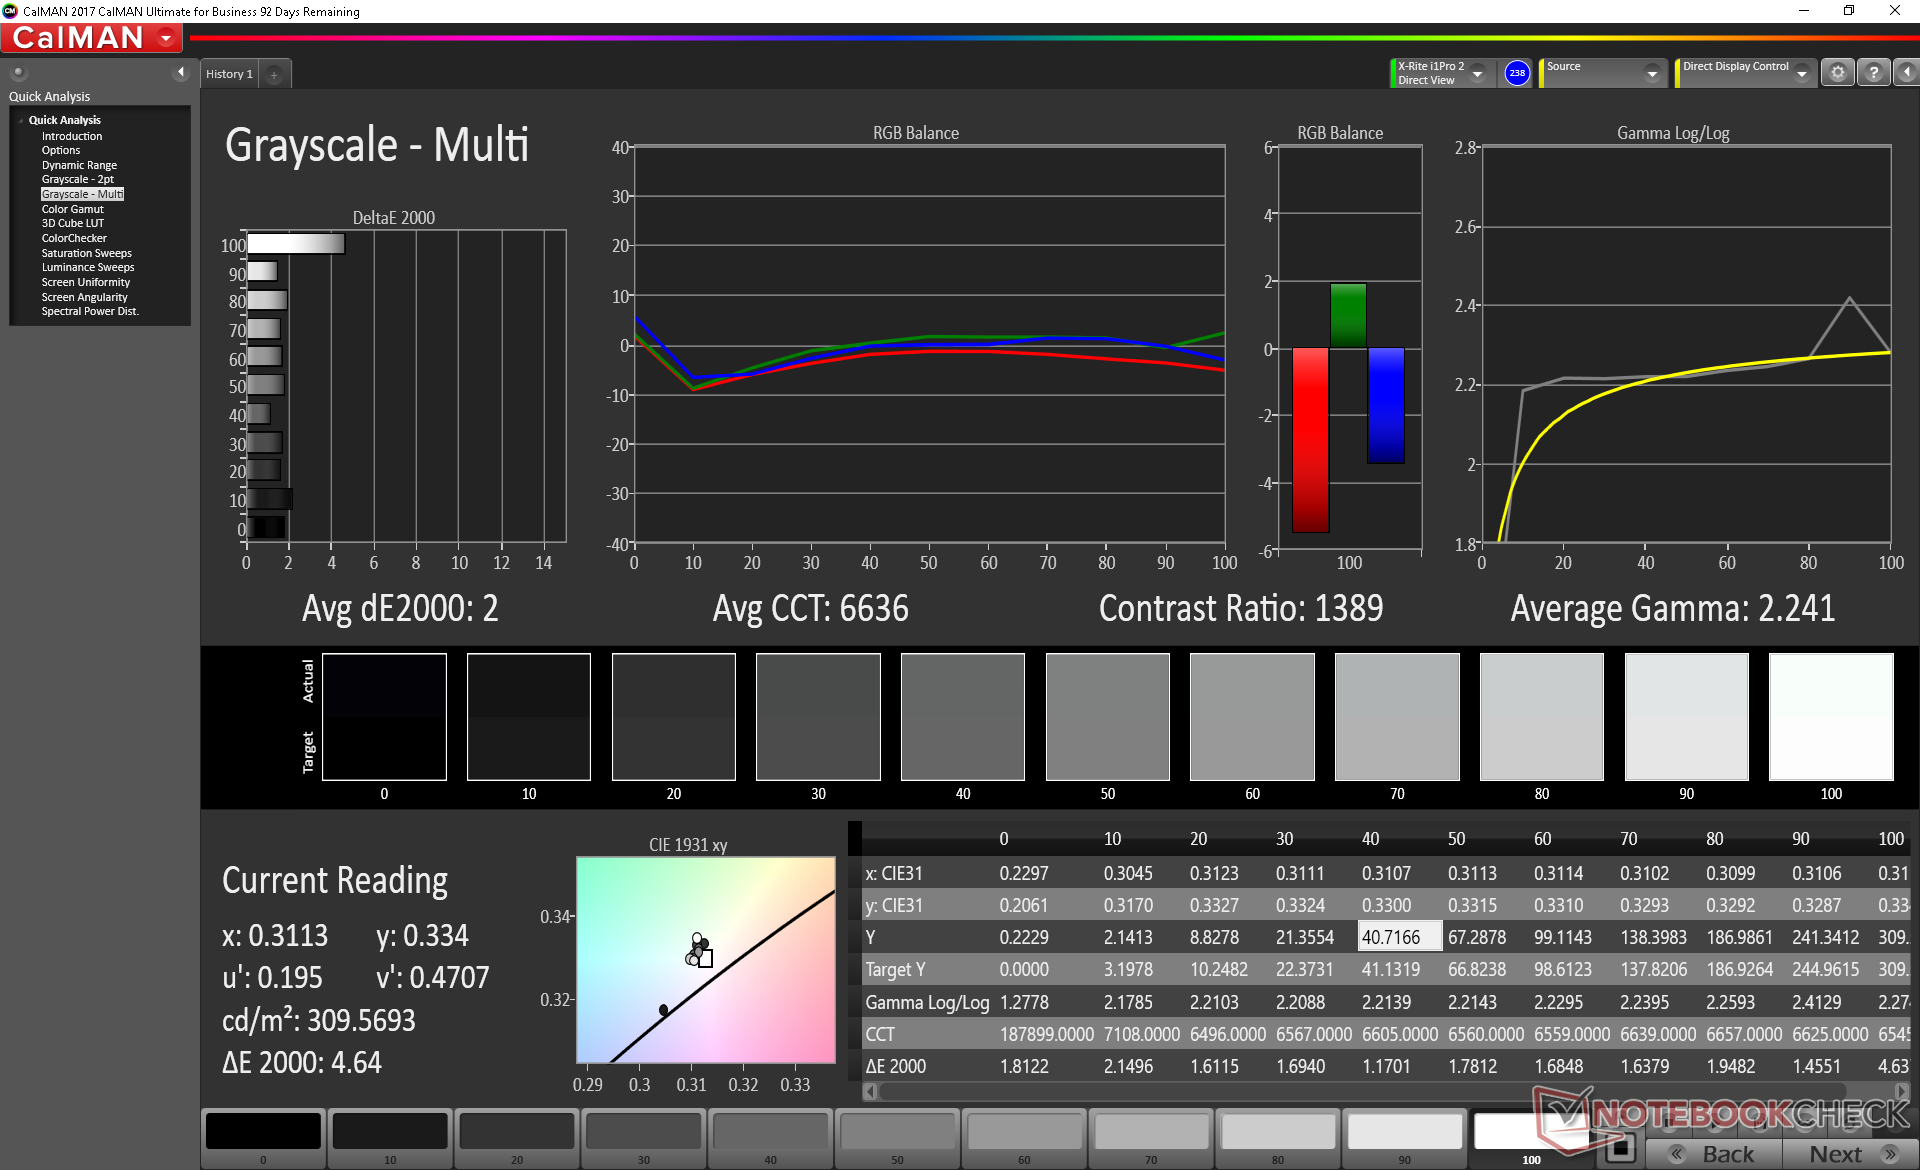
calibrated: 1.64
ΔE Greyscale Calman: 7.9 | ∀{0.09-98 Ø4.97}
95.5% sRGB (Argyll 1.6.3 3D)
60.8% AdobeRGB 1998 (Argyll 1.6.3 3D)
65.9% AdobeRGB 1998 (Argyll 3D)
95.1% sRGB (Argyll 3D)
65.3% Display P3 (Argyll 3D)
Gamma: 2.35
CCT: 8455 K
| Alienware m15 R2 P87F Sharp LQ156M1, IPS, 15.6", 1920x1080 | Razer Blade 15 RTX 2080 Max-Q Sharp LQ156M1JW03 (SHP14C5), IPS, 15.6", 1920x1080 | Asus Zephyrus S GX531GX AU Optronics B156HAN08.2, IPS, 15.6", 1920x1080 | MSI GS65 Stealth 9SG Sharp LQ156M1JW03 (SHP14C5), IPS, 15.6", 1920x1080 | Lenovo Legion Y740-15ICHg LP156WFG-SPB2, IPS, 15.6", 1920x1080 | Alienware m15 GTX 1070 Max-Q AU Optronics B156HAN, IPS, 15.6", 1920x1080 | |
|---|---|---|---|---|---|---|
| Display | 3% | -0% | 4% | -3% | -4% | |
| Display P3 Coverage (%) | 65.3 | 66.9 2% | 65.6 0% | 67.6 4% | 63.5 -3% | 63.5 -3% |
| sRGB Coverage (%) | 95.1 | 98.1 3% | 92.2 -3% | 97.5 3% | 92.4 -3% | 89.4 -6% |
| AdobeRGB 1998 Coverage (%) | 65.9 | 68.5 4% | 66.9 2% | 68.9 5% | 64.7 -2% | 64.5 -2% |
| Response Times | 2% | 24% | -10% | -33% | -23% | |
| Response Time Grey 50% / Grey 80% * (ms) | 16.4 ? | 12.8 ? 22% | 7 ? 57% | 13.6 ? 17% | 18.8 ? -15% | 18 ? -10% |
| Response Time Black / White * (ms) | 8.8 ? | 10.4 ? -18% | 9.6 ? -9% | 12 ? -36% | 13.2 ? -50% | 12 ? -36% |
| PWM Frequency (Hz) | 23810 ? | 23810 ? | 23260 ? | |||
| Screen | 24% | 13% | 25% | 6% | 5% | |
| Brightness middle (cd/m²) | 324.2 | 293 -10% | 323.6 0% | 282.3 -13% | 320.4 -1% | 353.6 9% |
| Brightness (cd/m²) | 304 | 270 -11% | 315 4% | 269 -12% | 298 -2% | 346 14% |
| Brightness Distribution (%) | 90 | 87 -3% | 91 1% | 90 0% | 85 -6% | 86 -4% |
| Black Level * (cd/m²) | 0.38 | 0.29 24% | 0.29 24% | 0.32 16% | 0.42 -11% | 0.3 21% |
| Contrast (:1) | 853 | 1010 18% | 1116 31% | 882 3% | 763 -11% | 1179 38% |
| Colorchecker dE 2000 * | 5.01 | 1.69 66% | 3.31 34% | 1.17 77% | 3.21 36% | 4.55 9% |
| Colorchecker dE 2000 max. * | 12.7 | 3.37 73% | 5.74 55% | 3.29 74% | 5.54 56% | 7.91 38% |
| Colorchecker dE 2000 calibrated * | 1.64 | 1.24 24% | 2.73 -66% | 1.06 35% | 2.36 -44% | 3.37 -105% |
| Greyscale dE 2000 * | 7.9 | 2.3 71% | 2.9 63% | 1.3 84% | 3.6 54% | 4.1 48% |
| Gamma | 2.35 94% | 2.3 96% | 2.29 96% | 2.2 100% | 2.27 97% | 2.27 97% |
| CCT | 8455 77% | 6758 96% | 6765 96% | 6643 98% | 6503 100% | 7434 87% |
| Color Space (Percent of AdobeRGB 1998) (%) | 60.8 | 63 4% | 59.7 -2% | 63.8 5% | 59 -3% | 57.9 -5% |
| Color Space (Percent of sRGB) (%) | 95.5 | 98.5 3% | 91.8 -4% | 97.5 2% | 92 -4% | 88.9 -7% |
| Total Average (Program / Settings) | 10% /
17% | 12% /
12% | 6% /
17% | -10% /
-1% | -7% /
-0% |
* ... smaller is better
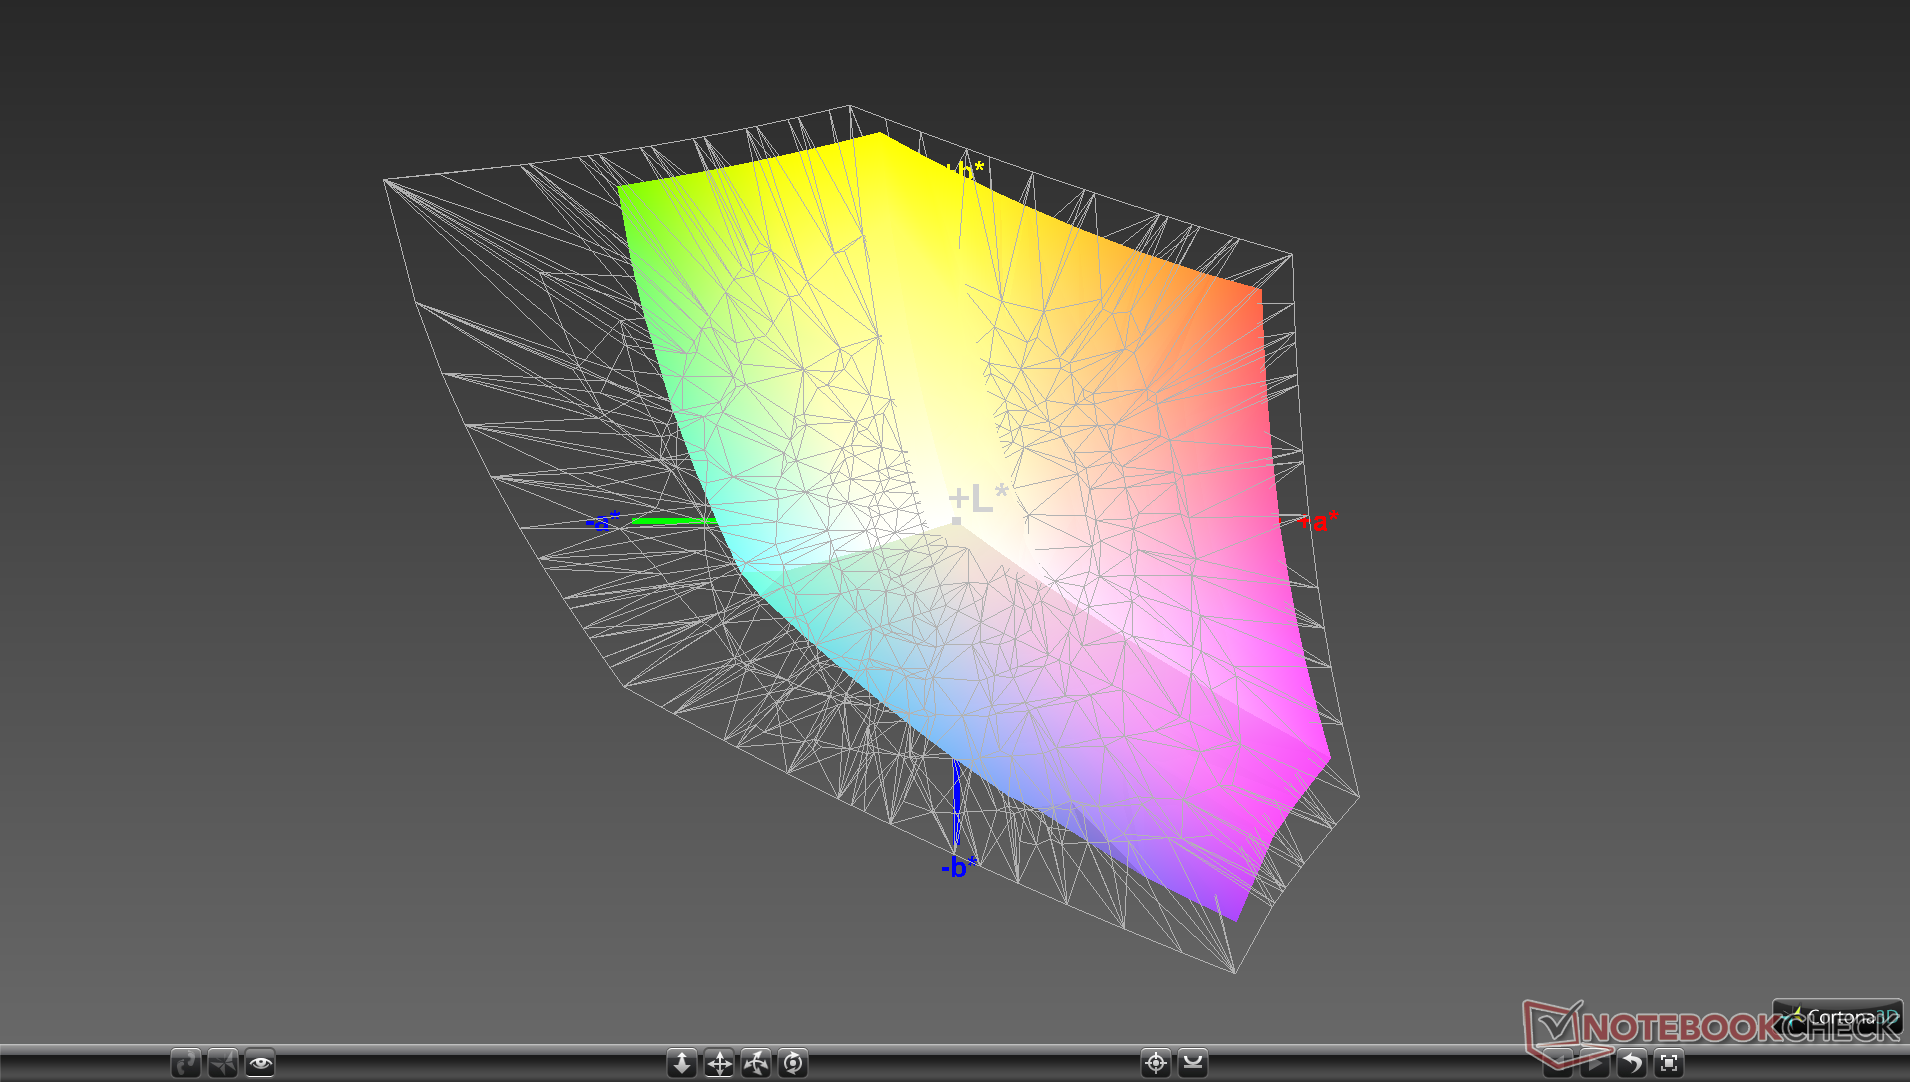
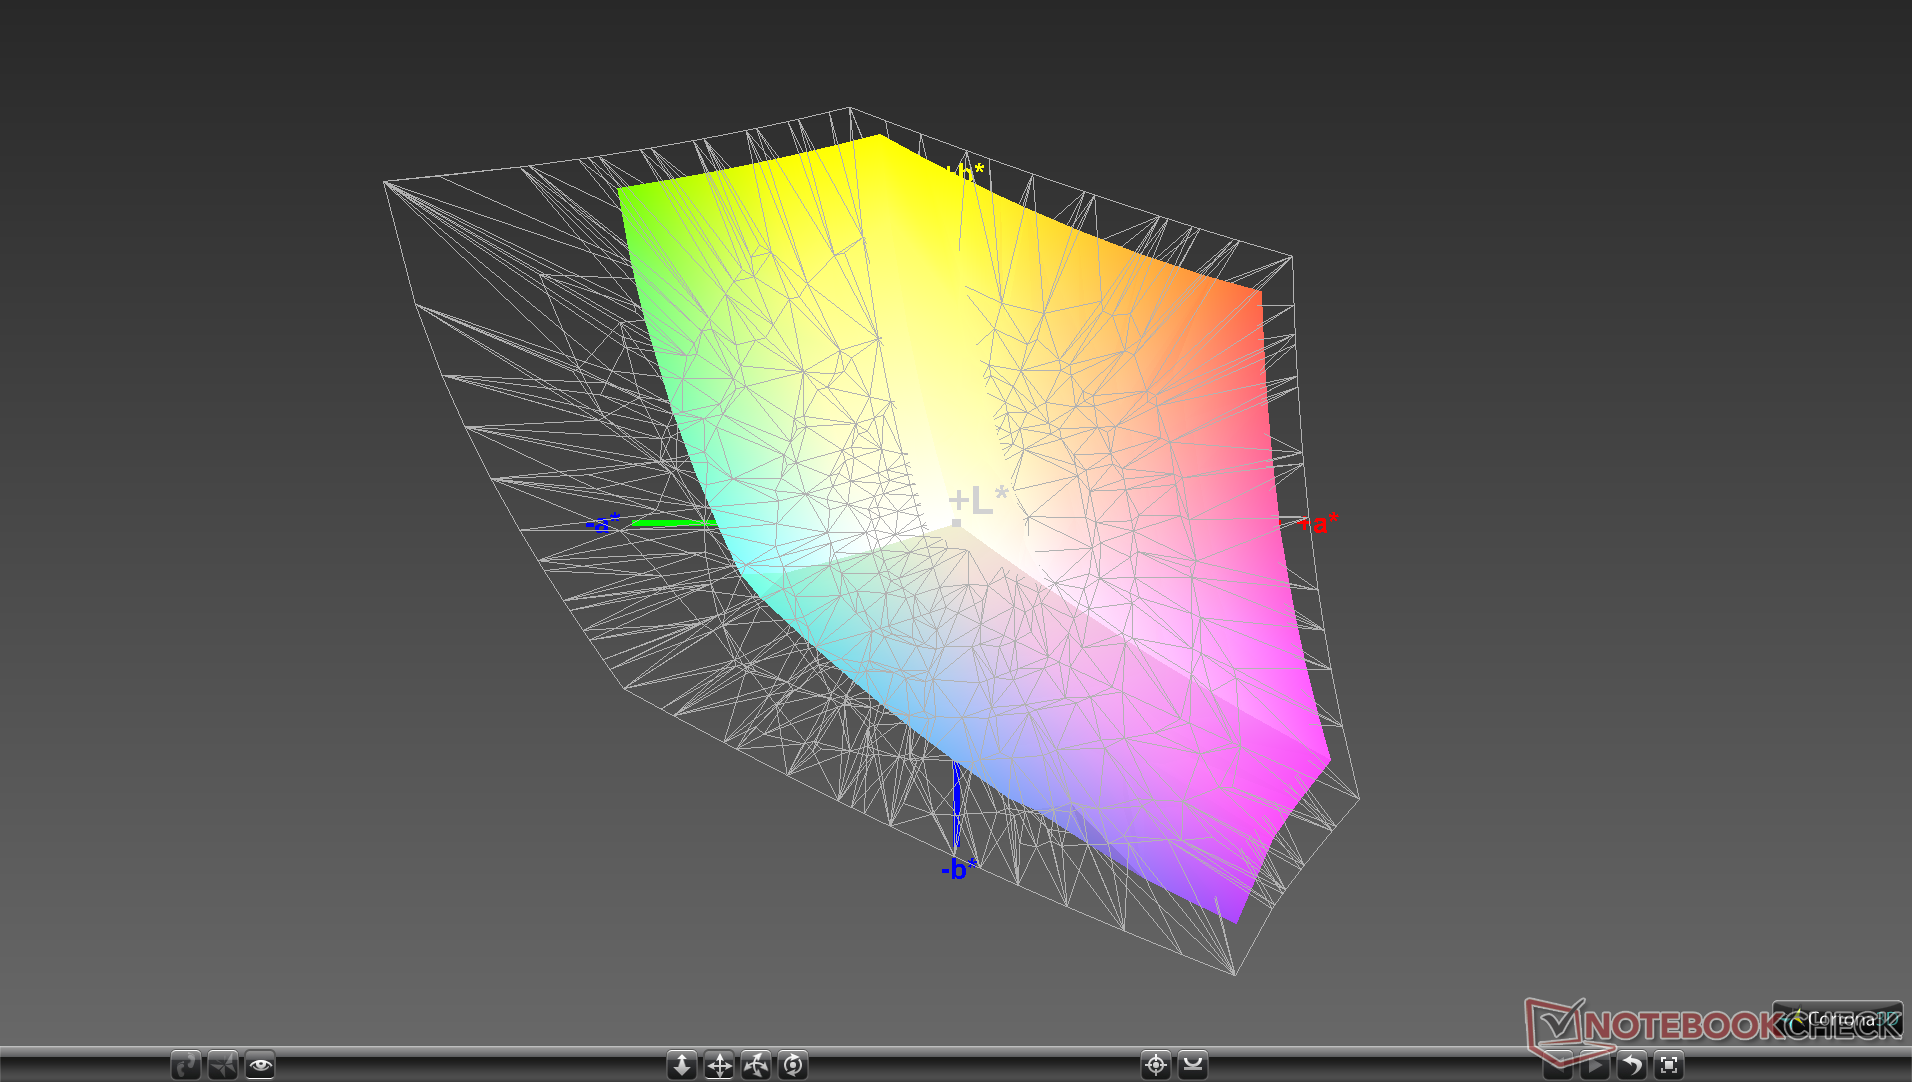
Color space covers sRGB almost in its entirety to represent a high quality panel. For these 144/240 Hz IPS panels, however, this is relatively common. Users looking for even wider colors would have to consider the 4K UHD OLED SKU or the XPS 15 with the 4K UHD Sharp IGZO option.
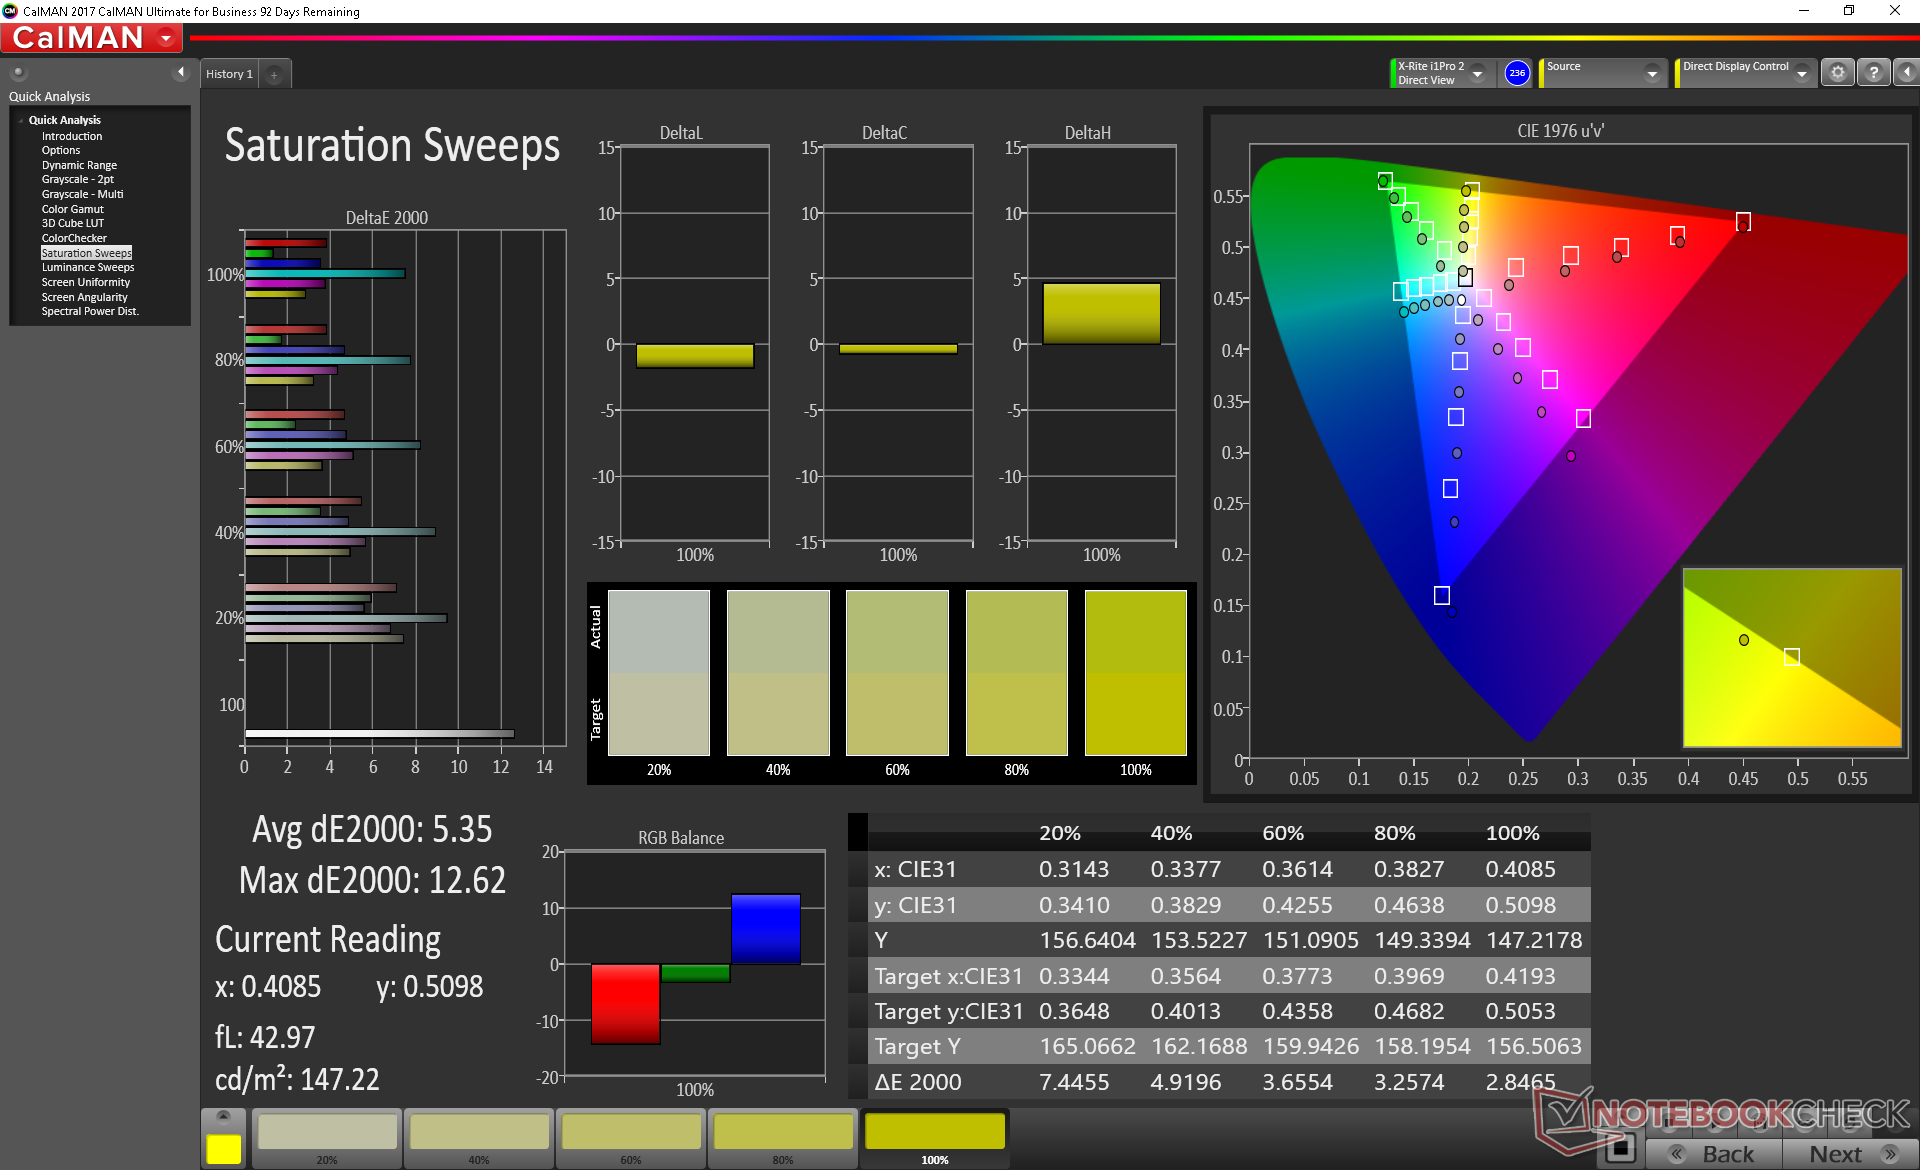
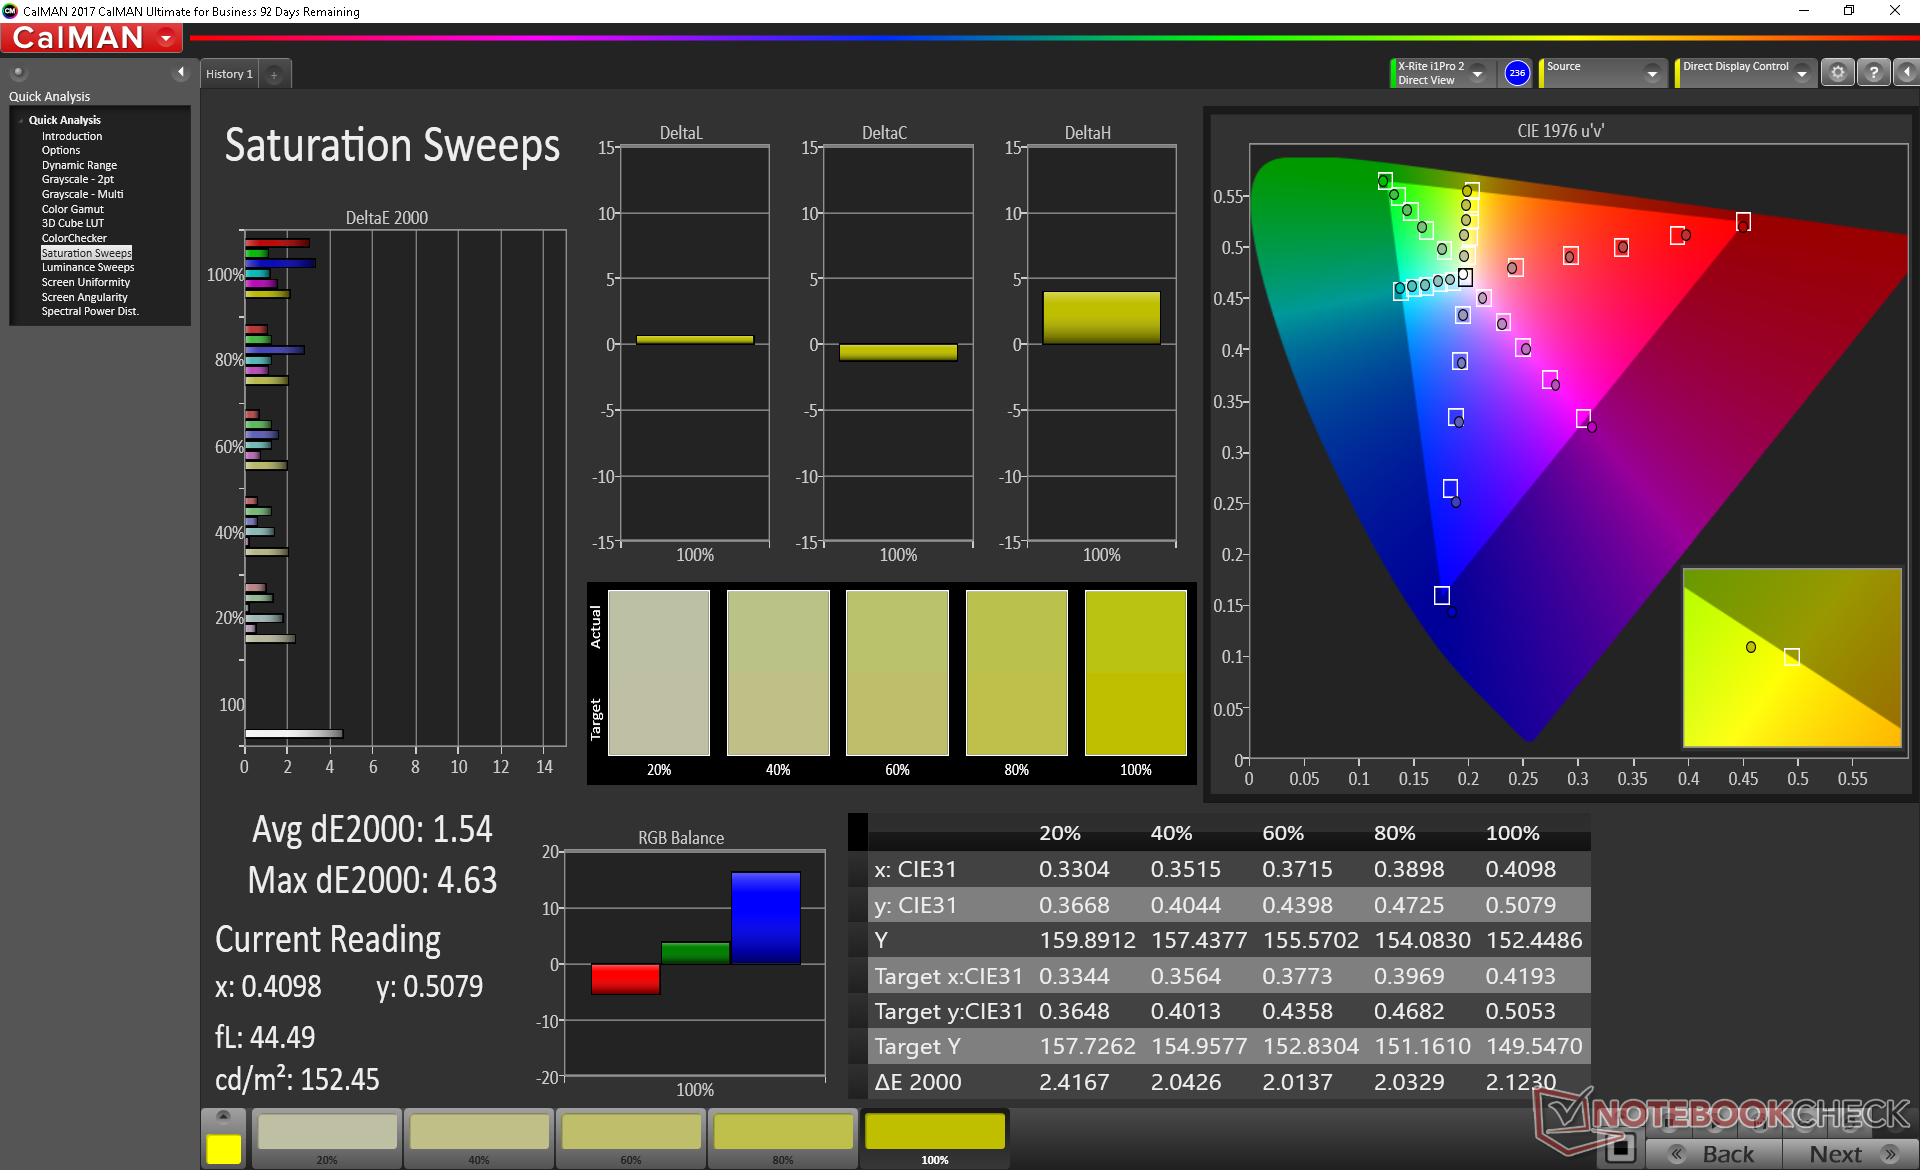
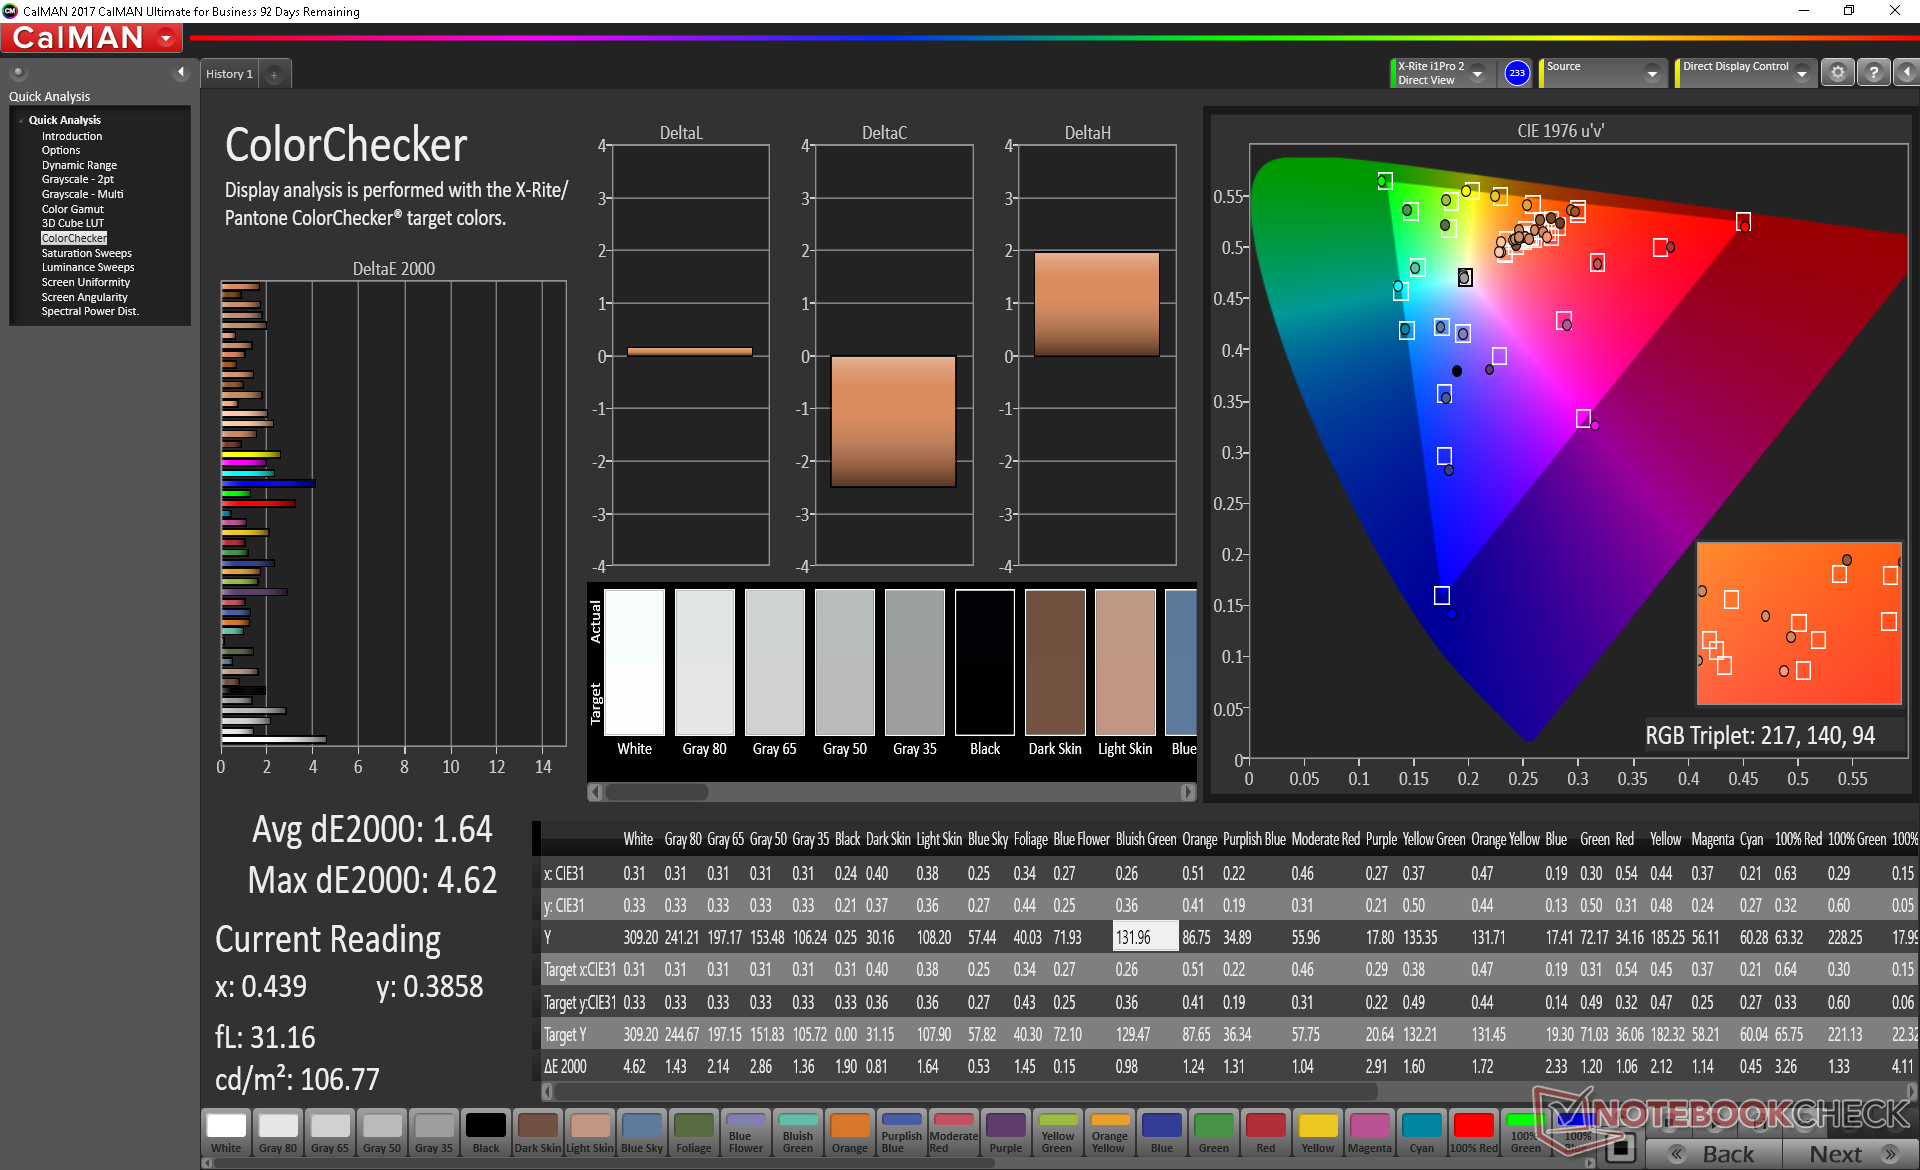
Further measurements with an X-Rite colorimeter reveal an inaccurate display out of the box. Color temperature is far too cool and so both grayscale and color saturation DeltaE values are high at 7.90 and 5.35, respectively. Our calibration attempt directly addresses these issues for a significantly more accurate display with final grayscale and color saturation DeltaE values of just 2 and 1.54, respectively. We recommend users to download and apply our ICC profile above or calibrate the display firsthand in order to get the most out of the IPS screen.
Display Response Times
| ↔ Response Time Black to White | ||
|---|---|---|
| 8.8 ms ... rise ↗ and fall ↘ combined | ↗ 4.4 ms rise | 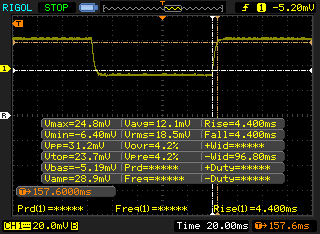 |
| ↘ 4.4 ms fall | ||
| The screen shows fast response rates in our tests and should be suited for gaming. In comparison, all tested devices range from 0.1 (minimum) to 240 (maximum) ms. » 24 % of all devices are better. This means that the measured response time is better than the average of all tested devices (19.9 ms). | ||
| ↔ Response Time 50% Grey to 80% Grey | ||
| 16.4 ms ... rise ↗ and fall ↘ combined | ↗ 7.6 ms rise | 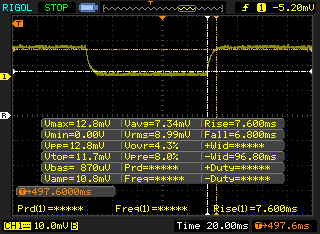 |
| ↘ 6.8 ms fall | ||
| The screen shows good response rates in our tests, but may be too slow for competitive gamers. In comparison, all tested devices range from 0.165 (minimum) to 636 (maximum) ms. » 30 % of all devices are better. This means that the measured response time is better than the average of all tested devices (31.1 ms). | ||
Screen Flickering / PWM (Pulse-Width Modulation)
| Screen flickering / PWM detected | 23810 Hz | ≤ 24 % brightness setting | 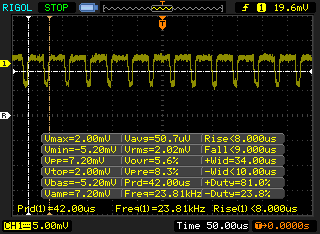 |
The display backlight flickers at 23810 Hz (worst case, e.g., utilizing PWM) Flickering detected at a brightness setting of 24 % and below. There should be no flickering or PWM above this brightness setting. The frequency of 23810 Hz is quite high, so most users sensitive to PWM should not notice any flickering. In comparison: 52 % of all tested devices do not use PWM to dim the display. If PWM was detected, an average of 7784 (minimum: 5 - maximum: 343500) Hz was measured. | |||
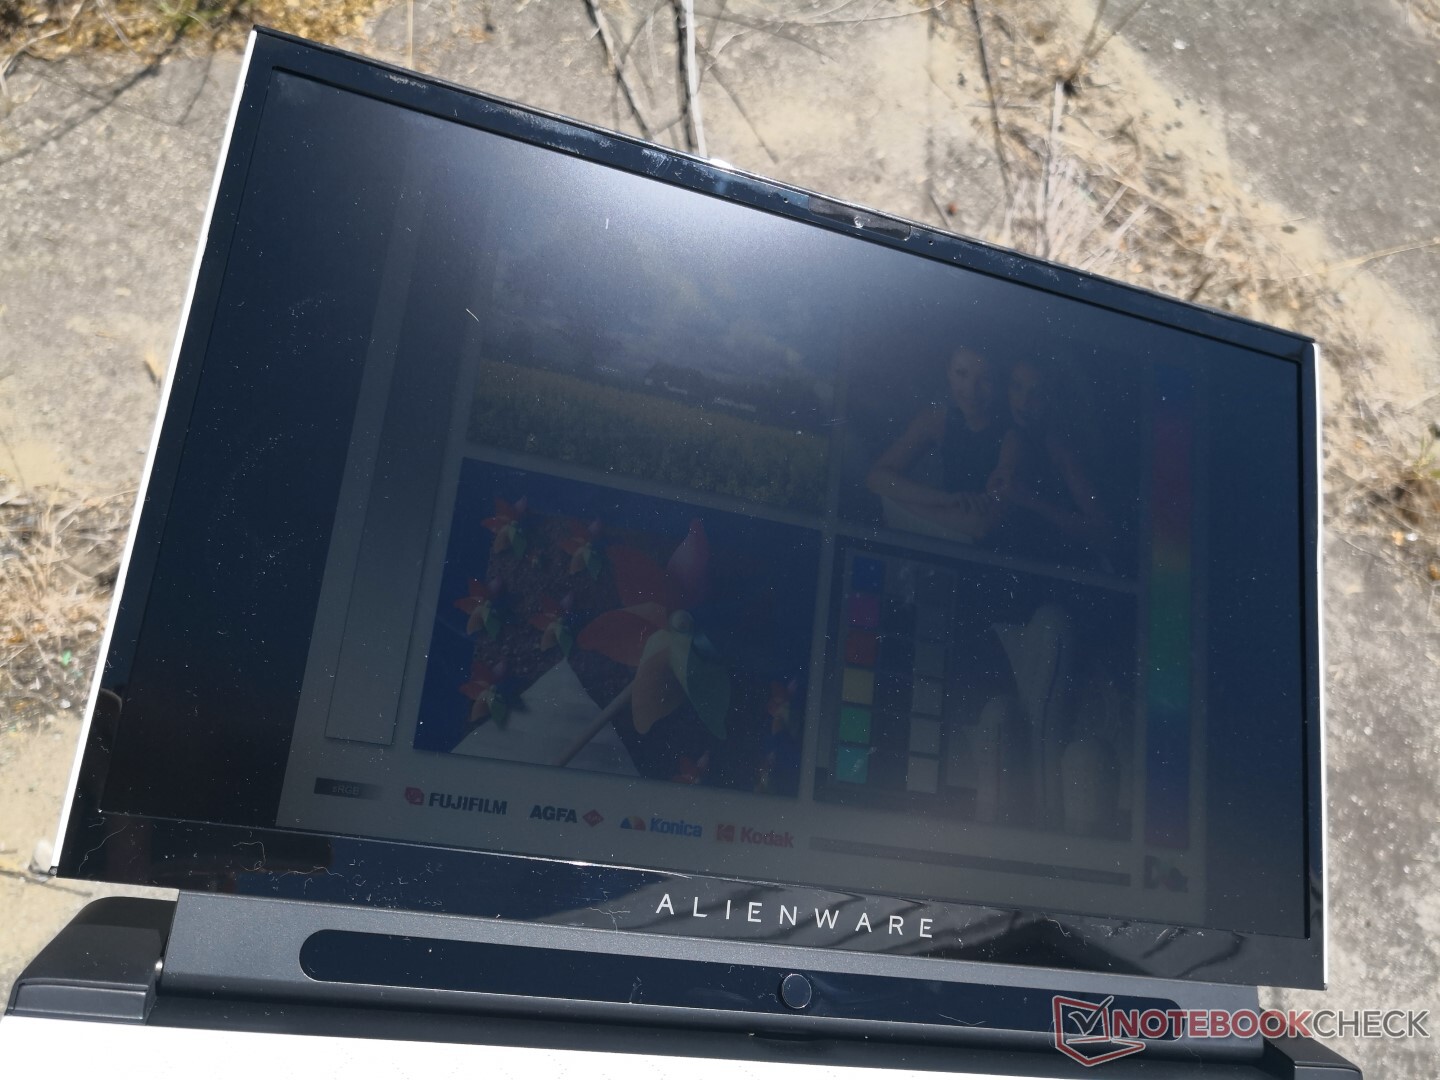
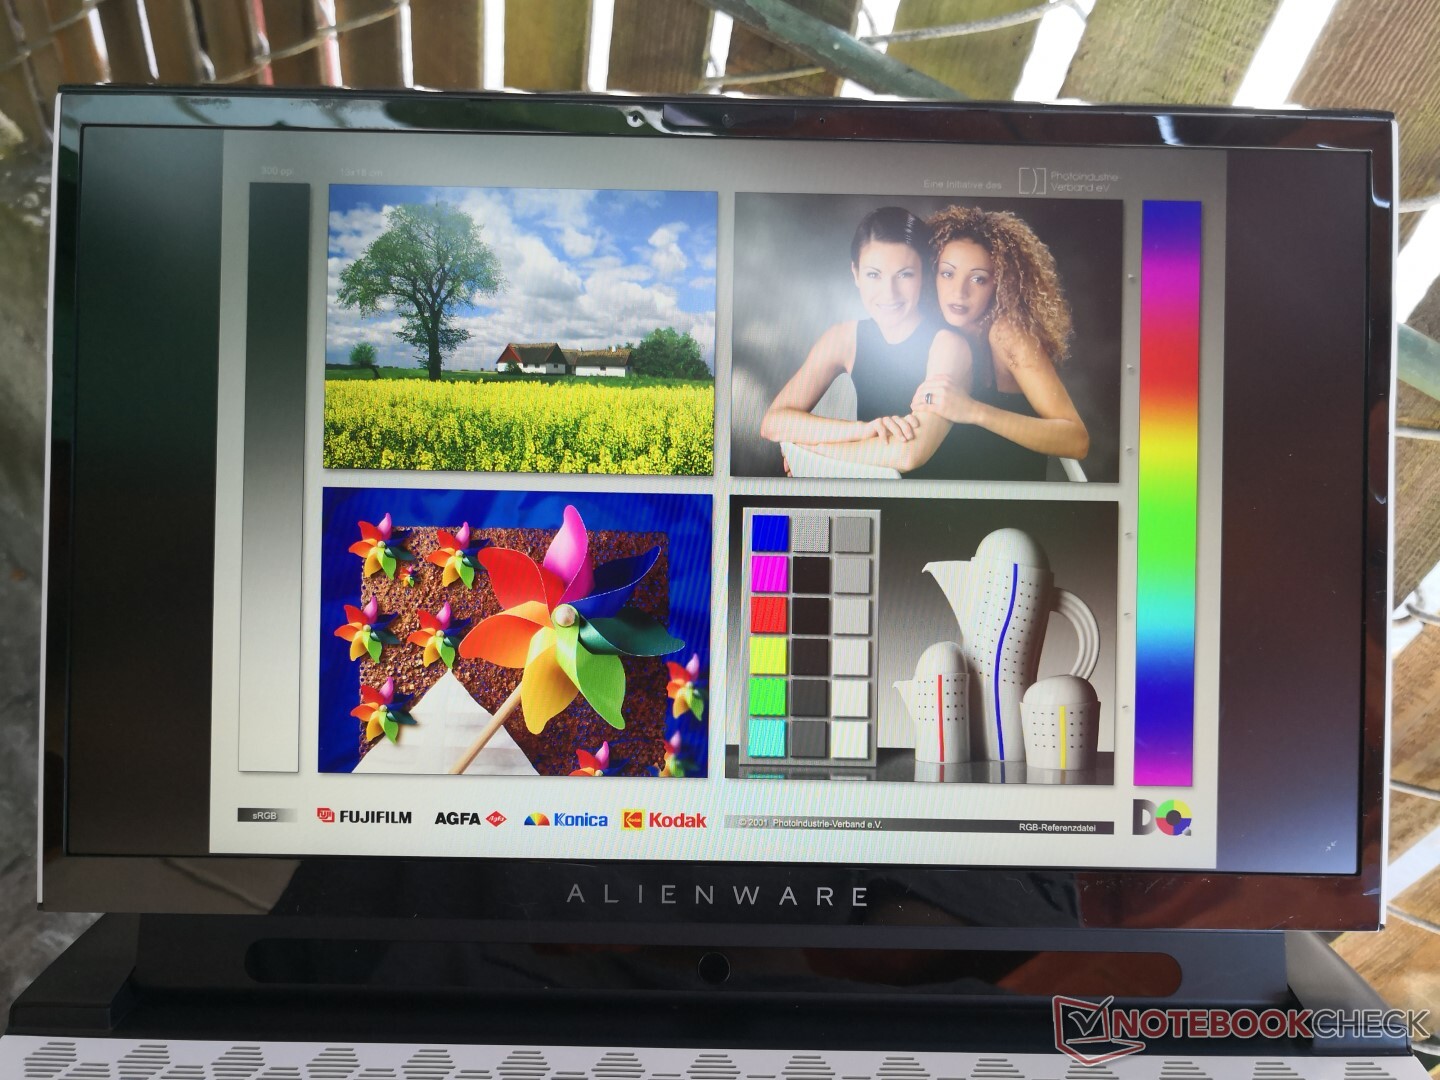
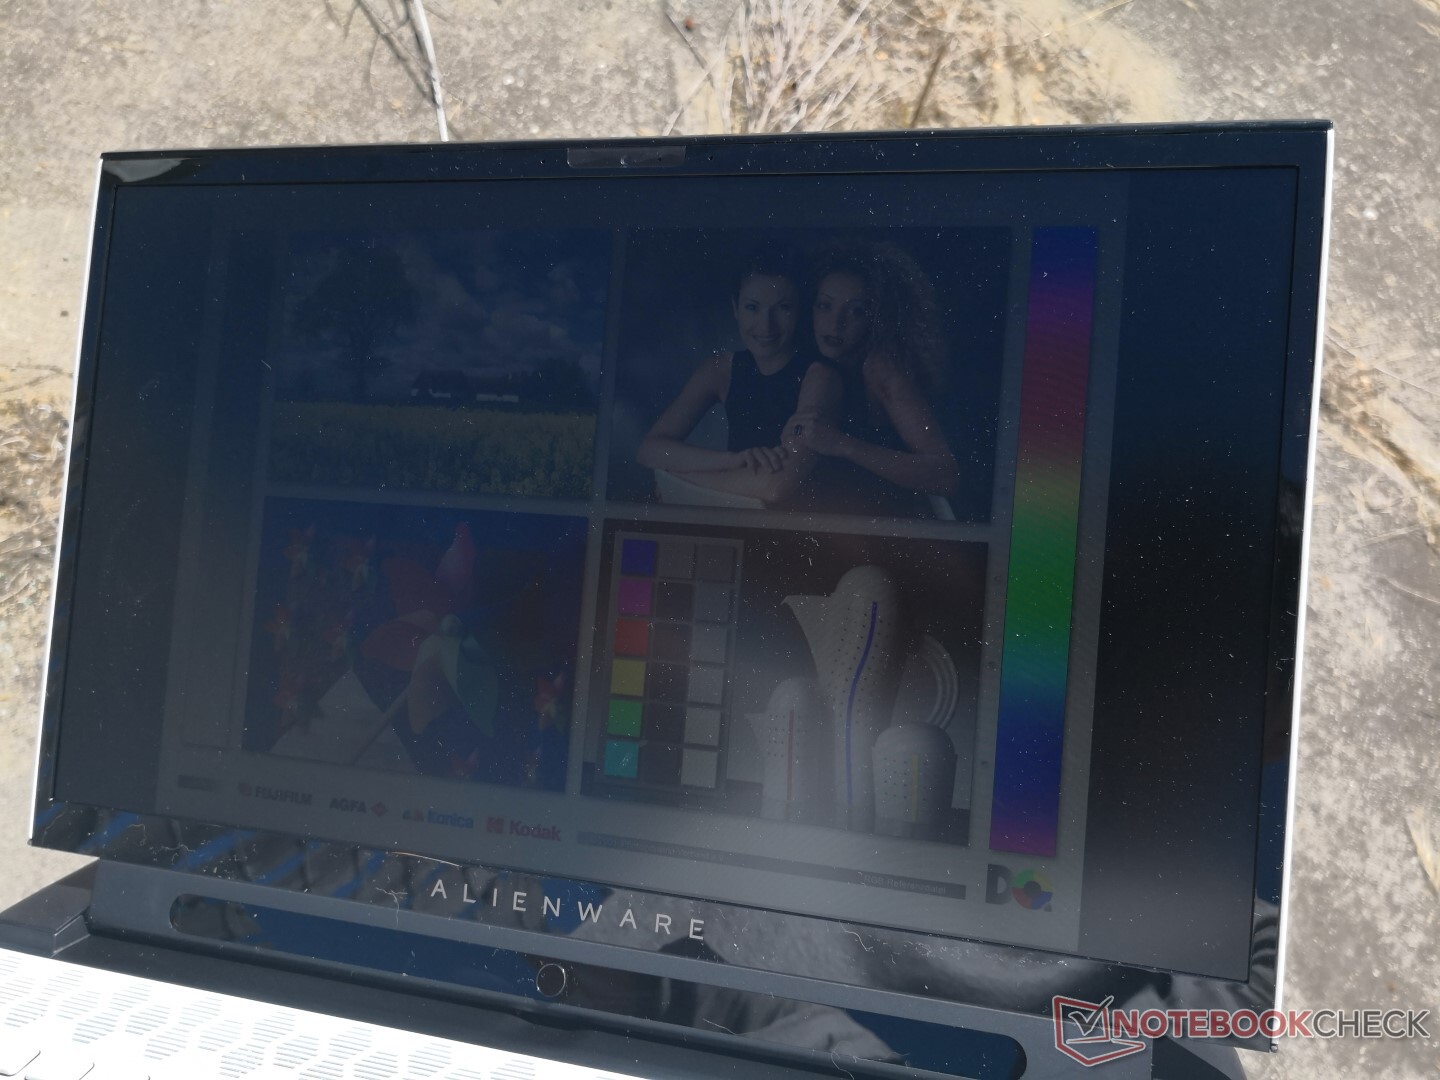
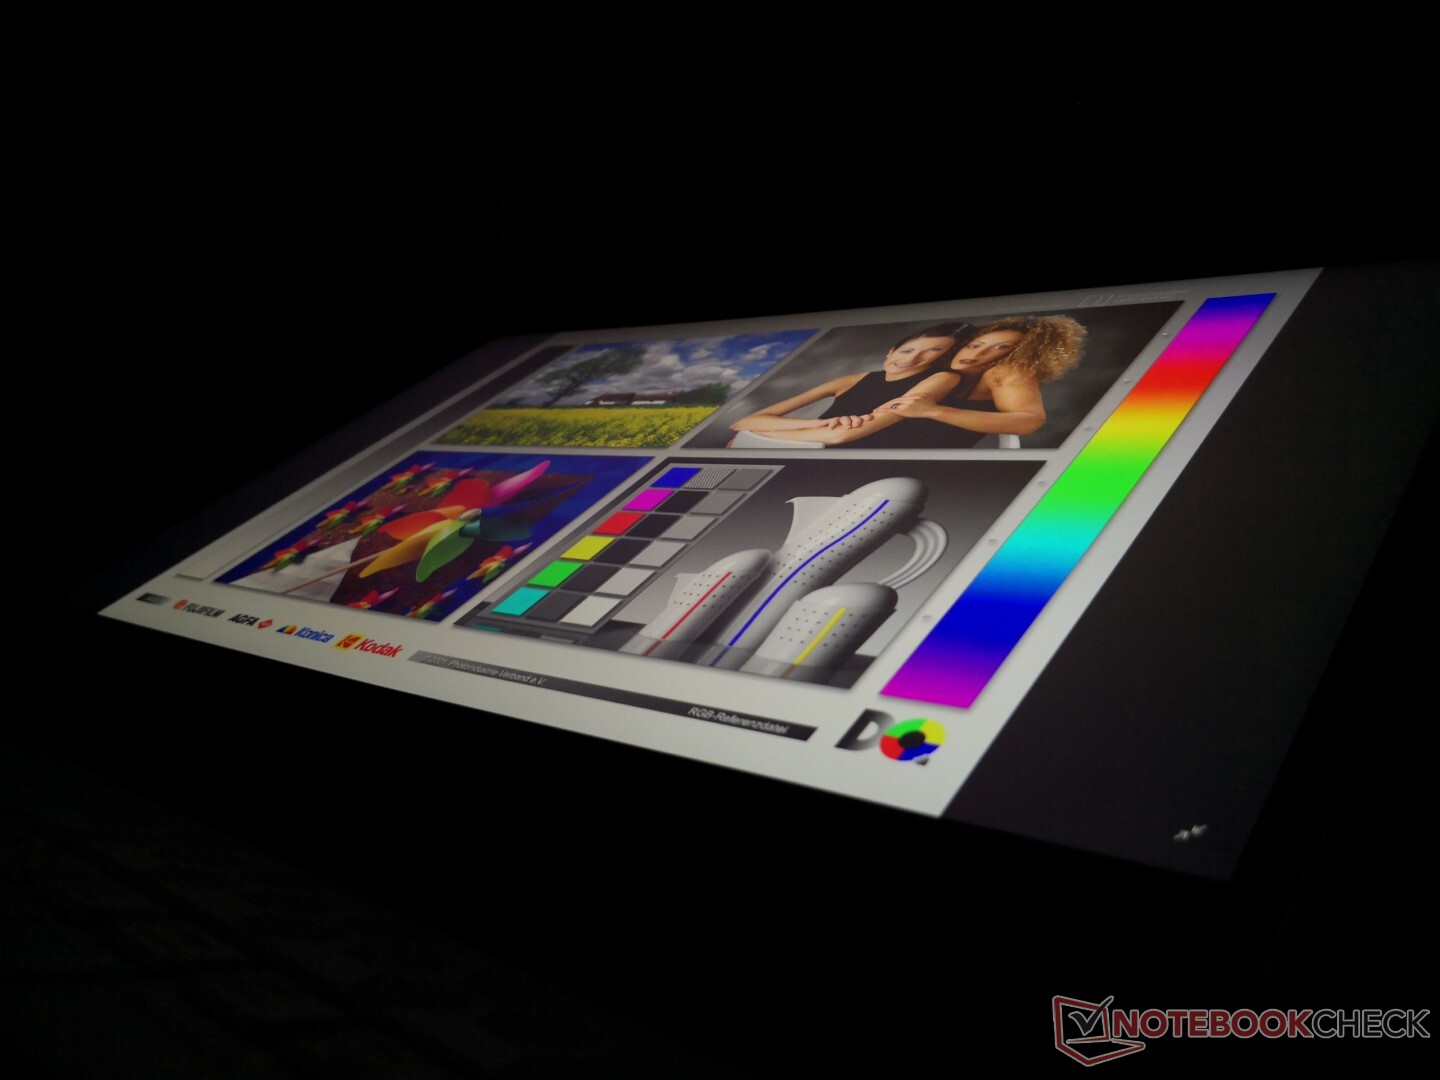
Since display brightness is average for a 15.6-inch gaming laptop, outdoor visibility is not any better or worse than most other competing systems. Users may want to consider the OLED Alienware m15 SKU which offers a brighter display to be less straining on the eyes when outside. Viewing angles are wide on our IPS panel with only small changes to contrast and brightness if viewing from extreme angles.
Performance
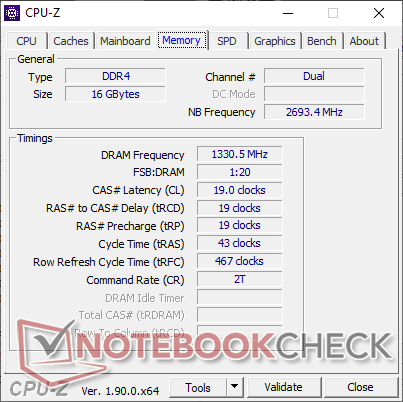
In an effort to obtain lower starting prices, Alienware laptops have always offered a very wide range of CPU, GPU, storage, and RAM options. The lowest configuration in particular comes with just 8 GB of soldered DDR4-2666 RAM. Since RAM is non-upgradeable, we suggest avoiding this configuration as it can hinder the multi-tasking capabilities of the Alienware. Current SKUs max out at 16 GB of RAM with the promise of 32 GB options in the future.
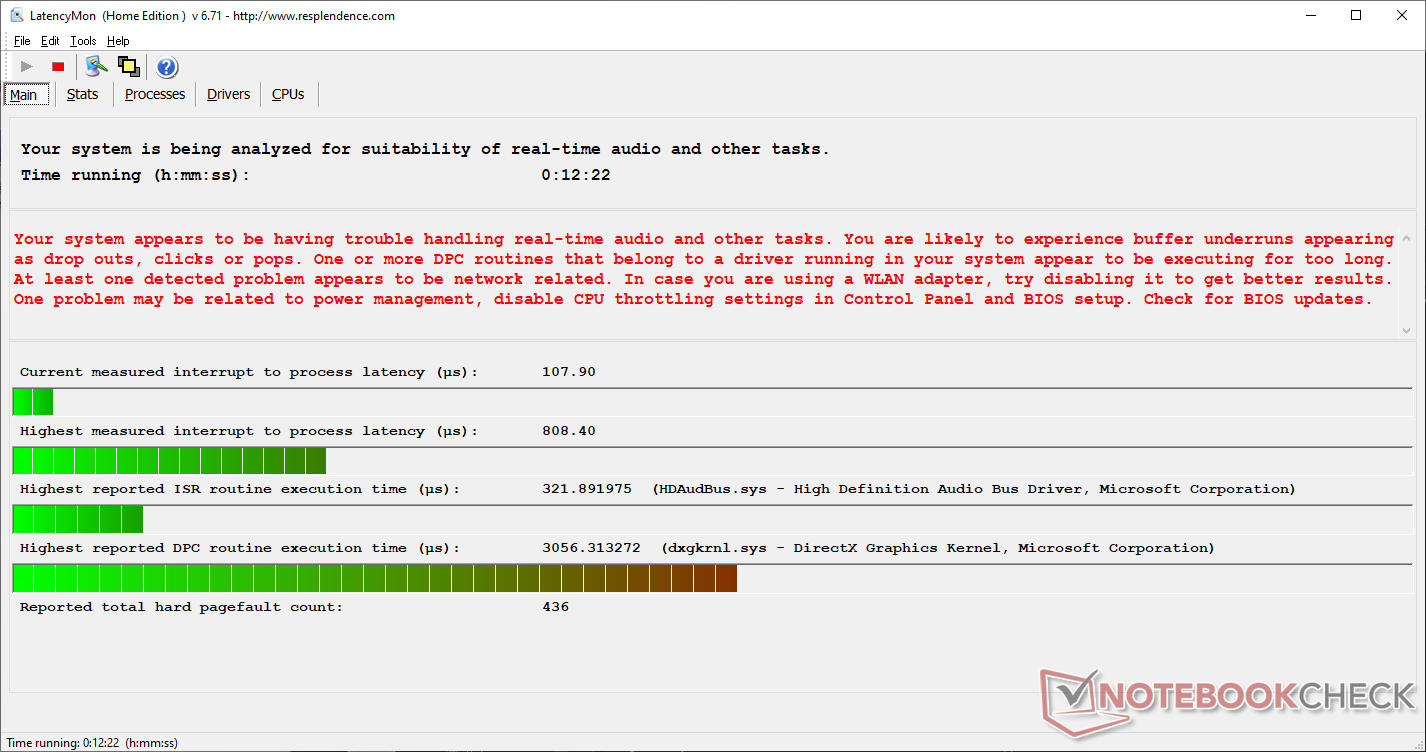
LatencyMon shows DPC latency issues even when the wireless is disabled.
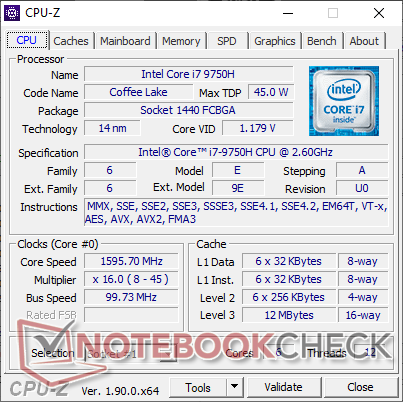
Processor
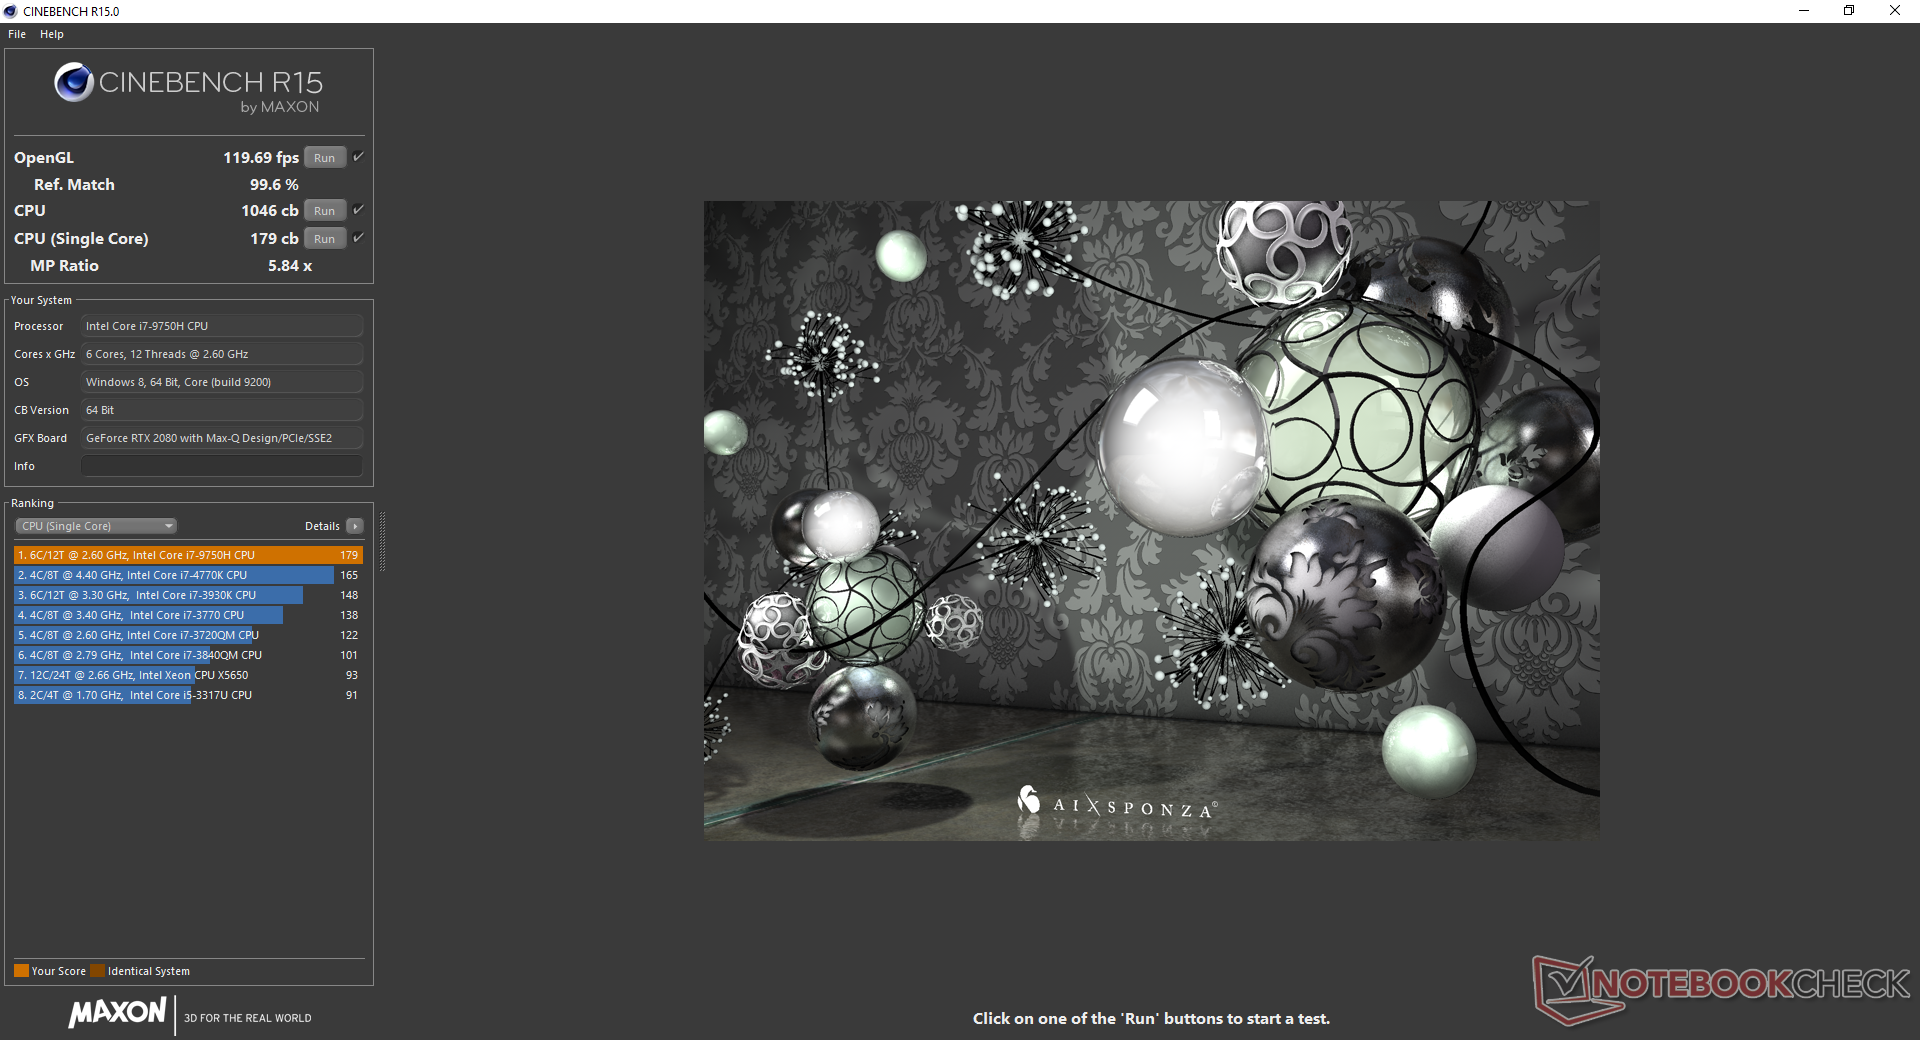
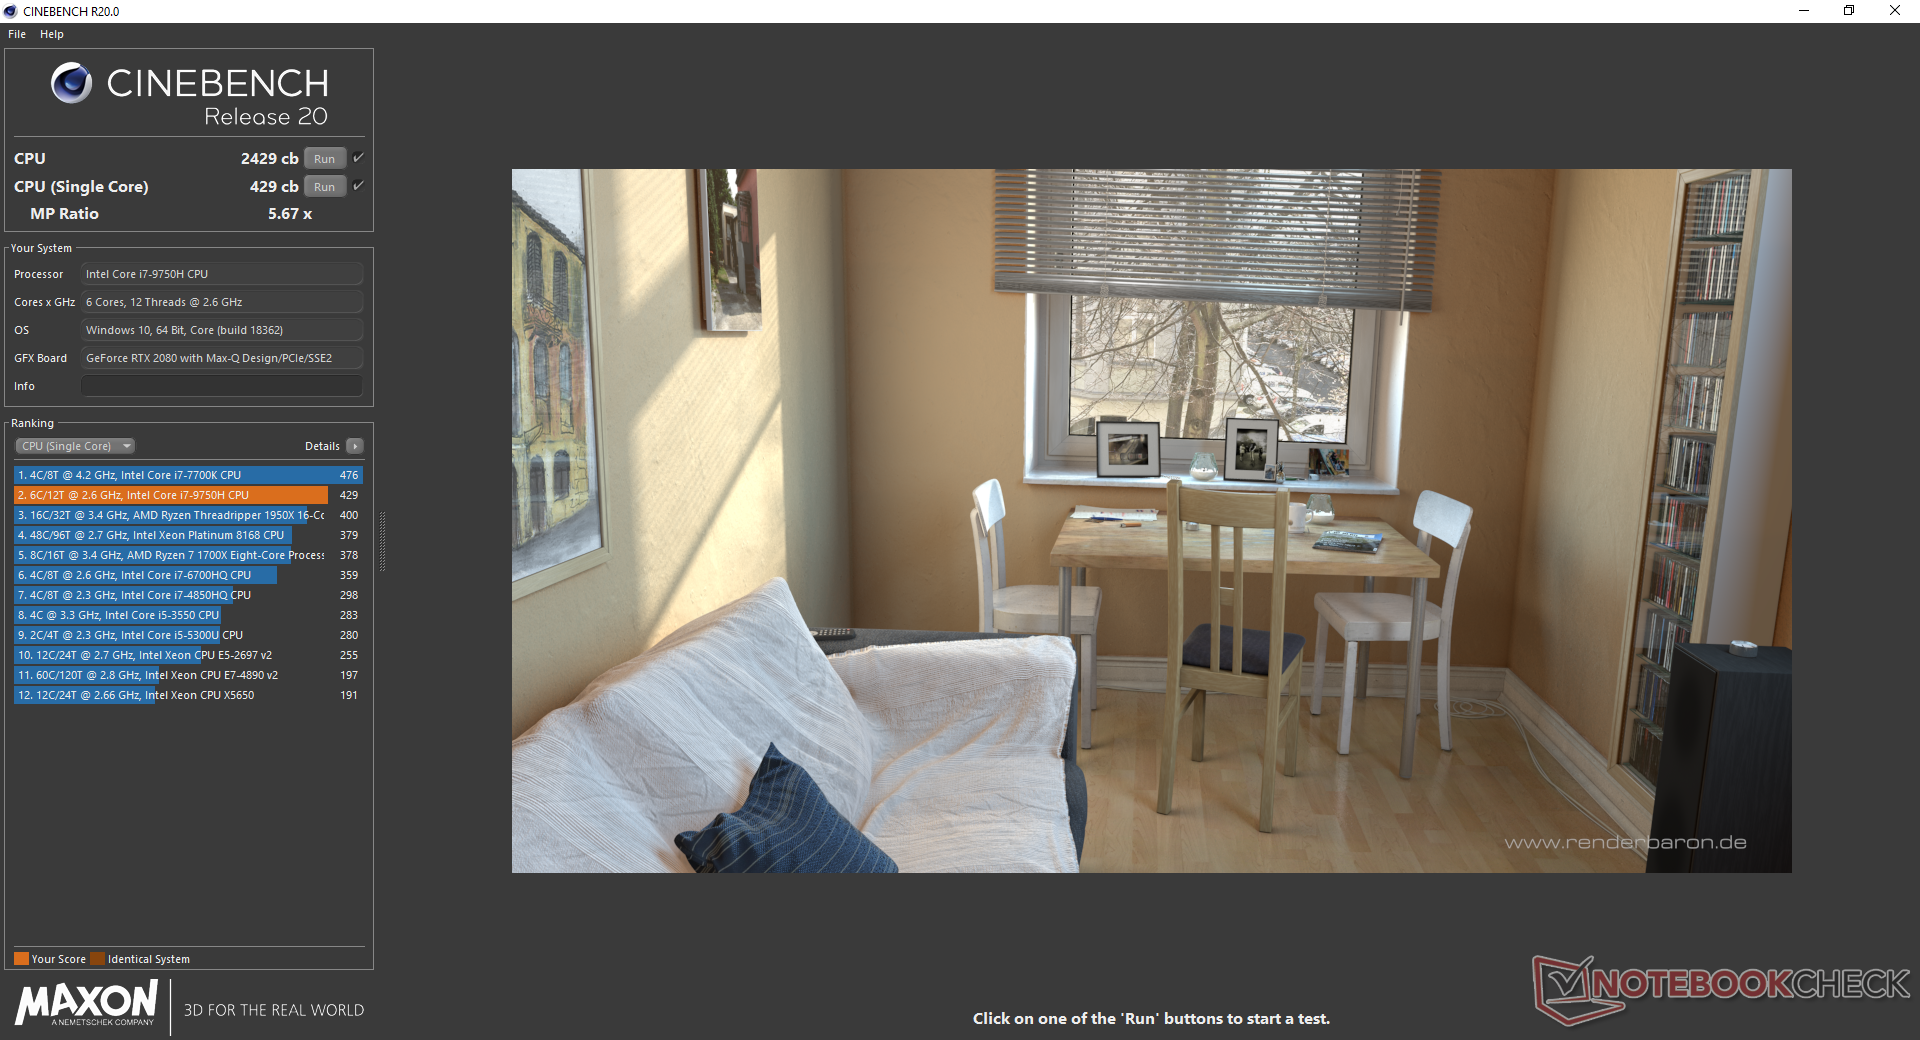
Raw multi-thread performance in CineBench R15 is 12 percent slower than the average Core i7-9750H in our database taken from 39 other laptops. When running the same test in a loop, we can see notice the poor maximum Turbo Boost potential for ultimately slower performance than expected. Both the Asus Strix Hero III G731GV and even the original Alienware m15 R1 with the older Core i7-8750H CPU is able to consistently outperform the i7-9750H in our Alienware m15 R2. The culprit is the very high CPU temperature of the m15 R2 preventing it from sustaining higher clock rates as we will explore in our Stress Test section below.
Nonetheless, raw performance is still 25 to 30 percent faster than the quad-core Core i5-8300H or i5-9300H. Upgrading to the unlocked Core i9-9980HK SKU can potentially bring 50 percent faster performance or more over the i7-9750H in theory, but we have our doubts due to the already high running temperatures of our lesser Core i7-9750H SKU.
See our dedicated page on the Core i7-9750H for more technical information and benchmark comparisons.
System Performance
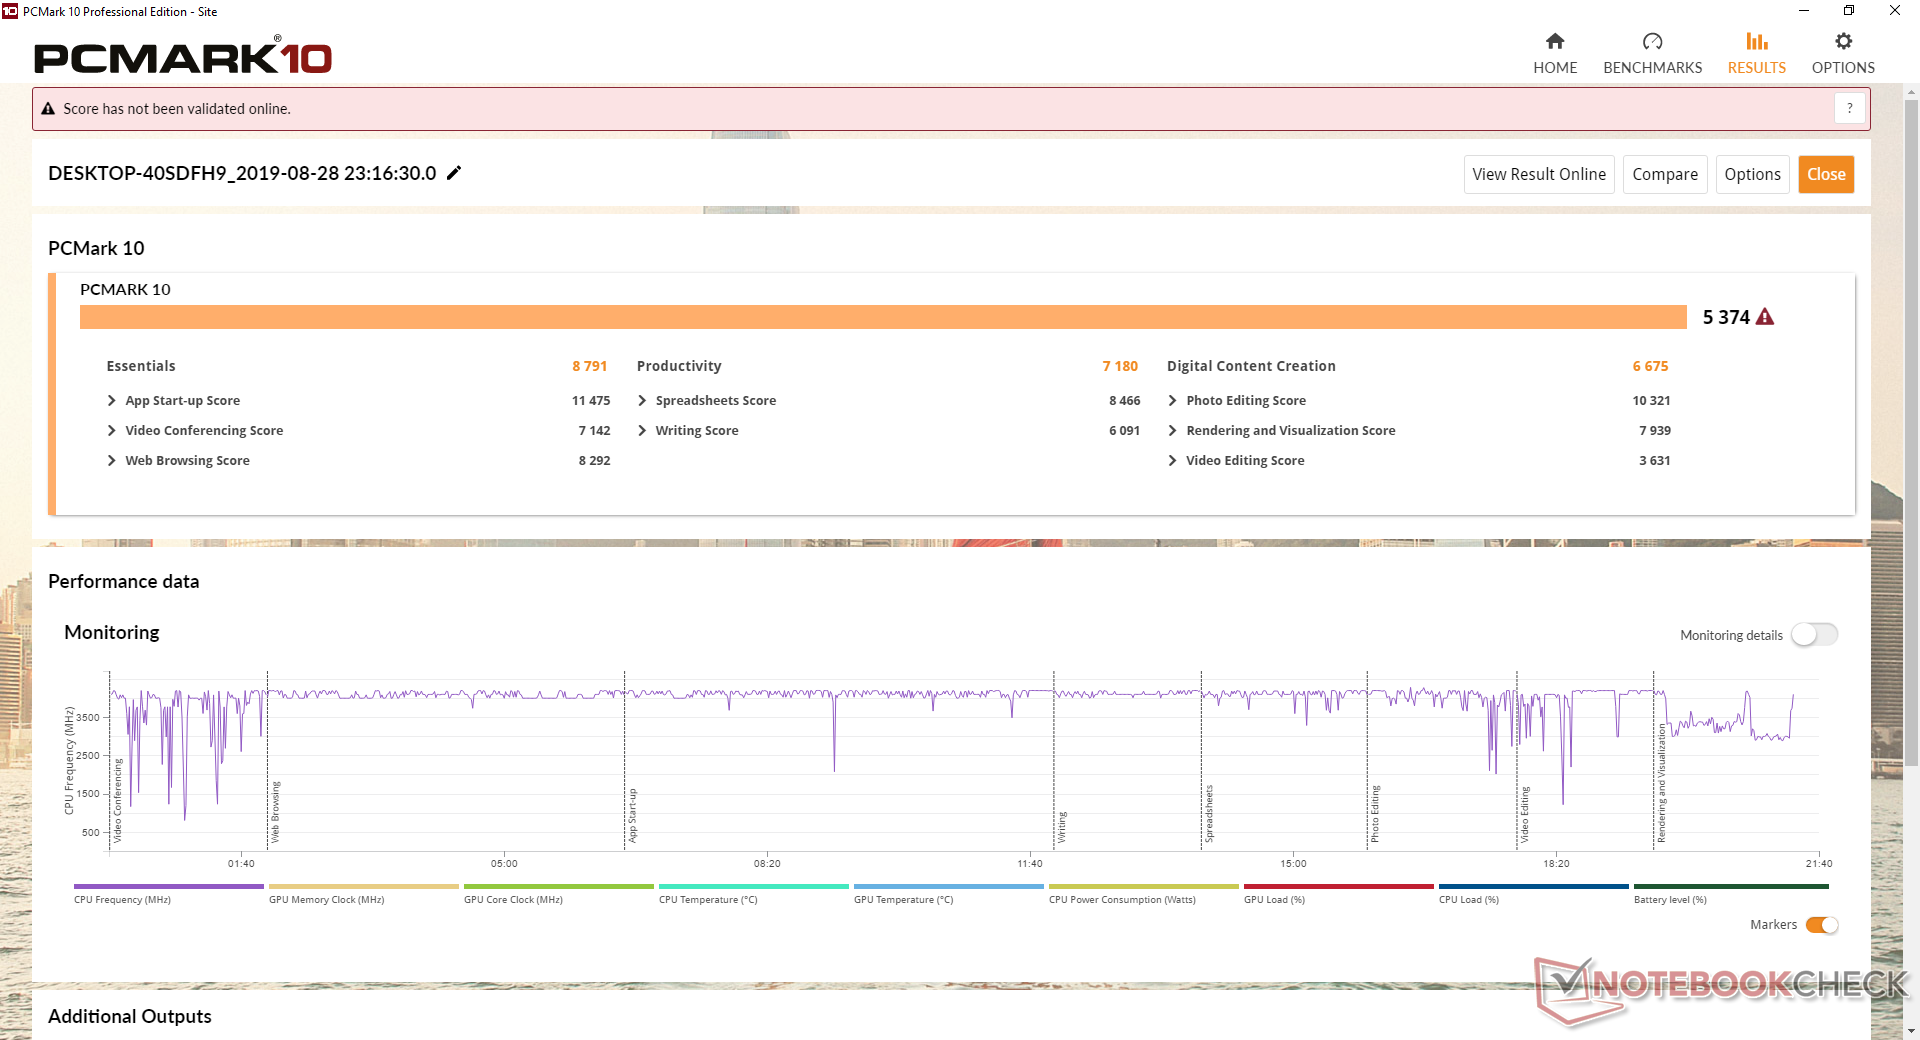
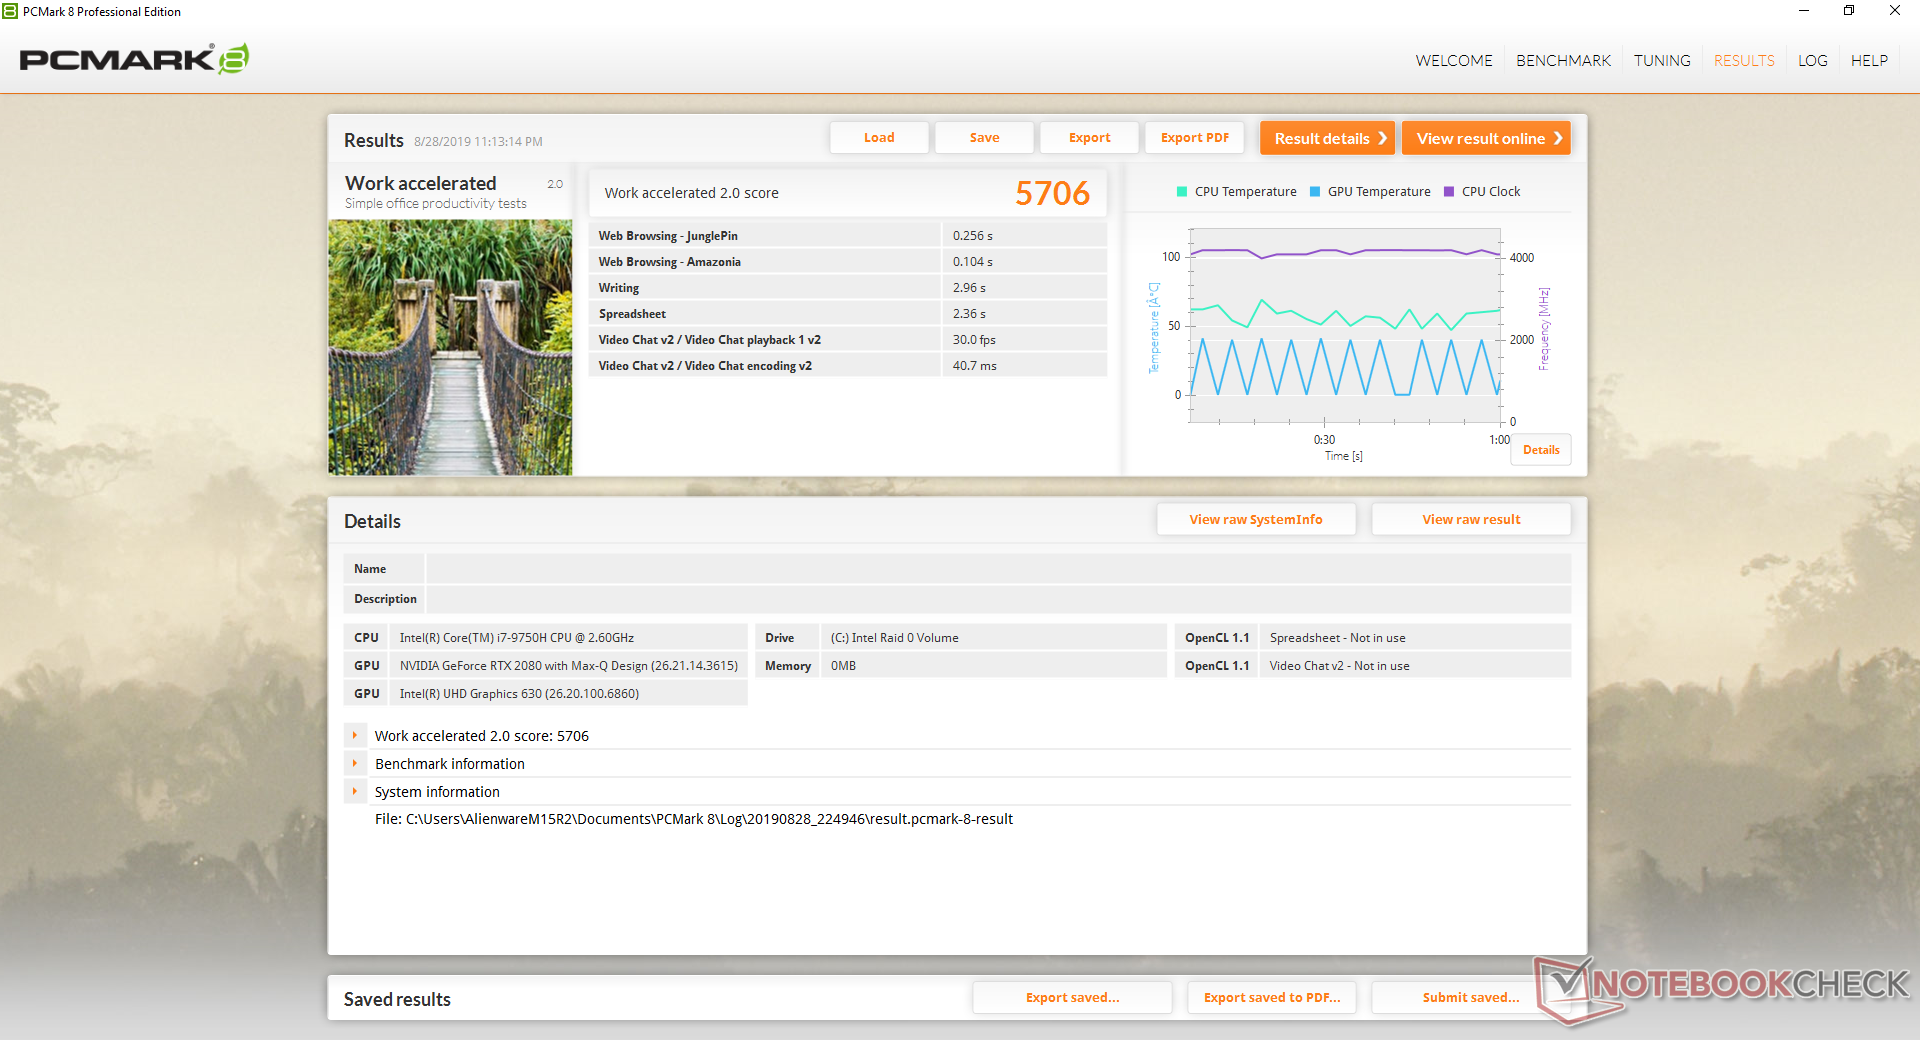
PCMark results for the m15 R2 are comparable to other gaming laptops with GeForce RTX graphics if not slightly lower as scores are consistently a few percentage points behind. Even the last generation Alienware m15 R1 is able to outscore the m15 R2 by up to 5 percent to show how minimal the performance delta can be between the two generations.
We experienced no hardware or software issues during our time with the test unit. Note that the screen will automatically dim after about 30 seconds of inactivity regardless of what the Windows settings will tell you. Instead, you'll have to launch the Tobii eye-tracking software in order to toggle the automatic dimming feature.
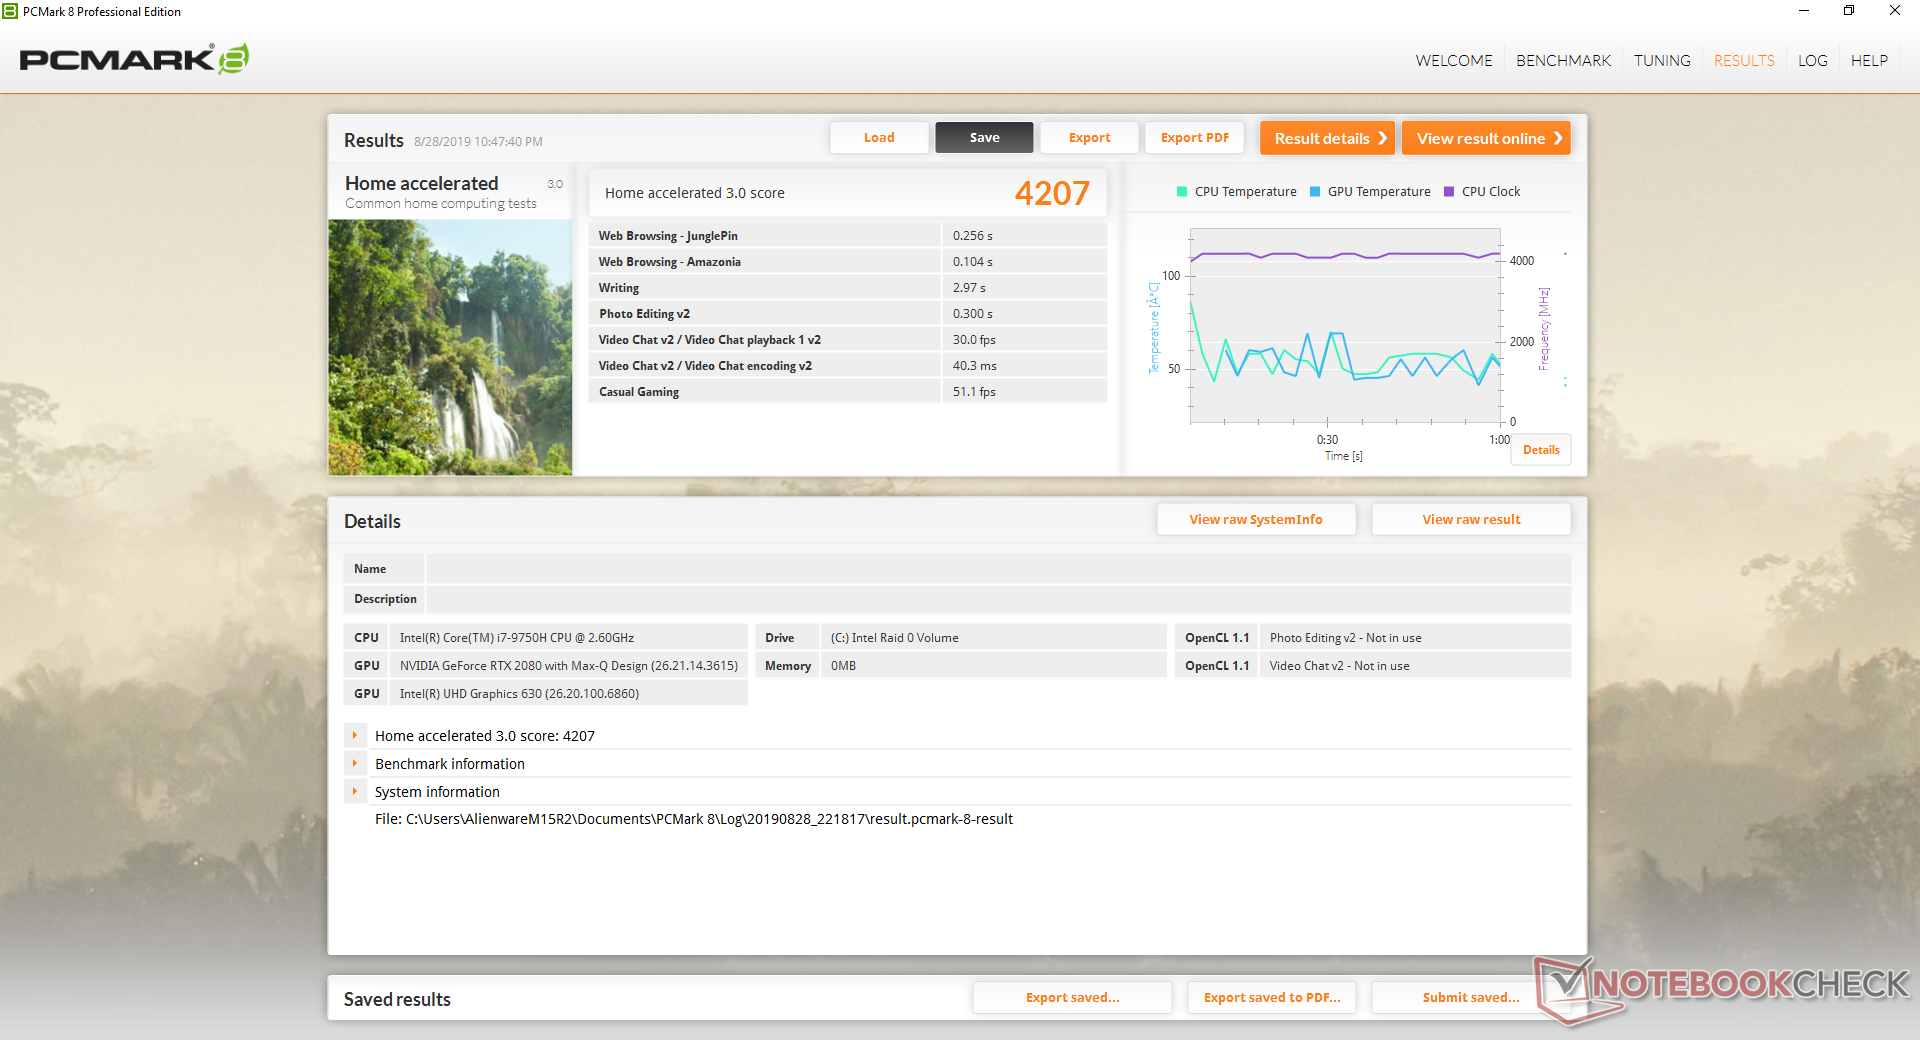
| PCMark 8 Home Score Accelerated v2 | 4207 points | |
| PCMark 8 Work Score Accelerated v2 | 5706 points | |
| PCMark 10 Score | 5374 points | |
Help | ||
Storage Devices
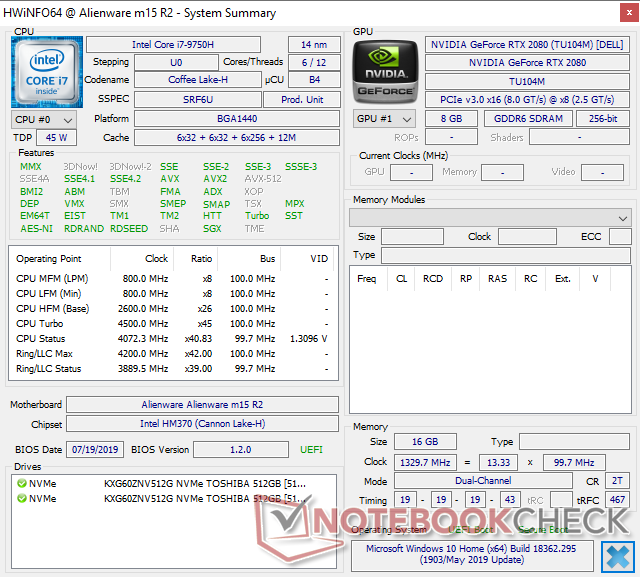
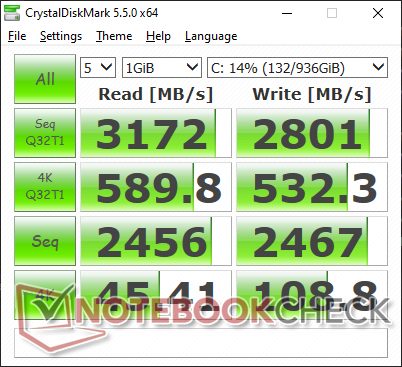
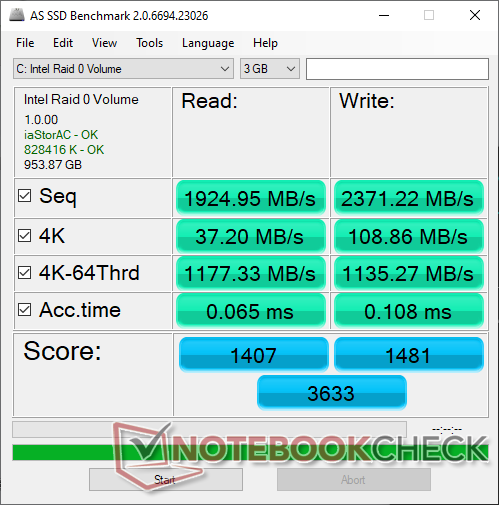
Two M.2 2280 NVMe slots are available for a combined total capacity of up to 4 TB. The older, larger, and heavier Alienware 15 R4 model includes two M.2 slots and a third 2.5-inch SATA III bay for even more storage options. Our specific test unit has been configured with two 512 GB Toshiba XG6 KXG60ZNV512G NVMe SSDs in RAID 0 to be an upgrade from the Toshiba XG5 on the Alienware m15 R1.
Average sequential write rate is about 2x faster than on the Dell Latitude 7400 2-in-1 equipped with just a single 512 GB Toshiba XG6 SSD. Sequential read rate, however, remains almost the same. A single 512 GB Samsung SSD PM981 is able to perform similarly to our dual Toshiba XG6 setup.
See our table of HDDs and SSDs for more benchmark comparisons.
| Alienware m15 R2 P87F 2x Toshiba XG6 KXG60ZNV512G (RAID 0) | Alienware m15 P79F Toshiba XG5 KXG50ZNV512G | Razer Blade 15 RTX 2080 Max-Q Samsung SSD PM981 MZVLB512HAJQ | Asus Zephyrus S GX531GX Intel SSD 660p SSDPEKNW512G8 | MSI GS65 Stealth 9SG Samsung SSD PM981 MZVLB512HAJQ | Dell Latitude 7400 2-in-1 Toshiba XG6 KXG60ZNV512G | |
|---|---|---|---|---|---|---|
| AS SSD | -12% | 12% | -26% | 20% | -49% | |
| Seq Read (MB/s) | 1925 | 1937 1% | 1832 -5% | 1239 -36% | 2005 4% | 2289 19% |
| Seq Write (MB/s) | 2371 | 1066 -55% | 1864 -21% | 920 -61% | 1580 -33% | 1163 -51% |
| 4K Read (MB/s) | 37.2 | 31.76 -15% | 52.1 40% | 45.74 23% | 49.33 33% | 22.29 -40% |
| 4K Write (MB/s) | 108.9 | 102.6 -6% | 108.3 -1% | 95.7 -12% | 103.8 -5% | 28.92 -73% |
| 4K-64 Read (MB/s) | 1177 | 1140 -3% | 1159 -2% | 322 -73% | 1241 5% | 415.6 -65% |
| 4K-64 Write (MB/s) | 1135 | 938 -17% | 1807 59% | 722 -36% | 1730 52% | 199.5 -82% |
| Access Time Read * (ms) | 0.065 | 0.058 11% | 0.05 23% | 0.073 -12% | 0.054 17% | 0.122 -88% |
| Access Time Write * (ms) | 0.108 | 0.04 63% | 0.034 69% | 0.047 56% | 0.036 67% | 0.143 -32% |
| Score Read (Points) | 1407 | 1366 -3% | 1394 -1% | 492 -65% | 1490 6% | 667 -53% |
| Score Write (Points) | 1481 | 1147 -23% | 2102 42% | 910 -39% | 1991 34% | 345 -77% |
| Score Total (Points) | 3633 | 3168 -13% | 4221 16% | 1654 -54% | 4230 16% | 1300 -64% |
| Copy ISO MB/s (MB/s) | 2073 | 946 -54% | 2083 0% | 1236 -40% | 3025 46% | 1767 -15% |
| Copy Program MB/s (MB/s) | 576 | 452.8 -21% | 496.5 -14% | 703 22% | 713 24% | 379.4 -34% |
| Copy Game MB/s (MB/s) | 1426 | 1013 -29% | 977 -31% | 812 -43% | 1554 9% | 1055 -26% |
* ... smaller is better

GPU Performance
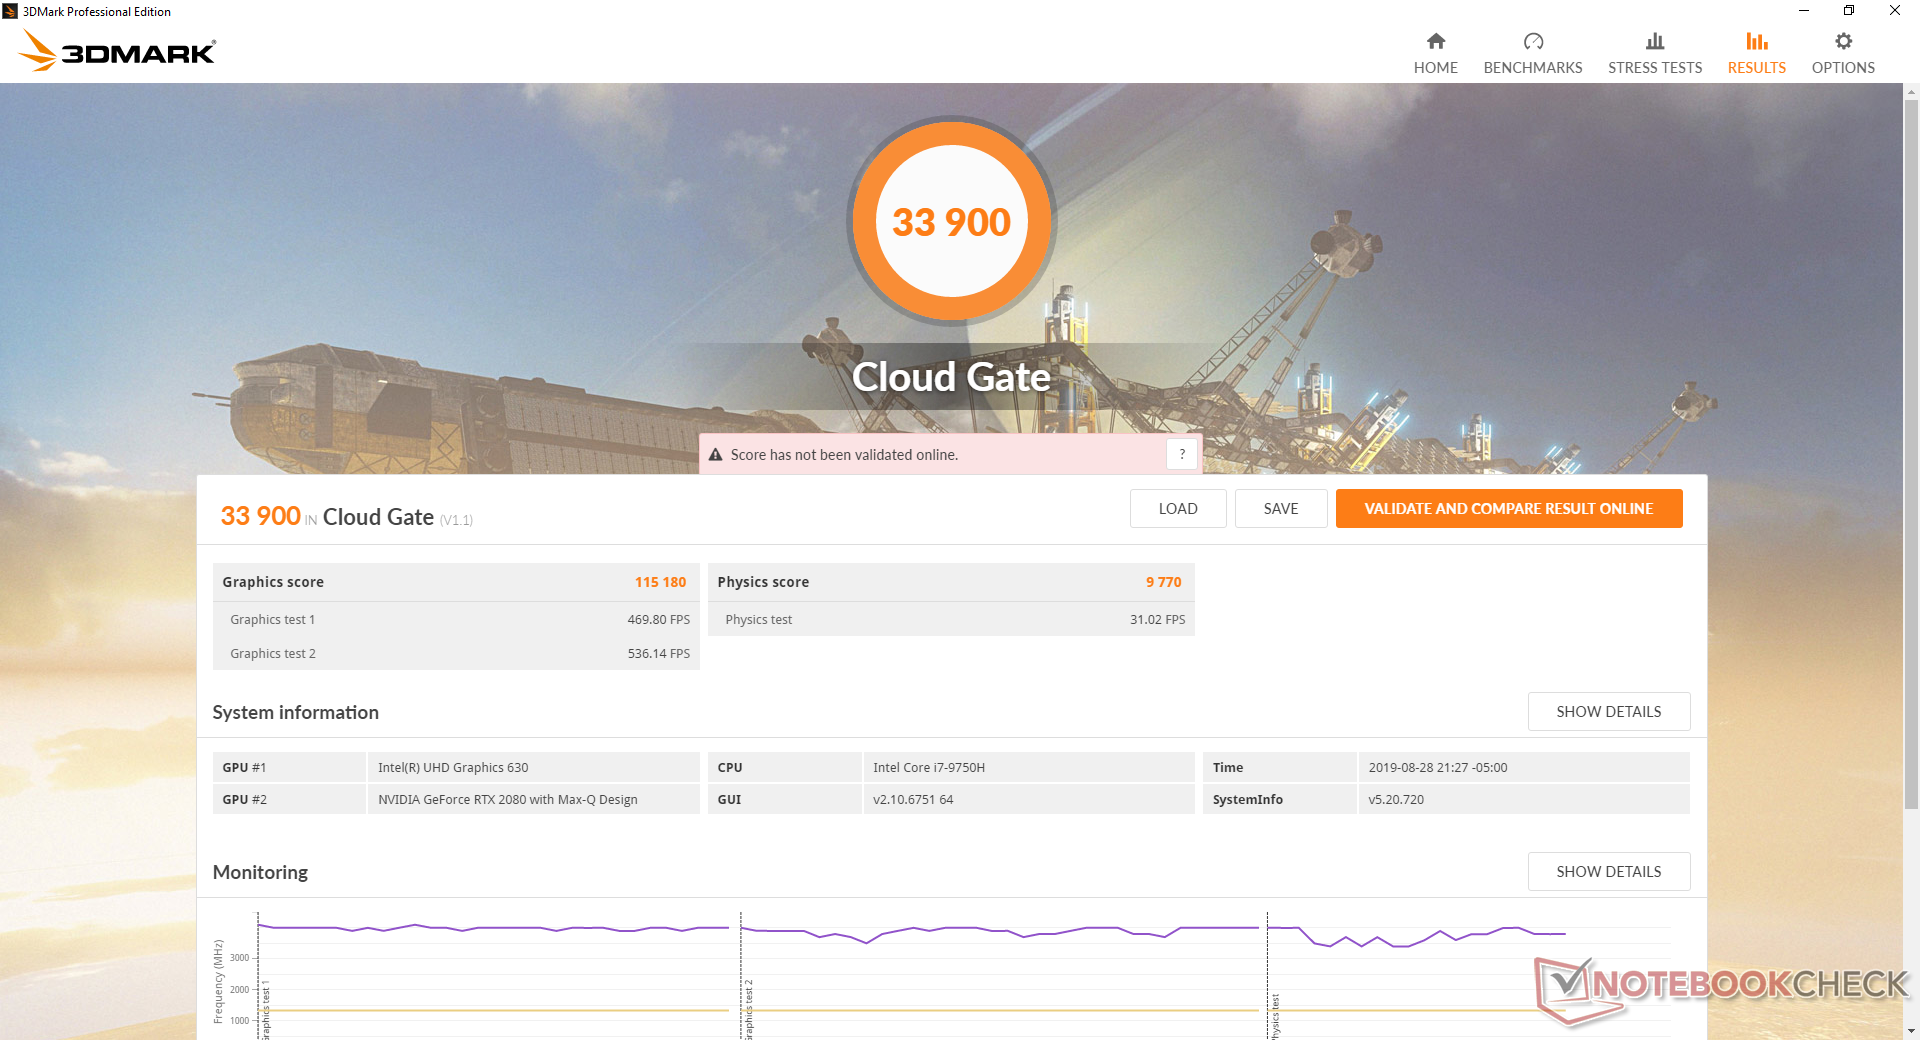
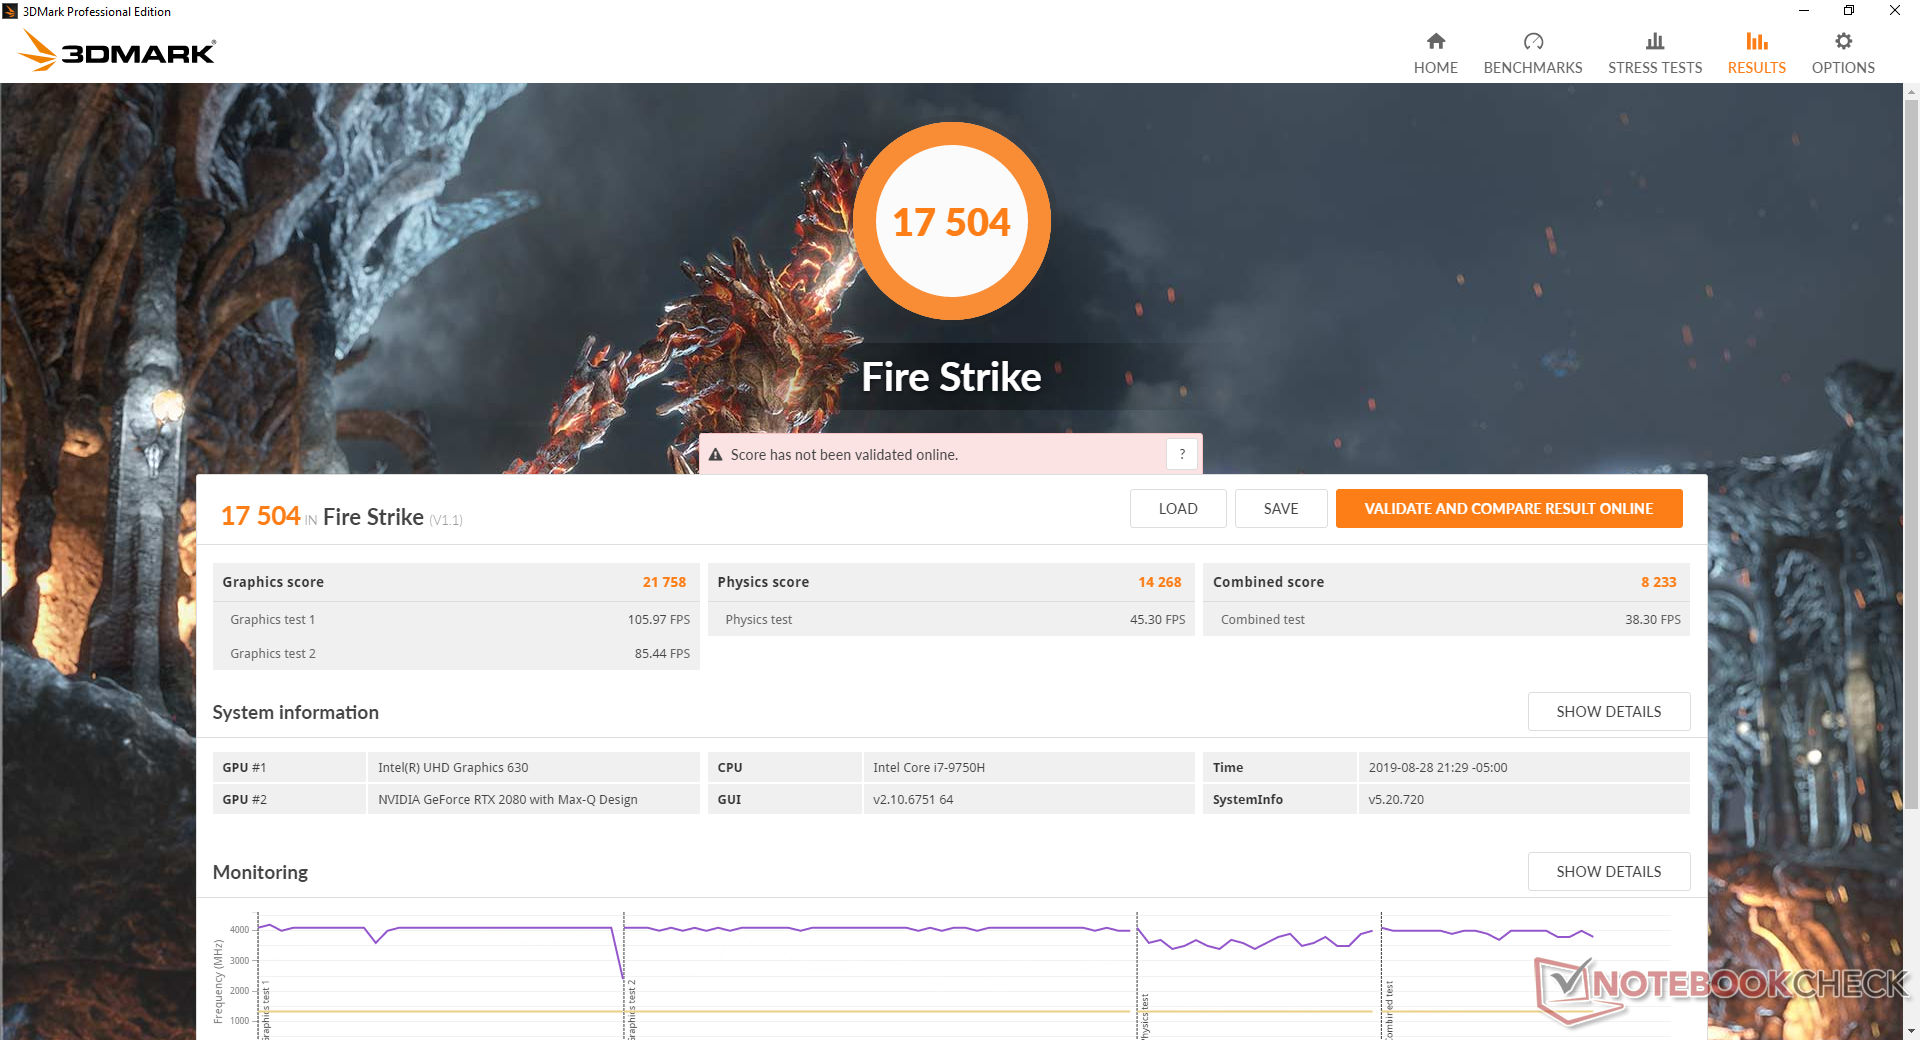
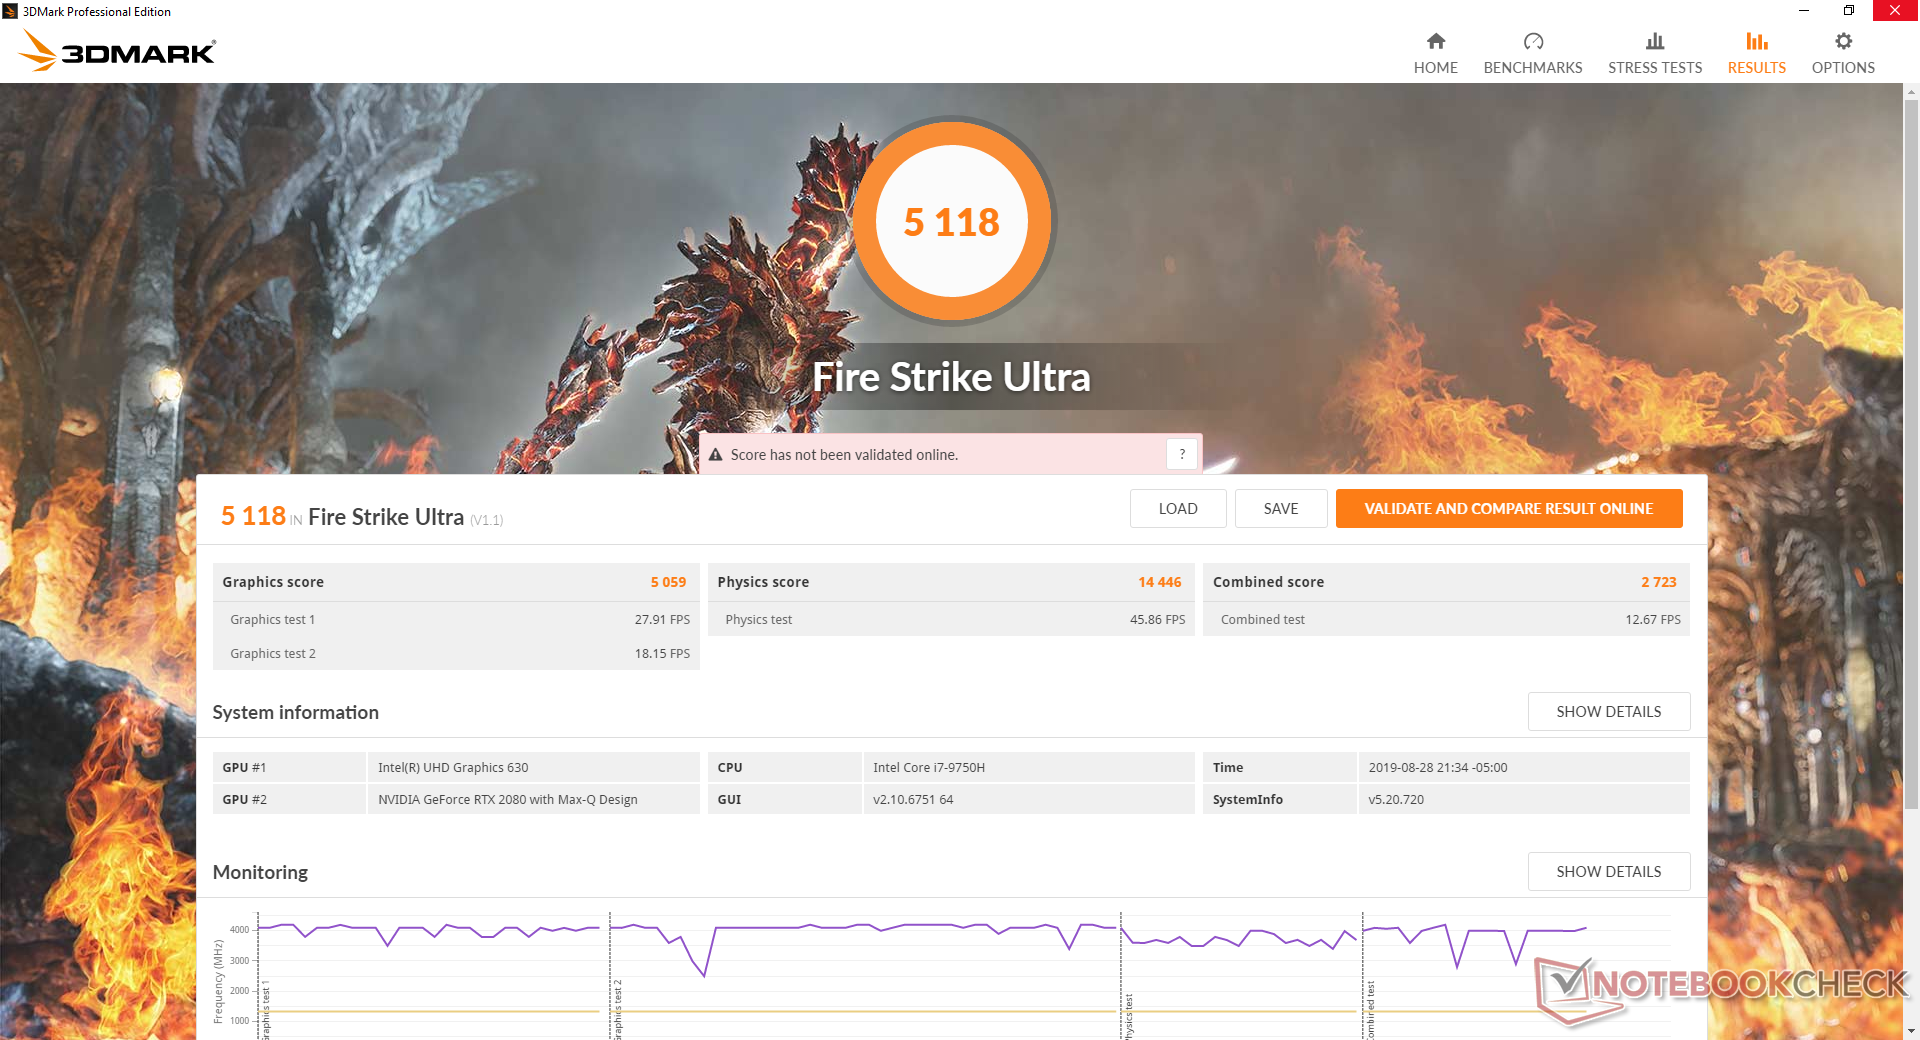
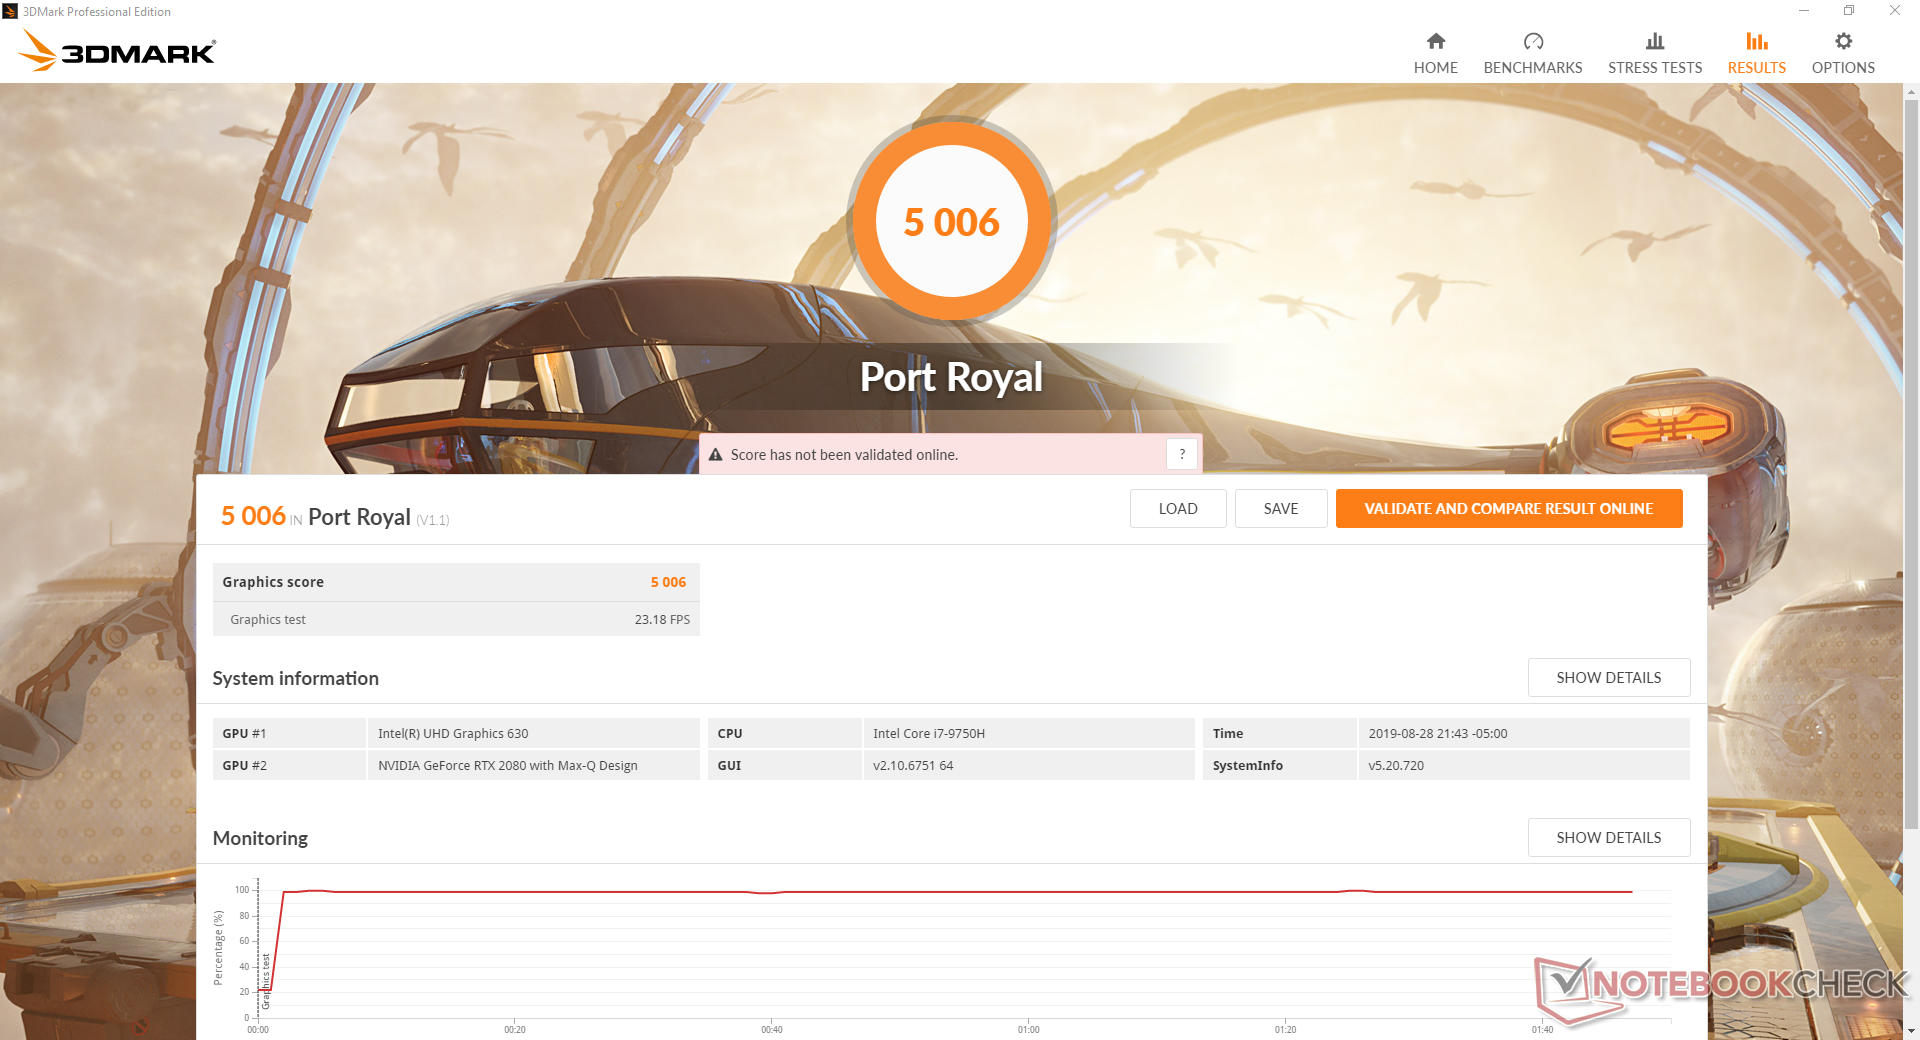
Unlike the under-performing CPU, the GPU is performing where we expect it to be. 3DMark results are slightly higher than the average RTX 2080 Max-Q in our database taken from 14 other gaming laptops by about 7 percent. Graphics performance is roughly 20 to 25 percent slower than the larger Alienware Area-51m with the full-power RTX 2080 and about 30 percent faster than the RTX 2070 Max-Q. When compared to the last generation Pascal series, Turing GPUs are at their best when running newer DX12 titles where they are most efficient.
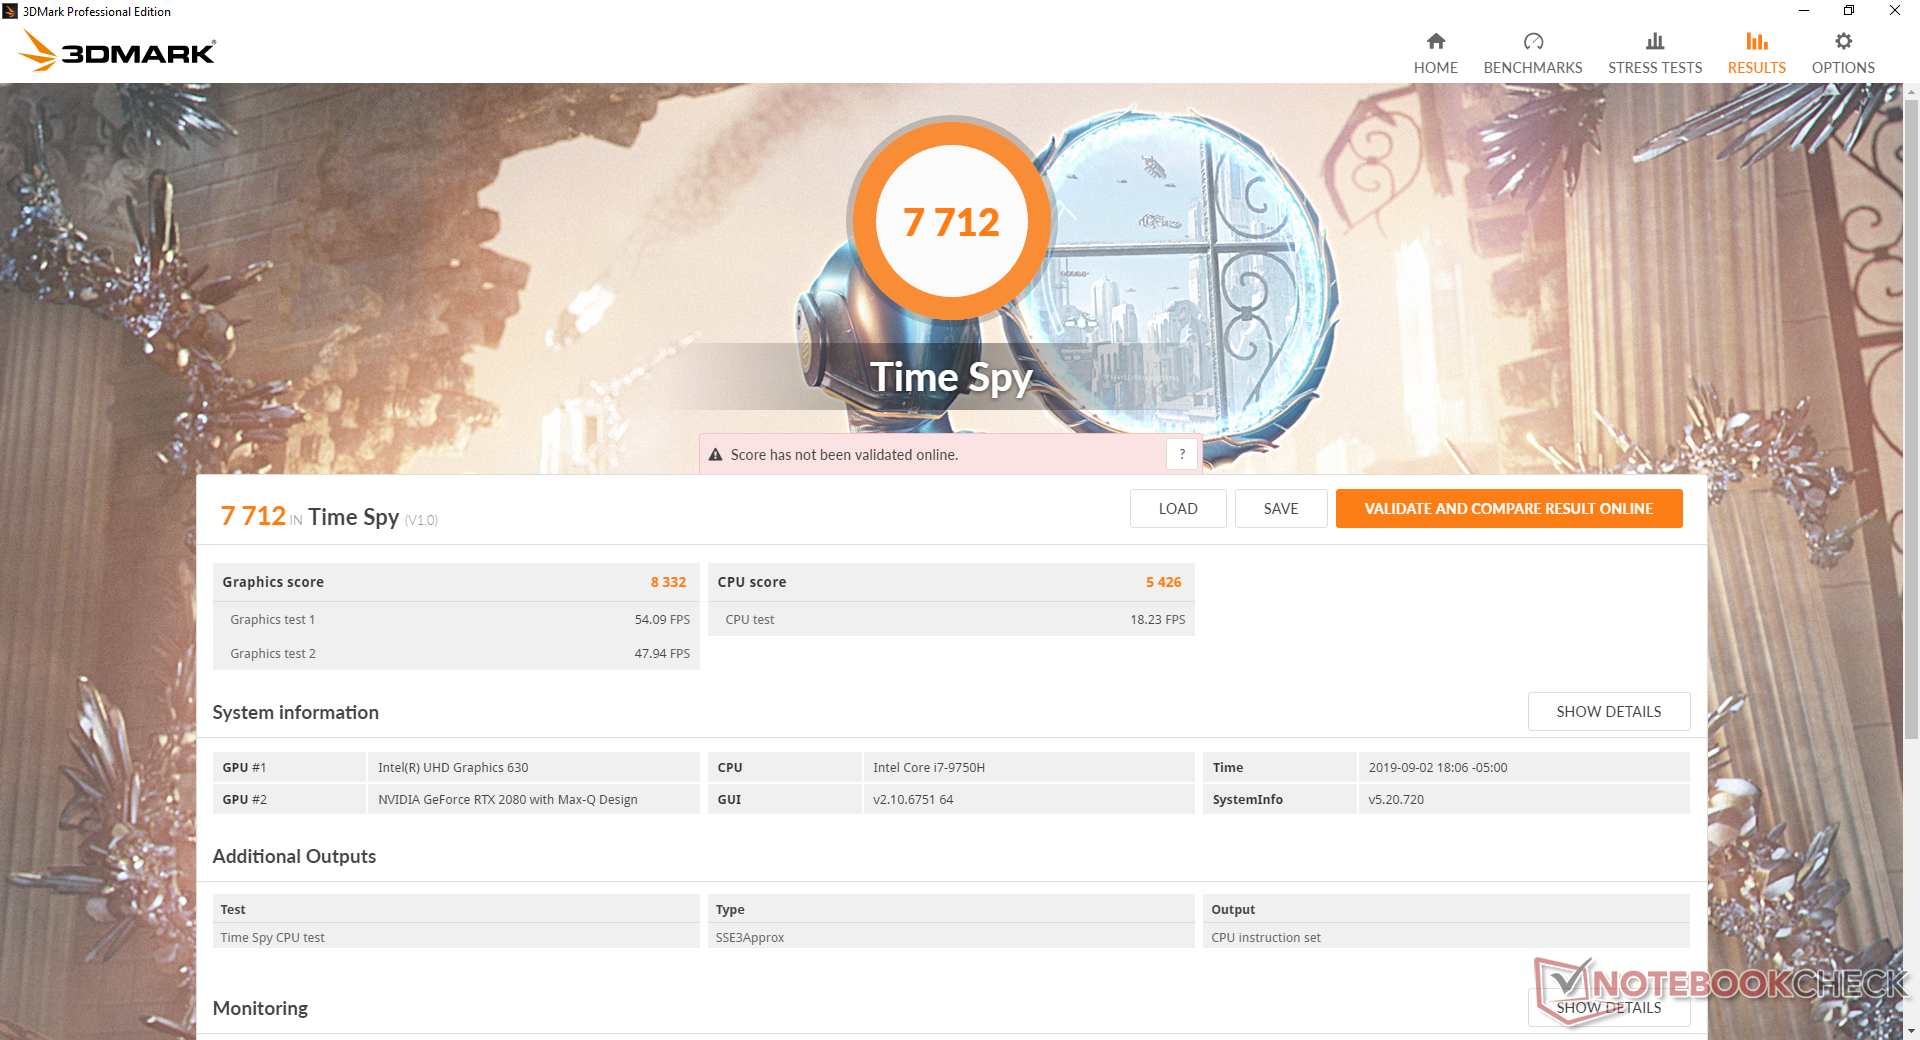
It's important to note that any performance differences between Balanced Fan and Maximum Fan modes are minimal. A Time Spy run on Balanced Fan mode returns essentially the same CPU and GPU scores as Maximum Fan mode as shown by the screenshots below. As a result, Maximum Fan mode is most useful for cooler core temperatures rather than faster performance.

| 3DMark 11 Performance | 19885 points | |
| 3DMark Cloud Gate Standard Score | 33900 points | |
| 3DMark Fire Strike Score | 17504 points | |
| 3DMark Time Spy Score | 7785 points | |
Help | ||
Gaming Performance
The RTX 2080 Max-Q is unquestionably a fast GPU capable of playing the latest games. Unfortunately on the Alienware m15 R2, the GPU is held back a bit by the limited CPU Turbo Boost potential of the chassis. Our 3DMark Physics scores above are about 5 to 10 percent slower than the average Core i7-9750H in our database. When gaming, this small CPU performance deficit can potentially impact frame rates by about 5 to 10 percent. This is most noticeable when running games on lower settings in order to reach higher frame rates where the CPU becomes more stressed. Shadow of the Tomb Raider on Low settings, for example, is 13 percent slower than the Origin PC EVO16-S equipped with the same CPU and GPU. This is somewhat disappointing considering that high frame rate targets are the best way to exploit the high refresh rate of 144 Hz and 240 Hz panels.
If your intention is 60 FPS gaming, however, then the slightly slower CPU performance of the Alienware should have almost no impact since the process will be more GPU bound.
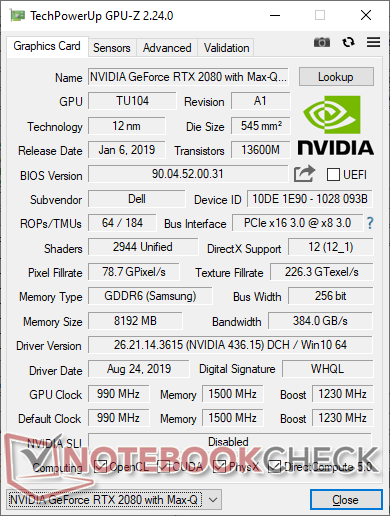
See our dedicated page on the GeForce RTX 2080 Max-Q for more technical information and benchmark comparisons.
When idling on Witcher 3 for over an hour, we're able to record two instances of sudden frame dips to single-digit frame rates as shown by our graph below. We reran the test to make sure they weren't flukes, but the frame dips would occur again during the second test. We're unsure of the cause, but unforeseen background activity is a likely culprit.
| low | med. | high | ultra | |
|---|---|---|---|---|
| BioShock Infinite (2013) | 314.6 | 273.1 | 251.7 | 166.5 |
| The Witcher 3 (2015) | 274.5 | 215.4 | 144.5 | 81.3 |
| Rocket League (2017) | 248.7 | 239.3 | 218.5 | |
| Shadow of the Tomb Raider (2018) | 114 | 91 | 89 | 87 |
Emissions
System Noise
Fan noise and behavior remain essentially identical to the m15 R1 despite the small changes to the cooling solution. Idling on desktop can range from completely silent to as loud as 49 dB(A) if set to Maximum Fan mode. If not gaming, be sure to set the fan to Quiet mode for a silent to almost silent word processing or video streaming experience. Attempting to game on Quiet mode will bump fan noise to a maximum of 40 dB(A).
Fans will pulse more frequently when set to Balanced mode. Gaming on Balanced mode will bump fan noise to the 49 dB(A) to 55 dB(A) range while Maximum Fan mode will maintain a flat 55 dB(A). The low 50 dB(A) range is not uncommon on most ultra-thin gaming laptops meaning that the Alienware isn't noticeably any quieter or louder than many of its competitors. If you want a quieter gaming laptop with the same RTX 2080 Max-Q GPU, then you may want to consider the Lenovo Legion Y740-15ICH or Blade 15.
We're able to notice very slight electronic noise when placing an ear near the keyboard keys. It's minor enough to be essentially inaudible when sitting at a normal distance from the laptop.
| Alienware m15 R2 P87F GeForce RTX 2080 Max-Q, i7-9750H, 2x Toshiba XG6 KXG60ZNV512G (RAID 0) | Alienware m15 P79F GeForce RTX 2070 Max-Q, i7-8750H, Toshiba XG5 KXG50ZNV512G | Razer Blade 15 RTX 2080 Max-Q GeForce RTX 2080 Max-Q, i7-9750H, Samsung SSD PM981 MZVLB512HAJQ | Asus Zephyrus S GX531GX GeForce RTX 2080 Max-Q, i7-8750H, Intel SSD 660p SSDPEKNW512G8 | MSI GS65 Stealth 9SG GeForce RTX 2080 Max-Q, i7-9750H, Samsung SSD PM981 MZVLB512HAJQ | Lenovo Legion Y740-15ICHg GeForce RTX 2070 Max-Q, i7-8750H, Samsung SSD PM981 MZVLB256HAHQ | |
|---|---|---|---|---|---|---|
| Noise | -4% | 14% | 1% | 8% | 10% | |
| off / environment * (dB) | 28.3 | 28.2 -0% | 28.3 -0% | 28.7 -1% | 28.3 -0% | 28 1% |
| Idle Minimum * (dB) | 28.5 | 30.3 -6% | 28.8 -1% | 29.8 -5% | 30.4 -7% | 32.6 -14% |
| Idle Average * (dB) | 28.5 | 35.4 -24% | 28.8 -1% | 32.4 -14% | 30.5 -7% | 32.7 -15% |
| Idle Maximum * (dB) | 49 | 50.3 -3% | 29 41% | 38 22% | 30.6 38% | 32.7 33% |
| Load Average * (dB) | 49 | 50.3 -3% | 33.5 32% | 38.2 22% | 37.6 23% | 33.3 32% |
| Witcher 3 ultra * (dB) | 49 | 50.2 -2% | 45 8% | 56.6 -16% | 46 6% | 41.6 15% |
| Load Maximum * (dB) | 55 | 50.2 9% | 45.2 18% | 56.6 -3% | 55.1 -0% | 45.2 18% |
* ... smaller is better
Noise level
| Idle |
| 28.5 / 28.5 / 49 dB(A) |
| Load |
| 49 / 55 dB(A) |
 | ||
30 dB silent 40 dB(A) audible 50 dB(A) loud |
||
min: | ||
Temperature
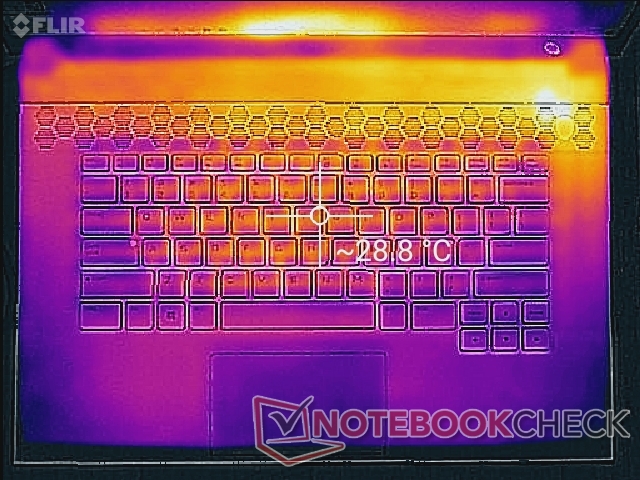
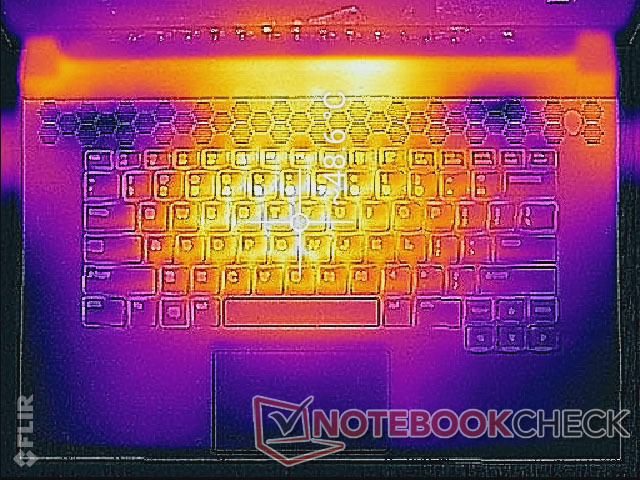
Surface temperatures when idling on Quiet mode are generally flat with the warmer areas toward the rear as expected. Surface temperatures will indubitably become cooler if idling on Balanced mode instead when the fans are more active by default.
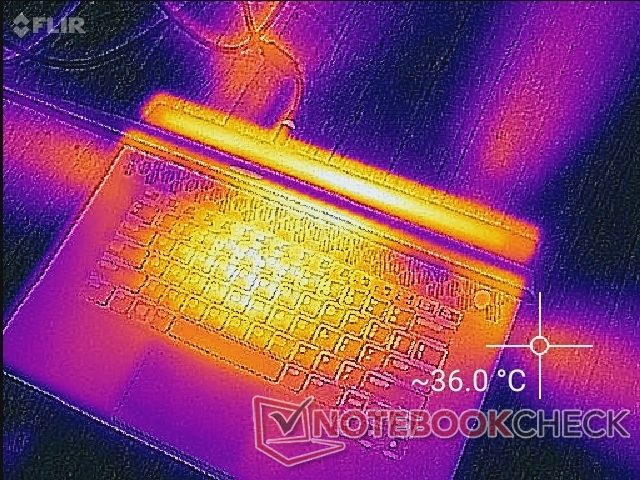
When gaming or running other high loads, the center of the keyboard can become as warm as 50 C compared to 45 C and 38 C on the Razer Blade 15 and Lenovo Legion Y740, respectively. Results are only slightly cooler than the original Alienware m15 R1 where surface temperatures can be as warm as 53 C. The warmer temperatures on the Alienware m15 R2 align with the warmer than expected CPU temperatures as our next section will detail. Thankfully, the palm rests and WASD keys never become uncomfortable warm when gaming.
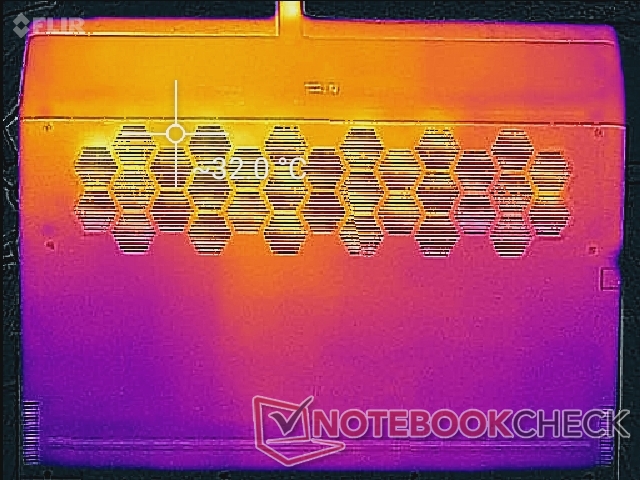
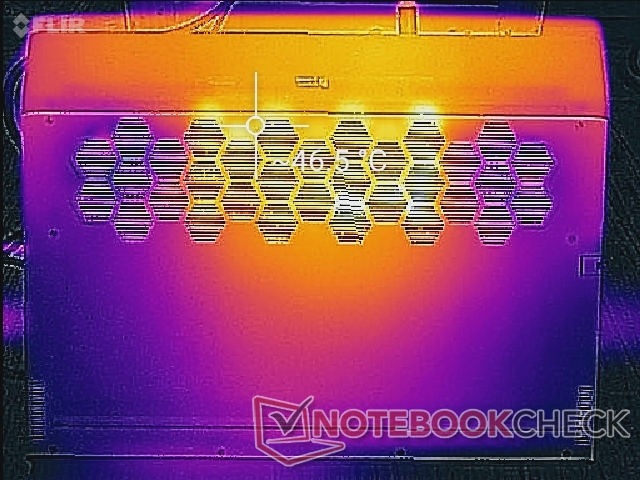
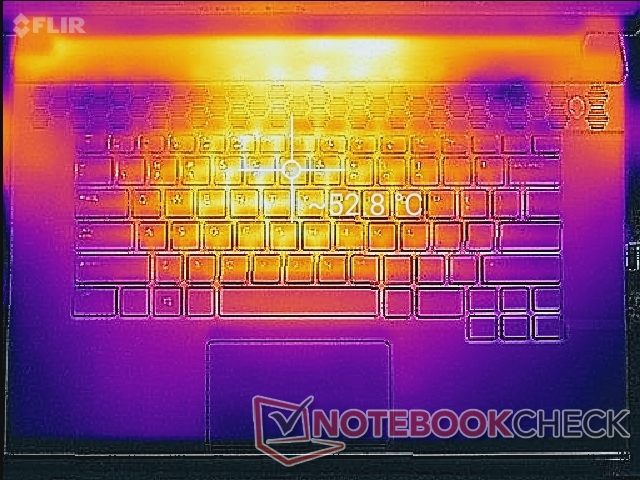
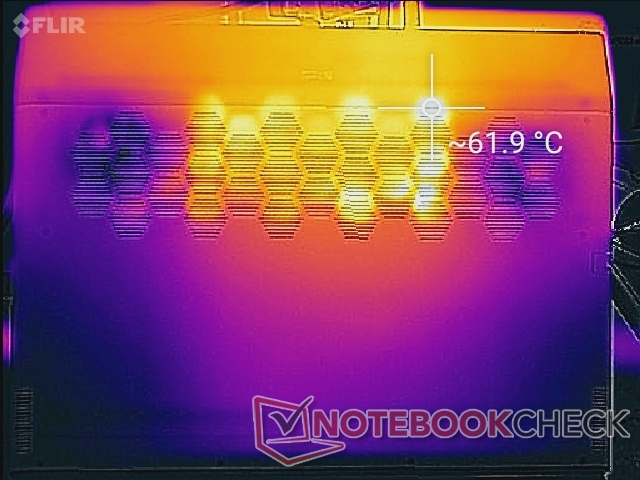
(-) The maximum temperature on the upper side is 53.8 °C / 129 F, compared to the average of 40.4 °C / 105 F, ranging from 21.2 to 68.8 °C for the class Gaming.
(-) The bottom heats up to a maximum of 58 °C / 136 F, compared to the average of 43.2 °C / 110 F
(+) In idle usage, the average temperature for the upper side is 28 °C / 82 F, compared to the device average of 33.9 °C / 93 F.
(±) Playing The Witcher 3, the average temperature for the upper side is 36.3 °C / 97 F, compared to the device average of 33.9 °C / 93 F.
(+) The palmrests and touchpad are reaching skin temperature as a maximum (32.2 °C / 90 F) and are therefore not hot.
(-) The average temperature of the palmrest area of similar devices was 28.8 °C / 83.8 F (-3.4 °C / -6.2 F).
Stress Test
We stress the system with synthetic loads to identify for any potential throttling or stability issues and it is here where we discover the crux of the Alienware m15 R2. When running Prime95, CPU temperature jumps immediately to 100 C with 4.0 GHz Turbo Boost lasting for no more than just a couple of seconds seconds. On most other gaming laptops, the rise in temperature is more gradual and maximum Turbo Boost benefits are longer. Clock rates eventually drop to the 3.1 to 3.2 GHz range with core temperatures still in the 90 C range. The Razer Blade 15 with the same Core i7 CPU as our Alienware settles at a much cooler core temperature of 63 C when subjected to the same Prime95 load.
Though Prime95 doesn't represent real-world loads, we're able to observe similar results when running Witcher 3 to represent typical gaming loads. CPU temperatures are just as high at nearly 100 C with CPU clock rates fluctuating between 2.2 GHz and 3.2 GHz as the processor struggles to balance clock rates with temperature. In contrast, the same CPU in the Razer Blade 15 runs stabler at 4.1 GHz and 80 C. Running our Alienware on Maximum Fan mode improves CPU clock rates somewhat, but the very high core temperatures remain. This disappointing CPU behavior lines up with our 3DMark and gaming benchmark observations above.
With the CPU sweating buckets, the RTX 2080 Max-Q GPU appears to have no performance issues whatsoever. Core temperature remains steady in the low 70 C range when gaming which is typical of a GeForce GTX or RTX Max-Q GPU.
Running on batteries will limit performance. A Fire Strike run on battery power returns Physics and Graphics scores of 9548 and 6296 points, respectively. compared to 14268 and 21758 points when on mains.
Note that HWiNFO stops recording CPU temperature once the core hits 100 C or greater.
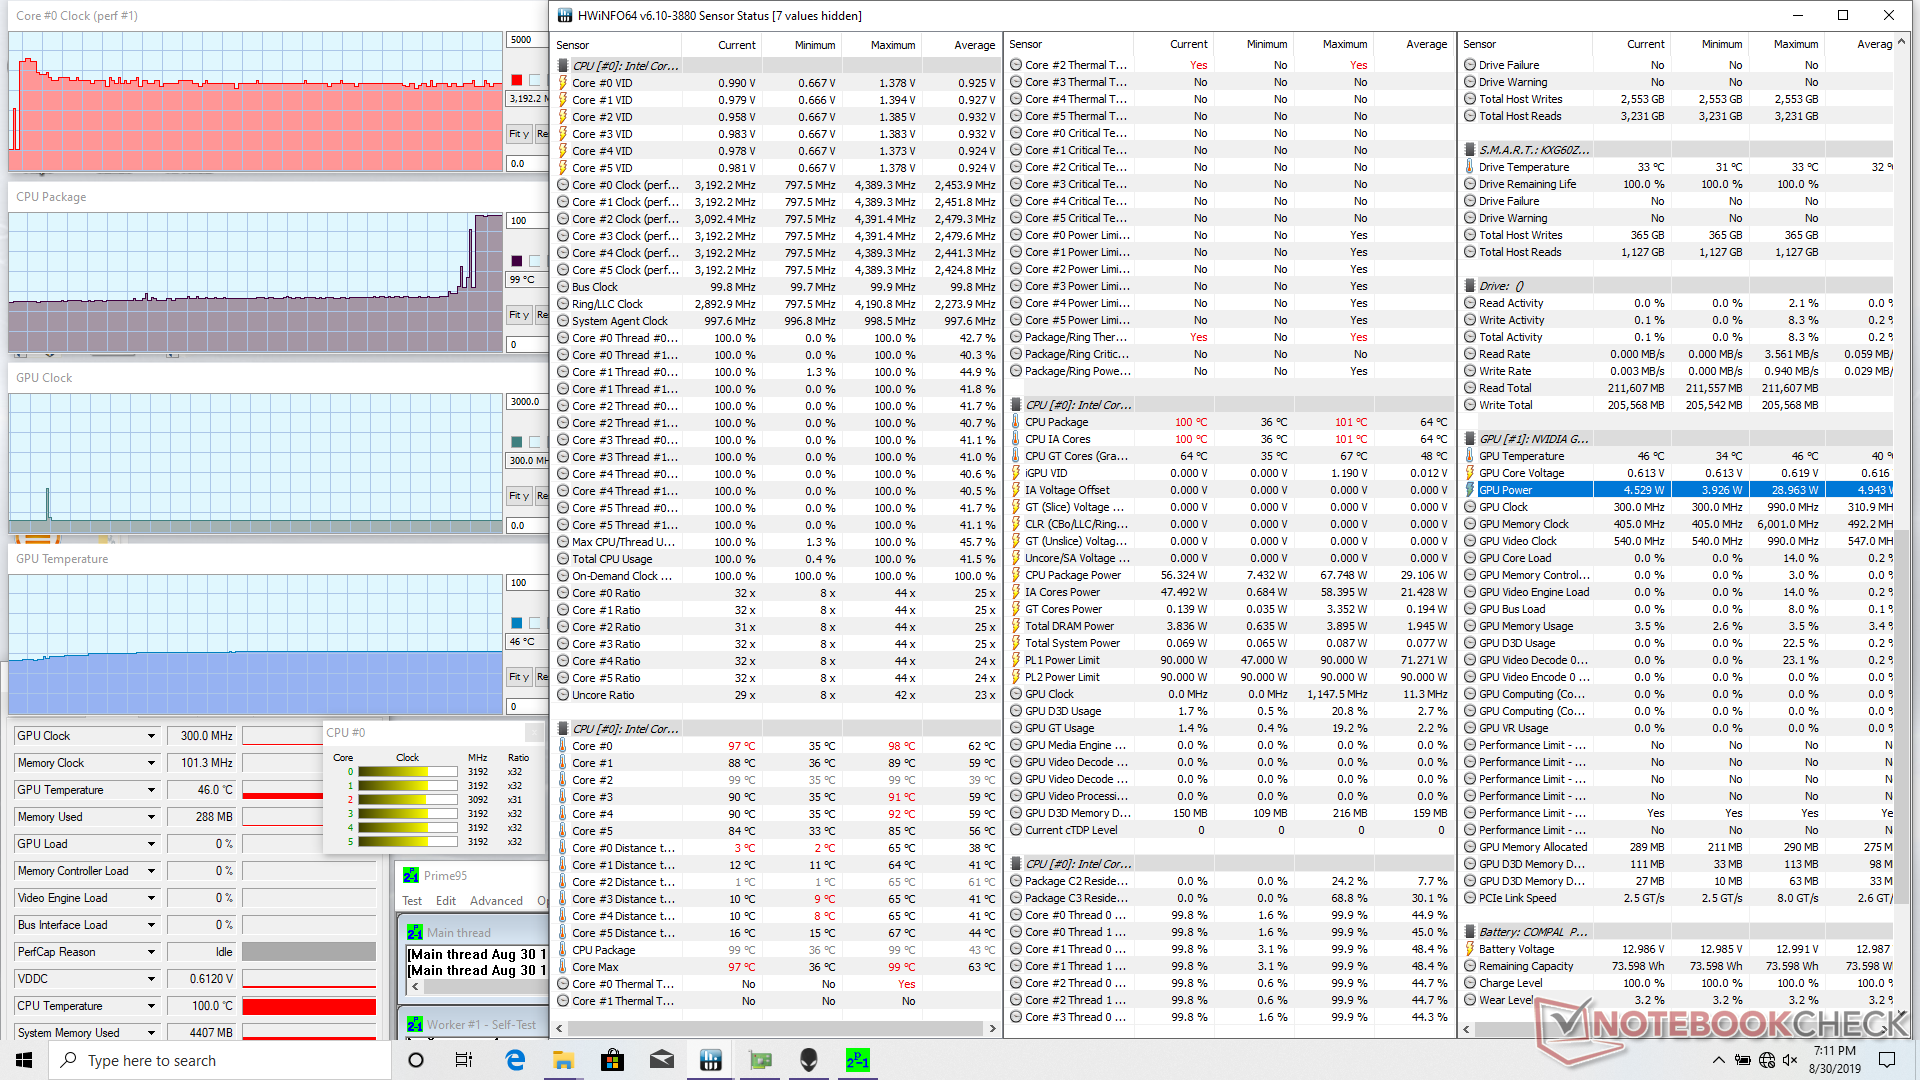
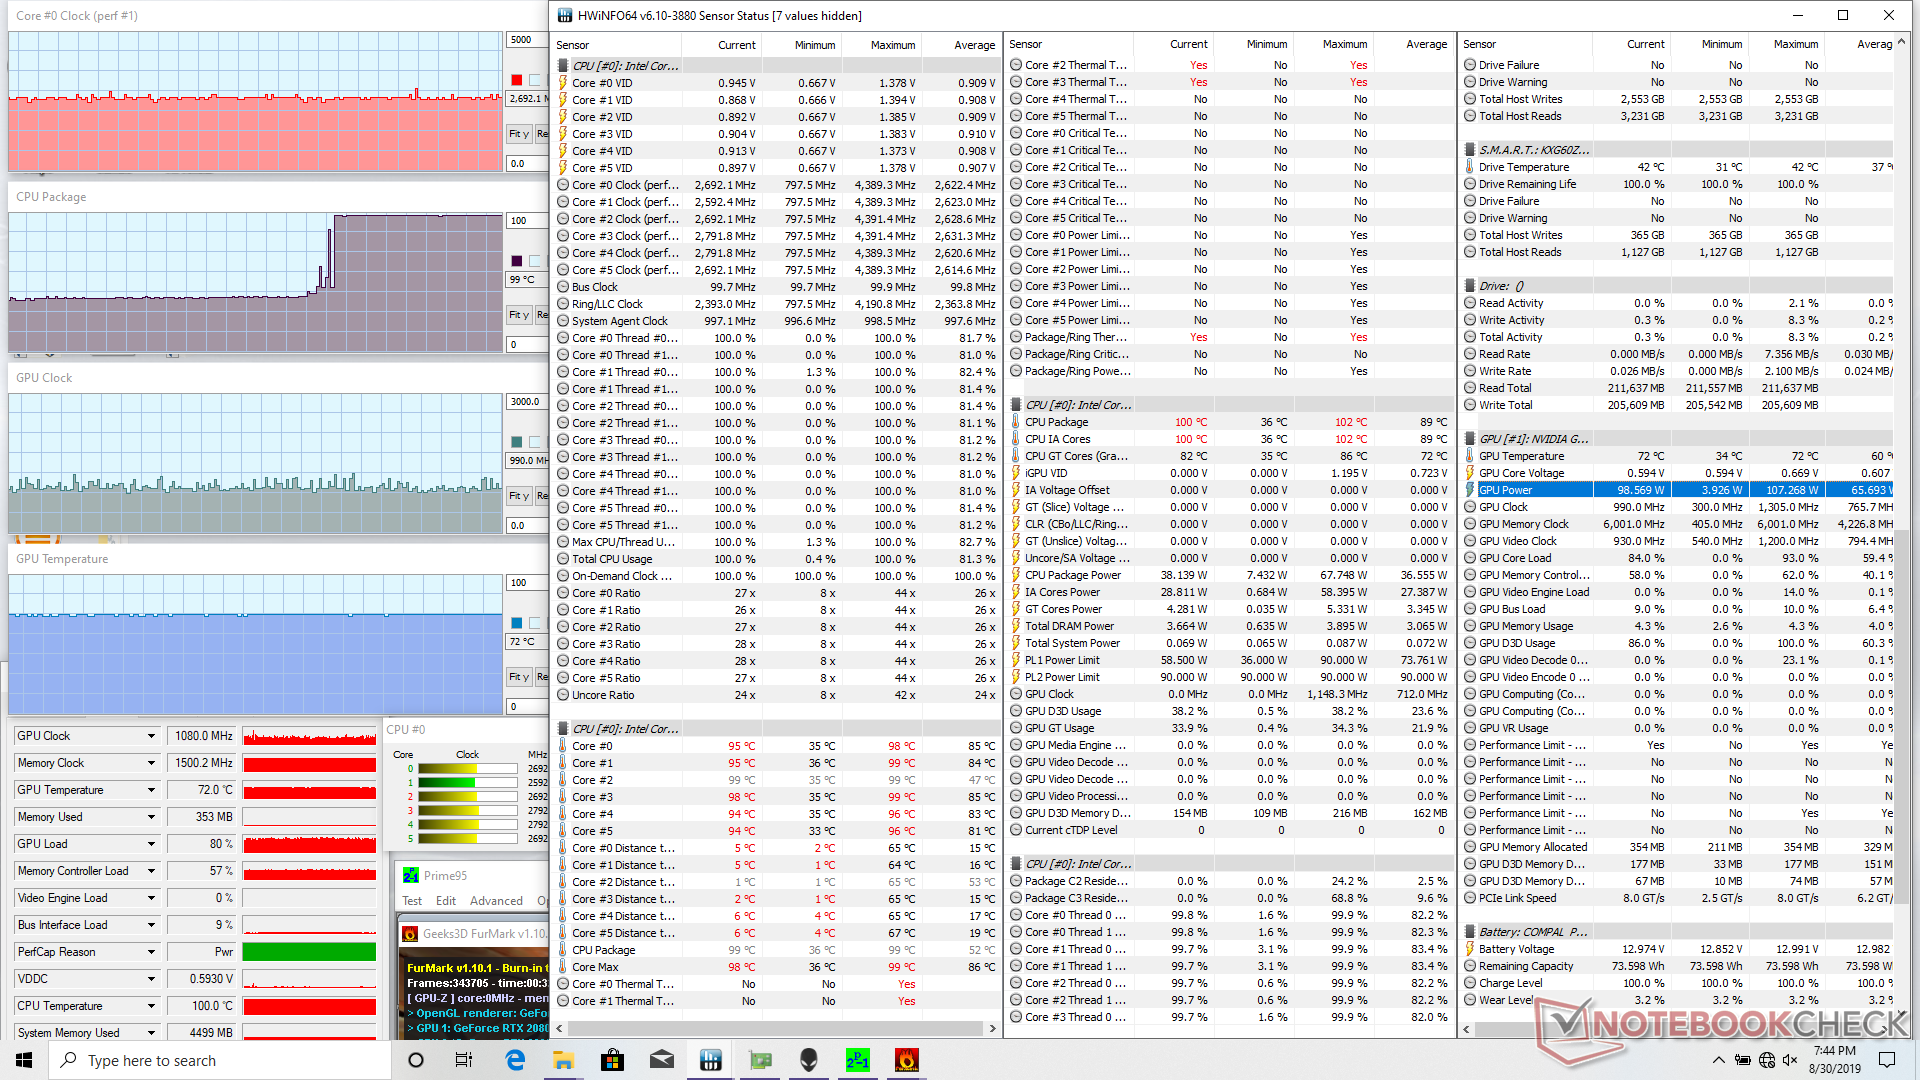
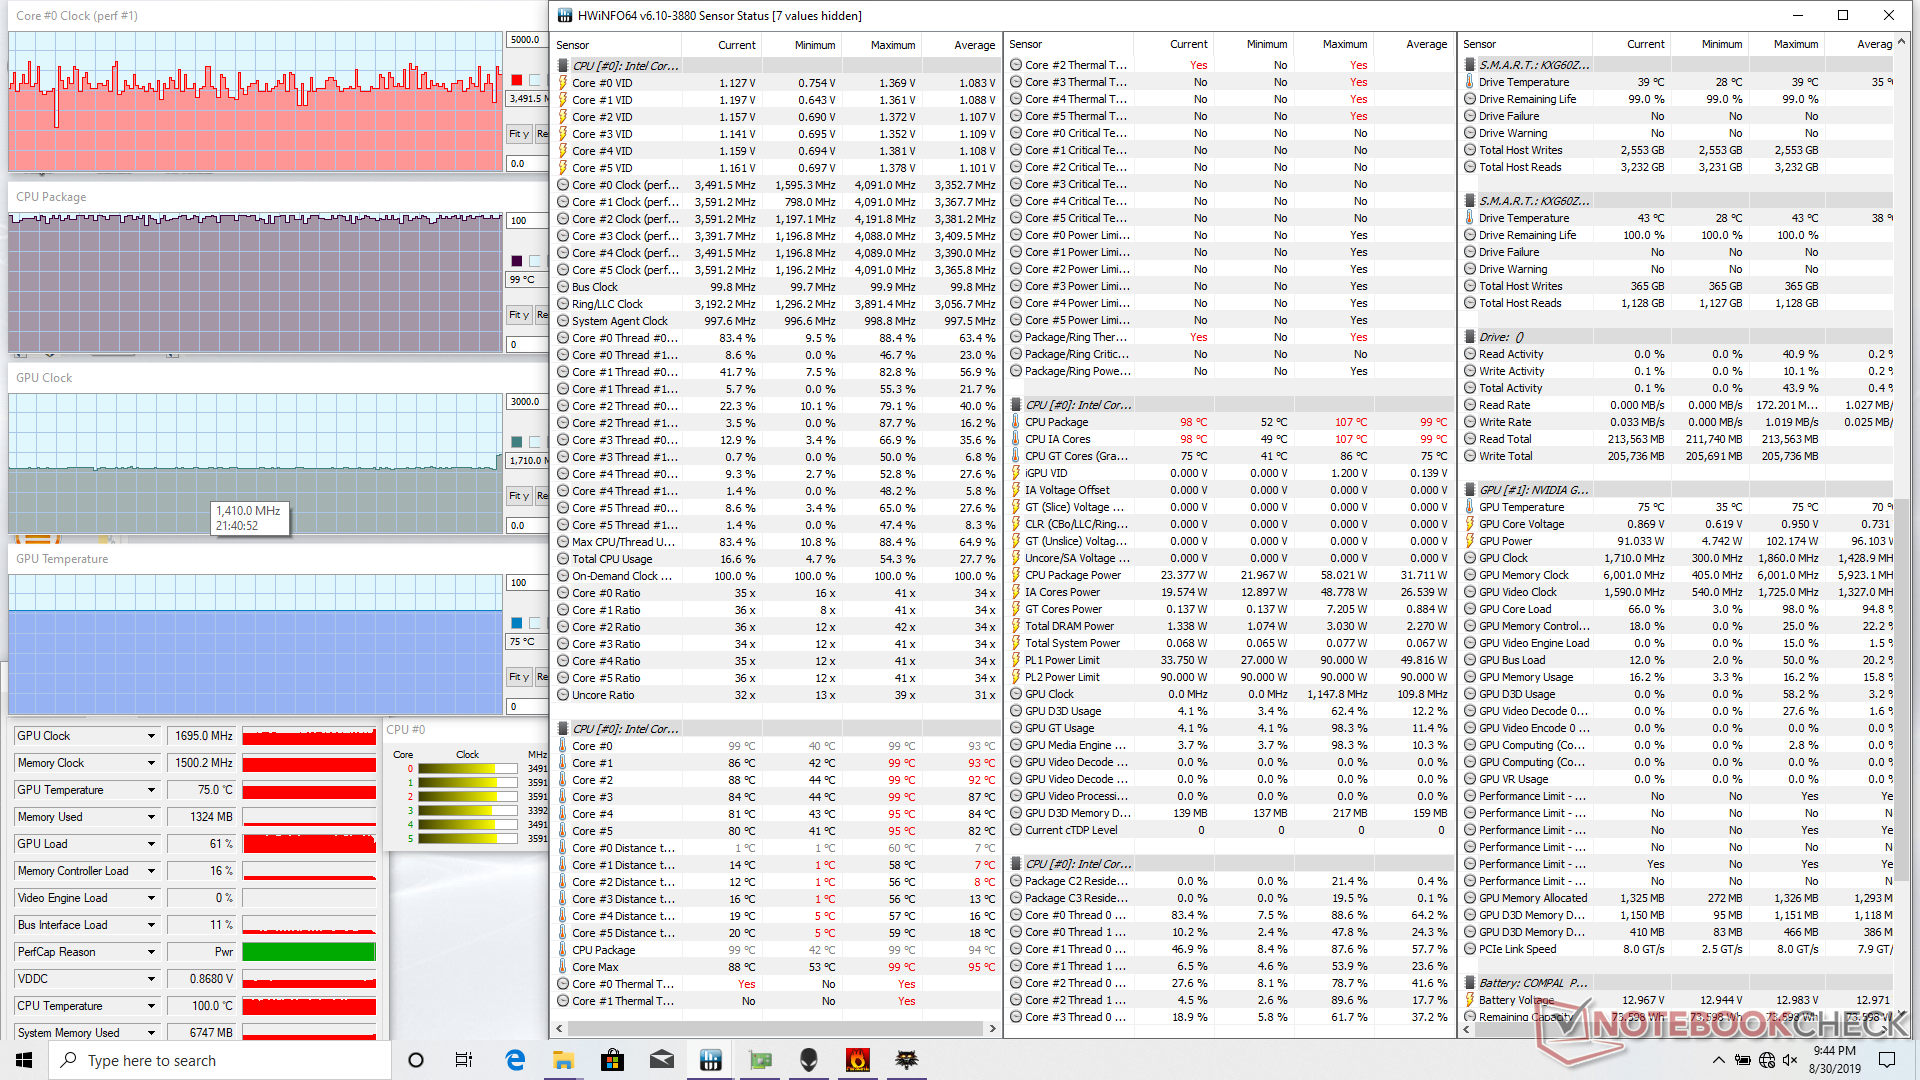
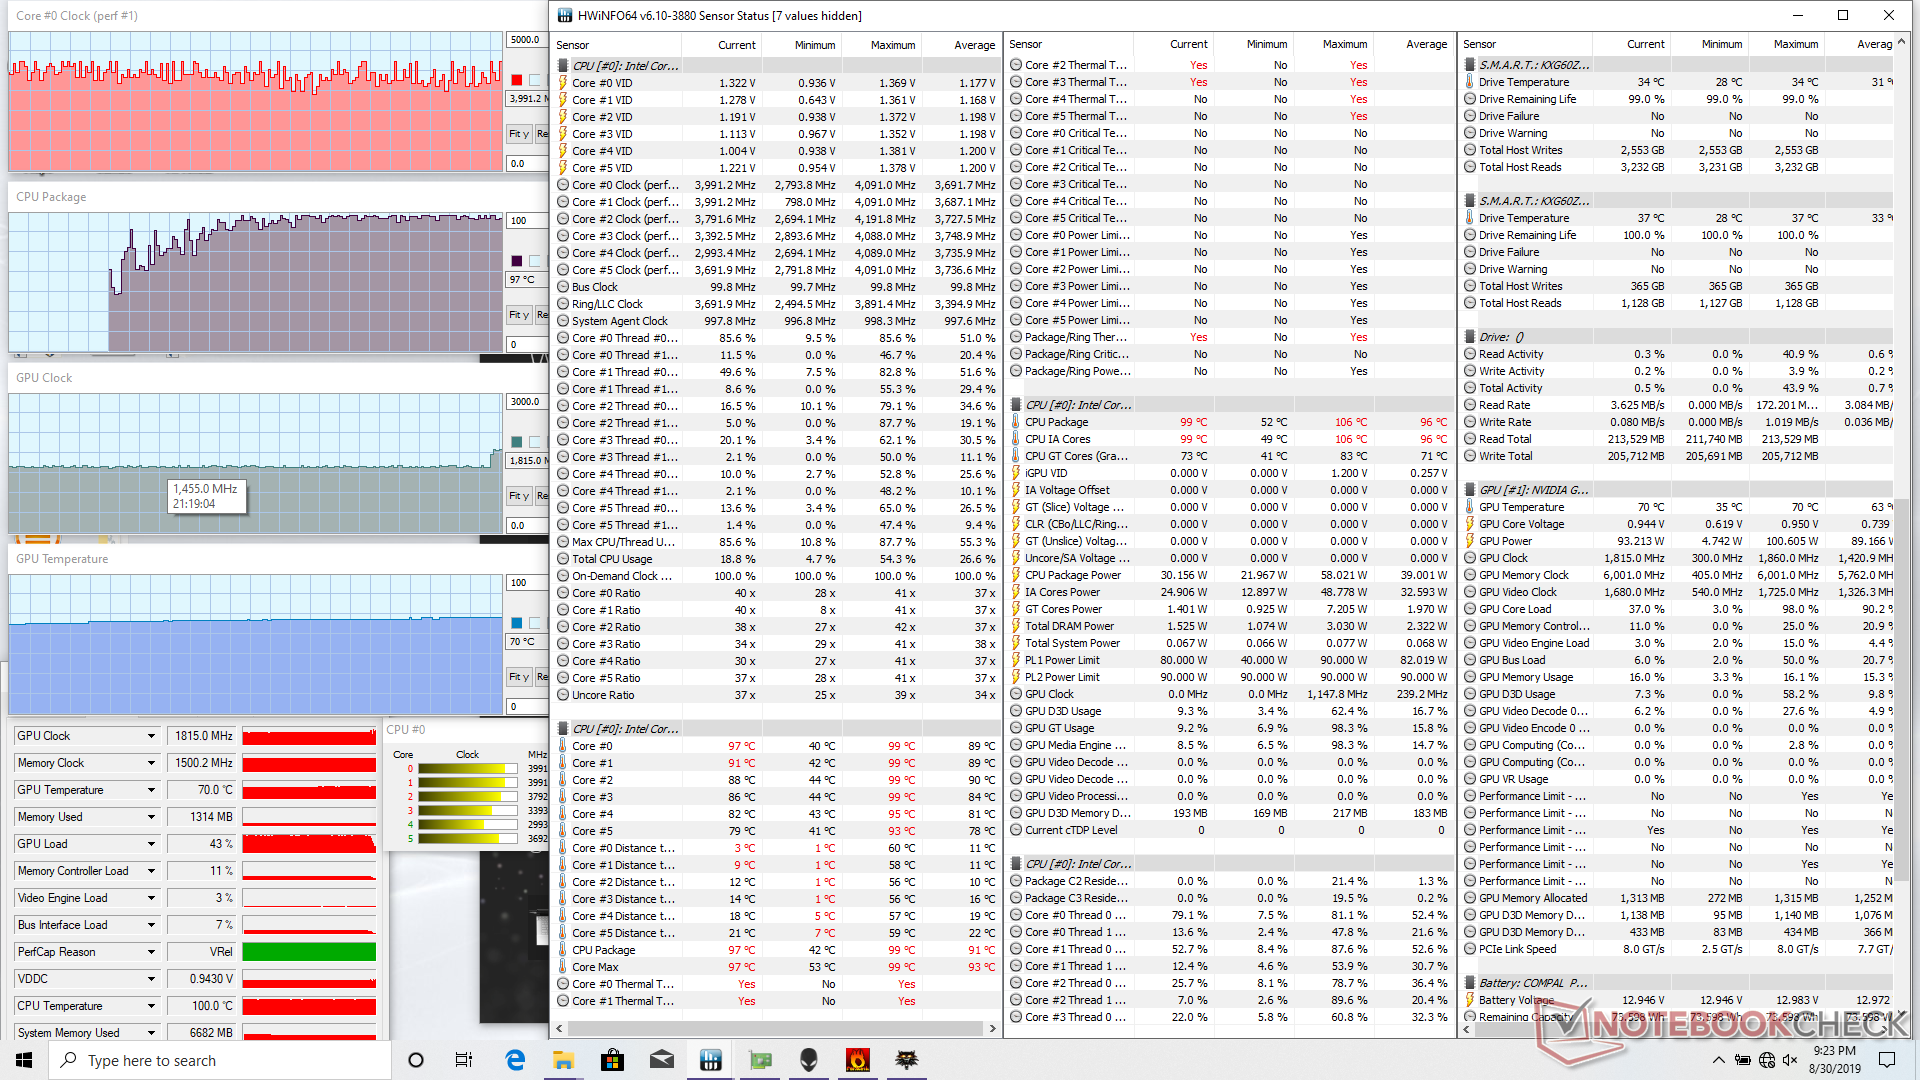
| CPU Clock (GHz) | GPU Clock (MHz) | Average CPU Temperature (°C) | Average GPU Temperature (°C) | |
| Prime95 Stress | 3.1 - 3.2 | -- | 100 | -- |
| Prime95 + FurMark Stress (Maximum Fan) | 2.7 | ~1080 | 100 | 72 |
| Witcher 3 Stress (Balanced Fan) | ~2.2 - 3.2 | 1410 | 99 | 75 |
| Witcher 3 Stress (Maximum Fan) | ~2.8 - 4.0 | 1455 | 99 | 70 |
Speakers
Maximum volume is loud and almost identical to what we measured on the m15 R1 but with a broader pink noise graph for better balance. The palm rests vibrate only slightly when on high volume settings. Bass is lacking which is unsurprising for an ultrathin gaming laptop with no dedicated subwoofer.


Alienware m15 R2 P87F audio analysis
(+) | speakers can play relatively loud (84 dB)
Bass 100 - 315 Hz
(-) | nearly no bass - on average 18.8% lower than median
(±) | linearity of bass is average (11.9% delta to prev. frequency)
Mids 400 - 2000 Hz
(+) | balanced mids - only 4.8% away from median
(+) | mids are linear (6.6% delta to prev. frequency)
Highs 2 - 16 kHz
(+) | balanced highs - only 1.3% away from median
(±) | linearity of highs is average (7.4% delta to prev. frequency)
Overall 100 - 16.000 Hz
(±) | linearity of overall sound is average (19.8% difference to median)
Compared to same class
» 69% of all tested devices in this class were better, 6% similar, 24% worse
» The best had a delta of 6%, average was 18%, worst was 132%
Compared to all devices tested
» 50% of all tested devices were better, 7% similar, 43% worse
» The best had a delta of 4%, average was 24%, worst was 134%
Apple MacBook 12 (Early 2016) 1.1 GHz audio analysis
(+) | speakers can play relatively loud (83.6 dB)
Bass 100 - 315 Hz
(±) | reduced bass - on average 11.3% lower than median
(±) | linearity of bass is average (14.2% delta to prev. frequency)
Mids 400 - 2000 Hz
(+) | balanced mids - only 2.4% away from median
(+) | mids are linear (5.5% delta to prev. frequency)
Highs 2 - 16 kHz
(+) | balanced highs - only 2% away from median
(+) | highs are linear (4.5% delta to prev. frequency)
Overall 100 - 16.000 Hz
(+) | overall sound is linear (10.2% difference to median)
Compared to same class
» 7% of all tested devices in this class were better, 2% similar, 91% worse
» The best had a delta of 5%, average was 18%, worst was 53%
Compared to all devices tested
» 5% of all tested devices were better, 1% similar, 94% worse
» The best had a delta of 4%, average was 24%, worst was 134%
Energy Management
Power Consumption
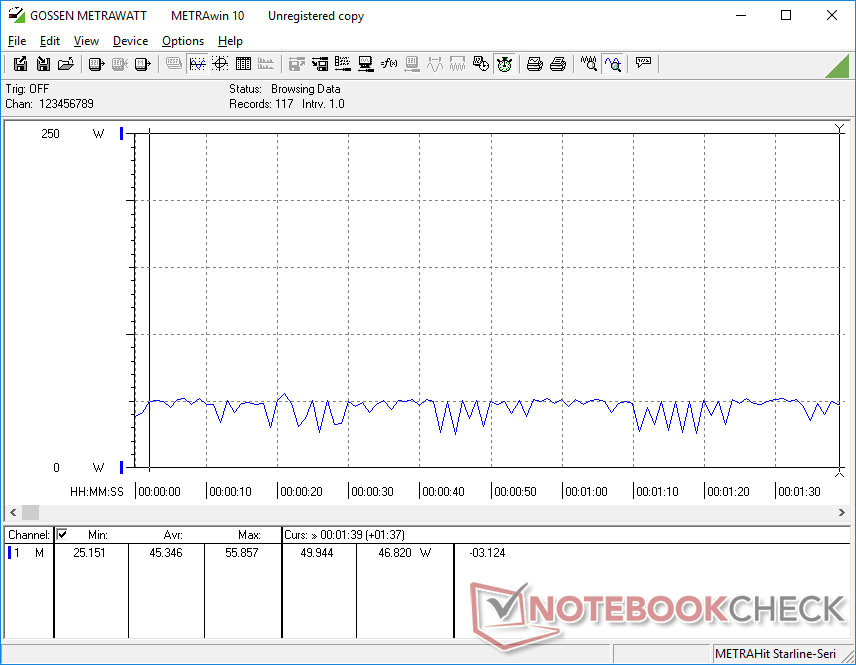
When idling, consumption can range from 19 W to as high as 52 W depending on the brightness level and performance setting. Consumption would sometimes spike for seemingly no reason even when on Quiet mode to suggest that Dell could be doing better at keeping background activity to a minimum when the system is at a power-saving state. In comparison, most other 15.6-inch gaming laptops are more efficient and would idle at the 20 W to 30 W range instead.
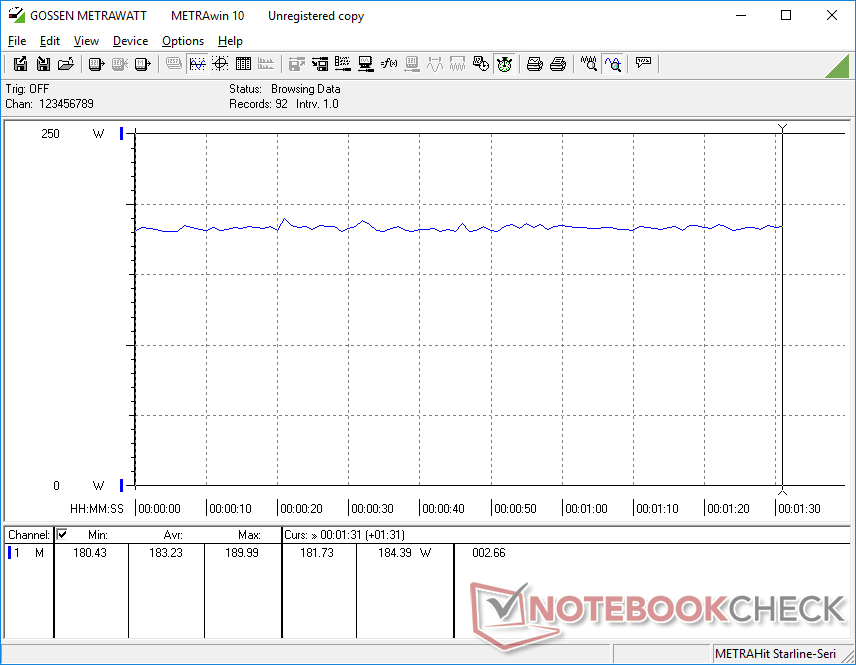
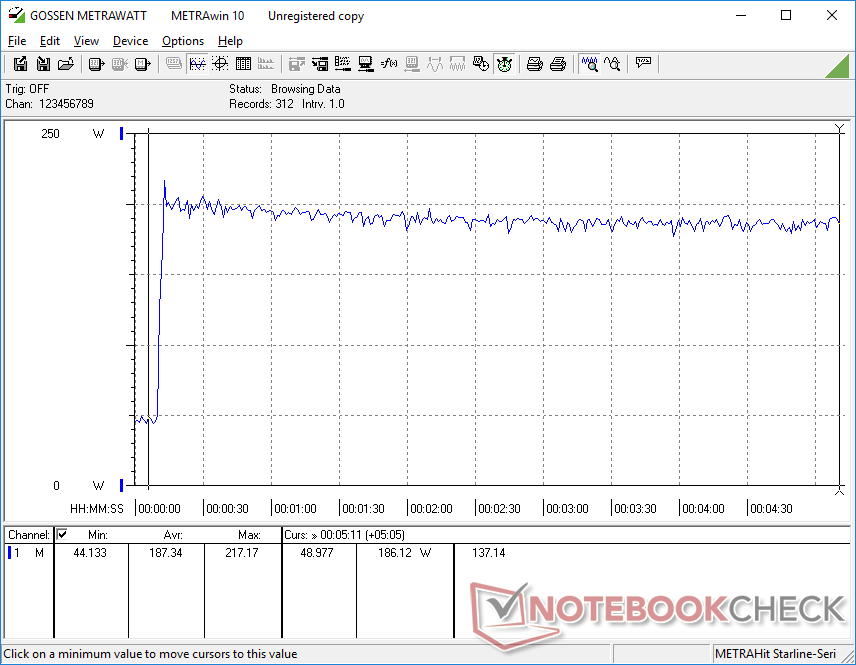
When gaming, consumption is steady at about 183 W compared to 159 W on the now-outdated Alienware 15 R3 with GTX 1080 Max-Q graphics. It's an 18 to 37 percent increase in graphics performance for a 15 percent increase in power consumption when jumping from the last generation Pascal GPU. The Blade 15 with the same RTX 2080 Max-Q GPU, however, is still the more power efficient machine as it consumes about 20 W less for a similar level of gaming performance.
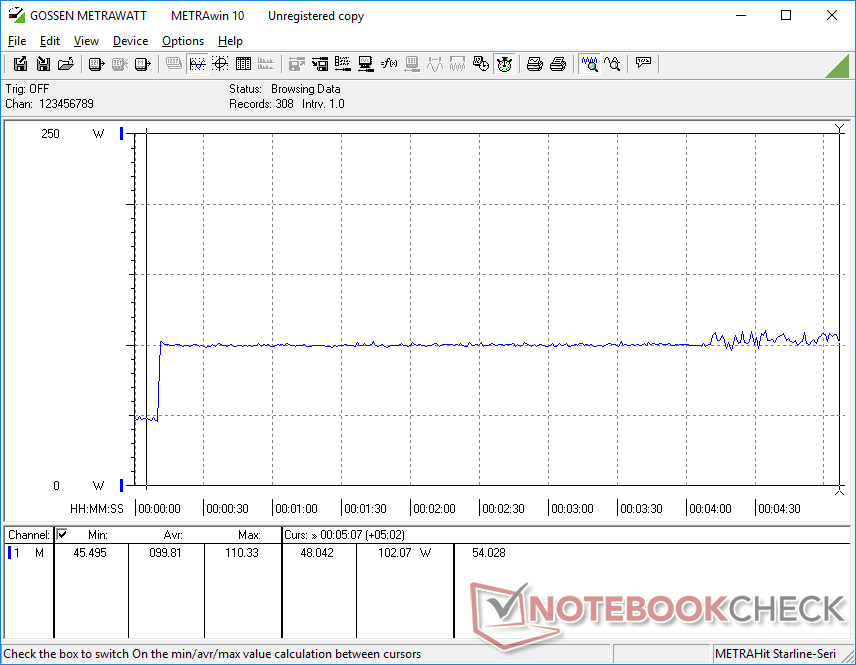
When running Prime95, consumption remains constant at about 102 W with no temporary spike that we would normally see on most other laptops. This suggests very limited maximum Turbo Boost potential which aligns with our Stress Test and CineBench R15 loop test observations above.
We're able to record a maximum consumption of 217 W from the medium-large (~20 x 10 x 2.5 cm) 240 W AC adapter meaning that there is enough headroom to both game and recharge simultaneously. The Dell adapter is slightly thinner than most other adapters but at the cost of a larger footprint.
| Off / Standby | |
| Idle | |
| Load |
|
Key:
min: | |
| Alienware m15 R2 P87F i7-9750H, GeForce RTX 2080 Max-Q, 2x Toshiba XG6 KXG60ZNV512G (RAID 0), IPS, 1920x1080, 15.6" | Alienware m15 P79F i7-8750H, GeForce RTX 2070 Max-Q, Toshiba XG5 KXG50ZNV512G, OLED, 3840x2160, 15.6" | Razer Blade 15 RTX 2080 Max-Q i7-9750H, GeForce RTX 2080 Max-Q, Samsung SSD PM981 MZVLB512HAJQ, IPS, 1920x1080, 15.6" | Lenovo Legion Y740-15ICHg i7-8750H, GeForce RTX 2070 Max-Q, Samsung SSD PM981 MZVLB256HAHQ, IPS, 1920x1080, 15.6" | MSI GP65 Leopard 9SE-225US i7-9750H, GeForce RTX 2060 Mobile, Toshiba KBG30ZMT512G, IPS, 1920x1080, 15.6" | Alienware 15 R3 Max-Q i7-7820HK, GeForce GTX 1080 Max-Q, LiteOn CX2-8B256, IPS, 1920x1080, 15.6" | |
|---|---|---|---|---|---|---|
| Power Consumption | 35% | 34% | 24% | 31% | 18% | |
| Idle Minimum * (Watt) | 19 | 10.9 43% | 12.5 34% | 22.9 -21% | 13.6 28% | 22 -16% |
| Idle Average * (Watt) | 40.5 | 12.3 70% | 15.3 62% | 27.2 33% | 17.9 56% | 26 36% |
| Idle Maximum * (Watt) | 52 | 19 63% | 20.7 60% | 27.5 47% | 20.6 60% | 33 37% |
| Load Average * (Watt) | 132.3 | 96 27% | 90.2 32% | 83.4 37% | 96 27% | 86 35% |
| Witcher 3 ultra * (Watt) | 183.3 | 161.7 12% | 162 12% | 143.6 22% | 154.6 16% | 159 13% |
| Load Maximum * (Watt) | 217.2 | 229.1 -5% | 209.3 4% | 160.5 26% | 218.6 -1% | 215 1% |
* ... smaller is better
Battery Life
Despite having a smaller battery than the original Alienware m15 R1 (76 Wh vs. 90 Wh), WLAN runtimes between them remain somewhat similar. We're able to record 5.5 hours of real-world WLAN use before automatic shutdown to be just slightly above average for a gaming laptop.
Recharging from empty to full capacity takes about two hours. The Thunderbolt 3 port cannot be used to recharge the system.
| Alienware m15 R2 P87F i7-9750H, GeForce RTX 2080 Max-Q, 76 Wh | Alienware m15 P79F i7-8750H, GeForce RTX 2070 Max-Q, 90 Wh | Razer Blade 15 RTX 2080 Max-Q i7-9750H, GeForce RTX 2080 Max-Q, 80 Wh | Asus Zephyrus S GX531GX i7-8750H, GeForce RTX 2080 Max-Q, 50 Wh | MSI GS65 Stealth 9SG i7-9750H, GeForce RTX 2080 Max-Q, 82 Wh | Lenovo Legion Y740-15ICHg i7-8750H, GeForce RTX 2070 Max-Q, 57 Wh | |
|---|---|---|---|---|---|---|
| Battery runtime | -5% | 79% | -45% | 9% | -31% | |
| Reader / Idle (h) | 9.2 | 15.9 73% | 3.9 -58% | |||
| WiFi v1.3 (h) | 5.5 | 5.2 -5% | 6.6 20% | 3 -45% | 6 9% | 2.8 -49% |
| Load (h) | 0.7 | 1.7 143% | 0.8 14% |
Pros
Cons
Verdict
As the second generation model in the series, we expect the Alienware m15 R2 to be objectively better than the first generation Alienware m15 R1 in every way. This isn't necessarily the case even on paper; both RAM and WLAN are now soldered while battery capacity is smaller this time around. In turn, users gain 2.5 Gbit Ethernet, improved keyboard feedback, optional Wi-Fi 6, per-key RGB lighting, and an arguably more attractive look that doesn't feel any weaker or stronger than the outgoing design it replaces.
Dig deeper into the m15 R2 and its disadvantages begin to show. CPU temperature in particular is too high for comfort at nearly 100 C when gaming even with the fans set to maximum. We would have been okay with the high temperatures had they meant quieter fans or faster performance than the competition, but that is not the case. If alternatives like the Asus Zephyrus S GX531, HP Omen 15, Razer Blade 15, or MSI GS65 can each run 20 C cooler, then there's no reason why the Alienware m15 R2 shouldn't be able to as well. We unfortunately observed these same results on the older Alienware m15 R1 to suggest that the m15 R2 chassis doesn't solve one of our main criticisms about the relatively new Alienware m15 series.
Perhaps as a result of the high CPU temperatures, the Core i7-9750H in the m15 R2 performs slightly slower than the average i7-9750H in our database and even the Core i7-8750H in the Alienware m15 R1. CPU Clock rates can be much more variable than anticipated and frame rates when gaming are consequently a bit lower as well when the CPU is heavily stressed.
If you're in the market for an Alienware laptop, there's no shame in opting for the older Alienware m15 R1 as the m15 R2 is more of a sideways step in terms of overall performance, upgradeability, and features. We recommend investing in a high refresh rate display while avoiding the Core i9 and base 8 GB RAM configurations.
The new upgrades over the last generation Alienware m15 R1 model are mostly skin deep. While the Alienware m15 R2 looks sleeker with added per-key RGB lighting, internal attributes like fan noise and very warm CPU temperatures haven't really changed.
Alienware m15 R2 P87F
- 09/05/2019 v7 (old)
Allen Ngo
Price comparison
