Asus ROG Strix RTX 2080 OC Desktop Graphics Card Review
A few days ago we reviewed the Asus ROG RTX Strix 2070 OC, the low-end of the current Turing line-up. Now, we are going to take a closer look at the Asus ROG RTX Strix 2080 OC, the second-fastest Turing GPU and only second to the RTX 2080 Ti. At the time of writing, the GPU sold for around 950 Euros (~$1083) in Europe, and US prices were not yet available. In other words: It was around 300 Euros (~$342) more expensive than the RTX 2070 but still a whopping 500 Euros (~$570) cheaper than the 2080 Ti. At 1,450 Euros (~$1653) the latter is even more expensive than the Nvidia Titan X when it was first launched.
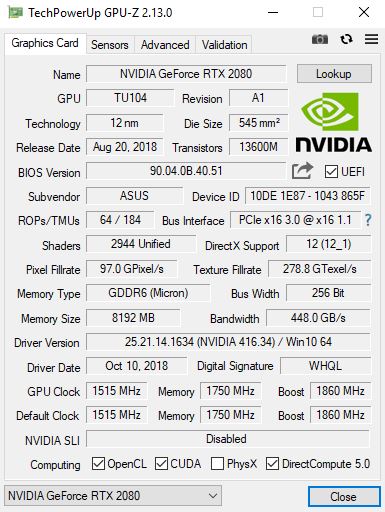
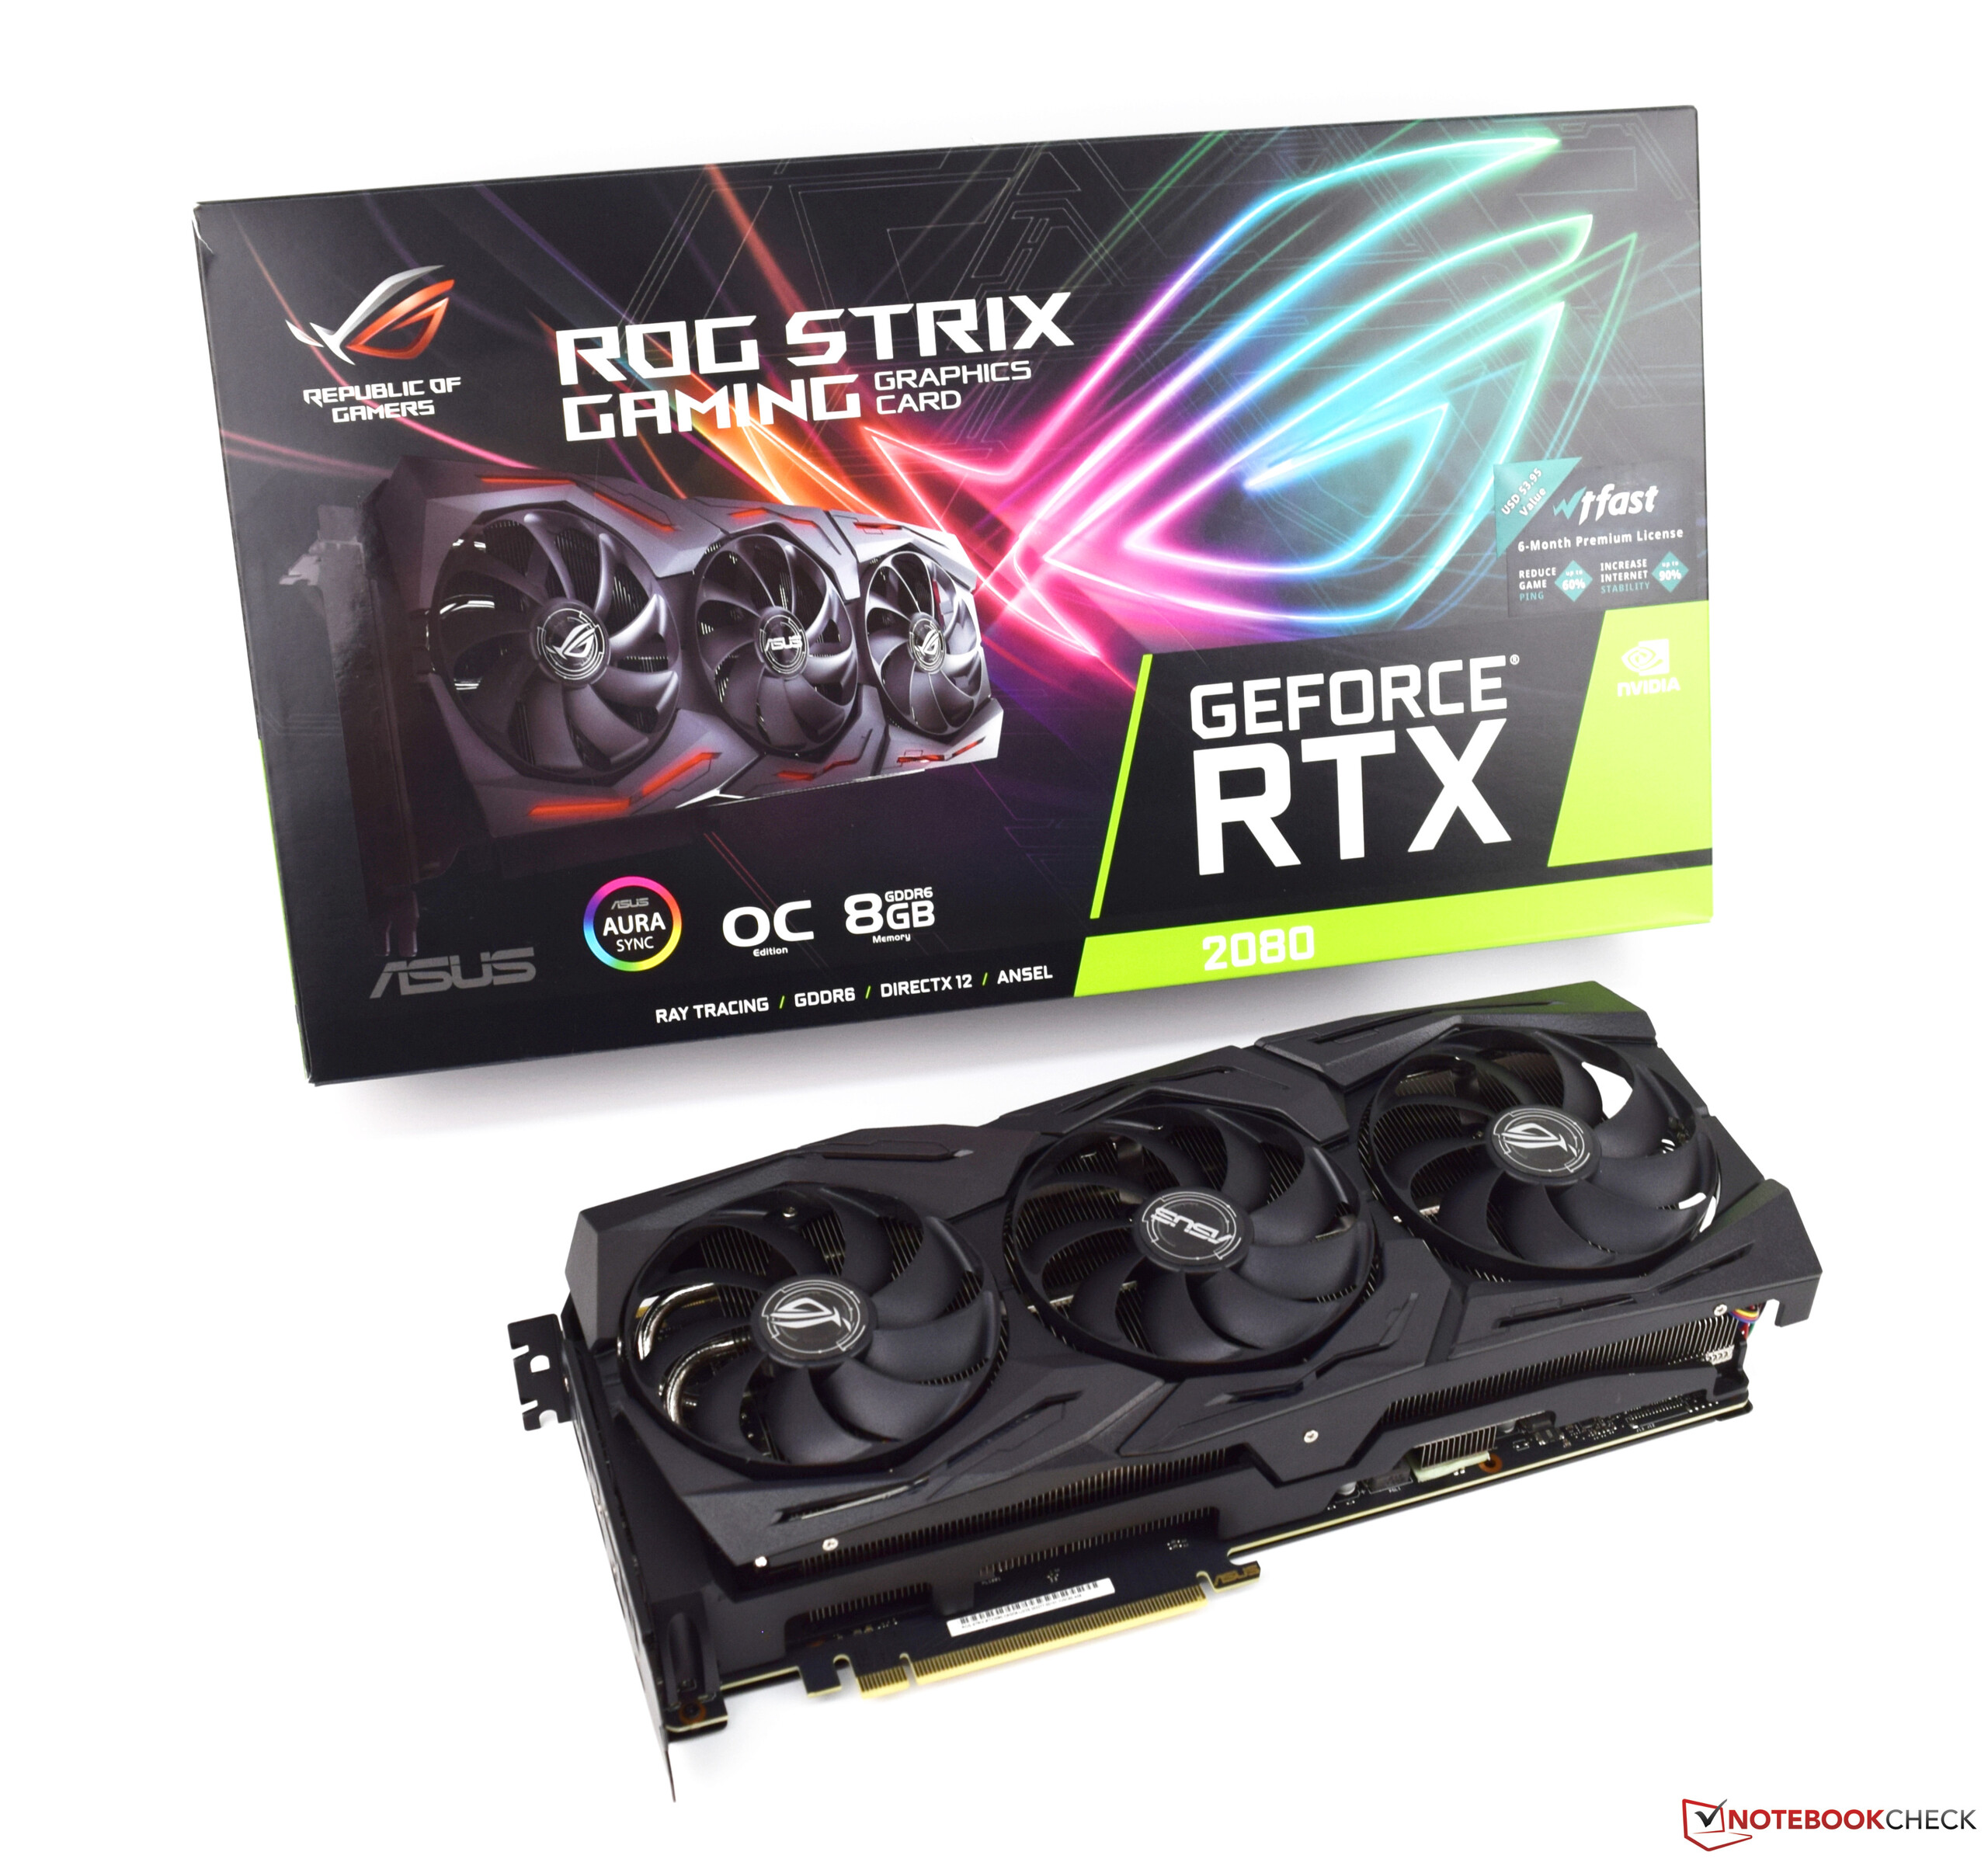
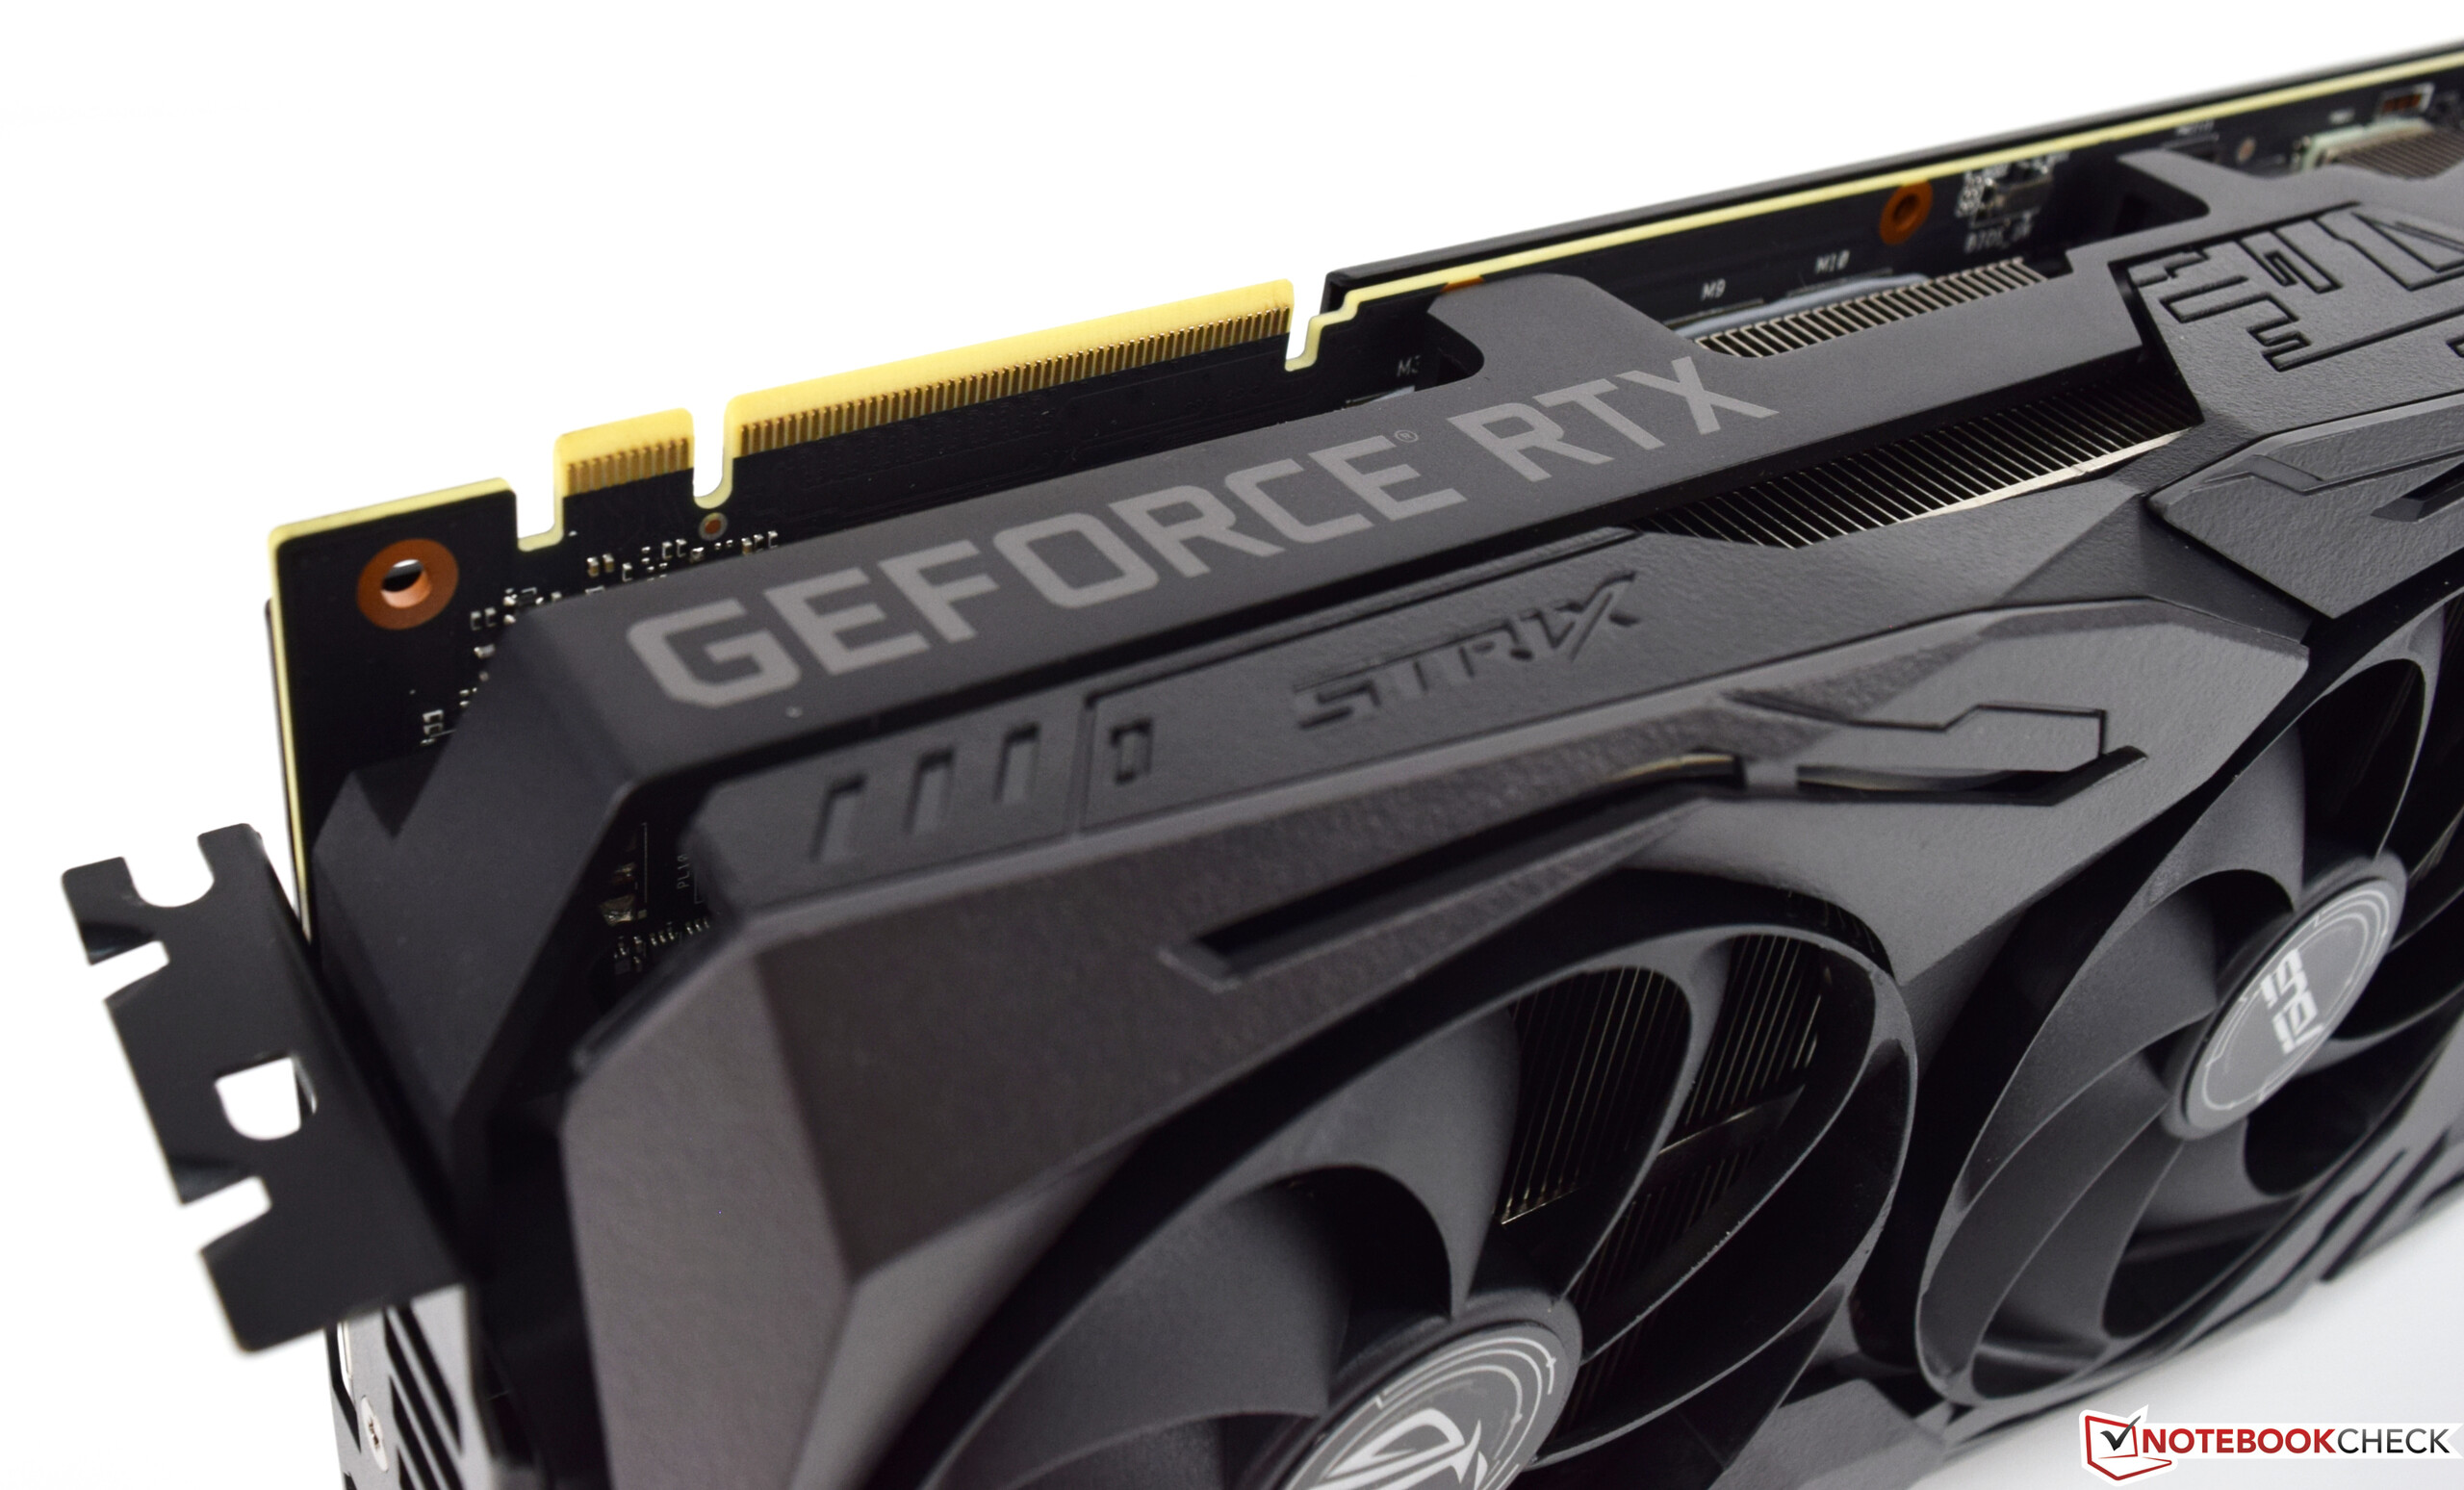
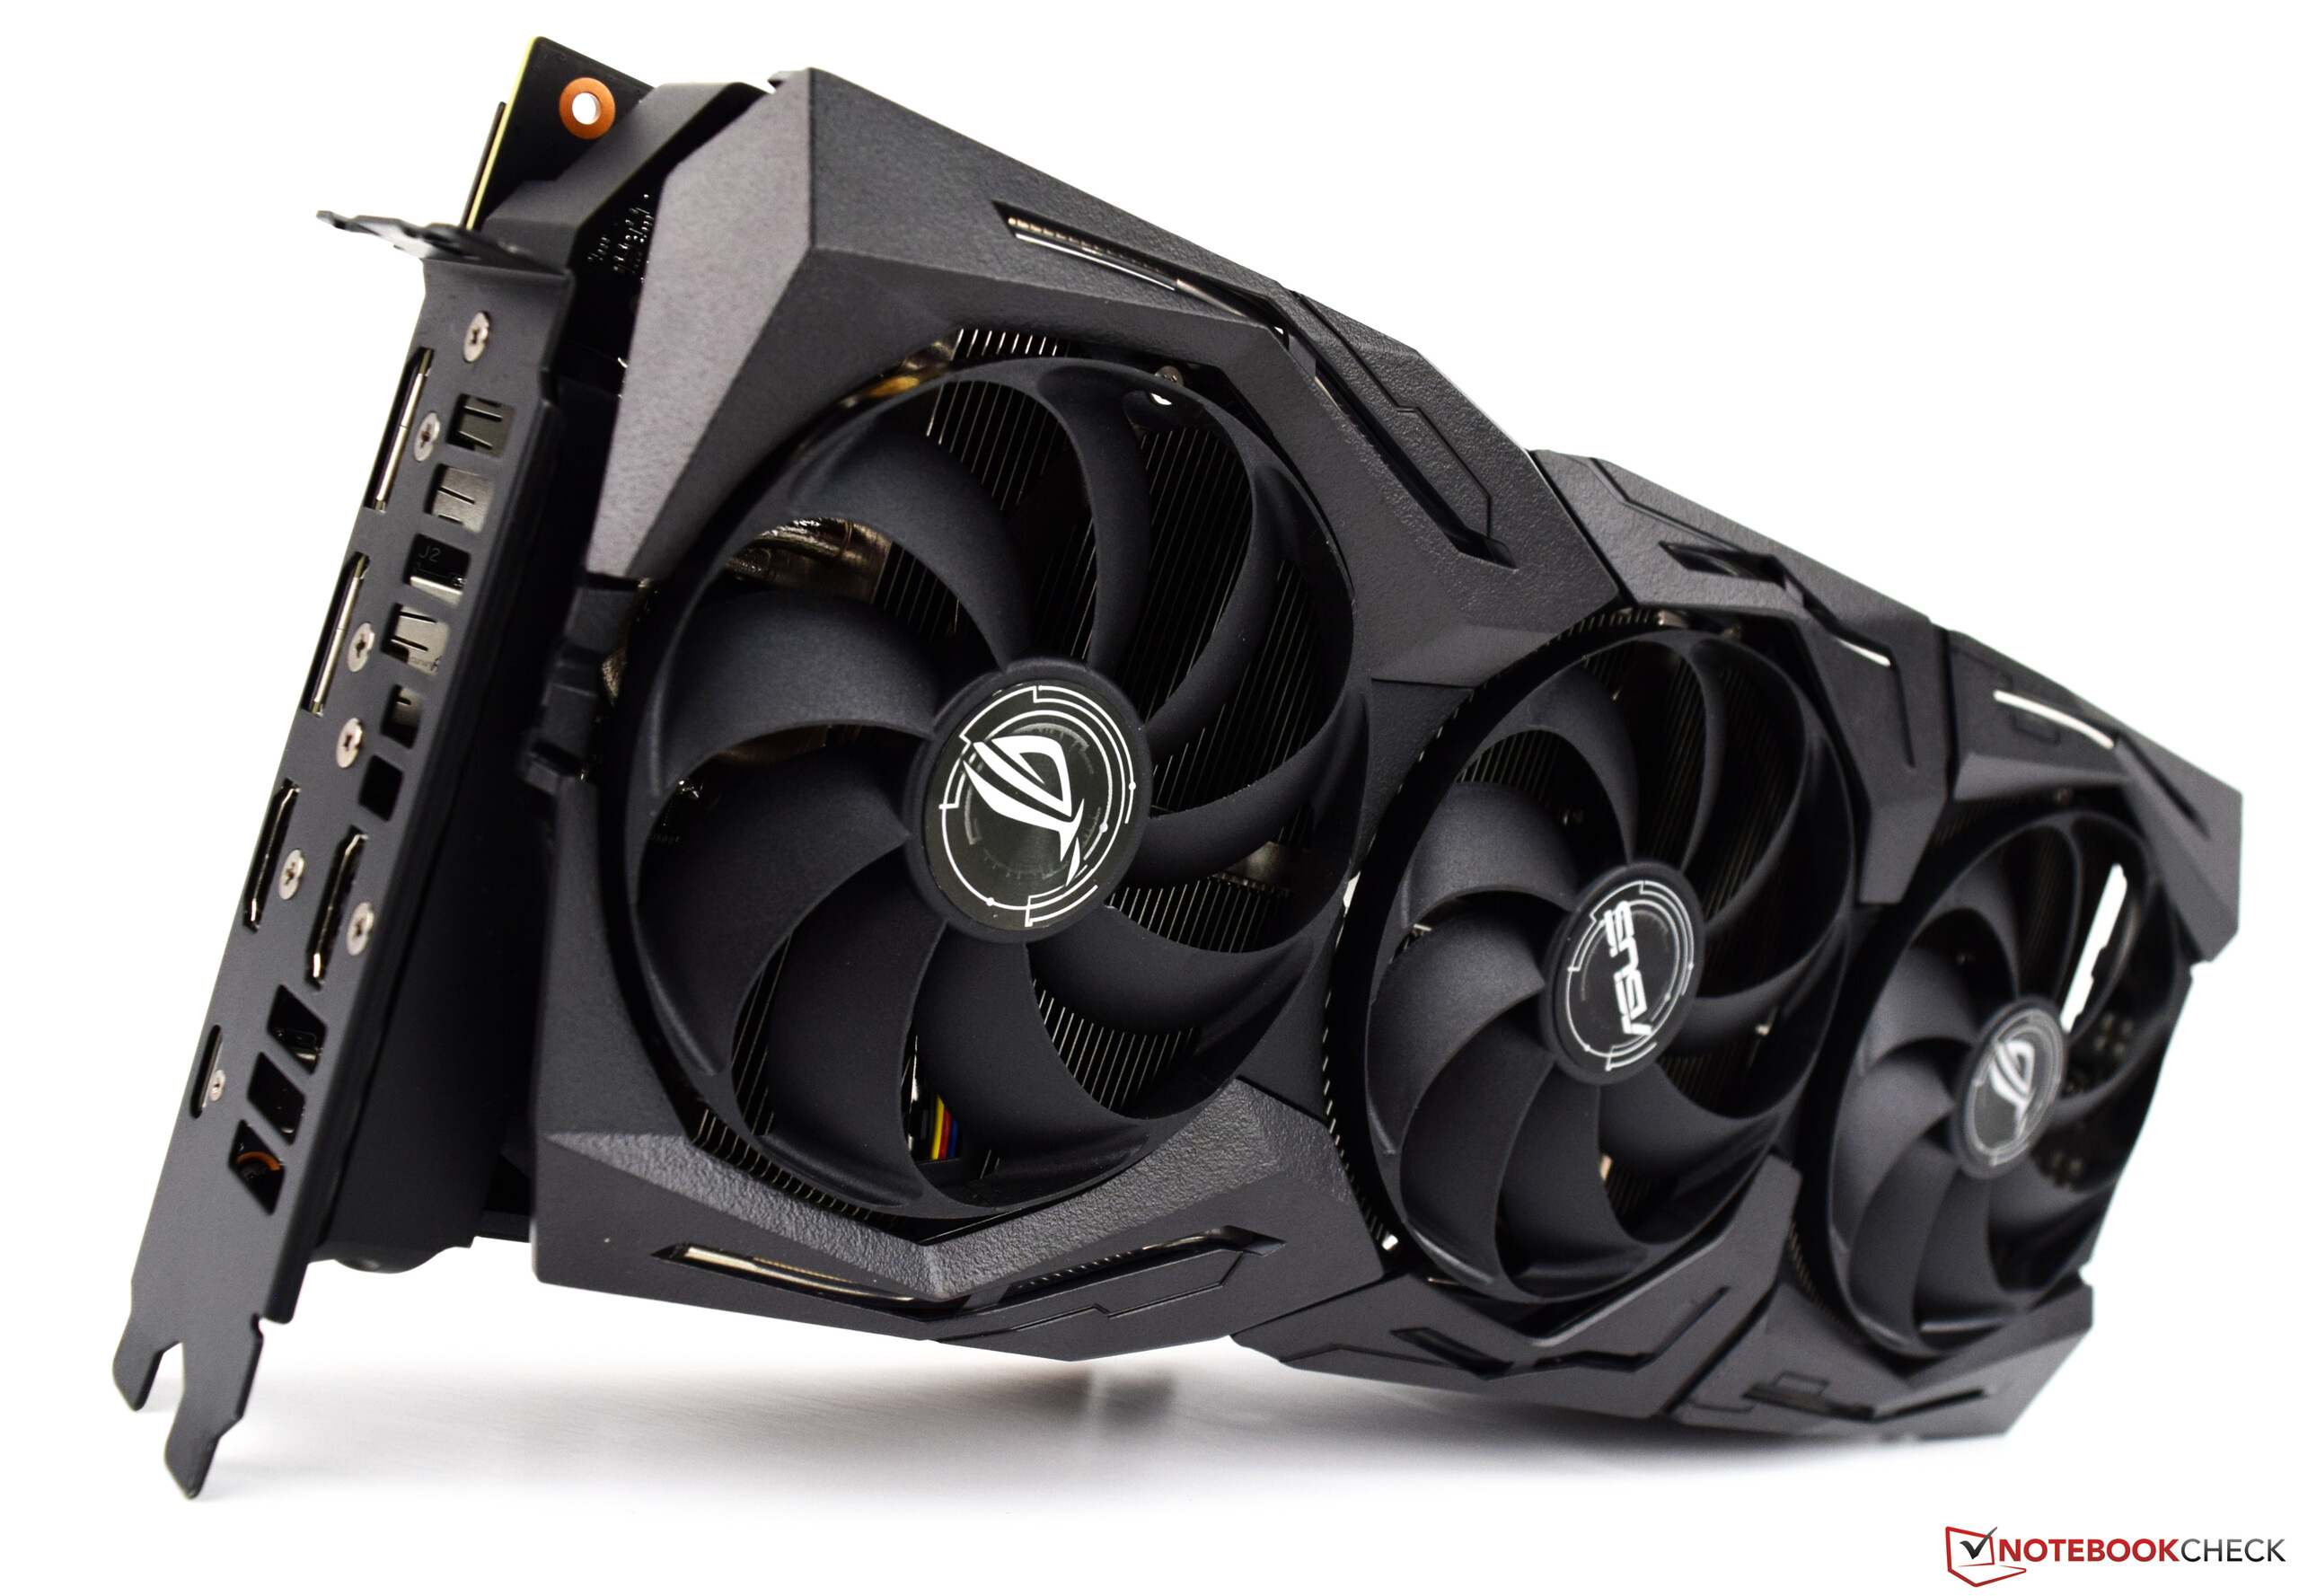
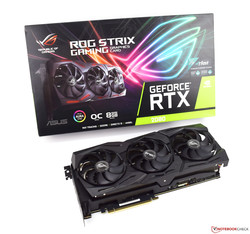
Asus ROG provided us with an ROG RTX Strix 2080 OC sample. It is one of the fastest GPUs currently available. It is overclocked by default and offers an impressive gaming performance. Its massive cooler is not only capable of keeping it cool under sustained load but was also pleasantly quiet.
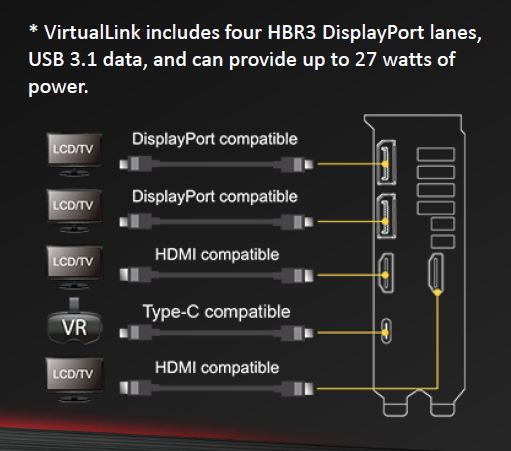
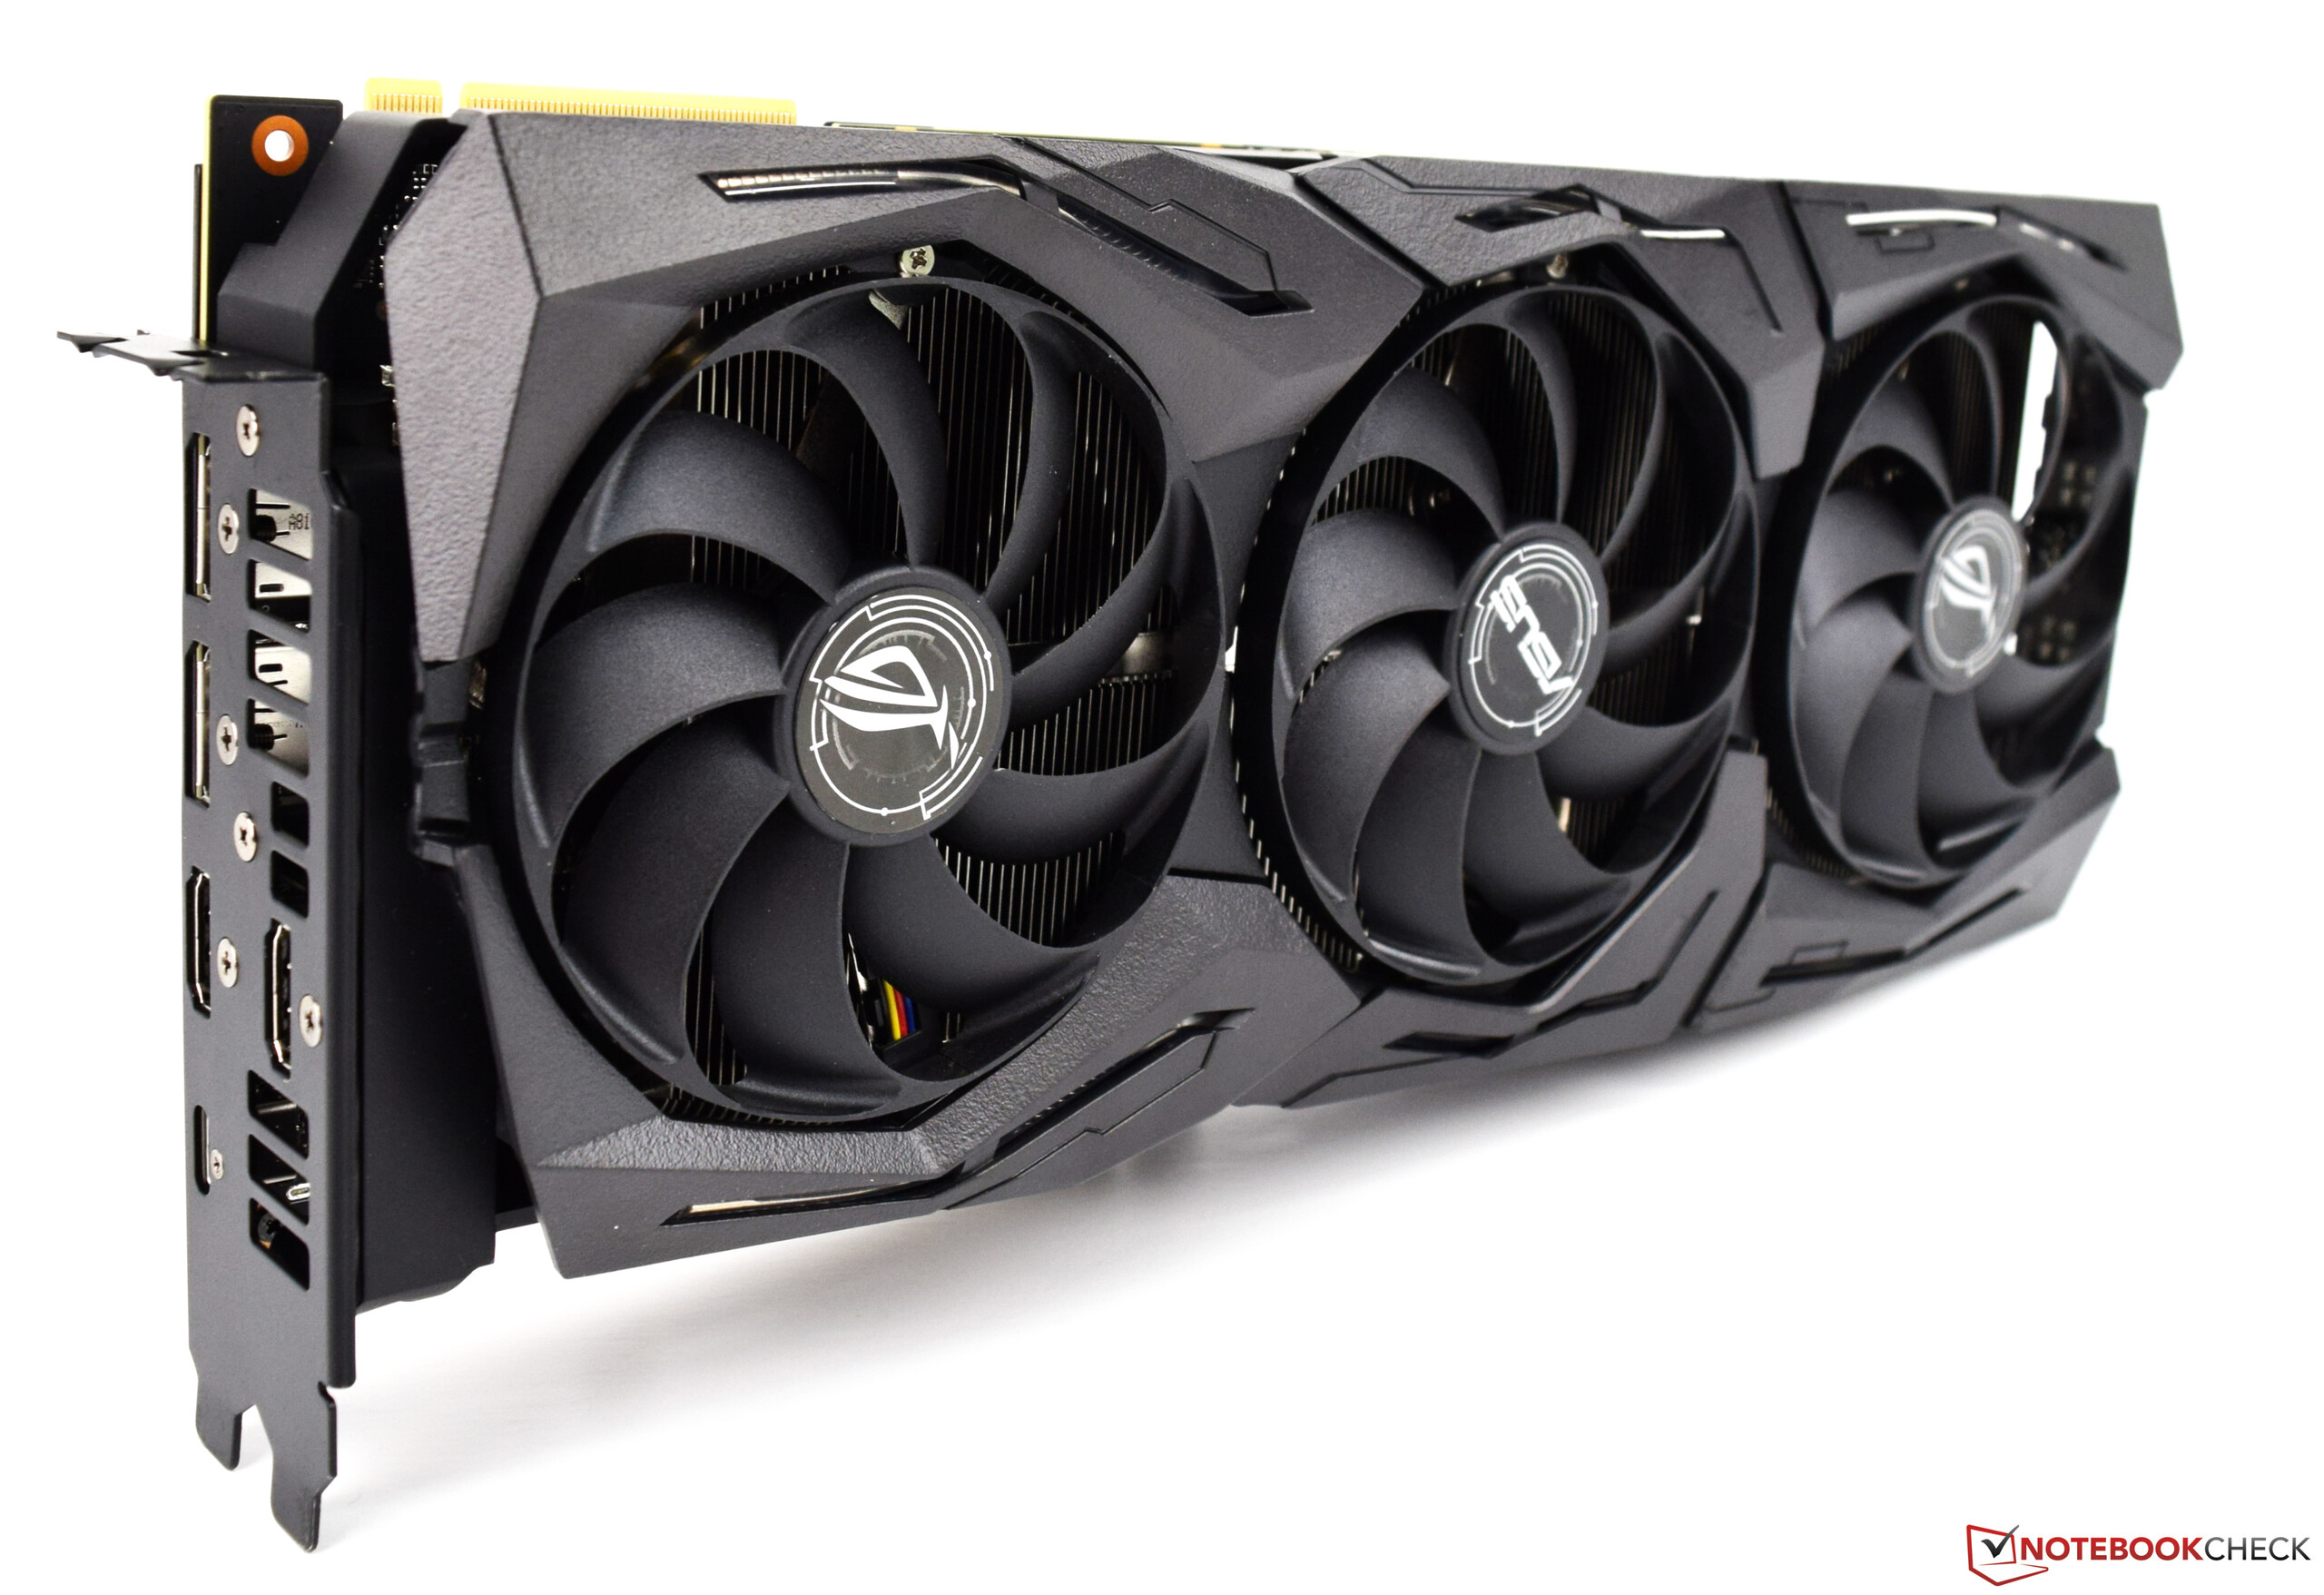
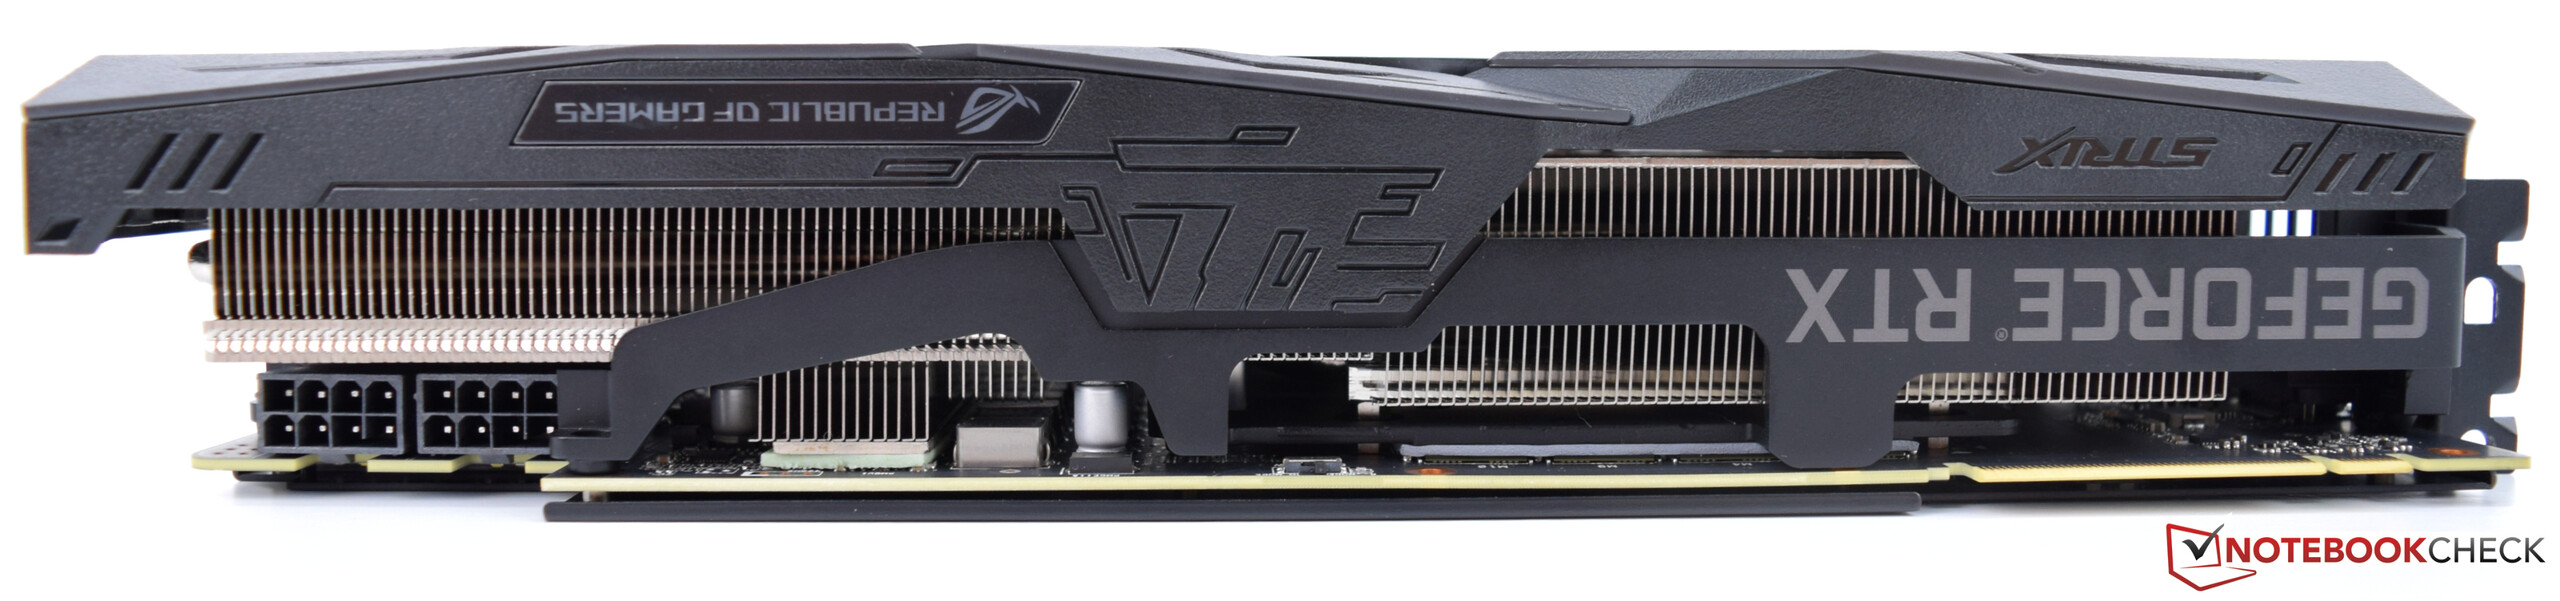
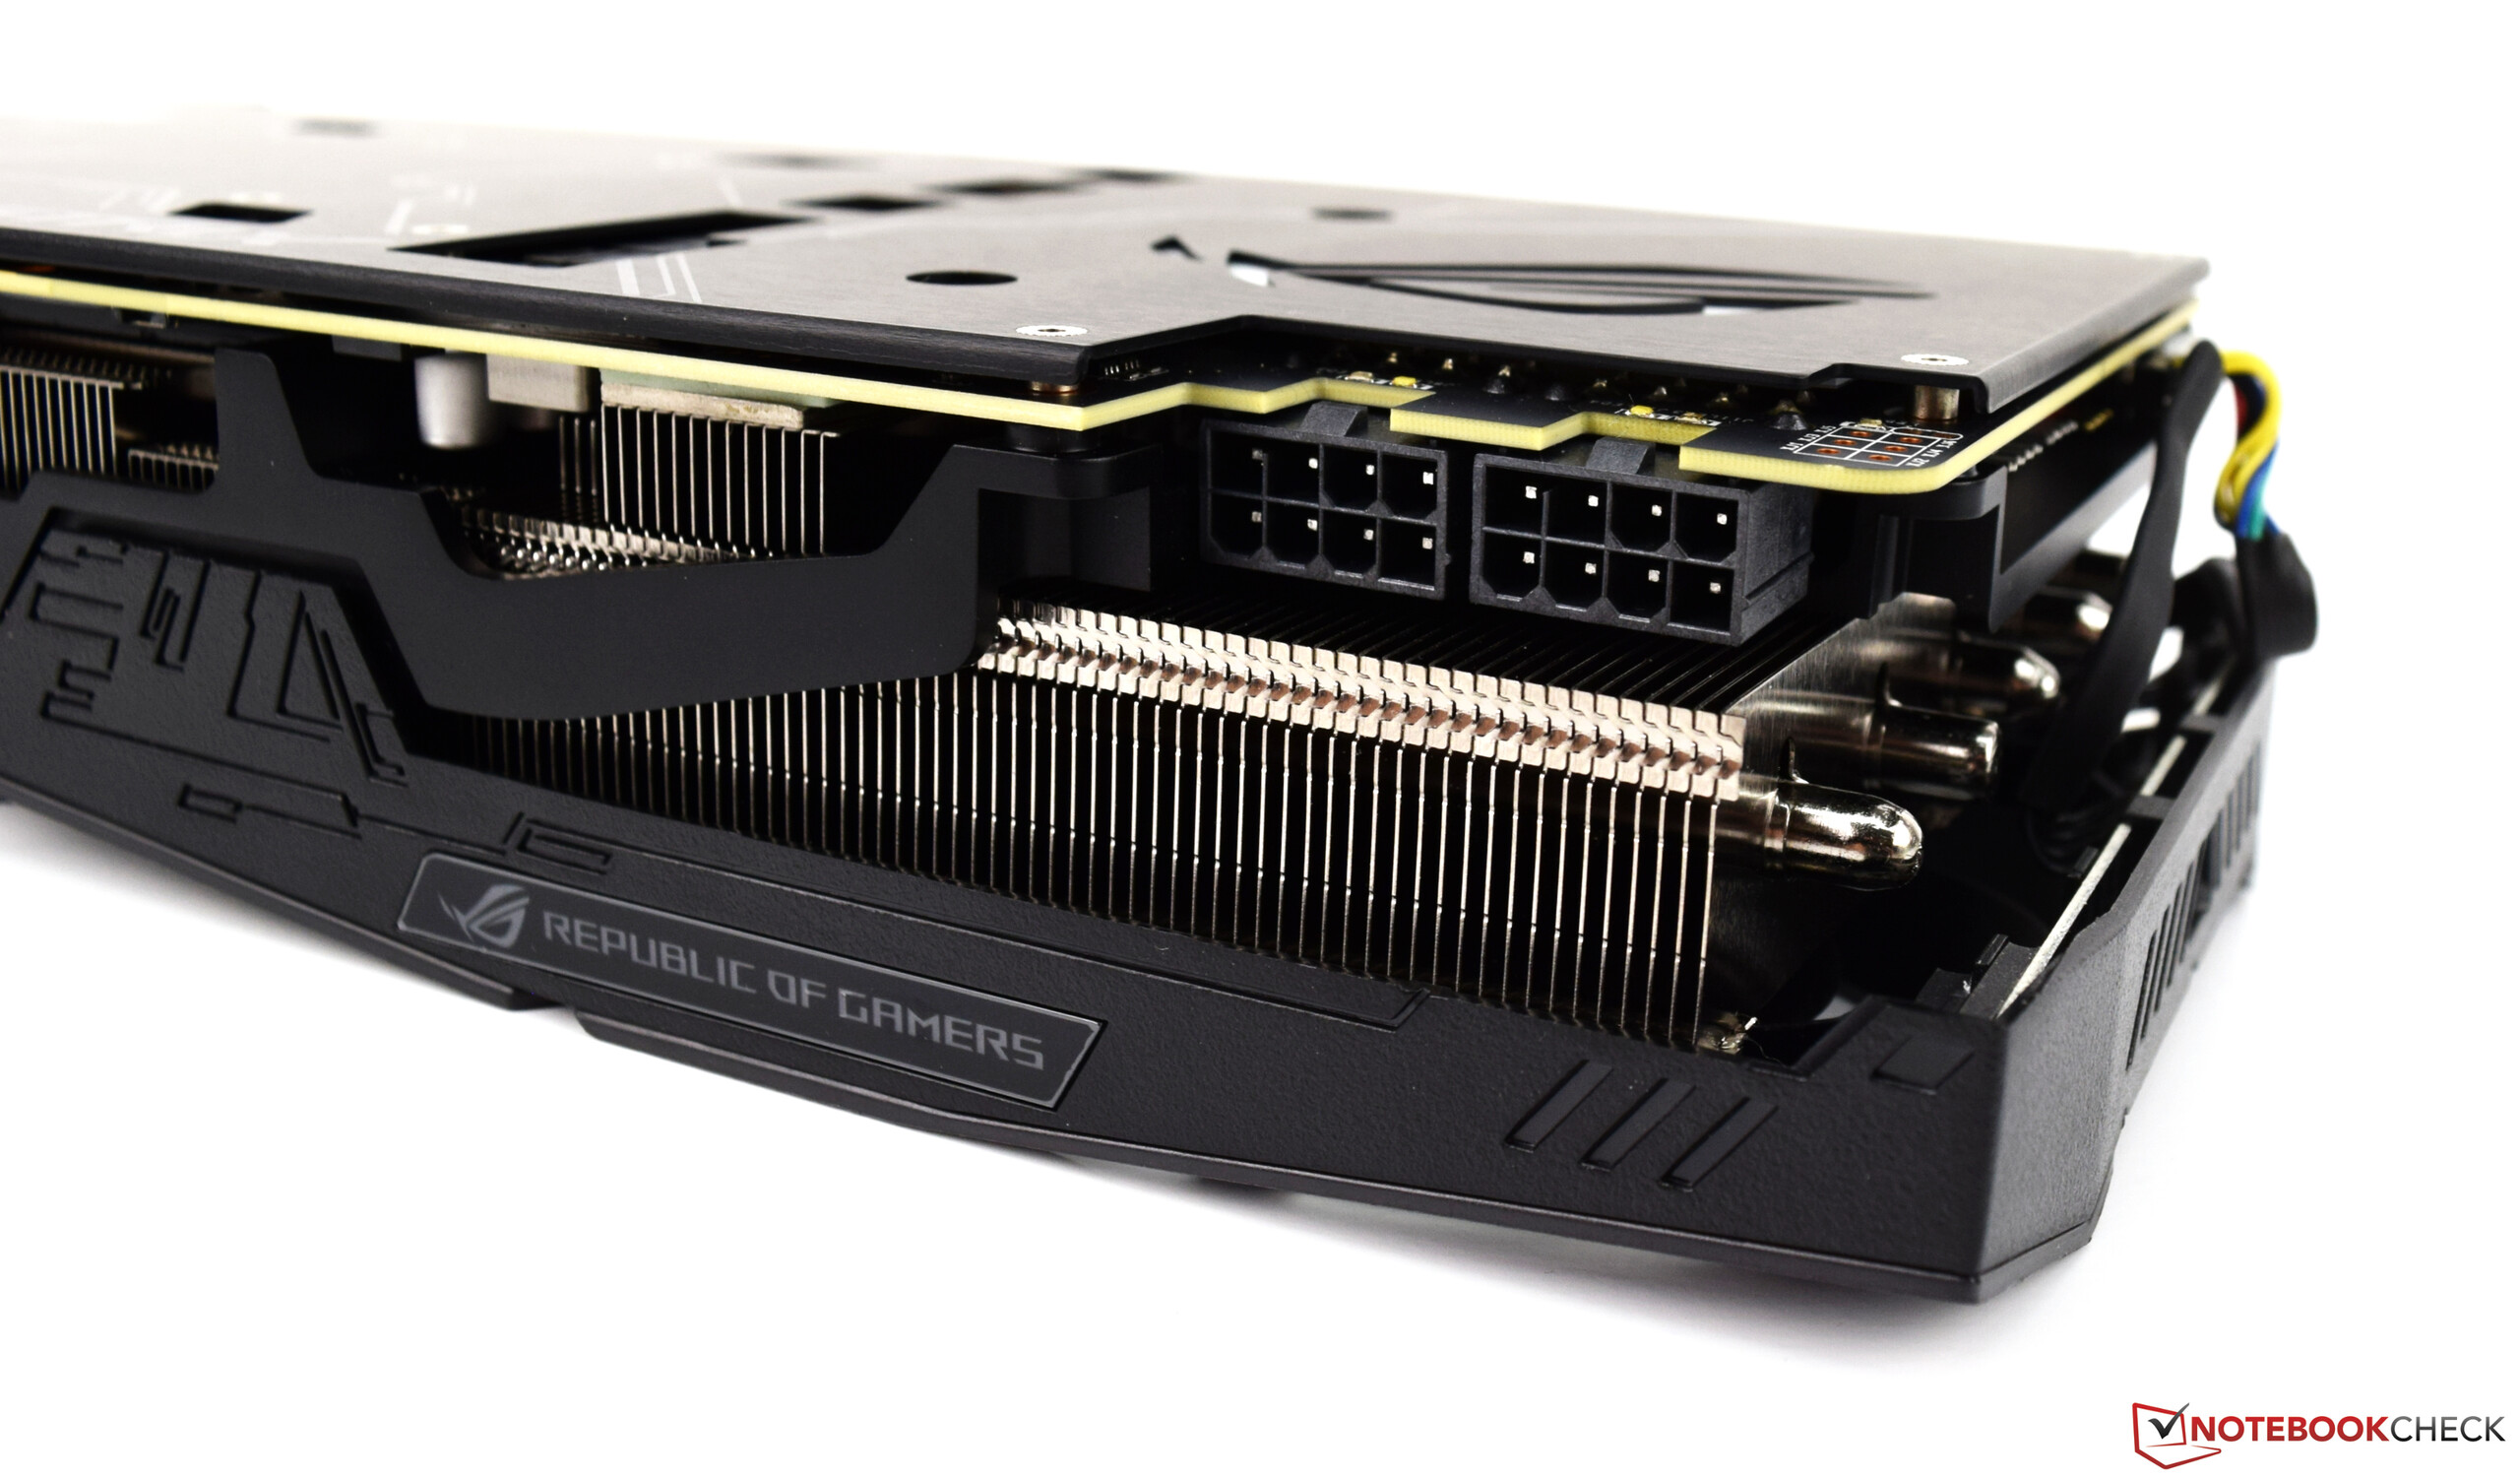
External displays can be attached via 2x DisplayPort 1.4, 2x HDMI 2.0b, or USB-C for VR devices. Internally, two 8-pin connectors are required, and both the RTX 2080 and RTX 2080 Ti support dual GPUs via the newer so-called NVLink connector, the successor to SLI.


Asus ROG RTX Strix OC - Serie vs. Nvidia GTX Founders Edition
| Specifications | RTX 2070 | RTX 2080 | RTX 2080 Ti | GTX 1070 FE | GTX 1080 FE | GTX 1080 Ti FE |
| Chip | TU106 | TU104 | TU 102 | GP104 | GP104 | GP102 |
| Manufactured | 12 nm | 12 nm | 12 nm | 16 nm | 16 nm | 16 nm |
| Shaders | 2,304 | 2,944 | 4,352 | 1,920 | 2,560 | 3,584 |
| Texture Units | 144 | 184 | 272 | 120 | 160 | 224 |
| GPU Base Clock | 1,410 MHz | 1,515 MHz | 1,350 MHz | 1,506 MHz | 1,607 MHz | 1,481 MHz |
| GPU Boost Clock | 1,815 MHz | 1,860 MHz | 1,650 MHz | 1,863 MHz | 1,733 MHz | 1,582 MHz |
| Memory Bandwidth | 448 GB/s | 448 GB/s | 616 GB/s | 256 GB/s | 320 GB/s | 484 GB/s |
| Memory Size | 8 GB GDDR6 | 8 GB GDDR6 | 11 GB GDDR6 | 8 GB GDDR5 | 8 GB GDDR5X | 11 GB GDDR5X |
| Power (Watt) | 175 W | 225 W | 260 W | 150 W | 180 W | 250 W |
Ryzen 7 2700X Test System
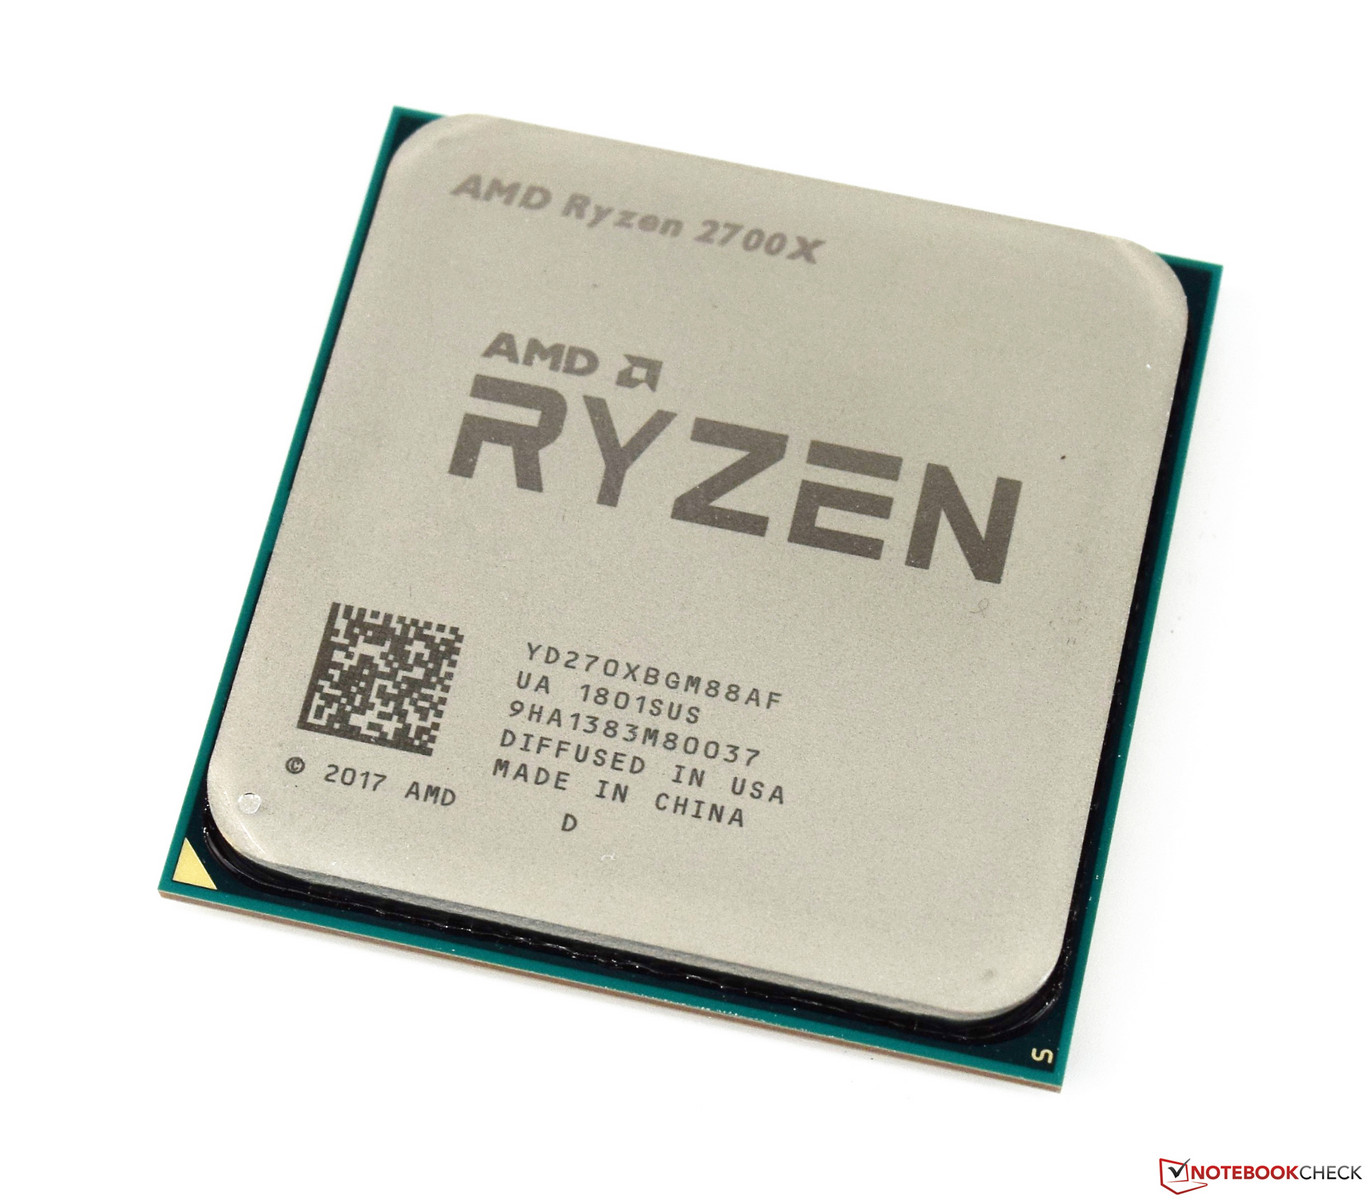
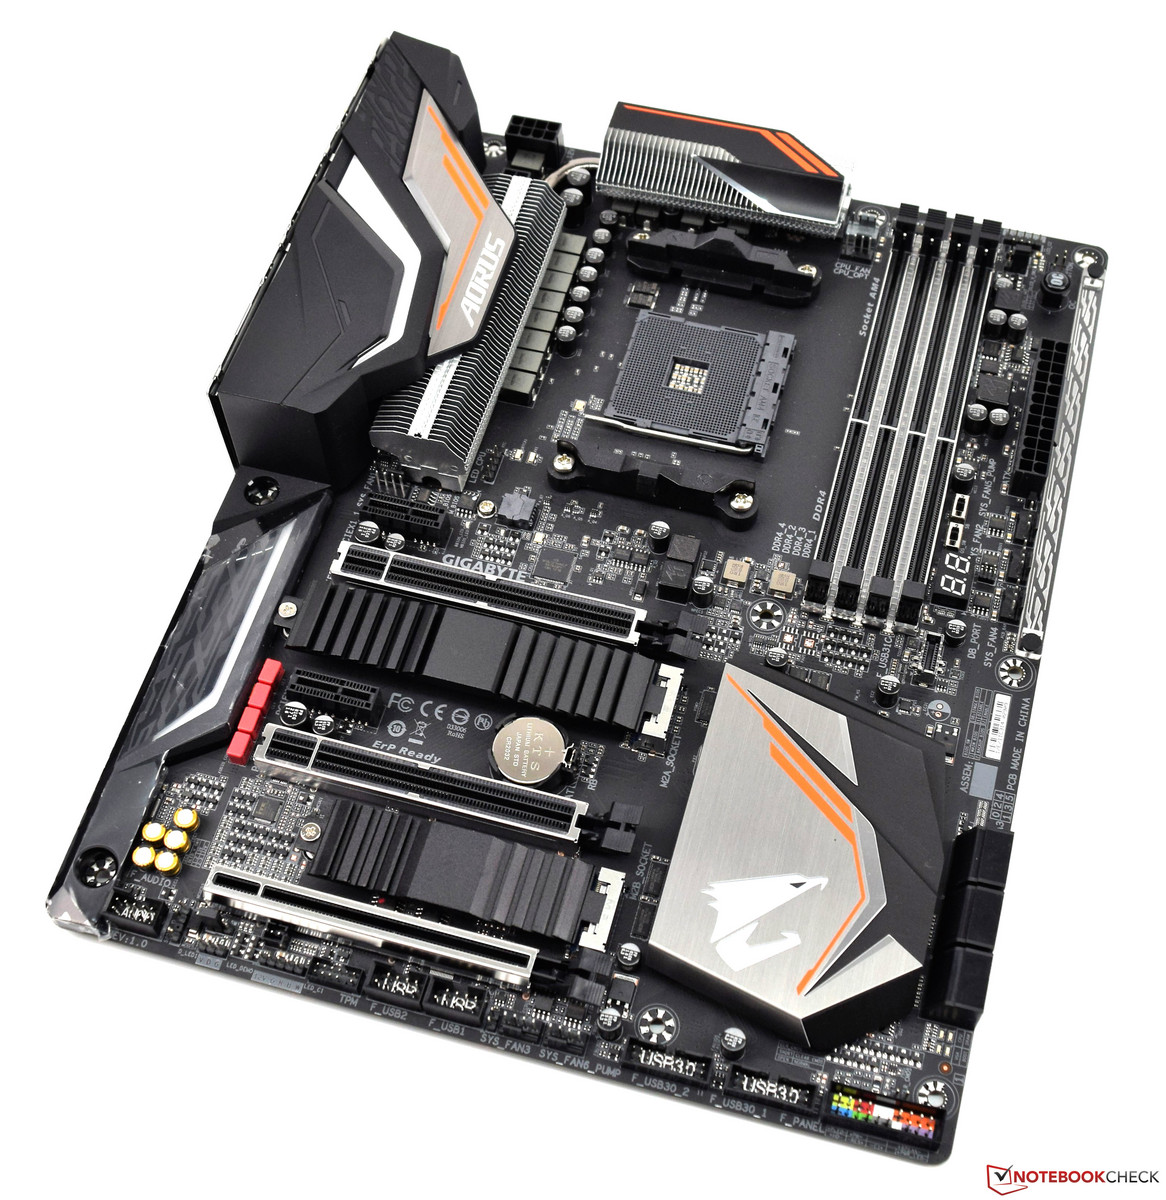
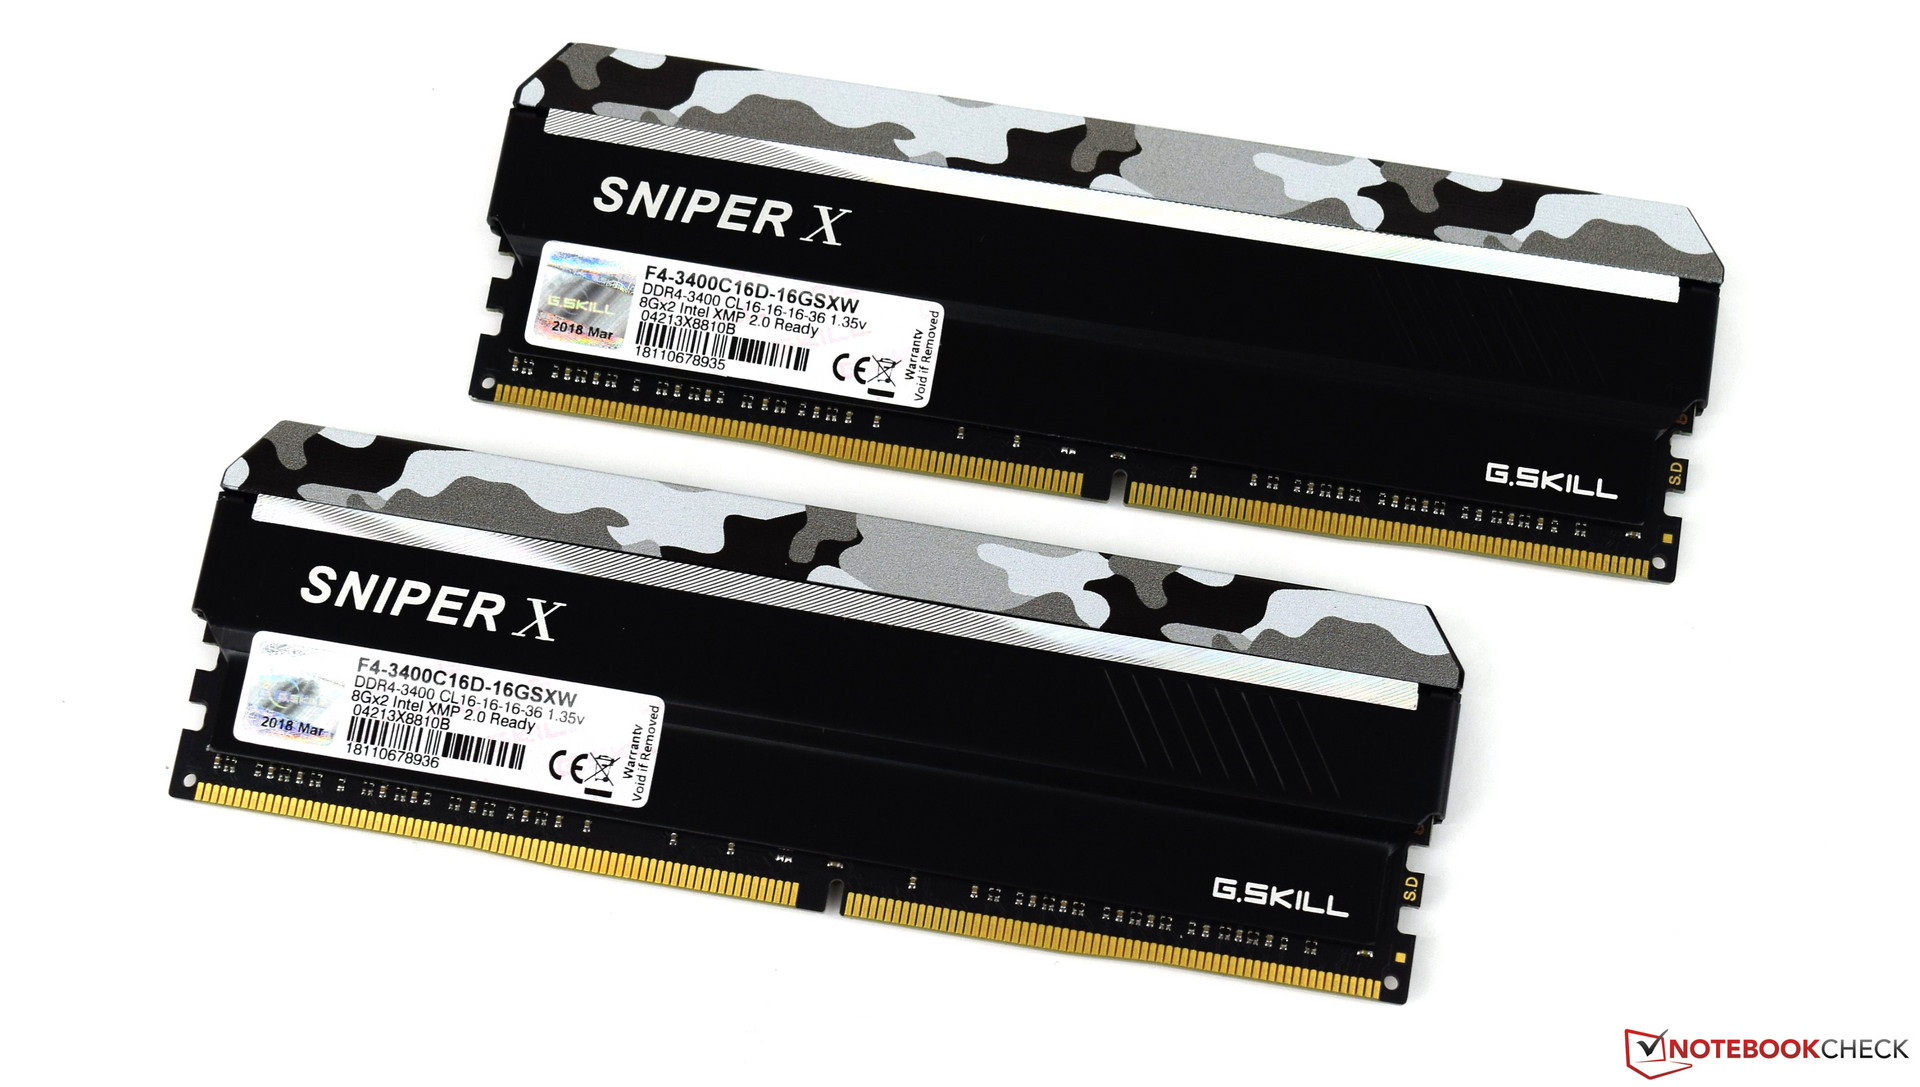
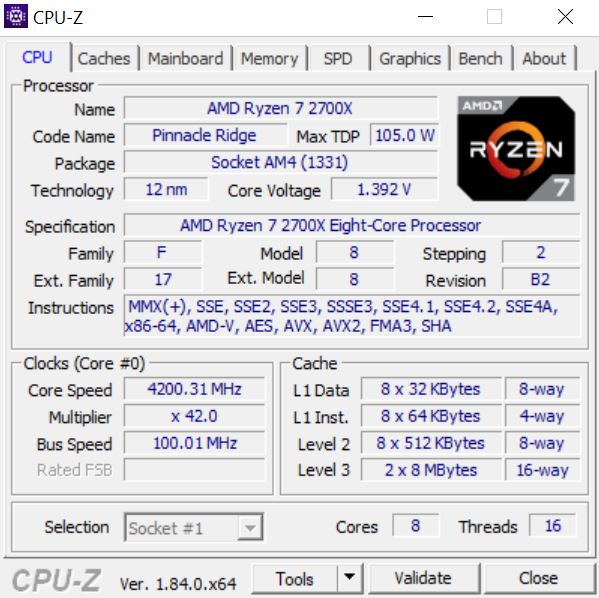
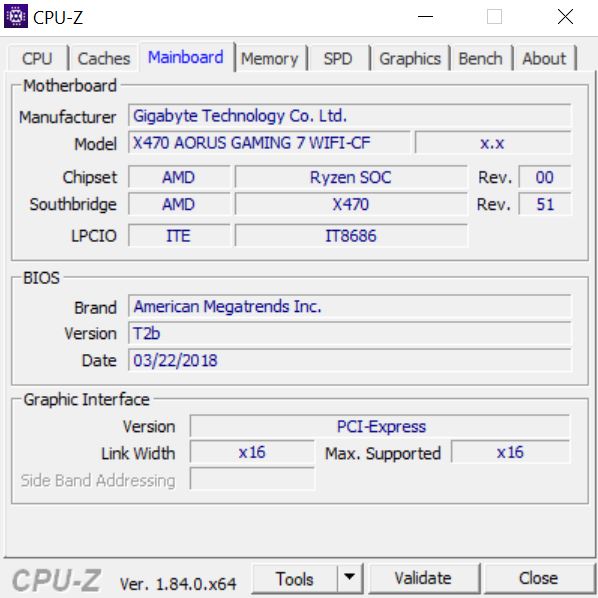
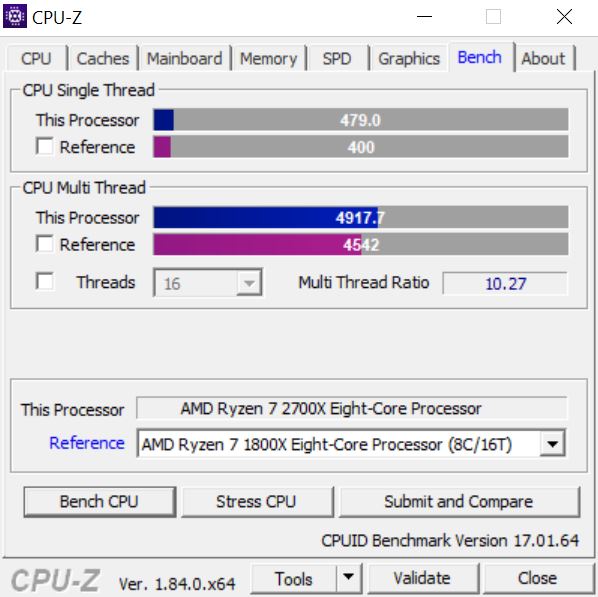
Our test system was based on a Gigabyte X470 Aorus Gaming 7 WiFi AMD-based motherboard, a blazingly fast AMD Ryzen 7 2700X CPU, an AIO Be Quiet Silent Loop 280 mm CPU cooler, and 16 GB of G-Skill DDR4-3400 RAM. The display used for this setup was Acer’s Predator XB321HK UHD monitor. We would like to thank AMD for providing us with the test platform.
| Case | Corsair Carbide Air 540 ATX Cube |
| CPU | AMD RYZEN 7 2700X |
| CPU cooler | Be Quiet Silent Loop 280mm |
| RAM | G-Skill Sniper X 16 GB DDR4 3,400 MHz |
| Mainboard | Gigabyte X470 Aorus Gaming 7 WiFi |
| Display | Acer Predator XB321HK 4K |
| SSD | ADATA SP900 M.2 SSD |
| HDD | 2 TB Western Digital (for games) |
| OS | Microsoft Windows 10 Professional 64-Bit (Version 1809) |
| Driver | Nvidia 416.34 |


Clock Speeds
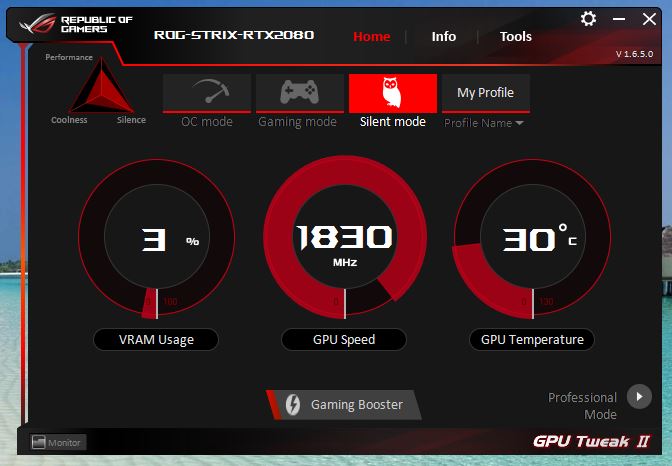
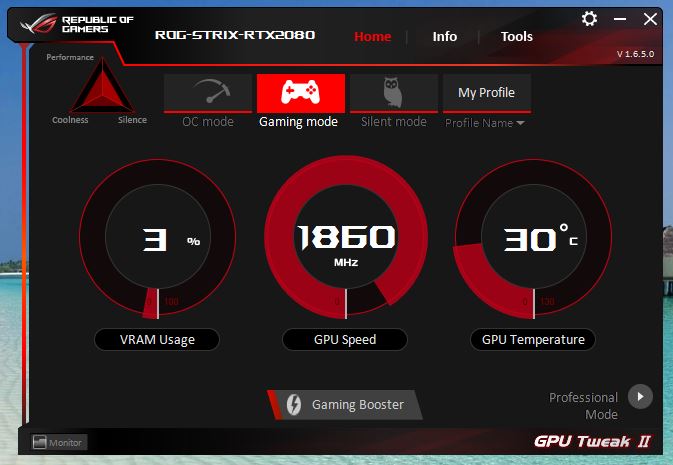
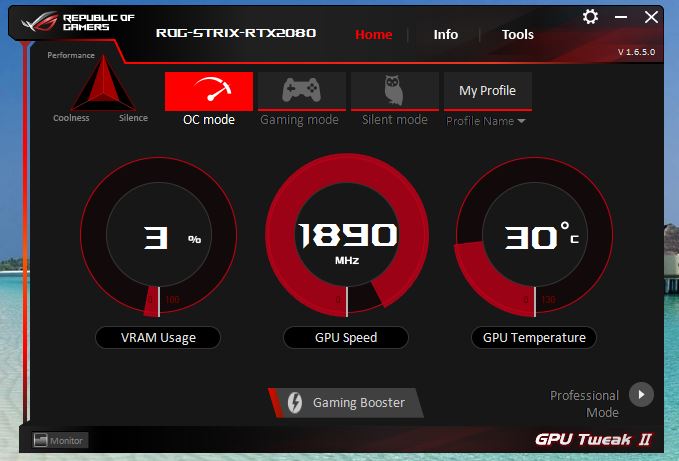
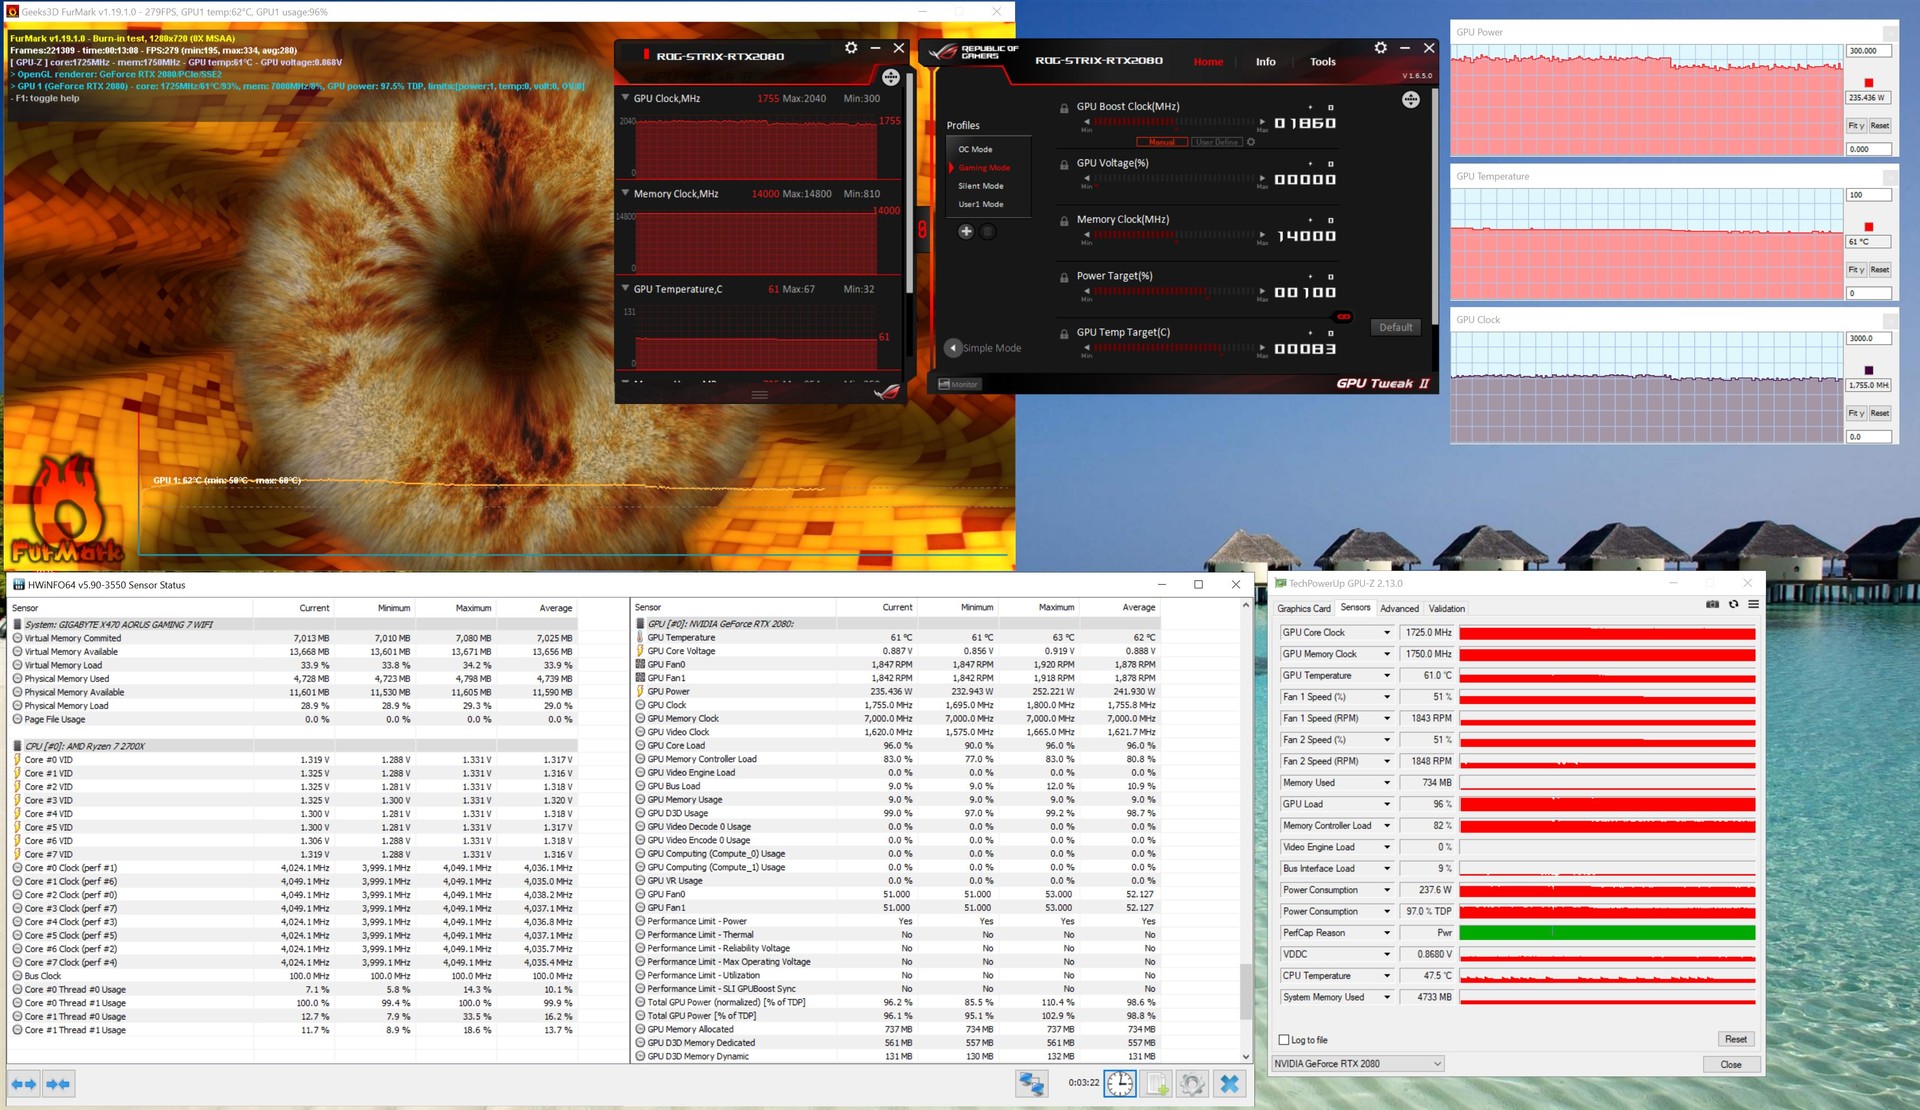
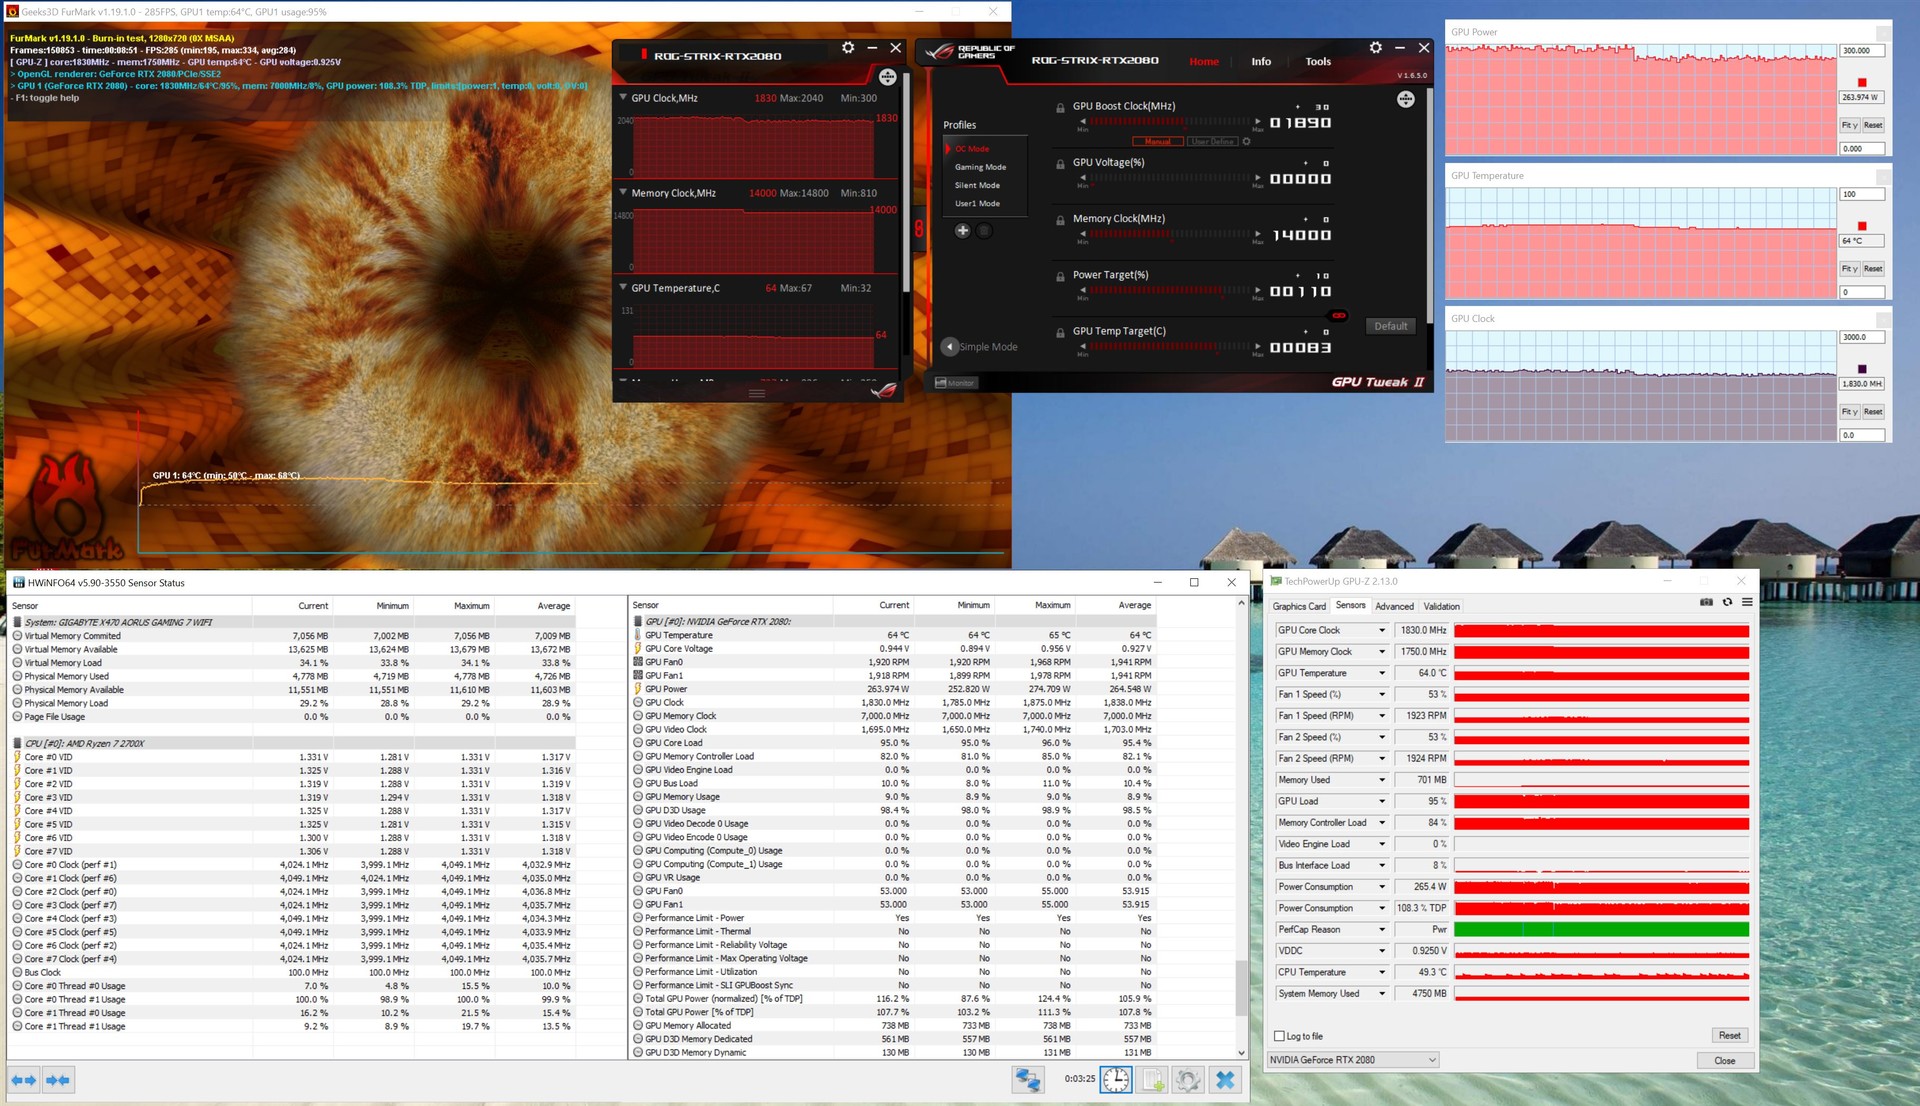
The Asus ROG RTX Strix 2080 OC runs faster than Nvidia’s Founders Edition. With a turbo boost of 1,890 MHz in OC mode it clocked 90 MHz higher. Two other modes can be selected with Asus GPU Tweak: a Silent mode (1,830 MHz) and a Gaming mode (1,860 MHz). The modes also modify the power target, from 110% in OC mode to 100% in Gaming mode and 90% in Silent mode. As it sits right in-between OC and Silent mode we decided to run all of our tests and benchmark in Gaming mode.
In addition to these three presets you can obviously also manipulate clock speeds manually.
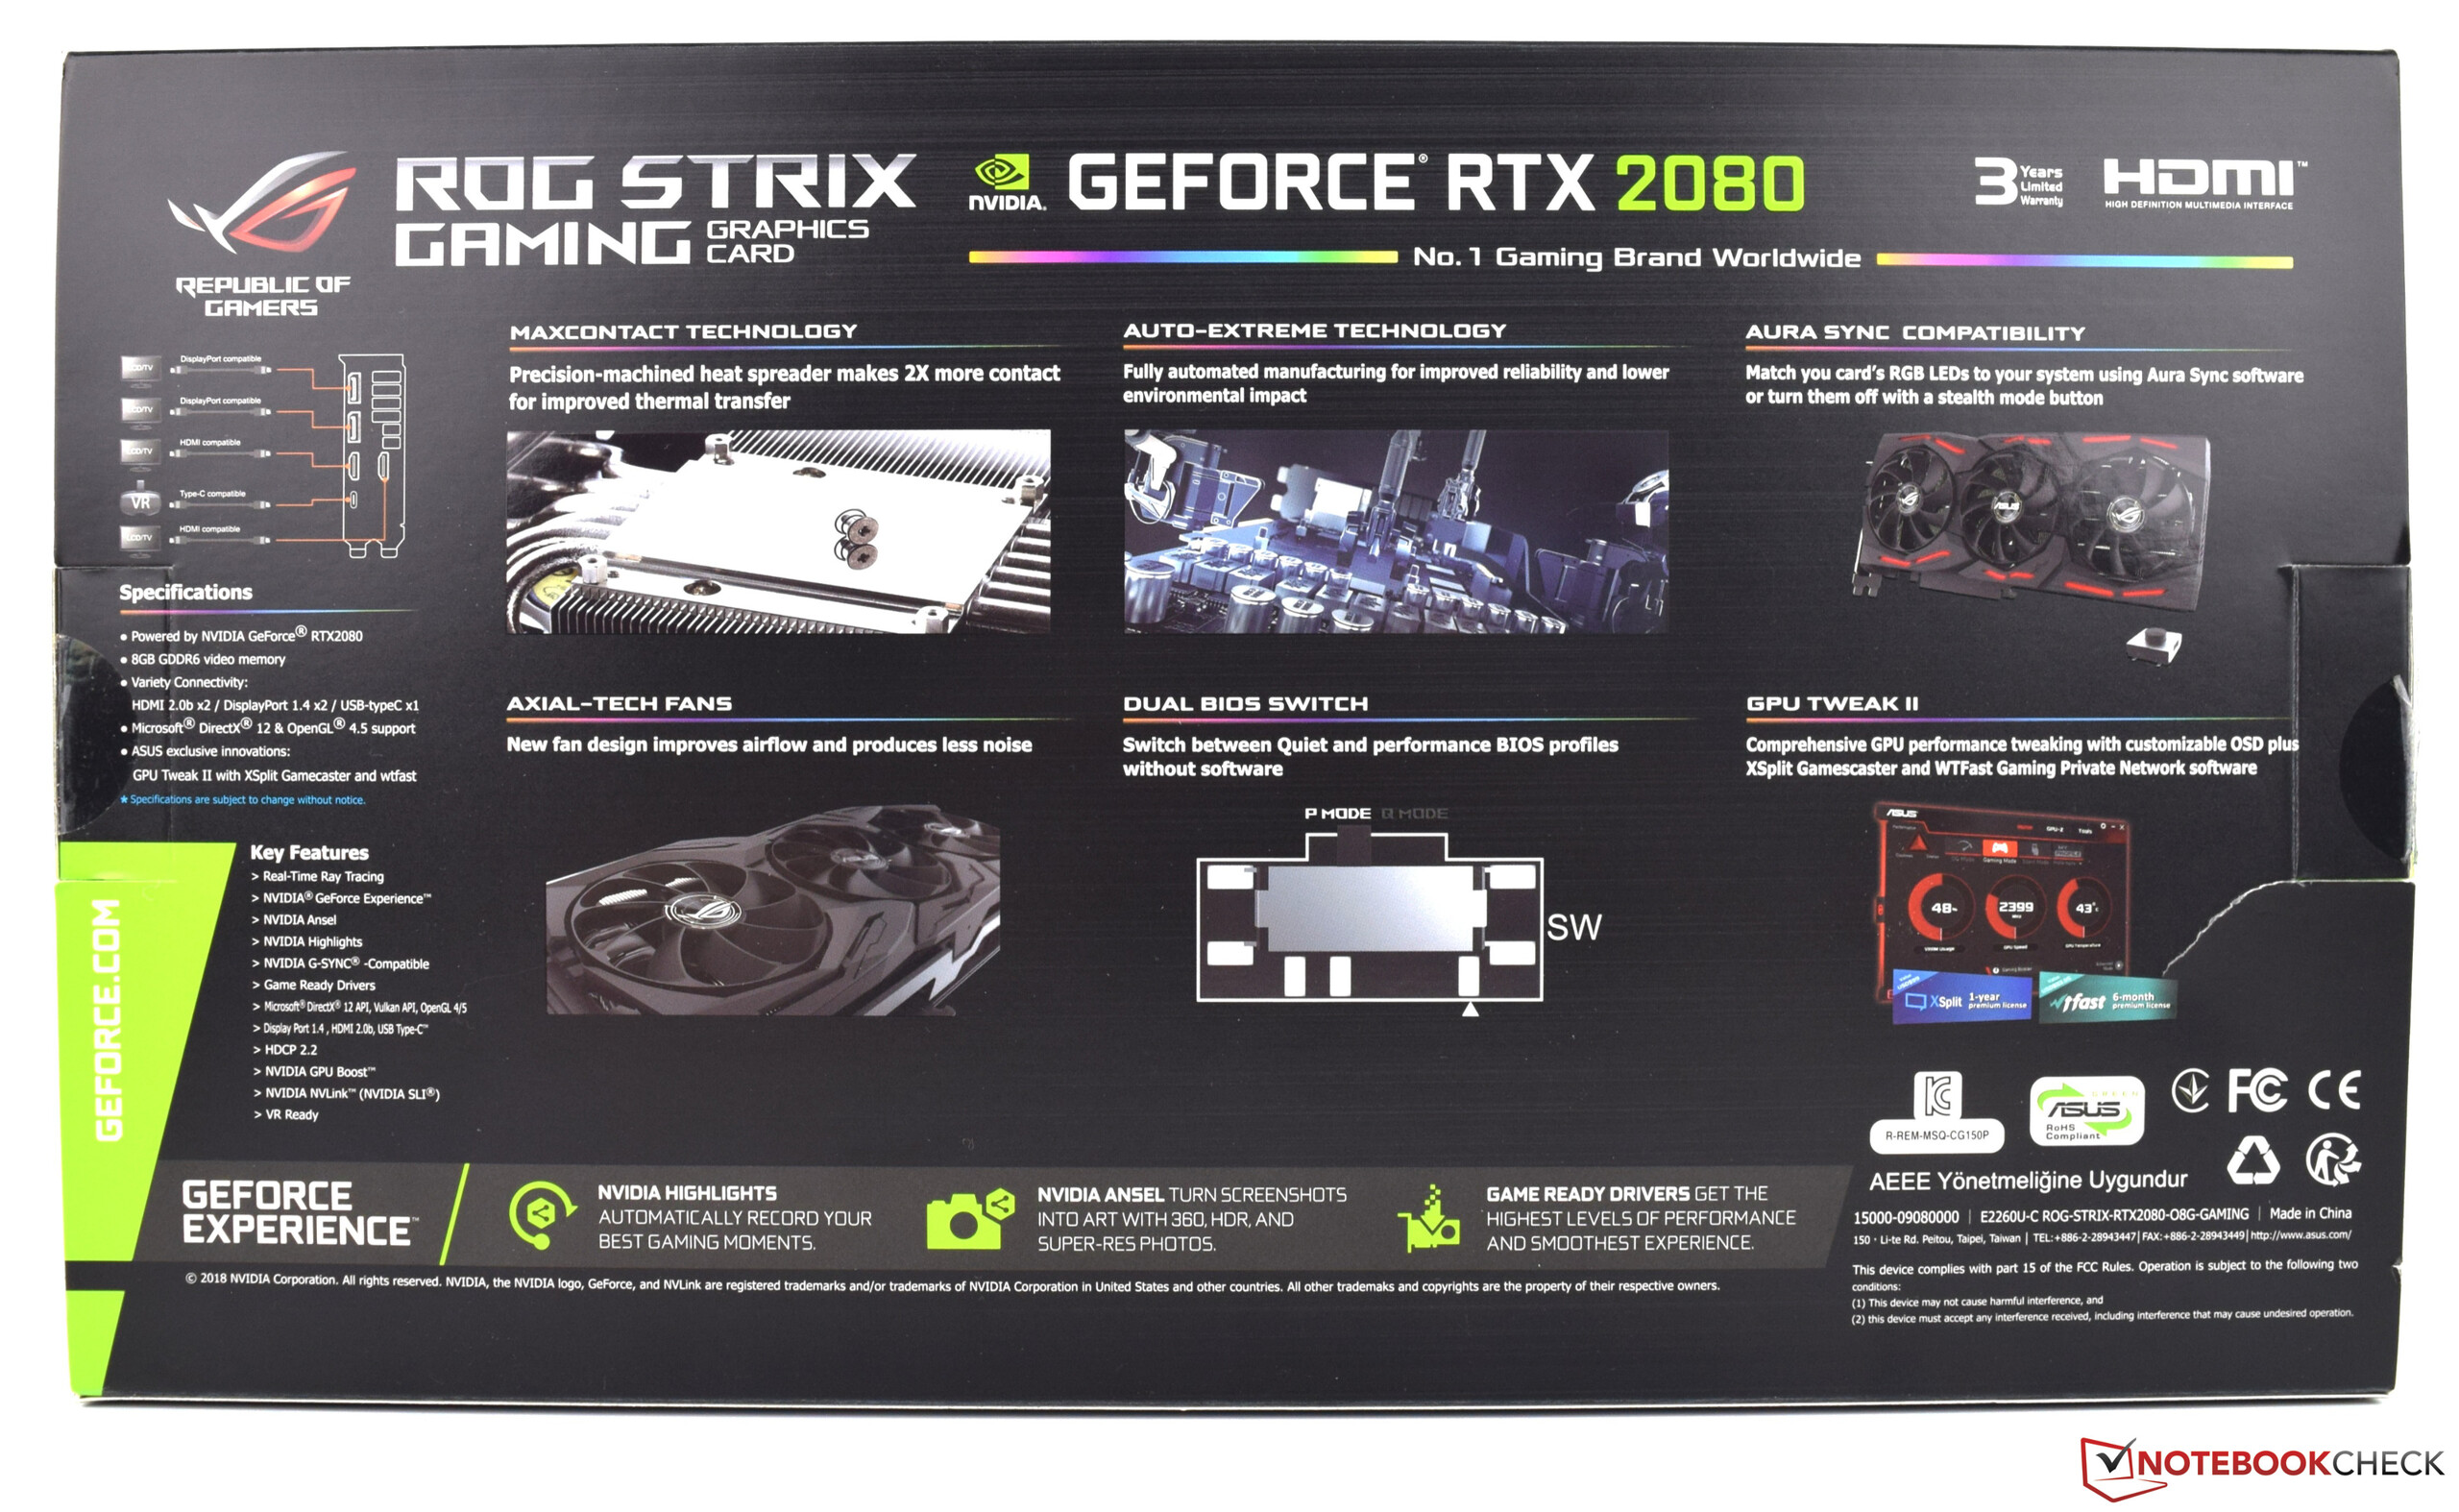
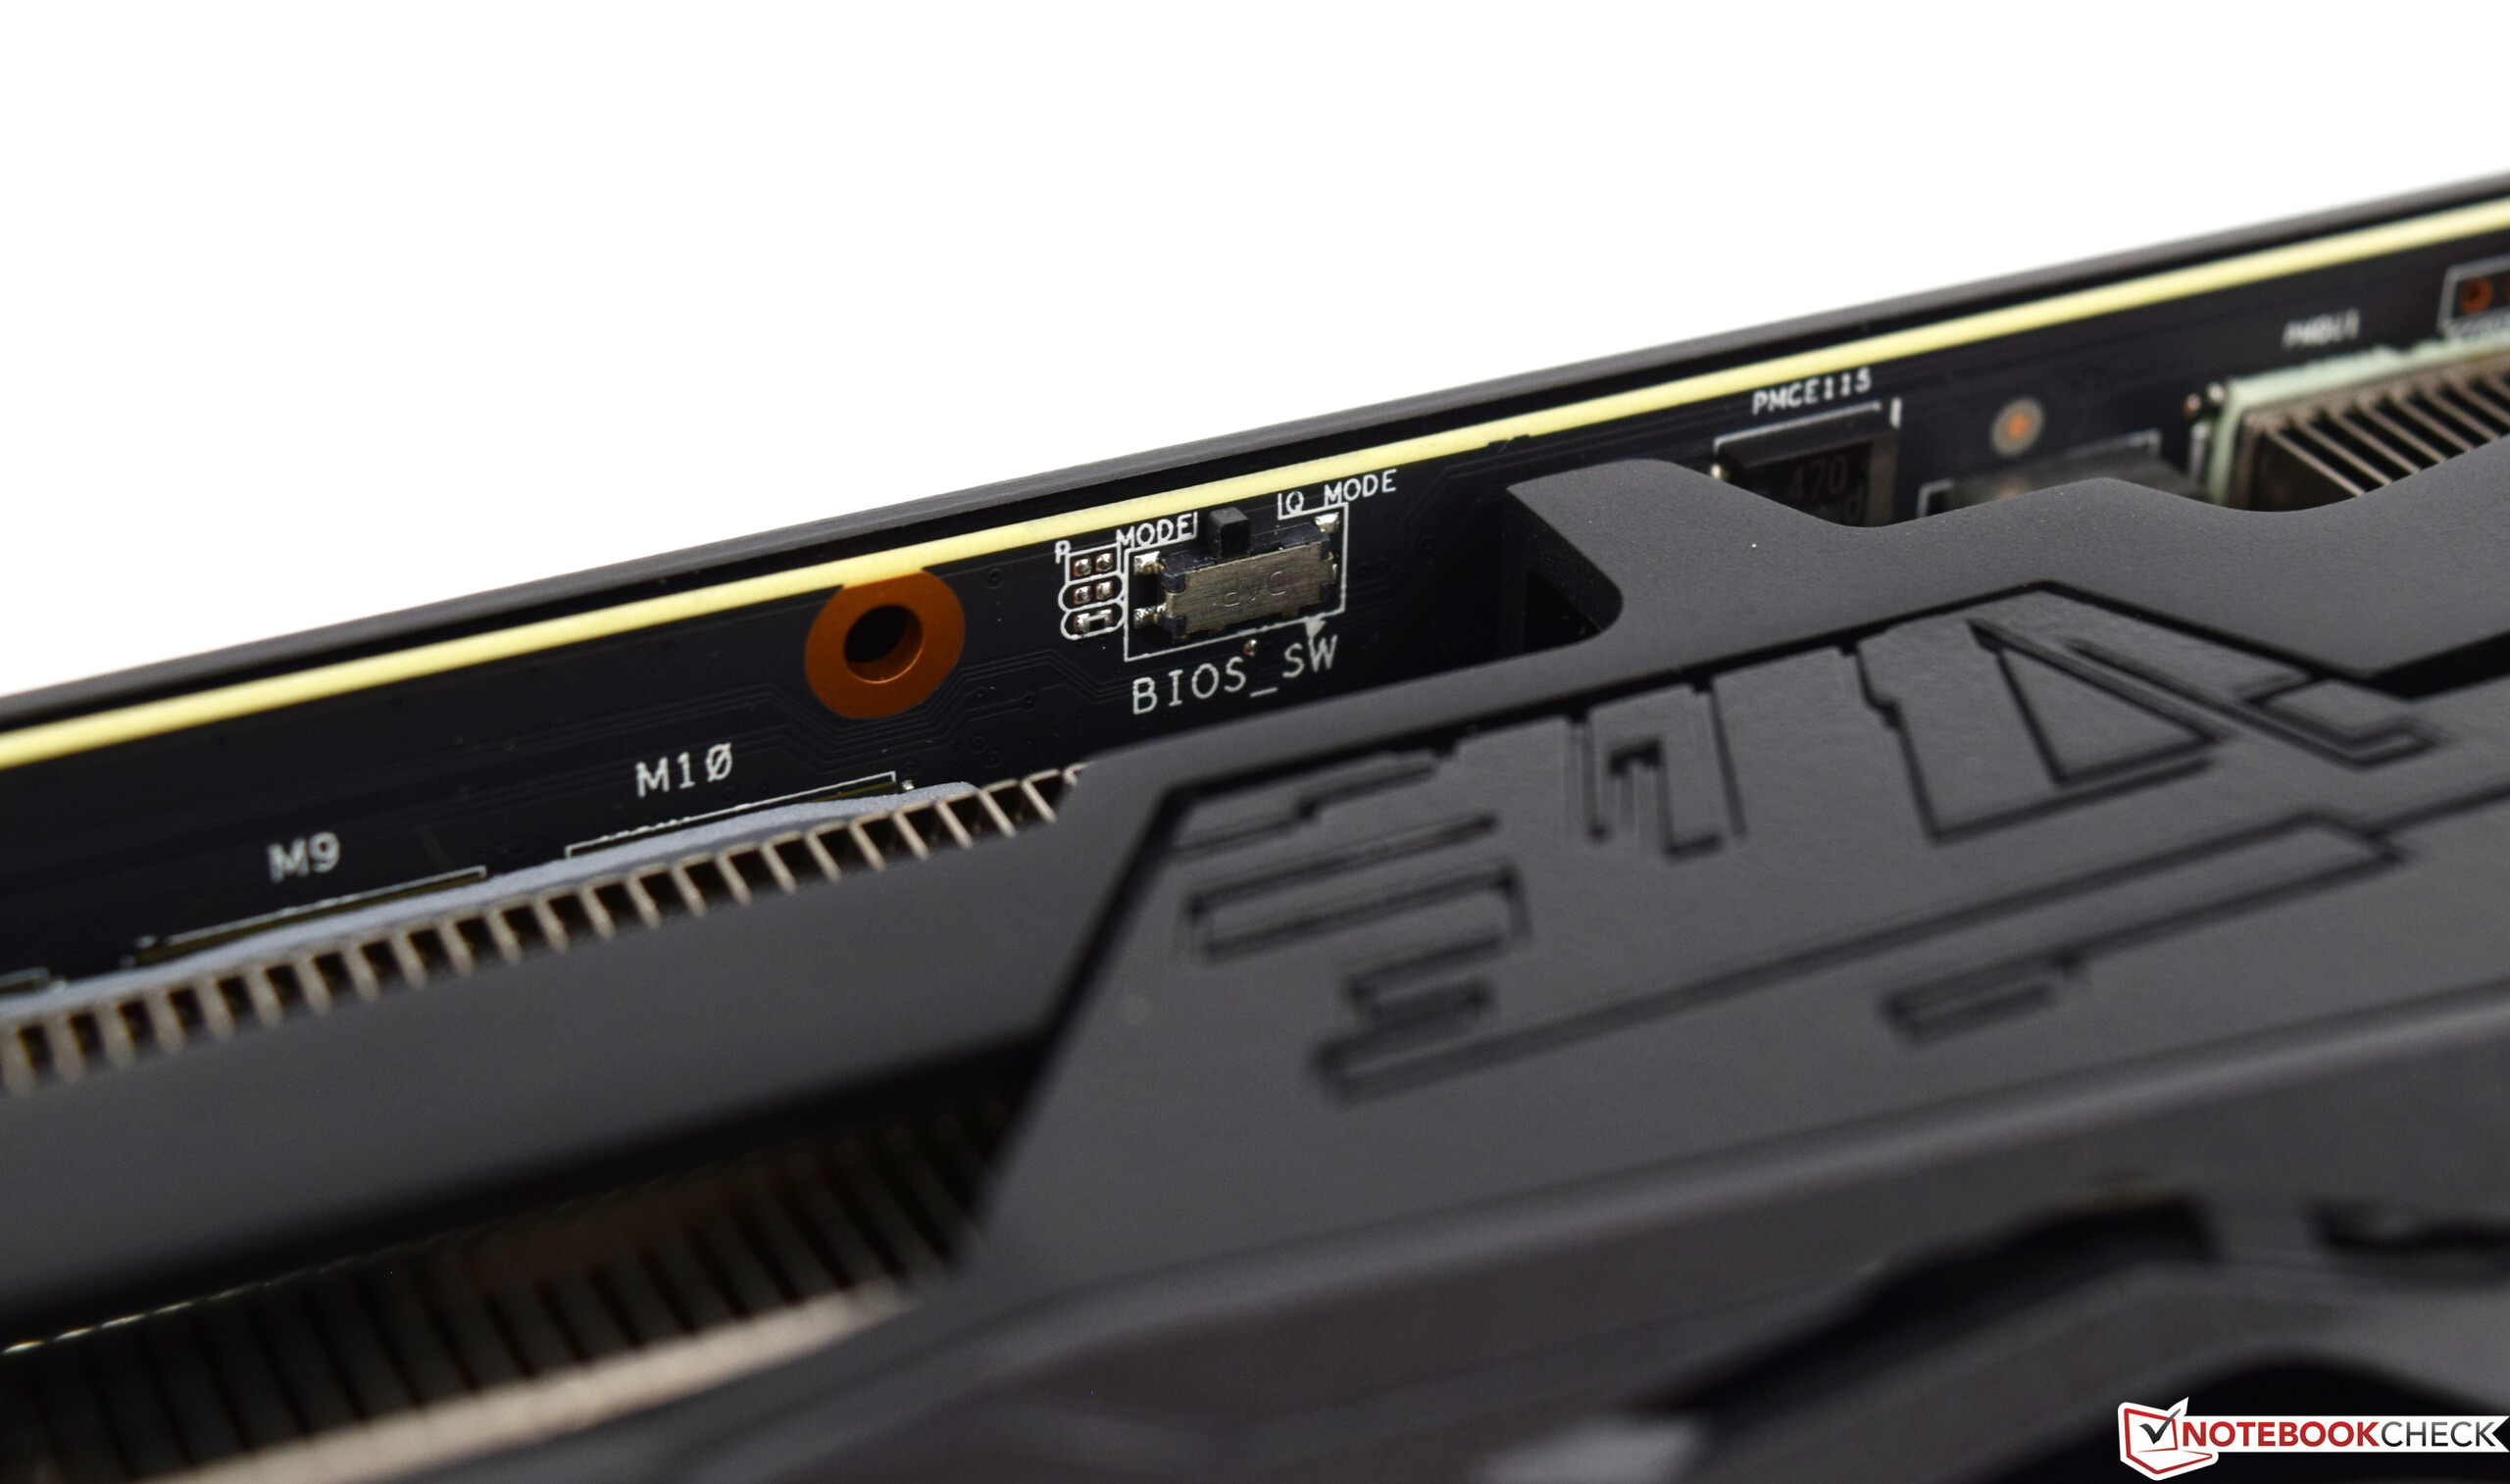
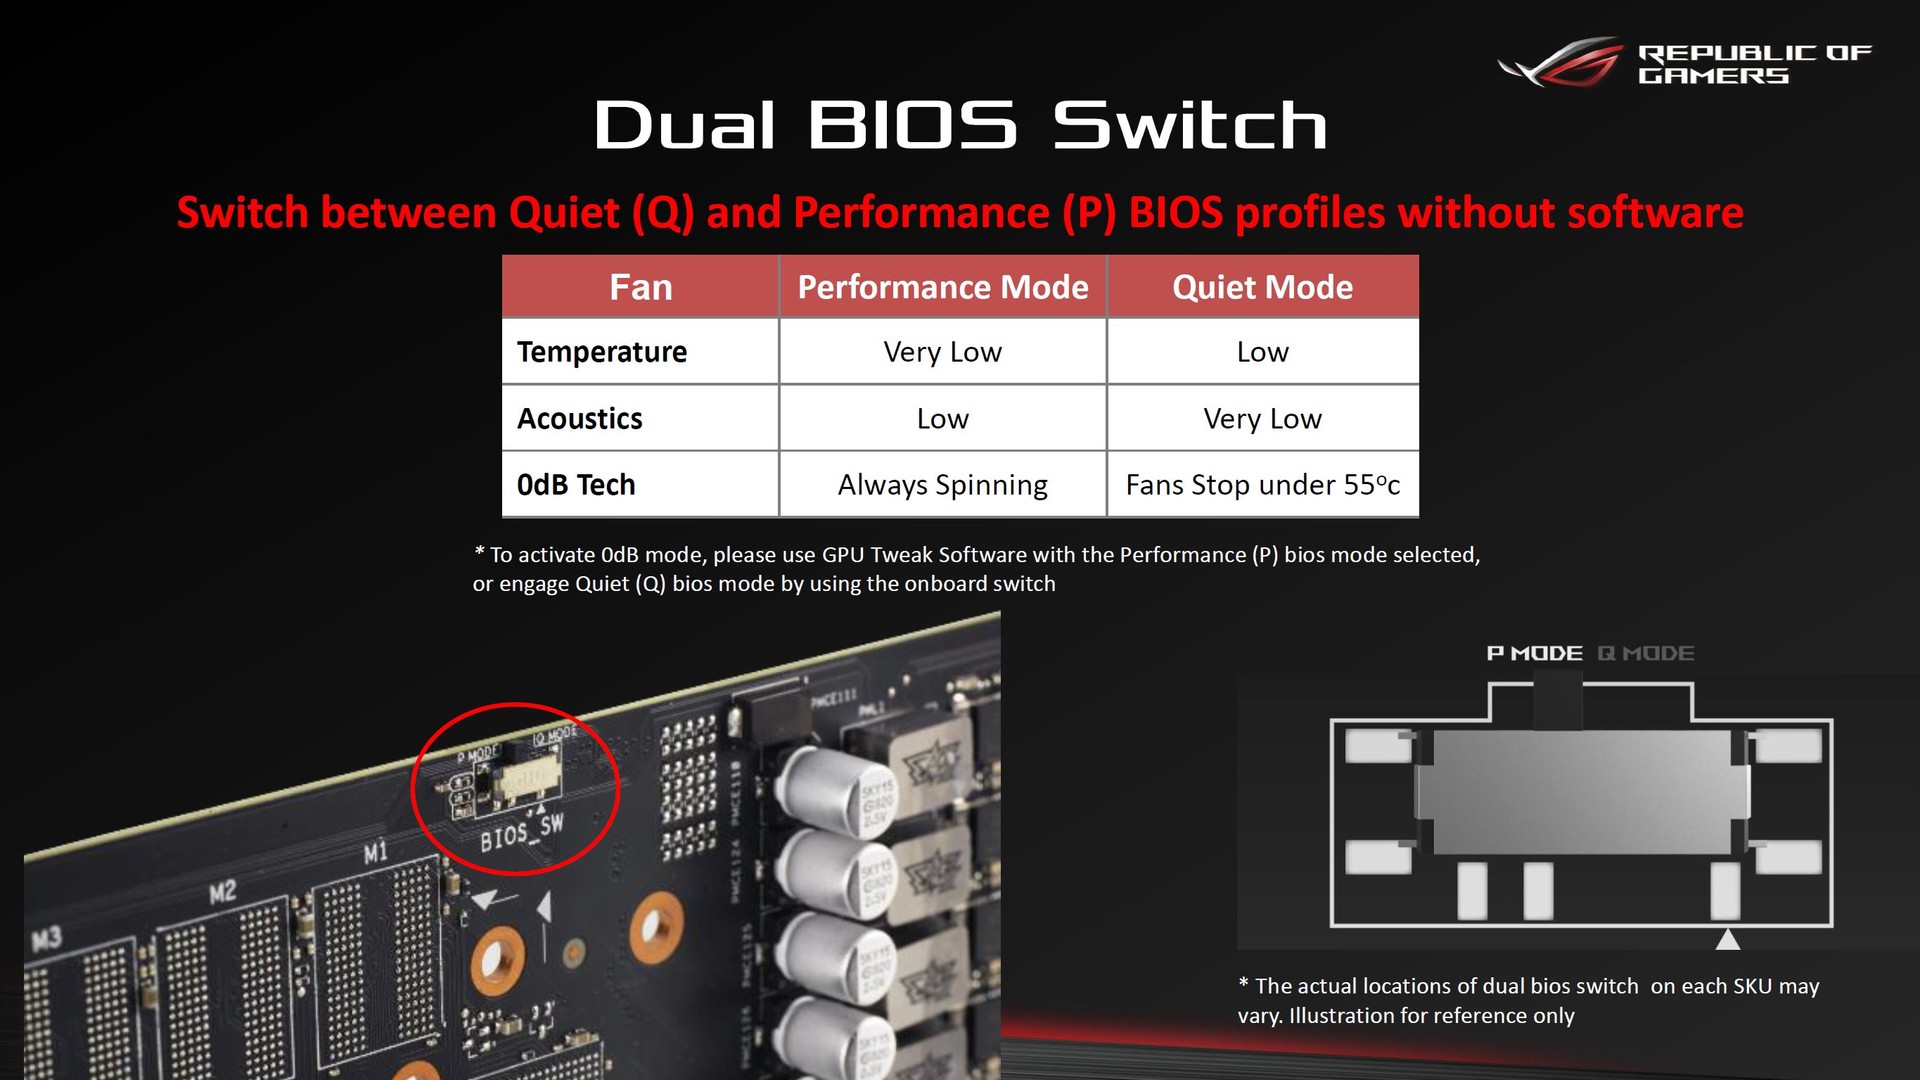
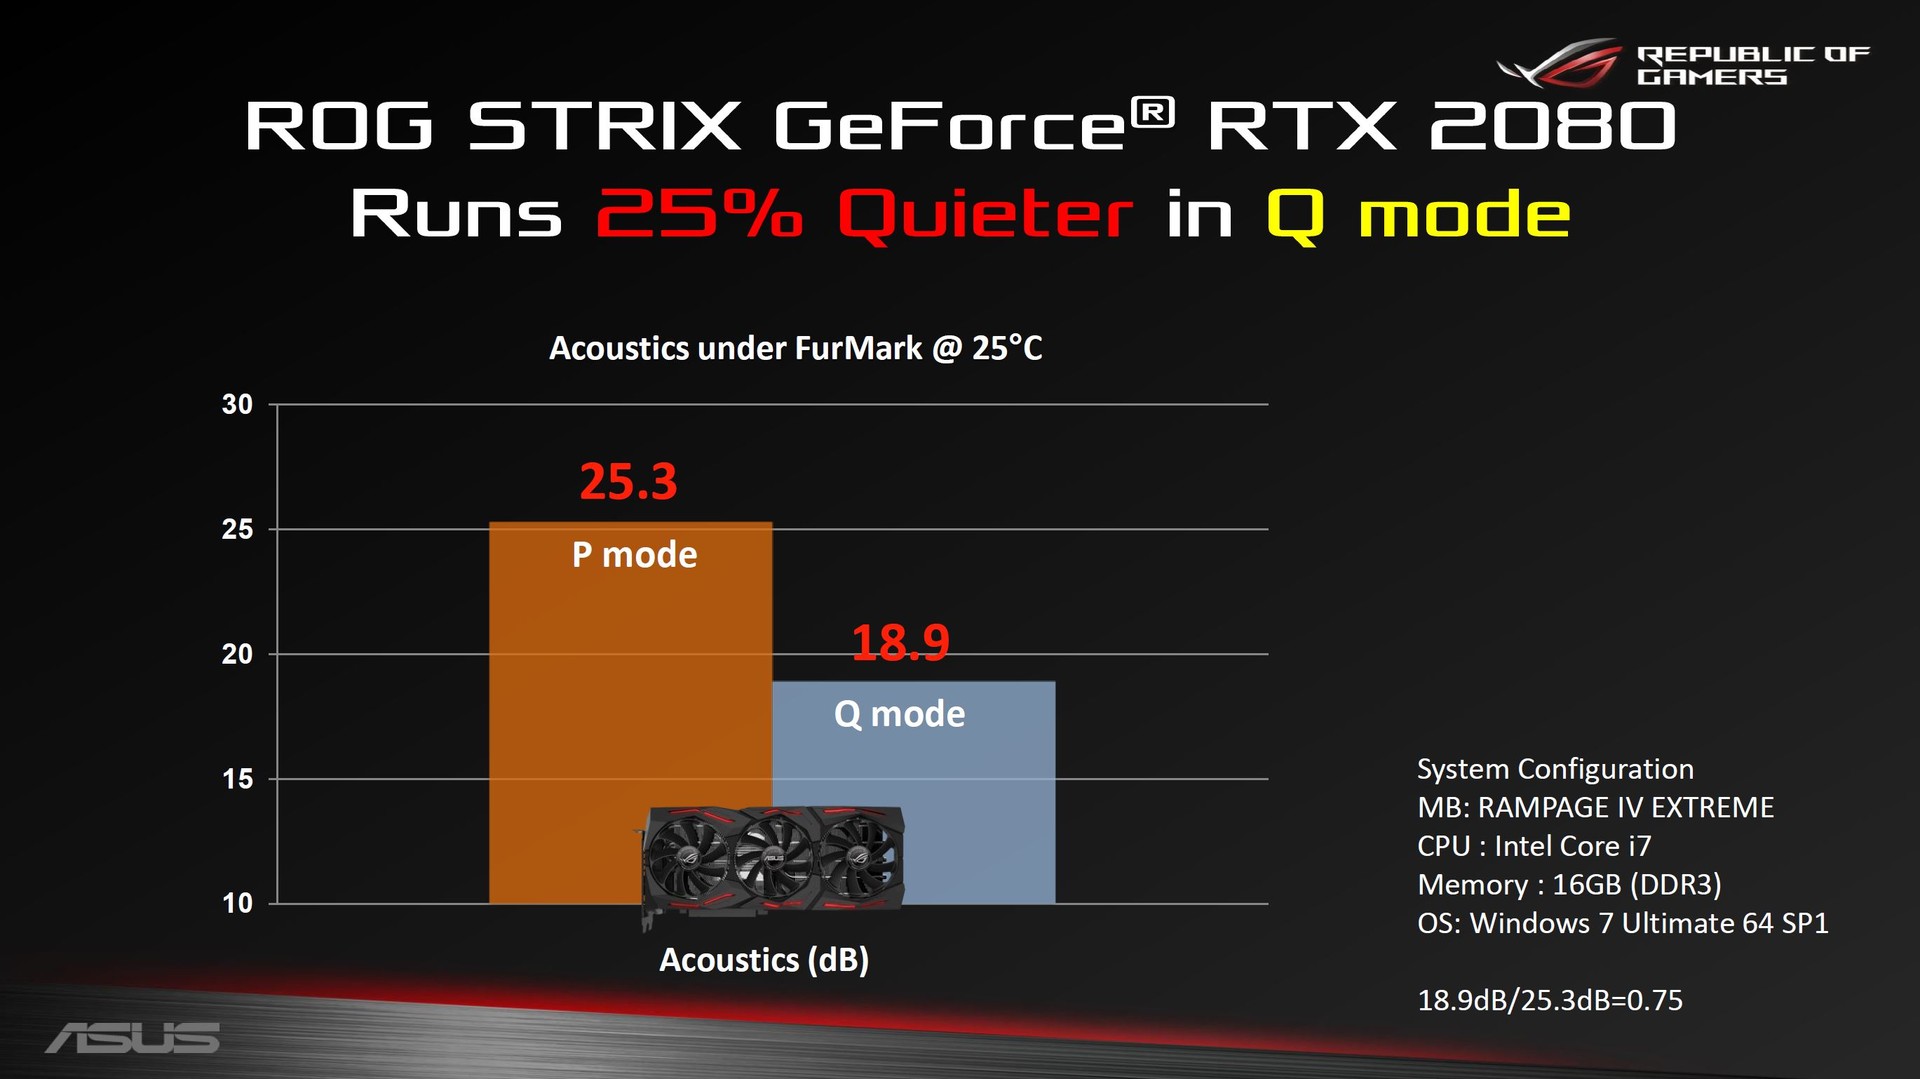
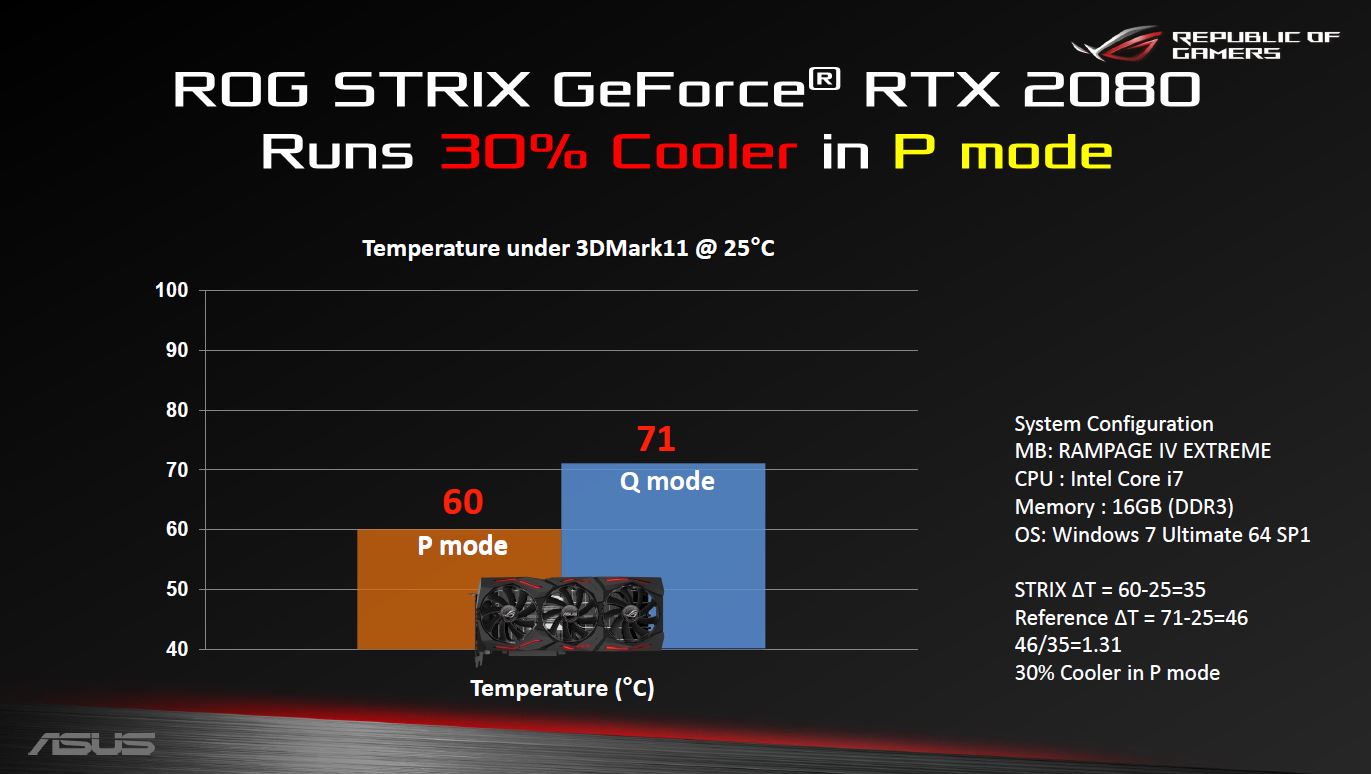
A special feature is the ROG RTX Strix 2080 OC’s dual BIOS featuring a Performance mode and a Quiet mode. The fans are always on in Performance mode, resulting in higher noise emissions when idle. In return, temperatures were lower. In Quiet mode the fan is off until a temperature threshold of 55 °C is reached. We ran all of our tests and benchmarks in Performance mode.
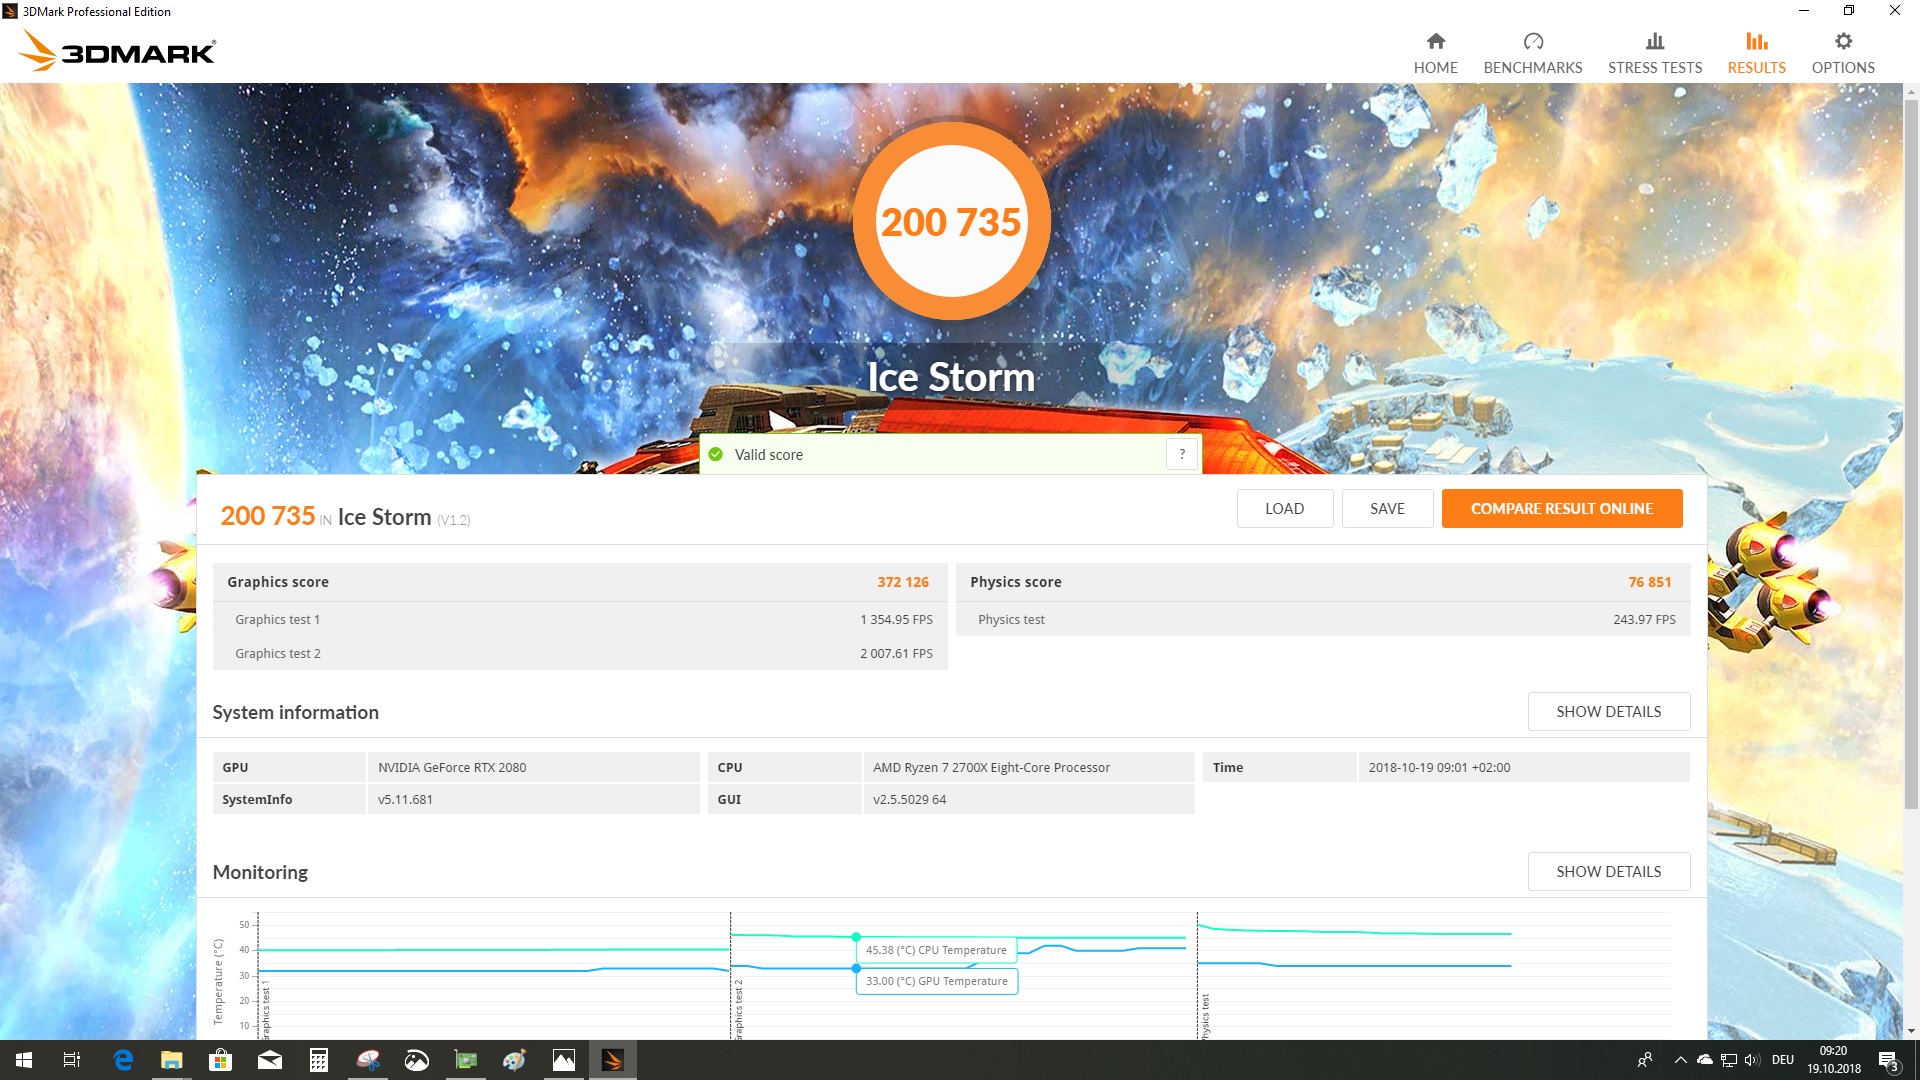
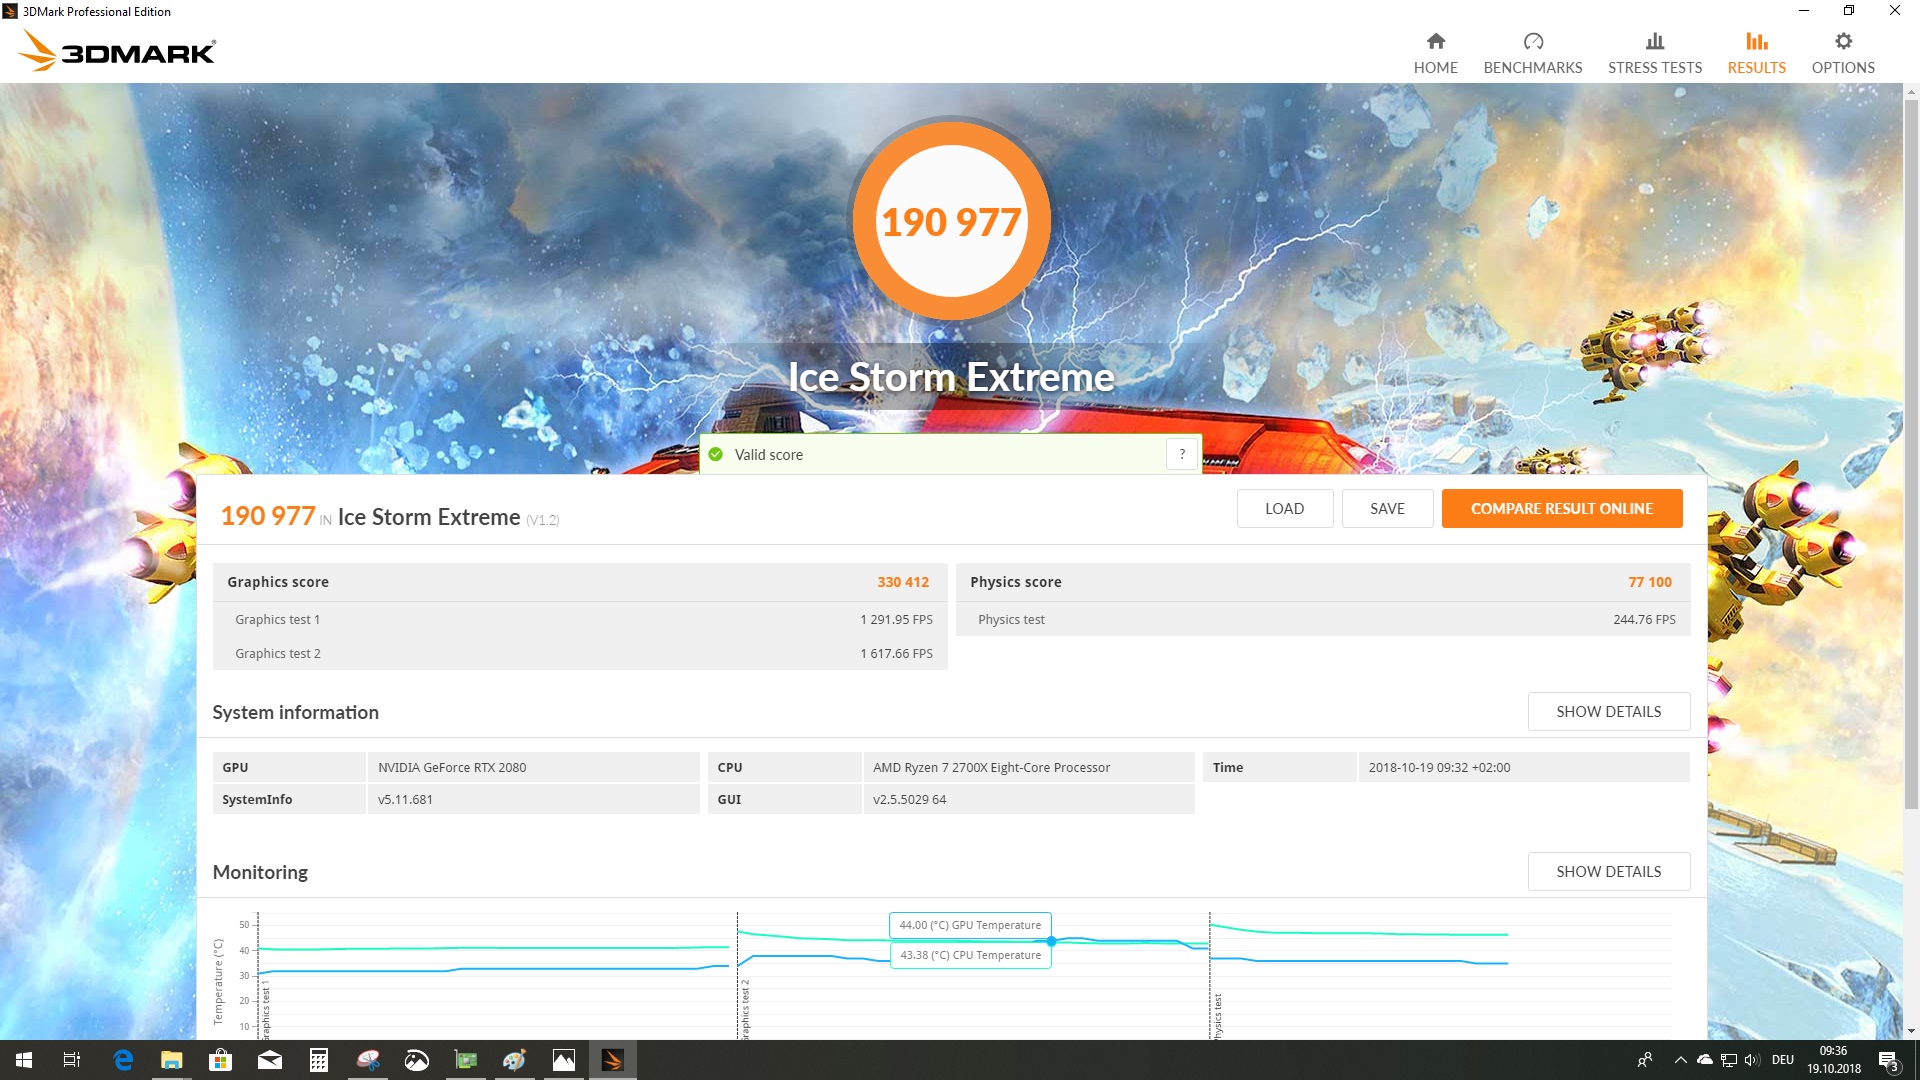
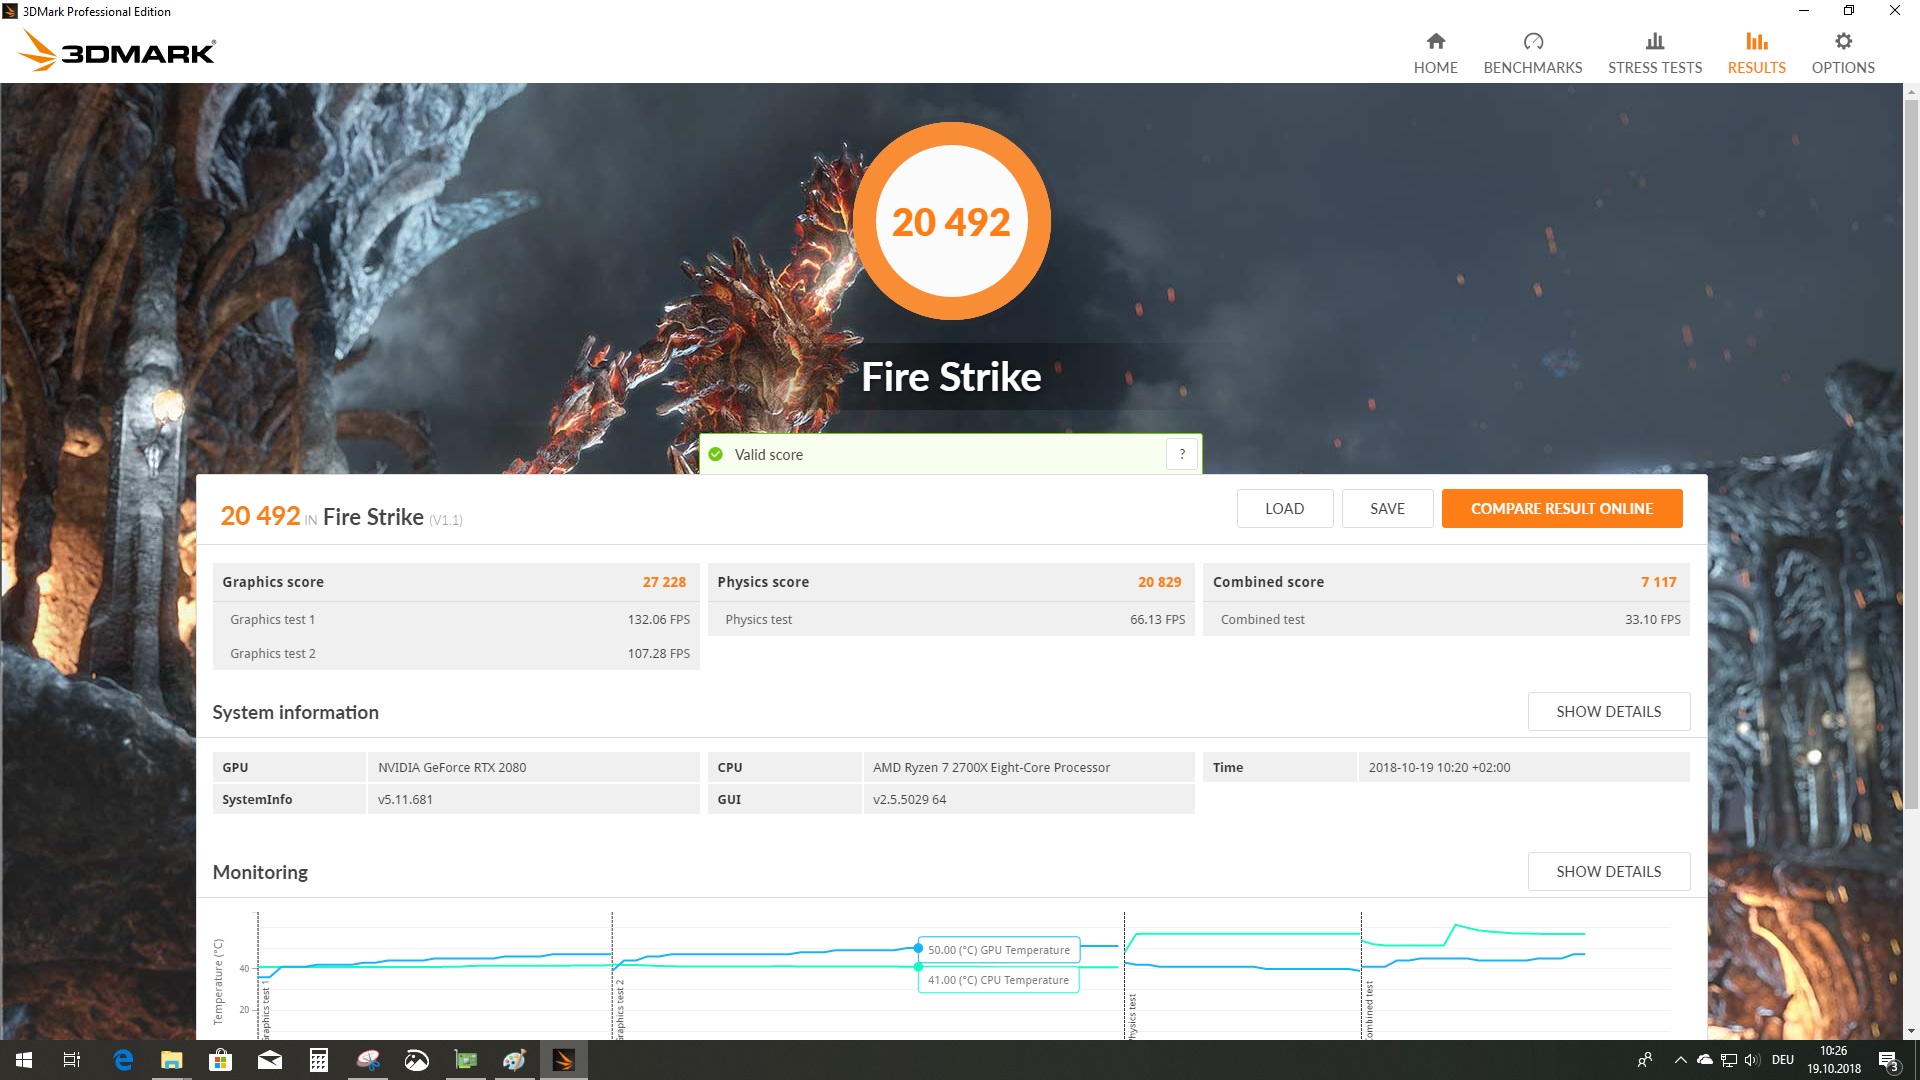
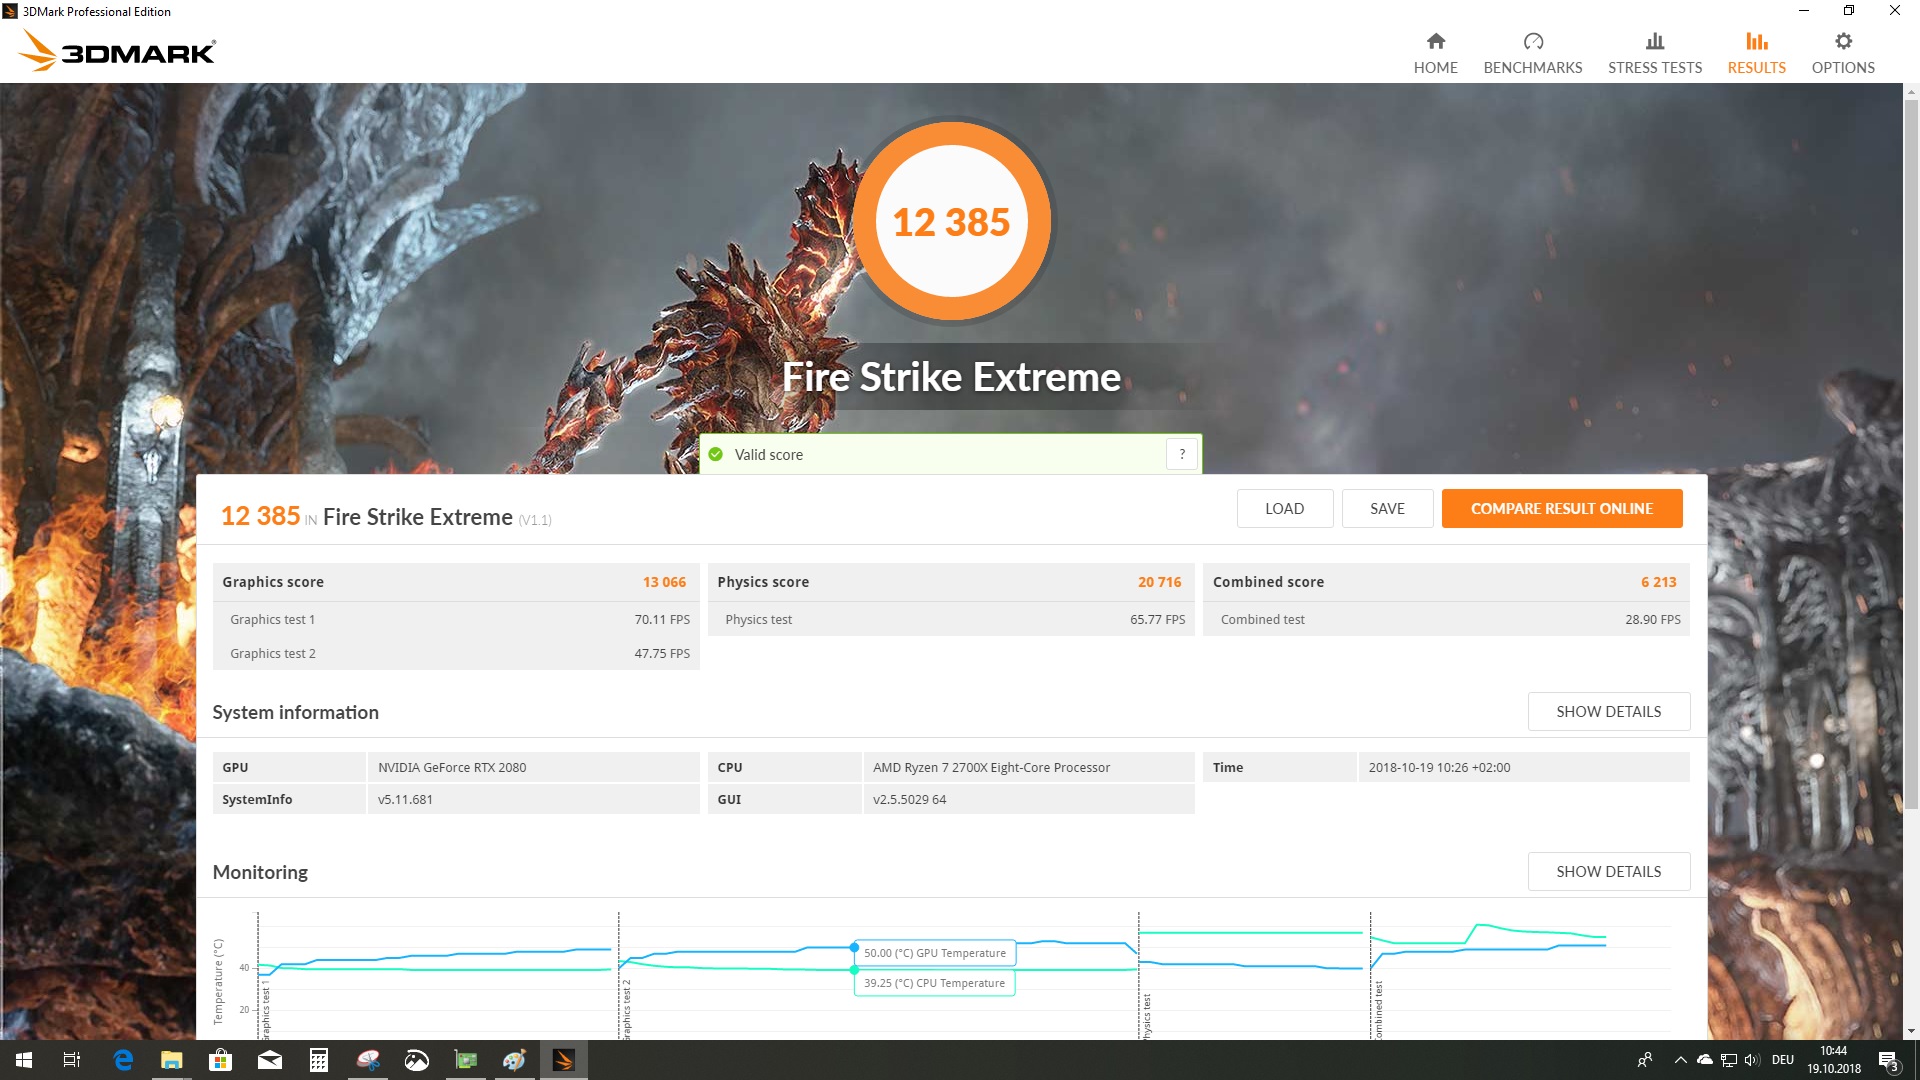
Synthetic Benchmarks
The Asus ROG Strix RTX 2080 OC performed right in-between a GeForce GTX 1080 Ti Founders Edition and the Asus ROG Strix RTX 2070 OC. In 3DMark, it was up to 16% faster. Compared to its immediate Pascal-based predecessor the RTX 2080 OC was even up to 30% faster. At the time of writing AMD does not have a GPU capable of competing head-to-head with the 2080 OC. The Radeon RX Vega 64 performed similarly to a GeForce GTX 1080 and RTX 2070, but it was certainly not fit to hold a candle to the RTX 2080.


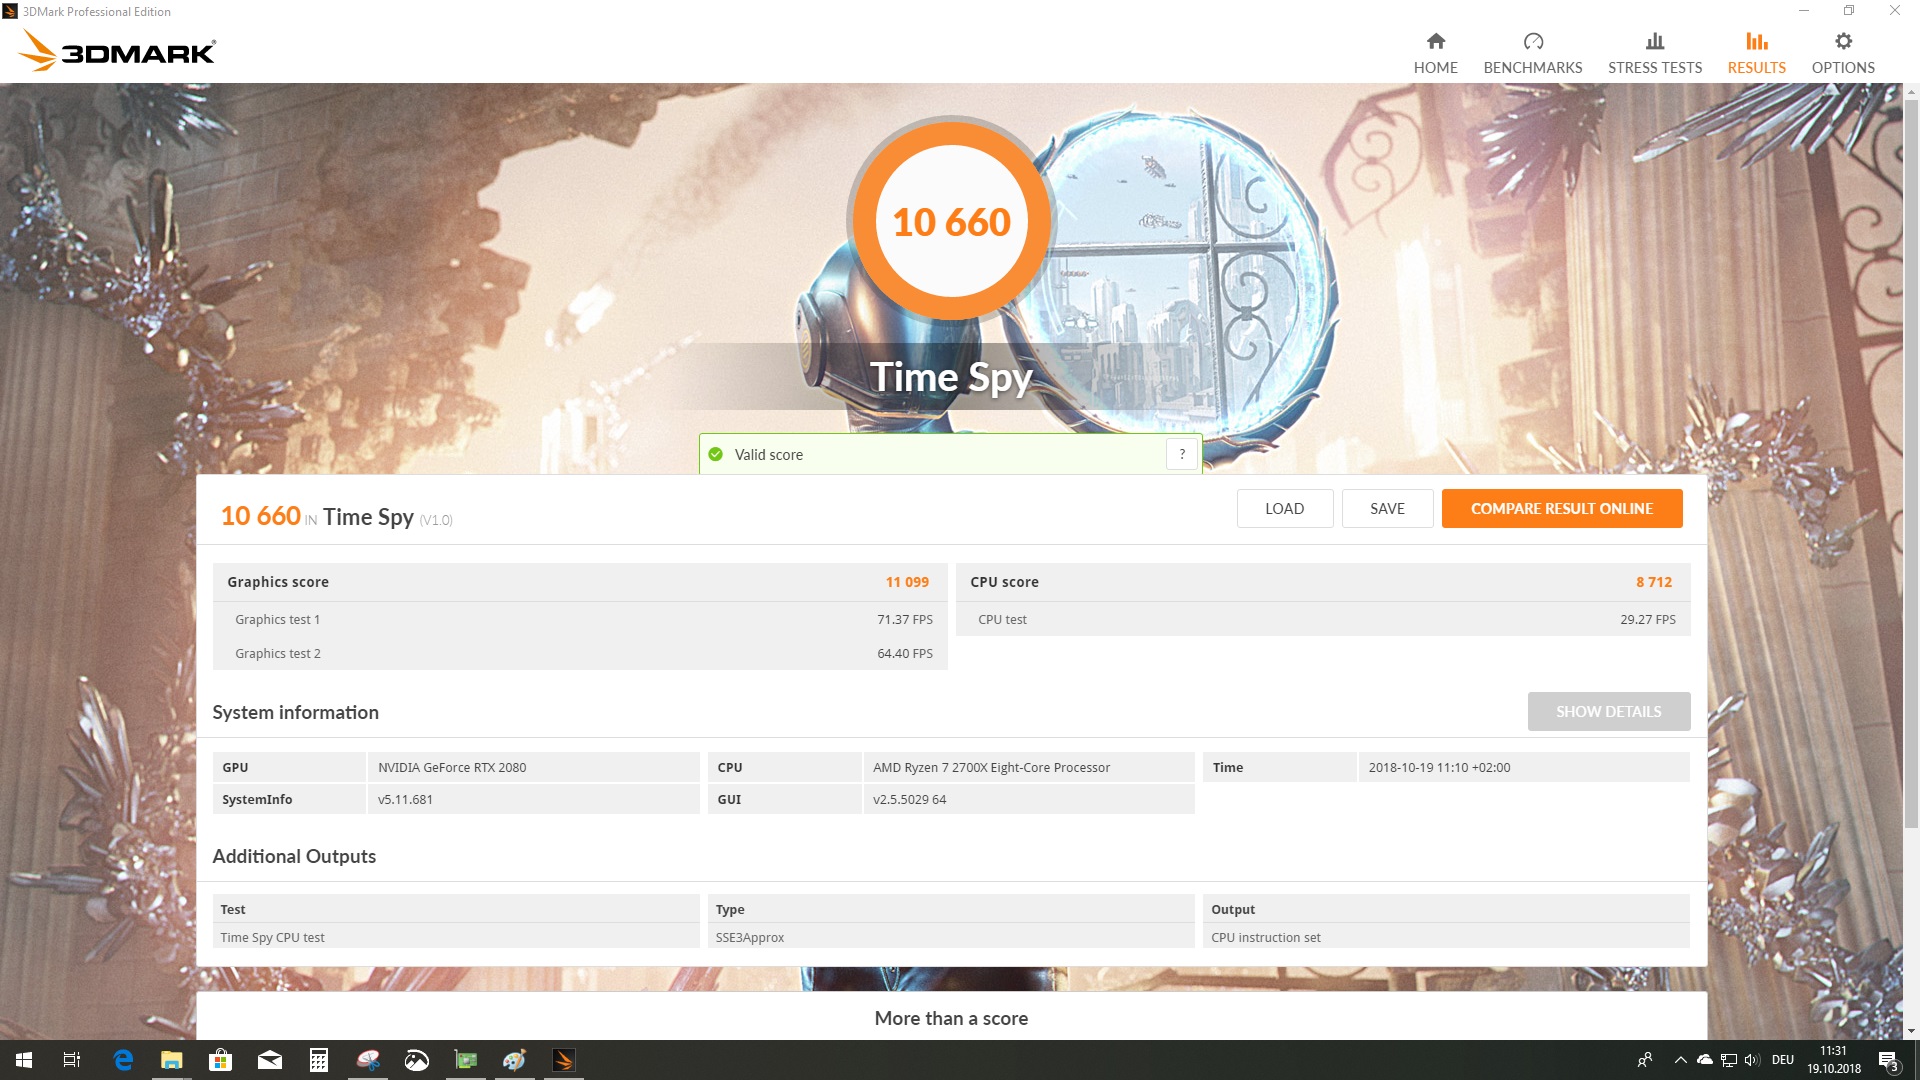

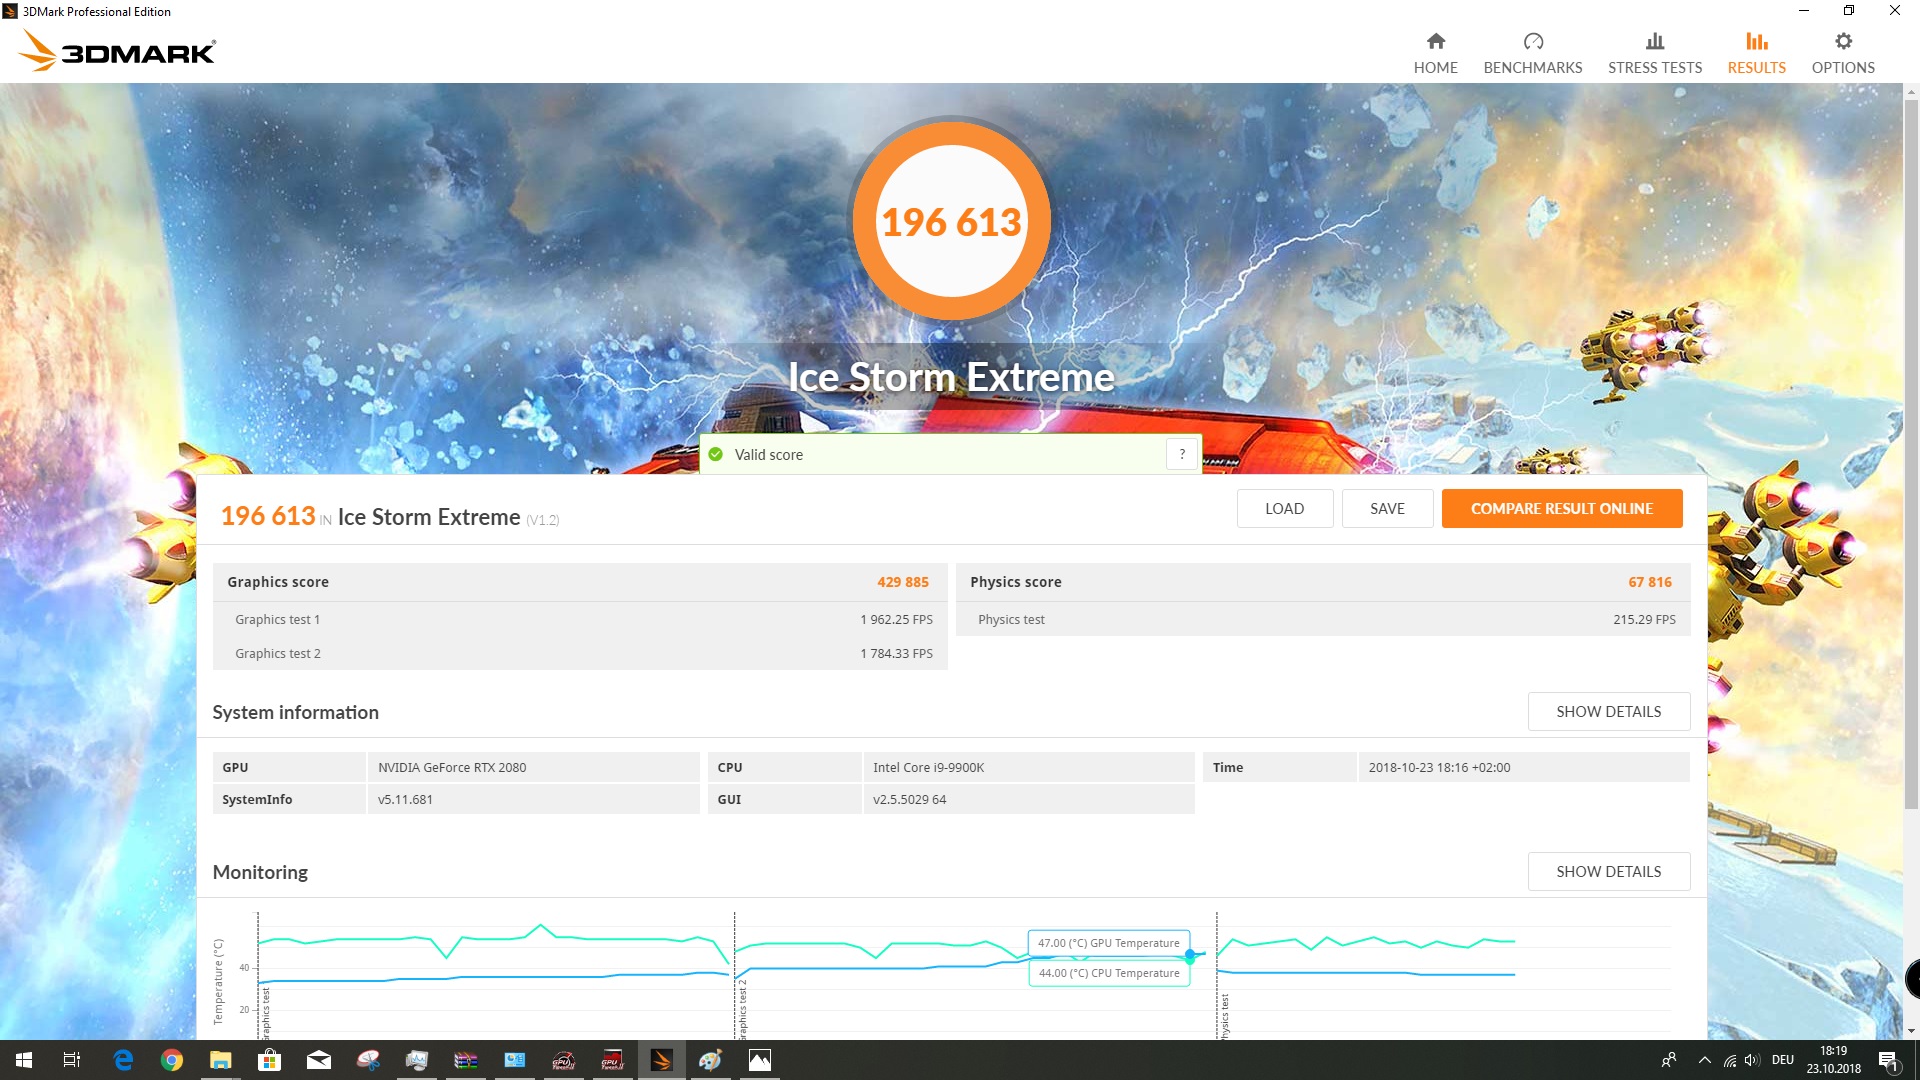
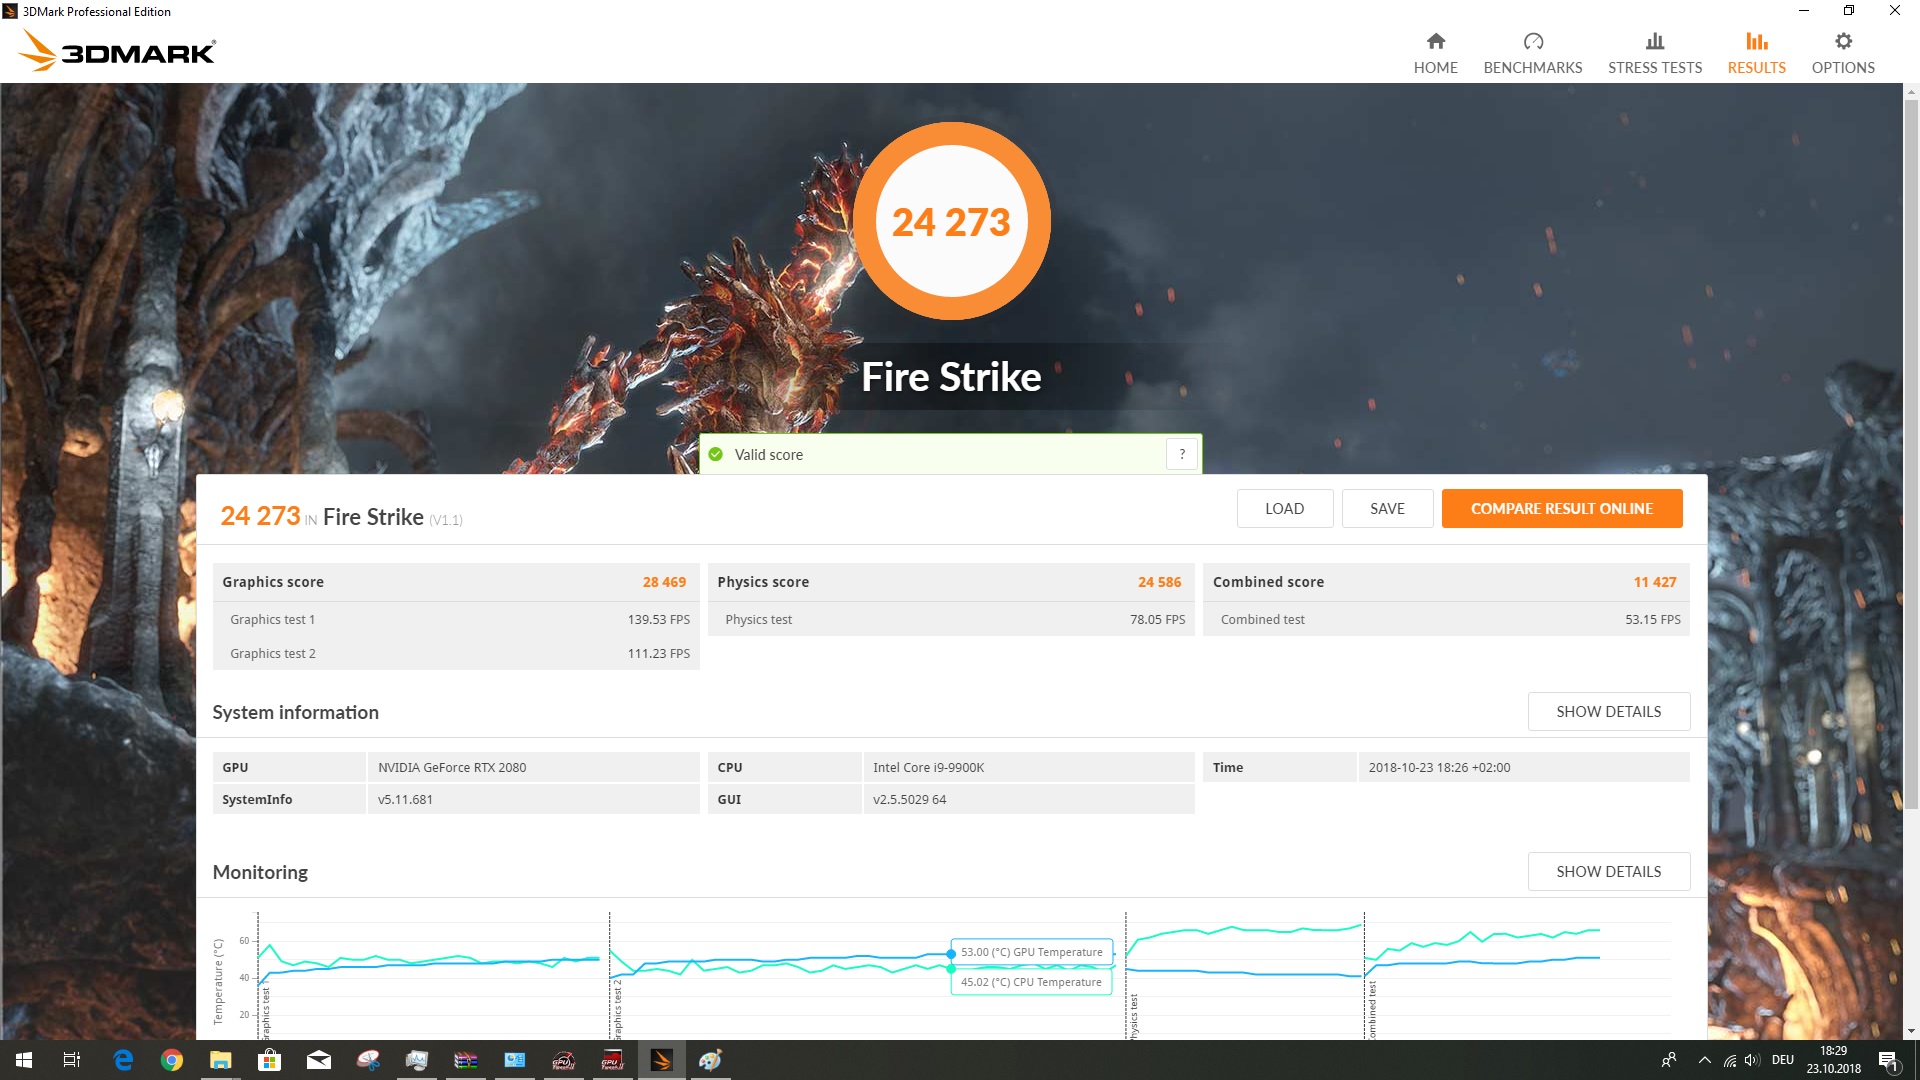
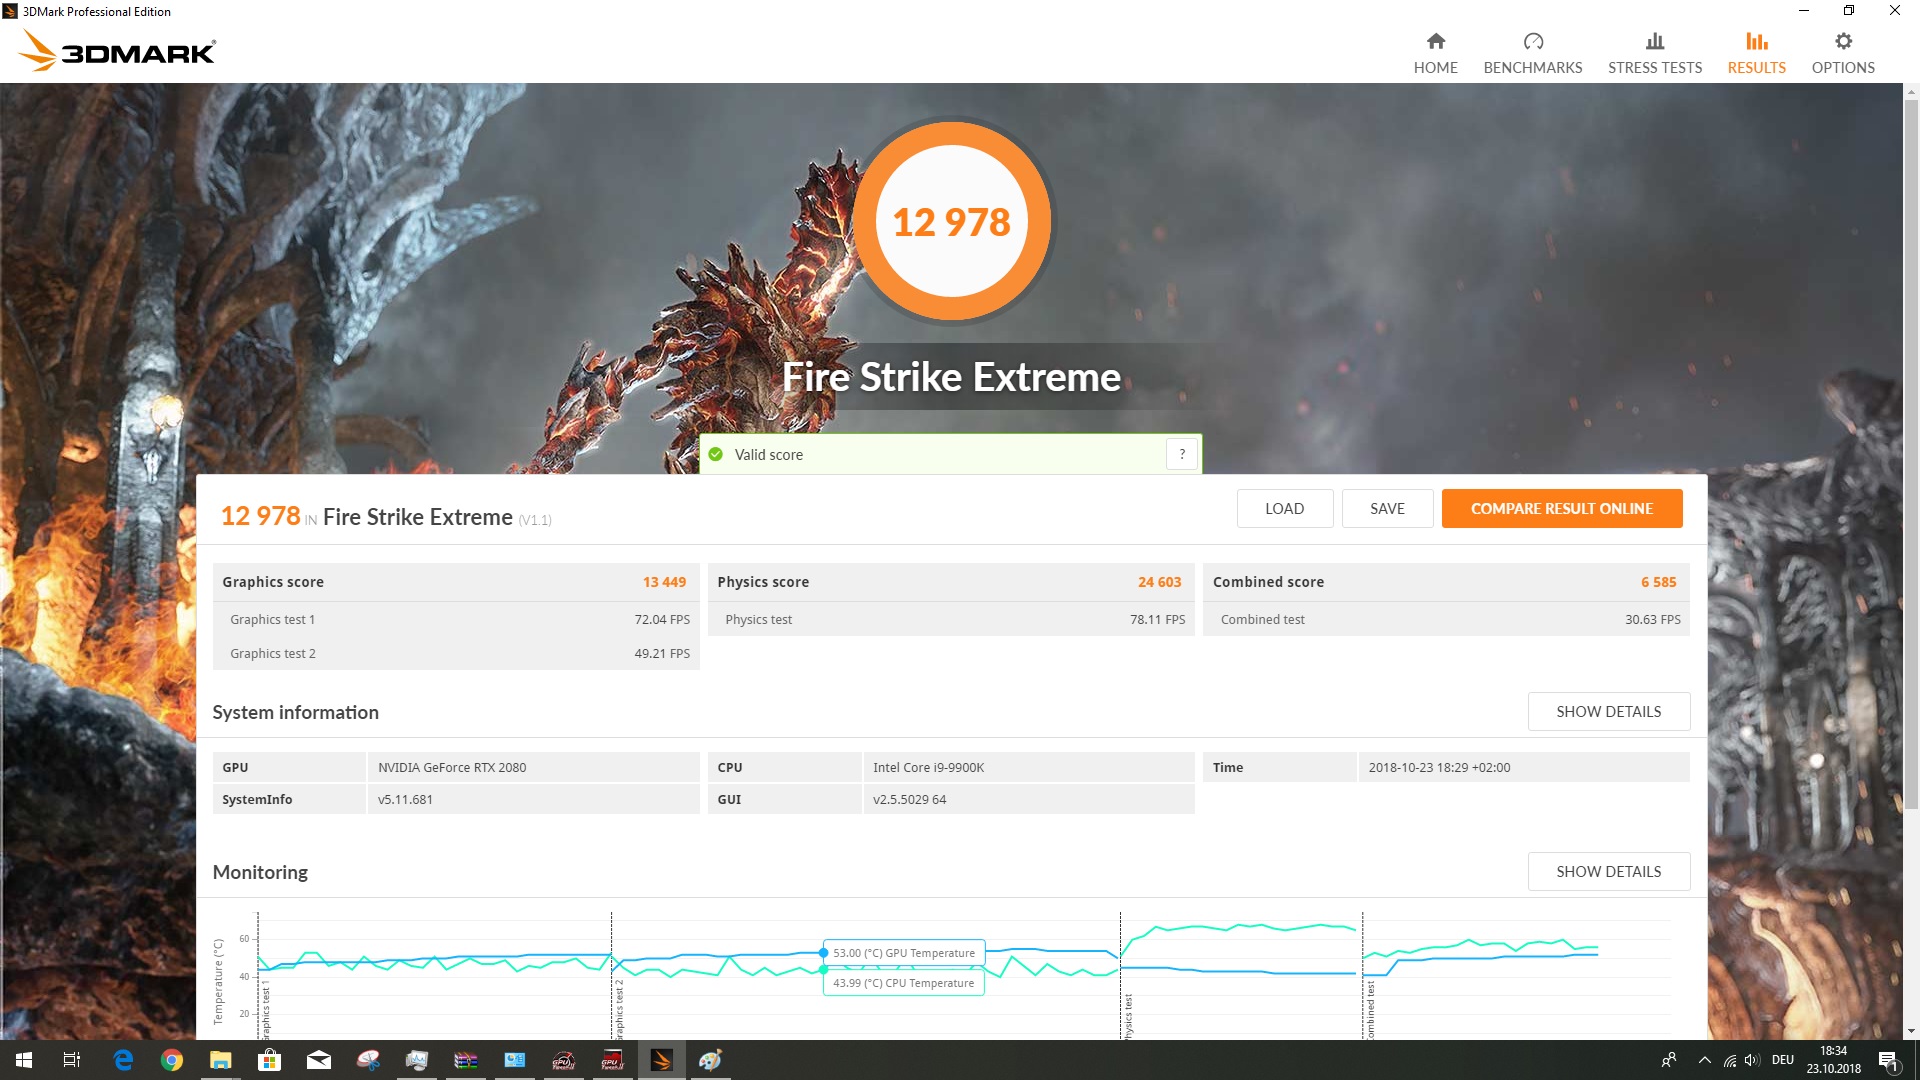
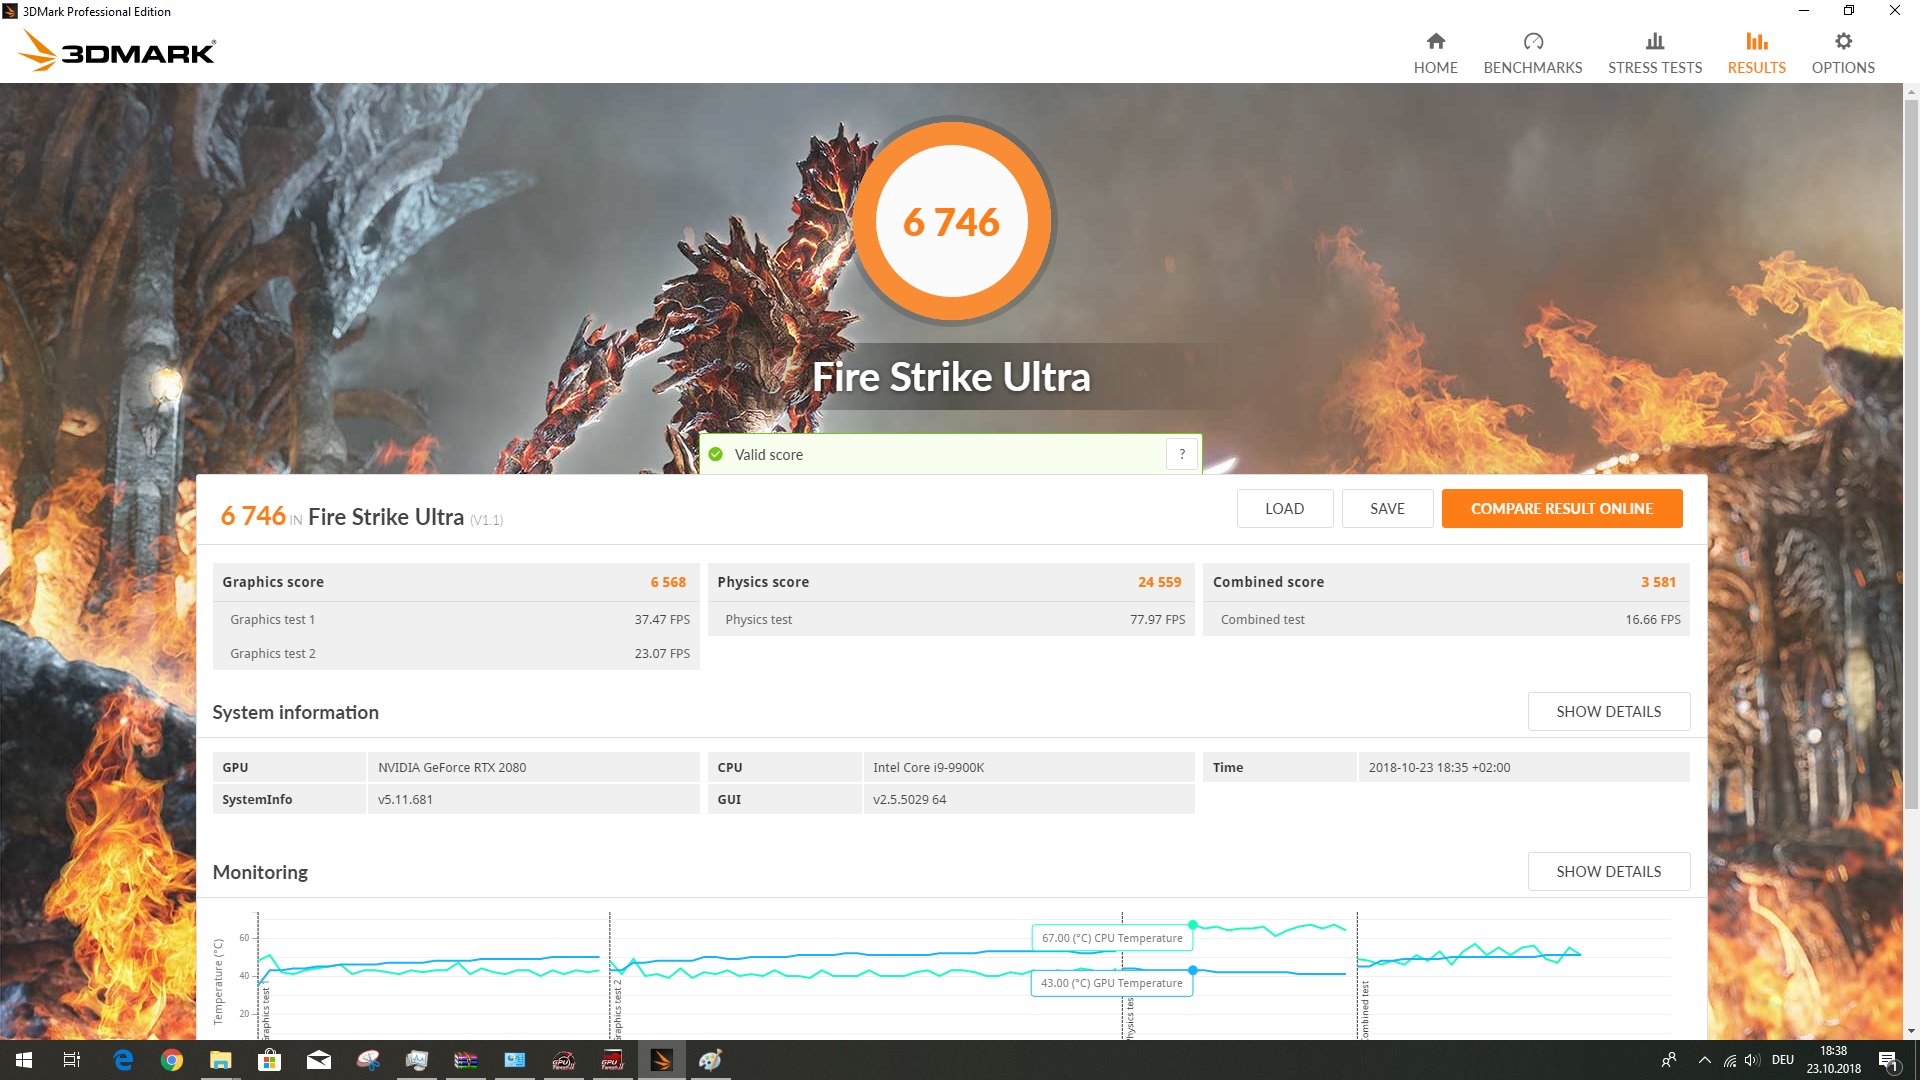
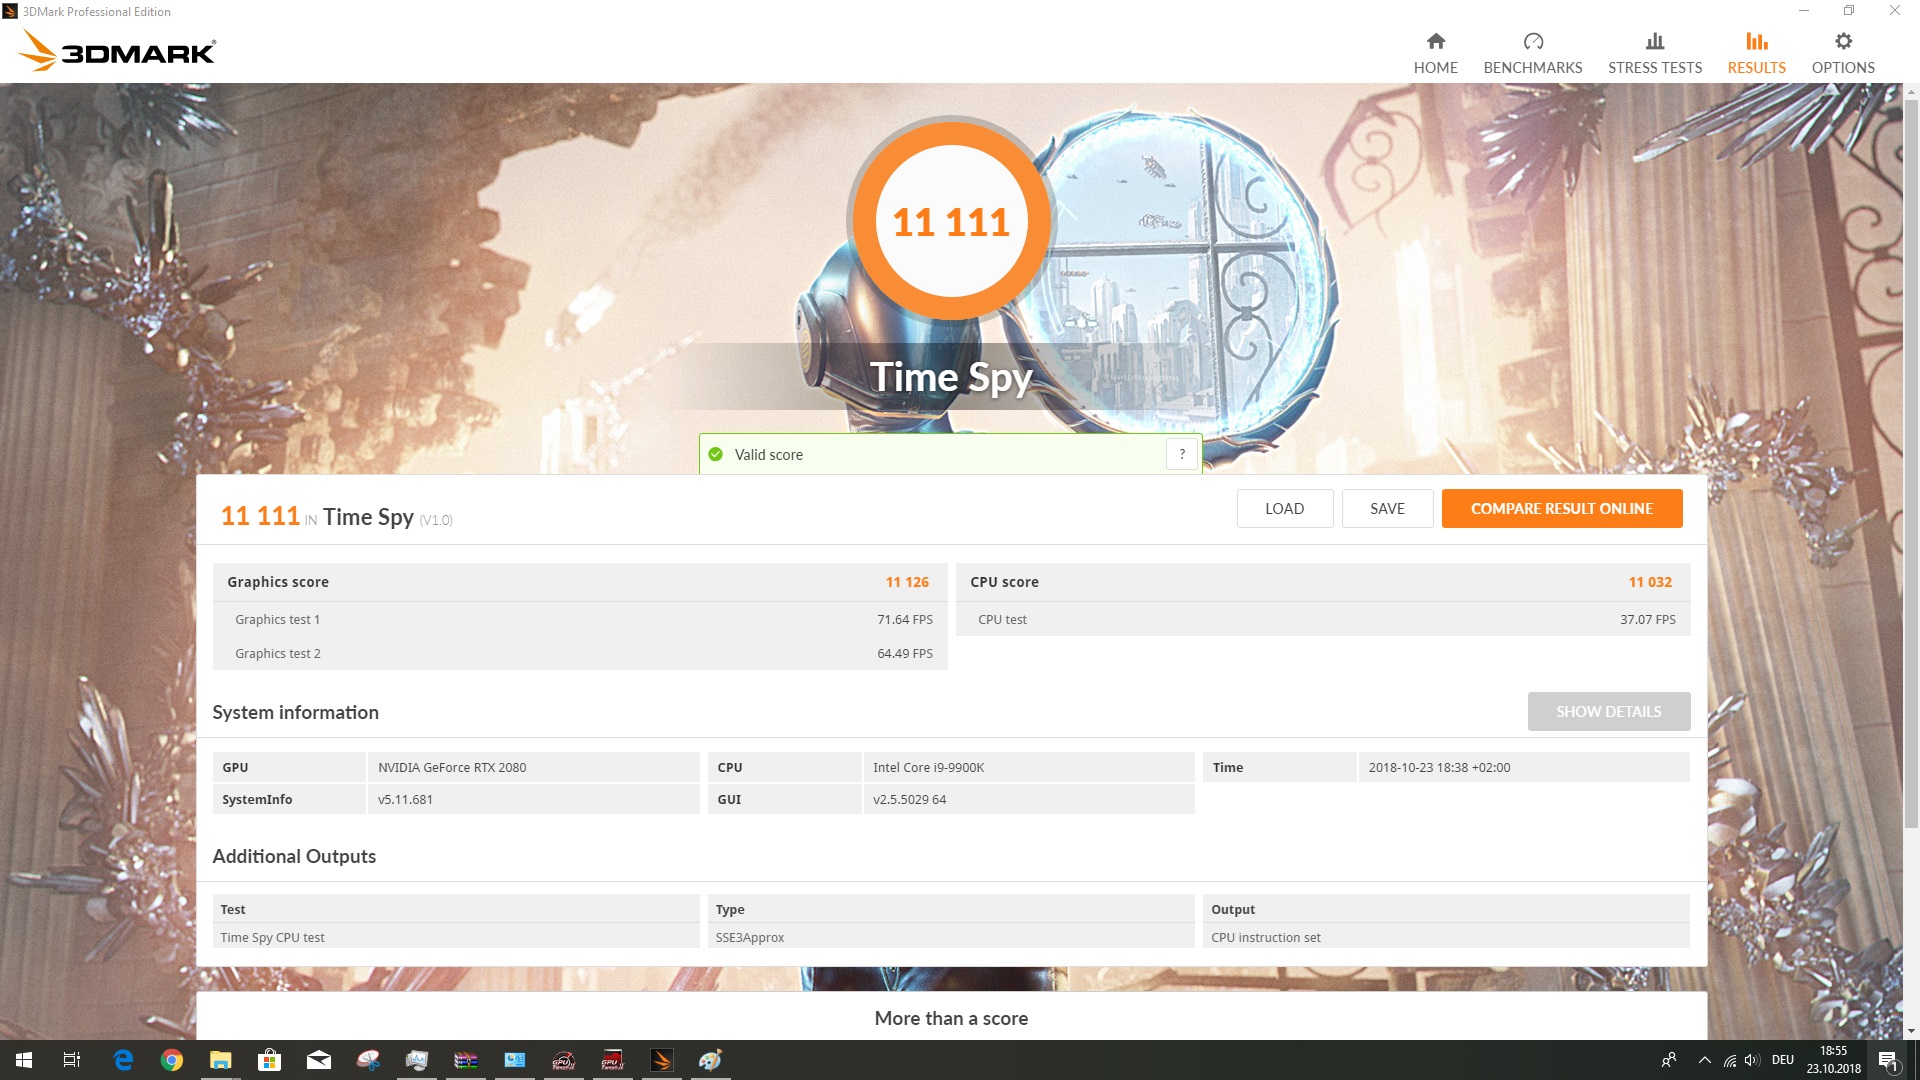
Synthetic Benchmarks @ Intel Core i9-9900K
While running our tests we got our hands on an Intel Core i9-9900K system with a higher IPC than AMD’s Ryzen. Thus, we decided to run a few benchmarks on Intel’s octa-core platform as well. The Intel CPU was faster than AMD’s competitor, however the differences were almost negligible and no more than 3-5%. In other words: The Intel test setup was not significantly faster than our AMD setup.


| 3DMark | |
| 1920x1080 Fire Strike Graphics | |
| Intel Core i9-9900K, Asus ROG Strix RTX 2080 OC | |
| Asus ROG Strix RTX 2080 OC | |
| 1280x720 Cloud Gate Standard Graphics | |
| Intel Core i9-9900K, Asus ROG Strix RTX 2080 OC | |
| Asus ROG Strix RTX 2080 OC | |
| 3840x2160 Fire Strike Ultra Graphics | |
| Intel Core i9-9900K, Asus ROG Strix RTX 2080 OC | |
| Asus ROG Strix RTX 2080 OC | |
| Fire Strike Extreme Graphics | |
| Intel Core i9-9900K, Asus ROG Strix RTX 2080 OC | |
| Asus ROG Strix RTX 2080 OC | |
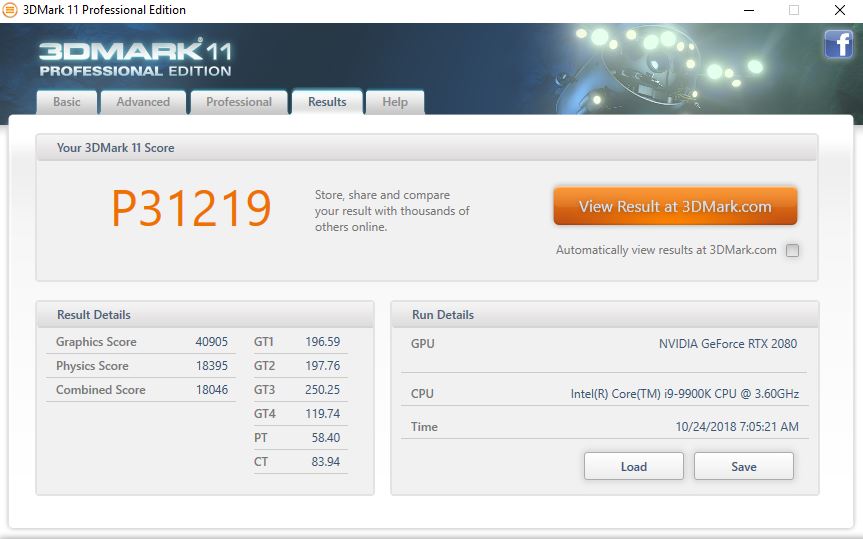
| 3DMark 11 - 1280x720 Performance GPU | |
| Intel Core i9-9900K, Asus ROG Strix RTX 2080 OC | |
| Asus ROG Strix RTX 2080 OC | |
Gaming Benchmarks
Running our synthetic benchmarks suite already hinted at the RTX 2080 OC’s level of performance. Running actual games, however, is a whole different story. In order to determine the 2080 OC’s gaming performance we ran some current games, and it performed very well overall. In some games, it even outperformed the GeForce GTX 1080 Ti. All current games should run very smoothly in 4K.
A noteworthy difference to the Asus ROG Strix RTX 2070 OC was only measurable in resolutions above 1080p. This too backs up our impression that the 2080 OC was made for 4K gaming. Those who game in FHD or WQHD resolutions will be perfectly fine with an RTX 2070.
| Call of Duty Black Ops 4 | |
| 1920x1080 Very High / On | |
| NVIDIA GeForce RTX 2080 (Desktop) | |
| AMD Radeon RX Vega 64 | |
| NVIDIA Titan X Pascal | |
| NVIDIA GeForce RTX 2070 (Desktop) | |
| NVIDIA GeForce GTX 1080 (Desktop) | |
| NVIDIA GeForce GTX 1070 (Desktop) | |
| NVIDIA GeForce GTX 1060 (Desktop) | |
| 3840x2160 Very High / On | |
| NVIDIA GeForce RTX 2080 (Desktop) | |
| NVIDIA Titan X Pascal | |
| AMD Radeon RX Vega 64 | |
| NVIDIA GeForce RTX 2070 (Desktop) | |
| NVIDIA GeForce GTX 1080 (Desktop) | |
| NVIDIA GeForce GTX 1070 (Desktop) | |
| NVIDIA GeForce GTX 1060 (Desktop) | |
| Assassin´s Creed Odyssey | |
| 1920x1080 Ultra High Preset | |
| NVIDIA GeForce RTX 2080 (Desktop) | |
| NVIDIA GeForce GTX 1080 (Desktop) | |
| NVIDIA Titan X Pascal | |
| NVIDIA GeForce RTX 2070 (Desktop) | |
| NVIDIA GeForce GTX 1070 (Desktop) | |
| AMD Radeon RX Vega 64 | |
| NVIDIA GeForce GTX 1060 (Desktop) | |
| AMD Radeon RX 580 (Desktop) | |
| 3840x2160 Ultra High Preset | |
| NVIDIA GeForce RTX 2080 (Desktop) | |
| NVIDIA Titan X Pascal | |
| NVIDIA GeForce RTX 2070 (Desktop) | |
| NVIDIA GeForce GTX 1080 (Desktop) | |
| AMD Radeon RX Vega 64 | |
| NVIDIA GeForce GTX 1070 (Desktop) | |
| NVIDIA GeForce GTX 1060 (Desktop) | |
| AMD Radeon RX 580 (Desktop) | |
| FIFA 19 | |
| 1920x1080 Ultra Preset AA:4x MS | |
| NVIDIA GeForce GTX 1080 (Desktop) | |
| NVIDIA GeForce GTX 1070 (Desktop) | |
| AMD Radeon RX Vega 64 | |
| AMD Radeon RX 580 (Desktop) | |
| NVIDIA GeForce GTX 1060 (Desktop) | |
| NVIDIA GeForce RTX 2080 (Desktop) | |
| NVIDIA Titan X Pascal | |
| NVIDIA GeForce RTX 2070 (Desktop) | |
| 3840x2160 Ultra Preset AA:4x MS | |
| NVIDIA GeForce RTX 2080 (Desktop) | |
| NVIDIA Titan X Pascal | |
| NVIDIA GeForce RTX 2070 (Desktop) | |
| NVIDIA GeForce GTX 1080 (Desktop) | |
| AMD Radeon RX Vega 64 | |
| NVIDIA GeForce GTX 1070 (Desktop) | |
| NVIDIA GeForce GTX 1060 (Desktop) | |
| AMD Radeon RX 580 (Desktop) | |
| Forza Horizon 4 | |
| 1920x1080 Ultra Preset AA:2xMS | |
| NVIDIA GeForce RTX 2080 (Desktop) | |
| AMD Radeon RX Vega 64 | |
| NVIDIA GeForce GTX 1080 (Desktop) | |
| NVIDIA Titan X Pascal | |
| NVIDIA GeForce RTX 2070 (Desktop) | |
| NVIDIA GeForce GTX 1070 (Desktop) | |
| AMD Radeon RX 580 (Desktop) | |
| NVIDIA GeForce GTX 1060 (Desktop) | |
| 3840x2160 Ultra Preset AA:2xMS | |
| NVIDIA GeForce RTX 2080 (Desktop) | |
| NVIDIA Titan X Pascal | |
| NVIDIA GeForce GTX 1080 (Desktop) | |
| AMD Radeon RX Vega 64 | |
| NVIDIA GeForce RTX 2070 (Desktop) | |
| NVIDIA GeForce GTX 1070 (Desktop) | |
| AMD Radeon RX 580 (Desktop) | |
| NVIDIA GeForce GTX 1060 (Desktop) | |
| F1 2018 | |
| 1920x1080 Ultra High Preset AA:T AF:16x | |
| NVIDIA GeForce RTX 2080 (Desktop) | |
| NVIDIA GeForce RTX 2070 (Desktop) | |
| NVIDIA Titan X Pascal | |
| NVIDIA GeForce GTX 1080 (Desktop) | |
| NVIDIA GeForce GTX 1070 (Desktop) | |
| AMD Radeon RX Vega 64 | |
| AMD Radeon RX 580 (Desktop) | |
| NVIDIA GeForce GTX 1060 (Desktop) | |
| 3840x2160 Ultra High Preset AA:T AF:16x | |
| NVIDIA GeForce RTX 2080 (Desktop) | |
| NVIDIA Titan X Pascal | |
| NVIDIA GeForce RTX 2070 (Desktop) | |
| NVIDIA GeForce GTX 1080 (Desktop) | |
| AMD Radeon RX Vega 64 | |
| NVIDIA GeForce GTX 1070 (Desktop) | |
| NVIDIA GeForce GTX 1060 (Desktop) | |
| Monster Hunter World | |
| 1920x1080 Highest Preset (Image Quality High) | |
| NVIDIA GeForce RTX 2080 (Desktop) | |
| NVIDIA Titan X Pascal | |
| NVIDIA GeForce RTX 2070 (Desktop) | |
| NVIDIA GeForce GTX 1080 (Desktop) | |
| AMD Radeon RX Vega 64 | |
| NVIDIA GeForce GTX 1070 (Desktop) | |
| AMD Radeon RX 580 (Desktop) | |
| NVIDIA GeForce GTX 1060 (Desktop) | |
| 3840x2160 Highest Preset (Image Quality High) | |
| NVIDIA GeForce RTX 2080 (Desktop) | |
| NVIDIA Titan X Pascal | |
| NVIDIA GeForce RTX 2070 (Desktop) | |
| AMD Radeon RX Vega 64 | |
| NVIDIA GeForce GTX 1080 (Desktop) | |
| NVIDIA GeForce GTX 1070 (Desktop) | |
| AMD Radeon RX 580 (Desktop) | |
| NVIDIA GeForce GTX 1060 (Desktop) | |
| Far Cry 5 | |
| 1920x1080 Ultra Preset AA:T | |
| NVIDIA GeForce GTX 1080 (Desktop) | |
| NVIDIA GeForce RTX 2070 (Desktop) | |
| NVIDIA GeForce RTX 2080 (Desktop) | |
| AMD Radeon RX Vega 64 | |
| NVIDIA GeForce GTX 1070 (Desktop) | |
| NVIDIA Titan X Pascal | |
| NVIDIA GeForce GTX 1060 (Desktop) | |
| AMD Radeon RX 580 (Desktop) | |
| 3840x2160 Ultra Preset AA:T | |
| NVIDIA GeForce RTX 2080 (Desktop) | |
| NVIDIA Titan X Pascal | |
| NVIDIA GeForce RTX 2070 (Desktop) | |
| AMD Radeon RX Vega 64 | |
| NVIDIA GeForce GTX 1080 (Desktop) | |
| NVIDIA GeForce GTX 1070 (Desktop) | |
| AMD Radeon RX 580 (Desktop) | |
| NVIDIA GeForce GTX 1060 (Desktop) | |
| The Crew 2 | |
| 1920x1080 Ultra Preset | |
| NVIDIA GeForce GTX 1060 (Desktop) | |
| NVIDIA GeForce GTX 1070 (Desktop) | |
| NVIDIA GeForce GTX 1080 (Desktop) | |
| NVIDIA Titan X Pascal | |
| AMD Radeon RX 580 (Desktop) | |
| NVIDIA GeForce RTX 2070 (Desktop) | |
| NVIDIA GeForce RTX 2080 (Desktop) | |
| 3840x2160 Ultra Preset | |
| NVIDIA GeForce RTX 2080 (Desktop) | |
| NVIDIA GeForce RTX 2070 (Desktop) | |
| NVIDIA Titan X Pascal | |
| NVIDIA GeForce GTX 1080 (Desktop) | |
| NVIDIA GeForce GTX 1070 (Desktop) | |
| AMD Radeon RX 580 (Desktop) | |
| NVIDIA GeForce GTX 1060 (Desktop) | |
| Assassin´s Creed Origins | |
| 1920x1080 Ultra High Preset | |
| NVIDIA GeForce RTX 2080 (Desktop) | |
| NVIDIA GeForce RTX 2070 (Desktop) | |
| NVIDIA GeForce GTX 1080 Ti (Desktop) | |
| NVIDIA GeForce GTX 1080 (Desktop) | |
| NVIDIA GeForce GTX 1070 (Desktop) | |
| AMD Radeon RX Vega 64 | |
| NVIDIA GeForce GTX 1060 (Desktop) | |
| AMD Radeon RX 580 (Desktop) | |
| 3840x2160 Ultra High Preset | |
| NVIDIA GeForce RTX 2080 (Desktop) | |
| NVIDIA GeForce GTX 1080 Ti (Desktop) | |
| NVIDIA GeForce RTX 2070 (Desktop) | |
| NVIDIA GeForce GTX 1080 (Desktop) | |
| NVIDIA GeForce GTX 1070 (Desktop) | |
| AMD Radeon RX Vega 64 | |
| NVIDIA GeForce GTX 1060 (Desktop) | |
| AMD Radeon RX 580 (Desktop) | |
| Kingdom Come: Deliverance | |
| 1920x1080 Ultra High Preset | |
| NVIDIA GeForce RTX 2080 (Desktop) | |
| NVIDIA GeForce RTX 2070 (Desktop) | |
| NVIDIA GeForce GTX 1080 (Desktop) | |
| NVIDIA GeForce GTX 1080 Ti (Desktop) | |
| AMD Radeon RX Vega 64 | |
| NVIDIA GeForce GTX 1070 (Desktop) | |
| NVIDIA GeForce GTX 1060 (Desktop) | |
| AMD Radeon RX 580 (Desktop) | |
| 3840x2160 Ultra High Preset | |
| NVIDIA GeForce RTX 2080 (Desktop) | |
| AMD Radeon RX Vega 64 | |
| NVIDIA GeForce GTX 1080 Ti (Desktop) | |
| NVIDIA GeForce RTX 2070 (Desktop) | |
| NVIDIA GeForce GTX 1080 (Desktop) | |
| NVIDIA GeForce GTX 1070 (Desktop) | |
| AMD Radeon RX 580 (Desktop) | |
| NVIDIA GeForce GTX 1060 (Desktop) | |
| Fortnite | |
| 1920x1080 Epic Preset | |
| NVIDIA GeForce RTX 2080 (Desktop) | |
| NVIDIA GeForce GTX 1080 Ti (Desktop) | |
| NVIDIA GeForce RTX 2070 (Desktop) | |
| NVIDIA GeForce GTX 1080 (Desktop) | |
| NVIDIA GeForce GTX 1070 (Desktop) | |
| NVIDIA GeForce GTX 1060 (Desktop) | |
| AMD Radeon RX 580 (Desktop) | |
| 3840x2160 Epic Preset | |
| NVIDIA GeForce RTX 2080 (Desktop) | |
| NVIDIA GeForce RTX 2070 (Desktop) | |
| NVIDIA GeForce GTX 1080 Ti (Desktop) | |
| NVIDIA GeForce GTX 1080 (Desktop) | |
| NVIDIA GeForce GTX 1070 (Desktop) | |
| NVIDIA GeForce GTX 1060 (Desktop) | |
| AMD Radeon RX 580 (Desktop) | |
| Final Fantasy XV Benchmark | |
| 1920x1080 High Quality | |
| NVIDIA GeForce RTX 2080 (Desktop) | |
| NVIDIA GeForce GTX 1080 Ti (Desktop) | |
| NVIDIA GeForce RTX 2070 (Desktop) | |
| NVIDIA GeForce GTX 1080 (Desktop) | |
| NVIDIA GeForce GTX 1070 (Desktop) | |
| AMD Radeon RX Vega 64 | |
| AMD Radeon RX Vega 64 | |
| NVIDIA GeForce GTX 1060 (Desktop) | |
| AMD Radeon RX 580 (Desktop) | |
| 3840x2160 High Quality | |
| NVIDIA GeForce RTX 2080 (Desktop) | |
| NVIDIA GeForce GTX 1080 Ti (Desktop) | |
| NVIDIA GeForce RTX 2070 (Desktop) | |
| NVIDIA GeForce GTX 1080 (Desktop) | |
| NVIDIA GeForce GTX 1070 (Desktop) | |
| AMD Radeon RX Vega 64 | |
| AMD Radeon RX Vega 64 | |
| NVIDIA GeForce GTX 1060 (Desktop) | |
| AMD Radeon RX 580 (Desktop) | |
| Destiny 2 | |
| 1920x1080 Highest Preset AA:SM AF:16x | |
| NVIDIA GeForce RTX 2080 (Desktop) | |
| NVIDIA GeForce GTX 1080 Ti (Desktop) | |
| NVIDIA GeForce RTX 2070 (Desktop) | |
| NVIDIA GeForce GTX 1080 (Desktop) | |
| NVIDIA GeForce GTX 1070 (Desktop) | |
| NVIDIA GeForce GTX 1060 (Desktop) | |
| 3840x2160 Highest Preset AA:SM AF:16x | |
| NVIDIA GeForce RTX 2080 (Desktop) | |
| NVIDIA GeForce RTX 2070 (Desktop) | |
| NVIDIA GeForce GTX 1080 Ti (Desktop) | |
| NVIDIA GeForce GTX 1080 (Desktop) | |
| NVIDIA GeForce GTX 1070 (Desktop) | |
| NVIDIA GeForce GTX 1060 (Desktop) | |
| The Witcher 3 | |
| 1920x1080 Ultra Graphics & Postprocessing (HBAO+) | |
| NVIDIA GeForce RTX 2080 (Desktop) | |
| NVIDIA GeForce GTX 1080 Ti (Desktop) | |
| NVIDIA GeForce RTX 2070 (Desktop) | |
| AMD Radeon RX Vega 64 | |
| NVIDIA GeForce GTX 1070 (Desktop) | |
| AMD Radeon RX 580 (Desktop) | |
| 3840x2160 High Graphics & Postprocessing (Nvidia HairWorks Off) | |
| NVIDIA GeForce RTX 2080 (Desktop) | |
| NVIDIA GeForce GTX 1080 Ti (Desktop) | |
| NVIDIA GeForce RTX 2070 (Desktop) | |
| AMD Radeon RX Vega 64 | |
| NVIDIA GeForce GTX 1070 (Desktop) | |
| AMD Radeon RX 580 (Desktop) | |
| Watch Dogs 2 | |
| 1920x1080 Ultra Preset | |
| NVIDIA GeForce GTX 1080 Ti (Desktop) | |
| NVIDIA GeForce RTX 2080 (Desktop) | |
| NVIDIA GeForce RTX 2070 (Desktop) | |
| AMD Radeon RX Vega 64 | |
| NVIDIA GeForce GTX 1060 (Desktop) | |
| AMD Radeon RX 580 (Desktop) | |
| 3840x2160 High Preset | |
| NVIDIA GeForce GTX 1080 Ti (Desktop) | |
| NVIDIA GeForce RTX 2080 (Desktop) | |
| NVIDIA GeForce RTX 2070 (Desktop) | |
| AMD Radeon RX Vega 64 | |
| NVIDIA GeForce GTX 1060 (Desktop) | |
| AMD Radeon RX 580 (Desktop) | |
| Battlefield 1 | |
| 1920x1080 Ultra Preset AA:T | |
| NVIDIA GeForce GTX 1080 Ti (Desktop) | |
| NVIDIA GeForce RTX 2080 (Desktop) | |
| AMD Radeon RX Vega 64 | |
| NVIDIA GeForce RTX 2070 (Desktop) | |
| NVIDIA GeForce GTX 1060 (Desktop) | |
| 3840x2160 High Preset AA:T | |
| NVIDIA GeForce RTX 2080 (Desktop) | |
| NVIDIA GeForce GTX 1080 Ti (Desktop) | |
| NVIDIA GeForce RTX 2070 (Desktop) | |
| AMD Radeon RX Vega 64 | |
| NVIDIA GeForce GTX 1060 (Desktop) | |
| For Honor | |
| 1920x1080 Extreme Preset AA:T AF:16x | |
| NVIDIA GeForce GTX 1080 Ti (Desktop) | |
| NVIDIA GeForce RTX 2080 (Desktop) | |
| NVIDIA GeForce RTX 2070 (Desktop) | |
| NVIDIA GeForce GTX 1080 (Desktop) | |
| AMD Radeon RX Vega 64 | |
| NVIDIA GeForce GTX 1070 (Desktop) | |
| NVIDIA GeForce GTX 1070 (Desktop) | |
| AMD Radeon RX 580 (Desktop) | |
| NVIDIA GeForce GTX 1060 (Desktop) | |
| 3840x2160 High Preset AA:T AF:8x | |
| NVIDIA GeForce RTX 2080 (Desktop) | |
| NVIDIA GeForce GTX 1080 Ti (Desktop) | |
| NVIDIA GeForce GTX 1080 (Desktop) | |
| NVIDIA GeForce RTX 2070 (Desktop) | |
| NVIDIA GeForce GTX 1070 (Desktop) | |
| AMD Radeon RX Vega 64 | |
| NVIDIA GeForce GTX 1070 (Desktop) | |
| NVIDIA GeForce GTX 1060 (Desktop) | |
| AMD Radeon RX 580 (Desktop) | |
| Ghost Recon Wildlands | |
| 1920x1080 Ultra Preset AA:T AF:16x | |
| NVIDIA GeForce RTX 2080 (Desktop) | |
| NVIDIA GeForce GTX 1080 Ti (Desktop) | |
| NVIDIA GeForce RTX 2070 (Desktop) | |
| NVIDIA GeForce GTX 1080 (Desktop) | |
| NVIDIA GeForce GTX 1070 (Desktop) | |
| AMD Radeon RX Vega 64 | |
| NVIDIA GeForce GTX 1070 (Desktop) | |
| NVIDIA GeForce GTX 1060 (Desktop) | |
| AMD Radeon RX 580 (Desktop) | |
| 3840x2160 Ultra Preset AA:T AF:16x | |
| NVIDIA GeForce GTX 1080 Ti (Desktop) | |
| GTA V | |
| 1920x1080 Highest AA:4xMSAA + FX AF:16x | |
| NVIDIA GeForce RTX 2080 (Desktop) | |
| NVIDIA GeForce RTX 2070 (Desktop) | |
| NVIDIA GeForce GTX 1080 Ti (Desktop) | |
| NVIDIA GeForce GTX 1070 (Desktop) | |
| 3840x2160 High/On (Advanced Graphics Off) AA:FX AF:8x | |
| NVIDIA GeForce RTX 2080 (Desktop) | |
| NVIDIA GeForce RTX 2070 (Desktop) | |
| NVIDIA GeForce GTX 1080 Ti (Desktop) | |
| NVIDIA GeForce GTX 1070 (Desktop) | |
| Battlefield 4 - 3840x2160 High Preset | |
| NVIDIA GeForce RTX 2080 (Desktop) | |
| NVIDIA GeForce GTX 1080 Ti (Desktop) | |
| NVIDIA GeForce RTX 2070 (Desktop) | |
| AMD Radeon RX Vega 64 | |
| NVIDIA GeForce GTX 1070 (Desktop) | |
| low | med. | high | ultra | 4K | |
|---|---|---|---|---|---|
| Battlefield 4 (2013) | 200 | 200 | 200 | 200 | 121 |
| GTA V (2015) | 173.7 | 166.1 | 150 | 132.5 | 124 |
| The Witcher 3 (2015) | 319.5 | 270.2 | 179.6 | 103.4 | 73.8 |
| Rainbow Six Siege (2015) | 322.8 | 289 | 269.5 | 260.7 | 137.3 |
| Rise of the Tomb Raider (2016) | 293.2 | 208.4 | 184.8 | 158.5 | 73.4 |
| Far Cry Primal (2016) | 127 | 115 | 104 | 97 | 68 |
| The Division (2016) | 285.4 | 245.2 | 162.3 | 129.8 | 69.1 |
| Doom (2016) | 172.3 | 160.1 | 152.4 | 150.3 | 115.1 |
| Overwatch (2016) | 300 | 300 | 300 | 262 | 150 |
| Deus Ex Mankind Divided (2016) | 151.6 | 142.9 | 124.4 | 80.5 | 53.6 |
| Battlefield 1 (2016) | 193.3 | 182.5 | 166.6 | 154.1 | 90 |
| Watch Dogs 2 (2016) | 141.9 | 134.4 | 115 | 88.1 | 55.6 |
| For Honor (2017) | 294.1 | 224.3 | 216.3 | 172.6 | 77.6 |
| Ghost Recon Wildlands (2017) | 161 | 130 | 123 | 74 | 52 |
| Rocket League (2017) | 247.4 | 248.3 | 242.4 | 146.1 | |
| Dirt 4 (2017) | 316.8 | 249.3 | 215.8 | 159.6 | 99.2 |
| Playerunknown's Battlegrounds (PUBG) (2017) | 204.7 | 195 | 210.1 | 157 | 63.6 |
| Destiny 2 (2017) | 169.3 | 165.4 | 164.7 | 169.2 | 71.5 |
| Assassin´s Creed Origins (2017) | 116 | 104 | 103 | 87 | 51 |
| Call of Duty WWII (2017) | 250 | 245.8 | 198.7 | 169 | 97.4 |
| Fortnite (2018) | 259.2 | 218.9 | 182.2 | 165.3 | 63.6 |
| Final Fantasy XV Benchmark (2018) | 163.4 | 125.3 | 96.6 | 44.5 | |
| Kingdom Come: Deliverance (2018) | 139.5 | 129.6 | 108 | 83.3 | 38.5 |
| Far Cry 5 (2018) | 129 | 116 | 111 | 105 | 58 |
| The Crew 2 (2018) | 60 | 60 | 60 | 60 | 60 |
| Monster Hunter World (2018) | 156 | 144.6 | 143.1 | 116.5 | 38.2 |
| F1 2018 (2018) | 245 | 211 | 164 | 141 | 77 |
| Shadow of the Tomb Raider (2018) | 144 | 122 | 119 | 111 | 45 |
| FIFA 19 (2018) | 282.4 | 264.5 | 247.9 | 232.9 | 212.4 |
| Forza Horizon 4 (2018) | 170 | 153 | 148 | 125 | 77 |
| Assassin´s Creed Odyssey (2018) | 113 | 106 | 91 | 68 | 40 |
| Call of Duty Black Ops 4 (2018) | 250 | 198 | 193 | 175 | 68 |
Compute Performance
In addition to gaming, modern high-end GPUs are also often used for professional GPGPU computation, a stomping ground traditionally reserved for and dominated by Nvidia’s even more expensive Quadro series. In order to determine the RTX 2080’s GPGPU performance we ran Luxmark and Computemark. In Luxmark, the RTX 2080 OC clearly and effortlessly outperformed Nvidia’s Titan X. In Computemark, it was on a par with the GTX 1080 Ti and Titan X.
Compared to the RTX 2070 the RTX 2080’s 640 extra CUDA cores resulted in 6 and 11% higher performance in Luxmark and Computemark, respectively.
| NVIDIA GeForce RTX 2080 (Desktop) AMD Ryzen 7 2700X | NVIDIA GeForce RTX 2070 (Desktop) AMD Ryzen 7 2700X | NVIDIA GeForce GTX 1060 (Desktop) Intel Core i7-6700K | NVIDIA GeForce GTX 1070 (Desktop) Intel Core i7-4790K | NVIDIA GeForce GTX 1080 (Desktop) Intel Core i7-4790K | NVIDIA GeForce GTX 1080 Ti (Desktop) Intel Core i7-4790K | NVIDIA Titan X Pascal Intel Xeon E5-2680 v4 | |
|---|---|---|---|---|---|---|---|
| LuxMark v2.0 64Bit | -6% | -58% | -32% | -36% | -14% | -13% | |
| Room GPUs-only (Samples/s) | 3423 | 3333 -3% | 1773 -48% | 2474 -28% | 2327 -32% | 3050 -11% | 2991 -13% |
| Sala GPUs-only (Samples/s) | 7886 | 7293 -8% | 2584 -67% | 5012 -36% | 4708 -40% | 6600 -16% | 6920 -12% |
| ComputeMark v2.1 | -11% | -56% | -37% | -21% | 3% | 2% | |
| 1024x600 Normal, QJuliaRayTrace (Points) | 7122 | 6038 -15% | 3322 -53% | 4761 -33% | 6191 -13% | 7938 11% | 7847 10% |
| 1024x600 Normal, Mandel Scalar (Points) | 4427 | 3662 -17% | 2002 -55% | 2861 -35% | 3646 -18% | 4949 12% | 5096 15% |
| 1024x600 Normal, Mandel Vector (Points) | 3865 | 3316 -14% | 1994 -48% | 2706 -30% | 3284 -15% | 4391 14% | 4284 11% |
| 1024x600 Normal, Fluid 2DTexArr (Points) | 2506 | 2407 -4% | 963 -62% | 1390 -45% | 1758 -30% | 2092 -17% | 2032 -19% |
| 1024x600 Normal, Fluid 3DTex (Points) | 2564 | 2536 -1% | 985 -62% | 1402 -45% | 1730 -33% | 2275 -11% | 2254 -12% |
| 1024x600 Normal, Score (Points) | 20484 | 17690 -14% | 9266 -55% | 13121 -36% | 16610 -19% | 21646 6% | 21512 5% |
| Total Average (Program / Settings) | -9% /
-10% | -57% /
-56% | -35% /
-36% | -29% /
-25% | -6% /
-2% | -6% /
-2% |
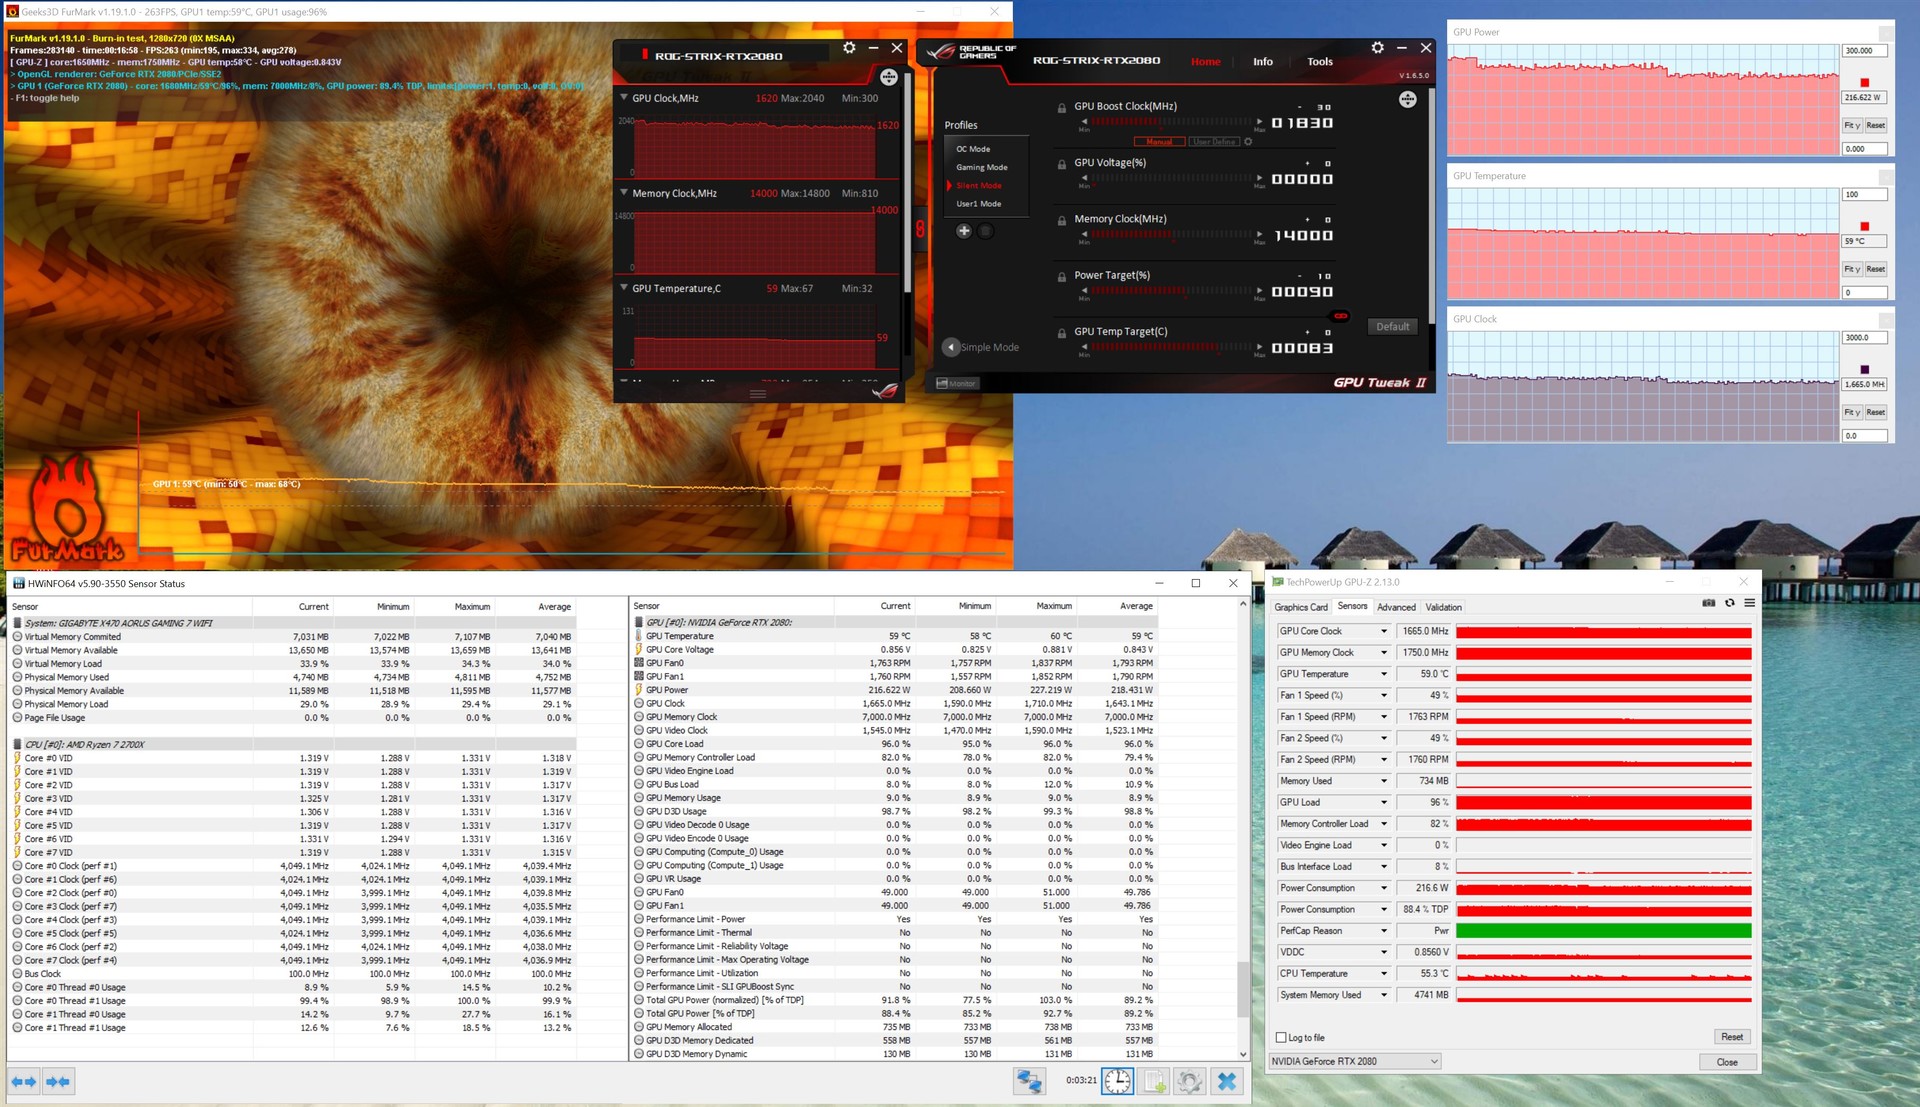
Emissions

Since we ran the GPU in Performance mode the fans were always on, and as a result the GPU was always audible. When idle, the fans ran at 23% or 800-900 RPM. Under load in Gaming mode, they ramped up to 51% and became very noticeable. Thanks to its three axial fans the noise emitted was much more pleasant than on previous generations with radial fans.
Given the higher power target in OC mode the GPU got slightly warmer as well, and the fans ran at around 2,000 RPM. Accordingly, they have plenty of wiggle room (45%) for those dreaded hot summer days.
The highest temperature we were able to measure was just 67 °C. Keep in mind though that we used an open case during our tests. A closed case is going to require adequate ventilation to keep the GPU cool and prevent heat accumulation.
At just 67 °C at an increased power target of 125% Asus chose the right cooler for the job.
Power consumption in Gaming mode was slightly higher than for the Founders Edition (240 vs. 225 W). In OC mode and the associated increased power target HWinFo reported an average of 264 W under load. Increasing the power target to 125% resulted in an average power consumption of 291 W with short peaks above 300 W.
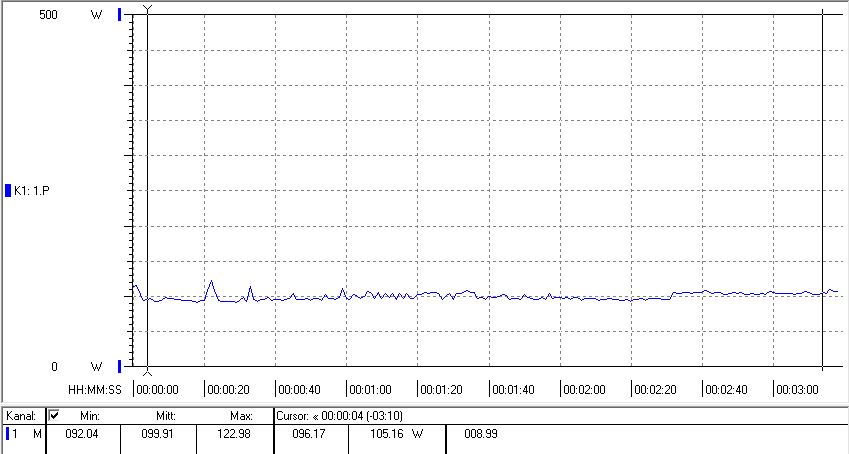
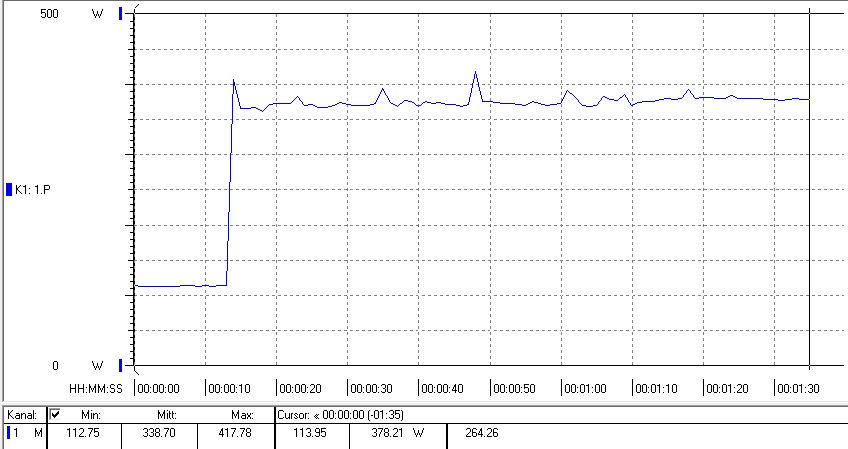
Using a calibrated Metrahit Energy power meter we also determined whole-system power consumption. When idle, the power meter read 99 W. When gaming, it read 380 W. Both measurements were taken without the monitor. The game chosen for this test was The Witcher 3 in 1080p (High preset).
As was the case with the Asus ROG Strix RTX 2070 OC, our current review unit also did not have much wiggle room for additional overclocking.
Both OC models are already overclocked ex factory and feature a higher turbo boost than specified by Nvidia. We tried manually adjusting the dials and overclocking even further using Asus GPU Tweak but were ultimately unable to increase performance noticeably. The GPU did not perform any better in our synthetic benchmarks.
In other words: The Asus ROG Strix RTX 2080 OC is already running at its maximum and optimum clock speed. Further improvements will require heavy modding, such as a power mod, water cooling, or liquid nitrogen cooling.
Verdict
The Asus ROG Strix RTX 2080 OC is one of the fastest currently available GPUs. In our benchmarks, the factory-overclocked graphics card was faster than a GeForce GTX 1080 Ti. Its 8 GB of GDDR6 VRAM wasn't a bottleneck, as can be seen in the excellent high resolution performance. Unfortunately, pricing is unsatisfactory due to a lack of competition. Our review unit sold for 949 Euros (~$1082) at the time of writing, and was thus about as expensive as a GeForce GTX 1080 Ti.
If you don’t need the Turing architecture’s new features, a used GPU might be the better choice. We advise against upgrading from a GeForce GTX 1080 Ti to an RTX 2080 - performance was not that much better and the highly praised new features, such as DLSS or real-time raytracing, are nowhere to be seen. These will have to wait for implementation by game developers, but for now it’s uncertain how these features will pan out. Not a single game with real-time raytracing and DLSS support was available at the time of writing.
The Asus ROG Strix RTX 2080 OC is aimed primarily at gamers looking for a GPU capable of running current games in UHD and high details.
For all others, the RTX 2070 might be the smarter choice as it offers a much better price-performance ratio than the RTX 2080.
If you already own a Pascal-based graphics card you should think twice before investing around $1,000. A GeForce GTX 1070 was significantly slower than the RTX 2080, however a GTX 1080 was not.
The Asus ROG Strix RTX 2080 OC requires a very fast CPU in order to deliver peak performance. Our benchmarks showed that AMD's Ryzen 7 2700X was easily capable of keeping up with Intel's Core i9-9900K. Unfortunately, we were unable to run any gaming benchmarks on the Intel platform due to time constraints.
We would like to thank Asus ROG Germany for providing us with the Asus ROG Strix RTX 2080 OC graphics card.

