Alienware 17 R5 (i7-8750H, GTX 1070, QHD) Laptop Review

The famous 17-incher from Alienware goes into its fifth generation in 2018. The homepage of the parent company, Dell, offers extensive configuration options for the gaming racer, with the basic models already being very different from each other.
This begins with the CPU, which comes from Intel's brand-new Coffee-Lake series and has six cores. In addition to the Core i7-8750H, the manufacturer also offers the particularly overclocking-friendly Core i9-8950HK with free multiplier. However, due to its enormous cooling requirements, we do not recommend it (see also the Alienware 15 R4).
The graphics card is a high-end chip from Nvidia. While price-conscious gamers will choose the GeForce GTX 1060 with 6 GB of GDDR5-VRAM, passionate gamers may want the GeForce GTX 1070 or GTX 1080 8-GB models. Particularly those who look for resolutions higher than 1920x1080 should splurge on the latter GPUs.
Apropos resolution, one of the most difficult decisions for the customers is the display. Dell is not only selling a classic Full HD IPS screen (60 Hz) but is also offering a very fast QHD TN display (120 Hz). In addition, at the top end of the price range there is an extremely sharp UHD IPS panel that corresponding to the QHD display also brings an eye-tracking module, but it only supports 60 Hz instead of 120 Hz. However you should be careful, as not all the models include Nvidia's G-Sync image improvement.
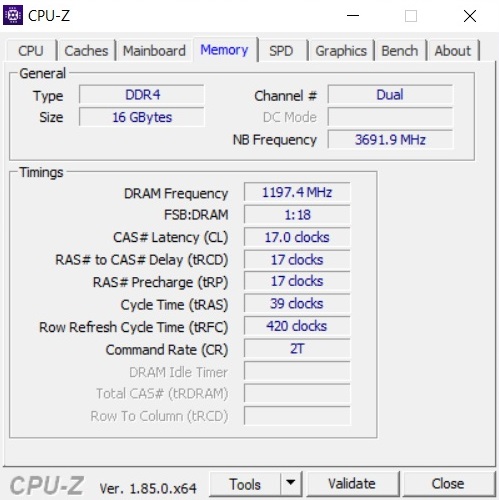
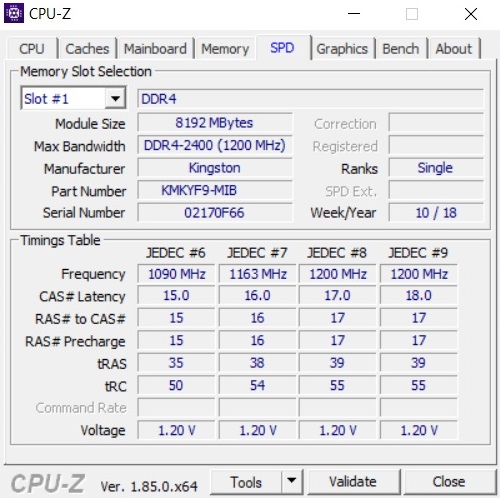
The range of the working memory of the Alienware 17 R5 reaches from 8 GB up to a maximum of 32 GB DDR4. Windows 10 is installed on an SSD sized between 128 GB and 1 TB.
So what does the whole thing cost? The most affordable version of the desktop replacement is available at a price starting at about 1700 Euros (~$1968; $1550 in the US). On the other hand, for our test unit with a Core i7-8750H, a GeForce GTX 1070, 16 GB of RAM, a 256-GB SSD, and a QHD panel you have to pay around 2400 Euros (~$2778; $2300 in the US). The competitors of the Alienware 17 R5 include other 17-inch gamers based on Coffee-Lake, such as the MSI GE73 8RF, the Acer Predator Helios 500, and the HP Omen 17t.
Since the metal case is identical to the last revision, we are not addressing the case, connections, and input devices here. You can find all the corresponding information in the review of the Alienware 17 R4.
Display
Like in the predecessor, the QHD panel is labeled AUO1496. In our opinion, 2560x1440 pixels is the perfect compromise between image sharpness and computing requirements and is ideally suited for the GeForce GTX 1070. Gamers should also be pleased about a quick response time: 6 ms black-to-white and 20.8 ms gray-to-gray are first-rate measurements in the laptop segment. Combined with the G-Sync technology, many games are incredibly fluid and smooth on the 120-Hz screen.
| |||||||||||||||||||||||||
Brightness Distribution: 86 %
Center on Battery: 398 cd/m²
Contrast: 780:1 (Black: 0.51 cd/m²)
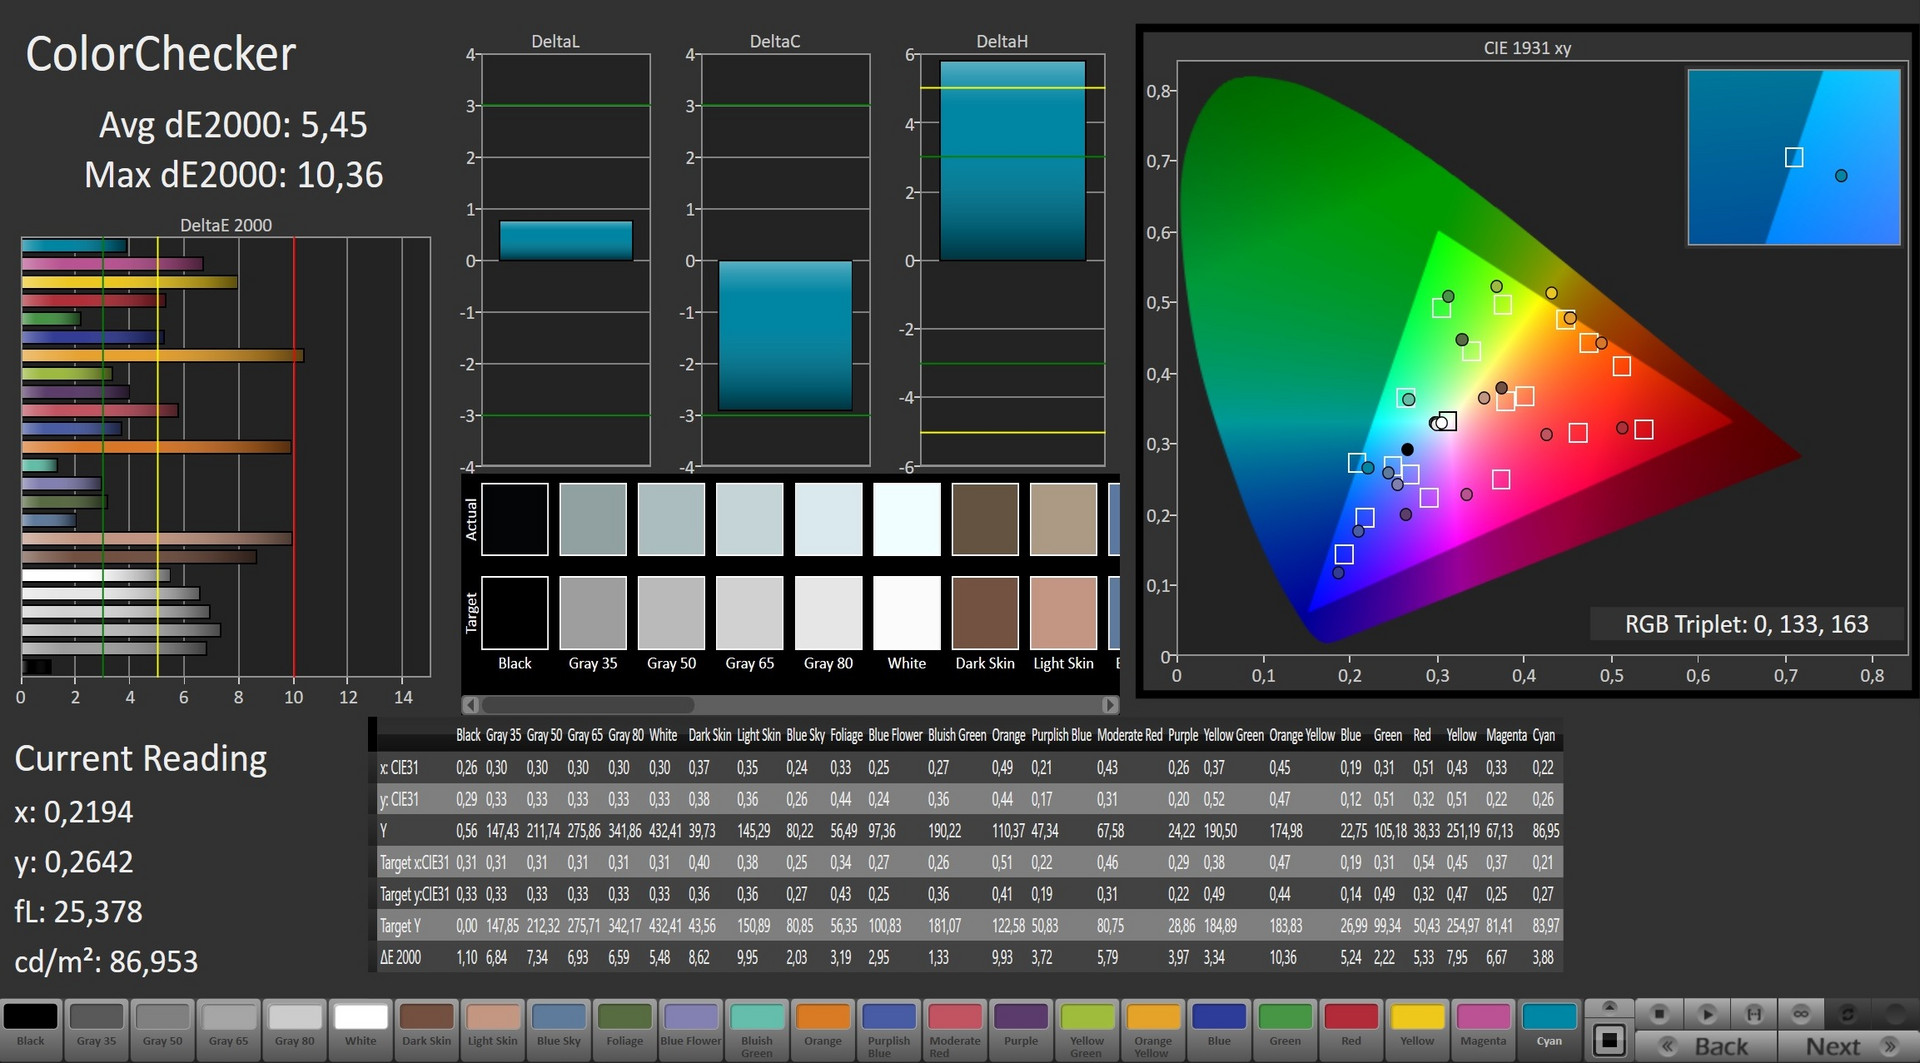
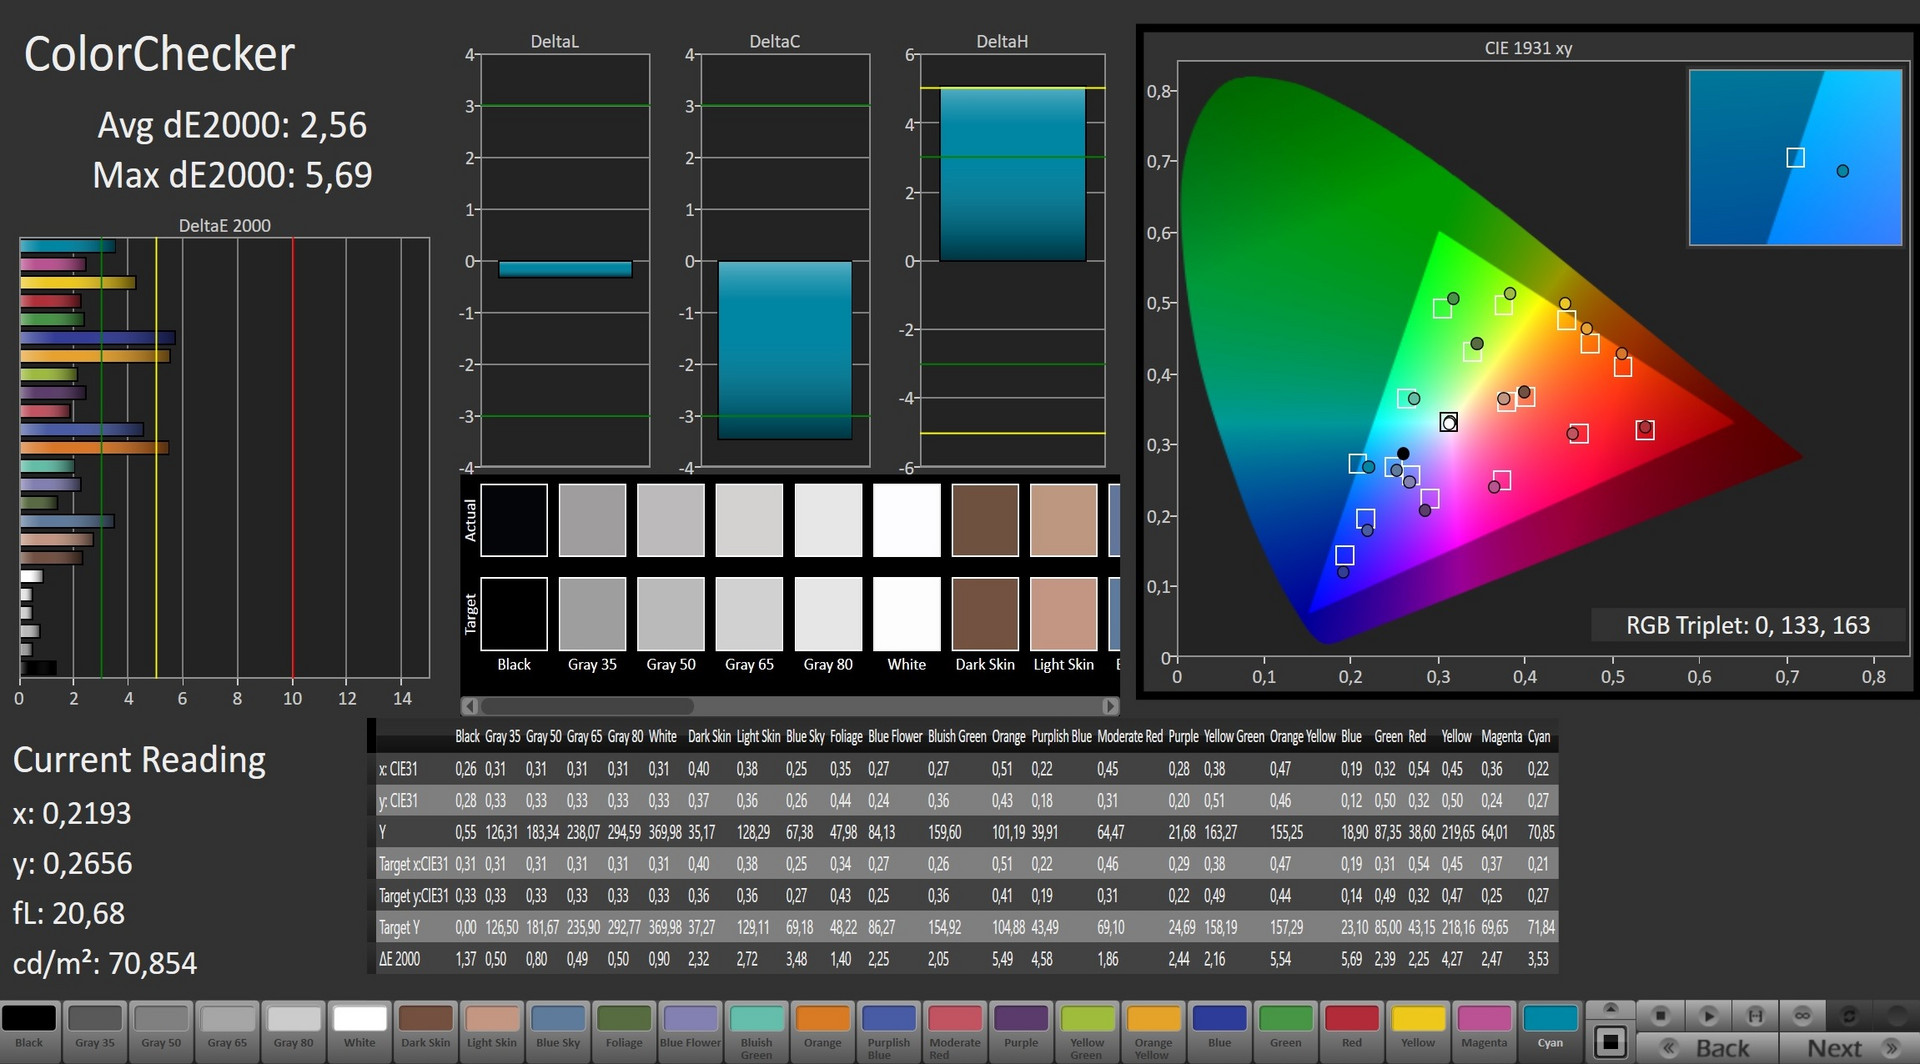
ΔE ColorChecker Calman: 5.45 | ∀{0.5-29.43 Ø4.73}
calibrated: 2.56
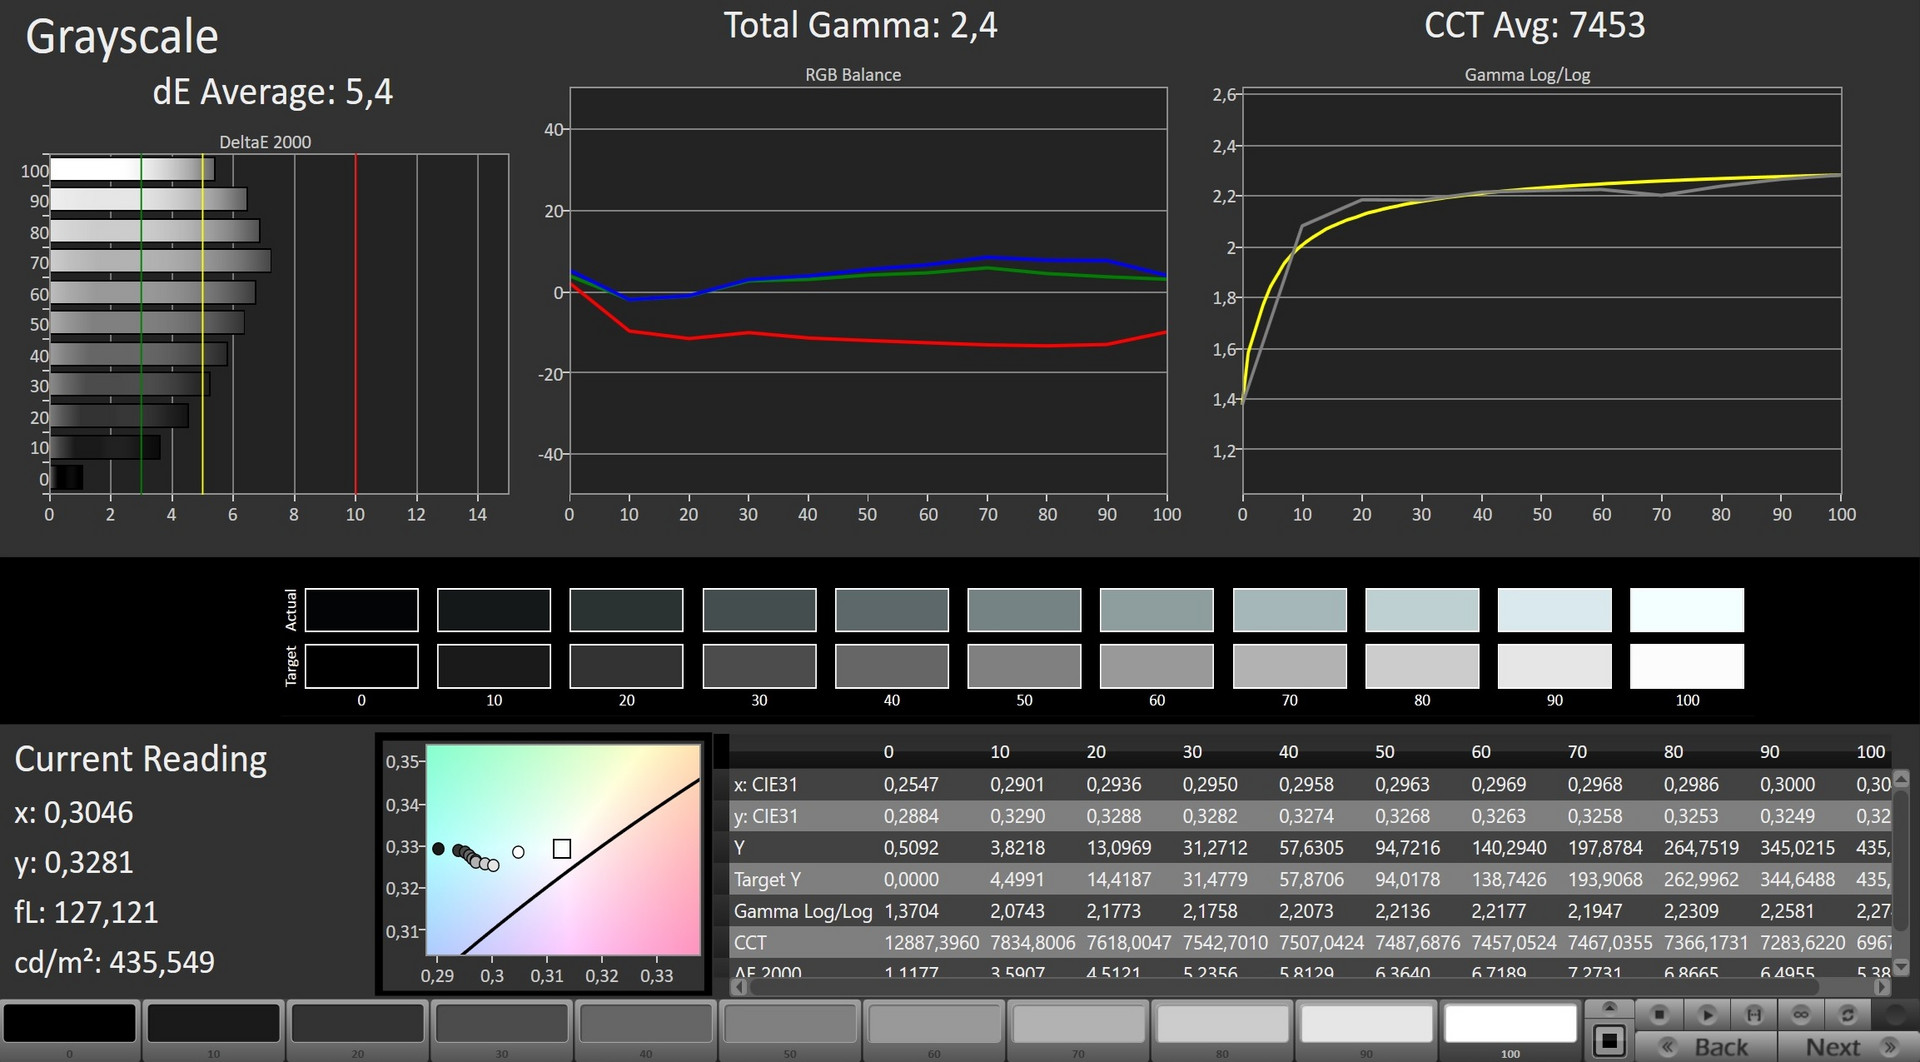
ΔE Greyscale Calman: 5.4 | ∀{0.09-98 Ø4.97}
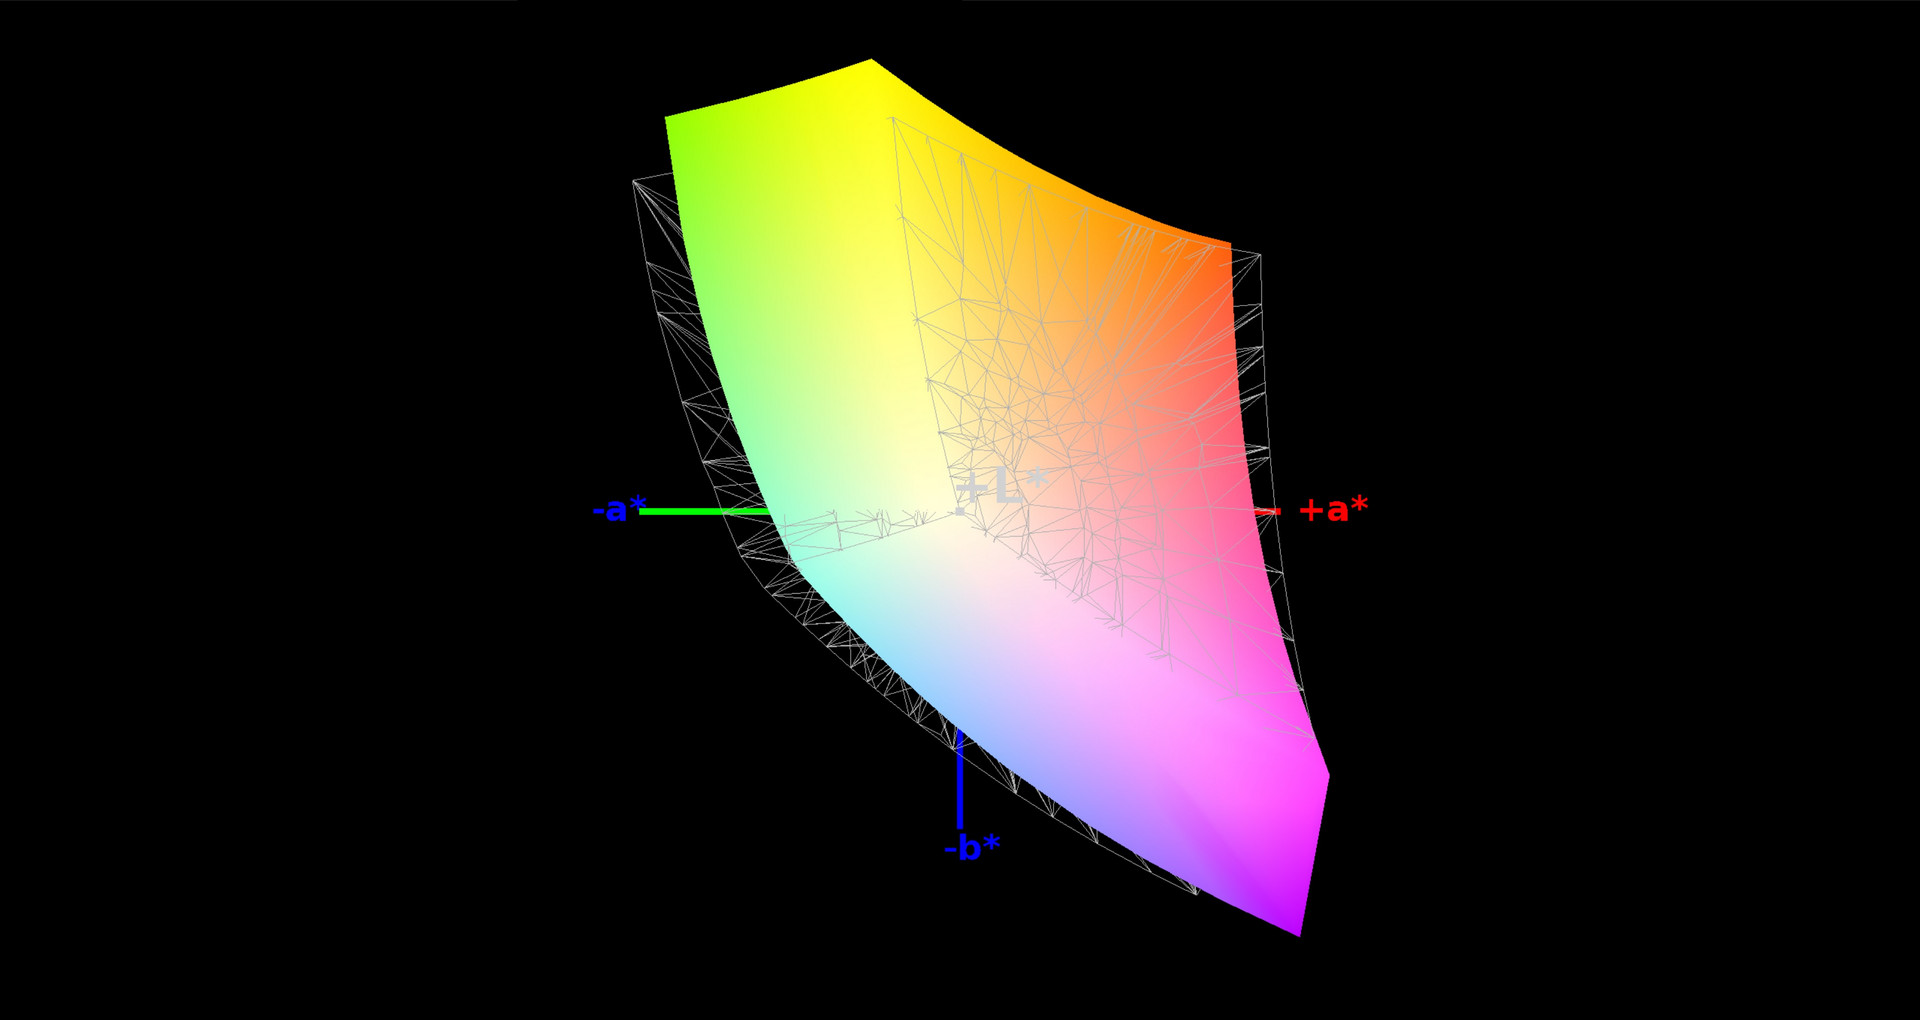
86% sRGB (Argyll 1.6.3 3D)
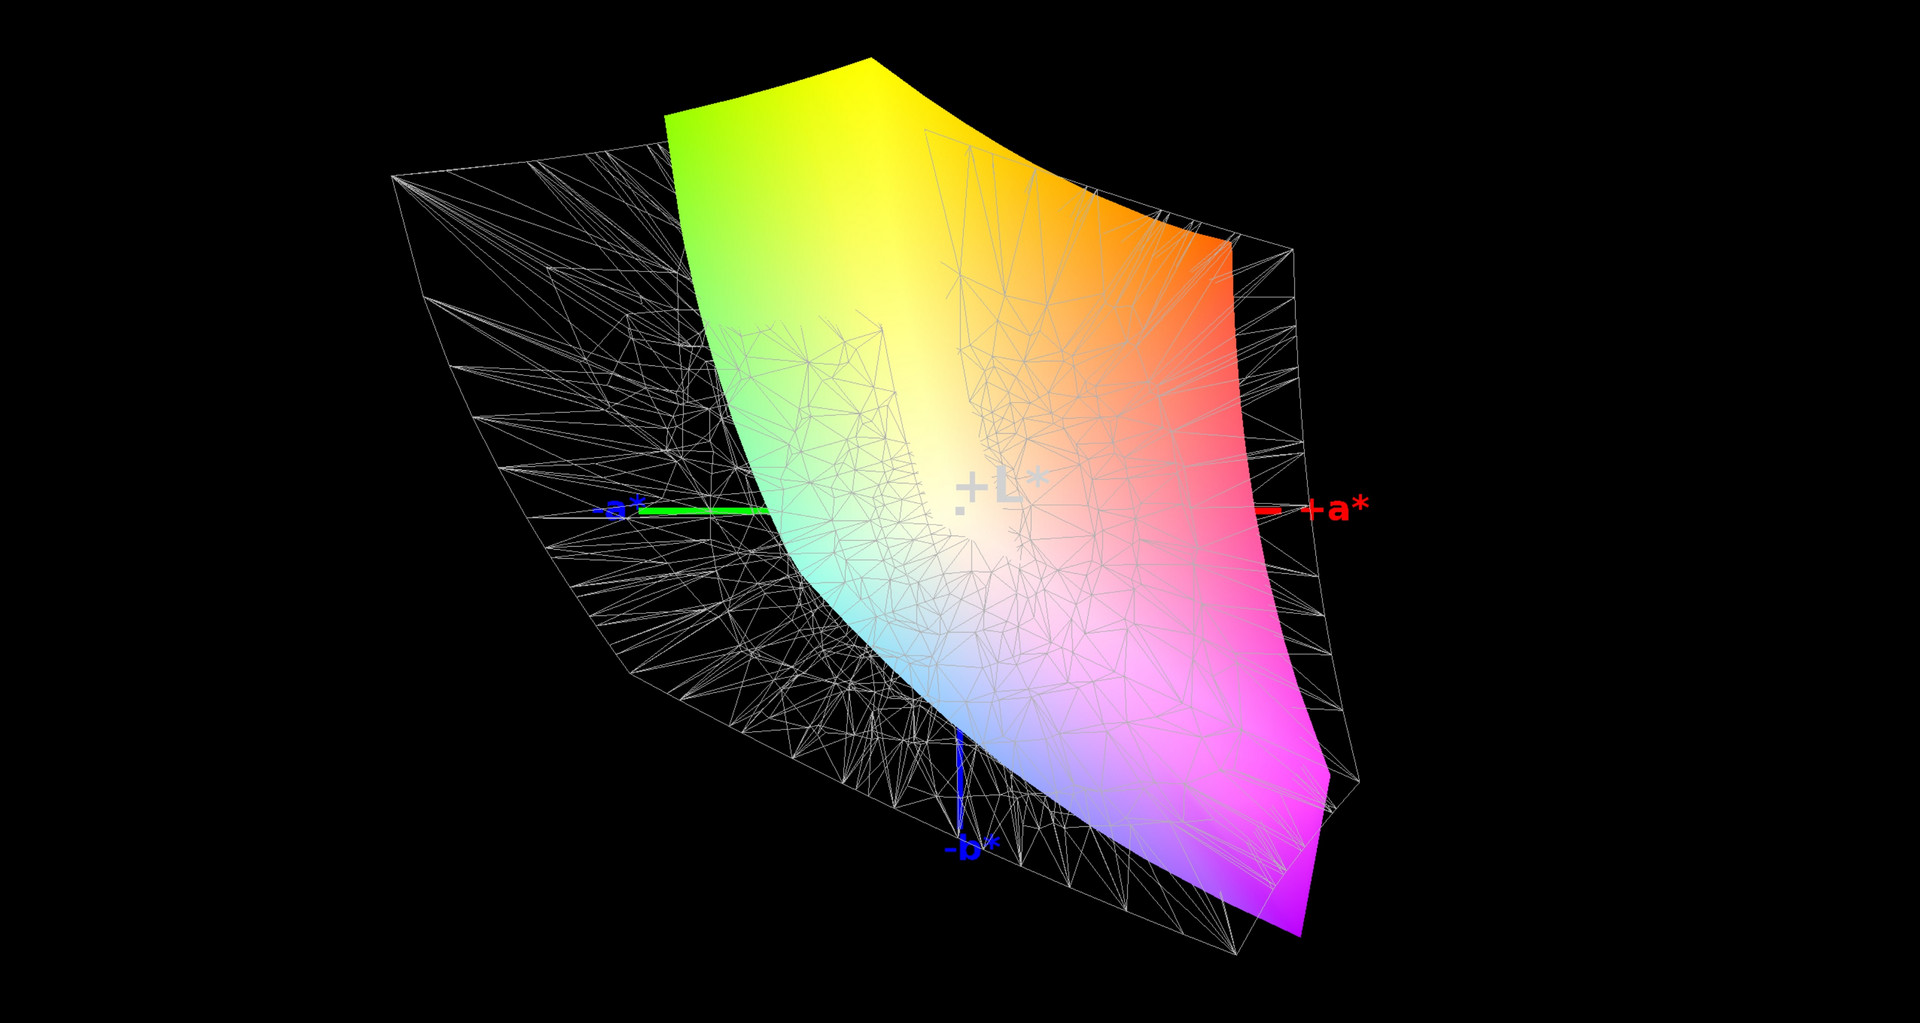
56% AdobeRGB 1998 (Argyll 1.6.3 3D)
62.9% AdobeRGB 1998 (Argyll 3D)
86.1% sRGB (Argyll 3D)
63.4% Display P3 (Argyll 3D)
Gamma: 2.4
CCT: 7453 K
| Alienware 17 R5 JYWWF_B173QTN (AUO1496), TN, 2560x1440 | Alienware 17 R4 TN LED, 2560x1440 | Acer Predator Helios 500 PH517-51-79BY AUO_B173HAN03, IPS, 1920x1080 | MSI GE73 8RF-008 Raider RGB Chi Mei N173HHE-G32 (CMN1747), TN WLED, 1920x1080 | HP Omen 17t-3AW55AV_1 AU Optronics AUO309D, IPS, 1920x1080 | |
|---|---|---|---|---|---|
| Display | -4% | 4% | 32% | 4% | |
| Display P3 Coverage (%) | 63.4 | 61.2 -3% | 64.4 2% | 90.8 43% | 65.4 3% |
| sRGB Coverage (%) | 86.1 | 82.9 -4% | 91.3 6% | 99.9 16% | 90 5% |
| AdobeRGB 1998 Coverage (%) | 62.9 | 60.5 -4% | 65.6 4% | 85.8 36% | 65.8 5% |
| Response Times | -79% | -9% | -81% | -26% | |
| Response Time Grey 50% / Grey 80% * (ms) | 20.8 ? | 30 ? -44% | 14 ? 33% | 28 ? -35% | 17.6 ? 15% |
| Response Time Black / White * (ms) | 6 ? | 12.8 ? -113% | 9 ? -50% | 13.6 ? -127% | 10 ? -67% |
| PWM Frequency (Hz) | 25000 ? | ||||
| Screen | -3% | -5% | 20% | 11% | |
| Brightness middle (cd/m²) | 398 | 402.3 1% | 335 -16% | 273 -31% | 343.6 -14% |
| Brightness (cd/m²) | 367 | 372 1% | 300 -18% | 273 -26% | 320 -13% |
| Brightness Distribution (%) | 86 | 86 0% | 82 -5% | 90 5% | 87 1% |
| Black Level * (cd/m²) | 0.51 | 0.62 -22% | 0.7 -37% | 0.26 49% | 0.34 33% |
| Contrast (:1) | 780 | 649 -17% | 479 -39% | 1050 35% | 1011 30% |
| Colorchecker dE 2000 * | 5.45 | 5.6 -3% | 4.99 8% | 3.52 35% | 3.74 31% |
| Colorchecker dE 2000 max. * | 10.36 | 9.8 5% | 9.32 10% | 6.34 39% | 5.33 49% |
| Colorchecker dE 2000 calibrated * | 2.56 | 1.93 25% | 2.09 18% | 3.49 -36% | |
| Greyscale dE 2000 * | 5.4 | 4.7 13% | 5.2 4% | 3.11 42% | 3.7 31% |
| Gamma | 2.4 92% | 2.14 103% | 2.49 88% | 2.43 91% | 2.36 93% |
| CCT | 7453 87% | 7519 86% | 7719 84% | 6999 93% | 6388 102% |
| Color Space (Percent of AdobeRGB 1998) (%) | 56 | 53.7 -4% | 59 5% | 76 36% | 58 4% |
| Color Space (Percent of sRGB) (%) | 86 | 82.2 -4% | 91 6% | 100 16% | 90 5% |
| Total Average (Program / Settings) | -29% /
-13% | -3% /
-4% | -10% /
9% | -4% /
5% |
* ... smaller is better
On the other hand, the TN technology it is based on also has several weaknesses. In addition to the mediocre color accuracy, we should also mention the limited viewing-angle stability, causing the image to change much faster, in particular vertically, than on an IPS display.
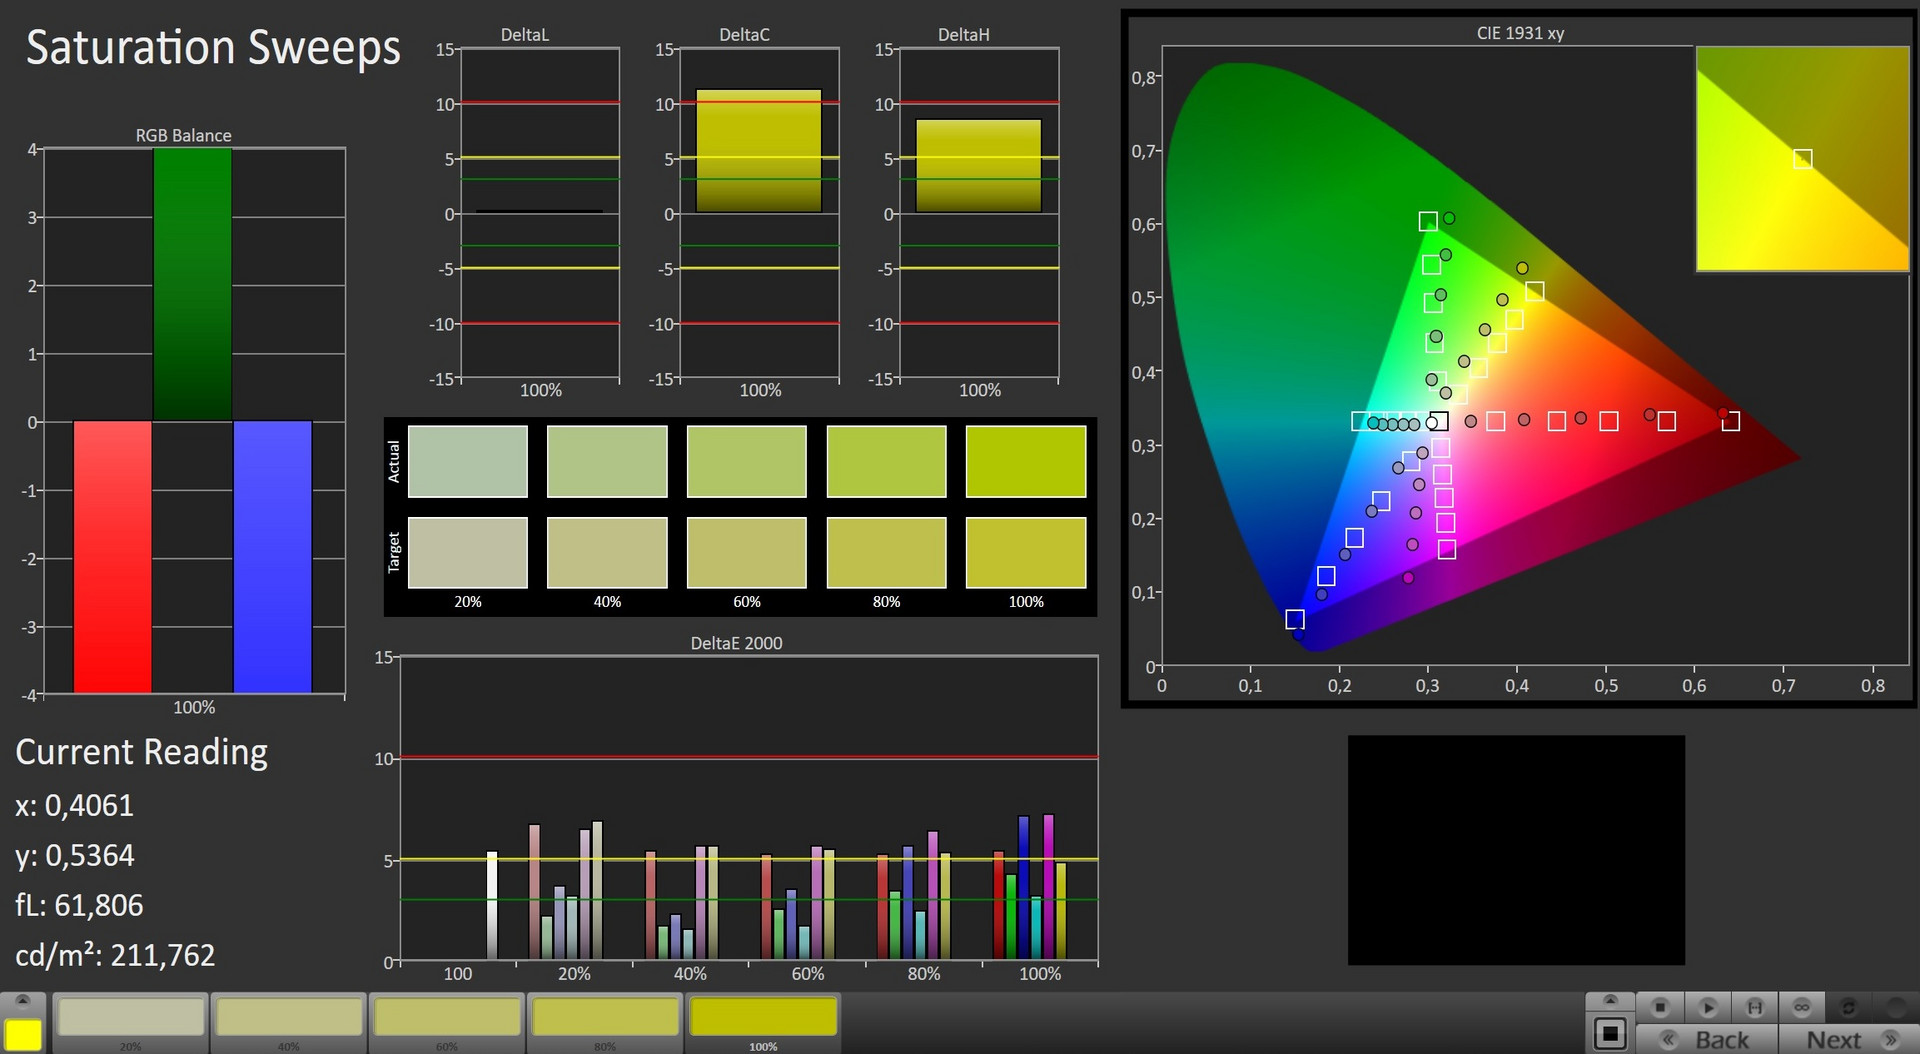

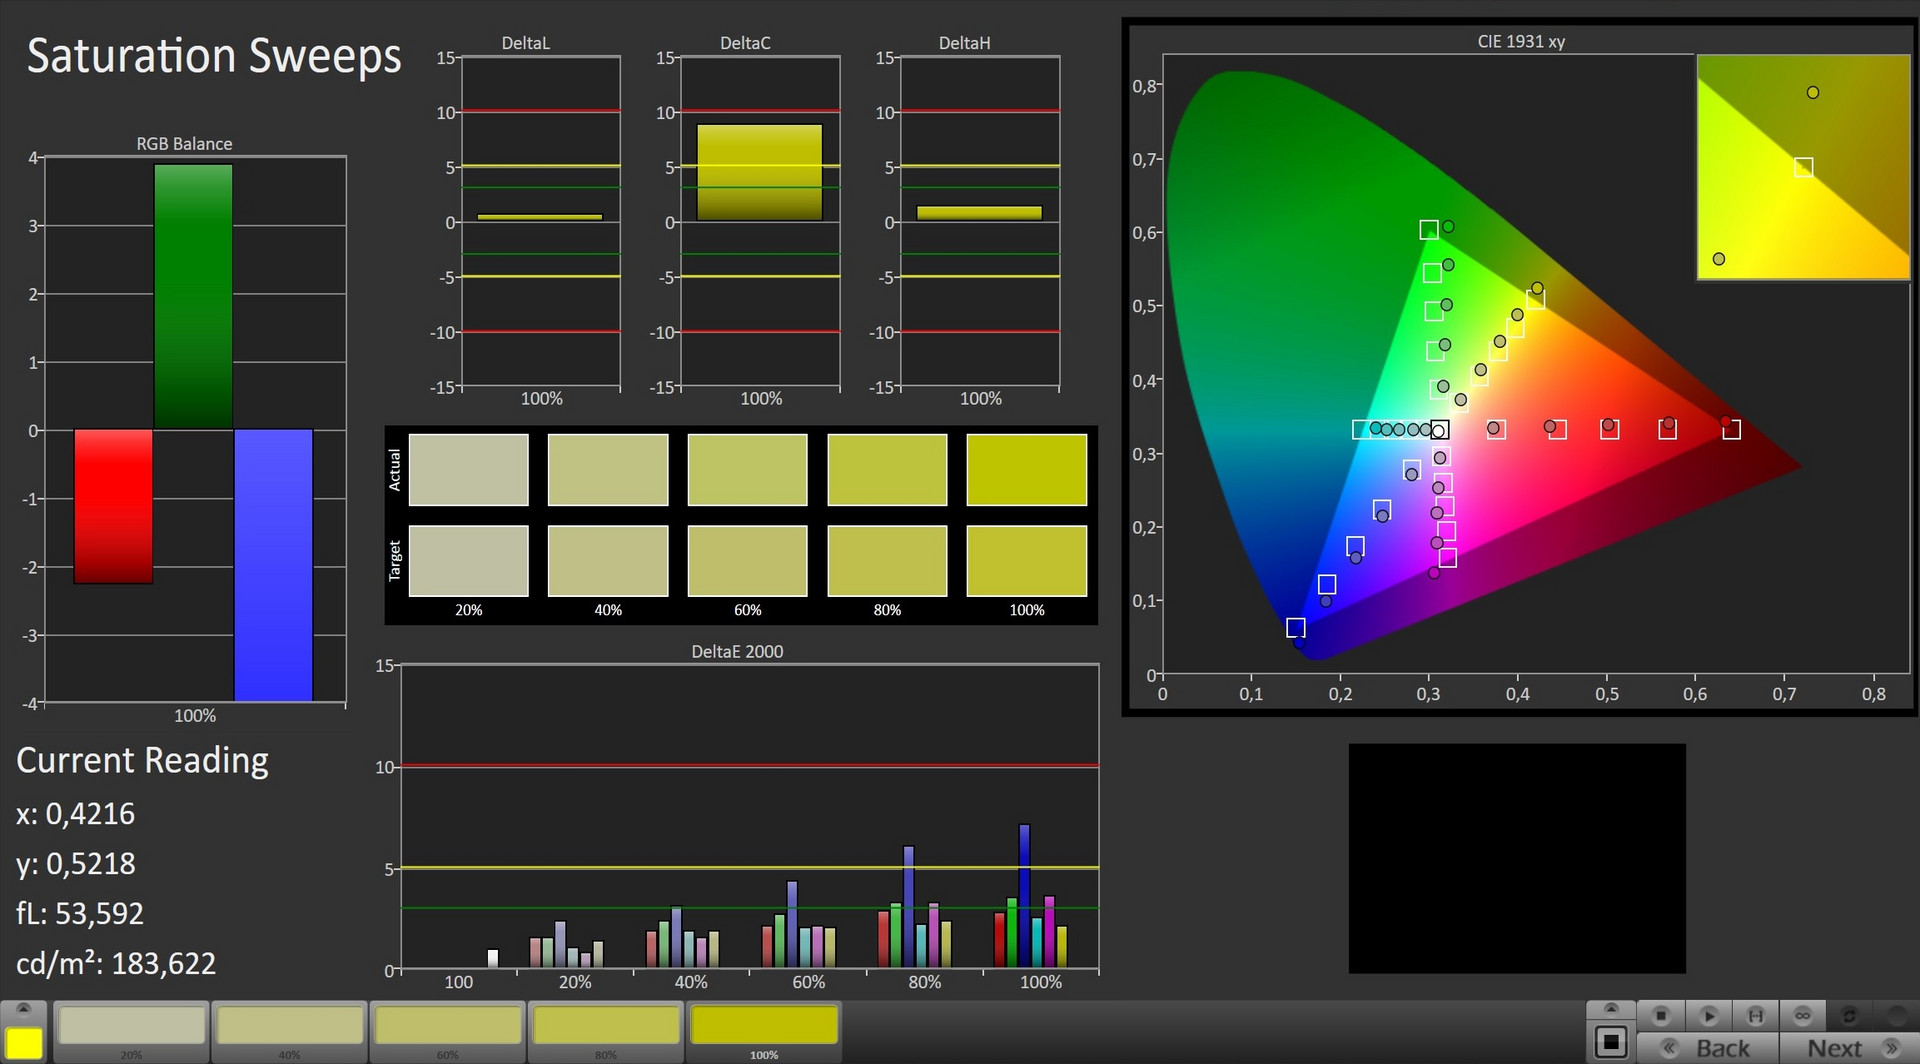
Otherwise there is hardly any reason for complaint. Color-space coverage of 86% sRGB and 56% AdobeRGB are sufficient for gaming and multimedia purposes. The QHD panel deserves some praise mainly for its high brightness. Only a few notebooks are able to surpass an average of 367 cd/m², and most competitors can only manage about 300 cd/m². Thanks to the ample brightness, you can use the Alienware 17 R5 outdoors without any problems, although the hefty weight of 4.4 kg speaks against moving it around a lot or taking a trip to the outdoors.
The fact that the contrast does not reach a top value (780:1 is only mediocre) despite the screen's brightness is due to its meager black value. 0.51 cd/m² often causes dark content to drift into the gray range.
Display Response Times
| ↔ Response Time Black to White | ||
|---|---|---|
| 6 ms ... rise ↗ and fall ↘ combined | ↗ 4 ms rise | 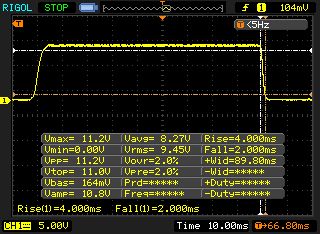 |
| ↘ 2 ms fall | ||
| The screen shows very fast response rates in our tests and should be very well suited for fast-paced gaming. In comparison, all tested devices range from 0.1 (minimum) to 240 (maximum) ms. » 18 % of all devices are better. This means that the measured response time is better than the average of all tested devices (19.9 ms). | ||
| ↔ Response Time 50% Grey to 80% Grey | ||
| 20.8 ms ... rise ↗ and fall ↘ combined | ↗ 11.6 ms rise | 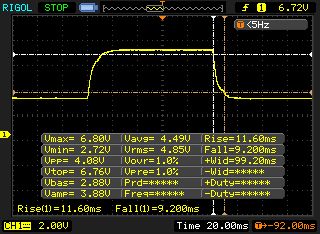 |
| ↘ 9.2 ms fall | ||
| The screen shows good response rates in our tests, but may be too slow for competitive gamers. In comparison, all tested devices range from 0.165 (minimum) to 636 (maximum) ms. » 33 % of all devices are better. This means that the measured response time is better than the average of all tested devices (31.1 ms). | ||
Screen Flickering / PWM (Pulse-Width Modulation)
| Screen flickering / PWM not detected | 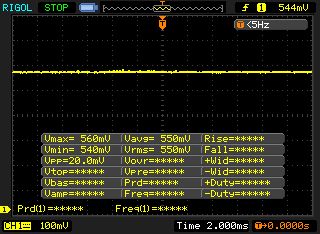 | ||
In comparison: 52 % of all tested devices do not use PWM to dim the display. If PWM was detected, an average of 7798 (minimum: 5 - maximum: 343500) Hz was measured. | |||
Performance
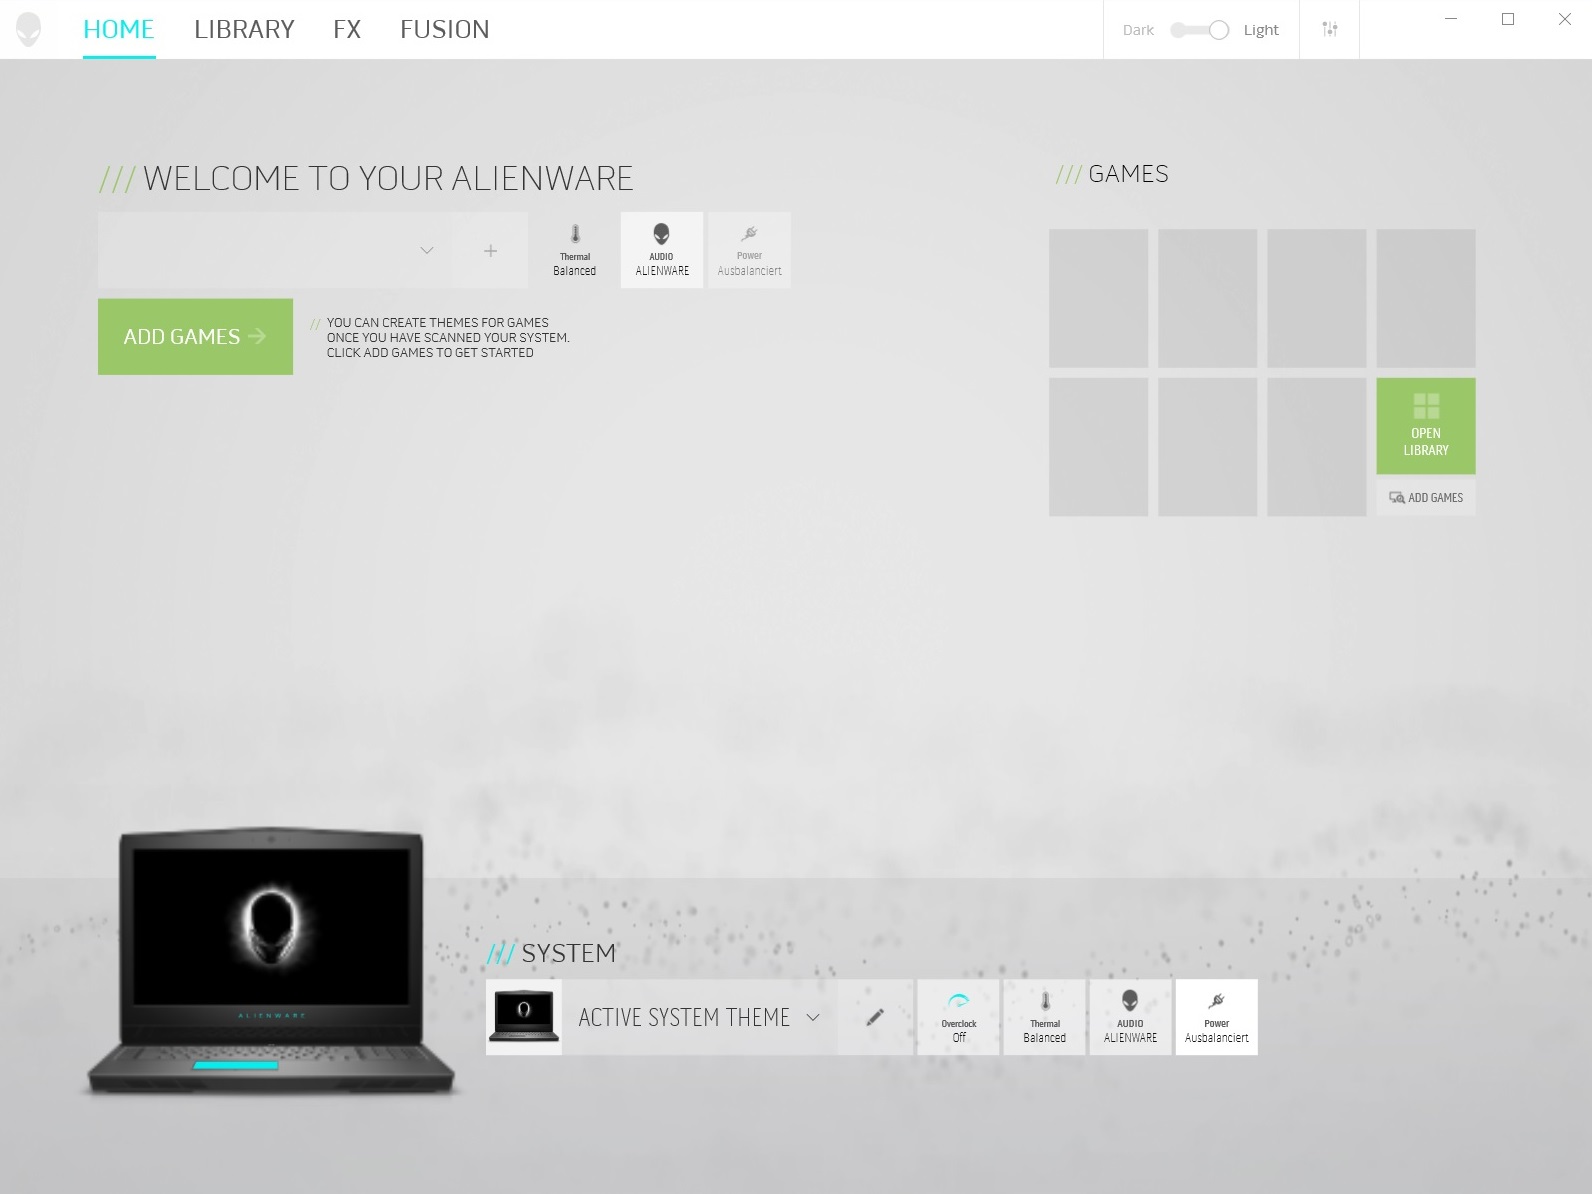
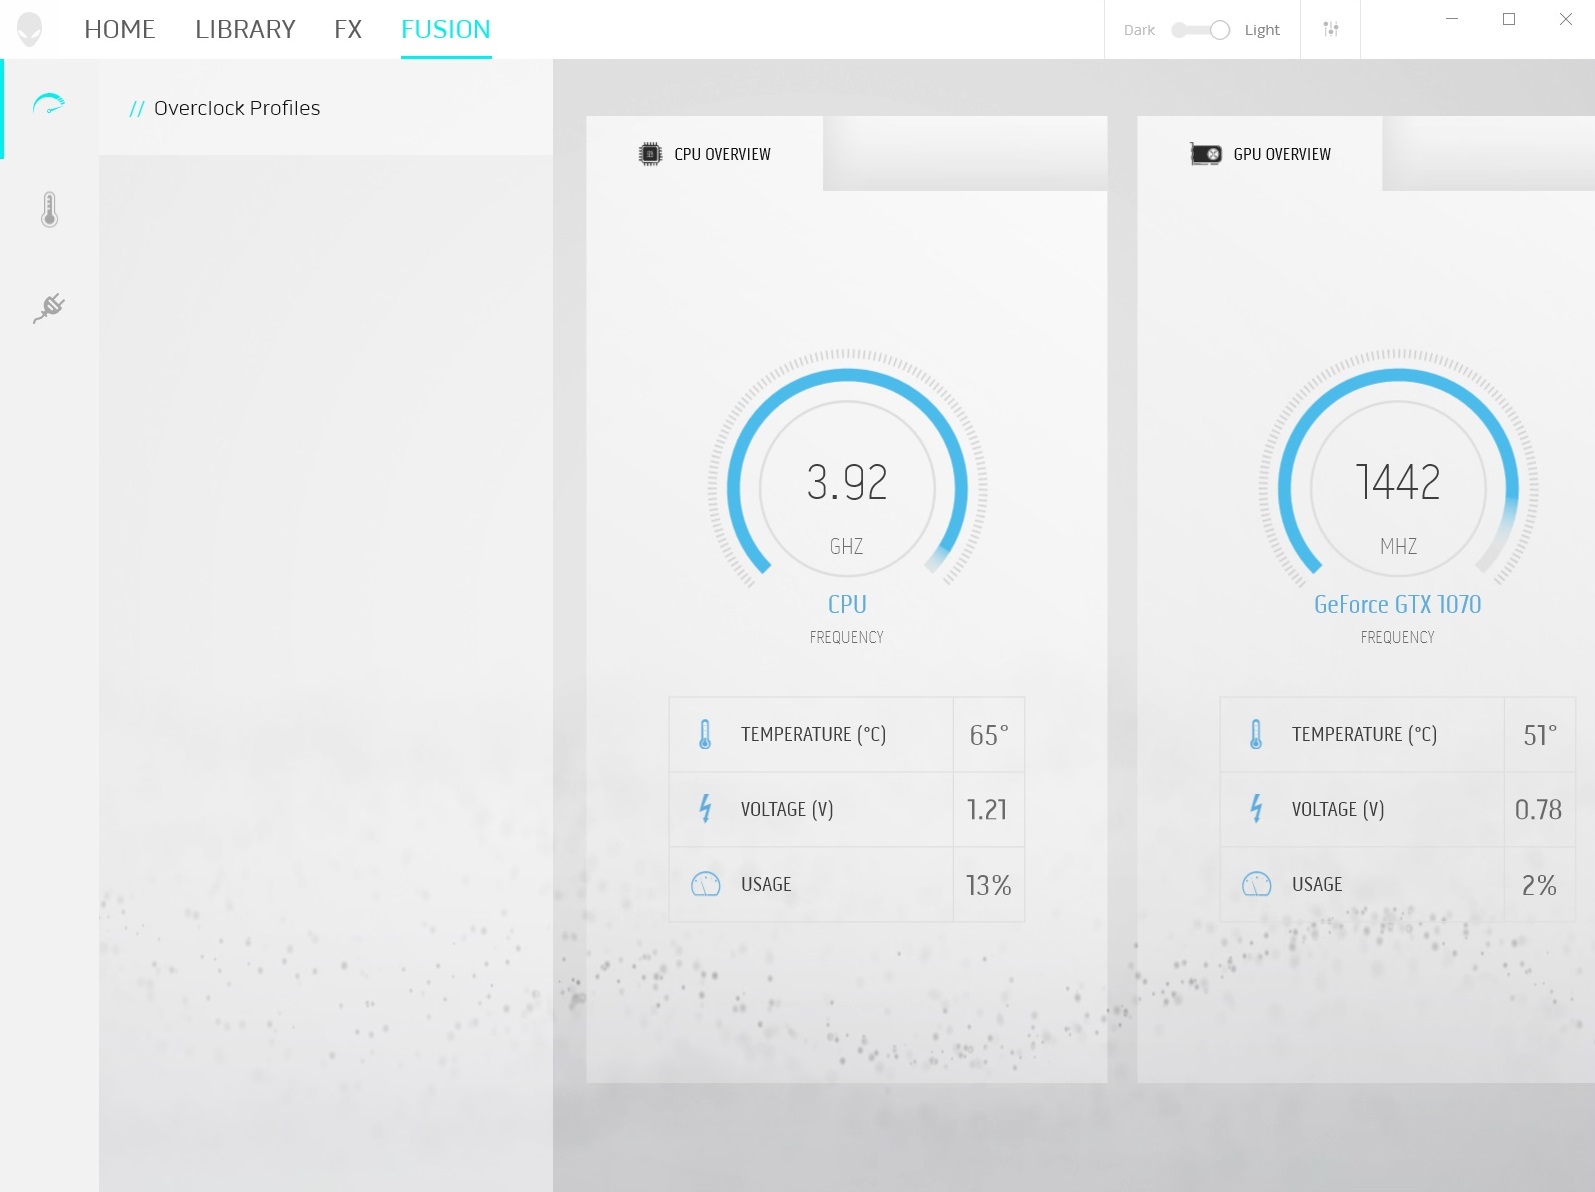
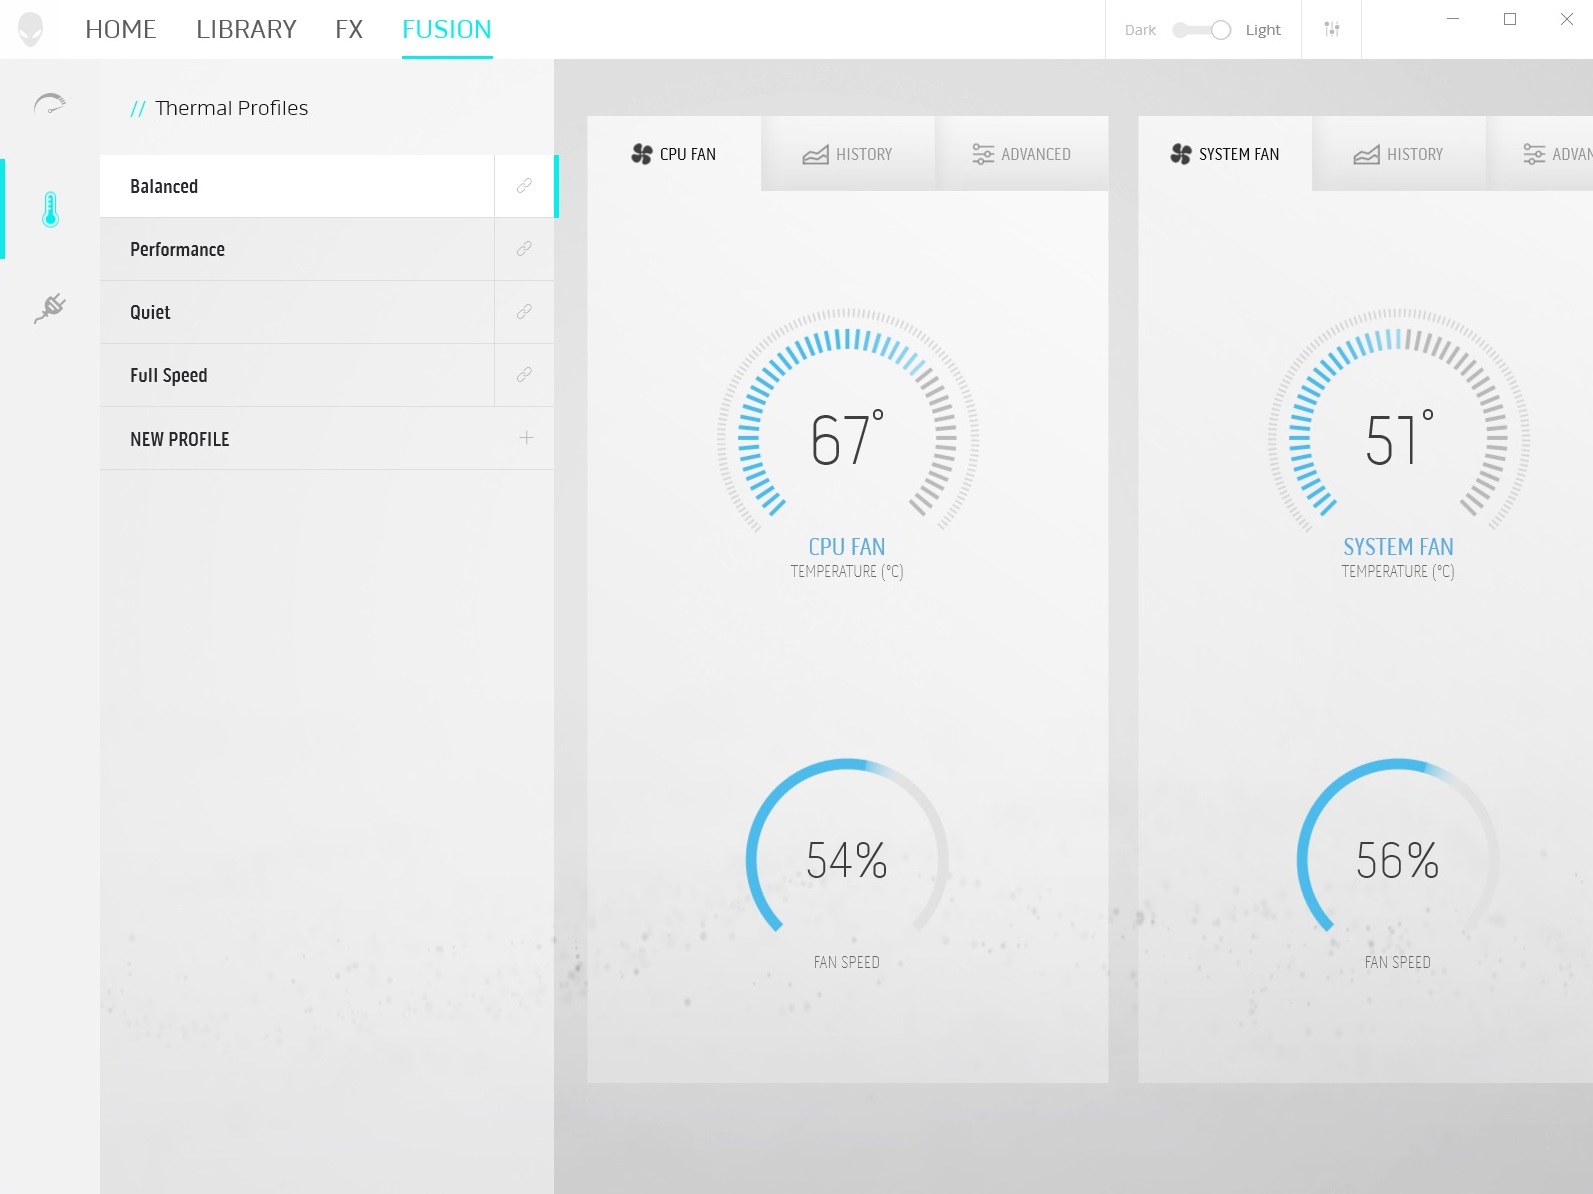
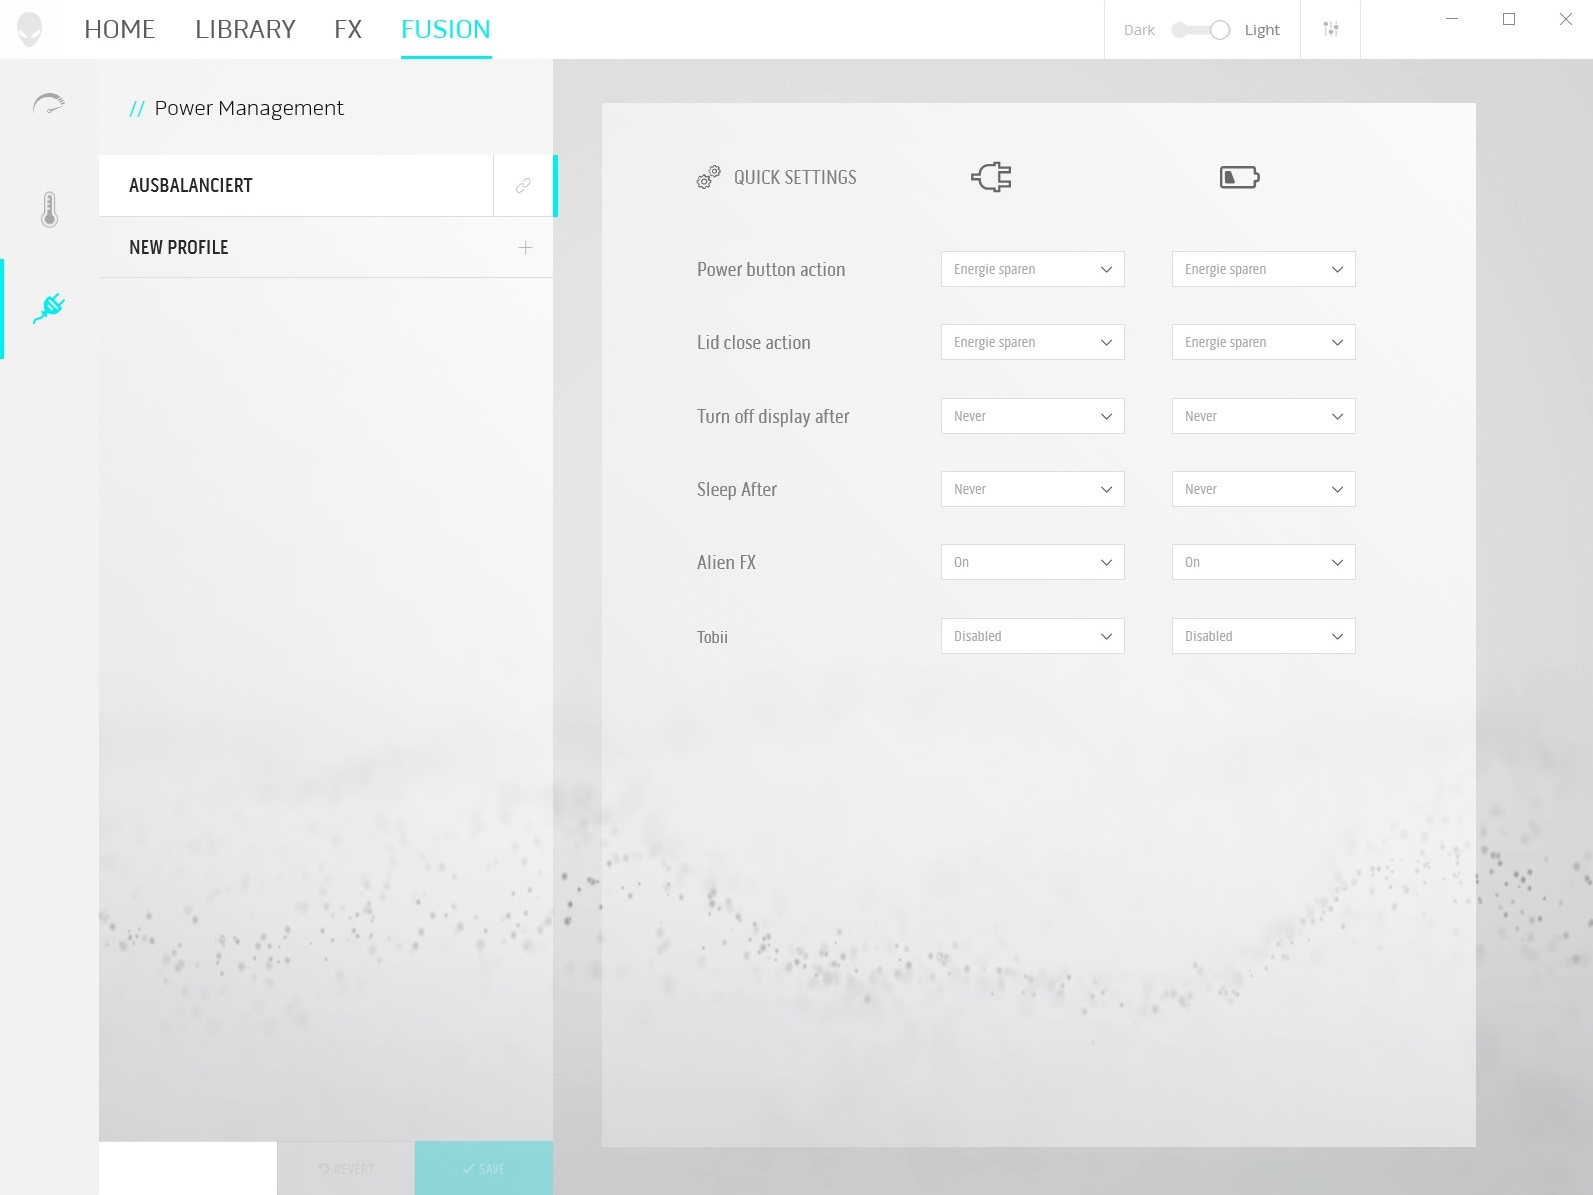
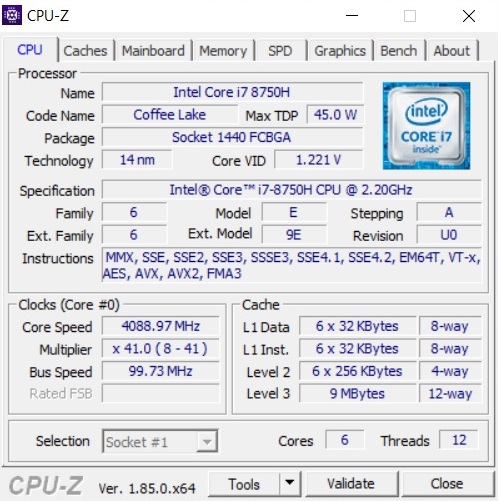
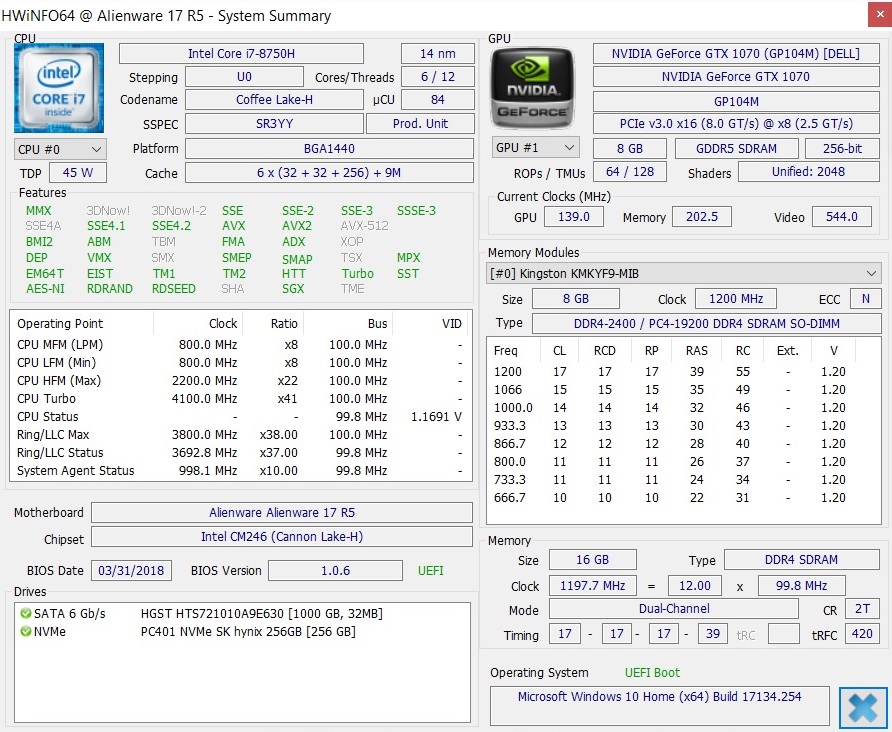
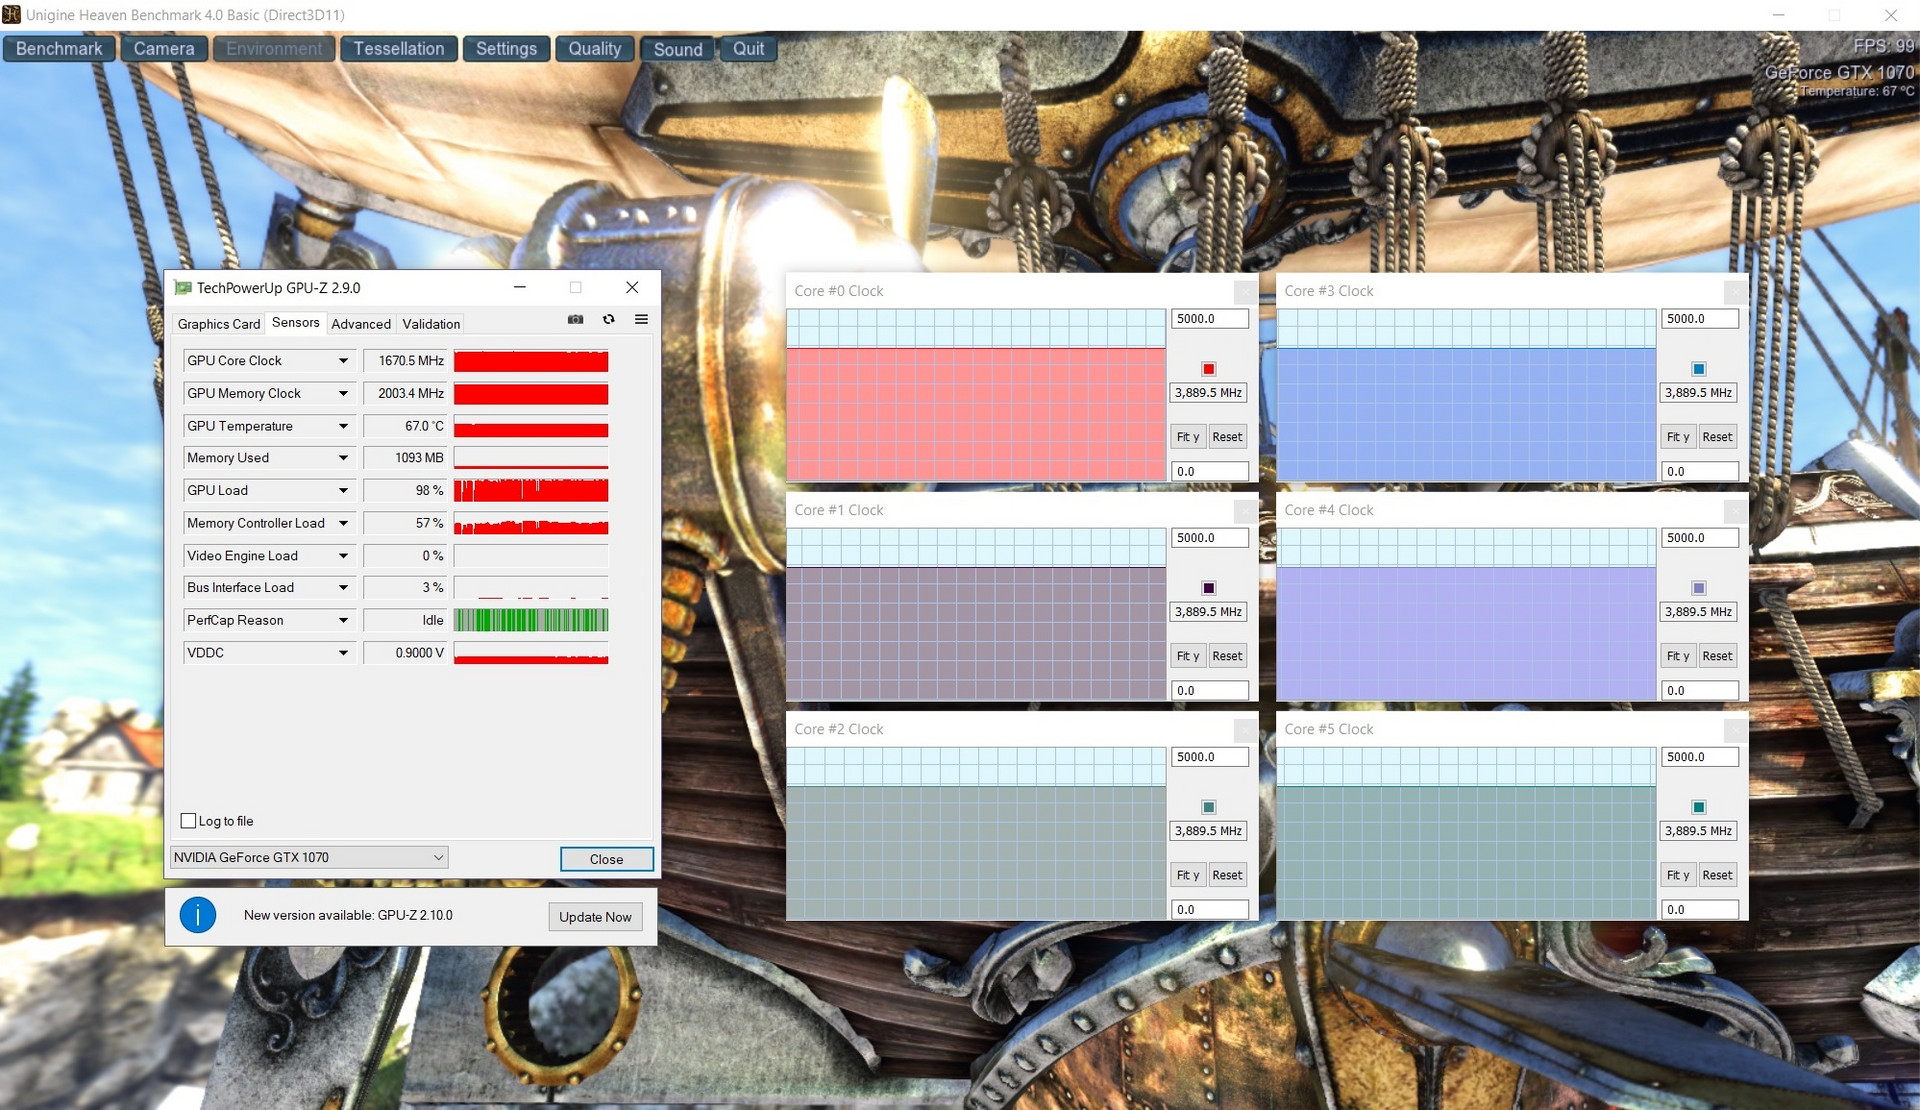
Before we take a look at the performance, some words about the installed tools: As customary with Alienware, the so-called Command Center is the central point for various monitoring and tuning options. In addition to the keyboard illumination, you can also optimize the sound and power-saving settings here. There are also various fan modes and overclocking functions. For our tests, we used the standard settings, which means deactivated overclocking and the balanced thermal mode (see screenshot #1).

Even if you go without the best CPU (Core i9-8950HK) and strongest GPU (GeForce GTX 1080), the Alienware 17 R5 offers more than enough power for everyday gaming. The Core i7-8750H and the GeForce GTX 1070 do not have any significant problems even with demanding games – at least in the Full HD and QHD settings. The frame rates only start to drop fast at 3840x2160 pixels. In order to be armed for the coming generation of games, you should at least choose 16 GB of RAM for the 17-incher.

Processor
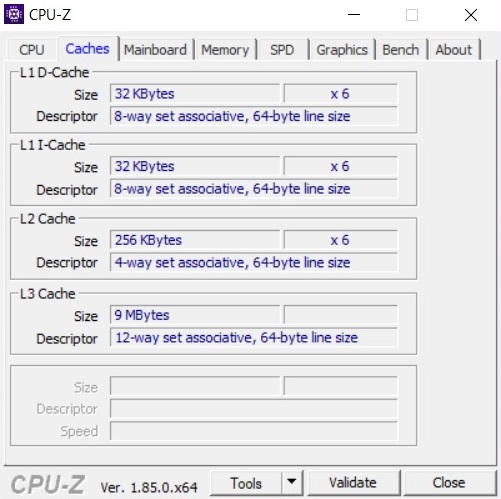
Intel's Core i7-8750H is currently the most popular CPU for gaming laptops. The hexa-core chip contains 9 MB of L3 cache (12 MB @i9-8950HK) and is able to run up to 12 threads in parallel via Hyper-Threading.
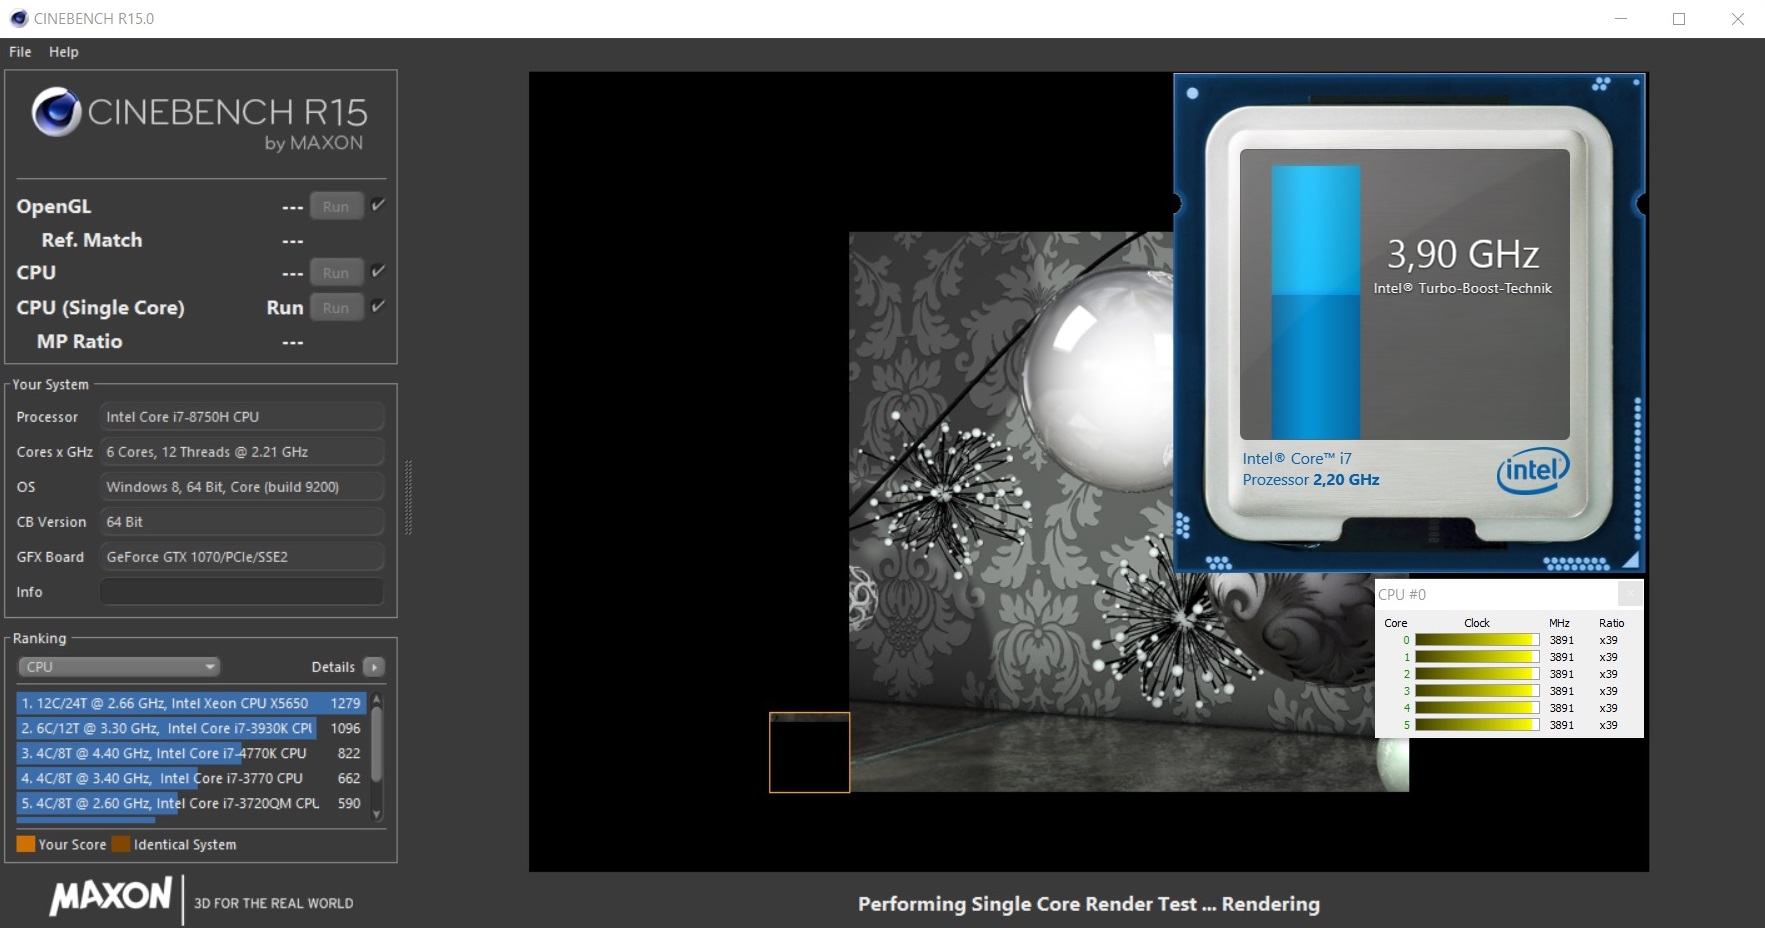

The basic clock speed is 2.2 GHz, and up to 4.1 GHz is possible via Turbo Boost (automatic overclocking). However, the Core i7-8750H only reaches this value in single-core scenarios. When all the cores are loaded, the limits are much lower, as our Cinebench loop also shows. During the first run, the clock speed already drops from 3.9 to 2.9 GHz, which is slightly disappointing for a high-end notebook.
Correspondingly, the Alienware 17 R5 falls behind the competitors in the benchmarks. As you can see in the comparison chart, the competitors are in parts more than 10% faster in the multi-core test of Cinebench R15 and R11.5. However, in real life most users should not perceive any difference, particularly since almost all games are GPU limited.
System Performance
The system performance, which concerns load times, the duration of installations, program starts, and boot processes, etc., depends primarily on the speed of the storage solution. In this regard, the Alienware 17 R5 strikes a good figure, although it does not surpass the competitors. In PCMark 10 for example, it is only sufficient for the last place among the competitors. However, with the exception of the HP Omen 17t, the overall scores are all very close together.
Storage Solution
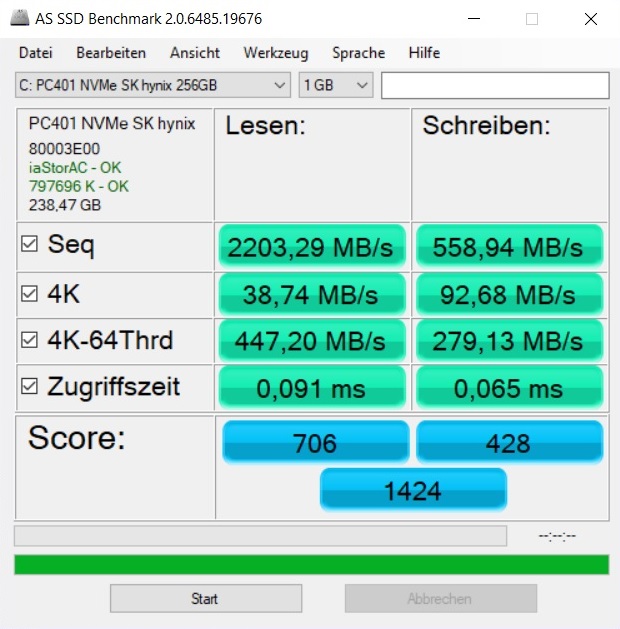
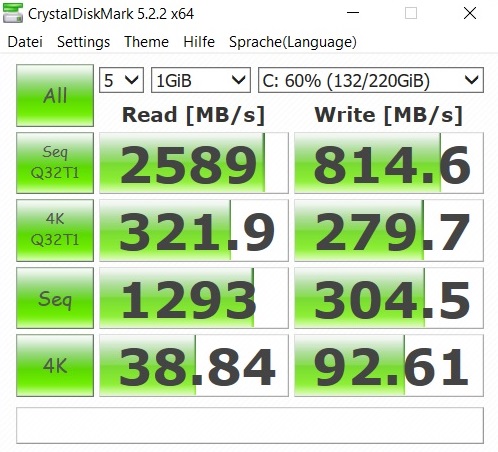
Our test unit uses an NVMe SSD from SK Hynix. The 256 GB PC401 M.2 model delivers a mixed performance. While at more than 2000 MB/s, the sequential read rate was at the typical level of a PCIe drive (AS SSD benchmark), the write rate remains behind our expectations. Around 560 MB/s in the sequential test make us think more of a SATA-III model (see the MSI GE73). The Samsung SSD PM981 of the HP Omen 17t shows that it can also go significantly faster, being almost four times as fast during sequential writes.
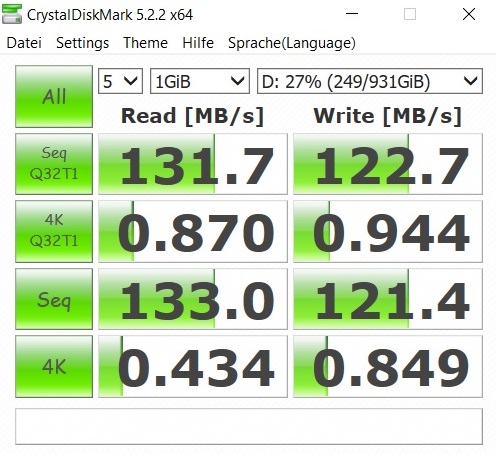
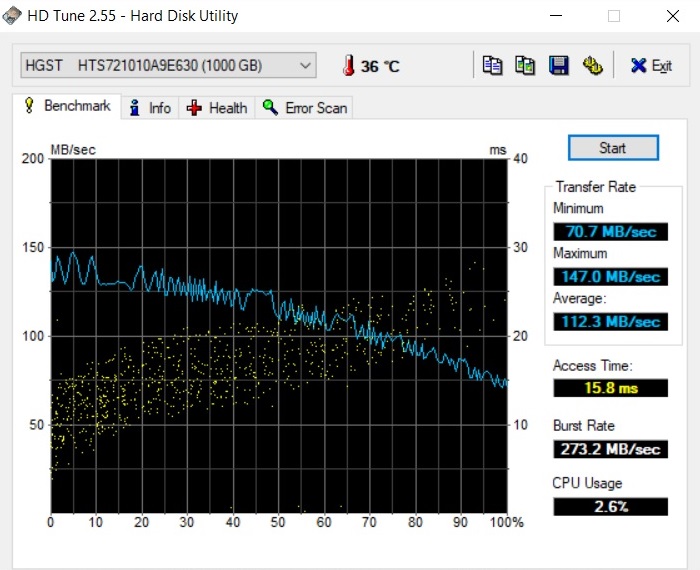
As secondary storage, the manufacturer has also included a 1-TB HDD in the 2.5-inch format. This is the HGST Travelstar 7K1000 that operates at 7200 rpm.
| Alienware 17 R5 SK hynix PC401 HFS256GD9TNG | Alienware 17 R4 SK Hynix PC300 NVMe 512 GB | Acer Predator Helios 500 PH517-51-79BY SK hynix SSD Canvas SC300 HFS256GD9MNE-6200A | MSI GE73 8RF-008 Raider RGB Toshiba HG6 THNSNJ256G8NY | HP Omen 17t-3AW55AV_1 Samsung SSD PM981 MZVLB512HAJQ | |
|---|---|---|---|---|---|
| AS SSD | 1% | 3% | -67% | 47% | |
| Seq Read (MB/s) | 2203 | 1752 -20% | 972 -56% | 511 -77% | 1473 -33% |
| Seq Write (MB/s) | 559 | 735 31% | 838 50% | 425.7 -24% | 1962 251% |
| 4K Read (MB/s) | 38.74 | 35.61 -8% | 38.57 0% | 14.07 -64% | 31.66 -18% |
| 4K Write (MB/s) | 92.7 | 113.4 22% | 80.7 -13% | 38.34 -59% | 84.4 -9% |
| Access Time Read * (ms) | 0.091 | 0.042 54% | 0.235 -158% | 0.071 22% | |
| Access Time Write * (ms) | 0.065 | 0.123 -89% | 0.054 17% | 0.097 -49% | 0.047 28% |
| Score Read (Points) | 706 | 831 18% | 859 22% | 417 -41% | 1304 85% |
* ... smaller is better

Graphics Card
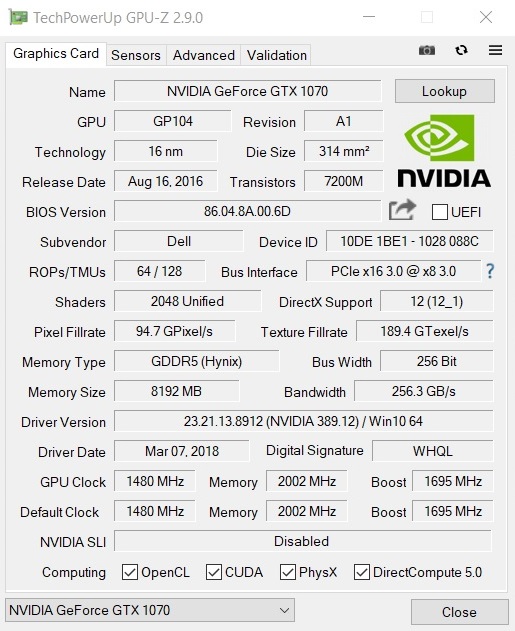
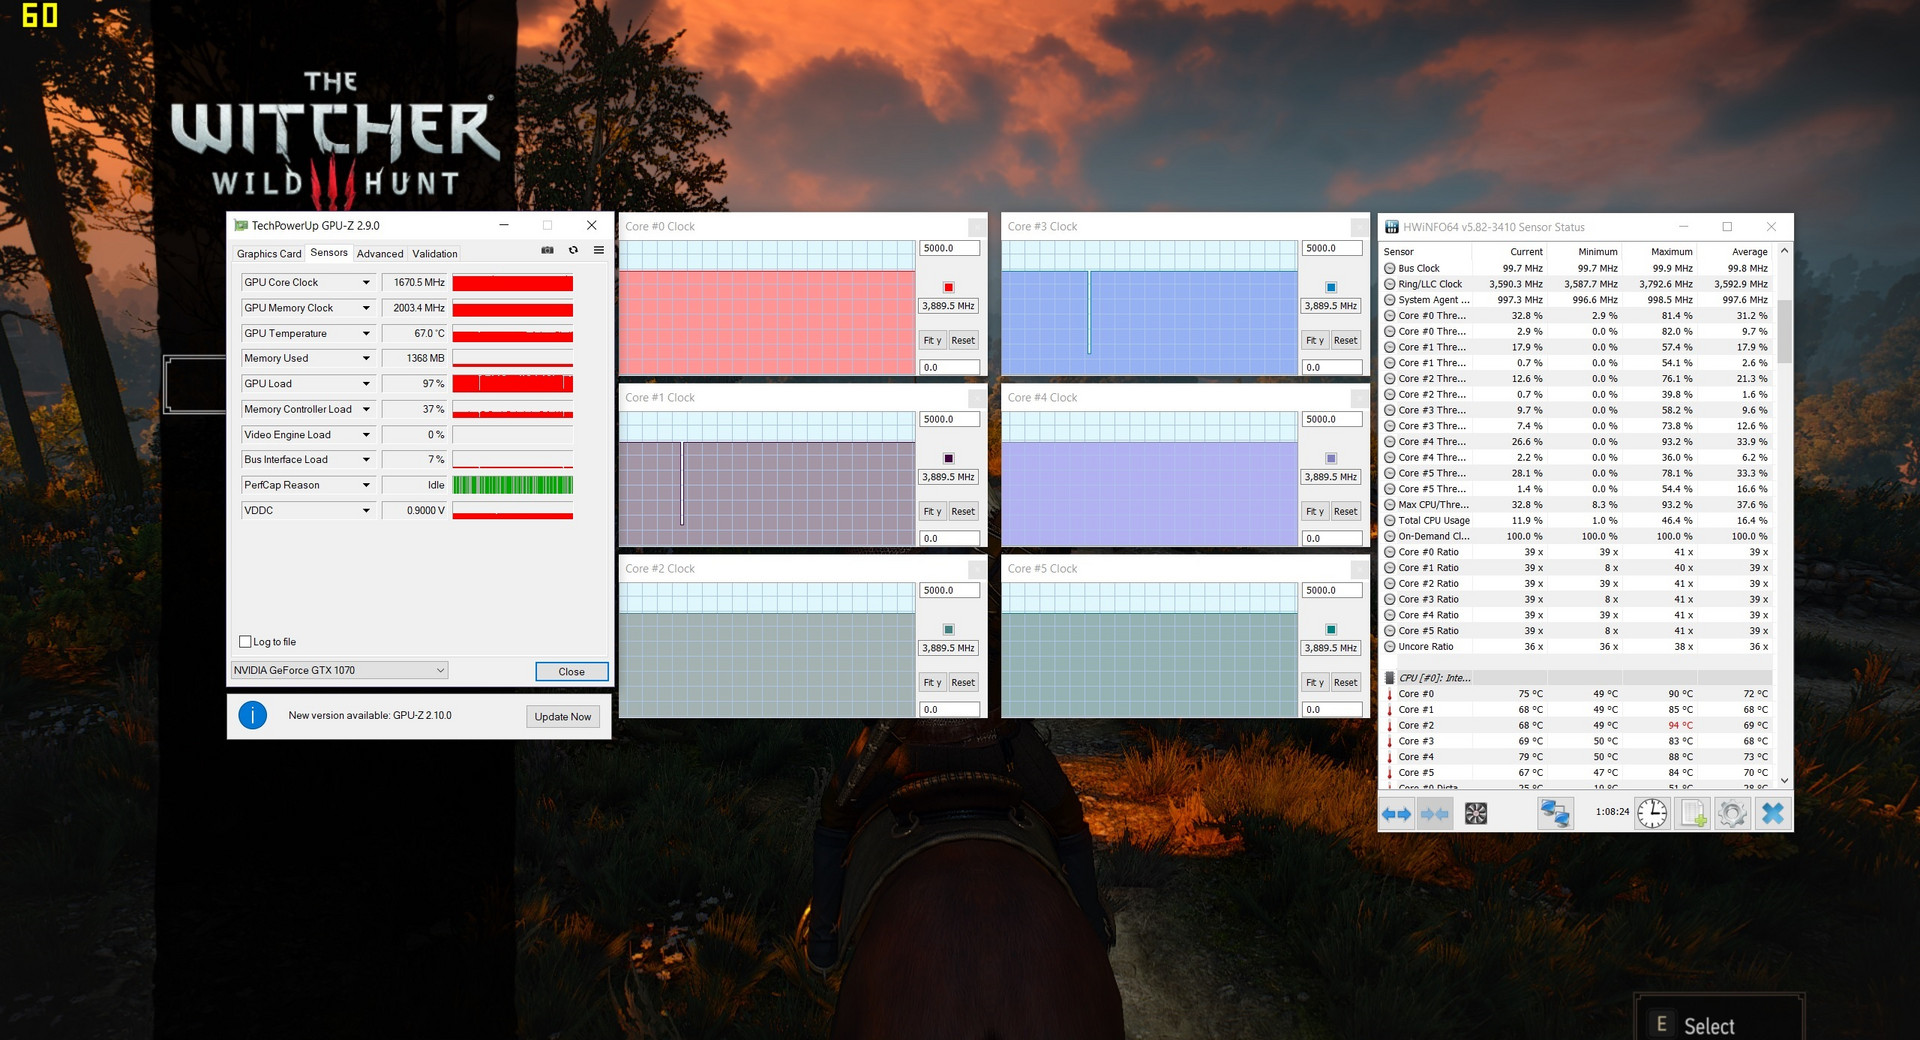
The display output is handled by a Pascal GPU from Nvidia. While the GeForce GTX 1060 is predestined for the Full HD display, we would recommend the GeForce GTX 1070 to buyers of the QHD panel version. The high-end model can score with 2048 shader units as well as 8 GB of GDDR5-VRAM and reaches up to 1873 MHz under load (Render test of the GPU-Z tool). During games and other 3D applications, the GTX 1070 levels out at about 1670 MHz, which is still respectable considering a basic clock speed of 1480 MHz.
| 3DMark 11 - 1280x720 Performance GPU | |
| Average of class Gaming (21841 - 80022, n=109, last 2 years) | |
| Alienware 17 R4 | |
| Alienware 17 R5 | |
| MSI GE73 8RF-008 Raider RGB | |
| HP Omen 17t-3AW55AV_1 | |
Thanks to the GPU overclocking which works well, the Alienware 17 R5 performs well in the graphics tests. The Fire-Strike run of 3DMark 13 places the 17-inch notebook on the level of the MSI GE73 and Acer Helios 500. Despite having an identical CPU/GPU combo, the HP Omen 17t is beaten by almost 10%. Looking at the predecessor, we can guess how the Alienware 17 R5 would perform with a GeForce GTX 1080: The test configuration of the old model performs 23% better.
| 3DMark 11 Performance | 18741 points | |
| 3DMark Cloud Gate Standard Score | 32992 points | |
| 3DMark Fire Strike Score | 15457 points | |
| 3DMark Time Spy Score | 5640 points | |
Help | ||
In the constant load test with The Witcher 3 (Full HD/Ultra) there was nothing that stood out besides the usual Turbo variations. The frame rate remained quite constant even after 60 minutes.
Gaming Performance
As already mentioned, the GeForce GTX 1070 is a good partner for the QHD display. Although with 2560x1440 pixels, the 120-Hz technology is not always fully used (in high to maximum settings it only sometimes reaches more than 60 FPS), you will be spared any stuttering even in computing-intensive games.
| F1 2018 - 2560x1440 Ultra High Preset AA:T AF:16x | |
| Alienware 17 R5 | |
| The Crew 2 - 2560x1440 Ultra Preset | |
| Alienware 17 R5 | |
| Need for Speed Payback - 2560x1440 Ultra Preset | |
| Alienware 17 R5 | |
| Assassin´s Creed Origins - 2560x1440 Ultra High Preset | |
| Alienware 17 R5 | |
| Destiny 2 - 2560x1440 Highest Preset AA:SM AF:16x | |
| Alienware 17 R5 | |
The chart below shows the results with 1920x1080 pixels, which can make better use of the 120 Hz. Nvidia's most expensive model, the GeForce GTX 1080, is only worthwhile for a very few users, since the higher performance – as long as you limit yourself to moderate resolutions – does not correspond to the higher price, increased cooling needs, and increased power consumption.
| low | med. | high | ultra | QHD | |
|---|---|---|---|---|---|
| The Witcher 3 (2015) | 109 | 60.8 | |||
| FIFA 18 (2017) | 326 | 319 | |||
| Destiny 2 (2017) | 142 | 119 | 82.4 | ||
| Assassin´s Creed Origins (2017) | 77 | 67 | 54 | ||
| Need for Speed Payback (2017) | 114 | 108 | 81.3 | ||
| The Crew 2 (2018) | 60 | 60 | 60 | ||
| F1 2018 (2018) | 117 | 84 | 68 |
Emissions
Noise Emissions
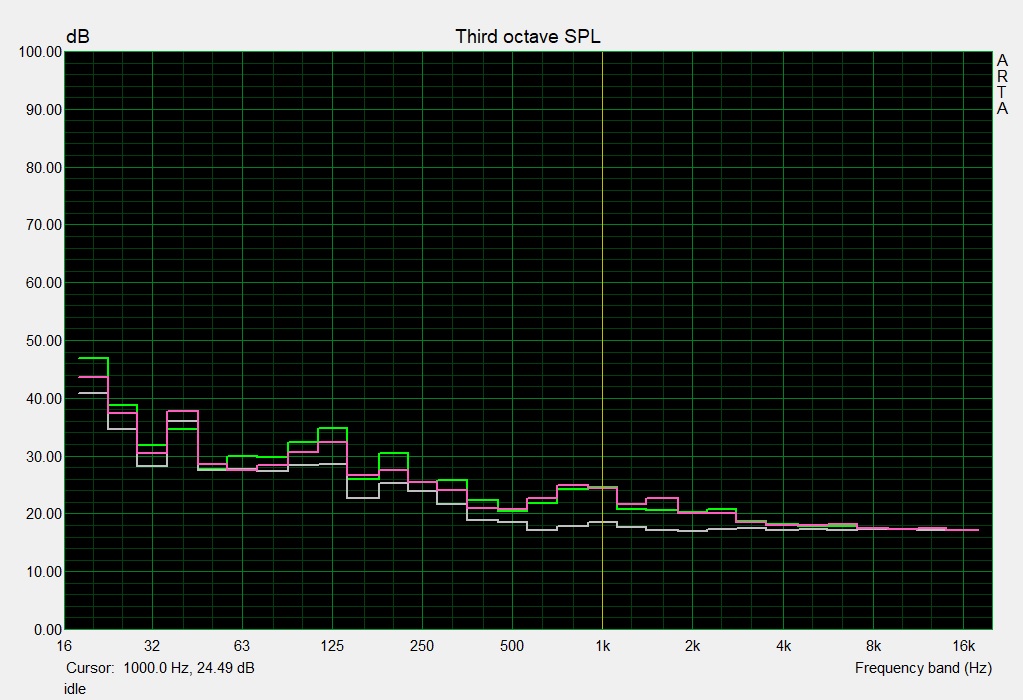
The noise development leaves mixed feelings. While the fans often remain completely deactivated during idle (allowing you to hear only the whirring of the HDD), during more load the noise quickly becomes loud. The best example is our The Witcher 3 test, where the Alienware 17 R5 produced an annoying 51 dB. We were also able to measure the same value during the stress test with the Furmark and Prime95 tools. Without headphones, gaming sessions bring no pleasure. Besides the MSI GE73 8RF, which is similarly present under load, most of the competitors remain quieter. The Acer Helios 500 and the HP Omen 17t reach at most 45 and 46 dB, respectively.
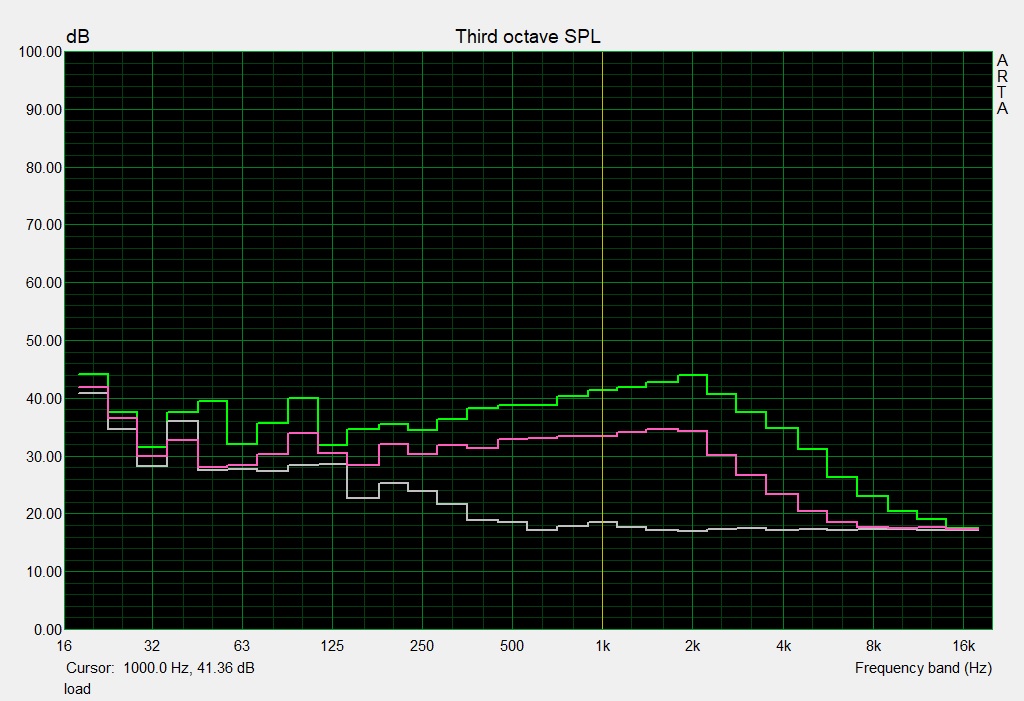
Since the components do not heat up excessively in 3D operation, there would really be some room for a lower noise level on the Alienware 17 R5. During typical gaming load, the CPU and GPU only heat up to barely 70 °C (158 °F).
Noise level
| Idle |
| 32 / 33 / 34 dB(A) |
| HDD |
| 33 dB(A) |
| Load |
| 43 / 51 dB(A) |
 | ||
30 dB silent 40 dB(A) audible 50 dB(A) loud |
||
min: | ||
| Alienware 17 R5 i7-8750H, GeForce GTX 1070 Mobile | Alienware 17 R4 i7-7820HK, GeForce GTX 1080 Mobile | Acer Predator Helios 500 PH517-51-79BY i7-8750H, GeForce GTX 1070 Mobile | MSI GE73 8RF-008 Raider RGB i7-8750H, GeForce GTX 1070 Mobile | HP Omen 17t-3AW55AV_1 i7-8750H, GeForce GTX 1070 Mobile | Average of class Gaming | |
|---|---|---|---|---|---|---|
| Noise | -4% | 3% | 0% | 5% | 10% | |
| off / environment * (dB) | 30 | 28.2 6% | 30.4 -1% | 30 -0% | 27.8 7% | 24.1 ? 20% |
| Idle Minimum * (dB) | 32 | 35.6 -11% | 31.2 2% | 32 -0% | 31.1 3% | 25.8 ? 19% |
| Idle Average * (dB) | 33 | 35.6 -8% | 35.3 -7% | 33 -0% | 31.1 6% | 27.5 ? 17% |
| Idle Maximum * (dB) | 34 | 35.7 -5% | 35.3 -4% | 34 -0% | 35 -3% | 30 ? 12% |
| Load Average * (dB) | 43 | 50.2 -17% | 44.4 -3% | 41 5% | 42 2% | 43.1 ? -0% |
| Witcher 3 ultra * (dB) | 51 | 50.2 2% | 41 20% | 50 2% | 44.5 13% | |
| Load Maximum * (dB) | 51 | 50.2 2% | 45.2 11% | 54 -6% | 46.5 9% | 54 ? -6% |
* ... smaller is better
Temperature
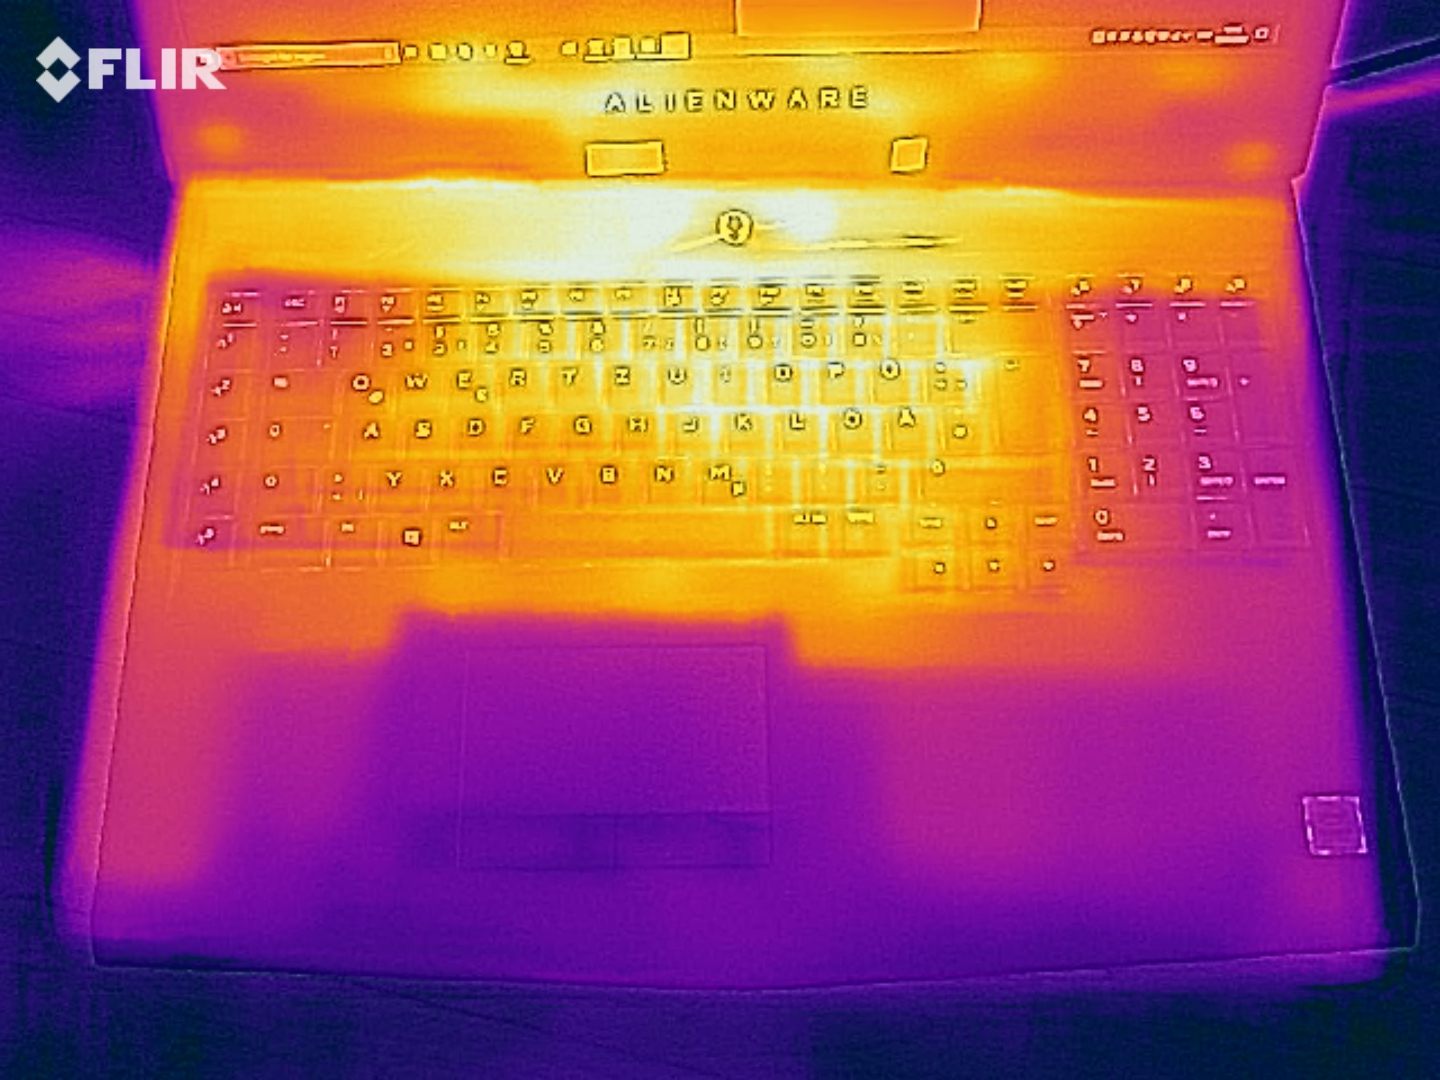
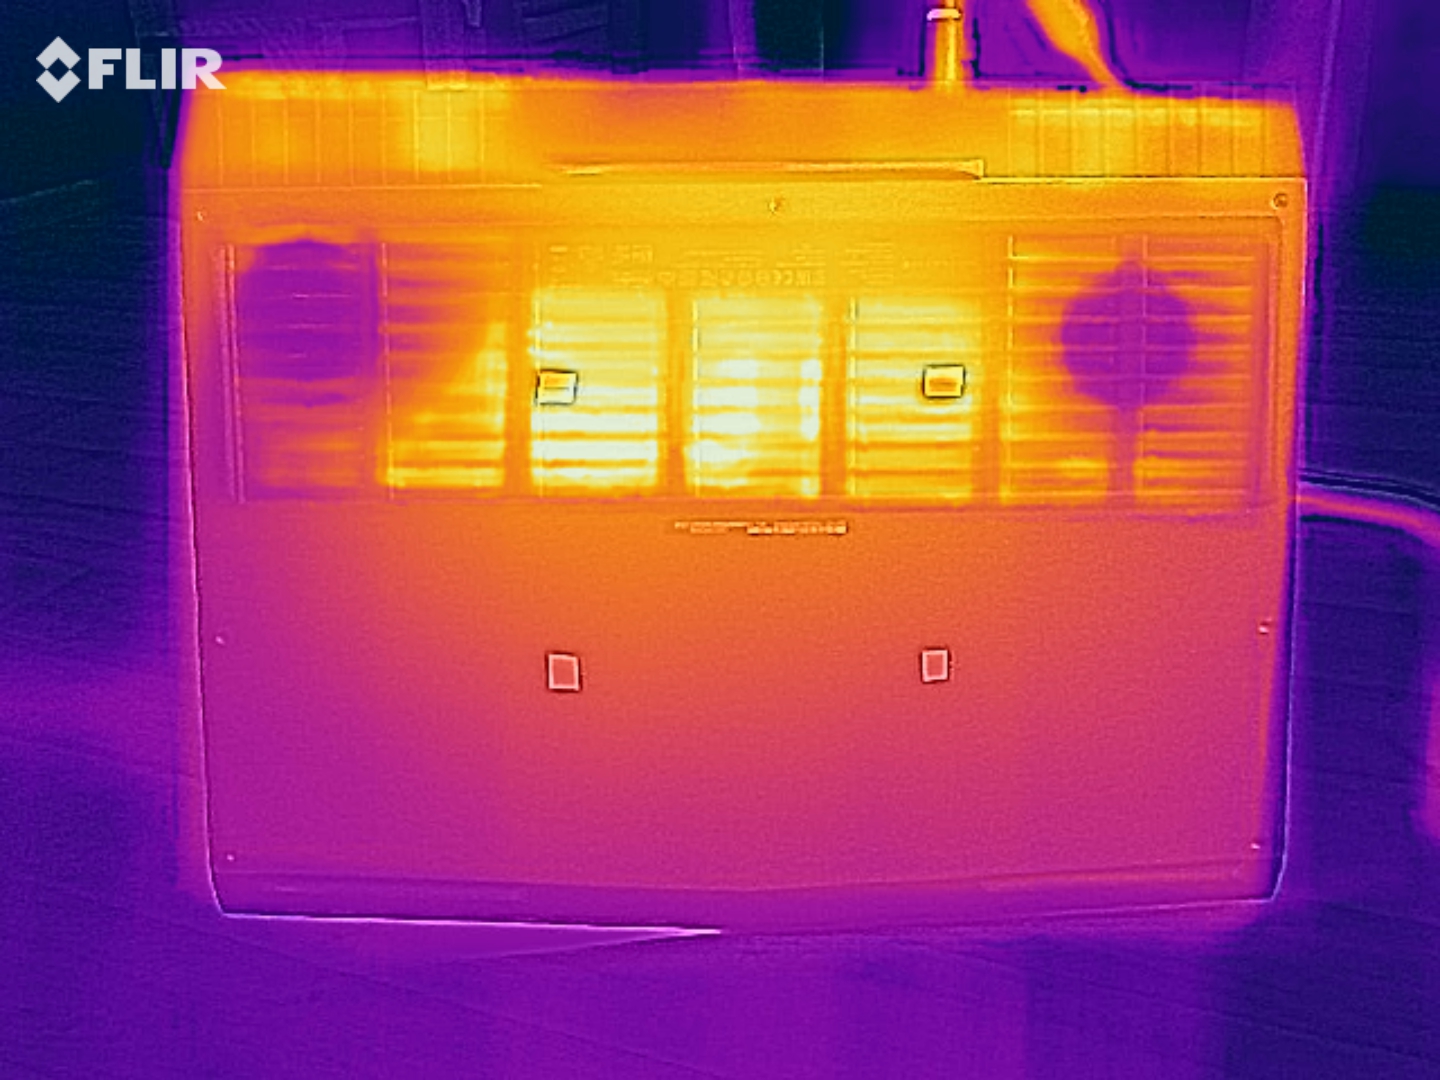
The temperatures vary strongly depending on the case area. We offer particular praise for the palm rest that always remains comfortably cool even under full load. The keyboard area also does not get as warm during 3D applications as in many other gaming laptops. On the other hand, things look worse on the bottom of the case, and a maximum of 58 °C (~136 °F) speaks against gaming sessions on your lap.
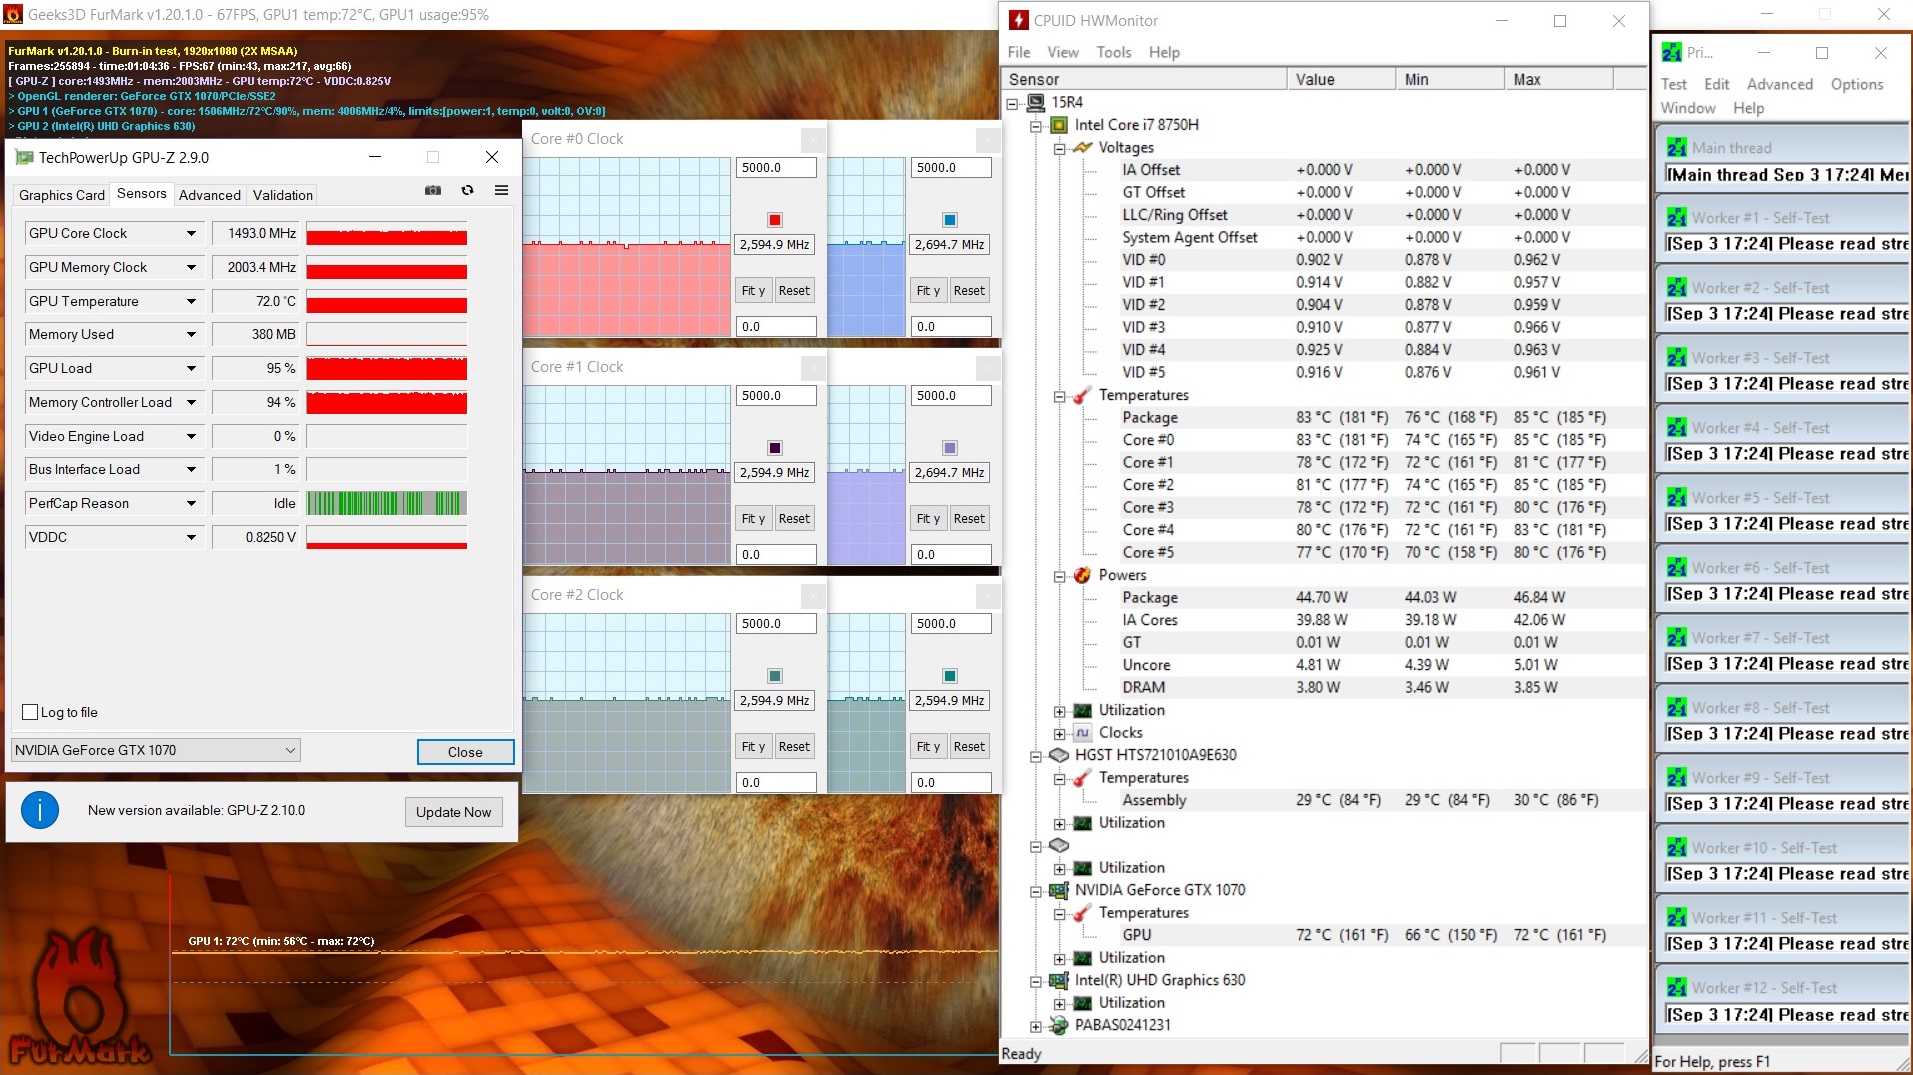
It is positive that the processor and graphics card do not show any throttling even in extreme situations. The Core i7-8750H completed the 60-minute stress test with Furmark and Prime95 at 2.6 GHz on average, while the GeForce GTX 1070 still achieved about 1500 MHz.
(-) The maximum temperature on the upper side is 46 °C / 115 F, compared to the average of 40.4 °C / 105 F, ranging from 21.2 to 68.8 °C for the class Gaming.
(-) The bottom heats up to a maximum of 58 °C / 136 F, compared to the average of 43.2 °C / 110 F
(±) In idle usage, the average temperature for the upper side is 34.9 °C / 95 F, compared to the device average of 33.9 °C / 93 F.
(±) Playing The Witcher 3, the average temperature for the upper side is 37.4 °C / 99 F, compared to the device average of 33.9 °C / 93 F.
(+) The palmrests and touchpad are reaching skin temperature as a maximum (32 °C / 89.6 F) and are therefore not hot.
(-) The average temperature of the palmrest area of similar devices was 28.8 °C / 83.8 F (-3.2 °C / -5.8 F).
| Alienware 17 R5 i7-8750H, GeForce GTX 1070 Mobile | Alienware 17 R4 i7-7820HK, GeForce GTX 1080 Mobile | Acer Predator Helios 500 PH517-51-79BY i7-8750H, GeForce GTX 1070 Mobile | MSI GE73 8RF-008 Raider RGB i7-8750H, GeForce GTX 1070 Mobile | HP Omen 17t-3AW55AV_1 i7-8750H, GeForce GTX 1070 Mobile | Average of class Gaming | |
|---|---|---|---|---|---|---|
| Heat | 13% | 21% | 13% | 11% | 14% | |
| Maximum Upper Side * (°C) | 46 | 49.6 -8% | 42.6 7% | 47 -2% | 44.2 4% | 45.2 ? 2% |
| Maximum Bottom * (°C) | 58 | 56 3% | 37.2 36% | 49 16% | 55.8 4% | 48.2 ? 17% |
| Idle Upper Side * (°C) | 40 | 29.6 26% | 33.6 16% | 32 20% | 31.6 21% | 31.1 ? 22% |
| Idle Bottom * (°C) | 41 | 29.2 29% | 31 24% | 34 17% | 35 15% | 34.3 ? 16% |
* ... smaller is better
Speakers
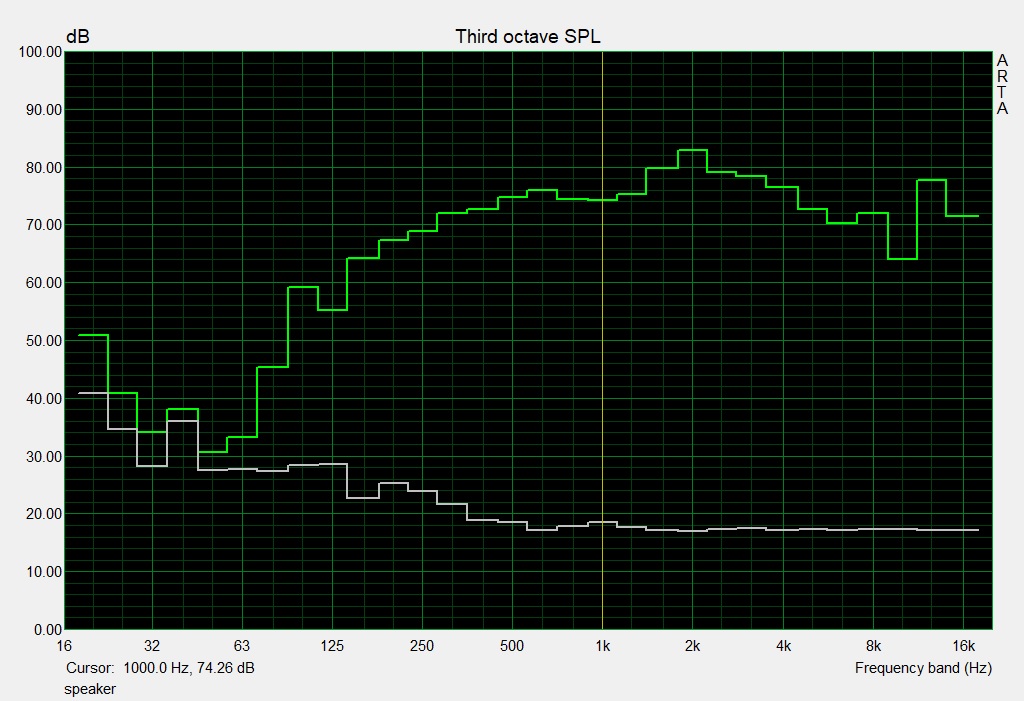
It is strange that while the sound system remained unchanged on paper, our audio analysis appears to have found a significant improvement of the sound compared to the predecessor. Besides the bass, the mids and highs have also supposedly improved. The maximum volume also differs from that of the old test.
Alienware 17 R5 audio analysis
(+) | speakers can play relatively loud (89 dB)
Bass 100 - 315 Hz
(±) | reduced bass - on average 9.8% lower than median
(±) | linearity of bass is average (10.1% delta to prev. frequency)
Mids 400 - 2000 Hz
(+) | balanced mids - only 2.4% away from median
(+) | mids are linear (3.1% delta to prev. frequency)
Highs 2 - 16 kHz
(+) | balanced highs - only 4.2% away from median
(+) | highs are linear (5.6% delta to prev. frequency)
Overall 100 - 16.000 Hz
(+) | overall sound is linear (9.5% difference to median)
Compared to same class
» 3% of all tested devices in this class were better, 1% similar, 95% worse
» The best had a delta of 6%, average was 18%, worst was 132%
Compared to all devices tested
» 4% of all tested devices were better, 1% similar, 95% worse
» The best had a delta of 4%, average was 24%, worst was 134%
Alienware 17 R4 audio analysis
(±) | speaker loudness is average but good (75 dB)
Bass 100 - 315 Hz
(-) | nearly no bass - on average 15.3% lower than median
(±) | linearity of bass is average (9.6% delta to prev. frequency)
Mids 400 - 2000 Hz
(±) | higher mids - on average 5.5% higher than median
(±) | linearity of mids is average (8.9% delta to prev. frequency)
Highs 2 - 16 kHz
(±) | higher highs - on average 5.1% higher than median
(±) | linearity of highs is average (9.7% delta to prev. frequency)
Overall 100 - 16.000 Hz
(±) | linearity of overall sound is average (22.4% difference to median)
Compared to same class
» 80% of all tested devices in this class were better, 6% similar, 14% worse
» The best had a delta of 6%, average was 18%, worst was 132%
Compared to all devices tested
» 65% of all tested devices were better, 6% similar, 29% worse
» The best had a delta of 4%, average was 24%, worst was 134%
Power Management
Power Consumption
Due to the lack of graphics-switching, the 17-incher needs quite a lot of power already during idle operation. Together with the result of the Alienware 17 R4, 28-37 watts is the worst value in the test field, and that is even though the Acer Helios 500 and the HP Omen 17 forgo Optimus, using G-Sync instead. On the other hand, with 112-231 watts under load the Alienware 17 R5 places in the middle of the competitors.
| Off / Standby | |
| Idle | |
| Load |
|
Key:
min: | |
| Alienware 17 R5 i7-8750H, GeForce GTX 1070 Mobile | Alienware 17 R4 i7-7820HK, GeForce GTX 1080 Mobile | Acer Predator Helios 500 PH517-51-79BY i7-8750H, GeForce GTX 1070 Mobile | MSI GE73 8RF-008 Raider RGB i7-8750H, GeForce GTX 1070 Mobile | HP Omen 17t-3AW55AV_1 i7-8750H, GeForce GTX 1070 Mobile | Average of class Gaming | |
|---|---|---|---|---|---|---|
| Power Consumption | -13% | 6% | 21% | 20% | 24% | |
| Idle Minimum * (Watt) | 28 | 37.5 -34% | 20.4 27% | 15 46% | 17.8 36% | 13.3 ? 52% |
| Idle Average * (Watt) | 32 | 37.6 -18% | 26.5 17% | 20 37% | 24.7 23% | 19 ? 41% |
| Idle Maximum * (Watt) | 37 | 37.6 -2% | 37 -0% | 26 30% | 29.6 20% | 24.5 ? 34% |
| Load Average * (Watt) | 112 | 122.4 -9% | 129 -15% | 97 13% | 110 2% | 108.1 ? 3% |
| Witcher 3 ultra * (Watt) | 192 | 180.3 6% | 186 3% | 186 3% | 167.8 13% | |
| Load Maximum * (Watt) | 231 | 277.4 -20% | 216 6% | 239 -3% | 178.6 23% | 254 ? -10% |
* ... smaller is better
Battery Life
Despite its powerful 99-Wh battery, the runtimes are unable to inspire. A maximum of 4.5 hours is no reason for cheering in 2018. Here, the lack of graphics-switching takes a particularly extreme toll. For comparison, the current endurance champion of gaming laptops, the Gigabyte Aero 15X v8, can manage more than 12 hours in an ideal scenario.
| Alienware 17 R5 i7-8750H, GeForce GTX 1070 Mobile, 99 Wh | Alienware 17 R4 i7-7820HK, GeForce GTX 1080 Mobile, 99 Wh | Acer Predator Helios 500 PH517-51-79BY i7-8750H, GeForce GTX 1070 Mobile, 72 Wh | MSI GE73 8RF-008 Raider RGB i7-8750H, GeForce GTX 1070 Mobile, 51 Wh | HP Omen 17t-3AW55AV_1 i7-8750H, GeForce GTX 1070 Mobile, 86 Wh | Average of class Gaming | |
|---|---|---|---|---|---|---|
| Battery runtime | -2% | 3% | -15% | 21% | 74% | |
| Reader / Idle (h) | 4.5 | 4.6 2% | 4.2 -7% | 5.1 13% | 4.5 0% | 8.71 ? 94% |
| WiFi v1.3 (h) | 3.6 | 3 -17% | 2.9 -19% | 3.1 -14% | 4.2 17% | 7.01 ? 95% |
| Load (h) | 1.1 | 1.2 9% | 1.5 36% | 0.6 -45% | 1.6 45% | 1.47 ? 34% |
| Witcher 3 ultra (h) | 1.1 | |||||
| H.264 (h) | 3.2 | 8.26 ? |
Verdict
Pros
Cons
Those looking for a stylish high-end notebook with good input devices, modern connections, and many illumination options should be pleased with the Alienware 17 R5.
Aside from some smaller details, the 17-inch case is able to convince, as long as you can come to terms with its thickness and hefty weight. The low battery life also takes away from the mobility. For the successor, we would also wish for better fan control, since the fans rev up unnecessarily during 3D operation.
There are also good and bad sides in the optional QHD display, which is very bright and also offers a very quick response time on one hand, but it suffers from a mediocre black value and limited viewing angles on the other hand. In addition, the Turbo performance of the CPU also could be better. During the multi-core load, the Core i7-8750H only makes use of its overclocking to a limited extent.
Overall, it is still sufficient for a spot in our Gaming Top 10. But the earlier dominance of Alienware laptops has been broken.
Alienware 17 R5
- 09/06/2018 v6 (old)
Florian Glaser
Price comparison
